Dry Forests: Ecology, Species Diversity and Sustainable Management
201
Complimentary Contributor Copy
Transcript of Dry Forests: Ecology, Species Diversity and Sustainable Management

Complimentary Contributor Copy

Complimentary Contributor Copy

ENVIRONMENTAL HEALTH - PHYSICAL, CHEMICAL
AND BIOLOGICAL FACTORS
DRY FORESTS
ECOLOGY, SPECIES DIVERSITY AND
SUSTAINABLE MANAGEMENT
No part of this digital document may be reproduced, stored in a retrieval system or transmitted in any form orby any means. The publisher has taken reasonable care in the preparation of this digital document, but makes noexpressed or implied warranty of any kind and assumes no responsibility for any errors or omissions. Noliability is assumed for incidental or consequential damages in connection with or arising out of informationcontained herein. This digital document is sold with the clear understanding that the publisher is not engaged inrendering legal, medical or any other professional services.
Complimentary Contributor Copy

ENVIRONMENTAL HEALTH - PHYSICAL,
CHEMICAL AND BIOLOGICAL FACTORS
Additional books in this series can be found on Nova‟s website
under the Series tab.
Additional e-books in this series can be found on Nova‟s website
under the e-book tab.
Complimentary Contributor Copy

ENVIRONMENTAL HEALTH - PHYSICAL, CHEMICAL
AND BIOLOGICAL FACTORS
DRY FORESTS
ECOLOGY, SPECIES DIVERSITY AND
SUSTAINABLE MANAGEMENT
FRANCIS ELIOTT GREER
EDITOR
New York
Complimentary Contributor Copy

Copyright © 2014 by Nova Science Publishers, Inc.
All rights reserved. No part of this book may be reproduced, stored in a retrieval system or
transmitted in any form or by any means: electronic, electrostatic, magnetic, tape,
mechanical photocopying, recording or otherwise without the written permission of the
Publisher.
For permission to use material from this book please contact us:
Telephone 631-231-7269; Fax 631-231-8175
Web Site: http://www.novapublishers.com
NOTICE TO THE READER The Publisher has taken reasonable care in the preparation of this book, but makes no
expressed or implied warranty of any kind and assumes no responsibility for any errors or
omissions. No liability is assumed for incidental or consequential damages in connection
with or arising out of information contained in this book. The Publisher shall not be liable
for any special, consequential, or exemplary damages resulting, in whole or in part, from
the readers‟ use of, or reliance upon, this material. Any parts of this book based on
government reports are so indicated and copyright is claimed for those parts to the extent
applicable to compilations of such works.
Independent verification should be sought for any data, advice or recommendations
contained in this book. In addition, no responsibility is assumed by the publisher for any
injury and/or damage to persons or property arising from any methods, products,
instructions, ideas or otherwise contained in this publication.
This publication is designed to provide accurate and authoritative information with regard
to the subject matter covered herein. It is sold with the clear understanding that the
Publisher is not engaged in rendering legal or any other professional services. If legal or any
other expert assistance is required, the services of a competent person should be sought.
FROM A DECLARATION OF PARTICIPANTS JOINTLY ADOPTED BY A
COMMITTEE OF THE AMERICAN BAR ASSOCIATION AND A COMMITTEE OF
PUBLISHERS.
Additional color graphics may be available in the e-book version of this book.
Library of Congress Cataloging-in-Publication Data
Dry forests : ecology, species diversity, and sustainable management / editor, Francis Eliott Greer.
pages cm -- (Environmental health : physical, chemical and biological factors) Includes index.
1. Tropical dry forests. 2. Forest animals--Tropics. I. Greer, Francis Eliott. QH541.5.T66D79 2014
578.730913--dc23
2014021846
Published by Nova Science Publishers, Inc. † New York
ISBN: 978-1-63321-292-3 (eBook)
Complimentary Contributor Copy

CONTENTS
Preface vii
Chapter 1 A Biogeographical Overview of the “Lianescent
Clade” of Violaceae in the Neotropical Region 1 Juliana de Paula-Souza and José Rubens Pirani
Chapter 2 Diversity and Distribution of Hymenoptera Aculeata
in Midwestern Brazilian Dry Forests 29 Rogerio Silvestre, Manoel Fernando Demétrio,
Bhrenno Maykon Trad,
Felipe Varussa de Oliveira Lima,
Tiago Henrique Auko and Paulo Robson de Souza
Chapter 3 The Brazilian "Caatinga": Ecology and Vegetal
Biodiversity of a Semiarid Region 81 Heloisa Helena Gomes Coe and
Leandro de Oliveira Furtado de Sousa
Chapter 4 Changes in the Labile and Recalcitrant Organic
Matter Fractions due to Transformation of
Semi-Deciduous Dry Tropical Forest to Pasture
in the Western Llanos, Venezuela 105 A. González-Pedraza and N. Dezzeo
Chapter 5 Ecology and Management of the Dry Forests and
Savannas of the Western Chaco Region, Argentina 133 Carlos Kunst, Sandra Bravo, Roxana Ledesma,
Marcelo Navall, Analía Anríquez, Darío Coria, Juan Silberman, Adriana Gómez and Ada Albanesi
Complimentary Contributor Copy

Contents vi
Chapter 6 Predicting Pasture Security in Rangeland Districts
of Kenya Using 1 km Resolution Spot Vegetation
Sensor NDVI Data 165 Mwangi J. Kinyanjui
Index 179
Complimentary Contributor Copy

PREFACE
Fossil records indicate the Neotropical Dry Forests had a more continuous
distribution in the recent geological past, especially in the late Pleistocene,
more precisely at the end of the last glacial period. Seasonal Deciduous
Forests are remnants of a broader continuous distribution that was present in
the past, ranging from North-Eastern Brazil to Argentina in the Pleistocene dry
period. This currently fragmented structure is the result of the dry, cold climate
that caused the retraction of Wet Forests to riversides and the spread of
seasonal forests. This book discusses the ecology, species diversity and
sustainable management of dry forests. The topics include a biogeographical
overview of the “lianescent clade” of violaceae in the Neotropical region;
diversity and distribution of hymenoptera aculeate in mid-western Brazilian
dry forests; the Brazilian "caatinga”; changes in the labile and recalcitrant
organic matter fractions due to transformation of semi-deciduous dry tropical
forest to pasture in the western llanos, Venezuela; ecology and management of
the dry forests and savannas of the western Chaco region, Argentina;
predicting pasture security in rangeland districts of Kenya using 1 km
resolution spot vegetation sensor ndvi data.
Chapter 1 - Violaceae is a cosmopolitan family comprising 22 currently
recognized genera and 1000-1100 species of trees, shrubs, subshrubs, herbs
and vines, occupying a wide range of habitat types and regions around the
world. Roughly half of the species in the family belong to a single genus,
Viola, which is almost exclusively herbaceous and occurs in temperate and
high altitude tropical zones. The remaining genera are confined to warm
regions of the tropics and subtropics and exhibit the wide diversity of mostly
woody growth forms previously mentioned. Independent phylogenetic studies
based on molecular data have consistently grouped all the vines of the family
Complimentary Contributor Copy

Francis Eliott Greer viii
together, converging to the recognition of a strongly supported "lianescent
clade", which includes Agatea (ca. 8 spp.), from the South Pacific Islands, and
the Neotropical Anchietea (7 spp.), Hybanthopsis (1 sp.) and Calyptrion (7
spp.). Apart from this intriguing disjunction which alone stimulates an
interesting biogeographic discussion, the phylogeny of the Neotropical
lianescent clade provides evidences for shifts between arid and humid habitats
in the distribution of taxa throughout the group‟s evolutionary history. In this
context, the present study discusses the differentiation of an
Amazonian/Mesoamerican moist forest lineage (Calyptrion) emerging from
what now forms a characteristically SDTF endemic group (the South
American Anchietea and Hybanthopsis), and further shifts in environmental
preferences within the species of the latter, from dry, open conditions to water-
related, forested habitats. Most of these shifts were found to be strongly
associated with particular morphological features.
Chapter 2 - The highly diverse Hymenoptera fauna in Neotropical forests
has been the focus of many studies investigating the structure of ecological
communities, particularly in the last ten years. Studies on the biogeography
and diversity of Hymenoptera, as well as the processes affecting their
maintenance, can be of great interest for planning effective conservation of the
biota on a regional scale. Such studies can also contribute to producing new
ecological and taxonomic data, particularly in areas where no previous records
exist for the group, as in the case of dry forests located in the middle of South
America.
In this context the authors present the first systematic inventory of
Hymenoptera made in the pristine dry forests of midwestern Brazil. The study
was conducted over eight years, in two regions; Bodoquena Mountain Range
and Brazilian Chaco. These locations are set in a large open area in a diagonal
formation of South America, the so-called "Pleistocenic Arc", extending from
the Caatinga in northeastern Brazil to the Chaco in Argentina, where the
contact areas occur between the Pantanal, Cerrado, Chaco, and Atlantic Forest.
The authors investigated the distribution patterns from each Hymenoptera
group and described the faunistic structure. An expressive number of rare and
endemic species was detected, and high beta diversity was revealed for all
Hymenoptera groups along the dry forest fragments. All groups studied
showed a similar species abundance distribution profile, denoting a model that
follows a truncated lognormal pattern. In order to identify species richness, the
most diverse taxon in a regional spectrum of the dry forests analyzed was
Formicidae with 294 species and morphospecies records, followed by Apidae
(150), Pompilidae (103), Vespidae (79), Crabronidae (74), Mutillidae (21),
Complimentary Contributor Copy

Preface ix
Sphecidae (20), Tiphiidae (15), Scoliidae (6), and Rhopalossomatide (1). In
total, 763 species were identified and morphospecies in 236 genera in ten
families. Despite the biogeographical relationships of the vegetation,
evolutionary effects of environmental formations and anthropogenic current
impacts may be reflected in the structure of the whole Hymenoptera
community on dry forests from mid-western Brazil. This region is considered
of very high biological importance, being extremely diverse, and it urgently
needs to be reflected as a hotspot.
Chapter 3 - In this chapter the authors present the ecological
characteristics and vegetal biodiversity of a typical Brazilian biome; Caatinga.
The name "Caatinga" comes from a Tupi-Guarani term that means "white
forest" or "clear forest" in reference to the clear gray appearance of the
vegetation during the dry season. It is an exclusively Brazilian semi-arid
ecosystem covering about 11% of the country. It extends over all the states of
the Northeast region and the north of Minas Gerais State, comprising an area
of 800,000 km2. The caatinga area extends from 2º54'S in the states of Ceará
and Rio Grande do Norte to 17º21'S in Minas Gerais State.
Generally, Caatinga is recognized as low-growing forest with
discontinuous canopy, deciduous foliage during the dry season and
xeromorphic characteristics shared by the species. However, Caatinga
physiognomies are extremely variable, depending on the rainfall regime
which, in general, does not exceed 1,000 mm/year and is concentrated in three
or four months of the year. They also depend on the characteristics of soils of
different geomorphological and geological origins, varying from high dry
forests up to 15-20 m tall, in more favorable soils in more humid
environments, to rocky outcrops with sparse low shrubs and Cactaceae and
Bromeliaceae in the crevices.
Caatinga stands out for presenting a large diversity of plant species,
currently having 4,478 recognized species in 8 eco-regions with 12 different
types of vegetation, many of which are endemic to the biome, and others that
can exemplify biogeographical relationships which help to clarify the
historical vegetation dynamics of the Caatinga itself as well as the entire
eastern area of South America.
Caatinga has been highly modified by diverse human activities. The
northeastern soils are suffering an intense process of desertification due to
replacement of natural vegetation with crops, done mainly through slash and
burn. Deforestation and irrigated cultivation are leading to soil salinization,
further increasing the evaporation of the soil water and accelerating the
process of desertification. Only the presence of the adapted vegetation of
Complimentary Contributor Copy

Francis Eliott Greer x
Caatinga has prevented the transformation of northeastern Brazil into a vast
desert. Despite threats to the biome, less than 2% of the Caatinga is protected
as conservation units under full protection.
Chapter 4 - The changes of labile and recalcitrant organic matter fractions
due to transformation of semi-deciduous tropical forest to pasture were
evaluated in an area of tropical dry forest in the western Llanos of Venezuela.
In this area, natural forest was converted to pasture by slash-and-burn. Estrella
grass (Cynodon nlemfuencis L) grows for cattle use. For determining microbial
activity, twelve soil samples were collected at 0-5 and 5-10 cm depth in
natural forest and in two pastures of 5 and 18-year-old (YP and OP,
respectively) on three periods along the year: at the beginning of the rainy
season (May), at the end of the rainy season (November) and during the dry
season (March). To determine total soil organic carbon (SOC) and total
extractable carbon (TEC), 12 samples were additionally collected at each site
at 0-5, 5-10, 10-20, 20-30, and 30-40 cm depth. SOC was determined by
Walkley and Black method and TEC was extracted with alkali solution. Cmic
was determined according to the CHCl3 fumigation-extraction method using
K2SO4. The water soluble carbon (WSC) was obtained by water extraction,
and the basal respiration (C-CO2) was carried out following the colorimetric
method of static incubations. The data sets were subjected to one-way analysis
of variance. Because clay content showed significant differences between
forest and pastures, it was used as a co-variable to adjust the data. Means were
separated with Tukey‟s test when statistical differences (P < 0.05) were
observed. SOC increased with the change from forest to pasture. YP showed
the highest SOC content, which was positively correlated with the clay
percentage. TEC was significantly higher in pastures than in forest. Cmic was
higher in OP during March, which can indicate that the organic matter there
was easily decomposed and therefore allowed to maintain a high microbial
population. Cmic decreased in the pasture soils in May, probably due to a
slower response of microbial communities to sudden changes in soil moisture.
The pastures showed higher WSC contents than the forest, probably due to a
less efficient use of the labile organic matter mineralized during the previous
rains. The lowest C-CO2 value was found in YP in November, which can
indicate lower efficiency of microorganisms to decompose the organic matter.
OP showed the highest C-CO2 value, probably due to a higher content of labile
organic matter, evidenced by the higher values of Cmic, WSC and TEC in this
site.
Chapter 5 - The Chaco region is a vast plain that extends into
northwestern Argentina and surrounding countries. Chaco is a quichua word
Complimentary Contributor Copy

Preface xi
meaning „a place for hunting‟ or „a place where I am self-sufficient‟ (Metraux
1946, Berton 2014, personal communication). Its northern limit is the
Amazon. At the southeast, it limits with the Pampas, and to the southwest with
the Monte, other key natural regions of Argentina. At the west, the Chaco
borders the tropical jungles. Boundaries among those regions are gradual, and
there are many shared plant and wildlife species.
In this chapter, the authors will give an overview of the ecological
features, research concepts and field methods applied, and research results
aimed to a sustainable management of the forests, grassland and savannas of
semiarid and arid Chaco subregions of Argentina, based in findings and
publications from INTA, UNSE as well as other institutions.
Chapter 6 - Ten day interval Normalized Difference Vegetation Index
(NDVI) data recorded from 1 km resolution SPOT VEGETATION sensor for
the period 2000 – 2011 was used to show variations in vegetation health in the
northern rangeland counties of Kenya to advise on pasture availability over
time and space. Using FAO land cover classification categories, three land
cover types were selected for pasture areas; Herbaceous, Herbaceous with
shrub and Open shrubs. The NDVI data was summarized for each vegetation
type in 8 counties in the northern rangelands of Kenya. Yearly trends of
vegetation were plotted and polynomial regression used to predict vegetation
indices at different times of the year. Results show that pasture specific
vegetation in the study areas cover over 17 million ha, a significant portion of
the total 59 million hectares of Kenya‟s land area making them very potential
for grazing and the national economic planning. The vegetation health was
very dependent on the hydrological fluxes and regression models for
predicting vegetation indices at specific periods of the year gave near perfect
fit in Garissa, Mandera and Wajir counties with coefficients of Determination
(R2) higher than 0.9 in all cases. ANOVA indicated no differences in
vegetation among areas, seasons and years implying that effects of climate
change and increased human activities have not compromised vegetation in the
study period. The study proposes enhancement of the pasture by promoting
nutritious and palatable grasses.
Complimentary Contributor Copy

Complimentary Contributor Copy

In: Dry Forests ISBN: 978-1-63321-291-6
Editor: Francis Eliott Greer © 2014 Nova Science Publishers, Inc.
Chapter 1
A BIOGEOGRAPHICAL OVERVIEW
OF THE “LIANESCENT CLADE” OF
VIOLACEAE IN THE NEOTROPICAL REGION
Juliana de Paula-Souza1
and José Rubens Pirani2
1Department of Environmental and Plant Biology,
Ohio University, US 2Instituto de Biociências, Universidade de São Paulo, Brazil
ABSTRACT
Violaceae is a cosmopolitan family comprising 22 currently
recognized genera and 1000-1100 species of trees, shrubs, subshrubs,
herbs and vines, occupying a wide range of habitat types and regions
around the world. Roughly half of the species in the family belong to a
single genus, Viola, which is almost exclusively herbaceous and occurs in
temperate and high altitude tropical zones. The remaining genera are
confined to warm regions of the tropics and subtropics and exhibit the
wide diversity of mostly woody growth forms previously mentioned.
Independent phylogenetic studies based on molecular data have
consistently grouped all the vines of the family together, converging to
the recognition of a strongly supported "lianescent clade", which includes
Agatea (ca. 8 spp.), from the South Pacific Islands, and the Neotropical
Anchietea (7 spp.), Hybanthopsis (1 sp.) and Calyptrion (7 spp.). Apart
from this intriguing disjunction which alone stimulates an interesting
Complimentary Contributor Copy

Juliana de Paula-Souza and José Rubens Pirani 2
biogeographic discussion, the phylogeny of the Neotropical lianescent
clade provides evidences for shifts between arid and humid habitats in the
distribution of taxa throughout the group‟s evolutionary history. In this
context, the present study discusses the differentiation of an
Amazonian/Mesoamerican moist forest lineage (Calyptrion) emerging
from what now forms a characteristically SDTF endemic group (the
South American Anchietea and Hybanthopsis), and further shifts in
environmental preferences within the species of the latter, from dry, open
conditions to water-related, forested habitats. Most of these shifts were
found to be strongly associated with particular morphological features.
INTRODUCTION
The Violaceae is a cosmopolitan family that comprises roughly 1000-1100
species distributed among 22 genera (Ballard et al. 2014, Wahlert et al. 2014).
Approximately half of the species of the family belongs to a single genus, the
predominantly herbaceous Viola, which is widely distributed in the temperate
Northern Hemisphere and high altitude areas of the Southern Hemisphere. The
remaining 21 genera are restricted to warm subtropical or tropical regions of
the world (except for a few species of Hybanthus s.l.), and they account for the
great diversity of life forms and reproductive traits observed in the family
(Ballard et al. 2014), including trees, shrubs, subshrubs, herbs and vines.
The “lianescent clade” is an informal term that was coined from the results
of recent phylogenetic studies (Feng 2005, Tokuoka 2008, Paula-Souza, 2009,
Wahlert et al. 2014), to refer to a strongly supported clade that comprises all
four lianescent genera in the family.
The lianescent clade includes ca. 20 species distributed among the South
Pacific Agatea A.Gray (8 spp.) and the Neotropical Anchietea A.St.-Hil.
(6 described and 1 new sp.), Calyptrion Ging. (4 described, 3 new spp.), and
the monotypic Hybanthopsis Paula-Souza. Besides sharing the twining life
form, all genera in this clade have in common strongly flattened seeds, which
are in most cases also winged. The diverse morphology of seed types is
suggested to be strongly correlated with dispersal strategies and occupancy of
habitats.
Raven & Axelrod (1974) postulated that the Violaceae probably
differentiated in South America after drifting from Africa, and have widely
spread from the new continent to occupy the most diverse habitats through-out
the world. In fact, recent fossil-calibrated dating analyses have confirmed that
the Malpighiales (where Violaceae belongs) originated in the Cretaceous and
Complimentary Contributor Copy

A Biogeographical Overview of the “Lianescent Clade” … 3
rapidly radiated, so that most of its families have origins at about 100 Ma ago
(Davis et al. 2005, Wang et al. 2009). However, apart from diaspores of
European Viola species in sediments from the Miocene (Meller & Hofmann
2004, Kovar-Eder 1999, Kovar-Eder & Hably 2006), the fossil record of
Violaceae is extremely sparce, and so far no attempts have been made to
obtain divergence dates within the family, except for a small group of North
American Viola (Marcussen et al. 2011). The reconstruction of the
biogeographical history of the Violaceae still lacks a global phylogeny
including the divergence time of the lineages (Santos & Amorim 2007;
Magallón 2004).
Biogeographical studies within the Violaceae have likewise been
restricted to small groups in Viola (Ballard, Jr. 2000; Havran et al. 2009),
despite the fertile grounds for this kind of investigation in the family,
uncovered by the recent evolutionary evidence. In this chapter we will discuss
a few hypotheses regarding the biogeographical history of the four genera
included in the lianescent clade of the family, with emphasis on the
Neotropical taxa, based on phylogenetic, morphological and ecological
evidence observed in the light of environmental changes through time.
THE PHYLOGENY OF THE LIANESCENT
GENERA OF THE VIOLACEAE
Before discussing biogeographical aspects of the lianescent clade of the
Violaceae, it is important to summarize and briefly discuss the phylogenetic
relationships among its taxa, according to recent molecular studies. The four
genera were segregated from the subtribes where they had traditionally been
placed based on a corolla feature: the presence of a distinct spur (Anchietea
and Calyptrion from subtribe Violinae) or a merely gibose sac (Agatea and
Hybanthopsis from subtribe Hybanthinae) at the base of the anterior petal.
Taylor (1972) had already found similarities between Agatea, Anchietea and
Calyptrion based on wood anatomy, but the idea of an evolutionary
relationship was rejected due to the then-inconceivable geographical
disjunction implicit in this group.
Although all four genera are represented in the available phylogenies
inferred from plastid DNA sequences (Paula-Souza, 2009; Wahlert et al.
2014), the evolutionary relationships among the taxa are not fully resolved.
Anchietea and Agatea are always each supported as monophyletic, however,
Complimentary Contributor Copy

Juliana de Paula-Souza and José Rubens Pirani 4
the results from the analyses of the trnL intron plus the trnL–trnF intergenic
spacer region are incongruent with the rbcL phylogeny alone and the
combined analyses, specifically concerning the affinities of Hybanthopsis and
the monophyly of Calyptrion (Figure 1).
In the first analysis, Calyptrion is paraphyletic in relation to Agatea, and
Hybanthopsis is sister to the remaining genera. In the rbcL analysis, this
monotypic genus has a moderate support as sister to Calyptrion + Agatea.
Here, the monophyly of Calyptrion is highly supported. The combined
analysis is similar to the rbcL alone, except for a weaker support to the
position of Hybanthopsis, and the low resolution between the sampled species
of Calyptrion, preventing any conclusion in respect to its monophyly. More
recent results of Maximum parsimony and Maximum likelihood analyses
based on a combined dataset of the same plastid DNA regions (Wahlert et al.
2014) showed the same topology as the previous combined analysis, but
slightly more resolved in regard to the paraphyly of Calyptrion. However,
considering the striking morphological differences combined with the
significant geographical gap between Calyptrion and Agatea, these two
lineages are still being treated as distinct genera, albeit indisputably with a
strong evolutionary affinity.
The biogeographical hypotheses presented here are based on the trnL
/trnL-trnF analysis of Paula-Souza (2009), since it includes a larger sampling
of South American taxa. It is important to point out, however, that whatever
analysis is used, the ultimate biogeographical conclusions related to the
original habitats of the lianescent clade and shifts of the lineages from wet to
dry environments would remain unchanged.
Figure 1. Details of phylogenetic hypotheses for the relationships among the lianescent
genera of the Violaceae, inferred from Maximum parsimony (MP) analysis of datasets
of trnL /trnL-trnF (a), rbcL (b) and trnL /trnL-trnF + rbcL (c). Numbers above
branches are bootstrap (BS) percentages. Extracted from Paula-Souza, 20091.
1 Refer to this author for the complete phylogenetic tree, methodology and vouchers.
Complimentary Contributor Copy

A Biogeographical Overview of the “Lianescent Clade” … 5
THE NEOTROPICAL LIANESCENT GENERA
OF THE VIOLACEAE
The Neotropical genera of the Violaceae are widely distributed throughout
South America (Figure 2). Calyptrion is a predominantly Amazonian genus
(one species extending north up to Mexico; Paula-Souza & Pirani, in press),
whose species exhibit a close association with seasonally wet to flooded areas,
being often found along “igapós” or less frequently in “várzea” forests.
Anchietea and Hybanthopsis are distributed in much drier and markedly
seasonal environments, such as the semideciduous forests of southeastern
Brazil or even the semi-arid northeastern Brazilian Caatinga and dry forests
(“bosques secos”) in Bolivia, northern Argentina and western slopes of the
Andes.
The phylogeny of the lianescent representants of the family (Figure 3)
supports the hypothesis of a past connection between all or most of seasonally
dry forests in South America. This can be evidenced by the close affinity
between Anchietea ferrucciae (narrowly endemic to caatingas of Abaíra in
Bahia state, Brazil) and Anchietea peruviana, native to the Andes of Peru and
Ecuador.
Figure 2. Geographical distribution of the lianescent Neotropical genera of Violaceae.
Complimentary Contributor Copy

Juliana de Paula-Souza and José Rubens Pirani 6
It is reasonable to consider Anchietea an endemic2 genus of the
Neotropical Seasonally Dry Forests (Pennington et al. 2000, 2003), or Tropical
Seasonal Forests Region (Prado 2000, previously designated as “Pleistocenic
Arc” by Prado & Gibbs 1993), occurring in all areas of the “dry diagonal”
described by Prado & Gibbs (1993). Thus, the species of Anchietea are found
from the Caatingas of northeastern Brazil (A. selloviana, A. ferrucciae), to
semideciduous forests of São Paulo and Paraná states in southeastern Brazil, in
forests from the valley of the upper Uruguay river and from the Paraguay-
Paraná system, Piedmont forests in transitional areas of northwestern
Argentina and southwestern Bolivia (A. pyrifolia, which can also occur in
wetter areas of the Atlantic Coastal forest), dry forests in serranías Chiquitanas
of southeast Bolivia (A. selloviana), and more sparsely in patches in arid and
semi-arid valleys from northern Bolivia through Peru, reaching southwestern
Ecuador (A. peruviana) (Figure 6). One still undescribed species, despite being
endemic to the Mata Atlântica domain, occurs in xeric habitats on rocky
outcrops of inselbergs, which clearly reflects the current fragmentation of
forested habitats as “land islands” (Prance 1996, Porembski & Barthlott 2000,
Porembski 2007).
The phylogenetic topology enables us to infer that the lianescent lineage
of Violaceae were originally adapted to dry habitats (Figure 4), having
secondarily spread to moister ones, as observed in the clade comprised by
Calyptrion + Agatea, and A. exalata + A. pyrifolia. The results of the
phylogenetic studies invoke the effect of the theories of niche conservatism
and niche evolution (Wiens 2004, Wiens & Donoghue 2004, Hawkins et al.
2006, Ricklefs 2006).
Figure 3. Details of the phylogenetic hypotheses of the relationships between the
lianescent genera of the Violaceae, based on trnL /trnL-trnF sequences: Mapping of
the vegetational types where the taxa occur (*extracted from Munzinger 2000, 2001).
2 It is also found at the Brazilian Cerrado, which is not included in any of these authors‟ seasonal
forests, but rather being considered as the distinct - though still definitely seasonal -, more
open vegetation type Savanna.
Complimentary Contributor Copy

A Biogeographical Overview of the “Lianescent Clade” … 7
Niche conservatism determines which environmental conditions the
members of a clade can tolerate, to which areas they can be dispersed, and the
nature of ecological barriers to their dispersal. On the other hand, niche
evolution allows a particular species and its decendants to disperse to new
habitats and climatic conditions, and to persist in environments that are prone
to changes. In this context, we could argue that the ancestral niche of the
lianescent Violaceae corresponds to the Seasonally Dry Tropical Forest
(SDTF) of South America, and the conquest of mesic or wetter habitats in this
group might have occurred with the emergence of the lineage from which
Calyptrion and Agatea diverged. The fact that A. pyrifolia is the most
widespread and frequently found species of this genus might be a consequence
of niche evolution at population level, as well as the expansion of its
preferential habitats and retraction of drier environments, more suitable for the
occupancy of the other species of the genus.
Several recent phylogeographic studies on Neotropical plant and animal
species lineages have shown the complexity of histories discovered, as well as
common patterns, for example cases of strong genetic structure and
Pleistocene to pre-Pleistocene divergence histories, which represent radiations
allowing to investigate broad biogeographic histories of associated biomes
(e.g. Martins 2001, Turchetto-Zolet et al. 2012), including analysis especially
concerned to the South American dry-diagonal (Werneck et al. 2012).
Figure 4. Details of the phylogenetic hypotheses of the relationships between the
lianescent genera of the Violaceae, based on trnL /trnL-trnF sequences: Mapping of
the type of habitat where they preferably occur (*extracted from Munzinger 2000,
2001).
Complimentary Contributor Copy

Juliana de Paula-Souza and José Rubens Pirani 8
The South American continent has a highly complex mosaic of
phylogeographical patterns, being composed of a variety of different
ecoregions (Morrone 2004, 2006, Aragon et al. 2011) and particularly
regarding to Amazonian taxa, speciation models are not still completely
satisfactory (Bush 1994, Turchetto-Zolet et al. 2012). In the case of the
lianescent genera of Violaceae, this situation is aggravated by the lack of a
resolved phylogeny indicating the pathways and timing of its colonization of
the Amazonian lowlands, either from the Atlantic Coastal Forest or from the
rising Andean Cordillera as explained below.
The hypothesis of a past connection between the Amazon and the Atlantic
Coastal Forest (Oliveira et al. 1999, 2005) concur with a possible migration of
a lianescent lineage of the Violaceae from the Caatinga to the Amazon. Many
authors (e.g. Oliveira-Filho & Ratter 1995, Meave et al. 1991) argued that
migrations from Amazonian taxa to the Atlantic Forest and vice-versa may
have occurred during the several humid phases of the Pleistocene or even prior
to that, which would have possibly been facilitated by a past dendritic network
of gallery forests, probably much more extensive than the present one.
Furthermore, paleoenvironmental records and fossils of the megafauna provide
strong evidence that tropical moist forests once occupied areas that are
currently covered by Caatinga (Hartwig & Cartelle 1996 apud Oliveira et al.
1999, Cartelle & Hartwig 1996 apud Oliveira et al. 1999, Behling et al. 2000).
This scenario might have further favored the migration and the establishment
of the lianescent lineage of Violaceae that later diversified in the Amazon and
further north.
Alternatively, we could also infer that the Amazonian lianescent lineage
had its origins from the southern part of the South American continent, from
populations of a past SDTF landscape covering a rising Andean Cordillera that
are currently restricted to the Piedmont Nucleus in Bolivia and northern
Argentina (Figure 2).
The Miocene-Pliocene paleobotanical and palynological records from the
high plain of Bogotá at 2475 m altitude (Cordillera Central, Colombia) include
taxa that are currently found on the Amazonian alluvial plains, indicating a
past lowland environment with swamp forests occurring in a few sites
(Wijninga 1996).
In addition to lowland taxa, the presence of typically montane elements in
the fossil record suggests the presence of mountains in the region, but
paleovegetation characteristics suggest a paleoelevation below 700 m. Besides
“terra firme” upland elements, the fossil record for lowland taxa in some sites
mainly represents the forest that covered drainage areas of rivers. In fact, the
Complimentary Contributor Copy

A Biogeographical Overview of the “Lianescent Clade” … 9
co-occurrence of montane and lowland pollen taxa in a particular deposit
generally reflects a past network of streams draining montane areas, the
sediments being carried down to the lowlands by rivers draining the montane
hinterland (Wijninga 1996). This past scenario of the Bogotá Plateau,
combined with the fossil record indicating the existence of SDTF forests in the
Andes during the Miocene (Burnham 1995, Burnham & Carranco 2004,
Hughes et al. 2004, Pennington et al. 2010), support the idea of a midelevation
montane, SDTF lineage ancestral to Anchietea coming from the south and later
giving rise to a lowland group adapted to moister environments like
Calyptrion.
According to this second hypothesis, therefore, the emergence of an
Amazonian lianescent lineage would be less related to climate changes and
associated glaciations of the Pleistocene, rather being more directly influenced
by earlier tectonism and orogeny which substantially predate the Milankovitch
Cycles of the Quaternary. The idea of an older divergence time to Calyptrion
(e.g. prior to the final rapid Andean uplift at ca. 10 Ma) is also coherent with
the expansion of a typically lowland Amazonian taxon in Central America.
Paleovegetational reconstructions show that the initial Andean uplift
(Early/Mid Miocene at 23-10 Ma) through the Pliocene provided habitats
comparable to those north of the Isthmus of Panama (Wijninga 1996, Koecke
et al. 2013) – a complex vegetation mosaic composed by low-mid
semievergreen forests, rain forests, fresh-water swamps and mangroves
(Retallack & Kirby, 2007). Interestingly, there are currently several records of
Calyptrion from mangroves in both eastern and western coasts of Central
America (especially in Mexico), while its occurrence in the same habitat in
South America is practically null. It is not possible to assert whether it was an
event of local southern extinction, or if the northern plants acquired a higher
salt tolerance after they became isolated from their South American sister-
groups.
The importance of the Panama Isthmus in the great biological exchange
established between the South American continent and Laurasian terrains is
very well known. From the botanical and zoological paleontological records,
the arrival of holartic elements in northern South America, as well as of
Gondwanan elements in Central America, have been extensively documented
(Burnham & Graham 1999).
The uplift of this landbridge and the final closure of the Central American
seaway during the late Pliocene to early Pleistocene (3.0 – ∼2.5 Ma) for many
years has been considered a defining event in biogeography, providing the
times for divergence resulting from vicariance between related groups
Complimentary Contributor Copy

Juliana de Paula-Souza and José Rubens Pirani 10
(Simpson, 1980; Gentry 1982a; Stehli & Webb 1985; Graham 1992; Wendt
1993; Burnham & Graham 1999, McCartney et al. 2000).
However, the “Great American Biotic Interchange” (GABI, Stehli &
Webb 1985) paradigm, which is mostly based on zoological patterns, should
be applied with caution. Recent studies have shown that due to a greater
readiness for dispersal, plants crossed between the Americas earlier than
animals and frequently exhibit disjunct distributions that are not
chronologically correlated with geological events (Cody 2010, Leigh et al.
2014). For instance, based on a dated phylogeny of the genus Inga (Fabaceae),
Richardson et al. (2001) provide probable dates for the presence of species of
the genus in continental and insular Central America a little older than what is
generally assumed for the connection of the isthmus. However, the authors
stressed the possibility of the colonization of Central American areas by some
species of Inga through islands that were formed prior to the full establishment
of the isthmus. Moreover, it has been suggested that the gap between the
landmasses by the Late Pliocene/Early Pleistocene was much narrower than
previously thought (Farris et al. 2011, Montes et al. 2012), which might have
facilitated a much earlier migration for many groups other than plants (e.g.
amphibians, Flynn et al. 2005, Pinto-Sánchez 2012; birds, Barker 2007, Weir
et al. 2009).
We believe that the hypothesis of water dispersal instead of land crossing
is the most plausible interpretation for the present distribution of Calyptrion in
Central America, since local ocean currents do not seem to represent barriers
to their propagules, given all the evidences supporting long-distance dispersal
as the explanation for the disjunction between that genus and Agatea. The
absence of records of Calyptrion in the Antilles is better explained on the light
of unfavorable ocean currents, rather than this being an evidence of its
expansion by land after the complete closure of the Panama Isthmus.
Paleoceanographical data indicates that prior to the Pliocene, local current-
flows would have delivered South American waifs to the Central American
coast, not to the Caribbean Islands, and present-day records still suggest that
surface-current dispersal and final deposition of propagules in the Antilles
coming from the northern South American shoreline is highly unpredictable,
even considering a northward flow with respect to this continent‟s coast
(Iturrialde-Vinent & MacPhee 1999).
A similar pattern is also observed in other groups within the Violaceae
(namely some lineages of Hybanthus s.l.), in which the continental
Mesoamerican floristic composition does not have common elements with the
islands‟.
Complimentary Contributor Copy

A Biogeographical Overview of the “Lianescent Clade” … 11
EVOLUTION IN SEED MORPHOLOGY AND ITS
ASSOCIATION TO SHIFTS IN PREFERABLE HABITATS
A probable synapomorphy of the lianescent clade, the flattened seeds of
Agatea, Calyptrion and Anchietea differ drastically from the predominantly
globose seeds in the rest of Violaceae (Figure 5). The only deviation in this
group is the seeds of Hybanthopsis, which, although flattened, show a
completely discordant morphology in relation to the remaining species of the
family as a whole. In fact, according to Gentry (1995), there is a strong
correlation between lianescent habit, anemochory and open habitats, an
inference that is clearly supported by the evolutionary history of the lianescent
genera of the Violaceae. The winged seeds of Anchietea suggest an
anemochorous dispersal through the predominantly arid or semi-arid
environments where this genus typically occurs. On the other hand, the
wingless, thick seeds of the Amazonian Calyptrion and its distribution along
water courses are hypothesized to be related to shifts in the dispersal strategy
of its species to hydrochory. This would lead us to the conclusion, based on
phylogenetic evidence, that the winged seeds of the South Pacific Agatea may
be related to a secondary shift to wind dispersal.
Ridley (1930 apud Good 1974) mentioned that in most cases, the presence
of wings on the propagules is related to dispersion, just as reduction and
thickening of the wings reflect adaptive changes in the dispersion from wind to
water (Gentry 1973, 1980, Pijl 1982).
Figure 5. Morphological diversity in seed shape among the lianescent genera of
Violaceae: a. Calyptrion pubescens, b-c. Calyptrion arboreum (dorsal and ventral
views); d. Anchietea pyrifolia, e. Anchietea ferrucciae, f. Anchietea selloviana, g.
Anchietea exalata, h. Anchietea peruviana, i. Agatea sp., j-k. Hybanthopsis bahiensis
(dorsal and lateral views).
Complimentary Contributor Copy

Juliana de Paula-Souza and José Rubens Pirani 12
Good (1974) further states that in vesicular fruits, the thin and
membranous carpel walls enable the whole structure to be carried by the wind
or eventually float up in water currents. All these features can be observed in
the lianescent genera of Violaceae. In Anchietea, for example, most species
have winged seeds, namely the two most widespread taxa, A. pyrifolia and A.
selloviana, which occur either in open areas of Caatingas and Savannas, or in
the border of more dense forests. Personal observations of natural populations
of A. exalata (in which the wings are greatly reduced and thickened) showed
that even though it is often registered as a forest species, it usually grows in
direct contact to water courses and is perhaps more properly considered
riparian. The close association of Calyptrion with watercourses is even more
easily observed, and its thick and unwinged seeds are an example of a
phenomenon common to other groups of species of plants that are considered
dissonant from their congeners due to the adaptations of the seeds to seasonal
environments flooded where they live, with several references to Amazonian
taxa (e. g. Tabebuia barbata, Gottsberger 1978, Gentry 1982; Erisma
calcaratum, Sytsma et al. 2004). This ability to float and be carried by water
currents is among the handful of evidence supporting a long-distance dispersal
as the most plausible explanation for the disjunction between Calyptrion and
the South Pacific Agatea.
ANCHIETEA, A GENUS MOSTLY RESTRICTED TO SDTF
As previously stated, the distribution of the species of Anchietea matches
the SDTF area in South America (Figure 6). Although there are overlappings
in their distribution ranges, we can observe a preference for mesic to wet
environments by Anchietea pyrifolia, and for drier conditions by A. selloviana.
Therefore, their distributions are complementary in the “dry diagonal” of
seasonal woodlands in South America (Prado & Gibbs 1993, Pennington et al.
2000, 2003). A. pyrifolia occurs in southeastern-south Brazil and adjacent
Paraguay and Argentina, with a disjunction at the Andean Yungas of
northwestern Argentina and southern Bolivia (Piedmont Nucleus according to
Prado & Gibbs 1993, Pennington et al. 2000). Anchietea selloviana, on the
other hand, shows a disjunct distribution in a large area in eastern Brazil and
Caatingas in the eastern part of this country, and a smaller area comprising dry
forests between Mato Grosso and Mato Grosso do Sul in Brazil and Bolivian
dry forests (“bosques secos chiquitanos”), also included in the Piedmont
Nucleus (Prado & Gibbs 1993, Pennington et al. 2000). The remaining two
Complimentary Contributor Copy

A Biogeographical Overview of the “Lianescent Clade” … 13
species (plus an undescribed one) show narrower distributions in eastern
Brazil (A. ferrucciae and Anchietea sp.) and the Andean Cordillera (A.
frangulifolia and A. peruviana). These later species can be considered
elements of the Bolivian and Peruvian Inter-Andean valleys as defined by
Pennington et al. 2000, extending farther north up to the Massif of Bogotá, but
it is noteworthy that they have completely disparate environmental preferences
– while A. peruviana is predominantly found in dry, open areas (“matorrales”,
“escrubes”, “laderas”), A. frangulifolia occurs preferentially in moist cloud
forests. Interestingly, the same pattern was observed by Havran et al. (2009)
for the Hawaiian violet lineage, for which the authors detected a dry and wet
clade for the Viola growing along the Hawaiian mountains.
The appearance of a new reproductive feature corresponding to a
tomentose ovary might be related to the conquest of environments with colder
climate by this genus. This is an autapomorphy of the Andean species of
Anchietea, which occurs exclusively in median altitudes of this mountain
range.
Figure 6. Geographical distribution of the species in Anchietea.
Complimentary Contributor Copy

Juliana de Paula-Souza and José Rubens Pirani 14
Figure 7. Examples of morphological diversity in indument and shape among the seeds
of Anchietea frangulifolia.
Miller (1986) stated that a noteworthy aspect of alpine tropical systems
around the world is the high occurrence of indument on their plants, covering
vegetative and/or reproductive parts. A probable evolutionary advantage of
coating structures with trichomes include protection against heat loss by
radiation and frosts (Miller 1986), a strong correlation being observed between
altitudinal gradient and density of indument in many groups of plants, e.g.
Puya (Bromeliaceae, Miller 1986), Encelia (Asteraceae, Ehleringer et al.
1981) and Espeletia (Asteraceae, Meinzer & Rundel 1985). In Puya, the dense
coat of trichomes on the inflorescence provides not only an increase in heat
gain, but also keeps the temperature inside the flowers significantly higher
compared to the glabrous flowers of species in lower elevations. Miller (1986)
concluded that the development of a dense indument in Puya species seemed
to be a functional response to the low temperatures of the Páramos, and an
important factor in their reproductive success, since higher floral temperatures
have been associated with significant increase of seed production. In
Anchietea, the trichome coating, even if only on the pistil, seems to provide
enough additional protection to the ovules in less favorable environments,
leading to the emergence of a distinct lineage in the group, occupying hitherto
unexplored niches not only for this genus, but the lianescent group as a whole.
The reasons for the development of an indument on the seeds of A.
frangulifolia, however, are still obscure. Other adaptative advantages resulting
from the coverage of plant organs by trichomes are the protection against
herbivory (Baruch & Smith 1979, Woodman & Fernandez 1991) and frosts
(Hedberg 1964), as mentioned above, in addition to repelling water, which
could prevent the establishment of pathogens during warmer seasons (Brewer
Complimentary Contributor Copy

A Biogeographical Overview of the “Lianescent Clade” … 15
& Smith 1997). Still, even if this evolutionary novelty confers some adaptative
advantage to plants that is still unknown to science, it does not seem to be
completely fixed in A. frangulifolia, appearing sporadically in some
populations (Figure 7), mainly from the northern Andes, and currently
available data preclude the formulation of hypotheses on this issue.
ANCHIETEA AND THE AMOTAPE-HUANCABAMBA ZONE
As previously stated, the fossil record suggests that the SDTF existed in
the Andes before the rapid final phase of the Andean orogeny during the late
Miocene (ca. 10 Ma). The Andean SDTF is currently restricted to valleys
between ca. 500-2,500 m altitude, and for many of the SDTF species confined
to the these valleys, the surrounding cordilleras represent a very effective
physical barrier for dispersal. Their biogeography was therefore highly
influenced by the rapid orogenetic movement, resulting, for example, in
altitudes of 4,000-5,000 m precluding the contact of midelevation montane
forest populations of the legume Cyathostegia occurring in adjacent valleys
(Pennington et al. 2010).
With respect to lowest altitudinal constraints, the existence of three
morphotypes of Anchietea with distinct distributions in the Andes – A.
peruviana and two disjunct populations of A. frangulifolia – suggests a strong
present or past influence of the Amotape-Huancabamba Zone, which is also
observed in other plant groups (Passiflora lobbii group, Passifloraceae,
Skrabal et al. 2001; Fuchsia, Onagraceae, Berry 1982; Calceolaria,
Calceolariaceae, Molau 1988; Urtica, Urticaceae, Ribes, Grossulariaceae and
Loasaceae, Weigend 2004, Weigend et al. 2005) and vertebrates (Duellman
1979; Duellman & Pramuk 1999). The Amotape-Huancabamba Zone is
situated from southern Ecuador to northwestern Peru, where the Andean
Cordilleras are partially interrupted by the drainage system of the Chamaya
and Marañón rivers. The Central and Eastern Cordilleras are at this site
completely interrupted by the formed valleys, and only the Western Cordillera
persists throughout the region, with its lowest elevation reaching 2145msm at
Abra de Porculla, in Peru (Weigend 2002, 2004). The area is characterized by
very high biological diversity and high rates of (micro)endemism (Young &
Reinel 1997), which are probably a result of the habitat mosaics and repeated
isolation of these fragments following the retreat of mountain forests that once
spread more widely over the area (Weigend 2002, Weigend et al. 2005,
2005a). It is suggested that the drastic reduction in width and altitude of the
Complimentary Contributor Copy

Juliana de Paula-Souza and José Rubens Pirani 16
Andean chain and disruption of habitats of this area (especially high montane)
were important in limiting dispersal of taxa between the northern and central
Andes, although this barrier has been more effective in cases of taxa adapted
to high altitudes. Furthermore, since the Marañón Valley runs in a north-south
direction, it probably remained sheltered from the moist air coming from the
east or the west, leading to a persistent semi-arid condition in the valley, which
may explain both the abundance of endemic plants adapted to this type of
habitat, and the disruption of migration across the valley slopes, especially for
taxa of high-montane humid environments (Simpson 1975, Weigend 2002).
The eastern slope of the Cordillera in this region is characterized by gradual
climate changes and less arid habitats, while the west slope and valleys are
covered by arid and semi-arid scrubs with isolated patches of cloud forests
(Simpson 1975, Weigend 2002, Weigend et al. 2005). Weigend et al. (2005a)
further state that these humid montane forest fragments exist between the
altitudes of 2600-3200msm of the arid slopes of the Northern and Central
Andes, and are considered remnants of a nearly continuous band that in past
eras covered larger areas in this region (Simpson 1975, Jaramillo et al. 2006).
The delineation of the Amotape-Huancabamba Zone is determined from
overlapping species or group of species from the north and the south, and the
presence of certain groups of plants that are endemic or at least have a higher
concentration of species in this area. Although Anchietea is represented by
only two species in the Andes, the morphological entity corresponding to A.
peruviana is restricted to dry areas of the Amotape-Huancabamba Zone
(Figure 8), and A. frangulifolia has a disjunct distribution in cloud forests
immediately south of this area (central Peru and western Bolivia) and more
isolated to the north (Massif of Bogotá). We could infer a past broader
distribution of A. frangulifolia along the moist montane forests that probably
extended over a wider area, which allowed continuity between the two
currently disjunct populations of this species. With the discontinuation of the
Eastern and Central Cordilleras, gene flow between populations of the north
and south would have been compromised, due the retreat of the moist forests
to the west of the Western Cordillera after the glacial period, and the barrier
imposed by the inter-Andean dry valleys. Some populations were able to
survive and thrive under such drier conditions, and differentiate into what is
now considered A. peruviana. Even so, some migration would still have been
possible, either through the relicts of rainforests on the western slope, or even
through the Abra de Porculla, thanks to the altitudinal distribution of A.
frangulifolia. This may explain the subtle morphological differences observed
between the disjunct populations of A. frangulifolia, which would be a result
Complimentary Contributor Copy

A Biogeographical Overview of the “Lianescent Clade” … 17
of its partial isolation, potentially leading to the emergence of two distinct taxa
in the future (Figure 8).
In this sense, we can apply to the populations of Andean Anchietea the
hypothesis raised by Fjeldså (1995: 98, apud Weigend 2002) against the
barrier effect of the Amotape-Huancabamba Zone, that the mere presence of
physical barriers is of less importance than are some specific ecological
conditions on both sides separately. Weigend (2002) argued that an important
contributing factor to the high number of species in the Amotape-
Huancabamba Zone is the colonization of atypical habitats, i.e. habitats where
either the genus as a whole or at least all the other species of a given group are
not usually found, so that closely related taxa may occur in environments as
diverse as arid slopes and cloud forests (such as Xylopodia and Klaprothia,
Loasaceae). As previously mentioned, this kind of colonization is observed in
the Andean Anchietea, with A. peruviana being more characteristically found
in arid environments compared to A. frangulifolia, which is found almost
exclusively in the wet montane forests.
Figure 8. Geographical distribution of Anchietea in the Andes.
We observe in this case that ecological constraints were indeed more
effective in the process of speciation than the geographical barrier imposed by
Complimentary Contributor Copy

Juliana de Paula-Souza and José Rubens Pirani 18
the interruption of the Cordillera. These data corroborate the results of other
studies of fauna and flora, in which the barrier effect of the Amotape-
Huancabamba Zone also was not explicitly noted (Fuchsia, Berry 1982;
Loasaceae, Weigend 2002; Asteraceae, Ferreyra, 1995; reptiles and
amphibians, Duellman 1979, Duellman & Pramuk 1999). However, it is worth
noting that this finding applies to low/medium montane organisms (such as
Anchietea), since one would expect a much greater influence of altitudinal
barrier in the upper montane populations of this region, as observed in
Lysipomia (Campanulaceae, Ayers 1999).
Unfortunately, the available phylogenies do not allow any reliable
conclusion as to the kind of environment the ancestral lineage of Anchietea
that reached the Andes would have originally occupied. The most
parsimonious hypothesis is that this lineage would primarily have established
in drier areas such as where A. peruviana is currently found, having
subsequently spread to the cloud forests where the typical subspecies is now
distributed. In either case, it clearly illustrates the shifts between dry and wet
environments as preferable habitats for the species within the lianescent clade.
CONCLUSION
As was highlighted by Santos & Amorim (2007), the value of
biogeographic reconstructions is dependent on available evidence supporting
monophyletic lineages, and “false taxa” (i.e., non-monophyletic) generate
inaccurate information in the search for general biogeographical patterns.
Therefore, any inferences about the biogeographic history of clades within the
Violaceae are still premature, and further studies should provide stronger
evidence to thoroughly evaluate the consistency of the hypotheses proposed
here. Moreover, even the dating methods of lineages in phylogenies based on
molecular data have been viewed with reservations, or even received harsh
criticism by many biologists and biogeographers (e.g. Heads 2005, 2008) and
the development of new tools or the improvement of existing ones is expected,
with a view to achieving greater consistency between estimates of molecular
and geological dating.
The available phylogeny for the Violaceae with respect to the lianescent
genera is still poorly resolved, and to a great extent limits the reconstruction of
reliable hypotheses for its taxa. Although the sampling for Anchietea is almost
complete, the inclusion of additional taxa of Calyptrion and Agatea, as well as
the analysis of different DNA markers, could greatly improve the resolution
Complimentary Contributor Copy

A Biogeographical Overview of the “Lianescent Clade” … 19
within the group. The available evidence, however, allows us to weave
interesting conjectures regarding the evolution of some morphological traits
associated with the environmental conditions where the taxa occur, and their
plasticity related to shifts between dry and moist habitats. Hopefully this will
provide a good starting point for future biogeographical studies with this
group. Despite the high levels of biodiversity observed in South America,
phylogeographical studies comprising members of its biota are still scanty to
provide a “big picture”, so every effort put into understanding the complexity
of its ecosystems is encouraged. This is even more urgent for poorly known
and threatened ecoregions such as the Amazonia and the Andes, the latter
comprising habitats that are considered cradles of ongoing diversification that
have been mostly overlooked by scientists and conservationists.
Understanding the evolutionary history of key elements of that biota, mainly
the mechanisms and adaptations that allowed organisms to survive and thrive
under geological instability and drastic climatic fluctuations over the last
million years, may allow us to trace strategies for our own future.
ACKNOWLEDGMENTS
This study was part of JPS‟ Ph.D. dissertation at Universidade de São
Paulo (USP), Brazil. Financial support for this project was provided by
FAPESP (Fundação de Amparo à Pesquisa do Estado de São Paulo), USP,
Myndel Botanica Foundation, IAPT (International Association for Plant
Taxonomy), and SSB (Society of Systematic Biologists). The authors thank
Dr. Melanie Schori (Ohio University, USA) and Dr. Alessandra dos Santos
Penha (Universidade Federal de São Carlos, Brazil) for the English review
(MS), critical reading and valuable suggestions for the manuscript.
REFERENCES
Aragon, E.; Goin, F.J.; Aguilera, Y.E.; Woodbume, M.O.; Carlini, A.A. &
Roggiero, M.F. 2011. Palaeogeography and palaeoenvironments of
northern Patagonia from the Late Cretaceous to the Miocene: the
Palaeogene Andean gap and the rise of the North Patagonian high Plateau.
Biological Journal of the Linnean Society 103(2): 305-315. doi:
10.1111/j.1095-8312.2011.01684.x.
Complimentary Contributor Copy

Juliana de Paula-Souza and José Rubens Pirani 20
Ayers, T. 1999. Biogeography of Lysipomia (Campanulaceae), a high
elevation endemic: An illustration of species richness at the Huancabamba
Depression, Peru. Arnaldoa 6: 13-28.
Ballard Jr., H.E.; Paula-Souza, J. & Wahlert, G.A. 2014. Violaceae in
Kubitzki, K. (ed.), Flowering Plants. Eudicots. The Families and Genera
of Vascular Plants, vol. 11. Berlin Heidelberg: Springer-Verlag. pp. 303-
322.
Ballard, H. E. & Sytsma, K. J. 2000. Evolution and biogeography of the
woody Hawaiian violets (Viola, Violaceae): Arctic origins, herbaceous
ancestry and bird dispersal. Evolution 54(5): 1521-1532.
Barker, F.K. 2007. Avifaunal interchange across the Panamanian isthmus:
insights from Campylorhynchus wrens. Biological Journal of the Linnean
Society 90(4): 687–702. doi: 10.1111/j.1095-8312.2007.00758.x.
Baruch, Z. & Smith, A.P. 1979. Morphological and physiological correlates of
niche breadth in two species of Espeletia (Compositae) in the Venezuelan
Andes. Oecologia 38: 71-82. doi: 10.1007/BF00347825.
Behling, H.; Arz, H.W.; Pätzold, J. & Wefer, G. 2000. Late Quaternary
vegetational and climatic dynamics in northeastern Brazil, inferences from
marine core GeoB 3104-1. Quaternary Science Reviews 19: 981-994. doi:
http://dx.doi.org/10.1016/S0277-3791(99)00046-3.
Berry, P.E. 1982. The systematics and evolution of Fuchsia sect. Fuchsia
(Onagraceae). Annals of the Missouri Botanical Garden 69: 1-198.
Brewer, C.A. & Smith, W.K. 1997. Patterns of leaf surface wetness for
montane and subalpine plants. Plant, Cell and Environment 20(1): 1-11.
doi: 10.1046/j.1365-3040.1997.d01-15.x.
Burnham, R.J. & Carranco, N. 2004. Miocene winged fruits of Loxopterygium
(Anacardiaceae) from the Ecuadorean Andes. American Journal of Botany
91: 1767-1773.
Burnham, R.J. & Graham, A. 1999. The history of neotropical vegetation: new
developments and status. Annals of the Missouri Botanical Garden 86:
546-589.
Burnham, R.J. 1995. A new species of winged fruit from the Miocene of
Ecuador: Tipuana ecuatoriana (Leguminosae). American Journal of
Botany 82: 1599-1607.
Bush, M.B. 1994. Amazonian speciation: a necessarily complex model.
Journal of Biogeography 21: 5-17.
Cartelle, C. & Hartwig, W.C. 1996. Macacos sul-americanos: Ossos que são
um verdadeiro tesouro. Ciência Hoje 21(125): 31-36.
Complimentary Contributor Copy

A Biogeographical Overview of the “Lianescent Clade” … 21
Cody, S.; Richardson, J.E.; Rull, V.; Ellis, C. & Pennington, R.T. 2010. The
Great American Biotic Interchange Revisited. Ecography 33: 326-332.
doi: 10.1111/j.1600-0587.2010.06327.x.
Davis, C.C.; Webb, C.O.; Wurdack, K.J.; Jaramillo, C.A., & Donoghue, M.J.
2005. Explosive radiation of Malpighiales supports a mid-Cretaceous
origin of modern tropical rain forests. American Naturalist 165(3): E36-
E65. doi: 10.1086/428296.
Duellman, W.E. & Pramuk, J.B. 1999. Frogs of the genus Eleutherodactylus
(Anura: Leptodactilydae) in the Andes of northern Peru. Scientific Papers
(Natural History Museum, the University of Kansas) 13: 1-78.
Duellman, W.E. 1979. The herpetofauna of the Andes: Patterns of distribution,
origin, differentiation, and present communities. In Duellman, W.E. (ed.)
The South American herpetofauna: Its origin, evolution, and dispersal.
Monograph of the Museum of Natural History, no. 7. Lawrence, KS:
Natural History Museum, University of Kansas. pp. 371-459.
Ehleringer, J.; Mooney, H.A.; Gulmon, S.L. & Rundel, P.W. 1981. Parallel
evolution of leaf pubescence in Encelia in coastal deserts of North and
South America. Oecologia 49: 38-41. doi: 10.1007/BF00376895.
Farris, D.W.; Jaramillo, C.; Bayona, G.; Restrepo-Moreno, S.A.; Montes, C.;
Cardona, A.; Mora, A.; Speakman, R.J.; Glascock, M.D. & Valencia, V.
2011. Fracturing of the Panamanian Isthmus during initial collision with
South America. Geology 39(11): 1007-1010. doi:10.1130/G32237.1.
Feng, M. 2005. Floral morphogenesis and molecular systematics of the family
Violaceae. Ph. D. Dissertation, Department of Biological Sciences,
College of Arts and Sciences, Ohio University. Athens. 279p.
Ferreyra, R. 1995. Flora of Peru: Asteraceae, Part 4. Fieldiana, Bot. 35: 1-101.
Fjeldså, J. 1995. Geographical patterns of neoendemic and older endemic
species of Andean forest birds: The significance of ecologically stable
areas. In: Churchill, S. P., Balslev, H., E. Forero & Luteyn, J. L. (eds.).
Biodiversity and conservation of neotropical montane forests. New York,
NY: New York Botanical Garden. pp. 89-102.
Flynn, J.J.; Nunez, C.; Carranza-Castaneda, O.; Miller, W.E.; Swisher, C.C.,
III &Lindsay, E. 2005. Geochronology of Hemphillian-Blancan Aged
Strata, Guanajuato, Mexico, and Implications for Timing of the Great
American Biotic Interchange. The Journal of Geology 113: 287-307.
http://hdl.lib.byu.edu/1877/1295.
Gentry, A.H. 1973. Generic delimitations of Central American Bignoniaceae.
Brittonia 25: 226-242.
Complimentary Contributor Copy

Juliana de Paula-Souza and José Rubens Pirani 22
Gentry, A.H. 1980. Bignoniaceae – Part 1 (tribes Crescentieae and
Tourrettieae). Flora Neotropica Monograph 25. New York, NY: New
York Botanical Garden.
Gentry, A.H. 1982. Bignoniaceae – Part 2 (tribe Tecomeae). Flora Neotropica
Monograph 25. New York: New York Botanical Garden.
Gentry, A.H. 1982a. Neotropical floristic diversity: phytogeographical
connections between Central and South America, Pleistocene climatic
fluctuations, or an accident of Andean orogeny?. Annals of the Missouri
Botanical Garden 69: 557–593.
Gentry, A.H. 1995. Diversity and floristic composition of neotropical dry
forests. In: Bullock, S.H.; Mooney, H.A. & Medina, E. (eds.). Seasonally
dry tropical forests. Cambridge, UK: Cambridge University Press. pp.
146-194.
Good, R. 1974. Geography of the Flowering Plants. 4a.
ed. United Kingdom:
Longman Group.
Gottsberger, G. 1978. Seed dispersal by fish in the inundated regions of
Humaita, Amazonia. Biotropica 10: 170-183.
Graham, A. 1992. Utilization of the isthmian land bridge during the Cenozoic
- paleobotanical evidence for timing, and the selective influence of
altitudes and climate. Review of Palaeobotany and Palynology 72(1-2):
119-128. http://dx.doi.org/10.1016/0034-6667(92)90179-K.
Hartwig, W.C. & Cartelle, C. 1996. A complete skeleton of the giant South
American primate Protopithecus. Nature 381: 307-311. doi: 10.1038/
381307a0.
Havran, J.C.; Sytsma, K.J. & Ballard, Jr., H.E. 2000. Evolutionary
relationships, interisland biogeography, and molecular evolution in the
Hawaiian violets (Viola: Violaceae). American Journal of Botany 96(11):
2087-2099. doi: 10.3732/ajb.0900021.
Hawkins, B.A.; Diniz-Filho, J.A.F.; Jaramillo, C.A. & Soeller, S.A. 2006.
Post-Eocene climate change, niche conservatism, and the latitudinal
diversity gradient of New World birds. Journal of Biogeography 33: 770-
780. doi: 10.1111/j.1365-2699.2006.01452.x.
Heads, M. 2005. Dating nodes on molecular phylogenies: a critique of
molecular biogeography. Cladistics 21: 62-78. doi: 10.1111/j.1096-
0031.2005.00052.x.
Heads, M. 2008. Biological disjunction along the West Caledonian fault, New
Caledonia: a synthesis of molecular phylogenetics and panbiogeography.
Botanical Journal of the Linnean Society 158: 470-488. doi: 10.1111/
j.1095-8339.2008.00866.x.
Complimentary Contributor Copy

A Biogeographical Overview of the “Lianescent Clade” … 23
Hedberg, O. 1964. Features of Afroalpine Plant Ecology. Acta
phytogeographica Suecica, 49. Uppsala: Almqvist and Wiksells
Boktryckeri.
Hughes, C.E.; Lewis, G.P.; Yomona, A.D. & Reynel, C. 2004. Maraniona. A
New Dalbergioid Legume Genus (Leguminosae, Papilionoideae) from
Peru. Systematic Botany 29(2): 366-374. doi: http://dx.doi.org/10.1600/
036364404774195557.
Iturrialde-Vinent, M.A. & MacPhee, R.D.E. 1999. Paleogeography of the
Caribbean region: Implications for Cenozoic Biogeography. Bulletin of
the American Museum of Natural History 238. 95p. http://hdl.handle.net/
2246/1642.
Jaramillo, C.; Rueda, M.J. & Mora, G. 2006. Cenozoic plant diversity in the
Neotropics. Science 311: 1893-1896. doi: 10.1126/science.1121380.
Kovar-Eder, J. & Hably, L. 2006. The Flora of Mataschen – A Unique Plant
Assemblage from the late Miocene of Eastern Styria (Austria). Acta
Palaeobotanica 46(2): 157-233.
Kovar-Eder, J. 1999. Oberdorf N Voitsberg (Styria, Austria) - a Key Section in
the Vegetation History of Early Miocene European Continental Deposits.
In Piller, W.E.; Daxner-Höck, G.; Domming, D.P.; Holger, C.F.;
Harzhauser, M.; Hubmann, B., Kollmann, H.A.; Kovar-Eder, J.; Krystyn,
L.; Nagel, D.; Peversler, P.; Rabeder, G.; Roetzel, R.; Sanders, D.;
Summesberger, H. (orgs.). Palaeontological Highlights of Austria.
Mitteilungen der Österreichischen Geologischen Gesellschaft 92: 215-
218.
Leigh, E.G.; O‟Dea, A. & Vermeij, G.J. 2014. Historical biogeography of the
Isthmus of Panama. Biological Reviews 89: 148-172. doi: 10.1111/
brv.12048.
Marcussen, T.; Blaxland, K.; Windham, M.D.; Haskins, K.E. & Armstrong, F.
2011. Establishing the phylogenetic origin, history, and age of the narrow
endemic Viola guadalupensis (Violaceae). American Journal of Botany
98(12): 1978-1988. doi: 10.3732/ajb.1100208.
Martins, F.M. 2011. Historical biogeography of the Brazilian Atlantic forest
and the Carnaval-Moritz model of Pleistocene refugia: what do
phylogeographical studies tell us? Biological Journal of the Linnean
Society 104(3): 499-509. doi: 10.1111/j.1095-8312.2011.01745.x.
McCartney, M.A.; Keller, G. & Lessios, H.A. 2000. Dispersal barriers in
tropical oceans and speciation in Atlantic and eastern Pacific sea urchins
of the genus Echinometra. Molecular Ecology 9(9):1391-400. doi:
10.1046/j.1365-294x.2000.01022.x.
Complimentary Contributor Copy

Juliana de Paula-Souza and José Rubens Pirani 24
Meave, J.; Kellman, M.; MacDougall, A. & Rosales, J. 1991. Riparian habitats
as tropical refugia. Global Ecology and Biogeography Letters 1: 69-76.
Meinzer, F. & Rundel, P. 1985. Morphological changes along an altitudinal
gradient and their consequences for an Andean giant rosette plant.
Oecologia 65: 278-283. doi: 10.1007/BF00379230.
Meller, B. & Hofmann, C.C. 2004. Paläoökologische Interpretation von
Diasporen- und Palynomorphen-Vergesellschaftungen aus obermiozänen
Seesedimenten (Mataschen bei Fehring, Oststeiermark, Österreich).
Joannea Geologie und Paläontologie. 5: 177-217.
Miller, G.A. 1986. Pubescence, floral temperature and fecundity in species of
Puya (Bromeliaceae) in the Ecuadorian Andes. Oecologia 70: 155-160.
doi: 10.1007/BF00377126.
Molau, U. 1988. Scrophulariaceae – Part 1 (Calceolarieae). Flora Neotropica
Monograph 47. New York, NY: New York Botanical Garden.
Montes, C.; Cardona, A.; McFadden, R.; Morón, S.E.; Silva, C.A.; Restrepo-
Moreno, S; Ramírez, D.A.; Hoyos, N; Wilson, J.; Farris, D; Bayona, G.A.;
Jaramillo, C.A.; Valencia, V.; Bryan, J. & Flores, J.A. 2012. Evidence for
middle Eocene and younger land emergence in central Panama:
Implications for Isthmus closure. Geological Society of America Bulletin
124(5-6): 780-799. doi: 10.1130/B30528.1.
Morrone, J.J. 2004. Panbiogeografia, components bióticos y zonas de
transición. Revista Brasileira de Entomologia 48(2): 149-162. doi:
http://dx.doi.org/10.1590/S0085-56262004000200001.
Morrone, J.J. 2006. Biogeographic áreas and transition zones of Latin America
and the Caribbean Islands based on panbiogeographic and cladistic
analyes of the entomofauna. Annual Review of Entomology 51: 467-494.
doi: 10.1146/annurev.ento.50.071803.130447.
Munzinger, J.K. 2000. Systématique des genres Hybanthus Jacq. et Agatea
A.Gray en Nouvelle-Calédonie, implications sur la phylogénie des
Violaceae ligneuses tropicales. Unpubl. Ph.D. thesis. Muséum National
d‟Histoire Naturelle, Paris. 213p.
Munzinger, J.K. 2001. Two new species of Agatea (Violaceae) endemic to
New Caledonia, with some taxonomic notes and a key to New Caledonian
species. Botanical Journal of the Linnean Society 137: 91-97. doi:
10.1111/j.1095-8339.2001.tb01110.x.
Oliveira, P.E.; Barreto, A.M.F. & Suguio, K. 1999. Late Pleistocene/Holocene
climatic and vegetational history of the Brazilian caatinga: the fossil dunes
of the middle São Francisco River. Palaeogeography, Palaeoclimatology,
Complimentary Contributor Copy

A Biogeographical Overview of the “Lianescent Clade” … 25
Palaeoecology 152: 319-337. doi: http://dx.doi.org/10.1016/S0031-0182
(99)00061-9.
Oliveira, P.E.; Behling, H.; Ledru, M.P.; Barberi, M.; Bush, M.; Salgado-
Laboriau, M.L.; Garcia, M.J.; Medeanic, S.; Barth, O.M.; Barros, M.A. &
Scheel-Ybert, R. 2005. Paleovegetação e paleoclimas do Quaternário do
Brasil. In Souza, C.R.G, Suguio, K., Oliveira, A.M.S. & Oliveira, P.E.
(eds.). Quaternário do Brasil. Ribeirão Preto, SP: Holos Editora. pp. 52-
74.
Oliveira-Filho, A.T. & Ratter, J.A. 1995. A study of the origin of central
Brazilian forests by the analysis of plant species distribution patterns.
Edinburgh Journal of Botany 52(2): 195-203. doi: 10.1017/
S0960428600000949.
Paula-Souza, J. 2009. Estudos Filogenéticos em Violaceae com ênfase na
Tribo Violeae e Revisão Taxonômica dos Gêneros Lianescentes de
Violaceae na Região Neotropical. Unpubl. Ph.D. thesis. Instituto de
Biociências, Universidade de São Paulo. São Paulo. 250p. Available at
http://www.teses.usp.br/teses/disponiveis/41/41132/tde-11092009-
182715/pt-br.php
Paula-Souza, J. & Pirani, J.R. Reestablishment of Calyptrion (Violaceae): a
nomenclatural treatment of the genus. Taxon (in press).
Pennington, R.T., Prado, D.E. & Pendry, C.A. 2000. Neotropical seasonally
dry forests and Quaternary vegetation changes. Journal of Biogeography
27(2): 261-273. doi: 10.1046/j.1365-2699.2000.00397.x.
Pennington, R.T.; Lavin, M.; Prado, D.E.; Pendry, C.A.; Pell, S.K. &
Butterworth, C.A. 2003. Historical climate change and speciation:
Neotropical seasonally dry forest plants show patterns of both Tertiary and
Quaternary diversification. Philosophical Transactions of the Royal
Society, B 359: 515–538. doi: 10.1098/rstb.2003.1435.
Pennington, R.T.; Lavin, M.; Särkinen, T.; Lewis, G.P.; Klitgaard, B.B.; &
Hughes, C.E. 2010. Contrasting plant diversification histories within the
Andean biodiversity hotspot. Proceedings of the National Academy of
Sciences of the United States of America 107(31): 13783-13787. doi:
10.1073/pnas.1001317107.
Pijl, L. van der. 1982. Principles of dispersal in higher plants. Berlin:
Springer-Verlag.
Pinto-Sánchez, N.R.; Ibáñez, R.; Madriñán, S.; Sanjur, O.I.; Bermingham, E.
& Crawford, A.J. 2012. The Great American Biotic Interchange in frogs:
Multiple and early colonization of Central America by the South
American genus Pristimantis (Anura: Craugastoridae). Molecular
Complimentary Contributor Copy

Juliana de Paula-Souza and José Rubens Pirani 26
Phylogenetics and Evolution 62(3): 954-972. http://dx.doi.org/10.1016/
j.ympev.2011.11.022.
Porembski, S. & Barthlott, W. (eds.) 2000. Inselbergs: biotic diversity of
isolated rock outcrops in the tropics. Ecological Studies, v. 146. Berlin:
Springer‐Verlag.
Porembski, S. 2007. Tropical inselbergs: habitat types, adaptative strategies
and diversity patterns. Revista Brasileira de Botânica 30(4): 579-586. doi:
http://dx.doi.org/10.1590/S0100-84042007000400004.
Prado, D.E. & Gibbs, P.E. 1993. Patterns of species distributions in the dry
seasonal forests of South America. Annals of the Missouri Botanical
Garden 80: 902-927.
Prado, D.E. 2000. Seasonally dry forests of tropical South America: from
forgotten ecosystems to a new phytogeographic unit. Edinburgh Journal
of Botany 57(3): 437-461.
Prance, G.T. 1996. Islands in Amazonia. Philosophical Transactions of the
Royal Society, B 351: 823-833. doi: 10.1098/rstb.1996.0077.
Raven, P.H. & Axelrod, D.I. 1974. Angiosperm Biogeography and Past
Continental Movements. Annals of the Missouri Botanical Garden 61(3):
539-673.
Retallack, G.J. & Kirby, M.X. 2007. Middle Miocene global change and
paleogeography of Panama. Palaios 22: 667-679.
Richardson, J.E.; Pennington, R.T.; Pennington, T.D. & Hollingsworth, P.M.
2001. Rapid diversification of a genus of neotropical rain forest trees.
Science 293: 2242-2245. doi: 10.1126/science.1061421.
Ricklefs, R.E. 2006. Evolutionary diversification and the origin of the
diversity-environment relationship. Ecology 87(7) Suppl.: S3-S13. doi:
http://dx.doi.org/10.1890/0012-9658(2006)87[3:EDATOO]2.0.CO;2
Ridley, H. N. 1930. The dispersal of plants throughout the world. Ashford: L.
Reeve & Co. 744p.
Santos, C.M.D. & Amorim, D.S. 2007. Why biogeographical hypotheses need
a well supported phylogenetic framework: a conceptual evaluation. Papéis
Avulsos de Zoologia 47(4): 63-73.
Simpson, B.B. 1975. Pleistocene changes in the flora of the high tropical
Andes. Paleobiology 1: 273-294.
Simpson, G.G. 1980. Splendid isolation: the curious history of South
American mammals. New Haven, CT: Yale University Press.
Skrabal, J., Tillich, H.J. & Weigend, M. 2001. A revision of the Passiflora
lobbii group (Passifloraceae) including some new species and subspecies.
Harvard Papers in Botany 6(1): 309-338.
Complimentary Contributor Copy

A Biogeographical Overview of the “Lianescent Clade” … 27
Stehli, F.G. & Webb, D.S. 1985. The great american biotic interchange. New
York, NY: Plenum Press.
Sytsma, K.J.; Litt, A.; Zjhra, M.L.; Pires, J.C.; Nepokroeff, M.; Conti, E.;
Walker, J. & Wilson, P.G. 2004. Clades, clocks, and continents: Historical
and biogeograpical analysis of Myrtaceae, Vochysiaceae, and relatives in
the Southern Hemisphere. International Journal of Plant Sciences 165(4
Suppl.): S85-S105.
Taylor, F.H. 1972. The secondary xylem of the Violaceae: a comparative
study. Botanical Gazette 133(3): 230-242.
Tokuoka, T. 2008. Molecular phylogenetic analysis of Violaceae
(Malpighiales) based on plastid and nuclear DNA sequences. Journal of
Plant Research 121(3): 253-260. doi: 10.1007/s10265-008-0153-0.
Turchetto-Zolet, A.C.; Pinheiro, F.; Salgueiro, F. & Palma-Silva, C. 2012.
Phylogeographical patterns shed light on evolutionary process in South
America. Molecular Ecology 22(5): 1193-1213. doi: 10.1111/mec.12164.
Wahlert, A.W.; Marcussen, T.; Paula-Souza, J.; Feng, M. & Ballard Jr., H.E.
2014. A Phylogeny of the Violaceae (Malpighiales) Inferred from Plastid
DNA Sequences: Implications for Generic Diversity and Intrafamilial
Classification. Systematic Botany 39(1): 239-252. doi: http://dx.doi.org/
10.1600/036364414X678008.
Wang, H.; Moore, M.J.; Soltis, P.S.; Bell, C.D.; Brockington, S.F.; Alexandre,
R.; Davis, C.C.; Latvis, M.; Manchester, S.R. & Soltis. D.E. 2009. Rosid
radiation and the rapid rise of angiosperm-dominated forests. Proceedings
of the National Academy of Sciences of the United States of America 106:
3853–3858.
Weigend, M. 2002. Observations on the biogeography of the Amotape-
Huancabamba zone in northern Peru. Botanical Review 68(1): 38-54. doi:
10.1663/0006-8101(2002)068[0038:OOTBOT]2.0.CO;2
Weigend, M. 2004. Additional observations on the biogeography of the
Amotape-Huancabamba zone in Northern Peru: Defining South-Eastern
limits. Revista peruana de biologia 11(2): 127-134.
Weigend, M., Cano, A. & Rodríguez, E.F. 2005. New species and new records
of the flora in Amotape-Huancabamba zone: Endemics and biogeographic
limits. Revista Peruana de Biologia 12(2): 249-274.
Weigend, M., Rodríguez, E.F. & Arana, C. 2005a. The relict forests of
Northwest Peru and Southwest Ecuador. Revista Peruana de Biologia
12(2): 185-194.
Weir, J.T.; Bermingham, E. & Schluter, D. 2009. The Great American Biotic
Interchange in birds. Proceedings of the National Academy of Sciences of
Complimentary Contributor Copy

Juliana de Paula-Souza and José Rubens Pirani 28
the United States of America 106(51): 21737-21742. doi: 10.1073/pnas.
0903811106.
Wendt, T. 1993. Composition, floristic affinities and origins of the Mexican
Atlantic slope rain forests. In: Ramamoorthy, T. P. et al (eds), Biological
diversity of Mexico, origins and distribution. Oxford: Oxford University.
Press, pp. 595–680.
Wiens, J.J. & Donoghue, M.J. 2004. Historical biogeography, ecology and
species richness. Trends in Ecology and Evolution 19(12): 639-644. doi:
http://dx.doi.org/10.1016/j.tree.2004.09.011
Wiens, J.J. 2004. Speciation and ecology revisited: Phylogenetic niche
conservatism and the origin of species. Evolution 58(1): 193-197. doi:
http://dx.doi.org/10.1554/03-447.
Wijninga, V.M. 1996. Neogene ecology of the Salto de Tequendama site
(2475 m altitude, Cordillera Oriental, Colombia): the paleobotanical
record of montane and lowland forests. Review of Palaeobotany and
Palynology 92(1-2): 97-156. doi: http://dx.doi.org/10.1016/0034-6667(94)
00100-6
Woodman, R.L. & Fernandez, G.W. 1991. Differential mechanical defense:
herbivory, evapotranspiration, and leaf-hairs. Oikos 60: 11-19.
Young, K.R. & Reinel, C. 1997. Huancabamba region, Peru and Ecuador. in
Davis, S. D., Heywood, V. H., Herrera-MacBryde, O., Villa-Lobos, J. &
Hamilton, A. C. (eds.). Centres of plant diversity: A guide and strategy for
their conservation, 3: North America, Middle America, South America,
Caribbean Islands. Cambridge, UK: IUCN Publications Unit. pp. 465-
469.
Complimentary Contributor Copy

In: Dry Forests ISBN: 978-1-63321-291-6
Editor: Francis Eliott Greer © 2014 Nova Science Publishers, Inc.
Chapter 2
DIVERSITY AND DISTRIBUTION OF
HYMENOPTERA ACULEATA IN MIDWESTERN
BRAZILIAN DRY FORESTS
Rogerio Silvestre1,2
, Manoel Fernando Demétrio1,2
,
Bhrenno Maykon Trad1,2
,
Felipe Varussa de Oliveira Lima1,2
,
Tiago Henrique Auko1,2
and Paulo Robson de Souza3
1Laboratório de Ecologia de Hymenoptera HECOLAB,
Faculdade de Ciências Biológicas e Ambientais- FCBA,
Universidade Federal da Grande Dourados- UFGD,
Rodovia Dourados Itahum, Cidade Universitária, Dourados, MS, Brazil 2Programa de Pós Graduação em Entomologia e Conservação da
Biodiversidade- PPGECB,
Universidade Federal da Grande Dourados- UFGD 3Programa de Pós-Graduação em Ecologia e Conservação,
Universidade Federal de Mato Grosso do Sul, Cidade Universitária,
Campo Grande, MS, Brasil
ABSTRACT
The highly diverse Hymenoptera fauna in Neotropical forests has
been the focus of many studies investigating the structure of ecological
Complimentary Contributor Copy

R. Silvestre, M. Fernando Demétrio, B. Maykon Trad et al. 30
communities, particularly in the last ten years. Studies on the
biogeography and diversity of Hymenoptera, as well as the processes
affecting their maintenance, can be of great interest for planning effective
conservation of the biota on a regional scale. Such studies can also
contribute to producing new ecological and taxonomic data, particularly
in areas where no previous records exist for the group, as in the case of
dry forests located in the middle of South America.
In this context we present the first systematic inventory of
Hymenoptera made in the pristine dry forests of midwestern Brazil. The
study was conducted over eight years, in two regions; Bodoquena
Mountain Range and Brazilian Chaco. These locations are set in a large
open area in a diagonal formation of South America, the so-called
"Pleistocenic Arc", extending from the Caatinga in northeastern Brazil to
the Chaco in Argentina, where the contact areas occur between the
Pantanal, Cerrado, Chaco, and Atlantic Forest. We investigated the
distribution patterns from each Hymenoptera group and described the
faunistic structure. An expressive number of rare and endemic species
was detected, and high beta diversity was revealed for all Hymenoptera
groups along the dry forest fragments. All groups studied showed a
similar species abundance distribution profile, denoting a model that
follows a truncated lognormal pattern. In order to identify species
richness, the most diverse taxon in a regional spectrum of the dry forests
analyzed was Formicidae with 294 species and morphospecies records,
followed by Apidae (150), Pompilidae (103), Vespidae (79), Crabronidae
(74), Mutillidae (21), Sphecidae (20), Tiphiidae (15), Scoliidae (6), and
Rhopalossomatide (1). In total, 763 species were identified and
morphospecies in 236 genera in ten families. Despite the biogeographical
relationships of the vegetation, evolutionary effects of environmental
formations and anthropogenic current impacts may be reflected in the
structure of the whole Hymenoptera community on dry forests from mid-
western Brazil. This region is considered of very high biological
importance, being extremely diverse, and it urgently needs to be reflected
as a hotspot.
Keywords: Ants, Bees, Wasps, Beta diversity, Neotropical region,
Pleistocenic arc
Complimentary Contributor Copy

Diversity and Distribution of Hymenoptera Aculeata ... 31
INTRODUCTION
Brazilian Dry Forests
On a large time-scale changes in climate and relief configuration would
have caused expansions and retractions of wet and dry forests in South
America. The Brazilian dry forests are represented by those which lose part of
their leaves during a particular time of year (semideciduous) and those which
lose all of their leaves during a particular season (deciduous), located in
Caatinga, Cerrado and Chaco (Prado 2000).
Fossil records indicate that in Tertiary and Quaternary periods, the
Neotropical dry forests had a more continuous distribution in the recent
geological past, especially in the late Pleistocene era, and more precisely at the
end of the last glacial period, between 18,000 and 8,000 years ago (Werneck et
al. 2012, Pennington et al. 2009). Prado and Gibbs (1993) pointed out that
seasonal deciduous forests are remnants of a broader continuous distribution
that was present in the past, ranging from northeastern Brazil to Argentina in
the Pleistocene dry period. This currently fragmented structure is the result of
the dry, cold climate that caused the retraction of wet forests to riversides and
the spread of seasonal forests (Pennington et al. 2009). Deciduous forests
comprise discontinuous patches along fertile valleys and basaltic and
calcareous rocks in a matrix of Cerrado on the Brazilian Central Plateau. Some
of these dry forests operate as islands or are mixed with other formations. This
Cerrado matrix, intersected by riparian forests, acts as a connection among dry
forests in northeastern Brazil, east of Minas Gerais and São Paulo states, and
forest remnants in Pantanal.
The midwestern Brazilian Dry Forests, within the Chacoan sub-region,
border the provinces of Chacoan, Cerrado, Pantanal and Parana Forest
(Morrone 2014) and still remain poorly sampled with respect to the
Hymenoptera fauna.
THE HYMENOPTERA GROUP
Hymenoptera are one of the largest orders of insects, comprising sawflies,
wasps, ants and bees. Over 150,000 species are recognized, with many more
remaining to be described. Hymenoptera have a great biodiversity and a great
biological, ecological and economic importance, participating in more than
Complimentary Contributor Copy

R. Silvestre, M. Fernando Demétrio, B. Maykon Trad et al. 32
50% of terrestrial food chains. They are great deprecators of other life forms.
The majority of wasp species (well over 100,000 species) are "parasitic"
(technically known as parasitoids), and the ovipositor is used simply to lay
eggs, often directly into the body of the host. Based on the feeding habits of
the known world Hymenoptera, 85% species represent parasitic forms and
15% are predatory forms (Grissel 2010, Godfray 1994).
Taxonomists traditionally divide this group into Symphyta and Apocrita,
the first being a relatively small and probably the most ancestral taxon, with
representatives of the Triassic fossils from 200 million years ago. The
Symphyta (sawfly) have few living species; the main feature is a constriction
between the thorax and the first segment of the abdomen (Goulet & Huber
1993). Apocrita is the group that contains most species of the Hymenoptera
and is divided into two groups: Parasitic and Aculeata (Gauld & Bolton 1988).
The Aculeata branch is characterized by special modifications of the
ovipositor, a complex device found only in the adult female. The mechanism
serves both as an egg depositing tube and a sting, allowing a female wasp to
temporarily paralyze a host so that an egg can be laid upon or within its host
(O‟Neill 2001).
The most familiar wasps belong to Aculeata, whose ovipositors have
adapted with a venomous sting, though many aculeate species do not sting.
Traditionally, nine families of wasps are recognized inside Vespoidea
(Fernández 2006, Brothers 1999), and traditionally the Apoidea comprises the
lineage bees and spheciform wasps, and the number of families changes
according to the adopted classification (Johnson et al. 2013, Debevec et al.
2012, Michener 2007, Melo & Gonçalves 2005, Brothers 1975). The
parasitism can occur in species of the Chrysidoidea group (La Salle & Gauld
1993) that is classified inside Aculeata and have a group relationship with
Vespoidea and Apoidea, representing an evolutionary link between wasps that
have stinger apparatus and those which are parasitic.
Formicidae, with more than 14,954 names of valid species and subspecies
worldwide, present estimates that can exceed 20,000 species (AntWeb 2014).
21 subfamilies are currently recognized, diagnosed from potential
synapomorphies (Fernandez & Sendoya 2004, Agosti & Alonso 2000). The
Neotropical region comprises 15 of these, with 136 genera and 4,164 species
and subspecies, of which 1,906 species are endemic. In Brazil 1,456 species
and 103 genera are recognized (AntWiki 2014).
Ants are one of the most important groups of insects in tropical forests.
They strongly influence the ecosystem since it is important in the
incorporation of nutrients to the soil and aeration, and they are predators of
Complimentary Contributor Copy

Diversity and Distribution of Hymenoptera Aculeata ... 33
other organisms in the environment regulating diversity (Hölldobler & Wilson
1990). Although they occupy all strata of an environment, many groups have
close relationships with plants, getting features like pollen and floral and extra
floral nectar and mostly protecting the plant host from other herbivores
(Delabie et al. 2007). The species composition of ants within assemblages is
influenced by the distribution of resources to be exploited and the strategies
used for obtaining, in this way, share the ecological niche with other
organisms (Silva & Brandão 2010, Silvestre et al. 2003).
The ant fauna, in comparative terms, is especially suitable for use as a bio-
indicator tool (ecological, environmental, and diversity) by presenting
relatively high local abundance, high local species richness (alpha diversity)
and high regional species richness (gamma diversity); it has many specialized
taxa which present with higher sensitivity to changes in the environment and
vegetation. Moreover, the taxon is sampled at a relatively low cost of
collection methodology; one previously defined sampling protocol, and is
usually easily separated into morphospecies, which make efficient processes
for conducting rapid inventories of biodiversity (Silvestre et al. 2012,
Hölldobler & Wilson 1990).
Inside the superfamily Vespoidea, Sapygidae, Bradynobaenidae,
Sierolomorphidae, and Rhopalosomatidae are considered rare with restricted
distribution and abundance, and Mutillidae, Pompilidae, Vespidae, Tiphiidae
and Scollidae are common in surveys in Brazil. These wasps are
phylogenetically related to the following groups: Chrysididae, Bethylidae,
Plumaridae and Apoidea Spheciformes (Peters et al. 2011).
Pompilidae contains 4,200 species distributed worldwide (Brothers &
Finnamore 1993) and the Neotropics have about 750 species (Fernández
2000).
Vespidae has about 4,500 described species, distributed in 268 genera
(Brothers & Finnamore 1993). Only three subfamilies are found in Brazil:
Masarinae, Eumeninae and Polistinae (Carpenter & Marques 2001).
Mutillidae contains around 10,000 species in the world and two of the
seven extant subfamilies are found in the Neotropics: Sphaerophtalminae and
Mutillinae (Brothers 2006, Brothers & Carpenter 1993). Their common name
velvet ant refers to their dense pile of hair. Their bright colors serve as
aposematic signals. Mutillidae exhibit extreme sexual dimorphism; the males
are winged and the females are wingless. Mutillidae are commonly associated
with the parasitism of bees.
Tiphiidae wasps are cosmopolitan, with predominance in tropical regions,
containing about 1,500 species distributed into seven subfamilies. The most
Complimentary Contributor Copy

R. Silvestre, M. Fernando Demétrio, B. Maykon Trad et al. 34
common species are parasitoids of Scarabaeoidea. Only some females and all
males are winged (Kimsey & Brothers 2006).
Scoliidae has about 300 species and five genera in the world and in the
Neotropics two genera of the subfamily Scoliinae are found: Campsomeris and
Scolia. The females have a robust aspect and digger habits. The most common
species are parasitoids of Scarabaeidae, Passalidae and Lucanidae (Fernández
2006).
Rhopalosomatidae consists of four genera and 40 species described
worldwide, and three genera and 20 species are known in Neotropical region
(Sarmiento 2006), and the genus Rhopalossoma is more commonly found in
open areas and sandbanks in Brazil.
The wasps are essential organisms for the maintenance of the population
of many arthropods, due to the fact that the diet of the larvae is based on
animal protein. Pompilidae feed on spiders almost exclusively;
Rhopalosomatidae feed on crickets; Vespidae eats mainly caterpillars, while
Scoliidae and Tiphiidae prefer beetles which they use for the development of
their larvae. The adults preferentially feed on nectar and so are potential
pollinators, or even mandatory Anthophilous (Auko et al. 2013, Hunt 1991).
Traditionally, all species of Vespoidea are called predators, while in the
development maturity the social wasps are progressively fed by adults, who
use more than one individual, thus being characterized as predation feeding
habits; the solitary species, which feed their larvae a different way, use only
one individual (except Eumeninae) as a host for their larvae, thus
characterizing a life cycle very similar to that found in the parasitic wasp,
traditionally called parasitoids (Godfray 1994). The difficulty in defining
groups Vespoidea inside the predatory and/or parasitoids behaviors should be
the great diversity of species presented in this group, which allows a wide
variety of habits and strategies, although belonging to the same taxon. Wasps
are a key element in understanding the evolution of social behavior, as they
comprise both species with solitary behavior and species that are truly social
(eusocial) (Hermes 2013).
Spheciforms refers to an extremely diverse cosmopolitan group of wasps.
There are currently 9,716 known living species in the world, distributed
among the following families: Heterogynaidae (8), Ampulicidae (200),
Sphecidae (735) e Crabronidae (8,773) (Pulawski 2014). Angarosphecidae is
extinct, and Heterogynaidae is restricted to the Old World (Amarante 2006,
Engel 2001). Amarante (2005, 2002) cataloged 1,928 species in the Neotropics
with the following richness: Crabronidae (1,732 species), and Sphecidae (196)
considering Ampulicinae as a subfamily of Sphecidae.
Complimentary Contributor Copy

Diversity and Distribution of Hymenoptera Aculeata ... 35
The females are usually solitary with hunters‟ habits; however, various
levels of social behaviors are found, including at least one example of
eusociality (Matthews 1991). Females can lay their nests by digging the sand,
soil, wood, occupying pre-existing cavities or even using materials such as
clay, waxes and plants for the construction of brood cells, which can be
individualized or joint (Amarante 1999). Almost all orders of insects are used
as prey, and some groups of springtails and spiders (Buschini et al. 2008,
Evans 2002, Bohart & Menke 1976).
In the world 16,000 species of bees are described with estimates of up to
20,000 species (Brady et al. 2009, Michener 2007, Pedro & Camargo 2000).
According to Roubik (1989), considering the new species proportionately
framed in groups under review; perhaps we would reach 40,000 species of
bees in the world. In the Neotropical region 5,600 species of bees are
recognized (Roubik 1995) and for the Brazil, Pedro & Camargo (2000)
estimate there are 3,000 species. According with Melo & Gonçalves (2005)
the faunal diversity of bees is restricted to a single family (Apidae),
considering five subfamilies Andreninae, Apinae, Colletinae, Halictinae and
Megachilinae, with 42 tribes and 219 species. The number of genera known in
Brazil for each subfamily of Apidae is: Halictinae (34), Colletinae (30),
Andreninae (30), Megachilinae (28) and Apinae 27 (+70), without the
inclusion of Anthophoridae (Silveira et al. 2006).
Bees, both social and solitary, are responsible for the maintenance of plant
diversity and ecological balance in most terrestrial ecosystems, and are
considered a keystone mutualistic species (O'Toole, 1993). They are one of the
most important pollinators in tropical forests in terms of number of species of
plants pollinated (Momose et al. 1998). If the bees disappeared the forests‟
structure would alter, because the plant species fertilized by bees would have a
diminished capacity to produce seeds. This essential "environmental service"
determines the formation of fruit and fertile seeds, which maintains genetic
diversity. The bees are not immune to "biodiversity crisis"; this is a big and
serious problem, because about 30% of human food derived from plants is
pollinated by bees (McGregor 1976 apud O'Toole, 1993).
In this study we described a species occurrence for Hymenoptera in two
expressive continuous dry forests along midwestern Brazil, trying to estimate
species richness for each taxon and check which model the distribution of
these groups of aculeate Hymenoptera present in this type of forestry
formation.
Complimentary Contributor Copy

R. Silvestre, M. Fernando Demétrio, B. Maykon Trad et al. 36
METHODS
Study Site
We had been surveying two particular dry forest regions located in Brazil.
We surveyed seventeen localities along one continuous block of deciduous
forest from September 2005 to February 2013. Seventeen wild expeditions
were performed in this period with seven days of collections in each, but not
with all expert groups together. To compose the sample unit we combined the
expeditions that have been made to the same location, and those performed in
nearby sites within a radius of 10 km buffers were grouped. Nine sites
emerged from this combination of collecting expeditions.
Plate 1. Nine buffers with 10 kilometers‟ radius sampled to Hymenoptera fauna in
deciduous forests areas in Bodoquena plateau and in Brazilian Chaco.
Parque Nacional da Serra da Bodoquena
The Bodoquena´s mountain range park (21º07´14,7”S 56º43´08,2”W-
central location) possesses 77,232 ha frames on Cerrado-Pantanal Biodiversity
Complimentary Contributor Copy

Diversity and Distribution of Hymenoptera Aculeata ... 37
Corridor; it is inserted on a core area of Atlantic Forest Biosphere Reserve.
The area is an environmental planning unit, being a watershed which supplies
the hydrological basin of western Brazil. The locality is sustained by
calcareous rocks of the Corumbá group-Neoproterozoic III. The lithological
characteristic of the tufas makes it possible to create a new unit, named Serra
da Bodoquena formation (Sallun Filho et al. 2009). It is characterized by a
high rocky massif, with altitudes varying between 200m and 770m asl.
Exposed limestone from the Tamengo formation predominates in this karstic
region, where rivers are found within canyons. The annual average
temperatures of the area fluctuate between 22°C and 26°C. The minimum
temperature can be as low as 0°C. The relative humidity is low and rarely
reaches 80%, and rainfall varies between 1300 mm and 1700 mm a year. The
hot and rainy season occurs between October and April, and the cold and dry
season from May to September.
Plate 2. Bodoquena mountain range in midwestern Brazil, with predominance of
deciduous and semi-deciduous plants species in carbonate rocks formation and iron
formation.
Brazilian Chaco
Porto Murtinho municipality, Mato Grosso do Sul State (MS) (21°42‟04”S
57°53‟06”W). Located in Central South America, the Gran Chaco is the more
extensive subtropical dry forest in the continent, and has approximately 3,400
plant species, including great diversity of plants with xeromorphic features
such as microfilia (small leaves), abundant thorns, underground systems and
stems adapted to drought (Pott et al. 2008, Prado 2000). With approximately
850,000 km2 and classified as Stepic Savanna (Silva & Abdon 2006), it covers
Complimentary Contributor Copy

R. Silvestre, M. Fernando Demétrio, B. Maykon Trad et al. 38
northern Argentina, western Paraguay, Bolivia and a small range in
southeastern Brazil (only 7 %). The Chaco is one of the major wooded
grassland areas in Central South America, and could therefore be of major
economic importance, although this resource is being overutilized and suffers
from intense degradation through unrestricted forest and bush clearing,
overgrazing and continuous monoculture. It is important to stress that there is
no desert zone within the Gran Chaco and that it extends into both tropical and
temperate zones. This vast region is an almost flat plain sloping gradually
eastwards, varying from 100 - 500 m above sea level, except for the Sierras in
Cordoba, Argentina, which reach 2,800 m; some hills in Paraguay are over
700 m (Riveros, 2002).
The name Chaco derives from the Quechua "Chaku" which means
"hunting territory", an allusion to the annual hunting expeditions, undertaken
by the Inca Empire in the region in pre-Columbian period (Pott et al. 2008). It
presents great diversity of ecosystems, high species diversity and endemism of
relatively high compared to other arid environments, semi-arid and sub-humid
(Silva et al. 2000, Redford et al. 1990).
Plate 3. Brazilian Chaco in Porto Murtinho Municipality. Aspects of diversified dry
forest vegetation.
A small fraction of the Chaco located in Brazil, bordering the extreme
south of Pantanal lowland, named Nabileque sub-region, is a part of the
portion known as Oriental or Humid Chaco, presents floristic contacts between
Chaco/Cerrado, Chaco/Dry Forest, Chaco/Limestone Forest, and others as an
Complimentary Contributor Copy

Diversity and Distribution of Hymenoptera Aculeata ... 39
extensive arboreal monodominant formation named Carandazal-Copernicia
alba Morong (Fava et al. 2008, Delsinne et al. 2007, Abdon & Silva 2006).
Sampling Protocol
For sampling Hymenoptera we used the following techniques:
Entomological net: The search for Hymenoptera specimens was
performed on trails in the woods, flowers on the banks of rivers and
streams, and directly into the nests. The sampling effort was five days
per location for a total of six hours daily.
Moërick traps: For each sampling event we utilized 50 yellow pans
arranged in transects of 500 m with 10 m distance between traps, and
collected after 24 hours. The specimens were transferred to alcohol
96%.
Malaise traps: A Malaise trap is a large, tent-like structure used
for trapping flying insects, particularly Hymenoptera and Diptera.
Insects fly into the tent wall and are funneled into a collecting vessel
attached to the highest point. Four Malaise traps were set at ground
level in each area, arranged for a period of five days per locality.
Mini-Winkler apparatus: The leaf-litter sampling was realized
following Ants of the Leaf Litter protocol. For each sample unit one
square meter of leaf-litter was extracted in Winkler´s apparatuses
covering one area with 10,000 m2. The sampling site was chosen by
selective form inside of each point, seeking the best micro-habitats for
the leaf-litter extraction in the forest, in general, near to the biggest
trees. In each sampling point material was extracted until we reached
the superficial soil layer. The sifted volume with up to 2 kg was
transferred to a collector bag. In the field laboratory this material was
extracted with mini-Winkler apparatus for 24 hours, and after this
period, the specimens were put in Eppendorfs pots.
Attractive baits: The bait, containing 1 cm3 of sardine, was dispersed
in a piece of paper for 1 h. A total of 100 baits were used in each of
the sampled areas.
Aromatic essences: Attractive with aromatic compounds for capturing
Euglossine males contain cineol, methyl salicylate, methyl benzoate,
Complimentary Contributor Copy

R. Silvestre, M. Fernando Demétrio, B. Maykon Trad et al. 40
eugenol, and vanillin. Fifty traps were performed (ten sets of five
baits) dispersed at 200 meter intervals.
In the Hymenoptera Ecology Laboratory (HECOLAB-UFGD) all
Hymenoptera species were kept in entomological pins. The voucher specimens
were deposited in the Biodiversity Museum of Universidade Federal da
Grande Dourados (UFGD), Mato Grosso do Sul State, Brazil.
Data Analyses
We adopt the concept of range, which is defined as the number of sites
occupied by a species within a region and the concept of relative abundance of
species, which is defined as the frequency distribution of absolute abundance
of the sites, is used to refer to the common or rare species in a community
(Magurran & McGill 2011).
The frequencies of species based in presence/absence were analyzed in the
range of region and grouped into classes or octaves of abundance (Lobo &
Favila 1999, Magurran 1988). The number of species in each octave varied as
follows: 1 (0-2); 2 (2-4); 3 (4-8), 4 (8-16) and so on, allowing us to view the
richness and quantitative distribution of species per sample unit. The data set
was analyzed using R software with the Vegan package (R Development Core
Team, 2010).
The sampling data of the nine samples localities were organized in
different data matrix for each family of the aculeate Hymenoptera plotted in
the software Microsoft Excel (2007). Only the presence/absence (occurrence)
of species sampled, importing the data matrix into the EstimateS (Colwell,
2013), assess and compare the diversity and composition of species
assemblages based on sampling data computed on this software. We built a
table with the same values obtained of diversity analyses, as the Shannon
diversity index, Chao 1 richness estimator and Second-order Jackknife
richness estimator (Jack2). When comparing species similarity of nine
localities, we calculate and use Morisita-Horn sample similarity index, using
also distance in kilometers between localities obtained with the software
Google Earth 7.1.2., which was compared with the similarity values obtained
and distance using a Pearson correlation computed on the software Statistica
8.0 (Statsoft Inc. 2007).
Complimentary Contributor Copy

Diversity and Distribution of Hymenoptera Aculeata ... 41
RESULTS
In total 763 species were identified and morphospecies of Hymenoptera
Aculeata (excluding Chrysidoidea) in 236 genera, classified in 10 families
(Appendix), in midwestern Brazilian dry forest, with 1,551 registers in nine
localities sampled. Some species illustrating the Hymenoptera fauna are in
Plates 4-10.
Formicidae was represented by all live subfamilies in the Neotropical
region. We sampled 294 species in 66 genera. The richest genera sampled was
Pheidole (27 species), Hypoponera (21), Pachycondyla (17), and Cephalotes,
and Camponotus with 16 species each.
We sampled for the Apidae 992 individuals belonging to 150 species in 65
genera, but 59 species could not be named or properly classified; only
morphospecies by a single expert, that was due to the absence of current
revisions of some genera and species of bees. All Apidae subfamilies present
in Brazil were sampled in the Bodoquena Plateau and Brazilian Chaco, Porto
Murtinho region. Apinae was the richest subfamily with 87 species and 41
genera, of which 18 species correspond to stingless bees (Meliponina). The
other subfamilies, in decreasing order, were Halictinae (28 species in nine
genera), Megachilinae (27 species in 10 genera), Colletinae (six species in
three genera), and Andreninae (two species in 2 genera). The richest genera
sampled were Megachile (15 species), and Ceratina and Augochlora with nine
species each.
We sampled 94 species of Spheciformes wasps (Apoidea) in 42 genera
being Crabronidae (74 species in 34 genera), and Sphecidae (20 species in 8
genera). Eremnophila binodis (Fabricius) (Sphecidae) was the most abundant
species recorded from the Spheciformes with 35 individuals collected. The
Crabronidae species Clitemnestra paraguayana Bohart, 2000, Trypoxylon
marginatum Cameron, 1912, and Stenogorytes megalommiformis (Strand,
1910) are recorded for the first time in Brazil.
A total of 225 species and 63 genera of the Vespoidea, in six families
(excluding Formicidae), were sampled, being Pompilidae (103 species and 22
genera), Vespidae (79 species and 25 genera), Mutillidae (21 species and 8
genera), Tiphiidae (15 species and 6 genera), Scoliidae (six species and one
genus), and Rophalosomatidae (one species and one genus). The more diverse
genera were Notochypus (Pompilidae) and Mischocyttarus (Vespidae) with
about 12 species sampled, and Ageniella and Pepsis with 10 species recorded,
both Pompilidae. Epipompilus aztecus (Cresson, 1869) (Pompilidae) was
registered for the first time in South America (Silvestre et al. 2010).
Complimentary Contributor Copy

R. Silvestre, M. Fernando Demétrio, B. Maykon Trad et al. 42
Plate 4. Bombus sp. (Apidae).
Plate 5. Argogorytes umbratilis (Crabronidae).
Complimentary Contributor Copy

Diversity and Distribution of Hymenoptera Aculeata ... 43
Plate 6. Poecilopompilus sp. (Pompilidae).
Plate 7. Proctonectarina sp. (Vespidae).
Complimentary Contributor Copy

R. Silvestre, M. Fernando Demétrio, B. Maykon Trad et al. 44
Plate 8. Traumatomutilla sp. (Mutillidae).
Plate 9. Cephalotes clypeatus (Formicidae).
Complimentary Contributor Copy

Diversity and Distribution of Hymenoptera Aculeata ... 45
Plate 10. Cylindromyrmex brasiliensis (Formicidae).
The estimated richness and Shannon diversity index for all taxa is
presented in Table 1. The richness for Hymenoptera Aculeata is estimated to
be up to 1,400 species, excluding Chrysidoidea wasps.
In the species abundance distribution (SAD) a truncated lognormal
distribution profile was verified for all taxa analyzed (Figure 1). This kind of
distribution denotes expressive rarity of species where the “hollow curve” is
configured between the first and second abundance octaves.
The similarity between the sampled point‟s buffers with 10 km radius
indicates no correlation with distance. Less than 40% of faunistic similarity is
explained by the proximity of the areas (r= -0,397). This pattern indicates high
beta diversity in this region (Figure 2).
Table 1. Richness estimated for Hymenoptera Aculeata in midwestern
Brazilian dry forest, and diversity index
Taxon Species Jack-II Chao 1 Shannon
Observed Estimated Estimated Diversity Index
Ants 294 468.58 443.50 5.40
Bees 150 310.63 369.19 4.84
Spheciformes 94 182.05 186.42 4.34
Vespoidea 225 444.81 516.26 5.12
Total 763 1,406.09 1,476.77 6.36
Complimentary Contributor Copy

R. Silvestre, M. Fernando Demétrio, B. Maykon Trad et al. 46
Figure 1. Distribution models for Hymenoptera, based on abundance of octaves,
sampled in midwestern Brazilian dry forest, between the years 2005 and 2013, in 9
buffer localities from Bodoquena mountain range to Brazilian Chaco.
Figure 2. Correlation analysis between similarities, based on Morisita-Horn index, and
distance in kilometers of the sampled points in midwestern Brazilian dry forest,
between the years 2005 and 2013, in 9 buffer localities from Bodoquena mountain
range to Brazilian Chaco (r= -0,397).
0
0.1
0.2
0.3
0.4
0.5
0 50 100 150 200Sim
ilari
ty (
Mo
risi
ta-
Ho
rn)
Distance Km
Complimentary Contributor Copy

Diversity and Distribution of Hymenoptera Aculeata ... 47
CONCLUSION
To detect and describe the fauna of a given region, and interpret the data
obtained in the field, does not constitute an easy task, even for relatively
undiversified groups. The preparation of a list of any vertebrate or invertebrate
taxon is not a trivial task and involves, besides the use of specific and efficient
techniques to sample a particular group, a reasonable knowledge of their
systematics, taxonomy, ecology and natural history in general (Lewinsohn &
Prado 2005). Faunal inventories currently are the most direct way to access
and experience the diversity of the components of the biome or locality in a
given space and time; however, the biological diversity cannot be reduced to
knowledge of the taxa that occur in a given area. This limitation of the
approach renounces the background history of the evolution of the area. The
species abundance distribution (SAD) is one of the most studied patterns in
ecology due to its potential insights into commonness and rarity, community
assembly, and patterns of biodiversity. However, the distribution pattern of
species abundance found in this study revealed that the Hymenoptera fauna on
dry forests is strongly influenced by the rarity of the species, or else there are a
great number of species with low frequency of occurrence and a smaller
number of species with high frequency of occurrence in all Hymenoptera
groups presented in this study. It is well established that the Hymenoptera
community is composed of a few common and many rare species.
The low similarity between the sampled points suggests that the aculeate
species are randomly distributed over the region. There is a trend of the
similarity between the samples to decrease with increasing distance (r=-0.39).
Consecutive sampled sites suggest a strong formation effect and the influence
of adjacent areas, considering the Cerrado matrix where the dry formations are
encountered, which are evidenced by high beta diversity, with different
arrangements of this Hymenoptera fauna and a high turnover in species across
sample points.
Hanson and Gauld (1995) registered the Hymenoptera fauna in Costa Rica
with the following richness in the families: Apidae (700), Formicidae (620),
Spheciformes (400), Vespidae (180), Pompilidae (250), Mutillidae (300),
Tiphiidae (30), Scoliidae (15), and Rhopalosomatidae (8). The richness
sampled in the Brazilian dry forest was approximately 40% of the fauna
richness of the Tiphiidae, Scoliidae, Pompilidae and Formicidae found in
Costa Rica that can be considered interchangeable between the fauna of South
and North America.
Complimentary Contributor Copy

R. Silvestre, M. Fernando Demétrio, B. Maykon Trad et al. 48
Rasmussen and Asenjo (2009) reported species-group taxa of aculeate
wasps of Peru and presented the first checklist of the 225 genera and 1,169
species, including Chrysidoidea wasps, not considered here; in this work they
sampled 301 species of Spheciformes (Crabronidae 262, Sphecidae 38, and
Ampulicidae 1), and 691 species of Vespoidea (Vespidae 403, Pompilidae
158, Mutillidae 88, Tiphiidae 32, Scoliidae 8, and Rhopalossomatidae 2),
totaling 992 species/morphospecies sampled of these aculeate wasp families in
Peru. In our work we obtained 319 species/morphospecies of these wasps‟
families in a small region of dry forest localities in midwestern Brazil.
All Vespoidea families occurring in Brazil were sampled here; about 50 %
of the genera of Vespoidea recognized from Brazil were sampled in this dry
forest region. The diversity of species of Vespoidea recorded here is higher
than in other biomes in Brazil, although the methods used in those studies are
not standardized (Santos et al. 2014, Morato et al. 2008). When comparing
only species of social wasps (Polistinae), the diversity of the dry forest was
similar to the work carried out in the Atlantic Forest (Tanaka Jr. & Noll 2011,
Santos et al. 2007), but was much lower than that observed in the Amazon
region by Silveira et al. (2008).
The diversity of Mutillidae (20 species registered) is underestimated due
to the difficulty of determining species and association between males and
females. These wasps are more common in savannahs or semi-desert areas
(Hanson & Gauld 2006). Previous studies have reported that Ageniella
(Pompilidae) and Ephuta (Mutillidae) are the richest tropical forests in the
Vespoidea genera (Santos et al. 2014, Morato et al. 2008). In our work Pepsis,
Ageniella, and Notocyphus were the richest genera in number of species
between Vespoidea groups. Pepsis is the most diverse genus in open
environments (Vardy 2000), and Notocyphus is associated with the presence of
other genera, as its species are cleptoparasitic of other Pompilidae.
Due to the shortage of Spheciformes specialists in Brazil, knowledge of
the group is incipient. Large gaps are still found in the geographical
distribution of the species and information about their biology are still
presented in a fragmented way, whereby a small number of species, which are
generally more tolerant of anthropogenic presence, are better known than most
rare and sensitive organisms.
Ruiz et al. (2002) catalogued 615 Spheciformes species in Mexico, and
Rasmussen and Asenjo (2009) registered 301 species of these wasps in Peru.
Amarante (2002) recorded 633 species in Brazil, and in the Mato Grosso do
Sul he indicates 57 species. In this work we obtain 94 Spheciformes species.
Complimentary Contributor Copy

Diversity and Distribution of Hymenoptera Aculeata ... 49
In this work we observed a nearby association of certain species to the
physical structure of environments, such as in areas with exposed soil and
riverbanks, where we observed that species make their nests by digging the
soil; for example, Argogorytes umbratilis (R. Bohart 2000), and Penepodium
sp. were observed nesting in exposed soil areas. At these sites we also
observed the activity of collecting mud by Sceliphron asiaticum (Linnaeus,
1758) which uses clay to build grouped cells in protected sites, as in the bark
of trees, rocky outcrops, or in cave walls and often more tolerant species use
human buildings. Other species use pre-existing cavities in which to supply
food for their offspring, as observed with the genera Podium and Trypoxylon.
We also observed the nesting activity of digger sand wasps (Bembicini) in
open areas of exposed sandy soils, common in dry forests in this region.
The number of bee species presented in this study differs from sampling in
areas of dry forest made by other researchers in other Neotropical localities.
Osorio-Beristain et al. (1997) recorded the bee fauna of the Biological Station
of Chamela, Mexico, composed of 87 genera and 228 species. Vinson et al.
(1993) in Costa Rica (Tempisque dry forest) reported 250 species. The lowest
species richness found in this study is probably due to the smaller size of the
sampled area. However, our inventory compared to that performed by
Gonçalves & Brandão (2008 ) in 17 selected localities, using Malaise traps,
representing a gradient of almost 20° of latitude in evergreen pristine Atlantic
Forest, was superior in number of species and genera sampled (107 species
and 50 genera for Atlantic Forest).
Vergara (2002) in the Central Plateau of Mexico detected the same pattern
of distribution of abundance found in this work for bees. In contrast to
modified landscapes, such as agroecosystems, with intensive management it is
possible to create homogenous habitats which often indicate a loss of rare taxa
and keystone species and dominance of a few aggressive/opportunistic species
of aculeate Hymenoptera (Vinson et al. 1993; Gess & Gess, 1993). Batista-
Matos et al. (2013) consider the solitary bees, and conclude that the least
disturbed and oldest areas shelter a greater richness and rare species; while the
types of land use more intensively managed house the greatest abundance and
lower species diversity.
New records of ant distributions were obtained in this work for Brazilian
dry forest. Probolomyrmex brujitae Agosti, 1995 and Atta saltensis Forel,
1913 were previously reported only in Argentina and Uruguay, and Gracilidris
pombeiro Wild & Cuezzo, 2006 only in Paraguay. This ant inventory is
comparable to that made by Groc et al. (2013) in a Pristine Amazon Forest in
French Guiana in the number of genera sampled.
Complimentary Contributor Copy

R. Silvestre, M. Fernando Demétrio, B. Maykon Trad et al. 50
We verify for leaf litter ants a specificity of micro-environmental niche in
the samples, and that many species‟ population have geographical restrictions,
where many unpredictable filters may be operating. Many specialized species
with reduced amplitudes inserted into specific guilds were observed. There is a
strong selective pressure induced by the action of fragmentation both locally
and within the limits of the biome/region, which may cause effects of chaotic
vicariates.
The result of the model abundance distribution of Hymenoptera species in
dry forest areas presented here follows the expected pattern of most large
assemblies studied by ecologists who follow a log normal pattern of
abundance of species. The log normal model shows that diversity is influenced
by the rarity of the species; this indicates that there is also a better structure
and higher occupation of niches in ecosystems with more conserved
landscapes, consequently having a greater number of micro-habitats
(Magurran, 2004). One aspect is extremely important for the conservation of
aculeate Hymenoptera observed in the dry forest in this study, which is the
maintenance of the integrity of the environments in many localities near rivers
and hills are actually more preserved than plane areas where agriculture and
livestock alter the integrity of the landscape (Silva, 2009).
The study area has a high diversity and high anthropogenic pressure; it
harbors endemic species and has among the phytophysiognomic components
one of the largest continuous examples of this type of vegetation in South
America. The seasonal deciduous forests play a role key in the distribution of
various elements of the fauna and flora (Morrone 2006, Morrone et al. 2004,
Spichiger et al., 2004, Prado & Gibbs 1993). The studied sites are located
diagonally from open areas and have a great variety of species, including
endemic species (Souza 2005, Colli et al. 2002, Duellman 1999).
The assessment and identification of priority areas and actions for
biodiversity conservation in Brazilian Biomes (MMA, 2002) has been
identified through studies of invertebrate fauna, mammals, birds, reptiles,
amphibians, and fishes in Bodoquena Plateau and Brazilian Chaco, which are
considered to be sites of very high biological importance, being extremely
diverse; this needs to be urgently reflected as a hotspot.
ACKNOWLEDGEMENTS
We are thankful to the Brazilian Institution CAPES and CNPq, and to the
Instituto Chico Mendes de Biodiversidade- ICMBio in Bonito, MS. We would
Complimentary Contributor Copy

Diversity and Distribution of Hymenoptera Aculeata ... 51
like to thank the people who helped us in field: Vander Carbonari, Hadassa
Costa, Fabiola Oliveira, Tainá Greice Ensina, Murilo Moressi, Luna Carinyana
Silvestre, Guilherme Dalponti, Nelson Rodrigues da Silva, and Sr. Neil and
family in Pitangueiras farm. We are also grateful to the owners of RPPN, Cara
da Onça Edson and Gerson; to Eduardo F. Santos for Pompilidae species
confirmations; and Bolivar Garcete Barrett for Eumeninae, Sphecidae and
Crabronidae identifications. Collections permit IBAMA number 10674-
11/09/2007. This work is dedicated to Maria Alice Silvestre in memoriam.
APPENDIX
Checklist of Hymenoptera sampled in midwestern Brazilian dry forest
Species/Morphospecies
Formicidae Acanthostichus brevicornis Emery, 1894
Acanthostichus sp.
Acromyrmex crassispinus (Forel, 1909)
Acromyrmex rugosus
Acromyrmex subterraneus (Forel, 1893) Acromyrmex sp. 1
Acromyrmex sp. 2
Anochetus diegensis Forel, 1912 Apterostigma auriculatum Wheeler, 1925
Apterostigma manni Weber, 1938
Apterostigma pilosum Mayr, 1865 Apterostigma wasmanni Forel, 1892
Asphinctanilloides sp. n Atta sexdens Linnaeus, 1758
Atta sp. 1
Atta saltensis Forel, 1913 Azteca alfari Emery, 1893
Azteca chartifex Emery, 1896 Azteca constructor Emery, 1896
Azteca sp. 1
Azteca sp. 2 Basiceros disciger (Mayr, 1887)
Blepharidatta conops Kempf, 1967
Complimentary Contributor Copy

R. Silvestre, M. Fernando Demétrio, B. Maykon Trad et al. 52
Brachymyrmex patagonicus Mayr, 1868
Brachymyrmex sp. 1 Brachymyrmex sp. 2
Brachymyrmex sp. 3 Brachymyrmex sp. 4
Camponotus crassus Mayr 1862
Camponotus melanoticus Emery, 1894
Camponotus (Myrmaphaenus) blandus blandus (Smith, F. 1858)
Camponotus (Myrmobrachys) mus Roger, 1863
Camponotus (Myrmothrix) renggeri Emery, 1894
Camponotus (Myrmothrix) rufipes (Fabricius, 1775)
Camponotu s (Myrmobrachys) senex (Smith, F., 1858) Camponotus (Myrmepomis) sericeiventris Guérin-Méneville, 1838
Camponotus (Myrmocladoecus) sexguttatus (Fabricius, 1793)
Camponotus (Tanaemyrmex) termitarius Emery, 1902 Camponotus sp. 1
Camponotus sp. 2 Camponotus sp. 3
Camponotus sp. 4
Camponotus sp. 5 Camponotus sp. 6
Carebara sp. 1
Carebara sp. 2
Cephalotes atratus (Linnaeus, 1758)
Cephalotes borgmeieri (Kempf, 1951) Cephalotes clypeatus (Fabricius, 1804)
Cephalotes depressus (Klug, 1824)
Cephalotes eduarduli (Forel, 1921) Cephalotes guayaki De Andrade& Baroni Urbani, 1999
Cephalotes incertus (Emery, 1906) Cephalotes jheringi (Emery, 1894)
Cephalotes maculatus (Smith F., 1876)
Cephalotes minutus (Fabricius, 1804) Cephalotes pallens (Klug, 1824)
Cephalotes pellans De Andrade & Baroni Urbani, 1999 Cephalotes persimilis De Andrade & Baroni Urbani, 1999
Cephalotes pusillus (Klug, 1824)
Cephalotes sp. 1 Cephalotes sp. 2
Cerapachys splendens Borgmeier, 1957
Crematogaster acuta (Fabricius, 1804) Crematogaster bruchi Forel, 1912
Crematogaster crinosa Mayr, 1862
Complimentary Contributor Copy

Diversity and Distribution of Hymenoptera Aculeata ... 53
Crematogaster curvispinosa Mayr, 1862
Crematogaster quadriformis Roger, 1863 Crematogaster stollii Forel, 1885
Crematogaster sp. 1 Crematogaster sp. 2
Crematogaster sp. 3
Crematogaster sp. 4 Cryptomyrmex boltoni (Fernández, 2003)
Cylindromyrmex brasiliensis Emery, 1901
Cyphomyrmex (gr. rimosus) sp. 1
Cyphomyrmex (gr. rimosus) sp. 2
Cyphomyrmex (gr. rimosus) sp. 3 Cyphomyrmex (gr. rimosus) sp. 4
Cyphomyrmex (gr. rimosus) sp. 5
Cyphomyrmex (gr. rimosus) sp. 6 Cyphomyrmex (gr. rimosus) sp. 7
Cyphomyrmex (gr. rimosus) sp. 8 Cyphomyrmex (gr. strigatus) sp. 1
Cyphomyrmex (gr. strigatus) sp. 2
Cyphomyrmex lectus (Forel, 1911) Cyphomyrmex olitor Forel, 1893
Cyphomyrmex sp. 1
Dinoponera australis Emery, 1901
Dolichoderus bispinosus (Olivier, 1792)
Dolichoderus lutosus (F. Smith, 1858) Dolichoderus lujae Santschi, 1923
Dolichoderus sp.
Dorymyrmex bicolor Wheeler, 1906 Dorymyrmex brunneus Forel, 1908
Dorymyrmex thoracicus Gallardo, 1916 Dorymyrmex sp.
Eciton burchellii (Westwood, 1842)
Ectatomma brunneum Smith, 1858 Ectatomma edentatum Roger, 1863
Ectatomma opaciventre (Roger, 1861) Ectatomma permagnum Forel, 1908
Ectatomma suzanae Almeida, 1986
Ectatomma tuberculatum Olivier, 1792 Forelius sp. 1
Gnamptogenys (gr. striatula) sp.1
Gnamptogenys striatula Mayr, 1884 Gnamptogenys sulcata (Smith, F. 1858)
Gracilidris pombeiro Wild & Cuezzo, 2006
Complimentary Contributor Copy

R. Silvestre, M. Fernando Demétrio, B. Maykon Trad et al. 54
Heteroponera microps Borgmeier, 1957
Hylomyrma balzani (Emery, 1894) Hylomyrma sp. 1
Hypoponera sp. 1 Hypoponera sp. 2
Hypoponera sp. 3
Hypoponera sp. 4 Hypoponera sp. 5
Hypoponera sp. 6
Hypoponera sp. 7
Hypoponera sp. 8
Hypoponera sp. 9 Hypoponera sp. 10
Hypoponera sp. 11
Hypoponera sp. 12 Hypoponera sp. 13
Hypoponera sp. 14 Hypoponera sp. 15
Hypoponera sp. 16
Hypoponera sp. 17 Hypoponera sp. 18
Hypoponera sp. 19
Hypoponera sp. 20
Hypoponera sp. 21
Kalathomyrmex emeryi (Forel, 1907) Labidus coecus (Latreille, 1802)
Labidus mars (Forel, 1912)
Labidus praedator (Fr. Smith, 1858) Leptogenys sp.
Linepithema humile (Mayr, 1868) Linepithema micans (Forel, 1908)
Linepithema sp. 1
Linepithema sp. 2 Megalomyrmex silvestrii Wheleer, 1909
Megalomyrmex wallacei Mann, 1916 Monomorium floricola Jerdon, 1851
Monomorium sp.
Mycetarotes sp. Mycocepurus goeldii (Forel, 1893)
Mycocepurus smithi (Forel, 1893)
Mycocepurus sp. Myrmelachista sp.
Myrmicocrypta sp. 1
Complimentary Contributor Copy

Diversity and Distribution of Hymenoptera Aculeata ... 55
Myrmicocrypta sp. 2
Neivamyrmex carettei (Forel, 1913) Neivamyrmex sp. 1
Neivamyrmex sp. 2 Nomamyrmex esembecki (Westwood, 1842)
Nesomyrmex spininodis (Mayr, 1887)
Nylanderia fulva (Mayr, 1862) Nylanderia sp. 1
Nylanderia sp. 2
Nylanderia sp. 5
Octostruma balzani (Emery, 1894)
Octostruma iheringi (Emery, 1888) Octostruma rugifera (Mayr, 1887)
Octostruma stenognatha Brown & Kempf, 1960
Octostruma sp. 1 Octostruma sp. 2
Octostruma sp. 3 Octostruma sp. 4
Odontomachus bauri Emery, 1892
Odontomachus meinerti Forel, 1905 Odontomachus sp. 1
Oligomyrmex sp.
Oxiepoecus sp.
Pachycondyla apicalis (Latreille, 1802)
Pachycondyla bucki (Borgmeier, 1927) Pachycondyla constricta (Mayr, 1884)
Pachycondyla crassinoda (Latreille, 1802)
Pachycondyla ferruginea (Smith, F. 1858) Pachycondyla harpax (Fabricius, 1804)
Pachycondyla inversa (Smith, F. 1858) Pachycondyla lunaris (Emery, 1896)
Pachycondyla luteola (Roger, 1861)
Pachycondyla marginata (Roger, 1861) Pachycondyla mesonotalis (Santschi, 1923)
Pachycondyla obscuricornis Emery, 1890 Pachycondyla striata (Smith F., 1858)
Pachycondyla verenae (Forel, 1922)
Pachycondyla villosa (Fabricius, 1804) Pachycondyla sp. 1
Pachycondyla sp. 2
Paraponera clavata (Fabricius, 1775) Paratrechina longicornis (Latreille, 1802)
Paratrechina sp. 1
Complimentary Contributor Copy

R. Silvestre, M. Fernando Demétrio, B. Maykon Trad et al. 56
Paratrechina sp. 2
Paratrechina sp. 3 Paratrechina sp. 4
Paratrechina sp. 5 Pheidole (gr. flavens) sp.
Pheidole cornicula Wilson, 2003
Pheidole dinophila Wilson, 2003 Pheidole gertrudae Forel, 1886
Pheidole gigaflavens Wilson, 2003
Pheidole jelskii Mayr, 1884
Pheidole oxyops Forel, 1908
Pheidole radoskowiskii Mayr, 1884 Pheidole scapulata Santschi, 1923
Pheidole spininodis Mayr, 1887
Pheidole transversostriata Mayr, 1887 Pheidole vafra Santschi, 1923
Pheidole sp. 1 Pheidole sp. 2
Pheidole sp. 3
Pheidole sp. 4 Pheidole sp. 5
Pheidole sp. 6
Pheidole sp. 7
Pheidole sp. 8
Pheidole sp. 9 Pheidole sp. 10
Pheidole sp. 11
Pheidole sp. 12 Pheidole sp. 13
Pheidole sp. 14 Pheidole sp. 15
Pogonomyrmex abdominalis Santschi, 1929
Pogonomyrmex micans Forel, 1914 Pogonomyrmex uruguaiensis Mayr, 1887
Pogonomyrmex naegelli Emery, 1878 Prionopelta marthae Forel, 1909
Probolomyrmex boliviensis Mann, 1923
Probolomyrmex petiolatus Weber, 1940
Probolomyrmex brujitae Agosti, 1995
Procryptocerus attenuatus Smith, 1876
Procryptocerus montanus (Kempf, 1957) Procryptocerus sp.
Pseudomyrmex (gr. ferrugineus) sp. 1
Complimentary Contributor Copy

Diversity and Distribution of Hymenoptera Aculeata ... 57
Pseudomyrmex (gr. oculatus) sp. 1
Pseudomyrmex acanthobius (Emery, 1896) Pseudomyrmex denticolis (Emery, 1890)
Pseudomyrmex gracilis (Fabricius, 1804) Pseudomyrmex pallidus (Smith, 1855)
Pseudomyrmex termitarius (Smith F., 1855)
Pseudomyrmex sp. 1 Pseudomyrmex sp. 2
Rogeria alzatei Kugler, 1994
Rogeria lirata Kugler, 1994
Rogeria sp. 1
Rogeria sp. 2 Serycomyrmex (gr. amabilis) sp. 1
Serycomyrmex (gr. amabilis) sp. 2
Serycomyrmex sp. Solenopsis (gr. germinata) sp.
Solenopsis (gr. invicta) sp. 1 Solenopsis (gr. invicta) sp. 2
Solenopsis (gr. rimulus) sp. 1
Solenopsis invicta Burren, 1972 Solenopsis pusillignis Trager, 1991
Solenopsis sp. 1
Solenopsis sp. 2
Solenopsis sp. 3
Solenopsis sp. 4 Solenopsis sp. 5
Solenopsis sp. 6
Solenopsis sp. 7 Solenopsis sp. 8
Stigmatomma armigerum (Mayr, 1887) Stigmatomma sp. 1
Stigmatomma sp. 2
Stigmatomma sp. 3
Strumigenys elongata Roger, 1863
Strumigenys eggersi Emery, 1809 Strumigenys xenochelyna (Bolton, 2000)
Strumigenys sp. 1
Strumigenys sp. 2 Strumigenys sp. 3
Strumigenys sp. 4
Strumigenys sp. 5 Strumigenys sp. 6
Tapinoma melanochepalum (Fabricius, 1793)
Complimentary Contributor Copy

R. Silvestre, M. Fernando Demétrio, B. Maykon Trad et al. 58
Thaumatomyrmex contumax Kempf, 1975
Thaumatomyrmex mutilatus Mayr, 1887 Trachymyrmex urich (Forel, 1893)
Trachymyrmex sp. 1 Trachymyrmex sp. 2
Trachymyrmex sp. 3
Typhlomyrmex rogenhoferi Mayr, 1862 Typhlomyrmex sp.
Wasmannia auropunctata (Roger, 1863)
Wasmannia lutzi Forel, 1908
Wasmannia sp. 1
Wasmannia sp. 2 Wasmannia sp. 3
Total= 294
Apidae sensu lato
Agapostemon sp. 1
Alepidosceles hamata Moure, 1947
Ancyloscelis cfr. apiformis (Fabricius, 1793)
Anthodioctes cfr. camargoi Urban, 1999
Anthodioctes sp. 1
Apis mellifera Linnaeus, 1756
Arhysosage flava Moure, 1958
Augochlora sp. 1
Augochlora sp. 2
Augochlora sp. 3
Augochlora sp. 4
Augochlora sp. 5
Augochlora sp. 6
Augochlora sp. 7
Augochlora thusnelda (Schrottky, 1909)
Augochlorella neocorinora
Augochlorella sp. 1
Augochlorella sp. 2
Augochlorella sp. 3
Augochloropsis cfr. tupacamaru (Holmberg, 1884)
Augochloropsis sp. 1
Augochloropsis sp. 2
Augochloropsis sp. 3
Augochloropsis sp. 4
Complimentary Contributor Copy

Diversity and Distribution of Hymenoptera Aculeata ... 59
Augochloropsis sp. 5
Augochloropsis sp. 6
Austrostelis zebrata (Schrottky, 1905)
Bombus (Fervidobombus) morio (Swederus, 1787)
Bombus (Fervidobombus) pauloensis Friese, 1913
Bothranthidium lauroi Moure, 1947
Centris (Aphemisia) mocsaryi Friese, 1899
Centris (Hemisiella) tarsata Smith, 1874
Centris (Hemisiella) vittata Lepeletier, 1841
Centris (Heterocentris) analis (Fabricius, 1804)
Ceratina (Ceratinula) sp. 1
Ceratina (Ceratinula) sp. 2
Ceratina (Crewella) sp. 1
Ceratina (Crewella) sp. 2
Ceratina (Crewella) sp. 3
Ceratina (Crewella) sp. 4
Ceratina sp. 1
Ceratina sp. 2
Ceratina sp. 3
Coelioxys (Acrocoelioxys) tolteca Cresson, 1878
Coelioxys (Acrocoelioxys) sp. 1
Diadasia cfr. willineri (Moure, 1947)
Diadasina riparia (Ducke, 1907)
Dialictus sp. 1
Dichanthidium exile Moure, 1947
Epanthidium bolivianum Urban, 1995
Epanthidium tigrinum (Schrottky, 1905)
Epicharis (Epicharana) flava Friese, 1900
Epicharis (Epicharis) bicolor Smith, 1854
Epicharis (Hoplepicharis) fasciata Lepeletier & Serville, 1828
Eufriesea auriceps (Friese, 1899)
Eufriesea violacea (Blanchard, 1840)
Euglossa (Euglossa) fimbriata Moure, 1968
Euglossa (Euglossa) townsendi Cockerell, 1904
Euglossa (Glossura) annectans Dressler, 1982
Eulaema (Apeulaema) cingulata (Fabricius, 1804)
Eulaema (Apeulaema) nigrita Lepeletier, 1841
Eulonchopria psaenythioides Brèthes, 1909
Exaerete smaragdina (Guérin, 1844)
Complimentary Contributor Copy

R. Silvestre, M. Fernando Demétrio, B. Maykon Trad et al. 60
Exomalopsis (Exomalopsis) auropilosa Spinola, 1853
Exomalopsis (Phanomalopsis) sp. 1
Exomalopsis sp. 1
Exomalopsis sp. 2
Exomalopsis sp. 3
Habralictus sp. 1
Habralictus sp. 2
Habralictus sp. 3
Habralictus sp. 4
Hylaeus sp. 1
Hylaeus sp. 2
Hylaeus sp. 3
Hylaeus sp. 4
Hypanthidium obscurius Schrottky, 1908
Leiopodus trochantericus Ducke, 1907
Lestrimelitta chacoana Roig Alsina, 2010
Lophopedia pygmaea (Schrottky, 1902)
Megachile (Acentron) verrucosa Brèthes, 1909
Megachile (Austromegachile) fiebrigi Schrottky, 1908
Megachile (Chrysosarus) bella Mitchell, 1930
Megachile (Chrysosarus) diversa Mitchell, 1930
Megachile (Chrysosarus) guaranitica Schrottky, 1908
Megachile (Leptorachis) rubricrus Moure, 1948
Megachile (Melanosarus) brasiliensis Dalla Torre, 1896
Megachile (Melanosarus) nigripennis Spinola, 1841
Megachile (Moureapis) apicipennis Schrottky, 1902
Megachile (Neochelynia) brethesi Schrottky, 1909
Megachile (Pseudocentron) curvipes Smith, 1853
Megachile (Pseudocentron) inscita Mitchell, 1930
Megachile (Sayapis) planula Vachal, 1909
Megachile (Tylomegachile) orba Schrottky, 1913
Megachile (Zonomegachile) gigas Schrottky, 1908
Melipona orbignyi (Guérin, 1844)
Melipona quinquefasciata Lepeletier, 1836
Melissodes nigroaenea (Smith, 1854)
Melissodes sexcincta (Lepeletier, 1841)
Melissodes tintinnans (Holmberg, 1884)
Melissoptila paraguayensis (Brèthes, 1909)
Melitoma nudipes (Burmeister, 1876)
Complimentary Contributor Copy

Diversity and Distribution of Hymenoptera Aculeata ... 61
Melitoma sp. 1
Mesocheira bicolor (Fabricius, 1804)
Mesoplia rufipes (Perty, 1833)
Moureanthidium paranaense Urban, 1995
Nananthidium willineri Moure, 1947
Neocorynura sp. 1
Osiris sp. 1
Oxytrigona tataira (Smith, 1863)
Paratetrapedia connexa (Vachal, 1909)
Paratetrapedia flaveola Aguiar & Melo, 2011
Paratetrapedia fervida (Smith, 1879)
Paratetrapedia leucostoma (Cockrell, 1923)
Paratetrapedia lineata (Spinola, 1853)
Paratetrapedia lugubris (Cresson, 1878)
Partamona cupira (Smith, 1863)
Pereirapis sp. 1
Plebeia droryana (Friese, 1900)
Plebeia sp. 1
Plebeia sp. 2
Plebeia sp. 3
Protosiris sp. 1
Ptiloglossa sp. 1
Ptilotrix cfr. relata (Holmberg, 1903)
Ptilotrix cfr. scalaris (Holmberg, 1903)
Ptilotrix sp. 1
Rhathymus bicolor Lepeletier & Serville, 1828
Rhophitulus sp. 1
Scaptotrigona depilis Moure, 1942
Schwarziana mourei Melo, 2003
Schwarzula timida (Silvestri, 1902)
Temnosoma sp. 1
Tetragona clavipes (Fabricius, 1804)
Tetragonisca fiebrigi (Schwarz, 1938)
Tetrapedia garofaloi Moure, 1999
Tetrapedia sp. 1
Tetrapedia sp. 2
Tetrapedia sp. 3
Tetrapedia sp. 4
Triepeolus sp. 1
Complimentary Contributor Copy

R. Silvestre, M. Fernando Demétrio, B. Maykon Trad et al. 62
Trigona aff. fuscipennis Friese, 1900
Trigona hypogea Silvestri, 1902
Trigona spinipes (Fabricius, 1793)
Trigona truculenta Almeida,1984
Trophocleptria sp. 1
Xylocopa (Neoxylocopa) suspecta Moure & Camargo, 1988
Xylocopa (Schonnherria) muscaria (Fabricius, 1775)
Xylocopa (Stenoxylocopa) nogueirai Hurd & Moure, 1960
Xylocopa sp. 1
Total= 150
Pompilidae
Ageniella sp. 1
Ageniella sp. 2
Ageniella sp. 3
Ageniella sp. 4
Ageniella sp. 5
Ageniella sp. 6
Ageniella sp. 7
Ageniella sp. 8
Ageniella sp. 9
Ageniella sp. 10
Agenioideus sp. 1
Agenioideus sp. 2
Aimatocare sp. 1
Aimatocare sp. 2
Anoplius (Arachnophroctonus) taschenbergi (Brèthes)
Anoplius sp. 1
Anoplius sp. 2
Anoplius sp. 3
Anoplius sp. 4
Aplochares sp.
Aporus sp. 1
Aporus sp. 2
Auplopus sp. 1
Auplopus sp. 2
Auplopus sp. 3
Auplopus sp. 4
Auplopus sp. 5
Complimentary Contributor Copy

Diversity and Distribution of Hymenoptera Aculeata ... 63
Auplopus sp. 6
Auplopus sp. 7
Auplopus sp. 8
Caliadurgus sp. 1
Caliadurgus sp. 2
Caliadurgus sp. 3
Caliadurgus sp. 4
Caliadurgus sp. 5
Caliadurgus sp. 6
Caliadurgus sp. 7
Ceropales sp. 1
Ceropales sp. 2
Dicranopilus sp. 1
Dicranopilus sp. 2
Entypus sp. 1
Entypus sp. 2
Entypus sp. 3
Entypus sp. 6
Epipompilus aztecus (Cresson, 1869)
Epipompilus sp. 1
Epipompilus sp. 2
Epipompilus sp. 3
Epipompilus sp. 4
Episyron conterminus conterminus (Smith, 1855)
Episyron sp. n
Euplaniceps sp. 1
Euplaniceps sp. 2
Euplaniceps sp. 3
Euplaniceps sp. 4
Notocyphus sp. 1
Notocyphus sp. 2
Notocyphus sp. 3
Notocyphus sp. 4
Notocyphus sp. 5
Notocyphus sp. 6
Notocyphus sp. 7
Notocyphus sp. 8
Notocyphus sp. 9
Notocyphus sp. 10
Complimentary Contributor Copy

R. Silvestre, M. Fernando Demétrio, B. Maykon Trad et al. 64
Notocyphus sp. 11
Notoplaniceps sp.
Paracyphononyx sp. 1
Paracyphononyx sp. 2
Paracyphononyx sp. 3
Pepsis crassicornis Mócsary, 1885
Pepsis sp. 1
Pepsis sp. 2
Pepsis sp. 3
Pepsis sp. 4
Pepsis sp. 5
Pepsis sp. 6
Pepsis sp. 7
Pepsis sp. 8
Pepsis sp. 9
Poecilopompilus sp. 1
Poecilopompilus sp. 2
Poecilopompilus sp. 3
Poecilopompilus sp. 4
Poecilopompilus sp. 5
Poecilopompilus sp. 6
Poecilopompilus sp. 7
Priochilus (Foximia) opacifrons Banks, 1944
Priochilus captivum Fabricius, 1804
Priochilus gloriosum Cresson, 1869
Priochilus cf. gracile Evans, 1966
Priochilus gracillimus Smith, 1855
Priochilus nobilis (Fabricius, 1787)
Priochilus nubilis Banks, 1946
Priochilus rhomboideusBanks, 1944
Priochilus scrupulum (Fox, 1897)
Priochilus sericeifrons (Fox, 1897)
Priocnemella sp. n
Priocnemella sp. 1
Priocnemella sp. 2
Priocnemella sp. 3
Tachypompilus sp. 1
Total= 103
Complimentary Contributor Copy

Diversity and Distribution of Hymenoptera Aculeata ... 65
Vespidae
Agelaia multipicta (Haliday, 1836)
Agelaia pallipes (Oliver)
Ancistroceroides alasteroides (Saussure, 1852)
Ancistroceroides atripes (Fox, 1902)
Ancistroceroides conjunctus (Fox, 1902)
Ancistroceroides rufimaculatus (Fox, 1902)
Ancistroceroides venuustus (Brèthes, 1905)
Apoica flavissima van der Vecht, 1972
Apoica pallens (Fabricius)
Brachygastra lecheguana (Latreille, 1824)
Brachygastra moulae Richards, 1978
Brachymenes discherus (Sausurre, 1852)
Ceramiopsis paraguaensis Bertoni, 1921
Eumenes rufomaculatus Fox, 1899
Hypalastoroides brasiliensis (Saussure, 1856)
Hypalastoroides elongatus (Brèthes, 1906)
Hypalastoroides nitidus (Brèthes, 1906)
Hypalastoroides paraguayensis (Zavattari, 1911)
Hypancistrocerus advena (Saussure, 1856)
Minixi brasilianum (Saussure, 1875)
Minixi suffusum (Fox, 1899)
Monobia angulosa Saussure, 1852
Monobia apicalipennis (Saussure, 1852)
Monobia schrottkyi Bertoni, 1918
Montezumia azurescens (Spinosa, 1851)
Montezumia ferruginea brasiliensis Saussure, 1856
Montezumia infernalis (Spinosa, 1851)
Montezumia pelagica sepulchralis Saussure, 1856
Montezumia petiolata Saussure, 1856
Montezumia sp.
Myschocyttarus latior Fox
Myschocyttarus sp. 1
Myschocyttarus sp. 2
Myschocyttarus sp. 3
Myschocyttarus sp. 4
Myschocyttarus sp. 5
Myschocyttarus sp. 6
Myschocyttarus sp. 7
Complimentary Contributor Copy

R. Silvestre, M. Fernando Demétrio, B. Maykon Trad et al. 66
Myschocyttarus sp. 8
Myschocyttarus sp. 9
Myschocyttarus sp. 10
Myschocyttarus sp. 11
Omicron sp. 1
Omicron sp. 2
Omicron sp. 3
Omicron sp. 4
Omicron spegazzinii (Brèthes, 1905)
Omicron tuberculatum (Fox, 1899)
Pachodynerus brevithorax (Saussure, 1852)
Pachodynerus corumbae (Fox, 1902)
Pachodynerus grandis (Willink & Roig0Alsina, 1998)
Pachodynerus guadulpensis (Saussure, 1853)
Pachodynerus nasidens (Latreille, 1812)
Pachodynerus serrulatus (Brèthes)
Pachymenes ghilianii (Spinosa, 1851)
Pachymenes picturatus Fox, 1899
Parancistrocerus longicornutus (Dalla Torre, 1904)
Plagiolabra andina Brèthes, 1906
Plagiolabra nigra Schulthess, 1903
Polistes canadensis (Linnaeus, 1758)
Polistes ferreri Saussure, 1853
Polistes simillimus Zikan, 1951
Polistes versicolor (Olivier, 1791)
Polistes sp. 1
Polistes sp. 2
Polistes sp. 3
Polybia ignobilis (Haliday, 1836)
Polybia occidentalis (Oliver, 1791)
Polybia sericea (Oliver, 1791)
Polybia sp.
Protonectarina sylveirae (Saussure, 1854)
Protopolybia exigua exigua (Saussure, 1906)
Santamenes novarae (Saussure, 1867)
Stenodynerus suffusus (Fox, 1902)
Zeta argillaceum (Linnaeus, 1758)
Zethus cylindricus (Fox, 1899)
Zethus diminutus (Fox, 1899)
Complimentary Contributor Copy

Diversity and Distribution of Hymenoptera Aculeata ... 67
Zethus romandinus (Saussure, 1852)
Zethus sessilis Fox, 1899
Total= 79
Crabronidae
Alinia sp.
Argogorytes umbratilis Bohart, 2000
Astata lugens Tashenber, 1870
Bembecinus sp.
Bicyrtes angulata (F. Smith, 1856)
Bicyrtes discisa (Taschember, 1870)
Bicyrtes lilloi (Willink, 1947)
Bicyrtes variegata (Olivier, 1789)
Bothynostethus sp.
Cerceris sp. 1
Cerceris sp. 2
Cerceris sp. 3
Cerceris sp. 5
Cliteminestra brasilica Bohart, 2000
Cliteminestra paraguayana Bohart, 2000
Ectemnius carinatus (Smith, 1873)
Ectemnius semipunctatus (Lepeletier & Brullé, 1835)
Ectemnius sp. 1
Ectemnius sp. 2
Hoplisoides vespoides (F. Smith, 1873)
Incastigmus iphis (Finnamore, 2002)
Incastigmus neotropicus (Kohl, 1890)
Incastigmus sp.
Larra bicolor predatrix (Strand, 1910)
Liris sp. 1
Liris sp. 2
Liris sp. 3
Liris sp. 4
Liris spp.
Lyroda sp.
Megistommum procerus (Handlirsch, 1888)
Metanysson sp.
Microbembex uruguayensis (Holbery, 1884)
Nitela (Tenila) sp.
Complimentary Contributor Copy

R. Silvestre, M. Fernando Demétrio, B. Maykon Trad et al. 68
Nitela sp.
Oxybelus peruvicus R. Bohart, 1993
Pison (gr. cressoni) sp.
Pison delicatum Menke, 1988
Pison longicorne Menke, 1988
Pison sp.
Pluto axillaris van Lith, 1979
Pluto nitens van Lith, 1979
Podagritus sp.
Rhopalum sp.
Rubrica nasuta (Christ, 1791)
Sagenista brasiliensis (Shukard)
Sagenista cayennensis (Spinola)
Scapheutes laetus (Smith, 1860)
Solierella sp. 1
Solierella sp.2
Stenogorytes megalommiformis (Strand, 1910)
Stenogorytes specialis (F. Smith, 1873)
Stictia punctata (Fabricius, 1775)
Stigmus sp. ♂
Tachysphex inconspicuus (W. F. Kirby, 1890)
Tachysphex ruficaudis (Taschenberg, 1870)
Tachysphex sp.
Tachytes chrysopyga (Spinola, 1841)
Tachytes coloratus R. Bohart, 1979
Tachytes fraternus (Taschenberg, 1870)
Tachytes hades Schrottky, 1903
Trypoxylon duckei Richards, 1934
Trypoxylon marginatum Cameron, 1912
Trypoxylon nitidissimum Richards, 1934
Trypoxylon oculare Menke,1968
Trypoxylon spp.
Trypoxylon Trypargilum (gr. albititarse) sp.
Trypoxylon Trypargilum sp. 1
Trypoxylon Trypargilum sp. 2
Trypoxylon Trypargilum sp. 3
Trypoxylon Trypargilum sp. 4
Trypoxylon Trypargilum spp.
Trypoxylon Trypoxylon sp.
Complimentary Contributor Copy

Diversity and Distribution of Hymenoptera Aculeata ... 69
Zannyson sp.
Total= 74
Mutillidae
Atillum sp.
Hoplocrates monacha (Gerstaecker, 1874)
Hoplocrates sp.
Mickelia sp.
Ptilomutilla pennata André, 1905
Sphinctopsis sp. 1
Sphinctopsis sp. 2
Sphinctopsis turnalia (Cresson, 1902)
Suareztilla sp.
Timulla sp. 1
Timulla sp. 2
Timulla sp. 3
Timulla spp. ♂
Traumatomutilla graphica (Gerstaecker, 1874)
Traumatomutilla manca (Cresson, 1902)
Traumatomutilla sp. 1
Traumatomutilla sp. 2
Traumatomutilla sp. 3
Traumatomutilla sp. 4
Traumatomutilla sp. 5
Traumatomutilla sp. 6
Total= 21
Sphecidae
Ammophila sp. 1
Ammophila sp. 2
Eremnophila binodis (Fabricius, 1798)
Eremnophila melanaria (Dahlbom, 1843)
Eremnophila opulenta (Guérin-Méneville, 1838)
Isodontia costipennis (Spinola, 1851)
Isodontia sp.
Penepodium haematogastrum (Spinola, 1851)
Penepodium sp. 1
Penepodium sp. 2
Penepodium sp. 3
Complimentary Contributor Copy

R. Silvestre, M. Fernando Demétrio, B. Maykon Trad et al. 70
Penepodium sp. 4
Podium sp. 1
Podium sp. 2
Prionyx thomae (Fabricius, 1775)
Sceliphron asiaticum Linnaeus, 1758
Sceliphron fistularium Dahlbom, 1843
Sphex dorsalis Lepeletier, 1845
Sphex ingens F. Smith, 1856
Sphex servillei Lepeletier, 1845
Total= 20
Typhiidae
Aelurus sp. 1
Aelurus sp. 2
Epomidiopteron sp.
Myzinum sp. 1
Myzinum sp. 2
Myzinum sp. 3
Myzinum sp. 4
Myzinum sp. 5
Myzinum sp. 6
Myzinum sp. 7
Pterombrus sp. 1
Pterombrus sp. 2
Thiphiodes sp.
Tiphia sp. 1
Tiphia sp. 2
Total= 15
Scoliidae
Campsomeris (Pygodases) terrestris (Saussure, 1858)
Campsomeris sp. 1
Campsomeris sp. 2
Campsomeris sp. 3
Campsomeris sp. 4
Campsomeris sp. 5
Total= 6
Complimentary Contributor Copy

Diversity and Distribution of Hymenoptera Aculeata ... 71
Rhopalosomatidae
Rhopalosoma sp.
Total= 1
REFERENCES
Abdon M.M. & Silva J.S.V. 2006. Fisionomias da vegetação nas sub-regiões
do Pantanal Brasileiro. São José dos Campos: INPE. Campinas: Embrapa
Informática Agropecuária. CD-Rom. ISBN: 85-17-00028-5,85. Available
from: http:/www.dsr.inpe.br/publicações.
Agosti D. & Alonso L.E. 2000. The ALL Protocol: a standard protocol for the
collection of ground-dwelling ants. In: Agosti D.; Majer J.D.; Alonso
L.E.; Schultz T.R. (Eds.). pp. 204–206. Ants: Standard Methods for
Measuring and Monitoring Biodiversity. Smithsonian Institution Press,
Washington.
AntWeb. Available from http://www.antweb.org. Accessed 13 May 2014.
AntWiki. Available from http://www.antwiki.org/wiki/Main_Page. Accessed
05 May, 2014.
Amarante S.T.P. 1999. Sphecidae. In: Joly C.A. & Cancello E.M. (Eds.).
Biodiversidade do Estado de São Paulo, Brasil: síntese do conhecimento
ao final do século XX, 5: Invertebrados terrestres. São Paulo: FAPESP.
Amarante S.T.P. 2002. A synonymic catalog of the Neotropical Crabronidae
and Sphecidae (Hymenoptera: Apoidea). Arquivos de Zoologia do Estado
de São Paulo 37(1):1-139.
Amarante S.T.P. 2005. Addendum and corrections to a synonymic catalogue
of the Neotropical Crabronidae e Sphecidae. Papéis Avulsos de Zoologia
45:1-18.
Amarante S.T.P. 2006. Crabronidae. pp. 457-496. In: Fernández F. & Sharkey
M.J. (Eds.). Introduccíon a los Hymenoptera de la Región Neotropical.
Sociedad Colombiana de Entomología y Universidad Nacional de
Colombia, Bogotá D.C.
Auko T.H.; Trad B.M.; Silvestre R.; Aoki C. 2013. Vespas Aculeata da
Reserva Particular do Patrimônio Natural Engenheiro Eliezer Batista. pp.
240-261. In: Rabelo A.P.C., Moreira V.F, Bertassoni A., Aoki C. (Eds.).
Aspectos Biológicos da Reserva - Particular do Patrimônio Natural
Engenheiro Eliezer Batista. Descobrindo o Paraíso RPPN EEB / Pantanal
Sul. Instituto Homem Pantaneiro. Rio de Janeiro, RJ.
Complimentary Contributor Copy

R. Silvestre, M. Fernando Demétrio, B. Maykon Trad et al. 72
Batista-Matos M.C.; Sousa-Souto L.; Almeida R. S.; Teodoro A.V. 2013.
Contrasting Patterns of Species Richness and Composition of Solitary
Wasps and Bees (Insecta: Hymenoptera) According to Land-use.
Biotropica 45: 73–79.
Bohart R.M. & Menke A.S. 1976. Sphecidae wasps of the world. A generic
revision. University of California Press, Berkley, xxx- 695pp.
Brady S.G.; Larkin L.; Danforth B. 2009. Bees, ants and stinging wasps–
Aculeata. In: Hedges S.B. & Kumar S. (Eds.). The Timetree of life.
Oxford University Press, New York. 551 pages.
Brothers D.J. 1975. Phylogeny and Classification of the Aculatea
Hymenoptera, with special reference to Mutillidae.
The University of Kansas Science Bulletin 50(11): 483-648.
Brothers D.J. 1999. Phylogeny and evolution of wasps, ants and bees
(Hymenoptera, Chrysidoidea, Vespoidea and Apoidea). Zoologica Scripta
28(1-2): 233-249.
Brothers D.J. 2006. Família Mutillidae. pp. 577-593. In: Fernández F. &
Sharkey M.J. (Eds.) Introducción a los Hymenoptera de la Región
Neotropical. Sociedad Colombiana de Entomologia y Universidad
Nacional de Colombia, Bogotá. D. C.
Brothers D.J. & Carpenter J.M. 1993. Phylogeny of Aculeata: Chrysidoidea
and Vespoidea (Hymenoptera). Journal of Hymenoptera Research 2: 227-
302.
Brothers D.J. & Finnamore A.T. 1993. Superfamily Vespoidea. pp. 161-278.
In: Goulet H. & Huber J.T. (Eds.). Hymenoptera of the world: an
identification guide to families. Ottawa: Agriculture, Canada.
Buschini M.L.T.; Borba N.A.; Brescovit A.D. 2008. Patterns of prey selection
of Trypoxylon (Trypargilum) lactitarse Saussure (Hymenoptera:
Crabronidae) in Southern Brazil. Brazilian Journal of Biology 68(3): 519-
528.
Carpenter J.M. & Marques O.M. 2001. Contribuição ao estudo dos vespídeos
do Brasil. Série: Publicações Digitais-UFB. 2: 1-147.
Colli G.R.; Bastos R.P.; Araújo A.F.B. 2002. The character and dynamics of
the Cerrado herpetofauna. pp. 223-241. In: Oliveira P.S. & Marquis R.J.
(Eds.). The Cerrados of Brazil: Ecology and Natural History of a
Neotropical Savanna. Columbia University Press, New York.
Colwell R.K. 2013. EstimateS: Statistical estimation of species richness and
shared species from samples. Version 9. User's Guide and application
published at: http://purl.oclc.org/estimates. Accessed 03 May, 2014.
Complimentary Contributor Copy

Diversity and Distribution of Hymenoptera Aculeata ... 73
Debevec A.H.; Cardinal S.; Danforth B.N. 2012. Identifying the sister group to
the bees: a molecular phylogeny of Aculeata with an emphasis on the
superfamily Apoidea. Zoologica Scripta 41: 527–535.
Delabie J.H.C.; Jahyni B.; Nascimento I. C.; Mariano C.S.F.; Lacau S.;
Campiolo S.; Philpott S.M.; Leponce M. 2007. Contributions of cocoa
plantations to the conservation of native ants (Insecta: Hymenoptera:
Formicidae) with a special emphasis on the Atlantic Forest fauna of
southern Bahia, Brazil. Biodiversity Conservation 16: 2359-2384.
Delsinne T.; Leponce M.; Roisin Y. 2007. Spatial and temporal foraging
overlaps in a Chacoan ground foraging ant assemblage. Journal of Arid
Environments 71:29-44
Duellman W.E. 1999. Distribution patterns of amphibians in South America.
pp. 255-327. In: Duellman W.E. (Ed.). Patterns of Distribution of
Amphibians. The Johns Hopkins University Press, Baltimore and London.
Engel M.S. 2001. A monograph of the baltic amber bees and evolution of the
Apoidea (Hymenoptera). Bulletin of the Museum of Natural History 250:
1-192.
Evans H.E. 2002. A Review of Prey Choice in Bembicine Sand Wasps
(Hymenoptera: Sphecidae). Neotropical Entomology 31(1): 1-11.
Fava W.S.; Bueno M.L.; Pontara V.; Salomão A.K.D.; Seleme E.P. 2008.
Fitossociologia do Estrato Herbáceo de uma Área de Carandazal no
Pantanal de Miranda, MS, Brasil. IX Simpósio Nacional Cerrado e II
Simpósio Internacional Savanas Tropicais Brasilia, DF. Availlable from:
http://simposio.cpac.embrapa.br/simposio_pc210/trabalhos_pdf/00776_tra
b1_ap.pdf. Accessed 10 May, 2014.
Fernández F. 2000. Sistemática y filogenia de los himenópteros de la región
Neotropical: Estado del conocimiento y perspectivas. pp. 211-231. In:
Martín-Piera F.; Morrone J.J.; Melic A. (Eds.). Monografias tercer
Milenio, Sociedad Entomológica Aragonesa (SEA), Zaragoza, España.
Fernández F. 2006. Família Scoliidae. pp. 557-558. In: Fernández F. &
Sharkey M.J. (Eds.). Introducción a los Hymenoptera de la Región
Neotropical. Sociedad Colombiana de Entomologia y Universidad
Nacional de Colombia, Bogotá. D. C.
Fernández F. & Sendoya S. 2004. Synonymic list of Neotropical ants
(Hymenoptera: Formicidae). Biota Colombiana 5: 3-105.
Gauld I. D. & Bolton B. 1988. The Hymenoptera. Oxford University Press,
Oxford, England. 332 p.
Gess F.W. & Gess S.K. 1993. Effects of increasing land utilization on species
representation and diversity of aculeate wasps and bees in the semi-
Complimentary Contributor Copy

R. Silvestre, M. Fernando Demétrio, B. Maykon Trad et al. 74
arid areas of Southern Africa. pp. 83-113. In: Lasalle J. & Gauld I.D.
(Eds.). Hymenoptera and Biodiversity. CAB International. Wallingford.
Godfray H.C.J. 1994. Parasitoids, Behavioral and Evolutionary Ecology.
Princeton University Press, Princeton, New Jersey. 473 pages
Gonçalves R.B. & Brandão C.R.F. Diversity of bees (Hymenoptera, Apidae)
along a latitudinal gradient in the Atlantic Forest. Biota Neotropica 8(4):
51-61.
Goulet H. & Huber J.T. 1993. Hymenoptera of the world: An identification
guide to families. Ottawa, Research Branch Agriculture Canada
Publication, 668p.
Grissel E. 2010. Bees, Wasps, and Ants: The Indispensable Role of
Hymenoptera in Gardens. Timber Press Ed. 335 pages.
Groc S.; Delabie J.H.C.; Fernández F.; Leponce M.; Silvestre R.; Orivel J.;
Vasconcelos H.L.; Dejean A. 2013. Leaf-litter ant communities
(Hymenoptera: Formicidae) in a pristine Guianese rainforest: stable
functional structure versus high species turnover. Myrmecological News
19: 43-51.
Hanson P.E. & Gauld I.D. 1995. The Hymenoptera of Costa Rica. Oxford
University Press. 893 pages.
Hanson P.Y. & Gauld I.D. 2006. Hymenoptera de la Región Neotropical.
Memoirs of the American Entomological Institute, Gainesville.
Hermes M.G.; Somavilla A.; Garcete-Barrett B.R. 2013. On the nesting
biology of Pirhosigma Giordani Soika (Hymenoptera, Vespidae,
Eumeninae), with special reference to the use of vegetable matter. Revista
Brasileira de Entomologia 57(4): 433–436.
Hölldobler B. & Wilson E.O. 1990. The Ants. The Belknap Press of Harvard
University, Cambridge.
Hunt J.H. 1991. Nourishment and the evolution of the social Vespidae. pp.
426-450. In: Ross K.G. & Matthews R.W. (Eds.). The Social Biology of
Wasps. Cornell University Press, Ithaca, NY.
Johnson B.R.; Borowiec M.L.; Chiu J.C.; Lee E.K.; Atallah J.; Ward P.S.
2013. Phylogenomics resolves evolutionary relationships among ants,
bees, and wasps. Current Biology 23: 1–5.
Kimsey L.S. & Brothers D.J. 2006. Familia Tiphiidae. pp. 597-608. In:
Fernández F.& Sharkey M.J. (Eds.). Introducción a los Hymenoptera de
la región Neotropical (Sociedad Colombiana de Entomologia y
Universidad Nacional de Colombia, Bogotá, Colombia.
Lasalle J. & Gauld I.D. 1993. Hymenoptera and Biodiversity. London, CAB
Int./ NHM. 368p.
Complimentary Contributor Copy

Diversity and Distribution of Hymenoptera Aculeata ... 75
Lewinsohn T.M. & Prado P.I. 2005. How many species are there in Brazil?
Conservation Biology 19: 619–624.
Lobo J. & Favila M.E. 1999. Different ways of constructing octaves and its
consequences on the prevalence of the bimodal species abundance
distribution. Oikos 87(2), 321-326.
Magurran A.E. 1988. Ecological Diversity and Its Measurement. Princeton
University Press, Princeton.
Magurran A.E. 2004. Measuring biological diversity. Oxford. Blackwell.
Magurran A.E. & McGill B.J. 2011. Biological Diversity - Frontiers in
measurement and assessment. Oxford University Press, Oxford.
Matthews R.W. 1991. Evolution of social behavior in sphecid wasps. pp. 570-
602. In: Ross K.G. & Matthews R.W. (Eds.). The Social Biology of
Wasps. Comstock, Ithaca.
Melo G.A.R. & Gonçalves R.B. 2005. Higher-level bee classifications
(Hymenoptera, Apoidea, Apidae sensu lato). Revista Brasileira de
Zoologia 22(1):153–159.
Michener C.D. 2007. The Bees of the World. The Johns Hopkins University
Press, Baltimore, Maryland.
MMA. 2002. Avaliação e identificação de áreas e ações prioritárias para a
conservação, utilização sustentável e repartição dos benefícios da
biodiversidade nos biomas brasileiros. MMA/SBF, Brasília. 404 p.
Momose K.; Yumoto T.; Nagamitsu T.; Kato M.; Nagamasu H.; Sakai S.;
Harrison R.D.; Itioka T.; Hamid A.A.; Inoue T. 1998. Pollination biology
in a lowland dipterocarp forest in Sarawak, Malaysia. I. Characteristics of
the plant pollinator community in a lowland dipterocarp forest. American
Journal of Botany 85: 1477-1501.
Morato E.F.; Amarante S.T.; Silveira O.T. 2008. Avaliação ecológica rápida
da fauna de vespas (Hymenoptera: Aculeata) do Parque Nacional da Serra
do Divisor, Acre, Brasil. Acta Amazônica 38(4): 789 – 798.
Morrone J.J. 2006. Biogeographic areas and transition zones of Latin America
and the Caribbean Islands based on panbiogeographic and cladistic
analyses of the entomofauna. Annual Review of Entomology 51: 467-494.
Morrone J.J.; Mazzucconi S.A.; Bachmann A.O. 2004. Distributional patterns
of Chacoan water bugs (Heteroptera: Belostomatidae, Corixidae,
Micronectidae and Gerridae). Hydrobiologia 523:159-173.
Morrone J.J. 2014. Biogeographical regionalisation of the Neotropical region.
Zootaxa 3782 (1): 1-110.
Osorio-Beristain M.; Domínguez C.A.; Eguiarte L.E.; Benrey B. 1997.
Pollination efficiency of native and invading Africanized bees in the
Complimentary Contributor Copy

R. Silvestre, M. Fernando Demétrio, B. Maykon Trad et al. 76
tropical dry forest annual plant, Kallstroemia grandiflora Torr ex Gray.
Apidologie 28: 11-16.
O‟Neil K.M. 2001. Solitary Wasps: Behavior And Natural History. Cornell
University Press, 406p.
O'Toole C. 1993. Diversity of native bees and agroecossystems. pp. 169-196.
In: Lasalle J.; Gauld I.D. (Eds.). Hymenoptera and Biodiversity. CAB
International. Wallingford.
Pedro S.R.M. & Camargo J.M.F. 2000. Apoidea Apiformes. In: Brandão
C.R.F. & Cancello E.M. (Eds.). pp. 197-211. Biodiversidade do Estado de
São Paulo: síntese do conhecimento ao final do século XX. FAPESP,
Ribeirão Preto.
Pennington T.R.; Lavin M.; Oliveira-Filho A. 2009. Woody plant diversity,
evolution and ecology in the tropics: perspectives from seasonally dry
tropical forests. Annual Review of Ecology, Evolution, and Systematic 40:
437-457.
Peters R.S.; Meyer B.; Krogmann L.; Borner J.; Meusemann K.; Schütte K.;
Niehuis O.; Misof B. 2011. The taming of an impossible child: a
standardized all-in approach to the phylogeny of Hymenoptera using
public database sequences. BMC Biology 9(55): 1-14.
Pott V.J.; Medeiros Y.; Sartori A.L.B.; Mauro R.A.; Souza P.R. 2008.
Biodiversidade nos meandros da Bacia do Apa. pp. 41-52. In: Broch S.O.;
Medeiros Y.; Souza P.R. Pé na água, uma abordagem transfronteiriça da
Bacia do Apa. Campo Grande, Editora da UFMS.
Prado D.E. 2000. Seasonally dry forests of tropical South America: from
forgotten ecosystems to a new phytogeographic unit. Edinburgh Journal
of Botany 57: 437-461.
Prado D.E. & Gibbs P.E. 1993. Patterns of species distribution in the dry
seasonal forest of South America. Annals of the Missouri Botanical
Garden 80: 902-927.
Pulawski W.J. 2014. Catalog of Sphecidae senso lato. Availlable from:
http://research.calacademy.org/sites/research.calacademy.org/
files/Departments/ent/sphecidae/Number_of_Species.pdf. Accessed
27/March,14.
R Development Core Team. 2010. R: A language and environment for
statistical computing, R Foundation for Statistical Computing, Vienna,
Austria. Available in: http://www.R-project.org.
Rasmussen C. & Asenjo A. 2009. A check list to wasps of Peru
(Hymenoptera: Aculeata). Zookeys 15: 1-78.
Complimentary Contributor Copy

Diversity and Distribution of Hymenoptera Aculeata ... 77
Redford K.H.; Taber A.; Simonetti J.A. 1990. There is more to biodiversity
than the Tropical Rain Forests. Conservation Biology 4: 328–330.
Riveros F. 2002. The Gran Chaco. Available at: http://www.fao.org/ag/
AGP/AGPC/doc/Bulletin/GranChaco.htm. Accessed 01 May, 2014.
Roubik D.W. 1989. Ecology and Natural History of tropical bees. Cambridge
University Press (USA), 514p.
Roubik D.W. 1995. Pollination of cultivated plants in the tropics. Agricultural
Services Bulletin, 118. Food and Agriculture Organization of the United
Nations, 198 p.
Ruiz C.E.; Coronado J.M.B.; Varela S.E.; Horta-Veja J.V. 2002. Sphecoidea.
In: Llorente-Bousquets J. & Morrone J. (Eds.). Biodiversidad, taxonomia
y biogeografia de artrópodos de México: hacia uma síntese de su
conocimento. Vol. III. Facultad de Ciencias, UNAM, México, D.F.
Sallun-Filho W.; Karmann I.; Boggiani P. C.; Petri S.; Cristalli P.S.; Utida G.
2009. The Deposition of Quaternaty Tufas in Mato Grosso do Sul State:
Proposal for the Definition of the Serra da Bodoquena Formation. Revista
do Instituto de Geociências 9(3): 47-60.
Santos G.M.M.; Bichara-Filho C.C.; Resende J.J.; Cruz J.D.; Marques O.M.
2007. Diversity and Community Structure of Social Wasps (Hymenoptera:
Vespidae) in Three Ecosystems in Itaparica Island, Bahia State, Brazil.
Neotropical Entomology 36(2): 180-185.
Santos E.F.; Noll F.B.; Brandão C.R. 2014. Functional and Taxonomic
Diversity of Stinging Wasps in Brazilian Atlantic Rainforest Areas.
Neotropical Entomology 43: 97-105.
Sarmiento C.E. 2006. Metodos generales de recoleccion. pp. 115-131. In:
Fernández F. & Sharkey M.J. (Eds.). Introduccíon a los Hymenoptera de
la Región Neotropical. Sociedad Colombiana de Entomología y
Universidad Nacional de Colombia, Bogotá D.C.
Silva N.M. 2009. Dinâmica de uso das terras dos municípios de Bonito, Jardim
e Bodoquena (MS) e o estado de conservação dos recursos biológicos do
Parque Nacional da Serra da Bodoquena e de sua zona de amortecimento.
Revista Brasileira de Agroecologia 4(3): 118-120.
Silva M.P.; Mauro R.; Mourão G.; Coutinho M. 2000. Distribuição e
quantificação de classes de vegetação do Pantanal através de levantamento
aéreo. Revista Brasileira de Botânica 23(2): 143-152.
Silva J.S.S. & Abdon M.M. Anais do 1° Simpósio de Geotecnologias no
Pantanal. 1. ed. Campinas: Embrapa Informática Agropecuária, 2006. v. 1.
1028p.
Complimentary Contributor Copy

R. Silvestre, M. Fernando Demétrio, B. Maykon Trad et al. 78
Silva R.R. & Brandão C.R.F. 2010. Morphological patterns and community
organization in leaf-litter ant assemblages. Ecological Monographs 80:
107-124.
Silveira F.A.; Pinheiro-Machado C.; Alves-dos-Santos I.; Kleinert A.M.P.;
Imperatriz-Fonseca V.L. 2006. Taxonomic constraints for the
conservation and sustainable use of wild pollinators– the Brazilian wild
bees. pp. 21-29. In: Kevan P.G. & Imperatriz-Fonseca V.L. (Eds.).
Pollinating Bees: the conservation link between agriculture and nature. 2
ed. MMA, Brasilia.
Silveira O.T.; Costa-Neto S.V.; Silveira O.F.M. 2008. Social wasps of the
wetland ecosystems in Brazilian Amazonia (Hymenoptera, Vespidae,
Polistinae). Acta Amazonica 38: 333–344.
Silvestre R.; Auko T.H.; Carbonari V. 2010. Insecta, Hymenoptera,
Vespoidea, Pompilidae, Epipompilus aztecus (Cresson, 1869): First record
in South America. Check List 6(4): 483-484.
Silvestre R.; Brandão C. R. F.; Silva R. R. 2003. Grupos funcionales de
hormigas: el caso de los grêmios del Cerrado, Brasil. pp. 113-143. In:
Fernández F. (Ed.). Introdución a las hormigas de la región Neotropical,
Instituto Humboldt, Bogotá. Colômbia.
Silvestre R.; Demétrio M.F.; Delabie J.H.C. 2012. Community Structure of
Leaf-Litter Ants in a Neotropical Dry Forest: A Biogeographic Approach
to Explain Betadiversity. Psyche 2012: 1-15.
Spichiger R.; Calenge C.; Bise B. 2004. Geographical zonation in the
Neotropics of tree species characteristic of the Paraguay-Parana Basin.
Journal of Biogeography 31: 1489-1501.
Statsoft Inc. 2007. STATISTICA (data analysis software system), version 8.0.
www.statsoft.com.
Tanaka Jr. G.M. & Noll F.B. 2011. Diversity of social wasps on
semideciduous seasonal forest fragments with different surrounding
matrix in Brazil. Psyche 2011 (ID 861747): 1–8.
Werneck F.P.; Nogueira C.; Colli G.R.; Sites J.W.; Costa G.C. 2012. Climatic
Stability in the Brazilian Cerrado: Implications for Biogeographical
Connections of South American Savannas, Species Richness and
Conservation in a Biodiversity Hotspot. Journal of Biogeography 39(9):
1695-1706.
Vardy C.R. 2000. The New World tarantula-hawk wasp genus Pepsis
Fabricius (Hymenoptera: Pompilidae). Part 1. Introduction and the P.
rubra species-group. Zool. Verh. Leiden 332, 29.xii: 1-86.
Complimentary Contributor Copy

Diversity and Distribution of Hymenoptera Aculeata ... 79
Vergara C.H. 2002. Diversity and Abundance of Wild Bees in a Mixed Fruit
Orchard in Central Mexico. pp. 169-176. In: Kevan P. & Imperatriz
Fonseca V.L. (Eds.). Pollinating Bees - The Conservation Link Between
Agriculture and Nature. MMA, Brasília.
Vinson S.B.; Frankie G.W.; Barthell J. 1993. Threats to the Diversity of
Solitary Bees in a Neotropical Dry Forest in Central America pp. 53-82.
In: Lasalle J. & Gauld I.D. (Eds.). Hymenoptera and biodiversity. CAB
International. Wallingford.
Complimentary Contributor Copy

Complimentary Contributor Copy

In: Dry Forests ISBN: 978-1-63321-291-6
Editor: Francis Eliott Greer © 2014 Nova Science Publishers, Inc.
Chapter 3
THE BRAZILIAN "CAATINGA":
ECOLOGY AND VEGETAL BIODIVERSITY
OF A SEMIARID REGION
Heloisa Helena Gomes Coe1
and Leandro de Oliveira Furtado de Sousa2
1Departament of Geography,
Universidade Estadual do Rio de Janeiro, Brazil 2Department of Vegetal Sciences,
Universidade Federal Rural do Semiárido, Brazil
ABSTRACT
In this chapter we present the ecological characteristics and vegetal
biodiversity of a typical Brazilian biome; Caatinga. The name "Caatinga"
comes from a Tupi-Guarani term that means "white forest" or "clear
forest" in reference to the clear gray appearance of the vegetation during
the dry season. It is an exclusively Brazilian semi-arid ecosystem
covering about 11% of the country. It extends over all the states of the
Northeast region and the north of Minas Gerais State, comprising an area
of 800,000 km2. The caatinga area extends from 2º54'S in the states of
Ceará and Rio Grande do Norte to 17º21'S in Minas Gerais State.
Generally, Caatinga is recognized as low-growing forest with
discontinuous canopy, deciduous foliage during the dry season and
xeromorphic characteristics shared by the species. However, Caatinga
physiognomies are extremely variable, depending on the rainfall regime
Complimentary Contributor Copy

Heloisa Helena Gomes Coe and Leandro de Oliveira Furtado de Sousa
82
which, in general, does not exceed 1,000 mm/year and is concentrated in
three or four months of the year. They also depend on the characteristics
of soils of different geomorphological and geological origins, varying
from high dry forests up to 15-20 m tall, in more favorable soils in more
humid environments, to rocky outcrops with sparse low shrubs and
Cactaceae and Bromeliaceae in the crevices.
Caatinga stands out for presenting a large diversity of plant species,
currently having 4,478 recognized species in 8 eco-regions with 12
different types of vegetation, many of which are endemic to the biome,
and others that can exemplify biogeographical relationships which help to
clarify the historical vegetation dynamics of the Caatinga itself as well as
the entire eastern area of South America.
Caatinga has been highly modified by diverse human activities. The
northeastern soils are suffering an intense process of desertification due to
replacement of natural vegetation with crops, done mainly through slash
and burn. Deforestation and irrigated cultivation are leading to soil
salinization, further increasing the evaporation of the soil water and
accelerating the process of desertification. Only the presence of the
adapted vegetation of Caatinga has prevented the transformation of
northeastern Brazil into a vast desert. Despite threats to the biome, less
than 2% of the Caatinga is protected as conservation units under full
protection.
I. INTRODUCTION
Despite the fact that the diversity of plants and animals in arid and semi-
arid environments occurs to a much lesser extent than in tropical forests, these
environments have a number of plants and animals adapted to their extreme
conditions, making them environments with high rates of endemic fauna and
flora.
In Brazil there are no deserts, but there is a semi-arid region, with unique
species and features, called “Caatinga”. The name "Caatinga" has a Tupi-
Guarani origin and means white forest. This name aptly characterizes the
aspect of vegetation during the dry season, when the leaves fall and only the
white and shiny trunks of trees and shrubs remain in the dry landscape
(Albuquerque & Banner, 1995).
It is the only exclusively Brazilian ecosystem, composed of a mosaic of
dry forests and shrub vegetation (steppe savanna), with enclaves of montane
rainforests and “cerrado” (Brazilian savanna) (Tabarelli & Cardoso da Silva,
2003). Until the present moment about 5,000 plant species have been recorded,
Complimentary Contributor Copy

The Brazilian "Caatinga"
83
approximately 300 of which are endemic (Giulietti et al., 2002), along with
185 fish species, 154 reptiles and amphibians, 348 species of bird and 148
species of mammal, when considering the plant formations typical to Caatinga
( MMA 2002 ).
In these groups of organisms, the level of endemism varies between 4.3 %
(birds) and 57% (fish) and, as said by Pennington et al. (2000), the biota of the
Caatinga has borne witness to the huge dry forest that was once distributed as
far as northern Argentina, through central Brazil. Also affecting the
biodiversity of the region is the maintenance of human populations through the
exploitation of important natural resources, such as firewood and medicinal
plants, and the environmental services provided by this ecosystem on a
regional and global scale (Gil, 2002). Perennial water streams are very rare in
the area of caatinga, confirming the high water deficit responsible for this
vegetation type.
As it does not show the green exuberance of tropical rainforests, which are
of such great importance in Brazil, and due to the dry appearance of
physiognomies dominated by cacti and shrubs, the Caatinga vegetation
suggests, to a less trained eye, a low diversification of fauna and flora. Among
the Brazilian biomes, the Caatinga is probably the most undervalued and
poorly known scientifically. This situation is due to an unjustified belief,
which should no longer be accepted, that the Caatinga is the result of the
modification of another plant formation, is associated with a very low diversity
of plants, without endemic species and is highly modified by human actions
(Giulietti et al., 2002). Despite being really rather altered, particularly in the
lowlands, the Caatinga is a biome of wide biodiversity, with biological
relevance and peculiar beauty, especially in regard to the multiplicity of plant
communities, formed by a range of combinations of soil types and
microclimate variations, besides the significant proportion of rare and endemic
taxa, many of which are commonly used by the population for their
therapeutic properties.
The variety of strategies used by the species to survive during the periods
of lack of rainfall are numerous and of great interest. Many plants shed their
leaves to reduce water loss during periods of water stress; several herbs have
annual life cycles, growing and flowering in the rainy season; cacti and
bromeliads accumulate water in their tissues and there is a predominance of
shrubs and small trees in the landscape (Leal et al., 2003). The strongly
xerophytic character of the native plants of Caatinga demonstrates, beyond any
doubt, that the semi-aridity of the region does not come from centuries ago,
but probably from millions of years.
Complimentary Contributor Copy

Heloisa Helena Gomes Coe and Leandro de Oliveira Furtado de Sousa
84
II. LOCALISATION
The Caatinga is the only large natural Brazilian region whose boundaries
are entirely restricted to the national territory, occupying primarily the
Northeast region, with some areas in the state of Minas Gerais. It extends from
2º54' to 17°21' S, comprising an area of approximately 800,000 km2,
representing 70% of the Northeast region and 11% of the Brazilian territory.
The region includes the states of Ceará (CE), Rio Grande do Norte (RN), most
of Paraíba (PB) and Pernambuco (PE), southeast Piauí (PI), the west of
Alagoas (AL) and Sergipe (SE), the north and central region of Bahia (BA)
and a strip extending into Minas Gerais (MG) following the river São
Francisco and a dry valley enclave in the middle region of the Jequitinhonha
(Figure 1). The island of Fernando de Noronha should also be included
(Andrade-Lima, 1981).
Figure 1. Location of Caatinga in Brazil.
Complimentary Contributor Copy

The Brazilian "Caatinga"
85
III. GEOLOGY, GEOMORPHOLOGY AND SOILS
In northeastern Brazil most of the caatinga areas are located in depressions
between plateaus (Ab'Sáber, 1974). However, there are some exceptions, such
as the low plateau of Raso da Catarina in Bahia state, the mountain range of
Borborema in Paraíba, or the Apodi Plateau in Rio Grande do Norte (Figure
2), where savanna vegetation is found not only in the depressions, but also in
the highlands (Andrade - Lima, 1981).
Figure 2. Caatinga at the Apodi Plateau (Photo: Coe, 2013).
In general, this province extends over undulating pediplains (Andrade &
Lins, 1964), exposed from Cretaceous or Tertiary sediments covering the basal
Brazilian Precambrian shield. A great process of pediplanation occurred
during the lower Tertiary and Quaternary (Ab'Sáber, 1974) to uncover the
current surfaces of crystalline Precambrian rocks (gneisses, granites and
schists), leaving only isolated remnants of younger surfaces throughout the
Caatinga. These remnants are characterized as inselbergs, such as in Quixadá,
CE (Figure 3), and in Patos, PB, mountains or plateaus, in order of decreasing
erosion.
Complimentary Contributor Copy

Heloisa Helena Gomes Coe and Leandro de Oliveira Furtado de Sousa
86
Figure 3. Inselberg in Quixadá, CE (Photo: Coe, 2009).
The vegetation varies with topography, with savanna vegetation on top of
the tablelands, such as Chapada do Araripe and coastal tablelands, evergreen
or semi-deciduous rainforests on the tops of the mountains (such as the
marshes of Pernambuco) and dry forests or arboreal caatinga on the slopes and
inselbergs (Prado, 2003). There are some sedimentary areas within the
Caatinga, such as the coastal areas and the Mossoró river basin in Rio Grande
do Norte (Andrade - Lima, 1966) and Raso da Catarina, as well as the regions
under the influence of the São Francisco River in Bahia.
As a result of the origin of the substrate of the Caatinga, soils are stony
and shallow, with the bedrock depths sparsely decomposed and many outcrops
of massive rocks (Tricart, 1961; Ab'Saber, 1974). The geomorphological and
geological origin of the Caatinga has resulted in several complex mosaics of
soils, with varying characteristics even within small distances (Sampaio,
1995). Extensive outcrops of rocks are regionally called "lajedos" that act
ecologically as desert environments where only succulent plants are found
(Figure 4). Pediments covered by more or less continuous layers of stones
(desert pavement) are also common.
Complimentary Contributor Copy

The Brazilian "Caatinga"
87
Figure 4. Lajedo of Soledade, RN (Photo: Coe, 2013).
Santos et al. (1992) found a good relationship between vegetation
(physiognomy - flora) and soil types, confirming the observations of Andrade -
Lima (1981) as to the close relationship between vegetation and soil in semi-
arid regions. Rodal (1992) noted that geographical proximity and
geomorphology are important to the understanding of the floristic similarities
of caatinga areas. The author indicated that nearby areas, albeit with different
morphopedologic aspects, showed greater similarity to each other than to other
areas, and that the flora of the areas of the “sertaneja” depression (crystalline)
is distinct from that of the sedimentary plateaus. The west of Pernambuco has
a particular caatinga flora, possibly related to the large patch of red-yellow
latosol which occurs there. Undoubtedly, most of the vegetation of the
Borborema plateau, located in the semi -arid region of Pernambuco, consists
of caatinga of greater height and a sharp floristic richness, which may possibly
be explained by lower temperatures, especially at night (Jacomine et al.,
1973).
Cailleux & Tricart (1959 apud Prado, 2003) postulated that, during the
Quaternary, the Caatinga did not suffere the big climate changes that affected
other areas of Brazil. The only evidence of a Pleistocene fluctuation was
provided by certain localized pebble layers that seem to be products of a more
torrential regime. However, there is evidence indicating that the northeast of
Complimentary Contributor Copy

Heloisa Helena Gomes Coe and Leandro de Oliveira Furtado de Sousa
88
Brazil had a much drier climate during certain periods of the Quaternary,
giving rise to the fields of paleo-dunes in Xique-Xique, Bahia (Ab'Sáber,
1977; Tricart, 1985; Clapperton, 1993). These wind formations must have
originated when the allochthonous São Francisco River, the only major
perennial river crossing the Caatinga, dried completely at its middle course
and sandy alluvial sediments, previously scattered in the area, were modelled
into dunes, especially by east and southeast winds (Prado, 2003).
IV. CLIMATE
The weather does not always play a significant role in the establishment of
plant formations. However, in the case of the Caatinga, it is clear that the
climate has a major influence. The vegetation of the caatinga always appears
to be associated with high water stress, indicating a complex network of
vegetation types determined by climatic factors (Reis, 1976).
The climate of the Northeastern region, classified as semi-arid tropical, or
as type Bsh, according to the Köppen classification, is characterized by high
temperatures and scarce and irregular rainfall. Reis (1976) describes the
climate in the areas of Caatinga as one of the most extensive areas of semi-
aridity in South America, highlighting some of the most extreme
meteorological values in Brazil: the highest solar radiation, low cloud cover,
the highest average annual temperature, lower rates of relative humidity,
higher evapotranspiration, and, above all, lower irregular rainfall, limited, in
most of the area, to a very short period of the year (2-3 months). These rains,
often of great intensity, lead to floods in reservoirs and water courses, as well
as to high runoff, with little or no infiltration, accentuating and worsening soil
erosion each year. Catastrophic phenomena such as droughts and floods are
very common. However, what most characterizes the region is the complete
absence of rain in some years (Nimer, 1972).
The average absolute maximum temperatures of the region are rarely
above 40°C, and they are restricted to drier areas (Lower São Francisco river
and the Jequitinhonha River Valley in Minas Gerais), while in wetter areas
outside the Caatinga, such as the states of Goiás and Pará, temperatures higher
than 40º or 42º C are much more frequent. Very high average annual
temperatures are another important characteristic of the Caatinga, with values
between 26 and 28º C (Nimer, 1972). However, all the areas above 250 m high
have lower average temperatures (20-22°C).
Complimentary Contributor Copy

The Brazilian "Caatinga"
89
This area is characterized by a climatic heterogeneity that makes it the
most complex among the Brazilian regions, deriving primarily from its
geographical position in relation to the various atmospheric circulation
systems and, secondarily, although still of great importance, from the relief
and also latitude and continentality, among other factors. This climatic
heterogeneity can be observed by comparing meteorological data of
precipitation, insolation and evaporation among 34 stations scattered
throughout the area of caatinga (figures 5, 6, 7 and 8).
Figure 5. Map showing the location of the studied weather stations of the caatinga.
Figure 6. Histogram of the total annual rainfall in 34 stations of the caatinga, with
totals ranging from about 500 mm/ year (Cabrobó, PE) to over 1100 mm/ year (Bom
Jesus do Piaui, PI).
Complimentary Contributor Copy

Heloisa Helena Gomes Coe and Leandro de Oliveira Furtado de Sousa
90
Figure 7. Histogram of the total hours of insolation per year in 34 stations of the
caatinga, with totals ranging from about 1300 h/ year (Itaberaba, BA) to over 3000 h/
year (Apodi, RN).
Figure 8. Histogram of total annual evaporation in 34 stations of the caatinga, with
totals ranging from about 1000 mm/ year (Garanhuns, PE) to over 4000 mm/ year
(Paulistana, PI).
The air masses that act in northeastern Brazil are the Equatorial Atlantic
(Ea), the Equatorial Continental (Ec), the Polar (P), the Tropical Atlantic (Ta)
and Tropical Kalaariana (Tk). Ta has marine properties (warm and wet) and
Tk has desert properties (warm and dry). It is precisely this air of desert origin
that determines the dryness in the Northeast region. Both influence the
formation of the Atlantic Polar Front (APF), when they meet the P, which
originated in the Antarctic periglacial region, as well as the Inter-Tropical
Convergence (ITC), when they meet Ea, formed in the North Atlantic. The
Complimentary Contributor Copy

The Brazilian "Caatinga"
91
FPA bifurcates into two paths: the inner continental, which can lead it up to
the equator line, and the maritime or coastal, which reaches the entire eastern
coast of the Northeast, as far as the cape of São Roque, in Rio Grande do
Norte. When it meets Ta, which is warm and rich in moisture, the seafront
cools it, leading to storms along the northeastern coast during autumn and
winter. This effect is accentuated when it introduces itself as a wedge of cold
air beneath the Tk (which acquired some moisture on the way from Africa to
Brazil), refreshing it and causing it to rise, triggering the conditional
instability. This explains the existing wet zone on the eastern coastal strip of
the Northeastern region. However, the FPA loses energy on its journey, not
only from South to North, but also within the region. The Ec originates in the
Amazon region and presents marine features (hot and humid), because it
receives water vapor emanating from the forest. In the summer, it expands and
affects the western flank of the Northeast. The low and irregular rainfall is due
to 2 factors: 1) an area of encounter or ending of 4 atmospheric systems - Ec,
Ta, Ea and Pa. When these air masses reach the region, they have lost much of
their moisture; 2) the presence of the Borborema Plateau, a natural barrier to
the passage of the warm moist air mass coming from the ocean.
The semi-arid nature of this area results principally from the
predominance of stable air masses pushed into the southeast trade winds,
which have their origin in the action of the South Atlantic anticyclone. The
entire eastern coast of Brazil consists of a narrow strip of lowlands behind
which there is a mountain range, known as the “Serra do Mar” (Atlantic
Forest), stretching from the state of Rio Grande do Norte to Rio Grande do
Sul. When the Atlantic-Equatorial air masses, charged with water vapor, are
transported by trade winds against the northeast coast of Brazil, they are
adiabatically moistened and they precipitate annually about 2000 mm of rain.
This is the area of the Atlantic Forest where the Equatorial Atlantic system
loses most of its moisture, while in the areas of rain shadow of mountain
ranges, the Caatingais subject to the effect of stable dry air masses (Andrade &
Lins, 1964). It is only when these dry masses encounter the few elevations
resulting from the pediplanation process that swamps occur, like islands of
humid vegetation within the semi-arid region (Andrade-Lima, 1966; Andrade
& Lins, 1964), because the air mass is moistened and precipitates its remaining
water in these regions. The zone of low pressure known as the Intertropical
Convergence Zone occurs where there is the meeting of the trade winds of
both hemispheres, positioned almost parallel to the equator line, at a latitude of
about 10° N (Prado, 2003). During the summer, this meeting line moves to the
south of the equator, bringing high climatic instability to the northern half of
Complimentary Contributor Copy

Heloisa Helena Gomes Coe and Leandro de Oliveira Furtado de Sousa
92
the Caatinga from February to April, which is the rainy season in most of
northeastern Brazil. The humid Equatorial continental mass originates along
the Amazon, producing heavy convection rains, and it can reach the west side
of the Caatinga from November to January, particularly when it occurs in
conjunction with the displacement towards the south of the Intertropical
Convergence. Thus, the rainy season follows a sequence from November to
January in the west and southwest, until February or April in the north and
northeast, depending on the penetration of two unstable moist masses coming
from the north and west, as well as their ability to displace the stable dry mass
brought by the trade winds. Catastrophic droughts occur when the humid
masses are unable to reach Caatingas (Andrade & Lins, 1965; Reis, 1976).
In summary, we may say that the dry zone of the Northeast region is a
result of the predominance of stable air brought by the trade winds. This
condition can frequently persist, causing calamitous droughts in the region.
However, the most common situation is that the penetration of the continental
Equatorial mass to the west, combined with the undulations of the Intertropical
Convergence Zone, in the northwest, determine the rainy season in most areas
of the Northeast region, in the sequence summer, summer-autumn.
The generally accepted phytogeographic concept of Caatinga coincides
approximately with the isohyet of 1000 mm (Nimer, 1972; Reis, 1976;
Andrade-Lima, 1981). About 50 % of the area receives less than 750 mm,
while certain regions have less than 500 mm, such as the Raso da Catarina and
a large central area of Pernambuco and Paraiba (Figure 9). However, what is
most important is not the total amount of annual rainfall, but the annual
distribution. Although the Brazilian semi-arid region can be defined by isohyet
800 mm, this value is of little relevance. The complexity of the climatic
characterization of the region is great, being marked by major anticipations or
delays to the rainy season and its concentration in a few years. One major
consequence is the reduced availability of soil water to plants and the fragility
of social and economic systems that depend on these precipitations.
Nevertheless, the delimitation of the Caatinga zone presents an extraordinary
coincidence between the line demarcating the scrublands and the isohyet of
1,000 mm annually. This illustrates a dependency between the Caatinga and
the climatic conditions, especially rainfall (Figure 9).
Complimentary Contributor Copy

The Brazilian "Caatinga"
93
Figure 9. Isohyets in Northeast Brazil.
Complimentary Contributor Copy

Heloisa Helena Gomes Coe and Leandro de Oliveira Furtado de Sousa
94
Rainfall in the region is complex, since its annual totals range from 2,000
mm in coastal areas on the east coast to less than 500 mm in the Raso da
Catarina area, between Bahia and Pernambuco, and Patos Depression in
Paraíba. Overall, the average annual rainfall in the Northeast is less than 1.000
mm, and in Cabaceiras (Paraíba State), the lowest annual rainfall in Brazil,
278 mm/ year, has already been recorded. The northern part of the region
receives between 1,000 and 1,200 mm/ year. Moreover, in the hinterland of
this region, the rainy season is usually only two months a year, and may, in
some years, not even exist, causing the so called “regional droughts”.
Almost the entire area suffers a concentration of 50 to 70% of rainfall in
three consecutive months, characteristic of a very strong seasonal climate.
Across the region the duration of the dry season is very variable, ranging from
two to three months in the humid swamps, six to nine months in most of the
region and up to 10 or 11 months in the Raso da Catarina (Nimer, 1972). In
general, the dry period increases from the periphery to the center of the
hinterland (Nimer, 1972; Nishizawa, 1976). The most important feature of this
climate is the extremely irregular rainfall system from year to year. The
rainfall regime in the semi-arid Northeast can be characterized in non-
anomalous years by two well-defined periods: a rainy summer and a dry
winter, forming a unimodal oscillation; November, December and January
being the wettest months. The driest months are June, July and August. The
rainfall period starts in September, reaches its maximum in December and
ends in May. A curiosity is that, despite it happening during the months of
summer/fall, the rainy season in the Northeast region is named "winter" by the
local people.
V. VEGETATION
The Caatinga has about 5000 species of angiosperms with about 300
endemic species (Giulietti et al., 2002). The dry aspect of vegetation during
most of the year transforms so quickly and dramatically when the rains come
that the landscape changes almost overnight (Figure 10).
The interaction of factors such as soil type, altitude and rainfall index
allows us to recognize different landscape units, forming a vegetation mosaic
so diverse that it makes classification of the Caatinga vegetation difficult
(Figure 11). An analysis of the classifications already proposed for the
Caatinga shows an absence of well-defined characteristics, which results in
Complimentary Contributor Copy

The Brazilian "Caatinga"
95
conflicts of opinion among researchers and imprecise delimitation concepts.
Several attempts at classification of this biome have been made. Eiten (1983)
proposes an approach based on the distribution and density of herbaceous,
shrubby and tree species. Other authors have proposed floristic-ecological
classification systems, emphasizing the relationship between the floristic
composition and possible ecological conditioning factors (Luetzelburg, 1922-
23; Andrade-Lima, 1981; Prado, 2003). Velloso et al. (2002), using data of the
biota with the main abiotic factors, proposed the division of the biome into
eight ecoregions.
Figure 10. Aspects of the Caatinga in Açu National Forest (RN): a) in the dry season,
b) in the rainy season (Photos: Sousa, 2013).
In general, the Caatinga is characterized by a type of xeromorphic
vegetation composed of low-growing forests, often with discontinuous canopy,
deciduous foliage in the dry season and trees and shrubs commonly armed
with spines or prickles. The most common plant families are Fabaceae,
Euphorbiaceae, Malvaceae, Asteraceae and Cactaceae, among others
(Figure 12).
The vegetation presents unique strategies to survive in these extreme
weather conditions such as the absence of leaves or their transformation into
spines on Cactaceae ( Figure 12a), microfilia or compound leaves with leaflets
reduced in most Fabaceae (Fig. 12b), Anacardiaceae and Burseraceae.
Some woody species, such as Pseudobambax marginatum (A.St.-Hil.) A.
Robyns (Figure 12c) and Commiphora leptophloeos (Mart.) J.B. Gillett,
among others, present chlorophyllated bast allowing some photosynthetic
activity during the dry season, when the leaves are absent. Succulent species
such as Cactaceae and Bromeliaceae (Figure 12 d) have aquifer parenchyma
Complimentary Contributor Copy

Heloisa Helena Gomes Coe and Leandro de Oliveira Furtado de Sousa
96
for water supply and some plants have specific organs for storage, like the
swollen trunks of Ceiba glaziovii (Kuntze) K. Schum. and tuberous roots of
Spondias tuberosa Arruda (Figure 12e).
Figure 11. Physiognomies of the Caatinga: a) open shrub caatinga, Lajes, RN; b)
coastal caatinga, Icapuí, CE; c) arboreal caatinga, Martins, RN; d) tall arboreal
caatinga, Portalegre, RN; e) riparian vegetation with predominance of Copernicia
prunifera, Gov. Dix-sept Rosado, RN; f) dense shrub caatinga, Açu, RN (Photos:Coe
& Sousa, 2014).
Complimentary Contributor Copy

The Brazilian "Caatinga"
97
Figure 12. Conspicuous plants of the caatinga: a) Cactaceae Pilosocereus gounellei; b)
Fabaceae Anadenanthera colubrina; c) Malvaceae Pseudobombax marginatum; d)
Bromeliaceae Encholirium spectabile; e) Anacardiaceae Spondias tuberosa; f)
Fabaceae Amburana cearensis; g) Capparaceae Cynophalla flexuosa; h)
Chrysobalanaceae Licania rigida.
Trees and shrubs are the predominant forms of life and in most of the
biome the canopy does not exceed 8 meters in height, with the exception of
some species like Amburana cearensis (Allemão) A.C.Sm. (Figure 12f),
Anadenanthera colubrina (Vell.) Brenan, Pseudobombax marginatum (A.St.-
Hil.) A. Robyns and Cordia oncocalyx Allemão, among others. Falling leaves
during the dry season is a common feature among the tree and shrub species,
except for some species such as Ziziphus joazeiro Mart., Spondias sp. and
Cynophalla flexuosa (L.) J. Presl (Figure 12g). Common species along river
banks, such as Licania rigida Benth. (Figure 12h) and Parkinsonia aculeata
L., also maintain their evergreen leaves due to higher water availability during
the year. Still in the arboreal stratum, there are striking succulent species in the
landscape of Caatinga, such as Cactaceae Cereus jamacaru DC., Pilosocereus
gounellei (F.A.C. Weber) Byles & Rowley, Pilosocereus catingicola (Gürke)
Byles & Rowley and Pilosocereus pachycladus F. Ritter.
Complimentary Contributor Copy

Heloisa Helena Gomes Coe and Leandro de Oliveira Furtado de Sousa
98
The herbaceous stratum is mainly composed of annual plants and it is
absent for about seven months of the year, appearing more frequently in the
rainy season through seed germination in annual species or resprouting from
underground store structures in geophytes. Among the annual species, we
commonly found several species of Fabaceae (genera: Chamaecrista,
Stylosanthes, Zornia and Macroptilium, among others), Malvaceae (genera:
Sida, Waltheria, Herissantia and Pavonia among others), and Poaceae
(genera: Aristida, Eragrostis and Andropogon, among others). Geophyte
species are common among Monocotyledons. Perennial herbaceous species
such as Melocactus spp., Tacinga inamoena (K. Schum.) N.P. Taylor &
Stuppy and Bromeliaceae Encholirium spectabile Mart. ex Schult. & Schult.f.
and Neoglaziovia variegata (Arruda) Mez and Bromelia laciniosa Mart. ex
Schult. & Schult.f., are less common, but nonetheless striking on the
landscape.
CONCLUSION
The Caatinga is proportionally the least studied among Brazilian natural
regions. Historically some myths were created about its biodiversity, such as
the homogeneous environment, having a biota poor in species and endemism
and slightly altered vegetation. These myths are totally unfounded since the
biome has the most diverse of the Brazilian landscapes considering both
geomorphology and the types of vegetation (Queiroz et al., 2006).
Furthermore, much of its surface has been highly modified by human use and
occupation and continues to go through a long process of alteration and
environmental degradation caused by the unsustainable use of natural
resources, which is leading to the rapid loss of unique species, the elimination
of important ecological processes and the formation of large cores of
desertification in various sectors of the region (Leal et al., 2003).
Unlike other semi-arid areas of the world, the Brazilian one is quite
populous, with about 20 million people (about 10 % of Brazil's population), it
being the region with the lowest levels of human development in Brazil.
The Caatinga has been highly modified by man. Garda (1996) indicates
that the soils are suffering an intense process of desertification due to the
replacement of natural vegetation with crops, mainly through slash and burn.
Deforestation and irrigated crops are leading to salinization of the soils, further
increasing the evaporation of water contained in them and accelerating the
Complimentary Contributor Copy

The Brazilian "Caatinga"
99
process of desertification. These various effects of anthropogenic activities
include, for example, changes in the behavior of animals due to construction
and maintenance of roads, mortality from trampling, changes in vegetation, the
ease of fire spread, changes in the chemical and physical environment,
expansion of exotic species and changes in human use of land and water
(Trombulak & Frissell, 2000). According to Garda (1996), only the presence
of the adapted vegetation of Caatinga has prevented the transformation of
northeastern Brazil into a vast desert. Despite threats to its integrity, less than
2 % of the Caatinga is defined as fully protected conservation units (Tabarelli
et al., 2000).
Some actions have been taken in an attempt to preserve this unique
ecosystem. Areas of extreme biological interest have been selected through
overlaying information of different groups of organisms (Silva et al., 2004)
and eight natural ecoregions have been proposed for the Caatinga Biome,
combining biotic and abiotic data. Associated with these ecoregions, 57 areas
of high conservation concern were defined for the Caatinga Biome, including
27 of Extreme Biological Importance (Velloso et al., 2002).
Even with these efforts, the biome can be considered one of Brazil's most
endangered, with less than 2% under full protection. Studies on the fauna and
flora of caatinga regions are fundamental. Many areas of Caatinga have not
even been sampled. Complete information on the distribution of the organisms
is essential to efficiently understanding the evolution, ecology and
conservation of the biome (Primack, 1995).
Recently, the Caatinga was recognized as one of 37 major natural regions
of the planet, according to the study coordinated by Conservation International
(Tabarelli & Silva, 2003). Large natural areas are ecosystems that are still
home to at least 70 % of its original vegetation cover, occupy more than
100,000 km2 areas and, thus, are considered strategic in the context of major
global changes (Gil, 2002). More specifically, the conservation of the Caatinga
is important for the maintenance of regional and global climate patterns, the
availability of drinkable water and of arable land and is an important part of
biodiversity. Unfortunately, the Caatinga remains one of the least scientifically
known among South American ecosystems. Moreover, besides the lack of
scientific knowledge there is a small number of conservation units (Tabarelli
& Vincent, 2002) and increasing human pressure (Castelletti et al., 2003). The
result is that several species found in the Caatinga are threatened with global
extinction and a bird species, Cyanopsitta spixii, is officially extinct from
nature.. These indicators reflect unequivocally, the absence of policies aimed
at the conservation of biological diversity of the Caatinga and its other natural
Complimentary Contributor Copy

Heloisa Helena Gomes Coe and Leandro de Oliveira Furtado de Sousa
100
resources. Strategies must be developed for more efficient use of altered areas
of the Caatinga for economic purposes, avoiding pressure on even slightly
altered areas.
ACKNOWLEDGMENTS
The authors would like to thank Wesley de Souza Paiva, Francisco
Ernesto de Souza Neto and Catia Pereira dos Santos for help in collecting
samples and Jenifer Garcia Gomes for the preparation of the figures.
REFERENCES
Ab‟Saber, A. N. (1974). O dominio morfoclimático semi-árido das Caatingas
brasileiras. Geomorfologia 43: 1-39.
Ab‟Saber, A. N. (1977). Problemática da desertificação e da savanização no
Brasil intertropical. Geomorfologia 53: 1-19.
Andrade, G. O. & Lins, R. C. (1964). Introdução ao estudo dos “brejos”
pernambucanos. Arquivos do Instituto de Ciências da Terra 2: 21-34.
Andrade-Lima, D. (1966). Vegetação. Atlas Nacional do Brasil, vol. II: 11.
IBGE. Conselho Nacional de Geografia, Rio de Janeiro.
Andrade-Lima, D. 1981. The caatingas dominium. Revista Brasileira de
Botânica 4: 149-163.
Albuquerque, S. G. & Bandeira, G. R. L. (1995). Effect of thinning and
slashing on forage phytomass from a caatinga of Petrolina, Pernambuco,
Brazil. Pesquisa Agropecuária Brasileira 30: 885-891.
Castelletti, C.H.M., Melo, A. M., Santos, M. T., Silva & J. M. C. (2003).
Quanto ainda resta da Caatinga? Uma estimativa preliminar In: Leal, I.R.,
Tabarelli., M., Silva, J.M.C. (Eds.), Ecologia e conservação da caatinga.
Ed. Universitária da UFPE, Recife, pp. 719-734.
Clapperton, C. M. (1993). Nature of environmental changes in South America
at the last Glacial Maximum. Palaeogeography, Palaeoclimatology,
Palaeoecology 101: 189-208.
Fernandes, A. G. (1996). Fitogeografia do semi-árido. p. 215-219 In: Anais da
Reunião Especial da Sociedade Brasileira para o Progresso da Ciência 4.
Feira de Santana, BA.
Complimentary Contributor Copy

The Brazilian "Caatinga"
101
Garda, E. C. (1996). Atlas do meio ambiente do Brasil. Editora Terra Viva,
Brasília.
Gil, P. R. (2002). Wilderness: earth’s last wild places. CEMEX, S.A., Cidade
do México.
Giulietti, A. M., Neta, A. L. B., Castro, A. A. J. F., Gamarra-Rojas, C. F. L.,
Sampaio, E. V. S. B., Virgínio, J. F., Queiroz, L. P., Figueiredo, M. A.,
Rodal, M. J. N., Barbosa, M. R. V., Harley, R. M., 2002. Diagnóstico da
vegetação nativa do bioma Caatinga.
Jacomine, P. T., Cavalcanti A. C., Burgos, N., Pessoa S. C. P. & Silveira C. O.
(1973). Levantamento exploratório-reconhecimento de solos do Estado de
Pernambuco. Divisão de Pesquisa Pedológica, vol. 1. Recife, PE.
(Boletim Técnico 26, Pedologia 14).
Leal, I. R., Tabarelli, M. & Silva J. M. C. (2003). Ecologia e conservação da
caatinga. Ed. Universitária da UFPE, Recife, p. 822.
Luetzelburg, P. (1922-23). Estudo botânico do Nordeste. Rio de Janeiro, lnsp.
Obr. cf Secas, Publ. 57, Sér. I-A. e. V. 130p.
MMA – Ministério do Meio Ambiente, dos Recursos Hídricos e da Amazônia
Legal (2002). Avaliação e ações prioritárias para a conservação da
biodiversidade da Caatinga. Universidade Federal de Pernambuco,
Conservation International do Brasil e Fundação Biodiversitas, Brasília.
Nimer, E. (1972). Climatologia da região Nordeste do Brasil. Introdução à
climatologia dinâmica. Revista Brasileira de Geografia 34: 3-51.
Nishizawa, T. (1976). Some characteristics of rainfall in the northeast of
Brazil. Tokyo Geographical Papers 20: 53-61.
Pennington, R. T., Prado, D. E. & Pendry, C. A. (2000). Neotropical
seasonally dry forests and Quaternary vegetation changes. Journal of
Biogeography 27:261-273.
Prado, D. E. (2003). As caatingas da América do Sul, In: Leal, I. R., Tabarelli,
M. & Silva, J. M. C. (Eds.), Ecologia e conservação da caatinga. Ed.
Universitária da UFPE, Recife, pp. 3-74.
Primack, R. B. (1995). A primer of conservation biology. Sinauer Associates
Inc., Massachusetts.
Queiroz, L. P. (2006). The Brazilian caatinga: phytogeographical patterns
inferred from distribution data of the Leguminosae. P. 113-149. In:
Penninigton R.T, Lewis G.P & Ratter J.A (eds.) Neotropical dry forests
and savannas. Royal Botanical Garden, Edinburgh.
Reis, A. C. (1976). Clima da caatinga. Anais da Academia Brasileira de
Ciências 48: 325-335.
Complimentary Contributor Copy

Heloisa Helena Gomes Coe and Leandro de Oliveira Furtado de Sousa
102
Rodal, M. J. N. (1992). Fitossociologia da vegetação arbustivo-arbórea em
quatro áreas de caatinga em Pernambuco. Tese de Doutorado.
Universidade Estadual de Campinas, Campinas, SP.
Sampaio, E. V. S. B. (1995). Overview of the Brazilian Caatinga. Pp 35-63 in:
S. H. Bullock, H. A. Mooney & E. Medina (eds.) Seasonally Dry Tropical
Forests. Cambridge University Press, Cambridge.
Santos, M. F. A. V., Ribeiro M. R. & Sampaio, E. V. S. B. (1992).
Semelhanças vegetacionais em sete solos de Caatinga. Pesquisa
Agropecuária Brasileira 27: 305-314.
Silva, J. M. C., Tabarelli da Fonseca, M. T. & Lins L. V. (orgs.) (2004).
Biodiversidade da Caatinga: Áreas e Ações Prioritárias para
Conservação. Ministério do Meio Ambiente, Brasília-DF.
Tabarelli, M., J. M. C., Santos, A. M. M. & Vicente, A. (2000). Análise de
representatividade das unidades de conservação de uso direto e indireto na
Caatinga: análise preliminar. In: Silva, J. M. C. & Tabarelli, M. (coord.).
Workshop Avaliação e identificação de ações prioritárias para a
conservação, utilização sustentável e repartição de benefícios da
biodiversidade do bioma Caatinga. Petrolina, Pernambuco.
www.biodiversitas.org.br./caatinga.
Tabarelli, M., Silva, J. M. C. (2003). Áreas e ações prioritária para a
conservação da biodiversidade da Caatinga. In: Leal, I. R., Tabarelli, M. &
Silva, J. M. C. (Eds.), Ecologia e conservação da caatinga Ed.
Universitária da UFPE, Recife, p. 777-796.
Tabarelli, M. & Vicente, A. (2002). Lacunas de conhecimento sobre as
plantas lenhosas da Caatinga. p. 25-40 In: Sampaio, E. V. S. B., Giulietti,
A. M., Virgírio, J. & Gamarra-Rojas, C. F. L. (orgs.). Caatinga: vegetação
e flora. Associação Plantas do Nordeste e Centro Nordestino de
Informações sobre Plantas, Recife.
Tricart, J. (1961). As zonas morfoclimáticas do nordeste brasileiro. Notícia
Geomorfológica 3: 17-25.
Tricart, J. (1985). Evidence of Upper Pleistocene dry climates in northern
South America. Pp 197-217. In: Douglas, I. & Spencer, T. (eds.).
Environmental Change and Tropical Geomorphology. Allen & Unwin,
London.
Trombulak, S. C. & Frissel, C. A. (2000). Review of ecological effects of
roads on terrestrial and aquatic communities. Conservation Biology 14:
18-30.
Velloso, A. L., Sampaio, E. V. S. B., Giulietti, A. M., Barbosa, M. R. V.,
Castro, A. A. J. F., Queiroz, L. P., Fernandes, A., Oren, D. C., Cestaro, L.
Complimentary Contributor Copy

The Brazilian "Caatinga"
103
A., Castro, A. J. E., Pareyn, F. G. C., Silva, F. B. R., Miranda, E. E., Keel,
S. & Gondim, R. S. (2002). Ecorregiões Propostas para o Bioma
Caatinga. TNC-Brasil, Associção Plantas do Nordeste, Recife.
Complimentary Contributor Copy

Complimentary Contributor Copy

In: Dry Forests ISBN: 978-1-63321-291-6
Editor: Francis Eliott Greer © 2014 Nova Science Publishers, Inc.
Chapter 4
CHANGES IN THE LABILE AND
RECALCITRANT ORGANIC MATTER
FRACTIONS DUE TO TRANSFORMATION OF
SEMI-DECIDUOUS DRY TROPICAL FOREST
TO PASTURE IN THE WESTERN LLANOS,
VENEZUELA
A. González-Pedraza1* and N. Dezzeo
2
1Universidad Nacional Experimental Sur del Lago “Jesús María Semprum”
(UNESUR), Programa Ingeniería de la Producción Agropecuaria,
Laboratorio de Suelos, Santa Bárbara, Municipio Colón, Estado Zulia,
Venezuela
2Instituto Venezolano de Investigaciones Científicas (IVIC), Centro de
Ecología, Laboratorio de Ecología de Suelos, Altos de Pipe, Estado
Miranda, Venezuela
ABSTRACT
The changes of labile and recalcitrant organic matter fractions due to
transformation of semi-deciduous tropical forest to pasture were
evaluated in an area of tropical dry forest in the western Llanos of
* E-mail: [email protected].
Complimentary Contributor Copy

A. González-Pedraza and N. Dezzeo
106
Venezuela. In this area, natural forest was converted to pasture by slash-
and-burn. Estrella grass (Cynodon nlemfuencis L) grows for cattle use.
For determining microbial activity, twelve soil samples were collected at
0-5 and 5-10 cm depth in natural forest and in two pastures of 5 and 18-
year-old (YP and OP, respectively) on three periods along the year: at the
beginning of the rainy season (May), at the end of the rainy season
(November) and during the dry season (March). To determine total soil
organic carbon (SOC) and total extractable carbon (TEC), 12 samples
were additionally collected at each site at 0-5, 5-10, 10-20, 20-30, and 30-
40 cm depth. SOC was determined by Walkley and Black method and
TEC was extracted with alkali solution. Cmic was determined according
to the CHCl3 fumigation-extraction method using K2SO4. The water
soluble carbon (WSC) was obtained by water extraction, and the basal
respiration (C-CO2) was carried out following the colorimetric method of
static incubations. The data sets were subjected to one-way analysis of
variance. Because clay content showed significant differences between
forest and pastures, it was used as a co-variable to adjust the data. Means
were separated with Tukey´s test when statistical differences (P < 0.05)
were observed. SOC increased with the change from forest to pasture. YP
showed the highest SOC content, which was positively correlated with
the clay percentage. TEC was significantly higher in pastures than in
forest. Cmic was higher in OP during March, which can indicate that the
organic matter there was easily decomposed and therefore allowed to
maintain a high microbial population. Cmic decreased in the pasture soils
in May, probably due to a slower response of microbial communities to
sudden changes in soil moisture. The pastures showed higher WSC
contents than the forest, probably due to a less efficient use of the labile
organic matter mineralized during the previous rains. The lowest C-CO2
value was found in YP in November, which can indicate lower efficiency
of microorganisms to decompose the organic matter. OP showed the
highest C-CO2 value, probably due to a higher content of labile organic
matter, evidenced by the higher values of Cmic, WSC and TEC in this
site.
Keywords: Soil organic matter fractions, dry tropical forest, pastures
INTRODUCTION
The variability in the soil organic matter (SOM) in different tropical
forests has been associated with the organic residue amount entering into the
soil and with the rate at which these residues are decomposed (Jaramillo &
Sanford 1995). It is known that the organic matter reserve in the soil has been
Complimentary Contributor Copy

Changes in the Labile and Recalcitrant Organic Matter Fractions ...
107
divided into two parts, namely passive or stable and labile or active. Humus is
the most stable SOM fraction. It is composed of humic substances derived of
the decomposition, and it is often complexed with the clay particles
(Christensen 1992, Stevenson 1994, Barrios et al., 1996). The carbon
associated with humic substances is also known as total extractable carbon
(Sánchez et al., 2005). This fraction promotes the formation of stable
aggregates in the soil, improves the soil structure, exerts an important effect on
the chemical and biological soil properties and constitutes the largest reservoir
of C circulating to medium term on a global scale (Oades 1984, Stevenson &
Cole 1999).
The labile organic fraction is composed of fresh plant remains subjected to
rapid decomposition. This fraction is particularly important in nutrient cycling
in soils under forest and pastures (Tisdall & Oades 1982, Stevenson 1994). As
a result of disturbances, it is the first lost fraction (Stevenson 1994, Gregorich
et al., 1996). This labile fraction consists of the microbial biomass and the
water soluble carbon. The microbial biomass represents from 1 to 5% of the
organic carbon content (Powlson et al., 1987, Alef & Nannipieri 1995), and it
is a reservoir of labile nutrients like nitrogen (N) phosphorus (P) and sulfur (S)
(McGill et al., 1981). Moreover, the C water soluble is a good index of the
available soil C and it represents a quickly available energy source for the
microorganisms (Huang and Song 2010).
Similarly, the soil CO2 flux is a good indicator of the carbon distribution
in the subsurface soil and ecosystem productivity and it reflects the biological
activity into the soil (Raich & Nadelhoffer 1989).
The forests conversion to agricultural land and pastures is a topic of
considerable interest, particularly for the scientific community related to
biogeochemical cycles, global climate change and biodiversity (Houghton
1990, Kummer & Turner 1994, Fearnside 2000, Fearnside & Laurance 2004).
Most of the studies on land use change effects in the tropic have been
conducted in rainforest areas (Matson et al., 1987, Montagnini & Buschbacher
1989, Piccolo et al., 1994, Neill et al., 1997a, b), while for the dry forest there
is little information (Brown & Lugo 1990, García-Oliva et al., 1994, Johnson
& Wedin 1997, Ellingson et al., 2000), even when the latter has been
considered one of the most threatened ecosystems on the earth planet (Janzen
1988, Houghton et al., 1991, Murphy & Lugo 1986, Kennard 2002).
In tropical dry forest the marked seasonality of rainfall has a strong
influence in the growth, productivity and organic matter dynamics (Martínez-
Yrizar 1995, Murphy & Lugo 1986, 1995). However by this forest type there
is scarce information about the process of soil matter organic formation and
Complimentary Contributor Copy

A. González-Pedraza and N. Dezzeo
108
nutrient recycling (Lugo & Murphy 1986). When these forests are cut and
burned to be converted into pasture, much of the organic matter present in
living plants, plant debris and soil, including humus, is oxidized and emitted as
CO2 to the atmosphere (Houghton 1990), resulting in a decrease in the soil
organic C content (Ohta 1990, Luizão et al., 1992, Desjardins et al., 1994,
Veldkam 1994, Cerri et al., 2004).
Tropical dry forest in Venezuela represents the most important life zone in
terms of the land surface, and it includes large areas covered by dense seasonal
dry forests developed on relatively fertile soils. In the last decades these
forests have been subjected to a high pressure of use associated with
population growth and the expansion of the agricultural frontier. After the tree
cutting, one of the main uses has been the establishment of pastures. However,
for this important region of the country there is no detailed information about
the changes occurred in the soil once the forests have been cleared and
converted into pasture, particularly with respect to soil C stocks. This
information is needed to predict the deforestation consequences and to design
effective pasture management. Therefore, the objective of this research was to
evaluate the changes in the labile and recalcitrant organic matter fractions due
to transformation of semi-deciduous dry tropical forest into pasture with
different ages (5 and 18 years old) in the Western Llanos, Venezuela.
MATERIALS AND METHODS
Study Site
The study was carried out in the Western Llanos of Venezuela (Figure 1),
located at approximately 120 m asl. The average annual rainfall in this region
is 1243.7 mm (1998-2008), with a rainy season from April to December and a
dry season from January to March. The average annual temperature is 26.8ºC,
with a maximum of 28.9ºC between March and April and minimum of 25.5ºC
between December and January. The relief is plane with slope between 0 to
2% (Ewel et al., 1976, MARN 2005). According to Holdridge (1957), the area
belongs to tropical dry forest with dominant deciduous vegetation. The soil
parent material is from alluvial origin, consisting of a sandy-clay-loam texture,
with kaolinite as dominant clay mineral (Ewel et al., 1976). In this region,
large areas of natural forest were converted into pasture by slash-and-burn.
Estrella grass (Cynodon nlemfuencis L) grows for cattle use.
Complimentary Contributor Copy

Changes in the Labile and Recalcitrant Organic Matter Fractions ...
109
Figure 1. Study area in the Western Llanos of Venezuela (SIRA-INIA-CENIAP 2010).
Soil Sample Collection
Soils were sampled in natural forest and in two adjacent pastures of 5 and
18-year-old (YP and OP, respectively). At each site, soil samples were
systematically taken from a 600 m2 plot. For determining microbial activity
(microbial carbon, water soluble carbon and soil respiration), twelve soil
samples were collected at 0-5 and 5-10 cm depth with a 5 cm diameter soil
core on three periods along the year: at the beginning of the rainy season
(May), at the end of the rainy season (November) and during the dry season
(March). To determine total soil organic carbon (SOC) and total extractable
carbon (TEC), 12 samples were additionally collected at each site with the soil
core at 0-5, 5-10, 10-20, 20-30, and 30-40 cm depth. These last soil samples
were collected only once on November 2005.
Laboratory Analyses
Total soil organic carbon (SOC) was determined using the Walkley &
Black (1934) wet oxidation method. Total extractable carbon (TEC) was
measured using the methodology proposed by Ciavatta et al., (1990).
Microbial biomass carbon (Cmic) was determined according to the CHCl3
fumigation-extraction method in field-moist samples (Vance et al., 1987).
Study area
Complimentary Contributor Copy

A. González-Pedraza and N. Dezzeo
110
Cmic was extracted from both fumigated and non-fumigated samples with 0.5
K2SO4. It was calculated by subtracting the extracted C in non-fumigated
samples from that measured in fumigated samples and dividing it by a Kc
value of 0.45. Water soluble carbon (WSC) was determined by McGill et al.,
(1986) method using a 1:2.5 relationship of soil (< 2 mm) and distilled water.
SOC, TEC, Cmic and WSC values were corrected to dry soil and the
results were expressed in C g.m-2
based on the soil bulk density (kg m-3
) and
depth (m). Basal soil respiration (C-CO2) was determined following the
colorimetric method of static incubations of Alef (1995). With this method the
CO2 evolution from soil microbial activity was measured in specified and
controlled laboratory conditions. The calculations were based on the weight of
dry soil and the results were expressed in mg C-CO2 kg-1
24 hr-1
. The
Cmic/SOC ratio, also called soil microbial quotient (qCO2), was calculated by
the following formula: qCO2= Cmic*100/COT.
Statistical Analysis
Statistical analysis of the data was carried out by an analysis of variance
(ANOVA). Because the soil clay content showed significant differences
between forest and pastures, it is was used as a co-variable to adjust the data.
Means were separated with Tukey´s test when statistical differences (P < 0.05)
were observed. When necessary, the data was transformed in order to
homogenize variances, and when that did not meet this assumption (P > 0.05)
according to Levenne´s test, a non-parametric Mann-Whitney test was applied.
To relate variables at sites of interest, a simple linear regression analysis was
used. All statistics were computed using STATISTICA for Windows 6.0
(Statistica 2001).
Results and Discussion
Soil organic Carbon
The soil organic carbon (SOC) was significantly (P < 0.05) higher in the
pastures than in the forest, with the exception of the 0-5 and 30-40 cm soil
depths, where no significant differences (P < 0.05) were detected (Figure 2).
Between 5-10 cm depth, the SOC was 62 and 38% higher in YP and OP,
respectively, than in forest. From 10 cm depth SOC decreased with increasing
soil depth in the three study sites. The most significant differences between the
Complimentary Contributor Copy

Changes in the Labile and Recalcitrant Organic Matter Fractions ...
111
studied sites were observed at 10-20 cm depth, where YP had an increase of
83% and OP of 49% with respect to forest (Figure 2).
Figure 2. Soil organic carbon (SOC) in the forest and in the 5-year-old (YP) and 18-
year-old (OP) pastures. All points are mean values with standard error bars across
forest and pastures. Lower case letters indicate significant differences (P < 0.05)
between land use classes at the same depth. Capital letters indicate significant
differences (P < 0.05) between depths by the same site.
SOC values in this study were relatively higher than those reported by
Fassbender & Bornemisza (1987) for tropical regions. As shown in Figure 2, it
was clear that transformation of semi-deciduous tropical dry forest into pasture
caused an increase in the SOC, which is not consistent with some reported data
in the literature (Detwiler 1986, Detwiler & Hall 1988, Davidson & Akerman
1993, Fujisaka et al., 1998, Tiessen et al., 1998, Powers et al., 2004).
Several factors can influence the soil carbon increases in those pastures
established after cutting and burning of forest, but the most significant are the
change in the mode of carbon assimilation by the vegetation, and the age of
the pastures. When the forest vegetation is replaced by grasses, it is possible to
expect an increase in the isotope 13
C concentration in the soil, due to the fact
that the C4 plants of the pastures contain a δ13
C heavier than the C3 plants of
the forests (Reiners et al., 1994, Johnson & Wedin 1997). On this respect,
0
5
10
15
20
25
30
35
40
45
0 500 1000 1500 2000 2500
Dep
th,
cm
Soil organic carbon (SOC), g C m-2
Forest YP OP
Aa AaAa
BbBbAa
ACcAbBa
CbCaBa
DaDaCa
Complimentary Contributor Copy

A. González-Pedraza and N. Dezzeo
112
Lopez-Ulloa et al. (2005) found that most of the soil C in pastures
corresponded to a mixture of the original forest vegetation and grasses. They
also observed that in soils pasture the 13
C value increased with pasture age (>
11-year-old), showing a gradual replacement of the carbon in the vegetation
type C3 by the carbon present in C4 vegetation. Jaramillo et al. (2003) also
found that the soil C content was about 20% higher in the pasture than in the
forest. However, some of this carbon was provided by the decomposition of
remain roots of the original forest.
A similar trend was observed by García-Oliva et al. (1994), who found an
increase of 17% in the soil organic matter content in pastures with 3-year-old,
compared with the original forest. This increase was also attributed to the
decomposition of forest tree roots still present in the pasture. They also found
that in 7-year-old pastures, the 13
C value indicated the presence of forest
roots in the pasture, while in 11-year-old pastures the C from forest vegetation
had decreased 71%, thus indicating that the C contribution from C4 plants was
much higher in older pastures. Similarly, Veldkamp (1994) found that the soil
organic C decreased gradually up to 20 years after deforestation and that it was
replaced by the organic carbon produced by the grass.
The adsorption of organic matter to clay minerals is one of the
mechanisms responsible for the soil C stabilization under pastures originally
established in areas that were covered by forest (Lopez-Ulloa et al., 2005). The
soil organic matter may be retained on clay particles surface and, may also be
coated and/or trapped within the interlayer spaces and/or micro aggregates,
allowing it to be protected from degradation by microorganisms (Tisdall &
Oades 1982, Hassink 1994, Matus & Maire 2000). This organic matter in
closer contact with the fine soil fractions corresponds to a longer material in
the soil (Skjemstad et al., 1996).
In this study, the positive correlations between SOC and clay percentage
in the soils of forest (r = 0.39) and of YP (r = 0.69) indicate that clay
percentage is acting in the soil organic matter retention or protection,
especially in YP, where the soil clay content was significantly higher than in
forest and in OP (González-Pedraza & Dezzeo 2011). It is also probably that
some of the C present in the soils of YP could still match the original forest
vegetation. Similar results were reported by Matus & Maire (2000), who found
that over 80% of the SOC was associated with clay and silt fractions. Ochoa et
al. (1996) found also a significant positive correlation between SOC content
and the soil clay percentage.
The SOC accumulation also depends of the nature (quantity and
frequency) of the material incorporated into the soil (Matus & Maire 2000). In
Complimentary Contributor Copy

Changes in the Labile and Recalcitrant Organic Matter Fractions ...
113
that sense, the grass deep roots and their productivity should have a large
effect on soil C inputs after deforestation. For example, Brown and Lugo
(1990) pointed out that pastures are constantly covered by vegetation, which
provides abundant organic matter, particularly from its roots during periods of
increased productivity. In our case, the studied pastures were covered with star
grass (Cynodon nlemfuensis L.), a plant with stoloniferous growth and
abundant roots production that enhances the input of abundant organic
material into the soil profile (Guzmán 1996). According to observations made
during the field sampling, star grass forms a layer on the ground made up by
leaves and remnants stems, which could also contribute to the higher SOC
content in the pastures.
Total Extractable Carbon (TEC)
At 0-5 cm of soil depth, no significant differences in TEC were observed
between the three studied sites. At 5-10 cm, 10-20 cm, 20-30 cm and 30-40 cm
of soil depth TEC values were significantly (P < 0.05) higher in OP than in
YP. However, between YP and forest only differences (P < 0.05) were found
at the 10-20 cm, 20-30 cm and 30-40 cm of soil depth (Figure 3).
Figure 3 also shows an uneven distribution of TEC across the soil profile,
with decreases and increases through the soil profile. However, when the
changes are analyzed site by site along the soil profile, it was observed that the
TEC tend to decrease with depth, except between 10-20 cm, where significant
increases (P < 0.05) were detected in forest and in OP.
The TEC/SOC relationship in the three studied sites and in all considered
soil depths ranged between 9.3 and 58.9% (Table I). Along the soil profile, the
TEC/SOC values were very similar between forest and OP. However, in YP
the values were significantly lower (P < 0.05) than in forest and OP, except at
the soil depth of 0-5 cm, where no differences were observed.
TEC decreases with the soil depth have been explained by the decrease of
soil organic carbon with increasing of depth (Ruiz et al., 2000). The lower
TEC values in YP may be related to the higher clay percentage found in these
soils in comparison with the soils of forest and OP (González-Pedraza &
Dezzeo 2011). It has been found that the clay soil content contributes to the
retention of soil humic carbon by bridge linkages with divalent cations such as
Ca (Oades 1984, Ruiz et al., 2000), and it makes difficult the extraction of the
soil organic carbon (Matus & Maire 2000). The Ca content in the studied soils
was high (González-Pedraza & Dezzeo 2011) and the correlation analysis
Complimentary Contributor Copy

A. González-Pedraza and N. Dezzeo
114
between TEC and Ca content across the soil profile showed a significant (P <
0.05) and positive relationships in YP and in forest (r = 0.47 and 0.38,
respectively).
Figure 3. Total extractable carbon (g C m-2
) in the forest and in the 5-year-old and 18-
year-old pastures. All points are mean values with standard error bars across forest and
pastures. Lower case letters indicate significant differences (P < 0.05) between land
use classes at the same depth. Capital letters indicate significant differences (P < 0.05)
between depths at the same site. YP: 5-year-old pasture; OP: 18-year-old pasture.
Table I. Total extractable carbon percentage in the soil organic carbon in
the forest and in the 5-year-old and 18-year-old pastures
Depth
(cm)
TEC/SOC (%)
Forest YP OP
0-5 28.5±7.5ABa
26.9±7.9Aa
32.54±4.1Aa
5-10 18.9±3.8Aa
9.3±3.1BCb
19.1±4.2BDa
10-20 55.9±20.0BCa
16.4±3.1Bb
52.3±11.2Ca
20-30 38.5±21.2BCa
13.15±3.2CDb
32.9±13.7Aba
30-40 58.9±41.1Ca
20.9±4.2Db
46.8±18.4Da
TEC/SOC (%): Total extractable carbon percentage in the soil organic carbon. Mean
values ± standard deviation. Lower case letters indicate significant differences (P
< 0.05) between sites at the same depth. Capital letters indicate significant
differences (P < 0.05) between depths at the same site. YP: 5-year-old pasture;
OP: 18-year-old pasture.
0
5
10
15
20
25
30
35
40
45
0 100 200 300 400 500 600 700 800
Dep
th, c
m
Total extractable carbon (TEC), g m-2
Forest YP OP
ABa
Aa
Ba
ABa
Aa
Aa
BCa
Bb
CDb
Db
Aa
BDb
Cc
ABa
Da
Complimentary Contributor Copy

Changes in the Labile and Recalcitrant Organic Matter Fractions ...
115
TEC/SOC ratio represents the SOC proportion that may be involved in
mineralization process (Guggenberger & Zech 1994, Kalbitz et al., 2003). In
our case, the TEC proportion regarding to SOC represented 9 to 27% in YP,
19 to 52% in OP and 18 to 59% in the forest. These values are similar to those
reported by Sanchez et al. (2005) for tropical soils of savanna and gallery
forest, which ranged between 19.98 and 42.88%. Meanwhile, Figuera et al.
(2005) found relationships TEC/SOC slightly higher (53 and 63%) than those
found in this study. In soils of the Central Llanos of Venezuela, Ruiz et al.
(1997a & b) found that the TEC represented approximately 50% of the SOC,
and its distribution was influenced by the clay content and the drainage
conditions of the soils.
Although in this study YP showed the highest SOC content in a great part
of the soil profile, the TEC content and the TEC/SOC relationship were low,
which may indicate that only a small part of the SOC was in an available form
to perform the microbial processes involved in the soil organic matter
mineralization.
Soil Microbial Carbon (Cmic)
Cmic values are presented in the Table II. At the end of the rainy season,
no statistical differences (P > 0.05) were observed between the three studied
sites, both at the 0-5 and 5-10 cm of soil depth. However, during the dry
season the Cmic at the soil depth of 0-5 cm showed a significant increase (P <
0.05) of 78% in OP compared to forest. At the same depth, but at the
beginning of the rainy season, YP presented a significant decrease of the 52%
in relation to forest.
Table II shows also that Cmic in the first 0-5 cm of the forest soil was
significantly higher at the beginning of the rainy season in comparison to the
dry season. At 5-10 cm of soil depth, Cmic in the forest was lower at the
beginning of the rainy season. Cmic in the first 5 cm of YP soil was
significantly lower at the beginning of the rainfall, in relation to the end of the
rainy season. In OP no statistical differences were observed between seasons
and soil depths.
The values of Cmic found in this study are below those reported for other
areas of tropical dry forest (Saynes et al., 2005), but are relatively similar to
the values registered for other soils in different regions of Venezuela (Sánchez
et al., 2005, Ruiz & Paolini 2004, Hernández 1998). According to the results
of Table II, it is evident that the seasonality in the precipitation regime had
Complimentary Contributor Copy

A. González-Pedraza and N. Dezzeo
116
important effects on the microbial biomass in YP, OP and in the forest. These
results reveal that the microbial populations respond differently to changes in
soil moisture content throughout the year. Often the literature indicates that the
dynamics of soil microbial processes is greatly affected by changes in
moisture content (Sparling et al., 1994, Raich & Tufekcioglu 2000 Jangid et
al., 2008, Maharning et al., 2009).
Table II. Soil microbial carbon (Cmic) in the forest and in the 5-year-old
and 18-year-old pastures
Season Depth (cm) Cmic (g m-2)
Forest YP OP
End of the rainy season 0-5 31.1±10.0ABa(1) 31.8±12.8Aa(1) 35.2±13.2Aa(1)
5-10 24.7±7.8Aa(1) 21.6±16.7Aa(1) 20.4±10.6Aa(2)
Dry season 0-5 20.4±14.0Aa(1) 29.1±15.8ABab (1) 36.1±14.6Ab(1)
5-10 27.1±8.5Aa(1) 25.9±9.7Aa(1) 21.8±10.3Aa(2)
Beginning rainy season 0-5 34.0±15.7Ba(1) 17.7±11.6Bb(1) 31.0±16.2Aab(1)
5-10 15.6±8.3Ba(2) 17.2±11.3Aa(1) 16.3±11.2Aa(2)
Mean values ± standard deviation. Lower case letters indicate significant differences
(P < 0.05) between sites at the same depth. Capital letters indicate significant
differences (P < 0.05) between season at each site and depth. Different numbers
indicate significant differences (P < 0.05) between depth/site/season. YP: 5 year-
old pasture; OP: 18-year-old pasture.
The soil water moisture content in the three studied sites was statistically
lower (P < 0.05) during the dry season than at the beginning and at the end of
the rainy season (González-Pedraza & Dezzeo 2011). The sudden wetting of
the soil at the beginning of the rainy season probably stimulated the soil
organic matter mineralization and microbial activity in the forest soils, which
was evidenced by a higher Cmic content. When the soil is suddenly wet, the
osmotic shock induces the cells breakdown and the intracellular labile
substrate release is rapidly used by the new generations of microorganisms
(Kieft et al., 1987). Also, after the soil wetting, the microorganisms that died
during the dry season releases more C microbial and nutrients for the growth
of plants (Bottner 1985, Lodge et al., 1994, Sanford & Jaramillo 1995).
The low values of Cmic in the soils of YP at the beginning of the rainy
season are comparable to the results reported by García-Oliva et al. (2006)
under similar conditions. It is probably that in YP the microbial communities
were extremely stressed and therefore they took longer time to recover from
Complimentary Contributor Copy

Changes in the Labile and Recalcitrant Organic Matter Fractions ...
117
the sudden change in soil moisture, so they are less efficient in competing with
plants for the nutrients use released at the beginning of the rains. Schimel et al.
(1999) note that it is possible that after a prolonged drought period, the
microbial biomass is less able to respond to soil moisture increase, so that it
does not reach the activity levels obtained during the continuously wet period.
No differences were observed in the Cmic content of OP in the three
evaluated seasons. This suggests that the microorganisms present in this
systems are little sensitive to the changes in soil moisture throughout the year.
It is possible that in this pasture the soil moisture during the dry season and the
availability of labile substrate are enough to achieve their metabolic activities.
The results of this study suggest that seasonal fluctuations in the soils
moisture content exert some influence on the microbial communities of forest
and YP, while in OP this seems to have no effect. Although no specific data
are available, these results seem to indicate physiological differences between
YP, OP and forest microbial communities, such as it was mentioned by
Nüsslein & Tiedje (1999), who suggested that the change of forest to pasture
led to modifications in the soil microbial communities composition.
The higher content of Cmic in OP during the dry season could indicate
that the organic matter in this old pasture is of better quality to maintain a high
and more active microbial population in comparison with that of the forest
soils. According to Potthast et al. (2010), the forest vegetation has higher
values of lignin and higher C:N ratios in comparison with the pasture
vegetation, which resulted in a better microbial activity in pastures soil.
Paterson et al. (2008) suggested that the type and quality of the litter that
enter into the soil produce changes in the activity and composition of
microbial communities, even in areas with similar soils. Although the litter
quality in the forest and pastures was not assessed in this study, it is known
that the organic matter provided by grasses is generally more palatable by soil
microorganisms than that produced by forest vegetation (Sparling et al., 1994,
Maharning et al., 2009).
Microbial Quotient (Cmic/SOC)
Between sites, the Cmic/SOC ratio showed not significant differences
(P > 0.05) in the first 5 cm of the soil during three periods of the year. From 5-
10 cm depth, Cmic/SOC ratio was significantly lower (P < 0.05) in YP at the
end of the rainy season and during dry season. Between seasons, no statistical
differences were observed in the Cmic/SOC ratio. It was also observed that the
Complimentary Contributor Copy

A. González-Pedraza and N. Dezzeo
118
Cmic/SOC tended to decrease with increasing depth, but these differences
were only significant in the YP and OP soils (Table III).
The microbial quotient represents the C associated with the live organic
matter fraction and provides an idea of the level and quality of the soil
degradation state. This ratio has been proposed as a sensitive indicator of
changes in soil organic matter (Hart et al., 1989), and their decrease would
indicate soil C losses (Anderson & Domsch, 1989b).
According to Alef & Nannipieri (1995), the Cmic represents only 1 to 5%
of the SOC. The results of this study indicate that in relation to SOC, Cmic
comprised 1.1 to 2.5% in forest soils, 0.7 to 2.3% in YP soils and 0.9 to 2.4%
in OP soils. These values were higher than those reported by Saynes et al.
(2005) for dry tropical forest soils in both the rainy and dry season (0.49 and
1.85%, respectively).
The lower values of Cmic/SOC in YP and OP at the 5-10 cm depth (Table
III) seem to indicate SOC losses along the year. During the dry season, the
decrease of Cmic/SOC ratio in forest could be associated with less substrate
utilization efficiency by soil microorganisms in this period.
Table III. Microbial quotient (Cmic/SOC) in soil forest and in 5-year-old
and 18-year-old pastures
Season Depth (cm) Cmic/SOC (%)
Forest YP OP
End of the
rainy
season
0-5 2.4±1.1Aa(1)
2.3±1.1Aa(1)
2.4±1.0Aa(1)
5-10 1.9±0.5Aa(1)
1.0±0.6Ab(2)
1.2±0.7Aab(2)
Dry
season
0-5 1.5±1.1Aa(1)
1.9±0.8Aa(1)
2.4±1.0Aa(1)
5-10 2.0±0.6Aa(1)
1.2±0.5Ab(2)
1.2±0.5Ab(2)
Beginning
rainy
season
0-5 2.5±1.1Aa(1)
1.4±1.4Aa(1)
2.2±1.4Aa(1)
5-10 1.1±0.8Ba(2)
0.7±0.5Aa(1)
0.9±0.7Aa(2)
Mean values ± standard deviation. Lower case letters indicate significant differences
(P < 0.05) between sites at the same depth. Capital letters indicate significant
differences (P < 0.05) between season at each site and depth. Different numbers
indicate significant differences (P < 0.05) between depth/site/season. YP: 5-year-
old pasture; OP: 18-year-old pasture.
Complimentary Contributor Copy

Changes in the Labile and Recalcitrant Organic Matter Fractions ...
119
Soil Carbon Water Soluble (SCW)
With few exceptions, no statistical differences (P > 0.05) in SCW were
observed at the 0-5 cm depth between the three studied sites, both at the
beginning and at end of the rainy season. During the dry season, the value of
SCW at 0-5 cm depth was statistically higher (P < 0.05) in YP than in forest.
At 5-10 cm depth, the values of SCW were significantly lower (P < 0.05) in
YP than in OP and in forest during the dry season and at the end of the rainy
season, while at the rainfall beginning these values in YP were higher.
Between seasons, the SCW content was higher in all studied sites during the
dry season at 0-5 cm depth, and decreased at the rainfall beginning. Between
depths, the SCW content tend to decrease with increasing soil depth (Table
IV).
Table IV. Soil carbon water soluble in the soil Forest and in 5-year-old
and 18-year-old pastures
Season Depth
(cm)
Soil carbon water soluble (SCW), g m-2
Forest YP OP
End of the rainy season 0-5 8.6±1.1
Aa(1) 7.6±1.1
Aa(1) 9.0±1.3
Aa(1)
5-10 7.5±0.8Aa(1)
4.4±0.8Ab(2)
8.0±0.8Aa(1)
Dry season 0-5 11.5±0.9
Aa(1) 17.6±1.5
Bb(1) 14.1±0.9
Bab(1)
5-10 8.3±1.0Aa(2)
1.6±0.6Bb(2)
5.6±0.6ABc(2)
Beginning rainy season 0-5 5.1±0.4
Ba(1) 6.3±0.5
Aa(1) 5.8±0.6
Ca(1)
5-10 4.4±0.7Ba(1)
8.4±0.6Cb(2)
5.1±0.9Ba(1)
Mean values ± standard deviation. Lower case letters indicate significant differences
(P < 0.05) between sites at the same depth. Capital letters indicate significant
differences (P < 0.05) between season at each site and depth. Different numbers
indicate significant differences (P < 0.05) between depth/site/season. YP: 5-year-
old pasture; OP: 18-year-old pasture.
Similar results were found by Gomez et al. (2008) for tropical soil forests
of low fertility, especially during the dry season and in the first five soil
centimeters. The SCW content increase during the dry season has been
associated with lower efficiency used by plants and soil microorganisms of the
labile organic matter mineralized during the previous rains. Therefore, the C
labile can be accumulated in the soil during the dry period (Jiang et al., 2006).
The SCW is one of the largest and most accessible C sources for the soil
microbial activity (García-Oliva et al., 2006 Jiang et al., 2006, Gómez et al.,
Complimentary Contributor Copy

A. González-Pedraza and N. Dezzeo
120
2008). The significant decrease of this labile fraction at the beginning of the
rainy season can be probably associated with a strong microbial activity that
consumes a large amount of SCW from the mineralization of the many
microorganisms that usually die during the dry period, and which in turn serve
as a substrate for microbial populations developed with the rains onset
(García-Oliva et al., 2006, Jiang et al., 2006, Gómez et al., 2008). In addition,
with the precipitation onset can occur that some C labile will be leaching on
the ground, as noted by Jiang et al. (2006).
Soil Basal Respiration (C-CO2)
Seasonal changes in C-CO2 in the forest and pastures are presented in
Table V. At the end of the rainy season, the basal respiration was significantly
lower in YP and significantly higher in OP (P < 0.05) than that of the forest,
both at 0-5 and 5-10 cm depth. At the beginning of the rainfall no statistical
difference (P > 0.05) were observed between sites, while in the dry period the
value of C-CO2 in YP was significantly higher than those of the forest and OP
at the 5-10 cm soil depth.
Between depths, the C-CO2 increased significantly (P < 0.05) with
increasing soil depth at the beginning of the rainfall in all studied sites. A
similar increase was detected in YP during the dry period, while in OP the C-
CO2 decreased significantly at the end of the rainy season. Between seasons,
soil basal respiration decreased significantly (P < 0.05) in forest, YP and OP
during the dry period and increased again at the beginning of the rainfall
(Table V).
The land use change of forest to pasture significantly affected the
microbial activity at the end of the rainy season. With respect to the forest, the
soil basal respiration in YP decreased 40%. This can be associated with a
lower efficiency in the soil microorganism activity to decompose the organic
matter remnant from the original forest, and that from secondary woody
vegetation in regrowth and from the grasses. When the forest is cut and burnt
to establish pasture, changes related with humidity conditions, temperature and
organic matter inputs occur in the soil (Fearnside & Barbosa 1998), affecting
the biological activity and respiration rate.
Complimentary Contributor Copy

Changes in the Labile and Recalcitrant Organic Matter Fractions ...
121
Table V. Soil basal respiration (C-CO2) in the forest and in 5-year-old and
18-year-old pastures
Season Depth (cm)
Soil basal respiration (C-CO2)
(mg C-CO2/100 g soil/day)
Forest YP OP
End of the rainy season 0-5 1.0±0.4
Aa(1) 0.6±0.2
Ab(1) 1.9±0.2
Ac(1)
5-10 0.7±0.1Aa(1)
0.5±0.2Ab(1)
1.7±0.1Ac(2)
Dry season 0-5 0.3±0.1
Ba(1) 0.2±0.1
Ba(1) 0.3±0.2
Ba(1)
5-10 0.3±0.1Ba(1)
0.7±0.4Ab(2)
0.2±0.1Ba(1)
Beginning rainy season 0-5 1.0±0.3
Aa(1) 1.0±0.3
Ca(1) 1.0±0.4
Ca(1)
5-10 1.2±0.5Ca(2)
1.4±0.1Ba(2)
1.5±0.1Ca(2)
Mean values ± standard deviation. Lower case letters indicate significant differences
(P < 0.05) between sites at the same depth. Capital letters indicate significant
differences (P < 0.05) between season at each site and depth. Different numbers
indicate significant differences (P < 0.05) between depth/site/season. YP: 5-year-
old-pasture; OP: 18-year-old-pasture.
In a global analysis, Raich & Tufekcioglu (2000) found that the rate of
soil respiration under pasture was 20% higher than under forest, and suggested
that the conversion of forest into pasture can stimulate CO2 emissions to the
atmosphere, because the grasses may have more photo assimilates available in
belowground biomass than the forest trees, just as a mechanism of adaptation
to constant defoliation during grazing or burning. These authors concluded
that the soil respiration rate is mainly controlled by climatic factors,
particularly the interaction between the moisture availability and soil
temperature, and they also suggested that the interaction between climatic
conditions and availability substrate generate fundamental limitations on the
potential rate of soil respiration.
Sparling et al. (1994) found that pastures with a high proportion of
microbial carbon showed higher soil respiration than the native forest. This
was attributed to the huge differences between organic matter types in both
ecosystems. The organic matter of the pastures provides a substrate more
appropriate to maintain a persistent and active microbial population, because it
normally has high cellulose content and low C/N.
Our results showed also that soil respiration varied with the season of the
year. Decreases in the soil respiration rate from the dry to the wet period have
been reported for forests and pastures (Davidson et al., 2000). According to
these authors, soil respiration in the dry season was higher in the forest than in
Complimentary Contributor Copy

A. González-Pedraza and N. Dezzeo
122
the pasture, probably because in this period the grasses entered in a stage of
senescence and inactivity resulting in a soil respiration lower rate. Meanwhile,
Schimel et al. (1999) support the idea that highly active microbial
communities are not able to survive long periods of drought.
The soil moisture conditions affected the microbial activity, independently
of the vegetation type. According to Cook & Orchard (2008), there is a linear
correlation between the respiration of the microorganisms and the soil water
content. In this study, the correlation analysis between the C-CO2 and moisture
percentage was positive in all sites, seasons and depths (r = 0.60 to 0.88),
reflecting a positive and direct relationship between moisture content and soil
microbial activity. The high microbial activity and soil basal respiration at the
beginning of rainfall can be associated with the fact that at this period
microorganism are consuming and metabolizing the substrate that is released
from the cells rupture by osmotic shock (Kieft et at. 1987, Schimel et al.,
1999).
Metabolic Quotient (qCO2)
At 0-5 cm soil depth, the qCO2 at the end of the rainy season was
significantly lower in YP and higher in OP (P < 0.05) than that of the forest
(Table VI). With few exceptions, during the dry season and at the beginning of
rainfall no differences (P > 0.05) between sites were found. When comparing
the qCO2 between seasons at each site, it was observed that qCO2 increased
significantly (P < 0.05) in YP at the beginning of rainfall. In OP at 5-10 cm
soil depth the qCO2 increased significantly (P < 0.05) at the end of the rainy
season. Other increases were also observed in YP during the dry period and in
all studied sites at the beginning of the rainy season (Table VI).
The lowest qCO2 value found in YP at the end of the rainy season not
necessarily might be indicating greater microbial efficiency in the C labile use.
Although this pasture had the highest SOC content, it may be that the soil
organic matter is of lower quality, less labile and therefore less available to
soil microorganisms. In addition, such low value may also be associated with a
reduced activity of microorganisms due to a substrate deficiency (Anderson
1982). This aspect, coupled with the possible protection of organic matter by
soil clay in YP, could be influencing the low qCO2 found at the end of the
rainy season.
Complimentary Contributor Copy

Changes in the Labile and Recalcitrant Organic Matter Fractions ...
123
Table VI. Metabolic quotient (qCO2) in the soil Forest and in 5-year-old
and 18-year-old pastures
Season Depth
(cm)
Metabolic quotient
qCO2 (mgC-CO2)/(mg Cmic/day)
Forest YP OP
End of the rainy season 0-5 1.9±1.3
Aab(1)
1.2±0.9Aa(1)
3.1±1.5ABb(1)
5-10 2.0±0.6Aa(1)
3.4±3.7Aab(1)
7.5±6.8Ab(1)
Dry season 0-5 1.6±2.0
Aa(1)
0.5±0.5Aa(1)
0.6±0.5Aa(1)
5-10 0.8±0.4Aa(1)
1.8±1.1Ab(2)
0.9±0.4Ba(1)
Beginning rainy season 0-5 1.9±0.8
Aa(1)
3.9±2.2Ba(1)
2.3±2.7Ba(1)
5-10 7.0±7.9Ba(2)
10.2±12.4Ba(1)
8.7±6.9Aa(2)
Mean values ± standard deviation. Lower case letters indicate significant differences
(P < 0.05) between sites at the same depth. Capital letters indicate significant
differences (P < 0.05) between season at each site and depth. Different numbers
indicate significant differences (P < 0.05) between depth/site/season. YP: 5-year-
old pasture; OP: 18-year-old pasture.
The highest qCO2 in OP might indicate the presence of more labile and
readily available substrate for microbial activity. This was evidenced in the
slightly higher Cmic and SCW values found in OP. This could be indicating
that OP is reaching a steady state associated to the old age of this pasture. The
qCO2 decrease during the dry season is more related to low specific activity by
soil microorganisms because they enter an idle state and even many die due to
low moisture availability and shortage of substrate. With the rainfall beginning
the available C forms increased in the soil, affecting the microorganism
specific activity and increasing the microbial populations that will use these
substrate sources.
CONCLUSION
The land use change from forest to pasture resulted in increases in soil
SOC content. The SOC increase in the 5-year-old pasture is attributed to the
additional C inputs from the original forest vegetation, secondary forest
vegetation that continued regrowth, aerial and underground input from leaves
and roots of the pastures and by soil organic matter retention due to higher
Complimentary Contributor Copy

A. González-Pedraza and N. Dezzeo
124
clay content. The SOC increase in OP was related to the pasture age, which
allowed it to reach a more stable state in the biomass production.
The labile soil organic matter fraction and the soil basal respiration were
affected by vegetation type, seasonality of rainfall and pasture age. Cmic and
SCW behavior indicates physiological differences between microbial
communities in the three study sites, which can be associated with the fact that
each site responded differently to the changes in soil moisture content. During
the dry season the soil microorganisms present in the pastures are less efficient
in using labile organic matter provided by the grass. The SCW decreased in
the three sites at the beginning of the rainy season, is indicating that this
fraction is the main substrate used by microbial populations developed during
this season. YP soil microorganisms were apparently less efficient to
decompose the organic matter, while in OP the best quality of the substrate
stimulated the microbial activity. Also, the old age of this pasture allowed
greater stability of soil microbial activity.
ACKNOWLEDGEMENTS
We thank Alma Mater Program of the Planning Office Sector University
(OPSU) of Venezuela for the partial financing awarded to the Soil Laboratory
of the Venezuelan Institute for Scientific Research (IVIC) for the development
of this research.
REFERENCES
Alef, K. (1995). Soil respiration. In: K. Alef & P. Nannipieri, (Eds). Methods
in applied soil microbiology and biochemistry. Pp. 214-219. London,
Great Britain. Academic Press.
Alef, K. & Nannipieri, P. (1995). Microbial biomass. In: K. Alef & P.
Nannipieri (Eds.). Methods in applied soil microbiology and biochemistry.
Pp 375-418. London, Great Britain. Academic Press.
Anderson, J. P. (1982). Soil respiration. In: A. L. Page, R. H. Miller & D. R.
Keeney (Eds.). Methods of soil analysis: Part II-Chemical and
microbiological properties. Agronomy Monograph Number 9. Pp 831-
871. Wisconsin, United States of America. American Society of
Agronomy and Soil Science Society of America.
Complimentary Contributor Copy

Changes in the Labile and Recalcitrant Organic Matter Fractions ...
125
Anderson, T. H & Domsch, K. H. (1989b). Ratios of microbial biomass carbon
to total organic carbon in arable soils. Soil Biology and Biochemistry, 21,
471-479.
Barrios, E. Buresh, R. J. & Sprent, J. I. (1996). Organic matter in soil particle
size and density fractions from maize and legume cropping systems. Soil
Biology and Biochemistry, 28,185-193.
Bottner, P. (1985). Response of microbial biomass to alternate moist and dry
conditions with 14C and 15N-labeled plant material. Soil Biology and
Biochemistry, 17, 329-337.
Brown, S. & Lugo, A. E. (1990). Effects of forest clearing and succession on
the carbon and nitrogen content of soil in Puerto Rico and US Virgin
Islands. Plant and Soil, 124, 53-64.
Cerri, C. E. Paustian, K. Bernoux, M. Victoria, R. Melillo, J. & Cerri, C. C.
(2004). Modeling changes in soil organic matter in Amazon forest to
pasture conversion with the Century model. Global Change Biology, 10,
518-532.
Christensen, B. T. (1992). Physical fractionation of soil organic matter in
primary particle size and density separates. Advances in Soil Science, 20,
1-90.
Ciavatta, C. Govi, M. Vittoriantisari, L. & Sequi, P. (1990). Characterization
of humified compounds by extraction and fractionation on solid
polyvinylpyrrolidone. Journal of Chromatography, 509, 141-146.
Cook, F. J. & Orchard, V. A. (2008). Relationships between soil respiration
and soil moisture. Soil Biology and Biochemistry, 40, 1013-1018.
Davidson, E. A. & Ackerman, I. L. (1993). Changes in soil carbon inventories
following cultivation of previously untilled soils. Biogeochemistry, 20,
161-193.
Davidson, E. A. Verchot, L. V. Cattânio, J. H. Ackerman, I. L. & Carvalho, J.
E. M. (2000). Effects of soil water content on soil respiration in forest and
cattle pastures of eastern Amazonia. Biogeochemistry, 48, 53-69.
Desjardins T. Andreux, F. Volkoff, B. & Cerri, C. C. (1994). Organic carbon
and 13
C contents in soils and soil size-fractions, and their changes due to
deforestation and pasture installation in eastern Amazônia. Geoderma, 61,
103-118.
Detwiler, R. P. (1986). Land use change and the global carbon cycle: the role
of tropical soils. Biogeochemistry, 2, 67-93.
Detwiler, R. & Hall, C. (1988). Tropical forest and the global carbon cycle.
Science, 239, 42-47.
Complimentary Contributor Copy

A. González-Pedraza and N. Dezzeo
126
Ellingson, L. J. Kauffman, J. B. Cummings, D. L. Sanford, R. L. & Jaramillo,
V. J. (2000). Soil N dynamics associated with deforestation, biomass
burning, and pasture conversion in a Mexican tropical dry forest. Forest
Ecology and Management, 137, 41-51.
Ewel, J. J. Madriz, A. & Tosi, Jr. J. A. (1976). Zonas de vida de Venezuela.
Memoria explicativa sobre el mapa ecológico. Segunda edición. Caracas,
Venezuela. Ministerio de Agricultura y Cría. Fondo Nacional de
Investigaciones Agropecuarias.
Fassbender, H. W. & Bornemisza, E. (1987). Química de suelos con énfasis en
suelos de América Latina: Componentes orgánicos y organominerales de
la fase sólida del suelo. (Second edition). San José, Costa Rica. Instituto
Interamericano de Cooperación para la Agricultura (IICA).
Fearnside, P. M. (2000). Global warming and tropical land-use change:
greenhouse gas emissions from biomass burning, decomposition and soils
in forest conversion, shifting cultivation and secondary vegetation.
Climatic Change, 46, 115-158.
Fearnside, P. M. & Laurance, W. F. (2004). Tropical deforestation and
greenhouse-gas emissions. Ecological Applications, 14, 982-986.
Fearnside, P. & Barbosa, R. (1998). Soil carbon changes from conversion of
forest to pastures in Brazilian Amazonia. Forest Ecology and
Management, 80, 35-46.
Figuera, K., Lozano, Z. & Rivero, C. (2005). Caracterización de diferentes
fracciones de la materia orgánica de tres suelos agrícolas venezolanos.
Venesuelos, 13, 34-46.
Fujisaka, S. Castilla, C. Escobar, G. Rodrigues, V. Veneklaas, E. J. Thomas,
R. & Fisher, M. (1998). The effects of forest conversion on annual crops
and pastures: Estimates of carbon emissions and plant species loss in a
Brazilian Amazon colony. Agriculture, Ecosystems & Environment, 69,
17-26.
García-Oliva F. Casar, I. & Morales, P. (1994). Forest-to-pasture conversion
influences on soil organic carbon dynamics in a tropical deciduous forest.
Oecologia, 99, 392-396.
García-Oliva, F. Gallardo, J. & Montaño, N. (2006). Soil carbon and nitrogen
dynamics followed by a forest-to-pasture conversion in western Mexico.
Agroforestry Systems, 66, 93-100.
Gómez, Y. Paolini, J. & Hernández, R. (2008). Sustitución de la sabana nativa
con plantaciones de Pinus caribaea (Pinaceae) en Venezuela: efecto sobre
parámetros indicadores de cambios en el carbono del suelo. Revista
Biología Tropical (Int. Journal Tropical Biology), 56(4), 2041-2053.
Complimentary Contributor Copy

Changes in the Labile and Recalcitrant Organic Matter Fractions ...
127
González-Pedraza, A. F. & Dezzeo, N. (2011). Efecto del cambio de uso de la
tierra sobre las características de algunos suelos en los Llanos
Occidentales de Venezuela. Interciencia, 36(2), 135-141.
Gregorich, E. G. Drury, C. F. Ellert, B. H. & Liang, B. C. (1996). Fertilization
effects on physically protected light fraction organic matter. Soil Science
Society of America Journal, 60, 472-476.
Guggenberger, G. & Zech, W. (1994). Dissolved organic carbon in forest floor
leachates: simple degradation products or humic substances? Science of
the Total Environment, 152, 37-47.
Guzmán, P. J. E. (1996). Pastos y Forrajes. (Tercera Edición). Caracas.
Espasande.
Hart, P. B. August, J. A. & West, A. W. (1989). Long term consequences of
topsoil mining on select biological and physical characteristics of two
New Zealand loessial soils under grazed pasture. Land Degradation and
Rehabilitation, 1, 77-88.
Hassink, J. (994). Effects of soil texture and grassland management on soil
organic C and N rates of C and N mineralization. Soil Biology and
Biochemistry, 26, 1221-1231.
Hernández, W. (1998). Efecto de tres sistemas de labranza sobre la dinámica
poblacional y la actividad microbiológica de un suelo cultivado con maíz.
Trabajo de Grado para optar al título de Magister Scientiarum en Ciencia
del Suelo. Maracay, Venezuela. Universidad Central de Venezuela.
Facultad de Agronomía. 134 pp.
Holdridge, L. R. (1957). Determination of world plant formations from simple
climatic data. Science, 105(2727), 367-368.
Houghton, R. A. (1990). The global effects of tropical deforestation.
Environmental Science & Technology, 24(4), 414-421.
Houghton, R. A. Lefkowitz, D. S. & Skole, D. L. (1991). Changes in
landscape of Latin America between 1850 and 1985. I: Progressive loss of
forest. Forest Ecology and Management, 38, 143-172.
Huang, J. & Song, C. (2010). Effects of land use on soil water soluble organic
C and microbial biomass C concentrations in the Sanjiang Plain in
northeast China. Acta Agriculturae Scandinavica, Section B-Plant Soil
Science 60(2), 182-188.
Jangid, K. Williams, M. Franzluebbers, A. Sanderlin, J. Reeves, J. Jenkins, M.
Endale, D. Coleman, D. & Whitman, W. (2008). Relative impacts of land-
use, management intensity and fertilization upon soil microbial
community structure in agricultural systems. Soil Biology and
Biochemistry, 40, 2843-2853.
Complimentary Contributor Copy

A. González-Pedraza and N. Dezzeo
128
Janzen, D. H. (1988). Tropical dry forest: the most endangered major tropical
ecosystem. In E. O. Wilson, & F. M. Peter (Eds.). Biodiversity.
Washington, D. C. National Academy Press.
Jaramillo, V. J. & Sanford, R. L. (1995). Nutrient cycling in tropical deciduous
forests. In: S. H. Bullock, H. A. Mooney & E. Medina. (Eds.) Seasonally
dry tropical forest. (pp 346-361). Great Britain. Cambridge University
Press.
Jaramillo, V. J. Kauffman, J. B. Rentería-Rodríguez, L. Cummings, D. L. &
Ellingson, L. J. (2003). Biomass, carbon, and nitrogen pools in Mexican
Tropical Dry Forest landscapes. Ecosystems, 6, 609-629.
Jiang, P. K. Xu, Q. F. Xu, Z. H. & Cao, Z. H. (2006). Seasonal changes in soil
labile organic carbon pools within a Phyllostachys praecox stand under
high rate fertilization and winter mulch in subtropical China. Forest
Ecology and Management, 236, 30-36.
Johnson, N. C. & Wedin, D. A. (1997). Soil carbon, nutrients and mycorrhizae
during conversion of dry tropical forest to grassland. Ecological
Applications, 71(1), 171-182.
Kalbitz, K. Schwesig, D. Schmerwitz, J. Kaiser, K. Haumaier, L. Glaser, B.
Ellerbrock, R. & Leinweber, P. (2003). Changes in properties of soil-
derived dissolved organic matter induced by biodegradation. Soil Biology
and Biochemistry, 35, 1129-1142.
Kennard, D. (2002). Secondary forest succession in a tropical dry forest:
patterns of development across a 50-year chronosequence in lowland
Bolivia. Journal of Tropical Ecology, 18, 53-66.
Kieft, T. L. Soroker, E. & Firestone, M. K. (1987). Microbial biomass
response to a rapid increase in water potential when dry soil is wetted. Soil
Biology and Biochemistry, 19, 119-126.
Kummer, D. M. & Turner II, B. L. (1994). The human causes of deforestation
in South-east Asia. BioScience, 44, 323-328.
Lodge, D. J., McDowell, W. H. & McSwiney, C. P. (1994). The importance of
nutrient pulses in tropical forests. Tree, 9(10), 384-385.
López-Ulloa, M. Veldkamp, E. & de Koning, G. H. J. (2005). Soil carbon
stabilization in converted tropical pastures and forest depends on soil type.
Soil Science Society of America Journal, 69, 1110-1117.
Lugo, A. E. & Murphy, P. G. (1986). Nutrient dynamics of a Puerto Rican
subtropical dry forest. Journal of Tropical Ecology, 2, 55-72
Luizão, R. C., Bonde, T. A. & Rosswall, T. (1992). Seasonal variation of soil
microbial biomass - The effects of clear felling a tropical rainforest and
Complimentary Contributor Copy

Changes in the Labile and Recalcitrant Organic Matter Fractions ...
129
establishment of pasture in the Central Amazon. Soil Biology and
Biochemistry, 24(8), 805-813.
Maharning, A. Mills, A. & Adl, S. (2009). Soil community changes during
secondary succession to naturalized grasslands. Applied Soil Ecology, 41,
137-147.
MARN. (2005). D.G.A.S. Dirección de Hidrología y Meteorología. Sistema
Nacional de Información Hidrológica y Meteorológica. SINAIHME.
Martínez-Yrízar, A. (1995). Biomass distribution and primary productivity of
tropical dry forests. In: S. H. Bullock, H. A. Mooney & E. Medina. (Eds.)
Seasonally dry tropical forest. (pp 326-345). Great Britain. Cambridge
University Press.
Matson, P. A. Vitousek, P. M. Ewel, J. J. Mazzarino, M. J. & Robertson, G. P.
(1987). Nitrogen transformations following tropical forests felling and
burning on a volcanic soil. Ecology, 68, 491-502.
Matus, F. J. & Maire, C. (2000). Relación entre la materia orgánica del suelo,
textura del suelo y tasas de mineralización de carbono y nitrógeno.
Agricultura Técnica, 60(2), 112-126.
McGill, W. B. & Cole, C. V. (1981). Comparative aspects of cycling of
organic C, N, S, and P through soil organic matter. Geoderma, 26,267-
286.
McGill, W. B. Cannon, K. R. Robertson, J. A. & Cook, F. D. (1986).
Dynamics of soil microbial biomass and water-soluble organic C in
Breton L after 50 years of cropping to two rotations. Canadian Journal of
Soil Science, 66, 1-9.
Montagnini, F. & Buschbacher, R. (1989). Nitrification rates in two
undisturbed tropical rain forest and three slash-and-burn sites of the
Venezuelan Amazon. Biotropica, 21(1), 9-14.
Murphy, P. G. & Lugo, A. E. (1986). Ecology of tropical dry forest. Annual
Review of Ecology and Systematics, 17, 67–88.
Murphy, P. G. & Lugo, A. E. (1995). Dry forest of Central America and the
Caribbean. In: S. H. Bullock, H. A. Mooney & E. Medina. (Eds.)
Seasonally dry tropical forest. (Pp 9-34). Great Britain. Cambridge
University Press.
Neill, C. Melillo, J. M. Steudler, P. A. Cerri, C. C. De Moraes, J. F. Piccolo,
M. & Brito, M. (1997a). Soil carbon and nitrogen stocks following forest
clearing for pasture in the southwestern Brazilian Amazon. Ecological
Applications, 7(4), 1216-1225.
Neill, C. Piccolo, M. Cerri, C. C. Steudler, P. A. Melillo, J. M. & Brito, M.
(1997b). Net nitrogen mineralization and net nitrification rates in soils
Complimentary Contributor Copy

A. González-Pedraza and N. Dezzeo
130
following deforestation for pasture across the southwestern Brazilian
Amazon Basin landscape. Oecologia, 110, 243-252.
Nüsslein, K. & Tiedje, J. M. (1999). Soil bacterial community shift correlated
with change from forest to pasture vegetation in a tropical soil. Applied
and Environmental Microbiology, 65, 3622-3626.
Oades, J. M. (1984). Soil organic matter and structural stability: Mechanisms
and implications for management. Plant and Soil, 76(1-3), 319-337.
Ochoa, G. R., Malagón, C. D. & Pereyra, J. (1996). El contenido de materia
orgánica, nitrógeno total y factores que los afectan en algunos suelos de
Venezuela. Revista Geográfica Venezolana, 37(1), 9-26.
Ohta, S. (1990). Influence of deforestation on the soils of the Pantabangan
area, Central Luzon, the Philippines. Soil Science & Plant Nutrition,
36(4), 561-573.
Paterson, E. Osler, G. Dawson, L. A. Gebbing, T. Sim, A. & Ord, B. (2008).
Labile and recalcitrant plant fractions are utilized by distinct microbial
communities in soil: independent of the presence of roots and mycorrhizal
fungi. Soil Biology and Biochemistry, 40, 1103-1113.
Piccolo, M. C. Neill, C. & Cerri, C. (1994). Net nitrogen mineralization and
net nitrification along a tropical forest-to-pasture chronosequence. Pant
and Soil, 162, 61-70.
Potthast, K. Hamer, U. & Makeschin, F. (2010). Impact of litter quality on
mineralization processes in managed and abandoned pasture soils in
Southern Ecuador. Soil Biology and Biochemistry, 42, 56-64
Powers, J. S. Read, J. M. Denslow, J. S. & Guzman, S. M. (2004). Estimating
soil carbon fluxes following land-cover change: a test of some critical
assumptions for a region in Costa Rica. Global Change Biology, 10, 170-
181.
Powlson, D. S. Brookes, P. C. & Christensen, B. T. (1987). Measurement of
soil microbial biomass provides an early indication of changes in total soil
organic matter due to straw incorporation. Soil Biology and Biochemistry,
19, 159-164.
Raich, J. W. & Nadelhoffer, K. J. (1989). Belowground carbon allocation in
forest ecosystems: Global trends. Ecology, 70, 1346-1354.
Raich, J. W. & Tufekcioglu, A. (2000). Vegetation and soil respiration:
Correlations and controls. Biogeochemistry, 48, 71-90.
Reiners, W. A. Bouwman, A. F. Parsons, W. F. J. & Keller, M. (1994).
Tropical rain forest conversion to pasture: Changes in vegetation and soil
properties. Ecological Applications, 4(2), 363-377.
Complimentary Contributor Copy

Changes in the Labile and Recalcitrant Organic Matter Fractions ...
131
Ruiz, M. & Paolini, P. (2004). El cultivo y el agua de riego sobre el carbono
de la biomasa microbiana. Agronomía Tropical, 54(2), 161-178.
Ruíz, M. Elizalde, G. & Paolini, P. (1997a). Caracterización de las sustancias
húmicas presentes en microagregados de suelos de dos toposecuencias.
Agronomía Tropical, 47(4), 381-395.
Ruíz, M. Elizalde, G. & Paolini, P. (1997b). Distribución de la materia
orgánica asociada a microagregados de suelos de dos toposecuencias.
Agronomía Tropical, 47(4), 489-506.
Ruíz, M. Elizalde, G. & Paolini, P. (2000). Correlaciones entre el carbono
orgánico de los microagregados y algunos atributos del suelo en paisaje de
sabana. Revista Facultad de Agronomía (Maracay), 26, 125-135.
Sánchez, B. Ruiz, M. & Ríos, M. M. (2005). Materia orgánica y actividad
biológica del suelo en relación con la altitud, en la cuenca del río Maracay,
estado Aragua. Agronomía Tropical, 55(4), 507-534.
Saynes, V. Hidalgo, C. Etchevers, J. D. & Campo, J. E. (2005). Soil C and N
dynamics in primary and secondary seasonally dry tropical forests in
Mexico. Applied Soil Ecology, 29, 282-289.
Schimel, J. P. Gulledge, J. M. Clein-Curley, J. S. Lindstrom, J. E. & Braddock,
J. F. (1999). Moisture effects on microbial activity and community
structure in decomposing birch litter in the Alaskn taiga. Soil Biology and
Biochemistry, 31, 831-838.
SIRA-INIA-CENIAP. (2010). Sistemas de Información en Recursos
Agroecológicos. Estación meteorológica Barinas. Instituto Nacional de
Investigaciones Agrícolas. Ministerio del Poder Popular para la
Agricultura y Tierras.
Skjemstad, J. O. Clarke, P. Taylor, J. A. Oades, J. M. & McClure, S. G.
(1996). The chemistry and nature of protected carbon in soil. Australian
Journal of Soil Research, 34, 251-271.
Sparling, G. P. Hart, P. B. S. August, J. A. & Leslie, D. M. (1994). A
comparison of soil and microbial carbon, nitrogen, and phosphorus
contents, and macro-aggregate stability of a soil under native forest and
after clearance for pastures and plantation forest. Biology Fertility of Soils,
17, 91-100.
Statistica. (2001). Basic Statistical Analysis Methods. Versión 6.0. StatSoft,
Tulsa, OK.
Stevenson, F. J. (1994). Humus chemistry. (2nd Edition) New York. John
Wiley and Sons.
Stevenson, F. J. & Cole, M. A. (1999). Cycles of Soil. Carbon, nitrogen,
phosphorus, sulfur, micronutrients. Soil Carbon Budgets and Role of
Complimentary Contributor Copy

A. González-Pedraza and N. Dezzeo
132
Organic Matter in Soil Fertility. (Second edition). United State of
America. John Wiley & Sons, Inc.
Tiessen, H. Feller, C. Sampaio, E. V. S. B. & Garin, P. (1998). Carbon
sequestration and turnover in semiarid savannas and dry forest. Climatic
Change, 40, 105-117.
Tisdall, J. M. & Oades, J. M. (1982). Organic matter and water stable
aggregates in soils. Journal of Soil Science, 33, 141-163.
Vance, E. Brookes, P. C. & Jenkinson, D. S. (1987). An extraction method for
measuring soil microbial biomass C. Soil Biology and Biochemistry, 22,
999-1000.
Veldkamp, E. (1994). Organic carbon turnover in 3 tropical soils under pasture
after deforestation. Soil Science Society of America Journal, 58, 175-180.
Walkley, A. & Black, A. (1934). An examination of the digestion method for
determining soil organic matter and proposed modification of the chromic
acid titration method. Soil Science, 37, 29-38.
Complimentary Contributor Copy

In: Dry Forests ISBN: 978-1-63321-291-6
Editor: Francis Eliott Greer © 2014 Nova Science Publishers, Inc.
Chapter 5
ECOLOGY AND MANAGEMENT OF THE DRY
FORESTS AND SAVANNAS OF THE WESTERN
CHACO REGION, ARGENTINA
Carlos Kunst1, Sandra Bravo
2, Roxana Ledesma
1,
Marcelo Navall1, Analía Anríquez
3, Darío Coria
1,
Juan Silberman3, Adriana Gómez
1 and Ada Albanesi
3
1Instituto Nacional de Tecnología Agropecuaria (INTA),
Santiago del Estero Experimental Station, Santiago del Estero, Argentina. 2Universidad Nacional de Santiago del Estero (UNSE), Botany Chair,
Santiago del Estero, Argentina 3Universidad Nacional de Santiago del Estero (UNSE),
Ecology and Soil Microbiology Chairs,
Santiago del Estero, Argentina
INTRODUCTION
The Chaco region is a vast plain that extends into northwestern Argentina
and surrounding countries (Figure 1). Chaco is a quichua word meaning „a
place for hunting‟ or „a place where I am self-sufficient‟ (Metraux 1946,
Berton 2014, personal communication). Its northern limit is the Amazon. At
the southeast, it limits with the Pampas, and to the southwest with the Monte,
other key natural regions of Argentina. At the west, the Chaco borders the
Complimentary Contributor Copy
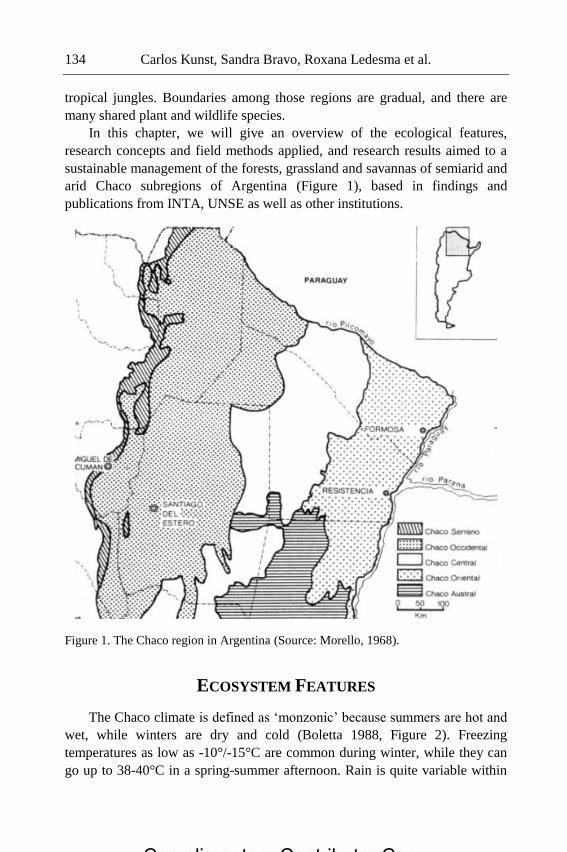
Carlos Kunst, Sandra Bravo, Roxana Ledesma et al.
134
tropical jungles. Boundaries among those regions are gradual, and there are
many shared plant and wildlife species.
In this chapter, we will give an overview of the ecological features,
research concepts and field methods applied, and research results aimed to a
sustainable management of the forests, grassland and savannas of semiarid and
arid Chaco subregions of Argentina (Figure 1), based in findings and
publications from INTA, UNSE as well as other institutions.
Figure 1. The Chaco region in Argentina (Source: Morello, 1968).
ECOSYSTEM FEATURES
The Chaco climate is defined as „monzonic‟ because summers are hot and
wet, while winters are dry and cold (Boletta 1988, Figure 2). Freezing
temperatures as low as -10°/-15°C are common during winter, while they can
go up to 38-40°C in a spring-summer afternoon. Rain is quite variable within
Complimentary Contributor Copy

Ecology and Management of the Dry Forests and Savannas …
135
and between seasons and tends to decrease from 700-800 mm in the east and
west to 200-300 mm toward the south (Boletta 1988). Average air
temperatures follows the same pattern, balancing in some way the diminishing
rainfall.
Figure 2. Climodiagram of Santiago del Estero.
The western Chaco is a vast plain, with a slight slope toward the southeast
and crossed by several rivers, such as the Salado and Dulce. Toward the south,
as rainfall decreases, rivers become semipermanent streams. Sediments
brought by rivers and streams from the mountains and sierras located in the
western side are the original material of soils. In the semiarid part soils belong
to the order Mollisol, and in the arid sector Aridisols and Entisols. Although
some are undeveloped (A – A/C horizons) they have usually no severe
limitations for root growth such as caliche layers. Toward the south, there are
areas with severe salt accumulations and problems with clay texture
(„barreales‟), that seriously restrict plant growth in the lowland sites.
The vegetation of the Chaco region is a mosaic of hardwood forests,
savannas and grasslands (Bucher, 1982; Morello and Adámoli, 1974, Bordón
1983). These vegetation types correspond to different soil and drainage
features related to the geomorphological processes associated with water
runoff (e. g. levees and flats, Bucher 1982). At a scale ~ 1:20,000, soil and
vegetation types of Chaco are located along a catena from the „upland‟ to the
„lowland‟.
Complimentary Contributor Copy

Figure 3. Ecological sites, associated vegetation types and species in the Chaco region, at scale= 1:20,000 (modified from Kunst et al.
2006).
1
Range Sites
Good condition Poor condition
Features Upland Midland Lowland Upland Midland Lowland
Physiognomy Tall hardwood forest Woodland Savanna Low-Forest - Shrubland Shrubland Shrub-thicket
Tree species Schinopsis lorentzii
Aspidosperma
quebracho blanco
Prosopis nigra
Aspidosperma quebracho
blanco
Aspidosperma quebrachoblanco Prosopi snigra
Aspidosperma quebracho
blanco
Prosopisnigra
Aspidosperma quebracho
blanco
Aspidosperma quebrachoblanco
Shrub species Acacia furcaptispina Acacia aroma Acacia furcaptspina
Celtis spp
Larrea divaricata
Celtiss pp Acacia aroma
Aloyssia spp
Schinus spp
Aloyssia spp
Grass and forb
species
Trichloris pluriflora
T. crinita
Setaria leiantha
Digitaria californica
Pappophorum pappipherum
Trichloris pluriflora
Paspalum spp
Elionorusmuticus
Heteropogon contortus
Paspalum spp
Schizachirium tenerum
Setaria leiantha
Setaria spp
Neoboutelua lophostachya
Forbs
Setaria leiantha
Setaria spp
Neoboutelua lophostachya
Trichloris pluriflora
Digitaria insularis
Standing forage
(kg MS*ha-1)
600-1300 2000-3000 2000-5000 < 500 300 300-1000
Stocking rate
(ha*UG-1)
12-5 4-3 4-2 12 25 6
2
Complimentary Contributor Copy

Ecology and Management of the Dry Forests and Savannas …
137
A vegetation model, using the ecological site concept, was provided by
Kunst et al., (2006b, Figure 3): hardwood forests occupy the upland sites,
while the woodlands and savannas are located on the intermediate and lowland
sites, respectively. The tree species Schinopsis lorentzii (quebracho colorado
santiagueño) and Aspidosperma quebracho-blanco (quebracho blanco)
dominate in upper layers of the forests (c. 15 m tall). Prosopis nigra
(algarrobo negro), Ziziphus mistol Griseb. (mistol), Cercidium praecox (brea),
Geoffroea decorticans (chañar) and Jodina rhombifolia(sombra de toro) are
common species in the mediumstrata. Acacia aroma, Acacia furcatispina,
Capparis atamisquea, Condalia microphylla (piquillín), and Porlieria
microphylla (cucharero) characterize the shrub strata (López de Casenave et
al., 1995). Natural grasslands occupying interfluvial homogeneous soils and
savannas are dominated by Elionurus muticus Spreng. (“aibe”, “espartillo”,
“paja amarga”), Heteropogon contortus, Schyzachirium spp., Trichloris
crinita, Trichloris pluriflora, Gouinia paraguariensis, Gouinia latifolia,
Setaria argentina, Setaria gracilis, Digitaria sanguinalis, Pappophorum
pappiferum, Papophorum mucronulatum (Herrera et al., 2003). Trees such as
A. quebracho-blanco, P. nigra, and shrub species such as A. aroma, Schinus
sp., Celtis sp. are scattered across the savannas in small patches or isolated
trees (Kunst et al., 2003). Currently dense shrub thickets and degraded
secondary forests are widespread in the region, caused by livestock
overgrazing, indiscriminate logging, changes in the fire regime, and fencing.
CHACO VEGETATION: THEN AND NOW
Descriptions of the original vegetation types of the Chaco are scarce. The
chronicles of European conquerors and scientists traveling along vast
territories of Chaco region described great grassland areas and dense forests
where indigenous people carried out their subsistence activities such as
hunting, raising animals, harvesting of fruits, among others. Comments as the
following have been provided by these old chronicles:
„There are large grasses and very good settlements for raising cattle
in big numbers such as those of Spain and to made windmills and other
homesteads which can make them prosperous..'1
Anonymous Relation, 1572, cited by Montes (2008).
1Free translation.
Complimentary Contributor Copy

Carlos Kunst, Sandra Bravo, Roxana Ledesma et al.
138
„…they are covered by extensive and thick forests, some with high
trees, some quite open in beautiful green meadows and fields‟2
Caamaño (1778)
„…In all this land and plains there is a large number of ostridges,
they are brown and big…they run very fast‟2
Lizarraga (circa 1600)
„Burning grasslands or the bush is a common hunting method
throughout the Chaco…The charred carcasses of animals overtaken by
the fire are gathered up and eaten on the spot. Later the Indians return to
the fired area to stalk the countless deer lured by the salty ashes or the
thick and tender new grass‟
Métraux (1946)
Old maps as well as the names of several places suggest that until the mid
XX century, grasslands and forests shared the Chaco landscape in an even
proportion (Figure 4). Fire was probably responsible of that fact, since it was
extensively used by the native for hunting and war (Bravo et al. 2001).
The part of the Chaco region located to the south of the Salado River was
settled by the Europeans since the Spanish conquest since ~ year 1500 AD.
Livestock breeding (cattle, mules, goats and horses) was the most important
productive activity. The area located to the north of this river was mostly
unexplored until to the late XIX Century. Intensive settlement of the Chaco
began in the earlier XX Century: timber operations based on native forests
became the most important trade, providing fence posts, firewood, charcoal
and railway ties. Early agricultural farms were developed in the east and west.
Timber operations declined around 1960, and in the next decade extensive
areas of land were cleared for agriculture, mostly sorghum and soybean
occupying the areas with the best edaphic and climate conditions (Grau et al.
2005). Today, cattle ranches alternate with large agricultural farms and areas
with small landowners.
DISTURBANCES AND PLANT ADAPTATIONS IN THE CHACO
Together with floods and droughts, fire was, and still is a common event
in the Chaco. It was used by the natives for hunting and war in pre-Columbian
times (Metraux 1946, Tortorelli 1947, Morello and Saravia Toledo 1959).
Today is mainly used as a tool for rangeland management and vegetation
clearing (Kunst et al. 2012).
Complimentary Contributor Copy

Ecology and Management of the Dry Forests and Savannas …
139
Figura 4. Vegetation types of the Chaco in the late 1930‟s. (Frenguelli 1940).
Although fire is qualified as a „common event‟ in the Chaco, there are few
studies that address the fire regime of the Chaco ecosystems. There is evidence
Complimentary Contributor Copy

Carlos Kunst, Sandra Bravo, Roxana Ledesma et al.
140
that the savannas are a fire-prone community: E. muticus, the dominant grass,
contains citral terpenes in its foliage, making the species very flammable
(Burkart 1969).
Fire usually starts in the savannas as high intensity headfires, but they
often show low severity on soils because its fast speed (Kunst et al., 2000).
The fire regime of ecotones between an E. muticus savannas and forests has
been studied by dendrochonological techniques on native woody species,
estimating a mean fire free interval 3-5 years during the last century (Bravo et
al., 2001b). There is no information about the fire regime of the forests,
although there are empiric evidences as oral communication from rural
inhabitants and studies about fire resistance in tree species of the genus
Prosopis, mentioning fire scars in branches until 7 m height, suggesting that
crown fires can occur under extreme climatic conditions (Bravo et al., 2001a;
Bravo et al., 2008). Grass species of the forests recover quickly after fires and
in the savannas environments fire is associated to an increase in herbaceous
diversity during 3- 6 years after fire event (Kunst et al., 2003). The unusual
intense fires that occurred in the Chaco forests probably originated the „fire
grasslands‟ (`quemados‟) due to all aboveground structure of the native
vegetation was eliminated and replaced immediately by an homogeneous
herbaceous stratum. These “fire grassland” were maintained by recurrent fires
performed by the aborigines (Morello y Saravia Toledo 1959).
Studies about fire tolerance of the native hardwood tree and shrub species
composing the medium and high strata of the forests and savannas suggest
both high fire resistance and fire tolerance, as related to traits such as barks
thickness, bud features, resprouting pattern and phenology among others
(Bravo et al. 2001b; 2006; 2008, 2001a).
The dominant species of the upper stratum of Chaco forests; A.
quebracho-blanco and S. lorentzii are remarkably resistant to fire at the mature
state and reestablish damaged aerial structures by profuse resprouting (basal
and epicormic Figure 5). Both species have thick bark, a trait allowing them to
effectively protect the cambium tissue of the bole, branches and buds.
Therefore, this great ability to resprout after fires produces some arquithectural
changes such as an increase of plant cover and multi-stemmed forms
principally on sapling and pole-sized trees (Bravo et al., 2011, 2012, Figure 5).
Secondary tree and shrub species of the medium and lower strata of the
forests and savannas have a differential fire resistance according to bark
thickness, plant height and foliage features.
Complimentary Contributor Copy

Ecology and Management of the Dry Forests and Savannas …
141
Figure 5. Response to fire in native woody species of Argentine Chaco region. A- Fire
scars in S. lorentzii, B. Basal resprouts in A. quebracho-blanco, C. Basal resprouts in
C. atamisquea, D. Bark exfoliation in G. decorticans.
Fire usually eliminates aerial structures of shrub species such as Acacia
aroma, A. furcatispina, Capparis atamisquea, Celtis sp. and Schinus sp.,
because of their lower plant height and thin bark thickness than the tree
Complimentary Contributor Copy

Carlos Kunst, Sandra Bravo, Roxana Ledesma et al.
142
species. These species recover mainly by basal resprouts, and the initial plant
cover could even increase after a fire depending of fire severity, their aerial
bud bank and reserve levels (Kunst et al. 2000, 2009). Secondary tree species
of Chaco forests such as Prosopis nigra, P. alba, Ziziphus mistol, Geoffroea
decorticans, and Cercidium praecox have different fire resistance according to
different combination of thickness and density of their barks, which allow
them keeping alive the main bole and buds. The main bark feature related to
fire resistance is thickness but a higher bark density may contribute to delay
the time to reach ignition (Bravo et al., in press). Thick bark species as A.
quebracho-blanco and P. alba resist to high severity fires due to the greater
isolation of cambial tissues and buds. Other species, with lower bark thickness
can resist to medium and low severity due to greater bark density, a fact that
delays the time to reach ignition. Bark protection, however, could be
insufficient in high severity fires. This has been observed in P. nigra and Z.
mistol. Other thin bark species, like G. decorticans and C. praecox
continuously exfoliate the bark tissues becoming very susceptible yet in low
intensity fires (Figure 5). High severity fires, or a high fire frequency could
overwhelm the bark protection, and to produce the loss of epicormic buds of
stem and branches. Even in these cases, the species showed a high ability to
differentiate adventitious buds from collar zone producing vigorous basal
resprouts (Kunst et al., 2000; 2012).
The stress caused by fire usually adds to the dryness and cold typical of
autumn and winter in Chaco region and this synergism influences also the fire
tolerance of native vegetation. The mortality after medium to high intensity
prescribed fires reached until 10 % of individuals (Bravo et al., 2014, in press)
and these values could diminish if fire occur at late fire season (late spring and
early summer) when better environmental conditions promote fast recovery of
vegetation.
The effect of fires on the sexual propagation and dispersion of native
woody species is an interesting future research line because will allow to
comprise its relationship with forest dynamic in spatial and temporal scale.
VEGETATION MANAGEMENT: FOREST AND SAVANNAS
During the European conquest, cattle and goat breeding was the main
productive activity in the Chaco. The native vegetation was used as the main
source of forage. From the late XIX until the middle XX century, colonizers
Complimentary Contributor Copy

Ecology and Management of the Dry Forests and Savannas …
143
produced the greatest change in the native vegetation through intensive
deforestation to provide railway sleepers, the exploitation of the “quebracho”
for the tannic acid industry, and the use of fire for clearing the land for
agriculture and grazing (Soares 1990).
In the late 1940‟s, livestock activities were remarkably reduced by
overgrazing of grasslands and savannas (Adámoli et al., 1990). The decrease
in fine fuel load in open areas reduced the fire frequency and facilitated the
invasion of Acacia, Prosopis, Mimosa and Mimoziganthus shrub species
(Morello y Adámoli, 1973). Currently, savannas and grasslands of Chaco are
maintained by recurrent fires performed by cattle ranchers. The implantation
of tropical grass species belonging to the genus Panicum, such as P. maximum
cv Gatton is the most common strategy to increase to livestock production in
Chaco (Kunst et al., 2014). Since these exotic species have a greater biomass
production potential than native pastures therefore, changes in the fire regime
should be expected.
Historically, due to climatic, soil and technological restrictions,
agriculture was viable as an economic alternative in Argentina in the central
and southern subregions of the Chaco (Figure 1). From 1975 on,
approximately, it occurred an intensive deforestation in Chaco region
increasing the agricultural areas at the expense of native forest (Grau et al.,
2005; Boletta et al., 2006). The traditional crops as cotton; bean and chikpea
were replaced by sorghum and soybean (Morello et al. 2004). Within the
native forests the fire is used as tool for land clearing and elimination of
residues of forest operations (Boletta et al., 2006). The silvopastoral systems
can also use fire as a tool management of the shrub strata and some recent
studies give information about resistance of native woody species to
prescribed fires (Kunst et al., 2012; Bravo et al., 2014).
Silviculture in the Chaco
One of the main productive uses of Chaco forests is logging. Native
hardwood species are highly valued in the whole country as fuel (charcoal or
firewood), for building livestock management facilities (fences) or as railway
sleepers. The dominant species A. quebracho-blanco and S. lorentzii are
locally named “quebracho”, from “quiebra hacha” (axe breaker), which tells
about their wood hardness (density 0,8 and 1,2 kg.dm3-1, respectively) (Kryn
1954). S. lorentzzi wood yield up to 24% on tannin extraction (Luna 2012),
which gives a great suitability to use it outdoors, in direct contact with soil and
Complimentary Contributor Copy

Carlos Kunst, Sandra Bravo, Roxana Ledesma et al.
144
water, standing for decades without any preservation treatment. Railway
sleepers have been reported to be as sound as when installed, after more than
40 years in service (Kryn 1954). Charcoal of A. quebracho-blanco is valuated
as the best, both at home and in foreign countries where is exported.
Considering the whole country, these products have a great participation in the
productivity of the Chaco native forests, Almost 80% of national production of
the native forests (4 million Mg.year-1
) comes from Chaco region, and 80% of
it is firewood (for charcoal and other uses).
The structure of western Chaco forests is uneven-aged, which high
densities in smaller size classes, and a decreasing density in higher ones. A
well conserved forest usually presents more than 7 m2.ha-1
of basal area of
“quebrachos” (Brassiolo, 2005), and present near 170 trees.ha-1
with DBH >
10cm, and less than 7 trees.ha-1
with DBH > 45 cm. In the size range from
saplings to DBH = 10cm, Gómez and Navall (2008) found more than 2000
individuals.ha-1
. In the Chaco forests the size classes and species are
completely mixed, and no groups can be clearly identified, except in the lower
size classes of Schinopsis lorentzii (DBH < 10cm).
The diameter growth for both dominant species in the western Chaco
forests is highly variable. In selected individuals, growth rates around 0.3 – 0.4
cm.year-1
have been reported (Gimenez and Ríos, 1999). However, when
considering the whole plot and all DBH classes, other researchers reported
smaller values (0,1 to 0,3 cm.year-1
) (Araujo 2003, Cid Londínez et al., 2013).
Volumetric growth is estimated around 1 to 1,5 m3.ha
-1.yr
-1 (Unique 2007).
The traditional harvesting approach of hardwood forests in the western
Chaco has been the harvest of the best individuals of selected species, without
considerations on forest sustainability, remaining structure or cover (Morello
et al., 2005; Unique, 2007). Additionally, uncontrolled grazing and burning
caused that currently, a high proportion of the western Chaco forests are in a
“regeneration” state (Brassiolo, 2005). This state is characterized by a lower
proportion of commercial species, and a higher proportion of small diameter
trees and shrubs than those observed in well conserved forests.
It has been recommended that the sustainable management of western
Chaco forests could be performed by selective cutting, combined with the
management of remaining trees selected by applying the “future-tree” concept
(Brassiolo et al., 2007). In this approach, mature individuals are harvested, and
thinning is applied on the remaining individuals in the same operation.
Preferred individuals are selected as “future trees”, and some of their
competitors are removed by thinning. To be sustainable, the overall cutting
should be less or equal than the product of cutting rate and annual growth of
Complimentary Contributor Copy

Ecology and Management of the Dry Forests and Savannas …
145
the stand. The return interval recommended for western Chaco forests is
usually 20 yr. Additionally, conditions to favor natural regeneration are
needed. It has been recommended to apply regeneration protection intervals of
5 yr after forest harvesting. At least, 100 trees.ha-1 should reach a “safe
height” (>2m to avoid grazing damage) 5 years after each cutting event
(Brassiolo, 1997; Brassiolo and Pokorny, 2000).
Range and Grassland Management in the Chaco
Standing forage in the upland site in good condition is estimated around
700 -1000 kg*ha-1
, while in the lowland site is 5000-6000 kg*ha-1
(Kunst et
al., 2006). Grass species belonging to the genera Trichloris, Setaria and
Digitaria dominate in the upland site, while Elionorus, Botriochloa,
Heteropogon, Pennisetum and Aristida are abundant in the lowland site.
Broadleaf species of the genus Justicia, Lantana and Zexmenia are also quite
common, the first two in the upland site, while the third is abundant in the
midland site. Preference of grass species by cattle was reported by Kunst et al.,
(1995). In forests, the most preferred species are D. californica and C. ciliata.
T.pluriflora and crinita are of intermediate preference. Appropriate stubble
height for native grass species for the forest spcies is around 15 cm, as
reported by Renolfi et al., (1987). In the savannas, the most preferred species
is Heteropogon contortus, followed by Pappophorum caespitosum (Kunst
1982).
Trees and shrubs belonging to the genus Prosopis and Acacia provide
foliage and edible fruits of high quality, they are quite considered by ranchers
and cattlemen of the Chaco (Diaz). The genus Prosopis in the Chaco comprise
several native species such as P. alba, P. kuntzei and P. ruscifolia, that are
quite important in the Chaco, as sources of hardwood of high quality that can
be used for furniture and building construction, fruits and shadow in
silvopastoral systems. The Santiago del Estero Experimental Station is testing
P. alba consociated with pastures of Panicum and Chloris in order to develop
a system than can ameliorate saline soils.
Silvopastoral Systems: A New Approach
Intensive land use has converted large areas of the Chaco in dense shrub
thickets and secondary forests, whose „suitability‟ for livestock and timber
Complimentary Contributor Copy

Carlos Kunst, Sandra Bravo, Roxana Ledesma et al.
146
operations is low. Herbaceous standing biomass is insignificant due to either
low plant density and/or small plant size. The high density of woody plants
and their thorny stems also decrease forage accessibility and hamper livestock
and personnel movements (Nai Bregaglio et al., 1999). Current stocking rates
are negligible, a fact that negatively influences the economy of ranching
operations in areas with woody states (Fumagalli et al., 1997, Kunst et al.,
2006). These problems are shared with other arid and subhumid regions of the
world, creating complex management situations (Gifford and Howden 2001;
Burrows 2002, Van Auken 2009).
From the point of view of forest management, the excess of shrubs and
young tree individuals (advance regeneration) decrease the availability of
resources for tree growth, thus the community requires thinning.
Figure 6. Yield (standing crop) of native grass species and Panicum maximum after a
Low Intensity Roller Chopping treatment. Average 1997-2002. “La Maria”
Experimental Ranch, Santiago del Estero Experimental Station. References: RC:
roller-chopping only, native grass species. RC+seeding: roller-chopping plus seeding
of Panicum maximum cv Green panic.
Complimentary Contributor Copy

Ecology and Management of the Dry Forests and Savannas …
147
LOW INTENSITY ROLLER-CHOPPING (RBI)
A „roller-chopper‟ is an iron drum with diameter =1.4 m and width = 2.5
m, filled with 3000 kg of water, armed with blades, usually pulled by a 4-
wheel articulate tractor or by a D4 Caterpillar bulldozer. Nowadays, „roller
chopping‟ is widely used in the Chaco region. Reasons are a lack of fine fuel
for carrying out a prescribed fire, high cost of chemical products and
ecological concerns. Roller chopping is a mechanical disturbance aimed at
creating a park-like vegetation structure, which is more suitable for livestock
operations than the current dense, homogeneous „woody state‟ (Kunst et al.,
2003). Woody individuals –especially trees- with DBH > 10-15 cm are left
standing in different patterns and densities, while at the same time the rest,
especially shrubs, are crushed and left as residues that can degrade naturally or
be burnt. The latter practice should be carefully practiced because fire is
extremely soil degrading due to the high density of the wood of the woody
Chaco species. Forage yields and stocking rates usually increase due to the
seeding of a grass species simultaneously with the roller chopping. Exotic
species of the genus Panicum (Poaceae) are commonly used (Ledesma 2006).
They are summer growth perennials which possess the C4 syndrome, and are
adapted to shadow. Average P. maximum yield in under tree cover is estimated
5000-8000 kg DM*ha-1
, a magnitude higher than the standing crop of native
pastures, increasing stocking rates significantly (Kunst et al., 2012, 2014).
Tree thinning and roller-chopping have one thing in common: they are
disturbances, defined here as an event that kills or partially destroys biomass
in a site, creating new after-disturbance environmental conditions (Sousa
1984, Platt and Connell 2003). Parameters of a disturbance such as intensity
and severity can be used to manage their outcomes (White and Jentsch 2001,
Norkko et al., 2006, Buhk et al., 2007). By proper handling the tractor and
roller-chopper sizes, and the number of passes over the standing vegetation,
intensity and severity of the mechanical disturbance could be properly
planned. This is the main principle of the „Low Intensity roller-chopping‟
(RBI) technique developed by research personnel of the Santiago del Estero
Experimental Station to establish a silvopastoral system in the Chaco region.
The mechanical disturbance serves several purposes: (a) to create site
availability by specifically reducing the aboveground structure of shrubs and
decreasing their competence for resources (also called thinning or clearing in
literature); (b) to increase sunlight availability, (c) to facilitate forage
accessibility and livestock movements, and (d) to thin the tree population to an
Complimentary Contributor Copy

Carlos Kunst, Sandra Bravo, Roxana Ledesma et al.
148
acceptable density. Roller chopping should be aimed at controlling shrub
plants, since they are the main source of „problems‟ instead of trees. The top
soil horizon is slightly disturbed so to seed germination is enhanced.
Severity of the disturbance aimed to create a silvopastoral system could be
assessed by the amount of woody biomass crushed and left as a residue.
SOILS IN SILVOPASTORAL SYSTEMS CREATED BY RBI
Soil is an essential part of any production system. In this section, we will
address the effect of silvopastoral systems on the soil organic matter, and the
structure and functions of soil microbial community. Mollisols, entisols and
alfisols occupy 38 %, 28 % and 16,5 % of the region, respectively. The first
soil order have a better productive capacity than the other two, while the
entisols are less evolved and shallow, mainly showing an ochric epipedon
(Morello et al., 2012). The resilience and buffering capacity of these soils is
limited when faced to an unsustainable management (Sanzano et al., 2005).
However, homogenization of the vegetation (shrub physiognomy) does not
mean that soils also behave in the same way, and could confuse managers.
Figure 7. Annual dynamics of mean shrub volume as percent of the initial volume in
plots with a silvopastoral system established with Low intensity roller chopping.
Complimentary Contributor Copy

Ecology and Management of the Dry Forests and Savannas …
149
Research conducted by the Santiago del Estero National University in
roller-chopped forests using a medium intensity and severity approach has
shown that the mechanical treatment and rotational grazing does not affect
bulk density 5 years after the initial disturbance (Table 1). Therefore, water
and air movement in the soilis not reduced. In upland sites, the soil total
organic carbon (TOC), particulate organic carbon (POC), microbial carbon
biomass (MBC), and the ratio MBC:TOC are not modified either. These
results are attributed to the brush residues left and crushed by the roller
chopper, mainly composed by twigs and leaves. Roots of Panicum are quickly
degraded and incorporated into the soil. However, cattle grazing, even
rotational (grazing in winter+ rest in early summer) decreases TOC, POC and
the ratio MBC:TOC, likely due to the export of plant residues taken away by
the animals (Taddese et al., 2002). However, the level of total nitrogen (TN)
increases, a fact attributed to addition of Nitrogen and Phosporus via faeces, as
it has been reported by silvopastoral systems in other world ecosystems
(Nyakatawa et al., 2011)
Tree cover has a significant effect: TOC and POC decrease as the distance
to the main bole of a tree increases, probably due to a litter accumulation
gradient (Figure 8). In silvopastoral systems, litter play a significant role in the
dynamics of soil carbon because of litter and soil retain more C than the plants
(Kumada et al., 2008). It is essential that in a silvopastoral system crown
canopies overlap because this cover provides litter rich in carbon. Tree effect
depends on the species: under Ziziphus mistol, TOC content is higher than
under A. quebracho blanco and S. lorentzii canopy cover because of the first
species produce between 16 – 64 % more litter than the other two species.
Effects on Soil Functions
In an upland site, the creation of a silvopastoral system that keeps the
majority of the tree individuals standing, maintain a higher magnitude of the
fractions of soil carbon of fast mineralization, the mineralization rate (kc) of
the soil as well as the activity of the microbial population involved in the
initial degradation of SOM. The high activity of dehydrogenase also supports
this finding. In lowland sites, enzymatic activity increases, because soil water
availability stimulate microbial activity and hence enzyme production
(Albanesi et al., 2003, Table 2).
Complimentary Contributor Copy

Table 1. Soil bulk density, total organic carbón(TOC), particulate organiccarbón (POC), total nitrogen (TN),
microbial biomass carbon, ratio MBC:TOC and metabolic quotient (qCO2) at a depth 0-15 cm, in a roller-chopper
experiment
BA
(gr soil cm-3)
TOC
(g C kg-1 soil)
POC
(g C kg-1 soil)
TN
(g N kg-1 soil)
MBC
(ug C g suelo-1)
MBC:TOC
(%) qCO2
Control 0,84 a1 30,10 b 25,37 b 2,24 a 226,07b 0,58 a 0,26 ab
Roller-chopped 0,84 a 28,77 b 24,14 b 2,72 a 167,63 b 0,55 a 0,28 ab
Roller- chopped plus
cattle grazing 0,87 a 22,94 a 18,91 a 2,11 a 91,84 a 0,37 a 0,46 b
Table 2. Potential mineralizable Carbonl (C0), mineralization rate (kc), and dehidrogenase activity (Dh-asa) at 0-15
cm soil depth in a roller-chopper experiment bterween 1999-2003. Roller chopping applied in 2000. „La María‟
Experimental Ranch INTA Santiago del Estero. Referencias: Ecological sites: UP, upland; MD: Midland; LL,
lowland. Treatments: Control, no treatment; RBI: low intensity roller chopping with seeding of Panicum
C0
(mg C kg-1 soil)
kc
(mg C kg-1 soil day-1)
Dh-asa
(mg TPF kg-1 de suelo h-1)
Sitios ecológicos
UP MD LL UP MD LL UP MD LL
Control 384,4 344,2 338,7 0,040 0,054 0,019 96,8 103,9 119,3
RBI 454,1 290,1 386,7 0,027 0,064 0,025 96,1 95,2 134,2
Complimentary Contributor Copy

Figure 8. Soil organic carbon (black bars) and particulate organic carbon (grey bars) in g C kg-1
of dry soil at a depth = 0-15 cm, average
2007-2012. „La María‟ Experimental Ranch, INTA Santiago del Estero. References: RBI. two roller-chopperpasses plus seeding of
Panicum; „RBI con pastoreo‟, ídem RBI plus grazing Control: no treatment. 1. 0,50 m from the tree bole; 2. crown center, and 3, crown
border.
Control
0
10
20
30
40
1 2 3 1 2 3 1 2 3
M Qb Qc
RBI
0
10
20
30
40
1 2 3 1 2 3 1 2 3
M Qb Qc
RBI con pastoreo
0
10
20
30
40
1 2 3 1 2 3 1 2 3
M Qb Qc
Complimentary Contributor Copy

Carlos Kunst, Sandra Bravo, Roxana Ledesma et al.
152
However, in grazed silvopastoral systems located in the upland site the
microbial metabolic quotient (qCO2) increases, a fact suggesting some stress
that decreases the water use efficiency of soil microorganisms (Table 1).
In the midland site, RBI and the seeding of tropical grasses decrease the
carbon stock available for mineralization in the short term (C0) and the
mineralization rate (kc) increase (Table 2). The midland site has usually less
TOC and POC of fast mineralization. These facts suggest that the grazing
management of tropical grasses in a silvopastoral system in this site should be
carefully planned because small magnitude of C0 and a fast mineralization rate
could increase the loss of SOC.
RBI Effects on the Structure and Composition of Soil Microbial
Communities
Research conducted during five years in the semiarid and humid Chaco
regions using terminal restriction fragment lengthpolymorphism (TRFP)
suggest that in the upland and midland sites, roller chopping and the seeding of
tropical species modify the composition of soil microbial communities a year
after the initial treatment (Figure 8). This result agrees with research that
indicates that soil bacterial communities change as the production system
changes, a fact that includes modification of the plant community and soil
features (Lupatini et al., 2013). In the case of RBI, the change in communities
may reflect the significant input of C through the incorporation of plant
residues as a result of the roller-chopping treatment. The microbial population
re-establish after five years of the initial disturbance, agreeing with Vallejo et
al., (2012) that found similar results in a Prosopis juliflora silvopastoral
systems when compared with the control. These results suggest that RBI has
low impact on soil microorganisms, and that they present high resilience to the
environmental alterations caused by production systems (Vallejo et al., 2012).
Forage Yields and Stocking Rates in Silvopastoral Systems
Created by RBI
After the roller-chopper treatment, grass yields increase up to 1000 % or
more, considering native or tropical exotic species (Figure 6, Kunst et al.,
2012, 2014). These yields represent a concomitant increase of stocking rate.
Complimentary Contributor Copy

Ecology and Management of the Dry Forests and Savannas …
153
Roller chopping plus seeding of P.maximum decreases herbaceous diversity,
but woody plant diversity is not affected when the disturbance is of medium to
low intensity (Kunst et al., 2012).
Shrub Control in a Silvopastoral Systems Created by RBI
Native woody plants, especially shrubs, „return‟ because most are
sprouters: mechanical treatments and/or fire rarely kill them (Bond and
Midgley 2001, Van Auken 2009, Bravo 2008). An important aspect in
silvopastoral systems is their „longevity‟ related to the shrub stratum, referred
in literature as persistence, duration of the treatment, treatment life, or
thickening (Heitchmidt and Pieper 1983, Noble et al., 2005; Gifford and
Howden 2001), since shrub regrowth severely hampers the transit of livestock
and personnel. „Longevity‟ estimates how long the „disruption‟ caused by the
disturbance used to create the silvopastoral system will last. Naveh (1990,
2004), based on the Prygogyne dissipation equation, stated that the main issue
of a management program is to establish the regime of disturbance, defined by
the longevity (~„return interval‟) of treatments. Concerns are both economical
(treatment amortization, Teague et al., 2008) and ecological, since the
disturbance cannot have a return interval that may endanger the sustainability
of the population of a desirable woody or wildlife species (Navall 2008).
Cattlemen in the Chaco have reported that the average longevity of a
severe roller chopper treatment is 3 years (Casas et al., 1978), an interval at
odds with the conservation of forest species, especially their advance
regeneration. Research in the Santiago del Estero Experimental Station has
showed that when a disturbance of intermediate severity is used, longevity of
the treatment could at least 6 years (Figure 7), a more appropriate return
interval for a sustainable silvopastoral system.
The genus Prosopis comprise several native species such as P. alba, P.
kuntzei and P. ruscifolia, that are quite important in the Chaco, as sources of
hardwood of high quality that can be used for furniture and building
construction, fruits and shadow in silvopastoral systems. The Santiago del
Estero Experimental Station is testing P. alba consociated with pastures of
Panicum and Chloris in order to develop a system than can ameliorate saline
soils.
Complimentary Contributor Copy

Carlos Kunst, Sandra Bravo, Roxana Ledesma et al.
154
WILDLIFE
Hábitats
There are several wildlife habitats in the Chaco: rivers, swamps and
lagoons; cultivated lands and exotic pastures, saline flats, savannas and
grasslands, forests and shrublands. However, for habitat management the
ecosystem classification based on ecological sites and state and transitions is
more specific and detailed (Figure 9). The most significant modifications in
wildlife habitat the Chaco are the disappearance of savannas and grasslands,
the increase of woody component of the vegetation and the transformation of
the upland tall forest in a dense shrub thicket (Bucher, 1980). These
modifications have been caused by overgrazing, indiscriminate logging and
changes of the fire regime. In order to successfully manage wildlife either for
conservation or commercial purposes it is essential to classify vegetation types
using as criteria the quality of these types for wildlife habitat.
Figure 9. Dendrogram build using TRFLP profiles, Ward method and euclidean
dsitance. References: INTA: semiarid environment; Herrero: subhumid environment.
T. Control; SP1. 1 year after roller-chopping treatment; SP5. 5 years after roller-
chopping treatment; Qb, cover of Aspidosperma quebracho blanco; Qc cover of
Schinopsis lorentzii, M cover of Zizyphus mistol.
Complimentary Contributor Copy

Ecology and Management of the Dry Forests and Savannas …
155
Limiting factors
Critical factors for wildlife in the Chaco are (Bucher, 1980):
Annual dry season that affects primary production and causes the
vanishing of water bodies.
Highly variable rainfall pattern, annual and seasonally.
Extreme oscillations of air temperatures, between 49ºC and -10ºC in
the extremes.
Two environmental pulses, fire and floods.
Bucher (1980) indicate that when confronted with the limiting factors,
wildlife has to adapt by maintaining an appropriate thermal and water balance,
and by building a protection for wildfires and floods, and irregular hunting.
This author summarizes the ethological and physiological adaptations to cope
with these limiting factors.
Species list (not exhaustive, see Table 3):
Mammals: Mazama gouazoubira, small deers, „guasuncha‟.
Tayas supecari, Catagonus wagneriand Pecari tajacu, wild oars,
Tapirus terrestres, tapir,
Puma concolor, puma
Panthera onca, yaguareté,
Herpailurus yaguarondi and Leoparduspardalis (wildcats)
Canidae, foxes
Several species of Dasypodidae, armadillos.
Lagostomus maximus, vizcacha
Pumas and yagueretes are hunted because they conflict with livestock and
other farm animals.
Birds: Myopssi tamonachu, cotorra, Amazona aestiva, parrot
Zenaida auriculata, torcaza,
Columba maculosa and C. picazur, doves, paloma grande.
Emberizidae, Turdidae
Ducks, Anatidae
Tinamidae, quail
Ophidia: Micruruspyrrhocryptus, coral snake, dangerous for men.
Crotalus durissus terrificus, rattlesnake, cascabel
Bothropoides diporus, Rhinocerophis alternatus and Rhinocerophis
ammodytoides, Yararás.
Complimentary Contributor Copy

Carlos Kunst, Sandra Bravo, Roxana Ledesma et al.
156
Reptiles:
Lizards: Tupinambis merianae and Tupinambis rufescens, looked after
because their skins,
Emblematic species for conservation are Myermeco phagatridactyla, ant
bear, and Priodontes maximus, a large armadillo.
Other information about Chaco wildlife could be found in Canevari &
Vaccaro, 2007; Parera, 2002; Ares, 2007; Naroski & Izurieta, 2003; Short,
1975, Cabrera, 2009), Cabrera, 2010; Leynaud & Bucher, 1999, Heredia,
2008; Gallardo, 1987;and Cabrera, 1998).
Use Values
According to Primack & Ros (2002), the values of use of the Chaco
wildlife are:
Consumption: Hunting for food is very common in the Chaco,
practiced by the aborigines and small farmers (Bucher, 1980). Meat is
the first objective, but skins and eggs are also used.
Commercial hunting. Hunting for sport and recreation is also quite
common. Zenaida auriculata, a dove species declared „agricultural
plague‟ could be hunted without restriction in some Chaco provinces.
Indirect Values
Non consumptive, environmental services. It is assumed that
dispersion of native plant species and the regulation of insect
populations are among the services brought by wildlife.
Existence values. There is an increasing concern about these values of
the Chaco wildlife by people.
Threats
According to Bucher (1980) main wildlife threats are: hunting, habitat
modification such loss of plant cover, loss of wetlands, croplands, overuse of
rivers, and fencing, a practice that limit wildlife movement.
Several mammalian species have decreased their population sizes and
distributions areas dramatically, such as Blastocerus dichotomus, ciervo de los
Pantanos, swamp deer; Ozotoceros bezoarticus, ciervo de las pampas, pampas
deer; and Lama guanicoe, guanaco (Canevari & Vaccaro, 2007; Parera, 2002).
Complimentary Contributor Copy

Table 3. List of some wildlife species of the western Chaco of economic importance (not exhaustive)
Species Food Hunting Commercial hunting Control hunting
Mammalians
Mazama gouazoubira X X X (hide, meat)
Tayassu pecari and T. tajacu X X X (hide, meat)
Catagonus wagneri X X
Tapirus terrestris X X X (meat)
Dasypodidae X
Puma concolor X X X (hide) X (damage to livestock)
Panthera onca X X X (hide) X (damage to livestock)
Herpailurus yaguarondi X (hide) X (damage to farm animals)
Leopardus pardalis X (hide) X (damage to farm animals)
Lycalopex griseus X X X (hide) X (damage to livestock and farm animals)
Birds
Myopssita monachus X X (pets) X (damage to crops)
Zenaida auriculata X X X (meat) X (damage to crops)
Columba maculosa and C. picazuro X X X (damage to crops)
Diverse Anatidae X X X (meat) X (damage to crops)
Diverse Tinamidae X X X (meat)
Diverse Emberizidae y Turdidae X (singing birds)
Amazona aestiva X (pets)
Reptiles
Boa constrictor occidentalis X X (hide, pets)
Chelonoidis petersi X X (hide, pets)
Tupinambis merianae and T. rufescens X X (hide)
Complimentary Contributor Copy

Carlos Kunst, Sandra Bravo, Roxana Ledesma et al.
158
REFERENCES
Albanesi A., C. Kunst (ex aequo), A. Anriquez, J. Silberman, R. Ledesma, M.
Navall, J.A. Dominguez Nuñez, R. A. Duffau, R. A. Suarez, D.
Werenistky, D. Coria, O. Coria. 2013. Rolado selectivo de baja intensidad
(RBI) y sistemas silvopastoriles de la región chaqueña. In: Hacia la
construcción del desarrollo agropecuario y agroindustrial de la FAyA al
NOA. Eds. Albanesi A., R. Paz, M.T. Sobrero, S. Helman, S. Rodriguez.
Ediciones Magna Publicaciones. ISBN: 978-987-1726-16-5.
Albanesi, A.; A. Anriquez; C. Kunst; C. Lopez. 2003. Calidad de suelo.
Propiedades biológicas y evaluación en ecosistemas semiáridos. En:
Albanesi et al. (ed) Microbiología Agrícola. Un aporte de la investigación
argentina. UNSE ISBN 987-99083-X. 7:22.
Arshad, M.; S. Martin. 2002. Identifying critical limits for soil quality
indicators in agroecosystems. Agriculture, Ecosystems and Environment
88: 153-160.
Boletta, P. E. 1988. Clima. Cap.1, pag. 7-21, In: Desmonte y habilitación de
tierras en la Región Chaqueña semiárida. R. R. Casas, ed. Red de
Cooperación Técnica en el uso de los Recursos Naturales en la Región
Chaqueña Semiárida, FAO, Santiago, Chile.
Bordón, A. 1983. Comentarios e ideogramas sobre la vegetación de la Pcia del
Chaco emergentes de una muestra de descripciones de vegetación en
relación a series de suelo. Bol. No 86, INTA EERA Saénz Peña.
Bravo S. 2008. Manejo de rolados: caracteres estructurales de leñosas que
influencian la producción de rebrotes frente tratamientos mecánicos. En
RBI. Rolado Selectivo de Baja Intensidad Pag 126-131. Eds: Kunst C.,
Ledesma R., Navall M. Ediciones INTA.
Bravo S., Kunst C., Leiva M., Ledesma R. 2012. Espesor de corteza y
tolerancia la fuego en especies nativas del Chaco en estadio juvenil. Actas
2do Congreso Nacional de Sistemas Silvopastoriles, 195, ISBN 978-987-
679-123-6.
Bravo, S. 2010. Anatomical changes induced by fire-damaged cambium in two
native woody species of argentine Chaco region. IAWA Journal 31 (3):
283 - 292.
Bravo, S., A. Giménez y G. Moglia. 2001. Efectos del fuego en la madera de
Prosopis albaGriseb. yP. nigra (Griseb.) Hieron. Mimosaceae. Bosque 22
(1): 51 – 63.
Complimentary Contributor Copy

Ecology and Management of the Dry Forests and Savannas …
159
Bravo, S., A. Giménez y G. Moglia. 2006. Caracterización anatómica del leño
y evolución del crecimiento en ejemplares de Acacia aroma y Acacia
furcatispina en la Región Chaqueña. Bosque 27 (2): 146-154.
Bravo, S., C. Kunst, R. Grau. 2008. Suitability of the native woody species of
the Chaco region, Argentina, for use in dendroecological studies of fire
regimes. Dendrochronologia 26, 43 – 52.
Bravo, S., C. Kunst, A. Giménez y G. Moglia. 2001. Fire regime of Elionurus
muticus Spreng. savanna, Western Chaco region, Argentina. International
Journal of Wildland Fire (10): 65-72.
Bravo, S., C. Kunst, M. Basualdo, M. Leiva, R. Ledesma. 2011. Assessment of
the aerial bud bank of native tree and shrub species of the Chaco region,
Argentina. International Rangeland Congress, 4 – 9 de abril, Rosario,
Argentina.
Bravo, S., Kunst, C. Leiva, M, Ledesma, R. 2012. Espesor de corteza y
tolerancia al fuego en especies nativas del Chaco es estadio juvenil.
Segundo Congreso Nacional de Sistemas Silvopastoriles. 9 - 11 de mayo
Santiago del Estero.
Camaño J. 1955. “Noticia del Gran Chaco” (1778). Ed. Guillermo Furlong.
Escritores Coloniales Rioplatenses VIII. Librería del Plata S.R.L. Buenos
Aires. 186 pp.
Cid Lendínez D., Iturre M., Araujo P., González García C. 2013. Crecimiento
del área basal en parcelas permanentes de inventario forestal continuo.
Quebracho 21: 115-120.
Cubbage, F., Balmelli, G., Bussoni, A., Noellemeyer, E., Pachas, A., Fassola,
H., Colcombet., L., Rossner, B., Frey, G., Dube, F., Lopes de Silva, M.,
Stevenson, H., Hamilton, H., Hubbard, W..2012. Comparing silvopastoral
systems and prospects in eight regions of the World. AgroforestSyst
(2012) 86:303–314 DOI 10.1007/s10457-012-9482-z
De Araújo Marques, J., CunhaLeite, L., Moya Romero, D. Bienestar animal en
sistemas silvopastoriles. Revista Colombiana de Ciencia Animal. - RCCA,
Vol 4, No 1.
Francaviglia R., A. Benedetti, L. Doro, S. Madrau, L. Ledda. 2014. Influence
of land use on soil quality and stratification ratios underagro-silvo-pastoral
Mediterranean management systems. Agriculture, Ecosystems and
Environment 183 (2014) 86– 92.
Frenguelli, J. (1940) Rasgos principales de fitogeografía argentina.
Publicacion periódica No 2, Museo de La Plata, La Plata, Argentina.
Herrera, P., Torella, S., Adámoli, J., 2003. Los incendios forestales como
modeladores del paisaje en la región chaqueña. In: Kunst, C., Bravo, S.,
Complimentary Contributor Copy

Carlos Kunst, Sandra Bravo, Roxana Ledesma et al.
160
Panigatti, J (Eds.), Fuego en los Ecosistemas Argentinos. Ediciones INTA,
Argentina, pp. 145-156.
Gomez A., M. Navall 2008. Manejo de rolados: efectos del rolado sobre la
estructura del bosque. Implicancias para el manejo forestal. En RBI.
Rolado Selectivo de Baja Intensidad Pag 117-125. Eds: Kunst C.,
Ledesma R., Navall M. Ediciones INTA.
Jose S. 2012. Designing sustainablesilvopastoralsystems: fromresource
availability to management interventions. Actas 2º Congreso de
sistemassilvopastoriles “Una oportunidad para el desarrollosustentable”
Ed Arroquy J., R. Ledesma, S. Roldán, A. Gomez. 1º edición Santiago del
Estero. Ediciones INTA. pp 488. ISBN 978-987-679-123-6Smith et al.,
2012)
Kumada, S.; T. Kawanishi; Y. Hayashi; K. Ogomori; Y. Kobayashi; N.
Takahashi; M. Saito; H. Hamano; T. Kojima; K. Yamada. 2008. Litter
carbon dynamics analysis in forests in an arid ecosystem with a model
incorporating the physical removal of litter. Ecological Modelling 215:
190–199.
Kunst C, R. Ledesma, S., Bravo, A. Albanesi, A. Anriquez, J. Godoy. 2009.
Fire as a tool for rangeland improvement in Northwestern Argentina. 1st
South American Symposium on Fire Ecology and Management, Centro
Nacional Patagónico, CENPAT, Puerto Madryn, Argentina.
Kunst C., Ledesma R., Bravo S., Albanesi A., Godoy J. 2012. „Rolados‟ y
diversidad botánica III: efecto en el sitio media loma. Actas 2do Congreso
Nacional de Sistemas Silvopastoriles, 254-258, ISBN 978-987-679-123-6.
Kunst C., Ledesma R., Godoy J. 2012, Acumulación de biomasa aérea de
Panicum máximum cv gattonpanic en rolados. Actas 2do Congreso
Nacional de Sistemas Silvopastoriles, 61-65, ISBN 978-987-679-123-6,
Kunst C., Ledesma R., Godoy J., Navarrete V. 2012. Dinámica del volumen de
arbustivas en rolados de baja intensidad. Actas 2do Congreso Nacional de
Sistemas Silvopastoriles, 76-80, ISBN 978-987-679-123-6,
Kunst C., R. Renolfi, H. Pérez y F. Dalla Tea. 1995. Preferencia de bovinos
por gramíneas nativas de bosques y arbustales de la región chaqueña
occidental. Rev. Arg. Prod. Animal 15: 110-113.
Kunst, C. 1982. Descripción, ecología, valor nutritivo, calidad y valor
forrajero de algunas gramíneas del campo natural de la Pcia de Sgo del
Estero‟. 40 p. Ediciónes INTA.
Kunst, C., R. Ledesma, M. Castañares, M. Cornacchione, H. van Meer, J.
Godoy. 2014. Yield and growth features of Panicum maximum (Jacq.)
Complimentary Contributor Copy

Ecology and Management of the Dry Forests and Savannas …
161
varTrichoglumecv Petrie (Green Panic) under woody cover, Chaco region,
Argentina. Agroforest Syst DOI 10.1007/s10457-013-9663-4.
Kunst C., Bravo S., Moscovich, J. Herrera, J. Godoy y S. Vélez. 2003. Fecha
de aplicación de fuego y diversidad de herbáceas en una sabana de
Elionorus muticus (spreng) O. Kuntze (aibe). Rev. Chilena de Historia
Natural 76: 105-115.
Kunst C. Ledesma R., Bravo S., Albanesi A., Anriquez A., van Meer H.,
Godoy J. 2012. Disrupting woody steady states in the Chaco region
(Argentina): responses to combined disturbance treatments. Ecological
Engineering 42: 42-53.
Kunst, C., S. Bravo, F. Moscovich, J. Herrera, J. Godoy y S. Vélez. 2000.
Control de tusca (Acacia aroma Gill. Ap H. et Arn.) mediante fuego
prescripto. Revista Argentina de Producción Animal 20 (3 – 4): 199 – 213.
Kunst, C.; R. Ledesma; M. Navall (eds). 2008. Rolado Selectivo de Baja
intensidad. Edit. INTA EEA Santiago del Estero. 140 pág.
Kunst, C; R. Ledesma; S. Bravo; J. Godoy; V. Navarrete. 2009. Sistemas
silvopastoriles en el Chaco Semiárido III: efecto del rolado sobre la
estructura de especies arbustivas nativas. Actas 1er. Congreso Nacional de
Sistemas Silvopastoriles, Misiones, 14 -16 de mayo, pp. 1-7.
Lagomarsino A., A Benedetti, S. Marinari, L. Pompili, M. C. Moscatelli, P. P.
Roggero, R. Lai, L. Ledda, S. Grego. 2011. Soil organic C variability and
microbial functions in a Mediterranean agro-forest ecosystem. Biol Fertil
Soils (2011) 47:283–291
Lizárraga, R. de. (circa 1600). Descripción colonial. Bs. AS. 1916.
http://www.lluisvives.com/servlet/SirveObras/acadLetArg/680161415454
67830532279/p0000001.htm#I_0_ consulted 26/03/2014
Lupatini M, Suleiman AKA, Jacques RJS, Antoniolli ZI, Kuramae EE, de
Oliveira Camargo, F.A., WürdigRoesch, L.F. 2013 Soil-borne bacterial
structure and diversity does not reflect community activity in Pampa
biome. PLoS ONE 8(10): e76465. doi:10.1371/journal.pone.0076465
Lopez de Casenave, J., Pelotto, J., Protomastro, J. 1995. Edge-interior
differences in vegetation structure and composition in a Chaco semi-arid
forest, Argentina. Forest Ecology and Management 72: 61-69.
Morello, J., S. Matteuchi, A. Rodriguez, M. Silva, M. 2012. Ecorregiones y
complejos ecosistémicos argentinos. Orientación Gráfica Editora. Buenos
Aires, Argentina. 752 p.
Métraux A. 1946. Ethnology of the Chaco. p. 197-379. In.: Steward, J. Ed.
Handbook of south American indians. Smithsonian Institution, Bull. 143,
Complimentary Contributor Copy

Carlos Kunst, Sandra Bravo, Roxana Ledesma et al.
162
Vol. I, The marginal tribes. US Government Printing Office.http://
biodiversitylibrary.org/page/26734435
Montes A. 2008. Indígenas y conquistadores de Córdoba. Ediciones Isquitipe.
Bs. As.
Morello J., Matteucci S.D. 2000. Singularidades territoriales y problemas
ambientales de un país asimétrico y Terminal. Realidad Económica 169.
En http://www.iade.org.ar
Navas Panadero, A. 2010. Importancia de los sistemas silvopastoriles en la
reducción del estrés calórico en sistemas de producción ganadera tropical.
Rev. Med. Vet. no.19.
Ng, E., Patti, A., Rose, M., Schefe, C., Wilkinson, K., Smernik, R.,
Cavagnaro, T. 2014. Does the chemical nature of soil carbon drive the
structure and functioning of soil microbial communities? Soil Biology &
Biochemistry 70: 54-61
Nyakatawa, E.Z.; D.A Mays; K. Naka; J.O. Bukenya. 2011. Carbon, nitrogen,
and phosphorus dynamics in a loblolly pine-goat silvopasture system in
the Southeast USA. Agroforest Syst DOI 10.1007/s10457-011-9431-2
Pérez, E., Soca, M., Díaz, L., Corzo, M. 2008. Comportamiento etológico de
bovinos en sistemas silvopastoriles en Chiapas, México Pastos y Forrajes
v.31 n.2.
Renolfi, R., Fabiani A., Kunst C., Pérez H., Dalla Tea F.. 1987. Estimación de
la altura de uso adecuado de gramíneas nativas de la región chaqueña
occidental (Sgo del Estero). Revista Argentina de Producción Animal 7:
181-189.
Sanzano G. A., R. D. Corbella, J. R. García, G. S. Fadda. 2005. Degradación
física y química de un Haplustol típico bajo distintos sistemas de manejo
de suelo. Cienc. Suelo (ARGENTINA) - 23 (1) 93-100.
Taddese, G.; M.A. Mohamed Saleem; A. Abyie; A. Wagnew. 2002. Impact of
grazing on plant species richness, plant biomass, plant attributes, and soil
physical and hydrological properties of Vertisol in East African highlands.
Environ Manage 29:279–289.
Tortorelli L. 1947. Los incendios de bosques en la Argentina. Ministerio de
Agricultura, Dirección Forestal, Buenos Aires, 238 p.
Vallejo, V., Arbelí, Z., Terán, W., Lorenz, N., Dick, R., Roldan, F. 2012.
Effect of land management and Prosopisjuliflora (Sw.) DC trees on soil
microbial community and enzymatic activities in intensive silvopastoral
systems of Colombia.Agriculture, Ecosystems and Environment 150
(2012) 139– 148.
Complimentary Contributor Copy

Ecology and Management of the Dry Forests and Savannas …
163
Viglizzo, E.F.; E. Jobbágy. 2010. Expansión de la Frontera Agropecuaria en
Argentina y su Impacto Ecológico-Ambiental. Ediciones INTA. ISBN Nº
978-987-1623-83-9. 102p.
Complimentary Contributor Copy

Complimentary Contributor Copy

In: Dry Forests ISBN: 978-1-63321-291-6
Editor: Francis Eliott Greer © 2014 Nova Science Publishers, Inc.
Chapter 6
PREDICTING PASTURE SECURITY IN
RANGELAND DISTRICTS OF KENYA USING
1 KM RESOLUTION SPOT VEGETATION
SENSOR NDVI DATA
Mwangi J. Kinyanjui Department of Resource Surveys and Remote Sensing,
Nairobi, Kenya
ABSTRACT
Ten day interval Normalized Difference Vegetation Index (NDVI)
data recorded from 1 km resolution SPOT VEGETATION sensor for the
period 2000 – 2011 was used to show variations in vegetation health in
the northern rangeland counties of Kenya to advise on pasture availability
over time and space. Using FAO land cover classification categories,
three land cover types were selected for pasture areas; Herbaceous,
Herbaceous with shrub and Open shrubs. The NDVI data was
summarized for each vegetation type in 8 counties in the northern
rangelands of Kenya. Yearly trends of vegetation were plotted and
polynomial regression used to predict vegetation indices at different times
of the year. Results show that pasture specific vegetation in the study
areas cover over 17 million ha, a significant portion of the total 59 million
hectares of Kenya‟s land area making them very potential for grazing and
the national economic planning. The vegetation health was very
dependent on the hydrological fluxes and regression models for
Complimentary Contributor Copy

Mwangi J. Kinyanjui
166
predicting vegetation indices at specific periods of the year gave near
perfect fit in Garissa, Mandera and Wajir counties with coefficients of
Determination (R2) higher than 0.9 in all cases. ANOVA indicated no
differences in vegetation among areas, seasons and years implying that
effects of climate change and increased human activities have not
compromised vegetation in the study period. The study proposes
enhancement of the pasture by promoting nutritious and palatable grasses.
Keywords: Range lands, pasture availability, vegetation indices
INTRODUCTION
Rangelands, defined as vast natural landscapes largely comprising of
grasslands, shrublands, woodlands, wetlands, and deserts, cover almost half of
the Earth‟s land surface (Tal, 2009). In Kenya, they comprise up to 80% of the
total land cover (Rao and Mathuva, 2000). and support the livelihoods of
pastoral communities characterized by large herds of livestock that often
compete for scarce pasture with wild ungulates (Oba et al., 2003). Most of the
rangeland counties of Kenya occur in the northern parts of the country and
David (2010) described them as areas with low rainfall and elongated
droughts. The pastoral communities living here are largely nomadic since they
have to relocate their animals from time to time in search of better pasture
(Berger, 2003). As such pasture availability is a prime issue and is often a
cause of conflict in Kenyan rangelands (Fratkin, 2001 and Otuoma et al,
2009).
If pasture is managed well in the rangelands, they become sustainable
ecosystems (Majule et al., 2009). Management entails availing pasture of the
right quality to meet the demands of all the grazers all the time (Prins and
Beekman, 2008). In these dry areas of Kenya, Berger (2003) has detailed
requirements for a good rangeland management programme. It would ensure
that the carrying capacity is not exceeded through culling and stock reduction,
provision of alternative food during the dry season and implementation of
policies that protect the natural resources. Management also includes proper
prediction of drought seasons which would aid relocation of livestock to areas
of better pasture and would aid communities in coping with changing climatic
patterns (Anyamba et al, 2002).
Methods of pasture prediction range from traditional systems (Berger,
2003) to remote sensing techniques (Zhao et al., 2007) and soil potential
measurement methods (Kusumo et al., 2010). For vast areas, remote sensing
Complimentary Contributor Copy

Predicting Pasture Security in Rangeland Districts of Kenya …
167
has been used to compare vegetation data from season to season (Anyamba et
al, 2002) and also among areas (Kinyanjui, 2011). Since pasture availability is
a cyclic event influenced by climatic conditions, hydro-ecological fluxes and
anthropological factors (Otuoma et al, 2009) it may be possible to predict
pasture availability based on the season of the year. This study sought to
predict pasture availability in rangeland counties of northern Kenya and
develop tools for pasture prediction. Using 10 day interval vegetation health
Index data from the Endeleo project (Endeleo, 2013), the variation of
vegetation health from season to season and spatially would help advise
communities on “danger seasons” when they would need to relocate herds or
cull and optimal relocation sites.
METHODS
Study Area and Land Cover Mapping
The study area comprised the northern arid counties of Kenya namely
Marsabit, Mandera, Wajir, Samburu, Garissa, Baringo, Laikipia and Isiolo
(Figure 1). From the FAO land cover map (FAO, 2003) which has 29 land
cover types for Kenya, areas of herbaceous vegetation designated in class A12
(Natural and Semi natural Terrestrial Vegetation) of the Africover legend were
clipped. The specific cover types relevant to pasture were; Open low shrubs
(65-40% crown cover), Open shrubs (45-40% crown cover), Open to closed
Herbaceous vegetation, Shrub savannah and Sparse shrubs. However, using an
image enhancement method (Eastman, 2003), Endeleo project (Endeleo, 2013)
has merged the 29 FAO classes to give 11 classes and provides vegetation
index data based on the 11 classes. The merged pasture specific land cover
classes in the Endeleo data set are referred to Herbaceous, Herbaceous with
shrub and Open shrubs.
NDVI Tools
Using the 11 land cover classes, Endeleo project (Endeleo, 2013) provides
10 day (dekadal) interval data on changes in vegetation health and density all
over Kenya using two indices namely; the Normalised Difference Vegetation
Index (NDVI) and the Dry Matter Productivity (DMP). The data is received
Complimentary Contributor Copy

Mwangi J. Kinyanjui
168
through the African Monitoring of the Environment for sustainable
Development (AMESD) server in the Department of Resource Surveys and
Remote Sensing (DRSRS). The indices are calculated to show variations from
spectral characteristics of the vegetation as recorded by the 1 km resolution
SPOT VEGETATION sensor. An average of 10 day data is smoothed to
remove possible dips related to bad values, with an algorithm based on Best
Index Slope Extraction (Viovy et al., 1992) which inspects each pixel‟s profile
and removes all abrupt local minima.
Figure 1. Location of the range land districts studied.
Complimentary Contributor Copy

Predicting Pasture Security in Rangeland Districts of Kenya …
169
The NDVI which has been used to indicate vegetation health and density
(Anyamba, et al., 2002 and Kinyanjui 2011) was selected for this study. Ten
day interval data for each vegetation type in each county was summarized into
excel tables cover the period January 2000 and December 2011. This data was
used for analyzing vegetation conditions over time, among seasons and among
counties. This illustrates varying vegetation conditions would be used as a
proxy to show pasture availability (Tucker and Sellers, 1986).over space and
time.
Data Analysis
Trends of vegetation changes were plotted to show low and high seasons
and predict changes over the study period. ANOVA and the Normal Deviate
(Zar, 1999) were used to show differences in NDVI among counties and
among seasons and illustrate seasons with extremely low values. Polynomial
regression (Zar 1999) was used to develop equations that predict the
vegetation conditions of a county area at a time. Using the forward stepwise
procedure in Data Fit 9.0.59 Statistical Software the best “polynomial of fit
“with the coefficient of multiple determination (R2), Adjusted Coefficient of
Multiple determination (Ra2), the Durbin-Watson statistic and standard error of
estimate (SEE) the best polynomial was selected.
RESULTS AND DISCUSSION
The Vegetation Conditions of Kenya
Areas Available for Pasture
There were over 17 million hectares with pasture related vegetation in the
8 counties studied (Table 1). Marsabit and Wajir counties had the most
extensive vegetation of interest with 4.9 million and 4.6 million hectares
respectively as compared to the counties of Laikipia and Baringo which are
dominated by other vegetation types (Figure 2). Shrub savannah was dominant
with about 7 million hectares but mainly restricted to Marsabit, Wajir and
Garissa counties. Although abundance of grasses may not imply availability of
pasture (Ali and Tomrat, 2009), the extensive grasslands show the potential for
grazing in these rangelands described as supporting over 4% of Kenya‟s
human population (Berger, 2003) and availing up to 70% of Kenya‟s land
cover for pastoral activities (Tal, 2009).
Complimentary Contributor Copy

Mwangi J. Kinyanjui
170
Table 1. The extent of the herbaceous vegetation types among the districts
County Open low
shrubs
(65-40%
crown
cover)
Open
shrubs (45-
40% crown
cover)
Open to
closed
herbaceous
Shrub
savannah
Sparse
shrubs
Total
Marsabit 1,069,470 159,913 641,176 1,864,835 1,180,578 4,915,972
Wajir 885,977 828,135 510,644 1,857,359 615,082 4,697,197
Garissa 772,869 104,916 114,004 1,029,771 42,112 2,063,671
Isiolo 604,969 96,963 301,631 832,154 167,379 2,003,097
Mandera 695,421 169,392 47,033 336,091 280,010 1,527,947
Samburu 463,499 132,976 215,700 424,477 122,407 1,359,059
Baringo 184,333 67,089 66,449 210,116 36,695 564,681
Laikipia 158,121 11,868 33,540 276,806 2,405 482,740
Total 4,834,659 1,571,252 1,930,177 6,831,609 2,446,668 17,614,365
Figure 2. Vegetation distribution in the selected counties.
Complimentary Contributor Copy

Predicting Pasture Security in Rangeland Districts of Kenya …
171
Vegetation Trends within the Year
Averages of NDVI calculated for the study period indicated that
vegetation had a similar trend among the seasons of the year for all counties
(Figure 3). The vegetation was healthy in November – January season but
gradually decreased towards March. There was a minor peak in April – June
followed by an elongated period of poor vegetation between June and October.
The differences in vegetation health for all the counties and in all vegetation
types were significant (P < 0.05) between the dry and wet periods. However,
there were no significant differences (P < 0.05) among counties except that
Laikipia had a slightly higher average than the other counties. It was noted that
Laikipia County has some artificial grasses which could have enhanced the
vegetation Index. In all cases, open shrub vegetation type was healthier
(Figure 2) with an average Index of over 0.3 which is described as normal for
shrublands and grasslands (Endeleo, 2013). Herbaceous vegetation was
poorest with values of the Index going below 0.2 which Endeleo (2013)
describes as poor. The difference in health of the herbaceous and open shrub
vegetation may be attributed to the presence of shrubs on pasture lands. These
shrubs might have enhanced the spectral characteristics of the vegetation and
may not imply better pasture. However, this may also be an indication of the
improvement of grasses that grow below shrubs as they are protected from the
direct sunlight (Lamprey and Yussuf, 1981).
The trend of vegetation changes among seasons of the year illustrates its
strong dependence on the hydrological fluxes (Otuoma et al, 2009) making it
easy to predict based on the rainfall patterns. In all the vegetation types, 6th
order polynomials were selected as best predictors of the vegetation health in
the seasons of the year (Table 2). Garissa County had the best trends with the
three polynomials selected for herbaceous with shrub, open shrub and
herbaceous vegetation types giving Ra² values over 0.94 which indicates high
level of agreement between predicted and real values (Zar, 1999). Mandera
and Wajir counties also had vegetation with good predictability and in all
cases agreement between predicted and real values was over 90%. The 6th
order polynomial assumes a trend of rising and falling values (Zar, 1999) and
would best predict vegetation that follows a bimodal and trimodal patterns as
described for the rainfall patterns of the study area (David, 2010). Laikipia, the
county where artificial grasses were identified on the ground had the lowest
predictability with two polynomials giving about 60% agreement between
predicted and real values. The vegetation of Laikipia County is therefore less
influenced by hydrological patterns.
Complimentary Contributor Copy

Mwangi J. Kinyanjui
172
Figure 3. The trend of vegetation in sampled counties.
Table 2. Models for estimating vegetation indices for selected districts
District
Vegetation
Type Relationship (y = NDVI, x = dekad) Ra²
Baringo
Herbaceous
with shrub
y = -3.05x6 +2.38x5 - 2.73x4 - 1.99x3 +5.84x2
- 4.23x +0.41 0.78
Open shrub
y = -4.30x6 + 3.79x5 - 8.60x4 - 9.24x3 + 5.14x2
- 4.26x + 0.48 0.77
Herbaceous
y = 9.49x6 - 1.53x5 + 1.07x4 - 3.82x3 + 6.57x2
- 4.21x + 0.39 0.71
Garissa
Herbaceous
with shrub
y = -1.15x6 + 9.13x5 - 1.84x4 - 1.50x3+ 7.75x2
- 6.62x + 0.41 0.95
Open shrub
y = -1.36x6 + 1.10x5 - 2.42x4 - 9.55x3 + 8.04x2
- 7.14x - 0.45 0.95
Wajir Laikipia
Isiolo Marsabit
Garissa Mandera
0.15
0.2
0.25
0.3
0.351
0-J
an
10
-Fe
b
10
-Mar
10
-Ap
r
10
-May
10
-Ju
n
10
-Ju
l
10
-Au
g
10
-Se
p
10
-Oct
10
-No
v
10
-De
c
ND
VI
Time of the year
Herbacious Herbacious with shrub Open shrub
0.3
0.35
0.4
0.45
0.5
10
-Jan
10
-Fe
b
10
-Mar
10
-Ap
r
10
-May
10
-Ju
n
10
-Ju
l
10
-Au
g
10
-Se
p
10
-Oct
10
-No
v
10
-De
c
ND
VI
Time of the the yearherbacious with shrub herbacious open shrubs
0.1
0.15
0.2
0.25
0.3
0.35
10
-Jan
10
-Fe
b
10
-Mar
10
-Ap
r
10
-May
10
-Ju
n
10
-Ju
l
10
-Au
g
10
-Se
p
10
-Oct
10
-No
v
10
-De
c
ND
VI
Time of the yearherbacious herbacious with shrubs open shrubs
0.1
0.15
0.2
0.25
0.3
10
-Jan
10
-Fe
b
10
-Mar
10
-Ap
r
10
-May
10
-Ju
n
10
-Ju
l
10
-Au
g
10
-Se
p
10
-Oct
10
-No
v
10
-De
c
ND
VI
Time of the yearherbacious herbacious with shrub open shrubs
0.15
0.2
0.25
0.3
0.35
0.4
10
-Jan
10
-Fe
b
10
-Mar
10
-Ap
r
10
-May
10
-Ju
n
10
-Ju
l
10
-Au
g
10
-Se
p
10
-Oct
10
-No
v
10
-De
c
ND
VI
Time of the yearherbacious herbacious with shrub open shrub
0.15
0.2
0.25
0.3
0.35
10
-Jan
10
-Fe
b
10
-Mar
10
-Ap
r
10
-May
10
-Ju
n
10
-Ju
l
10
-Au
g
10
-Se
p
10
-Oct
10
-No
v
10
-De
c
ND
VI
Time of the yearherbacious herbacious with shrubs open shrubs
Complimentary Contributor Copy

Predicting Pasture Security in Rangeland Districts of Kenya …
173
District
Vegetation
Type Relationship (y = NDVI, x = dekad) Ra²
Herbaceous
y = -8.36x6 + 6.36x5 - 1.07x4 - 2.00x3+ 7.02x2
- 5.80x + 0.36 0.94
Laikipia
Herbaceous
with shrub
y = -8.43x6 + 7.82x5 - 2.29x4 + 1.43x3 +
3.41x2 - 4.38x + 0.49 0.61
Open shrub
y = -1.24x6 + 1.17x5 - 3.69x4 + 3.72x3 +
1.65x2 - 0.04x - 0.51 0.73
Herbaceous
y = -8.36x6 + 6.90x5 - 1.49x4 - 1.13x3 + 6.82x2
- 0.06x + 0.51 0.62
Mandera
Herbaceous
with shrub
y = -1.29x6 + 1.09x5 - 2.76x4 + 9.62x3 +
4.46x2 - 4.52x + 0.34 0.92
Open shrub
y = -1.30x6 + 1.03x5 - 2.22x4 - 7.74x3 + 6.70x2
- 5.54x +0.36 0.91
Herbaceous
y = -1.30x6 +1.17x5 - 3.50x4 - 3.45x3 - 8.65x2
- 2.56x + 0.28 0.94
Marsabit
Herbaceous
with shrub
y = -6.04x6 + 4.83x5 - 9.72x4 - 8.69x3 + 4.34x2
- 0.04x + 0.27 0.84
Open shrub
y = -8.14x6 + 6.32x5 - 1.18x4 - 1.41x3 + 5.87x2
- 4.75x + 0.33 0.87
Herbaceous
y = -3.06x6 + 2.33x5 - 3.62x4 - 9.49x3 + 3.00x2
- 2.30x + 0.19 0.76
Wajir
Herbaceous
with shrub
y = -1.12x6 + 9.71x5 - 2.59x4 + 1.34x3 +
3.44x2 - 4.06x + 0.32 0.93
Open shrub
y = -1.18x6 + 9.64x5 - 2.23x4 - 1.01x3 + 5.55x2
-5.18x + 0.36 0.93
Herbaceous
y = -1.18x6 + 1.07x5 - 3.18x4 + 2.95x3 +
1.46x2 - 0.03x + 0.29 0.94
Vegetation Trends over Time
Vegetation conditions for the June – July period denoted as the season of
poor vegetation and October – November season denoted as season of good
vegetation indicated differences among years in the 2000 – 2011 study period.
In all the years, vegetation indices of the herbaceous vegetation type decreased
gradually from the first dekad of June to the first dekad of July (Figure 4).
Conversely, the indices increased gradually from the last dekad of October to
the last dekad of November. There were no significant differences (P < 0.05)
in vegetation indices for the low vegetation seasons in all the vegetation types.
However, differences were noted for the high vegetation season attributed to
years 2006 and 2011 in Wajir and Isiolo Counties and 2004, 2006 and 2011 in
Complimentary Contributor Copy

Mwangi J. Kinyanjui
174
Mandera County. In these years, the vegetation indices show enhanced values
tending towards 0.5 which is characteristic of spectral indices in forest
vegetation (Endeleo, 2013). These results imply that the vegetation of the
rangelands may be improving in the period 2000 to 2011 and the seasons have
not been altered. This finding agrees with Anyamba et al. (2002) who
predicted a shrinking of the Sahelian vegetation using data sets from 1980s to
1990s. the findings therefore predict better vegetation for the study areas in
future.
Figure 4. The trend of vegetation in the June July and October November season.
Wajir
Marsabit
Mandera
Isiolo
Garissa
0
0.1
0.2
0.3
0.4
0.5
YEAR 2000
YEAR 2001
YEAR 2002
YEAR 2003
YEAR 2004
YEAR 2005
YEAR 2006
YEAR 2007
YEAR 2008
YEAR 2009
YEAR 2010
YEAR 2011
ND
VI
30-Oct 10-Nov 20-Nov 30-Nov
0
0.1
0.2
0.3
0.4
0.5
YEAR 2000
YEAR 2001
YEAR 2002
YEAR 2003
YEAR 2004
YEAR 2005
YEAR 2006
YEAR 2007
YEAR 2008
YEAR 2009
YEAR 2010
YEAR 2011
ND
VI
30-Oct 10-Nov 20-Nov 30-Nov
0
0.1
0.2
0.3
0.4
0.5
YEAR 2000
YEAR 2001
YEAR 2002
YEAR 2003
YEAR 2004
YEAR 2005
YEAR 2006
YEAR 2007
YEAR 2008
YEAR 2009
YEAR 2010
YEAR 2011
ND
VI
30-Oct 10-Nov 20-Nov 30-Nov
0
0.1
0.2
0.3
0.4
0.5
YEAR 2001
YEAR 2002
YEAR 2003
YEAR 2004
YEAR 2005
YEAR 2006
YEAR 2007
YEAR 2008
YEAR 2009
YEAR 2010
YEAR 2011
ND
VI
30-Oct noplot 10-Nov noplot 20-Nov noplot 30-Nov noplot
0
0.1
0.2
0.3
0.4
0.5
YEAR 2000
YEAR 2001
YEAR 2002
YEAR 2003
YEAR 2004
YEAR 2005
YEAR 2006
YEAR 2007
YEAR 2008
YEAR 2009
YEAR 2010
YEAR 2011
ND
VI
30-Oct 10-Nov 20-Nov 30-Nov
0
0.1
0.2
0.3
0.4
0.5
YEAR 2000
YEAR 2001
YEAR 2002
YEAR 2003
YEAR 2004
YEAR 2005
YEAR 2006
YEAR 2007
YEAR 2008
YEAR 2009
YEAR 2010
YEAR 2011
ND
VI
10-Jun 20-Jun 30-Jun 10-Jul
0
0.1
0.2
0.3
0.4
0.5
YEAR 2000
YEAR 2001
YEAR 2002
YEAR 2003
YEAR 2004
YEAR 2005
YEAR 2006
YEAR 2007
YEAR 2008
YEAR 2009
YEAR 2010
YEAR 2011
ND
VI
10-Jun 20-Jun 30-Jun 10-Jul
0
0.1
0.2
0.3
0.4
0.5
YEAR 2000
YEAR 2001
YEAR 2002
YEAR 2003
YEAR 2004
YEAR 2005
YEAR 2006
YEAR 2007
YEAR 2008
YEAR 2009
YEAR 2010
YEAR 2011
ND
VI
10-Jun 20-Jun 30-Jun 10-Jul
0
0.1
0.2
0.3
0.4
0.5
YEAR 2001
YEAR 2002
YEAR 2003
YEAR 2004
YEAR 2005
YEAR 2006
YEAR 2007
YEAR 2008
YEAR 2009
YEAR 2010
YEAR 2011
ND
VI
10-Jun noplot 20-Jun noplot 30-Jun noplot 10-Jul noplot
0
0.1
0.2
0.3
0.4
0.5
YEAR 2000
YEAR 2001
YEAR 2002
YEAR 2003
YEAR 2004
YEAR 2005
YEAR 2006
YEAR 2007
YEAR 2008
YEAR 2009
YEAR 2010
YEAR 2011
ND
VI
10-Jun 20-Jun 30-Jun 10-Jul
Complimentary Contributor Copy

Predicting Pasture Security in Rangeland Districts of Kenya …
175
SUMMARY AND CONCLUSION
The rangeland districts of Kenya have vast areas that comprise pasture
potential areas. The areas can be enhanced to make them sustainable to meet
the demand of the growing pastoral population. Some of the management
activities that would make the rangelands sustainable are proper prediction of
pasture availability. This study has demonstrated that it is possible to predict
pasture availability in the districts using vegetation indices that show the
health of vegetation.
The study found out that the vegetation patterns of the selected counties
are largely similar. They are highly dependent on the rainfall and therefore a
dry season indicates poor vegetation in all the counties. As such there is no
option for relocation of the livestock since all the counties experience similar
conditions. This implies that in the July - October period when an elongated
low pasture season is anticipated, culling and stock reduction should be
proposed as an alternative to translocating the animals. Moreover, the study
has proposed models that can be used to predict vegetation indices. For
example, using the models, the effects of climate change on the vegetation can
be tested for specific periods and advice on mitigation methods. This would be
very relevant in extreme droughts which severely affect the vegetation.
Similarly the models can be used to test effects of natural and anthropogenic
effects like fires that can totally eliminate vegetation.
The study found no evidence of a decrease in vegetation health in the
period 2000 – 2011. As such there is no negative effect to the vegetation due
to climate change or the increasing human population in the study area.
Therefore the sustainability of these ecosystems has not been compromised. It
would be necessary to establish the specific carrying capacities of the specific
vegetation types to be able to advise pastoralists on the optimal number of
livestock to keep. As in the case of Laikipia County, it is possible to enhance
the pasture through artificial means which would improve the potential of
these lands to support grazers.
The study used vegetation indices as a proxy for pasture availability. This
may not imply presence of quality pasture. The nutrient content of the various
grasses and their palatability should be assessed and proposals made to
enhance the grazing potential of the study areas.
Complimentary Contributor Copy

Mwangi J. Kinyanjui
176
ACKNOWLEDGMENT
This study was part of the resource surveys carried out by the Department
of Resource surveys and Remote Sensing in the Ministry of Environment. We
wish to thank Endeleo project for image analysis, specifically Delrue Josefien
of VITO who guided us on data processing methods.
REFERENCES
Ali, S. M. and Tamrat, B. (2009): Forage production and plant diversity in two
managedrangelands in the Main Ethiopian Rift. African Journal of
Ecology 48, 13–20.
Anyamba, A., Tucker, C. J. & Mahoney, R. (2002): From El Nino to La Nina:
vegetation response patterns over East and Southern Africa during the
1997–2000 periods. Journal of Climate 15, 3096–3103.
Berger, R., (2003): Conflict over natural resources among pastoralists in
northern Kenya: A look at recent initiatives in conflict resolution. Journal
of International Development 15, 245–257.
David J. A. (2010): Response of native ungulates to drought in semi-arid
Kenyan rangeland. African Journal of Ecology 48, 1009–1020.
Endeleo (2013): Endeleo Manual. http://endeleo.vgt.vito.be/index.html.
Retrieved January 2013.
FAO. (2003). Africover land classification. http://www.africover.org/system
/africover_data.php. Retrieved January 2013.
Fratkin E. (2001): East African pastoralism in transition, Maasai, Boran and
Rendille cases. African Studies Review 44:1.
Kinyanjui, J. M. (2011): NDVI based vegetation monitoring in the Mau forest
complex, Kenya. African Journal of Ecology 49: 165-174.
Kusumo, B. H., Hedley, M. J., Hedley, C. B., Arnold, G. C. and Tuohy, M. P.
(2010): Predicting pasture root density from soil spectral reflectance: field
measurement. European Journal of Soil Science 61, 1-13.
Lamprey H, Yussuf H. 1981. Pastoralism and desert encroachment in northern
Kenya. Ambio X: 131–134.
Majule, A. E., Mbonile, M. J. and. Campbell, D. J (2009): Ecological gradients
as a framework for analysis of land-use change in East Africa. African
Journal of Ecology 47 (Suppl. 1), 55–61.
Complimentary Contributor Copy

Predicting Pasture Security in Rangeland Districts of Kenya …
177
Oba, G., Weladji, R. B., Lusigi, W.J and Stenseth, D. N. C. (2003): Scale-
dependent effects of grazing on rangeland degradation in northern Kenya:
A test of equilibrium and non-equilibrium hypotheses. Land Degradation
and Development.14: 83–94.
Otuoma, J., Kinyamario, J Ekaya, W., Mrigesh K. and Nyabenge, M. (2009):
Effects of human–livestock–wildlife interactions on habitat in an eastern
Kenya rangeland. African Journal of Ecology.47, 567–573.
Prins, H. H. T and Beekman, J. H. (2008): A balanced diet as a goal for
grazing: the food for the Manyara buffalo. African Journal of Ecology 27,
241-259.
Rao M.N and Mathuva, M.R (2000): Legumes for improving maize yields and
income in semi-arid Kenya. Agriculture, Ecosystems and Environment
78:123–137.
Tal, A. (2009): The logic and logistics of grazing regulations. Land
Degradation and Development.20: 455–467.
Tucker, C. J. and Sellers, P. J (1986). Satellite remote sensing of primary
production," International Journal of Remote Sensing 7, 1396-1416.
Viovy, N., Arino, O. & Belward, A.S. (1992) The Best Index Slope Extraction
(BISE): A method for reducing noise in NDVI time series. International
Journal of Remote Sensing.13, 1585–1590.
Zar, J.H. (1984) Biostatistical Analysis, 4th
Ed. Prentice-Hall, Englewood
Cliffs, NJ. 662 pp.
Zhao, D., Starks, P.J., Brown, M. A, Phillips, W. A. and Coleman, S. W.
(2007): Assessment of forage biomass and quality parameters of Bermuda
grass using proximal sensing of pasture canopy reflectance. Grassland
Science 53 (2007) 39–49.
Complimentary Contributor Copy

Complimentary Contributor Copy

INDEX
A
access, 47
accessibility, 146, 147
acid, 132, 143
activity level, 117
adaptation(s), 12, 19, 121, 155
adsorption, 112
adults, 34
Africa, 2, 74, 91, 176
age, 23, 111, 124
agriculture, 50, 78, 138, 143
air temperature, 135, 155
algorithm, 168
amortization, 153
amphibians, 10, 18, 50, 73, 83
anatomy, 3
angiosperm, 27
ANOVA, xi, 110, 166, 169
Argentina, v, vii, viii, x, xi, 5, 6, 8, 12, 30,
31, 38, 49, 83, 133, 134, 143, 159, 160,
161, 162, 163
aromatic compounds, 39
arthropods, 34
Asia, 128
assessment, 50, 75
assimilation, 111
atmosphere, 108, 121
Austria, 23, 76
average longevity, 153
B
banks, 39, 97
barriers, 7, 10, 17, 23
base, 3
beetles, 34
behaviors, 34
biochemistry, 124
biodegradation, 128
biodiversity, ix, 19, 25, 31, 33, 35, 47, 50,
77, 79, 81, 83, 98, 99, 107
biogeography, viii, 9, 15, 20, 22, 23, 27, 28,
30
biological activity, 107, 120
biomass, 107, 109, 116, 117, 121, 124, 125,
126, 127, 128, 129, 130, 132, 143, 146,
147, 148, 149, 150, 162, 177
biotic, 26, 27, 99
birds, 10, 21, 22, 27, 50, 83, 157
Bolivia, 5, 6, 8, 12, 16, 38, 128
Brazil, vii, viii, x, 1, 5, 6, 12, 19, 20, 29, 30,
31, 32, 33, 34, 35, 36, 37, 38, 40, 41, 48,
72, 73, 75, 77, 78, 81, 82, 83, 84, 85, 87,
88, 90, 91, 93, 94, 98, 99, 100, 101
Brazilian dry forests, vii, 31
breakdown, 116
breeding, 138, 142
buffalo, 177
burn, ix, x, 82, 98, 106, 108, 129
Complimentary Contributor Copy

Index
180
C
caatinga, vii, ix, 24, 81, 83, 85, 86, 87, 88,
89, 90, 96, 97, 99, 100, 101, 102
cambium, 140, 158
carbon, x, 106, 107, 109, 110, 111, 112,
113, 114, 116, 119, 121, 125, 126, 127,
128, 129, 130, 131, 132, 149, 150, 151,
152, 160, 162
carbon emissions, 126
Caribbean, 10, 23, 24, 28, 75, 129
Caribbean Islands, 10, 24, 28, 75
cattle, x, 106, 108, 125, 137, 138, 142, 143,
145, 149, 150
C-C, x, 106, 110, 120, 121, 122
cellulose, 121
chemical, 99, 107, 147, 162
Chile, 158
China, 127, 128
chopping, 146, 147, 148, 150, 152, 153, 154
circulation, 89
classes, 40, 77, 111, 114, 144, 167
classification, xi, 32, 88, 94, 154, 165, 176
clay minerals, 112
climate(s), vii, xi, 9, 13, 16, 22, 25, 31, 87,
88, 94, 99, 102, 134, 138, 166, 175
climate change, xi, 9, 16, 22, 25, 87, 166,
175
climatic factors, 88, 121
close relationships, 33
closure, 9, 10, 24
CO2, x, 106, 107, 108, 110, 120, 121, 123
cocoa, 73
Colombia, 8, 28, 71, 72, 73, 74, 77, 162
colonization, 8, 10, 17, 25
commercial, 144, 154
communication, 140
community(s), viii, ix, 21, 30, 40, 47, 74,
75, 78, 83, 102, 107, 117, 129, 130, 131,
140, 146, 152, 161, 166, 167
competitors, 144
complexity, 7, 19, 92
composition, 10, 22, 33, 40, 95, 117, 152,
161
compounds, 125
computing, 76
conditioning, 95
configuration, 31
conflict, 155, 166, 176
conflict resolution, 176
Congress, 159
conservation, viii, x, 21, 28, 30, 50, 73, 78,
82, 99, 101, 153, 154, 156
construction, 35, 99, 145, 153
Continental, 23, 26, 90
corolla, 3
correlation, 11, 14, 40, 45, 112, 113, 122
correlation analysis, 113, 122
cost, 33, 147
Costa Rica, 47, 49, 74, 126, 130
cotton, 143
covering, ix, 8, 14, 39, 81, 85
criticism, 18
crop(s), ix, 82, 98, 126, 143, 146, 147, 157
crown, 140, 149, 151, 167, 170
crown fires, 140
crystalline, 85, 87
CT, 26
cultivation, ix, 82, 125, 126
cycles, 107
cycling, 107, 128, 129
D
danger, 167
data analysis, 78
data processing, 176
data set, x, 40, 106, 167, 174
database, 76
decomposition, 107, 112, 126
deficiency, 122
deficit, 83
deforestation, 108, 112, 113, 125, 126, 127,
128, 130, 132, 143
degradation, 38, 112, 118, 127, 149, 177
deposition, 10
depression, 87
depth, x, 106, 109, 110, 111, 113, 114, 115,
116, 117, 118, 119, 120, 121, 122, 123,
150, 151
Complimentary Contributor Copy

Index
181
deviation, 11
diet, 34, 177
digestion, 132
dispersion, 11, 142, 156
displacement, 92
distilled water, 110
distribution, vii, viii, 2, 5, 10, 11, 12, 13, 16,
17, 21, 25, 28, 30, 31, 33, 35, 40, 45, 47,
48, 49, 50, 75, 76, 92, 95, 99, 101, 107,
113, 115, 129, 170
divergence, 3, 7, 9
diversification, 19, 25, 26, 83
diversity, vii, viii, ix, 1, 2, 11, 14, 15, 22,
23, 26, 28, 30, 33, 34, 35, 37, 38, 40, 45,
47, 48, 49, 50, 73, 75, 76, 82, 83, 99,
140, 153, 161, 176
DNA, 3, 4, 18, 27
DOI, 159, 161, 162
dominance, 49
drainage, 8, 15, 115, 135
drought, 37, 117, 122, 166, 176
dry forests, vii, viii, ix, 5, 6, 12, 22, 25, 26,
30, 31, 35, 47, 49, 76, 82, 86, 101, 108,
129
E
ecological processes, 98
ecology, vii, 28, 47, 76, 99
economic systems, 92
ecosystem, ix, 32, 81, 82, 83, 99, 107, 128,
154, 160
Ecuador, 5, 6, 15, 20, 27, 28, 130
EEA, 161
egg, 32
endangered, 99, 128
energy, 91, 107
England, 73
environment(s), ix, 4, 5, 7, 8, 9, 11, 12, 13,
14, 16, 17, 18, 26, 33, 38, 48, 49, 50, 76,
86, 98, 140, 154
environmental change, 3, 100
environmental conditions, 7, 19, 142, 147
environmental degradation, 98
environmental services, 83, 156
enzymatic activity, 149
enzyme, 149
equilibrium, 177
erosion, 85
evaporation, ix, 82, 89, 90, 98
evapotranspiration, 28, 88
evidence, 3, 8, 10, 11, 12, 18, 19, 22, 87,
139, 175
evolution, 6, 7, 19, 20, 21, 22, 34, 47, 72,
73, 74, 76, 99, 110
exile, 59
exploitation, 83, 143
extinction, 9, 99
extraction, x, 39, 106, 109, 113, 125, 132,
143
F
families, ix, 2, 30, 32, 34, 41, 47, 48, 72, 74,
95
farmers, 156
farms, 138
fauna, viii, 18, 29, 31, 33, 36, 41, 47, 49, 50,
73, 75, 82, 83, 99
fencing, 137, 156
fertility, 119
fertilization, 127, 128
filters, 50
fire event, 140
fire resistance, 140, 142
fires, 140, 142, 143, 175
fish, 22, 83
flank, 91
floods, 88, 138, 155
flora, 18, 26, 27, 50, 82, 83, 87, 99, 102
flowers, 14, 39
fluctuations, 19, 22
food, 32, 35, 49, 156, 166, 177
food chain, 32
forest ecosystem, 130, 161
forest fragments, viii, 16, 30, 78
forest management, 146
formation, viii, 30, 35, 37, 39, 47, 83, 90,
98, 107
formula, 110
Complimentary Contributor Copy

Index
182
fossils, 8, 32
fragility, 92
fragments, 15
frequency distribution, 40
fruits, 12, 20, 137, 145, 153
fungi, 130
G
genetic diversity, 35
genus, vii, 1, 2, 4, 5, 6, 7, 10, 11, 13, 14, 17,
21, 23, 25, 26, 34, 41, 48, 78, 140, 143,
145, 147, 153
germination, 98, 148
glacial period, vii, 16, 31
global climate change, 107
global scale, 83, 107
Google Earth, 40
gracilis, 57, 137
grass(es), x, 106, 108, 112, 111, 113, 117,
120, 121, 122, 124, 137, 138, 140, 143,
145, 146, 147, 152, 166, 169, 171, 175,
177
grasslands, 129, 135, 137, 138, 140, 143,
154, 166, 169, 171
grazers, 166, 175
grazing, xi, 121, 143, 144, 145, 149, 150,
151, 152, 162, 165, 169, 175, 177
Great Britain, 124, 128, 129
greenhouse, 126
greenhouse gas, 126
greenhouse gas emissions, 126
growth, vii, 1, 107, 113, 116, 144, 146, 147,
160
growth rate, 144
H
habitat(s), vii, viii, 1, 2, 4, 6, 7, 9, 11, 15,
16, 17, 18, 19, 24, 26, 49, 50, 154, 156,
177
hair, 33
harbors, 50
hardness, 143
hardwood forest, 135, 137, 144
harvesting, 137, 144, 145
health, xi, 165, 167, 169, 171, 175
heat loss, 14
height, 87, 97, 140, 141, 145
herpetofauna, 21, 72
heterogeneity, 89
highlands, 85, 162
history, viii, 2, 3, 11, 18, 19, 20, 23, 24, 26,
47
Holocene, 24
horses, 138
host, 32, 33, 34
human, ix, xi, 35, 49, 82, 83, 98, 99, 128,
166, 169, 175, 177
human actions, 83
human development, 98
humidity, 37, 88, 120
humus, 108
hunting, xi, 38, 133, 137, 138, 155, 156, 157
hymenoptera aculeate, vii
hypothesis, 5, 8, 9, 10, 17, 18
I
identification, 50, 72, 74
image, 167, 176
image analysis, 176
in transition, 6, 176
income, 177
Indians, 138
individuals, 41, 142, 144, 146, 147, 149
industry, 143
inferences, 18, 20
insects, 31, 32, 35, 39
institutions, xi, 134
integrity, 50, 99
intron, 3
iron, 37, 147
islands, 6, 10, 31, 91
isolation, 15, 17, 26, 142
isotope, 111
Complimentary Contributor Copy

Index
183
K
Kenya, vi, vii, xi, 165, 166, 167, 169, 175,
176, 177
kill, 153
L
landscape, 8, 50, 82, 83, 94, 97, 98, 127,
130, 138
landscapes, 49, 50, 98, 128, 166
larvae, 34
Late Pleistocene, 24
Latin America, 24, 75, 127
leaching, 120
lead, 11, 88, 91
legend, 167
legume, 15, 125
levees, 135
lianescent clade, vii, viii, 1, 2, 3, 4, 11, 18
life cycle, 34, 83
light, 3, 10, 27, 127
lignin, 117
limestone, 37
livestock, 50, 137, 143, 145, 147, 153, 155,
157, 166, 175, 177
logging, 137, 143, 154
logistics, 177
longevity, 153
low temperatures, 14
M
magnitude, 147, 149, 152
majority, 32, 149
Malaysia, 75
mammal(s), 26, 50, 83
man, 98
management, vii, xi, 49, 108, 127, 130, 134,
138, 143, 144, 146, 148, 152, 153, 154,
159, 160, 162, 166, 175
mangroves, 9
Maryland, 75
mass, 91, 92
materials, 35
matrix, 31, 40, 47, 78
matter, x, 74, 106, 107, 112, 118, 120, 121,
122, 124, 125, 132
measurement, 75, 166, 176
meat, 157
media, 160
median, 13
Mediterranean, 159, 161
Metabolic, 122, 123
metabolizing, 122
meter, 39, 40
methodology, 4, 33, 109
Mexico, 5, 9, 21, 28, 48, 49, 79, 126, 131
microbial communities, x, 106, 116, 117,
122, 124, 130, 152, 162
microbial community, 127, 148, 162
microclimate, 83
micronutrients, 131
microorganism(s), x, 106, 107, 112, 116,
117, 118, 119, 120, 122, 123, 124, 152
Microsoft, 40
migration, 8, 10, 16
mineralization, 115, 116, 120, 127, 129,
130, 149, 150, 152
Miocene, 3, 8, 9, 15, 19, 20, 23, 26
Missouri, 20, 22, 26, 76
MMA, 50, 75, 78, 79, 83, 101
models, 8, 46, 175
modifications, 32, 117, 154
moisture, x, 91, 106, 116, 117, 121, 122,
123, 124, 125
moisture content, 116, 117, 122, 124
morphogenesis, 21
morphology, 2, 11
mortality, 99, 142
mosaic, 8, 9, 82, 94, 135
mountain ranges, 91
N
National Academy of Sciences, 25, 27
national product, 144
native species, 145, 153
Complimentary Contributor Copy

Index
184
natural resources, 83, 98, 100, 166, 176
Neotropical Dry Forests, vii
Neotropical region, vii, 30, 32, 34, 35, 41,
75
New Zealand, 127
nitrification, 129, 130
nitrogen, 107, 125, 126, 128, 129, 130, 131,
149, 150, 162
nodes, 22
North America, 3, 28, 47
null, 9
nutrient(s), 32, 107, 108, 116, 117, 128, 175
O
oceans, 23
old age, 123, 124
operations, 138, 143, 146, 147
organic matter, vii, x, 105, 106, 107, 108,
112, 113, 115, 116, 117, 118, 119, 120,
121, 122, 123, 124, 125, 127, 128, 129,
130, 132, 148
organs, 14, 96
oscillation, 94
overgrazing, 38, 137, 143, 154
overlap, 149
oxidation, 109
P
Pacific, 23
Panama, 9, 10, 23, 24, 26
Paraguay, 6, 12, 38, 49, 78
parallel, 91
parenchyma, 95
pathogens, 14
pathways, 8
permit, 51
personal communication, xi, 133
Peru, 5, 6, 15, 16, 20, 21, 23, 27, 28, 48, 76
Philippines, 130
phosphorus, 107, 131, 162
phylogenetic tree, 4
physical characteristics, 127
physical environment, 99
physical structure, 49
physiological correlates, 20
pistil, 14
plant growth, 135
plants, 9, 10, 12, 14, 15, 16, 20, 25, 26, 33,
35, 37, 77, 82, 83, 86, 92, 96, 97, 98,
108, 111, 112, 116, 117, 119, 146, 148,
149, 153
plasticity, 19
plastid, 3, 4, 27
Pleistocene, vii, 7, 8, 9, 10, 22, 23, 24, 26,
31, 87, 102
Pliocene, 8, 9, 10
pollen, 9, 33
pollinators, 34, 35, 78
pools, 128
population, x, 7, 34, 50, 83, 98, 106, 108,
117, 121, 147, 149, 152, 153, 156, 169,
175
population growth, 108
population size, 156
positive correlation, 112
positive relationship, 114
precipitation, 89, 115, 120
predation, 34
predators, 32, 34
predictability, 171
preparation, 47, 100
preservation, 144
primate, 22
productive capacity, 148
project, 19, 76, 167, 176
propagation, 142
protection, x, 14, 82, 99, 112, 122, 142, 145,
155
Puerto Rico, 125
R
radiation, 14, 21, 27, 88
radius, 36, 45
rain forest, 9, 26, 28, 129, 130
Complimentary Contributor Copy

Index
185
rainfall, ix, 37, 81, 83, 88, 89, 91, 92, 94,
101, 107, 108, 115, 119, 120, 122, 123,
124, 135, 155, 166, 171, 175
rainforest, 74, 107, 128
rangeland, vii, xi, 138, 160, 165, 166, 167,
175, 176, 177
reading, 19
recognition, viii, 1
reconstruction, 3, 18
recovery, 142
recreation, 156
recycling, 108
regeneration, 144, 145, 146, 153
regions of the world, 2, 146
regression, xi, 165, 169
regression model, xi, 165
regrowth, 120, 123, 153
regulations, 177
relatives, 27
relevance, 83, 92
relief, 31, 89, 108
remote sensing, 166, 177
requirements, 166
researchers, 49, 95, 144
residues, 106, 143, 147, 149, 152
resilience, 148, 152
resistance, 142, 143
resolution, vii, xi, 4, 18, 165, 168
resources, 33, 100, 146, 147
respiration, x, 106, 109, 110, 120, 121, 122,
124, 125, 130
response, x, 14, 106, 128, 176
restrictions, 50, 143
root(s), 96, 112, 113, 123, 130, 135, 176
root growth, 135
rotations, 129
Royal Society, 25, 26
runoff, 88, 135
S
salt accumulation, 135
salt tolerance, 9
savannah, 167, 169, 170
savannas, vii, xi, 101, 132, 134, 135, 137,
140, 143, 145, 154
science, 15, 23, 26
scientific knowledge, 99
scrublands, 92
SEA, 73
sea level, 38
Seasonal Deciduous Forests, vii
seasonal flu, 117
seasonal forests, vii, 6, 26, 31
seasonality, 107, 115, 124
security, vii
sediments, 3, 9, 85, 88
seed, 2, 11, 14, 98, 148
seeding, 146, 147, 150, 151, 152, 153
semi-deciduous dry tropical forest, vii, 108
senescence, 122
sensing, 166, 177
sensitivity, 33
services, 156
settlements, 137
sexual dimorphism, 33
shape, 11, 14
shelter, 49
shock, 116, 122
shoreline, 10
shortage, 48, 123
showing, 89, 112, 148
shrubs, vii, ix, xi, 1, 2, 82, 83, 95, 97, 144,
145, 146, 147, 153, 165, 167, 170, 171
signals, 33
simple linear regression, 110
skeleton, 22
social behavior, 34, 35, 75
software, 40, 78
soil erosion, 88
soil type, 83, 87, 94, 128
solution, x, 106
South America, viii, ix, 2, 4, 5, 7, 8, 9, 10,
12, 19, 21, 22, 25, 26, 27, 28, 30, 31, 37,
41, 50, 73, 76, 78, 82, 88, 99, 100, 102,
160
South Pacific, viii, 1, 2, 11, 12
Spain, 137
specialists, 48
Complimentary Contributor Copy

Index
186
speciation, 8, 17, 20, 23, 25
species richness, viii, 20, 28, 30, 33, 35, 49,
72, 162
spiders, 34, 35
stability, 124, 130, 131
stabilization, 112, 128
standard deviation, 114, 116, 118, 119, 121,
123
standard error, 111, 114, 169
state(s), ix, 5, 6, 12, 16, 31, 81, 84, 85, 88,
91, 118, 123, 124, 140, 144, 146, 147,
154, 161
statistics, 110
stock, 152, 166, 175
storage, 96
storms, 91
stratification, 159
stress, 38, 83, 88, 142, 152
stretching, 91
structure, vii, viii, 7, 12, 29, 30, 31, 35, 39,
50, 74, 107, 127, 131, 140, 144, 147,
148, 161, 162
Styria, 23
subsistence, 137
substrate, 86, 116, 117, 118, 120, 121, 122,
123, 124
succession, 125, 128, 129
sulfur, 107, 131
sustainability, 144, 153, 175
syndrome, 147
synthesis, 22
T
taxa, viii, 2, 3, 4, 6, 8, 12, 16, 17, 18, 33, 45,
47, 48, 49, 83
taxonomy, 47
techniques, 39, 47, 140, 166
temperature, 14, 24, 37, 88, 108, 120, 121
terpenes, 140
terrestrial ecosystems, 35
territory, 38, 84
testing, 145, 153
texture, 108, 127, 135
thinning, 100, 144, 146, 147
thorax, 32
threats, x, 82, 99, 156
time series, 177
tissue, 140
topology, 4, 6
trade, 91, 92, 138
traits, 2, 19, 140
transformation(s), vii, x, 82, 95, 99, 105,
108, 111, 129, 154
translation, 137
treatment, 25, 144, 146, 149, 150, 151, 152,
153, 154
tropical dry forest, x, 76, 105, 107, 108,
111, 115, 126, 128, 129
tropical forests, 22, 32, 35, 48, 76, 82, 106,
128, 129, 131
tropical rain forests, 21
turnover, 47, 74, 132
U
United Kingdom (UK), 22, 28
United Nations, 77
United States (USA), 19, 25, 27, 28, 77,
124, 162
Uruguay, 6, 49
V
Valencia, 21, 24
variables, 110
variations, xi, 83, 165, 168
velvet, 33
Venezuela, v, vii, x, 105, 106, 108, 109,
115, 124, 126, 127, 130
vertebrates, 15
violaceae, vii
vouchers, 4
W
war, 138
Washington, 71, 128
Complimentary Contributor Copy

Index
187
water, viii, ix, x, 2, 9, 10, 11, 12, 14, 75, 82,
83, 88, 91, 92, 96, 97, 98, 99, 106, 107,
109, 116, 119, 122, 125, 127, 128, 129,
132, 135, 144, 147, 149, 152, 155
water vapor, 91
watershed, 37
western llanos, vii
Wet Forests, vii
wetlands, 156, 166
wetting, 116
wildlife, xi, 134, 153, 154, 155, 156, 157,
177
Wisconsin, 124
wood, 3, 35, 143, 147
worldwide, 32, 33, 34
X
xylem, 27
Y
Yale University, 26
yield, 143, 147
Complimentary Contributor Copy