
Deposition to forests in Europe: most important factors influencing dry deposition and models used...
10
Deposition to forests in Europe: most important factors influencing dry deposition and models used for generalisation Jan Willem Erisman a, *, Geert Draaijers b a ECN, PO Box 1, 1755 ZG Petten, The Netherlands b Commission for Environmental Impact Assessment, PO Box 2345, NL 3500, Utrecht, The Netherlands Received 19 September 2002; accepted 10 January 2003 ‘‘Capsule’’: The influence of forest characteristics on deposition can be modelled reasonably well; forest edge effects and dynamical processes are still uncertain. Abstract Dry deposition of gases and particles to forests is influenced by factors influencing the turbulent transport, such as wind speed, tree height, canopy closure, LAI, etc. as well as by factors influencing surface condition, such as precipitation, relative humidity, global radiation, etc. In this paper, an overview of these factors is given and it is shown which are the most important determining temporal and spatial variation of dry deposition of sodium and sulphur. Furthermore, it is evaluated how well current deposition models are able to describe the temporal and spatial variation in dry deposition. It is concluded that the temporal variation is not modelled well enough, because of limited surface-wetness exchange parameterisations. The influence of forest characteristics are modelled reasonably well, provided enough data describing the forests and the spatial variation in concentration is available. For Europe these data are not available. The means to decrease the atmospheric deposition through forest management is discussed. # 2003 Elsevier Science Ltd. All rights reserved. Keywords: Dry deposition; Gases; Particles; Forests; Parameters; Europe 1. Introduction There are currently two methods to estimate deposi- tion from measurements: micrometeorological methods and throughfall. Both methods are used for different purposes. Micrometeorological studies are used to understand and parameterise the dry deposition pro- cesses, whereas the throughfall method is used to deter- mine soil fluxes and the influence of parameters or conditions determining deposition, in cases where micrometeorology fails, such as complex terrain or for- est edges. Both methods are needed to develop, para- meterise and evaluate deposition models. Models (or measurements) are needed to determine the inputs to forests and to determine how management of forests can reduce inputs by deposition. In this paper, results of micrometeorological and throughfall studies will be used to illustrate the parameters influencing dry deposi- tion and therewith influencing the relation between atmospheric deposition and forest management. Deposition models currently being used to determine site specific deposition are the so-called inferential models (e.g. Hicks et al., 1987; Erisman, 1993; Erisman and Draaijers, 1995). Results of two such models will be used here to determine forest inputs. Model results are evaluated using long-term micrometeorological and throughfall methods and it will be determined if parameters affecting deposition are represented enough in the models. The main emphasis in this paper is on dry deposition, as for wet deposition forest characteristics are not important. The only components considered are sulphur and sodium, because both are expected to behave inert in canopies, and therefore throughfall fluxes are not influenced by canopy exchange (e.g. Parker, 1983; Erisman and Draaijers, 1995). 2. Meteorological and surface conditions The dry deposition of gases and particles from the atmosphere to a receptor surface is governed by the 0269-7491/03/$ - see front matter # 2003 Elsevier Science Ltd. All rights reserved. doi:10.1016/S0269-7491(03)00049-6 Environmental Pollution 124 (2003) 379–388 www.elsevier.com/locate/envpol * Corresponding author. Tel.: +31-224-564-155; fax: +31-224- 568-488. E-mail address: [email protected] (J.W. Erisman).
Transcript of Deposition to forests in Europe: most important factors influencing dry deposition and models used...
Deposition to forests in Europe: most important factors influencingdry deposition and models used for generalisation
Jan Willem Erismana,*, Geert Draaijersb
aECN, PO Box 1, 1755 ZG Petten, The NetherlandsbCommission for Environmental Impact Assessment, PO Box 2345, NL 3500, Utrecht, The Netherlands
Received 19 September 2002; accepted 10 January 2003
‘‘Capsule’’: The influence of forest characteristics on deposition can be modelled reasonably well; forest edge effects anddynamical processes are still uncertain.
Abstract
Dry deposition of gases and particles to forests is influenced by factors influencing the turbulent transport, such as wind speed,tree height, canopy closure, LAI, etc. as well as by factors influencing surface condition, such as precipitation, relative humidity,global radiation, etc. In this paper, an overview of these factors is given and it is shown which are the most important determining
temporal and spatial variation of dry deposition of sodium and sulphur. Furthermore, it is evaluated how well current depositionmodels are able to describe the temporal and spatial variation in dry deposition. It is concluded that the temporal variation is notmodelled well enough, because of limited surface-wetness exchange parameterisations. The influence of forest characteristics are
modelled reasonably well, provided enough data describing the forests and the spatial variation in concentration is available. ForEurope these data are not available. The means to decrease the atmospheric deposition through forest management is discussed.# 2003 Elsevier Science Ltd. All rights reserved.
Keywords: Dry deposition; Gases; Particles; Forests; Parameters; Europe
1. Introduction
There are currently two methods to estimate deposi-tion from measurements: micrometeorological methodsand throughfall. Both methods are used for differentpurposes. Micrometeorological studies are used tounderstand and parameterise the dry deposition pro-cesses, whereas the throughfall method is used to deter-mine soil fluxes and the influence of parameters orconditions determining deposition, in cases wheremicrometeorology fails, such as complex terrain or for-est edges. Both methods are needed to develop, para-meterise and evaluate deposition models. Models (ormeasurements) are needed to determine the inputs toforests and to determine how management of forestscan reduce inputs by deposition. In this paper, results ofmicrometeorological and throughfall studies will beused to illustrate the parameters influencing dry deposi-
tion and therewith influencing the relation betweenatmospheric deposition and forest management.Depositionmodels currently being used to determine site
specific deposition are the so-called inferential models (e.g.Hicks et al., 1987; Erisman, 1993; Erisman and Draaijers,1995). Results of two such models will be used here todetermine forest inputs. Model results are evaluated usinglong-term micrometeorological and throughfall methodsand it will be determined if parameters affecting depositionare represented enough in the models. The mainemphasis in this paper is on dry deposition, as for wetdeposition forest characteristics are not important. Theonly components considered are sulphur and sodium,because both are expected to behave inert in canopies, andtherefore throughfall fluxes are not influenced by canopyexchange (e.g. Parker, 1983; Erisman andDraaijers, 1995).
2. Meteorological and surface conditions
The dry deposition of gases and particles from theatmosphere to a receptor surface is governed by the
0269-7491/03/$ - see front matter # 2003 Elsevier Science Ltd. All rights reserved.
doi:10.1016/S0269-7491(03)00049-6
Environmental Pollution 124 (2003) 379–388
www.elsevier.com/locate/envpol
* Corresponding author. Tel.: +31-224-564-155; fax: +31-224-
568-488.
E-mail address: [email protected] (J.W. Erisman).

concentration in air and by turbulent transport pro-cesses in the boundary layer, as well as by the chemicaland physical nature of the depositing species and thecapability of the surface to capture or absorb gases andparticles. The process is illustrated in Fig. 1. The trans-port of gases and particles from the atmosphere to closeto the receptor surface is governed by the level ofatmospheric turbulence, generated by both wind shearand buoyancy. The higher the level of atmospheric tur-bulence, the more efficiently gases and particles aretransported to a given receptor surface. Given a con-stant sink strength for a particular pollutant of interest,the concentration gradients above the receptor will varyaccording to the intensity of atmospheric turbulence. Awell-mixed unstable boundary layer leads to relativelysmall concentration gradients and to low resistance tovertical transport. For a boundary layer with near neu-tral stability, buoyancy has essentially no influence onthe level of turbulence. Stable stratified boundary layersare associated with much larger gradients, because ver-tical motions are suppressed.In the vicinity of sources, the dry deposition is deter-
mined primarily by the configuration of the sources, thetype of sources and the pollutant’s mixing in the atmo-sphere. For high level sources, the deposition near to thesource is small and increases with downwind distancefrom the source until it reaches a maximum after whichit decreases again. For ground-level sources, highest dry
deposition takes place directly next to the source whereconcentrations are highest and decreases downwind. Atsome distance, the influence of sources on the concen-tration gradient is diminished. At this point, the pollu-tant is mixed throughout the boundary layer andprimarily the dry deposition process determines theconcentration gradient above the receptor surface. If thereceptor surface can act both as a source and sink, as inthe case of ammonia or carbon dioxide, the shape of thegradient will be determined by the extent of the sourceor sink flux. The gradient will then show the shape ofthe net emission or net deposition flux.Generally, two layers can be distinguished in the
boundary layer for transport of pollutants to the recep-tor: the fully turbulent layer and the quasi-laminarlayer. The quasi-laminar layer is introduced to quantifythe way in which pollutant transfer differs frommomentum transfer in the immediate vicinity of thesurface (Hicks et al., 1987). In this layer, the transportto the receptor surface is dominated by molecular dif-fusion. Once at the surface, the chemical, biological andphysical nature of the surface determines the capture orabsorbency of the gases and particles. For gases, surfaceuptake is frequently controlled by the ability of the sur-face to absorb the specific chemical species. For reactivetrace gases, such as HNO3, molecules are collectedimmediately upon contact with all surfaces (e.g. Hue-bert and Robert, 1985). Less reactive, but soluble, gases,
Fig. 1. The dry deposition process. Ra is the aerodynamic resistance, Rb is the quasi-laminar layer resistance, Rc is the surface resistance, z0 is the
roughness length and d is the displacement height.
380 J.W. Erisman, G. Draaijers / Environmental Pollution 124 (2003) 379–388
such as SO2 and NH3, tend to be taken up throughstomata or through the leaf. These gases can also beabsorbed in water layers at the leaf surface, or at the soil(Fowler et al., 1991; Hicks et al., 1989). The chemicalcomposition of the surface is important for snow, iceand water (Hicks et al., 1989). For particles, the processof dry deposition is even more complex and the list ofpotentially determining factors is much longer.Mechanisms of deposition are diffusion, interception,impaction, gravitational settling and phoretic mechan-isms (Slinn, 1982). Almost no particles are able to dif-fuse through stomatal openings. Transfer through thequasi-laminar layer close to the surface presents a con-siderable restriction on the deposition of 0.1–1.0 mmparticles. Uptake of particles by surfaces is thus largelycontrolled by micro-structures and turbulence intensity.The meteorological and surface conditions influencing
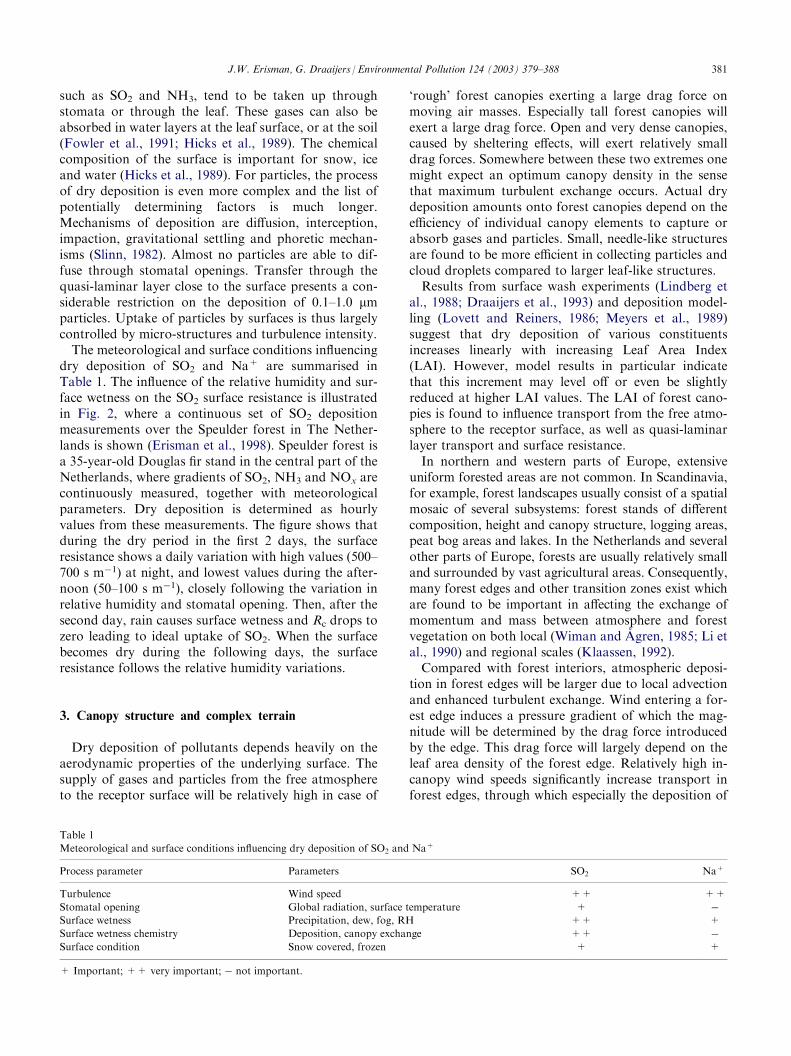
dry deposition of SO2 and Na+ are summarised inTable 1. The influence of the relative humidity and sur-face wetness on the SO2 surface resistance is illustratedin Fig. 2, where a continuous set of SO2 depositionmeasurements over the Speulder forest in The Nether-lands is shown (Erisman et al., 1998). Speulder forest isa 35-year-old Douglas fir stand in the central part of theNetherlands, where gradients of SO2, NH3 and NOx arecontinuously measured, together with meteorologicalparameters. Dry deposition is determined as hourlyvalues from these measurements. The figure shows thatduring the dry period in the first 2 days, the surfaceresistance shows a daily variation with high values (500–700 s m�1) at night, and lowest values during the after-noon (50–100 s m�1), closely following the variation inrelative humidity and stomatal opening. Then, after thesecond day, rain causes surface wetness and Rc drops tozero leading to ideal uptake of SO2. When the surfacebecomes dry during the following days, the surfaceresistance follows the relative humidity variations.
3. Canopy structure and complex terrain
Dry deposition of pollutants depends heavily on theaerodynamic properties of the underlying surface. Thesupply of gases and particles from the free atmosphereto the receptor surface will be relatively high in case of
‘rough’ forest canopies exerting a large drag force onmoving air masses. Especially tall forest canopies willexert a large drag force. Open and very dense canopies,caused by sheltering effects, will exert relatively smalldrag forces. Somewhere between these two extremes onemight expect an optimum canopy density in the sensethat maximum turbulent exchange occurs. Actual drydeposition amounts onto forest canopies depend on theefficiency of individual canopy elements to capture orabsorb gases and particles. Small, needle-like structuresare found to be more efficient in collecting particles andcloud droplets compared to larger leaf-like structures.Results from surface wash experiments (Lindberg et
al., 1988; Draaijers et al., 1993) and deposition model-ling (Lovett and Reiners, 1986; Meyers et al., 1989)suggest that dry deposition of various constituentsincreases linearly with increasing Leaf Area Index(LAI). However, model results in particular indicatethat this increment may level off or even be slightlyreduced at higher LAI values. The LAI of forest cano-pies is found to influence transport from the free atmo-sphere to the receptor surface, as well as quasi-laminarlayer transport and surface resistance.In northern and western parts of Europe, extensive
uniform forested areas are not common. In Scandinavia,for example, forest landscapes usually consist of a spatialmosaic of several subsystems: forest stands of differentcomposition, height and canopy structure, logging areas,peat bog areas and lakes. In the Netherlands and severalother parts of Europe, forests are usually relatively smalland surrounded by vast agricultural areas. Consequently,many forest edges and other transition zones exist whichare found to be important in affecting the exchange ofmomentum and mass between atmosphere and forestvegetation on both local (Wiman and Agren, 1985; Li etal., 1990) and regional scales (Klaassen, 1992).Compared with forest interiors, atmospheric deposi-
tion in forest edges will be larger due to local advectionand enhanced turbulent exchange. Wind entering a for-est edge induces a pressure gradient of which the mag-nitude will be determined by the drag force introducedby the edge. This drag force will largely depend on theleaf area density of the forest edge. Relatively high in-canopy wind speeds significantly increase transport inforest edges, through which especially the deposition of
Table 1
Meteorological and surface conditions influencing dry deposition of SO2 and Na+
Process parameter
Parameters SO2 Na+Turbulence
Wind speed ++ ++Stomatal opening
Global radiation, surface temperature + �Surface wetness
Precipitation, dew, fog, RH ++ +Surface wetness chemistry
Deposition, canopy exchange ++ �Surface condition
Snow covered, frozen + ++ Important; ++ very important; � not important.
J.W. Erisman, G. Draaijers / Environmental Pollution 124 (2003) 379–388 381

super-micron particles and cloud and fog water dropletswill be enhanced (Wiman and Agren, 1985). Particleresuspension through bounce-off or blow-off processesmay be relatively intense near the very edge of a forestat extremely high wind speeds and low stickiness of thecollecting surface (Wu et al., 1992).As explained in the previous section, for gases stoma-
tal resistance is known to be one of the controlling fac-tors for dry deposition. Enhanced solar radiation anddaytime temperatures in forest edges may reduce sto-matal resistance and consequently promote dry deposi-tion. At the same time, enhanced evapotranspirationand the additional water consumption by dense understorey vegetation usually present in forest edges, mayreduce the availability of soil moisture through whichstomata close and stomatal resistance increases. It maybe hypothesised that trees in forest edges are less fre-quently covered with a water film due to enhanced eva-poration (Ranney et al., 1978). However, interception offog and cloud water is more efficient in forest edges thanin forest interiors (Weathers et al., 1992), which againcould increase the occurrence of water films. Fig. 3shows the influence of forest edges on the Na+ deposi-tion as determined with throughfall measurements inthree different forest edges (Draaijers, 1993). The forestedge effect is only noticeable in the first 100 m (or aboutfive times the tree height) of the edge, afterwards theforest edge influence becomes negligible. The enhance-ment of net throughfall fluxes in forest edges dependson LAI and canopy chemistry (Draaijers, 1993).Existing models describing transport and deposition
of pollutants in forest edges suggest a very large hor-
izontal depletion of super-micron particles downwind ofa forest edge (Wiman and Agren, 1985; Bosveld andBeljaars, 1987; Van Pul et al., 1991). The associatedhorizontal deposition patterns show a distinct max-imum around the forest wall. Sub micron particles andgases are found subject to relatively small depletion andedge effects. This is in agreement with ambient air con-centration measurements (Dasch, 1987; Wiman andLannefors, 1985), and deposition measurements in for-est edges using surface wash methods (Potts, 1978;Hasselrot and Grennfelt, 1987; Draaijers et al., 1988;Beier and Gundersen, 1989). Little is known on theprocesses regulating the deposition enhancement in for-est edges.Fig. 4 shows an example of the influence of the tree
height and roughness length on the annual SO42� and
Na+ net throughfall as measured in 30 different standsin an area of only 3�3 km2 on the Utrechtse Heuvelrugin the centre of The Netherlands. Both figures show thatthe influence of forest characteristics can be large: anincrease of 2 in z0 results in a twofold increase in Na+
net-throughfall flux and a factor 1.5 higher SO42� net
throughfall flux. The roughness length is the meteor-ological variable defined as the ‘height’’ where the windprofile is effectively zero. Several forest characteristicsare included in z0: crown coverage, stand height andLAI. Different concepts are available to determine z0:wind profile measurements, landscape classifications,turbulence measurements, etc. (e.g. Wieringa, 1992;Erisman and Draaijers, 1995). Effectively, z0 increaseslinearly with stand height and canopy closure, up tocertain levels, where z0 levels off (Draaijers, 1993).
Fig. 2. Continuous measurements of SO2 deposition over Speulder forest. The circles represent the measured hourly surface resistances, whereas the
drawn line is the 6 h moving average. The top line represents the relative humidity measured above the canopy.
382 J.W. Erisman, G. Draaijers / Environmental Pollution 124 (2003) 379–388

4. Deposition models and generalisation of deposition
to forests in Europe
Currently two types of deposition models are used:those using measurements as much as possible andthose using a mixture of modelled data and measureddata. Models using only modelled data are not dis-cussed here, because the receptor scale of these modelsis too coarse to determine deposition on the level offorest (stands). Examples of measurement based modelsare those used in the USA (Hicks et al., 1991), the UK(Smith et al., 2000), Sweden (Lovblad et al., 1993) andthe Netherlands (Erisman, 1993). EDACS andDEADM are models estimating deposition of acidifyingcomponents and base cations on a small scale in Europe
and the Netherlands respectively, using a mixturebetween measured and modelled data (e.g. Erisman etal., 1996). In both models wet deposition is obtainedfrom interpolated wet deposition measurements atrespectively 800 (Europe) and 14 (The Netherlands)sites. Dry deposition is inferred from concentrationsand dry deposition velocities on respectively �10�20km and 1�1 km for Europe and The Netherlands. Forthis land use data, interpolated meteorological data (50m height), and modelled (Europe) or interpolated mea-sured (The Netherlands, except NH3) concentrationsare used. The dry deposition velocity in the two modelsis obtained using parameterisations of the surfaceexchange processes for gases and particles for differentland use classes as presented in Erisman et al. (1994a).
Fig. 3. The influence of forest edges on the Na+ deposition as determined with throughfall measurements (Draaijers, 1993).
Fig. 4. The influence of tree height and roughness length z0 (see Fig. 1) on the deposition derived from throughfall measurements made in 30 dif-
ferent forest stands (Draaijers, 1993). Regression: SO4 and tree height 0.41 and z0 0.17; Na and tree height 0.19 and z0 0.23.
J.W. Erisman, G. Draaijers / Environmental Pollution 124 (2003) 379–388 383

These parameterisations are the most uncertain part ofthe models, provided concentrations are available frommeasurements. Vds have been measured only very lim-ited and only a few studies were made where it wasaimed at developing or evaluating surface exchangeparameterisations (e.g. Wesely and Hicks, 1977, 2000;Hicks et al., 1987; Voldner et al., 1986; Wesely, 1989;Erisman et al., 1994a,b; Erisman, 1994; Draaijers andErisman, 1993; Erisman and Draaijers, 1995; Zhang etal., 2002). It is therefore important to evaluate whetherthe parameterisations used in models are able to describethe strong temporal and spatial variability of drydeposition, and whether model estimates lead to equalannual inputs as those obtained from measurements. Thisto ensure that policy development for forest managementor forest protection, for example, by using the critical loadconcept, is based on accurate exceedance estimates.Experiments used here to show the temporal and
spatial variation of deposition comprise continuousgradient measurements of sulphur and nitrogen speciesover Speulder forest, experiments on the particledeposition to Speulder forest and throughfall measure-ments at several stands, including forest edges, in TheNetherlands and Europe. The experiments are exten-sively described in Erisman and Draaijers (1995),Draaijers (1993), Erisman et al., (1994a, 1998). Gen-erally, the interest of measuring or modelling depositionto forests is on the annual average inputs. For under-standing and modelling the deposition processes we areinterested in the temporal variation, i.e. hourly values.For determining the influence of site characteristics,spatial variation on an annual basis is more important.In the following sections, temporal and spatial varia-tions will be shown, in order to determine if the currentknowledge incorporated in deposition models is suffi-cient to determine the deposition to forests and what isneeded to improve current estimates.
4.1. Meteorological and surface conditions
The temporal variation in dry deposition models canbest be evaluated at a site where continuous measure-ments are available, and where forest characteristics arewell known. Continuous gradient measurements of SO2
are available since the beginning of 1993 at the Speulderforest in The Netherlands (Erisman et al., 1998). Fig. 2shows an example of the temporal variation of modelledand measured surface resistance Rc for SO2. The tem-poral variation is reasonably described, although a lotof scatter is observed, and during some periods sys-tematic differences. Fig. 5 shows the comparison betweenmodelled and measured values for different SO2 fluxclasses. On an annual basis, no systematic differences areobserved between the modelled and measured fluxes. Oneof the reasons for the reasonable agreement could be thatin most occasions the aerodynamic resistance Ra and the
quasi-laminar layer resistance Rb are the most impor-tant parameters determining the dry deposition velocityVd and, with the concentration, the flux. The uncer-tainty in Ra and Rb estimates is relatively small. WhenRc values become larger, the parameterisations willbecome more important. Thus in areas with low NH3
concentrations, or in dry regions, the Rc parameterisa-tions will probably be inaccurate to estimate deposition,and systematic biases might be expected. Another rea-son for the reasonable agreement might be that the Rc
parameterisation is developed from measurements inthe same regions as Speulder forest. Continuous mea-surements of SO2 dry deposition made in Scotland andin the eastern part of Germany showed larger differ-ences between modelled and measured deposition para-meters (see Erisman et al., 1998).Sodium deposition estimates were made at Speulder
forest using several experimental methods and modelswithin the so-called Aerosol project (Erisman et al.,1994b). Methods comprised gradients above the canopyin three different size classes, accumulation experimentson artificial and natural branches and throughfall mea-surements. Deposition estimates of the different meth-ods agreed reasonably well, within 20%. Dry depositionof Na+ is mainly determined by its ambient concen-tration and by impaction (showing a relation with thefriction velocity) and sedimentation. As particle sizeincreases, for example, as relative humidity increases,the dry deposition velocity increases strongly.
4.2. Canopy structure and complex terrain
The spatial variation of deposition can best be testedwith annual average deposition measurements made indifferent regions in Europe. No micrometeorologicaldeposition measurements are available on that scale. Upto now only three permanent micrometeorological sites,in Scotland, Germany and The Netherlands wereestablished (Erisman et al., 1998). For this reason,throughfall measurements made at a large number ofsites are used, assuming that canopy exchange does notplay an important role for sulphur and sodium.
Fig. 5. Comparison of modelled and measured fluxes of SO2.
384 J.W. Erisman, G. Draaijers / Environmental Pollution 124 (2003) 379–388

4.2.1. Comparison of deposition estimates withthroughfall dataIn order to evaluate the model, generated deposition
estimates are compared to deposition estimates derivedfrom throughfall and stemflow measurements.Throughfall and stemflow measurements have beenfound very useful for independent evaluation of deposi-tion models (e.g. Erisman and Draaijers, 1995). A majorlimitation when using throughfall and stemflow mea-surements is that information to distinguish between in-canopy and anthropogenic sources of chemical com-pounds often is lacking, thereby hampering accuratedeposition estimation. Another problem when usingthroughfall and stemflow measurements for modelevaluation is related to the spatial scale of the estimates.Throughfall and stemflow deposition estimates usuallyrefer to a particular forest stand, whereas modeldeposition estimates hold for an area approximately10�20 km wide. For this reason only sulphur andsodium are considered here, as these components can beregarded as inert when the forest is not influenced byplagues or diseases. Furthermore, local information(stand averages) on z0 is used instead of 10�20 km gridaverages.Results of throughfall, stemflow and bulk precipita-
tion measurements were obtained from national orga-nisations responsible for throughfall and stemflowmonitoring in their countries (Table 2). In total, resultsfrom 203 throughfall measurement sites were gathered,of which 51 in The Netherlands. The measurement sitesare reasonably well distributed over Europe althoughsites in southern Europe are almost lacking. Themajority of the sites (71%) is situated in coniferous for-
est stands; only 17% in deciduous forest stands and12% in mixed forest stands. Monitoring took placebetween 1987 and 1994 for a period of at least 1 year.Data for 1989 were used but, if not available, the aver-age for the whole measurement period was computedand used for model evaluation.The comparison of modelled deposition with net-
throughfall for the European sites is given in Fig. 6. TheDutch data are plotted separately, because the deposi-tion model estimates are made with the DEADMmodel, whereas the rest of the European data were esti-mated with EDACS. The comparison shows that theDutch data correlate reasonably well, with no systema-tic differences. Significant correlations (P<0.05) werealso found between modelled dry deposition and drydeposition estimated from throughfall and bulk pre-cipitation measurements for the other European sitesbut the scatter is considerable, especially for SOx. To alarge extent this can be attributed to the large uncer-tainty in air concentrations. Air concentrations of acid-ifying components are based on the EMEP (Co-operative Programme for Monitoring and Evaluation ofthe Long-Range Transmission of Air Pollutants in Eur-ope) model which has a poor spatial resolution(150�150 km), whereas air concentrations of basecations are based on a simple scavenging model (Draai-jers et al., 1997). The scatter in the results can also beattributed to uncertainty in the throughfall measure-ments (Draaijers et al., 1996). Significant differencesfound for SOx, and Na+ can to a large extent beattributed to the fact that in many cases estimates fordifferent years are compared. As a result of its sea-salt origin, for Na+ a strong year-to year variation
Table 2
Per country the number of throughfall monitoring locations in coniferous, deciduous and mixed forest stands, respectively, used for model eval-
uation. The measurement period is also presented
Country
No. of sites Measurement periodConiferous
Deciduous MixedCzech Republica,b
6 1990–1994Denmarkb
1 1992Finlandb
9 1989–1992Francec
18 8 1993Germanyd,b
63 12 2 1989Hungaryb
1 1990–1993Netherlandse
51 2 4 1987–1991Norwayb
2 1990–1993Polandb
1 1993–1994Russian Federationb
2 1990–1993Swedenb
4 1989–1993Switserlandf
12 5 1987–1992a Data provided by the Czech Geological Survey, Prague (T. Paces and J. Cerny).b Data from the ICP-Integrated Monitoring Programme provided by the Finnish Environmental Agency, Helsinki (S. Kleemola and M. Forsius).c Data provided by the Office National des Forets, Fontainebleau (E. Ulrich).d Data provided by the University of Stuttgart (Th. Gauger, R. Koble and G. Smiatek).e Data available at the National Institute of Public Health and the Environment, Bilthoven.f Data provided by the Institut fur Angewandte Pflanzenbiology, Schonenbuch (S. Braun).
J.W. Erisman, G. Draaijers / Environmental Pollution 124 (2003) 379–388 385

may be expected. No significant differences were foundif only measurement data of 1989 were used forcomparison.
4.2.2. Forest edgesThe results of an extensive field study on the effects of
canopy structure and edge aspects on deposition aredescribed by Draaijers (1993). On the basis of theseresults and information gathered on forest fragmenta-tion in the Netherlands, the deposition to Dutch forestsis estimated taking edge effects into account. In general,net throughfall fluxes inside forests increase exponen-tially towards forest edges. The width of the zone withenhanced net throughfall fluxes approximates five edgeheights. Net throughfall enhancement of SO4
2�, NO3�
and NH4+ near forest edges (on average, a factor of 2) is
smaller than that of Na+, Cl� and Mg2+ (on average, afactor of 5). Differences are attributed to the sources ofthese ions in throughfall. Net throughfall of SO4
2�, NO3�
and NH4+ in the Netherlands is determined to a large
extent by dry deposition of gases and submicron parti-cles, and net throughfall of Na+, Cl� and Mg2+ largelyby dry deposition of super micron sea salt particles.Net throughfall enhancement in forest edges also
strongly depends upon forest density and edge aspect.For SO4
2�, NO3� and NH4
+, very strong relationshipswere observed between net throughfall enhancementand silhouette area density, suggesting that drag forces(influencing aerodynamic transport) mainly determinethe differences between forest edge and forest interiordry deposition. For Na+, Cl� and Mg2+, a strongrelation was found with leaf area density, which suggest
Fig. 6. Relationship between modelled dry deposition and dry deposition estimated from throughfall and bulk precipitation measurements.
386 J.W. Erisman, G. Draaijers / Environmental Pollution 124 (2003) 379–388

that for these ions in-canopy wind speeds largely deter-mine the differences between forest edge and forestinterior dry deposition. Forest edges exposed to pre-vailing wind directions and/or high pollutant doses areespecially subject to enhanced dry deposition. ForSO4
2�, NO3� and NH4
+, the largest net throughfallenhancement was found in forest edges with SE, S, SWor W aspect, because of prevailing wind directions andsources. This was in agreement with results from anextensive survey of the groundwater quality under for-ests in the Netherlands (Bouwmans and Beltman,1991). The largest SO4
2� and NO3� concentrations in
groundwater were found in forest edges exposed to SE,S, SW and W wind directions. For Na+ and Cl�, thelargest net throughfall enhancement was observed inforest edges exposed to S, SW, W and NW winddirections.In large parts of Europe, extensive uniform forests are
more the exception than the rule and also Dutch forestsare considerably fragmented. Almost 80% of all forestcomplexes in the Netherlands are smaller than 5 ha, andmore than 70% of all individual forest stands smallerthan 1.5 ha. For an edge width of five edge heights, itwas computed that at least 50% of the total forestedarea in the Netherlands is influenced by edge effects. Byneglecting edge effects, dry deposition of acidifyingcompounds to forests in the Netherlands as a wholemay be underestimated by approximately 5–10%. Simi-larly, dry deposition of (sea salt) particles may beunderestimated by 20–25%. These are upper limits ofunderestimation because it may be expected thatenhanced dry deposition in a forest edge leads to adownwind depletion of gases and particles, resulting inrelatively reduced dry deposition in the forest interior.Forest edges may not influence dry deposition on theregional or national scale, on the local scale, however, itcan be of much importance.
5. Synthesis
The most important factors influencing dry depositionare: external leaf wetness, surface wetness chemistry,stomatal opening and the roughness length, which isdetermined by the canopy height, canopy closure andLAI. Comparison of modelled with measured temporalvariation in deposition of SO2 showed that the agree-ment is reasonable. However, the temporal variation isnot modelled detailed enough, and extrapolation toother regions and conditions is uncertain. Annual fluxesto forests in The Netherlands and Europe can be mod-elled reasonably well, showing that the influence of for-est characteristics on the annual variation in drydeposition is well understood and parameterised. There-fore, in areas where reasonable coverage of concentration,meteorological, land use and surface characteristic data
is present (such as The Netherlands) dry deposition tohomogeneous stands can be modelled with reasonableaccuracy, except for nitrogen compounds (ground-levelsources, bi-directional fluxes; Erisman and Draaijers,1995; Sutton et al., 1998). On the European scale, how-ever, there is a serious lack of data: spatial variation inconcentration, accurate land use, tree height and crownprojection or LAI data are lacking.Regional scale and receptor-oriented deposition
models treat deposition as an one-dimensional (vertical)transfer to homogeneous surfaces with infinite length.By determining turbulent exchange parameters at aheight of 50 m above the receptor surface, it is assumedthat enhanced turbulent exchange induced by localroughness transitions is sufficiently taken into accountin the deposition estimates (Erisman, 1992, 1993).Advection processes are not considered in these models.To date, there is no technique available to adequatelycompensate for ‘edge effects’ as the underlying processesare still scarcely studied and the land-use data necessaryare usually not available.The relation between atmospheric deposition and
forest management is on the one hand to understand theinputs, so foresters can consider that for choice of spe-cies, loss of production, etc. On the other hand, forestmanagement can be used to reduce atmospheric input,but only to a small extent. If reduction of deposition toforests is the aim of management, tree height should bekept as low as possible, stands should be homogeneous,deciduous mono-cultures, without transition zones anda minimum of forest edges. Furthermore, the under-storey should be taken away and no forests should beplanted on hill tops. However, the question arises if thisis the optimal configuration for production, ethics, bio-diversity and recreational use of forests?! Moreover, it isquestionable whether the reduction of atmosphericdeposition in this way is such that the negative aspectsare compensated for: probably not!
References
Beier, C., Gundersen, P., 1989. Atmospheric deposition to the edge of
a Spruce forest in Denmark. Environmental Pollution 60, 257–271.
Bosveld, F.C., Beljaars, A.C.M., 1987. Complex terrain effects on dry
deposition. In: van Dop, H. (Ed.), Air Pollution Modelling and its
Applications IV. Plenum Press, New York.
Boumans, L.J.M., Beltman, W.H.J., 1991. Kwaliteit van het bovenste
freatische grondwater in de zandgebieden van Nederland, onder bos
en heideveld. Rijksinstituut voor Volksgezondheid en Mili-
euhygiene, Bilthoven (rapport nr. 724901001).
Dasch, J.M., 1987. Measurement of dry deposition to surfaces in
deciduous and pine canopies. Environmental Pollution 44, 261–277.
Draaijers, G.P.J., Ivens, W.P.M.F., Bleuten, W., 1988. Atmospheric
deposition in forest edges measured by monitoring canopy
throughfall. Water and Air Soil Pollution, 42:129-136.
Draaijers, G.P.J., 1993. The Variability of Atmospheric Deposition to
Forests. PhD Thesis, University of Utrecht, The Netherlands.
Draaijers, G.P.J., Erisman, J.W., 1993. Atmospheric sulphur
J.W. Erisman, G. Draaijers / Environmental Pollution 124 (2003) 379–388 387

deposition onto forest stands: throughfall estimates compared to
estimates from inference. Atmospheric Environment 27A, 43–55.
Draaijers, G.P.J., Erisman, J.W., Spranger, T., Wyers, G.P., 1996. The
application of throughfall measurements for atmospheric deposition
monitoring. Atmospheric Environment 30, 3349–3361.
Draaijers, G.P.J., Leeuwen van, E.P., Jong, P.G.H., de en Erisman,
J.W., 1997. Base cation deposition in Europe—Part I. Model
description, results and uncertainty. Atmospheric Environment 31,
4139–4157.
Erisman, J.W., 1992. Atmospheric Deposition of Acidifying Com-
pounds in the Netherlands. PhD Thesis, Utrecht University, The
Netherlands.
Erisman, J.W., 1993. Acid deposition onto nature areas in the Neth-
erlands; Part I. Methods and results. Water, Air and Soil Pollution
71, 51–80.
Erisman, J.W., 1994. Evaluation of a surface resistance parameteriza-
tion of SO2. Atmospheric Environment 28, 2583–2594.
Erisman, J.W., van Pul, A., Wyers, P., 1994a. Parameterization of dry
deposition mechanisms for the quantification of atmospheric input
to ecosystems. Atmospheric Environment 28, 2595–2607.
Erisman, J.W., Draaijers, G.J.P., Duyzer, J.H., Hofschreuder, P., van
Leeuwen, N., Romer, F.G., Ruijgrok, W., Wyers, G.P., 1994b.
Contribution of Aerosol Deposition to Atmospheric Deposition and
Soil Loads onto Forests. (Report No. 722108005). National Insti-
tute of Public Health and Environmental Protection, Bilthoven, The
Netherlands.
Erisman, J.W., Draaijers, G.P.J., 1995. Atmospheric deposition in
relation to acidification and eutrophication. Studies in Environ-
mental Research 63, Elsevier, the Netherlands.
Erisman, J.W., Mennen, M.G., Fowler, D., Flechard, C.R., Spindler,
G., Gruner, A., Duyzer, J.H., Ruigrok, W., Wyers, G.P., 1998.
Deposition monitoring in Europe. Environmental Monitoring and
Assessment 53, 279–295.
Erisman, J.W., Potma, C., Draaijers, G.P.J., Van Leeuwen, E.P., Van
Pul, W.A.J., 1996. A generalised description of the deposition of
acidifying pollutants on a small scale in Europe. Water, Air and Soil
Pollution 85, 2101–2106.
Fowler, D., Duyzer, J.H., Baldocchi, D.D., 1991. Inputs of trace
gases, particles and cloud droplets to terrestrial surfaces. Proc. R.
Soc. Edinburgh 97B, 35–59.
Hasselrot, B., Grennfelt, P., 1987. Deposition of air pollutants in a
wind-exposed forest edge. Water, Air and Soil Pollution 34, 135–
143.
Hicks, B.B., Baldocchi, D.D., Meyers, T.P., Hosker Jr, R.P., Matt,
D.R., 1987. A preliminary multiple resistance routine for deriving
dry deposition velocities from measured quantities. Water, Air and
Soil Pollution 36, 311–330.
Hicks, B.B., Draxler, R.R., Albritton, D.L., Fehsenfeld, F.C., Hales,
J.M., Meyers, T.P., Vong, R.L., Dodge, M., Schwartz, S.E., Tanner,
R.L., Davidson, C.I., Lindberg, S.E., Wesely, M.L. 1989. Atmo-
spheric Processes Research and Procecess Model Development.
(State of Science/Technology, Report No. 2). National Acid Pre-
cipitation Assessment Program.
Hicks, B.B., Hosker, R.P., Meyers, T.P., Womack, J.D., 1991. Dry
deposition inferential measurement techniques—I. Design and tests
of a prototype meteorological and chemical system for determining
dry deposition. Atmospheric Environment 25A, 2345–2359.
Huebert, B.J., Robert, C.H., 1985. The dry deposition of nitric acid to
grass. Journal of Geophysical Research 90, 2085–2090.
Klaassen, W., 1992. Average fluxes from heterogeneous vegetated
regions. Boundary-Layer Meteorology 58, 329–354.
Li, Z., Lin, J.D., Miller, D.R., 1990. Air flow over and through a for-
est edge: a steady state numerical simulation. Boundary-Layer
Meteorology 51, 179–197.
Lindberg, S.E., Lovett, G.M., Schaefer, D.A., Bredemeier, M., 1988.
Coarse aerosol deposition velocities and surface-to-canopy scaling
factors from forest canopy throughfall. Journal of Aerosol Science
19, 1187–1190.
Lovblad, G., Erisman, J.W., Fowler, D., 1993. Models and Methods
for the Quantification of Atmospheric Input to Ecosystems. (Report
no. Nord 1993:573) Goteborg, Sweden, 3–7 November 1992. Nordic
Council of Ministers, Copenhagen, Denmark.
Lovett, G.M., Reiners, W.A., 1986. Canopy structure and cloud water
deposition in subalpine coniferous forests. Tellus 38B, 319–327.
Meyers, T.P., Huebert, B.J., Hicks, B.B., 1989. HNO3 deposition to a
deciduous forest. Boundary-Layer Meteorology 49, 395–410.
Parker, G.G., 1983. Throughfall and stemflow in the forest nutrient
cycle. In: McFadyen, A., Ford, E.D. (Eds.). Advances in Ecological
Research, Vol. 13.
Potts, M.J., 1978. The pattern of deposition of air-borne salt of marine
origin under a forest canopy. Plant Soil 50, 233–236.
Van Pul, W.A.J., Van Aalst, R.M., Erisman, J.W., 1991. Deposition
of air pollution at a forest edge: a simple approach. In: Slanina, J.
(Ed.), Eurotrac-Biatex Annual Report. FRG, Garmisch Parten-
kirchen.
Ranney, J.W., Bruner, M.C., Levenson, J.B., 1978. The importance of
edge in the structure and dynamics of forest islands. In: Burgess,
R.L., Sharpe, D.M. (Eds.), Forest Island Dynamics in Man-domi-
nated Landscapes. Springer, New York, pp. 67–95.
Slinn, W.G.N., 1982. Predictions for particle deposition to vegetative
surfaces. Atmospheric Environment 16, 1785–1794.
Smith, R.I., Fowler, D., Sutton, M.A., Flechard, C., Coyle, M., 2000.
Regional estimation of pollutant gas dry deposition in the UK:
model description, sensitivity analysis and outputs. Atmospheric
Environment 34, 3757–3777.
Sutton, M.A., Burkhardt, J.K., Guerin, D., Nemitz, E., Fowler, D.,
1998. Development of resistance models to describe bi-directional
ammonia surface-atmosphere exchange. Atmospheric Environment
32, 473–480.
Voldner, E.C., Barrie, L.A., Sirois, A., 1986. A literature review of dry
deposition of oxides of sulfur and nitrogen with emphasis on long-
range transport modelling in North America. Atmospheric Envir-
onment 20, 2101–2123.
Weathers, K.C., Lovett, G.M., Likens, G.E., 1992. The influence of a
forest edge on cloud deposition. In: Schwartz, S.E., Slinn, W.G.N.
(Eds.), Precipitation Scavenging and Atmosphere–surface
Exchange. Hemisphere, Washington, pp. 1415–1424.
Wesely, M.L., Hicks, B.B., 1977. Some factors that affect the deposi-
tion rates of sulfur dioxide and similar gases on vegetation. J. Air
Pollut. Contr. Assoc. 27, 1110–1116.
Wesely, M.L., 1989. Parametrization of surface resistances to gaseous
dry deposition in regional-scale numerical models. Atmospheric
Environment 23, 1293–1304.
Wesely, M.L., Hicks, B., 2000. A review of the current status of
knowledge in dry deposition. Atmospheric Environment 34, 2261–
2282.
Wieringa, J. Updating the Davenport roughness classification. J. Wind
Engin. Indust. Aerodynamics 1992, 41.
Wiman, B.L.B., Agren, G.I., 1985. Aerosol depletion and deposition in
forests—a model analysis. Atmospheric Environment 19, 335–347.
Wiman, B.L.B., Lannefors, H.O., 1985. Aerosol characteristics in a
mature coniferous forest: methodology, composition, sources and
spatial concentration variations. Atmospheric Environment 19,
349–362.
Wu, Y.L., Davidson, C.I., Dolske, D.A., Sherwood, S.I., 1992. Dry
deposition of atmospheric contaminants to surrogate surfaces and
vegetation. Aerosol Science and Technology 16, 65–81.
Zhang, L., Moran, M.D., Makar, P.A., Brook, J.R., Gong, S., 2002.
Modelling gaseous dry deposition inAURAMS: a unified regional air-
quality modelling system. Atmospheric Environment 36, 537–560.
388 J.W. Erisman, G. Draaijers / Environmental Pollution 124 (2003) 379–388


![Gallipoli - Britain's Most Terrible Defeat [German]](https://static.fdokumen.com/doc/165x107/631e4f7b05964b686800c042/gallipoli-britains-most-terrible-defeat-german.jpg)

