Fill Ups of Straight Lines and Pair of Straight Lines - SelfStudys
Upload
independentCategory
view
3download
0
(CANCER RESEARCH 58, 5396-5405. December 1. 1998]
Drug Resistance Patterns of Human Neuroblastoma Cell Lines Derived fromPatients at Different Phases of Therapy1
Nino Keshelava, Robert C. Seeger, Susan Groshen, and C. Patrick Reynolds2
Division af Hematology-Oncology. Children.! Hospital Los Angeles, his Angeles, California V0033 ¡N.K., R. C. S., C. P. R.], and Departments of Pediatrics ¡N.K., K. C. S..
C. P. K.I, Pathology 1C. P. R.¡.and Preventive Medicine IS. C.I, University of Southern California School of Medicine, Los Angeles, California
ABSTRACT
To determine whether neuroblastomas acquire a sustained drug-resis
tant phenotype from exposure to chemotherapeutic agents given to patients in vivo, we studied neuroblastoma cell lines established at differentpoints of therapy: six at diagnosis before therapy (DX), six at progressivedisease during induction therapy (PD-Ind), and five at relapse afterintensive chemoradiotherapy and bone marrow transplantation (PD-
BMT). Cells were maintained in the absence of drug selective pressure.Dose-response curves of melphalan, cisplatin, carboplatin, doxorubicin,
and etoposide for the cell line panel were determined by measuringcytotoxicity with a 96-well-plate digital imaging microscopy (DIMSCAN)
microassay. Drug resistance of cell lines progressively increased with theintensity of therapy delivered I'Mvivo. The greatest resistance was seen in
PD-BMT cell lines: 1C,,,, values in I'D-liM I cell lines were higher than
clinically achievable drug levels by 1-37 times for melphalan, 1—9timesfor carboplatin, 25-78 times for cisplatin, 6-719 times for doxorubicin,and 3-52 times for etoposide. Genomic amplification of MYCN did notcorrelate with resistance. Cross-resistance by Pearson correlation
(r a 0.6) was observed between: (a) cisplatin + doxorubicin; (In carboplatin + cisplatin, etoposide, or melphalan; (c) etoposide + cisplatin,melphalan, or doxorubicin. These data indicate that during therapy,neuroblastomas can acquire resistance to cytotoxic drugs because of thepopulation expansion of tumor cells possessing stable genetic or epigeneticalterations that confer resistance.
INTRODUCTION
Neuroblastoma is a malignant childhood neoplasm of the sympathetic nervous system. Myeloablative chemoradiotherapy supportedwith BMT1 improves survival for high-risk neuroblastoma patients ( 1,
2), especially if followed by treatment with high-dose 13-m-retinoicacid (3). Even with intensive therapy, the majority of high-risk neu
roblastoma patients eventually develop progressive disease that isrefractory to further therapy (4). Drug resistance of neuroblastomasthat progress during or after chemotherapy could depend on thealtered expression of drug resistance genes (5-7), tumor cells in"sanctuary" sites of low-drug penetration (8), tumor hypoxia (9, 10),
tumor cells resting out of cell cycle (11), or all of the above. Nocurrent experimental data favors any of the above mechanisms. How-
Received 2/27/98; accepted 9/25/98.The costs of publication of this article were defrayed in part by the payment of page
charges. This article must therefore be hereby marked advertisement in accordance with18 U.S.C. Section 1734 solely to indicate this fact.
1Supported in part by a Childrens Hospital Los Angeles Research Institute Research
Career Development Fellowship; the Neil Bogart Memorial Laboratories of the T. J.Marteli Foundation for Leukemia. Cancer, and AIDS Research; by National CancerInstitute Grants CA60104. CAI3539, and CAI4089; and by the American Institute forCancer Research.
2 To whom requests for reprints should be addressed, at Division of Hematology-
Oncology, MS# 57, Childrens Hospital Los Angeles, 4650 Sunset Boulevard, Los Angeles. CA 90027. Phone: (323) 669-5646; Fax: (323) 664-9226/9455; E-mail: cpreynol®hsc.usc.edu.
3 The abbreviations used are: BMT. bone marrow transplantation: DX, cell lines
established from patients at diagnosis; PD-Ind, cell lines established from patients withprogressive disease during induction chemotherapy; PD-BMT, cell lines established frompatients at relapse after BMT; PD-Auto-BMT; cell lines established from patients withprogressive disease after autologous BMT; PD-Allo-BMT, cell lines established frompatients with progressive disease after allogeneic BMT; FDA. fluorescein diacetate;RT-PCR. reverse transcriplion-PCR; TH, tyrosine hydroxylase; PPL, peak plasma level;CSS. continuous steady-state concentration: PBS-GS. PBS +5% goat serum.
ever, because most newly diagnosed high-risk neuroblastomas re
spond to chemotherapy whereas most relapsed tumors do not, it islikely that selection of tumor cells with alterations conferring drugresistance occurs.
Genomic amplification of MYCN is associated with advanced disease (12) and poor prognosis of neuroblastoma patients (13), but verylittle experimental data exist on the correlation of MYCN with chemotherapy sensitivity/resistance. It is not clear whether MYCN has arole in the emergence of drug resistance after initially successfulchemotherapy, or whether the poor outcome of neuroblastoma patients with MYCN amplification is mediated by other mechanisms.
To develop a model system for identifying drugs that are effectiveagainst resistant neuroblastoma and for understanding the mechanisms by which neuroblastoma cells escape chemotherapy (especiallymyeloablative therapy), we have established a panel of cell lines frompatients with neuroblastoma at various points during the course oftheir disease. Cell lines were established at diagnosis, at progressivedisease during induction therapy, and at relapse after intensive chemoradiotherapy and BMT. The panel includes pairs of cell linesestablished from tumors of four patients at diagnosis and again atdisease progression during induction chemotherapy. In this study, wehave determined the sensitivity of this cell line panel to drugs commonly used in the therapy of neuroblastoma and the relationship ofMYCN genomic amplification to drug resistance.
MATERIALS AND METHODS
Cell Lines. A panel of 17 human neuroblastoma cell lines were established from patients at various points during therapy: 6 DX, 6 PD-Ind, and5 PD-BMT (3 PD-Auto-BMT and 2 PD-Allo-BMT). DX cell lines werederived from patients before any chemotherapy was given, PD-Ind celllines came from patients treated with induction chemotherapy, and PD-
BMT cell lines were obtained from patients treated with myeloablativechemoradiotherapy (Table 1).
Human neuroblastoma cell lines SMS-KAN, SMS-KANR, SMS-KCN,SMS-KCNR. SK-N-BE(l). SK-N-BE(2), SMS-SAN, SMS-LHN, and LA-N-6have been characterized previously (14-16). CHLA-15. CHLA-42, CHLA-20,CHLA-51, CHLA-8, CHLA-79. CHLA-90, and CHLA-134 are newly estab
lished cell lines. All of the cell lines were cultured in complete mediumconsisting of Iscove's modified Dulbecco's medium (IMDM, Bio Whittaker,
Walkersville, MD) supplemented with 3 mM L-glutamine (Gemini Bioprod-
ucts. Inc.. Calabasas, CA), insulin and transferrin 5 /xg/ml each and 5 ng/ml ofselenous acid (ITS Culture Supplement, Collaborative BiomédicalProducts,Bedford, MA), and 20% heat-inactivated fetal calf serum (PCS). All of the celllines used were studied within passages 10 through <30 (except SMS-KCNR.which was tested at passage 32, and SMS-SAN, which was tested at passage40) and cultured at 37°Cin a humidified incubator containing 95% air + 5%
CO2 atmosphere. Cells were cultured without antibiotics to facilitate detectionof mycoplasma, for which all of the cell lines tested negative. Cell lines werenot selected for resistance in vitro.
Drugs and Chemicals. Melphalan (L-PAM), cisplatin (CDDP), carboplatin
(CBDCA), and doxorubicin hydrochloride (DOX) were obtained from NIH(Bethesda, MD). Etoposide (ETOP) was obtained from Bristol-Myers Squibb
Co. (Princeton, NJ). FDA was purchased from Eastman Kodak Company(Rochester, NY), eosin Y from Sigma Chemical Co, (St. Louis, MO), andTRlzol reagent from Life Technologies (Grand Island, NY).
5396
Research. on February 7, 2015. © 1998 American Association for Cancercancerres.aacrjournals.org Downloaded from
DRUG RESISTANCE IN NEUROBLASTOMA CELL LINES
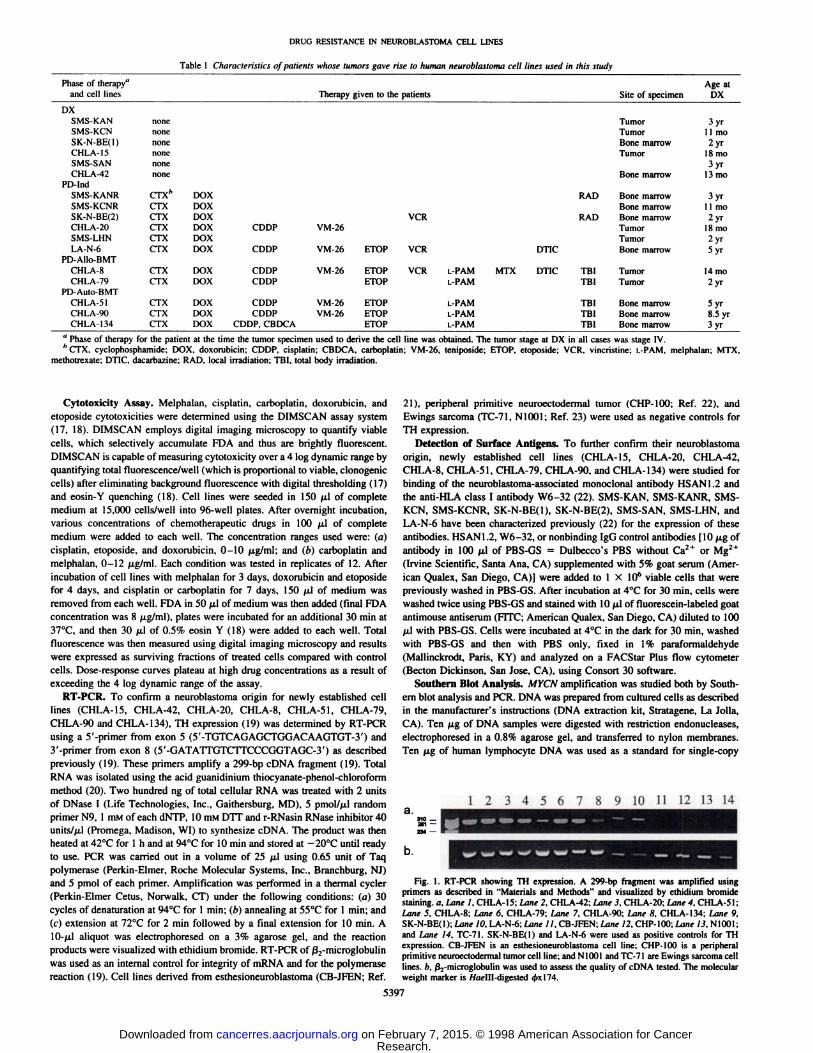
Table 1 Characteristics of patients whose tumors gave rise to human neuroblastoma cell lines used in this study
Phase of therapy"
and celllinesDXSMS-KAN
SMS-KCNSK-N-BE(l)
CHLA-15SMS-SAN
CHLA-42PD-lnd
SMS-KANRSMS-KCNRSK-N-BE(2)
CHLA-20SMS-LHN
LA-N-6PD-Allo-BMTCHLA-8CHLA-79
PD-Auto-BMTCHLA-51
CHLA-90CHLA-134none
nonenone
nonenone
nonecrx*CTXCTX
CTXCTX
CTXCTXCTXCTX
CTXCTXDOX
DOXDOX
DOXCDDPDOX
DOXCDDPDOX
CDDPDOXCDDPDOX
CDDPDOX CDDPDOX CDDP. CBDCATherapy
given (o the patients Site ofspecimenTumor
TumorBonemarrow
TumorBone
marrowRAD
Bone marrowBonemarrowVCR
RAD Bone marrowVM-26 TumorTumor
VM-26 ETOP VCR DTIC BonemarrowVM-26
ETOP VCR L-PAM MTX DTIC TBITumorETOPL-PAM TBITumorVM-26
ETOP L-PAM TBI Bone marrowVM-26 ETOP L-PAM TBI Bone marrow
ETOP L-PAM TBI Bone marrowAge
atDX3yr
11mo2yr
18mo3yr
13mo3yr
11mo2yr
18mo2yr5yr14
mo2yrSyr8.5
yr3yr
" Phase of therapy for the patient at the time the tumor specimen used to derive the cell line was obtained. The tumorfcCTX, cyclophosphamide: DOX. doxorubicin; CDDP. cisplatin; CBDCA. carboplatin: VM-26. leniposide: ETOP.
methotrexate: DTIC. dacarbazine: RAD. local irradiation; TBI, total body irradiation.
stage at DX in all cases was stage IV.etoposide; VCR. vincristine; L-PAM. melphalan; MTX.
Cytotoxicity Assay. Melphalan, cisplatin, carboplatin, doxorubicin, andetoposide cytotoxicities were determined using the DIMSCAN assay system(17, 18). DIMSCAN employs digital imaging microscopy to quantify viablecells, which selectively accumulate FDA and thus are brightly fluorescent.DIMSCAN is capable of measuring cytotoxicity over a 4 log dynamic range byquantifying total fluorescence/well (which is proportional to viable, clonogeniccells) after eliminating background fluorescence with digital thresholding (17)and eosin-Y quenching (18). Cell lines were seeded in 150 ¿ilof completemedium at 15,000 cells/well into 96-well plates. After overnight incubation,
various concentrations of chemotherapeutic drugs in 100 ¡úof completemedium were added to each well. The concentration ranges used were: (a)cisplatin. etoposide. and doxorubicin, 0-10 /xg/ml; and (b) carboplatin andmelphalan, 0-12 /j.g/ml. Each condition was tested in replicates of 12. After
incubation of cell lines with melphalan for 3 days, doxorubicin and etoposidefor 4 days, and cisplatin or carboplatin for 7 days, 150 ¡uof medium wasremoved from each well. FDA in 50 ¡uof medium was then added (final FDAconcentration was 8 jj.g/ml), plates were incubated for an additional 30 min at37°C,and then 30 ju.1of 0.5% eosin Y (18) were added to each well. Total
fluorescence was then measured using digital imaging microscopy and resultswere expressed as surviving fractions of treated cells compared with controlcells. Dose-response curves plateau at high drug concentrations as a result of
exceeding the 4 log dynamic range of the assay.RT-PCR. To confirm a neuroblastoma origin for newly established cell
lines (CHLA-15, CHLA-42, CHLA-20, CHLA-8, CHLA-51. CHLA-79,CHLA-90 and CHLA-134), TH expression (19) was determined by RT-PCRusing a 5'-primer from exon 5 (5'-TGTCAGAGCTGGACAAGTGT-3') and3'-primer from exon 8 (5'-GATATTGTCTTCCCGGTAGC-3') as described
previously (19). These primers amplify a 299-bp cDNA fragment (19). TotalRNA was isolated using the acid guanidinium thiocyanate-phenol-chloroform
method (20). Two hundred ng of total cellular RNA was treated with 2 unitsof DNase I (Life Technologies. Inc.. Gaithersburg. MD). 5 pmol//j.l randomprimer N9, 1 mM of each dNTP, 10 mM DTT and r-RNasin RNase inhibitor 40
units/(xl (Promega. Madison, WI) to synthesize cDNA. The product was thenheated at 42°Cfor l h and at 94°Cfor 10 min and stored at -20°C until ready
to use. PCR was carried out in a volume of 25 ¡i\using 0.65 unit of Taqpolymerase (Perkin-Elmer. Roche Molecular Systems, Inc., Branchburg, NJ)
and 5 pmol of each primer. Amplification was performed in a thermal cycler(Perkin-Elmer Cetus, Norwalk, CT) under the following conditions: (a) 30cycles of denaturation at 94°Cfor 1 min: (b) annealing at 55°Cfor 1 min: and(c) extension at 72°Cfor 2 min followed by a final extension for 10 min. A
10-/xl aliquot was electrophoresed on a 3% agarose gel, and the reactionproducts were visuali/.ed with ethidium bromide. RT-PCR of ß2-m\crog\obu\\n
was used as an internal control for integrity of mRNA and for the polymerasereaction (19). Cell lines derived from esthesioneuroblastoma (CB-JFEN; Ref.
21), peripheral primitive neuroectodermal tumor (CHP-100; Ref. 22), andEwings sarcoma (TC-71, N1001; Ref. 23) were used as negative controls for
TH expression.Detection of Surface Antigens. To further confirm their neuroblastoma
origin, newly established cell lines (CHLA-15. CHLA-20, CHLA-42,CHLA-8, CHLA-51, CHLA-79, CHLA-90, and CHLA-134) were studied forbinding of the neuroblastoma-associated monoclonal antibody HSAN1.2 andthe anti-HLA class I antibody W6-32 (22). SMS-KAN, SMS-KANR, SMS-KCN, SMS-KCNR, SK-N-BE(l), SK-N-BE(2), SMS-SAN, SMS-LHN, andLA-N-6 have been characterized previously (22) for the expression of theseantibodies. HSAN1.2. W6-32. or nonbinding IgG control antibodies (10 /¿gofantibody in 100 /xl of PBS-GS = Dulbecco's PBS without Ca2+ or Mg2 +
(Irvine Scientific, Santa Ana, CA) supplemented with 5% goat serum (American Qualex, San Diego. CA)] were added to 1 X IO6 viable cells that werepreviously washed in PBS-GS. After incubation at 4°Cfor 30 min, cells were
washed twice using PBS-GS and stained with IO /ni of fluorescein-labeled goat
antimouse antiserum (FITC; American Qualex. San Diego. CA) diluted to 100/¿Iwith PBS-GS. Cells were incubated at 4°Cin the dark for 30 min, washed
with PBS-GS and then with PBS only, fixed in 1% paraformaldehyde
(Mallinckrodt. Paris, KY) and analyzed on a FACStar Plus flow cytometer(Becton Dickinson. San Jose. CA), using Consort 30 software.
Southern Blot Analysis. MYCN amplification was studied both by Southern blot analysis and PCR. DNA was prepared from cultured cells as describedin the manufacturer's instructions (DNA extraction kit, Stratagene. La Jolla,
CA). Ten /ng of DNA samples were digested with restriction endonucleases,electrophoresed in a 0.8% agarose gel, and transferred to nylon membranes.Ten fig of human lymphocyte DNA was used as a standard for single-copy
1234567 10 11 12 13 14a.
b.
Fig. 1. RT-PCR showing TH expression. A 299-bp fragment was amplified usingprimers as described in "Materials and Methods" and visualized by ethidium bromide
staining, a. Lane 1, CHLA-15; Lane 2, CHLA-42; Lane 3, CHLA-20: Lane 4. CHLA-51;Lane 5. CHLA-8: Lane 6, CHLA-79; Lane 7, CHLA-90; Lane 8. CHLA-134; Lane 9,SK-N-BE(I); Urne IO. LA-N-6: Lane II. CB-JFEN; Lane 12. CHP-100: Line 13. N1001:and Lane 14. TC-71. SK-N-BE(I) and LA-N-6 were used as positive controls for THexpression. CB-JFEN is an esthesioneuroblastoma cell line: CHP-100 is a peripheralprimitive neuroectodermal tumor cell line: and N1001 and TC-71 are Ewings sarcoma celllines, h. (3,-microglobulin was used to assess the quality of cDNA tested. The molecularweight marker is //«pill-digested $xl74.
5397
Research. on February 7, 2015. © 1998 American Association for Cancercancerres.aacrjournals.org Downloaded from
DRUGRESISTANCEIN NEUROBLASTOMACELLLINES
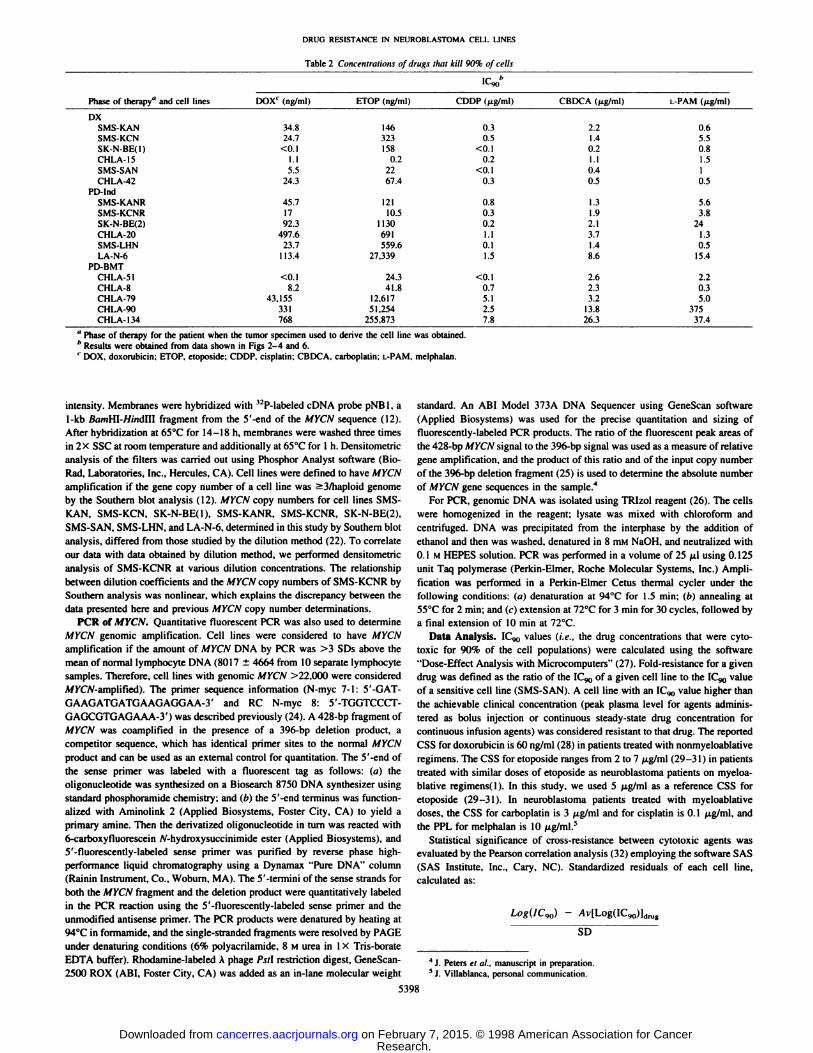
Table 2 Concentrulinns of drugs that kill 90% of cells
Phase of therapy" and celllinesDXSMS-KANSMS-KCNSK-N-BE(l)CHLA-15SMS-SANCHLA-42PD-IndSMS-KANRSMS-KCNRSK-N-BEI2)CHLA-20SMS-LHNLA-N-6PD-BMTCHLA-51CHI
.A-SCHLA-79CHLA-90CHLA-134DOX'
(ng/ml)34.824.7<0.11.15.524.345.71792.3497.623.7113.4<0.18.243,155331768ETOP(ng/ml)1463231580.22267.412110.51130691559.627,33924.341.812.61751.254255.873ICco"CDDP(jig/ml)0.30.5<0.10.2<0.l0.30.80.30.21.10.11.5<0.10.75.12.57.8CBDCA(/ig/ml)2.21.4(12I.I0.40.51.31.92.13.71.48.62.62.33.213.826.3L-PAM(fig/ml)0.65.50.81.510.55.63.8241.30.515.42.20.35.037537.4
" Phase of therapy for the patient when the tumor specimen used lo derive the cell line was obtained.'' Results were obtained from data shown in Figs 2-4 and 6.1 DOX, doxorubicin: ETOP. etoposide; CDDP, cisplatin; CBDCA, carboplatin: L-PAM.melphalan.
intensity. Membranes were hybridi/.ed with <2P-labeled cDNA probe pNBl. a
1-kb B</HiHI-//;;idIII fragment from the 5'-end of the MYCN sequence (12).
After hybridi/ation at 65°Cfor 14-18 h. membranes were washed three timesin 2X SSC at room temperature and additionally at 65°Cfor 1 h. Densitometric
analysis of the filters was carried out using Phosphor Analyst software (Bio-
Rad, Laboratories, Inc., Hercules. CA). Cell lines were defined to have MYCNamplification it the gene copy number of a cell line was >3/haploid genomeby the Southern blot analysis (12). MYCN copy numbers for cell lines SMS-KAN. SMS-KCN. SK-N-BE(l), SMS-KANR, SMS-KCNR. SK-N-BE(2),SMS-SAN. SMS-LHN, and LA-N-6, determined in this study by Southern blot
analysis, differed from those studied by the dilution method (22). To correlateour data with data obtained by dilution method, we performed densitometricanalysis of SMS-KCNR at various dilution concentrations. The relationshipbetween dilution coefficients and the MYCN copy numbers of SMS-KCNR by
Southern analysis was nonlinear, which explains the discrepancy between thedata presented here and previous MYCN copy number determinations.
PCR of MYCN. Quantitative fluorescent PCR was also used to determineMYCN genomic amplification. Cell lines were considered to have MYCNamplification if the amount of MYCN DNA by PCR was >3 SDs above themean of normal lymphocyte DNA (8017 ±4664 from 10 separate lymphocytesamples. Therefore, cell lines with genomic MYCN >22.000 were consideredA/KC/V-amplified). The primer sequence information (N-myc 7-1: 5'-GAT-GAAGATGATGAAGAGGAA-3' and RC N-myc 8: 5'-TGGTCCCT-GAGCGTGAGAAA-3') was described previously (24). A 428-bp fragment of
MYCN was coamplified in the presence of a 396-bp deletion product, a
competitor sequence, which has identical primer sites to the normal MYCNproduct and can be used as an external control for quantitation. The 5'-end of
the sense primer was labeled with a fluorescent tag as follows: (a) theoligonucleotide was synthesi/ed on a Biosearch 8750 DNA synthesi/er usingstandard phosphoramide chemistry: and (h) the 5'-end terminus was function-
ali/ed with Aminolink 2 (Applied Biosystems, Foster City, CA) to yield aprimary amine. Then the derivati/ed oligonucleotide in turn was reacted with6-carboxyfluorescein /V-hydroxysuccinimide ester (Applied Biosystems), and.V-fluorescenlly-labeled sense primer was purified by reverse phase high-performance liquid chromatography using a Dynamax "Pure DNA" column
(Rainin Instrument. Co.. Woburn, MA). The _V-termini of the sense strands for
both the MYCN fragment and the deletion product were quantitatively labeledin the PCR reaction using the S'-tluorescently-labeled sense primer and the
unmodified antisense primer. The PCR products were denatured by heating at94°Cin formamide. and the single-stranded fragments were resolved by PAGE
under denaturing conditions (We polyacrilamide. 8 M urea in I X Tris-borateEDTA buffer). Rhodamine-labeled A phage Pst\ restriction digest. GeneScan-2500 ROX (ABI. Foster City, CA) was added as an in-lane molecular weight
standard. An ABI Model 373A DNA Sequencer using GeneScan software
(Applied Biosystems) was used for the precise quantitation and si/.ing offluorescently-labeled PCR products. The ratio of the fluorescent peak areas ofthe 428-bp MYCN signal to the 396-bp signal was used as a measure of relative
gene amplification, and the product of this ratio and of the input copy numberof the 396-bp deletion fragment (25) is used to determine the absolute numberof MYCN gene sequences in the sample.4
For PCR, genomic DNA was isolated using TRI/.ol reagent (26). The cellswere homogenized in the reagent: lysate was mixed with chloroform andcentrifuged. DNA was precipitated from the interphase by the addition ofethanol and then was washed, denatured in 8 mM NaOH. and neutrali/.ed with0.1 M HEPES solution. PCR was performed in a volume of 25 ¡uusing 0.125unit Taq polymerase (Perkin-Elmer. Roche Molecular Systems. Inc.) Ampli
fication was performed in a Perkin-Elmer Cetus thermal cycler under thefollowing conditions: («)denaturation at 94°Cfor 1.5 min: (h) annealing at55°Cfor 2 min: and (c) extension at 72°Cfor 3 min for 30 cycles, followed bya final extension of 10 min at 72°C.
Data Analysis. IC,„>values (i.e., the drug concentrations that were cyto-
toxic for 90% of the cell populations) were calculated using the software"Dose-Effect Analysis with Microcomputers" (27). Fold-resistance for a given
drug was defined as the ratio of the IC<)0of a given cell line to the ICW valueof a sensitive cell line (SMS-SAN). A cell line with an ICg,, value higher than
the achievable clinical concentration (peak plasma level for agents administered as bolus injection or continuous steady-state drug concentration for
continuous infusion agents) was considered resistant to that drug. The reportedCSS for doxorubiein is 60 ng/ml (28) in patients treated with nonmyeloablativeregimens. The CSS for etoposide ranges from 2 to 7 ^.g/ml (29-31 ) in patientstreated with similar doses of etoposide as neuroblastoma patients on myeloa-
blative regimens( 1). In this study, we used 5 jxg/ml as a reference CSS foretoposide (29-31). In neuroblastoma patients treated with myeloablative
doses, the CSS for carboplatin is 3 ¿tg/mland for cisplatin is 0.1 ¿ig/ml,andthe PPL for melphalan is 10 /ig/ml.s
Statistical significance of cross-resistance between cytotoxic agents was
evaluated by the Pearson correlation analysis (32) employing the software SAS(SAS Institute, Inc., Cary. NC). Standardized residuals of each cell line,calculated as:
Log(IC90) -
SD
43. Peters el al., manuscripl in preparation.5J. Villablanca. personal communication.
5398
Research. on February 7, 2015. © 1998 American Association for Cancercancerres.aacrjournals.org Downloaded from
DRUG RESISTANCE IN NEUROBLASTOMA CELL LINES
DX PD-Ind PD-BMTIO2
10' -g
10° -3
io-2 -
Vf10'10°
'EDco
10-3
102
10' -j
10°-I10- -g
io-2-iIO"3 -3
102
101110°-3
bà 10'•8
con
IO'2 -:
10-3 -3
102
10' -3
10° J10-10-2 -|
~!
102410' -:10°10" -tIO-2 J
SMS-KAN
SMS-KCN
SK-N-BE(1)
CHLA-15
SMS-SAN
CHLA-42
SMS-KANR
SMS-KCNR
SK-N-BE(2)
CHLA-20
SMS-LHN
LA-N-6
0 1
CHLA-51
CHLA-90
0 1
CHLA-79
0 10 20 30 40 50
(Mg/ml)
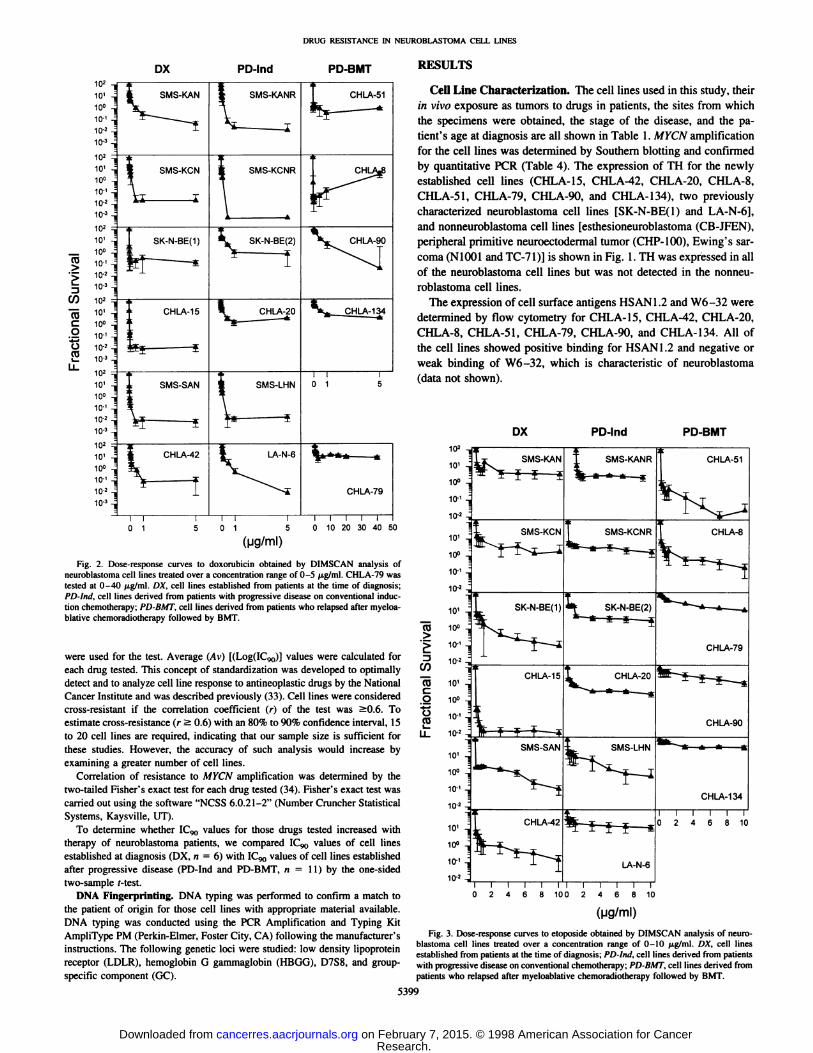
Fig. 2. Dose-response curves to doxorubicin obtained by DIMSCAN analysis ofneuroblasloma cell lines treated over a concentration range of 0-5 jig/ml. CHLA-79 wastested at 0-40 /ig/ml. DX. cell lines established from patients at the time of diagnosis:PD-lnd. cell lines derived from patients with progressive disease on conventional induction chemotherapy; PD-BMT. cell lines derived from patients who relapsed after myeloablative chemoradiotherapy followed by BMT.
were used for the test. Average (Avi KLogflCgo)] values were calculated foreach drug tested. This concept of standardization was developed to optimallydetect and to analyze cell line response to antineoplastic drugs by the NationalCancer Institute and was described previously (33). Cell lines were consideredcross-resistant it the correlation coefficient (r) of the test was SO.6. Toestimate cross-resistance (r a 0.6) with an 80% to 90% confidence interval, 15
to 20 cell lines are required, indicating that our sample size is sufficient forthese studies. However, the accuracy of such analysis would increase byexamining a greater number of cell lines.
Correlation of resistance to MYCN amplification was determined by thetwo-tailed Fisher's exact test for each drug tested (34). Fisher's exact test was
carried out using the software "NCSS 6.0.21-2" (Number Cruncher Statistical
Systems, Kaysville, UT).To determine whether 1C«,values for those drugs tested increased with
therapy of neuroblastoma patients, we compared IC^, values of cell linesestablished at diagnosis (DX, n = 6) with ICqo values of cell lines establishedafter progressive disease (PD-Ind and PD-BMT. n = 11) by the one-sidedtwo-sample f-test.
DNA Fingerprinting. DNA typing was performed to confirm a match tothe patient of origin for those cell lines with appropriate material available.DNA typing was conducted using the PCR Amplification and Typing KitAmpliType PM (Perkin-Elmer, Foster City, CA) following the manufacturer's
instructions. The following genetic loci were studied: low density lipoproteinreceptor (LDLR), hemoglobin G gammaglobin (HBGG), D7S8, and group-
specific component (GC).
RESULTS
Cell Line Characterization. The cell lines used in this study, theirin vivo exposure as tumors to drugs in patients, the sites from whichthe specimens were obtained, the stage of the disease, and the patient's age at diagnosis are all shown in Table 1. MYCN amplification
for the cell lines was determined by Southern blotting and confirmedby quantitative PCR (Table 4). The expression of TH for the newlyestablished cell lines (CHLA-15, CHLA-42, CHLA-20, CHLA-8,CHLA-51, CHLA-79, CHLA-90, and CHLA-134), two previouslycharacterized neuroblastoma cell lines [SK-N-BE(l) and LA-N-6],and nonneuroblastoma cell lines [esthesioneuroblastoma (CB-JFEN),peripheral primitive neuroectodermal tumor (CHP-100), Ewing's sar
coma (N1001 and TC-71)] is shown in Fig. 1. TH was expressed in all
of the neuroblastoma cell lines but was not detected in the nonneuroblastoma cell lines.
The expression of cell surface antigens HSAN1.2 and W6-32 weredetermined by flow cytometry for CHLA-15, CHLA-42, CHLA-20,CHLA-8, CHLA-51, CHLA-79, CHLA-90, and CHLA-134. All of
the cell lines showed positive binding for HSAN1.2 and negative orweak binding of W6-32, which is characteristic of neuroblastoma
(data not shown).
DX PD-Ind PD-BMT
CD
CO
Co
ta
102
10'
10°
10-'
IO'2
10'
10°
10-'
10-2
10'
10°
IO'2 -,
10'
10°
10-'
10-2
10'
10°
10-' -j
10 2 -Õ
10'
10°
10" -g
io-2-;
SMS-KAN
CHLA-8
SK-N-BE(1)
CHLA-15
-*—^SMS-SAN
| CHLA-42
Tir .
^^
SMS-KANR
-*-*-*—*
CHLA-51
SK-N-BE(2)
CHLA-20
SMS-LHN
LA-N-6
CHLA-79
CHLA-90
CHLA-134
10
Fig. 3. Dose-response curves to etoposide obtained by DIMSCAN analysis of neuro-blastoma cell lines treated over a concentration range of 0-10 fig/ml. DX, cell linesestablished from patients at the time of diagnosis; PD-lml, cell lines derived from patientswith progressive disease on conventional chemotherapy; PD-BMT, cell lines derived frompatients who relapsed after myeloablative chemoradiotherapy followed by BMT.
5399
Research. on February 7, 2015. © 1998 American Association for Cancercancerres.aacrjournals.org Downloaded from

DRUG RESISTANCE IN NEUROBLASTOMA CELL LINES
DX PD-Ind PD-BMT
102
10°10-'
1010' -j10° -
10 ' -j
10-2
CO'Eu
CO"55
o'•6
2
102 -¡10'10°10'io-2
10210'10°10-'10-»
102
10'
10»-g10-'
io-2
10>-g10' -310°10-'
10--g10-'=
SMS-KAN
SMS-KCN
CHLA-42
SMS-KANR
SMS-KCNR
SK-N-BE(2)
CHLA-20
SMS-LHN
LA-N-6i—i—i—i—i—i—rO 2 4 6 8 10 12 O
I—I—I—I—I—T
2 4 6 8 10 12
CHLA-51
K CHLA-8
ft
CHLA-90
CHLA-134
T—I—I—I—I—T
0 2 4 6 8 10 12
(kig/ml)
Fig. 4. Dose-response curves lo carboplatin (•)and cisplatin (O) obtained by DIM-SCAN analysis of neurohlasloma cell lines are shown. The concenlration range tested forcarboplatin was 0-I2 Mg^n1'an^ *orcisplatin was 0-10 fig/ml. DX, cell lines establishedfrom patients at the time of diagnosis; PD-lnit. cell lines derived from patients withprogressive disease on conventional chemotherapy: PD-BMT, cell lines derived frompatients who relapsed after myeloahlative chemoradiolherapy followed by BMT.
We confirmed by DNA fingerprinting that PD-Allo-BMT cell lines,CHLA-8 and CHLA-79, matched the tumor specimens from theappropriate patients; PD-Auto-BMT cell lines, CHLA-51, CHLA-90,and CHLA-134, matched bone marrow obtained from the patient, andpaired cell lines matched each other (CHLA-15 to CHLA-20, SMS-KCN to SMS-KCNR, and SK-N-BE(l) to SK-N-BE(2)). An exception was SMS-KAN and SMS-KANR, in which one locus did notmatch, presumably because of the loss of heterozygosity in SMS-
KANR during disease progression.Cytotoxicity Studies. We determined the sensitivities of the cell
line panel to drugs commonly used for neuroblastoma: doxorubicin,etoposide, cisplatin, carboplatin, and melphalan. Results of cytotox-
icity assays were expressed as IC9()values for each drug tested (Table2). These values were calculated from the dose-response curvesshown in Figs. 2-4 and 6.
Dose-response curves for the panel of neuroblastoma cell lines to
doxorubicin are shown in Fig. 2. All of cell lines established atprogressive disease during induction chemotherapy (PD-Ind) and celllines established at relapse after myeloablative therapy (PD-BMT)
were derived from patients treated with doxorubicin (Table 1). Asshown in Table 2, the ICW for doxorubicin generally increased withthe intensity of therapy: DX cell lines showed an IC90 of <0.1-35
ng/ml, PD-Ind cell lines 17-498 ng/ml, and PD-BMT cell lines<0.1-43,155 ng/ml. The doxorubicin IC9() was higher than the clin
ically achievable steady state drug concentration (CSS) in patientstreated with nonmyeloablative doses for 0 of 6 DX cell lines, 3 of 6PD-Ind cell lines, and 3 of 5 PD-BMT cell lines. CHLA-20 had thehighest doxorubicin IC90 value within the PD-Ind group, which waseight times higher than the CSS. For the doxorubicin-resistant PD-BMT cell lines, the IC90 values were 719 (CHLA-79), 6 (CHLA-90),and 13 (CHLA-134) times higher than the reported CSS.
Dose-response curves of cell lines to etoposide are shown in Fig. 3.
Etoposide or another epipodophyllotoxin, teniposide, was used to treatpatients from whom two PD-Ind and all of the PD-BMT cell lines
were derived (Table 1). Etoposide IC90 values ranged from 0.2 to 323ng/ml for DX cell lines, from 11 to 27,339 ng/ml for PD-Ind cell lines,and from 24 to 255,873 ng/ml for PD-BMT cell lines. The ICco foretoposide was higher than the CSS for 0 of 6 DX, 1 of 6 PD-Ind, and3 of 5 PD-BMT cell lines. Generally, resistance to etoposide wasfound in PD-Ind (LA-N-6) and PD-BMT (CHLA-79, CHLA-90, andCHLA-134) cell lines derived from patients treated with etoposide.However, two PD-BMT cell lines, CHLA-8 and CHLA-51, whichwere derived from etoposide-treated patients, were not resistant. Theetoposide IC90 for the resistant PD-Ind cell line (LA-N-6) was sixtimes higher than the reported CSS. Etoposide resistant PD-BMT celllines showed IC90 values 3 (CHLA-79), 10 (CHLA-90), and 51(CHLA-134) times higher than the CSS.
Dose-response curves for carboplatin and cisplatin are shown inFig. 4. The dose-response to cisplatin is steeper than for carboplatin.
This observation might lead to the impression that cisplatin is morecytotoxic than carboplatin. However, a comparison of surviving fractions at the clinically achievable CSS (3 /ng/ml for carboplatin and 0.1/M.g/ml for cisplatin in patients treated with myeloablative doses)showed that, for many cell lines, carboplatin was more cytotoxic thancisplatin at the levels achievable in patients (Fig. 5). The IC90 forcarboplatin was higher than the achievable CSS for 0 of 6 DX, 2 of 6PD-Ind, and 3 of 5 PD-BMT cell lines. By contrast, cisplatin IC90values for 4 of 6 DX, 6 of 6 PD-Ind, and 4 of 5 PD-BMT cell lines
were higher than the CSS. The carboplatin IC90 for DX cell linesranged from 0.2 to 2.2 /xg/ml, for PD-Ind cell lines from 1.3 to 8.6/j.g/ml, and for PD-BMT cell lines from 2.3 to 26.3 fig/ml. The
cisplatin IC90 for DX cell lines ranged from 0.3 to 0.5 ftg/ml, forPD-Ind cell lines from 0.2 to 1.5 /xg/ml, and for PD-BMT cell linesfrom < 0.1 to 7.8 fig/ml. The IC9() values of carboplatin-resistant
102
¡
e" 10-'
A
DX PD-Ind PD-BMT
Fig. 5. Surviving fractions at clinically achievable drug concentrations: carboplatin, 3/ig/ml (•);cisplatin. 0.1 /¿g/ml(A). These results were derived from DIMSCAN analysisof neuroblastoma cell lines treated over a wide concentration range of each drug. DX,celllines established from patients at diagnosis: PD-lnii, cell lines established from patientswith progressive disease on induction chemotherapy; PD-BMT,cell lines established frompatients after myeloablative chemoradiotherapy and BMT.
5400
Research. on February 7, 2015. © 1998 American Association for Cancercancerres.aacrjournals.org Downloaded from

DRUG RESISTANCE IN NEUROBLASTOMA CELL LINES
DX PD-Ind PD-BMT
(0'E
3V)15o
2
102
10'
10°
10-'
10-2
102
101
10°
10-'
10-2
102
10'
10°
10-'
10*
102
10'
10°
10-'
10-2
102
101
10°10-'
10-2
102
SMS-KAN
SMS-KCN
SK-N-BE--
CHLA-15
SMS-KANR
SMS-KCNR
SK-N-BE-2
CHLA-20
CHLA-51
CHLA-8
CHLA-79
CHLA-90
12
9 12
(\iglm\)Fig. 6. Dose-response curves to melphalan obtained by DIMSCAN analysis of neu-
roblastoma cell lines over a concentration range of 0-12 p.g/ml are shown. DX, cell linesestablished from patients at the time of diagnosis; PD-Ind, cell lines derived from patientswith progressive disease on conventional chemotherapy; PD-BMT, cell lines derived from
patients who relapsed after myeloablative chemoradiotherapy followed by BMT.
PD-Ind cell lines were >1 (CHLA-20) and three (LA-N-6) timeshigher than the CSS, and of carboplatin-resistant PD-BMT cell lineswere >one (CHLA-79), five (CHLA-90), and nine (CHLA-134)times higher than the CSS. The IC90values of cisplatin-resistant DXcell lines were three (SMS-KAN, CHLA-42), five (SMS-KCN), andtwo (CHLA-15) times higher than the cisplatin CSS, and cisplatin-resistant PD-Ind cell lines had IC,*,values 8 (SMS-KANR), 3 (SMS-KCNR), 2 (SK-N-BE(2), 11 (CHLA-20), and 15 (LA-N-6) timeshigher than CSS. Cisplatin-resistant PD-BMT cell lines had ICg,,values 7 (CHLA-8), 51 (CHLA-79), 25 (CHLA-90), and 78 (CHLA-
134) times higher than the achievable CSS.The cytotoxicity of melphalan over a range of concentrations for
the cell line panel is shown in Fig. 6. Melphalan IC90 values werehigher than PPL achieved by myeloablative doses of the drug for 0 of6 DX, 2 of 6 PD-Ind, and 2 of 5 PD-BMT cell lines. Melphalan IC^values for DX cell lines ranged from 0.5 to 6 /¿g/ml,for PD-Ind celllines 0.5 to 24 /J,g/ml, and for PD-BMT cell lines 0.3 to 375 /J.g/ml.The melphalan IC^ for the resistant PD-Ind cell lines (SK-N-BE(2)and LA-N-6) was two times higher than PPL. Melphalan-resistantPD-BMT cell lines showed IC^ values 38 (CHLA-90) and 4 (CHLA-
134) times higher than the PPL.5401
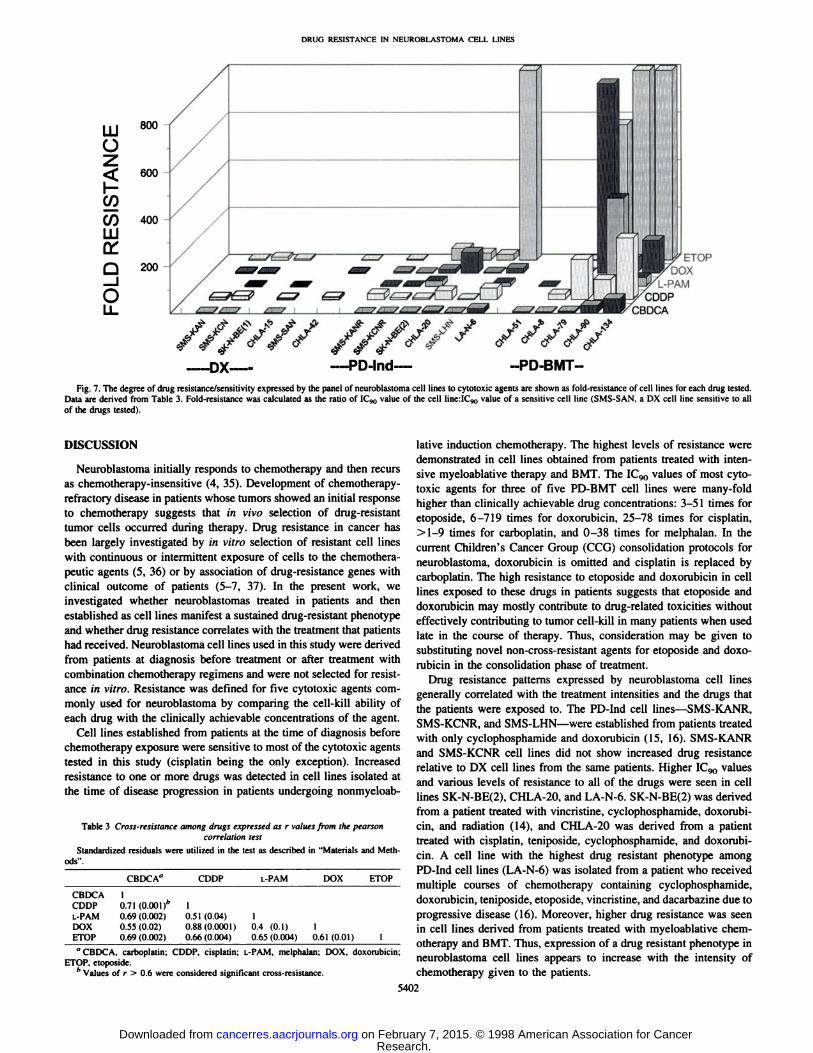
The degree of drug resistance/sensitivity for the panel of neuroblastoma cell lines to cisplatin, carboplatin, melphalan, doxorubicin,and etoposide is summarized in Fig. 7. Fold-resistance calculated foreach cell line was used to compare resistance/sensitivity of the celllines for each cytotoxic agent. Most cell lines established from patients before treatment were sensitive to most drugs, whereas resistance was increased in cell lines established after induction chemotherapy, and it was highest in those cell lines established from patientsafter intensive chemoradiotherapy.
Drug Resistance Phenotype in DX and PD-Ind Paired CellLines. Withinthe panel of 17 neuroblastomacell lines studied, therewere pairs of cell lines derived from the same patients (four differentpatients) at diagnosis and then after progression during inductiontherapy: (a) SMS-KAN + SMS-KANR; (b) SMS-KCN + SMS-KCNR; (c) SK-N-BE(l) + SK-N-BE(2); and (d) CHLA-15 + CHLA-20. PD-Ind cell lines SMS-KANR and SMS-KCNRwere derived from patients treated with cyclophosphamide and doxorubicin (Table 1). SMS-KANR and SMS-KCNR did not show increased drug resistance relative to the DX cell lines derived from thesame patients (Table 2). Thus, in 2 of 4 pairs, there was no increasein drug resistance in PD-Ind cell lines compared with DX cell lines.
SK-N-BE(2) was derived from a patient after treatment with cyclophosphamide, doxorubicin, and vincristine (Table 1). SK-N-BE(2)showed increased drug resistance relative to SK-N-BE(l), a DX cellline from the same patient (Table 2). For example, the IC90values forSK-N-BE(2) were greater than IC90values for SK-N-BE(l) by 9230times for doxorubicin, 7 times for etoposide, 9 times for cisplatin, 13times for carboplatin, and 30 times for melphalan.
CHLA-20 was derived from a patient after treatment with cyclophosphamide, doxorubicin, cisplatin, and teniposide (Table 1), andIC90 values for this cell line were higher than clinically achievablelevels for doxorubicin, cisplatin, and carboplatin (Table 2). CHLA-20showed increased resistance to doxorubicin, cisplatin, and carboplatinwhen compared with CHLA-15, a DX cell line from the same patient.IC90 values for CHLA-20 were greater than those for CHLA-15 by436 times for doxorubicin, 3839 times for etoposide, 4.9 times forcisplatin, and 3.5 times for carboplatin.
Cross-Resistance Patterns. Statisticalsignificance of cross-resistance was evaluated for neuroblastoma cell lines by the Pearsoncorrelation test (Table 3). Significant cross-resistance was found between: (a) cisplatin and doxorubicin (r = 0.88; P = 0.0001); (b)cisplatin and carboplatin (r = 0.71; P = 0.001); (c) carboplatin andetoposide (r = 0.69; P = 0.002); (d) carboplatin and melphalan(r = 0.72; P = 0.002); (e) etoposide and cisplatin (r = 0.66;P = 0.004); (/) etoposide and doxorubicin (r = 0.61; P = 0.01); and(g) melphalan and etoposide (r = 0.65; P = 0.04).
Drug Resistance Increased with Therapy. The IC,*,values of thecell lines significantly increased with therapy (from DX to PD-Ind andPD-BMT): (a) doxorubicin (P = 0.04); (b) etoposide (P = 0.03); (c)cisplatin (P = 0.03); (d) carboplatin (P = 0.002); and (e) melphalan(P = 0.04; one-sided two-sample t test).
Although most cell lines were tested at similar passage number(mid 20s), the range was from passage 3 to 40. Using a regressionanalysis of sequential sums of squares with passage number as acontinuous explanatory variable and cell line group as a class variable,we found that the increase in resistance of cell lines established aftertherapy was significant if we controlled for cell line passage number.
MYCN Amplification in Cell Lines. In 4 of 6 DX, 3 of 6 PD-Ind,and 2 of 5 PD-BMT cell lines, MYCN genomic amplification wasdetected (Table 4). The two-tail Fisher's exact test did not show
correlation between MYCNamplification and resistance to doxorubicin (P = 0.33), etoposide (P = 0.29), carboplatin (P = 0.13), cisplatin(P = 1), or melphalan (P = 1).
Research. on February 7, 2015. © 1998 American Association for Cancercancerres.aacrjournals.org Downloaded from
DRlic; RKSISTANa: IN N'LUKOKLAS TOMA I'L-Ll. LINKS
Û_iO
600
LU 80°
O
ÃœcoCO 400
LU
200ETOP
DOXL-PAM
CDDPCBDCA
//////--DX— --PD-Ind- --PD-BMT-
Fig. 7. The degree of drug resistance/sensitivity expressed by the panel of neuroblastoma cell lines to cytotoxic agents are shown as fold-resistance of cell lines for each drug tested.Data are derived from Table 3. Fold-resistance was calculated as the ratio of ICyo value of the cell lineilC,*, value of a sensitive cell line (SMS-SAN. a DX cell line sensitive to all
of the drugs tested).
DISCUSSION
Neuroblastoma initially responds to chemotherapy and then recursas chemotherapy-insensitive (4, 35). Development of chemotherapy-
refractory disease in patients whose tumors showed an initial responseto chemotherapy suggests that in vivo selection of drug-resistant
tumor cells occurred during therapy. Drug resistance in cancer hasbeen largely investigated by in vitro selection of resistant cell lineswith continuous or intermittent exposure of cells to the chemothera-peutic agents (5, 36) or by association of drug-resistance genes withclinical outcome of patients (5-7, 37). In the present work, we
investigated whether neuroblastomas treated in patients and thenestablished as cell lines manifest a sustained drug-resistant phenotype
and whether drug resistance correlates with the treatment that patientshad received. Neuroblastoma cell lines used in this study were derivedfrom patients at diagnosis before treatment or after treatment withcombination chemotherapy regimens and were not selected for resistance in vitro. Resistance was defined for five cytotoxic agents commonly used for neuroblastoma by comparing the cell-kill ability of
each drug with the clinically achievable concentrations of the agent.Cell lines established from patients at the time of diagnosis before
chemotherapy exposure were sensitive to most of the cytotoxic agentstested in this study (cisplatin being the only exception). Increasedresistance to one or more drugs was detected in cell lines isolated atthe time of disease progression in patients undergoing nonmyeloab-
Table 3 Cross-resistance among drugs expressed as r values from the pearsoncorrelation test
Standardi/ed residuals were utilized in the test as described in "Materials and Methods".
CBDCACDDPL-PAMDOXETOPCBDCA"1
0.71(0.001)''
0.69(0.002)0.55(0.02)0.69(0.002)CDDP10.51
(0.04)0.88(0.0001)0.66(0.004)L-PAM10.4
(O.I)0.65(0.004)DOX
ETOP10.61(0.01)
1"CBDCA. carboplatin; CDDP. cisplatin; L-PAM. melphalan; DOX. doxorubicin:
ETOP. etoposide.'' Values of r > 0.6 were considered significant cross-resistance.
lative induction chemotherapy. The highest levels of resistance weredemonstrated in cell lines obtained from patients treated with intensive myeloablative therapy and BMT. The ICl)0 values of most cytotoxic agents for three of five PD-BMT cell lines were many-foldhigher than clinically achievable drug concentrations: 3-51 times foretoposide, 6-719 times for doxorubicin, 25-78 times for cisplatin,>l-9 times for carboplatin, and 0-38 times for melphalan. In thecurrent Children's Cancer Group (CCG) consolidation protocols for
neuroblastoma, doxorubicin is omitted and cisplatin is replaced bycarboplatin. The high resistance to etoposide and doxorubicin in celllines exposed to these drugs in patients suggests that etoposide anddoxorubicin may mostly contribute to drug-related toxicities withouteffectively contributing to tumor cell-kill in many patients when used
late in the course of therapy. Thus, consideration may be given tosubstituting novel non-cross-resistant agents for etoposide and doxo
rubicin in the consolidation phase of treatment.Drug resistance patterns expressed by neuroblastoma cell lines
generally correlated with the treatment intensities and the drugs thatthe patients were exposed to. The PD-Ind cell lines—SMS-KANR,SMS-KCNR, and SMS-LHN—were established from patients treatedwith only cyclophosphamide and doxorubicin (15, 16). SMS-KANRand SMS-KCNR cell lines did not show increased drug resistance
relative to DX cell lines from the same patients. Higher ICq() valuesand various levels of resistance to all of the drugs were seen in celllines SK-N-BE(2), CHLA-20. and LA-N-6. SK-N-BE(2) was derived
from a patient treated with vincristine, cyclophosphamide, doxorubicin, and radiation (14), and CHLA-20 was derived from a patient
treated with cisplatin, teniposide, cyclophosphamide, and doxorubicin. A cell line with the highest drug resistant phenotype amongPD-Ind cell lines (LA-N-6) was isolated from a patient who received
multiple courses of chemotherapy containing cyclophosphamide,doxorubicin, teniposide, etoposide, vincristine, and dacarbazine due toprogressive disease (16). Moreover, higher drug resistance was seenin cell lines derived from patients treated with myeloablative chemotherapy and BMT. Thus, expression of a drug resistant phenotype inneuroblastoma cell lines appears to increase with the intensity ofchemotherapy given to the patients.
5402
Research. on February 7, 2015. © 1998 American Association for Cancercancerres.aacrjournals.org Downloaded from
DRUG RESISTANCE IN NEUROBLASTOMA CELL LINES
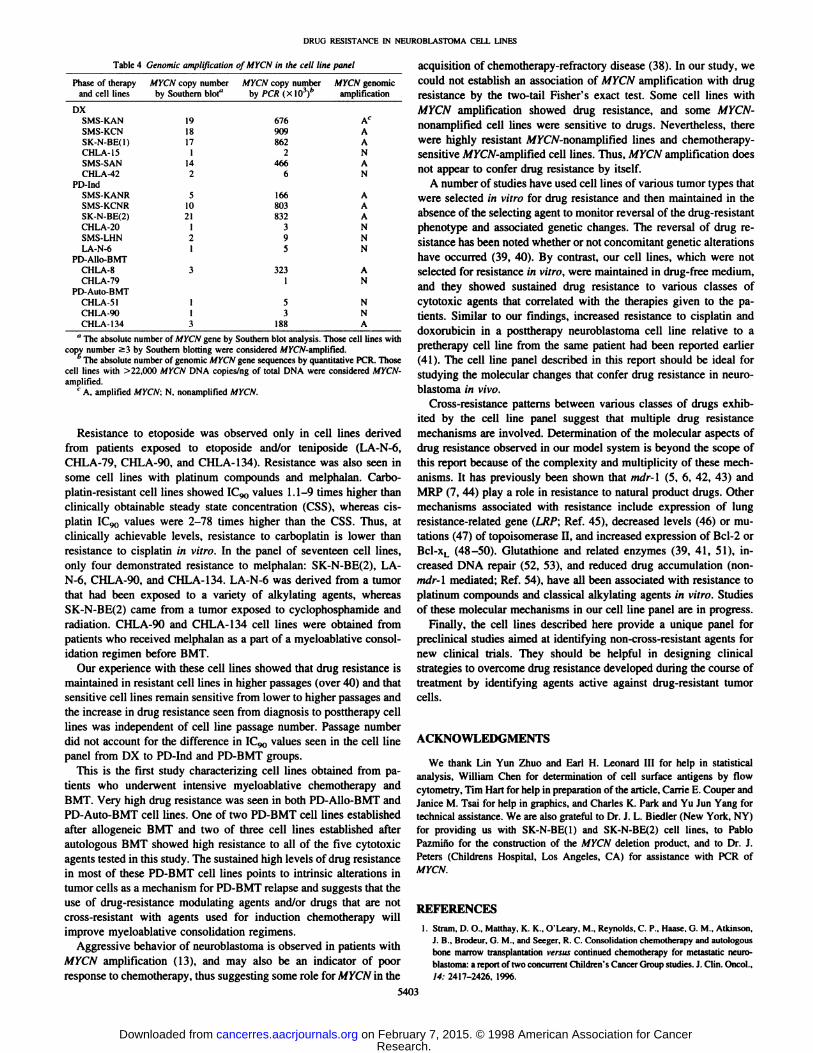
Table 4 Genomic amplification of MYCN in the cell line panel
Phase of therapy MYCN copy numberand cell lines by Southernblot"DXSMS-KANSMS-KCNSK-N-BE(l)CHLA-15SMS-SANCHLA-42PD-IndSMS-KANRSMS-KCNRSK-N-BEI2)CHLA-20SMS-LHNLA-N-6PD-Allo-BMTCHLA-8CHLA-79PD-Auto-BMTCHLA-51CHLA-90CHLA-1341918171142510211213113MYCN
copy numberby PCAIXIOV676909KW246ft61668(13832395323153188MYCN
genomicamplificationAcAANANAAANNNANNNA
" The absolute number of MYCN gene by Southern blot analysis. Those cell lines with
copy number >3 by Southern blotting were considered A/KOV-amplified.The absolute number of genomic MYCN gene sequences by quantitative PCR. Those
cell lines with >22,000 MYCN DNA copies/ng of total DNA were considered MYCN-
amplified.c A, amplified MYCN: N. nonamplified MYCN.
Resistance to etoposide was observed only in cell lines derivedfrom patients exposed to etoposide and/or teniposide (LA-N-6,CHLA-79, CHLA-90, and CHLA-134). Resistance was also seen insome cell lines with platinum compounds and melphalan. Carbo-platin-resistant cell lines showed IC90 values 1.1-9 times higher thanclinically obtainable steady state concentration (CSS), whereas cis-platin IC9() values were 2-78 times higher than the CSS. Thus, at
clinically achievable levels, resistance to carboplatin is lower thanresistance to cisplatin in vitro. In the panel of seventeen cell lines,only four demonstrated resistance to melphalan: SK-N-BE(2), LA-N-6, CHLA-90, and CHLA-134. LA-N-6 was derived from a tumor
that had been exposed to a variety of alkylating agents, whereasSK-N-BE(2) came from a tumor exposed to cyclophosphamide andradiation. CHLA-90 and CHLA-134 cell lines were obtained from
patients who received melphalan as a part of a myeloablative consolidation regimen before BMT.
Our experience with these cell lines showed that drug resistance ismaintained in resistant cell lines in higher passages (over 40) and thatsensitive cell lines remain sensitive from lower to higher passages andthe increase in drug resistance seen from diagnosis to posttherapy celllines was independent of cell line passage number. Passage numberdid not account for the difference in IC90 values seen in the cell linepanel from DX to PD-Ind and PD-BMT groups.
This is the first study characterizing cell lines obtained from patients who underwent intensive myeloablative chemotherapy andBMT. Very high drug resistance was seen in both PD-Allo-BMT andPD-Auto-BMT cell lines. One of two PD-BMT cell lines established
after allogeneic BMT and two of three cell lines established afterautologous BMT showed high resistance to all of the five cytotoxicagents tested in this study. The sustained high levels of drug resistancein most of these PD-BMT cell lines points to intrinsic alterations intumor cells as a mechanism for PD-BMT relapse and suggests that theuse of drug-resistance modulating agents and/or drugs that are notcross-resistant with agents used for induction chemotherapy will
improve myeloablative consolidation regimens.Aggressive behavior of neuroblastoma is observed in patients with
MYCN amplification (13), and may also be an indicator of poorresponse to chemotherapy, thus suggesting some role for MYCN in the
acquisition of chemotherapy-refractory disease (38). In our study, we
could not establish an association of MYCN amplification with drugresistance by the two-tail Fisher's exact test. Some cell lines with
MYCN amplification showed drug resistance, and some MYCN-
nonamplified cell lines were sensitive to drugs. Nevertheless, therewere highly resistant A/XCjV-nonamplified lines and chemotherapy-sensitive MKCA'-amplified cell lines. Thus, MYCN amplification does
not appear to confer drug resistance by itself.A number of studies have used cell lines of various tumor types that
were selected in vitro for drug resistance and then maintained in theabsence of the selecting agent to monitor reversal of the drug-resistant
phenotype and associated genetic changes. The reversal of drug resistance has been noted whether or not concomitant genetic alterationshave occurred (39, 40). By contrast, our cell lines, which were notselected for resistance in vitro, were maintained in drug-free medium,
and they showed sustained drug resistance to various classes ofcytotoxic agents that correlated with the therapies given to the patients. Similar to our findings, increased resistance to cisplatin anddoxorubicin in a posttherapy neuroblastoma cell line relative to apretherapy cell line from the same patient had been reported earlier(41). The cell line panel described in this report should be ideal forstudying the molecular changes that confer drug resistance in neuroblastoma in vivo.
Cross-resistance patterns between various classes of drugs exhib
ited by the cell line panel suggest that multiple drug resistancemechanisms are involved. Determination of the molecular aspects ofdrug resistance observed in our model system is beyond the scope ofthis report because of the complexity and multiplicity of these mechanisms. It has previously been shown that mdr-\ (5, 6. 42, 43) and
MRP (7. 44) play a role in resistance to natural product drugs. Othermechanisms associated with resistance include expression of lungresistance-related gene (LRP; Ref. 45), decreased levels (46) or mutations (47) of topoisomerase II, and increased expression of Bcl-2 orBcl-xL (48-50). Glutathione and related enzymes (39, 41, 51), increased DNA repair (52, 53), and reduced drug accumulation (non-mdr-\ mediated; Ref. 54), have all been associated with resistance to
platinum compounds and classical alkylating agents in vitro. Studiesof these molecular mechanisms in our cell line panel are in progress.
Finally, the cell lines described here provide a unique panel forpreclinical studies aimed at identifying non-cross-resistant agents for
new clinical trials. They should be helpful in designing clinicalstrategies to overcome drug resistance developed during the course oftreatment by identifying agents active against drug-resistant tumor
cells.
ACKNOWLEDGMENTS
We thank Lin Yun Zhuo and Earl H. Leonard III for help in statisticalanalysis. William Chen tor determination of cell surface antigens by flowcytometry, Tim Hart for help in preparation of the article. Carrie E. Couper andJanice M. Tsai for help in graphics, and Charles K. Park and Yu Jun Yang tortechnical assistance. We are also grateful to Dr. J. L. Biedler (New York, NY)for providing us with SK-N-BE(l) and SK-N-BE(2) cell lines, to Pablo
Pazmiño for the construction of the MYCN deletion product, and to Dr. J.Peters (Childrens Hospital, Los Angeles, CA) for assistance with PCR ofMYCN.
REFERENCES1. Stram. D. O.. Malthay. K. K.. O'Leary. M.. Reynolds. C. P., Haase. G. M.. Atkinson.
J. B.. Brodeur. G. M., and Seeger. R. C. Consolidation chemotherapy and autologousbone marrow transplantation versus continued chemotherapy for metastatic neuroblastoma: a report of two concurrent Children's Cancer Group studies. J. Clin. Oncol..
14: 2417-2426. 1996.
5403
Research. on February 7, 2015. © 1998 American Association for Cancercancerres.aacrjournals.org Downloaded from

DRUG RESISTANCE IN NEUROBLASTOMA CELL LINES
17. Proffill, R. T., Tran, J. V.. and Reynolds. P. C. A fluorescence digital image
28.
29.
30.
2. Matlhay. K. K.. Harris, R., Reynolds, C. P., Shimada, H.. Black. T.. Stram. D. O., and 25.Seeger. R. C. Improved event-free survival (EPS) for autologous bone marrow
transplantation (ABMT) vs chemotherapy in neuroblastoma: a Phase III randomizedChildren's Cancer Group (CCG) study. Proc. Am. Soc. Clin. Oncol., 17: 525a. 1998. 26.
3. Reynolds, C. P., Villablanca, J. G., Stram, D. O.. Harris. R., Seeger, R. C., andMalthay. K. K. 13-m-retinoic acid after intensive consolidation therapy for neuroblastoma improves event-free survival: a randomized Children's Cancer Group 27.
(CCG) study. Proc. Am. Soc. Clin. Oncol., 17: 2a, 1998.4. Seeger, R. C., and Reynolds, C. P. Treatment of high-risk solid tumors of childhood
with intensive therapy and autologous bone marrow transplantation. Pediatr. Clin.North Am.. 38: 393-424, 1991.
5. LaQuaglia, M. P., Kopp. E. B., Spengler, B. A., Meyers. M. B.. and Beidler, J. L.Multidrug resistance in human neuroblastoma cells. J. Pediatr. Surg.. 26: 1107-1112.
1991.
6. Goldstein, L. J., Fojo, A. T., Ueda, K.. Crist. W., Green, A., Brodeur, G., Pastan, !..
and Gottesman. M. M. Expression of the mullidrug resistance, MDRl. gene inneuroblaslomas. J. Clin. Oncol.. 8: 128-136. 1990.
7. Morris. M. D.. Bordow, S. B., Marshal. G. M.. Haber, P. S.. Cohn, S. L., and Haber.M. Expression of the gene for multidnig-resistance-associated protein and outcome in
patients with neuroblastoma. N. Engl. J. Med., 334: 231-238, 1996.
8. Kushncr, B. H., Vogel, R., Hajdu. S. I., and Helson. L. Melastatic neuroblastoma andtesticular involvement. Cancer (Phila.), 56: 1730-1732. 1985.
9. Kennedy. K. A. Hypoxie cells as specific targets for chemotherapy. Anticancer Drug ^Design. 2: 181-194, 1987.
10. S MI..i. Ih. A. C. Therapeutic attack of hypoxic cells of solid tumors: presidential jj
address. Cancer Res., 48: 775-778, 1988.
11. Hayes. F. A.. Green, A. A., and Mauer. A. M. Correlation of cell kinetic and clinicalresponse to chemotherapy in disseminated neuroblastoma. Cancer Res., 37: 3766-
3770. 1977. 34
12. Brodeur. G. M.. Seeger. R. C.. Schwab, M., Varmus, H. E., and Bishop. J. M.Amplification of N-myc in untreated human neuroblaslomas correlates with advanced 35
disease stage. Science (Washington DC). 224: 1121-1124. 1984.
13. Seeger, R. C., Brodeur. G. M., Sather, H., Dalton. A., Siegel. S. E., Wong, K. Y., andHammond. D. Association of multiple copies of the N-myc oncogene with rapid 36.
progression of neuroblastomas. N. Engl. J. Med., 313: 1111-1116, 1985.
14. Rosen. N., Reynolds. C. P.. Thiele. C. J.. Biedler. J. L., and Israel, M. A. IncreasedN-myc expression following progressive growth of human neuroblastoma. Cancer
Res., 46: 4139-4142, 1986. 37.
15. Reynolds. C. P.. Biedler, J. L.. Spengler. B. A.. Reynolds, D. A.. Ross. R. A.. Frenkel,
E. P.. and Smith. R. G. Characterization of human neuroblastoma cell lines established before and after therapy. J. Nail. Cancer Inst., 76: 375-387. 1986. 38.
16. Wada. R. K.. Seeger, R. C.. Brodeur. G. M.. Einhorn, P. A., Rayner, S. A.. Tomayko.M. M., and Reynolds. C. P. Human neuroblastoma cell lines thaà express N-myc
without gene amplification. Cancer (Phila.), 72: 3346-3354. 1993.39.
40.
41
42.
microscopy system for quantifying relative cell numbers in tissue culture plates.Cytometry, 24: 204-213. 19%.
18. Frgala. T., and Proffitt. R. T. A novel 96-well plate cytotoxicity assay based on
fluorescence digital imaging microscopy. Proc. Am. Assoc. Cancer Res.. 36: 303,
1995.
19. Miyajima. Y., Kalo. K.. Numata. S.. Kudo. K.. and Horibe, K. Detection of neuro
blastoma cells in bone marrow and peripheral blood at diagnosis by the reversetranscriptase-polymerase chain reaction for tyrosine hydroxylase mRNA. Cancer
(Phila.). 75: 2757-2761, 1995.
20. Chomczynski. P.. and Sacchi, N. Single-step method of RNA isolation by acid
guanidinium thiocyanate-phenol-chloroform extraction. Anal. Biochem.. 162: 156-
159, 1987. 43
21. Sorensen, P. H., Wu. J. K., Berean, K. W., Lim, J. F.. Donn. W., Frierson, H. F..
Reynolds. C. P.. Lopez Terrada. D.. and Triche. T. J. Olfactory neuroblastoma is a ^
peripheral primitive neuroectodermal tumor related to Ewing sarcoma. Proc. Nati.Acad. Sci. USA. 93: 1038-1043, 19%.
22. Reynolds. C. P.. Tomayko, M. M.. Donner, L.. Helson, L., Seeger. R. C.. Triche, T. J.. 45
and Brodeur. G. M. Biological classification of cell lines derived from humanextra-cranial neural tumors. Prog. Clin. Biol. Res., 271: 291-306. 1988.
23. Whang Peng. J.. Triche. T. J.. Knutsen. T., Miser, J., Kao Shan. S.. Tsai, S., and Israel,
M. A. Cytogenetic characterization of selected small round cell tumors of childhood.Cancer Genet. Cytogenel.. 21: 185-208, 1986. 46.
24. Crabbe. D. C. G., Peters, J.. and Seeger, R. C. Rapid detection of MYCN gene
amplification in neuroblastomas using the polymerase chain reaction. Diag. Mol.Pathol., /: 229-234, 1993.
5404
Celi. F. S.. Zenilman. M. E., and Shuldiner, A. R. A rapid and versatile method to
synthesize interna) standards for competitive PCR. Nucleic Acids Res., 21: 1047,
1993.Chomczynski. P. A reagent for the single-step simultaneous isolation of RNA. DNA
and proteins from cell and tissue samples. Biotechniques, 15: 532-534. 536-537,
1993.Chou. J., and Chou, T. Multiple drug-effect analysis (program B). In: J. Chou and
T. C. Chou (eds.). Dose-effect Analysis with Microcomputers, pp. 19-64. New York:
Memorial Sloan-Kettering Cancer Center. 1987.
Sabbagh. R.. Ledere. J.. Sunderland. M.. and Theoret. Y. Chronopharmacokinetic ofa 48-hr continuous infusion of doxorubicin to children with acute lymphoblastic
leukemia. Proc. Am. Assoc. Cancer Res.. 34: 198, 1993.
Boos. J.. Krumpelmann. S.. Schulze Westhoff. P., Euting, T.. Berthold. F., andJürgens,H. Steady-state levels and bone marrow toxicity of etoposide in children and
infants: does etoposide require age-dependent dose calculation? J. Clin. Oncol., 13:
2954-2960, 1995.
Bennett. C. L.. Sinkule, J. A.. Schilsky, R. L., Senekjian, E., and Choi, K. E. PhaseI clinical and pharmacological study of 72-hour continuous infusion of etoposide in
patients with advanced cancer. Cancer Res.. 47: 1952-1956. 1987.D'Incaici, M.. Farina. P.. Sessa. C.. Mangioni. C., Conter, V., Masera, G.. Rocchetti,
M., Pisoni. M. B., Piazza. E.. Beer, M., and Cavalli, F. Pharmacokinetics of VPI6-
213 given by different administration methods. Cancer Chemolher. Pharmacol., 7:141-145, 1982.
Zar, J. H. Simple linear correlation. In: Biostatistical Analysis, pp. 236-243. Engle-
wood Cliffs, NJ: Prentice-Hall. 1974.
Paul. K. D., Shoemaker. R. H.. Hodes. L.. Monks, A., Scudiero, D. A.. Rubinstein. L.,
Plowman, J., and Boyd, M. R. Display and analysis of patterns of differential activity
of drugs against human tumor cell lines: development of mean graph and COMPAREalgorithm. J. Nati. Cancer Inst., 81: 108-112. 1989.
Fleiss, J. L. Statistical Methods for Rates and Proportions, pp. 24-26. New York:
John Wiley & Sons. 1981.
Hartmann. O.. Pinckerton. C. R.. Philip, T.. Zucker. J. M., and Breatnach. F.Very-high-dose cisplatin and etoposide in children with untreated advanced neuro
blastoma. J. Clin. Oncol.. 6: 44-50. 1988.
Komiyama, S., Matsui. K.. Kudoh, S.. Nogae. I., Kuratomi, Y.. Saburi. Y., Asoh, K.,
Kohno. K.. and Kuwano, M. Establishment of tumor cell lines from a patient withhead and neck cancer and their different sensitivities to anti-cancer agents. Cancer
(Phila.). 63. 675-681. 1989.
Schneider, E.. Cowan. K. H.. Bader. H.. Toomey. S.. Schwartz, G. N.. Karp. J. E.,Burke, P. J., and Kaufmann, S. H. Increased expression of the multidrug resistance-
associated protein gene in relapsed acute leukemia. Blood, 85: 186-193, 1995.
Nakagawara, A.. Kadomalsu. K.. Sato. S.. Kohno, K.. Takano. H., Akazawa. K..
Nose, Y., and Kuwano, M. Inverse correlation between expression of multidrugresistance gene and N-myr oncogene in human neuroblaslomas. Cancer Res., 50:
3043-3047, 1990.Hamaguchi. K., Godwin, A. K., Yakushiji, M.. O'Dwyer, P. J., Ozols, R. F., and
Hamilton. T. C. Cross-resistance to diverse drugs is associated with primary cisplatin
resistance in ovarian cancer cell lines. Cancer Res.. 53: 5225-5232. 1993.
Sugimoto, Y.. Roninson. 1. B.. and Tsunio. T. Decreased expression of the amplifiedmuri gene in revenants of multidrug-resistant human myelogenous leukemia K562
occurs without loss of amplified DNA. Mol. Cell. Biol., 7: 4549-4552. 1987.
Kuroda. H., Sugimoto. T.. Ueda, K.. Tsuchida, S., Horii, Y., Inazawa, J., Sato, K.. and
Sawada, T. Different drug sensitivity in two neuroblastoma cell lines established fromthe same patient before and after chemotherapy. Int. J. Cancer, 47: 732-737, 1991.
Chen, C. J.. Chin, J. E., Ueda, K., Clark, D. P., Pastan, I., Gottesman, M. M., and
Roninson. 1. B. Internal duplication and homology with bacterial transport proteins inthe MDRl (P-glycoprotein) gene from multidrug-resistant human cells. Cell. 47:
381-389, 1986.
Bradley, G.. Naik, M., and Ling. V. P-glycoprotein expression in multidrug-resistant
human ovarian carcinoma cell lines. Cancer Res., 49: 2790-2796. 1989.
Grant, C. E.. Valdimarsson. G., Hipfner, D. R., Almquist, K. C., Cole, S. P., andDeeley, R. G. Overexpression of multidrug resistance-associated protein (MRP)
increases resistance to natural product drugs. Cancer Res., 54: 357-361, 1994.
Scheper. R. J., Broxterman. H. J., Scheffer, G. L., Kaaijk, P., Dalton. W. S., van
Heijningen, T. H. M., van Kalken. C. K.. Slovak, M. L., de Vries. E. G. E., van der
Valk. P.. Meijer, C. H. L. M., and Pinedo. H. M. Overexpression of a M, 110.000vesicular protein in non-P-glycoprotein-mediated multidrug resistance. Cancer Res.,
53: 1475-1479, 1993.
Kubo, T., Kohno, K., Ohga, T., Taniguchi, K., Kawanami, K., Wada, M„and
Kuwano, M. DNA topoisomerase Ha gene expression under transcriplional control inetoposide/teniposide-resistant human cancer cells. Cancer Res., 55: 3860-3864,
1995.
Research. on February 7, 2015. © 1998 American Association for Cancercancerres.aacrjournals.org Downloaded from

DRUG RESISTANCE IN NEUROBLASTOMA CELL LINES
47. Chan, V. T. W., Ng, S. W., Eder, J. P., and Schnipper, L. E. Molecular cloning and mononuclear cells of cancer patients, and its induction by buthionine sulfoximineidentification of a point mutation in the topoisomerase II cDNA from an etoposide- treatment. Cancer Res.. 53: 3662-3666, 1993.resistant Chinese Hamster ovary cell line. J. Biol. Chem., 26«.-2160-2165, 1993. 52. Lai, G. M., Ozols, R. F., Smyth. J. F., Young, R. C., and Hamilton, T. C. Enhanced
48. Dole, M. G., Jasty, R., Cooper, M. J., Thompson, C. B., Nunez, G., and Castle, V. P. DNA repair and resistance to cisplatin in human ovarian cancer. Biochem. Pharma-
Bcl-xL is expressed in neuroblastoma cells and modulates chemotherapy-induced col., 37: 4597-4600, 1988.
apoptosis. Cancer Res., 55: 2576-2582, 1995. 53. Parker, R. J., Eastman. A., Bostick-Bruton. F., and Reed, E. Acquired cisplatin
49. Dole, M., Nunez, G., Merchant, A. K., Maybaum, J., Rode, C. K., Bloch, C. A., and resistance in human ovarian cancer cells is associated with enhanced repair ofCastle, V. P. Bcl-2 inhibits chemotherapy-induced apoptosis in neuroblastoma. Can- cisplatin-DNA lesions and reduced drug accumulation. J. Clin. Invest., 87: 772-777,
cer Res., 54: 3253-3259, 1994. 1991.
50. Miyashita, T., and Reed, J. C. Bcl-2 oncoprotein blocks chemotherapy-induced 54. Loh, S. Y., Mistry, P., Kelland, L. R., Abel, G., and Harrap. K. R. Reduced drug
apoptosis in a human leukemia cell line. Blood, 81: 151-157. 1993. accumulation as a major mechanism of acquired resistance to cisplatin in a human51. Yao, K., Godwin, A. K., Ozols, R. F., Hamilton, T. C., and O'Dwyer, P. J. Variable ovarian carcinoma cell line: circumvention studies using novel platinum (II) and (IV)
baseline y-glutamylcysteine synthetase messenger RNA expression in peripheral ammine/amine complexes. Br. J. Cancer, 66: 1109-1115, 1992.
5405
Research. on February 7, 2015. © 1998 American Association for Cancercancerres.aacrjournals.org Downloaded from
1998;58:5396-5405. Cancer Res Nino Keshelava, Robert C. Seeger, Susan Groshen, et al. Derived from Patients at Different Phases of TherapyDrug Resistance Patterns of Human Neuroblastoma Cell Lines
Updated version
http://cancerres.aacrjournals.org/content/58/23/5396
Access the most recent version of this article at:
E-mail alerts related to this article or journal.Sign up to receive free email-alerts
Subscriptions
Reprints and
To order reprints of this article or to subscribe to the journal, contact the AACR Publications
Permissions
To request permission to re-use all or part of this article, contact the AACR Publications
Research. on February 7, 2015. © 1998 American Association for Cancercancerres.aacrjournals.org Downloaded from
Copyright © 2022 FDOKUMEN