
Driving the Economy through Innovation and Entrepreneurship
865
Driving the Economy through Innovation and Entrepreneurship Department of Management Studies, Indian Institute of Science, Bangalore Emerging Agenda for Technology Management
-
Upload
khangminh22 -
Category
Documents
-
view
0 -
download
0
Transcript of Driving the Economy through Innovation and Entrepreneurship

Driving the Economy through Innovation and Entrepreneurship
Department of Management Studies, Indian Institute of Science,Bangalore
Emerging Agenda for Technology Management

Driving the Economy through Innovationand Entrepreneurship


Editors
Driving the Economythrough Innovationand Entrepreneurship
Emerging Agenda for TechnologyManagement
Department of Management Studies,Indian Institute of Science, Bangalore

Editors
ISBN 978-81-322-0745-0 ISBN 978-81-322-0746-7 (eBook)DOI 10.1007/978-81-322-0746-7Springer New Delhi Heidelberg New York Dordrecht London
Library of Congress Control Number: 2013933346
# Springer India 2013This work is subject to copyright. All rights are reserved by the Publisher, whether the whole or partof the material is concerned, specifically the rights of translation, reprinting, reuse of illustrations,recitation, broadcasting, reproduction on microfilms or in any other physical way, and transmission orinformation storage and retrieval, electronic adaptation, computer software, or by similar or dissimilarmethodology now known or hereafter developed. Exempted from this legal reservation are brief excerptsin connection with reviews or scholarly analysis or material supplied specifically for the purpose of beingentered and executed on a computer system, for exclusive use by the purchaser of the work. Duplicationof this publication or parts thereof is permitted only under the provisions of the Copyright Law of thePublisher’s location, in its current version, and permission for use must always be obtained fromSpringer. Permissions for use may be obtained through RightsLink at the Copyright Clearance Center.Violations are liable to prosecution under the respective Copyright Law.The use of general descriptive names, registered names, trademarks, service marks, etc. in thispublication does not imply, even in the absence of a specific statement, that such names are exemptfrom the relevant protective laws and regulations and therefore free for general use.While the advice and information in this book are believed to be true and accurate at the date ofpublication, neither the authors nor the editors nor the publisher can accept any legal responsibility forany errors or omissions that may be made. The views expressed by the authors are their own and are notnecessarily shared by the editors or the publisher or the organizations that the authors represent. Thepublisher makes no warranty, express or implied, with respect to the material contained herein.
Printed on acid-free paper
Springer is part of Springer Science+Business Media (www.springer.com)
Department of Management StudiesIndian Institute of ScienceBangalore

Preface
Technological advancement, contributing as the key driving force to the develop-
ment and prosperity of advanced countries, is a part of history. In the 1980s and
1990s, technology development contributed to the rapid advancement and transfor-
mation of newly industrializing economies (NIEs). In the New Millennium, BRICS
(Brazil, Russia, India, China, and South Africa) economies have been experiencing
relatively high rate of economic growth, thereby influencing and shaping global
economic growth, particularly by the means of industrialization through knowledge
intensive industries and entrepreneurship. This shift of focus from industrialized
to NIEs and further to BRICS economies has been pushing technology development
and management to the forefront repeatedly as an agenda for global economic
thinking. The way BRICS economies in association with NIEs and industrialized
countries contribute to the emergence of new technologies, in addition to the
innovation and management of existing technologies, would determine and con-
tribute to the emergence of a new global economy, in the future. It is in this
backdrop that the Department of Management Studies, Indian Institute of Science,
Bangalore, which is one of the oldest management schools in the country, decided
to organize an International Conference on Technology Management between18
and 20 July 2012.
Considering that economic growth in the BRICS and other developing
economies in the new century is driven not solely by traditional factor inputs, but
more importantly by technology-driven innovation and new generation of entre-
preneurship, we have accordingly identified the theme of the International Confer-
ence: Driving the Economy Through Innovation and Entrepreneurship: EmergingAgenda for Technology Management. We invited theoretical as well as empirical
research papers including industry case studies relating to the theme from across the
world. We received impressive response in the form of more than 240 paper
abstracts from 23 different countries by 31 October 2011. We short-listed 167
paper abstracts and communicated to the authors accordingly, requesting them to
submit full papers by 31 January 2012. Overall, we got 128 full papers, and based
on a double-blind review process, we short-listed a total of 74 papers (comprising
145 authors across 20 countries) for the final presentation.
v

This volume comprising three parts is a compendium of 72 papers presented
in the International Conference on Technology Management conducted during
18–20 July 2012 at the Indian Institute of Science, Bangalore. The three parts of
the volume cover papers under three different streams, namely, (1) Technology
Development, Sustainability and Markets; (2) Development of Human Resources
for Innovation and Technology Management; and (3) ICT Applications, E-
Governance and New Product Development. Under each stream, papers focusing
on diverse sectors such as agriculture, industry and services as well as regions
ranging from emerging markets like India to Latin America are presented. Further,
these papers varied in terms of their methodologies ranging from model building
and testing to the development of theoretical propositions and empirical data
analysis, apart from case studies. Overall, these papers provide a description and
analysis of contemporary technology management issues covering diverse
economies in the world.
The organizers of the conference are greatly indebted to all the authors (from
academia, R&D institutes and laboratories, government organizations and industry)
who have come from different parts of the world, presented their papers and
contributed to their intensive and fruitful discussions. We express our sincere
gratitude to all the referees who had reviewed the paper in every stage, starting
from short-listing of the abstracts, to the final form as it appears in this book. We are
thankful to all the session chairs who conducted the proceedings meaningfully
and impressively. We are equally grateful to all of our sponsors, particularly the
Government of Karnataka, Defense Research and Development Organization
(DRDO), Government of India, Bharath Electronics Limited (BEL), Bharath
Earth Movers Limited (BEML) and Karnataka Knowledge Commission (KKC),
Bangalore, in addition to our institute authorities without whose support this event
could not have been organized in this grand manner. Finally, we strongly believe
that this volume will contribute significantly to the understanding of emerging
issues in technology management, in the era of globalization, and facilitate further
research in industry as well as academia.
Editors
vi Preface

About Us
The Indian Institute of Science (IISc), Bangalore, founded by Jamsetji Nusserwanji
Tata, came into existence on 27 May 1909. Over the period, IISc has emerged as an
institution of higher learning pursuing excellence in research and education in
diverse fields of science and engineering. It is probably the oldest and the finest
institution of its kind in India; it also has a very high international rating in the
academic world. IISc provides facilities for post-graduate research and advanced
instruction in traditional as well as in many important emerging areas of science and
engineering and collaborates with industry and other research institutions in solving
challenging problems in science and technology. Today, IISc faculty members
carry out research and consultancy projects in six different divisions comprising
40 departments/centers/cells/laboratories.
The Department of Management Studies at the Indian Institute of Science (IISc),
established in 1948, is one of the oldest departments of management in India. It has
been running postgraduate programmes and the doctoral programme since the mid-
1950s. Based in the premier research institute of higher learning, it positions itself
to train students in futuristic areas like technology management, business analytics
and policy analysis. The origin of the Department can be traced back to 1947 when
the section of economics and social sciences was set up. This pioneering step was
largely a result of the long-term vision of J. N. Tata, who had sown the seeds of
management education and research in the country. This vision was given sub-
stance by the resolution of the Indian Institute of Science to establish a
“. . .Philosophical and Educational Department, including methods of education,
ethics and psychology, Indian history and archaeology, statistics and economics,
and comparative philology”. In the eventful almost six and half decades of its
existence, the Department has made pioneering contributions in management
education and research in India. Today, the Department comprising 11 faculty
and 4 staff members offers the masters of management programme leading to a
specialization in business analytics or technology management and research
programme leading to the degree of Ph.D.
vii


Editorial Team
Part 1
Prof. M. H. Bala Subrahmanya
Dr. P. Balachandra
Prof. R. Srinivasan
Part 2
Prof. K. B. Akhilesh
Dr. Parameshwar P. Iyer
Part 3
Prof. Chiranjit Mukhopadyay
Prof. P. Ramachandran
Dr. M. Mathirajan
Editors’ Affiliations
1. Prof. M. H. Bala Subrahmanya, Professor and Chairman, Department of
Management Studies, Indian Institute of Science, Bangalore-560012, India
2. Dr. P. Balachandra, Principal Research Scientist, Department of Management
Studies, Indian Institute of Science, Bangalore-560012, India
3. Prof. R. Srinivasan, Professor, Department of Management Studies, Indian
Institute of Science, Bangalore-560012, India
4. Prof. K. B. Akhilesh, Professor, Department of Management Studies, Indian
Institute of Science, Bangalore-560012, India
5. Dr. Parameshwar P. Iyer, Principal Research Scientist, Department of
Management Studies, Indian Institute of Science, Bangalore-560012, India
6. Prof. Chiranjit Mukhopadyay, Associate Professor, Department of Management
Studies, Indian Institute of Science, Bangalore-560012, India
7. Prof. Parthasarathy Ramachandran, Associate Professor, Department of
Management Studies, Indian Institute of Science, Bangalore-560012, India
8. Dr. M. Mathirajan, Principal Research Scientist, Department of Management
Studies, Indian Institute of Science, Bangalore-560012, India
ix


Contents
Part 1
Part 1.1 Technology and Emerging Markets
Innovation Objectives, Strategies and Firm Performance:
A Study of Emerging Market Firms . . . . . . . . . . . . . . . . . . . . . . . . . . . . 3
Aniruddha
Technology for Rural Market Development . . . . . . . . . . . . . . . . . . . . . . 13
V.K. Nangia, Vinay Sharma, Anita Sengar, and Ritika Mahajan
Bridging Digital Divide and Capacity Building in Rural India . . . . . . . . . 25
Shailaja Rego, Naresh Kumar, and P.N. Mukherjee
Considerations About How to Eliminate the Technological
Backwardness of Latin America . . . . . . . . . . . . . . . . . . . . . . . . . . . . . . . 37
Paulo R. Feldmann
Part 1.2 Technology Management
Technology Management to Accelerate
Competitiveness Journey: Exploratory Case
of a Renewable Energy Focal Firm from India . . . . . . . . . . . . . . . . . . . 51
Kirankumar S. Momaya and S. Chachondia
Assessment of Technology in the View of Sustainability
and Capability Approach: A Case-study of Home Inverters . . . . . . . . . 63
Pramod Khadilkar and Monto Mani
Design-Technology and Sustainability . . . . . . . . . . . . . . . . . . . . . . . . . . 75
Sudhir Rama Murthy and Monto Mani
xi

Technology Management Issues in the Indian Medical
Devices Industry: A Morphological Analysis . . . . . . . . . . . . . . . . . . . . . 87
Ananthavalli Ramesh and L. Prakash Sai
Managing Innovation in Perceived Low-Tech Industries:
A Review of the Technology Management Practices
of the Fish Processing Industry of Newfoundland and Labrador . . . . . . 99
Christian E. Coronado Mondragon and Adrian E. Coronado Mondragon
Part 1.3 Technology and Development
Role of Technology Management in Development . . . . . . . . . . . . . . . . . 111
Niruti Gupta and V. Devadas
Role of IT to Encounter Rising Food Inflation . . . . . . . . . . . . . . . . . . . . 125
Gururaman Subramanian, Kanishka Maheshwari, and Ashish Kaushik
Achieving Dynamic Capability Through Collaborative
ICT Infrastructure: A Strategic Driver for SMEs
in Emerging Economies . . . . . . . . . . . . . . . . . . . . . . . . . . . . . . . . . . . . . 137
Shahriar Sajib and Renu Agarwal
Innovation and Economic Performance of Ancillary SMES:
An Empirical Analysis . . . . . . . . . . . . . . . . . . . . . . . . . . . . . . . . . . . . . . 149
R. Sudhir Kumar
Part 1.4 Technology and Sustainability
Survival and Growth Strategies for Small- and Medium-Scale
Enterprises in India: A Key for Sustainable Development . . . . . . . . . . . 163
Ravindra Tripathi, Rajesh Kumar Shastri, and Sweta Agarwal
Technologies for Social Goods, Latest Trends . . . . . . . . . . . . . . . . . . . . 175
Neha Jain
Analytical Approach on Economic Development in India
Focusing on Strategies for Application of Technology . . . . . . . . . . . . . . 187
Nirmalendunath Ghosh
Urban Land Management: The Retrospect of Three
Metro Cities in India . . . . . . . . . . . . . . . . . . . . . . . . . . . . . . . . . . . . . . . 199
Pooja Nigam and V. Devadas
Part 1.5 Technology and Market
Marketing Dynamics in Technology-Based Industries:
Pioneering Advantage, Customer Experience,
and Adaptive Pricing . . . . . . . . . . . . . . . . . . . . . . . . . . . . . . . . . . . . . . . 213
Gurumurthy Kalyanaram
xii Contents

Changing Consumer Perception of Electronic Vehicles
Through Branded Technical Components . . . . . . . . . . . . . . . . . . . . . . . 223
Christian Linder and Sven Seidenstricker
Dominance of Chinese Market: An Empirical Study . . . . . . . . . . . . . . . 237
Arun Kumar Gopalaswamy, S.S.S. Kumar, and Chia-Hsing Huang
Is Cloud Computing a Tipping Point for IT Innovation Leading
to Next Wave of Business Growth in Developing Economies . . . . . . . . . 249
Ramkumar Dargha
Advanced External Counter Pulsation:
A Solution for Healthy Heart . . . . . . . . . . . . . . . . . . . . . . . . . . . . . . . . . 259
Mohammed Ismail and S. Sookthi
Managing Technology for Marketing Success . . . . . . . . . . . . . . . . . . . . 271
Prafulla Kumar Das
Part 2
Part 2.1 Innovation Management
Review of Corporate Management Model for Defense
R&D Programs . . . . . . . . . . . . . . . . . . . . . . . . . . . . . . . . . . . . . . . . . . . 291
K. Ajith Kumar and V.P. Jagathy Raj
Utilities’ Technology Management of Smart Grid
Innovation and Implementation . . . . . . . . . . . . . . . . . . . . . . . . . . . . . . . 303
Torben Tambo
Towards Patients as Innovators: Open Innovation
in Health Care . . . . . . . . . . . . . . . . . . . . . . . . . . . . . . . . . . . . . . . . . . . . 315
Christoph W. Kuenne, Kathrin M. Moeslein, and John Bessant
Does “Strategic Patenting” Threaten Innovation
and What Could Happen If It Did? . . . . . . . . . . . . . . . . . . . . . . . . . . . . 329
Bernard Girard
Monetization of Intellectual Property:
An Open Innovation Perspective . . . . . . . . . . . . . . . . . . . . . . . . . . . . . . 341
P.M. Rao
Part 2.2 Human Resource Management
Role of Innovation in Practices of Human Resources
for Organizational Competitiveness: An Empirical Investigation . . . . . 355
Shivani Pandey and Debdeep De
Contents xiii
Work Behaviors of Korean and Indian Engineers:
A Study of Comparison . . . . . . . . . . . . . . . . . . . . . . . . . . . . . . . . . . . . . 367
M.K. Sridhar and Paul Jeong
Demographic and Personality Determinants of Entrepreneurial
Tendencies of Aspirant Human Resources . . . . . . . . . . . . . . . . . . . . . . . 377
Subhash C. Kundu and Sunita Rani
Reducing Voluntary Turnover Through Improving
Employee Self-Awareness, Creating Transparent Organizational
Cultures, and Increasing Career Development . . . . . . . . . . . . . . . . . . . . 389
Jeffrey R. Moore and Douglas Goodwin
Impact of Technology on Leadership Style:
Using “Least Preferred Coworker” . . . . . . . . . . . . . . . . . . . . . . . . . . . . 405
R. Srinivasan, B. Janakiram, and Rajendra Todalbagi
Part 2.3 Learning and Knowledge Management
An Empirical Model to Foster Innovation and Learning
Through Knowledge Sharing Culture . . . . . . . . . . . . . . . . . . . . . . . . . . 419
Vijila Kennedy and M. Kirupa Priyadarsini
Collaborative Learning and Knowledge Management:
A Case Study . . . . . . . . . . . . . . . . . . . . . . . . . . . . . . . . . . . . . . . . . . . . . 429
Giulia Monetta, Francesco Orciuoli, and Gabriella Santoro
A Descriptive Analysis of Intellectual Capital Concept
Implementation Within Slovak Companies . . . . . . . . . . . . . . . . . . . . . . 443
Ján Papula and Jana Volná
Two Perspectives on Intellectual Capital and Innovation
in Teams: Collective Intelligence and Cognitive Diversity . . . . . . . . . . . 453
Ishani Aggarwal and Anita Woolley
Effective Utilization of Tacit Knowledge
in Technology Management . . . . . . . . . . . . . . . . . . . . . . . . . . . . . . . . . . 461
Indumathi Anandarajan and K.B. Akhilesh
Part 2.4 Technology and Innovation
Semantic Web as an Innovation Enabler . . . . . . . . . . . . . . . . . . . . . . . . 475
Ranjith Nayar, K. Venugopalan, Rajeshwari Narendran,
and Smitha Nayar
How to Charge Electric Vehicles: A Comparison
of Charging Infrastructure Concepts and Technologies . . . . . . . . . . . . . 487
Benedikt R€omer, Tobias Schneiderbauer, and Arnold Picot
xiv Contents

Innovations in an Emerging Software Cluster . . . . . . . . . . . . . . . . . . . . 499
M. Arun
Innovation Management Strategy: Empirical
Evidence from Indian Manufacturing Firms . . . . . . . . . . . . . . . . . . . . . 511
Jyoti S.A. Bhat
Rethinking the Management of Technological Innovations,
Product Complexity and Modularity: The Effects
of Low-Probability, High-Impact Events
on Automotive Supply Chains . . . . . . . . . . . . . . . . . . . . . . . . . . . . . . . . 525
Adrian E. Coronado Mondragon
and Christian E. Coronado Mondragon
Part 2.5 Technology Nurturing
Enhancing and Leveraging Potential for Innovation . . . . . . . . . . . . . . . 539
V. Kovaichelvan
A Soft Technology for Effective Enactive Management . . . . . . . . . . . . . 551
Osvaldo Garcı́a de la Cerda and Alejandro Salazar Salazar
The Evolution of the Production Function:
Transition to the “Value Creation Cube” . . . . . . . . . . . . . . . . . . . . . . . . 561
Moira Scerri and Renu Agarwal
Factors Contributing to Teachers’ Attitude
Towards Knowledge Sharing . . . . . . . . . . . . . . . . . . . . . . . . . . . . . . . . . 573
Soofi Anwar and K. Durga Prasad
Vocational Value Vector (V3) Management in Technical
Vocational Education and Training (TVET) for Enhanced
Industrial Employability . . . . . . . . . . . . . . . . . . . . . . . . . . . . . . . . . . . . 585
K.M. Nagendra, S. Radha, and C.G. Naidu
Critical Factors in Managing Creativity in an SME
Global Challenger . . . . . . . . . . . . . . . . . . . . . . . . . . . . . . . . . . . . . . . . . 599
Sandhya Sastry
Part 3
Part 3.1 E-Governance
E-Governance and the ‘Developing’ Countries:
Conceptual and Theoretical Explorations . . . . . . . . . . . . . . . . . . . . . . . 611
Chetan B. Singai
Compartmentalization of E-Governance Practices . . . . . . . . . . . . . . . . . 621
P.V. Bokad, P.M. Kuchar, and Priya V. Satpute
Contents xv

Project Nemmadi: The Bytes and Bites of E-Governance
in Karnataka, India . . . . . . . . . . . . . . . . . . . . . . . . . . . . . . . . . . . . . . . . 633
Madhuchhanda Das Aundhe and Ramesh Narasimhan
An Empirical Investigation into the Extent of Green IT Practices
in Sri Lanka’s Data Centers: A Case Study Approach . . . . . . . . . . . . . . 645
Nadeera Ahangama and Kennedy D. Gunawardana
Part 3.2 Technology and Supply Chain Management
ICT Innovation for Buyer-Seller Relationships
in International Supply Chains . . . . . . . . . . . . . . . . . . . . . . . . . . . . . . . 659
Fabio Musso and Mario Risso
SCM and ICT: A Cornerstone to Sustainable
Development of Agribusiness: An Analytical Study . . . . . . . . . . . . . . . . 671
Y.M. Raju
A Two Stage Supply Chain Model for Multi Sources
and Destinations, Incorporating Quantity
and Freight Discounts with Case Study . . . . . . . . . . . . . . . . . . . . . . . . . 683
Kanika Gandhi, P.C. Jha, and M. Mathirajan
Adoption of Freight Management System (FMS) in Logistics:
An Exploratory Study . . . . . . . . . . . . . . . . . . . . . . . . . . . . . . . . . . . . . . 695
Timira Shukla and M.R. Bansal
Swap in Downstream Petroleum Supply Chain: An Effective
Inventory Handling Tool . . . . . . . . . . . . . . . . . . . . . . . . . . . . . . . . . . . . 703
Hari Mohan Jha Bidyarthi and Laxmikant B. Deshmukh
Part 3.3 Technology, Development and ICT
Implementation Issues of Aadhaar: The Human Resource
Information System for India . . . . . . . . . . . . . . . . . . . . . . . . . . . . . . . . . 719
Jesiah Selvam and K. Uma Lakshmi
Aadhaar and Financial Inclusion: A Proposed Framework
to Provide Basic Financial Services in Unbanked Rural India . . . . . . . . 731
Saikumar Rathod and Shiva Krishna Prasad Arelli
Use of Mobile Phones by Small-Scale Farmers for Price
Discovery of Fresh Produce: A Case Study from the
Malur Taluk in Karnataka . . . . . . . . . . . . . . . . . . . . . . . . . . . . . . . . . . . 745
Navolina Patnaik
Mobile Banking: A Study on Progress and Customer Perception
in India for Financial Inclusion . . . . . . . . . . . . . . . . . . . . . . . . . . . . . . . 757
S. Sudalai Muthu and T. Kadalarasane
xvi Contents

Domestic Remittance: Money Transfer Anywhere
and at Anytime in India . . . . . . . . . . . . . . . . . . . . . . . . . . . . . . . . . . . . . 775
Deepak Venkatesh and Anand Kumar Bajaj
Part 3.4 IT Offshoring
Power Politics in the Governance of IT Outsourcing:
The Undermining of Top IT Executives . . . . . . . . . . . . . . . . . . . . . . . . . 787
Subrata Chakrabarty and Jun Wang
Offshore Pricing with Onshore Management: A Case Study
in Innovation and Technology Management . . . . . . . . . . . . . . . . . . . . . . 795
Gokul Bhandari, Rudra Pandey, and Gerry Kerr
International Competitiveness of Russian IT Firms:
Strong Rivals or Survivors at the Edge? . . . . . . . . . . . . . . . . . . . . . . . . 805
Irina Jormanainen, Andrey Panibratov, and Marina Latukha
Perspectives of Users and Service Providers on Deployment
Maturity Assessment: A Study of Product Lifecycle
Management Systems (PLMS) . . . . . . . . . . . . . . . . . . . . . . . . . . . . . . . . 815
S.R. Venugopalan, L.S. Ganesh, and L. Prakash Sai
Part 3.5 New Product and Services Development
ICT in New Product Development: Revulsion to Revolution . . . . . . . . . 833
Nityesh Bhatt and Abhinav Ved
A Study of Structural Antecedents of Product Development
Teams’ Flexibility on Small and Large Teams . . . . . . . . . . . . . . . . . . . . 847
K. Srikanth and K.B. Akhilesh
Developing Sustainable IT Market Information Services:
The Case of Esoko . . . . . . . . . . . . . . . . . . . . . . . . . . . . . . . . . . . . . . . . . 857
Olayinka David-West
Design and Development of an Online Database Management System
(AGRI-TECHBASE): For Agricultural Technologies of ICAR . . . . . . . 869
A. Razia Mohamed, P. Vineeth Kumar,
S. Abhilash, C.N. Ravishankar, and Leela Edwin
Integrated AHP-TOPSIS Model for Software Selection
Under Multi-criteria Perspective . . . . . . . . . . . . . . . . . . . . . . . . . . . . . . 879
Santanu Kumar Misra and Amitava Ray
Contents xvii

Part 1
Part 1.1
Technology and Emerging Markets

Innovation Objectives, Strategies
and Firm Performance: A Study
of Emerging Market Firms
Aniruddha
1 Introduction
The ability of a firm to generate continuous innovations is considered to be a source
of sustainable competitive advantage (Dess and Picken 2000; Tushman and
O’Reilly 1996). Firms which innovate continuously are able to mitigate the negative
effects of environmental uncertainty and complexity (Tsai et al. 2009; Li et al. 2008)
and generate superior firm performance (Yam et al. 2011; Tsai and Tsai 2010).
The extant research on innovation has so far focussed majorly on the developed
markets, and limited research is available on emerging markets (Guan et al. 2009).
The environment in which emerging market firms operate is very different from
that encountered by firms in developed markets (Tsai et al. 2009; Li et al. 2008).
Emerging markets are characterised by higher uncertainty and complexity on
account of environmental factors like regulation, institutional voids, varying and
diverse consumer demand, rapid rate of technology change, intense competition,
etc. (Tsai and Tsai 2010; Li et al. 2008). Various innovation management theories
applicable in developed markets may not be applicable as such in the emerging
markets (Guan et al. 2009; Li et al. 2008).
The environmental context of a firm decides the primary strategic objectives of
the firms (Tidd 2001). These strategic objectives often require creation of value,
which can be achieved by pursuing innovation activities in the firm (Chesbrough
2008). The strategic objectives which trigger the innovation process in the
organisation are referred to as innovation objectives (Leiponen and Helfat 2010).
The innovation objectives of the firm define the innovation strategy to be pursued
by the firm in order to achieve the desired innovation performance (Guan et al.
2009; Burgelman et al. 2004).
Aniruddha (*)
Strategic Management Group, Indian Institute of Management, Lucknow, India
e-mail: [email protected]
Department of Management Studies, Indian Institute of Science, Bangalore,
Driving the Economy through Innovation and Entrepreneurship,DOI 10.1007/978-81-322-0746-7_1, # Springer India 2013
3

Emerging market firms are characterised by increasing competition on account
of deregulation leading to surge of multinational corporations along with birth of
new firms in industries (Girma et al. 2009). The combined effect of MNCs and new
domestic players is the rise in technological intensity, complexity and uncertainty
in the market (Barrell and Pain 1997). On one hand, increasing consumer demand
has increased the growth potential, and on the other, customers are demanding
customised products and services (Woertera and Roper 2010). Firms are continu-
ously pressurised to reduce costs as well as offer differentiated products (Guan et al.
2009). The dynamics of the emerging markets have forced firms to adopt multiple
innovation objectives (Guan et al. 2009; Song et al. 2005).
Pursuing specific innovation objectives requires specific innovation strategy
which allocates resources and channelises process and system controls (Constantine
and Marianne 2009; Burgelman et al. 2004). Each innovation objective requires
different sets of resource allocation and control systems to achieve the desired
results (Moshe 2010; Voss et al. 2008; Sanchez 1995). Firms which pursue multiple
objectives have a difficult and complex task at hand as it requires not only allocating
resources but also coordinating resources across these innovation objectives
(Constantine and Marianne 2009; Teece 2007; Wang and Ahmed 2007). This can
be achieved by adopting suitable strategy which facilitates the firms to achieve the
desired set of innovation objectives (Moshe 2010; Burgelman et al. 2004).
Extant research however remains silent on the interrelationship between the
various innovation objectives pursued by the firm. The focus of this chapter is to
analyse the relationships between the various innovation objectives and the
innovation strategies pursued by the firm. Firms need to make certain trade-offs
in the portfolio of their innovation objectives based on the choice of innovation
strategy. Each innovation strategy can be identified with a basket of favourable and
unfavourable innovation objectives. Firms can accordingly make trade-offs
amongst the innovation objectives and choose the innovation strategy with the
most favourable basket of objectives. We also analyse the impact of each
innovation strategy on the innovation performance of the firm so as to enable
firms to decide on a suitable basket to achieve desired results.
2 Theory
2.1 Innovation Objectives
Research has identified numerous innovation objectives; however, based on our
literature survey, emerging market context and our discussions with practitioners,
we have identified a set of 14 innovation objectives. The innovation objectives and
their relationship with innovation are described briefly in this section:
1. Develop radically innovative product: Based on the Schumpeterian rents,
radical or discontinuous innovations change the market structure and bring
4 Aniruddha

about paradigm shifts in the industry technological cycle (Rehman et al. 2010;
Hill and Rothaermel 2003).
2. Introduce niche products or technology: Instead of competing head-on with the
market leaders, firms chose to enter the market by focussing on a specific niche
segment. The niche segment offers low competition and higher rents (Parrish
et al. 2006).
3. Improve production processes for existing products: Firms competing in
extremely competitive markets, where dominant design has already been
established, are tight pressed to reduce the costs of products. Improvement of
production processes results in increased cost efficiencies (Utterback and
Abernathy 1975).
4. Replace products being phased out: Firms need to continuously innovate to not
only innovate and launch new products but also phase out old products and
provide improved substitutes for the earlier products. Cannibalisation or crea-
tive destruction of old products is a necessary condition for firms to achieve
competitive advantage (Guan et al. 2009; Chesbrough 2008).
5. Maintain or increase market share: Firms continuously strive to increase the
market share, for which they perform a combination of product, process and
business model innovations. The combination of the three allows firms to
capture superior market share by offering differentiated, unique, cost-efficient
and accessible products and services (Dess and Picken 2000; Tushman and
O’Reilly 1996).
6. Exploit new domestic market: Firms continuously perform market innovations
to develop and exploit new domestic markets. The frugal innovations and
bottom of the pyramid approach have specifically focussed on developing
new domestic markets (Eyring et al. 2011; Wang and Ahmed 2007).
7. Exploit new international market: Domestic market firms which were basically
confined to domestic markets have started exploiting other emerging markets
for increasing their sales. This requires customising products and services to
suit the new international market requirement (Tolstoy and Agndal 2010;
O’Cass and Weerawardena 2009).
8. Improve product quality: Increased technologies and production techniques
have resulted in higher product quality demands. Organisations in order to stay
in competition not only need to bring out new products but also improve the
quality of old products and services (Prajogo and Sohal 2003).
9. Improve existing technology to reduce reliance on imported equipment/know-
how: Domestic firms have been dependent on external licensed technology
from international organisations. Post-deregulation the same technology
partners have started competing with the domestic firms. The domestic firms
need to develop in-house technology development capabilities so as to reduce
their overdependence on external technologies (Jones et al. 2001).
10. Reduce consumption of raw materials: Raw material cost is an important
component of the overall product costs. Firms need to continuously innovate
and look for processes and materials which can reduce their raw material costs
(Tomovic et al. 2010).
Innovation Objectives, Strategies and Firm Performance: A Study of Emerging. . . 5

11. Reduce energy consumption: Energy consumption is one of the major costs
in all organisations. Developing market firms are specifically starved on power
supply and many times buy costly power from secondary sources. The energy
consumption accordingly becomes an important component of the cost.
Firms need to develop processes to reduce the energy consumptions (Johnstone
et al. 2010).
12. Improve working conditions: Lately, organisations have started realising the
importance of human resource in overall firm growth. Employee retention and
motivation is one of the major issues in technology- and knowledge-based
firms. Firms must continuously innovate to improve the working conditions of
the employees (Antoncic and Antoncic 2011).
13. Reduce production cost: Production cost is another important cost which
impacts the overall cost of the product especially in the manufacturing sectors.
Firms need to continuously look for available options of reducing the produc-
tion costs. Firms innovate to design superior production machinery to reduce
the production costs (Tomovic et al. 2010; Utterback and Abernathy 1975).
14. Partner with Value Net members for increasing WTP: Firms use their
innovation capabilities to partner with superior Value Net partners so as to
achieve long-term gains. It is seen that innovation networks usually allow
innovating members only to join the network. Membership of a particular
innovation network results in long-term technology agreements and knowledge
transfers (Esteve and Ramon 2010; Nieto and Santamarı́a 2010).
Objectives 1 and 2 are in line with the firm goal of extending its existing product
range through innovation. Objectives 5, 6 and 7 are measures of increasing sales
and market share through innovation. Objectives 10, 11 and 13 majorly focus on
cost-cutting exercise. Objective 9 reflects the situation of most Indian firms during
the 1990s, whereby they had to spend a lot of money to acquire new equipment or
know-how from developed countries.
2.2 Innovation Strategy
Miles and Snow (1978) in their book have identified four broad strategies for
innovating firms Defender, Prospector, Analyzer and Reactor. However, based on
our qualitative study and review of existing literature on emerging markets, we
have identified five broad innovation strategies adopted by firms (Guan et al. 2009).
The five innovation strategies are briefly described below:
1. Innovation leader: Maintains technological leadership and is majorly focussed
on risk-taking in new products and new markets.
2. Cost-efficient follower: Monitors the actions of leaders with a more cost-
efficient product.
3. Imitator: Majorly focussed on imitating technologies, products and processes of
innovation leader.
6 Aniruddha

4. Technology importer: The core of its innovation lies at importing technologies
from advanced countries and incorporating them in indigenised products.
5. Laggard: Lags in innovation and majorly focussed on protecting its existing
products and markets by incremental innovations and cost reductions.
2.3 Innovation Performance
Innovation performance is an integration of exploration (opportunity-seeking
activities) and exploitation (advantage-seeking activities) output of the firms
(Constantine and Marianne 2009; Lawson and Samson 2001). Innovating firms
need to maintain a balance between the exploration and exploitation (Zhou and Wu
2010). Exploitation can be broadly defined as the refinement and extension of
existing competences and technologies and generation of immediate predictable
returns (Moshe 2010; Zhou and Wu 2010). Exploitation on the other hand deals
with experimentation with new alternatives and scanning, identification and seizing
of new opportunities (Moshe 2010; Zhou and Wu 2010). The firms not only need to
focus on Ricardian rents which are generated from exploitation activities and can be
measured by the current and past performance of the organisation but also on the
Schumpeterian rents (Chesbrough 2008). Schumpeterian rents are generated from
the exploration activities of the firm and involve creating value from radical and
discontinuous changes (Chesbrough 2008). We thus need to focus not only on the
past and current performance of the firm but also obtain insights on the future
performance potential of the firm.
The innovation performance has been measured using the following three
measures (Hope 2009; Combs et al. 2005; Lawson and Samson 2001):
(a) The firm’s relative performance to the innovation leader in the particular
industry of the firm’s operations. This is considered as a measure of the
exploitation or the advantage-seeking behaviour of the firm, as it reflects the
current innovation position of the firm.
(b) Impact of firm’s innovative capability and initiatives on the last 3 years’ sales
and revenue generated by the firm. This is considered as a second measure of
the exploitation or the advantage-seeking behaviour of the firm; it explores the
exploitation of the innovation capability to generate revenue from the
innovation outputs of the firm.
(c) Firm’s planned current initiatives in generating innovative capabilities and
output for the future performance of the firm. The measure specifically reflects
the exploration and opportunity-seeking behaviour of the organisation.
The innovation performance parameters are thus selected so as to measure the
balance between the exploration and exploitation capabilities of the firm and the
innovation objectives and strategies which specifically lead to exploration and
exploitation in a firm.
Innovation Objectives, Strategies and Firm Performance: A Study of Emerging. . . 7

3 Methodology
The interrelationship between various innovation-influencing factors was measured
using a combination of qualitative (Barr 2004) and quantitative techniques (Slater
and Atuahene-Gima 2004). We performed our study in two stages (Harrigan 2009).
The first stage consisted of a qualitative study where we interviewed five senior
managers of an Indian multinational firm operating in a technology-intensive
industry (Barr 2004). The insights obtained from the senior managers regarding
innovation objectives and innovation strategy trends in the market were linked to
the literature review performed by the authors. The combined conceptual model
developed based on the inputs from the literature review and qualitative study was
used as an input for the second stage of the study.
The second stage of the study included the quantitative analysis using an online
questionnaire (Simsek et al. 2005; Slater and Atuahene-Gima 2004). The question-
naire consisted of one question for each of the parameters of our study which has
been identified before (Guan et al. 2009). The empirical testing and questionnaire-
based methodology were used specifically to test the interrelationship amongst the
various factors and the relative importance of each of these factors and their
contribution to the final innovation capability and performance of the firm.
The questionnaire consisted of three parts: the innovation objectives, the
innovation strategies and the innovation performance. The questionnaire was
initially pilot tested in two Indian large-scale enterprises, and the feedback received
on understanding and clarity was used to refine the questionnaire before final
distribution. The sample consisted of Indian firms which have been incorporated
in India before liberalisation, i.e. firms which have seen the pre-liberalisation
environment and which have faced the challenges of the transformation. The
multinational firms selected for study were those which had operations in India,
and at least some percentage of value-adding activity in their final product or
service was performed in India.
The questions in the questionnaire were objective type, and all questions were
made compulsory. The respondent had to select one option out of the Likert scale
ratings (from 1 to 7). Thus, to ensure uniformity of the response and minimum
wastage of time by the respondents as the respondents are majorly of middle
management rank, the questionnaire was designed using a uniform scale with no
subjective questions. The questionnaire was prepared using a popular online ques-
tionnaire design tool, and the questionnaire was distributed using online medium
only. The author’s social network resources were utilised to get the responses filled
from the desired organisations. The only criterion for acceptance of the company in
the sample set was that at least ten responses from the particular company should
have been received for the company to be analysed in the sample set. The question-
naire was responded by managers from 110 companies; however, out of these, only
82 companies fulfilled the criteria of more than ten responses and hence were
accordingly selected. All in all, 1,189 responses were evaluated for arriving at the
final results.
8 Aniruddha

SPSS software was utilised to perform analysis on the received forms and
correlation; OLS regression was used to analyse the relationship between our
study parameters, i.e. innovation objectives, innovation strategy, innovation per-
formance and environmental context (Shaver 2007).
4 Results
A definite relationship can be seen between the innovation strategy pursued by the
firm and the innovation objectives. Based on the results of the OLS regression, we
were able to identify certain objectives which were positively impacted by a
particular innovation strategy. At the same time, another set of objectives for the
same strategy was identified which were negatively impacted. The results of the
relationships obtained from the OLS regression are documented below. The Table 1
describes the relationship between innovation strategy and its favourable and
unfavourable objectives. All results were found significant at 0.01 significance
level. The overall R2 for the model was 0.56, which explains the strength of the
model in predicting the relationships.
We also performed the relationship analysis between innovation strategy and the
exploration and exploitation capability of the firm. From the results presented below,
it can be seen that innovation leader is the only strategy which balances exploration
and exploitation. It can also be seen that cost-efficient follower is a more efficient
strategy for firms specifically focussing on exploitation as it provides better results
for exploitation as compared to innovation leader. Imitator is a negatively impacting
strategy as can be seen by the negative relationship with the performance. Technol-
ogy importer strategy coupled with cost-efficient follower can be seen to be the most
superior innovation strategy in terms of balancing exploration and exploitation. The
firms which focus on cost-efficient follower strategy along with importing comple-
mentary technologies are likely to exceed the innovation performance in comparison
to the other innovation strategies (Table 2).
5 Conclusion and Future Research
We have been able to establish a relationship between various innovation
objectives, innovation strategy and innovation performance of the firms. Trade-
off baskets have been identified for the five innovation strategies, which can help
managers select the relevant strategy based on the firm objectives. We have also
been able to establish that cost-efficient follower combined with technology
importer strategy is a superior strategy for emerging market firms as can be seen
from the performance impact of firms. Innovation leader adopts a mix of explora-
tion and exploitation. Firms following imitator and laggard strategies are likely not
to achieve superior performance in the changing dynamic environment.
Innovation Objectives, Strategies and Firm Performance: A Study of Emerging. . . 9

Our research has certain limitations; the sample was based on convenience
sampling. A more refined way of sampling should be adopted to collect the data.
The study has adopted a perception-based approach; the study in the future should
be conducted using empirical data from supporting secondary sources for validation
of results. The antecedents of innovation objective selection need to be identified,
and their impact on firm’s strategy should be established. The study can also
focus on the impact of firm characteristics like ownership, country of origin,
technological intensity and product type.
References
Antoncic JA, Antoncic B (2011) Employee satisfaction, intrapreneurship and firm growth:
a model. Ind Manage Data Syst 111(4):589–607
Barr PS (2004) Current and potential importance of qualitative methods in strategy research. In:
Research methodology in strategy and management, vol 1. Elsevier Ltd, Oxford, pp 165–188
Table 1 Innovation strategy and related innovation objective trade-offs
Innovation
strategy Favourable objectives Unfavourable objectives
Innovation
leader
Develop radically innovative product Maintain or increase market share
Replace products being phased out Reduce production cost
Improve working conditions Reduce consumption of raw materials
Cost-efficient
follower
Maintain or increase market share Develop radically innovative product
Improve production processes for existing products Introduce niche products or
technologyPartner with Value Net members for increasing WTP
Improve product quality
Imitator Introduce niche products or technology Develop radically innovative product
Exploit new domestic market Improve working conditions
Improve product quality
Technology
importer
Improve existing technology to reduce reliance on
imported equipment/know-how
Maintain or increase market share
Improve production processes for existing products Replace products being phased out
Partner with Value Net members for increasing WTP Exploit new international market
Laggard Reduce consumption of raw materials Maintain or increase market share
Reduce production cost Develop radically innovative product
Reduce energy consumption Exploit new international market
Table 2 Innovation strategy and innovation performance relationship
Innovation performance
Relative to leader Last 3 years Future trend
Innovation strategy B Sig B Sig B Sig
(Constant) 0.27 0.14 �0.19 0.36 �0.23 0.27
Innovation leader 0.19 0.00 0.14 0.00 0.16 0.00
Cost-efficient follower 0.31 0.00 0.22 0.00 0.06 0.08
Imitator �0.11 0.00 0.08 0.01 �0.03 0.34
Laggard 0.01 0.72 0.08 0.00 0.04 0.06
Technology importer 0.01 0.72 0.04 0.09 0.06 0.00
10 Aniruddha

Barrell R, Pain N (1997) Foreign direct investment, technological change, and economic growth
within Europe. Econ J 107(445):1770–1786
Burgelman R, Maidique MA, Wheelwright SC (2004) Strategic management of technology and
innovation. McGraw-Hill, New York
Chesbrough H (2008) Orchestrating appropriability: towards an endogenous view of capturing
value from innovation investments. In: Shane S (ed) Handbook of technology and innovation
management. Wiley, Chichester
Combs JG, Crook TR, Shook CL (2005) The dimensionality of organizational performance and its
performance and its implications for strategic management research. In: Research methodol-
ogy in strategy and management, vol 2. Elsevier Ltd, Amsterdam, pp 259–286
Constantine A, Marianne WL (2009) Exploitation-exploration tensions and organizational ambi-
dexterity: managing paradoxes of innovation. Organ Sci 20(4):696–717
Dess GG, Picken JC (2000) Changing roles: leadership in the 21st century. Organ Dyn 28:18–34
Esteve A, Ramon CM (2010) Open versus closed innovation: a model of discovery and diver-
gence. Acad Manage Rev 35(1):27–47
Eyring MJ, JohnsonMW, Nair H (2011) New business models in emerging markets. Harv Bus Rev
89(1/2):88–95, 8p, 2
Girma S, Gong Y, Gorg H (2009) What determines innovation activity in Chinese State-owned
enterprises? The role of foreign direct investment. World Dev 37(4):866–873
Guan JC, Yam RC, Tang EP, Lau AKW (2009) Innovation strategy and performance during
economic transition: evidences in Beijing, China. Res Policy 38:802–812
Harrigan KR (2009) Using hybrid research methodologies for testing contingency theories of
strategy. In: Research methodology in strategy and management, vol 5. Emerald Group
Publishing Limited, Bingley, pp 121–136
Hill CWL, Rothaermel TF (2003) The performance of incumbent firms in the face of radical
technological innovation. Acad Manage Rev 28(2):257–274
Hope J (2009) Performance management in the innovation age: An introduction. Innovation in
Action Series. IBM Cognos Innovation Center for Performance Management. Copyright IBM
Corporation 2009
Johnstone N, Haščič I, Popp D (2010) Renewable energy policies and technological innovation:
evidence based on patent counts. Environ Resourc Econ 45(1):133–155
Jones GK, Lanctot A, Teegen HJ (2001) Determinants and performance impacts of external
technology acquisition. J Bus Ventur 16(3):255–283
Lawson B, Samson D (2001) Developing innovation capability in organisations: a dynamic
capability approach. Int J Innov Manage 5(3):377–400
Leiponen A, Helfat CE (2010) Innovation objectives, knowledge sources and the benefits of
breadth. Strateg Manage J 31:224–236
Li Y, Guo H, Liu Y, Li M (2008) Incentive mechanisms, entrepreneurial orientation, and
technology commercialization: evidence from China’s transitional economy. J Prod Innov
Manage 25:63–78
Miles RE, Snow CC (1978) Organizational strategy, structure, and process. McGraw Hill,
New York
Moshe F (2010) Beyond dualism: stability and change as a duality. Acad Manage Rev 35(2):
202–225
Nieto MJ, Santamarı́a L (2010) Technological collaboration: bridging the innovation gap between
small and large firms. J Small Bus Manage 48(1):44–69
O’Cass A, Weerawardena J (2009) Examining the role of international entrepreneurship,
innovation and international market performance in SME internationalisation. Eur J Mark
43(11/12):1325–1348, 24p
Parrish ED, Cassill NL, OxenhamW (2006) Niche market strategy for a mature marketplace. Mark
Intell Plann 24(7):694–707
Prajogo DI, Sohal AS (2003) The relationship between TQM practices, quality performance, and
innovation performance: an empirical examination. Int J Qual Reliab Manage 20(8):901–918
Innovation Objectives, Strategies and Firm Performance: A Study of Emerging. . . 11

Rehman IH, Kar A, Raven R, Singh D, Tiwari J, Jha R, Sinha PK, Mirza A (2010) Rural energy
transitions in developing countries: a case of the Uttam Urja initiative in India. Environ Sci
Policy 13(4):303–311
Sanchez R (1995) Strategic flexibility in product competition. Strateg Manage J 16:135–159
Shaver JM (2007) Interpreting empirical results in strategy and management research.
In: Research methodology in strategy and management, vol 4. Elsevier Ltd, Amsterdam,
pp 273–293
Simsek Z, Veiga JF, Lubatkin MH (2005) Challenges and guidelines for conducting internet based
surveys in strategic management research. In: Research methodology in strategy and manage-
ment, vol 2. Elsevier Ltd, Amsterdam, pp 179–196
Slater SF, Atuahene-Gima K (2004) Conducting survey research in strategic management.
In: Research methodology in strategy and management, vol 1. Elsevier Ltd, Burlington,
pp 227–249
Song M, Droge C, Hanvanich S, Calantone R (2005) Marketing and technology resource comple-
mentarity: an analysis of their interaction effect in two environmental contexts. Strateg Manage
J 26:259–276
Teece DJ (2007) Explicating dynamic capabilities: the nature and microfoundations of (sustain-
able) enterprise performance. Strateg Manage J 28(13):1319–1350
Tidd J (2001) Innovation management in context: environment, organization and performance. Int
J Manage Rev 3(3):169–183
Tolstoy D, Agndal H (2010) Network resource combinations in the international venturing of
small biotech firms. Technovation 30(1):24–36, 13p
Tomovic CL, Ncube LB, Walton A, Grieves M (2010) Development of product lifecycle manage-
ment metrics: measuring the impact of PLM. Int J Manuf Technol Manage 19(3–4):167–179
Tsai M, Tsai C (2010) Innovation capability and performance in Taiwanese science parks:
exploring the moderating effects of industrial clusters fabric. Int J Organ Innov 2:80–103
Tsai Y, Lin JY, Kurekova L (2009) Innovative R&D and optimal investment under uncertainty in
high-tech industries: an implication for emerging economies. Res Policy 38:1388–1395
Tushman ML, O’Reilly CA (1996) Ambidextrous organizations: managing evolutionary and
revolutionary change. Calif Manage Rev 38:8–30
Utterback JM, Abernathy WJ (1975) A dynamic model of process and product innovation. Omega
3(6):639–656
Voss GB, Sirdeshmukh D, Voss JG (2008) The effects of slack resources and environmental threat
on product exploration and exploitation. Acad Manage J 51(1):147–164
Wang CL, Ahmed PK (2007) Dynamic capabilities: a review and research agenda. Int J Manage
Rev 9(1):31–51
Woertera M, Roper S (2010) Openness and innovation—home and export demand effects on
manufacturing innovation: panel data evidence for Ireland and Switzerland. Res Policy 39(1):
155–164
Yam RC, Lo W, Tang EP, Lau AK (2011) Analysis of sources of innovation, technological
innovation capabilities, and performance: an empirical study of Hong Kong manufacturing
industries. Res Policy 40:391–402
Zhou KZ, Wu F (2010) Technological capability, strategic flexibility and product innovation.
Strateg Manage J 31:547–561
12 Aniruddha

Technology for Rural Market Development
V.K. Nangia, Vinay Sharma, Anita Sengar, and Ritika Mahajan
1 Introduction
India is a country where more than 70 % of the population lives in rural areas, where
rural areas consist of more than 6.38 lakh villages, out of which more than 30% has
a population of more than 2,000. Fifty percent of the total GDP of India is
contributed by rural areas. The reforms in the post-economic reform period have
led to remarkable improvement in the economic growth. This is revealed through
analysis of factors like GDP, employment index, human development, balance of
payments, etc. The analysis of the impact needs adequate attention, especially in the
context of rural markets. An examination undertaken in this respect revealed
that though rural India is not shining, there have been massive improvements
(Dev 2004). Rural markets are catching the attention of the marketers. Being mostly
untapped, the huge potential makes them a strong attention. Mahatma Gandhi
always emphasised the importance of rural India. C. K. Prahalad’s ‘Bottom of the
Pyramid’ also threw the issue into limelight. The philosophy on which the book is
based is the need for developing rural markets. The preface of the book says that
the poor must become active, informed and involved consumers (Prahalad 2005).
To develop the rural markets, various issues like education, healthcare, efficient
markets and governance need to be taken care of. Rural marketing is, in fact,
developmental marketing (Dikkatwar 2009). With the use of technology pervading
every facet of our lives, endeavours which promote rural market development
through technology should be encouraged.
The word technology comes from the Greek word technologia (tewnologı́a),meaning skill, art and craft, and logy (logı́a), meaning the study of (MerriamWebster dictionary 2011). It explains the term as ‘the practical application of
V.K. Nangia • V. Sharma • A. Sengar (*) • R. Mahajan
Department of Management Studies, Indian Institute of Technology, Roorkee, India
e-mail: [email protected]; [email protected]; [email protected];
Department of Management Studies, Indian Institute of Science, Bangalore,
Driving the Economy through Innovation and Entrepreneurship,DOI 10.1007/978-81-322-0746-7_2, # Springer India 2013
13

knowledge especially in a particular area’ (ibid.). According to Prof. G. B.
Harrison, technology is the process of using scientific, material and human
resources in order to meet human need or purpose. UNDP’s Human Development
Report (2001) on the issue of transformation being brought about by technology
emphasised that ‘no individual, organization, business or government can ignore
these changes. The new terrain requires shifts in public policy – national and global –
to harness today’s technological transformations as tools for human development.’
The use of technology leads to two potential benefits (Nirvikar Singh 2006). One is
that of increased efficiency and the other is of reduced economic inequality.
Specifically, in the context of rural markets, the latter holds importance.
2 Defining the Term ‘Rural’
‘Rural’ emerged as an adjective linked to the Latin noun rus, meaning an open
area. The adjective form stuck and was incorporated into several European
languages to refer to something relating to those areas outside cities (Woods
2011). There are numerous other definitions given by several bodies such as RBI,
Census of India, NABARD and Planning Commission. It is not possible to justly
indicate the place at which rurality ends or where urban conditions begin (Meserole
1938). Sahara group defines it as locations having shops/commercial establish-
ments up to 10,000 are treated as rural, whereas LG defines rural and semi-urban
areas as all other cities other than the seven metros (Kashyap 2007). Harish Bijoor
(CEO of Brand and Business Strategy Consultants) says, ‘Rural is not a geography; it
is a mindset. Those who possess it are rural and those who do not are urban.’ So, rural
sociology and economics play a very vital role in rural markets. Social life of the
community is divided into two distinct segments, rural and urban which interact
among themselves but each is sufficiently distinct from the other in terms of occupa-
tion, density, size of community, mobility, environment, homogeneity and system of
interaction (Desai 1969). Rural economy of India is characterised by growing
commercialisation, rurbanism (Jha 2003) and huge participation of institutions in
socio-economic development of rural areas (Dhingra 1983).
The term ‘Rural Marketing’ was earliest used by Shah in the reports of sub-
committee set up by the National Planning committee in 1937 (Shah 1947). The key
for succeeding the rural market lies in comprehending the rural psyche (Dogra and
Ghuman2008). Gopalasawamy (2005) emphasized upon all flows between rural-urban
and within rural whereas Iyer (2004) states that Rural marketing refers to developing
marketing mix for goods and services leading to exchange between urban and rural
markets, which satisfies consumer demand and also achieves organizational objectives.
3 Technology and Rural Market Development
Despite debates on the pros and cons of the uses of technology, there is adequate
literature supporting the use of technology for economic and social change
(Kaushik and Singh 2004). According to Nandi (2002), economic growth and social
14 V.K. Nangia et al.

empowerment can be achieved through the use of information and communication
technology. It can empower the poor by improving their access to use of government
services through e-governance as well as to schemes such as those of microfinance
(Cecchini and Scott 2003). The availability of opportunities of health, education and
access to markets to the poor is also enhanced through the use of technology
(Malhotra 2001). Though it may seem paradoxical at a certain level to talk about
such initiatives in a country where millions live below poverty line, yet there are
many existing examples of such type which need to be emulated. This study is based
on one such example which draws its strength from industry-academia collaboration.
4 Integrated Rural Development: A Case Study
of Charba Village (Dehradun, Uttarakhand)
4.1 How Was This Idea Conceived?
SIIRD (Students’ Initiative for Integrated Rural Development) is the result of the
initiative taken up by students of IIT Roorkee for the development of rural areas.
In 2006, a few B-Tech students interested in working for rural development
approached Prof. V. K. Nangia (Govt. of India Chair Professor in Knowledge
Economy, Coordinator Uttarakhand Development Cell and Prof., Dept. of Manage-
ment Studies, IIT Roorkee) who sensitised them with various problems and
possible challenges faced by people in rural India. Prof. Nangia addressed this
subject in a very innovative way by supporting this initiative with his National
Competitiveness in Knowledge Economy project which was awarded to him by
the Department of Information Technology, Government of India, and SIIRD
has evolved as its rural development vertical. SIIRD is based on government-
academia-industry-society partnerships, and its objective was to develop a sustain-
able development model in a village called Charba.
4.2 Focus on the Participating Elements of DevelopmentalEfforts Through the People Who Could Best Do It
Uniqueness of the project lies in the voluntary use of student force for the larger good
of society by integrating the efforts of industry-academia-government-society. There-
fore, selection of students is a key task for SIIRD because travelling for two and a half
hours in a rickety state transport bus and then staying in the village during night in the
absence of electricity are a very tough task which requires lot of vigour. SIIRD’s
selection procedure makes sure that right students are selected for the job. The key
qualities that it seeks in students are their dedication, willingness, self-motivation to
work for the nation and their aptitude to think solutions and as well as strategise them.
When Charba village was identified, SIIRD started the process of recruitment.
In the beginning of every new session, SIIRD conducts an orientation talk which
is followed by a series of rounds for the selection of interested students (Table 1).
Technology for Rural Market Development 15

With the passage of time, SIIRD has become one of the most sought-after groups
on the IIT Roorkee campus.
4.3 Selection of the Village
After selecting most appropriate participating elements for the project, the next task
was identification of a target village which makes SIIRD unique and different from
other development agencies. Since centralised planning and lack of coordination
among development agencies are few of the major challenges faced by the Indian
government, it was very important for SIIRD to identify a village to be worked on
having the following characteristics:
1. The village had to be a true representative of Uttarakhand in terms of its
topography, social and cultural diversity.
2. The village was to be physically accessible considering the rocky and mountain-
ous topology of Uttarakhand.
3. The village was required to have the support of local government bodies and
should be crime-free for students to work.
Through the method of ground surveying, SIIRD decided to search for its targeted
village. Seventeen villages in three districts of Uttarakhand were covered in a span of
2 years. The surveys may be broadly classified according to the Table no. 2 men-
tioned in next page. After all these vast and exhaustive surveys, SIIRD team finally
identified Charba village in March 2008 to work in. Charba is located in Sahaspur
block of Dehradun District, 40 km from the heart of Dehradun City. Its topography
can be classified into three parts: Lower Charba, plain; Middle Charba, semi-hilly;
Upper Charba, hilly. SIIRD team observed that Charba, having a population of just
over 10,100, represents the whole of Uttarakhand in terms of social and cultural
diversity and topography. It is also well connected with NH-72 through an 8-km road.
4.4 Infusion of Developmental Activities
4.4.1 Information and Communication Technology (ICT)
Awareness Initiative
The main objective of this initiative is to create awareness about the use and
benefits of information and communication technology and develop a healthy
relation with the villagers.
Table 1 No. of students
selected against no. of
applications
Year No. of applications No. of selections
2008 23 8
2009 69 25
2010 149 30
16 V.K. Nangia et al.

Methodology: Meetings of villagers were convened, and the uses and benefits of
information and communication technology were demonstrated. Door-to-door
demonstrations were also done. Practical hands-on exposure of computer and
Internet was given to villagers. The villagers were also provided an opportunity
to experience the use of computer and Internet. These demonstrations helped SIIRD
team to identify ‘champions’ (villagers who were supportive and willing to help
carry our initiatives forward).
Achievements: A total of about 350 man days were spent for this initiative (of which
about 150 man days spent in the village) from June 2008 to February 2009. The team
identified 15–20 champions in the village who help the team during visits. About
three-fourth of the village has been covered by door-to-door demonstrations, and the
team has spread its presence in the village. Training of Trainers Programme: All the
computer centre trainers of Charba have undergone training imparted by IIT
Roorkee students in three training programmes. Softwares like Microsoft Office,
basic Flash, basic Photoshop, elementary C, Tally, etc., were taught to them.
4.4.2 Entrepreneurship Initiative
The main objective of this initiative is to find the suitable entrepreneurs in
Charba village for running the soochna kutir (Janadhar) to ensure awareness
Table 2 Surveys for selection of the village
District Haridwar Tehri Garhwal Dehradun
Time period 2006–2006 2006–2008 2008–2008
District
topology
Plains Hilly and rocky Semi-hilly
Village
surveyed
Bhijouli Tutai Chak Rampur
Chogani Lakshmipur
Kilwan Shekonwala
Kansyud Dhulkot
Daang Navgaon
Jhakogi Brahmanon Ki Charba
Jhakogi Kilwano Ki
Raiduni
Gair
Shivalipatal
Findings Village lacked in social
diversity
Villages are rich in social
diversity but are very
difficult to reach
Villages are rich in
social and
cultural diversity
with easy
accessibility
Conclusion It was decided to search
Uttarakhand’s culture in
its interior; thus,
Surkhanda Devi pass in
Tehri Garhwal District
was selected
Even the first village Tutai
Chak was reached after
descending for 2 h in
Surkhanda Devi valley.
Thus, Sahaspur block of
Dehradun was selected
Charba village was
identified for
proceeding with
SIIRD work
Technology for Rural Market Development 17

and usage of information and communication technology in Charba. Janadhar is the
e-Governance initiative of the government of Uttarakhand. It was started in March
2005. The initiative was taken up with funding from the UNDP and technical
guidance by the Indian Institute of Technology, Roorkee (IIT).
Methodology: The main objective of the e-Governance initiative is to deliver
information of public interest and services related to various government
departments at the doorsteps of the citizens of Uttarakhand by setting up citizen-
centric information kiosks (soochna kutirs) for e-Governance in the state.
Achievements: A total of about 200 man days were spent for this initiative from
September 2008 to March 2009. Suitable entrepreneurs were identified for running
the information kiosks (soochna kutir) to ensure the awareness and usage of benefits
of information and communication in Charba. Eight soochna kutirs (information
kiosks) were studied in Naintal by five students. Three soochna kutirs (information
kiosks) were set up and inaugurated in Charba under the UNDP-funded
e-Governance project by Prof. H. K. Verma, Deputy Director, IIT Roorkee. Train-
ing of the personnel manning the soochna kutirs (information kiosk) was done in
UNDP office, IIT Roorkee.
4.4.3 Primary School ICT Education Initiative
Its main objective is to provide basic computer education to the students of primary
schools of Charba village and make this education system sustainable.
Methodology: Identification of primary stakeholders (students, parents, teachers,
team members) and obtaining their views on computer education, preparing course
materials in Hindi for teaching in primary schools in consultation with the teachers
in conformity to the private school course structure and integration of Sarva
Shiksha Abhiyan (SSA) with SIIRD, thereby ensuring sustained government sup-
port to the primary school ICT education initiative.
Achievements: About 150 man days were spent for this initiative from January
2009 to November 2009. Course structure (in Hindi) and details and database of all
four primary schools are prepared. ICT education was imparted to students of
primary schools by SIIRD team. Met Mrs. Geeta Nautiyal, District Education
Officer, Dehradun District, and obtained approval for integration of Sarva Shiksha
Abhiyan (SSA) with the primary school ICT education initiative. SSA officials
agreed to extend support to SIIRD for its future initiatives. About ten videos were
made which will serve as self-learning toolkit illustrating the usage of simple
software like Notepad, Calculator, etc.
4.4.4 Girls’ Education Initiative
Its main objective is to train the girls of Charba in ICT and make them champions so
that they may in turn impart training to other villagers and thus make this education
system sustainable.
18 V.K. Nangia et al.

Methodology: The focus is on training the girls of age group 12–15 years from the
village so that they could further train the students in the village. Target is to train
about 30 girls in Charba.
Achievements: About 50 man days were spent for this initiative fromMarch 2009 to
November 2009. Trainingwas given by IITR girls: SevenCharba girls were trained in
ICT at IIT. Training was given by combined efforts of IIT R girls and Charba: 20
students were trained at the house ofMr. Baljeet Singh (champion) on 15thMay 2009.
Thirty-six students were trained in primary school no. 3 on 16th May 2009. Five new
girls were trained from Charba by IITR girls from 8th to 10th August 2009.
4.4.5 Health Initiative
Its main objective is to improve the health status of the village with the assistance of
health institutes in nearby areas, mainly by organising health camps and to connect
them with doctors in village by teleconferencing.
Achievements: Contacted Himalayan Institute Health Trust (HIHT) in Dehradun
District and discussed about health initiative. SIIRD team is in the process to
organise a health camp in the village with HIHT assistance soon. Villagers were
made aware about e-Health, and their interest was created in it, and the team got a
good feedback from them.
4.4.6 Employability Initiative
Its main objective is to improve the employability of the unemployed or underem-
ployed people of the Charba village by skill development or getting their existing
skills tested and certified.
Methodology: Creating a platform for villagers and industry to reduce the gap
between them. Designing of training module and training the villagers to impart
necessary employment skills. Recruitment of the trained villagers.
Achievements: About 80 man days were spent for this initiative from January 2009
to November 2009. Met CII officials and other local industrialist of Selaqui,
Dehradun District, and integrated them with this initiative. In consideration of the
industrial demands, motivational training of five villagers was done in Haridwar.
Another meeting with CII and other local industrialist of Haridwar to discuss
recruitment of trained villagers.
4.4.7 Agriculture Initiative
Its objective is to improve the agriculture status by increasing the rate of production
in agriculture using scientific tools and research.
Technology for Rural Market Development 19

Methodology: Integrate multiple stakeholders (like Krishi Vigyan Kendra, IFFCO,
etc.) in this initiative. To focus on a specific group of about 12–15 farmers who
would be champions in agricultural initiative. Expertise of professors and students
of Biotechnology Department will play a crucial role in this initiative.
Achievements: About 30 man days were spent for this initiative from March 2009
to November 2009. Basic survey of agricultural practices in the Charba village.
Identified five potential farmers for the target group of this initiative.
4.5 Associating People and the Institutesfor Strengthening These Activities
In order to achieve the defined objectives of SIIRD, there is a need to associate
people and various institutes so that these activities could be strengthened. Few of
the associations have been mentioned below:
United Nations Development Project’s (UNDP) e-Governance initiative:
• Integrated the Uttarakhand government’s UNDP-funded e-Governance project
by setting up three soochna kutirs (information kiosks) at Charba
• Principal investigator: Prof H. K. Verma, Deputy Director, IIT Roorkee
Sarva Shiksha Abhiyan for primary school ICT education:
• Integrated SSA for the primary school ICT education initiative
• Officials in charge: Mrs. Geeta Nautiyal, District Education Officer, Dehradun
District, and Mr. S. P. Semwal, District Head of Computer Aided Learning
Program (CALP), Dehradun District
Confederation of Indian industries (CII):
• Integrated CII for the employment initiative and arranged for the training of the
unemployed youth of Charba
• Officials in charge: CII, Uttarakhand unit at Dehradun
SIIRD is on the lookout for integrating the private sector in this social cause to
create a model synergising the efforts of government, academia and industry
(public and private sectors) for rural development.
4.6 Evolution of the Model
A model has been proposed which is an integrated model of several new
collaborative approaches that are possible, mainly in the Indian scenario, to
strengthen academia-industry interface:
20 V.K. Nangia et al.

Approach of SIIRD-IITR towards sustainability in Charba through theintegrated model:
• Integration with existing projects – SIIRD integrated with e-Governance project of
Prof. H. K. Verma, Deputy Director of IIT Roorkee. It installed three information
kiosks in Charba where uttaraportal.in provides villagers with basic information
of weather, competitive examinations, etc., charging only a nominal amount.
• Integration with CSR programmes of corporates – After creating informa-
tion and communication technology awareness through door-to-door and mass
demonstrations, SIIRD integrated with IIT Roorkee and Infosys Foundation
which donated 16 and 15 computers respectively to 4 primary schools of Charba.
• Integration with government schemes – In integration with Sarva Shiksha
Abhiyan, SIIRD launched Teacher’s Computer Training Program. IIT Roorkee
students designed a basic computer course material. The course was taught to the
primary school teachers so that they can teach the students and make the system
sustainable. SSA will issue certificates for the teachers.
• Integration with autonomous education institution and other autonomous bodies
– With the aim of solving health problems in the village, SIIRD integrated with
LHMC, NRHM, RSBY and CMOs of Dehradun and Sahaspur and organised
health camps. Two health camps have already been organised. A total of 673
patients have been treated in an area where normal health camp receives less
participation. Such is the goodwill of SIIRD in Charba (See Figure no. 1).
• Integration with industry – To meet the erratic power supply in the primary
schools of Charba, SIIRD integrated with JNNSM and Gensol Consultants Pvt.
Ltd. to provide 90% subsidy and seed capital respectively for 20-kW solar panel
systems which are to be installed in four primary schools of Charba. The letter of
intent has been signed, and DPRs have been submitted at UREDA.
• International collaboration – SIIRD has integrated with Acara Institute, USA, after
winning Acara Challenge 2010 with 1st and 2nd positions. Acara is funding the
“myrain” (winning team) with US $10,000 to install drip irrigation systems in the
village. Acara Challenge 2011 is again won by student team of SIIRD
• Towards sustainability – SIIRD recently started Young Champions Program
(YCP) with the aim of replicating the student model group in Charba. This
model group is being mentored to understand the model of SIIRD. The students
of Inter College, Charba, were identified as young champions, and a team of five
girls and eight boys was made.
4.7 Working for the Self-Sustenance of This Constituted System
SIIRD will promote and propagate the student-driven industry-academia-government-
society collaborative model by visiting various institutions in the country. It also
aims at replicating its model in all IITs, IIMs and other important institutions of
the country. It wants to work in Charba and make it a self-sustainable village and
then extend the scope of work in the nearby areas of Charba through the Young
Champions team.
Technology for Rural Market Development 21

In the coming years, SIIRD wants to double the current workforce from 60 to
120 members. It will continue sensitising the students of IIT Roorkee and other
institutions by organising awareness programmes, carrying forward the 170-year-
old legacy of IIT Roorkee’s contribution to national development.
4.7.1 Strategy for Primary School ICT Education Initiative
This is one of our major initiatives being implemented in Charba. The purpose of
this initiative is to provide basic computer education to the students of the primary
schools of Charba village and make this education system sustainable. Under this
initiative, the student team interacted with teachers of primary schools, students and
their parents as regards ICT education in the primary schools of Charba. Course
Fig. 1 Integrated model of academia-industry interface (Nangia 2011)
22 V.K. Nangia et al.

material was prepared (in Hindi) for the students and was used for teaching.
Interaction with teachers and students took place, and the database of students
was compiled for all the four primary schools of Charba. Ten simple, self-learning
video lessons have been prepared for illustrating the usage of Paint, Notepad and
other basic software.
4.7.2 Proposed Methodology of SIIRD to Ensure Sustainability
Acquiring Computers for Primary Schools: Obtaining computers from private/
public sector units for installation in the primary schools of Charba. Sarva Shiksha
Abhiyan officials, Dehradun District, have agreed to support in the installation of
computers in the primary schools of Charba.
Training of Teachers Programme: Once computers are installed in the primary
schools, the primary school teachers will be trained under Microsoft Academy or
Teach for India in Dehradun under the rural development initiatives of the govern-
ment of Uttarakhand and by the students of IIT Roorkee. These trained teachers
will further impart knowledge to the students thus making the system sustainable.
Developing Simple Software Videos: These would serve as self-learning tools
for the teachers as well as students. About ten self-learning videos for MS Paint,
Calculator and some basic software have been prepared by SIIRD team using
software like Cam Studio.
Refining the Course Content: As this sustainable system gets going, topics in the
course structure could be reviewed, and more topics would be included
5 Conclusion
Rise in the rural people’s income and enhancement of purchasing power of farmer
lead to new opportunity of development in rural market. Initiatives like SIIRD
which follows integrated model academia-industry interface truly help in improv-
ing the economic condition of rural people. A survey by the National Council for
Applied Economic Research (NCAER), India’s premier economic research entity,
recently confirmed that rise in rural income is keeping pace with urban incomes
from 55 to 58% of the average urban in 1994–1995, the average rural income
has gone up to 63–64% by 2001–2002 and touched almost 66% in 2004–2005.
The rural middle class is growing at 12% against the 13% growth of its urban
counterpart. Higher rural incomes have meant larger markets. Already, the rural tilt
is beginning to show. Issues of large size, huge potential, low-penetration level,
increased accessibility of rural markets, increasing income and purchasing power of
rural consumers, saturation and huge competition in urban markets are responsible
for rising attractiveness of rural markets (Velayudhan 2007). In order to tap rural
markets, there is a need to understand the meaning of ‘rural’ and rural consumer
insight which could only be understood by rural psychology, sociology and eco-
nomic aspect and thereby help marketers in optimising four Ps (product, price,
Technology for Rural Market Development 23

place and promotion) through rationalising upon the whole of the marketing
procedure, logistics, integrated marketing communication, product innovation and
amplification at all the steps. As quoted by Levitt (1973):
The patience of the past, which assumed that in due time the right things would somehowfinally happen by themselves, no longer works.
Now some are impatiently asking too much, in contrast to those who have asked toolittle, and society has no choice but to do what is right.
Rural marketers have no choice but to do that is right.
References
Cecchini S, Scott C (2003) Can information and communications technology applications con-
tribute to poverty reduction? Lessons from rural India. Info Technol Dev 10:73–74
Desai AR (1969) Rural sociology in India, 5th edn. Popular Prakashan, Bombay, pp 10–12
Dev M (2004) How to make rural India shine. Economic and Political Weekly 39(40):4415–4422
Dhingra IC (1983) Rural economics, 4th edn. Sultan Chand & Sons, New Delhi, pp 5–7
Dikkatwar RU (2009) Issues and challenges in using information communication technologies
towards rural market development. Pravara Manag Rev 8(2), retrieved online at http://papers.
ssrn.com/sol3/papers.cfm?abstract_id=1530628
Dogra B, Ghuman K (2008) Rural marketing – concepts and practice. Tata McGraw Hill,
New Delhi
Gopalasawamy TP (2005) Rural marketing – environment, problems, strategies, 2nd edn. Vikas
Publishing House, New Delhi
Iyer SR (2004) Marketing strategies for rural Indian Markets. www.alliancebschool.com
Jha M (2003) Rural marketing: some conceptual issues. Econ Pol Wkly 23(9):8–16
Kashyap P (2007) The rural marketing book-text and practice. Biztantra, New Delhi
Kaushik PD, Singh N (2004) Information technology and broad-based development: preliminary
lessons from North India. World Dev 32:591–607
Levitt T (1973) The third sector: new tactics for a responsive society. AMACOM, New York
Malhotra C (2001) Rural informatics and information technology policies for rural development in
India in emerging institutions. In: Jain SP (ed) Proceedings of NIRD foundation day seminar
for decentralized rural development. NIRD, Hyderabad, 7–8 January 2001, pp 223–250
Meserole WH (1938) What do you mean – rural and urban? J Mark 2(3):233–235
Nangia KV, Pramanik C (2011) Towards an integrated model for academia-industry interface in
India. World Acad Sci Eng Technol 73:333–342
Nandi B (2002) Role of telecommunications in developing countries in the 21st century. In: 14th
biennial conference, International Telecommunications Society (ITS), Seoul
Prahlad CK (2005) The fortune at the bottom of the pyramid. Wharton School Publishing, Upper
Saddle River
Shah KT (1947) Rural marketing and finance. Vora & Company, Bombay
Singh N (2006) Information technology and rural development in India, Paper 563. Department of
Economics, University of California, Santa Cruz, p 34
Technology (2011) In Merriam Webster’s online dictionary. Retrieved from http://www.merriam-
webster.com/dictionary/technology
UNDP’s Human Development Report (2001) Published for the United Nations development
programme (UNDP). Oxford University Press, New York. Retrived online at http://hdr.undp.
org/en/media/completenew1.pdf
Velayudhan SK (2007) Rural marketing: targeting the non-urban consumers, 2nd edn. Response
Books, New Delhi
Woods M (2011) Rural. Routledge, New York
24 V.K. Nangia et al.

Bridging Digital Divide and Capacity
Building in Rural India
Shailaja Rego, Naresh Kumar, and P.N. Mukherjee
1 Introduction
ICT encompasses communication services like telephony and Internet that run over
telecommunication networks. Recently, telecom sector has registered a phenome-
non growth and is considered one of the fast-growing sectors in India. The rapid
growth of ICTs has accelerated the economic and social change (Nandi 2002)
across all sectors of human activities worldwide, and the blending of ICTs is
expected to continue fast. Hence, the pervasive nature of ICTs has made interactive
communication possible without any hindrance and a driving force for development
and poverty reduction. Now, telecommunication sector has opened new opportunities
to make use of telecommunication technologies in their socio-economic and cultural
development in a better way. So, penetration of communication technologies is not
limited to urban areas only but has shown its presence in rural areas also. Rural
telecommunication applications attempt to offer general ideas and solutions to the
people who have disadvantages of basic facilities, for example, safe drinking water,
education, employment generation and human rights. Therefore, governments of the
respective countries have been attempting to exploit the technological advancement
by offering improved and affordable services to the rural communities. Accordingly,
considerable use of telecommunication technologies such as telephones, mobile
technology, Internet, etc., was observed in rural areas. Telecommunication is on
S. Rego
N M I M S University, Mumbai, India
e-mail: [email protected]
N. Kumar (*)
National Institute of Science Technology & Development Studies, New Delhi, India
e-mail: [email protected]
P.N. Mukherjee
Vivekanand Education Society’s Institute of Management Studies & Research, Mumbai, India
e-mail: [email protected]
Department of Management Studies, Indian Institute of Science, Bangalore,
Driving the Economy through Innovation and Entrepreneurship,DOI 10.1007/978-81-322-0746-7_3, # Springer India 2013
25

government’s priority with constant emphasis to increase accessibility in rural
areas since new economic policies. However, penetration rate of telecommunication
services such as telephony is lesser in rural than in urban areas which is attributed to
low access of the technology. This resulted to slow diffusion of telecommunication
services in rural areas and gave rise to digital divide. But the inter-sectoral applications
have boosted demand of telecommunication technologies. Subsequently, a phenome-
non expansion in telecommunication network was recorded which has improved
quality and labour productivity at different level across the geographical region.
India is a large country comprising nearly 72% rural population that indicates
a huge potential of ICTs in rural areas. The Government of India has realised
the emerging potential, so various policy measures are formulated to expand the
telecommunication network in rural India. The major focus is to make accessible
telephone services to reduce gap in teledensity between urban and rural areas. In this
context, the Department of Telecommunications (DoT) has taken several positive
measures to stimulate demand for telephones in rural areas. It was estimated that
every fifth person in villages was connected, from wage earners to shopkeepers and
farmers to fishermen, and telecom services are helping to increase their productivity
(The Indian Telecom Success Story, India Telecom 2009). Therefore, the objective
of this chapter is to provide an assessment of digital divide, in terms of teledensity,
and telecommunication potential and capacity building in rural India.
2 Measures of Digital Divide and Relevance of the Problem
‘Digital divide’ refers to unequal access to ICTs like telephones, Internet, etc., in
any social system. The concept of digital divide came into existence during the
1990s which was used to describe a market gap in access to the use of ICT devices
like the number of fixed line phones per inhabitants or the number of mobile users
or the Internet connections in the population (Singh 2010). The OECD further
elaborates digital divide: ‘The gap between individuals, households, businesses
and geographic areas at the different socio-economic levels with regard to their
opportunities to access ICTs and their use of Internet (OECD 2001)’. Thus, the
digital divide is analysed in terms of penetration of telecommunication technologies
on the following approaches (Buente and Robbin 2008; Hilbert 2011):
• Theoretical explanations for the digital divide or who connects with which
attributes: demographic characteristics of connected individuals and their
cohorts
• Means of connectivity or how individuals and their cohorts are connecting and to
what: infrastructure, location, and network availability
• Purpose of connectivity or why individuals and their cohorts are connecting:
reasons individuals are online and uses of the Internet and ICTs
• Lack of connectivity or why individuals and their cohorts are not connecting
26 S. Rego et al.

The divide appears due to various factors like historical, socio-economic,
geographic, educational, etc. On the basis of the variables, Hanimann and Ruedin
(2007) classified the digital divide into three categories as (i) a geographical digital
divide (between regions and countries), (ii) a social digital divide (between social
classes) and (iii) an upgraded digital divide (between technology and humans)
(Hanimann and Ruedin 2007). Therefore, the major components of digital divide
pertain to diffusion of ICTs which are an integral part of telecommunication
technologies. India is one of the emerging telecommunication powers in the
world, so it is imperative to analyse the growth pattern of telecom network. Indian
telecommunication services network expanded from about 84,000 connections
(fixed line) at the time of independence to about 206.83 million working
connections as on March 2007 (which consists of 40.77 million fixed telephone
lines and 166.05 million mobile phones). At present, India has a robust tele-
phone network comprising 787 million telephone connections (2010), including
mobile phones, and is one of the largest in the world and second largest among the
emerging economies (after China) with a wide range of services such as basic,
cellular, Internet, paging, very small aperture terminal (VSAT), etc. In addition,
the National Internet Exchange of India was set up by the Department of Informa-
tion Technology (DIT) to ensure that Internet traffic, originating and destined
for India, is routed within India. The objective of Internet exchange was to cut
the cost of Internet usage and to make efficient use of international bandwidth and
to save foreign exchange. It also improved quality of services for the customers by
avoiding multiple international hops and lowering delays. The status of the present
telecom network is shown in Table 1.
The digital divide is due to a variation in the use and degree of accessibility of
ICTs. However, the scope of this chapter is limited to analyse the divide in terms of
teledensity, which is a major component of telecommunication and ICTs. The
analysis is relevant because over the last decade, penetration of telecommunication
network has registered an unprecedented penetration in India, and the gap is now
narrowing between rural and urban India (Table 2).
The narrowing gap between rural and urban telephony was tested using depen-
dent sample t-test (paired t-test) to compare the growth of rural versus urban areas.
Table 1 Telecom network
status in India as of December
2010
1. Number of telephone connections 787.29 million
2. Number of telephone exchanges 38,461
3. Switching capacity (public) 135.159 million
4. VPTs 570,127
5. Rural phones 259,829,747
6. Urban phone 527,460,348
7. Wireless subscribers 752.20 million
8. PCOs (local + STD + highway) 1,649,826
9. Broadband subscribers 10.92 million
10. Internet 17.96 million
Source: Annual report 2010–2011, DoT
Bridging Digital Divide and Capacity Building in Rural India 27

The null and alternative hypotheses are Ho: there is no difference in rural and urban
growth and H1: rural growth is more than the urban growth. Average difference (m)and standard deviation (Sd) were 9.2647 and 18.2871 respectively. The t-value was2.1494, and p-value was 0.0231 where H0: m1 � m2 < ¼ 0. Here, m1 is rural
growth, and m2 is urban growth. The analysis indicates that at 5% level of signifi-
cance, the rural growth is more than the urban growth. It can also be concluded that
among all states, rural teledensity is growing on an average 9.28% more than the
urban teledensity. Similarly, correlation between the GDP growths with the tele-
density growth of the states was analysed, and obtained results were represented in
Table 3. Here, the null and alternate hypotheses are Ho: there is no relationship
between teledensity growth and GDP growth and H1: there is positive relation-
ship between teledensity growth and GDP growth.
Table 2 State-wise
percentage growth of
teledensity (December
2009–March 2011)
Sl. no. States Rural Urban Total growth
1. Andhra Pradesh 61.01 45.49 50.41
2. Assam 49.47 50.45 50.97
3. Bihar 85.10 57.95 69.28
4. Delhi – – 50.56
5. Gujarat 62.70 63.79 64.10
6. Haryana 49.78 68.70 61.31
7. Himachal Pradesh 57.29 78.73 66.83
8. Jammu and Kashmir 33.20 7.50 17.80
9. Karnataka 79.17 49.75 57.33
10. Kerala 62.74 50.37 54.89
11. Madhya Pradesh 89.27 51.63 63.59
12. Maharashtra 68.02 51.34 56.45
13. North East 56.33 60.17 59.15
14. Orissa 68.97 78.47 75.50
15. Punjab 57.63 62.37 61.99
16. Rajasthan 40.24 42.78 41.79
17. T. N. 49.28 42.93 46.11
18. U. P.(W) UP (E) 91.84 53.84 67.36
19. W. B. and Kolkata 88.16 67.16 74.84
20. Total 69.37 52.44 58.52
Table 3 Correlations matrix for GDP and ICT growth
GDP growth ICT Growth
GDP growth Pearson correlation 1 0.399a
Sig. (2 tailed) 0.039
N 27 27
Teledensity growth Pearson correlation .399a 1
Sig. (2 tailed) .039
N 27 28
Correlation is significant at the 0.05 level (2 tailed)aAnalysis based on state-wise data taken from Planning Commission
28 S. Rego et al.

From the above analysis, it can be stated that there is positive correlation at 5%
level of significance between teledensity growth and GDP growth.
3 Growth of Telecom Sector
The telecommunication sector has travelled a long journey in India that began
with the first experimental electric telegraph line between Kolkata and Diamond
Harbour in 1850 which was opened for the use of the British East India Company
in 1851 (Communications in India). Since then, there has been a tremendous
growth in the telecommunication sector, and now, India has the world’s second
largest mobile subscriber with over 865 million as of August 2011 (Highlights of
Telecom Subscription Data as on 31st August 2011). The increasing potential of
telecommunication encouraged foreign investment and private players by means
of competition. The studies show that India was the world’s most competitive and
one of the fastest growing telecom markets in the world (Dharmakumar; Kannan
2010). Competition enhanced quality in services; subsequently, Indian telecom-
munication services have been recognised the world-over as an important tool
for socio-economic development. Accordingly, telecommunication has been wit-
nessing the highest growth rate and is a major contributor in Indian economy. Due
to multifaceted applications, telecommunication is considered a basic infrastruc-
ture along with power and transportation. The development in telecommunication
sector could be possible by expanding required infrastructure mostly after the
policy of economic liberalisation. The growth of telecommunication sector in
India can be divided into three phases (Indian Telecom Industry).
Phase I represented the pre-liberalisation (1980–1989) period. In this phase, the
private sector was allowed in telecommunications for equipment manufacturing in
1984. Subsequently, in 1986, Mahanagar Telephone Nigam Limited (MTNL) and
Videsh Sanchar Nigam Limited (VSNL) were set up for expanding infrastructure,
and the Telecommunication Commission was set up in 1989. The major achieve-
ments were delicensing of the manufacturing of telecom equipments in 1991. The
New Economic Policy was announced on 24 July 1991 aiming India’s competitive-
ness in the global market, rapid growth of exports, attracting foreign direct invest-
ment and stimulating domestic investments. The second phase represented the
post-liberalisation (1990–1999) period which was considered a transformative
phase of the telecommunication sector allowing private sectors and value-added
service (VAS) such as paging services which was introduced in 1992 followed
by the National Telecom Policy (NTP) in 1994. The focus of the NTP-1994
was to ensure availability of telephone on demand to achieve universal service
at affordable and reasonable prices. Finally, the third phase (2000 onwards) was
a revolutionary period of Indian telecom sector which accelerated the telecom-
munication growth in India. In this phase, major technological and policy
initiatives were taken to enhance quality and access of telecom activities with
an objective for penetrating telecom in the remote and rural areas. Further,
Bridging Digital Divide and Capacity Building in Rural India 29

Calling Party Pays (CPP) was implemented, and a new NTP came in 2004 with the
formulation of broadband policy, and foreign direct investment (FDI) limit was
increased from 49 to 74% in 2005. Recently, number portability was implemented
in 2011 which was pending since 2006 which gave an option to the subscribers to
switch to any mobile operator without changing the number. Driven by various
policy initiatives, the Indian telecommunication sector witnessed comprehensive
reforms in the last decade which attracted private operators and considerable FDI
in the sector. FDI boosted the basic telecommunication infrastructure and network
which were required to expand telecommunication services in rural areas. The
FDI promoted competition in the market which benefitted consumers by making
telecommunication facilities more affordable and improved data quality. The
growth of FDI and private network is given in Figs. 1 and 2.
Competition in telecommunication market reduces cost of call charges and mobile
sets which increased telephone subscribers base many folds during the last decade. It
is significant that the growth of Indian subscriber base happened during that period
when the entire world was affected by the global economic meltdown; recessionary
trends were observed across the world, but Indian economic growth was affected
marginally. The spurt in the subscriber base paved the way for modern communica-
tion services in rural areas which contributed the Indian economy due to growth in
sales of services and equipments. The number of telephone subscribers reached
621.28 million at the end of the financial year 2009–2010. The share of wireless
subscribers reached 584.32 million as compared to 391.76 million in 2008–2009, and
the growth was nearly 49.15% during this period. The rural market also reached the
190.88-million mark in 2010 as against 111.63 million in 2009 excluding CDMA
which worked out to a growth of about 71% over the last year. According to an
estimate, there were 32.67% of total wireless subscribers in rural areas in the year
2009–2010. The total numbers of fixed telephone connections were 36.96 million,
while mobile subscribers were 9.93 million in the rural areas. The fast growth of
0
2000
4000
6000
8000
10000
12000
14000
FD
I in
flow
(R
s. m
illio
n)
Year
Fig. 1 FDI inflow in telecom sector (in millions) (Source: TRAI and DoT; *FDI inflow from April
to November 2011)
30 S. Rego et al.

mobile phones adversely affected fixed telephones in the last few years and replaced
the fixed telephone segment. Further, BSNL and MTNL registered a decline while
private operators gained a growth of 11.51% by increasing the connections from 5.04
million to 5.62 million in 2010. The growth of subscribers during the past decade
(1998–2010) is given in Fig. 3.
The fast growth of subscribers signifies that the telecommunication infrastruc-
ture has grown comparable with the emerging nations of Asia and the world. The
Indian telecommunication sector achieved success due to suitable regulatory
0
10
20
30
40
50
60
70
80
90
Per
cent
age
shar
e
Year
Fig. 2 Growth of private telecom network (1998–2011) (Source: TRAI and DoT various annual
reports;*up to March 2010)
0
100
200
300
400
500
600
700
No.
of
subs
crib
ers
Year
Total Subscribers
Wireless
Fig. 3 Growth of subscribers (in millions) (Source: DOT and TRAI)
Bridging Digital Divide and Capacity Building in Rural India 31

policies and favourable business environment for the private operators. In 1997,
the establishment of the Telecom Regulatory Authority of India (TRAI) encouraged
increase in the share of private telecom companies in the telecom market. Later,
the new National Telecom Policy with cellular telecom services in 1999 spurred the
diffusion of mobile communication in India. Subsequently, several measures were
initiated by the Government of India to promote telecom services. Further, Com-
munication Convergence Bill 2001 was established to regulate the transfer of all
forms of communication including broadcasting, telecommunications and multi-
media. Indian Telegraph (amendment) Rules 2004 was introduced with the objec-
tive to set guidelines for development of public telecom services in India.
4 Digital Divide and Teledensity in India
The digital inability and differences in sharing of ICTs are observed between poor
and rich communities and between geographical areas. The most prevalent digital
divide is found between rural and urban areas in developing countries which are
also reflected in India. Since digital divide is generally visible in the accessibility of
telephony (fixed line and mobile), the present study is, therefore, limited to pene-
tration of telephony in India. According to the International Telecommunication
Union (ITU), the penetration of telephony is one of the core indicators for global
identification of teledensity (2007) among the indicators (Core ICT Indicators). In
the early days of independence, the telecommunication services were accessible in
the urban areas, and teledensity was scanty in India. The reason was insufficient
infrastructure and scarcity of resources. The teledensity was 0.37, 0.80 and 2.89 in
the year 1980, 1990 and 2000, respectively; however, density was negligible in
rural areas. This indicates that the teledensity was very low before the economic
liberalisation which increased with economic reforms. The policy of economic
liberalisation broke down the government monopoly and several private operators
invested in the telecommunication sector particularly in the mobile communication.
The entry of private investment and FDI spurred the expansion of telecom infra-
structure which yielded a rapid penetration of telephony in India. According to
TRAI (2009–2010), the total number of wireless subscriber base (GSM, CDMA and
WLL (F)) was at 584.32 million, and the number of wireline subscribers was 36.96
million on 31 March 2010. Further, on an average, more than 15 million telephone
subscribers were added every month during the financial year 2010. Moreover,
there were 4.59 million public call offices (PCOs), BSNL 1.67 million, MTNL
0.195 million, private operators 2.73 million and 0.58 million village public
telephones (VPTs) in 2009–2010. The overall teledensity was 53.46 where rural
and urban teledensity was 24.56 and 122.00, respectively, in the financial year
2010. The comparative growth of teledensity is given in Fig. 4.
Also, there were 16.18 million Internet subscribers in the financial year 2010 as
compared to 13.54 million 2009. Besides, there were 117.87 million wireless data
subscribers who are accessing the Internet through wireless (GSM and CDMA)
32 S. Rego et al.

networks. The number of broadband connections was 8.77 million in the year 2010
as compared to 6.22 million in 2009. The growth and diffusion attributed to policy
reforms in the telecommunication sector which raised teledensity. The suitable
policy reforms in the telecommunication sector provided competitive environment
to private telecom operators and inflow of FDI in the country. The competition in
telecom market encouraged tariff war which reduced call charges drastically. The
decline of tariff charges significantly influenced penetration rate of mobile commu-
nication that gave rise to rural subscribers. The disparities in the distribution of
telecommunication access also existed within the country despite fast growth of
telecommunication connections. Hence, the rural teledensity in some backward
states like Chhattisgarh (2.77%); Jharkhand (2.35%); Arunachal Pradesh, Manipur
and Nagaland (7.78%); and Uttarakhand (9.46%) is very low.
5 Challenges for Capacity Building in Rural Areas
The digital divide is not simply an issue of access of telecommunication services
but also of obstacles in the application and affordability of the services. Though
India has achieved a great success in the telecommunication sector, a large number
of the population are still deprived of the use of technologies. The statistics are not
favourable to rural India where teledensity is nearly 25%. This needs attention as
nearly 70% of the population reside in villages. Further, growing population, lack
of sufficient funds, affordability and delays in implementation of government
policies have led to unequal development which widens digital divide. The issues
have been studied in comparison to the existence of relevant differences between
geographical areas focusing on the different speeds of diffusion of telecommunica-
tion technologies (Kenny 2001). Telecommunication is supposed to play an
0
20
40
60
80
100
120
140
1996
1997
1998
1999
2000
2001
2002
2003
2004
2005
2006
2007
2008
2009
2010
Tele
dens
ity
Year
Rural
Urban
India
Fig. 4 Comparative growth of teledensity* in India (Source: TRAI and DoT; *teledensity means
telephones per hundred persons)
Bridging Digital Divide and Capacity Building in Rural India 33

important role in facilitating connectivity across the country; the policies, therefore,
must examine all factors that account for the poor accessibility and quality of
services. In order to ensure connectivity in rural community, remedial measures
should be taken, and priority should be given to those areas which frequently suffer
from seasonal loss of road connectivity. This will enable the affected people to
access the information of their interest rather than be isolated.
For providing telecommunication access in rural areas, infrastructure must be
built up for both fixed and wireless technologies. In order to properly use ICTs by
the rural population, the issues relating to nature of demand, potential investment
and revenue and organisational mechanisms should be addressed to ensure reliable
service (Bhatnagar 2000). A sizeable population migrates to urban areas for better
opportunity of earnings, so for the remaining family members, connectivity tele-
communication may be a feasible way. It was argued that the revenue potential
from rural areas is small (ICICI 1998), so incentives should be given to private
operations and made mandatory for service providers to extend their network to
rural areas. However, many small initiatives are already in place that need to be
more robustly utilised like the Bangladesh’s model of Grameen Telephone (BGT)
(Grameenphone). Further, there is a need to look for value addition in telecommu-
nication services like creating Internet kiosks from where multiple operational
services can be offered. The services include access to public and market informa-
tion, delivery of news and education, etc. Further, ensuring just physical avail-
ability of phones does not mean that they are working and are being used, as large
number of VPTs in villagers reported either out of order or disconnected due to non-
payment of bills (Das 1998). Therefore, there is a need to encourage Grameen
Telecom initiatives in collaboration with PCOs as microenterprises which can signif-
icantly increase access to rural telecommunication systems (Bhatnagar 2000).
Growing rural areas have already seen a shift from agriculture-based livelihood to
different occupations, so it is important that technology reaches to the large
population to exploit the benefits of technology.
Telephone is a useful technology for information flows; therefore, it can play an
important role to get various information regarding agriculture-related issues like rate
of various crops and more importantly to get information about weather, variety of
crops, appropriate season of seed sowing, use of pesticide, etc. For providing such
information, the Ministry of Agriculture established Kisan Call Centre (KCC) in
January 2004. Farmers can use the facility for management of agriculture-related
information through KCC which can be helpful to overcome information asymmetry
between farmer and farmer, village and village and region and region. Thus, with the
increase in choices of farm inputs, pesticides, herbicides and high-yielding varieties
of seeds, a farmer requires guidance from an agriculture expert. The KCC enables
farmers to have direct discussions with the subject experts who are able to analyse the
problem effectively and provide the solution directly (Anand). The KCC model has
helped expedite farmer query faster. Therefore, there is a need to expand the scope
of the KCC to the interior rural areas and farmers. However, to increase teledensity
only is not a solution for rural welfare. Thus, the capacity building through commu-
nication technologies could be achieved by linking technology with livelihood and
improving the quality of life of the rural people.
34 S. Rego et al.

6 Discussion and Conclusions
Telecommunication sector has made a significant impact on the entire economic
spectrum in India and captured a significant growth over the last decade. Telecom-
munication is a part of information technology, and there is a belief in the economic
circles that a 1% increase in telephone density leads to a 3% increase in the GDP.
Recently, telecommunication technologies have converged due to the mobile
communication and increased inter-sectoral and multiple applications of the tele-
phony. According to the Moore’s law, in every 18 months, the number-crunching
capacity of the computers doubles, and the price comes by half. The analogy may
be applicable to the telecommunication as the telecom industry has also experi-
enced fast growth. The pervasiveness of telecommunication helped in the increas-
ing use of computers, but the penetration of telephony in rural India is not as fast
as in the urban areas. This is attributed to the insufficient infrastructure and
affordability of the technology as nearly 25% of population is still below the
poverty line, and statistics is more alarming in rural areas. However, the empirical
statistics indicates that growth rate of teledensity was substantial during the last
decade. The overall teledensity crossed 53 and rural teledensity was 24.56 and
urban teledensity was 122 respectively in the financial year 2010. The growth
figures are reasonable; however, slow diffusion of telecommunication services
persists in the rural area. Despite existing constraints, there is considerable scope
for growth of teledensity attributed to the large niche of unexplored market. This is
relevant as there are 640,867 villages (census of India 2011) in India where 68.84
per cent of the population resides. The challenge is to attract potential users such as
microclusters of artisan and rural need-based allied services to adopt telephony.
Further, availability of electricity in rural areas is also one of the most challenging
bottlenecks to bridge digital divide between rural and urban India (Rao 2005).
The operational level of the rural telecommunication is perhaps the most chal-
lenging issue to increase penetration of teledensity in rural areas. The government
must permit and give preference to Internet connectivity which will be much cheaper
than the normal telephony. To address the issue of unreliable power supply which is
a major concern for private operators in rural areas, the resources should be
channelised towards renewable energy sources. Data indicates that more than two
lakh villages still do not have telephones out of six lakh villages, and previous ‘go it
alone’ policies for public and private sector have not helped due to diverse interest;
therefore, public-private partnership should be encouraged. One cannot deny that
private sector companies too understand their social corporate responsibility as
company like Reliance has come up with massive programmes for providing band-
width in states like Gujarat, Andhra Pradesh and Tamil Nadu. However, with
the combination of the efforts of both the private and the government sector, the
teledensity in rural India will increase certainly in the coming years with the objective
of inclusive growth of rural India. Moreover, the pace for the implementation of rural
telecommunication policy must accelerate to minimise digital divide. Therefore, it is
important to implement telecom policies comprehensively at a quicker pace to
Bridging Digital Divide and Capacity Building in Rural India 35

encourage telecom services in rural India. The analysis draws attention that
the current policy scenario there is a move and a sure indication that the gap in
the digital divide is now narrowing. The study is more relevant if it can assert that
the narrowing of the digital divide does contribute to the growth negating the
requirement for urban areas to grow at the cost of depleting rural areas making
the economy to lean towards a more industrialised segment and negating its
agricultural and natural resource development. Analysis further indicates a posi-
tive correlation between states’ GDP growth and teledensity growth. The greatest
challenge of diffusion of teledensity in rural areas, however, remains unsolvable
unless the ICT is not linked with the livelihood of the common people.
References
Anand R Kisan call center: bridging the information gap, January 2011. http://www.thebetterindia.
com/2304/kisan-call-center-bridging-information-gap/
Bhatnagar S (2000) Enhancing telecom access in rural India: some options. In: India telecom
conference, Asia-Pacific Research Center, Stanford University, November 2000. http://www.
iimahd.ernet.in/~subhash/pdfs/TelecomPaperStanford2000.pdf
Buente W, Robbin A (2008) Trends in internet information behavior, 2000–2004. J Am Soc Inf Sci
Technol 59(11):1743–1760
Communications in India (2011) http://en.wikipedia.org/wiki/Communications_in_India
Core ICT Indicators, November 2005. http://www.itu.int/ITU-D/ict/partnership/material/CoreICT
Indicators.pdf
Das P (1998) Rura; telephony: telecommunications development in rural India, Connectworld
India annual, ICICI, India, pp 42–45
Dharmakumar R India telcos: battle of the titans. Forbes, October 2011. http://www.forbes.com
Grameenphone (2012) http://en.wikipedia.org/wiki/Grameenphone
Hanimann T, Ruedin E (2007) Digitale Gr€aben oder Digitale Br€ucken? Chancen und Risiken f€urSchwellenl€ander
Highlights of Telecom Subscription Data as on 31st August, 2011, TRAI. August 2011. http://
www.trai.gov.in/WriteReadData/trai/upload/PressReleases/841/Press_Release_Aug-11.pdf
Hilbert M (2011) The end justifies the definition: the manifold outlooks on the digital divide and
their practical usefulness for policy-making. Telecommun Policy 35(8):715–736
ICICI (1998) The village public telephone of the poverty of universal service coverage – a study of
telecommunications development in rural India, ICICI Ltd. Mumbai, India
Indian Telecom Industry (2011) http://www.dnb.co.in/IndianTelecomIndustry/OverviewTI.asp
Kannan S (2010) India’s 3G licence bidders bank on big changes. BBC News, 7 April 2010. http://news.bbc.co.uk/2/hi/business/8607866.stm
Kenny C (2001) Prioritising countries for assistance to overcome the digital divide. Commun
Strateg 41(1):17–36
Nandi B (2002) Role of telecommunications in developing countries in the 21st century, 14th
biannual conference. International Telecommunication Society, Seoul
OECD (2001) Understanding the digital divide. OECD, Paris, p 5
Rao SS (2005) Bridging digital divide: efforts in India. Telemat Inf 22(4):361–375
Singh S (2010) Digital divide in India: measurement, determinants and policy for addressing the
challenges in bridging the digital divide. Int J Innov Digital Econ 1(2):1–24
The Indian Telecom Success Story, India Telecom (2009) http://www.kpmg.de/docs/
The_Indian_Telecom_Success_Story.pdf
36 S. Rego et al.

Considerations About How to Eliminate
the Technological Backwardness of Latin
America
Paulo R. Feldmann
1 Introduction
At the beginning of the sixteenth century, some of the inhabitants of Latin America,
mainly the Aztecs, Mayas, and Incas, had scientific and technological knowledge
many times superior to that of Europe or China. In some fields, such as astronomy,
botany, pharmacology, and metallurgy, the Spanish assimilated the knowledge
acquired in the region and spread this throughout Europe.
Today, however, Latin America has stopped being an important provider of
scientific and technological knowledge, despite that it represents approximately 9%
of the world’s population, the region as a whole, corresponds to merely 1.2% of the
total investment in science and technology. According to the World Bank, in the
year 2007, the world invested approximately $1029 billion in this area of which
only $12.5 of this total came from Latin America. This represents approximately
0.56% of the accumulated GDP of the continent which, when compared to the
1980s, has not increased. During that time, the average expenditure, from Latin
American countries, relative to GDP was 0.45% versus 2.0% in European average
and 2.9% in the United States.
Different statistical studies indicate that Latin America, its countries, and local
companies invest very little in science and technology or research and develop-
ment. This is, indeed, an important fact as it could compromise the entire future
economic development of the region. Hobsbawm (1999, p. 505), upon analyzing
the end of the twentieth century, comments that “. . . two areas that visibly generatefew scientists in absolute and relative terms: Latin America and Africa.”
The theme of this study is to analyze some characteristics of the predominant
business environment in Latin America with the intention of verifying which
aspects further the emergence of innovations but more importantly the important
P.R. Feldmann (*)
School of Economics and Business, University of São Paulo-USP, São Paulo, Brazil
e-mail: [email protected]
Department of Management Studies, Indian Institute of Science, Bangalore,
Driving the Economy through Innovation and Entrepreneurship,DOI 10.1007/978-81-322-0746-7_4, # Springer India 2013
37

obstacles that hinder it and what can be done to minimize them. We intend to
highlight the role of a large company in generating technology and to indicate how
its absence is a fact that makes it difficult to produce more technology in Latin
America.
Below, Table 1 – Expenditures of some countries in science and technologyrelative to GDP in 2007 – indicates how much some countries invested in 2007
according to the World Bank. Looking at this table, you can see that even the
country that spends the most in Latin America with Science and Technology, which
is Brazil, it is much less than what the developed countries spend. This is a chronic
problem in the region which has only become accentuated with time. The impor-
tance of Latin America in the area of Science and Technology in the world is
increasingly less.
2 Historical Background and Main Causes of Technological
Backwardness
Freeman and Soete (1997) give a historic retrospective of what happened in the
region, commenting that until the beginning of the 1950s the industrial develop-
ment throughout Latin America was characterized by the reduced degree of tech-
nological sophistication and by the simple importation of technology, mainly from
the United States and Germany, that was incorporated to capital goods. From the
second half of the 1950s, various countries introduced measures of protection to
their respective national markets trying to eliminate or substitute the importations.
It was during this time that countries of the region began to manufacture middle
and high end items having greater technological complexity. The strategy
employed, mostly by Brazil, Argentina, and Mexico, was to seek investments
from foreign companies, mainly in the automobile segment. The respective
governments also invested, but in the segments with a longer maturation period,
Table 1 Expenditures in
science and technology
relative to GDP in 2007Country
Expenditures with Science and
Technology relative to GDP in %
Israel 4.76
Japan 3.44
Germany 2.54
USA 2.72
UK 1.82
China 1.44
India 0.80
Latin America 0.56
Brazil 1.10
Argentina 0.51
México 0.37
Data from OCDE – www.oecd.org
38 P.R. Feldmann

such as raw material and infrastructure, but not in the sectors of media and
high-density technology. What happened is that explicit technological importation
increased without the necessary internal effort to absorb these technologies.
Larrain (in Robert Gwynne 1999), when explaining why Latin America has not
advanced as much as Asia in the last 20 years, has attributed much of this back-
wardness to the closed market and to the protectionism that predominated in the
region during the 1970s and 1980s. According to him, the lockup did not expose
the region to international competition and ended up delaying the building of
the necessary infrastructure for local researchers to develop their projects.
Erber (2002), analyzing the main reasons for the technological delay of Latin
America, points to seven principal aspects:
1. The small number of large global-sized companies and being that these same
companies are not in mid- or high-technology sectors.
2. The weak relationship between the university and the business world.
3. Low number of graduating engineers.
4. The lack of industrial policy oriented toward greater advances in science and
technology.
5. Intellectual property or copyrights are not prioritized, and the legislation per-
taining to these themes is weak.
6. Little encouragement for the appearance of a Schumpeterian entrepreneur.
7. Banks do not finance R&D.
We will now touch upon these seven aspects in greater detail.
3 The Relation Between Production of Technological
Innovations and the Geographic Characteristics of Latin
America
Why is not Latin America a region that produces more technology? And, what is the
reason, except for a few distinguished exceptions that there are no companies that
stand out globally in more advanced areas of technology originating from this
continent? This is an age-old discussion, but a very important one, and which,
deep down, is the attempt to answer the question: “What makes some places in the
world more propitious to innovation than others?”
The abundance of natural resources in Latin America has been pointed out
as an important explanation for having little concern with the innovation that
predominates in the region. Fairbanks and Lindsay (2000) state that the local
businessmen tend to presuppose that the advantages in natural resources, abun-
dant raw material, and cheap labor will proportion positions of leadership in the
export markets and, because of this, do not create the conditions for such
innovation. Asian or African countries are constantly surpassing Latin American
countries, especially when these countries try to be strong in areas related to
Considerations About How to Eliminate the Technological Backwardness. . . 39

natural resources or cheap labor. The reason is that African or Asian countries can
and make their costs with labor even cheaper or enter the international market
selling a natural resource for less. Furthermore, Fairbanks and Lindsay (2000)
point out another important reason for the lack of innovations: It is the deficient
cooperation among the companies. According to them, there is no culture of
cooperation among the companies of the region. Contrary to countries such as
Italy, where they have “clusters,” also referred to as industrial groups, promoting
cooperation and encouraging the companies to unite, for example, and jointly
seek external markets, launch a new brand or even invest jointly in R&D –
research and development – whereas in Latin America, almost invariably, the
businessmen see the competitor as an enemy that should be knocked down.
This contributes to creating a climate of mistrust, suspicion, in every sector that
always destroys any possibility of cooperation. An honorable exception is the
automobile industry and their relations with the suppliers of auto parts in Argentina,
as well as in Brazil or in Mexico. But this is the exception to the rule, probably, due
to the fact that these are sectors where there is a predominance of foreign money.
This lack of business cooperation also explains the small number of clusters inthe region and as Fairbanks and Lindsay state (2000): “. . .we note a profoundabsence of clusters in correlated or support sectors, and a corresponding lack ofinnovation: companies that do not cooperate amongst themselves are not capableof learning from one another.”
Dicken (1998) calls attention to the fact that the old division of labor, when the
developed countries produced manufactured goods and the developing countries
sold their commodities, minerals, or agricultural products, is not valid any longer.
Today, the flow of merchandise throughout the world is extremely complex and has
become possible because of the fragmentation of the commodity chain. However,
what we see is the existence of some commodity chains which extend throughout
numerous countries of Latin America, but they are almost entirely headed by
companies with headquarters in countries of the developed world. As examples
of these chains, we could cite the automobile, pharmaceutical, data processing
and telecommunication equipment, finished consumer electronic goods, and the
chemical sectors. Generally speaking, the companies of these sectors have North
American, European, or Japanese capital and are in Latin America in search of
a profitable market, the size of which is not small and also with the intention of
obtaining cheap labor to employ in their production lines, which most times is
limited to finished goods. Any phase of the vast process of the value chain of global
companies will not be realized in the respective subsidiaries in Latin America if in
that phase there is a need for some technological development. In this hypothesis, it
will certainly be realized in the headquarters of these companies which can be
found exactly in North America, Europe, or Japan.
It should be noted that Porter and Stern (2002) mentioned Latin America and
emphasized as great vulnerabilities in the region, referring to increased innovations,
the lack of a link between the universities and the companies. According to them,
“the system of higher education in Latin America has little to do with the companies
and little involvement with the national policies related to science and technology.”
40 P.R. Feldmann

This is confirmed by other authors who have dedicated themselves to analyze the
question of science and technology of the continent. Sagasti (1981) points out that
one of the chronic problems of Latin America is the enormous distance between
producing science and the generation of technology which, according to him, is
a consequence of the nonexistence of a constructive university-company relationship.
This same aspect is placed by Millan and Concheiro (2000) when they analyze
the reasons for Mexico’s backwardness in the questions of science and technol-
ogy. They go beyond, mentioning that an additional reason for the country’s delay
in this question is the lack of an industrial policy that would define the priority
areas for investment, and it is very clear that contrary to the more developed
countries where the companies invest in research and development; inMexico, this
expenditure is largely done by the government. Thus, while in Japan, Germany,
and the United States the private companies are responsible, respectively, for 67.1,
61.1, and 58.4% of the total expenditures with R&D, in Mexico, this amount
is merely 17.6.
In 1999, the British magazine Nature produced a special edition called “Sciencein Latin America.” In the article dedicated to Mexico, there is an important analysis
about the fact that helps to explain the numbers above and that is repeated
throughout the continent: “Part of the problem is cultural. Mexico inherited theEuropean tradition of the scientist as an academic and not the North Americanmodel of scientist-inventor and businessman. For a university researcher to havea link with industry is considered prostitution by his colleagues. On the side ofindustry, there is not a strong tradition in R&D investment. Until the beginning ofthe 80’s, Mexico had an industrial policy defined by the state and protectionismwhich resulted in little incentive to invest in innovation. Now the companies want tomodernize their technology, but they turn more to foreign companies for help, andare not willing to wait the time necessary for national science and technology tofind the answers to their needs.”
4 The Problem of the Absence of Large Companies with Capital
Originating in the Latin American Region
More than 30 years ago, Galbraith (1978, p. 47) pointed to the fact that large
companies are always increasing their supremacy and strength over the economy
because only they will have the conditions to sustain the expenses needed for
innovation. “The small company does not have the conditions to sustain the costthat innovation demands” Galbraith said in “The New Industrial State” (1978). In
all of his books, Galbraith (1978, p. 21–22) stressed the advantages of a large
organization: “The large organization can tolerate the uncertainty of the market,which cannot be done with a smaller firm. It can escape through contracts, whicha smaller firm cannot do (. . .) All, with the exception of the pathologically romantic,now recognize that this is not the time for the small.”
Considerations About How to Eliminate the Technological Backwardness. . . 41

More recently, Stiglitz and Walsh (2003, p. 338–9) explained the reasons why
technological innovation is increasingly a subject restricted to the large corporation.
Stiglitz points out four reasons that make it difficult for small companies to generate
technology. “First, to compensate for the expenses with research and development,and in this way stimulate innovation, the inventions are protected from the compe-tition through patents. Patents are destined specifically to limit the competition.Second, the industries in which technological change is important normally haveelevated fixed costs. This means that the average cost is decreasing to levels ofproduction that are quite high - another characteristic which limits the competition.Third, the industries that are characterized by rapid technological change are alsothose in which the advantages of an increasingly larger experiment, with newproduction techniques, could cause rapidly decreasing costs. Finally, why aren’tbanks, in general, willing to finance research & development, it is difficult to raisefunds for new and small companies. All this makes it difficult to enter the marketand reduce the competition in the sense defined by the basic competitive model.”And this fact, according to Stiglitz, explains the importance of subsidies for small
companies.
Through analyzing the relations that usually appear annually about the biggest
companies in the world, we note that not even the biggest Latin American
companies can be considered expressive and active in the areas where the most
important technological developments occur. This was clear, for example, in the
2011 report of the North American consulting firm BoozCo (old BoozAllen) where
they investigated the information referring to the year 2010, of the 1,000 companies
in the world that most invested in R&D and where they state that there are only five
Latin American companies – Petrobrás, Vale, CPFL, Totvs, e Embraer – by the
way, these are all Brazilian. Undoubtedly, this causes concern: Despite the fact that
the GDP of the region corresponds to 7% of the world GDP, only 0.5%, of those
1,000 companies mentioned in the report are from Latin America.
The same gravity could be noted when one examines the Forbes Year 2010 list –
www.forbes.com – which present the 2000 largest companies in the world. There,
we note that only 76 companies are from Latin American, in other words, 3.8% of
the report. The biggest reason or concern is not so much the number, which is very
small, but the fact that only Embraer can be considered as high technology. In other
words, almost all of the Latin American companies that are among the 2000 biggest
are from sectors such as retail, mining, food, and commodities where the techno-
logical component is very low.
Brito Cruz (2004, p. 13–15) calls attention to the role of the company, in general,
in the production of technology, highlighting that if the place for science and
education is the university, the place for development and technology is, par
excellence, the company. He cites the case in the Unites States where in 2001
there were one million people working in R&D – research and development, being
that 80% of these same worked for companies and only 20% for universities or
government research centers. Brito Cruz states that unfortunately this fact is not
the reality in Brazil. In Brazil, in 2001, there were 125 thousand people working
42 P.R. Feldmann

in R&D, of which only 23% worked in companies. South Korea has a population
four times less than Brazil but has a greater number of researchers: 160 thousand
people and approximately 59% of them work for private companies.
With these data in hand, Brito Cruz (2004, p. 6–9) referring to Brazil said that
“contrary to what is imagined, technological innovation is created much more in thecompany than in the university. In Brazil there has lately been a tendency to attributeto the university the responsibility for the innovation that would make the companymore competitive. This is a serious mistake and which, if taken seriously, could causegreat damage to the Brazilian university system, taking it away from its specificmission, that of educating professionals and generating fundamental knowledge”.
5 Institutional and Policy Dimension
For Malecki (1997), the general panorama of technology in Latin America shows
that institutions are weak and political considerations predominate, which end up
costing more due to the lack of long-term strategies for science and technology and
the lack of involvement of the private sector.
Peter Dicken (1998) emphasizes that an important characteristic in the develop-
ment of third world countries, Asian or Latin American, is the strong presence of
the state. Nonetheless, this author points to the fact that in Latin America the
governments were not as successful as the Asians. According to him, the main
reason for this lack of success was the absence of concern with increased internal
empowerment aiming to increase exportations. While in Asia, the greatest concern
was increasing exportations of industrialized products, in Latin America, the
emphasis was in substituting importations.
Related to this aspect in 1999, the British magazine Nature published a special
supplement called “Science in Latin America” with an interesting article by its
editor Collin Macilwain (1999) in which he analyzed the conditions of science and
technology on the Latin American continent at the end of the twentieth century, but
which continues to be totally valid. In the beginning of this twenty-first century, the
intellectuals and Latin American scientists lament the extinction on the noncom-
petitive industrial base that existed behind the commercial barriers of the old Latin
American economy (pre-neoliberalism). In that economy the role of science and
technology was clear: Science would help technology build a domestic
industrial base that would take the region to the developed world. However, says
Macilwain, a large part of this industry, due to noncompetitiveness, collapsed when
this became evident during its peak, in the 1990s, and the neoliberal doctrine
brought international competition. As such, factories and companies were sold to
multinational corporations who are modernizing them, with technology imported
from abroad. Macilwain concludes science and technology in Latin America need
to redefine their role in this new configuration.
Considerations About How to Eliminate the Technological Backwardness. . . 43

Since the mid-1960s, in all of the countries throughout Latin America, we
assisted the creation of numerous centers and institutions of research and develop-
ment, but all were of a public nature. Nonetheless, few deserved special attention
and money from their respective governments. In spite of this, some of these were
decisive in creating quality research in the economic sectors of their areas, and
today, they play a fundamental role. We can mention at least two Brazilian
examples, ATC – Aeronautic Technological Center (CTA, Centro Tecnológico da
Aeronáutica), which is considered to be the main reason behind the success of
Embraer and EMBRAPA (Brazilian company of cattle and grains) which is consid-
ered responsible for the greater part of the research which resulted in the enormous
increase of the Brazilian agricultural productivity during recent times. Malecki
(1997) considers that what has occurred in these two areas in Brazil should be a
model of what should have been followed by the other Latin American countries.
Chris Freeman and Luc Soete (1997), upon comparing the economic development
of some nations in Asia, specifically South Korea and Taiwan, with the progress in
Latin America during the decade of the 1980s, called attention to the importance of
the differences that exist in some few aspects. Some of them are institutional like:
1. Deteriorated educational system with few graduating engineers
2. Much transference of technology, especially the United States, with low absorption
capacity due to little investment of local companies in research and development
3. Weak infrastructure of science and technology
Conceding subsidies or fiscal incentives for projects of research and develop-
ment receives low priority on the agendas of most of the governments of Latin
American countries. The country most advanced in this theme is Brazil that only
recently approved legislation – the “Lei do Bem” or “well-being law” – which
supports innovation, but which only timidly fumbles the question of incentives.
We cannot conclude this analysis of the why there is little involvement with
innovation and technology, especially when we talked about institutional aspects,
without speaking of the vulnerability of the patent system existing in many of the
Latin American countries: Many local companies see their investments in research
paralyzed by the absence of mechanisms that guarantee the propriety of the
research results. As all research activity consists of risk for the companies,
it would be vital for the existence of such a mechanism. Nonetheless, to obtain
a patent in Latin America is something very difficult and slow.
6 Final Considerations
As we have seen, Latin America is very wealthy in natural resources, and, gener-
ally, the labor is cheap, and these are the main ingredients that stimulate large
companies of the region, with very rare exception. Why a region so blessed with
natural resources and gifts of nature has failed in developing and industrializing in
the same way that other regions have had success? We have sought to explain, and,
44 P.R. Feldmann

as we have seen, there are many different aspects and explanations. We have
emphasized in this chapter one of these aspects related to the fact that the region
is not successful at generating an expressive number of global companies. Latin
America has a few powerful companies but almost always performing in sectors
that were important in the nineteenth century and became irrelevant in this twenty-
first century. Being a global player in sectors such as drinks, cement, mining,
agriculture fish, or steel is not bad, but it is not sufficient. As we have seen, more
developed countries have companies in sectors that dominate the world economy,
such as communications, software, hardware, medical equipment, or pharma-
ceuticals. In other words, we can say that the big Latin American companies,
generally, are out of the high technology sectors with very rare exception, such as
the Brazilian Embraer, manufacturer of planes, or the Mexican Mabe, in electron-
ics. So it is easy to notice that when companies from Latin America achieve size
and projection, they are in low technology industries, most of the time producing
“commodities.” Petrobras and Cemex are excellent examples.
It is clear that no country can survive, with dignity, exporting only their
agricultural and mineral “commodities” to pay, for example, for the importation
of pharmaceuticals or computers, as is today the rule in almost all of the countries of
Latin America. Increasingly, the wealth of natural resources of the region is being
consumed as currency, instead of, at least, being administered as a basis for
sustainable development. Basing development in raw materials is never the solu-
tion. All we need to do is look at the countries of OPEC, who supposed that they
could achieve higher stages of development at the cost of petroleum when the exact
opposite is what happened.
Furthermore, the recent globalization of Latin American countries together with
the growth of the population is radically affecting the environment of the continent.
The growth of exportations has been mainly in the sectors of agriculture, fish, and
mining. This means more deforestation for the exportation of wood and making
more lands available for agriculture and livestock.
But it is important to make this very clear that the solution of the aspects
mentioned in this chapter cannot be exclusively up to the Latin American
companies: Some measures of governmental support are necessary. For example,
the small investment in education, and the little infrastructure destined to research
are very important to explain the little presence of Latin America in all that is
relevant today in science and technology. Generally, the fragility of the infrastruc-
ture is a serious problem for all the countries of the region. It is fundamental that the
same be perfected to facilitate a more competitive flow of material, machines, and
goods. The way things are, this kind of inefficiency greatly increases the operational
costs and makes it very difficult for the companies to become globally competitive.
In fact, this is not the only point where the various governments from the countries
of the region fall short. The Latin American companies need to operate in a legal
system, but sometimes, they are politicized, and, frequently, they are corrupt and
with markets of weak capital and very low levels of savings. Credit is very difficult,
and mechanisms for long-term financing are rare. Interest rates are very high, and in
some countries like Brazil, the tax load has already surpassed one-third of GDP.
Considerations About How to Eliminate the Technological Backwardness. . . 45

Another important measure that should involve government and society is the
stimulation to form big conglomerates as has been done in Korea and Japan and to
support the formation of clusters as is the case in the United States and Italy.
The treatment of this question is extremely difficult for the various governments
of the region and because of this fact the society and the legislators will have to be
involved. There are no other alternatives: Without big groups, strong and healthy,
and without professional administration, there is no way to compete in the difficult
scenario of globalization. Without horizontal and vertical groupings of related
companies, in other words, “clusters,” you cannot achieve even economies of
scale, nor technological development. A typical example is what happens with
exportations. The companies will only increase, sustainably, their exportations
when they are more productive and more competitive, and this depends very
much on them. It has taken Brazil a long time to perceive this mistake, but it
seems that now it is clear for its businessmen and government. Nonetheless, it still
is a chronic mistake throughout the region, with different shades, to think that
increasing exportations is merely a question of macroeconomic policy and that it is
enough to change the exchange rate or the interest rate or play with inflation goals.
Not that the governments have been wrong, a good part of the governments have
acted correctly, from a macroeconomic point of view, but the positive results were
short lived, as the problem, truthfully, is due to the companies, in the way that they
define their strategies and in their management. Solving the macroeconomic
problems could be a necessary condition, but it is not enough to increase com-
petitiveness. It is fundamental that attention is also given to the problems of the
company, examining them up close, actuating as soon as they appear, and assisting
in what makes it difficult to increase international competitiveness. As incredible as
it may seem, in spite of being specific and individual problems, the governments
have very much to do, especially because they are responsible for increasing
the competitiveness of the countries as a whole.
References
Brito Cruz CH (2004) A Universidade, a Empresa e a Pesquisa. Instituto de Fı́sica Gleb Wataghin,
Universidade Estadual de Campinas. Disponı́vel em http://www.ifi.unicamp.br/~brito/artigos/
univ-empr-pesq-rev102003b. Accessed 31 Aug 2006
Dicken P (1998) Global shift. The Guilford Press, New York
Erber F (2002) Perspectivas da América Latina em Ciência e Tecnologia. UFRJ, mimeo
Fairbanks M, Lindsay S (2000) Arando o Mar: Fortalecendo as fontes ocultas de crescimento em
paı́ses em desenvolvimento. Qualitymark, Rio de Janeiro
Freeman C, Soete L (1997) Economics of industrial innovation. MIT Press, Cambridge
Galbraith JK (1978) O Novo Estado Industrial. Pioneira, São Paulo
Hobsbawn E (1999) Era dos extremos: o breve século XX. Companhia das Letras, São Paulo
Larrain J (1999) Cultural change in Latin America. In: Gwynne R, Kay C (eds) Latin America
transformed. Arnold, London, pp 182–202
Macilwain C (1999) Sci Lat Am Suppl Nat 398: pp 1–32
Malecki E (1997) Technology & economic development. Longman, London
46 P.R. Feldmann

Millan B, Concheiro A (2000) Mexico 2030: Nuevo Siglo, nuevo paı́s. Fondo de Cultura, México
Organization for Economic Co-operation and Development (OCDE) OECD statistical database.
Disponı́vel em http://www.oecd.org. Acesso em julho 2006
Porter M, Stern S (2002) Inovação e Localização de mãos dadas. HSM Manage 30(1):118–125
Sagasti F (1981) Ciencia, Tecnologia y Desarollo Latinoamericano. Fondo Cultura, México
Stiglitz J, Walsh C (2003) Introdução à Microeconomia. Campus, Rio de Janeiro
Magazines and Internet Sites
Booz & Co The one thousand companies that invest the most in R&D. www.booz.com
Forbes “2000 Global”. www.forbes.com
Organization for Economic Co-operation and Development OECD statistical database. Available
em http://www.oecd.org
World BankWorld Bank statistical data base. Available in http://devdata.worldbank.org/wdi2006/
contents/Table4_1.htm
Considerations About How to Eliminate the Technological Backwardness. . . 47

Part 1.2
Technology Management

Technology Management to Accelerate
Competitiveness Journey: Exploratory Case
of a Renewable Energy Focal Firm from India
Kirankumar S. Momaya and S. Chachondia
1 Introduction
Discontinuities such as worldwide recession can provide exciting opportunities for
emerging countries and their firms capable of accelerating their competitiveness
journey. Among many emerging countries, Brazil, Russia, India, China, and South
Africa (BRICS) were expected to provide growth impetus to world economy in
recession due to their size and associated markets; China has already emerged to be
the second largest economy due to accelerated competitiveness. Relatively younger
but huge population is a key driving factor to help India make some remarkable
jump in competitiveness ranks (from 47 in 2005 to 28 in 2009, Yadav and Momaya
2011). Competitiveness journey to next stages and the discontinuities demand new
perspectives and rapid scale-up in business, technological, management, and other
capabilities for sustainability.
With growing aspirations, the countries will need massive scale-up in emerging
industry of renewable energy. Large countries by population such as India face
unparallel challenges in their journey to development. Economic developmentmodels
that proliferate with globalization are very energy intensive, and the large countries
can becomemajor sources of emissions of carbon and other gases, but the countries do
not have maturity of technology to manage them. For instance, despite significant
reduction, energy intensity per unit of GDP remains quite high for India (Table 1),
indicating wastages and low efficiencies. At the same time, the countries are
K.S. Momaya (*)
SJM School of Management (SOM) and National Centre for Photovoltaic Research and Education
(NCPRE), IIT Bombay, Powai, Mumbai 400076, India
e-mail: [email protected]
S. Chachondia
New Silk Route (NSR), Mumbai, India
SJM School of Management (SOM), IIT Bombay, Powai, Mumbai 400076, India
e-mail: [email protected]
Department of Management Studies, Indian Institute of Science, Bangalore,
Driving the Economy through Innovation and Entrepreneurship,DOI 10.1007/978-81-322-0746-7_5, # Springer India 2013
51

increasingly expected to reduce their carbon load and adopt renewable energies (RE),
even with several misfits and resulting imbalances, e.g., in terms of technologies, cost,
capabilities, and trade. For instance, a review of thermal power plants, the dominant
mode of capacity addition, points to serious issues of resources (coal, water), pollu-
tion, and social and environmental damage (e.g., Dharmadhikari and Dixit 2011).
After strong interest in 1970s, photovoltaics (PV) are driving rebirth of solar
industry in India. While R&D (e.g., at Indian Institutes of Technology/IITs or IISc)
did result in pilots and applications, wider diffusion through cost reduction (e.g., by
economies of scale) is the game best played by firms. Rapid diffusion of wireless
communication in India is a demonstrated case, and wireless energy may do the
same (Kumar et al. 2010). Industries and focal firms that have or build capabilities
to address the issues related to energy smartly have a huge opportunity to contribute
to world. Focal firms are those close to center of an industry’s ecosystem due to
unique differentiated positions they strive for (at least in a country) and can often be
large firms due to diverse capabilities needed including one related to risk of
technology development.
Attractive forecasts and government intervention were driving investments in
photovoltaics as firms of Indian origin (FIOs) try to scale-up. As latecomers, many
seem to be caught in the vicious loop of “technological capability gap.” The $60
billion PV market is expected to increase to $300 billion by 2020. Being less
harmful than thermal, several focal firms of Indian origin (FFIOs) are keen to
contribute to this growth of PV. Innovations and technology management can
play a key role if the firms want to really grow for a long time.
Taking the case of renewable energy industry and a capable focal firm, we try to
make sense of the phenomenon of “technological gap vicious loop,” key dilemma,
including one related to competitiveness, technology management, innovation, and
critical success factors (CSF).
2 Brief Literature Review
Literature review has been given briefly for this application-focused chapter. Only
two key concepts whose application is being explored are discussed briefly here.
Table 1 Trends in energy intensity for select large countries
Country Kt oil equivalent/Bn $ GDP (year 2000) Kt oil equivalent/Bn $ GDP (year 2007)
Brazil 293 177
China 911 578
France 191 102
India 994 505
Japan 111 117
Russia 2,349 519
UK 152 75
USA 234 170
Source: Composed based on data from PC (2011)
52 K.S. Momaya and S. Chachondia

2.1 Competitiveness Stages and Journey
Competitiveness is a context-specific concept with high relevance across levels:
from country to firm and beyond. We will focus on firm level in this chapter. Firms
can ascend the stages (e.g., from locally competitive to globally; Momaya 2001) and
can accelerate the journey up stages by effectively leveraging drivers such as
strategy, organizational, and technologymanagement capabilities. In simple generic
terms, competitiveness of a firm can be defined as its ability to conceive/design/
engineer/manufacture/distribute/service battery of product(s)/service(s) better than
competitors on a sustained basis. Such generic competitiveness can be evaluated on
performance factors such as productivity, financial, international, and technological
as well as several “competitiveness assets/process” factors (Momaya 2011). Specific
definitions need to be evolved by the firm considering factors such as stage in
“competitiveness journey,” mission, vision, and values.
2.2 Critical Success Factors (CSF)
An industry’s CSFs are those competitive factors that most affect industry member’s
ability to prosper in the marketplace. Sometimes referred to as key success factors
(KSF; e.g., for breakthrough, Shiba and First Learning Community 2006) that can be
the particular strategy elements, product attributes, resources, competencies, com-
petitive capabilities, and market achievements that spell the difference between
being a strong competitor and a weak competitor—and sometimes between profit
and loss (Thompson et al. 2010). They identify common types of industry CSF
across areas from manufacturing, marketing, and distribution to skills and
capability-related. For instance, they listed following technology-related CSFs:
• Expertise in a particular technology in scientific research (important in
pharmaceuticals, mobile communications, and most high-tech industries)
• Proven ability to improve production processes (important in industries where
advancing technology opens the way for higher manufacturing efficiency and
lower production costs)
From generic skills and capability-related perspective, technology, manufacturing,
and other CSFs can have overlaps.
3 Methods
For this practitioner-focused chapter, we explored multiple methods to address
key questions. The most important element is exploratory case study. In light
of the context, approach of exploratory case study (Yin 2003) is adapted
Technology Management to Accelerate Competitiveness Journey: Exploratory. . . 53

with focal firms as a unit of analysis. We also use secondary data to make sense of
situation, actors, and processes as part of SAP-LAP model (Sushil 2009). Several
constructs were adapted from the ones developed and tested for similar context
of accelerated growth (e.g., Umamaheswari 2010) and simplified. The case
focuses on situation (large emerging country context, vicious loop, latecomer
eMNE), actors (top management team, partners, complementors) and processes
(e.g., entrepreneurial orientation [EO], opportunity identification [OI], strategic
leadership [SL], technology management [TM] including technology assessment,
transfer, adoption, adaptation, upgradation), and trends in performance (growth,
financial, profitability). Elements of SAP-LAP are implicitly embedded in the
case due to limitations of space.
Selection of case company was done after examining several alternatives.
Key criteria considered were:
• Active player in some arena of renewable energy (or intent and capabilities
to enter)
• Track record of high growth amidst challenges achieving revenues more than
2,000 crore in 2010
• Leading market position in India and preferably internationally
• Manufacturing capabilities
Among several companies that met criteria, Moser Baer India Ltd. (MBIL),
Tata-BP, Suzlon, Solar-semiconductor, and Indosolar came closer. Ultimately,
Moser Baer was selected for the following reasons:
• Has reached heights such as within top three ranks in the world in manufacturing
of storage media
• Has manufacturing capabilities involving sophisticated technologies
The case draws heavily on official facts given by the company.
4 Case of Moser Baer
4.1 Situation-Actors-Processes (SAP)
Since founding, Moser Baer has played game of technology-related businesses with
short life cycles. Moser Baer India was founded in New Delhi in 1983 as a time
recorder unit in technical collaboration with Maruzen Corporation, Japan, and
Moser Baer Sumiswald, Switzerland (Moser Baer 2011a). In 1988, Moser Baer
India moved into the data storage industry by commencing manufacturing of 5.25-
in. floppy diskettes. By 1993, it graduated to manufacturing 3.5-in. micro floppy
diskettes (MFD).
Entry into CD business helped it climb higher stages of international competi-
tiveness. In 1999, Moser Baer India set up a 150-million unit capacity plant to
manufacture recordable compact disks (CD-Rs) and recordable digital versatile
54 K.S. Momaya and S. Chachondia
disks (DVD-Rs). The strategy for the optical media project was identical to what
had successfully been implemented in the diskette business—creating a facility that
matched global standards in terms of size, technology, quality, product flexibility,
and process integration. The company became the only large Indian manufacturer
of magnetic and optical media data storage products, exporting approximately 85 %
of its production.
Cooperation with OEMs was a key element of internationalization strategy.
Since inception, Moser Baer has always endeavored to create its space in the
international market. Aiding the company in its efforts has been a carefully planned
and sustainable business model—low costs, high margins, high profits, reinvest-
ment, and capacity growth. Along the way, deep relationships have been forged
with leading OEMs, with the result that today there are hardly any global technol-
ogy brands in the optical media segment that Moser Baer is not associated with.
Company has aggressive plans to repeat the past successes in international arena
in photovoltaic. Its cooperation with institutes such as IITs and IT BHU helped it
rapidly enter new arena by enhancing technology transfer and absorption. It got
approval from Ministry of Science and Technology of India for its in-house R&D
center, a driver of its efforts in technology and patents. By 2010, the firm has global
presence with products sold in more than 82 countries (Moser Baer 2011a).
Key milestones in Moser Baer’s photovoltaic-related journey are given in Table 2.
Let us have a look at key elements of its PV plan.
Key elements of strategy of Moser Baer build on its generic strategy of
other businesses. Here is just a glimpse of key elements (adapted from annual
reports e.g., Moser Baer 2011a):
• Present across the entire value chain and investments in multiple PV
technologies
• A combination of adapted technology and low-cost manufacturing expertise,
with fully automated production facilities ensures top quality products
• Production capacity of 50 MW crystalline cells, 50MW crystalline modules, and
90 MW thin films in 2011 with expansion plans in place
• Also had an initial capacity of a few megawatts in concentration PV
• Products meet international standards including UL, IEC, ETL, and CE
• Claims strong commitment to R&D and innovation
Firm leveraged core competencies in high-volume manufacturing of optical
media products to create a world-class photovoltaic manufacturing facility. CD,
DVD, Blue Ray, and PV cells all involve coating a substance on a flat surface.
Strategy was to straddle multiple technology platforms and to drive scale to be able
to drive down the costs of the technology and make it more affordable to consumers
globally.
The solar photovoltaic business got major boost with India’s national solar
mission. In January 2010, Indian government announced $19 billion plan
envisaging 20,000 MW off-grid interactive and 2,000 MW off-grid applications
in three stages by 2022. With increasing capacities in manufacturing, strong EPC
capabilities, Moser Baer has potential to emerge as a key international player from
India if it can come out from the vicious loop.
Technology Management to Accelerate Competitiveness Journey: Exploratory. . . 55

4.2 Key Learning
While the firm has demonstrated capabilities on mass manufacturing and marketing
front, technological capabilities seem to have lagged behind relatively. The firm
has been quite fast at seizing opportunities, installing capacities and certifications,
and exploring local and international markets. The firm will leverage relationships,
distribution, cost leadership, and “can do” attitude to become a global market
Table 2 Key technology management-related milestones in Moser Baer’s photovoltaic journey
2005
Announced Moser Baer Photovoltaic Ltd. (MBPV) as its wholly owned subsidiary
Signed MoU with IIT, Delhi
2006
Signed technology MoU with IT BHU
In-house R&D center approved by Ministry of Science and Technology
2007
Acquired OM&T BV—a Philips’ optical technology and R&D subsidiary
Announced start of trial run of solar photovoltaic cell production facility
Set up the world’s largest thin film solar fab
Launched US$150 million FCCBs
Moser Baer Photo Voltaic announced commercial shipment of solar photovoltaic cells
Moser Baer Photo Voltaic announced US$880 million strategic sourcing tie-up with REC Group
2008
Moser Baer plans 600 MW thin film PV capacity with an estimated investment of over $1.5 billion
Moser Baer Photo Voltaic announces strategic sourcing tie-up with LDK Solar
Moser Baer announces successful trials of first Gen 8.5 thin film plant
Moser Baer secures customer sales orders of $500 million for solar modules
Global investors inject Rs. 411 crore into Moser Baer’s solar photovoltaic business
Moser Baer announces successful trials of first Gen 8.5 thin film plant
Moser Baer Photo Voltaic announces strategic sourcing tie-up with LDK Solar
Moser Baer plans 600 MW thin film PV capacity with an estimated investment of over $1.5 billion
2009
Moser Baer’s thin film solar modules are now IEC certified
Moser Baer to set up one of India’s largest rooftop solar PV installations in Surat
Moser Baer’s thin film line ready for production of ultra-large solar modules
2010
Achieves 7.3% efficiency for single junction thin film modules
Thin film product becomes internationally certified
Emerges as the first solar PV company from India to achieve 100 MW of installations globally
“under its own brand”
2011
Starts commercial production of junction boxes
Commissions India’s largest 5 MW solar farm in Sivaganga, Tamil Nadu, and 5 MW plant in UK
Doubles warranties on products through in-house R&D
2012
Moser Baer Photo Voltaic was admitted to corporate debt restructuring (CDR) in January
Source: Adapted from Moser Baer (2011a, b), web site, annual reports, and media reports
56 K.S. Momaya and S. Chachondia

leader in every business (Moser Baer 2011a; mission). The firm has been trying
to accelerate development of products, services, and even technologies. For
technologies, it has started R&D center. It is trying to accelerate technological
capabilities through collaborations with institutes such as IITs (see Table 2) as well
as acquisitions. Still, patterns in R&D spend or patents are fuzzy (glimpse is given
in Table 3) to say it has started climbing on stages of technological maturity.
The case gives some clues to approach taken by latecomers to catch up and the
role of technology management in that. Ability to reach among top three ranks in
storage media is attributed to capabilities the firm developed in quality mass
manufacturing. If the focus is on manufacturing part only, the CSF can be often
found in:
• Technology assessment, identification, and selection
• Excellence in technology transfer and adoption, adaptation
Strong urge of the promoters to do a business away from technology hints at
challenges to technology-related industries from India. Despite being a very suc-
cessful company to have played hardware business in fast-growing ICT industry
and reached remarkable global heights, the firm is fast diversifying into segments of
energy sector where technology is not a key driver. Hence, such firms will be more
interested in that part of technology management that is urgently needed for cost
competitiveness, such as technology transfer and absorption (TTA). They would
not like to play either fast games of rapid invention to commercialization or
marathon games of differentiation through deeper technovation capabilities.
Mismatches in risk and time profiles of enterprises in India and emerging
technologies can be considered a key reason for many Indian firms shying away
from playing games based on technology management.
5 Emerging Findings and Discussion
Let us first begin with macro level before going in details. Several countries have
active interest in renewable energy and focal firms from those countries having
contributed massively to help the country take the lead. Let us start from some
quick learning from reality of wind energy, a dominant renewable energy where a
focal firm from India did make a mark. Germany has often taken the lead and
sustained for quite some time (Table 4). Overall, EU has undisputed lead in the
industry and has sustained competitiveness, partly due to innovation and techno-
logical capabilities. China often enters late as a follower but has capabilities to
Table 3 Trends in recent patent applications by Moser Baer
Year of publication date ! 2004 2005 2006 2007 2008 2009 2010
Moser Baer India 1 3 2 – – 2 7
Moser Baer Photo Voltaic – – – – 8 6 1
Source: Developed based on search at worldwide database of European Patent Office
Technology Management to Accelerate Competitiveness Journey: Exploratory. . . 57

enter top league by shifting the critical success factors toward “performance/price
ratios” and manufacturing excellence. India was far ahead of China in terms of
installed capacity of wind energy at beginning of 2000, but China overtook in 2008
with a massive lead. Limited success of India can be partly attributed to accelerated
competitiveness of the highly entrepreneurial focal firms such as Suzlon, but
the firm seems to have entered the vicious loop once the competition intensified,
e.g., from China (Table 4).
The case of MBIL and learning from firms in related renewable industries
(Suzlon) support the phenomenon we may call “low capability vicious loop.”
The phenomenon has elements such as slow learning, weak capability focus in
strategic intent, gaps in leadership, and weak cooperation in micro and macro
environments. The elements have linkages at firm, industry, country, and higher
levels (e.g., of the loop, please refer to Mittal et al. 2009). From the case and
ongoing research on competitiveness over years, we identified the following
characteristics of the phenomenon in terms of generic capabilities:
• Significant scale-up in sales due to opportunity-based growth and profits, often
driven by growth and entrepreneurial orientation (e.g., Umamaheswari 2010)
• Yet low investment in human resources and capability building, low learning
maturity, less able to scale-up except on sales, e.g., neglect of the technological
capabilities (e.g., forecasting, assessments) and hence often opting to be latecomer
• Less able to balance opportunity based and capability based
• Unable to scale-up or even sustain when industry or segment is commoditized
(e.g., due to economies of scale by players from China); starts focusing on
another segment or industry and less able to break out from the vicious loop
In the context of this chapter, we will focus on technological capability.
The MBIL case and Suzlon example support many of the above characteristics.
Technology management can be a CSF for FFIO, but they seem unable to scale
up TM capabilities and get caught in the vicious loop. There seems to be major gaps
in technology assessment and forecasting, transfer and absorption, R&D, design
Table 4 Trends in installed wind energy capacity of major countries (MW)
2001 2002 2003 2004 2005 2006 2007 2008 2009
China 402 469 567 764 1,260 2,604 5,910 12,020 25,805
EU total 17,315 23,159 28,598 34,371 40,551 48,029 56,531 64,719 74,767
Germany 8,754 11,994 14,609 16,629 18,415 20,622 22,247 23,903 25,777
India 1,456 1,702 2,125 3,000 4,430 6,270 7,845 9,655 10,926
Japan 302 338 580 809 1,049 1,394 1,538 1,880 2,056
Spain 3,337 4,825 6,203 8,263 10,027 11,623 15,145 16,689 19,149
US 4,275 4,685 6,372 6,725 9,149 11,575 16,824 25,068 35,064
World 23,900 31,100 39,931 47,620 59,091 74,050 93,835 1,20,297 1,58,505
India as % of
world
6.09 5.47 5.32 6.30 7.50 8.47 8.36 8.03 6.89
China as % of
world
1.68 1.51 1.42 1.60 2.13 3.52 6.30 9.99 16.28
Source: Global Wind 2009 Report, Global Wind Energy Council
58 K.S. Momaya and S. Chachondia

and development (RDDE), and other capabilities. The loops were found to be
much adverse in the information and communication technology and electronic(ICTE) industry (e.g., telecom, Mittal et al. 2009). For instance, it is estimated that
due to similar reasons linked to elements in the loop, even with low actual value
added, the domestic production in electronics in India can only be raised to US$100
billion against a demand of US$400 billion in 2020 (MCIT 2011). The rest would
have to be met by imports resulting in adverse consequences on several fronts
such as employment, national security, trade balances, forex, and technology. Focal
firms with stronger capabilities and links between technology and business strategy
(e.g., Tata Motors) are more likely to climb up in competitiveness journey.
This exploratory research hints at several potential areas for further exploration,
key ones are listed here:
• Business system design at industry level is often done by a leading developed
country. It seems that once the technology is embedded in products or com-
ponents, latecomer firms from emerging countries have only limited choices on
downstream of industry value system, e.g., operations, marketing, and services.
On such parts, technology is merely an enabler; hence, limited scope for technol-
ogy management as core technology development is involved. In open markets
such as India where pace of change is fast, how should the classical dilemma
about long technology development cycles (Nobeoka 2006) and much shorter
market cycles be resolved. This is particularly a key dilemma for latecomer
firms from emerging countries, where it is very difficult to get out from the
vicious loop of “low technological capabilities” (e.g., for a case of telecom,
see, Mittal et al. 2009). Asian firms such as Samsung and Huawei could break
out and provide rich contexts for research.
• Breakout from the vicious loops often demands breakthrough management on
part of a capable focal firm(s). Efforts by some clusters in India (e.g., under the
guidance of Shiba and First Learning Community (2006)) may help some firms
reach higher stages of competitiveness. Breakout and sustained competitive-
ness of an industry of a country also require supportive thinking and environ-
ment on part of other stakeholders of an industry, including governments
(Mittal et al. 2009). Focus on capability-based (e.g., Umamaheswari 2010)
approach to accelerate competitiveness demands high cooperation on internal
and external fronts. Enormous scale-up that institutes such IIT Bombay are
trying in photovoltaics (through centers such as NCPRE) can make much
bigger impact, if the cooperative strategies among industry, academia, and
governments are implemented effectively.
• Higher stages invariably demand international competitiveness. Accelerated
competitiveness journey often requires major focus on international fronts to
achieve balances on several fronts. This can be a high potential area of research.
Phenomenon of breakthrough growth, particularly by EMNEs from India, is an
under-researched and under-implemented dimension.
• Winning through innovation and technology is very challenging but possible.
Sustaining the lead is even more challenging. At the same time, balances
Technology Management to Accelerate Competitiveness Journey: Exploratory. . . 59

with profitability, environmental impacts, and new growth industries are also
important that even countries with highly sustainable development such as Japan
(e.g., METI 2010; Aoshima 2012) find it challenging.
• More than technological capabilities (which can be sometimes developed in
narrow contexts), organizational capabilities assume higher importance, if the
technologies developed are to be taken to higher levels of diffusion internation-
ally. There is need to develop frameworks and matrices affecting stages of
technology management maturity to accelerate competitiveness journey such
as internal factors—organizational and technological capabilities—and external
factors such as country’s technological competitiveness (Momaya 2008) and
related and supporting industries.
6 Concluding Remarks
Few remarks that link this chapter with years of our ongoing research on competi-
tiveness and role of technology management may add value as we conclude this
exploratory case-based paper. Focal firms with rapid scale-up capabilities can play
a key role in breaking the vicious loops and accelerating growth of sustainable
industries, including cleaner energy. Technology management can be a key driver
depending on context. While in several countries, particularly China, Japan, and
Korea, the cooperative strategies have made the focal firms do impactful scale-up
leveraging technology management, the situation in India seems less conducive.
There are, in simple strategic management terms, two paths to excellence and
sustainable competitiveness: opportunity-based and capability-based. Only a few
firms in India are able to achieve the balances needed among the two and other
fronts to accelerate the competitiveness journey. The growth also requires building
sound ecosystems of related and supporting industries, without which fragmented
technological excellence of select firms and institutions cannot be translated into
sustainable industries. There is very important role for governments if the firms and
industries in India are to break the persisting vicious loops. Obviously, there is
enormous scope for execution excellence of strategies and research—a challenge
for firms and institutes with youth and energy.
Acknowledgements The author(s) wish to acknowledge the support of the Ministry of New
and Renewable Energy (MNRE), Government of India, to the National Centre for Photovoltaic
Research and Education (NCPRE). Financial support from IIT Bombay, IRCC for competitiveness
research project is acknowledged. Cooperation from professionals in Moser Baer and Suzlon and
several young researchers in the project is gratefully acknowledged. Particularly, R. Mukundan,
Gouri Gargate, and Raj Mohan at Technology Strategy Lab, SJMSOM, IIT Bombay, and
Dr. R. Umamaheswari and other volunteers at the Strategy and Competitiveness Lab, DMS, IIT
Delhi, have contributed.
60 K.S. Momaya and S. Chachondia

References
Aoshima Y (2012) Balancing environment, energy, and industry competitiveness: importance
of the micro-level analysis (in Japanese). Hitotsubashi Bus Rev 59(4, Spring):78–96
Dharmadhikari S, Dixit S (2011) Thermal power plants on the anvil: implications and need
for rationalization. Discussion paper. Prayas Energy Group, Pune. www.prayaspune.org/peg.
Last accessed 20 Nov
Kumar A, Shankar R, Momaya K, Gupte S (2010) The market for wireless electricity: the case of
India. Energy Policy 38:1537–1547
MCIT (2011) A triad of policies to drive a national agenda for ICTE. Ministry of Communications
and Information Technology (MCIT), New Delhi
METI (2010) Industrial competitiveness: current status and issues facing Japanese industries.
Report by Ministry of Economy, Trade and Industry, Tokyo
Mittal SK, Momaya K, Sushil (2009) Technological competitiveness of telecommunication
industry in India: glimpse of reality, opportunities and challenges. Glob J Bus Excell 2
(1):22–33
Momaya K (2001) International competitiveness: evaluation and enhancement. Hindustan Pub-
lishing Corporation, New Delhi
Momaya K (2008) Exploring cooperative strategies for innovation: case of biopharmaceutical
firms from India and Japan. J Sci Policy Res Manage, Japan 23(4):327–338
Momaya K (2011) Cooperation for competitiveness of emerging countries: learning from a case of
nanotechnology. Competitive Rev 21(2):152–170
Moser Baer (2011a) Moser Baer annual reports, various years
Moser Baer (2011b) Web site: http://www.moserbaer.com/. Accessed 10 Nov 2011
Nobeoka K (2006) (MOT 技術経営入門[GijutsuKeiei] Nyumon) Introduction to MOT.
Nikkei, Tokyo
PC (2011) Low carbon strategies for inclusive growth: an interim report. Planning Commission,
Government of India, New Delhi
Shiba S, First Learning Community (2006) Breakthrough management: the Indian way III. CII,
Gurgaon
Sushil (2009) SAP-LAP linkages. Glob J Flex Syst Manage 10(2):55–61
Thompson AA, Strickland AJ, Gamble JE, Jain AK (2010) Crafting and executing strategy:
the quest for competitive advantage. Tata McGraw Hill, New Delhi
Umamaheswari R (2010) Strategic factors for achieving breakthrough growth: a study of select
firms in Indian context. Unpublished Ph.D. thesis, IIT Delhi
Yadav SS, Momaya K (2011) Editorial. Int J Glob Bus Competitive. Available at http://www.
giftsociety.org/volume-5-december-2010.html?Itemid¼88. Last accessed 25 Dec
Yin RK (2003) Case study research: design and methods. Sage Publications, Thousand Oaks
Technology Management to Accelerate Competitiveness Journey: Exploratory. . . 61

Assessment of Technology in the View of
Sustainability and Capability Approach:
A Case-study of Home Inverters
Pramod Khadilkar and Monto Mani
1 Introduction
Unbridled exploitation of natural and societal resources to singularly sustain
economic prosperity has evidently resulted in ubiquitous pollution, environmental
disruption, inequity, ill-health, starvation, and poverty. While technologies (in the
form of products) are intended to enhance human well-being, in pursuit of devel-
opment, many have infringed upon basic human abilities, traditional practices,
societal well-being, and sustainability. For example, obesity, stress, intolerance,
etc., are clearly attributed to modern lifestyles based on the influx of modern
technology/products/gadgets. Introduction of any technology/product in society
carries significance far greater than that originally intended. Though the extent of
this significance usually remains unperceived, it is crucial as it determines
sustainability. With imminent realities of resource scarcity and climate change,
society must cautiously pursue development. Every new technology introduced
should thus be evaluated for its implications on sustainability. Despite increasing
access to information and consequent awareness, evaluation of products in view of
sustainability is uncommon. It is important to mention that the terms technologyand product are used interchangeably in this chapter, as in the modern context,
a product essentially is a technology embodiment.
Evaluating a technology in view of sustainability solely on materials used in
its manufacture (such as in life cycle assessment) is important but not sufficient.
P. Khadilkar
Centre for Product Design and Manufacturing, Indian Institute of Science,
Bangalore 560012, India
e-mail: [email protected]
M. Mani (*)
Centre for Sustainable Technologies and Centre for Product Design and Manufacturing,
Indian Institute of Science, Bangalore 560012, India
e-mail: [email protected]; [email protected]
Department of Management Studies, Indian Institute of Science, Bangalore,
Driving the Economy through Innovation and Entrepreneurship,DOI 10.1007/978-81-322-0746-7_6, # Springer India 2013
63

The products’ mere adoption in society, over time, can result in severe debilitating
social consequences (e.g., extensive computer-related occupation and recreation
leading to social and health problems such as depression, loneliness, violence, and
spinal distress which would not have been foreseen at its time of introduction;
social disruption in family and personal relationships are also evident due to social
networking portals such as Facebook and Twitter). Products for societal adoption
are generally purchased by society (viewed as a market). Every new product
potentially views the societal landscape differently, i.e., a different environment
with individual with varying aspirations, values, constraints, and capabilities.
A seemingly harmless technology in one context might bring in irreversible dam-
aging effects that threaten future sustainability in a different context (e.g., adoption
of calculators has vitiated the ability of mental math among youth, even to perform
simple basic arithmetic operations).
Sustainability evaluation in view of a technology can be a complex and data-
intensive exercise. However, designers and strategists (and even discerning
customers) should be able to access a methodology that could permit evaluation
of a technology for its impact on sustainability. A methodology that is simple,
relatively less data/resource intensive, scientific, and still fairly dependable in its
sustainability assessment would be extremely valuable today. Sustainability assess-
ment is difficult without sound methodology and without clear consideration of the
various environmental, societal, and social factors involved (Bell and Morse 1998).
The main reasons for this include (Ritchey 2011):
1. Relevance of multiple factors of strong social, cognitive, and political nature that
are not easy to meaningfully quantify.
2. The complexities involved are in principle nonreducible and often difficult to
comprehensively delineate.
3. Dependency of everything on everything else attributed to extreme nonlinearity
in social systems. A marginal factor, with change in other parameters over time,
could grow to be the most significant factor determining subsequent change.
This means the final verdict on sustainability assessment would be a shaded
collage rather than a clear black-and-white answer. The methodology presented
here attempts to integrate qualitative considerations (as data) with quantitative
variables to ascertain likely future (sustainability) scenarios in view of technol-
ogy/product use. The validity of the assessment depends on the extent of informa-
tion available and consultation with experts linked with qualitative data.
2 Methodology for Sustainability Assessment
Designing technologies/products directly linked with people are termed wicked as
they need long-term social, commercial, and organizational planning (Ritchey 2011)
for appropriate product strategizing. Evaluating long-term systemic effects is a part
64 P. Khadilkar and M. Mani

of the wicked problem. Further, the complexity involved and lack of design clarity
has been acknowledged in design literature (Cross 2000; Ulrich and Eppinger 2004).
For assessing any technology, an in-depth understanding of the product is
crucial. Further, with many variants of the technology in the market, it is important
to discern the motive/acceptance underlying each variant. Societal and environ-
mental factors will influence the way a product has been derived (configured),
accessed, used, and retired. All these dimensions are interlinked and should be
studied in an integrated manner to provide a unified perspective for sustainability
assessment. The assessment methodology should aim to alleviate the daunting
complexity involved in the seemingly simple sequence of steps as illustrated
through a working example on home inverters.
2.1 Understanding History of the Technology/Product
The history behind the technology’s conception, the primary underlying need and
its evolution over time, should be studied. An appreciation is to be developed on the
technical and social challenges faced including societal objections in adopting the
technology (e.g., use of calculators in schools). Defining the range of product
variants or applications is important.
2.1.1 Home Inverter as a Case Study
A home inverter comprises a technology-intensive product aimed to store and provide
backup electricity to run critical domestic appliances, such as for lighting and
computers, to mitigate problems of power cuts. The technology was discerned based
on definitions – technical/vernacular, reasons for its sustained market demand – both
technical and practical (frequent power cuts). The technology depends on alternating
current (AC) as the primary source of power, with batteries being viably used to
store direct current (DC) for conversion to AC when required. Different types of
domestic inverters (sine wave, modified sine wave, etc.) have also been considered.
The statistics on its sales, service, and prominent market sizes have been gathered to
realize the product’smarket volume. Evident literature on accidents, repairs, burnouts,
and social change pertaining to inverters has also been collaged in this stage.
Here, the product is considered as a whole without going into its details.
2.2 Initial View of Sustainability
Here, an initial unbiased perception of sustainability in view of the product is
generated and recorded for two scenarios, one for the society with (adopting) the
product and another without. This exercise forces the evaluator (individual or a
Assessment of Technology in the View of Sustainability and Capability Approach. . . 65

team) to critically look at the product for its positive and negative impacts on the
three spheres of sustainability, i.e., society, environment, and economy. This initial
view aids in perceiving likely future changes which would permit the identification
of missing considerations among the huddle of variables generated later. The
generated initial view is presented below.
2.2.1 Inverter: Initial View
• Social factors:
– Inverters are primarily used to run computers, TVs, fans, etc., categorized
into needs, necessities, and luxuries. Thus, predominant use of inverters is
toward improving quality of life (computers) and not basic needs (lighting).
– In earlier days, the absence of electricity saw people gather in a common
place to gossip and keep in touch; the availability of inverters has diluted this
social interaction.
• Economy:
– The associated industry provides employment and income to many families.
– Further, illegal (unregistered) manufacturers offer interesting value proposi-
tion through recycled batteries and electronic components. This also supports
an informal sector in the recovery of dead batteries and discarded inverters.
• Environment:
– Inverters contribute to e-waste that poses a major environmental hazard
threatening human and biodiversity health.
– The manufacture and recycling of batteries involves the use and disposal of
carcinogenic materials that are generally not safely handled nor disposed.
2.3 Morphological Analysis
The termmorphology is derived fromGreek word “morphe,” which means structure
or form. It is the study of the shape and arrangement of parts of an object and how
these parts “conform” to create a whole (system). The object in question may be
physical (e.g., an organism, a gadget/thing) or conceptual (mental) (e.g., word
forms, concepts/ideas) (Ritchey 2006). The product (system) working in a particular
environment influences each other and is reflected in the way the product functions.
The structure of the product is designed to fulfill certain functions. Understanding
this structure permits backtracking through its function, need, and the environment
to identify the origin behind the product/technology. These insights are unlikely to
be available in printed literature and are often more tacit than verbal.
66 P. Khadilkar and M. Mani

Morphology analysis permits the product to be broken into subparts, with each
subpart identified with a specific function, life cycle, and consequent environmen-
tal, social, and economic linkages. This detailed exercise enhances the evaluators’
appreciation of the product in terms of its basic subparts (and functions). www.
techmotivator.iitm.ac.in provides online reference for beginners.
2.3.1 Inverter: Morphology
The morphology analysis also permits the identification of various impacts of the
product on the immediate living environment. While the printed circuit boards (PCB)
from the inverter contribute to e-waste, insight into the battery used provides informa-
tion on the hazards, including overheating and generation of fumes which influences
where these are placed inside homes. Recycled batteries contribute to lead and
chromiumcontaminationof groundwater that is consumedby the community. Figure1
illustrates a part of the comprehensive morphological analysis presented as a table.
2.4 Systems Analysis
A system comprises three aspects: elements, interconnections, and a function or
purpose (Meadows and Wright 2008). A technology/product can be viewed as a
Input power sun windsource of generation coal nuclear hydro
BatteryBattery type deepcycle marine
non-leak techabsorbed glass mat cell
partitionselectrode material lead calcium lead antimonyelectrolyte material alkalineelectrode thicknessbattery life 5-8 years 10years-abovespecification of battery VoltsEnergy density energy/sizeMaintainace regular maintainancebattery external
Converter Cktstep up transformer combinedstep down transformer combinedinverter CircuitInput power Interface InternationalOutput interface InternationalWiring (Inside home ) newOutput wave form modified sine wave sine waveprice to government to environmentsize medium bigshape
casing metal mixcolor International brand
disposal Major parts circuits battery
places of use suburban ruralportability stand alonemanufacturing assembledassembly separatedcharging use- charge
lead/lead oxideacidic (sulfhuric acid)
maintainance freeenergy/weight
Morphology of Domestic Inverters
plastic
Regional
grid
starting
3-4 yearsAmH
separate
gelled electrolyte
portable
existing
separate
squareto user
urban
body
local esthetic taste
standard company
inbuilt
single unituse<->charge
small
Regional
Fig. 1 Morphology analysis (partial)
Assessment of Technology in the View of Sustainability and Capability Approach. . . 67

system, or the system boundary can comprise the society that adopts it, or the
natural environment that supports its manufacture, and so on. Deciding this bound-
ary is a crucial task that is aided through the morphological analysis. The actors
(stakeholders) that are involved in the manufacturing, distribution, use, servicing,
and retrieval of the product are part of the system. The immediate natural and
societal environments connected with these stakeholders are also considered as the
part of system.
Following this, the entire system is organized into subsystems and entities that
are further characterized into attributes or variables (Mani et al. 2005). Two levels
of interactions are evident in systems analysis. The interaction among entities is a
generic view and has to be dealt with initially before characterizing detailed
interactions at the level of attributes defining entities. Entity interactions provide
a bird’s-eye view of the entire system, while variable interactions provide an
insider’s worm’s-eye view; the latter, if done first, can limit in comprehending
the vastness of the system involved.
2.4.1 Inverter: Systems Analysis
Inverter has been divided into four subsystems (Fig. 2), viz., (1) actors in the product
life cycle, (2) ecology encompassing product usage, (3) product (inverter), and
Fig. 2 Entity interaction diagram
68 P. Khadilkar and M. Mani

(4) external factors affecting all the three subsystems. The subsystem comprises
entities that are mapped based on interactions between them. The positive or
negative impact and the extent of impact are also captured graphically. This analysis
has been based on extensive primary data. Wherever possible, quantitative data has
been gathered and experts have been consulted to verify both the relevance and
intensity of interactions.
Interactions can be observed as change in attributes characterizing entities. The
variable interaction diagram illustrates every entity characterized as variables
involved in the interaction. The entity interaction and variable interaction diagrams
have revealed many interesting interactions/influences (e.g., the influence of glob-
alization on inverter use is dominant but not very obvious). Globalization can be
viewed in terms of increasing energy-guzzling shopping malls and night shifts,
resulting in frequent electricity shortage in residential areas and also an increasing
number of aged living alone. The increasing floating unskilled laborers from rural
areas rely on small businesses in urban fringes, leaving behind their aged family
members. These laborers depend on affordable roadside eateries that in turn repre-
sent those largest small businesses in urban areas depending on (recycled) inverters.
Figure 3 lists variables against each entity and subsystem. For example, in
subsystem usage ecology, the entities include urban ecology, rural ecology, small
businesses, and medical facilities (products akin to domestic inverters). Few
variables linked with entity urban ecology include “availability of electronic and
electrical equipment” and “employment opportunities.” The availability of electri-
cal and electronic equipment determines the cost and sales of inverters; increased
Subsystem Entity variables (only 2 representative variables listed as example)Availability of electronic and electrical equipments and gadgetsEmployment opportunities
External funding for rural developmentprofitability of agriculture-related businesses
number of small businessesDeep cycles of batteries
number of C-sections and operationsnumber of vaccination drives
use of social networking websitesnumber of nuclear families
inflation ratesPrice of computers, laptops, mobiles
Night shiftsNumber of old people staying alone
environmental friendly materialse-waste disposal technologies
Recycling regulations Adherence to regulations
electricity theftEfficiency of distribution of electricity
Planning for future, emergency(electricity needs)Regulation for take back of e-waste
Avarage temp (local + global)Rate of Air contamination
number of illegal manufactures (of inverters)safety standards for workers
technical know-how of seller and service peopleavailability of service option
use for entertainmentuse for safety ( CCTV etc)
amount of illegally recycled invertersenvironmental consideration while recycling
efficiency of usagerecharging from Grid
disposal
batteriesproduct`
actors in product life cycle
external factors
electricity board
government management
environment
manufacturer
distribution
user
usage ecology
Social factors
economy
Globalization
technology
pollution board
urban Ecology
Rural Ecology
Small businesses (Mixed ecology)
Medical facilities (Mixed ecology)
Fig. 3 Subsystems, entities, and representative variables
Assessment of Technology in the View of Sustainability and Capability Approach. . . 69

sales (usage) influences electricity consumption. Employment opportunities depend
on the rate of urbanization that is influenced by resource usage in the urban ecology.
Industry-specific manpower requirements based on data from the Ministry of
Commerce have been used as indicators. Density of electronic shop dealers have
been used as an indicator for proficiency in inverter availability.
2.5 Cross Impact Analysis Using Kane’s Simulation
Kane’s simulation (KSIM) developed by Julius Kane in 1972 is based on the
expected nature of interactions between time-series variables instead of conditional
event probabilities (Gordon 1994). KSIM adeptly captures behavior of nonlinear
feedback systems without mathematical sophistication (Kane 1972) adopting
systems thinking principles. KSIM has been successfully used for sustainability
assessment of human settlements (Mani et al. 2005). The interactions among
variables identified through a systems approach are captured as a cross impact
matrix. The matrix captures causality in terms of direct interactions on a pairwise
basis (between two variables); the matrix also permits the identification of variables
that are mutually exclusive and collectively exhaustive. Kane (1972) provides a
detailed discussion on adopting Kane’s simulation. The mathematical formulations
can be built as macros in MS Excel to run the simulation for a fixed timeline
(between 15 and 25 years).
The steps involved in generating the cross impact matrix include:
1. Listing all the variables in an n row by n column matrix, where n is the number of
variables.
2. Interactions are captured as impact (interaction-coefficient) of column variables
on the row variables and represented in terms of positive or negative or zero
impact on a predefined scale comprising a number of pluses or minuses. The
number of pluses and minuses are converted to numeric value by assigning some
within a range of +1 ~ �1.
3. Each variable is bounded between its own unique minimum and maximum
limits. These ranges are assigned for its current status based on statistical data
or expert’s opinion.
The cross impact analysis evaluates growth or decay trends associated with a
variable based on the net result of positive and negative impacts attributed to all
other system variables. The results of the cross impact are presented as variable-
trend graphs.
2.5.1 Inverter: Cross Impact Analysis
The evaluation of variables in cross impact matrix has also filtered duplication and
redundancy among system variables. Gauging and assigning appropriate initial
70 P. Khadilkar and M. Mani

(base-case) values for each variable and the interaction coefficients require access
to extensive statistical data and experts’ opinion. This process takes considerable
time and effort.
The sustainability assessment into home inverters revealed interesting trends
among variables (see Fig. 4). While population increase, computer prices, and
population health show negative trends, the number of illegal inverter manufacturers
shows a steep increase.
Based on this analysis, strategists could attempt to intervene by altering key
variable values to verify/effect controllability on salient (target) variables while
also observing the effect on other variables determining social, environmental, and
economic sustainability. This would permit dynamic forecasting that would aid
appropriate product design and strategy.
2.6 Interlink with Capability Approach
Capability approach (CA) was originally proposed by Nobel Laureate Amartya Sen
as a normative framework to broadly evaluate individual well-being and social
arrangements. CA can further enhance societal considerations in sustainability
assessment, and it would rely on the freedom of individuals operating at two levels,
firstly the freedom to decide what the individual wants to be and do, i.e.,
capabilities, and secondly the freedom to achieve and/or realize from the list of
capabilities, referred to as functionings (Sen 1993). CA emphasizes that technol-
ogy/product is not exclusively important, but what matters more is how it affects the
life of the people. CA comprises salient peculiarities that are linked with
sustainability assessment, such as:
1. Distinction between means and ends (Robeyns 2005; Sen 2000) – any given
technology is evaluated for the ends it is expected to achieve. Based on the
importance to people’s freedom in deciding what they want to be and do, every
Fig. 4 Trend of salient variables
Assessment of Technology in the View of Sustainability and Capability Approach. . . 71

technology adopted is envisaged to fulfill some basic needs. Adoption of CA in
product evaluation will persuade the evaluator to think in terms of “why a
product is desired by the user in the first place.” In conjunction with the
morphological analysis and systems approach, CA would immensely help in
identifying suitable product variants/configurations.
2. Distinction between the means and achieved capabilities (Robeyns 2005; Sen
2000): sustained adoption of a product is determined not only based on technical
and material means (resources) but also based on other means such as social,
infrastructural, and geographical. Appreciating this would aid the evaluator in
expanding the system boundary for cross impact analysis. Khadilkar and Monto
(2012) introduce such a framework in detail.
Though morphology and systems analysis help evaluators to fathom the com-
plexity involved in sustainability assessment, the initiation into the exercise
depends largely on the individual skill of the evaluator. CA, owing to its thought
framework (as explained above), guides the evaluator in the initial fuzzy part
through a questions-based approach, answers to which would smoothly forge into
morphology and systems analysis.
2.6.1 Inverter: Through Lens of Capability Approach
The two questions posed by CA to the evaluator are the following: (1) Why wouldthe user want the inverter? (2) What means would ensure the inverter’s sustainable
use/adoption? Thinking through and answering these questions would intuitively
lead into morphology analysis and systems thinking. Answering the first question
links instrumental need to intrinsic need (basic needs of human being) and, in the
process, reveals many different dimensions that are not linked directly with product
(see Fig. 5). Answering the second question broadens the system boundary to
include nontechnical considerations (see Fig. 6).
Fig. 5 Connecting means to ends (“why” question)
72 P. Khadilkar and M. Mani

In discerning the “why” in the question posed in Fig. 5, the evaluator is mentally
forced to link the technologywith the use intended by the users for the product. Often
the inadequate success of a technology/product in terms of its usage can be attributed
to disconnect with higher-level needs. For example, if the need for entertainment is
not satisfied from a TV program, the user would refrain from using the TV. Thus, if
the home inverter is not intended for running TVs, the users would refrain from
owning one. They might value the time to be and gossip with friends.
Based on CA-related literature, in discerning the “what” question, the various
resources required could be readily identified (Robeyns 2005; Kleine 2010). CA
would ensure that evaluator considered the spectrum of available needs which
would vary from community to community (or region to region). CA will also
aid in interpreting the outcomes of the sustainability assessment. In the case of
home inverters, the initial steep rise and subsequent dip in the instances of illegal
battery manufacturers can be attributed to stricter recycling regulations, rising
public awareness, and international pressure. CA reveals the fact that in the illegal
manufacture of batteries, the health and thereby livelihoods of the workers involved
are adversely affected. This is likely to continue unless suitable policies and
regulations are put in place to ensure appropriate livelihood entitlements such as
a healthy work environment. With the same income, the workers have an increased
opportunity to live a healthy life.
2.7 Conclusion
Sustainability evaluation in view of a technology can be a complex and data-
intensive exercise involving societal, environmental, and economic considerations
that are often difficult to quantify. A methodology that is simple, relatively less
data/resource intensive, scientific, and still fairly dependable in its sustainability
Fig. 6 Differentiating between means and a capability (“how” question)
Assessment of Technology in the View of Sustainability and Capability Approach. . . 73
assessment would be extremely valuable to product designers and strategists.
The current chapter attempts to present one such methodology to evaluate a
technology/product in view of sustainability by adopting a case study of home
inverters. Morphological analysis and systems approach form the basis of the
proposed methodology leading to a cross impact analysis-based simulation
(KSIM). Further, the methodology also integrates capability approach by
recognizing the fact that the human dimension is central in the sustainable use/
adoption of any technology.
This chapter also demonstrates, through the case study of home inverters, that
the inherent complexity of sustainability assessment can be dealt with using
structured thinking. Adoption of CA aids in handling complexity by structuring
the thinking behind the assessment and also permits a greater appreciation of the
results. The integrated methodology would aid designers and strategists (and even
discerning customers) to access a technology for its likely impact on sustainability
and identify suitable design strategies.
Acknowledgement This chapter is primarily an outcome of a project undertaken as part of the
course on Technology and Sustainable Development offered at the Indian Institute of Science.
Integrating the capability approach dimension has been made possible as part of a research grant
from the Netherlands Organization for Scientific Research (NWO) for the project “Technology
and Human Development – A Capability Approach.”
References
Bell S, Morse S (1998) Sustainability indicators: measuring the immeasurable. Earthscan
Publications Ltd, London
Cross N (2000) Engineering design methods strategies for product design. Wiley, West Sussex
Gordon TJ (1994) Cross-impact method. From http://www1.ximb.ac.in/users/fac/dpdash/dpdash.
nsf/23e5e39594c064ee852564ae004fa010/2a7a6240bcf05ebde5256906000a7322/$FILE/
Cross-im.pdf. Retrieved on 10 Apr 2010
Kane J (1972) A primer for a new cross-impact language – KSIM. Technol Forecast Soc Change
4:129–142
Khadilkar P, Monto M (2012) A methodological framework to investigate the connect between
capability approach and livelihood enhancement using ICT. In: Dahmani A, Jean-Michel L
(eds) The information and communication technologies (ICTs) in southern countries: from
promises to the socio-economic reality. Karthala Publications, Paris
Kleine D (2010) Ict4what? – using the choice framework to operationalise the capability approach
to development. J Int Dev 22:674–692
Mani M, Ganesh LS, Varghese K (2005) Enhanced futures system – integrated cross-impact
analysis and GIS. Futures Res Q 21(3):19–45
Meadows DH, Wright D (2008) Thinking in systems – a primer. Earthscan Publications, London
Ritchey T (2006) Problem structuring using computer-aided morphological analysis. J Oper Res
Soc (JORS) 57(7):792–801
Ritchey T (2011) Wicked problems/social messes: decision support modelling with morphological
analysis. Springer, Berlin
Robeyns I (2005) The capability approach: a theoretical survey. J Hum Dev 6:93–114
Sen A (1993) Capability and well-being. In: Sen A, Nussbaum M (eds) The quality of life.
Clarendon, Oxford
Sen A (2000) Development as freedom. Oxford University Press, New York
Ulrich KT, Eppinger SD (2004) Product design and development. Tata McGraw-Hill, New Delhi
74 P. Khadilkar and M. Mani

Design-Technology and Sustainability
Sudhir Rama Murthy and Monto Mani
1 Introduction
Sustainability requires diversity in both the natural world and in the idea-space.
To ensure survival in a competitive environment, one needs to constantly adapt and
evolve by being creative. The intellectual capacity to continually innovate has
resulted in the advancement of human skill and ingenuity, effectuating the domi-
nance of the human species (McCrone 1991). Design-technology refers to a tech-
nology used by designers in the design process. These technologies have evolved
over time, and each design-technology has had many common traits with its
predecessors. The topic discussed is design-technology in the context of
sustainability. Relevant to this topic is an understanding of creativity, design-
technology and skills. The introduction section explains these concepts with rele-
vance to the chapter. Based on an understanding of sustainability in the context of
design-technology, broad guidelines for the role of technology in the design process
are formalized, and then, the capability approach is used as a framework of thought
regarding the role of design-technology.
Section 2 details a list of guidelines on the association between technology and
design, based on sustainability considerations. Section 3 explores design morphol-
ogy by employing the capability approach to conceptualize it.
S. Rama Murthy (*)
Centre for Sustainable Technologies, Indian Institute of Science, Bangalore 560012, India
e-mail: [email protected]
M. Mani
Centre for Sustainable Technologies and Centre for Product Design and Manufacturing,
Indian Institute of Science, Bangalore 560012, India
e-mail: [email protected]; [email protected]
Department of Management Studies, Indian Institute of Science, Bangalore,
Driving the Economy through Innovation and Entrepreneurship,DOI 10.1007/978-81-322-0746-7_7, # Springer India 2013
75
1.1 Creativity
According to Otto Rank, ‘Creativity is an assumptions-breaking process. Creative
ideas are often generated when one discards preconceived assumptions and attempts a
new approach or method that might seem to others unthinkable’. Creativity requires
this freedom from constraints of thought, conformance to standards or adherence to
established paths. It is through people thinking differently from everyone around them
and before them that novelty is achieved. The accommodation of inept, illogical, and
unscientific ideas is also necessary en route to feasible solutions. This perspective on
creativity is particularly relevant in the context of a design-technology as it must
permit such illogicality to occur.
Societies and cultures are diverse, and so are ways of interpretation, communi-
cation, problem-perception, appreciation, thinking and problem-solving. It is also
known that cultural beliefs, values and behaviours affect how people interact with
technologies. This link between cultural diversity and creativity must be acknowl-
edged by design-technology, particularly if it is to be used across cultures.
A further relevant aspect of creativity is its larger role in sustainable develop-
ment. Creativity and diversity are essential for society’s survival and development.
Overspecialization impedes adaptability (Papanek 1984). Sustainable development
is one that promotes quality of life (IUCN 1993), while maintaining, among other
things, further attributes of humanity such as cultural diversity (IUCN 1986).
Human development requires creativity not just for problem-solving but also for
nurturing intellectual diversity. Any technology participating in the design process
must recognize this importance of maintaining creativity so as to not trample upon
intellectual diversity.
1.2 Design-Technology
Design involves a conception in the mind, subsequently externalized through
a medium, the outcome being discernable by one or more of the senses. This
externalization communicates the (mental) design to oneself, a working group,
an audience or client for purposes such as feedback, refinement and appreciation.
These externalizations represent the development of designs – they have an inter-
active role and a crucial effect on the mechanics of the design activity (Bilda
and Gero 2005). While the design initiation, conception and preliminary externa-
lizations have predominantly remained a manual ‘human’ exercise, numerous
design tools are available to support subsequent design synthesis, communication
and refinement.
Conceptualization happens in the mind of the designer (Ferguson 1992). The
design process may involve an individual imagining an idea first, bringing it into
form and then communicating it to others with whom the designer may then
jointly develop it further – such freedom demands that the tool (or medium) used
76 S. Rama Murthy and M. Mani

be flexible. The design-aid must help the person or group communicate readily
and flexibly to generate more and richer ideas, while maintaining the diversity of
those ideas.
Design-aids have been used through the ages to assist designers in the process of
creating new products. Design-technology may assist in all design activities such as
conceptualization, implementation (and manufacturability) and product usage
(Brooks 2010; Sayers 1941). The capabilities of these design-aids have evolved
with progress in technology. The then prevalent sophistication of technology has
determined the nature of tools used by society to meet its needs in that period.
Design-aids or tools were originally physical devices such as a template or a
specialty artefact that designers and artisans relied on for ensuring dexterity,
advancement, extension and mastery over their specialized skill. These tools were
relied upon subsequent to a period of manual engagement with that skill, i.e. the
tools were rarely used at the beginning, but extensively used after a certain level of
skill was manually acquired. In the modern world, however, rapid advancement of
technology in computational power has reorganized the entire spectrum of extended
design-aid and ability available to the designer. This makes the study of design-
technology relevant in recent light. Computer-aided design (CAD) is one such
technology prevalent in design practice.
Design-aids serve three principal purposes: (1) visualization (establishing a
design space where a fleeting idea is captured and externalized), (2) communica-
tion (with a design group, client group or a manufacturer) and (3) documentation
(of the design’s progress and for archiving purposes). The design-aids adopted in
the design process were originally intuitive and indigenous but have gradually
become specialized and professional.
Historically, design-aids have illustrated a strong vibe with prevalent
technology, viz.:
1. Sketching and colouring: These were the rudimentary ways of conceptualizing
in the history of humankind. Early humans used charcoal and plant dyes to
design on cave walls. Even this very first form of design-aid satisfies all the three
requirements, viz., visualization, communication and documentation.
2. Drawing aids – the invention of geometric tools: With advancements in warfare,
architecture and astronomy, new geometric tools were the design-aids. The
emphasis shifted away from visualization and moved towards documentation.
3. Engineering drawing: Here, the goal is to accurately and unambiguously capture
all the geometric features and communicate them to a manufacturer. This
emerged in the time of ship building and mass-production factories. The com-
munication of design to manufacturers became the focus.
4. CAD: The emergence of computer as a design-aid began with the aircraft industry.
The advantages of CAD have helped it spread across the product industry.
CAD is today a dominant design-technology. CAD tools primarily aid the
capture of only the structure while the description of a design involves its
functionality, performance and behaviour as well (Hsu and Woon 1998). Design
attempts to bring order to the natural chaos that develops new products (Brooks
2010). A design-technology must nurture the occurrence of this chaos. As an
Design-Technology and Sustainability 77

integral design tool, CADmust not interfere with the creative manoeuvers at work
by restricting free thinking, which would otherwise lead to stereotypical or
inflexible approaches. It is because CAD does not permit vagueness that it is
today primarily used in the later stages of the design process, only after all the
design parameters are formalized and dimensions are narrowed down with a fair
degree of certainty. It is crucial to arrive at a sustainability-based rationale for
where design-technology (including CAD) presently stands in the design process
and where it should/should not be.
The path of a technology must accommodate diversity, wherein the intention is
not merely to augment human abilities but also to recognize, accommodate and
foster diversity in culture. Cultural identities are crucial to sustainability as these
have evolved in response to local conditions of environment, climate, resources and
spiritual values. A design-technology which creates a common platform must not
create an environment of uniformity. Any design-technology must appreciate
diversity as a trait of the design processes (Leonard-Barton 1995). This requires
that the technology be free of single sequential paths for solutions, preconceived
techniques, assumptions, distinct methodologies (because there are numerous
methodologies and the technology must not vote for or against any model),
constraints or standards. The interface between human and machine must be free
of distractions and hindrances to communication. A technology used in the design
process must be flexible and (a) accommodate effective communication within a
group comprising diverse designers, (b) encourage generation of diverse (even
inept) ideas that carry potential for new and better ideas, (c) retain contradictory
thoughts and unexplored ideas – even those that might appear illogical or unproven
and (d) integrate logic and science to aid in the synthesis of design solutions.
1.3 Technology and Skill
Skill represents an ability acquired by training (WordWeb 2005) and may be
understood as one’s ability to perform a certain task effectively. Humans have
used the skills at their disposal to meet their requirements and, with time, enhanced
these skills. The very purpose of technology is to expand human capabilities
(Oosterlaken 2009), and this plays a central role in the development of skills.
Skills are acquired in the adoption of a technology – say, in handling equipment
such as a lathe or CAD tool. The very existence of technology implies an underlying
existence of skills – the skills to create that technology and the skills to use it
(DeGregori 1989). With the incorporation of a technology into a routine, users
begin to think through that associated technology (Veblen 1961). It is at this
juncture that technology begins to influence the way users think. Designers may
be induced to think in terms of the steps and processes by which desired forms
emerge. These steps and processes are determined by the technology available.
Further, attempts to introduce design-aids at an early design phase have led to the
user describing an idea or solution in terms acceptable by the technology/machine
78 S. Rama Murthy and M. Mani

(Willey 1976; Weinzapfel 1973). Design practice and education are also driven in
part by the technology available (Bilda and Gero 2005) and so are human
capabilities and skills. Technology-intensive skills require time and training for
the user to develop proficiency.
Sustainability lays emphasis on a prosperous self-reliant society amidst a stable
ecosystem. A self-reliant society fundamentally indicates retention of basic human
capabilities and capacity to innovate, be creative and adapt (to ensure survival).
Any technology aiding human creative thinking must not substitute the same,
thus resulting in a dilution of the original human capacity. ‘The best of modern
technology and experience is . . . designed to serve the human person instead of
making him the slave of machines’ (Schumacher 1973). With changing technologies,
some skills will be retained, developed and channelized while few other skills will
become extinct. The loss of skills may be understood as the consequence of technol-
ogy choices and progression (including obsolescence of other technologies). A tech-
nology should ideally enhance human skills and abilities and not inhibit human
capabilities, creativity or innovation. The loss of certain skills and capabilities on
adoption of a certain technology should not adversely affect the survival, stability and
sustainability of future generations.
2 Guidelines for Design-Technology
The role of technology in the design process is only as much as humans permit it to
be. A technology can be most beneficial by being employed in some activities while
kept away in others. Thus, keeping sustainability as the primary criterion, the
authors propose the following guidelines to underlie the association between
design-technology and the designer:
1. Activities truly cerebral must still be done by the human (Papanek 1984). The
human conceives, while the machine computes (Willey 1976), resulting in an
intimate co-operative complex (Coons 1963). It is further possible that the
machine can take over what is monotonous and repetitive, sparing more time
to be devoted towards intellect during the design process. If this help is not
provided, the human may, in order to economize on mental effort, resort to a
habitual response, leading to similar outcomes (Brooks 2010) by which diversity
in design is stunted.
2. The progression and adoption of technology should not inhibit human
capabilities of creative expression, innovation, decision-making or self-reliance.
The technological path will determine which skills are retained and which skills
are lost (e.g. sketching using charcoal, making dyes to paint on cave walls). The
lost skills must not threaten the survival and sustainability of future generations.
3. Technology should permit the designer to learn as the design process carries
forwards. It should be flexible and be adopted in ways desired by its diverse
Design-Technology and Sustainability 79

users. During the design process, problem-learning with the associated realities
and the use of design-aids happens (Hsu and Woon 1998; Willey 1976).
4. Adoption of the same technology (design-aid) should not result in designers
thinking alike and arriving at similar designs. Technology must encourage each
designer to develop his or her own style and preserve cultural diversity.
5. Designers first think of the entire system in terms of its major subsystems. Then,
through finer refinements, more detail gets incrementally added in (Brooks 2010;
Cross and Dorst 1999). CAD tools in use today help us work backwards, while a
true design-aid should help us design forwards – arrive at a final destination as
we move along the design process, with the design-aid aiding us along the path.
This is related to technology permitting the designer to learn aspects of the
problem/design requirement as the design process progresses.
6. Technology must not become central to the design process to the extent that
designers not conversant with that technology are excommunicated from the
design world.
It is important to note that despite advancement in design-aid technologies, the
most fundamental, or archaic, of techniques for idea/design expression/externaliza-
tion such as charcoal, sand and clay have prevailed due to their simplicity and
intuitive (primal) ease. They offer unparalleled dexterity and versatility of expres-
sion only to be matched or amplified by the allied skill and mastery developed by
the artist/designer (e.g. calligraphy).
The following section of this chapter shall concentrate on one particular aspect
of the guidelines, i.e. the human machine co-operative complex, also relevant to
guidelines (1) and (2).
3 Design Morphology and Capability Approach
The quality of the design outcome is determined by the manner in which the
technology enhances the capabilities of designers. This relationship can be explored
in detail using the framework of capability approach (CA). CA is not a theory that
can explain the ‘designer–design-technology’ relationship, but it will help concep-
tualize and evaluate this relationship better. The key idea of CA is to expand human
capabilities – increase the options available to people and their freedom to achieve
valuable activities and states – and then let them choose the path they desire
towards their goals (Alkire 2005). CA is used here as a framework for the evalua-
tion of how a design-technology enhances the outcome of the design process.
This includes people’s ability to represent designs with the technology. CA can
evaluate the design-technology based on its impact on the designers’ capabilities to
innovate or design.
CAD, or any design-technology, must strive to expand human capabilities to
achieve valuable activities or ‘doings’ in CA terminology, such as designing better.
A design-technology must create an enabling environment rather than offer
80 S. Rama Murthy and M. Mani

multitude of resources or options. The distinction between these is where the
strength of the capability approach is evident. An important question to ask is
‘which capabilities will the people who will enjoy them value?’ (Alkire 2005) and‘which capabilities are relevant to the . . . project; which may be affected directly or
indirectly’.
Employing the CA terminology (Alkire 2005) and applying the CA framework
(Robeyns 2005) to the use of a design-technology, it emerges that the artefacts of
the technology (viz., tools, paraphernalia, boards, CAD software, computers) are
all resources (goods/services) or commodities. Users are concerned with what a
technology can do for them – the activities and states (doings and beings togethercalled functionings) that they can achieve with these resources and commodities.
These achievable activities and states represent the capabilities of the users. Thesecapabilities provide the designers with options to choose from and to finally arrive
at the desired design goals. The link between the technological tools (commodity)
and the capabilities of the human is the set of conversion factors. Based on
conversion factors (such as individual skills of the designers), these commodities(artefacts of design-technology) transform into capabilities. Applying Nussbaum’s
(2000) three categories of capabilities (terminology distinct from Amartya Sen’s
capability approach) to the design-technology exercise, basic capabilities (seeing,limb movement, intelligence) mature into internal capabilities (tool-operation skill,professional communication) which then require suitable external conditions
(availability of tools, other material and social environments) to finally result in
combined capabilities. The purpose of this exercise would result in asking the
deeper questions of ‘how does the designer become capable of designing better’
rather than ‘what options should a design-technology, say CAD, show him on the
work space’. As Sen (2004) argues, functionings (valuable activities and states)
relevant to the purpose of the exercise – in this case design-technology usage – will
have to be identified anew for each exercise.
A morphological study permits an overall appreciation of the interactions within
a structure through an articulation of its constituent components and its association
with externalities. Current design literature provides numerous models chara-
cterizing design activity (Pahl and Beitz 1996; Brooks 2010). These models assist
the designer along the process as the clarity on the design that is evolving improves.
However, in this chapter, the focus is not on the entire design process but instead on
the interaction between the designer and the technology when the idea is captured,
worked on and recorded. This is represented by the following four steps (Fig. 1). To
simplify the discussion, we shall focus on the creation of an aesthetically pleasing
form by a designer using a design-technology. The attempt here is to understand
this human-technology nexus through:
1. Ideation
2. Externalization
3. Communication
4. Documentation
Design-Technology and Sustainability 81

The design-technology influences the way designers think in the following two
phases: (1) externalization – dictating the available steps through which a designer
must think in order to arrive at the desired outcome (this is itself interference in
terms of the thought process of the designer), and (2) communication – the final
representation is constrained by what the design-technology permits the designer to
represent (a simplified example would be a designer trying to represent a 3D form
on paper, a 2D medium).
3.1 Ideation
The design-form or idea is always formed in the mind of the designer. This
represents the initiation or seeding of an idea itself and is essentially a mental
faculty/capacity and is usually not identified with any medium (Bilda and Gero
2005; Tovey 1989). Sketches and other 2D and 3D representations (models)
are attempts to reproduce the designer’s mental images (Tovey 1989). An appro-
priate medium is subsequently important as externalizing an idea can reduce
cognitive load (Puttre 1993) and mentally relax the designer to then concentrate
on furthering the idea (Tovey 1989). Designers also employ visual thinking to
visualize forms and images (McKim 1980; Amheim 1969; Ullman et al. 1989) by
devising spatial mental models (Brooks 2010). It is common for designers to first
postulate an idea (solution) and then react to it piece by piece (Willey 1976).
Fig. 1 Role of designer and role of technology
82 S. Rama Murthy and M. Mani

The design thus evolves by successive modification as the details begin to emerge –
looking at what has already been externalized and then improving those ideas.
Externalization is thus an essential requirement for iterative generation and refine-
ment of ideas.
From a CA perspective, the designer’s basic capabilities of intelligence, shape
perception and logical reasoning must be nurtured into internal capabilities such as
having knowledge (of engineering, the purpose of design, usage scenarios, art and
existing solutions) and thinking of forms and functions. The role of technology in
this phase is to readily communicate to the designer what he/she had already
externalized. The design-technology must provide a favourable environment to
convert these internal capabilities into combined capabilities. At a deeper level,
CA highlights that ‘knowledge’ and ‘thinking of forms’ are functionings that must
be enabled and fostered.
3.2 Externalization
Ideation represents a spark or momentary occurrence of an idea/approach and
utilizes short-term memory, which is fleeting and limited in capacity. Externaliza-
tion attempts to capture that fleeting idea onto a medium. The dexterity of the
medium to quickly capture the idea is crucial (Lipson and Shpitalni 2000; Jenkins
and Martin 1993). To be effective, design-aids must accommodate for the nature of
short-term memory and mental imagery in designing (Bilda and Gero 2005) by
being flexible (Puttre 1993).
The designer having performed the vital task of conceptualization in the ideation
stage (Hsu and Woon 1998) needs to now have the idea captured efficiently and
effectively. The conduciveness of a design-medium in receiving and representing
this information determines the success of the technology (Dorta et al. 2008).
For lucid translation, the designer must find it convenient to provide stimulus to
the medium (Buxton and Myers 1986; Brooks 2010). Design-aids are still evolving
to lucidly receive and translate such stimulus.
The description of a product idea may involve the expression of its structure,
function and behaviour. A designer may prefer a combination of these schemes
to best capture and communicate thoughts (Hsu and Woon 1998). The design-aid
must accommodate interoperability by supporting multiple formats freely and
concurrently.
The human wants the idea to be captured in all its aspects before it may be lost.
Basic capabilities such as the designer’s sense organs and limb control are reflected
in her internal capabilities of representing the form as imagined and representing
that idea fluently. But these activities require support to develop over time – access
to the medium for practice and experience, attuned senses for the task, choosing the
design tool from among many and using it appropriately. However, when these
activities of representation are of an intuitive nature, they do not require time to
develop. In either case (trained or intuitive), the role of the design-technology is
to be a receptive medium thereby enabling the functionings mentioned above.
Design-Technology and Sustainability 83

3.3 Communication
This step permits communication and collaboration in the design process, and
modern design-technologies have evolved to network designers across the world.
This represents the idea in terms of what is captured and the attributes of the
concept generated up to the finalization of the concept. It is likely that design
acumen and enthusiasm may shift from one member to another in a group – with
one designer leading a certain phase; the design-technology must accommodate this
(Brooks 2010). Multiple formats need to be accommodated as each (designer-
preferred) format has its own advantages. This provides richness to the information
captured (Larkin and Simon 1987; Jenkins and Martin 1993; Lipson and Shpitalni
2000). In this design stage, technology can increase its relevance by performing the
roles that are repetitive/iterative in nature, if relevant to that task.
The design-technology must serve as a forum for the exchange of information.
This involves the designers’ basic capabilities of speech and logical reasoning
being trained into formal speech, language, access to the forum and professional
protocol for communication. The designer wants to communicate the idea already
captured on the medium to himself/herself and to fellow designers. The material
and social environment to establish and maintain such a forum also become
important when viewed from the perspective of CA.
3.4 Documentation
This represents a final outcome of the design. After the design is deemed satisfac-
tory, this will be the final stage before the design is given to a manufacturer.
The outcome may be in the form of detailed design drawings for manufacture
and subsequent transition for use by a consumer. The delivery usually represents a
protocol for the final design and allied deliverables. The communication of infor-
mation for manufacturability is one of the vital roles of technology.
The designer wants to perform the activities of storing the designs and
instructing the manufacturer. CA then identifies that for instructing, the designer
must have knowledge of the available manufacturing facilities and establish a
communication protocol with the manufacturer. Storage of designs includes choice
of storage formats/methods, authorizations and the resources and skill required to
access the archives. This is crucial as the same designs may be retrieved frequently
for modification and/or reference. The designer must be able to identify what is to
be stored and how. The role of the technology is to not only store the final design
and unambiguously communicate the design to a manufacturer but to also docu-
ment the entire design progress such that this record may help the designer at a
convenient time. To enable the storage of designs, the design-technology must
make available the required options of formats for storage of designs.
84 S. Rama Murthy and M. Mani

4 Conclusion
The chapter explores the purpose and role of a design-technology. Considerations
of diversity, creativity and skill are explained in relevance to this topic. A set of
guidelines on the association between technology and design is established.
The chapter focuses on the role of the designer and the role of design-technology
in imagining, capturing, communicating and storing an idea. With the capability
approach framework, it is seen that the relationship has more depth than the mere
use of a tool for a particular task. With this framework, the chapter attempts to
better understand the design process, in terms of the activities and states of the
designer. Relevant concerns emerging from the capability approach perspective
have been identified in various stages of the design morphology. This entire
research theme would help determine the larger direction in which design-
technologies must progress, along with numerous related societal processes, thus
taking sustainability concerns into consideration.
References
Alkire S (2005) Briefing note-capabilities and functionings: definitions and justification. Human
Development and Capability Association. www.capabilityapproach.com/pubs/HDCA_Brie-
fing_Concepts.pdf. Accessed April 27, 2012
Amheim R (1969) Visual thinking. University of California Press, Berkeley
Bilda Z, Gero JS (2005) Do we need CAD during conceptual design? In: Martens B, Brown A
(eds) Computer aided architectural design futures: proceedings of the 11th international CAAD
futures conference held at the Vienna University of Technology, Vienna, Austria, 20–22 June
2005, pp 155–164. Springer, Dordrecht
Brooks FP Jr (2010) The design of design: essays from a computer scientist. Addison-Wesley
Professional, Upper Saddle River
Buxton W, Myers BA (1986) A study in two-handed input. In: Mantei M, Orbeton P (eds) CHI ’86
Proceedings of the SIGCHI (Special Interest Group on Computer-Human Interaction)
conference on human factors in computing systems, Boston, MA, USA, 13–17 April 1986.
Association for Computing Machinery, New York, pp 321–326
Coons SA (1963) An outline of the requirement for a computer aided design system. In: Johnson
EC (ed) AFIPS ’63 (Spring) Proceedings of the May 21–23, 1963, spring joint computer
conference, Detroit, USA. Association for Computing Machinery, New York, pp 299–304
Cross N, Dorst K (1999) Co-evolution of problem and solution spaces in creative design. In: Gero
J, Maher M (eds) Computational models of creative design IV. Key Centre of Design, Sydney
DeGregori TR (1989) A theory of technology: continuity and change in human development.
Affiliated East-West Press, New Delhi
Dorta T, Pe´rez E, Lesage A (2008) The ideation gap: hybrid tools, design flow and practice.
Des Stud 29(2):121–141
Ferguson ES (1992) Engineering and the mind’s eye. The MIT Press, Cambridge, MA
Hsu W, Woon IMY (1998) Current research in the conceptual design of mechanical products.
Comput Aided Des 30(5):377–389
International Union for Conservation of Nature (IUCN) (1986) Tradition, conservation and
development: occasional newsletter of the commission on ecology’s working group on tradi-
tional ecological knowledge. IUCN, Gland
Design-Technology and Sustainability 85

International Union for Conservation of Nature (IUCN) (1993) Guide to preparing and
implementing national sustainable development strategies and other multi-sectoral environ-
ment and development strategies. IUCN, New York
Jenkins DL, Martin RR (1993) The importance of free hand sketching in conceptual design:
automatic sketch input. In: Hight TK, Stauffer LA (eds) Design theory and methodology, DTM
’93: presented at the 1993 ASME design technical conferences, 5th international conference on
design theory and methodology, Albuquerque, New Mexico, 19–22 September 1993, vol 53 of
DE series. American Society of Mechanical Engineers, New York, pp 115–128
Larkin JH, Simon HA (1987) Why a diagram is (sometimes) worth ten thousand words. Cognit Sci
11(1):65–99
Leonard-Barton D (1995) Wellsprings of knowledge: building and sustaining the sources of
innovation. Harvard Business School Press, Boston
Lipson H, Shpitalni M (2000) Conceptual design and analysis by sketching. J AI Des Manuf 14
(5):391–401
McCrone J (1991) The ape that spoke: language and the evolution of the human mind. William
Morrow, New York
McKim RH (1980) Experiences in visual thinking, 2nd edn. Brooks/Cole, Monterey
Nussbaum MC (2000) Women and human development: the capabilities approach. Cambridge
University Press, Cambridge
Oosterlaken I (2009) Design for development: a capability approach. Des Issues 25(4):91–102
Pahl G, Beitz W (1996) Engineering design – a systematic approach, 2nd edn. Springer, London
Papanek V (1984) Design for the real world: human ecology and social change, 2nd edn. Thames
& Hudson, London
Puttre M (1993) Gearing up for conceptual design. Mech Eng 115:46–50
Robeyns I (2005) The capability approach: a theoretical survey. J Hum Dev 6(1):93–114
Sayers DL (1941) The mind of the maker, 1st edn. Methuen, London
Schumacher EF (1973) Small is beautiful: economics as if people mattered. Blond & Briggs,
London
Sen A (2004) Capabilities, lists, and public reason: continuing the conversation. Fem Econ 10
(3):77–80
Tovey M (1989) Drawing and CAD in industrial design. Des Stud 10(1):24–39
Ullman DG,Wood S, Graig D (1989) The importance of drawing in the mechanical design process.
Preprints of NSF engineering design research conference, University of Massachusetts,
Dartmouth
Veblen TB (1961) The place of science in modern civilization. The Viking Press, New York
Weinzapfel G (1973) It might work but will it help? In: Proceedings of the design activity
international conference, London
Willey DS (1976) Approaches to computer-aided architectural sketch design. Comput Aided Des 8
(3):181–186
WordWeb software (2005) Version 4. Princeton University, Princeton. Retrieved on July 10, 2009
86 S. Rama Murthy and M. Mani

Technology Management Issues
in the Indian Medical Devices Industry:
A Morphological Analysis
Ananthavalli Ramesh and L. Prakash Sai
1 Introduction
Technology management (TM) can be viewed from many different perspectives.
The two words technology and management can be interpreted as technology,
management, technology management and management of technology. However,
all of them are interrelated and integrated into technology management system
as a whole. Technology is defined as applied science and limits the scope on
the issues engaged by engineers and scientists. Management involves degree of
creativity, leadership, risk, performance and concern about uncertainty. Gaynor
(1996) defined management as an applied art that involves using the linkage
of data, information, knowledge and the social interaction between people in
solving problems.
The management of technology (MOT) has been under the strong influence
of engineering-based disciplines (Chanaron and Jolly 1999). The field’s structure
is inherited from research and development (R&D) management, and the main-
stream in the literature initially dealt with topics such as project evaluation and
selection, R&D organization, technology forecasting, etc. Strong emphasis was put
on the management of technological assets through MOT. However, TM is defined
as a whole system of product, knowledge, resources, infrastructure and activities
(Dankbaar 1993). TM is applicable to every phase of technology-oriented businesses
(application or development) such as R&D, product development and manufacturing
and knowledge management and processes. It provides a platform to new business
horizon in terms of products, processes and assets (patents).
A. Ramesh (*) • L.P. Sai
Department of Management Studies, Indian Institute
of Technology Madras, Chennai 600036, India
e-mail: [email protected]; [email protected]
Department of Management Studies, Indian Institute of Science, Bangalore,
Driving the Economy through Innovation and Entrepreneurship,DOI 10.1007/978-81-322-0746-7_8, # Springer India 2013
87

Many research articles are published pertaining to technology development
(Klepper 1996), diffusion (Rogers 1995), substitution (Dodds 1973) and forecasting
(Bass 1969). Authors discuss about the key parameters that affect the stages of
technology management. However, mapping of all stages of technology management
with adequate parameters does not exist. This chapter attempts to map the parameters
in different stages of technology management for Indian medical devices industry.
Major issues pertaining to technology management in the Indian medical
devices will be discussed conceptually in this chapter in terms of the following:
1. Regulation issues (from the perspective of the policy planners)
2. Technology choice and justification (from the perspective of manufacturers
and users)
Technology leads the medical devices to improve the service quality and also
cutting cost in order to curemanydiseases. The complicated electrocardiogram12 lead
(ECG/EKG) replaces capillary electrometers and, in turn, is replaced by personal
handheld devices. According to Global Harmonization Task Force (GHTF), medical
devices referred to all tools ranging from sophisticated computerized medical equip-
ment to simple tongue depressor. However, it does not include aids for disabled,
animal treatment devices and accessories.
2 Indian Medical Devices Industry
The medical device industry in India is valued at $2.7 billion in 2008. Driven by
increasing awareness and affordability coupled with an increasing patient pool, the
market is forecast to grow by 12% annually for the next 7 years to reach $6 billion
in 2015 (NewsMedical 2009). The fact that the Indianmedical device industry, so far,
has remained insulated from the global recession can be attributed to several ongoing
trends. Medical tourism is estimated around $45 billion in 2010. Cost of medical
tourism in India is cheaper compared to the other countries like Singapore, Thailand
andMalaysia (Businessworld 2011). Report fromAssociated Chambers of Commerce
and Industry of India (ASSOCHAM) points out that players belonging to private
equity segment have started exploring ways for investing in such health-care facilities.
The industry is viewed as highly capital intensive, with a long gestation period.
Efficacy, safety and product quality are the key attributes of the medical devices
which differentiate from other products (Abrams and Hessel 1987). Efficacy is
measured in terms of effectiveness and efficiency. Extensive verification and validation
is performed to increase the efficacy. Animal, clinical and market tests are performed
to improve the safety and quality parameters. Pre-market approval (PMA) is manda-
tory to sell the product in the USA especially for class 3 (life-supporting medical
devices) products. The product should obey the government regulation which is
different from one country to another. TM issues pertaining to policy, technology
choice and justification are discussed in this chapter from the perspective of policy
planner, manufacturer and user.
88 A. Ramesh and L.P. Sai

Indian medical industry is unique mainly because of the following reasons:
Regulation (for Policy Planners)
Indian regulation calls only forULmarking for all themedical devices.ULmarking
tests only the product against its stated product performance. FDA and EU
categorizes the medical devices into class 1 to class 3 based on risk (class 3 is the
highest risk); however, Indian medical device regulation is still on anvil. UL mark
facilitates the foreign manufacturers (especially from the USA and Europe) to
capture the Indian market (since the CE and FDA norms are more stringent than
UL norm). However, Indian manufacturers have to further fulfil the stringent
FDA regulation and CEmark if they want to capture the overseas market.
Product Development (for Manufacturer)
Indian medical devices are deployed in hospitals based on return on investment
(ROI), the cost of the machine (patient’s affordability) and utilization are
need for Indian market. Since the development of medical devices depends
on the technology platform and innovation, it challenges the Indian
manufactures in terms of R&D investment, technology innovation and over-
seas competition. It took nearly 30 years for GE to capture Indian market.
Though GE health care was established in India during the 1960s, it made the
breakthrough product (Logic-100 – ultrasonography machine) by 1990 after
partnering with Wipro for low-cost product (Business India 2008).
Multinational players such as GE and Philips redeveloped the MRI machines to
suit Indian market by reducing the price tag to one fifth of the original prices
(Business India 2008, 2011). However, the original equipment are developed
in the USA/EU to suit FDA and CE mark regulation. Apart from the product
competition, Indian medical device manufacturer faces competition in terms of
financial back up, domain knowledge and development cost.
Medical Insurance (User)
Indian medical insurance is operated by government and private players. Though
government insurance is affordable and free for underprivileged population (below
poverty line [BPL]), the preferred provider network (PPN)1 for such scheme is
substantially less (Businessworld 2010), whereas the private medical insurance has
higher premium amount and has higher PPN and covers all the diseases. The
difference in PPN is mainly because of hospital tariffs. Most of private hospitals
are equipped with latest technology machines, infrastructures, etc., which increase
the cost of the medical treatment. If insured in the USA and Europe, Third Party
Administrator (TPA) rationalizes the medical treatment tariffs by assessing the
prescribed treatment options and medications. In India, 10–15% of the patient
population is under medical insurance cover, and the remaining have to pay
from their own pocket without TPA assessment (Business India 2011). Uninsured
1 PPN is a list of hospitals that can claim dues directly from the insurer instead of charging the
patient.
Technology Management Issues in the Indian Medical Devices Industry. . . 89

patients travel across India for the right treatment options. Treatment options
are explored in terms of cost, reputation of the doctor and contacts which are ill
structured. Considering all these uniqueness, this chapter attempts to bring out
the possible technological challenges in Indian medical device industry from the
policy planner, producer and user perspectives. This has been done based on the
literature review and screening of the variables that are identified as key issues in
Indian Medical Devices Industry.
3 Literature Review
In this chapter, literature review is discussed in two categories, namely, technology
management and medical devices:
3.1 Technology Management
Technology changes the way many business activities are conducted. The effective
TM brings competitive advantage, which is one of the key important factors
for many companies. It is necessary to understand, communicate and integrate
technology strategy with marketing, financial, operations and human resource
strategies.
Technology management maturity model (TMMM) was employed to assess
the technology management maturity level by promoting technology management
capability (Phaal et al. 2001; Wu et al. 2010). Wu et al. developed empirical model
to evaluate the importance of strategic planning of TM for high-tech Chinese
organizations. TMMM had five levels, namely, initial level, defined level, managed
level, benchmarking level and continuous improvement level. Strategy planning for
technology elements were identified (such as resources, organizational culture and
quality) were evaluated. Selection of these elements and applicability to multinational
organizations were not discussed. Gregory (1995) established TM five-process
model through protection, identification, selection, acquisition and exploitation.
Skilbeck and Cruickshank (1997) extended Gregory’s five-process model, linking
the frame work to business activities such as corporate, business and operational
level. A technology management assessment procedure (TMAP) was employed to
manufacturing organization to assess development and testing processes (Phaal
et al. 2001). Through a case study, the authors proved that TMAP improved organi-
zational communication and decision-making process.
Steven Klepper (1996) discussed about product lifecycle (PLC) in terms of
entry, exit, growth and innovation. The author further discussed and proved the
role of technology selection on PLC such as how technology selection criteria
influenced the market penetration. Cooper and Kleinschmidt (1986) conceptually
established product development process based on available technology. The authors
divided the development process into three different categories with respect to
90 A. Ramesh and L.P. Sai

technology, time and risk. Many frameworks were developed to understand the
diffusion of new technology (Rogers 1995) and mentioned about different types of
followers for adapting new technology such as early adapters, followers, leapfroggers
and laggards. Diffusion theory was further deployed to understand the technology
forecast (Bass 1969). This chapter addresses this gap through TM processes and
conceptually identified the issues faced during this phases.
3.2 Medical Device
Medical Technology constantly strives to innovate to improve the products for the
benefit of the patients and healthcare professionals. In addition to this different
policy choices, funding, procurement, producer-user relationship are some of key
parameters of medical technology management. The technology adaptation process
is affected due to government policy especially medical insurance regulation
(Nandakumar et al. 2009). The authors further indicated that, medical technology
diffusion is also different with respect to economic status of the country. This
affects the hospitals to procure and adapt for newer medical devices. 1967 smallpox
was eradicated in USA however only by 1970 the eradication program was initiated
in India and Nigeria.
Appelt and Hauser (2006) proposed clinical marketing framework to address
product introduction, adoption and PLC management of medical devices. The
authors commended that the commercial success of medical devices was deter-
mined by the strength of clinical evidence. This evidence-based marketing was
further supported by Torbica and Cappellaro (2010) through their study on medical
equipment diffusion in Europe.
4 Methodology
4.1 Morphological Analysis
Morphological analysis, a term coined by Zwicky (1962), means deconstruction
of a specified problem or system into its basic variables, each variable becoming
a dimension on a morphological box. Morphological analysis (MA) is employed to
list and analyse the various options and dimensions. MA is preferred mainly
because of its capability to bring up the qualitative and quantitative methods
on surface for the exploration. With this structured methodology, the technology
management issues of medical devices can be done very effectively and efficiently.
MA is a problem-structuring and problem-solving technique by systematically anal-
ysing dimensions and options. It is designed for multidimensional, non-quantifiable
problems, where the statistical and mathematical models will not yield results.
Technology Management Issues in the Indian Medical Devices Industry. . . 91

Hall (1969) used this technique to develop a three-dimensional morphology of
system engineering. Newer, innovative applications of MA have been proposed by
some authors. Shurig (1984) introduced the ‘Category Grid’ method while using the
idea of morphology to explore new technologies. Yoon and Park (2005) introduced
‘keyword-based’ MA to identify technology opportunities. Later, through a hybrid
approach, they used MA to forecast new technology (Yoon and Park 2007). MA is
applied in this chapter to conceptually address the issues faced by Indian medical
devices industry based on the available literatures.
5 Regulation Issues
The regulation of medical devices is a vast and rapid evolving field. It is compli-
cated because it is tied up with legal technicalities in terms of safety, cost and
reliability. Regulations for medical devices can be segregated into three different
phases, namely, pre-market, on-market and post-market. The following figure
(Fig. 1) explains the regulation phases and regulation requirement:
The number of published literatures in the field of medical device regulation
is provided in the following graph (Fig. 2). The literature search is performed
by searching ‘medical devices’ and ‘regulation’ in title, abstract or in keywords.
Further, the article is analysed for the relevant contribution. The first article was
published by Foote (1978) by analysing the scope for improvement of Food
and Drug Administration (FDA). Later, in 1987, Hauptman and Roberts studied
about the impact of regulations (pros and cons) for medical device manufacturers.
WHO and GHTF published several articles with respect to development of medical
device regulations. Seventy percent of the publications are from theUSA commenting
about FDA. European Union has publication contribution of 10–15%, whereas there
is no published literature commending about Indianmedical device regulatory system.
Table 1 provides MA for regulation issues which pertain to the Indian medical
device policy planner, starting from identification of regulatory requirements for the
new medical device. The key dimensions are identified from the published literatures
and shortlisted based on the applicability in Indian medical device industry. Few key
Fig. 1 Medical device regulation
92 A. Ramesh and L.P. Sai

differences observed (between India and other countries) through literature review
are listed below:
• Medical insurance company is one of the key stakeholders in the USA/EU
for medical device approval. They also worked as treatment administrators by
controlling the prescribed treatments and costs. Thus, ‘Cycle of Care’2 and ‘Flow
of Money’3 is different in India and the developed countries.
• Researchers have contributed by studying US and EU medical device regula-
tion which pertains to its development and effectiveness. However, literatures
2 Based on how patients interact with medical system in place; it focuses on diagnosis and
treatment.3 Stakeholders behind the medical treatment to finance the cycle of care.
1970-1980 1981-1990 1991-2000 2001-2011
Number ofPublications
2 35 51 112
0
50
100
150
Number of Publications on Medical Device Regulation
Fig. 2 Published articles in medical device regulation
Table 1 Regulation issues
Dimension
(issues) Options (solutions)
Regulation
certification*
Applicable for
medical devices
Not applicable for
disable aids
Certification
depends on
References Technology type Product class
Regulation
applicability*
Product electronics Product software Physical
product
Regulatory type Pre-market Post-market Import Export
Regulation for* Manufacturer Vendor User
Applicable
standards
India (UL marking) USA (PMA)* EU (CEMark)* China (SFDA-
CE mark)*
Product risk High risk Low
Reference* Technology Functional Software Electronics
Post-market
surveillance
Registration
(implants)
Distribution record Recall
procedures
Mandatory
reporting
Regulation – legal requirement for medical device to sell in the market; regulations are applicable
to product, software and electronic components. Post-market surveillance: after-sale plan, espe-
cially for implants, recall activities and reliability
Keeping in mind the constraints on the length of the chapter, only selected dimensions and
references are presented and briefly explained. The authors can be contacted for the full morpho-
logical analysis explanations and references for the dimensions
Technology Management Issues in the Indian Medical Devices Industry. . . 93

commending about Indian medical device industry are rare. The listed issues and
options facilitate the researchers to contribute in the future to enhance the Indian
medical device industry. ‘*’ marked in the MA table indicates the availability of
literatures (not from India) in the specified dimension.
6 Technology Choice and Justification Issues
The manufacturers of medical technology constantly innovate new medical devices
for the patient’s benefits. The technology advancement of every new medical device
is beneficiary to healthcare professionals (improved access and process) and to
patients (lesser pain and reduced recovery time). Literature search is employed by
analysing ‘TM’ in abstract and keywords further analysing ‘medical device’ in the
complete text. One hundred and forty two articles are identified based on this search,
and 53 articles are shortlisted based on the study objective. Product quality in medical
device was first initiated by Caceres et al. (1983) by studying the medical technology
choice and justification. Literature contribution in TM of medical devices is growing
in every decade with different areas of interest (Fig. 3).
Understanding of regulation requirements for the proposed new medical device
will pave a way for technology choice (selection, implementation and strategy). Indian
medical device industry is different in the following ways for technology choice and
justification:
• User justification of medical devices is a complex evolutionary process. The
demand as well as on the supply side has a crucial impact on technology
justification. Indian medical device industry has yet to establish the relationship
between producer and user. In India, associated risk to user/buyer especially in
post-market surveillance determines the product justification (Business India2011). Product disposability is key concern in India mainly because of lack of
established disposal processes.
• The following MA table (Table 2) provides the research contribution. The ‘*’
marked dimensions have more literature contribution (not from India) than other
dimensions.
1981-1990 1991-2000 2001-2011
Number ofPublication
2 18 33
0
20
40
Number of Publications in Technology Management of Medical Devices
Fig. 3 Published articles in TM of medical device
94 A. Ramesh and L.P. Sai

Table
2Technologychoiceandjustificationissues
inIndianmedical
deviceindustry
Dim
ension(issues)
Options(solutions)
Techn
ologychoice
(for
policymakersan
dman
ufacturers)
Technologytype*
Existing
Increm
ental
Breakthrough
Technologyfor*
Diagnosis
Prevention
Monitor
Treatment
Valuefortechnology(benefitperiodofan
advanced
medical
technology)
Verylongterm
(more
than
10years)
Longterm
(1–10years)
Shortterm
(lessthan
a
year)
Riskclasses(notapplicable
forIndia
asondate)*
Class
I(low
risk)
Class
II(m
oderaterisk)
Class
III(highrisk)
Class
IV
(highest
risk)
Sourcing
Imported
(finished
product/
parts)
Exportraw
materialand
importparts
In-house
manufacturing
R&D
set-up
In-house
Mergersandacquisitions
Multinational
company
Intellectual
property
rights*
Patented
NotPatented
Applied
forpatent
Proposedtechnological
impactto
user*
High
Medium
Noim
pact
Social
impact
Rural
Urban
Publichealthcentres
Donation
Usertype*
Doctors
Nurses
Lab
technician
Individual
Technologytesting*
Virtual
Lab
testing
Clinical
testing
Technologyhazardtype*
Hazard
Nothazard
Usagepattern*
Frequently(once
inaday)
Use
andthrow
Once
inamonth
Once
inayear
Customer
expertise
Expert
Skilled
Sem
i-skilled
Training
required
Product
launch*
Lead-lag
effect
(cross-
countryinfluence)
Notapplicable
Riskpotential
onproduct
life
cyclestage*
Saddle
point
Takeoffperiod
Technology
generations
Scopeofcompetition*
High(m
anyplayers)
Medium
(few
players)
Low(nocompetition)
(continued)
Technology Management Issues in the Indian Medical Devices Industry. . . 95

Table
2(continued)
Dim
ension(issues)
Options(solutions)
Techn
ologyjustification
issues
(for
user/bu
yer)
Technologyim
pact
Perform
ance
Features
Functionality
Usability
Product
operational
requirem
ent*
Needrefillsandaccessories
Specificenvironment
Calibration/m
aintenance
Scheduledmaintenance
Onrequest
Product
disposal*
Reuse
Recycle
Stringentdisposal
process
Buy-back
Post-m
arket
surveillance*
Registration(implants)
Distributionrecord
Mandatory
reporting
channels
Complaints
Saddle
isdefined
asdecreased
insalesbetweenearlyandmainmarket
(Peres
etal.2010).Takeoffisdefined
astimeat
whichadramatic
increase
insales
occursthat
distinguishes
thecut-offpointbetweentheintroductionandgrowth
stageoftheproduct
life
cycle(Peres
etal.2010)
96 A. Ramesh and L.P. Sai

7 Discussions and Conclusions
Patient population in India continues to demand improved health services. The fact
that the corporate hospital groups in India are responding to the demand by building
up new health-care infrastructure should ensure that all stakeholders in this industry
continue to benefit (Business India 2011). Understanding of key dimensions for
effective regulation, technology choice and justification will facilitate Indian medi-
cal device industry to grow in terms of effective regulation and research contribu-
tion. This chapter brings out the key dimensions for TM and research gap (for the
benefit of the Indian policy planners, manufacturers, users and researchers) through
MA. MA is employed in this chapter mainly because of simplicity and ability to
bring out the hidden issues. Buyer/user decision process is different in Indian
government and private hospitals which is beyond the scope of this study.
Indian medical device industry should also equip itself by several innovative
devices developed by Indian manufacturers to meet the demand.
References
Abrams HL, Hessel S (1987) Health technology assessment, problems and challenges.
Am J Roentgenol 149:1127–1132
Appelt P, Hauser T (2006) Prescribing innovations: a practical framework for effective marketing
of medical device innovations. J Med Mark 6:195–202
Bass FM (1969) New product growth model for consumer durables. Manage Sci 15:215–227
Business India (2008) Driving medical device innovation, 1 June, pp 69–74
Business India (2011) Changing faces (Hospital survey), 24 July, pp 64–75
Businessworld (2010) Differential treatment, 17 July
Businessworld (2011) Health care opportunities, 25 April
Caceres CA, Yolken HT, Jones RJ, Piehler HR (1983) Medical devices: measurements,
quality assurance and standards. American Technical Fub&shm Ltd., pp 306–312
Chanaron JJ, Jolly D (1999) Technological management: expanding the perspective of manage-
ment of technology. Manage Decis 37:613–620
Cooper RG, Kleinschmidt EJ (1986) An investigation into the new product process: steps,
deficiencies and impact. J Prod Innov Manage 3:71–85
Dankbaar B (1993) Research and technology management in enterprises: issues for community
policy. Overall Strategic Review, EUR, 15438-EN, Brussels
Dodds W (1973) An application of the Bass model in long-term new product forecasting. J Market
Res 10:308–311
Foote SB (1978) Loop and loopholes: hazardous device regulation under the 1976 medical device
amendments to the food, drug and cosmetic act. Ecol Law Q 7:101–135
Gaynor GH (1996) Handbook of technology management. McGraw-Hill, New Delhi
Gregory MJ (1995) Technology management: a process approach. Proc Inst Mech Eng
209:347–356
Hall AD (1969) Three-dimensional morphology of systems engineering. IEEE Trans Syst Sci
Cybern 5(2):156–160
Hauptman O, Roberts EB (1987) FDA regulation of product risk and its impact upon young
biomedical firms. J Prod Innov Manage 4:138–148
Technology Management Issues in the Indian Medical Devices Industry. . . 97
Klepper S (1996) Entry, exit, growth and innovation over the product life cycle. Am Econ Rev
86:562–583
Nandakumar AK, Beswick J, Thomas CP, Wallack SS, Kress D (2009) Pathways of health
technology diffusion: the United States and low-income countries. Health Aff 28:986–995
News Medical (2009) Comprehensive report on medical equipment in India. Published on 29
October
Peres R, Muller E, Mahajan V (2010) Innovation diffusion and new product growth models:
A critical review and research directions, International Journal of Research in Marketing,
27:91–126
Phaal R, Farrukh CJP, Probert DR (2001) Technology management process assessment: a case
study. Int J Oper Prod Manage 21:1116–1132
Rogers EM (1995) The diffusion of innovation, 3rd edn. Free Press, New York
Shurig R (1984) Morphology: a tool for exploring new technology. Long Range Plann 17:129–140
Skilbeck JN, Cruickshank CM (1997) A framework for evaluating technology management
processes. Portland international conference on management of engineering and technology
(PICMET), Portland, July
Torbica A, Cappellaro G (2010) Uptake and diffusion of medical technology innovation in
Europe: what role for funding and procurement policies? J Med Market 10:61–69
Wu W, Liang D, Yu B, Yang Y (2010) Strategic planning for management of technology of
China’s high technology enterprises. J Technol Manag China 5:6–25
Yoon B, Park Y (2005) A systematic approach for identifying technology opportunities: keyword-
based morphology analysis. Technol Forecast Soc Change 75:145–160
Yoon B, Park Y (2007) Development of new technology forecasting algorithm: hybrid approach
for morphology analysis and conjoint analysis of patent information. IEEE Trans Eng Manage
54:588
Zwicky F (1962) Morphology of propulsive power. Monograph 1. Society for Morphological
Research, Pasadena
98 A. Ramesh and L.P. Sai

Managing Innovation in Perceived Low-Tech
Industries: A Review of the Technology
Management Practices of the Fish
Processing Industry of Newfoundland
and Labrador
Christian E. Coronado Mondragon and Adrian E. Coronado Mondragon
1 Introduction
A myriad of studies in innovation management emphasizing the pre-eminence of
high-tech industries in the knowledge economy have been the common denomina-
tor in the innovation debate. In this regard, Christensen et al. (2011) have acknowl-
edged the fact that the innovation dynamics of industries in the primary sector have
received limited attention from scholars, practitioners and policymakers. Non-
etheless, primary sector activities are still the source for economic progress for
developed and developing nations alike.
This study is aimed to help document the dynamics of innovation and techno-
logical chance in the fishing and fish processing industry of the Canadian province
of Newfoundland and Labrador. We believe this chapter will be useful to enable the
improvement of managerial practices by local producers. In addition, it could assist
in the documentation of the policy changes needed to ignite economic sustainable
growth for this industry in the province of Newfoundland and Labrador.
1.1 North Atlantic Fisheries and Fish Processing Industry
The fishing and fish processing industry in the North Atlantic has been a source of
wealth and labour for centuries. According to Agnarsson (2003), the North Atlantic
C.E.C. Mondragon (*)
School of Ocean Technology, Fisheries and Marine Institute of Memorial
University of Newfoundland, P.O. Box 4920, St John’s, NL, Canada A1C 5R3
e-mail: [email protected]
A.E.C. Mondragon
School of Management, Royal Holloway University of London,
Egham Hill, Surrey TW20 0EX UK
e-mail: [email protected]
Department of Management Studies, Indian Institute of Science, Bangalore,
Driving the Economy through Innovation and Entrepreneurship,DOI 10.1007/978-81-322-0746-7_9, # Springer India 2013
99

countries that are more heavily dependent on the fish processing industry are the
Faroe Islands, Iceland, Greenland (Denmark), Newfoundland (Canada) and, to a
lesser degree, Norway.
Danielsson (1997), as cited in Agnarsson (2003), emphasized that in terms of
labour productivity, the Icelandic fish processing industry is slightly more produc-
tive than their Norwegian or Danish counterparts. Olafsson (2001), as cited in
Agnarsson (2003), claims that in terms of processing efficiency, Iceland and
Norway represent the clear benchmark for the North Atlantic region. In Olafsson’s
study, the average efficiency of fish processing firms in Iceland and Norway is the
same, with a score of 0.83. Newfoundland was not considered in Agnarsson’s study
due to the lack of detailed and available data. The picture in Fig. 1 shows a highly
automated fish processing facility in Iceland circa 2009.
1.2 Canada’s and Newfoundland and Labrador’s FishingIndustry Context
According to Fisheries and Ocean Canada (2011), shellfish (lobster, crab, shrimp,
scallop, clam, mussels and oysters) are the most profitable seafood accounting for
$1.26 billion CAD, in landing value (fished shellfish) for the year 2009. In Canada,
groundfish (cod, haddock, halibut, Greenland turbot, flatfish, pollock and others)
landings accounted for $237 million CAD in 2009. According to the same report,
pelagic fish’s (tuna, herring and mackerel) landed value was $101 million CAD
in 2009.
Fig. 1 Automated fish processing facility in Iceland (Courtesy of Mr. Randy Gillespie,
reproduced with permission)
100 C.E.C. Mondragon and A.E.C. Mondragon

In terms of commercialization formats, the Food and Agriculture Organization
(FAO) (2010) report of the subcommittee of Fish Trade reports that due to the
increasing changes on consumer patterns, live and fresh fish have become increas-
ingly important sources of monetary value, as stated in the following quotation
from the FAOs (2010: p. 7):
Producers of traditional products, in particular of canned fish, have been losing market
share to suppliers of fresh and frozen products as a result of long-term shifts in consumer
preferences. Consequently, the price of canned fish products has dropped in most markets.
The Canadian province of Newfoundland and Labrador (NL) is located in the
North Atlantic corner of the North American subcontinent. The province has an
estimated population of circa 511,000 inhabitants (NL Statistics Agency 2011).
Historically, the fishing industry in the Canadian province of NL has been the
backbone of the provincial economy. It is also a very important component of
the social tissue for Newfoundlanders and Labradorians. For more than 200 years
of economic provincial history, the fishing industry in NL has been dedicated and
focused mostly on the fishing, processing and commercialization of groundfish (i.e.
cod fish). Today, the fishing industry has lost relevance to the provincial and
national economy.
For instance, in Canada, the fishing industry alone contributes to approximately
two billion Canadian dollars into the national GDP (Fisheries and Oceans Canada
2011). In the year 2008, the fishing and fish processing industry provided employ-
ment for nearly 80,000 people in the whole country (Idem).
Particularly, for the province of NL, the fishing (hunting and trapping included)
and fish product industry contributes 0.7 and 0.8, respectively, to the provincial
GDP (Department of Finance 2010). According to Fisheries and Oceans Canada
(2011), in the province of Newfoundland and Labrador, the most commonly
captured species, for its commercial value, are crustaceans (snow crab, lobster
and shrimp) and groundfish (cod and turbot).
Figure 2 below helps to graphically portray the value of captured species in
terms of their commercialization format. Basically, for high-value low-yield species
(i.e. lobster and snow crab), the fresher it is, the higher value it has.
1.2.1 Current Technology Adoption Practices in the Fishing Industry
of Newfoundland and Labrador
Traditionally, the economy of the province of Newfoundland and Labrador has
been bound to the exploitation of fish- and fishing-related products for generations
(Fisheries Heritage 1998). However, ever since the exploitation of nonrenewable
resources started in the late 1990s, the industry has experienced a continuous
degradation of its technological and social foundation. This situation has made
it harder for Newfoundland’s fish producers and manufacturers to remain com-
petitive in the global fish product market. Most of provincial fish producers
are small to medium enterprises in size making it harder to devote extensive
resources to develop new technologies; most of these manufacturers do not have
Managing Innovation in Perceived Low-Tech Industries: A Review. . . 101

R&D departments. According to a prominent executive of the fishing industry in
the province, this situation is described as follows:
Nearly all harvesting and processing enterprise [in the Province] are small and medium
sized enterprises (SMEs) and SMEs typically don’t spend much on innovation in any
industry. Our industry also has the added problems of poor Return-on-Investment (ROI)
and a short operating season, so participants are under ongoing pressure to minimize costs.
In addition to the situation described above by the prominent executive, it was
highlighted that Newfoundland and Labrador’s fishing is defined as being low-tech,
labour-intensive and low-yields on ROI. Under these conditions, innovations are
mostly incremental and are generated by innovations mostly adopted from outside,
not generated from within. As explained by the same prominent executive:
In the fishing industry, groundbreaking technologies come along occasionally. The steam
engine, radar for navigation, sonar for finding fish, and hydraulics for handling fishing
gear have all had major impacts on harvesting. Refrigeration technology transformed an
industry that preserved its products through salting, smoking, and canning into one that
distributes most products fresh or frozen. In groundfish processing, flow-line technology
has greatly improved efficiency. Currently, the industry is being transformed, because
aquaculture is becoming a big factor in markets for fish products.
Furthermore, the competitive and the low-tech nature of the product and the
market dynamics of the industry discourage collaboration between industry
participants, as described below in the opinion of the same prominent executive:
The seafood sector is intensely competitive, with many suppliers, no effective barriers to
entry, and many products that are substitutes for each other. This can lead to innovations
in products, processing technologies, and marketing. However, it can also lead to unethical
practices, where one species is marketed as another that is more valuable or a poorer
quality product is represented as being higher in quality.
Fig. 2 Format that maximizes economic value of most commonly captured species
102 C.E.C. Mondragon and A.E.C. Mondragon

2 Literature Review
Despite this fact, the so-called low-tech industries account for more that 90% of the
GDP for Western European countries (Von Tunzelmann and Acha 2005; Hirsch-
Kreinsen et al. 2008; Christensen 2010). Until recently, the study of innovation was
heavily concentrated in the study of high-tech industry; fortunately, this pattern is
changing as described by Christensen (2010).
Traditionally, primary sector activities have been considered low-tech. According
to the OECD (2006), low-tech industries account for the bulk of economic activities
in developed and developing nations alike. According to the OECD (1994), the
definition of low-tech corresponds to those industries that devote on average less
than 0.9% of their expenditures to R&D.
In terms of previous research on these industries, authors such as Von Tunzelmann
and Acha (2005) and Hirsch-Kreinsen et al. (2008), among others, have devoted
significant efforts to unwrap the dynamics of innovation for low-tech industries.
In relation to the fishing industry, early studies in the field of technology manage-
ment and in the fishing industry described mixed dynamics of innovation (Levine
and McCay 1987). According to Levine and McCay (1987), innovation is generated
mostly in the way fish stocks are caught. Furthermore, they emphasize the fact
that innovation and technological change is driven by the perception of the future.
“An optimistic future in the industry will delay change, whereas a pessimistic future
will accelerate the adoption of certain catching technologies” (Levine and McCay
1987: p. 252). In a more recent study, Robertson and Smith (2008) clearly
demonstrated the increasing technological sophistication in a perceived low-tech
industry such as fishing. According to Robertson and Smith (2008: p. 112), current
fishing technology “includes the embodiment and adoption of applied technologies
in domains such wireless communication, radar, sonar, optical technologies,
robotics, fluid dynamics and material science.”
3 Methodology
The purpose of this chapter is to present a case study based on qualitative reports of
the implications and effects of product innovation, process innovation, systems’
integration and the need to rethink the management of technological innovations for
the so-called low-tech industries. An ancillary aim of this study is to serve as a
cornerstone to develop further research that could help provincial and federal
policymakers to devise and enact policies which improves economic development
in the province of Newfoundland and Labrador. Case studies were selected as an
appropriate research tool since these present and describe a situation for which little
or not sufficient empirical studies are available (Yin 2003).
Managing Innovation in Perceived Low-Tech Industries: A Review. . . 103

3.1 Case Study No. 1: Industrialization of Fish ProcessingPlants in Newfoundland
The fish processing industry of Newfoundland and Labrador is characterized for its
labour intensity and low levels of automation. Typically, wages in the provincial fish
processing industry are high when compared to similar activities conducted in
developing nations. This situation ultimately causes Newfoundland’s industry to
lag behind in competitiveness when compared to developing nations. Nonetheless,
the productivity levels of the NL fishing and fish processing industry compared to
nations with similar demographics, geography and level of economic development
(e.g. Iceland and Norway) are precarious at best. The Icelandic and Norwegian
fishing and fish processing industry is well known for their high levels of automation
and high productivity and efficiencies (Christensen 2010; Eggert and Tveteras 2011).
On this situation, the premier of the province, Honourable Kathy Dunderdale,
expressed her opinion about the grim outlook of the provincial fishing and fish
processing industry in the following statement: “We’ve got many people chasing
too few fish, and these plants are going to collapse and fail because they are not on
sound economic models” (McLeod 2011).
Development of policies designed to improve the efficiency and productivity
in the fish processing industry is lead by the Atlantic Canada Opportunities Agency
(ACOA) of the Canadian federal government. ACOA is currently supporting
several initiatives aimed to improve the efficiency and productivity of the fish
and shellfish processing industry.
3.1.1 The Crustacean Meat Commercialization Project: An opportunity
to Maximize Synergies and Improve Efficiency
Currently, the Canadian Centre for Fisheries Innovation (CCFI) is working on the
implementation of several projects to automate the extraction of high-value and
low-yield species such as lobster and snow crab. The CCFI is committed to the
development of automated production lines that minimizes human intervention.
Currently, CCFI works on the implementation and integration of complex systems
that enable the seamless extraction of shellfish. The integration of these technologies
includes systems such as visual controllers, automated conveyors, robots, logic
controllers, high-pressure processing equipment, lobster and crab meat extraction
apparatus, waste disposal equipment and processed product systems. The drawing
below depicts the foreseen automated system to seamlessly extract crustacean
meat (Fig. 3).
3.2 Case Study No. 2: Increasing Value Retentionin the Logistic Chain of Live Shellfish
Innovations in the transportation of live fish and shellfish have mostly been con-
centrated on the development of incremental improvement in container technology.
104 C.E.C. Mondragon and A.E.C. Mondragon

Companies such as BioNovations Inc., from the Atlantic province of Nova Scotia in
Canada, have pioneered the development of high-tech containers for the transport of
live fish and shellfish products. To the best of their knowledge, the authors of this
chapter are not aware of any related project to increase the visibility of supply chain
for shellfish products.
Lobster and other perishable shellfish products retain higher value alive rather
than butchered. For this reason, we believe that a technology that helps increase the
survivability rate of shellfish products during transportation (especially for long-
haul ground trips) could be very beneficial to harvesters, logistics providers and end
users (retail or restaurants).
According to Berka’s (1986) report on transportation of live fish, the survival
conditions that minimize the mortality rate of transported animals are:
• Quality of transported animals
• Adequate amount of dissolved oxygen
• pH, carbon dioxide and ammonia
• Water temperature
• Activity and quantity of animals transported
The authors are proposing a pilot project that provides harvesters and end users
with access to real-time and historical information on the conditions of transported
animals such as water temperature, dissolved oxygen, salinity, pH and water
temperature information. A better understanding of the dynamic biophysical
conditions influencing the survivability of transported animals will be useful for
harvesters, logistic operators and end users to better control their value chain and
will allow better decisions on improving the transportation of these animals (Fig. 4).
4 Conclusions and Future Research
This chapter has discussed innovation and technology in a perceived low-tech
industry, namely, the fish processing industry. Recent studies on innovation in the
primary industry sector, such as Christensen et al. (2011), have helped to redefine
Fig. 3 Conceptual drawing of automated crustacean meat extraction system
Managing Innovation in Perceived Low-Tech Industries: A Review. . . 105
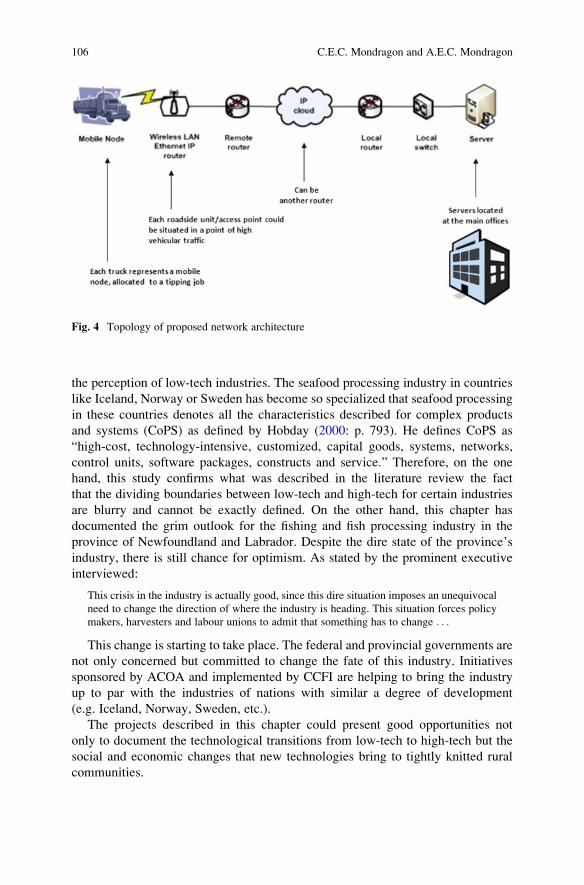
the perception of low-tech industries. The seafood processing industry in countries
like Iceland, Norway or Sweden has become so specialized that seafood processing
in these countries denotes all the characteristics described for complex products
and systems (CoPS) as defined by Hobday (2000: p. 793). He defines CoPS as
“high-cost, technology-intensive, customized, capital goods, systems, networks,
control units, software packages, constructs and service.” Therefore, on the one
hand, this study confirms what was described in the literature review the fact
that the dividing boundaries between low-tech and high-tech for certain industries
are blurry and cannot be exactly defined. On the other hand, this chapter has
documented the grim outlook for the fishing and fish processing industry in the
province of Newfoundland and Labrador. Despite the dire state of the province’s
industry, there is still chance for optimism. As stated by the prominent executive
interviewed:
This crisis in the industry is actually good, since this dire situation imposes an unequivocal
need to change the direction of where the industry is heading. This situation forces policy
makers, harvesters and labour unions to admit that something has to change . . .
This change is starting to take place. The federal and provincial governments are
not only concerned but committed to change the fate of this industry. Initiatives
sponsored by ACOA and implemented by CCFI are helping to bring the industry
up to par with the industries of nations with similar a degree of development
(e.g. Iceland, Norway, Sweden, etc.).
The projects described in this chapter could present good opportunities not
only to document the technological transitions from low-tech to high-tech but the
social and economic changes that new technologies bring to tightly knitted rural
communities.
Fig. 4 Topology of proposed network architecture
106 C.E.C. Mondragon and A.E.C. Mondragon

References
Agnarsson S (2003) Economic performance of the North Atlantic fisheries: final report. Institute
of Economic Studies, University of Iceland. Retrieved from http://www.nora.fo/files/13/
20070411152506602.pdf. Accessed 26 Apr 2012
Berka R (1986) The transport of live fish: a review. EIFAC technical paper, 48, p 52
Christensen JL (2010) Low-tech, high performance cluster in knowledge-based economies. Paper
presented at the summer conference 2010 on opening up innovation: strategy, organization and
technology
Christensen JL, Dahl M, Eliasen S, Nielsen R, Østergaard CR (2011) Patterns and collaborators of
innovation in the primary sector: a study of the Danish agriculture, forestry and fishery
industry. Ind Innov 18(02):203–225
Danielsson Á (1997) Labour productivity in the fish processing industries in Iceland, Norway and
Denmark. Mimeo, presented at the symposium on the efficiency of North Atlantic fisheries in
Reykjavik, Iceland, 12–13 Sept 1997
Department of Finance (2010) The economic report of Newfoundland and Labrador. Retrieved
from http://www.economics.gov.nl.ca/ER2010/TheEconomicReview2010.pdf. Accessed 26
Apr 2012
Eggert H, Tveteras R (2011) Productivity development in Icelandic, Norwegian and Swedish
fisheries. Appl Econ 45:709–720
FAO (2010) Committee on fisheries: sub-committee on fish trade report. United Nations, Buenos
Aires (Accessed 26 Apr 2012). Retrieved from http://www.fao.org/docrep/meeting/018/
k7290e.pdf. Accessed 10 Dec 2011
Fisheries and Oceans Canada (2011) Canada’s wild fisheries: facts and figures (Accessed 26 Apr
2012). Retrieved from http://www.dfo-mpo.gc.ca/fm-gp/sustainable-durable/fisheries-peches/
stats01/aqua-wf-ss-eng.htm. Accessed 10 Nov 2011
Fisheries Heritage (1998) Newfoundland and Labrador heritage. Retrieved from http://www.
heritage.nf.ca/society/fishery.html. Accessed 26 Apr 2012
Hirsch-Kreinsen H, Hahn K, Jacobson D (2008) The low-tech issue. In: Hirsch-Kreinsen H,
Jacobson D (eds) Innovation in low-tech firms and industries. Edward Elgar, Cheltenham,
pp 3–24
Hobday M (2000) Editorial “Innovation in complex product systems”. Res Policy 29:793–804
Levine E, McCay B (1987) Technology adopt ion among Cape May fishermen. Hum Organ
46(3):243–253
McLeod J (2011)What about that fish plant, by The Telegram December 12. Retrieved from http://
www.thetelegram.com/News/Local/2011-09-24/article-2759146/%26lsquo%3BWhat-about-that-
fish-plant,-b%26rsquo%3By%3F%26rsquo%3B/1. Accessed 26 Apr 2012
Newfoundland and Labrador Statistics Agency (2011) Annual population – Canada, Provinces and
Territories; 1971–2011. Retrieved from http://stats.gov.nl.ca/Statistics/Population/. Accessed
26 Apr 2012
OECD (1994) Science and technology policy. Review and outlook. OECD, Paris
OECD (2006) OECD science, technology and industry outlook 2006. OECD, Paris
Olafsson K (2001) Efficiency and productivity in the production of dry and salted fish in Norway
and Iceland: a comparative study. B.A. thesis, Norwegian College of Fishery Science, University
of Tromso
Robertson PL, Smith K (2008) Distributed knowledge bases in low-and medium-technology
industries. In: Hirsch-Kreinsen H, Jacobson D (eds) Innovation in low-tech firms and
industries. Edward Elgar, Cheltenham, pp 93–116
Von Tunzelmann N, Acha V (2005) Innovation in low-tech industries. In: Fagerberg J, Mowery D,
Nelson R (eds) The Oxford handbook of innovation. Oxford University Press, Oxford,
pp 406–430
Yin RK (2003) Case study research: designs and methods. Sage Publications, Thousand Oaks
Managing Innovation in Perceived Low-Tech Industries: A Review. . . 107

Part 1.3
Technology and Development

Role of Technology Management
in Development
Niruti Gupta and V. Devadas
1 Introduction
The governments and development agencies around the world have focused
on achieving development by targeting on poverty reduction for more than two
decades. There have been advances, but still nearly a quarter of the world’s popula-
tion still suffers from extreme income poverty, especially in the third world countries.However, increase in income levels and GDP growth rate are inadequate and
ephemeral measure for development. Development is multifaceted and goes beyond
increases in income levels to incorporate human welfare by enhancing people’s
choices and their substantive freedoms by providing both social and economic
opportunities.
Sustainable development is a theory of socio-economic and physical development,
not just a theory of economic growth. It considers human freedom as both the end and
the means of development (Sen 1999). Because material resources are important and
contribute to the improvement of standards of living, the theory of human develop-
ment does not deny the need for economic growth, but it holds that growth should
increase people’s choices, i.e. it should allow people to enjoy the fruits of growth in the
form of better nutrition and health, more security, protection against crime and
physical violence, better access to knowledge, more time for leisure and rest, greater
political and cultural freedom and greater participation in community life (UNDP
2001). To put it briefly, the ultimate objective of development is to provide an
environment in which the individual can lead a long, healthy and productive life.
The Declaration on the Right to Development, adopted by the UN General
Assembly on 4 December 1986, states in its Article 1 that ‘the right to development
is an inalienable human right by virtue of which every human person and all peoples
N. Gupta (*) • V. Devadas
Department of Architecture and Planning, Indian Institute of Technology,
Roorkee, Roorkee, Uttarakhand, India
e-mail: [email protected]; [email protected]
Department of Management Studies, Indian Institute of Science, Bangalore,
Driving the Economy through Innovation and Entrepreneurship,DOI 10.1007/978-81-322-0746-7_10, # Springer India 2013
111

are entitled to participate in, contribute to, and enjoy economic, social, cultural and
political development, in which all human rights and fundamental freedoms can be
fully realized’. Thus, right to development becomes central to human development
as well as over all holistic sustainable development.
Poverty is widespread in India. The World Bank in 2004 estimated that almost
one third of the world’s poorest population lives in India (World Bank 2004). The
Oxford Poverty and Human Development Initiative study done in 2007 used
Multidimensional Poverty Index to conclude that Uttar Pradesh state had the fifth
last MPI rank in the Indian states having 69.9% of its total population of 192.6
million living under poverty, contributing the largest share of 21.3% of the total
Indian poor. Economic disparities and lack of choices are even more profoundly
visible in the rural areas of Uttar Pradesh, where poverty, low quality of life and
disguised unemployment are considered to be the way of life.
Poverty reduction, although, can be achieved by increasing economic opport-
unities, expanding people’s choices and freedoms and improving their quality of
life and ‘livability’ are equally important for holistic poverty alleviation; hence, the
role of sustainable human development approach becomes prominent (Sen 1993).
This requires the provision of both employment opportunities and social and
physical infrastructure, that is readily available and usable, as well as an advance-
ment in technology to support productivity, thereby further increasing economic
opportunities and improving living standards.
Taking Lucknow District as the case study, this chapter attempts to give an
insight to the current development levels in the district and assess the elements
responsible towards achieving progressive development and poverty alleviation
while understanding the role of technology management for achieving these elements
for a holistic development, both in terms of economic development and improvement
in quality of life and livability. This chapter concludes with the policy level inter-
ventions required for the implementation of the technology-based projects and bring-
ing the stakeholders involved together.
2 Lucknow District Profile
Lucknow District, located in the heart of the state of Uttar Pradesh, housing
Lucknow City, capital of the state, has been taken up as the study area for my
research ‘Planning for Sustainable development in Lucknow District’ to understand
levels of development in poverty-stricken areas.
2.1 Physical Setting
Lucknow District has an area of 2,528 sq. km. It lies between north latitudes 26�300
and 27�100 and east longitudes 80�300 and 81�130. It is a part of central Ganga
Plain with a total population of 3,647,834 as per 2001 census (density, 1,443
persons/sq. km) (Fig. 1).
112 N. Gupta and V. Devadas

The district comprises of four tehsils, namely, Malihabad, Bakshi Ka Talab,
Lucknow and Mohanlalganj. Lucknow tehsil forms to be the district headquarter
which includes the City of Lucknow, the capital city of Uttar Pradesh and the
largest urban centre in the district. The tehsil of Malihabad is further divided into
Mal Vikas Khand and Malihabad Vikas Khand, while the tehsil Mohanlalganj is
divided into Gosainganj Vikas Khand and Mohanlalganj Vikas Khand.
The district has 835 villages distributed among the tehsils housing a total rural
population of 1,326,873. The village and urban centre distribution among the tehsils
is shown in the Table 1.
2.2 Occupational Structure and Economic Profile
The city is primarily a tertiary and service sector-based city, with a very small
percentage of secondary sector. The tertiary sector comprises of about 63% of the
total work force of the district, while 32% is involved in agrarian activities (Fig. 2).
Fig. 1 Census of India. 2001 District Administrative Atlas for Uttar Pradesh. Lucknow DistrictMap. [map]. Regenerated by Niruti Gupta: using AutoCAD 2008. 5 October, 2010
Role of Technology Management in Development 113

2.2.1 Agriculture
Secondary sector being small, primary sector and the rural areas, therefore, become
the major income generator for the district. About 92% of the district area is under
cultivation. Cultivation mainly includes sugar cane, food grains and tobacco.
Malihabad area, famous for its mangoes, contributes hugely to the district’s econ-
omy through exports.
2.2.2 Industries
In Lucknow, there are 39 large- and medium-scale industries, 12,058 small-scale
industries and 21,895 handicraft industries. Some prominent industries located in
Fig. 2 Census of India. 2001 Primary Census Abstract for Lucknow District. Tehsilwise Distri-bution of Occupational Structure in Lucknow District. [map]. Generated by Niruti Gupta: using
AutoCAD 2008, Microsoft Office Excel 2007. 10 October, 2010
Table 1 District profile
Sr. no. Tehsil Total no. of villages Urban centres
1 Malihabad 187 Malihabad, Kakori
2 Bakshi Ka Talab 208 Mahona, Itaunja
3 Lucknow 210 Lucknow
4 Mohanlalganj 230 Nagram, Gosainganj, Amethi
Total 835
Source: Census (2001)
114 N. Gupta and V. Devadas

the city are the units of Tata Engineering and Locomotives, Hindustan Aeronautics
Ltd., Scooters India Ltd., Union Carbide Limited and Mohan Meakins Breweries
Limited. Among the small-scale industries, the important ones are hosiery and
garments, repairing and servicing, rubber and plastics, chemical, and chemical
products, paper products and printing (Majumdar 2005).
The rural areas also house the small-scale industry of traditional chikan and zardoziembroidery and handicraft works, which is the next big contributor to the district’s
economy.
3 Dissatisfaction from Rural Life in the District
In my research, 18 villages and 14 wards were selected in the district based on their
development index (discussed in the next section) for conducting 300 household
surveys (180 in rural areas and 120 in urban areas) that focused primarily on
poverty levels, quality of life and social and physical infrastructure availability.
Based on the results of the primary survey, following inferences were drawn:
3.1 Lack of Employment Opportunities in Rural Areas
Rural areas are less promising in terms of employment opportunities. The worst
affected people are the landless farmers who do not find employment as there is a
higher percentage of small and medium farmers having small landholdings who do
not require agricultural labourers regularly. In addition, the wages offered are also
small as compared to the wages offered in the city. Moreover, people with large
families find it difficult to support themselves with the income through agriculture.
Thus, they are forced to come to the city and work as either ancillary or domestic
household workers or construction labourers. These workers eventually settle down
in the city in slums and squatter settlements leading to urban blight (Fig. 3).
The primary survey shows that almost 33% of the respondents commute to the
city seeking for jobs as ancillary workers or construction labourers. The primary
survey also shows that around 21% of the respondents are working as construction
workers in the city. This makes them economically vulnerable both in short run and
in long run. In the short run, they do not have employment guarantee as they are
unskilled as well as the construction process gives only a temporary employment
security. Lucknow City is a tertiary and service sector-based city, having a very
small secondary sector. It is currently in a developing phase and has high rates of
ongoing construction activities. The rate of construction activities would gradually
slow down in a few years, making these construction labourers economically
vulnerable in the long run.
Role of Technology Management in Development 115

3.2 High Instances of Selling of Agricultural Land
The investigation shows that almost 17% of the respondents have sold their
agricultural lands in the past 5 years. These people now are either employed in the
city as ancillary workers with low salaries or have established some small business of
their own. It was observed in all the 31 instances that although the value of their
physical assets was high, their expenditures were much higher than their income
levels. The current living standards cannot be maintained for a long time with such a
huge difference between the income and expenditure levels. Thus, these people also
become economically vulnerable in the long run.
3.3 Conversion of Agricultural to Non-agricultural Zones
It was observed that the agricultural lands sold within the past 5 years now have
construction of housing schemes being done on them, thereby converting them into
non-agricultural zones. Such construction activities result in haphazard develop-
ment which does not conform to the authorised development plan and therefore also
lack in physical infrastructure. The unchecked rezoning limits the land available for
agriculture, the primary generator of the economy for the district which would
ultimately lead to economic unsustainability in the future.
3.4 Declining Traditional Arts and Local Handicrafts
Lucknow, since long, has been known for its traditional chikan and zardozi works
and local handicrafts. The 27 instances in the survey show that these artisans and
craftsmen lead a very poor and miserable life. Most of these are women-headed
households. It was observed that lack of financial security, income opportunity
and raw material and market availability has curbed the traditional art. The artisans
Fig. 3 Gupta, Niruti. Survey of 180 households in 18 villages of Lucknow district for establishingliving standards in rural Lucknow. Lucknow: Adhaeya, Asti, Ataura, Bajpur Gangaura, Belwa,Bhaisora, Chanda Coder, Jehta, Khargapur, Kharsara, Kuroni, Mall, Paharpur, Parvatpur, Rahata,
Samerapitpur, Sardarpur Karora, Udaypur, 8–22 June 2011. Unpublished Survey
116 N. Gupta and V. Devadas

now seek for jobs as construction labourers in the city as these jobs are more paying.
As a result, the traditional arts are declining.
3.5 Lack of Infrastructure
The major setback in the development of the rural areas is the lack of both social
and physical infrastructure. Unavailability of electricity has an adverse impact on
the functioning of small-scale and cottage industries. Similarly, unavailability of
social infrastructure has an adverse effect on the health and education of the rural
people. The infrastructure availability in the urban areas makes the city more of a
status symbol for the rural folks, who want to abandon their rural lives and switch to
a more ‘glamorous’ life in the city, thereby increasing the pressure on the city.
4 Measures for Poverty Alleviation
4.1 Poverty, Infrastructure and Development
For understanding the relationship between poverty, infrastructure and development
in the district, a development index and a centrality index were developed. The
development index has been calculated for every village in the district by finding
out the geometric mean of the following sub-indices: growth rate index, population
density index, SC/ST population index, sex ratio index, literacy rate index, female
literacy rate index, WFPR index and female WFPR index.
Calculation
ðXÞIndex =x�minðxÞ
maxðxÞ �minðxÞ (1)
Centrality index is a measure of availability of social and physical infrastructure
in a village. It is calculated on the basis of provision of following sub-parameters:
education facility, medical facility, drinking water supply, power supply, bus service
facility, railway service facility, post and telegraph facility, bank service and recrea-
tion centre facility. For each of these facilities, a score of 2 is given if the facility is
present within the village, 1 is given if it lies within a range of 5 km from the village
and 0 if the facility is not at all available.
Figure 4 shows a comparison of development zones and centrality index. The
comparison clearly indicates the dependence of development on the provision of
infrastructure availability. Provision of infrastructure can thus enhance the levels of
development.
Role of Technology Management in Development 117

On the basis of development zones, 18 villages were selected throughout the
district in which primary surveys were conducted for assessing the income levels
and standards of living in each zone. Table 2 shows that both monthly household
and per capita income levels strongly depend on the development zone in which the
household lies. This concludes that for achieving higher income levels and thereby
alleviating poverty, higher development is required which can be achieved by
provision of adequate social and physical infrastructure. Provision of social infra-
structure enhances the capabilities of people, while the physical infrastructure
availability provides the enabling economic environments and opportunities.
4.2 Improving Agricultural Performance for Poverty Alleviation
A paper produced by DFID (2004) emphasises the historically close correlation
between different rates of poverty reduction over the past 40 years and differences
in agricultural performance. The authors see a close link between agriculture and
poverty reduction. Firstly, there is a direct impact of improved agricultural
Fig. 4 Comparing development index and centrality index (Source: Maps created on the basis of
data from Census 2001)
Table 2 Comparison of development zones, income levels and standards of living
Development
zones
Average monthly
household income (Rs.)
Average per capita
income (Rs.) Livability Quality of life
High (above 0.4) 5,943 792 0.65 0.30
Medium (0.2–0.4) 4,923 488 0.63 0.23
Low (0.0–0.2) 2,500 267 0.56 0.14
Source: Primary Survey
118 N. Gupta and V. Devadas

performance on rural incomes; secondly, better agricultural performance results in
cheaper food for both urban and rural poor; and thirdly, agriculture performance has
a fundamental role in the economic growth of farm based industrial sector.
4.3 Poverty Reduction by a Shift to Non-farm ActivitiesWithin Rural Areas
Another route by which poverty could be reduced even in the absence of economic
growth is through migration of farmworkers to off-farm jobs, either in rural or urban
areas. Christiaensen and Todo (2009) observe that as countries develop, their econo-
mies restructure away from agriculture into manufacturing and services, and people
move from rural to urban areas. They also observe that migration from farm to non-
farm work in rural areas is poverty reducing but not migration from farm to non-farm
jobs in urban areas.
The immigration process to urban areas works bestwhen cities are labour-intensive
secondary sector-based cities. Lucknow City and most of the cities in north India are
tertiary and service sector-based cities which can only provide low-paying ancillary
jobs to the immigrants, which results in lowering of their quality of life. It, therefore,
becomes important to create off-farm jobswithin the rural areas to bring about the shift
to non-farm activities and reduce the disguised unemployment prevalent in the rural
areas. Creation of the off-farm jobs in rural areas would not only provide for more
economic choices in the rural areas but also account for bigger landholdings which,
due to lack of economic alternatives, are subdivided on inheritance and result in
low-yield subsistence farming.
5 Technology Management and Enhancing
Economic Opportunities
In the light of above mentioned measures for reducing poverty and achieving a
holistic development, initiation of technology-based projects, technological inno-
vations and management, knowledge management and dissemination and informa-
tion management and communication can play a vital role for achieving these
measures and advancement of rural areas.
Rural areas in the district as well as in the state form the bottom of the pyramid
with immense manpower that is unskilled and hence are economically backward.
As observed by Prahalad (2005) both public and private sector need to join hands
with the rural folks for refining their skills and improving their performance by
imparting focused knowledge and providing them with economic alternatives and
choices. Figure 5 shows that the working procedure of the partnership can result in a
win-win situation for all stakeholders. The figure shows the development cycle of
the plan as each investment cycle results in the improvement of the rural
performance.
Role of Technology Management in Development 119

5.1 Technological Interventions for ImprovingAgricultural Performance
5.1.1 Research and Development
Research and innovation of technologies is the key to improving agriculture
performance. Biotechnological development can be used for hybridisation of better
yielding seeds and fighting plant diseases forminimising agricultural risks. Innovation
of eco-friendly fertilisers and pest control methods also aids to improve the perfor-
mance. Research on various herbs, which hold medicinal values, is also important as
these herbs may add on greatly to economy generation.
5.1.2 Industrialisation of Agriculture
The involvement of the private sector in agriculture can solve a lot of issues faced
by the primary sector in today’s context by following a corporate and industrial
approach in this sector. The lands being sold off for unauthorised housing develop-
ment can be instead purchased by the private sector for consolidation into large
land chunks with enhance productivity. The farmers can be employed by these pri-
vate companies on minimum wages as determined by the government. In the cases
where farmers do not want to sell their land, private sector can act as funding and
marketing partners where they share the profits and the risks with the farmers.
Fig. 5 Performance improvement and development cycle
120 N. Gupta and V. Devadas

5.1.3 Precision Farming and Geographic Information Systems
The satellite images and soil analysis software can be used to generate the precise
amount of fertilisers and chemicals to be used in different parts of the farmland. This
enhances productivity along with reducing input costs and thus increases profits.
5.1.4 Product Diversification and Value-Added Product Development
Food processing is an effective way of bringing in diversification of the products
along with adding an appreciation value to it for targeted consumers. It also helps in
prolonging the shelf life of the product.
5.1.5 Post-harvest Technological Development
As agro-products are perishable, it is important to develop technologies that expand
the post-harvest or shelf life of the products. Innovations in food storage, pro-
cessing, packaging and transportation can result in increasing shelf life in a wide
variety of high-quality products being available year round.
5.1.6 Information Technology and Communication for Demand
Assessment and Effective Marketing
The twenty-first century has been referred bymany as information age. Use ofmodern
communication systems and computers can dramatically enhance the capability of the
sector. Firms can assess consumer demands globally, farmers can produce crops for
specific markets, and researchers around the world can collaborate to gather and
analyse data.
5.2 Technology-Based Project for Providing Off-Farm Jobs
5.2.1 Establishment of Supportive Rural Agro and Dairy Product Industries
The rural area in the district has prevalent unemployment and disguised unemploy-
ment. Encouraging private sector to develop supportive rural industries would be
beneficial for reducing the employment gaps. The role of the supportive industries
is to assess market demand of various products and contract the raw materials to the
farmers with an initial investment for timely supply for fresh raw materials.
Role of Technology Management in Development 121

5.2.2 Involvement of Private Sector and Standardisation of Cottage
and Craft Industries
Government with the help of private enterprises, management agencies and NGOs
can directly aid the situation through technology management projects, targeted at
the grass roots and then upscaled, whose benefits are relevant to enhancing income
opportunities through capacity building and focused knowledge dissemination,
thereby resulting in standardised, consistent and quality production. The micro-
enterprises thus set up can use the homes of the workers as production grounds,
reducing the need of their immigration to the city and thereby reducing the urban
blight, while the intervention of the private sector for these setups can be utilised for
infrastructure provisions against the profit incentives, thereby resulting in a better
quality of life and higher income levels of the rural inhabitants.
5.2.3 Capacity-Building Programmes and Certification Courses
Though the government has ongoing capacity-building programmes, but for its rapid
implementation, the government should step back and become a facilitator, while the
private sector should be the provider. The private sector should run capacity-building
programmes as well as focused knowledge dissemination sessions for technical train-
ing for the artisans, craftsmen, cottage industryworkers as well as farmers and provide
them with certification.
5.3 Technological Interventions for Infrastructure Development
5.3.1 Biogas Plants and Rural Energy
Energy is the perquisite for the success of any technological advancement. Private
sector in collaboration with dairy owners, as a part of development initiative against
profit incentives or tax rebates, can set up biogas plants to generate energy for
domestic use.
5.3.2 Water Management and Irrigation
Irrigation technology innovations and water management plans can greatly enhance
the agricultural productivity. Effective watershed programmes help in water storage
along with revitalising the water table. The rural areas in the district currently depend
on tube wells for irrigation purposes other than rainfall. Technological improvements
made in water storage and conveyance can reduce energy use and water losses
presently being incurred.
122 N. Gupta and V. Devadas

6 Conclusion
For a holistic development and poverty alleviation in the rural areas, performance
improvement becomes a key point. Government being a facilitator and private
sector being the provider is a more efficient way of providing knowledge, technical
support and infrastructure in the massive and scattered but potential rural zones.
This would also help in reducing the pressure on the urban areas which makes them
magnets for urban blight.
The implementation of these projects requires government support in the form of
policy interventions. Firstly, a heavy investment in research and development at
grass root level is required; secondly, infant industries and private partners should
be given protection; and thirdly, emphasis should be given on export quality pro-
duction for establishing international markets. India, being an agro-based economy,
requires saving of agricultural land and increasing agricultural performance with a
futuristic view of capturing global food market which can be achieved efficiently by
technological advancement and industrialisation of rural areas.
References
Christiaensen L, Todo Y (2009) Poverty reduction during the rural–urban transformation – the role
of the missing middle. International Association of Agricultural Economists, Beijing
Department for International Development (2004) Agriculture, growth and poverty reduction.
http://dfid-agriculture-consultation.nri.org/summaries/wp1.pdf. Accessed 5 Apr 2012
Majumdar P (2005) Dynamics of urban development: changing face of Lucknow. Abhijeet
Publications, Lucknow
Prahalad CK (2005) The fortune at the bottom of the pyramid: eradicating poverty through profits.
Wharton School Publishing, Upper Saddle River
Sen A (1993) Capability and well-being. Oxford Clarendon Press, New York
Sen A (1999) Development as freedom. Oxford University Press, Oxford
United Nations Development Program (2001) Human development report. United Nations Devel-
opment Program, New York
World Bank (2004) World development report: making services work for poor people. Oxford
University Press, Washington, DC
Role of Technology Management in Development 123

Role of IT to Encounter Rising Food Inflation
Gururaman Subramanian, Kanishka Maheshwari, and Ashish Kaushik
1 Introduction
There are people in the world so hungry, that God cannot appear to them except in theform of bread. – Mahatma Gandhi
The paradox India is facing today is “Millions of common people are starving for
food; tons of food grains are allowed to rot in food depots, while inflation is
spiraling high.” The cost of food items is increasing rapidly, making them unafford-
able to a majority of people. Recently, the onion prices soared (Rs.60–80 per kg-1),
and there was a sugar and milk crisis in year 2008.
On the supply side, India is the world’s second largest producer of food, behind
Brazil, but has the largest number of people suffering with hunger and starvation.
India faces a challenge, as high food inflation of 18.32% affects the common
man and cripples household incomes—which is alarming, considering that the
wholesale price index of food grains had shown only single-digit growth, largely
below 5%, throughout the last 13 years. Even the famine of 2002–2003, when food
grain production plunged to 174.2 million tons from 212 million the year before,
had not hurt the consumer as much. India is also the world’s largest producer of
many spices; the second largest producer of wheat, rice, sugar, groundnut, and
inland fish; and the third largest producer of tobacco and accounts for a tenth of the
world fruit production while being the foremost producer of banana and sapodilla
(chikoo in India).
The increasing yields over the years, barring sporadic declines, are not render-
ing food grains affordable. In 2008–2009, food grain production scaled a record
G. Subramanian (*) • K. Maheshwari
Consultant Value Chain Planning, Oracle
e-mail: [email protected]; [email protected]
A. Kaushik
Consultant Buisness Planning, Oracle
e-mail: [email protected]
Department of Management Studies, Indian Institute of Science, Bangalore,
Driving the Economy through Innovation and Entrepreneurship,DOI 10.1007/978-81-322-0746-7_11, # Springer India 2013
125

of 234.47 million tons thanks to a cycle of good monsoons between 2005 and
2008. While drought reduced production to 218.19 million tons in 2009–2010, it
was still enough to swell buffer stocks. Prices, however, increased by 19% earlier
last year.
So it is mandatory to analyze the causes of inflation, identify the causes within
our control, and improve upon them.
2 Causes of Inflation
Globally food prices have been rising since 2005, and many of the factors
contributing internationally seem to be contributing equally to the domestic
markets. Most of the commonly cited reasons for food inflation are domestic food
production, trade and global prices, food grain management, and long-term infla-
tion1. Apart from the above, changes in stocks and exports at the cost of domestic
consumers lead to inflation.
Domestic food production is dependent on monsoon, and many factors influence
global food prices. Long-term inflation is the result of the economic policies and
performance year after year, and it is the reflection of what is being done today into
the future.
So it is food management which is under our control. Food management is about
how we manage the entire food supply chain. Causes that drive inflation that are
attributable to food management are as follows:
1. Dependency on the 4-month monsoon season when 80% of rainfall happens.
That means that there are no proper round the year irrigation systems.
2. Supply chain constraints are not considered in procurement and are not aligned
to demand.
3. Farm production is not linked to market demand.
4. Delayed decision making due to lack of real-time information.
5. Timely release of the stocks held by FCI in small but frequent batches.2
6. Reducing percentage of arable land and increase in disposable income.
For example, the first indication of a serious fall under sugarcane acreage was
available in the first week of July 2008, but export of sugar continued despite this
signal. From Apr to Sep 2008, India exported sugar worth $960 million, and in the
next six months (Oct 2008–Mar 2009), it imported sugar worth $127 million.
During the Apr–Sep 2009, India imported sugar worth $30613. In a short span of
time, the price paid for imported sugar turned out to be more than double the price
fetched by exports. This implies that with a correct assessment of situation, sugar
exported at a low price could have been kept in stock to meet the deficit in
production that emerged in a few months.
Going further, we discuss the solutions for points 2 to 5 that can be addressed
immediately and within our control—not that other factors are not significant—but
they largely depend on government actions, policies, and monsoon.
126 G. Subramanian et al.

3 Why India Needs an Efficient Food Supply Chain System
3.1 Need to Procure at Food-Surplus States and Transport Themto Food-Deficit States
Wheat and rice are the most commonly consumed food in India. India is a vast
country with 28 states and 7 union territories. Out of this, only 7 states have more
than 5% share in the total rice production in India with Andhra Pradesh topping
the list with 15% contribution. Only 5 states have more than 5% of the total wheat
production with Uttar Pradesh topping the list with 35% contribution. But Uttar
Pradesh is also the most populous state, and most of the production is consumed
within the state. So we are left with only Punjab and Haryana as the food-surplus
states. Table 14 presents a status of the state-wise food production in India.
As per the authors’ discussion with FCI officials in Delhi and the Deputy Director,
food and civil supplies department inKarnataka, FCI has storage depots at almost each
district head quarters and has to transport the procured grains to each of these
locations. FCI maintains that their main constraint is with the railways in transporting
the food grains from food-surplus to food-deficit states, particularly to the states where
there is no backward traffic (e.g., North East). Karnataka had received food grains
from rakes originally headed for North East but were diverted due to some issues.5
Table 1 (Percentage of Contribution to total production columns added by the authors)4
Thousand tons
Contribution to total
production (%)
2010–2011 Rice Wheat Rice Wheat
AP 14385 10 15.09 0.01
Assam 4752 64 4.99 0.07
Bihar 3320 4670 3.48 5.43
Chhattisgarh 6159 127 6.46 0.15
Gujarat 1523 3854 1.60 4.49
Haryana 3472 11041 3.64 12.85
Himachal 131 670 0.14 0.78
J&K 508 290 0.53 0.34
Jharkhand 1137 151 1.19 0.18
Karnataka 4047 245 4.25 0.29
Kerala 543 . 0.57 0.00
MP 1772 7627 1.86 8.88
Maharashtra 2669 2292 2.80 2.67
Orissa 6558 5 6.88 0.01
Punjab 10837 15829 11.37 18.42
Rajasthan 266 7215 0.28 8.40
TN 6139 . 6.44 0.00
UP 12014 30001 12.60 34.91
Uttarakhand 545 887 0.57 1.03
West Bengal 12333 842 12.94 0.98
Other states 2215 109 2.32 0.13
All India 95325 85928 100 100.0
Bold numbers represent the food surplus states for that commodity in India. State which have more
than 5% contribution to the production are marked bold.
Role of IT to Encounter Rising Food Inflation 127

So it is an obvious requirement to procure at food-surplus states, store them
properly, and transport them to the food-deficit states and again store them till it is
lifted by the respective agencies. So thismeans that a robust supply chainmanagement
is required.
3.2 Need to Estimate Demand Accurately
An analysis through the offtake from the respective states vis-à-vis the procurement
(Table 24) indicates that procurement is not aligned to the demand. Considering
the huge volume handled by the PDS, 1% amounts to 2.25 lakh tons! There is a 17%
gap between allotment and offtake which clearly shows that the supply is not
aligned to demand.
As per the discussion with the state food department officials in Karnataka (done
on a sample basis), the state department calculates the requirement on a monthly
basis based on the number of cardholders and their categories and informs FCI/state
agencies responsible for storage5. So it is possible for FCI to get the estimates
for a few years on a rolling basis and allocate the food grains in line with the
demand projected by the respective state governments. While this may prove to be
a massive task if done manually, FCI has to leverage information technology and
use decision support systems.
3.3 Need to Control Mounting Food Subsidy
The quantum of food subsidy depends on the level of procurement of food grains.
So it is essential to procure based on demand than procuring based on policies.
The subsidy-released data in Table 33 shows that the increase can only be attributed
to increased procurement and inefficient supply chainmanagement. A 30% increase in
minimum support price (MSP) was implemented in 2007–2008, and there has not
been a significant increase in the MSP also since then. Even after accounting for
a population growth of an average of 6% and practically no change in the percentage
of TPDS population, the increase in food subsidy is not justified.
Table 46 is self-explanatory and gives details of consistent increase in stock levels,
while the storage capacity is not geared up to meet this stock increase. From the stock
levels, we can fairly assume that the procurement is not aligned to demand.
3.4 Need to Maintain Shelf-Life Details and Enable FIFOProcess (First In First Out)
To avoid wastage due to various reasons, there is a need to estimate and maintain
shelf-life data. For implementing this model, a system is required to track each
procurement lot with a shelf-life period attached to it. Another requirement is to
issue the lots that arrived first to avoid the wastage due to storage for a long time.
128 G. Subramanian et al.

Table 2 Allocation and offtake of wheat, 2009–2010, under TPDS (in thousand tons)4
State/union territories Allotment Offtake Offtake (%)
Andhra Pradesh 254.51 30.16 11.9
Arunachal Pradesh 9.43 8.98 95.2
Assam 277.51 223.13 80.4
Bihar 1534.22 1001.24 65.3
Chhattisgarh 238.2 155.8 65.4
Delhi 445.34 436.54 98
Goa 7.48 6.27 83.8
Gujarat 1289.04 712.83 55.3
Haryana 980.47 501.67 51.2
Himachal Pradesh 312.1 289.83 92.9
J&K 224.13 223.14 99.6
Jharkhand 583.93 368.46 63.1
Karnataka 357.44 296.07 82.8
Kerala 249.88 223.96 89.6
Madhya Pradesh 2807.66 2708.11 96.5
Maharashtra 2793.98 2099.03 75.1
Manipur 19.09 14.27 74.8
Meghalaya 17.16 16.72 97.4
Mizoram 7.49 7.46 99.6
Nagaland 34.37 33.58 97.7
Orissa 392.82 371.12 94.5
Punjab 1213.92 987.53 81.4
Rajasthan 1945.46 1919.34 98.7
Sikkim 2.94 2.95 100.3
Tamil Nadu 210.4 211.12 100.3
Tripura 28.04 24.32 86.7
Uttar Pradesh 4318.53 3945.01 91.4
Uttarakhand 260.44 233.81 89.8
West Bengal 1922.27 1908.12 99.3
A&N Islands 8.76 4.45 50.8
Chandigarh 22.1 22.05 99.8
D&N Haveli 0.64 0.34 53.1
Daman and Diu 2.03 0.32 15.8
Lakshadweep 0 0 –
Puducherry 11.94 3.33 27.9
Grand total 22783.72 18991.06 83.4
Table 3 (2009–2010 data up
to 10-Feb-2010)3Subsidy released (Rs. in crore)
Year FCI States Total % increase YOY
2004-05 23280 2466 25746
2005-06 19871 3200 23071 �10.4
2006-07 20786 3042 23828 3.3
2007-08 27760 3500 31260 31.2
2008-09 36744 6924 43668 39.7
2009-10 44879 9660 54539 24.9
Role of IT to Encounter Rising Food Inflation 129

3.5 Pilferage Due to Theft or Diversion of Food Grains
According to Justice D.P.Wadhwa’s committee which was constituted in 2006 to
look into the maladies affecting the proper functioning of PDS, some of the
deficiencies of PDS are multiple ration cards being issued under a single name, faulty
system of issue and record keeping, and pilferage—PDS food grains find way to
market, and all the lot do not reach the eligible/needy person, no biometric identifi-
cation for the users, no central monitoring system to track the carriage trucks, and the
delivery mechanism has no RFID (radio frequency identification device)11.
All the factors explained above justify the need for an efficient food supply chain
management and an efficient food supply chain planning system. Efficient
operations will result in huge savings on the food subsidy bills, and the same can
be used to build better infrastructure. For example, the savings can be used to
implement better packing material as the gunny bags used at present get torn in 4 to
5 months, and the food grains are spilled across the warehouse. The warehouse
personnel sweep the spilled grains and pack it again, and this activity leads to
complaints on the quality food grains distributed through PDS5.
4 Canadian Wheat Board Case Study
Improved business processes and supporting technologies now provide greater visibilityand control of both costs and inventory. The outcome: reliable and consistent productdelivery to the customer resulting in better returns for farmers – Dale Martin, VicePresident, Logistics and Supply, Canadian Wheat Board 9.
The Canadian Wheat Board (CWB) is a farmer-controlled organization that mar-
kets wheat and barley grown by Western Canadian producers, and it is the largest
single seller of them in the world, holding more than 20% of the international
market. The CWB is the marketing agency for over 75,000 farmers.
Table 4 Annual procurement, offtake and stocks (Quantity in million tons)6
Year
Procurement Offtake Stocks
Rice Wheat Total Rice Wheat Total Rice Wheat Total
2005-06 26.69 14.79 41.48 25.08 17.17 42.25 13.68 2.01 16.62
2006-07 26.3 9.23 35.53 25.06 11.71 36.77 13.17 4.7 17.93
2007-08 26.29 11.13 37.42 25.22 12.2 37.43 13.84 5.8 19.75
2008-09 32.84 22.69 55.53 24.62 14.88 39.5 21.6 13.43 35.58
2009-10 32.59 25.38 57.98 26.89 21.97 48.86 26.71 16.13 43.36
2010-11 31.13 25.92 56.79 29.8 23.07 52.87 28.82 15.36 44.35
2011-12 7.79 27.88 35.67 2.28 1.68 3.96 25.27 35.88 61.3
Note: (1) Total stocks include coarse cereals. (2) For 2010–2011, procurement data is up to August
18, 2011, offtake for the period April 30, 2011, and stocks as on August 01, 2011
130 G. Subramanian et al.

The CWB has three main supply chain strategic objectives, namely7, (1) shipping
a safe, consistent, and high-quality product to customers; (2) creating value for
farmers by reducing supply chain costs and encouraging competition in the supply
chain; and (3) delivering high-quality service to farmers.
The grain from Western Canada travels an average of 1300 km from origin to
export position compared to Australia or Argentina where grain travel less than
300 km. The storage capacity of CWB is also less than competitors. Grain exports
from Canada’s west coast ports average 20 million tons annually, yet the working
capacity of the terminals is less than 1 million tons requiring a just-in-time approach
to planning and execution of grain shipments7.
4.1 CWB’s Role in Supply Chain
In 2006, the CWB launched a three year initiative—the supply chain transformation
(SCT) program—to reengineer its supply chain processes and modernize the
backbone of its information systems. This strategic program involved replacing,
revamping, and/or improving all aspects of the CWB’s supply chain. The goals
were to address a number of immediate needs and position the CWB for future
growth and change9. CWB also has a strong vision, mission, and objectives
strengthened by a strong strategy.
The CWB’s supply optimization group assesses the quantity and quality of grain
available for marketing and combines this information with supply chain capacity
and sales information to develop the export sales program. Before a sales is made,
the CWB’s marketing group coordinates with supply optimization to ensure prod-
uct and capacity availability. Once a sale is made, the marine logistics assess when
to order grain for the sale and communicates its demand to CWB rail logistics. The
key objectives of rail logistics are to get the right grain into place at the right time
to meet the requirements of the CWB’s sales program7. The supply chain optimi-
zation practices have also been acknowledged in the CWB’s Annual report of
2009–2010 under section “CWB Performance Highlights.”
4.2 Web Portal for Farmers
Just a note to say – Well Done! Just did my 07 permit. No trip to town, no waiting foranybody, no need to use a line company. Added land and filled out and done in under5 minutes – Producer, July 20079
The CWB launched an online web portal for farmers—named as the Farmer
Procurement and Payment Services (FPPS). FPPS provides the CWB with a single
source of information about the producers and provides the producer with a
single destination to find out their standing with the CWB9.
Role of IT to Encounter Rising Food Inflation 131

5 Proposed Solution and Suggestions
Food is our common ground, a universal experience. – James Beard
5.1 Proposed Solution and Suggestions
• Design a demand driven supply chain solution.
• Design a web portal to be shared among farmers and procurement bodies. Portal
would contain the information of procurement forecast.
• Design an optimal sourcing and distribution strategy and find the optimal
location for storage warehouse.
• Embedded intelligence for tracking, monitoring and analyzing various leakage/
pilferage factors with all involved organizations under one integrated software
though they are separate legal entities. This will ensure proper tracking and
accountability and seal pilferage due to theft and “siphoning” to a great extent.
• Once real-time data is available, the agencies involved in food grain pro-
curement, storage, and distribution can work on eliminating the bottleneck
constraints since the optimization model identifies such constraints.
• The identification of constraints will also serve a national objective of addressing
the growth requirements of backward regions so that railways will not have any
constraint to move goods to every corner of India since they will be assured of
backward goods traffic.
• With the implementation of nation-wise integrated software to plan and manage
operations, FCI and all allied agencies can move to a weekly planning buckets to
actively and quickly respond to fluctuations instead of the monthly system being
followed at present.
• All the above solutions when implemented will result in an efficient and effec-
tive food supply chain in India resulting in controlled inflation and more value
to farmers.
5.2 Forecast Demand
Forecasting demand is based on applying statistical models on the history and the
underlying causal factors. Purchasing power parity, population, government
policies, arable land, sowing area and yield, and monsoon are examples of causal
factors that can be modeled.
Considering the massive scale and complexity of operations, we propose a
robust software to estimate the demand.
132 G. Subramanian et al.

5.3 Optimize Supply
India’s current wheat consumption is close to 70 million tons, while production is
close to 80 million tons—still not a comfortable scenario because of uncertain
weather, wastage, and pilferage due to various reasons and export. To have an
optimized supply chain, there is a need to forecast agricultural production since it is
one of the supply parameters. Whether it is a constraint or not depends on the
monsoon which is difficult to forecast. But there are scientific methods to forecast
agricultural production based on multiple regressions. These statistical methods
certainly give a fairly accurate forecast that is more appropriate for planning12.
5.4 Conceptual Optimization Model
Once demand forecast is available, the supply chain model is optimized using linear
programming-based software which recommends least cost supply chain model
after going through a huge number of iterations quickly. Our conceptual model has
four states and their respective storage facilities. Two states are wheat-surplus
states, and two are wheat-deficit indicating that wheat would move from surplus
states to meet demand of the deficit states. The transportation system is railway, and
it is also modeled as a constraint in the supply chain. Figure 1 is the proposed
conceptual flow.
Rationstores
Governmentagencies (like mid-day meals)
WH 1
WH 2
ProcurementCentre 1
ProcurementCentre 2
Local Farmers
If I knew what crop to produce and how much?
Where to have warehouse so as to minimize wastage and transport cost?
How much to buy so as to satisfy demand and reduce wastage?
Is there any system to track and analyze my wastage ?
ProcurementCentre 2
Fig. 1 Pictorial view of issues in Food supply chain
Role of IT to Encounter Rising Food Inflation 133

The input data we have considered are 15-year demand projection (subjective
estimation) from 2 deficit states, available quantity of wheat from surplus states,
distribution capacity of railways, and storage capacity of FCI.
The software recommends when and by howmuch railways should scale up their
distribution capacity, when and by how much FCI should scale up their storage
capacity, and from where to procure to incur the least cost.
The 15-year model gives enough insight to FCI to collaborate with railways on
where and when they should align the distribution capacity. This approach gives all
the stakeholders enough visibility and time to plan for infrastructure. Figures 2a, b
are screenshots of the conceptual model10. Figure 2b is the “alert” screen that lists
down the exceptions which need to be resolved by the planners.
6 Conclusion
While food production and yield has consistently increased over the years, it is not
reflected in the affordability due to high inflation. This is mainly due to imbalances
in regional food grains production and consumption that have not been managed
efficiently. Considering the large scale of operations in the food grains management
in India, it is practically not possible to manage with manual and disintegrated
pockets of computerized software. So there is a compelling need to integrate all the
Fig. 2 Conceptual model for Food Supply Chain
134 G. Subramanian et al.

organizations involved in the food grain management under one roof to remove all
the operational inefficiencies. The subsidy bill saved in the improved supply chain
efficiencies can be invested to minimize the constraints and build better infrastruc-
ture, thus triggering a vicious chain of improvements that will become irreversible
over a period of time. These operational efficiencies will certainly contain inflation
and bring more value to all the stakeholders in the food chain from source to the
target consumer. And finally, we do not have to set new trends with high risks, since
we already have successful cases as examples to emulate and become efficient.
References
David P (2011) Role of CWB in supply chain. http://www.hbra.ca/files/CWB in the supply chain -
August 4 2011 (2).pdf. Accessed 28 Oct 2011
Gopinathan CK (2000) An indirect method of forecasting the annual food production of India.
http://drs.nio.org/drs/handle/2264/255. Accessed 4 Nov 2011
FCI (2010) Annual report 2009–10. http://fcamin.nic.in/AnnualReport 2009-10.pdf. Accessed
28 Oct 2011
RBI statistical data. http://www.rbi.org.in/scripts/AnnualPublications)
Kaushik B (2010) Economics of food grain management in India. Department of Economic
Affairs Working Paper, No. 2/2010-DEA
Ramesh C (2010) Understanding the nature and causes of food inflation. Econ Pol Wkly 45:10–13
CWB (2011) Annual report 2010–11. http://www.cwb.ca/public/en/about/investor/annual/pdf/
2010-11_annual-report_en.pdf. Accessed 28 Oct 2011
Wadhwa DP (2009) Wadhwa committee report on PDS. http://pdscvc.nic.in/reportoncomputer-
isationofPDS.htm. Accessed 4 Nov 2011
Farmer Procurement and Payment Services, CWB (2009). http://www.obsglobal.com/SiteCollec-
tionDocuments/FPPS-Mar2009lowres.pdf. Accessed 21 Dec 2011
Centre for Monitoring Indian Economy, www.cmie.com
Role of IT to Encounter Rising Food Inflation 135

Achieving Dynamic Capability Through
Collaborative ICT Infrastructure: A Strategic
Driver for SMEs in Emerging Economies
Shahriar Sajib and Renu Agarwal
1 Research Background
Small- and medium-sized firms in emerging economies need to strengthen their
human capital in order to compete in volatile, dynamic and transitioning envir-
onments. We theoretically argue that the managerial and organisational capabilities
of these individual firms, as a result of participating within an SVN, consequently
foster dynamic capabilities within individual partnering firms. Entrepreneurship alert-
ness of these individual partnering firms is one such capability which plays a vital role
in sensing external change and helpsmanagers of such firms to seize opportunities and
address the challenges of the changing business environment. No doubt, these SME
firms have a less comprehensive knowledge base, are strapped for resources, and
possess limited sensing and seizing capability than large-sized firms. However, consi-
dering the context of service industries in emerging economies, such as India and
China, this chapter theoretically illustrates the interrelationships and interdepen-
dencies between various constructs and the instrumental role that formal and informal
information/knowledge flow play in facilitating development of this tacit capability.
S. Sajib (*) • R. Agarwal
Management Discipline group, UTS Business School,
University of Technology, Sydney, Sydney, Australia
e-mail: [email protected]; [email protected]
Department of Management Studies, Indian Institute of Science, Bangalore,
Driving the Economy through Innovation and Entrepreneurship,DOI 10.1007/978-81-322-0746-7_12, # Springer India 2013
137

2 Literature Review
2.1 Role of ICT in Building Dynamic CapabilityThrough Entrepreneurship Alertness
2.1.1 Importance of Dynamic Capability Building
Dynamic capability view (DCV) emphasises on the capability of integrating, building
or reconfiguring organisational resources and internal and external competencies in
order to react to changing dynamics of the market (Teece 2007, 2009). Dynamic
capability enables firms to sustain their competitive advantage through relentless
modification or creation of organisational configuration during turbulence in the
external environment through improved capability (Eisenhardt and Martin 2000;
Zollo and Winter 2002). As DCV has emerged as a robust theoretical framework,
it is, therefore, important to investigate what factors drive SMEmanagers capabilities
in real life that help facilitate themcoordinate, integrate and reconfigure organisational
resources and competencies as changes happen (Eisenhardt and Martin 2000).
Sensing, seizing and reconfiguring capacities are identified as core components of
managerial capability in order to achieve dynamic capability (Teece 2007). Pavlou
and Sawy (2011) break down the higher-order construct ‘reconfigure capability’ into
two constructs which are ‘integrating capability’ and ‘coordinating capability’. Teece
(2007) points that it is challenging for firms to deploy enterprise-level capability of
sensing, seizing and reconfiguring capabilities throughmicro-foundations of dynamic
capability, which are organisational structure, decision rules, disciplines, processes or
procedures across organisational boundary. Zajac et al. (2000) support this observa-
tion by providing empirical evidence that a firm needs to continuously align its core
strategies based on its internal resource profile, considering external environmental
factors in order to demonstrate excellence in performance.
On the other hand, Sambamurthy et al. (2003) stress that in order to enhance
agility, firms are relying more on information technologies, including processes,
knowledge and communication tools. They demonstrated that investment in infor-
mation technology enhances a firm’s performance through increased agility, digital
options and entrepreneurial adaptation, which ultimately lead firms to achieve a
competitive advantage. In order to build and sustain competitive advantage, knowl-
edge sharing is considered as a crucial resource in dynamic environment (Teece
2007). Camisón and Forés (2010) echo the importance of external knowledge to
adapt in competitive environment. Empirical studies have grounded this fact
that inter- and intra-organisational learning processes create the basis of dynamic
capabilities (Agarwal and Selen 2009, 2011). Furthermore, Agarwal and Selen
(2009) empirically demonstrate the importance of collaborative agility, collabora-
tive innovative capacity and entrepreneurial alertness in achieving strategic, pro-
ductivity and performance outcomes in an SVN.
138 S. Sajib and R. Agarwal

2.1.2 Importance of ICT Capability for SME Firms
Teece (2007) argues that in order to incorporate intuition capability of the
organisational sensing process, ICT can play a comprehensive role to aid organi-
sational responsiveness. Reflexive processes need to have the capability to filter mass
information from the external environment to identify the relevant information about
the competitiveness in the market to facilitate managers, entrepreneurs and business
leaders to react rapidly in order to seize the opportunity (Hough and White 2004).
Hodgkinson and Healey (2011) argue that technology is participating in search and
sense-making activities of organisations in the form of knowledge management
systems or decision support systems. Aral and Alstyne (2011) illustrate that ICT
mechanisms enable partnering firms to achieve information advantage in a network
to intercept novel information from the information flow across the network. Agarwal
and Selen (2008) stated that adaptation of technology provides transactional benefits
to the firms such as speed, quality, cost, dependability and flexibility. Further, Agarwal
and Selen (2008) mentioned that integration of information flow through ICT systems
across inter- and intra-organisational boundaries maintaining confidentiality can
enrich cognitive and informative dimensions of the business ties in SVN.
2.1.3 Tacit and Explicit Knowledge, Formal and Informal Flow
and Its Association with ICT
Johannessen et al. (2001) emphasised that heavy reliance on technology and ICT
systems in managing organisational knowledge may undermine the strategic impor-
tance of tacit knowledge, which is difficult to transfer through technology. Johan-
nessen further argued that ability to incorporate information technology to transfer the
tacit knowledge of employees facilitates organisations to achieve sustainable compet-
itive advantage. As such, Benner and Tushman (2003) emphasised establishing
effective interaction between tacit knowledge and ICT infrastructure of the firms.
On the other hand, scholars such as Daft and Weick (1984) and Bhardwaj and Monin
(2006) emphasised on combining informal and formal information flow in order to
capture both tacit and explicit knowledge of an organisation. Conway (1995) showed
that during different phases of innovation process such as idea generation, problem
solving or testing phase, informal mechanism of information transfer is important for
transferring information and ideas.
2.1.4 Importance of Economic Policy Support to Foster SME Advancement
From a micro-level, Ahuja (2000) found that structural hole within an economy has
a negative impact on innovation in a firm’s network where both direct and indirect
ties with other firms have positive effect on the innovation capability of the focal
firm. Freeman and Sandwell (2008) demonstrate that networking plays a critical
Achieving Dynamic Capability Through Collaborative ICT Infrastructure. . . 139

role during the economic development stage of a country; therefore, institutional
networksmay play a vital role in helping firms in emerging economy’s sustain through
the transitional period. Due to lack of symmetric distribution, information entre-
preneurship opportunities exist (Minniti 2008), which requires better ties and collabo-
ration with SVN in order to contemplate into opportunities. As an example, in order to
face innovation challenges, the Indian innovation system needs to focus on creating
higher inter-firm cooperation and support cross-fertilisation of knowledge between
different industrial sectors in order to diversify internal market (D’Costa andW. B. D.
R. Group 2006). In the case of Israel, Breznitz (2006) demonstrated that universities
from Israel have a high R&D capability, which helped its IT industry to have a scien-
tific base and innovation orientation. However, as majority of newly industrialised
countries lack sophisticated R&D infrastructure, policies should be focused around
fostering dynamic capability building within firms.
2.1.5 How Do SMEs Operate in Emerging Economies?
Che et al. (2011) define an emerging economy as one that experiences rapid eco-
nomic growth through rise in income and purchasing power. Bruton et al. (2008)
mention that in emerging economies, SMEs play a vital role in driving and improving
economic condition through creating employment opportunities and social develop-
ment. Globalisation, rapid changes in technology and customer preferences have
created significant pressures on SMEs to become competitive at the global standard
(Singh et al. 2010), all of which depict the volatile environment under which SME
firms operate. Cavusgil et al. (2003) highlighted that direct access to information and
knowledge is critical for building competitiveness of SMEs. They further argued
that effective collaboration facilitates sharing of tacit knowledge among partners
that enable SMEs to access strategic information (Cavusgil et al. 2003). In the context
of SMEs in emerging economy Che et al. (2011) emphasises the need to improve
network linkages through building capability for internationalisation. We are
prefering this line instead. Networking, clustering and collaboration with other
firms provide SMEs access to knowledge about opportunities in the international
market, which can provide support in accessing necessary resources and capabilities,
and also help to reduce entry barriers. Therefore, networking and collaboration are
seen as a potential driver of internationalisation of SMEs (Chen 2003).
Having discussed the theoretical background of this chapter, in the remaining
part of this chapter, we will now discuss a theoretical model which can facilitate
the capability building of partnering firms through increased collaborative entre-
preneurship alertness. First, we will present the theoretical model, and then we will
briefly present the constructs that are used in deriving the theoretical framework.
This is then followed by the hypotheses underpinned by arguments about the causal
relationships that exist among various constructs. This chapter will then finally
provide implications of the theoretical model at the end.
140 S. Sajib and R. Agarwal

3 Hypothetical Theoretical Model
Figure 1 presents the theoretical framework presented in this chapter. It illustrates the
interrelationship between various constructs: collaborative architecture management
(CAM), collaborative organisational infrastructure (COI), information technology
infrastructure flexibility (ITIF) and collaborative entrepreneurship alertness (CEA)
which consecutively affect the entrepreneurship alertness (EA) of partnering firms
within the SVN network. The CAM construct is underpinned by aspects of collabo-
ration that focus onmanagerial roles that help facilitate effective collaboration among
partners. The COI construct illustrates the adoption of technological infrastructure
that facilitates the information and knowledge sharing among partners. The ITIF
construct demonstrates characteristics of ICT infrastructure, and finally the CEA
construct represents the collaborative entrepreneurship alertness capability of the
SVN network, which refers to a collective nature of entrepreneurship practice
adopted by a network of firms. The successful interplay between these four constructs
affects entrepreneurship alertness (EA) of individual firms belonging to service value
network (SVN), and it is the demonstration of this derived capability for a SME
partnering firm which is central to this chapter.
4 Defining Constructs of Service Value Network
Agarwal and Selen (2005) described service value network (SVN) as a kind of
network of value chains which shares a combined core competency of various
stakeholders. SVN mobilises resources and competencies for the creation and
reinvention of value through reviving roles and responsibilities of different stake-
holders (Agarwal and Selen 2005). Basole and Rouse (2008) stated that an SVN
creates value through a complex web of relationship between business firms and
customers. They further argue that SVN is influenced by social, political, econom-
ical and technical factors. Kraemer et al. (2010: p. 8) defined SVN as follows:
‘Service Value Networks are Smart Business Networks that provide business value
Fig. 1 Theoretical model for achieving dynamic capability in SMEs in emerging economies
Achieving Dynamic Capability Through Collaborative ICT Infrastructure. . . 141

by performing automated on demand composition of complex services from a
steady but open pool of complementary as well as substitutive standardized service
modules through a universally accessible network orchestration platform’.SVN offers customers various channels of choice through aligning relationships,
technology, knowledge and processes across the network (Agarwal and Selen
2005). Process integration, technology adoption and information sharing across
systems are all critical criteria for the success of SVN (Agarwal et al. 2011, 2012).
IT can be a potential catalyst for promoting and enhancing capabilities to work
collaboratively with flexibility and speed in SVN; therefore, IT process and system
integration on an end-to-end basis can enhance organisational benefit (Agarwal
et al. 2011; Basole and Rouse 2008).
Each of the constructs in coming up with the framework is defined in Fig. 1,
some of the constructs are used as defined by original authors, and some are newly
defined in this context.
Agarwal and Selen (2008) defined ‘collaborative organisational infrastructure
(COI)’ as a construct which allows sharing information and knowledge through
integration of information and communication technology across the collaborative
network with a mutually agreed cost, revenue and risk-sharing performance.
The construct COI through the aid of process and system integration across the
organisational boundaries enables information and knowledge sharing across SVN
which in effect facilitates achieving sustainability in the system for delivering
service innovation (Agarwal et al. 2011, 2012).
The elements of collaborative architecture management (CAM) are essential
managerial skills required to align operational and strategic objectives, mutual
goals, capabilities, management style and protection of asset across the collabora-
tive network (Agarwal and Selen 2008). Collaborative alignment, complementar-
ity, conflict management, compatibility and protection of assets are identified as
dimensions of SVN in previous empirical studies (Dyer and Singh 1998; Jayaram
2004). CAM is further defined as an organisational driver that delivers the ability of
alignment and coordination of resources, routines and activities spanning across
inter- and intra-organisational boundaries sharing mutually agreed risk, cost and
revenue (Agarwal et al. 2011, 2012).
Duncan (1995) pointed out that compatibility, connectivity and modularity as
the major components of information technology infrastructure flexibility (ITIF).Compatibility is the ability to share information across the organisation which
empowers employees through readily available data, information and knowledge
(Duncan 1995; Tapscott and Caston 1993). Connectivity is the capability of IT
infrastructure to communicate with internal or external environment (Duncan 1995).
Tapscott and Caston (1993) stated connectivity as an ability of seamless information
and resource sharing across various platform. Finally, modularity is described as the
capability to reconfigure the components of information technology infrastructure for
the purpose of sharing and reusing standardised business processes across the
organisation (Duncan 1995; Schilling and Steensma 2001).
Duncan (1995) emphasised that through ITIF, firms can achieve strategic
innovation across the business processes. In order to succeed in a rapidly changing
142 S. Sajib and R. Agarwal

competitive external environment, ITIF has been considered as a source of core
competency (Bhatt and Grover 2005; Chung and Rainer 2003) and elevated service
offering (Agarwal et al. 2011, 2012) for organisations.
Entrepreneurship alertness (EA) in firms has been a major concern for academic
research. EA is basically identified as a capability of firms which helps them
identify unexplored opportunity through maintaining an attentive cognition about
the external changes in the markets. Yu (2001) emphasises on maintaining an
alertness system to grab and realise the opportunity. Yu illustrates two views; the
first one is ‘ordinary discovery’ where an entrepreneur attempts to exploit
opportunities through improving some unnoticed aspects of a particular area of
interest. The second view is ‘extraordinary discovery’ where entrepreneurs con-
template upcoming events through new ideas which have radical implications
(Yu 2001).
Organisations need to develop two distinct capabilities namely ‘strategic fore-
sight’ and ‘systemic foresight’ in order to explore the current and future
opportunities and threats in the marketplace (Sambamurthy et al. 2003: p. 250).
Sambamurthy et al. (2003) defined ‘strategic foresight’ as the ability to anticipate
opportunities, threats and discontinuities in the marketplace through increasing
alertness about the dynamics of the market. ‘Systemic foresight’ is defined as the
capability to apply knowledge and experience to take competitive actions. Hence,
in the context of an SVN, Agarwal and Selen (2009: p. 435) redefine EA of a firm as
follows: ‘Underpinning the logic of opportunity and innovation, entrepreneurial
skills are likely to help front-of-house staff maintain customer satisfaction and
provide operations staff with a higher-order ability to explore and exploit options
when subjected to varying customer needs, thus arming them with an ability to
spontaneously deliver customized solutions to customers’.
We will use this definition to define the EA capability of an SME firm within the
context of this firm.
Collaborative entrepreneurial alertness (CEA) is defined by Miles et al. (2005)
as a collaborative effort to pursue innovation and commercialisation of innovation
through sharing complementing resources, skills and collaborative decision making
between firms. Therefore, CEA can be defined as a collaborative process of
attaining unexploited opportunities through sharing information among the partners
of SVN. Agarwal and Selen (2009) compare entrepreneur skill as a higher-order
capability for exploring and exploiting options during the changing nature of
customer demands. Agarwal and Selen (2009) further argue that EA creates posi-
tive drive to deliver customised solutions to the customers in a spontaneous
manner. Ribeiro-Soriano and Urbano (2009) describe ‘collaborative entrepreneur-
ship’ as facilitated by collaborative relationships and assisted by knowledge crea-
tion and continuous innovation. Ribeiro-Soriano and Urbano (2009) further
described CE as a business model that can facilitate collaborative activities and
decision making through allocating resources appropriately.
Combining the understanding of CE and EA, we are defining and creating a new
construct called collaborative entrepreneurship alertness (CEA) which refers to
creating a collective cognition of entrepreneurs within SVN through encouraging
Achieving Dynamic Capability Through Collaborative ICT Infrastructure. . . 143

collective actions among the partners and disseminating strategic information about
market dynamics to foster information symmetry across the boundary of SVN in
order to build capability of innovation.
5 Research Hypotheses
In this section, we will illustrate the underlying arguments that will enable us to
hypothesise relationships between various constructs in support of the research
framework postulated herein.
In an SVN setting, efficient information sharing, decisions about technology
adoption and integration across end-to-end processes all can have an impact on the
performance of partnering firms. COI construct facilitates the process of building a
sustainable service system for service innovation through the properties of infor-
mation and knowledge sharing facilitated by an integrated system (Agarwal et al.
2011). Therefore, the goals of CAM is to synthesise knowledge from COI and
successfully coordinates and facilitate the reconfiguration of resources and skills
across the organisational boundaries of an SVN using information and knowledge
accessible from the service system. Therefore, we postulate that COI will have a
positive effect on CAM as postulated by Agarwal et al. (2011). Huber (1991)
identified that boundary-spanning personnel of an organisation act as organisational
sensors through performing the task of environmental scanning. For example,
Stewart (1973) found that public servants of governmental organisations serve as
organisational sensors for government. Hough and White (2004) suggested that
scanning activities of firms need to increase in accordance with the increase in
uncertainty in the environment. Therefore, we can argue that COI will play positive
role in delivering CEA through sharing information from various internal and
external sources of SVN. Zhang and Ziegelmayer (2009) mentioned that architec-
tural design of collaborative organisation will determine the characteristics of IT
infrastructure in a collaborative environment; therefore, COI will effect directly to
the dimensions of ITIF.
H1a: COI has a positive effect on CAM, H1b: COI has a positive effect on
CEA, and
H1c: COI has a positive effect on ITIF
Flexibility in information technology infrastructure will allow faster information
sharing across the organisational boundary which will eventually allow the
managers to make rapid decision in collaborative manners (Agarwal and Selen
2008). Moreover, ITIF will bring transparency of information flow across the
processes of SVN which will enable the managers to attain the objective of
reconfiguring resources and skills across SVN.
ITIF will increase the IT responsiveness of the firm as a result managers will be
able to react in a rapid manner in a changing environment (Duncan 1995). IT
responsiveness therefore can be reflected as responsiveness to end-users
demands, decision making for managers, environmental changes or business
144 S. Sajib and R. Agarwal

process changes. ITIF will make the IT system of SVNmore responsive to address
the changes; therefore, ITIF will enable managers of partnering companies of
SVN to make decisions collaborate and work collectively to achieve mutual goals
(Zhang and Ziegelmayer 2009).
H2: ITIF has a positive impact on CAM
Johannessen et al. (2001) pointed out that modern business is facing challenges
of globalisation, environmental turbulence, complexity and rapid advancement
of information technology. Firms who have demonstrated to successfully
achieve dynamic capability in their adaptive business ecosystem have done it
through innovation, learning, involvement and collaboration with other enter-
prises, entities or institutions (Teece 2009). As Ribeiro-Soriano and Urbano
(2009) highlighted the importance of collaborative decision-making processes
to react sharply in a rapidly changing environment, managerial aspects of coll-
aborative architecture become highly critical to deliver innovation as an out-
come of collective effort. Therefore, in order to satisfy the definition of CEA that
we stated earlier, it is very critical to deploy effective leadership and managerial
skill as formulated by CAM’s ability to manage SVN’s successfully and to
remain competitive in a dynamic environment.
H3: CAM has positive impact on CEA
Huber (1991) identified that boundary-spanning personnel of an organisation act as
organisational sensors through performing the task of environmental scanning.
For example, Stewart (1973) found that public servants of governmental organi-
sations serve as organisational sensors for government. Kiesler and Sproull (1982)
noted that problem sensing is a critical component of managerial behaviour in
changing environment which enables organisations to react promptly through
cognitive process of formulating effective managerial actions to address the prob-
lem. Hough and White (2004) suggested that scanning activities of firms need to
increase in accordance with the increase in uncertainty in the environment.
Jantunen et al. (2005) emphasised that in order to utilise and renew the knowledge
base of firms, SME firms need an ability to internalise externally generated
knowledge and combine the informationwith existing knowledge base. As a result,
capabilities of SVNmanagers to effectively deploy CEAwill have positive impact
in building EA for the individual companies.
H4: CEA has positive impact on CE
This hypothetical framework provides an interrelationship between constructs
that we have defined earlier. The framework needs to be operationalised in order
to verify the underlying arguments.
6 Implications for Managers and Policymakers
and Future Research
The framework carries significant implications for both managers and policymakers
of emerging economies. Ruiz-Mercader et al. (2006) suggest that ICT influences
organisational performance when context of learning environment has taken place
Achieving Dynamic Capability Through Collaborative ICT Infrastructure. . . 145

into practice comes into play. Further, the authors also emphasise that collaborative
information technology has positive impact on both individual and organisational
level learning outcome. Therefore, the findings of this chapter can motivate SME
managers to collaborate with SVN to improve their external information processing
capability in order to build dynamic capability through increased situational aware-
ness and entrepreneurship alertness. As cost is a primary concern for the managers
of SMEs, connecting flexible collaborative organisational information technology
infrastructure will drive operational flexibility and therefore provide competitive
advantage to the SMEs (Zhang and Ziegelmayer 2009). Integrating with the SVN
through ICT will drive entrepreneurship alertness skills and at the same time reduce
institutional cost of receiving strategic information from external environment; there-
fore, it will be a strategic driver for SMEs to participate in SVN. As a result, SMEs of
emerging economies will become more competitive to compete successfully in
present globalised world. Therefore, this chapter provides strategic guideline for the
policymakers and managers to leverage resources to SMEs more effectively and
efficiently in order to build dynamic capability.
7 Conclusion
SMEs need to participate within collaborative network and should focus on institu-
tional aspect of collaboration in order to gain advantage of participating in a network.
COI and CAM are very important higher-order construct for building an effective
SVN which will able to deliver mutual goal for the partners. On the other hand,
through implementing flexible ICT companies with higher resource capacity can
leverage SME partners with responsive operational capability to react with the chan-
ges in accordance with market dynamics. Sustainable development of SMEs is key
factor for the sustainable economic development. Firms in emerging economies need
to pay special attention for building dynamic capability which will help drive their
economic growth. Identifying strategic drivers to motivate SMEs to participate in
SVN therefore carries high significance. This chapter draws upon this issue and
provides a theoretical framework for policymakers and SME managers. In order to
verify the validity of the theoretical framework developed in this chapter, a robust
empirical study is required. This chapter is an initial step towards a bigger step to
investigate this important issue.
References
Agarwal R, Selen W (2005) Services value network consortia: recent literature and operational
definition. In: ANZAM symposium (Australia and New-Zealand Academy of Operations
Management), 13–14 June 2005, Capricorn Coast, Queensland, Australia
Agarwal R, Selen W (2008) Coordination, integration and alignment as enablers for building
sustainable service value networks. In:Sixth international logistics and supply chain congress,
Istanbul, Turkey
146 S. Sajib and R. Agarwal
Agarwal R, Selen W (2009) Dynamic capability building in service value networks for achieving
service innovation. Decis Sci 40(3):431–475
Agarwal R, Selen W (2011) Multi-dimensional nature of service innovation: operationalisation of
the elevated service offerings construct in collaborative service organisations. Int J Oper Prod
Manage 31(11):1164–1192
Agarwal R, Choi J, Ramamurthy R, Selen W, Selim HM (2011) How can service-oriented
architecture drive service innovation in newly emerging service systems? In: ICIPM2011:
The 7th international conference on advanced information management and service, Jeju
Island, Korea. IEEE Print version. ISBN: 978-89-88678-44-2
Agarwal R, Choi J, Ramamurthy R, Selen W, Selim HM (2012) Service-oriented architecture as a
driver of service innovation in newly emerging service systems: an exploratory view. Int J Inf
Process (IJIPM) 3(2):85–97
Ahuja G (2000) Collaboration networks, structural holes, and innovation: a longitudinal study.
Admin Sci Q 45:425–455
Aral S, Van Alstyne M (2011) The diversity-bandwidth trade-off1. Am J Sociol 117(1):90–171
Basole R, Rouse W (2008) Complexity of service value networks: conceptualization and empirical
investigation. IBM Syst J 47(1):53–70
Benner MJ, Tushman M (2003) Exploitation, exploration, and process management: the produc-
tivity dilemma revisited. Acad Manage Rev 28(2):238–256
Bhardwaj M, Monin J (2006) Tacit to explicit: an interplay shaping organization knowledge.
J Knowl Manage 10(3):72–85
Bhatt GD, Grover V (2005) Types of information technology capabilities and their role in
competitive advantage: an empirical study. J Manage Inf Syst 22(2):253–277
Breznitz D (2006) Innovation-based industrial policy in emerging economies? The case of Israel’s
IT industry. Bus Polit 8(3):3
Bruton GD, Ahlstrom D, Obloj DAK (2008) Entrepreneurship in emerging economies: where are
we and where should the research in the future go? Entrep Theor Pract 32(1):1–14
Camisón C, Forés B (2010) Knowledge absorptive capacity: new insights for its conceptualization
and measurement. J Bus Res 63(7):707–715
Cavusgil ST, Calantone RJ, ZhaoY (2003) Tacit knowledge transfer and firm innovation capability.
J Bus Ind Mark 18(1):6–21
Che ZS, Scott-ladd B, Entrekin L, Adham KA (2011) Networking and internationalization of
SMEs in emerging economies. J Int Entrep 9(4):259–281
Chen T (2003) Network resources for internationalization: the case of Taiwan’s electronics firms.
J Manag Stud 40:1107–1130
Chung SH, Rainer RK Jr (2003) The impact of information technology infrastructure flexibility on
strategic alignment and applications implementation. Commun Assoc Inf Syst 11(11):191–206
Conway S (1995) Informal boundary-spanning communication in the innovation process: an
empirical study. Technol Anal Strateg Manage 7(3):327–342
D’Costa AP, W. B. D. R. Group (2006) Exports, university-industry linkages, and innovation
challenges in Bangalore, India. World Bank, Development Research Group
Daft RL, Weick K (1984) Toward a model of organizations as interpretation systems. Acad
Manage Rev 9:284–295
Duncan NB (1995) Capturing flexibility of information technology infrastructure: a study of
resource characteristics and their measure. J Manage Inf Syst 12:37–57
Dyer J, Singh H (1998) The relational view: cooperative strategy and sources of interorganiza-
tional competitive advantage. Acad Manage Rev 23:660–679
Eisenhardt K, Martin J (2000) Dynamic capabilities—what are they? Strateg Manag J
21:1105–1121
Freeman S, Sandwell M (2008) Professional service firms entering emerging markets: the role of
network relationships. J Serv Market 22(3):198–212
Hodgkinson GP, Healey MP (2011) Psychological foundations of dynamic capabilities: reflexion
and reflection in strategic management. Strateg Manage J 32(13):1500–1516
Hough JR, White MA (2004) Scanning actions and environmental dynamism: gathering informa-
tion for strategic decision making. Manage Decis 42(6):781–793
Achieving Dynamic Capability Through Collaborative ICT Infrastructure. . . 147

Huber GP (1991) Organizational learning: the contributing processes and the literatures. Organ Sci
2:88–115
Jantunen J, Puumalainen K, Saarenketo S, Kyl€aheiko K (2005) Entrepreneurial orientation,
dynamic capabilities and international performance. J Int Entrep 3(3):223–243
Jayaram J (2004) Influence of initiators on supply chain value creation. Int J Prod Res
42:4377–4399
Johannessen JA, Olaisen J, Olsen B (2001) Mismanagement of tacit knowledge: the importance of
tacit knowledge, the danger of information technology, and what to do about it. Int J Inf
Manage 21(1):3–20
Kiesler S, Sproull L (1982) Managerial response to changing environments: perspectives on
problem sensing from social cognition. Admin Sci Q 27:548–570
Kraemer J; ConteT, Blau B, Dinther CV, Weinhardt C (2010) Service value networks: unleashing
the combinatorial power of service mashups. Working paper series on social science research
network: http://papers.ssrn.com/sol3/papers.cfm?abstract_id=1582902
Miles RE, Miles G, Snow C (2005) Collaborative entrepreneurship: how communities of
networked firms use continuous innovation to create economic wealth. Stanford University
Press, Stanford
Minniti M (2008) The role of government policy on entrepreneurial activity: productive, unpro-
ductive, or destructive? Entrep Theor Pract 32(5):779–790
Pavlou PA, Sawy OAE (2011) Understanding the elusive black box of dynamic capabilities. Decis
Sci 42(1):239–273
Ribeiro-Soriano D, Urbano D (2009) Overview of collaborative entrepreneurship: an integrated
approach between business decisions and negotiations. Group Decis Negotiation 18(5):419–430
Ruiz-Mercader J, Merono-Cerdan A, Sabater-Sanchez R (2006) Information technology and
learning: their relationship and impact on organisational performance in small businesses. Int
J Inf Manage 26(1):16–29
Sambamurthy V, Bharadwaj A, Grover V (2003) Shaping agility through digital options: reconcep-
tualizing the role of information technology in contemporary firms. MIS Q 27:237–263
Schilling MA, Steensma H (2001) The use of modular organizational forms: an industry-level
analysis. Acad Manage J 44:1149–1168
Singh RK, Garg SK, Deshmukh SG (2010) The competitiveness of SMEs in a globalized
economy. Manage Res Rev 33(1):54–65
Stewart J (1973) JR Mallory, The structure of Canadian Government. Macmillan of Canada,
Toronto, 1971, pp xii, 418. Can J Polit Sci 6(04):680–682
Tapscott D, Caston A (1993) Paradigm shift: the new promise of information technology. McGraw
Hill, New York
Teece DJ (2007) Explicating dynamic capabilities: the nature and microfoundations of (sustain-
able) enterprise performance. Strateg Manag J 28(13):1319–1350
Teece DJ (2009) Dynamic capabilities and strategic management: organizing for innovation and
growth. Oxford University Press, Oxford
Yu T (2001) Entrepreneurial alertness and discovery. Rev Austr Econ 14(1):47–63. http://dx.doi.
org/10.1023/A:1007855505727
Zajac EJ, Kraatz MS, Bresser F (2000) Modelling the dynamics of strategic fit: a normative
approach to strategic change. Strateg Manage J 21(4):429–453
Zhang J, Ziegelmayer JL (2009) RESOURCE OR CAPABILITY? A dissection of SMEs IT
infrastructure flexibility and its relationship with IT responsive. J Comput Inf Syst 50(1):46–53
Zollo M, Winter SG (2002) Deliberate learning and the evolution of dynamic capabilities. Organ
Sci 13:339–351
148 S. Sajib and R. Agarwal

Innovation and Economic Performance
of Ancillary SMES: An Empirical Analysis
R. Sudhir Kumar
1 Introduction
SMEs account for a considerable majority of industrial units and contribute to the
major proportion of employment, output and exports in most developing as well as
developed countries. Globalisation, the process of continuing integration of the
countries in the world, has increased the movement of goods, services, ideas, capital
and technology across national borders. This free movement of goods has enhanced
the opportunity for competitive SMEs of developing countries to cater to wider
international markets (Bala Subrahmanya 2005).
Innovation is one of the main factors underlying countries’ international competi-
tiveness and their productivity, output and employment performance. The production
and use of knowledge is at the core of value-added activities, and innovation is at the
core of firm’s and nation’s strategies for growth (Michie 1998). Technological inno-
vation is a strategic weapon to counter global competition and is an important means
of acquiring and strengthening competitiveness for a firm. Small firms would be
able to achieve technological upgradation through innovations, and climb up the
value chain for the production of high-value items, to survive and grow in the compe-
titive environment (Bala Subrahmanya 2006). Because of its flexibility in production
and potential for developing managerial skills, individual initiatives and rich personal
relations, SMEs are often promoted as a source of technological innovations in indu-
strialised economies (Bala Subrahmanya 2005).
In the globalisation era, there has been an increasing trend of multinational
corporations (MNCs) expanding their production bases to developing countries,
which offer growing markets on the one hand and better conditions of manufacturing
(mainly labour and infrastructural conditions) on the other, to have advantages of
R.S. Kumar (*)
Mechanical Engineering Department, N. S. S. College of Engineering,
Palakkad 678 008, Kerala, India
e-mail: [email protected]
Department of Management Studies, Indian Institute of Science, Bangalore,
Driving the Economy through Innovation and Entrepreneurship,DOI 10.1007/978-81-322-0746-7_13, # Springer India 2013
149

productivity and distribution (UNCTAD 2002). India is no exception, and many
global MNCs in various sectors including automobile industry have started their
operations in India. This international expansion of MNCs provides more scope for
local ancillary SMEs to receive latest technological inputs for carrying out inno-
vations enabling SMEs to enhance their economic performance.
Whether and how Indian ancillary SMEs would make use of their innovations to
enhance their economic performance is the objective of this chapter. This chapter
attempts to analyse the innovations carried out by ancillary SMEs in the automobile
industry of India and probe the role of innovations in their economic performance
using primary data collected from 81 manufacturing SMEs in Bangalore.
2 Literature Review
Schumpeter (1934) defined innovation as related to five types, namely, introduction
of new product or a qualitative change in existing product, process innovation new
to an industry, opening of a new market, development of new sources of supply for
raw materials or other inputs and changes in industrial organisation. Innovation can
be defined as the application of new ideas to the products, processes or any other
aspect of a firm’s activities. A technological product innovation can involve either
a new or an improved product whose characteristic differs significantly from pre-
vious products. A technological process innovation is the adoption of new or
significantly improved production methods, including methods of product delivery
(OECD 1997).
Roy and Wield (1985) view technological innovation as the transformation of
an idea into a new or improved saleable product or operational process in industry
or commerce. Innovation does not occur when new idea is generated, rather when
that idea is successfully commercialised. Sen and Egelhoff (2000) argue that the
innovation capabilities of a firm may be focused on improving existing products
and processes, which are referred to as incremental innovations or developing new
products and processes based on entirely different concepts and theories, which can
be referred to as radical innovations.
Most of the SMEs, which are basically subcontractors for other large firms, do
not perform R&D in any formal sense, and much of their technology is derived
from their large enterprise (LE) customers. Engaging in external technical and other
linkage activities can increase the technical, market and managerial know-how of
the small firm and can form an important part of its overall innovatory activities
(Rothwell 1991). Innovative activity is strongest among firms that combine their
in-house R&D efforts with technical support from external sources (Macpherson
1997), and customers are considered to be a more important source of innovation
than suppliers and scientific developments (de Jong and Marsili 2006). Ancillary
SMEs are likely to have fruitful alliance with their LE customers, which generally
possess complementary resources, enabling SMEs to carry out more innovations.
150 R.S. Kumar

Many researchers have pointed out the role of innovation in achieving better firm
performance. Edwards and Delbridge (2001) argue that innovation is a key factor for
sustaining economic competitiveness and is directly connected to a firm’s operational
and business performance. Yam et al. (2004) showed that technological innovation
capability of a firm is having a positive effect on its competitive performance. Han
et al. (1998) argue that organisational innovativeness is a key factor in delivering
superior corporate performance. Roper (1997) showed that innovative products
introduced by firms made a positive contribution to sales growth. Scherer (as quoted
in Coad and Rao 2008) suggested that sales growth is a particularly meaningful
indicator of post-innovation performance, and Deshphande et al. (1993) revealed that
innovative firms tend to be the better performers.
These studies clearly point out that a crucial factor for enhancing SME perfor-
mance is the continuous attempt to improve their innovative capacity. In this
context, this chapter analyses the innovations carried out by SMEs and probes the
role of innovation in the economic performance of SMEs, with reference to
ancillary SMEs in the automobile industry of India.
3 Research Methodology
Automobile industry is undergoing rapid transformation with major global players
expanding their manufacturing bases to industrialising economies in Southeast
Asia, China, India, among others. Local sourcing in the automobile industry has
increased, enabling ancillary SMEs of the host countries to have subcontracting
relationship with automobile manufacturers and enhance their innovative perfor-
mance. This context enhances the need as well as scope for SME suppliers to carry
out innovations and become competitive to be a part of the supply chain of major
automobile manufacturers. The objective of this chapter was studied with reference
to ancillary SMEs in the automobile industry of India.
The data were collected from SME suppliers in Bangalore who are manufac-
turing parts and components for production or assembly line requirements of the
automobile industry. The relevant data were collected from 81 ancillary SMEs
during the second half of 2006 and first half of 2007 using a structured question-
naire by visiting the firms and having personal interviews with entrepreneurs/senior
managers of the firms.
The measurement of innovation is difficult due to the broad nature of innovative
activities. One method to assess innovation is to measure the inputs and outputs
of innovative activity (Rogers 1998). Most commonly used inputs of innovation
activity are R&D expenditure and R&D personnel, whereas outputs of innovation
are number of new product/process developments, product/process modifications,
patents, etc. (Esposito 1993). Even though none of these measures can be consid-
ered stand-alone measure of innovation, these measures can be good indicators
of innovation (Rogers 1998). Therefore, details regarding innovations carried out
by the sample SMEs in the last 2 years with respect to new product/process
Innovation and Economic Performance of Ancillary SMES: An Empirical Analysis 151

developments and modifications, raw material selection and proportion of R&D
allocation were collected. Since R&D activity of small firms is distributed over
operational areas, R&D expenditures of such firms are either unidentified or under-
estimated (Roper 1999). Innovative capability of an SME cannot be underestimated
just because of the absence of any formal R&D allocation in the firm, and therefore,
we collected information regarding the informal resource allocation for R&D or
new product developments (NPD) of these SMEs. Innovative performance was
measured based on six dimensions of innovation, namely, new product develo-
pments, product modifications, process improvements, informal R&D/NPD expen-
diture, informal R&D/NPD employees and raw material selection.
Economic performance of a firm can be assessed in terms of different indicators
depending on the context and objectives for measurement. Tsai and Wang (2008)
measure value added as the indicator for firm performance in their study on how
external technology acquisition affects a firm’s performance because the major
purpose for a firm to acquire external technology is to enhance their value added
through product or process innovation. In this study, economic performance has
to be analysed at the firm level, and therefore, economic performance was assessed in
terms of gross value added. In order to probe whether SMEs made use of innovations
for their economic performance, multiple regression analysis was performed with
innovation score, along with factors of production, capital and labour as explanatory
variables and value addition as criterion variable.
To have a more comprehensive picture of the effect of the predictors on
the response variable, quantile regression (QR) is performed using the equation.
Quantile regression is a statistical technique intended to estimate, and conduct
inference about, conditional quantile functions. Just as classical linear regression
methods based on minimising sums of squared residuals enable one to estimate
models for conditional mean functions, quantile regression methods offer a mecha-
nism for estimating models for the conditional median function and the full range of
other conditional quantile functions.
4 Role of Innovation in Economic Performance: Analysis
and Inferences
A quantitative assessment of innovations carried out by SMEs was done based on
the information gathered for the six dimensions of innovation. Firms were ranked as
very low, low, average, high or very high for each of these variables of innovation,
and scores ranging from 1 to 5 were given to these rankings (1–very low, 2–low,
3–average, 4–high and 5–very high) for each variable. A consolidated innovation
score for each firm was calculated by summing up the scores of all the six variables,
and thus, the minimum possible value for innovation score is 6 and maximum
possible value is 30. Innovation score thus calculated would clearly indicate the
relative performance of these firms in terms of their overall innovation since it is
152 R.S. Kumar

based on the six different dimensions of innovation. The details of the innovation
score along with the scores of the six dimensions calculated for the firms are shown
in Table 1.
We considered new products as products which were new to the SME firms and
fully developed by these firms as per customer requirements or by own initiative.
The mean value for new product developments was above 3.5 implying that
the innovative performance in terms of new product developments is above aver-
age. Product modifications refer to incremental improvements, which SMEs could
achieve for the existing products, and these improvements could have been initiated
by the SMEs or their customers. The mean value of 3.432 indicates that these firms
were able to carry out significant product modifications, which is an indicator of
incremental innovations.
Competitive environment in which the SMEs are operating has put tremendous
pressure on SMEs to have continuous improvement for their manufacturing oper-
ations, in addition to their product features. Our discussions with entrepreneurs/
managers of SMEs revealed that the profit margin for manufacturing SMEs has
come down drastically in the decade and these SMEs have to operate with cost
reduction in all aspects without compromising on quality and delivery, for their
survival. This context calls for the need to continuously improve the manufacturing
processes for cost reduction as well as quality improvement, and the mean value
above 3 suggests that SMEs were having significant process improvements.
In general, SMEs are constrained to have formal R&D allocation because of their
inherent nature of small size and resource inadequacy. At the same time, these SMEs
incur a considerable expenditure for innovative activities, mainly, for new product
developments which they may not be able to retrieve from the customers. The data
related to this informal expenditure were collected as a proportion of annual spending
over total sales from the SMEs. The mean value for this innovation dimension score
was less than 2.5 which indicates that the extent of informal R&D/NPD expenditure
allocation is average only. Given the fact that manufacturing SMEs operate in a
highly competitive environment with low profit margins, these SMEs may also be
constrained in terms of extra finance for their innovative activities, and this could be
one of the reasons for the low mean score of this dimension.
Information regarding the informal allocation of employees for innovative
activities by these firms and information based on the proportion of the employees
Table 1 Details of innovation score
Dimensions Mean Std. deviation Range Min. Max.
Percentiles
25 50 75
New product developments 3.617 1.056 4 1 5 3 4 4
Product modifications 3.432 1.204 4 1 5 3 4 4
Process improvements 3.136 1.232 4 1 5 2 3 4
Informal R&D/NPD expenditure 2.136 0.972 3 1 4 1 2 3
Informal R&D/NPD employees 2.235 1.087 4 1 5 1 2 3
Raw material selection 3.679 1.047 4 1 5 3 4 4
Consolidated innovation score 18.235 3.655 18 8 26 17 19 20
Innovation and Economic Performance of Ancillary SMES: An Empirical Analysis 153

used exclusively for new product developments and other innovative jobs over
total employees were collected. The mean value was less than 2.5 implying that
the innovative performance in terms of informal R&D/NPD employees is also only
average. In most of these firms, entrepreneur himself was involved in new product
developments and other innovative activities. This could be because of the lesser
number of total employees for SMEs as compared to large firms, constraining the
SMEs to spare more employees exclusively for innovative activities.
Quality and cost of raw materials play a major role in the operational perfor-
mance of manufacturing SMEs. SMEs can be innovative in terms of raw material
selection by way of searching for better quality raw materials and better source of
raw materials which may apparently lead to radical raw material substitution for
their products. Innovation score for raw material selection had a mean value above
3.5 indicating the significant SME efforts of searching for better raw materials in
terms of quality, price and source.
The mean value of consolidated innovation score between 18 and 19 for SMEs
indicates that these small firms were having moderate innovative performances
in terms of their overall innovative activities. In order to have more insight into
the interrelationship among the variables used to measure innovation and to probe
the underlying structure of the data, factor analysis using the data on innovation
variables was performed. R type of factor analysis based on principal components
was performed on these six variables, and the criterion for the number of factors to
extract was latent root (eigenvalue) criterion. Hence, the factors having latent roots
or eigenvalues greater than 1 were considered significant; all factors with latent
roots less than 1 were considered insignificant and were discarded. The results of
the factor analysis on innovation variables are summarised in Table 2.
The six variables of innovation are loaded into three factors, and these three
factors explained about 75% of the variance of the variables. New product develo-
pment, product modifications and process improvements which are output indi-
cators of innovation are loaded to the first factor with 32.23% of the variation.
Informal R&D/NPD expenditure and informal R&D/NPD employees which are
input indicators of innovation are loaded to the second factor with 24.22% of the
variation. Raw material selection which cannot be exclusively attributed to input
or output of innovations is loaded separately into a third factor with 19.04% of the
Table 2 Results of factor
analysis on innovation
variables
Factors
Innovation variables 1 2 3
New product development 0.867
Product modifications 0.830
Process improvements 0.494
Informal R&D/NPD expenditure 0.847
Informal R&D/NPD employees 0.847
Raw material selection 0.862
Eigenvalue 1.934 1.453 1.142
Cumulative percentage of variance 32.23 56.45 75.49
154 R.S. Kumar

variation. This implies that technological innovation of a small firm can be attributed
to three factors: output of innovation, input of innovation and raw material selection.
To analyse the role of innovation of these SMEs on their economic performance,
innovation score was included in Cobb-Douglas production function as one of the
explanatory variables along with capital and labour, and the production function
was modified as
Y ¼ A KaLb innovation scoreg (1)
By taking the logarithm, this equation was written as
ln Y ¼ ln Aþ a ln K þ b ln Lþ g ln innovation score (2)
The positive role of innovation in the improvement of economic performance
would be indicated by a significant positive value for coefficient g in the equation.
The results of the regression analysis with innovation score as one of the expla-
natory variables are summarised in Table 3. The coefficient of labour was very high
and statistically significant indicating the major contribution of labour for the value
addition in these firms. The coefficient of innovation score was also positive and
statistically significant implying that innovations of these SMEs also contributed to
the value addition along with the labour. The coefficient of 0.759 for the innovation
score in the production function implies that an increase of 1% in innovation score
would increase value addition by 0.759%, given the other inputs. This implied that
though labour was having major contribution for value addition, these SMEs were
able to make use of their innovations also for the value addition.
The absence of multicollinearity is ascertained for multiple regression model since
the values of variable inflation factors (VIF) for the independent variables were in
the acceptable range. The Durbin-Watson coefficient tests for autocorrelation and
value 2.346 indicated independence of observations for the regression model.
In order to have a more comprehensive picture of the effect of innovation on
economic performance (value addition), we performed quantile regression using the
same equation, which will reveal the variation of estimated slope parameters at
different quantiles of the response distribution. Quantile regression, which was intro-
duced by Koenker and Bassett (1978), extends the regression model to conditional
Table 3 Results of regression of innovation score (dependent variable: ln Y)
Explanatory variables
Unstandardised
coefficients t-Values VIF
Constant 9.000*** 6.407
ln K 0.100 1.279 2.690
ln L 0.948*** 6.461 2.873
ln Innovation score 0.759* 1.799 1.167
Adj R2 0.706 Sig. 0.000
F value 60.999 Durbin-Watson 2.346
* Indicates significance at 10 % level; *** Indicates significance at 1 % level
Innovation and Economic Performance of Ancillary SMES: An Empirical Analysis 155

quantiles of the response variable and takes into consideration the heterogeneity of
firms. While classical linear regression describes how the mean value of the response
variable varies with a set of explanatory variables, quantile regression describes the
variation in the quantiles of the response. The values of coefficient g at different quan-tiles were used to assess how innovations would influence the value addition of SMEs
operating with different economic performance levels.
The results of the quantile regression are summarised in Table 4. The value of
coefficient of innovation score was decreasing below median firms and increasing
above median firms. The coefficient estimate for the innovation score was having
lower values for below average firms evaluated near the median (Q¼0.50) and
relatively higher values at upper range of quantiles. Figure 1 shows the pattern
of change in value addition (ln VA) for change in innovation (ln innovation score)
for different quantile values (for constant capital and labour at mean value). The
continuous black line represents the OLS regression line. When the quantile regres-
sion solution was evaluated below the median firm, slope of the curve was lesser
implying that innovations tend to have less influence on the value addition. How-
ever, for those SMEs with better economic productivity at the upper quantiles
above median firms, slope of the curve was more, indicating the sharp increase in
coefficient of innovation score. This implies that for SMEs having average eco-
nomic productivity, their innovations would contribute less to their economic
performance as compared to those SMEs having high economic productivity.
High-performing SMEs were able to make more use of their innovations for their
economic performance. The variation of coefficient estimate for the innovation
score for different quantiles is shown in Fig. 2.
Table 4 Results of quantile regression of ln innovation score
Quantiles Intercept ln K ln L ln innovation score
0.10 11.470004 �0.012779 0.971345 0.149095
(0.00000) (0.92559) (0.00016) (0.84034)
0.20 7.827181 0.114085 0.914744 0.937369
(0.00001) (0.25442) (0.00000) (0.08343)
0.25 7.795429 0.137114 0.838998 0.958183
(0.00000) (0.14524) (0.00000) (0.05987)
0.35 8.503905 0.112619 0.988326 0.736476
(0.00000) (0.21040) (0.00000) (0.12998)
0.50 8.165824 0.219954 0.700888 0.718853
(0.00000) (0.01487) (0.00004) (0.14116)
0.65 6.825956 0.289593 0.646308 0.988321
(0.00003) (0.00136) (0.00015) (0.04334)
0.75 6.916520 0.240919 0.742900 1.152372
(0.00002) (0.00771) (0.00001) (0.01846)
0.80 6.365077 0.274007 0.675034 1.279865
(0.00004) (0.00151) (0.00003) (0.00616)
0.90 7.400799 0.197547 0.853805 1.231232
(0.00000) (0.02430) (0.00000) (0.00946)
Coefficients (p-values in parenthesis)
Bold values indicate that the values of coefficient of innovation score for these quantiles are
significant at 15 % level
156 R.S. Kumar

5 Conclusion
Accelerated process of globalisation has exposed SMEs of developing countries to
intense international competition and at the same time, offers more opportunities to
competitive SMEs to exploit international markets. This context calls for the need
for SMEs, having their own strategic significance in any economy, to become
highly competitive in all aspects of business. Small firms should recognise the
need of continuous improvement of their innovative capabilities, which in turn can
lead to better economic performance enabling them to become globally competi-
tive. This chapter has analysed the nature of innovations carried out by Indian
ancillary SMEs and the role of innovations in their economic performance.
12
13
14
15
16
17
18
1.5 2 2.5 3 3.5
ln Innovation Score
ln V
A 0.1
0.25
0.5
0.75
0.9
OLS
Fig. 1 OLS and quantile regression curves
0
0.2
0.4
0.6
0.8
1
1.2
1.4
0
0.2
0.4
0.6
0.8 1
Quantiles
Coe
ffic
ient
s
Quantile
OLS
Fig. 2 OLS and quantile
regression estimates of ln
innovation score
Innovation and Economic Performance of Ancillary SMES: An Empirical Analysis 157

Innovation of a small firm can be related to new product developments, product
modifications, process improvements, informal R&D/NPD expenditure, informal
R&D/NPD employees and raw material selection. The present study has assessed
the firm level innovation of the sample firms in terms of these dimensions and found
that these firms do innovate and their level of innovation is moderate. But the level
of innovation in the areas of informal R&D/NPD expenditure and informal R&D/
NPD employees is not high as compared to other dimensions of innovation, and this
could be due to their resource constraints, being small in size.
Factor analysis using the data on innovation dimensions revealed that these
dimensions can be reduced to three factors. New product development, product
modifications and process improvements which are output indicators of innovation
are loaded to the first factor, informal R&D/NPD expenditure and informal R&D/
NPD employees which are input indicators of innovation are loaded to the second
factor and raw material selection which cannot be exclusively attributed to input or
output of innovations is loaded separately into a third factor. This implied that
technological innovation of a small firm could be attributed to three factors: output
of innovation, input of innovation and raw material selection.
Economic performance was assessed at the firm level with reference to the
effective utilisation of various inputs in the process of gross value addition. Analysis
using multiple regression model revealed the contributory role of innovation, along
with the labour, for better economic performance of small firms. Analysis using
quantile regression models clearly showed variation of the effect of innovation on the
economic performance for SMEs having different economic productivities. Coeffi-
cient of innovation was having higher values for firms at the upper quantiles above
median firms compared to those at lower quantiles, implying that innovations
contributed less to the economic performance of SMEs having average and low
factor productivities as compared to those which had higher factor productivities.
SMEs having high economic productivity tend to make more of use their innovations
for economic performance than SMEs with average economic productivity.
References
Bala Subrahmanya MH (2005) SMEs in India: will they be able to join “Global Chains”?
CA J Chart Account (The Institute of Chartered Accountants of India, New Delhi) 54
(3):421–427
Bala Subrahmanya MH (2006) Innovation to cope with globalisation: a case study of a Japanese
SME. Technol Monitor (Jan–Feb):40–44
Coad A, Rao R (2008) Innovation and firm growth in high-tech sectors: a quantile regression
approach. Res Policy 37(4):633–648
de Jong JPJ, Marsili O (2006) The fruit flies of innovations: a taxonomy of innovative small firms.
Res Policy 35:213–229
Desphande R, Farley JU, Webster FE (1993) Corporate culture, customer orientation, and
innovativeness in Japanese firms: a quadrad analysis. J Market 57(1):23–37
Edwards T, Delbridge R (2001) Linking innovative potential to SME performance: an assessment
of enterprises in industrial South Wales. Paper for 41st European regional science association
158 R.S. Kumar

meeting, Zagreb, Croatia, August 2001. Available on http://www.ersa.org/ersaconfs/ersa01/
papers/full/135.pdf. Accessed 30 May 2007
Esposito E (1993) Technology measurement: a composite approach. Technol Forecast Soc Change
43:1–17
Han JK, Kim N, Srivastava RK (1998) Market orientation and organizational performance: is
innovation a missing link? J Market 62:30–45
Koenker R, Bassett GW (1978) Regression quantiles. Econometrica 46:33–50
Macpherson AD (1997) A comparison of within-firm and external sources of product innovation.
Growth Change 28:289–308
Michie J (1998) Introduction. The internationalisation of the innovation process. Int J Econ Bus
5(3):261–277
OECD (1997) The Oslo manual – proposed guidelines for collecting and interpreting technologi-
cal innovation data. OECD, Paris
Rogers M (1998) The definition and measurement of innovation. Melbourne Institute working
paper, No. 10/98, University of Melbourne
Roper S (1997) Product innovation and small business growth: a comparison of the strategies of
German, UK and Irish companies. Small Bus Econ 9:523–537
Roper S (1999) Under reporting of R&D in small firms: the impact on international R&D
comparisons. Small Bus Econ 12:131–135
Rothwell R (1991) External networking and innovation in small and medium-sized manufacturing
firms in Europe. Technovation 11(2):93–112
Roy R, Wield D (1985) Product design and technological innovation: a reader. Open University
Press, Philadelphia
Schumpeter JA (1934) The theory of economic development. Harvard University Press,
Cambridge, MA
Sen FK, Egelhoff WG (2000) Innovative capabilities of a firm and the use of technical alliances.
IEEE Trans Eng Manage 47:174–183
Tsai K-H, Wang J-C (2008) External technology acquisition and firm performance: a longitudinal
study. J Bus Ventur 23:91–112
UNCTAD (2002) World investment report 2002: transnational corporations and export competi-
tiveness. New York and Geneva, Part I – Trends in international production
Yam RCM, Guan JC, Pun KF, Tang EPY (2004) An audit of technological innovation capabilities
in Chinese firms: some empirical findings in Beijing, China. Res Policy 33:1123–1140
Innovation and Economic Performance of Ancillary SMES: An Empirical Analysis 159

Part 1.4
Technology and Sustainability

Survival and Growth Strategies for Small-
and Medium-Scale Enterprises in India:
A Key for Sustainable Development
Ravindra Tripathi, Rajesh Kumar Shastri, and Sweta Agarwal
1 Introduction
The term MSME defines small-scale industrial (SSI) units and medium-scale
industrial units. The MSME sector manufactures a wide range of industrial products
such as food products, beverages, dairy products, tobacco and tobacco products,
cotton textiles, wool, silk, synthetic products, hemp, jute and jute products, trade,
crafts, wood and wood products, furniture and fixtures, paper and paper products,
printing publishing and allied industries – engineering, appliances and apparatus,
etc. The technological problem has emerged as a prime problem in the competitive
era (Agarwal 2010). Study of Dr. D. Himachalam has emphasised the role of
entrepreneurs and government programmes in the development of small scale
sector. ‘Entrepreneurship development in small scale sector revealed that entre-
preneurship development and small scale industrial development are the obverse
and reverse of the same coin’.
The enterprises in India can be classified as (Table 1):
Before independence, the small- and medium-scale industries represent the
village and the urban cottage industry manufacturing items like machines, hard-
ware, food processing, handicrafts, ayurvedic plants, handloom cloths, etc. These
industries received recognition and support during the freedom movement as
these industries play a prominent role during the freedom struggle to fight against
foreign commodities (Ghatak 2006) in India. These industries played the part and
parcel of life in society, and people were accustomed to traditional goods and
services. The MSME sector is a nursery of entrepreneurship, often driven by
individual creativity and innovation. The sector contributes 8% of India’s GDP,
R. Tripathi (*) • R.K. Shastri • S. Agarwal
Department of Humanities and Social Sciences, Motilal Nehru National
Institute of Technology, Allahabad, Uttar Pradesh, India
e-mail: [email protected]; [email protected]; [email protected]
Department of Management Studies, Indian Institute of Science, Bangalore,
Driving the Economy through Innovation and Entrepreneurship,DOI 10.1007/978-81-322-0746-7_14, # Springer India 2013
163

45% of the manufactured output and 40% of its export. As per the estimates of
fourth All India Census of MSMEs, the number of enterprises is estimated to be
about 59 million persons in over 26 million units and provide employment to an
estimated 60 million persons (Annual Report, fourth Census of MSME 2011).
Out of 26 million MSMEs, only 1.5 million are in the registered segment, while
24.5 million are in the unregistered segment. The state-wise distribution of
MSMEs shows that more than 55% of these enterprises are in six states, namely,
Uttar Pradesh, Maharashtra, Tamil Nadu, West Bengal, Andhra Pradesh and
Karnataka (Tables 2 and 3).
Table 2 Composition of MSME in India, 2011
Characteristics Registered sector (%) Unregistered sector (%) Total SSI sector (%)
No. of rural units 44.33 56.8 55
No. of SSI units 65.55 38.75 42.26
No. of tiny Units 97.9 99.9 99.5
No. of women enterprises 10 10.13 10.11
Table 3 Financials of MSMSE in India, 2001–2010
Sl. no. Year
Total
MSME’S
(lakh nos.)
Fixed investment
(Rs. crore)
Production
(Rs. crore)
Employment
(Lakh person)
Exports
(Rs. crore)
1 2001–2002 4.07 5.11 8.03 4.44 2.07
2 2002–2003 4.07 5.16 11.54 4.36 20.73
3 2003–2004 4.07 4.87 15.78 4.31 13.52
4 2004–2005 4.07 4.98 17.90 4.11 27.42
5 2005–2006 4.07 5.27 15.83 4.37 20.76
6 2006–2007 111.48 166.20 42.49 101.62 21.50
7 2007–2008 4.51 11.47 11.47 5.34 10.67
8 2008–2009 4.53 11.39 11.39 5.35 NA
9 2009–2010 4.53 11.59 11.59 5.47 NA
Source: Annual report (2010–2011)
Table 1 Classification of MSME in India, 2006
Type of
enterprise
Engaged in manufacture
or production of goods
Engaged in providing or rendering
of services
Micro
enterprise
Does not exceed 25 lakhs rupees Does not exceed ten lakh rupees
Small
enterprise
More than 25 lakh rupees but does not exceed
5 crore rupees
More than ten lakh rupees but does
not exceed two crore rupees
Medium
enterprise
More than five crore rupees but does not
exceed ten crore rupees
More than two crores but does not
exceed five crore rupees
Source: Development Commissioner (MSME) Ministry of Micro, Small and Medium Scale
Enterprises (2006)
164 R. Tripathi et al.

2 Detailed Objectives of This Chapter
1. To study the activities of micro-, small- and medium-scale enterprises in India.
2. To identify the challenges faced by MSMEs in the era of techno upgradation,
transfer after globalisation.
3. The governmental schemes and its role to develop technological upgradation to
improve the sustainable development in small- and medium-scale enterprises
promoting research and development activities.
4. To explore the Cartel model and find new opportunities for MSMEs in India.
3 Activities of Small-Scale Industries in India
In India, the MSMEs play a pivotal role in the overall industrial economy of
the country. The sector has shown admirable innovativeness and adaptability to
survive the recent economic changes and recession. It contributes to around 40%
of industrial production and exports. It manufactures more than 6,000 diverse
products, ranging from low-tech items to technologically advanced products. The
micro, small and medium enterprises (MSMEs) have been accepted as the engine
of economic growth and for promoting equitable development. However, if we
compare the growth of MSMEs in India with those in the neighbouring countries in
Southeast Asia like Japan and China, we still lag behind due to lack of technology
and research and development (Fig. 1).
Fig. 1 Characteristics of Indian small- and medium-scale enterprises (Plan 2007–2012)
Survival and Growth Strategies for Small- and Medium-Scale Enterprises. . . 165

The diagram describing the current characteristics of MSME and challenges
they are facing in the globalised era.
There are some major hurdles; firstly, major hurdle for this sector is low credit
availability. Secondly, major hurdle is lack of technological innovation. These units
working at the base level still work on obsolete technology because of which not
only the cost of production is high but also the product fails to meet market demand
in terms of quality and appearance. Thirdly, the generic problem occurs such as
technological obsolescence, domestic and global competition, fund shortages,
rating of MSMEs and uncertain market scenario. Because of liberalisation
and opening up of the economy, the MSMEs face high competition from imports
and therefore need technological upgradation to manufacture better quality
products at cheaper rates. The Techmart, a workshop on the concept of upgrading
the industries which is held yearly, this year called as Techmart-2011, attracted
a good response from trade and industry. 208 micro and small enterprises are
representing from the states of Delhi, Punjab, Himachal Pradesh, Uttar Pradesh,
Maharashtra, Kerala, Gujarat, Chandigarh, Haryana, Rajasthan, Hyderabad,
Madhya Pradesh, West Bengal, Karnataka, Tamil Nadu, Chhattisgarh, Jammu
and Kashmir, etc., including more than 45 units from North Eastern States
participating in the exhibition to be informed with latest technological develop-
ments covering a wide range of engineering, manufacturing and allied industries.
Though India ranks at top in terms of availability of human resource in science and
technology, technology intervention in the small-scale industry sector is still very
low, and as a result, the cost of production is much higher in India than other
developing nations in Asia. The artisans, weavers, manufacturers, developers, etc.,
remain unaware of the latest designs and current market trend. They manufacture
products of old designs which fail to attract new buyers. Therefore, there is a need
to encourage engineers, fashion designers, professionals and entrepreneurs to
work with the small- and medium-scale units which would be mutually beneficial
and would help revive the unit.
3.1 Technological Shortcomings Identified in the Indian MSMEs
(a) Low levels of research and development
(b) Poor adaptability to changing trade trends
(c) Desire to avoid risk
(d) Non-availability of technically trained human resources
(e) Lack of access to technological information and consultancy service
(f) Isolation from technology hubs (Fig. 2)
Thus, there is a need to promote product development through governmental
schemes, entrepreneurship, etc. Here, the techno entrepreneurs can play a key
role to facilitate the development of new prototype models in these industries to
166 R. Tripathi et al.

promote sustainability. The main constraint is the challenge of technology transfer
and adoption due to lack of technical manpower, lack of implementation of policies
and plans and low infrastructure that retards the growth in the MSME sector.
4 The Role of MSMEs in India (Fig. 3)
4.1 The Ayurvedic Plants
In India, drugs of herbal origin have been used traditionally for treatment of wounds
and major diseases. They worked partially commercially but practised their skills to
treat the patient to come out of illness. Traditional knowledge had always
contributed to modern medicine and health care. Moreover, with the commerciali-
zation of even natural resources, traditional knowledge, the sustainability has been
hampered due to the issues of ‘privatisation’, ‘alienation’ and ‘biopiracy’, which
have become the major areas for concern. In globalisation, these pressures have
manifoldly increased on the innovator and the successor of these enterprises.
Presently the West is adopting our traditional practices be it medicine, meditation
or Yoga. To strengthen this, first, the government should take further steps to
preserve, protect and promote the traditional cultures and knowledge of the
innovators. Second, side by side, they should also be encouraged (rewarded) to
Fig. 2 The challenges of technology transfer in developing countries like India (Pradhan,
February 2010)
Survival and Growth Strategies for Small- and Medium-Scale Enterprises. . . 167

develop and opportunity be provided for education and scientific study. Third,
another important aspect is to facilitate and educate concerned officials at the
state and especially at the local levels to understand and respect the culture
differences. Modern science can give a broader perspective to local sustainability,
whereas traditional knowledge can provide in-depth experience. Fourth is to pro-
mote alternative means of livelihood products and services, including forest and
agricultural products, herbal medicines, cultural heritage or traditional health-based
tourism and ecotourism. Fifth, young people should be encouraged to learn more
about their cultural heritage as well as tolerance and respect for other cultures and
traditions.
4.2 The Tribal Handicrafts
The Indian tribes represent a part of Indian society with diversified language,
culture, skills, traditions, livelihood, etc. They are rich in resources and skills that
can be strengthened through preserving, honouring the characteristics of Indian
tribes with maintaining their ancestral cultures and skills to make themselves self-
sufficient and earn their livelihood. The Indian tribal has the strength to preserve
their cultural heritage but lacks in funds and support to counter in present era.
Handicrafts are mostly defined as ‘Items made by hand, often with the use of simple
tools and are generally artistic or traditional in nature’. It includes domestic articles,
smoking pipes, footwear, hunting arrows, combs, wooden and stone plates and
textile items. The processing industry includes minor forest products and decorative
items like jewellery, ankle bells, necklaces, head gears, head dresses, wall paintings,
deities of wood, stone and artefacts. The cane and bamboo, woodcarvings, bell metal
handicrafts, deities, flower vases, agarbatti stands and bowls are important handicraft
of Chhattisgarh and Arunachal state due to availability in nearby forest area.
Terracotta items like horses, elephants and flower vases are traditional handicrafts
Fig. 3 The role of these three
MSME in the technological
upgradation and transfer
168 R. Tripathi et al.

moulded by tribals of Chhattisgarh state (Planning Commission, Government of
India 2006). Woollen shawls and scarfs are prominent among tribals of Uttaranchal
due to availability of raw material. The women entrepreneurs can play a pivotal role
in these industries and can be a rich source of employment and trade in India.
4.3 The Food Processing Industry
The food processing industry acts as a vital link between the agriculture and
industrial segments of the economy. The Indian food processing has tremendous
potential for the producers to enhance their entrepreneurial skills for making one
self-sufficient and independent. There are a number of micro, small and medium
enterprises like fruits and vegetables, grain processing, beverages, processing of
meat, marine products, pickles, chutneys, edible oils, oil seeds, biscuits, high-
protein food, specialised packaging and spices which require technology for their
processing and storage. Here, the techno entrepreneurs can play a vital role for the
freezing, preservation and processing of items for value addition. The Indian
farmers and growers are skilled both in production and processing of food products
and can create units at the household level to foresee the business opportunities.
Need for Technological Transformation of MSME in Present Scenario
1. Technical know-how to be promoted by government in MSMEs for
standardisation and best practices in the enterprise.
2. Cost procurement at the subsidised rate for the MSMEs to promote their
innovativeness in the enterprise.
3. Finance at concessional rate is given to them through efficient services of
microfinancing, performance and credit capital subsidy schemes for technologi-
cal upgradation, etc.
4. Mentors (through government schemes) should facilitate the products and
services.
5. Production system at par with high-scale enterprises.
6. Marketing of the MSMEs product at lower rate as a part of market assistance
given.
7. Promotion of information and communication technology in Indian manu-
facturing sector to adopt best and standardised business practices. The main
aspect that drives growth in MSME sector is technology. It has recently intro-
duced innovative schemes under the National Manufacturing Competitiveness
Programme covering the entire gamut of manufacturing in the sector aiming to
develop global competitiveness among Indian MSMEs by focusing on:
(a) Marketing support.
(b) Support for entrepreneurial and managerial development of MSMEs through
incubators.
Survival and Growth Strategies for Small- and Medium-Scale Enterprises. . . 169

(c) Enabling manufacturing sector to be competitive through quality manage-
ment standard and quality technology tools.
(d) Building awareness on intellectual property reforms to protect their skill and
innovation.
(e) Promotion of information and communication technology in MSMEs to
facilitate long communication with the buyers at nominal charges. The
technology has facilitated the economy of money, time and resources in
the unit leading in reduction per unit cost due to intervention of technology.
5 Opportunities for Research and Development in MSMEs
A question arises why Indian MSMEs innovate and focus on research and develop-
ment. In the present globalised era, the Indian MSMEs use strategies, techniques
and innovative processes to survive under the new technological regime. Therefore,
MSMEs are required to develop or acquire necessary competitive resources like
new technologies to compete with large national and foreign firms. The rapidly
changing consumer preferences, shorter product life cycle and growing quality
consciousness clearly call for MSME to upgrade their technological assets. This
chapter basically focuses on in-house research and development activities of Indian
manufacturing MSMEs during the period after 1991. Research and development is
required not only to develop distinctive technological competencies but also to
successfully absorb external technologies imported from foreign alliances and
projects (Krishnaswamy et al 2010). The MSME (R&D) has undergone shift in
its structure during 1999, and the share of stand-alone firms in total research and
development became more than doubled to 55% in 2005–2008 from low of 23% in
1991–1994 for small- and medium-scale firms. The Indian MSMEs, which have no
access to technological resources of business groups and foreign investors, are
upgrading the scale of their research and development activities to meet the
growing market competition. The research and development expenses by Indian
small manufacturing firms grew by 33% between 1991–1994 and 1995–1999 from
Rs. 325 million to Rs. 1,426 million. The technological development includes
entrepreneurship, training and education, entrepreneurship development courses,
skill development programmes, internship programmes, business development
services, information and communication technologies, production technologies,
technology incubators, E-business and portals, etc., for MSMEs growth in India.
The Government of India has implemented many schemes for technological
upgradation, modernization and protection of workers like infrastructure develop-
ment, entrepreneurship development as well as increase in the investment limit (to
Rs. 50 million) for small-scale units producing certain items. The Government of
India has set up a new ministry in October 1999 to provide more focused attention
to the development of the small-scale industries. Several expert committees had
also been set up in the 1990s to assess the problems of the small-scale industries.
Most of the recommendations of these committees relating to simplifying of loan
application forms, launching of a new credit guarantee scheme, raising of compos-
ite loans, etc., have been accepted and implemented (Fig. 4).
170 R. Tripathi et al.

Here, the model explains the role of producers, consumers and retailers in the
MSME sector. It emphasises on the significant contributions of Cartel in the
economy.
6 Operations of the Cartel System in Food Processing,
Ayurvedic and Tribal Handicraft Industries
The food processing MSME produces a variety of food products like jelly, achar,
beverage, spices, oil, frozen fruits and vegetables. If the industry adopts the Cartel
model, then the industries in the similar activities can club themselves for a
common objective and can earn profits. The ayurvedic industry is also not able to
publicise its product and add new innovations in medicine sector. Innovation is the
prime factor for any industry to sustain competitiveness which can be facilitated
through Cartel model. The model works on the concept of networking of units,
allocating resources, utilising skills and managing funds. The tribal handicrafts
have not yet achieved growth due to absence of link from the outer world. Here, the
Cartel model can link them with other handicraft units which would provide support
to their innate art and culture. The large-scale enterprises as mentioned have
oligopolistic market, the same can be applied to the small- and medium-scale
enterprises to encourage them, as a tool facilitating sustainability.
6.1 Working Aspect of MSMEs in India Through Focusingon Cartel Model
As defined by economists, Cartel is a group of formally independent producers
whose goal is to increase their collective profits by means of price fixing, limiting
Establishment of direct linkage between producers and consumers
Research and DevelopmentAssist in Government Regulations
Cost Optimization and Collective profits
Technological Up gradation
Value Chain
Fostering Entrepreneurship
Rationalization of economic activities and cooperation in firms
Purchasing price and purchasing agreements
Provide quality products to consumer, Healthy competition
Cartel
Advertising Cost
Off set structuraldisadvantages
Fig. 4 Importance of Cartel model in MSME sector (India 2010, pp. 1–15; OECD 2005)
Survival and Growth Strategies for Small- and Medium-Scale Enterprises. . . 171

supply or other restrictive practices such as antitrust laws, and they usually occur in
oligopolies and usually involve homogeneous products. To enable MSMEs over-
come the mentioned issues and enhancing their access to new technologies for
increasing their competitiveness in the international market, they should have a
conducive environment, which includes formulation of appropriate national
policies and programmes, building of technological capacity, knowledge flows
and technology databases and then, finally, research and development. The
MSMEs can be technically upgraded through technological cooperation with
large enterprises such as R&D institution, academic institution and centres of
technology development. After the independence, the scientific and technological
base of the country has grown considerably. Today, it consists of a wide range of
infrastructure in terms of laboratories, R&D institutions, the chain of institutions
under CSIR, DST, DBT, ICAR, etc., besides academic institutions like IITs, NITs,
etc. The third form of support to MSMEs, including technology upgradation,
training, reskilling, entrepreneurship development, etc., comes in the form of
schemes programmes by Ministries of Small-Scale Industries in Science and Tech-
nology, Textiles, Food and Agriculture, Labour and Employment etc.
The Cartel model is effective when the units are ready to work on a common
platform in a cooperative way to face fierce competition. Since the late nineteenth
century when the modern Cartel movement properly arrived with the rise of big
business based on scale and scope, the term Cartel has spread worldwide and has
more focused into big industries like petroleum, beverages, railways, telephone
industries, post offices, textiles, etc., to create concentration of power among few
players. In the 1980s, the Cartel system was much effective in various industries
due to focus on localization. Key importance of Cartels is that they do not abolish
competition but promote a network of companies working for a similar objective
and require funds, technology, manpower and skills for their growth. The Cartels
*Where F-Firms
F5F4 F6
* F1 F2 F3
.Impactsustainability-new product, process, procedures
.Employmentcreation
.Research and development(Technological upgradation).Competition
.Techno Entrepreneurs
.GovernmentInstitutions
RESEARCH AND DEVELOPMENT
Challenges
.Low output
.Diversified skill
.Lack of funds
.No scope for expansion
.Low Profitability and knowhow
Fig 5 Working aspect of Cartel model in MSMEs (Barmecha, May 2007)
172 R. Tripathi et al.

promote research and development activity beforehand, making them strong to face
the perils of globalisation.
6.1.1 Issues in Cartels
Cartels appear among domestic firms first, before going international. A few
international cartels appeared by the 1880s and the 1890s in steel rails, aluminium,
textiles, apparels, cosmetics, publishing, electric lamp, explosives, rubber, syn-
thetic alkali, petrol, diamond and shipping sectors. Food stuff cartels could also
be run in food products such as cocoa, coffee, sugar, tea, bananas, wheat, tin, etc.,
and have a great scope as these are the most precious and sustainable industries for
our economy in near future for alleviating poverty, promoting employment and
sustaining the culture.
The model here shows that all the firms are networked, dealing with same
products and services at the same place. They integrate the resources, funds,
surplus, assets, technology and skills to have a positive impact on the working of
the units and facilitation of growth and development as a whole. There are four
pillars to run an enterprise in which infrastructure and technology simultaneously
play a critical role in the growth and development of an enterprise. The single unit
generally lacks in funds, skills, resources, technology, infrastructure, etc. Now,
here, Cartel model aims at networking the producers and maintaining a similar
competitive price in the market. They work on the strategy of oligopolistic market
where sellers are few and buyers are many. The profits are enjoyed in the short
as well as in the long run. Feasibility test includes the following:
1. There should be a competitive environment.
2. All the producers are willing to form a Cartel.
3. There should be supply control and restrictions.
4. No major player of that product in the market.
5. Working for a common objective.
Thus, these enterprises lacking in resources can adapt themselves for innovation,
technological development through Cartel model, which can be a positive approach
for growth in MSMEs. Here, research and development can be promoted in these
units formed by cartel by investing a part of profits for managing change. The skills
transferred by innovator to successor have to be updated to maintain competitive-
ness, standards, quality and performance.
7 Conclusion
Technology transfer means sharing of knowledge. Transfer does not mean move-
ment or delivery but application at wholesome. Technological upgradation was
introduced in April 1999 and has helped to overcome the technological disadvan-
tage in the country to some extent. However, in the coming years, many small- and
Survival and Growth Strategies for Small- and Medium-Scale Enterprises. . . 173

medium-scale enterprises have been established with foreign collaboration through
foreign direct investment, joint ventures, projects, imports of machinery and equip-
ment, technical assistance through human resource, etc. Thus, the foremost part of
technology is survival which promotes sustainability in the environment. The skill
transferred from innovator to successor needs technological upgradation to meet the
present competitive challenges and reduction of total cost per unit for economy of
resources. Thus, we can say that technology works as a facilitator for innovation
and creative activities in the MSMEs to flourish in the present scenario.
References
Agarwal H (2010) The MSME’s in India – need to fuel these engines of economic growth. Policy
proposals in India
Barmecha VS (2007) Cartel- formation, dynamics and repercussions of its fall. Bachelor of
Science, New York University, New York
Ghatak S (2006) Micro, small and medium enterprises (MSMEs) in India: an appraisal
Government of India (2010) Report of Prime Minister’s Task Force on Micro, small and medium
scale enterprises
Krishnaswamy KN, Mathrajan M, Subhramanya Bala MH (2010) Importance of technological
innovation for SME growth: evidence from India. World Institute for Development Economics
Research, Helsinki
Ministry of Micro, Small and Medium Scale Enterprises. Annual report, 2008–2009. 2009–2010,
and 2010–2011. www.msme.gov.in
Planning Commission, Government of India (2006) Socio-Economic and Educational Develop-
ment Society (SEEDS)-Status study of Tribal handicrafts – an option for livelihood of tribal
community in the states of Rajasthan, Uttaranchal, Chhattisgarh and Arunachal Pradesh
Prasdhan JP (2010) R&D strategy of small and medium scale enterprises in India: trends and
determinants. Sardar Patel Institute of Economic and Social Research (SPIESR), Gujarat
The Report on theWorking Group, The Eleventh Year Plan (2007–2012), Science and Technology
for Small and Medium Scale Enterprises (SMEs)
174 R. Tripathi et al.

Technologies for Social Goods, Latest Trends
Neha Jain
1 The Study
The term ICT, acronym for Information and Communication Technology,
embraces many technologies that enable us to receive, communicate, or exchange
information with others. Youth is the enthusiastic emerging power of today and
controlling authority of tomorrow. It focuses on and attempts to highlight someexceptional advancement made by some outstanding administrators/teachers/educationists. As they, with the help of ICT, have opened new horizons and avenuesfor other institutions to follow them. This could be made real and possible by theleadership attributes in them and also with the zeal that they have to innovate theexisting practices. Leadership ability is not innate; it can be learned and developed
in due course. To prepare more effective leaders, development initiatives must
release tridimensional abilities – not only to lead business but also to lead oneself
and others by means of technology. The purpose of this study is to transform theyouth into prime leaders for them to be globally accustomed and outstanding withthe aid of technology. The focus of development must shift from the training given
to the youth in the classrooms to the reins of leading or pioneering their nation
to progress and success.
For this purpose, two best practices chosen for this research study are
mentioned below:
1. Using ICT (Information and Communication Technology) to bring the sea
change in higher education system
2. Mentoring sessions by teachers to know their students more closely
N. Jain (*)
Centre for Global Excellence, Seshadripuram First Grade College, Yelahanka, Bangalore, India
e-mail: [email protected]
Department of Management Studies, Indian Institute of Science, Bangalore,
Driving the Economy through Innovation and Entrepreneurship,DOI 10.1007/978-81-322-0746-7_15, # Springer India 2013
175

2 Objectives
(a) To improve higher education system with introducing innovative methods with
the support of ICT, like attendance, work diary, conducting tests, internal
assessment marks, messages to parents on mobile, and course and subject
details
(b) To improve the teaching–learning standards in higher education by changing
the roles and responsibilities of teachers into mentors with the aid of ICT
(c) To create an overall healthy teaching–learning-centered environment with the
help of good higher administrative authorities and management, as they have
the power to decide and implement innovative practices
3 Hypothesis
(a) The present study has the prior hypothesis, that ICT is the global and universal
aspect which can bring about great changes in the present higher education
system, institutional roles, and the student generation to make them hold the
reins of leadership to create a better world.
(b) The mentoring system is the best way to change and mold the students to the
best of their capabilities. This can also develop a healthy relationship between
the teacher, students, and parents.
4 Research Design
4.1 Methodology
The study is basically both empirical and exploratory. An attempt is made in this
chapter to identify the variables of ICT, which are critical and at the same time very
popular among the masses. The study can be further regarded as exploratory as it
would explore various new trends in higher education for innovations and changeswith ICT which can be the ideal examples for the future.
4.2 Primary and Secondary Data
Both the primary and secondary data have been used to carry out this research.
The primary data have been collected by collecting case studies I and II from
the Seshadripuram First Grade College, Yelahanka, Bangalore, where these are
considered to be the best and innovative practices.
The secondary data were collected from journals, magazines, books, Internet
and brochures, and various related websites on mentoring.
176 N. Jain

4.3 Data Analysis
The data collected for this study are presented only after it was properly analyzed
and thoroughly examined to be used for this research study. Also the data collected
from both primary and secondary sources are based on factual information, and
these case studies are the really practiced in the above-mentioned institution. ACTS/IPOMO and mentoring are the two innovative best practices, which this institution
has pioneered in to achieve the better targets set for best higher education with
innovation.
4.4 Technical Analysis
There is a technical team of ACTS/IPOMO in this institution always to take care ofthe technical updating and solving of any problems if at all it occurs to any faculty,for example, in submitting attendance or be it any related matters. The ACTS/IPOMO team is technically very sound and efficient to take care of not only helpingfaculty but also they regularly conduct workshops for teachers and students so as totrain them to perform. Even the normal messages of meetings and circulars are sentthrough this ICT-based system, with the help of this technical team. Mentorcontacts parents through ICT (ACTS/IPOMO).
The technical analysis is truly concerned with the gadgets of ICT available in the
market now which are the modes of ICT which are connected to server. Initially
past trends and the contemporary have been studied carefully to measure the
effectiveness and access that ICT can have on the higher education system.
Also technical analysis is done to know the fastness that ICT has in reaching out
to the masses in any part of the any part of city and even in the entire country if the
teacher or student is travelling.
5 Case Studies I and II
The two case studies have been taken up for this research work. The best innovative
practices have been portrayed in the systematic manner so as to understand the
innovation used by this prestigious institution to improve higher educational
teaching–learning standards.
(a) Case study I highlights the ICT-based innovative practice by the use of mobile
technology. Later in the study, the finding and conclusion are drawn based on
this technology. This case study focuses on the external sources used for thebetter and simple conduct of teaching–learning pedagogy.
(b) The second case study, case study II, on mentoring is the showcase of the inner
attributes of the strengths of this institution. This is taken up to focus on theinternal powerful sources that can be adopted to improve the higher educationsystem. The findings and conclusion are based on this mentoring system only.
Technologies for Social Goods, Latest Trends 177

ACTS/IPOMO has developed this application not only for handling internal
assessment and making attendance but also for career guidance. This innovative
practice has attracted widespread attraction and acceptance in academic cracks and
media coverage at parents for monitoring their wards progress.
ACTS/IPOMO also saves stationary as no registers are used to take attendance
and also the records are preserved on day to day basis which can be used and stored
at any point of time. The software installed in the mobile phones also has the
capacity to save the entire course details pertaining to each course/stream, semester,
or subjects separately so as to help the teacher click on the subject he or she is taking
during that hour. The periods are also installed in the mobiles with an hour duration
to specify the beginning and ending of one class indicating the exact time, for
example, 08:30, 09:30, and 10:30 a.m. Lesson plans are also included in it. The tests
of all the subjects for all the semesters are also conducted with the help of this
sophisticated and commonly used device as the teachers have been trained and are
only required to give the question papers in CD format. Hence, this practice is in
itself benchmark in the country of its own kind and in the future may give birth to
many more such technological experiments to bring about a drastic change in the
existing norms in education.
6 Case Study I: ACTS/IPOMO
Best Example of Using Technology to Be the Leaders: Pioneered by SeshadripuramFirst Grade College, Yelahanka, Bangalore
This innovative mobile technology is invented and pioneered by SeshadripuramFirst Grade College, an esteemed educational institution of the SeshadripuramGroup of institutions in Bangalore, Karnataka. In the age where mobile phones are
banned in educational institutions completely, Seshadripuram First Grade Collegehas been a pioneer in inventing the latest trend to use this device (mobile), with the
help of the installed software in it to help the faculties reduce their workload of
taking attendance, consolidating it each month end, taking tests, doing corrections,
and maintaining records of tests and its marks; not only this, it also saves tons of
stationary. Also the parents are regularly updated of their wards presence or
absence with proof as the data is available. This case study is the best precedence
of proper use of ICT and technology for normal routine work that the teachers do in
their institutions.
This is something which is the very first of its kinds to happen in India or even inthe entire world. This technology is named as ACTS/IPOMO (attendance andcourse tracking system/interactive platform on mobile). SFGC has put into service
the ubiquitous mobile technology to record and track students’ attendance and to
test their competence; internally, ACTS works on mobile-based registration soft-
ware for student’s information, individual student’s account with log in and pass-
word, log in and password for principal to access/track student’s information
regularly, and SMS-based automated attendance making and attendance registers.
178 N. Jain

IPOMO is a next-generation technology company, committed to giving the
mobile learning edge to today’s students and institutions. ACTS/IPOMO’s cuttingedge technology in learning–teaching and evaluation methodologies will address
the needs and challenges of the twenty-first-century learning.
6.1 Findings
IPOMO case study i-IPOMO is a new generation technology company, by former
senior executives of Wipro and Infosys, committed to creating possibilities in
mobile learning. With two patents (pending of grant) in mobile learning technology
and 2 years of research in teaching–learning methodology, IPOMO is poised to
bring in a much needed revolution in the education space.
6.1.1 Changes in Student’s Roles with ICT
A shift from to
Passive recipient of information active participant in the learning process
Reproducing knowledge producing knowledge
Learning as solitary activity learning collaboratively with others
6.1.2 Changes in Teachers’ Role to Create Better Students with ICT
A shift from to
Knowledge transmitter learning facilitator, collaborator, coach
Primary source of information knowledge navigator and co-learner
Teacher controlling and directing teacher giving students more options
All aspects of learning responsibilities for their own learning
The changing role of teachers is aptly summed up in the quip that teachers have
moved from being “sages on the stage” to becoming “guides on the side.” Theteacher is no longer the all knowing authority. The new role can be perhaps linked
to that of a team coach or the conductor of an orchestra who tries to bring out the
best performances in all players.
6.2 What IPOMO Offers?
HYPERLINK “http://www.ipomo.in/ipomocampus.html”
IPOMO Campus: Enabling Interactive Learning
Technologies for Social Goods, Latest Trends 179

• Lesson Plan: Teachers can upload the lesson plan for the current semester in
their mobiles, which helps them to concentrate more on teaching effectively.
• Parents are informed via messages about their wards progress, parent–teachermeetings, attendance, etc.
• Lecture status: The lecture status is readily available on the teacher’s personal
mobiles as well as it is recorded to have the consolidated attendance of the class.
• Work diary: Technology is so advanced in IPOMO that teachers can prepare the
work diary in it, which again saves time, is a very safe documentation for future
records, and saves stationary too.
• Assignments announcement: Teachers can give assignments through IPOMO,
which saves time, and also students get the message wherever they are; hence, no
excuses are entertained later on that they were absent.
• Institutional messages and notification: IPOMO helps the institutional messages
to be sent to the faculties with great ease and very quickly to entire staff and
students, about any updates, meetings, seminars, etc.
• Student feedback: Even students are asked to give feedback on their teaching
faculty and on other issues anonymously, so that things are not biased, which is
possible only because of this great technology pioneered by SFGC.
• Dash board: It displays the status of classes going on in the campus and the
classes let off due to any unavoidable circumstances. It also shows the details of
various events happening in the college to everyone.
In essence, IPOMO Campus is the interactive learning platform that creates a
personalized, meaningful, and interactive teaching–learning and evaluation
experience.
• HYPERLINK “http://www.ipomo.in/ipomostudent.html” IPOMO TWEEK:This is designed as “a friend and guide in the pocket!” It is an application on
the mobile that connects a student to quality coaching/mentoring inputs for a
competitive or academic exam he or she is preparing for.
IPOMO Campus Is a Solution Created Exclusively for Institutions. At Five Core
Levels, It Improves the Following
1. Classroom productivity of teachers.
2. Assessment efficiency and speed.
3. Teacher guidance of students.
4. Parent–teacher engagement.
5. Students also can access his/her academic data, view attendance data, interact
with lecturer.
Classroom Management Is Well Taken Care Off as Things Are Dealt with
Technology Mentioned Below
1. Attendance and Internal Marks: Teachers take attendance, enter internal marks
on the device, and submit for real-time consolidation.
2. Reports: Teachers can pull real-time report of a student anytime, anywhere.
Consolidated reports can be obtained anytime, anywhere
180 N. Jain

Continuous Internal Assessment Can Be Recorded with Technology As
Conduct tests: Institute can conduct internal tests (objective type) using mobile
phones Immediate results: Students can know their results immediately, identify
learning patterns: helps in identifying slow and advanced learners objectively.
6.3 Concluding Comments of Case Study I, IPOMO
Globalization and technological change processes that have accelerated in
tandem over the past 15 years have created a new global economy, “powered
by technology, fueled by information driven by knowledge.” The emergence of
this new global economy has serious implications for the nature and purpose
of educational institutions in creating globally competent leaders. Education
patterns across the world are experiencing a sea change, powered by innovative
technologies and possibilities. In fact, never before has technology influenced
the quality and depth of learning as significantly as today. While at the student
level, newer learning paradigms have created more empowered students, at the
institution level, technology has vested in them power they never thought possi-
ble. Across schools, colleges, and institutions of higher learning, the focus today
is on the quality of learning of the students. Here is the next-generation solution
to enhance the quality of learning – in an interactive manner.
6.3.1 ICT Brings Exponential Growth in Information and Knowledge
Information and knowledge are the new forms of wealth and are driving force fordevelopment. The extraordinary expansion of knowledge is brought about by ICT,which has made it possible to generate, store, transmit, retrieve, and processinformation at vastly increased speeds. All this has implications for lifelonglearning because educators now recognize that learning does not stop after formaleducation ends; critical challenges for educators are how to ensure equal access all
to this global storehouse of knowledge and how to equip all citizens with the
necessary skills for the new global environment, with youth leaders to take the lead.
For developing the leadership traits, ICT have the potential for increasing access
to, and improving the relevance and quality of, education. ICT greatly facilitates
the acquisition and absorption of knowledge, offering developing countries un-
precedented opportunities to enhance educational systems, improving policy
formulations and execution, and widen the range of opportunities for business
and the underprivileged.
One of the greatest hardships endured by the poor, and by many others, who live
in the poorest countries, is their sense of isolation. The new communication
technologies promise to reduce that sense of isolation and to open access to
knowledge in ways unimaginable not long ago.
Technologies for Social Goods, Latest Trends 181

6.3.2 ICT Will Be the Silver Bullet to Get Rid of All the Problems
of Higher Education
If there is one truism that has emerged in the brief history of ICT use in education, it
is this: It is not the technology but how you use it! Put it another way, “How you use
technology is more important than if you use it at all. . . unless our thinking about
technology changes along with the continuing expansion of the ICTs in the educa-
tion then our technology investment will fail to live up to its potential.”
Technology then should not drive education, rather educational goals and needs,
and careful economics must drive technology use. Only in this way can educational
institutions can effectively an equitably address the key needs of the population, to
help them as a whole response to new challenges and opportunities created by the
global economy. ICT alone cannot resolve educational problems as such problems
are rooted in well-entrenched issues of poverty, social inequality, and uneven
development.
7 Case Study II
Mentoring by Teachers at SFGC, Yelahanka, Bangalore
7.1 Introduction
“Mentoring is to support and encourage people to manage their own learning in
order that they may maximize their potential, develop their skills, improve their
performance and become the person they want to be.” (Eric Par sloe, The Oxford
School of Coaching & Mentoring).
In the Greek mythology “mentor” is the name of Ulysses’ friend. He was asked
to take care of Telemachus, Ulysses’ son, during his wanderings. The goddess
Pallas Athena used to transform herself into the shape of mentor to help Telema-
chus in times of troubles. The protection of gods is imposed on him by a mentor.
This picture of “protection by gods” delivered by a mentor is a kind of dream about
omnipotential guidance and help by a constant companion.
Sometimes, a mentor feels this kind of responsibility towards the mentee.
Sometimes, the mentee expects miracles from the mentor.
7.2 Mentoring in SFGC
Sehadripuram First Grade College, Yelahanka, Bangalore, has adopted yet another
innovative practice of mentoring done by the various teachers, for all classes. All
students have a particular mentor for their entire 3 years in the college that they
182 N. Jain

spend. To each mentor, some 40 students are allotted. The mentors job is to closely
watch the students’ performance, record it every semester, and have a track of their
weaknesses and talents. Also, the mentor conducts regular meetings with students
every month so as to know them, help them, and make them grow in a healthy
environment. Each mentor is a role model and a friend, a philosopher, and a guide
to his\her students. Mentor teachers operate all their activities also through ACTS/
IPOMO. The below-mentioned activities are also carried with mobile to spread the
information about anything to students and parents.
• Mentors mend the ways of their students if required. Also, they report to the
higher authority about the well-being of their lot, regularly.
• Mentors also conduct parent–teacher meeting regularly, twice a semester toupdate the parents of their wards growth.
• Mentors also deal with personal problems of the students along with theclass–teachers and principal if required.
• Mentors maintain the profile of students for 3 years.• Mentors and mentee report are submitted to the internal quality assurance cell
(IQAC).• Mentor’s effective mentoring changes the students’ behavior and performance
immensely.• Mentors also solve the problems that parents have with their wards and vice
versa.
7.3 Findings
Based on the above case study II, mentoring is a powerful personal development
and empowerment tool. It is an effective way of helping people to progress in their
careers and is becoming increasing popular as its potential is realized. It is a
partnership between two people (mentor and mentee) normally working in a similar
field or sharing similar experiences. This relation is carried out through ICT. It is ahelpful relationship based upon mutual trust and respect.
With ACTS/IPOMO, that is, it is more effective. Technology is really worth ifused correctly, for the social good and higher education improvement. These arethe benefits to the mentees or the students. This can be defined as social goodswhich ICT may gift to all.
• A mentor is a guide who can help the mentee to find the right direction and who
can help them to develop solutions to career issues.
• HYPERLINK “http://www.hepg.org/hep/book/104/SpotlightOnStudentEngage-
mentMotivationAndAchievement” Spotlight on Student Engagement, Motiva-tion, and Achievements.
• A mentor should help the mentee to believe in herself and boost her confidence.
A mentor should ask questions and challenge, while providing guidance and
encouragement.
Technologies for Social Goods, Latest Trends 183

• Mentoring allows the mentee to explore new ideas in confidence. It is a chance to
look more closely at yourself, your issues, opportunities, and what you want in
life.
• Mentoring is about becoming more self-aware, taking responsibility for your life
and directing your life in the direction you decide, rather than leaving it to
chance.
• Mentor is person focused. It is less of a formalized professional relationship and
more of a partnership, more like a friendship. We provide guidelines and training
for our mentors and mentees, but the issues discussed will vary depending upon
the issues being faced by the mentee.
• Teach students to ask their own questions. Mentors rely upon having had similar
experiences to gain an empathy with the mentee and an understanding of their
issues. Mentoring provides the mentee with an opportunity to think about career
options and progress.
• HYPERLINK “http://www.hepg.org/hep/book/130/TeachingAsAMoralPractice”
Teaching as a Moral Practice: Sometimes understood as habits of mind,
“dispositions” represents a new concept in teacher education. Conversations
about professional dispositions in teaching often touch on issues such as attitudes,
values, moral commitment, and social justice.
• Success: Teaching Immigrant and Second-Language Students draw on the work
of teachers, administrators, and researchers to identify the practices that reach
diverse students most effectively and easily with ACTS/IPOMO.
7.4 Concluding Comment on Mentoring
For more than a decade, clear and consistent research has shown that the quality of
teachers is the most powerful mentoring-related determinant of student success.
Capitalizing on this now-large body of evidence, many education leaders have
begun to invest in new-teacher mentoring. It’s a smart bet. When mentors are wellselected, well trained with ICT, and given the time to work intensively with new
students, they not only help average students become good, but good students
become great. And because new students are most often assigned to the mentors,
the most challenging students, instructional-mentoring programs provide a power-
ful lever for closing the teacher-quality gap and ensuring that all students, regard-
less of their backgrounds, have a real opportunity to succeed as ICT can reach out to
anyone, anywhere; even if parents or mentees cannot meet the mentors in person,
contact could be made through mobile tracking system.
Entire cohorts of beginning teachers have begun to foster student gains similar to
or greater than their veteran peers’ results. And mentors are reigniting their own
passion for teaching.
When mentoring programs thrive, educational systems are also more likely to
develop a comprehensive vision for assessing and supporting instructional excel-
lence and to reconfigure their evaluation and tenure structures around that vision.
184 N. Jain

More important, they have a much greater chance of transforming their schools into
vibrant learning communities capable of helping all teachers, and all students,
succeed. ACTS/IPOMO with ICT has really made all these things very simpler.
7.5 General Conclusion of this Study
Innovation in teaching and learning is most likely to take place when:
(a) The innovator feels a degree of security within an understood community or
cultural context, recognizes the need for change, and has encouragement or
support from the head of department, dean, or other person in authority.
(b) The institution has a policy establishing parity between research and teaching
and learning, including for purposes of promotion, and the policy is reflected in
practice.
(c) Colleagues and people in authority show an interest in disseminating the
outcomes of innovation.
(d) Resources are available through the department, an innovations fund or similar
fund, and an educational development or learning support unit.
“Our country’s dominant higher education policies have focused on expanding
access for more than half a century – allowing more students to afford higher
education. Yet changing circumstances mandate that we shift the focus of higher
education policy away from how to enable more students to afford higher education
with technology to how we can make a quality post-secondary education affordable
and accessible. The challenge before the country also mandates a new definition of
quality from the perspective of students – so that the education is valuable to them
and that through it they improve their lives and thus improve the country’s fortunes,
too. And if a post-secondary education is fundamentally affordable – meaning
lower in cost, not just price – this will also answer the question of how to extend
access by enabling students to afford a higher education.”
Hence, the two case studies prove that the initiatives are to be taken up effectively
by the management of any teaching temple, in such a way that it only promises the
growth of all with technology for social goods. . .latest trends. . .with ICT.
Technologies for Social Goods, Latest Trends 185

Analytical Approach on Economic Development
in India Focusing on Strategies for Application
of Technology
Nirmalendunath Ghosh
1 Introduction
Current socioeconomic condition in India covering states of different standards of
economic system has led the researchers and planners to think about sustainable
economic development strategies that will address to the issue of an equitable access
to better services and availability of benefit out of economy resources to all section
of the population across the country. There is inverse relationship between better
socioeconomic condition and the resentment of people through different channels of
expression. There is general perception on economic development in the country that
corresponds to better living standard of the population within the ambit of better
availability of services and income opportunities to entire population. Actually, the
above perception in the perspective of current growth in economy contradicts the real
scenario of society across the country. The findings of the NSS round survey of the
Central Statistical Organization under Ministry of Statistics and Programme Imple-
mentation reveal that the density of low-income group population is more compared
to high-income group in rural area, and the consumption level of the household
in rural area is below all India average. Further, social indicators when analyzed
in-depth reveal inadequacy of available infrastructure, specially in irrigation of
agriculture, distribution of population to available health-care facilities, and access
to education for achieving desired level of qualification in order to get gainful
employment. All these issues aggravate the living condition because of the chain
reaction in an economy system that comprises subsystems of service and economic
resource. Analysis shows that input and output of any subsystem have linkage with
other subsystems in the economy that validates the concept of relative economic
development in the country. There are perceptible differences in socioeconomic
development between urban and rural areas; existing well-developed infrastructures
N. Ghosh (*)
EX-Superintending Engineer, Power Sector, SEB, 16/1,Huzurimull Lane, Kolkata 700014, India
e-mail: [email protected]
Department of Management Studies, Indian Institute of Science, Bangalore,
Driving the Economy through Innovation and Entrepreneurship,DOI 10.1007/978-81-322-0746-7_16, # Springer India 2013
187

in services and economy resources support penetrating benefits of economic growth
into urban sector, while lack of infrastructures is hardly conducive to diffuse such
benefit in most of the rural area in the country. The other side of the economy system
is the uncertainties in availability of consumable goods within the reach of average
income level of population which depends on variation of price level in the market
according to flow of supply and purchasing power of population commensurate with
their employment level. In case of imbalance in supply and demand of the goods in
the market system, purchasing power of population will be destabilized. The supply
system depends upon various inputs that are vulnerable to uncertainties in availability
of raw materials, transport, infrastructures, and policy issue on taxes in the states.
The objective of this discussion is to achieve the goal of economic development by
working out a strategy that is guided by technology-driven development process,
embedded with the mechanism of synchronized activities in the economy system and
evolving new policies to achieve a balanced growth of infrastructure in economy
system that will be conducive to enhance access to benefit of services covering all
classes of people in India. The concept of satisfactory level of economic growth is
based on quality improvement by infusion of technology in the subsystems of basic
services, while the subsystem of supplying consumable goods to meet the demand in
market infrastructure needs satisfactory level of production through diffusion of
agricultural technology, biotechnology, information and communication technology,
automation in manufacturing and remote metering, and renewable energy technol-
ogy. In order to bring out transparency in the logic of the discussion, an indicator, that
is, access to benefit of services, has been evolved that is related to actual demand of
services and the purchasing power of the population. The economies of the different
selected states have been assessed on the basis of this indicator, focusing on the rural
area where people mostly working in agricultural sector dominate rural population
who are in lower economic level compared to population in urban area. The analysis
attempts to unfold the impact of technology application on the development of
subsystems for improved services to the people in India as well as focused on inherent
characteristics of interdependence of subsystems to achieve perceptible development
in economy system. Finally, the discussion highlights the policy measures for
application of technology to bring about the development. The discussion starts
with present economic scenario in India.
2 Present Economy System in India
2.1 Assessment on Development Criterion
The standard of living manifested through consumption of goods and access to
services is on the line of demarcation between rural and urban economy based on
natural resources, culture, changing trends of demography, and climate dominating
the specific geographical location across the states in India. Rural population
188 N. Ghosh

constitute 70–80%of total population in India, and out of total workforce in rural area,
64% male and 79% female are either self-employed in agriculture or as agricultural
laborers (MOSPI). Therefore, the analysis starts with economy system in rural India
that represents a realistic scenario of socioeconomic development across India. The
application of seeds, fertilizer, and mode of irrigation on the input side and the
productivity, transport system, road connectivity, and marketing infrastructure on
the output side are the major issues that dominate the income level from agriculture
and allied services. The farmer’s investment capacity depends on the income from
varying patterns of agricultural productivity – mostly depend on monsoon in major
area because of lack of irrigation facilities – and the available infrastructure of
marketing subsystem that is controlled through intermediaries. Then, there is finan-
cing subsystems providing loan to farmers that have linkage with uncertainties of
farmer’s income, capacity for investment, and debt payment. The populations need
full employment in order to achieve purchasing power to meet bare necessities of life.
There are dearth of basic infrastructures for institutions of vocational, technical
training, and professional educational facilities in proportion to population in rural
villages. The employed population of rural area in organized sector is less than the
same category in urban area. In rural area, more persons are self-employed whose
income is not regular to achieve purchasing power tomeet bare necessities of life who
are not getting of perquisites as available to regular salaried population in urban area.
According to statistics (MOSPI 2011), there was marginal rate of improvement in
unemployment level of 4.25% only during the period 2005 and 2010. In order to
understand the trend of growth in rural economy, the data on the different parameters
during the last decade are tabulated below in Table 1.
This observation implies that high percentage of rural population is in low-income
group compared to the urban areas that in turn reflect on their low purchasing power
capacity. Moreover, the impacts of high inflation cast a shadow of uncertainty in their
living. Urban economy is more developed than rural economy because of better avai-
lability of infrastructure in education, energy, health, and communication subsys-
tems. Equally, market price is sensitive to variation in supply of commodities from
agriculture to manufacturing, which in turn depend on availability of transport and
communication infrastructures. It is seen that net availability of food grain has
declined corresponding to its lower productivity during the year 2005–2006 and
2008–2009. Consequent to rise in wholesale price index, the purchasing power of
Table 1 All India pattern of changing economy scenario between 2000 and 2009
Year
Growth of
population
(%)
Index no.
agricultural
productivity
yield/ha
Net avail of
food grain/
capita/day
(gm)
WPI
(2004–2005
¼ 100)
Avail.
of elect/
capita
(kWh)
Average
MPCE (Rs.)
Rural Urban
2000–2001 144.4 416.2 75.2 498 933
2005–2006 8.47 180.6 445.3 104.4 90.4 625 1,171
2008–2009 3.59 177.6 436 125.9 112.7 1,053 1,984
Source: Economic survey, Ministry of Finance and Central Statistical Organization
Analytical Approach on Economic Development in India Focusing on Strategies. . . 189

the HH remains at the same level even though productivity increased marginally and
the poorest of population in rural and urban areas will have no scope to meet their
bare necessities of living that are further aggravated due to high rate of population
growth.
2.2 Linkage of Subsystem
Economy in India is an open system after trade liberalization that became vulnerable
due to changes in world economy. Import and export of products and flow of FDI
in different sectors’ influence on the functioning of economy resources subsystem.
So the competitive nature of the market need constant upgradation of technology to
maintain the subsystems in good economic state. On the other hand, service utility’s
functioning depends on the economic resources. Therefore, there should be total
harmony in functioning of economic resources and utility subsystem. This is possible
by implementation of development activities with penetrating technology equalizing
standard of service in all the subsystem activities.
2.2.1 Logic of Subsystem Functioning
The concept of the diagram (Fig. 1) that outlined whole economy system is explained
logically. The following mathematical expression will clarify the logic of the subsys-
tem functioning due to penetrating technology into the subsystem.
Let a, m, and s represent agricultural, manufacturing, and service sector resources,
and utility subsystem and marketing infrastructures are represented by u and mr,
where u represents combined utility service energy, education, health, and communi-
cation that are represented by q, e, h, and c, respectively; then, if dN is the penetration
of technology in subsystem, the eq for stabilizing the total economy will be
adN1� þmdN2þ sdN3 ¼ qþ eþ hþ cð Þ dN5þmrdN4 (1)
If contribution to market from economy resource is sm4, tm4, and om4,
respectively, from agriculture, manufacturing, and service sector, then, Eq. (1)
can be rewritten by
adN1�sm4þ mdN2�tm4þ sdN3om4 ¼X
qþ eþ hþ cð Þ dN5þmrdN4
On the other hand,
Xerdne ¼
XudnþmrdN4 (2)
190 N. Ghosh

The linkage of the subsystem has been shown in Fig. 1, where er, e, and u are energyresources, contribution to market, and growth of services. Therefore, penetration of
technology in economic resources, service sector, and marketing infrastructure is
essential to achieve balanced development in economy system. The system linkage
diagram, if studied in-depth, will reveal that reliability in functioning of energy
subsystem is essential to drive development in other subsystem because of its prime
necessities as basic input to all subsystems. The study is now directed to energy
subsystem that is major input to different subsystems.
2.2.2 Energy Subsystem and Its Development
Though primary energy sources are oil, gas, and coal, the study focused on
secondary source, that is, electricity that acts as major input for operation of other
subsystems. According to research studies, economic development in the country is
highly correlated to development in energy sector. Annual report of planning com-
mission indicates that there is only 80.7% achievement in electrification of unelec-
trified villages and 56.1% of targeted BPL HH, respectively, till march 2010. Only
46% of HH in rural area have access to electricity compared to 99% HH in urban
area. There is deficiency of 33.2% in achieving target capacity addition during
2009–2010. The shortfall in supply to meet peak demand and energy requirement
that varies from state to state is in the range of 10–18% and 8.8–15%, respectively
(Govt. of India portal). There is shortage in coal supply of around 11 BU in
2009–2010 compared to shortage of 1.6BU in 2005–2006. Moreover, there are
AgricultureSub system
ManufacturingSub system
Service SectorSubsystem
Economy System Rural Urban
Community Self Employed Salaried Casual Labour
Utility sub system Education Health Energy Communication
aδN1
mδN2 aδN1
mδN2 sδN3
mrδN4
uδN5
Marketing Sub system
Fig. 1 Economy system in rural and urban India
Analytical Approach on Economic Development in India Focusing on Strategies. . . 191

some hindrances in supplying electricity to each HH of the electrified villages due
to deficiency in purchasing power of lower income group HH. Another constraint to
meet requirement of power is lagging capacity addition to targeted plan; this is
observed from achievement in respect of installed capacity during 11th five-year
plan period between 2007 and 2012. Power sector achieved capacity addition of
50,555 MW power plants as of 31.3.2012 against revised target of 62,374 MW
during 2007–2012 (Planning Commission). Share of installed capacity for grid
interactive renewable energy sources is only 12.27% of total installed capacity
out of all resources during all the plan period. Before proceeding to assessment of
agriculture subsystem, it is necessary to evolve an indicator as a measurement tool
that is explained in next section.
3 Approach to Assessment of Development
3.1 Evolving Indicator: Access to Benefit of Services
A very perceptive assessment of growth of development is based on GDP growth in
the country. Nevertheless, variation of this indicator is actually a virtual perception
on the economic development because of its impact on outer level of economy
system. The penetration of benefit due to economic growth into the grassroot level
of the population depends on cascading effect of economy that may be obscured
due to embedded counter activities in the subsystems. Access to benefit of services
indicator (abs) has been evolved to assess the economic development in reality of
the states. This is defined as the capacity of a family or individual in a HH to enjoy
the benefit of available services or goods in the economy system according to his
purchasing power that has linkage with his income and social environment. The
justification on applying this tool to assess the development of state has been done
by analysis of the basic economic resources. The study focused on – agriculture that
is major economic resource rural population who constitutes 70% of total popu-
lation in India. It has been observed that monthly per capita expenditure on food
consumption of the population in rural and urban areas is almost 53 and 40% of
total HH expenditure, respectively. Therefore, the analysis starts with access to
food distribution services in rural area. Firstly, the states are selected for analysis
according to its elevation or lowering in the order of ranking for performance in
development during 2005 and 2010. The next step is to evaluate the development in
the agriculture subsystem and allied services that are correlated to availability of
food production. Thereafter, in the analysis performed on evaluation of food
consumption trend commensurate with the purchasing power of the population
in rural area across the country focusing on the states, considering its change in
rank due to improvement in performance or nonperformance, 80% of the HH
are dependent on agriculture and allied services. Nevertheless, it does not imply
that performance in agriculture to stabilize food supply is the sole criterion for
192 N. Ghosh

determining rank. The indicator abs has been evolved by the following mathematical
relationship between purchasing power, income, and price of the goods and
services:
Access to benefit of basic services=goods absð Þ
¼ Purchasing power ppð ÞActual demand of services=goods adsð Þ (3)
The value of parameter is in rupees, and the abs index signifies the variation of
the living standard that is quite different from the assessment of living standard by
GDP growth. This scale of measurement of the indicator is 0–1, lower and upper
values indicate deficiency or adequacy in access to benefit of services.
Then,
pp1
pr1X1� pr1X2 ¼ I1 . . . (4)
andpp2
pr2� X1� pr2X2 . . . ¼ I2 . . . (5)
where pp1 and pp2 are prices of food and X1 and X2 are consumption quantities in
HH at income levels I1 and I2, respectively.If a sequence is X, (k) satisfies
MX k þ 1ð Þ ¼ NXðkÞ þ b;
where pr is the price level of the goods or services and I is average MPCE taken as
proxy to income of HH. x1 and x2 are the consumption levels in quantities that will
balance income of HH. pp is the consumption value in rupees.
Then, applying Jacobi’s method of evaluating the values of x1 and x2, replacingD for M and D � A for N, then,
DX k ¼ 1ð Þ ¼ D� Að ÞXk þ b k ¼ 0; 1 . . .ð Þ
Assumed zero vector as X0,denoting figure in xk as (x1, x2) and x (k + 1) as 6y1, y2
Pp1
����� 0
Pr1
0 pr2
��������
��������y1
y2
������������ ¼
0 pr1
�pp2=pr2 2pr2
�������� x1x2
��������þ I1
I2
��������
Analytical Approach on Economic Development in India Focusing on Strategies. . . 193

Y1¼ pr1x2þ I1ð Þ � pr1
pp1
y2 ¼ �pp2=pr2x1þ 2pr2x2þ I2ð Þpr2
(6)
for k ¼ 0, x (1) ¼ (x1, x2) ¼ (0, 0), then
X 1ð Þ ¼ y1; y2ð Þ ¼ I1 � pr1,pp1½
I22pr2�
� �. . . (7)
Substituting this values in (6),
x2ð Þ ¼ y1; y2ð Þ ¼ ð�pp2=Pr2Þ � I1*(pr1=pp1) + 2*pr2 � ðI2=2pr2Þ þ I2Pr2
Then, the value ads is computed by substituting value of pr1, pr2 in
x2ð Þ ¼ y1; y2ð Þ ¼ ½�pp2=pr2�I1�pr1=pp1½ � þ I2 þ I2� pr2= . . . (8)
ads ¼ x2*(pr1, pr2) and taking the available consumption value of the goods/
services as abs ¼ pp1ads
3.2 Validation of Indicator: Abs
This concept of abs is validated by substituting relevant data of MPCE value for
rural and urban HH from NSS 66th survey 2010 for states selected on the basis of
ranking for performance; abs and parameter value in the above mathematical
expression (4), (5), (6), (7), and (8) were computed in Excel worksheet. Those
values are tabulated in Table 2.
The price of food has been taken from the report of NSS, Central Statistical
Organization. Assumed that consumption of food of different items is varied with
the rise in purchasing power consequent to income rise and inflation effects. Similar
exercise was performed for urban area HH, taking the values of monthly per capita
consumption expenditure and price from NSS 66th round survey 2008–2009.
The observation reveals that abs indicator value is in the lower side of scale 0–1
in respect of lower deciles, whereas top decile HH are in better position having
value on the higher side of the scale 0–1, specially WB, Gujarat, Punjab, Karnataka,
and Bihar. Abs value in urban area shows the urban economy in HH of lower
deciles in most of the states is marginally better than rural counterpart; abs value is
within the range of 0.39–0.58 in lower 20% deciles excepting Punjab, Gujarat, WB,
and Tamil Nadu. The comparative study on the trend of development in food
194 N. Ghosh

distribution relative to abs has been shown in Fig. 2. It is observed that the trend of
change in pattern of abs curve is consonant with change in pattern of MPCE curve
during the year 2005–2006 and 2008–2009. It appears that status of states in respect
of food distribution is almost the same except Bihar and Tamil Nadu. In the case of
Tamil Nadu, abs is low compared to its achievement in agriculture by technology
application. This implies deficiency in other subsystems that appear as constraint to
improvement in purchasing power of rural population. This method, therefore,
determines the hidden deficiency in system. Evaluation of abs in other subsystem
likewise will reveal the real status of that subsystem regarding access to benefit of
that service for the population to adopt remedial measures.
3.3 Effect of Application of Technology in Agricultureto Assess Abs
The study focused now on the states to assess the improvement of abs due to
application of technology in agriculture (Planning Commission).
Andhra Pradesh: Implemented ICT and farm mechanization, productivity increased
by 22.08%. Nevertheless, access to benefit of services in both lower and top
deciles did not improve.
Punjab: Zero-tillage technology was implemented; 99% area is irrigated, and
productivity is maximum. Both lower and top deciles are on the higher side of
abs scale.
Table 2 Evaluation abs value on food consumption in selected states – rural area 2009
Indicator AP MH Kar Jh B Ch WB Pb Gj TN
AbsL1 0.36 0.35 0.41 0.41 0.55 0.36 0.43 0.39 0.41 0.35
Abs L2 0.47 0.43 0.55 0.51 0.87 0.49 0.52 0.47 0.51 0.40
Abs L3 0.46 0.62 0.66 0.66 0.31 0.63 0.69 0.62 0.76 0.59
AbsL4 0.50 0.69 1.13 0.73 0.34 0.72 0.79 0.72 0.92 0.66
Note: p1, p2, p3, p4 are different prices of food products at increasing rate, that is,
p1 < p2 < p3 < p4AbsL1 ¼ lower 0–10% deciles, absL2 ¼ lower 10–20%, absL3 ¼ top 70–80%, abs4 ¼ top
80–90% deciles
Table 3 Evaluation of abs values on food consumption in selected states – urban area 2009
Indicator AP MH Kr Jh Br Ch WB Pb Gj TN
AbsL1 0.26 0.34 0.35 0.39 0.46 0.32 0.42 0.70 0.36 0.37
AbsL2 0.19 0.45 0.46 0.53 0.58 0.45 0.54 0.91 0.45 0.46
AbsL3 0.38 0.49 0.38 0.49 0.63 0.53 0.60 0.58 0.51 0.55
AbsL4 0.45 0.54 0.46 0.54 0.69 0.58 0.71 0.69 0.55 0.63 s
Source: Own
AP Andhra Pradesh, Br Bihar, Gj Gujarat, MH Maharashtra, TN Tamil Nadu, Kr Karnataka, JhJharkhand, Ch Chhattisgarh, WB West Bengal, Pb Punjab
Analytical Approach on Economic Development in India Focusing on Strategies. . . 195

Maharashtra: Maximum area is irrigated, but soil conservation technology need to
be adopted.
Top deciles and lower deciles of HH are on the higher and lower side of abs scale,
respectively.
WB: Hybrid technology and use of organic manures were adopted, depending on
monsoon. Top and bottom deciles of HH are in upper and lower side of abs scale.
Tamil Nadu: Drip and fustigation technology in irrigation, sustainable rice intensi-
fication, and remote sensing and hybrid technology were implemented. Both
lower and top deciles HH are on mid-scale of abs.
4 Development of Economy Through Application of Technology
4.1 Core Issues for Development in the System
A framework of policy issues that covers all the subsystems is narrated here; a broad
application of emerging technologies – in the form of efficient hardware, better
organizational concept, and introducing new knowledge input – is a method to
enhance efficiency within a dynamic system to enable rural population for better
access to benefit of services. Since energy is major driving input to manufacturing,
agriculture, education, health, and communication subsystems, it is essential to
improve achievement for capacity addition against planned target by applying
more weight age to set up network of distributed generation by renewable energy
technology and modernization of grid structure, at the same time reducing demand
by technologically improved energy-efficient end-use devices are essential. Applica-
tion of real metering technology will reduce distribution losses with better revenue
return. Adequate availability of energy will support technology application in the
development of educational subsystem. Agriculture needs energy for water manage-
ment, storage, and in production activities. The opening of more institutions of
learning in distance education mode at block level utilizing information and commu-
nication technology for access to higher education and vocational courses for rural
population will be possible if adequate supply of energy is available. The health-care
systems in rural area need more health centers where better availability of energy
0
50
100
150
AP BR JH GJ PB MH WB TN
Month
% o
f abs
& M
PC
E
ABS(%)
MPCE(%)
Fig. 2 Trend of growth abs (%) and MPCE (%) during 2005–2009
196 N. Ghosh

with desired level of medical equipment of latest technology is essential. Optimum
linkage of economy resources with major service sectors for its better performance is
possible by ICT replacing age old system for faster economic growth.
4.1.1 Policy Measures Toward Technology Application
The following policy measures are suggested for application of technology in the
system that covers all the economy resources and service sector:
1. R&D activities need be supported by the government for technology innovation
at academic institutions by financial allocation at higher percentage of GDP, and
networking between science and technology institutions, industries, and utilities
should be improved toward mandatory application of their innovative technol-
ogy in the field level within a stipulated time period from the date of its patent
(Sharif 2008).
2. Socioeconomic studies based on reliable database need be undertaken to ascer-
tain about acceptance of emerging technology by rural and urban people.
3. In the energy sector, efficiency improvement at supply side, capacity addition
according to planned target, modernization of grid, optimum use of renewable
energy resources for distributive generation in rural area, increased use of energy-
efficient appliances in distribution, and real time metering should be done.
4. Modernization of manufacturing process in central and state sectors by diffusion
of technology to bring stability in supply chain and allowing incentive to farmers
in agriculture and allied services for access to technology on the basis of produ-
ctivity and area of cultivable land are the required course of action.
5. FDI in economy resources and service sectors should be increased that aimed at
technology transfer and creating competitive environment in this system as well
as more grant-in-aid in technology education and vocational training at higher
percentage of GDP in budget for financing students of LIG need be approved.
6. ICT enabled central monitoring institution to monitor technology application in
the subsystems in close coordination with the states need be established for
synchronizing progress of development and policy implementation in the country.
5 Conclusion
The economy system in India embodies subsystems of services and economy
resources. The analysis of economy system clearly explained by diagrams and
mathematical expression shows that functioning of each of the subsystems that
contribute to whole economy system in India will deliver proper services to the
population only if diffusion of technology in all the subsystems is synchronized to
set the work on the right track of country’s development. The discussion revolves
around rural economy that counts on 70% of total population in India, touching
Analytical Approach on Economic Development in India Focusing on Strategies. . . 197

briefly on urban economy to bring out the hidden gap between actual demand of
services and actual access to benefit of services by an indicator – access to benefit of
services (abs) as a tool of assessment on a sample agricultural subsystem. It has
been justified by analysis with real data that abs is well below normal requirement
on a scale of 0–1 among lower income group HH in rural area and marginally better
in respect of HH in urban area across the states in India except for some economi-
cally developed states like Punjab and Gujarat. One’s perception of economic
development in an economy system based on the indicator GDP get sidetracked
by this tool of assessment in order to know true scenario for country’s economy.
The living standard of people depends upon better availability of infrastructures in
services together with better infrastructure for feeding inputs to economy resources
and disposal of product through well-organized marketing subsystem; in last
paragraph, possibility of applying suitable technology to each of the subsystems
has been highlighted, ending with suggested policy measures to achieve goal of
inclusive growth.
References
Directorate of Economics and Statistics, Department of agriculture and cooperation. http://eands.
dacnet.nic.in/At_Glance_2010/4.5(B).xls. Accessed 12 Sep 2011 and 23 Dec 2011
Economic Survey, Ministry of Finance. http://indiabudget.nic.in, Government India Portals. www.
india.gov.in/states/agriculture. Accessed 19 Sep 2011, 21 Nov 2011 and 22 Dec 2011
Government of India portal. www.india.gov.in/states/agriculture. Accessed 17 Sep 2011 and
18 Dec 2011
NSS 66th round survey, Ministry of statistics and program implementation, Central statistics
organization. www.mospi.gov.in. Accessed 19 Sep 2011 and 22 Dec 2011
Planning commission, Annual report to the people on infrastructure 2009–2010. http://
planningcommission.gov.in/. Accessed 22 Dec 2011
Selected socio economic statistics India – October 2011, MOSPI. www.mospi.gov.in. Accessed 14
Dec 2011
Sharif N, Lu et al (2008) Mobilizing technology transfer from university to industry. J Technol
Manage China:51–52. Emerald Group of Publishing
198 N. Ghosh

Urban Land Management: The Retrospect
of Three Metro Cities in India
Pooja Nigam and V. Devadas
1 Introduction
Today, most of the Indian metropolitan cities are beset with the problems of
urban sprawl, unplanned growth and inadequate supply of serviced land for public
purposes, especially housing, speculative holding of urban land, illegal settlements
and slums. The major reasons which can be attributed to this is the ineffectiveness
of the land management policies and legislations to coordinate the fast pace of
urban growth and development, as evident in the past few decades. These problems
are aggravated due to unregulated use of land, unauthorised developments and
large-scale encroachments of public land. The land records, registration procedure and
administration are also fraught with inadequacies, irregularities and malpractices.
To deal with these problems related to urban land and to ensure a balanced sustain-
able development, economic viability, environment appropriateness and social equity
along with efficient land management are required.
The basic measure for providing land management in the country is by designing
a comprehensive approach to land policy. So far, most of the policies framed by the
state governments have failed miserably to accomplish their goals to some extent
or on whole. In addition, the government has instrumented some fiscal sources
like taxation, stamp duty, surcharge on sale of property, betterment levy, etc., for
providing revenue for their various functions and activities. A fiscal system needs to
be framed so that land proves to be profitable to all, including the government and
the public, and yet satisfies the social benefit. Technology can provide additional
tools to tax administrators to observe and monitor individuals and transactions.
Besides these, improvement in institutional management is required. Land record
and information system which is the basis for all the experiments and innovations
P. Nigam (*) • V. Devadas
Department of Architecture and Planning, IIT Roorkee, Roorkee,
Uttarakhand, India
e-mail: [email protected]; [email protected]
Department of Management Studies, Indian Institute of Science, Bangalore,
Driving the Economy through Innovation and Entrepreneurship,DOI 10.1007/978-81-322-0746-7_17, # Springer India 2013
199

needs immediate reform so as to ensure clear property title, efficient and transparent
land transactions, better evaluation of government land policies, etc. The institutional
system needs to be strengthened in all areas, i.e. technical skill, personal manage-
ment, work efficiency, etc. With the introduction of information and communication
technologies (ICT) or e-governance, cadastral mapping with the help of GIS (geo-
graphic information system), the administration procedure can be ameliorated to gain
better internal efficiency.
In this chapter, an attempt is made to analyse the major lacunae in the land
management system of the Indian cities responsible for inefficiency and ineffec-
tiveness in bringing out a planned development through ICT. Three case studies are
selected, which have almost similar characteristics regarding their urban growth
and development in the past decades, namely, Delhi, Ahmedabad (Gujarat) and
Jaipur (Rajasthan), for quantitative analysis of their virtues and flaws. This chapter
contains the review of existing land management in the fast-growing cities of
a developing country like India in both conceptual and operational terms with the
help of case studies and through deliberate study of the problems and critical analysis
of the existing policy options within the administration available; interventions are
suggested to disaggregate the problems.
2 Urban Land Management
Land management is the process of managing the use and development
(in both urban and rural settings) of land resources (http://en.wikipedia.org/wiki/
Land_management). An effective land management in urban context requires good
governance or administration within the institutional framework and a strong
interaction and understanding of the user group by the institution. ‘Land adminis-
tration’ term is employed by the UN Economic Commission for Europe to describe
the processes of recording and disseminating information about the ownership,
value and use of land and its associated resources. All this in return needs institu-
tional arrangements, legal frameworks, land information system, stakeholders’
consultations, land markets valuation and finally technology for the processing part.
2.1 Land Record and Information System
Ideally, local governments including municipal bodies, special purpose sectoral
development agencies and development authorities should have urban land records
system for legal protection of their land resources and to facilitate the planning
and development process which is the key point of sustainable development. For
example, an up-to-date cadastral map defining boundaries of every parcel of land
and an essential component of a land titling process would be extremely helpful
200 P. Nigam and V. Devadas

in efficient transaction of properties and determining a fair tax base of properties.
Also, such a system supplemented along with a land information system can be
used for keeping complete information regarding location of all parcels of land in
a specific area, their land use type, intensity of development and also for monitor-
ing changes in their physical and socio-economic attributes and would eventually
be very helpful in preparation of physical development/redevelopment plans. But
unfortunately, in our country, land records are maintained in a very fragmented and
sloppy manner.
Recording of land rights and their periodic updating is a prerequisite for an
effective land policy. This not only ensures the avoidance of harassment of the
urban poor and farmers by the private builders as well as the government land
management agencies who generally tend to ignore the welfare of the poor during
the process of land acquisition and disposal. An ideal land record and information
system should have the following features:
1. Computerisation of plot-wise ownership and other important details for issue of
timely and accurate ownership certificate to the landowners to avoid confusions
and delays.
2. To achieve low-cost, easily reproducible and fast retrievable storage media, both
in graphical and textual form.
3. The whole system should be consolidated and user-friendly and not fragmented
and confusing.
4. The regular updation of the data at specified intervals of time should be easy and
convenient and fast.
5. The data should contain not only the physical but also the social and economic
attributes of the land parcels.
2.2 Land Registration and Transfer Process
The process of transacting sale/purchase of land, transferring ownership rights and
getting it legally registered with the government is quite a difficult and cumbersome
process for a common man. One has to go through a series of perplexing steps
imposed by the government on the transaction of sale/purchase of properties slowing
down the whole procedure. A land transfer/sale deed can be registered with the
government only after certain clearances have been obtained and fee for registering
the sale deed and transferring ownership rights has been paid to the concerned
authorities. Also, as a consequence of all these restrictions and requirements of
payments to the government including sellers, purchasers and the clerical staff,
they learn to devise methods by which they can avoid the restrictions and payments.
In general, we can state that the present land administration procedure is not only
slow and inefficient but lacks transparency too, resulting in the growth of corruption
and affecting the common man adversely.
Urban Land Management: The Retrospect of Three Metro Cities in India 201

2.3 E-Governance
The land records were earlier generated by employing manual labour and making
use of inexpensive, approximate and sometimes outdated instruments. As the entire
exercise was manual, completion of survey and mapping operations taking years,
even decades, and by the time the maps and the land registers used to get ready for
the use of public, they were already outdated to a great extent. Hence, though the
computerisation of the land records maintenance is an essential task, but for making
the required piece of information available to the public is even more essential.
Here comes the role of e-governance in an effective way at the grass-roots level.
The sole objective of e-governance is to provide relevant information at the
doorsteps of the citizens at a low cost through which they could save time and
money without making them suffer by going through all the tiring and lengthy
procedures of filling application forms and visiting the concerned staff in the
agencies in person. The most widely accepted definition of the term e-governance
is ‘e-government’ or electronic government referring to the use of Information and
Communication Technologies (ICTs) by the government agencies in public favour
for the following purposes:
1. Exchanging informationwith citizens, businesses or other government departments
2. Speedier and more efficient delivery of public services
3. Improving internal efficiency
4. Reducing costs or increasing revenue
5. Reducing manual labour of the clerical staff as well as the public involved
6. Increasing integration among the various branches and departments by avoiding
confusion
3 Issues at Administration Level on Reality Grounds
3.1 Experience of Ahmedabad, Delhi and Jaipurin the Past Decades
Ahmedabad is considered as one of the most important centres of trade and
commerce in western India and the home of several scientific and educational
institutions of national, regional and global importance. The pace of development
in Ahmedabad just like Delhi and Jaipur is very high, resulting into pressure on
the urban infrastructure and services, hence requiring an efficient planning proce-
dure for its growth in the future years. In Ahmedabad, town-planning schemes
are a successful instrument for urban development. The preparation and implemen-
tation of TP schemes are done with usage of new advanced technologies. TP
schemes involve computation of land value using computer-based GIS technique.
202 P. Nigam and V. Devadas

The plan of original plots and final plots along with existing structures clearly
shows remarkable improvement in layout of street pattern and making the plots of
regular shape with the use of computer-based technologies (Ballaney 2008). In
India, Gujarat is the first state to apply GIS to fully plan, implement and monitor
watershed management. Gujarat State Watershed Management Agency (GSWMA)
has used technology to benefit 1,048 villages, 7.08 lakh hectares and 2.5 lakh
farmers (www.geospatialworld.net).
Geographic information system (GIS) is a computer-based tool for mapping
and analysing things that exist and events that happen on earth. GIS technology
integrates common database operations such as query and statistical analysis with
the unique visualisation and geographic analysis benefits offered by maps. These
abilities distinguish GIS from manual system and make it consolidated, user-
friendly and hence valuable to a wide range of public and private enterprises for
explaining events, predicting outcomes and planning strategies (Mishra and Pal
2000). In the conventional mapping and recording procedure, the data is widely
distributed. To retrieve any kind of information, different branches and sub-
branches of land record department have to be contacted and traced, which is
very time consuming. The GIS technology not only makes the data retrieving fast
and easy as compared to the manual method but it also guarantees the availability
of information since it is very easy to detect a missing piece of information through
computers and fill the gap.
Delhi, the capital of India, leads among these three cities as far as the
computerisation of land records for the planning purpose is concerned. Their
system incorporates facility to dole out compensation and enhanced compensa-
tion information along with the legalities involved in their business process
including scanning, digitising and geo-referencing of the village maps, layout
plans, master and land use plan. In this context of automation of land records,
spatial digital maps are generated with due authentication (Centre for Develop-
ment of Advanced Computing 2008). Jaipur, though, has initiated the comput-
erisation of land records like the other cities using the GIS technique for
planning process is lagging behind the other two cities. Most of the time, the
government authorities have to rely on private agencies for preparation of their
development plans, even after getting their own staff trained in GIS. One
common problem faced by both Ahmedabad and Jaipur is the coordination of
the previous data which has been on papers from the last so many years to the
latest data which has been developed on computers in the past few years. As
a matter of fact, all these cities have poor land information systems with
consequent financial and other costs to both the public and urban managers.
This is due to the fact that the computerisation of records does not refer to simply
the data regarding title and ownership of the land parcels in electronic database
form. Urban development organisations are required to have good information
on land, not only including ownership but also price, conditions on use,
affordability in relation to shelter, land value increases in relation to overall
inflation rates, etc.
Urban Land Management: The Retrospect of Three Metro Cities in India 203

3.1.1 Hurdles in Achieving an Ideal Land Record and Information System
in These Cities
One should keep in his/her mind that, however pleasing and appealing it may seem
from above, the computerisation of land records with the help of GIS or even in
the basic electronic database format is not an easy task to achieve in these Indian
cities. The TP schemes in Ahmedabad make slow progress. Some of the opera-
tional problems are delayed transfer of funds to the implementing authority, delay
in development of need-based software, poor computer training facilities for the
field revenue staff, non-availability of private contractors for data entry and lack
of administrative focus. These problems are inherent in the cities of Delhi and
Jaipur too. Computerisation only involves entering the available land record and
enabling their printout. The regular updation of land records is a challenge in itself.
Since the other departments of the government are also fraught with inefficiency
and irregularities, it creates an impact on the working of the land department too.
Regarding the land titling process, it is a common observation in the villages
that persons in whose name the land is recorded are either deceased or do not
possess that land. Among other problems, land data may not be available for public
access; there may be unwillingness to share information on the part of govern-
ment officials. The existing problems and their solutions through ICT have been
summarised in Table 1.
4 Role of E-Governance at Institutional and Fiscal Level
4.1 E-Governance on the Reality Grounds
Awarded for best e-governance through three national e-governance awards in
2011, Gujarat is a frontline state in the implementation of e-governance policies
and projects and setting up of key infrastructure for e-governance at a certain level.
For the efficient management of increasing administrative responsibilities and the
welfare activities, Ahmedabad Municipal Corporation had initiated a project on
e-governance. A provision of Rs. 500 lakhs had been made for this project for
2002–2003 with the help of state government. This project, focussed on increasing
computerisation in financial and property tax departments, linking all zonal offices
with each other by electronic media and centralising collection of property tax,
i.e., tax payment to be done at any zonal office, provided it falls under municipal
corporation limits (Official Gujarat State Portal 2009). Under this project, a few
civic centres having certain specific number of nodes in each zonal office had been
set up, whereby total information is web-based and linked. One can calculate one’s
own tax online. Also, there is a complaint redressal department, which is an open
system, meaning one can find out the status of his/her complaint.
204 P. Nigam and V. Devadas

Delhi had planned a roll-out of 8,000 ‘government to citizen kiosks’ in 2008
through a project called Jeevan. While 23 departments and 104 services have been
identified to be brought under the ‘Jeevan’ project, 45 priority services would be
made available initially through computerised citizen service centres or portals with
264 online payment gateways. Services will include payment of utility bills, getting
licences or certificates, issue of forms, etc., on a single online platform. Rajasthan
government has also set up over 500 e-mitra (e-friend) service centres on public
private partnership basis in 31 out of 32 districts including Jaipur with services
including certificates, payment of bills, ration card, etc., with business process
reengineering in linked departments and SARATHI (Stamp and Registration
Table 1 The problems existing within the land records and information system and their solutions
Underlying problems
within the existing
conventional system ICT offered solution Hurdles in ICT efficient system
Land records are fragmented
in various departments
Single-window approach for
physical, social and
economic attributes of the
land parcel
Poor interaction among the
various departments and
agencies
Boundaries of the land parcels
are not defined properly
The GIS-based technique
ensures accuracy
Lack of technical staff well
versed in the software as
well as other limitations like
availability of electricity
Land titles are not clear Electronic database mentions
the titles clearly
Unwillingness and laziness to
maintain the land records by
the clerical staff
Missing gaps and errors in the
information become
evident at the time of
planning or taxation
process
Chances of errors become very
less in computer-based
system and can be easily
rectified
Unwillingness to rectify the
errors until and unless
required in the 11th hour
Confusing and lengthy manual
procedure
User/customer-friendly
approach resulting into
quick and easy processing
Unawareness of the common
public about the latest
technology and procedure
followed or unavailability
of sufficient computers and
cyber cafes
Regular updation is not
possible
Updation of data at regular
intervals is much easier
after monitoring the
changes
The changes are not monitored
regularly through field
survey due to lack of staff or
funds
Graphical version of the data is
either unavailable or
available in a very untidy
manner
Soft copy of graphical data is
easy to make available even
on a massive scale to the
public through web portals
or other method
Non-acquaintance with the
simple technology by the
common public
Lack of transparency Automated system leaves less
chances of manipulation
and faults within the data
Intentional fudging with the
data due to political reasons
Urban Land Management: The Retrospect of Three Metro Cities in India 205

Automation with Technology and Information) e-registration in an hour
(E-governance and Best Practices 2008). This kind of set-up improves the internal
as well as external efficiency of the urban local bodies and strengthens the bond
between the government and the common public.
Most of the urban local bodies make most of the information available on
their web portals. The exchange of information is a two-way procedure where the
concerned person can not only see the specific information made available by the
authority but also lodge complaint online and check the status of any application or
complaint filed. E-governance allows the user to participate too in the procedure in
the process of transactions, registration, etc., and providing feedbacks rather than
limiting his/her role to a mere spectator in any institutional procedure.
4.2 Miles to Go in E-Governance
The aforesaid cities do not have a proper and complete computerised system of
all the land records and information. In general, the revenue-earning departments
like the commercial taxes, excise, most of the urban local bodies in Ahmedabad,
Delhi and Jaipur, stamps and registration, revenue and land records, municipalities,
etc.,have taken a number of important e-governance initiatives. All these departments
have a highly informative website, downloadable forms, options for lodging com-
plaints and giving feedbacks, procedures and timelines for procuring services, etc., on
the Internet in Hindi or any other local language like Gujarati. The best part is the
option where a customer can get his/her work done and check some information like
status of complaint application, lottery result or even file a complaint through SMS
service through his/her mobile. But still all this is like a drop in the ocean compared
to the international standards. The administration can be made much stronger, trans-
parent and user-friendly in terms of e-governance. Figure 1 illustrates the difference
between the conventional and e-governance approaches for various land administra-
tion features or services for general public.
5 ICT in Tax Administration
5.1 Taxation
Tax administration, though a bit confounding in a general concept, is much duller in
developing countries as compared to developed countries because of the lack of
qualified staff, primitive style of record keeping along with half-hearted attempt for
use of technology, absence of proper interaction among the governmental agencies
themselves and to some extent the lack of political will to enforce good governance.
A successful tax administration must be comprehensive, covering all aspects of tax
administration, namely, coverage, valuation, collection, enforcement and taxpayer
206 P. Nigam and V. Devadas

service. Municipal revenues account for 0.6 % of the country’s GDP (Reforming
the Property Tax 2004). So, there is enormous potential for enhancing and improv-
ing local revenue collection with the help of advancing technology. Looking at the
pace of growth of our urban economy and demand for better efficiency in the
government institutions, a strong institutional framework is required to exploit this
potential and upgrade urban infrastructure and services. Institutional capacity build-
ing is very essential for efficient functioning of the government and hence effective
delivery of urban services.
Due to ineffective taxation, the low income in municipal revenues is a cause for
serious concern. Taxation has been recognised as one of the principal source of
revenue generation in urban local bodies. Unfortunately, the tax yield is very poor,
owing to the legal and administrative problems, lying within the whole of tax
system. Now is the time to make this tax a highly productive instrument of revenue
generation for local bodies. Since Ahmedabad is the leading city in e-governance,
•Personally go to concerned authorities to get a documented form by paying a heavy amount.
MASTER PLANS, BUILDING BYE LAWS,
ETC
•Go to office for applying and keep visiting for many months for enquiring about the status until the application is accepted.
LAND REGISTERATION AND TRANSACTION
•Keep checking newspapers and other sources for the information or go to concerned authority personally.
ISSUE OF NOTICE REGARDING LAND ACQUISITION OR
DISPOSAL THROUGH LOTTERY SCHEME
•Visit the office in person and go through cumbersome process and keep visiting the office for checking its status standing in quues for hours.
COMPLAINT REGARDING ANY URBAN SERVICE
•Keep checking the newspaper for any specific news or personally visit the different offices for enquiry.
•No Guarantee of getting information.
CURRENT STATUS OF PROJECTS AND
DEVELOPMENT WORKS
•Wait for the bill and personally go to office to pay standin in long queues.
•No transparency in the generation of bill.TAX COLLECTION
Available at web portals in downloadable format free of cost.
Apply and pay the fees online sitting at home.
Check and enquire only on the concerned agency’s website.
Lodge complaint online and enquire the status of the application.
Check on the web portal for the information free of cost.
Check and calculate bill online and even pay online.
Features/ Services Conventional /ManualApproach
E-Governance Approach
Fig. 1 Comparison between the conventional/manual approach and e-governance approach for
land management system
Urban Land Management: The Retrospect of Three Metro Cities in India 207

its tax collection rates remain generally the highest among all the cities. Along with
Delhi, it was among 6 cities with high concentration of service tax assesses and
major tax contribution, i.e. revenue of Rs. 8,827 crores (62 % of the total tax
receipt) for the year 2004–2005, while Jaipur was at 12th position (Annual Perfor-
mance Report 2004–2005). Jaipur ranks very low as compared to the other metro
cities each year, as far as tax collection is concerned.
5.2 ICT as an Answer to Ineffective Taxation
An effective procedure to curb the inefficiencies in the taxation is discussed below:
1. One of the main reasons is the failure in citation and evaluation of all the properties
lying in the metropolitan area. All these different aspects of land administration are
interlinked and interconnected.The problemof land recordsmaintenance and titling
eventually results into an efficient fiscal set-up. A comprehensive and periodic
maintenance with regular update of properties along with other socio-economic
proper details will broaden the tax base coverage and increase revenue generation in
tax administration. This can be achieved through carrying out field surveys, tax
mapping and use of modern technology like Global Positioning System.
2. The taxation is considered complete only when the tax is actually collected after
the assessment of the properties. Tax collection is particularly challenging in
developing countries where payment of full taxes is not taken seriously by the
people. Apart from this, the procedure is too slow to complete the taxation
process. Earlier, bills were not always issued in time. However, computerisation
of tax information in all the three municipal corporations has helped in speedy
generation of tax bills. The existing problems within taxation and their solutions
through ICT have been summarised in Table 2.
The main problem still lies within the comprehensiveness of the land records and
management system. For example, while a development plan is prepared, the first
task is to prepare a base map. When the plans are prepared, very accurate cadastral
maps and landownership details have to be developed. The cadastral maps and
records are required by the planning agencies to prepare maps and databases as well
as the revenue department for taxation and evaluation. Both of these function
separately, however, and they maintain and update their own records, resulting in
considerable confusion and overlapping of details. Again, the spatial records are not
linked with the databases. The lack of maps and the absence of databases hinder
planning and management functions by different departments. Hence, while the
plans are prepared, there is an opportunity as well as prerequisite to build a fairly
accurate GIS-based base map and land record system that can be used by both the
planning and revenue departments.
The problem is evident in all the three metro cities even in Ahmedabad, where
preparation of TP schemes requires accurate land record data and information
system, resulting in exercising the whole thing. Through the cases of Delhi and
208 P. Nigam and V. Devadas

Jaipur too, it can be concluded that the problem lies mainly in the lack of interac-
tion, and the ego clashes between the development authority and the municipal
corporation since the task of planning and development lies within the development
authority and the revenue generation within the municipal corporation. Thus, better
e-governance would result into better institutional framework, hence better fiscal
set-up and vice versa as evident in Fig. 2.
Table 2 The problems existing within the taxation and administration and their solutions
Existing problems ICT offered solution Hurdles in ICT efficient system
Land records are not in
consolidated form
Interconnection of all the
graphical and text version
of data through internal
server within the
government agencies
Poor interaction among the
various departments and
agencies within the
government
Size and boundaries of the land
parcels are not defined
properly, resulting in
confusion of area to be
considered for taxation
The GIS- and GPS-based
techniques ensure accuracy
with minimum chances of
errors
Lack of technical skill within
the staff or even lack of
funds within the agency
Land titles are not clear, and
hence, their listing and
assessment becomes
difficult
Computers ensure clarity and
ease the computation and
calculation burden for
taxation
Unwillingness and laziness to
maintain even the electronic
database of land records by
the clerical staff
Overburden on the clerical staff
due to lengthy manual
procedure
Tech-friendly approach,
resulting into quick and
easy processing of data
Lack of technical skills among
the staff
Lack of transparency within the
taxation process
Options of online calculation
of tax and filing of
complaint sitting at home
ease the process
Ill-maintenance of the web
portals resulting into
confusion
Information andCommunication
Technology
LandPolicy andadministrat
ion
Fiscalsetup andtaxation
Inst i tut ionalsetup
Fig. 2 Interrelationship between different aspects of land management
Urban Land Management: The Retrospect of Three Metro Cities in India 209

The present e-governance in Ahmedabad, Delhi and Jaipur provides the improve-
ment in service delivery, making it quicker and easier as compared to the manual
procedure, but for the complete transformation, it is essential to list out the various
services provided by different departments and connect the similar services,
i.e. single-window approach. For example, registration of property or its transaction
must lead to an updation in the land records and hence calculation of tax; a
connection of birth and death registration with the tax payer documents shall reduce
the disarray within the system; GIS may help to have a better picture of the tax
collection statistics within the area in graphical terms, etc.
6 Conclusion
In brief, this chapter shows the possible solutions for some of the hurdles in efficient
land management through information and communication technology approach
through the case studies. Though, it is comforting to see the initiation of technolog-
ical approach in a developing country like India. But, still we need immense improve-
ment to reach a certain level where technology can be utilised to its maximum
potential for a better and efficient land management and administration. The cities
have started using technological advancement as a tool to rectify their functioning.
On the other hand, there are so many other remaining tools and techniques which
can help the institutions and urban local bodies to improve themselves.
References
Annual Performance Report (2004–2005). Directorate General of Service Tax, Mumbai
Ballaney S (2008) The town planning mechanism in Gujarat, India. The World Bank, Washington,
DC. http://www.hcp.co.in/downloads/35/Town%20Planning%20of%20Gujarat.pdf. Accessed
5 Dec 2011
E-governance and Best Practices (2008). india.gov.in/govt/studies/annex/6.3.1.pdf. Accessed 5
Dec 2011
Land management information system (LMIS) for Delhi development authority (2008),
e-governance applications. Centre for Development of Advanced Computing, Noida. http://
www.cdacnoida.in/eGovernance/e_gov.asp. Accessed 6 Dec 2011
Mishra A, Pal DJ (2000) Land record information management system (LRIMS) – a conceptual
framework. Centre for Development of Advanced Computing, Pune
Official Gujarat State Portal (2009) www.gujaratindia.com. Accessed 6 Dec 2011
Reforming the Property Tax (2004) National Institute of Urban Affairs, New Delhi
210 P. Nigam and V. Devadas

Part 1.5
Technology and Market

Marketing Dynamics in Technology-Based
Industries: Pioneering Advantage, Customer
Experience, and Adaptive Pricing
Gurumurthy Kalyanaram
1 Market-Share Pioneering Advantage
1.1 Empirical Evidence
Empirical studies have shown that in most cases, being first to the market provides
a significant and sustained market-share advantage over later entrants. Still, later
entrants can succeed by adopting distinctive positioning and marketing strategies.
Pioneers in most industries, once they have reached the status of incumbent, are
powerful. Sometimes, however, they get complacent or are not in a position to cater
to the growing or shifting demands of the marketplace. New entrants can take
advantage of gaps in the offerings of these aging pioneers or find innovative ways to
disrupt the customer preference and market structure.
There is a large literature documenting the importance of order of entry for early
entrants in consumer packaged and other goods (Kalyanaram et al. 1995; Robinson
et al. 1995; Karder et al. 1993; Kalyanaram and Urban 1992). Bond and Lean (1997),
Berndt et al. (1995), Charles King et al. (2000), Ling et al. (2002), and Kalyanaram
(2008)1 have documented strong order-of-entry effects in the pharmaceutical drugs
markets also.
Empirical generalization (Kalyanaram et al. 1995) leads to a simple expression
to compute the market-share penalty for later entrants: the new entrant’s forecasted
market share divided by the first entrant’s market share equals, roughly, to one
G. Kalyanaram (*)
NMIMS University, Mumbai, India
e-mail: [email protected]
1 The empirical results show “the innovator’s market share in the prescriptions category (OTC
category) dropping from 100% to about 58 (61) percent after the second brand enters, to 43 (47)
percent after the third entrant, to 35 (39) percent after the fourth brand enters, and to 30 (34)
percent after the fifth brand enters. Consistently, the market shares for the first entrant are higher by
3–5 points in the over-the-counter drugs category than in the prescription (Rx) drugs category.”
Department of Management Studies, Indian Institute of Science, Bangalore,
Driving the Economy through Innovation and Entrepreneurship,DOI 10.1007/978-81-322-0746-7_18, # Springer India 2013
213

divided by the square root of order of entry of the new entrant. Therefore, if there
are two players in the market, the first entrant will have a market share of 59%
and the second entrant will have a market share of 41% (which is 70% of 59%).
This formulation is derived from generalizations across studies including those
illustrated in Table 1.
In this study, we illustrate the dynamics of technology-based industries with the
evolution of the cellular industry in Europe. Kalyanaram and Gurumurthy (1998)
examined the data from cellular industry in several countries in Europe. This data
captures the early years of the wireless market in Europe, as the wireless service
providers started entry into European markets in early 1990s. See Table 2.
Except for one case (in Britain), the data shows that the later entrants suffer
a market-share penalty. This relationship is consistent and monotonic. Even in an
aggregate computation across all the countries—Belgium, France, Germany, Italy, the
Netherlands, and Spain—the average market shares of the first and second entrants
are 58.5 and 41.5%, respectively. These figures are consistent with the results in
Table 1 since the second entrant has about 70% of the pioneer’s market share.
Pioneering market-share advantage is muted in some conditions. When con-
sumer learning is limited, the pioneering advantage will be limited. Consumer
learning becomes very difficult if the product becomes complex and technical.
For example, when picture phones were introduced in the late 1970s, the market did
not respond because consumers could not find occasions to use the product. The
pioneering advantage is also limited in a cluttered market: if there are many
available brands, consumers react by becoming confused.
1.2 Analysis of Early European Wireless Markets
An analysis of the evolution of wireless markets in Europe indicates that first
entrants are also market leaders in all the countries (Table 2) Pioneers in cellular
service establish a presence in the marketplace, build brand equity, and create an
excellent distribution network. In light of the facts that the quality of service is
primarily determined by coverage and that the first entrant’s network infrastructure
is generally superior, the first entrant’s market-share advantage is evident. As the
customers become used to enhanced coverage over time, the later entrants have to
invest significantly to achieve this same coverage—an effort that is capital intensive
and time consuming. All new networks have initial bugs that take time to fix.
Table 1 Order-of-entry effect and relative market shares
Entry order Urban et al. (1986) Kalyanaram and Urban (1992) Berndt et al. (1995)
First 1.00 1.00 1.00
Second 0.71 0.76 0.70
Third 0.58 0.64 0.57
Fourth 0.51 0.57 0.49
Fifth 0.45 0.53 0.44
Sixth 0.41 0.49 0.40
214 G. Kalyanaram

Subscribers are just not willing to go through another learning curve when there is
already a robust supplier of service. In light of switching costs and other
parameters, consumers are risk averse. Accordingly, consumers prefer to stick to
the choice that is already demonstrably functional.
Another frequent constraint in the wireless market is access to property to build
the towers, since the first entrants have already seized the ideal sites for coverage.
This, in turn, may require the later entrant to invest larger amounts in network
infrastructure to gain similar coverage. Given these hurdles, it can take 2–3 years
before a challenger achieves coverage competitive with the incumbent’s.
In addition to coverage and related quality of service, another formidable barrier
to entry for new entrants, till recently, has been the challenge of number portability.
Customers would have to get a new cellular number when they switch carriers since
they cannot take the same phone number with them as is done in landline networks.
In general, customers do not like to change their phone number where customers
receive calls in their mobile phones. The number portability issue now remains less
challenging, though there is a cost involved. Thus, we see the inherent advantages
to being first in the market in the wireless industry: control of ideal sites, freedom to
evolve and fine-tune network coverage, building of brand loyalty by offering
superior customer service, locking in customers by subsidizing equipment for an
extended period under fixed-service contracts, and gaining control of key channels
of distribution.
Pioneering advantage can be sustained through constant innovation. For exam-
ple, in telecommunications industry, two obvious sources of differentiation are
superior network infrastructure and customer service. In the wireless industry,
customers are repeat purchasers, since their contract terms typically last for only
Table 2 Wireless market in Europe, 1988
Country Operator Order of entry Date of entry
Net annual
market share (%)
Belgium Belgium Mobile 1 January 1994 60
Belgium Mobistar 2 August 1996 40
France France Telecom 1 July 1992 55
France SFR 2 December 1992 45
Germany Mannesmann 1 June 1992 52
Germany T-Mobile 2 June 1992 48
Italy Telecom Italia Mobile 1 October 1992 68
Italy Omnitel Pronto Italia 2 October 1992 32
Netherlands PTI Telecom 1 July 1994 55
Netherlands Libertel (now Vodafone) 2 September 1995 45
Spain Telefonica Moviles 1 July 1995 61
Spain Airtel 2 September 1995 39
Britain Vodafone 1 July 1992 42
Britain Cellnet 2 January 1994 31
Britain DCS 1800 One-2-One 3 September 1993 7
Britain DCS 1801 Orange 4 April 1994 20
Marketing Dynamics in Technology-Based Industries: Pioneering Advantage. . . 215

1 or 2 years. This situation offers an opportunity to the later entrants. A later entrant
can lure some of the customers from the earlier entrant by a good network
infrastructure and by gaining access to good distribution networks. This is evident
from the fact that the incumbents in several countries have not been able to sustain
their lead and the differences between early entrants and second entrants are
decreasing rapidly. For example, in Britain, Vodafone had an 18-month advantage
over its prime competitor, Cellnet, with similar technology. Three years after
the launch of Cellnet, however, the difference inmarket share in annual net additions
between Vodafone and Cellnet is only 11%. Vodafone has been able to retain its
lead in the recent past only by fighting back efficiently on the customer service
dimension and by developing creative service-bundling strategies (Kalyanaram and
Gurumurthy 1998).
2 Competitive Strategies for Later Entrants
The order-of-entry market-share phenomenon has clear strategic implications for
later entrants (Kalyanaram and Gurumurthy 1998). A preferred strategy for a
later entrant may be to develop a superior product with either unique benefit
features and/or a lower price (i.e., better positioning). Such positioning can be
accomplished through substantial changes in either the product or promotion
strategies. For example, the Chrysler Corporation redefined perceptions of its
minivans by introducing caravan, a two-door van. The Ford Corporation’s
Windstar which was expected to be a marquee van lost substantial share to the
caravan. When the General Motors Corporation decided to reposition its
Oldsmobile, it changed not only its product but also its advertising copy. The
new copy appealed to consumers over 30 years old, projecting the image of a
younger professional woman via this voice-over: “This car is not only for your
father’s generation, but it’s for you too.”
A second route for later entrants is to discover creative ways to increase product
trial. Kalyanaram and Urban (1992) have found that the market-share advantage
for the early entrants comes from higher trial penetration. There are several
possibilities. For example, limited demonstration of usage or prototypes in software
products and test usage in automobiles are fruitful approaches. Also, distributing
the product through new channels such as direct marketing (think of the Lands’ End
catalogue or the Mary Kay cosmetics parties) or a home-shopping-network channel
placing the product in the hands of more consumers is another approach.
The later entrants can position themselves as variety enhancers, rather than as
replacements or substitutes for the pioneers. An example is Orange, the late-entry
cellular service provider in Britain, which successfully nudged aside the pioneers.
Orange entered the market almost 30 months after the first entrant, Vodafone, and
9 months after One-2-One, and with technology similar to One-2-One’s. Orange,
however, has followed a very aggressive entry strategy. It not only invested heavily
216 G. Kalyanaram

in the network over the first 2 years of introduction but also developed aggressive
pricing strategies. Orange seized a third of Britain’s total market’s first quarter 1996
growth by offering about a 30% savings to end users, compared with Vodafone and
Cellnet. The pricing strategy was effective enough to compensate for Orange’s
relatively poor network coverage.
Later entrants can also succeed by attacking high-growth markets particularly
when there is a significant shift in the industry. Such shifts can be due to changes
in regulation, or technological breakthroughs that improve the product, or break-
throughs that improve the process of manufacturing and delivering the product.
The classic example is MCI’s success in penetrating the long-distance market and
winning a regulatory battle with the AT&T Corporation.
Another strategic option for the later entrant is micro-segmenting the customer
base, that is, targeting high-value customers who are able and willing to pay
a higher price for the product or service relative to the cost incurred in catering to
that segment. For example, the competitive-access providers (now competitive
local exchange carriers, or CLECS), in order to provide local telecommunications
services, basically skimmed the best customers of the regional Bell operating
companies by offering a lower price. This was possible because the regional com-
panies had adopted an average price scheme partly dictated by the Federal
Communications Commission.
Innovators have also been successful in entering markets with a significantly
better technology. Usually, however, technological innovation gives a company
an edge for only a time, since incumbents catch on fairly quickly. Given
that this is the case, new entrants should support their innovations with effective
positioning, appropriate pricing, and aggressive advertising. For example, IBM,
a later entrant to the personal computer market, captured the lead in the 1980s by
developing the technology and using its powerful marketing engine. Later,
Compaq and Dell fundamentally redefined the business. Compaq reduced
the cost by changing the manufacturing process and having superior logistics.
Dell, in addition to using an efficient manufacturing process and superb logistics,
invented the mail-order or direct channel to access end users, who by now were
comfortable with personal computer technology. IBM was not able to react to
these changes fast enough and lost its lead in the 1990s (Kalyanaram and
Gurumurthy 1998).
3 Customer Experience
Urban (2005), Von Hippel and Thomke (2002), and others have addressed the
importance of engaged customer and such engaged customer as the source of
innovation. Customer “service” and “experience” offerings should go beyond the
pure products-related offering (e.g., basic installation/maintenance service) to an
extended set of offerings (e.g., post-purchase consultative facilitation, design of
Marketing Dynamics in Technology-Based Industries: Pioneering Advantage. . . 217

warranties). This set of extended offerings will create a value-added ecosystem,which will provide consumers both tangible and intangible benefits that go beyond
the mere adoption/consumption/usage of the product. The ecosystem will enhance
the total “experience” of the customer. We call these extended offerings of theecosystem as “customer service offer zones.”
As we move through “offer zones,” the firm is presented with new and different
opportunities and challenges to capture and maximize value using different busi-
ness models. One should keep in mind the interactive effect of these “customer
experience and service zone” offerings and core product. Understanding the inter-
active effect will enable optimal pricing and ability to capture value during
a customer/product life cycle. For example, by pricing songs at iTunes at 99 cents,
Apple has been able to generate more demand for iPods priced between $250 and
$350. Another example is the cost of hardware versus ongoing maintenance and
software upgrades. Companies can price the core product at a lower margin to capture
higher margin and revenue from incremental services.
Customer experience, value, and service are important in all industry sectors
and across product life-cycle stages. However, the type of experience and value
would differ depending on the sector/product life cycle and the nature and delivery
of that experience and service. We will first briefly discuss the strategic impli-
cations in the mature phase and then in the growth phase of product/sector life
cycle. Our context for discussion is the high-technology industries and markets.
3.1 Mature Phase of Life Cycle and Customer Offer Zones
Several firms have shown the value of focusing on customer care and experience
during the maturity phase in a product/sector life cycle. Such a strategy enables
firms to think creatively beyond pure product rationalization and cost dimensions
(business efficiency) to generate growth. The most oft-quoted example that fits this
description is IBM’s turnaround from the early 1990s. IBM has generated signifi-
cant growth over the last 10+ years from the services business which accounts for
over 50% of revenue today. IBM has truly created a new dimension of growth by
leveraging customer service and as well as having redefined how hardware and
software with services can be bundled to create unique value.
Another example of this trend is EMC which, as a firm, has transformed from
a hardware-centric company to software-based holistic-offering (including hard-
ware and software) company. HP is yet another company that has regenerated
growth in a relatively mature market by enlarging and diversifying its services
business (including online classes on digital photography and entertainment). We
are likely to see emergence of a more customer services led strategy from other
large hardware-centric companies like Sun.
In the telecommunications equipment industry, Ericsson has created a very large
services-based business that now offers clear incremental value-added service that
goes beyond the basic maintenance service. The services business has enabled the
218 G. Kalyanaram

company to generate significant overall growth, and it has increased customer
stickiness of its core hardware and software products as well. Thus, while there is
substantial collateral benefit to services, there is also an increase in core product-
related revenues.
3.2 Growth Phase of Life Cycle and Customer Offer Zones
When firms are in growth phase, the value of customer experience and service is
likely to be viewed differently. Skype is a classic example of focus on customer
service. The true driver of growth has been their ability to enhance customer experi-
ence by making relevant changes in their software strategy and in addition offering
“wraparound” customer service. In the case of Skype, customer service is an embed-
ded cost to increase adoption of its offering which, in turn, improves the overall value
of the company.
Apple’s iPod is another example of a company in growth stage which has
focused on customer service and experience that is more enriching the standard
user interface (for which Apple is well recognized). Apple provides information at
points of purchase through well trained representatives at flagship stores and/or in
the call centers. This has enhanced the overall experience and increased adoption of
the service. Thus, typically in growth oriented stages, quality of service is important
to facilitate faster adoption.
3.3 Managing Variability Introduced by the Users
When users become part of offerings of a firm, there is a greater variability
introduced in the design of the offering. Managing this variability is critical and
important for making an offering profitable. Customers introduce variability in
many different ways. For example, the customers do not necessarily want the
offering at times when it is most convenient for the firm. There is often a timing
mismatch. In many service environments such as retail stores, call centers or
physician clinics, such mismatch is often serious. Another form of variability is
request by the users of an offering or attribute that is not under consideration. Of
course, there is the subjective preference variability. That is, users vary in their
reactions to an offering. For example, a miniature phone size might be well received
by some users, while other users may find the operation of the phone difficult.
In light of this heterogeneity in preferences, it is important for a firm to set up
strategies (such as micro-segmentation of users, queuing of requests, build
redundancies) to retain productive user input and yet maintain profitability of the
process.
Marketing Dynamics in Technology-Based Industries: Pioneering Advantage. . . 219

4 Adaptive Pricing
One of the most important attributes of offerings is price. We posit that price, too,
should also be user-driven. Adaptive pricing allows for this user-driven pricing.
Adaptive pricing consists of two main elements: (1) letting the customer/user set
any price he/she considers fair after the purchase/consumption experience, and
(2) letting the firm/seller or a marketplace of firms track that price and use that
information to determine whether to make further offers of that kind to that user/
consumer in the future (Reisman 2010). Adaptive pricing “creates a dynamically
adaptive cycle of offers, prices, feedback, and further offers that rewards those
who pay fairly and cuts off those who do not (Reisman 2010).” Consumers
become part of the decision-making, and thus feel empowered by added trust
and flexibility.
For example, some music and downloadable games including Radiohead in
2007 have experimented with different versions of adaptive pricing and found
moderate success. In case of Radiohead, while a reported 60% downloaders did
not pay at all, enough did (paying an average of $8.05 in the USA and $4.64
elsewhere) to make that experiment modestly successful.
Empirical research (Kalyanaram and Little 1994; Kalyanaram and Winer
1995) has shown that consumers carry a reference price for a brand, and they
adapt this reference price based on new information and experience. Reference
price is an internal price that consumers form to assess the value of the product/
brand of choice. The reference price is consumer and brand specific. The concept
of adaptive pricing is analogous to constant updating of reference price through
new experiential and market inputs. A parsimonious but elegant operationa-
lization of reference price at time t is a concave function of reference price at
t�1 and the price at t.The adaptive pricing approach designed by a firm must take into consideration
the cost structure. In technology-based industries, the costs decrease over time. For
instance, it is a fact that products like digital cameras watches, color TV, personal
computer, videocassette recorder, and hand-held calculators have had a sharp
drop in (output) prices since the introduction of these products. Technological
innovations and competitive dynamics cause reduction in prices.
Generally, while adaptive pricing can be practiced by a dynamic firm that
innovates and takes care of customer needs or being customer centered, it has to
balance this with the elasticity of demand for its product or service. The pricing
must, therefore, also be carried out within the context of the type of industry—
constant-cost, increasing-cost, or decreasing-cost industry. But the principal factor
driving the pricing is the elasticity of demand. If a firm is able to expand its
customers and sustain their loyalty, then the demand elasticity can become more
inelastic—thus, as holding the customers to the product and the firm, the firm can
have some dominant role in setting the price.
In summary, dynamic pricing approach is most appropriate for technology-based
industries and products.
220 G. Kalyanaram

5 Summary
Technologies are constantly evolving.Managing technologies is, therefore, a dynamic
process. Market entry, customer experience, and pricing dynamics constitute funda-
mental components of technology management. This chapter addresses and analyzes
these three issues.
While we have shown that early entrants enjoy sustained market-share advan-
tage and that this empiricism has strategic implication, two important questions are:
• What is the reason for this market phenomenon?
• Is there evidence of advantage in return on investment?
There are several economic (e.g., Schmalensee 1982) and behavioral (e.g., Kardes
and Kalyanaram 1992) arguments for the market-share phenomenon. First argument
is that consumers in general are risk averse. If a product or service provides enough
satisfaction, consumers do not want to risk switching to a new product. Second, the
pioneer becomes the prototype for the product category. Later entrants are compared
to the pioneer and always somewhat unfavorably. Whenever consumers think of
photocopying for example, Xerox is the name that jumps to mind. Third, consumers
learn best the attributes of early entrants. More knowledge translates into more
strongly held beliefs and great confidence in choice. And lastly, early entrants are
able to secure the best positioning in the marketplace.
Does the pioneering advantage manifest itself in return-on-investment metrics
apart from market share? Yes, after substantial research and development invest-
ments, being early in the market is rewarding. Research shows that the pioneers
enjoy a higher return on investment in both consumer and industrial goods (see
Tables 3 and 4). This research and development investment and continuous new
product launch is also used as an entry barrier by several pioneers.
With regard to customer experience as a source of innovation, the evidence is
overwhelming. Von Hippel (1994, 2005) and others (e.g., Anthony and Bettencourt
2008; Urban 2005) have shown that in many industries such medical technology,
instruments about 70% of the innovations come from end users and customers.
Therefore, an engaged and proactive customer is the most productive and efficient
source of innovations. However, firms have to facilitate customer input. As an
illustration, when medical instruments were modularized, the innovative consumer
Table 3 Return on
investment and order of
market entry, consumer goods
Consumer goods Return on investment (%)
Market pioneers 25
Early followers 19
Late entrants 16
Table 4 Return on
investment and order of
market entry, industrial goods
Industrial goods Return on investment (%)
Market pioneers 24
Early followers 19
Late entrants 15
Marketing Dynamics in Technology-Based Industries: Pioneering Advantage. . . 221

experimented and improvised. But modularization was a necessary condition for
this experimentation to happen.
Finally, adaptive pricing has been well documented in economics and marketing
literature. Reisman (2010) has developed a patented algorithm to price adaptively.
References
Anthony UW, Bettencourt LA (2008) Giving customers a fair hearing. MIT Sloan Manage Rev
49(Spring):63–68
Berndt ER, Bui LT, Reiley DH, Urban GL (1995) Information marketing and pricing in the U.S.
anti-ulcer drug market. Am Econ Rev 85(2):100–105
Bond RS, Lean DF (1997) Sales, promotion and product differentiation in two prescription drug
markets. Staff Report of the Bureau of Economics of the Federal Trade Commission,
Washington, DC
Kalyanaram G (2008) The order of entry effect in prescription (Rx) and the over-the-counter
(OTC) pharmaceutical drugs. Int J Pharm Healthc Mark 2(1):35–46
Kalyanaram G, Gurumurthy R (1998) Strategies to grow and compete in a dynamic marketplace.
Strateg Bus (12):1–11. Reprinted in The Capital, Turkey
Kalyanaram G, Little JDC (1994) A price response model developed from perceptual theories.
J Consum Res 21(December):408–418
Kalyanaram G, Urban GL (1992) Dynamic effects of order of entry on market share, trial
penetration and repeat purchases for frequently purchased consumer goods. Mark Sci 11
(Summer):235–250
Kalyanaram G, Winer RL (1995) Empirical generalizations from reference price research. Mark
Sci 14(3) Part 2 (of 2):G161–G169
Kalyanaram G, Robinson WT, Urban GL (1995) Order of market entry: established empirical
generalizations, emerging empirical generalizations, and future research. Mark Sci 14(3) Part
2 (of 2):G212–G221
Karder FR, Kalyanaram G, Chandrashekaran M, Dornoff RJ (1993) Brand retrieval, consideration
set composition, consumer choice and pioneering advantage. J Consum Res 20(June):62–75
Kardes FR, Kalyanaram G (1992) Order-of-entry effects on consumer memory and judgment: an
information integration perspective. J Mark Res 29(August):343–357
King C III (2000) Marketing, product differentiation and competition in the market for antiulcer
drugs. Harvard Business School Working Paper No. 01-014, Boston
Ling DCY, Berndt ER, Kyle MK (2002) Deregulating direct to consumer marketing of drugs:
effects on prescription and over-the-counter product sales. Paper presented at the University of
Chicago Law School – Medical School Conference, The regulation of medical innovation and
pharmaceutical markets, Chicago, 20–21 Apr 2001. Revised version, March
Reisman R (2010). http://www.fairpayzone.com/. Accessed 13 Jan and 10 July 2012
Robinson WT, Kalyanaram G, Kalyanaram G, Urban GL (1995) First-mover advantages from
pioneering new markets: a survey of empirical evidence. Rev Ind Organ 9(February):1–23
Schmalensee R (1982) Product differentiation advantages of pioneering brands. Am Econ Rev
11:349–365
Urban G (2005) Customer advocacy: a new era in marketing. J Public Policy Mark 24
(1, Spring):155–159
Urban GL, Carter T, Gaskin S, Mucha Z (1986) Market share rewards to pioneering brands: an
empirical analysis and strategic implications. Manage Sci 32(6):645–659
Von Hippel E (1994) Sources of innovation. Oxford University Press, New York
Von Hippel E (2005) Democratizing innovation. MIT Press, Cambridge, MA
Von Hippel E, Thomke S (2002) Customers as innovators: a new way to create value. Harv Bus
Rev 80(4):74–81
222 G. Kalyanaram

Changing Consumer Perception of Electronic
Vehicles Through Branded Technical
Components
Christian Linder and Sven Seidenstricker
1 Introduction
Today, a number of established manufacturers offer the first standard electric
vehicles. At the same time, battery manufacturers are working on the latest genera-
tion of lithium-ion batteries with much wider ranges. With this new technology, one
major change has happened to big automotive brands such as Volkswagen, Toyota,
Mercedes and Renault. While consumers estimate them, in relation to component
suppliers, to be relatively competent at producing cars with combustion motors, the
know-how for electro- (e-) cars is seen to be held by suppliers such as battery or
drive system manufacturers. So what we observe today is a switch in knowledge
and competencies (PWC 2011). From a technical point of view, battery range is the
biggest challenge. Today, performance is – due to energy density and power density
– about 150 km per charge, and the number of rechargings is very limited. The total
added value of an average battery to an electric car is around 30–40% (ACATECH
2010). The price in relation to the kilometre reading is, for many potential
consumers, too high. So it is not surprising that, today, consumers are resolute
and that the current sales volume in e-cars is relatively low.
But price is not the only thing that matters. E-mobility is a paradigm change in
mobility and a clear innovation for the common car. Consumers’ hesitation over
buying e-cars can be described in terms of diffusion theory (Rogers 2003). It is well
known that people do not adopt innovations instantly but instead pass through
stages in the adoption process. Other than the early adopters, the majority of
possible users wait before they make their buying decision. Diffusion theory asserts
that the rate of diffusion is influenced by the perceived characteristics of the
innovation, as well as by the structural characteristics of the organisation and the
C. Linder (*) • S. Seidenstricker
Institute of Human Factors and Technology Management,
University of Stuttgart, Nobelstrasse 12, 70186 Stuttgart, Germany
e-mail: [email protected]
Department of Management Studies, Indian Institute of Science, Bangalore,
Driving the Economy through Innovation and Entrepreneurship,DOI 10.1007/978-81-322-0746-7_19, # Springer India 2013
223

personal characteristics of the target audience. Further, it is known that consumer
adoption increases if consumers have the chance to observe others using the innovation
effectively (Rogers 2003). These major factors reflect the complexity between techno-
logical innovation and its commercialisation. For commercialisation, the concepts of
technology push and demand pull are the driving forces in the process of innovation
(Wonglimpiyarat andYuberk 2005). The commercialisation complexity, or, in the case
of e-mobility, how radical the new technology is seen as by potential users, has effects
on consumers’ trust in the promised advantages of e-cars compared to existing cars.
Low trust requires a big push effort. Likewise, today, the battery (in terms of price,
lifetime and range) is one of the characteristics which makes the decision difficult for
potential users. Further, consumers have little experience of e-cars, as there is neither
ownership nor experience of e-cars among family, friends or peer groups. Therefore,
car manufacturers have to try hard to push e-mobility. This explains why nearly every
country with ambitions in these markets has its own support programmes for the
research, market development and financing of new e-mobility projects of many types.
In this study, we ask if the brand perception of such an ingredient-branding
alliance can help to increase the adoption of e-cars. An increased acceptance would
lead to lower push efforts and a higher consumer pull. Some studies (Swaminathan
et al. 2011) indicate that such effects can be realised through ingredient branding
(IB). Therefore, one must ask if the acceptance of e-mobiles can be increased
through a strong component brand for critical parts, in particular the battery. Our
findings include critical implications for car producers to help them improve the
acceptance of their products through creating strategic brand alliances with compo-
nent suppliers.
2 Theoretical Background and Hypothesis Development
2.1 The Ingredient-Branding Framework
Ingredient branding (‘IB’) is a special form of alliance that exists between two
companies which co-operate in designing and delivering the product, with a particu-
lar emphasis on the possibility of recognising and identifying the components used in
the final product (Kotler and Pfoertsch 2006). In other words, IB is a form of a
business-to-business (B2B) branding strategy between a manufacturer and a supplier
in which the supplier’s end product becomes one of the components of the manufac-
turer’s offering (Erevelles et al. 2008). IB happens when a component (battery) of the
end product (e-car) is promoted to the final user.
The idea behind IB is that the ingredient or component brand forms an alliance
with the end product brand in an effort to create brand awareness and generate pull
effects through the value chain (Havenstein 2004). The push and pull concept is
critically important to understanding IB and the motivations that guide it because
IB can be seen as a solution to the aforementioned push and pull concepts in
224 C. Linder and S. Seidenstricker

technology innovation and the diffusion process. In the push strategy, the marketing
strategy is directed towards the OEMs, whereas in the pull strategy, a direct appeal
is made to the consumer to choose the final product that has the branded component.
One important aspect of this view is that the marketing mix in an IB strategy
involves both push and pull effects. The only factor that separates these effects is
the distinction between consumer and manufacturer behaviour. It is the consumer
behaviour that creates the pull and the manufacturer behaviour that creates the push.
We can consider the push and pull effects as being effects of marketing mix
decisions. Supporting pull with push increases the probability of adoption, and
the combination of push and pull strategies creates magnification of the complete
marketing mix.
The supplier typically offers a component or a service to his or her customer,
who is generally the OEM. As a result, the supplier enters into a B2B relationship
with the producer of a product such as an automobile or an electronic item. The
OEM, on the other hand, makes a product that is to be used by his or her customer,
who is the final user. When the final user buys the product or service from the
OEM, he or she associates himself or herself with the OEM in a pure business-to-
consumer (B2C) relationship. According to this principle (Pfoertsch et al. 2008),
there are two separate stages of the customer relationship: the first stage between
the supplier (here: battery producer) and the OEM (here: car manufacturer) and the
second between the OEM and the final user. In IB strategy, we find that the two
stages are interconnected (see Fig. 1): step 2 (communicating the component brand
to the customer) follows step 1 (communicating the component brand to the OEM).
Step 3 occurs when the supplier tells the final user that a particular ingredient is part
of the final product offering, which makes the final user choose the product over
other competitive offerings. Here, the component supplier anticipates the fact that
the OEM also has a customer who, in the end, defines the demand. The pull of the
final product which contains the desired component by the final customer takes
place in step 4. This continuous process of push and pull will result in a high success
rate if done appropriately.
The idea of IB as a brand strategy has been around for quite some time in
marketing (McCarthy and Norris 1999). However, only in recent years has it gained
greater prominence. Some examples of IB campaigns to create brand awareness
about ingredients are ‘Intel Inside’, ‘Gore-Tex, Guaranteed to keep you dry’, and
Component SupplierBattery Producer
OEMCar Manufacturer End User
(4) Pull (4) Pull
(1) Push (2) Push
(3) Push
Ingredient Brand Innovation Diffusion Process
Fig. 1 The ingredient-branding technology innovation diffusion
Changing Consumer Perception of Electronic Vehicles Through Branded. . . 225

‘100 percent cotton’; these campaigns are for ingredients, such as computer chips or
materials, which are contained within final consumer products, such as computers
or clothing. To sum up, it is the popularity of the component among consumers that
drives the demand for products that contain the branded ingredient. There has also
been an argument that this demand then influences firms in the middle of the value
chain to use these ingredients in their products. As a consequence, IB has been
known to change the way firms interact in the value chain.
2.2 Hypothesis Development
This study investigates the effects of batteries as a branded component and their
influence on the perception of the end product, the whole e-car. On basis of the IB
concept, a review of relevant literature was undertaken with its primary focus being
to define the research variables and the conceptualised relationships between them.
2.2.1 Trust
Innovations by definition are new and therefore incorporate risk because the user
cannot refer to prior experience. The concept of trust comes into play as a solution
for this specific problem of risk (Kim et al. 2008). Trust has been widely studied in
marketing, especially in the literature about branding (e.g. Morgan and Hunt 1994).
A brand can be understood as a trust mark for all intangible trust-generating activity
in the absence of human input. Therefore, a brand is a symbol of quality and
assurance in building trust (Keller 1987). It is known that customers perceive
companies with a good reputation as more credible and trustworthy and as providing
greater value, and the brand can be a symbol for such a reputation. Sahina et al. (2011,
p. 1291) defined trust as: ‘a consumer’s confident belief that he or she can rely on the
seller to deliver promised services’. The effect of the special trust in brands is the
willingness of the average consumer to rely on the ability of the brand to perform its
stated function. Scholars have identified several characteristics of a trustworthy brand
(Morgan and Hunt 1994). Referring to these findings, we can see that it is important
for a brand consistently to keep its promise of value to consumers, through the way
the product is developed, produced, sold, serviced and advertised, even in bad times
when some kind of brand crisis arises (Sahina et al. 2011). These brand characteristics
lead to consumer loyalty – the deeply held commitment to rebuy or patronise a
preferred product consistently in the future (Oliver 1980). Brands therefore create
emotional connections between the consumer and the product. While a theoretical
model of trust in component brands is still missing, several case studies have shown
that trust also plays a role in IB (Kotler and Pfoertsch 2010).
Hypothesis H1a: High trust in the ingredient brand (IB trust) leads to lower
perceived risk in the final product (car risk).
226 C. Linder and S. Seidenstricker

It is known that trust is directly built if consumers have a good and stable
experience of the quality of a product over a long time. If consumers trust that
the important components in the final product are of high quality, one could assume
that they perceive the quality of the product to be higher.
Hypothesis H1b:High trust in the ingredient brand (IB trust) leads to high perceived
quality of the final product (car quality).
2.2.2 Recognised Quality
The recognised quality of a product or an ingredient is defined as the customer’s
assumption about the quality of that product compared to the quality of another
product (Aaker 1991). It is very close to the concept of trust. Recognised quality is
an estimation of a product by the consumer. Therefore, it can differ from the real
quality of the product. We have to consider that the recognised quality of the end
product can be considered to be either lower than that of the branded component or
higher when first evaluated by the consumer (Kotler and Pfoertsch 2006). This is a
crucial point in the OEM’s decision to commit itself to an IB partnership with a
supplier. Identifying a suitable partner depends on the contribution of the compo-
nent brand to the recognition of the total end product (Kotler and Pfoertsch 2010).
So it can be expected that a component with high recognised quality leads to an
enhanced recognised quality of the end product. This effect must be even greater if
the consumer assumes that the branded component has a high importance for the
functioning of the total product.
Hypothesis H2:High recognised quality of branded component (IB quality) leads to
high perceived quality of the final product (car quality).
2.2.3 Relative Advantage
Relative advantage is a measure of the gain of the innovation over the existing
market offer. It is a subjective assumption of the adopter (Rogers 2003). Studies so
far show that there is a positive correlation between the perceived relative advan-
tage and the probability of adaption of the innovation. The relative advantage can
be seen as a result of a consumer’s positive decision after comparing new features
of the innovation with existing features of actual market offers (Bagozzi and Lee
1999). This decision process typically considers product characteristics, the possi-
ble field of application and the price performance ratio (Krafft and Litfin 2002).
Rogers (2003) argued that the cost of acquisition, the prevention of mispurchase
and the time savings in the buying process also play a role. Finally, as for IB, image
is an important determinant of relative advantage (Moore and Benbasat 1996). If a
consumer judges that a product, according to these aspects, is superior, the proba-
bility of him buying it is increased. This means that it is reasonable to assume a
spillover effect of IB on the relative advantage of the final product. In other words,
Changing Consumer Perception of Electronic Vehicles Through Branded. . . 227

the perceived predominance of the component leads to a positive effect for the end
product because the consumer is aware that at least the component’s characteristics
are above market standard.
Hypothesis H3a: High perceived relative advantage of branded component (IB rel
adv) leads to high perceived quality of the final product (car quality).
If the component has a relative advantage compared to other market offers, the
risk of the final product is reduced. This means, in terms of the battery and the e-car,
that if the battery is perceived as superior to other offered batteries, the risk of
buying an e-car which does not match the expected performance is lower.
Hypothesis H3b: High perceived relative advantage of branded component (IB rel
adv) leads to low perceived risk of the final product (car risk).
2.2.4 Car Quality and Car Risk
There is an association between the way consumers judge the quality of a product
and the risk they perceive of making a wrong decision because of lower than
expected performance. In consumer behaviour literature, this relationship is widely
analysed (e.g. Sánchez-Fernández and Iniesta-Bonillo 2009). The results show that
the likelihood of purchasing a product goes up if consumers take advantage of a
higher quality compared to alternative offerings. Based on these insights, we might
also assume that a higher perceived quality of the e-car leads to a lower perceived
risk in buying a bad vehicle.
Hypothesis H4: High perceived quality of the e-car (car quality) leads to low
perceived risk in buying (car risk).
2.2.5 Adoption
Adoption is simply seen as the aforementioned concept of Rogers (2003). It includes
the consumer’s decision to buy the innovation. A risk perception is one of the aspects
which influences the adoption process. It captures uncertainty with the innovation
such as complexity, the ability to test the innovation and whether the innovation can
be observed and principally means uncertainty arising from specific innovation char-
acteristics (Rogers 2003). Risk perception also includes adopters’ perception of the
enormity of the potential negative consequences should adoption failures occur.
Several empirical studies document the role that perceived risk plays in value per-
ceptions (Chen and Dubinsky 2003) and therefore in acceptance of the innovation.
We used ‘adoption’ here to mean the preference in principle for a certain e-car. We
might assume that acceptance is correlated with the perceived quality of the e-car as
well as with the risk associated with the buying decision. In cases where perceived
quality is high and perceived risk is low, the probability of buying the innovation is
increased, and therefore, the innovation has an enhanced adoption by consumers.
228 C. Linder and S. Seidenstricker

Hypothesis H5a: High perceived quality of the e-car (car quality) leads to a high
adoption (adoption).
Hypothesis H5b: Low perceived risk in buying the e-car (car risk) leads to a high
adoption (adoption).
3 Research Methodology
3.1 Sample and Research Design
The theoretical IB framework in Fig. 1 and the eight hypotheses were operationalised
and transferred into the structural equation model (SEM) in Fig. 2. Each of the six
constructs (see Fig. 2) is represented by a set of items (2–5; see Table 1), which were
measured on a five-point Likert scale. Some of the measured items were reverse
scored (see Table 1). We chose online questioning using a set of contact addresses
which we received from car dealers. The survey was limited to Germany and took
place in October 2011. In order to analyse the impact of strong component brands for
batteries on the perception of the e-car, we modulated the impact of IB as antecedent
and innovation assessment as consequence (IB ! innovation). In the relationship
between positive-presumed innovation and consumer adoption, we conceptualised
innovation as antecedent and adoption as consequence (innovation ! adoption). In
the questionnaire, the interviewees were confronted with different battery brands and
were asked to evaluate the characteristics of the component (IB trust, IB quality, IB
IB TRUST
Ingredient Brand Innovation Diffusion Process
IB QUALITY
IB REL ADV
CAR QUALITY(R2=0.854)+
CAR RISK (R2=0.889)+
Adoption(R2=0.565)+
H1a=0.477***
H5a=0.305**
H5b=0.466***
H4=0.214*
H3b=-0.376**
H3a=0.439***
H1b=-0.352**
H2=0.053*
*p<0.05.**p<0.01.***p<0.001.+R2 values are significant at p<0.001:
Fig. 2 Results for structural model
Changing Consumer Perception of Electronic Vehicles Through Branded. . . 229

rel adv) (see items in Table 1). Similarly, the interviewees gave their estimation of a
specific e-car with the branded component (car quality, car risk) and an impression of
the likelihood that they would purchase such a car (adoption). This approach gives us
a chance to identify the impact of IB on the perception of the e-car and its impact on
adoption.
In total, 1,421 persons were contacted, and 177 (¼12.5%) questionnaires were
returned. We had to reject ten impractical questionnaires. Our sample therefore has
an adjusted return rate of 11.7% (N ¼ 167), which is average for comparable
studies. The sample consisted of 121 males (¼72.5%) and 64 females (¼27.5%).
None of them had yet purchased an e-car. Fourteen (¼8.3%) said that they did not
Table 1 Operational definition of constructs and results of measurement properties
Construct Item Operational definition
Factor
loading
Cronbach’s
alpha CR AVE
IB quality IBQ1* Emphasised product reliability 0.827** 0.880 0.972 0.678
IBQ2* Component met our
expectations
0.877**
IBQ3* Emphasised high quality 0.722**
IBQ4* Extent is satisfied 0.644**
IBQ5* Supplier has good functionality 0.647**
IB re adv IBrA1* Compared to similar items 0.946** 0.932 0.950 0.792
IBrA2* Relative to industry average 0.760**
IBrA3* The best on the market 0.903**
IBrA4* Better than the other 0.958**
IBrA5* Has advantages the other did not
have
0.870**
IB TRUST IBT1 Supplier brand stands for
keeping promises
0.876** 0.890 0.819 0.697
IBT2 This brand does not break faith 0.934**
IBT3 Brand stands for concerned
about our quality
0.820**
IBT4 Brand shows that . . . looks outfor our interests
0.769**
IBT5 Brand has high integrity 0.763**
Car quality CQ1 Has high quality 0.902** 0.963 0.771 0.873
CQ2* No concerns with the quality 0.789**
CQ3 Satisfied with the final product 0.783**
CQ4 Quality is above standard 0.753**
CQ5 It is a quality vendor 0.882**
Car risk CRP1* There is not much uncertainty 0.965** 0.933 0.949 0.792
CRP2* Level of overall risk 0.956**
CRP3* I can handle the risk 0.939**
CRP4* The normally acceptable risk 0.910**
CRP5* It is nearly risk free 0.853**
Adoption ADO1 I am in favour of adopting 0.989** 0.977 0.889 0.917
ADO2 I can imagine myself buying 0.989**
*Reverse scored; ** p < 0.001
230 C. Linder and S. Seidenstricker

plan to buy a car with an electric engine in the near future. Thirty-two (¼19.1%)
of them already planned to change to an e-car within the next 5 years. The rest
(121 ¼ 72.2%) could imagine driving an e-car but planned to wait. The reasons for
their waiting were, for example, the relatively high prices and the weak network of
charging stations. These questions in the demographic part of the questionnaire
were formulated as open questions. Fifty-three (¼31.7%) interviewees had first-
hand experience with e-cars, with most of them quoting their experience as a driver
or passenger in an employer’s car or at a business event, etc. The questions about
the kind of experience were also open questions. One hundred and nineteen
(¼71.2%) saw themselves as well informed about e-mobility due to newspapers,
internet and TV.
3.2 Research Approach and Software Used
Partial least squares (PLS), an SEM measurement, was used to test the proposed
research model. SEM (Bollen 1989) includes a number of statistical methodologies
for investigating a network of causal relationships, defined according to a theoreti-
cal model, linking two or more latent complex concepts, each measured through a
number of observable indicators (Vinzi et al. 2010). There are a number of reasons
for choosing PLS. This measurement can be used to investigate models that use
second-order formative indicators (Chin 1998). Further, it allows the modelling of
latent constructs under conditions of non-normality, and it is appropriate for small
to medium sample sizes (such as N ¼ 167) (Chin et al. 1996). It is certainly more
appropriate when there is no elaborated theory and the research model is at an early
stage of development or has not yet been tested extensively (Teo et al. 2003). We
used the software SmartPLS 2.0, an SEM path modelling package, for the calculation
(Ringle et al. 2005).
4 Results
The construct operationalisation for SEM differs for formative and reflective mea-
surement models. There are a number of criteria which help researchers to decide
which model is appropriate (Jarvis et al. 2003). None of the criteria for formative
models were met by the six constructs, so we designed the whole model in a reflect-
ive way. The quality of a reflective measurement model is determined by convergent
validity, construct reliability and discriminant validity (Bagozzi and Phillips 1982;
Churchill 1979). On basis of the results of the measurement model, researchers can
evaluate the explanatory power of the entire model as well as the predictive power of
the independent variables. Therefore, the hypotheses can be tested, and statements
about their adequacy can be made, so explanatory power and predictive power are
used (Bagozzi and Phillips 1982).
Changing Consumer Perception of Electronic Vehicles Through Branded. . . 231

4.1 Testing the Measurement Model
The results of the PLS component-based analysis, correlations matrix of constructs,
alpha coefficients, PLS-computed variability for each construct and item-construct
correlations are presented in Tables 1 and 2.
The convergent validity is a measure of the degree to which an operation is
actually similar to other operations to which it theoretically should be similar. It is
analysed by indicator reliability and construct reliability (Peter 1981). The indicator
reliability is shown in Table 1. For all factors – except IBQ4 and IBQ5 – loadings
were above the recommended 0.7 parameter value (significance tests were con-
ducted using the bootstrap routine) and were significant at the 0.001 level. Con-
struct reliability is an indication of the extent to which operationalisation of the
constructs actually measures what the theory led us to expect. It is ordinarily tested
by using two indices: composite reliability (CR) and average variance extracted
(AVE). Table 1 shows that the estimated indices were above the threshold of 0.6 for
CR (Bagozzi and Yi 1988) and 0.5 for AVE (Chin 1998) in the sample, and
therefore, we had no restriction on our further analyses. Finally, discriminant
validity, a statistical procedure to test whether concepts or measurements that are
supposed to be unrelated are, in fact, unrelated (Campell and Fiske 1959), was
applied. This index is analysed by looking at the item-construct correlation
described in Appendix 1. The requirements for discriminant validity are fulfilled
if the loading of each indicator is higher for the respective construct than for any
other construct. If this is the case, indicators of different constructs are not related to
each other. In our sample, discriminant validity was achieved.
Table 2 shows the intercorrelation among constructs. The degree of association
between the exogenous constructs (IB trust, IB quality, IB rel adv) and the variance
inflation factors indicate that there is no multicollinearity.
4.2 Testing the Structural Model
The data in Table 3 support the proposed structural model (see Fig. 2). Explanatory
power is the ability of a model effectively to explain the subject matter to which it
Table 2 Intercorrelations among constructs (N ¼ 167)
Construct
Intercorrelations
Mean SD (a) (b) (c) (d) (e) (f)
Car risk (a) 2.34 1.13 –
Car quality (b) 2.99 0.98 0.8994* –
IB quality (c) 3.43 1.19 0.6339* 0.6180* –
IB trust (d) 3.09 0.88 0.9100* 0.8983* 0.6237* –
IB rel adv (e) 2.65 1.24 0.9108* 0.8930* 0.6081* 0.8831* –
Adoption (f) 3.87 1.08 0.7398* 0.7236* 0.4718* 0.7245* 0.7268* –
*p < 0.01
232 C. Linder and S. Seidenstricker

pertains. To examine it, the squared multiple correlations (R2) of the dependent
variables have to be taken into account. All three values (car quality R2 ¼ 0.854,
car risk R2 ¼ 0.889, adoption R2 ¼ 0.565) are encouragingly high. The estimated
path effects, associated t values and p values, as well as the result of the bootstrappingapproach to obtain statistical significance of path coefficients by using t tests, showthat final product perception was significantly influenced by IB (see Table 3).
Predictive power refers to a model’s ability to generate testable predictions, and
it is tested by analysing the magnitude of the standardised parameter estimates
between constructs, together with the corresponding level of significance; it is
recommended that this should exceed the 0.2 level (Chin 1998). In the sample,
only one path coefficient does not exceed this level (H2 ¼ 0.053).
As Fig. 2 shows, the results of the bootstrapping procedure revealed strong signifi-
cance (at the p<0.05, p<0.01 or even p<0.001 levels) of all dependent variables
(except for H2 ¼ 0.053; IB quality ! car quality). As result, we can support six out
of seven of our hypotheses. One has to be rejected from this study (see Table 3).
5 Conclusion and Discussion
Our key findings show that, on the basis of our data, perceived trust in the component
brand has positive effects on the perceived quality of the e-car and lowers the
assumed risk in buying such a car. Because trust is an important factor in purchase
decisions, we prove that a strategic alliance with a supplier could add value to
the OEM’s offerings. Our results show that if e-car manufacturers decide to use a
high-quality brand, in terms of brand trust and relative advantage of batteries in their
final product, they can benefit from this IB alliance. These benefits affect product
characteristics which are of central importance. Typically, car manufacturers com-
pete strongly to present their products as being of high quality. Our findings show that
it is possible for spillover effects to support this strategy.
Our research is limited in two main areas. First, our sample was restricted to
Germany, a country with traditionally high ambitions in environmental protection
and a strong automotive industry. For this reason, e-mobility is at the top of the
political agenda, and potential consumers are highly educated. On the basis of our
Table 3 Results of hypotheses
Path/hypothesis Path coefficient
Hypothesised relationship (p value) T value Results
IB trust ! car quality 0.477 4.7786* Supported
IB trust ! car risk �0.352 2.2518* Supported
IB quality ! car quality 0.053 1.5222** Not supported
IB rel adv ! car quality 0.439 2.0020* Supported
IB rel adV ! car risk �0.376 7.9115* Supported
Car quality ! adoption 0.305 4.1651* Supported
Car risk ! adoption 0.466 2.9609* Supported
*p < 0.01; **p < 0.05
Changing Consumer Perception of Electronic Vehicles Through Branded. . . 233

findings, we can make no prediction about buying behaviour in other countries
because it has to be assumed that the basic characteristics of buyers may differ. As
brand literature shows, brands and the emotions behind them are a complex field of
study. Secondly, in this research, we only analysed three brand elements of IB, and
we neglected the host brand. We have to take into account that it is not just trust,
quality and relative advantage that characterise a brand. Further, the interaction of
the component brand and the host brand is a field which, in IB literature, has not
been fully investigated. The positive effect of IB quality (IB quality ! car quality)
on car quality is not supported in our study. This is surprising because it is contrary
to previous research.
There are some implications of our study for both suppliers and manufacturers.
We have shown that, especially in such a difficult new market as e-mobility,
additional gains can be achieved if strategic alliances are built. Strategic alliances
have positive effects for the e-car manufacturer as well as for the supplier. They can
also foster the completion of new innovations in battery technologies because of the
chance to create a superior component brand and so become a favoured partner of
the OEMs. We assume that such partner strategies promote a shift in knowledge
from the OEM to the supplier, in the eyes of the consumer, but we also see a chance
for better competition between e-car manufacturers. For companies, a successful
way of positioning themselves between these options will be a major issue of the
future.
Today, we do not know much about the e-mobility market and the challenges it
faces in the near future. There are a lot interesting questions left for research. First,
from a marketing point of view, all possible brand effects have not yet been
analysed and nor have the interaction between component and host brand. We
only know about some particular influences of individual brand characteristics. This
is too little to be able to develop the necessary approach for planning and structur-
ing an IB partnership in practice. It is necessary to knowmore about the influence of
value change, the innovation power of the component and public awareness and
how these issues affect value creation for the end product.
References
Aaker DA (1991) Managing brand equity: capitalizing on the value of a brand name. Free Press,
New York
ACATECH (ed) (2010) Wie Deutschland zum Leitanbieter f€ur Elektromobilit€at werden kann.
Springer, Berlin
Bagozzi RP, Lee KH (1999) Consumer resistance to, and acceptance of, innovations. Adv Consum
Res 26(1):218–225
Bagozzi RP, Phillips L (1982) Representing and testing organizational theories: a holistic
construal. Adm Sci Q 27:459–489
Bagozzi RP, Yi Y (1988) On the evaluation of structural equation models. J Acad Mark
Sci 16:74–94
Bollen KA (1989) Structural equations with latent variables, Wiley, New York
234 C. Linder and S. Seidenstricker

Campell DT, Fiske DW (1959) Convergent and discriminant validation by the multitrait-
multimethod matrix. Psychol Bull 56:81–105
Chen Z, Dubinsky AJ (2003) A conceptual model of perceived customer value in e-commerce:
a preliminary investigation. Psychol Mark 20:323–347
Chin WW (1998) Issues and opinion on structural equation modeling. MIS Q 22(1):vii–xvi
Chin WW, Marcolin BL, Newsted PR (1996) A partial least squares latent variable modeling
approach for measuring interaction effects: results from a Monte Carlo simulation study and
voice mail emotion/adoption study. In: DeGross JI, Srinivasan A, Jarvenpaa SL (eds)
Proceedings of the seventeenth international conference on information systems. Association
for Information Systems, Cleveland, pp 21–41
Churchill G (1979) A paradigm for developing better measures of marketing constructs. J Mark
Res 16(1):64–73
Erevelles S, Stevenson TH, Srinivasan S, Fukawa N (2008) An analysis of B2B ingredient
co-branding relationships. Ind Mark Manage 37(8):940–952
Havenstein M (2004) Ingredient branding: Die Wirkung der Markierung von Produktbestandteilen
bei konsumtiven Gebrauchsg€utern. Dt. Univ.-Verl, Wiesbaden
Jarvis CB, MacKenzie SB, Podsakoff PM (2003) A critical review of construct indicators and
measurement model misspecification in marketing and consumer research. J Consum Res
30(2):199–218
Keller KL (1987) Memory factors in advertising: the effects of advertising retrieval cues on brand
evaluations. J Consum Res 14:316–333
Kim DJ, Ferrin DL, Rao RH (2008) A trust-based consumer decision-making model in electronic
commerce: the role of trust, perceived risk, and their antecedents. Decis Support Syst
44:544–564
Kotler P, Pfoertsch W (2006) B2B brand management. Springer, Berlin
Kotler P, Pfoertsch W (2010) Ingredient branding: making the invisible visible. Springer, Berlin
Krafft M, Litfin T (2002) Adoption innovativer Telekommunikationsdienste – Validierung der
Rogers-Kriterien bei Vorliegen potenziell heterogener Gruppen. Zeitschrift f€ur betriebs-
wirtschaftliche Forschung 54:64–83
McCarthy MS, Norris DG (1999) Improving competitive position using branded ingredients.
J Prod Brand Manage 8(4):267–285
Moore GC, Benbasat I (1996) Integrating Diffusion of Innovations and Theory of Reasoned action
models to predict utilization of information technology by end- users. In: Kautz, K. (Ed.),
Diffusion and adoption of information technology. Proceedings of the first IFIP WG 8.6Working Conference on the Diffusion and Adoption of Information Technology, Oslo, Norway,Octover 1995, Chapman & Hall, London, pp.132–146
Morgan RM, Hunt SD (1994) The commitment-trust theory of relationships marketing. J Mark
58:20–38
Oliver RL (1980) A cognitive model of the antecedents and consequences of satisfaction
decisions. J Mark Res 17(4):460–469
Peter J (1981) Reliability: a review of psychometric basics and recent marketing practices. J Mark
Res 16:6–17
Pfoertsch W, Linder C, Chandler J (2008) Measuring the value of ingredient brand equity at
multiple stages in the supply chain: a component supplier’s perspective. Interdiscip Manage
Res 4:571–595
PWC (ed) (2011) Elektromobilit€at: Herausforderungen f€ur Industrie und €offentliche Hand.
PricewaterhouseCoopers, Stuttgart
Ringle C, Wende M, Will A (2005) SmartPLS: 2.0 (beta). SmartPLS, Hamburg
Rogers EM (2003) Diffusion of innovation. The Free Press, New York
Sánchez-Fernández R, Iniesta-Bonillo ÁM (2009) Efficiency and quality as economic dimensions
of perceived value: conceptualization, measurement, and effect on satisfaction. J Retail
Consum Services 16(6):425–433
Changing Consumer Perception of Electronic Vehicles Through Branded. . . 235

Sahina A, Zehirb C, Kitapç{b H (2011) The effects of brand experiences, trust and satisfaction on
building brand loyalty: an empirical research on global brands. Proc Soc Behav Sci
24:1288–1301
Swaminathan V, Reddy SK, Dommer SLL (2011) Spillover effects of ingredient branded
strategies on brand choice: a field study. Mark Lett 22:1–15
Teo HH, Wei K, Benbasat I (2003) Predicting intention to adopt interorganizational linkages:
an institutional perspective. MIS Q 27(1):19–49
Vinzi VE, Trinchera L, Amato S (2010) PLS path modeling: from foundations to recent
developments and open issues for model assessment and improvement. In: Vinzi VE, Chin
WW, Henseler J (eds) Handbook of partial least squares. Springer handbooks of computational
statistics. Concepts, methods and applications. Springer, New York, pp 47–82
Wonglimpiyarat J, Yuberk N (2005) In support of innovation management and Roger’s Innovation
Diffusion theory. Gov Inf Q 22:411–422
236 C. Linder and S. Seidenstricker

Dominance of Chinese Market: An Empirical
Study
Arun Kumar Gopalaswamy, S.S.S. Kumar, and Chia-Hsing Huang
In the 1950s, Japan held a prominent position as a low-cost manufacturer and
gained abnormal profits through international sales. In a span of three decades,
Japan became one of the world’s pioneers of “quality” in products and services.
However, in the last decade or two, China has gained a prominent position and has
replaced Japan – in terms of low manufacturing cost – and has improvised its
position from a low-cost provider to the pioneer.
With geographical area of 24 million square meters during Ming Dynasty from
1368 to 1644, China was the largest country in the world. During 1405–1433, the
king of Ming Dynasty sponsored seven naval expeditions which led to enhanced
international trade between China and Southeast Asia countries, making China the
only super power in the world. Today, the USA with a geographical area of 9.6
million square meters is the world’s fourth largest country after Russia, Canada, and
China (9.7 million square meters), respectively.
End of Cold War, China started building relationships with Indonesia, Singapore,
and Brunei. China gradually ended its support to the communist parties in the
Southeast Asian countries and started establishing diplomatic relationships with
ASEAN. It was evident after the 1991 ASEAN Foreign Minister’s meeting that
China was clearly on the way to make a formal ASEAN+1 relation. China started
with as a ASEAN consultation partner in the year 1991 and moved to the dialogue
A.K. Gopalaswamy (*)
Department of Management Studies, IIT Madras, Chennai, Tamil Nadu, India
e-mail: [email protected]; [email protected]
S.S.S. Kumar
Department of Finance and Accounting, Indian Institute of Management Kozhikode,
Kozhikode, Kerala, India
e-mail: [email protected]
C.-H. Huang
Department of Finance and Accounting, SolBridge International School of Business,
151-13 Samsung 1-dong, Dong-gu, Daejeon 300-814, South Korea
e-mail: [email protected]
Department of Management Studies, Indian Institute of Science, Bangalore,
Driving the Economy through Innovation and Entrepreneurship,DOI 10.1007/978-81-322-0746-7_20, # Springer India 2013
237
partner position by the year 1996. The 1997 Asian financial crisis originating from
Thailand spread to the other ASEAN countries.When the financial crisis and currency
devaluation were threatening all ASEAN countries, China stayed still to hold its
currency and provided financial help to Thailand and Indonesia and even controlled
the ASEAN financial crisis by the end of 1997. The ASEAN-China free trade area
(ACFTA) was proposed by China in 2001 and was subsequently signed in 2010. The
ACFTA will bring trade and economic benefits to the ASEAN countries and China
(Roland-Holst and Weiss 2004; Liu and Luo 2004; Tongzon 2005; Park 2007). This
free trade zone consists of ten ASEAN countries.
This is not the first time that the world is facing a rising nation. This time, it is
rising China and is different from the cases of the USA and Japan. When the USA
and Japan rose to power, their populations were only 30 million and 100 million,
respectively. However, this is the first time that the world is facing the rise of such a
populous nation of more than 1.3 billion. ASEAN is the gateway for China to access
natural resources and sea routes that bring necessary international trade and stable
economic growth. Since 1978, China cautiously started the reforms and a coopera-
tive approach with ASEAN nations. China has now replaced the USA and Japan to
become the locomotive of the Asian countries.
The GDP of China was 228,600 million international dollar in the year 1820 and
was number one in the world. The USA’s GDP became number one in the world in
the year 1895. Japan became the largest country in terms of GDP in Asia in the year
1968 (Maddison 2007). China started its reform in 1978, and its GDP is 5,878,257
million international dollar in the year 2010 replacing Japan to be the largest
economy in Asia.
The export processing zones established in China in the 1980s initiated a complete
transformation of China’s coastal regions. The export processing trade, supported by
a strong manufacturing base established in the 1950s and complemented by technol-
ogy imported since the 1980s, progressively became a catalyst for China’s economy.
Following in the footsteps of other Asian catch-up countries, China’s exports rapidly
started moving up the value chain away from low-tech products to hi-tech products.
Between 1992 and 2005, China’s medium- to high-technology exports grew 22%
annually, while high-technology exports grew by 32%. By 2008, 43% of China’s
exports were directly related to machinery, mechanical appliances, and electrical
equipment, and China now dominates the global markets for these and other types of
machinery.
In 1988, China’s first high-technology zone was established in the Zhongguancun
(ZGC) suburb in northwestern Beijing with government support. Such high-tech-
nology zones like ZGC were governed based on a model called “smaller government,
more services.” This strategy envisaged the creation of an organic link between
scientific research and industrial production, giving firms and institutions an incentive
to innovate. As a complement to this, growing numbers of state-owned enterprises
(SOEs) converted to non-state ownership and commercial for-profit forms, and many
government research institutions also branched out into business.
Significant progress had already been achieved with the strategic plan 2006–2020
(MLP, GERD) increased to 1.54% in 2008 from 0.57% in 1995. Occurring at a time
238 A.K. Gopalaswamy et al.

when its GDP was growing exceptionally fast, China’s GERD now ranks behind
only next to the USA and Japan. The number of triadic patents (granted in all three of
the major patent offices in the USA, Japan, and Europe) granted to China remains
relatively small, reaching 433 in 2005 (compared to 652 for Sweden and 3,158 for
Korea), yet Chinese patent applications are increasing rapidly. Chinese patent
applications to the World Intellectual Property Office (WIPO), for example,
increased by 44% in 2005 and by a further 57% in 2006. From a total of about
20,000 in 1998, China’s output of scientific papers has increased fourfold to about
112,000 as of 2008, moving China to second place in the global rankings, behind
only the USA. In the period 2004–2008, China produced about 400,000 papers, with
the major focus areas being material science, chemistry, physics, mathematics, and
engineering, but new fields like biological and medical science were also gaining
prominence. Further, China took 12.3% of the world’s total R&D spending in 2010,
second only to the USA. China had 200,300 patent applications in 2008, which rank
third next to Japan and the USA. Table 1 gives the facts with regard to science and
technology in China.
One of China’s biggest criticisms is on the role of FDI’s in China’s technology and
growth. It should, however, be noted that China’s growth began with a successful
domestic market before China became the global manufacturing hub. Chinese firms
began to taste success in many industries (there were of course industries which relied
on foreign firms) within their own markets. Only after considerable success did they
venture outside. This success coupled with the various policies initiated by the
Chinese government lured FDIs to China. Though FDI’s play a key role, it should
also be noted that China will not fall over in case of a FDI’s pull over.
The enhanced trade has also resulted in the deregulation, an integration of other
emerging financial markets with China. Till recently, it was strongly believed that
integration among the emerging economies was dominated by the USA with the
emerging economies closely following the trend. The USA has dominated the eco-
nomic and financial markets of the world for a long time, but the recent financial crisis
has challenged the leadership position of the United States in the financial sector.
Table 1 China’s science and technology (S&T) facts
2004 2005 2006
Personnel engaged in S&T
activities
3.48 million 4.13 million 4.96 million
Funding for S&T activities $63.4 billion $90.7 billion $104.5 billion
Expenditure on R&D, by output $28.7 $43.9 billion $67.5 billion
Gross expenditure on R&D in
relation to GDP
1.23 % 1.42 % 1.54 %
Total value of exports of hi-tech
products
$24.2 billion $41.2 billion $60.8 billion
Total value of imports of hi-tech
products
$23.6 billion $36.2 billion $50.0 billion
Total enrolment of engineering
and science postgraduates
420,444 547,002 619,355
Source: China Statistical Yearbooks (2005, 2007, 2009)
Dominance of Chinese Market: An Empirical Study 239

The focus of this chapter is to study the increasing dominating role of China in
Southeast Asia especially driven by the enhanced trade, technology transfer, and
strong and focused economic outlook. Though there are quite a few factors attemp-
ting to study the dominating role of China like technological and trade dominance,
this chapter addresses only the dominance of the Chinese stock market over other
ASEAN markets. The research also attempts to study the cointegration of China’s
stock market with prominent ASEAN countries like Singapore, Malaysia, Thailand,
Indonesia, and the Philippines. The reason is that Chinese market seems to affect
ASEAN markets due to its economic size and growth and its relationships with
ASEAN countries by the ASEAN+1 policy. The US stock market is included in this
chapter since a host of studies by Swanson (1987), Chowdhury (1994), Copeland and
Copeland (1998), Janakiramanan and Lamba (1998), Jeong (1999), Ghosh et al.
(1999), Darrat and Zhong (2002), Rim and Setaputra (2010), and Yoshida (2010)
have all proved the dominance of the USA on the ASEAN emerging markets and also
have provided evidence of integration of these markets with the USA.
It can be observed that the USA-ASEAN bilateral trade was $130 billion in
2003, and during the same period, it was $78 billion for China and ASEAN. But the
scenario had changed by 2008 when China overtook the USA in terms of bilateral
trade with ASEAN. In 2008, China and ASEAN saw a bilateral trade of $231
billion, whereas the US-ASEAN bilateral trade was $177 billion. This further leads
to the fact that the dominance role of the USA on East Asian economies was
decreasing and these economies were rather being influenced by other markets in
the region. Economic trends have also provided evidence that China is the dominant
factor in the region and is threatening the USA in terms of global dominance.
China’s GDP growth rate was about 10% in 2010 with increased consumption. This
also increased China’s imports and has positive impact on the Asian economies.
This chapter is organized as follows. In the next section, we present a brief
review of the literature related to the relationships of US stock market, China stock,
and ASEAN stock market before and after the 1997 Asian financial crisis. This
serves as a rationale for this chapter. Next, the data and the statistical models in this
chapter are presented followed by empirical result, and conclusion is the last section.
1 Literature Review
Prior to 1997 Asian financial crisis, daily returns of Asian stock markets were less
correlated with the return of US stock market, and the weekly and monthly returns
were highly correlated with the return of US stock market (Bailey and Stulz 1990).
Monthly ASEAN stock index returns of Indonesia, Malaysia, the Philippines,
Singapore, and Thailand were correlated with each other except Indonesia (Palac-
McMiken 1997). Studies have observed that there was no cointegration between the
Asian stock markets (Hong Kong, Korea, Malaysia, the Philippines, Singapore,
Taiwan, and Thailand) and the US stock market (DeFusco et al. 1996).
240 A.K. Gopalaswamy et al.

During the 1997 Asian financial crisis, Asian stock markets did not have any
evidence of cointegration but had significant short-run linkages (Roca et al. 1998).
Malaysia stock market was significantly affected by the US stock market;
Indonesia, the Philippines, Singapore, and Thailand were not affected by the US
stock market (Ghosh et al. 1999). The long-run cointegration relationships and
short-run causal linkages between ASEAN stock markets and the US stock market
became stronger during the crisis (Yang et al. 2003).
After the 1997 Asian financial crisis, the ASEAN stock markets and the US stock
market became more integrated (Yang et al. 2003; Chai 2003; Daly 2003; Park
2005; Fooladi and Rumsey 2006; Majid et al. 2008). From international parity
condition point of view, though China and ASEAN have strong linkages with
respect to good and service markets, the financial integration is still not significantly
integrated (Laurenceson 2003). However, Rim and Setaputra (2010) find that for
the whole period of 1992–2006, the US stock market influence remained strong on
ASEAN markets, the integration between the US and ASEAN stock markets and
among ASEAN stock markets had not increased, and there was no interaction
between ASEAN markets. From November 1993 to July 2008, the stock markets
of China and its three emerging market neighbors are not interrelated (Jayasuriya
2011).
With the development of the ASEAN plus China policy and the growth of
Chinese economy, will the shifting population and economic centers, the interna-
tional trade, and the spread of advanced production techniques change the financial
markets casual relationships?
2 Data and Methodology
The primary focus of the study is to assess the level of stock market integration
among the ASEAN countries and also the changing role of dominance from the
USA to China. The focus on ASEAN countries was essentially driven by the free
trade agreement between ASEAN and China in 2009. Though Vietnam, Brunei, and
Lao being part of ASEAN singed the free trade agreement with China, these
countries have been omitted from this study as they either do not have a stock
market or the market is still in a very nascent stage. Therefore, the study is restricted
to Singapore, Malaysia, Thailand, Indonesia, and the Philippines in the ASEAN
region with China and the USA as the dominant partners.
In the last two decades, these regions have witnessed two essential impacts:
firstly by the East Asian financial crisis in 1997 and secondly the 2008 subprime
crisis. In order to avoid the effect of the East Asian financial crisis, the data used for
the study is from January 1, 1998 to January 31, 2010. Stock market index data
(Thailand SET – Thailand, Philippine SEI – the Philippines, Jakarta SE Composite
– Indonesia, Shanghai SE A Share – China, Straits Times Index – Singapore, FTSE
Dominance of Chinese Market: An Empirical Study 241

Bursa Malaysia KLCI –Malaysia) for all the countries listed have been obtained for
the entire 12-year period. The index data is restricted to major stock indexes of the
country. Data was obtained from Yahoo! Finance. The data set is divided into two
parts: one part prior to the subprime crisis and another representing the postcrisis or
recovery period. Based on the market movements, the year 2007 has been identified
as the year for structural break. Hence, the period from January 1, 1998 to December
31, 2006 is chosen as the period indicating the “period prior to China having a
dominant role,” and the period from January 1, 2007 to January 31, 2010 is chosen as
the “period of China’s dominance role.” The index data for all the countries were
obtained for the entire period.
Many financial and economic time series are not stationary, and it is rather
difficult to model nonstationary processes as their coefficients are not stable over
time. To achieve stationarity generally, the data will be differentiated one or more
times for econometric modeling purposes. But differencing the series may result in
loss of information pertaining to long-run trends. Cointegration is a statistical
property exhibited by some of the time series data. If a pair of stock prices Xt and
Yt are cointegrated, it means that the two variables share common stochastic trends
and move together in the long run. In other words, it implies that if X and Y are
cointegrated, then for the system to return to long-run equilibrium, either X or Yshould respond to the size of the disequilibrium. Two common tests employed for
testing cointegration are the Engle and Granger (1987) test and Johansen (1988)
multivariate cointegration test. Johansen’s test is a more powerful test particularly
in a multivariate context. It is robust to various deviations from normality and
yields consistent results irrespective of the variable used as the dependent variable.
In this study, the price co-movements among the stock markets are tested in
using the Johansen’s (1988) test. This test uses maximum likelihood procedures to
determine the number of cointegrating vectors among the variables. The Johansen’s
test is based on a vector-error-correction model
DXt ¼Xp�1
i¼1
GiDXt�i þPXt�p þ et:
Xt is a (n � 1) vector of prices, and is a (n � n) matrix of short-run dynamics,
coefficients p is the long-run impact matrix, and e is a (n � 1) vector of
innovations. Johansen’s methodology can be thought of as a multivariate gener-
alization of the unit root tests. The test centers around the matrix p, partitioning itinto two matrices a and b both of which are n � r such that p ¼ ab, where arepresents the speed of adjustment to disequilibrium and b is a matrix of long-run
coefficients. The rows of b may be defined as the r distinct cointegrating vectors,
and looking at the rank of the P matrix through its eigenvalues, cointegration
could be confirmed. Two test statistics are used to test for the existence of rcointegrating vectors – trace statistic (ltrace) and the max-eigenvalue statistic (lmax)
242 A.K. Gopalaswamy et al.

with differing assumptions about the alternative hypothesis. The test statistics are
formulated in the following way:
ltrace ¼ �2LogðQÞ ¼ �TXn
i¼rþ1
logð1� liÞ; r ¼ 0; 1; 2; . . . n� 2ð Þ; n� 1ð Þ:
The trace statistic tests the restriction r � q (q < n) against the unrestricted
alternative r � n; Q ¼ (restricted maximized likelihood� unrestricted maximized
likelihood).
lmax statistic is given as under tests that there are r cointegrating vectors against
the alternative that r + 1 exists:
lmax ¼ �T Logð1� lrþ1Þ; r ¼ 0; 1; 2; . . . n� 2ð Þ; n� 1ð Þ:
Johansen and Juselius (1990) provide critical values for the two test statistics.
If the test statistic is greater than the critical value from Johansen’s tables, the null
hypothesis that there are r cointegrating vectors is rejected against the alternative
hypothesis that there are more than r (for ltrace) or that there are r + 1 (for lmax).
3 Empirical Results
The daily stock indices of Thailand (SET), Indonesia (Jakarta SE Composite), the
Philippines (Philippine SEI), China (Shanghai A Share), Malaysia (FTSE Bursa
Malaysia KLCI), the USA (S&P 500), and Singapore (Straits Times Index) are
plotted in Fig. 1. From the figure, it may be noticed that all the markets crashed
during the middle of 2008 along with western markets lead by the USA. But the
Asian markets recovered and returned to the precrisis period before the end of the
year yet the US market was still in the comatose mode. It appears that Indonesian
market rallied substantially during 2004–2008, but this has to be seen against the
background that Indonesian market was in doldrums around 1998 (post Asian
crisis).
From the summary statistics, it was found that the distributions for all indices
were able to reject the null hypothesis of normality according to the Jarque-Bera
normality test. Next, we investigated the order of integration as nonstationarity has
to be established before testing for cointegration. All the indices were transformed
into natural logs, and tests for the unit roots are performed using the augmented
Dickey-Fuller tests and Phillips and Perron tests. The selection of the optimal lags is
determined based on Hannan-Quinn criteria.
Statistics indicated that the indices are nonstationary at their levels; therefore,
the presence of unit root in all the series cannot be rejected. However, the ADF and
PP tests for the first differences of the series reject the null hypothesis of unit root
Dominance of Chinese Market: An Empirical Study 243

for all the indices. Hence, it can be concluded that all the series are integrated of
order 1, that is, I(1).
Johansen’s cointegration test results are summarized in Table 2. The empirical
findings indicate the presence of one cointegrating vector in the full sample and also
0100200300400500600700800
01-0
1-19
98
01-0
7-19
98
01-0
1-19
99
01-0
7-19
99
01-0
1-20
00
01-0
7-20
00
01-0
1-20
01
01-0
7-20
01
01-0
1-20
02
01-0
7-20
02
01-0
1-20
03
01-0
7-20
03
01-0
1-20
04
01-0
7-20
04
01-0
1-20
05
01-0
7-20
05
01-0
1-20
06
01-0
7-20
06
01-0
1-20
07
01-0
7-20
07
01-0
1-20
08
01-0
7-20
08
01-0
1-20
09
01-0
7-20
09
01-0
1-20
10
Thai Phil Indo Chi Mal Sp Spore
Fig. 1 Daily stock indices
Table 2 Tests for
cointegrationRank Trace test p value lmax test p value
Full sample
0 169.94 0.0002 67.108 0.0001
1 102.84 0.0937 47.804 0.0119
2 55.032 0.7599 25.857 0.5376
3 29.174 0.9421 10.455 0.993
4 18.719 0.7819 9.9652 0.8995
5 8.7542 0.6116 4.9932 0.8957
6 3.761 0.0525 3.761 0.0525
First subsample
0 181.22 0 63.413 0.0004
1 117.8 0.0075 45.602 0.0239
2 72.203 0.1523 33.033 0.1392
3 39.169 0.5656 24.427 0.2535
4 14.742 0.9429 6.8019 0.9895
5 7.9403 0.6932 5.9708 0.8165
6 1.9695 0.1605 1.9695 0.1605
Second subsample
0 216.83 0 84.029 0
1 132.8 0.0003 57.018 0.0004
2 75.782 0.0882 34.344 0.1002
3 41.438 0.4524 18.699 0.6601
4 22.739 0.5319 12.9 0.6958
5 9.8392 0.5036 7.2274 0.6916
6 2.6118 0.1061 2.6118 0.1061
244 A.K. Gopalaswamy et al.

in the two subsamples. Presence of cointegration among the markets indicates that
the prospective price fluctuations in one market can be determined to some extent
based on the price information available on other markets.
The normalized cointegrating vector for the two subsamples is presented inTable 3.
The relative size of the coefficients indicates the respective influence of the indivi-
dual stockmarkets in the system. In the first subsample, itmay be noticed that long-run
relationships of the South Asian markets with the USA are much stronger than those
with China.While in the second subsample, the coefficients of long-run relationship of
the South Asian markets are bigger in size with the Chinese markets than those with
the USA. Further across the two subperiods, the size of the coefficients shows a
gradual increase with Chinese markets and a decline in size with the US market.
These trends suggest the growing influence of Chinese markets in the South Asian
region and the gradual decline of the influence of the US market.
In order to get a quantitative measure of the changing short-run interdepen-
dencies between the stock markets of Asia and the USA, variance decomposition
analysis is attempted. The variance decompositions reflect the proportion of the
fluctuations in the dependent variables that can be attributed to their own innovations
versus innovations to other variables. It also helps in understanding the magnitude of
a movement in one variable that can be explained by other variables movements in
terms of the percentage of the forecast error variance of that variable.
From the variance decomposition results for 1-day,5-day,15-day, and 20-day
horizons, it was observed from the first subperiod the predominant role played by
Thailand market followed by the US market in explaining the fluctuations in the
regional markets, excepting the Chinese market which seems to be absolutely exoge-
nous market. Further, the regional markets are almost uninfluenced by fluctuations in
the Chinese market. In the second subperiod, the influence of Thailand and the USA
is still substantial, but an important emerging trend is the growing influence of
Chinese markets on other regional markets compared with the first subperiod.
4 Conclusions
This study aims to assess the level of dominance of China over other emerging Asian
markets. The power of dominance was purely driven by the technological super-
iority and advancement it has achieved over the last few decades. The expected role
Table 3 Normalized
cointegrating vectorPre Post
China The USA China The USA
Thai 2.6288 1.7083 2.1552 �1.1244
Phi �3.2239 �6.7988 4.1127 0.16986
Indo 1.6828 �16.326 �2.9818 �2.3609
Chi 1 13.297 1 �2.7945
Mal �1.6063 7.8294 �6.4429 3.5958
US 5.6916 1 �0.25915 1
Spore �1.7128 25.217 1.1249 3.0185
Dominance of Chinese Market: An Empirical Study 245

of dominance was tested purely driven by the fact that China has become one of the
largest manufacturing bases for the entire world. Further, the free trade agreement
between ASEAN and China in 2009 triggers the growing economic ties between the
ASEAN countries and China. The study examines the aspect of dominance from the
perspective of cointegration among the stock markets of Thailand, Malaysia,
Singapore, Indonesia, and the Philippines with China. The study employs Johansen’s
(1988) multivariate cointegration test conducted by dividing the data in to two
subperiods 1998–2006 and 2007–2010. The empirical results indicate that the data
are nonstationary in levels but are stationary in first differences. Hence, the
cointegration method could be deployment in testing for market integration. The
results indicate that the predominant role played by Thailand market followed by
the US market in explaining the fluctuations in the regional markets, in the first
subperiod and the Chinese market, seems to be absolutely exogenous market. How-
ever, in the second subperiod, the influence of Thailand and the USA is still
substantial, but an important emerging trend is the growing influence of Chinese
markets on other regional markets compared with the first subperiod. These trends
indicate the growing influence of Chinese markets in the South Asian region and the
gradual decline of the influence of the US market.
References
Bailey W, Stulz RM (1990) Benefits of international diversification: the case of Pacific BasinStock
markets. J Portf Manage 16:57–61
Chai HY (2003) Interactions between the Euro and Europe’s financial markets. Asia Pac J EU Stud
1:117–135
Chowdhury AR (1994) Stock market interdependencies: evidence from the Asian NIEs.
J Macroecon 16:629–651
Copeland M, Copeland T (1998) Lads, lags, and trading in global markets. Financ Anal J 54:70–80
Daly KJ (2003) Southeast Asian stock market linkages: evidence from pre- and post-October 1997.
ASEAN Econ Bull 20:75–85
Darrat AF, Zhong M (2002) Permanent and transitory driving forces in the Asian-Pacific stock
markets. Financ Rev 37:35–52
DeFusco RA, Geppert JM, Tsetsekos GP (1996) Long-run diversification potential in emerging
stock markets. Financ Rev 3:343–363
Engle RF, Granger CWJ (1987) Cointegration and error correction: representation, estimation and
testing. Econometrica 55:251–276
Fooladi IJ, Rumsey J (2006) Globalization and portfolio risk over time: the role of exchange rate.
Rev Financ Econ 15:223–236
Ghosh A, Saidi R, Johnson K (1999) Who moves the Asia-Pacific stock markets- US or Japan?
Empirical evidence based on the theory of cointegration. Financ Rev 34:159–170
Janakiramanan S, Lamba AS (1998) An empirical examination of linkages between Pacific-Basin
stock markets. J Int Financ Mark Inst Money 8:155–173
Jayasuriya SA (2011) Stock market correlations between China and its emerging neighbors.
Emerg Mark Rev 12:418–431
Jeong J (1999) Cross-border transmission of stock price volatility: evidence from the overlapping
trading hours. Glob Financ J 10:53–70
Johansen S (1988) Statistical analysis of cointegration vectors. J Econ Dyn Control 12:231–254
246 A.K. Gopalaswamy et al.

Johansen S, Juselius K (1990) Maximum likelihood estimation and inference on cointegration with
applications to the demand for money. Oxford Bull Econ Stat 52:169–210
Laurenceson J (2003) Economic integration between China and the ASEAN-5. ASEAN Econ Bull
20:103–111
Liu Y, Luo H (2004) Impact of globalization on international trade between ASEAN-5 and China:
opportunities and challenges. Glob Econ J 4:1–8
Maddison A (2007) Contours of the world economy, 1–2030 AD. Essays in macro-economic
history. Oxford University Press, Oxford
Majid MSA, Merra AKM, Omar MZ (2008) Interdependence of ASEAN-5 stock markets from the
US and Japan. Glob Econ Rev 37:201–225
Palac-McMiken ED (1997) An examination of ASEAN stock market: a cointegration approach.
ASEAN Econ Bull 13:299–311
Park KH (2005) A test of financial integration in East Asia. Multinatl Bus Rev 13:75–95
Park D (2007) The prospects of the ASEAN-China free trade area (ACFTA): a qualitative
overview. J Asia Pac Econ 12:485–503
Rim H, Setaputra R (2010) Study on relationships between financial markets in the US and
ASEAN countries. Int Bus Econ Res J 9:1–6
Roca ED, Selvanathan EA, Shepherd WF (1998) Are the ASEAN equity markets interdependent?
ASEAN Econ Bull 15:109–120
Roland-Holst D, Weiss J (2004) ASEAN and China: export rivals or partners in regional growth?
World Econ 27:1255–1274
Swanson PE (1987) Capital market integration over the past decade: the case of the US dollar. J Int
Money Financ 6:215–225
Tongzon J (2005) ASEAN–China free trade area: a bane or boon for ASEAN countries? World
Econ 28:191–210
Yang J, Kolari JW, Min I (2003) Stock market integration and financial crises: the case of Asia.
Appl Financ Econ 13:477–486
Yoshida Y (2010) Is this time different for Asia? Evidence from stock markets, Kyushu Sangyo
University discussion paper no. 40
Dominance of Chinese Market: An Empirical Study 247

Is Cloud Computing a Tipping Point for IT
Innovation Leading to Next Wave of Business
Growth in Developing Economies
Ramkumar Dargha
1 How GDP of Emerging Economies Expected
to Shape Up in Future
Over the next 5–10 years, emerging markets (markets excluding developedmarkets)
are likely to account for much of the economic growth. In order to compete in such
an environment, businesses and companies in these emerging markets need to be
prepared so that they are ready tomake use of this enormous opportunity available in
front of them. Technology preparedness plays a very important role in this endeavor.
Emerging markets are expected to have a major share in the global GDP by 2015
(The European Business Review). By 2015, the global GDP is expected to be
60,000 billion dollars (or 60 trillion dollars). The GDP growth during this period
is expected to be around nine trillion dollars. Out of this growth of nine trillion,
more than 60% of the growth is expected to come from emerging markets.
The summary of this growth pattern is depicted in the diagram below (Fig. 1)
(The European Business Review).
Key points to note from the above diagram are:
1. Key importance and contribution expected from the emerging markets. These
markets expected to contribute more than 60% of this growth.
2. These emerging markets themselves are expected to grow by CAGR of nearly
6% on an average, while a selected few emerging markets like India and China
are expected to grow more than 7% CAGR in coming 5–10 years.
R. Dargha (*)
Infosys Limited, Electronics City, Bangalore, Karnataka 560100, India
e-mail: [email protected]
Department of Management Studies, Indian Institute of Science, Bangalore,
Driving the Economy through Innovation and Entrepreneurship,DOI 10.1007/978-81-322-0746-7_21, # Springer India 2013
249
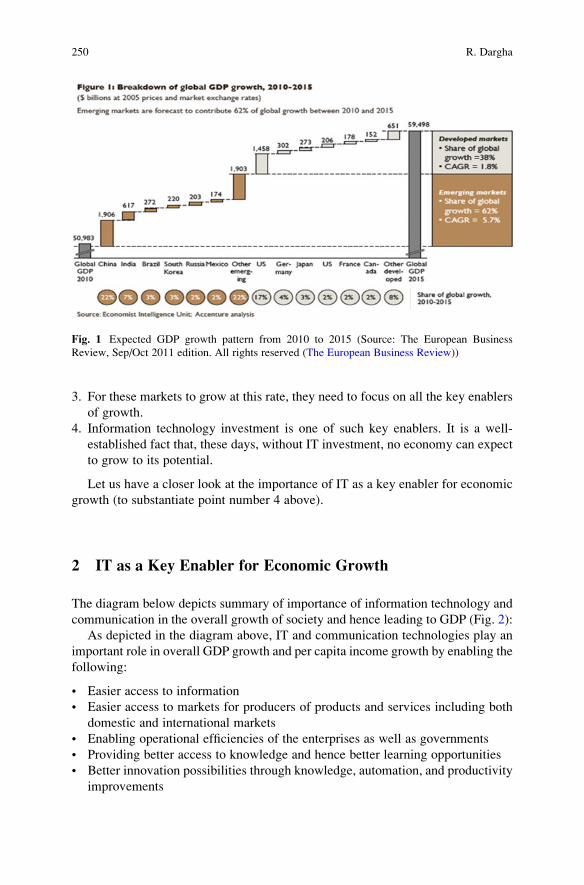
3. For these markets to grow at this rate, they need to focus on all the key enablers
of growth.
4. Information technology investment is one of such key enablers. It is a well-
established fact that, these days, without IT investment, no economy can expect
to grow to its potential.
Let us have a closer look at the importance of IT as a key enabler for economic
growth (to substantiate point number 4 above).
2 IT as a Key Enabler for Economic Growth
The diagram below depicts summary of importance of information technology and
communication in the overall growth of society and hence leading to GDP (Fig. 2):
As depicted in the diagram above, IT and communication technologies play an
important role in overall GDP growth and per capita income growth by enabling the
following:
• Easier access to information
• Easier access to markets for producers of products and services including both
domestic and international markets
• Enabling operational efficiencies of the enterprises as well as governments
• Providing better access to knowledge and hence better learning opportunities
• Better innovation possibilities through knowledge, automation, and productivity
improvements
Fig. 1 Expected GDP growth pattern from 2010 to 2015 (Source: The European Business
Review, Sep/Oct 2011 edition. All rights reserved (The European Business Review))
250 R. Dargha

In addition to IT, other key enablers also need to come together for the overall
social and economic development like government fiscal and monetary policies,
social policies, economic policies, and foreign relationship policies. However, IT is
a core component for all these to come together and to make the economic growth
in a country feasible.
Dos Santos et al. (Information technology: when it is worth the investment 2007)
note that the IT investments have a significant impact on the outcome of a firm’s
internal activities and processes. Brynjolfsson and Hitt (Information technology:
when it is worth the investment 2007) observed that the investments on computer
capital and IT staff spending contributed significantly to firm level output. They
also affirmed that the return on investment for computer capital was higher than the
one for noncomputer capital.
Another study by Qiang (2009) (Alcatel Lucent strategic white paper information
and communication technologies enablers of a low carbon economy) states that the
overall growth affects of information technology and communications on low- and
middle-income economies (like emerging economies) is significantly higher as com-
pared to high-income economies (like developed economies). For instance, for every
10% point increase in Internet penetration, there will be a 1.12% growth in GDP in
emerging economies as compared to 0.77% increase in GDP in developed economies.
It is thus clear that IT plays a very significant role in overall economic growth in
a country including emerging economies.
Information and Communication Technology Impact
EasierAccess to
Information
Easier Access toMarkets
Operational and
AdministrativeEfficiencies
Better learningOpportunities
ProductivityImprovements
Social and Economic DevelopmentGovernanceEfficienciesthrough e-
governanceinitiatives
More empowerment
of People
Education and
HealthcareEfficiencies
Development of core growth engines
Human Resource
Development
Poverty Reduction
InnovationOpportunities
Increase inGDP
Increase inPer Capita
Income
Fig. 2 Impact of information and communication technology on increase in GDP
Is Cloud Computing a Tipping Point for IT Innovation Leading to Next Wave. . . 251

3 Expected Spend on IT in Emerging Economies
and IT Spend as Percentage of Revenue
Businesses in emerging economies would increasingly look to IT to help support
the challenges of growth. They would need IT to support their needs to increase
customer satisfaction levels, innovations in supply chain management, business
processes optimizations, and in overall innovation in their businesses. These in turn
will place enormous demands on the IT environment including infrastructure,
software, networks, storage, middleware, etc. IT will thus be a primary driver of
business growth in emerging economies in coming years.
How much percentage of revenue that each of these economies spends on IT
today? This metric is one of the key metrics used to compare relative spend across
markets and industries. As per Gartner IT Key metrics data (2006) (Gartner Key
Metrics 2009), in the USA (an example of a developed economy), the BFSI sector
spends the largest of about 12% of revenue on IT expenditure followed next by
media, insurance, and telecommunications sectors. Overall average IT spend as
percentage of revenue is about 4.1% of revenue.
However, if we look at the same metric in emerging or developing markets like
India, the average IT spend as percentage of revenue is around 1.8% which is less
than half of that in developed markets.
As we can see, there is a clear discrepancy in the amount of IT investments
(measured as percentage of revenue generation) between developing and developed
economies. Developing economies have quite a lot to catch up in this aspect. Add to
this is the fact that the GDP these economies are going to grow by more than three
times that of the developed economies. So clearly there is a need for the IT
investments in emerging economies to grow by more than six times as compared
to that of developed economies.
One estimate by Global IT research firm International Data Corporation (IDC)
and Microsoft Corp (Contributions of IT Sector to Global Economic Recovery
2012) on IT Industry in India, states that IT spending in India is expected to grow to
USD 37.6 billion at a compounded rate of growth of 11.8 percent. IT in India is
expected to drive creation of more than 300,000 new jobs between end of 2009 and
end of 2013. As per Gartner (Gartner Press Release 2012) the global IT spending
will reach around 3.8 trillion US dollars in 2012.
4 Now the Question Is: Do Emerging Economies Have This
Wherewithal to Spend on IT and Still Be Competitive
in World Economy or Do They Have Better Options
As is evident from the above discussion, to keep with the pace of economic growth
and IT needs of the businesses as well as to compete with global economy, the
IT investment needs of emerging economies are quite huge. Doing a simple
252 R. Dargha

calculation based on increase of GDP in emerging economies by 2015 indicates
that these emerging economies would need a total investment of around 1,500billion USD by 2015 (around 3% of 5,000 billion USD, which is the GDP growth
from all emerging economies in absolute numbers).
Now the question is, do these emerging economies have the wherewithal to
spend so much on IT and still be competitive in world economy, or do they have
better IT options?
There would be many different parameters for IT decision making in an
enterprise. These could be:
• Cost of IT
• Time to implementation
• Flexibility and scalability
• Existing IT landscape within an enterprise
• Brand of IT vendor, etc.
As per a recent survey by Zinnov Consulting (Cloud computing in India CIOs
perspective), IT costs seem to be a dominant factor for IT decision making in Indian
scenario (assumed as a representative of emerging economy in this chapter).
Now, let us look at cloud computing technology as a viable alternative for IT in
emerging economies.
5 Cloud Computing as an IT Option
Cloud computing (Cloud computing key considerations for adoption. Infosys)
refers to the technology that enables functionality of an IT infrastructure, IT
platform, or an IT product to be exposed as a set of services in a seamlessly scalable
model so that the consumers of these services can use what they really want and pay
for only those services that they use (pay-per-use). A more formal definition of
clouding computing as per Gartner is: “a style of computing where massively
scalable IT-enabled capabilities are delivered as a service to external customers
using internet technologies.”
Cloud computing “technology” refers to the technology (including IT infrastruc-
ture, IT platforms, and IT applications) that enables the IT functionality to be
exposed as services in a multitenant manner. The enabling technologies include
(but not limited to) virtualization, grid technologies, SaaS-enabled application
platform (SEAP), service-oriented architecture (SOA), metering tools and
technologies, etc. Cloud “services” refer to those types of services that are exposed
by a cloud vendor and that can be used by a cloud consumer on a “pay-per-use”
basis. These services are exposed as industry standard interfaces like web services
(using service-oriented architecture, SOA) or REST services or any proprietary
(though rarely) services. The types of these services can be broadly classified as
follows:
Is Cloud Computing a Tipping Point for IT Innovation Leading to Next Wave. . . 253

• Software as a service (SaaS): The applications like customer relationship
management (CRM), e-mail, instant messaging (IM), and office productivity
applications are offered as a “service” by a cloud vendor. For example,
salesforce.com, SFA services, Google office productivity applications, or
Microsoft Exchange Online, etc. Here, the consumers of the service (an enter-
prise or individual user) will use only those functionalities that they really want
and pay for what they use. The vendor will host and manage the required
infrastructure and applications to support these services. The consumers need
not worry about deploying or managing the infrastructure required to host these
applications.
• Platform as a service (PaaS): This can broadly be defined as application devel-
opment environments offered as a “service” by the vendors. The development
community can use these platforms to code their applications and then deploy
the applications on the infrastructure provided by the cloud vendor. Here again,
the responsibility of hosting and managing the required infrastructure will
be with the cloud vendor. Some of the examples are Google App Engine,
salesforce.com, Force.com, etc.
• Infrastructure as a service (IaaS): Here, the entire computing infrastructure is
provided as a “service” by the cloud vendor. The actual computing infrastructure
that is provided could be a storage environment, database environment, or a
complete Linux environment. Here again, the responsibility of hosting and
managing the infrastructure will be with the vendor. Examples include Amazon
EC2, Amazon SimpleDB, and Amazon S3.
6 Is Cloud Computing a Savior for Developing Economies and
Can This Technology Provide an Edge to These Economies
In order to meet the challenges faced by the emerging economies, these emerging
economies will look for ways to get the best return on their IT investment and at the
same time would want to satisfy all their core needs of IT technologies. Cloud
computing is expected to enable emerging markets in developing innovative
products and services. With cloud computing, emerging economies are expected
to have better access to infrastructure, applications, and tools at a much lesser costs
and more importantly on a pay-per-use model, which is particularly suitable for
high cost-conscious businesses in emerging economies. Leveraging cloud services
is expected to top business and software strategies in emerging markets. Cloud
technology along with well-established business strategies is expected to speed up
the creation of innovative products or services.
Some of the examples of recent projects initiated by the government of India
(again used a representative of an emerging economy for our purposes) which could
be good candidates for cloud computing technology are:
254 R. Dargha

• The Unique Identification project (AADHAAR project): This project requires
enormous amount of storage data and huge processing capacity. Owning and
maintaining such large infrastructure in on-premise (traditional data centers)
could be cost prohibitive.
• Indian Railways Online Passenger Reservation System: This project is a case of
fluctuating demand as well as high capacity demand due to large number of users
using this system daily. This calls for an IT solution which is flexible, agile, and
yet cost-effective, which cloud technology can potentially provide.
• India’s right to information act requires digitizing databases and storing huge
amounts of data in a cost-effective manner.
The governments would need lot of computing power, storage capacity, flexibil-
ity, and agility (flexible IT to satisfy fluctuating demand, ability to scale up based on
need) but yet in a very cost-effective manner. Cloud computing could thus be one of
the viable options.
We also need to find key IT goals of emerging economies, and see if how some
of these goals can be addressed by this cloud computing technology. Some of the
key current IT goals as per a survey conducted by Zinnov Consulting (Cloud
computing in India CIOs perspective) are:
1. Agility and flexibility of IT
2. OPEX models
3. Reach and customer engagement
4. Efficiency enhancement
5. Best of bread
Cloud computing technology has potential to satisfy each of these goals.
7 Expected Cost Benefits of Cloud Computing
There are many benefits of cloud computing. Summary of these benefits are:
• Cost savings
• Faster time to deployment of IT
• Reduce IT management burden
• Flexible payment models through pay-per-use Opex model
• Less procurement time
• Lower the barrier of entry
While there are many benefits of cloud computing as described in previous
section, let us take cost factor as an example (since cost seems to be one of the
major factor for cloud adoption), and see how this technology is expected to be
more beneficial cost wise.
IT costs in a typical enterprise can be divided into three main categories:
1. Infrastructure costs which typically account for nearly 50% of the total IT costs
Is Cloud Computing a Tipping Point for IT Innovation Leading to Next Wave. . . 255

2. Existing application maintenance costs which account for nearly 35% of the
total IT costs
3. New application development costs which typically account for nearly 15% of
the total IT costs
Since cloud computing environment leverages the concept of “economies of
scale” to cut down costs for all users, we can expect significant savings in the above
costs, particularly the first item above. As depicted in the diagram below, one study
from Microsoft (The economies of cloud from Microsoft) indicates that SMBs
(small and medium businesses) can experience nearly 40 times cost benefit (cost per
server) whereas large enterprise can experience nearly 10 times cost benefit (Fig. 3).
8 Are Emerging Economies in a Better Position for Leveraging
Cloud Computing Technologies Compared to Developed
Economies
Now, let us ask this question, “Are emerging economies in a better position for
leveraging cloud computing technologies compared to developed economies?”
One way to answer this question is to look at some of the key inhibiting factors
for cloud adoption for large enterprises, and see if these inhibiting factors in fact are
kind of advantageous as far as small and medium business in emerging economies
is concerned.
Fig. 3 Expected cost benefits from public cloud and private clouds based on number of servers
(Source: Microsoft Corporation (The economies of cloud from Microsoft))
256 R. Dargha

Some of the key inhibiting factors for large enterprises in developed
economies are:
• Existing legacy systems: This means the large enterprises will be reluctant to get
away with the existing infrastructure and systems due to the presence of “his-
tory” in these systems. For companies in emerging economies, this issue does
not arise since these economies currently have low levels of existing IT systems
and are implementing IT from ground up. Hence, they can leap frog into newer
technologies like cloud computing without much issue due to legacy systems.
• Internal institutional resistant to change: This is again very much prevalent in
existing large enterprises in developed economies. Whereas in companies in
emerging economies, since the current institutional capacity is limited, this issue
almost is nonexistent.
• Existing rigid and complex procurement systems: Large existing enterprises in
developed economies would already have existing procurements systems which
could be inflexible for changes and hence may not be amenable for flexible
procurement models provided by cloud technology. This is not an issue with
companies in emerging economies.
Due to the above reasons, in fact the emerging economies are in a better position
to leap frog into cloud computing models to drive efficiencies due to cost. In
addition, by adopting the cloud technologies, these companies in emerging
economies can almost nullify the IT-based competitive advantage of the large
enterprises which they were enjoying so far.
9 Conclusions
In this chapter, we have looked at how world GDP growth is expected to shape up in
near future and how GDP growth is related to IT investments. We then looked at
some of the IT challenges emerging economies may face when their economies
would grow. We also analyzed the current IT spend as percentage of revenue and
compared the same between companies in emerging economies and large
enterprises in developed economies. Given the gaps in current IT spend and also
given the fact that the emerging economies are expected to grow at a much faster
rate, there will be enormous pressures on IT investments in these emerging
economies. In this backdrop, we analyzed how cloud computing technology
could be a savior for these emerging economies for their future needs.
Based on this analysis, we can conclude that cloud computing technology has
very good potential in these emerging economies and sometimes much more as
compared to the developed economies. This would be like a win-win situation for
both the emerging economies and for cloud vendors.
Is Cloud Computing a Tipping Point for IT Innovation Leading to Next Wave. . . 257

References
The European Business Review. http://www.europeanbusinessreview.com/?p=4547. The article
was originally published in The European Business Review, September/October 2011 edn,
pp 42–45
Stewart W, Coulson S, Wilson R (2007) Information technology: when it is worth the
investment. Commun IIMA 7(3). http://www.iima.org/CIIMA/14%20CIIMA%207-3-07%
20Stewart%20119-122.pdf
Paradox lost? Firm level evidence of high returns to information systems spending. http://ccs.mit.
edu/papers/CCSWP162/CCSWP162.html
Alcatel-Lucent Strategic White Paper: information and communication technologies: enablers of a
low-carbon economy. http://www.alcatel-lucent.com/eco/docs/CMO7526101103_ICT_Enablers-
eco_EN_StraWhitePaper.pdf
GartnerKeyMetricsData (2009) http://www.gartner.com/technology/consulting/key_metrics_data.jsp
Contributions of IT Sector to global economic recovery. http://www.microsoft.com/india/msindia/
pressreleases/new-study-reports-on-contributions-of-it-sector-to-global-economic-recovery/183/
Cloud computing in India – CIOs perspective. http://cloudconnectevent.com/downloads/
Zinnov_Cloud_CIO_Perception_Study_India.pdf
The economies of cloud: from Microsoft. http://www.microsoft.com/en-us/news/presskits/cloud/
docs/The-Economics-of-the-Cloud.pdf
Cloud computing – key considerations for adoption. Infosys. http://www.infosys.com/cloud/
resource-center/documents/cloud-computing.pdf
Gartner press release, January 5 2012. http://www.gartner.com/it/page.jsp?id=1888514
258 R. Dargha

Advanced External Counter Pulsation:
A Solution for Healthy Heart
Mohammed Ismail and S. Sookthi
1 Introduction
Technology for survival and growth: Someone from a middle class family started
with an idea to set up an organization of high calibre, which will address the burning
issues of the nation. Projects identified were the following:
1. Separation of antibiotic from milk
2. Help common man to live long with a healthy heart
3. Produce low-voltage, room temperature plasma for miraculous healing
This required capital investment. When he was in the final year of engineering,
his father passed away. He did not have anyone to invest on his ideas. In fact, people
started laughing on his ideas and discouraging him. He was working with one of
the MNC in the field of sales and marketing. He never lost hope. For setting up a
research-based organization, he decided to set up a system for wealth creation. He
knew this was possible only upon successful management of:
1. Technology
2. Innovation
3. Change
As we all know, technology is the most influential factor in the wealth creation
system. In simple words, it is considered as a seed of the wealth creation system.
M. Ismail (*) • S. Sookthi
Asrah Technologies India ltd, Bangalore, Karnataka, India
e-mail: [email protected]
Department of Management Studies, Indian Institute of Science, Bangalore,
Driving the Economy through Innovation and Entrepreneurship,DOI 10.1007/978-81-322-0746-7_22, # Springer India 2013
259

With proper nourishment and exposure to good and healthy environment, a seed
grows to become a healthy tree. A challenge was selection of right technology to
generate capital. Here, the purpose of wealth creation was to set up research-based
profitable organization that will contribute to the nation, society and mankind.
Finally, one fine day process began.
Objective: Set a system to generate capital for research-based organization with
proper utilization and management of human capital.
Search: With lots of market research different technologies identified. Main objec-
tive was to identify a technology that can also support the organization in the
process of product development. Identify and analyse information required for a
business plan, design and present business, financial and marketing plans based on a
budget and design an action plan.
Select: Technology-based services related to professional staffing were identified asmost reliable and affordable technology. Selected and formulated an ethical frame-
work for operational plans, established business, financial and operational goals and
objectives.
Implement: Birth of Asrah Technologies India Limited. Registered as a public-
limited company under Companies Act 1956 on 1 Jan 2010. Identified verticals for
business. Set up business premises, set up operational systems, implement financial
systems, calculated the risks of a new venture.
Capture: Went all out in the market place by positioning
“Engineers recruit Engineers”
“Touch your future”
With a focussed approach, Asrah could make a good breakthrough by getting
good and dependable clients. Now, the business started prospering and funds started
flowing in.
In the organization, most of the employees were fresh engineers who worked
on recruitment services at the same time supported for product development. The
company has a positive employee development policy. Each person has a job profile
and a training plan is arranged accordingly. There is also considerable attention paid
to quality management and leadership training. The company got certified as ISO
9001: 2008 and ISO 13485: 2003.
Technology intelligence: Asrah had identified three projects to be taken up. Financialsituation of the company allowed them only one at a time. Technology intelligence
provided them an understanding of current and potential changes taking place in the
environment. The value of technology intelligence was not merely in the information
but in the process of generating it. They could identify most viable project based on
current financial situation, time compression, existing infrastructure and availability
of existing human resource.
260 M. Ismail and S. Sookthi

Herring model:
1. Need assessment: Based on the current financial situation, which is the most
viable project? Asrah can’t afford long term project immediately. Asrah can’t
afford expensive resources. This project has to generate funds for next project.
2. Planning: How are we going to find the answers for these questions? Identified
sources for basic and secondary information.
3. Collection: The major strength of Asrah was they were into recruitment services
and they had huge data base of candidates across industry and levels. Reaching
any technical or managerial profession from any industry or organization was
very easy for them. Approached different educational institutions.
4. Analysis: Collected data was organized in a meaningful way to create a new
insight and conclusion.
5. Presentation: Analysis is presented to the management and advanced external
counter pulsation was decided as most appealing system.
2 Systems Analysis
The name of the system: Advanced external counter pulsation
Top ten causes of death in India (Age 25–69 as percentage)
Rank Causes of death Total
1 Cardiovascular diseases 25
2 COPD, Asthma, Other Respiratory Diseases 10.2
3 Tuberculosis 10.1
4 Malignant and other neoplasm 9.0
5 Ill-defined conditions 5.3
6 Digestive diseases 5.1
7 Diarrheal diseases 5.0
8 Unintentional injuries 4.6
9 Intentional self-harm or suicide 3.0
10 Malaria 2.8
Sources: (Sharma 2010) India Today, New Delhi, April 12, 2010
Advanced External Counter Pulsation: A Solution for Healthy Heart 261

The purpose of the system: Heart diseases have emerged as the number one killer
in both urban and rural areas of the country.
Heart diseases have emerged as the number one killer in both urban and rural
areas of the country. The largest ever study of one million deaths shows cardiovas-
cular disease has replaced communicable diseases as the biggest killer in India.
Summary – Report on Causes of Death: 2001–2003 in India from Census India
Preliminary results from the largest study (prospective study one million deaths in
India – RGI-CGHRProspective Study Collaborators, yet to find out the exact causes of
mortality in India) have revealed that heart ailments take most lives in both urban and
rural areas. The results are surprising because they indicate a reversal in disease patterns
in the country from communicable diseases to non-communicable or lifestyle diseases.
“Whatwe have found is quite provocative. If you look at rural areas of poorer states like
Uttar Pradesh and Bihar, the leading cause of death among middle aged males is
cardiovascular disease. Heart attacks are killing people not just in urban areas,” said
Dr Prabhat Jha, director of the Centre for Global Health Research at the University of
Toronto and lead researcher of the study. The study is being carried out in collaboration
with the Registrar General of India (RGI) and the Indian Council of Medical Research
(ICMR). (Sharma 2010) India Today, New Delhi, April 12, 2010.
3 Cardiovascular Disease as a Threat to Economic Stability
“When the heart is set right, then the personal life is cultivated. When the personal life is
cultivated, then the home life is regulated. When the home life is regulated, then the
national life is orderly: And when the national life is orderly, then the world is at peace.”
–Confucius
The economic implications of cardiovascular disease are vast. In developing
countries, heart disease has historically affected the more educated and higher
socioeconomic groups, but this is changing.
What researchers are finding is that in developing countries, cardiovascular
disease disproportionately affects working-age adults from lower socioeconomic
groups. Also, people from lower socioeconomic groups fare worse if they develop
heart disease; their mortality after a heart attack is higher than someone from a high
socioeconomic group. This has led researchers to claim that if the global epidemic
of heart disease continues, it will have an impact on the viability of a number of
countries’ economies. Already, researchers estimate that between the developing
economies of Brazil, India, China, South Africa and Mexico, 21 million years of
future productive life are lost each year because of cardiovascular disease.
The economic impact is felt both as a cost to the country’s health system as well
as the loss of income and production of those affected either directly by the disease
or as caregivers to those with cardiovascular disease, who cease to work.
As the world’s largest democracy and a rising power, India has gradually begun
to play a larger role on the international stage, at the same time, according to BPL
Tendulkar committee report, 32.7% of population (410 million) are below poverty
line (earning less than $1.25/day). As per the executive summary report of the
census 2011, 68.83% of the Indian population lives in about 640,867 villages.
262 M. Ismail and S. Sookthi

4 Coronary Heart Disease
CHD is the most common type of heart disease in adults. It occurs if a waxy
substance called plaque builds up on the inner walls of your coronary arteries.
These arteries carry oxygen-rich blood to your heart. Plaque narrows and stiffens
the coronary arteries. This reduces the flow of oxygen-rich blood to the heart
muscle, causing chest pain – angina.
Angina is a symptom of coronary heart disease. Plaque build-up also makes it
more likely that blood clots will form in your arteries. Blood clots can partially or
completely block blood flow, which can cause a heart attack. There are many known
CHD risk factors. You can control some risk factors, but not others.
Risk factors you can control include:
• High blood cholesterol and triglyceride (tri-GLIS-er-ide) levels (a type of fat
found in the blood)
• High blood pressure
• Diabetes and prediabetes
• Overweight and obesity
• Smoking
• Lack of physical activity
• Unhealthy diet
• Stress
The risk factors you cannot control are age, gender and family history of CHD.
Following a healthy lifestyle can help you and your children prevent or control
many coronary heart disease risk factors. Because many lifestyle habits begin
Advanced External Counter Pulsation: A Solution for Healthy Heart 263

during childhood, parents and families should encourage their children to make
their heart-healthy choices. For example, you and your children can lower your risk
of coronary heart disease if you maintain a healthy weight, do physical activity
regularly, follow a healthy diet and avoid smoking.
On average, people at low risk of coronary heart disease live nearly 10 years
longer than people at high risk of coronary heart disease.
If you already have coronary heart disease, lifestyle changes can help you
control your risk factors. This may prevent coronary heart disease from worsening.
Even if you are in your 60s, 70s or 80s, a healthy lifestyle can lower your risk of
dying from coronary heart disease.
4.1 Current Treatment for Angina
Angina is a symptom of CHD. Treatments include (1) drug therapy beta-adrenergic
blocking agents, nitrates and calcium channel blocking agents in single or in combi-
nation; (2) revascularization by either coronary artery bypass grafting; or (3) percu-
taneous transluminal coronary angioplasty. Further research for more therapeutic
options for chronic angina has yielded a wide range of new treatment modalities in
various stages of clinical evaluation, which includes (1) transmyocardial laser revas-
cularization, (2) spinal chord stimulation, (3) transcutaneous electrical nerve stimu-
lation and (7) external counterpulsation. In the USA, experience with external
counter pulsation and modified version of external counter pulsation was successful
in relieving angina, reducing reversible perfusion defects in radionuclide scans, and
improving exercise tolerance is based on series of case studies.
5 AECP Technological Innovation Model
264 M. Ismail and S. Sookthi

6 Advanced External Counter Pulsation (AECP)
A modified version of ECP with added features is non-invasive, outpatient treatment
for coronary artery disease with angina refractory to medical and/or surgical therapy.
Asrah considers the use of ECP for all other conditions (e.g. erectile dysfunction,
heart failure, hepatorenal syndrome, restless leg syndrome, retinal artery occlusion,
rotational vertebrobasilar insufficiency, stroke and sudden deafness) experimental
and investigational.
7 Why Advanced External Counter Pulsation (AECP)
A common man with heart disease will not face an urgent medical crisis and can
comfortably delay surgery. For many patients, the diagnosis seems to come without
warning and heart attack occurs when there is a sudden and complete blockage in a
coronary artery, leaving an area of the heart without blood flow.
In our country where 410 million people are earning less than 20,000–22,000
rupees per year, if they come across this situation, how are they going to face this
crisis? They will have no other option than to either borrow money or to sell off
their property. Cause people with so less earning will neither have anything to save
for their future nor covered with health insurance. If they do not have any alterna-
tive, then death is the final solution for them.
The people who can afford this end up spending a huge amount on angioplasty,
stenting or bypass surgery. But this is not the end. Research in recent years has
provided clear evidence that heart disease is not a plumbing problem, defined by
blockages in the arteries that bring blood to the heart. Eight percent of bypass surgery
patients, 20% of stenting patients and 54% of angioplasty patients repeat procedure
within a few years. Heart attack occurs even after these blockages have been fixed.
We now recognize that cardiovascular disease is a chronic, system-wide illness in
which poorly functioning blood vessels weaken circulation, precisely in and around
the heart. Majority of the factors which damages these blood vessels are:
1. Inflammation and autoimmune conditions
2. Chronic infections
3. Genetic predisposition
4. Lifestyle habits
These factors create an atmosphere where blockages can develop and flourish.
So Cardiovascular disease should not be defined as just by blockages, but it should
be by its underlying cause, damaged blood vessel that inhibits blood flow. Bypass
surgery, stents and angioplasty target individual blockages only, not the underlying
disease.
Heart disease progresses slowly and blockages take many years to develop. Just
because a diagnosis has been made and blockages have been identified does not
Advanced External Counter Pulsation: A Solution for Healthy Heart 265

mean operating on them is a dire emergency. In most cases, you have time to take
a breath, educate yourself, weigh your options and make a careful decision. One
study conducted at Harvard provided a powerful illustration of this lack of urgency.
Of 88 patients who had been advised to undergo bypass surgery, 74 patients (84%)
received second opinion contradicting that recommendation. Sixty of seventy four
Patients (68% of total) chose to indefinitely delay the operation. None of the patients
who opted against bypass died during the nearly two and a half years of follow-up.
The study concluded that the number of surgical interventions could be reduced by as
much as 50% among patients who receive a second opinion that removes the sense of
urgency from their decision-making process.
Some doctors simply do not accept the irrefutable science that has redefined
heart disease. Although they know the old “heart disease is about blockages” model
no longer holds, they still base their practice on it and continue to open blocked
arteries anyway. In a candid expose on 21 March 2004, New York Times, Dr. Eric
Topol, an interventional cardiologist at the Cleveland Clinic, stated bluntly: “There
is just this embedded belief that fixing an artery is a good thing.” In the same article,
Dr. David Hillis, an interventional cardiologist at the University of Texas South-
western Medical Centre, offered a possible explanation for this mentality, sug-
gesting business plays a significant role. “If you are an invasive cardiologist and joe
Smith, the local internist, is sending you patients, and you tell them they don’t need
the procedure, pretty soon Joe Smith doesn’t send patients anymore.” He explained,
“Sometimes you can talk yourself into doing it even though in your heart of hearts
you don’t think it is right” (Braverman 2005).
Dr. Hillis cited another possible explanation, “a patient may come into the
doctor’s office convinced that an invasive procedure is the right course of action.”
“Americans want a full-court press,” Dr. Hillis said. I think they have talked to
someone along the line who convinced them that this procedure will save their life.
They are told, “If you don’t have it done, you are. . . a walking time bomb.” The
Times article included this summation from Dr. David Waters of the University of
California. “(Coronary Artery Disease) is a systemic disease. It occurs throughout
all the coronary arteries. If you fix one segment, a year later it will be another
segment that pops and gives you a heart attack so systemic therapy has the potential
to do a lot more.” But, he added, “There is a tradition in cardiology that doesn’t
want to hear that” (Braverman 2005).
Not only does traditional cardiology not want to hear it, but since most patients
rely on their doctors to educate them about their disease. Many heart disease sufferers
do not get the information they need to make appropriate treatment decision
(Braverman 2005).
8 Asrah’s Advanced External Counter Pulsation System
It is to treat heart disease by alleviating their symptoms, preventing complications
such as heart attacks and maximizing their quality of life. Our treatment would take
a systemic, rather than a localized approach. Advanced external counter pulsation
266 M. Ismail and S. Sookthi

helps in increasing coronary perfusion, increasing diastolic perfusion pressure,
decreasing ventricular load, increasing venous return, increasing coronary collat-
eral flow to ischemic regions of myocardium, eliminating toxins such as carbon
dioxide and lactate and supplying more nutrients such as oxygen and glucose.
9 Our Objective
Current Invasive treatment cost: Rs. 2–5 Lacs (Burden is too heavy for commonman.)
Current Non-invasive treatment cost: (35 sittings � 1 h) is between Rs.
70,000–120,000 at different heart care centres.
There are approximately 250 ECP and EECP installations in India. Major supply
is either from the USA or China.
Approximate cost of US-made systems ranges from Rs. 20–48 Lacs plus tax.
Chinese systems cost Rs. 10–18 Lacs plus tax.
Our objective is to drastically reduce the treatment cost by reducing the system
cost. We are working towards helping 32 % of my country people who are below
poverty line.
Our objective is to transform the lives of the patients whose heart disease is so
advanced that they cannot eat or do normal activity without severe symptoms,
making them return to activities they had given up.
Our objective is to help the nation by making every heart a healthy heart.
The inputs to the system:
1. NIBP
2. ECG
3. SPO2
4. Respiration
5. Pressurized flow of air
The system’s outputs:
1. Inflation
2. Deflation
The subsystems or components of the system:
1. Air compressor
2. Patients bed
3. PLC based system
4. Cuffs
5. Solenoid valves
6. Precision regulators
7. System software
Advanced External Counter Pulsation: A Solution for Healthy Heart 267

The feedback used by the system: A series of four compressive air cuffs
which inflate and deflate in synchronization with the patient’s cardiac cycle via
microprocessor-interpreted ECG signals are wrapped around each leg and on hand:
one at calf level, another slightly above the knee, third on the thigh and fourth on
the fist. The three cuffs are larger versions of the familiar blood pressure cuff and one
is a little smaller. During diastole, the four sets of air cuffs are inflated sequentially
(distal to proximal) compressing the vascular beds within the muscles of the calves,
lower thighs, upper thighs and fist. This action results in an increase in diastolic
pressure, generation of retrograde arterial blood flow and an increase in venous
return. The cuffs are deflated simultaneously just prior to systole, which produces a
rapid drop in vascular impedance, a decrease in ventricular workload and an increase
in cardiac output.
In the short-term, this method of therapy is thought to deliver more oxygen to the
ischemic myocardium by increasing coronary blood flow during diastole, while at
the same time, reducing the demand for oxygen by diminishing the work require-
ments of the heart. Long-term benefit is expected to result as coronary collateral
flow to ischemic regions of the myocardium is increased. The nerves in the hands
are stimulated. These nerves carry the signals to the brain, particularly to parts that
are concerned with emotions. The piled up mental energy due to stress is released.
This relaxes the mind. It improves the blood circulation and helps in supplying
more nutrients such as oxygen and glucose. It also eliminates toxins such as carbon
dioxide and lactate. A full course of ECP typically involves 5 h of treatment per
week, delivered in 1- to 2-h sessions for 7 weeks, for a total of 35 h of treatment.
Since this product is under patent application process, so we would not be able to
discuss in detail.
10 Lab to Market
The government can support biomedical industry bringing innovation and technol-
ogy to market in a variety of ways:
• Design instruments that promote private risk-taking and stimulate markets for
private risk capital
• Government interventions should be designed to promote risk-taking and stimu-
late the private risk capital market.
• The government needs to align carefully its provision of support for innovation
throughout the entire commercialization cycle with different policy instruments
at different stages: early stage, growth stage and mature stage.
Effective sequencing should aim at building significant deal flow of early-stage
projects before supporting venture capital.
268 M. Ismail and S. Sookthi

11 Conclusion
For all of us across the world, the heart is much more than a fist-sized muscle,
working efficiently from birth until death, pumping blood continuously about 70 ml
per beat, and it usually beats 70 beats per minute, 100,800 times in a day, and
nearly one million barrels of blood in an average lifetime! The heart holds a deep
emotional and spiritual significance for us. We thank people from the bottom of our
heart, love and heart are almost synonymous for us, and we even suffer heartbreak-
ing losses. So when this wonderful organ starts giving up, we lose heart. Sadly, we
ourselves are the cause of its abuse by appalling lifestyles.
Institutes across India suggest that 90% of heart cases coming to them fall under
lifestyle category. The less healthy hearts still beat, but they are not strong enough
for living and enjoying a good quality of life. Apart from giving a wide range of side
effects, most presently used treatments for heart diseases transfuse enormous fear in
body cells, which react by releasing large amounts of the stress hormones. This by
itself can threaten the healing system. Until lately, these treatments were conceived
to bemore or less safe but are nowdistinguished by leading heart centres and resources
to be the primary cause of a new ailment known as chronic heart failure. Chronic
heart failure is a gradual death-experience that has attained epidemic ratios. This has
emerged as the number one killer in both urban and rural areas of India causing
economic loss to the country. Heart disease continues to claim one American life
every 34 s. While we apply old rules to treat it, it is the leading killer, the most costly
disease and the primary cause of disability in most of the countries, but we have the
ability to quickly change these facts. This is only possible by educating our self,
changing our thoughts and changing our interpretations. The need for AECP has never
been greater, and as our population ages, the need will continue to rise exponentially.
Experiencing the treatment and making it widely available would change the
entire face of the condition. It is the only way to knock heart disease off its perch
as our most deadly and expensive illness. It is the only human choice. The power
of human choice is dramatically demonstrated by the Indian freedom movement.
It was not the power of arms or revolution that got us freedom. It was the power of
choice. When India’s leaders decided the country must be free and succeeded in
convincing the people to will and work for it, there was no force on earth strong
enough to keep the country under foreign rule. India was freed by the collective
decision of its people. Today, once again, we need a collective decision to free our
heart from coronary artery disease. Hundreds of thousands of lives and hundreds of
billions of rupees are at stake. This is a public health issue, an economic issue and a
bioethical issue.
“Your life is important to your loved ones. They can’t afford to lose you”
Advanced External Counter Pulsation: A Solution for Healthy Heart 269

References
Braverman D (2005) The only noninvasive way to overcome heart disease. Celestial Arts,
New York
Gaziano TA (2007) Reducing the growing burden of cardiovascular disease in the developing
world. Health Aff 26(1):13–24
Khalil T (2009) Management of technology the key to competitiveness and wealth creation. Tata
McGraw-Hill, New Delhi
Mackay J, Mensah G (2004) Atlas of heart disease and stroke. World Health Organization, Geneva
Narayanan VK (2011) Managing technology and innovation for competitive advantage. Dorling
Kindersley India Pvt. Ltd, New Delhi
Sharma DC (2010) India’s no.1 killer: heart disease. India Today, New Delhi, April 12, 2010
The Center for Global Health and Economic Development (2004) A race against time: the
challenge of cardiovascular disease in developing economies. The Earth Institute at Columbia
University, New York
Tidd J, Bessant J (2012) Managing innovation integrating technological, market and organiza-
tional change. Wiley, New Delhi
270 M. Ismail and S. Sookthi

Managing Technology for Marketing Success
Prafulla Kumar Das
1 Introduction
Kotler et al. (2007) while discussing on today’s marketing communications
mentioned that marketing communication would increasingly occur as a personal
dialogue between the company and its customers. From the point how a company
would reach its customers, they felt that the company would be forced to find out
how the customers could reach the company effortlessly. Technological advances
have allowed people and the company to communicate with each other through the
Internet, fax machines, cellular phones, and other wireless appliances. Personalizing
communications and creating dialogues by saying and doing right things to the right
customers at the right time would become critical for the marketer, Kotler et al.
thought. Ansari and Mela (2003) mentioned that the exchange process in the
information age became increasingly customer initiated and to an extent, customer
controlled. Marketers and their representatives would have to wait until customers
agreed to participate in the exchange. Even the marketers entered the exchange
process; customers would define the rules of engagement. They would insulate
themselves with the help of agents and intermediaries if they so chose. The authors
were of the opinion that even the customers had started to define what information
they needed and what offerings they would be interested in.
Elliot and Percy (2011) thought that brands were cocreated by its customers
and the organization’s employees. In the process of cocreating the brand,
employees may have to take the help of easily available and affordable technology.
P.K. Das (*)
Faculty of Marketing, Regional College of Management, Chakadola Vihar,
Chandrasekharpur, Bhubaneswar 751023, India
e-mail: [email protected]
Department of Management Studies, Indian Institute of Science, Bangalore,
Driving the Economy through Innovation and Entrepreneurship,DOI 10.1007/978-81-322-0746-7_23, # Springer India 2013
271

But, managing technology in an organization would be to understand the value
of certain technology for the organization. Continuous development of technol-
ogy is valuable as long as there is a value for the customer. Therefore, the
technology management function in an organization would be to argue when to
invest on technology development and when to withdraw, the authors thought.
In this study, an attempt was made to utilize easily available technology to
improve marketing function in the operating level of the field in the pharma-
ceutical industry.
2 The Uniqueness of Pharmaceutical Selling
Pharmaceutical selling is different from all other types of selling. Here, the
customer himself is not the consumer, and the consumer, on the other hand, has
got no say in deciding the product he would purchase. Therefore, companies
personalize the marketing communications for more impact. This ethical,
high-involvement product is sold by the prescriptions of doctors, who, in turn,
decide the types of medicines to be used after thorough checkup. Therefore, the
products are not generally advertised in TV or radio. Personal selling has been
the most effective medium of communication. Print media are used for specific
journal discussions, advertisements, and information through medical index
books like MIMS (monthly index of medical specialties), CIMS (current index
of medical specialties), IDR (Indian drug review), and Drug Today. Some of
the companies have been using reputed daily newspapers to write advertorial
columns on approaching new pharmaceutical products. It is probably for inducing
word-of-mouth (WOM) communication amongst the readers. In some cases,
advertisements are given in reputed (Note: In the paper, product and brand
are used synonymously.) local dailies before the formal launch of a product.
It is perhaps with the intention of informing a particular segment of doctors on
the arrival of a new preparation. Integrated communication approaches such as
CME (continued medical education), journal and textbook extract handouts,
sponsoring conferences, release of website, gifts like books, articles for better
diagnosis, samples, reminder articles of use, visual aids, and in rare cases, panel
discussions by accepted subject authorities are used in various degrees by phar-
maceutical companies. In an overcommunicated society like ours, getting,
keeping, and growing customers has become difficult. In this process also,
companies incur wastage in terms of money, man, and machine utilities. If the
use of day-to-day, affordable technology could help identify, organize, and
use available data for marketing productivity, it would probably help managing
waste in Indian context.
The days of “sell,” “sell,” and “sell” by the sales force are gone (Kotler et al.
2007). They are to know how to diagnose a customer’s problem and the corres-
ponding solution for him to earn higher profit. Companies are to define specific
272 P.K. Das

sales force objectives, time to spend on current customers, time to devote for the
prospects, time to spend for the established brands as well as for new brands, and gap
to meet different types of stakeholders like doctors, chemists (drug retailers), and
stockist who work for them. Ordering pattern, settlement of dues, minimum order
amount, payment duration, and penalty in case of delayed payment are to be defined
explicitly. Training activities for keeping employees knowledgeable and motivated,
incentives for retailers and stockist, and timely managing public interfaces in case of
difficulties would also become the responsibilities of the management for smooth
performance. Kotler et al. (2007) found out that regardless of selling context, sales
people would generally do one or more of the following specific tasks:
• Prospecting: Searching for prospects or leads
• Targeting: Deciding how to allocate their time amongst customers and prospects
• Communicating: Informing the customers about the products and services
• Selling: Approaching, presenting, answering queries, overcoming objections,
and closing sales
• Servicing: Providing various services to customers—consulting on problems,
providing technical assistance, arranging finance, and expediting delivery of goods
• Information gathering: Conducting market research
• Allocating: Deciding which customer will get how much scarce products during
shortages
Sontakki (2000) mentioned that the sales or selling process would refer to the
sequential series of actions taken by the salesman. That would lead toward a
prospect taking a desired action and would terminate with a follow-up to ensure
purchase and post-purchase satisfaction. The commonly accepted stages in the sales
process are the following: prospecting, pre-approach, presentation and demonstra-tion, overcoming objections, and closing the sales. It is to be remembered that these
steps are not stand alone but interdependent. Sontakki identified few questions to
qualify a “suspect” to a prospect. These questions were:
• Does he need my product or service?
• Does he perceive a need or a problem that may be satisfied by my product or
service?
• Does he have sincere desire to fulfill the need or to solve his problem?
• Can my product or service convert his desire into belief?
• Does he have financial resources to pay for?
• Does he have the authority to buy?
• Will his purchase be large enough to be profitable?
3 Database and Technology Application for Better Performance
Keeping all these requirements in mind, a table may be prepared as given in the
Table 1 on an Excel sheet. Additional information about the birth day and marriage
date of the qualified prospects would help call planning. It would also help build
and continue relationship with the customer.
Managing Technology for Marketing Success 273

From the information, identified numbers of qualified prospects (as per the
strategy) would be picked up for promotion. A prospect may be dropped after
three calls if he did not respond to the promotion. A list of actual buyers
of the product would be prepared by calling on the nearby drug retailer and
looking to the actual dispatch from the stock point. Table 2 would provide
necessary insight to the field person on the actual performance of the brand X
vis-à-vis competitors. When placed on the excel sheet, the potential prescribers
may be identified on the basis of their contributions to the company’s kitty. From
that identified list, most important customers may be selected for special promo-
tion as or when called for. While collecting the data, a notebook, or a diary, or a
tablet PC with the format would help identify the prospects and their standing for
the company on monthly basis.
With the increase in competition, the fortunes of brands are changing very fast.
New products in the category, new companies, and new products with better value
propositions keep on flooding the market. It is also found out that about 95%
of brands do not see life beyond 1 year (Verma 2006). It has also been found out
that break-even for an identified product would be achieved after 3 years. In such a
complex situation, keeping track of the performance of a brand and its competitors
would be useful. The table below would help identify the movement, strategy, and
coverage of the brand on study against its competition. These information would
probably help the management formulate tactical moves to defend and increase
market share. A diary, a notebook, or a tablet PC would organize the data for current
and future use (Table 3). Asking the stock outlets for better coverage and designing
of visit plan may help in this direction. In spite of that, if the company fails to cover
the market properly, it may think of appointing a sub-wholesaler. On the other hand,
the names of the identified wholesalers may be kept in the mind for future
expansion.
It would be wise to keep track of the presently performing brands which
contribute about 80% of the business. In general, 4–5 product categories contribute
to most of the business for any given company. Authors like Kotler et al. (2007)
recommend that at least 80–85% of time and money may be invested for those
product categories. But, in the Indian competitive scenario when more than 4–5
products are being introduced by even a medium-level concern, investing that
amount of time and money for established brands would be difficult. Further
research would probably be required to find out whether it contributed to brand
failure. But, keeping the practicality in view, at least 50% of time may be chalked
out for the established brands, and the rest 20% may be kept for two rising new
brands. Table 4 provides an organized approach to identify the prescribers of best
five and rising two product categories to keep their names and approximate business
contributions in mind for business investments. The share of high-profit products
may be considered to increase through special promotion for optimizing
profitability.
If the prescriber base for any or more of these products was found to be narrow,
slow expansion to identified noncontributing prospects would be useful. Direct
dialogue would certainly help in this direction. The increase in customer base
274 P.K. Das

Table
1Form
atforpreparingdatabaseofprospects
Sl
no.
Potential
prescriber
(suspect)
Prescribersofthe
samemolecule
Prescribersofthe
competitormolecule
Early
adopter/
prescriber?
Price
conscious?
Committedto
competitor?
Final
list
Besttime
tomeet
Birthday
Marriage
date
1.
2.
3.
- n
Managing Technology for Marketing Success 275

Table
2Form
atforpreparingtheprescribers’
list
Retailer
Nam
eofthe
prescriber
of
thebrand
Frequency
(H/L)
Businessam
ount
approx.
Prescribersofthe
competitor1
Frequency
(H/L)
Business
amount
approx.
Prescribersof
thecompetitor2
Frequency
(H/L)
Businessam
ount
approx.
1.
a.a.
a.
b.
b.
b.
c.c.
c.
2.
3.
276 P.K. Das

Table
3Market
survey
form
at
Sl
no.
Nam
eofthe
retailer
Competitorand
itsproduct
Price
Frequency
of
visitofMR
Whether
onspecial
promotion?
Schem
e
Frequency
of
promotion
Stockistand
coveragefrequency
Businessam
ountofthe
category
approx.
1.
a. b.
c.
2.
3.
Managing Technology for Marketing Success 277

would contribute insulating the brands from quick erosion. A notebook or a diary
may help while collecting the data. Transferring the data to the computer through
excel sheets would immediately help organize information to give direction to
promotion. When the entire list of doctors with their prescribing habit would
be prepared in one sheet per area, it would give direction to the promotion for
consolidating the existing customer base and for gradual expansion. This may be
done by putting products in the x-axis and list of doctors with their code numbers in the
y-axis (Table 5). The report would immediately separate noncontributing customers.
They may be considered for business improvement, and when not possible, the
investment may be reduced for managing cost. A master file mentioning the month-
wise visiting date and investment may be kept handy for reference. The details may be
put in an excel sheet. Chemist audit may be done before calling on the customer.
It would certainly add strength to presentation and investment (Table 6).
It has been an accepted fact that 20% of customers contribute to 80% of business.
In that logic, maintaining the list of core customers like doctors or chemists with
personal details would help organizing and getting business from them. Tables 7
and 8 would help not only visualizing the market trend; the marketing performance
of the field staff would immediately be reflected when one sees the visiting pattern.
Sending birthday and marriage cards even through e-mail and reminding them with
scheme, introduction of new molecules, and latest report on product performance
(from reputed journal publications) would help the customer take better decisions.
It may so happen that the field staff would not be able to call on the core customers
at identified intervals. But, this gap may be fulfilled through electronic reminders.
Use of simple technology like pen drive may help transfer the product information
for future use in case the Internet is not available.
Table 4 Format for market-wise prescribers’ compiled list (Best five and second-best two products)
Retailer
Name of
the doctor
Product
C*1
(H**/L)
Product
C2(H/L)
Product
C3(H/L)
Product
C4(H/L)
Product
C5(H/L)
R1
(H/L***)
R2
(H/L)
1. a.
b.
c.
2.
3.
C* Core product, R Rising product, H** High, L*** Low
Table 5 Format for prescribers’ compiled list (Best five and second-best two products)
Code
number of
doctor
Name of
the doctor
Product
C*1
(H**/L)
Product
C2(H/L)
Product
C3(H/L)
Product
C4(H/L)
Product
C5(H/L)
R1
(H/L***)
R2
(H/L)
C* Core product, R Rising product, H** High, L*** Low
278 P.K. Das

A chemist database of top retailers and their purchasing pattern always
strengthens the position of a company. Tables 8, 9, and 10 would help compile
chemist and stockist data for organizing the action plan.
There is a word in the business circles that the sale is complete when the
payment is realized. Capital being the elixir of life for a business, it would
be important to see that the money is realized in time. Table 11 would provide
the guideline for the details of payment position for an area. A reminder to the
stockist through e-mail or mobile messaging before 2 days or a day before and
direct telephonic talk on the same date would probably fetch payment from him.
As delay in payment may delay in the placing of fresh order, it assumes great
importance. Rising union activities amongst stockist and sub-wholesalers would
not allow the company to collect interest for delayed payment. It would be wise on
the part of sales people not to book excess of new and slow moving items. An eye to
the product performance and booking of fast moving products would help the
company to be in the right path to control the business. In case, a stockist hesitates
to place order according to the agreed norms, this table would help guide the field
operator to show him the actual paid-up stock held by him (as per the agreement one
stockist would keep 1 month’s paid-up stock).
Settlement of breakage and expiry goods has been the bone of contention for
most of the business deals. Table 12 would guide the field operatives (including
managers) to keep an eye to this issue so that the C&F agent does the settlement in
time. Timely settlement of dues also enhances the respect of the company as well as
field personnel amongst the stockist. If a fixed time gap is agreed upon, this table
would guide the managers to discuss with the C&F agent where he went wrong.
In order to control the expiry amount amongst the promoted goods, discussion may
be initiated with the field staff to contain the expiry level to the agreed point.
Table 13 discusses about both expiry and breakage as sometimes, expiry goods may
be shown as damaged/broken stock. Therefore, taking them together would proba-
bly help contain the amount to the agreed level.
It is the consistent performance of brands that is vital for the good health of
an organization. Month-wise movement of core products (Table 14) would give
sufficient hint on the actual performance of the company. Before the windfall,
measures may be initiated to stop the slide. In order to control the performance
Table 6 Format for month-wise investment details on doctors
Code
no. of
doctors
Name
of the
doctor
Prescribed
core product
code (H/L) Jan Feb Mar Apr May Jun Jul Aug Sep Oct Nov Dec
C1
C2
C3
C4
R1
R2
Managing Technology for Marketing Success 279

Table
7Form
atforcore-doctors’personal
data-base
Sl.
no.
Nam
eofthe
doctor
Birthday
Marriage
day
Phone
no.
Mobile
E-
Whether
interested
toget
inform
ation
throughmail/message
Besttimeto
meet
Present
prescriber
Past
prescriber
1.
2.
3.
280 P.K. Das

Table
8Form
atforchem
istdata-base
Sl.
no.
Nam
eof
the
chem
ist
Stockistfrom
whom
purchasing
Modeof
payment(cash/
credit)
Phone
no.
Mobile
E-
Whether
interested
toget
inform
ationthroughmail/
message
Besttime
tocallon
Interested
forschem
e
Purchaseam
ount
limit
1.
2.
3.
Managing Technology for Marketing Success 281

of a territory, it would be important to know, on a single sheet, how all the
stockist are doing and what would be the individual stockist contribution to
the territory performance (Table 15). This may help discussing the business
with the individual stockist, manager, or field staff while analyzing performance
vis-à-vis the competition. This would certainly drive home the point (required
performance to the actual performance) for which people are paid. Table 14 may
be used for the entire range of management personnel to control the product
performance. A pen drive, laptop, or a tablet PC would be useful to carry the data
for discussion.
4 Conclusion
Companies across the world are forced to change their offerings to suit the
market needs. Changing customer preferences, technological changes, and altering
government policies are some of the major factors which fuel new product devel-
opment (Chunawalla 1998), but risks associated with new product development is
often high (Kotler and Armstrong 1996). The authors conducted a study on
Table 9 Format for individual stockiest business data
Sl.
no.
Name of
the
products Package
Price/
unit
Secondary
saleaTotal
amount
Business
last year
same month
Progressive
business
current year
Progressive
business
last year
1.
2.
3.aActual sale of products at the stockist counter
Table 10 Format for combined stockiest business data
Sl.
no.
Name
of the
products Package
Price/
unit
Combined
secondary
sale
Total
amount
Total
business
last year Growth
Business
year before
last year Growth
1.
2.
3.
Table 11 Format for month-wise payment and purchase details of parties/stockiest
Sl
no.
Name
of the
stockist
Bill
no. Amount
Payment
date Transporter Bank
Bank
sola
no.
Date of
actual
payment
No. of
days of
delay
Interest
amount
1.
2.
282 P.K. Das

Table
12
Form
atforbreakage/expirydetailsofan
area
Sl
no.
Nam
eofthe
stockist
Product
nam
e
Batch
no.
Expiry
date
No.of
units
Bill
no.
Dateof
billing
Schem
e
amount
Dateofbill
settlement
Dateofsubmittingto
C&Fagent
Dateofbreakage/
expirysettlement
1.
2.
Managing Technology for Marketing Success 283

consumer packaged goods (comprising mostly line extensions) to find the failure
rate at 80%. Verma (2006) found that the new product failure across categories even
in the European and American countries was as high as 95%. In the process of
developing new products, old and established brands are being relegated to the
backseat. But, a company has to keep a balance between yesterday’s breadwinners
and tomorrow’s breadwinners to remain successful in the market. In this complex
situation, pinpointing the exact causes for brand failure and developing suitable
strategies for greater success would be difficult.
A company, on the other hand, has to develop a profitable marketing strategy
for improving stakeholders’ value. While developing strategy, it has to rely on
balancing the company’s competencies with market opportunities. Marketing
expenditure must also be optimized to achieve greater success at the marketplace.
In the fast-changing world, marketing can no longer remain the premise of the
marketing department alone. Operations through TQM, customer satisfaction
through managing customer database, sales management through CRM, and
finance through customer profitability analysis are the areas where technology
could play a significant role. Technology is changing and becoming accessible on
every passing day. It would be the responsibility of every management to utilize
affordable and easily accessible technology in innovative ways for deriving
necessary mileage from the market. It would be useful not to forget the words
of Al Ries and Jack Trout (2003), “When people become successful, they tend to
become less objective. They often substitute their own judgment for what the
market wants.”
Table 13 Format for loss due to breakage and expiry
Sl
no.
Name of the
stockist
Expiry
amount
Breakage
amount
Total
amount
% to total
sales
% last
year
% year before
last year
1.
2.
284 P.K. Das

Table
14
Form
atforrecordingmonth-w
isebusinessperform
ances
Slno.
Nam
eoftheproduct
andpackage
No.ofunits
Price
Jan
Feb
Mar
Apr
May
Jun
Jul
Aug
Sep
Oct
Nov
Dec
Total
1.
2.
3.
Managing Technology for Marketing Success 285

Table
15
Stockiest-w
iseperform
ance
foramonth/year
Sl
no.
Nam
eoftheproductand
package
Price
Stockist
1
Stockist
2
Stockist
3
Stockist
4
Stockist
5
Total
units
Totalam
ount
inRs.
Totalunits
lastyear
Totalam
ountin
Rs.
(lastyear)
1.
2.
3.
286 P.K. Das

References
Ansari A, Mela C (2003) E-customization. J Mark Res 40(2):131–145
Chunawalla SA (1998) Product management, 1st edn. Himalaya Publishing House, New Delhi,
p 83
WDavis S, Longoria T (2002). Harmonizing your touch points. Brand Pack 17–23 25
Elliot R, Percy L (2011) Strategic brand management. Oxford University Press, New Delhi
Kotler P, Armstrong G (1996) Principles of marketing, 9th edn. Prentice-Hall of India, New Delhi,
p 337
Kotler P, Keller KL, Abraham K, Mithileswar J (2007) Marketing management: A South Asian
perspective, 12th edn. Pearson Education, Delhi
Ries Al, Trout J (2003) The 22 immutable laws of branding. Profile Books Ltd, London
Sontakki CN (2000) Advertising and salesmanship. Kalyani Publishers, Ludhiana
Verma HV (2006) Brand management: text and cases, 2nd edn. Excel Books, New Delhi
Managing Technology for Marketing Success 287

Part 2
Part 2.1
Innovation Management

Review of Corporate Management Model
for Defense R&D Programs
K. Ajith Kumar and V.P. Jagathy Raj
1 Introduction
During the early decades, the entire engineering industry was technology driven,
and great inventions and discoveries lead the new product development process.
However, things have changed, and today in competitive business and engineering
industry, we have both technology-driven business and business-driven technology.
Under the present circumstances, strategic decisions on selection (Thamhain and
Wilemon 1975) and proper implementation of projects/program by corporate
managements are very important in any industry.
R&D is a creative activity carried out by qualified scientists, engineers, etc.
Technology on the other hand implies theoretical as well as practical knowledge,
skills, and techniques which help in realizing processes and systems for conversion
of inventions, discoveries, etc., to products and services. The competitive world has
brought in a change in this pace as well as approach, and the emphasis is on early
conversions of inventions and technology into products.
Major R&D programs of strategic importance are undertaken by the government
particularly in the defense and space sectors. Each of these programs is multidisci-
plinary, technologically challenging, and cost and resource intensive aimed at
bringing the country to the forefront in scientific and technological research. Identi-
fication of critical success factors of a project and the role of the parent organization
in control and implementation of these factors are very important (Buell 1967).
K.A. Kumar (*)
NPOL, DRDO, Kochi, India
e-mail: [email protected]
V.P.J. Raj
School of Management studies, CUSAT, Kochi, India
e-mail: [email protected]
Department of Management Studies, Indian Institute of Science, Bangalore,
Driving the Economy through Innovation and Entrepreneurship,DOI 10.1007/978-81-322-0746-7_24, # Springer India 2013
291

Also, selection and managing similar programs and projects and achieving the
required results are challenging tasks, and how the corporate management meets/
should meet this very important function is the point of discussion in this chapter.
2 Role Definition: Corporate and Technology Management
The corporate function of R&D is to provide the decision makers the right
information to link R&D and business such that the organization sustains a com-
petitive edge in the market. To realize new, better products and services requires
inputs of corporate resources which includes capital, manpower, materials, etc.
A schematic representation is shown in Fig. 1.
The role of corporate management here is to feel the pulse of business.
It has to allot the required resources which include capital and manpower to see
that the output of R&D is timely developed to marketable products and processes.
Also, the organization structure should be geared to aid program management by
way of monitoring, resource support, and control.
Technology management is equally important in R&D. Efficient management of
technology is required to position any organization be it business or otherwise in a
highly competitive environment (Buell 1967). This is more important in the case
of high-technology research where the expenditure involved is also quite large.
Technology management primarily consists of two tasks:
(a) Monitoring and studying research activity within the organization and
identifying those technologies which can realized into systems with some
definite business value.
(b) Understand the requirements of the customer and also study contemporary
systems elsewhere. Also identify business opportunities and initiate R&Dwork.
Thus, a typical corporate management model for strategic programs currently
followed by public-funded research organizations is given in Fig. 2 (Fernandez and
Navarro 2004).
Research & Development
Inventions,Acquiring,developmentof newtechnologies
Corporate function ofR&D
New, Improved products andServices
Increasedbusiness and Domain leadership
Market response
Feedback internal
Fig. 1 Corporate function and management of R&D – conventional model
292 K.A. Kumar and V.P.J. Raj

3 Problem Definition and Research Methodology
3.1 Need for a New Corporate Management Model
Strategic programs undertaken by public-funded research organizations are
multidisciplinary, technologically challenging, and cost and resource intensive
aimed at bringing our country to the forefront in scientific and technological research.
Factors causing project failures and delay are different in the life cycle of the project
specifically front-end planning stage and project execution stage (Pinto and Mantel
1990; Pinto and Prescott 1988; Thamhain and Wilemon 1975). It is also worthwhile
to analyze the macro organizational structure and its influence on program manage-
ment. Typical factors for analysis include speed, support, flexibility, innovation,
leadership, and control. The following queries are pertinent while proposing the new
model and structure:
(a) What structures make for fast decisions and delivery of product ahead of
competitors?
(b) What structure will minimize bottlenecks without incurring risk?
(c) What structure will maximize flow of knowledge and information throughout
the organization?
(d) What is the best balance between centralization and decentralization?
(e) What levels of autonomy, accountability, and participation go with each of the
potential structures?
(f) How well do the relationships between individual work centers and between
work centers and headquarters work?
(g) Which structure will best support the desired organizational culture and values?
(h) How will the balance between local and central control be attained?
A comparison of some of the parameters of interest for strategic program
management with respect to existing organizational structures is summarized
below (Stanford 2007).
Corporate function ofR&D
Increased acceptabilityin the geo political scenario
High technologylarge strategic programs in Defense & Space technologies
Reduce dependabilityon import of strategic
Building & MaintainingHigh technology base within
Resources
TechnologyRoad maps
Sanctions & Embargo
Short term plans ofindividual departments
Long Term Perspective Plan User Requirements
Govt policy for development of scienceand Technology
Fig. 2 Corporate function and management – strategic programs
Review of Corporate Management Model for Defense R&D Programs 293

Parameter Functional Divisional Matrix Cluster
Program resource
efficiency
Excellent Poor Moderate Excellent
Time efficiency Poor Good Moderate Excellent
Adaptability Poor Moderate Good Good
Accountability Good Excellent Poor Good
Program/project
environment
Stable Heterogeneous Complex with multiple
demands
Fast
paced
Taking into consideration all the factors listed above, it is felt that the present
corporate management model needs to be studied to identify factors and reasons
and suitably modified to avoid project delays and subsequent failures.
4 The Study
4.1 Sample
Two system-level projects were chosen for the study, both of which are now in
the tactical evaluation phase (Pinto and Mantel 1990). A survey questionnaire
assessed the present model with respect to its usability, efficiency, and limitations
(weaknesses and challenges). The questionnaire on a summative Likert scale format(Pinto and Prescott 1988) was used to collate information. Responses were received
on key project management issues starting from the genesis of the project, under-
standing of R&D goals and objectives, key performance indicators (KPI), organi-
zational support, etc.
4.2 Measurement Instrument
The questionnaire was developed as a research/diagnostic instrument to enable the
project directors of the two projects to assess the status of their respective projects
through answering a series of questions related to project management issues.
In this research, the survey required the two respondents to use a 5-point Likert
scale to indicate the degree to which the responses can be categorized under key
project management issues. The full instrument, then, was composed of about 250
questions under 5 sections, and the instrument’s measure of the adequacy of the
model is an aggregate of the total responses received under each of the key project
management issues.
4.3 Procedure and Analysis
The questionnaire asked participants to respond to a series of questions pertaining
to the selection, execution, and validation of the project they are handling.
294 K.A. Kumar and V.P.J. Raj
Respondents were given considerable latitude in choosing their own criteria to
respond on the adequacy and efficiency of the existing model. The project handled
by the respondent then served as the frame of reference while completing the
questionnaire. The two chosen projects were similar projects and were having
identical phases in the project life cycle.
The complete survey questionnaire and detailed analysis data are omitted for
reasons of brevity. However, the analysis brought out the following key information
on the present corporate management model being followed in the organization.
4.4 Results: Weaknesses
1. Lack of focus: The research programs undertaken are diverse and many times do
not follow a unified road map which is acceptable to the different stakeholders
including the users. Need for peer review at sanction level.
2. Project performance management: The productivity of an industry (DeCotiis and
Dyer 1979) can very easily be measured in tangible terms by the profit generated
or increase in turnover, whereas research outcome of most of projects of the
public-funded R&D organizations are ambiguous.
3. Project execution methodology (Balachandra and Raelin 1980) being followed
does not suit the present standards of other contemporary organizations. The
private industry and other business organizations continuously change with
changing political and economic scenario. However, the same is not true in the
case of the public-funded research organizations.
4. The R&D–industry–academic collaboration is very weak specifically in
public-funded research, and the survey pointed to numerous areas where tech-
nology gaps can be successfully handled by R&D–industry–academia collabo-
ration. The successful industries doing high-technology work are mostly in the
private sector.
5. The research organizations do not create much business in the new development
scenario, and it will not break even to support high-technology skill and infra-
structure development within the industry. Subsequently, new technologies and
new skill already developed are also not channelized properly.
6. The development contract/purchase management procedures of the research
institutions are not conducive for timely completion/execution of projects.
4.5 Results: Challenges as Envisaged for Future Projects
(a) Creation of a sound and successful technology base: An organization having a
sound technology base will be capable to take up new technology development
work. Those organizations that build technology base promote technology
consciousness among the different levels of work force. Thus, they develop a
Review of Corporate Management Model for Defense R&D Programs 295

sound technology culture. An example is the case of the Japanese industry.
Their technology base is well developed, and today, they have the prowess in
innovation and entrepreneurship.
(b) Identification of core competence and developing it. All organizations have
core competence. The challenge is to identify it, nurture it, and fully develop it.
C. K. Prahalad and Gary Hamel have described core competence as the
collective learning in an organization. It is the ability to coordinate diverse
skills and integrate various technologies.
(c) Realization of a research charter: This calls for a total change in the way high-
technology system projects are undertaken by discussing with people outside
the organization. It is essentially efforts required to realize a common research
charter. A research charter is an expression of shared understanding of the goals
of research of a project or program. The focus is on broad scope and not on
specifics.
(d) New challenges and outlook: High-technology projects essentially carry high
risks. Long time horizons, uncertainty of research outcome, etc., make man-
agement of high-technology projects extremely difficult. The present trend of
globalization has led to joint R&D programs. Also, the magnitude and speed of
technological change has also favored joint R&D program. Thus, strategic
alliance in R&D has emerged. A strategic alliance interacts with competitive
environments through optimization of combined objectives.
5 New Framework for Corporate Management
of Defense R&D Programs
A new framework for corporate management of strategic R&D programs/projects
specifically in the defense sector is proposed which has a layered and networked
architecture covering program/project sanction and governance and regulating
authority and implementation levels. The following key attributes are identified
for the new framework which shall help in successful selection, sanction, develop-
ment, and production of key defense systems and technologies for the armed forces.
5.1 Key Attributes
(a) The objectives and scope of the program are perfectly matched in line with the
national science and technology policy, defense acquisition policy, defense
services road map, etc. This is verified by a high level expert committee.
(b) The scope feasibility, technology feasibility, and evaluation are carried out by
an interdisciplinary expert committee.
296 K.A. Kumar and V.P.J. Raj

(c) It is ensured that the technology is available within the country or shall not be a
constraint for the project.
(d) It is also ensured that the adequate industry support and infrastructure is
available within the country or abroad
(e) The program is initiated, implemented, moderated, and governed by a
regulating body.
(f) The working level in the network model shall be responsible in initiation,
implementation, and completion of the project/program (Fig. 3).
Since multiple agencies and departments are participating in the networked
mode, an “apex council called National Science and Technology Council” (referred
to as NSTC in further discussions) needs to be formed with selected council
members from each of the participating agencies and departments. When determin-
ing the representation from different departments, care must be taken to ensure
that all activity areas are covered starting from program concept to realization
and utilization. For each strategic program, a Program Science and Technology
Advisory Panel (referred to as PSTAP in further discussions) which is a subset
of NSTC is formed in a similar fashion from the apex council members of NSTC.
This shall be the official regulatory body for the selection, design, development,
implementation, review, configuration management, evaluation, and utilization.
Apart from NSTC and PSTAP, there are multiple executing groups for each of
the program implementation tasks. The constitution of these groups is function
dependent like design, analysis, production, evaluation, etc., and experts are
inducted into the group as and when required.
National Science and Technology Council (NSTC)
Program Science and Technology Advisory Panel (PSTAP)
GOVERNANCE ENVIRONMENT
PROGRAM/PROJECT REGULATORY ENVIRONMENT
System Design & Development team
System Test andEvaluation Team
System Exploitation team
User requirements
Reps from ministry of defence, Space
Public / Private industry
Academia
Ministry of Finance
Regulatory Standards committee
IMPLEMENTATION ENVIRONMENT
Fig. 3 New framework for corporate management – defense programs
Review of Corporate Management Model for Defense R&D Programs 297

6 Implementation of the Proposed Framework
6.1 Roles and Responsibilities
An overview of the roles and responsibilities of all the key levels in the proposed
framework are listed below with respect to six key domain areas. The key domain
areas are:
1. Selection of strategic program
2. Envisaged value – tangible and nontangible
3. Resource management
4. Predicted outcome – commercial and noncommercial
5. Program progress measurement
6. Performance measurement
6.1.1 National Science and Technology Council (NSTC)
(At Organizational Headquarters Level)
The National Science and Technology Council is formed at the organization
headquarters and is the apex body governing the research program. It is the top
most level in the networked model and has a very important role in identifying,
sanctioning, and implementation of programs and projects within the organization.
The constitution of the NSTC consists of senior officials and technocrats from
central research organizations, academia, key ministries of the government,
planning commission, representatives from the public sector and private sector
industry, etc. The NSTC policies and proposals shall be in line with the science
and technology road map, concerned technology road map, acquisition policy if
any, etc. The major role of NSTC shall be:
1. Program identification and need study
2. Program scope development and governance
Apart from that, we are proposing the following major initiative which shall be
useful for all technology critical projects and programs. This needs to be
administered and monitored by the NSTC.
3. National technology resource assessment
National technology resource assessment (DATE manual of the DRDO) consists
of estimation of both knowledge and infrastructure resource assessment.
(a) Knowledge factor: This is a function of core technology base available within
the organization and also what is available with other central R&D institutions
within the country, Indian industry. This can be rated as an integer on a
1–10 scale.
298 K.A. Kumar and V.P.J. Raj

(b) Infrastructure factor: This indicates a measure of infrastructure and facilities
available within the R&D organizations and also elsewhere within the country.
This also can be rated as an integer on a 1–10 scale.
(c) The technology resource index is a composite parameter and is a function of
both knowledge factor and infrastructure factor. Many a time, one of these
factors has more relative importance compared to the other. Thus, technology
index can be derived as follows:
Technology resource index ¼ a Knowledge factorð Þ þ 1� að Þ Infrastructure factorð Þ10
Technology resource index needs to evaluate for core technologies that are
applicable to major public-funded R&D programs and projects. NSTC needs to
compile technology index values for core technologies as well as subtechnologies
and periodically update and maintain. The above principle is demonstrated with the
following example.
Example Project: Underwater Sensor System
The core technologies are acoustic transducers (knowledge factor – 7, infrastructure
factor – 8, a ¼ 0.8). Similar estimations are carried out for other core technologies
applicable for underwater sensor systems like ASW oceanography, digital signal
processing, underwater engineering, etc. In each of these core technologies,
subtechnologies are also identified and resource index evaluated. For example,
core technology digital signal processing can be further subdivided into:
1. Spectrum estimation
2. Time frequency analysis
3. Spatial signal processing etc.
4. Adaptive beam forming techniques
5. Signal auto correlation for classification
6.1.2 Program Science and Technology Advisory Panel (PSTAP)
The PSTAP is a subset of NSTC but can be located at the headquarters level.
This group shall be responsible for the following important functions starting from
finalizing the scope of the project to the project closure and client interaction.
Program performance management by continuously monitoring schedule variance
and cost variance and also decisions on project sanction and project period exten-
sion comes under the purview of the PSTAP.
The major activities are listed below and include:
1. Scope design
2. Program review
3. Implementation
Review of Corporate Management Model for Defense R&D Programs 299

4. Program progress review
5. Resource usage
6. Program performance management
7. Program closure
8. Program effectiveness analysis
6.1.3 System Design and Development Team
The system design and development team is the project team at the nodal labora-
tory/work center level for the selected program and headed by a project or program
director. This team shall be responsible for the design, development, implementa-
tion, progress review, configuration management, and performance of the system.
The project director is guided by the PSTAP and is empowered to take all
decisions with respect to the project/program. The project director is also responsi-
ble for the project outcomes as well as for the delays in completion. The project
director is the approving signatory for all decisions and transactions in the project.
The project director shall have project managers working under him in each of the
functional streams.
6.1.4 System Test and Evaluation Team
The system test and evaluation team at the nodal laboratory level is responsible for
finalization of acceptance test criteria for the evaluation of the system in consulta-
tion with the user group. This is an important activity since the test schedules and
methodology need to be finalized based on the acceptance criteria and the original
quality requirements for the system. The modality of conduct of evaluation is also
finalized where it is mentioned at what stage each function or property of the system
is going to be demonstrated.
6.1.5 System Exploitation Team
The prototype system needs to be exploited under the actual conditions, and its
efficacy needs to be validated. Also, reliability and maintainability figures are to be
logged for improving upon the system performance in the production versions.
6.2 New Program/Project Initiation Under the New Framework
1. The organization in consultation with the NSTC shall initiate the new projects
and programs for sanction. NSTC to in principle approve the proposal before the
project definition document is prepared.
300 K.A. Kumar and V.P.J. Raj

2. Project definition document (PDD) is prepared and approval sought from the
users. The approved PDD is submitted to NSTC for detailed analysis and vetting.
3. Once the NSTC clears the PDD, PSTAP is constituted and action initiated for
both administrative and financial sanctions of the project at headquarters level.
4. PSTAP intimates the nodal laboratory of the final sanction of the project and
requirement of formation of system design and development team.
5. PSTAP to guide the system design and development team in completing the
major activities of the project like preliminary design, technology assessment,
vendor identification, critical design reviews, planning, controlling, and execu-
tion of the project.
6. The PSTAP oversees the formation of system test and evaluation team at the
nodal laboratory level and ensures that the system is formally handed over with
complete information including documentation.
7. The test and evaluation team shall carry out the detailed evaluation of the system
including factory acceptance tests and field evaluation trials.
8. PSTAP shall recommend closure of the project based on the reports of the test
and evaluation team. It shall also receive periodic reports from system exploita-
tion team.
7 Discussions
The concern with the adequacy of the methodology being adopted by the public-
funded research organizations in executing nonsuccessful large value projects
stems from the same roots as concern with the problem of selecting the right project
for execution. Most of the research on project management focuses the issue of
selection, failure study, and termination decisions and is generic (Buell 1967; Avots
1969). Our study shows that there are some important contingency factors that force
us to relook the existing model and recognize the role of different stakeholders at
different stages in the project life cycle. The new framework adopts a holistic
approach in selection and execution of high-technology defense projects. Follow-
up interviews with some of the respondents confirmed the idea that the new
framework shall aid in horizontal integration of projects within an organization
since the members of NSTC and PSTAP shall be common.
8 Limitations and Conclusions
This study has some limitations. One major limitation was the limited sample size
of the study conducted. As indicated earlier, the mode of execution of mission mode
projects, technology demonstration projects, and science and technology projects is
all different, and hence, the study focused on the mission mode projects only.
The study and analysis focused only on some of the issues of corporate management
Review of Corporate Management Model for Defense R&D Programs 301

and omitted environmental factors which are beyond the control of the corporate
management. Technological obsolescence, superior technology alternatives, etc.,
are examples. Our focus has been on factors over which the corporate management
can exert some change and exert control.
Even with these limitations, the study has important implications in understand-
ing the role of corporate management in undertaking technologically challenging
defense projects. (1) The projects are not initiated and approved in isolation by
individual laboratories. (2) Headquarters of the organization has a more involved
role with formation of NSTC and PSTAP as compared to the present administrative
role. (3) PSTAP can administer performance management with the crucial
decisions including terminating the project. A new framework is proposed for
strategic high-technology programs of national importance. Program implementa-
tion using this model is discussed with the assumption that this model shall be more
suitable because of the various advantages over the present model.
References
Avots I (1969) Why does project management fail? Calif Manage Rev XII:77–82
Balachandra R, Raelin JA (1980) How to decide when to abandon a project. Res Manage 23:24–29
Buell C (1967) When to terminate a research and development project. Res Manage X(4):275–284
DATE manual for Defence Research and Development Organisation, Date of release Dec, 2001
DeCotiis TA, Dyer L (1979) Defining and measuring project performance. Res Manage
XXII:17–22
Fernandez E, Navarro J (2004) “Decision support tools for R & D project selection in public
organizations,” from the web. Proceedings of IAMOT, Washington, DC
Pinto JK,Mantel SJ Jr (1990) The causes of project failure. IEEETrans EngManage 37(4):269–276
Pinto JK, Prescott JE (1988) Variations in critical success factors over the stages in the project life
cycle. J Manage 14:5–18
Stanford N (2007) Guide to organisation design. The Economist book. Economist, London
Thamhain HJ, Wilemon DL (1975) Conflict management in project life cycles. Sloan Manage Rev
17:31–50
302 K.A. Kumar and V.P.J. Raj

Utilities’ Technology Management of Smart
Grid Innovation and Implementation
Torben Tambo
1 Introduction
Smart grid is high on the technological and political agenda in most countries, and the
term expresses much of today’s governmental and entrepreneurial efforts made in
response to the environmental challenges of the twenty-first century (Wissner 2011).
Smart grids are intended to match energy-consuming devices with energy-producing
devices for the purpose of balancing supply and demand in a world with less available
fossil fuels and an increasing reliance on the more volatile character of renewable
energy. Smart grids encompass information and communication technologies (ICT)
in the power network, and they are able to control both the supply and demand side
with especially electric vehicles and heat pumps for accumulation of asynchronous
energy. The development trajectory runs at least until the year 2050 (Regeringen
2011) and relies on heavy innovation efforts (Tambo 2011) at all component levels,
including consumer attitudes and expectations. Large investments in smart grid are
foreseen worldwide (Bhanhoo 2010; Joosting 2010).
Electricity companies are touted to take the lead in implementing (Goodman
and Griffith 1991) and designing the infrastructure for smart grid innovations
(J€arventausta et al. 2010; Kiesling 2010; Ilic 2010). In this connection, the electric-ity companies must accept, adopt, promote, operate and manage different
constituting technologies, each dependent on a full line of innovation activities
stretching 5–40 years ahead. The purpose of this chapter is to give an account of
the technology management process (Bengtsson and Ågerfalk 2010; Foxon and
Pearson 2008; Gamser 1988; Garrity 2009; Meeus and Saguan 2011) facing
electricity companies acting on behalf of consumers and society in their endeavour
to transform the global impact of energy. This chapter studies the possibilities for
smaller electricity companies to comprehend, select and prioritise among a host of
standards, products and solutions.
T. Tambo (*)
Aarhus University, AU Herning, 7400 Herning, Denmark
e-mail: [email protected]
Department of Management Studies, Indian Institute of Science, Bangalore,
Driving the Economy through Innovation and Entrepreneurship,DOI 10.1007/978-81-322-0746-7_25, # Springer India 2013
303

The raison d’être of this study lies in its use of a management of technology
approach (Tidd et al. 2008) for understanding innovation and implementation in
smart grids (Magnusson and Martini 2008; Snow et al. 2010). Strong optimism
has enveloped smart grid innovation as a determining factor in managing the
transition from fossil to renewable/non-fossil energy (Shum and Watanabe 2009;
Tsoutsos and Stamboulis 2005). Deregulation, however, has forced electricity
companies to reduce the size of their organisations and probably also their
capabilities within management of technology (Jamasb and Pollit 2011; Kiesling
2010; Switzer and Trout 2007). The views and suggestions of this chapter are
expected to be useful for strategic planners in the energy sector and environmen-
talist policy makers.
2 Method
In terms of methodology, this chapter is based on a mixed approach encompassing
both qualitative and quantitative elements. The dominating qualitative element
employs an interpretivistic, sociologically inspired research lens. The quantitative
part includes a series of technical feasibility-oriented studies, among them follow
on technical process studies. Methodological study of innovation systems is
inspired by Carlsson et al. (2002).
This chapter is based on studies of a number of energy companies – two trading
and service companies as well as six studies in five distribution companies – in
relation to national and international initiatives. The company approach has been
within the frame of university-enterprise relationships, and the qualitative obser-
vations are based on strategic, technological assignments set by the companies and
given to the university. A literature study includes recent contributions on smart
grid and management of technology in the cleantech/electricity sector. The view on
innovation theory is mainly drawn from the field of management of technology
(Tidd et al. 2008; Schilling 2008).
3 Theory
The urgent necessity of transforming the energy system and the expectation that
smart grid technologies should be the controlling component in that connection
imply that the theoretical approach of this study must be to examine how innovation
efforts are to be organised around the desired technologies and their inclusion into
spheres of application.
Optimisation of the energy system is a scientific and engineering challenge
requiring insight, foresight (Koch et al. 2008; Vanston 2003) and identification of
opportunities and threats (Lichtenthaler 2006). Occasionally, users have been engaged
by means of general awareness campaigns or indirect economic incentives. As this
study is a part of a larger, more techno-centric project, we have chosen to narrowly
304 T. Tambo

focus on the innovation and organisation perspectives. Authors like Vergragt and
Brown (2007), Herring and Roy (2007), Ornetzeder and Rohracher (2006) and
Gamser (1988) suggest looking at broader innovation and engagement potentials
than traditional technical solutions. Market pull and technology push in innovation
management is suggested by Brem and Voigt (2009).
Formerly, there was a direct relationship between manufacturing, distribution
and sale of energy. Deregulation and liberalisation have split the unity into inde-
pendent organisations (Switzer 2007; H€am€al€ainen et al. 2000). Independent tradersare allowed to sell energy using any network, making this the actual point of sale
for deciding whether to go with a more or less green energy solution; in effect, eco-
labelling of energy imposes challenges of credibility (Banerjee and Solomon 2003).
Traditional distribution companies are granted a monopolistic status and remain
regulated, bound to a public service obligation (PSO) regime that limits funding,
investment and economic potential for innovation (Jamasb and Pollit 2011). The
partial deregulation affects only a select few issues, leaving the remainder highly
regulated (Carpio and Margueron 2009; Olsen et al. 2006); governmental control
mechanisms are prevalent throughout the energy system (Luiten et al. 2006).
The introduction of ICT reshapes the electricity grid and realises the ‘smart’
element in ‘smart grid’ (Bengtsson and Ågerfalk 2010; Jenkin et al. 2010;
J€arventausta et al. 2010; Sisley 2007). The ICT technology stack is thus an enabling
technology for smart grids, merging communication and information. The studies
described below seek to identify the interrelations of these technologies. Low-
power short-range communication and distributed databases are of interest.
Sustainable ICT (‘green IT’) and ICT for application in sustainable contexts are
often confused, but a strong sharing of concepts and technologies exists between
these two notions (Harmon et al. 2010).
Within the context of innovation, fundamental questions are how to define
innovation, the targets and scope of innovation, the drivers of innovation and the
system of innovation. Schilling (2008) describes the strategic nature of innovation.
Nonaka and Takeuchi (1996) propose to view innovation as a matter of organisational
knowledge creation. Davenport (1993) discusses the process of innovation. The
system of innovation is brought to the front, since the broadest conceivable form of
engagement and impact is present: the whole society. Carlsson et al. (2002) and
Edquist (2006) contribute to the detailed understanding of the systems of innovation.
In their discussion of cleaner technologies, Foxon and Pearson (2008) explore deeper
the drivers of and barriers to innovation. Kiesling (2010) deals with the specific
promotion of innovation in the electricity industry.
The time aspect of innovation (Luiten et al. 2006) and the character of the
innovation continuum characterise success potentials, success criteria and organi-
sation of the management of technology. Tidd et al. (2008) describe successful
management of technology based on modernistic, collaborative forms of companies
and organisation of work. Mirata and Emtairah (2004) unfold a case study of con-
tinuous innovation in cleantech, initiated and sustained through a regional industrial
cluster. Magnusson and Martini (2008) propose to see organisations in this area as
having a dual competency in operations and innovation. In the development of the
electricity industry, this might indicate a key focal point as this is exactly the
Utilities’ Technology Management of Smart Grid Innovation and Implementation 305

expectation held by consumers and regulators. Looy et al. (2005) support the view of
the dual competency, but they replace the term dual with ambidextrous, thus,
emphasising that innovation and operations are not parallels, but a matter of deeply
rooted competencies.
Management of technology (Nill and Kemp 2009) discusses radical innovation
in sustainable energy innovation and suggests three models: (1) strategic niche
management, (2) transition management and (3) time strategies. Further on in this
chapter, management of technology is the key notion as (1) smart grid is pervasive
and not a niche, (2) history of green energy has an intrinsic prolongation that
couples more to continuous approaches than clear transition and (3) time strategies
are generally superseded by financial constraints. This does not fully rule out the
possibility of disruptive innovation, but the empirical studies below do not currently
indicate that a major breakthrough is imminent. The host of technologies can be
observed and managed as a portfolio (McNally et al. 2009).
Additionally, with respect to the extended time horizon of the depicted
innovation object, technology roadmapping is expected to be a supporting disci-
pline (Harmon et al. 2010; Petrick and Echols 2004; Phaal et al. 2004). Systematic
prioritisation of the innovation effort is expected to be accomplished by means of
financial planning, innovation load, consumer adaption, business partner readiness
and management of changes to the ‘master planning’. Uncertainty seems strong and
the roadmapping must take care to include different scenarios.
Innovation and drivers for technological change are traditional areas of study
within the electricity sector (Hughes 1983). Life cycles for large electricity infra-
structures typically span 10–20 years for planning and construction, and the opera-
tional life is typically 30–50 years. In the context of smart grid for smaller energy
distribution companies, much product innovation is expected to take place within
suppliers and to be promoted by governmental incentives (Hendry et al. 2010). As
the companies are left with technical rather than technological solutions, innovation
is assumed to be directed towards screening, financing, implementation, operation,
marketing and life cycle management. Tidd et al. (2008) contribute to the understand-
ing of context definition, search, selection and implementation. Moreover, they
highlight the issue of ‘capturing the benefits of innovation’, which in this case is
remarkable as the companies only marginally reap the benefits of the innovation.
Companies might be regarded as contractors acting on behalf of society and
emphasising the governmental role.
4 National and Industrial Cases
Most electricity companies in Denmark are SMEs. Smart grids are orchestrated by
a central, governmentally controlled organisation, but local companies can pick and
choose from the technology stack. One overall system-responsible organisation has
issued this roadmap for top-level innovation and activities maturing over the next
10–40 years (Table 1):
306 T. Tambo

Heat pumps and electric vehicles are major factors because of their ability to
store and release fluctuant wind power. No particular approach to or explicit
reflection on management of technology is stated at Energinet.dk (2010), only an
underlying assumption of a necessity for change and development is perceptible.
Listed below are the cases where different local electricity companies are working
to respond to the challenge.
Forming part of a university-enterprise collaboration programme entails the
completion of a series of smaller feasibility studies. The aim of the individual
studies was to identify future perspectives in the electricity supply related to smart
grid – particularly networked technologies. The main business area of all the
companies is that of trading, selling or distributing electricity; most companies
distribute electricity, but some only sell (Table 2).
Most companies have less than five employees working directly with develop-
ment and planning of future technologies. There is a strong tradition throughout the
organisation of ongoing optimisation of existing and aged systems and components
in line with the continuous improvement discussion by Cole (2001).
The SW, SE, ED, MU and MI studies have a strategic and innovation-oriented
scope. SY, SE, SF and NR are more technical. As such, the studies represent a dual
approach in the understanding of the reality of the companies that have to face
intertwined technical and business/strategic issues. None of the companies see
themselves as ambidextrous. However, niches are found within the companies
insofar as very small teams work more holistically with selected aspects, such as
photovoltaic or farm biogas-powered electricity.
The companies find themselves at a very early stage of a very long and generally
very unclear technological and commercial trajectory. A quote from NR: ‘We have
now spent 40 years stabilising and cost-reducing the network. Now we are looking
at spending the next 40 years making the network more volatile and at higher costs’.
Mixed signals from governmental and regulatory bodies along with (fear of)
wrong or unclear technological decisions have the following consequences:
– No clear and specific national technological mandate exists.
– Feasibility studies are managed by the electricity companies by applying for
central funds – with no obligation to make permanent solutions, more meeting
demonstration purposes.
Table 1 Governmental roadmap for Smart Grid in Denmark (Energinet.dk (2010))
Phase
First: facilitation
2010–2012
Second: establishment
2013–2020
Third: commercialisation
2021–
Change in
society
Heat pumps (HP) gain
momentum
HP common
Small sales of EVs
HP dominant
EV common
First versions of EVs
Aim Mobilise actors Basic infrastructure Balance power grid using
smart gridAgree on standards Diffuse solutions
Key activities ICT standards
Roles and responsibilities
Smart grid market
mechanisms
Smart grid in everything
Optimisation
Commercialise smart
grid
Utilities’ Technology Management of Smart Grid Innovation and Implementation 307

Table 2 Empirical cases from the university-enterprise collaboration
Company Study orientation
Management of technology
emphasis
SE Electricity in partially deregulated markets is a
consumer product that needs to be sold to
customers reflecting customers’ buying
behaviour. Smart software solutions from the
mobile virtual network operator industry can
support younger, web savvy customers and
improve business processes
New technology for sales and
business integrationN/A
SW The company needs guidelines in terms of how to
balance between electricity from wind turbines,
garbage combustion, biomass combustion,
photovoltaic, biogas, natural gas and externally
produced electricity
Multi-source energy management
65.000
SF Reviewing communication protocol selection for
automatic metre reading. A host of wired and
wireless communication protocols in various
frequency bands (~bandwidth, ~interactivity)
has been tested and evaluated. Wireless M-
BUS seems to be the right choice despite little
operational track record
Establish wireless metres and
infrastructure9.000
NN Automatic metre maturity analysis. In-house
network technologies, access Net and
backbone network technologies have been
evaluated and tested in a multi-parametric
approach. Recommendations have been issued
as to supplier and network management
Metres and communication
technologies in shaping of the
future30.000
NR Capability review of information infrastructure
and proposal for long-term redesign of the
consumer-grid integration. NR lacks
infrastructure for the next step in billing
systems. The review points to solutions similar
to those of the SE company above, but NR is
constrained by older IT systems
Business process integration and
infrastructure adaption150.000
ED Larger consumers are critical in adapting to the
volatility of a renewable power source,
especially wind turbines. Since most large
consumers are already well optimised from a
technical viewpoint, new methods must be
used to ensure continuous improvements and
adaption to flexibility.
Strategic sales and marketing
using technologyN/A
MU Assuming that heat pumps are critical to the
inclusion of residential consumers in the smart
grid, the study aimed at assessing scenarios for
marketing, sales and service of heat pumps for
residential use
Creation of business plans for
heat pump marketing150.000
MI Screening for smart grid enablers and components
in a distribution network. Infrastructure is
assessed and found adequately sufficient for the
early phases of pragmatic smart grids, also with
Designing full scale ‘prosumer’
integration150.000
(continued)
308 T. Tambo

– ‘Unregulated’ competition among traditional and new suppliers of IT, infra-
structure, network equipment and metres increases the potential for making
wrong choices.
– Prohibition on adding charges to consumers or traders from distribution
companies; thus, smart grid enabling must be funded from operational income.
– Investments in domestic fibre-optic networks did not benefit smart grid enabling.
In management of technology, reluctance seems to prevail among companies
that see themselves as about to start or just having started with smart grids. Solid
and detailed long-term roadmaps sparsely exist, with political uncertainty. Sudden
events can also induce major changes, e.g. public acceptance of nuclear power
plants, environmental impact of onshore wind turbines, carbon capture and storage
technologies.
5 Discussion and Proposals
As an instrument for reducing the environmental footprint, smart grid is a critical
issue for both society and the utility enterprises. Central in this respect is the utility
enterprises’ ability to solve the issue. The case studies all include a broad network
of suppliers, and the companies are highly aware of the fact that innovation at
product and product system level is largely supplier-driven. Other types of
innovation include and (some) engage the customers. Neither of the projects
takes consumers’ requirements and expectations into account. The broad definition
of innovation indicated in Vergragt and Brown (2007), Herring and Roy (2007),
Ornetzeder and Rohracher (2006) and Gamser (1988) seems to be reflected in the
studies.
This study has found that the electricity companies are struggling to keep up
with societal policies on energy technology innovation. Companies strive for
stabilisation and regularity. Now they have to support far more diverse technologies
while coping finances and organisation. Also, several dead-end technologies are
continuously emerging and need to be kept ‘harmless’. The key finding is that the
companies have to free smart grid innovation from the embrace of dealing with
Table 2 (continued)
Company Study orientation
Management of technology
emphasis
observations of customers acting both as
consumers and producers (‘prosumers’)
SY As power line communication has become
commonplace in automatic metre reading,
various new issues influence the quality of the
reading process, e.g. outages and unavailability
stemming from load shift and phase changes
Early mover technology
development and optimisation250.000
Utilities’ Technology Management of Smart Grid Innovation and Implementation 309

everything and instead focus on an innovation management process only dealing
with high-prioritised technologies. Seen from the viewpoint of the companies, the
majority of which are consumer-owned; the problem is not so much a lack of
innovation in the industry, but far more a lack of methodologies suitable for
managing innovation. The electricity sector is divided into distribution, sales and
production of energy, making it even more difficult for the distribution companies
alone to manage the interlinking and infrastructure provision between the two other
parties and the consumers.
The findings are mostly applicable for smaller (SME) electricity distribution
and trading companies (<250,000 households) in industrialised areas potentially
with strong legislative regulation, monopolistic or public service obligations
(PSO) in casu Denmark. The selling of electricity to deregulated markets, as
done in the cases of SE and ED, adds further complexity, as SE and ED are
owned by the (small) monopolistic distribution companies (Switzer and Trouet
2007; H€am€al€ainen et al. 2000).
The cases demonstrate reliance on active participation in innovation ecosystems
(Snow et al. 2010), including university collaboration. Collaboration also exists
with national interest organisations and with selected groups of geographically
similar companies. Suppliers represent a very technically credible ecosystem but
tend to lock in on or be biased towards a specific technology and fail, for instance, to
fully comply with open standards. The collaboration approach adds an entrepre-
neurial dimension to smart grids in line with Miles et al. (2005) in sustaining
continuous innovation.
Business implications of smart grid innovation are expected to show us the
difference between winners and losers on the global energy arena; the social
implications of success, failure or reluctance might be devastating (Sharma and
Ruud 2003). The general assumption is that a modified and outspoken position on
dynamic prioritisation of technologies is required within management of technol-
ogy in the energy sector.
Solutions can be found by actively including smaller and larger consumers in the
smart grid development and by excluding distribution companies. Consumers can
be offered various incentives for using energy in a more green manner, e.g. by
buying eco-labelled power, using electric vehicles and heat pumps that poll central
data sources and subscribing to elevate levels of transparency with metre reading
technologies. The study described in Schultz and Tambo (2011) shows how larger
consumers can redefine their consumption profile – not as a technical project, but by
implementing a distinct organisational innovation system engaging a range of
company-internal competencies.
The study indicates that electricity distribution companies are able to improve
the utilisation of resources required for sustaining the management of technology in
smart grid by means of a series of potential initiatives, e.g.:
– Strict prioritisation of supported technologies
– Clear roadmapping of supported technologies and associated support systems
310 T. Tambo

– Shift the responsibility of making critical decisions onto the regulatory bodies
– Distribute responsibilities downstream to the consumers
– Support alternative vendors that have systems bypassing the electricity company
– Embrace a clearer dual self-perception in the innovation and operation activities
– Decide clearly on internal or external innovation and vendor roles
The argument emerging from the discussion above is that management of
technology is a requisite element of smart grid innovation. Nill and Kemp
(2009) also suggest taking into consideration radical or disruptive innovation
possibly relating to some aspects of smart grid innovation, e.g. certain network
product technologies or agreed standards. The cases, however, indicate a breadth
and a time extent of implementation, marketing, financing and support, making
at least the non-product innovation call for management of technology
approaches. The roles played by government may blur the picture (Hendry et al.
2010) as it (1) can provide direct funding, (2) by legislation may enforce certain
groups to finance the innovation, (3) as a regulator is in a position to withdraw
monopoly licences and pass the licences to stronger market actors and (4) can set
up legislative frameworks for both producers and consumers for how green the
energy should be. If the role of the government is this strong, then an aspect of
‘enforced management of technology’ gains relevance. This contradicts with
a benevolence of the technology.
Companies are found to be highly aware of their task and of the innovative
character. Collaboration is widespread, but not ‘ideal’ and equal, as government
and suppliers are taking the lead. The idea of management of technology is
attractive but troublesome for the smaller and/or the financially troubled
companies. The innovation types are centred around the product system, but there
are indications of, e.g. marketing (MU) and customer internal innovation (ED)
being potential alternative innovation types. The companies’ organisational
innovation system has not been detailed in this study, but this system would
tentatively be expected to drive the management of technology: As this chapter
focuses on smaller companies, innovation systems for management of technology
have not been easily identifiable as they tend to be deeply embedded in the
organisation. The idea of embeddedness leads to the relevance of observing the
whole company as having dual or even ambidextrous competencies (Magnusson
and Martini 2008; Looy et al. 2005).
In terms of suggestions for further work, it would primarily be interesting to look
into the outcome of the specific projects in relation to the use of explicit manage-
ment of technology tools. In this connection, it would be interesting to observe the
performance of the smallest versus the largest of the companies with respect to the
transformation of experimentation into operations and their respective abilities to
deliver the environmental promises of smart grid. As with the timeline in Table 1,
there are high expectations but vague recommendations in many years to come. The
internal versus the external drive and yield of innovation would also be interesting
to monitor.
Utilities’ Technology Management of Smart Grid Innovation and Implementation 311

6 Conclusion
This chapter has discussed smart grid as a management of technology object for
utility enterprises – primarily electricity. Smart grid’s institutionalisation into
national and international standards, encompassing a wide range of different
geographical and demographical conditions, might make it highly difficult to
implement at local levels. The fact that there are about 100 rather autonomous
electricity companies in a relatively small country makes smart grid innovation and
adoption a challenge. Nevertheless, 22% of all smart grid projects are carried out in
Denmark (JRC 2011). The studies presented in the case section indicate a piece-
meal and pragmatic approach.
With a global and national push on greener technologies, smart grid is an
excellent case of mandated innovation transferring into a management of technol-
ogy complex. It is driven by political and environmentalist initiatives influenced by
financial and market aspects. This chapter suggests a stronger and more explicit
management of technology policy formulation at both national and local level. At
an intermediate level, it would be beneficial to develop from ‘random’ experiments
to a higher degree of systematic transformation.
This chapter has studied smart grid innovation under the lens of management
of technology. Smart grid innovation would strongly benefit from the inclusion of
a more distinctive adherence to the use of management of technology, with individual
companies and ecosystems as the critical factors. Management of technology theory
provides an applicable framework for organising and structuring smart grid inno-
vation. With this conclusion, smart grid has just embarked on a journey pointing
at least 40 years ahead, a journey that requires constant momentum. The companies
are certainly on a new path with speed and a magnitude comparable to the electricity
innovation of the early days as described by Hughes (1983).
References
Banerjee A, Solomon BD (2003) Eco-labeling for energy efficiency and sustainability. Energy
Policy 31:109–123
Bengtsson F, Ågerfalk PJ (2010) Information technology as a change actant in sustainability
innovation. J Strateg Inf Syst 20(1):96–112
Bhanhoo S (2010) China’s smart grid investments growing. New York Times, February 1
Brem A, Voigt K-I (2009) Integration of market pull and technology push in the corporate front
end and innovation management. Technovation 29:351–367
Carlsson B et al (2002) Innovation systems: analytical and methodological issues. J Res Policy
31:233–245
Carpio L, Margueron M (2009) Future strategies for distribution concessionaires in partially
deregulated electric power sectors: Brazil. Electr J 22(7):70–80
Cole RE (2001) From continuous improvement to continuous innovation. Calif Manag Rev 40
(5):8–30
Davenport TH (1993) Process innovation. Harvard Business School Press, Boston
312 T. Tambo

Edquist C (2006) System of innovation – perspectives and challenge. In: Fagerberg J et al (eds)
The Oxford handbook of innovation. University Press, Oxford, pp 182–208
Energinet.dk (2010) Smart grid I Denmark (in Danish). Energinet.dk, Fredericia
Foxon T, Pearson P (2008) Overcoming barriers to innovation and diffusion of cleaner
technologies: a sustainable innovation. J Clean Prod 16:148–161
Gamser MS (1988) Power to the people – technology users and management of energy innovation.
Energy Policy 16(1):27–35
Garrity TF (2009) Innovation and trends for future electric power systems. In: Proceedings of the
power systems conference 2009
Goodman PS, Griffith TL (1991) A process approach to the implementation of new technology.
J Eng Technol Manag 8:261–285
H€am€al€ainen R et al (2000) Cooperative consumers in a deregulated electricity market. Energy Int
J 25:857–875
Harmon R, Daim T, Raffo D (2010) Roadmapping the future of sustainable IT. In Portland
international conference on management of engineering and technology (PICMET), 18–22
July, Phuket
Hendry C, Harborne P, Brown J (2010) So what do innovating companies really get from publicly
funded demonstration projects and trials? Energy Policy 38:4507–4519
Herring H, Roy R (2007) Technological innovation, energy efficient design and the rebound effect.
Technovation 27:194–203
Hughes TP (1983) Networks of power: electrification in western society, 1880–1930. The Johns
Hopkins University Press, Baltimore
Ilic M (2010) Transforming SCADA into dynamic monitoring and decision systems: the missing
link in smart grids. In: Power and Energy Society general meeting, 2010, IEEE
Jamasb T, Pollit MG (2011) Electricity sector liberalisation and innovation: an analysis of the
UK’s patenting activities. Res Policy 40:309–324
J€arventausta P, Repo S, Rautiainen A, Partanen J (2010) Smart grid power system control in
distributed generation environment. Annu Rev Control 34:277–286
Jenkin T, Webster J, MacShane L (2010) An agenda for ‘Green’ information technology and
systems research. Inf Organ 1:1–24
Joosting J-P (2010) Smart grid spending expected to top $45 billion by 2015. EE Times. July 8,
2010. Retrieved from http://eetimes.eu
JRC (2011) Smart grid projects in Europe: lessons learned and current developments. European
Commission Joint Research Centre Institute for Energy, Petten
Kiesling LL (2010) Promoting innovation. Institute of Economic Affairs, London
Koch C et al (2008) Institutionalized technological foresight – methods, impact and role in policy
making and business development. In: Proceedings of IAMOT, Dubai, UAE
Lichtenthaler E (2006) Technology intelligence identification of technological opportunities and
threats by firms. Int J Technol Intell Plan 2(3):289–323
Looy Bv, Martens T, Debackere C (2005) Organizing for continuous innovation. Creativity Innov
Manage 14(3):208–221
Luiten E, Lente H, Blok K (2006) Slow technologies and government intervention: energy
efficiency in industrial process technologies. Technovation 26:1029–1044
Magnusson M, Martini A (2008) Dual organisational capabilities: from theory to practice – the
next challenge for continuous innovation. Int J Technol Manage 42(1/2):1–19
McNally RC et al (2009) Exploring new product portfolio management decisions: the role of
managers dispositional traits. Ind Mark Manag 38(1):127–143
Meeus L, Saguan M (2011) Innovating grid regulation to regulate grid innovation: from the
Orkney Isles to Kriegers Flak via Italy. Renew Energy 36:1761–1765
Miles RE, Miles G, Snow CC (2005) Collaborative entrepreneurship: a business model for
continuous innovation. Organ Dyn 35(1):1–11
Mirata M, Emtairah T (2004) Industrial symbiosis networks and the contribution to environmental
innovation: Landskrona. J Clean Prod 13:993–1002
Utilities’ Technology Management of Smart Grid Innovation and Implementation 313

Nill J, Kemp R (2009) Evolutionary approaches for sustainable innovation policies: from niche to
paradigm? Res Policy 38:668–680
Nonaka I, Takeuchi H (1996) A theory of organizational knowledge creation. IJTM Special Publ
Unlearn Learn 11(7/8):833–845
Olsen OJ, Johnsen TA, Lewis P (2006) A mixed nordic experience: implementing competitive
retail electricity markets for household. Electr J 19(9):37–44
Ornetzeder M, Rohracher H (2006) User-led innovations and participation processes: lessons from
sustainable energy technologies. Energy Policy 34(2):138–150
Petrick I, Echols AE (2004) Technology roadmapping in review: a tool for making sustainable new
product. Technol Forecast Social Change 71:81–100
Phaal R, Farrukh CJP, Probert DR (2004) Technology roadmapping—a planning framework for
evolution and revolution. Technol Forecast Social Change 71:5–26
Regeringen (2011) Energistrategi 2050. The Danish Government, Copenhagen
Schilling MA (2008) Strategic management of technological innovation. McGraw-Hill, New York
Schultz S, Tambo T (2011) Organisational innovation systems for a greener industry. In:
Proceedings of the 20th IAMOT, Miami, FL
Sharma S, Ruud A (2003) On the path to sustainability: integrating social dimensions into the
research and practice. Bus Strateg Environ 12:205–214
Shum KL, Watanabe C (2009) An innovation management approach for renewable energy
deployment—the case of solar photovoltaic. Energy Policy 37:3535–3544
Sisley E (2007) Enterprise architecture for the smart grid: a status update. Carnegie-Mellon.
Online at http://www.sei.cmu.edu
Snow CC, Fjeldstad ØD, Lettl C, Miles RE (2010) Organizing continuous product development
and commercialization. J Prod Innov Manage 28:3–16
Switzer S, Trout JP (2007) The “optimal” structure of the deregulated electric utility industry.
Electr J 20(6):8–17
Tambo T (2011) Smart grid innovation management for SME Electricity Companies. In:
Proceedings of the CINET 2011, Aarhus, September 2011
Tidd J, Bessant J, Pavitt K (2008) Managing innovation – integrating technological, market and
organizational change. Wiley, Chichester
Tsoutsos T, Stamboulis Y (2005) The sustainable diffusion of renewable energy technologies as an
example of an innovation-focused policy. Technovation 25:753–761
Vanston J (2003) Better forecasts, better plans, better results. Res Technol Manage 46(1):47–58
Vergragt PJ, Brown HS (2007) Sustainable mobility: from technological innovation to societal
learning. J Clean Prod 15:1104–1115
Wissner M (2011) The smart grid – a saucerful of secrets? Utilities Policy 19:14–19
314 T. Tambo

Towards Patients as Innovators: Open
Innovation in Health Care
Christoph W. Kuenne, Kathrin M. Moeslein, and John Bessant
1 Introduction
While other big industries have adopted the advantages of the information
technology age since the 1980s (Von Hippel 1988; Schepers et al. 1999), the health
care sector has been quite hesitating to do similarly, especially in support of
coordination and cooperation between institutions. Now the influence of techno-
logical advance on health care is likely to further increase (Randeree 2009).
One of the recent developments in the health care sector, termed Health 2.0, hasbeen the use of Internet or Web 2.0-based technology in health care (Van De Belt
et al. 2010; Oh et al. 2005). Recent studies give evidence that the number of
Internet users worldwide that go online for health-related purposes is growing
significantly (Kummervold et al. 2008). Over the past few years, many online
platforms for consumers of health care have arisen to give information about
disorders and to facilitate networking with like-minded sufferers. The imple-
mented functionality ranges from simple information distribution and general
C.W. Kuenne (*)
Institute of Information Systems, University of Erlangen-Nuremberg,
Nuremberg, Germany
e-mail: [email protected]
K.M. Moeslein
Institute of Information Systems, University of Erlangen-Nuremberg,
Nuremberg, Germany
HHL – Leipzig Graduate School of Management, Leipzig, Germany
e-mail: [email protected]
J. Bessant
University of Exeter Business School, Exeter, UK
Institute of Information Systems, University of Erlangen-Nuremberg,
Nuremberg, Germany
e-mail: [email protected]
Department of Management Studies, Indian Institute of Science, Bangalore,
Driving the Economy through Innovation and Entrepreneurship,DOI 10.1007/978-81-322-0746-7_26, # Springer India 2013
315

health advice to highly active patient communities specialized on rare conditions.
Also, some of the platforms integrate elements of open innovation – if it is
bringing people together who have not exchanged ideas and knowledge before –
or solution-oriented discussions around users’ problems. Some reports herald that
Web-based tools in health care are powerful and radical means to changing
current roles of health care consumers as well as professionals and medical
practice (e.g. Christensen et al. 2009).
Surprisingly, given recent trends and challenges in the areas of health care,
notably Health 2.0, and innovation management, notably open innovation, the
innovation potential of Health 2.0 is still under-researched. The aim of this study
is to further knowledge in the area. This chapter provides the essential systematiza-
tion of online platforms in the Health 2.0 space and goes beyond existing knowl-
edge by applying an innovation perspective. The research presented here starts to
build knowledge in the field, led by the following research questions:
1. How can Health 2.0 platforms be systemized within an innovation-orientedtaxonomy?
2. What are preliminary learnings from a large-scale open innovation pilot in thisfield?
In the following section, we start answering the questions by presenting the
state of knowledge in the field. Then, we describe the methods of our empirical
study (cf. Sect. 3), followed by the presentation of findings (cf. Sects. 4 and 5).
A discussion of results, limitations, and future research closes this chapter.
2 Setting the Scene
2.1 Web 2.0 in Health Care
Compared to Web 1.0, the so-called first generation of the Internet, the difference
of Web 2.0 is foremost about user participation, openness, and network effects
(Musser and O’Reilly 2007; O’Reilly 2005). Users can more easily create, add,
and publish information and content to the Web. For that reason, Web 2.0 has also
been called ‘social Web’, and the amount of user-generated content has increased
enormously (OECD 2007). This recent trend has also shown impact on health
care-related online offers which is then described as Health 2.0 (Van De Belt et al.2010; Eysenbach 2008; Hughes et al. 2008). There is still no general consensus
regarding the definition of Health 2.0. Van de Belt et al. (2010) performed a
systemic literature review and came up with 46 unique definitions of which 9
definitions were found in scientific literature, while the rest originated from grey
literature. They conclude by finding seven leading themes within all definitions
(see Table 1).
316 C.W. Kuenne et al.

2.2 Imperative for Open Innovation
One approach, advocated in the UK-based Wanless report (Wanless 2002), placed
considerable weight on the role of the patient as a key architect in developing
health care systems for the future. It emphasizes that better access to information
can help patients to be fully involved in decisions, not just about treatments, but
also about the prevention and management of illness. With user involvement
gaining more importance, the role of the patient is moving beyond an ‘informed
consent’ to an ‘informed choice’.
This mirrors the wider moves towards what Von Hippel calls the democratizationof innovation and implies much higher levels of user engagement in design and
development of customized solutions matched to local and specific needs rather than
a generic ‘one size fits all’ approach (Von Hippel 2005). Related to the increasing
need for innovation in health care, there is a paradigm shift in managing innovation.
Often referred to as open innovation (Chesbrough 2003), this approach is about
achieving and sustaining a higher degree of innovation by opening up the tradition-
ally closed innovation process. It suggests that the process of product and service
development should better integrate and leverage external knowledge resources
provided by a wide range of external actors, such as customers and users. These
external actors enable the innovating organization to learn more easily about their
needs and to benefit straight away from their solution proposals for specific problems
they might already have in mind.
Clearly there is considerable potential in approaches which mobilize a wider
community, including patients and carers as part of the ‘innovation front end’ in
health care. One powerful set of tools, already widely used in industry to enable
open innovation, are those which mobilize the enormous reach of the Internet to
create platforms on which shared exploration of health care challenges can take
place involving a wide community (Bessant et al. 2012). The emergence of
interactive capabilities in the online space can be an effective source of jointly
constructed and shared knowledge through participation of patients, caregivers,
health professionals, researchers, and others.
Table 1 Recurrent themes within definitions of Health 2.0 (Van De Belt et al. 2010)
1. Web 2.0 technology: Web 2.0 as the underlying technology for communication and
information sharing
2. Consumers
involvement:
Increased participation or empowerment of patients or consumers of
health care
3. Professionals
involvement:
Apart from health care consumers only, increased participation or
empowerment of health professionals or other stakeholders, e.g.
payers, providers, researchers
4. Communities: Emergence of online communities and social networking in Health 2.0
5. Collaboration: Improving collaboration between patients and health professionals
6. Health data: Stronger focus on health information and content, one that is patient-
driven or user-generated
7. Change of health
care:
Positive impact or change on the health care system in terms of higher
quality and efficiency in health care
Towards Patients as Innovators: Open Innovation in Health Care 317

3 Method
As practice and research in the field of Health 2.0 is still recent, we chose an
exploratory approach to study contemporary real-world innovation practices1.
Data collection and analysis is based on the following four steps. First, weidentified several hundreds of health- or medicine-related online platforms
while focusing on English or German language websites only. This search process
mainly employed (1) cases found via Google Web search, (2) referenced cases
mentioned in the literature, and (3) referenced cases mentioned during the
practitioner-oriented Health 2.0 conference series 2011. With this at hand, we
created an empirical set of 122 health websites that follow the Web 2.0 criteria.
Purely static health websites with no interaction functionalities for the users were
disregarded. Second, we conducted linear analytical in-depth case studies on the
sites functionalities (Yin 2003). Collecting data followed the same procedure for
each platform: after registering a user account, relevant information, and key
characteristics were compiled from public and member areas. As a result, we
created case vignettes for each of them. Third, we derived a systematization
according to the pattern-matching approach (Yin 2003). At this point, we create
a taxonomy which identifies recurring types of Health 2.0 platforms. Fourth and
lastly, we present experience and preliminary findings from design-oriented
research: under the leadership of the second author, a large-scale research pilot
in the focus area of rare diseases has been implemented and evaluated to gather
first-hand experience from integrating patients as innovators in an open
innovation environment.
4 Classifying Health 2.0 Platforms
In the following, we propose possible dimensions of a classification approach for
Health 2.0 platforms. It is taking an innovation-oriented perspective while leaning
on the groups of innovators involved as well as the expected innovation outcome
(Kuenne et al. 2011).
4.1 Groups of Innovators
With the recent shift towards open innovation, innovation processes have to
integrate three distinct types of innovators: core inside innovators, peripheral inside
innovators, and outside innovators (Neyer et al. 2009). Traditional research and
development (R&D) departments, classified as core inside innovators, hold a
1 This paper builds on and advances previous research that has been submitted to the 2011 World
Conference on Mass Customization, Personalization, and Co-Creation (MCPC).
318 C.W. Kuenne et al.

central responsibility on filling the innovation pipeline with promising ideas.
Employees from other departments than R&D are named peripheral insideinnovators. This group is not directly responsible for innovation. Through their
daily job though, they gain relevant experience and knowledge that can be a
valuable contribution to the innovation process. Beyond the organization’s
boundaries, outside innovators represent all external players like customers,
users, retailers, suppliers, and competitors. When they participate in the innovation
process, their heterogeneous backgrounds and the outside-in perspective can create
enriching contributions.
Hence, one way to classify Health 2.0 platforms is to look at the groups of
innovators involved in health care. The patient stands at the end of a complex
industry whose leading rationale is to improve health care. The patient is both
actuator and receiver of all health-related efforts. Accordingly, the differentiation
of the three types of innovators introduced before needs to be adjusted and led by a
patient-centric perspective.
From the perspective of a patient, there are numerous relationships to problem
solvers who can deal with the patient’s health problems. In the first place, it is the
patient’s relationship to any sort of care providers, such as a dedicated general
practitioner who typically has the best overview of the patient’s health status. In the
course of medical treatment, the GP might send the patient to medical specialists for
further examination. In addition to the GP, the patient could consult other health
professionals and medical experts on a one-to-one basis, ranging from technical
encyclopaedia to health counsellors from industry partners. We consider the differ-
ent instances of medical experts described here as core inside innovators – they all
share a direct and very close relationship to the patient while acting as qualified
problem solvers for the patient’s health issues.
As a consequence of Health 2.0, the traditional one-to-one relationship between
doctor and patient is supplemented by a number of new relationships with like-
minded people. Here, one major group consists of fellow patients who suffer from a
similar disease pattern and also their caregivers and family relatives who suffer
indirectly. They all have acquired relevant experience and knowledge in the same
field. As fellow sufferers are less familiar with the patient’s detailed situation than
the supervising GP but still can share relevant experience, this group could be
considered as peripheral inside innovators from a patient-oriented perspective.Other stakeholders who do not directly share disease experience with the patient
make up a third type of innovator. They can contribute specific technical knowledge
in order to solve, or at least facilitate dealing with, the patient’s health problem.
These could come from the afore-introduced side of suppliers, payers, and
regulators. Typical examples are industry partners like medical device manufa-
cturers or service businesses specialized on a particular aspect of medical care.
According to the previous logic of patient-centric perspective, we consider this
group as outside innovators.To conclude, one approach to classify Health 2.0 platforms is about
patient-related innovator groups consisting of three clusters: (1) medical expert-
to-patient relationships, (2) patient-to-patient relationships, and (3) other
Towards Patients as Innovators: Open Innovation in Health Care 319

stakeholder-to-patient relationships. It is conceived as a shell model, which means
that, for example, patient-to-patient relationships are consecutively based on
expert-to-patient relationships (see Fig. 1).
4.2 Degree of Innovation
An important aspect of innovation is the degree of novelty involved. Obviously,
upgrading minor details of a product like improving medical care through
new ways of servicing is not the same as finding a formula fighting an HIV
infection or a rare disease. There is a continuum reaching from incremental
improvements to radical changes (Garcia and Calantone 2002; Tidd et al. 2005).
Incremental innovations are more widely seen in practice than ‘new to the world’
products. The cumulative gains in efficiency which come along with incremental
changes are often larger over time than gains from occasional radical innovations.
In contrast to incremental improvements, radical innovations change the
‘rules of the game’ and challenge the boundary conditions (technology, markets,
social, regulatory, etc.), but they enable a totally new opportunity space for
innovation (Foster and Kaplan 2001; Francis and Bessant 2005). Radical
innovations account for only 6–10% of all innovation projects (Ettlie 1999).
Yet, it is important to note that it is the perceived degree of novelty which matters
(Tidd et al. 2005).
Patient Stakeholder
Patient Patient
Patient Expert
E.g. classical relationship
Patient – Doctor
E.g. Patient –Industry to
facilitate clinical trials
Collective interaction in virtual
communities
# of people
Fig. 1 Classical relationship patient-doctor enhanced by relationships created in virtual
communities
320 C.W. Kuenne et al.
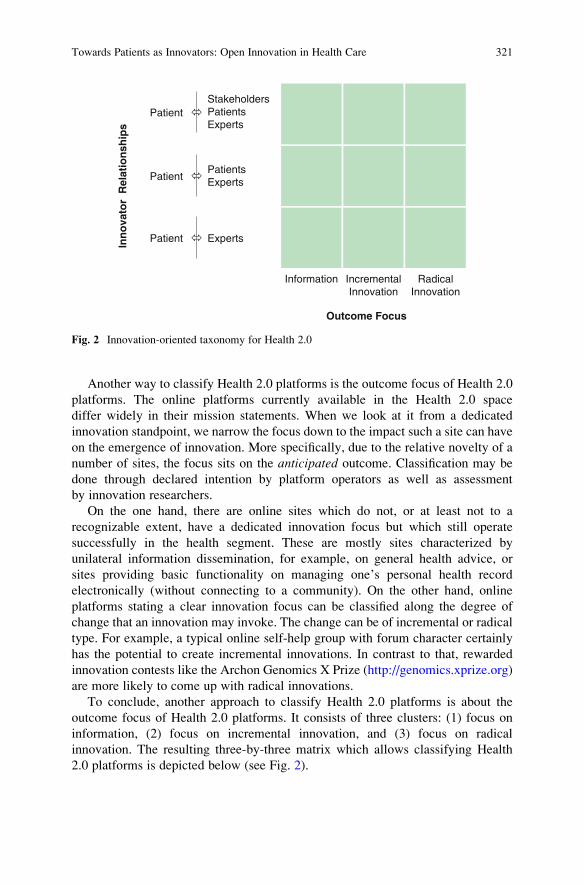
Another way to classify Health 2.0 platforms is the outcome focus of Health 2.0
platforms. The online platforms currently available in the Health 2.0 space
differ widely in their mission statements. When we look at it from a dedicated
innovation standpoint, we narrow the focus down to the impact such a site can have
on the emergence of innovation. More specifically, due to the relative novelty of a
number of sites, the focus sits on the anticipated outcome. Classification may be
done through declared intention by platform operators as well as assessment
by innovation researchers.
On the one hand, there are online sites which do not, or at least not to a
recognizable extent, have a dedicated innovation focus but which still operate
successfully in the health segment. These are mostly sites characterized by
unilateral information dissemination, for example, on general health advice, or
sites providing basic functionality on managing one’s personal health record
electronically (without connecting to a community). On the other hand, online
platforms stating a clear innovation focus can be classified along the degree of
change that an innovation may invoke. The change can be of incremental or radical
type. For example, a typical online self-help group with forum character certainly
has the potential to create incremental innovations. In contrast to that, rewarded
innovation contests like the Archon Genomics X Prize (http://genomics.xprize.org)
are more likely to come up with radical innovations.
To conclude, another approach to classify Health 2.0 platforms is about the
outcome focus of Health 2.0 platforms. It consists of three clusters: (1) focus on
information, (2) focus on incremental innovation, and (3) focus on radical
innovation. The resulting three-by-three matrix which allows classifying Health
2.0 platforms is depicted below (see Fig. 2).
Information IncrementalInnovation
Outcome Focus
Inn
ova
tor
Rel
atio
nsh
ips
RadicalInnovation
StakeholdersPatientsExperts
Patient
PatientsExpertsPatient
ExpertsPatient
Fig. 2 Innovation-oriented taxonomy for Health 2.0
Towards Patients as Innovators: Open Innovation in Health Care 321

4.3 Qualifying the Taxonomy
Popular examples of health-related sites in the USA are, for example, WebMD(http://www.webmd.com), Yahoo Health (http://health.yahoo.net), and RevolutionHealth (http://www.revolutionhealth.com). These sites are mainly one-way infor-
mation resources for health seekers, ranging from general health advice to more
troublesome disorders like cancer or heart disease. Each article is reviewed by one
or more physician editors before publication. Revolution Health also uses patient
chat groups to multiply results, but the perspective remains centred on the single
consumer. The outcome focus of these three sites certainly does not lie on
innovation creation, but information dissemination. So we propose to classify
WebMD and Yahoo Health into the lower-left field of the taxonomy, and RevolutionHealth due to its additional forum approach into the middle-left field.
Established patient support groups can be found on, for example, DailyStrength(http://www.dailystrength.org) and CureTogether (http://www.curetogether.
com). Focus lies on sharing knowledge, experience, and support in active discus-
sion boards, which eventually leads to incremental innovation. We consider
these examples to be located in the very middle field of the taxonomy. A further
advanced example is PatientsLikeMe (http://www.patientslikeme.com), an online
community for patients with life-changing diseases. At PatientsLikeMe, physiciansare not directly involved in the interactions taking place on the site. But still,
there are medical experts. It needs thorough understanding of each supported
condition to create structured profile masks enriched by meaningful metrics and
graphs as available on PatientsLikeMe. The expert knowledge lies in there.
More obvious is the interaction between patients which needs no further comment
here. Industry or non-profit partners are able to create subpages on the site and,
thus, can reach out to patients for, for example, trial recruitment, education
purposes, or sentiment analysis. Furthermore, the site presents radically new
ways of exploiting patient-reported health data and accelerating research. For
the above reasons, we rank PatientsLikeMe in the upper-right field of the
taxonomy.
Another innovatory example is GemeinsamSelten (http://www.gemeinsamselten.
de), mainly an open innovation platform and community for patients and affected
people of rare diseases. This platform connects patients to a multitude of possible
problem solvers like caregivers, researchers, engineers, and other patients.
Unlike PatientsLikeMe, this site has an almost exclusive focus on innovation
creation through the open collection of problems and ideas for potential solutions
and the support of a joint development of innovative solutions. Other studies
have already reported about user innovation and its contribution on radical
innovations (Lettl et al. 2006; Piller andWalcher 2006). Hence, we assume similar
potential for GemeinsamSelten and position it in the upper-right field of the
taxonomy. All above-mentioned platforms are rendered in the taxonomy below
(see Fig. 3).
322 C.W. Kuenne et al.

5 Piloting Open Innovation in Health Care: The Case
of GemeinsamSelten (‘Together Rare’)
5.1 Pilot Description
On the platform GemeinsamSelten (http://www.gemeinsamselten.de), users can
initiate and participate in finding ideas and solutions that help people affected by
a rare disease. The site, which has gained over 180,000 visitors, more than 1,100
members that are engaged in more than 200 problems and innovative solutions
since its launch in March 2011, and that addresses so far a German-speaking
community only, accommodates three main functional components: a social net-
work, a marketplace for exchanging problems and ideas for potential solutions, and
an open innovation initiative based on a series of contest-like challenges.
The platform strives to collect problems of rare disease patients and ideas
for potential solutions and, thereby, increase public awareness. The collective
aim of people engaging in innovation activities on the platform is to jointly
develop innovative solutions for the patients’ reported problems. Across the
great variety of illnesses, patients and their families are often confronted with
similar types of problems. The site targets people who know about the daily
troubles of rare disease patients – may it be the patient himself or persons
concerned. These people might have thought about tricky problems, possible
solutions, and even practical implementations. However, in order to become a
participating member, interested people do not have to possess experience on rare
conditions. The intention of the site is to bring people from diverse backgrounds
Information IncrementalInnovation
Outcome Focus
Inn
ova
tor
Rel
atio
nsh
ips
RadicalInnovation
StakeholdersPatientsExperts
Patient
PatientsExperts
Patient
ExpertsPatient
Fig. 3 Selected Health 2.0 cases populated into the taxonomy
Towards Patients as Innovators: Open Innovation in Health Care 323

together – if they are caregivers, health workers, physicians, and nurses
(i.e. core inside innovators); family members, friends, and fellow patients (i.e.
peripheral inside innovators); or researchers, engineers, product managers, and
civil servants (i.e. outside innovators).
The research group behind the platform organizes so-called challenges in whichparticipants can compete for the best ideas for potential solutions. During a chal-
lenge, which lasts approximately 3 months, participants can present unsolved
problems, submit solution proposals, and collectively work on refining ideas and
concepts. At this point, the social community features of the site enable members
to create a personal profile, connect to others, discuss ideas, and comment on
others’ contributions. Proposals for solutions on GemeinsamSelten can cover
descriptions on technical aids and products, medical and caregiving services,
medical-technical services, or housekeeping and social services. After the closing
date of each challenge, a jury of multidisciplinary experts evaluates submitted
concepts and nominates the most promising ones.
GemeinsamSelten is part of an overall initiative of the German Federal Ministry
of Education and Research. The term ‘Gemeinsam fuer die Seltenen’ can be
translated as ‘jointly fighting rare diseases’ or ‘together rare’. It shall illustrate
the point that the many are collaborating to support the few. In brief, the platform
has three distinctive features: it (1) creates a community with people from diverse
backgrounds to promote knowledge exchange and collaborate on innovative
concepts, (2) collects patient’s problems, needs, but also ideas for potential
solutions in a central place, and (3) organizes a series of innovation contest-like
challenges to find promising solutions for improving the quality of life of rare
disease patients.
5.2 Preliminary Pilot Results
It is a designated goal of the pilot to attract participants from different backgrounds,
such as suffering patients as well as the interested public. While registering to the
platform, new participants can indicate one out of nine different roles. An analysis
on the distribution of roles is shown in Table 2 for the period from March to June
2011 (Bullinger et al. 2012). Clearly, most participants chose the role ‘patient’
which corresponds to initial expectations given the design of the platform. More
surprisingly, the role ‘interested person’ constitutes the second largest group
representing roughly one third of all participants. As a preliminary indication, it
seems that the well-disposed public has a genuine interest in being more actively
integrated in finding ways to better health care.
Furthermore, only ‘patients’ and ‘family members’ were allowed to specify their
disease pattern during the registration process. Out of total 450 ‘patients’ and
‘family members’ (see Table 2), 191 of such participants indicated an affiliation
with 145 different diseases. As the analysis on the distribution of different diseases
unveils (see Table 3), 82% of all diseases being reported only occur once (Bullinger
324 C.W. Kuenne et al.

et al. 2012). Due to the fact that the pilot platform addresses all rare diseases while
not making any further restrictions, this diversity among registered diseases is in
line with initial expectations. It could be interpreted as a large diversity of experi-
ential and clinical backgrounds as well.
6 Discussion and Conclusion
One fruitful direction for many public and private sector organizations has been to
seek the ideas and involvement of their users – and the potential certainly exists for
doing so within health care. There are many examples where patients have played a
key role in developing solutions to their health care challenges – and there is
evidence that this process is accelerating. In this chapter, we have tried to focus
on one of the new avenues along which such engagement might take place – the
growing use of online and interactive platforms in the health care sector, often
termed as Health 2.0.
Health 2.0 platforms with a strong innovation focus seem especially promising
for two reasons. Firstly, Web 2.0 technologies offer a growing number of ways in
which patients can acquire a voice on the Internet – and through which it can be
heard by others, and the conversations move towards shared solution generation.
Secondly, patients and other stakeholders that get involved as innovators provide
important information on needs and potential solutions. In peer-led patient
Table 2 Roles of
participantsRole of participant Number Percent (%)
Patient 358 45
Interested person 283 35
Family member 92 11
Innovator 19 2
Health care employee 16 2
Researcher 16 2
Supporter 9 1
Caregiver 5 1
Physician 5 1
Total 803 100
Table 3 Diversity of
registered diseasesRecurrence of registered diseases Number Percent (%)
1x 119 82
2x 17 12
3x 3 2
4x 3 2
5x 1 1
6x 2 1
Total 145 100
Towards Patients as Innovators: Open Innovation in Health Care 325

communities, this means that patients (and their carers) can not only provide each
other with knowledge and support – they can also jointly engage in the development
of innovation concepts and innovative solutions in the context of the respective
disorder. Such communities, characterized by a high degree of interaction between
users, and reciprocal exchange of information have been shown to be powerful
engines of innovation.
Acknowledgements This research was partially supported by the German Federal Ministry of
Education and Research (project EIVE, 01FG09006). The sponsor had no role in the study design,
the collection, analysis and interpretation of data, the writing of the report, or the submission of the
paper for publication.
References
Bessant J, Kuenne CW, Moeslein KM (2012) Opening up healthcare innovation: innovation
solutions for a 21st century healthcare system. Advanced Institute of Management Research,
London
Bullinger AC, Rass M, Adamczyk S, Moeslein KM, Sohn S (2012) Open innovation in health care:
analysis of an open health platform. Health Policy 105(2–3):165–175
Chesbrough HW (2003) Open innovation: the new imperative for creating and profiting from
technology. Harvard Business School Press, Boston
Christensen C, Grossman JH, Hwang J (2009) The innovator’s prescription: a disruptive solution
for health care. McGraw-Hill, New York, 496 pp
Ettlie J (1999) Managing innovation. Wiley, New York
Eysenbach G (2008) Medicine 2.0: social networking, collaboration, participation, apomediation,
and openness. J Med Internet Res 10(3):e22
Foster R, Kaplan S (2001) Creative destruction: why companies that are built to last underperform
the market and how to successfully transform them. Currency/Doubleday, New York
Francis D, Bessant J (2005) Targeting innovation and implications for capability development.
Technovation 25(3):171–183
Garcia R, Calantone R (2002) A critical look at technological innovation typology and
innovativeness terminology: a literature review. J Prod Innov Manage 19(2):110–132
Hughes B, Joshi I, Wareham J (2008) Health 2.0 and Medicine 2.0: tensions and controversies in
the field. J Med Internet Res 10(3):e23
Kuenne CW, Rass M, Adamczyk S, Bullinger AC, Moeslein KM (2011) Patients as innovators: an
open innovation perspective on health 2.0. In: Proceedings of world conference on mass
customization, personalization, and co-creation 2011, San Francisco, CA
Kummervold PE, Chronaki CE, Lausen B, Prokosch H-U, Rasmussen J, Santana S et al (2008)
eHealth trends in Europe 2005–2007: a population-based survey. J Med Internet Res 10(4):e42
Lettl C, Herstatt C, Gemuenden HG (2006) Users´ contributions to radical innovation: evidence
from four cases in the field of medical equipment technology. R&D Manage 36(3):251–272
Musser J, O’Reilly T (2007) Web 2.0 principles and best practices. O’Reilly Media, Sebastopol
Neyer AK, Bullinger AC, Moeslein KM (2009) Integrating inside and outside innovators:
a sociotechnical systems perspective. R&D Manage 39(4):410–419
OECD (2007) Participative web: user-created content. Organisation for Economic Cooperation
and Development, Paris
Oh H, Rizo C, Enkin M, Jadad A (2005) What is eHealth: a systematic review of published
definitions. J Med Internet Res 7(1):e1
326 C.W. Kuenne et al.

O’Reilly T (2005) What is web 2.0: design patterns and business models for the next generation of
software. Social Science Research Network working paper series. SSRN
Piller FT, Walcher D (2006) Toolkits for idea competitions: a novel method to integrate users in
new product development. R&D Manage 36(3):307–318
Randeree E (2009) Exploring technology impacts of Healthcare 2.0 initiatives. Telemed J e-Health
15(3):255–260
Schepers J, Schnell R, Vroom P (1999) From idea to business – how Siemens bridges the
innovation gap. Res Technol Manage 42(3):26–31
Tidd J, Bessant J, Pavitt K (2005) Managing innovation: integrating technological, market and
organizational change. Science and technology, 3rd edn. Wiley, Chichester
Van De Belt TH, Engelen LJ, Berben SA, Schoonhoven L (2010) Definition of Health 2.0 and
Medicine 2.0: a systematic review. J Med Internet Res 12(2):e18
Von Hippel E (1988) The sources of innovation. Oxford University Press, New York
Von Hippel E (2005) Democratizing innovation. MIT Press, Boston
Wanless D (2002) Securing our future: taking a long-term view. HM Treasury, London
Yin RK (2003) Case study research design and methods, 3rd edn. Sage Publications, Thousand
Oaks
Towards Patients as Innovators: Open Innovation in Health Care 327

Does “Strategic Patenting” Threaten Innovation
and What Could Happen If It Did?
Bernard Girard
Recent buyouts of Nortel’s patent portfolio (6,000 patents) by Microsoft, Apple,
and Sony for US$4.5 billion and of Motorola Mobility’s (14,600 patents accepted,
6,700 in tutorial) by Google for $12.5 billion have focused attention on the role of
these portfolios in the business world and on their high value. These developments
raise several questions: is the number of patents still a good indicator of technolog-
ical progress? Was it a good idea to extend the scope of patentability? Is the
strategic use of patent portfolios an opportunity or a threat to science and techno-
logical progress?
In the first section, we document the main evolutions of this market: the wild
growth of patenting and licensing, the degradation of patent quality, the continuous
rise of their prices, and the spreading of strategic patenting and of portfolio
management. In the second section, we examine the impact of these evolutions
on innovation and invention.
1 Patents, Licensing, and Litigation: A Wild Growth
The world of industrial property has been marked, these last few years, by the
sizable expansion of filed patents. Today, more than 350,000 patents are filed
each year in the United States, and nearly 200,000 are accepted.1 The same is
true in Europe and Asia. This phenomenon is related to a few major events: the
B. Girard (*)
UQAM, Paris, France
e-mail: [email protected]
1 The data used in this chapter are all of US origin. This choice is justified because the changes
described here took their source in the United States. It is in this country that emerged a market for
patents, and it is there that most of its specialists work: 72 % of brokers are installed in the USA
(Monk 2009). This is due to the size of the US market and to the specifics of its legal environment.
Department of Management Studies, Indian Institute of Science, Bangalore,
Driving the Economy through Innovation and Entrepreneurship,DOI 10.1007/978-81-322-0746-7_27, # Springer India 2013
329

globalization of the economy, the extension of the scope of patentable inventions,
the multiplication of licenses, and finally, the development of strategic patenting.
Due to globalization, international firms look for patent’s protection in all major
markets. That was not always true. In the early 1990s, Apple filed in Europe only a
selection of its patents. Today, it files all of them in all major European countries,
despite the very high costs of translation. All major international companies do the
same. According to the USPTO (US Patent and Trademak Office), only four of the
top ten recipients of US patents in 2010 are based in the United States, and 51% of
all patents granted in the USA are of foreign origin. In the 1990s, foreigners were
usually granted around 45% of all US patents.
In recent years, the scope of patentable inventions spread to new areas: biotech-
nology, software, and business methods.2 USPTO started patenting living products
(bacteria), software (that had long escaped the patentability), production, and
management methods of doing business. Nothing being previously patented in
these areas, early entrants sought property rights for almost everything, including
obvious “innovations” like the “one-click” that allows a customer to make a
purchase on Amazon. Presumably, the idea would have come to anyone interested
in this business.
This explosion in patenting coincided with a more systematic use of licenses that
became a significant source of revenue for companies with a strong patent portfolio
(Kamiyama and alii, McGrath. . .). Far from being just a tool to protect technology,
patents give property rights that one canmarket, rent, or sell. Nationwide, an estimated
$120 billion is each year generated from patent licenses, up from $15 billion in 1990.
Income from licenses contributes to a large extent to the profits of numerous
companies (Zunica 2009). According to Levine, IBM’s fees from licensing and
custom-developing intellectual property for other companies were on track to top
$1.1 billion in 2009. Qualcomm collects almost all its revenue—$10.4 billion in
2009—from selling licenses and making the chips containing its patented 3 G mobile
phone technology, known as CDMA (Levine 2010).
Some companies have long identified this source of income. Roger Smith, head
of industrial property of IBM in the early 1990s said: “You get value from patents in
two ways, through fees, and through licensing negotiations that give IBM access to
other patents. The IBM patent portfolio gains us the freedom to do what we need to
do through cross-licensing—it gives us access to the inventions of others that are
the key to rapid innovation.”
This proliferation of licenses is, in part, due to changes in technology that makes
an increasing use of standards and interoperability: products of different companies
cooperate and must, thus, use the same technologies. But it also comes from
changes in regulations. In 1996, the Supreme Court issued a patent for business
methods “making it increasingly impossible to manufacture an electronic device
without receiving a cease and desist letter or other notice from a patentee demand-
ing a large royalty or threatening an injunction” (Nielsen and Samardzija 2007).
2 And may continue to do so as US courts opened the door to the patentability of diagnoses as in
Mayo v. Prometheus Labs.
330 B. Girard

Many companies took advantage of the need to operate patents they own to
develop practices which border on predatory. Monk cites the case of a company
whose patents portfolio tripled following the intervention of its lawyers that wanted
to build a shield against possible prosecution by competitors (Monk 2009).
Recently, Microsoft accused the manufacturers of Android smartphones and tablets
of infringing 25 of its patents. What could they do? Challenge the patentability of
some of these inventions? It is the promise of a long legal battle. Buy licenses? This
is what Amazon and HTC chose to do (Gutierrez 2011), but it can only encourage
attacks by predators of all kinds, including NPE (non-practicing entities) or patent
trolls (Layne-Farrard 2010), companies who make their living out of lawsuits for
patent infringement.3
With so much at stake, patent disputes are increasingly ending up in court at the
expense of the patent holders. In the 1980s, US courts dealt 1,000 patent litigations.
These disputes have multiplied as US courts are quite severe with the trespassers.
They generally ask the licensee to pay a royalty rate of 25% of its expected profits
for the product that incorporates the infringed patents. And they continue to do so
despite the ruling Uniloc Inc. vs. Microsoft Corp. “that held that the 25% rule of
thumb is a fundamentally flawed tool for determining a baseline rate in a hypothet-
ical negotiation” (Dallman 2011). In fact, this level of royalties is so high that a
company may have to stop the manufacture of its product even if it is innovative.
These cases are always very expensive. It was calculated that each party in a trial
spends an average $4.5 million. Even when patents are very similar, one must sue
each patent separately, which greatly increases costs that are generally included in
R&D budgets. Instead of financing research, companies pay lawyers.
(Source: McGraph)
3 These companies are more numerous that one can imagine, and not just American. They have
grown since one of them got, through transaction, $162 million from RIM, the Blackberry
producer. A specialist in these issues identified 51 NPEs in the US (Shestra 2010).
Does “Strategic Patenting” Threaten Innovation and What Could Happen If It Did? 331
2 A Notable Degradation of the Average Quality of Patents
These developments went with a significant diminution (at least reported by all
professionals) of the average quality of patents. IBM’s former Director of Licens-
ing, Emmett Murtha, estimates that 97% of all US patents have no economic value:
“I think the majority of patents are not licensed because the technology they
embody is not really useful, not feasible to commercialize, or simply not market-
able for a variety of reasons” (M-CAM 2003). A figure that a specialist quoted by
the New York Times confirms: “Good companies use only 20% of their patents,”
said Sam Khoury, the president of Inavisis International, a consulting firm that
appraises patents, trademarks, and related corporate assets. “Badly run companies
use only 10%” (Feder 2002). And an expert calculated that approximately 50% of
patents are not considered valid after a legal dispute (Reback 2006). This decline in
quality does not prevent companies from exploiting their portfolio. Apple was able
to prohibit the marketing of Samsung’s tablets in Germany, thanks to patents that
described its own tablets in a way that could apply to any similar product: a
rectangle with icons that can be activated by passing the finger on it.
Several reasons can be cited for this decline. The most common is the increased
workload of the patent office that leads to less rigorous controls.
Professionals regularly complain, as evidenced by this letter that examiners from
several offices have sent their leaders in 2007: “Unfortunately, in many patent
offices, the pressures on examiners to produce and methods of allocating work have
reduced the capacity of examiners to provide the quality of examination the peoples
of the world deserve” (The 271 Patent Blog, 2007).
3 Prices: A Very High Inflation
Because they are so often of a poor quality, patents that give a competitive
advantage to their owner are not so frequent. Yet their value is increasing. Assum-
ing, as all commentators explained when the deal was done, that Google acquired
Motorola Mobility for its patent portfolio and only for this, each patent was valued
at just over $510,000, which is the exact price at which Novell sold, according to
Frost & Sullivan’s Craig Carter, 882 patents a few months earlier. Microsoft,
Apple, and Sony have paid more (in the range of $750,000) for the patents they
bought from Nortel, and RIM is said to have paid $173 million for 65 patents from
Philips (Monk 2009). It is as if a particularly high market price was being created
through these various transactions.
This inflation of prices has objective reasons. The most obvious is the desire of
companies to protect themselves in all major markets. The cost of filing a patent in
two countries is about $17,000; the filing in fifteen countries is about $120,000
(WIPO 2008).
332 B. Girard

Other factors contribute to this increase of prices, such as the required translation
into several languages for European patents.4 More significant are endogenous
factors such as an increasing complexity that can be measured in several ways.
Education is one: patent’s authors are increasingly PhDs. This appears in the US
statistics but even more in the European surveys.
Based on a survey of 27,531 European inventors, Giuri et al. (2006)
This complexity of patents can also be measured by the increasing size of patents
measured by the number of words.
Patents are longer, more complex, as suggested by this graph done on a sample
of 10,000 patents up by Patenlyo. The inflection of the curve in the 1980s coincides
with the opening of new patentable domains and the creation (in 1982) of the
4Once a patent is granted by the European Patent Office, it must be validated in each country in
which the applicant seeks protection. It usually means translation in the national language.
Does “Strategic Patenting” Threaten Innovation and What Could Happen If It Did? 333

US Court of Appeals, which has streamlined and secured intellectual property.
Its creation was followed by a sharp increase in the number of patents.
The number of claims has also increased. Each claim being subjected to billing
the cost of a patent grew. It can reach extravagant sums: the 13,000 claims the
owner of the US2005/0182468 patent requested cost him 1$.3 million. The more a
company has paid to get a patent, the more it will be tempted to value it highly even
if it does not use it.
This increasing number of claims is related to the growing complexity of patents,
to the nature of inventions, but also to changes in the legal context in the mid-1990s:
US Supreme Court ruled in 1996 (Markman vs. Westview) that the interpretation of a
patent was a matter of law and not a question of fact, which leads to a more restrictive
interpretation of the scope covered by each claim, therefore the temptation tomultiply
them to keep the patents as inclusive as possible. In fact, the drafting of patents being
entrusted to lawyers (the drafting of a patent is a round trip between the inventor, often
an engineer, and lawyers) is very sensitive to the developments of case law.
The proliferation of litigations also plays a role: a patent which has stood the test
of the court acquires value as the risk of a dispute disappears.
Exogenous factors also contributed to patent’s increased value. In the USA,
companies that give patents to nonprofit organizations, universities, or hospitals can
benefit from tax cuts. This practice is widespread. Companies that engage in this
practice are naturally interested in getting the maximum value from their portfolio.
When General Motors faced with serious financial difficulties envisaged to give its
patent portfolio to nongovernmental organizations (NGO), its CEO did not hesitate
to assign it a very high value ($3–5 million for each patent) to increase its tax
exemptions (M-CAM 2003).
Other factors played a role like the purchases of patents to protect oneself from
litigation or the creation of a market for high-tech companies. When a start-up is
sold to a large company, most of its capital is intangible: skills, patents, and designs
(Haeussler et al. 2009).
334 B. Girard

A lucrative market was created with companies whose interests are purely
financial (Watanabe 2009). The case of Ampex is significant. This company that
manufactured the first audiotape owns a patent portfolio that could generate signifi-
cant revenues. In 2005, a hedge fund, Valuevest, wanted to buy it to exploit what its
managers thought was fair value (The 271 Patent Blog, 08/09/2007).
4 Portfolio Management or Predation
There is in this price inflation something of a speculative bubble. All components of
a bubble are there: imitation, mimetic contagion, anticipation of future behaviors
based on beliefs, and, of course, difficulty to properly value assets.
The techniques used to calculate the value of a patent or a portfolio pose almost
insoluble problems. Several methods exist, but they do not necessarily give the
same results. But there is more.
Behind this inflation lies a significant change in the behavior of tech companies,
especially the big ones: they have chosen to manage their patent portfolios as a real
asset. At all times, firms have filed patents to lure their competitors (Langinier
2005); General Electric was famous in the twenties for practicing “defensive
patenting” (Nicholas 2005); DuPont used its patents to prevent the arrival of new
entrants to its markets (Hounsell 1988), but firms that engage today in these
practices want to value their intangible assets.
These portfolios represent a growing part of business assets. A research com-
pany, Ocean Tomo, has assessed the rise of these intangible assets as follows:
“In 1975 more than 80% of corporate value reflected in the S&P 500 was tangible
assets, while intangible assets comprised less than 20% of market capitalization.
Today, the ratio of tangible to intangible assets has inverted—nearly 80% of
corporate value resided in intangible assets (Ocean Tomo 2011).” By intangible
assets, one must understand patents, brands, and reputation.
Does “Strategic Patenting” Threaten Innovation and What Could Happen If It Did? 335

These results can be challenged, but they are corroborated by numerous studies
(King 2003). The OECD explains that “in the United Kingdom investment in
intangibles is estimated to have more than doubled as a share of market sector gross
value added between 1970 and 2004.” They are symptomatic of a new phenomenon:
inflation of intangible assets. As explained by RPX, players on this market, “patent
litigation used to be a form of legal redress. Today it is a business model.”
5 Intellectual Property Rights: A Questionable Theory
It is, in fact, the whole governance of innovation that has changed. These changes
were made on behalf of the theory that industrial protection is an incentive to
innovate. A theory that can be summarized in a few lines: not enough inventions
will be made unless incentives are provided; patents are the most effective means of
providing these incentives.
This thesis is old. It is found in the texts of the first patent lawyers, but is it true?
We reported at the beginning of this article the explosion in the number of
patents. This growth is generally seen as a sign of the acceleration of technical
progress (Kirankabeş 2010), but these figures make their best sense when broken
down by technology. More than 29,000 patents have been filed in the United States
around USB (Universal Serial Bus), more than 27,000 on JPEG images, and more
than 3,300 on 3G cellular modems. And this is not unique to computer science.
The inhibition of angiogenesis, a recent strategy to fight cancer, has led to 28,000
patents, and sunitinib, a drug for the treatment of kidney cancer, to 3,000. Is not that
in any case too much? Are these techniques so complex that they require so many
inventions? This is unlikely. As we have seen, so many other factors contribute to
the expansion of the number of patents that it has ceased to be a reliable indicator of
technological progress.
The critique of industrial protection is not new. In an article published in 1950,
Fritz Machlup and Edith Penrose showed that it has accompanied the beginnings of
the patent law (Machup 1950). It is only when the protectionists have prevailed over
the free traders in the aftermath of the crisis of 1873 that patent proponents won out
after a vigorous propaganda campaign.5 This shows that intellectual property
protection was not obvious to most classical economists even if Adam Smith,
John Stuart Mill, and Jeremy Bentham “viewed patents as a justifiable exception
to free trade principles.”
Contemporary criticism rarely mentions these ancient texts as it rather seeks to
analyze the current situation. It has several origins. It comes, in part, from industrial
5 Hostility to protectionism was particularly strong in Britain, where it gave birth to an abolitionist
movement and in Germany. Defenders of patents saw it a protection of the industry similar to
customs duties.
336 B. Girard

property specialists concerned about some of its deviations (USPTO 2003) and who
highlight the various weaknesses of current arrangements.
It also comes from economists. The Austrian School (Murray Rothbard, among
others) has long criticized intellectual property, accusing it, among other
shortcomings, of diverting investment in basic research. If this risk has long seemed
low, it has gained consistency since universities have the opportunity to apply for
patents (1980 in the USA): a university like Yale, which had five patent applications
filed in1981, had 246 in 2011 (97 United States and 149 abroad). How can one
exclude that this has been done at the expense of basic research?
It was only recently that orthodox economists have questioned the link between
patents and innovations. Josh Lerner showed that the smaller a company, the more
it tends to favor trade secrets over patenting (Lerner 2000). Carl Shapiro expressed
concern about the risk of holdup (Shapiro et al. 2007); others have developed
models showing that a patent could reduce the potential for innovation (Tuomas
and Kanniainen 2000) and highlighted the disappointing results of the extension of
property law (Dey 2007). Based on an historical review, Bessen and Hunt have
questioned the impact of patent systems on innovation: “In some industries such as
pharmaceuticals, patents provide strong positive incentives to invest in innovation.
But in many other industries, perhaps most, patents fail to perform like property and
they may actually discourage innovation” (Bessen and Hunt 2007).
Historians of British industry have also shown that the sectors in which there was
more innovations were not those in which more patents have been filed, which is
reminiscent of the contemporary situation: IT is probably the sector in which
innovations were in recent years the most numerous; it is also one of in which it
was for long very difficult to file patents (MacLeod 1986).
These interrogations about the impact of patents on innovation finally come from
practitioners. In its 2003 survey, USTPO cites a programmer who says: “The ease
with which the US patent office has given patents in the last few years has already
dampened my plans to write software as a primary business.” Patents are not or are
no longer the engine of innovation that their advocates present. This is confirmed by
the Berkeley patent survey of 700 US start-up in 2008 (Graham et al. 2009). It
shows:
– That they do not consider patent as an incentive to innovate.
– That the use of patents by start-up varies by industry: low in the software world,
and it is more important in companies involved in healthcare (biotechnology,
medical devices). The main reason is probably related to the time to market.
– That the start-ups that file patents do it primarily at the request of shareholders.
Confirming these results, Bessen and Hunt indicate that large European
companies do file patents for only 36% of their innovations (Bessen and Hunt
2009). Only the pharmaceutical industry proceeds otherwise. In most sectors, firms
innovate without worrying about patents. The industrial sectors that could not until
recently patent their inventions, such as IT, were no less inventive.
Does it mean that patents do not contribute to the development of innovation?
Not necessarily. Some authors have suggested, like Pigou, that patents were not
Does “Strategic Patenting” Threaten Innovation and What Could Happen If It Did? 337

conducive to innovation, but oriented it: “By offering the prospect of reward for
certain types of invention, they (the patent laws) do not indeed appreciably stimu-
late inventive activity, which is, for the most part, spontaneous, but they do direct it
into channels of general usefulness” (Pigou 1920). In the same vein, Petra Moser
has shown “that patent systems influenced the distribution of innovative activity
across industries. Inventors in countries without patent laws concentrated in
industries where secrecy was effective relative to patents, e.g., food processing
and scientific instruments” (Moser 2003).
One can advance other arguments in their favor. To defend their institution, the
rapporteur of the project of creating patents in France, Stanislas de Boufflers,
advanced in 1790 an interesting argument: patents contribute to innovation because
they promote the circulation of inventions and they give those who so wish the
ability to access and possibly negotiate (Procès-verbal 1789–1791). They foster the
dissemination of information which can be regarded as a positive externality.
Contemporary experience tends to confirm this thesis. It is a weak protection that
favored the emergence of Silicon Valley as the center of IT innovation in the 1980s.
Ronald Gilson showed that it was the impossibility to enforce “not to compete”
contracts that explains the development of this cluster: an employee with an idea his
company did not wish to develop could bring it to a competitor or create his own
company (Gilson 1998).6 Thus, ideas and inventions could move freely and be
tested. The same argument could be applied to China. A poor protection of
inventions, a high mobility of engineers willing to share the secrets of their
employer did not hinder the development of its economy. On the contrary, it
seems to have favored its expansion (Barboza 2011).
If patents are not an incentive to invention, the recent developments that attempt
to manage patent portfolios as an asset like any other may stifle innovation and
remove this positive externality. Several factors can contribute to the receding of
innovation. The first, stressed by several authors, is the diversion of R&D funds
toward legal expenses, whether to file patents and to defend them in litigation. Then
come the high costs of litigation and the use of patents as a threat that creates a new
uncertainty (Graham 2006).
This uncertainty is worsened by the proliferation of patents. The firm that would
like to develop a new drug to inhibit angiogenesis in the fight against cancer
should ensure that it does not infringe any of the 28,000 patents already filed on
this very recent and promising technique. The risk that it could be the case is
obviously very high. No doubt the laboratory can buy licenses, but as suggested by
Carl Shapiro, if the firm has to give just 1% of its revenues to each holder of patents
it infringed, it may soon give up (Heller and Eisenberg 1998).
All these developments may stifle innovation. They may also profoundly alter
the direction of research. This is especially true in academia: universities that file
patents may focus on applied research at the expense of basic research. Disciplines
6 This thesis is supported by recent studies that establish a correlation between the productivity and
mobility of researchers (Hoisl 2007).
338 B. Girard

that cannot be patented, mathematics, physics, and social sciences, could suffer.
This is not the only danger: patenting imposes secrecy and therefore inhibits the flow
of information which is at the heart of scientific activity. Patents make it more
difficult for other researchers to use new ideas. They can create conflicts within the
academic community: who is going to reap the most benefits? Who will get the most
funding: those that do basic research or those that file patents? This trend is particu-
larly worrisome in China as it encourages its academics to file patents (Ward 2011).
In the area of business, these developments could be no less significant. R&D
could no longer be guided by the laboratories or marketing departments but by
financiers whose main aim is to maximize the rent from the patent portfolio. They
could try to get the best valuation of the portfolio, but they could also push
defensive strategies at the expense of more interesting work.
In short, these recent developments are likely to hamper innovation. Unless, of
course, governments decide otherwise. It’s the legislature that created property
rights, changes in regulations are responsible for the changes we documented. But
all governments do not approve of these changes. Some might rebel, especially
among the BRICS (India, Brazil, etc.), and want a more liberal regime (Bird and
Cahoy 2007). We could see the emergence of a “digital divide” between overpro-
tective countries and those that want to protect inventors from all over the world
from excessive IP litigation.
References
Barboza D (2011) Entrepreneur’s rival in China: the state. The New-York Times, December 6
Bessen J, Hunt R (2007) An empirical look at software patents. J Econ Manage Strateg
16(1):157–189, 03
Bessen J, Hunt R (2008–2009) Of patents and property. Regulation 31(4):18–27
Bird R, Cahoy D (2007) The emerging BRIC economies: lessons from intellectual property
negotiation and enforcement. Northwest J Technol Intell Prop 5(3)
Dallman, A (2011) Is “the 25% rule’ still alive after Uniloc”, Patent lawyer Blog, 27 September 2011
Darrow J (2007) The patentability of enantiomers, implications for the pharmaceutical industry.
Stanf Technol Rev 2:10
Dey S (2007) Are patents discouraging innovation, SSRN
Feder B (2002) Business, patent donations are new corporate gift. The New-York Times, Novem-
ber 1, 2002
Gilson R (1998) The legal infrastructure of high technology industrial districts: Silicon Valley,
Route 128, and covenants not to compete, Stanford Law School
Giuri P et al (2006) Everything you always wanted to know about inventors (but never asked),
evidence from the PatVal-Eu survey, Discussion paper, 2006–11,Munich School ofManagement
Graham P (2006) Are software patents evil, Paul Graham blog
Graham SJH, Sianr, Merges RP, Samuelson P (2009) High technology entrepreneurs and the patent
system: results from the 2008 Berkeley patent survey. Berkeley Technol Law J 24:255–327
Gutierrez H (2011) Android patent infringement: licensing is the solution. Microsoft on the issues,
21 mars 2011
Haeussler C, Harhoff D, M€uller, E To be financed or not . . . The role of patents for Venture capitalfinancing, discussion papers 253, SFB/TR 15 Governance and the Efficiency of Economic
Systems, 2009
Does “Strategic Patenting” Threaten Innovation and What Could Happen If It Did? 339

Heller A, Eisenberg R (1998) Can patents deter innovation? The anticommons in biomedical
research. Science 280(5364):698–701
Hoisl K (2007) Does mobility increase the productivity of inventors. Discussion paper 2006–13,
Munich School of management
Hounshell DA, Smith JK (1988) Science and Corporate Strategy, Du Pont R&D, 1902-1980,
Cambridge, UK, Cambridge University Press
Kamiyama S, Sheeran J, Martinez C Valuation and Exploitation of Intellectual Property,
No 2006/5, OECD Science, Technology and Industry Working Papers, OECD Publishing
King K (2003) The valuation and exploitation of intangible assets. EMIS, Welwyn Garden City
Kirankabeş MCem (2010) Relationship between gross domestic expenditure on R&D (GERD) and
oatent applications. Middle Eastern Finance Econ (8):161–171
Langinier C (2005) Using patents to mislead rivals. Can J Econ 38(2):520–545
Lanjoow J, Lerner J (1997) The enforcement of intellectual property rights: a survey of the
empirical literature. NBER, Cambridge, MA
Layne-Farrard A, Schmidt K (2010) Licensing complementary patents: patent trolls, market
structure and excessive royalties. Berkeley Law Technol Rev 25:1121–1122
Lerner J (2000) 150 years of patent protection. NBER, Cambridge, MA
Levine S (2010) IBM may not be the patent king after all. Bloomberg Business Week, 13 janvier
2010
Machup P (1950) The patent controversy in the nineteenth century. J Econ Hist 10(1):1–29
MacLeod C (1986) The 1690s patents boom: invention or stock-jobbing? Econ Hist Rev
39(4):549–571
M-CAM (2003) Patent donations, special report for the Department of Treasury
McGrath S, Kedrowski K Trends in patent damages. American bar association
McLeod C (1986) The 1690s patents boom: invention or stock-jobbing? Econ Hist Rev
39(4):549–571
Menell P, Powers M, Carlson S (2010) Patent claim construction, a modern synthesis and
structural framework. Berkeley Technol Rev 25:711
Monk A (2009) The emerging market for intellectual property: drivers, restrainers, and
implications. J Econ Geogr 9(4):469–491
Moser P (2003) How do patent laws influence innovation. NBER, Cambridge, MA
Nicholas T (2005) Do Intangibles Cause Stock Market Bubbles? Evidence from the Great Crash,
LSE Working Papers
Nielsen CM, Samardzija MR (2007) Compulsory patent licensing: is it a viable solution in the
United States? Mich Telecomm Tech L Rev 13:509
Ocean Tomo (2011) Patent cases files involving fortune 100 companies
Pigou A (1920) The Economics of Welfare, p.185
Procès-verbal de l’Assemblée nationale, vol 41, Assemblée nationale constituante (1789–1791)
Reback (2006) G Patently absurd, Forbes, 24 June 2002
Shapiro C, Farrell J, Hayes J, Sullivan T (2007) Patents and hold-up. Antitrust Law J
74(3):603–670
Shestra S (2010) Trolls or market makers? An empirical analysis of non practicing entities.
Columbia Law Review 10(144):114–160
Tuomas T, Kanniainen V (2000) Do patents slow down technological progress? Ind J Organ
18(7):1105
USPTO (2003) To promote innovation, The proper balance of trade law and patent policy, Federal
Trade Commission
Ward AM (2011) Why do Chinese Academics file so many patents. The IPKat, février 2011
Watanabe Y (2009) Patent licencing and the emergence of a new patent market. Houst Bus Tax J
9:445
WIPO (2008) World Patent Report: a statistical review
Zunica MP, Guellec D (2009) Who licenses out patents and Why?: lessons from a business survey.
OECD, Paris
340 B. Girard

Monetization of Intellectual Property:
An Open Innovation Perspective
P.M. Rao
1 Introduction
We start with the familiar proposition that innovation, out of which intellectual
property (IP) is created, is costly to produce but relatively easy and inexpensive to
imitate. As a result, innovative firms which invest heavily in R&D face what is
known as the problem of appropriability. The difficulty such firms face in
appropriating the fruits of their innovative effort—with or without legal protection
in the form of patents, copyrights, trade secrets, and the like—has been well
established (Arrow 1962; Williamson 1975, among others). In the language of
economics, the social rate of return on innovation or the return to society in the
form of new and better quality products at lower prices—and/or the production
processes that reduce costs and improve the quality of end products and services—
far exceeds the private risk-adjusted rate of return to the firm. The extent of
divergence between the social rate of return (SRR) and the private rate of return
(PRR) is evidence of the extent of the appropriability problem—a source of market
failure in the production of innovation—which leads to underinvestment in R&D.
This too has been well documented in the economics literature. According to Jones
and Williams (1997), the social rate of return on R&D estimated by various
scholars is about 30%, which is considered a lower bound, and about three
times higher than the private rate of return. For a detailed discussion of estimated
annual rates of return to R&D according to numerous studies, see Nadiri (1993).
The greater (smaller) the divergence between SRR and PRR, the smaller (greater)
the extent to which a firm is able to appropriate the fruits of its innovative effort.
When innovative firms are able to achieve PRR above the risk-adjusted rates of
return on their investments in R&D, they are said to be enjoying supernormal
profits, which Nordhaus (2004) calls Schumpeterian profits. Put differently,
P.M. Rao (*)
Long Island University-Post Campus, 720 Northern Boulevard, Brookville, NY 11548, USA
e-mail: [email protected]
Department of Management Studies, Indian Institute of Science, Bangalore,
Driving the Economy through Innovation and Entrepreneurship,DOI 10.1007/978-81-322-0746-7_28, # Springer India 2013
341

realization of supernormal profits means firms are able to capture a piece of the
SRR as well. In his pioneering empirical study of the extent of Schumpeterian
profits in the US economy over the 1948–2001 period, Nordhaus provides
a macroestimate and concludes that “only a miniscule fraction of the social returns
from technological advances over the 1948–2001 period (little over 2%) was
captured by producers, indicating that most of the benefits of technological change
are passed on to consumers rather than captured by producers” (Italics added,
p. 1). And Schumpeterian profits were only 2.8% of US corporate profits during
the same period. To be sure, appropriability varies greatly across industries and
firms within the patent life, and farming and farm-equipment sectors have a low
rate of profit despite their rapid productivity growth. Apple apparently has been
enjoying extranormal profits, at least for the time being, on its product line of
iTunes, iPods, iPhones, and iPads. We now discuss many ways individual firms in
a market economy monetize intellectual property (IP) and, in the process, attempt
to privatize at least some of the benefits of innovation society enjoys for free.
Although, the term IP can be defined to include a wide range of intangible assets,
for purposes of this chapter, it refers to all technology-based intangible assets of
a firm—an idea or a design for a new product or a process, a computer software
package, and the like that may be protected as a property right under the legal
framework that includes patents, copyrights, trademarks, or trade secrets.
2 Many Forms of Monetization
In modern economies, monetization of IP by firms takes several forms. Perhaps, the
most common form of monetization involves incorporating the technology into
a physical product—sometimes referred to as embodied technology—and markets
it. This is typical of innovating firms producing and marketing goods. In short,
monetization of IP occurs—in the product markets—through sale, lease, and rental
of products in which the technologies are embodied. That the embodied technology
remains the dominant means of monetization can be seen from the fact that
innovative effort in the form of R&D input is still largely concentrated in
manufacturing. In 2009, in the USA, about 76% of company-funded R&D by US
MNEs was in manufacturing (Barefoot and Mataloni 2011). As might be expected,
judging from data on top US patent holders, a similar concentration of R&D output
in the form of patents appears to be present in the manufacturing sector (USPTO
2004). This is despite the fact that manufacturing in the developed world’s
economies accounts for increasingly smaller fraction of output and employment
and nonmanufacturing sector—outside of telecommunications and electric utilities
to a limited extent—which was once devoid of much innovation is now a rapidly
growing center of innovation mainly in the form of software development.
Note that monetization of IP—whether it is embodied into products or not—
requires significant investments in complementary marketing assets in the form of
building and sustaining difficult-to-imitate brand name and reputation of the firm,
342 P.M. Rao

establishing relationships with customers and distributors alike, and various pro-
motional efforts in order to maximize the return on R&D investments.
A second form of monetization of IP occurs when an innovating firm employs its
new technology in the production process, which reduces the cost and/or improves
the quality of the end products, and services it produces and markets. Note that
process innovations—this is certainly true of industrial processes—are generally
not patentable. However, processes are difficult to replicate. Legal protection of
process innovations is mainly in the form trade secrets.
A third form of monetization of IP is through licensing of technologies. This has
become a significant and growing means of monetizing IP. Cross-border technol-
ogy licensing has grown dramatically in the recent period. Between 1999 and 2009,
US receipts from licensing of industrial processes and computer software to other
countries and payments to other countries have grown at an average annual rate of
about 25% (see Table 1).
Moreover, as shown in Table 2, licensing revenues account for almost 100% of
revenues of a technology firm like Rambus, which specializes in innovative computer
Table 1 US receipts and payments of royalties and license fees, 1999 and 2009 ($ millions)
1999 2009 CAGR (%)
Total, all sources $50,044 $115,021 8.67
Receipts 39,670 89,791 8.59
Payments 10,374 25,230 9.49
Industrial processes and computer software 9,687 93,128 25.27
Receipts 7,602 71,660 24.04
Payments 2,085 21,468 26.12
Source: Bureau of Economic Analysis (2011)
Table 2 Licensing revenues of selected high-tech firms, 2010
Company
name Revenue sources
Revenue
($ millions)
Percentage of total
revenue (%)
Rambus Royalties from patent licenses 288.4 89.18
Royalties from technology licenses 31.8 9.83
320.2 99.01
Total revenue 323.4
Microsoft Windows operating systems 19,494 31.20
Microsoft Office and other software 19,076 30.53
Servers 15,378 24.61
53,948 86.34
Total revenue 62,484
Qualcomm Licensing revenue 4,011 36.52
Total revenue 10,982
IBM Software licensing 22,485 22.68
Total revenue 99,120
Source: Hoover’s online database, 10-K annual reports
Monetization of Intellectual Property: An Open Innovation Perspective 343

memory design called RDRAM; a vast portion of the revenue stream of software
firms like Microsoft (86%); and significant portion of a diversified firm like IBM
(23%). Note that there are no physical products involved here. Technology is
disembodied from the product. A variant of technology licensing is cross licensing,
which involves companies exchanging technologies through the licensing process
and netting out the difference in terms of valuation. Teece (2000) describes in detail
various methods of valuation in the technology-licensing process.
A fourth form of IP monetization occurs when technologies are sold outright.
This form of monetization is less common compared to licensing. A recent
dramatic example of this form of monetization involved acquisition of Motorola
Mobility, a subsidiary of Motorola, by Google for $12.5 billion (Richtel and
Wortham 2011). The assets acquired by Google were simply the patents held
by Motorola Mobility. Thus, Motorola, the parent, monetized IP held by its
subsidiary, Motorola Mobility, in the form of patent portfolio, a rich trove of
17,000 patents. Another more recent example is Microsoft’s deal involving
$1 billion for 800 patents held by AOL. Note that licensing, cross licensing, and
sale of technologies suggest the presence of a “market” for technologies. Indeed,
Baumol (2002) and Arora and Gambardella (2001), among others, observed about
the emergence of a growing market for technologies. An interesting twist on this
occurs when the acquiring company’s motive may have more to do with the value
of human capital in the form of hard-to-get talented people employed by the firm
to be acquired than the latter’s patent portfolio. For example, Facebook has
acquired some 16 companies, including Gowalla, in the last few years with the
intention of buying talent rather than technology or user data as part of the deal.
This is especially the case when the firm to be acquired is somewhat of a start-up
with its financial feet not firmly on the ground.
A fifth form of monetization involves securitization of intellectual property.
While IP-backed securitization remains a small fraction of total asset-backed
securitizations, Hillery (2004) documents several deals involving patents, copy-
rights, and even trademarks. One such deal was the pharmaceutical patent royalty
securitization (a $225 million deal involving a pool of patents on 13 drugs from
12 companies and Memorial Sloan-Kettering) of variable funding notes in 2003
by the Royalty Pharma Finance Trust. Note that the deal can be structured so that
the owner of IP continues to have an equity component of the royalty stream, while
the buyer participates on the debt side at rates far lower than the typical venture
capital lenders. One way to view securitization is it makes the “market” for IP
more efficient than it would be otherwise.
A sixth form of monetization involves firms that acquire patents from failed
companies and independent inventors—often cheaply—and “monetize” them by
bringing infringement law suits against companies whose products are related to
such patents. Note that such firms are not in the business of creating any
technologies or making any products themselves. They specialize in recovering
damages and collecting royalties on unauthorized use of their patent rights. The suit
brought by NTP, a small Virginia-based company, against Research in Motion
(RIM) for violation of its wireless e-mail-related patents, which claimed over
344 P.M. Rao

a billion dollars in damages, is a case in point. NTP is a patent-holding company
that does not make or sell products. Ultimately, RIM settled the case with NTP
for $612.5 million (Somaya et al. 2011). Such firms are inelegantly called patent
trolls, meaning, they are in the business of gaming the system by taking advantage
of the weaknesses inherent in the patent system. However, it is important to note
that patent trolls do create market for inactive and/or marginal patents and provide
some reward to the original owners, which might not exist in their absence.
All forms of IP monetization suffer—albeit to a different degree—from the
appropriability problem due to reverse engineering and imitation around patents,
competitors hiring away employees with trade secrets, and unpaid-for leakages
to the licensees and unintended third parties because of the difficulty of writing
technology-licensing contracts. On the other hand, rapid growth of technology
licensing, monetization through sale of patent portfolios (e.g., Motorola Mobility),
and securitization are indicators of the emerging, albeit highly imperfect, market
for technologies.
3 The Role of Complementary Marketing Assets in IP
Monetization
The most obvious but important point here is that investments in marketing assets—
promotional effort to create and sustain difficult-to-imitate brand name and the
reputation of the firm, establishment of an efficient distribution system, after-sales
service, customer relationship management (CRM), and associated information
systems, for example—complementary to innovation mitigate the problem of
appropriability. Figure 1, adapted from Teece (2000) by Rao (2005), shows strong
complementary marketing assets—along with hard replicability of innovation
and tight intellectual property rights—result in a strong appropriability regime.
A detailed discussion of the conceptual framework suggested by Fig. 1 is provided
Inte
llect
ual Pro
pert
y R
ight
s
Inherent Replicability
Tig
ht
StrongAppropriability
ModerateAppropriability
Hard
Loo
se Weak-to-
ModerateAppropriability
WeakAppropriability
Easy
Complementary Marketing Assets
WeakStrong
Fig. 1 Key determinants of
appropriability regime
(Source: Adapted from Teece
2000, p. 19; Rao 2005, p. 41)
Monetization of Intellectual Property: An Open Innovation Perspective 345

in Rao (2005). Vinod and Rao (2000) have shown that, in the high-technology
segment of the pharmaceutical sector, interfirm variation in promotional intensity
(i.e., ratio of promotional expenditures to sales) is largely explained by variation in
R&D intensity (i.e., ratio of R&D expenditures to sales). The authors also provided
an econometric test of complementarity between R&D and promotion. Pharmaceu-
tical firms specializing in the production and marketing of patented prescription
drugs could be spending well above 40% of sales on promotion during the effective
life of the patent in order to build the brand name which will enable them to
compete—in the postpatent period—against cut-throat price competition from
generics. The brand equity built during the life of the patent with the physicians
and patients alike is so strong that firms are able to actually raise the prices in the
relatively inelastic consumer segment in response to cut-throat price competition
from the generics.
More recently, evidence, albeit indirect, of the importance of R&D and market-
ing to high-tech firms and their complementary relationship came from an impor-
tant study by Hulten (2010). Hulten used familiar macrolevel growth-accounting
techniques to explain sources of Microsoft’s average annual rate of growth in real
output of 30.0% over the 1988–2006 period and found that R&D and sales and
marketing together explained—roughly in equal proportion—43% of Microsoft’s
growth. Microsoft’s employment data reported by Hulten are consistent with the
importance of R&D and marketing. In 2006, 28% of Microsoft’s employees were in
product research and development, 30% in sales and marketing, 17% in product
support and consulting, and 10% in general administration. Note that only 3% of
Microsoft’s 71,000 employees were in manufacturing and distribution.
To cite another example of the role of marketing assets in mitigating the
appropriability problem, few would argue about Apple’s ability to produce
Schumpeterian-like profits in recent years that has as much to do with the strength
of its brand name, often personified in its CEO the late Steve Jobs and supported by
huge investments in its own uniquely designed retail stores amply populated by
educated and salaried sales people ready and willing to serve—as with its brilliant
design and software. To elaborate on this point a bit, Apple offshored all
manufacturing of iPhone 4 to low-cost high-quality Asian countries and still
captured nearly 60% of the total value as a reward for its investments in design
innovation and marketing assets (Kraemer et al. 2011).
4 Open Innovation and Monetization of IP
Open innovation as a means of monetizing IP has its roots in the notion of user
innovation proposed by von Hippel (2005), among others. The trend toward open
innovation has been discussed at length by Ghauri and Rao (2009), and this section
draws heavily upon that discussion. Several recent trends—the growing importance
346 P.M. Rao

of innovation networks, increasing trend toward alliances, and licensing coupled
with private-public nonprofit linkages—may be viewed as indicators of the
emerging open innovation (OI) paradigm that has received much attention in recent
years (Chesbrough 2003). In contrast to the traditional vertically integrated (VI)
closed innovation model, a company following the OI model commercializes
internal as well as external ideas by utilizing outside as well as in-house pathways
to the market. In the OI model, large companies are seen as becoming more and
more as “market coordinators of increasingly distributed and vertically
disintegrated value chains” (Christensen 2006: 46). As such, OI is the antithesis
of the VI model; it challenges the core competency perspective of corporate
innovation, and it emphasizes research and production via collaboration and
networks. Firms adopting the OI model recognize the value of external IP as well
as profits to be made from others’ use of its IP through licensing, joint ventures, and
the like. Among the pharmaceutical MNEs, Pfizer is such a firm. It uses external
innovations in its product mix and markets internal as well as external innovations
(West et al. 2006).
Open innovation is often compared, albeit loosely, with the “open-source”
movement led by IBM and other companies in the software development (Although
OI and “open source” have some elements in common, it is important to note that
the open-source movement is unique to the software sector and is driven by network
externalities and other factors that are not present in many sectors). In the open-
source model, developers are free to access and build upon the efforts of others
without paying royalties. Investment by firms in the “open-source” projects to gain
competitive advantage through pooled R&D is consistent with open innovation.
Pisano (2006) provides an interesting story about Merck’s Gene Index story in
this context. It suggests that, contrary to the traditional view of IP strategy, a firm
with strong downstream marketing assets may find the value of those assets higher
in a regime of weak IPRs than in a strong one. This was the case of Merck’s
collaboration (in response to venture capital firms aggressively patenting genes
associated with diseases in which Merck’s research and marketing assets are strong)
with Washington University to create a database of human gene sequence and make
all findings public within 48 h. Merck viewed its interests as best served by
preventing privatization of genes that could result in lockout in research areas
central to its survival. Thus, the advocates of the OI model suggest that firms
with strong R&D and downstream marketing assets may find that it is compatible
with a high degree of appropriability even as it dilutes IPRs.
Still, open innovation (OI) presents a challenge to monetization of intellectual
property to both biotech firms and firms operating under the open-source model. The
(OI) model goes against the traditional approach of maximizing profits through
innovation from strong IPRs (Christensen 2006; West and Gallagher 2006). More-
over, Chesbrough (2011) argues that product-driven companies are finding it harder
to differentiate because of rapid commoditization made possible, in part, due to
numerous software products. For example, Motorola’s highly successful razor cell
phone fell by the wayside within 3 years due to pressure from Apple and Google who
Monetization of Intellectual Property: An Open Innovation Perspective 347

are building platforms and services in collaboration with thousands of companies.
The solution is to transform physical products into platforms with a variety of
services that are created through open innovation. A different kind of transforma-
tion occurred at Amazon which started in 1994 as an online book seller and within
a period of just over 10 years created and sustained one of the most successful
online retail industry platforms in the world and leveraged its technology to move
into providing web services to third-party retailers (Isckia and Lescop 2009).
Schwarz and Takhteyev (2009) argue that the intrinsic inefficiencies of proprie-
tary software led to alternative mechanisms—such as the open-source software
(OSS) movement—that provide software as a public good. One source of ineffi-
ciency has to do with holdup problem which occurs when users of software must
make complementary investments to modify and/or customize it for their unique
needs and when the success of such investments depends on the cooperation of
software vendor. Another source of inefficiency has to do with production of
software becoming more expensive when the source code is not open to the end
users. The authors explain why open source dominates certain sectors of the
software industry and not others. For example, the top ten programming languages
all have an open-source implementation because they require substantial comple-
mentary investments and users have the need and the capacity to modify the source
code. On the other hand, software for none of the top ten computer games is likely
to need modifications and is offered to users with little or no programming skills to
modify software even when the source code is offered to them. Therefore, it is
virtually all proprietary.
Open-source operating systems and tools are being embraced not only by
individuals, but they have become preferred systems and tools for Internet
companies such as Amazon, Facebook, Google, and Yahoo! as well as IBM,
Intel, and Oracle, among others. Corbet (2007) estimates that about a third of the
changes to a recent release of Linux kernel were made by employees of only five
companies (IBM, Novell, Intel, Oracle, and Red Hat). Schwartz and Takhteyev
(2009) report that in 2001, IBM announced its plans to contribute $1 billion to
Linux open-source operating system and later reported that the investment was
recovered in 1 year. This is not surprising because, given the need for complemen-
tary investments and frequent modifications in the software combined with their
capacity to make modifications, these companies see the individual and collective
benefits in making software a public good. Therefore, monetization of investments
in OSS occurs through products and services enabled by the software rather than
software itself. The holdup problem is largely mitigated.
While open innovation—of which OSS is one example—has the property of
increasing SRR, it simultaneously reduces appropriability and hence innovator
firm’s incentive to innovate. This is especially the case when an innovator firm
lacks the depth and breadth of downstream products and services (like, e.g., IBM)
that benefit from OI. Put differently, a firm like IBM has more to gain by playing
the OI as well as the proprietary game at the same time, whereas a firm like Rambus
specializes in the production and licensing of proprietary technologies for its
existence and survival.
348 P.M. Rao

5 Summary and Concluding Remarks
Monetization of IP presents a challenge with or without IPRs. This is because
innovation possesses characteristics of a public good, and as a result, the problem of
appropriability—the difficulty innovative firms face in monetizing IP—arises.
Nordhaus (2004) estimated that over the 1948–2001 period, supernormal profits
for innovation in the US economy—that is, profits over and above the risk-adjusted
return—were very small, only 2.8% of corporate profits. However, this does not
stop individual firms from continuing to innovate in search of supernormal profits,
and some of them like Apple succeed, at least for some period.
Monetization of IP occurs in many forms. They include sale, lease, and rentals of
technology embodied in products and services—which is the most common form;
process technologies that reduce cost of production and/or improve the quality of
end products and services; licensing and cross licensing of technologies, a rapidly
growing means of monetization; sales of technologies such as those that occur
through acquisition (e.g., Motorola selling Motorola Mobility to Google); securiti-
zation of IP; and infringement suits against firms whose patents are related to
inactive and marginal patents acquired by patent trolls. The appropriability problem
is present in all forms of monetization. The degree to which firms are able to
appropriate the benefits of innovation depends not only on how tight IPRs are and
how hard it is to copy but also on myriad complementary marketing assets in the
form of difficult-to-imitate strong and sustainable brand name and reputation of the
firm, promotion, distribution systems, and the like.
The traditional approach to mitigating the appropriability problem has been to
internalize innovative activity within the firm through vertical integration (VI). The
open innovation (OI) model, which has clearly taken hold in the software sector in
the form of open-source software (OSS), turns the traditional VI model of
innovation—and proprietary software—on its head. The rapid rise of OSS since
the mid-1990s could be described as innovation without property rights. The
essence of the OI model, in contrast to the traditional closed and VI model of
innovation, is it enables firms to receive external ideas and produce competitively
superior innovation and commercialization by opening their own innovation to
outsiders. It also expands the innovation space. As such, it emphasizes research and
productivity via collaboration and networks. Still, despite the doubling of projected
revenues between 2009 and 2013, worldwide forecast of OSS revenues for 2013
($8.1 billion) pales in comparison to $ 169.5 billion revenues from proprietary
software applications (www.linux.com/news/enterprise, August 2009). Thus, it
appears that despite the inefficiencies of proprietary software noted earlier, higher
excludability keeps it dominant, at least for the foreseeable future. At the same time,
Microsoft chose to team up with Novell, which like Red Hat, participates under the
open-source license to share their respective patent portfolios on a bilateral basis.
Moreover, Microsoft’s Shared Source Initiative, which gives licensees the right
to review and in some cases modify its source code for several of its platform
products, represents an example of a trend on the part of firms producing proprietary
Monetization of Intellectual Property: An Open Innovation Perspective 349

software seeking to obtain the benefits of the open-source model. And Red
Hat, which has consistently taken the position that patents generally impede
innovation in software, now takes the view that they are needed as a defense against
misuse by a small number of very large companies who amassed large numbers of
software patents (www.RedHat.com/RedHat Patent Policy, 4/7/2008). Thus, as
suggested by Rao et al. (2009), there appears to be a movement toward coexistence
and convergence between OSS and proprietary software producers. On the other
hand, the experience with OI in sectors outside of software is too limited to draw
conclusions with any high level of confidence.
Acknowledgements The author thanks Hayley Stewart for her excellent research assistance.
References
Arora A, Gambardella A (2001) Markets for technology. MIT Press, Cambridge, MA
Arrow KJ (1962) Economic welfare and allocation of resources for invention. In: Nelson R (ed)
The rate and direction of incentive activity. Princeton University Press, Princeton
Barefoot KB, Mataloni RJ (2011) Operations of U.S. multinational companies in the United States
and abroad. Survey of Current Business (November):29–48Baumol WJ (2002) The free-market innovation machine. Princeton University Press, Princeton
Bureau of Economic Analysis (2011) Detailed statistics for cross-border trade, royalties and
license Fees, 1999 and 2009, Table 4. http://www.bea.gov/international/international_services.
htm#summaryandother
Chesbrough H (2003) The Era of open innovation. MIT Sloan Manage Rev 44(3):35–41
Chesbrough H (2011) The case for open services innovation: the commodity trap. Calif Manage
Rev 53(3):5–20
Christensen JF (2006) Withering core competency for the large corporation in an open innovation
world? In: Chesbrough H (ed) Open innovation: researching a new paradigm. Oxford Univer-
sity Press, Oxford, pp 35–61
Corbet J (2007) Who wrote 2.6.20? http://LWN.net/Articles/222773/
Ghauri PN, Rao PM (2009) Intellectual property, pharmaceutical MNEs and the developing.
J World Bus 44(2):206–215
Hillery JS (2004) Securitization of intellectual property: recent trends (March), Washington/CORE.
www.wcore.com
Hulten CR (2010) Decoding Microsoft: intangible capital as a source of company growth. NBER
working paper 15799. National Bureau of Economic Research, Cambridge, MA
Isckia T, Lescop D (2009) Open innovation within business ecosystems: a tale from Amazon.com.
Commun Strateg 74(2nd quarter):37–54
Jones CI, Williams JC (1997) Measuring the social return to R&D. Stanford University, Stanford
Kraemer KL, Linden G, Dedrick J (2011) Capturing value in global networks: Apple’s iPad and
iPhone. University of California, Irvine
Nadiri MJ (1993) Innovations and technological spillovers. Working paper no. 4423. National
Bureau of Economic Research, Cambridge, MA
Nordhaus WD (2004) Schumpeterian profits in the American economy: theory and measurement.
NBER working paper 10433. National Bureau of Economic Research, Cambridge, MA
Pisano GP (2006) Science business. Harvard Business School Press, Boston
Rao PM (2005) Sustaining competitive advantage in a high-technology environment: a strategic
marketing perspective. Adv Competitive Res 13(1):33–47
350 P.M. Rao

Rao PM, Klein JA, Chandra R (2009) Innovation without property rights and property rights without
innovation: recent developments in the ICT sector. Ad Competitive Res 19(1&2):83–99
Red Hat, Inc. Statement of Position and Our Promise on Software Patents. http://www.RedHat.
com/RedHat Patent Policy. Accessed on 4 July 2008
Richtel M, Wortham J (2011) Motorola’s identity crisis. The New York Times. www.nytimes.
com/2011/08/22/technology
Schwartz M, Takhteyev Y (2009) Half century of Public Software Institutions: open source as
a solution to hold-up problem. NBER working paper 14946. National Bureau of Economic
Research, Cambridge, MA
Somaya D, Teece D, Wakeman S (2011) Innovation in multi-invention contexts: mapping
solutions to technological and intellectual property complexity. Calif Manage Rev 53(4):47–79
Teece D (2000) Managing intellectual capital. Oxford University Press, Oxford
USPTO (2004) Annual list of top 10 organizations receiving most US Patents. http://www.uspto.
gov/main/homepagenews/bak11jan2005.htm
Vinod HD, Rao PM (2000) R&D and promotion in pharmaceuticals: a conceptual framework and
empirical exploration. J Mark Theory Pract 8(4):10–20
von Hippel E (2005) Democratizing innovation. MIT Press, Cambridge, MA
West J, Gallagher S (2006) Patterns of Open Innovation in Open Source Software, in Henry
Chesbrough, Wim Vanhaverbeke and Joel West, eds., Open Innovation: Researching a New
Paradigm, Oxford: Oxford University Press, pp 82–106.
West J, Vanhaverbeke W, Chesbrough H (2006) Open innovation: a research agenda. In:
Chesbrough H (ed) Open innovation: researching a new paradigm. Oxford University Press,
Oxford, pp 285–307
Williamson OE (1975) Markets and hierarchies: analysis and antitrust implications. The Free
Press, New York
Monetization of Intellectual Property: An Open Innovation Perspective 351

Part 2.2
Human Resource Management

Role of Innovation in Practices of Human
Resources for Organizational Competitiveness:
An Empirical Investigation
Shivani Pandey and Debdeep De
1 Introduction
In an age of severe competition and increasing complexity, effectual human
resource management (HRM) can no longer be at ease with simply implementing
the traditional set of practices. There is a persistent need to develop and put into
practice new and improved human resource (HR) practices subsequently to remain
competitive.
The present study identifies innovation as a significant enabler for organizations,
to create value and sustain competitive advantage in a rapidly changing environ-
ment. Organizations with advanced level of innovativeness will be more successful
in offsetting the changing environments and in building new competencies that
allow them to attain better performance. To facilitate innovation initiatives, an
organization must depend significantly on HR practices which are the principal
means by which organizations can influence the behavior of individuals and
achieve organizational goals.
Regardless of the recognition of the existing relationship among HR practices,
innovation, and organizational performance, very little has been examined from an
empirical perspective. Preceding literatures (Wintermantel and Mattimore 1997)
have paid emphasis to the link of HR practices and organizational upshot such as
productivity, efficiency, flexibility, and financial performance, but the understand-
ing requires to be extensive, to encompass innovation in organizational perfor-
mance. The purpose of this chapter lies in filling this gap in literature, i.e., this study
S. Pandey • D. De (*)
Jaypee Business School, Jaypee Institute of Information Technology, Noida 201307, India
e-mail: [email protected]; [email protected]
The view expressed is of the authors and not of the institute they belong to. Usual disclaimer
applies.
Department of Management Studies, Indian Institute of Science, Bangalore,
Driving the Economy through Innovation and Entrepreneurship,DOI 10.1007/978-81-322-0746-7_29, # Springer India 2013
355

empirically analyzes the relationship between practices of human resource and
innovation and the effect of both on organization’s performance.
In the consecutive sections, the literature on this topic is analyzed followed by
the methodology for the study and finally, findings along with the managerial
implications of the study, its limitations, and our suggestions for future research,
are presented.
2 Review of Literature
2.1 Innovation and HR Practices
Organization’s structure and management practices have undergone a radical
change in the fast pace and competitive environment, each firm devising their
own unique method to counter issues like fierce competition, globalization, tech-
nology change, etc. As the world is becoming more competitive and unbalanced
than ever before, organizations are increasingly becoming more practical and
rational in identifying HR issues and institutionalizing innovation in human
resource practices (HRP). To survive in the age of cutthroat competition, industries
like manufacturing, ITES, etc., are seeking to gain competitive advantage at all
cost and are turning to more innovative sources through different HR practices to
ensure the effective functioning and survival of the organization. HR practices in
innovative organizations are treated as the organization’s strategy to persuade
team responsibilities, augment organizational culture, and build up customer
relationships through involvement and empowerment.
The term innovation has been at variance in respect of whether “objective
newness” is well thought-out as an important criterion of innovation or considers
an innovation to be a system, product, or program which is new to the adopting
organization. The adoption of innovation in HR practices can be considered effec-
tive within the social system of the organization as they are intended to improve
organizational effectiveness and competitiveness by influencing employee attitudes
and behavior. Organizations often take on HRM innovations in order to emerge as
more legitimate. Nowadays, HR skills and knowledge are a means to success in
research and development. Moreover, there is a general recognition about the
significance of HRM as a determinant of innovation because it is considered that
the innovative capacity of an organization dwells in the imagination, intelligence,
and creativity of its employees and that their inference and support are needed for
the development and implementation of innovation. Organizations can improve
the success rate of their innovative HR programs by providing top-level support for
HR innovations, ensuring that the HR department is not isolated from other
departments, and that if HR does not meet the challenge of change, it risks
being disbanded. Innovative HR practices build competencies and capabilities
for better-quality performances today and simultaneously create long-term fertility
for innovation of business ideas and strategies for future.
356 S. Pandey and D. De

2.2 Functional Innovative HR Practicesand Organization Growth
A budding body of pragmatic research has examined the effect of certain HRM
practices on organization’s performance. Although a long list of best HR practices
can influence either autonomously or collectively the organizational performance,
we chose to examine select HR practices that can be expected to influence
the organization’s performance. For instance, recruitment and selection (Olian
and Rynes 1984) engrosses employing appropriate and competent candidates
through internal/external sourcing (Sonnenfeld and Peiperl 1988) which offers
greater significance to be attached to fit between person and organization culture.
Thus, the elevated level of implementation of recruitment that attaches individual
organizational fit is likely to result in high organizational innovation and that
attracting and selecting the right employees increase the employee productivity,
boost organizational performance, and contribute in reducing turnover, resulting
in better growth and outcome. Performance management (Schuler and Jackson
1987) increases employee obligation and satisfaction since employees are given
prospects to discuss about their work performance, which in turn, directs them to
perform superiorly and increase involvement in bringing innovation in activities.
In a similar stratum, innovative learning (training) and development programs(Chen and Huang 2009) may be related to organization’s performance in many
ways. Firstly, these programs amplify the organization specificity of employee
skills, which, in turn, increases employee productivity and trims down job dissat-
isfaction that results in employee turnover. Secondly, training and developing
internal human resources reduces the cost and risk of hiring, selecting, and
internalizing people from external labor markets, which again increase employee
organization’s productivity and cost-effectiveness and reduces turnover (Miles
and Snow 1984). Organic compensation system (Mabey and Salaman 1995)
grants financial reward, promotion, and other recognition in order to motivate
employees to take risk, develop successful new products, and generate different
ideas, thereby leading to organization’s productivity, cost-effectiveness, and
increasing efficiency. As soon as the strategic value and the immense organiza-
tional transition that is involved in building a corporate-wide innovation capabil-
ity are recognized, leadership automatically moves to center stage. HR leaders
take an initiative by turning a company’s strategic objective with regard to
innovation into tangible everyday action; they make the necessary changes to
executive roles and goals, political infrastructures, recruitment strategy, broad-
based training, performance appraisals, awards and incentives, employee contri-
bution and commitment, value systems, and so on. In short, HR leaders are the
individuals who can build an organization where everyone, everywhere, is in
charge/responsible for innovation every day—whether as a trendsetter, adviser,
innovator, manager, mentor, or team member. It is truly considered that the
pioneering capacity of a firm dwells in the intelligence, imagination, and
Role of Innovation in Practices of Human Resources for Organizational. . . 357

creativity of its employees, assuming that employee’s knowledge at a vast extenthas a dominant role in influencing the organizational innovation because it is the
individuals’ proficiency and precious knowledge that allow them to obtain novel
ideas and make the first move toward innovation. The explicit advancement, if an
organization makes in its HR practices, may, thus, dole out the exclusive
requirements of the organization and its employees. It can therefore be said that
innovation plays a pivotal role in select HR practices by developing new insights
and competence, thereby resulting in organizational competitiveness and
performances.
2.3 Innovative HR Practices and Organizational Performance
HR being some of the most unique and complicated to imitate resources of
any organization primarily because many of their most vital characteristics are
tacit and highly complex. Therefore, HR is therefore a primary source of sustain-
able competitive advantage for the organization. The importance of executing
internally consistent innovation in HR practices leads to higher organizational
performance. The impact on organizational performance of sets or “bundles”
of innovative HRM practices can be greater than the cumulative impacts of all
the traditional HR practices comprising the bundle. That is because the use
of innovative HR practices allows companies to get synergies from the comple-
mentarities among them. Furthermore, a greater emphasis on innovation that
fosters HR practices seems to be an important illuminating factor for greater
success or performance of an organization. Therefore, we can say that the
organizations which encourage innovation in its HR practices would be positively
coupled with its performance in terms of stakeholder’s satisfaction, corporate
decision making, customer satisfaction, and overall growth. Thus, it is clear
that innovation is more contributing to HRM practices when adopted, not in
isolation but as a scheme of jointly reinforcing practices (Jiménez-Jiménez and
Sanz-Valle 2008).
3 Objectives
The objectives of this chapter are:
(a) To understand the linkage between human resource management and innovation
and organizational competitiveness
(b) To analyze how innovative HRM practices contribute in successful functioning
of an organization
358 S. Pandey and D. De

4 Research Methodology
Literature reveals some obvious yet interesting facts. The design of this chapter has
been empirical where a sample has been taken and validation of the facts stated
through literature has been tried to achieve. In order to attain the objectives of the
study, the Human Resource Department of IT and manufacturing companies are
targeted to collect the data, where convenient sampling has been used. The present
study takes up a questionnaire survey approach. The choice of the research design
was based on the nature of the research objectives. Questionnaire has been used as a
tool for conducting this study. The questionnaire is divided into four major parts.
The first part includes bringing innovation into practice; the second part talks about
functional performances of human resource practices that relate directly to the three
main organizational performance indicators, i.e., productivity, cost-effectiveness,
and efficiency. The third part comprises of organizational performances in terms of
stakeholder’s satisfaction, corporate strategic decision making, customer satisfac-
tion, and organizational growth. The last fraction of the questionnaire concludes
with the degree of innovation involved in select human resource practices.
Data collection is the significant part of the research. The data collected for
this research is primary. This research has been conducted on 40 companies in
Delhi and NCR region (Delhi NCR being one of the industrial hubs in India). Forty
questionnaires were prepared and sent to the HR department of the respective
companies, out of which 30 responses came back and were analyzed. Variables in
the questionnaire include select human resource practices, degree of innovation
involved, and organizational performance indicators. All independent and depen-
dent variables required five-point Likert style responses ranging from “extremely
low” to “extremely high.” A five-item scale reflects the extent to which
organizations are satisfied with the achievements in their development and imple-
mentation of innovation in select-HR-practice activities. The analysis has been
carried out using descriptive statistics, and a correlation matrix has been designed.
Further stepwise regression analysis has been carried out to see which particular
innovative HR practices influence and/or explain organizational performance.
Other than Microsoft Excel, SPSS has been used to carry out the results of the study.
5 Findings
Recruitment and selection, compensation system, and employees’ knowledge are
found to be significantly correlated with the three most important factors enhancing
the competitiveness of the firm, namely, productivity, cost-effectiveness, and
efficiency. The competitiveness of the firms may be best judged in terms of three
basic parameters, namely, increased efficiency, reduced cost, and increased pro-
ductivity. The correlation matrix as provided in the Table 1 suggests that recruit-
ment and selection is a key factor in enhancing the firm’s efficiency and
Role of Innovation in Practices of Human Resources for Organizational. . . 359

Table
1Correlationmatrix
R&S
L&D
PMS
Lead
CS
EK
Effe.
Cost
eff.
Prod.
Effe.
Cost
eff.
Prod.
Effe.
Cost
eff.
Prod.
Effe.
Cost
eff.
Prod.
Effe.
Cost
eff.
Prod.
Effe.
Cost
eff.
Prod.
R&S
0.617
0.34
0.59
0.381
0.48
0.448
0.73
0.45
0.05
0.302
0.293
0.0246
0.423
0.28
0.45
0.458
0.405
0.352
L&D
�0.15
�0.46
�0.21
�0.159
�0.12
�0.13
0.032
�0.071
�0.01
�0.218
�0.174
�0.2
�0.2
�0.2
�0.2
�0.128
�0.28
�0.284
PMS
�0.12
0.1
0.05
0.035
0.33
0.309
0.302
0.271
0.234
0.298
0.323
0.389
0.19
0.22
0.24
0.056
0.132
0.128
Lead
0.143
0.44
0.32
0.036
0.48
0.497
0.245
0.363
0.288
0.497
0.454
0.55
0.382
0.47
0.292
0.463
0.48
0.494
CS
0.27
0.56
0.43
�0.027
0.52
0.485
0.298
0.485
0.366
0.483
0.488
0.602
0.511
0.59
0.426
0.486
0.481
0.515
EK
0.326
0.3
0.4
0.199
0.43
0.382
0.083
0.159
0.07
0.344
0.287
0.297
0.448
0.37
0.396
0.435
0.477
0.401
Abbreviations:R&SRecruitmentandselection,L&DLearninganddevelopment,CSCompensationsystem
,PMSPerform
ance
managem
entsystem
,Lead.Leadership,
EKEmployees’
knowledge,Costeff.Cost-effectiveness,Prod.
Productivity,Effe.Efficiency

productivity. The values of the compensation system in the matrix suggest that
it has a significant effect on cost-effectiveness and productivity of the firm.
It is important to note that learning and development, on the other hand, has a
negative impact particularly on the cost-effectiveness, as it increases the cost to the
organizations. Thus, the result shows that the role of HR is by and large seen as
critical in making sure that firms are able to attract, retain, inspire, and develop
human assets or resources according to existing and future requirements to enhance
competitiveness. The recruitment and selection of employees is therefore essential
to the operating of an organization, and there are undeniable reasons for getting
it right. Inappropriate selection decisions lessen organizational effectiveness, nul-
lify reward and development strategy, and can be distressing for executives and
managers who have to deal with employees lacking the attributes required for their
skill set to be used as a desirable resource in any organization. Holding on to
employees’ knowledge in a deregulated, competitive environment has been found
to be one of the most significant resources for competitive advantage for firms,
which is only possible with practicing of innovative recruitment practices and
implementing innovation in compensation and reward systems like using clear
remuneration policies, flexible hours, and competency-based payment schemes
which in turn can help in stimulating creativity throughout the organization
(Amabile et al. 1996).
A stepwise multivariate linear regression analysis is carried out to predict the
values of the dependent variables, i.e., organizational performance (Y) which is
represented by stakeholder’s satisfaction, corporate strategic decision making,
customer satisfaction, and organizational growth for a given set of explanatory
variables where x1, x2, x3, and x4 are degree of importance given to innovation,
keenness of organization for investing in innovative practices, the HRM
personnel’s involvement in integrating innovation in HR practices, and the degree
of acceptance of flexibility in innovative practices, respectively.
This multiple linear regression model for explanatory variable HRM personnel’s
involvement in integrating innovation in HR practices has R-squared value of
0.123. Thus, 12.3 % of the variation in organizational performances can be
explained by this model (Table 2).
The ANOVA results clearly indicate that the HRM personnel’s involvement in
integrating innovation in HR practices within the organization affects the
stakeholder’s satisfaction in a significant way. The F value and the significance
level are provided in the Table 3 for reference.
Table 2 Model summary
Model R R square Adjusted R square Std. error of the estimate
1 .391a .153 .123 .66918aPredictors: (constant), the HRM personnel’s involvement in integrating innovation in HR
practices
Role of Innovation in Practices of Human Resources for Organizational. . . 361

The multiple linear regression model for explanatory variable degree of flexibil-
ity in innovative practices has an R-squared value of 0.113 (Table 4).
The degree of flexibility in innovative practices significantly affects the level of
corporate decision making (significant level <5 %) (Table 5).
Similarly Table 6 shows the degree of importance given to innovation has an R-squared value of 0.228.
ANOVA results in Table 7 shows that degree of importance given to innovation
significantly affects the growth of the organization (significant level <5 %).
Table 4 Model summary
Model R R square Adjusted R square Std. error of the estimate
1 .379a .143 .113 .79771aPredictors: (constant), degree of acceptance of flexibility in innovative practices
Table 5 ANOVAa
Model Sum of squares Df Mean square F Sig.
1 Regression 2.982 1 2.982 4.687 .039b
Residual 17.818 28 .636
Total 20.800 29aDependent variable: corporate strategic decision makingbPredictors: (constant), degree of acceptance of flexibility in innovative practices
Table 6 Model summary
Model R R square Adjusted R square Std. error of the estimate
1 .505a .255 .228 .54017aPredictors: (constant), degree of importance given to innovation
Table 7 ANOVAa
Model Sum of squares Df Mean square F Sig.
1 Regression 2.797 1 2.797 9.585 .004b
Residual 8.170 28 .292
Total 10.967 29aDependent variable: organizational growthbPredictors: (constant), degree of importance given to innovation
Table 3 ANOVAa
Model Sum of squares Df Mean square F Sig.
1 Regression 2.262 1 2.262 5.050 .033b
Residual 12.538 28 .448
Total 14.800 29aDependent variable: stakeholder’s satisfactionbPredictors: (constant), the HRMpersonnel’s involvement in integrating innovation inHR practices
362 S. Pandey and D. De

6 Conclusion
The analysis suggests that an organization hoping to enhance performance through
innovation should pay attention to its HR practices. It is important to note that
innovation, like any organizational outcome, has multiple determinants in particular;
it should emphasize the implementation of a set of practices which enhance
innovation, e.g., recruitment and selection, learning and development, systematic
performance management, leadership, organic compensation system, and employees’
knowledge. The state of innovative HR practices is changing in India, and
organizations are professionalizing their recruitment and compensation policies to
face competition. Practical implications of this research are seen in some Indian firms
like Infosys, Wipro, TISCO, State Bank of India, Ranbaxy, and many others which
have understood that the differentiator for advanced performance is people and are
thus setting an example for other companies for focusing on innovative recruitment
and selection and compensation practices to improve their firm performance (Som
2006). However, this has achieved limited success as competitiveness is yet to be
achieved through this route. The degree of focus/importance given on/to innovation
came out to be the most important practice for enhancing firm performance, followed
by theHRMpersonnel’s involvement in integrating innovation in HR practices within
the organization which influences moderately the stakeholder’s satisfaction as
revealed in the results (Table 8). It is clear that the organizational performance does
not depend on the keenness of the organizationwhichmeans that in today’s globalized
world the organizations do not have a choice whether or not to invest in innovative
practices of HR in enhancing the firm performance and thereby competitiveness but
are almost bound to do so to share a considerable size in the market.
This chapter in relation to the context presents a number of practical inferences.
Firms today are required to change their business strategies and management
practices in the dynamic and uncertain business environment. Technological
innovations, in high-technology firms, turn out to be significant in adapting and
resorting to fast changes. Even in this case, innovation depends intensely on
Table 8 Innovative HR practices and organizational performance
S.
No.
Degree of innovative HR practices
explained by Organizational performance indicators
Impact
factor
1 The degree of focus/importance
given on/to innovation
Organizational growth Maximum
2 Keenness of organization for
investing in innovative practices
Organizational growth, stakeholder’s
satisfaction, corporate strategic
decision making, customer
satisfaction
None
3 The HRM personnel’s involvement
in integrating innovation in HR
practices within the organization
Stakeholder’s satisfaction Moderate
4 The degree of flexibility in
innovative practices
Corporate strategic decision making Least
Role of Innovation in Practices of Human Resources for Organizational. . . 363

attainment of new knowledge which could be obtained only when an organization
fully utilizes its human resources in several innovative ways to sustain competi-
tiveness. Innovative human resource practices can therefore play a vital role in
sustaining and contributing to the conception, incorporation, and utilization of
knowledge by preparing employees, meeting challenges, and responding to the
dynamics of the work environment with high technological and critical skills.
Organizations, where innovation and engagement in sustained efforts are more
observable, become necessary to consider how best to draw upon the skills and
knowledge of the whole workforce. This is where employee’s knowledge has an
imperative role to play in development of organizational innovation. Managers
should therefore look forward in preventing individuals to be restricted into limited
perceptual frameworks. In the end, innovation depends on the conception of skills
and new ideas; therefore, managers must make an effort to build up ways intended
to enhance new and diverse thinking among the employees. Organizations, at the
same time, must implement means to develop existing skills, knowledge, and mind-
set of its people. This is where effective training, appraisal, and systematic contin-
gent reward helps in ensuring that employees are comprehensible about their tasks
and have the essential skills necessary to perform efficiently.
Thus, while we say that innovative practices are required or have become a
mandatory part in any organization, it has to be understood that the organization has
to adopt such measures not only by their choice but also in view of the available
workforce aligning the same with the market requirement that would increase the
competitiveness in the days to come. Moreover, the skill set has to be linked with
the compensation of the employees, so that they can get sufficient motivation to
aspire for undergoing such trainings that would lead them to remain competitive in
their work environment. Hence, while we understand that for any organization to
remain sustainably competitive in its business, the employees in the organization
have to follow suit, the design of which should be taken in the spirit of the risk and
reward practices that are percolating from the macrobusiness environment to the
microlevel of the employees.
References
Amabile TM, Conti R, Coon H, Lazenby J, Herron M (1996) Assessing the work environment for
creativity. Acad Manage J 39(5):1154–1184
Chen C-J, Huang J-W (2009) Strategic human resource practices and innovation performance—
the mediating role of knowledge management capacity. J Bus Res 62(1):104–114
Jiménez-Jiménez D, Sanz-Valle R (2008) Could HRM support organizational innovation? Int
J Hum Resour Manage 19(7):1208–1221
Mabey C, Salaman G (1995) Strategic human resource management. Blackwell, London
Miles RE, Snow CC (1984) Designing strategic human resources systems. Organ Dyn 13(8):36–52
Olian JD, Rynes SL (1984) Organizational staffing: integrating practice with strategy. Ind Relat 23
(2):170–183
Schuler RS, Jackson SE (1987) Linking competitive strategies with human resource management
practices. Acad Manage Exec 1(3):207–219
364 S. Pandey and D. De

Som A (2006) Bracing for MNC competition through innovative HRM practices: the way ahead
for Indian firms. Thunderbird Int Bus Rev 48(2):207–237
Sonnenfeld JA, Peiperl MA (1988) Staffing policy as a strategic response: a typology of career
systems. Acad Manage Rev 13(4):588–600
Wintermantel R, Mattimore K (1997) In the changing world of human resources: matching
measures to mission. Hum Resour Manage 36(3):337–356
Role of Innovation in Practices of Human Resources for Organizational. . . 365

Work Behaviors of Korean and Indian
Engineers: A Study of Comparison
M.K. Sridhar and Paul Jeong
1 Introduction
Cultural understanding is a key issue in the development of international or cross
border business. The greatest challenge to international business today is the
management of business operations across cultural boundaries. In recent years,
knowledge-based software business is facing very unusual problems of cross-
cultural and work-related behavior issues. Such problems are found to be the
major cause for software joint-development business failures between any two
countries. This chapter explores the major differences in work-related behavior
between South Korean and Indian engineers in knowledge-based software business.
Though a considerable number of works have been done on culture in interna-
tional business, there is hardly any work done on the culture for business relation-
ship between South Korea and India, particularly in the area of knowledge-based
software business. One most important factor that can be attributed to absence
of such work in the past is due to low level of economic relationship between the
two nations. Though South Korea and India shared diplomatic ties since 1973, the
bilateral trade and investments between the countries remained low till the last
decade in spite of their structural complementarities.
M.K. Sridhar (*)
Karnataka JnanaAayoga, Government of Karnataka, Room # 219, II floor, Vidhana Soudha,
Dr. B.R. AmbedkarVeedhi, Bangalore 560 233, Karnataka, India
e-mail: [email protected]
P. Jeong
Indo – Korea Science & Technology Center, First Floor, Entrepreneurship Center,
IISc Campus, Bangalore 560 012, Karnataka, India
e-mail: [email protected]
Department of Management Studies, Indian Institute of Science, Bangalore,
Driving the Economy through Innovation and Entrepreneurship,DOI 10.1007/978-81-322-0746-7_30, # Springer India 2013
367

2 Need for the Study
One of the trends in ICT system software development is globalization. ICT software
industry is becoming more and more globally interconnected. The software is getting
developed in a diverse cultural organization and their subsidiaries. More and more
companies are outsourcing their work across globe with diversified cultural back-
grounds. This acceleration of global business development has generated a lot of
interests in management research across cultures on international business
A number of scholars have argued that the existing local, sociocultural context
is a critical factor in mediating the globalization process in a specific context
and, in turn, will have an impact on the complexity of globalization. According
to Greet Hofstede (1980, 1984), “The business of International Business is culture.”
Culture impacts each aspects of business in the international arena - the actors, the
activities, the transformation of resources, as well as the environment in which this
takes place and the interactions involved.
There are several models that theorize culture within the context of ICT.
However, Hofstede’s five cultural dimensions are the most widely used model for
studies on cultural and cross-cultural issues in the IT field (Myers and Tan 2002).
A study by Myers and Tan (2002), observed that 24 out of 36 studies from cross-
cultural ICT literature used Hofstede’s cultural dimension constructs.
A number of works are carried out on the cultural aspect, issues, and challenges
with global ICT software development. Ifinedo (2004) and Herbsleb and Moitra
(2001) examined the challenges and issues in global ICT system software develop-
ment in multisite and multicultural environments. The challenges and issues asso-
ciated are strategic, cultural, and inadequate communication; project and process
management; trust; geographical distance; and strategic, political, and economical
issues. One of the most significant obstacles in global software development is
communication. Communication style and complexity of language barriers are key
factors among developers and become barriers in most of the projects (Huang and
Trauth 2007; Cho 2007). Abraham (2009) and Greg Borchers (2003) examined the
cultural factors and differences in software development with the help of original
Hofstede’s dimension between the cultures to analyze the cultural impact on project
management, configuration management, and software architecture to relate vari-
ous attitudes and behaviors of the team members. Few researchers have examined
the managing aspect of cross-cultural issues in global software development
(Krishna andWalsham 2004; Gregory et al. 2008). Many researchers recommended
ways to address and resolve problems and challenges in cross border software
outsourcing relationships. Some of the suggested mechanisms to reduce the cultural
impact, are, training on culture to understand different cultural norms and values,
having a culturally aware liaison officer who could act as bridge between the teams,
approaches to staffing etc.
The issues connected with ICT industry are reasonably differing with other
industries. The software development business is basically a knowledge-based
business model, and the problems of managing both offshore and onsite workers
in cross-cultural-related issues are complex. Knowledge-based work is highly
368 M.K. Sridhar and P. Jeong

interdependent. It is creative, individually styled, and many times cannot be fully
planned, and the work consists of analytic and abstract processing of information
and knowledge. Individuals working in such industry highly depend on each other
for the exchange of information about their jobs (Perlow and Weeks 2002). One of
the crucial challenges facing this industry is to overcome misunderstandings and
conflict between engineers of different nationality and background due to lack of
understanding of each other’s culture and working behaviors of team members. In
today’s global business environment, not only the understanding of values and
cross-cultural is necessary but also the understanding of the work behavioral
differences between engineers of different countries is required for successful
developmental work.
Thus, the problems, challenges, and issues associated with global software devel-
opment are many. One of the most significant obstacles in global software develop-
ment is the cultural differences and values which reflect in the work behavior among
engineers from different countries working on the same project. Hence, there is
a need for the present study. Though a sizable number of studies have been done
on culture in international business, there is hardly any work done on the cultural for
business relationship between South Korea and India, particularly in the ICT sector.
Given the enormous rise in the number and nature of interfaces between South
Korean and Indian business due to enhanced cooperation between the countries
post-CEPA (a kind of FTA), it is essential that these two nations understand each
other’s cultural values and work behavioral differences for successful business
ventures. Given the lack of any previous work on this topic, such work is completely
a virgin territory. Through such research work and findings, meaningful business
protocols can be made which can be used by both Indian and South Korean
businesses to adapt and succeed in their business relationships.
Since the value system is an inner and intrinsic aspect of person, it is not easily
recognized by others. The nature and the types of work values that people distin-
guish are all based on the theory of basic human values. The work-related behaviors
are the expressions of general values in the work setting (Ros 1999). It is observed
that the work behavioral dimensions or work goals usually studied are quite broad;
they refer to what a person wants out of work in general rather than to the narrowly
defined outcomes of particular jobs. Although some work is carried out based on
Vunderink and Hofstede’s list of work goals items by Routamaa et al. (2007), in this
particular study, a behavioral dimensions model is developed to study the work
behavioral difference between South Korean and Indian engineers.
3 Research Design
This study covered the exploration of cultural values and work behavioral issues in
software development business in the context of Indian and Korean organizations;
this chapter examines mainly the work behavioral differences. Several objectives
were derived for this study; however, the key focus here is to address the differences
of work behavior between Korean and Indian engineers.
Work Behaviors of Korean and Indian Engineers: A Study of Comparison 369

Data were collected primarily from ICT companies in India and Korea. Basi-
cally, the companies who have experience of working with either Korean or Indian
companies, or Korean companies having subsidiaries in India, were selected. The
sample size of respondent organization was six software development organizations
located in India and Korea out of the total population of 35 organizations. Thus, the
sample forms 17% of the population. The respondents (primarily managers and
engineers) who have experienced working with their counterparts (either Korean or
Indians) were selected randomly by the HR managers from these companies.
A survey was conducted among them, and a total of 135 respondents’ data or
samples were collected. Structured questionnaire was developed in English and was
divided into sections such as demographic and work behavioral dimensions
consisting of 30 behavioral statements/questions which were designed for this
study, as explained subsequently. The response to each question was marked on
a five-point Likert scale such as SA (strongly agreed), A (agreed), CS (can’t say),
D (disagree), and SD (strongly disagree). These scales were then converted to
a value of 5,4,3,2, and 1, respectively.
Work behavior dimensions, work behavior factors, and work behavior domains
of Korean and Indian engineers were analyzed by weighted mean values. T-test isused to test the significant difference of various work behavior factors. Chi-square
test is used to test the significant difference of work behaviors with age for Korean
and Indian engineers.
The profile of respondent (Fig. 1) software engineers of the study could be
summarized as:
• Majority of them belonged to the age group of 25–34 years.
• Majority of them were male respondents.
• Most of the respondents were technical degree holders and postgraduates.
Fig. 1 Profile of respondent
370 M.K. Sridhar and P. Jeong

4 Operational Definition of Work Behavior
Work behaviors were measured by various statements which were developed
through brainstorming and interviewing with project managers, project leaders,
and senior engineers. Thirty “behavioral statements” were selected by correlation
test. They are called “work behavioral dimensions.” These 30 behavior dimensions
were classified into 6 “work behavioral factors.” They are process, task, time,
individual, team, and emotion.
• Process factor consists of six behavior dimensions which are mainly related to
documentation.
• Task factor has eight behavior dimensions which are related to achievement of
the task.
• Time factor has five behavior dimensions which are related to importance given
to time.
• Team factor has four behavior dimensions which are related to team working
and collaboration.
• Emotion factor has three behavior dimensions which are related to person’s
emotions.
• Individual factor has four behavior dimensions which are related to individual
life preferences.
Six “work behavior factors” are further classified into two “work behavioral
domains.” They are work domain and people domain.
• Work domain mainly refers to all those factors which are directly related to
implementation of project. Hence, it includes process, task, and time factors.
• People domain refers to all those factors which are related to interpersonal
interaction of work. Hence, it includes team, individual, and emotion factors.
5 Results Analysis
5.1 Work Behaviors of Korean Engineers
Weighted average mean values of work behavior factors and domains of Korean
engineers are given in the Table 1 below.
In terms of working style, there are two factors, namely, task and emotion. They
reveal whether the engineers are oriented toward task or emotion or both. Task factor
has “high” orientation with 3.99, whereas emotion factor has “medium” orientation
with 3.31.With regard to team working, orientation toward team or individual is
ascertained. Team factor has “high” orientation with 3.68, whereas individual factor
has “medium” orientation with 3.21.With respect to project management, there are
two factors, namely, process and time. Both process factor and time factor have
“medium” orientation with mean values of 3.60 and 3.51 respectively.
Work Behaviors of Korean and Indian Engineers: A Study of Comparison 371

Basic human values such as “a sense of accomplishment” and “responsible” are
related to task orientation. In comparing the study of values by Onesimo et al.
(2008), terminal values such as “a sense of accomplishment,” “responsible,” and
“capable” of Koreans among various age groups were found to be their topmost
priority. This could explain the higher orientation for task behavior factor compared
to other work behavioral factors.
The “work”-related behavior domain for Korean engineers has “high orienta-
tion” with mean 3.70, whereas people-related behavior domain has “medium
orientation” with mean 3.28. The influences of Confucianism, Japanese, and
Americans on Korean corporate culture are significant. Korea as a society evolved
under highly competitive environment. South Korea is extremely work-oriented;
the people are hard working and industrious. In the corporate culture, achieving task
or result is more important than harmony with others. This could explain why the
weighted mean value of “work”-related behavior domain is much higher than the
people behavior domain.
With respect to age groups (younger, older), it is observed that younger Koreans
have higher mean values compared to older ones in case of factors such as team
(younger: 3.92, older: 3.58), process (younger: 3.80, older: 3.51), and individual
factors (younger: 3.33, older: 3.15). In case of time and emotion factors, older
Koreans marginally score more when compared to younger ones. The average
means of both groups are more or less equal in case of task behavioral factor.
In the case of behavioral domains, the mean values of younger and older Korean
engineers for “work” domain are more or less the same, both having higher
orientation with a mean value difference of 0.06. With respect to “people” behav-
ioral domain, younger Korean engineers score marginally higher than the older
Koreans with a mean difference of 0.15.
Chi-square test has been used to test the significance of association between
behavior domains and age. Chi-square test results reveal that the age of Korean
engineers has an influence on people behavioral domain.
5.2 Work Behaviors of Indian Engineers
Weighted average mean values of work behavior factors and domains of Indian
engineers are shown in the Table 2.
Among the behavioral factors, the team factor has the highest mean value
compared to other factors. With regard to team working, team factor has high
Table 1 Work behavior
factors of Korean engineersBehavior factors Mean values Orientation
Task 3.99 High
Team 3.68
Process 3.60 Medium
Time 3.51
Individual 3.21
Emotion 3.13
372 M.K. Sridhar and P. Jeong

orientation with mean 4.10, whereas individual factor has medium orientation with
mean 3.51. With respect to project management, process and time factors have
medium orientation with mean values 3.66 and 3.27, respectively. In terms of
working style, task factor has higher orientation with mean 3.84, whereas emotion
factor has medium orientation with a mean of 3.16.
With respect to behavioral domains, work and people domains of Indian
engineers have medium orientation with almost similar mean values 3.59 and
3.53, respectively.
With respect to age groups (younger, older), it is observed that the means of
younger Indians are higher compared to older ones in case of individual, emotion,
and team factors; whereas, in case of time, process, and task factors, older Indian
engineers marginally score more compared to younger ones. The maximum mean
difference is observed in case of individual factor wherein the mean values for
younger and older Indian engineers are 3.66 and 3.29, respectively. Younger Indian
engineers appear to give more preference to individual factors such as “comforts in
life,” “giving priority to personal issues,” etc.
In case of “people”-related behavioral domain, the mean value of younger Indian
engineers is 3.70 compared to 3.43 for older Indian engineers. However, in the case
of “work”-related behavioral domain, both younger and older engineers scored
more or less similar with 3.56 and 3.64 mean values, respectively.
Chi-square test reveals that there exists statistically significant association
between the people behavior domain of Indian engineers and their age, and also
no statistically significant association was found between the “work” behavior
domain of Indian engineers and their age.
5.3 Work Behaviors Between Korean and Indian Engineers
The following section analyzes the difference in mean values of work behavioral
factors and domains of Korean and Indian engineers.
The highest difference in the mean values of various behavior factors between
Korean and Indian engineers is observed in team factor (Korean, 3.68; Indian,
4.10; difference, 0.41) and the lowest difference of the same is observed in
emotion factor (Korean, 3.13; Indian, 3.16; difference, 0.04). Process factor of
Indian and Korean engineers is found to be similar with a mean difference of 0.06.
With regard to team factor, Indian engineers have higher orientation than Koreans
Table 2 Work behavior
factors of Indian engineersBehavior factors Mean values Orientation
Team 4.10 High
Task 3.84
Process 3.66 Medium
Individual 3.51
Time 3.27
Emotion 3.16
Work Behaviors of Korean and Indian Engineers: A Study of Comparison 373

with a mean difference of 0.41. Individual factor of Indian engineers is higher
than Koreans with a mean difference of 0.3. Time factor of Korean engineers has
higher orientation than Indians with a mean difference of 0.23. For task factor,
Korean engineers have higher orientation than Indians with a mean difference of
0.15. The mean values of both process and emotion behavioral factors of Korean
and Indian engineers are found to be similar with a marginal difference.
Results of statistical mean values reveal that task and time factors of Korean
engineers have higher orientation than Indian engineers, whereas team and individ-
ual factors of Indian engineers have higher orientation than Korean engineers. And
the process and emotion factors of both Indians and Koreans have more or less
similar orientation.In the case of “people”-related behavioral domain, Indian engineers have higher
orientation than Korean engineers with a mean difference of 0.19. And in the case
of “work”-related behavioral domain, Korean engineers have higher orientation
than Indian engineers with a mean difference of 0.11.
T-test is used to test the significant difference of various work behavior factors
between Korean and Indian engineers. T-test results indicated that there are work
behavioral differences between Indian and Korean engineers related to task orien-
tation, team orientation, time orientation, and individual factors. However, no
significant behavioral differences are found between Indian and Korean engineers
relating to process- and emotion-related work behavioral factors.
T-test results also revealed that there are work behavioral differences in terms of
both people and work behavioral domains between Indian and Korean engineers.
6 Findings and Discussion
Some of the key findings and analysis of this study with respect to work behavior
differences between Korean and Indian engineers are discussed below.
With respect to “work”-related behavioral domain factors (task, time, and
process), it is found that Korean engineers have higher orientation for both time
and task factors than Indian engineers. In terms of task accomplishment, Korean
engineers are found to be more responsible and accountable to achieve the work
goals of the organization than their Indian counterpart. Korean engineers are also
found to be more particular about schedule and timeline of the projects than Indian
engineers by staying beyond working hours to finish the project as per the plan. This
analysis reveals that Korean engineers are more task and time oriented in nature in
the workplace than Indian engineers. In terms of process orientation, it is found that
both Korean and Indian engineers almost equally agree in terms of process work
behaviors such as documentation, minutes of meetings, etc., with a marginal mean
difference.
With respect to “people”-related behavioral domain factors (team, individual,
and emotion), it is observed that Indian engineers have higher orientation for team
and individual work behavior factors than Korean engineers. Indian engineers
374 M.K. Sridhar and P. Jeong

exhibited more team-oriented work behavior such as “all team members are equally
responsible,” “helping colleagues,” etc., in the work place than Korean engineers.
Indian engineers also exhibited a higher “individual” work behavior pattern such as
“job that provides time for comforts in life,” “self-learning,” etc., than Korean
engineers. Indian engineers seem to have more preference to have a job that will
provide work-life balance, personal time, comforts, and self-learning. In the case of
“emotion” work behavior factor, both Korean and Indian engineers have similar
work behavioral pattern with a marginal mean difference. Both Korean and Indian
engineers regret for being harsh and abrasive in the work place. Koreans are more
emotional than Indian engineers if harsh words are used in the work place.
This study reveals that there are significant work behavioral differences
between Indian and Korean engineers in task-, team-, time-, and individual-
orientation-related work behavioral factors. No significant behavioral differences
are found between Indian and Korean engineers related to process orientation and
emotion-related work behavioral factors. This study also revealed that there are
work behavioral differences in terms of “people” and “work” behavioral domains
between Indian and Korean engineers.
7 Conclusions
A major contribution of this study has been to understand and explore the work
behavior of Indian and Korean engineers and their differences particularly in the
context of ICT industry. Analysis and findings of this study bring out a set of
business protocols for Korean and Indian companies to avoid any conflicts and
make successful joint developmental work. Usually, business protocol means a set
of guidelines between the companies for successful cross border business operation;
however, this study suggested a set of project management protocols (for both
Korean and Indian managers) considering work behavioral factors of Indian and
Korean engineers and Korean and Indian managers who are managing offshore,
onsite development projects; they should be made aware of work behavior of
engineers to manage such projects to reduce the impact due to cultural differences.
The business relationship between Korea and India has been accelerated since
CEPA (signed between Korea and India in 2010). This has uncovered more
business opportunities for Indian and Korean companies for the global market
because of their respective strength in ICT industry. In addition, merger of other
industries with IT technology, enhancement of hardware capability, growing
demand for software development, and shortage of engineers in Korea are some
of the trends to be noted. Hence, the demand of collaboration between Koreans and
Indians in software development industry becomes greater. This cannot happen
without good and enduring relations between them. Understanding and apprecia-
tion of value system and work behavior of the other is essentially a prerequisite for
successful business operation.
Work Behaviors of Korean and Indian Engineers: A Study of Comparison 375

References
Abraham LR (2009) Cultural differences in software engineering. In: Proceedings of the 2nd
annual conference on India Software Engineering Conference, Pune, India
Borchers G (2003) The software engineering impacts of cultural factors on multi-cultural software
development teams. In: Proceedings of the 25th international conference on software engineer-
ing (ICSE’03). IEEE, Los Alamitos, pp 540–545
Cho J (2007) Globalization and global software development. Issues Inf Syst VIII(2):287–290
Gregory R, PriflingM, Beck R (2008) Managing cross-cultural dynamics in it offshore outsourcing
relationship, the role of cultural intelligence. In: Second information systems workshop on
global sourcing: services, knowledge and innovation
Herbsleb JD, Moitra D (2001) Global software development. Lucent Technologies. IEEE Softw
18(2):16–20
Hofstede G (1980) Culture’s consequences: international differences in work related values. Sage,
Newbury Park
Hofstede G (1984) Culture’s consequences. Sage, London
Huang H, Trauth E (2007) Cultural influences and globally distributed information systems
development: experiences from Chinese IT professionals. In: Proceedings of ACM SIGMIS-
CPR Conference, St Louis, Missouri, USA, pp 36–45, April 2007
Ifinedo P (2004) Challenges in software and information systems development in multi-site and
multi-cultural ambience. Proceedings of the 9th AIM conference, Paris, France
Krishna SS, Walsham G (2004) Managing cross-cultural issues in global software outsourcing.
Commun ACM 47(4):62–66
Myers MD, Tan FB (2002) Beyond models of national culture in information systems research.
J Global Inf Manage 10:24–32
Onesimo A, Murphy EF, Greenwood RA et al (2008) A preliminary exploration of generational
similarities and differences in values between the United States, United Kingdom, Iceland,
Japan, Korea, Colombia and the Philippines. DLSU Bus Econ Rev 18(1):29–46
Perlow L, Weeks J (2002) Who’s helping whom, layers of culture and workplace behavior.
J Organ Behav 23:345–361
Ros M (1999) Basic individual values, work values, and the meaning of work. Appl Psychol Int
Rev 48(I):49–71
Routamaa V, Hautala TM, Mohsin M (2007) Managing cultural differences: values and work
goals in culture and personality contexts. In: Proceedings of the 10th international conference
creativity & innovation, Kyoto Japan: imperatives for global business and development
376 M.K. Sridhar and P. Jeong

Demographic and Personality Determinants
of Entrepreneurial Tendencies of Aspirant
Human Resources
Subhash C. Kundu and Sunita Rani
1 Introduction
For many years, scholars employed “trait research” in attempting to identify a set
of personality characteristics that would distinguish entrepreneurs fromothers. A great
dealwas known about the personality characteristics, personal background, and family
background (Louw et al. 2003) of entrepreneurs such as age, gender, birth order,
family size, education levels, socioeconomic status, and religion that urged them to
set up a business venture. Still very few studies had been carried out on the demo-
graphic variables and psychological characteristics as predictors of entrepreneurship
in India despite the growing importance of entrepreneurship in the country.
In view of this, the present study intended to examine entrepreneurial vs.
managerial personality characteristics in combination with various demographic
factors and to predict the entrepreneurial tendencies of aspirants. This study
included subjects at important life stages. High school was the stage when career
aspirations were first taking form (Wilson et al. 2007). Adult career expectations
and intentions began to be formed in the teen years, at least for college-bound
students (Low et al. 2005). Further, the sample in the study also involved adults, in
the age range of 31–40 years and above, who had already chosen a career as
entrepreneurs or managers. This age range was considered to be the most active
in terms of entrepreneurial activity (Reynolds et al. 2002), might be because they
were likely to be a group that would act on their intentions in a relatively short time
frame. Further sub-objectives of the study were:
• Do personality traits influence the entrepreneurial/managerial tendencies?
• Do demographic variables influence entrepreneurial/managerial tendencies?
• To predict aspirant human resources’ entrepreneurial/managerial tendencies.
S.C. Kundu (*) • S. Rani
Haryana School of Business, Guru Jambheshwar University of Science and Technology,
Hisar 125001, Haryana, India
e-mail: [email protected]; [email protected]
Department of Management Studies, Indian Institute of Science, Bangalore,
Driving the Economy through Innovation and Entrepreneurship,DOI 10.1007/978-81-322-0746-7_31, # Springer India 2013
377

2 Review of Literature and Hypotheses Formulation
The studies had shown that entrepreneurs usually started at early age falling between
25 and 40 years (Koh 1996), whereas the women entrepreneurs were late starters
having the range of 40–44 years (Lee 1997). Women’s participation rates in entre-
preneurship were lower than men (Minniti 2006). Male and female entrepreneurs
differed on personality characteristics and traits (Hisrich and Brush 1983) and educa-
tion (Buttner andRosen 1988). Further, female entrepreneurswere found confident and
resourceful and enjoyed the challenge of entrepreneurial activity (Mordi et al. 2010).
Kundu and Rani (2008) found differences between males and females on achievement
and innovation and by gender and course categories (Kundu and Rani 2004). Person-
ality traits differed between first and later born (Carlson andKangun 1988), and in fact,
first born were more entrepreneurial (Lee 1996). The entrepreneurs tended to be the
oldest children (McClelland et al. 2005). Attaining a high level of education did not
help the business start-up process (Stuart and Abetti 1990). Men often studied
in technical or business areas, whereas most women in liberal arts (Hisrich 1990).
Entrepreneurship was a typical example of a planned and intentional behavior
that in turn was determined by attitudes, personality traits, and situational variables
(Krueger et al. 2000). Members of business family often played a critical role in the
creation and survival of new ventures (Aldrich and Cliff 2003). Founders tended to
have self-employed parents, those needed to be supportive and encourage indepen-
dence, achievement, and responsibility (Hisrich and Brush 1986). Family played an
important role (Shivani et al. 2006) in two ways, i.e., direct support and through the
development of social, community, and economic networks (Stewart 2003). So, the
following hypotheses:
H1 Entrepreneurs start their businesses comparatively at early age than managers.
H1a Age does have an impact on the prediction of entrepreneurial/managerial
tendencies of aspirants.
H2 Gender does have an impact on entrepreneurial/managerial tendencies.
H2a Gender does have an impact on the prediction of entrepreneurial/managerial
tendencies of aspirants.
H3 Birth order determines the entrepreneurial/managerial tendencies.
H3a Birth order does have an impact on the prediction of entrepreneurial/manage-
rial tendencies of aspirants.
H4 Size of the family/number of siblings does have an impact on the entrepreneur-
ial/managerial tendencies.
H4a Size of the family/number of siblings does have an impact on the prediction of
entrepreneurial/managerial tendencies of aspirants.
H5 Educational qualifications do have an impact on entrepreneurial/managerial
tendencies.
H5a Educational qualifications do have an impact on the prediction of entrepre-
neurial/managerial tendencies of aspirants.
H6 Subjects studied do have an impact on entrepreneurial/managerial tendencies.
H6a Subjects studied do have an impact on the prediction of entrepreneurial/
managerial tendencies of aspirants.
378 S.C. Kundu and S. Rani

H6b Choice of career (intentions) does have an impact on prediction of
entrepreneurial/managerial tendencies among aspirants.
H7 Father’s occupation influences the entrepreneurial/managerial tendencies.
H7a Father’s occupation does have an impact on the prediction of entrepreneurial/
managerial tendencies of aspirants.
H8 Family background does have an impact on entrepreneurial/managerial
tendencies.
H8a Family background does have an impact on the prediction of entrepreneurial/
managerial tendencies of aspirants.
H9 Socioeconomic status does have an impact on entrepreneurial/managerial
tendencies.
H9a Socioeconomic status does have an impact on the prediction of entrepreneur-
ial/managerial tendencies of aspirants.
Personality characteristics, as measured by personality tests and questionnaires,
were effective predictors of the subsequent entrepreneurial activity of individuals
(Stewart et al. 1999). There was a well-established body of research on the
psychological characteristics associated with entrepreneurship (Littunen 2000).
Need of achievement, affiliation, and power (McClelland 1965); tolerance for
ambiguity and autonomy (Sexton and Bowman 1984); resistance to conformity
(Sexton and Bowman 1983); risk taking (Palmer 1971); locus of control (Rotter
1966); and assertiveness, forward-looking, critical thinking, creativity, innovation,
preparedness, responsibility, open-mindedness (Yonekura 1984) ready to change,
dominance, endurance, self-esteem, low anxiety level, and self-reliance (Sexton
and Bowman 1985) were analyzed with respect to entrepreneurship and were
identified as correlates of being or desiring to be an entrepreneur (Bonnett and
Furnham 1991). Psychological characteristics that were unique to entrepreneurs
(vis-à-vis non-entrepreneurs) were a logical first step in studying entrepreneurship
(Koh 1996). So, the study proposed following hypotheses:
H10 Entrepreneurs and managers do differ on sixteen personality factors (16 PF)
(given in italics form in first column of Table 2).
H11 Entrepreneurs and managers do differ on second-order factors (see underline
factors in first column of Table 2).
H12 Entrepreneurs and managers do differ on composite factors (given in bold form
in first column of Table 2).
H13 Personality traits do have impact on prediction of entrepreneurial/managerial
tendencies of aspirants.
3 Research Methodology
The Sixteen Personality Factors Questionnaire (16 PF) was used to measure the
sixteen primary personality factors (16 PF), second-order factors, and composite
factors (Cattell 1946). The 16 PFwas one of the most influential and well-researched
Demographic and Personality Determinants of Entrepreneurial Tendencies. . . 379

personality inventories (Dancer and Woods 2006). Manual scoring key and norms
table were used for scoring and converting raw scores to sten (standard ten) scores
for sixteen primary personality factors (16 PF).
The survey was conducted in two phases. In the first phase, the questionnaires
were administered to respondent students of senior school to university level
(including MBAs) in eighteen educational institutions in North India (including
both males and females). In the second phase, the questionnaires were served to 450
managers and 450 entrepreneurs (including both males and females) in the same
area. We stopped survey across categories after receiving 200 correctly completed
questionnaires. Further, late-received and incomplete questionnaires were not con-
sidered. Out of 3,150 target sample, we could collect only 1,595 questionnaires, and
finally, a total of 1,400 completed questionnaires were found in all respect that were
used for analysis purpose. Table 1 showed the category-wise breakup, response
rate, and percent to total of the sample.
Multinomial logistic regression (MLR) was used in the study to differentiate
personality traits and demographic characteristics of entrepreneurs and managers
and to predict the category and number of aspirants falling in entrepreneurial or
managerial category. In the light of existing literature, the personality traits embod-
ied in sixteen factors along with demographic variables (control variables) such as
age, gender, birth order, etc., were considered as determinants of entrepreneurial or
managerial tendencies for specifying the MLR model.
4 Results and Discussion
Table 2 showed the logistic regression coefficients, Wald statistic, and Exp (B)
(odds ratios) of independent variables. Collectively, these factors could distinguish
between entrepreneurs and managers at an overall accuracy rate of 92.5% for
entrepreneurs and managers. Table 2 showed that age, birth order, educational
qualifications, and socioeconomic status were significant in differentiating
entrepreneurs from managers and in prediction of entrepreneurial tendencies
of aspirants. The odds ratio showed that with one level increase in age, the chances
Table 1 Description of sample
Categories Target sample Received Rejected Total Response rate (%) % to total
Matric 450 245 45 200 44.4 14.28
Senior secondary 450 236 36 200 44.4 14.28
Graduates 450 221 21 200 44.4 14.28
Postgraduates 450 232 32 200 44.4 14.28
MBAs 450 236 36 200 44.4 14.28
Managers 450 215 15 200 44.4 14.28
Entrepreneurs 450 210 10 200 44.4 14.28
Total 3,150 1,595 195 1,400 44.4 100
380 S.C. Kundu and S. Rani

Table
2Summaryresultsofmultinomiallogisticregression(dependentvariable:entrepreneur/manager)
Entrepreneur
BStd.error
Wald
Sig.
Exp(B)/oddsratios
Model
fittinginform
ation
Intercept
35.122
5.324
43.519
0.000
Likelihoo
dratiotests
Warmth
(A)
0.736**
0.224
10.771
0.001
2.087
�2loglikeliho
od
Reasoning(B)
0.533**
0.182
8.539
0.003
1.704
Interceptonly
¼554.518
Emotiona
lstab
ility(C)
�0.115
0.336
0.117
0.732
0.891
Final
¼185.106
Dom
inance(E)
�0.186
0.240
0.598
0.439
0.830
Chi-square¼
369.412
Liveliness(F)
�0.742*
0.318
5.436
0.020
0.476
df¼
34,Sig.¼
0.000
Rule
consciousness(G
)0.347
0.267
1.696
0.193
1.415
Goo
dnessof
fit
Social
boldness
(H)
0.346
0.287
1.456
0.228
1.413
Pearson¼
611.305
Sensitivity
(I)
�0.287
0.239
1.442
0.230
0.751
df¼
265,Sig.¼
0.000
Vigilance
(L)
�0.752**
0.196
14.799
0.000
0.471
Deviance
¼185.106
Abstractedness(M
)�0
.699**
0.282
6.170
0.013
0.497
df¼
265,Sig.¼
1.000
Privateness(N)
�0.321*
0.148
4.724
0.030
0.725
Pseud
oR-squ
are
Apprehension(O
)�0
.096
0.248
0.149
0.699
0.908
CoxandSnell¼
0.603
Openness
tochang
e(Q
1)�0
.576*
0.234
6.049
0.014
0.562
Nagelkerke¼
0.804
Self-reliance(Q
2)0.149
0.253
0.347
0.556
1.161
McFadden
¼0.666
Perfectionism
(Q3)
1.065**
0.263
16.416
0.000
2.900
Percent
correct¼
92.5%
Tension(Q
4)0.600*
0.301
3.985
0.046
1.823
Extraversion
�1.844*
0.824
5.007
0.025
0.158
Anxiety
�0.061
0.985
0.004
0.951
0.941
Toughpoise
�2.759**
0.870
10.066
0.002
0.063
Independence
1.297
1.020
1.618
0.203
3.660
Superegocontrol
�5.316**
1.291
16.942
0.000
0.005
Adjustment
0.463
0.705
0.431
0.511
1.589
Leadership
�0.017
0.947
0.000
0.986
0.983
Creativity
0.923
0.921
1.004
0.316
2.516
Age
�0.178**
0.045
15.828
0.000
0.837
Gender
0.423
0.437
0.934
0.334
1.526
Birth
order
�1.504**
0.468
10.326
0.001
0.222
(continued)
Demographic and Personality Determinants of Entrepreneurial Tendencies. . . 381

Table
2(continued)
Entrepreneur
BStd.error
Wald
Sig.
Exp(B)/oddsratios
Model
fittinginform
ation
Siblings
�0.360
0.340
1.119
0.290
0.698
Educational
qualifications
�1.731**
0.531
10.633
0.001
0.177
Subjects
�0.525
0.355
2.187
0.139
0.591
Father
occupation
�0.330
1.036
0.102
0.750
0.719
Fam
ilybackground
0.050
1.042
0.002
0.962
1.051
Socioeconomic
status
�3.268**
0.814
16.133
0.000
0.038
Note:1.Thereference
category
ismanager.2.*p�
.05;**p�
.01
382 S.C. Kundu and S. Rani

of the respondents moving toward entrepreneurship decreased by about 17%. So,
on the basis of these results, H1 was accepted. Similarly, in case of birth order,
with one degree change, i.e., with the subject going toward higher birth order, the
chances of moving toward entrepreneurship decreased by 78%. It indicated that first
born had more chances of becoming entrepreneurs as also found in various studies
(Watkins and Watkins 1983). Thus, H3 was accepted. With increase in educational
qualifications, the chances of the subject moving toward entrepreneurship
decreased by about 82%. It indicated that the higher the educational qualifications,
the lesser the chances to become entrepreneurs. So, H5 was accepted. In case of
socioeconomic status, with the subject moving down from high to middle high,
from middle high to middle, the chances of becoming entrepreneurs decreased.
It indicated that the higher the socioeconomic status, comparatively the more
would be the chances of moving toward entrepreneurship. As a result, H9 was
accepted. Further, gender, siblings, family background, father occupation, and
subjects chosen for academics were not significant in prediction of entrepreneur-
ship. Hence, H2, H4, H6, H7, and H8 were rejected.
Among the personality traits, factor A, i.e., warmth; factor B, i.e., reasoning;
factor F, i.e., liveliness; factor L, i.e., vigilance; factor M, i.e., abstractedness; factor
N, i.e., privateness; factor Q1, i.e., openness to change; factor Q3, i.e., perfection-
ism; factor Q4, i.e., tension; extraversion; tough poise; and superego control
emerged as significant predictors of entrepreneurship and distinguished them
from managers. Further, Table 2 revealed that factor C, factor E, factor G, factor
H, factor I, factor O, factor Q2, anxiety, independence, adjustment, leadership, and
creativity were not found significant in prediction of the entrepreneurial/managerial
category. So, H10, H11, and H13 were partially accepted and H12 was rejected.
The odds ratio for factor A indicated that for each one unit increase in the score
there were more than double chances that the participant will move toward
entrepreneur category. Similarly, for each one point increase on the factor B,
there were 70% chances that the respondent would fall in entrepreneur category.
Factor F’s effect was in the opposite direction as with one point increase being
associated with the decreased chances of the subject falling in entrepreneur
category by about 52%. The same trend was noticed for factor L, factor M, factor
N, factor Q1, extraversion, tough poise, and superego control, where the chances
of subjects falling into entrepreneur category decreased with increase in these
factors. The odds ratio for factor Q3 indicated that for each one point increase in
the score there were more than double chances of the subject moving toward
entrepreneur category. Similar impact was visible in case of factor Q4 where the
odds ratio indicated that with one point increase in the score there were 82% more
chances of the subject falling in entrepreneurial category. These results indicated
that higher sten scores of traits like warmth, reasoning, perfectionism, and tension
and lower sten scores of traits like liveliness, vigilance, abstractedness, private-
ness, openness to change, extraversion, tough poise, and superego control were
indicators of entrepreneurial tendencies if personality traits were studied along
with demographic variables.
Demographic and Personality Determinants of Entrepreneurial Tendencies. . . 383

Being realistic was one of the 11 common characteristics identified in the
entrepreneurs (Kao 1991). Entrepreneurs were trusting, accepting conditions, and
easy to get along with (Hornaday 1982; IPAT Staff 1991). Extroverts were sociable,
self-confident, and optimistic which were characteristics valued at senior levels of
management (Moutafi et al. 2007). Entrepreneurs ventured into new and risky
environment, set new trends which called for nonconformity, and were not guided
by pre-learned set of rules. They were ready to take calculated risks (Kao 1991).
Brandstatter (1997) found business founders to be more emotionally stable, less
rational and therefore more intuitive, and more independent than those who had
taken over the business from others. Envick and Langford (2000) found that
entrepreneurs were significantly lower than managers in conscientiousness and
agreeableness, but no significant differences were found with extraversion, neurot-
icism, or openness to experience.
Table 3 showed the predicted results of aspirants in terms of various demo-
graphic variables. The model predicted the entrepreneurial/managerial tendencies
of aspirants based on the traits and demographics of entrepreneurs (N ¼ 200) and
managers (N ¼ 200) using the results shown in Table 2. These results indicated that
with increase in age, the entrepreneurial tendency decreased while the managerial
tendency increased. Hence, H1a was accepted. Gender was not a significant factor
in prediction of entrepreneurship. So, H2a was rejected. In case of birth order, the
aspirants who were eldest children in the family were predicted more in the
entrepreneurial category (62.3%). Similarly, in case of siblings, the aspirants with
less number of siblings were predicted more in entrepreneurial category, whereas
the aspirants with more number of siblings were predicted in managerial category.
It also indicated toward positive impact of small family on entrepreneurship.
Hence, H3a and H4a were accepted.
With increase in educational levels, the entrepreneurial tendencies decreased
(matric students ¼ 76.5%, senior secondary students ¼ 77.5%, graduates
¼ 39%, postgraduates ¼ 34.5%, MBAs ¼ 31.5%) and managerial tendencies
increased. A large number of aspirants studying combination of subjects
(76.5%) were predicted in entrepreneurial category followed by humanities
(53.1%). Aspirants having commerce or management background were predicted
more in managerial category (69.1%). So, H5a and H6a were accepted. Stuart andAbetti (1990) found that advanced education beyond the bachelor’s degree did not
help in entrepreneurship. Choice of career/intention showed that a significant
number of aspirants with intention to choose entrepreneurship as a career was
predicted in entrepreneurial category (56.8%) against predicted in managerial
category (43.2%). Hence, H6b was accepted. Family background and father
occupation did not show any significant difference in prediction of aspirants in
entrepreneurial/managerial category, which resulted into rejection of H7a and
H8a. In case of socioeconomic status, majority of aspirants predicted in entrepre-
neurial category were in high socioeconomic status (76.5%) followed by middle
high socioeconomic status (68.1%), whereas more number of aspirants with
middle socioeconomic status were predicted in managerial category (70.3%).
Hence, H9a was accepted.
384 S.C. Kundu and S. Rani

5 Conclusions, Limitations, and Implications of the Study
The results derived showed that younger age group and first born had more
chances of becoming entrepreneurs. Higher educational qualifications decreased
the chances of moving toward entrepreneurship. Further, comparatively higher
socioeconomic status increased the chances of the aspirants moving toward
Table 3 Summary table of predicted response categories
Demographic variables
Predicted response category
Entrepreneurs Managers
Age group Up to 20 327(75.5) 106(24.5)
21–30 189(33.5) 376(66.5)
31–40 2(100) –
Gender Male 257(51.4) 243(48.6)
Female 261(52.2) 239(47.8)
Birth order First 261(62.3) 158(37.7)
Second 246(53.6) 213(46.4)
Third 11(12.1) 80(87.9)
Fourth – 22(100)
Fifth – 8(100)
Sixth – 1(100)
Sibling One 109(68.6) 50(31.4)
Two 276(56.8) 210(43.2)
Three 126(46.7) 144(53.3)
Four 5(8.1) 57(91.9)
Five 2(10.5) 17(89.5)
Six – 3(100)
Eight – 1(100)
Educational qualifications Matric 153(76.5) 47(23.5)
10 + 2 155(77.5) 45(22.5)
Graduation 78(39) 122(61)
PG 69(34.5) 131(65.5)
MBA 63(31.5) 137(68.5)
Subjects Humanities 197(53.1) 174(46.9)
Commerce/mgt 76(30.9) 170(69.1)
Science 92(50.3) 91(49.7)
Others 153(76.5) 47(23.5)
Father occupation Business 205(54.5) 171(45.5)
Service 313(50.2) 311(49.8)
Family background Business 211(53) 187(47)
Service 307(51) 295(49)
Socioeconomic status High 13(76.5) 4(23.5)
Middle high 378(68.1) 177(31.9)
Middle 127(29.7) 301(70.3)
Choice of career Executive/officer 318(49.1) 330(50.9)
Business person 200(56.8) 152(43.2)
Note: Percentages are indicated in parentheses
Demographic and Personality Determinants of Entrepreneurial Tendencies. . . 385

entrepreneurship. Among the personality traits, warmth, reasoning, liveliness,
vigilance, abstractedness, privateness, openness to change, perfectionism, tension,
extraversion, tough poise, and superego control showed significant impact in
predicting entrepreneurial behavior. Further, the commonness in entrepreneurial
and managerial traits in the study revealed that some managerial skills were also
required to be a good entrepreneur and vice versa (Kuratko and Hodgetts 2004).
The study does have implications for younger population of students,
professionals, organizations, and government. In particular, with knowledge per-
sonality traits along with demographic variables, programs can be initiated by
governments to develop and enhance these traits in order to encourage entre-
preneurship that will ultimately help in reducing the pressure of the problem of
unemployment in developing economies like India. Further, organizations can
cultivate corporate entrepreneurship to enhance corporate innovation and perfor-
mance. These findings can be used as a career guidance tool for student aspirants
who want to continue for higher studies or want to go for self-employment after a
particular stage of education.
In particular, future research can investigate the relationship between psycho-
logical characteristics and entrepreneurial inclination in combination with other
factors, such as financial, family, and environmental support, precipitating events,
and economic conditions prevailing in a country or a particular region. Rather
cross-cultural studies covering wide spectrum of respondents can be pursued by
future researchers.
References
Aldrich HE, Cliff JE (2003) The pervasive effects of family on entrepreneurship: toward a family
embeddedness perspective. J Bus Ventur 18(5):573–596
Bonnett C, Furnham A (1991) Who wants to be an entrepreneur? A study of adolescents interested
in a young enterprise scheme. J Econ Psychol 12(3):465–478
Brandstatter H (1997) Becoming an entrepreneur – a question of personality structure? J Econ
Psychol 18:157–177
Buttner EH, Rosen B (1988) Bank loan officers’ perceptions of the characteristics of men, women,
and successful entrepreneurs. J Bus Ventur 3(4):249–258
Carlson L, Kangun N (1988) Demographic discontinuity: another explanation for consumerism?
J Consum Aff 22(1):55–73
Cattell RB (1946) Description and measurement of personality. World, New York
Dancer LJ, Woods SA (2006) Higher-order factor structures and inter-correlations of the 16PF5
and FIRO-B. Int J Sel Assess 14(4):385–391
Envick BR, Langford M (2000) The five-factor model of personality: assessing entrepreneurs and
managers. Acad Entrep J 6(1):6–17
Hisrich RD (1990) Entrepreneurship/intrapreneurship. Am Psychol 45(2):209–222
Hisrich RD, Brush CG (1983) The woman entrepreneur: characteristics and prescriptions for
success. Lexington Books, Lexington
Hisrich RD, Brush CG (1986) The women entrepreneur: starting, financing, and managing a
successful new business. Lexington Books, Lexington
386 S.C. Kundu and S. Rani

Hornaday JA (1982) Research about living entrepreneurs. In: Kent C, Sexton D, Vesper K (eds)
Encyclopedia of entrepreneurship. Prentice-Hall, Englewood Cliffs, pp 26–27
IPAT Staff (1991) Administrator’s manual for the sixteen personality factor questionnaire. IPAT,
Champaign
Kao JJ (1991) The entrepreneur. Prentice-Hall, Englewood Cliffs
Koh HC (1996) Testing hypotheses of entrepreneurial characteristics. J Manage Psychol
11(3):12–25
Krueger N, Reilly MD, Carsrud AL (2000) Competing models of entrepreneurial intentions. J Bus
Ventur 15(5–6):411–432
Kundu SC, Rani S (2004) Entrepreneurial orientation of aspiring managers: a study. Int J Manage
Enterp Dev 1(3):233–250
Kundu SC, Rani S (2008) Human resources’ entrepreneurial attitude orientation by gender and
background: a study of Indian Air Force trainees. Int J Manage Enterp Dev 5(1):77–101
Kuratko DF, Hodgetts RM (2004) Entrepreneurship – theory, process, and practice. Thomson Asia
Private Ltd., Singapore
Lee J (1996) The motivation of women entrepreneurs in Singapore. Women Manage Rev
1(2):18–29
Lee J (1997) The motivation of women entrepreneurs in Singapore. Int J Entrep Behav Res
3(2):93–110
Littunen H (2000) Entrepreneurship and the characteristics of the entrepreneurial personality.
Int J Entrep Behav Res 6(6):295–309
Louw L, van Eeden SM, Bosch JK, Venter DJL (2003) Entrepreneurial traits of undergraduate
students at selected South African tertiary institutions. Int J Entrep Behav Res 9(1):5–26
Low K, Yoon M, Roberts B, Rounds J (2005) The stability of vocational interests from early
adolescence to middle adulthood: a quantitative review of longitudinal studies. Psychol Bull
131(5):713–737
McClelland DC (1965) Need achievement and entrepreneurship: a longitudinal study. J Pers Soc
Psychol 1:389–392
McClelland E, Swail J, Bell J, Ibbotson P (2005) Following the pathway of female entrepreneurs:
a six-country investigation. Int J Entrep Behav Res 11(2):84–107
Minniti M (2006) Entrepreneurs examined. Bus Strat Rev 17(4):78–82
Mordi C, Simpson R, Singh S, Okafor C (2010) The role of cultural values in understanding the
challenges faced by female entrepreneurs in Nigeria. Gender Manage Int J 25(1):5–21
Moutafi J, Furnham A, Crump J (2007) Is managerial level related to personality? Br J Manage
18:272–280
Palmer M (1971) The application of psychological testing to entrepreneurial potential. Calif
Manage Rev 13(4):32–38
Reynolds P, Carter N, Gartner W, Greene P, Cox L (2002) The entrepreneur next door,
characteristics of individuals starting companies in America. Ewing Marion Kauffman Foun-
dation, Kansas City
Rotter J (1966) Generalized expectations for internal versus external control reinforcement.
Psychol Monogr Gen Appl 80(1):1–27
Sexton DL, Bowman N (1983) Determining entrepreneurial potential of students. Acad Manage
Proc 42:408–412
Sexton DL, Bowman N (1984) Personality inventory for potential entrepreneurs:evaluation of a
modified JPI/PRF-E test instrument. In: Hornaday JA et al (eds) Frontiers of entrepreneurial
research. Babson University Press, Center for Entrepreneurial Studies, Wellesley
Sexton DL, Bowman N (1985) The entrepreneur: a capable executive and more. J Bus Ventur
1(1):129–140
Shivani S, Mukherjee SK, Sharan R (2006) Socio-cultural influences on Indian entrepreneurs: the
need for appropriate structural interventions. J Asian Econ 17(1):5–13
Stewart A (2003) Help one another, use one another: toward an anthropology of family business.
Entrep Theory Pract 27(4):383–396
Demographic and Personality Determinants of Entrepreneurial Tendencies. . . 387

Stewart WH, Watson WE, Carland JC, Carland JW (1999) A proclivity for entrepreneurship;
a comparison of entrepreneurs, small business owners, and corporate managers. J Bus Ventur
12(2):189–214
Stuart RW, Abetti PA (1990) Impact of entrepreneurial and management experience on early
performance. J Bus Ventur 5(3):151–162
Watkins JM, Watkins DS (1983) The female entrepreneur: her background and determinants of
business choice – some British data. In: Hornaday JA, Timmons JA, Vesper K (eds) Frontiers
of entrepreneurship research. Babson University Press, Center for Entrepreneurial Studies,
Wellesley, pp 271–288
Wilson F, Kickul J, Marlino D (2007) Gender, entrepreneurial self-efficacy, and entrepre-
neurial career intentions: implications for entrepreneurship education. Entrep Theory Pract
31(3):387–406
Yonekura S (1984) Entrepreneurship and innovative behaviour of Kawasaki Steel: The post world
war II period. Discussion paper no. 120, Institute of Business Research, Hitotsubashi
University, Kunitachi, Tokyo
388 S.C. Kundu and S. Rani

Reducing Voluntary Turnover Through
Improving Employee Self-Awareness, Creating
Transparent Organizational Cultures,
and Increasing Career Development
Jeffrey R. Moore and Douglas Goodwin
1 Introduction
Successful companies exist when employees and stakeholders interact in a
constructive manner to focus on the accomplishment of critical tasks. This research
examined the ways self-assessment and peer assessments can be used to reduce
organizational dysfunction by increasing employee self-awareness as well as
improving employee career progression. Employee management behaviors in a
service company were assessed by their peers in order to determine positive
organizational culture and level of stress. The study also explored two links: (a)
between the consistency of self-evaluation versus peer evaluation of the employee
and the level of stress in the organization and (b) between the consistency of peer
evaluation versus the supervisor’s performance expectation of the employee and the
level of stress in the organization. The researchers hypothesized that lower levels of
stress within the organization indicate a higher perception of skill among
employees. This study also explored which management skills are most important
for developing a healthy work culture in a service industry.
2 Review of the Literature
A company spends a significant part of its budget on recruiting, developing, and
retaining its employees. According to a report entitled Retaining Talent, high
turnover is very costly to organizations (Allen 2008). Voluntary turnover is expen-
sive due to replacement costs which can be as high as 50–60% of the annual salary,
new training costs of a replacement, paid benefits to the employee, as well as
J.R. Moore (*) • D. Goodwin
Anderson University, 316 Boulevard, Anderson, SC 29621, USA
e-mail: [email protected]; [email protected]
Department of Management Studies, Indian Institute of Science, Bangalore,
Driving the Economy through Innovation and Entrepreneurship,DOI 10.1007/978-81-322-0746-7_32, # Springer India 2013
389

increased workload of the HR staff (Allen 2008). The total costs are estimated to
represent on average of more than 12% of pretax income. With a high turnover rate,
around 75%, the total costs are around 40% of pretax income. The report indicated
that employee engagement and development are critical in retaining and improving
an organization’s human capital (Allen 2008).
Social scientists have long studied the dynamics of groups and their impact on
the employee and the organization. Forsyth (1999) refers to a group as a collection
of two or more employees who share a common goal, have a stable pattern of
relationships, and perceive themselves as being a group. Benne and Sheats (1948)
stated that the roles within the group tend to be differentiated between task-oriented
roles and relations-oriented roles (socio-emotional). The two categories of task and
culture (relations) roles in examining group dynamics within the organization
informed the current research study.
In the mid-1970s, Hare (1976) examined the impact of cohesiveness and the
lack of cohesiveness in groups. Groups, which lacked cohesiveness and where
employees did not like each other, often worked against each other. Current research
shows that highly cohesive groups are the ones where employees accept the group’s
goals, work toward meeting goals, have a sense of belonging to the group, and have
higher performance (Beal et al. 2003). Data on group cohesiveness indicate that
cohesiveness is a positive trait as employees in cohesive groups enjoy belonging to
the group, accept and accomplish the group’s goals, have fewer absences from their
jobs, and show less voluntary turnover (Aronson and Mills 1959; Cartwright 1968;
George and Bettenhausen 1990; Long 1984).
As relationships thrive in healthy partnerships, strategic alignment is improved
and organizational goals are reached. Inversely, as relationships become toxic
and survivalist, relationships deteriorate and organizational goals are lost to more
immediate personal goals. When there is a sustained unhealthy toxic culture devel-
oped, silos are created (i.e., isolated work units do not communicate and are hostile
one to another), and the organization loses its strategic focus and effectiveness
(Moore et al. 2011).
2.1 Conceptual Models
Two conceptual models were used as the basis for this research. The Healthy versus
Toxic Organization Model measures the stress in partnerships from a task as well as
a culture dimension (Moore 2006). The Competing Values Framework (CVF)
measures the management skill of employees in an organization (Quinn et al.
2007). CVF has been used extensively in research on organizational and leadership
effectiveness and has become a tool for teaching management and leadership in
universities. The framework is divided into four quadrants representing the Human
Relations, Internal Process, Rational Goal, and Open Systems management models
(Fig. 1). These models are associated with the action words collaborate, control,
390 J.R. Moore and D. Goodwin

compete, and create, respectively. Within each of these quadrants, Quinn and
colleagues (2007) noted two management roles, bringing the total management
roles of the CVF to eight.
The Healthy versus Toxic Organization Model stems from research on virtue
and survival behaviors in an organization (Moore 2006). Data show when virtue
behaviors of truth, vision, and service existed in organizational partnerships, growth
was present. Inversely, when survivalist behaviors of deception, use of fear, pride,
or greed existed in organizational partnerships, toxicity was present. Stress in an
organization, either internal or external, distorts a department’s behavior to adapt
and cope with the stress and interdepartmental dysfunction.
The Competing Values Framework provides a frame for examining specific
feedback from peers and the supervisor’s expectations and compares it to the
self-assessment of each employee. Based on a scientific method for approaching
these differences, a road map for employee career development and healthy cultural
engagement and effectiveness can be established.
3 Methodology
Data for this research were collected in 2011 from a small medical service company
in Atlanta, Georgia, with 21 employees. This company services national clinics and
hospitals that cannot afford to hire full-time medical specialists. The service
consists of reading and giving expert analyses for requested patient records. The
company is comprised of the following five departments: executive, sales,
operations, medical doctors (MDs), and finance/information technology (IT).
Fig 1 Competing values framework (Adapted from Quinn et al. 2007)
Reducing Voluntary Turnover Through Improving Employee Self-Awareness. . . 391

3.1 Survey Instruments
Three survey instruments were used in the data collection: (a) a self-assessment
survey, (b) a peer assessment survey, and (c) a supervisor assessment survey.
These surveys incorporated the CVF and Healthy versus Toxic Organization
Models. All of the surveys administered were comprised of the same 20 questions
which were scored on a scale of 1–7. A score of seven is high, indicating mastery or
proficiency in a management behavior. The peer assessment score is computed by
averaging four or five evaluations of employees who routinely work with that
individual. The supervisor assessment was completed by the supervisor, not on
the individual’s performance but on his or her expectations of what the job
performance standard should be for that position.
In order to represent graphically the results of the survey, a scale was developed
to clarify the division between healthy and toxic organizational dynamics and was
based on Lencioni’s (2002) five dysfunctions of a team model. Based on the scores
from the survey, employees could be evaluated as healthy or toxic, clarifying the
realities of the departments in the company. An employee that receives a 5.0 and
below was classified as being stressed (i.e., toxic). These scores were given by the
peer assessment in either the accomplishment of tasks or the healthy culture
dimensions of the Healthy Culture Model.
4 Findings
The data for this research are presented in five parts: (a) the differences between
the employee’s self-assessment and their peer evaluation of management skill,
(b) the differences between the employee’s peer evaluation and the gap with their
supervisor’s expectation of their management skill, (c) the correlations between
the employee’s self-assessment and their peer evaluation of management skill,
(d) the correlations between the employee’s peer evaluation and the gap with
their supervisor’s expectation of their management skill, and (e) the correlation
for the employees in crisis and those who are not between their peer evaluation and
the gap with their supervisor’s expectation of their management skill.
Table 1 shows the difference between the self-assessment and peer assessment of
eight management skills. The highest score possible is a 7. A negative difference
indicates that the peer assessment was lower than the self-assessment. The individ-
ual scores of employees in the five departments were averaged together to provide an
average score of peer perception and the difference between their self-assessments
and their peers’ perceptions. It is interesting to note that two departments show signs
of stress and organizational dysfunction as measured by their peers with scores of
5.0 or lower. The MDs showed the greatest difference between their own percep-
tion of their management skill ability and what their peers thought. In particular,
their producer (i.e., managing time and stress effectively) and monitor skills
392 J.R. Moore and D. Goodwin

Table
1Differencesbetweenself-perceptionandpeerperceptionofmanagem
entskill
Human
relationsmodel
Open
system
smodel
Rational
goal
model
Internal
process
model
Healthyrelational
model
Facilitator
Mentor
Innovator
Broker
Producer
Director
Coordinator
Monitor
Task
Culture
Peer
Diff.
Peer
Diff.
Peer
Diff.
Peer
Diff.
Peer
Diff.
Peer
Diff.
Peer
Diff.
Peer
Diff.
Peer
Diff.
Peer
Diff.
Executive
7.0
1.0
6.8
0.3
6.5
0.0
6.9
�0.1
6.8
0.3
7.0
0.5
6.9
�0.1
6.8
0.3
6.8
0.1
6.9
0.2
Sales
6.2
�0.4
6.7
0.2
6.2
0.0
5.9
0.2
6.3
�0.5
5.9
�0.4
6.6
0.1
6.4
�0.4
6.4
�0.3
6.6
0.0
MD
5.2
�1.7
5.0
�1.2
5.3
�1.2
4.4
a�0
.84.9a
�1.9
4.7
a�0
.75.3
�1.1
4.7
a�2
.45.0
a�1
.75.4
�0.9
OPS
5.4
�0.5
5.7
�0.5
5.1
�0.3
4.7
a�0
.25.3
�0.7
5.0
a0.0
5.5
�0.3
5.5
�0.4
5.0
a�0
.95.7
�0.3
Finance
IT6.4
0.4
6.2
0.1
5.9
0.1
5.8
�0.4
6.2
0.2
6.0
0.5
6.4
0.5
6.1
0.5
6.1
0.0
6.5
0.5
aScoresin
theorganizational
dysfunctional
range
Reducing Voluntary Turnover Through Improving Employee Self-Awareness. . . 393

(i.e., doing things right) were the lowest. It was also interesting to note that the
difference is rather large with �1.9 and �2.4 which equates to �25 and �34%,
meaning they thought they were outstanding at these skills. This reveals a blind spot
on the part of the MDs. The second department to show signs of stress was the
operations (OPS) group in the areas of broker (presenting ideas) and task
accomplishment.
It was noteworthy to find that the executive, sales, and finance/IT departments
are perceived as very competent at what they do. Furthermore, perceptions of their
skills were congruent with their peer’s perceptions, and for the most part, their peers
thought they had a higher skill level than they think of themselves.
The difference between the peer assessment and the supervisor standard can
be observed in Table 2. The highest score possible was a 7. A negative gap score
indicates that the peer assessment was lower than the supervisor standard. The
individual gap scores of employees in the five departments were averaged together
to give or provide an average score of peer perception and the gap with their
supervisor’s standard expectation.
The results point to the same two departments with important organizational
dysfunctions. These results measure the perceived performance of the employees
by their supervisor’s expectations. This differs from Table 1 which compared their
peer’s perceived performance to their own perception. Worth noting was that the
OPS department is underperforming in more skills than the MD department.
The OPS department is underperforming their supervisor’s standard by at least
12.5% (.9) in the producer, coordinator, monitor, and task accomplishment skills,
and the MD department is underperforming in the area of the monitor (doing things
right) by about 25%. The researchers confirmed the assessment of the executive,
sales, and finance/IT departments as doing very well in the organization. These
departments almost always overachieved their supervisor’s standards.
Tables 1 and 2 confirm that two departments are stressed with particular atten-
tion needed for the OPS department. Due to the fact that the sample size for the
doctors was small, the OPS department with 11 employees was isolated and
statistical analyses were used to determine correlations between the eight manage-
ment skills and the task and culture variables.
Table 3 shows the correlations between the peer perception of management skill
of all the individuals in the group with the difference between their self-perception
and their peers. Higher peer perception had a strong correlation with a positive
difference in self-perception, whereas others had a greater perception of their
performance. Lower peer scores were strongly correlated to a high negative differ-
ence, while others had lower perceptions of an individual’s performance than the
individual had of himself or herself.
The data in Table 2 show that in the OPS department, the producer, monitor, and
task accomplishment skills are all strongly correlated. This means that the
employees in the OPS department who received the lowest scores had greater levels
of difference with their own perception of their work. This constitutes a blind spot
in the OPS department thinking they are good producers and monitor well and
perceiving that they are good at accomplishing team tasks. Without the 360-degree
394 J.R. Moore and D. Goodwin

Table
2Differencesbetweenpeerperceptionandsupervisorexpectationmanagem
entskill
Human
relationsmodel
Open
system
smodel
Rational
goal
model
Internal
process
model
Healthyrelational
model
Facilitator
Mentor
Innovator
Broker
Producer
Director
Coordinator
Monitor
Task
Culture
Peer
Gap
Peer
Gap
Peer
Gap
Peer
Gap
Peer
Gap
Peer
Gap
Peer
Gap
Peer
Gap
Peer
Gap
Peer
Gap
Executive
7.0
0.5
6.8
0.3
6.5
0.0
6.9
0.4
6.8
0.3
7.0
0.5
6.9
0.4
6.8
0.3
6.8
0.3
6.9
0.3
Sales
6.2
�0.1
6.7
0.4
6.2
0.5
5.9
0.2
6.3
�0.2
5.9
0.4
6.6
0.6
6.4
�0.1
6.4
0.1
6.6
0.5
MD
5.2
�0.3
5.0
0.0
5.3
�0.7
4.4
�0.1
4.9
�0.6
4.7
0.7
5.3
�0.5
4.7
�1.8
a5.0
�0.3
5.4
0.1
OPS
5.4
�0.6
5.7
�0.5
5.1
�0.7
4.7
�0.5
5.3
�1.0
a5.0
�0.7
5.5
�0.9a
5.5
�0.9
a5.0
�1.2
a5.7
�0.5
Finance
IT6.4
0.7
6.2
0.1
5.9
0.3
5.8
0.8
6.2
�0.3
6.0
0.6
6.4
0.3
6.1
�0.1
6.1
0.0
6.5
0.6
aScoreslower
than
�0.9
showan
importantunderperform
ance
ofsupervisorstandard
Reducing Voluntary Turnover Through Improving Employee Self-Awareness. . . 395
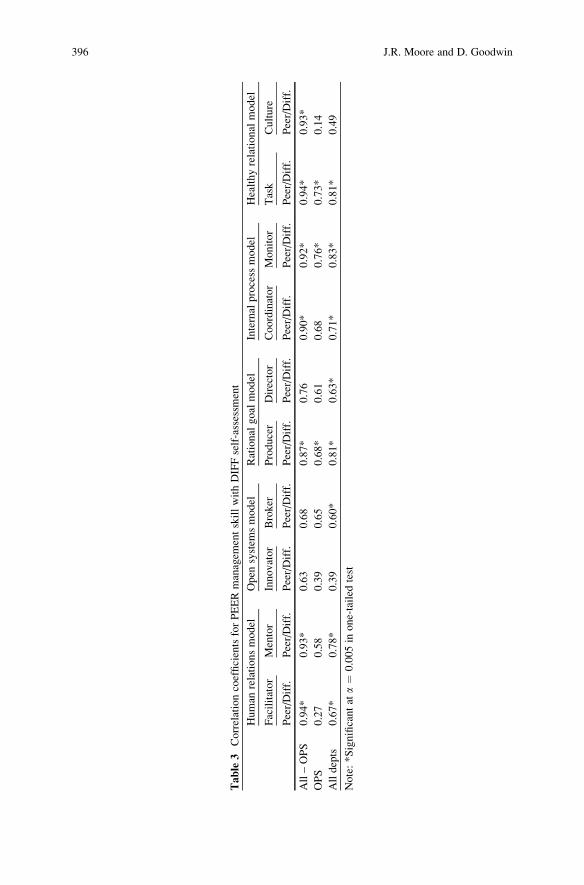
Table
3CorrelationcoefficientsforPEERmanagem
entskillwithDIFFself-assessm
ent
Human
relationsmodel
Open
system
smodel
Rational
goal
model
Internal
process
model
Healthyrelational
model
Facilitator
Mentor
Innovator
Broker
Producer
Director
Coordinator
Monitor
Task
Culture
Peer/Diff.
Peer/Diff.
Peer/Diff.
Peer/Diff.
Peer/Diff.
Peer/Diff.
Peer/Diff.
Peer/Diff.
Peer/Diff.
Peer/Diff.
All–OPS
0.94*
0.93*
0.63
0.68
0.87*
0.76
0.90*
0.92*
0.94*
0.93*
OPS
0.27
0.58
0.39
0.65
0.68*
0.61
0.68
0.76*
0.73*
0.14
Alldepts
0.67*
0.78*
0.39
0.60*
0.81*
0.63*
0.71*
0.83*
0.81*
0.49
Note:*Significantat
a¼
0.005in
one-tailed
test
396 J.R. Moore and D. Goodwin

organizational assessment intentionally revealing this blind spot, stress will likely
continue to rise in the remainder of the organization and produce voluntary turnover
when the employee finds another job or when the employee is terminated by their
supervisor.
Table 4 demonstrates the correlations between the peer perception of manage-
ment skill of the employees in different departments of the organization and the
peer perception of their task accomplishments. A higher peer perception has a
strong correlation with a higher task perception. This is a logical and an expected
correlation to the extent that someone was perceived as accomplishing team tasks
well to that same extent they were perceived as strong in management skills.
A noteworthy observation is that management skills are correlated to the team
task accomplishment.
For all of the departments with the exception of OPS, all of the management
skills are positively correlated with the perception of team task accomplishment.
However, in the OPS department, all of management skills except the mentor skillare correlated with the team task accomplishment. When looking at the entire
company, all of the management skills are positively correlated with the perception
of team task accomplishment.
Table 5 shows the correlations between the peer perceptions of management
skill of the employees in different departments of the organization with the peer
perception of their participation in developing a healthy culture. A higher peer
Table 4 Correlation coefficients for PEER management skill with PEER assessment of Task
accomplishment
Human relations
model
Open systems
model
Rational goal
model
Internal process
model
Facilitator Mentor Innovator Broker Producer Director Coordinator Monitor
Peer/
Task
Peer/
Task
Peer/
Task
Peer/
Task
Peer/
Task
Peer/
Task
Peer/
Task
Peer/
Task
All – OPS 0.97* 0.95* 0.92* 0.96* 0.98* 0.96* 0.91* 0.98*
OPS 0.80* 0.63 0.79* 0.82* 0.75* 0.72* 0.74* 0.89*
All depts 0.88* 0.76* 0.87* 0.89* 0.87* 0.84* 0.84* 0.88*
Note: *Significant at a ¼ 0.005 in one-tailed test
Table 5 Correlation coefficients for PEER management skill with PEER assessment of Healthy
Culture
Human relations
model
Open systems
model
Rational goal
model
Internal process
model
Facilitator Mentor Innovator Broker Producer Director Coordinator Monitor
Peer/
Cult.
Peer/
Cult.
Peer/
Cult.
Peer/
Cult.
Peer/
Cult.
Peer/
Cult.
Peer/
Cult.
Peer/
Cult.
All – OPS 0.95* 0.98* 0.91* 0.95* 0.95* 0.90* 0.98* 0.92*
OPS 0.66 0.63 0.55 0.35 0.66 0.55 0.72* 0.3
All depts 0.86* 0.84* 0.74* 0.71* 0.85* 0.78* 0.89* 0.66*
Note: *Significant at a ¼ 0.005 in one-tailed test
Reducing Voluntary Turnover Through Improving Employee Self-Awareness. . . 397

perception has a strong correlation with a higher healthy culture score. This is a
logical and an expected correlation to the extent that someone who is perceived as
being a healthy member of the team will be perceived, to the same extent, as strong
in management skills. Particularly noteworthy is which management skills are
correlated to the healthy culture score.
For all of the departments except OPS, all of the management skills are posi-
tively correlated with the healthy culture score. However, in the OPS department,
none of management skills correlated with the healthy culture score, with the
exception of the coordinator skill. When looking at the company as a whole, all
of the management skills are positively correlated with the healthy culture score.
It is possible to conclude that the most important indicator for the OPS department
is the task score which influences seven of the eight management skills. An employee
in theOPS department can create stress for the othermembers of the company because
of a lack of skill, which leads to not completing team tasks but having a good
attitude and being a healthy teammember. The organization should look at developing
the OPS team task accomplishment skill since all of the employees’ other
competencies will be perceived as improving.
The correlations between the gap of management skill of the employees and
their accomplishment of team tasks in regard to his/her supervisor expectation are
illustrated in Table 6. A positive gap means the employee has exceeded their
supervisor’s standard, while a negative gap score indicates that they have
underperformed. The correlation is that as a supervisor standard is exceeded in
their management skill so will their score in the completion of team tasks be
exceeded. Further, there is a correlation between management skills and task
accomplishment gap score.
For all of the departments except OPS, all of the management skills are positively
correlated with the team task accomplishment gap score, except for the innovator.However, in the OPS department, only the innovator, broker, director, and monitorskills are correlated.When looking at the company as awhole, all of themanagement
skills are positively correlated with the team task accomplishment gap score.
Table 7 shows the correlations between the gap of management skill of the
employees with regard to his/her supervisor expectation and the gap in their engage-
ment in developing a healthy team also in regard to his/her supervisor expectation.
Table 6 Corr. coeff. for supervisor standard GAP in skill with supervisor standard GAP in Task
accomplishment
Human relations
model
Open systems
model
Rational goal
model
Internal process
model
Facilitator Mentor Innovator Broker Producer Director Coordinator Monitor
Gap/
Gap T
Gap/
Gap T
Gap/
Gap T
Gap/
Gap T
Gap/
Gap T
Gap/
Gap T
Gap/
Gap T
Gap/
Gap T
All – OPS 0.79* 0.80* 0.70 0.79* 0.93* 0.75* 0.77* 0.80*
OPS 0.72* 0.53 0.82* 0.75* 0.63 0.87* 0.68 0.81*
All depts 0.76* 0.69* 0.80* 0.78* 0.78* 0.81* 0.78* 0.67*
Note: *Significant at a ¼ 0.005 in one-tailed test
398 J.R. Moore and D. Goodwin

A positive gap means that the employee has exceeded their supervisor’s standard,
while a negative gap score means that they have underperformed the standard.
The correlation is that as a supervisor standard is exceeded in their management
skill so will their score in the developing a healthy team be exceeded. The interesting
observation is to note which management skills are correlated to developing a
healthy team gap score.
For all of the departments except OPS, the management skills which are
positively correlated with developing a healthy team score are the facilitator(managing conflict in a healthy way), mentor (developing others), and coordinator(working across functions). However, in the OPS department, none of the manage-
ment skills are correlated. These findings further confirm the results in Table 5
where an OPS employee may have a high healthy team score but be under-
performing in all his/her management skills. When we look at the whole company,
we find that the facilitator, mentor, producer, and coordinator are positively
correlated with developing a healthy team gap score.
Table 8 focuses on two different groups of employees, the stressed employees
and the non-stressed employees. Employees that received a 5.3 and below in task
completion or healthy culture by peer perception were categorized as being stressed
or causing stress. Eight out of the 21 employees were categorized as being stressed.
The turnover risk is high due to the fact that seven of the eight are in the OPS
department, representing 64% potential turnover in the department and 33% for the
company. The two departments affected were the MD and OPS departments.
The correlations between the management skills of the employees perceived by
their peers and the gap in their task accomplishment in regard to his/her supervisor
expectation can also be found in Table 8. The broker skill (presenting ideas) and themonitor skill (doing things right), at 97%, are positively related. In looking at the
second group of non-stressed employees, the key management skills that correlate
with exceeding their supervisor’s expectations are the producer, coordinator, andmonitor.
The results clearly indicate that the key management skill to be developed in the
stressed employee is the monitor and broker skill. The monitor skill is an essential
skill in a medical service industry where the proper diagnosis might be the difference
between life and death. The organizational culture of the company has very low
Table 7 Corr. coeff. for supervisor standard GAP in skill with supervisor standard GAP in
Healthy Culture
Human relations
model
Open systems
model
Rational goal
model
Internal process
model
Facilitator Mentor Innovator Broker Producer Director Coordinator Monitor
Gap/
Gap C
Gap/
Gap C
Gap/
Gap C
Gap/
Gap C
Gap/
Gap C
Gap/
Gap C
Gap/
Gap C
Gap/
Gap C
All – OPS 0.89* 0.89* 0.46 0.53 0.61 0.38 0.73* 0.62
OPS 0.46 0.43 0.13 0.27 0.58 �0.03 0.44 0.36
All depts 0.75* 0.77* 0.38 0.50 0.69* 0.41 0.69* 0.50
Note: *Significant at a ¼ 0.005 in one-tailed test
Reducing Voluntary Turnover Through Improving Employee Self-Awareness. . . 399

Table
8Stressedem
ployeesgroupcorr.coeff.forPEERperceptionofskillvssupervisorstandardGAPofTaskaccomplishment
Human
relationsmodel
Open
system
smodel
Rational
goal
model
Internal
process
model
Healthyrelational
model
Facilitator
Mentor
Innovator
Broker
Producer
Director
Coordinator
Monitor
Task
Culture
Peer/Gap
TPeer/Gap
TPeer/Gap
TPeer/Gap
TPeer/Gap
TPeer/Gap
TPeer/Gap
TPeer/Gap
TPeer/Gap
TPeer/Gap
T
Stressed
0.59
0.73
0.7
0.85*
0.75
0.25
0.61
0.97*
0.75
0.81
NotStresse
0.53
0.55
0.51
0.21
0.71*
0.46
0.76*
0.77*
0.56
0.58
Note:*Significantat
a¼
0.005in
one-tailed
test
400 J.R. Moore and D. Goodwin

tolerance for an employee that is not focused on doing things right. A secondary area
of improvement for a stressed employee is to improve their presentation skills
internally. For the employee that is not stressed and wants to advance his/her career,
the key management skills to develop are the monitor, producer, and coordinator.
4.1 Post-assessment
Approximately 1 year after the 360-degree organizational assessment was conducted,
the company was asked to identify which employees had been voluntarily or invol-
untarily terminated. After this 1-year period, the company reported six employees no
longer work at the company. Two of the employees voluntarily left the organization
and the four other employees were terminated. All six of these employees were part
of the stressed employee group that was identified. The remaining 13 employees are
still employed and adding value in the company.
In the original assessment, there were eight stressed employees. We predicted
that two of these eight employees were likely to voluntarily leave the company.
When we returned a year later to conduct the post-assessment, we found that of
those we predicted would voluntarily leave the company, one member was invol-
untarily terminated and the other changed his/her management behaviors to meet
their supervisor’s and team’s expectations. The terminated employee demonstrated
very high self-assessed stress in feeling part of the team culture. The reformed
employee showed moderate self-assessed stress in team task completion. Undoubt-
edly, this organizational assessment process has revealed a gap in skills, and we
hypothesized this was a driving force to correct their behavior.
There were two employees who voluntarily left the company. These employees
did not previously display self-assessed team stress. However, the 360-degree tool
helped them identify performance issues for which they were unaware. We believe
that their reasons for leaving were that they did not (a) perceive that their contribu-
tion was adequately valued and (b) see themselves over the long term strategically
fitting into the company, based on the perceived limitations of their current man-
agement skill sets.
The eight stressed employees had a reform rate of 25% since two of the eight
changed their management behaviors to meet their supervisor and team expectations.
The 360-degree assessment process provided these employees with an awareness of a
blind spot concerning their weak performance, allowing the employees to
intentionally change their behavior and improve their careers.
5 Conclusion
Successful companies are organizations that have leaders who develop the
management skills of their employees while developing a healthy culture as well
as being focused on accomplishing tasks. Using a management skills self-assessment,
Reducing Voluntary Turnover Through Improving Employee Self-Awareness. . . 401

peer assessment, and supervisor standards, the leadership of the organization can
determine the health of the culture, level of stress, and alignment of its work units.
Skills strongly correlated to task accomplishment that leaders can help their
employees develop are the monitor (doing things right), producer (managing time
and stress), and coordinator (managing across functions). The mastery of these
management behaviors will promote the accomplishment of tasks, decreasing stress
in the organization and increasing a healthy workplace. Furthermore, employees who
were perceived as creating dysfunction by not accomplishing team tasks had the
highest correlation of failure, at 97 %, in the mastery of the monitor skill. Utilizingthis framework, leaders can then help their direct reports make significant progress,
based on quantifiable data, promoting employee engagement within their work and
ultimately career growth.
This research study supports the need for self-assessment and peer assessment of
management behavior to locate organization areas of dysfunction and stress.
A barrier that potentially undermines this effort is among managers who avoid
the performance evaluation process because they find it is unpleasant (Lawler et al.
1984). Research shows that some managers dislike giving feedback so much that
they will not carry out appraisals unless there is administrative pressure behind
them (Lawler et al. 1984).
The follow-up post-assessment validated the model presented with 100% pre-
dictability of the at-risk employees. Eight employees were originally identified in
the stressed employee group. After a 1-year period, six of the eight were no longer
employed in the organization. For all six employees, their peers did not perceive they
met their supervisor’s expectations. The two remaining employees from the at-risk
group were able to successfully reform their management skills through intentional
career development based on the 360-degree organizational assessment tool.
Through the use of training in monitor behaviors, directors can improve the
effectiveness and alignments of their employees who potentially disrupt the work
environment and are in danger of termination. This research demonstrates the
benefits of self-assessment and peer assessment of management behavior to
improve one’s self-awareness in the organization, reducing blind spots, exposing
a more accurate accomplishment of tasks, and creating a more transparent organi-
zational culture where employee career development is encouraged.
References
Allen D (2008) Retaining talent. Society of Human Resource Management Research, pp 1–57
Aronson E, Mills J (1959) The effects of severity of initiation on liking for a group. J Abnorm Soc
Psychol 59:178–181
Beal DJ, Cohen R, Burke MJ, McLendon CL (2003) Cohesion and performance in groups:
a meta-analytic clarification of construct relation. J Appl Psychol 88:809–820
Benne KD, Sheats P (1948) Functional roles of group members. J Soc Issues 4:41–49
Cartwright D (1968) The nature of group cohesiveness. In: Cartwright D, Zander A (eds) Group
dynamics: research and theory, 3rd edn. Harper & Row, New York, pp 91–109
Forsyth DL (1999) Group dynamics, 3rd edn. Wadsworth, Belmont
402 J.R. Moore and D. Goodwin

George JM, Bettenhausen K (1990) Understanding pro-social behavior, sales performance, and
turnover. J Appl Psychol 75:698–709
Hare AP (1976) Handbook of small group research, 2nd edn. Free Press, New York
Lawler E, Mohrman A, Resnick S (1984) Performance appraisal revisited. Organ Dyn 13(1):20–35
Lencioni P (2002) The five dysfunctions of a team. Jossey-Bass, New York
Long S (1984) Early integration in groups: a group to join and a group to create. Hum Relat
37:311–322
Moore JR (2006) Organizational DNA: law of virtue. BookSurge, Central
Moore JR, Kizer LE, Jeon BP (2011) Leading groups to create healthy culture through
accomplishing tasks aligned to strategy. Int J Manage Inf Syst 15(2):55–64
Quinn RE, Faerman SR, Thompson MP, McGrath MR, St Clair LS (2007) Becoming a master
manager: a competing values approach. Wiley, Hoboken
Reducing Voluntary Turnover Through Improving Employee Self-Awareness. . . 403

Impact of Technology on Leadership Style:
Using “Least Preferred Coworker”
R. Srinivasan, B. Janakiram, and Rajendra Todalbagi
1 Introduction
The present day competitive scenario is witness to rapid changes in technology due
to market pressure. This imposes a heavy challenge on organizational leadership to
maintain acceptable performance levels.
The Least Preferred Coworker (LPC) scale is used in contingency theory
(Ayman et al. 1995) to measure a person’s leadership style. For example, it
measures a person’s style by how he/she describes a coworker with whom he/she
had difficulty completing a job. This does not need to be a coworker he/she disliked
a great deal, but rather someone with whom he/she least likes to work. After he/she
has selected this individual, the LPC instrument asks him/her to describe his/her
coworker on a metrics of 18 parameters.
Low LPCs are Task Motivated. They are individuals whose primary needs are to
accomplish tasks and whose secondary needs are focused on getting along with
people. In a work setting, they are concerned with achieving success on assigned
tasks, even if at the cost of having poor interpersonal relationships with
coworkers. Low LPCs gain self-esteem through achieving their goals. They
attend to interpersonal relationships but only after they have directed themselves
toward the tasks of the group.
R. Srinivasan
Department of Management Studies, Indian Institute of Science, Bangalore, Karnataka, India
e-mail: [email protected]
B. Janakiram
Department of Management Studies, M. S. Ramaiah Institute of Technology, Bangalore,
Karnataka, India
e-mail: [email protected]
R. Todalbagi (*)
Management Consultant and Quality Evangelist, Bangalore, Karnataka, India
e-mail: [email protected]
Department of Management Studies, Indian Institute of Science, Bangalore,
Driving the Economy through Innovation and Entrepreneurship,DOI 10.1007/978-81-322-0746-7_33, # Springer India 2013
405

Middle LPCs are Socio-Independent Leaders. In the context of work, they are
self-directed and not overly concerned with the task or with how others view
them. They are more removed from the situation and act more independent than
low or high LPCs.
High LPCs are Motivated by Relationships. These individuals derive their major
satisfaction in an organization from getting along with people with interpersonal
relationships. A high LPC sees positive qualities even in the coworker she or he
least prefers, even though the high LPC does not work well with that person.
In an organizational setting, the high LPC attends to tasks but only after she or he
is certain that the relationships between people are in good shape.
This chapter extends the LPC to build linkage with demographic parameters.
It examines the sample built on the hypothesis that there is a co-relationship between
leadership style and various demographic parameters.
2 Objectives of the Study
To do the following in the changing technology scenario:
• Make use of survey instrument to classify the LPCs as low, medium, and high for
a knowledge industry
• Analyze leadership style based on LPC
• Study the relationship of leadership with respect to demographic factors along
with socioeconomic factors
3 Organization and Methodology
A product development organization in the space of media and entertainment is
chosen as a sample organization for the study of leadership style using LPC metrics.
This organization has been witnessing rapid technological changes. This impacts
the market share of the company in a big way.
The organization is engaged in development of products in the space of digital
content and content management tools, specifically addressing computer graphics
and image processing solutions. The organization addresses the niche market
segments such as broadcast animation covering international TV networks, print
and publishing media, video professionals, and corporate presentation.
The organization employs computer software development engineers, graphic
artists, and animators who form the core team of production activities carried out by
the organization. Thus, the organization employs people with diverse educational
and socioeconomic background to execute its product development activity. This
diverse mix of population forms an interesting sample, for study and analysis
of leadership style inventory, with respect to different demographic parameters.
The organization was started around 8 years ago and has fully well established in
its business space and is now working successfully. It employs close to 200 people
406 R. Srinivasan et al.

across different product development activities with different skill sets and
competencies to execute its projects. A sample of 100 employees was chosen for
this leadership style survey across the organization forming a representative sample
of the organization.
LPC instrument was administered on this set of employees, and the score was
collected along with other demographic data for the sample.
The final LPC score is determined by adding up the numbers encircled on all
of the 18 parameters. If the score is 57 or below, it is a low LPC, which suggests
that the person is task motivated. If the score is within the range of 58–63, it is
middle LPC, which means the person is independent. Individuals who score 64 or
above are called high LPCs, and they are thought to be more relationship motivated.
As the LPC is a personality measure, the score one gets on the LPC scale is
believed to be quite stable over time and not easily changed. Low LPCs tend to
remain low, moderate LPCs tend to remain moderate, and high LPCs tend to remain
high. Research findings show that the test-retest reliability of the LPC is very strong
(Fiedler and Chemers 1984; Northhouse 2001; Robbins 2005).
Thus, collected sample data was further analyzed on demographic parameters
categorized under:
• Gender
• Age
• Origin or native (hailing from a city or a small town)
• Mother tongue
• Medium of instruction during schooling (regional language/English)
• Educational background
• Job function
• Impact of technology
• Work experience
4 Results of Demographic Analysis
4.1 Analysis by Gender
LPC scale
Gender Low Medium High Grand total
Distribution count:
Male 6 15 66 87
Female 1 13 14
Grand total 6 16 79 101
Distribution %:
Male 7% 17% 76% 100%
Female 7% 93% 100%
Grand total 6% 16% 78% 100%
Impact of Technology on Leadership Style: Using “Least Preferred Coworker” 407

Out of the total sample, 86% is male and 14% is female strength. With respect to
LPC score, females are distributed more on high LPC with 93% compared to only
76% male. The low LPC counts are nil in case of female respondents. One can inferfrom the above analysis that females tend to be more relationship-motivated leadersthan their counter parts. This has to be taken with caution as female distribution
in the sample is low at 15% only.
4.2 Analysis by Age
LPC scale
Age band Low Medium High Grand total
Distribution count:
20–30 6 4 42 52
31–40 9 26 35
>40 3 11 14
Grand total 6 16 79 101
Distribution %:
20–30 years 12% 8% 81% 100%
31–40 years 26% 74% 100%
>40 years 21% 79% 100%
Grand total 6% 16% 78% 100%
408 R. Srinivasan et al.

The sample is distributed with 52% in the age range up to 30 and balance 35% in
the range of 30–40 and 13% in the age range >40. One important observation that
can be inferred from the analysis is that people in the lower age group of up to 30
are more distributed on high LPC compared to people beyond the age of 30. Soyounger people exhibit more relationship-motivated leadership style in comparisonto older people.
4.3 Analysis by Native/Origin
LPC scale
Origin (City/town) Low Medium High Grand total
Distribution count:
City 4 30 34
Town 6 12 49 67
Grand total 6 16 79 101
Distribution %:
City 12% 88% 100%
Town 9% 18% 73% 100%
Grand total 6% 16% 78% 100%
The sample has distribution of 66% people hailing from town, and balance
34% from city bringing-up. Interestingly, city group has no low LPC and has
got higher concentration of high LPCs with 88%, whereas town group has got
73% high LPCs. One may infer from the above analysis that city folks are moredriven by relationship-motivated leadership style in comparison to people comingfrom town.
Impact of Technology on Leadership Style: Using “Least Preferred Coworker” 409

4.4 Analysis by Mother Tongue
LPC scale
Mother tongue Low Medium High Grand total
Distribution count:
Kannada 4 9 33 46
Tamil 1 3 11 15
Malayalam 3 10 13
Telugu 1 10 11
Hindi 6 6
Marathi 1 3 4
Oriya 3 3
English 2 2
Bengali 1 1
Grand total 6 16 79 101
Distribution %:
Kannada 9% 20% 72% 100%
Tamil 7% 20% 73% 100%
Malayalam 23% 77% 100%
Telugu 9% 91% 100%
Hindi 100% 100%
Marathi 25% 75% 100%
Oriya 100% 100%
English 100% 100%
Bengali 100% 100%
Grand total 6% 16% 78% 100%
The sample has close to 50% Kannada speaking people, 40% other souther
languages (Tamil, Telugu and Malayalam) distributed in the range of 10–15% each.
However, interestingly, LPC scores are distributed almost same except Telugu
which is skewed toward high LPC scores. The inference that can be drawn fromthe above analysis is that all southern language speaking people seem to havesimilar leadership style distribution except Telugu speaking people.
410 R. Srinivasan et al.

4.5 Analysis by Medium of Study During Schooling
LPC scale
Medium of study (R/E) Low Medium High Grand total
Distribution count:
English 4 9 48 61
Regional 2 7 31 40
Grand total 6 16 79 101
Distribution %
English 7% 15% 79% 100%
Regional 5% 18% 78% 100%
Grand total 6% 16% 78% 100%
Sixty percent of the sample have done their schooling in English medium, while
balance 40% have done their schooling in their regional language medium. It isclear from the above data analysis that medium of instruction had no bearing on theleadership style of people, since the distribution of LPC scores between low,medium, and high is almost identical between regional language and Englishmedium schooling of the sample.
4.6 Analysis by Educational Background
LPC scale
Educational qualification Low Medium High Grand total
Distribution count:
Diploma 1 11 12
Graduate 1 4 20 25
Postgraduate 1 5 6
Prof. degree-engg. 4 8 34 46
Prof. degree-mgmt. 2 9 11
Prof. degree-accts. 1 1
Grand total 6 16 79 101
(continued)
Impact of Technology on Leadership Style: Using “Least Preferred Coworker” 411

LPC scale
Educational qualification Low Medium High Grand total
Distribution %:
Diploma 0% 8% 92% 100%
Graduate 4% 16% 80% 100%
Postgraduate 17% 83% 100%
Prof. degree-engg. 9% 17% 74% 100%
Prof. degree-mgmt. 18% 82% 100%
Prof. degree-accts. 100% 100%
Grand total 6% 16% 78% 100%
This sample has 46% engineering graduates, 25% graduates, 12% diplomas, and
11% management graduates. Diplomas have the highest high LPCs with 92%,
engg. graduates have the least high LPCs with 74%. Others are having around
80% of high LPCs.
We can infer from the above analysis that there is a corelation between educa-
tional background and their leadership style.
Also we can infer that engineering graduates have higher percentage of taskmotivational leadership style, while diplomas have higher percentage of relation-ship motivational leadership.
4.7 Analysis by Job Function
LPC scale
Function Low Medium High Grand total
Distribution count:
Production 6 10 60 76
Support 6 19 25
Grand total 6 16 79 101
Distribution %:
Production 8% 13% 79% 100%
Support 24% 76% 100%
Grand total 6% 16% 78% 100%
(continued)
412 R. Srinivasan et al.

The sample has a distribution of 75% of production employees and 25% of
support employees. Distribution of LPC scores across production and supportfunction is almost similar with high LPCs of 79 and 76%, respectively. Althoughthe production has low LPCs of 8%, there are no low LPCs under support andmiddle LPCs are higher under support at 24%.
4.8 Impact of Technology
LPC scale
Role Low Medium High Grand total
Distribution count:
Animators 1 3 13 17
Graphic artists 1 16 17
Software engineers 4 4 28 36
Support executives 1 8 22 31
Grand total 6 16 79 101
Distribution %:
Animators 6% 18% 76% 100%
Graphic artists 6% 94% 100%
Software engineers 11% 11% 78% 100%
Support executives 3% 26% 71% 100%
Grand total 6% 16% 78% 100%
This sample has around 36% of software engineers, 31% of support personnel,
17% of graphic artists, and 17% of animators. The LPC score distribution among
Impact of Technology on Leadership Style: Using “Least Preferred Coworker” 413

different roles is almost similar with an exception of graphic artists having higher %
toward high LPCs with 94% and support executives having lowest high LPCs
with 71%. The above analysis reveals that support personnel, software engineers,
animators are having higher percentage of task-motivated leadership style, in
comparison to Graphic artists who represent fully relationship-motivated leadership
style. Animators and software engineers, who work with technology, are showing a
higher percentage of task-driven leadership style in comparison to other roles,
which shows influence of technology on leadership style. This might have also to
do with individual contributor versus team contribution as a technical worker is
more associated with machines and technology, and less with people, though the
overall result depends on a good balance between the task and relationship even in
a technological work environment, as the final outcome is a result of integration
of various individual work products realized by many individual contributors to
reach the final product or service delivery. One can infer from the above thattechnological work environment gives rise to higher task-driven leadership stylecompared to nontechnical work environment.
4.9 Analysis by Work Experience
LPC scale
Experience range Low Medium High Grand total
Distribution count:
1–5 years 4 1 31 36
6–10 years 2 8 22 32
11–15 years 4 13 17
16–20 years 4 4
>21 years 3 9 12
Grand total 6 16 79 101
Distribution %:
1–5 years 11% 3% 86% 100%
6–10 years 6% 25% 69% 100%
11–15 years 24% 76% 100%
16–20 years 100% 100%
>21 years 25% 75% 100%
Grand total 6% 16% 78% 100%
414 R. Srinivasan et al.

This sample has a distribution of 37% of up to 5 years of experience, 32% of
6–10 years experience, 17% of 11-15 years of experience, and 4% of 16–20 years
of experience and 12% of >20 years of experience band.
The following observations can be made from the above analysis.
At lower experience bracket (1–5 years), highest relationship-motivated leader-
ship style with 86% of high LPC distribution is observed. In the middle experience
bracket (6–10 years), relationship-motivated leadership style is lowest with 69% of
high LPCs. And then again at higher experience bracket (>11 years), relationship-
motivated leadership style increases to around 75%.
One may infer from the above that, during the early part of the career, peopleexhibit relationship-motivated leadership style, while in the mid career, you see ahigher task-motivated leadership style and again slightly higher percentage ofrelationship-motivated leadership at senior levels but less than what is seen inpeople in their early part of career (Srinivasan 2012a, b).
5 Summary Conclusions and Inferences
1. Changing work environment with increasing adoption of technology and con-
tinuously changing technology has an impact on leadership. Leadership styles
can lead to effective organizational management and contribute to improved
organizational performance. It is also observed that technical workers have
higher task-driven leadership style compared to nontechnical workforce.
2. Female population exhibits higher percentage of relationship-motivated lead-
ership style in comparison to their male counterparts.
3. Youngsters show more relationship-motivated leadership style compared to
older people.
4. People coming from city show higher relationship-motivated leadership style
in comparison to people coming from towns, who show higher task-motivated
leadership style.
5. People from southern states of the country have an almost similar distribution
of leadership style except Telugu region.
6. Medium of instruction in schooling has no bearing on the leadership style
exhibited by an individual.
7. Also, we can infer that engineering graduates have higher percentage of task-
motivated leadership style, while diplomas have higher percentage of
relationship-motivated leadership.
8. Job function of an individual has low to moderate influence on one’s leadership
style.
9. Job roles have a definite impact on leadership style. Software engineers and
animators showed a higher percentage of task motivational leadership, while
graphic artists represented fully relationship-motivated leadership style.
Impact of Technology on Leadership Style: Using “Least Preferred Coworker” 415

10. People in their early career tend to exhibit more of a relationship-motivated
leadership style, while duringmid career show a higher task-motivated leadership
style and again higher relationship-motivated leadership style at senior level but
much lower than early career.
The above inferences and conclusions help as an extension to contingency theory of
leadership, which can be further used for intervention of organizational develop-
ment and optimization of leadership resources in an organization, thus helping
boost the productivity of an organization.
6 Limitations
The sample size for the study being limited to 100 respondents, there is a strong
possibility that findings may change with a large sample size. Also, the composition
of the sample has to be kept in mind while extending the applicability of findings.
The study done on knowledge industry needs to be examined further, as to
whether it holds good for other industry segments and sections as well.
References
Ayman R, Chemers MM, Fiedler F (1995) The contingency model of leadership effectiveness:
its levels of analysis. Leadership Q 6(2):147–167
Fiedler FE, Chemers MM (1984) Improving leadership effectiveness: the leader match concept,
2nd edn. Wiley, New York
Northouse PG (2001) Leadership theory and practice, 2nd edn. Sage Publications, Inc, Thousand
Oaks
Robbins SP (2005) Organizational behaviour, 11th edn. Prentice Hall of India, New Delhi
Srinivasan R (2012a) Services marketing, the Indian context, 3rd edn. Prentice Hall of India,
New Delhi
Srinivasan R (2012b) Strategic management, the Indian context, 4th edn. Prentice Hall of India,
New Delhi
416 R. Srinivasan et al.

Part 2.3
Learning and Knowledge Management

An Empirical Model to Foster Innovation
and Learning Through Knowledge Sharing
Culture
Vijila Kennedy and M. Kirupa Priyadarsini
1 Introduction
In today’s knowledge-based economy, knowledge is the most important resource
for an organization to gain competitive advantage (Stewart 1996). Knowledge crea-
tion, sharing, and dissemination are the main activities in knowledge management.
Being part of knowledge management (KM) process (Kim and King 2004), knowl-
edge sharing is the exchange of experience, events, thoughts, or understanding of
anything. Knowledge sharing culture is viewed as an important process because it
results in shared intellectual capital (Liao et al. 2007). Knowledge sharing culture
is defined in many ways: Culture with a positive orientation to knowledge is the
one that highly values learning on and off the job (Davenport et al. 1998); positive
attitudes of leaders and colleagues toward knowledge processes (Dobrai and Farkas
2008); people would share ideas and insights because they see it as natural rather
than something they are forced to do (McDermott and O’Dell 2001); and a way of
organizational life that enables and motivates people to create, share, and utilize
knowledge (Oliver and Kandadi 2006). Knowledge sharing culture impacts the
organization in many ways – at individual, group, and organizational level.
The aims of this chapter are to explore and measure the impact of knowledge
sharing culture on foster of learning and innovation in organizations in IT sector.
To assess the knowledge sharing culture, Theory of Planned Behavior (TPB)
(Ajzen 1991) framework was adapted. This chapter examines the application of
TPB model which proposes that behavioral attitude, subjective norms, and perceived
behavioral control are predictors of behavioral intentions and actual behavior
among IT professional’s perception of knowledge sharing culture. The study also
analyzes the influence of knowledge sharing culture on innovation and learning
culture of the organization.
V. Kennedy (*) • M.K. Priyadarsini
KCT Business School, Kumaraguru College of Technology, Coimbatore, India
e-mail: [email protected]; [email protected]
Department of Management Studies, Indian Institute of Science, Bangalore,
Driving the Economy through Innovation and Entrepreneurship,DOI 10.1007/978-81-322-0746-7_34, # Springer India 2013
419

2 Review of Literature
Knowledge is regarded as a fluid mix of framed experiences, values, contextual
information, and expert insights that provide a framework for evaluating and
incorporating new experiences and information (Davenport 1997). Knowledge has
been classified as explicit and tacit knowledge (Nonaka 1994). While it is easy to
transmit explicit knowledge through formal language, it is much difficult, on the other
hand, to convey tacit knowledge (Nonaka and Takeuchi 1995). Though knowledge
itself is essential for an organization, knowledge sharing is a very significant process
which will enhance the permeation of knowledge across the employees. The impor-
tance of knowledge sharing to organizations has been widely acknowledged.
Knowledge sharing culture contributes to knowledge application, innovation, and
ultimately the competitive advantage of the organization (Jackson et al. 2006). Knowl-
edge sharing between employees and within and across teams allows organizations to
exploit and capitalize on knowledge-based resources (Cabrera and Cabrera 2002;
Damodaran and Olphert 2000; Davenport and Prusak 1998). Research has shown
that knowledge sharing is positively related to reductions in production costs, faster
completion of new product development projects, team performance, innovation
capabilities, and firm’s performance (Arthur and Huntley 2005; Collins and Smith
2006; Cummings 2004; Hansen 2002).
Sharing of knowledge at the individual level is the most critical to an organiza-
tion, even though it may exist at other levels of an organization that include team
and organizational levels (Lukas et al. 1996). A firm can successfully achieve
promotion of knowledge sharing culture not only by directly incorporating knowl-
edge in its business strategy but also by changing employee attitudes and behaviors
to promote willingness and consistent knowledge sharing (Lin 2007).
The positive impacts of knowledge sharing are productivity, task completion
time, organizational learning (Argote 1999; Argote and Paul 2000; Cummings
2004), enhanced innovation, and reducing redundant learning efforts (Scarbrough
2003).
Growth and sharing of knowledge are recognized as the most important elements
in becoming a learning organization (Easterby-Smith and Araujo 1999; Marsick and
Watkins 1994; Senge 1990). Johnston and Hawke (2002) define learning culture as
the existence of a set of attitudes, values, and practices within an organization which
support and encourage a continuing process of learning for the organization
and/or its members. A learning culture is said to exist in an environment where
teamwork, collaboration, creativity, and knowledge processes exist that have a
collective meaning and value (Joo 2007). For an organization to improve its
performance, it requires a learning culture (Kumar 2005). Hence, organizations
take deliberate effort to develop learning culture (Walsham 2002). Mixed results
have been found in studies examining the relationship between learning culture and
knowledge sharing. Taylor and Wright (2004) found that a climate that encouraged
innovation and focused on learning from failure was positively related to effective
knowledge sharing. Hsu (2006), in the case studies of companies in Taiwan,
420 V. Kennedy and M.K. Priyadarsini

highlighted the significance of continuous learning through knowledge sharing. Lee
et al. (2006), however, did not find a significant relationship between knowledge
sharing and learning orientation.
Innovation is about “a process of developing and implementing a new idea”
(Van de Ven and Angle 1989). Kanter (1988) states that innovation is most likely to
occur in organizations that (a) have integrative structures, (b) emphasize diversity,
(c) have multiple structural linkages inside and outside the organization, (d) have
intersecting territories, (e) have collective pride and faith in people’s talents, and
(f) emphasize collaboration and teamwork.
Literature search revealed that hardly any research has been conducted on the
role knowledge sharing culture based on TPB model and its influence on innovation
and learning. Thus, the result of this study may be relevant to various stakeholders
in IT sector. For the management of IT organizations, findings of this study will be
of great significance. It will shed light on how the knowledge sharing behavior can
be encouraged among its employees. From an academic perspective, this study’s
insights will add to the existing literature on the impact of knowledge sharing
culture on innovation and learning.
3 Research Hypotheses and Model
This research study aims at assessing the extent to which IT companies promote
knowledge sharing environment and its effect on innovativeness and learning and
development. The Theory of Planned Behavior (TPB; Ajzen 1988, 1991) proposes
a model about how human action is guided. It predicts the occurrence of a specific
behavior provided that the behavior is intentional. The model is depicted in Fig. 1
and represents the three variables which the theory suggests will predict the
intention to perform behavior. Intentions are the precursors of behavior.
Innovativeness and learning and development are the critical factors for success
for any organization, more so for IT industries. Therefore, the TPB model had been
extended by adding these two constructs.
The variable names in this model reflect psychological constructs, and so they
have a special meaning within the theory. In the context of this study knowledge
sharing intention can be used as a proximal measure of knowledge sharing behav-
ior. Attitude towards knowledge sharing refers to a person’s overall evaluation of
knowledge sharing. Subjective norms are a person’s own estimate of the social
pressure whether to/not to share knowledge. Perceived behavioral control refers to
the extent to which a person is able to enact knowledge sharing.
Studies have shown that attitude has a positive influence on intention to behave
(Chang 1998). In this study, attitude toward knowledge sharing refers to the IT
professional’s positive or negative view about knowledge sharing. But since
An Empirical Model to Foster Innovation and Learning Through Knowledge. . . 421

knowledge sharing has many positive influences in the organization, IT professionals
will have a positive view about it. Hence, the following hypothesis was formulated:
H1: IT professionals’ attitude toward knowledge sharing will positively affect the
intensions to share knowledge.
Subjective norms are the social pressures a person faces which influence them
to have intentions of certain behavior. In this study, subject norms about knowl-
edge sharing refer to the pressures that IT professionals face from the system or
people in their organization encouraging knowledge sharing behavior. Therefore,
the following hypothesis was formulated:
H2: IT professionals’ subjective norms regarding knowledge sharing will positively
affect the intensions to share knowledge.
Perceived behavioral control is the disposition and skills, knowledge, abilities,
and information an individual has concerning a particular behavior. In this study,
this refers to the IT professionals’ perceived behavioral control toward knowledge
sharing intention. Hence, the following hypothesis was formulated:
H3: IT professionals’ perceived behavioral control regarding knowledge sharing
will positively affect the intensions to share knowledge.
According to TPB, higher behavioral intention exhibits stronger behavior
(Chang 1998). In this study, IT professionals’ intentions to share knowledge will
enhance behavior. This led to formulating the following hypothesis:
H4: IT professionals’ intention to share knowledge will positively influence the
knowledge sharing behavior.
Attitude towardsKnowledge
Sharing
Learning and Development
Innovativeness
Subjective Norms
Perceived Behavioural
Control
KnowledgeSharing Intention
Knowledge Sharing
Behaviour
Fig. 1 Conceptual framework
422 V. Kennedy and M.K. Priyadarsini

Studies have shown that knowledge sharing culture fosters learning at individual,
group, and organizational levels (Argote 1999). Therefore, the following hypothesis
was formulated:
H5: Knowledge sharing culture will positively influence organizational learning
and development.
Creativity and Innovation thrives in organizations where knowledge is shared.
Innovation is looked at from two perspectives: Innovativeness – the degree to which
an organization welcomes new ideas and capacity to innovate – is the degree to
which the organization has the capacity to adopt or implement new ideas. Hence,
the following hypothesis was formulated for this study:
H6: Knowledge sharing culture will positively influence organizational innovation.
4 Methodology
The population of the study consisted of the IT professionals in Coimbatore. Online
survey questionnaire was sent to 550 IT professionals. Usable 295 questionnaires
were returned which were used for the study.
The standardized questionnaire (Ajzen 1991) with five constructs included in the
TPB framework comprises of (1) attitudes toward knowledge sharing, the degree
to which the IT professionals believe that their organization thinks favorably about
knowledge sharing; (2) subjective norms about knowledge sharing, the degree to
which IT professionals social pressure to share knowledge; (3) perceived behav-
ioral control to knowledge sharing, the degree to which the IT professionals feel the
ease of sharing knowledge; (4) intentions to knowledge sharing, the degree to which
IT professionals believe that their organizations promote knowledge sharing; and
(5) knowledge sharing behavior, the degree to which company actually shares
knowledge with others. All constructs had multiple items.
To measure on innovativeness and learning, the instrument developed by Hurley
and Hult (1998) was used. The capacity to innovate was operationalized as the
number of new ideas that had been adopted by the organization and recognized in
formal award program. The learning construct measures the degree to which
support is provided for formal and informal learning in the organization.
All the constructs of the study were measured from items adapted from previous
studies, with some alterations to account for the peculiarity and setting of the study.
To improve the reliability and validity, multiple-item measures were used for all
of the variables. Responses were recorded along a five-point Likert scale ranging
from 1 (strongly disagree) to 5 (strongly agree) for all the items in the questionnaire.
The data collected was analyzed by developing suitable hypothesis. Structural
equation modeling was used to test the goodness of the framework developed
through the VPLS software.
An Empirical Model to Foster Innovation and Learning Through Knowledge. . . 423

5 Results and Discussions
5.1 Reliability and Validity
Reliability and validity tests were conducted for all the constructs in the conceptual
model. The reliability of the seven constructs used in the study was carried out
using VPLS software. The reliability of the constructs refers to the accuracy with
which the constructs repeatedly measure the same phenomenon within permissible
variation. The composite reliability for internal consistency of the constructs was
tested and was above 0.7. The Cronbach alpha scores were found to be greater than
0.7 which is good reliability for social science research (Nunnally 1978). The AVE
scores for all the constructs are greater than 0.5 indicating sufficient convergent
validity (Table 1).
5.2 Correlation of the Model Constructs
The correlation values were generated using the VPLS software for the constructs
in the model. The results of the correlation analysis are shown in Table 2. It can
be seen that all the correlation values are greater than 0.6. Innovativeness showed
the lowest correlation for attitude toward knowledge sharing and knowledge shar-
ing intentions. All the correlation values were also found to be significant at
0.05 level.
5.3 Testing the Conceptual Model
The result of VPLS structural equation model is given below in Fig. 2. Tests of
significance for all paths were conducted using bootstrap resampling procedure.
The test of each link is mapped to each path in the model. The estimated path
coefficient along with their t-statistic is shown in the model. All the paths are found
to be significant and important in magnitude (Table 3).
Table 1 Reliability and validity of constructs
Constructs Composite reliability AVE Cronbach alpha
Attitude toward knowledge sharing 0.92 0.75 0.89
Subjective norms about knowledge sharing 0.93 0.76 0.89
Perceived behavioral control 0.83 0.56 0.74
Knowledge sharing intentions 0.94 0.84 0.90
Knowledge sharing behavior 0.81 0.52 0.83
Innovativeness 0.82 0.75 0.82
Learning and development 0.81 0.73 0.77
424 V. Kennedy and M.K. Priyadarsini

Table 2 Correlation of the model constructs
Constructs Attitude
Subjective
norm
Perceived
behavioral
control
Knowledge
sharing
intentions
Knowledge
sharing
behavior Innovativeness
Attitude 1
Subjective norm 0.749 1
Perceived
behavioral
control
0.777 0.804 1
Knowledge
sharing
intention
0.802 0.759 0.774 1
Knowledge
sharing
behavior
0.795 0.788 0.822 0.82 1
Innovativeness 0.633 0.77 0.76 0.644 0.77 1
Learning and
development
0.79 0.808 0.811 0.79 0.81 0.758
Attitude towardsKnowledge
Sharing
Learning andDevelopment
Innovativeness
SubjectiveNorms
PerceivedBehavioural
Control
Knowledge Sharing Intention
Knowledge Sharing
Behaviour
0.402(4.802)
0.245(3.64)
0.226(3.038)
0.757(18.260)
RSq=0.638 RSq=0.573
RSq=0.561
RSq=0.557
0.749(18.897)
0.746(12.98)
Fig. 2 Model of knowledge sharing’s impact on innovativeness and learning and development
Table 3 Structural model: bootstrap
Hypothesis
Standardized
path coefficient t-Statistic
Attitude toward KS ! knowledge sharing intentions 0.402 4.802
Perceived behavioral control ! knowledge sharing intentions 0.245 3.640
Subjective norm ! knowledge sharing intentions 0.226 3.038
Knowledge sharing intentions ! knowledge sharing behavior 0.757 18.260
Knowledge sharing behavior ! innovativeness 0.749 18.897
Knowledge sharing behavior ! learning and development 0.746 12.980
An Empirical Model to Foster Innovation and Learning Through Knowledge. . . 425

From the figure and the R-squared of knowledge sharing intention, it can be
concluded that 63 % of the overall variation in knowledge sharing intention is of the
sample as explained by the three constructs, namely, attitude, behavioral control,
and subjective norms. Among the three, knowledge sharing intention is influenced
positively to a greater extent by knowledge sharing attitude with a path coefficient
of 0.40. Perceived behavioral control and subjective norms contribute to 22 and
24 % of the variations in knowledge sharing intention. Therefore, the hypothesis
that above three constructs affect knowledge sharing intentions is accepted and
evident. The next hypothesis to be tested is that of the impact of intentions on
behavior. The model results depict that knowledge sharing intention is able to
explain 57 % of the variation in the knowledge sharing behavior.
The main objective of the study is to assess the extent to which innovativeness
and learning and development can be fostered in the techno savvy IT industry
through knowledge sharing culture. The path coefficient for knowledge sharing
behavior to innovativeness was found to be 0.74, and this amounts to explaining
56 % of variation in innovativeness, while the remaining 44 % is being explained by
other factors which do not form a part of this study. Similarly, knowledge sharing
explains 55 % of variation in organizational learning and development. Therefore,
the hypothesis that knowledge sharing affects organizational learning and develop-
ment is accepted.
The empirical results of the model show that all the six hypotheses H1, H2,
H3, H4, H5, and H6 are verified. It can be seen that the first three hypotheses that
the knowledge sharing intention is influenced by attitudes, subjective norms, and
perceived behavioral control are positive and significant. Innovativeness (path
coefficient 0.749 and t-statistic ¼ 18.87) and organizational learning and develop-
ment (path coefficient ¼ 0.746 and t-statistic ¼ 12.98) are influenced by knowl-
edge sharing behavior. This empirical investigation supports the Theory of Planned
Behavior and also supports the fact that innovativeness and organizational learning
and development are influenced by knowledge sharing behavior.
6 Conclusion
Knowledge sharing culture is an initiative of knowledge management. However,
the success of this depends not only on the organizational initiatives but more from
the change at the individual level. This study was an attempt in that direction to see
how an individual’s intentions are influenced and, in continuum, how his behavior
is influenced by his intentions. The study also throws light on how the knowledge
sharing behavior can have a great effect on the innovativeness and organizational
learning and development. Having realized this, organizations should start taking
steps to strengthen the individual’s faith and belief in knowledge sharing so that he
starts inculcation of a knowledge sharing culture.
To make knowledge management imperatives, successful individuals must
understand that the creation and application of new knowledge is essential to the
survival of almost all businesses. Expertise learned and applied at one part of the
426 V. Kennedy and M.K. Priyadarsini

organization is not leveraged at another part. Only if employees can realize the
magnitude of the efforts that go into creating and sustaining a knowledge sharing
culture, and the benefits that accrue to them as individuals in terms of learning, they
shall remain supportive. Therefore, organizations need to bring in processes that
shall be able to absorb the knowledge sharing among its employees. Some
suggestions by David Gurteen (2000) in creating a knowledge sharing culture like
overcoming objections to create a knowledge sharing culture, rewarding knowledge
sharing culture, and motivating knowledge sharing can go a long way in improving
an organization’s learning and fostering innovation. Another area that may be a
great value addition in this is to put in place the knowledge sharing technology and
train and educate people in its effective use. The two together – people with the
appropriate knowledge sharing mindset and the appropriate knowledge sharing
technology to support them – will rapidly bring about a knowledge sharing culture
that can give any organization a competitive edge over their competitors.
References
Ajzen I (1988) Attitudes, personality and behaviour. OUP, Milton Keynes
Ajzen I (1991) The theory of planned behaviour. Organ Behav Hum Decis Process 50:179–211
Argote L (1999) Organizational learning: creating, retaining and transferring knowledge. Kluwer
Academic Publishers, Boston
Argote L, Paul I (2000) Knowledge transfer: a basis for competitive advantage in firms. Organ
Behav Hum Decis Process 82(1):150–169
Arthur JB, Huntley CL (2005) Ramping up the organizational learning curve: assessing the impact
of deliberate learning on organizational performance under gainsharing. Acad Manage J
48(6):1159–1170
Cabrera A, Cabrera EF (2002) Knowledge-sharing dilemmas. Organ Stud 23:687–710
Chang MK (1998) Predicting unethical behavior: a comparison of the theory of reasoned action
and the theory of planned behavior. J Bus Ethics 17(16):1825–1834
Collins CJ, Smith KG (2006) Knowledge exchange and combination: the role of human resource
practices in the performance of high-technology firms. Acad Manage J 49(3):544–560
Cummings JN (2004) Work groups, structural diversity and knowledge sharing in a global
organization. Manage Sci 50(3):352–364
Damodaran L, Olphert W (2000) Barriers and facilitators to the use of knowledge management
systems. Behav Inf Technol 19(6):405–413
Davenport TH (1997) Information ecology. Oxford University Press, New York
Davenport TH, Prusak L (1998) Working knowledge: how organizations manage what they know.
Harvard Business School Press, Boston
Davenport TH, De Long DW, Beers MC (1998) Successful knowledge management projects.
Sloan Manage Rev 39(2):51–57
Dobrai K, Farkas F (2008) Knowledge-based services: examining knowledge processes in public-
serving nonprofit organizations. Int J Knowl Cult Change Manage 8(2):9–21
Easterby-Smith M, Araujo L (1999) Organisational learning: current debates and opportunities.
In: Easterby-Smith M, Burgoyne J, Araujo L (eds) Organisational learning and the learning
organisation. Sage, Thousand Oaks, pp 1–21
Gurteen D (2000) Creating a knowledge sharing culture. Knowl Manage Mag 2(5), February 1999
http://www.ikmagazine.com/xq/asp/txtSearch.david+gurteen/exactphrase.1/sid.6D1D2F97-
D8A0-4493-BCE5-9164C3C10AFF/articleid.5FF740F3-3298-4353-B9AE-30D0B4F41AFE/
qx/display.htm
An Empirical Model to Foster Innovation and Learning Through Knowledge. . . 427

Hansen MT (2002) Knowledge network: explaining effective knowledge sharing in multiunit
companies. Organ Sci 13(3):232–248
Hsu IC (2006) Enhancing employee tendencies to share knowledge – case studies of nine
companies in Taiwan. Int J Inf Manage 26(4):326–338
Hurley RF, Hult GTM (1998) Innovation, market orientation, and organizational learning:
an integration and empirical examination. J Mark 62:42–64
Jackson SE, Chuang C-H, Harden EE, Jiang Y, Joseph JM (2006) Toward developing human
resource management systems for knowledge-intensive teamwork. In: Joseph JM (ed)
Research in personnel and human resources management, vol 25. JAI, Amsterdam, pp 27–70
Johnston R, Hawke G (2002) Case studies of organizations with established learning cultures.
National Centre for Vocational Education Research, Adelaide
Joo B (2007) The impact of contextual and personal characteristics on employee creativity in
Korean firms. Thesis, University of Minnesota
Kanter RM (1988) When a thousand flowers bloom: structural, collective and social conditions for
innovation in organizations. In Straw BM, Cummings LL (eds) Research in organizational
behavior, vol 10, J.A.I. Press, Greenwich
Kim J, King J (2004) Managing knowledge work: specialization and collaboration of engineering
problem-solving. J Knowl Manage 8(2):36–52
Kumar N (2005) Assessing the learning culture and performance of educational institutions.
Perform Improv 44(9):27–34
Lee J-H, Kim Y-G, Kim M-Y (2006) Effects of managerial drivers and climate maturity
on knowledge-management performance: empirical validation. Inf Resourc Manage J 19(3):
48–60
Liao SH, Fei WC, Chen CC (2007) Knowledge sharing, absorptive capacity, and innovation
capability: an empirical study of Taiwan’s knowledge-intensive industries. J Inf Sci 33(3):340–359
Lin H (2007) Knowledge sharing and firm innovation capability: an empirical study. Int J Manpow
28(3/4):315
Lukas B, Hult G, Ferrell O (1996) A theoretic perspective of the antecedents and consequences of
organizational learning in marketing channels. J Bus Res 36(3):233–244
Marsick V, Watkins K (1994) The learning organisation: an integrative vision for HRD. Hum
Resour Dev Q 5(4):353360
McDermott R, O’Dell C (2001) Overcoming cultural barriers to sharing knowledge. J Knowl
Manage 5(1):76–85
Nonaka I (1994) A dynamic theory of organizational knowledge creation. Organ Sci 5(1):14–37
Nonaka IO, Takeuchi H (1995) The knowledge-creating company: how Japanese companies
create the dynamics of innovation. Oxford University Press, New York
Nunnally JC (1978) Psychometric theory. McGraw Hill, New York
Oliver S, Kandadi KR (2006) How to develop knowledge culture in organizations? Amultiple case
study of large distributed organizations. J Knowl Manage 10(4):6–24
Scarbrough H (2003) Knowledge management, HRM and innovation process. Int J Manpower
24(5):501–516
Senge P (1990) The fifth discipline: the art and practice of the learning organisation. Doubleday
Currency, New York
Stewart TA (1996) Intellectual capital: the new wealth of organization. Doubleday Currency,
New York
Taylor WA, Wright GH (2004) Organizational readiness for successful knowledge sharing:
challenges for public sector managers. Inf Resour Manage J 17(2):22–37
Van de Ven AH, Angle HL (1989) An introduction to the Minnesota innovation research program.
In: Van de Ven AH, Angle HL, Poole MS (eds) Research on the management of innovation.
Harper & Row, New York, pp 3–30
Walsham G (2002) Knowledge management: the benefits and limitations of computer systems.
Eur Manage J 19(6):599–608
428 V. Kennedy and M.K. Priyadarsini

Collaborative Learning and Knowledge
Management: A Case Study
Giulia Monetta, Francesco Orciuoli, and Gabriella Santoro
1 Introduction
The aim of this chapter is to present an Italian firm, MOMA, the main actor of the
network ‘Pole of Excellence on Knowledge’. This chapter illustrates in detail the
company’s vision, evolution, profile and business strategy emphasising how these
aspects differentiate MOMA from its competitors. In particular, the specific
objectives of the research paper are:
– To identify resources (organisational, human, technological, physical and finan-
cial) exploited for commitment to research and innovation
– To highlight individual competences with a focus on the enhancement of human
resources to constantly improve the value proposition
– To develop a process to classify and place relevant information as a shared
resource (often referred to as a ‘knowledge repository’) that can be assessed by
all relevant stakeholders.
The first part of this chapter presents a brief description of the methodology
used for data collection and data analysis. After, a case study of an Italian firm is
presented to help illustrate how MOMA gives access to knowledge management
facilities and practises and meets the need for collaboration and communication in
a working environment. The data-gathering sources were both secondary and
G. Monetta (*)
Department of Study and Business Research, University of Salerno, Salerno, Italy
e-mail: [email protected]
F. Orciuoli
Center of Research for Pure and Applied Mathematics, University of Salerno, Salerno, Italy
e-mail: [email protected]
G. Santoro
MOMA Ltd, Baronissi (SA), Italy
e-mail: [email protected]
Department of Management Studies, Indian Institute of Science, Bangalore,
Driving the Economy through Innovation and Entrepreneurship,DOI 10.1007/978-81-322-0746-7_35, # Springer India 2013
429

primary in nature, and the second part of this chapter provides a detailed analysis
of the phenomenon investigated. Finally, we present our conclusions, underlining
the research implications for academicians, industry leaders, technology managers
and innovators.
2 Methodology
Our research was developed according to a qualitative approach and a methodology
based on a field case study (Eisenhardt 1989; Yin 1994; Ryan et al. 2002).
A combination of case analysis, observation and interviewing approach was
used. Attributes such as evolution of the company, corporate philosophy, human
resource management, products, customers and competitors, technology strategy,
technological strengths and weaknesses, the integration of technology strategy with
corporate strategy, technology management practices and business performance
were studied in depth. Opting for a choice of ‘revelatory case’ (Bryman and Bell
2007) – the presence of particular elements and content information (Saunders et al.
2003) – the analysis of the firm MOMA was put in place.
2.1 Data Collection
Following Eisenhardt’s suggestions (1989), we combined different methods of data
collection. The analysis is based on the collection of qualitative and quantitative
information obtained in the course of two successive interviews with the entrepre-
neurial team (scientific coordinator and general manager) of the ‘Pole of Excellence
on Knowledge’ conducted on the basis of semi-structured questionnaires and an
analysis of printed documentary sources.
In more detail, to analyse MOMA, the sources of empirical evidence can be
divided into the following:
Semi-structured interviews: the primary method of data collection involved a total
of six semi-structured interviews with the following organisational members: sales
and communication director, strategic business manager, production manager,
R&D manager, quality, safety and control manager, human resources manager.
The questions asked during the interviews were non-standardised, the dual aim
being to ensure involvement on the part of the respondents and, at the same time, to
give them a certain degree of freedom in their responses (Kvale 1996). Interviewing
time ranged from half an hour to two hours, and most of the interviews were
recorded. Whenever this was not possible, detailed field notes were taken.
Interviews were based on a list of open-ended questions developed on the basis
of the main research questions, such as specific initiatives and relationships with
business partners.
430 G. Monetta et al.

Annual reports and other external communication tools: Annual reports regardingthe economic and financial situation, the Corporate Code of Conduct and Ethics
Code were analysed, as were the corporate website, press releases and other
documents for institutional and market communication.
Field observation: the company was visited between September and December
2011 in order to experience directly day-to-day company life.
Corporate histories and other archival material: an archival search helped us trackthe evolution of MOMA over time and at different levels of analysis.
2.2 Data Analysis
As first-order codes became consolidated across interviews, we started aggregating
them and moving from open to axial coding. As a general consideration, and given
the selected strategy of inquiry, theory was created iteratively from observation
and data, and emerging ideas were compared with archival data and the literature
in order to validate the findings and inform interpretation. The systematisation
and codification of the answers of the questionnaires were carried out separately
by two researchers (Silverman 2001). The analyses were then compared to discuss
and resolve differences. Where these differences could not be resolved easily,
clarification was sought from the support of the sales and communication director
for MOMA’s ‘Business Development’ area, Gabriella Santoro, involved in drafting
the paper.
As explained in the data collection section, data were gathered from different
sources in order to validate findings through both documentation and triangulation
and to build a coherent justification for assumptions. Finally, conclusions were
evaluated by company representatives.
3 Case Study
3.1 Company Profile
MOMA, created as a non-profit spin-off of CRMPA (Centre for Research in Pure
and Applied Mathematics), was established in 1993 as a limited liability consor-
tium that distinguished itself for its innovative approach in the areas of knowledge
and learning. In 2000, the original consortium was changed to a limited liability
company whose corporate structure included a minor participation of Italian IT
companies, made up mainly of experts from both local universities and interna-
tional companies. Over the years, MOMA encouraged employee-based participa-
tion in the company. Since 2010 furthermore, MOMA has changed to a joint-stock
company.
Collaborative Learning and Knowledge Management: A Case Study 431

MOMA performs activities in industrialisation and marketing of products and
advanced services in the ICT industry with a particular focus on the knowledge and
learning as well as that of the collaboration sector. More precisely, with reference to
the NACE code used for European industry classification (EUROSTAT), MOMA
ranks 72.19 for other research and experimental development on natural sciences
and engineering and 62.0 for computer programming, consultancy and related
activities. MOMA leverages the combination of ‘strength of technological know-
how and absolute focus on offering personalised services’. Its approach is based on
knowledge orientation with the objective of utilising information and communi-
cation technology to create knowledge as opposed to the simple acquisition of
information. MOMA also sustains specific learning models to improve effective-
ness and efficiency in learning processes and knowledge management (Aziz and
Poorsartep 2010; Vequist 2008).
The search for excellence and the awareness of competition based on ideas,
know-how and expertise are summed up in the company’s corporate vision: ‘Models,
techniques and system environments based on semantics and knowledge represent
the decisive competitive factor for production systems and are the keystones for
modern companies to respond to complex challenges’. Through technology, MOMA
facilitates organisational and production renewal processes that allow businesses
to differentiate themselves and become leaders in their markets. Starting from the
definition of e-learning solutions, in the educational field (schools and universities)
based on explicit knowledge representation, MOMA has expanded its vision by
developing learning and knowledge solutions in the corporate field through innova-
tive technologies (Schmidt and Kunzmann 2007) in order to represent and manage
the whole knowledge cycle as well as the business process, with reference to both
knowledge repository and management and human resource management for
activities and projects. Consequently, the company is committed to the develop-
ment of information technology systems capable of responding to the growing
needs of collaboration, communication and economic factors in knowledge.
3.2 The ‘Pole of Excellence on Knowledge’
MOMA is the main actor of the ‘Pole of Excellence on Knowledge’. In this network,
university departments, research centres and firms are focused on providing inno-
vation through collaborative and knowledge-sharing processes based on a suitable
division of roles along the value chain.
More precisely, the experience stems from the Department of Information
Engineering and Applied Mathematics (DIIMA) at the University of Salerno,
thanks to a team of young graduates, technicians and researchers, interested in
the ICT innovation technologies, and headed by Professor Saverio Salerno, the
group’s acknowledged leader. After a preliminary but encouraging phase for R&D
activities, not fully exploited due to complex university bureaucracy in the 1990s,
the team and its leader created the Centre of Research on Pure and Applied
432 G. Monetta et al.

Mathematics (CRMPA) as a non-profit research centre. It conducts activities in the
ICT sector and sets up various collaborations with industrial R&D groups –
including those at an international level – contaminating the process with industrial
and market visions Gaeta and Piscopo (2011). Currently, CRMPA has a structure
based on a network of young professionals, also expert in fields other than ICT.
Intense participation in European community-funded projects entails exchange of
experiences and work with European companies. Key persons with sensitive and
systematic awareness of external relationship dynamics coordinate the project
teams and the professionals.
In 2000, a CRMPA spin-off created Mo.M.A. (Mathematical Models and
Applications), now known as MOMA, a firm which is dedicated to the industria-
lisation, production and marketing of innovative solutions for e-learning and
knowledge platform. Three years later, from a project developed by DIIMA (now
DIEII – Department of Electronic Engineering and Information Engineering),
in collaboration with CRMPA and MOMA and financed by the Italian Ministry
of University and Research, the Centre of Excellence on Methods and Systems
for Competitive Enterprises (CEMSAC) was set up. Through ICT application,
it defines processes and products, electronic systems, methods and technologies
for knowledge and learning. As a consortium non-profit organisation, it manages
R&D programmes and technological innovation in order to promote collaboration
between the scientific world and the economic context. In addition, CEMSAC
promotes entrepreneurial initiatives to increase corporate competitiveness, growth
and development in the local territory. The latest addition to the Pole is MIA
(Methodologies Investment Applications). Started in 2007 as a limited liability
company, it focuses on methodological and operational aspects for the social Web.
The company’s overall offer is enriched by business issues regarding Enterprise 2.0
for the management of informal knowledge and on personal productivity PWLE
(Personal Learning Environments Working). The MIA business strategy is based on
the creation of ‘ad hoc’ solutions and the use of techniques of data mining and
knowledge discovery, guaranteed by the active collaboration of experts with a high
scientific and technological level of expertise.
Both MIA and MOMA are responsible for production and marketing of the
products created and designed by the Pole. Depending on the type of output, either
one or both firms (alternately or jointly) deal with the production and marketing of
products developed. In short, through the integration of different actors (university
departments, research centres, consortia and firms), the ‘Pole of Excellence on
Knowledge’ covers the entire chain of innovation from basic research to industrial
research and from pre-competitive development at the industrial level to commer-
cialisation of products. Each actor provides specific contributions of skill and
expertise along the value system (Porter 1985) of knowledge production (Fig. 1).
The Pole’s value system is enhanced by Italian and international partnerships
with other scientific organisations, research centres and university departments, as
well as large Italian firms. In a relational vision (Normann and Ramirez 1995),
the Pole promotes, transfers and shares knowledge and technology that are trans-
ferred in processes and products (Hakansson and Snehota 1989). Thus, partners
Collaborative Learning and Knowledge Management: A Case Study 433

with common goals and converging interests share skills and competencies on the
basis of a learning network logic (Thorelli 1986; Jarillo 1988). In particular,
the network’s main areas of ICT-based expertise are learning and knowledge
technologies, networks, future Internet and security.
With respect to the ‘Learning and Knowledge Technology’, the focus is
mainly on exploiting state-of-the-art knowledge technologies (e.g. natural language
processing, computational intelligence, machine learning, ontologies) in order to
support technology-enhanced learning scenarios including personalised learning,
collaborative learning, competency-driven learning, workplace learning, simulation-
based learning, talent management, organisational learning, knowledge management,
human resource management and so on. In the last year, new specific competences
have been developed in the Pole, regarding knowledge extraction, knowledge
alignment and ontology matching/merging.
According to the ‘network’ area, the focus is mainly on studying and defining
solutions based on fluid dynamic models to optimise speed and travel time, supply-
chain strategic design, flows optimisation, production planning and optimisation
of package routing policy, the optimisation of traffic coefficients and service quality
studies.
In the ‘future Internet’ area, the focus is mainly on studying the semantic Web,
social Web, cloud computing and Internet services technologies in order to define
new smart applications for virtual organisations and extended enterprise manage-
ment, enterprise-class social networks, service annotation, discovery and interoper-
ability, etc.
In the ‘security’ competence area, the focus is on image analysis methods,
tools and technologies to optimise common security processes (area supervision,
profiling, automatic identification and recognition), methods and models for data
RE
LA
TIO
NA
L M
AR
KE
TIN
G
ST
AK
EH
OL
DE
RS
CO
MM
UN
ICA
TIO
N
Joint activity
Support activitiesin common
Primary activities of each actor
QU
ALI
TY
LOG
IST
ICIN
FO
RM
AT
ION
SY
ST
EM
HU
MA
N R
ES
OU
RC
E M
AN
AG
EM
EN
T
AC
CO
UN
TA
BIL
ITY
- R
EP
OR
TIN
G
Design
DIEII
CRMPA
CEMSAC
MOMAand/or MIA
ProductionMarketing
Research
Deployment
Fig. 1 The Pole value system
434 G. Monetta et al.

information fusion of heterogeneous information in multimodal biometry contexts,
techniques and tools finalised to intelligence agencies and scientific investigations,
mathematical and technological methods and methodologies for digital fingerprint
recognition.
3.3 Technological Resources and Human Capital
From the technological point of view, the specific competences claimed by MOMA
can be divided into two groups. The first, mainly focused on Learning and Knowl-
edge Technology and future Internet, has been gradually acquired by exploiting
the collaboration within the Pole in the context of R&D projects. The second is
mainly represented by software engineering, software architecture and software
development platform competences. It has been acquired in several years by means
of blended learning and training activities.
Figure 2 shows the main software technologies (see in particular the techline)that MOMA exploits in order to build IWT (Intelligent Web Teacher), its main
software product, and other prototypes and applications. IWT is a software platform
that meets the needs of information, training and knowledge in various areas of
education, business and professional use. It is used to improve the creation and
sharing of knowledge through collaborative environments, social networking,
communities, integration of computational tools, the simulation of a virtual reality
environment and competency management. It includes several suites (learning,
competency/resource management, enterprise knowledge management and collab-
oration/cooperation management) built on a modular and scalable software archi-
tecture. Its innovative and distinctive elements can be applied in different advanced
technological scenarios.
Fig. 2 The evolution of MOMA technology experience
Collaborative Learning and Knowledge Management: A Case Study 435

Currently, MOMA is defining new software solutions: I-recruitment, for analysing
curricula vitae; I-press, generating personalised press releases; and I-manual, pro-
viding personalised and adaptive manuals. All are complementary to IWT suites.
In the course of its activities, MOMA has developed the following: CWT (collabo-
ration Web tool), a modular system aimed at services for the management of
cooperative work and distributed processes; MoMAM@th, an interactive online
maths workbook; RIPArTI, software for the management of company costs based
on the principles of ABC; ‘TourismOnLine’, a Web portal for the promotion of
tourism; ‘Formamentis’, an interactive forum that allows the daily emulation
of educational activities performed in classrooms by students and teachers; and
‘Banca Dati Lavoro’, a software application where all job opportunities can be
archived and accessed via the Web.
In addition, Fig. 2 shows the importance of the R&D projects for the growth of
competences. In particular, the objective of ARISTOTELE project (VII Framework
Programme of the European Union) is mainly on improving the learning ability and
work training of human resources within firms through the design and development
of models, methodologies, technologies and tools that support the management of
those skills. Already, the LOCOSP project (FAR) has defined a software platform
to support dynamic collaboration among enterprises. Also within the KEEN project
(FAR, a II level masters programme entitled Chief Knowledge Officer) has been
developed to train on the use of information technology that enables sharing and
management of corporate knowledge.
The evolution of technology in MOMA is closely linked to the development of
knowledge and skills in human resources. MOMA learning and training activities
for its employees are embedded in the knowledge and learning management
activities of the Pole (Grieco et al. 2010). Firstly, the formal training courses
are delivered in blended mode by using IWT and internal or external teachers.
Moreover, informal learning is enabled by means of a knowledge management
solution realised on the Microsoft Sharepoint 2010 platform, used to manage and
share documents; to sustain an internal enterprise social network, corporate blogs,
and enterprise wikis; and mainly to provide a PWLE. All these informal tools allow
skilled employees to practise coaching, mentoring and so on. The entire vision of
learning and knowledge management within the Pole relays on the exploitation
of ontologies (Schmidt and Kunzmann 2006; Gruber 1993).
MOMA is characterised by a lean and efficient organisation that is rapidly
expanding and evolving in the market, consisting of approximately 30 employees
and additional collaborators that vary according to specific initiatives. As already
emphasised, the company is supported by key individuals as well as by a system of
external scientific and industrial partnerships. In order to cover the industrialisation
and exploitation phases along the value system (see Fig. 1), MOMA has designed
its organisational structure in four activity areas: marketing and market research,
production, sales and assistance. Corporate governance promotes participation in
company ownership and involvement in decision-making processes of the most
talented employees. In other words, the strong commitment to research and
innovation and the focus on the individual for the valorisation of human resources
allow a constant improvement of the value proposition.
436 G. Monetta et al.

3.4 Market Orientation and Competition
MOMA provides innovative software solutions for the management of advanced
training and knowledge, for critical business processes and for skills management
in the market segments not already provided for by competitors.
MOMA’s strategic business units (Hofer and Schendel 1978; Hax and Majluf
1991) are the following:
Consultancy and service: this unit supports businesses and governments in
specialised and systematic consulting for identification of bids for tender and
funding channels, development of industrial and scientific partnerships, manage-
ment of proposal development and dissemination and enhancement of results.
In addition, it offers turnkey solutions for content technologies and services, higher
education services for courses, master and Ph.D.
Research projects and orders: this unit deals with participation in European, nationaland regional projects, especially in the areas of learning and knowledge technologies.
It is also responsible for customised software solutions developed on work orders.
IWT solutions: this unit deals with personalised knowledge-based systems, solutions
for learning, competency management, enterprise KM and collaboration tools.
Prototypes and applications: in this unit, activities based on collaboration and
defined solutions oriented at e-Science are carried out.
MOMA addresses a variety of broad and different targets, from complex
organisations to individual operators. More precisely, MOMA’s customer portfolio
is divided into the following segments:
– Education (25%): government school (national and local), higher education
(universities, business schools, etc.), high schools and students (as end users)
– Corporate (60%): system integrators, companies and SMEs
– Government (15%): articulated in European, national and local geographical
levels
From a competitive analysis, the market is characterised by the presence of big
ICT players that are established in the most common business segments of man-
agement software production (such as ERP, CRM, etc.) and by specialised players
in the niche segment for knowledge management systems (content and document
management) and data mining. The solutions offered by the latter are more or
less sophisticated but are not based on mathematical models for complex systems.
The comparative analysis carried out by MOMA, in the application of knowledge
and management systems, learning systems, social Web in the workplace systems,
human capital management and in innovation factory systems shows a relevant
competitive advantage based on the use of a semantic approach as well as compu-
tational intelligence and user profiling techniques. Other distinctive elements are a
modular and flexible offer, based on high customisation; rapid product develop-
ment, thanks to participation in the Pole; competitive prices and high investments
in R&D; and anticipation of market needs.
Collaborative Learning and Knowledge Management: A Case Study 437

3.5 Value Proposition
The success of MOMA’s outputs is a market-oriented development process and
the company’s resources (technological and human). MOMA combines service
innovation synergies with existing resources (human capital, technological resources,
relational vision). MOMA makes extensive use of ‘soft’ organisational mechanisms
and proficiency in the development process between the requirements of the new
service and sufficiency of knowledge and marketing resources. Furthermore, the
synergy is the result of established partnership with its clients and other stakeholders
(employees, suppliers, research entities, industrial and commercial partners).
The value proposition of MOMA is enhanced by the following:
– Integrated behaviour: the firm guides clients and partners towards coordinated
and dynamic management that involves all actors in the Pole.
– Sharing of information: the firm has developed flexible tools for collaborative
knowledge management that responds quickly to unexpected variations in busi-
ness situations; by exploiting the quality and speed of the information exchange,
they can achieve optimum results thanks to their use of modern technology.
– Integration of processes: from basic research to industrial development of
products along the value system of knowledge, this integration is achieved by
process teams. The transition to a process management logic has underlined how
there needs to be stronger links between management and the creation of value
for clients.
– Partnership: strong alliances with system integrators and IT companies (Italdata,
Fastweb, etc.) are based on a win-win logic. In this way, activities can be carried
out in a coordinated fashion, creating business relationships that can produce
higher earnings than if activities were all carried out separately.
– Cooperation: by establishing relationships with clients for the management
of specific and high additional value activities. In order to promote flexible
responses, MOMA implements integrating mechanisms to approve clients’
special requests, define focus teams dedicated to particular clients and tackle
unexpected events and changes in demand.
3.6 Business Performance
In recent years, MOMA’s business offerings in products and services in the ICT
sector recorded a growth rate of 20–25% per year, which reached objectives in 2010
for an overall production value of approximately 2,227,077 € (Fig. 3).
In terms of economic success, the attractiveness of the marketplace and the
company’s ability to launch services that meet customer needs are important
determinants. Paradoxically, these positive economic results were achieved despite
the extremely negative economic conditions both at national and international level
and confirmed the strength and positive trend recorded by MOMA in recent years.
438 G. Monetta et al.

Also the main economic and financial indicators in the 2010 (ROI: 1.41%; ROE:
53.74%; ROS: 5.1%) remain positive.
Positive results are recorded not only from an economic and financial point of
view but also at a relational level. Over the last 3 years, MOMA has doubled its
relationships with its various stakeholders (Table 1).
Table 1 highlights both a positive or negative trend in strictly quantitative terms.
From a qualitative point of view, the trend is positive overall for all stakeholder
categories (Freeman 1984). Despite the reduced number of clients, relationships
with some of them have been consolidated. This is confirmed by the significant
increase of production value in the last year (see Fig. 3). Furthermore, in qualitative
terms, partnerships have also developed if we consider the opportunities arising
from the collaboration in R&D projects and commercial activities. A case in point
concerns the synergistic and virtuous collaboration with Publicis Healthware Ltd.,
for e-training of medical staff in European countries; Poste Italiane group, to
develop components and tools for team building management; FIAT group, for
sharing tacit and explicit knowledge within the company and its clients; FORMEZ
and other local governments, to improve the learning ability and training of their
employees.
4 Conclusions
This chapter presents a case study of an original innovative business model where
high tech meets research centre. A formula to guarantee innovation and the evolution
of products and services offered with respect to any competitor, MOMA offers
reliable, useful, up-to-date technology solutions through which timely knowledge
0
500
1000
1500
2000
2500Thousands
Euro
2008 2009 2010
Year
Investments
Fig. 3 Business growth
Table 1 Relational turnover 2008 (%) 2009 (%) 2010 (%)
Employees +20 0 +12
Suppliers �0.07 100 �0.03
Clients �30 +35 �30
Partnerships +33 +100 +130
Collaborative Learning and Knowledge Management: A Case Study 439

not only can be created and shared internally, but also externally (e.g. among
business partners). It develops models, methods and innovative technologies to
support the acquisition, elaboration and information and knowledge sharing by the
use of emergent social software platforms within companies or between companies
and their customers or partners. MOMA possesses specialised and highly distinc-
tive competences in the fields of mathematical models and knowledge-based
applications and for the creation of new business and organisation models. These
competences, united and opportunely integrated with those of the other actors of
the ‘Pole of Excellence on Knowledge’, are of prime importance, differentiating
MOMA from its competitors.
This chapter demonstrates how the vision of MOMA has evolved over time.
Starting from the definition of e-learning solutions, in the educational field (schools
and universities), based on explicit knowledge representation, MOMA has expanded
its vision by developing learning and knowledge solutions in the corporate field
through paradigms such as Enterprise 2.0 and innovative technologies such as
semantic Web and computational intelligence.
5 Managerial and Research Implications
The following research and managerial implications from the case study analysed
can be drawn. The case study could be used as an example of successful manage-
ment of knowledge innovation. As such, more than a point of arrival, these findings
represent a starting point, that is, the basis for further investigation modalities and
perspectives. However, the field research suffers from the limit of having consid-
ered only one case study, and should be replicated to verify the findings.
In addition, the study might be useful to enable knowledge management to
identify factors that will drive collaborations, alliances and networks; online social
networks and Enterprise 2.0. Managers can identify key processes and consider the
possible contributions, with reference to both human resource management and
knowledge repository.
References
Aziz KA, Poorsartep M (2010) Inter-organisational collaborative knowledge management (CKM):
a conceptual model. Int J Bus Excell 3(1):19–37
Bryman A, Bell E (2007) Business research methods. Oxford University Press, New York
Eisenhardt KM (1989) Building theories from case study research. Acad Manage Rev 14(4):
532–550
Freeman RE (1984) Strategic management: a stakeholder approach. Pitman, Boston
Gaeta M, Piscopo R (2011) A case of successful technology transfer in southern Italy, in the ICT:
the pole of excellence in learning and knowledge. In: D’Atri A et al (eds) Information
technology and innovation trends in organizations. Springer, Berlin/Heidelberg, pp 302–309
440 G. Monetta et al.

Grieco C, Mangione GR, Orciuoli F, Pierri A (2010) An innovative approach to improve the
performances of the research community. In: ICALT conference, Sousse, Tunisia, pp 722–723
Gruber TR (1993) Toward principles for the design of ontologies used for knowledge sharing.
Int J Hum Comput Stud 43:907–928
Hakansson H, Snehota I (1989) No business is an island: the network concept of business strategy.
Scand J Manage 4(3):187–200
Hax AC, Majluf NS (1991) La gestione strategica dell’impresa. ESI, Napoli
Hofer CW, Schendel D (1978) Strategy formulation: analytical concepts. West Publishing,
St. Paul
Jarillo JC (1988) On strategic networks. Strateg Manage J 9(1):31–41
Kvale S (1996) InterViews: an introduction to qualitative research interviewing. Sage Publications,
London
Normann R, Ramirez R (1995) Le strategie interattive di impresa. EtasLibri, Milano
Porter ME (1985) Competitive advantage. The Free Press, New York
Ryan B, Scapens R, Theobald M (2002) Research method and methodology in finance and
accounting. Thomson, London
Saunders M, Lewis P, Thornhill A (2003) Research methods for business student, 3rd edn. Prentice
Hall, London
Schmidt A, Kunzmann C (2006) Towards a human resource development ontology for combining
competence management and technology-enhanced workplace learning. In: Meersman R,
Tahiri Z, Herero P (eds) On the move to meaningful internet systems 2006. OTM 2006
workshops. Springer, Berlin/Heidelberg, pp 1078–1087
Schmidt A, Kunzmann C (2007) Sustainable competency-oriented human resource development
with ontology-based competency catalogs. In: Cunningham, Cunningham (eds) e challenges
07, Den Haag. http://publications.professional-learning.eu/schmidt_kunzmann_sustainable-
competence-management_eChallenges07.pdf
Silverman D (2001) Interpreting qualitative data. Sage, London
Thorelli HB (1986) Networks: between markets and hierarchies. Strateg Manage J 7(1):37–51
Vequist DG (2008) Collaborative knowledge management (CKM) and enterprise knowledge
management. In: Cartelli A, Palma M (eds) Encyclopedia of information communication
technology (ICT), vol 1. Idea Group Inc (IGI), Herschey, pp 87–94
Yin RK (1994) Case Study Research, 2nd edn. Sage Publications, London
Collaborative Learning and Knowledge Management: A Case Study 441

A Descriptive Analysis of Intellectual Capital
Concept Implementation Within Slovak
Companies
Ján Papula and Jana Volná
1 Intellectual Capital Model as a Measurement System
for Knowledge Management
In the 1950s, Maslow and Herzberg argued in their management theories that
the single individual’s personal motivation plays a crucial role in realizing their
activity. Human capital of a company was thus understood as a place, where the
value was created through knowledge. Because knowledge was in human indivi-
duals and it could not be created without people, the aim of the company was to
develop and manage those people. Human capital became the center of knowledge
management while the distribution of knowledge among organization’s employees
was considered as its main activity (Mouritsen and Larsen 2005).
The evolution of knowledge management has later completed the human capital
representing the knowledge source of the company as the object of knowledge man-
agement with other components of intellectual capital, namely, with organizational
and relational capital (relational capital including the customer relationship). The idea
is that in reality, it is not possible to separate employees from the company’s internal
and external relations. Individual items of knowledge are always oriented toward
something outside the person, and therefore, the object of knowledgemanagement has
been broadened to all parts of intellectual capital (Mouritsen and Larsen 2005).
At these times, intellectual capital of a company can be understood as the value-
adding element of knowledge management of that company. It is value adding in a
sense that it brings a numerical value to knowledge management activities through
usage of so called intellectual capital indicators that can bemeasured. It is important to
note that measurable objects are easier to evaluate and manage. Both knowledge
management and intellectual capital tend tomanage knowledge assets toward creating
J. Papula (*) • J. Volná
Faculty of Management, Comenius University, Odbojárov 10,
820 05 Bratislava, Slovakia
e-mail: [email protected]; [email protected]
Department of Management Studies, Indian Institute of Science, Bangalore,
Driving the Economy through Innovation and Entrepreneurship,DOI 10.1007/978-81-322-0746-7_36, # Springer India 2013
443

values for better achieving of strategic goals of organization. While knowledge
management brings theoretical and practical framework of setting and realizing know-
ledge initiatives throughout all of defined areas of internal and external environment,
intellectual capital on the other hand gives the structure needed for proper evaluation
and visualization of indicators which will be used for measurement of knowledge
management initiatives and gained results (Fig. 1).
In the complex assessment of knowledge management, there is appropriate to use
the model of intellectual capital, which evaluates the structure of knowledge assets
from the point of view of value creation. The essence of intellectual capital is the value
creation that can be understood as a complex of intangible property, knowledge, skills,
processes, and applied experience and technologies used in organizations to ensure a
competitive advantage on the market. Intellectual capital measures knowledge inten-
sity and knowledge performance through clearly defined structured indicators.
There are several views at the breakdown structure of intellectual capital model
presented in literature, usually consisting of three main components: human capital,
internal (structural or organizational) capital, and external (relationship) capital inclu-
ding customer relationship component. As human and organizational capital both
contain knowledge oriented toward something inside the organization, the relational
capital contains knowledge items oriented outside the company. To define every com-
ponent of intellectual capital independently, human capital can be described as
combinations of knowledge, skills, innovativeness, and ability of the company’s indi-
vidual employees (Edvinsson andMalone 1997). The human capital cannot be owned,
it can only be rented (Edvinsson 1997). The structural capital consists of internal
structure, which includes patents, concepts, models, computer, and administrative
systems. Popular is defining the structural capital as knowledge that does not go home
at night (Stewart 1998) or what’s left behind when the staff went home (Edvinsson
1997). The third category of intellectual capital resources comprises external struc-
ture, customer capital, and market assets, which are basically about relations with
customers (Bukh et al. 2001).
Fig. 1 Intellectual capital as a measurement system for knowledge management
444 J. Papula and J. Volná

2 Research Methodology
The aim of our research is to discover the usage of the intellectual capital concept
within Slovak companies. For the research, we have used the breakdown structure
of intellectual capital as used in majority of literature independently with the
customer capital (not as a part of relational capital); also four different intellectual
capital dimensions were defined: the human capital, the organizational capital,
the relational capital except customer relationship element, and independently the
customer capital.
The sample consists of 29 randomly selected Slovak companies, which were
interviewed face-to-face regarding their opinion about the importance of different
areas of knowledge management and their usage of individual intellectual capital
indicators. Interviews were conducted during April and May 2011 with company
owners, company directors, financial directors, or financial controllers. As already
outlined, our interview consists of two different parts. In the first part, companies
have been interviewed about their opinion about importance of different areas of
knowledge management, what is shown in Table 1. It was possible to allocate one
of four different answers to individual questioned areas:
1. The specific area has for the company almost no importance.
2. Weak to medium importance.
3. Medium till strong importance.
4. Very strong importance.
Second part of interview contains questions regarding the usage of different
intellectual capital indicators by interviewed companies. Indicators were grouped to
four different areas, according to used breakdown structure of intellectual capital.
Table 2 shows questions of the second part of interview. The extent of involvement
in evaluating of intellectual capital indicators by interviewed companies was
measured by giving the interviewees four different possibilities to answer:
1. We do not measure/evaluate the specific area/indicator.
2. We evaluate on minimal basis.
3. We partially evaluate.
4. We definitely evaluate.
We have also asked interviewees if they understood and evaluated the term
intellectual capital, but we have decided not to report this question in our paper. We
have understood that the term and the concept of intellectual capital as we described
earlier in this paper is almost absolutely unknown within managers in Slovakia, and
even if they answered that they knew the term of intellectual capital, they did not
mean the concept as described in our paper.We therefore do not consider this research
question and its results as unbiased and applicable for our research. Evaluating given
conditions, we think our research, thanks to given questions about usage of specific
A Descriptive Analysis of Intellectual Capital Concept Implementation. . . 445

intellectual capital indicators, reviews conscious and as well unconscious usage of
intellectual capital concept within Slovak companies because companies may not
understand the correct meaning of the term intellectual capital, but they can use
specific intellectual capital indicators to evaluate different parts of their business
without knowing that they manage the intellectual capital of company.
To allocate percentage values for given answers, we have used following
methodology:
1. 1% for answers “with almost no importance” in first part of interview and “we do
not measure/evaluate the specific area/indicators” in second part of interview
Table 1 Questions 1–8 of the interview
From the vision and strategy point of view of your company, what importance do you accredit
to the following areas?
1. Brand and company image building
2. Relationships to external subjects
3. Quality of human resources
4. Knowledge (knowledge management)
5. Process of continual improvement
6. Optimization of processes
7. Innovations
8. Informatization and technologies
Table 2 Questions 9–33 of the interview
To what extent does your company evaluate
the following indicators from customer
dimension?
To what extent does your company evaluate
the following indicators from organizational
dimension?
9. Market share
10. Customer satisfaction
11. The perception company’s image by
customers
12. Penetration index
13. Profitability of customers
14. Loyalty of customers
15. Expenditures on marketing and external
communication
22. Innovation activity (on product, resp.
organization as a complex level)
23. Process changes (optimizational,
innovational)
24. % of sales invested into research and
development
25. Whole productivity
26. Company image perceived by
employees
To what extent does your company evaluate
following indicators from relational
dimension?
To what extent does your company evaluate
following indicators from human resources
dimension?
16. Partnerships building
17. Number and fruitfulness of cooperation
(common projects) with partners
18. Care of business partners
19. Cooperation with schools and universities
20. Value of goodwill
21. Knowledge chain extensiveness
27. Employee satisfaction with management
(management style)
28. Average age of management and
employees
29. Educational degree of employees
30. Total no. of hired people during the year
31. Employee abilities development
32. % of sales invested into training and
development
33. Employee satisfaction with job description
446 J. Papula and J. Volná

2. 35% for answers “weak to medium importance” in first part of interview and
“we evaluate on minimal basis” in second part of interview
3. 65% for answers “medium till strong importance” in first part of interview and
“we partially evaluate” in second part of interview
4. 99% for answers “very strong importance” in first part of interview and “we
definitely evaluate” in second part of interview
3 Results
As a result of our research, we have acquired an electronic database consisting of
information about answers in the form of following types: 1, 35, 65, and 99% for
every area of importance of individual parts of knowledge management as shown in
Table 1 and for every intellectual capital indicator involvement as in Table 2. Data
collected are presented in this chapter through descriptive statistics and analyzed
based on histograms, bar charts, and statistics summaries such as average, median,
and standard deviation. Figure 2 shows the bar chart reporting average values for
questions 1–8. From the picture, the importance of individual parts of knowledge
management for companies in Slovakia can be analyzed. As can be seen, Slovak
companies pointed “brand and company building” as the most important area.
Other areas with importance are “quality of human resources,” “process of contin-
ual improvement,” and “relationship to external subjects.” “Informatization and
technologies” on the other hand was evaluated as the area of knowledge manage-
ment with lowest importance for managers in Slovakia.
Figures 3 and 4 present histograms for questions 9 till 33 divided into defined
intellectual capital dimensions: customer and relational dimension (Fig. 3) and
organizational and human resources dimension (Fig. 4). Histograms, together
1. Brand and company image building
2. Relationships to external subjects
3. Quality of human resources
4. Knowledge (knowledge management)
5. Process of continual improvement
6. Optimalisation of processes
7. Innovations
8. Informatisation
0 10 20 30 40 50 60 70 80 90 100
Fig. 2 Bar chart of average values for answers of questions 1–8
A Descriptive Analysis of Intellectual Capital Concept Implementation. . . 447

with statistical summaries such as average, median, and standard deviation
presented in Tables 3, 4, 5, and 6, give adequate base for evaluating the results.
Absolutely most monitored area of intellectual capital by managers in Slovak
companies is the customer relation’s area with average value 70.2% and median
65%. From the customer relation’s area, it is important to underline the specific
indicator of customer satisfaction evaluation (labelled in text as 10. Customer
satisfaction), which has attained the highest average value of 86.2% and the lowest
standard deviation value of 18.7%. This fact can be interpreted as that the
companies in Slovakia primarily focus on and evaluate the indicator of customer
satisfaction (the highest achieved average) and that this specific indicator can be
Fig. 3 Histograms for customer dimension of intellectual capital evaluation by companies:
answers of questions 9–15 (left) and for relational dimension of intellectual capital evaluation:
questions 16–21 (right)
Fig. 4 Histograms for organizational dimension of intellectual capital evaluation by companies:
answers of questions 22–26 (left) and human resources dimension of intellectual capital evalua-
tion: questions 27–33 (right)
Table 3 Statistical summaries for interviewed indicators of customer dimension of intellectual
capital
Intellectual capital indicator Average Median Standard deviation
9–15. Customer dimension 70.2 65 28.1
9. Market share 77.4 99 27.9
10. Customer satisfaction 86.2 99 18.7
11. The perception of company’s image by customers 79.5 99 25.6
12. Penetration index 39.2 35 33.5
13. Profitability of customers 63.8 65 33.5
14. Loyalty of customers 71.7 65 27.5
15. Expenditures on marketing and external
communication
73.9 65 29.7
448 J. Papula and J. Volná

considered as well as the most stable from all indicators monitored (the lowest
standard deviation). Human resources area and organizational area have resulted
with average value between 56 and 59% and median 65%. The least controlled
dimension by Slovak managers with average value of 51.1% and median 50% is the
relational dimension.
4 Discussion and Conclusion
Although the topic of knowledge management and management of intellectual
capital is among Slovak enterprises still new and not established, conducted survey
has pointed out some facts regarding existing situation.
Table 5 Statistical summaries for interviewed indicators of organizational resources dimension
of intellectual capital
Intellectual capital indicator Average Median Standard deviation
22–26. Organizational dimension 56.4 65 32.3
22. Innovation activity 61.4 65 32.1
23. Process changes 49.1 65 33.0
24. % of sales invested into research and
development
35.8 35 34.5
25. Whole productivity 79.6 99 32.3
26. Company image perceived by employees 55.8 65 30.0
Table 6 Statistical summaries for interviewed indicators of human resources dimension of
intellectual capital
Intellectual capital indicator Average Median Standard deviation
27–33. Human resources dimension 59.0 65 32.3
27. Employee satisfaction with management 66.9 65 26.8
28. Average age of management and employees 43.6 35 36.8
29. Educational degree of employees 66.0 65 33.7
30. Total no. of hired people during year 55.2 65 40.0
31. Employee abilities development 74.9 65 28.9
32. % of sales invested into training and development 43.9 35 36.9
33. Employee satisfaction with job description 62.2 65 23.4
Table 4 Statistical summaries for interviewed indicators of relational dimension of intellectual
capital without the customer relation’s component
Intellectual capital indicator Average Median Standard deviation
16–21. Relational dimension 51.1 50 31.1
16. Partnerships building 67.1 65 34.2
17. Number and fruitfulness of cooperation with
partners
57.0 65 33.4
18. Care of business partners 74.8 65 24.6
19. Cooperation with schools and universities 26.9 1 32.8
20. Value of goodwill 40.2 35 33.8
21. Knowledge chain extensiveness 40.4 35 27.5
A Descriptive Analysis of Intellectual Capital Concept Implementation. . . 449

First of all, managers of enterprises do perceive the role and the importance of
resources for fulfilling the strategy of their company and at the same time they are
aware of the benefits of long-term targeted investments in areas falling within
intellectual capital. In terms of competitiveness, they correctly identify the impor-
tance of human resources, processes, and corporate image. But further investiga-tion has revealed that while organizations are aware of the importance and benefits
of resources related to intellectual capital, the proper indicators which testify these
resources are not measured or evaluated by them. Taking into consideration the fact
that it is difficult to manage objects without the possibility to measure them, or in
other words, managers cannot manage what they do not measure, the question is
how the organization can fulfill its strategy through intellectual capital resources if
they are not measured properly.
In the meaning of the performance management systems, to achieve the objectives
of various dimensions of intellectual capital, it is necessary to clearly define all
parameters that determine the performance of a given dimension. Through these
indicators, it is possible to assess the company’s success in increasing the intellectual
capital as a source for the development of sustainable competitive advantage and
to provide feedback that is crucial for progress and continuous improvement of a
company.
The results of our research show that there is a discrepancy between what Slovak
companies consider as important for the implementation of the strategy and what is
actually measured and evaluated by them. More than 80% of companies consider
the area of continual improvement and about 70% consider the area of optimali-zation processes as important. At the same time, only 49% of companies evaluate
the indicators of process changes, and only 61% of companies evaluate the indi-
cators of innovation activities. Just over 80% of companies consider the area of
external relationships as an important area, but the indicators which assess thebuilding partnerships are evaluated by only 67% of them, and indicators evaluating
the number and fruitfulness of cooperation with partners is evaluated by only 57%
of companies, and the indicators of knowledge chain extensiveness are evaluated
by only 40% of companies. The median of all evaluated indicators in relationaldimension is only at 50% level. Finally, the area of quality of human resources isconsidered as important by about 85% of companies, but only 43.9% of these
companies evaluate the percentage of sales invested into training and development.The second finding from our research is the fact that companies are more focused
on indicators presenting outcomes of activities already executed, let us call them
outcome indicators, and that companies less track the indicators that measure
today’s activities with outcomes coming in the future, let us call them predictive
indicators. According to this research, Slovak companies most evaluate the follow-
ing indicators: customer satisfaction, the perception of company’s image to custo-mers, whole market share, and productivity. These all are outcome indicators which
present outcomes of already realized activities. On the other hand, the least
evaluated indicators by Slovak companies are percentage of sales invested intoresearch and development, cooperation with schools and universities, knowledgechain extensiveness, and percentage of sales invested into training and develop-ment, all predictive indicators.
450 J. Papula and J. Volná

As a conclusion we recommend to Slovak organizations to ensure that their
intellectual capital performance management model meets following criteria:
(a) The model includes assessment of both outcome indicators and predictive
indicators. Outcome indicators tell the company about the results and allow
the measurement of final effects. Predictive indicators tell companies about the
bases, respectively about causes to the results.
(b) The model should respect the cause and effects principle.
(c) The model contains the indicators form all four dimensions of intellectual capital
(human capital, organizational capital, relational capital, customer’s relations
capital).
We understand that the limitation of this research is that it examines a relatively
small number of companies. This analysis is therefore a preliminary step toward a
much more detailed research on intellectual capital management among Slovak
companies. We also suggest accomplishing a correlation analysis between matching
areas of first part and second part of interview, also between the importance of
individual areas of knowledge management and matching indicators followed up
by companies to receive answers important for understanding the situation more
precisely.
Acknowledgement This chapter has been funded by project VEGA 1/0920/11.
References
Bukh PH, Larsen HT, Mouritsen J (2001) Constructing intellectual capital statements. Scand J
Manage 17:87–108
Edvinsson L (1997) Developing intellectual capital at Skandia. Long Range Plann 30(3):366–373
Edvinsson L, Malone MS (1997) Intellectual capital. The proven way to establish your company‘s
real value by measuring its hidden brainpower. Harper Business, London
Mouritsen J, Larsen LT (2005) The 2nd wave of knowledge management: the management control
of knowledge resources through intellectual capital information. Manage Account Res
16:371–394
Stewart T (1998) Intellectual capital. Nicholas Brealey Publishing, London
A Descriptive Analysis of Intellectual Capital Concept Implementation. . . 451

Two Perspectives on Intellectual Capital
and Innovation in Teams: Collective Intelligence
and Cognitive Diversity
Ishani Aggarwal and Anita Woolley
1 Introduction
Creativity and innovation are becoming increasingly important for organizational
effectiveness (Woodman et al. 1993; Kaplan et al. 2009). The importance of organi-
zational teams for enhancing and maintaining an organization’s creative potential and
innovative performance is widely recognized (Rietzschel et al. 2009). Teams have
creative potential because they draw together individuals with diverse backgrounds
and perspectives toward a shared creative purpose (e.g., Bantel and Jackson 1989).
Unlike tasks with a single correct answer, developing creative ideas often means
addressing ambiguous problems that necessitate the divergent perspectives and
cross-fertilization of ideas that teams are expected to provide (Kaplan et al. 2009).
However, if innovation implicated generation of ideas alone, then teams would have
much more creative potential than individuals given the increased availability of
resources provided by diverse perspectives. But because it is a multifaceted, multi-
stage phenomenon (Rietzschel et al. 2009), and involves both divergent and conver-
gent processes (Levine and Moreland 2004), it is important to understand the
implications of using teams through the cycle of the creative process.
In the following sections, we will discuss two properties of the team related to
the teams’ intellectual capital, i.e., collective intelligence and cognitive style
diversity, which can contribute toward our understanding of the teams’ potential
to innovate. Borrowing from these two perspectives, we will generate propositions
that will help us predict the conditions under which teams will have the greatest
potential to innovate.
I. Aggarwal (*) • A. Woolley
Tepper School of Business, Carnegie Mellon University, 5000 Forbes Avenue, Pittsburgh,
PA 15213, USA
e-mail: [email protected]; [email protected]
Department of Management Studies, Indian Institute of Science, Bangalore,
Driving the Economy through Innovation and Entrepreneurship,DOI 10.1007/978-81-322-0746-7_37, # Springer India 2013
453

2 Innovation in Teams
Innovation encompasses two stages: the generation of new ideas and their imple-
mentation (H€ulsheger et al. 2009; Amabile 1996; West and Farr 1990; Woodman
et al. 1993). It involves generating a set of novel ideas, i.e., divergent thinking, and
also narrowing this set to one alternative, i.e., convergent thinking (Levine and
Moreland 2004). Farr et al.’s (2003) framework, conceptualizes innovation in four
stages: problem identification, idea generation, idea evaluation, and idea imple-
mentation. This model, like past models (Amabile 1988; Kanter 1988; West 2002)
conceptualizes the innovative process as entailing a series of temporally ordered
stages (Kaplan et al. 2009). In this chapter, we will focus on the idea generation and
idea implementation phases of innovation since the former encapsulates divergent
processes and the latter convergent processes. Studying these two phases will help
us understand the contrasting demands on teams incurred by the two opposing
creative forces.
Both the idea generation and idea implementation phases are important parts of
the creative process. The need for divergent thinking can be seen in terms of the
need to take different perspectives and to generate alternative solutions when faced
with problem-solving or decision-making tasks, whereas the need for convergent
thinking can be seen in a group’s need to evaluate alternatives and choose one to use
or recommend (Milliken et al. 2003). One can imagine an organizational team
generating a brilliant idea that is original and has the potential to give an organiza-
tion extraordinary competitive advantage in the market, but failing to implement it
either because of the idea’s complexity or lack of thoroughness, or team level
factors such as lack of skill, lack of coordination, or inability to forge consensus
about the means to achieve the selected idea (Aggarwal and Woolley 2010).
Similarly, a team can have all processes needed to implement the idea in place
but lack a highly creative or breakthrough idea. Whereas divergent thinking
promotes generation and sharing of as many different ideas as possible, convergent
thinking allows groups to select among the available options and to put these ideas
into practice (West 2000; Milliken et al. 2003).
In the following sections, we will consider the relationship between the teams’
potential to innovate, here conceptualized as their projected ability to generate and
implement ideas, and two distinct team properties: collective intelligence and
cognitive style diversity.
3 Collective Intelligence
The first perspective exploring the relationship between the team’s intellectual
capital and its potential to innovate draws on recent work on collective intelligence
in teams (Woolley et al. 2010). Collective intelligence refers to a patterned regularity
in group interaction that allows us to measure and predict a group’s performance
454 I. Aggarwal and A. Woolley
across a wide array of tasks. It is distinct from characteristics of individual members
in teams. Collective intelligence is theorized as resulting from the availability of
different resources required for different tasks, combined with a collective’s ability to
both utilize the different resources available and integrate them to generate solutions
to novel problems.
Teams that are highly collectively intelligent demonstrate an ability to generate
solutions to multiple problems, which involves processes such as breaking percep-
tual sets, breaking cognitive sets, and trying new problem-solving strategies (Taggar
2002). Also, teams that have the ability to performwell over time across different task
domains demonstrate the ability to utilize their member resources well. This includes
bringing forth the multitude of perspectives, ideas, and opinions that members may
hold (Milliken et al. 2003). Because of this demonstrated ability, collective intelli-
gence should be positively associated with idea generation which relies on divergent
processes.
A lot of dysfunction in groups occurs because they tend to quickly settle into
habitual modes of interaction (Bettenhausen and Murnighan 1991; Gersick 1988;
McGrath and Rotchford 1983); however, it is possible for them to identify and
change dysfunctional patterns of behavior (Gersick and Hackman 1990; Milliken
et al. 2003). Recent research on collective intelligence in human groups
demonstrates that it is an important component in group learning of coordination
(Aggarwal et al. 2011). We expect the enhanced ability of highly collectively
intelligent groups to coordinate over time will also promote idea implementation
as it relies heavily on the convergent processes required by coordination.
Proposition 1: A team’s collective intelligence will have a positive relationship
with the team’s potential to both generate creative ideas and to implement them.
4 Cognitive Style Diversity
Cognitive diversity in the group relates to differences in nonobservable (Milliken
and Martins 1996) or deep-level (Harrison et al. 1998) characteristics of members.
Organizational researchers have suggested that cognitive diversity in the composi-
tion of a group may enhance task-related or cognitive performance, especially
on tasks requiring creativity (Austin 1997; Bantel and Jackson 1989; McLeod
et al. 1996).
We conceptualize cognitive diversity in terms of cognitive styles, which are
psychological dimensions that represent consistency in information acquisition and
processing in individuals (Bartlett 1932; Paivio 1971; Richardson 1977; Ausburn
and Ausburn 1978; Messick 1984). Three cognitive styles that are of particular
interest to us because of their direct relation to functional specialties common in
organizations are verbalizers, spatial visualizers, and object visualizers (Kozhevnikov2007). Verbalizers process information in words, spatial visualizers process informa-
tion in terms of spatial relations among objects, and object visualizers process
Two Perspectives on Intellectual Capital and Innovation in Teams: Collective. . . 455

information in terms of the global size, shape, and color of objects. People with
different cognitive styles are represented in different professions. For example,
scientists are stronger than visual artists in spatial visualization, whereas visual
artists are stronger than scientists in object visualization (Blajenkova et al. 2006;
Kozhevnikov et al. 2005).
4.1 Cognitive Resources
A high level of cognitive diversity is generally associated with a wide range of
perspectives and opinions members bring to the task (Strasser 1992). For creativity
and innovation to occur, teams must first have a variety of resources to draw from and
second, must combine those resources in novel ways (Nijstad and Stroebe 2006).
Cognitive styles provide teams with such cognitive resources. High group creative
potential results from the availability of a broad array of skills, expertise, and
knowledge in the group. The greater the representation of the three different cognitive
styles in the team, the more potential the team has to generate creative ideas and
solutions. Past research has also demonstrated that cognitive resources have a positive
influence on performance in implementation and execution tasks (Aggarwal and
Woolley 2010). Therefore, we expect that increased cognitive resources will give
the team access to different modes of thinking and processing information and higher
potential for the idea generation as well as idea implementation.
4.2 Cognitive Divergence
Most cognitive resources reside within different individuals in a team. And, while
added resources, in terms of a variety of perspectives, skills, and knowledge may be
beneficial to innovation, the differences in members’ perspectives can have different
implications for convergent and divergent processes. For example, these differences
might facilitate the tabling of different perspectives and encourage discussion and
debate that are fruitful for idea generation. However, the positive effects of diver-
gence in behaviors and opinions during the idea generation phase may backfire when
teams turn to the task of implementing ideas (Kaplan et al. 2009). For example, they
may lead to communication and coordination difficulties (Klimoski and Mohammed
1994; Cannon-Bowers et al. 1993; Mathieu et al. 2000; Mathieu et al. 2005; Rentsch
and Klimoski 2001), errors in performance and inability to form consensus about the
best means to execute the solution (Aggarwal and Woolley 2010).
Proposition 2: Cognitive resources in the team will be positively associated with
the team’s potential to generate ideas, especially when coupled with higher cogni-
tive divergence.
456 I. Aggarwal and A. Woolley

Proposition 3: Cognitive resources in the team will be positively associated with
the team’s potential to implement ideas, especially when coupled with lower
cognitive divergence.
Cognitive diversity should also be related to collective intelligence. With added
cognitive resources, team decisions and actions are more likely to encompass the
full range of perspectives. Since collective intelligence captures the patterned
regularity in group interaction and predicts group performance across a wide
array of tasks, we would expect that the team’s cognitive resources will increase
the team’s ability to tackle tasks with multiple demands well and be positively
associated with collective intelligence. Also, based on our previous propositions,
while some amount of cognitive divergence might facilitate idea generation, too
much of it is likely to hurt idea implementation. Given this trade-off, we propose a
nonmonotonic—inverted U shape—relationship between cognitive style diversity
and collective intelligence, such that increase in cognitive divergence will be
positively related with collective intelligence until a certain point, after which the
relationship will become negative.
Proposition 4: Collective intelligence will have a positive relationship with cog-
nitive resources.
Proposition 5: Collective intelligence will have an inverted U-shaped relationship
with cognitive divergence.
5 Discussion
Teams are the locus of creativity and innovation in organizational settings. The
increasing use of teams to generate and implement creative ideas and solutions calls
for a deeper understanding of the team properties that affect different phases of a
team’s creative process. We explore collective intelligence and cognitive diversity
as contributors to intellectual capital in teams, and generate propositions relating
both to the divergent (idea generation) and convergent (idea implementation)
phases of innovation.
Collective intelligence, which refers to a patterned regularity in group interac-
tion that measures a group’s performance across a wide array of tasks, demonstrates
the team’s ability to constantly update its strategy in the face of new challenges and
uncertainty to perform on tasks requiring different knowledge, skills, and processes
for effective outcomes. We expect that this property of the team will be positively
related to the team’s potential for both divergent and convergent processes (Fig. 1).
It has been demonstrated that diversity, the second perspective, is a double-
edged sword (Milliken et al. 2003; Moreland et al. 1996). Although it can increase
the range of knowledge and skills available to the group and stimulate divergent
thinking, it can also inhibit effective communication and decrease interaction.
For these, and related reasons, diversity has the potential to both facilitate and
inhibit innovation in groups (Nijstad et al. 2003; O’Reilly et al. 1998). In order to
Two Perspectives on Intellectual Capital and Innovation in Teams: Collective. . . 457

resolve this paradox, we dissect the different aspects of diversity, i.e., cognitive
resources and cognitive divergence, and generate propositions about their relation-
ship with the two critical phases of innovation (Fig. 1).
Both collective intelligence and cognitive diversity are ways of indexing intel-
lectual capital in teams. We also generate propositions to understand the relation-
ship between the two. Overall, investigating how these team properties affect the
team’s potential to generate and implement ideas will lead to a more comprehensive
understanding of how to use teams effectively to maximize their potential for
innovation in organizations, while minimizing any associated costs.
References
Aggarwal I, Woolley AW (2010) Do you see what i see? The effect of members’ cognitive styles
on team processes and performance. Paper presented at the 70th meeting of the Academy of
Management, Montreal, Canada
Aggarwal I, Woolley AW, Chabris C, Malone T (2011) The relationship between collective
intelligence, cognitive diversity and team learning. Paper presented at the 71st meeting of
the Academy of Management, San Antonio, TX
Amabile TM (1988) A model of creativity and innovation in organizations. In: Staw BM,
Cummings LL (eds) Research in organizational behavior, vol 10. JAI Press, Greenwich,
pp 123–167
Amabile TM (1996) Creativity in context: update to the social psychology of creativity. Westview
Press, Boulder
CognitiveResources
CollectiveIntelligence
Potential forIdea
Implementation
Potential forIdea
Generation
CognitiveDivergence
+
+
+
+
+
-
Fig. 1 The proposed relationship between collective intelligence, cognitive diversity, and poten-
tial for idea generation and implementation
458 I. Aggarwal and A. Woolley

Ausburn LJ, Ausburn FB (1978) Cognitive styles: some information and implications for
instructional design. Educ Commun Technol J 26:337–354
Austin JR (1997) A cognitive framework for understanding demographic influences in groups.
Int J Organ Anal 5(4):342–359
Bantel KA, Jackson SE (1989) Top management and innovation in banking: does the composition
of top team members make a difference? Strateg Manage J 10:107–124
Bartlett FC (1932) Remembering, a study in experimental and social psychology. Cambridge
University Press, Cambridge
Bettenhausen K, Murnighan JK (1985) The emergence of norms in competitive decision-making
groups. Administrative Science Quartely 30(3):350–372
Bettenhausen KL, Murnighan JK (1991) The development of an intragroup norm and the effects of
interpersonal and structural challenges. Adm Sci Q 36(1):20–35
Blajenkova O, Kozhevnikov M, Motes MA (2006) Object-spatial imagery: a new self-report
imagery questionnaire. Appl Cognit Psychol 20:239–263
Cannon-Bowers JA, Salas E, Converse S (1993) Shared mental models in expert team decision
making. In: Castellan NJ Jr (ed) Individual and group decision making: current issues. LEA,
Hillsdale, pp 221–246
Farr JL, Sin HP, Tesluk PE, Shavinina LV (2003) Knowledge management processes and work
group innovation. Elsevier Science, New York
Gersick CJ (1988) Time and transition in work teams: toward a new model of group development.
Acad Manage J 31:9–41
Gersick CJ, Hackman RJ (1990) Habitual routines in task-performing groups. Organ Behav Hum
Decis Process 47:65–97
Harrison D, Price K, Bell M (1998) Beyond relational demography: time and the effects of surface-
and deep-level diversity on work group cohesion. Acad Manage J 41:96–107
H€ulsheger UR, Anderson N, Salgado JF (2009) Team-level predictors of innovation at work:
a meta-analysis spanning three decades of research. J Appl Psychol 94:1128–1145
Kanter RM (1988) Three tiers for innovation research. Commun Res 15:509–523
Kaplan S, Brooks-Shesler L, King EB, Zacaro S (2009) Thinking inside the box: how conformity
promotes creativity and innovation. In: Mannix EA, Neale MA, Goncalo JA (eds) Research on
managing groups and teams, vol 12. Emerald, Bingley, pp 229–266
Klimoski R, Mohammed S (1994) Team mental model: construct or metaphor? J Manage
20:403–437
Kozhevnikov M (2007) Cognitive styles in the context of modern psychology: toward an
integrated framework. Psychol Bull 133:464–481
Kozhevnikov M, Kosslyn SM, Shephard J (2005) Spatial versus object visualizers: a new charac-
terization of visual cognitive style. Mem Cognit 33:710–726
Levine JM, Moreland RL (2004) Collaboration: the social context of theory development. Pers
Soc Psychol Rev 8:164–172
Mathieu JE, Heffner TS, Goodwin GF, Salas E, Cannon-Bowers JA (2000) The influence of shared
mental models on team process and performance. J Appl Psychol 85(2):273–283
Mathieu JE, Heffner TS, Goodwin GF, Cannon-Bowers JA, Salas E (2005) Scaling the quality of
teammates’ mental models: equifinality and normative comparisons. J Organ Behav 26:37–56
McGrath JE, Rotchford NL (1983) Time and behavior in organizations. Res Organ Behav
5:57–101
McLeod PL, Lobel SA, Cox TH (1996) Ethnic diversity & creativity in small groups. Small Group
Res 27:248–264
Messick S (1984) The nature of cognitive styles: problems and promise in educational practice.
Educ Psychol 19:59–74
Milliken F, Martins L (1996) Searching for common threads: understanding the multiple effects of
diversity in organizational groups. Acad Manage Rev 21:402–433
Milliken FJ, Bartel CA, Kurtzberg TR (2003) Diversity and creativity in work groups: a dynamic
perspective on the affective and cognitive processes that link diversity and performance.
Two Perspectives on Intellectual Capital and Innovation in Teams: Collective. . . 459

In: Paulus P, Nijstad B (eds) Group creativity: innovation through collaboration. Oxford
University Press, New York, pp 32–62
Moreland RL, Levine JM, Wingert ML (1996) Creating the ideal group: composition effects at
work. In: Davis J, Witte E (eds) Understanding group behavior, vol 2. Erlbaum, Mahwah,
pp 11–35
Nijstad BA, Stroebe W (2006) How the group affects the mind: a cognitive model of
ideageneration in groups. Pers Soc Psychol Rev 10:186–213
Nijstad BA, Stroebe W, Lodewijkx HFM (2003) Production blocking and idea generation: does
blocking interfere with cognitive processes? J Exp Soc Psychol 39:531–548
O’Reilly CA III, Williams KY, Barsade S (1998) Demography and group performance: does
diversity help? In: Neale MA, Mannix EA, Gruenfeld D (eds) Research on managing groups
and teams, vol 1. JAI Press, Greenwich, pp 183–208
Paivio A (1971) Imagery and verbal processes. Holt, Rinehart & Winston, New York
Rentsch J, Klimoski R (2001) Why do ‘great minds’ think alike? Antecedents of team member
schema agreement. J Organ Behav 22(2):107–120
Richardson A (1977) Verbalizer-visualizer: a cognitive style dimension. J Ment Imag 1:109–126
Rietzschel EF, De Dreu CKW, Nijstad BA (2009) What are we talking about, when we talk about
creativity? Group creativity as a multifaceted, multistage phenomenon. In: Mannix EA, Neale
MA, Goncalo JA (eds) Research on managing groups and teams, vol 12. Emerald, Bingley,
pp 1–28
Strasser G (1992) Information salience and discovery of hidden profiles by decision-making
groups: a “thought experiment”. Organ Behav Hum Decis Process 52:156–181
Taggar S (2002) Individual creativity and group ability to utilize individual creative resources:
a multilevel model. Acad Manage J 45:315–330
West MA (2000) Reflexivity, revolution, and innovation in work teams. Adv Interdiscip Stud
Work Teams 5:1–29
West MA (2002) Sparkling fountains or stagnant ponds: an integrative model of creativity
and innovation implementation in work groups. Appl Psychol Int Rev 51:355–424
West MA, Farr JL (1990) Innovation at work. In: West MA, Farr JL (eds) Innovation and creativity
at work: psychological and organizational strategies. Wiley, Chichester, pp 3–13
Woodman RW, Sawyer JE, Griffin RW (1993) Toward a theory of organizational creativity. Acad
Manage Rev 18:293–321
Woolley AW, Chabris CF, Pentland A, Hashmi N, Malone TW (2010) Evidence for a collective
intelligence factor in the performance of human groups. Science 330:686–688
460 I. Aggarwal and A. Woolley

Effective Utilization of Tacit Knowledge
in Technology Management
Indumathi Anandarajan and K.B. Akhilesh
1 Introduction
Technology is the most visible competence of individuals as it represents the
tools that human beings use to do activities. In the present day, there is increasing
competition in all aspects of life; there is continuous change in customer expec-
tations leading to greater demand for new technologies and innovations. Technol-
ogy can be defined as know-how. Know-how encompasses patents and ancillaries
to the working of product and process technologies (Kotabe et al. 1996). Technol-
ogy is a combination of physical capital and organizational capital resources
(Barney 1991), which firms use to gain sustained competitive advantage.
Technology represents the means while knowledge represents the end of a
process. Technology has both forms of knowledge, i.e., tacit and explicit knowl-
edge. For technology to be successfully transferred to others, there has to be sufficient
learning that organization has to obtain by managing both types of knowledge.
Knowledge management systems need to address both tacit and explicit knowledge
systems of intervention and practice to achieve the desired results. This chapter
attempts to understand the issues of technology management from knowledge man-
agement perspective in technology intensive companies.We in this chapter argue that
organization need to be creative in supporting multiple initiatives to capture and use
tacit knowledge, for the growth and building technology capabilities of the organiza-
tion. We have proposed a model for effectively capturing the tacit knowledge, as well
as suggested appropriate techniques that would help in increasing the acquisition
of tacit knowledge.
Polanyi identified the significance of the concept of tacit knowledge. Polanyi
(1966) encapsulates the essence of tacit knowledge in the phrase “we know
more than we can tell.” Nonaka (1991, p 98) explores the term further: “tacit
I. Anandarajan (*) • K.B. Akhilesh
Department of Management Studies, Indian Institute of Science, Bangalore, India
e-mail: [email protected]; [email protected]
Department of Management Studies, Indian Institute of Science, Bangalore,
Driving the Economy through Innovation and Entrepreneurship,DOI 10.1007/978-81-322-0746-7_38, # Springer India 2013
461

knowledge is highly personal and hard to formalize and, therefore, difficult to
communicate to others.” Tacit knowledge is experiential knowledge. It is linked
to personal perspectives, intuition, emotions, beliefs, know-how, experiences, and
values. It is intangible and not easy to articulate, making it difficult to share with
others (Polanyi 1966; Nonaka and Takeuchi 1995; von Krogh et al. 2000). In
comparison, explicit knowledge has a tangible dimension that can be more easily
captured, codified, and communicated.
Nonaka and Takeuchi (1995) further articulate the distinction between explicit
and tacit knowledge and state that when tacit and explicit knowledge interact,
“knowledge conversion” occurs. They describe the process of creating knowledge
as a spiral and believe that the interaction of tacit and explicit knowledge produces
four modes of knowledge conversion that are interconnected. Nonaka et al. (2000)
have identified the four modes of knowledge conversion; they are socialization
(from tacit to tacit), externalization (from tacit to explicit), combination (from
explicit to explicit), and internalization (from explicit to tacit). These four modes of
knowledge conversion form a spiral, the SECI process. Knowledge created through
this spiral process can trigger a new spiral of knowledge creation, expanding horizon-
tally and vertically across organizations. This interactive spiral process takes place
both intra- and interorganizationally. Tacit knowledge is further considered to
comprise two dimensions; the first is the technical dimension which encompasses
the “know-how,” and the second is the cognitive dimension which consists of
beliefs, ideas, and values which we often take for granted (Nonaka andKonno 1998).
Michael Polanyi (1966) argues that knowledge cannot be completely codified.
“While tacit knowledge can be possessed by itself, explicit knowledge must rely
on being tacitly understood and applied. Hence all knowledge is either tacit or rootedin tacit knowledge. A wholly explicit knowledge is unthinkable.” Technological
knowledge is not as well codified as scientific knowledge. Kuhn’s (1970) analysis
of scientific revolutions shows the importance of tacit knowledge in shaping the
trajectory of scientific knowledge, and tacit knowledge shapes technological dev-
elopment even more powerfully (Nonaka and Takeuchi 1995). Tacit knowledge is
a main resource for new knowledge creation and continuous innovation.
The key characteristic that defines the technology is the fact that it focuses on the
know-how of the organization. One of the major concerns of technology manage-
ment is to transfer the technology, licensing of the technology, and revenues
obtained from them. Today, there are several other aspects of modern technology
development described below.
1.1 Modern Technological Developments
Modern technological development includes technology transfer, open innovation,
technological forecasting, technological licensing, collaboration, risk taking, etc., and
each of these evolved into a very specialized activity of technology management.
Following, we give a few lines on each of this, so tacit knowledge could be integrated
taking into consideration of all of the above-mentioned practices.
462 I. Anandarajan and K.B. Akhilesh

1.1.1 Technology Transfer
Technology transfer has been defined by Charles and Howells (1992) as “the
diffusion of the complex bundle of knowledge which surrounds a level and type of
technology.” Such a wide-ranging definition of technology transfer includes transfers
of information and knowledge at a micro- and macro-level between individuals,
organization, and economies. Ounjian and Carne (1987) state that the most important
dimension in relation to technology transfer is the role of people in initiating and
facilitating transfers of knowledge and technology between organizations and places
through person-to-person communication.
1.1.2 Open Innovation
Chesbrough (2003) coined the notion “open innovation” to signify a new model for
organizing technological innovation in large R&D-intensive companies. According
to this model, “firms can and should use external ideas as well as internal ideas, and
internal and external paths to market, as the firms look to advance their technol-
ogy.” Open innovation is effective and possible with the increasing availability and
mobility of knowledge workers. Dosi (1982, 1988) argues that tacit knowledge is
a key element of the innovative process.
1.1.3 Collaboration
Collaboration today focuses on the knowledge perspectives such as sharing, exchang-
ing, and integrating knowledge to overcome barriers to achieve the research goals
(Carayannis et al. 2000). Owing to knowledge is not restricted to be created only
inside an organization; it can be obtained from outside the organization (McAdam
2000). Sharing of experiences of different partners based on their tacit knowledge
tends to play a crucial role in effective development and implementation of tech-
nology. Collaboration is a process of knowledge transfer. It might take the form of
specific, identifiable skills and technologies (Hamel 1991). It can lead to a number
of tangible and intangible benefits, including the acquisition of specific skills and
competencies, the achievement of interfirm cooperation, or the simple acquisition
of knowledge generally, such as learning how to learn from collaboration itself
(Simonin and Helleloid 1993). Technological knowledge is an intangible asset that
can serve as a source of competitive advantage when it is valuable, not imitable,
and not substitutable (Barney 1991).
1.1.4 Technological Forecasting
Technological forecasting is an exploration of developments in the technology
domain in which the possible applicability is assessed over a longer term (Coates
et al. 2001). Technological forecasting is used in many cases, ranging from vision
Effective Utilization of Tacit Knowledge in Technology Management 463
development on the future to investment decisions with regard to emerging
technologies. Technological forecasting offers a comprehensive view of the tech-
nologies already available of emerging technologies and the way these technologies
influence or substitute each other (Porter et al. 1991). Technology management
helps to understand the future, and so forecasting comes handy to develop road
maps for the future growth and development in the technological aspects.
1.1.5 Technology Licensing
Technology licensing has been historically referred to the transfer of technology for
a fee from a technologically dominant firm to technologically deficient firms
(Kotabe et al. 1996). Traditional literature (Buckley and Casson 1976) posits that
the net profits extracted by the licensor from a licensing transaction are lower for
licensing than for keeping the technology in-house or licensing it to the firm’s own
subsidiaries because transfer and opportunity costs are higher for transferring
technology to other firms. As a result, licensing was expected to be employed
mostly when extracting the remaining value from a mature technology (Telesio
1979). A firm licenses its technology to others for increasing consumer acceptance
of its technology (Dunning 1981).
1.1.6 Risk Taking
Every human endeavor involves risk (Wider and Davis 1998). Risk can be defined as
the chance of an event occurring that is likely to have a negative impact on project
objectives and is measured in terms of likelihood and consequence (Wideman 1992;
Carter et al. 1993; Chapman 1998). Risk taking is an important element of innovation.
Risk can be better assessed through past insights, experiences, and expertise.
The scope of technology management mentioned above is only an illustration,
but it is an evolving and expanding space playing the strategic role in creating new
opportunities for the organization on the one hand and achieving the growth on the
other. Through this chapter, we would like to put forth a model depicting the
existence of tacit knowledge at all spheres and its importance. We also argue in
this chapter that organizations should create multiple initiatives for acquiring tacit
knowledge; there are several techniques that could be adopted by the organization
for increasing and effective utilization of tacit knowledge. Here, we highlight some
of the techniques in relation to our proposed model.
2 Model
Our proposed model is depicted in the Fig. 1 below, where core technology, explicit
knowledge, and people all have their own “tacit” knowledge; we suggest from
this model to bring all of them together to have better technology management.
This tacit knowledge which is present at all levels as shown in the figure needs
464 I. Anandarajan and K.B. Akhilesh

to be transferred from people to explicit knowledge to core technology and vice
versa, which is illustrated below.
The proposed model comprises of technology at the core, with technology
developed by the organization as well as technology borrowed from other R&D’s.
Core technology also comprises both physical and organizational resources.
Explicit knowledge is codified knowledge; it is in the form of procedures,
guidelines, techniques, standards, testing, instruction, software, etc. This comprises
of both explicit knowledge inside the organization which is standards and procedures,
testing, etc., developed “inside” the organization, while explicit knowledge obtained
from “outside” is from outside the organization, i.e., R&D units, partners, etc.,
i.e., who developed a product and stored their instructions, the procedures to operate
in the form of manuals.
People comprises of organizational members working within the organization
and stakeholders as well as the suppliers for the raw materials, the new R&D
developed, and the consumers of the finished technology.
Transferring knowledge from the core technology comprising of “Developed”
and “Borrowed” tacit knowledge in terms of the do’s and don’ts in handling
technology, knowledge required to operate the technology etc. is captured as
explicit knowledge and transferred to people comprising of stake holders, suppliers,
organizational members and customers, and vice versa. The core technology
comprises of both physical and organizational resources, these resources are used
in the making of technology which is again tacit knowledge. Technology is the most
Explicit KnowledgeInside
Technology at the core
Physical Resources
Organizational Resource
“Developed” &“Borrowed”
Explicit KnowledgeOutside
People – Organizational members
People – Stake holders
PEOPLE
PEOPLE
Suppliers
Customers
Fig. 1 Knowledge transfer model from tacit knowledge to technology at the core.# Akhilesh K.
B. & Indumathi Anandarajan, 2012
Effective Utilization of Tacit Knowledge in Technology Management 465

efficient way to capture the tacit knowledge and stored in explicit mode of
knowledge.
Explicit knowledge is captured, recorded, and stored in appropriate fashion, in
terms of standards, procedure’s guidelines, techniques, standards, testing, instruction,
software, etc. The explicit knowledge inside the organization which is standards and
procedures, testing, etc., developed from the tacit knowledge of people who are
working within/“inside” the organization. Explicit knowledge outside is obtained
tacit knowledge from people outside the organization, i.e., R&D units, partners, etc.,
who are experts in the respective field. The explicit knowledge is then transferred
to the people who would in turn come with their own knowledge in the field which
is acquired through experience; all the individuals are encouraged to read and
understand the stored knowledge about the core technology.
People comprise organizational experts who have acquired the knowledge
through trial and error and hence possess lot of experiential tacit knowledge. People
also comprise customers who demand the product on the basis of their needs and
requirements which is formed from their tacit knowledge; it could be the suppliers
who provide the requirements for a particular technology while placing the order,
and it could be the stakeholders as they influence the top management, all these
different people tend to have their respective tacit knowledge in the field which
needs to be effectively managed.
While on the other hand there could also be capture of tacit knowledge and
its transfer the other way around wherein knowledge from people comes first, their
experiences, their knowledge about usage of tools, learnings and experiences
obtained while developing and innovating new technology, etc., can be acquired
and transferred on face-to-face interaction, from people to people and stored in a
manner where this knowledge can be made portable. The portable knowledge is
moved to the next level and is made explicit for all the other individuals to acquire
and utilize it in the future with the help of intranets, groupware, search engines, and
databases. This explicit knowledge is made available to people who are within
the organization as well as to people who are outside the organization and require
such expert tacit knowledge. This explicit knowledge will help to move to the crux
of tacit knowledge to core technology and will help in understanding the core
technology as well as in developing new technology in the future.
This kind of model of understanding tacit knowledge at different levels and
trying to analyze it at a deeper and intense level is a necessity now as previously
organizations were working in silos, where they believed that succession planning
happens within each group and pace of technology development is slow and
systematic. Now we are in opposite scenario where there are shortened technology
life cycles, extremely competitive technology, demand for new technology, usage
and acceptance of different methodologies which are faster and easier, as well as
increased effective use of communication which is becoming cheaper. There is pull
factor from people for acquiring knowledge with the usage of Facebook, Linked in,
and Twitter, so for organization there is a need to see how they can leverage and use
them effectively for capturing tacit knowledge. People use all these tools exten-
sively but do not meet organizational goals; hence, using it effectively and captur-
ing tacit knowledge which is experiential are important. Hence, we suggest
466 I. Anandarajan and K.B. Akhilesh

organizations should get creative and support as well as adopt the newer techniques
for acquiring and increasing tacit knowledge.
3 Techniques for Increasing Tacit Knowledge
The techniques suggested for increasing the tacit knowledge are superimposed on
the suggested model and are hence grouped into the same three broad divisions
as per the model. They are technology centric, explicit centric, and people centric.
We strongly believe that understanding techniques and applying the same will help
the organization to grow.
3.1 Technology Centric
3.1.1 Virtual Platform
Virtual platform is the working environment where people work remotely across
time and/or place and/or organizational boundaries (Townsend et al. 1998).
Advances in information technology have made it possible for people to communi-
cate and coordinate remotely (Saunders 2000). Major advantage of virtual platforms
is that they help exploit the knowledge of distributed employees with diverse
backgrounds and experiences (Malhotra and Majchrzak 2004). Research has shown
that people with different backgrounds are able to contribute to integrated knowl-
edge repositories to support a firm’s knowledge management activities (Alavi and
Tiwana 2002). Thus, tacit knowledge can be effectively captured within virtual
platform.
3.1.2 Hyperlinking
Hyperlinking uses reference to that data which the professional can directly follow;
it helps in enabling a shared context on a particular subject, capturing all the innate
tacit knowledge and converting to explicit knowledge, thereby possessing a special
significance in knowledge management activities for capturing tacit knowledge.
Fahey and Prusak (1998) suggest that a shared context is important since in its
absence, “individuals’ differing perspectives, beliefs, assumptions, and views of
the future are most likely to collide and thus immobilize decision-making.” There
are both explicit and implicit links. Explicit links are set by the creator as well as the
other users. Implicit links are the links that exist between the knowledge content,
the tags, categories, information about authors and their other writings, etc.; this
way the innate/tacit knowledge can be captured and further put to use.
Effective Utilization of Tacit Knowledge in Technology Management 467

3.1.3 Hypermedia
Hypermedia is a computer-based information retrieval system that enables a user
to gain or provide access to texts, audio and video recordings, photographs, and
computer graphics related to a particular subject, e.g., e-mail correspondence and
graphical representations. According to Shum (1998), “hypermedia is an ideal
technology for capturing informal knowledge types with relationships that are
hard to formalise.” Hypermedia helps in collaborating and shared understanding
to capture the tacit knowledge. This form of knowledge helps in storage by
the organization and eventually becomes organizational knowledge once it is
integrated and can be retrieved and utilized for the benefit and growth of the
organization.
3.2 Explicit Knowledge Centric
3.2.1 Joint Conferences
Joint conferences are participatory meeting designed for discussion, fact finding,
problem solving, etc., designed to capture tacit knowledge of all the experts
present and facilitate knowledge transfer among one and all. The advantage of
using these activities for capturing tacit knowledge is the high commonality of
interests that usually exists among participants, allowing the interaction and two-
way flow of knowledge to easily happen. Conferences often focus on particular
areas of knowledge. The main purpose of a conference is to transfer new
knowledge (Rollof and Sefcik 2010).
3.2.2 Communities of Practice
Community of practice was developed by Jean Lave and Etienne Wenger.
A community of practice is a collection of people who engage on an ongoing basis
in some common endeavor (Eckert and McConnell-Ginet 1992). Communities of
practice steward the knowledge assets of organizations and society. It is learning
systems wherein peers tend to informally connect with one another to solve
problems, share ideas, build tools, and transfer knowledge based on all of their
innate learnings or experiences, i.e., tacit knowledge.
3.2.3 Collaborative Knowledge Management
Collaborative knowledge management is where there are articles or written
material on topics and the interested members can connect between all the readers,
468 I. Anandarajan and K.B. Akhilesh

individuals who have read and commented. This kind of platform brings together
individuals with similar interest and hence leads to stimulating their past
experiences and perspectives on the field, thereby exchange of their tacit knowl-
edge. This is a useful method of capturing the tacit knowledge of individuals in the
same specialization.
3.3 People Centric
3.3.1 Human-Centered Systems
The “human-centered systems” approach recognizes that technology can only
be as effective as the humans who must use it. The success of “human-centered
technology” comes from putting people first and recognizing that the human
contribution is a critical part of technology development, system implementation,
and operation (US DoT 1999). Individuals are the creators of technology, and
hence, it is necessary to obtain their experiences, learnings, and ideologies which
comprise of the core tacit knowledge about the technology.
3.3.2 Exchange of Personnel
Exchange of personnel involves bringing together professionals working on related
topics and to promote knowledge exchange and generation through union and
diversity. Professionals who possess knowledge on the same field are brought
together for exchanging ideas, information, and discussion on the matter of con-
cern, and thereby, their innate knowledge on the field is obtained and transferred
to the other individuals as well.
3.3.3 Mentoring
Mentoring is a process where in the experienced, knowledgeable person tends
to share his/her knowledge to the individual who is less experienced and knowl-
edgeable. This can be both a formal and an informal process. Informal process is
when two individuals come together and one seeks knowledge from the other, while
in the formal process, organization brings in the expert to share his knowledge with
the inexperienced. This is the most effective way of capturing tacit knowledge
as the individual who possesses the knowledge, tends to share their learnings,
understanding obtained from their success and failure, expertise they possess in
the field etc., are transferred to the person who does not possess such knowledge.
In conclusion, it can be said that the above-mentioned techniques and the
proposed model help in capturing the innate knowledge which the individual/
organization possesses through their past experience. When knowledge is obtained
Effective Utilization of Tacit Knowledge in Technology Management 469

in this fashion, it becomes clear, is accurate, becomes very important, and is of
value to the receiver. The difference between a good and a star performer is huge
especially in knowledge-intensive business. Tacit knowledge has the potential for
making a star performer. Organizations are realizing that it is no use having good
technology and not being able to transfer. When implementing technology man-
agement, we need to check the proven experience of adopting the interventions and
current pressures of organization. Exposure of people through multicultural work
context defines the specific scope and success of the alternatives proposed. This
chapter is not overclaiming about the possible interventions; however, we want
each of the organization to recognize problems which are complex and develop
some appropriate actions to rely on monitoring each of these interventions and
constitutions of the team to be implemented. Some of the suggested methods will
bring out enhanced understanding and better performance. Several researchers also
have verified that the capturing of tacit knowledge by third parties is almost next
to impossible. Once we recognize the limitations of some of the practices, organi-
zation may work hard to make the intervention more successful through better
collaboration and exchange of experiences in a systematic way.
References
Alavi M, Tiwana A (2002) Knowledge integration in virtual teams: the potential role of KMS.
J Am Soc Inf Sci Technol 53:1029–1037
Barney J (1991) Firm resources and sustained competitive advantage. J Manage 17(1):99–121
Buckley PJ, Casson MC (1976) The future of the multinational enterprise. Macmillan, London
Carayannis EG, Alexander J, Ioannidis A (2000) Leveraging knowledge, learning, and innovation
in forming strategic government university- industry(GUI) R&D partnerships in the US,
Germany and France. Technovation 20:477–488
Carter B, Hancock T, Morin J, Robins N (1993) Introducing RISKMAN: The European project
risk management methodology. NCC Blackwell, Oxford
Chapman RJ (1998) Effectiveness of working group risk identification and assessment techniques.
Int J Proj Manage 16(6):333–343
Charles D, Howells J (1992) Technology transfer in Europe: public and private networks.
Belhaven Press, London, p 3
Chesbrough H (2003) Open innovation: the new imperative for creating and profiting from
technology. Harvard Business School Press, Cambridge, MA
Coates V, Fahrooque M, Klavans R, Lapid K, Linstone H, Pistorius C, Porter A (2001) On the
future of technological forecasting. Technol Forecast Soc Change 67:1–17
Dosi G (1982) Technological paradigms and technological trajectories: a suggested interpretation
of the determinants and directions of technical change. Res Policy 11:147–162, North Holland
Publishing Company
Dosi G (1988) The nature of the innovative process. In: Technical change and economic theory.
Pinter, London, pp 221–238
Dunning JH (1981) Alternative channels and modes of international resource transmission in
controlling international technology transfer: issues, perspectives and policy implications.
Pergamon, New York, pp 3–26
Eckert P, McConnell-Ginet S (1992) Think practically and look locally: language and gender as
community–based practice. Ann Rev Anthropol 21:461–490
470 I. Anandarajan and K.B. Akhilesh

Fahey L, Prusak L (1998) The eleven deadliest sins of knowledge management. Calif Manage Rev
40(3):265–276
Hamel G (1991) Competition for competence and inter-partner learning within international
strategic alliances. Strateg Manage J 12:83–103
Kotabe M, Sahay A, Aulakh PS (1996) Emerging role of technology licensing in the development
of global product strategy: conceptual framework and research propositions. J Mark 60(1):
73–88
Kuhn TS (1970) The structure of scientific revolutions. University of Chicago Press, Chicago
Malhotra A, Majchrzak A (2004) Enabling knowledge creation in far-flung teams: best practices
for IT support and knowledge sharing. J Knowl Manage 8:75–88
McAdam R (2000) Knowledge management as a catalyst for innovation within organizations:
a qualitative study. Knowl Process Manage 7:233–241
Nonaka I (1991) The knowledge-creating company. Harv Bus Rev pp 96–104
Nonaka I, Konno N (1998) The concept of “Ba”. Calif Manage Rev 40(3):40–54
Nonaka I, Takeuchi H (1995) The knowledge creating company: how Japanese companies create
the dynamics of innovation. Oxford University Press, New York
Nonaka I, Toyama R, Konno N (2000) SECI, Ba and leadership: a unified model of dynamic
knowledge creation. Long Range Plann 33(4):4–34
Ounjian ML, Carne EB (1987) A study of the factors which affect technology transfer in a multi-
location multibusiness unit corporation. IEEE Trans Eng Manage EM-34:194–201
Polanyi M (1966) The tacit dimension. Routledge & Kegan Paul, London
Porter AL, Roper AT, Mason TW, Rosini FA, Banks J (1991) Forecasting and management of
technology. Wiley, New York
Report by U.S. Department of Transportation (1999) Human centered systems – the next challenge
in transportation
Rollof J, Sefcik M (2010) An exploratory study on knowledge transfer at a university conference.
J Knowl Manage Pract 11(2). http://www.tlainc.com/articl227.htm
Saunders CS (2000) Virtual teams: piecing together the puzzle. Pinnaflex Education Resources
Inc, Cincinnati
Shum S (1998) Negotiating the construction of organizational memories. http://d3e.open.ac.uk/
general/negotiating-org-mem/negotiating-org-mem-01.html
Simonin BL, Helleloid D (1993) Do organizations learn? An empirical test of organizational learning
in international strategic alliances. In: Academy of management best papers proceedings,
pp 222–226
Telesio P (1979) Foreign licensing policy in multinational enterprises. Praeger Publishers,
New York
Townsend AM, DeMarie SM, Hendrickson AR (1998) Virtual teams: technology and the work-
place of the future. Acad Manage Exec 12:17–29
von Krogh G, Ichijo K, Nonaka I (2000) Enabling knowledge creation: how to unlock the mystery
of tacit knowledge and release the power of innovation. Oxford University Press, New York
Wideman RM (1992) Project and program risk management – a guide to managing risks and
opportunities. Project Management Institute, Pennsylvania
Wider C, Davis B (1998) False starts – strong finishes. Inf Week 7(11):41–53
Effective Utilization of Tacit Knowledge in Technology Management 471

Part 2.4
Technology and Innovation

Semantic Web as an Innovation Enabler
Ranjith Nayar, K. Venugopalan, Rajeshwari Narendran, and Smitha Nayar
1 Introduction
The Flemish Government says, “With the advent of the Web, companies and
research institutions. . .realize that they can no longer rely on their own research
to innovate.” The Internet has evolved into the primary vehicle for communication,
information, and commerce. This chapter examines why Web 3.0 is an enabler for
innovation and its management. Existing literature defines Semantic Web in differ-
ent ways; a concise definition is “Highly specialized information silos, moderated
by a cult of personality, validated by the community, and put into context with the
inclusion of meta-data through widgets” (Spalding 2007). While information silos
are Web 1.0, community validation is a characteristic of Web 2.0, and contextuality
(or “semantic”) via metadata is a feature of the interoperability characteristic and
user-centric “cult of personality.”
This chapter examines the role of evolving Web as innovation enablers, with
examples of financial and nonfinancial enterprises like investment bank DrKW,
Wells Fargo, and Dell. By an informal definition, in Web 1.0, we “read” from the
Web as hierarchies distributed information to us. In Web 2.0, we “write” to the
Web and learned the possibilities of peer-to-peer networks by participating in
social networks. In Web 3.0, we “execute” on the Web and collaborate to deliver
community outcomes. Web 3.0 will connect and focus effort with the same
R. Nayar (*) • R. Narendran
Department of Business Administration, Mohanlal Sukhadia University, Udaipur, India
e-mail: [email protected]; [email protected]
K. Venugopalan
Department of Informatics and Computational Sciences,
Mohanlal Sukhadia University, Udaipur, India
e-mail: [email protected]
S. Nayar
Design Innovation Group, Asinnova Innovation Management, Singapore
e-mail: [email protected]
Department of Management Studies, Indian Institute of Science, Bangalore,
Driving the Economy through Innovation and Entrepreneurship,DOI 10.1007/978-81-322-0746-7_39, # Springer India 2013
475

commercial and community outcomes in open, transparent, and accessible
networks. They harness the wisdom of crowds for superior decision making
and focus collective effort (Cake 2011). The Web 3.0 consortium, W3C, defines
Semantic Web as a web of data. “There is lots of data we all use every day, and
it is not part of the web. I can see my bank statements on the web, and my
photographs, and I can see my appointments in a calendar. . .. Can I see bank
statement lines in a calendar? Why not? Because we don’t have a web of
data. Because data is controlled by applications, and each application keeps it
to itself. The Semantic Web is about two things. It is about common formats for
integration and combination of data drawn from diverse sources, where on the
original Web mainly concentrated on the interchange of documents. It is also
about language for recording how the data relates to real world objects. That
allows a person, or a machine, to start off in one database, and then move
through an unending set of databases which are connected not by wires but by
being about the same thing” (Web3 Consortium 2011).
2 Driving Innovation
Experts say, “Web3.0 will deliver a new generation of business applications that
will see business computing converge on the same fundamental on-demand archi-
tecture as consumer applications. This is not something that’s of merely passing
interest to those who work in enterprise IT. It will radically change the
organizations” (Wainewright 2005).
We conducted two surveys: mid to senior professionals across industries and
four countries—the UK, India, Singapore, and Taiwan—(with average age of
37.5, 15-year work experience, and 1:1 distribution of IT versus non-IT profiles)
showed the two primary drivers for driving innovation in any organization are
prevalence of a “culture of innovation” and an organization to sustain this
culture (Narendran and Nayar 2011). Our second survey in a controlled sample
in India (22 MBA students, 55% engineers, with 2.5-year work experience)
shows 82% IT usage in organizations and 50% prevalence of Web search for
new information at work. Eighty-two percent agreed innovative organizations
show higher energy in their people and functions. Taken together, the high trend
of IT usage will help deployment of enterprise social networks or “e-SocNets.”
While difficult to quantify gains from innovation, literature does show
evidences of 5% increased productivity due to organizational transformation,
coexisting with internal IT (Brynjolfsson and Hitt 2000). Consequently,
transforming the organization via e-SocNets and Semantic Web will help
increase productivity. Matteo Rizzi, innovation manager at SWIFT, examines
Web 2.0 in the financial community as a business enabler, bringing collabora-
tion to the next level using KM, utilizing social context and reputation as part of
the new business paradigm and how Web 2.0 maximizes innovation, knowledge
management, and social data.
476 R. Nayar et al.

2.1 Web 2.0
The shortfall of Web 1.0 (document exchange; lacking participation) led to Web
2.0 which boosted collaborative innovation. In turn, its shortfall of interoperabil-
ity will be overcome in Web 3.0 which brings a contextual paradigm. Web 2.0
covers a range of technologies, most commonly, blogs, wikis, podcasts, informa-
tion tagging, prediction markets, and social networks. Making innovation work
using Web 2.0 within a business needs sufficient technology integration of the
Web 2.0 tools with the legacy IT systems, managers who are comfortable in peer-
credibility-based leadership, and employees “agreeing” to a socialization of
business (Domı́nguez 2011).
Web 2.0 tools do not necessarily simplify innovation management. However,
they bring together the expertise into one network and enhance communication in
line with the cryptic, informal, short, (and, more important) public twitter-like
platform, unlike email communication where most information sharing is personal
and hence locked in intray silos. Survey data confirmed market research group
Gartner’s anticipated trend: “By 2014, social networking services will replace
e-mail as the primary vehicle for interpersonal communications for 20% of business
users” (McAfee 2010).
Exhibit: 1 The New Tools (Chui et al 2009)
2.2 Web 3.0
Web 3.0., on the other hand, enables interoperability across platforms, enhancing
KM capability and communication. Its “guided search” will be a staging point,
where search engines do not provide relevance. Hence, technology enablers enable
innovation not only by idea sharing but also by providing better insights and
contexts. They also become new branding and market research tools and low-cost
advertisement, bringing not just enabling but redundancy.
Semantic Web as an Innovation Enabler 477

Experts (like J. P. Rangaswami, CIO at investment bank DrKW) expect today’s
core enterprise applications will be superseded by four new types of applications in
Web 3.0 era where “powerful forces are in motion that are going to fundamentally
shake up our current view of enterprise applications, replacing the current
demarcations—ERP, CRM, BI, collaboration, and so on—with something new.”
And that all requirements will coalesce around four core application families of
requirements—which are already shaping DrKW’s internal architecture:
Publishing: Any application that generates data will act as though it’s a content pub-
lisher, using RSS or similar to publish its data. The significance of this is that it reduces all
of these applications to the level of raw feed generators: “You can’t differentiate, it’s just
content.” Discovery: Single, homogenous database where everything is stored and
discoverable, with access and authorization controls added only as necessary for specific
items or classes of information. Fulfillment: This is the application that makes things
happen, most notably for customers. Identity management plays a crucial role here,
controlling the catalog choices that are shown to each user and their rights to approve
shipment. Conversation: All the channels of collaboration between people, either inside
the organization or beyond its walls.
These will enhance innovation, e.g., application-independent raw feed enables
interoperability.
2.3 Asian Innovation
The Web as an innovation tool as well as a marketing tool (via semantic clustering)
is invaluable in an Asian context where cost sensitivity is very high. Over the past
2 years, the Asia New Business Creation project, conducted by the Danish Universe
Foundation, has done extensive research in Asian companies and produced case
studies and workshops to exchange methods among five large Danish companies
and three Asian companies (Haier from China, Singapore’s STe, and Woonjin/
Coway from Korea). The study concluded that Asian companies are different from
Western companies in their approach to innovation. It identified four generic
elements of the Asian approach (Hesseldahl 2011):
1. Suitability of products (as opposed to generic).
2. Ability to let go of style or details in order to chase the market.
3. Fluidity, i.e., support change and uncertainty.
4. Companies are young, have fluid organization structures, and are in a hurry to
grow up.
These are especially true for financial services and banking industry where
product differentiation is narrow and customer spectrum is wide. Asian companies
tend to work on existing products, adapting these to local community needs, driven
by diversity of Asian marketplace, price sensitivity, and features their target
customers need. Banks, traditionally, have not been threatened by innovations
introduced by other organizations trying to enter their sector because of the barriers
imposed by security requirements and regulation.
478 R. Nayar et al.

An innovation for the currency remittance industry in Singapore was done by
one of the authors for Asinnova LLP and proposed for implementation to Singapore
Telecom to enter the financial sector as a strategy to derive competitive advantage
using developments in telephony as the technology enabler. Lessons drawn from
that include the reservations by SingTel to invest in a technology that is easy to
penetrate by competition. However, the Internet is opening opportunities for firms
keen to enter the sector, e.g., PayPal, CheckFree, and Amazon, which are offering
new payment models that are becoming popular with customers.
Many on-line start-ups are providing tools to enable customers manage personal
finance. Some larger banks, e.g., BBVA in Spain, responded to these evolutions in
the market and are rethinking their on-line banking models, experimenting with
how to combine Web 2.0 capabilities, such as personalization and information
aggregation, with financial services that make the customer experience simpler
and more relevant (Domı́nguez). This implies a stronger need for community and
contextual information, and input from grassroots—areas where Web 3.0 can play a
significant differentiating role. Web 2.0 impacts both knowledge diffusion within
and outside a company, and product commercialization with its smaller “path-of-
innovation.” Forrester Research found 25% of enterprises set Web 2.0 priorities in
2008, and predicts a $4.6 billion enterprise spending on Web 2.0 by 2013. But,
enterprises need clear Web 2.0 policy to maximize benefits, as done at Wells Fargo
and Dell. P&G targets half its innovations to come via its open innovation commu-
nity. However, McKinsey survey shows that among companies that have tried and
implemented Web 2.0, 22% were dissatisfied with results. McAfee (2010) survey
shows 49% primary concerns about Web 2.0 security (virus, malware), productivity
27%, legal risks 15%, and reputation 9%. Success depends on having a clear Web
2.0 strategy, as well as managing it through each of these three levers: “technology,
managers, and employees” (Domı́nguez 2010). Yet, Web 2.0 adoption rate is high
(60% in Canada to Brazil 100%) (McAfee 2010).
2.4 Web 2.0 and 3.0 and Innovation
Ning and O’Sullivan (2006) have developed a framework for Semantic Innovation
Management System (SIMS) based on metadata harvesting and RDF access
technologies and developed a practical case study using RDF Gateway. Their
work “demonstrates the feasibility and potential to adopt Semantic Web
technologies to improve innovation management across extended enterprises.”
Any enterprise that is large and spread across multiple areas of operation or
geographies can be considered an extended enterprise.
Extended enterprises face a problem in managing internal innovation that while
innovation does grow with collaboration, it is largely a collection of local process.
Collaboration across boundaries helps seed new ideas and germinates local ideas—
and, indeed, helps carry developing concepts further. Yet, innovation is essentially
local in nature (much as imported seeds will probably flower in the local soil, but
Semantic Web as an Innovation Enabler 479
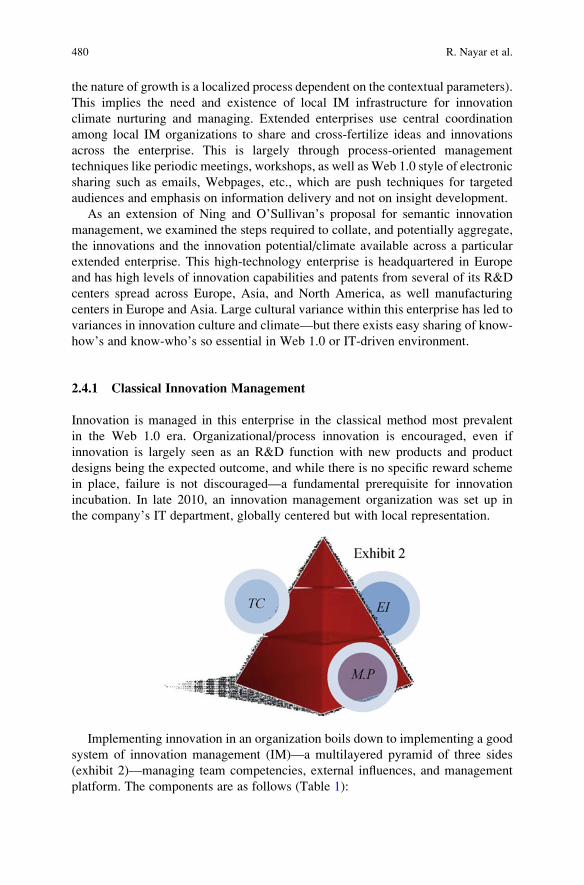
the nature of growth is a localized process dependent on the contextual parameters).
This implies the need and existence of local IM infrastructure for innovation
climate nurturing and managing. Extended enterprises use central coordination
among local IM organizations to share and cross-fertilize ideas and innovations
across the enterprise. This is largely through process-oriented management
techniques like periodic meetings, workshops, as well as Web 1.0 style of electronic
sharing such as emails, Webpages, etc., which are push techniques for targeted
audiences and emphasis on information delivery and not on insight development.
As an extension of Ning and O’Sullivan’s proposal for semantic innovation
management, we examined the steps required to collate, and potentially aggregate,
the innovations and the innovation potential/climate available across a particular
extended enterprise. This high-technology enterprise is headquartered in Europe
and has high levels of innovation capabilities and patents from several of its R&D
centers spread across Europe, Asia, and North America, as well manufacturing
centers in Europe and Asia. Large cultural variance within this enterprise has led to
variances in innovation culture and climate—but there exists easy sharing of know-
how’s and know-who’s so essential in Web 1.0 or IT-driven environment.
2.4.1 Classical Innovation Management
Innovation is managed in this enterprise in the classical method most prevalent
in the Web 1.0 era. Organizational/process innovation is encouraged, even if
innovation is largely seen as an R&D function with new products and product
designs being the expected outcome, and while there is no specific reward scheme
in place, failure is not discouraged—a fundamental prerequisite for innovation
incubation. In late 2010, an innovation management organization was set up in
the company’s IT department, globally centered but with local representation.
Implementing innovation in an organization boils down to implementing a good
system of innovation management (IM)—a multilayered pyramid of three sides
(exhibit 2)—managing team competencies, external influences, and management
platform. The components are as follows (Table 1):
480 R. Nayar et al.

This method, while effective, tends to be limited largely to the geographies (even
virtual geographies which too are limited), yet does extend the geographies of the
facilitator. Improvements in communication technologies have, of course, moved
some of the geographical boundaries, but the new virtual geographies are perhaps
best described as the inclusion of either some specific remote expertise or some remote
less-engaged participants who aremore validators than part of the team and hencemay
be described as more cooperative innovation than collaborative innovation.
2.4.2 Web-Driven Innovation Management
The benefits of introducing collaborative communication technologies into
enterprises are obvious, even if the results are not guaranteed. Current knowledge
and information repositories tend to exist in application silos and interoperability—
the ability to access information residing in different operating systems/
applications/databases—that ranges from limited to nil. Introducing collaborative
tools fashioned on Web 2.0 technologies—equivalents of Facebook and Twitter—
will not address this problem but will enable people (experts, researchers, and
engineers) to share communication and information within their communities at
the speed of modern communication, cutting across geographical or functional
barriers. This turns enterprises into fast moving/reacting enterprises (or Enterprise
2.0, a term being popularized by Andrew McAfee of MIT (McAfee 2010)) where
hierarchies and silos have lesser significance. These enterprises are also fundamen-
tally more democratic, less encumbered by processes and protocol, one where
hierarchies are established more by the peer recognition than by organization charts.
Web 3.0’s interoperability across application is important since it helps bridge
knowledge fractured into silos. We also make use of interoperability to aggregate
geographically distributed activities that have interest confluence.
The first author is working on building a semantic tool that will be able to
aggregate talent (of experts) in a network (intranet/extranet/the Internet/social
networks), with a focus on leveraging employee networks to increase individual
and organizational performance with an enterprise. This is envisaged as the first
step to move the enterprise to McAfee’s (2009) Enterprise 2.0.
Social networks exist throughout this organization in various forms. The more
formal ones include ITIL tools like Remedy. Organizational network analysis
(ONA) helps analyze network to identify nodes where strong collaboration helps
Table 1 Components of three sides of innovation management pyramid
Team competency (TC) External influences (EI) Management platform (MP)
Idea management Internal to company Culture
User management Industry level Strategy
Project portfolio management Socio-technical level Tools and processes
Platform management Metrics
Project management
Semantic Web as an Innovation Enabler 481

increase innovation (Garud et al. 2010), or effectiveness where some experts are not
collaborating to the level expected. We could compare this with an individual’s
performance appraisal data available to identify nodes or experts in terms of their
broader collaborative contributions. This second dimension helps executives iden-
tify which employees are extensively leveraged and which employees have poten-
tial to contribute more to the network. Examining talent along both dimensions
would reveal four levels of talent utilization: high-performing, marginalized,
hidden, or underutilized talent.
By identifying specific network-centric practices and conducting a set of in-
depth case studies using ONA to expand our knowledge of how networks impact
performance and to understand the behavior of top performers, we attempt to
establish a road map for leaders interested in building collaboration through talent
management. We target this network to become the predominant social network
in the enterprise under study and to enhance semantic innovation within this
enterprise.
Innovation has many facets, or components—business model innovation, busi-
ness function innovation, product innovation, operations innovation, etc. Each of
these facets has several layers: execution strategy, business strategy, technology
enablers, and innovation enablers. Technology enablers are primarily Web tools,
like micro-blogs instead of market research, social networks that boost the potential
to collaborate on the innovation of value, and wikis. Mostly, these are Web 2.0
technology-based tools:
Innovation is “the process of making changes in something established by introducing
something new”, which can be viewed as a cyclic loop consisting of four distinct phases,
i.e., recognition, initiation, implementation, and stabilization. Within a typical
organisation, there are various degrees of innovation from simply suggesting ideas or
managing a single project to managing an entire programme of change comprising various
performance indicators and portfolios of projects. To support the lifecycle of innovation,
different innovation management tools or tool families have been developed. Conceptually,
they can be classified as five layers, i.e., individual innovation, project innovation, collabo-
rative innovation, distributed innovation, and semantic innovation.
Current research focuses on the development of structured collaboration environments,
and the entire system is designed to be used collaboratively by every user of the system to
gather information and update their own contributions to their community. Distributed
innovation is innovation across a particular intranet within an organization’s supply chain
and even a specific virtual team. This level of innovation is defined by all of the “collabo-
rative”, “project” and “individual” innovations, taking place lower in the innovation
hierarchy. The tools required for distributed innovation, which build mostly on portal
servers (e.g., Sharepoint, Lotus Notes, and Plumtree), are in their infancy. Principal design
features include enterprise wide search and navigation, user personalisation, integration and
content management, notifications (push technologies), workflow, and application integra-
tion to other information sources. Since current state of the art is manual browsing, a well-
designed collaboration/management structure is necessary to allow any individual easy
access to the information that they are looking for. The generation of semantic innovation
is derived by the emerging semantic web technology. (Li and O’Sullivan 2004)
Web 3.0 will enable innovation more by virtue of the contextuality of search,
such as semantic clustering which enables one to search for concepts and ideas and
their interrelations rather than Web 1.0’s search of static strings. This ability to
482 R. Nayar et al.

search for concepts expands the informational horizon that the innovator is seeking
information of and from, as well as shrinks the time horizon that is consumed in
executing that search effectively. The efficacy of idea development is clearly a
function of both.
How will Web 3.0 be an enabler for innovation management? In two ways: first,
like innovation itself, Semantic Web will enable innovation managers seek contex-
tually valid IM techniques from a more focused information horizon; second, and
more important, IM practitioners will be able to aggregate innovations happening
within a defined boundary (such as intra-enterprise) within the contextual space
they seek to working in.
We will examine these in some length here:
1. Studies show that the two primary drivers of innovation in an organization are
the prevalence of a culture of innovation and the prevalence of an organization to
drive innovation. McKinsey consulting says, “Organizing the innovation process
from beginning to end is a critical element of IM. Lack of formal organization is
a common problem. Execution is the biggest challenge. Fundamentally, the
biggest challenge is organisation.” Deployment of Web 2.0 in an enterprise
has two major effects on establishing the culture: first, it is a major change, a
new one at that, and this change passes down a clear commitment toward
innovation from the top management to the middle managers and to the pro-
spective innovators, both product innovators and those concerned with process
improvements; second, the availability of SocNet applications like Twitter (or
its enterprise-level equivalents like Yammer) encourages better communication
which is especially useful across an extended enterprise. Further down the
second point, the availability of a network of experts/expertise has a snowball
effect as professionals come out of silos and build on incremental ideas that are
discussed freely in a way that is difficult to sustain in, say, email communication.
Web 2.0 deployment within the enterprise also streamlines the work of an
innovation management organization as the gathering of innovation information
becomes easier (so too the dissemination) due to the prevalence of experts’
networks which will also help in specific innovation examples by bringing
together even those who are not directly involved, but interested in the topic,
to contribute incrementally.
2. Most extended enterprises have innovations happening in different areas and
geographies. The more formalized projects are usually visible across the enter-
prise, even while the routine or day-to-day are not. Yet, via the FOAF (from
“friend of a friend”) which is an RDF-based schema to describe persons and their
social network in a semantic way, we can parse user pages or describe articles
about people. Since Semantic Web promises a vision to make information and
knowledge machine accessible in the Web rather than displaying them for
interpretation by humans, semantic innovation which exploits the potential of
Semantic Web technologies will improve effectiveness and efficiency of
innovation management in a large networked organization. This is true for
each individual aspect of the innovation pyramid described in p. 5. Within
Semantic Web as an Innovation Enabler 483

each of these “sides,” we have the different component layers. RDF, OWL, and
FOAF technologies provide the ability to aggregate each of these layers present
in the different areas of the extended enterprise.
We take one layer to illustrate the point: According to the fact that different
organization or project contexts can make statements about the same innovation
process using different language, semantic mediation which can make use of
concepts and relations defined elsewhere and facilitate the interaction between
shared ontologies and different local ontologies is another technical pillar for
semantic innovation (Ning and O’Sullivan). Semantic Web can be envisioned
as an extension of the current Web, which makes the Web more understandable
to computer programs, and then allows data to be shared and reused across
application, enterprise, and community boundaries easily (Berners-Lee et al.
2001). The original proposition of semantic innovation is to exploit the potential
of Semantic Web technology to improve the effectiveness and efficiency of
innovation management in the large networked organization. One of these is
semantic clustering, a technique that groups related concepts—by enabling
computers to understand sentence meaning and group similar text across
a large number of documents, statistically profiling the co-occurrence of all
the themes—but unable to judge importance of the concept. It explains the idea
flow created by the Internet to help understand how people are ideating across
the Web by analyzing their opinions (Shaughnessy 2010). This points to Web
2.0 conversations becoming a market research tool. Therefore, enterprises need
to start experimenting with digitally active population (within the enterprise and
in the marketplace) by using Web 2.0 tools and SocNets, say with company-
controlled community, “perhaps through a blog, that gives your customers
a place to offer feedback about your products and services—a basic move
many companies still ignore” (Hoffman 2009).
We are engaged in an experiment to extend this principle in this enterprise to
design a model to augment the engagement of vast pool of knowledge workers
and technical experts present in the European extended enterprise under study.
Studies have indicated that the enterprise was losing advantage of its technical
expertise since the level of engagement of its expertise was insufficient. The
experiment is ongoing, and this author has drawn up a model named Interactive
Semantic Energy Calibration Tool (InterSECT) with seven axes for classification
of engagement energy. Each axis measures (via a set of 7–12 questions) the time-
variant energy of a participant, the time-invariant energy as well as semantic
factors that contribute to engagement. This model is currently in validation stage
and will be implemented after that. The semantic factors involve the level of
integration of the Web 2.0+ tools with legacy information system tools available
to the experts to enumerate their technical innovations, as well as the two other
key factors, namely, acceptance of SocNet as a way of professional working and
hierarchies based on peer credibility. The validation of these factors will conclu-
sively point to acceptability of Web 2.0/3.0 in conventional but forward-looking
extended enterprises.
484 R. Nayar et al.

The bottom line is that by focusing on the fundamental aspects of the consumers’
online behavior—not just current best practices—companies will be better prepared
when Web 2.0+ morphs into Web 3.0 and beyond (Hoffman 2009).
3 Conclusion
Web 3.0 overcomes the limitations of Web 1.0. It helps link people within
communities of common interest, and this collaboration will help deliver a higher
quality of community outcomes. The development of Web 2.0 technologies is
leading to change in enterprises, or what is increasingly being defined as Enterprise
2.0, which brings social networks inside firewalls. With the IT evolution—or
revolution—bringing in newer technology of Web 3.0, semantics will also come
inside enterprises and lead to Enterprise 3.0 with major implications on how
organizations work. While it is early to predict what these impacts will be, the
most obvious implication will be a boost in their innovation capability because of
increased participation or deeper engagement of quasi-hidden talent pools (Kumar
and Puranam 2011) within the community and by integrating separate groups and
geographies. They aggregate the “wisdom of crowds” for superior decision making
and focus collective effort on prioritized outcomes (Cake 2011). We have attempted
to define the implications on the way these enterprises will innovate and drive their
innovation. Semantic Web will enable innovation by being an aggregator of
innovations practiced across the extended organization via SIMS, or Semantic
Innovation Management Systems. In parallel, techniques like semantic clustering,
semantic mediation, and its characteristic of breakdown of information silos through
interoperability across applications and easing knowledge management will give a
significant boost to innovation itself with enterprises and in the open innovation
community.
References
Berners-Lee T, Hendler J, Lassila O (2001) The semantic web. Sci Am Mag 284(5):34–43
Brynjolfsson E, Hitt LM (2000) Beyond computation: information technology, organizational
transformation and business performance. J Econ Perspect 14(4):23–48, American Economic
Association
Cake M (2011) Management 3.0: the Web 3.0 “Central Brain” to coordinate innovation, collabo-
ration, workflow and outcomes across industry and across the world. Manage Innov Exch
http://www.managementexchange.com/hack/management-30-web-30-%22central-brain%22-
coordinate-innovation-collaboration-workflow-and-outcomes-
Chui M et al (2009) Six ways to make Web 2.0 work, McKinsey Quarterly Feb 2009
Domı́nguez M (2010) Evolving innovation in large companies through Web 2.0: no goals –
no promise. http://www.innovationmanagement.se/2010/11/01/evolving-innovation-in-large-
companies-through-web-2-0/
Semantic Web as an Innovation Enabler 485

Domı́nguez M (2011) http://www.innovationmanagement.se/2011/03/16/innovation-in-large-
companies-the-use-of-web-2-0-as-an-innovation-pathway/
Garud R, Gehman J, Kumaraswamy A (2010) Complexity arrangements for sustained innovation:
lessons from 3M corporation. Soc Sci Res Netw Organ Stud 32(6):737–767
Hesseldahl P (2011) Learning from Asian innovation. http://www.innovationmanagement.se/
2011/09/23/learning-from-asian-innovation/
Hoffman DL (2009) Managing beyond Web 2.0, companies should prepare now for the day when
Web 2.0 morphs into Web 3.0. https://www.mckinseyquarterly.com/Strategy/Innovation
Kisselburgh L, Spafford EH, Vorvoreanu M (2010) Web 2.0: a complex balancing act. McAfee
study. http://www.mcafee.com/us/resources/reports/rp-first-global-study-web-2.0-usage.pdf
Kumar N, Puranam P (2011) India inside: the emerging innovation challenge to the west. HBR.
http://hbr.org/product/india-inside-the-emerging-innovation-challenge-to-/an/12801-HBK-ENG
Li J, O’Sullivan D (2004) Semantic innovation management. The fourth international conference
on electronic business (ICEB2004), Beijing, pp 586–590
McAfee A (2009) Enterprise 2.0: new collaborative tools for your organization’s toughest
challenges, 1st edn. Harvard Business School Press, Boston
McAfee Inc (2010) Web 2.0: a Complex Balancing Act—first global study on Web2 usage, risks
and best practices
Narendran R, Nayar R (2011) Innovation as a strategy for competitive advantage in banking.
Society for Global Business and Economic Development (SGBED)
Ning K, O’Sullivan D (2006) Semantic innovation management across the extended enterprise. Int
J Ind Syst Eng 1:109–127
Shaughnessy H (2010) How semantic clustering helps analyze consumer attitudes. http://blogs.
hbr.org/research/2010/07/every-day-in-the-english.html
Spalding S (2007) How to define Web 3.0. http://howtosplitanatom.com/news/how-to-define-
web-30-2/
Wainewright P (2005) The four application pillars of enterprise 3.0. http://www.zdnet.com/blog/
saas/the-four-application-pillars-of-enterprise-30/73?tag¼rbxccnbzd1
Web3 Consortium (2011) Notes from W3C. http://www.w3.org/2001/sw/
486 R. Nayar et al.

How to Charge Electric Vehicles:
A Comparison of Charging Infrastructure
Concepts and Technologies
Benedikt R€omer, Tobias Schneiderbauer, and Arnold Picot
1 Introduction
The transportation sector accounts globally for over 50 % of the world’s oil
consumption and is responsible for 23 % of the world’s CO2 emissions (IEA
2011). Additionally, motorized transport is responsible for several local emissions
such as noise, particulate matters, smell, hydrocarbons, and nitro oxides, which
matter especially in densely populated areas (U.S. Environmental Protection Agency
1994). Charged with electricity from renewable energy sources, electric vehicles
(EV) can avoid these negative influences. EVs are in development by nearly all
original equipment manufacturers (OEM) with first models already in the market.
By 2020, global EV (incl. plug-in hybrids) sales are expected to reach 6.9 million
vehicles per year (Tanaka 2011). However, one of the main restraints for the EV
market and the consumer acceptance of EV is a lack of charging stations. As the
setup of charging infrastructure is still in the very beginning, it is important to
develop, implement, and support the right technologies. In particular, it is unclear
which technologies are most suitable for certain charging locations. Our combined
qualitative and quantitative research makes the following contributions: first, we
provide an overview of technology selection methods, charging technologies, and
categories of charging locations. Second, we provide key criteria for assessing
charging technologies. Third, we propose a decision framework for selecting
suitable charging technologies. Last, we test the framework on the European market
B. R€omer (*) • T. Schneiderbauer
Center for Digital Technology and Management, Ludwig-Maximilians-Universit€at M€unchenand Technische Universit€at M€unchen, Arcisstr. 21, 80290 Munich, Germany
e-mail: [email protected]; [email protected]
A. Picot
Institute for Information, Organisation and Management, Ludwig-Maximilians-Universit€atM€unchen, Ludwigstr. 28 VG II, 80539 Munich, Germany
e-mail: [email protected]
Department of Management Studies, Indian Institute of Science, Bangalore,
Driving the Economy through Innovation and Entrepreneurship,DOI 10.1007/978-81-322-0746-7_40, # Springer India 2013
487

and recommend a selection of charging technologies depending on the planned
location. This chapter addresses researchers in the field of technology management
and assessment as well as practitioners from the automotive and energy industry.
2 Comparing Infrastructure Setups
2.1 Decision Tools
To answer our research question, we considered quantitative as well as qualitative
criteria. For solving complex decision problems, we found a variety of multicriteria
decision analysis tools in literature (Ananda and Herath 2009; Kiker et al. 2005;
Linkov et al. 2006). Developed by Saaty (1977, 1980), the analytical hierarchy
process (AHP) is widely used and has been applied to diverse decision problems.
Vaidya and Kumar (2006) analyzed 150 application papers and give an overview of
AHP applications. Chou et al. (2004) used the AHP to compare technology
alternatives for e-payment systems using technological, social, and economic
factors. We could not find an AHP application for an evaluation in the area of
charging infrastructures. However, it was used for an analysis of alternative-fuel
buses for public transportation (Tzeng et al. 2005).
2.2 Charging Infrastructure Technologies and ChargingLocation Types
EVs can be charged using a cable, via battery swapping or wireless through
inductive charging (excluded from our study due to immaturity of technology).
Our study examines four different technologies: normal, semifast, and fast charging
(all wired) as well as battery swapping.
Normal charging (United States (USA): level 1 charging) refers to the power
level, which standard power outlets provide in domestic installations. The rating of
power outlets differs around the world (1.8 kilowatts (kW) to 3.7 kW). Semifastcharging (USA: level 2 charging) has a higher power level (7.2–22.2 kW). It uses
mainly three-phase power connections. Fast charging (USA: level 3 charging)
provides the highest power levels (50–250 kW). Fast charging stations are mainly
direct current (DC) systems and need specific expensive fixed infrastructure. The
power level determines the speed of charging ranging from 16.5 h to charge a
30 kWh battery (typical size of a car battery) at 1.8 kW to only around 10 min
at 250 kW (Van den Bossche 2010). Battery swapping is an automated process
to replace an empty battery of an EV with a fully charged one. It allows quick
charging (replacement) with switch times of around one minute but requires a high
488 B. R€omer et al.
degree of standardization and compatibility for various vehicles and high investments
for swapping stations (Lombardi et al. 2010).
Charging systems differ also in communication capabilities between the EV, the
charging station, and the further entities such as grid operators. Supported functions
(use-cases) exceeding mere charging like safety control, billing, or grid stabili-
zation (e.g., power renegotiations and charge rescheduling) lead to additional
communication requirements. Relevant use-cases and communication capability
levels will be described in the upcoming standard IEC/ISO 15118 (Schmutzler and
Wietfeld 2010).
Drivers of EV can charge their vehicles in different locations. Depending on the
location, charging behavior, economics of charging, and, as a consequence,
investments for charging infrastructures vary. In accordance with Framel et al.
(2010), in this chapter, locations are categorized into four types:
• Home charging is used for charging at private places (e.g., garages), where the
EV is typically parked for a long time.
• Work/business charging relates to locations where EVs usually stay for several
hours, e.g., place of work.
• Public charging applies to places the EV is parked for a few hours (e.g.,
restaurants or shopping malls).
• Highway charging is used for locations, where the short stop’s main purpose is
charging.
3 Method and Procedure
In our study, we combine qualitative and quantitative methodologies. In a first step,
we conduct expert interviews in order to find and verify relevant evaluation criteria
for the comparison of charging infrastructure technologies. In a second step, we
apply the AHP, adapting the approach of Chou et al. (2004) and combining it with
the methodology of direct point allocation (Saunders 1994). Key inputs for the
second step are the evaluation criteria we determined in the first step.
3.1 Expert Interviews
Expert interviews are specific semi-structured interviews. The main interest lies on
the experts’ knowledge (Meuser and Nagel 1997). As the application of charging
infrastructure technologies for EV is a relatively new research field, only limited
information is publicly available in reports or papers. Therefore, we use a system-
atizing expert interview to treat experts as guides, who help to gain specialized
knowledge (Bogner et al. 2009).
We identified relevant stakeholders for the research question: charging station
manufacturers, charging infrastructure providers, utilities, original equipment
How to Charge Electric Vehicles: A Comparison of Charging Infrastructure. . . 489

manufacturers (OEMs), and other industry experts like consultants. To identify
possible interviewees, we used an analysis of the EV market by Frost and Sullivan
(2009) and analyzed conferences for EV infrastructure. As a conceptional pre-
paration for the interviews, we developed an interview guideline and sent it to
identified experts. Through these activities, we built up knowledge upfront,
increased the probability of interviewees’ acceptance to participate, and structured
the interviews themselves (Liebold and Trinczek 2009; Trinczek 1995). From 50
approached interview candidates, 20 experts participated. Interviewees were high-
and mid-level managers of eight charging station manufacturers, four utilities,
two OEMs, two charging station providers, and four other industry experts. The
interviewees were located in the USA, Europe, and Japan. Each interview was
conducted separately (one-to-one) via telephone in May and June 2011. The
interviews lasted between 30 and 90 min and have been recorded. We paraphrased
all interviews and selectively transcribed specific points of special importance
(Liebold and Trinczek 2009). Views, opinions, and attitudes of interviewees
were analyzed and compared using thematic coding (Flick 2009). As the last step,
interview evaluations were confirmed by respective interview participants. As a
result, 11 relevant criteria for an assessment of charging infrastructure technologies
have been identified and verified. These are described in the results section.
3.2 Adapted Analytical Hierarchy Process
We used an adapted AHP to evaluate and compare the application of four charging
infrastructure technologies in four different location types. First, we used previ-
ously identified evaluation criteria and the described technologies to construct the
hierarchical structure of alternatives, factors, and subfactors (Bhushan and Rai
2004). We broke down the three main criteria of technological, economic, and
social factors into 11 subfactors. Second, we calculated priority weights between
subfactors. The industry experts were involved in this evaluation and we conducted
this step four times to calculate priority weights for all location types. We adapted
the AHP using the direct point allocation to keep the effort for participants low and
thus increase the participation rate. Third, we evaluated the performance of the four
technology alternatives in each of the criteria through pairwise comparison. Fourth,
we calculated the total value for each technology alternative based on data from an
expert poll multiplied with the priority weights (Chou et al. 2004). This procedure
again was performed for each of the charging locations, hence four times with
varying goals. The general procedure is illustrated in Fig. 1.
The data collectionwas conducted by an expert survey as this is considered to bethe best source of sample data to the AHP (Chou et al. 2004). Characteristics of the
criteria vary for different regions of the world. Eleven European experts partici-
pated in the survey: employees of four charging station manufacturers, three
utilities, two OEMs, and two consultancies. Thus, the sample is covering the
views of the major players of the charging infrastructure industry and is balanced
between different industry groups. As charging infrastructure technologies are
490 B. R€omer et al.

not yet widely brought to the market, we did not ask consumers as they might lack
necessary experience and knowledge.
For the direct point allocation, experts were asked to allocate a fixed number of
points to the 11 evaluation criteria to determine their relative importance
(Schoemaker and Waid 1982). The questioned participants had to allocate four
times 100 points for each of the four charging locations. To aggregate the subjective
allocations of participating experts, the arithmetic mean was used.
For the pairwise comparison, all alternatives are paired against all others
regarding each of the sub-criteria. We chose this technique to ease decision making
as it requires survey participants to make only relative judgements instead of
absolute ones (Kiker et al. 2005). The questioned experts had to compare alternative
technologies in the context of each criterion (e.g., charging time). Adapting the
scale recommended by Saaty (1977), we used a nine-level scale (ranging from
“alternatives are equal” (1) to “one alternative is extremely better than the other”
(9)). Saaty (1990) gives a detailed description of the pairwise comparison method-
ology and of the related calculation algorithm. For the calculation of local ratings
and testing for consistency, we used the software MakeItRational.
The final step of the adapted AHP is the aggregation of the relative weights ofthe decision elements. Hence, the local rating of each of the alternatives for each
subfactor is multiplied by the priority weight of the respective subfactor to receive
the global ratings. The sums of all global ratings for each technology are used to
select an alternative (Bhushan and Rai 2004). This step was performed for each of
the locations. The results are described in the second part of the findings section.
4 Findings
Our findings are structured in two parts. In the first section, we explain the identified
evaluation criteria. In the second section, we present the results of the adapted AHP
survey for Europe.
Structure of the adapted AHP
Evaluating Charging Infrastructure Technologies for Charging Locations (Home, Work/Business, Public, Highway)
Technological
Semi-fast charging Fast Charging Battery Swapping
Economic Social
Normal charging
1. Charging Time
2. Degree of Standardization
3. Influence on Battery
4. Local Grid Impact
1. Energy Cost
2. Energy Management
3. Initial and installation Cost
4. Operation and Maintenance Cost
5. Revenue Possibilities
1. Ease of Use
2. Safety
Goal
Criteria
Alternatives
Sub-criteria
Fig. 1 Structure of the adapted AHP
How to Charge Electric Vehicles: A Comparison of Charging Infrastructure. . . 491

4.1 Choosing the Right Criteria Is Key for Taking Good Decisions
The evaluation criteria provide the most important input factors for the adapted
AHP for comparing charging infrastructure technologies. In this section, we present
and explain the evaluation criteria, which are results of an analysis of expert
interviews and accompanying literature review. We structure the criteria into
three categories: technological factors, economic factors, and social factors with
respective subfactors.
4.1.1 Technological Factors
Technological factors consist of the subfactors charging time, local grid impact,
degree of standardization, and influence on battery, which we explain in detail:
Charging time: Charging time can be differentiated into theoretical charging time
and charging speed. The theoretical charging time measures the time needed to
charge the battery of an electric vehicle from 0 to 100 % and in the case of fast
charging from 0 to 80 %, whereas charging speed is defined as the number
of kilometers, which can be driven by charging the electric vehicle for 1 h. The
charging speed of normal charging is 18.5 km/h, the one of semifast charging up
to 111 km/h, and fast charging goes up to 250 km/h (Van den Bossche 2010).
In comparison, a battery swapping station takes on average less than one minute
to switch the battery, which enables the vehicle to drive a distance of typically
about 150 km (Yudan 2010).
Local grid impact: Although the adoption of electric vehicles is expected to be
gradual, experts predict that the distribution of electric vehicles will be concen-
trated throughout certain neighborhoods. In these areas, early adopters of elec-
tric vehicles are clustered due to demographics such as educational level and
income. This might result in local strain on transformers and even transformer
failures (Boulanger et al. 2011). Therefore, the most demanding issues for utility
companies are the distribution of transformers and substations, which have to be
upgraded with respect to the anticipated charging load of EVs in these cluster
areas (Laufenberg and Moorhouse 2010). Due to distinct power levels, the grid
impact varies for different charging technologies.
Degree of standardization: In general, standardization can be seen as one of the
key enablers for the adoption of the electric vehicle. The standardization of
plugs, communication, interfaces, and power is of major importance to make the
interoperability of chargers and vehicles feasible (Brown et al. 2010). The level
of standardization is different for the studied technologies. In Europe, the
standardization of the plug for normal charging and semifast charging is already
on a high level. However, Germany, Austria, the Netherlands, and other Euro-
pean countries prefer one specific standard, called type 2, while France and Italy
are in favor of the type 1 plug (Society of Motor Manufacturers and Traders
2010). In the United States and Japan, a plug for level 1 and level 2 is defined in a
492 B. R€omer et al.

joint standard (Chambers 2011). For DC fast charging, there are two charging
standards on the way. On the one hand, there is the CHAdeMO standards, which
is already deployed in several charging stations in the world. On the other hand,
European and American automakers are working on an AC/DC combo con-
nector (European Committee for Standardization 2011). Battery swapping
requires big efforts for standardization on the side of the electric vehicle, as it
needs the capability to remove and release the battery very fast by having the
battery pack at a certain position under the vehicle. Currently, the EASYBAT
consortium, consisting mainly of Better Place, Renault SA, and Continental, is
working on building a standard for a battery switch platform (Gabay 2011).
Influence on battery: As batteries are very expensive and present such an important
part for electric vehicles, it is crucial that a battery is not damaged during
charging. OEMs design the battery of an electric vehicle for a lifetime of
about 10 years, which equals about 3,000 charging cycles. In order to avoid
battery deterioration, the battery should neither be overcharged nor be over-
heated during the charging process.
4.1.2 Economic Factors
Economic factors include the subfactors energymanagement, energy costs, initial and
installation costs, operation and maintenance costs, as well as revenue possibilities:
Energy management: The possibilities for energy management depend on the way
the electric vehicle is integrated with the grid. Thereby, five different ways
of charging (not to be confused with the four examined technologies) can be
differentiated depending on the complexity of connectivity (Brylawsk et al.
2008). Convenience charging means that the electric vehicle starts charging as
soon as it is plugged in, similar to typical appliances. Timed charging is more
advanced and allows delaying the charging process for a given time until an
installed program or the utility company gives a signal to start. Smart charging
enables real time communication between an electric vehicle and the grid and
is thereby able to adjust the charging directly to the needs of the grid. In addition,
the electric vehicle can provide unidirectional ancillary services such as fre-
quency regulation. Vehicle-to-building/home is similar to vehicle-to-grid (V2G),
but the electric vehicle communicates only locally with the energy management
system of the building and not with the grid. The batteries of the electric vehicles
can be used via a bidirectional power transfer as a back-up power for certain
periods of time in order to increase flexibility and reliability of the electrical
power distribution system. Vehicle-to-grid is the most complex form of connec-
tivity as an electric vehicle is directly connected to the grid and enables
a bidirectional energy flow. V2G offers all the functionalities and benefits of
the other options and also makes bidirectional ancillary services possible like
spinning reserve (Boulanger et al. 2011; Brylawsk et al. 2008). The studied
technologies differ in suitability for the usage of energy management services as
they are operated with different power levels and over different time spans.
How to Charge Electric Vehicles: A Comparison of Charging Infrastructure. . . 493

Energy costs: The energy costs for a driver of an electric vehicle will differ mainly
depending on the charging infrastructure technology. The reasoning behind
this is that the running costs for a connection to the power supply increase
with the level of charging power provided, which results in higher energy costs.
In addition, experts anticipate that in future when more and more electric
vehicles are on the road and replace conventional internal combustion engine
vehicles, governments will introduce some kind of mobility tax on the distributed
electricity. Imposed taxes may differ across distinct charging infrastructure
technologies in order to support technology-specific properties.
Initial and installation costs: The total costs for a charging station consist of
hardware and one-time installation costs. The installation costs consist of labor,
construction, and permitting costs. These costs vary widely depending on the type
of charging station and on the location they are installed (Wiederer and Philip
2010). The total cost of a charging station for normal charging is 500–3,000 €,while a charging station for semifast charging costs 5,000–11,000 €. A fast
charging station accounts for total costs of 40,000–60,000 € and the costs for a
battery swapping station vary between 400,000 and 1,100,000 €.Operation and maintenance costs: The operation costs of the charging station are
related, among others, to the management of the process topology including
billing, customer management, and other features. However, these costs occur
only for smart chargers with integrated communication functionality. Other
operating costs can occur in public places when parking space in front of charging
stations needs to be rented. In addition, for fast charging, a certain provision fee
has to be paid to the utility company for making such high amounts of power
available. The maintenance costs for charging stations consist of carrying out
necessary maintenance, cleaning tasks, and inspections of the functionality of
the charging station and vary for the different technologies (Wiederer and Philip
2010).
Revenue possibilities: There are two basic models to generate revenues from a
charging station, the pay-per-use model and the subscription model. In a pay-
per-use model, revenues are determined by the degree of utilization of the
charging station, the throughput in kWh, and the price per kWh. In a subscription
model, the consumer has to pay a subscription fee for using the charging station
either monthly or annually (Frost and Sullivan 2011). Both models can also
be combined. Further revenues may be generated depending on technologies.
These could be a combination of charging and parking, charging and shopping (free
charging gives an incentive to go shopping/eating in nearby shops/restaurants),
and advertisement as well as the gas station concept (secondary services).
4.1.3 Social Factors
Social factors are composed of the subfactors, ease of use and safety:
Ease of use: The ease of use to charge an electric vehicle is decisive to increase
market penetration of electric vehicles by showing their convenience and
decreasing the barriers of technology acceptance. Therefore, the whole charging
494 B. R€omer et al.

process should be designed as convenient as possible from a consumer per-
spective. The charging process at a charging station involves the use of the
charger and connector as well as handling the control elements (authentication/
identification, billing, etc.). Control elements as well as necessary process steps
differ with the studied technologies.
Safety: The different types of charging stations have to be protected from
overcharging, technical shocks, vandalism, as well as accidents with the electric
vehicles’ battery. The intelligence and the protection mechanism, which are
integrated into a charging station, are increasing with power levels in order
to provide sufficient safety features. In the standard IEC 61851-1, the different
charging modes are defined, and certain safety standards are determined.
In addition, it is important to educate consumers on the charging process of an
electric vehicle with different voltage levels in order to reduce their anxieties,
especially for fast charging.
4.2 Not “One Ring to Rule Them All”: Different Technologiesfor Different Locations
Figure 2 shows the alternative utility scores of the different charging infrastructure
technologies for the respective charging location. These scores illustrate the prefer-
ences toward a charging infrastructure technology for the different locations. In the
following, the results for each location are explained in detail:
Home: As shown in Fig. 2, normal charging scores 34.61 %, semifast charging
29.71 %, fast charging 15.69 %, and battery swapping 19.99 %. The three sub-
factors with highest priority weights are ease of use (17 %), initial and installation
costs (13 %), and safety (12 %). Thus, normal charging is the superior charging
infrastructure technology for home charging, followed by semifast charging.
Battery swapping and fast charging are not recommendable. Normal charging is
ranked best in all three aspects: technological, economic, and social.
Fig. 2 Alternative utility scores for the different charging locations (rounded values)
How to Charge Electric Vehicles: A Comparison of Charging Infrastructure. . . 495

Work/business: Normal charging scores 32.55 %, semifast charging 29.04 %, fast
charging 17.62 %, and battery swapping 20.78 %. The three subfactors with
highest priority weights are in this case as follows: ease of use (15 %), safety
(11 %), and the degree of standardization (11 %). Hence, we recommend normal
charging for the charging location work/business followed by semifast charging.
Battery swapping and fast charging are not considered to be a viable option for
this location. Once more, normal charging outperforms the other alternatives in
all three factors technological, economic, and social, while semifast charging is
always ranked second.
Public: Normal charging scores 24.80 %, semifast charging 24.88 %, fast charging
26.22 %, and battery swapping 24.10 %. Most important subfactors are revenue
possibilities (20 %), charging time (16 %), and ease of use (9 %). Fast charging is
ranked best in regard to economic factors as the revenue possibilities are
considered to be very high and account for 20 % in this case. It can be concluded
that fast charging is the most preferred option for the charging location public.
However, as utility scores of other alternatives for this location are very close,
we cannot give a general recommendation. Individual cases should be analyzed.
Highway: Normal charging scores 22.84 %, semifast charging 22.88 %, fast
charging 29.25 %, and battery swapping 25.03 %. Most important subfactors
are revenue possibilities (23 %), charging time (22 %), as well as initial and
installation costs (9 %). We recommend fast charging for highway locations.
5 Conclusion and Implications
Finding the right infrastructure setup is key to leverage the huge potential of EVs.
We provide a catalogue of 11 criteria to assess the technologies of normal, semifast,
and fast charging as well as battery swapping. Furthermore, we developed and
tested a decision framework for the selection of the most suitable technology in
specific use-cases. For Europe, we found that, on the one hand, at home and
workplaces, normal charging is the most suitable technology. Hence, for these
locations, more expensive technologies should not be promoted by governments
and advertised by manufacturers. On the other hand, in public places and for
highway stations, fast charging is the most suitable technology. Thus, publicly
accessible stations should offer fast charging. For all studied use-cases, our recom-
mendation is that battery swapping stations should not be implemented.
6 Limitations and Further Research
Our study provides a decision framework for the selection of charging technologies
and recommends a selection of technologies for certain use-cases in Europe.
However, there are still some limitations providing avenues for further research.
496 B. R€omer et al.

First, the defined location types are still an aggregation of use-cases, which could
be differentiated more precisely, e.g., depending on the income-level in home
locations or depending on the branch in work/business context. Especially for
public locations, further differentiation could lead to more stable recommendations.
Second, we only applied the decision framework on Europe. As conditions and
preferences differ around the world (e.g., varying power levels), future research
could focus on other regions, followed by a comparison of technology selections.
Third, our research compared the technologies of normal, semifast, and fast charg-
ing as well as battery swapping. Further research could be extended on inductive
charging technologies. Fourth, we interviewed and surveyed experts as up to now
market penetration of charging technologies is on a low level. Future research could
directly question end users.
References
Ananda J, Herath G (2009) A critical review of multi-criteria decision making methods with
special reference to forest management and planning. Ecol Econ 68(10):2535–2548
Bhushan N, Rai K (2004) Strategic decision making: applying the analytic hierarchy process.
Springer, New York
Bogner A, Littig B, Menz W (2009) Interviewing experts, 1st edn. Palgrave Macmillan,
Basingstoke
Boulanger AG, Chu AC, Maxx S, Waltz DL (2011) Vehicle electrification: status and issues. Proc
IEEE 99(6):1116–1138
Brown S, Pyke D, Steenhof P (2010) Electric vehicles: the role and importance of standards in an
emerging market. Energy Policy 38(7):3797–3806
Brylawsk M, Lovin AB, Schewel L (2008) Smart Garage Charrette report. Rocky Mountain
Institute, Snowmass
Chambers N (2011) Power politics: competing charging standards could threaten adoption of
electric vehicles. http://www.scientificamerican.com/article.cfm?id¼fast-charging-electric-
vehicle-standards&print¼true. 14 July 2011
Chou Y, Lee C, Chung J (2004) Understanding M-commerce payment systems through the
analytic hierarchy process. J Bus Res 57(12):1423–1430
European Committee for Standardization (2011) Focus Group on European electro-mobility:
standardization for road vehicles and associated infrastructure. European Committee for
Standardization
Flick U (2009) An introduction to qualitative research, 4th edn. Sage Publications, Los Angeles
Framel C, Little G, Salisbury M (2010) Preparing for the arrival of electric vehicles. U.S.
Department of Energy, Washington, DC
Frost and Sullivan (2009) Executive assessment of new business models and their ROI for vehicle
manufacturers; utilities and infrastructure service providers in the electric vehicle market. Frost
and Sullivan
Frost and Sullivan (2011) Strategic technology and market analysis of electric vehicle charging
infrastructure in Europe. Frost & Sullivan, London
Gabay C (2011) Models and generic interfaces for easy and safe battery insertion and removal
in electric vehicles. http://cordis.europa.eu/fetch?CALLER¼FP7_PROJ_EN&ACTION¼D&
DOC¼6&CAT¼PROJ&QUERY¼012db0fa4c34:5429:5754f83e&RCN¼97743. 15 July 2011
IEA (2011) CO2 Emissions from fuel combustion highlights. International Energy Agency, Paris
How to Charge Electric Vehicles: A Comparison of Charging Infrastructure. . . 497

Kiker GA, Bridges TS, Varghese A, Seager TP, Linkov I (2005) Application of multicriteria decision
analysis in environmental decision making. Integr Environ Assess Manag 1(2): 95–108
Laufenberg K, Moorhouse J (2010) Electric vehicles: powering the future. The Pembina Institute
Liebold R, Trinczek R (2009) Experteninterview. In: K€uhl S, Strodtholz P, Taffertshofer A (eds)
Handbuch Methoden der Organisationsforschung. VS Verlag f€ur Sozialwissenschaften,
Wiesbaden, pp 32–56
Linkov I, Satterstrom FK, Kiker G, Seager TP, Bridges T, Gardner KH, Rogers SH, Belluck DA,
Meyer A (2006) Multicriteria decision analysis: a comprehensive decision approach for
management of contaminated sediments. Risk Anal 26(1)
Lombardi P, Heuer M, Styczynski Z (2010) Battery switch station as storage system in an
autonomous power system: optimization issue. Paper presented at the IEEE Power and Energy
Society general meeting
Meuser M, Nagel U (1997) Das Experteninterview: Wissenssoziologische Voraussetzungen und
methodische Durchf€uhrung. In: Friebertsh€auser B, Prengel A (eds) Handbuch Qualitative
Forschungsmethoden in der Erziehungswissenschaft. Weinheim-Basel, Weinheim, pp 481–491
Saaty TL (1977) A scaling method for priorities in hierarchical structures. J Math Psychol 15(3):
234–281
Saaty TL (1980) The analytic hierarchy process: planning, priority setting, resource allocation,
1st edn. McGraw-Hill, New York
Saaty TL (1990) How to make a decision: the analytic hierarchy process. Eur J Oper Res
48(1):9–26
Saunders JH (1994) A comparison of decision accuracy in the analytic hierarchy process and point
allocation. George Washington University, Washington, DC
Schmutzler J, Wietfeld C (2010) Analysis of message sequences and encoding efficiency for
electric vehicle to grid interconnections. Paper presented at the IEEE vehicular networking
conference (VNC), Jersey City, NJ
Schoemaker PJH, Waid CC (1982) An experimental comparison of different approaches to
determining weights in additive utility models. Manage Sci 28(2):182–196
Society of Motor Manufacturers and Traders (2010) Report on the current situation and future
direction of electric vehicle charger standardisation. Society ofMotorManufacturers and Traders
Tanaka N (2011) Technology roadmap: electric and plug-in hybrid electric vehicles. International
Energy Agency, Paris
Trinczek R (1995) Experteninterviews mit Managern: Methodische und methodologische
Hintergr€unde. In: Brinkmann C, Deeke A, V€olkel D (eds) Experteninterviews in der
Arbeitsmarktforschung: Diskussionsbeitr€age zu methodischen Fragen und praktische
Erfahrungen. Institute for Employment Research N€urnberg, pp 59–67. http://www.iab.de/en/
publikationen/weitere-publikationen/weitere-publikationen-details.aspx/Publikation/i950829f02
Tzeng G-H, Lin C-W, Opricovic S (2005) Multi-criteria analysis of alternative-fuel buses for
public transportation. Energy Policy 33:1373–1383
U.S. Environmental Protection Agency (1994) Automobile emissions: an overview. U.S.
Environmental Protection Agency, Washington, DC
Vaidya OS, Kumar S (2006) Analytic hierarchy process: an overview of applications. Eur J Oper
Res 169(1):1–29
Van den Bossche P (2010) Electric vehicle charging infrastructure. In: Pistoia G (ed) Electric and
hybrid vehicles: power sources, models, sustainability, infrastructure and the market. Elsevier,
Amsterdam, pp 517–543
Wiederer A, Philip R (2010) Policy options for electric vehicle charging infrastructure in C40
cities. Harvard Kennedy School, Boston
Yudan A (2010) Accelerating e-mobility: better place. Presentation held at the Automotive
Summit on November 9, 2010 in Brussels.
498 B. R€omer et al.

Innovations in an Emerging Software Cluster
M. Arun
1 Introduction
India is home to a thriving software industry with an estimated total production of
Rs. 3,012 billion (2009–2010). The industry, with its strong export orientation, has
done wonders for India’s foreign exchange, earning a gross export revenue of 50.1
billion USD. It has put India in the fifth place among countries that export infor-
mation and communication technology (ICT) services and in the first place among
non-OCED countries (UNCTAD 2009). India is also the most dynamic country in
terms of software services export, going by the data on export growth between 2000
and 2007 (UNCTAD 2009).
These impressive figures notwithstanding the Indian software industry have also
come in for some criticism for not being innovative and offering only low-value
services (D’Costa 2002; Joseph and Harilal 2001; Heeks 1996). Researchers attri-
bute the industry’s growth to India’s low wage rates, an advantage which India
could soon lose in the face of stiff competition from other Asian and East European
countries. Most authors, therefore, believe that for the industry to sustain its growth,
it should move up the value chain with an increase in wage rate or grow quantita-
tively with increased labour supply which could, on the other hand, lower wages.
Anything short of these strategies is expected to stunt the growth of the Indian
software industry.
India’s low share of software products1 in total software and related services
exports (Heeks 1996; Joseph and Harilal 2001) has been oft-cited as a sign of lack
M. Arun (*)
Society for Promotion of Alternative Computing and Employment,
C11, Elenkom Gardens, Vellayambalam,
Trivandrum 695010, Kerala, India
e-mail: [email protected]
1 Software products are those pieces of software which provide generic functionality so that it can
be useful to more than one user. Software products are made once and sold many times.
Department of Management Studies, Indian Institute of Science, Bangalore,
Driving the Economy through Innovation and Entrepreneurship,DOI 10.1007/978-81-322-0746-7_41, # Springer India 2013
499

of innovation in the industry. The export orientation of the industry and the lack of a
domestic market for software are held responsible for this turnaround (D’Costa
2002; Heeks 1996). However, there are others who argue that the Indian software
industry is moving up the value chain (Arora et al. 2001; Balakrishnan 2006). Their
argument is based on anecdotal evidence of software products coming up in India
and the enhanced capability of Indian software industry in the form of adoption of
new technology and upgradation of software development processes. The emer-
gence of embedded software development is also considered as an indication of
Indian firms delivering higher value services.
Innovation in software sector need not be only in the form of new technology
or products. Recently, new business models have become an important source of
innovation. From software as a value add to hardware, software production has
evolved into an independent specialised activity. With the evolution of technology,
the business model has continued to change. This interaction between business
model and technology has been a continuous source of innovation in software
sector. Recently, with the emergence of free and open source software (FOSS), a
range of new business strategies and licensing software has come up (Lippoldt and
Stryszowski 2009), fuelling more innovation in the sector.
This chapter is structured into five sections. Section 2 summarises the research
question and methodology. In Sect. 3, I briefly discuss the analytical framework
used for this study and clarify some of the concepts used. Section 4 provides a
background picture of the software industry in Trivandrum and an analysis of the
case studies. In the concluding section, I reflect on the findings of case study and
their implication for the Indian software industry.
2 Research Question and Methodology
Existing literature throws little light on innovation in the Indian software industry.
Developing a micro level picture can help comprehend innovation as it manifests
itself in whole of Indian software industry. Hence, I raise the following questions in
the context of the emerging software cluster in Trivandrum:
• Are the software firms in the cluster innovative?
• If yes, how do they innovate?
To answer the research questions, I adopted multiple case study methods (Yin
2009) covering six firms from Trivandrum cluster. While Trivandrum has only a
small share in India’s overall software production, it is one of the oldest and fast
growing clusters. It is a microcosm of the Indian software industry in that both are
dominated by software service firms with a few large firms and several small firms.
But there is a limit to this comparability. This study does not capture innovation in
large firms which contribute to a bulk of India’s software production. The study also
leaves out multinational firms in India.
500 M. Arun

The most important challenge was in accessing information. Firms, in general,
are not open about their internal operations. This study required someone at the
senior management level to provide necessary information.
3 Analytical Framework
The word innovation comes from the Latin word, ‘innovatus’, which means
‘to renew or change’. According to Joseph Schumpeter, innovation is what drives
economy through a qualitative change at a historical time (Fagerberg 2005).
Change brings the newness that is often associated with innovation. Schumpeter
identifies five different types of innovation—(1) introduction of new products,
(2) new methods of production, (3) identification of new sources of supply, (4)
exploitation of new market and (5) new ways to organise business. Despite the
recognition of five types of innovation, in economics literature, there is an overem-
phasis on the first two. For example, in OECD’s Oslo Manual (OECD 2005),
innovation refers to ‘implemented technologically-new products and processes
and significant technological improvements in products and processes’. A broad
perspective of innovation as outlined by Schumpeter has been adopted for this
study. The study looks at whether firms are able to bring in change within them-
selves and in the world around.
Innovation is nowadays considered a complex interactive process involving several
actors. These actors include firms like suppliers and organisations like governments,
academic institutions, users, etc. They influence and are influenced by each other.
The system of innovation approach helps to understand innovation in its complexity.
It is considered as a holistic and multidisciplinary approach to innovation (Edquist
2005). Lundvall whomade pioneering contributions to the development of the system
of innovation approach argues that, even if the approach is not sufficiently ‘theoreti-
cal’, it does offer itself as an analytical tool to build general and valid knowledge of
causality relating to innovation (Lundvall 2010). He refers to the system of innovation
as an analytical framework (see Lundvall (2007) for general process involved using
this analytical framework). Along with this broad framework, I also use ideas devel-
oped in the sectoral system of innovation.
The idea of sectoral system of innovation comes out of the question, why
different sectors of industry like chemical, software, machine tools, etc., differ in
terms of innovation. Apart from the difference in terms of actors, institutions and
interconnections, Malerba, the pioneer of this approach, brings in characteristics
of knowledge and technological domain as the key differentiator for innovation in
different industrial sectors (Malerba 2002). The boundary of sectoral system is
determined by knowledge and technological domain, which can have national,
regional and global dimensions.
Innovations in an Emerging Software Cluster 501

3.1 Learning
Learning is the most important process in innovation. Two different modes of
learning are discussed in the context of innovation—STI and DUI mode of learning
(Lundvall 2010). STI learning is the learning associated with scientific and techno-
logical knowledge creation. R&D and other activities that relate to utilisation and
access to knowledge are emphasised here. It is associated with exchange of explicit
codified knowledge. DUI learning, on the other hand, is about learning by doing,
using and interacting. It involves organisational learning, employee participation
and competency building, participation in industrial networks, etc. (Jensen et al.
2007). I try to look at the role of these different learning modes in software firms in
Trivandrum.
4 Software Cluster in Trivandrum
The growth of software industry was closely tied up with the growth of electronics
industry in Kerala in the 1970s. Trivandrum, the capital city of Kerala, was one of
the nine locations selected by the Government of India to setup software technology
parks. Until 2004–2005, the software industry of Kerala was almost exclusively
based in Trivandrum. Although new locations like Kochi have emerged, Trivandrum
continues to be the most important hub for software industry in Kerala.
Most software firms in Trivandrum are situated in Technopark, a technology park
under the government. As of November 2010, it is a host to 164 fully operational
firms, which account for nearly 30,000 employees. Out of these firms, 110 are
software firms and 52 are ITeS firms (2 are unknown). Two software firms, UST
Global and IBS Software Services, together account for nearly 40% of the total
employment (6,000 numbers each). Both firms were started by entrepreneurs from
Kerala who were working abroad.
In terms of size, the industry is positively skewed. Twenty-six percent of
software firms and 31% of ITeS firms are in the incubation stage with 10 or less
number of employees. Four firms in software sector and two firms in ITeS sector
have more than 500 employees.
More than 60% of firms were started and are owned by Indian entrepreneurs.
Except for the two Indian IT majors, Infosys and Tata Elxsi, all other firms were
started in Technopark by entrepreneurs from Kerala. Thirty-one percent of the firms
have foreign equity. There are no important multinational firms in Kerala.
5 Case Study Analysis (Table 1)
5.1 Nature of Innovation
Table 2 summarises the case studies. Adoption of new processes and acquiring new
technological capabilities are two important forms of innovation in the cluster.
502 M. Arun
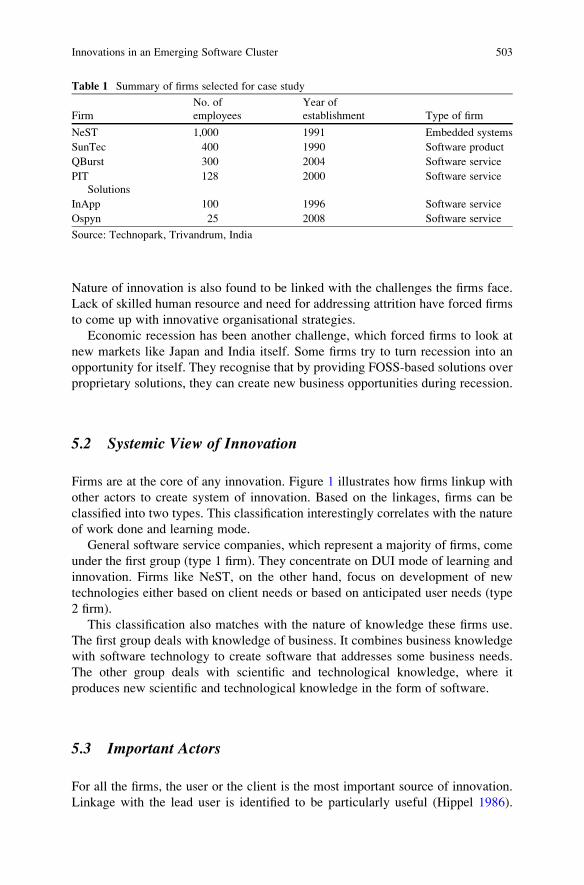
Nature of innovation is also found to be linked with the challenges the firms face.
Lack of skilled human resource and need for addressing attrition have forced firms
to come up with innovative organisational strategies.
Economic recession has been another challenge, which forced firms to look at
new markets like Japan and India itself. Some firms try to turn recession into an
opportunity for itself. They recognise that by providing FOSS-based solutions over
proprietary solutions, they can create new business opportunities during recession.
5.2 Systemic View of Innovation
Firms are at the core of any innovation. Figure 1 illustrates how firms linkup with
other actors to create system of innovation. Based on the linkages, firms can be
classified into two types. This classification interestingly correlates with the nature
of work done and learning mode.
General software service companies, which represent a majority of firms, come
under the first group (type 1 firm). They concentrate on DUI mode of learning and
innovation. Firms like NeST, on the other hand, focus on development of new
technologies either based on client needs or based on anticipated user needs (type
2 firm).
This classification also matches with the nature of knowledge these firms use.
The first group deals with knowledge of business. It combines business knowledge
with software technology to create software that addresses some business needs.
The other group deals with scientific and technological knowledge, where it
produces new scientific and technological knowledge in the form of software.
5.3 Important Actors
For all the firms, the user or the client is the most important source of innovation.
Linkage with the lead user is identified to be particularly useful (Hippel 1986).
Table 1 Summary of firms selected for case study
Firm
No. of
employees
Year of
establishment Type of firm
NeST 1,000 1991 Embedded systems
SunTec 400 1990 Software product
QBurst 300 2004 Software service
PIT
Solutions
128 2000 Software service
InApp 100 1996 Software service
Ospyn 25 2008 Software service
Source: Technopark, Trivandrum, India
Innovations in an Emerging Software Cluster 503

Table
2Innovationin
firm
sunder
study
Firm
Firm
type
Typeofinnovation
Sourceofinnovation
opportunity
Knowledgesource
Significance
ofNDA
Learningmode
Presence
of
form
alR&D
NeST
Embedded
New
technology
development,
HRprocess
Developmentin
hardware
technology
Hardware
manufacturers
(client),FOSS
community,
research
organisations
Strong
STIMode
Yes
SunTec
Software
product
New
featuresin
product,HR
process
New
platform
software
technology,new
business
requirem
ent
Suppliersof
platform
software,user
community
Nil
Combinationof
STIand
DUI
Yes
InApp
Software
services
New
market,new
technological
capabilities,
new
quality
practices
Learningnew
software
technology
Suppliersof
platform
software,FOSS
community
Moderate
DUImode
No
PIT
Solutions
Software
services
New
technological
capabilities,
new
quality
practices
Learningnew
software
technology
Suppliersof
platform
software,FOSS
community
NA
DUImode
No
QBurst
Software
services
New
technological
capabilities,
new
organisational
practice
Learningnew
software
technology
Suppliersof
platform
software,FOSS
community
Nil
DUImode
No
Ospyn
Software
services
New
technological
capabilities
Learningnew
software
technology
FOSScommunity
Nil
DUImode
No
Source:
Owncompilation
504 M. Arun

Product firms like SunTec have created user communities on the Internet which
help them identify new requirements and faults in existing software. The client has
been the source of technological- and process-related knowledge, particularly when
the client is an intermediate user with technological capabilities of its own.
Academic institutions enter innovation process in two ways. They build human
resource through educational activities and develop knowledge through research
activities. For all the firms in the cluster, academic institutions like universities are a
source of skilled human resource. This has been identified as the most important
role of academic institutions in the innovation system.
Type 2 firms use academic institutions as sources of knowledge. Firms specia-
lising in embedded systems like NeST have linkages with institutions like Sree
Chitra Tirunal Institute for Medical Sciences & Technology (SCTIMST), College
of Engineering, Trivandrum, and Centre for Development in Advanced Computing
for research. They build technological and scientific knowledge collaboratively
(STI learning).
Demand for human resource has spawned a large number of private training
institutions. They focus on training people in specific technological skills that firms
need. They fill the gap between a university level education and the industry’s needs.
Expert professionals are the next set of actors who contribute independently to
the innovation process of a firm. While there is a lot of discussion around reverse
migration and knowledge coming back, none of the firms studied here were able to
give an example of an expert coming back to the cluster with new knowledge and
enhancing the innovation potential of the firm. However, many of the entrepreneurs
are expert professionals who have worked outside the cluster. Interpersonal relation
Fig. 1 Innovation system in Trivandrum software cluster
Innovations in an Emerging Software Cluster 505

is another channel through which an expert professional contributes to innovation
process. This has been exploited in the case of type 2 firms, where knowledge
access is restricted.
Epistemic communities form a very important source of knowledge for firms in
a cluster. Virtual communities in the form of mailing lists act as an important
knowledge base for firms. There are communities centred around various techno-
logies and products. Some of them are supported by supplier firms like a community
of developers using a microprocessor, or they are independent like free software users
group. Unlike codified and explicated knowledge that is available through knowledge
bases like scientific articles, books or patents, these communities are source of what
is usually considered as tacit, contextual knowledge. The firms find it easier and
efficient to use these community forums to raise questions about technical challenges
they face. According to a manager of a research division, these community forums
are a more efficient source of knowledge than even a known peer in the cluster,
as chances of getting contextually relevant knowledge is higher in forums in which
professionals from different parts of the world participate. Often, they receive a
response from someone who has experienced a similar challenge. In the process,
a lot of contextual knowledge which is tacit gets explicated.
5.4 Open Technology and Innovation
Open technologies like web-related technologies and free and open source software
have contributed significantly to innovations by firms. Open nature of knowledge
and fewer cost barriers such as licensing give firms easier access to knowledge. All
the firms reported to be heavy users of free software. More than 50% of NeST’s
projects now depend on GNU/Linux operating system, the most popular free
software operating system. Firms become part of an epistemic community built
around these technologies and access knowledge from it.
There is a significant concentration of firms working on web technologies in
the cluster. All the generic software solution providers in the cluster work with
web technologies. Most of them claim expertise in free software tools for web
development. These tools vary from a simple tool to publish content on the web to
software development framework to develop complex software for business needs.
Availability of free software for all these needs helps firms to provide various
solutions, from websites to high-value e-commerce and social networking solu-
tions, easily and quickly. Free availability of tools helps firms to move up the value
ladder. It is observed that firms start off as a simple website design company. Then,
they make use of tools like content management system to provide more complex
websites and slowly move to higher value solutions such as cloud-based software.
From supply side, heavy concentration of firms in web technologies has to be
understood from the point of view of low entry barrier with very low skill require-
ment, low cost of access to knowledge (open, non-proprietary knowledge base) and
advanced development tools (free software) and high level of scalability from
506 M. Arun

simple website to complex software (innovation potential). On the demand side,
the industry has been moving more towards web-based solutions for custom
software needs. Demand for services also varies considerably in its quality, from
a simple website to complex software. Web has turned out to be the most important
platform for software innovation in the last several years.
5.5 Learning and Related Institutions
Accessing and accumulating knowledge is one of the most important processes
that go on in firms. Two important institutions that have come up in this context are
non-disclosure agreements (NDAs) and FOSS licence. NDAs play a significant role
in knowledge access for all firms. While the objective of NDA is to limit a firm’s
ability to exploit knowledge transferred to it, the case studies show that it does not
achieve its objective.
Similarly, the FOSS model of open and collaborative development provides
access to a wealth of knowledge which firms leverage on. Stock of knowledge
openly available for appropriation enables new firms to leapfrog older firms which
have accumulated knowledge.
As a source of knowledge, virtual epistemic communities have a prominent role.
A lot of contextual and tacit knowledge flows through these communities. Considering
the importance of tacit knowledge in production, it is important that the working of
these communities is investigated more. SunTec has been able to create a community
around its software, which provides inputs for innovation. It is an innovative approach
to ensure continued flow of knowledge relevant for innovation from users to firms.
5.6 Global Linkages over Local
One interesting aspect that comes out in the case study is that important knowledge-
related linkages of innovation are global. These include the linkage between firms
and the user/market and between firms and suppliers of technology. Only a few
firms have connections with other agents regionally or nationally. Hence, clusters
like Technopark appear as nodes in a global system of innovation. Their linkage
with national or regional actors is primarily for skilled human resource.
6 Conclusion
6.1 Innovation
The growth record of Indian software industry has proved all pessimistic observers
wrong. The study of software firms in Trivandrum suggests that the industry is indeed
Innovations in an Emerging Software Cluster 507

innovative. The industry has been improving its capabilities through improvement in
process, absorption of new technological capabilities and entry into new markets.
Discussions on the innovativeness of Indian software industry are often based on
the assumption that creation of software products and new technological knowledge
signals superior innovation. Such an assumption comes out of a narrow perspective
of innovation which emphasises on technological knowledge and STI mode of
learning. The micro level investigation shows that software service firms are also
quite innovative and dynamic.
Literature on the Indian software industry so far has not looked into the
characteristics of the knowledge base that the firms in the industry deal with. This
chapter argues that there are at least two sub-sectoral systems of innovation that
depend on two different knowledge base-business knowledge and technological
knowledge. These sub-sectoral systems emphasise on different modes of learning
and adopt different models. Further research in this direction will help to better
explain the service orientation of the Indian software industry and its evolution.
6.2 Changing Pattern of Innovation
The innovation strategy of software firms has been predominantly based on learning
the latest technologies, combining them with business knowledge and building
solutions for specific needs of customers. It follows Schumpeter Mark II model
characterised by ‘creative accumulation’. The industry is dominated by a stable
core of large firms which present a significant barrier for new firms from entering.
This configuration is changing with the availability of technological knowledge
through FOSS and spillovers. The industry may move to Schumpeter Mark I model
characterised by ‘creative destruction’ (See Malerba 2002 for discussion on this).
Rather than follow technologies developed outside, the industry may build new
technologies at home. The industry may come up with new products and services that
address as well as create new demand. The current stable organisation of industry
could be replaced by a more turbulent one, with new firms emerging with new
technologies or addressing new demands.
References
Arora A, Arunachalam VS, Asundi J, Fernandes R (2001) The Indian software services industry.
Res Policy 30:1267–1287
Balakrishnan P (2006) Benign neglect or strategic intent? Contested lineage of Indian software
industry. Econ Pol Wkly 41(36):3865–3872
D’Costa AP (2002) Export growth and path dependence: the locking-in of innovations in the
software industry. Sci Technol Soc 7:51
Edquist C (2005) Systems of innovation–perspectives and challenges. In: Fagerberg J, Mowery
DC, Nelson RR (eds) The Oxford handbook of innovation. Oxford University Press, Oxford
508 M. Arun

Fagerberg J (2005) Innovation: a guide to the literature. In: The Oxford handbook of innovation.
Oxford University Press, New York, pp 1–26
Heeks R (1996) India’s Software Industry: State Policy, Liberalisation and Industrial Develop-
ment, Sage Publications, Inc, Thousand Oaks, CA, USA
Hippel EV (1986) Lead users: a source of novel product concepts. Manage Sci 32:791–805
Joseph KJ, Harilal KN (2001) Structure and growth of India’s IT exports: implications of an
export-oriented growth strategy. Econ Pol Wkly 36(34):3263–3270
Lippoldt D, Stryszowski P (2009) Innovation in the software sector. OECD Publishing, Paris
Lundvall B (2007) National innovation systems-analytical concept and development tool. Ind
Innov 14:95
Lundvall B (2010) National systems of innovation: toward a theory of innovation and interactive
learning. Anthem Press, New York
Malerba F (2002) Sectoral systems of innovation and production. Res Policy 31:247–264
Jensena MB, Johnsonb B, Lorenzc E, Lundvall BA (2007) Forms of knowledge and modes of
innovation, Research Policy 36(5):680–693
OECD (2005) Oslo manual: proposed guidelines for collecting and interpreting technological
innovation data. OECD, Paris
UNCTAD (2009) Information economy report 2009: trends and outlook in turbulent times.
Technical report, United Nations
Yin RK (2009) Case study research: design and methods. Sage Publications, Inc, Los Angeles
Innovations in an Emerging Software Cluster 509

Innovation Management Strategy: Empirical
Evidence from Indian Manufacturing Firms
Jyoti S.A. Bhat
1 Background
The importance of having a well-focused innovation management strategy to
achieve a competitive edge needs no underscoring. Firms are well aware that
innovation performance has a significant impact on overall firm performance.
Several researchers have analysed the underlying factors that contribute towards
successful management of innovation. Two sets of opposing concerns dominate,
one focusing on strengthening of core capabilities for retention of business stability
and the second on acquisition of new capabilities to meet change requirements
(Kim and Mauborgne 2005). Despite an increased interest in reconciling continuity
and change in this context, few studies have examined how to balance the two. This
chapter analyses the impact of innovation management processes covering both
continuity and discontinuous change-related dimensions, on innovation perfor-
mance and on overall firm performance in an emerging country situation. Analysis
of the Indian manufacturing industry in this context offers some interesting
perspectives.
The broad rationale used in this chapter and an introduction to the basic concepts
are presented in the next section. The following section delineates the approach
used in the study, followed by a report on the major findings and important
implications emerging from these. The final section concludes by presenting the
study contributions and limitations.
J.S.A. Bhat (*)
Department of Scientific and Industrial Research, Ministry of Science and Technology,
Government of India, New Delhi, India
e-mail: [email protected]
Department of Management Studies, Indian Institute of Science, Bangalore,
Driving the Economy through Innovation and Entrepreneurship,DOI 10.1007/978-81-322-0746-7_42, # Springer India 2013
511
2 Innovation and Its Management
Although acknowledged widely that innovation is critically important, there is no
academic consensus yet about its definition, scope, characteristics or operationa-
lization. The definition for innovation adopted for use in this chapter is the mecha-
nism by which firms produce new and improved products, processes and systems
required for adapting to changing markets, technologies and modes of competition
(National Knowledge Commission 2007).
Innovation management literature dwells on the innovation process itself: the
development of new products, processes or services; and on innovation compe-
tence: the ability to develop and carry out innovative activities. Innovation man-
agement in a firm, referred to in this paper as its innovation capabilities, is a set of
firm processes that influence the outcome of innovation, including the development
of new products, processes or services, and improvements thereof. The outcome of
innovation, referred to as innovation performance in this paper, influences the
overall firm performance.
A firm needs to have ambidextrous capabilities enabling it to adapt to shifting
environments to ensure continued survival and competitiveness (Birkinshaw and
Gibson 2004). March’s (1991) exploration-exploitation framework has explicitly
brought out the importance of inculcating organizational preparedness and simul-
taneously implementing measures for creation of innovation capabilities. However,
pursuing change and continuity simultaneously creates tensions that are fairly
significant, as the goals and time horizons of these two approaches are undeniably
most often quite divergent and dissimilar (Mintzberg 1994). Yet, firms that balance
and reconcile these tensions effectively appear to achieve greater innovation per-
formance and, in addition, higher firm performance (Bhat et al. 2011a).
Literature indicates that five broad categories of firm processes encompass the
innovation capabilities of a firm. Each category has a number of continuity pro-
cesses as well as change processes that are distinct in terms of purpose and
implementation. Technology processes play a central role in acquiring innovation
development capabilities for sustaining organization-level competitive advantage
(Tushman and Anderson 1986). Technology processes are as important for the
success of planned new product development as for enabling the firm to improve its
response to sudden changes in the environment prompted by external technology
developments (Bhat 2011). The firm’s organizational processes are vital to promote
a facilitating culture for encouraging continuous innovation and at the same time
enable smooth and creative transition of skill sets in times of unanticipated change
(Barney 1995). The learning processes are concerned with knowledge accumula-
tion within the firm and influence its continuous improvement capabilities and
its ability to create new and useful knowledge (Nonaka and Takeuchi 1995). The
firm’s managerial processes generate and strengthen the skills, knowledge and
resources to implement an innovation (Teece 2007). Trott (1998) describes how
interactions of the functions with the external environment, or the firm’s networkingprocesses, are equally as important as the interactions of the internal functions such
512 J.S.A. Bhat
as research and manufacturing within the organization for successful innovation
management. These processes enable the firm forge effective alliances for planned
activities and at the same time fall back on partnerships in times of unantici-
pated change. Invariably, each of these five sets of processes has both continuity
and change dimensions. This surmises that innovation management in a firm largely
comprises managing different continuity and change dimensions of its technology,organization, learning, managerial and networking processes. A firm’s innovation
capability is thus multifaceted, involving all these dimensions meshed in an
integrated manner. Prior research offers interesting insights into the characteristics
of each of these innovation management dimensions (Bhat 2010; Bhat et al. 2011a).
The continuity dimensions in the case of each set of processes follow a trajectory
that is quite different from that of the change dimensions, and yet, both are
necessary for growth and survival of the firm. Harmonizing these tensions is a
challenge but necessary to enhance innovation performance (Bhat et al. 2011a),
as mentioned below:
H1: Capability of a firm to manage both continuity and change aspects ofinnovation will be positively related to its innovation performance.
2.1 Continuity and Change Dimensions of Technology Processes
Considering technology continuity processes related to innovation, new product
development projects conceived with long-term business targets in view and
implemented through accumulation of knowledge from a variety of different inputs,
such as marketing, R&D and manufacturing, allow technology skills to build up
gradually over time, with better understanding of customer needs (e.g. Nonaka and
Takeuchi 1995). A company-wide integrated approach in this regard is especially
significant. Unforeseen change prompts the need for technology processes that
allow experimentation and exploration because it is impossible to tell which options
are appropriate (Bhat 2005). Partnerships, even unlikely alliances, for generation of
technology solutions are resorted to when change occurs. Dynamic technological
capabilities enable firms to achieve superior long-term business performance
(Teece 2007).
2.2 Continuity and Change Dimensions of OrganizationProcesses
Literature on organizational continuity aspects of innovation has identified appropri-
ate resources, and several elements of the work environment, such as organizational
systems, practices and processes; use of teams and organization orientation;
Innovation Management Strategy: Empirical Evidence from Indian Manufacturing. . . 513

champion holding a senior position and with proven leadership capability; and
shared corporate platforms and functions, as drivers of innovation (e.g. Collins
and Porras 1997; Bhat 2005). Mintzberg (1994) has observed that flexibility and
its entrepreneurial mode are both important for innovation. This organizational
strategy-making mode can provide a clear and complete vision or direction, a
degree of deliberateness, and provide for integration of strategies with each other
and with the environment and yet allow the flexibility to elaborate and rework the
vision. Hence, both continuity and change-related organization processes matter
to innovation performance (Bhat 2010; Bhat et al. 2011a).
2.3 Continuity and Change Dimensions of Learning Processes
Learning capabilities comprising communication, specialized domain knowledge,
adaptability, collaboration, teamwork, planning and organizing have inter alia
been identified as crucial for honing of innovation capabilities. Change-capable
organizations have processes for organizational learning, benchmarking, best
practices and leveraging the knowledge of customers, competitors, suppliers and
partners (e.g. Leonard-Barton 1995). When dramatic changes occur that radically
alter an organization’s equilibrium, adequate steps to overcome organizational
inertia can make the outcome favourable (Beer and Nohria 2000). Doubtless,
learning processes have both continuity and change dimensions, that both coop-
erate and act in conflict, and yet both of which matter to innovation performance
(Bhat et al. 2011c).
2.4 Continuity and Change Dimensionsof Managerial Processes
Amongst managerial continuity aspects, the importance of linking technology strat-
egy to business goals for a company to thrive has been emphasized (Barney 1995).
Other critical factors include building and embedding an enduring and innovation-
supportive culture, appropriate organizational mechanisms for orchestrating manage-
rial skills and the vibrant and emphatic support by senior management (Collins and
Porras 1997). Managing change comprises myriad interconnected and interdependent
areas, calling for a ‘proactive/intended strategy’ that merges with a ‘reactive/adaptive
strategy’ (Mintzberg 1994). Different managerial processes including use of a strate-
gic framework, resource planning, tactics to handle varied risk situations and use of a
‘shared language’ for effective communication have been advocated to handle
change (e.g. Tushman and Anderson 1986). There is no gainsaying that both conti-
nuity and change managerial processes are vital for innovation performance (Bhat
et al. 2011b, c).
514 J.S.A. Bhat

2.5 Continuity and Change Dimensions of Networking Processes
Mechanisms and technologies to support different types of knowledge discovery,
capture, sharing and application systems from external sources are important.
The process enables the fusion of knowledge flows between people, facilitating
the knowledge transfer from person to person or from information to person (Bhat
et al. 2008). Lead users, partners and even competitors can be valuable sources of
innovation in an environment that supports sustained learning (von Hippel 2005). In
his innovation management framework, Trott (1998) draws attention to the utmost
need for interactions of the various organizational functions with the external
environment, particularly the customer (Nonaka and Takeuchi 1995). External
suppliers and lead users can be important conduits of knowledge, and interaction
with them can be particularly beneficial (von Hippel 2005). Hence, it is difficult
to deny that change and continuity aspects of networking are both necessary for
innovation performance (Bhat et al. 2011a, b).
There have been many empirical studies firmly establishing that innovation
performance, in itself, also markedly influences firm performance (Bhat et al.
2011b). Thus, the above continuity and change innovation management processes
also positively influence firm performance, as mentioned below:
H2: Capability of a firm to manage both continuity and change aspects ofinnovation will be positively related to firm performance.
3 Data and Measures
This chapter uses evidence from empirical analysis based on an opinion survey
of manufacturing firms in India. Data collected for the research uses cross-sectional
survey methodology, involving collection of information from different manufac-
turing firms at a single point in time. Purposive sampling, targeting the top
management (managing directors/chief executive officers or executives designated
by them) of 150 Indian manufacturing firms fulfilling specific financial perfor-
mance criteria, has been used. Firms covered are those with highest financial
performance (basis: highest average return on total assets during 2006–2007 and
2007–2008) selected from amongst top performing Indian firms during 2008 (basis
for top performance: market perception measured by highest average market
capitalization in 2007–2008). The sectors covered are (1) auto/auto-components
(private sector), (2) chemicals/drugs/pharmaceuticals (private sector), (3) general
engineering (private sector) and (4) general engineering (public sector).
Traditionally, measures for innovation performance rely on input-related factors
such as amount of R&D expenditure, R&D intensity, and number/kind of scientific/
technical personnel, patents and publications. In India, these measures have not
only been particularly unflattering in terms of assessing innovation capabilities of
firms, but not very effective either. Patenting and publishing activity by Indian firms
Innovation Management Strategy: Empirical Evidence from Indian Manufacturing. . . 515

is nominal and does not signify the extent of innovative activities carried out
by them. In fact, Indian firms have acquired the reputation of being innovative
with very less resources, giving rise to the term ‘frugal innovation’ (The Economist
2010). Under the circumstances, we measure innovation performance of Indian
firms on innovativeness (being novel), success in introduction of new products/
processes/services and improvements in managerial and production processes lead-
ing to improved product/service quality and features (Bhat et al. 2010).
Financial measures such as net profit, returns on assets and operating profit margin
popularly assess firm performance. However, several studies have drawn attention to
the need for balancing between financial and nonfinancial measures with regard
to overall firm performance (e.g. Kaplan and Norton 1996). Clear definition of
innovation goals, aligning them towards organizational goals, customer satisfaction,
resource availability and process quality improvements are aspects that measure
firm performance (e.g. Griffin and Page 1996). Thus, we link firm performance to
stakeholder (shareholder, government, employee, management, local community,
government supplier and collaborator) satisfaction, resource (financial and human
resource) generation capabilities, reliability (quality and timeliness) of internal
processes and the extent of linkage between the innovation goals and the business
goals of the firm (specificity, relevance and measurability).
The input variables are measured by drawing on the discussion presented earlier
in Sect. 2 and on research undertaken in this regard (Bhat 2010; Bhat et al. 2011a).
There have been directed efforts to develop a valid and reliable instrument
to measure the variables under consideration effectively. The questionnaire covered
130 items. Suggestions from seven seasoned experts, comprising three academicians
and four from industry, established face validity. Carrying out of criterion validityusing the same set of experts ensured the questionnaire’s predictive or external
validity.
The questionnaire has been pilot tested on four select firms, which are a subset of
the 150 sample firms. Based on the suggestions received, we carry out modifica-
tions in the language, sequencing and formatting of the questionnaire to improve its
clarity before administering it to the sample firms. The questionnaires, with a
request to generate a consolidated firm-level response, were directly addressed to
the chief executive officers/managing directors of each of the firms and in turn been
directed internally to a core team. Sixty-nine usable responses received out of the
one hundred and fifty firms targeted in the survey indicate a firm response rate of
46%, which is quite satisfactory, as each firm response is in effect a distilled effort
of a core team in each firm.
4 Results and Discussion
Data collected from each firm covered its strategy relating to management of
innovation, as well perceptions about its innovation performance and overall firm
performance, using a 7-point Likert scale (1: strongly disagree to 7: strongly agree).
The respondent firms profile is as indicated in Table 1.
516 J.S.A. Bhat

Construct validation and empirical inquiry being closely aligned, principal
component factor analysis was done to validate the constructs. The summary results
are as presented in Table 2.
A measure possesses construct validity if the factor loading is greater than 50%.
The cumulative percentage values of the factor loadings range between 63.491 and
89.829%; both are well above the recommended cut-off of 50%, thus justifying
inclusion of all the constructs.
The summary results of Cronbach’s alpha values computed to assess the reli-
ability of the questionnaire are as reproduced in Table 2. The Cronbach’s alpha
values range from 0.7911 to 0.9603. Both these values being well above the
accepted criterion for internal consistence of 0.701, the reliability of the constructs
was established.
From the univariate analysis conducted to identify major trends, the mean values
across the industry sectors are as summarized in Table 3.
Table 1 Profile of respondent firms
Sector Number of firms % of total respondents
Auto and auto-components 17 24.64
Chemicals, drugs and pharmaceuticals 18 26.09
Miscellaneous 23 33.33
Public sector 11 15.94
Table 2 Summary of principal component factor analysis and reliability test results
Sr No Variables Cumulative % of loadings Cronbach’s alpha
Firm performance
1 Innovation goals 87.026 .9145
2 Innovation resources 83.954 .8054
3 Internal processes 89.829 .8822
4 Stakeholder satisfaction 78.797 .9603
Innovation performance
5 Innovativeness Only one item Only one item
6 New product/service 77.917 .8733
7 Managerial process improvements Only one item Only one item
8 Production process improvements 75.891 .8381
Continuity and change capabilities
9 Technology continuity 67.971 .8312
10 Organization continuity 81.548 .9233
11 Learning continuity 82.764 .9237
12 Managerial continuity 75.487 .8884
13 Networking continuity 63.491 .7911
14 Technology change 81.251 .9201
15 Organization change 71.076 .8611
16 Learning change 81.013 .9218
17 Managerial change 86.186 .9439
18 Networking change 75.143 .8827
Innovation Management Strategy: Empirical Evidence from Indian Manufacturing. . . 517

There is no significant difference between the mean values of the variables
across the industry sector groups. In order to examine the scope for using a unified
approach across the entire sample, we conduct one-way analysis of variance
(ANOVA) tests to identify significant differences between the sectors of industry.
The significance level of all the variables is observed to be greater than 0.01 (99%
significance), and the F values (observed) are lower than the F value (critical) for all
the variables studied, thus establishing that there is no significant difference
between the various sectors in respect of the variables being studied.
After establishing the homogenous nature of the sample, we examine the
relationships between the independent and dependent variables. Firstly, we identify
definitive criteria for discrimination amongst the respondent firms. For this purpose,
we classify the data into two clusters using the K-means (quick cluster) test using
innovation performance. This statistical analysis procedure attempts to identify
relatively homogeneous groups of cases based on selected characteristics, using
an algorithm that iteratively estimates the cluster means and assigns each case to the
cluster for which its distance to the cluster mean is the smallest. This is necessary
Table 3 Summary results of one-way ANOVA and univariate analysis
Variables F Sig.
Industry sector means
Auto
and
auto-
comp
Chem,
drugs
and
pharma
General
engg. –
private
General
engg. –
public
Innovation performance
1. Innovativeness .563 .642 5.8235 6.0000 6.0435 5.6364
2. New product/service 1.746 .166 6.1471 6.1667 6.2174 5.5455
3. Managerial processimprovements
.282 .838 5.9412 5.9444 6.1739 5.9091
4. Production processimprovements
2.178 .099 5.8039 6.2407 6.2319 5.6061
Firm performance
5. Innovation goals 1.555 .209 6.0000 6.0000 6.1449 5.4545
6. Resource generation 1.637 .189 5.8824 6.0556 6.1522 5.3636
7. Process capabilities 2.329 .083 5.5882 6.1389 6.0435 5.3636
8. Stakeholder satisfaction .884 .454 5.7794 6.1806 6.0870 5.8409
Continuity and change capabilities
9. Technology continuity 2.248 .091 5.4338 5.9144 5.8406 5.4280
10. Organization continuity 2.976 .038 5.5539 6.0556 6.1105 5.5189
11. Learning continuity 1.322 .275 5.1868 5.7444 5.6130 5.2409
12. Managerial continuity 1.805 .155 5.3848 5.9537 5.8967 5.4621
13. Networking continuity 2.153 .102 5.0809 5.7515 5.4529 5.2008
14. Technology change 2.928 .040 4.6667 5.6343 5.5290 5.2955
15. Organization change 3.044 .035 5.1299 5.7037 5.6431 4.9697
16. Learning change 1.830 .150 5.1544 5.7292 5.5489 5.0795
17. Managerial change 1.496 .224 5.2230 5.6574 5.7183 5.2045
18. Networking change 3.058 .034 5.1544 5.6991 5.7971 5.0227
518 J.S.A. Bhat

to identify the innovation performance mean value that divides the data into two
clusters. In the results brought out in Table 4, cluster 1 is the moderate innovation
performance cluster, and cluster 2 is the high innovation performance cluster. The
innovation performance mean for the moderate innovation performance cluster is
5.03 and that for the high innovation performance cluster is 6.36. Further, the means
of all the continuity and change factors are lower for the moderate innovation
performance cluster suggesting that all these factors under consideration are impor-
tant for innovation performance. Dividing the cases into two categories after con-
verting innovation performance into a categorical variable, we employ stepwise
discriminant analysis using the new categorical variable as the grouping variable,
in order to determine the factors that discriminate between these two groups.
This analysis technique is useful to build a predictive model of group member-
ship by generating a discriminant function, based on linear combinations of the
predictors that provide the best discrimination between the groups. The procedure
firstly generates functions from the above sample of firms for which group member-
ship is known and then applies these functions to the data with measurements for the
predictors but unknown group membership. The predictors are selected in steps by
entering those with acceptable values meeting entry and removal selection criteria.
Table 5 indicates the success rate for prediction of membership of the grouping
variable’s categories using the discriminant function developed from the analysis.
Overall, 92.8% of the original cases are correctly classified, with 100% of
moderate innovation performance firms being accurately classified and only 91.4%
Table 4 Cluster analysis results: final cluster centres (N ¼ 69)
Ser. Factors Cluster 1 Cluster 2
Innovation performance 5.03 6.36
1 Innovativeness 4.94 6.25
2 Innovation new product/service 5.14 6.41
3 Innovation managerial process improvement 4.89 6.41
4 Innovation production process improvement 5.13 6.35
Firm performance 4.88 6.31
5 Firm innovation goals 5.07 6.27
6 Firm resource generation 4.69 6.37
7 Firm process capabilities 4.72 6.25
8 Firm stakeholder satisfaction 5.04 6.33
Continuity and change capabilities
9 Technology continuity 4.88 5.98
10 Organization continuity 5.02 6.16
11 Learning continuity 4.36 5.88
12 Managerial continuity 4.63 6.10
13 Networking continuity 4.47 5.73
14 Technology change 3.93 5.79
15 Organization change 4.41 5.78
16 Learning change 4.26 5.83
17 Managerial change 4.37 5.90
18 Networking change 4.47 5.85
Innovation Management Strategy: Empirical Evidence from Indian Manufacturing. . . 519

of the high performance firms being correctly classified. The Wilks’ lambda, used as
the statistical criteria to identify the significant factors, is .464, and the eigenvalue is
1.157, revealing a fair discriminating power, as brought out in Table 6. The chi-
square value and p-value (sig.) indicate that discrimination between the two groups is
highly significant.
Out of the ten independent factors, technology change and managerial continuity
are the significant predictors of innovation performance, as evident from the
standardized canonical discriminant function coefficients presented in Table 7.
Thus, aspects such as provision of alternative mechanisms for innovation implemen-
tation, multiple sources for idea generation, experimentation, strategic partnerships
and effective mechanisms for new technology alerts, technology acquisition, tech-
nology transfer and spin-offs encompassing technology change and the firm’s
business-technology strategy link, external technology and consumer environment
trend tracking efforts, top management commitment and use of effective
procedures encompassing managerial continuity appear to be vital for innovation
performance. Hence, both continuity and change processes matter vitally to
innovation performance.
Table 8 lists the pooled within-groups correlations between the factors and
standardized canonical discriminant functions ordered by absolute size of correla-
tion within the function. The table reveals the inter se importance of the remaining
factors. Managerial change, learning change, learning continuity, networking change,
organization continuity, organization change, technology continuity and networking
continuity in descending order of importance influence innovation performance.
Further, it is observed that the correlations amongst the factors are not very divergent
(highest .904 and lowest .681), signifying that both continuity and change factors
Table 5 Discriminant analysis classification results
Grouping variable
Predicted group membership
TotalA B
Count Moderate innovation performance (A) 11 0 11
High innovation performance (B) 5 53 58
% Moderate innovation performance (A) 100 0 100.0
High innovation performance (B) 8.6 91.4 100.0a92.8% of original grouped cases correctly classified
Table 6 Eigenvalues and Wilks’ lambda values of canonical discriminant function analysis
Function Eigenvalue % of variance Cumulative % Canonical correlation
1 1.157 100.0 100.0 .732
Test of function(s) Wilks’ lambda Chi-square Df Sig.
1 .464 50.726 2 .000
Table 7 Standardized
canonical discriminant
function coefficients
Significant predictors Function
Managerial continuity .539
Technology change .576
520 J.S.A. Bhat

influence innovation performance. Evidently, focus on only one set of factors would
lead to diminished innovation performance, thus confirming the hypothesis H1 set
out to be tested.
Next, the predictors for overall firm performance have been determined by
repeating the above cluster analysis and discriminant analysis procedures after
including the innovation performance factors amongst the input variables tested.
Innovation performance and technology continuity (standardized canonical discrimi-
nant function coefficients of .574 and .571, respectively) have been identified as the
significant predictors. Once again, the correlations (maximum .925, minimum .687)
amongst the input factors (continuity, change and innovation performance-related)
were not divergent. Thus, it emerges that a holistic focus by a firm on managing both
continuity and change dimensions of innovation matters to its overall performance
captured in the dimensions studied, confirming hypothesis H2. Besides, keeping in
view that technology change and managerial continuity influence innovation perfor-
mance significantly, it is established that technology change, managerial continuity
and technology continuity have preeminent roles of in respect of firm performance.
These results may be viewed in the context of the environment prevalent in most
emerging countries. Firms in such countries, in general, do not spend exorbitantly
on R&D, exceptions apart. Systems for technology appropriation have also evolved
very differently in these countries in keeping with their culture, ethos and prevailing
requirements. Yet, the pressure to compete, and not merely survive, but also grow
in the face of strong domestic and global competition, has made innovation an
imperative. The focus on both technology change and technology continuity by firms
that have been successful in using innovation to improve performance brings out the
importance accorded by them to technology-related processes. The significance of
managerial continuity implies that top management commitment, setting specific
innovation targets and implementation of effective management systems are vital to
perpetuate growth. Whilst the inter se priority amongst the continuity and change-
related innovation management processes derived pertain only to Indian manufac-
turing companies in specific areas of activity, these are likely to be the same across all
sectors, as validated by the ANOVA results. These findings have important
implications for all emerging countries with similar high innovation potential and
with similar environments.
Table 8 Structure matrix Variable Function
Technology change .904
Managerial continuity .889
Managerial change .792
Learning change .778
Learning continuity .774
Networking change .726
Organization continuity .714
Organization change .707
Technology continuity .689
Networking continuity .681
Innovation Management Strategy: Empirical Evidence from Indian Manufacturing. . . 521

5 Conclusions
The major contribution of this chapter is the analysis of innovation performance in
an emerging country situation, where the measures for innovation performance are
different from other more established economies. The analysis has revealed that
Indian manufacturing industry has been giving due importance to innovation. Focus
of innovation is more on new product development as well as on product and
process improvements and less in terms of conventionally referred indicators such
as patents or publications. Homogeneity of the Indian manufacturing industry
has been established in respect of innovation management strategy. Discriminant
analysis has yielded the key predictors of a firm’s innovation performance to be
related to technology change processes in terms of providing for options, strategic
partnerships, technology alert mechanisms and well-aligned technology acquisi-
tion and transfer mechanisms and managerial continuity processes relating tobusiness-technology strategy link, external environment trend tracking, top manage-
ment commitment and effective routines and procedures. These processes, together
with technology continuity processes encompassing those concerned with customer-
oriented new product development, company-wide innovation, efficient idea
sourcing and flexible operations, are significant predictors of overall firm perfor-
mance. Thus, convergence of continuity and change dimensions of managing
innovation leads to higher innovation performance and enhanced overall firm
performance has been established, and an innovation strategy direction that firms
may adopt whilst prioritizing performance concerns is suggested.
One limitation needs to be mentioned. The research has focused on select sectors
of the Indian manufacturing industry with particular financial performance
yardsticks, and the conclusions are universalized based on statistical tests at 99%
confidence level. These results may hence need verification across other sectors and
in other emerging country situations.
References
Barney JB (1995) Looking inside for competitive advantage. Acad Manage Exec 9(40):49–61
Beer M, Nohria N (2000) Cracking the code of change. Harv Bus Rev 78(30):133–141
Bhat JSA (2005) Concerns of new technology based industries – the case of nanotechnology.
Technovation 25(5):457–462
Bhat JSA (2010) Managing innovation: understanding how continuity and change are interlinked.
Global J Flex Syst Manage 11(1&2):69–80
Bhat JSA (2011) Technological ambidexterity in the management of government infrastructure
programmes. J Asian Public Policy 4(3):350–356
Bhat JSA, Sushil, Jain PK (2008) Strategic management of change and continuity: case of
technology and social capital in India. In: Proceedings of eighth global conference on flexible
systems management, Stevens Institute of Technology, Hoboken, NJ, 14–16 June 2008,
pp 852–861
Bhat JSA, Sushil, Jain PK (2010) Inter-relations among innovation performance variables: results
from empirical evidence of Indian manufacturing firms. In: Tenth global conference on flexible
522 J.S.A. Bhat

systems management: designing for flexibility and security for the future, Keio University,
Tokyo, Japan, 26–27 July 2010
Bhat JSA, Sushil, Jain PK (2011a) Strategic confluence of continuity and change for improved
innovation performance. Int J Eng Manage Econ 2(3&4):175–194
Bhat JSA, Sushil, Jain PK (2011b) Strategic management of innovation focusing on confluence of
continuity and change. Int J Green Comput 2(2):106–126
Bhat JSA, Sushil, Jain PK (2011c) Innovation by harmonizing continuity and change – a case.
J Bus Strategy 32(2):38–49
Birkinshaw J, Gibson C (2004) Building ambidexterity into an organization. Sloan Manage Rev
45(4):47–55
Collins JC, Porras JI (1997) Built to last: successful habits of visionary companies. Harper
Business, New York
Griffin A, Page AL (1996) PDMA success measurement project: recommended measures for
product development success and failure. J Prod Innov Manage 13(6):478–496
Kaplan RS, Norton DP (1996) The balanced scorecard. The Harvard Business Press, Boston
Kim WC, Mauborgne R (2005) Blue ocean strategy: how to create uncontested market space and
make the competition irrelevant? Harvard Business School Press, Boston
Leonard-Barton D (1995) Well-springs of knowledge building and sustaining the sources of
innovation. Harvard Business School Press, Boston
March JG (1991) Exploration and exploitation in organizational learning. Organ Sci 2(1):71–87
Mintzberg H (1994) The rise and fall of strategic planning. Prentice-Hall, New York
National Knowledge Commission (2007) Innovation in India. Available from: http://knowledge-
commission.gov.in/downloads/documents/NKC_Innovation.pdf. Accessed 15 Sept 2008
Nonaka I, Takeuchi H (1995) The knowledge-creating company. Oxford Press, New York
Teece DJ (2007) Explicating dynamic capabilities: the nature and microfoundations of sustainable.
Enterprise performance. Strateg Manage J 28(13):1319–1350
The Economist (2010) First break all the rules: the charms of frugal innovation – a special report
on innovation in emerging markets. April 15Trott P (1998) Innovation management and new product development. Pearson Education, Harlow
Tushman ML, Anderson P (1986) Technological discontinuities and organizational environments.
Admin Sci Q 3:439–465
von Hippel E (2005) Democratizing innovation. MIT Press, Cambridge
Innovation Management Strategy: Empirical Evidence from Indian Manufacturing. . . 523

Rethinking the Management of Technological
Innovations, Product Complexity
and Modularity: The Effects of Low-Probability,
High-Impact Events on Automotive
Supply Chains
Adrian E. Coronado Mondragon and Christian E. Coronado Mondragon
1 Introduction
Modularity has delivered multiple benefits such as the introduction of postponement
and the effective management of complexity to various industry sectors. In the
automotive sector, the management of technological innovations using modularity
to provide customized products can be seen in the use of complex electronic
components such as microcontroller units (MCUs) to support a large number of
vehicle applications. In this case, specialized suppliers and not original equipment
manufacturers (OEMs) are behind the development of MCUs and other complex
automotive components. This shift represents a well-known value migration from
the final product manufacturer to component suppliers, the result of the former’s
outsourcing decisions and the pursuit of platforms by the latter (Sako 2011).
Furthermore, OEMs in the auto sector have deployed lean principles to run the
supply chains of complex automotive components such as MCUs.
The increasing use of modules that depend on complex automotive components
such as MCUs has its roots in the use of a modular architecture, the controller area
network (CAN) which was originally designed to enable MCUs to communicate
with each other (Wright 2011), hence making possible to connect additional devices
as further technological developments take place. In modern vehicles anywhere
from 30 to over 100, MCUs are used to control everything from electronic parking
brakes, pre-crash seat belts and engine control units to onboard entertainment
systems, stability control and power steering (Automotive News, April 8 2011c).
A.E.C. Mondragon (*)
School of Management, Royal Holloway University of London,
Egham Hill, Surrey TW20 0EX, UK
e-mail: [email protected]
C.E.C. Mondragon
School of Ocean Technology, Fisheries and Marine Institute of Memorial
University of Newfoundland, P.O. Box 4950, St John’s, NL, Canada
e-mail: [email protected]
Department of Management Studies, Indian Institute of Science, Bangalore,
Driving the Economy through Innovation and Entrepreneurship,DOI 10.1007/978-81-322-0746-7_43, # Springer India 2013
525

Extreme situations such as Black Swans which are low-probability, high-impact
events like the earthquake/tsunami disaster that hit Japan in March 2011 or the
floods that took place in Thailand during the summer of 2011 can seriously disrupt
the operation of automotive supply chains, as the sources of innovation for modular
architectures located within the firms supplying highly engineered components like
MCUs prove to be irreplaceable or very difficult to copy/imitate. Black Swans, as
defined by Taleb (2007, xxiii), are events with ‘rarity, extreme impact and retro-
spective (though not prospective) predictability’. The Japan earthquake and sub-
sequent tidal wave or tsunami of March 2011 have been labelled as a Black Swan
for the global auto industry (Automotive News, March 30 2011a; Yahoo News,March 30 2011) as it has affected not only the Japanese industry and economy, but
its ramifications are felt everywhere in today’s integrated global supply chains.
Few months later, disaster struck again as supply chain disruptions resulted from
the floods that hit Thailand in 2011.
In the aftermath of Japan’s earthquake/tsunami and the Thai floods, numerous
voices have indicated the need for the global auto industry to rethink how it sets
up its supply lines, as there might be some cracks, some inefficiencies and some
unplanned-for problems in the global supply system (Automotive News, March 30
2011a). Furthermore, practitioners recognize that the industry may have consolidated
its suppliers too much; it may have exceeded sharing parts across too many models
and may have built regional models with global parts, which means lines going down
for cars that do not sell anywhere else (Automotive News, March 30 2011a). However,
there have been practitioners asking manufacturers not to move away from lean
inventory and just-in-time delivery and production processes, even in the wake of a
number of well-documented disasters this year that have hit the automotive supply
chain (Automotive Logistics Magazine, November 2011).
Given the evolution of events in 2011, this chapter makes an argument for the
need to rethink the management of technological innovations, product complexity
and modularity in order to mitigate the negative effects caused by Black Swans in
automotive supply chains. Following on Sako’s (2011) suggestion that a product
manufacturer can regain control of its supply chain by reshaping its industry and
developing an ecosystem of providers engaged in complementary innovation, this
chapter revisits the principles of ‘supplier parks’ addressed in Coronado Mondragon
and Lyons (2008). This chapter presents the case of the supply chain of an MCU-
based module used in powertrain applications. A network of semiconductor fabrica-
tion facilities or ‘fabs’ in combination with the principles of the supplier park model
is presented as an alternate configuration that can be used to mitigate the effects of the
Black Swan in automotive supply chains.
2 Modularity, Technological Innovations
and Product Complexity
Modularity has delivered multiple benefits to several sectors, and the automotive is
no exception. The adoption of modularization gives the opportunity to handle mass
customization and impact customer satisfaction, especially for products with high
526 A.E.C. Mondragon and C.E.C. Mondragon

innovation content like today’s passenger vehicles. Under a modular product
architecture, platform products normally have a fixed number of modules with
customization being achieved through variant modules to choose among a set of
given module options (Huang et al. 2007).
A simple representation of the use of MCUs to control various applications in
modern passenger vehicles is shown in Fig. 1. In this illustrative example, three
MCUs are used to control some key vehicle systems. MCU1 is used to control the
audio systems, the dashboard and panel of instruments, heating/air conditioning and
the airbags; MCU2 is used for the purpose of controlling the engine module,
electronic stability programme (ESP), traction, suspension and brakes, and MCU3
is used to control the lights, blinker, wipers, lever, electric mirrors, windows and
locking/entry system. Modern passenger cars from basic compact models to luxury
high-performance models have electronic control units (ECUs).
MCUs are specialized parts with a high content of proprietary technology.
The degree of complexity of key components such as MCUs represents a formid-
able challenge in case of disruptions from a Black Swan. Automotive News (April 42011b) reported that for raw materials and some components, automakers can make
the switch fairly swiftly. Replacing electronics and other highly engineered parts –
already in short supply before the March quake-tsunami – takes substantially more
time. The next section presents the disruption to the supply chain of MCUs and
discusses relevant work that has been undertaken related to addressing supply
chain risk.
3 Review of Research on Supply Chain Disruptions
In the automotive sector, OEMs and their suppliers have fully embraced the
principles of lean thinking in their operations, from vehicle assembly to the supply
chain of the most critical modules and components used to build a vehicle. The
trend towards lean supply chains might result in low inventories achieved by close
collaboration with customers and suppliers, but this leads to high vulnerability
Fig. 1 Simple illustration of the applications of automotive MCUs in modern passenger vehicles
Rethinking the Management of Technological Innovations, Product Complexity. . . 527

since turbulences in the supply chain can barely be compensated without safety
stocks (Thun and Hoenig 2011).
The Black Swans represented by the earthquake/tsunami and floods of the year
2011 confirm that one of the major shortcomings of the lean thinking philosophy
is the lack of recovery plans in case of disruptions to the supply of components,
especially when these components are complex and difficult to replace. For this
reason, numerous academics and practitioners have indicated the importance of
successfully handling disruptions from natural catastrophes. Altay and Ramirez
(2010) highlight that it has become imperative to better understand how catastrophes
affect global supply chains. The researchers state that reasons to support this include
the compelling evidence that the frequency and intensity of natural disasters are
increasing (Altay 2008). Indeed, the earthquake/tsunami of Japan and the floods in
Thailand show how severe this situation has become, especially when looking at the
disruptions to the supply of specialized components with proprietary technology
such as MCUs. Figure 2 depicts the disruptions to the global supply chain of MCUs
made in Japan and more particularly to the situation experienced by Renesas and
the first-tier suppliers and OEMs that use its line of products. Renesas, the largest
manufacturer of MCUs with a global market share of 41%, concentrates about 90%
of its global capacity in Japan (Automotive News, April 13 2011d), which means
that production of MCUs at its Japanese sites was severely disrupted, and as a direct
consequence, Japanese vehicle assembly plants and numerous facilities around the
world have to idle production.
The extent of the scale of the problem has been truly colossal. Ohnsmann et al.
(2011) report that Japanese automaker’s such as Toyota Motor Corp and Honda
Motor Co. plans to operate their factories overtime to recover production lost to
Fig. 2 Disruptions to the global supply chain of MCUs made in Japan
528 A.E.C. Mondragon and C.E.C. Mondragon

parts shortages caused by Japan’s earthquake may be delayed until early 2012
because of the floods experienced in Thailand. Ohnsmann et al. (2011) state that
Toyota, Asia’s biggest carmaker, had to scale back output in Japan for a third
week and suspended overtime in North America for a second week as disruptions
from the floods spread. Also affected, Honda had to temporarily eliminate overtime
and run North American plants at half capacity until Japan’s third-largest auto-
maker finished assessing its inventory. In early November 2011, Toyota’s plants in
the USA and Canada were forced to suspend overtime and Saturday output, with
reduced production affecting facilities in South Africa, Indonesia, Philippines,
Vietnam, Pakistan and Malaysia.
The disruption to the supply chain of MCUs has raised questions on the long-
term viability of lean policies in a global scale. Wagner and Bode (2006) highlight
that a number of scholars have recognized that modern supply chain manage-
ment initiatives have great potential to make operations leaner and/or more agile
in a stable environment but simultaneously amplify the fragility of supply chains.
Fragility becomes evident in the aftermath of the Black Swan. The researchers
suggest the assumption that the more complex the interactions and the tighter coupled
the supply chain, the more prone the supply chain is to unexpected, untoward events.
In fact, academics in the literature have recognized that significant negative impact
on organizations can result from failure to manage supply chain risks effectively.
Khan and Burnes (2007) state that negative impacts include financial losses,
reduction in product quality, damage to assets and loss of reputation. Identified
consequences of disruptions to the supply chain might include financial losses,
a negative corporate image or a bad reputation eventually accompanied by a loss
in demand as well as damages in security and health (Juttner et al. 2003). Thun and
Hoenig (2011) highlight that lean management approaches prove to be very effi-
cient and seem to be indispensible in order to be competitive in the automotive
industry, but they bear the risk of making supply chains vulnerable.
4 Supply Chain Configurations to Mitigate the Impact
of Black Swans
Slowly, auto OEMs have started to recover from the disruptions to their supply
chain operations. However, some of the immediate solutions considered by affected
OEMs like Toyota (to prevent a repeat of what happened after the disaster) include
a request for suppliers of complex electronic components like MCUs to hold
additional months of inventory (Automotive News, September 6, 2011e). Toyota’s
demands contradict lean manufacturing principles that have been widely promoted
and adopted in the auto industry, not to mention the high cost that such move might
represent. Automotive Logistics Magazine (November 2011) reports that Toyota
is establishing a system to track bottlenecks down to the second tier, especially for
complex components, by instilling a need for disaster prevention and response
methods throughout the tier levels and by creating safety stock. However, according
Rethinking the Management of Technological Innovations, Product Complexity. . . 529

to the same publication, carmakers’ efforts were not enough to keep a sufficient
level of inventory during the Thai floods.
Richter (2011) reports that Renesas whose operations were hampered by earth-
quake damage in Japan sees industry moving away from the obsession with lean
inventories and low cost and more towards a policy that recognizes the alternate
costs that they would incur if they had to stop producing. The way to recovery by
Renesas, as discussed by Murray (2011), highlights that throughout the recovery
period, the company communicated with customers around the world, calling
many of them on a daily basis and giving them real-time updates on the rebuilding
of the ‘fab’. The author reports that the company pulled parts from inventory
wherever possible and provided similar ‘superset’ microcontrollers when direct
replacements were not available. In some cases, they also shifted manufacturing
from one of their most damaged production sites to so-called dual fabs in Singapore
and Taiwan. It is important to highlight that the manufacturing process for MCUs
has a long lead time; this means that it can take up to 2 months to manufacture a
batch of MCUs (Automotive News, April 8 2011c).
In the aftermath of the earthquake/tsunami, Renesas created a continuity plan
(Murray 2011; Renesas 2011) comprising of three key strategies:
(a) Keeping inventory ready, which is about maintaining a healthy inventory to
recover from a natural disaster, as the tendency is to let inventory drop.
(b) Partner with customers, this involves adopting a ‘multi-fab’ strategy that would
make possible to shift manufacturing to another factory. When dealing with
customers who want application-specific integrated circuits, the strategy for
Renesas is to work with them to build masks for these types of circuits at an
alternative ‘fab’, hence becoming ‘fab-ready’.
(c) Establish a risk strategy, the company tells its customers where their devices fit
within a three-level risk strategy. The first levels involve having ‘multi-fabs’ to
supply devices in 3 months, the second level is about having the ‘fab-ready’
strategy and in case customers are employing an older fabrication process
which is the third level, Renesas will make inventory available in advance.
After reviewing the strategy adopted by Renesas, the leading manufacturer of
MCUs for automotive use, it becomes evident the fact that the strategy adopted does
not contemplate the relocation of production facilities/‘fabs’ outside Japan, which
at present concentrates 90% of the company’s global capacity. The argument here
is that it would make sense to spread the risk of impact of the next Black Swan by
relocating MCU ‘fabs’ near first-tier production facilities which sometimes happen
to be in close geographic proximity to OEM vehicle assembly plants. The supplier
park is a concept which has been around for a while, and it has been widely adopted
in European vehicle manufacturing sites. The VW group, Ford Europe, GM Europe
and PSA Peugeot-Citroën have developed supplier parks around their European
vehicle assembly plants. Therefore, the above facts might support the definition
of the research objective, which is to compare the convenience of adopting the
530 A.E.C. Mondragon and C.E.C. Mondragon

characteristics of the supplier park model into a ‘multi-fab’ strategy to spread the
impact of Black Swans. The research question might read like this:
– How would it compare a ‘multi-fab’ strategy that still concentrates most of its
global capacity in one country against a ‘multi-fab’ strategy that incorporates
elements of the supplier park model?
The next section discusses the characteristics of the supplier park model and
presents the illustrative case of the supply chain of MCUs used for powertrain
applications for an Asian vehicle manufacturer with production in Europe.
5 ‘Multi-Fab’ Strategy for MCUs and Supplier Parks
Coronado Mondragon and Lyons (2008) highlight that organizations have acknowl-
edged the importance of synchronizing the flow of material in the supply chain which
relies heavily on the reliable delivery of components. In the automotive industry,
synchronized sequenced production has its origins in just-in-time (JIT) deliveries.
Furthermore, the geographic proximity of suppliers to the OEM can be seen as a
structural mechanism for integrating supply chains. This concept is not new as Tetu
(1998) postulated that companies have to see themselves as part of the whole chain
and accept the need to achieve a global optimum. Figure 3 depicts the illustrative case
for a commonly found supply chain arrangement for powertrain modules involving
the manufacturing and shipping of MCUs components from the Far East to first-tier
suppliers located in Europe. Those first-tier suppliers supply modules using the
MCUs shipped from the Far East in this case Japan to OEM vehicle assembly plants
located in various countries within Europe, in this case the UK. Figure 3 highlights
the effect of the Black Swan represented by the earthquake/tsunami that hit Japan on
the second-tier supplier which is the manufacturer of MCUs.
In the illustrative case depicted in Fig. 3, the UK-based OEM passenger vehicle
assembly plant manufactures 137,054 vehicles out of a total capacity of 170,000.
Fig. 3 Disruption to the supply chain of MCUs for powertrain applications with second-tier
supplier located in the Far East
Rethinking the Management of Technological Innovations, Product Complexity. . . 531

The car with the greatest volume accounts for an annual volume of 72,740 units,
a daily output of 285 cars. The first-tier manufacturer of powertrain modules is
based in Spain. The MCU-based powertrain modules are used in three vehicle
configurations that include a 1.8-l gasoline engine manufactured in the UK and two
diesel engines, 2.0 and 2.2 l manufactured in Eastern Europe. A key element that
has been successfully managed by most vehicle manufacturers is schedule stability
through better information sharing. Indeed, greater stability in the vehicle manu-
facturer schedule is critical for reliable schedule and deliveries by upstream
suppliers. For years, first-tier suppliers serving several OEMs have acknowledged
that Japanese vehicle manufacturers are efficient at producing stable schedules.
Figure 4 illustrates a suggested reconfiguration of the supply chain of MCUs for
powertrain applications where the schedule stability from the OEM facilitates
making decisions such as relocating the MCU ‘fab’ outside Japan/Far East to
Europe and hence closer to customers.
Relocating a ‘fab’ is expensive, added to the fact that production lead time
of MCUs is long; the production process requires clean conditions and a source of
power that is long and uninterrupted. However, ‘fab’ relocation meets the new
conditions set by the industry who is calling for a more diverse sourcing strategy
(Automotive Logistics Magazine, November 2011). Relocation meets sourcing
strategy requirements for both OEMs and first-tier suppliers as a ‘fab’ gets closer
to their production sites but also for the manufacturer of MCUs, as the diversifica-
tion of production locations mitigates the impact of future Black Swans. There are
also implications in terms of costs reduction as air freight (both reduction of energy
consumption and emission of greenhouse gases) is replaced by road transport.
Figure 5 illustrates the supply network that may result from the combination
of the ‘multi-fab’ strategy with the inherent characteristics of the supplier park
arrangement. In its current form, the ‘multi-fab’ strategy means that it would make
possible to shift manufacturing to another factory. That works fine within a country
where it is possible to link wafer manufacturing with assembly and tests sites and
shift manufacturing based on demand needs. But rather than confining the entire
network to the geography of a country and region, in this case Japan and the
Far East, the network must be able to relocate one or more of its nodes outside its
Fig. 4 Supply chain of MCUs for powertrain applications with second-tier supplier relocated
to Europe
532 A.E.C. Mondragon and C.E.C. Mondragon

original geography, hence creating a base node that is still ‘fab-ready’ with wafer
manufacturing, assembly and test capabilities. The relocation move depicted in
Fig. 5 might represent benefits in terms of diversification for the MCUmanufacturer
itself. The European node facilities of the second-tier supplier (MCU manufacturer)
should be close enough to support deliveries to a supplier park configuration and
still benefit from OEM and first-tier supplier’s schedule stability. By having
diversified production sites with ‘multi-fab’ capabilities, the MCU manufacturer
may be in a better condition to mitigate disruptions of the next Black Swan.
6 Conclusions and Future Research
The Black Swans represented by the natural disasters of 2011 have pushed organi-
zations to rethink the management of technological innovations, product complex-
ity and modularity based on the capacity of the Black Swan to disrupt supply
chains. In the automotive industry, the disruption to the supply chains of complex
components that are difficult to replace has forced companies to review their supply
chain strategies without disclosing any details to the public. The truth is that well-
known production models such as supplier parks and its underlying principles based
on information sharing, schedule stability, geographic proximity, time windows for
delivery and offset times control are fundamental to mitigate the disruptions caused
by the Black Swan. Process flexibility, high levels of responsiveness and reliable
Fig. 5 Proposed network configuration for the second-tier supplier manufacturer of MCUsserving a European supplier park location
Rethinking the Management of Technological Innovations, Product Complexity. . . 533

vehicle manufacturing plans resulting in schedule stability are nothing new but also
important to overcome future Black Swans.
In the supplier park model, several first-tier suppliers of critical modules that
make use of MCUs such as computer engine controls, instrument panels and
dashboards, infotainment and HVAC, among others, have dedicated substantial
resources to build facilities that are in close distance from the OEM vehicle
assembly plant. Hence, it may seem as a logical step for the second-tier/MCU
manufacturer to have a site that is close to the supplier park. The ‘multi-fab’
strategy based on a network linking wafer manufacturing with assembly and tests
sites capable of shifting manufacturing faces severe limitations against the Black
Swan as long as the network is confined to a country or region. In order to mitigate
the effects of the Black Swan, the ‘multi-fab’ strategy needs to consider relocating
one or more of its nodes outside its original geography, hence creating a base node
that is still ‘fab-ready’ (comprising of wafer manufacturing, assembly and test
capabilities) and relatively close to first-tier suppliers and OEMs which may be
operating using the supplier park model.
The supply chain of MCU-based modules used in the automotive industry is a
truly multi-tier supply chain. Hence, supply chain strategic plans designed to
mitigate the disruptions by the Black Swans will have to consider trust between
suppliers and customers which is an area that could be explored in the light of Black
Swans affecting global supply chains.
References
Altay N (2008) Issues in disaster relief logistics. In: Gad-el-Hak M (ed) Large-scale disasters:
prediction, control, and mitigation. Cambridge University Press, Cambridge, pp 120–146
Altay N, Ramirez A (2010) Impact of disasters on firms in different sectors: implications for
supply chains. J Supply Chain Manage 46(4):59–80
Automotive Logistics Magazine (2011) Car makers told: don’t hoard, distribute. November 16–22.
http://www.automotivelogisticsmagazine.com/Newsitem.aspx?aid¼1216. Accessed 26Apr 2012
Automotive News (2011a) Quake may prompt auto industry to revisit supply chain, expert says.
March 30, 2011. http://www.autonews.com/apps/pbcs.dll/article?AID¼/20110330/COPY01/
303309851. Accessed 1 Dec 2011
Automotive News (2011b) High-tech suppliers are the toughest to replace. April 4, 2011.
http://www.autonews.com/apps/pbcs.dll/article?AID¼/20110404/OEM01/304049961/1117#
ixzz1KvBW1N3B. Accessed 4 Dec 2011
Automotive News (2011c) Key supplier to shift chip production from damaged plant. April 8,
2011. http://www.autonews.com/apps/pbcs.dll/article?AID¼/20110408/OEM10/110409902/
1329. Accessed 01 Dec 2011
Automotive News (2011d) After quake, Toyota finds switching suppliers is huge task. April 13,
2011. http://www.automotivenewseurope.com/apps/pbcs.dll/article?AID¼/20110413/COPY/
304139979/1424#ixzz1JsKyhpzu. Accessed 01 Dec 2011
Automotive News (2011e) Toyota wants to quake-proof its supply chain, avoid risks. September 6,
2011. http://www.autonews.com/apps/pbcs.dll/article?AID¼/20110906/OEM01/110909911/
1117#ixzz1XILajBdo. Accessed 07 Sept 2011
534 A.E.C. Mondragon and C.E.C. Mondragon

Coronado Mondragon AE, Lyons AC (2008) Investigating the implications of extending
synchronised sequencing in automotive supply chains: the case of suppliers in the European
automotive sector. Int J Prod Res 46(11):2867–2888
Huang GQ, Zhang XY, Lo VHY (2007) Integrated configuration of platform products and supply
chains for mass customization: a game-theoretic approach. IEEE Trans Eng Manage 54(1):
156–171
Juttner U, Peck H, Christopher M (2003) Supply chain risk management: outlining an agenda for
future research. Int J Logist 6(4):197–210
Khan O, Burnes B (2007) Risk and supply chain management: creating a research agenda. Int J
Logist Manage 18(2):197–216
Murray C (2011) Renesas recount Japan earthquake recovery. Design News Magazine,
November issue. http://www.designnews.com/author.asp?section_id¼1395&doc_id¼234094
&itc¼dn_analysis_element. Accessed 06 Dec 2011
Ohnsmann A, Mukai A, Hagiwara Y (2011) Toyota, Honda may not recover output until 2012 with
Thai flood. Businessweek, November 5. http://www.businessweek.com/news/2011-11-06/
toyota-honda-may-not-recover-output-until-2012-with-thai-flood.html. Accessed 26 Apr 2012
Richter A (2011) How to protect your supply chain. Vision Magazine, November/December,
14–16
Renesas (2011) Renesas electronics business continuity plan. October.
Sako M (2011) Technology strategy and management driving power in global supply chains.
Commun ACM 54(7):23–25
Taleb NN (2007) The black swan, the impact of the highly improbable. Penguin, London
Tetu L (1998) Supply chain planning & synchronization. APICS. The performance advantage 8,
6 June 1998
Thun J-H, Hoenig D (2011) An empirical analysis of supply chain risk management in the German
automotive industry. Int J Prod Econ 131:242–249
Wagner S, Bode C (2006) An empirical investigation into supply chain vulnerability. J Purch
Supply Manage 12:301–312
Wright A (2011) Hacking cars. Commun ACM 54(11):18–19
Yahoo news (2011) Japan carmakers take steps in North America to fight disruption. March 30.
http://news.yahoo.com/s/nm/20110330/bs_nm/us_japan_automaker_output. Accessed 06 Dec
2011
Rethinking the Management of Technological Innovations, Product Complexity. . . 535

Part 2.5
Technology Nurturing

Enhancing and Leveraging Potential
for Innovation
V. Kovaichelvan
1 Background
India is an emerging economy that offers abundant business opportunities in a
highly competitive environment. Indian companies are required to compete with
global players who have sound business models, matured business processes, core
competences and strong brand equity. Indian organizations have to build scale and
sustainable competitive advantage in order to effectively compete and grow not
only India but also in the global markets. Profitable business growth can be achieved
only through innovative products and services. This is even more important in the
automotive industry, where the author isworking in. The Indian automotive industry is
highly competitive and dynamic with innovation being driven by customers, compe-
tition and legislation. Hence, automotive organizations always strive to enhance their
capacity for innovation by aligning their talent management process to this goal.
Talent management process starts with hiring the right engineers at entry level, then
developing their competencies and creating the right environment for innovation.
2 Capacity for Innovation
Krishnan (2010) emphasizes the need for innovation in India as the needs of Indian
customers are different from that of customers in other parts of the world. Indian
organizations have to close large gaps in their performance with reference to their
counterparts from developed nations. Cost advantages tend to erode with time and
hence Indian companies have to innovate to build sustainable competitive advantage.
V. Kovaichelvan (*)
Department of Management of Studies, Anna University,
Coimbatore, India
e-mail: [email protected]
Department of Management Studies, Indian Institute of Science, Bangalore,
Driving the Economy through Innovation and Entrepreneurship,DOI 10.1007/978-81-322-0746-7_44, # Springer India 2013
539

Krishnan (2010) points out that the countries such as Japan and South Korea have
become major industrial powers in the world by innovation.
Krishnan and Prahalad (2008) in their book The New Age of Innovation explains
two principles for innovation. The first one is N ¼ 1 which means that the individual
is at the heart of the experience. With the locus of value shifting from products and
services to experience, value creation must focus on individual consumers. This
approach requires focus on flexibility, quality, cost, customer interface and scalabil-
ity. The second principle is R ¼ G which refers to the approach of understanding the
nature of the response base of large firms and learning how to access high-quality
resources at low cost. This principle covers access to resources, speed, scalability and
innovation arbitrage. This would require a different set of capabilities.
As per Krishnan (2010), some of the requirements to build capacity for inno-
vation include transformation of large private companies and creating an incentive
system for institutions of higher learning that is more consistent with the streng-
thening of industrial innovation capabilities. The Indian automotive industry is
dominated by multinational companies from Japan, Korea, the USA and Europe.
These companies have built capacity for innovation in their respective countries
with experienced people and excellent infrastructure. Only a few Indian companies
focus on innovation, and even they face several constraints both internal and
external. The emergence of IT and ITES sector has led to proliferation of engineer-
ing education institutions in the country. Unfortunately, the quality of engineering
education has been steadily deteriorating. This sector not only hires engineers from
computer science and IT branches but also from core branches such as mechanical,
electrical and electronics.
Design, development and manufacture of automotive products require a strong
foundation in domain knowledge and continuous learning to keep pace with rapid
technological developments. As the most students are assured of placement in
the IT and ITES sector, they focus more on clearing examinations and securing a
placement without acquiring in-depth domain knowledge and skills. Given this
scenario, most companies are required to offer foundation courses and on-the-job
training to acquaint the engineers with fundamental knowledge and skills and make
them fit for contributing to the innovation process. It takes 2–3 years to get the
engineers fully functional in their roles especially in design and development.
Engineers depend only on in-company training programmes and experience to
acquire competence. They do not invest adequate time for continuous learning
required to enhance their potential for higher responsibilities and challenges and
hence capacity for innovation.
3 Defining Potential
Research shows that organizations that successfully identify and develop high-
potential talent will enjoy short- and long-term advantages over their competitors.
The reality is that it is difficult to identify high-potential talent and ensure that they live
540 V. Kovaichelvan

up to expectations. The Corporate Leadership Council has been doing pioneering
work on strategies that build employee potential. Of the more than 300 strategies,
programmes and interventions examined in this study, fewer than 80 truly build
employee potential.
Based on the quantitative research, Corporate Leadership Council (2005)
recommends a framework to identify high-potential employees and develop them
to realize their full potential. They define a high-potential employee as someone
with the ability, engagement, and aspiration to rise to and succeed in more senior
and critical positions (shown in Fig. 1). Ability of an employee is determined by
innate ability which is part of their core personality and learned skills are acquired
through formal and informal learning. Engagement is about how an employee is
governed by four factors such as rational commitment, emotional commitment,
discretionary efforts and intent to stay on with the job/organization. Aspiration is
advancement, recognition, financial rewards and overall enjoyment one seeks to
achieve in their life or career.
4 Challenges in Aligning Careers with Potential
As discussed earlier, the reality in India is that a large proportion of students who
join engineering courses are driven by parental aspirations or peer group influences
rather than their own aspirations based on their innate abilities. Hence, the disci-
pline of the courses they choose, the interests they pursue and the organizations and
roles they opt for do not lead to enhancing or leveraging their potential. Many of
them are not fully engaged during their studies, career and life, and in the process,
they do not learn the skills that are required to excel in their studies, current and
future roles.
There are not enough scientific methods to determine innate abilities and career
counselling to choose the right courses and careers. Parents and students go by the
opportunities available for immediate placement rather than a long-term career.
Those who have a better alignment of their jobs with their innate ability and have
clear aspirations do excel in their studies and career. Others take the jobs that come on
their way, and they neither make adequate progress in their career nor contribute their
best to their organizations.
Fig. 1 Potential of
employees
Enhancing and Leveraging Potential for Innovation 541

The author is engaged in an experiment with a polytechnic and an engineering
college where students are assessed for their innate abilities, oriented to set right
aspirations aligned with their innate abilities, created opportunities to engage and
learn the knowledge and skills towards not only their current role but enhance their
potential for future roles.
5 Assessing Innate Abilities
One of the most popular and widely referred reference works on competency is
Spencer and Spencer (1993). According to the authors, “Competency is an under-
lying characteristic of an individual that is causally related to criterion—referenced,
effective and/or superior performance in a job or situation”. They list the following
five types of competency characteristics in their work as shown in Fig. 2.
Motives: The thing a person consistently thinks about or wants that cause action
Traits: Physical characteristics and consistent responses to situations or information
Self-concept: A person’s attitude values or self-image
Knowledge: Information a person has in specific content areas
Skill: Ability to perform a certain physical or mental task
Surface level knowledge and skill competencies are relatively easy to assess and
develop through education and training. Motive and trait competencies are more
difficult to assess and to develop which is equivalent to the innate ability mentioned
in the CLC research. Spencer and Spencer (1993) recommend that organizations
should assess motives and trait competencies as the basis for selection and teach the
knowledge and skills required to do specific jobs.
The author along with a team of an applied psychologist and line managers
identified the motives and trait competencies for three benchmarked roles in his
organization. The ideas have been sourced from the above-mentioned trait theory
and adapted to the requirement and relevance of the author’s organization. A few
examples of trait include rigour, sociability and idea orientation; abstract reasoning
and examples of motives include achievement and affiliation.
The identified traits and motives were defined for better understanding and
assessment. For example, sociability includes five factors such as inclusion, belong-
ingness, intimacy, collaboration and empathy: inclusion—paying attention to a
person and treating him as important; belongingness—willingness to join others
on tasks particularly in challenging situations; intimacy—interpersonal openness,
being close and affectionate; collaboration—supporting and complimenting,
adding value; empathy—sensing the difficulties of others, concern for others’ diffi-
culties and being in the shoes of others. Abstract reasoning includes four factors
such as synthesizing, correlating, and theorizing and recognizing patterns and
generalizing for application. Each of these factors is defined in terms of behaviours
which can be observed and measured.
542 V. Kovaichelvan

Traits and motives and their levels required for a few key roles in research and
development (R&D), production engineering (PED) and manufacturing operations
(operations) are established. Three levels for trait and motive include high (H),
medium (M) and low (L). For example, for CAD/design engineers in R&D, the
identified traits and motives are rigour(H), sociability(M), idea orientation(H),
abstract reasoning(H), flexibility(M) and achievement(H), and for team/group
leader, the identified traits and motives were rigour(H), sociability(H), influ-
encing(H), urgency(H) and achievement(H) and affiliation(H).
Assessment of motives and traits is a very challenging task. Traits and motives are
tracked from the behavioural manifestations or cognitive responses to hypothetical
situations framed in a questionnaire, individual tasks, group tasks and behavioural
event interviews (BEI). Behaviourally anchored rating scales (BARS) are used to
measure each of the trait or motive. One or more tools measure each of the selected
traits and motives. Many of the assessment activities are performed by the candidates
individually, while a few activities are performed in a group. Assessors are trained on
how to observe the candidates during the activities and to assign scores as per
guidelines. The duration for each activity was fixed based on the target group.
While all the individual and group activities are conducted over a day, a separate
day is dedicated for conducting BEI.
This framework was initially applied for selection of students in the polytechnic
and engineering college based on their innate abilities and later utilized for deciding
their roles. (Table 1: Selection and role fitment using traits and motive) shows the
final output of trait and motive scores and the roles the candidates are most suited for.
It can be seen that some candidates are found to have fitment for more than one role.
6 Engaging to Learn the Skills
The author has benchmarked several universities in the USA and UK who follow
competency-based education framework. In these universities, engineering
programmes have clearly articulated programme objectives. Further, the content
of the courses and pedagogies are aligned to deliver the programme objectives.
Fig. 2 Characteristics of
competency
Enhancing and Leveraging Potential for Innovation 543

Table
1Selectionandrole
fitm
entusingtraitsandmotive
S.
NO
Nam
eRIG
OUR
SOCIA
BILITY
ABSTACT
REASONIN
G
IDEA
ORIENTATIO
NFLEXIBILITY
URENTLY
INFLUENCIN
ACHIV
EMENT
AFFILIA
TIO
N
CAD
Engineer
Proving
engineer
Team
Leader
1AAAA
1.00
0.79
1.00
0.65
0.89
0.91
0.74
1.00
1.00
PED
2BBBB
0.90
1.00
1.00
0.82
1.00
0.81
0.80
0.89
1.00
CAD
PED
TL
3DDDD
0.96
0.78
1.00
0.62
0.89
0.82
0.79
1.00
1.00
PED
TL
4EEEE
0.96
0.90
1.00
0.75
1.00
1.00
0.85
1.00
1.00
CAD
PED
TL
5FFFF
0.94
0.74
0.95
0.82
0.89
0.94
0.68
0.78
0.88
CAD
PED
6GGGG
0.81
0.78
0.85
0.96
0.89
0.92
0.78
0.89
0.88
PED
7HHH
0.86
0.81
0.95
0.68
0.78
0.81
0.91
0.89
1.00
TL

There is a good balance between lectures for knowledge and understanding and
tutorials for acquiring the skills. In addition, hands-on live projects involving
design, manufacturing and testing have become integral part of the engineering
programme right from first year and not just in final year. There is also an emphasis
on multidisciplinary awareness both in terms of the choice of courses and projects.
The programmes not only prepare the students for the immediate roles but provide
perspectives, learnability and professional development required for future roles.
While a great deal of the school education in India is oriented to rote learning,
engineering is all about understanding and application in order to design, manufac-
ture and service products. Towards this, the author studied the Bloom’s taxonomy
framework described in A Taxonomy for Learning, Teaching, and Assessmentby (Anderson et al. 2001) based on research carried out on cognitive and knowl-
edge dimensions of learning. Anderson et al. (2001) explains that there are six
dimensions of cognitive learning such as remember, understand, apply, analyse,
evaluate and create. These six dimensions represent cognitive complexity; that
is, “understand” is believed to be more cognitively complex than “remember”.
“Apply” is believed to be more cognitively complex than “understand” and so on.
The knowledge dimension contains four categories: factual, conceptual, procedural
and metacognitive. These categories are assumed to lie along a continuum from
concrete (factual) to abstract (metacognitive).
In addition to Bloom taxonomy, another methodology that is useful for devel-
oping competency-based education is instructional design methodology. Learning
objectives can be delivered through a structured design of instructions, activities
and projects. In this regard, Gagné et al. (2005) have presented a detailed approach
to instructional design.
According to Gagné et al. (2005), instruction facilitates learning when it
supports the internal events of information processing. Instructions are external
events that must align with internal events to support internal learning processes.
Gagné et al. (2005) list five domains of capabilities. They include intellectual skillswhich are to do with symbols, like putting things into categories, applying rules and
principles and solving problems; cognitive strategies that govern the individual’s
own learning, remembering and thinking behaviour which are developed with
experience; verbal information that are the facts organized stored in the learner’s
memory which provide learners with structure or foundation upon which to build
other skills; attitudes that amplify an individual’s positive or negative reaction to
some person, thing or situation; and lastly motor skills that underlie performances
whose outcomes are reflected in the rapidity, accuracy, force or smoothness of
body movements.
An effective learning process must address most of the above capabilities. It is
not enough to concentrate the instruction on any one or two of these capabilities.
Based on the benchmarking of engineering education, Bloom taxonomy, instruc-
tional design methodology and the author’s experience in developing competency-
based education programmes in-house, detailed process steps were established for
competency-based engineering education programme.
Enhancing and Leveraging Potential for Innovation 545

First, programme objectives relating to functional competencies for the
undergraduate programme in mechanical engineering were defined as follows: At
the end of the programme, students will:
1. Apply scientific principles and concepts relating to development of products and
processes
2. Design and develop products and processes that deliver requirements of the
target customer group and related quality functions
3. Use modelling and simulation to analyse systems’ behaviour and optimize for
results
4. Demonstrate working level understanding and appreciation of interdisciplinary
domains that are required for design of products and processes
5. Check the design for DFX—assembly, manufacture, cost, quality and reliability,
serviceability, recyclability, environment, ergonomics, etc.
6. Choose appropriate quality tools and techniques for problem solving
7. Understand industrial and business environment in which the enterprise operates
Similarly behavioural objectives are defined for the programme.
After the programme objectives were identified, objectives for each of the
courses were articulated by a team of faculty from the institution and subject matter
experts from the author’s organization. Next, the content for teaching was mapped
to the course objectives using instructional design methodology. Appropriate
teaching/learning methodologies were selected based on the knowledge and cogni-
tive dimension of the course objectives. Some sample methodologies used are
indicated in Table 2: Teaching/learning methodologies. The review of the content
was conducted by team of experts. Once the content development stage was
completed, trainers or teachers who would handle the class were oriented with
the content and methodology. Then a pilot is conducted and review is carried out to
make necessary improvements prior to regular delivery of the programme.
Evaluation of learning was carried out using assignments, continuous assess-
ment tests and examinations with weightages for each Bloom categories. Based
on the weightages, the types of questions and number of questions are decided.
A comprehensive question paper is prepared using these guidelines. After each test
and examination, an analysis is made to understand how the whole class had
performed and how each individual student has performed. Then assignable
causes—such as content not adequate, teaching methodology not appropriate
etc.—and appropriate actions are initiated.
Two streams of specialization are planned, namely, design and manufacturing
with electives appropriate to the streams. Internships are organized in the industry
during every vacation, aligned to the competencies of the specific roles for which
they are being groomed. During the last semester, projects are designed to learn and
demonstrate their competencies and to confirm their role readiness.
The first batch of engineers from the polytechnic has been assigned to three
functions, namely, R&D, PED and operations under managers handpicked to
mentor and coach them. Periodic reviews are conducted by the author with the
managers and students. At the end of the projects, formal reviews are conducted to
546 V. Kovaichelvan
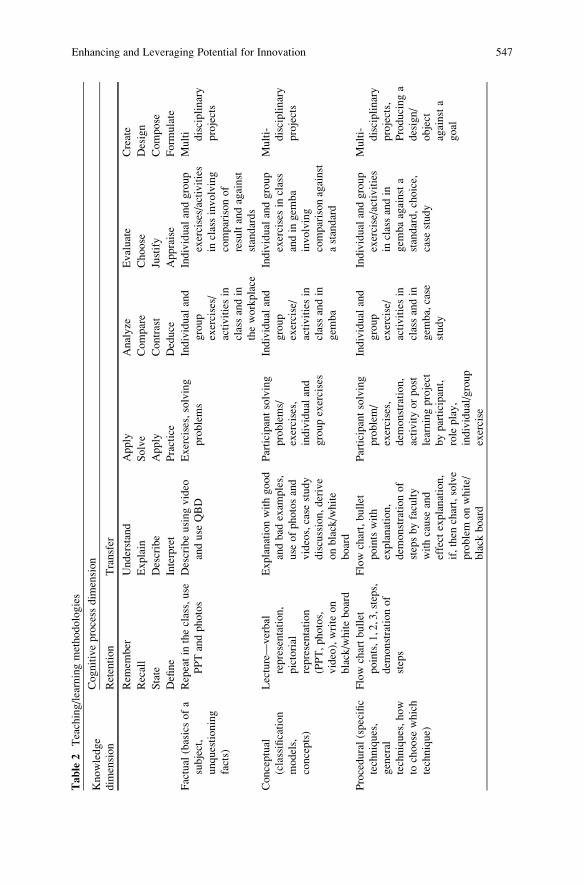
Table
2Teaching/learningmethodologies
Knowledge
dim
ension
Cognitiveprocess
dim
ension
Retention
Transfer
Rem
ember
Understand
Apply
Analyze
Evaluate
Create
Recall
Explain
Solve
Compare
Choose
Design
State
Describe
Apply
Contrast
Justify
Compose
Define
Interpret
Practice
Deduce
Appraise
Form
ulate
Factual
(basicsofa
subject,
unquestioning
facts)
Repeatin
theclass,use
PPTandphotos
Describeusingvideo
anduse
QBD
Exercises,solving
problems
Individual
and
group
exercises/
activitiesin
classandin
theworkplace
Individual
andgroup
exercises/activities
inclassinvolving
comparisonof
resultandagainst
standards
Multi
disciplinary
projects
Conceptual
(classification
models,
concepts)
Lecture—
verbal
representation,
pictorial
representation
(PPT,photos,
video),write
on
black/whiteboard
Explanationwithgood
andbad
exam
ples,
use
ofphotosand
videos,case
study
discussion,derive
onblack/white
board
Participantsolving
problems/
exercises,
individual
and
groupexercises
Individual
and
group
exercise/
activitiesin
classandin
gem
ba
Individual
andgroup
exercisesin
class
andin
gem
ba
involving
comparisonagainst
astandard
Multi-
disciplinary
projects
Procedural(specific
techniques,
general
techniques,how
tochoose
which
technique)
Flowchartbullet
points,1,2,3,steps,
dem
onstrationof
steps
Flowchart,bullet
pointswith
explanation,
dem
onstrationof
stepsbyfaculty
withcause
and
effect
explanation,
if,then
chart,solve
problem
onwhite/
black
board
Participantsolving
problem/
exercises,
dem
onstration,
activityorpost
learningproject
byparticipant,
role
play,
individual/group
exercise
Individual
and
group
exercise/
activitiesin
classandin
gem
ba,case
study
Individual
andgroup
exercise/activities
inclassandin
gem
baagainsta
standard,choice,
case
study
Multi-
disciplinary
projects,
Producinga
design/
object
againsta
goal
Enhancing and Leveraging Potential for Innovation 547

verify if the students have learnt the competencies and are able to execute the
projects effectively following the standard operating procedures (SOP) and achiev-
ing the outcome. A formal viva was conducted by a panel of head of the department
of the polytechnic, senior managers from corporate. It was found that most of them
were able to accomplish more than 70% ready for the target roles. Along with
their managers, a review is carried out with the managers and faculty to identify
actions for improvement in the next cycle.
7 Aspiration
As mentioned earlier, most students opt for engineering are driven by parental
aspirations or peer group influence. It is important that the students have their own
aspiration or a goal for themselves. CLC defines aspiration as advancement,
recognition, financial rewards and overall enjoyment one seeks to achieve in their
life or career. Towards this, Frankl (2006) in his book Man’s Search for Meaningemphasizes the necessity of finding meaning in life even in adverse situations.
Ulrich and Ulrich (2010) say that “The Why of Work refers to the human search for
meaning that finds its way into our offices and factories, a search that motivates,
inspires, and defines us. Humans are meaning-making machines who find inherent
value in making sense out of life. The meaning we create can make life feel rich
and full regardless of our external circumstances or give us the courage to change
our external circumstances. Employees who find meaning at work are more
competent, committed and contributing”. All these references clearly emphasizes
the need for meaning, purpose and goals which can drive people to engage, learn
the competencies and realize what they aspire.
Workshops were conducted for first batch of students in the engineering college
and entry level engineers to create awareness about himself/herself on realities of
self and life-path, develop perspectives on own professional self and set personal
goals and align his/her career with it. This workshop used interactive activity-based
learning experiences which helps the engineers to make their own choices without
regrets. It is planned to share the output of the workshop with the managers, the first
batch of engineers. A mentoring and coaching workshop is planned for the
managers to help them acquire the skills for formal mentoring and coaching.
8 Validation of Innate Ability to Students’ Performance
The author has carried out a hypothesis test to validate the alignment of diploma
students’ trait level to their academic performance. For example, engineers
identified for design role are required to possess traits such as abstract reasoning,
idea orientation and rigour at a higher level compared to roles in other functions.
Trait scores and academic performance of two batches of 35 diploma students are
548 V. Kovaichelvan

used for this testing. The outcome of the test shows that “with 95% confidence,
the students with better trait score, obtained 10 marks higher compared with other
students with t-value of 2.07”.
This approach of selecting engineers based on the innate ability is applied for
campus recruitment of graduate engineers. On their joining the company, a foun-
dation test is carried out covering students selected from several institutes across the
country. An analysis was carried out to check the relationship between trait scores
and scores in the foundation test. It is found that P value <0.05 and hence the data
is significant and there is a positive correlation with scores for three traits (Table 3).
The author is planning to refine this model further to improve the correlation by
two-pronged approach. First is to improve the accuracy of assessment of trait
through a qualification of observers and interview panel members through a formal
workshop and assessment. Second is to evaluate students identified for design using
their performance on higher Bloom level questions in the design-related courses
and in the project work. Eventually, the author is planning to carry out this
validation by assessing the potential of engineers in their entry level and next role.
9 Conclusion and Way Forward
This approach comprising both focused selection and development of engineers has
shown significant difference in the way the students are motivated, actively
engaged, taking ownership for learning and ready to take on challenges. Most of
the students for this programme come from rural backgrounds and are the first-
generation students getting into vocational or professional education. They lack
language skills as they have done their schooling through Tamil medium, and most
of their parents are not educated and cannot guide them through their education and
career. Despite these constraints, the programme was able to provide competence
for entry level role.
For realizing full potential of the programme, it is necessary to raise the bar for
performance continuously. The author is planning to monitor and review each batch
Table 3 Relationship Plot - Trait score vs Average marks
Test score
Rigor 0.3860.022
Idea orientation 0.4390.008
Abstract reasoning 0.3600.034
Enhancing and Leveraging Potential for Innovation 549

of engineers for 2 years along with their managers. In addition, they have to engage
in continuous learning to enhance their potential further to prepare themselves for
future roles. Towards this, competency-based education and training framework
are introduced in the organization to enable the engineers to continuously learn the
new skills for future roles. Towards equipping the managers, programmes are
planned to provide skills to coach and mentor the engineers. This is likely to be a
long and exciting journey for human excellence.
References
Anderson LW, Krathwohl DR, Airasian PW, Cruikshank KA, Mayer RE, Pintrich PR, Raths J,
Wittrock MC (2001) A taxonomy for learning, teaching and assessing. Addison Wesley
Longman, New York
Corporate Leadership Council (2005) Realizing the full potential of rising talent (Volume I):
a quantitative analysis of the identification and development of high-potential employees.
Corporate Executive Board, Washington, DC
Frankl VE (2006) Man’s search for meaning. Beacon, Boston
Gagné RM, Wager WW, Golas KC, Keller JM (2005) Principles of instructional design.
Wadsworth Cengage Learning, Belmont
Krishnan RT (2010) From jugaad to systematic innovation. The Utpreraka Foundation, Bangalore
Krishnan M, Prahalad C (2008) The new age of innovation. Tata McGraw-Hill, New Delhi
Spencer LM, Spencer SM (1993) Competence at work. Wiley India, New Delhi
Ulrich D, Ulrich W (2010) The why of work. Tata McGraw-Hill Education, New Delhi
550 V. Kovaichelvan

A Soft Technology for Effective Enactive
Management
Osvaldo Garcı́a de la Cerda and Alejandro Salazar Salazar
1 Introduction
The task of every administrator can be understood as taking care of the human
activity system for which he is responsible. This task is made complex when we see
the accelerated rate of change in industry, markets, product lifetime, international
competition, quality, costs, and the sophistication of the products and services that
they require (Bullinger et al. 1995; Nudurupati et al. 2011).
Historically, the tools and methodologies created for administration have faced a
reductionism problem associated with the human beings that constitute the organi-
zation. Therefore, these tools have deficiencies when considering that it is possible
to establish an objective representation that is adequate to the problem situations,
without including considerations of the human beings that operate the developed
models. In this sense, it can be seen that there is dissatisfaction of the administrators
because at the time of applying them, they do not see the real advantages of their
use, and this idea is reinforced by the research of Tangen (2004), who finds strong
criticism by the users and researchers of the many platforms and mechanisms
developed for management control.
These human beings, acting in their role as administrators, arise as observers in
the experience of being aware of themselves, of what they do, and of the possible
consequences of what they do (Maturana 2008), accounting for their different
emotional states through self-observation, generating structural interactions and
couplings in the language (Maturana and Varela 1987), and forming conversational
networks that become complex systems whose participants have the ability of
operating individually as autonomous agents and influencing others (Garcia and
Saavedra 2011).
O. Garcı́a de la Cerda (*) • A. Salazar Salazar
Departamento de Ingenierı́a Industrial, Universidad de Santiago de Chile,
Av. Ecuador 3769, Región Metropolitana, Santiago, Chile
e-mail: [email protected]; [email protected]
Department of Management Studies, Indian Institute of Science, Bangalore,
Driving the Economy through Innovation and Entrepreneurship,DOI 10.1007/978-81-322-0746-7_45, # Springer India 2013
551

In that sense, the CLEHES ontological tool has been created, which allows
the configuration of an observer capable of distinguishing and characterizing the
mode of being of human beings, of their interactions, and of the networks that they
constitute, from six constitutive and interlinked dimensions: Body (Cuerpo in
Spanish)–Language–Emotions–History–Eros–Silence (Garcı́a and Saavedra 2006;
Garcı́a 2009). Each dimension of CLEHES is a domain from which human beings
observe and operate in the interactions moving around in the social scenario, opening
and closing conversations, triggering or resolving conflict situations, building
networks, and participating or inhibiting their participation according to their way
of interpreting the world. These dimensions configure micro- and multi-identities
as they are observed in human beings moment by moment, in their community or
organization.
This tool is considered as a technology because it brings repertoires of distinc-
tion to the body and creates practices. This is supported by the observation of
human beings that constitute organizations as a unit and as a complex activity
system, that belong to relations networks, that reflect on themselves, that know and
learn in action, that also have a designing ability in the conversations in which they
participate, and that can change, if desired, their way of operating, taking charge
of the consequences that it implies.
Aware of this complexity, an enactive approach to administration has been
prepared aimed at providing distinctions and practice to those in charge of manage-
ment so that they can attenuate the complexity that is configured from human
activity systems. Enactive management arises to offer a particular view of manage-
ment as the explicative undertones of what is human and their implications in the way
in which not only the administrators, but all persons, see themselves and others.
2 Enactive Management
A particular approach of management organizations is based on the proposal that
the science of enaction gives to the cognition phenomenon (Varela et al. 1992;
Masciotra et al. 2007; Stewart et al. 2010), which among its main ideas states that a
living organism “enacts” its effective action and embodies it in the world, in that
way constituting its perception and therefore its cognition, so that the basic ability
of human cognitive systems is not only the manipulation of symbols or the
processing of information but being in the world (Shanon 2010), thereby creating
the world in which it exists (Maturana 1987).
Different observers express that enaction in its conception delivers an alternative
view of what is stated by the classical theories of cognition, as is the case with the
representationalist line, which state the existence of objective entities in the real
world, independent of the observer, and where cognition is understood in terms
of perceiving, processing, and acting on information (McGee 2005) and it is
also understood as a computation over mental representations at the same time
that the cognizing subject is not committed with the world but is conceived as a
distant neutral observer (Engel 2010). Varela expresses that enaction is not the
552 O. Garcı́a de la Cerda and A. Salazar Salazar

representation of a pregiven world by a pregiven mind but is rather the enactment of
a world and a mind on the basis of a history of actions that a being in the world
performs (Varela et al. 1992). Therefore, the world arises from how we move,
touch, breathe, feel, and respond to others, i.e., from our living experience.
What is particular about enaction is the embodiment of the world, where the
body that we have influences how we think, placing cognition in the interaction of
the body and the world (Hutchins 2010). Enaction is then the idea that an organism
creates its own experience through action, so it is not a passive receiver of inputs
from the surroundings, but it is action in itself, and just as experience is formed
will be how they act.
Enactive management states that the administrator takes the place of the
observer and choreographer of viability. In this sense, he is continually generating
meanings in the interaction with other human beings, in combination with the
histories, experiences, expectations, thoughts, and humor with which he embodies
those interactions (Di Paolo et al. 2010), bringing out a spectrum of concepts not
seen under the previous paradigm, which are those involved with the human factor,
i.e., we no longer have a set of tasks to direct, but human beings and their
interactions, emotions, and expectations appear (Garcı́a and Mendoza 2011).
CLEHES is the main tool of enactive management. As an ontological tool, it
allows human beings to be characterized in those dimensions that make up their
identity, where by means of self-observation, observation of the interactions and of
the networks that we constitute allows self-learning and learning from others,
attenuating organizational complexity (Garcı́a 2009). In this sense, an organization
can be characterized as a network of CLEHES coupled by means of language
interactions, in turn forming conversational networks. These networks make it
possible to evaluate the coherence with respect to the actions of the human beings
in the organization, constructing the realities perceived by the observer responsible
for its care in the different organizational domains and contexts. Therefore, manag-
ing these networks requires conversational and communicational distinctions that
trigger and support them, from their primary activities and from each of the
organizational subsystems.
Enactive management is concerned with those performance elements that arise
from human beings, moment by moment, from their interactions, and from the
networks that constitute them, using tools that allow or facilitate the design of
the strategic conversations oriented to action and performance. In this sense,
administrators must be capable of abandoning the linear view of the organizations in
their operation in the day-by-day urgency, to take position in a platform of reflexive
observation in terms of the pursuits of the human activity system and its operation.
3 The Technology
What will be proposed here is a soft technology that makes it possible to configure
distinctions that can be used to trigger strategic organizational conversations in a
learning system of the actors oriented at survival and viability, giving rise to that we
A Soft Technology for Effective Enactive Management 553

call effectiveness. A particular strategy consists of four nonlinear steps that will
be explained below.
3.1 Configuration of the Attention Focus
Configuring the attention focus is to have clarity about the situation with which
the administrator is faced. This is a conversational process that is carried out by the
actors of the process, consisting in the observation and self-observation of their own
current operation, as well as looking at the organization’s context and current
situation. In this process, the administrators/observers should be capable of know-
ing and understanding how the CLEHES that constitute the organization, system,
or subsystem are related.
The observed situation provides a combination of circumstances in which the
administrator will be at some point in time, and he must generate effective actions
that allow him to keep the organizational viability. In this sense, it is possible to
observe the inseparable relation between the person and its acts by means of which
the administrator places himself and the situation that “acts” on the person
(Masciotra et al. 2007), the situation being an emergency that results from the
relation between the administrator’s personal conditions, his ability for observation,
the distinctions that he has in his CLEHES, and the conditions of the surroundings.
The intervention of the actors to allow the configuration of an attention focus
with an organizational sense takes place at this stage of the methodology, allowing
the characterization of the actors involved, as well as generating the maps of the
conversational networks that they constitute. However, the importance of configur-
ing the focus is not only to characterize the relevant actors for the organizational
performance but also to map the conversations, existing and missing, that affect
the performance of the system and the people.
3.2 Critical Enactive Factors
We state that a critical enactive factor (CEF) is a contextual determinant attributed
by an observer or a system of observers that allows the design of conversations for
the conservation or transformation of the human activity system and from there
triggers both the required structural transformations and adjustments in behavior,
generating embodied learning in persons. This configuration allows constituting
and observing the system as a dynamic learning metasystem.
CEFs emerge from the self-observation that administrators carried out on
the components of their CLEHES and from observation, in terms of CLEHES, of
both the interactions in which administrators participate and the organizational
networks to which they belong. These CEFs must be considered as a design
space that allows opening or closing of some organizational conversations starting
554 O. Garcı́a de la Cerda and A. Salazar Salazar

at the focus configured by the administrator. To identify them, a set of enactive
technologies supported on CLEHES are used in order to facilitate self-observation
and the observation of the organization in different contexts and domains (Garcı́a
and Saavedra 2006, 2011; Garcı́a 2009; Garcı́a and Laulié 2010; Garcı́a and
Orellana 2008).
The CEFs are configured as states, elements, relationships, conversations, or
measurements oriented at achievement which appear relevant moment by moment,
and they are seen as constructors of observation, self-observation, and enaction
spaces for human beings. In particular, the CEFs are related with reflection and
awareness spaces with respect to the performance of the system under care and with
the operational deficiencies that affect viability in the future.
The set of CEFs generated could include measurable elements and nonquantifi-
able elements that result from the multiple interactions of human beings that have
great incidence in organizations. Thus, what is essential in critical enactive factors is
that they allow the design of the missing conversations and their constituent actors
oriented at the action to improve the organizational performance and their learning.
3.3 Cognitive References
When the critical enactive factors have been declared, it is necessary to be able
to evaluate whether the observer’s expectations are being met or it is necessary to
generate structural adjustments. With respect to the cognitive references within
the enactive context, they arise as a consequence of enacting the situations; they are
supported by common sense and are stored in the form of experience, helping the
observer or administrator to have the possibility of knowing the system under care.
The design of cognitive references, measurements, and indicators through data
treatment for the generation of information allows coupling the systems to the
CLEHES. This brings about an observer that learns from distinctions, which enacts
according to its practices, constituting the learning system.
Every time an expectation is or is not fulfilled, different emotionalities are
generated that affect the CLEHES of the administrators, establishing their action
space possibilities and configuring design spaces that allow making the decision of
generating changes in the system because every decision making comes from a
human being that is ontologically erotic emotional (Garcı́a and Mendoza 2011).
In this sense, organizational achievement arises when group individual achievements
in the language are coordinated (Garcı́a and Laulié 2010), creating action insofar as
the participation of others is promoted and holding them responsible for the actions
they perform (Garcı́a and Mendoza 2011).
3.4 Support on Soft–Hard Technologies
The use of technologies in a human sense can be conceived as the ability to
constitute different psychic and emotional states in the body; in this approach,
A Soft Technology for Effective Enactive Management 555
we can say that technology should be conceived from the perspective of touching
and altering the perceptions, generating distinctions which, expressed in language
and associated with the experience (history) of human beings, allow people to act in
a particular domain. In enactive management, the emphasis lies in the effectiveness
of the action.
Communicational and conversational technologies of observation and self-
observation allow conflictive situations in organizations to be attenuated or dis-
solved, as well as to make changes and adjustments in the observers, to configure
freedom and autonomy spaces in operational, strategic, and political aspects.
The use of hard–soft technologies can be understood as a way of facilitating
the incorporation of distinctions and practices as part of the learning process of
human beings and their ability to trigger different emotional states. When the
practices become transparent to the persons, they become part of their embodiment
(Espejo and Reyes 2011), allowing them to be used effectively in the search for
organizational solutions.
4 Enactive Experiences
Two of the more significant experiences with top executives in charge all the way
from small companies to large corporations will be discussed in what follows.
4.1 Enactive Experience A
This process was enacted by the executives of a software company in an insolvency
situation. In the focus stage, laboratory sessions took place in which the executives
brought up from their History the organizational pains that were affecting them.
Starting from there and after various self-observation exercises on organizational
actions, the following conversation was observed, triggered by the CEO’s expres-
sion: “We are not doing the correct things.” This sentence, together with data
on drops in sales and profits, led the sales manager to express her resentment
against the CEO due to unrecognized previous commitments and the programming
manager to express his doubts and fears on the deadlines and costs that they would
not be able to fulfill.
Observing the interaction of the executives, a characterization was made of their
CLEHES, showing that they not only spoke a different language, but in view of
their previous learning history, they were also responding in a different way to
commitments, were not paying the same attention to their efficiency and effective-
ness numbers, and were not assuming emotionally the necessary authority, and
loyalties played a fundamental role in personal covering up, neglecting organiza-
tional meaning. Different perceptions with respect to the motives had triggered the
problem situation, responsibilities were avoided, and the lack of communication
556 O. Garcı́a de la Cerda and A. Salazar Salazar
and coordination among the executives of the sales and implementation areas in
situations that required joint work was made clear. Credibility, broken trust, and
professional ego problems had caused this breakage that inhibited conversations on
organizational performance, setting off a list of organizational pains that affected
all the workers.
Work sessions and workshops with observation protocols on the interactions of
the executives allowed changing the observer in terms of judgments, complaints,
resentments, and denials, focusing on their conversational breakages, changes, and
conservation. The enactive silence in states of reflection and positioning their
body consciously in the various organizational problem situations opened up new
conversations between the group of executives. A list of organizational pains that
could be seen as important design spaces were related to organizational structure,
efficiency, missing conversations, and lack of leadership skills, which were then
dealt with through educational activities and soft methodologies such as automatic
writing, creating poems, songs, and storytelling, among others.
Structural adjustments of the CLEHES of the actors involved in the various
organizational conversations allowed the configuration of new CEFs such as the
mood of the personnel and the executives themselves when facing high uncertainty
situations, as well as the enactive silence spaces when reflecting on the right things.
The missing conversations and coordination between the executives were enacted,
trust among the different actors of the process was repaired, and, something very
important, in view of the lack of leadership skills of the CEO himself to allow him
to direct the organizational transformation process, an educational program to
support the management in soft technologies was designed. These transformations
have allowed those executives to remain in their positions, grow, and develop.
4.2 Enactive Experience B
The second enactive experience that will be shared corresponds to a large mining
corporation, its human groups in charge of production and sales, and its CEO. The
intervention focused on the tension seen by the CEO between the sales executives
and those in charge of production. The former, seeing themselves as a strategic
group of a corporation that is a leader in the world’s copper market, had a very high
self-esteem because they belonged to a group with a higher organizational status,
and they were mainly concerned with the fulfillment of the production plans and
the production schedules to ensure that the clients would receive the product on the
agreed dates.
The above triggered negative effects in the emotional state of the persons
because they saw the arrogance with which the group of executives was acting,
as well as in their ability to understand production: only from the perspective of
the amount produced, without including costs. The silence areas were therefore
characterized with respect to the inhibited production conversations, and it was
discovered that cost was not considered to be a relevant CEF. There were different
A Soft Technology for Effective Enactive Management 557

mines, with different production and transport costs, and different product quality,
i.e., each mine had its own map of cognitive references, while the executives only
recognized the aspects related to product quality.
When the executives were confronted in self-observation workshops with these
areas of silence with respect to their work, they stated that it was not important to set
costs as a reference because the whole production would be sold anyway. This
denial indicated that the executives were assuming that there was no organizational
learning related with knowing the costs, and at the same time, it constituted an
excuse for not incorporating new conversations to reflection on the strategy of sales
and relation with the clients in terms of differentiation between products that until
then had been treated homogeneously.
The design, using soft technologies in CLEHES, became apparent in the follow-
ing way: at first, it was centered on three stages. First, self-observation of the
History that characterized the human group and allowed knowing its Languages,its competencies acquired enactively, and its Emotions and moods with respect to
their role in the organization; second, observation of the interactions and causes of
their arrogance by pretending to know what they did not know specifically with
respect to production, which was verified by their conversational absence; and
third, observation of the networks, confrontation with a Silence area means
establishing the organizational damage to performance, its costs, and its justifica-
tion. Mitigation of the damage required establishing a new organizational distribu-
tion of the Bodies (Cuerpos) and renewing the conversations in which the persons
participate, giving rise to an enactive organizational transformation.
With respect to the new CEFs and their cognitive references, information on
costs was structured to produce a reflection on the relation between the sales
strategy and the organization’s performance. This reflection put in evidence the
cognitive shortsightedness of the sales group, generating conditions to modify the
relations between sales and production. This process was generated by means of
the creation of management indicators in an “enactive map” format that changed
the conversational dynamics of those who make up the organization. The conver-
sations were focused on the performance of people at all levels, who started
interacting from an enactive observer, embodying the CEFs and their cognitive
references, and making them part of their new daily practices, their bodily
arrangements, and the desires of each of the constituents in managing this learning
process.
5 Learnings and Final Remarks
Current experience and evidence show increasing dissatisfaction among adminis-
trators in terms of the results generated by the present tools to administer the
complexity of organizations. It is stated that such dissatisfaction has been the
consequence of limited attention and education of the actors in their structural
coupling with the human system, and this situation is the main source of all
organizational pains.
558 O. Garcı́a de la Cerda and A. Salazar Salazar

In this sense, enactive management emerges as a complementary view in
management, placing at the center of its study the human being and its ontology
in its role as an administrator. CLEHES allows the administrator to generate action
and enaction in multiple domains, configuring an important strategic design space
to attenuate the pains, ruptures, and breakages characteristic of human activity
systems, particularly in top management.
Critical enactive factors are configured as strategic elements for performance in
different organizational domains and contexts that allow, first, to become aware of
the organizational inhibitions of performance, and second, to design the missing
conversations oriented at action to improve performance and incentivizing an
embodied organizational learning. In this sense, self-awareness emerges as the
central element of the critical enactive factors in personal terms because from
observation and self-observation, they lead to taking responsibility for the organi-
zational aspects of daily practice. The above results in making adjustments in the
structure and the conversational networks within the organization.
The organizational intervention processes allowed making a number of impor-
tant changes within the organizations that were studied. On the one hand, important
adjustments were generated in their structure and in their reference performance
systems, and on the other hand, successful changes were achieved in the types of
conversations and in the relational dynamics of the constituents by generating
changes in the observers that configured the managers, executives, and CEOs.
This is the main factor that makes it possible to evaluate the success or failure of
the applications.
The application of soft technologies and the delivery of distinctions in enactive
management and its CLEHES tool allowed the administrators to configure qualified
observers with greater autonomy when facing organizational situations problem, in
addition to a greater capacity for solving conflicts. This movement of the observer,
from a linear view in terms of input–output to a correction of his own mistakes and
questioning the actions of his operation, has constituted the learning system in the
administrators, which is an important process in the care of the human activity
system.
Acknowledgments The authors acknowledge with thanks the support of the Departamento de
Ingenierı́a Industrial and DICYT-USACH through project 061217GDC “Gestión Enactiva: Uso de
herramientas para la efectividad organizacional” and all the companies that used the proposed
technology for this particular research. Special thanks to our colleagues Renato Orellana
Muermann and Marı́a Soledad Saavedra for their contribution in the discussion and edition of
this work.
References
Bullinger H, Fremerey F, Fuhrberg-Baumann J (1995) Innovative production structures –
precondition for a customer-orientated production management. Int J Prod Econ 41(1/3):15–22
A Soft Technology for Effective Enactive Management 559

Di Paolo E, Rohde M, De Jaegher H (2010) Horizons for the enactive mind: values, social
interaction, and play. In: Stewart JR, Gapenne O, Di Paolo EA (eds) Enaction: toward a new
paradigm for cognitive science. MIT Press, Cambridge, MA, pp 33–87
Engel A (2010) Directive minds: how dynamics shapes cognition. In: Stewart JR, Gapenne O,
Di Paolo EA (eds) Enaction: toward a new paradigm for cognitive science. MIT Press,
Cambridge, MA, pp 219–243
Espejo R, Reyes A (2011) Organizational systems: managing complexity with the viable system
model. Springer, London
Garcı́a O (2009) Human re-engineering for action: an enactive educational management program.
Kybernetes 38(7/8):1329–1340
Garcı́a O, Laulié L (2010) The CLEHES-MOOD an enactive technology toward effective and
collaborative action. Syst Res Behav Sci 27:319–335
Garcı́a O, Mendoza C (2011) Enactive management: application of CLEHES and VIPLAN.
Kybernetes 40(3/4):439–453
Garcı́a O, Orellana R (2008) Metasystemic re-engineering: an organizational intervention, deci-
sion making and decision support technologies. In: Adams F, Humphreys P (eds) Encyclopedia
of decision making and decision support technologies, vol II. IGI Global, London, pp 612–617
Garcı́a O, Saavedra M (2006) Self-management: an innovative tool for enactive human design,
creativity and innovation in decision making and decision support, vol I. Ludic Publishing Ltd,
London, pp 195–214
Garcia O, Saavedra M (2011) Enactive management: dancing with uncertainty and complexity.
In: Jerzy J, Lasker G (eds) Advances in analysis and decision-making for complex and
uncertain systems, vol 1. The International Institute for advanced studies in systems research
and cybernetics, Stuttgart, pp 1–6
Hutchins E (2010) Enaction, imagination, and insight. In: Stewart J, Gapenne O, Di Paolo E (eds)
Enaction: toward a new paradigm for cognitive science. MIT Press, Cambridge, MA,
pp 425–450
Masciotra D, Roth W-M, Morel D (2007) Enaction: toward a Zen mind in learning and teaching.
Sense Publishers, Rotterdam/Taipei
Maturana H (1987) Everything is said by an observer. In: Thompson WI (ed) Gaia, a way of
knowing: political implications of the new biology. Lindisfarne Press, New York, pp 65–82
Maturana H (2008) Anticipation and self-consciousness. Construct Found 4(1):18–20
Maturana H, Varela F (1987) The tree of knowledge: the biological roots for human understand-
ing. Shambhala Publications, Boston
McGee K (2005) Enactive cognitive science. Part 1: background and research themes. Construct
Found 1(1):19–34
Nudurupati SS, Bititci US, Kumar V, Chan FTS (2011) State of the art literature review on
performance measurement. J Comput Ind Eng 60:279–290
Shanon B (2010) Toward a phenomenology of the conscious. In: Stewart J, Gapenne O, Di Paolo E
(eds) Enaction: toward a new paradigm for cognitive science. MIT Press, Cambridge, MA,
pp 387–424
Stewart J, Gapenne O, Di Paolo E (2010) Enaction: toward a new paradigm for cognitive science.
MIT Press, Cambridge, MA
Tangen S (2004) Performance measurement: from philosophy to practice. Int J Prod Perform
Manag 53(8):726–737
Varela F, Thompson E, Rosch E (1992) The embodied mind: cognitive science and human
experience. Gedisa, Santiago
560 O. Garcı́a de la Cerda and A. Salazar Salazar

The Evolution of the Production Function:
Transition to the “Value Creation Cube”
Moira Scerri and Renu Agarwal
1 Introduction
Natural resources (e.g. land, labour and capital) all contribute to production in
varying proportions. Changes in the proportions, and the way in which they contrib-
ute, have occurred over many decades. A number of scholars and government reports
concur that reliance on physical resources have declined, replaced by intangible
factors such as knowledge and information (Australian Government 2007; Stam
2007). Toffler (1981) views the shift as occurring in three waves with the first
being the domestication of mankind and the move from hunter and nomad to farmer
and land owner. The second wave refers to the industrial revolution with the third
focusing on the technetronic age, knowledge work, demassification, and diversity as
the preferred operational methods (Toffler 1981). Therefore, we accept the role
of historical time in relation to industrial dynamics and organisational theory and
endeavour to understand the impacts and measures of value creation in today’s
organisations.
This chapter is theoretical in nature, follows the evolution of production in the
context of developed nations and is developed in four stages. We begin with the
industrial economy, then incorporating the service- and knowledge-based econ-
omy, followed by the creative economy before concluding with the rationale for the
development of the Value Creation Cube (VCC) framework. At each stage, we
examine the work of scholars whose contributions aid in clarifying the transitions to
a more productive- and knowledge-dependent economy.
M. Scerri (*) • R. Agarwal
Management Discipline Group, UTS Business School,
University of Technology Sydney, Sydney, Australia
e-mail: [email protected]; [email protected]
Department of Management Studies, Indian Institute of Science, Bangalore,
Driving the Economy through Innovation and Entrepreneurship,DOI 10.1007/978-81-322-0746-7_46, # Springer India 2013
561

2 Industrial Economy
The characteristics of the industrial economy introduced and described by Frederick
Taylor (1911) through his time and motion studies are standardisation, specialisation,
synchronisation, concentration, maximisation and centralisation. These were later
extended by the introduction of the scientific management of production theory (Stam
2007). Taylor worked on the premise that there was one best method to perform any
task and established a set of principles to illustrate this phenomenon (Stam 2007).
Underpinning these principles was the division of labour (Fischer and Sirianni 1994;
Stam 2007) where managers were seen as intellectually superior to employees and,
therefore, having responsibility to supervise and organise their own work. This
included the responsibility for selecting, training and developing employee skills.
Furthering Taylor’s viewpoint, Stam (2007) saw the employee contribution as pri-
marily physical in nature and an extension of machines where tasks are performed in
unison, routinely, and in a set sequence. Henceforth, efficiency experts popularised
Taylor’s viewpoint on the importance of management (Fischer and Sirianni 1994).
Over time, scientific study of the workplace continued and moved away from
the mechanical aspects of work towards the inclusion of behavioural and motiva-
tional factors (Campion and Thayer 1987). In this context, Hackman and Oldfield’s
Job Design Theory and Job Characteristic Model make a significant contribution.
The three classic variables are the employees psychological state and effects on
motivation, job characteristics that affect the psychological state of the individual
and employee attributes which show the effects and responses to complex and
challenging jobs. In this context, Hackman and Oldham provide five components
relating to the core job dimensions which affect employee motivation – namely,
skill variety, task identity, task significance, autonomy and lastly feedback. Using a
five-point Likert scale, a motivational potential score (MPS) matrix is determined,
wherein a near-zero score in skills variety, task identity or task significance will not
affect the overall score, whereas a near-zero score in autonomy or feedback will
affect the overall MPS. Next, we examine the operations and marketing literature to
show how contributions from this field shaped the transition to the service- and
knowledge-based economy.
3 Service- and Knowledge-Based Economy
In this section, we provide details on both the overlay of manufacturing models to
the service domain and where the service domain takes on its own area of study
devoid of a manufacturing.
Whilst the definition of services has been cumulative and variable, it was not
until Vargo and Lusch (2004) rejected the goods dominant (GD) logic that a
breakthrough occurred in the understanding of services. Vargo and Lush defined
services as the application of competencies, knowledge and skills for the benefit of
562 M. Scerri and R. Agarwal

another party (Vargo and Lusch 2004, 2008). Sampson and Frohle’s (2006) Unified
Service Theory (UST) extends this on the foundation that customer input is anecessary and sufficient condition to define a production process as a serviceprocess (Sampson and Froehle 2006, p. 331). More recently, Spoher and Maglio
(2008) provide a more holistic and systemic view, after which Agarwal and Selen
(2011, p. 1169) define services system as the application of competencies (knowl-edge, skills and experience) of the stakeholders, whereby customers provide them-selves, or provide significant inputs into the service production process and in thebest case are transformed by the simultaneous consumption – the experience whichintegrates key service characteristics and symptoms of services, along with
partnerships, knowledge, skills and experience. After accepting the service system
views, we look at the contributions arising from service marketing and operations
literature.
Schmenner (1986) derived the Service Process Matrix (SPM) from the Product
Process Matrix which described factor operations in relation to production with the
horizontal axis (X-axis) representing the degree of customer interaction andcustomisation and the vertical axis (Y-axis) as the degree of labour intensity,being the ratio of labour costs to plant and equipment (Schmenner 1986). Subse-
quently, Schmenner (1994) overlayed a manufacturing framework to services and
applied the Theory of Swift Even Flow to operations of service businesses which
states that productivity increases as the speed of materials (or information)increases and variability decreases (Schmenner 1994, p. 102). Schmenner’s (1986)
framework shows four operating models: Service Factory (SF), Mass Services (MS),
Service Shop (SS) and Professional Services (PS). In response to criticism of
Schmenner’s (1986) SPM, dimensions of the axis were amended with the Y-axisrenamed as the degree of relative throughput which relates to the speed of opera-
tions and the X-axis represents the degree of variability, whilst still referring to
the interface between the customer and the organisation (Schmenner 2004) added
with the notion of the productivity diagonal as shown in Fig. 1 (Schmenner 1994).
A number of limitations existed with this model, namely, the axes, were
designated as low and high and there was no accurate way of mapping co-
ordinates and, therefore, plotting the organisations’ operation on the matrix.
Secondly, the assumption that organisations have a single mode of operation is an
incorrect assumption as many organisations choose multiple operating models to
cater for different customer segments. Finally, the notion of throughput is flawed:
production in manufacturing is linear in nature, whereas the creation of services is
based on the dynamic interactions between customers, employees and suppliers.
Henceforth throughput as it was defined by Schmenner (2004) cannot be applied in
the context of services and that these limitations prevented Schmenner’s SPM from
being operationalised (Scerri and Agarwal 2011). In this context, Agarwal and
Selen (2005) recognised the importance of technology as an enabler in the SPM,
especially in the context of emerging service value networks. This contribution is
discussed next.
Whilst Schmenner’s (2004) model incorporated the characteristics of variability
and throughput, it failed to acknowledge or provide causal relationships between
The Evolution of the Production Function: Transition to the “Value. . . 563

the two. Agarwal and Selen (2005) do this with the introduction of a third dimen-
sion – the degree of technovation. The introduction of the Z-axis, along with the twoexisting dimensions of Schmenner’s (2004) framework – the degree of variability
and the degree of relative throughput resulted in the creation of the Service Cubicle(Agarwal and Selen 2005). In this Service Cubicle as shown in Fig. 1, the produc-
tivity diagonal now moves from the bottom right-hand corner to the top left-hand
corner of the Service Cubicle.Agarwal and Selen (2005) attributed the improvements in throughput and the
ability to reduce variation (especially in the back office functions) across the service
value network to technology and innovation. The significance of this achievement
was twofold. Firstly, the use of technology introduced a new operating space and an
ability to extend the provision of services across time and space. Secondly, it
provided mechanisms that resulted in increased productivity through automating
the back office functions where technology could perform functions previously
processed manually. This reinforced the notion that the means of increasing pro-
ductivity (or achieving increased business value) is achieved by minimising the
use of labour and maximising the use of technology, machinery or both. Whilst
Agarwal and Selen (2005) make a significant contribution, they inherited the limit-
ations of the SPM. After having outlined the various concepts centred on the service
processes, we next examine various emerging service theories and concentrate
discussion around service dominant (SD) logic, UST, networks and social capital.
Vargo and Lusch contend that a GD-logic treats services the same way as a good,
whereas a SD-logic considers services as a process of doing something for anotherparty in its own right (2008). This can be interpreted as part of the evolutionary
process whereby the role of knowledge is elevated and that human resources should
no longer be viewed merely as physical labour or an extension of machines. Rather,
it is the ability to apply competencies, knowledge and skills that becomes themeans
Fig. 1 Service cubicle (Source: Agarwal and Selen 2005)
564 M. Scerri and R. Agarwal

of creating economic value (Ng 2008). These competencies may also be embedded
in products, and the consumer purchases the product for the embedded service
rather than for the features of the physical product. Managers, on the other hand,
still require skills to manage employees’ work but these now involve the need for
personal and emotional intelligence in the form of dynamic capabilities for the
successful performance of their changing roles (Agarwal and Selen 2009; Pfeffer
and I 2000; Pfeffer and Sutton 2000).Whilst there has been a shift in the nature of
production from physical to intangible realms, the measure of productivity remains
unchanged. This is the topic of our research endeavours, and we discuss the con-
tribution of UST next.
Sampson and Frohle (2006) make a significant contribution to our understand-
ing of services which is underpinned by three main concepts. The first notes that
the customer is a provider of input into the production process, and their input is a
necessary and sufficient condition for the service process to begin. In this way,
customers are co-creators and co-producers in the service process. The second
concept involves the definition of a customer and the differentiation between the
entity that purchases the service and the entity to which the service is delivered.
Goldratt (1992) viewed throughput as the rate at which the system generated
money through sales; the implication being that if something was not produced
and sold, then it would be not treated as throughput. This definition does not take
into account other supplementary or support services required for an organisation
to operate (Goldratt 1992; Sampson and Froehle 2006). These services are often
referred to as knowledge-intensive business services. Additionally, the bidirec-
tional nature of services means service supply chains become hubs, rather than
functioning as linear chains (Fitzsimmons and Fitzsimmons 2006). In these inter-
organisational operations, service providers perform the function of an inter-
mediary, acting on behalf of customers, when dealing with outside suppliers
(Fitzsimmons and Fitzsimmons 2006; Sampson and Froehle 2006). This further
complicates the involvement of downstream customers in the service process as
networks are created connecting customers and suppliers through direct and
indirect ties (Ter Wal and Boschma 2009) giving rise to new network formations.
This is an area identified for future research.
Given the importance of inter-firm operations in service delivery, human inter-
actions play a significant role in connecting organisations and creating value through
social interactions and by supporting technical integration (Onyx et al. 2007; Ter
Wal and Boschma 2009). At this point, it is pertinent to introduce the contribution
of Bruno Latour’s (2005) Actor Network Theory (ANT). ANT is a distinctive
approach that combines the study of sociology with technology to provide a socio-
technical view of social construction of individuals into groups and networks, which
Latour terms appropriate social aggregates (2005, p. 5). Latour claims that the
causes of group formation and reformation determines the dynamic nature of groups
and that this aspect is worthy of further study (Latour 2005). Latour also suggests
that value is created in the invisible associations and interactions between agents, and
this concurs with scholars such as Putman (1993), Baker et al. (2011) and Onyx et al.
(2007) in their contention that social networks create social capital.
The Evolution of the Production Function: Transition to the “Value. . . 565

Putman (1993, p. 167) defines social capital as those features of social organ-isation, such as trust and networks that improve the efficiency of society by facilit-ating co-ordinated actions. Therefore, social interactions and social networks are
often used to create and maintain a competitive advantage by protecting privileges
and excluding wider access to resources and knowledge (Baker et al. 2011; Onyx
and Bullen 2000; Onyx et al. 2007; Ter Wal and Boschma 2009) and are avai-
lable regardless of wealth or status. Social connections exist in three structural
forms: bridging, bonding and linking. It is the interconnectedness of these networks
that form the basic ingredient of social capital, the dimensions of which are trust,
reciprocity, tolerance of diversity and social agency (Baker et al. 2011; Onyx and
Bullen 2000; Onyx et al. 2007).
Next we move from service- and knowledge-based economy to the time-related
phenomenon in the creative economy.
4 Creative Economy
Creative industries are defined as the cycle of creation, production and distributionof goods and services that use creativity and intellectual capital as their primaryinput (Creative Economy Report 2008).Whilst other scholars define creativity with
an outcome focus and as producing something novel, useful ideas or products,
Dewett (2004) and Potts (2009) view it in process terms stating: the adoption anddiffusion of new technologies that drive economic growth and evolution are signifi-cantly affected by the creative industries through their role in handling and pro-cessing social information about new things. Given the importance of creativity
and intellectual capital, we adopt the Csikszentmihalyi (2008) theory of flow as
the means for examining value creation in the creative space.
Csikszentmihalyi (2008) claims that the human nervous system is able to process
up to 110 bps data, and during the creative process, this capacity is totally con-
sumed. No human attention is left to monitor the self; the state of mind cannot
determine feelings, and there is no realisation of identity through consciousness, in
effect, existence is temporarily suspended. Csikszentmihalyi (2008) designates this
mental position as state of flow and describes it as the state in which the mind is in
dynamic equilibrium with the task at hand. The individual’s attention is most
productive when operating at full capacity and exists in this state (Csikszentmihaly
1996).Csikszentmihalyi identified the phenomenological landscape mapped into
eight graduated levels which are: arousal, anxiety, worry, apathy, boredom, relaxa-
tion, control and flow (Fig. 2) (Nakamura and Csikszentmihaly 2002). It can take at
least 10 years to achieve the balance between challenge and skill which results in
the state of flow(Csikszentmihalyi 2008), highlighting that experience as well as
skill is a contributor to productivity.
A number of contradictions surface when comparing Csikszentmihaly (2002)
theory of flow model with that of Schmenner’s (2004) Service Process Matrix.
The first is the role of time. Schmenner advocates reducing the time for production,
whereas creativity requires time and space in which employees become lost in time
566 M. Scerri and R. Agarwal

to produce. The second contradiction is over the point of maximum productivity
wherein both the SPM and the Service Cubicle maximum productivity
are represented by a single point, whereas the creative economies maximum
productivity exists in a zone. The third contradiction arises from the differences
in economic outcome. Schmenner’s point of productivity moves to reducing cycle
time (improved throughput times) and lowering variability whereas Csikszent-
mihalyi’s theory of flow supports the ability to create value through customers
engaging in the service delivery process for as long as possible.
Two other interesting points worth emerge – the first is description of the flow
experience as being independent of organisational culture and is the same regard-
less of activity, culture, gender, age, social status or sex (Csikszentmihaly 1996),
and the second is with creativity each output must have utility and be deemed
relevant and useful to managers, customers or other peers requiring employees
being willing to take risks (Dewett 2004). This risk-taking characteristic is also
attributed to entrepreneurs and is discussed next.
Schumpeter (1942) is known for his contribution on innovation and entrepre-
neurship (Muller 2011). He claims that the dynamism of capitalism is not brought
about by owners of capital but by entrepreneurs who bring innovation in the form
of new products, new markets and new forms of distribution (Greve 2003; Muller
2011; Schumpeter 1942; Smith 2006). Entrepreneurs do this in one of six ways:
by creating or bringing new products to market, by producing better versions of
existing products, by creating new markets, by creating new methods of production,
by creating new sources of production for existing commodities or by creating new
Fig. 2 Current model of the flow state (Source: Nakamura and Csikszentmihaly 2002)
The Evolution of the Production Function: Transition to the “Value. . . 567

forms of economic organisation (Schumpeter 1942). The change brought about by
entrepreneurs is described by Schumpeter (1942, p. 81) as creative disruption,where the innovations have such dynamic effects that it is possible for incumbents
to be displaced. From a psychological viewpoint, entrepreneurs need to achieve a
high internal locus of control, a willingness to take risks and a need for autonomy
and independence (Muller 2011; Schumpeter 1942). From a personal characteristic
perspective, an ability to possess a narrow focus on the immediate change, self-
centredness and less reliance on tradition are traits that assist entrepreneurs in
driving change, leading the means of production and drawing others to follow
(Muller 2011). This has implications for organisational leaders looking for inno-
vations and drivers of change when considering job design and job character-
istics. The creative nature and drive of entrepreneurs is linked to the capability of
leading. This, in turn, can result in creating a temporary monopoly and a conse-
quent generation of high profits.
Recent work by Agarwal and Selen (2009) extend entrepreneurial capabilities
and innovation beyond the individual to the organisation through an empirically
validated, integrated framework, which includes constructs such as organisational
relationship capital, collaborative organisational learning, entrepreneurial alert-
ness, collaborative innovative capacity and collaborative agility. The transforma-
tive effects applied across industry sectors are able to demonstrate entrepreneurial
and innovative capabilities in a service value network. Kastelle and Steen (2010)
also suggest using network analysis to understand the process of idea generation,
opportunity recognition and knowledge diffusion in a social context.
Next we draw together the strengths of each of the existing models and create the
Value Creation Cube (VCC) framework.
5 Value Creation Cube (VCC) Framework
According to Sampson and Froehle (2006), the discipline of services management
cannot exist and advance without theories and paradigms. The aim of this research
is to create a new and improved model which includes key components of existing
models, yet also overcomes existing shortcomings. We determine the different
components that make up the VCC model and provide a summary of each of the
scholars whose work has contributed to the conceptualisation of the VCC as shown
in Fig. 3.
Next, we describe the various entities that form parts of the VCC, that is,
customers, employees, managers, suppliers and shareholders, and explain the ratio-
nale for their inclusion and role in the context of the VCC framework.
Unlike some of the earlier models where customers were seen as separate to the
production process, we accept Vargo and Lusch (2004) and Sampson and Froehle
(2006) view of the customer as co-producer and, therefore, visualise customers as
contributors, participants and recipients of the service process. In doing so, we also
recognise customer-introduced variability and how organisations reduce or
568 M. Scerri and R. Agarwal

accommodate (Frei 2006) these into their operations. This will form a component of
the VCC. It also aligns with, and improves on, Schmenner’s (2004) framework, also
accepts the importance of technology as described by Agarwal and Selen (2005)
as an enabler-reducing variability and incorporates technology-enabled service off-
erings as part of the customer channel/variability constructs.
Taylor’s (1911) view that employees and managers perform fundamentally dif-
ferent functions is well accepted, and therefore, this division of labour is incorporated
in the VCC. However, we adopt the term “employee” in recognition that physical
labour and cognitive, behavioural, and emotional elements are required to perform a
job. These different dimensions of employees and managers will be incorporated into
the VCC framework. Further, creativity and problem-solving capabilities as deter-
mined by Csikszentmihalyi (2008) are critical to value creation, either for dealing
with customer variability or for the ability to innovate by creating new and novel
products for which customers are willing to pay (Frei 2006).
Suppliers contribute to, participate in and are recipients of the service process orservice value networks. We accept Agarwal and Selen’s (2005) view that technol-
ogy is an enabler to connect external suppliers, primarily through the automation of
back office functions. However, we also recognise that the “high-low” measure is
inadequate as organisations may have technical capabilities that are underutilised
by suppliers or trade partners. This is supported by the notion of technology
diffusion (Rogers 1962) that notes time is required for people to accept or reject
new technology and/or information. We also acknowledge the importance of an
open relationship with suppliers which serves to aid information exchange, improve
co-ordination and expedite problem solving across different stakeholders (Baker
et al. 2011; Onyx et al. 2007). The constructs for supplier integration will range
from manual processing or no integration to full integration.
Whilst the importance of shareholders was not a focus of this chapter, we do
acknowledge Rapport’s (1986) view that the primary responsibility of management
and business is to increase the value of its shareholder investments and that profit
Fig. 3 Scerrri and Agarwal
(Source: Original)
The Evolution of the Production Function: Transition to the “Value. . . 569

maximisation is one of the fundamental assumptions of economic theory (Scitovsky
1943). Hillenbrand Industries 1984 annual report states that shareholder value “is
created when a company creates free cash flow in excess of the shareholder
investment in business” (cited in Rapport 1986, p. 1). In addition, the performance
measures set out in Kaplan and Norton’s Balanced Scorecard show financial
perspectives including cash flow, incomes, sales, market share and stock price
(Kaplan and Norton 1992). We include each of these measures as contributions to
the constructs of shareholder measures in the VCC.
Organisational processes are often represented graphically via linear input-pro-
cess-output diagrams. However, the resource configuration for service delivery
differs from this given that consumption and production occur simultaneously and
require multiple interactions or conversations. Therefore, we illustrate the dynamic
nature of services and the VCC as illustrated in Fig. 4 where the bidirectional nature
of interactions, transactions and dialogue are transformed by decisions, actions and
co-ordinated efforts (Sampson 2011; Vargo and Lusch 2004, 2008). Operations
management now extends beyond the firm as resources and resource capabilities
available include those owned by customers and suppliers and those that can be
accessed or delivered by technical means. The configuration and constructs pro-
posed in the VCC provide a mechanism in which to systematically provide and
measure value generated for all entities. Furthermore, it delivers on the service
systems view described earlier by Spoher and Maglio (2008) and the service value
network view of Agarwal and Selen (2009, 2011). In relation to this, factors
signifying social and societal aspects are represented, which include customer
choice, levels of technology adoption, knowledge, skills, experience, levels of
motivation and engagement, aspects which Pott’s describes as being themechanismsof economic evolution (Potts 2009, p. 2).
6 Conclusion
From a theoretical perspective, the VCC framework as depicted in Fig. 3 represents
the next stage in the evolution of the transition between service- and knowledge-
based industries and the emerging creative economy. The VCC framework provides
a mechanism to accommodate quality, volume, variety and cost differences attrib-
uted to all stakeholder groups, all occurring simultaneously. In relation to this, the
bidirectional nature allows for both inputs and outputs to be identified at the same
time. The next phase of this research in service production is to define and empiri-
cally validate these underpinning constructs so that there is a generalisable and
acceptable way of determining the operational efficiencies based on the intangible
attributes of the service, knowledge and creative economies, work for which is
currently under progress.
570 M. Scerri and R. Agarwal

References
Agarwal R, Selen W (2005) The service cubicle: a new service taxonomy. In: Annual EurOAM
conference, European Operations Management Society, Budapest, Hungary, 19–22 June 2005
Agarwal R, Selen W (2009) Dynamic capability building in service value networks for achieving
service innovation. Decis Sci 30(3):431–475
Agarwal R, SelenW (2011) Multi-dimensional nature of service innovation – operationalisation of
elevated service offering construct in collaborative service organisations. Int J Prod Manage
31(3):21–38
Australian Government (2007) Servicing our future. Treasury, Australian Government, Canberra
Baker E, Onyx J, Edwards M (2011) Emergence, social capital and entrepreneurship:
understanding networks from the inside. Emerg Complex Organ 13(3):21–38
Campion M, Thayer PW (1987) Job design: approaches, outcomes and trade-offs. Organ Dyn
15(3):66–79
Creative Economy Report (2008) United Nations, Geneva, Switzerland
Csikszentmihaly M (1996) Creativity: the work and lives of 91 eminent people. Harper Collins,
New York
Csikszentmihaly M (2002) Flow: the classic work on how to achieve happiness, Rider, London
Csikszentmihaly M (2008) Creativity, fulfillment and flow, TED website. http://www.youtube.
com/watch?v=fXIeFJCqsPs Viewed 05 June 2011
Dewett T (2004) Employee creativity and the role of risk. Eur J Innov Manage 7(4):257–266
Fischer F, Sirianni C (eds) (1994) Case studies in organisation and bureaucracy. Temple
University Press, Philadelphia
Fitzsimmons JA, Fitzsimmons MJ (2006) Service management: operations, strategy, and
information technology, 5th edn. Irwin/McGraw-Hill, New York
Frei F (2006) Customer-introduced variability in service operations. Harv Bus Sch 9:1–18, Note
606-063
Goldratt E (1992) The goal. North River Press, Great Barrington
Greve H (2003) Organizational learning from performance feedback: a behavioural perspective on
innovation and change. Cambridge University Press, Cambridge
Kaplan R, Norton D (1992) The balanced scorecard – measures that drive performance. Harv Bus
Rev pp 71–79
Kastelle T, Steen J (2010) Using network analysis to understand Innovation. Innov Manag Policy
and Pract 12(1):2–4
Latour B (2005) Re-assembling the social. Oxford University Press, New York
Muller J (2011) Thinking about capitalism: Lecture 22 – Schumpeter on innovation and resent-
ment. Catholic University of America, New York. http://www.youtube.com/watch?
v¼oeCpDIiR150. Viewed 9 Dec 2011
Nakamura J, Csikszentmihaly M (2002) The concept of flow. In: Snyder CR, Lopez SJ (eds)
Handbook of positive psychology. Oxford University Press, Oxford/New York, pp 89–105
Ng ICL (2008) The pricing and revenue management of services. Routledge, London
Onyx J, Bullen P (2000) Sources of social capital, Soc Cap Public Policy Austr 17(3):105–135
Onyx J, Edwards M, Bullen P (2007) The intersection of social capital and power: an application to
rural communities. Rural Soc 17(3):215–230
Pfeffer J, Sutton RI (2000) The knowing-doing gap. Harvard Business School Press, Boston
Potts J (2009) Why creative industries matter to economic evolution. Econ Innov New Technol
18(7):663–673
Putman R (1993) Making democracy work: civic traditions in modern Italy. Princeton University
Press, Princeton
Rapport A (1986) Creating shareholder value, 2nd edn. The Free Press, New York
Rogers E (1962) Diffusion of innovation. Free Press, Glencoe
Sampson S (2012) Visualizing service operations. J Serv Res 15(2):182–198
The Evolution of the Production Function: Transition to the “Value. . . 571

Sampson S, Froehle C (2006) Foundations and implications of a proposed unified services theory.
Prod Oper Manage 15(2):329–343
Scerri M, Agarwal R (2011) Redefining productivity through inter-firm operations and supply
chains. Paper presented to the 9th ANZAM operations and supply chains and service
management, Geelong, 15–17 June 2011
Schmenner R (1986) How can service businesses survive and prosper? Sloan Manage Rev
27(3):12–32
Schmenner R (1994) Service firm location decisions – some mid western evidence. Int J Serv Ind
Manage 5(3):35–56
Schmenner R (2004) Service businesses and productivity. Decis Sci 35(3):333–347
Schumpeter J (1942) Capitalism, socialism and democracy. Harper & Row, New York
Scitovsky T (1943) A note on profit maximisation and its implications. Rev Econ Stud
11(1):57–60
Smith D (2006) Exploring innovation. McGraw Hill, Berkshire
Spoher J, Maglio PP (2008) The Emergence of Service Science: Towards Systematic Service
Innovation, IBM Research Centre, San Jose, CA
Stam C (2007) Knowledge productivity designing and testing a method to diagnose knowledge
productivity and plan for enhancement. Universiteit Twente, Enschede
Taylor F (1911) The principles of scientific management, Harper & Brothers, New York
Ter Wal A, Boschma R (2009) Applying social network analysis in economic geography: framing
some key analytic issues. Ann Reg Sci 43(3):739–756
Toffler A (1981) Third wave. Bantam Books, New York
Vargo SL, Lusch RF (2004) Evolving to a new dominant logic for marketing. J Mark 68:1–17
Vargo SL, Lusch RF (2008) From goods to service(s): divergences and convergences of logics. Ind
Mark Manag pp 1–6
572 M. Scerri and R. Agarwal

Factors Contributing to Teachers’ Attitude
Towards Knowledge Sharing
Soofi Anwar and K. Durga Prasad
1 Introduction
Knowledgemanagement (KM) has long been gaining organisational attention. Efforts
to capture and leverage a firm’s knowledge resources have become a major drive to
the success of any organisation. In today’s knowledge-driven economy, knowledge
has become the strategic asset of an organisation. Organisations are increasingly
recognising the role of knowledge resource (Smith 2001; Ofek and Sarvary 2001)
in building and sustaining a firm’s competitive advantage position (Kankanhalli
et al. 2005; Ried 2003) in the market. In knowledge-intensive organisations, knowl-
edge-related competencies are the primary source of competitive advantage, and focus
on building pro-knowledge-sharing environment and implementing effective KM
strategies to acquire and utilise explicit and tacit knowledge becomes the critical
success factor. Organisations are widely adopting KM initiatives to capture and
leverage the knowledge effectively.
Within the KM domain, a critical factor that needs most attention is knowledge-
sharing behaviour. A successful KM implies a good combination of both human
participation and IT collaboration tools. Knowledge-sharing technologies can be
a facilitator for sharing and storing of knowledge resource. Unless the people are
inclined towards knowledge sharing and form a favourable attitude towards shar-
ing their knowledge, no KM tools and techniques will provide effective results.
Previous empirical research findings on knowledge-sharing behaviour have identi-
fied some of the major barriers to knowledge sharing as well as motivators to share
knowledge.These factors range from individual factors to organisational and tech-
nological factors. Therefore, facilitating and reinforcing actual knowledge-sharing
behaviour is central to the success of KM.
S. Anwar (*) • K.D. Prasad
Birla Institute of Technology (Ranchi) UAE Campus, Dubai, UAE
e-mail: [email protected]; [email protected]
Department of Management Studies, Indian Institute of Science, Bangalore,
Driving the Economy through Innovation and Entrepreneurship,DOI 10.1007/978-81-322-0746-7_47, # Springer India 2013
573

Developing pro-knowledge-sharing organisational climate and fostering actual
knowledge-sharing behaviour of teachers are vital in universities and higher education
institutions since faculty members are the knowledge workers. In an educational set-
up, effective knowledge sharing ensures that teachers aswell themanagement are able
to realise and develop their potential to the fullest and offer quality education. The tacit
knowledge that academic staff creates or gains is embedded in their minds and
constitutes the storehouse of an educational institution’s intellectual capital. Being a
knowledge-intensive organisation, universities and higher education institutes have an
enormous scope to develop and implement effective knowledge-sharing strategies and
build knowledge-sharing culture to achieve academic excellence.
2 Review of Literature
Knowledge sharing is concerned with the willingness of individuals in an organi-
sation to share with others the knowledge they have acquired or created (Gibbert
and Krause 2002). A firm can successfully build a knowledge-sharing culture
not only by directly incorporating knowledge in its business strategy but also
by changing employee attitudes and behaviours to promote willing and consistent
knowledge sharing (Connelly and Kelloway 2003; Lin and Lee 2004). The
sharing of knowledge could take place through personal interaction and face-
to-face communication and also indirectly through some knowledge archive.
Sharing of tacit knowledge mainly takes place through socialisation, and more
and more efforts need to be put to convert tacit knowledge into explicit form.
Making tacit knowledge into explicit form allows it to be documented and shared
within the organisation.
Most research works concerning KM acknowledge the role of knowledge shar-
ing and the need to foster knowledge sharing (Davenport and Prusak 1998; Alavi
and Leidner 2001; Bartol and Srivastava 2002; Cabrera and Cabrera 2002; Bock
et al. 2005) for effective implementation of KM program. Although there are
many benefits associated with knowledge sharing (Kautz and Mahnke 2003), for
the most part, its facilitators are unknown (Szulanski 1996; Wiig 1997), and
the organisational and individual enablers of knowledge sharing are not properly
clarified (Connelly and Kelloway 2003). Unfortunately, people do not share their
knowledge under all circumstances, and they have enough reasons not to share
their knowledge as much as the organisation would like them to (Cho et al. 2007).
Knowledge sharing cannot be forced but can only be encouraged and facilitated
(Gibbert and Krause 2002). When people are motivated enough to share, a KM
initiative will find its success (Connelly and Kelloway 2001).
The extensive review of previous literature on knowledge sharing recognises
the existence of different influences on employee knowledge-sharing activities,
574 S. Anwar and K.D. Prasad

such as individual, organisational and technological factors (Lee and Choi 2003;
Connelly and Kelloway 2003; Taylor and Wright 2004). Referring to the individual
dimension, most authors agree that knowledge sharing depends on individual
characteristics, including experience, values, motivation and beliefs. Bock et al.
(2005) summarise the individual factors affecting knowledge-sharing behaviour as
anticipated extrinsic rewards (financial incentives or points towards promotion),
anticipated reciprocal relationships (desire to maintain relationship with others) and
sense of self-worth (sense of value brought by knowledge sharing through compe-
tence or power). According to Lu et al. (2006), individual factors such as greed,
self-efficacy (perception of person’s ability to valuable contributions and their
criticality), interpersonal trust and teamwork were found to be influencing
knowledge-sharing behaviour. Wasko and Faraj (2005) suggested that individual
motivators may enable employee willingness to share knowledge. Employees are
motivated when they think that knowledge-sharing behaviours will be worth the
effort and able to help others. Therefore, the expectation of individual benefits can
promote employees to share knowledge with colleagues. In individual level,
knowledge sharing can also be impacted by concerns over the individual’s status
or ‘competitive advantage’ over others being lost by sharing the valuable knowl-
edge one possesses (Huber 2001; Riege 2005; Hislop 2005; Fink and Distere 2006).
According to study conducted by Sun and Scott (2005) on barriers to knowledge
sharing, more significant barriers were fear of loss of ownership and fear of loss of
control of knowledge. Riege (2005), Rugullies (2003) and Garfield (2006)
highlighted the importance of time in knowledge sharing, referring to lack of
contact time and interaction between other knowledge workers in the organisation
and also lack of time to share knowledge in general.
From the organisational factors dimension, in the context of knowledge
sharing, the different aspects of organisational climate are critical drivers of
knowledge sharing, such as reward systems linked to knowledge sharing (Bartol
and Srivastava 2002), open leadership climate (Taylor and Wright 2004) and
top management support (MacNeil 2003, 2004). According to Bock et al. (2005), the
organization climate that comprise of trust, open and free flow of communication,
tolerance to failure, pro social norms and willingness to help each other is highly
conducive for knowledge sharing. Kim and Lee (2006) found social networks and
performance-based reward systems to be a significant organisational factor
influencing knowledge sharing.
Finally, referring to the technological dimension, employee usage of IT applica-
tions (Kim and Lee 2006; Lu et al. 2006; Meenakshi 2002; and Sundari 2003) and
user-friendly IT systems (Kim and Lee 2006) is found to influence positively on
sharing knowledge. ICT can be effectively used to facilitate the codification, integra-
tion and dissemination of organisational knowledge (Song 2002).
Factors Contributing to Teachers’ Attitude Towards Knowledge Sharing 575

3 Research Purpose and Methodology
3.1 Significance and Purpose of This Research
An educational institute will be able to gain and sustain its competitive advantage
through developing knowledge-sharing culture and facilitating high degree of
knowledge sharing among its academic staff. Though many empirical researches
have been undertaken in the area of knowledge-sharing behaviour, majority of them
focus on corporate executive knowledge-sharing behaviour. Very limited research
studies have been carried out on knowledge sharing in higher education and factors
determining teachers’ knowledge-sharing behaviour. Therefore, this study focuses on
seeking the faculty perspective on factors that positively and negatively influence
their knowledge-sharing behaviour. This research attempts to obtain insights into the
factors contributing to teachers’ attitude towards knowledge sharing. The objectives
of this study are as follows:
• To understand and analyse teachers’ attitude towards knowledge sharing
• To identify the individual factors contributing to teachers’ attitude towards
knowledge sharing
• To analyse the role of organisational factors in teachers knowledge-sharing
behaviour
• To determine the role of technological factors and teachers’ attitude towards
knowledge-sharing technologies
3.2 Research Methodology, Sample and MeasurementInstruments
Both primary and secondary data were collected for carrying out this research.
Secondary data was mainly used in developing the conceptual framework and
designing the questionnaire and measurement constructs. As it was a faculty knowl-
edge-sharing behaviour, a survey was undertaken to carry out this study. Full-time
faculty members teaching in engineering colleges in Mangalore were chosen as the
sample. Of the 100 questionnaires distributed, 72 completed and usable question-
naires were returned, representing a response rate of 72%.
The questionnaire was designed into two sections. The first part of the question-
naire was related to demographic information. The second section of the ques-
tionnaire comprised 34 scale items designed to ascertain the views of faculty
members on factors contributing to their attitude towards knowledge sharing.
A seven-point Likert-type scale (ranging from 1 ¼ strongly disagree to 7 ¼ strongly
agree) was used, and the respondents were required to state the extent to which they
agree or disagree with these statements. Most of the scale items validated through
reliability test were either adopted from previous studies on knowledge sharing or
adapted to suit the purpose of this research.
576 S. Anwar and K.D. Prasad

4 Data Analysis and Discussion
4.1 Demographic Profile of Survey Participants
The demographic variables used in this study are gender, age, highest qualifications
and current job position. Table 1 below gives demographic details of faculty survey
participants:
It can be seen from the above table that majority of participants for the survey
were female faculty members. The respondents are spread around different age
groups. Majority of the participants have either bachelor’s or master’s degree.
Assistant professors constitute the highest percentage of respondents for survey.
4.2 Teachers Perception of Factors Contributing to AttitudeTowards Knowledge Sharing
4.2.1 Individual Factors Contributing to Attitude Towards Knowledge
Sharing
Individual factors used in this study are the perceived reciprocal benefits, reputation
enhancement, rewards and incentives for knowledge sharing, fear of loss of knowl-
edge power, enjoyment in helping others, degree of competition and seniority in
the hierarchy, self-efficacy and attitude towards knowledge sharing. On a seven-
point Likert-type scale, value 7 was assigned to ‘strongly agree’, and value 1 was
assigned to ‘strongly disagree’; as such, high mean score represents high intensity
Table 1 Demographic
profile of survey participantsCharacteristics Frequency Percentage
Gender
Male 30 0.42
Female 42 0.58
Age
21–30 20 0.28
31–40 24 0.33
41–50 16 0.22
51–60 12 0.17
Highest qualification
Bachelor’s degree 26 0.36
Master’s degree 24 0.33
Doctorate degree 22 0.31
Current job position
Assistant professor 34 0.47
Associate professor 22 0.31
Professor 16 0.22
Factors Contributing to Teachers’ Attitude Towards Knowledge Sharing 577

of that variable in influencing knowledge sharing. Table 2 below presents these
individual factors with the corresponding standard deviation (SD) value and the
ranking based on its importance. The variables are arranged in descending order
representing their importance influencing knowledge sharing.
The above data reveal that faculty members have basically an overall positive
attitude towards knowledge sharing with the high mean score. The analysis of scale
items reveals that knowledge sharing is being viewed as important and pleasant
experience. Further, the major factors that influence them to have this attitude are
reciprocal benefits, perceived enjoyment in helping others, reputation enhancement
and self-efficacy, and their importance can be understood from the corresponding
ranks shown in above table. Within perceived reciprocal benefits, affiliation with
colleagues and meeting their own knowledge requirements are found to be the
significant factors. Within perceived reputation enhancement, knowledge sharing
leads to faculty recognition; appreciation and status improvement are the most
important factors motivating to share their knowledge. It may here be noted that
organisational rewards and degree of competition and seniority are not that signifi-
cant in influencing faculty attitude to share their knowledge. Within rewards for
knowledge sharing, sponsoring for workshops, FDP and higher studies are
indicated to be the suitable rewards for knowledge sharing. However, the fear of
loss of knowledge power is ranked the least indicating that it does not bear any
significant impact on their knowledge-sharing behaviour.
4.2.2 Organisational Factors in Contributing to Attitude Towards
Knowledge Sharing
Organisational climate guides the employee behaviour by conveying to them what
behaviour is appropriate and desirable. Numerous studies have recognised the role
of organisational climate as a critical driver of knowledge-sharing behaviour and
emphasised the need to create knowledge-sharing organisational climate. The factors
used in this are top management leadership and support, teamwork, fairness, affilia-
tion, innovativeness, organisational rewards for knowledge sharing and facilities for
Table 2 Role of individual factors in knowledge sharing
Individual factors influencing knowledge sharing Mean SD Rank
Attitude towards knowledge sharing 6.50 0.63 1
Perceived reciprocal benefits 6.46 0.63 2
Perceived enjoyment in helping others 6.40 0.64 3
Perceived reputation enhancement 6.33 0.73 4
Self-efficacy 6.10 0.86 5
Perceived degree of competition and seniority 4.36 1.61 6
Perceived organisational rewards and incentives 3.91 1.53 7
Perceived loss of knowledge power 1.82 0.94 8
Source: Faculty Survey
578 S. Anwar and K.D. Prasad

knowledge sharing available in the organisations. Table 3 below presents these
organisational factors influencing knowledge sharing with mean scores, standard
deviation (SD) value and the corresponding ranks. The variables are arranged in
descending order representing their importance influencing knowledge sharing.
The above table shows that teamwork and cooperation among faculty members
in their departments with mean 6.40 and SD-0.62 are ranked as the important
organisational factor for knowledge-sharing attitude formation. Management’s high
encouragement for innovative ideas and suggestions is found to be the second
important factor contributing to their knowledge sharing. Lower ranks obtained for
organizational support in terms of knowledge sharing technology and rewards and
recognition for knowledge sharing indicates the opportunity for strengthening and
reinforcing actual knowledge sharing behavior.
4.2.3 Technological Factors Contributing to Attitude Towards Knowledge
Sharing
Information and communication technology (ICT) use and knowledge sharing are
closely linked, because ICT can enable rapid search, access, retrieval and sharing of
knowledge. Past empirical findings emphasise the role of technological factors on
influencing knowledge-sharing behaviour. The factors used in this study are per-
ceived usefulness of technology, availability of technology and the degree of usage
of ICT. Table 4 below shows the faculty perception of role and actual usage of ICT
in knowledge sharing. The variables are arranged in descending order representing
their importance influencing knowledge sharing.
It can be seen from the above data that teachers have a positive attitude towards
technology and its contribution in knowledge sharing. Perceived usefulness of
technology in knowledge sharing is high among the faculty with mean score of
6.11, SD 0.63. Technology enables them to share their knowledge easier, faster and
most effectively. Availability of such technologies for knowledge sharing is rated
Table 3 Role organisational factors in knowledge sharing
Organisational factors influencing knowledge sharing Mean SD Rank
Teamwork and cooperation 6.40 0.62 1
Organisational encouragement for innovative ideas 6.11 0.83 2
Organisational support in terms of knowledge-sharing technology 5.57 0.86 3
Organisational support in terms of rewards and recognitions 5.14 0.64 4
Source: Faculty Survey
Table 4 Role of technological factors in knowledge sharing
Technological factors influencing knowledge sharing Mean SD Rank
Perceived usefulness of technology 6.11 0.63 1
Technology availability 6.02 0.86 2
Technology usage 5.82 1.23 3
Source: Faculty Survey
Factors Contributing to Teachers’ Attitude Towards Knowledge Sharing 579

second highest with mean score of 6.02 and SD 0.86. Technology usage by the
faculty members is rated relatively low with the mean score of 5.82 and SD 1.23,
thus revealing opportunity for improving the usage of technology by the teachers
for knowledge sharing amongst their colleagues.
5 Implications
The top management and leadership of universities and higher education institutes
plays a vital role in creating pro-knowledge-sharing climate, facilitating knowl-
edge sharing through IT support and KS infrastructure and also fostering actual
knowledge-sharing behaviour with rewards and reinforcement. Based on the findings
of the study, the role of top management of universities and higher education
institutes in promoting knowledge sharing can be broadly categorised into:
Firstly, at the individual level, management can significantly influence teachers’
attitude towards knowledge sharing through its pro-knowledge-sharing policies
and strategies. Secondly, leadership of the organisation plays a crucial role in
building knowledge-sharing culture within the organisation. Collaborative plan-
ning; emphasising team works, ‘community of practices’, knowledge-sharing re-
wards and recognitions; linking knowledge sharing to performance appraisal; and
increased sharing of knowledge through meetings, discussions, seminars/work-
shops, newsletters, magazines and data bases should be part and parcel of knowl-
edge-sharing culture. Finally, technology support is critical in facilitating effective
knowledge sharing. Knowledge-sharing technologies such as data bases, web portals,
intranets, Internet, etc., will be the major enablers to knowledge sharing. IT systems
can help in converting tacit knowledge from research, workshops and class room
activities to explicit form, and the management should ensure the availability and
usage of right IT systems and processes for knowledge sharing. Thus, the factors
contributing to teachers’ attitude towards knowledge sharing range from soft issues to
hard issues, and in both these categories, the top management and leadership of the
higher education institutes has a major role to play.
6 Conclusion
For any higher educational institution to stay ahead of their competition, they must
be able to exploit the internal knowledge that resides within the human memory of
their skilled faculty and academic staff. Therefore, an understanding of teachers’
knowledge-sharing behaviour and the factors that either positively or negatively
contribute to their attitude towards knowledge sharing will help the top management
of higher education institute to build knowledge-sharing climate and encourage the
degree of knowledge sharing that takes place among faculty and reinforce their actual
knowledge-sharing behaviour. From the overall analysis of findings of this study on
580 S. Anwar and K.D. Prasad

teachers’ attitude towards knowledge sharing, it is revealed that individual, organisa-
tional and technological factors significantly contribute to teachers’ attitude towards
knowledge sharing. Knowledge-sharing behaviour is a complex process that is deter-
mined bymultiple factors ranging from soft factors (organisational culture and climate,
individual attitude, etc.) and hard factors (IT, organisational incentive systems, etc.).
Thus, understanding of these factors influencing knowledge-sharing behaviour will
help the top management and leadership of universities and higher education institutes
to formulate motivational strategies to enhance knowledge-sharing behaviour of its
faculties and build knowledge-sharing climate within the organisation.
Al-Alawi et al (2007) found that trust, communication, information system,
rewards and organization structure is positively related to knowledge sharing in
organizations. According to Bock and Kim (2002) attitude has significant influence
on knowledge sharing, but extrinsic rewards do not significantly influence knowl-
edge sharing. According to Chennamaneni (2006), individual factors such as
reciprocity, reputation, enjoyment in helping others is positively associated towards
knowledge sharing. Organizational climate and tools and technology for knowledge
sharing also significantly influence knowledge sharing. Cummings (2003) argues
that knowledge sharing has its roots embedded in the technology transfer and
innovation literature and highlights the need for overcoming the factors that can
impede or complicate knowledge sharing efforts. Knowledge workers are vastly
different from other types of workers in their motivation, attitude and need for
autonomy (Davenport Thomas 2005).
Gold et al (2001) focused on core capabilities that are needed to facilitate KM
success and the findings reveal that both knowledge infrastructure capability and
knowledge process capabilities positively influence organizational effectiveness.
According to Kim and Ju (2008), perceptions and reward systems are the most
important factor influencing knowledge sharing. Findings of Lee et al (2006) shows
that organizational climate is linked to higher KM performance; rewards, top
management support, IT service quality are critical managerial drivers for knowl-
edge friendly organizational climate.
References
Al-Alawi AI, Al-Marzooqi NY, Mohammed YF (2007) Organizational culture and knowledge
sharing: critical success factors. J Knowledge Manage 11(2):22–42
Alavi M, Leidner DE (2001) Knowledge management and knowledge management systems:
conceptual foundations and research issues. MIS Q 25(1):107–136
Bartol KM, Srivastava A (2002) Encouraging knowledge sharing: the role of organizational
rewards systems. J Leadersh Org Stud 9(1):64–76
Bock GW, Kim YG (2002) Breaking the myths of rewards: an exploratory study of attitudes about
knowledge sharing. Inf Res Manage J 15(2):14–21
Bock GW, Zmud RW, Kim YG, Lee Jae-Nam (2005) Behavioral intention formation in
knowledge sharing: examining the roles of extrinsic motivators, social-psychological forces,
and organizational climate. MIS Q 29(1):87–111
Factors Contributing to Teachers’ Attitude Towards Knowledge Sharing 581
Bollinger AS, Smith RD (2001) Managing organizational knowledge as a strategic asset. J Knowl
Manag 5(1):8–18
Cabrera A, Cabrera EF (2002) Knowledge-sharing dilemmas. Org Stud 23:687–710
Chennamaneni A (2006) Determinants of knowledge sharing behaviors: developing and testing an
integrated theoretical model. Unpublished doctoral thesis, the University of Texas at Arlington
Cho H, Gay G, Davidson B, Ingraffea A (2007) Social networks, communication styles, and
learning performance in a CSCL community. Comput Educ 49:309–329
Connelly C, Kelloway K (2001) Predictors of knowledge sharing in organizations. MSc thesis;
Queen’s School of Business, Queen’s University, Kingston
Connelly CE, Kelloway K (2003) Predictors of employees’ perceptions of knowledge sharing
cultures. Leadersh Org Dev J 24(5):294–301
Cummings J (2003) Knowledge sharing: a review of the literature. The World Bank, Washington,
DC, OECD Working Paper
Davenport TH, Prusak L (1998) Working knowledge: how organizations manage what they know.
Harvard Business School Press, Boston
Dvenport Thomas H (2005) Thinking for a living – how to get better performance and results from
knowledge workers. Harvard Business School Press, Boston
Fink D, Distere G (2006) Knowledge management in professional service firms. In: Schwartz
DG (ed) Encyclopedia of knowledge management. Idea Group, London, pp 381–388
Garfield S (2006) 10 reasons why people don’t share their knowledge. KM Rev 9(2):10–11
Gibbert M, Krause H (2002) Practice exchange in a best practice marketplace. In: Davenport
TH, Probst GJB (eds) Knowledge management case book: siemen best practices. Publicis
Corporate Publishing, Erlangen
Gold AH, Malhotra A, Segars AH (2001) Knowledge management: an organizational capabilities
perspective. J Manage Inf Syst 18(1):185–214
Hislop D (2005) Knowledge management in organizations: a critical introduction. Oxford Univer-
sity Press, London
Huber GP (2001) Transfer of knowledge in knowledge management system: unexplored issues
and suggested studies. Eur J Inf Syst 10:72–79
Kankanhalli A, Tan BCY, Wei KK (2005) Contributing knowledge to electronic knowledge
repositories: an empirical investigation. MIS Q 29(1):113–143
Kautz K, Mahnke V (2003) Value creation through IT-supported knowledge management? The
utilization of a knowledge management system in a global consulting company. Inform
Sci 6:75–88
Kim S, Lee H (2006) The impact of organizational context and information technology on
employee knowledge-sharing capabilities. Public Adm Rev 66(3):370–385
Kim S, Ju B (2008) An analysis of faculty perceptions: attitudes toward knowledge sharing and
collaboration in an academic institution. Library Inf Sci Res 30:282–290
Lee H, Choi B (2003) Knowledge management enablers, processes, and organizational
performance: an integrative view and empirical examination. J Manage Inf Syst 20(1):179–228
Lee JH, Kim YG, Kim MY (2006) Effects of managerial drivers and climate maturity on
knowledge-management performance: empirical validation. Inf Res Manage J 19(3):48–60
Lin HF, Lee GG (2004) Perceptions of senior managers toward knowledge-sharing behaviour.
Manag Decis 42(1):108–125
Lu L, Leung K, Koch PT (2006) Managerial knowledge sharing: the role of individual, interper-
sonal, and organizational factors. Manag Org Rev 2(1):149–153
MacNeil CM (2003) Line managers: facilitators of knowledge sharing in teams. Empl Relations
25(3):294–307
MacNeil CM (2004) Exploring the supervisor role as a facilitator of knowledge sharing in teams.
J Eur Ind Train 28(1):93–102
Meenakshi N (2002) Knowledge sharing in schools: perceptions of teachers. Master of Science
(Information Studies) thesis. School of Communication and Information, Nanyang Techno-
logical University, Singapore
Ofek E, Sarvary M (2001) Leveraging the customer base: creating competitive advantage through
knowledge management. J Manage Sci 47:1441–1456
582 S. Anwar and K.D. Prasad

Reid F (2003) Creating a knowledge sharing culture among diverse business units. Employ Relat
Today 30(3):43–49
Riege A (2005) Three-dozen knowledge sharing barriers managers must consider. J Knowl
Manage 9(3):18–35
Rugullies E (2003) Knowledge management/organizational needs: changing culture is key to
effective knowledge sharing, CIO.com http://www2.cio.com/analyst/report1164.html
Song S (2002) An internet knowledge sharing system. J Comput Info Syst 42(3):25–30
Sun PY-T, Scott JL (2005) An investigation of barriers to knowledge transfer. J Knowl Manag
9(20):75–90
Szulanski G (1996) Exploring internal stickiness: impediments to the transfer of best practice
within the firm. Strat Manag J 17(Winter Special Issue):27–43
Taylor WA, Wright GH (2004) Organisational readiness for successful knowledge sharing:
challenges for public sector managers. Info Resour Manag J 17(2):22–37
Wasko MM, Faraj S (2005) Why should I share? Examining social capital and knowledge
contribution in electronic networks of practice. MIS Q 29(1):35–57
Wiig KM (1997) Knowledge management: an introduction and perspective. J Knowl Manag
1(1):6–14
Factors Contributing to Teachers’ Attitude Towards Knowledge Sharing 583

Vocational Value Vector (V3) Management
in Technical Vocational Education and Training
(TVET) for Enhanced Industrial Employability
K.M. Nagendra, S. Radha, and C.G. Naidu
1 Introduction
Vocational education is an educational subsystem that specifically helps learners
prepare themselves for jobs. Finch and Crunkilton (1979) explain that vocational
education emphasises the development of skills, performance and preparation for
jobs. It is related not only to the development of skills but also to that of all
competencies that learners possess to express themselves in jobs. According to
Wenrich (1974), all competencies that can be developed include all domains
belonging to learners, namely, knowledge, skills and work attitudes, while learners’
potentials include feeling, sight, thought and action. Therefore, vocational educa-
tion is directly related to the way of empowering all potentials belonging to learners
in order that they possess certain competency.
The vocational training system of India offers training through public industrial
training institutes (ITIs) as well as industrial training centres (ITCs) that are private
establishments. Enrolment-wise, the ITIs are much larger, while most private ITCs
offer only a few trades. Therefore, in some states, the number of public ITIs is in
dozens, while the number of private ITCs is in hundreds. Until recently, the
numbers of private ITCs had been growing very rapidly but reached saturation
very soon, and their numbers are now declining. The number of public ITIs has
exhibited slow growth, while student enrolments and graduations are diminishing.
The Government of India has made a considerable investment in skills development
of young people through setting up the ITIs. Historically, they have been
established with the major aim being to speed up the process of industrialisation
K.M. Nagendra (*) • C.G. Naidu
School of Vocational Education and Training (SOVET), IGNOU, New Delhi, India
e-mail: [email protected]; [email protected]
S. Radha
Regional Services Division, IGNOU, New Delhi, India
e-mail: [email protected]
Department of Management Studies, Indian Institute of Science, Bangalore,
Driving the Economy through Innovation and Entrepreneurship,DOI 10.1007/978-81-322-0746-7_48, # Springer India 2013
585

in this country. This, however, determined the rather limited range of national
vocational qualifications, the majority of which are basic industrial trades, while the
non-engineering trades necessary for development of, for instance, the services
sector, continue to be under-represented.
Recognising the high demand for skill in the country, the Central Advisory
Board of Education (CABE) committee in its 57th meeting held on 19 June 2010 in
New Delhi highlighted the need for a NVEQF to provide a common reference
framework for linking various vocational qualifications and setting common
principles and guidelines for a nationally recognised qualification system and
standards. The National Policy on Skill Development 2009 (NPSD) of Government
of India identifies National Vocational Qualification Framework (NVQF) as the
main instrument for linking various education and training pathways. The NPSD
inter alia states ‘National Vocational Qualification Framework will be created with
an open flexible system, which will permit individuals to accumulate their knowl-
edge and skills and convert them through testing and certification into higher
diplomas and degrees. NVQF will provide quality-assured learning pathways
having standards, comparable with any international qualification framework.
NVQF will support lifelong learning, continuous upgradation of skills and knowl-
edge’ (NPSD 2009, p. 40).
It was agreed that NVEQF can bring about necessary changes in the education
and training system of the country with an aim to bridge the gap between demand
and supply of skilled work force, leading to increase in the employability of the
youth.
International experience on NVEQF is very recent. Until 2004, almost no
country in the world had a NVEQF. Even now, just a dozen countries have a
NVEQF, although more than 100 countries have initiated the process. An important
consideration is that countries that have been very successful in building their
education and training systems (e.g. Germany), or have experienced rapid eco-
nomic growth (the East Asian ‘tigers’), have done it without a NVEQF. In India
itself, the IT and telecom industry and employment therein has grown rapidly in
these sectors without an NVEQF in place. Therefore, it is absolutely critical that
in India we think very carefully as to why we need a NVEQF and what are the
problems that (a) the employers and (b) the potential employees (i.e. students) are
facing—which the NVEQF will supposedly address. Building an interface between
the educational system and labour market is not the easiest of things and is fraught
with unintended consequences. We should attempt to anticipate as many of the
consequences of implementing a NVEQF as possible.
PM’s Council on National Skill Development, constituted in 2008, has set a
target of creating 500 million skilled persons by 2022 with emphasis on inclusivity
so as to deal with divides of gender, rural/urban, organised/unorganised, employ-
ment and traditional/contemporary workplace. It has laid down the core governing
principles and operating strategies for skill development. The emphasis is on
promoting multiple models of delivery that can respond to differing situations
in various states and to utilise existing available infrastructure of educational
institutions for skill development after school hours without affecting formal
586 K.M. Nagendra et al.

education. The state governments are encouraged to set up the state-level coordination
body for skill development. But the employment situation of Karnataka in 2009
is given in the Table 1. The statistics indicate that only around 23% of the job seekers
in the job melas are employable, whereas nearly 41% of the aspirants need further
training in employability skills.
2 Literature Review
In a competitive workforce, it is not just having the right qualification or technical
skills that will land an individual a job, it could very well be their interpersonal
skills. How someone communicates is often the first impression an employer has
of a possible worker. Yet, it is precisely communication skills that employers
feel applicants are most lacking (Department of Education, Employment and
Workplace Relations, Commonwealth of Australia 2011). In line with modern
economies, workplaces are constantly changing, and as a result, employers are
looking for employees who are adaptable and who have skills beyond the technical
(Maxwell 2010). For example, a survey of CEOs found that 33.1% of employers
consider employability skills to be the most important factor when employing
graduates, whereas only 19.2% rated relevant work experience above employability
skills (Australian Industry Group and Deloitte 2009).
The Australian Chamber of Industry and Commerce and Business Council of
Australia define employability skills as ‘skills required not only to gain employment,
but also to progress within an enterprise so as to achieve one’s potential and contribute
successfully to enterprise strategic directions’ (2002, p. 3). Their framework identifies
eight main employability skills. These are communication, teamwork, problem-
solving, initiative and enterprise, planning and organising, self-management, learning
and technology. Despite all the attention these eight skills have received, there is
still no operational definition that trainers can use when designing curricula and
assessment tools. This deficiency leads to this set of skills being poorly understood
by VET practitioners (Australian Flexible Learning Framework 2009), not to mention
learners. Although called ‘employability’ skills, the abilities encompassed by these
skills have broader application, being relevant to a variety of tasks in daily life,
education, labour market, social networks and interpersonal relationships. Having
well-developed employability skills can also be an advantage in a fluid economic
climate—they can help individuals to prosper and cope with change (Callan 2003).
Employability skills tend to require a high order of mental complexity since
Table 1 Employment situation of Karnataka in 2009
Job seekers participated in job melas 78,014
Total employers participated in five mega skill ‘N’ job fairs 403
Employment created through mega job fairs 17,680
Training required 31,900
Source: Karnataka Vocational Training and Skill Development Corporation Ltd. (2009)
Vocational Value Vector (V3) Management in Technical Vocational Education. . . 587

they involve an active and reflective approach to life. In this sense, they are
multidimensional, comprising ‘know-how, analytical, cultural and communication
skills, and common sense’ (Allen Consulting Group 2006, p. 12).
There are two main options for the formal introduction of employability skills
into VET sector programmes—either embedded in training packages or kept
separate from the technical and vocational skills. The disadvantage of a separate
approach is that learners may not see the value of employability skills if they are
removed from their industry context (Cleary et al. 2006). Embedding them in
training packages means that they are integral and tailored to the industry-endorsed
competencies. Learners’ being able to see the relevance of the skills to workplaces
is central to their embracing them. The Australian National Quality Council’s 2005
endorsement for employability skills to be made explicit in training packages
provoked debate over how they should be embedded. There had previously been
some criticism about the way this was done, with teachers in particular sceptical
about whether students were really gaining the skills needed to be employable in a
range of jobs in different industries (Callan 2003). The Allen Consulting Group
(2004) had argued that incorporating employability skills consistently across train-
ing packages could help ease this criticism, since they would demonstrate the
relevance to the workplace, whatever the industry. In 2006, the key competency
framework was replaced by the employability skills framework, and the provision
of employability skills statements and summaries is now standard practice, with the
summaries individualised to the particular industry (Wibrow 2011).
Generally, under each qualification, the employability skills and their facets
are listed in an employability skills summary. The facets, which make up each of
the skills, have been modified to reflect the needs of the particular qualification.
The National Quality Council of Australia has developed a website which contains
the summary pages for each training package (http://employabilityskills.training.
com.au/).
According to Boud and Solomon (2001), competency refers to an ability to
demonstrate what one has acquired before. Competency attainment depends not
only on the effective implementation of a learning model but also on the assessment
system. Through an integrated assessment system, schools obtain accurate infor-
mation on the learning quality so that they can make up for the weaknesses. Thus,
assessment plays an important role in controlling the quality of education. Substan-
tially, Garavan and McGuire (2001) explain that competency can be viewed from
the two aspects, namely, individual’s attributes and learning outcomes. From the
former, competency is defined as one’s knowledge, skill and ability that result in
performance. From the latter, it is defined as the extent to which one’s performance
has satisfied the necessary standard. Hoffman (1999) states that a complex job can
employ the concept of competency as an individual’s attributes, while a simple job
can use the concept of competency as learning outcomes. Broadly speaking, there
are two types of competency, namely, the generic competency and the specific or
technical competency. The former, according to Wood and Lange (2000), includes
the writing, numeracy, communication, problem-solving abilities and social skill.
Nordhaug (1998) explains that the latter consists of knowledge of method, process
588 K.M. Nagendra et al.

and technique designed to accomplish particular tasks and abilities to use tools and
equipment. According to Harris et al. (1995), competency in the educational
perspective is measured in terms of three separate aspects, namely, knowledge,
skill and work attitude, and it refers to specific and technical competency.
The discussion on knowledge, skill and work attitude is presented below. Boyett
and Boyett (1998) define knowledge as understanding of how something works and
skill as an ability to apply knowledge to put something into reality. Attitude,
according to Saifudin Azwar (1988), consists of knowledge, emotion and
behaviour. Feldman (1993) states that knowledge refers to one’s thought of
and belief in an attitudinal object, emotion to feeling of an attitudinal object, and
behaviour to desire to act. A combination of knowledge and emotion can determine
one’s affective level. A high affective level makes one act. Sax (1980) states that
attitude has an element of consistency. An attitude is a strong emotion to respond
to an attitudinal object consistently. Therefore, attitude can be defined as a level of
emotion that makes someone act. The action is stimulated by a strong and stable
emotion. This means that an attitude has a characteristic of consistency to determine
an action choice.
The affective domain according to Bloom’s taxonomy (Woolfolk and Nicholich
1984) has five objectives. They include receiving, responding, valuing, organising,
and characterising. The process in which someone responds to an attitudinal object
starting from receiving, responding, valuing and organising to characterising
reflects a careful choice of action. On the basis of a study on the concept of
competency comprising knowledge, skill and attitude, it can be concluded that
competency in machinery practice consists of knowledge of the principle of
operating a tool machine, knowledge of the procedure of operating a lathe machine
and a milling machine, the skill of operating a lathe machine and a milling machine,
work accuracy and work consistency (Muhammad 2010).
3 Materials and Methods
3.1 Population and Sample
This is a descriptive study using a convenience sampling method. The population
consists of students attending TVET programme at Toyota Technical TrainingInstitute operated by a leading automobile OEM company near Bangalore, India.
Finally, 61 candidates were selected from the list of 372 eligible students for TVET
programme. They attended an intensive induction training programme (ITP)
in broad areas of social skills before the actual technical vocational training
(TVT) programme.
Vocational Value Vector (V3) Management in Technical Vocational Education. . . 589

3.2 Research Instrument
To assess students’ employability skills, we used the instrument prepared using the
psychometric parameters. The items in the instrument included most of the voca-
tional value vectors perceived necessary by corporations and industries across the
globe for enhanced employability. The employability skills instrument contained
six vocational value vector constructs described in the framework given in Fig. 1.
4 Intervention Strategy
The intervention strategy for developing each of the vocational value vectors
among the trainees is detailed below.
4.1 Commitment to Task
To enhance the trainees’ commitment to task, sessions were conducted on ‘goal
setting’ and ‘time management’. Following it, they were given a time table of daily
tasks and their accomplishment. The tasks included reporting to training sessions on
time, to prepare daily training reports and some outbound activities like community
services. These exercises primarily enhanced the awareness towards the tasks on
hand and promoted the commitment towards completing them.
4.2 Pride in Work
As just completion of the tasks is not a true indicator of the positive attitude, efforts
were made to motivate the trainees to feel proud about their accomplishments.
Also, they were encouraged to share their previous achievements through creative
presentations and talent exhibitions.
Fig. 1 Conceptual framework
590 K.M. Nagendra et al.

4.3 Adapting to Change
As the trainees came from different parts of Karnataka, they had apprehensions in
new environment. To improve their adaptability to change, sessions were
conducted based on ‘how to win friends and influence people’. This was
supplemented by guidance based on ‘health and hygiene’ and ‘work–life manage-
ment’. New industrial practices like safety, green path, walking in line, zebra
crossings, dress code, physical exercise, etc., were demonstrated and implemented.
4.4 Accepting Criticism
Most essential requirement for a learner is accepting criticism. Constructive
criticisms are the part and parcel of professional life. But coping with them is not
very easy. Hence, sessions were conducted on ‘how to stop worrying and start
living’. Also platform was provided for sharing their past experiences. During the
training, rigorous feedbacks were given through constructive criticism and contin-
uous counselling.
4.5 Extrovert
The most observable employability skill is communication. Most of the people tend
to be introverts because of poor communication skills. Hence, sessions were
conducted on basic communication skills and spoken English. Activities like
knowing game, storytelling, experience sharing and cultural activities were
conducted to improve communication skills. Every trainee was made to mandator-
ily participate in all these activities and thereby helping them to be extroverts.
4.6 Critical Eye for Abnormality
Most of our learning happens through observing the surroundings. If one fails to
observe, then irrespective of excellent training resources, the trainee fails to suc-
ceed. To promote learning through observation, problem-solving activities were
conducted for both individuals and teams. This helped the trainees to learn not only
from their mistakes but also from observing other’s mistakes.
Vocational Value Vector (V3) Management in Technical Vocational Education. . . 591

5 Results and Discussion
5.1 What Is the Level of Employability Skills of Studentsat the Technical Training Institute?
A descriptive analysis of students’ vocational value vectors is shown in Table 2.
The finding showed that the overall employability skills of students at technical
training institute are quite high (mean ¼ 71.47, SD ¼ 6.77). All the parameters of
employability skills have shown an improvement in their respective mean value.
All the six skill vectors have their mean value higher than the population
(mean ¼ 65.29, SD ¼ 7.54).
Three vocational value vectors, pride in work, accepting criticism and extrovert
thinking skills, have higher mean values after the training compared with overall
mean value. There is more than 5% improvement in the mean value of five skill
vectors except commitment to work. The highest change after training is ~7% in
critical eye for abnormality. The highest change after training with respect to
population is ~9% for pride in work and accepting criticism.
This showed that the system and strategy of teaching and learning in the
technical training institute under study was able to increase students’ pride in
work, accepting criticism, critical eye for abnormality and thereby their overall
employability to an appropriate level.
5.2 Hypotheses Tested in This Study
H01: There are no significant differences in the levels of identified vocational value
vectors among the students of TVT before and after the intensive ITP.
Students’ training status used as independent variable in t-test was one of the twovariable samples to compare students’ skills during study. Scores obtained from six
vocational value vectors were treated as dependent variable. Results are shown in
Table 3.
As shown at Table 3, there were significant differences of three out of six aspects
of students’ employability skills before and after ITP. The three vocational value
vectors showed the following values: as for pride in work [t (119) ¼ 2.67,
p < 0.05, two-tail], for accepting criticism [t (117) ¼ 2.16, p < 0.05, two-tail]
and for critical eye for abnormality, it is [t (116) ¼ 2.8, p < 0.05, two-tail]. There
was no significant difference for commitment to task [t (118) ¼ 0.1, p < 0.05, two-
tail], adopting to change [t (114) ¼ 1.95, p < 0.05, two-tail] and extrovert
[t (117) ¼ 1.89, p < 0.05, two-tail] between the two groups of students.
H02: There are no differences in overall employability skills level among students
of TVT before and after the intensive ITP.
592 K.M. Nagendra et al.

Table
2Descriptivestatistics
ofvocational
valuevectors
Description
Commitment
totask
Pridein
work
Adopting
tochange
Accepting
criticism
Extrovert
Criticaleye
forabnorm
ality
Overall
employability
Mean
Po
66.47
74.78
65.12
65.84
64.81
61.07
65.29
BI
68.58
77.87
66.26
68.72
67.90
59.43
67.20
AI
68.85
83.61
70.90
74.73
71.99
66.39
71.47
Standarderror
Po
0.82
0.75
0.72
0.73
0.73
0.70
0.39
BI
2.12
1.59
1.48
1.81
1.65
1.91
0.70
AI
1.87
1.44
1.87
2.11
1.41
1.59
0.87
Median
Po
66.67
75.00
66.67
66.67
66.67
58.33
66.70
BI
66.67
83.33
66.67
66.67
66.67
58.33
66.70
AI
66.67
83.33
75.00
75.00
75.00
66.67
70.80
Mode
Po
66.67
75.00
66.67
75.00
66.67
66.67
66.70
BI
58.33
66.67
66.67
66.67
75.00
66.67
66.70
AI
66.67
83.33
83.33
91.67
66.67
66.67
66.70
Standarddeviation
Po
15.75
14.49
13.87
14.00
14.06
13.46
7.54
BI
16.55
12.44
11.53
14.16
12.90
14.94
5.50
AI
14.59
11.28
14.64
16.45
10.97
12.45
6.77
Sam
ple
variance
Po
247.98
209.97
192.46
196.04
197.75
181.19
56.89
BI
274.06
154.83
132.93
200.59
166.29
223.32
30.22
AI
212.74
127.24
214.40
270.76
120.45
155.02
45.85
Kurtosis
Po
�0.40
0.56
0.23
0.11
0.51
0.37
1.69
BI
�0.11
�0.09
0.51
�0.38
�0.16
�0.02
0.15
AI
�0.42
0.76
�0.98
0.60
0.65
�0.31
�0.70
Skew
ness
Po
�0.24
�0.73
�0.26
�0.27
�0.56
�0.23
�0.90
BI
�0.20
�0.46
0.13
�0.06
�0.31
�0.08
0.03
AI
0.05
�0.85
�0.02
�0.88
�0.61
�0.44
�0.02
Minim
um
Po
16.67
25.00
8.33
16.67
16.67
8.33
33.00
BI
25.00
41.67
41.67
41.67
33.33
16.67
52.80
AI
41.67
50.00
41.67
25.00
41.67
41.67
56.90
(continued)
Vocational Value Vector (V3) Management in Technical Vocational Education. . . 593

Table
2(continued)
Description
Commitment
totask
Pridein
work
Adopting
tochange
Accepting
criticism
Extrovert
Criticaleye
forabnorm
ality
Overall
employability
Maxim
um
Po
91.67
100.00
100.00
100.00
91.67
100.00
82.00
BI
100.00
100.00
100.00
100.00
91.67
91.67
79.20
AI
100.00
100.00
100.00
100.00
91.67
91.67
84.70
Sum
Po
24725.00
27816.67
24225.00
24491.67
24108.33
22716.67
24288.50
BI
4183.33
4750.00
4041.67
4191.67
4141.67
3625.00
4099.10
AI
4200.00
5100.00
4325.00
4558.33
4391.67
4050.00
4359.80
Count
Po
372
372
372
372
372
372
372
BI
61
61
61
61
61
61
61
AI
61
61
61
61
61
61
61
Confidence
level(95.0%)
Po
1.61
1.48
1.41
1.43
1.43
1.37
0.77
BI
4.24
3.19
2.95
3.63
3.30
3.83
1.41
AI
3.74
2.89
3.75
4.21
2.81
3.19
1.73
Note:PoPopulation;BIBefore
inductiontraining;AIAfter
inductiontraining
594 K.M. Nagendra et al.

Table
3t-Testresultsassumingunequal
variances
Description
Commitmentto
task
Pridein
work
Adoptingto
change
Accepting
criticism
Extrovert
Criticaleyefor
abnorm
ality
Overall
employability
Before
After
Before
After
Before
After
Before
After
Before
After
Before
After
Before
After
Mean
68.6
68.9
77.9
83.6
66.3
70.9
68.7
74.7
67.9
72.0
59.4
66.4
68.1
71.5
Variance
274
213
155
127
133
214
201
271
166
120
223
155
34
46
Observations
61
61
61
61
61
61
61
61
61
61
61
61
61
61
Hypothesised
meandifference
00
00
00
0
df
118
119
114
117
117
116
118
t-Stat
0.10
2.67
1.95
2.16
1.89
2.80
2.91
P(T
<¼t
)one-tail
0.46
0.00
0.03
0.02
0.03
0.00
0.00
t-Criticalone-tail
1.66
1.66
1.66
1.66
1.66
1.66
1.66
P(T
<¼t
)two-tail
0.92
0.01
0.05
0.03
0.06
0.01
0.00
t-Criticaltwo-tail
1.98
1.98
1.98
1.98
1.98
1.98
1.98
Vocational Value Vector (V3) Management in Technical Vocational Education. . . 595

Student’s training statuswas used as independent variable in t-test as one of the twovariable samples to compare students’ skills during study. Scores obtained from
overall employability score were treated as dependent variable. Results are shown in
Table 3.
As shown in Table 3, there was significant difference in students’ overall
employability skills before and after ITP, with the following value [t (118) ¼ 2.91,
p<0.05, two-tail].
6 Conclusion
Results of study show that there are improvements in skills acquired by students as
a result of intensive induction training programme for the TVT course during this
study. Besides acquiring technical skills, students also had the opportunity to
acquire employability skills.
Out of six vocational value vectors, only one vector, namely, commitment to
task, has mean score as moderate, while other vectors such as pride in work,
adopting to change, accepting criticism, extrovert and critical eye for abnormality
tend to have high mean score values. By the result, it can be found that the intensive
induction training programme of the Toyota Technical Training Institute has
succeeded to equip its students with adequate vocational value vectors to enter
the TVT main course. Nevertheless, there still is room for improvement during the
TVT course. Research is under progress to develop a sustainable TVT model based
on vocational value vector management.
7 Suggestions
During the present research, it is observed that an intensive induction training
programme in the beginning of a conventional technical vocational training
(TVT) course was very much effective in enhancing the overall vocational value
vectors of the trainees. Further, for continuous improvement of these vectors to
enhance employability, they should be continuously assessed and constructive
feedback should be provided to the trainee for improvement.
Following specific activities are suggested as intervention strategies that can be
easily adopted for any TVT programme run by ITIs and ITCs to inculcate voca-
tional value vectors along with the specific technical skills in a TVT programme:
• Every trainee should be motivated to report every day on time for the training.
• Habitual late comers should be counselled for commitment to punctuality.
• Parking, walking and any such safety activities should be standardised as
per contemporary industrial/statutory norms, and adhering to them should be
promoted as a matter of pride.
• Instead of compelling the trainee to be the caretaker of institute property, he
should be made the pride owner of a section of training/institutional resources.
596 K.M. Nagendra et al.

• To make it easy for them to adopt, the trainees should be made to work in
different groups and should be made to work with different tools and equipments
on every occasion.
• Health and fitness should be part of adaptability.
• Working safely with proper safety wares should be part of skill attainment.
• Good housekeeping should be the organisation culture.
• Every day, there should be a general assembly, where a group of trainees, on
rotation, will speak aloud on topics like news, experience sharing, word for the
day, thought for the day, term for the day, etc. This will help in making them
extrovert by improving their collective communication skills.
• Every trainee should be encouraged to find the mistakes in his own work
(both trade skills and theory). He should be encouraged to avoid recurrence of
same mistake over a period of time through self-monitoring. This will develop
critical eye for abnormality.
• Constructive feedbacks at every stage will gradually develop the trainees to
accept professional criticisms.
References
Allen Consulting Group (2004) Development of a strategy to support the universal recognition and
recording of employability skills: a skills portfolio approach. Department of Education,
Science and Training, Canberra
Allen Consulting Group (2006) Assessment and reporting of employability skills in training
packages. Report to the Department of Education, Science and Training, Melbourne,March 2006
Australian Chamber of Commerce and Industry & Business Council of Australia (2002)
Employability skills for the future. Department of Education, Science and Training, Canberra
Australian Flexible Learning Framework (2009) The impact of e-learning on employability skills
development. Department of Education, Employment and Workplace Relations, Canberra
Australian Industry Group & Deloitte (2009) National CEO survey – skilling business in tough
times. Australian Industry Group, Sydney
Bakar AR (2007) Assessing employability skills of technical-vocational students in Malaysia.
J Soc Sci 3(4):202–207
Boud D, Solomon N (2001) Work-based learning: a new higher education? SRHE and Open
University Press, Ballmoor
Boyett JH, Boyett JT (1998) The guru guide: the best ideas of the top management thinkers. Wiley,
Toronto
Callan VJ (2003) Generic skills: understanding vocational education and training teacher and
student attitudes. National Centre For Vocational Education Research, Adelaide
Cleary M, Flynn R, Thomasson S (2006) Employability skills from framework to practice:
an introductory guide for trainers and assessors. Department of Education, Science and
Training, Canberra
Conclusions on skills for improved productivity, employment growth and development.
In: International labour conference, 2008
Defining generic skills – at a glance. National Centre for Vocational Education Research,
Commonwealth Of Australia, 2003
Department of Education (2011) Australian jobs 2011. Department of Education, Science and
Training, Commonwealth of Australia. http://www.deewr.gov.au/Employment/Research-
Statistics/Documents/AustralianJobs.pdf
Vocational Value Vector (V3) Management in Technical Vocational Education. . . 597

Feldman RS (1993) Understanding psychology. McGraw Hill, Inc., New York
Final Report, ‘Employability – Incentivising improvement’, UK Commission for Employment and
Skills, June 2010
Finch CR, Crunkilton JR (1979) Curriculum development in vocational and technical education:
planning, content and implementation. Allyn & Bacon, Inc., Boston
Garavan TN, McGuire D (2001) Competencies and work-place learning: some reflections on the
rhetoric and the reality. J Work-Place Learn 13(4):144–154
Gasskov V (2003) Industrial Training Institutes of India: The efficiency study report. ILO,
New Delhi
Harris R, Gutrie H, Hobart B (1995) Competency-based education and training: between a rock
and a whirlpool. Macmillan Education Australia, Melbourne
Hoffman T (1999) The meanings of competency. http://www.emerald-library.com
Implementation of revised syllabi for the trade of -Mechanic Motor Vehicle – under CTS/ATS’
Directorate General of Employment And Training, Ministry of Labour & Employment,
Government of India, No. DGET �2(1)/2001-CD, February 2002
Maxwell S (2010) Using rubrics to support graded assessment in a competency-based environ-
ment. National Centre for Vocational Education Research, Adelaide
Marope M (2010) 21st century development challenges and opportunities: demands on education
systems. In: 14th UNESCO-APEID international conference, Thailand, Bangkok, October 2010
Mehrotra VS, Sacheti AK (2005) Integrating vocational education and training with open learning
system: taking skills training to door step. In: ICDE international conference, New Delhi
MuhammadA (2010)Amodel of vocational competency assessment of industrial engineering students
of vocational high schools. Online http://journal.uny.ac.id/index.php/joe/article/view/193
Nagendra KM (2012) A new evolutionary model for employability skills development. J Eng Sci
Manag Educ, National Institute of Technical Teachers’ Training & Research 5(1):342–346
Nordhaug O (1998) Competence specificities in organization. Int Stud Manag Org 28(1):8–19
Planning Commission of India. Employment perspective and labour policy. Eleventh Five Year
Plan, Chapter 4, pp 76. http://planningcommission.nic.in/plans/planrel/fiveyr/11th/11_v1/
11v1_ch4.pdf
Rajan K (2007) FICCI survey on emerging skill shortages in the Indian industry. In: National
conference on skill building through public private partnership, 5–6 Oct 2007
Sax G (1980) Principles of education and psychological measurement and evaluation. Wadsworth
Publishing Co., Belmont
Skill Development Initiative Scheme (based on Modular Employability Skills) (2007) Implemen-
tation manual. Directorate General of Employment And Training, Ministry of Labour &
Employment, Government of India, October 2007
TeamLease Services Pvt. Ltd. Consolidated report – job fair statistics October 2008. Department
of Employment and Training, Karnataka, Online http://www.karskills.com/mes_job.html
TeamLease Services Pvt. Ltd. Karnataka employability primer. Department of Employment
and Training, Karnataka, Online http://www.karskills.com/etgdk.pdf
Wenrich RC (1974) Leadership in administration of vocational education. Charles E. Merrill Pub.
Co., Columbus
Wibrow B (2011) Employability skills – at a glance. National Centre for Vocational Education
Research, Commonwealth of Australia
Wood GD, Lange T (2000) Developing core skills. Educ Train 42(1):24–32
Woolfolk AE, Nicolich LM (1984) Educational psychology for teachers. Prentice-Hall, Inc.,
Englewood Cliffs
Working Group on Automotive Industry (2006) Eleventh Five Year Plan (2007–2012). Ministry of
Heavy Industries and Public Enterprises, Department of Industry, Government of India, August
2006. http://planningcommission.nic.in/aboutus/committee/wrkgrp11/wg11automaive.pdf
598 K.M. Nagendra et al.

Critical Factors in Managing Creativity
in an SME Global Challenger
Sandhya Sastry
1 Introduction
In 2006, Boston Consulting Group predicted that ‘Companies based in rapidly
developing economies such as Brazil, China, India, and Russia, will radically trans-
form industries and markets around the world’ and in the process, referred to these
companies as the global challengers. The global challengers follow an intense and
rapid internationalisation pathway, pursuing larger deals than their peers across
borders, the global incumbents, with approximately 60% of the M&As in developed
markets. Their growth trajectory has been remarkably exponential; their future
promising but unproven as yet. If they are to succeed in the long term, they would
have to develop sustained bases of competitive advantage. In high-technology
companies, maintaining high levels of creativity and innovation is critical in staying
ahead of the game.
The body of literature on cross-border M&As (which are the favoured strategic
choice of growth of SME global challenges) highlights differences in knowledge
and learning culture between merging firms during PMI (Hitt et al. 2001; Finkelstein
and Haleblian 2002; Hayward 2002). For executive leadership of an SME global
challenger, this presents an additional dimension, one that is critical to the success of
the enterprise, as conflict due to any one of these differences is enough to break the
deal or the impact negatively on performance.
This study focuses on technology acquisitions.1 It is a case study of one SME
global challenger, BetaNova, a clinical research organisation (CRO),which originated
in India less than a decade ago and has a presence in 50 countries and multiple
S. Sastry (*)
Lord Ashcroft International Business School, Anglia Ruskin University, Cambridge, UK
e-mail: [email protected]
1 Technology acquisitions is defined as transactions in which the acquired firm operates in a
technology industry such as networking equipment, software, medical devices, semiconductors
or biotechnology.
Department of Management Studies, Indian Institute of Science, Bangalore,
Driving the Economy through Innovation and Entrepreneurship,DOI 10.1007/978-81-322-0746-7_49, # Springer India 2013
599

operational sites and headquarters. In 2007, the Indian company, Beta India, then just
a few years old, acquired a 21-year-old German CRO, Nova Germany, and merged
the two companies to form BetaNova. In just 3 years, BetaNova has grown to achieve
a global presence.
While this type of company is not unique in itself, it represents a new breed
of multinationals, not from developed countries but from developing economies,
acquiring mature, established companies with advanced, state-of-the-art tech-
nologies (Ramamurti 2008). The differing motives of the challengers and the
incumbents are clear (Ghemawat and Hout 2009; Ramamurti 2012), since Beta
was looking to upgrade its capabilities and gain access to developed markets, while
Nova was looking for cost efficiencies and gain access to larger markets. The shared
goal is to remain highly competitive through stretching innovative capability,
squeezing costs and leveraging global reach. The merged company, meanwhile,
has to deal with adjusting to the new identity, internally causing clash and fuse as
they differ in many respects, not least being their differing experience curves,
innovative capacity and culture.
The takeover of an older more established firm by an infant firm causes addition
tensions. Their limited experience dictates that, especially in the very earliest
stages, they will be confronted with many situations they have never seen before.
Without adequate time or resources to plan fully and without a large repertoire of
prior experience, they will often be forced to improvise to create or enact solutions
(Churchill and Lewis 1983; Delmar and Shane 2003). This study focuses on
exploring the creative and learning environment within BetaNova while in its
earliest stages of its organisational life cycle.
2 Literature Review
Early research on creativity focussed on individual differences around people’s
backgrounds, personality traits and work styles of creative people (MacKinnon
1962). The finding was interesting but limited and was constrained as they could not
be applied in practice. This approach also failed to take into account the impact of
the environment on creativity and innovation. Contemporary approach to creativity
research, however, asserts that social environment can and does influence both the
level and the frequency of creative behaviour. This thrust is particularly strong in
the creativity of an entrepreneur, typically defined in terms of innovation.
Schumpeter (1934) described entrepreneurial activity as ‘the creative destruction
of an existing equilibrium within a particular industry’.
It is useful to be reminded about the distincton and the relationship between the two
terms – creativity and innovation. Creativity is the production of novel and useful
ideas. In order to be considered creative, a product or an idea must be different from
what has been done before. Innovation is the successful implementation of creative
600 S. Sastry

ideas. Drawing the three concepts of creativity, innovation and entrepreneurship
together, Amabile (1996) put forward a definition of entrepreneurial creativity:
The implementation of novel, useful ideas to establish a new business or new programme
to deliver products or sevices. The primary novel, useful ideas may have to do woth (a) the
products or services themselves, (b) identifying a market for the products or services, (c) ways
of producing or delivering the products or services, or (d) ways of obtaining resources to
produce or deliver the products or services.
Creativity resides in people, processes and products. Leveraging the sources
of creativity to orchestrate the innovation process, i.e. arranging, conducting and
leveraging the sources of creativity, that makes an enterprises achieve its competitive
advantage requires a dynamic capability (Teece 2007). ‘Entrepreneurial activity’ and
‘orchestrating the innovation process’ (ibid.) are very similar constructs. This chapter
posits that there are two distinct dimensions to this capability – internal resource
mobilisation (relating to creativity) and external environment negotiation (innovation,
commercialisation of ideas). Managing creative people and creating environments
that spur interactions which continually produce novel and fresh ideas is a prerequi-
site to ensuring long-term competitive advantage. The skills needed to make this
happen are internal to the organisation, and these are different to skills required to
succeed in the external environment. The extant literature on internal capabilities of
multinationals is extensive (Eisenhardt andMartin 2000; D’Este 2002; Athreye 2005;
Priem and Butler 2001), but in the context of an SME global challenger, it is non-
existent.
An extension of the resource-based view concerns knowledge as a source of
sustainable competitive advantage, as advocated in the knowledge- and learning-
based views of the firm (Kogut and Zander 1992; Grant 1996; Spender 1996).
Knowledge is particularly important for technology-based firms: generating and
exploiting knowledge in high-technology sectors demand that knowledge be con-
tinually replenished (Lane and Lubatkin 1998). Van de Ven and Polley (1992) and
Autio et al. (2000) opined that learning modes and practices do change over time,
over the organisational life cycle. Consistent with this view, Autio et al. (ibid.)
argued that younger firms have some ‘learning advantages’ because their short
history provides them with less to unlearn. Carayannopoulos (2009) confirmed
these findings that the lack of experience that sometimes challenges younger
firms can also create important learning advantages. Because the acquisition and
exploitation of knowledge are predominantly social processes (Kogut and Zander
1992), social capital may be critical for the long-term success of technology-based
firms. In general, however, the empirical evidence is suggestive rather than
definitive.
By highlighting the important links between creativity, learning and communi-
cation among multicultural teams during PMI, this research seeks to contribute to
further convergence between creativity exploitation, the domains of strategy and
entrepreneurship in young technology-based firms growing rapidly through cross-
border M&As.
Critical Factors in Managing Creativity in an SME Global Challenger 601

Following this line of argument, the following research questions are posed
based on the observations that (a) BetaNova to be in its infancy as an SME global
challenger and (b) as an enterprise formed for the most part by M&As:
Given that BetaNova has been in existence in 2007,
(a) What are the creativity-related PMI challenges faced by BetaNova?
(b) How successful has it been in ensuring a creative environment?
(c) What are the implications thereof for executive leadership?
3 Methodology
The research used both qualitative and quantitative methodologies to collect data.
The first question used an inductive approach and discusses key issues that emerged
as a result of analysing in-depth interviews with senior managers and executives.
The second question was approached deductively, analysing a data set of 58
employees surveyed, across their different country sites, finally presenting a dis-
tilled set of findings and recommendations as a response to the third research
question. To pretest the questionnaire, a four-stage approach was used, as suggested
by Churchill (1979) and Gray and Meister (2004).
4 Findings and Discussion
Several issues emerged from the analysis of interviews of six executives/senior
managers, which in reality were inherently complex problems, two of which were
highly relevant to the research questions: (a) creativity versus project deadlines
(b) ensuring a sense of ownership.
4.1 Creativity Versus Project Deadlines
Perception of individual creativity and innovativeness2 – Top management found
that people individually felt that they had not been innovative. Senior managers and
executives had to ‘sell’ the idea to individuals that they had indeed been sufficiently
innovative. Interviewees, i.e. senior managers and executives were agreed on the
concept of creativity, i.e. that creativity is a soft, imaginative process that starts
from when the problem is brought up, including the moment when the idea to solve
2 The terms creativity and innovation were used interchangeably during interviews, as it provides a
true reflection of how these constructs are referred to in real life.
602 S. Sastry

the problem has been born, and ends with the sharing of the idea with others. The
hard innovation process starts as soon as an idea is made public where organisations
put together a team, prepare a budget, project description, etc.3
In an environment such as BetaNova’s, the company cannot allow employees to
take all the time in the world to go through all four phases at their own pace. In
particular, the second phase, the incubation time, can be quite considerable, which
often conflicts with the strict deadlines defined and agreed between client and
supplier. In reality, the freedom to be creative is constrained by certain time-bound
activities, and respondents admitted that this is one of the most common challenges
for leadership.
Executives held a common view that a creative environment is one which
enables people to share ideas and feel they know their colleagues well enough to
discuss and interact freely. The challenge for management, they acknowledged,
is to get the balance right, ‘. . . to enable all the random things to happen. . .’ andto ensure there is ‘. . .enough opportunities as part of their routine work schedule. . .’to produce creative ideas on the one hand while adhering to project deadlines on
the other.
4.2 Sense of Ownership
The findings indicate that every site needs a charter and that people of each site
must own it, including the roadmap, which helps the scientists and the staff, and
say, e.g. ‘. . .we are going to produce insulin in the form of tablets, we are the first
site, we are the owner. . .’ The self-esteem and the sense of ownership attached to
‘owning the creative idea and making it happen’ are critical to the success of teams.
Conversely, a lack of sense of ownership can and does act as a barrier to creativity.
Managing the expectations of individuals and of project leaders is a crucial part of
leadership. A typical quote:We have learned that we have to do that in order to dothat to give them a sense of identity. We also need to ask, ‘What drives the scientists,the bio-chemist, etc.?’ Money is a big hygiene factor.
The research also found that another specific barrier when working with
scientists is that an ambitious scientist has two main goals in life: (a) to be the
first author of the article and (b) to be the first name on the patent. These two issues
are perhaps the reason that true creative scientific innovations are not shared at an
early stage because scientists want to keep the idea under wraps until it is suffi-
ciently protected by intellectual property rights and he/she is recognised as the idea
generator and owner.
3 The four phases of creativity are (1) problem identification, (2) incubation time to think about a
solution, (3) the ‘aha’ moment when you think of an idea and (4) action to share the idea with
others.
Critical Factors in Managing Creativity in an SME Global Challenger 603

The investigation into how successful BetaNova has been in creating a creative
environment yielded mixed results. The findings from the survey of 58 employees
of BetaNova, who were asked a number of questions about their company’s creative
environment, are presented below.
4.2.1 Cluster 1: Creativity and Culture
Individuals were asked about their perceived performance when working with
someone from the same or similar culture compared to working with someone
from a different culture. The majority of individuals felt that (a) they work better
with someone from a different culture, (b) they are more creatively motivated when
they are at work away from their home country and (c) they work harder when they
are away from their home country.4
4.2.2 Cluster 2: Communication and Change
Attitude to change and new practices is extremely positive. Over a third of those
interviewed said that they constantly seek opportunities beyond the role, i.e. that
they go beyond their expected roles, which indicates a need that the leadership must
address if they are to retain highly creative individuals.
Findings revealed that BetaNova has a fairly open environment, where people
feel comfortable to contribute to new ideas. Just over half the respondents felt
valued as their ideas had been actively listened to and acknowledged as being
‘valuable’. A significant number of respondents felt that BetaNova provides an
environment that challenges their thinking and an equal number feel that the work
culture actively encourages them to create newer and more powerful ideas. How-
ever, a fifth of individuals said they did not feel valued at all. Over two-thirds
however felt that they had insufficient opportunity to share and discuss ideas with
others in BetaNova, but they made time to interact with others. The finding of
concern, however, is that over half of those interviewed said that they did not know
people well enough to share and discuss ideas with them. This was reflected across
sites and cultural settings.
Employees had different views on the manner and the amount of engagement
they prefer – a third of respondents preferred to be told what to do; another one third
said they would like to be consulted on the goals; and the rest of them expected to
be actively engaged in the goal or plan as co-creators. The preference to be
co-creators was higher among Indians and Thais than among Germans and other
Europeans.
4 Unless otherwise indicated, results were tested and found significant at the 0.05 confidence level.
604 S. Sastry

4.2.3 Cluster 3: Employees’ Assessment of BetaNova
Most individuals felt that BetaNova uses latest research methods and that flexibility
is built into its process. This means that it can quickly reconfigure internal resources
to exploit external opportunities. However, a majority of respondents felt that their
team was creative but had the potential to do a lot better. Further, half of those who
were interviewed were dissatisfied with BetaNova’s environment for them as
individuals to achieve their full creative potential.
Respondents were asked about the most important factor in achieving success,
and an overwhelming majority across sites indicated ‘teamwork’ followed by
‘interpersonal communication’. By implication, leadership must design interfaces
that enable individuals and teams to communicate freely, without structural and
systemic barriers. One would expect that in such a company, most people would
know each other well enough to be able to share ideas; however, a third of those
interviewed said they did not know others well enough to exchange ideas, and
a quarter were unsure. If the situation is allowed to persist, it could lead to a feeling
of isolation and disconnect with the team and company. Further, data suggests that
some people find the time or make time to share ideas with others, with German
staff finding it more difficult to find the time than their Indian counterparts. By and
large, Indian employees were more flexible in their approach to work and work time
in general and as they tend to blur the boundaries between ‘work’ and ‘sharing
ideas’ compared to their German counterparts.
About half the employees find that BetaNova has the right work culture to realise
their full creative potential. However, it is the other half, those who are not happy in
the environment or are ambivalent, that need the attention of the leadership. As in-
depth interviews revealed, the biggest force driving scientists is the ability to learn
and to keep on learning new methodologies, new techniques, etc. They quite like to
say, ‘I have done this’, with a sense of pride.
Working teams and interacting groups impact on the ability of organisations to
stimulate creativity, innovation and new product development (Fong 2006). They
provide conditions for a dynamic mixture of ideas and ways of work and make
available complementary competencies and disciplines that favour creativity and
innovation.
5 Conclusions and Recommendations
Overall, the BetaNova has achieved a qualified success in ensuring a creative
environment. Managing expectations and reassuring employees of their creative
prowess, where appropriate, would go some way in creating a positive perception
of BetaNova’s creative ability. The results from this study are directly linked to
learning. New environments and new cultural contexts are platforms for new
learning, and this in turn acts as a refresher or catalyst for creative thinking.
Critical Factors in Managing Creativity in an SME Global Challenger 605

Researchers (Doz and Shuen 1990; Mody 1993) have pointed out that collaborations
and partnerships can be a vehicle for new organisational learning, helping firms to
recognise dysfunctional routines and preventing strategic blind spots.
The concept of dynamic capabilities as a coordinative management process
opens the door to the potential for inter-organisational learning. In this case, as
BetaNova has in its current state evolved rapidly through inorganic growth, its
constituent parts – the Indian, the German, the Thai, the Danish, the American – are
in the process of integrating into one entity, and therefore, the boundary between
‘inter’- and ‘intra’- organisational is blurred.
Cultural aspects affect workers’ knowledge and satisfaction and their capacity to
communicate and adapt to changes. Openness and dynamic contact between
individuals, teams and departments facilitate the acceptance of new perspectives
and are particularly relevant traits in organisational cultures able to stimulate
creativity and innovation (Martins and Terblanche 2003; Mumford et al. 2002).
Working under the umbrella of corporate identity does not guarantee success in
sharing knowledge and generating ideas. Increasing employee mobility across
international sites and creating communication opportunities should be a key
priority for the executive team.
References
Amabile T (1996) Creativity and innovation in organizations. Harvard Business School Publish-
ing, Boston
Athreye SS (2005) The Indian software industry and its evolving service capability. Ind Corp
Change 14(3):393–418
Autio E, Sapienza HJ, Almeida JG (2000) Effects of age at entry, knowledge intensity, and
imitability on international growth. Acad Manage J 43(5):909–925
Carayannopoulos S (2009) How technology-based new firms leverage newness and smallness
to commercialize disruptive technologies. Entrep Theory Pract 33(2):419–438. Wiley-Blackwell
Churchill G (1979) A paradigm for developing better measures of marketing constructs. J Mark
Res 16(1):64–73
Churchill C, Lewis VL (1983) The five stages of small business growth. Harv Bus Rev 61(3):
30–50
D’Este P (2002) The distinctive patterns of capabilities accumulation and inter-firm heterogeneity:
the case of the Spanish pharmaceutical industry. Ind Corp Change 11(4):847–874
Delmar F, Shane S (2003) Does business planning facilitate the development of new ventures?
Strateg Manage J 24(12):1165–1186
Doz Y, Shuen A (1990) From intent to outcome: a process framework for partnerships. INSEAD
Working Paper
Eisenhardt KM, Martin JA (2000) Dynamic capabilities: what are they? Strateg Manage
J 21:1105–1121
Finkelstein S, Haleblian J (2002) Understanding acquisition performance: the role of transfer
effects. Organ Sci 13(1):36–47
Fong TT (2006) The effects of emotional ambiguity on creativity. Acad Manage J 49:1016–1030
Ghemawat P, Hout TM (2009) China and India take on the multinationals. Financial Times,February 9
Grant RM (1996) Prospering in dynamically competitive environments. Organ Sci 7(4):375–387
606 S. Sastry

Gray PH, Meister DB (2004) Knowledge sourcing effectiveness. Manage Sci 50(6):821–834
Hayward M (2002) When do firms learn from their acquisition experience? Evidence from
1990-1995. Strateg Manage J 23:21–39
Hitt MA, Ireland RD, Camp SM, Sexton DL (2001) Strategic entrepreneurship: entrepreneurial
strategies for wealth creation. Strateg Manage J 22:479–491
Kogut B, Zander U (1992) Knowledge of the firm, combinative capabilities, and the replication
of technology. Organ Sci 3:383–397
Lane PJ, Lubatkin M (1998) Relative absorptive capacity and inter-organizational learning. Strat
Manag J 19(5):416–477
MacKinnon DW (1962) The personality correlates of creativity: a study of American architects.
Proc Fourteen Cong Appl Psychol 2:11–39
Martins EC, Terblanche F (2003) Building organisational culture that stimulates creativity and
innovation. Eur J Innov Manage 6(1):64–74
Mody A (1993) Learning through alliances. J Econ Behav Organ 20(2):151–170
Mumford MD, Scott GM, Gladdis B, Strange JM (2002) Leading creative people: orchestrating
expertise and relationships. Leadersh Q 13:705–750
Priem RL, Butler JE (2001) Is the resource-based ‘view’ a useful perspective for strategic
management research? Acad Manage Rev 26(1):22–40
Ramamurti R (2008) What have we learned about emerging-market MNEs? (chapter 13).
In: Ramamurti R, Singh JV (eds) Emerging multinationals from emerging markets. Cambridge
University Press, Cambridge
Ramamurti R (2012) Competing with emerging market multinationals. Bus Horizons 55(3):
241–249, Published for the Kelly School of Business, Indiana University
Schumpeter JA (1934) The theory of economic development. Harvard University Press,
Cambridge, MA
Spender JC (1996) Making knowledge the basis of a dynamic theory of the firm. Strateg Manage
J 17(Winter special issue):45–62
Teece D (2007) Explicating dynamic capabilities: the nature and micro-foundations of (sustain-
able) enterprise performance. Strateg Manage J 28(13):1319–1350
Van de Ven AH, Polley D (1992) Learning while innovating. Organ Sci 3(1):32–67
Critical Factors in Managing Creativity in an SME Global Challenger 607

Part 3
Part 3.1
E-Governance

E-Governance and the ‘Developing’ Countries:
Conceptual and Theoretical Explorations
Chetan B. Singai
1 Introduction
The Nehruvian vision of a vibrant India did materialize progress in atomic energy,
space exploration, communications, defence, science and technology, agriculture,
etc. But post-independence euphoria began vanishing as instruments of develop-
ment began yielding suboptimal results. Poverty, illiteracy and hunger, among
others, kept revisiting the country’s galloping population with nauseating regular-
ity, confounding planners and policymakers alike. Where do the fault lines lie?Deficiencies were noticed in governance. Since the early 1990s, which incidentally
coincide with the beginning of the economic reforms era in India, seven yardsticks
were identified as measures of what came to be called as ‘good governance’. These
were public sector management, accountability, legal and regulatory frameworks,
transparency and information, human rights, participatory approaches and military
expenditure. Among these public sector management, transparency and informa-
tion are relevant for the e-revolution within the dynamic discourse of governance in
the country.
The 1992 development lending institution-induced reform agenda for gover-
nance stimulated a lot of introspection among decision-makers in India as else-
where in the world. It was acknowledged that governance had to extend beyond
conventional bureaucracies to involve citizens (irrespective of any sort of discrimi-
nation) and consumer groups at all levels actively, to empower and inform the
public and disadvantaged groups and to ensure service and programme execution
through autonomous elected bodies. With the coming in of globalization, it is
inevitable that we ignore the dynamics of ICTs and its influences.
C.B. Singai (*)
Research Scholar, National Institute of Advanced Studies,
Indian Institute of Science campus, Bengaluru
e-mail: [email protected]
Department of Management Studies, Indian Institute of Science, Bangalore,
Driving the Economy through Innovation and Entrepreneurship,DOI 10.1007/978-81-322-0746-7_50, # Springer India 2013
611

India is the largest democracy of the world. Its administrative set-up is composed
of the central government, state governments and local administration. To reach
everybody in a diverse and highly populated country like India, e-governance seems
to be an appropriate mode of better governance. E-governance has been introduced
as a catalyst of change and development by the central, state and local governments
to re-energize the administrative structures. The private sector, non-governmental
organizations and rural sector have also taken recourse to e-governance to lift their
performance levels. The objective of the introduction of e-governance has been to
make the processes transparent, quantifiable, result-oriented and simple and to make
them function with greater speed.
2 Conceptual Framework
E-governance involves transformation of the organizational culture of the government.
Recent authors argue that governments are mandated by the citizen and business
demands to operate within new structures and parameters precipitated by information
technology. Current demands require cross-cutting services, which in turn require
government to improve communication and interaction across traditional bureaucratic
lines (Alexander and Grubbs 1998). These new requirements, which fundamentally
alter the nature of government, are made possible through the strategic use of informa-
tion and communications technologies. Garsons (1999) has divided the theoretical
frameworks of e-governance into four main areas: decentralization/democratization,
normative/dystopian, socio-technical systems and global integration theories. As far as
this chapter is concerned, the first two areas will suffice to explain the basic variations
in e-governance theories, facilitating administrative efficiency. The democratization/
decentralization theory of e-governance revolves around the progressive potential of
information and communications technologies and focuses on the positive governmen-
tal advances associated with e-governance. Normative/dystopian theory emphasizes
the high rate of conflict and failure associated with information technology application
and counters the positivist progressivism of decentralization/democratization theory
with realist view of inherent technological limits and contradictions.
There are two camps in the arena of e-governance: cyber-optimists and cyber-
pessimists. Cyber-optimists are hopeful that the development of interactive services,
new channels of communication and efficiency gains from digital technologies
will contribute towards the revitalization of the role of government executives in
representative democracies, facilitating communications between citizen and the
state. In contrast, cyber-pessimists express doubts about the capacity of governments
to adapt to the new environment effectively and with positive result insofar as the
questions of access and digital divide have repercussions for political participation.
E-government is a form of e-business in governance and refers to the processes
and structures needed to deliver electronic services to the public (citizens and
businesses), collaborate with business partners and to conduct electronic
transactions within an organizational entity. In this chapter, e-governance is
defined as the application of electronic means in, firstly, the interaction between
612 C.B. Singai

government and citizens (G2C) and government and businesses (G2B), as well as,
secondly, in internal government operations to simplify and improve democratic,
government and business aspects of governance (see Fig. 1 for illustration).
As mentioned before, e-governance is more than a government website on the
Internet. E-governance can be looked upon as a tool to facilitate good governance.
It has the potential to achieve better governance by bridging the gap, thereby
delivering more while systematically reducing costs, time and interactions
involved. E-governance drawing from the conceptual framework offers automa-
tion, informatization and transformation while simultaneously producing gover-
nance that is better and more innovative. However, while the conceptual framework
or the theoretical perspectives should pass through a phase of critical test – i.e.
institutional, people-centric, cost/finances and scientific dimensions – the contex-
tual ‘4-D’ is discussed below. E-governance in the Indian context has evolved or is
evolving across the country, but is backed with regional variations as well. The role
of the respective state in augmenting the implementation of e-governance could be
the main cause for such variations. In addition to this the increasing patterns of the
state to rely on the various sources of funding like private sector, public-private
partnership and so on, directs such variations and concerns.
Many developing countries, including India, have experienced and are
experiencing what some political scientists have described as the ‘crisis of
governability’.1 The signs of the decline in the authority of the state are evident.
These are to be found in, for instance, the decline in the quality of public services,
inordinate delays and cost overruns in public projects and increasing failures of
policies and plans to deliver what they promise. The administrative structure has
also proved to be incapable (emphasis added) of handling effectively the multiple
CitizenBusinessNGOs
Civil Society
Central Government
Local Government
G2G
G2G
G2C G2BG2G
Fig. 1 Interactions between main groups in e-governance (Source: Illustration derived from
Frissen (1992) cited in Backus (2001))
1 Kohli (1991) emphasizes on: Over the past two decades, a legitimate and moderately stable state
that was confident of its ability to lay out India’s agenda for socio-economic change has evolved
into a reactive state. This state is omnipresent, but feeble; it is highly centralized and
interventionist, and yet seems powerless. It has the responsibility to foster the ‘life-chances’
its many diverse social groups, but rather than initiating action, it primarily reacts (emphasisadded). Moreover, the state now appears capable neither of dealing with the concerns of diverse
interest groups nor of directing planned development (8).
E-Governance and the ‘Developing’ Countries: Conceptual. . . 613

tasks assigned to it. In addition to this, the state has become financially weak
because of fiscal overspending. This has further eroded its command over resources
for public investment and its capacity to intervene in favour of the poor.
In line with the challenges that the modern state faces, this chapter below
provides the proposed SWOT analysis for e-governance.
3 SWOT Analysis: E-Governance in India
Four SWOT analyses are presented below, with a focus on the following aspects of
e-governance:
• Cost/finance
• Institutional/policy level
• People-centric
• Scientific
The SWOT analyses below are indicative of certain theoretical propositions with
regard to e-governance in the developing countries. However, each of these aspects
could be exemplified with few e-governance initiatives in India.
3.1 Cost and Finance
Financial aspects related to e-governance are funding, cost-savings, business
models, e-commerce and spin-offs of e-governance (Table 1).
Internet access is too expensive for the poor in developing countries like India
(UNDP 1999). Each telephone connection may cost as much as Rs30,000 in urban
areas and Rs70,000–80,000 in villages, which is unaffordable by most low-income
families (Yadav 2001). It is also very expensive to gain Internet access in India: it
may cost about Rs25 per hour in cities and Rs150–1,200 per hour in rural areas
(Yadav 2001). Given this context, it is important to analyze the practicality of
having the paradigm of e-governance sustained. However, the wave of ICT has no
doubt reached the rural areas with initiatives like e-choupal and e-bhoomi, but they
are few among the much expected.
3.2 Institutional or Policy Level
Institutional aspects related to e-governance in India are the National e-Governance
Plan (2003–2007) and respective state government (SAWAN – State Area Wide
Network). Such strategies and policies, laws and legislations and financial support
can be considered to be an important political aspect for e-governance (Table 2).
India has undertaken massive initiatives to introduce e-governance at the
national, state and local levels. In terms of the total number of government websites,
614 C.B. Singai

although the advanced industrial countries top the list, India is ranked seventh in the
global list (Norris 2001). The top policymakers in India tend to justify the adoption
and expansion of e-governance on the grounds that it costs less, reduces waste,
promotes transparency, eliminates corruption, generates possibilities to resolve rural
poverty and inequality and guarantees a better future for citizens (Wadia 2000).
In short, the government tends to portray e-governance as the panacea for all ranges
of problems confronting India.
3.3 People-Centric
People-centric features related to e-governance are people and the socio-economic
dimensions, for instance, their level of education, employment, income, digital
divide, rural areas vs. cities, rich vs. poor, literacy, IT skills (Table 3).
There is a very low rate of literacy in countries like India, although the
correlation between education level and use of the Internet is quite significant.
In the case of Andhra Pradesh, one of the Indian states most aggressively pursuing
e-governance, even the basic literacy rate is only 44% (PCWorld 2000). Therefore,
one may become sceptical about the effectiveness of e-governance in such a context
where the majority cannot even read and write.
Table 2 Institutional aspects – implementation and maintaining of e-governance solutions
Strengths Weaknesses Opportunities Threats
Combination with
democratization
reforms
Internet as pull factor
Modern image
Budget
Cyber laws not available
No problem owner within
government
No expertise about
technology
Slow decision-making
process, hierarchy in
organizations
Short-term approach due to
elections
Integration and reform
Raise external funding
Show competitive edge
Transparency causes
natural change of
processes
Reinvent government
Bureaucracy
Piracy, misuse
Corruption
Maintaining
disorder, no
transparency
Political
instability
Resistance
Source: Backus (2001)
Table 1 Cost and finance – implementation and maintaining e-governance solutions
Strengths Weaknesses Opportunities Threats
E-governance good argument
for external funding
Transparency for businesses
(procurement)
Investors
Budget control
Cost-efficiency through
E-governance
New business
More efficiency tax revenues
Corruption
Source: Backus (2001)
E-Governance and the ‘Developing’ Countries: Conceptual. . . 615

3.4 Scientific
As discussed in the previous sections, scientific capability will be a bottleneck
for e-governance in developing countries. Scientific aspects involve software,
hardware, infrastructure, telecom, IT-skilled people and maintenance, safety and
security issues (Table 4).
Technically, the larger population in India is Scient. According to The Econo-mist, only 0.1 % of the population has Internet access at home (Kashyap 2000).
According to the UNDP (2000: 200), India has one of the lowest per capita Internet
hosts (0.01 per 1,000 people) in the world.
Recent concerns about the ‘digital divide’, the technology gap that exists
between distinct groups in the India, highlight the issues associated with the
move to e-government as a mode of service delivery, due to the potential
consequences for unconnected or underserved populations. Several studies note
racial, regional, educational, gender and age disparities among Internet users and
technology owners (Norris 2001). These gaps are of great concern for public
administrators, who must serve efficiently, effectively and equitably to fulfil their
public charge. The SWOT analysis illustrated above provides a comprehensive
illustration about the possibility of various threats and weaknesses that the
Table 3 People-centric aspects – implementation and maintaining e-governance solutions
Strengths Weaknesses Opportunities Threats
People eager to learn
IT skills
Skilled people
possible export
product
Basic education poor:
trainers needed
No IT literacy
Low literacy
Different languages
Public acceptance of self-
service models
Skill shortage:
competition with
private sector
Employment
increases
Education system
improve
People learn
structural job
Cheap manpower
widely
available
Promotion of
Internet
Better health care
Brain drain IT-skilled
people after training
Resistance of people
Digital divide
Privacy
Source: Backus (2001)
Table 4 Scientific aspects – implementation and maintaining e-governance solutions
Strengths Weaknesses Opportunities Threats
Everything is new:
no negative legacy
Shortage of IT-skilled
people
Second-hand hardware
available
Dependency of
technology
Leapfrogging possible High cost of Internet Use one standard
Internet as driving
(pull) factor
Heterogeneous data
Lack of IT standards?
Lack of IT standards? Costs of software licences
Source: Backus (2001)
616 C.B. Singai

paradigm of e-governance could face in India, while portraying the stages of
opportunities and strengths for the people and the system, respectively.
Following the SWOT analysis from the 4-D perspective of cost/finances, insti-
tutional/policy level, people-centric and scientific dimensions, it is evident that
implementing e-governance in India evidences various aspects of support and
challenges. Among the four, the institutional and people-centric dimensions are
central to the process of implementation. Decision-making, on one hand, and for
the assortment of people for whom the decision is made, on the other, provide
a paradoxical position, resulting in problems of successful implementation of
e-governance projects. Considering the aspect of progressive vision (cyber-optimists)
by the political agency is the most important aspect evolving e-governance models.
In addition to this, the political aspect is important to scale the e-governance
processes across the country, enabling acknowledgement from coalition of political
ideologies and government. The people-centric dimension plays an important role
as well. The diversity of people that the country accommodates is a major concern
for e-governance models (Bhattacharya 2001). As the popular academic and prac-
titioner concern states, the e-governance model is progressive for the country, but at
the same time, it is exclusive. It excludes a certain section of the population who
cannot and do not have access to the tools that enable use of e-governance tools,
‘digital divide’. Such exclusion has resulted in a major setback to the political
orientation and support to implementing e-governance.
In sum, e-governance has its own advantages and disadvantages as discussed
above. In India, it is suggested to explore the key aspects of institutional and people-
centric dimension in order to enhance the progressive and inclusive feature of
e-governance.
The use of information communication technology (ICT) in governance has impact
on the following aspects2:
• InformationWebsites are loaded with information; government websites are supposed to
provide an interface to the citizens and the officials. Governments will have to
collect, produce and update information daily. In the initial stage, content will be
static, but eventually, the content will be dynamic.
• Human ResourcesThe government has to support the e-governance centres with professionally
trained individuals and enable a technically sound environment. Maintaining
technological infrastructure requires IT-skilled resources. The government could
look forward to public-private partnerships (PPPs) in hiring and training people
across the country.
2 The key to the discussions is contextualized from Michiel Backus (2001). E-governance anddeveloping countries: Introduction and example. Research Report # 3; however, the examples aresituated to the Indian context.
E-Governance and the ‘Developing’ Countries: Conceptual. . . 617

• Safety MeasuresThe government has to strengthen its ‘cyber cell’ and enable robust technical
strategy (preferably through private ITES in the country) to tackle security
issues. Internet increases the number of entry points exponentially. Protection
is possible with antivirus software, firewall at gateways, encryption technology
and authentic identification tools (Backus 2001).
• 24*7 ServiceSystems and processes have to be adapted to a completely new service model.
The services delivered through e-governance model enable time-space compres-
sion. Citizen’s expectations towards government’s response times will change
because of the new communication medium. For instance, the citizens to
government interface the Bangalore one – ‘one-stop, non-stop services’. Such
services demand high technical calibre and commitment from the government
professionals and the right attitude among the users.
• ConfidentialityFollowing the extensive development and application of e-governance pro-
cesses, detailed information about citizens (e.g. Unique Identification Card-
UID) and businesses, are often held in multiple offices on many different
computer systems posing threat to citizen’s privacy. It is the responsibility
of the government to restrict the utilization of private information and secure
such information from access by unintended parties. Due to public concern
regarding privacy, several countries have already passed data protection laws.
• Need for IT-Enabled Services (Public and Private)With the implementation of e-governance, information technology (IT) is
becoming more and more important in government operations. The need
for a professional IT department wills inevitable increase, not only during
implementation, but also for maintenance of software, hardware and
infrastructure.
Given the above context, it is vital to appreciate that the impact of ICTs in
governance is not always negative though they are more evident. For instance, with
the growing population who posses education in IT and similar services (service
sector) and the robust human capital, in India, we have huge human resources who
are skilled in ICT application. Unlike many other developing countries, the country
can tap into these resources on one hand, and by successfully implementing
national policies on e-governance like the ‘National e-Governance Programme
(Ne-GP), the human resource could be used effectively by ensuring increased
employment.
4 Way Forward
Invoking the Nehruvian vision, the post-independence mission, the evolution of
various commissions for developmental programmes and the hitherto omission
of ‘effective’ e-governance in the country, this chapter has discussed relevance of
618 C.B. Singai

e-governance. The theoretical framework provides an overview of the existing
discourses on role of e-governance and their institutional relevance. Following
the theoretical dimension, the SWOT analysis (Backus 2001) situated and illustrated
the 4-D perspective that e-governance policies counter. This chapter discussed
how the institutional and people-centric dimension is central and unique to India
and how it is important to chalk out the meaning of e-governance in India. As a way
forward, I would like to state what government should supply in addition to what
it does provide through e-governance to the citizens. The government should supply
performance indicators, environmental indicators, audited accounts, management
reports and other relevant documents that are necessary for the citizens to assess the
performance of the government. E-governance has the potential to ensure in creating
a robust knowledge society (Mansell and When 1998) enabling informed and
sustainable development from an inclusive perspective. There is now considerable
momentum for government change along the e-government model. Governments
are competing to be seen as being on the leading edge, not laggard adopters
(Sprecher 2000).
Many cities across the globe (developing or less-developing) are moving away
from traditional administrative emphasis on standardization, departmentalization
and operational cost-efficiency, towards the ‘e-governance’ paradigm, which
emphasizes coordinated network building, external association and customer
services (Ho 2002). In this way, the reinventing government movement is tied to
the e-governance movement. It is still too early to assess e-government in terms of
effect on democracy. Clearly, there are great hopes that e-governance will provide
new opportunities for widening civic engagement and participation (Milward and
Snyder 1996). In principle, e-governance increases the reliability and accountability
of public organizations and potentially could ensure effective governance – people-
centric governance.
References
Alexander JH, Grubbs J (1998) Wired government: information technology, external public
organizations, and cyber democracy. Public Adm Manage Interact J 3(1):1–11
Backus M (2001) E-governance and developing countries: introduction and example. Researchreport, # 3. Available at htttp://editor.iicd.org/files/report3.doc. Accessed 14 Dec 2011
Bhattacharya M (2001) Social theory and development administration. Jawahar Publishers,
New Delhi
Frissen PHA (1992) Informatisation in public administration. Int Rev Adm Sci 58:307–310
Kashyap R (2000) From IT to E-governance. The Economic Times, 9 December
Garsons GD (1999) Information systems, politics, and government: lending theoretical
perspectives. In: Garson GD (ed) Handbook of public information systems. Marcel Dekker,
New York, pp 591–605
Ho A (2002) Reinventing local governments and the e-government initiative. Public Adm Rev 62
(4):434–444
Kohli A (1991) Democracy and discontent: India’s growing crisis of governability. Cambridge
University Press, Cambridge
E-Governance and the ‘Developing’ Countries: Conceptual. . . 619

Mansell R, When U (1998) Knowledge societies: information technology for sustainable devel-
opment. Oxford University Press for the United Nations, New York
Milward HB, Snyder LO (1996) Electronic Government: Linking Citizens to Public Organizations
through Technology. Journal of Public Administration Research and Theory 6(02):261–75
Norris P (2001) Digital divide? Civic engagement, information poverty and the internet in
democratic societies. Cambridge University Press, Cambridge
PC World (2000) Cyber states in India and E-governance. http://www.pcwindia.com/2000jun/cs.
htm. Accessed Dec 2011
Sprecher M (2000) Racing to E-government: using the internet for citizen service delivery. Gov
Finance Rev 16(5):21–22
UNDP (1999) Human development report 1999. Oxford University Press, New York
UNDP (2000) Human development report 2000. New York: Oxford University Press
Wadia J (2000) Welcome to digital democracy. Times Comput, 22 Nov. http://www.
timescomputing.com/20001122/nws1.html. Accessed Jan 2012
Yadav KPS (2001) Cover story: can Indian villages be logged on to infotech highway? Down to
Earth 9(18):28
620 C.B. Singai

Compartmentalization of E-Governance
Practices
P.V. Bokad, P.M. Kuchar, and Priya V. Satpute
1 Introduction
The dictionary meaning of e-government is (electronic-government), a generic termfor Web-based services from agencies of local, state and federal governments. Such
Web sites provide a wide variety of services to the public and have been extremely
helpful in reducing internal paperwork. For example, the myriad of forms that
government agencies require can typically be downloaded from a Web site. When
information on the site is clearly indexed and explained, the number of support calls
is dramatically reduced compared to the days before theWeb. To take the full use of
e-governance project and spread to all common citizens, it requires a full-fledged
communication network. India has taken this care through Telecom Regulatory
Authority of India (TRAI). TRAI in their detail report on number of Internet
connections in India said as below.
These are Internet connections and offices, and cyber cafes have many users
accessing a connection so actual number of users in India is significantly greater
than these numbers.
There are 19.67 million Internet subscribers in March 2011, a yearly growth of
21.59% with respect to March 2010. The broadcast users (>256 Kbps) are growing
at 33.49% and were up to 11.89 million at March 2011. Dial-up and narrow band
users (<256 Kbps) are growing at 5.12% and were up to 7.79 million at March
2011. Maharashtra is having (<256 Kbps) and broadband (>256 Kbps) subscriber
P.V. Bokad (*) • P.M. Kuchar
Department of Business Administration and Research, Shri Sant Gajanan
Maharaj College of Engineering, Shegaon 444 203, Maharashtra, India
e-mail: [email protected]; [email protected]
P.V. Satpute
Saraswati College, Gaulkhed Road, Shegaon 444 203, Maharashtra, India
e-mail: [email protected]
Department of Management Studies, Indian Institute of Science, Bangalore,
Driving the Economy through Innovation and Entrepreneurship,DOI 10.1007/978-81-322-0746-7_51, # Springer India 2013
621

base in the country. Tamil Nadu is second in Internet and broadband subscriber
(Chart 1).
The use of ICT in e-governance is proved significantly. To widespread the use
of e-governance services, the subscriber of using the broadband and Internet is
increasing day by day in India, and it is clear from the above chart.
2 State Level Initiatives in India
Andhra Pradesh: In Andhra Pradesh e-Seva, centres have been established in over
200 villages and towns delivering services to citizens based on a low-cost network-
ing model. There are total 46 bigger e-Seva centres at mandal headquarters, out
of which 16 are headed by MACTS (Mutually Aided Cooperative Societies)
(E-governance and Best practices) which are led by women and have at least 2,000
womenmembers.BhuBharati (E-governance andBest practices) is an integrated landinformation system and has been piloted in Nizamabad district. E-village project isdeveloped in Chiluvuru in Guntur district withWi-Fi connectivity. E-villageWeb site
and databases are the multipurpose household survey (MPHS) in the state. It includes
land record management system and Pattadar passbooks, ration cards management
system, cooperative bank loans management system. The state has also developed
Andhra performance tracking system for improving delivery of services and infra-
structure.Andhra is the pioneering e-governance state, improving citizen–government
interface through e-governance (E-governance and Best practices).
Delhi has rolled out of 8,000 ‘government to citizen kiosks’ in 2008 through a
project called Jeevan. The 23 departments and 104 services have been identified to
Chart 1 Showing trend in Internet/broadband subscription (TelecomRegulatoryAuthority of India)
622 P.V. Bokad et al.

be brought under the ‘Jeevan’ project; 45 priority services are made available
initially through computerized citizen service centres or portals with online pay-
ment gateway on a BOT basis. The services include payment of utility bills, getting
licenses or certificates, issue of forms, etc., on a single online platform.
Gujarat: The one-day governance model provides eight citizen services across the
counter in one hour. These eight services are income certificate, domicile certifi-
cate, addition/deletion/modification of name in ration card, etc., based on business
process re-engineering and set procedures.125 out of 143 municipal centres and all
225 talukas have these one-day governance centres or Jan Seva Kendras. Gujaratstate also developed a project named Computerized Interstate Check Posts inGujarat (E-governance and Best practices).
Karnataka: has opened 800 citizen service centres offering an integrated range of
services like certificates, pensions, social security payments and special packages
like Bhoomi and Kaveri – registration at ‘one-stop shops’. Bhoomi allows compu-
terized easy access and facilities for ‘mutations and updation of 20 million land
records belonging to 6.7 million farmers in an efficient and transparent way based
on a self-sustaining business models’. Other successful initiatives taken by Karna-
taka government are khajane, an online treasury project. Gram Swaraj is a project toimprove service delivery and management of public resources at the panchayat level.
Haryana: The Haryana government has started the best practices on ‘IntegratedWorkflow System for Paperless Admission’ with online off-campus counselling for
all technical courses including postgraduate, undergraduate and diploma education
that has obtained central award for Exemplary Horizontal Transfer of ICT-Based
Best Practice category in 2007–2008.Mustard Procurement Management System is
the agricultural-based project useful for the farmers. Janani Suvidha Yojana is the
project for maternal health care.
Kerala: Successfully piloted rural ICT access points Akshaya with e-payment
facilities. The SWIFT pilot programme provides one-point solution for 25 types
of certificates. PEARL is for administration of registration laws and documents.
Asraya is a community-based initiative to remove destitution.
Madhya Pradesh: Gyandoot is the community-owned rural Internet kiosks in Dhar
where the entire expenditure for the Gyandoot network has been born by Panchayats
and the community with no expenditure burden for the state or national government
(E-governance and Best practices). Decentralizing teacher management in MP low-
ered teacher absenteeism and reinforced accountability. Use of para-teachers made it
possible to extend a decentralized model of teacher management in MP that boosted
school enrolment in a fiscally constrained setting. Rogi Kalyan Samitis with auton-
omy to charge user fees and deploy them for purchase of equipment and maintenance
are other important experiments.
Maharashtra: has introduced special legislation, the Maharashtra Government
Servants Regulation of Transfers and Prevention of Delay in Discharge of Official
Duties Act, 2006, for improved public service delivery with time limit of 7 days for
Compartmentalization of E-Governance Practices 623

pending work with any government servant and overall time limit of 45 days for
clearance of the file. Appropriate disciplinary action has been laid against
defaulters. The Act also prescribes delegation with up to a maximum of three levels
of submission before final decision. Maharashtra government has also started some
impressive best practices including Koshvahini or e-treasury and e-registrationpackage. ‘Warana Wired Village’ is the well-known e-governance project of
Maharashtra state (E-governance and Best practices).
Rajasthan: has set up over 500 e-mitra service centres on PPP basis in 31 out of 32
districts with services including certificates, payment of bills, transport ticketing,
ration card, etc., with business process re-engineering in linked departments.
SARATHI (Stamp and Registration Automation with Technology and Information)
is an e-registration in an hour.
Tamil Nadu: In Tamil Nadu state, E-Registration Star and Regine are the
e-governance projects on a self-sustaining basis; SARI project in Madurai district
includes farming advice by the Madurai Agricultural College and Research Centre;
applications for government loans; e-mail, chatting and voicemail; eye care and
treatment; income, caste, birth and death certificates; old-age pension; computer
education; etc., are the services made available through this project.
Tripura E Suvidha Kendras: or service facilitation centres in all SDM are offices
providing 22 citizen services with tracking.
Uttar Pradesh: The Lokvani pilot of Sitapur district incorporated franchisee
e-kiosks which offer services related to grievances, land records, employment
services, tender services, court information system, etc., 15 services on a self-
sustaining basis.
The project allows for registration and tracking of applications. It has been rolled
out in 21 districts with over 398 kiosks, pilots in land records, e-registration, etc.,
underway. Over 16,000 common service centres are proposed.
West Bengal: There are gram panchayat accounts and management in 400
panchayats; GIS-based information system is at GP level. Pilots for Citizen Service
Centres are ongoing. Telemedicine projects are linking Referral and District Nodal
Centres or Hospitals providing teleconsultation with referral centres. There are
6,697 Citizen Service Centres for delivery of various services.
3 Improvements Expected in the Existing System
The success or the failure of the project is not only the successfully installation
of the project, but the need satisfaction of the citizens is more important. The
e-government projects have different lacunas which are required to be removed.
The reality gaps in e-governance projects explained by Heeks (2002–2003) (Heeks
2002) are shown below which supports this fact (Fig. 1).
624 P.V. Bokad et al.

The gaps shown in above model are of following nature:
Hard-soft gaps (Heeks 2003): The difference between the actual technology (hard)
and the social context (people, culture, politics, etc.) in which it operates (soft).
Private–public gaps: The difference between the private and public sectors means
that a system that works in one sector often does not work in the other one.
State context gaps: The gap that exists when trying to use the e-government systems
for both developed and underdeveloped states.
4 Reality in E-Governance Practices
E-governance is the interaction between citizens and government through elec-
tronic media. E-governance makes use of technological tools like Internet, public
kiosks, etc., to complete many government activities. In India, the waves of the
e-governance start in 1990. It has undergone many changes, faces many challenges
and gets updated time to time. Successful user-friendly and cost-effective imple-
mentation of e-governance practices has become the need of the hour. E-governance
has successfully crossed its childhood and is stepping in the youth stage. Almost
every state in the country either has a few central government e-governance projects
or state e-governance projects on their name. The different countries around the
world today have implemented e-governance in some manner and have their own
Fig. 1 Showing the need of bridging the gap between issues
Compartmentalization of E-Governance Practices 625

vision and objectives for future course of strategy. In India, state governments have
many commonalities in their functions, structures and processes, but even then,
implementation of e-governance project has not been homogeneous, but it is state
dependent. E-governance can enhance the speed and efficiency of operations by
streamlining processes, lowering costs, improving research capabilities and improv-
ing documentation and record-keeping. E-governance should contribute significantly
to the process of transformation of the government towards a leaner, with more cost-
effective government. E-governance should lead to e-government.
The leading techno-legal expert of India is of the view that ‘the Government and
Indian Bureaucrats need to change their mindset and stress more upon outcomes
and services rather than mere ICT procurement. India needs a services-based app-
roach that is not only transparent but also backed by a more efficient and willing
Government.
Presently the Bureaucrats and Government of India are in a “resistance mode”
towards novel and effective e-governance policies and strategies and they are
merely computerizing traditional official functions only. This is benefiting neither
the Government nor the citizens and is resulting in wastage of thousands of crores
of public money and UNDP/World Bank grants amount’.
The continued apathy, mismanagement and lack of accountability have finally
shown its impact. The World Bank had refused to operationalize the e-governance
support project known as ‘E-Bharat’ without its active management role in the same.
The World Bank did not agree to the framework for implementation of E-Bharat as it
was insisting on certain conditions to manage the project. For instance, against a
hands-on project management approach being favoured by the World Bank, India
was pushing for a programme mode where assistance could be linked to targets or
milestones.
It becomes the point of thinking and should take the alarm for e-governance
projects. Prevention is better than cure; hence, the Gov3 analysts have defined
seven classic causes which are required to consider to avoid failure of e-governance
project. These seven ‘signs’ are (Gov3 analysis, drawing on research published by
the UK government) as follows:
1. Lack of strategic clarity: A strong business case, driven by a clear set of benefits
owned by the key stakeholders, should be an essential precondition of any public
sector ICT investment. Unfortunately, this is not always the case, and too many
projects are driven by ‘what the technology can do’, not ‘what the organization
needs’.
2. Lack of sustained leadership at political and senior management level: Signifi-cant ICT projects require significant change, and significant change requires
leadership. Yet often, this is not forthcoming either because projects fail to
achieve the sustained leadership attention they need at the highest levels in
government or because those in leadership positions do not have the skills
they need to exercise effective leadership of ICT-enabled change.
3. Poor understanding and segmentation of user needs: Failure to engage closely
with users – whether citizens in the case of external services or public employees
626 P.V. Bokad et al.
in the case of internal services – is a common cause of project failure. Every
service will have very different users, each with different attitudes to and requi-
rements from the service.
4. Lack of effective engagement with stakeholders: Most ICT-enabled change
projects in the public sector involve complex sets of stakeholders – users,
suppliers and delivery partners elsewhere in the public, private and voluntary
sector. Failure to manage this complexity significantly increases risk of failure,
and yet, stakeholder management is typically an activity which gets squeezed
when project timescales or budgets get tight.
5. Lack of skills: Project management skills and transformational e-government
programmes require a rich mix of broader skills, for example, in change man-
agement, process mapping and redesign, channel management and marketing
and communications.
6. Poor supplier management: Strong partnership relationships with suppliers are
essential. Yet, many common supplier management practices militate against
this, leading to high risks of failure. Common mistakes include the following:
• Evaluating proposals primarily on immediate price rather than long-term
value for money (and in particular the degree of confidence that the chosen
supplier will secure delivery of the expected business benefits)
• Management of the supplier relationship being undertaken at too junior a
level within the organization – on major projects, this should be an issue for
the very top levels of management
7. ‘Big Bang’ implementation: Finally, many projects fail because they seek
to deliver too much technological and organizational change at once. Success
is much more likely in a programme with initial deliverables which create as
much customer value as possible for as low a level of technology expenditure
and delivery risk as possible, which learns from that experience and then moves
on to more sophisticated technological and organizational changes.
By using appropriate technology like Web 2.0/3.0, e-government can facilitate
communication, ease in use and improve the coordination of authorities within the
different tiers of government, starting with the central/federal government, state level
government, municipal corporations and village panchayats. The success can be seen
in the true sense when it will be linked between state to state and controlled by central
government. The unnecessary separation or state-dependent projects are becoming
costlier and uncontrollable. This is the only reason why more than 30% e-governance
projects are not successful in achieving their objectives.
5 Compartmentalization
Compartmentalization is a principle that limits the damage and protects other
compartments. It prevents others to use the services developed by one government.
But more compartmentalized methods/services or organizations are the threats for
Compartmentalization of E-Governance Practices 627

flexibility, creativity and innovation. Successful user-friendly and cost-effective
implementation of e-governance practices has become the need of the hour.
E-governance has successfully crossed its childhood and is stepping in the youth
stage. During its life cycle, it has come across and overcome number of problems
like multiplicity, digital divide and compatibility. But it appears that an e-governance
system functions in isolation in its number of practices. It gives birth to the com-
partmentalization which forbids others to take its use. It overburdens the nation as
individual states are spending huge amount for the development of e-governance
services for the similar purpose. It is just opposite to the claim made by the govern-
ment to provide e-governances to ‘anyone’ and ‘anywhere’.
Compartmentalization is good for the sake of security, but it should not be at
the cost of exploitation of common beneficiaries. ‘In today’s world compartmentali-
zation is not an option and we need to evolve from this nucleus created by Indian
government. Any half measures would be very risky for uswhen our dream to be an IT
super power seems to be within our reach. A system of oversight to audit progress
made towards stated objectives and corrective steps is unavoidable’ (Chaturvedi et al.).
6 Compartmentalization of E-Governance Practices
In the race of developing and implementing the e-governance projects for the better
government and considered the state as e-state, state governments are spending
lakhs and crores without considering its importance of the same project for the
people in other state. So, the intervention of the central government is required so
that any e-governance developed by the governments could be used by all the
citizens in the nation. The state centric concept of the e-governance should now be
replaced with really citizen centric, and the e-governance for everyone, everywhere
and at anytime should be proved. It is after all the money of the common citizen
which can be saved instead of giving it to the private businessman for developing
the software. The Table 1 below clears how different states are developing the
e-governance projects for the same service repeatedly and spending huge amount
on similar development in different states.
Parallel efforts: All the above six states have developed their individual
e-governance projects for the benefits of the citizens of their states. Every state
has spent their individual fund for the purpose of land record administration. The
individual effort leads to two important things. One is the huge investment for
the common purpose, and the other is influence of local administration procedure
of the state made the facility state dependent.
Other similar compartmentalized examples: The organization like Directorate
of Technical Education is controlling the total admission procedure for the courses
like B.E. and M.B.A. The MKCL has developed e-project for this purpose. The
database developed during this process by DTE is not accessible for the reporting
purpose to the A.I.C.T.E. So, the efforts are required to be duplicated for the
628 P.V. Bokad et al.

similar purpose. The database of universities and the DTE and AICTE have the
compartments so their usability is restricted and requires double effort.
7 Few Initiatives in This Direction
Public key infrastructure (PKI): The Indian state ofUttaranchal is developing a centraldata repository and a public key infrastructure (PKI) to make it easier for its citizens to
access government e-services (India State to Create Central Citizen Database 2006).
The project is financed to the tune of US$3 million (US$1.9 million) by the state of
Uttaranchal. Uttaranchal, in north India, is home to eight million citizens and 109
government departments. The project will consist of three parts – a household sur-
vey, design and implementation of the repository or Citizen Data Vault and the
development of PKI for citizens to access government services online or via public
kiosks. The sharing of information in turn will enable the deep integration of govern-
ment processes so that e-services can be designed around the lives and needs of
citizens. Citizens can enjoy reduced processing times, less paperwork and bureaucracy
and improved standards of service.
Table 1 Showing individual efforts in different states for similar need
State e-Project Service
Karnataka Bhoomi Allows computerized easy access and facilities for ‘mutations’ and
updation of land records for the farmers in an efficient and
transparent way
Andhra
Pradesh
Bhu Bharati An integrated land information system has been piloted in
Nizamabad district
Gujarat E-Dhara Enhances complete computerization of land records across the state.
Elimination of manual records and computer-controlled
mutation process
Madhya
Pradesh
Bhu-
Abhilekh
It is an application software product designed and developed by
NIC for the office of the commissioner, land records and
settlement, Department of Revenue, Government of Madhya
Pradesh to deliver excellent grass-root governance within the
domain of land management. Records of 35 million khasra (plot/
survey) numbers comprising of 10.5 million land owners have
been computerized, till date
Maharashtra SARITA It is a G2C-U project with an aim to design, develop and implement
a computerized application for registration of documents,
received at each Sub-Registrar Office and provide data updation
on timely basis to their respective Joint District Registrars and
higher offices under the purview of Department of Registration,
Pune, Maharashtra State
Tamil Nadu e-Services Welcome to anytime/anywhere e-Services of Govt. of Tamil Nadu.
Users can view the Patta Copy (Chitta Extract) and A-Register
Extract for the agriculture land
Compartmentalization of E-Governance Practices 629

Aadhaar: The unique identification number (Aadhaar) was conceived by the Indian
government as a means for residents to clearly and uniquely verify their identity
anywhere in the country. The mandate for the UIDAI includes defining the usage of
the number across critical applications and services (Notification – Constituting the
Unique Identification Authority of India’). The Public Distribution System is one
such application, and the UIDAI has accordingly laid out the potential role Aadhaar
can play within the PDS.
The expectation from the de-compartmentalization of the e-governance projects
developed for the state citizens should be utilized for the Indian citizen. If a common
man needs some financial loan or a retired person wants to apply for pension, he/she
should be able to apply for the same through Internet centre without physically going
to the required office. Going to a government office for a small task and waiting for
a long time could be a tiresome job and should be kept away.
8 Conclusion
The idea mooted by the government and initiatives taken by the different state
governments in India is worth to praise. States are also motivated for such efforts
by giving best project award by the government. In some cases, the financial
backing extended by World Bank, central government, or state government itself
and somewhere through public support. As the idea being an innovative, eye-
catching due to the use of computer technology and rewarding effort because it is
for the benefit of peoples in India, the real problems like cost overrun, uniqueness
and citizen centric are overlooked. All the states are putting their efforts and all
their resources for developing better and better e-governance project for their own
state which is the common problem for all the states. The same problem becomes
the reason for the failure of some projects, and the projects are required to be
withdrawn without making any discussion on why the project fails. So, to stop the
mis-utilization of the e-governance projects, it is required to remove compartmen-
talization between the state to state and e-governance project to project.
Compartmentalization issue is unknowingly wasting money, efforts and the
resources of the government. So, it is required to develop the best e-governance
project for the particular service for the peoples in all the states and then link all
such projects together to make centrally governed e-governance project.
References
Chaturvedi MM, Gupta MP, Bhattacharya J Cyber Security Infrastructure in India: a study by.
http://www.iceg.net/2008/books/2/9_70-84.pdf
E-governance and Best practices. http://india.gov.in/govt/studies/annex/6.3.1.pdf
630 P.V. Bokad et al.

Gov3 analysis, drawing on research published by the UK government (“Successful IT: modernizing
government in action”, Cabinet Office, 2000; “Common causes of project failure”, OGC, 2005)
and by the European Commission (through its breaking barriers to e-Government research
programme http://www.egovbarriers.org/)
Heeks R (2002) Information systems and developing countries: failure, success, and local
improvisations. Inf Soc 18:101–112
Heeks R (2003) Most eGovernment-for-development projects fail: how can risks be reduced?
eGovernment working paper series, paper no. 14
India State to Create Central Citizen Database, June 2006. http:/www.businessweek.com/print/
globalbiz/content/jun2006/gb20060602_447167.htm
Notification – Constituting the Unique Identification Authority of India’, part I, section 2, Gazette
of India, 28th January 2009
Telecom Regulatory Authority of India, recommendations on national broadband plan, 8th Decem-
ber, 2010. http://www.trai.gov.in/WriteReadData/trai/upload/PressReleases/744/qpressre-
lease22jul.pdf
Compartmentalization of E-Governance Practices 631

Project Nemmadi: The Bytes and Bites
of E-Governance in Karnataka, India
Madhuchhanda Das Aundhe and Ramesh Narasimhan
‘No Nemmadi1 at these centers’ was how the popular daily newspaper of Bangalorechose to characterize the status of the high-profile e-governance initiative called‘Nemmadi’, of the Government of Karnataka.2 Mr. Naveen, the new principal
secretary, e-governance, Government of Karnataka, browsed the report, folded
the newspaper and kept it aside. There were reports, in the past, of the private
partners not meeting their obligations laid down in the public-private partner-
ship (PPP) contract. A few days ago, there was a report in the press that the state
of Karnataka was slipping in the ranking on e-governance in India. Naveen had
been summoned by the office of the chief minister (CM) for an emergency
meeting after lunchtime, to be attended by the senior officials of the concerned
departments—e-governance, IT and revenue. A high-profile public project like
Nemmadi was fraught with high stakes in a democratic system. Naveen quickly
weighed the options in his mind. Nemmadi had to continue since it was addressing a
real need of the rural citizens of the state and for the same reason also enjoyed
strong political backing. He reasoned that the degree and depth of adoption by the
user departments would improve the situation. But he did not have direct control
over them. He wondered if everything was right with the PPP model, which was
being attempted for the first time for such a large-scale project. He knew it was
quite complicated to change the rules of the game midway. Naveen felt that the
situation might stabilize over time as the various actors involved in the process
M.D. Aundhe
IIM, Bangalore, Karnataka, India
e-mail: [email protected]
R. Narasimhan (*)
SVKM’s NMIMS University, Bangalore, Karnataka, India
e-mail: [email protected]
1Means ‘peace of mind’ in Kannada, the language spoken by the majority in the state of Karnataka.2 Deccan Herald, Bangalore, 30 August 2009.
Department of Management Studies, Indian Institute of Science, Bangalore,
Driving the Economy through Innovation and Entrepreneurship,DOI 10.1007/978-81-322-0746-7_52, # Springer India 2013
633

adapt and adjust to the new ways of doing things. He was aware of the challenges in
harnessing IT for improving the process of governance, especially in a democracy.
Mr. Naveen had, after all, served in the Department of IT, when the concept of
e-governance was in its infancy. He knew that a lot of ground had been covered
since then. He also knew the road ahead for e-governance was long and hard to
travel. Nemmadiwas an important milestone. He picked up the paper again and read
the report in detail. Mr. Naveen decided to meet with his team to discuss the issues
and prepare for the crucial meeting with the CM.
1 E-Governance in Karnataka
Karnataka had been a pioneer in e-governance in India. The e-governance strategy
for Karnataka was unveiled in the year 2000, even before the NeGP3 was in place,
as part of the IT millennium policy. A detailed action plan supported this strategy.
The goal was ‘to enhance the use of Information and Communication Technology
(ICT) in the functioning of the government in order to make required information
available to all citizens and to provide all services in an efficient way and identified
services on an online basis’.4
The e-governance department was separated from the Department of IT in
2003 and merged with the Department of Personnel and Administrative Reforms
(DPAR), more popularly known as General Administration, in other states.
In Karnataka, the Centre for e-Governance (CEG) was established as a society by
the Government of Karnataka under e-governance secretariat, DPAR. The Centre
for e-Governance is an autonomous and independent body specially formed to
implement and monitor various IT-enabled services and e-governance initiatives.
Karnataka is the only state, which thought e-governance should get proper amount
of focused attention and decided to have a separate department.
The other entities of the e-governance department were the secretariat, which is
the policy-making body, and the directorate of electronic delivery of citizen
services (DEDCS), which is responsible for the operational administration of the
e-governance projects. Besides the CEO of CEG, the heads of the secretariat and
the DEDCS also reported to the principal secretary, e-Governance Department,
Government of Karnataka.
3 NeGP is the National e-Governance Plan unveiled by the Government of India in 2006, which
has, since then, been guiding the formulation and implementation of the e-Governance projects by
various state governments.4 Details of the e-governance strategy for Karnataka can be accessed at http://www.bangaloreit.
com/, accessed on 15 December 2009.
634 M.D. Aundhe and R. Narasimhan
2 Nemmadi Project
Nemmadi was the first and the largest G2C5 e-governance project which offered to
rural citizens a range of 38 services such as RTC,6 caste, income, residence, birth,
death, etc., certificates, through 800 telecentres7 located at hoblis,8 across the state.
These certificates enabled the citizens to apply for benefits under various government
schemes, apply for admission to educational institutions and government jobs, etc.
2.1 Motivation
The first attempt at e-governance in Karnataka was made in 1998 and was called
Bhoomi. The Bhoomi initiative consisted of creating a database of computerized
land records. Through this initiative, 20 million records of land ownership of 6.7
million farmers in the state were digitized. The farmers could obtain online printed
copies of the rights and tenancy certificate (RTC) through telecentres in 177 taluk
offices. Mr. Shekhar, the then principal secretary, e-governance, had single-
handedly spearheaded the Bhoomi project. He was the main force behind Bhoomi.
The trigger had been provided by the then chief minister and had been taken up by
Shekhar very seriously. He was involved in it right from the inception to the details
of execution. Bhoomi had become synonymous with the person.
The Bhoomi project became a sort of benchmark in the study of e-governance
and ICT for development. The project was picked up as an object of study and
attracted the media, the international scholars and many students to it. Most of the
studies praised it as a success, though there were several critical ones too. One of
the main reasons of criticism of Bhoomi was the cost and time overrun. By 2004,
Bhoomi was on autopilot.
Project Bhoomi centralized land records at the taluk level. This required
villagers to travel up to the nearest taluk, which could be a very long distance
from the villages, to get the RTCs issued. Hitherto, the village accountant (VA) in
the village issued the RTCs. The citizens would ‘pay’ the VA and get the RTCs
issued. Now, they had to go all the way to the taluk office to get the same issue on
payment of a fee. There had been complaints about logistics problems. Citizens
wanted the delivery points to be at a closer proximity. This would also meet with
the government vision of getting ‘closer to the citizens’. To improve their reach, the
5 Refers to information, interactions, transactions, etc., between the government and citizens.6 Rights and tenancy certificates pertain to land ownership and play a vital role in the life of
farmers, for security of tenure, seeking crop loans, and bail in crime cases. This also helps Revenue
Administration and the private industry in agribusiness in planning.7 Telecentre is a kiosk where the citizen interface takes place—from the application for a service to
its final delivery kiosks where citizens-related services are rendered.8 Cluster of 3–5 villages.
Project Nemmadi: The Bytes and Bites of E-Governance in Karnataka, India 635

state government put in place a rural telecentre project, with the plan of locating the
telecentres at a hobli level. The rural telecentres would not be viable with Bhoomi
services alone being available on them. Therefore, Shekhar thought, other RDS9
services, for which the citizens had been travelling to the taluk office, could also be
offered through these telecentres. This would make the telecentre viable and at the
same time serve as a single window for all the services. This arrangement would
ensure Nemmadi (peace of mind) for the rural citizens. Thus, Nemmadi project was
born. Buoyed by the success of Bhoomi, Mr. Shekhar took it on himself to find out
more and identify every facet of service required by the villagers, which could be
integrated into a village centre of information.
In May 2003, Shekhar engaged the National Informatics Centre (NIC) to con-
duct a preliminary study to identify the services, which could be offered to the
citizens in rural Karnataka. The NIC, a Government of India organization under the
ministry of IT, was entrusted with the task of supporting the government—both
central and state—with services related to consultancy, development and deploy-
ment of ICT software and hardware. Its study revealed that around 40 services were
being availed by the citizens at the government offices. There had been increasing
demand for these services, beginning with the RTCs (under Bhoomi). This time, he
also wanted to ensure that he did not repeat the mistakes made in Bhoomi. One of
the major criticisms of Bhoomi was the time overrun. Therefore, to take care of that,
Mr. Shekhar was convinced, and this issue could be addressed by involving the
private sector in the project. As per him, what was needed was private sector
partners with energy and enthusiasm to take up this task and give it the speed and
vitality that, according to Shekhar, only the private sector could bring. Nemmadi’s
model, right from the beginning, was broader than that of Bhoomi. The concept of a
rural centre, which would integrate 38 services, is accessible at hobli level and work
without much government involvement while giving employment was immediately
appealing. With Bhoomi, Mr. Shekhar had learnt how to make things happen. He
gave Nemmadi all his energy and the benefit of his experience. He decided that the
telecentres would be set up by the private entrepreneurs at the hoblis and a fee of Rs.
10 per certificate would be charged to the citizen. The government would provide
the stationery, and the private party would provide the required infrastructure,
which would support the delivery of these services.
2.2 Process and Technology
The e-governance department of Karnataka assigned the requirements analysis and
design of the Nemmadi project to NIC. Besides, the analysis and design NIC was
also asked by e-governance department to execute a pilot project at Maddur.
9 Rural digital services is a generic term applied to any electronic service delivered to citizens in
the rural areas.
636 M.D. Aundhe and R. Narasimhan

EachNemmadi telecentre had a desktop computer system, peripherals and a human
telecentre operator. Besides the telecentres, Nemmadi also consisted of 176 Rural
Digital Services (RDS) back offices at the taluk10 level, where the citizen requests for
services were processed. Each telecentre at hobli level was connected to the nearest
RDS back office. All RDSback offices and telecentres were also connected to a central
database at the State Data Centre (SDC) in Bangalore. The telecentre was not
connected directly to the taluk server. All exchanges of data between the two
happened through the SDC. This was designed for reasons of security.
A taluk back office could service more than one telecentre. The back office was
headed by tahsildar,11 who was assisted by a group of functionaries: (1) village
accountants (VA) and revenue inspectors (RI) at the field level, (2) caseworkers at
the taluk office level and (3) a back-office operator. VA collected citizen-related
data, which was verified and attested by the RI. Caseworkers processed the citizen
applications and provided comments and recommendations to the tahsildar regard-
ing issue of certificates. The tahsildar was the final authority and the signatory for
the issue of certificates.
A citizen visited the telecentre with a request for a certificate. The telecentre
operator entered the oral request of the citizen into the system, in the required
format. If the certificate had been previously issued, the operator connected to the
SDC gave a search based on the key field and recovered the existing valid document
from the SDC database. He issued a print of the same to the applicant.
In the case of a new application, the application along with the necessary
documents was scanned and saved. The telecentre operator to the SDC uploaded
the soft copy of the application. The operator at the back office in the taluk received
the soft copy of the application by downloading from the SDC. The back-office
operator also received the hard copies of the applications, which were delivered
to him from the telecentres. He matched the hard copy and the soft copy of the
application. He checked the attached documents submitted. He then sorted out
the applications by moving them to respective revenue inspector (RI) login.12
The RI referred cases to village accountants (VA) if necessary and provided
field verification reports, manually, (signed physically by VA and RI; in some,
hoblis digital signature of RIs was also implemented) to the back-office
operator. The back-office operator accepted field verification reports and moved
the corresponding applications to the caseworker login.
The caseworker entered the field verification reports into the system, generated the
office note and gave his comments and recommendations. The back-office operator
then moved application along with the office note to tahsildar login. The tahsildar
digitally signed the certificate, and it was printed (see Fig. 1 below for the process).
10 Subdivision of a revenue district in a state.11 Tahsildars are government functionaries in charge of tahsil or taluk which is the lowest unit of
administration in a state.12 ‘Moving to a particular login’ refers to authorizing the concerned person for further processing
in the system.
Project Nemmadi: The Bytes and Bites of E-Governance in Karnataka, India 637

Once digitally signed, these certificates were uploaded to the SDC and printed from
the telecentre. The certificate, thus generated, contained a bar code, which represented
a digital signature. Nemmadi also intended to incrementally build a citizen database.
As part of servicing a request, the details of all the family members of an applicant,
such as caste, occupation, income, etc., were collected and stored at the SDC.
2.3 Pilot Project
The e-governance department began the telecentre initiative in 2004 with a pilot
project in Maddur, a town in Mandya district. The pilot project was executed by
NIC. A prototype of two services was built first and demonstrated to a committee
comprising divisional commissioners,13 tahsildars, caseworkers and a few
representatives from the industry. The services were, then, improved and piloted
in March 2004. Karnataka had some existing telecentres set up by an organization
named N-Logue Communication,14 as proof of concept of telecentre technology,
and were used to deliver telemedicine services. Shekhar (who was then the princi-
pal secretary of e-governance department) wanted to utilize the ten extant
telecentres of N-Logue which were being run by local entrepreneurs to offer
Back Office
TelecentreCitizen OralRequest
Print application
Certificate issued earlier?
Certificate
Details in citizen
database ?
Handover application to
Revenue Inspector
Accept field verification
report
Update remarks of
Village Accountant &
Revenue Inspector
Generate office note
Tehsildardigitally signs
certificate
Issue certificate
Y
N
Y
N
Fig. 1 Process flow of Nemmadi
13 Divisional commissioners are government functionaries who are responsible for the revenue
administration of two or more districts.14 N-Logue was an organization set up by a professor and his team from IIT, Chennai (a premier
engineering college in India), which used WLL technology to deliver telemedicine services.
638 M.D. Aundhe and R. Narasimhan

telecom and telemedicine services using the WILL15 technology. These existing
telecentres were used by NIC in the pilot project of Nemmadi. The connectivity to
the server was established using the WLL technology solution. NIC also developed
a communications framework application to link Nemmadi’s telecentres with
Bhoomi’s database. In 2005, another 14 services were added to the two services
piloted in Maddurtaluk of Mandya district. The pilot showed a success of the
technology, paving the way for the roll-out of more telecentres.
2.4 Roll-Out of Telecentres: Public-Private Partnership
A big bang approach for setting up telecentres was envisaged by Shekhar, to cover
800 hoblis across Karnataka within a period of 4 months. Shekhar had planned
private sector involvement to address the time overrun issue he had faced in case of
Bhoomi. Therefore, he floated a request for proposal (RFP) for a vendor who could
set up all the telecentres. There were several players, including established large
players, who responded to the RFP. However, the deal was bagged on the basis of
lowest price quoted in an open tender (in both zones of the state—north and south)
by a consortium of three organizations—3i Infotech, Comat Technologies and N-
Logue Communications.
3i Infotech was a global information technology company, which provided
technology solutions to over 1,500 customers in more than 50 countries across 5
continents, spanning a range of verticals—banking, insurance, capital market,
mutual funds and government. It was promoted by the NYSE-listed ICICI Bank,
India’s largest private sector bank. Comat Technologies was a private equity-
funded organization. It was an IT software services organization at its inception
in 1996. The initial investment of Rs. 30 crore had come from the consortium and
the state government, with 3i Infotech bearing almost 90% of the cost. This amount
was intended to cover the costs of all equipment, connectivity, VSAT operations,
real estate leasing, power, UPS and peripherals. Comat was responsible for all the
operational aspects of Nemmadi.
Comat began the roll-out of telecentres in November 2007. Hughes
Communications (a telecom equipment-providing company) was also involved
for providing VSAT16 connectivity. In the first round, 740 telecentres were to be
set up. ‘Setting up a centre was not simple’, Mr. Sanjay, VP Comat recounted.
15Wireless in local loop (WILL) is a telecommunication technology developed and patented by
Prof. Jhunjunwala in IIT, Chennai. This technology is expected to be cost-effective and hence
appropriate for application in rural India.16 A very small aperture terminal (VSAT) is a two-way satellite ground station equipped with a
dish antenna and is used to provide internet connectivity.
Project Nemmadi: The Bytes and Bites of E-Governance in Karnataka, India 639

We had targets like - 100 telecentres in the first month, 250 in the second and so on.We formed a Planning & Implementation Team to shortlist 2 or 3 locations in each hobli.The SLA requirement was 150 sq. ft. with a pucca17 roof, and on the ground floor, near abus stand or a gram panchayat office etc. There were no pucca buildings at all in manyhoblis! If we did shortlist some locations – by the time we went back for negotiation, theplace was not available! The moment they came to know it was a government project withsome private partner, they would back out. On one side, our meter was running – monthlytargets were laid down. Till long after, we were paying penalty despite the fact that wedeclared that there was no place of 150 sq. ft. space as per the SLA, in that particular hobli.Nobody anticipated these – no one has implemented a project of this kind. Just setting up800 centers in 4 months flat was a humongous exercise.
There were several ordeals for Comat. For the roll-out of telecentres, Comat had
to work with the VSAT vendor—Hughes Communication Ltd.—as well. VSAT
vendor required the telecentre location to be registered (i.e., defence clearance
obtained). VSAT connectivity could not be provided without proper earthing. For
Comat, earthing was a major issue, as in the hobli areas, as there were no skilled
people to do it. People had to be called from the taluk/district HQ to do the job. If a
Hughes engineer (VSAT required a special engineer to instal!) visiting a location
found that the earthing was not done, he proceeded further, as per his schedule, and
visited again only in the next cycle. This delayed the setting up of the telecentre.
Identification of telecentre locations, by itself, was very difficult, and then Comat
had to synchronize several activities—registration, earthing, VSAT connection,
etc., each performed by a different agency.
Comat had also to ensure that all the centres look the same—brick and mortar
structure with a counter. It had to come out with a standard format of agreement
with the landlords (11 months only and 3 months renewable); getting that accepted
over so many locations was a challenge. There was a political angle, as well; if the
telecentre location happened to be in the opposition party’s stronghold, Comat
faced added issues.
In the roll-out phase, 755 telecentres were made operational with rural digital
service provided across 55 taluks.
2.5 Operations of Telecentres: Public-Private Partnership
Besides the roll-out, Comat was also responsible for the day-to-day operations of the
telecentres. The role of the state government was limited to providing data
and connectivity only. Comat was supposed to build, own and operate the telecentres
for the first 5 years of the implementation. Nemmadi was governed by comprehensive
service-level agreement (SLAs) signed between Comat and the e-governance depart-
ment of Karnataka. For example, telecentre operators (of Comat) had to bank the cash
collected within 2.5 days. The reality at the ground level was very different from the
terms of the contract. More than 60% of the telecentres did not have banks within
15 kms, and it took the telecentre operator half a day to do this job. The operator, while
17 Firm or permanent roofing, as against roofs of straw and leaves found on huts in villages.
640 M.D. Aundhe and R. Narasimhan

doing the bank deposit work, missed the mandatory hourly ‘ping’ and had to pay
penalty for the same. Sanjay said ‘Despite our bringing the matter to their notice, thee-governance department continued to hold on to the SLAs in the RFP’.
The other telecentre operations issue faced by Comat was the economics of cash
management. Cash deposit in a non-home branch of the bank attracted additional
deposit charges of Rs. 10/Rs. 15 per transaction. This meant that even if there was a
bank near the telecentre if it was not a home branch (say, a Grameen Bank branch),
Comat lost the transaction amount.
Besides the items of agreement on the operational front, Comat ended up
supporting caseworkers, revenue inspectors and even the tahsildar in the taluk
office for interfacing with computers. Regarding this Sanjay, VP Comat said:
This was just a gesture on our part to increase adoption of technology and therefore,Nemmadi. However, this was often not acknowledged and we ended up doing a thanklessjob.
When asked about the SLAs, Sanjay said:
We should have been given some leeway in SLA formulation. It should have been aconsultative and dynamic process rather than a rigid one like it was. Looking at thismammoth project and its nature, the government should have made some allowances fora dynamic relook at SLAs. Penalty meter was running, and the government was notaccessible at all for any discussion.
Attrition among telecentre operators was a big issue that Comat faced on a regular
basis. Motivating people to return to work every morning took a lot of the Comat
team’s energy. There were technological challenges too. Since this was a multi-tiered
operation, multiple interface programs (software) were required. NIC had provided
some of the interface software (esp. for the RTCs), but some had to be developed by
Comat—the global services infrastructure (GSI) that provided a common platform to
deliver the diverse services. This also enabled both online aswell as offline (bywriting
data into the local queue) operation of RDS. Once online, the queue was synchronized
with the central database at the SDC. Comat also developed an asset tracking system
for tracking consumables—like printing paper—as well as the cash collection.
On the experience in the Nemmadi project and whether it made business sense
for Comat to continue the engagement, Sanjay observed:
It was a learning experience for all concerned. The process of SLA formulation andnegotiation should have been friendlier. The period of contract should be longer. Threeyears have gone just discovering the engagement. By the time one figures out the nuances,the contract period would be over, and if we were not chosen in the next phase, the entireengagement would not make any business sense for us. Over the long run, it may makebusiness sense, but for that the contract period should be longer than 5 years.
2.6 Monitoring of Telecentres
The Karnataka government set up the Nemmadi monitoring cell (NMC), which
received 3%of the share of all B2C andG2Cservice charges of the telecentre activities.
The NMC team consisted of six members, largely, on contract from reputed private
Project Nemmadi: The Bytes and Bites of E-Governance in Karnataka, India 641

organizations—a project manager (on contract from a private consulting company),
a deputy and 3 or 4 testers. The team had no one from the government. The contract
employees worked full time with the government and were given salaries in line with
the private sector. The NMC reported to DEDCS, and the latter was responsible for the
monitoring ofNemmadi among other e-governance projects of the state. For complains
related to employment, training, or infrastructure at particular telecentres, DEDCS
called upon the private partner (in this case, Comat) to sort the issue out. Besides
regular monitoring, if any government department (e.g., Agricultural Department)
wanted to add a service (e.g., commodity price), they came to DEDCS and discussed.
Based on the requirement, if some software needed to be developed, DEDCS got it
developed either by NIC or any other private IT organization.
Collection from Nemmadi was also handled by DEDCS. As per the agreement,
whatever proceeds the telecentre operator collected had to be deposited within
2.5 days in a special account created for this purpose. Ms. Latha, asst. director,
DEDCS, said:
We monitored every transaction and the total amount. The private partner could retain asper a slab rate– say 60% could be retained if the revenue is in a particular slab. SLA termswere strictly enforced. Penalty was levied on the basis of attendance. The operator’sattendance was recorded bio-metrically. If the money collected was not deposited intime, interest was levied. Software applications were used to calculate the penalty pertelecentre. G2C accounted for only 40% of Nemmadi’s revenue came, B2C servicescontributed the rest.
Besides the above monitoring mechanism, DEDCS instituted a third-party audit
conducted by independent organizations like NIC, STPI, Keonics,18 etc., to deal
with continued complaints of deputy commissioners, tahsildars and public regard-
ing delays, operator training, infrastructure, etc.
3 The Nemmadi Debate
Nemmadi project dated back to pre-NeGP years, but anticipated several of the
mission mode projects declared by NeGP later; hence, its relevance continued.
Nemmadi invited both bouquets and brickbats. The e-governance project had
bagged three prestigious awards19 during 2007–2008, in less than a year after it
18 STPI—Software Technology Parks of India (STPI)—is a society set up by the Ministry of
Communication and Information Technology, Government of India in 1991, with the objective of
encouraging, promoting, and boosting the software exports from India. Karnataka State Electron-
ics Development Corporation Limited (KEONICS) is in existence since 1976 with the main
objective of promoting electronics industries in Karnataka.19 National Silver Award for e-Governance, 2007–2008; Microsoft Award for e-Governance,
2007; Government Technology Award for e-Governance 2007; Microsoft e-Governance
Award—IT for Rural Development, 2007.
642 M.D. Aundhe and R. Narasimhan

was launched in October 2006. The citizens, the most important stakeholders of this
project, had mixed opinions. Some praised the system as very convenient. Students
did not have to miss school to obtain caste and income certificates; they put in an
application at the telecentre and then came back to collect it. The telecentres were
single window for certificate procurement, train ticket booking, mobile recharge,
etc., and thus made life easy. There were others who complained about longer cycle
time—earlier, the VA could provide the certificates in 3–4 days; now, the process
did not take less than 2 weeks. There were complains about the whole process
having become more cumbersome for users. Citizens also complained about lack of
facilities at the telecentre.
The government had its own take on the Nemmadi project too. The
e-governance department saw some major benefits of Nemmadi.
• Establishment of 800 telecentres had provided a good start—demonstrating
the concept.
• The reduced role of village accountant and revenue inspector and the
availability of an affordable alternative channel had benefited villagers.
• Awareness, literacy, and empowerment of villagers was itself a great
additional benefit.
• First time creation of data and its validation was a major challenge, but
repeatability of data was assured.
• It fits in neatly with NEGP. In fact, it had been a forerunner of CSCs, and
CSCs in NEGP were derived from the Nemmadi success story.
The e-governance department’s view was that, gradually, over time,
Nemmadi would cleanse the corruption in the system. The government,
thus, claimed that while the VA could not be completely done away with,
as they had been in the system for more than 150 years, their efforts would be
used in the creation and validation of the database. The tahsildars of various
taluks also felt that Nemmadi was in a stage of infancy.
NIC, as a technology provider, had mixed feelings too. It appreciated the
technological challenge in the size of the project and felt, eventually, it would
help citizens. However, it was not very happy with the government’s lack of
attention to the inefficiencies in the processes and indecisiveness when the
matter was raised. NIC had its misgivings—whether Nemmadi could ever be
successful without addressing the process issues.
The private partners of Nemmadi had mixed opinions too. They felt that
the government made undue demands and was rigid in its stand in the project.
While in the long run, they felt they might benefit from the project; at that
point, they were not sure of a meaningful business outcome.
Project Nemmadi: The Bytes and Bites of E-Governance in Karnataka, India 643

4 Way Forward
Naveen, when he took charge as the new principal secretary for e-governance, was
mandated to restore the state back to its No.1 position in e-governance. Nemmadi
was his debut project. He went over some key points before his team meeting.
In Nemmadi, while the infrastructure had come into place in quick time, the process
of change had not been as quick. However, citizens were gradually getting familiar
with the system. With that, the roles of village accountants and revenue inspectors
would get marginalized. The technological hurdles of interface software had been
surmounted. The process changes were, however, not in place. The relationship
with the private partner was shaping up. The monitoring mechanism was in place;
SLA issues needed more effort. The citizen database was getting built. With these
thoughts, Naveen entered the meeting room, where his team had already
assembled. . ..
Bibliography
Bhatnagar S, Chawla R (2007) Online delivery of land titles to rural farmers in Karnataka.
In: Narayan D, Glinskaya E (eds) Ending poverty in South Asia: ideas that work. World
Bank Publication, Washington, DC, pp 219–243
Bloomfield P (2006) The challenging business of long-term public-private partnerships: reflections
on local experience. Public Adm Rev 66(3):400–411
Chauhan R. (2009) National e-governance Plan in India, United Nations University – International
Institute for Software Technology, Planning Commission, New Delhi, 2003. UNU-IIST Report
No. 414 T
E-governance strategy of Karnataka, from http://www.bangaloreit.com/. Accessed 28 Oct 2009
Information technology annual report, 2007–2008, Government of India, Ministry of
Communications & Information Technology, Department of Information and Technology
Kumar R, Best ML (2006) Impact and sustainability of E-Government services in developing
countries: lessons learned from Tamil Nadu, India. Inf Soc 22:1–12
Kumara HS (2010) ICT driven E-Governance public service delivery mechanism in rural areas:
a case of rural digital services (NEMMADI) project in Karnataka, India. J Comput ICT Res 4
(2):37–45
Naik G, Basavarajappa KP, Sultana N, Rashmi KK (2010) Public value creation through private
partnership: lessons from public service delivery in Karnataka, India. In: Ramesh G et al (eds)
Public private partnerships. Routledge, New Delhi, pp 226–265
Oliveira T, Martins MF (2011) Literature review of information technology adoption models at
firm level. Electr J Inf Syst Eval 14(1):110–121
National e-governance Plan, from http://india.gov.in/govt/national_egov_plan.php. Accessed 28
Oct 2009
Prakash A, De R (2007a) Enactment of technology structures in ICT4D projects: a study of
computerization of land records in India. In: Pacific Asia conference on information systems
(PACIS) 2007 proceedings, Association for Information Systems
Prakash A, De R (2007b) Importance of development context in ICT4D projects: a study of
computerization of land records in India. Inf Technol People 20(3):262–281
644 M.D. Aundhe and R. Narasimhan

An Empirical Investigation into the Extent
of Green IT Practices in Sri Lanka’s Data
Centers: A Case Study Approach
Nadeera Ahangama and Kennedy D. Gunawardana
1 Research Background and Objectives
Green computing, the consumption of eco-friendly computing resources, is now
under the attention of environment agencies and businesses from diverse industries.
Mainstream corporate initiatives to “go green” are evolving from efforts to con-
serve the environment by reducing carbon footprint. Computing and IT establish
ments around the globe are particularly focused and alerted to go “green.” Green
computing refers to “supporting business critical computing needs with least possible
amount of power” (Wang 2007). Harmon and Auseklis (2009) defined green com-
puting as the “practice of using computing resources more efficiently while main-
taining or increasing overall performance.”
Benefits of green computing do not limit to ecological advantages. Today, IT
investors and customers started exhibiting an interest of knowing a company’s direct
and indirect carbon footprint in terms of greenhouse gas emissions (Kurp 2008).
Greening helps businesses to achieve competitive advantage. “Going green offers a
vital new path to innovation and to creating enduring value and competitive advan-
tage” cited Esty and Winston (2006). Murugesan (2008) affirmed that IT businesses
can reach competitive edge by adopting green IT practices, and IT sector as a whole
has a responsibility to help to create a more sustainable environment.
The electricity consumption by data centers in the USA as of 2006 was about 61
billion kilowatt-hours (kWh) which is “1.5 percent of total US electricity consump-
tion,” and this continued to grow (EPA 2007). The large amount of digital data
N. Ahangama (*)
School of Computing, Asia Pacific Institute of Information Technology,
Union Place, Colombo 02, Sri Lanka
e-mail: [email protected]; [email protected]
K.D. Gunawardana
Department of Accounting, University of Sri Jayewardenepura, Nugegoda, Sri Lanka
e-mail: [email protected]
Department of Management Studies, Indian Institute of Science, Bangalore,
Driving the Economy through Innovation and Entrepreneurship,DOI 10.1007/978-81-322-0746-7_53, # Springer India 2013
645

generated by various industries requires massive storage, processing, and transfer
facilities in data centers hosted in-house and remotely. Koomey (2008), as summ-
arized by Paivarinta (2009), recognized that servers around the globe said to
consume more than 100 TWh per year, which is more than the amount of energy
consumed by Finland per annum. Heavy electricity bills in data centers mark
significant expenses in enterprises to supply their ever-growing computing needs
(Poess and Nambiar 2008).
For most of service sector businesses, data centers contribute to the highest GHG
emissions, and if efforts are not taken to restrain emissions, it can be projected that
global carbon emission of data centers to quadruple by year 2020 (Forrest et al.
2008). Such circumstances illustrate the importance of applying green practices
in data centers. By employing green practices, “HP was able to decrease the number
of servers by 40% while increasing processing power by 250%” (Tang 2010).
Although the green endeavors in data centers are popular in western world, still
research attempts kept to a minimum in local context. Today, Sri Lanka is rushing
toward industrialization and also facing difficulties to supply power demand and
tolerate the hike of energy costs. Gartner (2008) reported that “The total data center
capacity in India is expected to reach 5.1 million square feet by 2012 and is projected
to grow 31% from 2007 to 2012.” Several reports testify that India and Sri Lanka
have the possibility of emerging as central data hubs and disaster recovery centers
in the region.
The objective of this study is to explore the extent in which data centers in
Sri Lanka apply a selected set of green practices in data centers. Nine cases were
carefully chosen and studied from Sri Lanka’s financial sector, to develop compre-
hensive knowledge to determine the extent that they follow green practices. Degree
of implementation was assessed by studying perceptions of IT managers from
chosen institutes by qualitative methods.
2 Data Centers and Green IT Practices
A data center is comprised of the network, physically and virtually everything
attached to it (Lyke and Cottone 2000). Arregoces and Portolani (2003) defined a
data center as a “controlled environment” under “centralized management” that hosts
critical computing resources, which enable business needs of the enterprise to run
“around the clock.” The smallest data centers are of the size not much larger than a
single rack while the biggest spread over thousands of square meters (Paivarinta
2009). Server racks in data centers are usually “6 to 8 feet tall. . . 6 square feet
(2 ft � 3 ft)” of floor area, and the main computer area of a data center is a raised
floor elevated so that “cool air can be blown in from under floor air ducts” (Mitchell-
Jackson 2001). Raised floor space demands high costs and requires efficient space
utilization.
Raised floor area could differ in various physical data center implementations,
but in average, 50–55% of the energy density of a data center is absorbed by its
646 N. Ahangama and K.D. Gunawardana
computer equipment (Blazek et al. 2004), and the rest is accounted for cooling/
ventilation/power supply and other physical components. The aggregated power
use by data center IT equipments reported as “0.5% of world electricity consump-
tion in 2005” (EIA 2006) added the cooling and other physical factors that figure
rise to 1% (Koomey 2008).
A data center primarily comprises three variations of electrical equipment
including servers, data storage equipment, and network equipment. Barth (2010)
divides energy consumption of a data center into two categories: “physical” and
“logical.” The physical energy consumption includes power supply, AC/DC con-
versions, cooling, heating, and ventilation. Logical energy is consumed by servers,
data storage, and network equipment. It is a common norm that 33–50% of data
center power is consumed by physical devices which also indicate that 50–67% of a
data center’s power is consumed by logical side.
In traditional servers, even at times, the processors are idle, or less active
surprisingly servers would still consume a substantial amount of power and release
heat (Loper and Parr 2007). Albers et al. (2007) discussed two mechanisms “speed
scaling” and “sleep states” to save processor energy at algorithmic level. The speed-
scaling technique adjusts the speed of a processor on demand dynamically. The
sleep-state technique shifts the server to a low power sleep-state when it is idle.
In an average, a server would utilize about 30% of its peak electricity consumption
when they are sitting idle (Poess and Nambiar 2008). Due to this fact, demand-
driven clock speed adjustments in server processors are being popularly equipped
by many vendors. A server with demand-driven options speeds up the system clock
in active states and slows down the clock in inactive states, reducing energy
wastage. Another green feature that can be adopted by data centers is upgrading
traditional large-scale servers to standard-based servers and blade servers (ibid.).
In a virtualized data center, “one physical server hosts multiple virtual servers”
(Murugesan 2008). Virtual machines operate in just the same way as physical servers
by virtual networks and file systems (Heiser 2008). Consolidating virtual servers
improve and simplify the “physical server infrastructure” of a data center by limiting
server resources to few powerful servers that consume low power (Murugesan 2008).
Benefits of virtualization include achieving quality of service, load-balancing across
clusters, power management in clusters (Heiser 2008), better hardware usage, and
reduction of data center floor space (Murugesan 2008). Some developers “differenti-
ate their products based on the energy demands that result from their code” cited Loper
and Parr (2007). Strong software algorithms reduces processing requirements by
eliminating redundant processing and accomplish a low-power consumption. Produc-
ing energy efficient software is rapidly catching the attention of software developers.
Well-designed software takes benefits of server capabilities and delivers improved
green performance (Intel 2006).
“The storage subsystem is the largest power consumer,” argued Poess and
Nambiar (2008). Reduction of number of disk drives in storage subsystems could
considerably reduce power consumption. Efforts to spin down disk drives have
been significantly discussed by researchers. Large form factor (LFF) disk drives
An Empirical Investigation into the Extent of Green IT Practices in Sri Lanka’s. . . 647

consume about 12 W per read/write operation, but small form factor (SFF) disks
consume about 8 W. Surprisingly, NAND-based solid state disks (SSD) with no
moving heads said to consume only about 0.03–0.06Wper read-and-write operation
(Poess and Nambiar 2008). Today, several low-power viable storage technologies
such as flash memory and micro-drives have been widely accepted to meet “ultra-
low idle current and high capacity” (Mathur et al. 2006). Although the industry
forecasted the downfall of magnetic tapes from quite a time, Chuan (2009) claimed
that “tape continues to flourish as the preferred technology for long term data
storage” due to significant eco-friendly attributes of tapes. Application of efficient
data compression methods significantly reduces number of disks needed to store data,
improving query performance and memory efficiency (Poess and Nambiar 2008).
Green IT begins with green data, but around 60% of the capacity of an average disk
simply stores “stale, duplicated, contraband, or useless data” (Green Data project
2007). Improved application management would optimize server requirements and
storage needs reducing power consumption for storage systems (Loper and Parr 2007).
Every data center must take initiatives to manage their information life cycle. In
an average organization, the probability of re-reference of data created in the same day
is about 70–80%, chance of re-reference of data that is 3 days old is 40–60%, 7 days
old data, 20–25%, and 1-month-old data is 1–5%where 3-month-old data re-reference
rate is nearly 0% (Clarke 2010). Information life cycle management includes various
strategies to manage data throughout data lifetime from data creation, active data
use, semi-active use, and finally disposal or preservation (McDonald et al. 2010).
All energy efficient methods used in logical side reduce the load to network
equipment. Network hosts consume large amount of power to keep “idle or unused
network hosts fully powered-on only to maintain their network presence” (Jimeno
and Christensen 2008). Low-cost, nonintrusive network monitoring technologies
such as wireless sensor networks (WSN) provide wider network coverage and opti-
mize energy consumption of network equipment in a raised floor (Liu et al. 2008).
Around 40% of power consumed in server farms accounted to A/C and ventil-
ation facilities to safeguard equipment from overheating. “Computer room air-
conditioning (CRAC) units blow cold air into the plenum, pressurizing the space
under the racks and forcing cool air up through perforated floor tiles” (Beck 2001).
Variable speed cooling systems can be designed in a “modular fashion” in which
extra modules are activated when cooling requirements increase and some modules
are deactivated when cooling needs decrease (ibid). Cooling capacity must match
IT loads of the data center, and CRAC unit temperatures and humidity setting should
be carefully handled, and “hot spots should be eliminated, and proper air velocity
provided, while ensuring that all air vents are properly located” (McNamara et al.
2008). McNamara et al. further identified that “using blanking panels to limit hot air/
cold air recirculation, having door ventilation on cabinets (no glass doors), unre-
stricted airflow in the back of the cabinets, and no shelves to block airflow” are the
best practices in airflow management.
The “lights out philosophy” would work better in data centers to provide lighting
only when it is required. “Standard lighting controls in combination with more
sophisticated building management systems can easily achieve a 50% reduction in
lighting electrical energy use” (Tschudi et al. 2004). The lighting energy cost can be
648 N. Ahangama and K.D. Gunawardana

reduced by inexpensive methods such as making use of “active sensors” to switch
off lights when data center is not occupied and “design light circuiting and
switching” to allow labor-intensive control (DCEM 2010).
Reviewing technical literature, we identified 15 standard green practices that are
applied in green data centers at a global level as indicators of implementing green
practices.
3 Research Methodology
This research is exploratory in nature. In researches with limited empirical evi-
dence, “it is too early to develop testable hypothesis,” argued Wong and Boon-itt
(2008). Flyvbjerg (2004) criticized that “the case study is a necessary and sufficient,
method for certain important research tasks in the social sciences, and it is a method
that holds up well when compared to other methods in the gamut of social science
research methodology.” A case study approach is best suited when the scope of the
study area is not well defined and when “there is no control over behavioral events”
(Azevedo et al. 2011; Perry 1998; Rowley 2002). This study is scoped to one indu-
stry in a single country due to the fact that institutional norms could change from
country to country and industry to industry (Kostova and Roth 2002). This research
does not clearly define the variables of study. It was difficult to identify relation-
ships between variables from past literature, and also, the research boundary for this
research was vague in nature. For these reasons, a case study approach is chosen for
this study.
Going in line with the latest research “the influence of green practices on supply
chain performance” by Azevedo et al. (2011), this research explores the implementa-
tion extent of different green practices in the target industry. Anonymity of the
company and respondents is kept to eliminate preconception and biasness of response.
Different analytical procedures assist during case study plan stated Yin (2004).
“One possibility is to stipulate some pattern of findings at the outset of your case
study. Your analysis would then consist of the analytic technique of pattern-matching the collected evidence against the initially stipulated pattern” (ibid).
Based on the research methods adopted by Azevedo et al. (2011) and Wong and
Boon-itt (2008), cross-case synthesis is employed to analysis individual case studies
scrutinize across various cases in this research. Cross-case study analysis techniques
do not come with any formulas, but statistical calculations and structured equation
models can be used for evaluations (Yin 2004). This research adopts cross-case
evaluations followed by fitting equation models.
3.1 Data Collection
A series of in-depth interviews were conducted to understand the current practices
carried out by top level IT decision makers of data centers under study. Nine
semi-structured interviews were carried out with IT heads of nine organizations.
An Empirical Investigation into the Extent of Green IT Practices in Sri Lanka’s. . . 649

A semi-structured interview “has a series of themes to be covered, as well as
suggested questions, at the same time there is openness to changes of sequence
and forms of questions in order to follow up answered given and the stories told by
the subjects” (Kvale 1996).
Companies that were listed in Colombo Stock Exchange were chosen for data
collection via structured interview technique, which all of them were from Bank
Finance and Insurance sector of Sri Lanka. Semi-structured interviews covered by a
sequence of themes, but a room is kept for openness. These empirical subjects were
selected considering their large representation of business in the country and heavy
operation of IT infrastructures including sound data centers. From each company,
following information was obtained and categorized. Keeping the anonymity, each
company is represented by a code: 1, 2, 3, 4, 5, 6, 7, 8, and 9.
3.2 Data Analysis
Cross-case analysis studies multiple cases and makes it is possible to construct a
logical chain of evidence of relationships between cases cited Yin (2002). It is very
important to understand that “if multiple cases are selected, each case must be treated
as a single case” cited Dooley (2002). Hence, each individual company under the
study has taken into consideration in isolation. The data collection and analysis
methods of Azevedo et al. (2011) and Wong and Boon-itt (2008) have been closely
followed in this research due to the same type of nature that has been studied.
Companies under study are represented by a (a ¼ 1, 2, 3, 4. . ...9). Fifteen (15)
green technological practices that were derived from literature were indexed by
symbol b (b ¼ 1, 2, 3, 4. . . 15). Iab is the implementation of green practice (b) inthe data center that belongs to company a. Iab ¼ 1 if the considered green practice bis employed by a. Iab ¼ 0 if the considered green practice b is not employed by a.The cumulative score of different green practices implemented by company a is
denoted by
GPa ¼X15
b¼1
Iab (1)
Equation 1 was developed taking different green practices implemented by an
individual company into consideration. The sum of Iab for all 15 practices adds up toGPa for the considered a. It is assumed that implementation of every b weighted
equally, which indicates that all practices contribute to sustainable development in
a similar manner. The company with the highest GPa is identified as the company
with highest level of green implementation, or the company with most number of
green practices in exercise.
650 N. Ahangama and K.D. Gunawardana

The cumulative score of the implementation of one specific green practice (b) byall the cases is denoted by
Cross - case IGPb ¼X9
a¼1
Iab (2)
Equation 2 was developed considering how one green practice is implemented by all
the cases. The sum of Iab in all companies composes IGPb for each green practice. It is
assumed that each aweighted equally, which indicates that each company contributes
to sustainable development in a similar manner. The green practice with the highest
IGPb can be identified as the most widely used green practice among all cases.
4 Cross-Case Comparison: Green Implementation
In this study, green implementation refers to how significantly a set of green techno-
logical practices are executed in company data centers. Given a list of commonly used
green IT practices, the interviewees were requested to select technological solutions/
activities that they are practicing currently with sufficient efficiency. A simple scale is
chosen to record responses, where implementation of each practice by a certain
company is weighted 1. To be precise, Iab ¼ 1 if the considered green practice b is
employed by a. Iab ¼ 0 if the considered green practice b is not employed by a.Respondents were given the opportunity to include or suggest any other practices
that they are implementing to achieve data center sustainability. But all practices
proposed linked to the practices in the identified list some way or the other. First, all
practices exercised by one company are considered to calculate GPa score for every acolumn-wise (refer to Table 1). Then, the implementation of one green practice by all
cases is considered to calculate IGPb score of every b row-wise (refer to Table 1).
Respondents have selected practices that their data centers are operated on currently,
from a given set of practices (Iab ¼ {0, 1}). It is important to note that this data coll-
ection is completely based on the IT managers’ perspectives on their data center
operations but no other experiments were conducted. The GPa for every a refers
to the green implementation score, that is, implementation extent of an individual
company.
Figure 1 indicates that the company 5 has scored the highest green implementa-
tion score which is 11; company 6 indicates the lowest green implementation score
of 3. Results of Fig. 1 suggest that rate of implementation of green practices by
different organizations ranges from 20 to 73%, which indicates a significant devia-
tion. Green implementation scores of companies are ranging from 3 to 11, and
but only four companies show above 50% rate of implementation. It was found that
the average GPa score percentage is 47% in considered cases. Hence, it can be
concluded that average rate of implementing different green practices by data
centers of financial sector companies lies below 50%.
An Empirical Investigation into the Extent of Green IT Practices in Sri Lanka’s. . . 651

IGPb, the implementation score for each green practice b, is calculated cross-
case. Server consolidation scored (100%) and ranked as the highest implemented
practice in the context (refer to Fig. 2). Server consolidation indicates a presence in
all the cases, in which all nine companies practicing it currently. Server virtua-
lization receives the second highest implementation rate (89%), and even the
companies that are at a low GPa rate follow server virtualization and consolidation
practices. The third highest significance received by virtualization of storage (78%).
Looking at the three highest cross-case IGPb scores, it can be concluded that conso-
lidation and virtualization in server and storage technologies receives top most
significance in the journey toward greening by data centers of financial sector
companies in Sri Lanka.
Though not the highest, the use of multi-core processes (56%), optimal lighting
(56%), measure and monitor power consumption, and thermal emission loads
(56%) indicate average significance levels of implementation in Sri Lanka. Some
practices such as information-application life cycle management (11%), use of
energy efficient software and algorithms (11%), and server processor adjustments
Table 1 Cross-case comparison of technological attempts by different data centers
Green practices (b)
Company (a)
Cross-
case IGPb
IGPb
9� 100%
1 2 3 4 5 6 7 8 9
Server virtualization 1 1 1 1 1 1 1 0 1 8 89
Sharing architectures 1 1 1 0 0 0 0 0 0 3 33
Server consolidation 1 1 1 1 1 1 1 1 1 9 100
Multicore processors 1 1 1 1 1 0 0 0 0 5 56
Adjust processer speed to
demand
0 0 1 0 0 0 0 0 0 1 11
Efficient software and
algorithms
0 0 1 0 0 0 0 0 0 1 11
Data compression 0 1 1 0 1 0 0 1 0 4 44
Virtualization of storage 0 1 1 1 1 1 1 1 0 7 78
Tape drives for long-term data
storage
0 0 1 0 1 0 1 0 1 4 44
Information, application, and
life cycle management
0 0 0 0 1 0 0 0 0 1 11
Measure, monitor thermal
power loads
1 1 1 1 1 0 0 0 0 5 56
Balanced cooling and
ventilation
1 0 0 1 1 0 0 0 0 3 33
Optimal lighting 1 0 0 1 0 0 1 1 1 5 56
Appropriate raised floor 1 1 0 0 1 0 1 0 0 4 44
Use of newer infrastructure
products
0 1 0 0 1 0 1 0 0 3 33
GPa 8 9 10 7 11 3 7 5 4
IGPa9
� 100% 53 60 67 47 73 20 47 33 27
652 N. Ahangama and K.D. Gunawardana

based on the demand (11%) show the least implemented scores in the considered
context. Out of the 15 practices studied, only 6 practices show a significance of
implementation currently. 60% of the green practices that were considered are
implemented in less than half of the cases.
Fig. 2 Cross-case ranking of cumulative score percentages of green practices under
implementation
Fig. 1 Cumulative score percentages of green practices implemented by nine companies
An Empirical Investigation into the Extent of Green IT Practices in Sri Lanka’s. . . 653

5 Conclusion
Summarizing, it could be concluded that data centers of finance sector in Sri Lanka
do not implement most of the green concepts in full. However, 40% of data centers
in the considered context are interested in exploring some green exercises. As per
the view of the respondents and empirical evidence, it can be concluded that data
centers in the study group identified the importance of greenness in technological
infrastructures but the implementation is in a transitional stage where some of
the technological IT practices such as consolidation and virtualization are being
implemented in large but other practices have received a low implementation rate.
With these results, it can be proposed that “companies in the financial sector
consider adopting some green technological practices in their data centers but green
implementation is not yet completed in all aspects.” Further, the research should be
directed to find key success factors that influence effective green data center
implementation toward sustainable development.
References
Albers S, Muller F, Schmelzer S (2007) Speed scaling on parallel processors. In: Parallel
algorithms and architectures. ACM, San Diego
Arregoces M, Portolani M (2003) Data center fundamentals. Cisco Press, Indianapolis
Azevedo SG, Carvalho H, Machado VC (2011) The influence of green practices on supply chain
performance. Transp Res. doi:10.1016/j.tre.2011.05.017
Barth S (2010) Reducing data center power consumption: KMWorld. Online available at: http://
www.kmworld.com/Articles/ReadArticle.aspx?ArticleID¼68133&PageNum¼1. Accessed 26
July 2010
Beck F (2001) Energy smart data centers: applying energy efficient design and technology to the
digital information sector. Research report. Repp, Washington, DC
Blazek M, Chong H, Loh W, Koomey JG (2004) Data centers revisited: the allocation of retrofits
and technology trends in a high-density technology trends in a high-density. J Infrastruct Syst
10:98–104
Chuan LC (2009) Tape storage: lean and green – and still thriving. Online available at: http://
www.computerworld.com.au/article/316605/tape_storage_lean_green_still_thriving/.
Accessed 15 Aug 2010
Clarke RA (2010) Data integrity means and practices. Online available at: http://www.digitalpre-
servation.gov/news/events/other_meetings/storage09/docs/3-4_Clarke-SUN-Data_Integrity.
pdf. Accessed 15 Aug 2010
DCEM (2010) Lighting: technical best practices: Data Center Energy Management. Online avail-
able at: http://hightech.lbl.gov/DCTraining/graphics/chart_room.html. Accessed 17 Aug 2010
Dooley LM (2002) Case study research and theory building. Adv Dev Hum Resour 4:35–54, Sage
EIA (2006) EIA international data and analysis. Online available at: http://www.eia.doe.gov/iea/
elec.html. Accessed 2 Aug 2010
EPA (2007) Report to Congress on server and data center energy efficiency. Public Law. U.S.
Environmental Protection Agency, Washington, DC
Esty DC, Winston AS (2006) Green to gold. Wiley, Hoboken
Flyvbjerg B (2004) Five misunderstandings about case-study research. In: Qualitative research
practice. Sage, Thousand Oaks
654 N. Ahangama and K.D. Gunawardana

Forrest W, Kaplan JM, Kindler N (2008) Data centers: how to cut carbon emissions and costs. Online
available at: http://www.mckinsey.com/clientservice/bto/pointofview/pdf/BT_Data_Center.pdf.
Accessed 21 July 2011
Gartner (2008) Gartner says Data Center capacity in India to surpass 5 million square feet by 2012.
Online available at: http://www.gartner.com/it/page.jsp?id¼808212. Accessed 17 July 2010
Green Data Project (2007) The Green Data Project – power hogs. Online available at: http://www.
greendataproject.org/index.php?option¼com_content&task¼view&id¼44&Itemid¼60.
Accessed 25 July 2010
Harmon RR, Auseklis N (2009) Sustainable IT services: assessing the impact of green computing
practices. Manage Eng Technol. IEEE, Portland
Heiser G (2008) The role of virtualization in embedded systems. In: Isolation and integration in
embedded systems. ACM, Glasgow
Intel (2006) Increasing Data Center density while driving down power and cooling costs. White
Paper. Intel Corporation
Jimeno M, Christensen K (2008) A network connection proxy to enable hosts to sleep and save
energy. In: Proceedings of IEEE international performance computing and communications
conference. IEEE, Austin, pp 101–110
Koomey JG (2008) Worldwide electricity used in data centers. Environ Res Lett 3:1–8, IOP
Publishing Ltd, London. Online available at: http://107.22.214.237/libraries/about-extreme/
1748-9326_3_3_034008.pdf
Kostova T, Roth K (2002) Adoption of an organizational practice by subsidiaries of multinational
corporations: institutional and relational effects. Acad Manag J 45:215–233, AOM, New York
Kurp P (2008) Green computing. Commun ACM 51:11–13
Kvale S (1996) Interviews an introduction to qualitative research interviewing. Sage, Thousand
Oaks
Liu J et al (2008) Project genome: wireless sensor network for data center cooling. Archit J
18:28–34
Loper J, Parr S (2007) Energy efficiency in Data Centers: a new policy frontier. Policy. Alliance to
Save Energy, Washington, DC
Lyke H, Cottone D (2000) IT automation: the quest for lights out. Prentice Hall, Upper Saddle
River
Mathur G, Desnoyers P, Ganesan D, Shenoy P (2006) Ultra-low power data storage for sensor
networks, Transactions on sensor networks. ACM, Nashville
McDonald D, McCulloch E, MacDonald A (2010) Greening information management. Project
report. University of Strathclyde, Glasgow
McNamara W, Seimetz G, Vales KA (2008) Best practices for creating The Green Data Center.
White Paper. The outsourcing Institute
Mitchell-Jackson JD (2001) Energy needs in an internet economy: a closer look at data center.
MSc thesis, University of California, Berkeley
Murugesan S (2008) Harnessing Green IT: principles and practices. IT Pro IEEE: 6(1):24–33
Paivarinta R (2009) Design and operation of energy-efficient data centers. Technical paper.
Helsinki University of Technology, Espoo
Perry C (1998) Processes of a case study methodology for postgraduate research in marketing. Eur
J Mark 32:785–802
Poess M, Nambiar RO (2008) Energy cost, the key challenge of today’s data center: a power
consumption analysis of TPC-C results. Proc VLDB Endow 1(2):1229–1240, ACM, Auckland
Rowley J (2002) Using case studies in research. Manage Res News 25:16–27
Tang H (2010) Going green: start with the Data Center: environment leader. Online available at:
http://www.environmentalleader.com/2010/03/24/going-green-start-with-the-datacenter.
Accessed 4 July 2010
Tschudi W, Xu T, Sartor D, Stein J (2004) High-performance data centers: a research roadmap.
Research plan. Lawrence Berkeley National Laboratory, Berkeley
An Empirical Investigation into the Extent of Green IT Practices in Sri Lanka’s. . . 655

Wang D (2007) Meeting green computing challenges. In: High density packaging and
microsystem integration. IEEE, Shanghai
Wong CY, Boon-itt S (2008) The influence of institutional norms and environmental uncertainty
on the supply chain integration in the Thai automotive industry. Prod Econo 115:400–410
Yin RK (2002) Case study research: design and methods. Sage, Newbury Park
Yin RK (2004) Case study methods-revised draft. In: Complementary methods for research in
education, 3rd edn. American Educational Research Association, Washington, DC
656 N. Ahangama and K.D. Gunawardana

Part 3.2
Technology and Supply ChainManagement

ICT Innovation for Buyer-Seller Relationships
in International Supply Chains
Fabio Musso and Mario Risso
1 Introduction
During the last decades, there has been a growing recognition of the important role
of innovation in international supply chains. However, most scholars treated this
theme in reference to larger companies and to specific areas of innovation, with a
primary attention placed on technological issues, particularly those relating to
information and communication technology (ICT) (Kim et al. 2006; Hausman
and Stockb 2003).
Few studies analyzed the phenomenon referring to small and medium enterprises
(SMEs) and following a comprehensive perspective that could give the possibility
to explore the connections between different fields of innovation. When SMEs are
involved, it is important to consider the role of the supply chain leader. In the retail
sector, this role is covered by large retailers, which can stimulate innovation along
the whole supply chain.
This work aims at analyzing the ICT innovation drivers within supply chains
with a perspective focused on the relationships between large retailers and SME
suppliers. A suppliers’ perspective was adopted by considering the point of view of
small-medium manufacturers in the food sector. On the base of a literature review,
it has been possible to formulate the research hypotheses, which have been tested
through an empirical research on a sample of 70 firms in the food sector.
F. Musso (*)
Department of Economics, Society and Politics, University of Urbino,
Via Saffi 42, 61029 Urbino (PU), Italy
e-mail: [email protected]
M. Risso
Department of Business Studies, University of Rome “Tor Vergata”,
Via Columbia 2, 00133 Rome, Italy
e-mail: [email protected]
Department of Management Studies, Indian Institute of Science, Bangalore,
Driving the Economy through Innovation and Entrepreneurship,DOI 10.1007/978-81-322-0746-7_54, # Springer India 2013
659

2 Innovation in Retailers’ Led Supply Chains:
A Marketing Channels Issue
In the case of retailers’ led supply chains, the concept of innovation must be viewed
in the context of marketing channels, as a liaison between production systems
and end markets. By this point of view, innovation can be seen as a strategic
activity for both industrial and distribution firms to acquire a competitive advantage
through a complex, multiorganizational, multidisciplinary interaction that requires
collaboration across various entities within the supply network, with a substantial
portion of the innovation process that occur at the buyer-seller interface level
(Ganesan et al. 2009).
The analysis of technological innovation in vertical relationships can be devel-
oped with reference to three levels.
The first level is related to ICT and logistics, since through innovations like GPS
tracking systems, electronic data interchange (EDI), and radio-frequency identi-
fication (RFID) it is possible to create and improve communication
infrastructures and monitoring systems for materials movement (Risso 2009).
However, despite the benefits associated with vertical communication standards,
previous studies revealed that their diffusion among SMEs has failed to a
surprising extent (Beck and Weitzel 2005).
The second level of cooperation refers to the joint management of supplying
activities through collaborative planning on replenishment. In the form of
vendor-managed inventory (VMI), the manufacturer gains access to the demand
and inventory information of its customer (Savaşaneril and Erkip 2010). Even in
this case, the diffusion of VMI systems seemed to be limited to larger firms
(Kulp et al. 2004; Vaaland and Heide 2007).
The third level of collaboration in supply chain processes has a strategic relevance
and refers to both end-customer analysis and the creation of joint marketing
policies, through the adoption of tools like Collaborative Planning Forecasting
and Replenishment (CPFR) and, in the retail sector, vendor managed category
management (VMCM) (Chung and Leung 2005; Cigolini and Rossi 2006;
Kaipia and Tanskanen 2003).
2.1 ICT and Logistics
The first level of cooperation that can be achieved in managing the supply chain
refers to ICT and logistics, with the objective of improving the productivity of
physical and information flows by improving the transportation network, the
logistics centers management, the noncompliance managing processes, and by
the establishment of communication infrastructures such as electronic data inter-
change (EDI) and Web-based EDI (Web-EDI).
In regard to logistics, some elements have resulted as changing factors that
go beyond a simple technical optimization. For innovative relationships within
660 F. Musso and M. Risso

the supply chain, logistics can be seen as an interface between strategic and
tactical issues of both partners (Musso 2012). The most recent fields in logistic
innovation are regarding monitoring systems for material management, both
inside and outside warehouses, with the adoption of radio-frequency identifica-
tion (RFID). RFID is the use of an object (typically referred to as an RFID tag)
applied to a product, or a package, for the purpose of identification and tracking
using radio waves.
RFID is also used in inventory systems, with relevant potential reductions in out
of stocks (Hardgrave et al. 2009). Other benefits of using RFID include the
reduction of labor costs, the simplification of business processes, and the reduction
of inventory inaccuracies.
The basic infrastructure for coordinating logistic processes among channel
partners is the EDI that has been defined as “tools which permit the automatic
exchange of data between remote applications in situations where these belong
to different organizations” (Martinez and Polo-Redondo 2001). The principal
attraction that EDI has for companies lies in the large number of references
exchanged. For large retailers, as well as wholesalers, EDI means a big saving, as
they work with a large number of suppliers (and/or customers) with a great quantity
of references, and all this means having to handle a vast amount of documents of
different types. This is why these are the companies that have promoted the
development of EDI in commercial distribution, in many cases forcing small-
scale suppliers to adopt this tool.
2.2 Joint Management of Supplying Activities
The second level of collaboration in supply chain processes is the joint manage-
ment of supplying activities, through techniques such as vendor-managed invent-
ory (VMI), which includes assortments decisions, activities for reducing stock-outs,
and the use of indicators to control and improve joint processes.
VMI is an operating model in which the supplier takes responsibility for the
inventory of its customer. In a VMI partnership, the supplier makes the main
inventory replenishment decisions for the customer. The supplier, which may be
a manufacturer, reseller, or a distributor, monitors the buyer’s inventory levels and
makes supply decisions regarding order quantities, shipping, and timing (Waller
et al. 1999). In VMI, the supplier is able to smooth the peaks and valleys in the flow
of goods and therefore to keep smaller buffers of capacity and inventory. Success-
ful VMI implementations in retailing can be found in the apparel industry. How-
ever, VMI has not gained large acceptance in the grocery supply chain.
2.3 Vertical Strategic Partnership
The third level of collaboration in SCM involves a higher degree of integration,
with marked implications for marketing, both in the end-customer analysis, and the
ICT Innovation for Buyer-Seller Relationships in International Supply Chains 661

establishment of certain policies through the adoption of methodologies such as
Collaborative Planning, Forecasting, and Replenishment (CPFR) and vendor man-
aged category management (VMCM).
CPFR is a methodology for the joint purchasing management between retailers
and their suppliers. It consists of joint sales forecasts and procurement schemes and
includes all activities that pertain to the management of assortments, such as
promotions and the introduction of new products. The CPFR encourages the
sharing of market information and collaborative planning for the establishment
and management of optimal assortments. The CPFR is suitable for those product
categories that require a high level of promotional activity and that are
characterized by significant fluctuations in demand.
VMCM is a concept for retail demand fulfillment that combines the ideas
of VMI, category management, and outsourcing. The more frequent application
for VMCM is on noncore product categories because the benefits of outsourcing are
most obvious: For a retailer, it is expensive to maintain knowledge and skills to
manage a minor product category, and the outsourcing risk is at its lowest in a
noncore category (Kaipia and Tanskanen 2003).
3 Research Questions, Methodology, and Data
In order to analyze the ICT innovation drivers within large retailers’ led supply
chains, a quantitative survey was conducted. The research was focused on small and
medium manufacturers in the agrofood sector that were involved as suppliers in
national and international supply chains led by large retailers. The food sector was
selected as traceability and control over suppliers requiring high level of interaction
capabilities.
The analysis was conducted in 2011 on a sample of 70 Italian manufacturers.
Data were collected through direct interviews with entrepreneurs and managers
responsible for sales and marketing activities, responding to a semistructured
questionnaire.
The sample was identified through the AIDA database by random extraction
from a list of companies which resulted suppliers of large retailers. Table 1 shows
the main characteristics of the sample.
Sales within the sample resulted mainly in the internal market (average 60% of
total turnover). The European market absorbs an average of 26% of turnover, and
extra-Europe exports are 14% of total sales. Sixty-eight percent of sales is
addressed to Italian large retailers. Fifty percent of firms developed relations with
international large retailers.
The relationship with retailers is more frequently indirect in international
markets, with 61% of respondents connected with international wholesalers. In
the internal market, only 40% of sales are intermediated by wholesalers. Small
retailers are indicated as customers by half of the sample, but the turnover is very
modest if compared with that developed with large retailers.
662 F. Musso and M. Risso
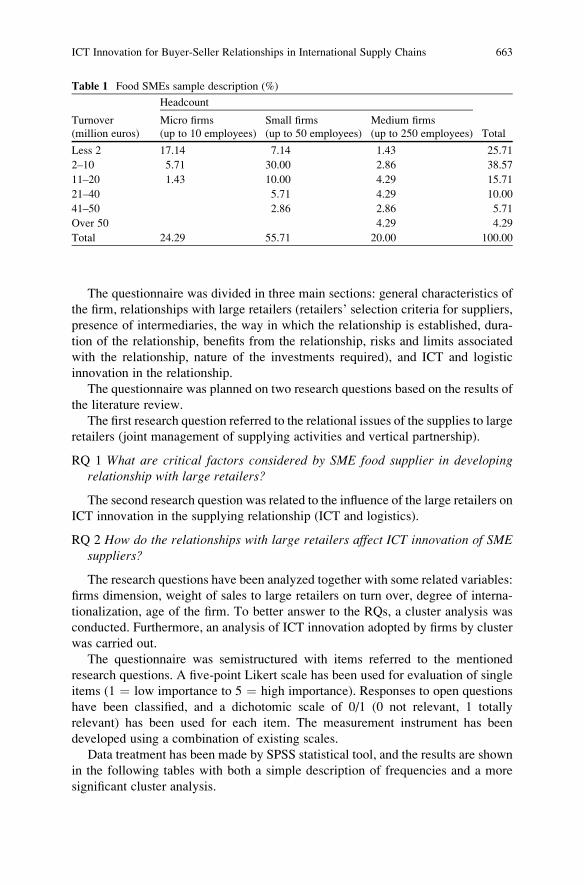
The questionnaire was divided in three main sections: general characteristics of
the firm, relationships with large retailers (retailers’ selection criteria for suppliers,
presence of intermediaries, the way in which the relationship is established, dura-
tion of the relationship, benefits from the relationship, risks and limits associated
with the relationship, nature of the investments required), and ICT and logistic
innovation in the relationship.
The questionnaire was planned on two research questions based on the results of
the literature review.
The first research question referred to the relational issues of the supplies to large
retailers (joint management of supplying activities and vertical partnership).
RQ 1 What are critical factors considered by SME food supplier in developingrelationship with large retailers?
The second research question was related to the influence of the large retailers on
ICT innovation in the supplying relationship (ICT and logistics).
RQ 2 How do the relationships with large retailers affect ICT innovation of SMEsuppliers?
The research questions have been analyzed together with some related variables:
firms dimension, weight of sales to large retailers on turn over, degree of interna-
tionalization, age of the firm. To better answer to the RQs, a cluster analysis was
conducted. Furthermore, an analysis of ICT innovation adopted by firms by cluster
was carried out.
The questionnaire was semistructured with items referred to the mentioned
research questions. A five-point Likert scale has been used for evaluation of single
items (1 ¼ low importance to 5 ¼ high importance). Responses to open questions
have been classified, and a dichotomic scale of 0/1 (0 not relevant, 1 totally
relevant) has been used for each item. The measurement instrument has been
developed using a combination of existing scales.
Data treatment has been made by SPSS statistical tool, and the results are shown
in the following tables with both a simple description of frequencies and a more
significant cluster analysis.
Table 1 Food SMEs sample description (%)
Turnover
(million euros)
Headcount
Micro firms
(up to 10 employees)
Small firms
(up to 50 employees)
Medium firms
(up to 250 employees) Total
Less 2 17.14 7.14 1.43 25.71
2–10 5.71 30.00 2.86 38.57
11–20 1.43 10.00 4.29 15.71
21–40 5.71 4.29 10.00
41–50 2.86 2.86 5.71
Over 50 4.29 4.29
Total 24.29 55.71 20.00 100.00
ICT Innovation for Buyer-Seller Relationships in International Supply Chains 663

3.1 Critical Factors for the Relationship with Large Retailers
Table 2 shows the weight of retailers’ selection criteria perceived by food SME
suppliers. Retailers’ evaluation criteria are referred, above all, to the ability of
suppliers to manage efficient relationships. In fact, apart from the criteria strictly
Table 2 Weight of retailers’ selection criteria perceived by food SME suppliers
N Mean Std. deviation t df Sig. (2-tailed)
Quality of the products and services 70 4.44 .927 40.106 69 .000
Reliability with regard to the fulfillmentof contractual conditions agree uponby the parties
70 4.39 .997 36.804 69 .000
Respect of safety and health standards 70 4.23 1.119 31.627 69 .000
Value for money of the products 70 4.04 .970 34.885 69 .000
Flexibility of producer: delivery times,lead times, etc.
70 3.93 1.121 29.332 69 .000
Technical potentiality: high volumes,innovation, quality control
70 3.87 1.154 28.075 69 .000
Contractual negotiations (discount,payment delay, special prize)
70 3.77 1.092 28.885 69 .000
Typicality of product (as made in Italy, IGP) 70 3.67 1.327 23.154 69 .000
Supplier reputation: share of market,volumes produced
70 3.61 1.107 27.312 69 .000
Brand of the supplier products 70 3.59 1.291 23.240 69 .000
Certification of the supplier/products(ISO, BRC, etc.)
70 3.59 1.222 24.556 69 .000
Financial situation of supplier to grantstability
70 3.56 1.137 26.165 69 .000
Respect of environmental standards forprocesses and products
70 3.54 1.163 25.481 69 .000
Respect of social and ethical standards 70 3.49 1.126 25.900 69 .000
Level of human resources of the supplier 70 3.44 1.072 26.874 69 .000
Availability to receive controls on theproduction processes
70 3.43 1.281 22.401 69 .000
Potentiality to develop 70 3.41 1.198 23.850 69 .000
Stock management: logistics capabilitiesand communication tools
70 3.37 1.119 25.216 69 .000
Wideness and attractiveness of rangeproducts
70 3.30 1.244 22.203 69 .000
Communication systems (EDI, VMI, CPFR,VMCM, etc.)
70 3.27 1.166 23.470 69 .000
Geographical proximity of supplier forshort delivery lead time
70 3.24 1.185 22.898 69 .000
Vendor organizations of the producer(above all after sale)
70 3.23 1.079 25.033 69 .000
Exclusiveness or customization ofproducts provided by supplier
70 3.21 1.284 20.942 69 .000
Supplier’s power factors in thenegotiations: scale economies etc.
70 3.20 1.111 24.094 69 .000
Investments required: technical endowment,minimum quantity
70 3.19 1.183 22.528 69 .000
Customer portfolio of the supplier 70 2.69 1.123 20.001 69 .000
Promotional support 70 2.64 1.192 18.547 69 .000
664 F. Musso and M. Risso

connected with the food sector (such as safety and health standards of products and
quality), respondents mainly indicate factors linked to the efficiency of the
relationship.
A cross analysis of evaluation criteria and turnover classes shows meaningful
differences. The most significant deviation concerns commercial organization and
communication systems. Firms who record higher turnover (more than 20 million
euro) consider sales organization one of the most important criteria in order to be
selected by retailers. This criterion is far less important in smallest firms.
Communication systems are highly considered by large suppliers but their
importance is rather underestimated by smaller ones. The same trend has been
recorded in the management of logistics capabilities. As the dimension of firms
increases, a less importance of specificity of products and customization of the offer
corresponds.
A cross analysis of the criteria on export turnover confirms and underpins these
difference. Manufacturers with higher export turnover consider the reliability to
the compliance with the negotiated conditions a fundamental requirement in order
to be selected by retailers. The same criterion is less important in firms with a more
limited share of export turnover. Even producer’s availability to be visited and
controlled by retailers is a factor that export-oriented firms consider more impor-
tant, while terms of negotiations (such as discount, annual prize, payment
conditions, etc.) become less important.
Most of the respondents declared that an increased retail power creates depen-
dence among smaller suppliers. Therefore, they are forced to accept a high control
from retailers, and they must respond to product and packaging adaption to
retailers’ requirements. Also a higher level of involvement in logistics is more
often required to suppliers.
The cluster analysis was conducted to identify specific categories of manufact-
urers inside the sample, as the results of the empirical research showed in
homogeneousbehaviors.
A K-Mean methodology has been followed for the analysis, which allows
minimized inertia within single groups and between clusters. The number of the
singled-out cluster is 4 that results after a series of tests that show it as the value that
returns the clearest differences.
The variables used to divide the sample into more homogeneous groups are
total turnover, export turnover, importance of private label production for large
retailers (as % of total turnover), duration of relationship with large retailer, and
headcount and age of the firm.
Table 3 shows the variables that contributed to define the clusters within the
sample. F-test shows that age of the firm, importance of private label production
for large retailers, headcount of the firm, duration of the relationship with large
retailers, and total turnover are the more significant variables.
Data on export turnover was not available from all the manufacturers. Consid-
ering their insignificant number, missing values are treated as with the option
“exclude cases pairwise” that allows assignment of single cases based on dis-
tances from the variables of those that are not missing values. Cluster 3 is the
ICT Innovation for Buyer-Seller Relationships in International Supply Chains 665

more numerous one, with a total of 27 units. Cluster 4 has 22 units, cluster 1 has
15 units, and cluster 2 has 6 units (see Table 4).
In cluster 1, turnover shows an average value between 10 and 20 million euro; the
importance of export sales is an average value between 20 and 40% of total turnover,
sales to large retailers for private labels an average weight of 71% (Table 5), the
duration of relationship with large retailers an average of 11 years, and the age of the
firm an average of 25 years. Thus, the cluster 1 is named “young and dynamic.”
In cluster 2, average turnover (41–50 million euro) and size and age of the firms
are the highest of the sample. The export turnover is between 20 and 40% on total
turnover; sales to national large retailers for private label products have an average
weight of 65%. Also, the length of relationships with large retailers is the high-
est with 23 years. Cluster 2 is named “old and consolidated.”
Cluster 3 shows the lowest average turnover of the sample (up to 10 million
euro), an export turnover limited (lowest of the sample between). The firms of
this cluster are the youngest of the sample, the sales to national large retailers for
Table 3 ANOVA analysis with different significance levels
Cluster
Mean square df Mean square df Error
Age of the firm 23622.743 3 215.923 59 109.403 0.000
% product produced in private label 11834.527 3 157.973 42 74.915 0.000
Total turnover 6.603 3 1.628 66 4.055 0.010
Duration of relation with large retailers 418.949 3 86.122 66 4.865 0.004
Export turnover 1.254 3 0.962 66 1.303 0.281
Headcount classification 1.787 3 0.387 66 4.624 0.005
F-tests should be used only for descriptive purposes because the clusters have been chosen to
maximize the differences between cases in different clusters. The observed significance levels are
not corrected for this and thus, cannot be interpreted as tests of the hypothesis that the cluster
means are equal
Table 4 Number of units per
clusterCluster Number of interviews
1 Young and dynamic suppliers 15
2 Old and consolidated suppliers 6
3 Younger and small suppliers 27
4 Old and small suppliers 22
Total interviews 70
Table 5 Importance of variables in the sample by cluster
Cluster
1 2 3 4
Headcount (1–4) 2.20 2.67 1.74 1.86
Total turnover (1–4) 2.73 4.00 2.11 2.23
Export turnover (1–4) 2.20 2.00 1.59 1.86
Age of the firm 24.77 128.67 17.56 61.26
% of private labels 71 65 6 11
Duration relation with large retailers 11 23 9 15
666 F. Musso and M. Risso

private label products have the lowest weight on turnover in the sample (6% of
the turnover), and the average of the length of relationships with large retailers
is the lowest with 9 years. Cluster 3 is named “younger and smaller.”
In Cluster 4, average turnover (10–20 million euro) and size of the firms are
small; the export turnover accounts between 20 and 40% of total turnover. Sales
to national large retailers for private label products have a limited importance
(11% of the turnover). The duration of the relationship with retailers is high, and
the age of the firm is elevated. Cluster 4 is named “old and small.”
The four clusters differentiate from each other mainly for importance of private
label on turnover and the age of the firm (see Fig. 1).
Differences in means within clusters are due to variance in responses and to
different consistencies of single clusters. Figure 1 shows the precise clusterization
of the sample that matches the weight of private label production on turnover and
age of the firm.
3.2 Influence of Large Retailers to ICT Innovationfor SME Suppliers
In regard to technological perspective, the analysis showed that for clusters 1, 3, and
4 ICT innovation was driven by the need to improve information sharing in real
time and reduce waste in business processes. However, the more involved in
Fig. 1 Weight of private label production on turnover and age of the firm
ICT Innovation for Buyer-Seller Relationships in International Supply Chains 667

changes in logistic innovation and in coordination with large retailers in the last
5 years were mainly clusters 1 and 2.
ICT innovative changes are different by cluster. Cluster 1 and 2 invested in
information exchange and logistic system (see Figs. 2 and 3). Less technological
innovation is generally detected in clusters 3 and 4.
None of the firms in the sample use the vendor-managed inventory and VMCM,
while CPFR is present in clusters 1 and 3 in a very limited extent. All firms except
for some in the clusters 3 and 4 have implemented traceability tools.
4 Results
From the Italian food manufacturers’ perspective, we can argue that small and
medium manufacturers have different behaviors related to ICT innovation in
their relationships with large retailers. Most of firms declared that the increased
retail power in the supply chain creates dependence and forces SMEs to receive
control, quality test and adaption of product and logistic processes to retailers’
requirements.
NO
Yes
Electronic Data Interchange (EDI)1
2
3
4
NO
Yes
WEB-EDI1
2
3
4
Fig. 2 The adoption of information exchange systems by clusters (EDI and WEB-EDI)
NO
YES
Multi- drop1
2
3
4
NO
YES
Multi- pick1
2
3
4
Fig. 3 The adoption of multipick and multidrop delivery systems
668 F. Musso and M. Risso

Therefore, the level of pressure that manufacturers perceive in retailers’ selection
criteria differs depending on their dimension and the importance of their products for
retailers’ assortments.
Larger firms (cluster 2) are less influenced by retailers in the negotiation for
technicalities, and they can better play their relational capabilities in order to
improve innovation.
The firms more involved in the production of private label products (cluster 1),
even if smaller, reveal major abilities in managing relationships with large retailers.
Among them, those that are part of international supply chains have better
capabilities to manage relations with large partners. Moreover, they follow a
middle-/long-term perspective that brings them to recognize the need of relation-
specific investments, included those on ICT.
Adaptation and collaboration seem to be the two main elements that charac-
terized the presence of SME manufacturers in supply chains managed by inter-
national large retailers.
Large retailers prefer suppliers which have resources and willingness to invest
in ICT and logistic innovation and adapt their processes.
When suppliers cannot benefit from a long-term approach of large retailers,
they are asked to guarantee structures, resources, and communicational tools to
manage the relationships. In this case, SMEs often face difficulties to invest in
logistics and ICT solutions.
5 Conclusions
This chapter analyzed the main drivers of ICT innovation in the relationships
between large retailers and SME suppliers, focusing on the collaboration criteria
adopted by retailers in organizing their supply chain and adopting ICT and logistics
new solutions.
The analysis on SME suppliers showed that large retailers could be a driver for
innovation in ICTs connected to channel relations for SMEs. Those which seem to
understand this trend are working to improve not only logistics/production man-
agement but their overall business system. In this way, they improve their capability
to mange relationships and can reduce their dependence from a single retailer
expanding their markets and customers opportunities.
Italian SMEs which operate continually with large retailers adapt their processes
but are sensible to innovations based on a collaborative approach in supply chain.
Smaller suppliers reveal a transactional approach and are remarkably oriented to
price competition, showing a delay in adopting more advanced SCM tools.
Actually, we can identify a range of situations. The first relates to a supply
relationship where the quality and specificity of products ensure a protective role of
large retailers toward those small suppliers that can characterize their assortments
(clusters 1 and 2). In such case, we can talk about a shared growth and a dynamic
support by retailers where rules, reliability, and compliance of suppliers are always
oriented by large partners, mostly international.
ICT Innovation for Buyer-Seller Relationships in International Supply Chains 669

The second situation regards a supply market where a dominant price competition
makes the relationship increasingly difficult. Retailers become more aggressive and
tend to standardize their requirements. In this case, it is possible to identify a dual
orientation. Larger suppliers belonging to cluster 4 invest in economies of scale, ICT,
and logistics to favor a value for money approach. Smaller suppliers (cluster 3) are
oriented to differentiation and typicality of products. They mainly focus on optimi-
zation of internal processes.
This study highlights some trends in ICT innovation from the perspective of
the supplier in a retailer’s led relationships. A complementary analysis should
investigate the motivations for retailers to foster innovation processes through the
relationship with small suppliers. A comparative cases analysis could be conducted
in other sectors and with manufacturers of other countries (i.e., EU) to verify the
similarities and differences.
References
Beck R, Weitzel T (2005) Some economics of vertical standards: integrating SMEs in EDI supply
chains. Electron Mark 15(4):313–322. doi:10.1080/10196780500302781
Chung WWC, Leung SWF (2005) Collaborative planning, forecasting and replenishment: a case
study in copper clad laminate industry. Prod Plan Control 16(6):563–574
Cigolini R, Rossi T (2006) A note on supply risk and inventory outsourcing. Prod Plan Control
17(4):424–437. doi:10.1080/09537280600650338
Ganesan S, George M, Jap S, Palmatier R, Weitz B (2009) Supply chain management and retailer
performance: emergent trends, issues and implications for research and practice. J Retail
85(1):84–94
Hardgrave BC, Miles RB, Mitchell Y (2009) Item-level RFID for apparel: the Bloomingdale’s
RFID initiative, working paper n. ITRI-WP147-0809, Information Technology Research
Institute, University of Arkansas
Hausman A, Stockb JR (2003) Adoption and implementation of technological innovations within
long-term relationships. J Bus Res 56(8):681–686
Kaipia R, Tanskanen K (2003) Vendor managed category management – an outsourcing solution
in retailing. J Purch Supply Manage 9(4):165–175
Kim D, Cavusgil ST, Calantone RJ (2006) Information system innovations and supply chain
management: channel relationships and firm performance. J Acad Mark Sci 34(1):40–54
Kulp SC, Lee HL, Ofek E (2004) Manufacturer benefits from information integration with retail
customers. Manag Sci 50(4):431–444
Martinez JJ, Polo-Redondo Y (2001) Key variables in the EDI adoption by retail firms.
Technovation 21:385–394
Musso F (2012) Technology in marketing channels: present and future drivers of innovation.
Int J Appl Behav Econ 1(2). doi:10.4018/IJABE
Risso M (2009) Strategie di approvvigionamento della grande distribuzione e relazioni con i
fornitori. Giappichelli, Torino
Savaşaneril S, Erkip N (2010) An analysis of manufacturer benefits under vendor-managed
systems. IIE Trans 42(7):455–477. doi:10.1080/07408170903459968
Vaaland TI, Heide M (2007) Can the SME survive the supply chain challenges? Supply Chain
Manage Int J 12(1):20–31. doi:10.1108/13598540710724374
Waller M, Johnson ME, Davis T (1999) Vendor-managed inventory in the retail supply chain.
J Bus Logist 20(1):183–203
670 F. Musso and M. Risso

SCM and ICT: A Cornerstone to Sustainable
Development of Agribusiness: An Analytical
Study
Y.M. Raju
1 Introduction
While China represents brawn, India represents brain
By . . .. Philip Kotler
The world is moving fast towards a borderless business situation. Physical
boundaries will remain, but the movements across will become absolutely free.
The flow of money, men, material and information will follow economic logic and
will go where the best returns are expected and agricultural products will always
have evergreen demand all over the globe.
Agriculture and agribusiness situation in India has undergone rapid changes in
the last two decades. Investment in agriculture both in public and private sector has
risen. But the growth rate has not only to be maintained but accelerated, and
fluctuations in agricultural production are to be minimized. The efforts are already
under way to evolve location-specific technologies, to supply chain management
and to transfer them to farmers and the agribusiness sector.
Indian agriculture is undergoing rapid transformation and low-volume agricul-
ture is giving way to high-value agribusiness. Indian banks and state and central
government are increasingly focusing on the supply chain, and this has led to
milestones achievements in the Indian agriculture sector. As a result, there has
been a sharp rise in foodgrain production, thanks to ‘Green Revolution’, ‘Yellow
Revolution’, ‘Blue Revolution’ and ‘White Revolution’.
The great Indian rural agriculturist’s dream continues to be a pie in the sky
of ‘Commercial Revolution’ in agricultural activities. Nearly 70% of the 1.21
billion strong Indians live in villages, with two out of three Indians informally
Y.M. Raju (*)
Department of Post-Graduate studies and Research in Commerce and Management,
Mangalore University, Mangalagangothri 574199, India
e-mail: [email protected]
Department of Management Studies, Indian Institute of Science, Bangalore,
Driving the Economy through Innovation and Entrepreneurship,DOI 10.1007/978-81-322-0746-7_55, # Springer India 2013
671

engaged, directly and indirectly, in agriculture and other allied activities.
These disadvantaged people are not using supply chain management (SCM)
and information communication and technology (ICT) in their farm activities.
The National Development Council and Eleventh Five-Year Plan also focus on
techno-economic in agricultural sector and increase in agricultural productivity.
Sustained economic growth is only possible through increased agricultural produc-
tivity and better farm management. This requires proper use of ICT and SCM in
farm activities. In order to gain competitive advantage and increased productivity
and profitability, these are the prerequisites like integrated farm operation, market
sensing, reducing the middlemen menace, attracting young educated bloods,
generating employment opportunities, time management, reduction of cost, resur-
rection of power from recession, farm planning, farm accounting etc.
‘Commercial Revolution’ and ‘Evergreen Revolution’ has to be proposed for the
economic growth of farming fraternity. ICT and SCM have not only yielded
measureable benefits to the farming communities but also provided technical and
financial empowerment.
This study proposes a new model for sustainable development of agribusiness in
farm activities, where ICT and SCM are the backbone engines of growth. Accesses
to find global markets have created immense opportunities for the farmers to
expand their agribusiness operations on foreign soils.
Against this background, this chapter makes an attempt to examine the ICT and
SCM in a changed approach to farm activities and encashed demographic dividend.
In order to achieve high rate of economic development, peace, prosperity and
Commercial Revolution in farm activities and the farmers, innovation, ICT and
SCM tools are to be used at the bottom of the pyramid. In agricultural sector, these
concepts are milestones to sustainable development. Agriculture is a noble profes-
sion, and it is a core competence as well. It should attract young educated bloods in
this sector, otherwise India will once again go back to an era of chronic shortage of
foodgrains and ‘begging bowl’ status.
2 Focus of the Study
This study examines the role of SCM and ICT in agribusiness in Dakshina Kannada
district in Karnataka state, India. Since the peasants are constantly facing various
types of risks, mitigating these risks will be a cornerstone for the financial
empowerment.
Risk is the possibility of adverse physical, mental and financial loss, especially
in the day-to-day activities in the farms. Risk mitigation is essential for not only
increasing the productivity but also for improving the quality of work life of the
peasants and agribusiness entrepreneurs through ICT and SCM. It provides maxi-
mum socio-economic advantages. It plays a significant role in bringing about socio-
economic development of peasant families. The concepts of ICT and SCM have
now to be a reality for the peasants. By creating awareness of the usage of SCM and
ICT in the farm sectors, our farmers and farm workers are going to get competitive
advantage in the global agribusiness era.
672 Y.M. Raju

3 SCM and ICT Contribution to Agribusiness
As we all know, SCM and ICT plays a vital role in the prevention and mitigation of
risks, employment generation, and recession-proof growth and sustainable devel-
opment of the poor and middle class, marginal farmers and gaining competitive
advantage as well. Nowadays, small, marginal farmers and farm workers must work
smarter rather than harder. It makes an enormous contribution to farming fraternity
and farm workers’ quality of work life, earning capacity, maintenance of stability,
financial empowerment and so on. The specific contribution from SCM and ICT in
the era of economic slowdown is as follows.
4 Integrated Productivity and Marketing Sensing
There is a direct correlation between SCM, ICT and agribusiness and agricultural
productivity. It provides market knowledge, demand and supply mechanism, usage
of resources, reduction of costs and maintenance of the law of variable proportions.
5 Time Management
Our farmers and farm workers are not practicing proper time management in their
agriculture activities. SCM and ICT teach them to maintain proper timemanagement.
Time management is a critical aspect of the farming and farm-workers fraternity.
6 Competitive Advantage
We have fertile land, world famous rivers, good environment, demographic
dividend, etc., but we failed to encash in the globalization. Our farmers and farm
workers are not gaining any advantage in spite of all these core competitive
advantages. Disadvantaged section will gain competitive advantage enormously
with the help of SCM and ICT.
7 Improving the Communication
Marginalized people are put in the dark since they are not getting up-to-date and
research-based or lab-based information. There is a big communication gap
between urban market and rural market. The SCM and ICT are bridge the gap
and boost the agribusiness in the country.
SCM and ICT: A Cornerstone to Sustainable Development of Agribusiness. . . 673

8 Improve the Logistics Management
We face problems on account of widespread nature of agribusiness, its varying size,
unorganized business system and lack of management techniques. Our peasants are
facing logistic management and other myriad problems. Majority of the peasants
are not aware of the availability of inputs and that the agricultural outputs are to be
sold timely. This leads to financial loss and reduction in the productivity. SCM and
ICT need to be used properly to solve myriad problems.
9 Attract Young Bloods and Generate
Employment Opportunities
Agriculture and agribusiness is a noble profession and most profitable business as
well, but nowadays, many youngsters in the agricultural and farm workers’ families
in the rural areas have migrated to cities, towns and Gulf countries in search of
Mickey Mouse jobs. By using the ICT and SCM in agriculture and agribusiness
sector, the youth can be retained in the farm sector, and it ensures prosperous
growth of marginal farmers with the generation of employment opportunities.
10 Reduction of Cost and Other Numerous Contributions
ICT and SCM empower the farmers, by helping them in the management of all
activities in the production process in maintaining utmost customer satisfaction by
using the least possible costs, great efficiency, cost saving gains, long-term profit-
ability and minimized delay. ICT and SCM are the seamlessly coordinated and
developed with the network of business.
11 Objectives of the Study
The central purpose of this empirical study is to examine the dynamic role of the
SCM and ICT in agribusiness and agricultural activities in the Dakshina Kannada
district of Karnataka state, India.
The specific objectives are the following:
1. To study the socio-economic profile of the respondents
2. To examine the usage of SCM and ICT in farm and agribusiness segments
3. To analyse the benefits of SCM and ICT in agribusiness
674 Y.M. Raju

4. To study the ways and means to convert farm workers into entrepreneurs in
agribusiness
5. To suggest a suitable model to mitigate stress and risks through SCM and ICT in
agribusiness
12 Methodology
This study was conducted in the Dakshina Kannada (D. K.) district. D. K. district is
one of the prominent districts in Karnataka state, India. Five nationalized banks
took birth in the undivided district; the district has the highest literacy rate in the
state, progressive farmers, growing cash crops, pioneering for adopting scientific
method of farming, highest rainfall and lowest rate of suicides. The major
parameters used to drawn the respondents are occupation of the respondents,
education level, type of crops grown, family size, farm worker’s age and income
level. This is an empirical study; the sample used in the study consisted of 250
respondents drawn through cluster with multistage random sampling technique.
The D. K. district consists of 5 talukas; 50 respondents are drawn randomly from
each taluk on a homogeneous basis.
13 Discussion and Results
13.1 Education Level of the Respondents
Educational background plays an important role in using ICT and SCM in the farm
operations. It helps the farmer’s proper understanding and usage of ICT and SCM in
their farm operations. The increasing internationalization of business has largely
freed it from the constraints of national borders. The world is seeing a growing
economic interdependence and technological advances in commercialization and
transportation contributing to the emergence of large global corporate.1 In this
scenario, good educational background is prerequisite. Incidentally, the Dakshina
Kannada district has the highest literacy rate in the Karnataka state, and more
importantly, the peasant is highly knowledgeable compared to any other districts in
the state (Table 1).
The above table shows that more than 20% of the respondents have had a college
education and above 10% of the peasants are illiterates.
From the analysis, it is found that more interestingly nearly 90% of the
respondents have a formal education. Thus, a majority of the peasants are literates.
1 Aseem Kumar (2000).
SCM and ICT: A Cornerstone to Sustainable Development of Agribusiness. . . 675

13.2 Occupation of the Respondents
Agriculture, fishing and other allied activities are the main occupation of the people
in this district. The district receives very good rainfall and has all means of efficient
transportation networks, financial networks and marketing facilities. Many talukas
have proximity to Mangalore City and Mangalore port. Agriculture is the backbone
of the district and highest rainfall is also one of the added values to the peasants
(Table 2).
It is clear from the foregoing table that 35% of the respondents are pursuing only
agriculture, 30% of the respondents are farm workers and more than 30% of the
respondents are pursuing agribusiness in small quantities. To sum up, one can
clearly deduce from the figures in the table that majority of the respondents were
involved in agriculture and agribusiness in unorganized methods.
13.3 SCM and ICT Used in Farming and Agribusiness
SCM and ICT are very effective weapons to identify the risks and mitigate the risks.
Management of risk is nothing, but earning profit, farmers and farm workers are
more and more acquainted with the marketing efficiency through SCM and ICT.
Marketing efficiency is essential for good market performance. It facilitates the
movements of agricultural goods from producers to consumers at the lowest
Table 1 The educational accomplishment of the respondents
Talukas Illiterates
Educational qualifications
Total
Up to
4th Std
Up to
7th Std
Up to
10th Std
College and special
trainings
Bantwal 5(2.00) 9(3.6) 24(9.6) 8(3.2) 4(1.6) 50(20.00)
Belthangady 6(2.4) 7(2.8) 20(8.0) 10(4.00) 7(2.8) 50(20.00)
Mangalore 7(2.8) 3(1.2) 24(9.6) 9(3.6) 7(2.8) 50(20.00)
Puttur 3(1.2) 8(3.2) 22(8.8) 12(4.8) 5(2.00) 50(20.00)
Sullia 8(3.2) 11(4.4) 12(4.8) 15(6.00) 4(1.6) 50(20.00)
Total 29(11.6) 38(15.2) 102(40.8) 54(21.6) 27(10.8) 250(100.00)
Source: Field survey data
Table 2 Occupation of the respondents
Talukas Agriculture only Farm workers Agribusiness in small quantities Total
Bantwal 19(7.6) 13(5.2) 18(7.2) 50(20.00)
Belthangady 18(7.2) 15(6.00) 17(6.8) 50(20.00)
Mangalore 13(5.2) 16(6.4) 21(8.4) 50(20.00)
Puttur 18(7.2) 17(6.8) 15(6.00) 50(20.00)
Sullia 21(8.4) 16(6.4) 13(5.2) 50(20.00)
Total 89(35.6) 77(30.8) 84(33.6) 250(100.00)
Source: Field survey data
676 Y.M. Raju

possible cost, consistent with the price of the goods desired by the consumers.
It empowers firms to keep their channel members happy, loyal and well motivated
towards trade by offering full assurance for the best ROI.2 For agribusiness and
farm activities SCM and ICT are complementary to each other (Table 3).
It is evident from the foregoing table that nearly 90% of the respondents are not
using SCM and ICT in their farm activities and small-scale agribusiness. More than
10% of the respondents are using some extent of SCM and ICT in their day-to-day
professional life to some extent.
From the above analysis, it is inferred that majority of the respondents are
not using SCM and ICT. They are not aware of and do not understand its benefits
and power.
13.4 Confidence Building Measure to Take-Up Agribusiness
India has three things which will gain confidence building and enhancement of skill
and knowledge; these three are democracy, demography and diversity. Democracy
motivates the ability to think and act free. Demography with over half of the Indian
population fewer than 25 years age provides requisite environment as innovation in
the agribusiness for the young. Diversity, of culture and language, provides an
environment in which innovation thrives.
Marginal farmers and farm workers normally show a lack of confidence to take-
up challenges and risks. Agribusiness requires strong confidence, attention, prob-
lem solving, flexibility and inner strength. Building confidence is not something
that 1 day falls from the sky or a lottery that the lucky person wins. Self-confidence
is a gut feeling; SCM and ICT provide a gut feeling and inner strength to the
marginal farmers and farm workers. Self-confidence is an important asset for
enhancing physical power and mental power to take-up challenges and risks to
disadvantaged section (Table 4).
2 Agrawal (2000).
Table 3 SCM and ICT in
farm activities and
agribusiness Talukas
SCM and ICT are using
TotalYes (some extent) No
Bantwal 5(2.00) 45(18) 50(20.00)
Belthangady 6(2.4) 44(17.6) 50(20.00)
Mangalore 4(1.6) 46(18.4) 50(20.00)
Puttur 6(2.4) 44(17.6) 50(20.00)
Sullia 9(3.6) 41(16.4) 50(20.00)
Total 30(12) 220(88) 250(100.00)
Source: Field survey data
SCM and ICT: A Cornerstone to Sustainable Development of Agribusiness. . . 677

It is clear from the above table that at least 55% of the respondents do not have
gut feelings and self-confidence and more than 25% of the respondents with self-
confidence and gut feeling are very poor. Less than 15% of the respondents have
self-confidence and gut feeling. It is evident that most of the respondents are not
having self-confidence and gut feeling. For agribusiness, self-confidence and gut
feeling are very important.
13.5 Venture the Young Educated Bloods into Agribusiness
The Indian economy has been witnessing a drastic change since mid-1991; with
new policies of LPG, India has great entrepreneurial potential. At present, rural
educated youths’ involvement in economic activities is marked as very low, by
excessive concentration on Mickey Mouse jobs and migration to cities and towns in
search of jobs. Development of youths plays an important role in nation building.
As they constitute the large number of the total population, young population and it
is demographic-dividend, youths have to play a significant role in the development
of the country. Several development programmes including technical and financial
support have been implemented by the state and central governments with a view to
make youths job providers instead of job seekers.
Knowledge is created and sustained through the police of work, meet, collabo-
rate, interact and socialize3. In D. K. district, a large number of agricultural family
youths migrated to Gulf countries in search of jobs. Rural entrepreneurship in
agribusiness is a prerequisite for the creation of a healthy and wealthy nation.
When rural youths are empowered, society with stability is assured. It ensures
peace, prosperity, sustainability and equity in the country (Table 5).
The above table divulges that more than 45% of the youths have migrated to
Gulf countries. These youths are from rural agricultural backgrounds. At least 30%
of the youths migrated to cities and towns. More than 15% of the youths are staying
in the rural areas, but they do not venture into farm activities.
To sum up, one can clearly deduce from the above table that rural youths have not
taken farm activities. These segments should be retained in their respective villages
and advised to take-up agribusiness with proper training to use SCM and ICT.
3 Paul H. Hildreth and Chris Kimbler (2004).
Table 4 Confidence level
and gut feeling of the
respondents
Talukas Good Very poor Cannot say Total
Bantwal 5(2.00) 15(6.00) 30(12.00) 50(20.00)
Belthangady 9(3.6) 13(5.2) 28(11.2) 50(20.00)
Mangalore 7(2.8) 12(4.8) 31(12.4) 50(20.00)
Puttur 5(2.00) 15(6.00) 30(12.0) 50(20.00)
Sullia 11(4.4) 16(6.4) 23(9.2) 50(20.00)
Total 37(14.8) 71(28.4) 142(56.8) 250(100.00)
Source: Field survey data
678 Y.M. Raju

14 Findings
The following are the findings of the study:
• Nearly 90% of the respondents are literates.
• The Dakshina Kannada district is the highest literate district in Karnataka state,
India.
• The district’s main occupation is agriculture and fishing. In addition to fishing
business, agribusiness also has vast potential.
• According to the survey, farm workers undertake agribusiness in small
quantities.
• It is evident that nearly 90% of the respondents are not using any SCM and ICT
in their farm activities.
• In a nutshell, the district is situated in a strategic position and possesses added
advantage to take-up agribusiness.
• The survey reveals that 85% of the respondents do not have gut feeling and self-
confidence.
• Two hundred and three respondents out of two hundred and fifty have migrated
to cities, towns and Gulf countries.
• Rural youths should be retained in villages and asked to venture into agribusi-
ness with proper training and incentives to use SCM and ICT; it creates wealth
and employment generation in the rural areas.
15 Suggestions
Consistent with the objectives of the study and findings of the study, the following
are the suggestions for sustainable development of agricultural and agribusiness
with the help of SCM and ICT:
• Farming is a noble profession. It attracts educated young bloods to venture into
farming activities and agribusiness through SCM and ICT.
Table 5 Table showing rural youths migrated to Gulf countries
Talukas
Rural youths migrated to Gulf countries
Total
Migrated
to Gulf
Migrated to
cities/towns
Stay in the village but
abandoned farm activities
Bantwal 20(8.0) 16(6.4) 14(5.6) 50(20.00)
Belthangady 28(11.2) 15(6.00) 7(2.8) 50(20.00)
Mangalore 24(9.6) 16(6.4) 10(4.00) 50(20.00)
Puttur 29(11.6) 12(4.8) 9(3.00) 50(20.00)
Sullia 20(8.0) 23(5.2) 7(2.8) 50(20.00)
Total 121(48.4) 82(32.8) 47(18.8) 250(100.00)
Source: Field survey data
SCM and ICT: A Cornerstone to Sustainable Development of Agribusiness. . . 679

• The D. K. district has the highest number of literates and knowledgeable youths.
Therefore, village level camps should be made for fostering innovation, aware-
ness of SCM and ICT in farm activities and agribusiness.
• Agribusiness entrepreneurship spirit should be kindled to rural youths. This
should stop migration to cities and Gulf countries.
• Dynamic youngsters from farming community migrated to Gulf countries in
search of Mickey Mouse jobs. These will stop and convert them as employers in
agribusiness with proper training at village levels.
• Creating awareness about SCM and ICT to be used in agribusiness to college
drop outs, nurture them with expert guidance and mentorship.
16 Conclusion
In the present era, there is a real boom in agribusiness and agricultural activities.
Indian economy is fully depended on agriculture and allied activities. SCM
and ICT are powerful tools to enhance productivity and profitability in farm
activities. The PURA concept advocated by our beloved former President of
India, Dr. A. P. J. Abdul Kalamji, helped us in overcoming poverty and inequality
by using SCM and ICT. Success is not to be found in a technology, in market
positions or in a business model; success resides in individual rural youths, to make
use the available technology and their abilities. Another important ingredient of
SCM and ICT are increasing creativity, self-confidence and disciplines; fostering
SCM and ICT have a power to creation of wealth, value and employment genera-
tion in rural areas. Rural youths possessed three T’s, that is talent, technology and
tolerance. It only requires to mentoring them to practise these in the farm sector.
References
Agrawal DK (2000) Ensure profitable ROI, ROS and ROME by means of logistical customer
service. In: Proceeding of international conference on delivery service quality, by 11m,
Ahmedabad. Macmillan India Ltd, New Delhi, pp 36–41
Anderson D, Dhillon Y, Remnant J (1998) Global supply management: satisfying the global
customer. In: Gattorna J (ed) Strategic supply chain alignment. Gower, Alsershot, pp 325–337
Anonymous (2000) SB saves millions with global supply scheme. Supply Manage 5(2):15–16
Arntzen BC, Brown GG, Harrison TP, Trafton LL (1995) Global supply chain management at
digital equipment corporation. Interfaces 25(1):69–93
Aseem Kumar (2000) A borderless business world managing global business: a strategic perspec-
tive. J Bus Ind Mark 4(3/4):7
Bird B (2002) Learning entrepreneurship competencies: the self-directed learning approach.
I J Entrep Educ 1:203–227
Bowersox DJ, Closs DJ (1996) Logistical management: the integrated supply chain process.
McGraw Hill, Singapore
680 Y.M. Raju

Davila T, Eptein MJ, Shelton S (2007) The creative enterprise managing innovative organizations
and people. Culture-vol-1–2. Praeger Persecutions, WestPoint/London
Dhameja SK (2002) Women entrepreneurs opportunities, performance, problems. Deep and Deep
Publication (P) LTD, New Delhi, p 11
Gopala Rao HS et al (2004) Farmers marketing in Karnataka. Surina Graphics, Mysore
Hamel GD, Prahalad CK (1989) Collaborate with your competitors-and win. Harv Bus Rev 67
(1):133–139
Hildreth PH, Kimble C (2004) knowledge networks: Innovation through communities of practices,
Phd issue 1, Idea group publishing, London
Hisrich RD, Peters MP (1995) Entrepreneurship, starting, developing and managing a new
enterprise. Richard D. Irwin Inc, Chicago
Johl SS, Kapur TR (2005) Fundamentals of farm business management. Kalyani Publishers,
New Delhi
Jose P, Ajith Kumar, Paul TM (2008) Entrepreneurship development. Himalaya Publishing,
New Delhi
Kurtko DF, Hodgetts RM (2007) Entrepreneurship. Dryden Press series in entrepreneurship,
Hardcover USA
Motwani J, Madan M, Gunasekaran A (2000) Information technology in managing global supply
chains. Logist Inf Manage 13(5):320–327
Parker DW (1994) Logistics management: cornerstone to sustainable competitive advantage.
Manage Serv 38(1):10–18
Peterman NE, Kennedy J (2003) Enterprise education: influencing students perception of entre-
preneurship. Entrep Theory Pract 28(2):129–145
Singh S (1985) Entrepreneurship and social change. Rawat Publications, Jaipur
SCM and ICT: A Cornerstone to Sustainable Development of Agribusiness. . . 681

A Two Stage Supply Chain Model for
Multi Sources and Destinations, Incorporating
Quantity and Freight Discounts with Case Study
Kanika Gandhi, P.C. Jha, and M. Mathirajan
1 Introduction
A supply chain network is a series of value chains (also called tier, state, or phase)
owned by one or more businesses. The chain starts with the raw material supplier
and ends with the consumer. Each intermediate tier is a supplier to its adjoining
downstream tier and a customer to its upstream tier. The traditional ways like face-
to-face management, manual tracking systems, paper-dominated order processing
systems, and wired communication links were the primary management tools avai-
lable to logistics managers, which are obsolete in current business situations. But
Tan et al. (2000) pointed out that SCs are becoming complex for two reasons.
First, a global imbalance in labor costs forces enterprises to source from countries
with cheaper labor in order to control production costs to stay competitive. Second,
consumers are becoming increasingly more sophisticated, demanding customized
products that better meet their needs. The resulting increase in product variation
makes demand forecasting more difficult as an enterprise now has to predict both
volumes and option mix instead of a single demand pattern. Furthermore, increased
product types result in a greater number of suppliers to manage and higher coor-
dination costs. In addition to optimizing its processes within itself, the enterprises
within a supply chain must now coordinate with each other. Shamim et al. (2008)
discussed that adoption of information and communications technology (ICT) is
K. Gandhi • P.C. Jha
Department of Operational Research, Faculty of Mathematical Sciences,
University of Delhi, Delhi 110007, India
e-mail: [email protected]; [email protected]
M. Mathirajan (*)
Department of Management Studies, Faculty of Engineering,
Indian Institute of Science, Bangalore 560012, India
e-mail: [email protected]
Department of Management Studies, Indian Institute of Science, Bangalore,
Driving the Economy through Innovation and Entrepreneurship,DOI 10.1007/978-81-322-0746-7_56, # Springer India 2013
683

spreading rapidly in supply chain management. As enterprises seek to improve
supply chain efficiency through increased integration, ICT can be considered as a
key enabler for supply chain management by supporting information sharing. The
same type of integration becomes emergent in the urgency conditions, where
consumers’ requirement is to be fulfilled in a short span. In such conditions, the
whole supply chain operates like just-in-time as time intervals for procuring and
transportation are more in number but short in durations.
A variety of research papers have contributed significantly in the study of two-stage
supply chains, integrated discounts, and transportation schemes among which few are
as follows. Regarding the integrated discounts and transportation schemes, Monahan
(1984) proposed a quantity discounts model where the vendor can determine the
discount schedule and batching policy to maximize its economic gains while add no
cost to the buyer. The model assumes that both buyer and vendor have the same
frequency of ordering and manufacturing setup, and the vendor’s inventory carrying
cost is unaffected by the buyer’s ordering frequency. Banerjee (1986) extended
Monahan’s (1984) model by incorporating vendor’s inventory carrying cost. The
model proposed byHalm andYano (1992) has proposed a synchronousmodel, aiming
to minimize the manufacturer’s and buyer’s inventory holding cost, manufacturer’s
setup cost, as well as transportation cost. Parlar andWang (1995) presented a quantity
discount schedule in which there is a unique per unit price for each quantity the buyer
might choose. They considered that the vendor does not have complete information on
buyer’s cost parameters but have known the buyer’s inventory holding cost. Assuming
demand is decreasing function of buyer’s selling price and the warehouse has
complete information on the system, Weng (1995) studied the single-warehouse mul-
tiple identical buyers system and suggested coordinating the system using quantity
discounts and franchise fees. Studying the system under both global information
environment and private information environment, Chen et al. (2001) generalized
Weng’s (1995) extended model to heterogeneous buyers. Further, many authors have
also contributed their research in the field of two-stage supply chains; Subramanya
and Sharma (2009) integrated two-stage supply chain network of an automobile com-
pany, measured the performance parameters, and established the priority decision
and queuing rules for improving the utilization of resources. The study restricted to
measuring operational processes in a two-stage supply chain between the supplier,
manufacturer, and distributors. Wang et al. (2009) examined the dynamics of a two-
stage supply chain consisting of one retailer and one distributor with order-up-to-
control policy. Lee et al. (2000) examined the value of information in a two-stage
supply chain under an autoregressive demand process.
The current study proposes a mathematical model for a two-stage supply chain
network with multisource and destinations, incorporating both quantity and freight
discounts. Particularly, the objective of the model is to minimize the total incurred
cost during procurement, holding at suppliers, transportation from different supply
points to halt point, holding at halt point, transportation from halt point to desti-
nations, and finally holding at destinations. To the best of our knowledge, the
problem configuration considered in this study has not been considered in the
earlier studies in the literature.
684 K. Gandhi et al.

2 Proposed Model Formulation
2.1 Problem Statement and Assumptions
The current model demonstrates a two-stage integrated procurement-transportation
model with the objective to minimize the total incurred cost movement of ordered
quantity from multisources to intermediate node and further to multidestinations,
where inventory carrying cost at intermediate node is higher than cost at sources
and destinations.
At the time of model development, the following assumptions were taken:
• Finite planning horizon; deterministic demand; supply is instantaneous.
• Variant prices of one type of product at different destinations.
• All products are available at all the sources; initial inventory at the planning
horizon is zero.
2.2 Sets
Product set with cardinality P and indexed by iPeriod set with cardinality T and indexed by tPrice discount break point set with cardinality L and indexed by lFreight discount break point with cardinality K and indexed by kSource set with cardinality J indexed by jDestination set with cardinality M indexed by mWaiting time set at intermediate node with cardinality G and indexed by t
2.3 Parameters
hijt Inventory carrying cost per unit of product i for tth period at source jfijmt Unit purchase cost from jth source to mth destination for ith product in
tth period
dijlt Discount factor that is valid if more than aijlt unit is purchased
0<dijlt<1
bjt Weight freight cost in tth period from source j to intermediate node
fjkt Transportation freight discount factor from source j to intermediate
node in period t at freight break kO1jt Holding cost at intermediate node for first halting day in period t for
source jðt� 1ÞO2jt Holding cost at intermediate node from second day onward for ðt� 1Þ
number of days in period t for source jhimt Inventory carrying cost per unit of item i for tth period at destination mCmt Cost of transportation from intermediate node to mth destination in
period t
A Two Stage Supply Chain Model for Multi Sources and Destinations. . . 685

Dimt Demand for item i in period t from mth destination
CRimt Consumption at destination m of product i in period taijlt Limit beyond which a price break becomes valid, availed from jth
source to intermediate node in period t for item i for jth price breakbjkt Limit beyond which a freight break becomes valid from jth source to
intermediate node at period t for kth freight breakwi Per unit weight of ith productINij1 Initial inventory of the planning horizon at source j for product iINim1 Initial inventory of the planning horizon at destination m for product i
2.4 Decision Variables
Xijmt Amount of item i ordered in period t from source j for destination mRijlt If the order size for all item types for period t is greater thanaijlt, the quantity
discount is applied Rijlt ¼ 1; if aijlt �Xijmt < aijðlþ1Þt0; otherwise
�
Iijt Inventory level at jth source for product i at the end of period tZjkt If the order size for all item types for period t is greater than bjkt, the freight
discount is applied Zjkt ¼ 1; if bjkt � L1jt < bjðkþ1Þt0; otherwise
�
L1jt Total weighted quantity transported in period t from source j to intermediate
node
L2mt Weighted transported quantity from intermediate node to destination m in
period tPrjmt Proportion of ordered quantity is to be transported to destination m, out total
available weight at intermediate node
Iimt Inventory level at mth destination for product i at the end of period t
vtjt1 if L1jt waits at halt0 otherwise
�
2.5 The Mathematical Model
Minimize
XTt¼1
XJj¼1
XPi¼1
hijtIijt þXLl¼1
RijltdijltXMm¼1
fijmtXijmt
( )" #þXTt¼1
XJj¼1
XKk¼1
ZjktfjktbjtL1jt� �
þXTt¼1
XJj¼1
XGt¼1
L1jt O1jt þ ðt� 1Þ � O2jt
� �vtjt
� �þXMm¼1
XTt¼1
L2mtCmt þXTt¼1
XMm¼1
XPi¼1
himtIimt
(1)
686 K. Gandhi et al.

Subject to
Iijt ¼ Iijt�1 þXMm¼1
Xijmt �XMm¼1
Dimt; i ¼ 1; . . . ;P; j ¼ 1; . . . ; J; t ¼ 2; . . . ; T (2)
Iij1 ¼ INij1 þXMm¼1
Xijm1 �XMm¼1
Dim1; i ¼ 1; . . . ;P; j ¼ 1; . . . ; J (3)
XTt¼1
Iijt þXMm¼1
XTt¼1
Xijmt �XMm¼1
XTt¼1
Dimt; i ¼ 1; . . . ;P; j ¼ 1; . . . ; J (4)
Iimt ¼ Iimt�1 þ Dimt � CRimt; i ¼ 1; . . . ;P; m ¼ 1; . . . ;M; t ¼ 2; . . . ; T (5)
Iim1 ¼ INim1 þ Dim1 � CRim1; i ¼ 1; . . . ;P; m ¼ 1; . . . ;M (6)
XTt¼1
Iimt þXTt¼1
Dimt �XTt¼1
CRimt; m ¼ 1; . . . ;M; i ¼ 1; . . . ;P (7)
Xijmt �XLl¼1
aijltRijlt i ¼ 1 . . .P; t ¼ 1 . . . T; j ¼ 1; . . . ; J;m ¼ 1; . . . ;M (8)
XLl¼1
Rijlt ¼ 1 i ¼ 1; . . . ;P; t ¼ 1; . . . ; T; j ¼ 1; . . . ; J (9)
L1jt ¼XMm¼1
XPi¼1
wiXijmt
XLl¼1
Rijlt
" #; t ¼ 1; . . . ; T; j ¼ 1; . . . ; J (10)
L1jt �XKk¼1
bjktZjkt; j ¼ 1; . . . ; J; t ¼ 1; . . . ; T (11)
XKk¼1
Zjkt ¼ 1; j ¼ 1; . . . ; J; t ¼ 1; . . . ; T (12)
XGt¼1
vtjt ¼ 1; t ¼ 1; . . . ; T; j ¼ 1; . . . ; J (13)
L2mt ¼ PrjmtL1jt ¼XPi¼1
oiXijmt; t ¼ 1; . . . ; T; m ¼ 1; . . . ;M; j ¼ 1; . . . ; J (14)
A Two Stage Supply Chain Model for Multi Sources and Destinations. . . 687

XMm¼1
Prjmt ¼ 1; t ¼ 1; . . . T; j ¼ 1; . . . ; J (15)
Xijmt; L1jt; L2mt � 0 Rijlt ¼ 0 or 1; Zjkt ¼ 0 or 1 vtjt ¼ 0 or 1 0 < Prjmt < 1
Iijt; Iimt are intergers
In the proposed mathematical model, Eq. (1) is the objective function to mini-
mize the cost incurred in holding ending inventory at source, cost of purchasing the
multiproducts reflected by the first term of the objective function; the combination
of transportation cost from the sources to the intermediate node and halting cost at
intermediate node is discussed in second term. Transportation cost from inter-
mediate node to different destinations and holding cost at destination is explained
in third term. The cost is calculated for the duration of the planning horizon. The
ordering cost is a fixed cost not affected by the ordering quantities and therefore is
not the part of objective function.
Equations (2), (3), (4), (5), (6), and (7) are the balancing equations for sources
and destinations where Eq. (2) finds that total ending inventory at each source of ith
product in tth period is found by reducing the demand of all the destinations from
total of ending inventory of previous period and ordered quantity at tth period of
all the destinations. Equation (3) finds that total ending inventory at each source
of ith product in first period is found by reducing the demand of all the destinations
from total of initial inventory if the planning horizon and ordered quantity at first
period of all the destinations. Equation (4) shows that total demand in all the periods
from all destinations is less than or equal to total of ending inventory and ordered
quantity at all the sources in all the periods, i.e., shortages are not allowed.
Equation (5) calculates ending inventory at mth destination for tth period by reducingconsumption of the same destination from the combination of ending inventory of
previous period and demand at mth destination. Equation (6) calculates ending
inventory for the first period at mth destination by reducing consumption of the
same destination from the combination of initial inventory of planning horizon and
demand of at mth destination. Equation (7) shows that total consumption in all the
periods at mth destination is less than or equal to total of ending inventory and
demand at destination m in all the periods, i.e., shortages are not allowed.
Equations (8) and (9) find out the order quantity of all products in period t whichmay exceed the quantity break threshold and avail discount on ordered quantity at
exactly one quantity discount level. Equation (10) is the integrator for stage one’s
procurement Eqs. (2, 3, 4, 5, 6, 7, 8, and 9) and transportation Eqs. (11, and 12), which
calculates weighted quantity to be transported from source j to intermediate node
according to weights per product. Equations (11) and (12) find out the weighted
transport quantity of all products in period t which may exceed the freight break
threshold and avail discount on transportation quantity at exactly one freight discount
break. Equation (13) finds out exact number of halting days at intermediate node.
Equation (14) calculates proportioned weighted quantity transported from inter-
mediate node of stage one to destination. Here, L2jt is the weight transported in stagetwo of the model, which is also equal to multiplied combination of the weight per unit
688 K. Gandhi et al.

and optimum ordered quantity. Whereas Eq. (15) ensures that whatever reached at
intermediate node has been transported to destinations in unequal proportions.
2.6 Price Breaks
As discussed above, variable Rijlt specifies the fact that when the order size at
period t is larger than aijlt, it results in discounted prices for the ordered items for
which the price breaks are defined as: Price breaks for ordering quantity are
df ¼dijlt aijlt � Xijmt < aijðlþ1Þt
dijLt Xijmt � aijLt
(
i ¼ 1; . . . ;P; t ¼ 1; . . . ; T; l ¼ 1; . . . ;L; j ¼ 1; . . . ; J; m ¼ 1; . . . ;M
Freight breaks for transporting quantity are
df ¼fjkt bjkt � L1jt < bjðkþ1Þt
fjKt L1jt � bjKt
(
t ¼ 1; . . . ; T; j ¼ 1; . . . J; k ¼ 1; . . .K
where df is the discount factor. And, bjkt is the minimum required quantity to be
transported.
3 Case Study
Pretty Heels Pvt. Ltd. is a leather shoes and bag company, who runs many stores in
the northern region of India, especially in metro city Delhi and NCR. Company’s
claim “We sell only leather products” is well appreciated by its customers, and
every store has very good footfall and revenue. Company policy is to keep all the
articles in parity among all the stores. By this way, they cannot have shortage at any
of its store and would be able to retain its reputation in market. In such a condition,
the company really has to take care of its supply chain. Pretty Heels is running 12
stores in Delhi and NCR, and 6 outsourced manufacturing plants that are fulfilling
the demand for the stores. In this current case, we are discussing a tiny environment
of the full scenario by taking three stores and two manufacturing plants and three
types of shoe articles especially for winter seasons: article type 1, closed belly with
3-in. heel; article type 2, back opened flat belly; and article type 3, flat closed belly.
Weight (in kg) per carton per product is 5, 6, and 3 kg. Considered manufacturing
plants located in Madhya Pradesh are as follows: plant I, Indore, and plant II,
Bhopal. Stores located in Delhi and NCR markets are named as store I, Noida
A Two Stage Supply Chain Model for Multi Sources and Destinations. . . 689

Sec-18 market; store II, GK M-block market; and store III, Connaught Place
market. The company’s major concern is to check and manage the cost of moving
ordered quantity from manufacturing plant to intermediate node and further to
stores, as the company is spending for cost of holding at stores, cost of procurement
while purchasing from manufacturer, cost of transporting ordered quantity from
manufacturing point to intermediate node (Alwar, Rajasthan), halting cost at inter-
mediate node, transportation cost from halting point to different stores, and one
more cost, i.e., cost of holding at manufacturing plant because the manufacturer
is providing discounts on bulk purchase so in such case he or she has to keep
bulk quantity in his or her warehouse to deliver to the stores. Company requires
this measurements and management especially for winter season, i.e., December
(period 1), January (period 2), and February (period 3). The data for the scenario is
as follows:
Table 1 Holding cost per unit at plant (Rs.)
Period I Period II Period III
Plant I Plant II Plant I Plant II Plant I Plant II
Article I 3.5 3.4 3.8 3.5 3.3 3.7
Article II 3.1 3.3 4 3.2 3.5 3.2
Article III 4 4.4 3.7 3.9 3 3.3
Table 2 Purchase cost for all stores (Rs.)
Period I Period II Period III
Product
I
Product
II
Product
III
Product
I
Product
II
Product
III
Product
I
Product
II
Product
III
Plant I 268 279 267 263 285 270 265 280 265
Plant II 280 260 282 271 265 272 270 260 270
Table 3 Quantity threshold and discount factor
Quantity
thresholds PDT I
Discount
factor
Quantity
thresholds PDT II
Discount
factor
Quantity
thresholds PDT III
Discount
factor
0–100 1 0–90 1 0–86 1
100–200 0.98 90–180 0.95 86–170 0.97
200 and above 0.95 180 and above 0.90 170 and above 0.95
Table 4 Weight threshold in all periods and plants and transportation cost per weight to halting
point
Weight thresholds Discount factor Transportation cost Plant I Plant II
2,000–5,000 1 Period I 15 14
5,000–8,000 0.98 Period II 14 12
8,000 & above 0.95 Period III 13 16
690 K. Gandhi et al.

Table 5 Holding cost at halting point
Period 1 Period 2 Period 3
Halting
day 1
Halting day 2
onward
Halting
day 1
Halting day 2
onward
Halting
day 1
Halting day 2
onward
Plant I 10 2 9 3 11 4
Plant II 9 4 10 7 8 4
Table 6 Holding cost at all the stores for all products (Rs.)
Period I Period II Period III
Product
I
Product
II
Product
III
Product
I
Product
II
Product
III
Product
I
Product
II
Product
III
Store I 2.5 2.1 3 2.8 3 2.7 2.3 2.5 2
Store II 2.4 2.3 3.4 2.5 3.2 2.9 2.7 2.2 2.3
Store III 2.3 2.7 3.7 2.6 3.5 2.6 2.4 2 2.6
Table 7 Demand from each store in all periods for all products
Period I Period II Period III
Product
I
Product
II
Product
III
Product
I
Product
II
Product
III
Product
I
Product
II
Product
III
Store I 170 189 170 172 188 172 169 184 167
Store II 179 167 179 174 169 176 176 164 173
Store III 185 187 174 183 184 172 182 185 170
Table 8 Consumption at each store in all period for all products
Period I Period II Period III
Product
I
Product
II
Product
III
Product
I
Product
II
Product
III
Product
I
Product
II
Product
III
Store I 168 179 167 163 185 170 165 180 165
Store II 180 160 182 171 165 172 170 160 170
Store III 181 180 170 179 180 171 175 180 168
Table 9 Transportation cost
per weight from halting point
to all destinations
Period I Period II Period III
Store I 12 11 16
Store II 15 14 14
Store III 14 16 13
Table 10 Initial inventory at
destination for period IProduct I Product II Product III
Store I 70 80 40
Store II 59 68 50
Store III 40 56 60
A Two Stage Supply Chain Model for Multi Sources and Destinations. . . 691

The date collected from the case study organization is employed to validate the
proposed model. A LINGO code for generating the proposed mathematical models
for the given date was developed and solved using LINGO 11.0. The results provide
optimal solution for the decision variables: optimum ordered quantity, inventory
level at sources and destinations, total weight transport from sources to halting
point, proportioned weight transport to destination from halting point, and number
of days to halt at intermediate node.
The total incurred cost is Rs. 37,23,490. The optimum ordered quantity from store
I is 200 cartons with quantity discount of 5% for product I, 212 cartons with 10%
discount for product II, and 183 cartons with 5% discount for product III. Inventory at
source in period I is 66, 29, and 0 cartons for each product respectively. Inventory at
store I, at the end of period I, is 72, 90, and 43 cartons for each product respectively.
Weight transport up to intermediate node is 8,001, 12,310, and 2,000 kg with
discounts of 5, 5, and 0% respectively. Weight transport from intermediate node
to store I is 2,821, 7,130, and 510 kg. In each period total weight quantity is kept
at halting point only for 1 day. Remaining managerial results are presented in the
Appendix.
4 Conclusion
Though there are many studies reporting on a two-stage supply chain network with
multisource and destinations, incorporating either quantity or freight discounts,
the objective of minimizing the total incurred cost during procurement, holding at
suppliers, transportation from different supply points to halt point, holding at halt
point, transportation from halt point to destinations, and finally, holding at
destinations in a two-stage supply chain network with both quantity and freight
discounts is not addressed so far. So, the current study proposed a mathematical
model for the literature gap identified and mentioned in this study. The proposed
model was validated by applying to the real case study data.
Acknowledgments Kanika Gandhi (lecturer, Quantitative Techniques and Operations) is thankful
to her organization “Bharatiya Vidya Bhavan’s Usha & Lakshmi Mittal Institute of Management”
for providing her the opportunity for carrying research work.
692 K. Gandhi et al.

Appendix: Managerial Reports Based on the Optimal Solution
from the Proposed Model
Exhibit 2 Inventory at each
manufacturing plantProduct I Product II Product III
Period I 66 29 0
Period II 433 533 0
Period III 0 0 0
Exhibit 3 Inventory at the stores
Period I Period II Period III
Product
I
Product
II
Product
III
Product
I
Product
II
Product
III
Product
I
Product
II
Product
III
Store I 72 90 43 81 93 45 85 97 47
Store II 58 75 47 61 79 51 67 83 54
Store III 44 63 64 48 67 65 55 72 67
Exhibit 4 Weight transport
quantity up to intermediate
node/discount availed from
each plant
Period I Period II Period III
Plant 8,001/5 12,310/5 2,000/0
Exhibit 5 Weight transport
quantity to destinationsPeriod I Period II Period III
Store I 2,821 7,130 510
Store II 2,590 2,590 510
Store III 2,590 2,590 980
Exhibit 6 Proportion
transported from
manufacturing plant to stores
Period I Period II Period III
Plant I, II Plant I, II Plant I, II
Store I 0.3525809 0.5792039 0.2550000
Store II 0.3237095 0.2103981 0.2550000
Store III 0.3237095 0.2103981 0.4900000
Exhibit 1 Ordered quantity/discount percentage availed for each manufacturing plant to halting
point
Period I Period II Period III
Product
I
Product
II
Product
III
Product
I
Product
II
Product
III
Product
I
Product
II
Product
III
Store I 200/5 212/10 183/5 496/5 685/10 180/5 0/0 0/0 170/5
Store II 200/5 180/10 170/5 200/5 180/10 170/5 0/0 0/0 170/5
Store III 200/5 180/10 170/5 200/5 180/10 170/5 94/0 180/10 170/5
A Two Stage Supply Chain Model for Multi Sources and Destinations. . . 693

References
Banerjee A (1986) Note on “a quantity discount pricing model to increase vendor profits”. Manage
Sci 32(11):1513–1527
Chen F, Federgruen A, Zheng Y (2001) Coordination mechanisms for a distribution system with
one supplier and multiple retailers. Manage Sci 47(5):693–708
Halm J, Yano CA (1992) The economic lot and delivery scheduling problem: the single item case.
Int J Prod Econ 28(2):235–251
Lee HL, So KC, Tang CS (2000) The value of information sharing in a two-level supply chain.
Manage Sci 46(5):626–643
Monahan JP (1984) A quantity discount pricing model to increase vendor profits. Manage Sci
30(6):720–726
Parlar M, Wang Q (1995) A game theoretical analysis of the quantity discount problem with
perfect and incomplete information about the buyer’s cost structure. RAIRO Oper Res
Recherche Opérationnelle 29(4):415–439
Shamim MH, Riaz S, Shaikh RA (2008) An analysis of rise and fall of SCM - ICT integration by
the FMCG sector in Pakistan. Proceedings of the World Congress on Engineering, 2
Subramanya KN, Sharma SC (2009) Integrated scheduling of a two stage supply chain network
using simulation – a case study. Int J Comput Sci Netw Secur 9(4):364–369
Tan GW, Shaw MJ, Fulkerson B (2000) Web-based supply chain management. Inf Syst Front
2(1):41–55
Wang H, Liu H, Yang J (2009) Dynamic analysis of a two-stage supply chain—a switched system
theory approach. Int J Adv Manuf Technol 43(1–2):200–210
Weng ZK (1995) Channel coordination and quantity discounts. Manage Sci 41(9):1509–1522
694 K. Gandhi et al.

Adoption of Freight Management System (FMS)
in Logistics: An Exploratory Study
Timira Shukla and M.R. Bansal
1 Introduction
The role of technology investments in logistics is beyond doubt. It involves the
integration of information, transportation, inventory, warehousing, material handling,
and packaging. When there are multiple vendors, multiple locations, as well as stock
points and manufacturing facilities, transportation of rawmaterial, supplies, and good
assumes great importance. The recent years have witnessed a transition from an era
focused primarily on developing infrastructure toward an era that is increasingly
focused on system integration and optimization in the field of freight management.
The past efforts, whether it was railroads or ports, was primarily oriented toward
system construction. Today, these systems are extensive and mature; the focus
therefore has shifted toward designing and developing an integrated solution which
can integrate different elements of back-end operations.
Freight management is a key element that links the existing production and
distribution processes. It accounts for significant cost in the supply chain. In India,
13% of our GDP is sunk in logistics cost (other countries spend in single digit).1
Though logistics business in India is still in initial stages, the scope for implementing
the back-end IT systems is immense. One of the back-end solutions is FMS,
that is, freight management systems. As logistics is the competency that links
an enterprise with its customers and suppliers, information about the customer
flows through the enterprise in the form of sales activity, forecasts, and orders. As
many activities like fleet management/transport, vendors, warehouses, inventory,
T. Shukla
Institute of Management Studies, Ghaziabad, India
e-mail: [email protected]
M.R. Bansal (*)
Dr. B. R. Ambedkar University, Agra, India
e-mail: [email protected]
1 Source: Article in The Strategist- Business Standard dated October 31, 2011.
Department of Management Studies, Indian Institute of Science, Bangalore,
Driving the Economy through Innovation and Entrepreneurship,DOI 10.1007/978-81-322-0746-7_57, # Springer India 2013
695

packaging, documentation, etc., are involved, integration is important to build an
effective system. FMS has the potential to build and strengthen these linkages in
the value chain to improve the bottom line. It has the potential to be an effective
enabler for the effective control of today’s complex logistics, and supply chain
network is beyond doubt.
It is important to mention that a successful business model encompasses strat-
egy, customer value, information system, process, and people (employee) manage-
ment.2 However, IT by itself will not guarantee returns as adoption of a particular
technology and/or software application requires complementary investments in
processes as well as people who are a vital link in any change agenda. It is in this
context that a study has been undertaken to identify the issues that are considered
important by the employees working in transport organizations.
1.1 FMS: Meaning and Significance
The operating responsibility of logistics is the geographical repositioning of raw
materials, work in process, and finished inventories where required at the lowest
cost possible. Thus the process is viewed in terms of two interrelated efforts,
inventory flow and information flow.
Inventory flow – The management of logistics is concerned with the movement and
storage of materials and finished products. From the initial purchase of a material
or component, the logistical process adds value by moving inventory when and
where needed. For a large manufacturer, logistical operations may consist of
thousands of movements, which ultimately culminate in the delivery of the
product to an industrial user, wholesaler, dealer, or customer.
Information flow – Information flow identifies specific locations within a logistical
system that have requirements. It includes coordination flows and operation flows.
Coordination flow – Coordination is the backbone of the overall information
system. The strategic objectives detail the nature and location of customers,
which are matched to the required products and services to be performed. The
forecasting utilizes historical data, current activity levels, and planning
assumptions to predict future activity levels. Logistical forecasting is generally
concerned with relatively short-term predictions. The overall purpose of infor-
mation planning/coordination flow is to integrate specific activities within a firm
and to facilitate overall integrated performance.
Operational flow – The second aspect of information requirements is concerned
with directing operations to receive, process, and ship inventory as required
supporting customer and purchasing orders. Operational requirements deal with
order management, order processing, distribution operations, inventory manage-
ment, transportation and shipping, and procurement.
2Weick (1993).
696 T. Shukla and M.R. Bansal

The FMS is expected to reduce lead times, inventories, and associated storage
costs. It is scalable and can be merged with supply chain management module as
well as order processing and warehouse/distribution module. FMS is a customized
Windows-based software developed for the companies involved in freight or logistics
business. Manpower issues are contentious as training them is also an important
element of the strategy. The human aspect is often overlooked, and therefore, an
empirical study of employees has been undertaken to obtain an insight into the
human dimension of IT.
2 Literature Review
The dominant theoretical model pertaining to technology acceptance (in this case,
FMS) is the technology acceptance model (TAM) propounded by Davis et al.
(1989). The TAM model has been adapted from the classical diffusion theory
propounded by Rogers (1983). The TAM posits that usefulness and ease of use
are the primary drivers of technology acceptance. The usefulness dimension focuses
on the user’s perspective regarding utility of the IT application in improving job
performance, and ease of use refers to the degree to which the user perceives the
solution to be free of effort (Davis et al. 1989). Lucas and Spitler (1999) have asserted
that IT impact does not materialize by themselves. Instead, it is the synergy between
IT and complementary organizational investments that creates positive impact
(Barua and Mukhopadhyay 2000; Zhu and Kraemer 2002; Russell and Hoag 2004).
As technology can be viewed as a kind of knowledge (Grant 1996), it has higher
probability of acceptance when it can be shared with the other employees in the
organization. Teece (1996) also found that technology innovation has a higher
probability of acceptance when it follows a technological paradigm. A large body
of research regarding factors impacting adoption suggests that individual factor and
organizational context are important determinants (Damanpour 1991; Tidd et al.
1997). These authors have posited that variables affecting technology adoption can
be individual, task related, and/or organization based. Individuals rarely have
complete autonomy regarding adoption of work place innovations. The other factor
that inhibits adoption is adopters’ ability to adopt which focuses on the skill sets
of the individuals in the organizations. Developing the employee skills is therefore
an important dimension in respect of technology-related innovations. It can be
summarized that while the adoption of information technology has been an exten-
sive area of study, research efforts have not probed in detail the impact of end-
users’ perspective. An empirical study has been conducted primarily focusing on
finding out the expectations of the potential adopters’ with respect to technology.
3 Purpose of the Study
The main objective of this chapter is to study the importance of freight management
system (FMS) in logistics companies in India. The main premise that is being
examined is that the more useful the innovation, the more likely it is that the
Adoption of Freight Management System (FMS) in Logistics: An Exploratory Study 697

logistics company will adopt the FMS. A structured questionnaire was administered
to the employees of logistics companies in Delhi and NCR (refer to annexure) to
find out their perception of FMS suite implemented in their organizations. The sample
size that is included for analysis is 100; the method adopted for selecting the sampling
elements is nonprobabilistic. The study is exploratory and analytical in nature. The
method of EFA (exploratory factor analysis) has been used to identify the important
factors that impact adoption of FMS. This method was used as it can minimize the
number of variables that have high factor loadings and group the variables.
4 Analysis and Discussion
The Tables 1, 2, and 3 show the frequency distribution of various demographic
variables of the employees working in the logistics company. An exploratory factor
analysis was carried out to identify the important factors that are of significance in
adopting the FMS. As the KMO (Table 4) value calculated is more than 0.5 (0.682),
the factor analysis was carried out to extract the factors that are important for
adoption (refer Tables 5, 6, and 7). The questionnaire contains 25 variables which
Table 1 Frequency
distribution of genderFrequency Valid percent Cumulative percent
Male 62 62.0 62.0
Female 38 38.0 100.0
Total 100 100.0
Table 2 Frequency
distribution of ageFrequency Valid percent Cumulative percent
18–25 62 62.0 62.0
26–35 32 32.0 94.0
36–50 5 5.0 99.0
>50 1 1.0 100.0
Total 100 100.0
Table 3 Frequency
distribution of employees
(function-wise)
Frequency Valid percent Cumulative percent
Sales 28 28.0 28.0
Marketing 38 38.0 66.0
Finance 16 16.0 82.0
HR 8 8.0 90.0
R&D 9 9.0 99.0
Others 1 1.0 100.0
Total 100 100.0
Table 4 KMO and Bartlett’s
testKaiser-Meyer-Olkin measure of sampling adequacy .682
Bartlett’s test of sphericity Approx. chi-square 467.215
Df 300
Sig. .000
698 T. Shukla and M.R. Bansal

Table
5Totalvariance
explained
Component
Initialeigenvalues
Extractionsumsofsquared
loadings
Rotationsumsofsquared
loadings
Total
%ofVariance
Cumulative%
Total
%ofvariance
Cumulative%
Total
%ofvariance
Cumulative%
12.940
11.761
11.761
2.940
11.761
11.761
2.171
8.684
8.684
22.212
8.847
20.607
2.212
8.847
20.607
1.961
7.844
16.528
31.969
7.877
28.484
1.969
7.877
28.484
1.847
7.389
23.916
41.774
7.097
35.581
1.774
7.097
35.581
1.826
7.303
31.219
51.546
6.183
41.764
1.546
6.183
41.764
1.747
6.988
38.207
61.474
5.896
47.660
1.474
5.896
47.660
1.662
6.648
44.855
71.261
5.045
52.705
1.261
5.045
52.705
1.522
6.090
50.945
81.219
4.875
57.580
1.219
4.875
57.580
1.424
5.697
56.641
91.152
4.609
62.189
1.152
4.609
62.189
1.387
5.548
62.189
10
.980
3.920
66.109
11
.921
3.682
69.791
12
.839
3.356
73.147
13
.811
3.245
76.393
14
.771
3.084
79.476
15
.737
2.948
82.424
16
.717
2.869
85.292
17
.592
2.367
87.659
18
.546
2.183
89.843
19
.469
1.877
91.719
20
.441
1.763
93.483
21
.403
1.612
95.095
22
.368
1.470
96.565
23
.333
1.331
97.896
24
.282
1.127
99.023
25
.244
.977
100.000
Adoption of Freight Management System (FMS) in Logistics: An Exploratory Study 699

Table 6 Rotated component matrixa
Component
1 2 3 4 5 6 7 8 9
Q5 �.675 �.107 �.142 �.120 .197 �.063 �.189 .189 .087
Q6 .048 .040 .062 .116 �.038 .840 .089 .105 .038
Q7 .272 .053 �.090 .697 .333 .080 .045 .135 �.107
Q8 .206 .072 .026 �.098 �.340 �.199 .618 .030 .088
Q9 .149 .022 .206 .227 .079 .319 �.041 .672 �.166
Q10 �.336 .015 �.037 .406 �.189 �.407 .163 �.072 �.011
Q11 .133 �.351 .200 .314 �.058 .360 �.507 .017 �.121
Q12 .615 �.024 �.360 �.085 .061 �.124 �.048 .035 .080
Q13 .027 �.082 �.090 �.781 .130 �.079 .078 �.017 �.100
Q14 .261 .324 .545 �.044 .219 .179 �.168 .097 .004
Q15 �.017 .069 .024 �.076 .743 �.066 �.003 �.094 .159
Q16 �.021 �.229 .441 �.040 .182 .050 .022 .173 �.066
Q17 .329 �.104 .119 .143 .549 .074 �.112 �.063 �.160
Q18 .095 .550 .115 �.340 .374 �.287 .038 .035 .063
Q19 �.690 .004 �.165 �.036 �.201 �.167 .023 �.008 .195
Q20 �.217 �.039 �.041 �.053 �.186 �.054 �.027 .804 .059
Q21 .250 .403 �.199 .006 �.425 �.035 �.300 �.118 .328
Q22 �.194 .031 �.014 �.032 .002 .051 .048 �.015 .811
Q23 .373 �.224 .293 .189 .156 �.294 .004 .012 .453
Q24 .105 .205 .530 �.248 �.136 �.242 �.103 .177 �.309
Q25 �.034 .725 �.012 .037 �.159 .306 �.006 �.109 .026
Q26 .312 �.149 �.063 .067 .037 .053 .354 .316 .282
Q27 �.053 .148 .760 .175 �.024 .050 .087 �.176 .168
Q28 �.029 .701 .233 .282 .068 �.157 �.027 .056 �.149
Q29 �.055 �.121 .033 .084 .097 .242 .721 �.089 �.049
Extraction method: Principal component analysis
Rotation method: Varimax with Kaiser normalizationaRotation converged in 15 iterations
Table 7 Factor matrix
Factor name Variables
Efficiency Efficiency
Effectiveness Less maintenance cost, reduced repetition of work, route optimization,
improved traffic analysis, saves time through billing system,
maintains consignee history, reduces weight on godown stock
User friendliness Controls better inventory system, user friendly and easy to implement,
provides 24 � 7 customer service, performs better tally integration,
customer login, SMS alerts
Reduced cost Efficiency, reduced ordering cost on maintaining and ordering,
improves management cost of whole organization, gives expiry
alerts, supports both remote and desktop application
Productivity Improves branch profitability, maintains data between different
companies, increases branch growth and productivity, improved
branch growth and productivity system
Result driven Reliability, affordable data security
Assurance Easy freight analysis, user friendliness
Confidentiality Privacy
700 T. Shukla and M.R. Bansal

denote the various parameters which impact the adoption of FMS in logistics
companies. By applying varimax rotation for data reduction, eight components
have been extracted; these eight components are the linear combination of 25
original variables.
5 Conclusion and Recommendation
It can be seen that efficiency and effectiveness are important dimensions of
adoption. The technological factors such as flow of information, savings in cost/
time, and transfer of information are important drivers affecting FMS suite as per
employee perception. The important factors that were identified from this explor-
atory study with regard to implementation of FMS software are the following:
• It should improve data security and assist in synchronization.
• It should minimize work repetition and improve route optimization.
• It should assist for better MIS reporting system and provide 24 � 7 customer
service.
The results show that logistics companies have the willingness to adopt
technologies to provide better services if it enables them to improve their perfor-
mance. However, it is very important for the organization to first implement trial
versions of the FMS software so that the employees can gain hands-on experience
in the use of software.
5.1 Limitations
FMS application is only an enabler; it has to be leveraged to deliver value by
improving the links between purchase and supply, though this aspect has not been
investigated. As the study was carried out on a small sample from Delhi/NCR, it
cannot be generalized. The other major limitation is that the study did not investi-
gate all the influential factors that affect adoption of FMS.
Annexure (List of Statements)
(Scaled on a 5-point scale with 1 for strongly disagree and 5 for strongly agree)
1. FMS is reliable and affordable.
2. Maintenance cost is less in FMS.
3. FMS reduces repetition of work.
4. It improves branch profitability.
5. It improves company’s route optimization.
6. It improves efficiency of company.
7. FMS is helpful in analyzing real-time traffic analysis.
Adoption of Freight Management System (FMS) in Logistics: An Exploratory Study 701

8. FMS helps in making sync of data from branch to branch.
9. It makes station-wise freight analysis easier.
10. It saves time through monthly customer billing system.
11. It helps in reducing work load of the company for maintaining records of the
company.
12. It helps in maintaining consignee history in an efficient manner.
13. It reduces the burden on godown stock.
14. It helps in controlling inventory management system (FIFO).
15. Privacy is maintained in FMS.
16. FMS is user friendly.
17. It improves the MIS reporting system in an organization
18. It improves data security
19. It improves the management system of the whole organization.
20. It provides 24 � 7 customer service.
21. It is user friendly and easy to implement.
22. It helps in increasing the growth and productivity of the company.
23. It supports both remote and desktop application.
24. It supports modules like booking, delivery, transshipment, good movement,
management, customer login, and SMS alerts.
25. FMS – intelligence gives expiry alerts (legal documents related to transportation).
References
Barua A, Mukhopadhyay T (2000) Information technology and business performance: past,
present and future. In: Zmud RW (ed) Framing the domains of IT management: projecting
the future through the past. Pinnaflex Educational Resources, Inc, Cincinnati, pp 65–84
Damanpour F (1991) Organizational innovation: a meta-analysis of effects of determinants and
moderators. Acad Manage J 34(3):555–590
Davis FD, Bagozzi RP, Warshaw PR (1989) User acceptance of computer technology: a compari-
son of two theoretical models. Manage Sci 35:982–1003
Grant RM (1996) Prospering in dynamically-competitive environments: organizational capability
as knowledge integration. Organ Sci 7(4):375–387
Lucas HC Jr, Spitler VK (1999) Technology use and performance: a field study of broker
workstations. Decis Sci 30(2):291–311
Rogers EM (1983) Diffusion of innovations, 3rd edn. Free Press, New York
Russell DM, Hoag AM (2004) People and information technology in the supply chain: social and
organizational influences on adoption. Int J Phys Distrib Logist Manage 34(1/2):102–122
Teece DJ (1996) Firm organization, industrial structure, and technological innovation. J Econ
Behav Organ 31(2):193–224
Tidd J, Bessant J, Pavitt K (1997) Managing innovation: integrating technological, market, and
organizational change. Wiley, New York
Weick K (1993) The collapse of sense making in organization. Admin Sci Q 38(4):628–652
Zhu K, Kraemer KL (2002) e-commerce metrics for net-enhanced organizations: assessing
the value of e-commerce to firm performance in the manufacturing sector. Inf Syst Res
13(3):275–295
Article in The Strategist- Business Standard dated October 31, 2011.
702 T. Shukla and M.R. Bansal

Swap in Downstream Petroleum Supply Chain:
An Effective Inventory Handling Tool
Hari Mohan Jha Bidyarthi and Laxmikant B. Deshmukh
1 Indian Petroleum Industry: An Overview
The Indian petroleum industry is one of the oldest in the world, with oil being struck
at Makum near Margherita in Assam in 1867 9 years after Col. Drake’s discovery
in Titusville. The industry has since come a long way. For nearly 50 years after
independence, the oil sector in India has seen the growth of giant national oil
companies in a sheltered environment. A process of transition of the sector began
since the mid-1990s, from a state of complete protection to the phase of open
competition. The move was inevitable if India had to attract funds and techno-
logy from abroad into its petroleum sector. The sector in recent years has been
characterized by rising consumption of oil products, declining crude production and
low reserve accretion. The years since independence have, however, seen the rapid
growth of the upstream and downstream oil sectors. There has been optimal use of
resources for exploration activities and increasing refining capacity and the creation
of a vast marketing infrastructure and a pool of highly trained and skilled man-
power. Indigenous crude production has risen to 35 million tonnes per year, an
addition of 14 refineries, an installed capacity of 69 million tonnes per year and a
network of 5,000 km of pipelines (OPEC Annual Statistical Bulletin 2007). But
with the consumption of hydrocarbons said to increase manifold in the coming
decades, the liberalization, deregulation and reforms in the petroleum sector are
essential for the health and overall growth of our economy (International Energy
Agency Statistics 2007).
The petroleum industry traditionally had prices decided by the Government of
India. Effective from 1 August 2004, the government put in a revised methodology
allowing oil companies limited freedom to revise the prices of motor spirit and
H.M.J. Bidyarthi (*) • L.B. Deshmukh
Department of Business Administration and Research, Shri Sant Gajanan
Maharaj College of Engineering, Shegaon 444 203, Maharashtra, India
e-mail: [email protected]; [email protected]
Department of Management Studies, Indian Institute of Science, Bangalore,
Driving the Economy through Innovation and Entrepreneurship,DOI 10.1007/978-81-322-0746-7_58, # Springer India 2013
703

high-speed diesel (HSD). The NELP (New Exploration Licensing Policy) has been
put into place, and more and more international operators are considering investing
in India. The total investment estimated in the petroleum sector from 1995 till 2010
is expected to be Rs. 4,32,000 crore (US$120 billion), out of which Rs. 2,58,000
crore (US$80 billion) are for the upstream sector alone (Petroleum Planning and
Analysis Cell, GOI). The petroleum, oil and lubricants (POL) product consumption
is slated to touch 155 million metric tonnes (MMT) by 2006–2007 and 200 MMT
by the year 2010 (HPCLs perspective plan: Vision 2020). Petrochemical industry in
India employs around 40,000 people directly and around four lakhs indirectly. This
sector caters to a whole host of industries like oil, gas, plastics, agrochemicals,
pharmaceuticals, clothing, housing, transportation, communication, healthcare etc.,
diversified nature of customers demanding well thought-out strategy for enhancing
customer satisfaction level. State of competition in the Indian petroleum industry
final report: January 20, 2009 by Indicus Analytics Pvt. Ltd, New Delhi.
2 Supply Chain Management: A Literature Review
The Supply Chain Council defines a supply chain as a “collection of activities
a company uses to plan, source, make and deliver a product or service” (Agrawal
2003). Supply chain management aims at managing the activities in the supply chain
to improve profitability for the organization (Coyle et al. 2003). Supply chain
management as a new business paradigm was motivated by the interest in integrating
procurement, manufacturing and distribution activities—integration made possible
by advances in IT (Shapiro 2004). SCM is more than a simple tool to evaluate and
optimize a supply chain; it is a complex, structured business relationship model (Bay
et al. 2004). It takes into consideration all aspects of the events required to produce
the company’s product in the most efficient and cost effective manner possible
(Quiett 2002). According to Mohanty and Deshmukh (2005), another very compre-
hensive definition of supply chain management is that it is a loop:
• It starts with customer and ends with customer.
• Through the loop flow all materials, finished goods, information and transactions.
• It requires looking at business as one continuous, seamless process.
This process absorbs distinct functions such as forecasting, purchasing, manufac-
turing, distribution, sales and marketing into a continuous business transaction
(Burgess 1998).
2.1 Petroleum Supply Chain
The supply chain of the petroleum industry is extremely complex compared to other
industries (Kidd et al. 2003). It is divided into two different, yet closely related, major
segments: the upstream and downstream supply chains. The upstream supply chain
704 H.M.J. Bidyarthi and L.B. Deshmukh

involves the acquisition of crude oil, which is the specialty of the oil companies. The
upstream process includes the exploration, forecasting, production and logistics man-
agement of delivering crude oil from remotely located oil wells to refineries (Fig. 1).
2.2 Inventory Management in Petroleum Supply Chain
In case of oil sector companies, especially those in the business of refining,
inventories may broadly be classified as (a) raw materials (b) intermediate stock
or work-in-progress or semi-finished goods and (c) finished goods stock.
(a) RawMaterial: Raw material includes crude oil stock consisting of high-sulphur
crude or low-sulphur crude or both. This may further be categorized into:
indigenous crude oil, i.e. offshore such as from Bombay High, Panna-Mukta
etc. or onshore crude oil such as South Gujarat, North Gujarat, Assam etc., and
imported crude oil such as Bonny Light, Labuan, Arab Mix, Dubai crude etc.
The main sources of procurement of imported crude oil are countries like
Nigeria, Iran, Saudi Arabia, Kuwait, Malaysia etc.
(b) Intermediate Stock: Intermediate stock refers to the stock of goods in semi-
finished form and held between manufacturing stages. At every point of time,
there are certain goods that are neither fully complete nor may be categorized as
raw materials.
(c) Finished Stock: Finished stock consists of goods complete in all respects and
ready for sale or distribution in the market which are either straight run products
such as petrol, diesel, kerosene, LPG etc. or specialty products such as benzene,
toluene, paraffin wax etc.
The analysis of the downstream oil companies reveals that their average inven-
tory to working capital ratio for the year 2008–2009 was 2.04 times as shown in
following Chart 1.
From the above chart, it is further evident that the inventory to working capital
ratio for the year 2008–2009 of IOCL and BPCL was 2.74 times and 2.78 times,
respectively, which was much higher than the average ratio, i.e. 2.04 times of all oil
sector PSUs taken together.
Fig. 1 Showing whole petroleum supply chain. Source: Strategic Shift in Indian Downstream
Sector Technologies in Supply Chain Management; August 2005 by: Ashish Gaikwad, Director –
Advanced Solutions, Honeywell Asia Pacific
Swap in Downstream Petroleum Supply Chain: An Effective Inventory Handling Tool 705

In the downstream oil companies, the crude oil is the major input. The crude is also
a high value item, and major funds of the company are invested in crude procurement
and its holding. It was observed that there was no industry practice/norm fixed by
these companies for keeping the crude inventory. The average raw material holding
in these oil companies was equal to 14.38 days of consumption as depicted in Chart 2.
IOCL, HPCL and CPCL were holding raw material stock equal to 23.19 days,
17.46 and 15 days stock consumption against the oil company’s average of
14.38 days. MRPL was carrying raw material stock of 9.34 days only as on 31
March 2009. Reduction in the raw material holdings by IOCL, HPCL and CPCL
would result in savings towards inventory carrying cost of Rs. 826.31 crore, Rs. 90.34
crore and Rs. 12.02 crore per annum, respectively. The average age of inventory of
oil refining and marketing companies, i.e. IOCL, HPCL, BPCL and NRLwas ranging
between 28.01 and 34.34 days, whereas it was 13.03 and 11.14 days in case of
refining companies, i.e. CPCL and MRPL, respectively (Chart 3).
Chart 2 Showing raw material holdings of oil companies
Chart 1 Showing inventory
to working capital ratios of oil
companies
Chart 3 Showing age of finished goods inventory of oil companies. www.cag.gov.in/html/
reports/commercial/2009-10.../chap3.pdf
706 H.M.J. Bidyarthi and L.B. Deshmukh

Hence, it is critical for the companies to fix stock levels for different categories
of stores, taking into account consumption pattern, lead time, storage space, market
trends, carrying cost, ordering cost etc.
2.3 The Swap Practice
In a commodity-type industry such as oil and petrochemicals, the source of the
commodity is often of no interest to the final customer as long as the commodity
adheres to its required specifications and the delivery of that commodity is made by
the promised due date. Therefore, competing oil and petrochemical companies form
supply chain alliances when delivering commodities to customers in order to reduce
transportation and inventory costs and improve customer service. In return, cost
savings for inventories in the overall supply chain are shared amongst participating
companies. This form of collaboration is referred to as shipment swapping. This
kind of collaboration with competitors creates a shared solution to common supply
chain obstacles and is predicted to be the “next big thing” (Morton 2003).
The swapping technique is currently applied by oil and petrochemical companies
around the world in all of its different forms: asset swapping, business swapping and
shipment swapping. However, because of the absence of any general analytical
discussion of swap practices in the literature, the author has conducted the survey
of petrol pumps in the state of Maharashtra to find out the benefits that can be sought
by using this swap practices.
The present research paper attempts to study and verify that the systematic
cooperative barter system of downstream supply chain management, i.e. swap,
has a positive bearing on inventory cost reduction saving company’s millions of
dollars. It further attempts to ascertain that the swap practice improves the customer
services by petroleum industry.
3 Problem Formulation
The petroleum downstream supply chain ever finds it difficult to reduce the cost of
inventory from refinery to the retailers. Uncertain demand pattern, refinery capac-
ity, inadequate transportation facility, supply depots storage capacity and so on are
the constraints for inventory management in downstream petroleum supply. The
swapping practices seem to be the better solution to the above constrained down-
stream supply chain model. Application of IMS technology further enhances effici-
ency of swapping practice in downstream supply chain management of petroleum
industry. Hence, the authors of this chapter find an opportunity to discuss the merits
Swap in Downstream Petroleum Supply Chain: An Effective Inventory Handling Tool 707

of swap (often called as hospitality or sharing) along with IMS technology with
respect to the inventory management by the public sector giants of petroleum
industry in the state of Maharashtra.
4 Methodology of Research
The Indian petroleum industry consists of 17 public sector oil refineries and 2 private
sector oil refineries in different parts of 10 states of the country. The companies under
private sector units of the industry, both by their numbers and also by their years of
operation, remain the dominant players in Indian petroleum industry. Rightly there-
fore, the investigator proposes to include public sector players of the Indian petro-
leum industry within the scope of the study.
Amongst the ten Indian states where petroleum refineries are located, the state
of Maharashtra alone accounts for largest share of installed capacity (excluding
private sector refineries in Gujarat) and also its refinery crude throughput. It is for
this reason that the authors have done the study to be confined within the territory of
Maharashtra so that its findings can be validly generalized for the country as a
whole. There are only two petroleum giants, BPCL (Bharat Petroleum Corporation
Limited) and HPCL (Hindustan Petroleum Corporation Limited), which have their
refineries located at Mumbai in the state of Maharashtra. Obviously therefore, the
author is left with no choice than to study only these two petroleum giants of India
from amongst the four major Indian petroleum companies including IOC (Indian
Oil Corporation) and GAIL (Gas Authority of India Ltd) besides HPCL and BPCL.
The physical flow of a product as highly inflammable as that of petroleum
through the entire length and breadth of the country encompassing all geographical
and topographical limitations to end no. of users for equally end no. of uses is a
gigantic task aptly taken care of by an emerging field of management science called
as supply chain management. However, petroleum product pricing being consid-
ered as a black hole of subsidies is an issue of hot debate amongst economists and
oil companies. The supply chain management in this industry remains to be more
concurrent and vibrant with its impact on petroleum pricing and petroleum subsidy
as well.
There are numbers of products of petroleum industry. However, of these products,
three, namely, HSD, LDO and lubes, are widely distributed and consumed in India as
these flow through different distribution channels. Hence, for the purpose of present
study, only these three products have been included within the scope for its data
collection and analysis.
The retailers of Maharashtra are clustered in to four geographies popularly
known as Khandesh, Marathwada, Vidarbha and West Maharashtra followed by
convenience sampling. Both the refineries and Gaigaon supply depots (District
Akola, Vidarbha) of HPCL and BPCL were given a structured questionnaire,
and the views of oil company representatives on the issues are collected. Forty
3PL and one hundred and fifty retailers’ responses are gathered through structured
708 H.M.J. Bidyarthi and L.B. Deshmukh

questionnaire and interviews of the concerns. The responses of refineries, supply
depots, retailers, and 3PL are analysed in the next section where some non-
value-adding activities in downstream petroleum supply chain are identified.
5 Swapping and Inventory Management in Maharashtra’s
Downstream Petroleum Supply Chain
5.1 Refineries’ Responses
BPCL has its only refinery at Mumbai in Maharashtra where the crude oil
derivatives, i.e. petroleum products, are separated. The company is having storage
depots at Manmad, Miraj, Gaigaon, Borkhedi, Pakni and Mumbai to cater to the
needs of the state. The transportation from refinery to the end user is generally
done through pipeline tank waggons, tank lorries etc. The most critical response
obtained from the company is “Oil Exchange practice is adopted by oil industry
members to reduce not only the inventory carrying & ordering cost but overall
supply chain cost”.
HPCL also has only one refinery at Mumbai in Maharshtra where crude oil
derivatives are separated. Sewree, Wadala, Vashi, Loni, Pakni, Panewadi, Gaigaon,
Khapri and Hazarwadi are some of the supply depots of HPCL in the state. Again,
the response of HPCL about swapping practice is “Reduced supply chain cost and
improved customer service (timely delivery) are the outcomes of such SWAP
practices”.
5.2 Retailers’ Responses
Retailers of HSD and lubes were conveniently chosen from the identified four
clusters, i.e. Vidharbha, Marathwada, Khandesh and West Maharashtra. Table 1
given below shows the number of sample retailers chosen from these clusters.
An important observation about the awareness of swap practices was obtained as
the awareness is only 33.33% in the state of Maharashtra, whereas more awareness
(i.e. 50%) was observed in company-owned retail outlets. Table 2 shows the
cluster-wise awareness of swapping practices.
As the awareness about swap found to be low, still this chapter reveals that about
19% reduction in the cost of distribution can be exhibited through swap practices.
Most of the remotely placed respondents showed the positive bearing of swap on
the inventory carrying cost of POL products. Availability of POL products supplies
at desired time is enhanced by 22% as a result of swap practices. The most obvious
finding is that swap practices reduce the lead times by 28%. All different parameters
that were researched reveal that petroleum customer service level (PCSL) is or can
Swap in Downstream Petroleum Supply Chain: An Effective Inventory Handling Tool 709

Table
1Showingretailersofselect
petroleum
products
Clusters
Vidharbha
Marathwada
Khandesh
WestMaharashtra
Totalno.
ofretailers
Category
respondents
Company
owned
Privately
owned
Company
owned
Privately
owned
Company
owned
Privately
owned
Company
owned
Privately
owned
HPCL
03
11
03
07
03
07
04
11
49
BPCL
02
07
04
11
03
10
03
10
50
Others
03
12
03
10
03
11
03
06
51
Totalno.ofretailers
08
30
10
28
09
28
10
27
150
Subtotal(bycluster)
38
38
37
37
150
710 H.M.J. Bidyarthi and L.B. Deshmukh

Table
2Showingretailersaw
arenessaboutsw
apofselect
petroleum
products
Clusters
Vidharbha
Marathwada
Khandesh
WestMaharashtra
Category
(ownership)
Company
owned
Privately
owned
Company
owned
Privately
owned
Company
owned
Privately
owned
Company
owned
Privately
owned
Totalretailers
08
30
10
28
09
28
10
27
Aware
06
05
07
08
04
07
06
07
Unaw
are
02
25
03
20
05
21
04
20
Subtotal(bycluster)
38
38
37
37
Swap in Downstream Petroleum Supply Chain: An Effective Inventory Handling Tool 711

be improved by 23%. And the strategic resources of these oil companies can be
optimally used amongst them and with marketing intermediaries and customers as
beneficiaries.
6 3PL Responses
Third party logisticians are the linking elements in the downstream petroleum
supply chains which include lubes dealers, LDO dealers, transporters etc. The
following responses of these 3PL were analysed. Though transporters are the
linking units in downstream petroleum supply chains, awareness of company’s
decision like swapping is very low. They work on contract and perform the assigned
tasks. Very few of 3PL know about swapping, and those who are aware insist on its
positive side, i.e. reduction of inventory costs. Lubes retailers and dealers find swap
as the most important tool in measuring the performance of lubes supply chains.
These parameters are indicated in Table 3:
Supply chain performance in HSD largely depends upon parameters shown in
the following pie Chart 4, indicating their critical role in the HSD supply chain
performance.
6.1 Other Critical Observations
Certain important activities and non-value-adding activities constitute the whole
petroleum downstream supply chain. Some of the non-value-adding activities identi-
fied are as follows: waiting of finished products in the storage depots, in transit and
any other storage point that increases the inventory carrying cost. Swapping can
reduced this waiting time to a great extent. Additional quality checks performed by oil
companies as a remedy to adulteration which not only increase the total landed cost
but also the carrying cost associated with finish stocks. Holding huge inventory at
refinery and storage points is another non-value-adding activity which hampers
the supply chain performance at large. Continuous overproduction will result in
Table 3 Showing ratings of supply chain parameters
Sr. no.
Supply chain
parameter
Very
important Important
Slightly
important Importance
% relative
importance
1 Oil prices 10 15 15 12.5 14.518
2 Lead time 22 8 10 15.4 17.88618
3 Refining margins 11 17 12 13 15.09872
4 Availability of
products
19 12 9 14.9 17.30546
5 Swap 21 11 8 15.4 17.88618
6 Inventory
automation
20 9 11 14.9 17.30546
712 H.M.J. Bidyarthi and L.B. Deshmukh

inefficient use of capital and large inventories at every storing point.Hence, systematic
cooperative reciprocal barter system, i.e. swapping practices amongst the oil com-
panies, will not only eliminate the non-value-adding activities but also improve the
downstream supply chain performance. The asset swapping and shipment swapping is
an ideal tool for downstream petroleum inventory control.
6.2 Advantage of HPCL
With 8,329 retail outlets across the country, HPCL today boasts of a healthy
network of happy and satisfied dealers as a result of initiative in indent management
system automation as a part of ERP implementation across HPCL operations.
HPCL and its dealers found themselves on the right end of the ordering process.
The IMS has not only satisfied dealer queries but has made it easier for internal
planning officers and other officials to review reports from time to time. The system
has done what it sets out to do, pumped up efficiency, whereas BPCL is still having
human interface in order processing. Timely availability of reports to plan further
product allocation in today’s competitive time definitely gives an edge. Besides,
saving productive man hours can be translated into quantitative benefits and above
all, a sound customer relationship. Swapping of products, information sharing
amongst the intermediaries, adequate transportation planning and reduction in lead
times are the proved opinions of downstream petroleum intermediaries. The follow-
ing Chart 5 gives the agreement of these benefits as an outcome of IMS (indent
management system).
7 Conclusions and Scope for Further Studies
There are found various pluses of swapping practices; however, very small portion of
distribution system (intermediaries) is aware of swap practices. Inventory issues have
ever made the task of distribution most tedious. Amongst the various inventory
Chart 4 Showing
parameters in downstream
petroleum supply chain
performance
Swap in Downstream Petroleum Supply Chain: An Effective Inventory Handling Tool 713

control tools, most of the techniques have lost its criticality as further cost reduction
is not possible by those techniques (Sahay 2000). Systematic cooperative reciprocal
barter system through swap has many advantages in downstream petroleum supply
chains. It reduces lead times to great extent, increases the availability of petroleum
products and reduces inventory carrying cost to a better extent which results in an
improved customer service level. Swapping also enhances the capability of oil
companies to identify and eliminate the non-value-adding activities like waiting
line times, frequent quality checks, overproduction etc. The supply chain perfor-
mance of a petroleum industry largely depends on the performances of individual
intermediary, stocking points and third party logisticians and ultimately depends on
the inventory control at each level. Therefore, the authors here underline the
contribution of swap in improving the petroleum downstream supply chain perfor-
mance. Swapping with the help of technology like IMS which is already in place
with HPCL gives the other oil companies a good scope for improving their order
processing.
The important aspect of measuring petroleum downstream supply chain perfor-
mance needs a thorough analysis for deciding the criteria for performance measure-
ment which can be a future scope of research. The analysis and costing part shall
give the clear-cut monetary benefits sought by swapping practices which requires
the attention of operations and finance specialists and hence is included in future
scope of research.
References
Agrawal DK (2003) Logistics and supply chain management. Macmillan India limited, New Delhi
Bay B, Tang N, Bennett D (2004) An empirical study of the imperatives for a supply chain
implementation project in Seagate Technology International. Supply Chain Manage
9(4):331–340
BP Statistical Review of World Energy (2007) http://www.bp.com/liveassets/bp_internet/china/
bpchina_english/STAGING/local_assets/downloads_pdfs/statistical_review_of_world_ener-
gy_full_review_2008.pdf
Burgess R (1998) Avoiding supply chain management failure: lessons from business process
re-engineering. Int J Logist Manage 9(1):15–23
Chart 5 Primary Data
714 H.M.J. Bidyarthi and L.B. Deshmukh

Coyle JJ, Bardi EJ, Langley CJ (2003) The management of business logistics: a supply chain
perspective, 7th edn. Thomson learning Inc, Singapore
http://indiabudget.nic.in/ub2004-05(I)/eb/sbe68.pdf
http://petroleum.nic.in/review.pdf
http://www.ppac.org.in/
International Energy Agency Statistics (2007)
Kidd J, Richter F, Li X (2003) Learning and trust in supply chain management. Manage Decis
41(7):603–612
Ministry of Statistics and Programme Implementation for sectoral growth rate of Ninth Plan
(2007). mospi.nic.in/mospi_new/upload/mospi_annual_report_2010-11.pdf
Mohanty RP, and Deshmukh SG (2007) Essentials of supply chain management, Jaico Publishing
House, Mumbai. www.na-businesspress.com/JMDC/EnyindaCI_Web5_7_.pdf
Mohanty R, Deshmukh S (2005) Supply chain management – theories and practices. Biztantra,
NewDelhi
Mortan R (2003) Good chemistry in supply chain. Logistics Today, October 2003 Issue, 44,10,
p 30
ONGC, OIL, DGH Bulletin (2007). www.dghindia.org/pdf/07-08.pdf
OPEC Annual Statistical Bulletin (2007). www.opec.org/opec_web/static_files_project/.../
asb2007.pdf
Petroleum Planning and Analysis Cell. Ministry of petroleum, Government of India, New Delhi
Public Sector Undertakings/DGCI&S, Kolkata/Ministry of Finance (2007) Petroleum Statistics.
www.indiaenvironmentportal.org.in/files/file/petstat.pdf
Quiett WF (2002) Embracing supply chain management. Supply Chain Manag Rev (Sept/Oct):45
Sahay BS (2000) Supply chain management in 21st century. Macmillan India limited, New Delhi
Shapiro JF (2004) Challenges of strategic supply chain planning & modeling. Comput Chem Eng
28:855–861
State of competition in the Indian petroleum industry final report: January 20, 2009 by Indicus
Analytics Pvt. Ltd, New Delhi
www.dyuthi.cusat.ac.in/xmlui/bitstream/handle/purl/. . ./Dyuthi-T0284.pdfwww.hartfuel.com/downloads/IntegratingPetroleumSupplyChain.pdf
www.indiastat.com/petroleum/
Swap in Downstream Petroleum Supply Chain: An Effective Inventory Handling Tool 715

Part 3.3
Technology, Development and ICT

Implementation Issues of Aadhaar: The Human
Resource Information System for India
Jesiah Selvam and K. Uma Lakshmi
1 Introduction
Human resource information system (HRIS) is a systematic procedure for collecting,
storing, maintaining, retrieving and validating data needed by organisation about
its human resources and personnel activities. HRIS is typically designed to enable
humans to perform tasks for which the human brain is not well suited like handling
large amounts of information, performing complex calculations and controlling many
simultaneous processes. Information system’s capabilities have grown over time
from plain database management to analytical report making to forecasting. Tansley
et al. (2001) examined the move towards HRM-style practices in organisations that
had developed HRIS as an opportunity structure that could enable a break with
the past. While HRIS benefits can be reaped even in e-governance, it is more relevant
for a country like India with a massive diverse population of 1.2 billion. In many
countries, technology has been successfully used in e-governance with focus on
illegal immigration, crime, terrorism and identity fraud listing the top, and in each,
identity abuse is a crucial component. Terrorists routinely use multiple identities up
to 50 at a time to hide and confuse. Sometimes, the cross-checking overheads are
more than the cost of technology infrastructure maintenance. The incidents like 9/11,
26/11 and the like have prompted the quest for more stable identity systems. ‘Identity
J. Selvam (*)
Department of Management Studies, Francis Xavier Engineering College,
Vannarpettai, Tirunelveli 627 003, Tamil Nadu, India
e-mail: [email protected]
K. Uma Lakshmi
Department of MBA, Indian Academy School of Management Studies,
Hennur Cross, Kalyan Nagar, Bangalore 560043, Karnataka, India
e-mail: [email protected]
Department of Management Studies, Indian Institute of Science, Bangalore,
Driving the Economy through Innovation and Entrepreneurship,DOI 10.1007/978-81-322-0746-7_59, # Springer India 2013
719

cards are not just technologies; they are also contemporary tools of governance which
may be used to address a multiple and shifting set of social and political problems’
(Bennet and Lyon 2008). Governments in the USA, the UK, Australia and several
other nations are responding to perceived security threats by introducing various
forms of mandatory or nearly mandatory domestic civilian national identity docu-
ments (Froomkin 2009; Greenleaf 2007).
2 Objectives of the Study
The study attempts to examine the implementation issues of Aadhaar, the unique
ID for the residents of India with the implicit objective of bringing out the possible
suggestions to the hindrances of implementation.
3 Identity Systems Across the World
An identity document is any document which may be used to verify aspects of a
person’s personal identity. If issued in the form of a small, mostly standard-sized
card, it is usually called an identity card (IC). New technologies could allow
identity cards to contain biometric information, such as photographs, face, hand
or iris measurements or fingerprints. Electronic identity cards or e-IDs are already
available in some territories such as Hong Kong, Malaysia, Estonia, Finland,
Belgium, Portugal, Morocco and Spain. History shows that the main function of
identity cards has been controlling labour and the workforce, to serve the objective
of creating a command economy, and the political dissent has often been a ‘close
second’ as in the case of Napoleonic identity card, the livret ID card of 1803 in
France, Nazi Germany’s census and statistical systems with IBM computers in
identification systems (Volkskartei – ID card with the Reich personnel number)
to find the human economic value which aided them in genocide and also in
suppressing political opponents, in China during Mao period as dang’an or dossier,
which compiled lifetime personal files (Allonby 2009). Of late as observed in
Britain, there is an intention to integrate and coordinate different services, such as
health and education, to make them function together as part of one system, sharing
data. UK mooted the ID card system to help tackle crime, illegal employment,
immigration abuse, ID fraud and terrorism. Though there is little hard evidence of
the card helping in the fight against crime, it was found to be useful in identifying
illegal immigrants. Biometric border control systems have been established in the
United States and the United Arab Emirates, and the EU is introducing biometric
visas. However, it should be noted that, internationally, the only requirement for
biometric passports is a digital photograph.
720 J. Selvam and K. Uma Lakshmi

4 Aadhaar, the Unique Identification System of India
Aadhaar (meaning foundation), the unique 12-digit identification number (Aadhaar),
was conceived by the Indian government primarily as a means for residents to
uniquely verify their identity anywhere in the country and secondarily as a base on
which any delivery system can be built. This being a random number generated,
devoid of any classification based on caste, creed, religion and geography, is issued by
UIDAI (Unique Identification Authority of India), headed by Mr. Nandan Nilekani,
former CEO, Infosys. Issued only once in a lifetime and for free of cost, this identifi-
cation card aims to enable identifying right PDS beneficiaries, financial inclusion of
marginal groups and expanded coverage of the poor through the elimination of fakes
and duplicates for welfare schemes. For an instance, Andhra Pradesh state government
unearthed 45 lakh bogus ration cards in 2009 (The Hindu 2009). The government as a
result launched an identity verification drive and has made it compulsory for residents
to provide the electoral roll number, a copy of the electricity bill and house rent bill
to receive a ration card. This has cut off many of the poor from accessing rations,
including the homeless, migrants and people living in informal housing. Aadhaar card
storing demographic and biometric information in a 64-KB smart card can be used as
proof of identity (PoI) and proof of address (PoA). At present, Indian citizens have 15
cards in approximates of 70 million PAN cards, 60 million passports, 90 million
drivers’ licence, 240million bank account holders, 170million LIC policyholders and
150 million Below Poverty Line cards (BPL). There are people who cannot open a
bank account because he/she has no documentation that can meet a bank’s KYC
(know-your-customer) norms. Among Indian children, about 45% malnutrition and
75% anaemia sufferings are existing which easily explains how ineffective govern-
ment welfare programmes are to reach the right. There are people who need but do not
possess any card, and there are peoplewithmultiples of tens of fake cards too.And this
extremity is one of the symptom as well as cause for corruption in Indian society.
Research estimates that the poor pay $10–12 billion in usurious interest each year.
EvenMFIs charge 20–30% interest. UID systemmay bring nearly 125 million people
into banking system over next 5 years (CLSA 2011).
Conceived in 2006, post Kargil War, as an initiative of Planning Commission of
India, Aadhaar project has evolved with reviews and updations at different stages
(see Table 1). The scale of the Aadhaar initiative is unprecedented, and its imple-
mentation demands active participation of central, state and local governments,
as well as public and private sector as registrars and enrolment agencies across the
country. UIDAI has headquarters in Delhi and a technology centre in Bangalore.
It also has eight regional offices in Chandigarh, Delhi, Lucknow, Ranchi, Guwahati,
Mumbai, Hyderabad and Bangalore. Aadhaar has its logo with yellow sun with a
fingerprint embedded in its centre.
4.1 Aadhaar as an Information System
Unlike businesses, government cannot function with a clear-cut goal, and rather it has
to balance diverse interests of the society while maintaining individual freedom,
Implementation Issues of Aadhaar: The Human Resource Information System. . . 721

peace, viable economy and so on. But to be a social infrastructure guarantor, there
should be an integrated national information system in place. Management informa-
tion systems play the crucial role of providing a wide range of streamlined options
from which decision-makers are able to make their preferred choices (Vittal and
Shivraj 2008). Aadhaar gives the basic identity infrastructure for residents, the auth-
entication of which lets the right individuals to reap the social benefits. An informa-
tion system is marked by input-process-output and the objective for which it exists.
Aadhaar systems take the demographic and biometric data as input, stores the data in
CIDR (Central Identities Data Repository) and after de-duplication process generates
the Aadhaar number, which is disseminated to residents.
The intended objectives of Aadhaar include giving citizens and migrants mobil-
ity of identity, bringing those without any existing identity documents into benefi-
ciary system through the ‘introducer’ system of pre-identified people, connecting
the database to social welfare schemes and financial inclusion of underprivileged by
reducing the overheads of KYC (know-your-customer) norms of banks through
UID data and suggested micro-ATMs, resident self-service to access up-to-date
information about their entitlements that are to be achieved by connecting to other
databases. Thus, it reengineers the public administration to be transparent and more
accountable.
Table 1 Phases and milestones of Aadhaar
Phase Details Date
Conception Decision to collate – the National Population
Register under the Citizenship Act, 1955,
and the unique identification number for
Below Poverty Line (BPL) families
project of the Department of Information
Technology
Early 2006
EGoM (Empowered Group of Ministers) was
constituted
04 December 2006
Sequence of meetings(4) of EGoM to make
UIDAI as executive authority
Between November 2007
and 2008
UIDAI formation, as an attached office under
the aegis of Planning Commission with an
initial core team of 115 officials
28 January 2009
Appointment of chairperson (Mr. Nandan
Nilekani, former CEO, Infosys) with
status of cabinet minister and Mr. Ram
Sewak Sharma as director general and
mission director
02 July 2009
The first meeting of the Prime Minister’s
Council of UIDAI Authority
12 August 2009
Phase I: UIDAI First enrolment September 2010
Target population: 200mn Target date: March 2012
Phase II: UIDAI
and NPR
To begin mid of April 2012, target: remaining
400 million population
To be completed by 2017
722 J. Selvam and K. Uma Lakshmi

4.2 Aadhaar Implementation Process
Implementation of Aadhaar includes preparation activities like MOUs with states
and registrars, training the operators, enrolment activities where the data collected
is stored in CIDR and, after de-duplication issuing the numbers, ongoing activities
like data updation and authentication (see Fig. 1). Creating public awareness and
publicising is also part of it.
4.2.1 Preparation Activities
UIDAI has written MOUs with states and union territories, public sector banks and
LIC as registrars for successful implementation. Registrars are to be paid 50 rupees for
each successful enrolment. Nodal departments for UID in each State and Union
Territory identified the introducers and conducted training camps. For enrolment,
enrolment needs minimum 40,000 kits, 40,000 operators, 13,000 supervisors and
4,000 technical support. L-1 and crossmatch will provide one eye scanner and one
finger print scanner. Going through the client software read-me documents available
on the UIDAI website, the software is currently designed for 32-bit operating systems
and requires Microsoft.NET Framework 3.5 SP1 andMicrosoft SQL Server 2008 R2.
Aadhaar has been planned to be publicised through campaigns/advertisements to
encourage enrolment through bus stops, pan shops, radio, TV, Doordarshan, retail
shops, autorickshaw stands,melas,mandis, post offices, railway stations, cinema halls,
sporting events, banners, posters, cable operators, satellite channels, mobile phones,
SMS campaigns, etc., and a dedicated website http://uid.gov.in has been set up.
Fig. 1 Aadhaar process flow (Source: http://uid.gov.in)
Implementation Issues of Aadhaar: The Human Resource Information System. . . 723

4.2.2 Enrolment Activities
Aadhaar card containing the UID number would be issued to every resident after
collecting one of the 17 documents required for identification and one of the 29
documents required for proof of residence as prescribed by the Union Government.
The card is issued to people for free, and people Below Poverty Line are to be paid
100 rupees per enrolment. The process includes going to the nearest enrolment
camp, submitting enrolment form with necessary documents, document verifica-
tion, biometric scanning of ten fingerprints and iris, getting photographed and given
an enrolment number upon completion; residents will be given acknowledgement
receipt and are issued an Aadhaar UID allotment letter having unique ID no. after
de-duplication by speed post within 20–30 days.
Figure 2 exhibits the magnitude of enrolments across the country. The small states
and UT such as Tripura, Sikkim, Puducherry, Himachal Pradesh, Delhi and Chandi-
garh made headways in the number of enrolments. Andhra Pradesh among the big-
gest states is an exception. The enrolment performance in the states like Assam,
Bihar, Chhattisgarh, Mizoram, Nagaland and West Bengal is rudimentary. The poor
performance on enrolment may be due to the lack of political consensus but despite
the fact that Aadhaar being one of the most rapidly adopted technologies in history
and the fastest government technology rollout anywhere. The success story is that
more than 12,500 transgender across the country have been issued ‘Aadhaar’ num-
bers by the Unique Identification Authority of India as on 28 October 2011. There are
successful pilots of transferring cash against purchase of LPG cylinders in Mysore,
for kerosene in Alwar and validation of PDS beneficiaries in Jharkhand and Aadhaar-
enabled payments for various government schemes in at least 50 selected districts by
the end of 2012. As of 31st March 2012, UIDAI has completed the target enrolment
of 200 millions.
Fig. 2 Aadhaar enrolments state/territory wise (Source: UIDAI 2012)
724 J. Selvam and K. Uma Lakshmi

4.3 Implementation Issues
Aadhaar has gone through several rounds of interdepartmental and indeed wider
public review and scrutiny, and the following issues are identified and discussed:
4.3.1 Strategic Issues
Multiple views and lack of coordination among government functionaries: In spite
of MOUs being written with state governments and public and private sector enter-
prises, there are objections and doubts, conflict of interest and lack of project
coordination as it was evident with home ministry’s National Population Register
(NPR) and RIC (Resident Identity Card), UIDAI and beneficiary programme in
charges like food ministry, MGNREGA, to provide interface to residents to gov-
ernment programmes.
Rejection of National Identification Authority of India (NIAI) bill by ParliamentaryStanding Committee (PSC) on finance: PSC’s observation that the UID project as
directionless and it may have far-reaching consequences for national security is a
big blow for the implementation.
Not one-time project as proposed: As repeatedly claimed by UIDAI, Aadhaar may
not be one-time project. Unlike pre-existing census, it has to keep up with popula-
tion dynamics of births and deaths, biometric data entry for children crossing
3 years and changes in biometric systems of individuals in case of damage.
Positioning of UID towards government schemes: In the largest democracy of the
world, where governments at centre and state come up with variety of populist
programmes, UID has to be positioned appropriately. System should build credibil-
ity by initiating a pilot UID-based government service for real-time authentication
like PDS.
Cost/benefit analysis and feasibility study: Finance Minister Pranab Mukherjee
allocated Rs 1,758 crore more for the project in the Budget 2012–2013. The
government has already spent Rs 14,232 on the project. The cost to cover the popu-
lation of 1.2 billion is likely to be up to Rs 18,000 crores. NGOs are demanding CBI
enquiry and CAG audit of the scheme. The allegation is that the actual benefits of
PDS and NREGA are limited, and compared to leakages of those systems, Aadhaar is
highly expensive. Individuals Below Poverty Line are handed over 100 rupees for
enrolment and registrars are with 50 rupees for each successful enrolment, and the
de-duplication cost has been brought down to Rs 2.75 per person (The Economic
Times, 20 Jan 2012). Centre provides Rs 300,000 crore of subsidies every year to the
Indian citizens, and UID can bring down pilferage to great extent. The repetition of
the exercise including cost has not been explained, and corruption and leakages are
given more focus.
Implementation Issues of Aadhaar: The Human Resource Information System. . . 725

Concerns on citizenship: Though NIAI Bill says Aadhaar is not an evidence of
citizenship and it is voluntary to enrol, the collaborative exercise with NPR is
turning the other way round.
Criticism that other countries scrapped the biometric cards: As for the criticism
that countries like the UK and the USA have abandoned identity schemes, one
cannot generalise it as there are several more European and Middle East countries
which are successfully implementing it. For instance, the UK has withdrawn its
National Identity Card in May 2010 because of the huge cost involved and possible
cost overturns.
4.3.2 Operational Issues
Enrolment: UIDAI website is not displaying enrolment camp in respective area
which is causing inconvenience to people. No electricity in remote places, and
people are using generators. Most of the time, people do not come with clean hands.
So, officials have to carry soap solutions and hand wash. Lack of operators in many
enrolment camps slowed down the process. They often confronted protests from the
NGOs and voluntary organizations of civil rights and liberties. As long as the iris
pattern is visible in a blind eye, its details can be captured. It can generate superior data
above all the other databases presently available. Physical hard-working people’s
hands would have morphed so as to not reveal fingerprints, and facial expressions
should be appropriate while photographing. Always conception is easy, delivery
is difficult, and huge and vast population is to be covered. Public and civil liberty
forums’ resistance may let some to wait and watch and in turn may slow down the
enrolment process.
Authentication: Internet and mobile connectivity and power problems in rural and
remote areas will be an issue. Mobile connectivity is now available in over three
lakh villages, and remaining shortages may be resolved over the next few years.
Illiteracy of the people to remember the 12-digit number and to safeguard Aadhaar
card in general is a major issue.
Maintenance: The identity infrastructure management is an ongoing process for
authentication as well as for managing UID data of individuals throughout their life
cycle. A faster approach for de-duplication to reduce UID enablement lifecycle can
be designed. Collaborating with other agencies to recreate application forms and
cards to include UID is an important issue and requires a careful approach.
4.3.3 Legal Issues
India does not have enough data security and privacy laws. The provisions in
Information Technology Act 2000 amendments 43 A and 72A are grossly inade-
quate. Per the NIAI bill, the violations can attract penalties in the form of fines of up
to rupees one crore and imprisonment extending up to a life term.
726 J. Selvam and K. Uma Lakshmi

No legal status to UID project: Unlike the projects like National Intelligence Grid(Natgrid), Crime and Criminal Tracking Network and Systems (CCTNS), National
Counter Terrorism Centre (NCTC), Central Monitoring System (CMS), Centre for
Communication Security Research and Monitoring (CCSRM), etc., which are not
governed by any legal framework, UID being an identity provider which can
connect to 21 possible databases and intending to prevent leakages in social welfare
schemes has been asked for revisions on account of missing ‘constitutional
safeguards’.
Not just social benefits, but national security as well: According to Clause 33 of
NIAI Bill, disclosure of information (including identity information of individuals)
can be made (a) by order of the competent court (b) in the interest of national
security. This can be done on the direction of an authorized officer of the rank of
Joint Secretary or above in the central government. It also provides for the Officers
of the Central Government the power to tag, profile, track and mount surveillance
and use as they deem fit information-including demographic and biometric informa-
tion. This clause may be prone to misuse and this may affect an individual’s privacy.
Inadequacy of existing laws: Existing legal framework of India has inadequacies to
address data security, privacy and identity theft.
Data security: Public-key infrastructure and randomness of the number serve for
data protection, as mere number does not reveal personal information in contrast
to China’s 18-digit ID number that has a pattern. Data can be transmitted at the
enrolment level by data collectors and accessed by registrar agencies and by the
foreign organisations engaged in de-duplication work like L-1 Identity Solutions,
which is connected with US intelligence agencies, and Accenture, which is on the
Smart Borders project with the US Homeland Security Department. Malicious
software may be developed to hack the databases. Outsourcing of the operation
of the CIDR should be by regulations by identifying the outsourcing provider and
thus disallowable. Any movement of CIDR data outside India should also be by
regulations (Greenleaf 2010).
Privacy and civil liberties: Most criticism is directed towards the enhanced possi-
bilities of extensive abuse of centralised and comprehensive databases with sensitive
data. Distinction between what is public and private information may be lost. The
trade-off between civil liberties and social development is being questioned.Misuse of
the identity system in case of communal riots or terrorist violence to target group, with
incidents like telephone tapping and surveillance as it happened during 1976 National
Emergency using selectively, cannot be ruled out. Interested parties, such as insurance
companies, may do individual profiling for business advantage.
Data breach and identity theft: Determining the link between data breaches and
identity theft is challenging, primarily because identity theft victims often do not
know how their personal information was obtained, ‘and identity theft is not always
detectable by the individual victims’. Identity theft may be used to facilitate or fund
other crimes including illegal immigration (to conceal their own true identity),
Implementation Issues of Aadhaar: The Human Resource Information System. . . 727

terrorism, phishing and espionage. There may be the tampering or superficial forging
of the actual biometric identity cards and impersonation.
Responsibilities of partnering agencies and introducers: Responsibilities and the
limit of introductions are not expressed for introducers. The regulations for regis-
trars, enrollers, and de-duplicating agencies retain any information that they collect/
process for the ‘convergence of data from discrete silos’.
Absence of external regulator: Unlike other regulatory laws such as labour laws,
where an inspectorate is created to monitor the working of an organisation, NIAI
bill has no external regulator.
4.3.4 Technological Issues
As biometric attributes of the residents are going to be used as the basic signature
for de-duplication (checking back the existing database for duplication) and to
ensure uniqueness, the biometric information like facial image, iris – both eyes and
fingerprints – all ten fingers is in the following sequence: First – left hand four finger
slap, second – right hand four finger slap, and at the end, both the thumbs are
captured, and for this computer system, digital camera, iris-capturing device and
fingerprint scanner are used. Iris is widely believed to be the most accurate
biometric. Also, the iris pattern of each eye is not correlated, so it gives two inde-
pendent biometric feature sets.
Social acceptability of technology needs building trust. Parliamentary standing
committee’s observation is that the estimated failure of biometrics could be as high
as 15%, given dependence of large population chunk on manual labour and stated
that the ‘technology is not error free’. As it happens with many device readers, the
technical failure to authenticate Aadhaar cardholder cannot be ruled out.
According to UIDAI Chief Architect Mr. Pramod Varma, the data centres have a
seamless physical as well as digital security systems in place at Bangalore and Greater
Noida facilities and that UIDAI had employed ‘logical security’ by petitioning data
centre into zones, separating them using firewall and network intrusion detection and
prevention system. According to him, ‘every enrolment data packet is always stored
in public-key infrastructure encrypted, tamper proof files and are never decrypted or
modified during transit until it reaches UIDAI’s data centres’. With increasing rate
of hacking and other cybercrimes, UIDAI security systems need regular updations.
The process of authentication has not been studied yet. The authority shall respond to
an authentication query with a yes or no ‘or with any other appropriate response, or
will it give a response code why it failed as in case of ATMs’.
5 Recommendations
The ability to properly identify persons to their true identity is central to the
Aadhaar system. Although the efficiency and efficacy of the project is yet to be
manifested, the very launch of this exercise has made it the largest biometric-based
728 J. Selvam and K. Uma Lakshmi

identity project in the globe. This especially necessitates the cross-checking of
various arrangements done by the UIDAI in connection with identification process,
to whom the information is handed over to, with whom contracts have been entered,
the state of pilot studies, the non-existence of privacy law, the relationship with
NATGRID and the possible connection with the Draft DNA Profiling Identity Bill,
2007.In a complex system like India, trade-offs between privacy and social develop-
ment have to be accommodated. Once modern systems of population registration are
implemented, with time they become progressively more developed and secure.
History shows that identity systems have hidden political agenda of control and
power, but in times of globalisation, symbiotic nature of public-private participation
and active civil liberty movements, we cannot conclude history is going to repeat. If
the enrolment centres can move to where customer resides/functions, the resentment
in public for waiting in queue reduces. Unlike the UK which maintained 50 cate-
gories of information, Aadhaar has simple data to prove the identity and has well-
defined levels of implementation. Portrayed as a panacea for all ills that exist in the
country, government functionaries should come up with consensus for successful
implementation.
6 Conclusions
Deemed to be the biggest initiative in creating the nation’s human resource infor-
mation system, UID may bring social transformation in a big way. In any organi-
sation, the success of any project depends on top management support, and it is
evident with Dr. Manmohan Singh and his cabinet standing by this project. Elec-
tronic voting machines and ATMs also once upon a time looked down by public.
Technology will be the chief instrument of reforms. The computerisation of railway
bookings two decades ago dramatically reduced the corruption, delays and harass-
ment routinely visited upon the average traveller. Mobile and internet technologies
open up possibilities for e-governance that cannot be anticipated in advance. ‘It’s a
dramatic socio-technical system conceived to identify and recognise the residents
of the country and connect them to the socio-economic benefits which they are
entitled to receive from the government’. Hence, it is evident that the government
stands firmly by this project despite the lack of internal coherence between the
ministers and non-consensus among political parties. There was universal agree-
ment that large-scale technology projects failed due to managerial, but not due to
technical reasons. The soothing condition in India is that the climate conduciveness
for technology implementation contributed positively to the extent of neutralisation
of inhibitors.
Implementation Issues of Aadhaar: The Human Resource Information System. . . 729

References
Allonby N (2009) ID cards – an historical view. Global Research, September 16, 2009
CLSA (2011). http://articles.economictimes.indiatimes.com. Accessed on 24 June 2011
Bennet CJ, Lyon D (2008) Playing the identity card: surveillance, security and identification in
global perspective. Routledge, London/New York
Froomkin AM (2009) Identity cards and identity romanticism, lessons from the identity trail:
anonymity, privacy and identity in a networked society. Oxford University Press, New York
Greenleaf G (2007) Australia’s proposed ID card: still quacking like a duck (UNSWLaw Research
Paper No.2007-1). Comput Law Secur Rep 23:1–15
Greenleaf G (2010) India’s national ID system: danger grows in a privacy vacuum (UNSW Law
Research Paper No. 43). Computer Law & Security Review 26(5):476–491
Tansley C, Newell S, Williams H (2001) Effecting HRM-style practices through an integrated
human resource information system: an e-greenfield site? Accessed on 14 Nov 2011 at http://
www.emeraldinsight.com/journals.htm?articleid¼879286
The Hindu (2009) 45 lakh bogus ration cards to be weeded out. Accessed on 22 Nov 2011 at http://www.hindu.com/2009/06/14/stories/2009061459200400.htm
UIDAI (2012). http://www.uid.gov.in. Accessed between November 2011 and April 2012
Vittal A, Shivraj K (2008) Role of IT and KM in improving project management performance.
VINE 38(3):357–369
730 J. Selvam and K. Uma Lakshmi

Aadhaar and Financial Inclusion: A Proposed
Framework to Provide Basic Financial Services
in Unbanked Rural India
Saikumar Rathod and Shiva Krishna Prasad Arelli
1 Introduction
Dr. C. Rangarajan committee’s report (Report of Committee on financial inclusion
and RBI 2008) says, “Financial inclusion is defined as the process of ensuring
access to appropriate financial products and services needed by all sections of the
society in general, and vulnerable groups such as weaker sections and low income
groups in particular, at an affordable cost in a fair and transparent manner by
regulated mainstream institutional players.” It means that easy access to basic
financial services such as credit, savings, insurance facilities and payments and
remittances enables economically and socially excluded people to integrate better
into the mainstream economy and to contribute to the development by protecting
them from shocks. But, per national sample survey data, 45.9 million farmer
households in the country out of a total of 89.3 million households do not have
access to credit, either from institutional or non-institutional sources. Also, Table 1
suggests that the number of rural branches as a percentage of total branches has
dropped from 50% in the year 2000 to 38.4% in 2010. In November 2005, RBI gave
directive to open no-frill accounts and use of business correspondent’s to reach
unbanked citizens. The latest data from RBI website about business correspondents
(BC)/customer service points (CSP) shows the increasing number of CSP’s being
opened in urban areas relative to rural places in the recent years (Table 2). Apart
from the banks, players who have demonstrated their reach in rural areas in a cost-
effective manner like mobile network operators (MNOs) may be allowed to offer
financial services. The problem of limited presence of banks in rural areas and
operating large number of tiny accounts profitably can be addressed by bringing in
MNOs into the ecosystem of financial inclusion. Telecom Regulatory Authority of
S. Rathod (*) • S.K.P. Arelli
MIS Department, MBA Students, IIM Calcutta, Diamond Harbour Road,
Joka P.O., Kolkata 700104, India
e-mail: [email protected]; [email protected]
Department of Management Studies, Indian Institute of Science, Bangalore,
Driving the Economy through Innovation and Entrepreneurship,DOI 10.1007/978-81-322-0746-7_60, # Springer India 2013
731

India’s (TRAI) annual report for the year 2010 indicates that 32.67% of total wireless
subscribers as of 2010 are in rural areas. Following bar chart shows the growth of
wireless subscribers from 2007 to 2011 in rural India. Mobile phones thus present an
enormous opportunity in spreading financial services to the unbanked citizens of the
country because of its unique feature of easy access and availability in remote places.
However, a critical challenge to successfully implement this concept lies in identity
verification or for completing the KYC (know your customer) requirements of RBI, to
open say mobile e-money accounts. The lack of clear identity documentation for the
poor creates substantial difficulties in establishing their identities to the banks
(UIDAI). This issue could be addressed with the recent government initiative of
providing unique identity to all the citizens under the project Aadhaar. Since RBI
agreed UID number as a valid identity document for opening bank accounts (RBI
Circular 2011), MNOs can leverage this as a valid source for user verification, unless
otherwise stated by RBI (Fig. 1).
2 Proposed Framework
The key stakeholders who are expected to play an important role in the delivery of
financial services through mobile payments framework in India are given in Table 3.
Table 1 Declining trend of rural bank branches (Presentation by Dr K.C. Chakrabarty 2011)
Year Rural Semi-urban Urban Metro Total Rural/total (%)
2000 32,734 14,407 10,052 8,219 65,412 50
2004 32,121 15,091 11,000 8,976 67,188 47.8
2008 31,002 17,724 14,397 13,019 76,142 40.7
2010 32,494 20,494 16,761 14,855 84,604 38.4
Table 2 Statistics of CSP’s
(Financial inclusion: state of
the sector report 2011)
Particulars Mar-10 Mar-11 Growth %
Total number of CSP’s 33,042 58,351 76.60
Total number of rural CSP’s 32,619 54,698 67.69
Total number of urban CSP’s 423 3,653 763.59
Fig. 1 Rural wireless subscriber base (in millions) (Annual Report of TRAI 2009)
732 S. Rathod and S.K.P. Arelli

2.1 Mobile E-Money
Individuals will use e-money in place of hard cash at all the access points – to make
purchases, to transfer money, etc. It is held in an account under the individual’s
name. Therefore, it is important that e-money should satisfy the following basic
properties of physical money to be robust and fool proof (Farsi 1997):
• Double spending: Safeguards must be in place to prevent counterfeiting.
• Transferability: It should be independent and portable, i.e. it should be freely
transferable between any two parties regardless of network, software/hardware
or storage mechanism. Most importantly it should be convenient.
• Divisibility: Divisibility means the ability to make change. So e-money will
come in rupees and smaller denominations that can make both high-volume and
small-value transactions on the mobile phone practical.
Mobile e-money will be stored like fungible talk time, which is separate from the
air talk time, provided already by the MNO. MNO would issue e-money to the
individual in exchange for cash deposit. Individuals can spend the e-money for all
kinds of transactions, if they know the UID number of other party with whom they
are transacting. Transactions like buying commodities, buying air talk time, paying
utility bills, transferring money to other mobile e-money accounts, etc., can be
easily done. Individuals can access their mobile e-money accounts using a simple
short message service (SMS)-based application on their mobile phones.
2.2 Opening of Mobile E-Money Account
Any individual interested in opening mobile e-money account has to approach
the retail shop, working on behalf of MNO or the correspondent of MNO. The
necessary documents to open mobile e-money account should be similar and not
as stringent as the current KYC norms of banks. A step-by-step process for enabling
e-money account is shown below.
Table 3 Key stakeholders in the delivery of financial services
RBI Regulator – grant of licences, laying down framework
Government Facilitator
TRAI Preventing illegal transactions with framework, basic
tariff structures
Unique Identity Development Authority
of India (UIDAI)
KYR and KYC, anti-money laundering program
National Payments Corporation of India
(NPCI)
24 � 7 real-time remittance processing system
MNOs and banks Service providers
Aadhaar and Financial Inclusion: A Proposed Framework to Provide Basic. . . 733

Enabling Mobile E-Money Account:
1. Customer gives the retailer shop his UID number, biometrics, mobile number,
and other KYC details to the retailer/correspondent of MNO.
2. Retailer/correspondent sends the information electronically to the MNO.
3. MNO sends request to verify the customer’s details to UIDAI server through
SWITCH.
4. MNO verifies the UID number and biometrics of the customer with the UIDAI
server.
5. Mobile e-money account is created by MNO.
6. MNO stores the mobile e-money account details, customer’s mobile number and
UID number in the Account Mapper.
7. The customer and the retailer/correspondent are intimated via message on their
mobiles.
8. MNO sends a pin number to the customer on his mobile for making future
transactions with his/her mobile e-money account (Fig. 2).
2.3 Transactions over the Mobile E-Money Account
A customer should be able to perform the following basic transactions: (1) cash
deposit – over the counter through a retailer or correspondent of MNO, (2) transfer
money – person to person transfer using mobile phone and person to person transfer
for purchase of goods and services, (3) withdraw cash – over the counter through a
retailer or correspondent of MNO, and (4) balance inquiry – balance or statement of
last N transactions.
2.4 Infrastructure Components
Branchless banking by MNO using mobile e-money account needs the following
in place:
Fig. 2 Enabling mobile e-money account
734 S. Rathod and S.K.P. Arelli

1. UIDAI: UIDAI is setting up the infrastructure for enrolment and storage of the
resident’s demographic as well as biometric information. UIDAI will provide
real-time online authentication of identities in a cost-effective and ubiquitous
manner for MNO.
2. SWITCH: A switch will be required to facilitate real-time transactions routing
between MNOs, UIDAI, Account Mapper and monitoring system. This switch
will help in executing large-volume transactions of small value between indivi-
duals in the same network of MNO or between two individuals in two different
networks. Switch should be capable of talking with UID authentication service
so that it can verify the identity of the customer when enabling mobile e-money
account. Switch would also query the Account Mapper with UID number to
obtain the details like mobile e-money account number and to proceed with
transactions like cash transfer and cash withdrawal.
3. Account Mapper: Account Mapper is the most crucial component in this model
of e-money transfers. It is essentially a database of all the citizens who have
enabled their mobile e-money accounts. The Account Mapper links the various
identifiers of a given individual. In the simplest form, a row would be created
against each individual, when he/she enables his mobile e-money account; the
row would have the UID number, the mobile number, and the mobile e-money
account number. Account Mapper is a shared repository by all the MNOs who
want to enter into the business of providing financial services through mobile
phones. The responsibility of setting up of Account Mapper and the SWITCH
can be taken up by organizations like NPCI.
4. Monitoring system: A monitoring system would be present to track all the
e-money transactions and report those suspicious transactions which pose the
threat ofmoney laundering and funding terrorist activities. The exactmechanism by
which the monitoring system would work is not discussed in detail in this chapter.
5. MNO’s infrastructure: MNO can provide basic financial services using his
existing mobile phone value chain. Resources used for providing mobile services
can be used to provide basic financial services. For example, existing retailers who
work on behalf of MNO for mobile recharge can be used as cash-in/cash-outlets.
MNO would also require other critical infrastructure components like switches,
customer management systems, auditing trails, reporting, etc.
2.5 Indicative Transaction Process
An indicative transaction process is shown for the following cases, which are very
basic in nature for providing financial services.
Aadhaar and Financial Inclusion: A Proposed Framework to Provide Basic. . . 735

2.5.1 Cash Deposit
Consider the case when retailer and customer belong to the same MNO. Following
are the steps involved in the process of depositing cash:
1. Retailer gets the UID number and the amount to be transferred from customer.
2. Retailer sends the information to MNO through the SMS-based application.
3. MNO has the database of all the individuals who have enabled mobile e-money
accounts under it, by using UID number; MNO gets the details of mobile e-money
account number of customer.
4. It then performs the appropriate action of debiting retailer’s e-money account
and crediting customer’s e-money account.
5. An SMS is sent to both customer and retailer involved in the transaction (Fig. 3).
Now consider the case when retailer and customer belong to different MNOs.
Following are the steps involved in this scenario:
1. Retailer gets the UID number and the amount to be transferred from customer.
2. Retailer sends the information to its MNO (which is referred as MNO(R))
through the SMS-based application.
3. Since the customer belongs to different MNO (customer’s MNO is referred as
MNO(C)), MNO(R) cannot access the details of customer. So MNO(R) sends
request to the SWITCH, with details of the customer to perform the transaction.
4. SWITCH, upon receiving the request, gets information (mobile e-money account
number) about the customer by performing a query on the Account Mapper using
the customer’s UID number.
5. SWITCH then directs the MNO(C) to perform the credit operation on the
customer’s mobile e-money account.
6. MNO(R) receives intimation from the SWITCH about the transaction whether it
was successful or not.
7. MNO(R) then performs debit operation on the e-money account of the retailer.
8. SMS will be received by both the customer and the retailer from their respective
MNOs (Fig. 4).
Fig. 3 Cash deposit (retailer and customer belong to same MNO)
736 S. Rathod and S.K.P. Arelli

2.6 Integration with Existing Banking World
The framework developed for mobile e-money ecosystem should smoothly integrate
with other similar financial systems. The Account Mapper links the various identities
of an individual, like UID number, bank account number, mobile number, mobile
e-money account number, etc., as shown in the figure below. A policy-driven app-
roach can be used by the individual, inwhich the individual can set policies as towhich
account (bank account/mobile e-money account) to use for what type of transactions
(Fig. 5).
A mobile e-money account holder can transfer money to another target individ-
ual by simply using the UID number. A command like the one shown below could
be issued in the SMS application by the customer.
Transfer_Money(From_UID, To_UID, Amount);
The target individual would then receive money in any of the bank or e-money
accounts based on the policy setting.
2.7 Role of Retailer/Correspondent of MNO
Individual retailers (shops were mobile recharge is done) will play a crucial role in
this model in terms of providing services to the customers. In this respect, they will
have the following responsibilities:
• Will act as e-money supplier by taking hard cash.
• Will act as hard cash providers by taking e-money.
Fig. 4 Cash deposit (retailer and customer belong to different MNOs)
Aadhaar and Financial Inclusion: A Proposed Framework to Provide Basic. . . 737

• Retailer would be responsible to enable mobile e-money account.
• Interface with customer, provide basic handholding and play a role in promoting
the financial literacy through mobile e-money transfers.
2.8 Role of Other Small Business Entities
Local retailers including kirana stores play an important role in the model. It is very
important to build the credibility and increase the acceptance of mobile e-money
for payments on purchase of commodities. This can be done by establishing trust,
showing benefits of using such a system to all the entities in village. The buyer will use
the UID number of the shop owner to transfer e-money for purchasing commodity.
Instant message confirmation will be sent to both. It should be noted that kirana
shop owner can now go to the retailer operating on behalf of MNO to get hard cash,
if needed.
2.9 Distinguishing the Role of Bank and MNO
MNO plays the principal role in the MNO-led banking model. All the aspects
of banking like account opening, account maintenance, cash-in/cash-out, etc., will
be performed by MNO. Clearly, the ownership of customer lies with the MNO in
this model. Banks will be at the back end of the model, without any direct inter-
action to the customer. MNO should deposit the equivalent of e-money issued in the
banks; this would limit the margin MNO would otherwise get by intermediation
spreads. This is the price MNO pays for not having to incur extra cost of obtaining
full banking license. Thus, banks are at the back end of the model, accepting deposit
from the MNO in the form of a pooled account mechanism. This would transfer
the risk of investment of funds from MNO to the bank, which is already governed
under the regulation of banking laws. MNO earns the interest from its deposit in the
bank, which can be passed on to the customers of MNO to make it profitable and
attractive to the customers. This would also encourage the customers of MNO to
use e-money accounts as a place to store and earn interest.
Fig. 5 Account Mapper
738 S. Rathod and S.K.P. Arelli

3 Analysis of the Framework
3.1 Understanding the Risks Involved
The four important risk factors as identified by the World Bank paper “Integrity in
mobile phone services” are anonymity, elusiveness, rapidity and poor oversight.
The proposed framework attempts to address these risks and also suggest a com-
prehensive approach in dealing with the majority of these issues.
• Anonymity: It is the risk of not knowing a customer’s actual identity. The proposed
model is based on the UID number which mitigates the risk of anonymity. UID
number tagged to every account tracks all transactions and fulfils the objective of
complete traceability and accountability. This prevents illegal transactions or
money laundering activities to a great extent.
• Elusiveness: It is the ability to disguise mobile transaction totals, origins and
destinations. It can be diminished by enhanced customer profiling, monitoring
and reporting. Since measures like limiting the number of accounts per customer
and number of transaction per month and limit on mobile e-money balance would
prevent abuse of users with multiple e-money accounts, we intend to include this
feature in the proposed model. Besides, an MIS system in this process would help
in monitoring and reporting the mobile e-money accounts operated by particular
MNO.
• Rapidity: It is the speed with which illicit transactions can occur. Mobile e-money
transactions are usually conducted in real time, which makes them very difficult
to monitor. Individuals can initiate transactions at any time. Since different steps
involved in the transaction occur very quickly in the order of fractions of a second
(sending instruction frommobile phone through the wireless network to theMNO,
authentication of the individual, accessing the account, processing the transaction
and the transaction clearance and settlement), the rapidity of the transaction does
not give MNO enough time to suspend a suspicious transaction until more infor-
mation is obtained. This risk can be mitigated by flagging certain types of trans-
actions with integrated internal control systems.
• Poor oversight: Transparent guidelines, clear regulations and licencing with
effective risk supervision of MNOs can help making the system more transpar-
ent and accountable. In the proposed model, both the banking regulators, RBI
and the telecom regulator, TRAI, play a major role, so they should leverage their
respective areas of expertise and agree on the areas of responsibility. This would
be help in mitigating the risk of poor oversight over MNO to a large extent.
3.2 Impact of the Model on the Society
Sein and Harindranath’s (2004), the first order or primary effect of ICT is simple
substitution of old technology by the new. Primary effect thus occurs when people
Aadhaar and Financial Inclusion: A Proposed Framework to Provide Basic. . . 739

use their mobile e-money accounts to make transactions instead of hard currency.
People in rural and poor regions do not have access to formal mechanism like savings
account to store money. When the mobile e-money accounts will be launched, they
would get access to basic banking facilities like store, transfer and withdraw money.
Mobile e-money accounts would facilitate trade,making it easier for people to pay for,
and to receive payments for, goods and services. People need not travel distances to
pay their electricity bills or to buy air talk time; instead, they can perform all the
transactions with the push of few button on their mobile phone. The second order or
the secondary effect would occur when more and more people use mobile e-money
accounts for making all kinds of transactions. One way of ascertaining the second-
order effect would be the number of mobile e-money accounts operating; the ratio-
nale behind this is that with more number of users, there would be more number of
transactions. The societal and the economic changes that may happen due to the
introduction of mobile e-money accounts come under third-order or tertiary effect.
3.3 Estimating Adoption Potential for the MobileE-Money Accounts
Per the Bass model, the population which adopts the mobile e-money account:
nðtÞ ¼ pN þ q� pð ÞNðtÞ � q NðtÞ½ �2 N=
Here, n(t) is the number adopting at a time t, N(t) is the cumulative number
of adopters at time t and N is the total potential. The two parameter innovation coeffi-
cient (p) and the imitation coefficient (q) have been taken as 0.38 and 0.03, respec-
tively (average valuesmeasured over years). Assuming that mobile e-money accounts
are first introduced in the state of Andhra Pradesh, then the market potential would be
45 million (which is the wireless subscriber base in AP of as of July 2011). Table 4
shows the pattern.
Table 4 Adoption of mobile
e-money (accounts)Quarter Adoption Cumulative adoption
0 0 0
1 1,350,000 1,350,000
4 3,026,730 8,554,660
8 4,971,655 26,464,058
12 2,331,802 40,753,086
16 394,800 44,411,979
20 50,203 44,927,446
24 6,120 44,991,189
28 742 44,998,932
32 90 44,999,871
740 S. Rathod and S.K.P. Arelli

From Fig. 6, it can be inferred that it would take around 14 years for the mobile
e-money accounts to fully penetrate into the market. Revenues earned through this
model are required to be shared between different players so as to make the system
sustainable aswell as profitable for all stakeholders. Table 5 describes a recommended
structure for sharing of revenues between various players in the whole ecosystem.
A simple calculation (Table 6) exemplifies revenue sharing details of the proposed
framework for the state ofAndhra Pradesh.A very conservative estimation for number
of transactions per user has been made with linear growth assumption. Few assum-
ptions like the population are constant, and the percentage revenue shared remains the
same which have been made for simplicity of calculation. Even with such assum-
ptions, one can see the huge potential of mobile e-money accounts from the revenue
sharing for different stakeholders (Table 5).
3.4 Regulatory Issues
In India, at present, MNOs are prohibited from issuing e-money to the public.
MNOs can get into partnership with the banks and offer the saving accounts which
are operated by banks. For MNO-led banking model to implement, there would be a
need for new regulations to allow MNOs to enter in the banking sector. RBI should
lay down appropriate regulatory mechanism to deal with all the concerns in the
MNO-led banking model. The e-money license which will be issued to the MNO
should clearly define the role and permitted activities of the MNO. MNOs should be
Fig. 6 Adoption of mobile e-money (curve)
Aadhaar and Financial Inclusion: A Proposed Framework to Provide Basic. . . 741

prohibited from engaging in intermediation of funds or asset transformation. The
risk arising out of investment of funds should be transferred to fully prudential-
regulated banks through pooled account mechanism. RBI must also ensure that any
liabilities issued by the MNO are fully covered by the pooled account mechanism.
The aspect of ownership of customer should be addressed very clearly by defining
that MNO be the sole company responsible for all customer grievances. The concerns
about money laundering and financial terrorism could be handled by infusing strong
security and authentication mechanisms that are provided by government initiative of
project Aadhaar. The UID-based micropayments offer stronger compliance with anti-
money laundering laws, both to the MNO offering financial services and the regula-
tor. Since a person’s UID will be tagged to every transaction, the regulator achieves
Table 5 Revenue sharing
Services/players A/c opening
Deposit withdrawal transfer/
remittance Balance inquiry
Retailer/
correspondent
Compensation to
cover customer
education costs
Compensation to at least cover
cashmanagement costs, which will
includecosts of maintaining 100%
coveragefor all transactions,
adequate liquidityto avoid running
out of cash at theretail outlet as also
the costs of securemovement of
cash from remote retailoutlets to
MNO
Compensation
to cover
transaction
costs
MNO Main player in the framework (1)
Revenue earned on per transaction
basis; (2) Interest income from
deposits in bank
SWITCH Operation expenditure derived from
MNO on the basis of number of
transactions executed
Account Mapper Operation expenditure derived from
MNO on the basis of number of
transactions executed
UIDAI May charge fee for authenticating
customer details during account
opening and whenever
authentication service is required
Table 6 Projected revenue for MNO in Indian Rupees (INR)
Number of transactions
Revenue sharing
(for retailers)
Revenue for MNO
(in Indian Rupees (INR))
10 1,283,199 1,710,932
20 12,225,926 16,301,234
30 20,217,351 26,956,468
35 23,620,374 31,493,832
40 26,999,359 35,999,146
45 30,374,913 40,499,884
742 S. Rathod and S.K.P. Arelli

full traceability and accountability. Thus, no trade-off is made between inclusion and
security. Other dimension in laying down the regulatory framework should involve
fixing the tariff structures for MNOs offering basic financial services on mobile
phone, ensuring that it is affordable by the poor and unbanked while it still remains
profitable for MNOs.
3.5 Financing the Project
Apart from the investment by MNO, government would need to develop a support-
ive ecosystem for the model to viable and profitable for MNO. At the initial stage,
the private players need support from the government through policy initiatives
and investments to help them set up back-end infrastructure like Account Mapper,
SWITCH and other ancillary installations. This could be partly supported by NPCI
which is incorporated to provide a national infrastructure for payments and settle-
ments in the country. The Universal Service Obligation Fund (USOF), created by
the New Telecom Policy of 1999, can be availed as a source of investment by the
government for building telecom infrastructure in rural areas (and thus taking
initiatives to further enhance the rural wireless subscriber base). Per current date,
the USOF position (Kashi Nath Jha (2010)) is provisionally at Rs. 14157.01 crores
at the beginning of F.Y. 2010–2011 which could be effectively utilized to fund this
project in initial stages. The Committee on Financial Inclusion under Dr. C.
Rangarajan (Report of Committee on financial inclusion, RBI 2008) proposed to
set up funds for meeting the cost of developmental and promotional interventions
under the head “Financial Inclusion Fund” and another exclusive fund to meet the
cost of technology adoption under the head “Financial Inclusion Technology Fund”
with an approximate overall corpus of Rs. 500 crores each. In the Union Budget for
2010–2011, the corpus of these funds was enhanced by Rs. 100 crores each. These
funds can be effectively used to help in developing a pilot project program to
develop mobile e-money banking transactions involving MNOs.
4 Comparison with M-Pesa
M-Pesa model of Kenya, being offered by Safaricom (an affiliate of Vodafone),
is similar in many aspects to the proposed model designed to enable users to complete
basic banking transactions without the need to visit a bank branch. One crucial
difference between the proposed model and the M-Pesa model is of the identity
and authentication mechanism. The proposed model is based on the unique identity
number issued by UIDAI, which provides online authentication of identities. Their
model, which provides online authentication of identities based on fingerprints and
iris scan, is one of a kind in the world. This strong authentication mechanism ensures
that genuine and real individuals would only get registered as customers. Also, the
UID-based model provides compliance with anti-money laundering laws both to the
regulator and the MNO.
Aadhaar and Financial Inclusion: A Proposed Framework to Provide Basic. . . 743

5 Conclusion
Inclusive growth must not suffer on the insistence of a particular model. Regulator
must allow other promising models to be developed which provide extensive reach
and easy accessibility as that of the case with MNO-based banking model. An MNO-
based banking model developed using UID would address the issues of identity and
authentication mechanism. Moreover, the proposed UID-based model offers stronger
compliance with anti-money laundering laws both to the regulator and the MNO.
For this model to be implemented successfully, the regulator should be proactive,
in developing policies for allowing MNOs to issue e-money, a supportive ecosystem
by building infrastructure (Account Mapper and SWITCH). A pilot project must be
tested before developing the complete model. Learnings from the M-Pesa model of
Kenya can be used to perform the test run.
References
TRAI (2009) Annual report of TRAI 2009–2010 and information note to the press (Press Release
No. 35 /2011) (2011). From http://www.trai.gov.in/traiannualreport.asp; Retrieved on 31 Aug,
2011
Chatain P, Coss R, Borowik K, Zerzan A (2008) Integrity in mobile phone financial services.
Measures for mitigating risks from money laundering and Terrorist financing. World Bank
working paper No: 146 http://siteresources.worldbank.org/INTAML/Resources/WP146_Web.
pdf; Retrieved on 10 Sept, 2011
Farsi MJ (1997) G€oteborg University. Digital Cash. www.simovits.com/archive/dcash.pdf;
Retrieved on 2 Sep 2011
Financial inclusion: state of the sector report, 26th Skoch Summit 2–3rd June 2011, Mumbai. From
www.skoch.org. Retrieved on 19 Sept, 2011
Jha KN (2010) National Institute of Communication Finance. Constitution and Administration of
USO fund. http://www.nicf.gov.in; Retrieved on Sept 15, 2011
Microfinance India, state of the sector report – 2009. Sage, Delhi/London. http://www.accessdev.
org/downloads/State_of_the_Sector_Report_2009.pdf
Chakrabarty KC (2011) Presentation by Dr K.C. Chakrabarty, Deputy Governor RBI, 26th Skoch
Summit Mumbai, June 2, 2011. From www.rbi.org; Retrieved on 20 Sept 2011
RBI (2008). Report of Committee on financial inclusion, RBI. From ww.rbi.org; Retrieved on 5
Sept 2011
RBI Circular (2011) RBI Circular on opening of small accounts. http://uidai.gov.in/images/
FrontPageUpdates/rbi_circular_15_feb.pdf. Retrieved on 12 Sept 2011
Sein, Harindranath (2004) Conceptualising the ICT artefact: Towards understanding the role of
ICT in national development. Info Soc 20:15–24
SKOCH (2011) Financial inclusion: state of the sector report, 26th Skoch Summit 2–3rd June
2011, Mumbai. From www.skoch.org; Retrieved on 19 Sept, 2011
Srinivasan N (2009) Microfinance India, state of the sector report – 2009. Sage, Delhi/London.
http://www.accessdev.org/downloads/State_of_the_Sector_Report_2009.pdf; Retrieved on 21
Sept 2011
UIDAI (2010) Planning Commission. Govt. Of India. Section 10 on “UID-enabled micropayment
architecture” In: The report of UID strategy overview – creating a unique identity number for
every resident in India”. From http://uidai.gov.in/; Retrieved on 29 Aug 2011
744 S. Rathod and S.K.P. Arelli

Use of Mobile Phones by Small-Scale Farmers
for Price Discovery of Fresh Produce: A Case
Study from the Malur Taluk in Karnataka
Navolina Patnaik
1 Introduction
Commercialization of agriculture with advent of retail chains, agro-processing
firms, and changing consumer preferences can shift the small-scale farmers from
self-sufficiency toward profit and income-oriented decision making (Pingali et al.
2005). However, higher transaction costs associated with commercial agriculture
deter small-scale farmers from participation. In this chapter, we show that mobile
phones help small-scale farmers of Malur Taluk in the state of Karnataka by reducing
the transaction costs associated with marketing.
Knowledge and information are important factors for agricultural development
through increased production and profitable marketing (Bertolini 2004). Various
kinds of information are required throughout the cropping cycle:
• Planning stage: What crops to produce? capital availability and access, input
requirements
• Production stage: Machinery and technology know-how, application of fertilizers,
application of pesticides
• Postharvest: Storage and packing
• Marketing: Marketing channels, market prices, and demand information
This chapter focuses on the marketing stage where farmers in Malur Taluk
of Karnataka use mobile phones while choosing marketing channel(s) to sell
the produce. The study primarily focuses on vegetable growers. On a daily
basis, the farmers choose to sell their produce from a variety of marketing
channels available: (1) APMC mandis (direct and commissioned), (2) self-selling
at local markets, (3) traders, (4) retail collection centers, (5) agro-processing
firms, and (6) HOPCOMS cooperative. There are several points-of-sale for
N. Patnaik (*)
Department of Economics, University of Hyderabad, Hyderabad, India
e-mail: [email protected]
Department of Management Studies, Indian Institute of Science, Bangalore,
Driving the Economy through Innovation and Entrepreneurship,DOI 10.1007/978-81-322-0746-7_61, # Springer India 2013
745

some of the above channels. For example, there are several traders to sell to and
various retail collection centers including Reliance, Food World, Namdhari, etc.
We use transaction cost economics to test the hypothesis that mobile phones
help small-scale farmers of Malur in (1) reducing information asymmetry and
(2) increasing profitability.
2 Literature Review
There are numerous studies highlighting the role of ICT (information and commu-
nication technologies) in the growth of small, medium, and microenterprises,
focusing on the developing countries in Asia and Africa. Here, we briefly review
the works that study the role of mobile technology for marketing of agricultural
produce by farmers.
One of the first success stories of use of mobile phones by farmers is from Senegal
in Western Africa (BBC 2002). An organization called Manobi implemented a
project that provides market price information via mobile technology. Manobi
independently collects prices and uploads them to its central database using mobile
phones. Farmers in the field can use their mobile phones to check prices before they
set off and find out where they will get the best offer for their produce. It was found
that the farmers have secured, on average, about 15% higher profits after having
paid net costs, including the price of Manobi’s service (IDRC 2005). Moreover,
an added benefit in reducing information asymmetry in the local context led to
farmers realizing that there were often higher returns in producing for the local
markets compared to the export markets.
Farmers and traders in Ghana used mobile phones to reduce transaction costs
and transportation costs (Overa 2006). In addition to helping farmers in marketing
their produce, mobile phones are used to coordinate logistics activities with traders,
leading to considerable cost savings. Aker (2008) used the data from Sub-Saharan
African country Niger to show that mobile phones reduce the price dispersion in
grain markets. A mathematical model that sequentially searches for traders to
maximize selling price predicts that mobile phone usage will increase the traders’
reservation prices and the number of markets searched, thereby reducing the price
dispersion. The model was tested with the data from Niger that showed a minimum
reduction of 6.4 % in the price dispersion. Mobile phone usage by farmers in
Uganda reduced the information asymmetry between farmers and traders (Muto
et al. 2008). Mobile phones enabled higher market participation of farmers in
remote areas and increased profitability in the sales with availability to information
through mobile phones.
In India, positive evidence has been found for mobile phones usage contributing
to increased productivity and profitability in agriculture (Mittal et al. 2010). It is
now generally agreed that mobile phone usage by farmers can reduce information
search costs and lower transaction costs, thereby enabling greater farmer participa-
tion in commercial agriculture (De Silva and Ratnadiwakara 2008). However, the
746 N. Patnaik

usage pattern and the benefit accrued vary across different locations based on the
supply-demand market dynamics.
Apart from agriculture, mobile phones have benefited fishermen in decreasing
price dispersion. Fishermen from the state of Kerala in India use mobile technol-
ogy to know the demand requirements and price information (Jensen 2007).
Based on the demand requirements, fishermen change the catch pattern suiting
the demand and also decide the best place to land to sell their catch. Such
dynamic change in pattern based on real-time demand information is not possible
in agriculture as the cropping cycle is in months. However, demand and price
information at several points-of-sale can help the farmers choose the best one
to trade. We show in the rest of this chapter the supply-demand dynamics of
vegetables for different marketing channels in Malur Taluk and the usage of
mobile phones to reduce the transaction costs.
3 Malur Taluk
Malur is located 47 km from Bangalore, and the Taluk is bound by Bangarpet
Taluk, Hoskote Taluk, and Salem district of Tamil Nadu. The agroclimatic and soil
conditions are conducive for development of horticulture, floriculture, sericulture,
agriculture, plantation crops, aromatic plants, and medicinal plants. For the scope of
this chapter, we focus only on marketing of horticulture crops like tomato, potato,
onion, cabbage, carrot, brinjal, beans, green chillies, sweet potato, Kohl varieties,
okra, radish, beetroot, capsicum, watermelon, gourd varieties, drumstick, leafy
vegetables, etc. The moderate climate enables vegetable cultivation and harvesting
throughout the year and caters to various nearby and distant markets. The method-
ology we adopted for primary data collection is in-depth interviews with the
following players in the Malur fresh produce supply chain: farmers, retail collection
centers, HOPCOMS cooperative, Innova Food Park, traders, and transport agents.
Malur Taluk comprises of 28 gram panchayats, and we interviewed farmers from
seven gram panchayats, namely, Abbenahalli, Araleri, H. Hosakote, Kudiyanur,
Madiwala, Nosagere, and Santhehalli. This study focuses on various strategic and
operational aspects of marketing by Malur farmers. For the scope of this chapter,
we confine to operational decisions of day-to-day selling of vegetables and use of
mobile phones to reduce the transaction costs.
4 Marketing Channels
TheAgricultural ProduceMarket Committee (APMC) is amarketing board established
by respective state governments in India that facilitates a fair marketing channel for
farmers to sell agricultural produce. Per the Constitution of India, agricultural market-
ing is state governed and hence regulated under State APMC Acts. APMC Act
Use of Mobile Phones by Small-Scale Farmers for Price Discovery of Fresh. . . 747

prevents direct procurement from farmers and setting up private yards. With the
advent of retail stores and agro-processing industries, several state governments
amended APMC Acts, allowing direct buying from farmers. This has opened up
many marketing channels for the farmers to sell their produce. With the amendment
of APMC Act in Karnataka, Malur farmers have the following marketing channels:
APMC markets (direct and commissioned), traders, retail collection centers, agro-
processing firms, HOPCOMS cooperative, and self-selling/local merchants.
The above marketing channels include only those available for daily selling of
vegetables. The strategic marketing option like contract farming is not included
though it is practiced in Malur by Namdhari. The scope of this chapter is to study
the impact of mobile phone usage on daily selling of vegetables, and hence, only
the above channels are chosen. Figure 1 shows the marketing supply chain of
vegetables in Malur as identified by our field study. In the following, we briefly
describe the different marketing channels and point-of-sale available therein.
4.1 APMC Markets
The Karnataka State Agricultural Marketing Board was established on 1 September
1972 per section 100 of the Karnataka Agricultural Produce Marketing (Regula-
tion) Act 1966 and Rules, 1968. All the major towns in Karnataka have APMC
Farmers
Traders
HOPCOMSCooperative
UnorganizedRetailers
TransportAgents
APMCMarkets
OrganizedRetailers
RetailCollectionCenters
HouseholdConsumers& Small
Enterprises
Production Intermediaries Markets Distribution Consumption
MediumEnterprises
(Hotels,Hospitals,Caterers)
Fig. 1 Fresh produce marketing supply chain of Malur
748 N. Patnaik

market yards with provisions for godowns (warehouses) and shops for traders and
commission agents. However, some of the markets are nonfunctional with no
trading, but only fee collection by APMC offices. Malur is one such nonfunctional
market, despite the large quantities of produce available for trading. With no
physical infrastructure for trading, Malur farmers sell the produce directly at nearbyAPMC markets or commission the sales at distant markets.
4.1.1 Direct Selling
New Kalasipalyam market and Yeshwantpur market in Bangalore and the Kolarmarket are preferred nearby markets for direct selling. Farmers load the produce
and transport to the markets. Large farmers use their own trucks or exclusively hire
trucks for transporting their own produce. Small farmers aggregate their supply and
pay the truck service on the basis of load and distance. As the above markets are
3–4 h away from Malur, farmers usually leave to the market late night or early
morning to participate in the auctions to sell the produce.
4.1.2 Commissioned Selling
There is no designated space for market in Malur, except for a row of shops of
traders and commission agents with basic facilities of weighing and billing. There is
a functional APMC office that collects fees and handles licensing to agents. The
farmers can commission transport agents to sell their produce at distant APMC
markets on their behalf. The vegetables are loaded into trucks on the roadside with
no proper storage facilities or docking stations. The transport agents collect fees for
transportation and represent the farmers for selling. The distant markets include
Chennai, Salem, Coimbatore, Hyderabad, and Bhubaneshwar.
4.2 Traders
Traders are intermediaries who buy from farmers and sell to small and medium
enterprise customers like merchants, hospitals, and hotels. Some traders speculate
on the selling price of the produce for the next day and buy from farmers to sell at
other markets. Based on the demand from the customers, traders contact farmers
specifying quantity and quality of the produce expected. Traders are located within
the village limits, and the farmers need to transport the produce on their own to the
traders’ shop. The trading price is negotiated on the basis of current or previous
day’s market price. Farmers obtain the nearby market prices, and discounting the
cost of transportation and other intangible costs settles for trading price. One of the
main advantages for the farmers is the immediate cash payment by traders and a
higher markup over the APMC market price for high-quality produce.
Use of Mobile Phones by Small-Scale Farmers for Price Discovery of Fresh. . . 749

4.3 Retail Collection Centers
Retail chains establish collection centers (CC) that function like private yards
where farmers bring in their produce to sell. The collection centers receive their
demand for various products from their respective retail stores and raise indents to
be satisfied by the procurement from farmers. Collection centers maintain supplyregistry containing the information about farmers. Based on the indents, farmers are
contacted through mobile phones to inform about the demand and the price. Once
the price is negotiated, farmers bring in their produce to the collection centers
where it is checked for quality, weighed, and traded. Depending on the arrange-
ment, the payment is either done on the same day or on periodic basis. Traders and
retail collection centers also do on-field trading where they visit the field with trucksand buy the produce directly at the field, thus saving on transportation and time for
farmers.
4.4 Agro-Processing Firms
Agro-processing firms adopt a similar strategy like retail collection centers for the
procurement of produce that merely get sorted, cleaned, and packed as high-quality
vegetables to be sold at retail stores or supermarkets.
4.5 HOPCOMS Cooperative
Horticultural Producers’ Co-operative Marketing and Processing Society (HOP-
COMS) Limited was established under the Karnataka State Co-operative Act in
1959. HOPCOMS serves as a fair market channel for farmers through direct procure-
ment. The societies have a network of 37,000 farmer members, with decentralized
procurement centers in 19 districts. Malur has HOPCOMS procurement center which
receives the demand daily along with a fixed quoted price. Based on the demand,
procurement personnel of HOPCOMS give indent to farmer members.
4.6 Self-Selling/Local Merchants
Another marketing channel is the local market, where the farmer/farmers’ family
members directly sell or sell to local merchants, to cater to the needs of local
consumers. The quantity sold through this channel is comparatively very less.
Leftovers and rejected produce from other channels are usually sold as last resort
through this channel.
750 N. Patnaik

5 Transaction Costs
Coase (1937) introduced the concept of transaction costs associated with informa-
tion, negotiation, monitoring, coordination, and enforcement of contracts. Since
then, several ways of defining and measuring transaction costs have been proposed.
However, there is no standard definition, but it can be broadly interpreted as costsassociated with market exchange (Singh 2008). The transaction costs vary based
on the characteristics of the marketing channels or points-of-sale, and lower trans-
action costs encourage higher participation. Commercialization of agriculture is
evident with the advent of retail and agro-processing firms. Higher transaction costs
of such new marketing channels would deter the small-scale farmers to participate
in commercial agriculture (Pingali et al. 2005). Here, we show that mobile phones
help reduce the transaction costs and thereby increase higher market participation
of small-scale farmers with increased profitability. In order to study the transaction
costs, we need to first identify the drivers that influence the choice of marketing
channels.
5.1 Primary Drivers that Influence the Choice of MarketingChannel(s)
Based on our in-depth interviews, the following factors are identified as the pri-
mary drivers that influence the choice of a marketing channel for the farmers of
Malur: price, intermediary (brokers, commission agents) fees, quantity (accepted
and rejected), quality grading, transportation cost, and payment lead time. Table 1
summarizes the characteristics of the marketing channels based on the following
drivers: (1) price discovery mechanism, (2) intermediary fees, (3) quantity, (4)
quality, (5) transportation, and (6) payment lead time. It should be noted that the
information shown in the table refers to marketing channels in Malur and may differ
for other locations. The drivers contribute to various tangible and intangible trans-
action costs, which we briefly describe in the remainder of this section.
Table 1 Characteristics of various marketing channels in Malur
Price
discovery
Intermediary
fee Quantity Quality Transportation
Payment
lead time
APMC direct Auctions 8–10 % Unlimited All <100 km 2 days
APMC
commissioned
Auctions 10–15 % Unlimited All <750 km 3 days
Retail CC Bargaining None <100 kg A, A+ <10 km Immediate
On-field Bargaining None <100 kg A, A+ NIL Immediate
Trader Bargaining None <150 kg B, A, A+ <10 km Immediate
HOPCOMS List price None <100 kg A, A+ <10 km Immediate
Self-selling Bargaining None <20 kg All <3 km Immediate
Use of Mobile Phones by Small-Scale Farmers for Price Discovery of Fresh. . . 751

5.2 Information Search Costs
Information search incurs costs with respect to timeliness and quality of informa-
tion. Farmers use variety of modes for information search: social networks, media,agricultural extension services, and communication technologies. We measure the
information search cost in terms of (1) availability of information, (2) monetarycost spent in acquiring the information, and (3) time required. For example, current
market price is unavailable in newspaper, money is paid in calling on a phone or
traveling to meet a person, and time is spent for obtaining information. Information
search cost increases with unavailability of information, money, and time.
5.3 Buyer Search Costs
Search for buyers incurs cost with respect to knowledge of potential buyers and
obtaining price and demand information. A farmer should firstly be aware of
existence and whereabouts of potential buyers and then need to obtain the buyer’s
price offering and demand information. Buyer search is a specific type of informa-
tion search and hence measured in the same way as above.
5.4 Transportation Costs
Cost of physical transportation of produce from farm to the point-of-sale is
measured in terms of (1) monetary cost for transportation and (2) time invested.
5.5 Intermediary Fees
Fees paid in monetary value to intermediaries like brokers, commission agents,
market fee, etc.
5.6 Payment Mode and Delay
It is generally perceived that immediate payment is preferred over delayed pay-
ment. Our interviews with farmers and other players revealed that this is subjective.
Some farmers preferred weekly or periodic payments than immediate payments.
The preference of cash over bank transfer is also subjective. Further, it also depends
on the marketing channel. Farmers generally trust retail collection centers and
accept late payments, whereas immediate payments are preferred with traders.
752 N. Patnaik

5.7 Quality Grading and Rejected Quantity
There is no automated quality grading and physical characteristics of the vegetables
determine the grading as A+, A, B, and C. Usually, 10–15 % rejection is observed in
marketing channels with quality restrictions (retail collection centers). We measure
this transaction cost in terms of (1) time taken for quality inspection, (2) time taken tosell the rejected quantity, and (3)monetary cost incurred to sell the rejected quantity.
5.8 Multiparty Negotiation Cost
Negotiation or bargaining is the price discovery mechanism for many marketing
channels listed in Table 1. A farmer is involved in multiparty negotiation
if he negotiates with more than one buyer for selling the produce. There are two
reasons for multiparty negotiation: (1) to strike a profitable deal and (2) toapportion the produce among different points-of-sale. If the aggregate supply is
less than demand for a specific vegetable on a given day, the farmers negotiate
with different buyers to strike a profitable deal. The prices offered by other buyers
are quoted by the farmers to increase their bargaining power and get a higher
price. On the other hand, if the farmer has more produce than required by a single
indent, then he negotiates with multiple buyers to apportion his produce to be sold
at different points-of-sale. We measure the multiparty negotiation cost in terms
of (1) time invested and (2) monetary cost incurred.
6 Reduction in Transaction Costs by Using Mobile Phones
The interviews with various players in Malur agriculture marketing supply chain
revealed that mobile phones are widely used in all the stages of the supply chain,
namely, planning, production, postharvest, marketing, and distribution. Mobile
phones help in obtaining information, knowledge, networking, coordinating logistics,
and marketing. In this chapter, we focus on the mobile phone usage for marketing.
In particular, we test the hypothesis that mobile phones help small-scale farmersin (1) reducing information asymmetry and (2) increasing profitability.
6.1 Reducing Information Asymmetry
Information asymmetry creates imbalance of power in transactions where one party
is better or more informed than the other. Farmers are generally perceived to be
poorly informed about the market prices and demand than the buyers. This is due to
the high information search costs. Any technology or process that can reduce
the search cost can essentially reduce the information asymmetry. Mobile phones
Use of Mobile Phones by Small-Scale Farmers for Price Discovery of Fresh. . . 753

reduce information asymmetry for Malur farmers by allowing real-time access to
following information from the different points-of-sale: (1) offered/expected price,(2) quantity demanded, and (3) expected quality. It is important to note that the
above price and demand information is obtained in real time and from local points-of-sale like retail collection centers and individual traders. In terms of information
search costs defined in the previous section, mobile phones are the cheapest and
only feasible mode of obtaining the above information in real time.
6.2 Increasing Profitability
Profitability to farmers is realized through higher sale price with reduced transaction
costs by trading with the optimal buyer. Mobile phones enable increased profitability
through (1) reduction in information search costs, (2) reduction in buyer search costs,
(3) increased bargaining power due to reduction in information asymmetry, and
(4) better deals through multiparty negotiation. Retail collection centers, traders,
and agro-processing firms maintain supply registry containing contact information
about farmers and their produce. Once indents are raised, preferred farmers are
contacted through mobile phones. Farmers also call the collection centers using
mobile phones to know the demand information and price offered. Thus, the buyer
search costs are typically mobile phone call charges with few minutes of talking time.
The APMC market price and price offered by other buyers are used as base price
for negotiation, discounting transportation, and other transaction costs. The above
information search is done through mobile phones which is the cheapest mode.
Empowered with market and demand information, the farmer has more bargaining
power with reduced information asymmetry. Further, mobile phones are used for
every single negotiation, and hence, multiparty negotiation is also cheaper. Figure 2
shows the percentage of farmers who have contacted different number of buyers
before final transaction. Around 63% of the farmers have contacted more than three
buyers before making the final transaction using mobile phones.
0; 12%
1; 8%
2; 17%
>= 3; 63%
Fig. 2 Number of buyers
contacted before final
transaction
754 N. Patnaik

6.3 Inclusive Growth by Empowering Small-Scale Farmers
Though it is widely accepted that mobile and other communication technologies
reduce the transaction costs, it is not always obvious whether small-scale farmers
are benefited (Pingali et al. 2005). In the case of Kerala fishermen from India,
mobile phones helped prosperous fishermen (Jensen 2007), but in the grains market
of Niger, mobile phones enabled inclusive growth of poor farmers (Aker 2008). We
show that in the case of Malur, mobile phones help small-scale farmers engage in
commercial agriculture due to the existing supply-demand dynamics. As shown in
Table 1, except for the APMC markets, quantity and quality in other marketing
channels are restricted. Retail collection centers and traders offer a 10–15% higher
markup over APMC market price for high-quality produce. However, 10–15% of
farmers’ produce is rejected as unacceptable quality. Given the lower demand in
quantity and higher price for good quality, small-scale farmers prefer to sell through
commercialized channels. The following observations are relevant: (1) Large
farmers choose to sell their produce primarily in APMC markets, (2) very few
large farmers apportion their produce to sell at different points-of-sale (usually to
retail collection centers or agro-processing firms), (3) small-scale farmers primarily
choose to sell to retail collection centers, followed by traders based on quality, and
(4) rejected quantity is usually sold at local markets or through self-selling channel.
7 Conclusions
Information and communication technologies in developing countries are helping
in commercialization of agriculture. In this chapter, we showed that mobile phones
help small-scale farmers in decreasing transaction costs associated with search of
information, search of buyers, and negotiating a trade. The study conducted at the
Malur Taluk in Karnataka showed that new marketing channels like retail collec-
tion centers and traders primarily use mobile phones for communication and
negotiation with farmers. Further, lower communication cost associated with the
mobile phones empowers farmers with real-time market information and enables
them to conduct multiparty negotiation resulting in higher profits.
References
Aker JC (2008) Does digital divide or provide? The impact of cell phones on grain markets in
Niger. Working Paper Number 154. Centre for Global Development, Washington, DC
BBC (British Broadcasting Corporation) (2002). Mobiles find right price for farmers. October 6,
2002. http://news.bbc.co.uk/2/hi/technology/2290540.stm
Bertolini R (2004) Making information and communication technologies work for food security
in Africa, 2020. International Food Policy Research Institute, Washington, DC, IFPRI Brief –
Africa Conference Brief II
Use of Mobile Phones by Small-Scale Farmers for Price Discovery of Fresh. . . 755

Coase RH (1937) The nature of the firm. Economica 4:386–405
De Silva H, Ratnadiwakara D (2008) Using ICT to reduce transaction costs in agriculture through
better communication: a case study from Sri Lanka. LIRNEasia, Colombo, Sri Lanka. http://
www.lirneasia.net/wp-content/uploads/2008/11/transactioncosts.pdf
IDRC (International Development Research Center) (2005) Acacia partner garners two major ICT
prizes. IDRC, Ottawa. http://www.idrc.ca/en/ev-68430-201-1-DO_TOPIC.html
Jensen R (2007) The digital provide: information (technology), market performance, and welfare
in the South Indian fisheries sector. Q J Econ CXXII(3):879–924
Mittal S, Gandhi S, Tripathi G (2010) Socio-economic impact of mobile phones on Indian
agriculture. Working Paper No: 246, Indian Council for Research on International Economic
Relations, New Delhi.
Muto M, Yamano T (2008) The impact of mobile phone coverage expansion on market partici-
pation panel data evidence from Uganda. Draft Discussion Paper, Japan International Co-
operation Agency (JICA)
Overa R (2006) Networks, distance, and trust: telecommunications development and changing
trading practices in Ghana. World Dev 34(7):1301–1315
Pingali P, Khwaja Y, Meijer M (2005) Commercializing small farms: reducing transaction costs.
ESAWorking Paper No. 05-08. Agricultural and Development Economics Division, The Food
and Agriculture Organization of the United Nations, Rome
Singh N (2008) Transaction costs, information technology and development. Indian Growth Dev
Rev 1(2):212–236
756 N. Patnaik

Mobile Banking: A Study on Progress
and Customer Perception in India
for Financial Inclusion
S. Sudalai Muthu and T. Kadalarasane
1 Introduction and Design
1.1 Introduction
Financial inclusion is delivery of banking services at an affordable cost to the vast
sections of disadvantaged and low-income groups (IDRBT 2010). Recent scenario
shows that wireless infrastructures have emerged as an effective option of
connecting to an ever-evolving expansive information network such as the Internet
and mobile phone service in India (Market Analysis and Consumer Research
Organisation 2004). In the twenty-first century, ‘mobile’ is not the only means of
communication; it is now the means of banking and financial services (Suoranto
2003; Mattila 2002; Tiwari et al. 2006a,b; Laukkanen 2007; Zeithaml and Gilly
2002; John and Gorman 2002). Various initiatives are already taken to use mobile
phones and its services to offer financial services to the unbanked and also provide the
benefit of convenient financial transactions (Reserve Bank of India 2009).
1.2 Statement of Problem
India has 1,200 million people; more than 800 million are mobile subscribers, but
only 400 million individuals are having bank accounts. It indicates the increase in
mobile penetration in India, and this mobile penetration helps to implement the
mobile banking system effectively, and it will help to bring all sections of people
into the banking system.
S.S. Muthu (*) • T. Kadalarasane
Department of Banking Technology, School of Management,
Pondicherry University, Puducherry 605014, India
e-mail: [email protected]; [email protected]
Department of Management Studies, Indian Institute of Science, Bangalore,
Driving the Economy through Innovation and Entrepreneurship,DOI 10.1007/978-81-322-0746-7_62, # Springer India 2013
757

In India many banks are offering mobile banking services, but the number and
volume of M-Banking transactions are lower than expected. There is no study
on the growth of M-Banking services in India. The customers’ acceptance and
adoption level also is very less in India. Very few earlier works concentrated on
assessing the acceptance level of M-Banking by the banks’ customers. Further,
most of the foreign studies are focused on adoption of M-Banking from customers’
view except Lebanese bank (Daghfous and Toufaily 2002), Sudanese commercial
banks (Mahdi and Dawson 2007) and Germany banks (Tiwari and Buse 2001).
Therefore, this study has been conducted to study the progress of M-Banking, to
assess the customers’ perception and to find out usage segment of M-Banking by
the customers and their habiting and inhibiting drivers in Indian context with the
following objectives.
1.3 Objectives of This Study
1. To study the present status of M-Banking system in India
2. To assess and analyse the customers perception towards mobile banking system
3. To assess and analyse the problems and difficulties in existing mobile banking
system
1.4 Hypothesis
Ho: There is significant relationship between the customers’ opinion towards
mobile banking and their demographic characteristics of the customers.
1.5 Methodology
This research is done by adopting both analytical and empirical research design.
1.5.1 Data and Source of Data
This study is based on both primary and secondary data sources. Primary data is
collected through interview schedule from the existing bank customers having
mobile phones. The required secondary data are collected from the sources of
RBI website, CMIE databases, books, journals, websites and other publications.
758 S.S. Muthu and T. Kadalarasane

1.5.2 Study Area
Puducherry Union Territory is the sampling area for this study. It is selected for
the intention of finding out the overall acceptance of M-Banking among the
customers. Puducherry has 124 bank branches. Those branches become public
sector (89 branches), private sector (22 branches), foreign sector bank (1 branch)
and RRBs (12 branches). Moreover, 24 public and 13 private sector banks and one
RRB and one foreign bank have opened their branches in Puducherry. Hence, the
researcher had undertaken this study in Puducherry.
1.5.3 Sample Size
Universe (bank customers) of the present study is finite in numbers. The selection
of sample customers (1,000 respondents) is taken for the study using stratified
disproportionate random sampling technique.
1.5.4 Tools for Analysis
All the collected data were analysed with the help of percentage analysis,
chi-square test, Garrett’s ranking techniques and exploratory factor analysis using
principal component analysis. The results of the analysis are given in the following
three different sections.
1.6 Scheme of the Report
In order to present the report in a lucid way, it has been divided into five sections.
The first section deals with an introduction and design of this chapter, and the
second section highlighted the mobile banking system and its trends in India.
The third section of this chapter presents the results of the survey conducted to
assess the customer perception towards mobile banking; the fourth section explains
the various mobile banking models, and the last part highlighted the concluding
remarks.
2 Mobile Banking System and Its Trends in India
2.1 Mobile Banking
Mobile banking simply means performing banking transactions through mobile
phones. Mobile banking is a term used for performing banking transactions, for
example, money transfer, balance checks, account transactions, payments, etc.,
via a mobile device such as a mobile phone.
Mobile Banking: A Study on Progress and Customer Perception in India. . . 759

Mobile banking is seen to be an extension of the existing payment infrastructure
of a bank to mobile phones as a channel for the leveraging of the mobile network
and its reach, to deliver banking services to consumers (Gavin Troy Krugel 2007).
2.2 Types of Mobile Banking Techniques
Technically speaking, most of these mobile banking services can be deployed using
more than one of the following channels.
1. IVR (Interactive Voice Response)
2. SMS (Short Messaging Service)
3. WAP (Wireless Access Protocol)
4. Standalone Mobile Application Clients
2.2.1 IVR – Interactive Voice Response
IVR or Interactive Voice Response service operates through pre-specified numbers
that bank gives to their customers. Customers make a call at the IVR number and
are usually greeted by a stored electronic message followed by a menu of different
options. Customers can choose options by pressing the corresponding number in
their keypads and are then read out the corresponding information, mostly using a
text to speech programme.
2.2.2 SMS – Short Messaging Service
SMS uses the popular text-messaging standard to enable mobile application based
banking. The way this works is that the customer requests for information by
760 S.S. Muthu and T. Kadalarasane

sending an SMS containing a service command to a pre-specified number. The bank
responds with a reply SMS containing the specific information.
2.2.3 WAP – Wireless Access Protocol
WAP uses a concept similar to that used in Internet banking. Banks maintain WAP
sites which customers access using a WAP compatible browser on their mobile
phones. WAP sites offer the familiar-form-based interface and can also implement
security quite effectively.
2.2.4 Standalone Mobile Application Clients
Standalone Mobile Applications are the ones that hold out the most promise as they
are most suitable to implement complex banking transactions like trading in
securities. They can be easily customized according to the user interface complex-
ity supported by the mobile. In addition, mobile applications enable the implemen-
tation of a very secure and reliable channel of communication.
Mobile Banking: A Study on Progress and Customer Perception in India. . . 761

One requirement of mobile application clients is that they require to be
downloaded on the client device before they can be used, which further requires
the mobile device to support one of the many development environments like
J2ME, Qualcomm’s BREW, Ovi, Android, etc.; J2ME is fast becoming an industry
standard to deploy mobile applications and requires the mobile phone to support
Java. Android is one of the fast-developing user-friendly platforms.
2.3 Mobile Banking Architecture
The mobile banking architecture is based on the specific requirement that the
facility is provided through GPRS-, GSM-, CDMA-, EDGE-, 3G- and CSD-
enabled mobile phones. The services can be provided to customers either directly
by the bank or through a 3rd-party vendor.
762 S.S. Muthu and T. Kadalarasane

Third-party service architecture is the more popular architecture as banks can
quickly roll out their mobile banking solutions by connecting to a 3rd party. In this
architecture, the mobile banking servers are located at the 3rd-party vendor’s data
centre. These servers will talk to the core banking servers of the bank through a
secured channel (dedicated or shared link) for authentication, authorization and
transaction processing.
2.4 Mobile Banking in India
Mobile banking was introduced in India in the year 2008. Corporation bank is the
first public sector bank that started mobile banking in India in the year 2008. Now,
32 banks had been granted permission to operate mobile banking in India, of which
6 belonged to the State Bank Group, 12 belongs to nationalized banks, and 13
belongs to private and one foreign banks.
2.5 Mobile Banking Services in India
The following is the comprehensive list of mobile banking services offered by
various banks in India.
Services provided through mobile banking in India:
Account information Payments and transfers Supporting services
Transaction statement Micropayment handling Request for credit
Account history Mobile recharging Checkbook requests
Transaction alerts Commercial payment Locating ATMs
Monitoring of deposits. Bill payment/other payments Other services
Loan statements Investment services General information
Mutual fund statements Portfolio management Loyalty-related information
Check status/stopping
payment
Stock quotes and personalized
alerts
Various promotional and other offers
and services
Mobile Banking: A Study on Progress and Customer Perception in India. . . 763

2.6 Third-Party Service Providers
Mobile banking services are offered through some third-party service providers.
They played an important role in providing mobile phone services. The following
are few important third-party service providers:
1. Payment service providers (PayMate, Ngpay, Obopay, etc.)2. Technology providers (Fundamo, Utiba, Mcheck, Accenture, Sybase 365 and
Cell Trust, etc.)3. Network service providers (BSNL, Airtel, Aircel, etc.)
4. Mobile vendors (Nokia, Samsung, Sony, BlackBerry, etc.)
5. Distribution agents (Oxicash, Beam Express Points)
6. Regulators (DIT, RBI)
7. Other forums (Mobile Payment Forum)
The performance and progress of mobile banking in India is given below.
764 S.S. Muthu and T. Kadalarasane

Table 1 shows the progress of mobile banking, and other given graph depicts the
mobile banking transactions provided by various banks in India. From the above it
is observed that the value of mobile transactions during the period is in rapid growth
and in increasing trend.
3 Customers Perception Towards Mobile Banking System
3.1 Introduction
Realizing the importance of mobile-based services offered by various banks, the
researcher has assessed the customers’ perception towards mobile banking services
offered by banks in Puducherry area. The results are shown below.
Mobile Banking: A Study on Progress and Customer Perception in India. . . 765

Table
1Progress
ofmobilebanking
Month
and
year
Mobilebanking(involumes)
Percentto
thetotal
Monthly
growth
rate
(incre./
decre.)
Monthly
growth
rate
(%
ofincre./decre.)
Yc ¼268977.87+
33487.338X
Yc¼
77209.87+
4909.19X
Yc¼
13746.39+
150.94X
Public
Private
Foreign
Public
Private
Foreign
Public
Private
Foreign
Public
Private
Foreign
Public
Private
Foreign
May’09
6,684
35,354
10,500
0.11
1.99
3.32
––
––
––
�99382.85
23208.78
12086.05
Jun’09
15,477
34,183
12,017
0.25
1.92
3.80
8,793
�1,171
1,517
131.55
�3.31
14.45
�65898.51
28117.97
12236.99
Jul’09
17,340
33,980
12,439
0.28
1.91
3.93
1,863
�203
422
12.04
�0.59
3.51
�32408.17
33027.16
12387.93
Aug’09
33,074
45,530
12,961
0.53
2.56
4.10
15,734
11,550
522
90.74
33.99
4.20
1079.17
37936.35
12538.87
Sep’09
41,465
44,450
13,254
0.67
2.50
4.19
8,391
�1,080
293
25.37
�2.37
2.26
34566.5
42845.54
12689.81
Oct’09
53,843
44,069
13,711
0.87
2.48
4.34
12,378
�381
457
29.85
�0.86
3.45
68053.84
47754.73
12840.75
Nov 09’
67,668
45,718
12,467
1.09
2.57
3.94
13,825
1,649
�1,244
25.68
3.74
�9.07
101541.18
52663.92
12991.69
Dec’09
91,959
51,261
13,373
1.49
2.89
4.23
24,291
5,543
906
35.90
12.12
7.27
135028.52
57573.11
13142.63
Jan’10
122,153
59,889
14,338
1.97
3.37
4.53
30,194
8,628
965
32.83
16.83
7.22
168515.86
62482.3
13293.57
Feb’10
141,442
39,929
13,696
2.29
2.25
4.33
19,289
�19,960
�642
15.79
�33.33
�4.48
202003.19
67391.49
13444.51
Mar’10
191,065
67,696
13,159
3.09
3.81
4.16
49,623
27,767
�537
35.08
69.54
�3.92
235490.53
72300.68
13595.45
Apr’10
203,755
72,041
13,418
3.29
4.06
4.24
12,690
4,345
259
6.64
6.42
1.97
268977.87
77209.87
13746.39
May’10
247,430
90,789
13,758
4.00
5.11
4.35
43,675
18,748
340
21.44
26.02
2.53
302465.21
82119.06
13897.33
Jun’10
272,140
84,970
14,529
4.40
4.78
4.60
24,710
�5,819
771
9.99
�6.41
5.60
335952.55
87028.25
14048.27
Jul’10
350,522
107,661
14,795
5.67
6.06
4.68
78,382
22,691
266
28.80
26.70
1.83
369439.88
91937.44
14199.21
Aug’10
408,738
104,590
15,261
6.61
5.89
4.83
58,216
�3,071
466
16.61
�2.85
3.15
402927.22
96846.63
14350.15
Sep’10
396,797
88,115
14,127
6.41
4.96
4.47
�11,941
�16,475
�1,134
�2.92
�15.75
�7.43
436414.56
101755.82
14501.09
Oct’10
444,449
97,225
14,329
7.18
5.47
4.53
47,652
9,110
202
12.01
10.34
1.43
469901.9
106665.01
14652.03
Nov’10
491,763
116,718
13,999
7.95
6.57
4.43
47,314
19,493
�330
10.65
20.05
�2.30
503389.24
111574.2
14802.97
Dec’10
533,479
133,555
14,003
8.62
7.52
4.43
41,716
16,837
48.48
14.43
0.03
536876.57
116483.39
14953.91
Jan’11
584,953
125,639
14,075
9.46
7.07
4.45
51,474
�7,916
72
9.65
�5.93
0.51
570363.91
121392.58
15104.85
Feb’11
578,872
114,026
14,590
9.36
6.42
4.61
�6,081
�11,613
515
�1.04
�9.24
3.66
603851.24
126301.77
15255.79
Mar’11
891,423
138,439
17,368
14.41
7.80
5.49
312,551
24,413
2,778
53.99
21.41
19.04
637338.59
131210.96
15406.73

Apr’11
670825.93
136120.15
15557.67
May’11
704313.26
141029.34
15708.61
Jun’11
737800.60
145938.53
15859.55
July’11
771287.94
150847.72
16010.49
Aug’11
804775.25
155756.91
16161.43
Sep’11
838262.62
160666.10
16312.37
Oct’11
871749.95
165575.29
16463.31
Nov’11
905237.29
170484.48
16614.25
Dec’11
938724.63
175393.67
16765.19
Total
6,186,491
1,775,827
316,167
100
100
100
Mean
268977.87
77209.87
13746.39
SD
238058.24
34867.24
1301.00
C.V
0.89
0.45
0.09

The study reveals that majority of the customers were in the age group
below 25 years (82.93 %); most of the customers are postgraduates (95.93 %),
and 7/10th of the customers are students (70.73 %). The chart given here reveals the
bank-wise respondents and their usage pattern of mobile services offered by banks
in the study area.
3.2 Various Mobile Services Offered by Banks
7/10th of the customers are availed banking services through public sector banks.
24% of the customers are using M-Banking system for the purpose of account
balance checking, followed by availing mini statement and monitoring of accounts.
The other usage patterns are given in the figure.
3.3 Reasons for Using Mobile Banking System
Garrett’s ranking technique result reveals that foremost reason for using this service
is instant and immediate information availed under M-Banking facilities because it
shows highest mean score (68.75) compared to other reasons. Time saving (53.85)
is a second important reason, and fast and effortless shows the third rank with
the mean score of 50.11. On the other hand, less cost got last reason for using
M-Banking system.
768 S.S. Muthu and T. Kadalarasane

3.4 Customers Perception Towards Mobile Banking System
Explorative factor analysis, a multivariate statistical technique, has been used to
identify the underlying factors that determine perception towards M-Banking
through the customer response against 14 statements using principle component
analysis. The responses are collected from the customers in the form of qualitative
nature in strongly agree, agree, neither agree nor disagree, disagree and strongly
disagree statements with the score of 5–1, respectively. The results are shown below.
Table 2 presents the factor loadings for each variable. The variables V13, V10,V12, V5 and V9 have loading of 0.826, 0.813, 0.790, 0.782, 0.699 and 0.451,respectively, on factor 1; this suggests that factor 1 is a combination of these
variables. So factor 1 can be named ‘convenience’. In the case of factor 2, columns
indicating variables V2, V6, V11 and V3 have loadings of 0.888, 0.834, 0.693, 0.686and 0.616, respectively, on factor 2, this suggests that factor 2 is a combination of
these variables. So factor 2 can be named as ‘24 � 7 Flexible Services’. In case of the
factor 3, columns indicate that variables V7 and V8 have loadings 0.840 and 0.813 onfactor 3, respectively; this suggests factor 3 is named ‘speed’ and V14 have a single
loading 0.881 on factor 4 named as ‘quick financial decision’. Hence, it is concluded
that ‘convenience’, ’24 � 7 flexible services’, ‘speed’ and ‘quick financial decision’
are the factors responsible for motivating customers to use mobile banking system.
3.5 Customers Opinion About Mobile Banking System
The opinions about mobile banking system were collected from the customers in
qualitative form through the five-point scaling technique. Overall scores of each
Table 2 Rotated component matrix (a)
Component
1 2 3 4
Educating the customer 0.826 0.021 0.074 0.141
Errorless 0.813 0.084 0.315 �0.205
Meet the needs in future 0.790 0.183 0.087 0.410
Low (or) no cost 0.782 0.421 �0.053 0.135
Security 0.699 0.169 0.303 �0.257
Easy to use 0.451 0.400 0.401 0.365
Privacy is maintained �0.104 0.888 0.069 �0.157
24 � 7 Availability 0.111 0.834 0.324 0.069
Customer-friendly device 0.348 0.693 0.183 0.154
Satisfies all my banking needs 0.287 0.686 �0.307 �0.140
Time savings 0.446 0.616 0.338 0.064
Motivate the work force 0.054 0.081 0.840 �0.042
Fast and effortless 0.353 0.171 0.813 0.058
Quick decision making 0.034 �0.069 �0.010 0.881
Source: primary data
Extraction method: principal component analysis
Rotation method: varimax with Kaiser normalization
Rotation converged in five iterations
Mobile Banking: A Study on Progress and Customer Perception in India. . . 769

and every customer are calculated; then customer opinion was assessed based
on the mean and standard deviation derived from total score of sample customers.
The customers’ opinion about mobile banking system is shown in Table 3.
Inferred from the above that more than half of the customers are moderately
viewed about mobile banking system provided by banks, and nearly 2/5 of the
customers are given poor opinion about mobile banking services, followed by
9.76% of the customers that are opined well.
3.6 Testing of Hypothesis
Pearson chi-square (w2) statistic should be used to test the relationship between the
customers’ level of opinion towards mobile banking and their demographic
characteristics of the customers. The results of the test and the asymptotic value
of w2 are given in Table 4.
3.7 Problems Faced by the Students
The problems faced by the customers while using mobile banking system are
collected from the various bank customers through the seven variables. Garrett’s
ranking technique is used to rank the major problems faced by the customers while
using M-Banking facilities, the results are shown in Table 5.
From the table, it is observed that major problem faced by the customer is mobile
signal problem that leads to poor connectivity; it shows highest mean score (63.11)
compared to other problems. The second problem is there is no standard software
(56.09) for mobile applications. It indicates that different operating softwares are
Table 3 Opinion regarding
Mobile Banking SystemOpinion Frequency Percent
Poor 48 39.02
Good 12 9.76
Moderate 63 51.22
Total 123 100
770 S.S. Muthu and T. Kadalarasane

available, but there are no comprehensive standard softwares for providing standard
services. Another important problem is vulnerability, which shows the third rank
with the mean score of 49.60. So the government and banks should take necessary
steps to educate the customers.
4 Mobile Banking Models and Standard
4.1 Mobile Banking Models
M-Banking models have often been falling into two primary categories, namely,
bank-based model and a nonbank-based model. Each model has distinct means of
operating, especially with respect to the relationship with the end customer in terms
of establishing accounts, deposit taking and lending services.
4.2 Bank-Led Model
The bank-focused model emerges when a traditional bank uses nontraditional
low-cost delivery channels to provide banking services to its existing customers.
Examples range from use of automatic teller machines (ATMs) to internet banking
Table 4 Relationship of demographic characteristics and level of opinion
Demographic character w2 df Asymp.sig Result
Sex 0.924 2 0.63 NS
Age group (in years) 2.846 4 0.584 NS
Educational qualification 9.759 4 0.045* S
Occupational status 2.521 4 0.641 NS
Family income 1.842 4 0.765 NS
Years of usage of mobile phone 1.694 4 0.792 NS
Frequency of visit to bank 0.307 4 0.989 NS
* ¼ Significance at 5 % level
Table 5 Problems regarding
usage of mobile banking
system
Problems Total score Mean Rank
Signal problem 7,762 63.11 I
No standard software 6,899 56.09 II
Mobile access charges 5,932 48.23 V
Security 6,039 49.10 IV
Vulnerability 6,101 49.60 III
Authentication 5,057 41.11 VII
Confidentiality 5,137 41.76 VI
Source: primary data
Mobile Banking: A Study on Progress and Customer Perception in India. . . 771

or mobile phone banking to provide certain limited banking services to banks’
customers. This model is additive in nature and may be seen as a modest extension
of conventional branch-based banking. The bank-led model offers a distinct alter-
native to conventional branch-based banking in that customer conducts financial
transactions at a whole range of retail agents (or through mobile phone) instead of at
bank branches or through bank employees. This model promises the potential to
substantially increase the financial services outreach by using a different delivery
channel (retailers/mobile phones), a different trade partner (Telco/chain store)
having experience and target market distinct from traditional banks, and may be
significantly cheaper than the bank-based alternatives. The bank-led model may
be implemented by either using correspondent arrangements or by creating a JV
between bank and Telco/nonbank. In this model, customer account relationship
rests with the bank.
In India in the year 2008, the Reserve Bank of India (RBI) issued mobile banking
guidelines that permit only licensed banks with a physical bank presence in India to
launch mobile banking using this bank-focused model.
The disadvantage of the bank-based model is that it may not be able to innovate
as easily or respond as rapidly to market needs. In addition, a bank-based model is
closely tied to existing services offered by a formal bank may have a more limited
reach than a nonbank service.
4.3 Nonbank-Led Model
The nonbank-led model is where a bank has a limited role in the day-to-day account
management. Typically, its role in this model is limited to safekeeping of funds.
Account management functions are conducted by a nonbank (e.g. Telco) which has
direct contact with individual customers and performs all functions.
One of the greatest advantages to the nonbank model is that it can more
easily increase access to financial services for those in low-income and rural
areas because the customer does not need to engage in a direct contractual relation-
ship with the bank. An additional potential advantage may be that the company
offering the service may not be subject to the more restrictive regulations imposed
on a traditional bank because it does not fall under the traditional definition of a
‘financial institution’, or its services may not fall under the definition of a ‘banking
activity’.
The disadvantage to a nonbank-based model is ensuring that sufficient capital is
in place to mitigate any financial risk due to a lack of funds within the system.
An additional disadvantage to the nonbank model is that it often necessitates the
need for further review and refashioning of banking and/or telecommunication
regulations in order to provide the service, as well as to provide adequate protection
for consumers.
772 S.S. Muthu and T. Kadalarasane

5 Conclusion
The result of this chapter reveals that mobile banking system is enjoying a rapid
growth in India. It has successfully crossed the introduction stage. Mobile banking
services are growing both in terms of volume and value of transaction.
Regarding the customer perception regarding M-Banking, mostly, young and
educated customers are very much interested to apply and avail mobile banking
services. ‘Convenience’, ‘24 � 7 flexible services’, ‘speed’ and ‘quick financial
decision’ are the factors responsible for motivating customers to use mobile
banking system. 7/10 of the customers are availed banking services through public
sector banks. There is a significant relationship between educational qualification of
the customers and their level of opinion regarding mobile banking system. The
bank should take some steps to educate their customers regarding various aspects of
M-Banking services. Most of the M-Banking customers are not satisfied with their
mobile network, so the mobile network service providers should take care of their
customers.
Regarding mobile banking models, in India, mostly bank-focused mobile bank-
ing model has been used and offered services. So the regulators may take some
steps to implement more nonbank models in India to extend the mobile banking
services. Effective and more user-friendly software may be introduced to simplify
the uses. The existing customers are not satisfied with present security measures, so
steps should be taken to introduce effective security measures to avoid mobile-
transaction-based crimes which would help to bring 100% financial inclusion in
India. Necessary steps are to be taken to frame guidelines related to security and
privacy of transaction. New legal frameworks are also needed that should define
supervisory structure of related entities and that would help to bring transparency in
all activities.
References
A Report by IDRBT (2010) Technology in banking – insight and foresight, pp 18–20. Ernst &
Young. http://www.ey.com/Publication/vwLUAssets/
A Report by MACRO (Market Analysis & Consumer Research Organization) (2004) Study of
mobile phone usage among the teenagers and youth in Mumbai. http://www.itu.int/osg/spu/ni
Daghfous N, Toufaily E (2002) The adoption of “e-banking by Lebanese banks : success and
critical factors. Available from http://www.esg.uqam.ca/recherche/documents/2007/02-2007.
Gavin Troy Krugel (2007) Mobile technology banking options: an overview of the different
mobile banking technology options, and their impact on the mobile banking market, FinMark
Trust. http://www.mfw4a.org/documents-details/mobile-technology-banking, p 53
John YJ, Gorman GE (2002) Internet use in South Korea. J Online Info Rev 26(5):335–344
Laukkanen T (2007) Internet vs mobile banking: comparing customer value perceptions. Bus
Process Manage J 13(6):788–797
Mahdi MOS, Dawson P (2007) The introduction of information technology in the commercial
banking sector of developing countries: Voices from Sudan. Info Technol People 20(2):184–204
Mobile Banking: A Study on Progress and Customer Perception in India. . . 773

Mattila M (2002) Factors affecting the adoption of mobile banking services. J Internet Bank
Comm 8(1)
Reserve Bank of India (2009) Branch banking statistics, vol 4. Reserve Bank of India, Mumbai
Suoranto M (2003) Adoption of mobile banking in Finland. Doctoral thesis, University of
JyvaSkyla
Tiwari R, Buse S (2001) The mobile commerce prospects: a strategic analysis of opportunities in
the banking sector. Hamburg University press, Hamburg
Tiwari R, Buse S, Herstatt C (2006a) Mobile banking as business strategy: impact of mobile
technologies on customer behaviour and its implications for banks. Research paper presented
at Portland international conference on management of engineering and technology
(PICMET), Istanbul, 8–13 July 2006
Tiwari R, Buse S, Herstatt C (2006b) Customer on the move: strategic implications of mobile
banking for banks and financial enterprises. Research paper presented at 8th IEEE international
conference on e-Commerce Technology, February. San Francisco
Zeithaml VA, Gilly MC (2002) Characteristics affecting the acceptance of retailing technologies:
a comparison of elderly and non-elderly consumers. J Retail 63(1):49–68
Web Resources
http://www.mobilebanking.co.in/mobile-banking/
http://profitsfinancesite.com/mobile-banking-definition-and-advantages/
http://www.ehow.com/about_6721541_definition-mobile-banking.html
http://www.arraydev.com/commerce/jibc/0306-04.htm
http://www.banking-gateway.com/editorial/09-2/FBA006_036_Deutsche%20Bank.pdf
http://www.ehow.com/banking-definitions/
http://www.infogile.com/pdf/Mobile_Banking.pdf
http://www.jonathandonner.com/donner_tellez_mbanking_use.pdf
774 S.S. Muthu and T. Kadalarasane

Domestic Remittance: Money Transfer
Anywhere and at Anytime in India
Deepak Venkatesh and Anand Kumar Bajaj
1 Overview
Financial inclusion is an integral part of India’s inclusive growth strategy. The
potential of remittance is tremendous in a country like India where migration to
urban areas especially by the poor is prominent. Remittances are an important and
stable source of external development finance (Maimbo and Ratha 2005). Its
potential for stimulating economic growth has been largely neglected by those
who explore such issues from the top down.
Up to 100 million circular migrant workers contribute as much as 10% to
the national gross domestic product (Thorat and Jones 2011). Circular migration
has become a much needed livelihood strategy (Thorat and Jones 2011). Average
annual remittance amount is about 20,000,1 and even the poorest migrant send
money home (Thorat and Jones 2011). Informal remittance channels are pervasive,
and migrants value security and speed of money transfers (Thorat and Jones 2011).
Bringing remittances into the mainstream of the financial system can act as an
important gateway for the financial inclusion of domestic migrants. While com-
mercial banks have the necessary technical infrastructure, they can lack convenient
delivery channels. Know-your-customer principles and other banking requirements
add to the inconveniences.
D. Venkatesh • A.K. Bajaj (*)
YES Bank, Nehru Centre, Worli, Mumbai, India
e-mail: [email protected]; [email protected]; [email protected]
1All currencies are in Indian rupees. 1 lakh is 100,000; 1crore is 10,000,000.
Department of Management Studies, Indian Institute of Science, Bangalore,
Driving the Economy through Innovation and Entrepreneurship,DOI 10.1007/978-81-322-0746-7_63, # Springer India 2013
775

2 Problem of the Migrant Worker
The options available to migrants for remitting money home include courier
service, “hawala” operators, relatives, money order, deposit into bank accounts,
etc. The major share of domestic remittances continues to be channelled through
trusted friends and relatives of migrants returning home (Tumbe 2011), whereas the
most popular formal sector remittance instrument – post office money order – is
also the most expensive mode with 5% service charge.
It is pertinent here to state the general experience of the migrant worker with the
formal banking channel. Since they do not belong to the city they work in, they do
not have the requisite KYC (know-your-customer) documents to open their bank
accounts. In their work city, they deposit cash in their hometown accounts using
anywhere banking module offered by various banks. But to do this, they have to
stand in long queues because banks open only couple of counters for 3–4 h in the
morning. Effectively half the day for these people is lost since they come in early at
6 a.m to stand in the queue and remain there till 11 a.m. to 2 p.m.
Overall, remitting money back home proves to be cumbersome, costly, and
vulnerable to fraud for the migrants. The three key problems faced by migrants
for remitting money are:
1. Insecurity due to dependence on informal channels
2. Unavailability of formal channels in non-banking hours
3. High-cost and time-consuming process
3 Solution to the Problem
YES Bank has conceptualized and designed an innovative way of providing
remittance services to the so-called financially excluded segment under the “YES
Money” initiative. YES Money is a multichannel and multiplatform banking product
suite comprising of services such as National Electronic Fund Transfer (NEFT) based
outward remittance service through business correspondent (BC) partners. Initially
corporate entities could not be appointed as BCs which was later relaxed by the
Reserve Bank of India (RBI) paving the way for YES Bank’s domestic remittance
solution under the banner of YES Money.
The service is targeted towards people who have access to formal bank accounts
at the terminating point (rural or native) but do not have such access at the origin-
ating point (urban or metro). YES Bank has utilized the BC model to bring the
transaction touch point closer to the customer that is even available at non-banking
hours. The end-to-end remittance takes less than 24 h. The sender can use this service
to remit money to over 85,000 NEFT-enabled branches of any bank across India.
This service generally costs the customer up to 1% of the transaction value.
As of November 16, 2011, domestic remittance services are being offered in
major migration centres such as Mumbai, Delhi, Surat and Pune. More than 76,000
776 D. Venkatesh and A.K. Bajaj

transactions have been executed amounting to 46.13 crores using this service.
Money has been sent to more than 4,000 branches of 48 banks across the country.
This model is sustainable and a market principle based being fuelled by the
necessity of the customers. The market forces cause this model to break even with a
marginal operating profit from the first day itself.
4 Operational Process
The process at both the banking correspondent’s and the customer’s end has been
kept very simple. It is an error-proof process where the BC administers the service
to the migrant worker.
4.1 Overview of Process
1. The mobile number of the customer is registered with the BC for this service.
An ID proof and a minimal one-time charge are required.
2. The hardware at the field includes a computer, printer and Internet connectivity.
The software requirement is met by the BC through their own platform. There is
no incremental cost that the BC outlet needs to incur for the initiative as it is an
additional service.
3. The customer (sender) needs to first register the beneficiary by providing
details of intended beneficiary that essentially includes the following:
(a) Beneficiary name
(b) Beneficiary account number
(c) Beneficiary bank name
(d) Indian Financial System Code (IFSC) of beneficiary bank
4. The front screen created for the BC outlets assists the sender in this process.
The BC selects the city, bank and the branch from the guided drop down list
in the system. Basis this selection the IFS code of the relevant bank branch is
automatically displayed.
5. To ensure the accuracy of beneficiary transaction details various checks and
balances are incorporated at the field level that includes short message service
(SMS) confirmation through one-time password (OTP) generation, system
checks on human errors, and generation of receipts.
6. The actual money transfer is initiated by the customer from any BC outlet by
providing the registered mobile number. Thereafter, the sender states the
registered beneficiary details and the amount to be remitted.
7. The customer receives an SMS giving the details of the amount, bank account
number, bank name, branch and city, and an OTP. This OTP is entered in the
system to confirm the acceptance by the sender that the details are correct.
Domestic Remittance: Money Transfer Anywhere and at Anytime in India 777

8. The BC then receives the cash from the sender and provides him with a
system-generated receipt.
9. Similar requests are submitted continuously from various BC outlets throughout
the day. At the BC’s back end, the system accepts these requests and in batch
mode uploads the request file on the Internet banking platform of YES Bank.
10. YES Bank processes these requests through NEFT transaction cycles and sends
the money into the respective accounts of other banks across the country.
11. The recipient in turn withdraws cash from the bank.
At present, this model has arrived at a stage where YES Bank is screening the
requests from the BC agents who want to participate in this remittance system and
selectively activating them to offer this service.
4.2 Flow Diagram of Process
The detailed steps involved in the service (Fig. 1) include the following:
1. BC agent purchases a prepaid balance from the BC against cash payment.
2. BC extends prepaid balance to agents against payments received.
3. Customer submits remittance request along with beneficiary details and makes
payment.
4. BC agents submit customer request on BC e-commerce portal.
5. BC back-end operation downloads/collects request from various agents at
defined time intervals and processes these in batches for uploading through
the BC remittance account with YES Bank.
6. BC accounts section transfers from the current account to the remittance
account an amount equivalent to all the transactions in the day obtained from
the e-commerce portal.
7. BC accounts section uploads the remittance batch in the NEFT section of YES
Bank Internet banking portal.
8. YES Bank back-end operations prepare a NEFT batch on RBI NEFT platform.
9. RBI NEFT platform credits beneficiary bank basis NEFT request from YES
Bank.
10. Beneficiary bank credits the beneficiary account.
11. BC prefunds its parking account with YES Bank to avail limits for overnight
transaction.
5 Benefits to Participants
The benefits of the solution deployed are availed by participants across the
value chain that includes the migrant worker, BCs, BC agents and YES Bank.
The pre-deployment and post-deployment scenario for the migrants remitting
money can be seen from Table 1 below:
778 D. Venkatesh and A.K. Bajaj

These customers need not be customers of YES Bank; in fact, the remitter need
not even have any banking relationship.
5.1 Socio-economic Benefits for Other Stakeholders
For the BC and BC agent:
1. In the first 6 months of the launch, the service offering has generated revenues of
more than 30 lakhs. This is shared with the BC and BC agents.
Fig. 1 Multichannel multi-partner remittance service
Table 1 Pre- vs. post-deployment of YES Money service for migrants
Pre-deployment Post-deployment (YES Money)
Risk of losing money via informal channels Secure electronic transfer through NEFT
Time taken for remittance is high Speedy transfer generally within 24 h
Loss of daily wages and productivity due to queue
system for limited time daily
No such loss due to numerous BC agents
and availability of this service 24 h
Costly (post office money order costs 5%, informal
channels are still higher)
Cost-effective (up to 1% of transaction
value)
Formal channel is unavailable during non-banking/
typical working hours
Available even in non-banking hours
KYC required for opening bank accounts at work cities
for remitting money
No KYC required for remitting money
under this service offering
Domestic Remittance: Money Transfer Anywhere and at Anytime in India 779

2. At the same time the retailers who have become business correspondent agents
earn a transaction fee for facilitating this remittance request. Some of the BC
agents do around 100 transactions per week and earn an additional income of
4,000 monthly. The retailers also have additional credibility after they have put
up YES Bank’s “business correspondent” board at their outlets.
3. TheBCagents are able to increase footfalls and increase sales at their regular stores.
Therefore, this service deployment has promoted a multi-stakeholder inclusive
ecosystem by providing the partners with remuneration commensurate to their efforts.
For the bank:
1. YES Bank has been able to participate in a business like remittance service that
traditionally requires a large branch network. The idea of leveraging the
BC network has worked for the bank in offering this service to non-banking
customers as well as customers of other banks.
2. In banking services one of the parameters considered for growth is the day-end
account balances (EOP balance – end of period). As observed nearly 50% trans-
actions are happening during post-banking hours, and this leaves the deposit
with YES Bank overnight. On an average during the initial pilot period, YES
Bank had 15 lakhs of free float, and this amount is growing as the popularity of
this service is emerging.
3. YES Bank has gained visibility through business correspondent retail outlets.
The brand continues to build upon its reputation as a leading innovator offering
convenience to the masses.
4. YES Bank is also getting leads to open accounts of good transacting customers
from this platform. There are at least 1% of the users who will be sourced from
this platform. This is one of the facets of financial inclusion initiatives which
have been taken up by YES Bank.
6 Quantitative Results and Observations
6.1 Increasing Number of Agents and Transactions
From June 2011 to November 2011, there has been an increase of over 15 times in
the number of agents under this service. The number of transactions has increased
by more than 2,500% (Fig. 2, Table 2).
6.2 Transaction Times: Post-banking Hours
Forty-five percent transactions are done during “after banking hours” that is before
10 a.m. and after 4 p.m. During this time period, majority of bank branches are
closed for customers (Fig. 3, Table 3).
780 D. Venkatesh and A.K. Bajaj

Fig. 2 Graph of growth in number of agents and transactions
Table 2 Growth in number
of agents and transactionsMonth Agents Transactions
Jun-11 35 399
Jul-11 92 942
Aug-11 175 2,689
Sep-11 251 4,226
Oct-11 476 6,998
Nov-11 552 10,590
Fig. 3 Graph of distribution of transacting hours of customers
Table 3 Transacting hour
patternsMonth Banking (%) Non-banking (%)
Jun-11 56 44
Jul-11 53 47
Aug-11 56 44
Sep-11 53 47
Oct-11 54 46
Nov-11 56 44
Domestic Remittance: Money Transfer Anywhere and at Anytime in India 781

6.3 Repeat Usage
Approximately 51% of the customers did more than one transaction (Fig. 4).
6.4 Transaction Size
The average ticket size of the transactions done over the period is Rs. 6,000 (Fig. 5).
This platform provides convenience of remittance to the users who do micro
remittance. Around 12% transactions are of Rs. 1,000 or less. There would be a
positive social impact by providing such a service to the lowest income group of the
economy.
Fig. 4 Pie chart showing the repeat usage of customers
Fig. 5 Pie chart showing the average size of transactions and their distribution
782 D. Venkatesh and A.K. Bajaj

6.5 Beneficiary Banks and Transaction Routes
The top three beneficiary banks account for over 85% of the transaction volumes
(Table 4).
Sixty-nine percent of the transactions are routed to Uttar Pradesh and Bihar
(Table 5).
7 Challenges
7.1 Settlement Risk with BC Agents
The risk involved the failure of the BC agent to deposit the money with the bank
after collecting the same from the end user. In order to eliminate the settlement
risk, BCs have been asked to open an account with YES Bank and pre-fund the
remittance account.
7.2 Anti-money Laundering
To deter such activities, a number of checks have been implemented. The basemitigant
is that the recipient’s account is KYC compliant with the beneficiary bank. The other
check involves monitoring transaction amounts and frequency of transactions.
7.3 Fraudulent Refunds
To ensure that on the event of a rejection of a NEFT the customer does not lose out,
a system of sending an SMS to the registered user is set up. The SMS has a
password which is to be presented to the agent to claim refund. This eliminates
the possibility of claiming fraudulent refunds.
Table 4 Top beneficiary
banksBank name % of transactions
State Bank of India 41
Union Bank of India 31
Punjab National Bank 14
Table 5 Transaction routes
Originating region Terminating region – share Terminating region – share
Mumbai Metropolitan Region Uttar Pradesh – 73% Bihar and Jharkhand – 12%
National Capital Region Bihar and Jharkhand – 54% Uttar Pradesh – 29%
Surat Uttar Pradesh – 39% Bihar and Jharkhand – 37%
Domestic Remittance: Money Transfer Anywhere and at Anytime in India 783

8 The Way Forward
8.1 Sustainability
There is a huge opportunity for expanding the reach of this innovation. The
target market segment for this service extends to all the cash payments into any
bank account across the country. On a segmented level, the remittance market for
migrant labourers itself is of around 116,000 crores. This model provides outreach
and convenience to this segment of users. With a growth in job opportunities in
towns and industrial corridors, there is mass migration of workers to these areas.
At current levels, there are around 750 transactions on a daily basis remitting an
average of 6,700 per transaction. With growing numbers to about 10,000 outlets in a
year’s time, executing 20 transactions a day, it would mean 200,000 transactions a
day. A modest fee per transaction of Rs. 10 would easily amount to Rs. 200,000 fee
income on a daily basis and 80 crores in overnight float.
Fifty-two percent of customers are new and have done one transaction; this
means that the portfolio is adding new and more users regularly. The remaining
48% of the customers are doing two transactions on a consistent basis which implies
that there is a comfort factor which the market is getting from this service and the
customers are willing to reuse this service.
8.2 Viability
During the test pilot period of 11 weeks, a modest amount of 100,000 had been earned
by the bank, and around four times this amount had been generated as income for the
banking correspondent agents. The point to be noted is thatmajority of the transactions
are being done post-banking hours proving the fact that the convenience of customers
is resulting in overnight float money for the bank. Themodel is profitable from the first
day where each transaction contributes to a fee for the BC agent and the bank. This
model puts to use the large banking network established in the last decade to provide
seamless remittance services to migrant workers.
References
Maimbo SM, Ratha D (2005) Workers’ remittances: an important and stable source of external
development finance. In: Ratha D (ed) Remittances development impact and future prospects.
The international bank for reconstruction and development/the World Bank Library of
Congress cataloging-in-publication data, Washington, DC, p 41
Thorat YSP, Jones H (2011) Remittance needs and opportunities in India (synthesis report).
Deutsche Gesellschaft f€ur Internationale Zusammenarbeit (GIZ) GmbH and National Bank
for Agriculture and Rural Development, New Delhi
Tumbe C (2011) Remittances in India: facts and issues. Working paper no. 331, Indian Institute of
Management, Bangalore
784 D. Venkatesh and A.K. Bajaj

Part 3.4
IT Offshoring

Power Politics in the Governance of IT
Outsourcing: The Undermining of Top
IT Executives
Subrata Chakrabarty and Jun Wang
1 Introduction
IT work has increasingly been outsourced by American (customer) firms to supplier
firms located in foreign locations—such as India and China (Chakrabarty 2006,
2008). This chapter examines power politics within customer firms that outsource
information technology (IT) work. One option for getting IT work done is out-
sourcing, which is defined as a customer firm paying a supplier firm to perform
certain work as per stated requirements, instead of getting the same work performed
in-house (Whitten et al. 2010; Zardkoohi et al. 2011). When the supplier firm is
located in a foreign country, this option is termed as offshore-outsourcing. Top
management power politics within a customer firm may play an important role in
budgetary spending decisions that determine where and how the firm’s IT work gets
performed (Chakrabarty and Whitten 2011; Green et al. 2007).
Certain top management executives of a customer firm can wield the power
needed to govern the outsourcing of IT work. Top executives can be classified into
two groups: business leaders and IT leaders. Job titles in the business leaders groupinclude the CEO (Chief Executive Officer), CFO (Chief Financial Officer), and
COO (Chief Operating Officer). Job titles in the IT leaders group include the CIO
(Chief Information Officer) and the Head of IT. The power of one group of top
executives can be greater than that of another group of top executives in matters
related to the governance of IT outsourcing. The research questions are as follows:
(a) With regard to the outsourcing of IT work, what are the antecedents to power
S. Chakrabarty (*)
Department of Management, College of Business Administration, University of Nebraska,
Lincoln, NE 68588, USA
e-mail: [email protected]
J. Wang
Information Technology Consultant, Professional Services Division,
Troux Technologies, TX 78730, USA
e-mail: [email protected]
Department of Management Studies, Indian Institute of Science, Bangalore,
Driving the Economy through Innovation and Entrepreneurship,DOI 10.1007/978-81-322-0746-7_64, # Springer India 2013
787

politics between the business leaders group and IT leaders group within a customer
firm? (b) What impact does the undermining of IT leaders by business leaders
within a customer firm have on outsourcing performance?
Figure 1 summarizes the theoretical model. The antecedents that can influence
power politics between groups of top executives within a customer firm are the custo-
mer firm’s financial performance prior to outsourcing (moderated by country cost
differences) and the size of its in-house IT workforce (moderated by country cultural
differences). Business leaders feel inclined to exercise greater power and control over
the outsourcing of IT work when the firm’s financial performance has been poor; this
is especially true when they perceive their in-house IT workforce to be a cost burden
(relative to the low-cost IT labor offered by suppliers from other countries such as
India and China). IT leaders derive power by virtue of leading a sizeable in-house IT
workforce. When the in-house IT workforce, which is usually expected to cooperate
and collaborate with the supplier’s IT workforce, find the cultural differences to be
overwhelming, they may incite political resistance against offshore-outsourcing
(Chakrabarty 2009; Green et al. 2007). They would prefer that their IT leaders (rather
than their business leaders) have the power over matters related to the governance of
outsourcing.
Despite resistance, however, IT leaders may eventually feel pressured to relin-
quish power when the firm performs poorly and the business leaders want the power.
Business leaders usually have lesser knowledge in matters related to IT than the IT
leaders that they have undermined (Chakrabarty et al. 2007; Green et al. 2007).When
business leaders undermine IT leaders in the governance of outsourcing, it can
POWER POLITICS
Power ofBusiness leaders group
(CEO, CFO, COO)relative to
IT leaders group(CIO, Head of IT, etc.)
withinCustomer Firm
OUTCOME
Outsourcing Performance
Outsourced Product QualityOutsourcing Efficiency
Firm Performance Prior to Outsourcing
Size of In-House IT workforce
Difference in Labor Cost in comparison toSupplier’s Country
Cultural Differenceswith Supplier’s workforce
Political supportfrom in-house IT workforce
P1a
P1b
P2a
P2b
P3a
P3b
Fig. 1 Theoretical model
788 S. Chakrabarty and J. Wang

eventually hamper both the efficiency and quality of outsourcing. This is especially
true when the business leaders attempt to take over the governance of outsourcing of
IT work without having the political support of the in-house IT workforce. In sum,
a paradox is evident: when it comes to the “outsourcing” of IT work, the business
leaders might find reasons to justify increasing their own power and lowering the
power of IT leaders, even though this can ultimately be detrimental to the quality and
efficiency of the outsourcing activity.
2 Propositions
2.1 Power Politics Is Influenced by Firm’s PoorFinancial Performance
Current geopolitical factors are such that the cost of skilled IT labor is substantially
lower in economies such as India and China than in advanced economies such as the
USA. Advanced economies, such as the USA, are also facing tremendous business
uncertainty and cost pressures. In matters related to the governance of the outsourcing
of IT work, it is possible that poor financial performance of a customer firm located
in USA prior to outsourcing would induce greater power dominance by its business
leaders and the undermining of its IT leaders. When business leaders are faced with
financial underperformance and uncertainty, they tend to respond in domains over
which they can wield greater control (Chakrabarty and Whitten 2011). Under condi-
tions of poor financial performance, business leaders within a customer firm become
overly conscious about efficiency and impose authority over activities such as out-
sourcing. This is because they see potential for cost cutting and budget tightening,
which would give them a feeling of higher control and lower risk.
A firm’s poor financial performance can make the business leaders insecure and
fuel power politics. In the fear of losing their jobs, the COO and CFO may ally with
the CEO and defend their grouping. Though business leaders (CEO, CFO, COO,
etc.) tend to attribute their firm’s financial success to their own personal qualities,
they tend to attribute the firm’s failure to other causes. An easy target for blame
would be the IT leaders. Business leaders often perceive the in-house IT department
to be a cost burden. Toward this end, business leaders sometimes suspect that the IT
leaders will be overprotective of their turf in order to safeguard their own jobs and
departments. This results in the IT leaders being given lesser representation or
being kept out of the loop, while the business leaders make the critical IT out-
sourcing decisions.
Hence, the lower the financial performance of an American firm prior to
outsourcing, the greater the possibility that the business leaders will want to negate
or dilute the authority of the IT leaders and want to take over a dominant authorita-
tive role in matters related to the governance of outsourcing of IT work. That is, the
association between an American firm’s past financial performance and the power
Power Politics in the Governance of IT Outsourcing: The Undermining of Top. . . 789

of its business leaders relative to its IT leaders will be negative. Further, such
undermining of IT leaders by business leaders within US-based customer firms in
matters related to IT outsourcing is all the more likely when geopolitical factors are
such that the cost of skilled IT labor is substantially lower in countries like India and
China than in the advanced economies like USA.
Proposition 1a. Poor financial performance prior to outsourcing increases the probabilitythat a customer firm’s business leaders will politically undermine (i.e., reduce the decision-making power of) its IT leaders in matters related to the governance of the outsourcing ofIT work.Proposition 1b. The above effect will be strongest when geopolitical factors are such thatthe cost of skilled IT labor is substantially lower in the supplier’s country (India, China,etc.) than in the customer’s country (e.g., USA).
2.2 Power Politics Is Influenced by Size of IT Workforce
A sizeable in-house IT workforce can help prevent IT leaders from being undermined
by business leaders in decisions regarding the governance of outsourcing. IT leaders
who lead a sizeable IT workforce will have greater legitimacy to demand such power
and thereby resist interference or dominance by business leaders (Chakrabarty
and Whitten 2011; Whitten et al. 2010). The leader of a sizeable population is
more likely to demand and obtain greater power. Across organizations, the power
of the departments or representation on major committees is often a result of the size
of the department. Similarly, IT leaders in a firm will find representation in the firm’s
important decision-making bodies if he/she leads a sizeable IT workforce. Command
over a sizeable IT workforce gives legitimacy and hence power to IT leaders because
it is more difficult to ignore the leader of a sizeable population. Therefore, an
important source of power that a firm’s IT leaders have is the sheer size of the
in-house IT workforce that they lead.
Further, the resistance by IT workers from the customer’s country (e.g., USA) is
likely to be aided by feelings of cultural differences against IT workers from the
supplier’s country (India, China, etc.) (Chakrabarty 2009; Chakrabarty et al. 2007).
After all, the in-house IT workforce would be expected to cooperate and collaborate
with the supplier’s IT workforce that is performing the outsourced work (Chakra-
barty et al. 2007; Green et al. 2007). During the process of collaboration, irrecon-
cilable cultural differences may arise between the in-house IT workforce and the
supplier’s IT workforce. This may result in the in-house IT workforce engaging in
political rebellion against their own business leaders in matters related to the
governance of outsourcing.
Hence, IT leaders who lead a more sizeable IT workforce are likely to obtain
greater power in the organization, and they can use this power to resist interference
or dominance by business leaders. This would be especially true when there are
aggravated levels of cultural differences between the in-house IT workforce and
the supplier’s IT workforce. Accordingly, the association between the size of the IT
790 S. Chakrabarty and J. Wang

workforce within the firm and the decision-making power of business leaders
relative to IT leaders will be negative.
Proposition 2a. Within a customer firm, the presence of a large-sized in-house IT workforceincreases the probability that its IT leaders will politically resist attempts by the businessexecutives to undermine them in matters related to the governance of the outsourcing ofIT work.Proposition 2b. Political resistance within a customer firm (where its IT leaders, supportedby in-house IT workforce, resist the attempts of business leaders to undermine them) willbe strongest when there are substantial cultural differences between workers fromthe supplier’s country (India, China, etc.) and workers from the customer’s country (e.g.,USA).
2.3 Power Politics Impacts Outsourcing Performance
The first two sets of propositions suggest that there are competing pressures arising
from the antecedent conditions, which can determine “who has how much power”
over the firm’s IT spending decisions and correspondingly over the outsourcing of
IT work. This section will develop propositions regarding the influence of decision-
making power on the performance of outsourcing of IT work (Chakrabarty and
Whitten 2011). Performance can be understood in terms of outsourcing efficiency
and outsourced product quality. First, good governance of IT outsourcing requires
effective decisions on IT spending in a manner that lowers transaction costs and
helps achieve outsourcing efficiency. In contrast to business leaders, the IT leaders
have healthy skepticism and substantial knowledge regarding current IT costs and
the management of IT in order to make effective outsourcing decisions. By virtue of
their expertise and experience in managing IT projects, the IT leaders are better at
making governance decisions. These better decisions help minimize hidden costs,
ensure operational efficiency, and ensure that the budget for product development is
not exceeded during outsourcing. Hence, undermining of IT leaders in governance
will hurt outsourcing efficiency.
Second, undermining of IT leaders in the governance of the outsourcing of IT
work can lead to a lower outsourced product quality. Not all requirements for a
complex IT product can be anticipated in advance, and much of the requirements
evolve over time. As requirements evolve, there is a continual process of deal
making between the customer and IT supplier. In this context, business leaders
make poor deals because of their lack of competence in IT matters. This is due
to business leaders falling prey to the tall promises and inducements of IT suppliers,
because they do not have the in-depth expertise to understand the complexities
behind the development of IT products. On the other hand, IT leaders are mindful
that technology requirements change rapidly in today’s fast-paced world—constant
supervision and micromanagement is required to ensure the supplier develops
products that meet requirements and are not obsolete.
In sum, the undermining of IT leaders by business leaders in matters related
to the governance of IT outsourcing can lead to poorer outsourcing performance.
Power Politics in the Governance of IT Outsourcing: The Undermining of Top. . . 791

This would be especially true when the business leaders lack the political support
of the in-house IT workforce. The in-house IT workforce, upset at their IT
leaders being sidelined, might not be cooperative enough with their business leaders
(Zardkoohi et al. 2011). This would aggravate the problems that the business
leaders face and compound the deleterious effect of business leaders not having
sufficient knowledge and expertise to deal with IT matters. Hence, we posit the
following:
Proposition 3a. In matters related to the governance of the outsourcing of IT work,the greater the political undermining of a customer firm’s IT leaders by its business leaders,the lower will be the outsourcing performance.Proposition 3b. The above effect will be strongest when business leaders do not have thepolitical support of the in-house IT workforce.
3 Conclusion
There is often power politics involved in the governance of the outsourcing of IT
work by top management executives of customer firms. In recent times, customer
firms located in advanced economies are facing a tremendous amount of business
uncertainty. Geopolitical factors are such that the cost of skilled IT labor is sub-
stantially lower in countries like India and China than in the advanced economies
like USA. When a US firm’s financial performance has been poor, its business
leaders (CEO, CFO, COO) may be tempted to undermine its IT leaders (CIO, Head
of IT, etc.) in order to exercise greater power over the outsourcing of IT work.
IT leaders can resist attempts by the business leaders to undermine their power
when they have the support of a sizeable in-house IT workforce. The resistance by
workers from the customer’s country (e.g., USA) is likely to be aided by feelings of
cultural differences against workers from the supplier’s country (India, China, etc.).
Ultimately, a consequence of business leaders undermining the IT leaders within a
customer firm, especially when the business leaders lack the political support of the
in-house IT workforce, is that it could hamper the quality and efficiency aspects of
outsourcing performance. Given that IT work is being increasingly offshore-
outsourced by American (customer) firms to supplier firms located in foreign
locations—such as India and China—research should consider the implications of
such power politics.
The arguments suggest that under conditions of a firm’s poor financial perfor-
mance, the business leaders tend to impose their power over IT leaders. The IT
leaders can resist being undermined if they have the support of a sizeable in-house
IT workforce. Eventually, both outsourcing efficiency and outsourced product
quality suffer if business leaders impose their power and undermine IT leaders.
Given the arguments, it might seem obvious that IT leaders tend to make better
decisions in IT-related work (just as the business leaders would tend to make better
decisions in some other business-related work). However, the primary importance
of this study is in its suggestion that when it comes to the “outsourcing” of IT work,
the business leaders might find reasons to justify increasing their own power and
792 S. Chakrabarty and J. Wang

reducing the power of IT leaders, even though this can ultimately be detrimental to
the outsourcing activity.
The arguments support the theoretical suggestions that when a firm’s financial
performance in the past was poor and the firm did not have a sizeable IT workforce,
then the business leaders give themselves greater decision-making powers and
undermine the IT leaders. Here, business leaders might argue that they are acting
in the interest of their firm. Paradoxically however, rather than leading to positive
consequences, lowering the power of IT leaders leads to poorer outsourcing perfor-
mance. Outsourcing performance is most satisfactory when power is solely with the
IT leaders group, second best when power is divided between the two groups (joint
decision making), and worst when it is solely with the business leaders group.
Hence, the governance of outsourcing should reside exclusively or at least partially
with IT leaders. Governance of outsourcing benefits from the “expert minds” of IT
leaders. Undermining of IT leaders therefore makes outsourcing “mindless” and
consequently hurts outsourcing performance. Future research can investigate if
such top management power politics in outsourcing results in downward spirals
of continuing distress.
References
Chakrabarty S (2006) Making sense of the sourcing and shoring maze—the various outsourcing &
offshoring alternatives. In: Kehal HS, Singh VP (eds) Outsourcing & offshoring in the 21st
century—a socio economic perspective. Idea group, Hershey, pp 18–53
Chakrabarty S (2008) The journey to new lands: utilizing the global it workforce through offshore-
insourcing. In: Tan FB (ed) Global information technologies: concepts, methodologies, tools,
and applications, vol 8. IGI, Hershey, pp 3777–3803
Chakrabarty S (2009) The influence of national culture and institutional voids on family ownership
of large firms: a country level empirical study. J Int Manag 15(1):32–45
Chakrabarty S, Whitten D (2011) The sidelining of top IT executives in the governance
of outsourcing: antecedents, power struggles, and consequences. IEEE Tran Eng Manag
58(4):799–814
Chakrabarty S, Whitten D, Green KW (2007) Understanding service quality and relationship
quality in IS outsourcing: client orientation & promotion, project management effectiveness,
and the task-technology-structure fit. J Comput Inf Syst 48(2):1–15
Green KW, Chakrabarty S, Whitten D (2007) Organisational culture of customer care: market
orientation and service quality. Int J Serv Stand 3(2):137–153
Whitten D, Chakrabarty S, Wakefield R (2010) The strategic choice to continue outsourcing,
switch vendors, or backsource: do switching costs matter? Inf Manag 47(3):167–175
Zardkoohi A, Bierman L, Panina D, Chakrabarty S (2011) Revisiting a proposed definition of
professional service firms. Acad Manag Rev, 36(1, dialogue):180–184
Power Politics in the Governance of IT Outsourcing: The Undermining of Top. . . 793
Offshore Pricing with Onshore Management:
A Case Study in Innovation and Technology
Management
Gokul Bhandari, Rudra Pandey, and Gerry Kerr
1 Background
On November 18, 2011, Scott H. DeLisi—the US Ambassador for Nepal—was full
of praise for DW and made the following remarks during the inauguration of the
Deerwalk Institute of Technology in Kathmandu, Nepal: “In my view, the real
future of Nepal is not in Singha Durbar, but in places like here at the Deerwalk
campus. The future is companies like Deerwalk and other emerging businesses in
promising sectors like IT. The future is in the young people here today who share
Rudra’s vision for developing Nepal’s IT industry. It’s in entrepreneurs who see
opportunity in Nepal, not the naysayers who merely see problems. Like Rudra,
I fundamentally believe that the IT industry can help transform Nepal’s economy,
creating opportunity for thousands of young Nepalis. Information technology has
transformed the way we do business around the globe, spurring new innovations,
breaking down communication and distance barriers, and reducing the cost of doing
business. It has opened trade and investment, helping to create millions of new jobs,
and transforming countries like India—and now Nepal”.
In less than 3 years of its birth, DW has already established itself as one of the
largest software companies in Nepal having a total of 170 employees and 30 US
companies as regular clients. In order to understand the current growth of DW despite
several challenges it is currently facing such as Nepal’s poor infrastructure
(interrupted electricity, limited Internet bandwidth and connectivity), uncertainty in
national politics and policy, and limited number of software graduates available for
G. Bhandari (*) • G. Kerr
Odette School of Business, University of Windsor, Windsor, ON, Canada
e-mail: [email protected]; [email protected]
R. Pandey
Deerwalk Inc., Lexington, MA, USA
e-mail: [email protected]
Department of Management Studies, Indian Institute of Science, Bangalore,
Driving the Economy through Innovation and Entrepreneurship,DOI 10.1007/978-81-322-0746-7_65, # Springer India 2013
795

hiring, it is important to know about both the personality, background, and evolution
of Rudra as a visionary and software entrepreneur.
2 Profile of an Entrepreneur
Rudra was born and grew up in a lower middle-class family at Kanakot, a small
mountainous village about 20 km northwest of Kathmandu, the capital city of
Nepal. His father, the sole breadwinner of the family, passed away at a tender
age of 35 leaving 4-year-old Rudra to be reared by his 66-year-old grandfather.
His grandfather was a wise and spiritual person who would instil in Rudra a strong
desire for excellence and perseverance and yet at the same time taught him the
importance of holding a detached and impassive outlook towards the outcomes
of one’s actions. As Rudra recalls in his recent interview with The Boss magazine,
“I knew I was the architect of my own destiny since childhood”. Having clearly
understood the importance of learning, his grandfather sent Rudra to Kathmandu
for schooling where he would spend the next 12 years of his life. During his school
days, he participated in various debate competitions and exhibited strong commu-
nication and leadership skills while maintaining a superior academic performance
in classes. After receiving a scholarship from Pakistan, Rudra completed his under-
graduate degree in engineering in which he developed a sophisticated database
system for managing student records. After completing his engineering study,
he returned to Nepal in 1989.
One thing that Rudra was really convinced of during his undergraduate days was
the belief that the future would belong to the software sector and its importance
would only grow in the days to come. So, as soon as he arrived in Kathmandu,
he joined the National Computer Centre, which was the most prestigious computer
institute in Nepal at that time. However, it did not take him long to realize that the
work he would be doing there needed very little programming talent and creativity
because the job involved hardware maintenance and operation tasks only, and
therefore, he decided to quit the job after a week. Then, he joined Nepal Telecom-
munications Corporation, the only telecom service provider in the country at that
time. As before, he did not see any future growth in the job because of the lack of
R&D budget and left the company after 6 weeks. Then, he joined the Royal Nepal
Academy of Science and Technology (RONAST) which was a premiere institute
for research. However, he realized that there was very little role and scope for
software engineers like him who were considered blue-collared workers compared
to physicists and mathematicians. Realizing that he would not be appreciated in
such an environment, he left the organization after 4 months. While working for the
RONAST, he had also joined a private computer institute as a part-time instructor
where he experienced the difference between private and public companies. Now
he started looking for more challenging jobs where he could play entrepreneurial,
innovative, and leadership roles. Fortunately, a job announcement from the World
796 G. Bhandari et al.

Bank appeared a perfect fit for him, which he applied for and secured without any
difficulty. In his own words:
In the World Bank job, I developed database systems using dBaseIV and Clipper. It also
gave me the opportunity to see different parts of Nepal and meet with people from all walks
of life. It boosted my self-esteem and helped me develop good communications and people
skills. It was the most fulfilling job I have ever had. It was also a very productive period
because I founded a computer institute called Comptronix with a friend of mine. It was
basically a hardware maintenance company but I was still interested in it because I was
trying to learn what it takes to own a company. This gave me the first taste of ownership
which is still fresh in my memory.
When the World Bank project was completed after 2 years, Rudra realized he had
developed enough skills to start a much bigger computer consultancy and software
development firm. With two other like-minded colleagues, he founded a company
called Global Engineering and Computer Services (GECS). Rudra says, “GECS was
involved in teaching programming languages, software development, and hardware
import from Singapore for distribution in Nepal. It taught me how to do international
trade for profit making”. Rudra was planning to expand his business and came to the
USA in 19 December 1993, to sign up a contract with a computer manufacturer from
Austin, Texas. Once he arrived in the USA, he saw a huge opportunity in software
market in the USA and decided to start his own business there. Within a week of his
arrival in the USA, he registered a software development and consulting firm called
American Open Enterprises in Boston, Massachusetts. However, as a Nepali citizen
with a tourist visa, it was not possible for him stay in the USA for a long time. So, in
the meantime, he secured admission in Computer Science Master’s programme at
Boston University Extension College and remained in the USA under student visa.
However, he soon realized the programmewould not teach him anything new, and so,
he switched to the doctoral programme in economics in Northeastern University from
which he graduated in 2001. During his study in the doctoral programme, he faced
financial hardship and worked as a night security guard in a big grocery chain called
Star Market for a month where he earned about $7/h. Then he worked as a parking
lot attendant at Commercial Wharf, Boston Waterfront for a year. While working as
an attendant, he would also hand over his resume along with parking receipts to the
visitors. One day, as luck would have it, an IT recruiter got his resume in the parking
lot. Impressed with Rudra’s IT skills, the recruiter offered him a consulting job at
Fleet Bank (now Bank of America) where he remained for 3 years. During these
years, he thoroughly understood the software consultancy market and met with
several charismatic and ambitious people, the most important of all being Dr. Chris
Kryder. Chris was a physician who attended Georgetown Medical School and com-
pleted residency in internal medicine in the Harvard Primary Care Program, and
thereafter earned an MBA from the Sloan School of Management at MIT to better
understand hospital management and operations. In the late 1990s while working as
chief medical officer, he began looking for software to help manage quality and cost
and move information transparently. At this juncture, he realized the conspicuous
absence of such products and decided to build on his own, only if someone could
teach him database management tool such as Microsoft Access. His search for a
Offshore Pricing with Onshore Management: A Case Study in Innovation. . . 797
database tutor ended up meeting with Rudra who then convinced Chris to jointly
found a healthcare software company called D2Hawkeye.
3 Founding of D2Hawkeye Inc.
The opportunity described by Kryder immediately resonated with Pandey. A host of
environmental factors were favourably lined up. American society was growing
older, while pressures were being felt in healthcare to improve efficiency and
contain costs. At the same time, sophisticated techniques were being developed
for estimating risk exposure in the financial services industry, which were ripe
for application elsewhere. Healthcare was a waiting opportunity. Moreover, the
opening of international trade offered the chance to exploit lower-cost computer-
programming capabilities. The only complications seemed to be the availability of
human resources and the political changes underway in some areas.
Rudra was ready for the opportunity when Chris called for the meeting. Rudra
was already intimately aware of the kinds of value that could be created by off-
shored programmers. A network of associates from his prior company GECS
(now called IT Experts Group) had been one of the key assets that Rudra brought
to D2Hawkeye. A connection between Boston and Kathmandu, Nepal was critical
to the initial success of the firm. However, in a matter of months after start-up
when the king Gyanendra seized the power through coup, prudent management
dictated that an alternative office location be based in Delhi, India for disaster
recovery.
A new venture in the healthcare risk-management software industry required
certain capabilities, including a deep understanding of medical needs, information
technology, and risk assessment. Certainly, Chris Kryder and Rudra Pandey, repre-
senting medicine and risk assessment and information technology, respectively, were
integral parts of D2Hawkeye. But, the team that was assembled represented great
depth in healthcare, general management, finance, medical consulting, research, and
medical informatics. Moreover, despite the considerable skill set represented at the
organization, key partnerships encompassed a distribution agreement formed with
Sun Life and a financing deal—after a nearly disastrous false start with a small
venture capital firm—with D2Hawkeye’s first customer, JSA Healthcare. All told,
success at D2Hawkeye was a function of flexible experimenting, carefully built team
relationships, closely managed economizing, and cherry-picked strategic alliances.
The development of the company was closely managed. Bootstrapping was the
primary means of financing, interjected by the deal with Sun Life and, later, by
outside financing from angel investors. The flagship product of D2Hawkeye was
D2Explorer which bundled D2ReportManager, D2Analyzer, and D2BenefitAdvisor.
The capitalization of D2Hawkeye was remarkably straightforward at the time growth
capital was secured, allowing more latitude in the major financing deal and in the
eventual merger with Verisk Analytics. However, the company was still in the growth
phase. For a detailed description of the venture capital financing options the company
face, please refer to the Harvard Business Case (Higgins et al. 2008).
798 G. Bhandari et al.

After the acquisition by Verisk in January 2009, Rudra became the Chief
Operating Officer essentially managing about 400 people from technology and
operations department with three managers directly reporting to him. Although a
subsidiary of Verisk, D2Hawkeye still had the primary development team called
D2Hawkey Services still located in Kathmandu, Nepal, and Rudra was dreaming of
making it bigger and bigger. However, he soon realized that the parent company
Verisk was interested more on earnings than on growth of the newly acquired
subsidiary. The management motto was “Buy, not build”, but Rudra was not very
happy with it because he wanted to see his brainchild prosper and grow and not just
become a revenue source for the parent company. Furthermore, Rudra felt less
powerful than before in Verisk in terms of decision making and realized he could
not do much to change the management’s view regarding D2Hawkeye. The parent
company Verisk went public in October 2009. At this point, he was faced with a few
alternatives. First, he could live a secured and peaceful life by continuing to work
as the COO for Verisk with a handsome salary, attractive stock option, and 209
package. In this case, he would be more like an employee of Verisk and less of
an entrepreneur. The second option would be to leave Verisk and initiate another
round of start-ups. However, this would mean giving up all the comfort and security
and start everything anew surrounded by risk and uncertainty again. On the positive
side, founding another start-up with human resources being supplied from Nepal
would be a step closer to his dream of running a company with 1,000 software
engineers. Also, he had obtained valuable experiences in key management and
technological issues involving business process outsourcing. He felt very confident
in his capability and started seeing himself as the CEO of a future company. Ulti-
mately, the thrill of the freestanding start-up, working without a net proved too
powerful for Pandey to resist, and he decided to walk the untrodden path yet again.
He informed Verisk of his intention to quit the company, and at their request, he
agreed to function as retainer until December 2010 for the smooth hand over of
responsibilities.
4 New Horizons at Deerwalk
Deerwalk Inc., with headquarter in Lexington, Massachusetts, symbolized his
dream, confidence, and entrepreneurial spirit. Because of his deep understanding
of healthcare software industry, he began to carve out a strategic technology base
that would have competitive advantage over others. He noticed how the first product
that he developed was built in Microsoft Access which was then converted into a
web-based system by using Java, SQLServer, and JRun for Windows. When it was
acquired by Verisk, the platform was converted to Oracle, Web Logic and Java to
conform to its other products. Contemplating the evolution and current trends in
software, Rudra realized that the future of IT would belong to inexpensive and
flexible, and therefore, Deerwalk must adopt such framework to remain competitive.
Keeping in view of the evolving and data-centric nature of healthcare informatics,
Offshore Pricing with Onshore Management: A Case Study in Innovation. . . 799

Rudra made a strategic decision from the very beginning to adopt a distributed,
open-source software framework such as Hadoop and a cloud-computing platform
such Amazon EC2. This decision proved very insightful because with very little
capital investment on hardware, DW has become a fully virtual software company
capable of competing in terms of cost, quality, and responsiveness.
DW offers high-quality services to its onshore clients with its local presence in
the USA and at the same time gives them the benefit of offshore pricing which is
generally lower than that from the local companies. Through its wholly owned
subsidiary based in Kathmandu, Nepal, DW engages in new product development
and maintenance initiatives. In the US office, DW has retained a technology team to
provide real-time support to its onshore customers. Rudra succinctly summarizes
the competitive strategy of his company as, “Our customers have the peace of mind
of working with someone from the US, while enjoying the cost savings of off-shore
development”. DW prides in its two innovative flagship products Makalu and
Everest which represent a data analytics platform and case management workflow
solution for nurses, respectively. Both of these products integrate claims, electronic
medical records, and relevant clinical data for conducting comprehensive analysis
of client data. We now provide their brief description.
Makalu: It is an integrated data analytic platform that enables Third Party
Administrators (TPAs), brokers, consultants, and physician groups and organi-
zations such as Accountable Care Organization’s (ACO) in the healthcare supply
chain to improve the coordination of benefits and care for members by providing
insights into the quality of care, major cost drivers, and possible areas for cost,
utilization, and quality improvements. There are several key features that distin-
guish Makalu from other products available in the markets such as deep integration
of data, scalable technology platform, ease of implementation, guaranteed lowest
cost of ownership, comprehensive reporting solution, data accessibility, and oppor-
tunity and risk identification. Appendix A shows the menu structure of Makalu
which a user can follow to access various types of analysis and reports. Figure 1
shows the user interface of Makalu’s dashboard.
Everest: It offers a suite of tools for healthcare enterprises to cost-effectively
coordinate care of their members while lowering costs. Everest provides a seamless
integration of care management activities focused on wellness, disease manage-
ment, case management, or utilization management into one platform. Everest’s
flexible architecture supports information exchange and integration with third party
data sources such as medical/pharmacy claims, HRAs, EMR/EHRs, and predictive
modelling products. Figure 2 shows the user interface of Everest’s dashboard.
Recently, DW has also started developing a healthcare portal called Yala (Fig. 3)
which has been designed to serve as the ultimate healthcare platform for individual
members for managing their health records online. Once rolled out, it is expected to
have several millions as its member base. In the following section, we discuss the
opportunities and challenges that the company is currently facing and conclude this
case outlining our views on the future of DW.
800 G. Bhandari et al.

Fig. 1 Screenshot of Makalu dashboard
Fig. 2 Screenshot of Everest
Offshore Pricing with Onshore Management: A Case Study in Innovation. . . 801

5 Discussion
As an offshoring company, DW has a lot of advantages over its local competitors.
According to Rottman and Lacity (2006), global outsourcing and offshoring enable
agile responses to business needs. Such responses can result in lower costs, increased
quality, implementation of seamless sunrise-to-sunrise development, reduced response
time, and dispersion in risks (Cattani et al. 2005). The importance of agile responses to
emerging business needs and opportunities is also highlighted by Rudra when he says,
“Given the speed of changes happening in technologies and their disruptive capacity,
it is not the biggest but the fastest one who is going to be the winner in this market.
Our core competency lies in our executive management team who fully understands
the dynamics of healthcare markets and wastes no time in making critical strategic
decisions. Our cohesive and dedicated development team has one of the fastest pro-
duction cycle and customer service responses in the industry”. Rudra’s former com-
panyD2Hawkeye had the reputation of being themost innovative healthcare company
in Massachusetts in 2007, and he seems very much determined to continue that legacy
in DW as well. In this regard, DW has recently formed a partnership with a local
Fig. 3 Screenshot of Yala
802 G. Bhandari et al.

hospital inKathmandu to convert their existing paper-based system to a fully electronic
healthcare information system. DW has also started venturing into telehealth with the
objective of remotely providing healthcare services to the patients.
Appendix A: Drill-Down Menu Structure of Makalu
Dynamic Reports
Quality Metrics
Top 20 Reports
Diagnoses
Procedure Group
Benefit Codes
Therapeutic Classes
Drugs
Analysis Overview
Network Utilization Summary
Benefit Cost Analysis
Benefit Cost (Net vs. Non Net)
Paid Claims Distribution
Diagnosis Analysis
Lifestyle Analysis
Member Relationship Analysis
Enrolment Activity
Age Group Analysis
Age/Relationship Analysis
Top 30 Providers
Cost Allocation Summary
Facility Analysis
Physician Analysis
Therapeutic Classes
Drugs
Loss Ratio
Medical Claim Lag
Monthly PMPM Trend
Total Healthcare Claims
Injectable Drugs
Provider List
Utilization Metrics
Healthcare Spend Quintile
Duplicate Claims
High Cost Members
Offshore Pricing with Onshore Management: A Case Study in Innovation. . . 803

Membership Distribution
Coverage by Relationship
Chronic Conditions
Data Search
Quality of Care
Member Search
Risk Analysis
Basic Reports
Custom Reports
References
Cattani K, Dahan E, Schmidt G (2005) Offshoring versus spackling. MIT Sloan Manag Rev 46(3)
Higgins RF, Lamontagne S, Kazan B (2008) D2Hawkeye: Growing the medical IT enterprise.
Harvard Business School Case No. 9-808-006, MA
Rottman JW, Lacity MC (2006) Proven practices for effectively offshoring IT work. MIT Sloan
Manage Rev 47(3):56–63
804 G. Bhandari et al.

International Competitiveness of Russian
IT Firms: Strong Rivals or Survivors
at the Edge?
Irina Jormanainen, Andrey Panibratov, and Marina Latukha
1 Introduction
The competitiveness of firms from emerging markets has come increasingly to the
focus of the international business research during last decades. The scholars have
attempted to comprehend the foundations of their competitiveness and whether
these foundations are different from those of developed market MNEs (Collinson
and Rugman 2007; Luo and Tung 2007; Demirbag et al. 2009). Although literature
has addressed these issues in the context of manufacturing firms from emerging
economies (Jormanainen and Koveshnikov forthcoming), service sector, and in
particular IT services, received significantly less attention. Indeed, only 50 aca-
demic studies for the time period of 1971–2007 were devoted to service companies
(Kundu and Merchant 2008). This proves that theoretical and empirical knowledge
about the patterns and determinants of international competitiveness in the service
sector are still limited and the analysis of their growth potential has yet not been
conducted in proper depth (Pauwels and de Ruyter 2005). Moreover, with regard to
the IT services, the existing studies have been conducted on the basis of empirical
evidence from Indian and Chinese firms (e.g., Narayanan and Bhat 2009), while
other contexts are clearly underresearched.
In this chapter, we aim to fill this gap by taking a close look at the nature and
sources of competitive advantages of Russian IT firms. We develop a framework
I. Jormanainen (*)
Department of Management and International Business,
Aalto School of Economics, Helsinki, Finland
e-mail: [email protected]
A. Panibratov
Department of Strategy and International Business, St. Petersburg Graduate
School of Management, St. Petersburg, Russia
M. Latukha
Department of Organizational Behavior and Personnel Management, St. Petersburg Graduate
School of Management, St. Petersburg, Russia
Department of Management Studies, Indian Institute of Science, Bangalore,
Driving the Economy through Innovation and Entrepreneurship,DOI 10.1007/978-81-322-0746-7_66, # Springer India 2013
805

explaining their international competitivenesswith the objective to extend the existing
theories on competitiveness of service firms from emerging markets. We ask howRussian IT service firms use their strategic resources to create a sustainable competi-tive advantage to expand internationally. Specifically, we aim to examine (a) what is
the nature of sustainable competitive advantage of Russian IT firms enabling the
international expansion, (b) what are the critical resources and capabilities supporting
the creation of this sustainable competitive advantage, and (c) how these IT firms
organize and explore the resources and capabilities when developing strategy for
international markets.
Due to the lack of previous knowledge about the studied phenomenon, we adopt
an explorative empirical approach and conduct a qualitative study to shed light on
the objectives of this research. Hence, our main methodology is multiple-case study
while using the results of the critical analysis of the existing research as guidance in
data collection process. Furthermore, we carefully account for the emerging issues
during the empirical investigation to be able to extend theorizing in this field.
We include in the study those Russian information technology (IT) sector
firms that focus their operations on software development and intellectual services
(integration, consultancy, and outsourcing). We conduct an empirical work in three
phases. First, we undertake a pilot study comprised of the personal interviews
with top managers of three Russian IT companies that have operations overseas.
The objective at this stage is to grasp an overall understanding about the nature
and the sources of Russian IT firms’ competitive advantages overseas. Also, we
attempt to understand the underlying features of Russian IT service sector. Second,
on the basis of accumulated knowledge during the pilot phase, we further examine
IT sector in order to locate more companies having international operations to
include them into the main study. As a result, we include 30 companies suitable
for a case investigation. Finally, at the third phase, we conduct personal inter-
views in selected companies to examine the nature and sources of their competi-
tiveness in international operations. The respondents were either owners or top
managers responsible for companies’ international operations. Also, companies’
internal documentation has been studied as an additional source of information.
The empirical evidence obtained during the case investigation is used as a primary
source for drawing the major conclusions of the study.
2 Internationalization and Competitiveness of Service
Firms from Emerging Markets
Service firms from emerging markets are increasing their efforts to integrate into the
global economy and have already started internationalization process (Panibratov
2012). Internationalization is broadly considered to be a process when a company
moves from operating in domestic market to international markets (Andersen 1993;
Buckley and Casson 1998). Recent studies have extensively addressed various
aspects of international operations of emerging market firms in manufacturing sector
806 I. Jormanainen et al.

context, while service sector received significantly less attention. However, it is
worth noting that the growth rates of international operations in service sector have
been documented to be even higher than those in manufacturing sector (Braga 1996;
Svetličič and Rojec 2003). Cardone-Riportella and Cazorla-Papis (2001) have sug-
gested that such drivers as increasingly tense competition in domestic markets, profit
margin pressure, and opportunity to develop business in foreign markets stimulate a
considerable growth of the service sector.
While some researchers argue that existing theoretical premises developed for
manufacturing firms are applicable to service companies (Boddewyn et al. 1986;
Katrishen and Scordis 1998), others suggest that direct applicability is questionable
(Johanson and Vahlne 1990). Moreover, Majkgård and Sharma (1998) propose to
distinguish among hard services, where production and consumption are decoupled,
and soft services, for which production and consumption occur simultaneously, as
they differ in the internationalization strategies. Moreover, the influence of external
and internal factors on service firms’ international expansion is also argued to be
different from those in manufacturing context (Erramilli 1990; Sanchez-Peinado
and Pla-Barber 2006).
Further, studies that focus specifically on foundations of competitiveness of
service firms overseas are even scarcer. If determinants of entry mode and incen-
tives for the international expansion have been addressed by the literature to date
(e.g., Ball et al. 2008), assessment of assets and capabilities that firms need to
successfully compete in international markets was largely overlooked. A traditional
conceptual model of sustainable competitive advantage (SCA) in service industries
is based on the research done by Barney (1991), Coyne (1985), Day and Wensley
(1988), Dierickx and Cool (1989), Lippman and Rumelt (1982), and Reed and
DeFillipi (1990) and highlights a firm’s distinctive organizational skills, and
resources are viewed as the source of a business’s competitive advantages in the
market (Bharadwaj et al. 1993). The characteristics of services, service sector, and
firm within an industry are shown as moderating the skills and resources underlying
a business’s competitive positional advantages. The sustainability of a business’s
competitive advantages is viewed as contingent on barriers to imitation of its
unique skills and resources. Bharadwaj et al. (1993) define the specific combi-
nations of resources that are unique to service industries and IT sector in particular.
They propose that the greater the complexity and co-specialization of assets needed
to market a service, the greater the importance of innovation as a source of com-
petitive advantage will become.
The SCA approach finds that firm-specific characteristics that support successful
international strategy implementation (Hitt et al. 2006). Also little is said about the
specific of internal resources on which international strategy implementation is
based and how it manages global operations to achieve planned results (Tallman
2001). Valuable resources must be managed accurately in terms of combination and
reinforcing to achieve a sustainable competitive advantage (Barney and Arikan
2001; Sirmon et al. 2007), especially in global environment. Buckley et al. (1992)
note that such characteristics of services as their intangibility, inseparability of
production and consumption, heterogeneity, and perishability contribute to increas-
ing the mobility of resources and capabilities of these firms, which makes them
International Competitiveness of Russian IT Firms: Strong Rivals. . . 807

more willing to become quickly involved in international markets. It is also argued
that to compete internationally requires companies to develop new routines and
organizational processes, which imply that firms must unlearn routines rooted in
domestic operations before new, internationally oriented routines can be learned
(Grant 1996). Domestic firms normally develop and build up resources and capa-
bilities at home that spread into international markets (Bilkey and Tesar 1977;
Cavusgil 1980; Johanson and Vahlne 1977, 1990).
Based on literature review, we can summarize different sources of SCA in
service companies. Some authors discuss innovations and technology level as main
sources of competitive advantage (Hitt et al. 2006;Martinez-Gomez et al. 2010;Melia
et al. 2010); others define firm-specific capabilities deriving from internal environ-
ment, namely, knowledge management practices (knowledge capital), marketing
and customers operations (customer capital), financial and informational resources,
corporate clients (relational capital), and management characteristics (Edvardsson
et al. 1993; Bharadwaj et al. 1993; Johanson and Vahlne 1977; Tallman 2001;
Hitt et al. 2006).
3 Russian Context for IT Service Sector
Aiming to fill the existing gap and considering the fact that service firms fromdifferent
sectors differ in their characteristics, we focus specifically on IT services. IT (infor-
mation technologies) sector is often interchangeably considered together with other
segments of ICT (information and telecommunication technologies) sector. In this
chapter, we emphasize that it is worthwhile to examine this segment separately as its
firms’ operations are rather different in nature from those in other segments of ICT
sector. Further, we suggest to distinguish between tangible and intangible segments
of IT sector. Intangible segment consists of a broad spectrum of soft information
technology services, whereas tangible segment focuses onmanufacturing of hardware
equipment and IT infrastructure. As software and service companies are shifting in
their development toward a new stage of internationalization due to the increasing
homogeneity in the world market, this sector is particularly interesting to study.
IT services are conducted at the top end of a value-added chain when the competitive
challenge is rooted in global standardization of products and operational procedures of
software and IT service firms.
In Russian context, IT service represents a particular interest for investigation of
international competitiveness as majority of studies have been conducted to analyze
the overall competitiveness ofRussian firms (Kalotay and Sulstarova 2010) and that of
firms in natural-resource industry (Panibratov and Verba 2011). To our knowledge,
top journals do not even fully recognize the existence of competitive capabilities of
Russian IT firms to expand abroad. Nevertheless, this sector plays an important role
in Russian economy, and it is worth 15 billion USD. The share of export has been
estimated as 2.75 billion USD in 2009 despite the crisis (RUSSOFT 2010), and in
2010, the total net value of IT products and services increased by 23.4%.
808 I. Jormanainen et al.

The intangible or intellectual segment of Russian IT sector is comprised of
(1) consultancy in business, IT, and information security; (2) integration (develop-
ment, network integration, and distribution); (3) and operation (SW and PC mainte-
nance, IT outsourcing, education, and training). As compared to hardware, the
software production sector has been growing very fast in domestic as well as in
international operations. In this sector, the Russian companies developed their
capabilities in their narrow niches (e.g., IT security, speech recognition, computer-
aided translation) and aimed to avoid competition with large transnational corp-
orations in such niches as, for example, operating systems and databases. A number
of Russian companies are already visible at the global market of IT outsourcing and
included in world ratings. According to National ICT Sector and Policy Appraisal
Report, among competitive advantages of Russian software companies are ability of
Russian companies to tackle nonstandard tasks essential for troubleshooting, product
development and managing high-end complex projects, and also Russia’s large pool
of high-skilled professionals with mathematics and science backgrounds capable of
solving complex and math-intensive problems (National ICT Sector and Policy
Appraisal Report 2009).
4 Theoretical Underpinning
We ground our theoretical development in the resource-based view (RBV) of the
firm as it represents a central theoretical foundation to explain the origin of firms’
competitive advantages (Barney 1991, 2001). The main premise of this approach is
that firm’s rare, valuable, and inimitable resources generating a competitive advan-
tage and thereby an above-normal rate of return (e.g., Barney 1991). We focus
on two specific types of resources – knowledge and capabilities – that are argued to
be a vital source of firms’ competitiveness in the global business environment
(Grant 1996). This approach is particularly applicable for intangible IT sector
where innovation is knowledge based and evolves rapidly. The nature of competi-
tion in this sector is rooted in the heterogeneity of innovative and organizational
capabilities and knowledge across firms.
We also build on premises of the literature on internationalization of service firms
that defines three groups of resources underlying the competitive and international
advantage. These are firm-level resources such as market orientation, entrepreneurial
orientation, and service innovation capability; management characteristics such as
global mindset and international experience; and firm characteristics such as size,
service type, and years in business (Javalgi and Martin 2007). However, as this
framework has been developed in context of developed economies, there is a need
to examine whether it can be applied to firms from emerging markets.
Further, the literature on competitiveness of emerging market firms exploring
the resources and capabilities used by emerging market firms for international
expansion finds that the ability to operate in environments with weak institutions
(e.g., Del Sol and Kogan 2007; Cuervo-Cazurra and Genc 2008), various types of
International Competitiveness of Russian IT Firms: Strong Rivals. . . 809

business and personal networks (Thomas et al. 2007; Kotabe et al. 2010; Manolova
et al. 2010), common language with international partners (Musteen et al. 2010),
and ethnic identity (Miller et al. 2008) often represents the basis of emerging
market firms’ competitive advantages in developing countries and assists them in
overcoming the liability of foreignness that they face when operating in developed
markets. Entrepreneurial motivation has also been found to be a very important
resource outbalancing the lack of education, pre-internationalization experience,
and technological and managerial knowledge (Liu et al. 2008; Latukha et al. 2011).
With regard to the size of the companies, the literature concludes that emerging
markets’ SMEs tend to rely on their networks more heavily than large emerging
market firms.
Further, emerging market firms often possess the ability to treat global competi-
tion as an opportunity to build missing capabilities and move into more profitable
industry segments by adopting strategies that turn their latecomer status into a
source of competitive advantage (Bonaglia et al. 2007). To achieve this, emerging
market firms develop an adaptive capability to transform key resources into positive
performance outcomes (Lu et al. 2010).
5 Empirical Results
The analysis of the extensive qualitative data from Russian IT service firms allowed
for extending the discussed above premises on competitiveness of service sector firms
from emerging economies. The results of this analysis enable to formulate the empi-
rically based propositions regarding the nature and sources of international competi-
tiveness of Russian IT service firms and develop an empirically grounded framework.
5.1 Propositions Development
The propositions were developed in such a way and order to provide an explanation
of the research questions formulated for this study.
The first objective in our examination was to understand the nature of competitive
advantages of Russian IT firms abroad and to analyze whether they are different
from those of developed countries’ firms. The results indicate that Russian firms are
capable of competing on the same foundations, that is, delivery of new highly
sophisticated products to the foreign markets. This finding is of value to the existing
research that often emphasizes the lack of technological capabilities of emerging
market firms. Further, Russian firms have an additional advantage, that is, an ability
to carefully match characteristics of the product and with the time of entry to the
international marketplace. Hence, our first proposition is formulated as follows:
P1: The competitive advantage of Russian IT service firms stems from their ability todevelop highly innovative products which are new to the foreign markets as well as from theability to carefully match the product and the time of entry to the international marketplace.
810 I. Jormanainen et al.
Proceeding with assessment of empirical data, we were able to further delineate
the competitive strength of researched firms. It appears that an ability to differenti-
ate the products’ characteristics targeted for developed and developing markets
according to the local needs and level of development represents the other compet-
itive advantage of Russian IT service firms. We summarized this finding as:
P2: The competitive advantage of Russian IT service firms stems from their ability todevelop a comprehensive and complex products to satisfy a broad range of customer needsin developed and developing markets.
The other important foundation of the Russian IT firms’ competitive advantage
originates from their ability to provide to foreign customers a full range of supporting
services at the lower price if compared with the international players. Hence, the third
proposition of the study is as follows:
P3: The main competitive advantage of Russian IT service firms stems from the provisionof competent supported services to the foreign customers at the competitive price.
Lastly, the important strength of Russian IT service firms has its roots in the fact
that their owners are highly ambitions, proactive, and risk-accepting individuals
who have succeeded to establish an efficiently operating management team having
similar strategic orientation and vision. Hence,
P4: The competitive advantage of Russian IT service firms stems from pro-activenessof owners in searching the paths for international growth.
Further, we have proceeded in the analysis toward the understanding of sources
for building mentioned above competitive advantages. The empirical evidence
shows that the solid technological knowledge acquired from the home environment
has allowed for development of advanced products and services to ensure competi-
tiveness in foreign markets. Thus, we formulated the next proposition as:
P5: The important source allowing for building competitive advantages of Russian ITservice firms is strong professional expertise of the technical personnel resulting from thehigh efficiency of the Soviet educational system in these specializations.
However, at the same time, there is a negative influence of the home environment,
which could be defined as a source or push factor for dedicating efforts toward
international expansion. The respondents have clearly indicated that Russian market
is often not ready for the consumption of the advanced IT products due to a lack of
supporting infrastructure and services. Hence, our last proposition is as follows:
P6: The source that incentivizes for building competitive advantage internationally is alack of readiness of domestic market for top innovative products.
5.2 Framework Development
On the basis of the formulated above propositions, we have developed an empirically
grounded framework that graphically shows themain arguments of the study. Figure 1
illustrates how the specific types of resources influenced building a sustainable
competitive advantage by Russian IT service firms in their international expansion.
International Competitiveness of Russian IT Firms: Strong Rivals. . . 811

6 Contributions
The contribution of this study is threefold. First, we extend the theorizing
on international competitiveness by outlining the nature of competitive advantage of
service forms from emerging economies. Hence, we contribute to the debates whether
emerging market firms are distinctive in their international strategy or comply with
the logic of developed market firms. Second, we bring more knowledge about the
behavior of Russia firms that is currently one of the less-researched contexts in the
field of international management. Third, we provide important conclusions for policy
makers how to provide support for IT companies for the international expansion.
Overall, this chapter draws attention to the fact that firms from emerging markets
possess a solid technology competitive advantages that allow them to become
strong rivals in international business arena. This observation should raise attention
of firms from developed market and to assist in planning of the further strategic
expansion as well as in development of new capabilities to compete against new
rivals appearing in the global business arena.
References
Andersen O (1993) On the internationalization process of firms: a critical analysis. J Int Bus Stud
24(2):209–231
Ball DA, McCulloch Jr WH, Geringer JM, Minor MS, McNett JM (2008) International business: the
challenge of global competition. 11 edn. The McGraw-Hill Companies, Inc. New York, USA
Fig. 1 Empirically grounded framework
812 I. Jormanainen et al.

Barney J (1991) Firm resources and sustained competitive advantage. J Manag 17(1):99–120
Barney JB, Arikan AM (2001) The resource-based view: origins and implications. In: Hitt MA,
Freeman RE, Harrison JS (eds) Handbook of strategic management. Blackwell, Oxford,
pp 124–188
Bharadwaj SG, Varadarajan PR, Fahy J (1993) Sustainable competitive advantage in service
industries: a conceptual model and research propositions. J Mark 57:83–99
Bilkey W, Tesar G (1977) The export behavior of smaller Wisconsin manufacturing firm. J Int Bus
Stud 9(2/3):93–98
Boddewyn JJ, Soehl R, Picard J (1986) Standardization in international marketing: is Ted Levitt in
fact right? Bus Horiz 6:69–75
Bonaglia F, Goldstein A, Mathews JA (2007) Accelerated internationalization by emerging
markets multinationals: the case of the white goods sector. J World Bus 42:369–383
Braga CAP (1996) The impact of internationalization of services on developing countries. Finance
Dev, March 1996, 1–8. http://www.worldbank.org/fandd/english/0396/articles/070396.htm
Buckley PJ, Casson MC (1998) Analyzing foreign market entry strategies: extending the internal-
ization approach. J Int Bus Stud 29(3):539–562
Buckley PJ, Pass CL, Prescott K (1992) Internationalization of service firms: a comparison with
the manufacturing sector. Scand Int Bus Rev 1(1):39–56
Cardone-Riportella C, Cazorla-Papis L (2001) The internationalisation process of Spanish banks:
a tale of two times. Int J Bank Mark 19(2):53–68
Cavusgil ST (1980) On the internationalization process of firms. Eur Res 8:273–281
Collinson S, Rugman AM (2007) The regional character of Asian multinational enterprises. Asia
Pac J Manag 24:429–446
Coyne KP (1985) Sustainable competitive advantage – what it is, what it isn’t? Bus Horiz
29(1):54–61
Cuervo-Cazurra A, Genc M (2008) Transforming disadvantages into advantages: developing-
country MNEs in the least developed countries. J Int Bus Stud 39:957–979
Day GS, Wensley R (1988) Assessing advantage: a framework for diagnosing competitive
superiority. J Mark 52(4):1–20
Del Sol P, Kogan J (2007) Regional competitive advantage based on pioneering economic
reforms: the case of Chilean FDI. J Int Bus Stud 38(6):901–927
Demirbag M, Tatoglu E, Glaister KW (2009) Equity-based entry modes of emerging country
multinationals: lessons from Turkey. J World Bus 44(4):445–462
Dierickx I, Cool K (1989) Asset stock accumulation and sustainability of competitive advantage.
Manage Sci 35(11):1504–1511
Edvardsson B, Edvinsson L, Nystrom H (1993) Internationalisation in service companies. Serv Ind
J 13(1):80–97
Erramilli MK (1990) Entry mode choice in service industries. Int Mark Rev 7(5):50–62
Grant RM (1996) Prospering in dynamically-competitive environments: organizational capability
as knowledge integration. Organ Sci 7(4):375–387
Hitt M, Bierman L, Uhlenbruck K, Shimizu K (2006) The importance of resources in the
internationalization of professional service firms: the good, the bad, and the ugly. Acad
Manage J 49(6):1137–1157
Javalgi R, Martin C (2007) Internationalisation of services: identifying the building blocks for
future research. J Serv Mark 21(7):391–397
Johanson J, Vahlne JE (1977) The internationalization process of the firm: a model of knowledge
development and increasing foreign market commitment. J Int Bus Stud 8(1):23–32
Johanson J, Vahlne JE (1990) The mechanism of internationalization. Int Mark Rev 7(4):11–24
Jormanainen I, Koveshnikov A (forthcoming) International activities of emerging market firms: a
critical assessment of research in top internationalmanagement journals.Manage Int Rev. In press
Kalotay K, Sulstarova A (2010) Modelling Russian outward FDI. J Int Manag 16(2):131–142
Katrishen F, Scordis N (1998) Economies of scale in services: a study of multinational insurers.
J Int Bus Stud 29(2):305–324
Kotabe M, Jiang CX, Murray JY (2010) Managerial ties, knowledge acquisition, realized absorp-
tive capacity and new product market performance of emerging multinational companies:
a case of China. J World Bus 46(2):166–176
International Competitiveness of Russian IT Firms: Strong Rivals. . . 813

Kundu SK, Merchant H (2008) Service multinationals: their past, present and future. Manage Int
Rev 48(4):371–377
Latukha M, Panibratov A, Safonova-Salvadori E (2011) Entrepreneurial FDI in emerging
economies: Russian SME strategy for Brazil. Int J Entrep Innov 12(3):201–212
Lippman SA, Rumelt RP (1982) Uncertain imitability: an analysis of interfirm differences in
efficiency under competition. Bell J Econ 13(3):418–438
Liu X, Xiao W, Huang X (2008) Bounded entrepreneurship and internationalisation of indigenous
private-owned firms. Int Bus Rev 17(4):488–508
Lu Y, Zhou L, Bruton G, Li W (2010) Capabilities as a mediator linking resources and the
international performance of entrepreneurial firms in an emerging economy. J Int Bus Stud
41:419–436
Luo Y, Tung RL (2007) International expansion of emerging market enterprises: a springboard
perspective. J Int Bus Stud 38:481–498
Majkgård A, Sharma D (1998) Client-following and market-seeking strategies in the internation-
alization of service firms. J Bus-to-Bus Mark 4(3):1–41
Manolova TS, Manev IM, Gyoshev BS (2010) In good company: the role of personal and inter-
firm networks for new-venture internationalization in a transition economy. J World Bus
45(3):257–265
Martinez-Gomez V, Baviera-Puig A, Mas-Verdú F (2010) Innovation policy, services and
internationalisation: the role of technology centres. Serv Ind J 30(1):43–55
Melia M, Perez A, Dobon S (2010) The influence of innovation orientation on the internationali-
zation of SMEs in the service sector. Serv Ind J 30(5):777–791
Miller SR, Thomas DE, Eden L, Hitt M (2008) Knee deep in the big muddy: the survival of
emerging market firms in developed markets. Manage Int Rev 48(6):645–665
Musteen M, Francis J, Datta DK (2010) The influence of international networks on internationali-
zation speed and performance: a study of Czech SMEs. J World Bus 45(3):197–205
Narayanan K, Bhat S (2009) Technological efforts and internationalization of IT firms in India.
Indian J Ind Relations 45(1):62–83
National ICT Sector and Policy Appraisal Report, Russia (2009) http://www.google.ru/url?
sa¼t&rct¼j&q¼russian%20it%20sector&source¼web&cd¼2&sqi¼2&ved¼0CDEQFjAB&url¼http%3A%2F%2Fwww.eeca-ict.eu%2Feeca%2Findex.php%2Fen%2Fusefulinfo%2Fnational-
reports%2Fdoc_download%2F17-russia-national-ict-sector-and-policy-appraisal-report&ei¼YaXQTrzjNIuaOvynoZgP&usg¼AFQjCNHDI-L0hEdpKJE98m8kXBzAfgS67w
Panibratov A (2012) Russian multinationals: from regional supremacy to global lead. Routledge,
London
Panibratov A, Verba C (2011) Russian banking sector: key points of international expansion.
Organ Mark Emerg Econ 2(1/3):63–74
Pauwels P, de Ruyter K (2005) Research on international service marketing: enrichment and
challenges. In: Pauwels P, de Ruyter K (eds) Research on international service marketing:
a state of the art. JAI Press, Greenwich, pp 1–7
Reed R, DeFillippi RJ (1990) Casual ambiguity, barriers to imitation and sustainable competitive
advantage. Acad Manage Rev 15(1):88–102
RUSSOFT (2010) The 7th annual survey of the Russian software export industry http://russoft.ru/
files/RUSSOFT_Survey_7_en.pdf
Sanchez-Peinado E, Pla-Barber J (2006) A multidimensional concept of uncertainty and its influence
on the entry mode choice: an empirical analysis in the service sector. Int Bus Rev 15:215–232
Sirmon DG, Hitt MA, Ireland RD (2007) Managing firm resources in dynamic environments to
create value: looking inside the black box. Acad Manage Rev 32(1):273–292
Svetličič M, Rojec M (eds) (2003) Facilitating transition by internationalisation; outward direct
investment flows from central European economies in transition. Ashgate, Aldershot/
Burlington/Singapore/Sydney
Tallman SB (2001) Global strategic management. In: Hitt MA, Freeman RE, Harrison JS (eds)
Handbook of strategic management. Blackwell, Oxford, pp 464–490
Thomas DE, Eden L, Hitt MA, Miller SR (2007) Experience of emerging market firms: the role of
cognitive bias in developed market entry and survival. Manage Int Rev 47(6):845–867
814 I. Jormanainen et al.

Perspectives of Users and Service Providers
on Deployment Maturity Assessment:
A Study of Product Lifecycle Management
Systems (PLMS)
S.R. Venugopalan, L.S. Ganesh, and L. Prakash Sai
1 Introduction
Organizations seek to enhance their competitiveness through a variety of approaches.
The management of product lifecycles is among the more important ones since it
involves all entities that exist along the value and supply chains of organizations.
Several factors, including (a) the globally spread demand for products, (b) intense
competition for market share, (c) increasing complexity of product designs due to
the tendency to embed multiple functionalities in a product, (d) globally distributed
collaborative manufacturing systems, (e) higher sophistication of manufacturing
and related industrial processes, and (f) use of more refined management methodo-
logies and tools, significantly influence the management of product lifecycles. The
management of product lifecycles is important since it involves all entities that exist
along the value and supply chains of firms. PLM experts/researchers/product
vendors hold the view that PLMS enable integration of various systems, data, and
processes from all the phases/stages of NPD and all the stakeholders of the
business/product through collaboration to provide the overall status/view about
the product.
In this study, PLM is viewed as a resource for managing an organization’s
products and other resources (technology, human, knowledge and information, and
organization) from conception to disposal. The practice of PLM is comprehensively
enabled by PLM systems (PLMS) that comprise an integrated set of various hardware
S.R. Venugopalan (*)
Aeronautical Development Agency, Ministry of Defence, Government of India,
P.B. No. 1718, Vimanpura Post, Bangalore 560 017, India
e-mail: [email protected]
L.S. Ganesh • L.P. Sai
Department of Management Studies (DoMS), Indian Institute of Technology Madras,
Chennai 60036, India
e-mail: [email protected]; [email protected]
Department of Management Studies, Indian Institute of Science, Bangalore,
Driving the Economy through Innovation and Entrepreneurship,DOI 10.1007/978-81-322-0746-7_67, # Springer India 2013
815

and software products that are blended into organizational policies and practices
concerning NPD. Organizations involved in PLM product development and organi-
zations that provide PLM consultancy or implementation service, evaluation, and
customization services are termed as PLMS service providers and those organizationsthat have implemented PLMS are termed as PLMS users.
The business reasons for adopting PLMS in the product industry are well
known. However, in practice, companies struggle with adopting and implementing
PLMS, which is founded on structural, cross-functional, and long-term interactions
and cooperation among all stakeholders. The primary reason for organizations’
struggles in adopting and implementing PLMS is that it affects a wide range of
internal and external processes. Specifically, PLM involves various modes of design
sharing in different design formats and travel to virtual offices to interface with
partners. PLMS benefit organizations by enabling them to progress from a sequential,
functional, and loosely linked PLM process to a concurrent, cross-functional, and
integrated one. The critical success of PLM is realized through its ability to purpose-
fully deliver the right information at the right time to the right person, each and
every time. Though PLMS offer several benefits, their implementation is challenging.
Successful PLMS implementation should be characterized by attaining optimal
PLMS deployment maturity and aligning PLMS with business goals. PLMS matu-
rity should not be judged by only the system’s technical capability since PLMS
implementation also involves cultural and organization change. This should be
approached in a different way, considering the existing policies and practices
and, more importantly, the requirements and attitudes of the users.
Organizations seek to be evaluated on their capabilities by independent agencies.
Maturity assessment frameworks serve as an easy way for organizations to gauge
their relative positioning in the competition and across value chains. Maturity
models provide organizations with a benchmark that could be used to gauge their
relative maturity with respect others in the industry. An organization needs useful
evaluations to describe its situation, in its own context. The maturity of an organi-
zation denotes the extent to which that organization consistently manages its
product information assets and leverages them effectively.
2 Literature Review
Balasubramaniam et al. (2003) discussed the challenges encountered in the migration
of legacy systems and how to overcome them. They also described the interactions
between people, process/practices, tools/technology, and data and discussed about
cultural change, multiplicity of legacy systems, and processes. Maturity levels
and their components were not clearly defined. Christopher (2003) presented a
maturity model on virtual product development (VPD), which defined five levels of
maturity for various tools and processes, in which he addressed some components
that could be adapted for PLMS deployment maturity assessments. His work
involved the use of a single scale for maturity assessment and did not describe
816 S.R. Venugopalan et al.

the assessment process. Saaksvuori and Immoneon (2004), in their book titled
Product Lifecycle Management, discussed about a PLMmaturity model to describe,
at an aggregate level, how a company and its management team can develop
and extend the use of an enterprise-wide PLM concept and related processes and
information systems. Walvekar and Subbanarasaiah (2004) discussed the best
practices for PLM implementation and the maturity assessment of various PLM
components such as data vaulting, data classification, management and search, bill
of materials, document management, multisite design collaboration, engineering
change management, design/drafting process management, and customer/supplier
collaboration across five levels. However, technological aspects and human
resource-related aspects were not addressed, and maturity levels were not clearly
defined, primarily because a single scale was used for all components and it was
applicable only to very few components of PLMS deployment. Batenburg et al.
(2005) discussed about how the concepts of strategic business/IT alignment and
capability maturity could be used to develop a PLM framework. By using the
framework, they could assess the PLM activities of 23 Dutch firms using SEI’s
CMMmodel to define the levels ofmaturity as level 0 – ad hoc, level 1 – departmental,
level 2 – organizational, and level 3 – interorganizational. The authors could not
assess the maturity of all PLMS components. The model used only one maturity
scale that is not equally appropriate to all dimensions featured in it. This assessment
enabled organizations to be placed in relative positions. Sharma (2005) discussed
the integration of three components – collaboration, product development, and
innovation. Using a technology framework, he also discussed about PLM maturity
with respect to information/process management and collaboration. Other aspects
of PLM were not addressed in the work. Venugopalan et al. (2009) proposed a
framework, using sound conceptual foundations of resource-centric perspectives of
organizations, and this has been developed based on the relevant research literature
and specifically on the well-known THIO framework (Ramanathan 1988) used
in technology capability assessment to assess PLMS deployment maturity. The
framework proposed by the authors posits that PLMS deployment maturity can be
evaluated across five maturity levels using four constituent dimensions – technology
resources (integrated hardware and software systems), human resources (individual
employees’ professional competencies and character, teams’ attributes), knowledge
and information resources (training manuals, process and procedure manuals,
best practices, standards), and organizational resources (policies, frameworks and
practices concerning communication, evaluation, planning and decision-making,
monitoring, and control systems and mechanisms) comprising 9, 6, 12, and 8
components, respectively. This framework is used for this study.
3 Objectives and Scope
This research work is confined to the context of national and multinational
organizations in India that are either users of or service providers for PLMS.
The deployment maturity of PLMS is assessed using the framework and the
Perspectives of Users and Service Providers on Deployment Maturity. . . 817

perspectives of both the users and the service providers. In India, nearly 35 different
organizations have been using different PLM systems for their product develop-
ment projects. These organizations have not implemented all the required compo-
nents of PLM systems for their product lines. This work uses an assumption that
if any organization has been using any of the PDM systems, project/program
management tools, portfolio management, configuration management, computer-
aided tools, and enterprise management systems for their product development
activities, and then they have been practicing the PLM concept (at least in parts)
and have used the systems for their product development.
The objectives of this research are the following:
1. To determine, based on the identified components (Venugopalan et al. 2009), the
levels of PLMS deployment maturity prevailing among firms, at an aggregate
level
2. To perform a detailed component-level analysis of PLMS deployment maturity
to contrast the assessments of PLMS service providers (organizations provid-
ing PLMS services) with those of PLMS users (organizations that have
implemented PLMS)
4 Description of the Research Work
This section describes the research methodology adopted for this research.
Survey instrument design and testing: The PLMS deployment maturity assessment
framework (Venugopalan et al. 2009) is operationalized through a survey
and pretested by experts who have several years of PLM experience. Earlier, a
pilot study was conducted among academicians, users of PDM/PLM systems, and
product development professionals for fine tuning and improving the questionnaire.
The survey included a specific question for each of the 35 components of PLMS
deployment maturity. SPSS version 17.0 has been used for all statistical analyses.
Reliability analysis has shown that the overall Cronbach’s alpha value is 0.973,
which indicates high internal consistency (Malhotra 2004).
Scales: An ordinal 5-point scale is used in this research to represent each level
of maturity. The effort, time, and cost required for improving the PLMS deploy-
ment maturity from one level to the next higher one are not the same across the five
maturity levels, and hence, an interval scale could not be used.
Sample: The questionnaire, administered via e-mail, uses a format that gives a detailed
description of the activities and processes for each component of each dimension
in each level of PLMS deployment maturity. Keeping in mind the use of PLMS
across industries, the availability of experienced professionals, the current state of
research on PLMS, and the time available for the entire study, convenience sampling
has been adopted. Practicing managers, and experts or senior engineers engaged
in PLM-related activities in 29 well-known medium- and large-sized organizations
818 S.R. Venugopalan et al.

were selected to respond to the questionnaire survey. Of the 29 organizations,
10 are PLMSSP, and the rest 19 are PLMSU.
Responses: A total of 112 sets of questionnaires were distributed, through conve-
nience sampling, to personnel in various organizations and individually tracked
over phone, e-mail, and personal interactions. A total of 59 responses were
obtained, of which 56 were usable. PLMSSP, automotive, aerospace, and high-
tech industries have been identified for this research on the basis of their presence in
earlier literature and the professional experience and knowledge of this researcher.
5 PLMS Deployment Maturity: Component-Level Analysis
The analysis of PLMS deployment at the component level involves simple
calculations of medians. Reviewing the results in Table 1 (given below) across
all component areas at the aggregate level of all organizations, the median
PLMS deployment maturity is at level 2 for five components, at level 3 for
26 components, and at level 4 for four components. All the components in organi-
zational resources are at level 3. In particular, the respondents indicated level
2 practices with respect to “deployment architecture,” “information security,”
“CAE,” “CAT,” and “CAM” practices. Interestingly, all these components per-
tain to technology resources. Four components, namely, “users’ learning curve,”
“adaptation of regulatory changes,” “design standardization/compliance,” and
“classification and release,” are at level 4. By calculating the mean of the medians
of the components of each dimension, a final score for each dimension is deter-
mined. Subsequently, the mean PLMS deployment maturity scores for each dimen-
sion are graphically portrayed using radar plots (Fig. 1). Interestingly, there is no
component rated at level 1 or level 5. This clearly suggests that the component-level
maturity scores are neither high nor low.
From Table 1 and Fig. 1, it can be easily observed that the overall PLMS
deployment maturity in Indian Industry is “average” (value ¼ 2.98).
5.1 PLMS Deployment Maturity: Component-Level AnalysisBetween PLMS Service Providers and PLMS Users
This research relies upon descriptive and inferential statistics to gain insights
regarding differences among PLMS users and service providers in terms of
their PLMS deployment maturity evaluated on the components described in the
framework. While previous studies have relied upon simple comparisons of
sample means, this study employs relatively efficient nonparametric tests to
determine whether statistically significant differences exist or not among the
selected groups. Finally, the comparison between groups is presented here at a
Perspectives of Users and Service Providers on Deployment Maturity. . . 819

more detailed level than previous studies, which have addressed the differences in
overall maturity or the differences associated with a single level of decomposi-
tion, at the component level.
In this section, the 37 responses collected from PLMSSP (19 different organiza-
tions) and 19 responses from PLMSU (10 different organizations) are analyzed
and discussed. The results are examined in the light of Obj. 2: The central tendency
of the PLMS deployment maturity levels reported by the respondents is used to
compare the overall performance across each dimension (presented in Table 2), and
the graphical representation of the same is presented in Fig. 2. The central tendency
of the PLMS deployment maturity levels reported by the respondents is used to
compare the overall performance across each dimension.
Central tendency: The median maturity of PLMSU is 2.77, and that of PLMSSP is
3.25. This clearly shows that the PLMS deployment maturity of PLMSSP is higher.
This result is to be expected because PLMSSP are motivated, by design, to promote
their products and services, and this is a good reason for this difference. PLMSSP
Fig. 1 Maturity of each dimension and all 35 components
Table 1 Central tendency of maturity of each dimension
Dimensions !Technology Human
Knowledge and
information Organization
Mean of
mediansCentral tendency #Median 2.44 3.12 3.35 3.00 2.98
Weighted avg. 2.343 2.982 3.34 3.05 2.93
Table 2 Central tendency reported by PLMSSP and PLMSU
Central tendency Technology Human
Knowledge and
information Organization
Overall
mean
Median Overall 2.44 3.12 3.35 3.00 2.98
PLMSU 2.33 2.66 3.08 3.00 2.77
PLMSSP 2.70 3.00 3.91 3.38 3.25
820 S.R. Venugopalan et al.

claim, naturally, that their products and services are superior. The results are also
graphically presented in Figs. 2 and Table 2. These results show that the maturity
levels of PLMSSP and PLMSU are comparable.
5.2 Differences Between PLMS Deployment Maturityof PLMSSP and PLMSU
The differences between the PLMS deployment maturity levels of PLMSSP and
PLMSU are identified and analyzed in this section using the following nonpara-
metric tests:
(a) Mann–Whitney U test – to test the differences between the two groups of
organizations
(b) Wilcoxon signed-rank test – to test the differences between the two related
groups by combining (pairing) the samples
5.2.1 Differences Between PLMSU and PLMSSP – Mann–Whitney U Test
The results of the test are given in Table 3 and discussed below.
The two groups of organizations are found to differ statistically in terms of the
11 components identified from Table 3 above and summarized in Appendix A at the
end. In most cases, the level of maturity in PLMSSP is at least one level higher than
in PLMSU. This can be seen in Fig. 2, presented earlier in this chapter. PLMSSP are
motivated, by design, to promote their products and services, and this is a good
reason for this difference. PLMSSP claim, naturally, that their products and
services are superior in terms of the following:
(a) Functional capabilities of the technology resources made available
(b) Enabling quicker learning and skill development, in terms of human resources
Fig. 2 Maturity of each dimension and components
Perspectives of Users and Service Providers on Deployment Maturity. . . 821

Table 3 Differences PLMSSP and PLMSU
Index Components
Mann–Whitney
UWilcoxon
W ZAsymp sig.
(2-tailed)
TR1 IT – systems/infrastructure/
technology
274.500 977.500 �1.418 0.156
TR2 Deployment architecture of info.
system
232.500 935.500 �2.129 0.033
TR3 Enterprise application integration 294.000 997.000 �1.051 0.293
TR4 Product data (PD) and its integration 221.500 924.500 �2.349 0.019
TR5 Information security 276.000 979.000 �1.397 0.162
TR6 Computer-aided design 245.500 948.500 �1.903 0.057
TR7 Computer-aided engineering 236.500 939.500 �2.136 0.033
TR8 Computer-aided testing/
troubleshooting
339.000 1042.000 �0.225 0.822
TR9 Computer-aided manufacturing 324.500 1027.500 �0.499 0.618
HR1 Organizational teams/people their
focus
259.000 962.000 �1.655 0.098
HR2 Organization culture 246.000 949.000 �1.877 0.061
HR3 PLM concept understanding 320.000 1023.000 �0.566 0.572
HR4 Learning curve of the users and
support
202.000 905.000 �2.767 0.006
HR5 Employees’ satisfaction and level
of involvement
253.500 956.500 �1.761 0.078
HR6 Organization structure and design 257.500 960.500 �1.736 0.083
KIR1 Product data/information
management.
282.500 985.500 �1.226 0.220
KIR2 Collaborative workspace 255.500 958.500 �1.755 0.079
KIR3 PLM tools 197.500 900.500 �2.763 0.006
KIR4 Adaptation to regulatory changes 229.000 932.000 �2.234 0.026
KIR5 Accessibility of the documents 200.000 903.000 �2.770 0.006
KIR6 Best practices 157.500 860.500 �3.519 0.000
KIR7 Legacy data migration and cleanup
for PLM
249.000 952.000 �1.840 0.066
KIR8 Manage training requirements 256.500 959.500 �1.709 0.087
KIR9 Design standardization/compliance 250.500 953.500 �1.841 0.066
KIR10 Classification and release 293.500 996.500 �1.048 0.295
KIR11 PLM process and application trained
employees
222.500 925.500 �2.291 0.022
KIR12 Knowledge management 249.500 952.500 �1.815 0.070
OR1 Organizational processes to support
PLM
275.500 978.500 �1.377 0.168
OR2 PLM vision 281.500 984.500 �1.256 0.209
OR3 Program management and leadership 305.000 1008.000 �0.830 0.407
OR4 PLM process maturity 182.500 885.500 �3.052 0.002
OR5 PLM strategy 254.000 957.000 �1.744 0.081
OR6 Enterprise PLM roadmap 198.500 901.500 �2.735 0.006
OR7 Innovation 284.000 987.000 �1.198 0.231
OR8 PLM implementation 253.000 956.000 �1.842 0.065
822 S.R. Venugopalan et al.

(c) Incorporation of industry’s “best practices” in their PLM systems, thus enabling
better utilization of knowledge and information resources
(d) Being consistent with the higher maturity of the PLM-implemented industries’
processes and roadmap
This, however, is apparently only their unfounded belief rather than being a
well-researched conclusion. One of the most important observations in this research
is that PLMS deployment maturity is viewed very consistently by both PLMSSP
and PLMSU, with very few exceptions. Also, the above differences between their
perceptions are only of the order of a single level of maturity. There is no statisti-
cally significant difference between PLMSSP and PLMSU in their views on PLMS
deployment maturity levels defined across the remaining 24 of the 35 component
areas. Keeping the above observations in mind, there is no strong argument to reject
the null hypothesis that there is no difference between the maturity levels reported
by PLMSSP and PLMSU. This should serve to encourage the two to understand
each other’s expectations, requirements, and capabilities to take PLM systems to
more productive and sophisticated levels of application.
5.2.2 Differences Between PLMSSP and PLMSU – Wilcoxon
Signed-Rank Test
Following the overall comparison presented above, the PLMS deployment maturity
assessments made by the two groups of organizations are specifically analyzed.
For this, the differences, if any, between the paired responses from the two groups
are determined, analyzed, and explained. The responses from each PLMSSP are
paired with those from the respective PLMSU that received the service. The paired
data is analyzed using the Wilcoxon signed-rank test. In this test case,
H0: There is no difference between the PLMS deployment maturity levels ofPLMSSP and PLMSU.
The Wilcoxon signed-rank test statistics for the matched pairs are given in
Table 4. There are 22 components in which a statistically significant difference is
found. These are summarized in Appendix A at the end. There is no statistically
significant difference between PLMSSP and PLMSU in their views on PLMS
deployment maturity levels defined across the remaining 13 of the 35 components.
Here also, the level of maturity reported by the respondents from PLMSSP
is at least one level higher than that reported by those in PLMSU. The 22 com-
ponents for which there are statistically significant differences include the 11
components reported in the overall comparison (Mann–Whitney U test) made in
the previous subsection. In the technology resource dimension, most of the
components in IT and in the engineering design domain and tools show statistically
significant differences between the two groups of organizations. In the human
resource dimension, all the components except the component “PLM understand-
ing” show differences. In the knowledge and information, and organizational
Perspectives of Users and Service Providers on Deployment Maturity. . . 823

resource dimensions also, there are significant differences in many of the critical
components including “adaptation to regulatory changes,” “design standardization/
compliance,” “classification and release,” “PLM process,” “organizational processes
and PLM implementation.” Keeping the above observations in mind, there are
sufficient reasons to reject the null Hypothesis that there is no difference between
the maturity levels reported by PLMSSP and PLMSU.
Table 4 Differences between PLMSSP and PLMSU – Wilcoxon matched pairs signed-rank test
grouping variable – organization type
Components – technology Z Asymp. sig. (2-tailed)
TR1 �2.594a 0.009
TR2 �3.518a 0.000
TR3 �1.423a 0.155
TR4 �3.473a 0.001
TR5 �1.877a 0.061
TR6 �3.181a 0.001
TR7 �4.617a 0.000
TR8 �1.276a 0.202
TR9 �0.845a 0.398
Components – human Z Asymp. sig. (2-tailed)
HR1 �2.311a 0.021
HR2 �2.432a 0.015
HR3 �0.734a 0.463
HR4 �4.740a 0.000
HR5 �2.534a 0.011
HR6 �2.544a 0.011
Components – knowledge and information Z Asymp. sig. (2-tailed)
KIR1 �0.750a 0.454
KIR2 �1.740a 0.082
KIR3 �4.016a 0.000
KIR4 �3.427a 0.001
KIR5 �5.123a 0.000
KIR6 �5.744a 0.000
KIR7 �1.883a 0.060
KIR8 �1.520a 0.128
KIR9 �3.001a 0.003
KIR10 �2.079a 0.038
KIR11 �3.916a 0.000
KIR12 �3.061a 0.002
Components – organizational Z Asymp. sig. (2-tailed)
OR1 �2.096a 0.036
OR2 �0.608a 0.543
OR3 �0.162b 0.872
OR4 �5.227a 0.000
OR5 �1.811a 0.070
OR6 �4.072a 0.000
OR7 �1.220a 0.223
OR8 �3.965a 0.000aBased on positive ranks
824 S.R. Venugopalan et al.

The significant differences can be attributed to the following reasons:
(a) The number of responses from PLMSU is more than that from PLMSSP.
(b) Significant differences between the two groups exist when one of the groups
exhibits larger dispersion of responses within the group.
(c) The number of junior-level respondents in PLMSSP is more than that in
PLMSU.
The above observations point to the need for further analysis on the samples,
and the same is addressed in the next subsection using senior-level respondents.
5.2.3 Differences Between Senior Management in PLMSSP
and PLMSU – Wilcoxon Signed-Rank Test
The responses from senior-level respondents from PLMSSP are paired with those
from the respective PLMSU that received the services. Ten responses from
PLMSSP are paired with ten from the respective PLMSU and compared for
differences using the Wilcoxon signed-rank test. The Wilcoxon test statistics are
tabulated in Table 5. There are only two components for which statistically signifi-
cant differences exist. These two belong to knowledge and information resources.
The most significant difference identified in this study between the two groups
occurs with respect to the two components, “best practices” and “PLM process and
application trained employee’s component area.” The median maturity reported
by respondents in PLMSSP for both components is 4, and the median reported by
those in PLMSU is 3. The views of PLMSSP that the incorporation of industry “best
practices” and PLM processes in their PLM systems, thus enabling better utilization
of knowledge and information resources by PLMSU, are reflected in their higher
rating of PLMS deployment maturity.
It is reiterated here that PLMS deployment maturity is viewed very consistently
by both PLMSSP and PLMSU, with very few exceptions. An analysis of the
remaining 33 of the 35 components reveals that there is no statistically significant
difference in PLMS deployment maturity levels rated by the two groups of
organizations. Based on the above observations, there is no reason for rejecting
the null hypothesis that there is no difference between the maturity levels reported
by PLMSSP and PLMSU. The views about PLMS deployment maturity held by
respondents of PLMSSP are consistently higher by at least one level.
6 Major Research Contributions and Conclusions
This research contributes to the theoretical and empirical analysis of PLMS deploy-
ment maturity assessment. This research provides a detailed, component-level
snapshot of the current levels of PLMS deployment maturity among the industries.
The research helps organizations to evaluate PLMS deployment maturity with
Perspectives of Users and Service Providers on Deployment Maturity. . . 825

respect to other organizations. The questionnaire developed in this research can
be used by industries to evaluate the PLMS maturity, which can in turn be used
to compare the PLMS maturity across industries. Scales were developed and tested,
and the framework was operationalized in the form of a questionnaire. This
research provides a detailed, component-level snapshot of the current levels of
PLMS deployment maturity with the perspective of service providers and users.
Table 5 Differences between PLMSSP and PLMSU – Wilcoxon matched pairs signed-rank test
(senior management) – grouping variable – organization type
Components – technology Z Asymp. sig. (2-tailed)
TR1 �1.543a 0.123
TR2 �1.552a 0.121
TR3 �0.730a 0.465
TR4 �0.877a 0.380
TR5 �0.574a 0.566
TR6 �1.066a 0.286
TR7 �1.634a 0.102
TR8 �1.006a 0.314
TR9 �0.425a 0.671
Components – human Z Asymp. sig. (2-tailed)
HR1 �0.837a 0.403
HR2 �0.960a 0.337
HR3 �0.061b 0.952
HR4 �1.508a 0.132
HR5 �1.150a 0.250
HR6 �0.552a 0.581
Components – knowledge and information Z Asymp. sig. (2-tailed)
KIR1 �0.180a 0.857
KIR2 �0.265a 0.791
KIR3 �0.997a 0.319
KIR4 �1.496a 0.135
KIR5 �0.604a 0.546
KIR6 �2.636a 0.008
KIR7 �1.715a 0.086
KIR8 �1.200a 0.230
KIR9 �1.496a 0.135
KIR10 �0.844a 0.399
KIR11 �2.309a 0.021
KIR12 �1.706a 0.088
Components – organizational Z Asymp. sig. (2-tailed)
OR1 �1.474a 0.140
OR2 �0.862a 0.389
OR3 �1.382a 0.167
OR4 �1.732a 0.083
OR5 �1.631a 0.103
OR6 �1.869a 0.062
OR7 �1.184a 0.237
OR8 �0.948a 0.343aBased on negative ranks
826 S.R. Venugopalan et al.

6.1 Limitations and Scope for Future Research
The total number of responses used to find the final outcomes is not sufficient to
generalize the results. To make an improved validation, many more organizations
need to be assessed. The measurement of outcome of PLM systems implementation
is not in the scope of this work. The mutual effects of enterprise application such as
ERP and PLM systems have also been kept out of scope. This research work can be
extended to other industries which are adopting PLM systems. Further analysis with
larger sample sizes will enable the study of industry-specific effects. With sufficient
data, the framework presented and discussed here can be extended to other enter-
prise systems such as ERP, SCM, and CRM systems.
Perspectives of Users and Service Providers on Deployment Maturity. . . 827

Appendix A Differences Between PLMSSP and PLMSU
S. no. Statistical tests
Components that show significant statistical
differences
RemarksDimension Components
1 Mann–Whitney
U test
Technology Deployment architecture,
product data and its
integration across its
lifecycle, and CAE
Accept the null
hypothesis
since there
are no
sufficient
reasons to
reject the null
hypothesis
Human Learning curve
Knowledge and
information
PLM tools, adaptation to
regulatory changes,
accessibility of documents,
best practices, and PLM
process
Organization PLM process maturity and
enterprise PLM roadmap
2. Wilcoxon
signed-rank
test
Technology IT – systems and infrastructure,
deployment architecture,
product data and its
integration across its
lifecycle, CAD, and CAE
Reject the null
hypothesis
since there
are significant
differences in
most of the
critical
components
across the
dimensions
Human Organizational team,
organizational culture,
learning curve, employees’
support to PLM, and
organizational structure and
design
Knowledge and
information
PLM tools, adaptation to
regulatory changes,
accessibility of documents,
best practices, design
standardization/
compliance, classification
and release, PLM process,
and knowledge mgmt.
Organization Organizational process, PLM
process maturity, enterprise
PLM roadmap, and PLM
implementation
3. Wilcoxon
signed-rank
test
Technology Nil. Accept the null
hypothesis.Human Nil.
Knowledge and
information
Best practices and PLM process
and application trained
employees
Organization Nil.
828 S.R. Venugopalan et al.

References
Balasusbramaniam K, Mahalingam G, Saji Joseph K, Shivananand MI (2003) Data migration for
PLM implementation – some challenges. In: Proceedings of PLM symposium, Bangalore,
India, 16–18 July 2003
Batenburg R, Versendaal J, Helmes RW (2005) The maturity of product lifecycle management in
Dutch organizations: a strategic alignment perspective. In: Proceedings of the International
Conference on product lifecycle management: emerging solutions and challenges for global
networked enterprise, Lyon, France. Inderscience, Geneva, pp 436–450
Christopher J (2003) Virtual product development. In: HP Asia VPD conference. http://h20427.
www2.hp.com/event/kr/ko/mcae2003/pdf/Track1_1.pdf
Malhotra NK (2004) Marketing research, 4th edn. Pearson Education India, New Delhi
Ramanathan K (1988) Technometric model – measurement of technology at the firm level.
International Journal of Science and Public Policy 15(4):230–249
Saaksvuori A, Immoneon A (2004) Product lifecycle management, 2nd edn. Springer, New York
Sharma A (2005) Collaborative product innovation: integrating elements of CPI via PLM
framework. Comput Aided Des 37(13):1425–1434
Stark J (2005) Product lifecycle management – 21st century paradigm for product realization.
Springer, London
Venugopalan SR, Ramakrishnan G, Ganesh LS, Prakash Sai L (2009) A framework for assessing
the maturity of product lifecycle management practices. In: Proceedings of PDMA India IV
annual international conference NPDC 2009: new product development – challenges in
meltdown times, IITM, Chennai, India, December 17–19 2009, pp 159–171
Walvekar R, Subbanarasaiah A (2004) Maturity assessment of PLM components: a positive step
towards an effective PLM implementation. In: Second National Conference on IT enabled
product development strategies, PSG Tech, Coimbatore, India, December 2004, pp 1–4
Perspectives of Users and Service Providers on Deployment Maturity. . . 829

Part 3.5
New Product and Services Development

ICT in New Product Development: Revulsion
to Revolution
Nityesh Bhatt and Abhinav Ved
1 Introduction
In 2011, Mahindra group entered the bike segment after success in scooter segment.
Honda has launched 42 bikes in different categories like sports, adventure, motor
scooter, etc., all over the world (Kanan 2010). In 2010, 60 bikes were launched in
India, and 30 were about to get launched by companies like Suzuki, TVS, BMW,
Bajaj, Honda, Yamaha, etc. (New Bikes in India 2010; Shravan 2009). In addition
to rising customer demands and increased competition, information and communi-
cation technology (ICT) revolution can also be attributed for this scenario. ICT
plays an important role in ensuring speed and quality at every stage of new product
development (NPD). In today’s fast-paced, competitive world, NPD with flexibility
and innovation is essential for success. New products can be seen in two ways.
In conventional way, new product means risk, huge investment, failure or prestige
issue. But in modern era, new product means opportunity, innovation, improve-
ment, profits and success. For example, 3 M has realised 25% of its sales from
products developed in the last 5 years (Takeuchi and Nonaka 1986). With software
packages like ERP and PLM, ICT not only helps in integration and information
exchange but also helps in meeting deadlines and making projects profitable.
2 Literature Review
IT forNPD is necessary condition but not sufficient for potential benefits (Durmusoglu
et al. 2006). New products provide increased sales, profits and competitive strength for
most organisations (Sivadas and Dwyer 2000). NPD involves successive steps from
N. Bhatt (*) • A. Ved
Institute of Management, Nirma University, Ahmedabad, India
e-mail: [email protected]; [email protected]
Department of Management Studies, Indian Institute of Science, Bangalore,
Driving the Economy through Innovation and Entrepreneurship,DOI 10.1007/978-81-322-0746-7_68, # Springer India 2013
833

idea generation to final launch of product to the market. The process of NPD
includes the steps like idea generation, idea screening, concept development and
testing, business analysis, beta testing and market testing, technical implementation
and commercialization (Venture Navigator 2007). Internet and related technologies
can add significant value during each stage of NPD (Howe et al. 2000).
NPD has long been recognised as one of the corporate core functions (Huang
et al. 2004). During the past 25 years, NPD has increasingly been recognised as a
critical factor in ensuring continued existence of firms (Biemans 2003). A study of
more than 700 of the Fortune 1,000 companies indicates that new products provide
approximately one-third of their profits (Booz, Allen and Hamilton 1982). The rate
of market and technological changes has accelerated in the past years, and this
turbulent environment requires new methods and techniques to bring successful
new products to the marketplace (Goodwin 2009). Particularly for companies with
short product life cycles, it is important to quickly and safely develop new products
and new product platforms that fulfil reasonable demands on quality, performance
and cost (Ottosson 2004). This global commitment to innovation can be seen from
the growth of worldwide R&D spending from an estimated $525 billion in 1996 to
approximately $1.1 trillion in 2007 (National Science 2007).
Microsoft’s Chief Information Officer, Stuart Scott, notes that his firm now spends
45% of its IT budget on supporting NPD efforts, a significant increase from the
30% in the past (Murphy 2007). Durmusoglu (2009) argues that IT infrastructure
is rare, imperfectly imitable and imperfectly mobile and thereby constitutes a capa-
bility of the firm that can lead to efficiencies in business processes. Three moderating
factors, intensity of competition, technological turbulence and market turbulence,
were posited to affect the strength of the relationship between a firm’s IT infrastruc-
ture capability and the efficiency of its NPD process (Durmusoglu 2009). Higher use
of IT tools in NPD was found in those companies where the importance of product or
project as well as project risk was more to the firm (Barczak et al. 2007). Haverila and
Ashill (2011) describe that IT helps in NPD process by gathering and disseminating
product and market information (Haverila and Ashill 2011). With the examples of
Xerox and Toyota’s NPD process, Jusco (2010) describes the use of information
technology to bridge the knowledge gap among product development team members
and utilise knowledge in a way to develop products faster (Jusco 2010).
Based on literature studied, authors have created a framework shown in Fig. 1
to discuss the role of ICT in NPD. It has three broad components. First component
covers the drivers for deployment of ICT tools in NPD. Second component deals
with various ICT tools, while the last component highlights its impact. Drivers for
IT deployment in NPD are easy to understand. With higher income and education,
aspiration level of people is touching new heights. There is a cut-throat competition
in every market due to privatisation and globalisation. Widespread proliferation of
various kinds of media has made the customers informed about various products and
services. All these factors necessitate effective utilisation of information technology
resources in the most efficient and innovative way.
834 N. Bhatt and A. Ved

3 Effective Usage of Information Technology
All above-mentioned advantages for NPD can be achieved through effective
application of ICT tools like simulation design CAD/CAM, 3D modelling, virtual
team, knowledge management, data mining/warehousing, artificial intelligence and
software tools like product life cycle management (PLM). These applications
independently and/or in combination boost NPD process.
3.1 Simulation Design and Modelling
Simulation means creating virtual environment and testing product virtually in the
environment required. It helps in product testing without actually building the
design, thus results in cost saving. Another advantage is level of details one can
get from simulation. Delphi automotive is working on noise comfort for passengers
in cars and pedestrians around the vehicles with the help of simulation. Simulation
reduces development time and more efficient design of car (Delphi 2011). Software
available with Siemens for plant simulation provides benefits like 3–6% savings in
initial investment, increases existing system productivity by 15–20%, reduces new
system costs by 5–20%, optimises resource consumption and re-use and reduces
inventories by 20–60% and throughput time by 20–60% (Plant Simulation 2011).
Automation and CAD software have helped in a great way to manufacturing and
construction industry. Vonderembse et al. (1997) conducted in-depth, on-site inter-
views with executives from four companies to understand how these organisations
cope with automation, integration and manufacturing system performance. The
earthmoving company found substantial improvement in efficiency, low cost and
shorter delivery time. For electric generator company, ICT not only enhanced
efficiency but also helped in reduction of order delivery time because part drawings
Fig. 1 Drivers of ICT in NPD and its impact
ICT in New Product Development: Revulsion to Revolution 835

could be easily and quickly retrieved; design changes could be incorporated quickly
with CAD and transferred to shop floor (Vonderembse et al. 1997).
Information technology is a platform for concurrent engineering, well known
for the construction industry (Salomone 1996). It improves management of engi-
neering process through better control of data, engineering activities, changes
and product configurations. IT has enabled multinational firms to work 24 � 7
and for 365 days, operating from different time horizons. It is estimated that con-
current engineering can save around 30–40% reduction in project time and 60–80%
reduction in design changes after release (Stark 1992, 1998). Engineering depart-
ment at L&T is using the Intergraph 3D plant design system (PDS) software for
developing a 3-dimensional model of the project encompassing all related aspects
including the layout, piping, mechanical, electrical, instrumentation and civil engi-
neering disciplines. Some of the direct benefits derived from this system include
auto-extraction of piping isometrics from the 3D CAD models, auto-extraction of
structural fabrication drawings through softwares such as dX-Steel, and checking of
interference between various elements of piping, equipment, structural, instrumen-
tation, etc., through the simulated ‘walk-through’. It has helped in not just reducing
errors but increased prestige of the company too (Larsen and Toubro 2010).
3.2 Knowledge Management (KM)
Knowledge management is the process of generating, documenting and dissemi-
nating knowledge among its employees. As the tacit knowledge is converted
into explicit knowledge in KM, employee attrition does not affect the organisations
too much. Employee learns from the past experiences occurred from similar pro-
jects; thus, KM helps in increasing productivity of employees in the organisation
(Bharadwaj 2000). Motorola capitalised on its portable pager business to develop
portable cellular telephones. Corning used its expertise in glass technology to
develop optical fibres (Ozer 2000). Dow Chemical—by focusing on the active
management of its patent portfolio—has generated over $125 million in revenues
from licensing and other ways of exploiting their intangible assets (Knowledge
Management 2010).
BP business managers attributed around $260 million of added value by using
this approach. A practical example of this has been in the cost reduction in the
construction of European retail sites. At the beginning of 1998, a challenge was set
of reducing the build costs of retail sites in Europe by 10%. A joint venture between
BP and Bovis was responsible for the management of these activities in Europe.
The Alliance invited the BP KM Team to help them achieve this outcome. Finally,
company realised savings of $74 million in 1998 giving them competitive advan-
tage in the mature European marketplace. This knowledge is now also being
leveraged on a global scale by project engineers in Venezuela, China, Poland and
Japan (KM and British Petroleum 2011).
836 N. Bhatt and A. Ved

3.3 Virtual Team
A virtual team can be defined as a group of interdependent people and sub-
teams who frequently interact through ICT channels and other means to achieve a
common goal. Virtual teams offer advantages like reducing relocation and travel
time and cost. It helps to utilise the best talent irrespective of geographical spread.
It gives higher freedom and autonomy to individual member of the team and thus
improves job satisfaction level and commitment of the employees. Many research
and development (R&D) organisations currently use a specialised knowledge portal
for research collaboration and knowledge management (Durmusoglu et al. 2006).
Furthermore, it can allow people to telecommute. Decathlon Systems, a software
vendor, adopted the concept of telecommuting to deal with cross-platform support,
training and complex customer issues for its new software. The process increased
productivity, motivated people and reduced overhead costs asmuch as 30% (Coleman
1997).
3.4 Data Warehousing
Data warehousing is the process of storing information and using it for various
purposes. Data mining is required to extract hidden pattern and trends from huge
chunk of data. Today, managers demand more information from the existing data
than in the past. Many companies establish their own data centres, while others host
its crucial data on Infrastructure as a Service (IAAS) mode. United Arrows, one
of Japan’s leading retailers, used SAP BusinessObjects XI to improve its merch-
andising operations. The new software allowed the company to extract data needed
to perform analyses and enables better decision making through real-time under-
standing of key performance indicators. In addition, other benefit was dramatic
reduction in data analysis time (reduced by about 1,300 h per year) (United Arrow
2011). UNE, a telecommunications company, leveraged SAP BusinessObjects Profit-
ability and Cost Management data warehousing tool. It allowed UNE to analyse the
costingmodel of the company, which led to the decision of using time-driven activity-
based costing (TDABC), a way of measuring and linking a company’s costs with the
goods and services it offers (UNE 2011).
3.5 Artificial Intelligence
Intelligence is the ability to think, imagine, create, memorise, understand, recognise
patterns, make choices, adapt to change and learn from experience. The Robotic
User Interface project is designed to create better human-machine interfaces,
ICT in New Product Development: Revulsion to Revolution 837

including robots and computer avatars that show more emotion. AI can be used to
solve various kinds of problems like deduction, reasoning, problem solving, knowl-
edge representation, planning, learning, natural language processing, motion and
manipulation, perception, social intelligence, creativity and general intelligence.
Various applications are developed with the AI in the field of finance, weather
forecast, aviation, heavy industry and space research (Plant Simulation 2011).
Gaming industry is using AI concept very intensively. Various games like ‘Medal
of Honor’ and ‘Counter Strike’ show soldiers fighting like real human being. These
games reflect all kinds of movements which is possible with real human being on
the computer screen (Unbreakable Virtual Toys 2010).
3.6 PLM/NPD Software
Product life cycle management (PLM) software allows companies to manage the
entire life cycle of a product efficiently and cost-effectively, from ideation, design
and manufacturing to service and disposal. Softwares like computer-aided design
(CAD), computer-aided manufacturing (CAM), computer-aided engineering (CAE)
and product data management (PDM) also perform this job partially. Companies
like Siemens and SAP are leading PLM vendors. PLM software helps in making
informed decisions at every stage of product life cycle. Procter & Gamble (P&G),
one of the world’s largest consumer products companies, with approximately 300
brands in more than 160 countries is taking advantage of the Tecnomatix plant
design and optimization solution from Siemens to minimise production losses and
improve the efficiency of manufacturing operations (Success 2011).
Unilever is another example of the effective use of PLM software to fight with
above-given challenges. For the past 10 years, Unilever has partnered with Siemens
to create a global specification management system that serves as the first major
component of its PLM system supporting its product innovation process. Software
helped it in specification management for improved raw material procurement
efficiency, knowledge re-use and improved top and bottom line growth (Cast
Study 2011).
3.7 Project Management
Project management is the discipline of planning, organising, securing and manag-
ing resources to achieve specific goals. B/E Aerospace, Inc., is a leading global
manufacturer of aircraft passenger cabin interior products for the commercial and
business jet aircraft markets as well as a leading global distributor of aerospace
fasteners. Its Flight Structures division is focused on aircraft interior reconfig-
urations and integrated programme management. It faced challenge to efficiently
integrate data from diverse sources which would help to complete aircraft interior
838 N. Bhatt and A. Ved

reconfigurations. It replaced a series of disparate project management systems with
Oracle’s Primavera P6 Enterprise Project Portfolio Management, which helped to
develop integrated programme schedules to plan and control deliverables on com-
plex integration and original equipment manufacturer programmes. It leveraged
earned value management (EVM) metrics to pinpoint and correct deficiencies in
resources or performance on a weekly basis. It migrated 80% of resource manage-
ment into Oracle Primavera P6, with future plans to include 100%, further improv-
ing efficiency (Oracle 2010).
ICT played very important role in development of Boeing 777 development.
Boeing 777 team used IT in three major parts: (1) during process of design and
development, (2) integration with final product and (3) for testing and training for
aircraft. Through IT-enabled integration of computers, telecommunication systems,
parts tracking system, robotics and material handling systems, it successfully
created globally interconnected network which helped in sharing of data among the
team all over the world (Sweetman 1996). It could work with virtual mock-up instead
of physical mock-up, thus eliminated 65% of changes due to errors. Training modules
designed based on computers helped in reducing training time to 47 days from
75 days. It helped them in quick information exchange regarding design data and
changes between various suppliers and vendors. Robotic tools were designed to
receive the data and respond to instructions with the precision of thousandth of an
inch (Snyder and Sankar 1998).
Panasonic, a leading electronics giant, had large amount of different sources of
data. The company was facing problem of data inconsistency, duplication and
incompleteness. To launch a new product, it required data like photographs, product
specifications, descriptions, manuals, pricing data and point of sale information
to suit the needs of each country and region, which required considerable time.
It created a centralised databank using master data management software (MDM)
from IBM which sent information to all employees who needed it with uniformity
(Research 2011). It helped in data consolidation and systemising the business
processes related to data in Europe. Within one and a half years of implementation,
Panasonic Europe was getting products to market faster and spending 50% less time
creating and maintaining product information. Time to market for a product was
reduced from 5–6 months to 1–2 months. It is estimated that Panasonic Europe
improved its efficiency by a factor of 5 and anticipates saving a million euros a year
while increasing sales by 3.5% (Duff 2002).
4 Impact of ICT Deployment in NPD
Technology affects NPD by shortening development time, increasing productivity,
improving quality, increasing collaboration and communication, reducing cost and
improving decision making. These aspects are discussed in following subsections.
ICT in New Product Development: Revulsion to Revolution 839
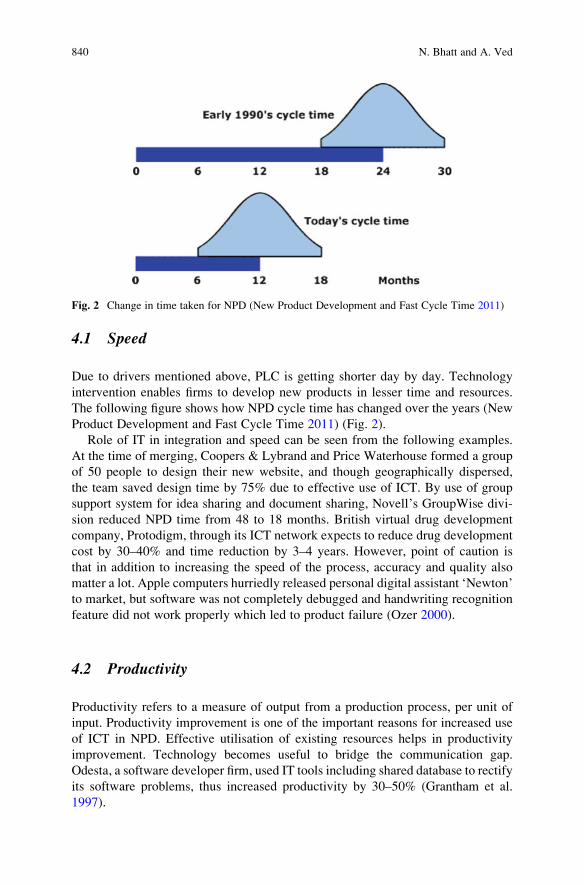
4.1 Speed
Due to drivers mentioned above, PLC is getting shorter day by day. Technology
intervention enables firms to develop new products in lesser time and resources.
The following figure shows how NPD cycle time has changed over the years (New
Product Development and Fast Cycle Time 2011) (Fig. 2).
Role of IT in integration and speed can be seen from the following examples.
At the time of merging, Coopers & Lybrand and Price Waterhouse formed a group
of 50 people to design their new website, and though geographically dispersed,
the team saved design time by 75% due to effective use of ICT. By use of group
support system for idea sharing and document sharing, Novell’s GroupWise divi-
sion reduced NPD time from 48 to 18 months. British virtual drug development
company, Protodigm, through its ICT network expects to reduce drug development
cost by 30–40% and time reduction by 3–4 years. However, point of caution is
that in addition to increasing the speed of the process, accuracy and quality also
matter a lot. Apple computers hurriedly released personal digital assistant ‘Newton’
to market, but software was not completely debugged and handwriting recognition
feature did not work properly which led to product failure (Ozer 2000).
4.2 Productivity
Productivity refers to a measure of output from a production process, per unit of
input. Productivity improvement is one of the important reasons for increased use
of ICT in NPD. Effective utilisation of existing resources helps in productivity
improvement. Technology becomes useful to bridge the communication gap.
Odesta, a software developer firm, used IT tools including shared database to rectify
its software problems, thus increased productivity by 30–50% (Grantham et al.
1997).
Fig. 2 Change in time taken for NPD (New Product Development and Fast Cycle Time 2011)
840 N. Bhatt and A. Ved

4.3 Quality
Investment in ICT leads to improved product as well as service quality. In healthcare
industry, ICT helps in improving diagnosis accuracy and reliability. British Petro-
leum has developed intense communication network throughout the world to get real-
time feedback from the customers. This results in improvement of its products
(Newing 1998). Qualcomm provides unique solution with the help of latest ICT
application called ‘2 net connect’. Asthma patients who are not using smartphones or
not likely to adopt them are the beneficiaries. It provides unique cloud-based service
to provide seamless connectivity between medical equipments. Medication sensors
are placed in equipments such as asthma pumps and inhalers, and data are recorded
on real-time basis which not only helps in tracking patient’s history but also assists in
clinical trials for new drugs (Qualcomm 2012).
4.4 Communication and Collaboration
Collaboration and communication are the prerequisite for NPD. Increasing
instances of cross-functional and cross-cultural teams have made it essential to
have an excellent communication channel. ICT has enabled companies like Levi’s
to have design unit in the USA and manufacturing at locations like India. Consult-
ing companies like PWC and Nielsen whose clients have wider geographical spread
extensively use IT to solve their problems. British Petroleum uses a computer-based
communication system named as ‘digital nervous system’ for effective communi-
cation among its dealers, project team and oil discovery teams. It helped in sharing
information and increased communication capability and saved cost on making
decisions about extending chemical plants and developing new oil fields and shut-
down time for refinery. Around $25b is the expected savings from the same
(Newing 1998). TI (Texas Instruments) also reduced the communication cost
with the help of IT by 33% (Cole-Gomolski 1997).
Owens Corning, an American building and construction solution provider, faced
challenge of integration between various departments. ERP system installation was
decided as an integration mechanism, connecting diverse departments through
shared database and common compatible software module. Successful implemen-
tation of ERP in turn led to 50% increase in inventory turnover and 20% reduction
in administrative costs and millions of dollars in logistics savings (Hammer and
Steven 1999).
4.5 Improved Decision Making
Availability of better and real-time information enables scientific decisions. IT also
provides an anonymous group discussion environment that can reduce different
ICT in New Product Development: Revulsion to Revolution 841

types of biases and promotes increased participation. Duke Energy, a well-known
power company in United States, revamped the way it worked with its building
contractor customers. In 1996, it was able to meet only 30–50% of its commitments
(e.g. laying down cables by promised time) to its customers. New system helped
them with detailed information about the man power availability and commitments
and helped them to negotiate commitment dates with contractors. They could
achieve 98% of commitment fulfilment after implementation of the new system
(Hammer and Steven 1999).
4.6 Cost Reduction
Cost reduction can be achieved by various ways with the help of ICT. Software
platforms like Lotus Notes not only helps in improving communication and
decision-making quality but also results in cost reduction. Texas Instruments’
calculator business unit was in trouble in early 1990s. It was facing problem due
to long cycle time and thus losing market share. New calculators were developed by
the team of people from engineering, marketing and other departments. IT systems
were established to communicate formal presentations, writings and information
and informal mails among the team members. The effect of such steps was seen
by successful introduction of new products by IT. The time taken to launch a new
product dropped by 50%, break-even point reduced as much as 80% and the unit
became market leader in that category (Hammer and Steven 1999).
It is a time of great expectation in the healthcare industry as organisations stand
on the cusp of new discoveries that will advance the treatment of serious and
chronic disease as well as open new commercial avenues for biotech and pharma-
ceutical companies. But the cost pressure is also increasing on companies which
require them to speed up the NPD process. According to industry estimates, around
US $1b is required for NPD in this sector (Oracle 2009). ICT can enhance efficiency
and quality of clinical data with electronic data capture (EDC). It can help in
streamline analysis, reporting and submission with integration of all clinical and
non-clinical data. It also reduces risk via process validation and compliance and
improves product quality with applications that automate compliance requirements.
Estimates that are approximately half of all trials now employ EDC, and 32% of
sites use Internet-based EDC, with spending on EDC solutions set to exceed $3
billion by 2011—a 15% growth rate from 2007. It implies that companies having
implemented such system are capable to run more cost-effective and complex trials.
Companies always try to find a compound as early as possible and either commit to
or eliminate it. One way to facilitate identification is by using adaptive clinical trial
designs, where the database is periodically ‘soft-locked’ and sponsor can simulate
a final analysis to see whether results are trending in the right way. In some cases,
this happens with every patient and every visit. With products like RDC (Oracle),
it is possible to visualise safety profiles early on and make decisions about the
progress of the trial (Grantham et al. 1997).
842 N. Bhatt and A. Ved

Dana-Farber Cancer Institute, one of the leading cancer research and care centres in
the United States, is using Oracle Healthcare Transaction Base and Oracle Fusion
Middleware components as the foundation for its new translational research infra-
structure. The new infrastructure is designed to maximise the value of clinical and
research data and help improve disease understanding and patient care. To design new
studies and address complex questions, Dana-Farber researchers need to aggregate
clinical, sample and genomic data from within and beyond the organisation’s coll-
ections. The new data infrastructure helps researchers investigate clinical data more
thoroughly, make complex queries and more complete data analysis and improve
experiment design (Oracle 2009).
With the help of ITI quality function deployment tools and services, one of the
world’s leading tractor manufacturers reduced two cycles of prototype, and due to
improved process efficiency, development costs were cut by 30%, and the tractor
was introduced in half the time of conventional development processes. It also led
to increase in 25% of market share. A leader in home appliances industry could
achieve 77% reduction to outer tube weight and 30 % cost reduction, and it also
achieved 30% more product reliability with the help of such tools (ITI 2010).
5 Conclusion
Large number of examples mentioned above from various industries across the
globe clearly shows the advantages of leveraging ICT for all the stakeholders. With
easy availability of these technologies and large number of successful (as well as
failure) case studies in the public domain, even medium- and small-scale industries
(SMEs) have also started adopting them to achieve their strategic goals. In present
dynamic era, mere adoption of ICT tools cannot provide competitive advantage, but
its non-adoption will surely lead to competitive disadvantage. Further, the early
adopters also need to continuously innovate to stay ahead of their competitors.
References
Barczak G, Sultan F, Hultink EJ (2007) Determinants of IT usage and new product performance.
J Prod Innov Manag 24(6):600–615
Bharadwaj A (2000) A resource-based perspective on information technology capability and firm
performance: an empirical investigation. MIS Q 24(1):169–96
Biemans W (2003) A picture paints a thousand numbers: a critical look at b2b product develop-
ment research. Bus Ind Market 18(6/7):514–528
Booz, Allen, and Hamilton (1982) New product development in the 1980s. Booz-Allen &
Hamilton, New York
Cast Study (2011) Retrieved 20 June 2011, from Siemens: http://www.plm.automation.siemens.
com/en_us/about_us/success/case_study.cfm?
Component¼64908&ComponentTemplate¼1481
ICT in New Product Development: Revulsion to Revolution 843

Cole-Gomolski B (1997) Early adopters say ‘net messaging slashes mail costs’. Computerworld
31(34):1–12
Coleman D (1997) Groupware-the changing environment. In: Groupware: collaborative strategies
for corporate LANs and intranets. Prentice Hall, Upper Saddle River, pp 1–38
Delphi (2011) Retrieved 21 June 2011, from Motoring dreams: http://motoringdreams.blogspot.
com/2011/05/delphi-to-present-simulation-method.html
Duff M (2002) Case study: Panasonic searches the Master data for a single version of truth. CIOInsight. Retrieved on 21 Sept 2011. From http://www.cioinsight.com/c/a/Case-Studies/Case-
Study-Panasonic-Searches-the-Master-Data-for-a-Single-Version-of-Truth/
Durmusoglu S (2009) The role of top management team’s information technology (IT) infrastruc-
ture view on new product development. Euro J Innov 12(3):364–385
Durmusoglu S, Calantone R, Sambamurthy V (2006) Is more information technology better for
new product development? J Prod Brand Manag 15(7):435–441
Goodwin R (2009) State of the science—the new remote data capture paradigm. Retrieved 21 Sept
2011, from Oracle: http://www.oracle.com/us/industries/040728.pdf
Grantham C, Carr J, Coleman D (1997) Groupware in hardware and software development
environments. Groupware: Collaborative Strategies for Corporate LANs and Intranets,
pp 629–643
Hammer M, Steven S (1999) How process enterprise really work. Howard Bus Rev 7(6):108–118
Haverila M, Ashill N (2011) Market intelligence and NPD success: a study of technology intensive
companies in Finland. Market Intel Plan 29(5):556–576
Howe V, Mathieu RG, Parker J (2000) Supporting new product development with the internet. Ind
Manage Data Syst 100(6):277–284
Huang X, Soutar GN, Brown A (2004) Measuring new product success: an empirical investigation
of Australian SMEs. Ind Mark Manag 33:117–123
ITI (2010) Case studies. Retrieved 27 Sept 2011, from ITI: http://www.iti-global.com/
CaseStudies/default.htm
Jusco J (2010) New models for product development. Industry Week 30–34Kanan. 2010. Mahindra to launch motorcycles by 2011. Retrieved 15 June 2011, from Bike
advice: http://bikeadvice.in/mahindra-launch-motorcycles-2011/
KM and British Petroleum (2011) Retrieved 20 June 2011, from Saic: http://www.saic.com/km/
who.html
Knowledge Management (2010) Retrieved 18 June 2011, from Skyrme: http://www.skyrme.com/
insights/22km.htm
Larsen and Toubro (2010) Retrieved 9 June 2011, from Epcworld Wide: http://www.
epcworldwide.com/capabilities/capabilities_technology.htm
Murphy C (2007) Microsoft’s CIO, COO discuss consolidating the company’s IT. Information
Week, Retrieved on17 Sept, from Information Week: www.informationweek.com/story/
showArticle.jhtml?articleID¼201806860
National Science Foundation (2007) Research and development Bolsters US Economic Growth.
Retrieved on 22 Sept 2011. from NSF: www.nsf.gov/news/news_summ.jsp?cntn_id110139
New Bikes in India (2010) Retrieved 15 June 2011, from Autos maxabout: http://autos.maxabout.
com/bikes/new-bikes-india
New Product Development and Fast Cycle Time (2011) Retrieved 7 June 2011, from new product
dynamics: http://www.newproductdynamics.com/
Newing R (1998) BP Introduces its $250m Digital Nervous System. Financial Times (IT Supple-
ment) 10–11
Oracle (2009) Oracle customer case study. Retrieved 16 Sept 2011, from Oracle: http://www.
oracle.com/us/industries/life-sciences/045934.pdf
Oracle (2010) Solutions. Retrieved 16 Sept 2011, from Oracle: www.oracle.com/us/solutions/be-
aerospace-primavera-150762.pdf
Ottosson S (2004) Dynamic product development – DPD. Technovation 24(3):207–217
844 N. Bhatt and A. Ved

Ozer M (2000) Information technology and new product development: opportunities and pitfalls.
Ind Mark Manag 29(5):387–396
Plant Simulation (2011) Retrieved 20 June 2011, from Siemens: http://www.plm.automation.
siemens.com/en_us/products/tecnomatix/plant_design/plant_simulation.shtml
Qualcomm (2012) Retrieved 20 Apr 2011, from Qualcomm: http://www.qualcommlife.com/sites/
all/themes/qualcomm/files/CaseStudy_Asthmapolis.pdf
Research (2011) Retrieved 20 June 2011, from IBM: http://domino.watson.ibm.com/comm/
research.nsf/pages/r.ai.html
Salomone T (1996) What every engineer should know about concurrent engineering. Manufact
Eng 75(3):110
Shravan (2009) Motor cycle news. Retrieved 15 June 2011, from India travel: http://www.
bcmtouring.com/forum/motorcycle-news-f29/list-bikes-coming-india-2010-a-t17554/
Sivadas E, Dwyer F (2000) An examination of organizational factors influencing new product
success in internal and alliance-based processes. J Market 64(1):31–50
Snyder CR, Sankar C (1998) Use of information technologies in the process of building the boeing
777. J Inform Technol Manage IX:3–43
Stark J (1992) Engineering information management systems: beyond CAD/CAM to concurrent
engineering support. Van Nostrand Reinhold, New York
Stark J (1998) Concurrent engineering. Retrieved 9 June 2011, from John stark: http://www.
johnstark.com/fwcce.html
Success (2011) Retrieved 20 June 2011, from Siemens: http://www.plm.automation.siemens.com/
en_us/about_us/success/index.shtml
Sweetman B (1996) As smooth as silk. Air Transp World 33(8):71–78
Takeuchi H, Nonaka I (1986) The new product development game. Harv Bus Rev 64(1):137–146
Unbreakable Virtual Toys (2010) Retrieved 22 June 2011, from Aigamedev: http://aigamedev.
com/premium/discussion/unbreakable-virtual-toys/
UNE (2011) Retrieved 20 June 2011, from SAP: http://www.sap.com/index.epx#http://www.sap.
com/asset/index.epx?id¼9571957a-af21-4386-883d-95dca9f2eb17&name¼UNE
United Arrow (2011) Retrieved 20 June 2011, from SAP: http://www.sap.com/index.epx#/asset/
index.epx?id¼8dc0ca5a-c316-4542-9f91-d4e0a784439c&name¼Venture navigator (2007) Product development stages. Retrieved 20 Aug 2011, from Venture
navigator: http://www.venturenavigator.co.uk/content/294
Vonderembse M, Raghunathan T, Rao S (1997) A post-industrial paradigm: to integrate and
automate manufacturing. Int J Prod Res 35:2579–2599
ICT in New Product Development: Revulsion to Revolution 845
A Study of Structural Antecedents of Product
Development Teams’ Flexibility on Small
and Large Teams
K. Srikanth and K.B. Akhilesh
1 Introduction
Product Development (PD) organizations operate in a dynamic environment. The
ever-expanding and competitive marketplace, increasing consumer demands,
shorter product life-cycles and rapidly changing technologies are some of the
reasons contributing to the volatility in business environment. Change and uncer-
tainty have become prevalent, and it is essential for the organizations to device
mechanisms to deal with these challenges effectively and derive competitive
advantage out of it. Many strategies have been proposed to overcome the challenges
of dynamic environment. Some of the prominent ones are mass customization,
lean enterprises and agile organizations. The foundation of all these strategies lies
in building organizational flexibility. The way to build flexibility into the organiza-
tion is to build flexibility into various entities of the organization. Teams represent
one such important entity. Building flexibility into PD teams would make them more
responsive to market and customer demands, thereby making them more effective to
cope with dynamic environment increasing.
2 Product Development
Product Development (PD), essentially, is a process of transforming an idea to a
product (Ulrich and Eppinger 2004). It consists of sequence of steps ranging from
identification of market opportunity to production and sale and delivery of the
product (Ulrich and Eppinger 2004). In its simplest form, a PD process can be
K. Srikanth (*) • K.B. Akhilesh
Department of Management Studies, Indian Institute of Science,
Bangalore 560012, India
e-mail: [email protected]; [email protected]
Department of Management Studies, Indian Institute of Science, Bangalore,
Driving the Economy through Innovation and Entrepreneurship,DOI 10.1007/978-81-322-0746-7_69, # Springer India 2013
847

visualized to be made up of three phases – early, mid- and late phases (Frishammar
and Ylinenpaa 2007). The ‘early phase’ includes activities ranging from identifica-
tion of product opportunity to building product concepts. This phase is followed by
‘mid-phase’, wherein the concepts are developed into detailed designs leading to
development, testing and validating the product. The ‘late phase’ involves the com-
mercialization and launch activities. For this work, we have focused on the ‘mid-
phase’ and shall be henceforth termed as ‘design and development phase’.
In a dynamic environment, the applicability of a traditional approach becomes
untenable. A traditional approach of PD involves clear-cut product definition, known
as ‘concept freeze’, followed by execution. This approach would be suitable when the
environment is fairly stable, and it is possible to accurately anticipate the required
information (Bhattacharya et al. 1998; Biazzo 2009). However, in case of dynamic
environment, anticipation is difficult. In such cases, it is recommended tomake the PD
process more ‘reactive’, i.e., build the ability to rapidly and efficiently introduce
modifications till late in the project (Verganti 1999). This kind of approach requires
PD teams to quickly and nimbly react to changes without sacrificing their efficiency.
There are empirical evidences to suggest that the approach of flexibility in PD was
beneficial for organizations to reduce the cost of changes, thereby minimizing the
impact of forecasting errors (Thomke and Reinertsen 1998; Thomke 1997).
3 Flexibility
Flexibility, in a broad sense, is defined as the ‘ability to adapt’ (Golden and Powell
2000). This leads us to a question of adapt to what. The study of literature reveals
that flexibility is about adapting to change (Evans 1991; Das and Elango 1995;
Golden and Powell 2000; Beach et al. 2000) and uncertainty (Adner and Levinthal
2004; Olsson andMagnussen 2007; Sethi and Sethi 1990; Golden and Powell 2000).
The association of flexibility with change is more apparent than with uncertainty.
This is evident in the way flexibility is conceptualized. For example, in conceptual
framework proposed by Golden and Powell (2000), flexibility is seen as means to
deal with foreseen and unforeseen changes. The unforeseen changes can be under-
stood to refer to uncertainty. In this paper, we consider both change and uncertainty
aspects explicitly and hence define flexibility as the ‘ability to deal with change anduncertainty’.
It is to be noted that change and uncertainty represent two different scenarios an
entity (say a team or organization) has to deal with, although there is a possibility of
one causing the other (Smith 2007). Uncertainty represents a condition in which
there is an absence or lack of complete information. Although the definition of
flexibility sounds very simplistic, researchers have always found flexibility to be a
‘hard-to-capture’ construct (Sethi and Sethi 1990). Its polymorphous and multidi-
mensional nature makes it domain and context specific. In this paper, the concept
of flexibility is studied in the context of teams involved in PD activity, termed as PD
team flexibility. This research contributes to the ongoing study on team flexibility,
which is in early developmental stage Li et al. (2010).
848 K. Srikanth and K.B. Akhilesh

4 PD Team Flexibility
According to Cohen and Bailey (1997), a team refers to ‘A collection of individuals
who are interdependent in their tasks, who share responsibility for outcomes, who
see themselves and who are seen by others as a social entity embedded in one or
more larger social systems and who manage their relationships across organiza-
tional boundaries’. A PD team is essentially a cross-functional team, formed with
personnel from different functional departments to support the design, development
and production of a new product.
The context of teams in PD organizations is an important one to understand. In a
changing and dynamic environment, PD activity has increasingly become team
driven to achieve higher performance. Organizations set up cross-functional teams
to react quickly and effectively. Their functional diversity is presumed to provide
the advantage of dealing with any challenges effectively, thus resulting in improved
performance. Building the capability to deal with change and uncertainty i.e.
flexibility is an important aspect of building successful PD teams.
4.1 Definition
PD team flexibility is defined as the ‘Ability of a product development team tohandle socio-technical changes and deal with uncertainty during course of PD bymeans of appropriate resources’. This definition is more comprehensive from the
earlier ones proposed by scholars (Mccomb et al. 2007; Lee and Xia 2005). It is
antecedent-based, similar to definition proposed by Mccomb et al. (2007), with a
focus on the resources of the team that create flexibility. Further, the scope of
changes is socio-technical as in Lee and Xia (2005) and also includes the uncer-
tainty aspects experienced by the team, which so far was not considered explicitly
in earlier studies.
4.2 Conceptual Framework
Based on the findings from the literature related to flexibility and team flexibility,
PD team flexibility was conceptualized to include two major capabilities: (1) ability
to cope with changes, i.e. change management, and (2) ability to deal with uncer-
tainties, i.e. uncertainty management. The change and uncertainty a team has to
deal is context dependent (say the stage of PD, type of industry, etc.).To cope with
these changes and uncertainty, the PD team makes use of available resources. The
resource-based perspective suggests that a team can be visualized as a bundle of
resources (such as people, technology and structure), each with its own enabling
impact on increasing flexibility. Ultimately, team flexibility has an impact on team
performance. It affects the efficiency and effectiveness of the teams. A point that
A Study of Structural Antecedents of Product Development Teams. . . 849

should be noted is the relationship of team flexibility on performance is often depen-
dent on other variables such as product complexity and team size, thus making the
relationship situation dependent.
5 Structural Resources
There are many resources that help in building flexibility. Humans with their skills,
attitude and behaviour are amongst the most flexible resources (Aggarwal 1995).
The other resources include technology and organization structure. Drawing on the
resource-based view, we can visualize teams to be combination of resources, each
with their unique ability towards contributing to competitive advantage. Teams’
structure can be considered as a resource that contributes towards team flexibility.
Structure in organization design literature is viewed as a means by which organi-
zations achieve desired objectives and performance levels through allocation of
responsibilities and exercise of control over resources. It plays a central role in the
way formal reporting relationships are defined; individuals are grouped together
and in establishing mechanisms for communication, control and coordination
amongst and between units of the organization (Daft 2007). Structural mechanisms
represent the means through which an organization gets the work done (Tatikonda
and Rosenthal 2000).
For this study, we identified structural practices popularly used by PD teams in
managing change and uncertainty. The degree of implementation of these practices
has an impact on teams’ ability to deal with change and uncertainty. They are
(1) Participative Decision Making (PDM), (2) Delayed Decision Making (DDM),
(3) Task Autonomy (TA), (4) Formalization (FRM) and (5) Review Procedure
Strictness (RPS). Although these practices do not represent the complete set of
activities, they do represent an important subset. A high degree of PDM and higher
DDM result in increasing the information flow (Lowin 1968; Lam et al. 2002;
Bordia et al. 2004) and duration of flow (Olsson 2006; Smith 2007), respectively,
thus reducing uncertainty. A high degree of TA, low degree of FRM and low RPS
will provide sufficient leeway to the team in effectively managing changes (Hack-
man 1980; Langfred and Moye 2004; Sethi and Iqbal 2008), thereby increasing
overall PD team flexibility.
6 Methodology
6.1 Questionnaire Development
We adopted an ex post facto, survey-based and cross-sectional design. A total of 120
responses were collected from PD teams in public and private sector. Convenience
850 K. Srikanth and K.B. Akhilesh

sampling strategy was adopted for this study. The unit of analysis was teams. The
population for the study was PD teams in public and private sector companies. Public
sector was represented by teams in defence-based R&D companies, whereas private
sector by software PD organizations. Target respondents were team leaders or/and
managers involved in design and development phase of the PD. The survey instru-
ment for the study was developed exclusively for this study and underwent two
rounds of pretesting. Majority of the items used for measuring the variables were
sourced from literature. The final questionnaire consisted of 48 questions, distributed
in four parts. A five-point Likert scale was employed for capturing the responses.
Reliability and validity was established. Content validity was established by seeking
expert opinion. Cronbach’s alpha was used as a measure of reliability. A value of 0.6
or above has been recommended for exploratory study (Nunnaly 1967).
6.2 Data Collection Procedure
Data required for the study was collected in two phases (pilot and main).
Companies with more than 10 years of PD experience and employing more than
1,000 employees were preferred. Contact was made with respective HR heads or
through known individuals in top management. Of the companies contacted, four
accorded permission (1 – private, 3 – public). The teams that participated in this
study were identified by the HR heads or PD heads. The criterion for participation
was based on the minimum experience level of the respondent (5 years for private
sector and 8 years for public sector). The minimum limit was arrived at based
on discussions with heads of the companies during the course of data collection.
The questionnaire was administered personally to all the respondents.
7 Analysis and Result
Before any of the results are to be presented, it has to be emphasized that this chapter
is a part of a larger study that was conducted to assess the impact of structural
antecedents on the efficiency of PD teams. The results reported here are limited to
only the main focus elements of this chapter, that is, participation and control (PAC)
and time-bound formalization (TBF). Factor analysis was performed separately on
teams’ structural practices related items. Five factors were extracted which accounted
for 63% of variance. These were (1) participation and control (PAC), (2) time-bound
formalization(TBF), (3) review procedure strictness (RPS), (4) progressive decision
making (PDM) and (5) procedural autonomy (PRA). Of these five factors, two (PAC
and TBF) which accounted for major portion of variance (37% of the total 63%) of
the accounted have been considered for this study. Refer to Table 1.
A Study of Structural Antecedents of Product Development Teams. . . 851

7.1 Participation and Control (PAC)
Factor 1 consists of items related to team members’ involvement in decision
making and control of PD activity. The factor represents both participation and
control enjoyed by teams during design and development activity. Hence, it has
been named as ‘participation and control’ (PAC). Participation and control are
two different aspects related to decision making. While participation represents
exchange of information between during decision making, control represents the
actual autonomy enjoyed by the teams to take decisions collectively without any
external interference. Greater team participation and greater team control would
eventually lead to self-managed teams. Studies related to organization development
have looked at participation and control separately while designing organizational
structures. But, in this study, the factor PAC appeals for looking at these elements
together in the interest of team flexibility.
PAC scores were compared across small and large teams. Large teams were
those which had more than ten team members. Comparison was performed both at
the item level and at the factor level using 2-sample independent t-tests (Table 2).Comparison of items related to PAC did not result in significant difference across
small and large team sizes; similar was the case at the factor level too. This suggests
the extent of PAC implementation was similar in small and large teams. This
was quite contrary to team-based literature, which suggests that extent of team
participation will be higher in case of smaller teams compared to large teams. The
result points to an interesting and prevalent aspect of organizations’ implementing
practices that are similar in nature across small and large teams. In other words, for
the present sample, the organizations have not differentiated small and large teams’
Table 1 Partial results of factor analysis of PD teams’ structural practices
Items 1. PAC 2. TBF
Team members were actively involved in product-related
decision making
0.602 0.050
Inputs provided by team members are given due
consideration during decision making
0.879 0.068
Supervisors and managers are supportive of the decisions
made by the team
0.667 0.062
Team has control over sequencing of the work activities 0.277 �0.196
Mostly, product-related decisions were taken just on time �0.025 0.263
Formal rules exist for carrying out every task 0.114 0.668
Formal procedures exist to deal with every possible
situation that may arise during the course of execution
of tasks
0.135 0.770
Team does not have to strictly adhere to the procedures for
doing the tasks
�0.065 0.576
% variance (cumulative %) 20.298 (16.317) 16.317 (36.614)
Cronbach’s alpha 0.703 0.631
The figures marked bold correspond to the highest factor loading for the respective item
852 K. Srikanth and K.B. Akhilesh

requirement, and hence we find no significant difference. PAC contains two
attributes – participation and control. Increasing PAC would require increasing
both team participation and team control. The latter is much more challenging to
achieve. Second interpretation of the result is possibly that in the design and
development stage of PD, it is possible to achieve similar extent of participation
and control in small and large teams. This in turn implies, while structuring PD
teams, especially large teams, proper measures have to be adopted to bring the
extent of team participation on par with the small teams. This observation is under
the assumption that smaller teams enjoy a greater degree of participation.
7.2 Time-Bound Formalization (TBF)
Factor 2 has items related to existence and adherence of formal rules along with a
definitive time frame for executing decisions. This factor has dimensions of time
and formal rules describing it. In a broad sense, it denotes a time-bound implemen-
tation of rules and procedures during the course of PD. Hence this factor is named
as ‘time-bound formalization’ (TBF). The factor emphasizes the importance of time
limits when implementing formal rules and procedures governing task execution or
decision making while handling change and uncertainty. Organization literature
does talk about formalization aspects; however, there is no direct mention of time-
lines w.r.t. implantation of these. This factor, in the interest of team flexibility,
emphasizes the need to actively consider the dimension of time in introducing
formalization aspects.
In a conceptual sense, the use of formalization techniques is attributed to job
standardization and reduction in variance of output. In the context of PD, a low
degree of formalization would be helpful in dealing with situations in PD as each
situation is unique, and hence, it can be argued that governance by rules would
affect the teams’ performance. This argument seems to be fine in the context of
Table 2 Team size-based comparison results of PAC
Items
Mean (SD)
p Value
Large Small
(n ¼ 45) (n ¼ 59)
Team members were actively involved in product-related
decision making
3.58(0.988) 3.78(0.832) 0.273
Inputs provided by team members are given due
consideration during decision making
4.09(0.733) 4.08(0.566) 0.974
Supervisors and managers are supportive of the decisions
made by the team
4.07(0.759) 4.07(0.583) 0.997
Team has control over sequencing of the work activities 3.76(0.830) 3.63(0.807) 0.430
Participation and control [PAC] 0.00(1.054) 0.009(0.809) 0.927
A Study of Structural Antecedents of Product Development Teams. . . 853

small teams, but in large teams, when participation is increased, the time required
for decision making also increases. In such situations, a time boundedness would be
rather helpful. In other words, TBF has to be considered in the light of PAC. In the
present study, the extent of TBF remained same across small and large teams, with
no significant difference emerging in case of both item and factor scores. The result
points to existence of TBF to a similar degree in both small and large teams, which
in turn consolidates the previous finding (in PAC) regarding organizations using
similar structural practice for small and large teams. The effect of TBF on small and
large teams is similar (Table 3).
8 Summary
PD team flexibility is an important consideration in the currently team-driven
PD industry. It provides the means to cope with change and uncertainty. PD team
flexibility can be improved by designing structural practices which are predisposed
to contribute to flexibility. Two such antecedents that play a crucial role in impro-
ving team flexibility are PAC and TBF. Structural practices designed around PAC
and TBF can impact PD team flexibility significantly.
PAC emphasizes the importance of teams’ prerogative in decision making and
execution in terms of both participation and control. While achieving higher partici-
pation is possible, transferring complete control to team is a challenging one. The
implementation of PAC is even more challenging in case of large teams, as it
requires a considerable effort and coordination. In the present study, we could not
find evidence of it. The results also point to a similar PAC adoption in the design
and development stage during design stage of PD.
TBF is another antecedent that can impact flexibility. A low degree of formali-
zation, with time-bound implementation can contribute to improving team flexibility.
Table 3 Team size-based comparison results of TBF
Items
Mean (SD)
p value
Large Small
(n ¼ 45) (n ¼ 59)
Mostly, product-related decisions were taken just
on time
3.070(1.074) 2.830(0.931) 0.243
Formal rules exist for carrying out every task 3.290(1.100) 3.410(0.893) 0.559
Formal procedures exist to deal with every
possible situation that may arise during the
course of execution of tasks
3.000(0.953) 3.070(1.015) 0.727
Team does not have to strictly adhere to the
procedures for doing the tasks
2.910(0.900) 3.020(0.919) 0.557
Time-Bound Formalization [TBF] �0.033(0.924) 0.027(0.857) 0.735
854 K. Srikanth and K.B. Akhilesh

This is especially helpful in case of large teams as it seeks to offset the increased time
consumption due to implementation of PAC. This practice in conjunction with PAC
would complement the efforts to increase flexibility. The comparative study did not
yield any significant difference for impact of TBF in small and large teams suggesting
that organizations use similar structural practice for small and large teams.
References
Adner R, Levinthal DA (2004) What is not a real option: considering boundaries for the applica-
tion of real options to business strategy. Acad Manage Rev 29(1):74–85
Aggarwal S (1995) Flexibility management: the ultimate strategy. Ind Manag 37(6):20
Beach R, Muhlemann A, Price D, Paterson A, Sharp J (2000) A review of manufacturing
flexibility. Eur J Oper Res 122(1):41–57
Bhattacharya S, Krishnan V, Mahajan V (1998) Managing new product definition in highly
dynamic environments. Manag Sci 44(11):50–64
Biazzo S (2009) Flexibility, structuration, and simultaneity in new product development. J Prod
Innov Manag 26(3):336–353
Bordia P, Hobman EV, Jones E, Gallois C, Callan VJ (2004) Uncertainty during organizational
change: types, consequences, and management strategies. J Bus Psychol 18(4):507–532
Cohen SG, Bailey DE (1997) What makes teams work: group effectiveness research from the shop
floor to the executive suite. J Manag 23(3):239–290
Daft RL (2007) Organization theory and design, 9th edn. South Western College Publishing,
Cincinnati
Das TK, Elango B (1995) Managing strategic flexibility: key to effective performance. J Gen
Manag 20(3):60–76
Evans JS (1991) Strategic flexibility for high technology maneuvers: a conceptual framework.
J Manag Stud 28(1):69–89
Frishammar J, Ylinenpaa H (2007)Managing information in new product development: a conceptual
review, research propositions and tentative model. Int J Innov Manag 11(4):441–467
Golden W, Powell P (2000) Towards a definition of flexibility: in search of the Holy Grail? Omega
28(4):373–384
Hackman JR (1980) Work redesign and motivation. Prof Psychol Res Pract 11:445–455
Lam SS, Chen XP, Schaubroeck J (2002) Participative decision making and employee perfor-
mance in different cultures: the moderating effects of allocentrism/idiocentrism and efficacy.
Acad Manag J 45(5):905–914
Langfred CW, Moye NA (2004) Effects of task autonomy on performance: an extended
model considering motivational, informational, and structural mechanisms. J Appl Psychol
89(6):934–945
Lee G, Xia W (2005) The ability of information systems development project teams to respond to
business and technology changes: a study of flexibility. Eur J Inf Sys 14:75–92
Li Y, Kuo-Chung K, Chen GH, Jiang JJ (2010) Software development team flexibility antecedents.
J Syst Softw 83(10):1726–1734
Lowin A (1968) Participative decision making: a model, literature critique, and prescriptions for
research. Organ Behav Hum Perform 3(1):68–106
Mccomb SA, Green SG, Dale CW (2007) Team flexibility’s relationship to staffing and perfor-
mance in complex projects: an empirical analysis. J Eng Technol Manag 24(4):293–313
Nunnally JC (1967) Psychometric theory. New York: McGraw Hill, p 640
Olsson NO (2006) Management of flexibility in projects. Int J Proj Manag 24(1):66–74
Olsson NO, Magnussen OM (2007) Flexibility at different stages in the life cycle of projects:
an empirical illustration of the freedom to maneuver. Proj Manage J 38(4):25–32
A Study of Structural Antecedents of Product Development Teams. . . 855

Sethi R, Iqbal Z (2008) Stage-gate controls, learning failure, and adverse effect on novel new
products. J Mark 72(1):118–134
Sethi AK, Sethi SP (1990) Flexibility in manufacturing: a survey. Int J FlexManuf Sys 2(4):289–328
Smith PG (2007) Flexible product development: building agility for changing markets. Wiley,
Hoboken
Tatikonda MV, Rosenthal SR (2000) Technology novelty, project complexity, and product
development project execution success: a deeper look at task uncertainty in product innovation.
IEEE Trans Eng Manage 47(1):74–87
Thomke SH (1997) The role of flexibility in the development of new products: an empirical study.
Res Policy 26(1):105–119
Thomke SH, Reinertsen DG (1998) Agile product development: managing development flexibility
in uncertain environments. Calif Manage Rev 41(1):8–30
Ulrich KT, Eppinger SD (2004) Product design and development, 3rd edn. McGraw Hill, New York
Verganti R (1999) Planned flexibility: linking anticipation and reaction in product development
projects. J Prod Innov Manage 16(4):363–376
856 K. Srikanth and K.B. Akhilesh

Developing Sustainable IT Market Information
Services: The Case of Esoko
Olayinka David-West
1 Introduction
In Africa, agriculture remains the major source of livelihood for about 60% of
the population but only amounts to 17% of its total gross domestic product (GDP).
The nascent nature of agriculture in developing economies vis-à-vis the potential
and opportunities abound has contributed to the classification of agriculture initi-
atives as developmental and often the responsibility of governments and/or devel-
opmental agencies that have developed established structures and processes for
agricultural extension. The need to close this gap has been identified as one of the
high-level objectives of the New Partnership for Africa’s Development (NEPAD)
through investments in numerous initiatives including “soft” infrastructure projects
that facilitate access to accurate price and market information (Harsch 2004) and
hence market information services (MIS).
MIS are part of a group of innovative farmer advisory services supporting the
collection and dissemination of agricultural information to farmers and other stake-
holders using voice, radio, mobile, etc. (Gakuru et al. 2009). MIS aim to increase the
efficiency of agricultural markets and contribute towards overcoming issues of mar-
ket failure based on inconsistent access (Ferris et al. 2008). As such, MIS assist
farmers in their ability to monitor market conditions, make better decisions on where
to sell their produce, and negotiate for improved prices rather than being compliant
price takers. MIS are beneficial to rural and travelling traders who have less access
to market information than their urban counterparts and in need of assistance in
decision-making and identification of opportunities. MIS market data is also useful to
O. David-West (*)
Lagos Business School, Pan-African University, KM 22 Lekki-Epe Expressway,
Ajah, Lagos, Nigeria
e-mail: [email protected]
Support for this study was provided by the UNDP Growing Inclusive Markets Initiative.
Department of Management Studies, Indian Institute of Science, Bangalore,
Driving the Economy through Innovation and Entrepreneurship,DOI 10.1007/978-81-322-0746-7_70, # Springer India 2013
857

financial institutions providing them the ability to monitor the long-term health of the
economy and, in the short term, assess the risk of lending to both large-scale indivi-
dual farmers and cooperative farming groups. For policy makers and researchers,
current and historical market information from MIS are used to review shifting
market patterns and to assist in planning processes such as finding ways to foster
market growth, planning for provision of appropriate marketing institutions, and
making decisions on when and where to invest in new marketing infrastructure
(Ferris et al. 2008).
In spite of the benefits to farmers, financial institutions, and policy makers, the
long-term support of MIS is fraught with scepticism from donors and government
agencies for reasons including but not limited to (1) poor historical performance
of government-managed MIS, (2) long-term funding requirements, (3) lack of
evidence to show the value of market information as a tool to assist farmers and
farmer groups to make better marketing decisions and increase their incomes, and
(4) bias towards farmers and rural traders (the major MIS beneficiaries) (Ferris et al.
2008). Typically deployed by public sector government agencies and/or donor-
supported agencies, MIS failures are associated with:
• Over emphasis on MIS design as opposed to commercial viability and sustain-
ability (Shepherd 1997)
• Time- or project-bound nature of donor-supported MIS where initiatives expire
once funds or timeframe elapse (Ferris et al. 2008; Shepherd 1997)
• Operational difficulties and challenges in the collection, processing, transmis-
sion, and dissemination of MIS data (Shepherd 1997)
Recent advancements in information and communications technologies and
their opportunities in enhancing operations and extending reach have not gone
unnoticed by development agencies. As such, IT-based MIS using the Internet,
mobile technology, etc., are gradually evolving, whilst issues associated with sustain-
ability and the short-term nature of MIS remain. The resultant impact of these MIS
challenges has led to a significant shortage of services amongst needy beneficiaries.
These vulnerabilities are confirmed in Garku et al.’s (2009) inventory of MIS in
Africa, where of 61 MIS reviewed, 41 (75%) were classified as active, 4 (6%) either
undergoing design or implementation, 5 (8%) as completed (expired), and 6 (10%)
unknown. Of the active projects, further analysis revealed that 7 (17%) have since
elapsed, 2 (5%) continued independently, and donors were substituted in 3 (7%) of
the projects. However, whilst commercially viable and sustainable MIS are feasible,
they are not widespread. This chapter seeks to identify factors for the development
and sustainability of agricultural MIS as well as to propose an exploratory model for
sustainable and commercially viable MIS is in emerging economies.
This study was conducted as part of a larger project on inclusive business
models, an initiative of the Growing Inclusive Market (GIM) team of the UNDP.
Through research initiatives, the GIM initiative seeks to understand inclusive
markets from enterprises in Africa, Asia and the Pacific, Eastern Europe (EE),
and the Confederation of Independent States (CIS), as well as Latin America and
the Caribbean, in a bid to foster the development of inclusive markets that will
create opportunities for the world’s poor. Using the case study method in the study of
858 O. David-West

Esoko, the objectives stated earlier were addressed in the quest for identifying factors
influencing MIS sustainability. Based on a single MIS case, this chapter proposes an
exploratory model of sustainable MIS that can be further developed with multiple
cases that facilitate cross-case analysis and theoretical saturation (Eisenhardt 1989).
The remainder of this chapter is set out as follows: Sect. 2 introduces Esoko and
extant literature on sustainability in general and with reference to IT initiatives.
Section 3 presents an overview of the method employed, and Sect. 4 outlines the
results. Section 5 discusses these results. Finally, Sect. 6 summarises and concludes
this chapter and identifies implications for future research.
2 Sustainable Market Information Services
2.1 Introducing Esoko
Esoko, or markets in Swahili, is an MIS that evolved from its earlier version called
TradeNet. Initially conceptualised as a single MIS operated by a central entity such
as a government agency, Esoko offers extension services for multi-market, multi-
commodity, multi-currency, and multilingual markets. Using global systems for
mobile (GSM) technologies, Esoko collects and distributes (pushes) market informa-
tion as short message service (SMS) alerts or text messages to subscribers. Esoko is
complemented by a website (www.esoko.com) that distributes market information
such as commodity prices, buy/sell offers, etc., on a self-service basis and also
provides institutional farmer communities access to the web market sites. In addition
to the recipients of market information (sellers), additional MIS stakeholders are
present across the agriculture value chain, including agricultural processors, farm-
ing associations/communities, buyers, governmental and non-governmental agencies
such as development partners, etc. Esoko facilitates the development of commodity
marketplaces that can be deployed and operated by franchise and/or association part-
ners, development agency projects, and public sector government services for the
benefit of farmers and/or traders that receive the information over mobile networks. A
summary of Esoko services, audience, and distribution channel is included in Table 1.
The Esoko system is developed in Accra, Ghana, by a team of local and inter-
national professionals. To date, Esoko has been deployed in support of projects
such as the Market Information Systems and Traders’ Organisations of West Africa
(MISTOWA) project funded by the United States Agency for International Devel-
opment (USAID) and as an independent service in countries like Afghanistan,
Ghana, and Nigeria.
2.2 Sustainability
Sustainability simply refers to a capacity to maintain an entity, outcome, service, or
process over time. Jenkins (2009) identifies three sustainability factors – economic,
Developing Sustainable IT Market Information Services: The Case of Esoko 859

environmental, and political. Economic factors explain the natural, financial, and
capital aspects; ecological factors define the biological diversity and ecological
integrity; and political factors aim at social systems that realise human dignity.
From the IT perspective, the assessment of sustainability in the evaluation of
success and failure of IS projects resulted in the identification of ten elements and
classified as either critical success factors (CSF) or critical failure factors (CFF)
(Heeks and Bhatnagar 1999). This group of ten factors includes environmental and
political factors but excludes the economic perspective. Other elements include
information, technical, people, management, process, cultural, structural, and stra-
tegic. The information factor relates to the quality and quantity of the information
content; the technical factor defines the technology including hardware and soft-
ware infrastructure and configurations. People and managerial factors encapsulate
the employee skills and competencies both at the operational and managerial levels,
respectively. Process factors seek to ensure that information serves cross-functional
groups and provides the relevant feedback. Organisational cultures in the workplace
permeate IS projects as cultural factors. Complementary organisational structures
that support the flow of information make up structural factors. Strategic factors are
defined by a strategic and cross-functional approach to IS deployments. Political
factors mask themselves in both public and private sector projects in the form of
Table 1 Summary of Esoko services
Service Description Target Channel
Mobile alert SMS text alerts of prices and offers
despatched to subscribers based on
defined preferences
Individual farmer/
trader/buyer
SMS
Direct
marketing
SMS-based direct marketing platform
available to business subscribers to
facilitate information sharing
Farming/trade
association/community
Internet
SMS
Scout Applications that can be used to build
polls by providing participants in the
field send information back. This
application can facilitate Q&A and
other services
Farming/trade association/
community, FMCG
Internet
SMS
Market sites Promotional website for business
subscribers such as farming/
agricultural communities offering
them a web presence
Farming/trade
association/community
Internet
Prices Historical collection of market-based
commodity process
Individual farmer/
trader/buyer
Internet
Buy/sell
offers
Offers are user-generated notifications/
solicitations for products available for
sale or purchase, respectively
Individual farmer/
trader/buyer
Internet
SMS
News and
Library
General information resources dedicated
to sharing/distribution of multimedia
content
All Internet
860 O. David-West

executive leadership and championing of the IS initiatives. Finally, environmental
factors are present when the IS projects support environmentally friendly initiatives.
In rural India, Kumar and Best (2006) exploited the CSF and CFF model in the
specification of the sustainability failure model for e-Government projects. They
identified 5 factors of sustainability – financial, cultural/social, technological, politi-
cal/institutional, and environmental. Economic factors define the financial and capital
resources required to sustain the IS project; political factors relate to the institu-
tional support mechanisms to avert project failure; cultural/social factors define the
social impacts of the project which if negative to groups or stakeholders may affect
project sustainability. Environmental/ecological factors are cognisant of environmen-
tal impacts, and technological factors define hardware and software resources.
Harmon and Auseklis (2009) introduce the second wave of sustainable IT services
extend IT sustainability beyond data centre efficiency and the minimisation of carbon
footprint to include the long-term importance of IT to organisations, customers, and
society at large. In this context, dimensions of sustainable IT services include service,
temporal, cost, organisational, and environmental. Service factors refer to the pro-
cesses for the delivery and continuous operation of IT services; temporal factors to the
clear understanding of the business, customer, and/or societal value derived from the
deployment of IT services. Cost services are associated with the financial costs asso-
ciated with the acquisition and operation of IT services that are supported by
organisational factors such as innovation in a rapidly changing environment. Finally,
environmental factors refer to the inclusion of environmental choices in the delivery of
IT services.
Whilst economic, environmental/ecological, and political factors are common, in
the IS context, technology and culture are integral characteristics in the operations of
IS that have been defined byKumar and Best (2006) andHeeks and Bhatnagar (1999).
The roles of process, strategy, structure, people,management, and information defined
in the CSF and CFF and partly by Harmon and Auseklis (2009) cannot be underesti-
mated in enterprise IS projects that have been known to fail for non-technical pro-
blems such as incompatible structures (Heeks and Bhatnagar 1999) and many others.
The summary of factors in Table 2 shows that whilst all ten factors proposed byHeeks
and Bhatnagar (1999) are relevant, finance cannot be understated. Although the
environmental definitions somewhat vary, the support MIS render to the environment
is more appropriate than that proposed by Harmon and Auseklis (2009). Thus, the ten
factors including economic form the initial list to be employed in the data analysis.
3 Method
This study employs the case study method (Yin 2003) for an in-depth analysis of an
emerging market MIS, Esoko. The case study method is based on the research
design developed by the UNDP GIM programme (UNDP Growing Inclusive
Developing Sustainable IT Market Information Services: The Case of Esoko 861

Markets Initiative 2009) that sought to understand the business model and identify
the role of actors or participants and the results of inclusive business models using
in-depth structured interviews. The depth of analysis provided by the case study
method makes it an appropriate strategy for the analysis and understanding of
sustainability in business models such as Esoko. The case-based research approach
adopted for the entire GIM project corresponds with the nine activities elaborated by
Eisenhardt (1989). However, in the case of this study, the primary activities conducted
include case selection, fieldwork (data collection), and within-case analysis.
3.1 Case Selection
From over 1,000 inclusive businesses identified as possible case study candidates,
100 possibilities were short-listed by the GIM core team. Criteria used in the selection
of the 50 cases included human development and poverty alleviating impact, com-
mercial viability, environmental sustainability, potential for growth, replication, and
significant impact, stakeholder relationships, and innovation (UNDP Growing Inclu-
sive Markets Initiative 2009).
3.2 Data Collection
Semi-structured interviews were conducted in September 2009 at the Esoko Ghana
offices with members of the Esoko team in using the GIM research protocol
comprising of questions seeking the creation, distribution of value alongside actors,
and impacts (UNDP Growing Inclusive Markets Initiative 2009). In addition
to the interview with the CEO and founder of Esoko, additional interviews were
Table 2 Summary of sustainability factors
Harmon and
Auseklis (2009) Jenkins (2009)
Kumar and
Best (2006)
Heeks and
Bhatnagar (1999)
Cost Economic Economic/
financial
Political Political Political
Information
Technological Technical
Organisation People
Management
Structural
Service Process
Social/cultural Social/cultural
Temporal Strategic
Environmental Environmental/ecological Environmental Environmental
862 O. David-West

conducted with personnel in product development, franchisee business development,
partner development, enumeration manager, monitoring and evaluation, and financial
management. Internal company documents were also acquired during the course of
the interviews.
3.3 Data Analysis
Transcripts of the recorded interviews were produced and imported into qualitative
data analysis tool, Nvivo version 9, for subsequent analysis. Using the list of extant
dimensions of sustainability as a starter list of codes (Miles and Huberman 1994),
provisional and holistic coding techniques (see Saldaña 2008) were applied to the
data in two coding cycles. The first cycle of coding was used to generate Nvivo
nodes for extant sustainability categories whilst the second cycle employed in
vivo and versus coding techniques comprising of direct phrases from interviewees
and comparisons, respectively. Although the absence of multi-case data made
cross-case analysis impossible, within-case analysis was facilitated by the various
roles of the interviewees within the organisation. The analysis of the documents and
interview transcripts resulted in 14 emergent factors of MIS sustainability that are
presented in the results section and substantiated by quotations.
4 Results
The exploratory model of sustainable MIS illustrated in Fig. 1 comprises of 14
factors in 3 dimensions – consumer, organisational, and institutional.
4.1 The Consumer Dimension of Sustainability
Information and usability impacted by culture are evident at the consumer level.
Information that is foundational to MIS is characterised by multiple markets, agricul-
tural commodities, and currencies – that are consumed by farmers, traders, etc.,
and subject to usability factors such as ease of use, reliability, accuracy, etc.:
And the other thing is that most of the people from the market told us consistently from the
start that they never trusted government data, that they felt that government data was first of
all very difficult to access and it was frequently inaccurate and the best data that they can
get is from themselves and from their traders.
The ICT orientation of MIS also subjects usability to technology adoption
factors that are embedded in culture:
Developing Sustainable IT Market Information Services: The Case of Esoko 863

We are dealing with mostly conservative communities that have done things in a specific
way and aren’t particularly tuned in the new technologies.
The demand for accurate, reliable, and usable information influences the
organisational strategy and the MIS provider organisation. The embodiment of
field-based enumeration services into the MIS organisation not only ensures infor-
mation accuracy, timeliness, etc., but also serves as a feedback loop from the
monitoring and evaluation perspective:
Another reason we have the enumeration staff is not only to gather market information but
also to make sure that those information reach the top management as a feedback and they
proffer ideas on what will make the company move forward.
4.2 The Organisational Dimension of Sustainability
At the organisational level, sustainability is expressed through strategic thinking
and orientation, people, processes, structures, management, capital, and techno-
logy that are directly influenced and driven by political will and determination. The
elements of strategy are founded in the conceptualisation of Esoko as a commercial
entity enforcing the focus on strategic attributes like the business model that
encompasses the value proposition; financial, distribution, and operational models;
risk management; competition; etc. The significance of the business model is
succinctly described as a fundamental of any business venture:
I think MIS never had a business model. I mean Bloomberg does.
Fig. 1 Exploratory model of sustainable MIS
864 O. David-West

The opportunities abound in the ICT-based MIS were also evident in the
conceptualisation of Esoko:
Agriculture projects were trying to build software and that was a recipe for disaster. As a
software and businessperson, I thought that was a great opportunity to build a product that
will be cheaper and better for all of these products and projects to use.
Whilst Esoko’s founder quickly identified the opportunities in MIS, capacity
differences between software development and agricultural initiatives were
evident:
Software companies build software and agriculture projects do capacity building or seed
distribution. So it is different kinds of skills for different companies.
Embedded in this business model are consumer and partner engagement strategies
that are also commercially oriented and can be implemented as business entities.
Consumer engagement is facilitated by the organisation structure where enumeration
agents responsible for collecting market prices also seek feedback and through
monitoring and evaluation (impact assessment) initiatives. For partner engagement,
the Esoko team have developed a toolkit comprising of business development aids for
commercial operations:
We have tried to develop a franchise model that presents it as a profitable business
opportunity and we are looking to attract individuals, companies, organisations, partners
in countries to do it that way.
The presence of a strategy influences the organisation and its operations includ-
ing the human resources, business processes, organisational structures, manage-
ment capacities, capital, and technology as explained by Esoko founder:
Software is never finished and when you launch a product, that is when it actually begins
because that’s when you actually have people using it and nobody uses it in a way you
imagine they will. So you have to be listening, you’ve got to be watching and you’ve got to
have the capacity to continue your technical development. So from our point of view, we
have not developed a product, we have developed a capacity and a team.
With technology rapidly advancing, technological innovations that ensure usabil-
ity and conformance with global standards are mandatory:
So as we better understood the market and as we began also witness some of the ways in
which technology was evolving with social networks like Facebook and Twitter, and where
we saw more user generated content and I think that’s how we began to understand how we
can use technology.
4.3 The Institutional Dimension of Sustainability
Institutional sustainability, although derived through various partnerships, is con-
strained by the operating environment comprising of political and cultural factors.
The development of Esoko would have been challenging without agriculture
extension expertise and funding from developmental agencies; however, additional
Developing Sustainable IT Market Information Services: The Case of Esoko 865

institutional relationships, such as those with mobile telecommunications operators
whose networks facilitate the distribution of SMS market information, are manda-
tory. In addition to the transmission of SMS messages, the dispersion of mobile
networks can also facilitate the direct and independent retail of Esoko and Esoko
subscription fees debited from mobile call credit:
We are looking at having an agreement with the mobile service providers to upgrade our
service as an option in their network.
In contrast to enterprise IT systems and services, the service-oriented nature of
MIS forms their dependence on institutional alliances that distribute the service,
provide access to farmers, capital, etc., that are however influenced by environmen-
tal, political, and societal/cultural factors in developing countries like Ghana where
this is evident in the absence of a high-tech industry and personnel:
One of the difficulties we are facing is in the highly skilled sector like software, which is
mostly non-existent in Ghana, is bringing in some of the capacity to train up local staff. I
think that some of the immigration issues has been problematic for us and I think that we
need help advocating with the government that we are not displacing a local industry, we
are actually creating a local industry and that if you don’t bring in that expertise.
Informed understanding of the cultural and adoption issues has influenced the
development and deployment of Esoko, which according to the product develop-
ment manager is complemented with appropriate teaching aids, processes, and
structures:
It’s not just releasing software and saying ok anybody can use it. It is also providing
guidance and putting people there to make sure they have access to the platform.
Although technology knowledge is an important factor in the adoption of ICT-
based MIS, the Esoko founder establishes the relationship between the value
proposition and technology adoption:
You also can see that given the right value proposition, every single one of them is capable
of learning those technology tools and using them to their advantage.
Finally, even though environmental factors are not explicitly derived from the
interviews, ICT-based MIS are not damaging to the environment in the provision of
alternative (non-paper) distribution channels for extension information:
I’m sure people will be sending out wedding and death notices on the SMS. I think that they
will be saving fuel costs and not in adding to the pollution, with transport, we’ll be able to
allow people to find trucks that are moving back and forth and reduce the number of trucks.
So indirectly the impacts on the environment could be significant because you’re just
making markets work more efficiently.
5 Discussion of Results
The proposed 14-factor model of sustainable MIS illustrated Table 3 can be
associated with Harmon and Auseklis’ (2009) definition of societal sustainable IT
services – “the aggregate value available to society from the systematic integration
866 O. David-West

and alignment of the individual IT service components for the purpose of creating
superior societal value”. In conclusion, whilst organisational factors positively
influence MIS, inhibitors are typically in the external institutional factors, and
depending on the inclusion of feedback mechanisms, the consumer factors may
be either influencing or inhibitive.
6 Limitations, Future Research, and Conclusion
Although commercially viable MIS are not widespread, this study shows that,
using services such as Esoko that offer dynamic distribution models, MIS can
easily be deployed globally. Although these findings, based on a single-case, are
a limitation, it serves as a research opportunity where data will not only facilitate
cross-case analysis but also ensure theoretical saturation. The exploratory model
proposed could serve as a guide to governments and development agencies consid-
ering the transformation of current agricultural services to ICT-based environments
Table 3 Emergent factors of MIS sustainability
Consumer Institutional Organisational
Information: multi-market,
multi-commodity, multi-
currency market information
Environmental: initiatives thatprotect the environment
Strategy: of commercially
oriented tactics
usability: initiatives that ensuremarket information are
accessible and usable by
farmers
Political: the political constraints inthe environmental environment
and executive leadership in the
MIS provider organisation
Technology: hardware,software, and
technical skills and
competencies
Societal/cultural: social andcultural perspectives of the
operating environment and the
consumers
Structures: structures thatensure all required
activities are
conducted
Partnerships: the variousinstitutional relationships
required to maintain the MIS
Management: managerial
skills and
competencies
Processes: processes tosupport MIS activities
People: operational skillsand competencies
Capital: financialresources required
develop and support
innovation capacities
Technology Innovation:the wherewithal to
extend the MIS
features in given
technological
advancements
Developing Sustainable IT Market Information Services: The Case of Esoko 867

and could also guide the development of ICT-based social ventures especially in the
agriculture sector. In sum, in addition to the 11 previously identified constructs,
consumer usability and partnerships are just as important to the viability and
longevity of MIS.
References
Eisenhardt KM (1989) Building theories from case study research. Acad Manag Rev 14:532–550
Ferris S, Engoru P, Kaganzi E (2008) Making Market Information Services work better for the
poor in Uganda. Research workshop on collective action and market access for smallholders,
Cali, Colombia
Gakuru M, Winters K, Stepman F (2009) Inventory of innovative farmer advisory services using
ICTs: the forum for agricultural research in Africa
Harmon RR, Auseklis N (2009) Sustainable IT services: Assessing the impact of green comput-
ing practices. In: Portland international conference for management of engineering and
technology, Portland, pp 1707–1717
Harsch E (2004) Agriculture: Africa’s ‘engine for growth’, vol 17, Africa recovery. United
Nations, New York
Heeks R, Bhatnagar S (1999) Understanding success and failure in information age reform. In:
Heeks R (ed) Reinventing government in the information age: international practice in
IT-enabled public sector reform. Routledge, London
Jenkins W (2009) Sustainability theory. Berkshire Encycl Sustain 2011:380–384 (Berkshire
Publishing Group)
Kumar R, Best ML (2006) Impact and sustainability of e-government services in developing
countries: lessons learned from Tamil Nadu, India. Inf Soc 22(1):1–12
Miles MB, Huberman A (1994) Qualitative data analysis: an expanded sourcebook. Sage,
Thousand Oaks
Saldaña J (2008) The coding manual for qualitative researchers. Sage, Thousand Oaks
Shepherd AW (1997) Market information services: theory and practice. Food and Agriculture
Organization of the United Nations, Rome
UNDP Growing Inclusive Markets Initiative (2009) Case study research programme
2009/10: research design. United Nations Development Programme (UNDP), New York
Yin RK (2003) Case study research design and method. Sage, Thousand Oaks
868 O. David-West

Design and Development of an Online Database
Management System (AGRI-TECHBASE):
For Agricultural Technologies of ICAR
A. Razia Mohamed, P. Vineeth Kumar, S. Abhilash, C.N. Ravishankar,
and Leela Edwin
1 Introduction
The Agricultural Research Institutions under the Indian Council of Agricultural
Research (ICAR) play a lead role in spearheading the scientific and technological
development of the country. With the advancements made by the information
technology and the increasing use of computers for the efficient management and
dissemination of knowledge, the information systems began to play a vital role
in agricultural planning and development (Sunil 2006). As the importance of
databases and their management in agriculture is well recognized and as informa-
tion processing has become the basis of a good decision support system, there
arouse a need for finding an ideal solution for creating a well-crafted data manage-
ment system that gives the power to efficiently direct the intellectual assets of an
R&D organization.
The Zonal Technology Management–Business Planning and Development
(ZTM-BPD) Unit established at Central Institute of Fisheries Technology, Cochin
is the zonal hub for R&D information management in ICAR for South India. The
unit caters to the needs of 21 ICAR research institutions that are specialized in areas
A.R. Mohamed (*) • P.V. Kumar • S. Abhilash
Zonal Technology Management – Business Planning and Development Unit,
Central Institute of Fisheries Technology, Matsyapuri P. O., Willingdon Island,
Cochin 682 029, KL, India
e-mail: [email protected]; [email protected]; [email protected]
C.N. Ravishankar
Fish Processing Division, Central Institute of Fisheries Technology,
Matsyapuri P. O., Willingdon Island, Cochin 682 029, KL, India
e-mail: [email protected]
L. Edwin
Fishing Technology Division, Central Institute of Fisheries Technology,
Matsyapuri P. O., Willingdon Island, Cochin 682 029, KL, India
e-mail: [email protected]
Department of Management Studies, Indian Institute of Science, Bangalore,
Driving the Economy through Innovation and Entrepreneurship,DOI 10.1007/978-81-322-0746-7_71, # Springer India 2013
869

like crop science, horticulture, animal science, fisheries and natural resource man-
agement. The role of the zonal institute includes the development and use of a data
management system for managing the intellectual assets of member institutes;
securing and safeguarding the IPRs; sensitization and capacity building to generate,
identify, and protect the IP generated; development of technology evaluation tools;
guidance in formulation of model business plans/project reports; technology trans-
fer/commercialization; business promotion through incubation; and reporting the
relevant institutional activities to ICAR. In an effort to strengthen the information
management capabilities of the member institutes under the zone and to effectively
address the related issues and concerns, the ZTM-BPD Unit responded to a call for
a new thrust and direction, for providing accurate and timely information, and
thereby rationalizing the data management processes in a cost-effective manner.
With this objective, the ZTM-BPD Unit conceptualized and developed the Online
Zonal Database Management System christened AGRI-TECHBASE, which provides
active linkages with all member institutes through a facilitative environment for
information processing and technology management.
Without an effective database management system, there will be lack of
adequate coordination within the research system, duplication of effort and lack
of continuity in building a knowledge base. The process of database management
includes the application of management on the deliberate sourcing and organiza-
tion of information arrangement with the objective of providing the information
needed for decisions, through improved efficiency and time effectiveness. AGRI-
TECHBASE is a complete database management system that is useful to a research
system from the level of the research institute up to the national level. The
21 member institutes can individually access the database through the project
website for updating, reviewing and monitoring the complete information database
relevant to the respective institute and thereby develop and organize the practice of
technology management and innovation. The system can help ICAR in understand-
ing and evaluating the potential technologies and scientific know-how developed
and the commercialization and revenue generation activities taken up by the
member institutes.
2 Methodology
The methodology followed in the development of AGRI-TECHBASE is based on
the nature and assessment of technological assets of member institutions under
South Zone. AGRI-TECHBASE was developed using the rapid-prototyping
method, using which an application can be developed one component at a time
and evaluating it simultaneously. After evaluation, the changes were incorporated,
and the process was repeated, eventually leading to the finished application. Each
step was iterated for about 2 or 3 months for perfecting the methods used. The rapid
prototyping provided frequent checkpoints for monitoring the development process
and also for experimenting with troublesome aspects of design and implementation.
The different phases involved in the development of AGRI-TECHBASE are
depicted in the following flow chart (Fig. 1).
870 A.R. Mohamed et al.

Compilation of knowledge base: The first phase consisted of the compilation of the
IP assets in the agriculture research institutes in South India. A survey was conducted
by the ZTM-BPD team among all the member institutes to collect information
regarding the R&D institution and its expertise and facilities; IP assets and their
commercial viability were collected through structured schedules created for the
purpose. Details of technologies/products developed, products commercialized and
IPR portfolios like patents, plant/animal varieties, copyrights, trademarks, consul-
tancy and contract services including analytical, trainings and capacity for imparting
training were collected. The process of technology development and status of refine-
ment of technology for commercialization were also recorded. The basic data on the
commercial aspects including the investment cost for setting up of a viable commer-
cial venture for making a business plan or a commercial project report were gathered
with respect to selected technologies of the zone. The target market, market size and
potential as evaluated by the inventors were also compiled.
Analysis: The second phase included assessment of information collected, evalua-
tion of technologies, analysis of requirements and their detailed specification. The
existing information management system was reviewed to assess its capabilities and
constraints, for identifying alternative system concepts. During the development of
online database, heavy emphasis was placed on end-user requirements.
Design: In the next phase, the focus was shifted from an emphasis on the real world
to techniques for realizing the application. The data was converted to database table
Compilation of Knowledge base
Analysis
Design
Implementation
Data Conversion
Testing
Training
Fig. 1 Phases in database
development
Design and Development of an Online Database Management System. . . 871

model using an architecture that was simple and easy to understand. As the database
covered a wide and diverse range of agricultural information, suggestions of subject
experts were taken on case to case basis. As part of involving the end users in the
development activity, a demonstration of the sample prototype model was given to
the members, to ensure the development of a system that is fully responsive to the
needs of the end user.
Implementation: The implementation phase consisted of developing all of the
system components like data entry forms and procedures, screens, back-end pro-
gramming, transfer/processing procedures and quality control procedures (Caldwell
2009). The design model developed during the previous phase was driven into the
database structure. As the rapid-prototyping approach was followed in the develop-
ment of database, it was necessary to field-test each subsystem before going full
scale. This field testing involved not only the programme but all aspects of the
system (e.g. data collection procedures, training and quality control).
Data conversion: During the data conversion phase, existing data was added to the
database. The cases where source data structure did not match the target data struc-
ture were identified, and many source databases that had data flaws were repaired.
Testing: After implementation, AGRI-TECHBASE was carefully tested before it
was commissioned for actual use. In this phase, the original management require-
ments were verified, and the system delivers the proper functionality. Testing also
uncovered the accidental errors that were introduced during data entry. The appli-
cation was also tested on multiple operating system platforms before releasing the
trial version.
Training: In order to accelerate the users on the system learning curve, a user
manual was developed and given to all the institutes. The users were given an initial
demonstration on the use of AGRI-TECHBASE, and the user queries were
addressed on a case to case basis.
The architecture of AGRI-TECHBASE consists of (1) user interface layer,
(2) server layer and (3) database layer. The user interface layer was developed
using tools like Dreamweaver, Photoshop, Flash, JavaScript and Ajax. The server
layer programming was done using the language PHP. The database layer was
developed using the relational database management system MySQL. The web
server used is Apache.
3 Results and Discussion
The AGRI-TECHBASE is designed to get more direction and accountability on
data management process and to streamline the flow of information from the
member institutes to the zonal institute and then to the central headquarters. The
system is used by the individual researchers, innovators and other practitioners to
locate possible sources of recorded information on R&D activities and technologies,
share and exchange information and also identify the potential innovations and
872 A.R. Mohamed et al.

breakthroughs. The AGRI-TECHBASE provides a user-friendly environment for
evaluating the potential technologies and scientific know-how developed and the
commercialization and revenue generation activities of the member institutes.
AGRI-TECHBASE consists of a user console and an administrative console.
The member institutes are given permission to access the database through the
user console using the unique user ids and passwords assigned to the individual
institute.
User console: In this section, the users can input, update, modify and view
information regarding technology portfolio, IP assets, success stories, institute
profiles, etc. The online documentation provides the ease of reproduction of the
documents, maintenance and easy access irrespective of the location.
Administrative console: This console gives access to the administrative module,
where the authorized person can view and manage all the master files in the
database. The administrator can control the user console and also monitor the
data management activities of each member institute (Fig. 2).
3.1 Information Centre
The information centre of AGRI-TECHBASE consists of subsections like Institute
Profile, Resources, Technology Portfolio, Plant Variety, Plant Germplasm, Patents,
Trademark, Copyrights and Design. The information provided in these sections
were finalized with the help of subject experts specialized in the respective fields.
Institute profile: The information given in this section is based on the basic
profile details of the particular institute, like the mandate, regional centres,
divisions, staff strength, awards received and contact details.
Fig.2 Login area and control panel of the database
Design and Development of an Online Database Management System. . . 873

Resources: The details of resources available with an institute includes training
programmes, expertise for training, campus facilities, testing, equipment, pilot
plant, experimental fields and services offered.
Plant variety: Under the zone, there are research institutions dealing with
horticulture crops, plantation crops and tuber crops. In order to include the details
of different varieties and hybrids of these plants, details such as name of the
crop, year of development, year of central release, inventors profile, parentage,
characteristics of the variety like soil type, pH range, disease/pest resistance,
unique/distinctive features, period of cultivation and years were included in this
section. From a commercialization point of view, information about the market
aspects, availability and costs of planting material/seed /propagule, etc., were
included. It also includes details of IP protection and technology transfer initiatives
for that particular plant variety or hybrid.
Plant germplasm: This section includes details like name of the crop, genetic
material, inventors’ profile, pedigree of the genetic stock, salient characteristics/
chief botanical and morpho-agronomic description, and details of technology
transfer.
Animal breed: This section deals with the technologies developed by the
institutes under the animal science division. The details given include name of the
breed and species, year of development, inventors’ profile, present area of distribu-
tion, parent stock/pedigree involved in the breed development, mode of breed
development, economic traits, status of protection and details of technology transfer.
Animal germplasm: The details include title and nature of genetic material,
inventors’ profile, pedigree of the genetic stock, salient characteristics and details
of technology transfer.
Technology portfolio: The technology portfolio highlights the complete infor-
mation about a particular technology, including its year of development, name
and contact details of inventors, brief description of technology and its claims/
highlights/advantages. The market aspects of the technology are also given signifi-
cance from a commercialization point of view. These include details about the
target segment, end-user profile, market size, sales and production capacity, and
economics including fixed capital and working capital. The portfolio also covers the
former technology transfer initiatives of that particular technology. The user inter-
face of the technology portfolio is depicted in Fig. 3.
Patents: The profile of patents includes details like title, status of protection, dateof filing, patent application number, date of grant, patent number, country, appli-
cant, inventors’ profile, date of last renewal, amount of renewal fee submitted and
date of next renewal.
Trademarks: This section includes details like trademark title, class, type, status
of protection, date of filing, application number, date of registration, registration
number, country and inventor’s profile.
Copyrights: The data consists of copyright title, class, language, contributors’
profile, description of work, status of publication, year of publication, country of
first publication, publishers’ profile and details of income generated from priced
publications.
874 A.R. Mohamed et al.

Fig. 3 User interface for technology portfolio
Design and Development of an Online Database Management System. . . 875

Design: This section is regarding information about an industrial design developed
by the institute. The fields are title, description, novelty of design, contributors’
profile, details of licensing/transfer of rights, status of protection, date of filing,
application number, date of registration, registration number and country.
The benefits of AGRI-TECHBASE can be viewed in two ways: (1) they support
the functions of zonal institute, and (2) they support the information and technology
management needs of various member institutes under the zone. The adoption of
the online zonal database management system has helped in increasing the effec-
tiveness and efficiency of information used by the institutes. As AGRI-TECHBASE
is incorporated in the project website, no special hardware are required; any
computer with a web browser can access the database. The database runs on a
web server so the user can access it from any computer connected to the internet.
The development cost was typically lower than stand-alone software. One of the
greatest benefits of databases is that data can be shared or secured among different
users. There is more control and accountability over how the data is managed
because the data all resides in one database.
AGRI-TECHBASE provides good reference for documenting technologies and
evaluating which technologies are appropriate for various development zones.
It presents advantages, salient features and cost-benefit analysis of technologies
in various levels of development. The system provides a simple platform for
assessing the existing R&D programs and the current resources. The additional
advantages that will accrue are low cost of operation, quick access to all relevant
information, integrated, direct and personalized (Singh et al. 2008). Having access
to the database at all times from multiple locations is another major advantage of
this type of database. With an online database, you could theoretically access the
information in the database from any computer. The information is also available
24 h a day, 7 days a week.
A crucial aspect of the system operation phase is the fact that the database design
team will end their involvement once the system is completely functional. At that
point, it is important that the end user have the technical know-how and resources to
continue operation of the system, maintain it and improve it, without further
assistance from the project team. Because of the inherent changes in the delegation
of posts in a government institution, it became necessary to develop a system that is
easy to use and improve and that will not collapse with the departure of a key
government person. To accomplish this goal, training materials and procedures
were developed, for assuring the continued operation of the system in the future.
As an online database is easier to hack and can more easily receive viruses and other
malware, there is a need for greater security as well as constant monitoring of the
database by knowledgeable personnel (Dizon 2004). With regard to the content
management of the website and the database, there are no specialized personnel in
the project for web development. This has resulted in the delay in updating of
database content due to other official overload.
ICAR has put in serious efforts to develop database management systems for
providing information about the current agricultural development, availability and
utilization of various economic resources and R&D activities in education sector.
876 A.R. Mohamed et al.

The Indian Agricultural Statistics Research Institute, New Delhi has designed an
online management of database on Indian Agricultural Education System through
NISAGENET (National Information System on Agricultural Education on Internet).
An online data management module has been developed for maintaining and
disseminating information on various activities of the agricultural universities
like academic, research and extension. The system is capable of maintaining an
up-to-date agricultural education data bank of all SAUs and deemed universities of
ICAR (Sharma et al. 2006). The National Academy of Agricultural Research
Management (NAARM) under ICAR had developed an integrated information
system, incorporating the data on academic, research and extension activities of
agricultural universities, AGRIUNIS, with support from Department of Science and
Technology (Murlidhar and Rama 1996). Indian Agricultural Statistics Research
Institute had developed a stand-alone software system NISAGE for storing the
information concerning education sector of NARS (Goyal 1998).
4 Conclusion
AGRI-TECHBASE is a unique database management system to help individual
researchers, innovators and other practitioners to locate possible sources of
recorded information on R&D literature, activities and technologies; share and
exchange information, identify potential innovations and breakthroughs; and iden-
tify possible sources of support. It helps in analysing, packaging and synthesizing
information for various users; refers services on ongoing researches, published
literature and technologies; identifies potential users of information; fosters public
awareness and understanding of trends in agricultural research, and disseminates,
packages and transfers technologies for utilization.
References
Caldwell JG (2009) Approach to management information system design. http://www.
foundationwebsite.org/ApproachToMIS.htm
Dizon JM (2004) Developing the BAS’ agricultural and fisheries statistics batabase: a web-based
approach. http://nscb.gov.ph/ncs/9thncs/papers/knowledgeBased_Developing.pdf
Goyal RC (1998) National Information System on Agricultural Education (NISAGE). In:
Proceedings of National Conference on Agricultural Research Statisticians, Indian Agricul-
tural Statistics Research Institute, New Delhi. pp 142–151
Murlidhar U, Rama RD (1996) Management information system -AGRIUNIS: experiences and
issues in an Indian context. J Inf Sci 22(4):277–286
Sunil P (2006) Science Tech Entrepreneur, Role of information technology in Agriculture (2006)
http://www.techno-preneur.net/information-desk/sciencetech-magazine/2006/aug06/
Role_Agri.pdf
Sharma A, Goyal RC, Gupta YR, Grover RB (2006) Design and on-line management of database
on Indian Agricultural Education System. J Indian Soc Agric Stat 60(3):155–161
Singh M, Singh P, Singh SB (2008) Decision support system for farm management. World Acad
Sci Eng Technol 39:346–349
Design and Development of an Online Database Management System. . . 877

Integrated AHP-TOPSIS Model for Software
Selection Under Multi-criteria Perspective
Santanu Kumar Misra and Amitava Ray
1 Introduction
In today’s increasing competitive business climate, information technology plays
a major role in success of companies. In today, markets having a great number of
competitors and therefore the competition are so fierce. Quality and cost do not
suffice in competition, and therefore, new competition parameters are needed like
delivery date in right time and customised product (Yusuf et al. 2006). Software
automates and integrates business processes and allows information sharing in
different business functions. In addition, software supports the finance, human
resources, operations and logistic, sale and market in functions through and effec-
tive and productive business process. At the same time, it improves the perform-
ance of organisation’s functions by controlling those (Hallikainen et al. 2006).
Although organisations can develop their own software, other ones may prefer
ready product to shorten application cycle. The vendors sell software which is
developed in different operating systems and available database in market. When
an organisation prefers to purchase software, it is going to be higher in cost
(Verville and Halingten 2003). The best suitable software product selection yields
positive results like increasing productivity, timely delivery, reduction of setup
time and reduction of purchasing cost. Other perspectives on software selection
focus on the criteria that organisations consider in selecting commercial software
(Wei et al. 2005a, b). Therefore, in this selection, multi-criteria decision-making
approach plays an important role. The analytical model integrated with AHP (Lai
et al. 2002; Wei et al. 2005a, b); Ahmad and Phillip 2006; Salo and Hamalainen
1997; Yurdakul 2004; Norita and Laplante 2006) model and technique for order
S.K. Misra (*) • A. Ray
Deparment of Computer Science and Engineering, Sikkim Manipal Institute of Technology,
Majitar, East-Sikkim 737136, India
e-mail: [email protected]; [email protected]
Department of Management Studies, Indian Institute of Science, Bangalore,
Driving the Economy through Innovation and Entrepreneurship,DOI 10.1007/978-81-322-0746-7_72, # Springer India 2013
879

preference by similarity to ideal solution (TOPSIS) (Balli and Korukoglu 2009;
Saghafian and Hejazi 2005; Ray et al. 2010; Chen 2000) will help to determine the
right judgment in software selection for an organisation based on organisation-
specific requirements. This chapter proposes an integrated model of AHP-TOPSIS
methodology considering both qualitative and quantitative factors. In the following
sections, we present the past research works done by the researchers. AHP method
and TOPSIS method have been discussed briefly. After that, the proposed analytical
model has been discussed including a numerical application of proposed model.
Finally, the sensitivity analysis and conclusion of the research are highlighted.
2 Literature Survey
In recent literature regarding the software selection, Sen et al. (2009) emphasised
a fuzzy quality function deployment approach for determining which of the non-
functional requirements reported by earlier studies are important to a company’s
software selection decision based on and integrated with its functional require-
ments. Solution provided in this study not only assists decision-makers in acquiring
software requirements and defining selection criteria but also supports in deter-
mining the relative importance of these criteria. Previously, the authors Sen et al.
(2009) in their paper ‘An integrated decision support system dealing with qualitative
and quantitative objectives for enterprise software selection’ proposed a hierarchical
objective structure that contains both qualitative and quantitative objectives that are
used to evaluate software products systematically. This approach uses a heuristic
algorithm, a fuzzy multi-criteria decision-making procedure and a multi-objective
programming model to make final selection decision. Dias-Neto and Travassos
(2009) proposed a strategy to select model-based testing approaches for software
projects called Porantim. Porantim is based on a body of knowledge describing
model-based testing approaches and their characterisation attributes and a process to
guide by adequacy and impact criteria regarding the use of this sort of software
technology that can be used by software engineers to select model-based testing
approaches for software projects. Petri Kettunen and Maarit Laanti in their literature
proposed a comparative selection model. Some real-life project case examples are
examined against this model. The selection matrix expresses how different process
models answer to different questions, and indeed, there is not a single process model
that would answer all the questions. This chapter investigates the software process
model selection in the context of large market-driven embedded software product
development for new telecommunications equipment. Li et al. (2009) proposed
selection technique for ABE (PSABE) which decomposes whole project into small
subset that consists only representative projects. The proposed methods are validated
on four datasets (two real-world sets and two artificial sets) and compared with
conventional ABE, feature-weighted ABE (FWABE) and machine learning methods.
880 S.K. Misra and A. Ray

Jadhava and Sonarb (2011) emphasised (1) generic methodology for software
selection, (2) software evaluation criteria and (3) hybrid knowledge-based system
(HKBS) approach to assist decision-makers in evaluation and selection of the
software packages. That also evaluates and compares HKBS approach with the
widely used existing software evaluation techniques such as analytic hierarchy
process (AHP) and weighted scoring method (WSM). Ayalaa et al. (2011) discusses
about the actual industrial practice of component selection in order to provide an
initial empirical basis that allows the reconciliation of research and industrial
endeavours. Yazgan et al. (2011) proposed an ANN model that has been designed
and trained with ANP results in order to calculate ERP software priority. The
artificial neural network (ANN) model is trained by results obtained from ANP. In
literature, majority of methods tried to reduce the comparisons required to evaluate
the appropriate one from many applications against many requirements with the help
of some process. Ghorbani and Rabbani (2009) proposed multi-objective algorithm
for project selection problem by increasing expected benefits and minimising the
absolute variation of allotted resource between each successive time periods. Vidal
et al. (2011) define a measure of project complexity in order to assist decision-
making when analysing several projects in a portfolio, or when studying different
areas of a project. Wei et al. (2005a, b) proposed an AHP-based solution for ERP
(enterprise resource planning) selection. Badri and Davis (2001) presented a 0–1 goal
programming model to select an IS (information system) project considering
multiple criteria including benefits, hardware, software and other costs, risk factors,
preferences of decision-makers and users, completion time and training time
constraints. Lai et al. (1999) discussed a case study for selecting a multimedia
authoring system using the AHP method. Javier Otamendi et al. (2008) proposed an
AHP-based model for software selection in smooth functionality of an international
airport. After gone through all these literature, it is clear that there is hardly any
literature which focuses on the selection of software product based on
organisational requirements. Rather, maximum literatures focus on to reduce the
complexity of risk factors, reduce complexity of selection process and motivates on
quantitative and qualitative factors for software selection. Some of the literature
focuses on the AHP-based priority ranking but do not get indexation using sensi-
tivity analysis for robustness of the selection process. Since AHP is based on the
subjective judgment of the decision-makers, therefore, error is inevitable in the
system. To reduce the error, researchers use integration of subjective factor mea-
sure and objective factor measure. In this model, TOPSIS decides the rank of the
software based on the concept that the alternatives are close to the positive ideal
solution and away from the negative ideal solution which is influenced by the
personal preference of the experts. TOPSIS is one of very efficient multi-criteria
decision-making method but hardly appears in the past literature review for soft-
ware selection purpose. After pointing out all these drawbacks of the past
literatures, authors are motivated on designing a simple selection model which
gives crisp results when all the alternatives follow same organisational
requirements. So this model will help to increase managerial skill for software
selection.
Integrated AHP-TOPSIS Model for Software Selection. . . 881

3 Methods
3.1 Analytical Hierarchy Process (AHP)
The analytical hierarchy process is a powerful and flexible multi-criteria decision-
making method that can be applicable in a variety of decision-making situations from
simple to complex situation. It is especially used to quantify managerial judgment of
the relative importance of each of several conflicting criteria used in decision-making
process. In this method, a problem is put into a hierarchical structure as follows:
(a) The overall objective of the decision
(b) Factors or criteria for the decision
(c) Sub-factors under those factors
(d) Decision option
The steps involved in AHP model are as follows:
Step-1: List the overall goal, criteria and decision alternatives. Step-2: Develop
a pairwise comparison matrix. Rate the relative importance between each pair of
decision alternatives based onSaaty’s nine-point scale. Thematrix lists the alternatives
horizontally and vertically and has the numerical rating comparing the horizontal
(first) alternative with the vertical (second) alternative. Step-3: Develop a normalised
matrix by dividing each number in a column in the pairwise comparison matrix by its
column sum. Step-4: Develop a priority vector. Average each row of the normalised
matrix. The row average forms the priority vector of alternative preferences with
respect to the particular criterion. Step-5: Calculate the consistency ratio [CI, RI and
CR]. Calculate the eigenvector or the relative weights and for each matrix of order ‘n’.
Compute consistency ratio using CI ¼ bmax � nð Þ n� 1ð Þ= , RI ¼ random inconsis-
tency ¼ 1.987 (n � 2)/n andCR ¼ CI/RI. The acceptable CR range varies according
to the size of matrix.
That is, 0.05 for the 3 by 3 matrix, 0.08 for a 4 by 4 matrix and 0.1 for all larger
matrices, n � 5. Step-6: Develop the overall priority vector by multiplying
normalised matrix of criteria with the priority matrix of decision alternatives
which is formed with priority vectors of different criteria. With this priority values,
judgment has been taken care of. Acceptable consistency value helps to ensure the
decision-maker reliability to determine the priorities for the set of criteria.
3.2 Technique for Order Preference by Similarity to IdealSolution (TOPSIS)
TOPSIS is a useful technique in the field of multi-criteria decision management.
The fundamental principle of the method is that the selected alternative should have
the shortest distance from PIS and the farthest distance from NIS. Suppose multi-
criteria decision system having m alternatives and n decision criteria, then the
decision matrix is presented by [xij]m � n, where xij is the numerical outcomes
882 S.K. Misra and A. Ray

obtained from ith alternative with respect to jth criteria. The steps involved in the
TOPSIS methods are as follows:
Step-1: Construct the normalised decision matrix(R) as rij ¼ Xij
ffiffiffiffiffiffiffiffiffiffiffiffiffiffiffiffiffiPmi¼1 X
2ij
q.,
where i ¼ 1, 2. . ., m and j ¼ 1, 2. . ., n and where rij is the element of the matrix.
This process tries to transform the attribute dimensions into non-dimensional
attributes which allows comparison across the attributes. Step-2: Calculate
weighted normalised decision matrix. Weights W* ¼ (W1, W2, W3, . . ., Wj,. . .,Wn) and
Pnj¼1 Wj ¼ 1. The matrix can be calculated by multiplying each column
of the matrix R with its associated weights Wj. Therefore, the weighted normalised
decision matrix V is as
W1r11 � � � Wnr1n... . .
. ...
Wmr1m � � � Wnrmn
0B@
1CA �
V1 � � � V1n
..
. . .. ..
.
Vm1 � � � Vmn
0B@
1CA. Step-3:
Determine ideal and negative ideal solutions. Let the two alternatives A+ and A� be
defined as
Aþ ¼ maxiVij j 2 Jj� �; miniVij j 2 J0j� �
i ¼ 1; 2; 3; . . . ;mj� �¼ Vþ
1 ;Vþ2 ;V
þ3 ; . . . ;V
þn
� �(1)
A� ¼ miniVij j 2 Jj� �; maxiVij j 2 J0j� �
i ¼ 1; 2; 3; . . . ;mj� �¼ V�
1 ;V�2 ;V
�3 ; . . . ;V
�n
� �: (2)
where J ¼ {j ¼ 1, 2, 3,. . ., n | j associated with benefit criteria}
J0 ¼ {j ¼ 1, 2, 3,. . ., n | j associated with benefit criteria}
Step-4: Calculate the separationmeasure. The separation between each alter can be
measured by the n-dimensional Euclidian distance. The separation of each alternative
from the ideal one is then given by Sþi ¼ffiffiffiffiffiffiffiffiffiffiffiffiffiffiffiffiffiffiffiffiffiffiffiffiffiffiffiffiffiffiffiffiffiffiffiffiPn
j¼1 Vij � Vþj
� �2r
, where i ¼ {1, 2, 3,
. . ., m}. Similarly, the separation from negative ideal one is given by
S�i ¼ffiffiffiffiffiffiffiffiffiffiffiffiffiffiffiffiffiffiffiffiffiffiffiffiffiffiffiffiffiffiffiffiffiffiffiffiPn
j¼1 Vij � V�j
� �2r
, where i ¼ {1, 2, 3, . . .,m}. Step-5: Calculate the relative
closeness to the ideal solution. The relative closeness of Ai with respect to A+
is defined as C�i ¼ S�i Sþi � S�i
� �; 0 < C�
i< 1 and i ¼ {1, 2, . . ., m}. It is clear thatC�i ¼ 1 if Ai ¼ A+ and C�
i ¼ 0 if Ai ¼ A�. An alternative Ai is closer to A+ as C�i
approaches to 1. Step-6: Rank the preference order. A set of alternative can now
be preference ranked according to the descending order of C�i .
4 Proposed Analytical Model
The stepwise approach for the current analytical model is as follows:
Step-A: Identify the decision-making team for selection purpose. The team then
analyses and identifies the organisational requirements from the software product.
At the same time, they also shortlist the tentative products for the organisation.
Integrated AHP-TOPSIS Model for Software Selection. . . 883

In our model, we announce them as decision criteria and decision alternatives.
Step-B: Identify the goal. The current job is focused on the selection of software
products from a pool of products. Step-C: Identify the decision criteria. Decision
criteria are totally based on organisation orientation, and weights are assigned with
a nine-point scale as mentioned in Table 2 to set importance among different
decision criteria. Step-D: Computation of priority ranking among all decision
criteria by using AHP model. It has been shown in Table 5. Step-D01: Composition
of the pairwise comparison matrix between decision criteria is shown in Table 3.
In this comparison matrix, if W weight is assigned to criteria1 with respect
to criteria 2, then 1/W weight is assigned to the criteria2 with respect to criteria1.
Step-D02: Construct the normalised matrix for criteria. This matrix representation
is shown in table form in Table 4. Step-E: In traditional TOPSIS, the weights of the
criteria are known precisely and are treated as important numerical data. The
obtained priority values of criteria by AHP as presented in Table 5 are introduced
as the weight values for the TOPSIS method. Step-F: Applying the different
mentioned steps of TOPSIS method, the computation of closeness values of all
alternatives from PIS (positive ideal solution) as well as NIS (negative ideal
solution) has been calculated and shown in Table 1. Step-G: Finally, apply sensi-
tivity analysis to achieve software index. Based on software index, suitable soft-
ware can be selected for the organisation. The flow diagram of the proposed model
is shown in Fig. 1.
Table 1 Relative closeness
to ideal solutionDecision alternatives Closeness index Closeness values
SOFT1 C�1 0.740
SOFT2 C�2 0.222
SOFT3 C�3 0.080
SOFT4 C�4 0.772
SOFT5 C�5 0.148
SOFT6 C�6 0.775
SOFT7 C�7 0.261
SOFT8 C�8 0.825
Table 2 Saaty’s nine-point
scaleCompared to 2nd entity, 1st entity is Numerical ratings
Extremely preferred 9
Very strongly preferred 7
Strongly preferred 5
Moderately preferred 3
Equally preferred 1
Intermediate judgment between two
adjacent judgments
2,4,6,8
Table 3 Pairwise
comparison matrix for criteriaReliability User friendly Security
Reliability 1 7 9
User friendly 1/7 1 7
Security 1/9 1/7 1
884 S.K. Misra and A. Ray

5 Numerical Application of Proposed Model
In this section, a hypothetical case study has been discussed as the validation of
proposed model by following all stepwise approaches. As an assumption, the criteria
like reliability, user friendly and security are considered as identified criteria decided
by the decision-making team for software selection. All the shortlisted software are
roughly named as SOFT1, SOFT2, SOFT3, SOFT4, SOFT5, SOFT6, SOFT7 and
SOFT8. Roughly, their costs are taken as 600(USD), 625(USD), 695(USD), 620
(USD), 640(USD), 720(USD), 644(USD) and 650(USD). Table 2 represents Saaty’s
nine-point scale. Based on Saaty’s nine-point rating scale, pairwise comparison
matrix is formed by considering horizontal alternatives versus vertical alternatives.
The result of pairwise comparison of ‘n’ criteria can be summarised in a [n � n]matrix ‘A’ in which each element aij (i, j ¼ 1, 2, 3) is the quotient of weights of the
criteria as shown. In this case, value of ‘n’ is 3:
A ¼a11 a12 a13a21 a22 a23a31 a32 a33
24
35; where aij ¼ 1 for i ¼ j and aij ¼ 1
aijfor aij 6¼ 0:
To follow Step-3 mentioned in AHP section, the formation of normalised matrix
(A0) is being done by dividing each element in a column of pairwise comparison
Table 5 Priority vectors for
criteriaCriteria Priority values
Reliability 0.729
User friendly 0.216
Security 0.055
Table 4 Normalised matrix
for criteriaReliability User friendly Security
Reliability 63/79 49/57 9/17
User friendly 9/79 7/57 7/17
Security 7/79 1/57 1/17
Forming decision making team
Identify criteria Identify alternatives
AHP model TOPSIS model Sensitivity analysis Selecting the optimal product
Fig. 1 Flow diagram of proposed analytical model
Integrated AHP-TOPSIS Model for Software Selection. . . 885

matrices (A) by its column sum. Sum of every column of correct pairwise comparison
matrix will be always 1:
A0 ¼
a11P3ai1
a12P3ai2
a13P3ai3
a21P3ai1
a22P3ai2
a23P3ai3
a31P3ai1
a32P3ai2
a33P3ai3
26664
37775:
This normalised matrix is shown in Table 4. In the next step, priority vector (P)of criteria is formed by averaging each row of normalised matrix. These values will
also add up to 1:
P ¼P1
P2
P3
24
35; where Pk ¼ Avgðk th row of A0Þ:
This priority vector is shown in Table 5. These priority values are treated as
the weight factors of TOPSIS method, which is represented in TOPSIS as W� ¼W1;W2;W3ð Þ ¼ Wreliability;Wuserfriendly;Wsecurity
� � ¼ 0:729; 0:216; 0:055ð Þ:One deci-sion matrix (D) has been formed with eight alternatives and three criteria represented
as [xij] 8 � 3. Here, xij is the numerical outcomes obtained from ith alternative with
respect to jth criteria using Saaty’s nine-point scale as
D ¼
Reliability User friendly Security
9 2 3
3 7 4
3 2 8
8 5 3
3 5 5
9 3 5
3 8 8
8 8 2
26666666666664
37777777777775
Then construct the normalised decision matrix (R) as rij ¼ xijffiffiffiffiffiffiffiffiffiffiffiffiffiffiffiffiffiPm
i¼1 X2ij
q.,
where i ¼ 1, 2,. . ., 8; j ¼ 1, 2, 3; and m ¼ 8 and where rij are elements of the
matrix. This normalised matrix is shown as
R ¼
Reliability User friendly Security
0:4984 0:1280 0:20420:1662 0:4481 0:27220:1662 0:1280 0:54450:4432 0:3201 0:20420:1662 0:3201 0:34030:4984 0:1920 0:34030:1662 0:5121 0:54450:4432 0:5121 0:1361
26666666666664
37777777777775
886 S.K. Misra and A. Ray

Then weighted normalised matrix (V) is calculated by multiplying each column
of the matrix R with its associated weight Wj. It can be expressed as
V ¼W1r11 � � � Wnr1n
..
. . .. ..
.
Wmr1m � � � Wnrmn
0B@
1CA �
V11 � � � V1n
..
. . .. ..
.
Vm1 � � � Vmn
0B@
1CA
¼
Reliability User friendly Security
0:3633 0:0276 0:01120:1211 0:0967 0:01490:1211 0:0276 0:02990:3230 0:0691 0:01120:1211 0:0691 0:01870:3633 0:0414 0:01870:1211 0:1106 0:02990:3230 0:1106 0:0074
26666666666664
37777777777775
As per Step-3 and Step-4 mentioned in the TOPSIS section, the ideal and
negative ideal solutions are calculated (Eqs. 1 and 2), and with these values, the
separation between each alternative is measured by n-dimensional Euclidian dis-
tance. Then relative closeness to the ideal solution is obtained as per Step-5 of
TOPSIS section. Ultimately, all the developers are ranked up with the descending
order of their relative closeness value from ideal and negative ideal solutions. This
relative closeness value is shown in Table 1 mentioned below.
Considering final results from AHP-TOPSIS model (Table 1) as subjective
factors and cost as objective factor, the sensitivity analysis is accomplished and
plotted in Fig. 2. With that index values’ optimum, one can be easily identified.
6 Sensitivity Analysis
A mathematical model introduced by Bhattachariyya et al. (2005), Ray et al. (2007,
2008), Dhar et al. (2010) is also applied here to combine the weighted rating
obtained from AHP-TOPSIS model with the software cost, to get the appropriate
solution of the proposed model:
DIi ¼ a� SFMi þ ð1� aÞ � OFMi (3)
where OFMi ¼ 1 OFUi
Pni¼1
1
OFUi
� � ��.
OFM is the objective factor measure. OFU is the objective factor utility which is
the software cost. SFM is the subjective factor measure. SI is the software index. ‘a’is the objective factor decision weight, a � 0 but a � 1. ‘n’ is the number of
alternatives. SFM values are the weighted rating values from the AHP-TOPSIS
model for each software, and OFM values are calculated from the cost values using
mentioned formula. Using Eq. 1, software index can be calculated. The choice of
Integrated AHP-TOPSIS Model for Software Selection. . . 887
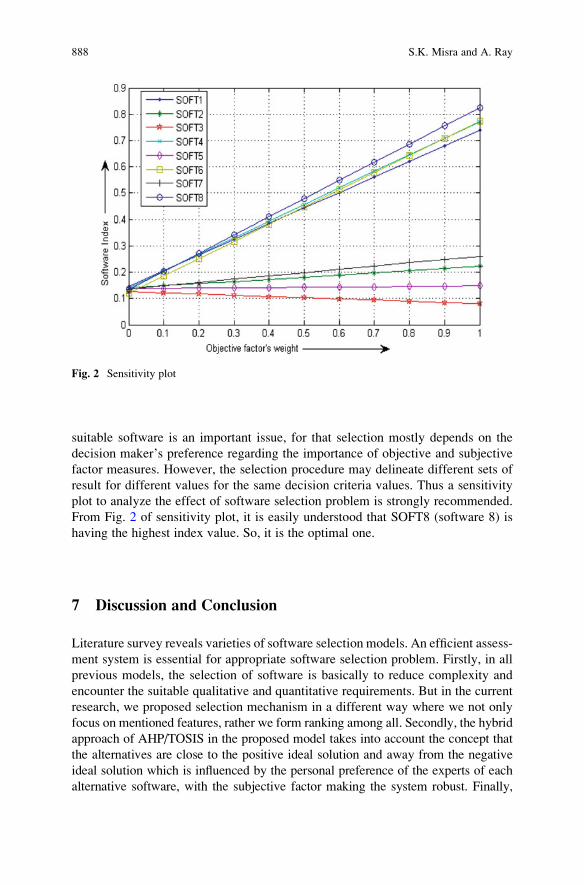
suitable software is an important issue, for that selection mostly depends on the
decision maker’s preference regarding the importance of objective and subjective
factor measures. However, the selection procedure may delineate different sets of
result for different values for the same decision criteria values. Thus a sensitivity
plot to analyze the effect of software selection problem is strongly recommended.
From Fig. 2 of sensitivity plot, it is easily understood that SOFT8 (software 8) is
having the highest index value. So, it is the optimal one.
7 Discussion and Conclusion
Literature survey reveals varieties of software selection models. An efficient assess-
ment system is essential for appropriate software selection problem. Firstly, in all
previous models, the selection of software is basically to reduce complexity and
encounter the suitable qualitative and quantitative requirements. But in the current
research, we proposed selection mechanism in a different way where we not only
focus on mentioned features, rather we form ranking among all. Secondly, the hybrid
approach of AHP/TOSIS in the proposed model takes into account the concept that
the alternatives are close to the positive ideal solution and away from the negative
ideal solution which is influenced by the personal preference of the experts of each
alternative software, with the subjective factor making the system robust. Finally,
Fig. 2 Sensitivity plot
888 S.K. Misra and A. Ray

sensitivity analysis of the proposed model provides the decision-maker a robust
decision support system to evaluate the performance of the software. Therefore, the
proposed software selection models overrule the traditional model in the sense that
the error generated due to the subjective judgment of the decision-makers rectified by
the proposed model. The advantages of the proposed model are as follows: it is well
suited for dealing appropriate ranking of software based on organisational require-
ments, it is simple and straightforward and it takes minimum time for calculation and
ultimately for choosing candidate. Some weakness of our proposed method might
be as follows: it does not include the detailed segmentation of software develop-
ment activities which play important role for selection. So there is scope for further
research in these areas.
References
Amitava R, Bijan S, Subir S (2010) The TOC-based algorithm for solving multiple constraint
resources. IEEE Trans Eng Manag 57(2):301–309
Ayala C, Hauge O, Conradi R, Franch X, Li Jingyue (2011) Selection of third party software in
Off-The-Shelf-based software development—an interview study with industrial practitioners.
J Syst Softw 84(4):620–637
Badri MA, Davis D (2001) A comprehensive 0–1 goal programming model for project selection.
Int J Proj Manage 19(4):243–252
Balli S, Korukoglu S (2009) Operating system selection using fuzzy AHP and TOPSIS methods.
Math Comput Appl 14(2):119–130
Bhattachariyya A, Sarkar BM, Kumar S (2005) Integrating AHP and QFD for robot selection
under requirement perspective. Int J Prod Res 43(17):3671–3685
Chen CT (2000) Extensions of the TOPSIS for group decision-making under fuzzy environment.
Fuzzy Set Syst 114:1–9
Dhar S, Ray A, Bera R (2010) Design simulation and sensitivity analysis of vertical handover
algorithm for vehicular communication. Int J Comput Sci Soft Technol 3(2):103–117
Dias-Neto AC, Travassos GH (2009) Model-based testing approaches selection for software
projects. Info Softw Technol 51:1487–1504
Ghorbani S, Rabbani M (2009) A new multi objective algorithm for project selection problem.
Adv Eng Softw 40:9–14
Hallikainen P, Kimpimaki H, Kivijarvi H (2006) Supporting the module sequencing decision in
the ERP implementation process. In: Proceedings of the 39th Hawaii international conference
on system sciences, 2006
Jadhav AS, Sonar RM (2011) Framework for evaluation and selection of the software packages:
a hybrid knowledge based system approach. J Syst Softw 84: 1394–1407
Lai VS, Trueblood RP, Wong BK (1999) Software selection: a case study of the application of the
analytical hierarchical process to the selection of a multimedia authoring system. Inf Manag
36:221–232
Lai VS, Wong BK, Cheung W (2002) Group decision making in multiple criteria environment:
a case using the AHP in software selection. Eur J Oper Res 137:134–144
Li YF, Xie M, Goh TN (2009) A study of project selection and feature weighting for analogy based
software cost estimation, J Syst Softw 82(2):241–252
Norita A, Laplante P (2006) Software project management tools: making a practical decision using
AHP. Software Engineering. Workshop SEW-30 (SEW’06), IEEE, Washington, DC
Integrated AHP-TOPSIS Model for Software Selection. . . 889

Otamendi J, Pastor JM, Garcia A (2008) Selection of the simulation software for the management
of the operations at an international airport. Simulat Model Prac Theory 16(2008):1103–1112
Ray A, Sarkar B, Sanyal S (2007) An integrated theory-of-constraints. In: Proceedings of IEEE
IEEM, pp 25–29
Ray A, Sarkar B, Sanyal S (2008) A holistic approach for production outsourcing. Strat Outsour
Int J 1(2):142–153
Resit YH, Semra B, Kerim G (2011) An ERP software selection process with using artificial neural
network based on analytic network process approach. Expert Syst Appl 36(5):9214–9222
Saghafian S, Hejazi SR (2005) Multi-criteria group decision making using a modified fuzzy
TOPSIS procedure. In International conference on computational intelligence for modelling,
control and automation, and international conference on intelligent agents, web technologies
and internet commerce (CIMCA-IAWTIC’05) vol 2, pp 215–221
Salo AA, Hamalainen RP (1997) On the measurement of preferences in the analytic hierarchy
process. J Multi-Criteria Decis Anal 6:309–319
Sen CG, Baracl{ H, Sen S, Basl{gil H (2009) An integrated decision support system dealing with
qualitative and quantitative objectives for enterprise software selection. Expert Syst Appl
36(3P1):5272–5283
Vidal L-A, Marle F, Bocquet J-C (2011) Using a Delphi process and the Analytic Hierarchy
Process(AHP) to evaluate the complexity of project. Expert Syst Appl 38:5388–5405
Verville J, Halingten A (2003) A six stage model of the buying process for ERP software. Ind
Mark Manag 32:585–594
Wei C-C, Chien C-F, Wang M-JJ (2005a) An AHP based approach to ERP system selection. Int
J Prod Eco 96:47–62
Wei C-C, Chien C-F, Wang M-JJ (2005b) An AHP based approach to ERP system selection. Int
J Prod Econ 96:47–62
Yusuf Y, Gunasekaran A, Wu C (2006) Implementation of enterprise resource planning in China.
Technovation 26:1324–1336
Yurdakul M (2004) Selection of computer-integrated manufac-turing technologies using a com-
bined analytic hierarchyprocess and goal programming model. Robot Comput Integr Manuf
20(4):329–340
890 S.K. Misra and A. Ray