Driving Performance on the Descending Limb of Blood Alcohol Concentration (BAC) in Undergraduate...
15
RESEARCH ARTICLE Driving Performance on the Descending Limb of Blood Alcohol Concentration (BAC) in Undergraduate Students: A Pilot Study Mathieu Tremblay 1,3☯ , François Gallant 2,3☯ , Martin Lavallière 4☯ , Martine Chiasson 1,3☯ , Dustin Silvey 5‡ , David Behm 5‡ , Wayne J. Albert 1‡ , Michel J. Johnson 2,3☯ * 1 Faculty of Kinesiology, University of New Brunswick, Fredericton, Canada, 2 École de kinésiologie et de loisir, Université de Moncton, Moncton, Canada, 3 Healthy Driver Research Group, Université de Moncton, Moncton, Canada, 4 MIT (Massachusetts Institute of Technology) AgeLab & New England University Transportation Center, Cambridge, United States of America, 5 School of Human Kinetics and Recreation, Memorial University of Newfoundland, St John’s, Canada ☯ These authors contributed equally to this work. ‡ These authors also contributed equally to this work. * [email protected] Abstract Young drivers are overrepresented in collisions resulting in fatalities. It is not uncommon for young drivers to socially binge drink and decide to drive a vehicle a few hours after con- sumption. To better understand the risks that may be associated with this behaviour, the present study has examined the effects of a social drinking bout followed by a simulated drive in undergraduate students on the descending limb of their BAC (blood alcohol concen- tration) curve. Two groups of eight undergraduate students (n = 16) took part in this study. Participants in the alcohol group were assessed before drinking, then at moderate and low BAC as well as 24 hours post-acute consumption. This group consumed an average of 5.3 ± 1.4 (mean ± SD) drinks in an hour in a social context and were then submitted to a driv- ing and a predicted crash risk assessment. The control group was assessed at the same time points without alcohol intake or social context.; at 8 a.m., noon, 3 p.m. and 8 a.m. the next morning. These multiple time points were used to measure any potential learning ef- fects from the assessment tools (i.e. driving simulator and useful field of view test (UFOV)). Diminished driving performance at moderate BAC was observed with no increases in pre- dicted crash risk. Moderate correlations between driving variables were observed. No asso- ciation exists between driving variables and UFOV variables. The control group improved measures of selective attention after the third asessement. No learning effect was observed from multiple sessions with the driving simulator. Our results show that a moderate BAC, al- though legal, increases the risky behaviour. Effects of alcohol expectancy could have been displayed by the experimental group. UFOV measures and predicted crash risk categories were not sentitive enough to predict crash risk for young drivers, even when intoxicated. PLOS ONE | DOI:10.1371/journal.pone.0118348 February 27, 2015 1 / 15 OPEN ACCESS Citation: Tremblay M, Gallant F, Lavallière M, Chiasson M, Silvey D, Behm D, et al. (2015) Driving Performance on the Descending Limb of Blood Alcohol Concentration (BAC) in Undergraduate Students: A Pilot Study. PLoS ONE 10(2): e0118348. doi:10.1371/journal.pone.0118348 Academic Editor: Michael Taffe, The Scripps Research Institute, UNITED STATES Received: October 1, 2014 Accepted: January 14, 2015 Published: February 27, 2015 Copyright: © 2015 Tremblay et al. This is an open access article distributed under the terms of the Creative Commons Attribution License, which permits unrestricted use, distribution, and reproduction in any medium, provided the original author and source are credited. Data Availability Statement: All relevant data are within the paper and its Supporting Information files. Funding: The authors have no support or funding to report. Competing Interests: The authors have declared that no competing interests exist.
-
Upload
independent -
Category
Documents
-
view
1 -
download
0
Transcript of Driving Performance on the Descending Limb of Blood Alcohol Concentration (BAC) in Undergraduate...

RESEARCH ARTICLE
Driving Performance on the Descending Limbof Blood Alcohol Concentration (BAC) inUndergraduate Students: A Pilot StudyMathieu Tremblay1,3☯, François Gallant2,3☯, Martin Lavallière4☯, Martine Chiasson1,3☯,Dustin Silvey5‡, David Behm5‡, Wayne J. Albert1‡, Michel J. Johnson2,3☯*
1 Faculty of Kinesiology, University of New Brunswick, Fredericton, Canada, 2 École de kinésiologie et deloisir, Université de Moncton, Moncton, Canada, 3 Healthy Driver Research Group, Université de Moncton,Moncton, Canada, 4 MIT (Massachusetts Institute of Technology) AgeLab & New England UniversityTransportation Center, Cambridge, United States of America, 5 School of Human Kinetics and Recreation,Memorial University of Newfoundland, St John’s, Canada
☯ These authors contributed equally to this work.‡ These authors also contributed equally to this work.* [email protected]
AbstractYoung drivers are overrepresented in collisions resulting in fatalities. It is not uncommon for
young drivers to socially binge drink and decide to drive a vehicle a few hours after con-
sumption. To better understand the risks that may be associated with this behaviour, the
present study has examined the effects of a social drinking bout followed by a simulated
drive in undergraduate students on the descending limb of their BAC (blood alcohol concen-
tration) curve. Two groups of eight undergraduate students (n = 16) took part in this study.
Participants in the alcohol group were assessed before drinking, then at moderate and
low BAC as well as 24 hours post-acute consumption. This group consumed an average of
5.3 ± 1.4 (mean ± SD) drinks in an hour in a social context and were then submitted to a driv-
ing and a predicted crash risk assessment. The control group was assessed at the same
time points without alcohol intake or social context.; at 8 a.m., noon, 3 p.m. and 8 a.m. the
next morning. These multiple time points were used to measure any potential learning ef-
fects from the assessment tools (i.e. driving simulator and useful field of view test (UFOV)).
Diminished driving performance at moderate BAC was observed with no increases in pre-
dicted crash risk. Moderate correlations between driving variables were observed. No asso-
ciation exists between driving variables and UFOV variables. The control group improved
measures of selective attention after the third asessement. No learning effect was observed
from multiple sessions with the driving simulator. Our results show that a moderate BAC, al-
though legal, increases the risky behaviour. Effects of alcohol expectancy could have been
displayed by the experimental group. UFOVmeasures and predicted crash risk categories
were not sentitive enough to predict crash risk for young drivers, even when intoxicated.
PLOS ONE | DOI:10.1371/journal.pone.0118348 February 27, 2015 1 / 15
OPEN ACCESS
Citation: Tremblay M, Gallant F, Lavallière M,Chiasson M, Silvey D, Behm D, et al. (2015) DrivingPerformance on the Descending Limb of BloodAlcohol Concentration (BAC) in UndergraduateStudents: A Pilot Study. PLoS ONE 10(2): e0118348.doi:10.1371/journal.pone.0118348
Academic Editor: Michael Taffe, The ScrippsResearch Institute, UNITED STATES
Received: October 1, 2014
Accepted: January 14, 2015
Published: February 27, 2015
Copyright: © 2015 Tremblay et al. This is an openaccess article distributed under the terms of theCreative Commons Attribution License, which permitsunrestricted use, distribution, and reproduction in anymedium, provided the original author and source arecredited.
Data Availability Statement: All relevant data arewithin the paper and its Supporting Information files.
Funding: The authors have no support or funding toreport.
Competing Interests: The authors have declaredthat no competing interests exist.
IntroductionYoung driver education, training programs, and legislative changes have been successful at de-creasing the number of collisions over the last few decades [1–3]. Over the last few years, inCanada, many provinces (that enforce their own driving legislation) have put in place restric-tive measures for young drivers. For instance, in New Brunswick (Canadian province on theeast coast), since 2009 individuals between the ages of 16 and 21 years must go through a grad-uated licensing program to obtain a driving permit. They cannot operate motor vehicles be-tween midnight and 5 a.m. There is zero tolerance for alcohol, therefore drivers must have ablood alcohol concentration (BAC) of 0.0 g/dL. Individuals who carry a learner’s permit canhave no more than one teenage passenger at a time. After successfully finishing the graduatedlicensing program (without violations), drivers 21 years of age become unrestricted, meaningthat the zero alcohol tolerance policy is lifted. Despite all actions taken, young drivers remainthe most at-risk group of drivers, underscoring the need to further understand the factors un-derlying collisions in this population.
In 2010, 27.7% of alcohol-related crashes resulting in serious injuries involved drivers be-tween the ages of 16 and 25 years [4]. Overall, this age group was implicated in 33.2% of all seri-ous alcohol-related injuries in Canada that year [4]. More alarming, the number of deaths inthis age group was 593, with alcohol being a factor in 299 of these cases, representing 50% of alldeaths in this age group [4]. The drivers of this age are scattered between the multiple steps ofthe licensing program. Even though this age group represents only 13.6% of the Canadian pop-ulation, it is responsible for 33.3% of alcohol-related crashes resulting in fatalities [5].
Many factors contribute to collisions in younger drivers, including driver inexperience,risky driving behaviour, and drug and/or alcohol consumption [6,7]. By far, alcohol is one ofthe most dangerous yet preventable factors responsible for driving-related collisions. Alcoholcan play an important role in many social events for this age group, and the acute impact of al-cohol consumption on driving is widely studied [8]. However, it is not uncommon for individ-uals to consume large amounts of alcohol in a short period of time, and to then take the wheela few hours later when they have reached legally acceptable BAC levels. A recent epidemiologi-cal study by French & Gumus [9], observed not only a significant increased prevalence ofmotor vehicle collision during the spring break season involving young drivers, but also a sig-nificant number of these crashes involving drivers with a BAC below 0.08 g/dL. This level isnot considered legally impaired in North America. Although there is a preponderance of stud-ies examining the effects of alcohol consumption on performance shortly following intoxica-tion, there are a lack of studies examining driving performance after a moreprolonged abstinence.
To better understand the effects of common practices regarding alcohol consumption ob-served in young drivers and driving performance, the present pilot study examined the effectsand relationships between simulated driving performance and crash risk in young drivers withBAC decreasing over time. This study recreated a combined social gathering and impaireddriving context, while capturing direct measures of driving performance.
Materials and Methods
DesignAn experimental design with two groups of young drivers was chosen for observation: 1) the ef-fects of decreasing BAC on driving performance and crash risk in the first group; and 2) thesecond group was used to control potential learning effects (performance improvement) ofmultiple sessions with assessment tools (i.e. driving simulator and useful field of view
Driving Performance in Undergraduate Students while Sobering Up
PLOSONE | DOI:10.1371/journal.pone.0118348 February 27, 2015 2 / 15

(UFOV)). For this pilot study, the statistical power was not enough (i.e.< 0.95; α = 0.05) to beable to conduct between-group analysis. Therefore, strictly intra-group comparisonswere performed.
ParticipantsTwo groups of 10 participants (12 women, 8 men) volunteered to take part in this study. Of thetwenty participants, four participants were unable to complete the protocol (two in eachgroup) due to simulator sickness. To be eligible, participants were required to have a valid driv-er’s license and be at least 19 years old, the legal drinking age in the province of New Bruns-wick. Participants were excluded from the study if they had chronic diseases, had issues linkedto alcohol consumption or did not consume alcohol weekly (at least 1 drink par week). Preg-nancy was also an exclusion factor. All drivers were recruited from the academic community ofthe university. This experiment was specifically approved by the Comité d'éthique de la recher-che avec les êtres humains of the Université de Moncton (reference number is CER-1213032).
Experimental group: The participants were invited to binge drink in a social gathering eventthat took place in a controlled environment in the lab, and were encouraged to invite a friendto this event. All participants were advised to abstain from drinking alcohol 24 hours prior totesting, have a good night’s sleep and eat well before the experiment. This group had an averageage of 21.6 ± 2.32 years (2 women, 6 men) and consumed an average of 7 ± 4.6 drinks weekly.For safety while consuming alcohol, a registered nurse supervised the participants.
Control group: In this group, participants completed the same protocol but without con-suming alcohol. This group had a mean age of 20.9 ± 2.35 years (4 women, 4 men). Since thisgroup did not consume alcohol during this study, alcohol related information was not recorded(i.e. issues with alcohol consumption, consumption habits).
ApparatusPhysiological assessment: A 3-lead ECG (MLA2340), was used to collect, condition (i.e. ampli-fication, filtering, converting) and record heart signals with the help of the Bio Amp unit(FE132) and an eight channel PowerLab unit (PL3508) (AdInstruments, United States ofAmerica (USA)). LabChart software (version 7, AdInstruments) was used for data collection,data analysis and calculation of heart rate variability (HRV). HRV was used to measure thephysiological response to alcohol [10,11].
Crash risk prediction: The Useful Field of View (UFOV) test is one of the most widely usedand better predictors available of driving performance and crash risk [12,13]. It is comprised ofthree subtests measuring: 1) processing speed; 2) divided attention; and 3) selective attention.These represent higher-order cognitive functioning required for safe vehicle driving. Aftercompleting all three subtests, the software places each participant into a relative crash risk cate-gory ranging from very low to very high. This test was performed on a 17” touch screen (EloTouchsystems 2700 Intellitouch USB) with UFOV software (version 6.1.4; Visual AwarenessResearch Group inc., USA).
Driving simulator: The simulated drives were completed on a driving simulator (VS500M,Virage Simulation, Canada). The open car simulator resembles a General Motors (GM) com-pact cab interior. The simulator consists of a driver’s seat, steering column, pedals, automatictransmission and a dashboard, which are mounted on a three-axis motion/vibration platformthat provides force feedback and vibration. Three 52” LCD displays provide 180 degrees frontview. The resolution is 1920x1080 pixels per front display. Rear view and side view mirrors aresimulated through the screens. Two side screens located behind the driver provide additionalvisual feedback for the left and right blind spots.
Driving Performance in Undergraduate Students while Sobering Up
PLOSONE | DOI:10.1371/journal.pone.0118348 February 27, 2015 3 / 15

ProceduresUpon arrival at the laboratory, each participant was briefed on the procedures of the experi-ment. All participants read and signed a consent form approved by the research ethics commit-tee of the Université de Moncton (CER-1213032). Participants were then given a generaldemographic questionnaire. In addition, a registered nurse sat with each participant and askedquestions related to alcohol consumption and alcohol behaviour. Following this initial screen-ing, 3-lead ECG electrodes were placed on the participants. Next, the participants were guidedthrough a 10 minute practice driving scenario to get familiarized with the simulator. After thisadaptation period, a 5 minute rest period was provided before proceeding with the UFOV andin-simulator driving assessment.
The simulated driving scenario was an urban drive that took an average of 13.6 ± 1.41 min-utes. This drive occurred on a clear day through a city while encountering different levels oftraffic density with other road users. Participants were guided through the simulation using aprogrammed voice (similar to a car GPS navigator) instructing participants to turn left or rightat various intersections. All participants underwent the same driving scenario. Both groupswere assessed at four time points (alcohol conditions):
• 8 a.m. on the first assessment day (BAC at 0 g/dL; Sober),
• 12 p.m. (four hours (4) after acute consumption with BAC within 0.05–0.07 g/dL; ModerateBAC),
• 3 p.m. (seven hours (7) after acute consumption with BAC within 0.01–0.04 g/dL; LowBAC),
• 8 a.m. the next morning (twenty-four hours (24) after acute consumption with BAC at 0 g/dL; 24H).
The participants in the control group were assessed at corresponding times of day (8 a.m.,noon, 3 p.m. and 8 a.m. the next morning). To validate that the experimental participants didnot exceed target BAC values, an ethylometer (Dräger Alcotest 7410 GLC, Draeger Safety Can-ada Ltd, Canada) was used before each testing period. All participants were at the appropriateBAC values before and during testing. This ethylometer was a loan from the city police service.Participants in the alcohol group were asked to consume one drink (30 mL of 40% Vodka)for every 11 kg of body weight in 60 minutes. The total number of drinks to be consumed wasequally distributed over the hour. The average consumption of 30 mL drinks in one hourwas 5.3 ± 1.4. This quantity of alcohol was deemed necessary to bring participants’ BAC over0.10 g/dL (high BAC), similar to what could be expected during a binge-drinking scenario. Fol-lowing consumption, the estimation of BAC was calculated with a Canadian adaptation of theWidmark formula [14], where a standard drink contains 13.6 g of alcohol [15]. This formulawas used to define the amount of time required for BACs to be at moderate and low levels.Widmark formula:
BAC ¼ ð0:806 � SD � 1:36Þ=ðBW �WtÞ � ðMR � DPÞ
where, 0.806 is a constant for body water in the blood (mean 80.6%), SD is the number of stan-dard drinks (10 g ethanol per drink); 1.36 is the factor to convert the amount in grams to Cana-dian standards, BW is the body water constant (0.49 for females, 0.58 for males); Wt is bodyweight (kg); MR is metabolism rate of alcohol elimination (0.017 for females, 0.015 for males);and DP is the drinking period (hour).
Driving Performance in Undergraduate Students while Sobering Up
PLOSONE | DOI:10.1371/journal.pone.0118348 February 27, 2015 4 / 15

Dependant variablesHRV.
• Mean heart rate (MHR) in beats per minute (bpm).
• Mean time intervals between normal-to-normal beats (MeanNN) in milliseconds (ms).
• Standard deviation time intervals between normal-to-normal beats (SDNN) in ms.
• Proportion of NN50 divided by total number of normal-to-normal beats intervals (pNN50)(NN50 is the number of pairs of successive intervals between normal-to-normal beats thatdiffer by more than 50 ms).
Driving performance in the simulator. Four driving variables were extracted from a stan-dardized report generated by the simulator, based on the VirageSimulation algorithm:
• Percentage of time spent over the speed limit (Speeding);
• Amount of driving errors (Mistakes) including collisions with object/vehicle/pedestrian, re-spect of signalisation, sudden stop and inappropriate handing of the vehicle in turns as wellas lane changes;
• General performance score (VSI Score) on 100 points resulting from the cumulative weightof six driving elements: steering control (15%), safety (30%), legality (30%), vehicle mobility(5%), road sharing (10%) and ecodriving (10%);
• Specific performance score from the six previous elements was calculated on 100 points:steering control (VSI Steering), safety (VSI Safety), legality (VSI Legality), vehicle mobility(VSI Mobility), road sharing (VSI Sharing) and ecodriving (VSI Ecodriving).
UFOV and crash risk prediction. Based on 4 measures obtained from the UFOV test [13]:
• Processing speed in milliseconds (ms) (subtest 1);
• Divided attention in ms (subtest 2);
• Selective attention in ms (subtest 3);
• From these measures, crash risk categories were obtained: 1) very low, 2) low, 3) moderate,4) high and 5) very high.
Statistical AnalysisFor the control group, one-way repeated measure ANOVA (comparison between time points)was performed to measure the potential learning effect due to repeated exposure on the simula-tor and UFOV test. If the result was significant (p< 0.05) a Holm-Sidak post-hoc methodwas conducted.
For the experimental group, one-way repeated measures ANOVAs (comparison betweentime points) were performed to measure the effects of decreasing BAC on physiological re-sponse, driving behaviour and UFOV measures. When p value was significant (p< 0.05), aHolm-Sidak post-hoc method was conducted. Crash risk categories were compared using aFriedman repeated measures analysis of variance on ranks. When p value was significant (p<0.05), a Dunnett’s post-hoc method was conducted. Spearman correlation coefficients were cal-culated to measure the relationships between driving performance and crash risk categories.Pearson correlation coefficients were completed to measure the relationships within and be-tween driving performance and UFOV subtest performance. SigmaPlot (version 12.5; Systat
Driving Performance in Undergraduate Students while Sobering Up
PLOSONE | DOI:10.1371/journal.pone.0118348 February 27, 2015 5 / 15
Software inc., USA) and Microsoft Excel (version 14.0.7; Microsoft, USA) were used to conductall analyses.
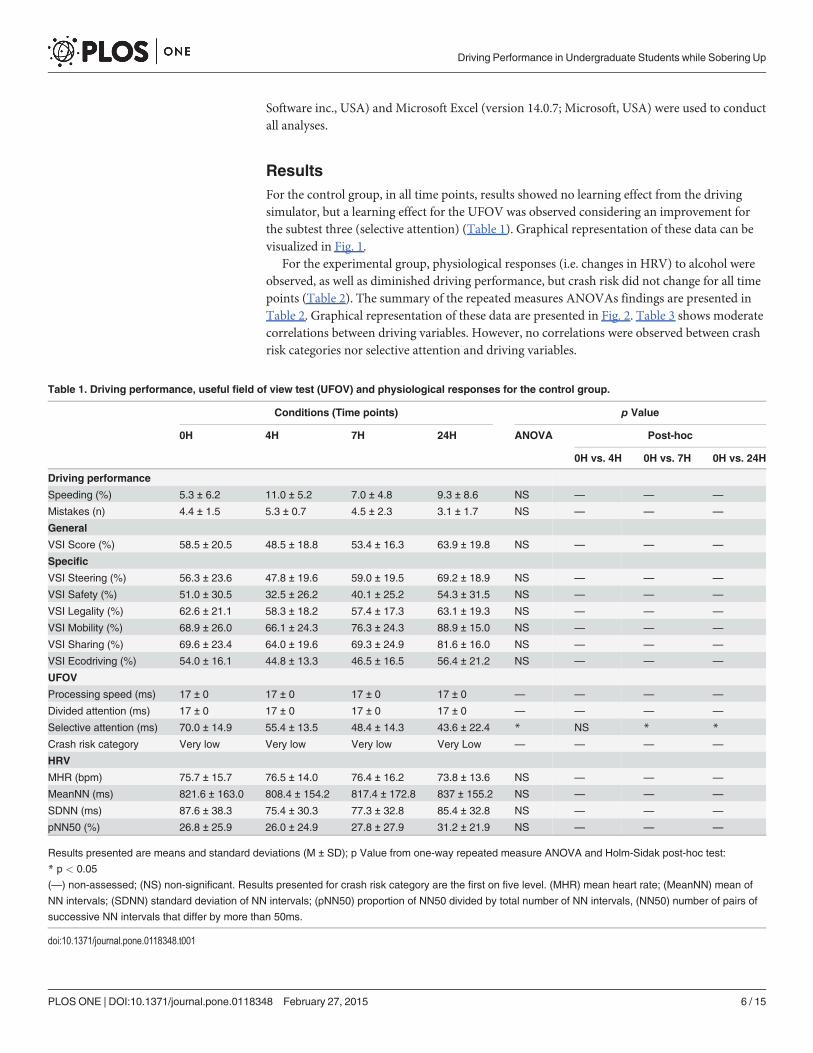
ResultsFor the control group, in all time points, results showed no learning effect from the drivingsimulator, but a learning effect for the UFOV was observed considering an improvement forthe subtest three (selective attention) (Table 1). Graphical representation of these data can bevisualized in Fig. 1.
For the experimental group, physiological responses (i.e. changes in HRV) to alcohol wereobserved, as well as diminished driving performance, but crash risk did not change for all timepoints (Table 2). The summary of the repeated measures ANOVAs findings are presented inTable 2. Graphical representation of these data are presented in Fig. 2. Table 3 shows moderatecorrelations between driving variables. However, no correlations were observed between crashrisk categories nor selective attention and driving variables.
Table 1. Driving performance, useful field of view test (UFOV) and physiological responses for the control group.
Conditions (Time points) p Value
0H 4H 7H 24H ANOVA Post-hoc
0H vs. 4H 0H vs. 7H 0H vs. 24H
Driving performance
Speeding (%) 5.3 ± 6.2 11.0 ± 5.2 7.0 ± 4.8 9.3 ± 8.6 NS — — —
Mistakes (n) 4.4 ± 1.5 5.3 ± 0.7 4.5 ± 2.3 3.1 ± 1.7 NS — — —
General
VSI Score (%) 58.5 ± 20.5 48.5 ± 18.8 53.4 ± 16.3 63.9 ± 19.8 NS — — —
Specific
VSI Steering (%) 56.3 ± 23.6 47.8 ± 19.6 59.0 ± 19.5 69.2 ± 18.9 NS — — —
VSI Safety (%) 51.0 ± 30.5 32.5 ± 26.2 40.1 ± 25.2 54.3 ± 31.5 NS — — —
VSI Legality (%) 62.6 ± 21.1 58.3 ± 18.2 57.4 ± 17.3 63.1 ± 19.3 NS — — —
VSI Mobility (%) 68.9 ± 26.0 66.1 ± 24.3 76.3 ± 24.3 88.9 ± 15.0 NS — — —
VSI Sharing (%) 69.6 ± 23.4 64.0 ± 19.6 69.3 ± 24.9 81.6 ± 16.0 NS — — —
VSI Ecodriving (%) 54.0 ± 16.1 44.8 ± 13.3 46.5 ± 16.5 56.4 ± 21.2 NS — — —
UFOV
Processing speed (ms) 17 ± 0 17 ± 0 17 ± 0 17 ± 0 — — — —
Divided attention (ms) 17 ± 0 17 ± 0 17 ± 0 17 ± 0 — — — —
Selective attention (ms) 70.0 ± 14.9 55.4 ± 13.5 48.4 ± 14.3 43.6 ± 22.4 * NS * *
Crash risk category Very low Very low Very low Very Low — — — —
HRV
MHR (bpm) 75.7 ± 15.7 76.5 ± 14.0 76.4 ± 16.2 73.8 ± 13.6 NS — — —
MeanNN (ms) 821.6 ± 163.0 808.4 ± 154.2 817.4 ± 172.8 837 ± 155.2 NS — — —
SDNN (ms) 87.6 ± 38.3 75.4 ± 30.3 77.3 ± 32.8 85.4 ± 32.8 NS — — —
pNN50 (%) 26.8 ± 25.9 26.0 ± 24.9 27.8 ± 27.9 31.2 ± 21.9 NS — — —
Results presented are means and standard deviations (M ± SD); p Value from one-way repeated measure ANOVA and Holm-Sidak post-hoc test:
* p < 0.05
(—) non-assessed; (NS) non-significant. Results presented for crash risk category are the first on five level. (MHR) mean heart rate; (MeanNN) mean of
NN intervals; (SDNN) standard deviation of NN intervals; (pNN50) proportion of NN50 divided by total number of NN intervals, (NN50) number of pairs of
successive NN intervals that differ by more than 50ms.
doi:10.1371/journal.pone.0118348.t001
Driving Performance in Undergraduate Students while Sobering Up
PLOSONE | DOI:10.1371/journal.pone.0118348 February 27, 2015 6 / 15

Physiological alcohol response (HRV)Under the influence of alcohol (moderate and low BAC), repeated measures ANOVA showeda higher MHR (p< 0.001). Lower MeanNN (p< 0.001), SDNN (p = 0.004) and pNN50 (p =0.013) were also observed (Table 2). Post-hoc analysis indicated a higher MHR at moderateand low BAC (p = 0.039; p = 0.046 respectively). Additionally, the MeanNN, SDNN, andpNN50 were lower at moderate and low BAC, when compared to sober (p< 0.001; p = 0.010;
Fig 1. Timeline of driving variables and selective attention (useful field of view test) for the control group. (A) Selective attention scores (inmilliseconds) for subtask 3 of useful field of view test; (B); Driving performance variables at the four assessed time points; (C) & (D) 7 driving simulator reportvariables divided into two graphs at four assessment time points.
doi:10.1371/journal.pone.0118348.g001
Driving Performance in Undergraduate Students while Sobering Up
PLOSONE | DOI:10.1371/journal.pone.0118348 February 27, 2015 7 / 15

p = 0.039, moderate BAC) (p< 0.001; p = 0.011; p = 0.046, low BAC). No significant differ-ences were found for any HRV variables between sober and after 24 hours conditions.
Driving performance and simulator learning effectNo learning effect was demonstrated by the driving simulator, as none of the driving perfor-mance variables were significantly different between the time points for the control group.
However, the group that consumed alcohol at moderate BAC exhibited decreased drivingperformance as they spent 8.3% more time over the speed limit (p = 0.011) and were implicatedin 3 additional driving errors (p = 0.023) when compared to their sober drive (Table 2). A driv-ing performance improvement at low BAC and after 24 hours, when compared to sober drivingwas observed for VSI Score (p = 0.034; p = 0.030), VSI Steering (p = 0.003; p = 0.002), VSI Mo-bility (p = 0.004; p = 0.002), VSI Sharing (p = 0.014; p = 0.002). No significant differences were
Table 2. Driving performance, useful field of view test (UFOV) and physiological responses of post-acute alcohol consumption.
Conditions (Time points) p Value
Sober (0H) Moderate BAC (4H) Low BAC (7H) Sober 24H ANOVA Post-hoc
0H vs. 4H 0H vs. 7H 0H vs. 24H
Driving performance
Speeding (%) 14.0 ± 7.1 22.3 ± 8.4 13.1 ± 6.5 12.6 ± 7.8 ** * NS NS
Mistakes (n) 6.8 ± 3.5 9.8 ± 3.9 5.6 ± 2.6 5.6 ± 1.8 ** * NS NS
General
VSI Score (%) 33.9 ± 27.3 27.8 ± 23.5 52.6 ± 18.0 54.4 ± 19.5 ** NS * *
Specific
VSI Steering (%) 32.1 ± 32.0 41.5 ± 31.2 66.3 ± 27.4 69.8 ± 11.6 ** NS ** **
VSI Safety (%) 18.9 ± 26.4 12.0 ± 18.9 34.9 ± 28.9 39.3 ± 26.7 * NS NS NS
VSI Legality (%) 43.1 ± 26.8 27.6 ± 30.4 54.4 ± 12.5 51.1 ± 26.0 NS — — —
VSI Mobility (%) 50.8 ± 41.2 67.1 ± 36.9 89.6 ± 23.1 94.1 ± 9.8 ** NS ** **
VSI Sharing (%) 39.4 ± 38.4 44.4 ± 35.5 71.4 ± 30.7 81.3 ± 16.4 ** NS * **
VSI Ecodriving (%) 39.4 ± 22.3 18.3 ± 21.6 41.6 ± 18.8 39.9 ± 21.1 * * NS NS
UFOV
Processing speed (ms) 17 ± 0 17 ± 0 17 ± 0 17 ± 0 — — — —
Divided attention (ms) 17 ± 0 24 ± 19.8 24.5 ± 21.2 17 ± 0 NS — — —
Selective attention (ms) 97.9 ± 36.7 94.3 ± 31.6 74.3 ± 34.5 72.0 ± 28.4 * NS NS NS
Crash risk category Very low Very low Very low Very Low — — — —
HRV
MHR (bpm) 79.1 ± 12.0 93.4 ± 12.5 91.7 ± 10.1 79.0 ± 10.5 *** *** *** NS
MeanNN (ms) 774,9 ± 126.2 652.5 ± 85.3 660.7 ± 70.0 773.0 ± 113.9 *** *** *** NS
SDNN (ms) 75.9 ± 32.8 53.8 ± 21.1 53.1 ± 16.6 73.1 ± 21.2 ** ** * NS
pNN50 (%) 22.7 ± 20.5 9.9 ± 16.8 9.3 ± 12.1 22.9 ± 16.6 * * * NS
Results presented are means and standard deviations (M ± SD); p Value from one-way repeated measure ANOVA and Holm-Sidak post-hoc test:
* p < 0.05
** p < 0.01
*** p < 0.001
(—) non-assessed; (NS) non-significant. Results presented for crash risk category are the first on five level. (MHR) mean heart rate; (MeanNN) mean of
NN intervals; (SDNN) standard deviation of NN intervals; (pNN50) proportion of NN50 divided by total number of NN intervals, (NN50) number of pairs of
successive NN intervals that differ by more than 50ms.
doi:10.1371/journal.pone.0118348.t002
Driving Performance in Undergraduate Students while Sobering Up
PLOSONE | DOI:10.1371/journal.pone.0118348 February 27, 2015 8 / 15

found for VSI Legality variables at any conditions. Moreover, VSI Safety has a significant dif-ference (p = 0.023), but post-hoc test shows no differences between sober and other timepoints. Significant relationships between Speeding and VSI Score (r = -0.70), Mistakes and VSIScore (r = -0.71) as well as Mistakes and Speeding (r = 0.63) were also observed and are pre-sented in Table 2 for the group with alcohol.
Fig 2. Timeline of driving variables and selective attention for the experimental group. (A) Selective attention scores (in milliseconds) for subtask 3 ofuseful field of view test; (B); Driving performance variables sensitive to moderate blood alcohol concentration (0.05–0.07 g/dL); (C) Driving simulator reportvariables sensitive to moderate blood alcohol concentration (0.05–0.07 g/dL); (D) Variables sensitive to driving simulator learning effect.
doi:10.1371/journal.pone.0118348.g002
Driving Performance in Undergraduate Students while Sobering Up
PLOSONE | DOI:10.1371/journal.pone.0118348 February 27, 2015 9 / 15

UFOV: learning effect, subtest measures and crash risk predictionThe control group obtained faster selective attention times at 7H (difference of mean = 21.4 ms;p = 0.033) and 24H (difference of mean = 26.4 ms; p = 0.014) time points, when compared to 0 H(Table 1). This shows a learning effect for this group in the third UFOV subtest. This group re-mained in the very low crash risk category throughout testing.
For the experimental group, no significant difference was found between the first and thesecond subtests (Table 2). However, the third subtest shows significant differences (p = 0.033).Over time points, we observe a decrease in selective attention time, however there are no signif-icant differences when compared to sober (p = 0.732; p = 0.068; p = 0.064, respectively). More-over, this group remained in the very low risk to crash category for all time points.
Additionally, there were no significant relationships between crash risk categories and driv-ing variables. No significant relationships were found between selective attention and Speedingnor Mistakes (Table 3).
DiscussionOur observations of four simulated driving sessions over 24 hours have shown no significantdifferences in driving performance in the control group. This allows us to rule out a learning ef-fect from the driving simulator in young drivers. However, the measures of selective attention(UFOV, subtest three) were significantly faster at 7 hours and 24 hours. These results demon-strate a learning effect for this task. Other UFOV tasks were at a maximum throughout testing(17 ms).
The effects of alcohol were measured across three major aspects over various time points.First, physiological assessment by HRV was sensitive enough to measure different levels ofBAC, as variables were only significantly affected at moderate (0.05–0.07 g/dL) and low BACs(0.01–0.04 g/dL). Moreover, after 24 hours post-acute consumption, HRV values were similarto the sober condition, showing that any physiological measurable alcohol effects are no longerpresent. Second, two driving variables were influenced by alcohol. Participants drove faster andmade more driving errors at moderate BAC, when compared to their sober drive. No differencewas found for these variables at low BAC and 24 hours. Nonetheless, other variables presentedsignificant results at low BAC and at 24 hours, indicating an increased driving performancewhen compared to sober. These variables are VSI Score, VSI Steering, VSI Mobility and VSISharing. Third, the results of UFOV placed this group in the same crash risk category throughall time points (i.e. very low risk). However, the subtest three shows a tendency of improvementat low BAC and 24 hours.
Table 3. Correlations between driving performances, selective attention and crash risk categories for the experimental group.
Mistakes VSI score Selective attention Crash risk category
Speeding 0.63* -0.70* NS NS
Mistakes - -0.71* NS NS
VSI score - - NS NS
Results present r value;
*p<0.05 from Pearson correlation. The association between crash risk category and drinving performances varaibles was measured by Spearman
correlation; General driving performance score (VSI Score); (NS) non-significant
doi:10.1371/journal.pone.0118348.t003
Driving Performance in Undergraduate Students while Sobering Up
PLOSONE | DOI:10.1371/journal.pone.0118348 February 27, 2015 10 / 15

Driving simulator: the effects of learning and alcohol expectancyEven though the control group did not show a learning effect with the driving simulator, the al-cohol group seems to have had one, given that variables were improved after 24 hours. Thestudy conducted by Sahami et al. [16] demonstrated that although overall learning effects pres-ent large inter-individual differences, practice does in fact generally impact on the steeringwheel and pedals control performance. The present study corroborates these findings as in ad-dition to improvements in overall driving scores, differences were observed for VSI Score, VSISteering, VSI Mobility and VSI Sharing (measures linked to steering and pedal control). There-fore, these variables should be considered when conducting drinking and driving simulator re-search in order to observe behavioural adaptations to the environment. However, taking intoconsideration that no learning effects were expected to be observed, another hypothesis mayexplain these disparities.
Oei & Morawaska [17] and Testa et al. [18] have observed behaviour changes in individualsanticipating alcohol consumption. These changes can be linked to the environment, the influ-ence of peers and the alcohol expectancy effect (AEE). According to Oei & Morawaska [17],the AEE is the dominating factor. In addition, there is a social influence on AEE where individ-uals can find themselves distracted from their task [18]. Furthermore, past drinking experi-ences may modulate behavioural responses to alcohol. Therefore, the AEE could haveinterfered with driving performances between sober and moderate BAC. This may be explainedby the fact that participants changed their behaviour before alcohol consumption (i.e. sober at0 hour). Being accompanied by a friend could play into the social factor explained by Testaet al. [18]. Additionally, this interference may have had a negative impact on learning effects tosimulated driving.
UFOV learning effectLearning effects for subtest three in the control group were observed. However, a tendency to-wards similar improvement for the alcohol group was present. Alcohol seems to have played aslowing factor in the learning effect for a selective attention task.
A few research teams studied the learning effect indirectly. Bentley et al. [19] assessed thetest-retest reliability and the repeatability of the UFOV with young people. Significant im-provements were observed between two UFOV tests administered 2 to 3 weeks apart. With dif-ferent participants, they administered five tests in the same day and only observed significantimprovements between the two first trials. Another research group, observed a retention timeof 3 months, for young participants after 9 days of training (1 per day) [20], In the presentstudy, we were able to see similar learning effects as both groups of participants wereUFOV neophytes.
Driving performance with decreasing BACUsing data from traffic fatalities, French & Gumus [9] observed that young drivers with BACsbelow 0.08 g/dL are more prevalent in traffic collisions. To clarify these observations, the pres-ent study directly measured driving performance on a simulator a few hours after a socialbinge-drinking bout. Our results show an increased number of errors occurred at higher driv-ing speeds while driving just under the legal BAC limit (moderate BAC), therefore increasingthe risk of traffic collisions. These findings partially agree with those of Moskowitz & Floren-tino [21] and Schnabel [22], who found that both low and moderate BAC induced driving im-pairments. However, we were unable to demonstrate driving impairment at low BACs. Ourresults seem to corroborate Hegg-Deloye et al. [23] findings, which a low BAC is not enough toalter driving behaviours in a controlled driving environment. Methodologically, we observed
Driving Performance in Undergraduate Students while Sobering Up
PLOSONE | DOI:10.1371/journal.pone.0118348 February 27, 2015 11 / 15

that low BAC was achieved after a 7 hour wait from a binge-drinking bout, while their partici-pants drank 1 to 2 beers in a 30 minute window to achieve the same level of intoxication.
McGwin et al. [24] have shown that crash involvement of younger drivers follows a trendfor risk-taking behaviour and lack of driving skill. Mainly, a tendency for speeding and otherrisk taking behaviours may explain their implication in collisions. The results of the presentstudy follow these same tendencies; under the influence of moderate BAC, younger driversdrove faster and showed an increased number of driving errors.
As discussed above, the AEE may have had an unexpected effect on driving performance inthe alcohol consumption group. The AEE impacts a multitude of social, cognitive and motorbehaviour. Burian et al. [25], have researched the effect of AEE on simulated driving perfor-mance. Risk-taking behaviour during a simulated driving task changed whether the partici-pants were expecting alcohol or not. This finding may help in explaining the lack of expecteddifferences between sober and moderate BAC in the present study.
Crash risk predictionThe immediate effects of alcohol on higher-order cognitive functioning have been studied [26].The UFOV, a test of visual processing, is one of the better known predictors of driving perfor-mance, usually used in older populations [12,13,27]. However, few studies have looked at its in-teraction with young adults, alcohol and driving. The present study shows that using fivecategories to predict the level of crash risk of a young individual is not sensitive enough. Fur-thermore, this classification system is unable to measure differences between different BAC atdifferent time points in the same population. Moreover, when the results of the three subtestsare analysed separately, we are able to observe that selective attention is the only measure pre-senting variablity. Yet, no differences were found at moderate BAC compare to sober. Dry et al.[26] observed no differences in selective attention for a moderate BAC, however high BAC de-creased performance. In accordance with our results, a moderate BAC was not enough to de-crease UFOV selective attention scores. This leads us to believe that the UFOV test, in youngerpopulations, is mostly sensitive to large variations of BAC.
For other UFOV subtests, the lack of variability in processing speed and divided attentionscores indicate that there may be a floor effect, demonstrating that these tasks are not adaptedfor young driver evaluation. Also, there was no relationships between UFOV measures, crashrisk categories, and driving variables, further indicating that this tool is not able to predict driv-ing risk of young drivers. This underscores the need to develop more sensitive and specific eval-uation tools for this population.
Practical implicationsOur results demand attention to 2 key points in intervention plans targeting young drivers.First, during social events, it is not uncommon for young drivers to wait a few hours until theyhave reached a legal BAC before taking the wheel. However, our results clearly indicate thatwaiting a few hours (i.e. moderate, legal BAC) after acute consumption is not a safe strategydue to increased at-risk behaviour. Second, an increased amount of risk caused by the AEE inyoung drivers deserves further attention. While driving to and from a social gathering, youngadults may go together, potentially mimicking driving under the influence behaviours and tendtowards risky behaviours by peer pressure [28].
Future researchMany drinking and driving research protocols tend to focus on post-consumption effects. Inregards to our results, AEE may play a larger than expected role in driving sober with friends,
Driving Performance in Undergraduate Students while Sobering Up
PLOSONE | DOI:10.1371/journal.pone.0118348 February 27, 2015 12 / 15
to a social event. This avenue of drinking and driving research warrants more attention. Add-ing a social and pre-consumption aspect to current research protocols, we would be able togather a more complete overview of drinking and driving in young adults.
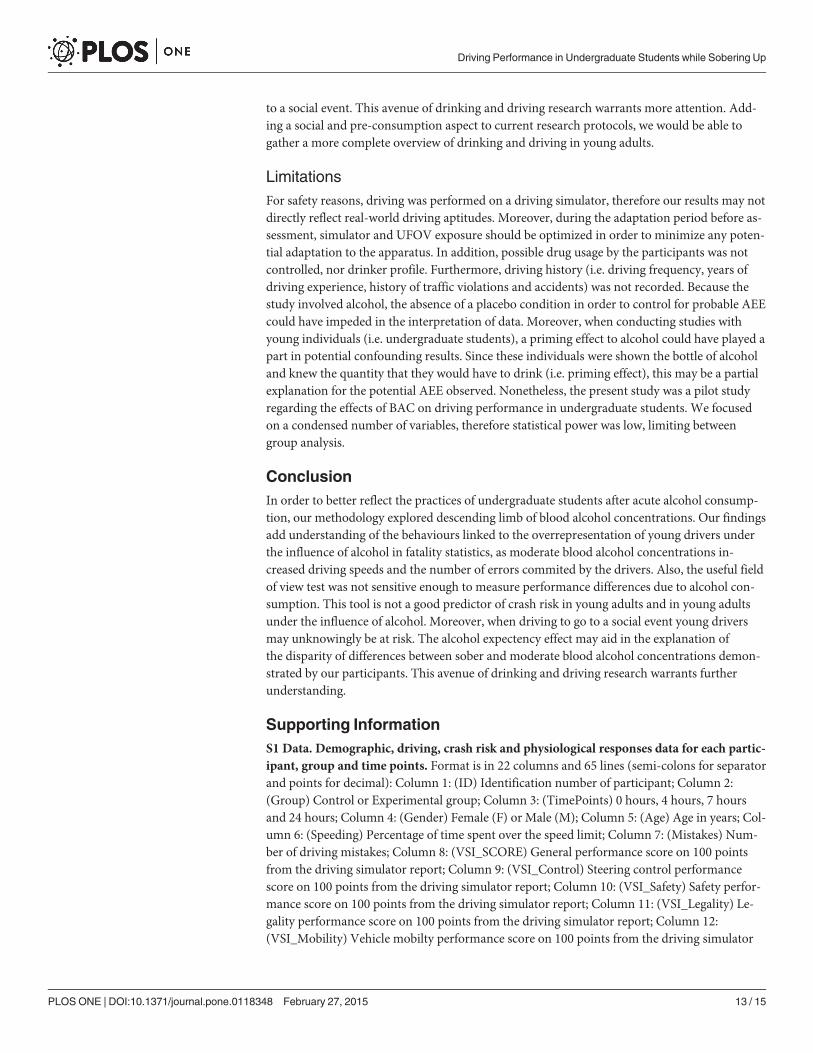
LimitationsFor safety reasons, driving was performed on a driving simulator, therefore our results may notdirectly reflect real-world driving aptitudes. Moreover, during the adaptation period before as-sessment, simulator and UFOV exposure should be optimized in order to minimize any poten-tial adaptation to the apparatus. In addition, possible drug usage by the participants was notcontrolled, nor drinker profile. Furthermore, driving history (i.e. driving frequency, years ofdriving experience, history of traffic violations and accidents) was not recorded. Because thestudy involved alcohol, the absence of a placebo condition in order to control for probable AEEcould have impeded in the interpretation of data. Moreover, when conducting studies withyoung individuals (i.e. undergraduate students), a priming effect to alcohol could have played apart in potential confounding results. Since these individuals were shown the bottle of alcoholand knew the quantity that they would have to drink (i.e. priming effect), this may be a partialexplanation for the potential AEE observed. Nonetheless, the present study was a pilot studyregarding the effects of BAC on driving performance in undergraduate students. We focusedon a condensed number of variables, therefore statistical power was low, limiting betweengroup analysis.
ConclusionIn order to better reflect the practices of undergraduate students after acute alcohol consump-tion, our methodology explored descending limb of blood alcohol concentrations. Our findingsadd understanding of the behaviours linked to the overrepresentation of young drivers underthe influence of alcohol in fatality statistics, as moderate blood alcohol concentrations in-creased driving speeds and the number of errors commited by the drivers. Also, the useful fieldof view test was not sensitive enough to measure performance differences due to alcohol con-sumption. This tool is not a good predictor of crash risk in young adults and in young adultsunder the influence of alcohol. Moreover, when driving to go to a social event young driversmay unknowingly be at risk. The alcohol expectency effect may aid in the explanation ofthe disparity of differences between sober and moderate blood alcohol concentrations demon-strated by our participants. This avenue of drinking and driving research warrants furtherunderstanding.
Supporting InformationS1 Data. Demographic, driving, crash risk and physiological responses data for each partic-ipant, group and time points. Format is in 22 columns and 65 lines (semi-colons for separatorand points for decimal): Column 1: (ID) Identification number of participant; Column 2:(Group) Control or Experimental group; Column 3: (TimePoints) 0 hours, 4 hours, 7 hoursand 24 hours; Column 4: (Gender) Female (F) or Male (M); Column 5: (Age) Age in years; Col-umn 6: (Speeding) Percentage of time spent over the speed limit; Column 7: (Mistakes) Num-ber of driving mistakes; Column 8: (VSI_SCORE) General performance score on 100 pointsfrom the driving simulator report; Column 9: (VSI_Control) Steering control performancescore on 100 points from the driving simulator report; Column 10: (VSI_Safety) Safety perfor-mance score on 100 points from the driving simulator report; Column 11: (VSI_Legality) Le-gality performance score on 100 points from the driving simulator report; Column 12:(VSI_Mobility) Vehicle mobilty performance score on 100 points from the driving simulator
Driving Performance in Undergraduate Students while Sobering Up
PLOSONE | DOI:10.1371/journal.pone.0118348 February 27, 2015 13 / 15

report; Column 13: (VSI_Sharing) Road sharing performance score on 100 points from thedriving simulator report; Column 14: (VSI_Ecodriving) Ecodriving performance score on 100points from the driving simulator report; Column 15: (UFOV_Categories) Crash risk catego-ries (i.e. very low, low, moderate, high and very high); Column 16: (UFOV1) Processing speedin milliseconds (subtest 1); Column 17: (UFOV2) Divided attention in milliseconds (subtest 2);Column 18: (UFOV3) Selective attention in milliseconds (subtest 3); Column 19: (MHR)Mean heart rate in beat per minutes; Column 20: (MeanNN) Mean time intervals between nor-mal-to-normal beats in milliseconds; Column 21: (SDNN) Standard deviation time intervalsbetween normal-to-normal beats in milliseconds; Column 22: (pNN50) Proportion of NN50divided by total number of normal-to-normal beats intervals (NN50 is the number of pairs ofsuccessive intervals between normal-to-normal beats that differ by more than 50 milliseconds).(CSV)
Author ContributionsConceived and designed the experiments: DS DB MJJ. Performed the experiments: MT FGMC. Analyzed the data: MT FGMLMCWJAMJJ. Contributed reagents/materials/analysistools: MT FGMLMC DBWJAMJJ. Wrote the paper: MT FGMLMC DS DBWJAMJJ.
References1. Roudsari B, Ramisetty-Mikler S, Rodriguez LA. Ethnicity, age, and trends in alcohol-related driver fatali-
ties in the United States. Traffic Inj Prev. 2009; 10(5):410–414. doi:10.1080/15389580903131506PMID: 19746303
2. Vanlaar W, Robertson R, Marcoux K, Mayhew D, Brown S, Boase P. Trends in alcohol-impaired drivingin Canada. Accid Anal Prev. 2012; 48:297–302. doi:10.1016/j.aap.2012.01.030 PMID: 22664694
3. Williams AF. Young driver risk factors: successful and unsuccessful approaches for dealing with themand an agenda for the future. Inj Prev. 2006; 12(suppl 1):i4–i8. doi:10.1136/ip.2006.011783
4. Traffic Injury Research Foundation (TIRF). The Alcohol-Crash Problem in Canada: 2010. 2013. Avail-able: http://www.tirf.ca/publications/PDF_publications/2010_Alcohol_Crash_Problem_Report_4_FINAL.pdf. Accessed June 19, 2014.
5. MADDCanada. Youth services—Statistics & Links. 2014. Available: http://www.madd.ca/madd2/en/services/youth_services_statistics.html. Accessed June 19, 2014.
6. Cherpitel C, Borges G, Giesbrecht N, Hungerford D, Penden M, Poznyak V, et al. Alcohol and Injuries:Emergency Department Studies in an International Perspective. World Health Organization. 2009.
7. Lambert-Bélanger A, Dubois S, Weaver B, Mullen N, Bédard M. Aggressive driving behaviour in youngdrivers (aged 16 through 25) involved in fatal crashes. Journal of Safety Research. 2012; 43(5–6):333–338. doi:10.1016/j.jsr.2012.10.011 PMID: 23206509
8. Martin TL, Solbeck PAM, Mayers DJ, Langille RM, Buczek Y, Pelletier MR. A review of alcohol-impaireddriving: the role of blood alcohol concentration and complexity of the driving task. J Forensic Sci. 2013;58(5):1238–1250. doi:10.1111/1556-4029.12227
9. French MT, Gumus G. Fast times during spring breaks: ares traffic fatalities another consequence? In:Proceeding of the 6th Annual Meeting on the Economics of Risky Behaviors. Colombia: IZA; 2014:20.
10. Romanowicz M, Schmidt JE, Bostwick JM, Mrazek DA, Karpyak VM. Changes in heart rate variabilityassociated with acute alcohol consumption: current knowledge and implications for practice and re-search. Alcohol Clin Exp Res. 2011; 35(6):1092–1105. doi:10.1111/j.1530-0277.2011.01442.x PMID:21332532
11. Karpyak VM, Romanowicz M, Schmidt JE, Lewis KA, Bostwick JM. Characteristics of heart rate vari-ability in alcohol-dependent subjects and nondependent chronic alcohol users. Alcohol Clin Exp Res.2014; 38(1):9–26. doi:10.1111/acer.12270 PMID: 24117482
12. Wood JM, Owsley C. Useful Field of View Test.Gerontology. 2014. doi:10.1159/000356753.
13. Edwards JD, Vance DE, Wadley VG, Cissell GM, Roenker DL, Ball KK. Reliability and Validity of UsefulField of View Test Scores as Administered by Personal Computer. Journal of Clinical & ExperimentalNeuropsychology. 2005; 27(5):529–543. doi:10.1080/13803390490515432
Driving Performance in Undergraduate Students while Sobering Up
PLOSONE | DOI:10.1371/journal.pone.0118348 February 27, 2015 14 / 15
14. Kypri K, Langley J, Stephenson S. Episode-centred analysis of drinking to intoxication in university stu-dents. Alcohol Alcohol. 2005; 40(5):447–452. doi:10.1093/alcalc/agh178 PMID: 15996969
15. CPHA. Too High a Cost: A Public Health Approach to Alcohol Policy in Canada. Ottawa (ON): Canadi-an Public Health Association; 2011:20. Available: http://www.cpha.ca/uploads/positions/position-paper-alcohol_e.pdf. Accessed June 19, 2014.
16. Sahami S, Jenkins J, Sayed T. Methodology to Analyze Adaptation in Driving Simulators. Transporta-tion Research Record: Journal of the Transportation Research Board. 2009; 2138:94–101. doi:10.3141/2138-13
17. Oei TPS, Morawska A. A cognitive model of binge drinking: The influence of alcohol expectancies anddrinking refusal self-efficacy. Addictive Behaviors. 2004; 29(1):159–179. doi:10.1016/S0306-4603(03)00076-5 PMID: 14667427
18. Testa M, Fillmore MT, Norris J, Abbey J, Curtin JJ, Leonard KE, et al. Understanding Alcohol Expectan-cy Effects: Revisiting the Placebo Condition. Alcohol Clin Exp Res. 2006; 30(2):339–348. doi:10.1111/j.1530-0277.2006.00039.x PMID: 16441283
19. Bentley SA, LeBlanc RP, Nicolela MT, Chauhan BC. Validity, Reliability, and Repeatability of the UsefulField of View Test in Persons with Normal Vision and Patients with Glaucoma. IOVS. 2012; 53(11):6763–6769. doi:10.1167/iovs.12-9718 PMID: 22956614
20. Richards E, Bennett PJ, Sekuler AB. Age related differences in learning with the useful field of view. Vi-sion Research. 2006; 46(25):4217–4231. doi:10.1016/j.visres.2006.08.011 PMID: 17027061
21. Moskowitz H, Florentino D. A Review of the Literature on the Effects of Low Doses of Alcohol on Driv-ing-Related Skills. USA: National Highway Traffic Safety Administration; 2000.
22. Schnabel E. Alcohol and driving-related performance—A comprehensive meta-analysis focusing thesignificance of the non-significant. 2012.
23. Hegg-Deloye S, Lavallière M, Tremblay A, Teasdale N. Driving is perceived as more difficult for lowblood alcohol concentration, but performance is not necessarily impaired. In: Proceedings of the 20thCanadian Multidisciplinary Road Safety Conference. Canada; 2010:14.
24. McGwin J, Gerald, Brown DB. Characteristics of traffic crashes among young, middle-aged, and olderdrivers. Accident Analysis & Prevention. 1999; 31(3):181–198. doi:10.1016/S0001-4575(98)00061-X
25. Burian SE, Hensberry R, Liguori A. Differential effects of alcohol and alcohol expectancy on risk-takingduring simulated driving. Hum Psychopharmacol Clin Exp. 2003; 18(3):175–184. doi:10.1002/hup.473
26. Dry MJ, Burns NR, Nettelbeck T, Farquharson AL, White JM. Dose-related effects of alcohol on cogni-tive functioning. PLoS ONE. 2012; 7(11):e50977. doi:10.1371/journal.pone.0050977 PMID: 23209840
27. Edwards JD, Ross LA, Wadley VG, Clay OJ, Crowe M, Roenker DL, et al. The useful field of view test:Normative data for older adults. Arch Clin Neuropsychol. 2006; 21(4):275–286. doi:10.1016/j.acn.2006.03.001 PMID: 16704918
28. Studer J, Baggio S, Deline S, N'Goran AA, Henchoz Y, Mohler-Kuo M, et al. Peer pressure and alcoholuse in young men: A mediation analysis of drinking motives. International Journal of Drug Policy. 2014;25(4):700–708. doi:10.1016/j.drugpo.2014.02.002 PMID: 24630076
Driving Performance in Undergraduate Students while Sobering Up
PLOSONE | DOI:10.1371/journal.pone.0118348 February 27, 2015 15 / 15