Driveability and Load Transfer Characteristics of Vibro-Driven ...
387
Terms and Conditions of Use: this document downloaded from vulcanhammer.info the website about Vulcan Iron Works Inc. and the pile driving equipment it manufactured All of the information, data and computer software (“information”) presented on this web site is for general information only. While every effort will be made to insure its accuracy, this information should not be used or relied on for any specific application without independent, competent professional examination and verification of its accuracy, suit- ability and applicability by a licensed professional. Anyone making use of this information does so at his or her own risk and assumes any and all liability resulting from such use. The entire risk as to quality or usability of the information contained within is with the reader. In no event will this web page or webmaster be held liable, nor does this web page or its webmaster provide insurance against liability, for any damages including lost profits, lost savings or any other incidental or consequential damages arising from the use or inability to use the information contained within. This site is not an official site of Prentice-Hall, Pile Buck, or Vulcan Foundation Equipment. All references to sources of software, equipment, parts, service or repairs do not constitute an endorsement. Visit our companion site http://www.vulcanhammer.org
-
Upload
khangminh22 -
Category
Documents
-
view
3 -
download
0
Transcript of Driveability and Load Transfer Characteristics of Vibro-Driven ...

Terms and Conditions of Use:
this document downloaded from
vulcanhammer.infothe website about Vulcan Iron Works Inc. and the pile driving equipment it manufactured
All of the information, data and computer software (“information”) presented on this web site is for general information only. While every effort will be made to insure its accuracy, this information should not be used or relied on for any specific application without independent, competent professional examination and verification of its accuracy, suit-ability and applicability by a licensed professional. Anyone making use of this information does so at his or her own risk and assumes any and all liability resulting from such use. The entire risk as to quality or usability of the information contained within is with the reader. In no event will this web page or webmaster be held liable, nor does this web page or its webmaster provide insurance against liability, for any damages including lost profits, lost savings or any other incidental or consequential damages arising from the use
or inability to use the information contained within.
This site is not an official site of Prentice-Hall, Pile Buck, or Vulcan Foundation Equipment. All references to sources of software, equipment, parts, service or
repairs do not constitute an endorsement.
Visit our companion sitehttp://www.vulcanhammer.org
DmEjlBILITY h\rD LOAD TRANSFER CHA.?WmFUSTICS OF VIBRO-DRWEN PILES
A Dissertation
Presented to
The Faculty of the Department of Clvil and Environmental Engineering
University of Houston
In Partial Fulfillment
of the Rtquircments for the Degree
Doclor of Philosophy
By
Daniel 0. IVong
Decanber. 1988

DR.NEABILlTY AhD LOAD TFbIiUSFER CHARACTERISTICS OF 1qBRO-DRNEN PILES
An Abstract
Presented to
The Faculty of the Department of Civil and Environmental Engineering
University of Houston
In Partial Fulfillment
of the Requirements for the Degree
Doctor of Philosophy
BY
Daniel 0. Wong
December, 1988
Abstract
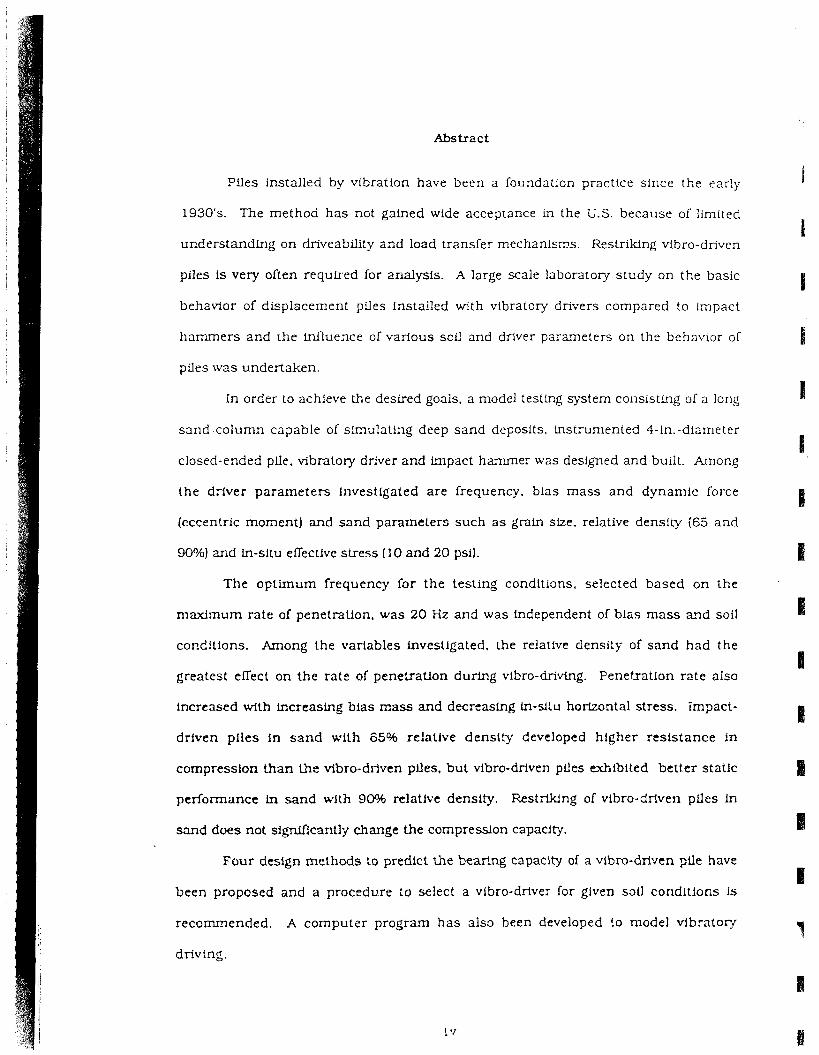
Piles installed by vtbration have been a foundation practice since the early
1930's. The method has not galned wide acceptance in the U.S. because of limited
understanding on driveability and load transfer mechanisms. Restr- vibro-drlven
piles is very often required for analysis. A large scale laboratory study on the basic
behavior of displacement piles installed with vibratory drivers compared to t rpac t
l~nmmers and rhe influence of various soil and driver parameters on the behavior of
piles was undertaken.
In order to achieve the desfred goais, a model testlng system consisting of a long
sand column capable of slmulating deep sand deposits. instrumented 4-in.-diameter
closed-ended pLle. vibratory driver and impact harmer was designed and built. Among
the driver parameters investigated are frequency, bias mass and dynamic force
(cccentric moment) and sand parameters such a s grain size. relative density i65 and
90%) and in-sltu elfective stress (10 and 20 psi].
The optimum frequency for the testing condltions. selected based on the
maximum rate of penetralion, was 20 Hz and was lndependent of bias mass ~ q d soil
condilions. Among the varlables investigated, the reiative density of sand had the
greatest elfect on the rate of penetration during vibro-driving. Penetratlon rate also
increased with increasing bias mass and decreasing in-s1:u horizontal stress. impact-
driven piles in sand with 85% relatlve density developed hlgher resistance in
compression Ulan I h e vibro-driven piles. but vibro-drivcn plies exhibited better statlc
performance in sand wlth 90% relative density. Restriking of vibro-driven piles In
sand does not signilicantly change the compression capacity.
Four design methods to predict the bearing capacity of a vibro-driven yile have
been propcsed and a procedure to select a vlbro-driver for given sol1 conditions Is
recommended. A computer program has also been developed !o model vibratory
driving.
The study reported herein was sponsored by the National Cooperative Highway
Research Program of the National Research Councll. The completion of thls study was
made possible by many individuals and organhations who contributed dlrectiy and
indirectly. The authcr is grateful to Dr. Cumaraswamy Vipulanandan. the author's
graduate ad~ l so r and the principal project co-investigator and Dr. Michael W. O'Neill.
the principal project co-investigator for their advice and guidance throughout this
study. Appreciation 1s also expressed to Drs. Sheng Taur Mau, Willlam E. Vanksdale
and Carl E. N o r m a n for serving in ihe author's dissertation co~nmittee and for offering
valuable suggestions.
The author is thankful to Maurfcio Oshoa and Oscar Ugaz. fellow graduate
students. and to Daniel Mofar, Mike McClellan and John Brown. fellow undergraduate
students. for their experimenthl a^~d theoretical help Ln ~s study. Recognflfon is also
given to Roy Henson. Martin Kowls and Brad Cana. Ckil Engineering Technicians. for
their technical asistance. to Will Rainey and Charles Deckert cf Ralmond Technical
Facilities, Inc. for designing the vibro-driver. and to the Waterways Experiment Station
of the U.S. An-ny Corps of Engineers fcr sharing Fnibrmation relative to parallel studies
of the behavior of piles installed by vibro-driving.
ABSTRACT
AC~'O~vL.EDCEME?.Ts
LIST OF TABLES
LIST OF FIGURES
CHAPTER
1. Ii\lTRODUCTION
1.1 OBTECTNES
1.2 RESE4XCH APPROACH
2. BACKGROUXD
2.1 IhrnODUCnON
2.2 DFUVING FORMUIAE
2.3 SUhlMAI?Y
3. DESCRIPTION OF TESTING SYSTEM
3.1 TEST CHAVBER
3.2 TEST PILE
3.3 V i B R O - D r n R
3.4 IMPACT HAMMER
3.5 DATA ACQUISITION SYSTEMS
Dynamic Data Acquisition System
Static Data Acquisltton System
3.6 SAND PLACEAMENT
3.7 CALIBRATION PROCEDURES
AxiaI Strahi Gage and F'icssure Eansducer Bridges
Amplitude of Tce Acceleration
Phase: Between Eead and Toe Accelerations
Phase Between Velocity and Force at Head or Toe
4. SA.XrD PROPERTIES A'iD TEST FESTJLTS
4.1 %\'D
Craln-Slze Distribution
Mtnfmum and Maximum Density
Permeability
Triaxial Compression
Interface Shear
Resonant Column
4.2 VIBRO-DRMSC PARAVETERS TESTS
Typical Force and Velocity Time Histories
Typical Lateral Pressure-Time Histories
Rate of Penetration
4.4 IMPACT AND XSTFUKE TESTS
Qplcal Force and Velocity Time Histories
Penetration Resistance
4.5 WATER EXPULSION
4.6 COMPRESSION AND UPLIFT TESTS
5. ANALYSISOFTESTRESULTS
5.1 PERFORU4.VCE REWTIONSHIP B-EN DRO-DRIVER AND IMPACT HAMMER
5.2 POWER AND ENERGY TRPLFiSMISSION
Energy
Power
5.3 RATE OF PENETRATION AND ACCELERATION
5.4 WAVE-EQ UAT?ON PARILMETERS
5.5 LOAD-MOVEMENT RELATIONSHIPS
5.6 STATIC UNrr LOAD TRANSFER RELATIONSHIPS
5.7 DYNAMIC LOAD TRANSFER RELATIONSHIPS
5.8 PHASE RELATIONSHIPS 176
6. ESTIMAnON OF B W N G CAPACrrY A\?3 SELECTION OF 186 VIBRO-DWTR
6.1 LOAD-MOVEMENT REMTIONSHP 190
Two-Parameter Model 192
Three- Parametzr Model 1 93
Four-Parameter Model
Static Load-Movement I?esbonse
6.2 E W N G CAPACrrY RELATIONSHIP
Power Transfer Mzthod 20 1
Normallzed Capacity method 2 10
Ultimate Resistance Method 2 12
6.3 SUMMAXI' OF METHODS TO ESTIMATE BFSLRINC CAPACI?Y 2 13
6.4 SELECTION OF VIBRO-DRIVER 215
7. MODELING OF VIBRATORY D R M N C 2 17
7.1 THEOREnCAL DEVELOPMEhT 2 19
7.2 PROPOSED V I B R O - D m C hlODEL 222
Modelfng of Vibro-Driver and Driving Force 224
Radlaljon Damping 225
Sol1 Model 23 1
7.3 NUMERICAL SOLUl7CN 243
7.4 AWYSIS OF W R O - D m N G BY WAVE EQUATION 25 1
8. CONCLUSIONS AND RECOhlMEXDAnONS 253
Vlbm-Driver and Pile Parameters 255
Effect of SoLl Parameters on Vibro-DriveablUty 257
Modeling of Statlc Unft Load ?kansfer Characteristics 257
Load Transfer Durlng Vibro-Drlving 258
Rtsldud Suesses 258
v i i i
Effect of R e s t n k h g the Vibro-Driven Pile
Estlrnation of Bearlng Capacity
Modeling of Vibratory Drivtng
8.2 RECOMMENDATIONS
REFERENCES
APPENDIX
A. COMPUTATION OF THEORETICAL W V E R
B. TIME HISTORIES AT FULL PILE PEhElTATlON FOR VIBRO- D R M N G TESTS
C. TAME HISTORIES AT FULL PENETRATION FOR IMPACT AVD RESTRIKING TESTS
D. OSE-DIMENSIONAL WAVE EQUATION AYALYSIS
TOPDFUVE ALGORITHM
SENSITIVITY ANALYSIS
E. STAnCLOADTESTINGLWDFAILURELOADS
TESTING PROCEDURES
INTERPRETATION O F FAILURE LOAD
F. USER'S MANUAL AND LISTING OF PROGRAM UH-ViBRO
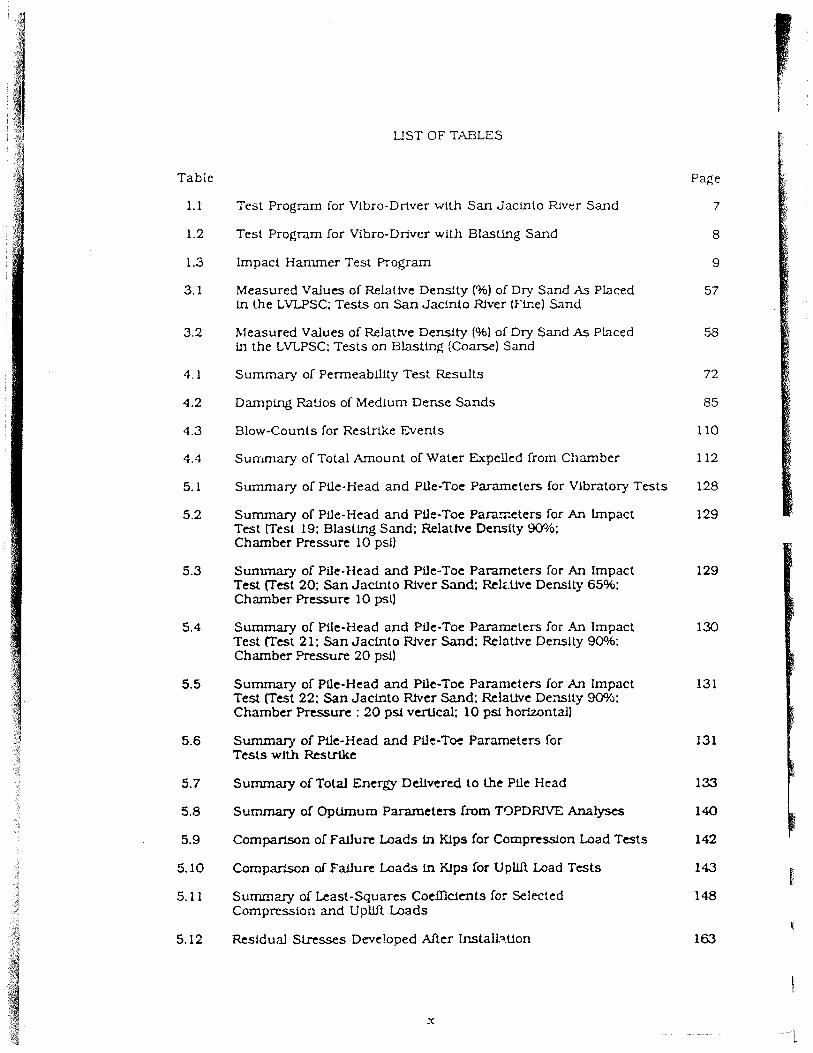
LIST OF TA3LES
Table
1.1
1.2
1.3
3.1
Page
Test Program for Vibro-Driver with San Jacinto Rver Sand 7
Test Prograni for Vibro-Driver with Blasting Sand 8
Impact Hammer Test Program 9
Measured Values of Relatlve Density ('36) of Dry Sand Xs Placed 57 in the LVLPSC; Tests on San Jacinto River (Fine) Sand
hfeasured Values of Relatke Density (%I of Dry Sand As Placed 58 in the LVLPSC: Tests on B1asLh-g (Coarse) Sand
Summary of Permeability Test Results 72
Darnping Ratios of Medlum Dense Sands 85
Blow-Counts for Restrike Events 110
S u r r m q or Total Amount of Water Expelled from Chamber 1 i2
Su imary of Pile-Head and Pile-Toe Parameters lor Vibratory Tests 128
Summary of Pile-Head and Pile-Toe P a r a ~ e t e r s for An Impact 129 Test [Test 19: Blastlng Sand: Relattve Density Wh: Chamber Pressure 10 psi1
Sunlmaq of Pile-Head and Pile-Toe Parameters for An Impact 129 Test Uest 20; San Jadnto Rfver Sand: Relz.Uve Density 65%: Chamber Pressure 10 psl)
Summary of Pile-Head and Pile-Toe Parameters for .4n Impact 130 Test (Test 21: San Jacinto Rlver Sand: Relative Denslty 90%; Chamber Pressure 20 psi)
Summary of Plle-Head and Pile-Toe Parameters for h Impact 13 1 Test (Test 22: San Jacinto Rfver Sand: RclaUvt Density 90%; Chamber Pressure : 20 psi vulical: 10 psi horlzontall
Summary of We-Head and Pile-Toe Parameters for Tests with Restrike
Summary of Total Energy Dcllvtred lo the Pile Head
Sunrnary of OptLmum Parameters from TQPDRJVE Analyses
Comparison of Fallun Loads In Kips for Compression Load Tests
Comparison of Failure Loads m Klps for U p U Load Tests
Summay of Least-Squares Coelllcients for Selected Compression and Uplift Loads
Residual Slrcsses Developed After InstalbUon
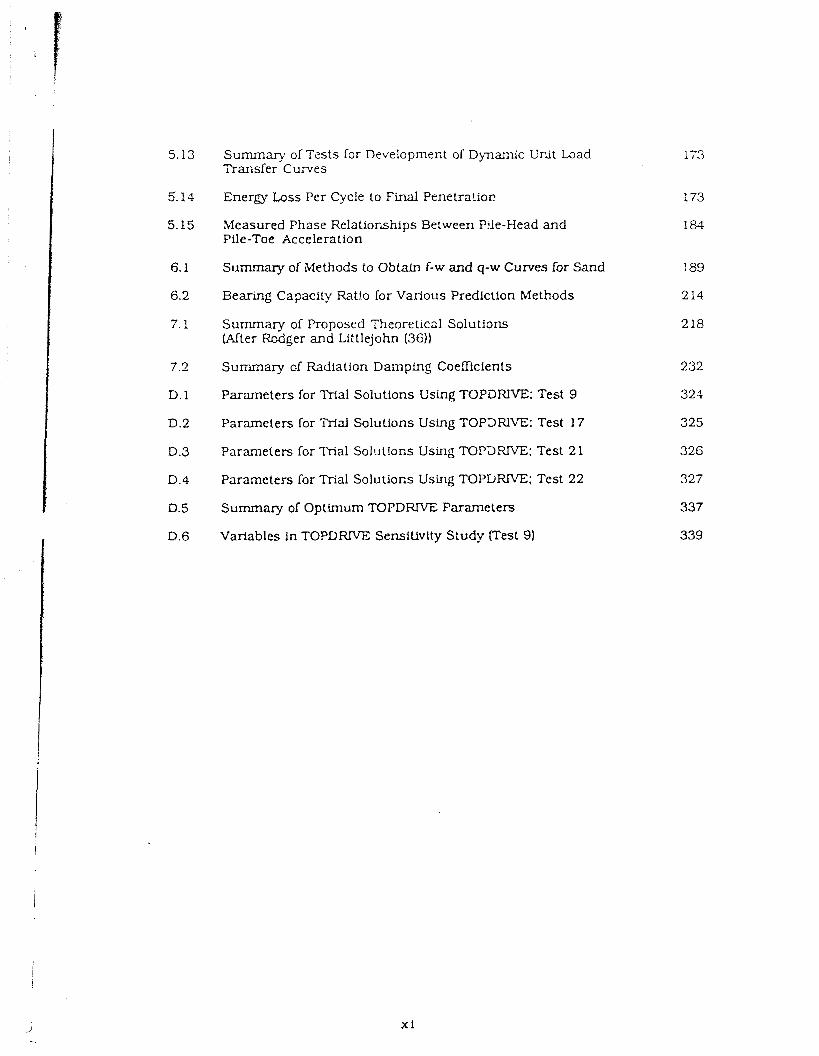
Summary of Tests for Development of Dynamic Unit Load Transfer Curves
Energy Loss Per Cycle to Find Penetratior!
Measured Phase Relationships Between Plle-Head and Pile-Toe Acceleration
Summary of Methods to Obiatn f-w and q-w Curves for Sand
Bearing Capacity Rat!o lor Various Prediction Methods
Summary of Proposed Theoretical Solutions (After Rodger and Littlejohn (36))
Summary of Radiation Damping Coefficients
Parameters for M a 1 Solutions Using TOPDRIVE: Test 9
Parameters for Rial Solutions Using TOP3RIVE: Test 17
Parameters for Trial Solullons Using TOP3RIVE: Test 2 1
Parameters lor Trial Soiutior,~ Using TOPIiRNE: Test 22
Summary of Optimum TOPDRIVE Parameters
Variables in TOPDm SensiUvity Study (Test 91
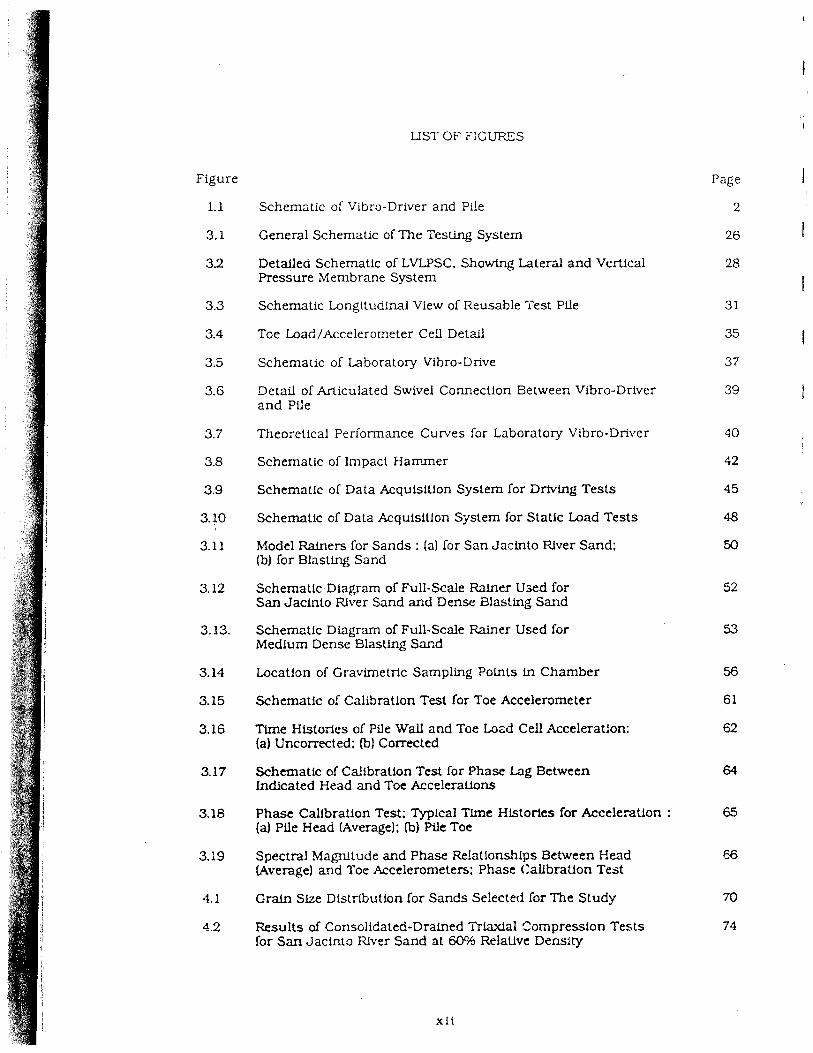
LIST OF FICUPES
Figure
1.1 Schemztic of Vibro-Driver and Pile
3.1 General Schematic of The Testing System
3.2 Detailed Schematic of LVLPSC, Showtng Laterd and Vertical Pressure Membrane System
3.3 Schematic Longituainal View of Reusable Test Pile
3.4 Toe Load/Accelerometer Cell Detail
3.5 Schematic 01 Laboratory Vibro-Drive
3.6 Detail 01 Articulated Swivel Connection Between Vibro-Driver and Pile
3.7 Theoretical Periormance Cuntes for Laboratory Vibro-Driver
3.8 Schematic 01 Impact Hammer
3.9 Schematic of Data Acquisition System for Driving Tests
3.10 Schematic of Data Acquisition Syslem lor Statlc Load Tests
3.1 1 Model Ralners lor Sands : (a) for San Jacinto River Sand: (b) for Blasting Sand
3.12 Schematic Diagram of Full-Scale Rainer Used for San Jacinlo FUver Sand and Dense Blasting Sand
3.13. Schemz?tic Diagram of Full-Scale Rainer Used for Medium Dense Blasting Sar.d
3.14 Location of Gravlmetric Sampling Points in Chamber
3.15 Schematic of Calibration Test for Toe Accelerometer
3.16 Time Histories 01 Pfle Wall and Toe Lozd Cell Acceleratlon: (a) Uncorrected; (bl Corrected
3.17 Schematic of Callbratlon Test for Phase Lag Between Indicated Head and Toe AcceleraUons
3.18 Phase Callbratlon Test; I'yplcal Tlme Histories for Acceleratlon : (a) Pile Head (Average): (b) Pile Toe
3.19 Spectral Magnitude and Phase Rdatlonships Between Head (Average] and Toe Accelerometers: Phase Callbration Test
4.1 Graln Size DistribuUon for Sands Selected for The Study
4.2 Results of Consolidated-Drained Maxial Compression Tests for San Jacinto River Sand at 60% Relative Density
Page
2
26
28
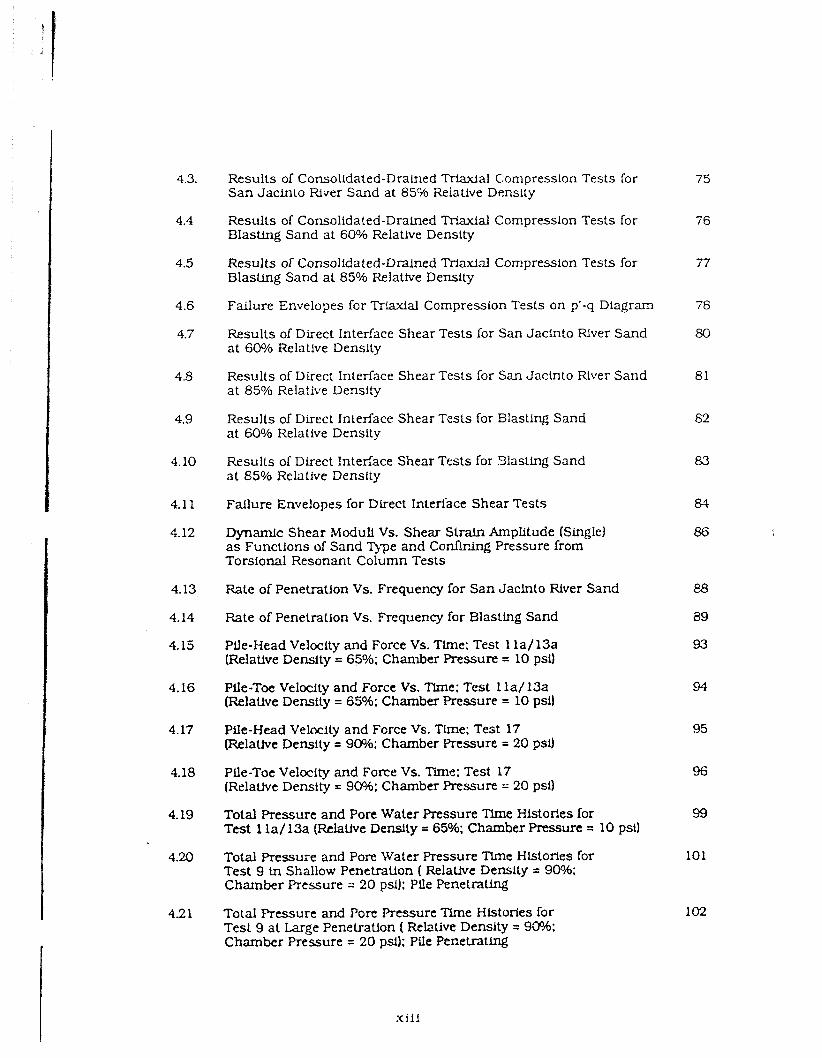
Results of Consolidated-Drained Triaxlal C:ompression Tests for San Jacinlo River Sand at 85% Relative Density
Results of Consolidated-Dnlned Triaxial Compression Tests for Blasting Sand at 60°h Relative Density
Results of Consolidated-Drained Maxizl Compresslon Tests for Blasting Sand at 85% Relative Densiiy
Failure Envelopes for Triaxial Compression Tests on p'-q Diagram
Results of Direct Interface Shear Tests for San Jacinto Rlver Sand at 60% Relatlve Density
Results of Direct Interface Shear Tests for San Jacinto River Sand at 85% Relative Density
Results of Direct Interface Shear Tests for Blasting Sand at 60% Relative Density
Results of Direct Interface Shear Tests for 3lasting Sand at 85% Relaiive Density
Failure Envelopes for Direct Interface Shear Tests
Dynamlc Shear Modull Vs. Shear Strain Amplitude (Single) a s Functions of Sand Type and C o n f i r ? Pressure from Torsional Resonant Column Tests
Rate of Penelration Vs. Frequency for San Jacinto River Sand
Rate of Penetralion Vs. Frequency for Blasting Sand
Pile-Head Veloclty and Force Vs. Tlme: Test 1 la/13a (Relatlve Density = 65%; Chanlber F'ressure = 10 psi)
Plle-Toe Velocity and Force Vs. m e : Test 1 l a / 13a (Relative Density = 65%~: Chamber Pressure = 10 psi1
Pile-Head Velocity and Force Vs. Time: Test 17 (Relative Density = 90%; Chamber Pressure = 20 psi)
Pile-Toe Velocity and Force Vs. Tlme: Test 17 (RelaUve Density = 90%: Chamber Pressure .: 20 psi1
Total Pressure and Pore Water Pressure Time Histories for Test 1 la/ 13a (Rtlattve Density = 65%; Chamber Pressure = 10 psi)
4.20 Total Pressure and Pore Water Pressure Tlme Hlstorles for Test 9 ln Shallow Penetration ( Ftelative Denslty = 90%; Chamber Pressure = 20 psi): Pile Penetrating
4 2 1 Total Pressure and Pore Pressure Time Histories for Tesl 9 at Large Penetration ( Rehtive Density = 9%: Chamber Pressure = 20 psi); Pile Penetrating
Total Pressure and Pore Pressure %ie Histor!es for Test 9 at Large Penetration ( !?elalive Density = 9Wh; Chamber Pressure = 20 psi); Pile Stationary
a t e of Penetration Vs. Toe Depth- to-Dfameter Ratio (D/B); SJR Sand at 900/6 Relatfve Density
Rate of Penetraticn Vs. Toe Depth-Lo-Diameter iiatio (D/B): BLS Sand at 90% Relative Density
Rate of PenetnUon 'Js. Toe Depth-to-Diameter Ratlo (D/B); Comparison of Tests a t f3S0h Relatlve Density and 10 psi Chamber Prssure
Rate of Penetration Vs. Toe Depth-to-Dfameter Patio (D/B): Comparison of Tests a1 900m Fklatlve Density and 20 psi Chamber Pressure
Driving Records for Impact Tests
Results of Compression Tests: VlSro-Driven Piles with Reslrike: ElTectfve Chamber Pressure = 10 psi
Results of Compression Tests: Vlbro-Driven Piles with Restrike; EITectlve Chamber Pressure = 20 psi (Test 9 Synthesized to Full Penetration by Program APILE)
Results of Compression Tests: Comparison of Behavior of Vibro-Driven Piles and Restruck Vlbro-Driven Piles: EITective Chamber Pressure = 10 psi
Results of Compression Tests: Comparison of Behavior of Piles Tested Under & = 0.5 with Piles Tested Under & =1.0; Effectlvc Chamber Pressur? = 10 psi
Results of Compressfon Tests: Compariscn of Pfies !-?stalled by Vibratlon, VibraUon wiUl Restriking and by Impact: SJR Sand: 90% Relative Density: 10 psl ECTective Chamber Prtssure
Results of Compression Tests: Comparison of Piles Installed by Vibration. VibraUon with Rcstrikfng and 3y Impact: BLS Sand: 90% Eklative Density; 10 psi Efleclive Chamber Pressure
Results of Compression Tests: Cornparisoil of Pfles I~lstalled by VlbraUon with ResWLiig and Impact; SJR Sand: 65% Relative Density; 20 psi EfI'ecUve Chamber Pressure
Results of Compression Tests: Comparison of PLles Installed by Vibration with Restriking aad Impact; SJR Sand: 90% Relative Density; 20 psi Efrective Chamber Pressure
Results of Uplift Tests: Vibro-Dtfven Piles with Restrike; EfT'eWe Chamber Pressure = 10 psi
e s u l t s of Uplift Tests: Vibro-Driver? Pees with Restrike; Effecllve Chamber P re - sun = 20 psi [rest 9 Synthesized to Full PenelraUon by Program APILE)
Results of UpliftTests: Comparison of Behavior of Vibro-Driven Piles and Restruck Vibro-Drlver, Piles; EfIective Chamber Pressure = 10 psi
Results of UpllfiTests: Corngarison of Behavior of Piles Tested Under KO = 0.5 with Ples Tested Under KO = 1.0; EffecWe Chamber Pressure = 10 psi
Results of Uplift Tests: Comparison of Pfles Installed by Vibration. Vibration with Restrlktng and by Impact; SJR Sand; 90% Relative Density; 10 psi Effective Chamber Pressure
Results of UpliftTests: Comparison of Pfles Installed by Vibration, Vibration with Restriking and by Impact: BLS Sand:
assure 90% Relative Density: 10 psi Effective Chamber Pr-
Results of Uplift Tests: Comparison of Piles Installed by Vibration wllh RestrFkLng and Impact; SJR Sand: 65% Relative Dens!ty; 20 psi Effective Chamber Pressure
Results of Uplift Tests: Comparison of Pfles Installed by Vibration with Restriking and Impact; SJR Sand; 90?h Relauve Density; 20 psi Effective Chamber Pressure
Relationship Between Penetration Velocity for Vibro-Driven Piles and Drivlng Resistance for Impact-Drlven Piles
Relationshfp Between Power Ratio and Peak Pile-Head Accelerationfor Vibro-Driven Piles
Pfle Penetraion Velocity (vp) Vs. Peak Plle-Head Acceleration (ah): Sand Relative Density = 65%; MectIvc Chamber Pressure = 10 psi
Pile Penetraion Velocity (vp) Vs. Peak P!Je-Head Acceleration (ah); Sand Relative Density = 90%; ElTective Chamber Pressure = 10 psi
Pile Penetraion Velocity (vp) Vs. Peak Pile-Head Acceleration (ah); Sand Relative Density = 90%; EfTectfve Chamber Pressure = 20 psi
Cornparfson of compression Capacities of Vlbro-Driven Piles and Impact- Driven Pi!es
Load Distribution for Test 17; Compression
Load DistribuUon for Test 17; Upli[t
f-w Relationships for Tests 5. 6 and 7
f-w Relationships for Tests 8.9 and 1 l a / 13a
5.11 f-w FWatlonsNps for T e s l 14. 15 and 16
5.12 f-w Relationships for Tests 17, 18 and 19
5.13 f-w Relationsh!ps for Tests 20. 2 1 and 22
5.14 q-w Ftelationships for Tests 5. 6. 7. 8. 9 and 1 1 a/ 13a
q-w Relationships for T e s l 14. 15, 16. 17, 18 and 19
q-w Relationships for Tests 20. 2 ! and 22
Summary Noxmal!.zed f-w Relatlon for Pile Driven by Impact and Vibrated into SJR Sand at 65Oh Relative Density
Summary Normaked f-w Relation for Pfle Driven by Impact lnto S J R Sand at 9G?! Relative Density
Summary Normalized f-w Relation for Pfle Vibrated into SJR Sand at 90% Relative Density
Summary Normalized f-w Relation for Pile Vibrated (nto BLS Sand at 65% Relative Density
Summary Normallzed f-w Relation for We Drlven by Impact into BLS Sand at 90076 Relative Density
Summary Normalized f-w Relation for Plle Vibrated into BLS Sand at 90% Relatlve Denslty
Summary Normalized q-w Relation for Pile Drlven by Impact and Vibrated into SJR Sand at 65% Relative Density
Summary Normalized q-w Relation for Pile Driven by Impact into S J R Sand at 9096 Relative Density
Summary Normalized q-w Relation for Pile Vibrated into S I R Sand at 90% Relathe Density
Summary h'onnalfied q-w Relatlon for PCe Vibrated lnto BLS Sand at 65% Rtlatlve Denslty
Summary Normallzed q-w Rtlatlon for Pfle Driven by Impact into BLS Sand at W! Relatlve Density
Summary Normallzed q-w Rclati~n for Pfle Vibrated into BLS Sand at 90% Relatlvt Density
Dynamic Unit b a d Transfer Curves: Test 5
Dynamic Unit lxMd Transfer Curves; Test 7
Dynamic Unit Load Transfer Curves: Test 9
Dynamic Unit Load Tnnsfer Curves; Test 1 1 a/ 13a
Dynamic Unit Load Transfer Curves; Test 14
Dqnamic Unit Load Trarsfer Cun7es for Pfle fn Motion and at Rdusal; Test 17
Comparison of Dynamic and Static Urilt Load Transfer Curves: Test 5
xv!
Comparison of Dynamic and Static Unit Load Transfer Curves; Test 7
Comparison of Dymmic and Static Un i t Lead Transfer Curves; Test 9
Comparison of Dynarnlc and Static Unit Load Transfer Curves; Test 1 la / 13a
Comparison of Dhnanlfc and StaUc Unit Load Transfer Curves; Test 14
Comparison of Dynamic and StaUc Unit L9ad Transfer Curves; Test 17
Comparison of Dynamlc (PUe at Rdusal) and Static Unit Load Trarder Curves: Test 17
Comparison of Experimental and Predicted Bearing Capacily Vs. Blow Count
Comparison of Experimental and Predlcted Bearing Capacity Vs. Rate of Penetration
Experimental and Predlcted f-w and q-w Curves: Tests 5.6 and 7
Experimental and Predlcted f-w and q-w Curves: Tesls 9. 1 la / 13a and 14
Eh-perlmental and Predlcted f-w and q-w Curves: Tests 15. 16 and 17
Experimental and Predicted f-w and q-w Curves: Tests 18, 19 and 20
Experimental and Predicted 1-w and q-w Curves; Tests 2 1 and 22
Measured and Predicted bad-Movement Culves: Tests 5 and 7
Measured and Predicted bad-Movement Curves: Tests 9 and 1 la/ 13a
Measured and Prcdrcted Load-Movemerit Curves; Tests 14 and 17
Measured and Predicted Laad-llla.ernent Curves; Tests 19 and 21
Frequency Histogram of Number of Laboratory Tests Vs. Ratio of Measured to Computed Normalized Static Compresstve Ple Capacity
Relationship of Normalized Capacity and Rate of Penetration
Vibro-Driving Model
Measured and Predlcted Pile Hesd Forces: Tests 5 and 7
Measured and Predicted PLie Head Forces; Tests 9 and 1 l a / 13a
Measured and Predicted We Head Forces; Tests 14 and 17
Reloading and Unloadhg Paths of Soil Msdel
Proposed Soil Model and Expermental Dynamic Unit Load Transfer Curves: Test 5
Proposed Soil Model and Expermental Dwarnlc Unlt Load Transfer Curves: Test 7
Proposed Sofl Model and r!3permental Dynamic Unit Load Transfer Curves; Test 3
Proposed Soil Model and Expermental Dynmdc Unit Load Transfer Curves: Test 1 1 a / 13a
Proposed Soil Model and Expermental Dynamic Unit Load Transfer Curves; Test 14
Proposed Soil Model and Expermental Dlnarnic Unit Load Transfer Curves: Test 17
Measured and Predicted Displacement Time Hbtories of Vibro-Driven Pile; Tesls 5 and 7
Measured and Predicted I)lsplacement Time Histories of Vibro-Drfven Pile: Tests 9 and 1 la/ 13a
Measured and Predicted Displacement Time Histories of Vibro-Driven Ptle; Tests 14 and 17
Measured and Predicted Rate of Penetration X's. Depth-to-Diameter RaUo (D/B); Tests 5 anti 7
Measured and Predicted Rate of Penetration Vs. Depth-to-Dlameter Ratio (D/B); Tesls 9 2nd 1 !a/ 13a
Measured and Predicted Rate of PenetraLion Vs. Depth-to-Diameter Ratlo D/B); Tests 14 and 17
Measured and Predicted Displacnlent Tlrne Histories of Vlbro-Driven Pile by UH-VlBRO and TOPDRNE
A1.
A2.
B. la.
Si.ng!e-Degree-of-Freedom System Model ~f Vibro-Driver
Fret-Body Diagram of the System
Pile-Head and Toe Acceleration Vs. m e : PenemUon=75 Inches; Test 5
B. lb.
9. lc.
B. ld.
B.2a
B.2b.
B.2c.
B.2d
B.3a.
8.35.
B.3c.
B.3d.
B.4a
B.4b.
B.4c
B.4d
B.5a
5.32.
8%
B.5d
Pile-Head Velocity and Force Vs. Time: Penetration=75 Inches; Test 5
Pile-Toe Velocity and Force Vs. Tlme: Penetration=75 Inches; Test 5
Totd and Pore Water Pressure Vs. Time a) Bottom of Pile Shalt: PenetraUon=75 Inches; Test 5
Pile-Head and Toe Acceleration Vs. Time; Penetration=7 1 Inches; Test 7
Pile-Head Velccily and Force Vs. Time; Penetration=7 1 Inches: Test 7
Pile-Toe Velwity and Force Vs. Time: Penetration=7 1 Inches; Test 7
Total and Pore Water Pressure Vs. Time at Bottom of Pile Shdt : Penetration=7 1 Inches; Test 7
Pile-Head and Toe Acceleration Vs. Time: Penetratfon=53 Inches: Test 9
Pile-Head Velocity and Force Vs. Time: Penctration=53 Inches: Test 9
Pilr-Toe Velocity and Force Vs. Time: Penetration=53 Inches: Test 9
Total and Pore Water Pressure Vs. Time at Bottom of Pile Shdt ; Penetntion=53 Inches; Test 9
Pile-Head and Toe Acceleration Vs. Time: Penetration=55 Inches: Test 9 (Refusd)
Pile-Head Velocily and Force Vs. TLme: Penetratlon=55 Inches; Test 9 (Refusal)
Pile-Toe Velocity and Force Vs. Time: Penetntion=55 Inches; Test 9 (Refusal)
Total and Pore Water Pressure Vs. Tlrne a? Bottom of Pile Shaft: Penetration=55 Inches: Test 9 (Rdusal)
Pile-Head and Toe Acceleration Vs. Tlrne: PenetraUon=75 Inches: Test 1 l a / 1%
Pile-Head Velocity and Force Vs. T h e : PenetraUon=75 Inches; Test 1 la/ 13a
Ptle-Toe Velocity and Force Vs. Tlrne: PenetraUon=75 Inches: Test 1 1 a/ 13a
Total and Pore Water Pressure Vs. Time at Bottom of Pile Shaft: PenetraEon=75 inches; Test 1 1 a/ 13a
Pile-Head and Toe Acceleration Vs. T h e : Penetration='i?, Inches: Test 14
Pile-Head 'Je!a-i!y and Force Vs. Time: Penetratlor,=72 Inches: Test 14
Pile-Toe Velocity and Force Vs. Time: Penetration=72 Inches: Test 14
Total and Pore Water Pressure Vs. Time at Bottom of PUe Shall; Pene tration=72 Inches: Test 14
Pile-Head and Toe Acceleration Vs. Time; Penetration=72 Inches; Test 17
Pile-Head Velocity and Force Vs. Time; Penetrallon=72 Inches: Test 17
PUe-Toe Velocity and Force Vs. Time: Penetration=72 Inches: Test 17
Total and Pore Water Pressure Vs. Time at Bottom of Pile Shaft; Penetration=72 Inches: Test 17
Pile-Head and Toe Acceleratlcn Vs. Time: Penetration=74 Inches: Test 17 (Refusal)
Pfle-Head Velocity and Force Vs. Time: Penetntion=74 Inches: Test 17 (Refusal)
Pile-Toe Velocity and Force Vs. Tlme; Pene tration=74 Inches; Test 17 (Refusall
Total and Pore Warer Pressure Vs. Time at Bottom of Pile Shaft: Penet~iaUon=74 !nches: Test 17 [Refusal)
Measured Head and Toe Force and Velocity-Impedance Time Histories; Restrike at Full Penetration; Test 6
Measured Head arld Toe Force and Veiocity-Impedance Time Hlstories; Restrike at Full Penetration; Test 7
Measured Head and Toe Force and Velocity-!npedar,ce i'lrne Hlstories; Restrike at Full Penetration; Test 8
Measured iiead mc! Toe Force and Velocity-Impedance Time Histories; Restrikt at Full Penetration: Test 9
Measured Head and Toe Force and Velocl@-Impedance Time Hlstories: Restr!!!e at Full Penetration; Test 15
Measured Head and Toe Force and Velocity-Impedance Tlme Histories: ResUike at Full Penetration; Test 16
Measured Head and Toe Force and Velocity-Impedance Time Histories; Restrike at Full Penetration: Test 17
Measured Head and Toe Force and Velccitjr-Impedance Time Hls!ories; Impact-Driving at Full Penetration: Test 19
Measured Head and Toe Force and Velocity-Impedance Time Histories; Impact-Driving at Full Penetration; Test 20
Measured Head and Toe Force and Velocity-Impedance Time Histories; Impact-Driving at Full PenetraUon; Test 2 1
Measured Head and Toe Force and Velocity-Impedance Time Histories: Impact-DrlvLng at Full Penetration: Test 22
Measured and Computed Pile-Head Velocities and Forces; Test 9
Measured and Computed Pile-Toe Velocities and Forces: Test 9
Measured and Computed Pile-Head Velwll_ies and Forces: Test 17
Measured and Computed Pile-Toe VelociUes and Forces: Test 17
Measured and Computed Pile-Head VelociUes and Forces: Test 2 1
Measured and Computed Pile-Toe Velocities and Forces: Test 2 1
Measured and Computed Pile-Head Velocities and Forces: Test 22
Measured and Computed Pile-Toe VeloclUes and Forces: Test 22
TOPDRIVE Analysis oTTest 9: Increased Toe Weight: VeIocilfes
TOPDRNE Analysis of Test 9; Increased Tce Weight; Forces
TOPDRIVE Analysis of Test 9: Variable Shaft Resistance: Velwitles
'IY>PDFUVE Anaiysls of Test 8: Variable Shaft Resistance: Forces
TOPDRNE Analysis of Tcst 9; Increased ?@e Weight and Variable Shaft Resistance: VelocfUes
TOPDRNE Analysis of Test 9; Increased Toe Weight and Variable Shaft Eieslslance: Forces
TOPDRIVE Ana'ysis of Test 9; Increased Toe Wefght. Variable Shaft Resistance and Decreased Ttme Step: Velocities
TOPDRNE Analysis of Test 9: Increased Toe Welght. Variable Shaft Resistance and Decreased Tlme Step; Forces
WEAP 86 Analysis of Test 9 Using Optlmum Parameters from TOPDRNE Analysis with Dmerent Cushion SWness
Elevation Schematic of StaUc Compression Testing Arrangement
ElevaUon Schemallc of StaUc U p U TestLng Arrangement
INTRODUCTION
Piles are usually stalled by impact driving or by the use of a vibrator affixed to
the head of the pile. A vibrator, or "vibro-driver." depicted schematical!y in Flg. 1.1.
produces a sinusoidal vert:cal forcing function at frequencies ranging from as low as 5
Hz lo a s high as 1 4 0 Hz. A vibratory driver typically consists of a vibrating element
(eccentric moments produced by unbalanced counterrotatlng masses snown in Fig. 1.1).
b!as mass. isolation springs between the bias mass and a connection to the pile. The
bias mass performs the function of producing a near-static compression force on the
pl,le that assists the vertical forcing function to drive the pile. This mass is prevented
from vibrating along with the vibrating element by means of the isolation springs,
which are of such a stillness to assure that the resonance frequency of the bias mass-
isolation spring system is considerably below the operating frequency of the vibrator.
The pile-vibrator coanection is usually a chuck-type or pinned connecticn. whose
detailed design is irnporta~t 111 the prevention of damage to the pile dufing aeving.
Vibratory drivers have been used for installing piles in many parts of the world
since the early 1930's a s a3 alternative to the more conventional impact hammers. In
recent years vibratory pile drivers have gained popularity with contractors reiative to
impact drivers because they produce less nolse and less damage to piles during driving
and permit signlflcantly faster rates of penetration In favorable soil co~dl t ions
(generally, cohesionless scfls). Vlbro-drivers are generally grouped as low-frequency
drivers ( u p to 4 0 i-iz). which operate mainly by reducing soil resistance !hrough
excitation of the soil particles and, perhaps, simultaneous bulldup of excess Fcre water
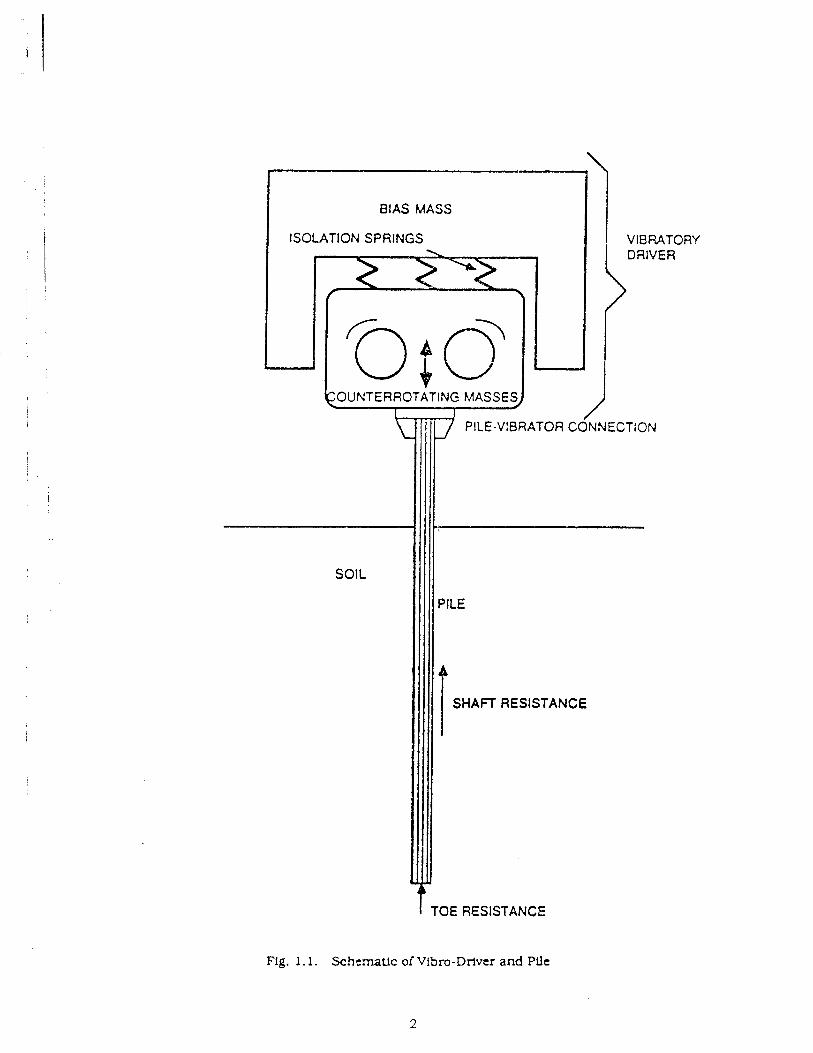
Fig. 1.1. Schematic o i Vibro-Driver and Pllt
BIAS MASS
ISOLATION SPfilNGS
SOlL
PILE
I SHAFT RESISTANCE
7 TOE RESISTANCE
pressure, and high-frequency drivers !-between 40 Iiz and 140 Hz). which often pera ate at
the free natural frequency or second harmonic frequency of the plle. which in turn
provides slgruficant ampltCication of the forcing function and more rzpid penetration.
Neither type of dnver Is considzred generallqr effective Fn deposits of cohesive soil. and
such soil 1s therefore excluded from the laboratory study. The most popular drivers in
operation are the low-frequency type, because they are easier to maintain
mechanically. whose operatlig frequencies arc from about 5 Hz to 40 Hz. Vibratory pile
dnvers have not gamed wmde acceptznce in the United States, except for the installation
and ejrlraclion of non-bearing piles such as sheet piles. because the engineering
community is generally unfamiliar wilh this method of installation and because there
i;re uncertahtles regarding the estimation of ultimate bearing capacity. Due to these
uncertainties. restriking a vibro-driven pfle with an Impact hammer is often required
to assure that a pile has developed a design bearing capacity. but this process greatly
reduces the economic beneflts of using vibratory drivers.
A limited number of laboratory model studies and full-scale studies on vlbro-
driven plles have been reported In the Ilterature. as summarked In Chapter 2. These
sludles relate vibratory driver parameters. such as dynamic force, displacement
amplitude. frequency and bias mass to the drivcabflity (rate oi penetration) and the
static bearing capaclty of the pile. Although ?ast studies are important. wry little has
been done to Lrlvestlgatt the iriluence or the soil parameters (particle size, volume
change characteristics, strength) and tn-situ stress conditions on the performance of
vibro-driven piles. In order to develop more accurate predictive methods for the
ultfmate bearing capac~ty and load-movement behavior of vlbro-driven plles. induced
residuzl stresses and +he magnitudes and dhtrlbutlon of shaft reslstanee along the ptle
and toe resistance (Fig. 1.1) must be u~lderstood in the context of the properties of the
soli. As a step toward developing a better understanding of the behavior oivlbro-dnven
piles in saturated cohesionltss soil, a detsiled. large-scale laborztory experfmental
study was undertaken. This laboratory study wzs limited to LmTestigaiing the
perforni'=ince of low-frequency vi5ro-drivers because of the predominance of their .
.&a1 sys
details re[
chamber. 7 2 s --
acquisitior
?ratcl?c .rverall objective of this study is to evaluate the load-deformation behavior
of piles installed in the laboratory with vibratory drivers. Specific objectives include
the following: (1) the identification of driver parameters and soil parameters that
significantly affect driveability and load-deformatfon b?rha:-ior of piles installed with
vibratory drivers; (2) a comparison of load-deformation behavior of piles tnsta!led
with vibratory drivers and impact hammers; (31 a comparison of load-deformation
behavior of piles installed with vibratory drivers wd'h and without restriking using an
impact hammer. to evaluate the effect of restriking; (4) the development of predictive
methods to estimate the bearlng capacity of vibm-dwen pUes and a procedure to select
a suitable vibro-driver for given driving condltlons: (5) the development of a computer
program to model vlbro-driving.
1.2 RESEARCH APPROACH
In order to achieve the desired goals. a model tesUng system was designed. built
and appropriately instrumented. The testlng system included a long sand column. pile.
vibratory W e r . impact hammer and data acqulsitlon equipment. The sand column
was formed in a containment vessel 30 inches in diameter and 1 0 0 inches in height.
The contafnment vessel was designed to apply confining pressures ln any selective
manner to simulate various in-sltu stress conditions and to submerge the sand. A
reusable, Instrumented. closed-ended steel pipe ('displacement pile") with 3 4-inch
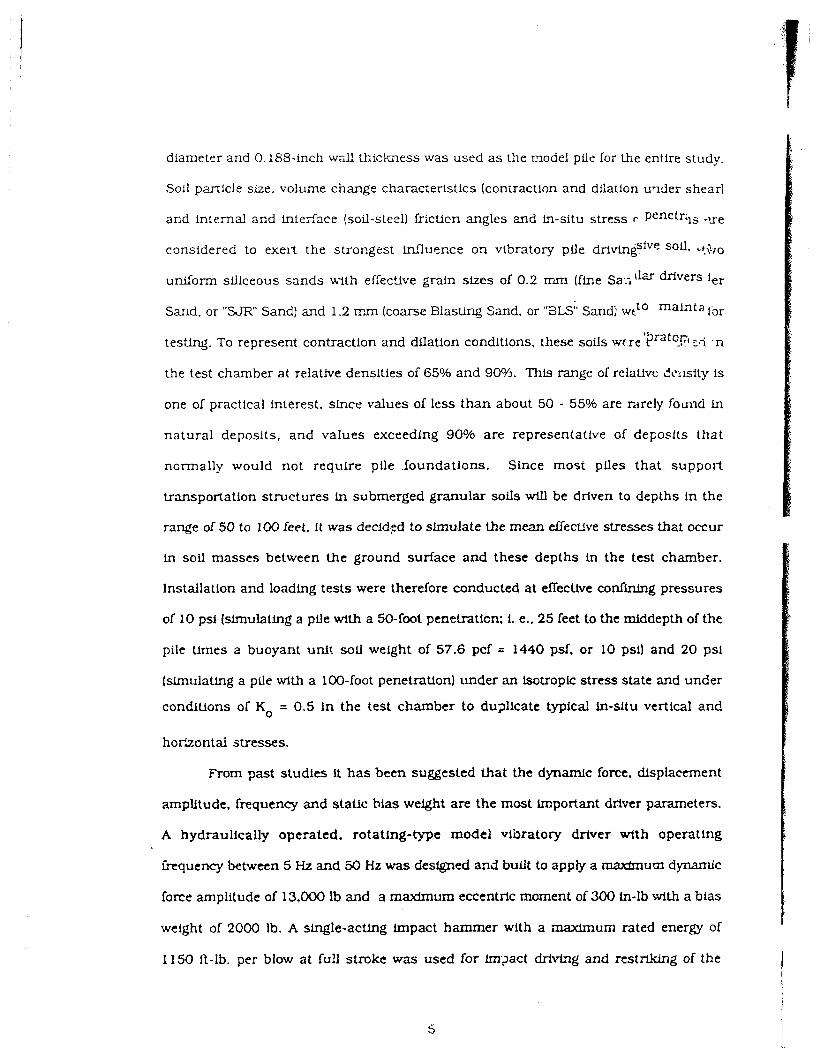
diameter and 0.185-tnch wsl! thickness was used a s the model plle for the entire study.
Soil particle sue, volume change charac~erfstlcs (contraction and dilation u ~ r l e r shear]
and tnternal ar,d interface (soil-steel) frictlcn angles and in-situ stress r penetr+s .we
considered to exelt the stror?gest incluellce on vtbratory pile drivingsfve Sou. ~!?,o
u d o r m sFllceous sands with ef:ec?ive grain sizes of 0.2 mm (fine Sa:i'lar drivers ler
Sarld, or "SJR8 Sand) and 1.2 rm (coarse BlasUng Sand, or '73~s''' Sand] wrtO mainta lor
testing. To represent contractlon and dilation condltions. these sails wrre'Prat0-?,*i . n
the test chamber at relative dens!ties of 65% and 90°h. This range of relativc 2ia~1slty is
one of practical interest. since values of less than about 50 - 55% are rarely found in
natural deposits, and values exceeding 90% are representative of d e ~ o s l t s that
normally would not require pile foundations. Since most plles that support
transportation structures in submerged granular soils will be driven to depths in the
nnge of 50 to 100 feet. it was decid$;d to simulate the mean elrecuve stresses that occur
in soil masses between the ground surface and these depths tn the test chamber.
installation and loading tests were therefore conducted at ellecthre confining pressures
of 10 psi (simulating a pile with a 50-foot penetraticn: i. e.. 25 feet to the middepth of the
pile Umes a buoyant unit sol1 weight of 57.6 pcf = 1440 psf. or 10 psi) and 20 psi
(slmulatfng a ptle with a 100-foot penetration) under an isotropic stress state and under
condiUons ol KO = 0.5 in the test chamber to du;llicate typical in-situ vertical and
hofmntal stresses.
From past studlts It has been suggested that the dynamic fom. displacement
amplitude. frequency and static bias weight are the most important drlver parameters.
A hydraulically operated. rotating-type model vibratory driver with operating
hquency between 5 Hz and 50 Hz was desfgned =ii burlt to apply a rnaxfrnum dynamic
force amplftude of 13,000 lb and a m-um eccentric moment of 300 in-lb with a bias
weight of 2000 lb. A single-acting impact hammer with a maximum rated energy of
I I 50 12-15. per blow at fuU stroke was used for Im?act drivk~g and restriking of the
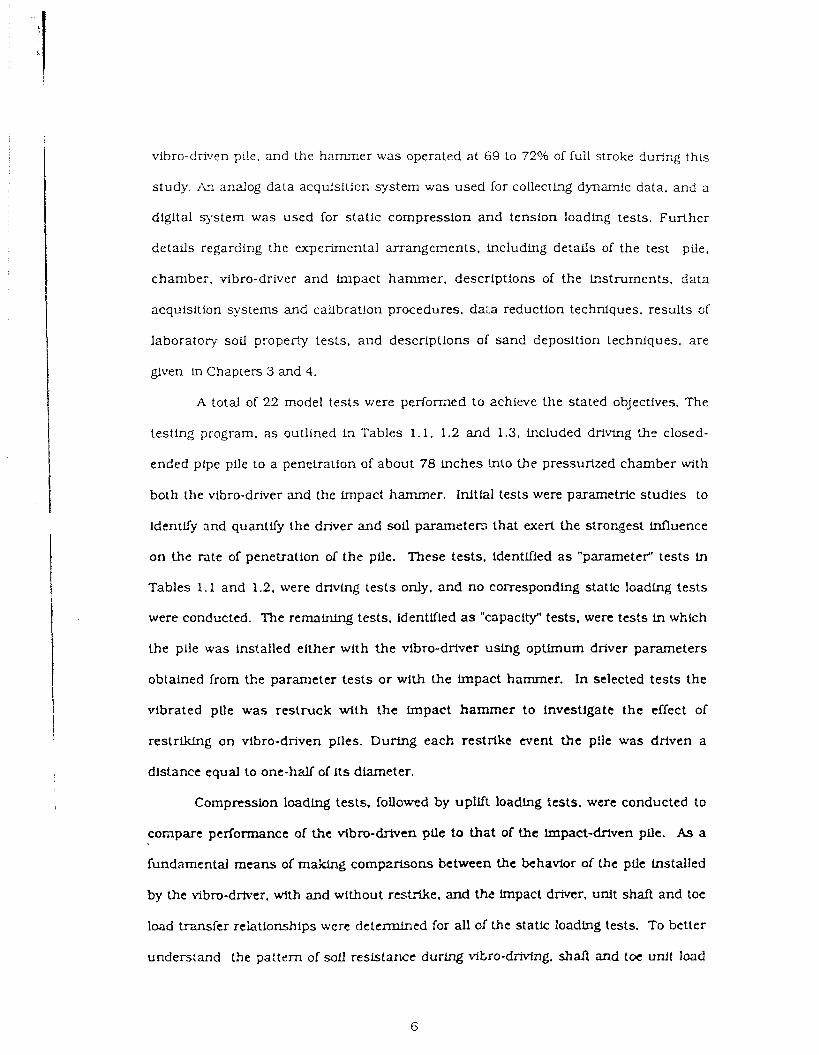
vibro-dnven pde. and the hammer was operated at 69 to 7Z0h of full stroke dur?ng this
study. A2 analog data acqulsilion system was used for collecting dynamic data. and a
digital system was used for static compression and tenston loading tests. Furiher
details regarding the experimental arrangements, including details of the test pile,
chamber. vfbro-driver and lmpact hammer. descriptions of the Lnstruments. data
acquisition systems and calibration procedures, da;a reduction techniques, results of
laboratory soil properiy tests. and descriptions of sand deposition techniques. are
given in Chapters 3 and 4.
A total of 22 model tests were performed to zchieve the stated objectives. The
testing program, as outlined in Tables 1.1, 1.2 and 1.3. lncluded d r l m g the closed-
ended plpe pfle to a penetration of about 78 inches into the pressurized chamber with
both the vibro-driver m d the impact hammer. Init ial tests were parametric studies to
ldentliy and quantify the driver and soil parameters that exert the strongest influence
on the rate of penetration of the pile. These tests. identified a s "parameter" tests in
Tables 1.1 and 1.2. were driving tests only. and no corresponding static loading tests
were conducted. The remaining tests, identified a s "capacity" tests, were tests in which
the pile was installed either with the vibro-driver using optimum driver parameters
obtained from the parameter tests or with the Impact hammer. In selected tests the
vibrated pfle was restruck with the impact hammer to investigate the effect of
restrFkLng on vibro-driven piles. During each restrike event the p!le was drlven a
distance equal to one-half of Its diameter.
Compression Ioadlng tests. followed by uplift loading tests. were conducted to
compare performance of t'lc vibro-driven pile to that of the lmpact-driven pile. As a
fundamental means of maldng compzrisons between the behavior of Ule pLle installed
by the vibro-drfver, with and without restrike, and the impact driver. unit shaft and toe
load transfer reiatlonships were determined for all of the static loading tests. To better
undersland the pattern of s o l resistance durfrg vftro-driving, shaft and toe unft load
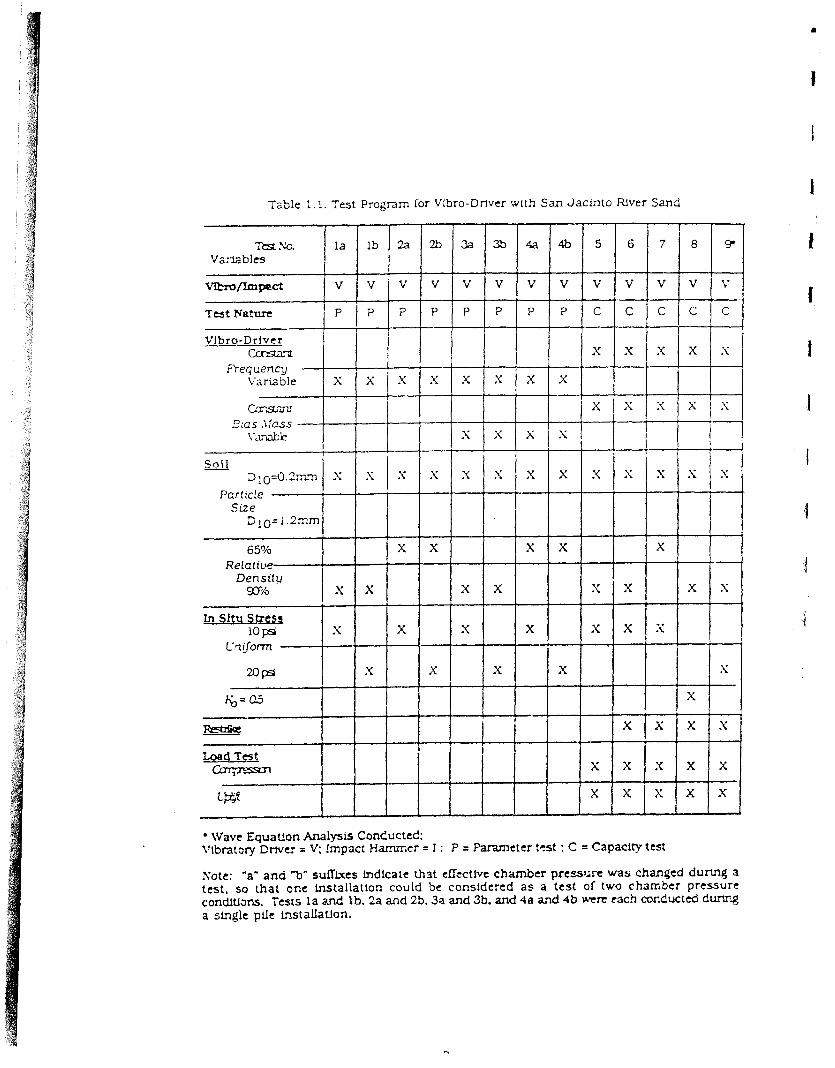
Table 1.1. Test Program for Vlbro-Drfvcr wtth San Jaclnto Rlver Sand
Wave Equaeon Analysis Conc!l;ctcd: \'lbrat=ry E w e r = V: !mpact Harnrr,cr = 1 : P = Parameter trst : C = Capacity test
Xotc: "a" and "b" suffLxes lndlcate that eEectlvc chamber pres?;re was changed during a test , so that one installation could be considered a s a test of two chamber pressure conditlans. Tests l a znc! lb. 2a and 25.3a and 3b. and 4a and 4 b wen: each cocducted durlrg a single pile LnstaIIaUon.
5
C
4b
P
6
C
X X S
S
2b
P
) ; > ; X X X X X X
2a
P
Rst NQ Variables
X 1
\ “ X ~ k
Soil - J I O = ~ : m i h
Pcr1:cle S u e
D1O=i 2mm
65% Relattue
7
x
i
X
31
P
vemmp~ct
~ e s t P r a m ' P I P
Vibro-Driver cb-lsmt
ryequency \'anable
~ZSGi i
2,as \;US
la
' : I S
X
D e n s ~ l y 93%
la!!&%rStress 10 Fst
C'7g0fVl
a@ %=aj
I3sBs
Log& Test
lb
X
.Y
X s
S
8
i
X
x
I
S
3b
P
X
I
S
9
C I C
X X X X S
4a
v v v v v v v v v v v v V
P
I i x
X
C
x
X
X
Y
:<
I x x x x
X X x X X
X ( X i
G ,
L&9
X
X
X
I
I X
X
i I
. I Z
! S
X
I X I X I
x
X
X
S
x
I
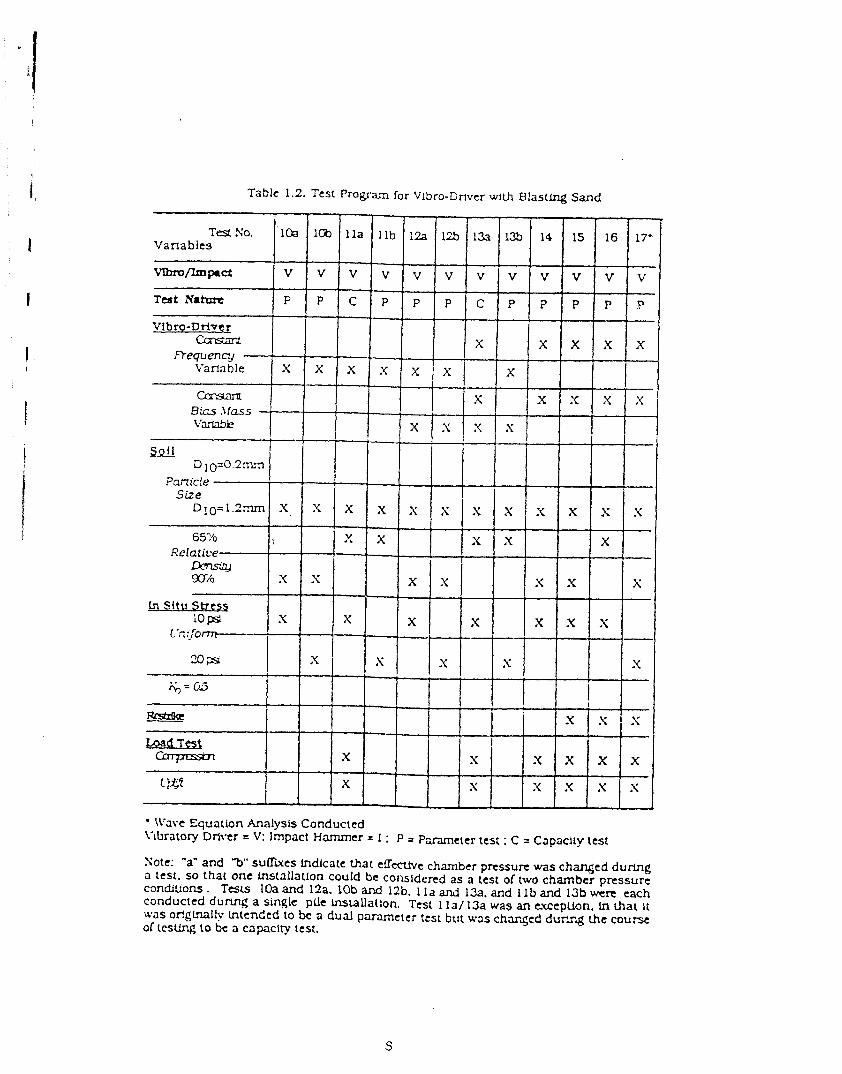
Table 1.2. Test Program for Vlbro-Drivcr wtth Blasting Sand
IVclve Equation Analysis Conducted Vibratory Driver = V: Impact Hammer = I : P = P m e t e r test ; C = Capacity Lest
Test No. Varla bi ts
Vfbm/lmp.d
Tcst Natan
Vlbm-Driver CcrrstarP
Requency Variable
CarSara Bias .Ifass
Sotc: "a" and "b" suU"cs indlcatc that effecuvc chamber p ~ s s u r t was changed durlng a test. so that one tnstallatlon could be Consldercd as a test of two chamber pressure conditions. Tests 10a and 12a. lob and 12b. I l a and 13a. and 1 lb and 13b we= each conducted dumg a single pile hs~allallon. Test 1 la/ 13a was an e.<cepUon. In that It was ofiglnaliy tntended to be a dud ppar;lmeter test but was charged d u m g the course of tcsung lo be a capacity test.
10a 1% l l a l l b 12a 1% 133. 13b
v V v v v v v v v v v v
P P C P P P C P T P P P
X
X X X x x x X
X
\:mk I 3Q!.!
D 10=0.2mx, 1 / I
?anic!e Size
D l o = 1 . 2 m X .
65'1'0 Relati~~e
-4 rnh
Ln Situ Strcsg io pd
c-fi Gr0-
3-
%=a
xT-j?(IS,---
14
x
.y
r pg
Bs!!s
15
X X X X
X X X X
x s
Y. X X ,Y
S X x
: < x x s
x
X
I
16
x
17'
I X
,Y
X x
I
X
)(
X
.-
x
X X X X
X S S
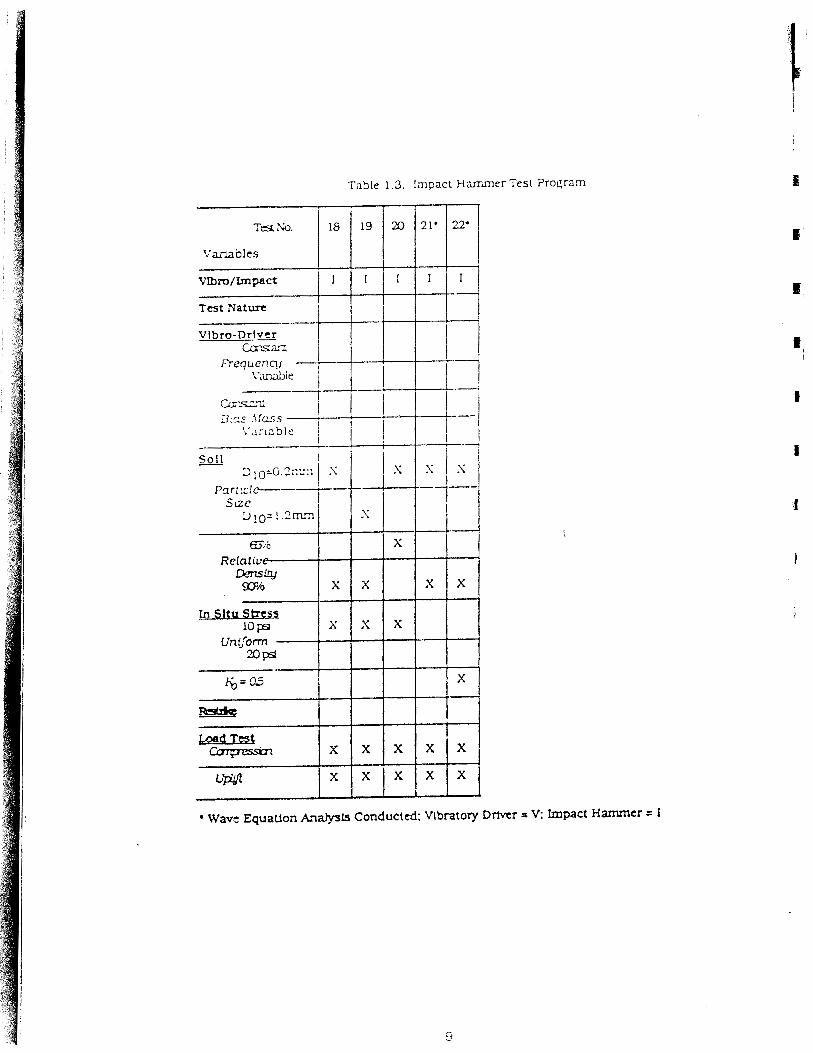
Table 1.3. Impact Harrhmer Test Program
Wave EquaUon A . i U Conducted: Vibratory Driver x V: Impact Hammer = I
22'
m=L
sot1 -
21' 20
1 I : I I
Frequenql
19 T d NO.
Variables
mm/Lmpact
Tcst Nature
Vlbro-Driver m53,';I
lfj
traisfer relatlonships were deterrntned from the dynamic data for the v ibra t l r~ pile for
selected condilions. In addition. wave equatlon st dies were conducted ~n mpact-
driven and vibro-driven/restrike pfles in order to understand whether Smith-type
wave equatlon parameters (quake. damplng and dlstributlon of resistance) that are
used in the analysis of Fmpact-driven pries can also be used for the evaluation of the
behavior of piles that are vibrated Inlo place and later restruck with an impact
hammer. Complete analysis of the test results were given in Chapter 5.
In Chapter 6, various methods for estimating the bearing capacity of a
displacement-type, vtbro-driven laboratory pile iq submerged. granular soil from
known driver and sol1 parameters are described. Several constitutive relationships
were used to model the static load transfer relationships of vibro-driven piles. A
procedure ls reommended for the selecuon of v!bro-driver to lnstall displacement piles
cf desired statlc capaclly for a given set of sou conditions.
In Chapter 7. a nonlinear soil model using static load transfer relationships
wilh appropriate degradation factors and hystersis is presensted. A one-dlmenslonal
rigid body model is also dexrlbed which predlcts the driveabllity of vibro-driven piles
using predicted forcing functions and an appropriate soil model. lncludlng both
radiation and hysteretic damping. A computer program has been developed for the
analysis. Selxted data were also a n d p e d uslng the wave equation computer program.
When compared to wave equatlon analysis, the rigid body steady state model predicts
the observed phenomena reasonably well.
Finally. Chapter 8 sumrnarlzes the conclus!ons Ulat can be deduced from this
study and provides ncmsnendatlons for further research.
CHAFTER 2
BACKGROUND
Research into vibratory driving of piles began Ln 1930 in Germany. and the firs:
cornrnercfai application was carried out in 1932. At. the same time, studies on vibration
of foundat io~s were carried out in the USSR. Pavyluk began his work on footing
vibrations in 1931, and Barkan in 1934 demonstrated that th: vertical vibration of a
pile markedly decreased the shalt shearing resistance between the pile and the soil (36).
In 1946, Rusakov and Khokhevich studied the mechanisms of low-frequency vibratory
drivers and observed lmpact between the pile and the soll. Commercial application of
low-frequency vibratory drivers in the USSR was demonstrated at the Gordy
hydroelectric development project, where a vibratory driver operating between 38 and
45 Hz. drove a total of 3700 sheet plles to depths ranging fro= 29.5 to 39.4 feet in
saturated sand and taking about 2 t o 3 minutes per pile. The vibratory driver drove
more sheets and consumed only 25% of the power compared to a pneumatic impact
hammer (191.
In 1953. high-frequency vibratory drivers with resiliently mounted surcharge
(bias masses1 were used to drive piles weighing 2.2 tons to depths of 65 feet in saturated
sand (191. In 1955. Tatarnfkov was able to apply the vibratory method to piles having
large toe resistance uslng low-lrequency dilvers (7- 16 Hz) (36). It was found that at !ow-
frequency of vibration, penetration ls enhanced by a large displacement amplitude and
the repeated impacts which occur due to the separation of the pile toe 2nd the soil. In
1956, a vibrocorer workiiig at 42 Hz with a 0. I-inch displacement. amplltcde and a 35
IGV electric motor was used to install casings for exploratory boreholes.
In 1957. Barkan 13) investigated many parameters that influence the vibratory
pile driving method. These include oscillator peak acceleration. displaceme~t
amplitude. frequency. noninertia load (bias mass). pile cross-sectional area. soil grain
size and angle of internal friction. and shaft resistance. This study concluded that. at
constant amplitude and frequency, penetration speed decreased with increasing pile
cross-sectional area, while the toe resistance increases and hence limits pezetration
and thereby the practical appllcatlon of the vibration method of pile driving. The
inertial and noninertial loads acting on the driver element influence the speed of
penetration and maximum driving depth. The toe resistance of the pile increases in
direct proportion to vibratory frequency. and hence driving at a high frequency is not
recommended by Barkan. There is a n optimum value of the driving force at which
penetration speed and penetration depth reach a maxlmum. and the nonfnertial loads
help in increasmg both the speed and maxlmum penetration. Th,k study also concluded
that linear oscillation theory may be used for the calculation of necessary vibratory
parameters when the amplitudes are less than 0.4 lnch. This observation agrees wlth
the conclusion of Shekhter (41). When the driving is carried out with large eccentric
moments on the vibrator and lf the vibrator displacement amplitudes are greater than
0.4 inch, linear oscillation theory is inadmissible.
In a follow-up discussion to Barkan's paper (3). Mao (25) described successes with
vibratory drivers in fine. coarse and gravelly sand and wen clays. Vibrators were very
eirectlve in sinking pfles Into more than 33 feet of sou. Various vibrators had vibrating
forces of 17.5 to 120 tons, frequencies of 6.7 to 16.7 Hz. unbalanced moments of 720 to
2740 ft-lb. and staUc weights of 4.5 to 11.25 tons. Durlng the construction (1955 to 1957)
of the Yantzu Rfver brldge at i-Iankow. Chlna. vibratory drivers were used to drive-16-
foot-dlameter hoilow concrete caissons though soft material to a depth of 1000 ft (26).
In 1959. Barkan attempted to lncrease the capacity of vibratory driven plles by
using the concept of soil-pile resonance. At the same time. Albert G . Bodine. Jr . ,
developed the sonic pile driver. which vibrates the pile near the pile's second harmontc
frequency. In 1961. the C.L. Guild Co. of h-ovidence, RI., demonstrated that the sonic
(resonant) pile S iver could drive a closed-end plle 71 ft. whfle an adjacent steam
hammer drove an identical pile only 3 lnches in the same time period. Furthermore,
Bodine's sonic driver was found to be successful in driving piles into permafrost. whfle
conventlonal impact driving often led to excess!ve pile damage (16). Meanwhfle.
German and French engineers were encouraged by the success of high-frequency
machines and designed thelr own new generation of dxlvers. However, the high rates of
wear ~ I I motors and bearings reduced the desgn frequency to 25 Hz (36).
From model tests Szechy (44) obtalned valuable data describing the effects of
vibratory driving and impact driving on the porosity of granular solls surrounding a
pile. Fine sand with a coefficient of unlfonnity of 2.5. internal friction angle of 3S0.
porosity of 0.34 and density of 1.75 t/m3 was used. The frequency of the vibrator varied
from 47 to 50 Hz. and the vibrator weighed 42 lb. The diameter of the seamless steel
tubes used to model pipe piles varied from 1.0 inch to 3.5 inches. Changes in void ratio
were measured to determine the change in relative density and the angle of Internal
friction of the soil. These results could be conceivably be used to include the effects of
vibratory drivlng in the static formulae to be used to find the bearing capacity of the
pile. Szechy's observations concerning the changes in void ratio can be summarized a s
follows. The change in porosity around vibrated open-bottom tubes dfifers
considerably compared to the drlver? tubes. There is only one common phenomenon ln
both. 1.e. the porosity just below the ground surface undergoes a cons!dexable reductton
A d e h i t e lmsenlng can be found to be about the mld-height outside the vibrated tubes.
whereas no practfcal changes occurs for the driven tubes. The greatest difference In the
change in porosity occurs below the plle. where .:ompaction occurs In the case of
vibrated tubes. and where slight loosening occurs III the case of driven tubes. Based on
these observations and assumirii that the degree cl compaction may be regarded a s a
measure of tne internal stress conditlons. it was concluded that the b e a ? ! resistance
will be derived mainly from point-resistance for vibrated tubes and from shaft friction
for driven tubes. Szechy theri compared the volume of soil lntruded int:, the tube, which
was much greater due to vibration than impact drivlng. In the case of vibrated tubes. he
observed that the height of the sou plug within the pile is on the average at the same
level a s the original ground surface and stands even hlgher in the tubes of larger
dlameter. The avenge reduction in porosity ol this inner soil core ranged from 2.5 to 11
percent. On the other hand, the ievel of the plug was always lower in drlven tubes, the
daerence Increasing with the reduction In the tnsido diameter of the tube at a generic
penetration. The reduction of the origlnal porosity was observed to be about 6 to I4
percent. The study also compared the bearing capacity of the vibrated tubes with that of
the driven tuSes. for various diameters. and it was concluded that vibrated piles are
inferior to driven plles. This fnferio13ty was most evident for small vibration tlmes to
force the plle to the required penetration depth. Thls lnferforlty nearly disappeared
when the vibration time exceeded one minute (the usual vlbratlon time was only about
20 to 40 seconds].
Hunter and Davlsson (17) studied the load transfer mechanisms of full-scale
piles in medium-dense and medium-fine sand. The angle of Lnternal friction of the s a ~ l d
varied from 32 to 35 degrees. and the steel-to-sand sLidlng friction angle was 25 degrees.
Thls study concluded that significant residual loads are developed in pflts driven with
conventional Impact h a n n e r s but that the residual loads from vibratory drivers did
not exceed the weight of the driver. It was also shown that the load transfer
. measurements made assumlng zero residual loads arc likely to bc tn emor with respect
to division of load Setwecn frict!on and polnt bearing. It was recommended that
instrumented pile tests should be organized so as to obtain the complete stress htstory
for the pfle. They also observed that +he shaft friction during compression loadlng was
about 30 percent higher than that during tension loadlng and that the avenge value of
the earth pressure coefficient was 1.1 for piles driven ulth a ~lbrator.
Bernhard (4) studied the effect of soil moistgre content on model piles vibro-
driven into Ottawa sand and Princeton red c!ay. Based on these experimental results a
dynamic formula for the estimation of bearing capacity of vibro-driven piles was
deve!oped. Schrnid (38) also studied the driving resistance and bearing capacity of
vibro-driven laboratory model piles. Cylindrical brass tubes of 3/4-inch diameter and
lengths varylng up to 36 inches were used a s pi!es. A variable-frequency
e1ectron:agnetic vibrator with a maximum dynamic force of 50 1b was ~ s e d in this
study. and the tests were I5uizrl to a uniform dry sand (Ottawa 30-40 sand at 0.44 void
ratio). I t was concluded that the peak force transmitted to the pile toe is a direct linear
function of frequency and non-inertial load and that for closed-end pipe piles there
appears to be a good correlation between maxlmum d p a m i c resistance and static
bearing capacity. It was also obsemed that the maxlmum penetration ve!oc!ty occurred
only at speciric oplimum frequencies and that the effect of skin friction during
7enetration was practically cegllgfble. Larnach and Al-Showof (22) conducted model
tests on pfles driven into sand by vibrators and developed a dimensional analysis that
resulted in a relationship between bearing capacity, penetration depth. d p m f c force
and total weight of the pile-vibrator system
Although these studies provide important Insights into the performance of
vibm-driven pffes. there are severa3 limitations to that preclude their direct adaptation
to the field. Most important m.ong the llmltatlons are scale ef ic ts (38) and inaccurate
modelling of in-situ effective stresses in the soil.
Based on a labcratary study on vibratory driving in granular soLls. Rodger and
Littlejohn (36) have identtned iwo types of vibratory pile driving. termed "slow" and
"fast." The occurrence of slow or fast motion is d e h e d by the mt!al sou density, pile
diameter. displacement ampiitude and acceleration of vibratlon. with slol.v vibro-

drivmg being the most common method. This stady also concluded that the two
parameters normally used ln deflnlng the range of 2pplication of ~dbratory dnvers are
the displacement amplitude and frequency of vibral!on and that the cho!ce of
frequency should be related to soil type: coarse grained sand 4-10 Ez; fine to medium
sand 10-40 Hz. They have also recommended ranges of values for frequency, peak
displacement and peak acceleration for dlITerent pile-soil condftlons. The amplitude of
vibrational acceleration has been accepted a s the parameter controlhg the occurrerice
of fluidization (shear strength reduction). With reference to the eEect of thls parameter
on the shearing strength of cohesionless soil. three distinct physical states Ln the sol!
are described a s sub-threshold (elastic response). trans-threshold (compaction
response) and fluidized response. During elastic response (acceleration < 0.6g). the shear
strength has not been found to decrease by more than 5%. In the trans-threshold state
(0.72 c accelerat!on < 1.5d the decrease in shear s t r e q h is governed by the exponential
function of acceleration of vibration, and the parameters oi this exponential are
determined by the grain she, shape and magnitude of static normal enective pressure.
During th: fluidized response state (acceleration > 1.5 g). shear strength reduction
reaches a maxlmum. According to the authors, this reduction should be achieved
theoretically at a n amplitude of acceleration equal to that of gravity; however. Fn
practice. due to the presence of inter-particle friction the amp1:tude of vibrat!on
required is approximately 1.5g. A theory has bee11 developed for slow vlbro-driving
based on rigid body motion. viscous-Coulomb shaft resistance and elasto-plastic toe
r e s i s t a ~ c t under combined sinusoidal excitation a ~ l d static surcharge force.
Experimental vexlficatlon of this theory has been acconplfshed by means of driving a
h~l ly instrumented 1.5-inch-outside-dianeter. closed-ended steel pfle into a bed of
dense untform sand (CU = 1.2. d l 0 = 0.29 mm) at a relailve density of 71.5% and havrng
an angle of internal fricuon cf 4 1 degrees (36).
A lull-scale field study was u~de r t aken by the L'. S. Naval Civil Engifieeri~g
Laboratory using 20-inch-diameter (0.5-inch wall thickness) open-ended pipe plles
and a vibro-driver with a 35-ton driving force (131. The soil at the test site consisted of
very dense sand with an average total unlt weight of about 127 pcf. m e piles were viSro-
driven in 4-loot lncrernents. and the dynamic resistance at these depths were
detemiined by using a diesel impact hammer. The maximum penetration that the piles
were able to attain was 13 feet, and the bearing capacity varied from 40 to 53 tons lor the
four piles tested. The rate of penetration varied from 0.03 to 0.30 feet/rnLnute near llnal
penetration. A Limited amount of tests were conducted using 8.63-hch-dlameter closed
and open ended plpe plles, but the extremely dense sand condltlons in the test area
limited both the type a n d quantity of data collected (13).
In 1986. a f!eld study was sponsored by the U.S. Army Corps of Engineers. Lower
Mississlppl Valley Dlvis:on, to compare the performance of vibro-driven pUes to
impact driven piles. In this study six H piles were driven using vibratory drivers to a
depth of about 35 it at the Hunter's Point shipyard in San Francisco. California. Two
borings at the 40 foot x 40 Coot site lndlcated 5 to 6 fezt of dense silty sand and gravel fill
underiain by medium-dense fine-to-medium sand. The bearing capacity of the vibro-
driven piles varied from 180 to 200 kips. except for one pUe which had only 135 Ups
capacity (32). The Deep FoundaUons Institute also sponsored a study to lnvestlgate the
performance of sllt vibratory drivers in drlvlng a 33 it long instrumented H-plle (HP
14x73) at t he same site. The six vibrators selected for thls study. had "free-air"
frequency, amplitude and acceleration varying between 22-26 1-h. 0.12-0.19 inches and
7.7g-11.6g. respecttvely. The maximum rate of pene'.ratlon during driving varied from 5
feet/-. to 2 1 feet/min, depending on the t - e of vibratory driver (47).
In another study performed by the U.S. Arm,? Corps of Engineers (28). the
performance of vibro-driven piles was compared to that of impact drive,? piles at
dlfTerent field sites. In the report five testir,g prograrrs have been discussed. induding
17
two Arkansas Wver Locks and D m (No. 4 and No. 3). a Crane Rail Track. Geochern:c;ll
Building (Harvard C'nlversity) and Wall No. 7 on 1-95. Providence, Rhode Island. At
Lock and Dam No.4 (also the source of some of the data of Hunter and Da~lsson). a
double-acting steam hammer and a Bodine sonic drhrer were used to drive 12- to 20-
inch-diameter pipe piles. 16-inch concrete piles and H piles. Comparing the load
carried by 16-inch pipe piles, impact-driven piles exhibited about 25OA greater toe
resistance and 2% higher shaft resistance than the vibro-driven $le. The H pile driven
by the Bodine sonic driver had 11% higher bearing capacity than the impact-driven
pile, with 23% higher shaft resistance but 55Yo lower toe resistance. Although the
impact-driven, 16-inch pipe pile showed an 8Oh higher compression capaclty. the ratio
of uplift to compression capacity of 0.48 remained almost a constant between the
impact-driven and vibro-driven piles. At the Arkansas River Lock and Dam No. 3 a
low-frequency vibratory driver and a steam impact hammer were used. The H pUes (14
BP73) driven with the impact hammer had hlgher capacities than the vibratory driven
piles by an average of 32 tons in compression and 5 tons in uplift. The uplift to
compression ratio varied from 0.25 to 0.31 for both impact- and vibro-driven piles. In
another study (pile foundation for a crane rail track]. prestressed concrete piles with 13
inch diameter were driven using a drop hammer with a 5-ton weight and a fret fall
distance of 15.8-inches, and a vibratory driver with frequency, amplitude and weight of
18.3 Hz. 0.39 inch and 5.6 tons. respectively. was also used. The bearing capacity ratio of
vibro-drlven to impact-driven varied between 0.25 to 0.88. It was also shown that when
vibro-driven piles had their last 9 feet of penetration produced by drMng with a drop
hammer. the bearing capacity reaches the failure load of a n Impact-driven pile.
2.2 DRIVING FOR?.TLUE
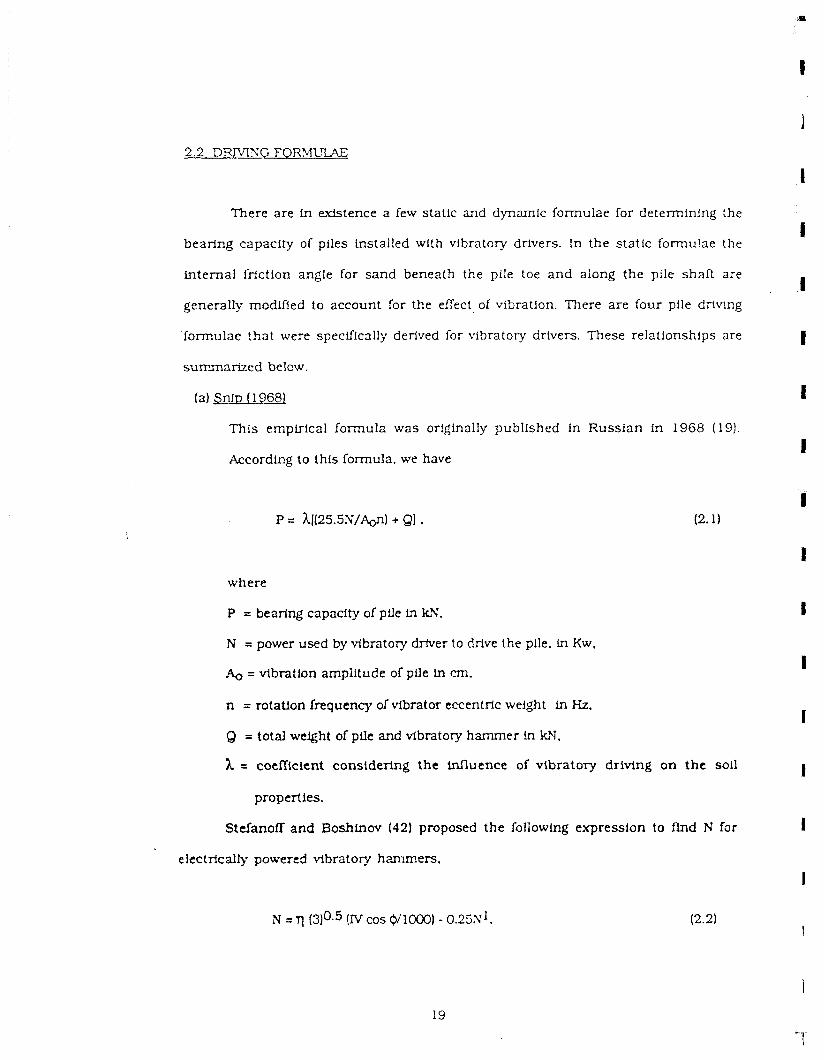
There are in existence a few static and dynamic formulae for determining the
bearing capacity of piles installed with vibratory drivers. In the static fomu!ae the
internal friction angle for sand beneath the pile toe and along the pile shaft are
generally modfied to account for the effect, of vibration. There are four pile driving
'iormulae that were specilIc3lly derived for vibratory drivers. These relationships are
summarized below.
(a) S ~ J D ( 19681
This empirical formula was originally published in Russian in 1968 (19).
According to this formula. we have
where
P = bearing capadty of p!Je in ki,
N = power used by vibratory driver to drive the pile. in Kw,
& = vibration ampiitude of pile in crn,
n = rotation frequency of vibrator eccentric weight in Hz.
Q = total weight of pfle and vibratory hammer in kN.
h = coefficient considering the influence of vibratory driving on the soil
properties.
Stefanoff and Boshlnov (421 proposed the following expression to find N far
elcctrfcally powered vibratory hammers,
N = Tj (3)0-5 !IV cos 0/1000) - 0 . 2 5 ~ ~ .
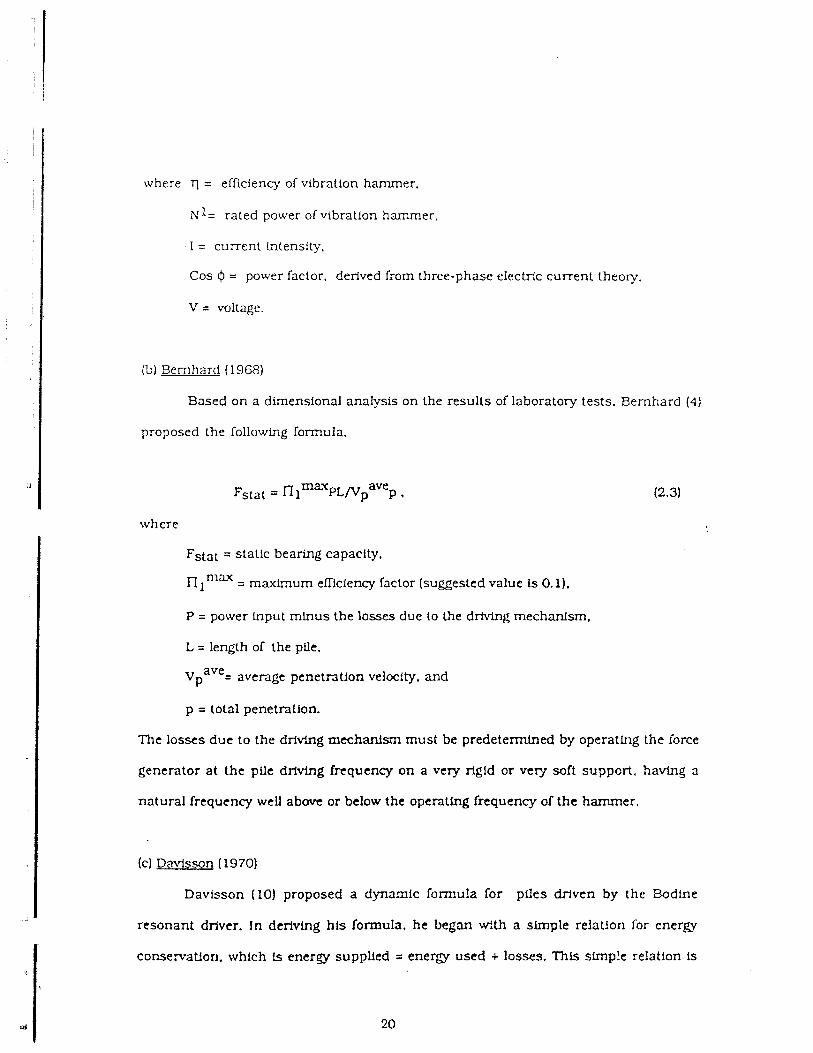
where ?l = efficiency of vibration hammer.
N ~ = rated power ofvibration hammer.
I = current intensity.
Cos Q = power factor, derived from three-phase electric current theory.
V = voltage.
('3) Bernhard (1968)
Based on a dimensional analysis on the results of laboratory tests. Bemhard (4)
proposed the following formula.
Fstat = I I l m a K ~ ~ / ~ p a v e p ,
where
Fstat = static bearing capacity,
n 1 "'" = maximum eITiciency factor (suggested value is 0.1).
P = power lnput mlnus the losses due to the driving mechanism.
L = length of the pile.
vpave= average penetntion velocity, and
p = total penetration.
The losses due to the dfivfng mechanism must be predetermined by operating the force
generator at the pile driving frequency on a very rigid or very soft support, having a
natural frequency well above or below the operating frequency of the hammer.
(c) Davisson (1970)
Davisson (101 proposed a dynamic formula for pfles driven by the Bodlne
resonant driver. In deriving his lormula, he began with a simple relation for energy
conservation. which is energy supplied = energy used + losses. This simple relation fs
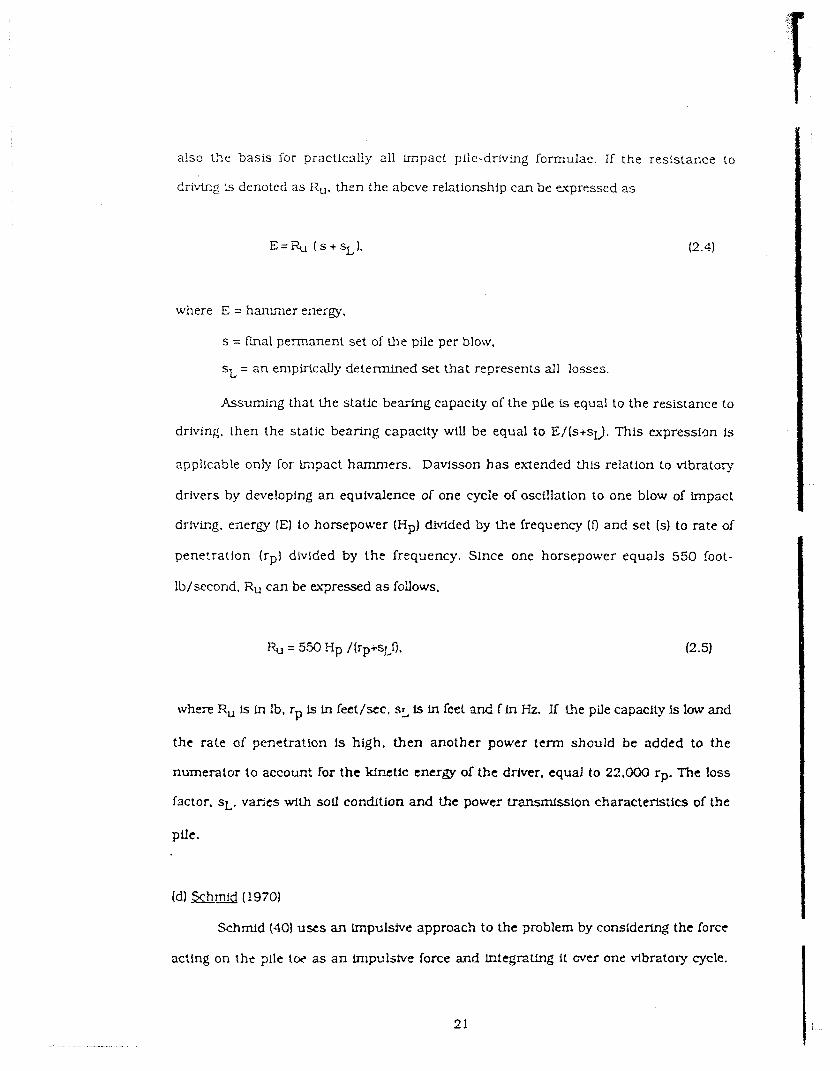
a!so tke basis for practically all inpact pile-driving formulae. If the resistance to
driving Is denoted as R,, then the abcve relationship can be expressed as
where E = hamiier energy.
s = h a 1 permanent set of the pile per blow,
sL = an empirically determined set that represents all losses.
Assuming that the static bearing capacity of the pile is equal to the resistance to
driving, then the static bearing capacity wffl be equal to Ej[s+sI). This expressim is
applicable only for impact hammers. Davisson has extended this relation to vibratory
drivers by developing an equivalence of one cycle of oscfllation to one blow of impact
driving. eaergy (E) to horsepower (Hpl divided by the frequency If) and set (s) to rate of
penetration (rp) divided by the frequency. Since one horsepower equals 550 ioot-
lb/sccond. RU can be wressed a s follows.
where R, is in !b, rp i s in feet/sec, s~ is in feet and fin Hz. If the pile capacity is low and
the rate of penetra!ion is high, then another power term shouid be added to the
numerator to account for the kinetic energy of the driver. equal to 22,000 rp. The loss
factor. SL, varfcs with soll condition and the power tr?.nsmission characteristics of the
pile.
(dl Schmid (19701
Schmid (401 uses an lmpulsivc approach to the pr~blem by considering the force
acting on the ?ile tw as an m~rlpolstve force and tntegnting it cver one vtbratory cycle.
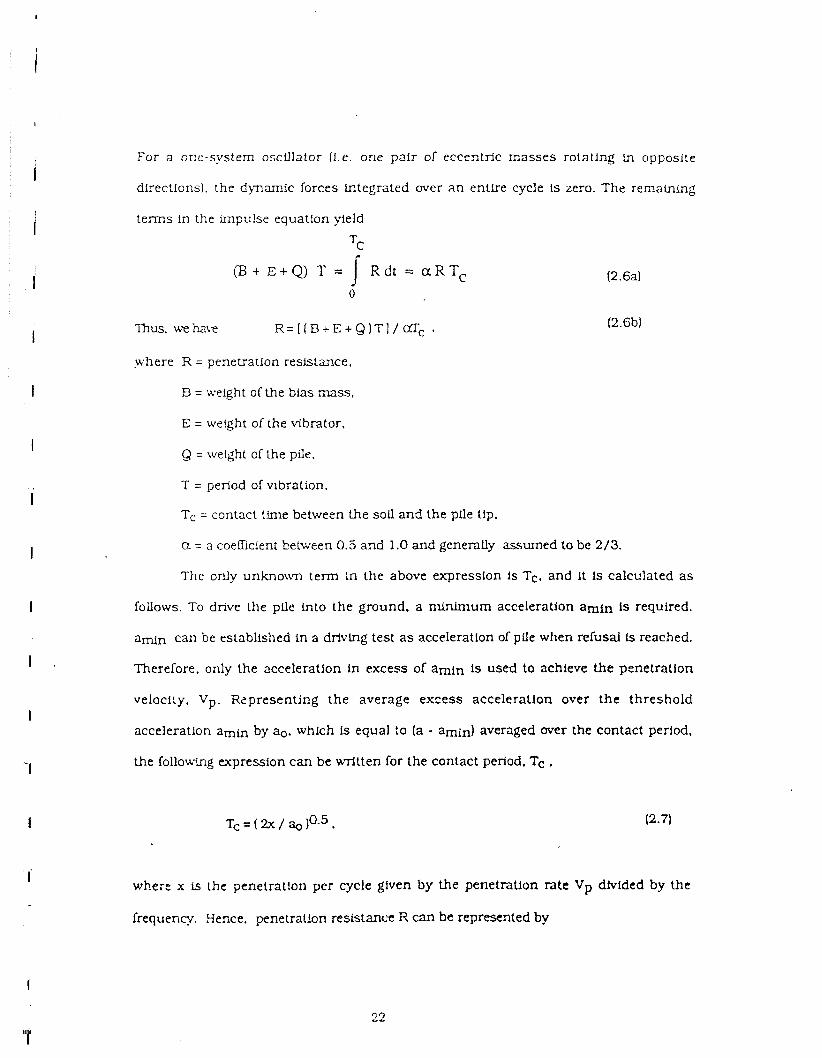
For a one-system oscfllator 0.e. one pair of eccentric masses rotating in opposite
directions). the dynamic forces integrated over an entire cycle ts zero. The remaining
terms in the impulse equation yield
(Bt E + Q ) T = R d t = a R T c I 0
where R = penetration resistance.
B = weight o l the bias mass,
E = weight of the vibrator.
Q = weight of the pDe,
T = period of vibration.
Tc = contact tmle between the soil and the pfle tip.
a = a coelficient hetween 0.5 and 1.0 and genenlly assumed to be 2/3.
The only unknown term in the above expression Is Tc, and it is calculated a s
follows. To drive the pfle into the ground, a rninlmum acceleration amin is required.
a m can be established in a drivlng test a s acceleration of pile when refusai is reached.
Therefore, only the acceleration in excess of amin is used to achieve the penetration
velocity. Vp. Representing the average excess acceleration over the threshold
acceleration a m h by ao, which is equal to (a - amin) averaged over the contact period.
the follouing expression can be written for the contact period, Tc .
where x is the penetratton per cycle given by the penetrauon rate Vp divided by the
frequency. Heme. penetrat!on resistance R can be represented by

More recen:!y. Chua et al. (S! applied the one-dlmenslonal wave equatior,, which
is a widely accepted mathematical model for impact-driven piles. to :he majysis of the
behaeor of vibro-driven piles. By replacing the impacting ram. cushion and capblcck
with a forckg functlon from a simple harmonic osciilator and the spring-mass syst:m
to represent bias mass above the vibrator. the authors claimed that gznera! agreement
was found between measured force-time hlstories along a full-scale pile that w a s
vibrated into a sand deposit (13) and those that were computed by means of the wave
equation, and the mathematical model provided a reasonable prediction of rate of plle
penetration. Although the authors did not publish the wave equation parameters
needed to obtain the correlations, they concluded that the wave equation can be adapted
to predlct the behavior of piles durFng vibratory installarion. -
2 .3 SC?A .VARY
A number of laboratory and full-scale studies on the behavior of vfbro-driven
piles have been published since commercial application of vibrztoxy pile driving began
ln the early 1930's. Vlbnting the pLle at i t s flrst or second harmonic frequency was
found to be a feasible and effect!ve way GI installation of pfles under certain soil
conditions. The laboratory studies have rcvealed that parameters influencing the
driveability and load transfer characteristics of vibro-driven piles are the acceleration,
displacement amplitude and frequency of the vibro-driver as well as soil grain stze and
. soil strength. However, these hboratory tests have f ' e d to simulate any in-siiu stress
effects and thus application of test results to full scale test data 1s questfonr;ble. A
handful of wel!-instrumented, full-scale tests have been reported where the bearing
capacity of vibro-driven piles are compared to impact-driven piles. In full-sca;s tests
there is very llttle contiol ii-~ the test variables such a s soil properties.
Four equations to predict the bearing capzcfty of vfbro-driven piles are reported
in the literature. Verification of wave equatlon analysis to study the vibratory pile
driving problem is in its prilininary stages. Howover. further verification of these
predictive methods from controlled tests are w-nted belore widely applying them in
the field.
CHAPTER 3
D E S C ~ I O N OF TESTING sysmrd
The complete testing system described in this chapter includes the test chamber.
t e s t pile, vibro-driver, impact hammer and data acquisition system. The calibrzition
procedure for the instrumentation and the sand placement devices are also discussed.
3.1 TEST CHAVBER
The test chamber is termed the "long variable lateral pressure sand column"
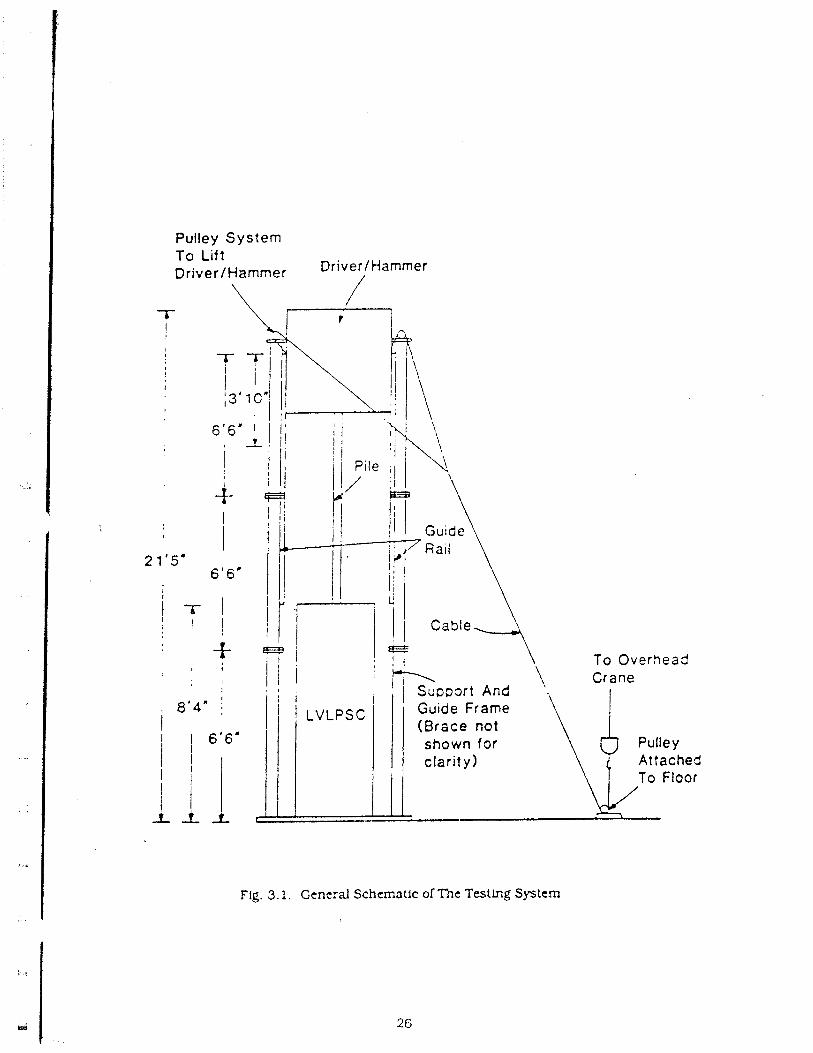
(LVLPSC). A conceptual schematic of the LVLPSC and the test arrangement is shown in
Fig. 3.1. The sand column was 30.0 inches in diameter by 100.0 inches high. The
boundaries of the sand column consisted of waffle-type . neoprene energy absorbers (2.0
lnches thick) at the base of the column. which made the base seml-rigid. and rubber air
pressure membranes at. the top and lateral boundaries. which made those boundaries
flexlb!e (constant. ccntrolled pressure boundaries:. An impermeable rubber membrane
was placed between the sand column and the boundaries to provide watertightness to
the sand column and permit it to be saturated. The pressure membrane at the top of the
LVLPSC was affixed to the underside of a steel plate that formed the top of the chamber.
The top membrane was flat.with three holes passing through i:: One for the pile port
and two drainage ports for passage of water that was expelled from the chamber during
insertion of the pile that allowed for free drainage of the soil.
Pulley System To Lift DriverIHamrner Driver1 Hammer
/
'\ I o u v e
Crane
\ T - n -rhea3
, : ] Supaart And '., I Guide Frame (Brace not shown for I I I c l a r i t y )
Fig. 3.1. General Schematic of The TestLng System
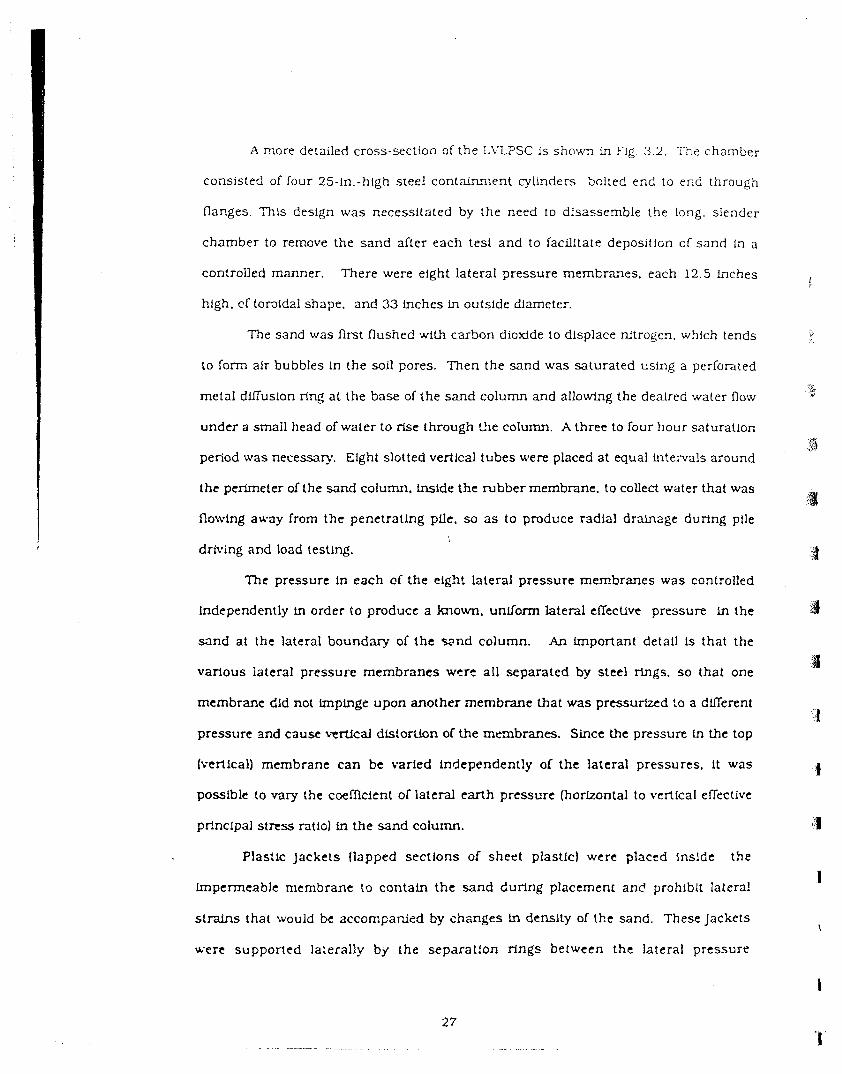
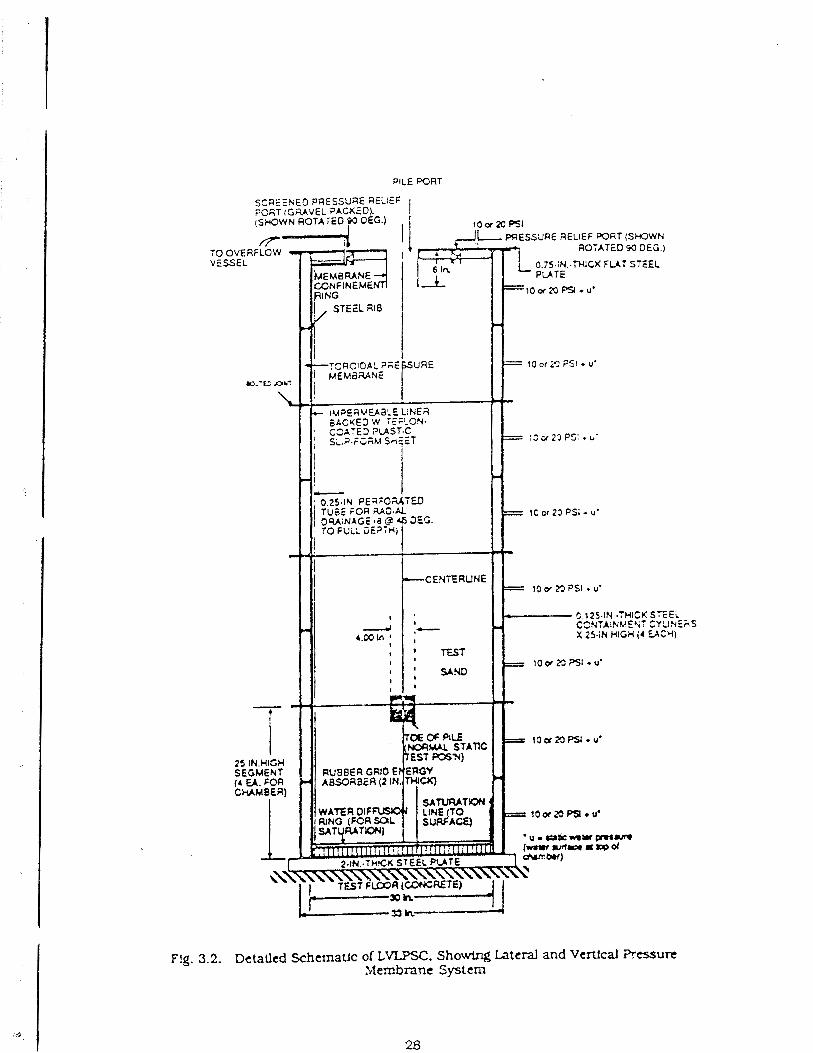
A more detailed cross-section of the L1,IPSC is shown in Fig . 3.2. The chamber
cons~sted of four 25-in.-high stee! contaiAmlent cylinders bolted end to end through
flanges. This design was necessitated by the need to disassemble the long, slender
chamber to remove the sand after each test and to facilitate deposition of sand In a
controlled manner. There were eight lateral pressure memkranes. each 12.5 inches
high. cf tomidal shape. and 33 inches in outside diameter.
The sand was first flushed with carbon dioxide to displace mtrogen. which tends
to form air bubbles in the soil pores. Then the sand was saturated using a perforated
metal diffusion ring at the base of the sand column and allowing the dealred water flow
under a small head of water to rise through t3e column. A three to four hour saturation
period was necessary. Eight slotted vertical tubes were placed at equal in!ervals around
the perimeter of the sand column. inside the rubber membrane. to collect water Ulat was
flowing away from the penetrating pile. so as to produce radial drainage during pile
driving and load testing.
The pressure in each of the eight lateral pressure membranes was controlled
independently in order to producc a known, unlform lateral effecuve pressure In the
sand at the lateral boundary of the sand column. An important detafl is that the
varlous lateral pressure membranes were all separated by steel rings. so that one
membrane did not impinge upon another membrane that was pressurized to a different
pressure and cause t-ertical distorllon of the membranes. Since the pressure in the top
Ivertlcal) membrane can be varied independently of the lateral pressures, it was
possible to vary the coemcient of lateral earth pressure (horizontal to vertical effective
prlnclpal stress ratlc) in the sand column.
Plastic Jackets (lapped sections of sheet plastic] were placed inside the
impermeable membrane to contain the sand Curing placement an? prohlblt Iatera!
strains that would be accompanied by changes Ln denslty of the sand. These jackets
were supported 1a:erally by the separation rlngs between the lateral pressure
?lLE PORT
S C ~ E E N E C ) PQESSURE RELIEF m a 1 rGFtnvEL PACKED). tSHOWN ROTA-iEO 80 OEG.1 , I 10 a 20 PSI
I I I I 3ESSURE RELIEF PORT ( S m W N
ROTATED 90 DEG.)
VESSEL o.:s.IN..THICK FLAT STEEL 6 In PLATE
CONF lNEM t n ~ % P S l * u .
CEWRLE
SEGMENT tr FA FOR
s q Lateral and Vertlcal Pcssurz 3.2. Detailed SchemaUc of LVLPSC. Shc !ilernbranc Systera
membranes. This procedure wzs necessitate:! because of the fact that during fillL?g L?,
lateral pressure membranes were not pressurized in order to ensure that pass:ve
conditions dld not e'xist at any point the sand. which would have also produced
density changes. Once the chamber was filled. It was pressurfied in steps so as to
minimize the differential pressuye between adjacent membranes, u p to the desired
values of total pressures. Soll deposition ar,d density control procedures are descrtbed
later in this chapter.
During filling, the forming jackets supported outward-directed radial normal
siresses from the sand (assumed approximately equal to at-rest eflective stresses). Once
the chamber was filled and lateral stresses from the bladders were applied. the lateral
body stresses were transferred to the air bladders, since the forming jackets were not
capable of supporting compressive hoop stresses. Therefore the total lateral stresses in
the sand at the boundary of the chamber were equal to the pressures in the bladders.
These values of pressure were maintained constant throughout the remainder of a test.
Because the bladder pressure was calculated to be equal to the desired lateral eirective
pressure plus the hydro stat!^ pore water pressure produced by a free water surface at the
top of the sand column, :he lateral eflective stresses remained constant in the sand
column at the boundary throughout a test. except possibly for brief periods af transient
pore water pressure. The vertical efTecUve stress at any point in the sand column was
theoretically equai to the vertical stress applied by the top membrane plus the body
stress produced by the buoyant soll within the column. However, Li the analysis of data
it was assumed that the vertlcal effective stress anywhere in the chamber is e q u d to the
pressure in the top membrane.
3.2 TEST PILE
This section describes !he reusable test pile that was employed during the study.
The choice of the diameter of the pile and chamber represented a compromise between
minimizing scale effects between m&um sand particle size (which was 2 rnrn In the
case of the coarse sand) and pile size. by utilizing a minimum pile diameter-to-soil
particle size ratio of 50 to avoid any scale effects. which resulted In ;he choice of the 4.0-
inch-diameter pile. The diameter of the sand column was set at 7.5 times the dian~eter
of the pile, which resulted in the 30-inch sand column diameter. With this calumn-to-
pile diameter ratio, some boundary effects may have occurred in the chamber (49).
although they would have been minimbed with the flexible boundary that was
employed. A longitudinal view of the p!le is shown in Fig. 3.3. The pfle was a 4.00 in.-
diameter steel lube with a 0.188-in.-thick wa!l. To mitigate the possibility of fatigue of
the pile head. vertical reinforcing strips were welded to the to;, of the pile as shown in
Fig. 3.3, and coupling the pfle to the driver was achieved by the introduction of an
articulated coupling between the pile head and the drlver.
Except for the accelerometers. the pile instrumentatfon was in place
permanently on the pile prior to the first trial test and remained on the pile throughout
the study. Seven levels of strain gages were placed in the pile wall. a s shown
schematically in Fg. 3.3. Each level was a full-bridge circuit. The levels are denoted by
the numerals "1-7." and the lwel marked "1" served as a force transducer during
vibration and Impact driving. The remaining six levels were read during the static load
tests to develop load transfer wms but were not read during driving. At each gage level
a linear strain gage was epoxy-bonded to the pLle wall in each of two slots machined
into the adernal side af the pLle wall, situated 180" apart on the perimeter of the pfle.
The two gages were wired as active gages in a Wheatstone brfdge. permitting the
cancellation of any bending stresses that d g h l have been Lnadvertently applied to the
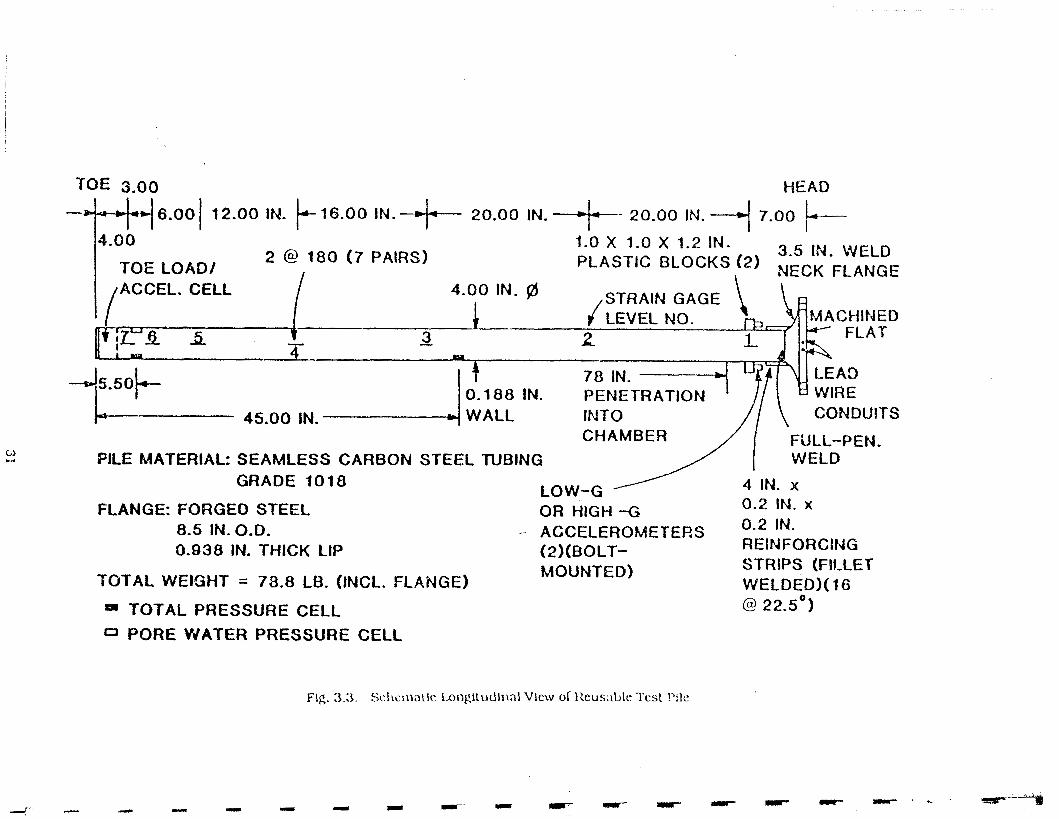
TOE 3.00 HEAD
46 .00 / 12.00 IN. /F16.00 IN.--/+--- 20.00 IN.-*- 20.00 IN.--+ 7.00 /r- 1.0 X 1.0 X 1.2 IN.
2 @ 180 ( 7 PAIRS) 3.5 IN. WELD TOE LOAD/ PLASTIC BLOCKS (2) NECK FLANGE
ACCEL. CELL
"e 45.00 IN. PENETRATION
C H A M ~ E R / 1 ';kbo~~~. PILE MATERIAL: SEAMLESS CARBON STEEL TUBING
GRADE 1018
FLANGE: FORGED STEEL
/ LOW-G 4 IN. x
OR HIGH -G 0.2 IN. x
8.5 IN. 0.0. -- ACCELEROMETERS 0.2 IN. 0.038 IN. THICK LIP (2)(BOLT- REINFORCIt.(G
MOUNTED) STRIPS (FD1,CET TOTAL WEIGHT = 78.8 LEI. (INCL. FLANGE) WELDED)( 16
P. TOTAL PRESSURE CELL 0 PORE WATER PRESSURE CELL
pile and sLmultaneously doubling the sensitit<@ of the circuit to axial stresses. The
dummies for this bridge were precision resistors placed directly outside the test
chamber to avoid difierences in temperature with that of the active gages on the pUe.
Lead wires for the active gages were carried through the Fnside of the pile to a conneciion
strip mated to the inside surface of the pile near the pile head, from which the leads
were gathered and soldered into a plug that could be connected with a mating plug from
the data acquisition system. The brldge circuits were completed outside the pile using
external dummy resistors.
Two miniature total pressure cells were constructed and embedded in the wall of
the test pile. with their sensing faces normal to the wall. as shown in Fig. 3.3. 'fie
primary purpose of these cells was to measure lateral stresses against the side of the pile
near the toe and near the mid-depth during the static load tests, when the pore water
pressures could be closely approxinlated a s hydrostatic. thus providing also a measure
of the elrectrve normal stresses on the pile shaft during static loading. The bottommost
of these cells was also read during installation, both impact and vibratory. to obtain an
indication of the time-dependent total lateral stresses against the side of the pile during
the installation processes, and together with the pore water pressure cell situated near
the pile toe. a measure of effective stress during installation. The cell operated on a
membrane principle. in which the membrane was a 0.600-in.-diameter by 0.008-h.-
thick steel plate that was integrally tied to a rigld ring at its boundary. The membrane
was instrumented with a single llnear strafn gage oriented so that its primary sensing
direction was perpendicular to the direction of propagation of the stress wave in the
pfle. This procedure was successful ln lsolaUng the cell from the low-magnitude stress
waves produced by vibratory driving, but some efiec! of the passage of stress waves
produced by impact driving was registered by the cells. Therefore. the data from thc
bottom-lwei total pressure! cell were not analyzed ex?ensively for impact Criving.
The total pressure cells were also read a s luil-bridges, with precision resistors
mounted a s described for the plle wall strain gages used in the adJacent arms and
opposite arm of the bridge to complete the circuit. The dSO size of the San Jacinto
River sand was approximately 0.4 mm. giving a ser~sitlve-membrane-diameter-to-sotl-
graln-diameter ratio of about 38. Correspondlngly. the dS0 size of the Blasting sand
was approximately 1.15 rnrn. gftmg a ratio of about :3 . These ratios afiect, to some
extent. the quality of the data. .Kith the better-quallty data expected ior the larger ratio.
A pore water pressure cell was mounted with its face normal to the wall of the
test ptle at the level of the lower total pressure cell, a s shown fn Flg. 3.3. The primary
purpose of this celI was to confLrm that the pore water pressure agafnst the pUe was
hydrostatic during laad testing. It was also read during vibratory driving to gain
inforination on the variation of pore water pressures during installation and the role of
pore water pressure development on dynamic soil resistance. Its design and operation
were Identical to the total pressure cells except that the sensing face [membrane) was
located below a small free-water saturation chamber !hat communicated with the pores
of the soil through two flnely perforated plastic disks separated by a segment of coarse
f i ter fabric. The cell was saturated by passing dealred water under pressure through a
tubular saturztlon line into t h e free-water chamber. which was vented to the
atmosphere though the perforated disks. Flow of water though the disk openings
indicted saturatlon of the cell, after whlch the saturation line was plugged. No
desaturation of the cell was observed during vibration. It was ilot possible to observe
whether desaturatlon occm-rcci durlng impact driving; however. the pfle was placed into
the chamber such a marmer that the pore water pressure cell was submerged before
driving c m u r c e d . such that dcsaturatlon was unll'iely.
A load cell was designed =d constructed to pennit direct measurement of the
load at the toe of the pile. The decision to use this load cell had a major impact on the
test program. because i ts use forced the clcsure of the pile !o and p r e d u d d the testing of

non-displacement pdes However, the fundamentzl Fnformatlon gamed from its use
(such a s measuremznt of dynamic load transfer :urves) was considered sulficlent
justification to warrant testing of closed-toed pUes. The toe load cell was attached to
the end of the test pde through a threaded connecti~n. A detail of this cell is shown ln
Fig. 3.4. Load was measured using the electronic resistance straln gage principle. with
eight gages bonded wtlh epoxy to a machined section of the cell mred In a full-bndgf:
configuration. Four of the gages were mounted vertically and served a s active gagcs:
four were mounted horizontally and acted a s temperature compensation gages. Thus .
the Wheatstone bridge schematic required no external dummy resistors. Wire
management and connection schemes were similar to those for the pile-wall strain
gages.
Mounted on the top of the toe load cell. lns:de the pile, were two piezoelectric
accelerometers. One was a low-g accelercmeter (range, 0-50 Q For use In the vibratory
tests. and one was a high-g Accelerometer (range. 0-2500 g) for use in the inpact tests or
during restnke events after installation by the vtbro-driver. The low-g accelerometer
was protected 10 2000 g and so was not damaged during impact events. The purposes of
the accelerometers were to provide a means of measuring power and energy at the toe of
the pile. and velocity and displacement of the toe sf the pile during dynamic events.
Energ. and power evaluation required simultaneous evaluation of the force and
acceleration time histories a t the toe. Thls informa',!on was useful in caliSratlng wave
equation models. as explained in Chapter 5 . ana In evaluating energy and power
transmission through the pLle to the pile toe in various sou conditions.
The complex geometry of the toe load cell cast some doubt on whether the
accelerations measured by the accelerometers mounted atop the cell were
representative of the acceierations on the pile wall. Thls concern prompted the
calibration that is described laler in this chapter.
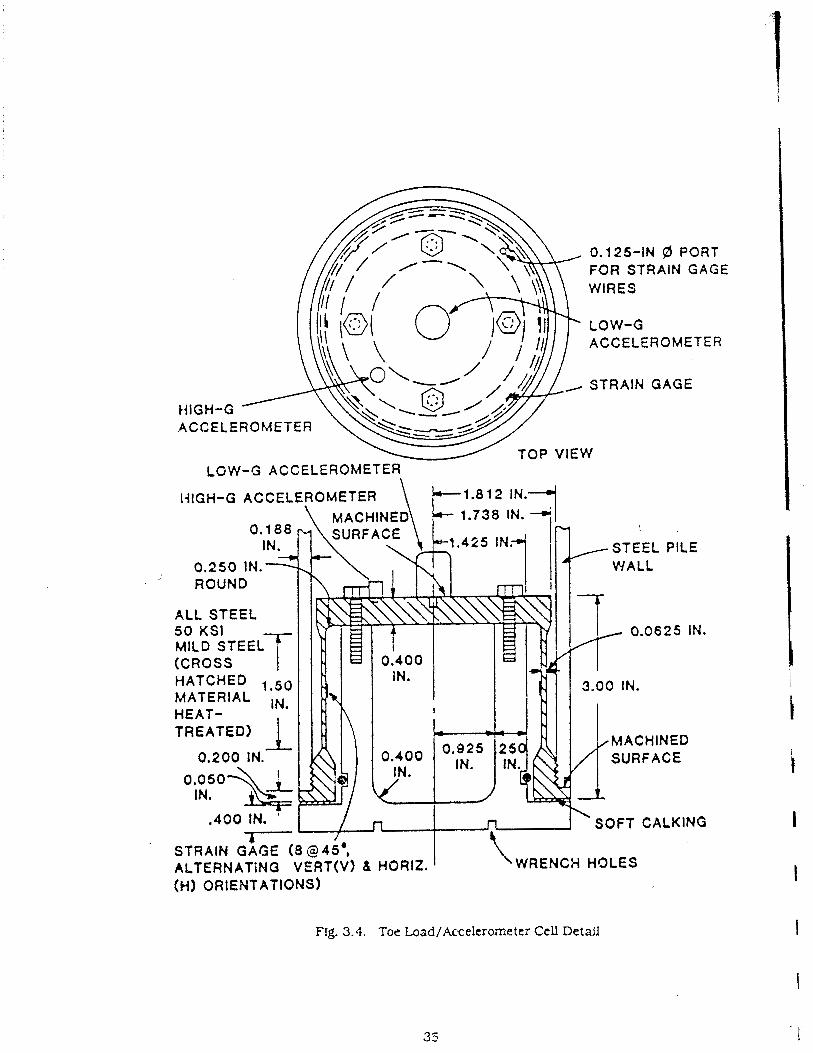
0.125-IN (8 PORT FOR STRAIN G A G E WIRES
v LOW-G ACCELEROMETER
STRAIN G A G E
TOP VIEW LGW-G ACCELEROMETER
ALL. S T E E L
SOFT CALKING
ALTERNATildQ WRENCH HOLES (HI ORIENTATIONS)
Fig. 3.4. Toe Load/Mcelerometer Cell Detail
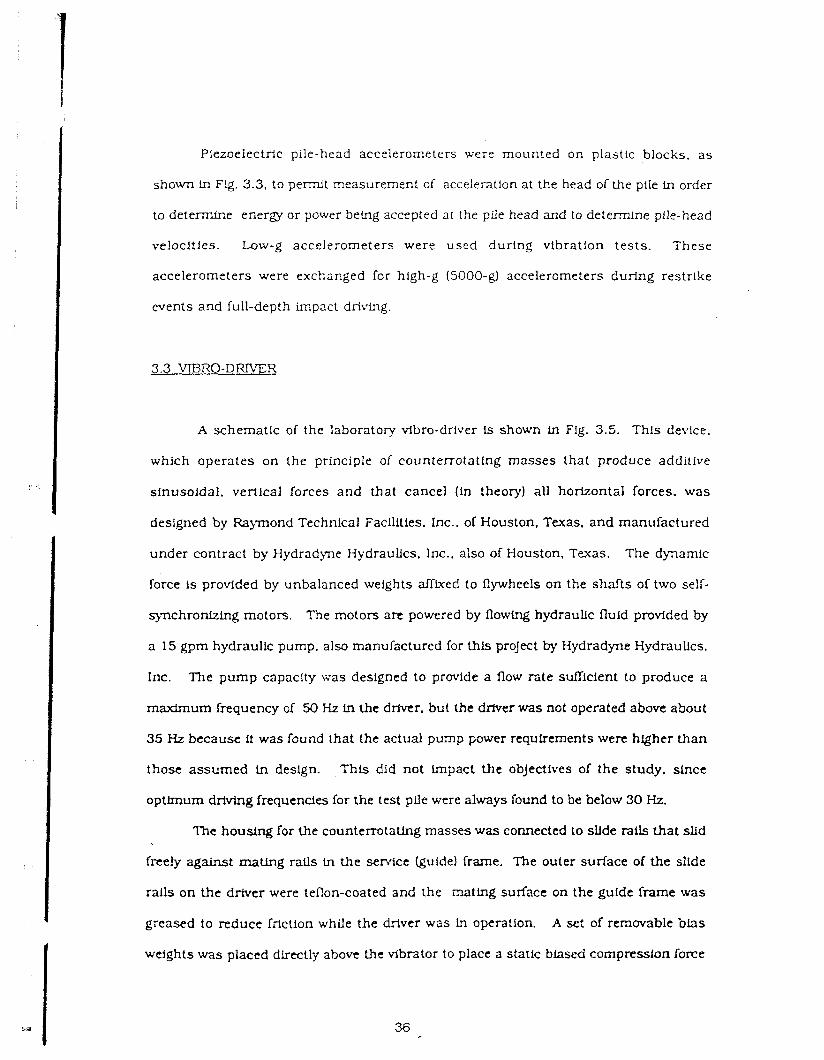
Piezoelectric pile-head accelerometers were mounted on plastic blocks. as
s h o w in Fig. 3.3, to permit measurement of acceleration at the head of the pile in order
to determine energy or power being accepted at the piie head and to determine pile-head
velocities. Low-g accelerometers were used during vibration tests. These
accelerometers were exchanged for high-g (5000-5) accelerometers during restrike
events and full-depth impact drit-ing.
A schematic of the laboratory vibro-driver is shown in Flg. 3.5. Thls device.
which operates on Ihe principle of counterrotattng masses that produce additive
slnusoidal, vertical forces and that cancel (in theory) all horizontal forces. was
designed by Raymond Technical Facilities. Inc.. of Houston, Texas. and manufactured
under contract by Hydradyne Hydraulics. Inc.. also of Houston. Texas. The dy;lamic
force is provided by unbalanced weights d k e d to flywheels on the shafts of two self-
synchronizing motors. The motors are powered by flowing hydraullc fluid provided by
a 15 gpm hydraullc pump, also manufactured for this project by Hydradyne Hydraulics,
Inc. The pump capacity was designed to prwide a flow rzte sufficient to produce a
maximum frequency of 50 Hz in the driver. but the drhrer was not operated above about
35 Hz because it was found that the actual pump power requirements w e n higher than
those assumed in design. This did not im?act the objectives of the study. since
optlrnum driving frequencies for the test pile were always found to be below 30 Hz.
The housing for the countemtatlng masses was connected to sllde ratls that slid
freely against mating rails in the senqce (guide) frame. The outer surface of the siide
ralls on the driver were teflon-caated and the mating surface on the guide frame was
greased to reduce friction while the driver was in operation A set of removable blas
weights was placed directly above Ule vibrator to place a static bhsed compression force
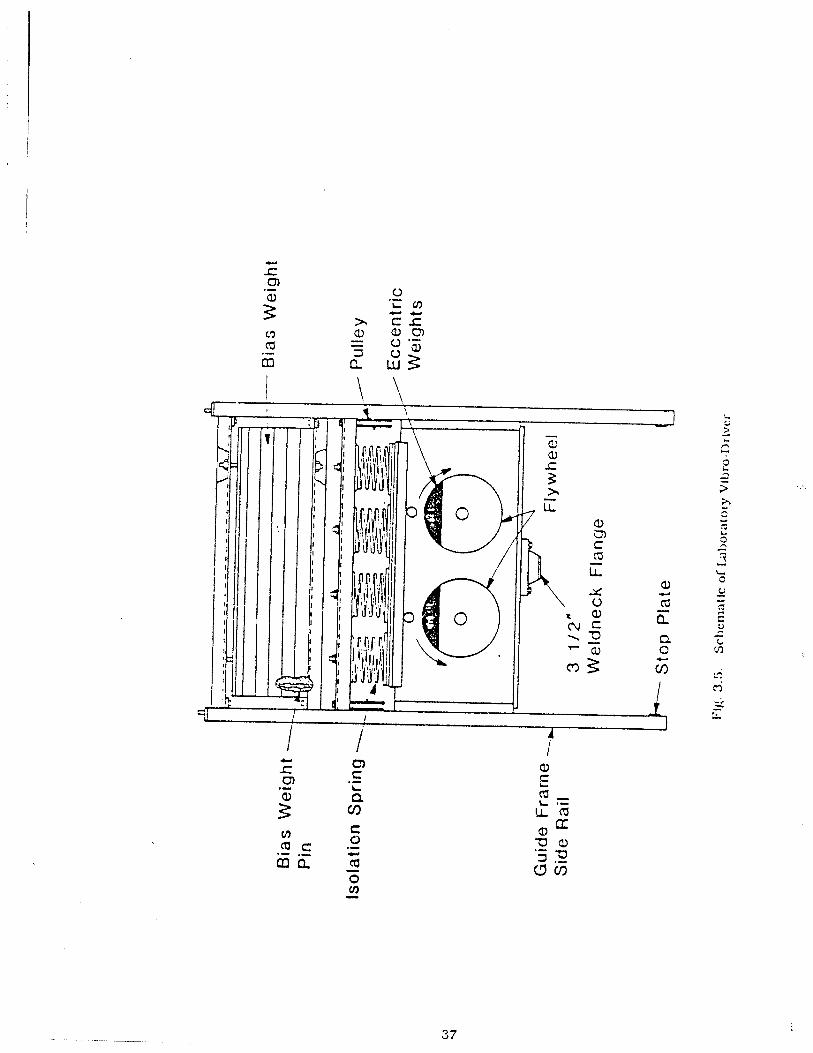
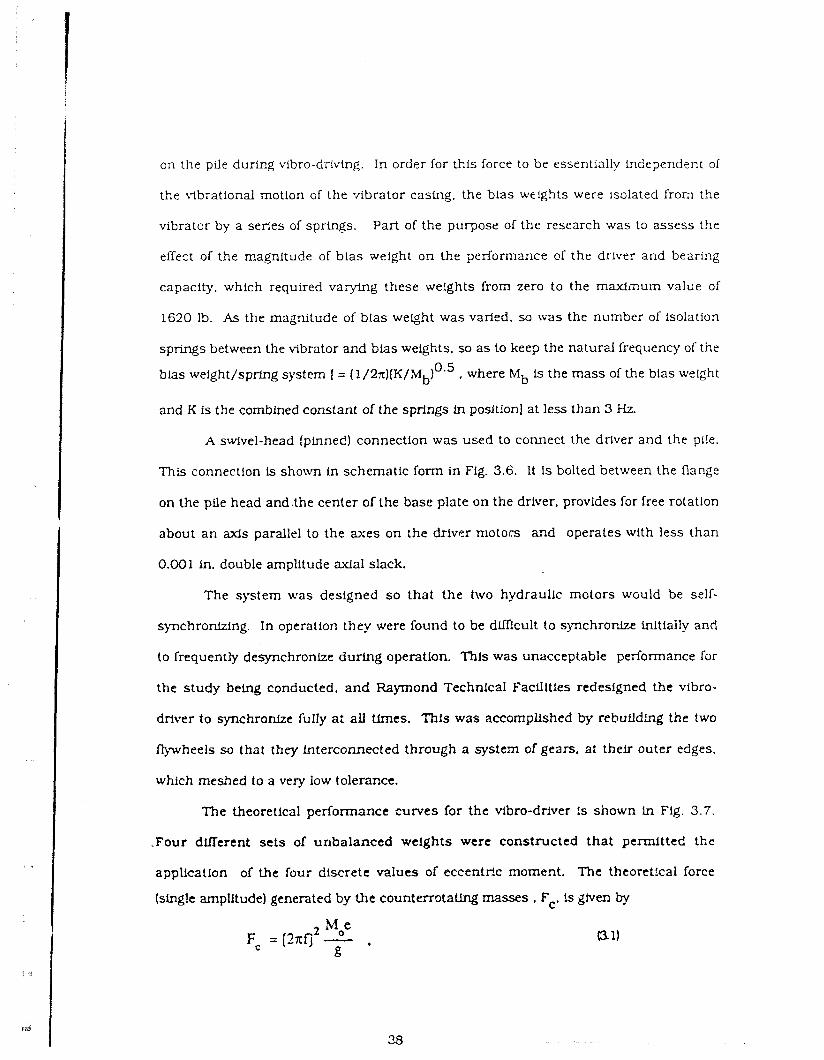
on the pile during vibro-driving. In order for *.is force to be essentially independe~t of
the blbrational motion of the .ribrator casing. the blas weights werc Isolated from the
vibrator by a series of springs. Part of the purpose of the research was to assess the
effect of the magnitude of bias weight on the ?erformance of the dnver and bearing
capacity. which required varying these weights from zero to the maxlmum value of
1620 lb. As the magnitude of blas weqht was varied. so was the number of isolation
springs between the vibrator and bias weights, so as to keep the natural frequency of the
bias weight/spmg system I = ( I / ~ ~ ) [ K / M ~ ) ~ . ~ . where M~ is the mass of the bias wcight
and K is the combined constant of the spri-rigs in position] at less than 3 Hz.
A swivel-head (pinned) connection was used to connect the driver and the plle.
This connection is shown in schematic form in Fig. 3.6. It is bolted between the flange
on the pile head and.the center of the base plate on the driver. provides for free rotation
about an axis parallel to the axes on the driver motors and operates with less than
0.001 in. double amplitude axial slack.
The system was designed so that the two hydraulic motors would be self-
spchronfzfng. In operation they were found to be dllficult to synchronize inftially and
lo frequently desynchronfie durlng operation. This was unacceptable performance for
the study being conducted, and Raymond Technical Facflltles redesigned the vibro-
driver to synchronize fuIIy a: all times. This was accompllsfied by rebufldlng the two
&wheels so that they interconnected through a system of gears. a: their outer edges,
which meshed to a very low to1erar.c~.
The theoretical performance curves for the vibro-driver is shown ln Fig. 3.7.
.Four d f i r e n t sets of unbalanced weights were constructed that permitted the
appUcation of the four discrete values of eccentric moment. The theoret!cal force
(single arnplltude) generated by the countenotallng masses . Fc. !s ghen by
V I E R 0 1 DRIVER v
0,375 IN. BOLTS (4/Rlf3 @ 1.0 IN.)
(MACHINED
SURFACE)
0.5-IN. BOLT
(3/R18 @ 1.5 IN.) REINFORCEMENT
TEST PILE u SIDE VIEW OF TYPICAL RIB + (BOTTOM RIS SHOWN)
Fig. 3.6. Dctui of Articulated Swivel Connection Between Vlbro-Drtvtr and Pile
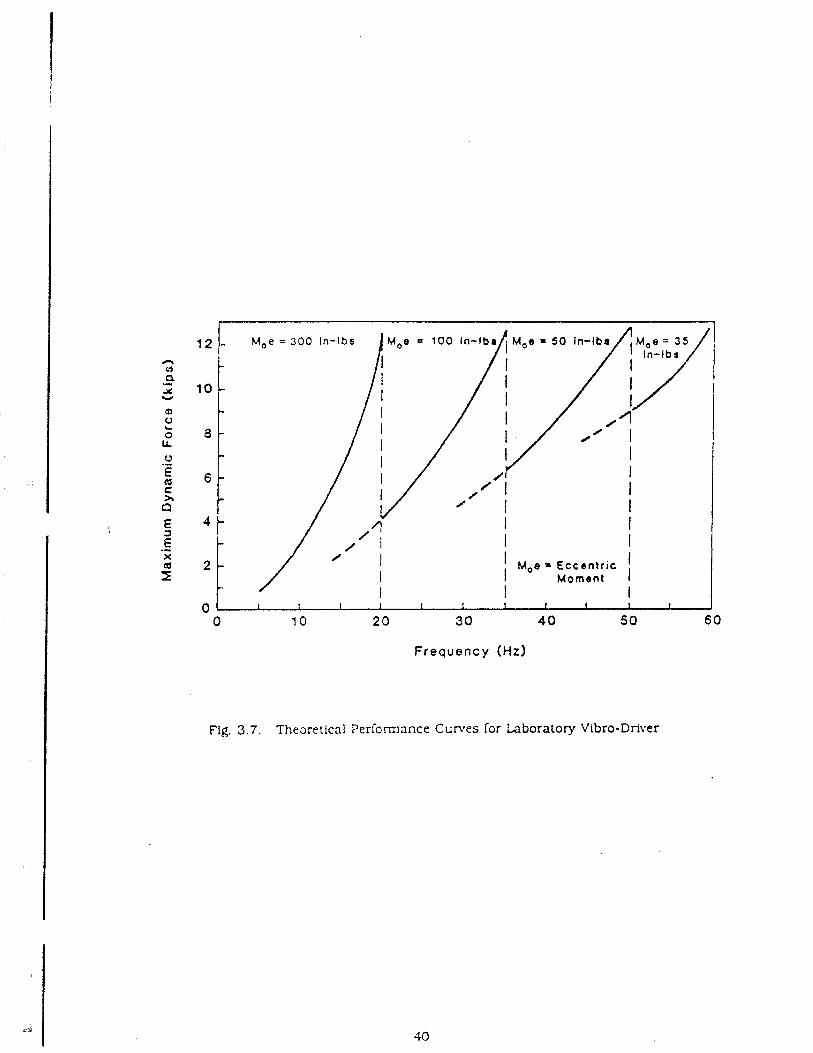
Frequency (Hz)
Fig. 3.7. Theoretical Periorrnance Curves for Laboratory Vibro-Driver
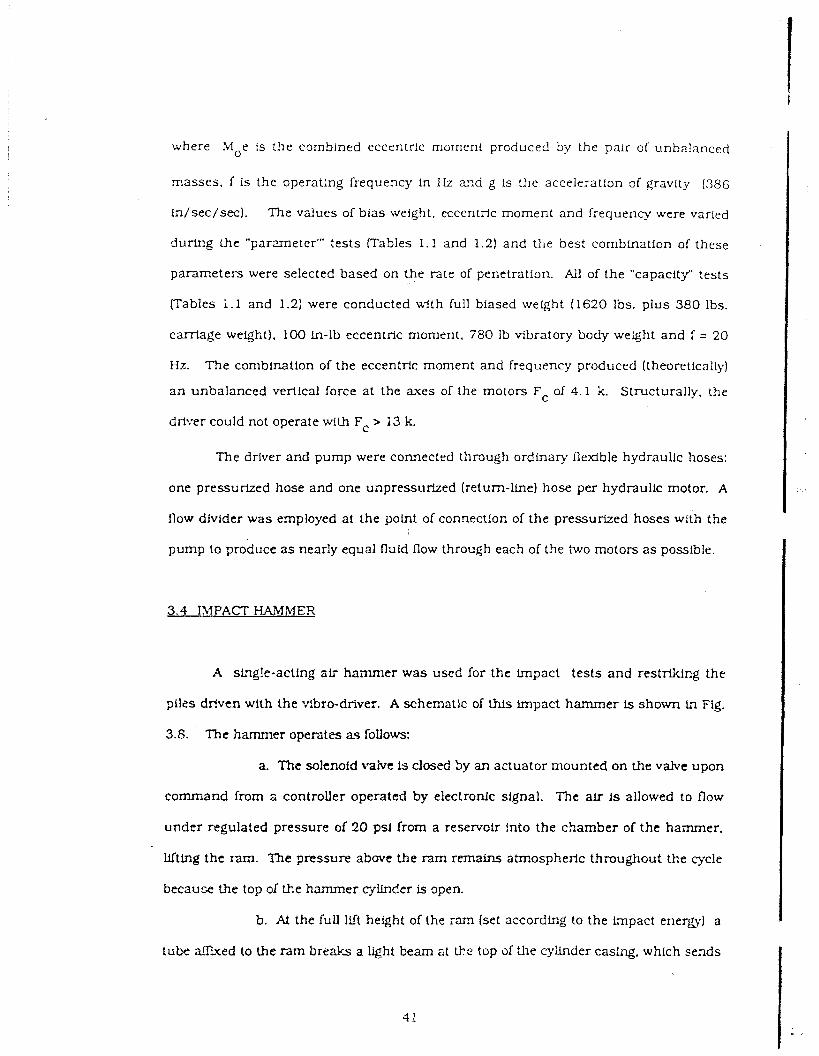
where Moe is the comblned eccentric moment produced by the pair of unba!anced
masses, f i s the operating frequency In Hz and g is the acceleratlon 3f gravity (386
Li/sec/sec). The vziues of bias weight. eccentric moment and frequency were varied
durir?g the "parmeter" ' tests (Tables 1.1 and 1.2) and the best combination of these
parameters were selected based on the rate of penetration. All of the "capacity" tests
(Tables i.1 and 1.2: were conducted with full biased weight (1620 Ibs. plus 380 Ibs.
carriage weight). 100 in-lb eccentric moment, 780 Ib vibratory body weght and f = 20
Hz. m e combination of the eccentric moment and frequency produced (theoretically)
a n unbalanced vertical force a t the axes of the motors Fc of 4.1 Ir. Structurally, the
driver could not operate with Fc > 13 k.
The driver and pump were connected through ordinary fle.dble hydraulic hoses:
one pressurized hose and one unpressurlzed (return-lne) hose per hydraulic motor. A
flow divider was employed at the point of connection of the pressurized hoses with the
pump to produce a s nearly equal fluid flow through each of the two motors a s possible.
3.4 IMPACT HAVMER
A st~gle-acting air hammer was used for the impact tests and restriking the
piles dr!ven with the vibro-driver. A schematic of this impact hammer is shown L? Fig.
3.6. The hammer operates as follows:
a. The solenoid vahre is dwed Sy an actuator mounted on the valve upon
command from a controller operated by electronic signal. The a& is allowed to flow
under regulated pressure of 20 psi from a reservoir into the chamber of the hammer.
lifting the ram. The pressure above the ram remains atmospheric throughout the cycle
because the top of the hammer cylinder is open.
b. At the full 1st height of the ram (set accordhg to the Lnpact energ.) a
tube f l i e d to the ram breaks a light beam at tl-:: top of the cylinder caslng. which sends
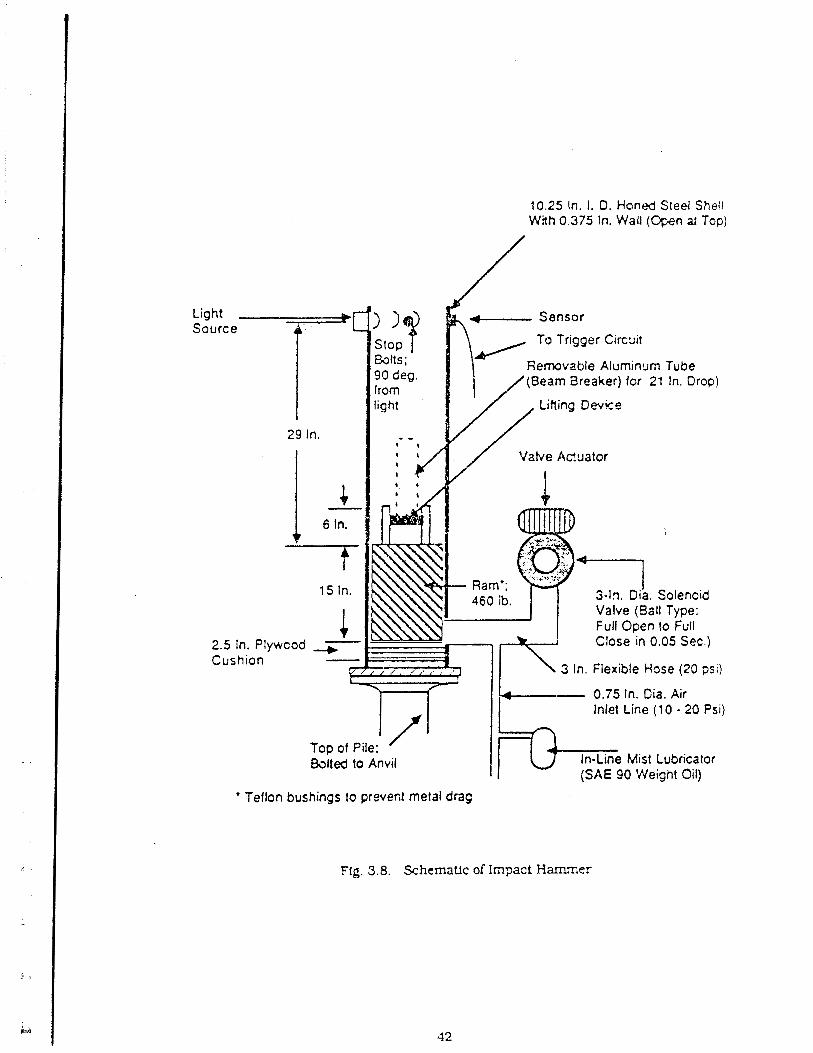
10.25 In. I. 0. Honed Steel Shell With 0.375 In. Wall (@en al Top)
To Trigger Circut
Removable Aluminum Tube /(Beam Breaker) for 21 In. Drop)
Valve Aduator
Close in 0.05 Sec.)
3 In. Flexible H ~ s e (20 psi)
Top of Pile: /
Baited to Anvil
0.75 In. Cia. Air Inlet Line (10 - 20 Psi)
Mist Lubricator (SAE 90 Weight Oil)
' Teflon bushings to prevenl metal drag
Fig. 3.8. Schematic of Impact Hanr .er
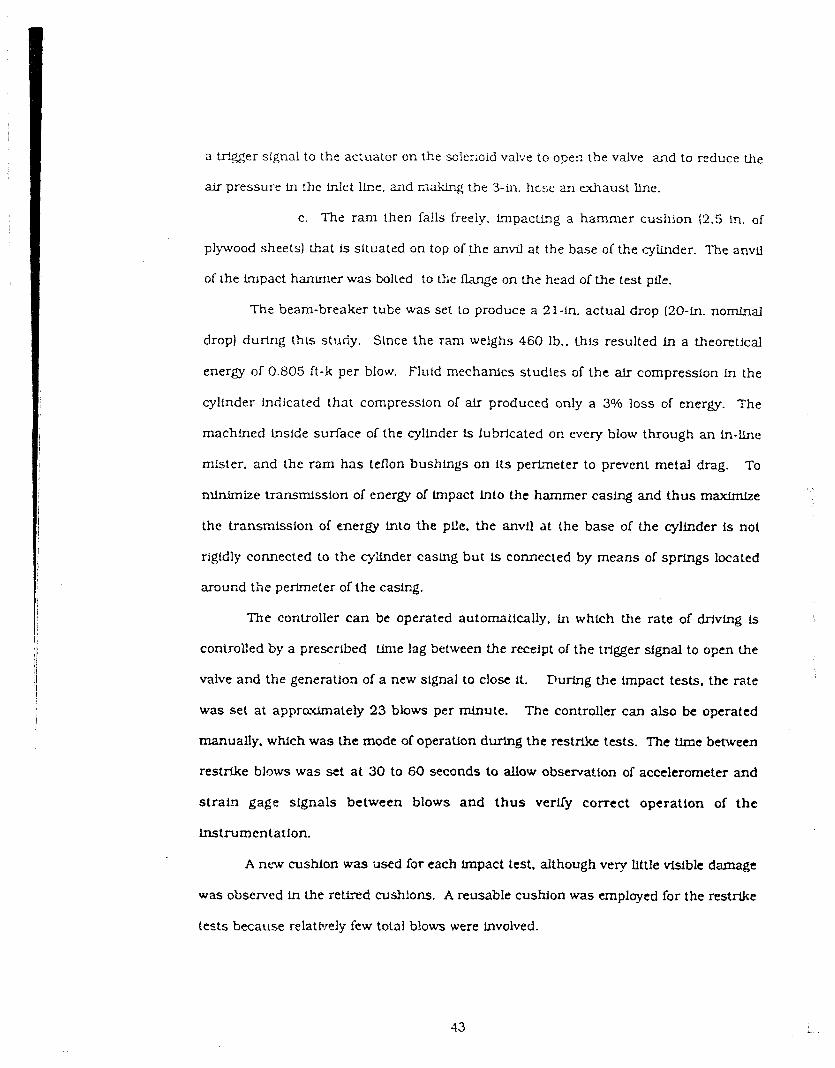
a tr!!er signal to the actuator on t h e solerAoid v&e to opec the valve and to reduce the
air pressure in !he Wet line, m d n a k l r the 3-m. hcse an exhaust h e .
c. The ram then falls freely. t ~ p a c t l ~ g a harnrner cushion (2.5 in. of
plywood sheets) that is sitcaled on top of the a n d at the base of the cylinder. The anvu
of the impact hammer was bolted to the flange on the head of the test pile.
The beam-breaker tube was set to produce a 21-in. actual drop (20-in. nomLnal
drop) during this study. Since the ram welghs 460 15.. this resulted in a theoretical
energy of 0.805 it-k per blow. Fluid mechanics studies of the air compression in the
cylinder indicated that compression 01 atr produced only a 3Oh loss of energy. The
machhed lnside surface 01 the cyllnder is lubricated on every blow through an i n - h e
mister, and the ram has tenon bushings on its perimeter to prevent metal drag. To
nlinimize transmission of energy of tmpact Lnto the hammer casing and thus maximLze
the transmission of energy into the plle. the anvil at the base of the cylinder is not
rigidly connected to the cyiinder caslng but is connected by means of sprlngs located
around the perimeter of the caslng.
The controller can be operated autornarically. in which the rate of driving is
controlled by a prescribed time lag between the receipt of the trigger signal to open the
valve and the generation of a new signal to dose it. During the impact tests, the rate
was set at apprauimately 23 blows per mlnute. The controller can also be operated
manually. which was the mode d operation during the restrike tests. The time between
restrike blows was set at 30 to 60 seconds to allow observation of accelerometer and
straL.1 gage signals between blows and thus verify correct operation of the
instrumentation.
A nenv cushion was used for each hnpact test. although very little visible damage
was observed in the retired cushions. A reusable cushion was employed for the restrike
tests because relatively few total blows were involved.
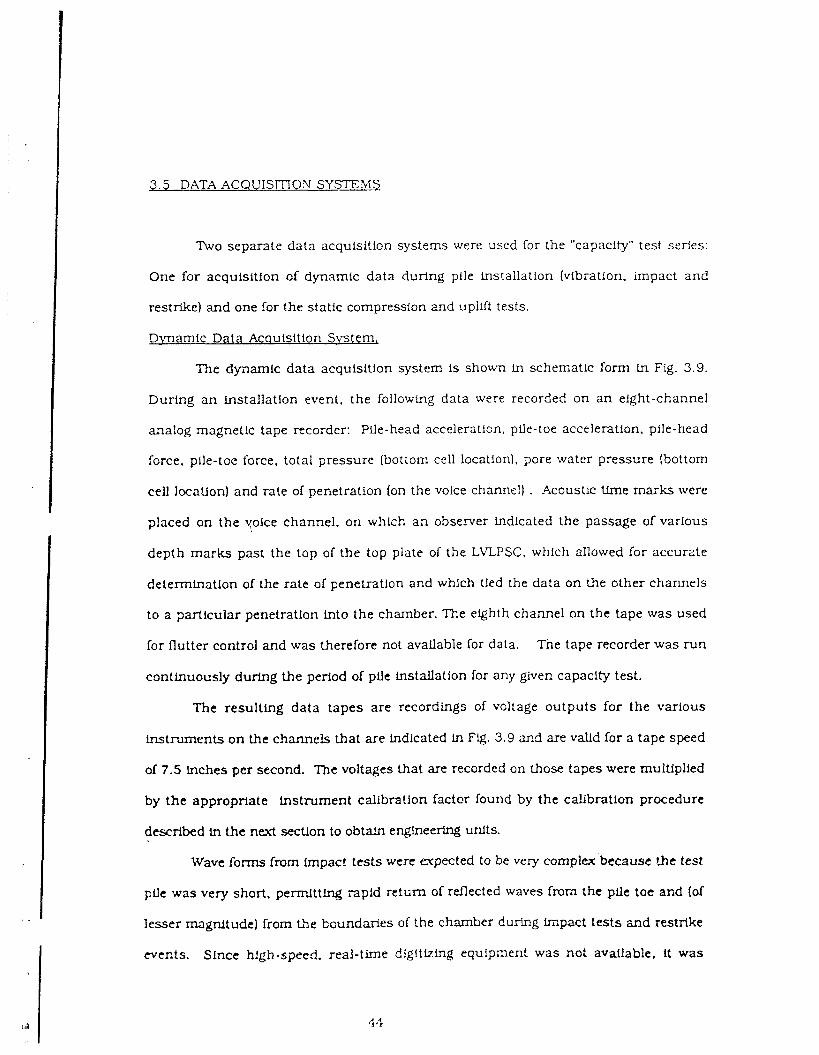
3 .5 DATA ACQUISITION S Y S T E X S
Two separate data acquisition systems were used for the "capacity" test series:
One for acquisition of dynamic data during pile installation (vibration. impact and
restrike) and one for the static compression and uplift tests.
Dvnamic Data Acoutsttion System,
The dynamic data acquisition system is shown in schematlc form ln Fig. 3.9.
During an installation event, the following data were recorded on an eight-channel
analog magnetic tape recorder: Pile-head acceleratfcn. pile-toe acceleration, pile-head
force, pile-toe force. total pressure (bottom cell location), pore water pressure (bottom
cell location] and rate of penetration (on the voice channel) . -4coustlc time marks were
p!aced on the yoice channel. on which an observer indicated the passage of various
depth marks past the top of the top plate ol the LVLPSC, which allowed for accurate
delerrninatlon of the rate of penetration and which tied the data on the other channels
to a ?articular penetration into the chamber. Tke eighth channel on the tape was used
for flutter control and was therefore not available for data. The tape recorder was run
continuously during the period of pfle installation for any given capacity test.
The resulting data tapes are recordings of voltage outputs for the various
instruments on the channels that are indicated in Fig. 3.9 ar.d are valid for a tape speed
of 7.5 inches per second. ?he voltages that arc recorded on those tapes were multfplied
by the appropriate instrument calibration factor found by the calibration procedure
described ln the next section to obtaln englneerlng units.
Wave forms from fmpac! tests were expected to be very complex because !he test
pfle was very short. permitt% rapid r e t ~ m of rellected waves from the pile toe and (of
lesser magnitude) from the boundaries of the chamber during impact tests and restrlke
events. Since h!gh-speed. real-time dlg!tking equipment was not available, it was
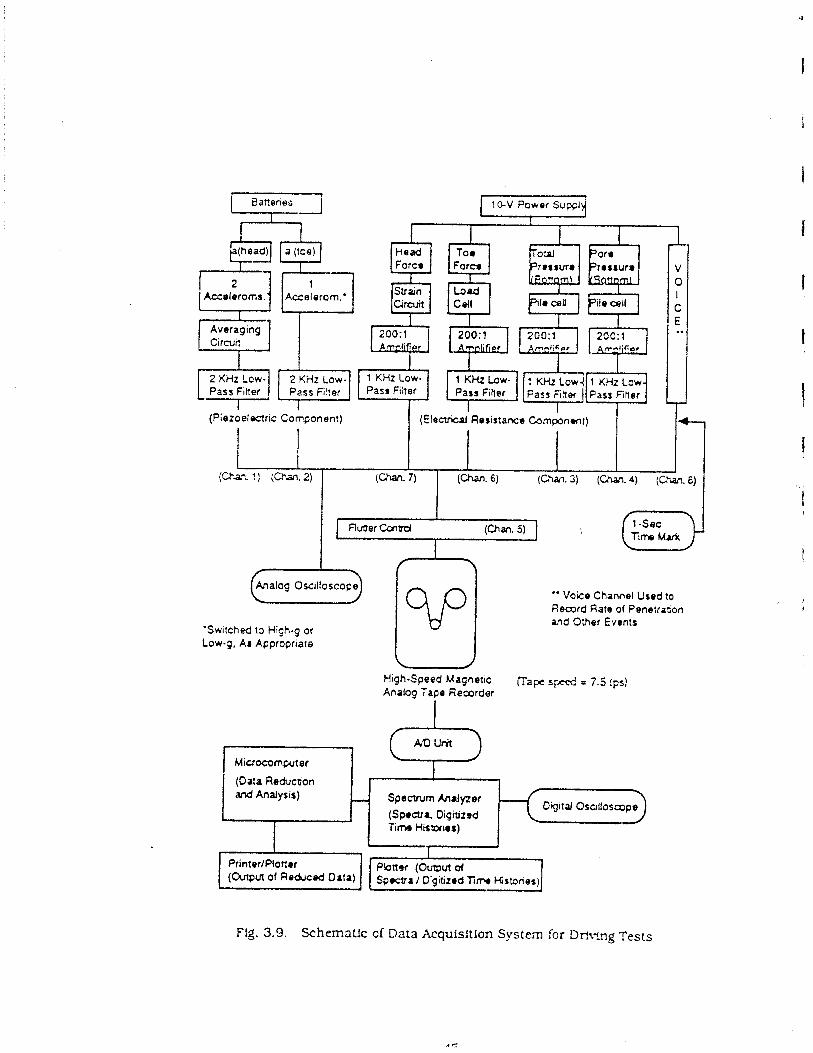
Averaging I 1 Pass F i l t ~
Accelorom.' 1 , ' 161 F o m
Load Cdl
(Piezoelectric Component)
I Ruzer CcnW (Ulan. 5)
I Time Mark
r \
Analog Oscilloscope Iwl 'Switched to Hishog or Low-0, As Appropriate
" Voice Channel Used to Record Rate of Penetnoon and Other Events
High-Speed Magnetrc (Ta? s& = 7.5 Ips] Analog Tape Remrder
Microcomputer m a I (Data Reducoon I &
and Analysis) Spectrum Analyzer C@td OsoUoscope
(SpocUl Digilizad T i m Historirs)
Flg. 3.9. Schematic of Data Acquisition S y s t m for Driving Tests
decided to record the b~r,amic data on analog tage 2nd to dfgitize olf llm at a rate that
was appropriate to replicate the analog slgnals. Thk was accomplished two channels at
a time by the digitizmg circuits contat?ed by an A/D converUcg unit that was coupled to
a spectrum anaiizer (Flg. 3.9). Digitized data were stored in the memory of the spectrum
analyzer for further processing by the spectrum analyzer (either Fourier analyses or
simple multiplication by callbration factors) after which they were output to z pen
plotter or to a microcorr.puter for further reduction and/or analysis.
Immediately after a test. digitized data were rwiewed for apparent correctness
using the digital oscilloscope. The digital oscilloscope was also used to monitor the
frequency of the acceleration of the vibratory driver in real time during vibratory
driving alter the output of an accelerometer placed on the caslng of the vibrator had
been converted to its fasi Fourier transform (FFT). This monitoring system permitted
accurate determination of driviiig frequency acd additionally gave information
regarding the synchronization of the motors on the vibratory driver (through
observation of the harmonics of the driving frequency and the decay of their
magnitudes with increasmg frequency).
Filtering was employed to remove the effects of frequency components of any
signals that are of no importance in the analysls of the tests. Low-pass fllters were
employed on all of the instruments. using a 2 KHz rolloff for the accelerometers and a 1
KHz rolloff for the circuits for the pfle-wall slraln gages. pressure cell and load cell.
The tape recorder itself had a nominal 5 KHz uprer h l t frequency response. Any
signals with frequency components higher than the rolloIT levels described above have
been discounted In the presentation and analysis of the data.
Phase shifts produced by the piezoelectric devices (accelerometers). as weU as by
components of the data acquisition system (an averaging circuit that was u.sed with the
pile-head accelerometers and the various fi1ters)was a concern. The dynamic
calibrations of the accelerometers r ep~r t ed in next section were therefore conducted
with the averaging ch-cuit &?d fFlters Ln the configuration used in the m ~ d e l tests. A
d!scussion of obsemed phase shlfts LS given In the next section.
Although not explic~tly shown In Fig. 3.9. each electrical resistance strain gage -
type circuit (including pUe-wall strain gages. pressure cells and toe load cell] was a full
XVheatstcne bridge that was connected to a shunting resistor to balance each circuit
individually prior to each tests. All instruments on the pile were zeroed by balancing
the circufts while the pile was resting vertically on the surface of the sand at the top of
the LVLPSC. without the harnmer/drtver restlng on its head. Therefare. the readrngs
that were taken during installation are readings relatlve the fnitially unstressed state
of the pile.
Static Data Acauisitlon Svstern,
The data acquisilion system that was used during the static load tests Is shown
schematically in Fig. 3.10. Data from 12 channels (plus the power supply) were
acquired on command from the microcomputer, which was manually controlled.
Readings of amplified data from all channels were made at intervals of pile head
movement of 0.01 inch (prior to a pile-head displacement of about 0.25 inch) and at
intervals of about 0.02 inches of penetration thereafter. resulting in 60 readlngs during
the loading phase of a test. Keying the computer sent a command to the scanner to read
each channel serially (requiring about 0.5 second). The clig!tal voltmeter used with the
scanner permitted acquisition of five digits of significant data. The digltfzed voltages
were sent to a buffer from which +hey were read immediately by the microcomputer.
Physically, all of the system shown within the dashed boundary in Fig. 3.10 was
contalned in one unit. I
The computer thee performed simple mathematical operations (multiplying the
voltage on each channel by the appropriate calibration factor) and wrote the resulting 1
output (in engineering units) to both paper tape and a magnetic tape cassette. The hard
copies (paper tapes1 have been =chived a s permanent records of the static tests. The
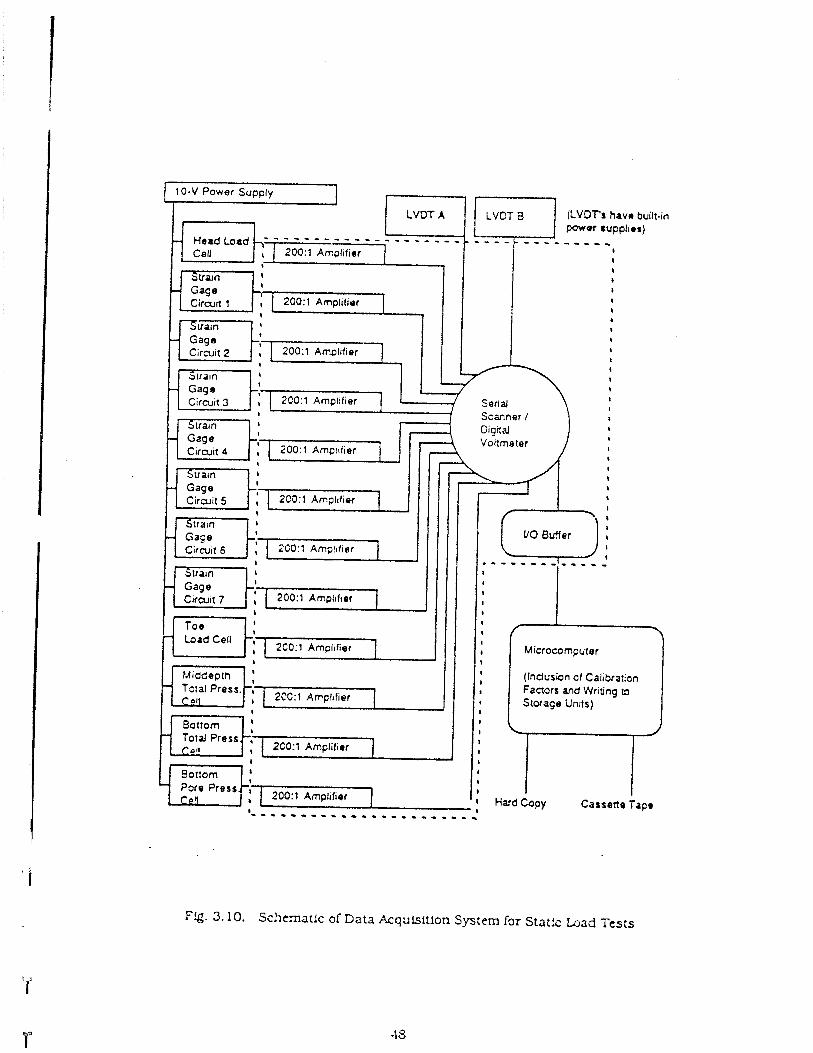
Fa. 3.10. Schematic of Data AcquLsltIon System for Stat!s Load Tests
10-V Power Supply I LVOT A
- - - - - - _ - _ _ _ _ I
I
Strain 4
Sua~n I i I
Stram I I - Gage
Circuit 4 200:l Amp:~l~er
Stram
i' 1: [ 200:. *mp, l f ,~ 1 I I
I
1
I i I
I
I I I
I
I f I
I Microcomputer I
MiCCepln I I (lndusion of Calibration - Tc:al Press. ' , a Factors and Writing 13
S ~ I ! , I Storage Un~ts) 2CC:l Amplrfier I
1 L I
I I
I
1 i Hard Copy Casseno Tace
LVCT a I
(LVOTs hava built-in POWW tupplior)
! - - - - - - - - , - 4
a I
I
1
t
4
4 I
4
I
I
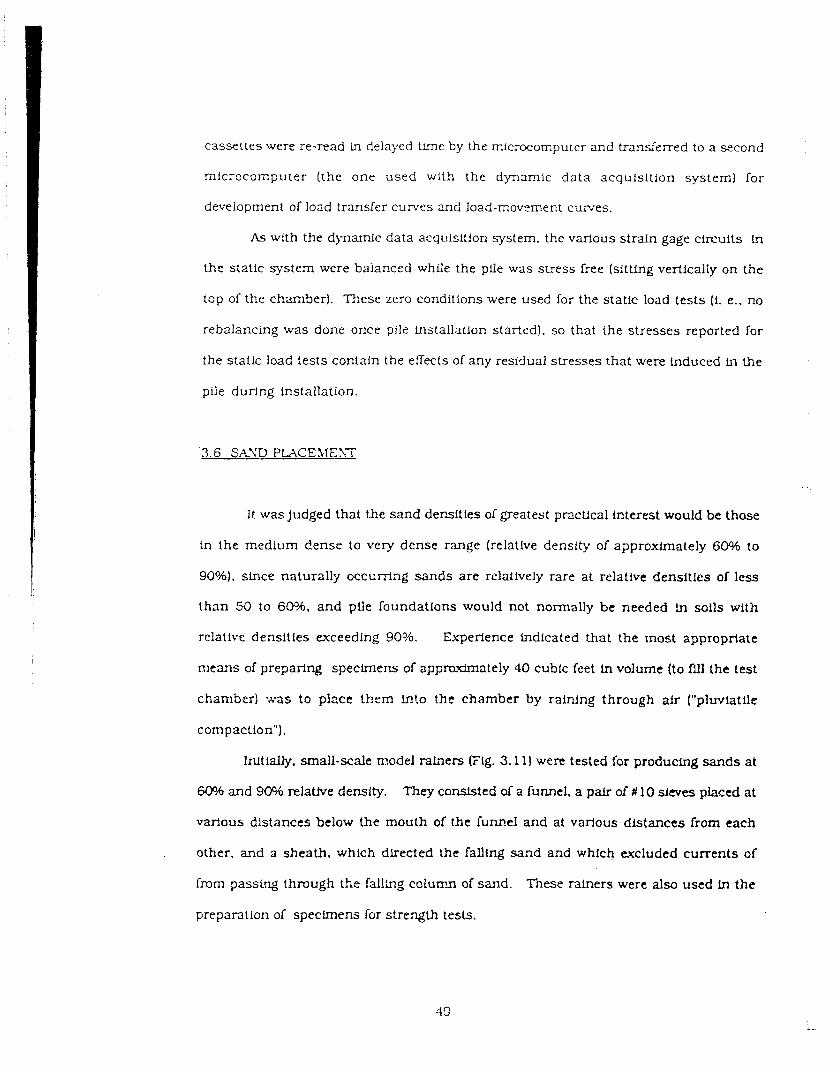
cassettes were re-read In delayed t m e by the rnicrwornputer and transferred to a second
microcomputer (the one used with the dynamic data 3.cquisition system] for
development of load transfer curves and load-movzment cu~rves.
As with the dynamic data acquisition system. the various strain gage circuits in
thc stztic system were ba ia~ced while the pile was stress free (sitting vertically on the
top of the chamber). These zero conditions were used for the static load tests (1. e.. no
rebalancing was done once pile installation started). so that the stresses reported for
the static load tests contain the efiecls of any residual stresses that were induced in the
pile during installation.
'3.6 SAYD PWCELIEhT
I t wasjudged that the sand densities of greatest practical interest would be those
in the medium dense to very dense range (relative density of approximately 6046 to
90%). since naturally occurring sands are relatively rare at relative densities of less
than 50 to 60336. and pile foundations would not normally be needed +a soils with
relative densities exceeding 90%. Experience indicated that the ~nos t appropriate
means of preparing specimens of approximately 40 cubic feet in volume (to flll the test
chamber) w s to place them ln!o the chamber by raining through air ("pluviatile
compaction").
Initially. small-scale model rairlers Gig. 3.111 were tested for producing sands at
600/6 and 90% relame density. They consisted of a funnel. a pair d # 10 sieves placed at
various distances below the mouth of the funnel and at various distances from each
. other, and a sheath. which directed the falling sand and which excluded currents of
from passing through the fallag colun?n of sand. These ralners were also used in the
preparation of specfmens for strength tests.
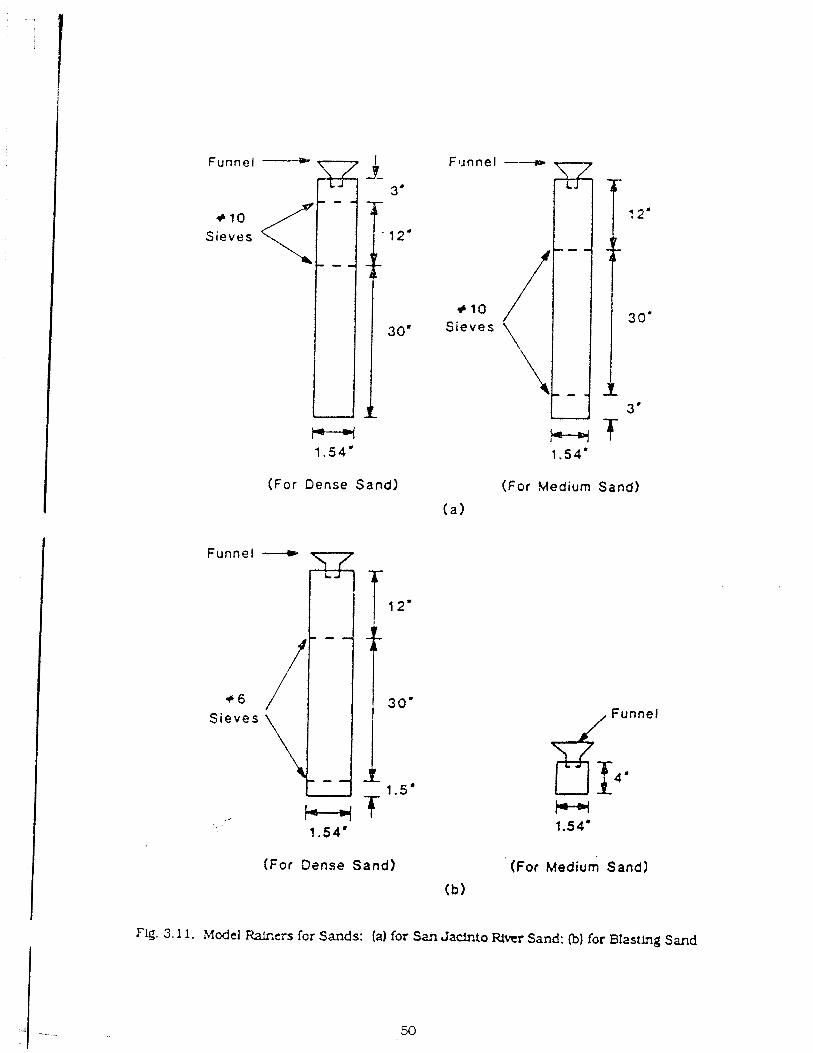
F u n n e l
Funnel \ /
+ 6 S i e v e s
Sieves
+ I 0 <- +10
Sieves
,
- - -
- -
L A
(For D e n s e Sand) (For Medium Sand)
( a 1
t---i 1.54'
, Funnel
(For Dsnse Sand) (For Medium Sand)
(b)
Fig. 3.1 1. Model Rakers for Sands: la1 for San Jacinto Riwr Sand; (b) for Blasting Sand
Full-scale rahers were then d ~ e l o p e d from t'le designs shown on Fig. 3.1 1. A
schematic diagram of the full-scale rair,er that was developed for deposition of both
sands in all states (except for the medium dense Blasting Sand) is shown in Fig 3.12. 1
In place of the funnel on the laboratory rainers, a pan hopper with a bottom-discharge
shutter was used in the full-scale rainer. The shut ter consisted of matching metal %
sheets with ccrrespondlng hole patterns, a s shown in Fig. 3.12. The top sheet was
designed so *ha? !t could slide laterally. As tke hopper was filled the holes in the top c
sheet were ou t of line with those on the bottom (staticnary1 sheet. To deposit the sand,
the top sheet was slid laterally until the holes aligned and the sand fell onto the top
sieve. The holes In the stationary sheet were machined in such a way a s to produce :
minimum turbulence of the falung sand particles a s they exited the shutter.
Attainment of the medium dense state (60-65% relative density) by pluviatile
compaction with Blastlng Sand could not be accomplished wlth the ralner shown in
Fig. 3.12;' therefore, it was necessary to construct another rainer for depositing sand
under those cond1Uons. That rafner is shown schematically in Fig. 3.13. li consisted of
a shutter. a s shown, whlch was activated by torsional motlon. No sieves were used. and
the sand was dropped through a distance of three inches directly from the shutter to the
surface of the newly deposited sand.
Us- the raL..g dev!ces described Fn the preceding section. each of the four
cells in the LVLPSC was filled wit! dry sand, beginning with the bottom cell and
concluding with the top cell. At the base of the bottom cell were placed the energy
absorbers described b d o n . followed by the water dilfusion ring and riser. prior to
beginning the ralnlng process. Plastlc forming jackets tha t could not resist
compress!ve hoop stresses werc used to provide lateral cordinemeat to the sand and
w e n put into place in a given ceU just prlor to b e p n i n g !he illling of that cell. Once the
topmost cell had been filled with dry sand, the top x p of the chamber was bolted into
?lace. The &amber was then piessurized to the required levels of total stress to
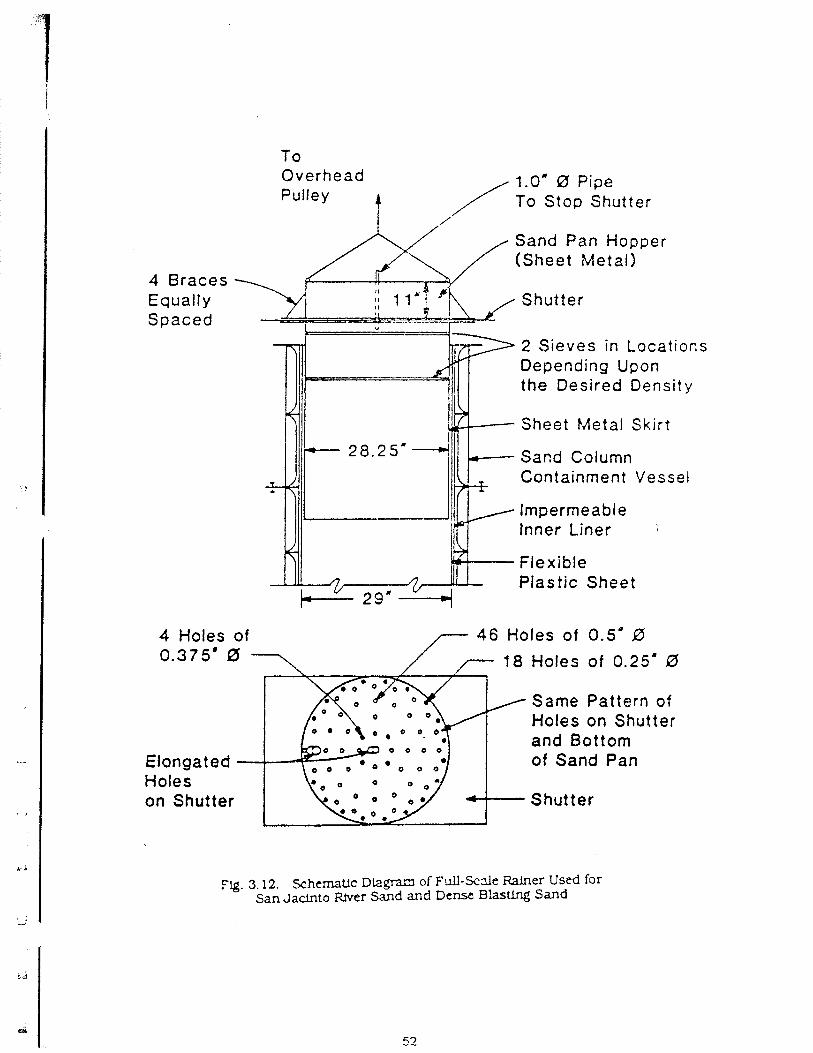
4 Braces Equally Spaced
To Overhead 1.0" 0 Pipe Pulley To Stop Shutter
/
Sand Pan Hopper (Sheet Metal)
Shutter
2 Sieves in Locations Depending Upon the Desired Densi ty
Sheet Metal S k i r t
Sand Column Containment Vessel
lmpermeabie Inner Liner
Flexible Plastic Sheet
4 Holes of 46 Holes of 0.5" 0 18 Holes of 0.25" 0
Same Pattern of Holes on Shutter and Bottom of Sand Pan
Shutter
F!g. 3.12. Schernatlc Di~!gran of Full-Scale Rainer Used f3r San Jaclnto Wer Sand and Dense BlasUng Sand
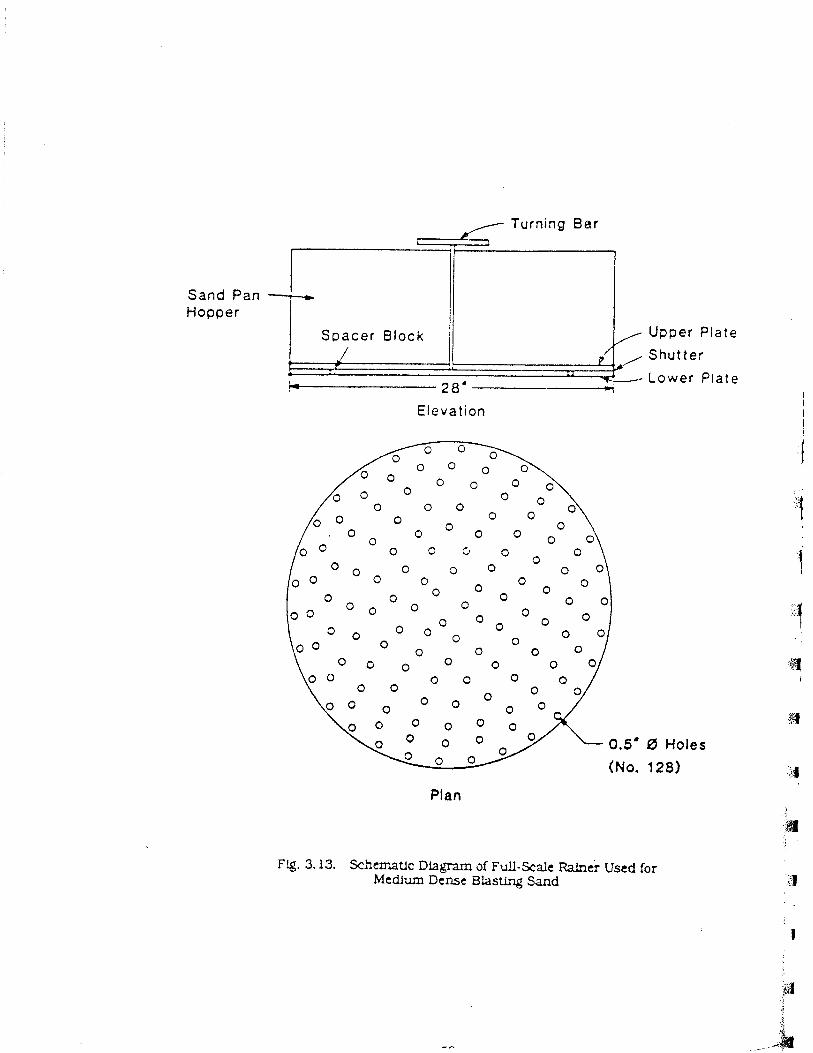
Elevation
Turning Bar L t
0 Holes
128)
Plan
I U p p e r Plate
Sand Pan Hopper
Ffg . 3.13. Schematic D l a g a m isf FuU-Scale ~ainc-r Used for Medium Dense Blasting Sand
L I 1
C= 28'
- S p a c e r Block
J
produce the effectiv~ stiesses required for the ~artlcular rest for which Ihe chamber was
being prepared. That is. the vertical total stress applied at the top of the chamber was
equal to the target effective stress. but the total stresses. in the lateral pressure
membranes were set equal to the target effective stress pius the pressure pmduced by the
head of water in the pores of the sofl ln the chamber. The pores of the dry sand were
then purged with carbon dio.xlde; finally, the chamber was saturated with deaired
water, through !.he Mus ton ring.
?The instrumented test plle was then placed into the top of the chamber through
the plle port to the elevation of the bottom of the pLle-port guide tube (Fig. 3.2). and the
test was conducted.
Following the ~ o ~ ~ l e t l o n of a given test, the free pore water was drained back
through the diffuser ring into the tank. The: chamber was then depressurized and the
pile exlncted vertically. The top cap of the chamber was then removed . and :he moist
sand was removed from the top cell by vacuuming or by shovelling. This process was
repeated with the remaining cells a s the sand was removed from the chamber in the
reverse sequence from which it was placed. The moist sand was then placed in a forced-
air convection oven for drybg. The oven-dry sand was then placed back tnto the
stockpile bin for reuse in future tests. The drying process. wkich occurred in a small
bakery-type oven, required about two days for 40 cubic feet of the Blasting Sand and
about three days for the 40 cubic feet of San Jacinto W e r Sand.
The grain-size distribution of the sand was checked against the initial
distrlbuuons (Fig. 4.1) periodlcaily during the test!ng program to observe whether reuse
resulted in degradation of the sand particles. None co-Ad be observed.
Preliminary studies with the full-sized rainers indicated that they give slightly
higher densjtfes in the chamber than the corrcsponciing laboratory rainers (Flg. 3.21.
Therefore. while the sofls were deposited at relatlve densities of approximately 6096
and 85% for small scale testing. the cornsponding relative densities attained In the
chamber were approximately 6596 and 90%. Since the process of isotropic
pressurization m the triaxial tests r a s e d the relative densities of the looser specimens
from about 60% to about 65Oh. the deposited relative densiLjr of 65Oh in the chamber to
represent the medium dense case is probably more representative of the actual relathe
density after pressurkalion of the chamber. Cravirnetric checks were also made of the
densities of the sands a s they were placed Ln the chamber ior every test. This was
accomplished through the follow'bg process:
a. Twelve sarngllng points were established within the chamber, a s indicated In
Fig. 3.14:
b. After placcrnent ol the fourth lift in each cell. c~luminurn sampling cans
(standard 1at;oralory molsiure sample cans). two inches in diameter and 1.5 lnches in
height, were placed on the sand surface and Ule next ltrt placed;
c. A thin-walled tube (longer than the height of can) was then pushed into the
sand isol~tlng each sampling can. The overburden sou was removed bdore recovering
the sample can;
d. me votd within the tube was filled with sand using the appropriate
labcratory rainer. and the tube was withdrawn;
e. The weight of the d;y soil wlthin the sampling can (whlch had a known
volume) was measured, t 5 e dry unit weight calcujated and the relative density
deterrnhed based on the h o w maimurn and macbnurn Index densities (chapter 4).
Results of the gravfmetric tests on the density samples u e given LTI Tables 3.1
a ~ d 3.2.
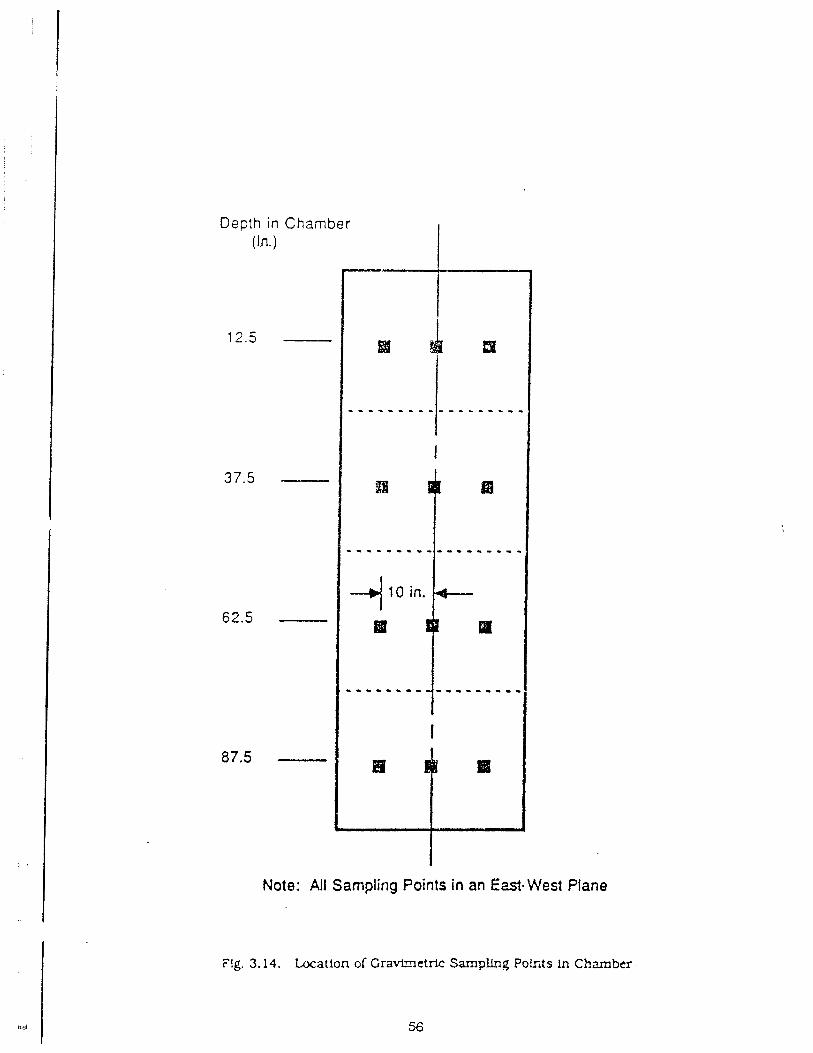
Depth in Chamber (In.)
I Note: All Sampling Points in an Em. West Plane
Flg, 3.14. Location of Cra-etric Sampling P o h t s in Chvnber
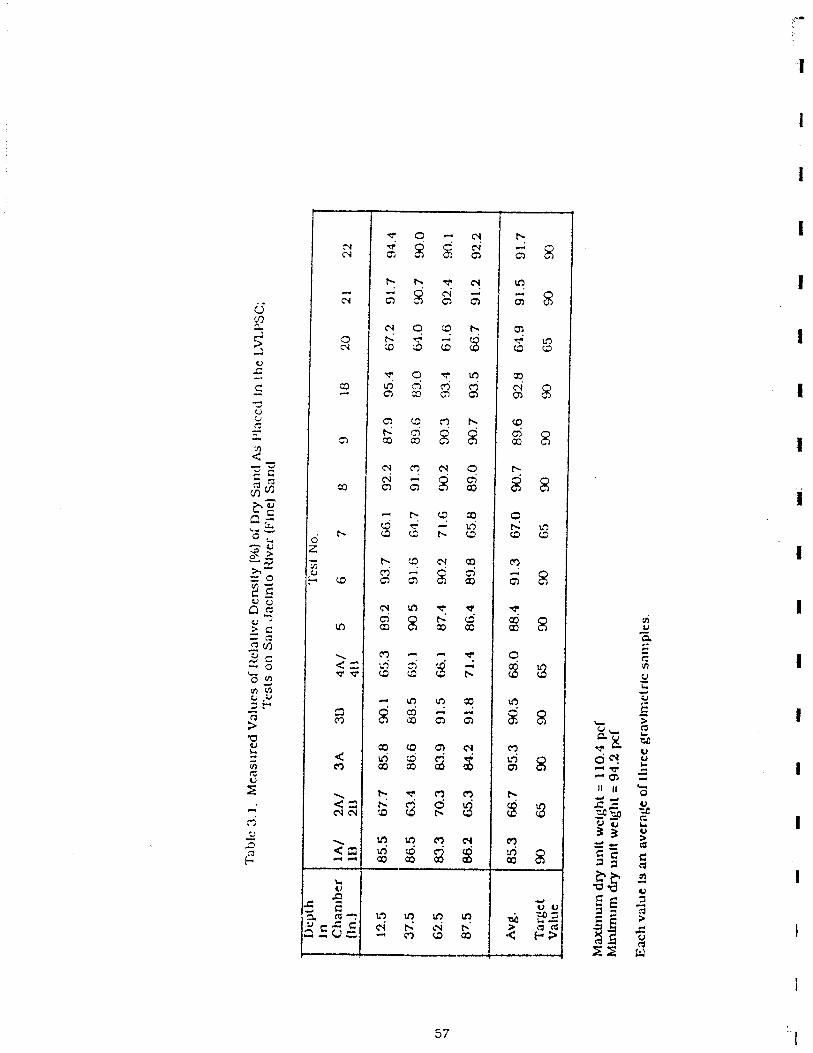
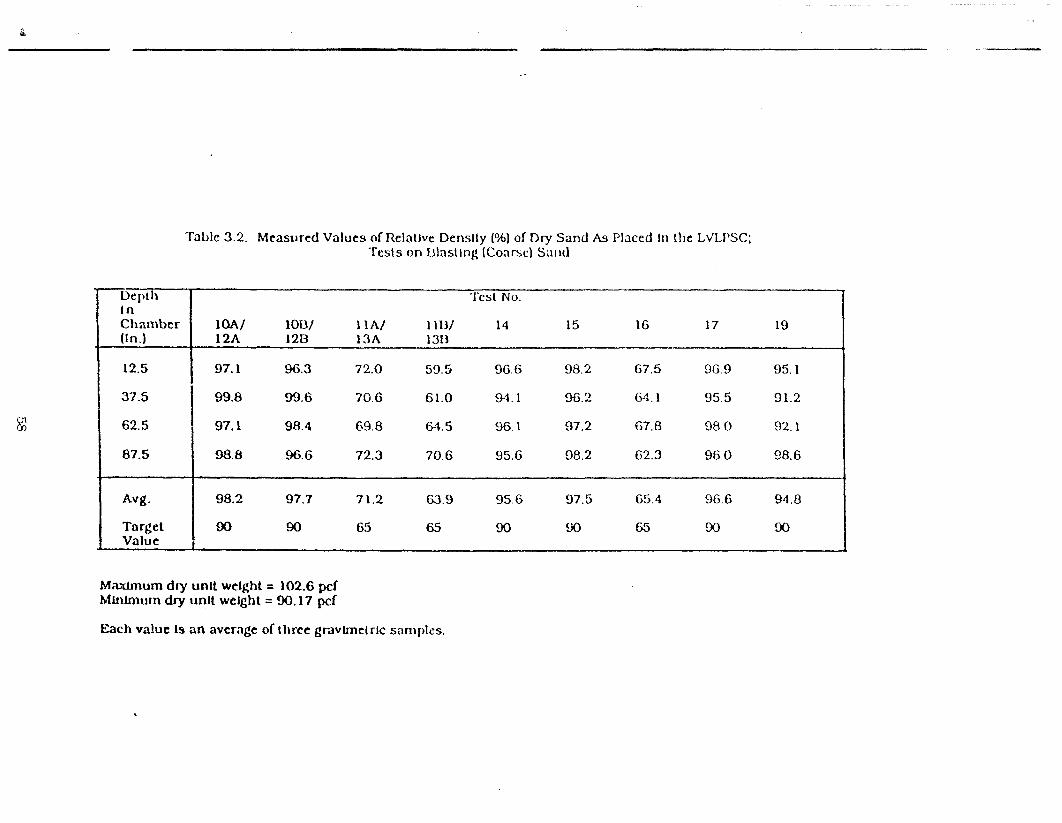
Tablc 3.2. Measured Values of Relnllvc Der~slly (%) of I)ry Sand As Placed In the LV1,I'SC; Tests on Dlnst~ng (Conrsc) S;lli(l
M,?xlmum dry unll welght = 102.6 pcf Mlrlln~urn dry unll weight = W. 17 pcf
Each vnlut Is an average of three gravlrnctrlc snnlples.
-. ~%-pli~ 1 n Chanrber (In.)
12.5
37.5
62.5
87.5
Avg,
Tnrget J Value
'l'cst Nu. v
1m/ IOU/ l ihl 11111 14 15 16 17 19 1 2 ~ 1213 13A 1313
97.1 96.3 72.0 59.5 9 G . 6 98.2 67.5 93.9 05.1
99.8 99.6 70. G 61.0 94.1 96.2 6.1.1 95.5 91.2
97.1 98.4 69.8 64.5 96.1 97.2 67.0 98.0 92.1
98.8 96.6 72.3 70.6 95.G 08.2 62.3 96.0 98.6
98.2 97.7 71.2 63.9 95.6 97.5 65.4 96.6 94.8
$HI 90 65 65 90 (90 65 90 90
-
Axial Strain Gape and Pressvre Transducer B r l d m .
The plle was calibrated in compression to a load of 41 kips on three separate
occasions: prior to the first test. during the testing program and after all the tests were
completed.
Tne calibration process was as follows: The plle was placed in a compression
loading dellce la wide-flange steel section configured to rest on the tips of its flanges on
the floor. with reaction plates welded on its ends). A hydraulic jack situated at the head
of the pi!e then applied a compression load of 4 5 kips, which was then released. This
process was repeated from three to five tlmes. in order to exercise the pile and mitigate
the effects of residual stresses from manufacture and welding. The pfle was then loaded i
in increments to 41 kips. and each strain gage bridge was read uslng the static data
acquisition system and bridge completion circuit that was used In the chamber tests.
along with a calibrated Lebow load cell, which was placed a t the head of the pile,
between the plle and the jack, and the power supply. A swivel-head device was placed 4
between the jack and the load ceil to minimize moments applied to the pfle during
calibration. The pile was not calibrated in tension. It was assumed that the
calibration constants determined from compression loadlng also applied to tension
(uplift) loading.
T h e pore water and t o t d pressure transducers were also calibrated statically.
whfle the pile was urJcaded. The callbration consisted of a fluid pressure test, in which
a small cylindrical water reservofr was clamped to the pfle dlrectly over the transducer
being tested. 'Pie water in !he calibration cylinder communicated directly with the
s e n s h g face of each traxsducer. {The pore water pressure transducers had been
saturated prior to this time.] Pressure was applied to the water column by a n air-over-
water devfce in a triaxial test panel and read by means o i a calibrated pressure
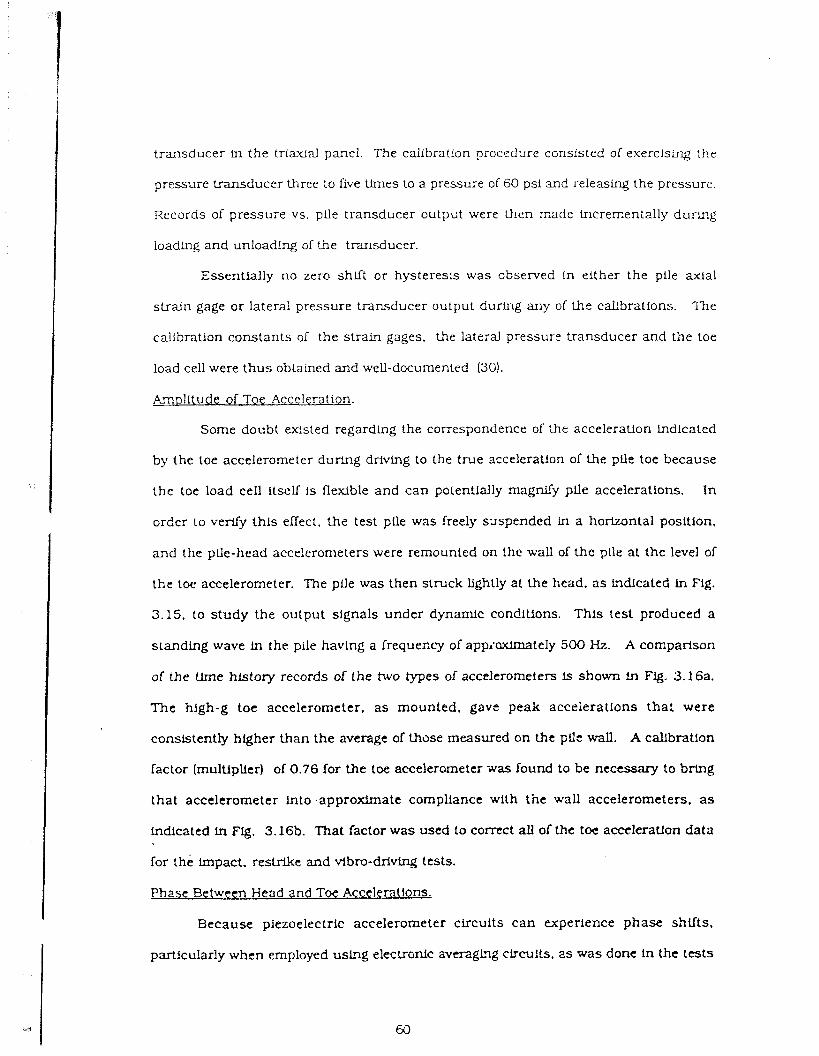
transducer in the tria>ual panel. The calibratlon procedure consisled of exercising the
pressure transducer three to five tlrnes to a pressure of 60 psi and releasing the pressure.
Records of pressure vs. plle transducer output were then n a d e tncremenially during
loading and unloading of the transducer.
Essentially no zero shift or hysteresis was observed In either the pile axial
strain gage or lateral pressure transducer output during any of the calibrations. The
calibration constants of the strain gages. the lateral pressur? transducer and the toe
load cell were thus obtained and well-documented (30).
Am~litude of Toe Acceleration.
Some doubt Wsted regarding the correspondence of the acceleration indicated
by the toe accelerometer during driving to the true acceleration of the pile toe because
the toe load cell Itself is flexible and can polentially magnify pLle accelerations. In
order to verify this effect, the test pile was freely sxspended In a horizontal position.
and the plle-head accelerometers were remounted on the wall of the plle at the level of
the toe accelerometer. The pile was then struck lightly at the head. a s indlcated In Fig.
3.15. to study the output signals under dynamfc conditions. This test produced a
standing wave ln the pile havtng a frequency of appioxlmately 500 Hz. A comparison
of the Urne history records of the two types of accelerometers is shown in Fig. 3.16a.
The hlgh-g toe accelerometer. as mounted, gave peak acceierations that were
consistently higher than the average of those measured on the put wall. A calibratlon
factor (multiplier) of 0.76 for the toe accelerometer was found to be necessary to bring
that accelerometer into .approximate compliance with the wall accelerometers. a s
indlcated in Flg. 3.16b. That factor was used to correct of the toe acceleratfon data
for th6 impact, restrike and vibro-driving tests.
Phase Between Head and Toe Acceleralfons,
Because piezoelectric accelerometer circuits can experience phase shuts.
particularly when employed usi..g e1ectrcjn.k averagbg circuils. as was done in the tests
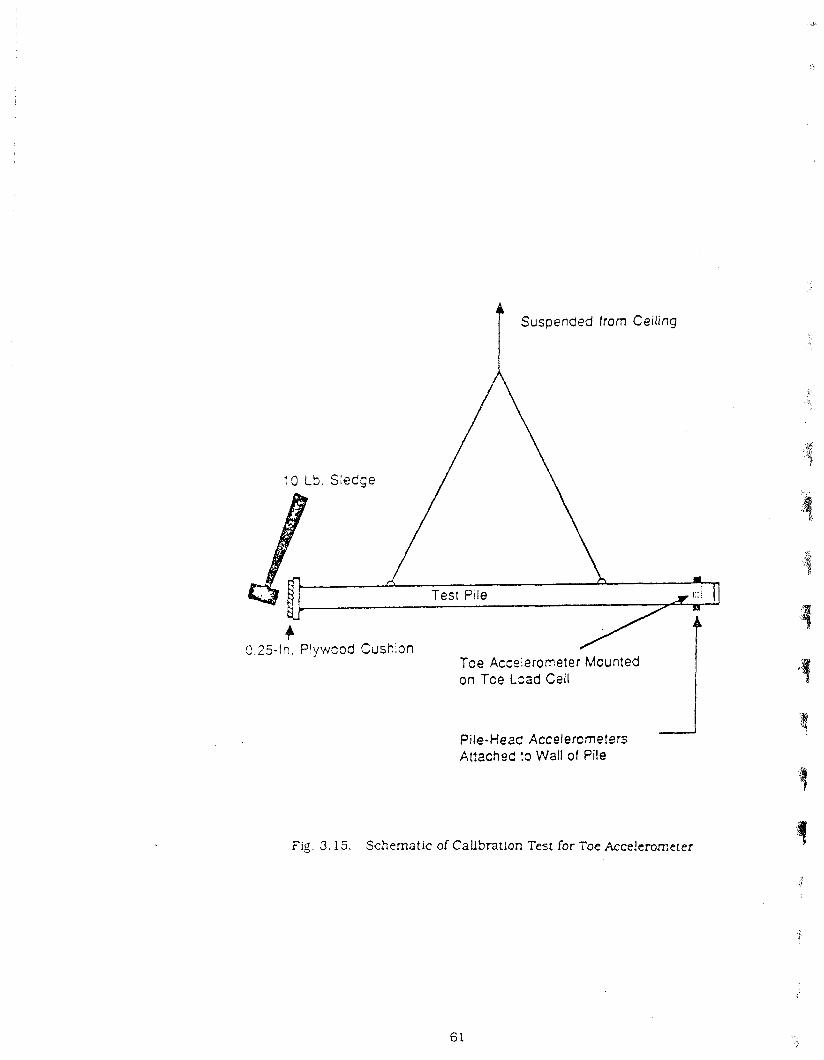
4 C.25-In. P!ywcoc' Cushion
Toe Accgieroce:er ' 1 Mounted on Tce Lctd Cell
Pi le-Held Accelercmeters Attached 13 Wall of Pile
Fig. 3.15. Schematic of Calibration Test for Toe Acce!erometer
4 0 0 ~ n Toe &el-
CALIBRATION FACTOR APPLIED roo ,
Flg. 3.16. T i n e Htstories cf P i e wall &?ti T G ~ Load Ce!! Arcclcratlon: (a) IJr,corrt~:ci: (b) Corrrded
reported here. it was also decided to detenrzne the phase between the !ow-g pile-head
accelerometers and the low-g pile-toe accelerometer that were acquired dur ing
vibratory installation. This particular phase shlft is mponan t because the toe and
head acceleration (and force) information was used to determine unit load transfer
relationships during vibrational installation. .The calculated phase between head and
toe is appra-dmately 2.9" at 20 Hz for a wavespeed of 16.300 ft/sec Ln steel. !n the data
reduction procedures the t ine history for the toe acceleration was then shlfted re!ative
to the head acceleration by 2.9".
The testing arrangement i s shown in Fig. 3.17. In which an available 4 Hz
(nominal] vibrator was used to excite the pile. Time historles of both the pile-head
(average) and pile-toe accelerometers are shown in Fig. 3.18. and the corresponding
phase and magnitude spectra and coherence function are shown in Fig. 3.19 (Note : the
cross power spectrum is a measure of mutyal power between two signals at each
frequency and the coherence function shows the degree of causality between the two
signals). At 3.9 Hz, the phase is 5". At 20 Hz the phase is then 25.6" (eaect due to
electrical circuit and size of pflel, such that the tee accelerometer data must be shsted
forward in Ume 22.7" relative to the recorded position in the time domain at 2
frequency of 20 Hz (that is. 3.15 msec).
No formal assessment was made of the phase shlft in acceleration at the toe
during impact drfvlng, since such shifts were not needed in the data analysis.
Phase Between Velocity and Force at Head or Toe.
No formal calibrations were made of the phase between force and acceleration at
either the head or the toe. When the velocity (integrated acceleration) acquired dur ing
each of the chamber tests was mu!tiplled by pile impedance at the head (or the toe1 and
the resulting time historles compared with the corresponding measured force-time
hlstorfes during the initial part of an impact blow: however, the resulttng curvfs did not
exactly match, indicating that a small electronic phase shill existed between force and
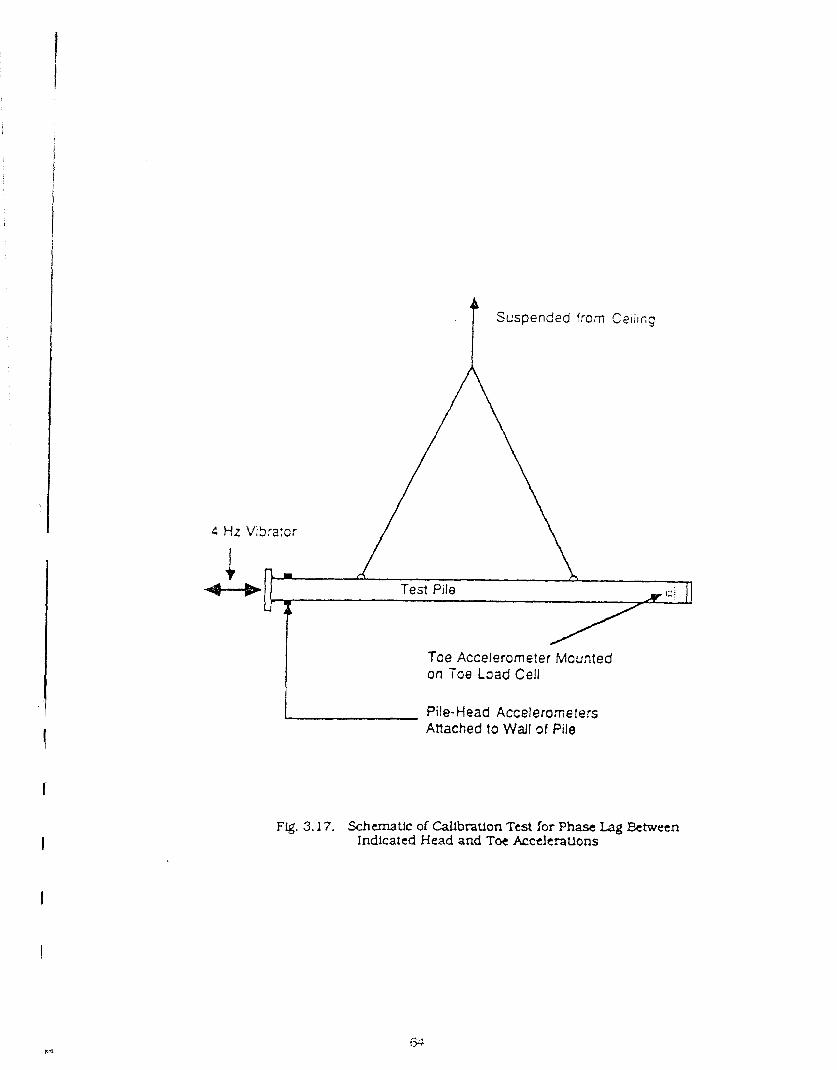
I Suspended from Ceii~ng
I Pile-Head Accelerome:ers Attached to Wall of Pile
4 Hz Vi3ra:cr
1 ;-
Fig. 3.17. Schematic of Callbration Test for Phase Lag &tween Indicated Head and Toe Acctleratlons
Test Pile I.. i .. . 4-+
Toe Accelercme!er Mounted on Toe Load Cell
-
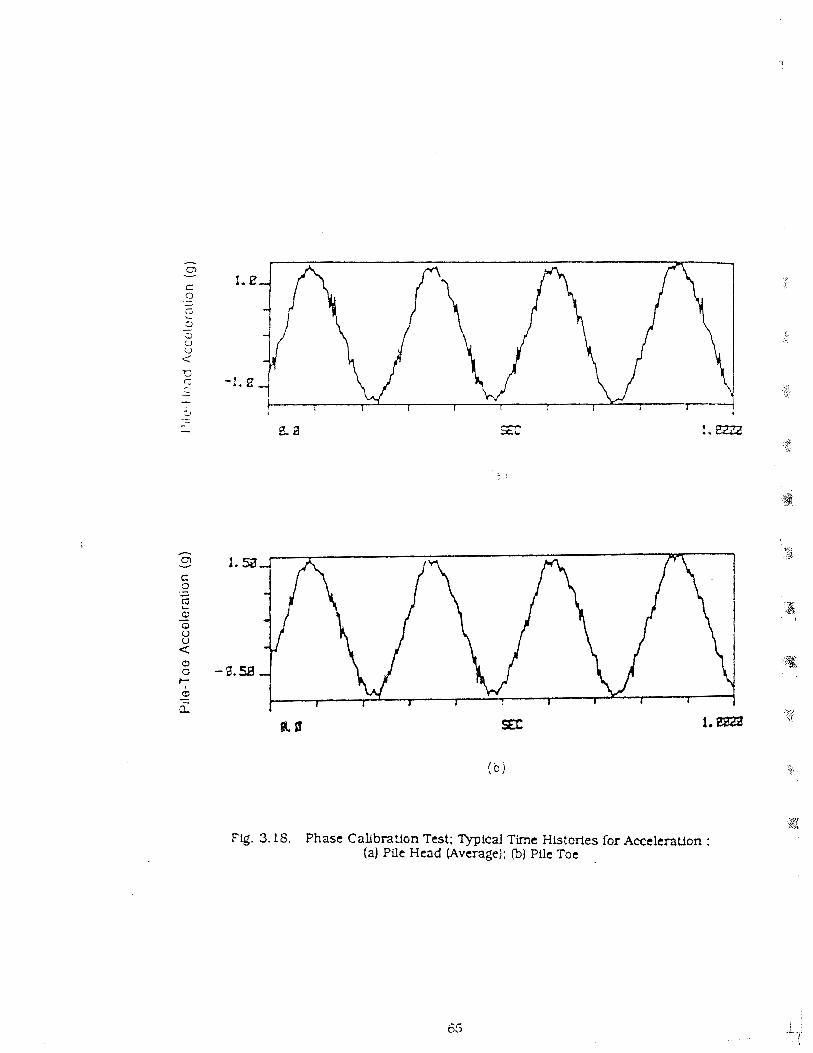
Flg. 3.18. Phase Calibraaon Test: 7'ypical Time Hlstcrles for AweleraUon : (a) Pile Head (Average): @I Pile Toe
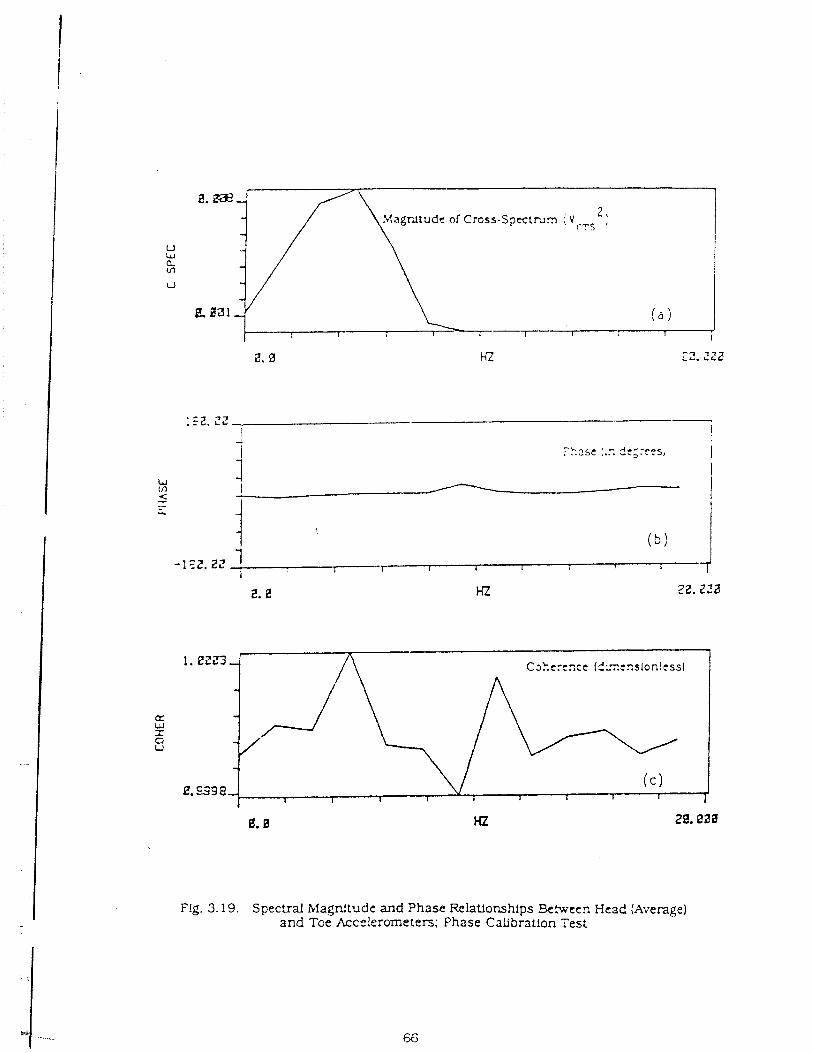
1. e m
E. 9 9 8
13. B 20. eaa
Fig. 3.19. Spectral bfzgnitude and Phase Relauonships Between Head (Average) and Toe Accelerometers; Phase Calibration Test
acceleration at the head (or toe) level. This shut was accounted for in the development
of pile force and velocity relations a n d for comparisons with the wave equation
solutions for the impact and restrike tests, a s stress wave theory require% This shlft, m
terms of time, was noted. and a corresponding shlft was made in the liitegrated
acceleration records h r purposes of computing energy (which requires that velocity and
force be nultip!!ed together timewise and integrated across time). N o corresponding
shu t s were made in th? vtbratory test data because of the low frequencies lnvolved
(approximately 20 Hz).
CHAFTER 4
SAND PROPERTIES AND TEST RESULTS
This chapter presents the properties o l the two sands and the results of all
driving tests.
Index. triaxial compression. interface shear . permeability and torsional
resonant column tests were conducted to characterize the San Jaclnto River Sand (SJR)
and Blasting Sand (BLS). Although these tests do not necessarily represent the stress
paths to which the sand wcs subjected in the LVLPSC during pile driving. they provide
info;matlon on the mechanical properties of the sacds. Past studies have ldentSied
that the grain slze cf sands were more important than the grading. Hence the efrect of
the effective grain size. d 10, was investigated but distribution was not.
The penetrations of piles of lnterest to transportation facility designers is in the
order of 50 to 100 feet. In selecting effective pressures ln the chamber, it was assumed
that the ground stresses for such penetrations could be simulated wtthtn a reasonable
approximation by a p p l y i ~ g an isotropic effective stress withln the chamber eqcal to
the ground stress that would occur at the middepth of the pfle IfKo in the deposit being
simulated were 1 .O. Hence, the in-situ lsotroplc effective stress levels of interest are tn
the range of 10 to 20 psi. Most of the pfle tests in thc chamber were conducted with
initial isotropic eflectfve pressures of 10 and 20 psi. However. the mean effective stress
ln !he soll mass during installation and static loadlng could tncrease'the level of mean
ellective stress around the pile considerably aba te the initial. ln-situ value. Therefore.
laboratory strength tests were conducted with confining stresses varying from 10 to 50
psi.
X fe;v piie dilving tes:s were conducted ln the LVLPSC with KO = 0.5 (anisotropic,
initial. in-sltu stresses in the scil), In which the 10 psi pressure range was maintained
for the horizontal effective pressures; however, no corresponding strength tests were
conducted under this inftial effective stress condition.
The grain size was the maln concern in this study and hence two uniform sands
were selected.
Grain-Size Distribution.
The averages of three grain-size distribution tests for the two test sands are
s h o u n in Fig. 4.1. For the San Jacinto a v e r Sand (SJN the effective g r a b size. d l O , is
0.2 rnm. and the coefficient of uniformity CU Is 1.74. From viscal observations the
typical shape of the grains was subrocnded, and the SJR is classified according to the
Unified Soil Classtfication System a s "SP." or a poorly graded fine sand. For the
Blastlng Sand ( B E ) dlC, and C, are 1.2 mrn and 1.42. respectively. The grain shapes
were angular lo subangular. and the Unified classFficat1on is "SP," or a poorly graded
coarse to medium saxd. Both sands were siliceous in mineralogy with no organics or
soil finer than the No. 200 sieve slze.
Minimum and Mzimum Denstty.
Volume-change characttristics of the sand are considered to be one of the factors
innuenclng the driveability and the behavior of the pile-soil system under load. The
volume-change characteristics are complex functions of the effective stresses and
initial density of the sand. Since the relative density of most m t u r a l sand deposlts
into which piles will be vlbrated will exceed 500h. it was decided to deposit the test soils
in the LLZPSC at target relative densities of 60 and 8S0h. In order to determine the
actual density required for the attainment of these values of relative density, it was
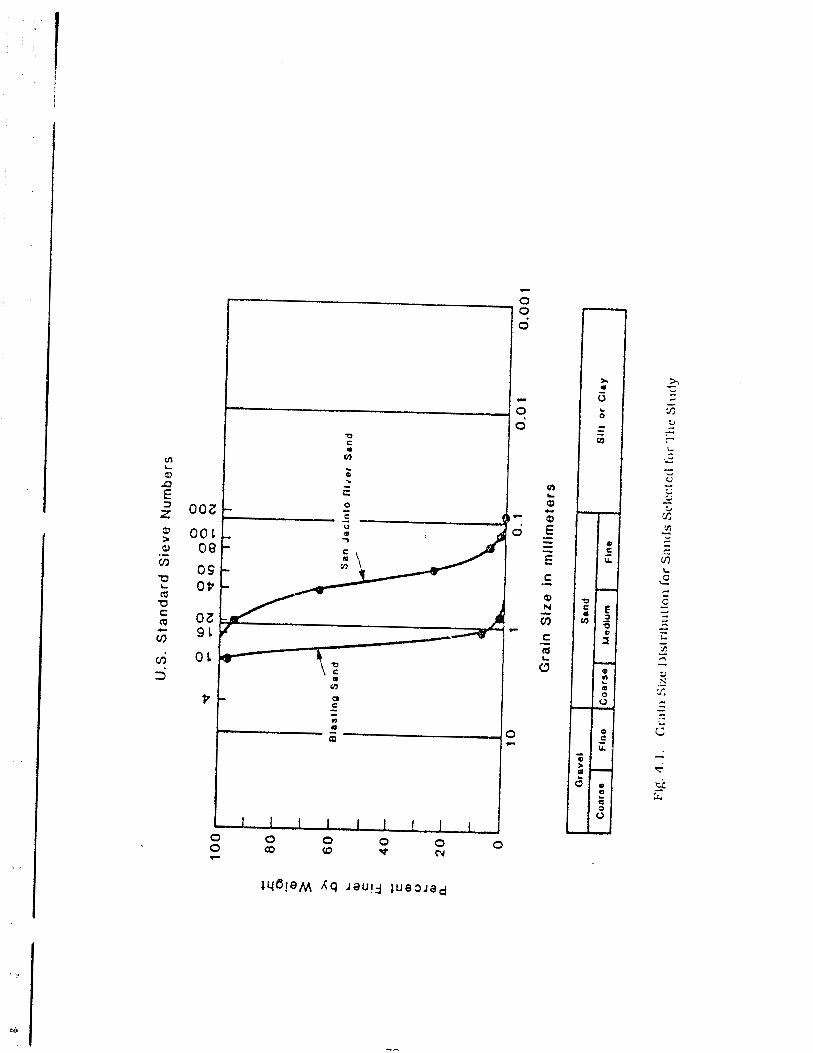
necessa7 to cmduct tests for ml rmum and maximum densities as defined by A S n f
standards D 4253 and D 4254 (1). Each density was obtained a s an average oi three test
results on sarmples taken randomly from the stockpiles of the sands. The mean values
of the maximum and rninlmum index densities for the SJR were 110.4 pcf (standard
deviation was 0.13 pcl) and 94.2 pci (standard deviation was 0.76 pcl), respectively,
(corresponding to a mhirnuln void ratio of 0.50 and a maximurn void ratio of 0.76). and
the corresponding index dexsities for BlasUng Sand were 102.6 pcf (standard devtat!on
was 0.02 pcfJ and 90.2 pcf (standard deviation was 0.57 p d . respectively (corresponding
to a minimum void ratio of 0.61 and a maximum void ratio of 0.83).
During triaxial testing the sample dlameter was established at 1.5 inches. When
SJR and BLS were deposited at a relative density of 60% and consolidated at hydrostatic
pressures of 10 and 20 psi, relative density was increased by about 5%. Therefore. while
the sands were deposited. both in the chamber and in trlaxial cells. at a relative densily
very near 60%. changes in relative densities could be expected during pressurization.
and some of the results are sumrnerkd in Tables 3.1 and 3.2.
Permeability.
Constant-head permeablllty tests were conducted on both solls deposited in the
relative density range of interest. Tests were ccnducted by depositing oven-dry soil by
raining through air into cylinders 3 inches in diameter by 6 inches high and then
saturating the samples very slowly with deaired water by gravity to simulate
approximately the procedures that were used to deposit and saturate the sand in the
LVLPSC. Flow during the permeability test was from top to bottom of the specimens,
parallel to the dlrecUon of the particle velocity vector during deposition. The results
are summarized in Table 4.1. I t is obsented that the Blasting Sand (the coarser of the
two test sands) is about twice as permeable as the San Jaciiito River Sand.
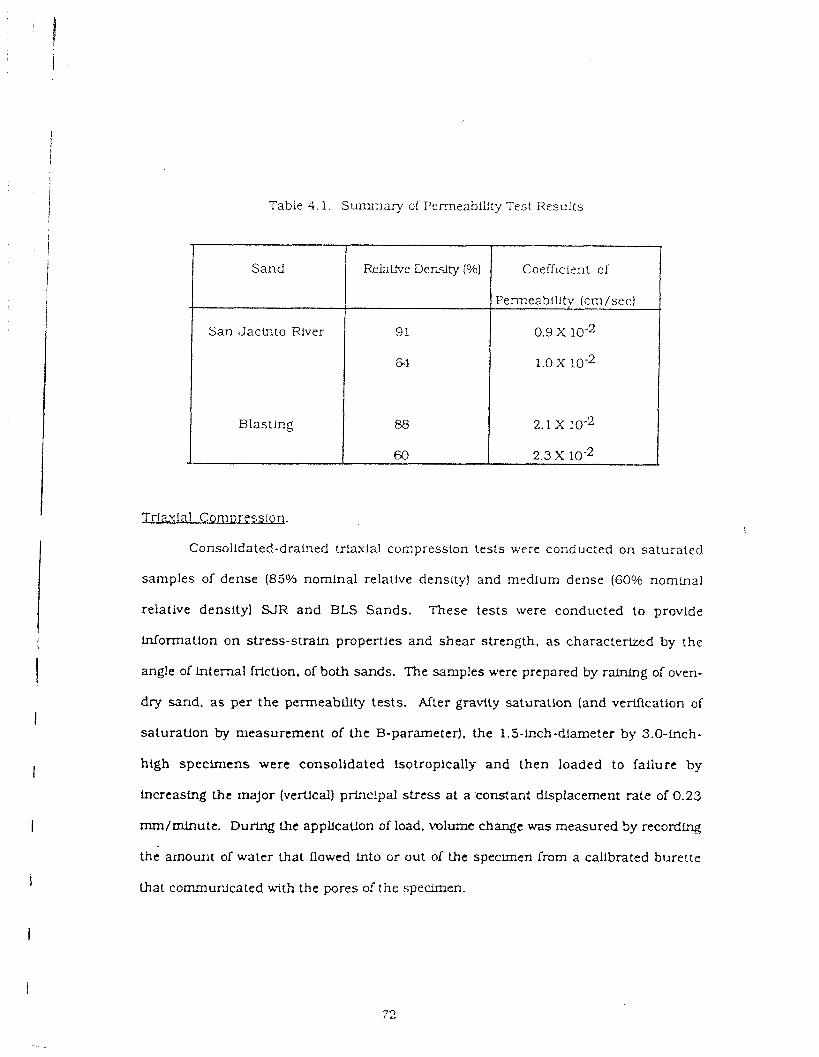
Table 4.1. Summary of Permeability Tes t R e s u l t s
Trtaulal Comnressloq.
Consolidated-dralned triaxial compression tests were conducted on saturated
samples of dense (85% nominal relatlve density) and medium dense (60°/6 nominal
relative density) S J R and BLS Sands. These tests were conducted to provide
infomation on stress-straln properties and shear strength, a s characterized by the
angle of internal friction. of both sands. The samples were prepared by raining or A oven-
dry sand, a s per the permeablllty tests. Aiter gravity saturation (and verification of
saturation by measurement of the B-parameter). the 1.5-inch-dlameter by 3.0-fnch-
high specimens were consolidated lsotroplcally and then loaded to failure by
increasing the major (vertical) princ!pal stress at a constant displacement rate of 0.23
rnm/mlnutc. During ihe appllcaUon of load, volume change was measured by recording
.A
the amount of water that flowed into or out of the specimen from a calibrattd burette
that cornmurdcated with the pores of the specimen.
- Sand
San Jacinto RIver
Blasting
RelaLVe Density (%)
9 1
a
88
a3
Coeflicierlt of
Permeability (cm/sec)
0.9 X
1.0 X 10-2
2.1 X lo-2
2.3 X loa2
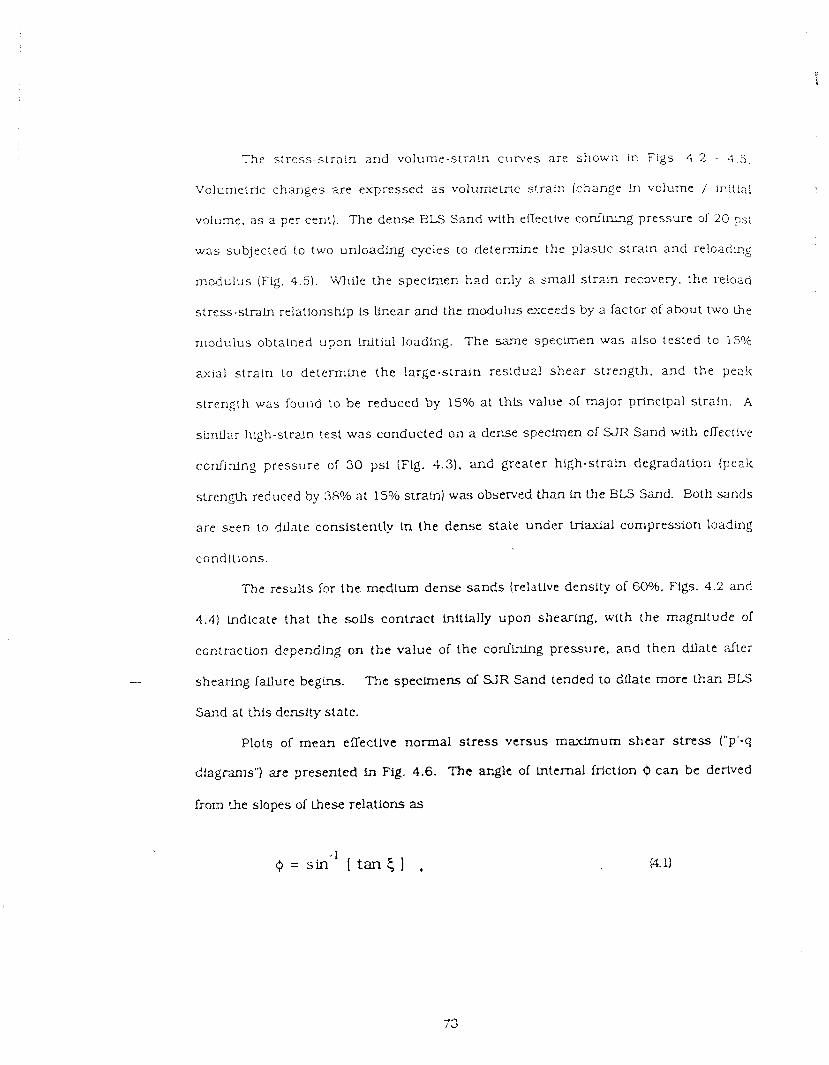
The s t ress -s t ra in and volume-strain curves are shown in Figs. 4 . 2 - .I.s,
Volumetric changes are expressed a s volumetric s!raln (change in volume / hi t la ]
volume. a s a per cent). The dense ELS Sand wlth efiective confining pressun, of 20 psi
was subjected to two unloading cycies to delennine the plastic s t ra ln and re!oadi~g
modulus (Fg. 4.5) . While the s p e c m e n had only a small s t rain recovery, the reload
stress-straln relationship i s h e a r and the modulus exceeds by a factor of about two t ? e
nlodulus obtained upon initial loading. The same specimen was also tested to 15?6
axial s train to determine the large-srrain residuzl shea r s t rength , and the peak
strength was four-ld to be reduced by 15Oh at this value of major principal s train. A
sirriilar high-straln test was conducted on a dense specimen of S J R Sand wlth eflective
conlining pressure of 30 ps i (Fig. 4.3), a n d greater high-strain degradation (peak
strength reduced by 38%0 a t 15% srrztn) was observed than fn the BLS Sand. Both s ands
a re seen to dilate consistently in the dense state under triaxial compression loading
conditions.
The results for t he medium dense s a n d s ( re l~ t lve density of 60%. Figs. 4.2 and
4.4) hdica te that the solls contract Wtial ly upon shearing, with b e magnitude of
contraction depending on the value of t he codLnLng pressure. and then dflate after
- shearing failure begins. The specimens of S I R Sand tended to d a t e more than BLS
Sand a1 this density state.
Plots of m e a n effective normal s t r e s s versus maximum shea r stress ("p'-q
diagrams") are presented in Fig. 4.6, 141e angle of Fntcrnal friction (l can be derived
from the slopes of Lhese relations as
- 1 Q = sin [ tan 5 1 ,
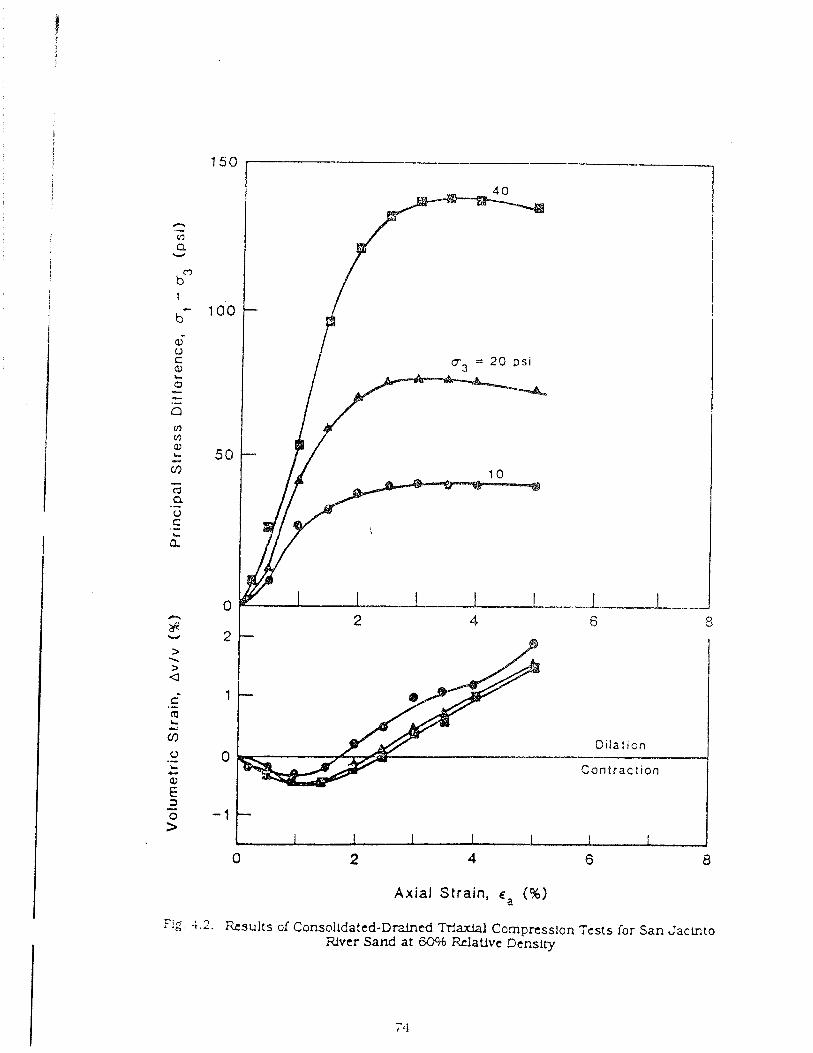
Axial Strain, ca (%)
Fig. 4.2 . Results of Consoilda!ed-Drained %axial Compression Tcsts ior San Jacinto River Sand at 60% Relative Density
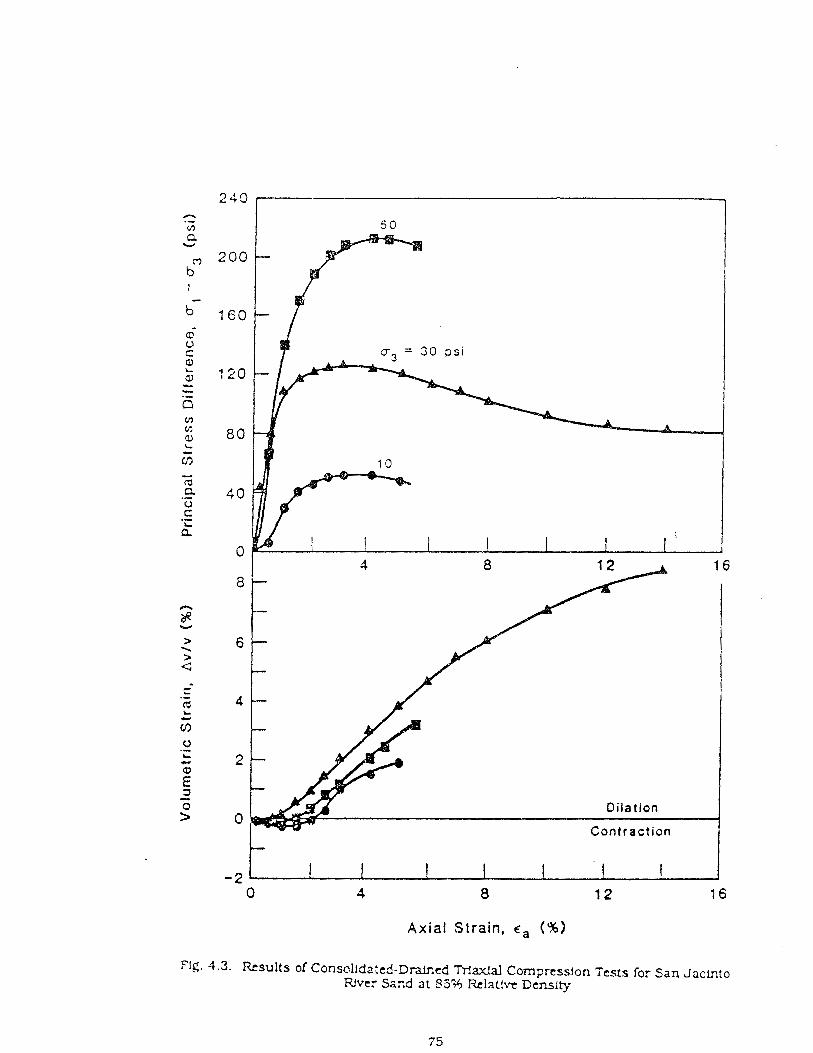
Axial Strain, r , (%)
'18. 4.3. ILsults of Consc1lda:cd-Dmcl 7Max!al Comprcsslon Tcsts for San Jaclrita Rvc; Sand at 35% Rrhciauve Density
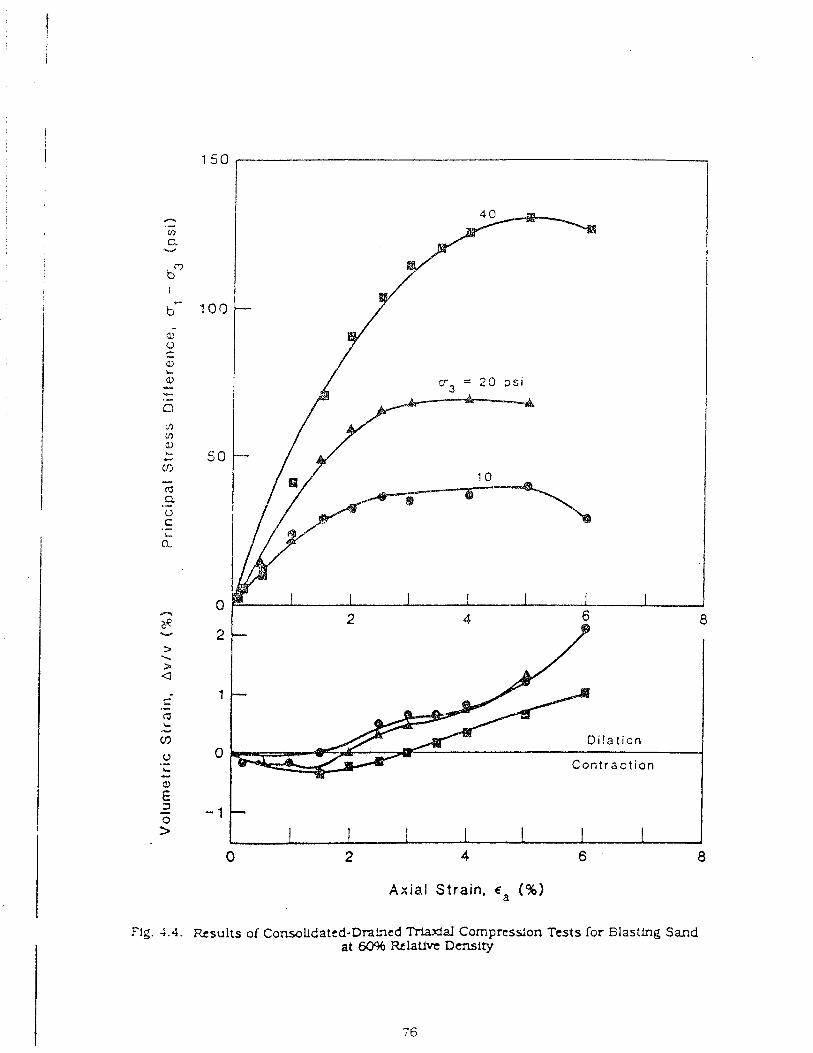
Axia l Strain, 6, (%)
Flg. 4.4. Results o l ConsoUdated-DmL?~d Maxlal Compress;on Tests for Blasting Sand at 60% Relative Density
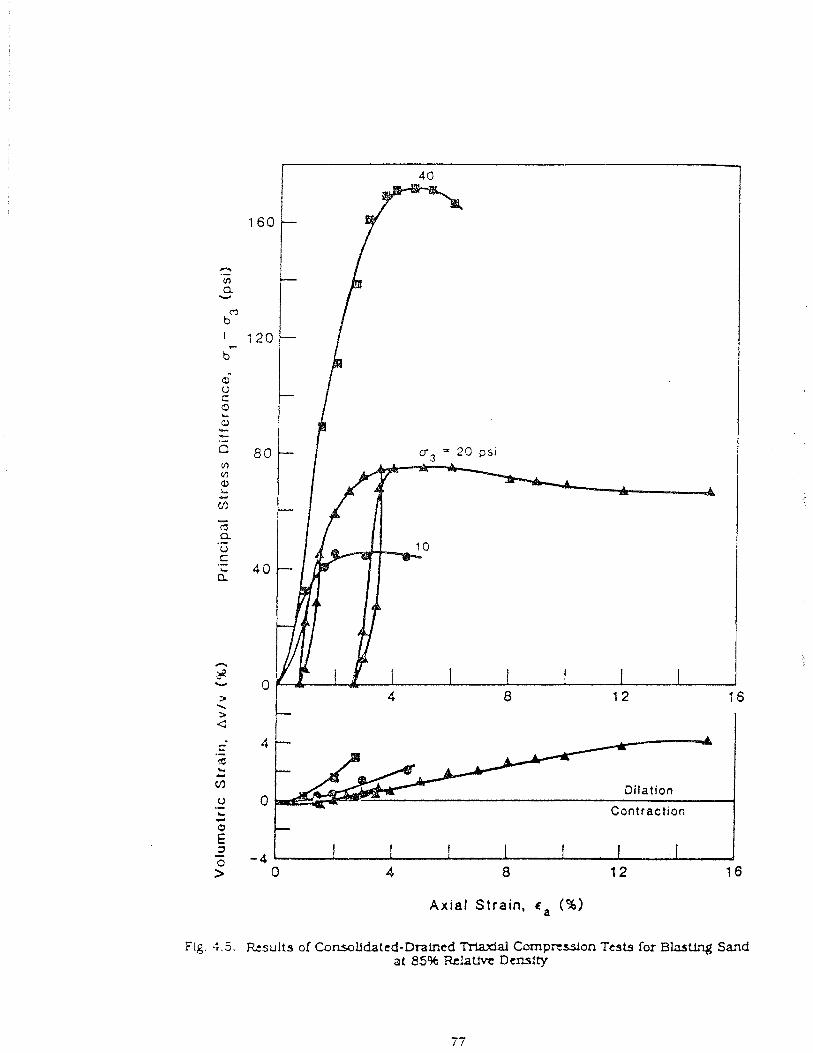
Axial Strain, c, (%)
Fig. 4.5 . Rtsults of Consolidated-Dralned Triaxial Compression Teats for Blasting Sand at 85% Rrlatfvt Density
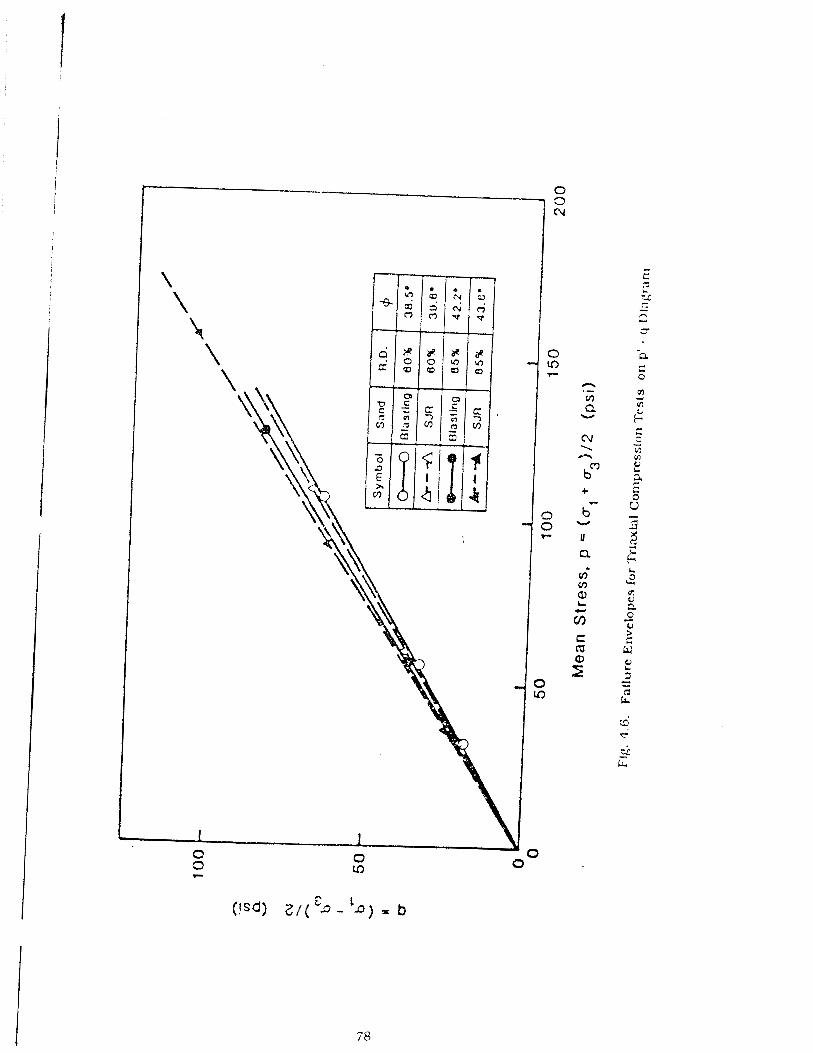
where : is thz s!ous ol the lppropriate 1:ne 111 Fig 4 6 Tllz angle of ~nterna l friction
v m e d from 33 5" to 43 6 "
Interface Shear
It was also considered lrnportant to investigate the interface shear strength
properties of Lhe sand 2nd the material comprismg the ou:er wall of the plle In order to
s tudy Lhls efI'ect. interface shear tests were conducted ?n a dkect shear apparatus Sand
was deposited by nlnlng the sol1 in a dry s ta te at yelalive densities of 60% and 850/6
onro a prepared flat steel pls:e Ln the bottom half of a clrcular dlrect shear box 3 inches
~n d~arneier , follow4ag whlch the top of the sand surface b a s vibrated lightry to ensure
that the relative density at the sand-sleel interface was equivalent to that m the sand
m a s s ~v i thm the shear box. In order to represent th: the pile surface closely, the steel
?late was made of the same m a t e n d a s the pile and was p e n the same fWsh a s that on
the p ~ l e by lightly machhlr ig it wiLh a n end mill and r ~ b b r g it with a n emery cloth
pllor to depositing the sand Aiter placement, the sand was saturated and tested in a
consolidated-draLned mode under normal interface stresses of 10. 30 arid SO psi. Both
shea r stress-displacement and vefiicd-horizontal-displacement relations, are glven In
Flgs 4 7 - 4 10 The .SJR Sand contracts at the interface at 60046 relative dersit-4 but
dllates ar 85% relative density (Figs. 4.7 and 4 8). wt.lle the BLS Sand contracts at 60%
relatlve demlty but rindergoes relztfvely mF?or volume change at 8.5% relative density,
except at the 50 psl normal s tress , where It contracts slightly. This type of interface
behavior suggests tha t the test plle will exhlblt somewhat M e r e n t load transfer
characteristics when installed in the two types of sand ln the LVLPSC.
Interface frictional failure envelopes are s h 9 w in Fig. 4.11. Tine interface
frictlon angle Is seen to be largest for dense SJR Sand (30") a?d smallest for rnedlum
d e r s e BLS Sand (25") It is noted that these values d e all considerabiy lower t3an :he
angles of h t e rna l frlctlon obtained from rrlzclal cor?presslon tests for peak pm-clpd
s t x s s d d e x n c e s ar,d are also somewhat lower tha? angles 9f internal friction that can
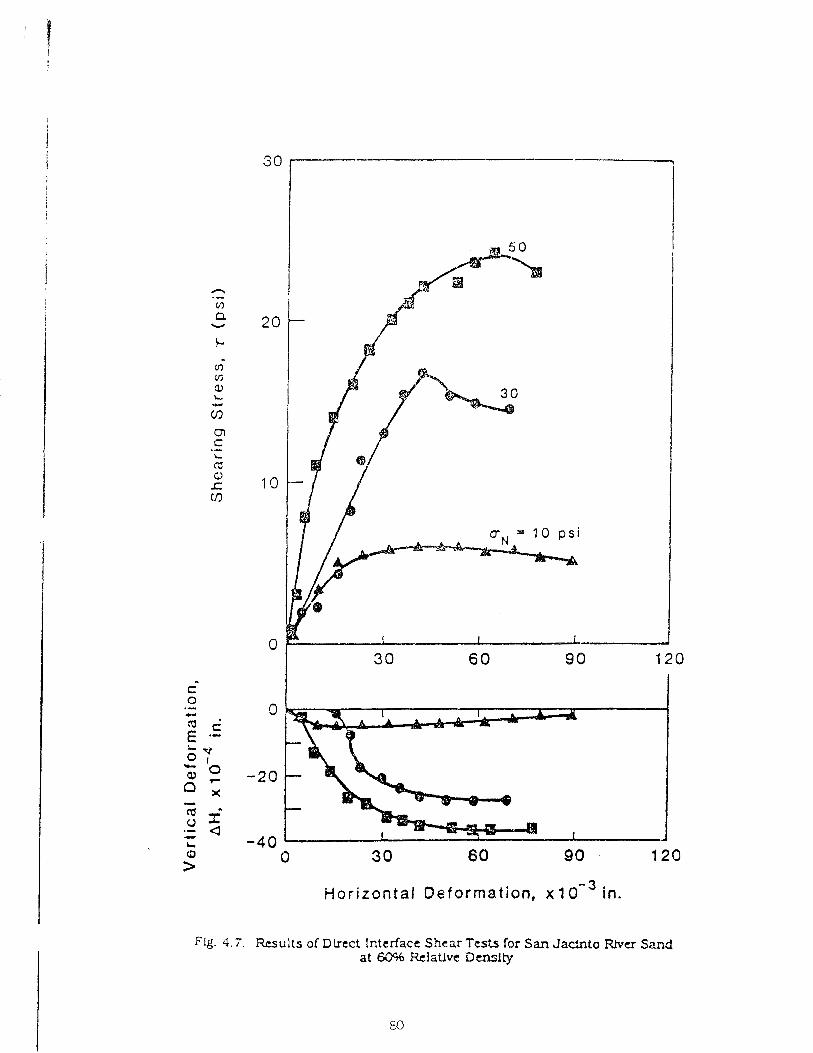
Hor izon ta l Deformation, x 7 o - ~ in.
Fig. 4.7. b u l t s of Bkcct Interface Shear Tests for Sari Jaclnto ,%a Sand at 60% RcIaUvc Density
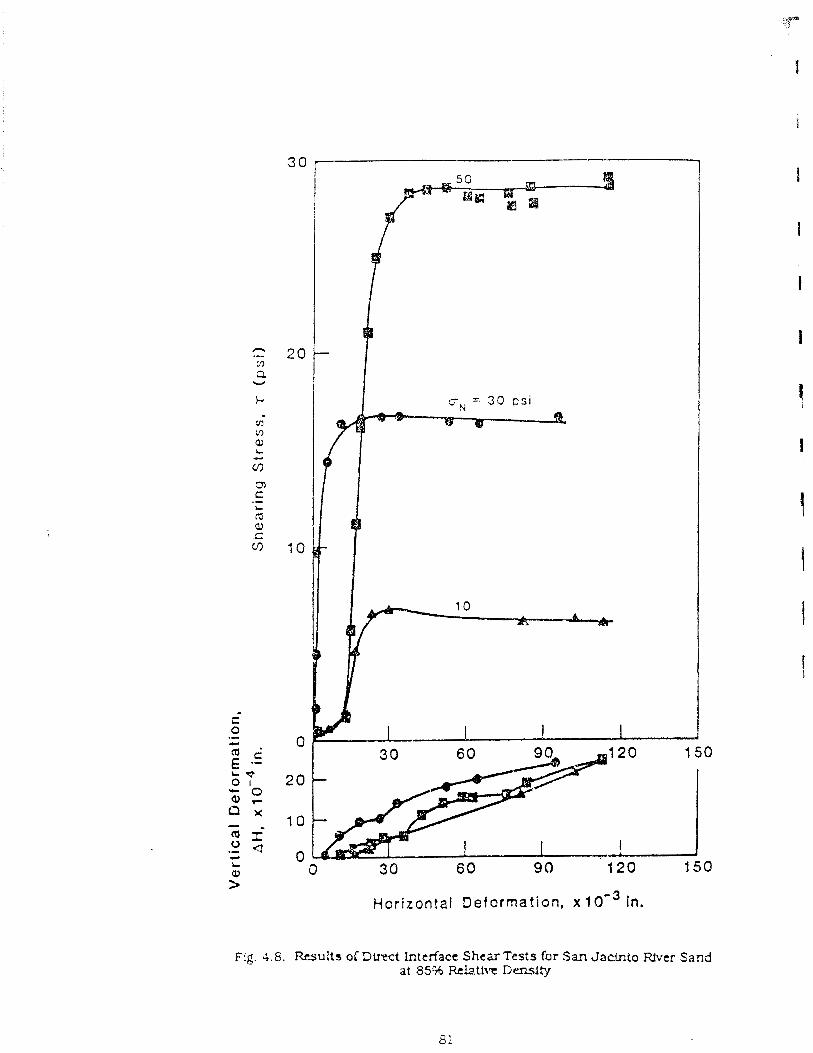
Horizontal Deformation, x 1 Q - ~ in.
Fig. 4.8. Results of D b x t Interface Shear Tests far San Jacinto River Sand at 85% Rrh.Uve De=ity
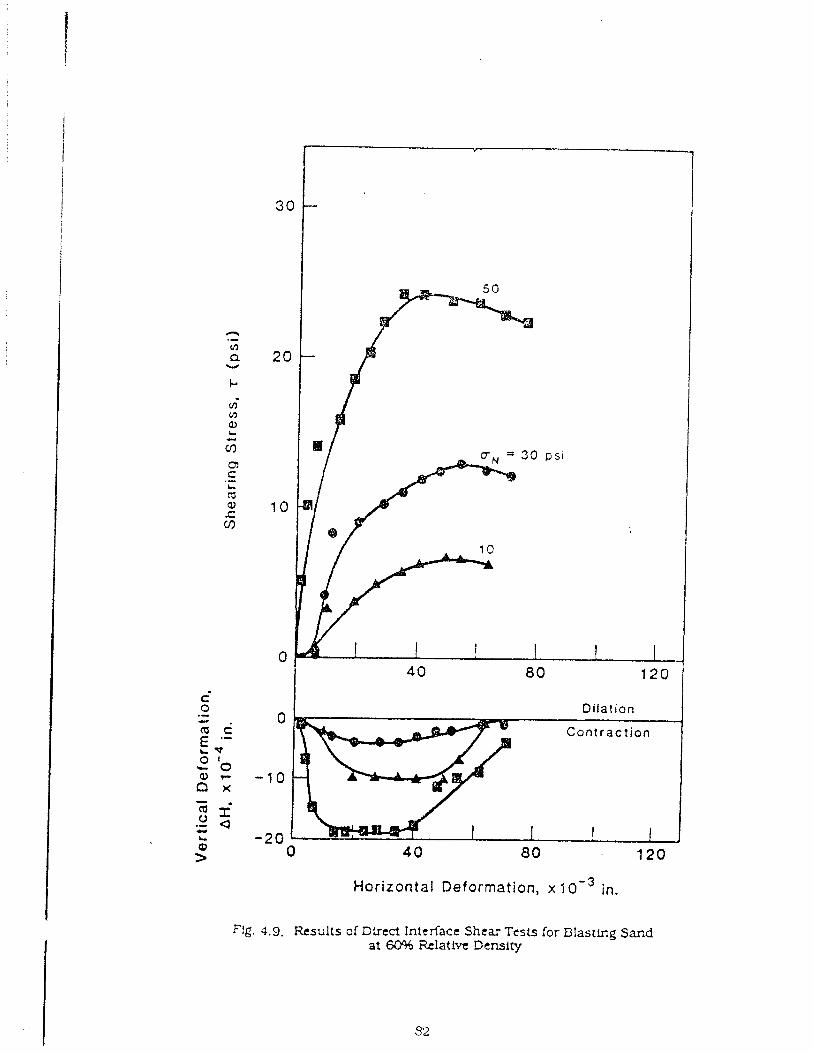
4 0 80 120
Dilat ion
Horizontal Deformation, x 1 o - ~ in.
F!g. 4.9. Results of D 4 n c t Intcrfacc Shear Tests for Blasting Sand at 6095 Szlativt Density
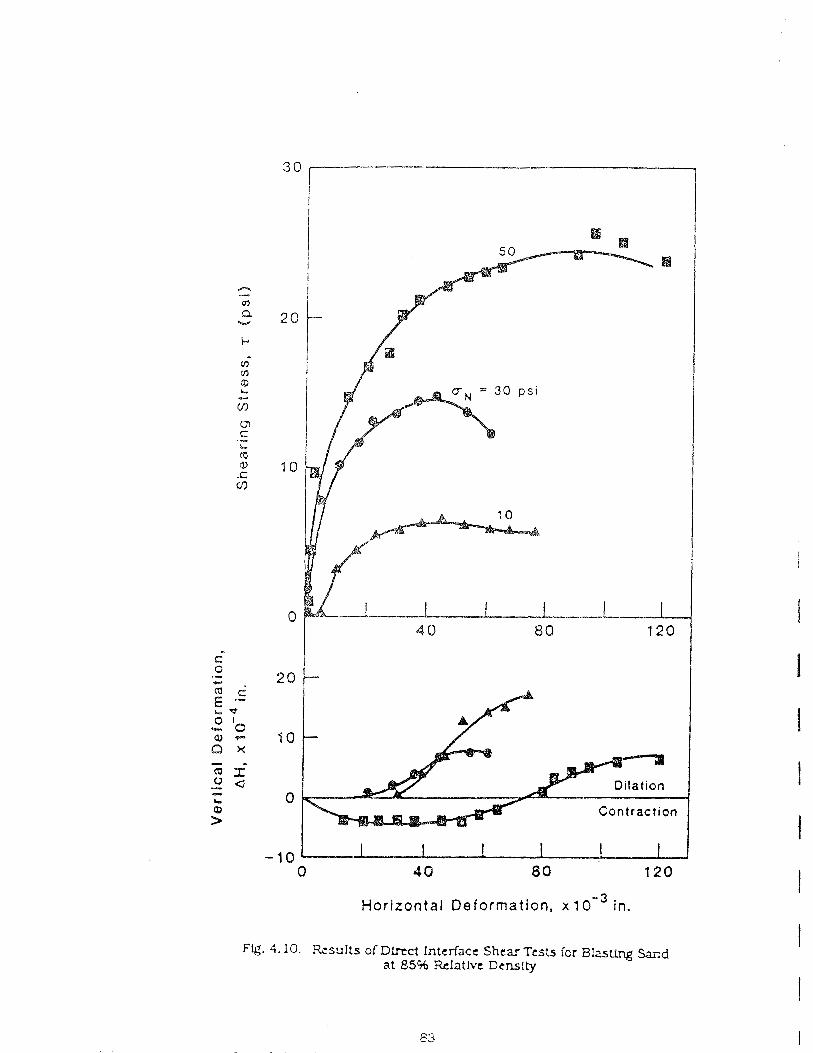
-10 - ' f I 1 I i 0
I 40 80 120
Horlrontal Deformation, x 1 o - ~ in.
Fig. 4.10. Rislilts of DLmt lnterfacc She= Tcsis icr B k s l l n g Sand at 85% -9rlaUvc Density
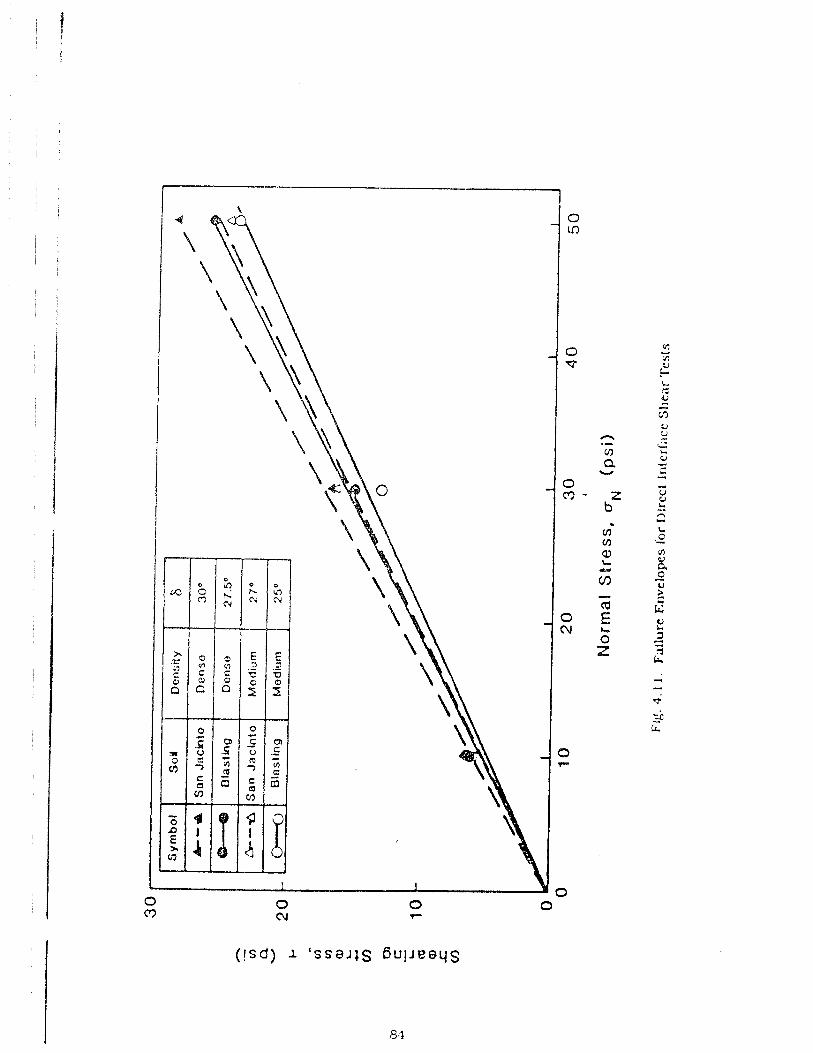
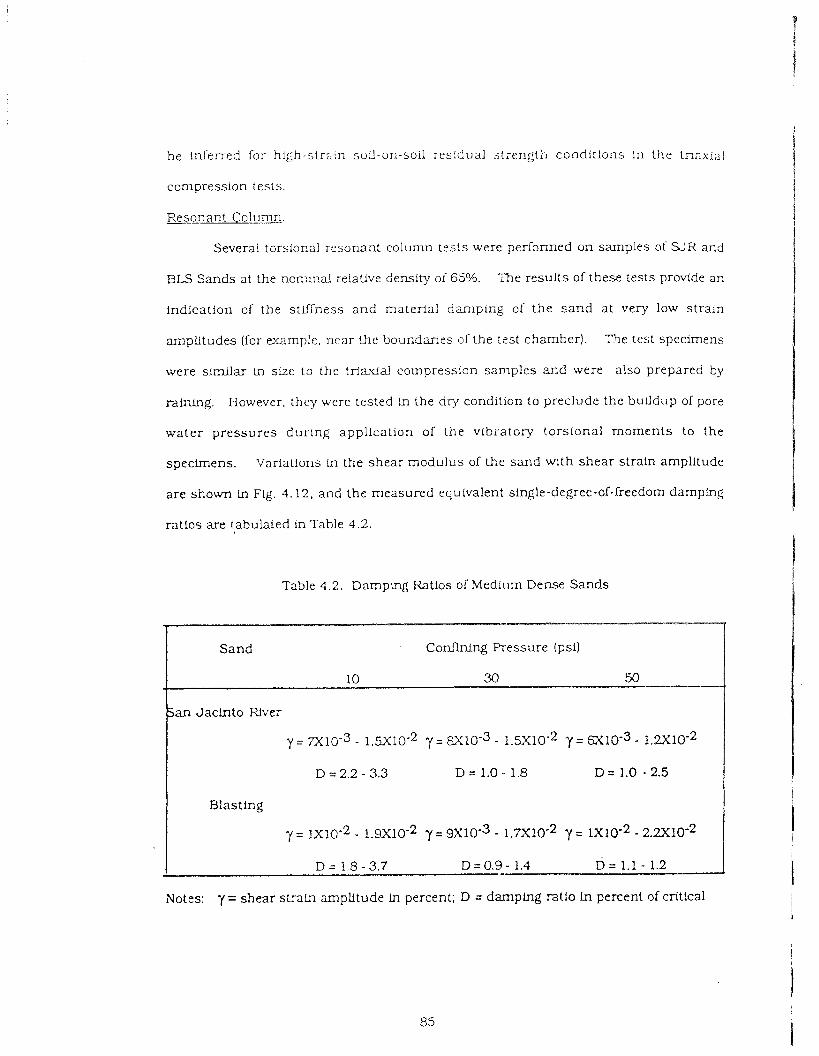
be inferred for high-str;:n soil-on-soil res!dual stiengtfl conditions in the triaxial
compression tests.
Resonant Column.
Several tors!onal resonant column tests were perf3rmed on samples of S J R and
BLS Sands at the n o r m ~ a l relative density of 65%. The results of these tests provide an
indication of the stiffness a n d material damping of the s a n d at very low strain
amplitudes [for example, near the boundaries of the test chamber). The test specimens
were similar in size to the triaxial compression samples and were also prepared by
raining. However, they were tested in the dry condition to preclude the bulldup of pore
water p re s su res dur ing application of the vibratory torsional momen t s to the
specimens. Variations in the shear modulus of the sand with shear strain amplitude
are shown in Fig. 4.12. and the measured equivalent single-degree-of-[reedom damping
ratlos are t,abulated m Table 4 .2 .
Table 4.2. Damplng Ratios of Meditirn Dense Sands
Cordhing Pressure (psi)
an Jacinto River
y = 7x10⁻³ - 1 . ~ 1 0 - 2 y= %lo-3 - 1 .5~10-2 y = 6x10⁻³ - 1.2~10-2
D = 2.2 - 3.3 D = 1.0 - 1.8 D = 1.0 - 2.5
y = =lo-2 - 1 . 9 ~ 1 0 - ~ Y = 9x10⁻³ - 1 . 7 ~ 1 0 - ~ y = l X 1 0 - ~ - 2.2X10-~
Notes: y = shear strah amplitude ln percent; D = damping ratlo Ln percent of critical
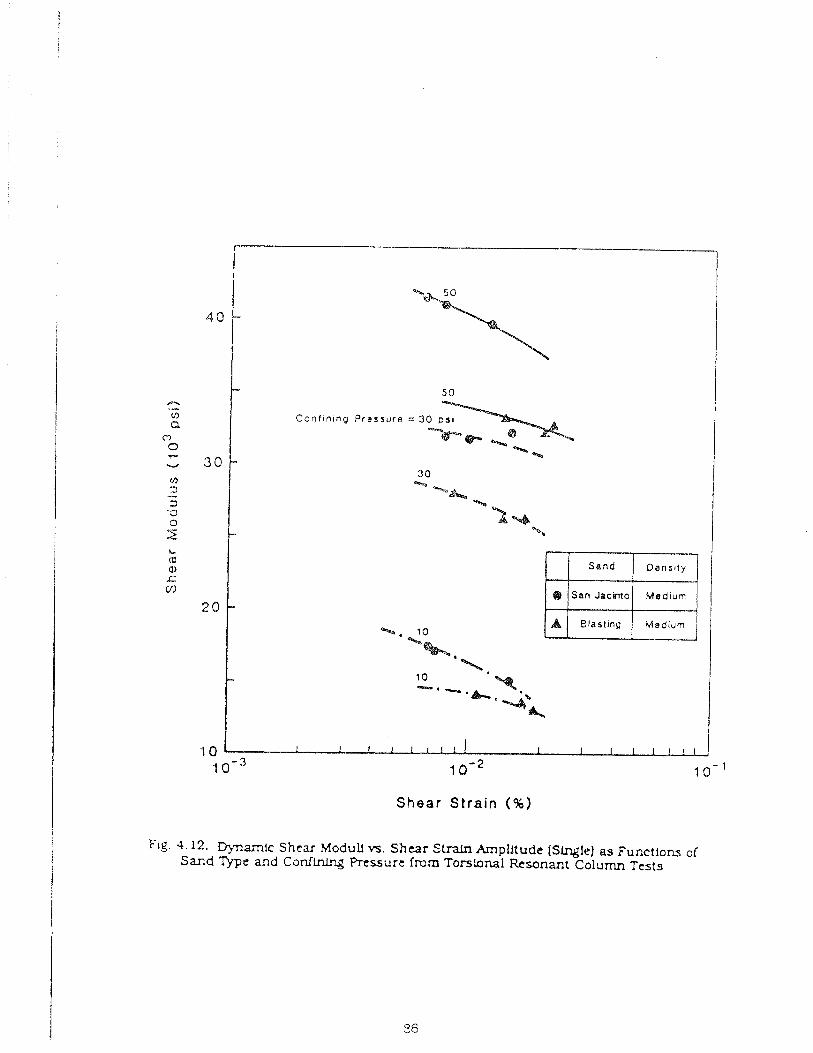
Shear Strain (%)
r I
Fig. 4.12. Dynamic Shcar Modull v ~ . Shear StraJn Amplltudc (Slnglel as Functiom of Sand Type and ConfhLng Pressure from Torsional Resonant Column Tests
4 0
3 0
-
- 50
I Conf in tng P r e s s u r e = 30
- 3 0 a,
-& %
2-4 - ".a
20
70
- %. 10
--. - 10
==--=-.
- . s q -. ..&-. , "L 1 1 I I l I l l 1 1 I I I ! I I ,
1 o - ~ 4 Q - ~ l o - '
At eqi?.iva!e::t cordinlng pressures and shear strairi ampli tudes the shea r
mcdulus of the ELS Sand :s much iower :ha11 :hat of :he S J R Sand. with dilTerences
lncreaslng with lnc reashg confining 7ressure. Th: damping ratios for both sands
appcar to be similar fcr equivalent ranges of shear s train amplitude a n d conlining
pressure. For both sands the d a m p i ~ g ratio tends to decrease slightly with hcreasing
conlining pressure.
The purpose oi the 'parameter " tests (Tables 1 1 and 1 2) was to assess the eflects
of bias mass , mean ellectlve chamber pressure, effective grain size and relatlve d e n s ~ t y
of the so11 on the penetration rate of the pile dur:ng vibratory driving. Data from all
paranleter tests with the vibro-driver a re summar'zed graphicalIy in the fonn of
pcnetratlon rate versus dnver frequency and are presenled in FIGS. 4.13 - 4 14
F1g 4 13a tnd~ca te s that 50 ir,-lb of unbalanced moment IS inadequate to drive
the test pile ID S J R Sand at 90°h relative density and 20 psi effective chamber pressure.
A low rate of penetration was achieved at 10 psi effec!ive chamber pressure in the
Irequency range of 10 to 25 Hz. with an optlrnum rate occurring at a frequency of about
20 Hz The efkct of hcreaslng the unbalanced moment to 100 hi-lb and increasing the
bias mass a re addressed In Fig. 4 13b. which provides data for SJR Sand in the "dense"
s tate (relative density = 90%) and at high (20 psi) effective chamber pressure. With a
minimum b k s m a s s a low rate of penetration was achieved by increasing the
unbalanced moment to 100 in-lb: however, the optimum rate of penetration of about
0.15 ips Is probably too low for rapid drlviiig app!icatlans. Increasing the welght of the
bias mass from the m n i m u m value of 380 lb (!he permanent carriage weight) to 2000 lb
[by adding 1620 Ib of bias msss) caused the rat: of penetratlon to trlple at the optimum
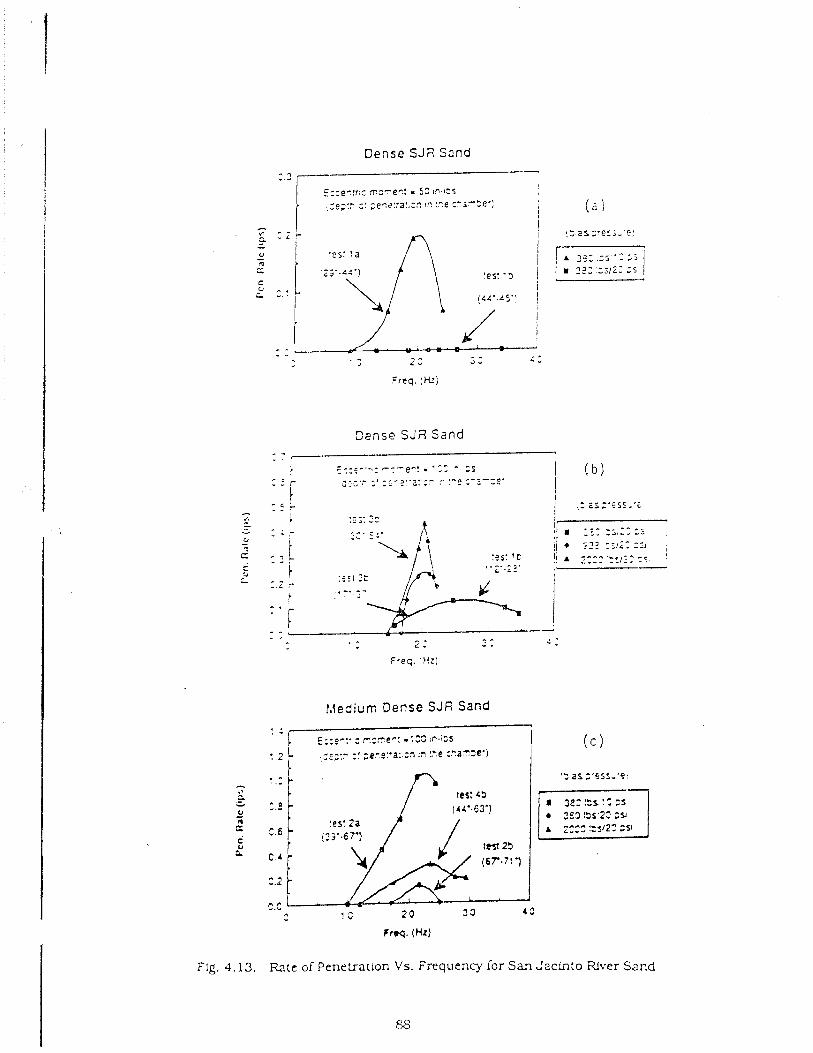
Dense S J 2 S a n d
Danse SJii Sand
!,.(edium Derse SJR Sand
ttbq. (Hz)
Flg. 4.13. Rate of Penetration Vs. Frequescy lor San daciiito Fiiver Sand
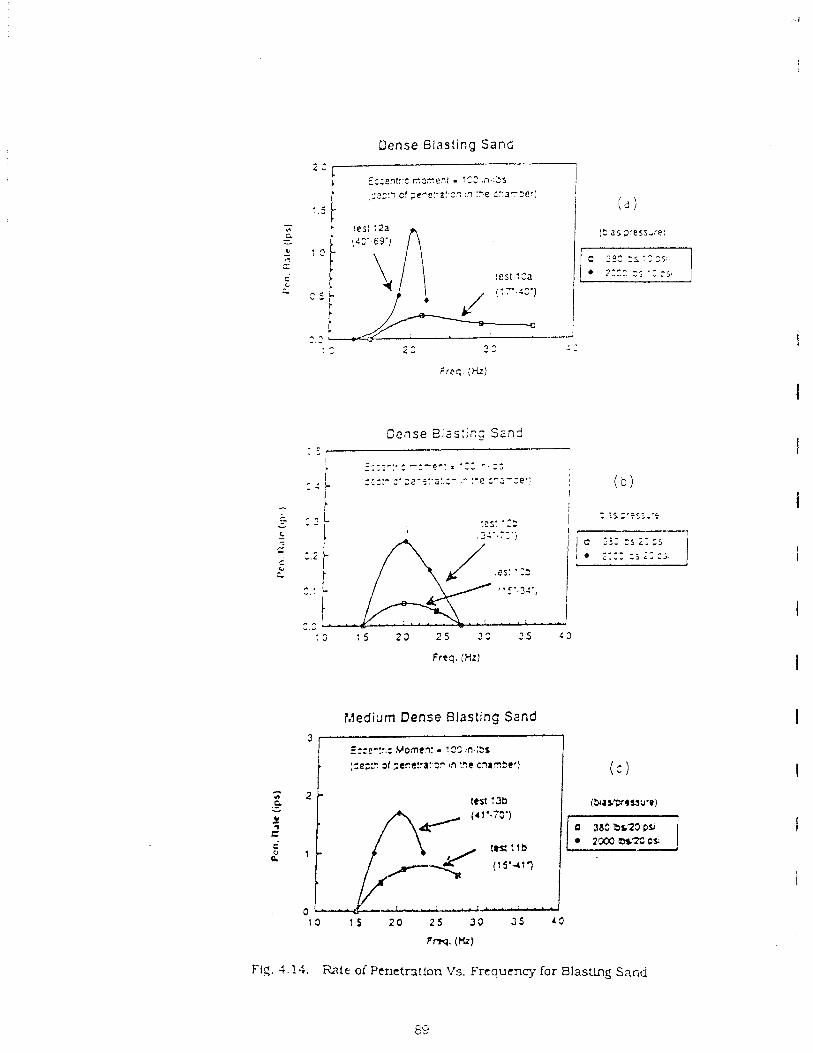
Dense Blasting Sand
Dei lse 2Ias:i:g Sand
Frrq. (HI)
fAedium Dense 8las:ing Sznd
Fig. 4.14. Xatt o i Pcnttntion Vs. Frcqucnc] for Blast*!: S x , d
driving frequency. which was agaln very near 20 I k . ?'he magnitude of the t;ks mass
appeared to have relatively little effect on tiie optimum driving frequency.
I t was declded that, because of the failure of the driver w l t h 50 t7-lb unbalmced
moment to drib~e the piie under 20 psi chamber pressure. even for relatively shd!ow
penetrattons. an unbalanced moment of at least 100 in-lb was needed for future d-imfig
tests. Examination of thr: driver performance curve (FLg,. 3.10) reveals that the next
h g h e s i discrete unbalanced rnoment exceeding 100 n - l b was 3 0 0 Ln-lb; however. that
moment could not be used above 20 Hz, since it produced forces exceeding the design
capaciiy of the driver at such frequencies. SInce a frequency ln the range of 20 Hz
appeared to be the optimunl driving frequency . it was declded not to conduct tests with
300 Fn-lb unbalanced moment. but to consider 100 In-lb a s the optlmum value.
Successful Fnstallation was achieved using this unbalanced moment ln ald tests but two,
where refusal was n e t prior to achieving full peneiralion of the pile.
Figure 4 . 1 3 ~ further cod i rms an optlmum driving frequency ol near 20 Hz for
S J R S,md, even at 65% relative density, regardless of the magnitude of bias mass. I t
also re idorces the conclusion d r a m previously f ~ r the dense sand condltion that
increasing the bias mass increases rate of penetrati3n signlr1cantly. Furthermore. it is
obvious in Fig. 4 . 1 3 that much higher rates of penetration were achieved under lower
ekc t ive chamber pressure (simulated mean sol1 pressure for 50-foot penetration) than
under the higher pressure (s f iu la ted 100-foot penetration).
Based on a review of Fig. 4.13 which applles to Srri Sand, it was concluded that a
driving frequency of 20 Hz, a maxLmum weight of bias m a s s of 2000 lbs and a n
unbalanced moment of 100 in-lb were the optimum parameters for the laboratory
testlng system ar,d that these parameters would be ~ s e d in future capacity-assessme~ts
tests u l th SJR Sand. Although the effects of' wave reflecttons from chamber b o u n d ~ ~ e s
and drainage conditions may have had some effecr. on optimum driving frequency in
the laboratory tests. there is no indication that the optimum frequency would have
byen signgicantly dflerenl from 29 Fiz In a full-scale field operation for the conditiors
that were simulated in the la'aorzitory.
Fig. 4 .14 ?resents the resul!s o i similar parameter tes t s using BLS Sand,
Identical conclus!ons with respect to optimum frequency, bias m a s s and e c c e n t r ; ~
mornent can be drawn a s were d ra~vn for S J R Sand. The one dflerence in BLS Sand
relative to SJR Sand is that for a given set of driver conditions and chamber pressures,
penetration was more rapid In the coarse BLS Sand in the medium-dense state than In
the fine S J R Sand in the medium-dense state , while very little difference was obsenred
in the dense state.
One significant efrect that iiras observed Fn the parameter tests that !s dlfllcult to
report quantitatively is that once tibro-drlving was s topped for a pile t ha t w a s
penetrating at a reasonable rale (as was necessary in some of the early tests !A order t o
synchronize the motors of the drlverl, tt was dLlllcult to relrLitiate positive penetration
with the same driver parameters that had successIully kept the pile penetrating prior to
the stoppage. This obsemation suggests that i t is important no: to stop driving the pLle
once a desirable rate of penetration h a s been reached, prior to achieving design
penetration.
4 .3 VIERO-DRWILrG CAF'.ACI?Y TESTS
Tmtcal Force and Velocltv TLme Hlstorle~.
Observation of the time histories of pile-head and plle-toe forces and velocities
provides further Fnslght h t o the mechanisms p rodwing penetratlon in vibro-drlven
plles. DetaLled force. \.,elocity, acceleration and lateral sofl pressure time Nstory data
for all vibro-capccity tests are provided in Appendix B. A few typical records a re also
presented in this chapter !n order to discuss some of the significant aspects of the
behavior of the plle-mil s;.stzz~ during LdSro-inst~llation. A few general t i ends that
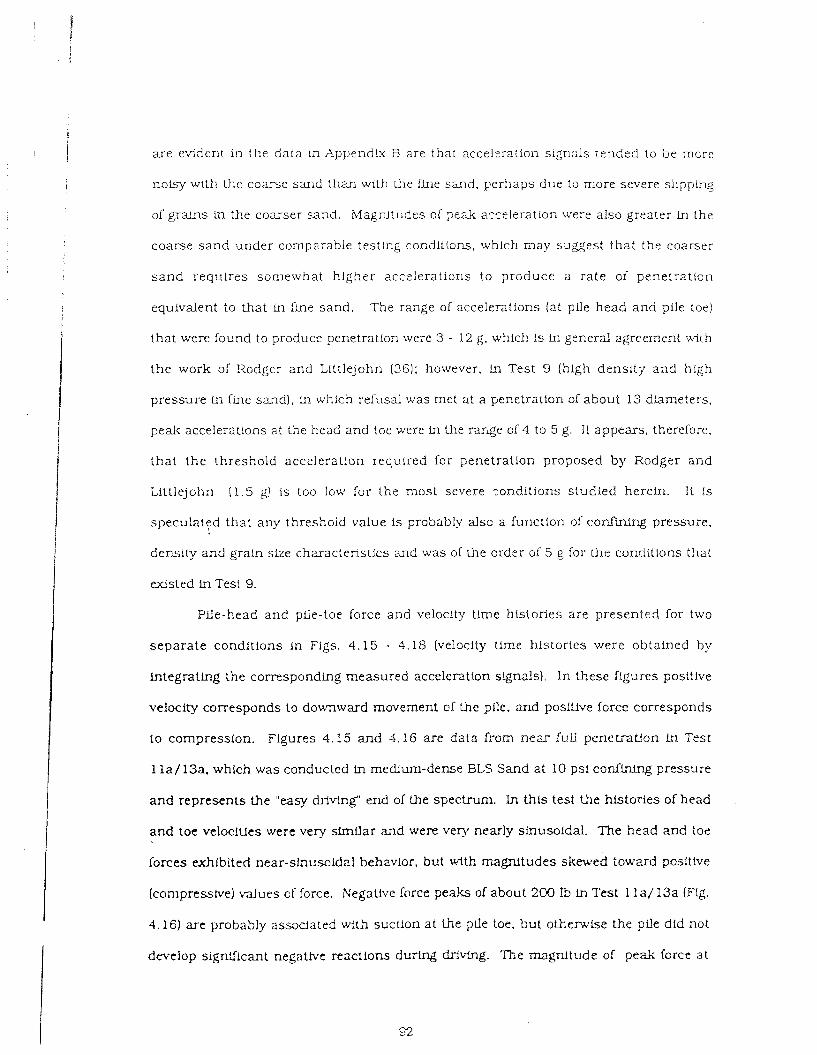
are evident in the data ti^ AppendLx B are that accelzraiion signzls tended to be mcre
noisy with the coarse sand Ihan with Lhe flne s a d . perhaps due to more severe slipping
of gralns Fn the coxse r :and. hlagnlcudes of pezk acceleration were also greater Ln the
coarse sand under comparable testing cor,dittons, which may suggest that t h e coarser
s a n d requires somewhat hlgher accelerations to produce a rate of penetration
equivalent to that in fine sand. The range of accelerations (at plle head and pile toe)
that were found to produce penetration were 3 - 12 g. which Is In general agreement with
the work of Rodger and Littlejohn ( 3 6 ) ; however. !n Test 9 (hlgh density and high
pressure In fine sand) , in which refusal was met at a penetration of about 13 diameters.
peak accelerations at the head and toe were ln the xar$e oh 4 to 5 g. I t appears, therefore.
tha t the threshold acceleration required for penetration proposed by Rodger and
Littlejohn (1.5 g! is too low for the most severe zonditlons studred herein. I t is
speculated t h a t any threshold value Is probably alsz a function of conltrai~.lg pressure.
density and graLn slze characteristics m d was of the order o15 g for the conditions that
existed in Test 9.
Pile-head and pile-toe force and velocity time histories are presented for two
separate conditions In Figs. 4.15 - 4 .18 (velxity time histories were obtalned by
integrating the corresponding measured acceleration signals). In these figures positive
velocity corresponds to downward movement of the pile. and positive force corresponds
to compression. Figures 4.15 and 1.16 are data from nezr fuii p e n e h t f o n in Test
-ssu re 1 la/13a, which was conducted fn medium-dense BLS Sand at 10 psi confhi rg pr-
and represents the "easy drivir,g' end of Ule spectrum. In this test Lle histories of head
and toe velocities were very similar and were very nearly sfnusoidal. The head and ioe
forces exhibited near-sinusoldal behzvior, but with magnitudes skewed toward positlve
(compresstve) values cl force. NegaUve fclrce peaks of about 200 Ib in Test 1 l a / 13a (Flg.
4.16) are probably assxia ted with suction at the plle tw, but othenvtse the pile did not
develop significant negative reactions durlng driving. The magnitude of peak force a t
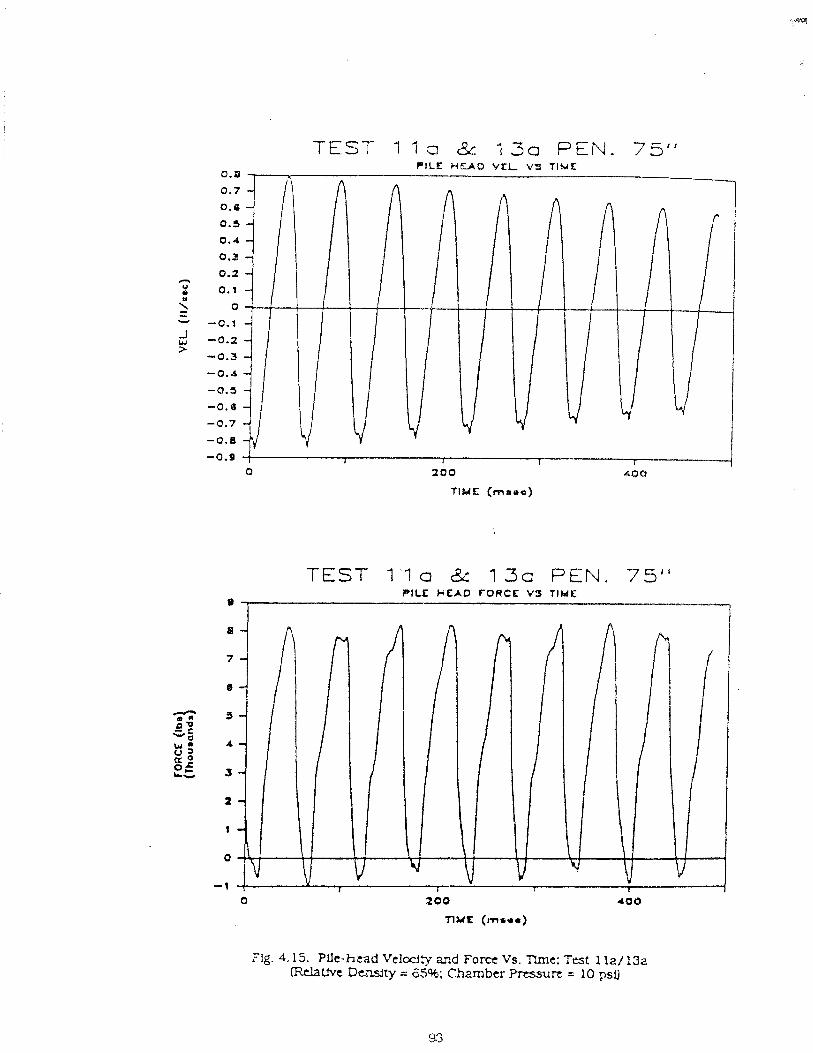
TEST 1 1 CI 8c 13a PEN. 75" PlLE HEAD VEL VS TIME
-0.9 f I 1 I 1
D Z O O roc9
TIME (meoc)
TEST I la & 13a PEN. 75'' PlLE HEAD FORCE V 3 TIWE
200
TlYf (mcrr)
Fig. 4.15. Pllc-h-cad Veloclq and Force Vs. Tlme: T a t 1 la/ 13a lfidatfn Density = 85%; Chvnbu i>rcssurr = 10 psi)
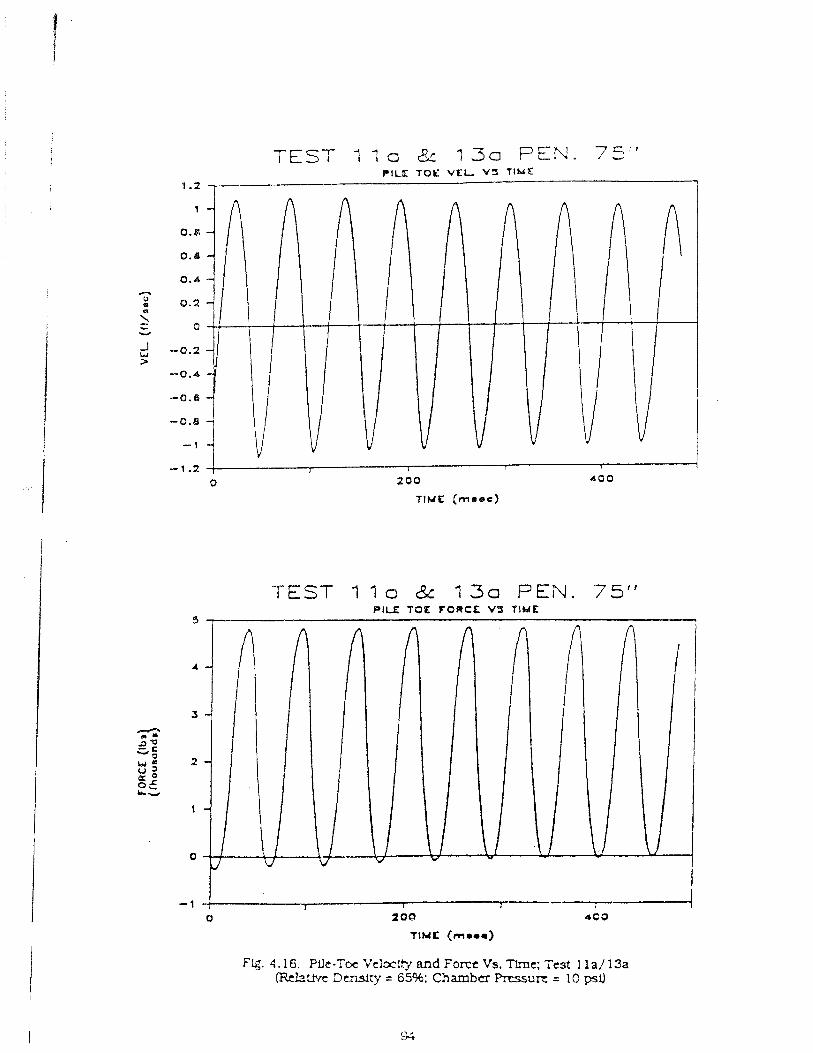
TEST I l a & 13a PEN. 75'' IPIU T O Y V T L V J T l u h
1.2 [ 1
I
-1.2 1 I I T 1 1
0 200 400
T l M E (mrec)
TEST 1 1 0 & 130 PEN. 75" PILE TOE FORCE VS T l M E
Fig. 4.16. Pile-Toc Vclcrlt-1 and Force Vs. Tlrnc; Test I 1 a/ 13a (fithtwe Density = 65%: Chamber hsstrrc = 10 pslJ
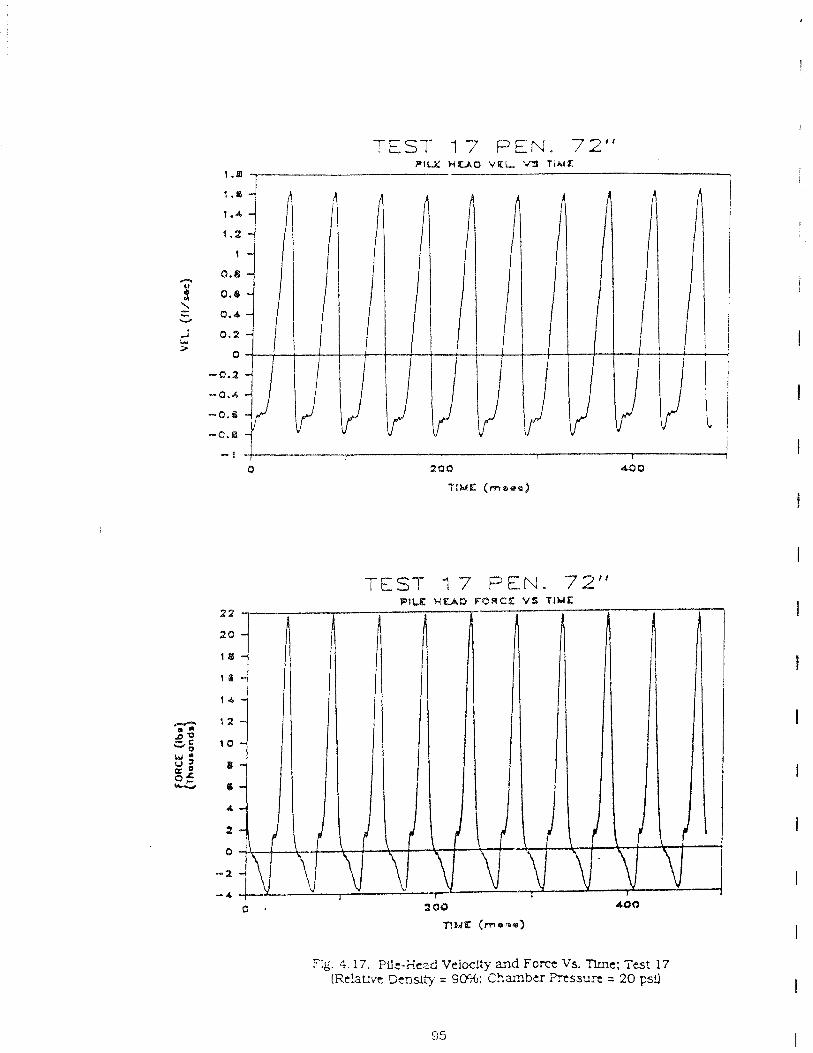
TEST 17 FEN. 72"
I I I 1 0 2 Q Q a80
TIME ( m a e a )
TEST "I PEN. 7'2"
Fig. 4.17. Pflt-Xead Velocity and F o m Vs. Tlme; 'Test 17 !Re!aUve Gensii)- = 9056: Chamber Ptssu r t = 20 ps!J
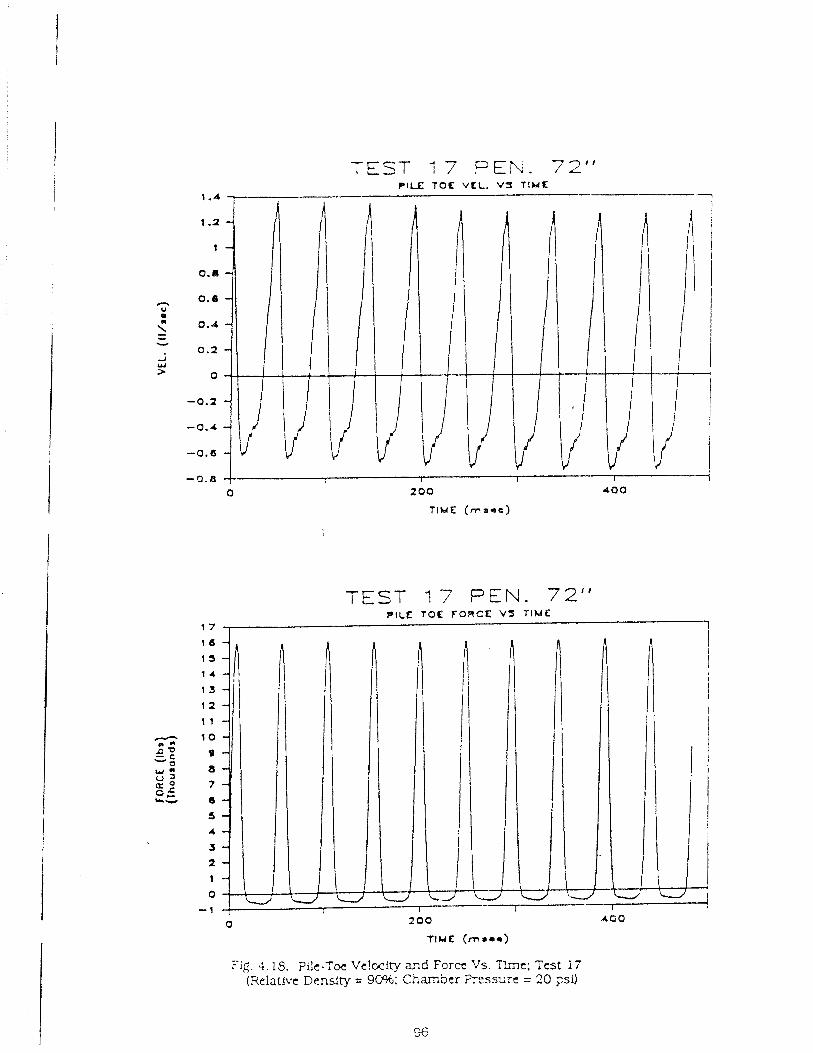
TEST 17 PEN. 72" PILE TOE vtt. VS TIME -
TEST 'I 7 PEN. 72" PILL: TOE FORCE VS T I M E
1 7 I
TlME (rn***)
Fig. 4.13, PCc-Tcc Ve!wity and Force VS. ?Li t : Test 17 (seiat!vc Density E 9W: ChaxTiScr F ~ s s z r e = 20 ;sU
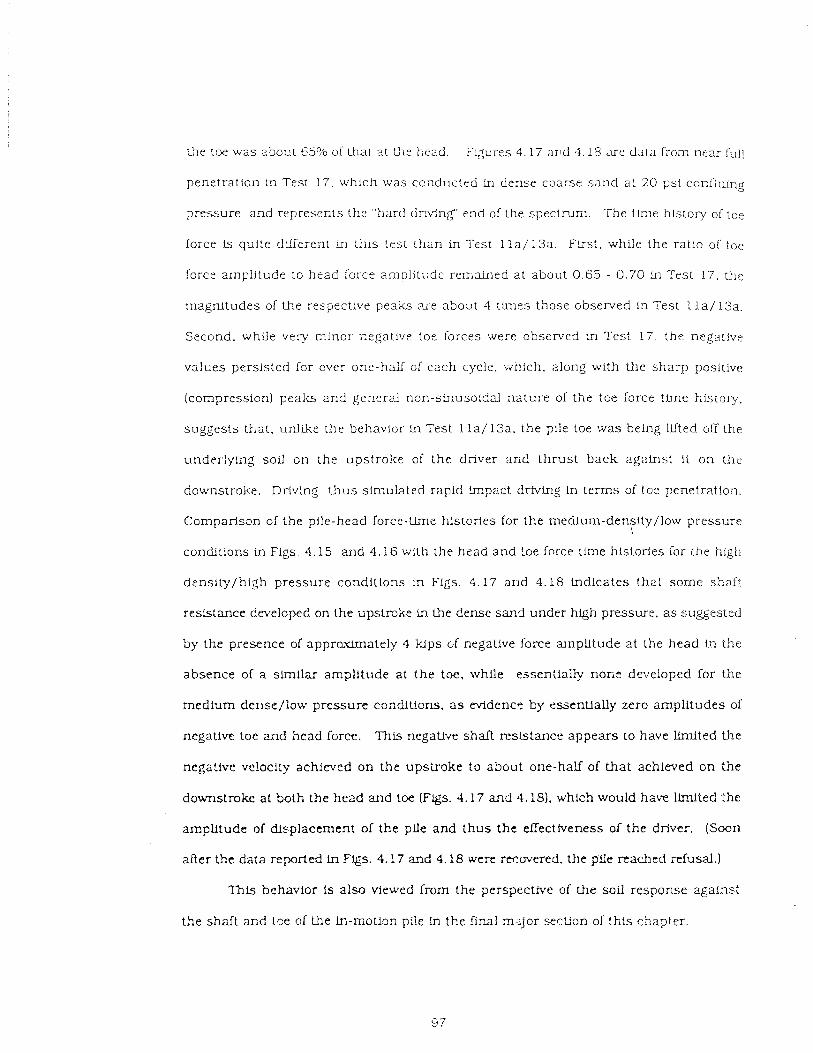
the tce was about 6596 of iha l at tJh: head. Fqures 4.17 and 4.18 x e data from near full
penetration tn Test 17, which was ccnducted in dense coarse sand at 20 psi c o n i - m g
pressure and represents the "hard driving' end of the spectrum. The tkne history oI' toe
I'orce is quite dflerent in this test t han in Test 1 l a / 13a. First. while the ratio of toe
force arnpiitude to head force amul1ti;de remained at about 0.65 - 0.70 Ln Test 17, the
magnitudes of the respective p e a k are about 4 times those observed Ln Test 1 l a / 13a.
Second, while very minor r,egat!ve toe forces were observed Test 17, the negative
values persisted for over one-half of e2ch cycle. ; -~nich. along with the sha rp positive
(compressinn) peaks and general non-stnuso!dal na ture of the toe force tlme history,
suggests that . unllke the behavlor ln Test 1 l a / 13a. the pile toe was being Uted off the
underiying soil on the upstroke of the driver and thrus t back against i t on the
dournstroke. Driving t h u s simulated rapid Fmpact drfvLng in terms of to:: penetaatlon.
Cornparissn of the pile-head force-time histories for the mealurn-density/low pressure
conditions in Figs. 4.1.5 and 4 .16 with the head and !oe force time b~lstorles for the higii
density/high pressure conditions in Figs. 4 . 1 7 and 4.18 indicates that some shaft
resistance developed on the apstroke Ln the dense sand under hlgh presswe, as suggested
by the presence of appraximately 4 kips ~f negative force amplitude at the head in the
absence of a shnLlar amplitude at the toe, while esseniiaily none dweloped for the
medium der)se/low pressure conditlons, a s evidence by essentially zero amplitudes of
negative toe and head force. This n e g a t l ~ e shalt resktance appears to have Ilmited t he
negative velocity achieved on the upstroke to about one-half of that achleved o n the
downstrokt: at both the head and toe (Figs. 4.17 and 4.18). which would hat-e llndted the
amplitude of displacement of t h e pLle and t h u s the elfecthreness of the driver. (Soon
zRer the data reported in Fgs. 4.17 and 4.18 were recovered, the pfle reached refusal.]
This behavior is also viewed from the perspective of the soil response against
the shaft and toe of the in-motion pde in tke final mGjor sectlon of this chapter.
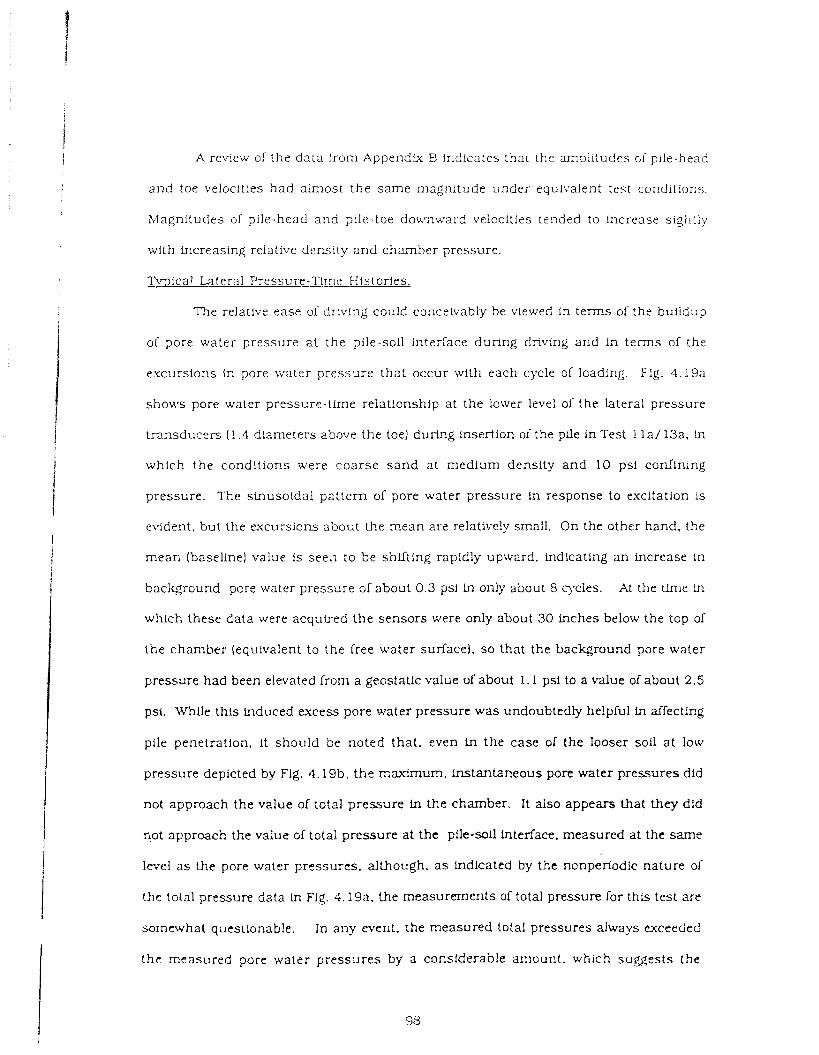
A review of the data irorn Appendix B indicates that the cf pile-head
and toe velocities had almost the same magnitude under equivalent test ccnd i t io~s .
Magnitudes of pile-head and pile-toe downward velocities tended to increase sightly
with lncreasing relative density and chamber pressure.
n p i c a l Lateral Pressure-Tlme Histor!es.
The relative ease of driving could conceivably be t-tewed in t e r n s of the buiidup
of pore water pressure at the pile-soil interface durlng driving and in terms of the
excursions in pore xvater pressure that occur with each cycle of lcadlng. F:g. 4.19a
shows pore water pressure-time relationship at the lower level o l the lateral pressure
transducers (1.4 diameters above the toe) during insertion of the pile in Test 1 l a / 13a. in
which the conditions were coarse sand at medium density and 10 psi confining
pressure. The sinusoldal pattern of pore water pressure in response to excitation is
evldent, but the excursions about Lhe mean are relative!^ small. On the other hand, the
mean (baseline) value Is see.] to be shLTting rapidly upward, indicating a n increase in
background pcre water pressure 01 about 0.3 psf in only about 8 cycles. At the tlrne Ln
which these data were acquired the sensors were only about 30 inches below the top of
the chamber (equivalent to the free water surface). so that the background pore water
pressure had been elwated from a geostatlc value of about 1.1 psi to a value of about 2.5
psi. While this induced excess pore water pressure was undoubtedly helpful in alTecting
pile penetration, it should be noted that. even ln the case of the looser soil a t low
pressure depicted by Fig. 4.19b. the maximum, instantaneous pore water pressures did
not approach the value of total pressure in the chamber. It also appears that they did
r!ot approach the value of total pressure at the pile-sol interface. measured at the same
level a s the pore water pressures. although, a s indicated by the nonperiodIc nature of
the total pressure data in Fig. 4.19a. the measurements of total pressure for thfs test are
somewhat questionable. In any event, the measured total pressures always exceeded
the measured pore water pressures by a considerable amount, which suggests the
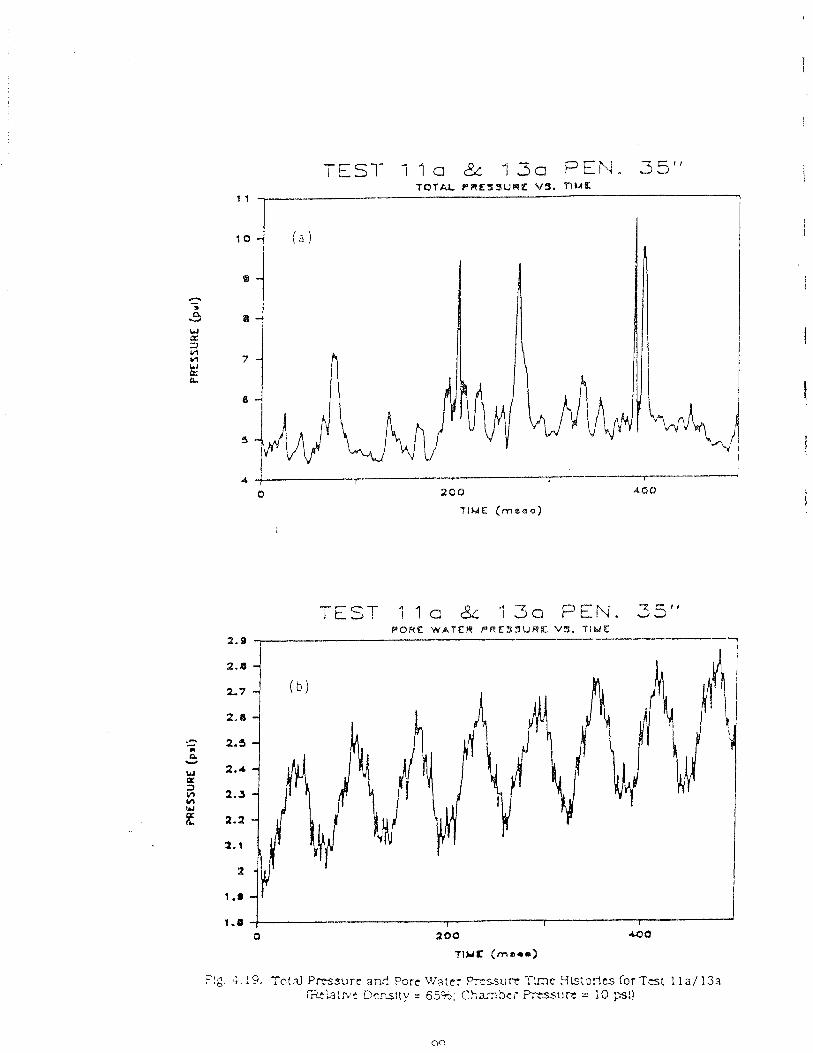
TEST- 1 4 a & " 1 3 e PEN. 35" T O T L PWES9UP.E VS. P l U K
1 1 1
T I M & ( m e e a )
T E S T I I e & 1 Sa PEN. 35" P O R E W A T E R P R E S 3 b l R t '43. T I M E
2.8 ,
1.e - - I I I
a a00 COO
l l Y L (rnaar)
'!c. G . !?, Total P=sure and Pcr t Wa:e; .-ssurr FJ;~c !-IIS:OTJCS :or TCSI 1 l a / 133 Td~k:h.t r\~:&:Jy = 65%: (S2;~7\.Sti --~JIT = ;O p!!
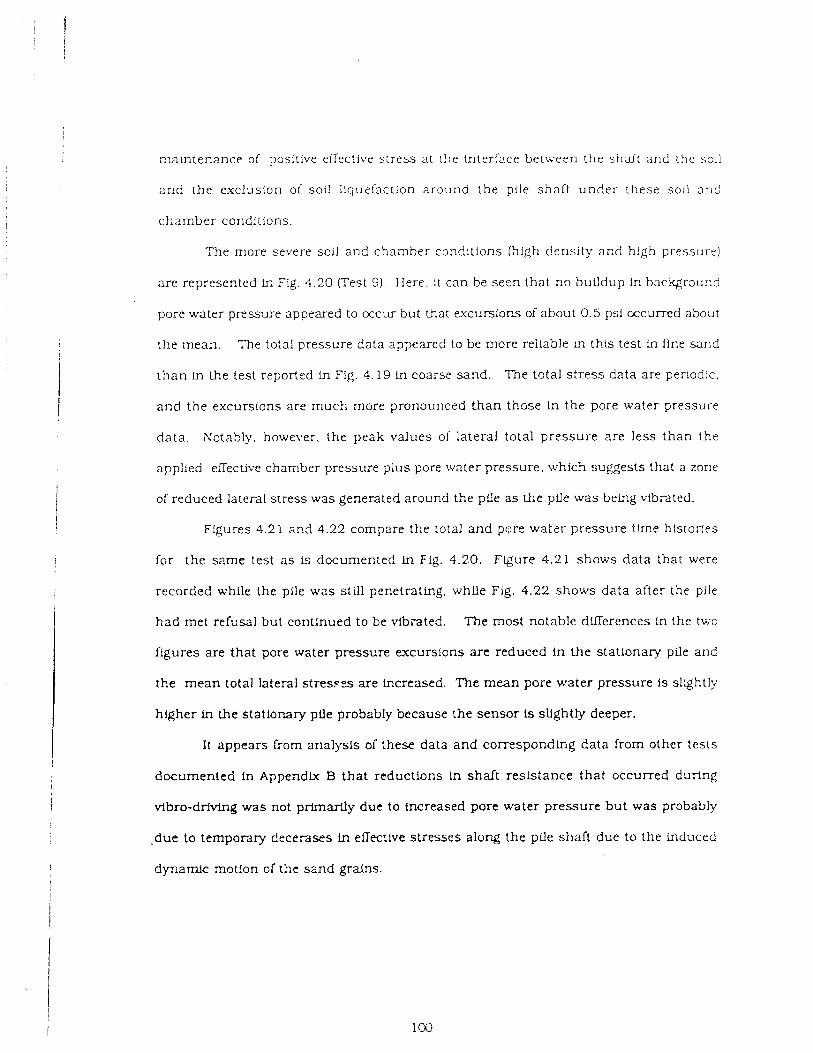
maintenance of positive eflectlve stress at [he tnterfzce between the s n i t and the so11
and the exclusion of soil iiqutfaction around the pile shalt under these soil a n d
chamber conditions.
The more severe soil and chamber conditions (high density and high pressure)
are represented hi Fig. 4.20 (Test 9) . Here. i t can be secn that no buildup in backgr3ur:d
pore water prcssure appexed to occur but b a t excursions of about 0.5 psi occurred about
the mean. The total pressure data appeared to be more reliable In this test in flne sand
than ln Lhe test reported Fn Fig. 4.19 In coarse sand. The total s tress data are periodic.
and the excursions are much more pronounced than those in the pore water pressure
data . Xotably, however, the peak values of lateral total pressure are less than the
applied ellective chamber pressure plus pore water pressure, which suggests that a zone
of reduced lateral stress was generated around the pfle as the pile was belng blbrated.
Figures 4.21 and 4.22 compare the total and pore water pressure time histodes
[or the same test a s is documented in Fig. 4.20. F g u r e 4.21 shows data that were
recorded while the pile was still penetrating, whlle Fig. 4.22 shows data after the pile
had met refusal but continued to be vibrated. The most notable dflerences in the twc
ilgures are that pore water pressure excursions are reduced in the stationary pile and
the mean total lateral stres.vs are increased. The mean pore water pressure is slightly
higher in the stationary pfle probably because the sensor is sllghtty deeper.
It appears from analysis oi these data and corresponding data from other tests
documented in Appendh B that reductions In shaft resistance that occurred durlng
vfbro-drivfng was not primarily due to increased pore water pressure but was probably
.due to temporary decerases in effective stresses along the pile shaft due to the induced
dynamic motion of the sand g r a b s .
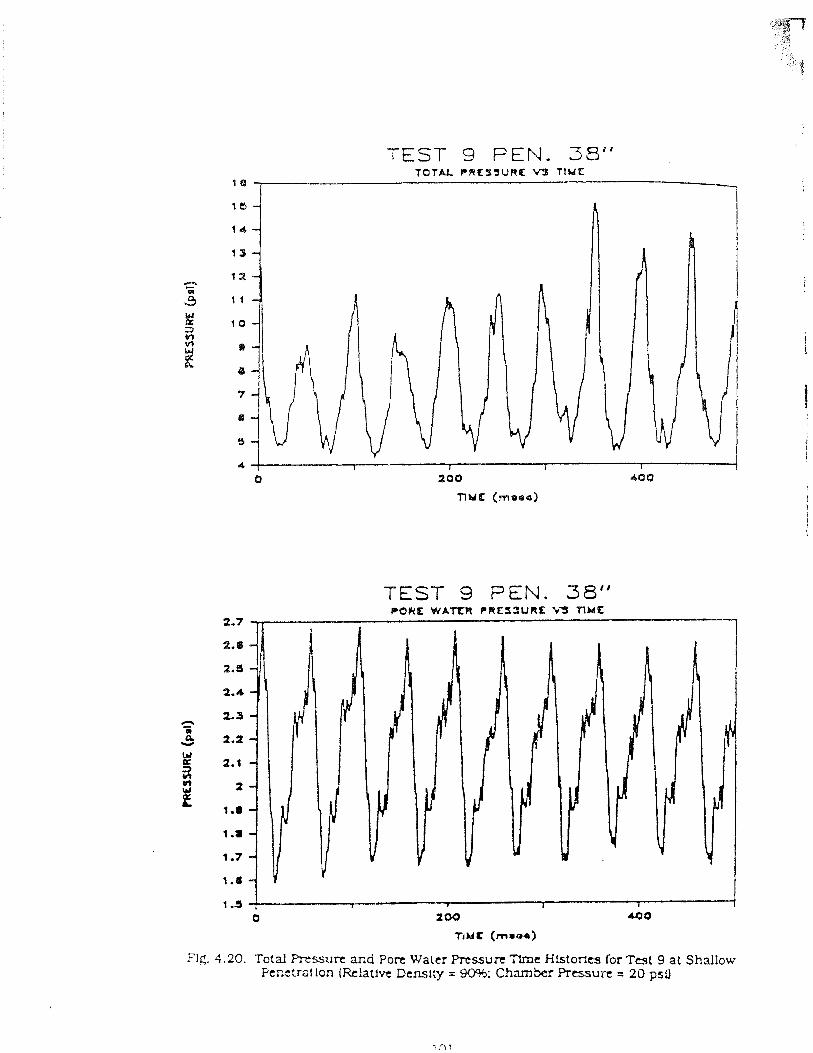
TEST 9 PEN. 38" TOTAL C R E S J L ' R L V3 TIME
1
TEST 9 P E N . 38" CORE WATISR PREf3UAE L J T I M E
Flg. 4.20. TotaJ P n s s u n and P o n Water F?-essure Time Histories for Test 9 at Shallow Ptnttrat ion (&iative Dcnsl!y = 90%; Chamber Prcssurt = 20 psO
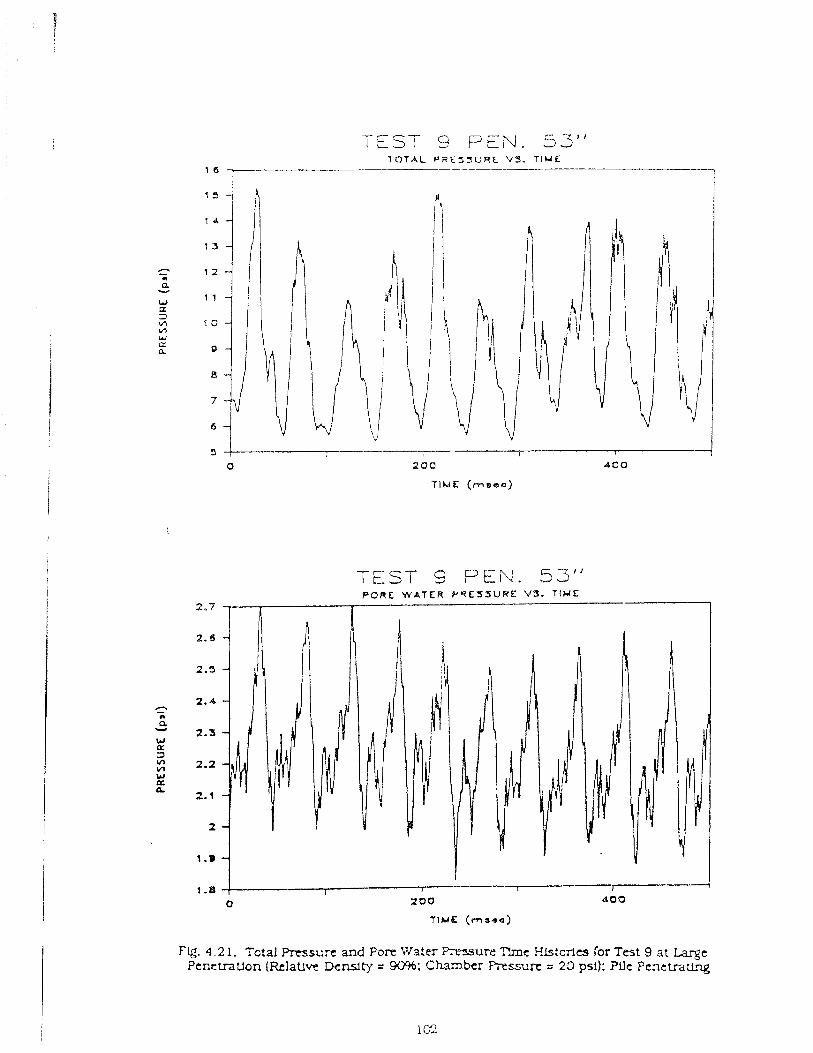
c---
I t 3 1 9 PEN. 53" T O T A L P R E S I J U R L V 3 . T I M E
1 6 1
I r 1 8 200 roo
T I M E ( m s s c )
TEST 9 PEN. 53" PORE W A T E R PteCrSSUWC V3. T I M E
2.7
2. s
2.5
h 2.4 -
m a w 2.3 W K I3
2.2 W (L P
2.1
2
1.0
1 .8 0 200 a03
T I Y E (mrsr)
Fg. 4.21. Tctal b s u r c and Pore Water i2;wYureTL.ne His?orlcs .corTest 9 at Large Penctratlon (Relattve Density = 9096: Chambc FTessurc = 23 psi); Pllc Penctrattng
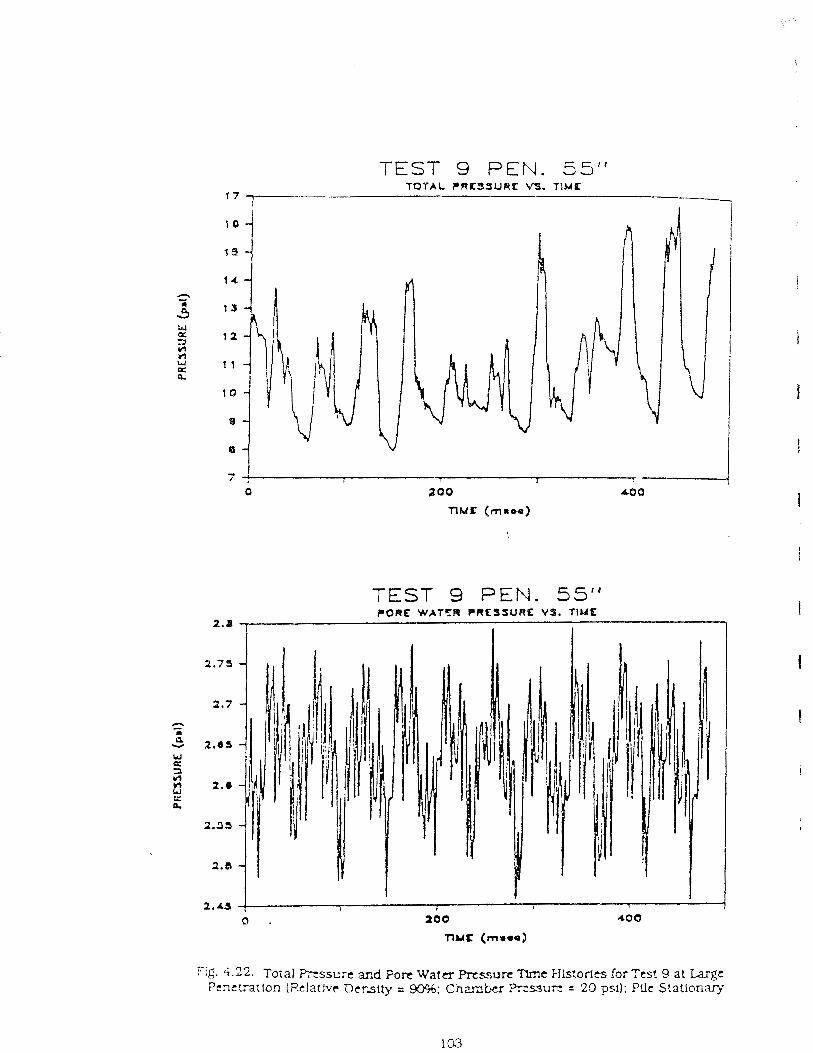
TEST S PEN. 55" TOTAL F'ffE53URIC M. TlUK
17
TEST 9 PEN. 55 ' " PORE WAT'IA PRESSURE VS. TIME
2.8 ,
-. : :g, 4.22. Total Pxssc;e and POR W a t a PrZs~ure Tlrne illstorles for Test 9 at Large
Penetration (P'latJvr Dcrslty = %; Ci.lmtcr Wssnrz = 223 psi); PUe Stationary
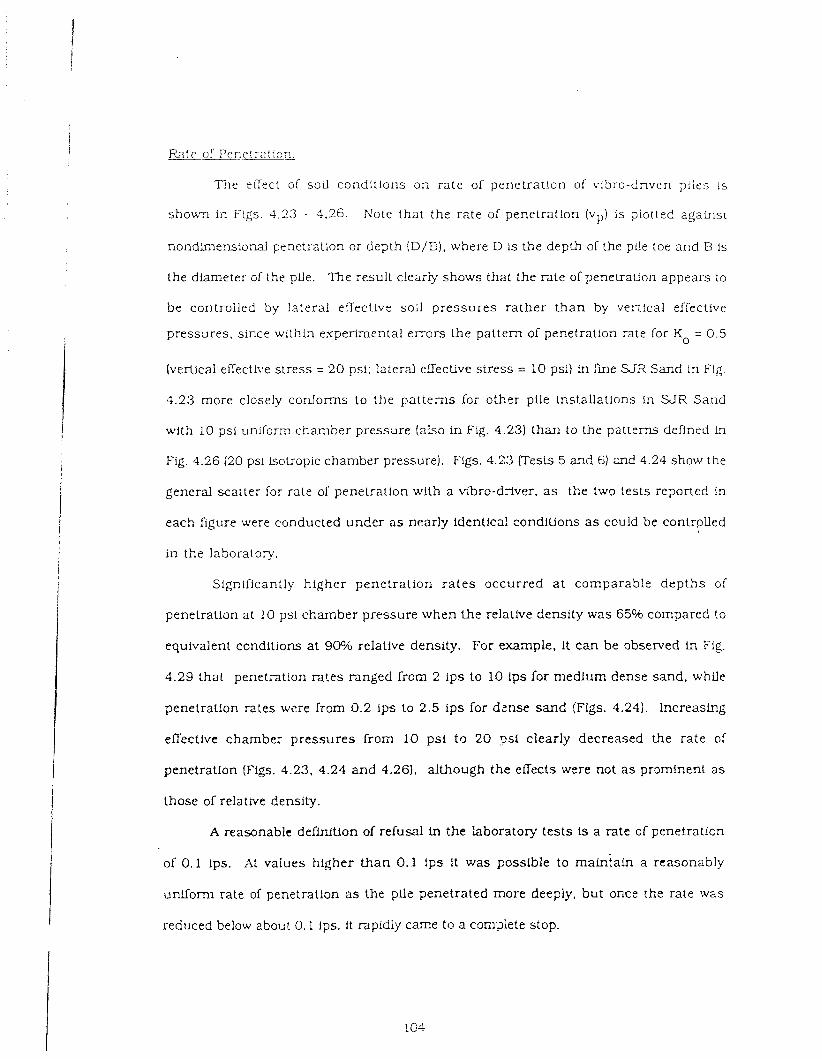
Rzte of P e n e t r ~ : i o ~ .
T'ne efTect of sod cond!tions oa rate of penetratlon of vibro-driven p;ies IS
shown i i ~ Figs. 4 .23 - 4.26. Note that the rate of penetratlon (vp) is plotted agalnsr
nondimensiornl penetration or depth (D/B). where D is the deptFl of the pile toe and B IS
the diameter of the ptle. The result clearly shows that the rate of penetration appears to
be controlled by lateral effective soil pressures rather than by vertical effective
pressures, since withL7 experimental errors the pattern of penetration rate for KO = 0.5
(vertical efIectl1.e stress = 20 psi; lateral eilective stress = 10 psl) in fine Sjii Sand in Fig.
4.23 more closely conforms to the patterns for othpr pile installations in S J R Sand
with 10 psi undorm chamber pressure (also in Fig. 4.23) than to the patterns defined h
Fig. 4.26 (20 psi isotropic chamber pressure). Figs. 4.23 (Tests 5 and 6 ) a d 4.24 show the
general scatter for rate of penetration with a vibro-dAver, a s the two tests reported in
each figure were conducted under a s nearly identica! conditions a s could be contrplled
in the laboratory.
Significantly higher penetration r a t e s occurred a t comparable depths of
penetration at 10 psi chamber pressure when the relative density was 65Oh compared to
equivalent conditions a t 90?h relative density. For example, it can be observed In Fig.
4.29 that penetration rates ranged from 2 Ips to 10 Ips for medium dense sand, while
penetralion rates were from 0.2 ips to 2.5 ips for d m s e sand (Figs. 4.24). Increashg
effective chamber pressures lrom 10 psi to 20 ?sl clearly decreased the rate of
penetration (Figs. 4.23, 4.24 and 4.261. although the eLTects were not a s prominent a s
those of relative denslty.
A reasonable definition of refusal Fn the laboratory tests Is a rate of penetration
of 0.1 ips. At values higher than 0.1 ips it was possible to malniafn a reasonably
uniform rate of penetration a s the pile penetrated more deeply, but once the rate was
reduced below zbout 0.1 ips. it rapidly came to a com?lete stop.
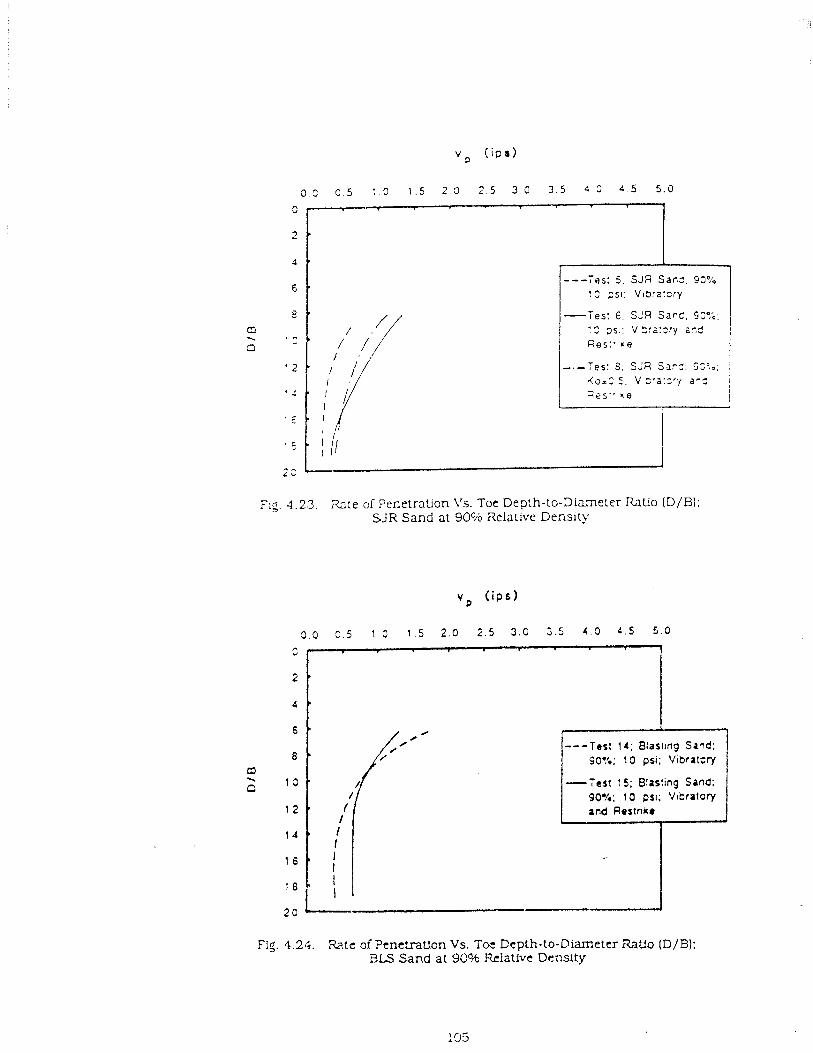
0 . 2 c . 5 : . 3 1.5 2 . 3 2 S 3 . 0 3 5 4 3 4 5 5.0
C
2
4
- - - Y e s : 5. SJA Sac:. 90%: . . - , ~ s l : V~b:a:c!ry
- Tes: 6 . SJR Sand. 33%.
CI . * . , 3s.: V S:;:=ry a?:! \
c3 F i g s : - ~ n e
' 2 -.-Tes: 8. SJA 534:: 32:0. doz: 5. V ;:a:zVy a-:: 7 2 s " rle I
Fig. 4.23. ~%:e of Penetration i's. Toe Depth-to-Diameter h t i o (D/B): S J R Sand at 90°/o Relalive Density
P ( i p s )
I i
0 -- - Tecf 14; Blast~ng Sand: 90%; 10 psi: Vibralcry
-Test 15; Blasting Saod: 90%; 10 psi; V~bratory and Rostnkr
Fig. 4.24. a t e of Penetratton Vs. Tot Depth-to-Diameter iiatio (D/B): BFS Sand at 90% Re1ath.c Drnslty
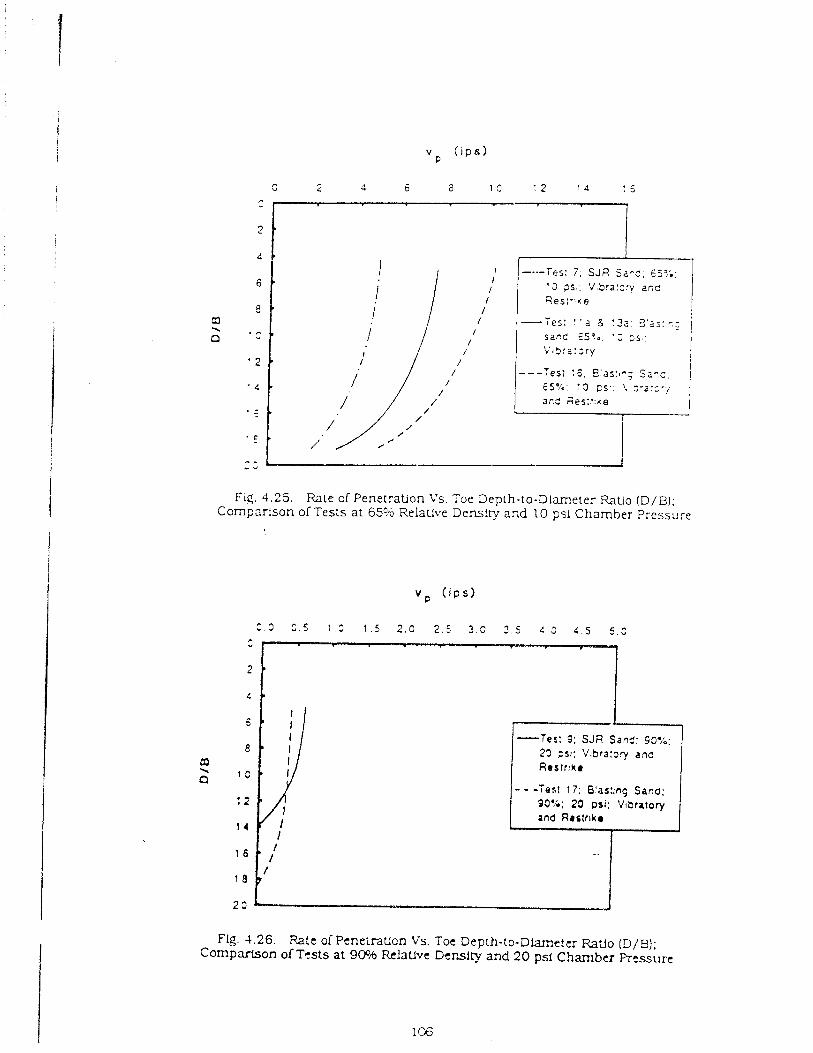
Fiq. 4.25. Rale of Penetration Vs. Toe Depth-to-Diameter Ratio (D/BI: Comparison of Tests at 659.0 Relative Denslty azd 10 psi Chamber Pressure
3 2 + 6 8 1 3 i 2 1 4 4 - . 3
,.
Fig. 4.26. Rate of Pcneiraticn Vs. Toe Depth-to-Diarr.ettr Ratio (D/B); Comparison of Tests at 90% FklaUve Density and 20 psi Chamber Pressure
2
4
6 @
' I
I -..- Tes: 7 . SJR Sacd; 65:;.
0 . 4
C3 . n
3 "
' 2
"2
. - -
. E
Res:.:lce
. sand GS?.. '; 2s. :
. - - -Test :6. E!:as:ly Sa-c :
'
, /
/ '
- - cl
m i c a 1 Focce and Ve!ocitv TPne Hist,=.
Plle-head and toe force a n d velocity time histories for lmpact and restrike
evznts a re given in Appendix C. To assis t in visual!zatlon. the velocity da ta are
presented in the form of !mpedance ( ~ p ~ l e / c o m p r e s s i o n wave velocity of the pile
material) times veloc!ty, ra ther t h a n velccity directly. At the initial force peaks the
velocity-impedance generally remains cons tant or increases slightly a s the force
decreases rapidly. This b e h z ~ l o r is opposite to that observed in impact-driven piles in
the field. in which velocity-impedance decreases more quickly than force once reflected
energy begins to re turn to the pile head. The behavior in the laboratory may be
explained by the apparent fact that reflected tenslon waves were returning from the toe
of the very short pile while the r a m was still decelerating agairist the pile head , causing
the s t r e s s to reduced while t he downward velocity of the pi!e head remained
temporarily high.
In general. larger departures in the velocity-impedance relatlons from the force
relations occurred at t h e intial peaks for the piles with low driving resistance (lower
soil density a n d lower soil pressure conditions) thar. for those with high driving
resistance (higher pressure and higher density]. suggesting larger magnitudes of tension
wave reflections, consistent with the development of lower toe resistance. The force
and velocity-tmpedance records usually exhibited a secondary peak at a tlme value (4 to
5 milliseconds after the initlal peak) that is consistent with the return of a reflected
compression wave from the base of the chamber. Tne time lapse between the Lnitia.1
peak a n d the second peak. representing the reflection of the wave frdtn the bottom of the
chamber, was generally consistent among all lrnpact and restrikz tests. except for those
t e s t s in wnich the pile was vibrated into position in medium-dense sand at low
c o d i n i n g pressure. fn which was the lapse period was longer. This increased lapse
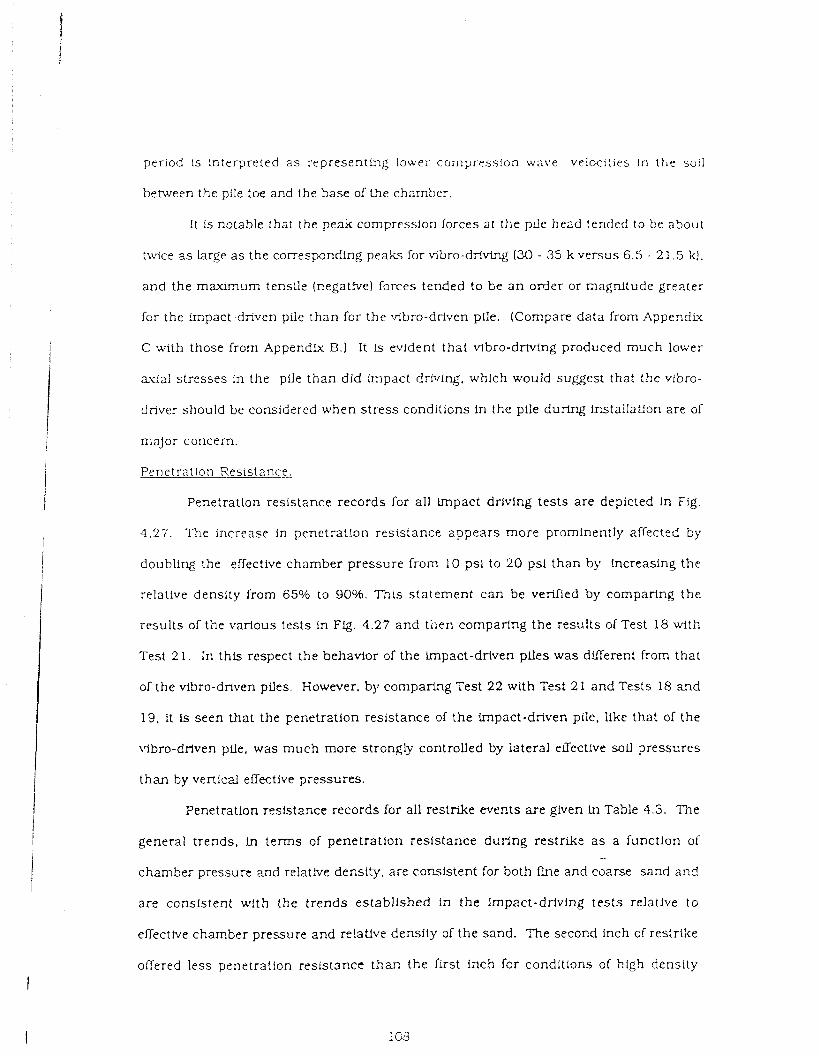
period !s interpreted a s representing lower compression wave velocities in t h e so11
between the pile toe and the base of t5e chamber.
I t is notable that the peak compression forces at the pUe head tended to be about
twice a s large a s the corresponding peaks for vibro-dilving (30 - 35 k versus 6.5 - 2 1.5 k).
and the maximum tensile (negative) forces tended to be a n order or magnitude greater
for the impact-driven pile than for the vlbro-driven pile. (Compare data from Appendix
C with those from Appendix B.) It Is evident that vlbro-driving produced much lower
axial stresses in the pile than did impact driving. which would suggest that the vibro-
driver should be considered when stress conditlons in the pile during installation are of
major concern.
Penetration Resistance.
Penetration resistance records for all lrnpact driving tests are depicted in Fig.
4 .27 . The increase In penetration resistance appears more prominently affected by
doubling the effective chamber pressure from 10 psi to 2 0 psi than by increasing the
relative density from 65% to 90°/6. This statement can be venfied by comparing the
results of the various tests in Fig. 4.27 and then comparlng the results of Test 18 with
Test 2 1. In this respect the behavior of the impact-driven piles was dmerent from that
of the vfbro-driven pUes. However. by comparing Test 22 with Test 21 and Tests 18 and
19, it is seen that the penetration resistance of the impact-driven pile, like that of the
~lbro-driven pUe. was much more strongly controlled by lateral ezective soil presscres
than by vertical effective pressures.
Penetration resistance records for all restrike events are glven ln Table 4.5. The
general trends, ln terms of penetration resistance during restrike as a function of -
chamber pressure and relative density, are consistent for both fine and coarse sand and
are consistent uqih the trends established in the impzct-driving t e s t s relative to
effective chamber pressure and relauve density of the sand. The second Lnch of restrike
olfered less penetration resistance than the first inch for conditions of high density
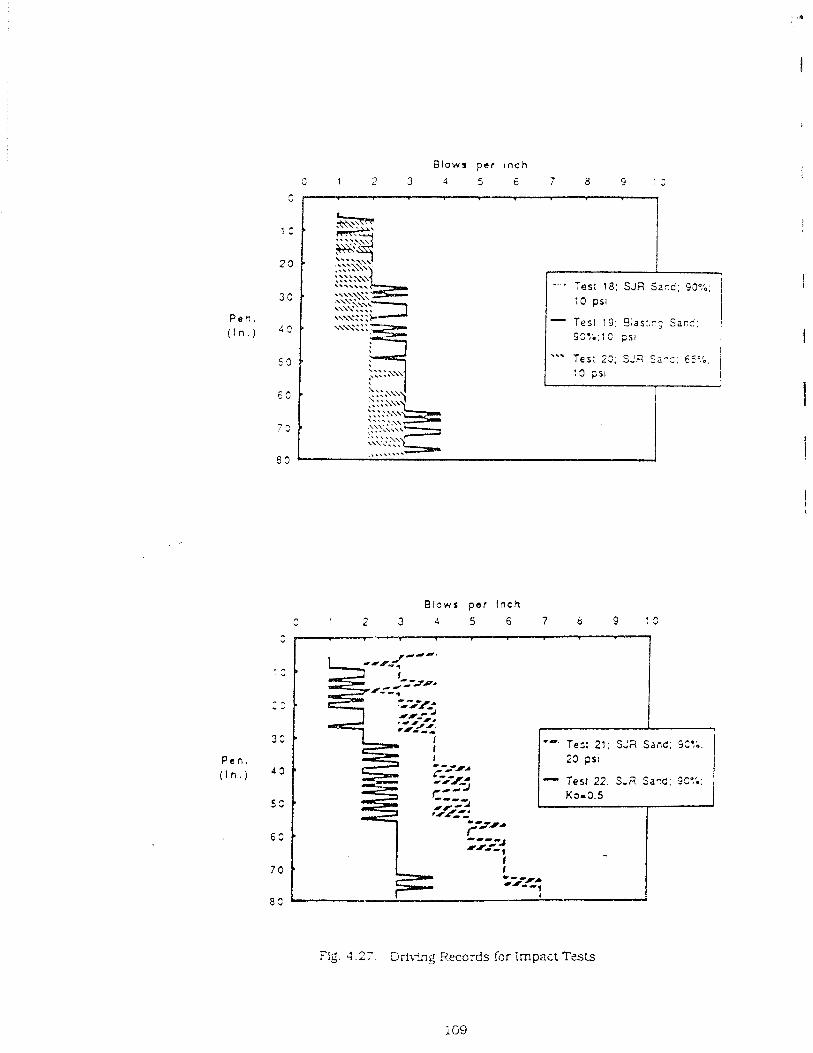
B l o w s p e r i n c h
v I 2 3 4 5 6 7 8 9 : S
h u
P e n .
( I n . ) 4 3 - Tesl 19: 9:as:.r; S a n d .
B l o w s per I n c h
P e n . ( 1 n . 1 4 3
Te:: 21; S:a Sand; 5::;.
Fig. 4 . 2 7 . T3rfiimg Records for Impact Tzsts
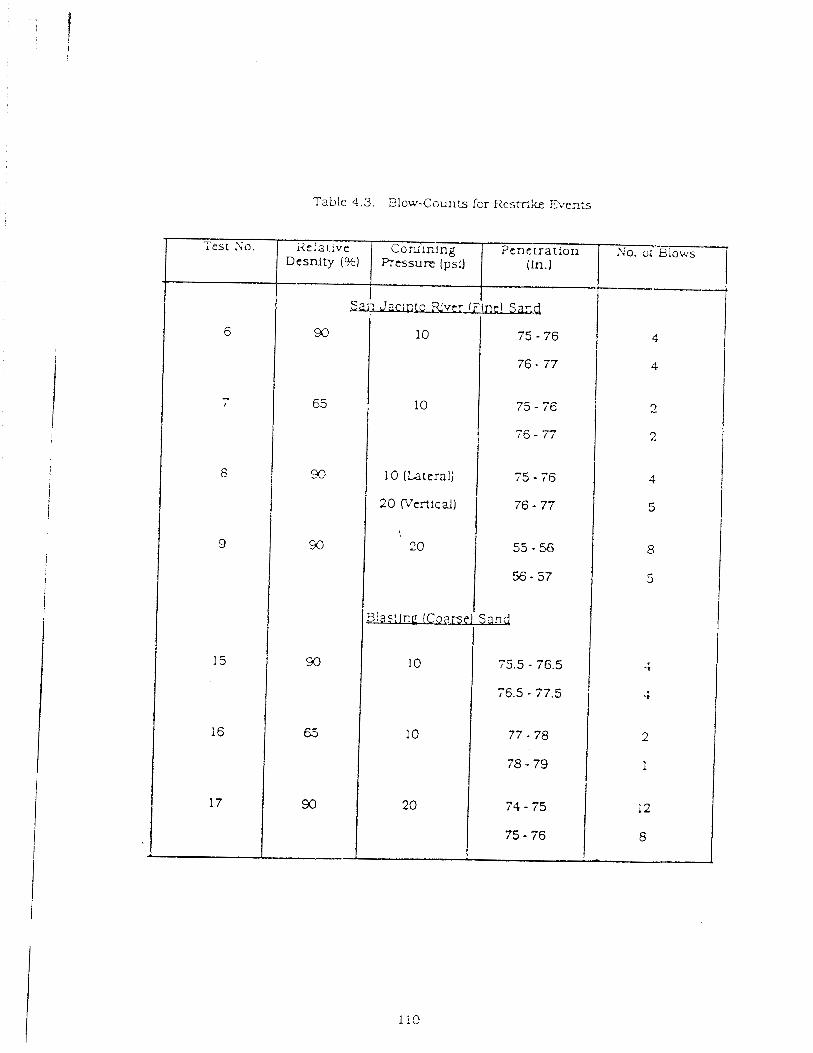
Table 4.3 . Blow-Counts fcr R e s t r k Events
and high pressure. however. Fiestrike penetia!:ons were !Imited to one-haif
diameter.
4.5 WATER EAYPCZSION
The test chamber. which is descnbed in detail ln Chapter 3 , permitted the
measurement of the volume of water eupe!led from the pores of the saturated sofl during
installation of the pile. IVhile the pores of the soil were sa tura ted , water volume
e-xpelled during a test does not necessarLly represent precisely the volume change in the
soil produced by installing the pile. since the vertical and lateral boundaries of the
chamber could expand or contract in order to mzintain a constant total pressure on
those surfaces. However, the volume of water evpelled is believed to be arl appravtmate
measure of the volume change produced by Fnstallation and should serve a s a mehns of
assessing the relative volume change produced by vibro-driving =d by lrnyact driving.
The results of the water expulsion measurements are given in Table 4.4.
The vibro-driver and impact driver produced about equal amounts of water
expulsion for the soil at 65% re!ative density. Vibro-driving produced much more water
expulsion than impact driving when the soil was at 90% relative denisty and more than
for vibro-driving at a relative density ~f 65Oh . ThLs result, which Is contrary to
intuition, appears to indicate that volume change In t2e vibro-driven piie is strongly
associated with the time requlred to vibrate the pile lnto position, which increases with
increasing relative density, a s indicated In Table 4.4.
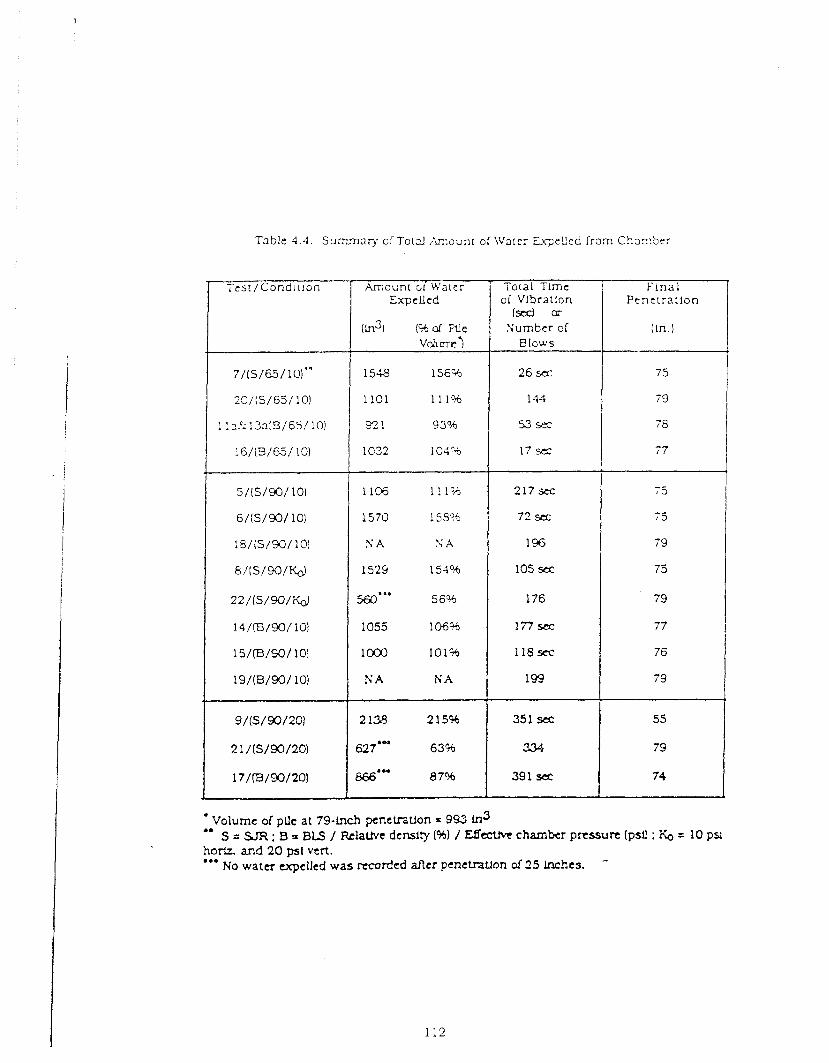
Table 4 . 4 . S u ~ r r n a q + ~ f T o ( 3 J , ' ~ o u ~ I oiIVa1er E q e l l e d [ram Ch2rnbt.r
Volume o i pile at 79-tnch penelrauon = 993 fn3 " S = SJR : B = BLS / RelaUve density I%) / EBtxtW chamber prvessun (psi! : I(o = 10 pw boa and 20 pst vcrt. 0..
No water expelled was recorded after venetratlon of 25 Inches.
*
Flnai Penetra t ion
(In.)
75
79
i-cst / C o n d ~ t j o n
7/[~/65/ 10)"
2 3 / ( 5 / 6 5 / 10)
! 12.5 133!5/65! 10)
I6/(3/65/ lo)
S,'(S/90/ 101
6/ (S/90/ 101
:8/(5/90/10)
6 /6 /9o / t6 ,
22/(s/9o/K&
13/(B/90/ 101
1 S / D / S o / 101
19/(B/90/ 101
9/(5/93/20t
2 1 /(s/90/20)
17/1B/90/201
iuTiotin~ o j Watsr Expellcd
(h3) 1% d Wc ~~7
1543 156%
! 101 11145
9'21 93Oh
1032 104%
1106 l! !OA
1570 15595
N A S A
1529 154%
w*'~ 56%
1055 106%
lOCO 101%
N A h' A
2 138 215%
627.- 63%
866'" 8 7%
78
77
r 3 - -
7 5
7 9
75
79
77
76
79
- 55
79
74 1
Total Tlmc o l V1brat:on
lsccf Sumbcr of
~ I G W S
26 scc
144
S3sa
17 ~r
217 s e ~
72 scc
1 96
105 SCZ:
176
177 sec
118scc
199
351 sec
336
391 scc
I
I
1
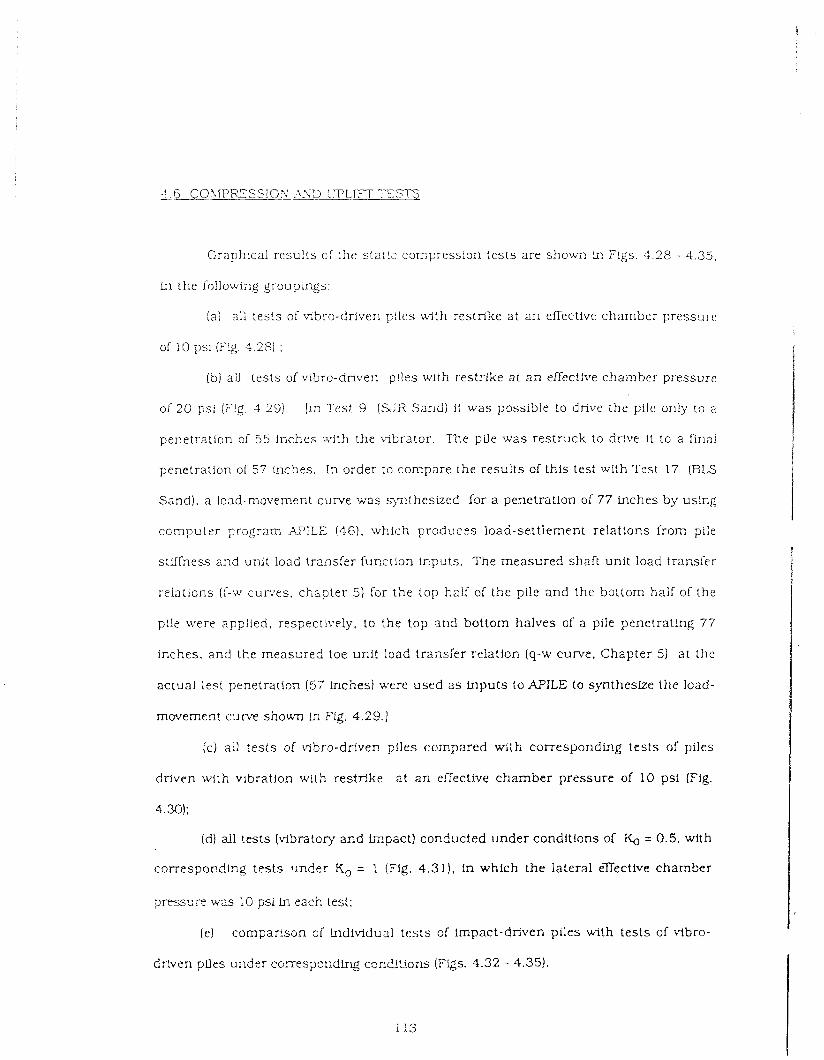
Graphical results cf the sta:!c comFression tests are shown Ln Figs. 3 . 2 8 - 4.35.
in the follou4ng groupings,
(a) dl tests of ~ S r o - d r i v e n piles with restrike a t an eflective chamber pressTJre
of 10 psi (Fig. 3.28) ;
(b) all tests of blbro-driven piles wlth restrFke at a n efiective chamber pressure
of 20 psi (Fiz. 3.29) . [in Test 9 (SdR Sand) i t was pgssible to drive the ~ i l e only to a
penetratfon of 55 inches with the ~ i b r a t o r . The pile was restruck to drive it to a final
penetration of 57 tnches. In order to compare the results of this test with Tcst 17 (BLS
Sand). a load-movement curve was synthesized for a penetration of 77 inches by uslng
comps t r r program APILE (46), which produczs load-seitiement relations from pile
stiffness and untt load transizr function inputs. The measured shaft unit load transfer
relations (f-w cufires, chapter 5) lor the top half of the pile and the bottom half of the
pile were applied, respec~lvely, to the top and bottom halves of a pile penetrating 77
inches, and the measured toe unit load transfer relation (q-w curve. Chapter 5) at the
actuai test penetration (57 Lnches) were used a s inputs to APILE to sjntheslze the load-
movement curve shown L-I Fig. 4.29.j
jc) a!! tests of vibro-driven piles compared with corresponding tests of piles
daven with vlbratlon with restbike a t a n efiective chamber pressure of 10 psi (Fig.
4.30):
(d) all tests (vibratory and impact) conducted under conditions of & = 0.5, with
corresponding tests l ~ n d e r KO = 1 (Fig. 4.31). ln which the lateral eTective chamber
pressurc was 10 psi In each test:
(e) corr,parison of individual tests of lmpact-driven ptles with tests of vtbro-
dr!ven pFles under conrespnding condl!ions (Fgs . 4.32 - 4.35).
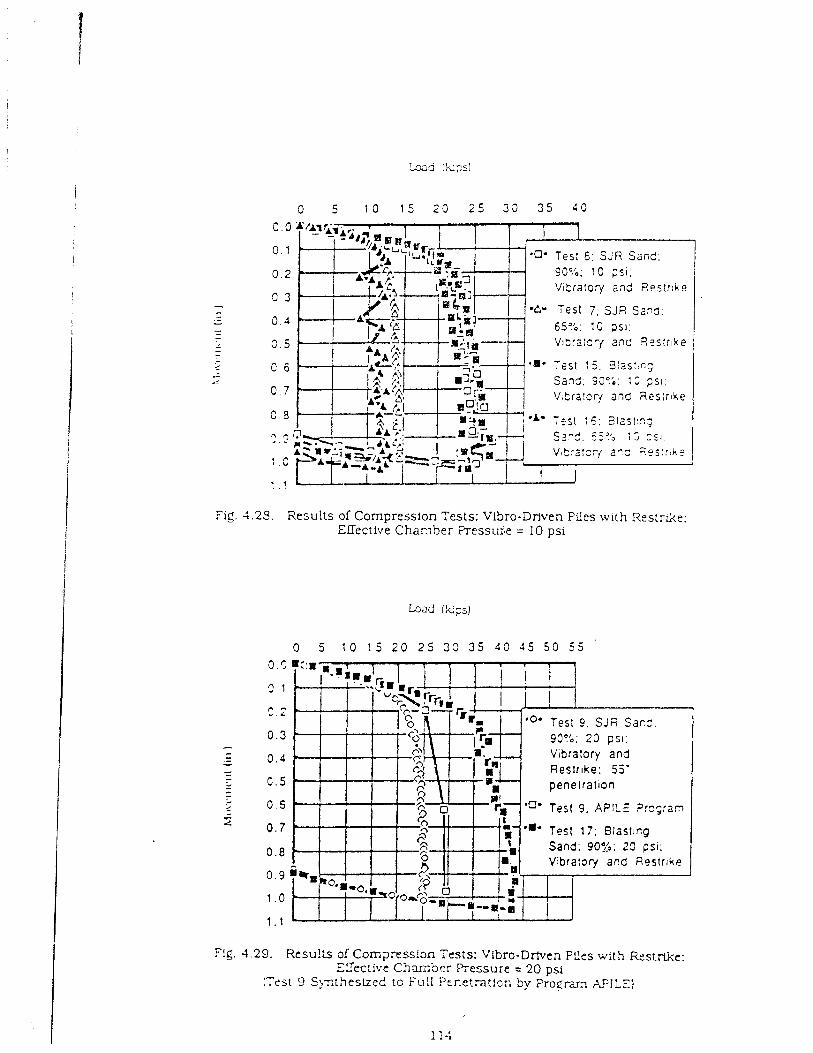
Fig. 4.23. Resul ts of Compression Tests: Vibro-Drlven Piles with Restrike: EITectfve Chamber ?ressufie = 10 psi
Load ( k p s j
0 5 1 0 1 5 2 0 2 5 3 9 35 40 4 5 5 0 5 5
Flg. 4.29. Resul ts of Cornpression Tests: Vlbro-Driven P2es with Rrstrlke: E!Tec:ive C 3 a r b c r Pressure = 20 psi
(Test 9 S)r,:heslzed to Full Pcr.etratlr~n by Proprvn AIILE)
h a d ilrcl;Si
I r'O. Tes l 5 Sji? S a n e ~ $ 1 ;
13 psi. V1S:a:ory 0 5 1 0 1 5 2 0 2 5 3 0 - -
. Test 6; S J R Sand, SC?:; ! O DSl: V ~ b r a : o r j and
0.1 . fies:r;ke
c . 2 ,. - 'Om Test 7; Sd2 Sane: 655;:
0.3 - :3 PSI; V ~ b r a l o r y and 2es:r:;re
Tes; ' :a 5 :;a. 3:as: -s
,̂ 5 s a r c 559;: :: cs,: ' / lbra:3ry
C 6 - , . m a - 1 es: ' c , 2'as:.c9 Sa--J
n - r . " . I
9C96 : 2 p s ~ ; Vtb'a:c?y
*A- r.5: '5. S..r:.-; Sam.: - A : Y - e ' S 2 5 . . Vfc.a!=.y ;,.- - 7 2 5 : - < s i
cs* .: z 3:. - - c = - * - - - - . - - - :::. .. - - - - 2s - - - . - - * - = - , i i-c 2 ~ 5 : . < e i
Fig -1.30 R ~ S U I I S of Conipress1on fcs ls : Comparison of Behavior of Vibro-Driiven p p s and Restruck Vibro-Driven Piles: ElTective C h m b e r Pressure = 10 psi
Vibratory and Restrike
7 . 4.3 1. Results of Compress i~n Tests: C c r n p m y ~ n of Behavior of POes Tested Under Kc = 0.5 ulU1 Pries Tested Under & = 1.0; Effective C h m b e r RDSU~C = 10 psi
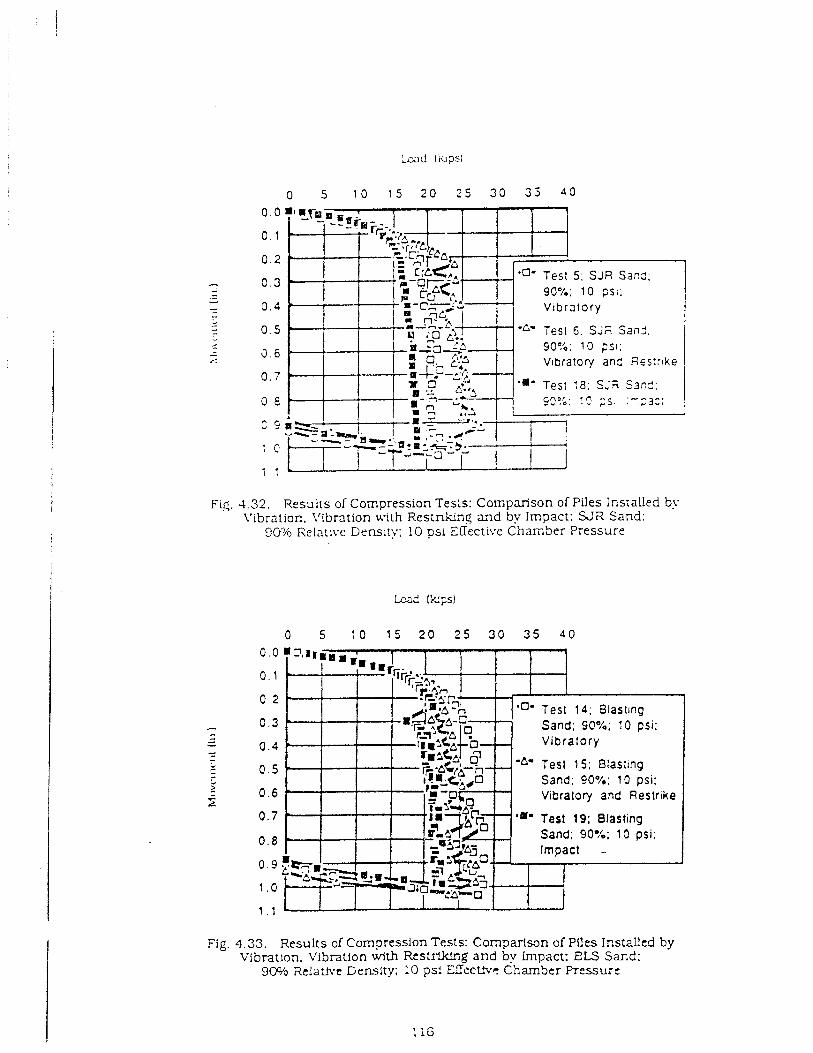
Fig. 4.32. Results of Compression Tes:s: Comparfson of Piles Installed by \'ibration. L'ibration with Restnkmg and t;v Impact: SJii Sand:
90')/0 Relative Density; 10 psi Egective Chamber Pressure
Sand; 90% 10 psi;
Test 1 5 ; Blast~ng Sand; 90°/.: 10 psi; Vibratory and Restrike
Test 19: Blasting Sand; 90%; 10 psi:
Fig. 4.33. Results of Compression Tests: Comparison of PCes LnstzEed by Vibration. Vibration with Rest1-g and by impact: ELS Sar.d:
9% i ic !a~vt Genslty; 10 psi EZICL!P Chamber Pressure
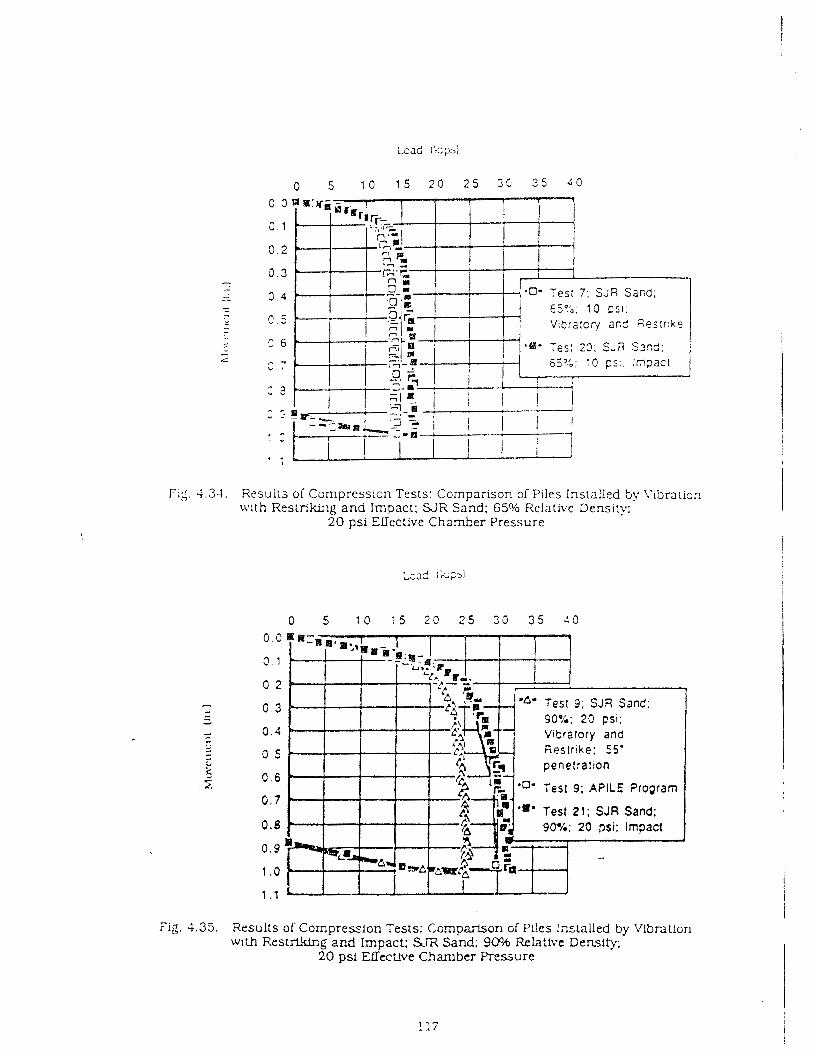
F . 4.4. Resulis o l Compression Tests: Comparison of Piles Installed by i'ibraiion \irith Restrikmg and Impact; S J R Sand: 65% Relative Density:
2 0 psi Eaective Chamber P r e s u r e
. - , A , ..- ,,, ( ' L V > l
Fig. 4.35. Results of Compression Tests: Comparison of Piles Installed by Vibration with Restriking and Impact: STR Sand: 90% Re1a:ive Density;
20 psi Effett&e Chamber Pressure
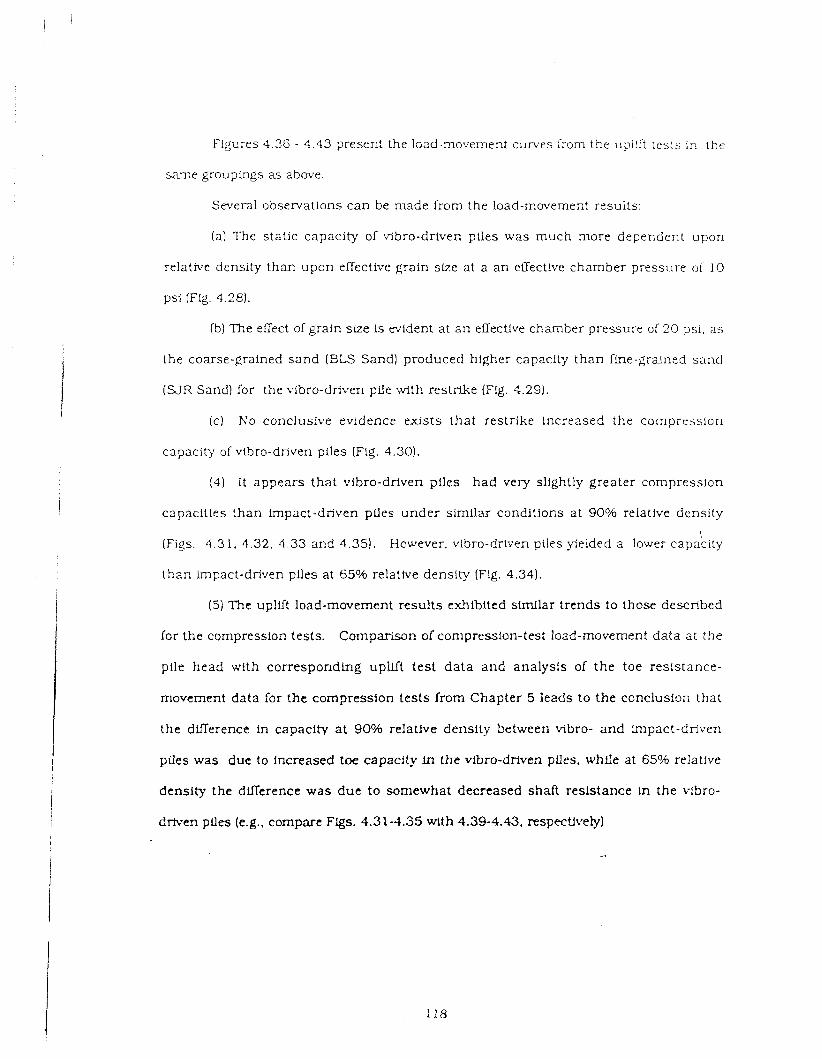
Figures 4.36 - 4.43 present the load-movement curves ::om the uplLrt ces:s in t h e
same groupings as above.
Sweral observatiorls can be made from the load-movement resuits:
(a) The static capacity of vibro-driven piles was much more dependent upon
relative density than upon effective grain size at a a n effective chamber pressure o i 10
psi (Fig. 4.28).
Ib) The errect of grain size is evident at a n elTectivr chamber pressure of 20 ps i , a s
the coarse-grained sand IBLS Sand) produced higher capacity than fine-grained sand
(SJR Sand) for the vlbro-driven pLle with restrike (Fig. C . 2 9 ) .
Ic) No conclusive evidence exists that restrike Increased the compress1011
capacity of vtbro-driven piles (Flg. 4.30).
(4) It appears that vibro-driven piles had very slightly greater compression
capacities than Impact-driven pfles under similar conditions at 90°h relathe density
(Figs. 4.31, 4.32. 4 .33 and 4.35). However, vibro-drlven piles yielded a lower capacity
than impact-driven pfles at 65% relative density (Fig. 4.34).
(5) The uplift load-movement results exlibited similar trends to those described
for the compression tests. Comparison of compression-test load-movement data at the
pile head with corresponding upW test da ta and analysis of the toe resistance-
movement data for the compression tests from Chapter 5 leads to the conclusion that
the dtiference in capacity a t 90?h relative density between vlbro- and impact-driven
ptles was due to increased toe capacity in the vlbro-driven piles, whFle at 65% relative
density the df i rence was due to somewhat decreased shaft reslstance ln the clbro-
driven piles (e.g.. compare Flgs. 4.31-3.35 with 4.39-4.43. respectively]
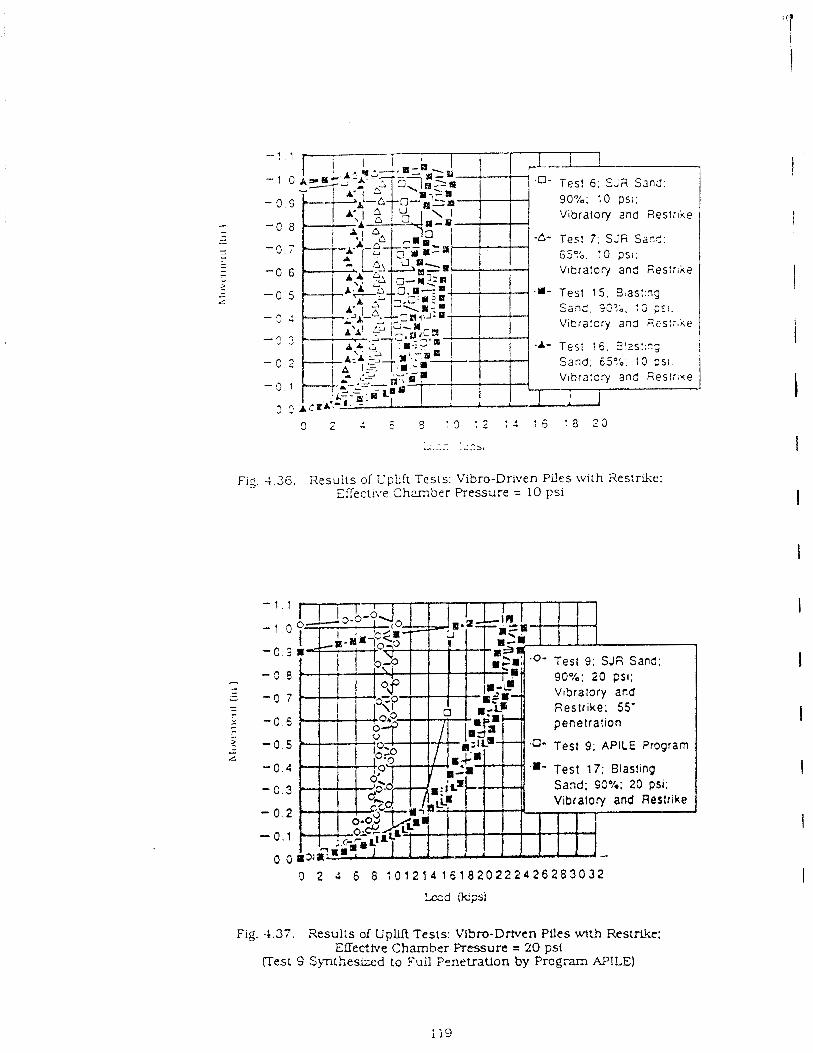
Fig. 4.36. Resu i t s of L'plift Tesis: Vibro-Driven Piles w ~ t h Res:rlke: Ef iec t~ve Chamber Pressure = 10 ps i
Restrike; 55'
Test 9; APILE Program
.a' Test 17; Blasting
Fig. 4.37. Results of Upllft Tests: Vlbro-Dmen Piles uqth Restrl.!!~: Effective Chamber Pressure = 'LO psi
(Test 9 Sqmthes.ized to Full Penetration by Program APILE)
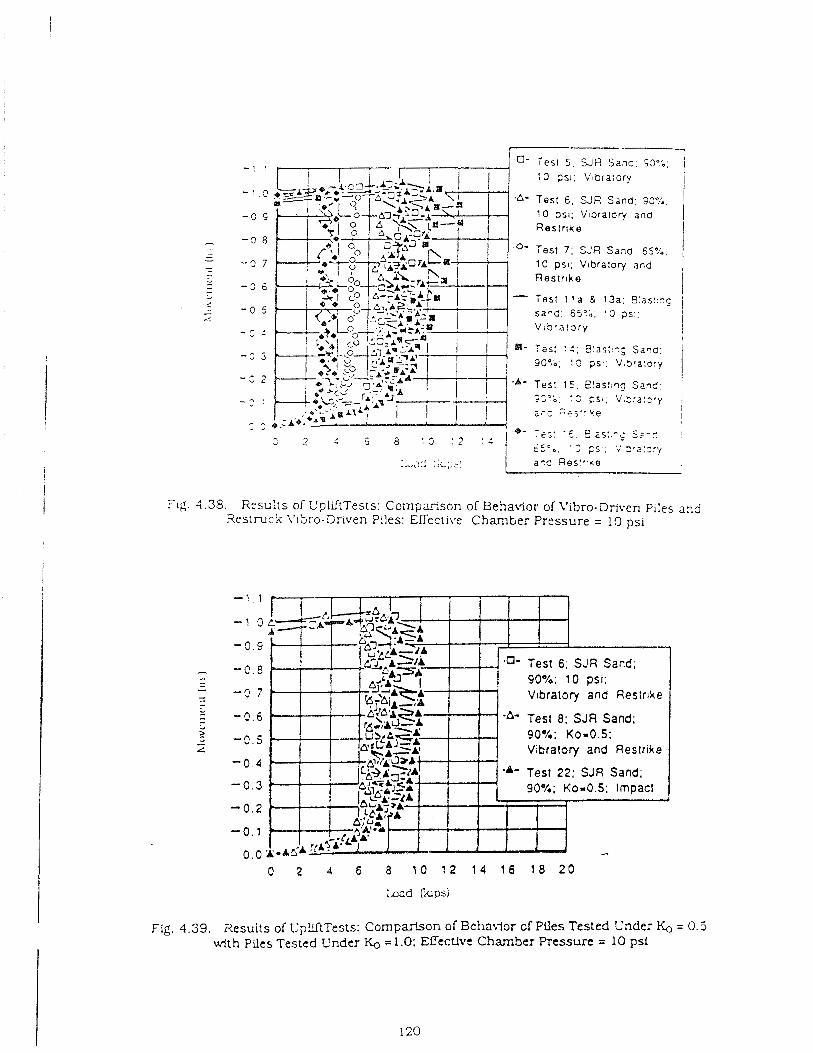
0- Test 5. SJFi Sand. 13";. 1 . : 3 ;sl: V~bra:ory
Test 6 . S J R Sand: 409:: 10 psi; Vlara~ary and 1 R e s l r ~ k e I I
I Test 7; S J R Sana, 55%. , 10 pst; V ~ b r a : o r j and j R e s t r i k e I
Tes: :<; 3 ' a s r ; ~ ; Sa.0, 904;: 13 p i : . V5ra:a:y
I Tes! 1 5 , e!as:;?g Sane: i A " 3 1 3.r ... .,. . P S I ; VI>!a:sfy i
- - - - --.. sm .. rt.> k e I I
Fig. -1.36. R c s ~ l l s of L'pldtTests: Ccmpafison of Behavior of Vibro-Driven Piles and Xestruck \ '~t.ro-Driven Piles: Elfecti\.e Chamber Pressure = 10 psi
Fig. 4.39. Results of LpLftTests: Comparison of Beha*,-ior cf Piles Tested Under KO = 0.5 with Piles Tested Under KO = 1.0: EfTective Chamber Pressure = 10 psi

Fig. 4 . 4 0 . Xesulls of Cpldt Tests: Cornpanson or Piles Installed by iVlbration. Vibralion wilh Restnkinq and by Impacl; S J K Sand:
90?/0 Re!ati\le Defisity; 10 psi EfTective Chamber Pressure
Fig. 4.41. .%suits cf UplifUests: Cornpaison of Piles Installed by C'ibratioa. 'Jibration with Restriking ar,d by Impact: BLS Sand:
900h iielative Density: 10 psi Effective Chamber .F?essure
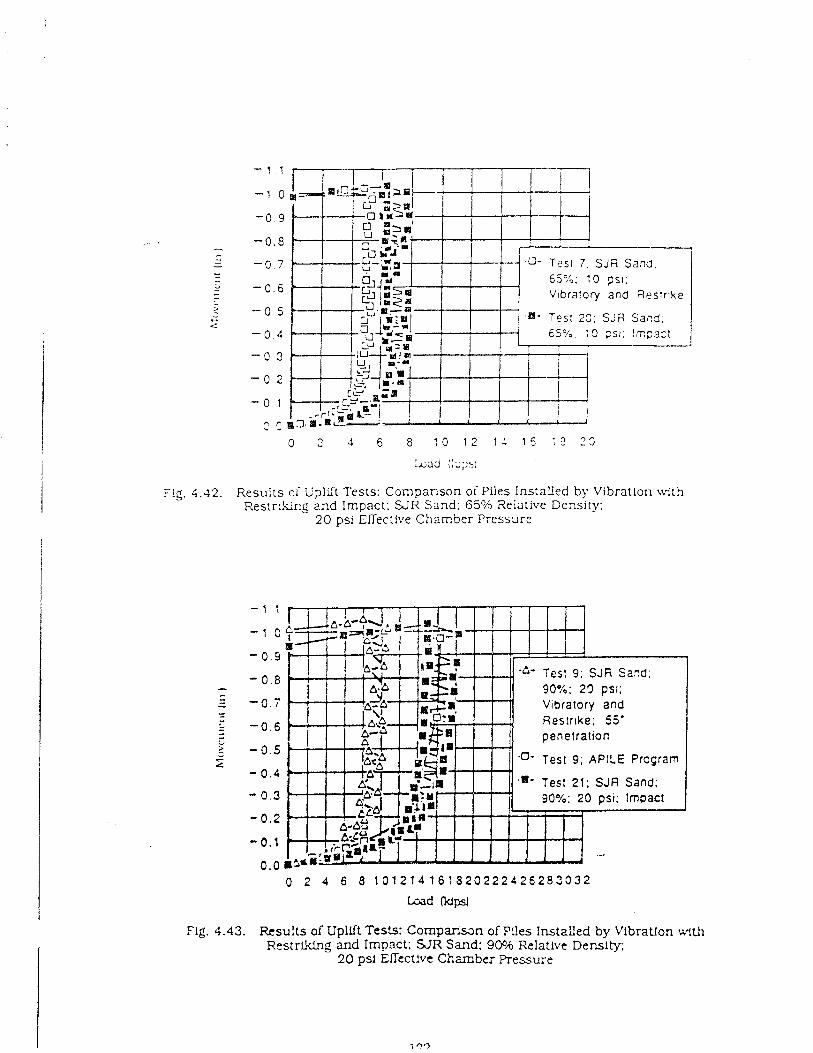
FIG. 4.42. Results o i Uplilt Tests: Comparison o i Piles Installed by Vibration u i t h Restrddng and Impact: SJR Sand; 65% Relative Density;
2 0 psi EITectlve Chamber Pressur?
Test 9; APILE Program
Fig. 4.43. Results of Uplift Tests: Cornparkun of Plles Instaxed by Vibration with Restriking and Impact: SJR Sand: 90% Relatlve Density:
20 psi Effective Cfizmber Pressure
CHAYJER 5
ANALYSTS OF TEST RESULTS
This chapter describes the analysis of relevant test data in order to develop
better understanding of vibro-driving and relationships of the following: (a) the
p e ~ o r m a n c e relationship between the model vibro-driver and the impact hammer. (b)
the power and ener&v transmissfon characteristics of the vibro-driver and impact
hammer, (c) the static capacity of vlbro-driven a n d impact-driven piles. (dl the
relationship between penetration rate and power transmission ratio of vibro-driven
piles. (e) the wave equetion parameters for restrike and Lrnpact events, (1) the static and
in-motion load transfer characteristics of vibro-driven piles and Ig) the phase
relationship between the plle head and toe of vibro-driven piles.
5 . 1 PERFORMANCE RELATIONSHIP BETWEEN VIBRO-DmR AND I M P A C T
HAMMER
A performance relationship between the model vibro-driver and model impact
hammer used in this study was established In terms of rate of penetration (vp) for the
vibro-driver and blow count @lows/lnch) for the tmpact hammer for tests where soil
conditions were identical. That relaUonship, shown in Fig. 5.1, denonstrates that for a
given pile, pair of drivers. pile cushioning, etc., it may be possible to convert rate of
vibro-drfver penetration h t o equivalent blow count for an Impact-driven pile. which
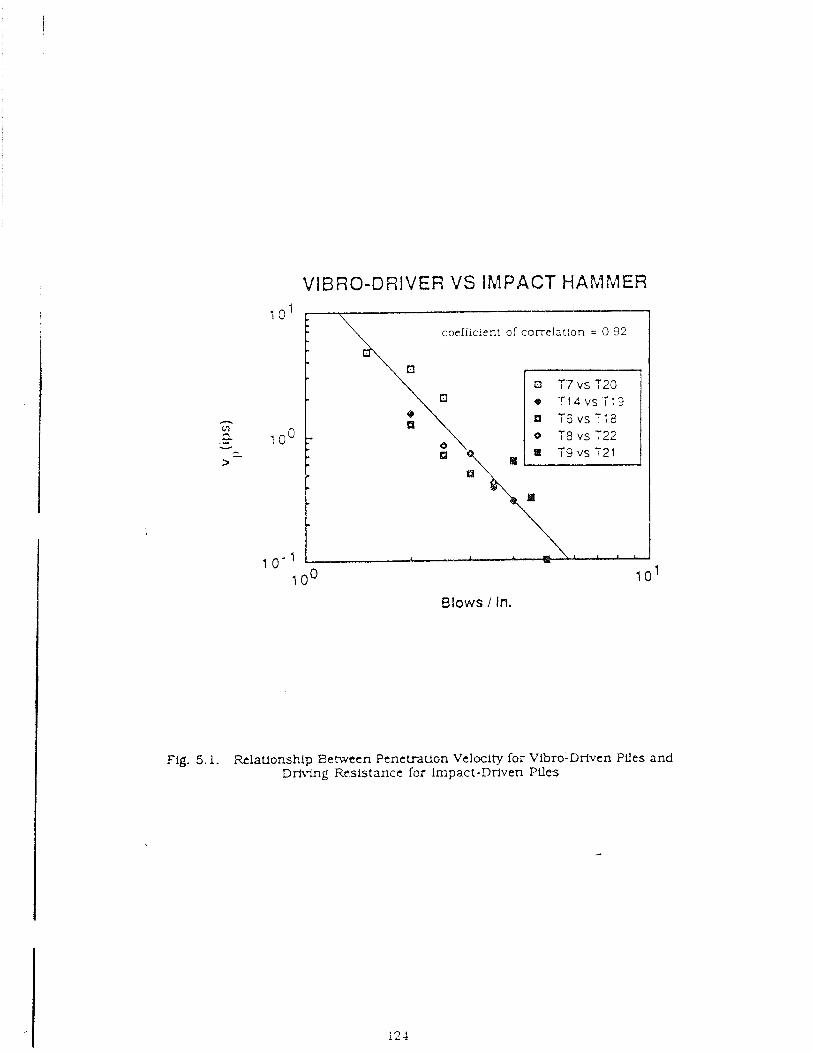
VIBRQ-DRIVER V S IMPACT HAbIMER
Blows l In,
Fig. 5.1. Relationship Eetween Penetration Velocity foi Vibro-Drlven Pfles and DrixW~g Resistance for Impact-Driven Pfles
m1g;r.t p s s i b l y be csed (9 verify pi!r capacity In granular soil. The re!atioriship is also
expressed a s
vp (ips) = 12.32 X -2.65 ,
where X = blow count of the hammer blow/in.).
h'ote that the particular relationship given m Eq. (5 .1) is only valid for drlver
and hammer in thls laboratory study.
This s ~ c t i o n describes certain procedures that were employed in reducing
d>-rlarnic data in cornpuling pile head and toe energy and power.
The following procedure was used in pi le-head a n d pile-toe energy
computations (impact events):
1. Digital time histories were developed from electronically filtered
analog records of head and toe force and acceleration for several consecutive blows (10.
if availble: less Lf 10 biows were not acqu!red, a s in some restrike events). u s b g a
dlgitizatlon time step of 78 p e c over a time window of 40 msec to ensure that the whole
biow was captured. The average records for these blows were then obtained by averaging
values for each time step.
2. A segment of each average digitized signal, containing the main
portion of the signal to be processed, was selected by first locating the peak value In the
strain gage (force) record and then including the previous 1.5 msec and the subsequent
20 rnsec, for a total of 2 1.5 rnsec. This wIndow ensures that adequate w o r d lengths are
utillzed for energy computations. S e ~ a r a t e windows were employed for the head and toe
records, and Identical windows were used for the force and acceleration data at one
location.

3 . Any zero offset % the pile-head ;;nu pile-toe s train gage signal was
removed by subtract ing the average of the 50 discrete force values immediately
preceding the time w i ~ d o w .
4. A correction was applied to the filterrd pile-head acceleration signal
ln order to ensure that the conditions of zero velocity and displacement equal to the
measured plle set are satisfied at the end of the tirne window of each blow considered in
?he analysis. This linear correction takes the form.
a,(t) = al0 - ( b + c t I , (5.2)
where
a,(t) = corrected acceleration signal:
a( t) = uncorrected acceleration signal;
b = aav - 0.5 c T (satisfymg veloc!ty condition):
c = 1 2 / ~ ~ ( S / T - vaV a 0.5 aav T 1 (satisfyiig displacement ccndition);
S = permanent pile set per blow in range of interest;
T = total period of the signal (2 1.5 miliisec I ;
-aav = average of acceleration signal over T and equal to
(1 /T 1 IoT a(t) dt: and
va, = average of velocity signal, obained from integration of original
signal over T and equal to ( 1 / T ) IoTv(t) dt, where v(t) = jot a(t) dt. A sFmllar correction
was made to the toe accelerometer signal.
5. Ned, the blow energy was computed a s follows, where am(t) ls the
corrected pile-head or toe acceleration signal and F,(t) is the corrected pile-head or toe
force signal:
(a) Compute velwity for each time step (time 1) by -
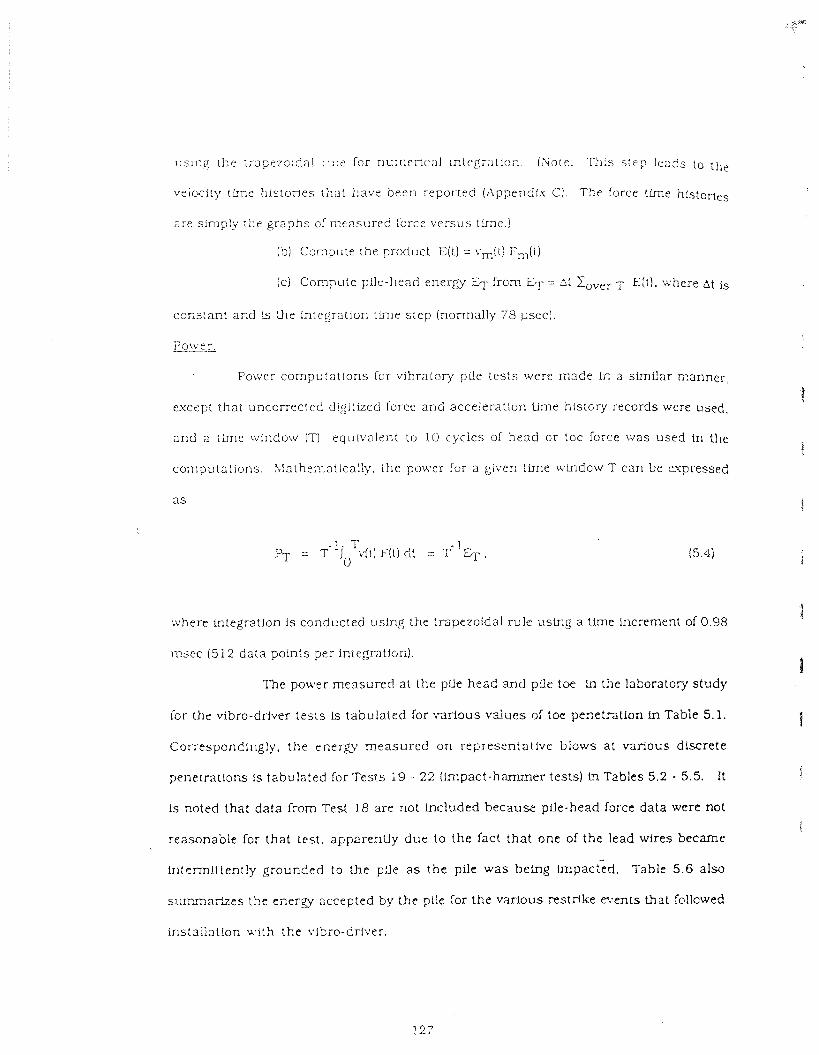
usir,q [he ;rapezaidal P~:;? for numerical integ;atloil. (Note: I?i;s s:ep leads ;o the
v e i w i t y tknr hfscories that h a v e been reported (Appen2tu Cl. The force tLrne hIstorles
are s~nlp ly d;e graphs of measured lorcr versus time.)
(b) Compute the product E(t) = viT,(1) F,(t).
(c) Compute pUc-head energy Er from Er - St Cover T Elt). where ~t is
cons:ant and is :he integration time s tep (normaily 78 psec).
Power.
Po\ver cornputatlons for vibratory pile tes ts were made In a slrnflar manner ,
except tha t uncorrected digitized force and acceleration time h l s t ~ r y records were used.
and a tLrne window (T) equi~raient to 10 cycles 06 head or toe force was used in the
computat ions. Xiatherr,atjca!ly, the power lor a. giver, time window?' c an be expressed
a s
where integration is conducted using the trapwoidal. rule uslng a time increment of 0.98
n x e c (512 data points per Lnlegr-ation).
The power measured at the plle head m d pfle toe In the laboratory study
for the vibro-driver tes ts Is tabulated for var ious values of toe per;etratlon in Table 5.1.
Correspondingly. the e n e ~ g y measu red on representative blows a t various discrete
penetrations is tabulated ior ' rests ;9 - 22 (h lpac t -hammer tests) tra Tables 5.2 - 5.5. I t
!s noted that data from Test 18 are not Lncluded because pile-head farce data were not
reasonable for that les t , apparently due: to t he fact tha t o m of the lead wires became
ir~termlttent!y grounded to the pile a s the pile was being Impac:cd. Table 5.6 also
summar~zes the ener-gy accepted by the pile for the varlous restrike e;ents that fcllowed
instaliat!on with t he v!bro-driver.
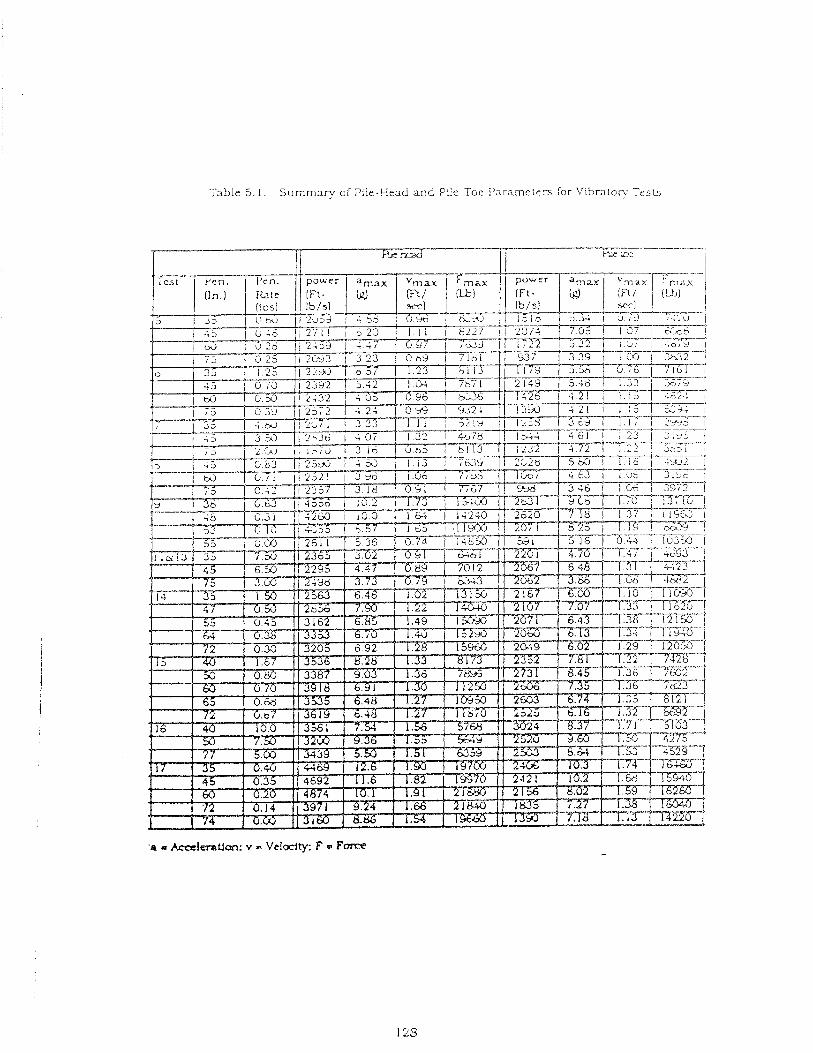
Table 5. I . S u ~ ~ r n a i y ol Pile-Head a n d Pile-'Toe ! ' a r m e t c r s :or Vibraior]: Tests
.a = hccelezatdan: v I. Velocity: F = Force -
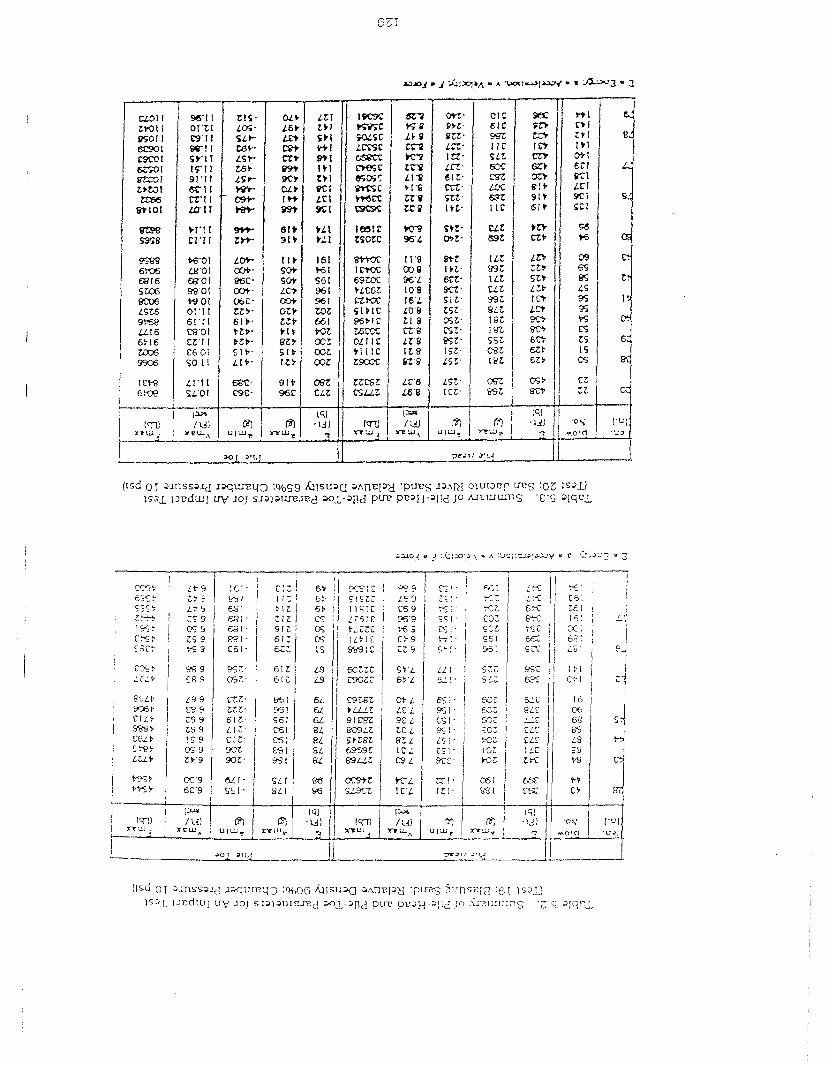
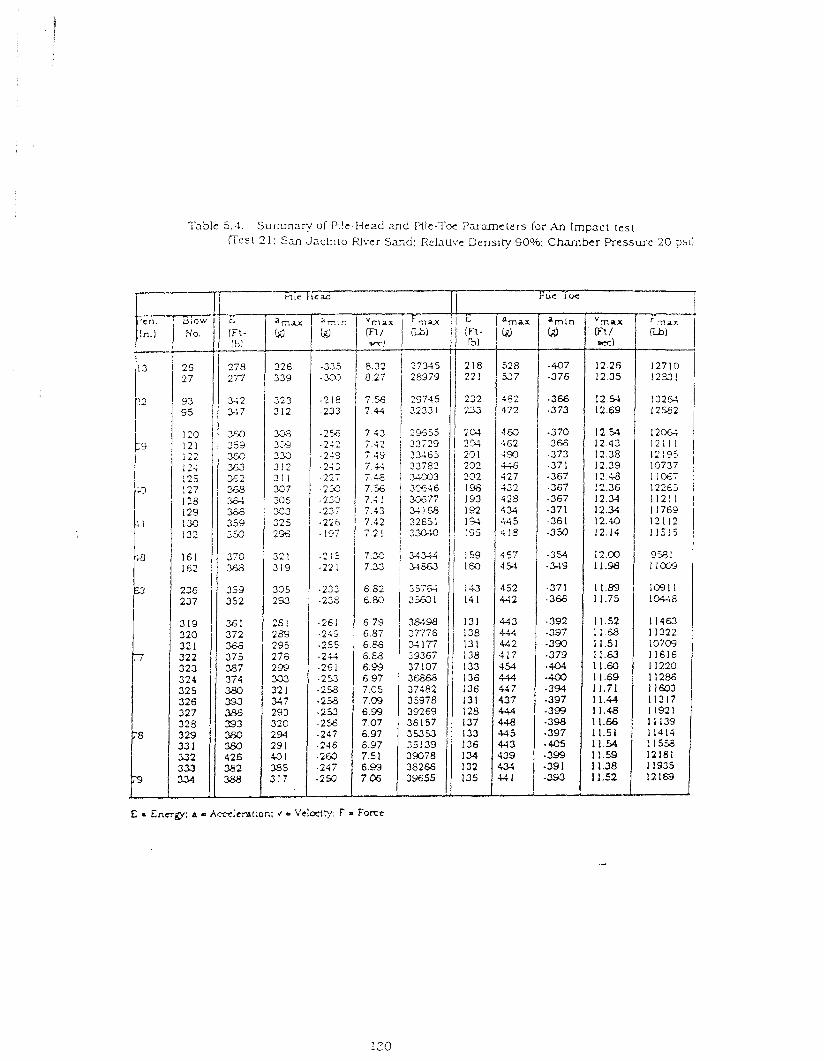
Table 5.4. S u m m w j o i P.!e.He-d and Pile-Tw Paramelers for Xn Impact test
(Test 11: Ssn JacLqLo River Sand: RelaUvc Llenstty 9096: Chamber Pressure 20 ps11
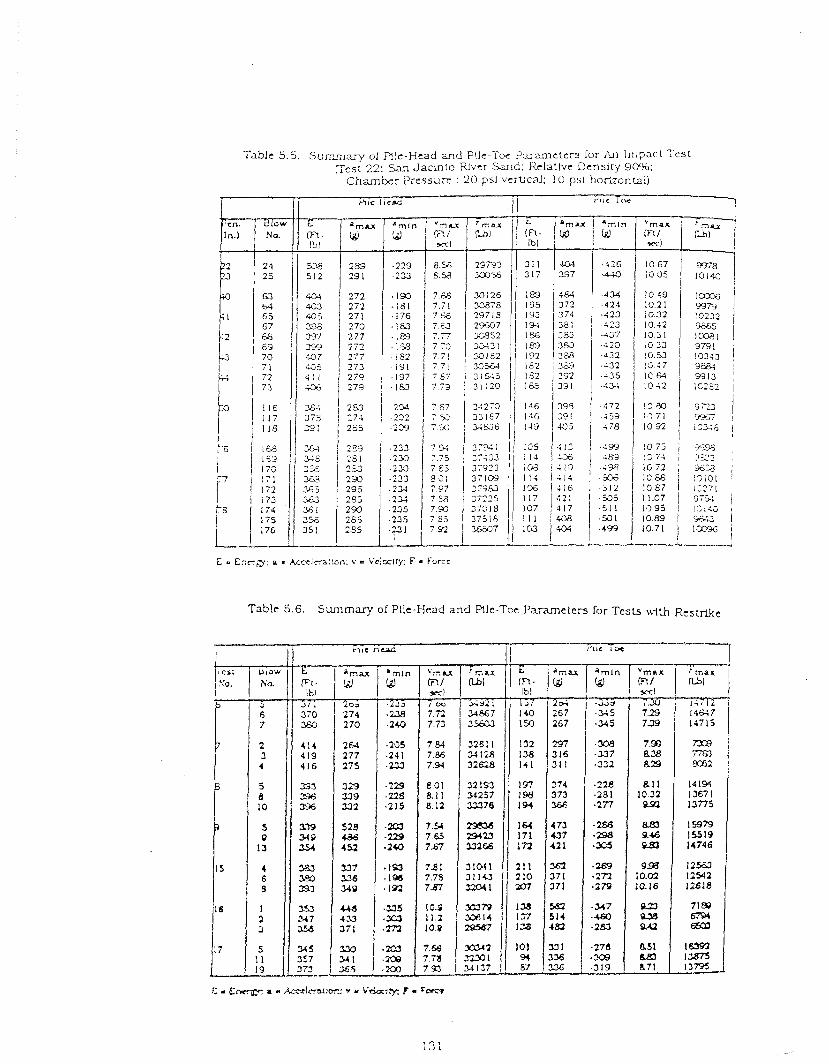
Table 5.5. S u r r m , ~ ~ of pie-Head and P!lc-Tm P a r u n e t c r s lor An Irr,pact Test j rest 22: San Jacinto W c r Sand: Kclattvr: Density 90%;
Ct~amber Prrssurr : 20 psi vcfical : I0 psi hofizan~al)
t'lrc Toe 7
I
512 2 9 2
63 70 7 1 7 2 7 3
E s Enrrgy: a = Accclca:!on: v = V c i r l v : F F o r e
Table 5.6. Summary of PUe-Head and Rlc-Toe P=ametcrs for Tests ~ l t h Rcstrtke
The total energy del~vered during the !nstalla!ion of vlbro-driven and irnpuct-
driver, piles is summarked in Table 5.7. I t can be observed that for conditions or
medlum dense sand (relative drnsi ty = 65°/0) and simulated depth of 50 feet (10 psi
enective chamber pressure) vibro-drlving required only about 65% of the energy, on the
average, required by impact d r f v i ~ g . in t e r n s of energy reaching the plle head (first
segment of Table 5.7) . On the other hand. vibro-drixtrg was found to require 3 to 8
times the total pile-head energy to install the pfle for very dense sand [relative density
= 9096) and /o r for a sirnul3:ed depth of 100 feet (20 psi erective chamber pressure) , a s
can be determined by obsening the last twcl segments of Table 5.7. I t is also clear from
Table 5.7 that more total energy was required to drive the plle either by vibration or by
impact a s the effective chamber pressure was increased from 10 psl to 2 0 psi. The total
delivered energy In b o b methods of t?stal!ation for an efiectlve chamber pressure of 2 0
psi avenged appraxtiately twice Cle value observed at 10 psi.
I1 I s polntfd out that poBrer or energy delbered t c the pLle head is not equivalent
to power or energy beIng produced by the vibro-driver o r impact hammer . The
theoretlcal power Pt of a counterrotatlng-mass vibrator. the type of clhrator that was
used in this s tudy to represent the most common type of vlbro-driver that i s used In the
field. c a n be computed based upon principles of mechanics, a s described in detail in
Appendlx A. Such power is a functlon of the operatf ig frequency, 0 ( rad ians per
second). eccentric mass, m, eccentricity of the eccentric mass. e. vibrator body mass, M,
weight of the bias mass. W, and value of the constant of the b l a t i o n springs, k, located
between the bias mass and the body of the vibrator, a s s u m m r i z e d ln Eqs. (5.5a) and
(5.5bl. 2 2 P, = [3W + 2(rneto + MZO I 1 Z ( 0 / 2 K ) . (5.5a)
where
3 2 Z = (me to - ) /M[WM)-O 1.
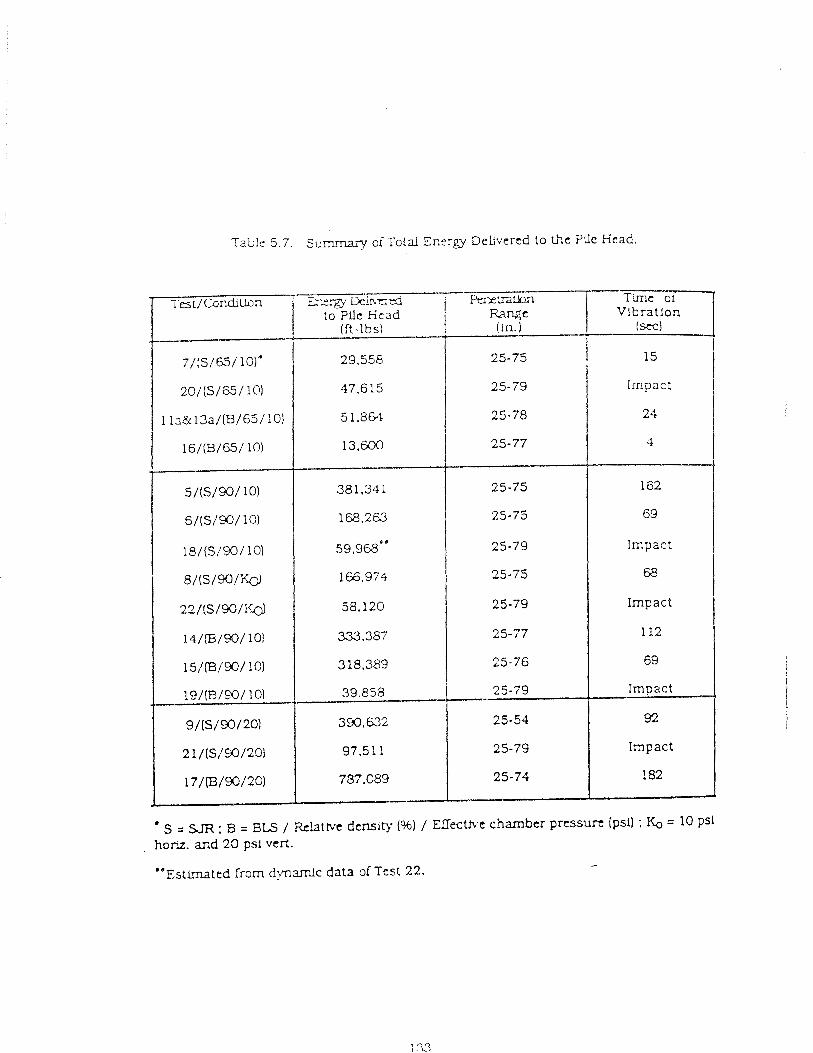
Table 5.7. Summary of Tatal E ~ e r g y Dehvercd to the Plle kiead.
I i
= : = B~~ / &htwc dcmiv (I% ) /iTectlvc chamber p r c s s u ~ (psi) : k = 10 Psl honz. and 20 psi vcrt.
' " ~ s t ~ m a t t d from dynamlc data of Tcst 22. /
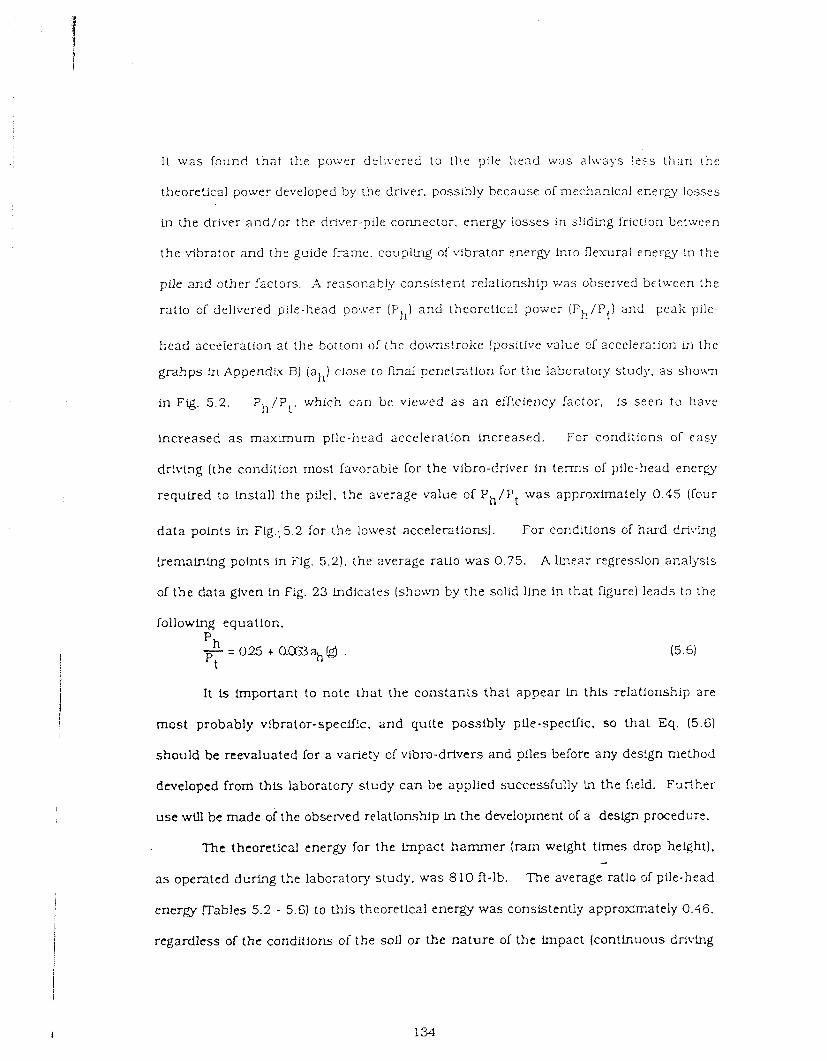
I t was found that the power delivered to the pile head was a l~vays less than [ h e
theoretical power developed by the driver. possibly because of rnechan!cal energy losses
in the driver and/or the dfiver-pile comector . energy losses in s1idir.g friction between
the vibrator and the guide frame. coupling of \dbrator energy into f lewrzl ener-gy ln t he
pile and other [actors. A reasonably consistent relationship was obsemed be*een the
ratio of delivered pile-head poj.vPr (Ph) and theoretical poxer (Ph /P t ) and peak pile-
head acceleration at the bot~orn of the downstroke [positive value of acceleration in the
grahps In Appendix B) (ah) close to f ind penetratlon for the labora tov study, a s shown
in Fg . 5.2. P h / P t . which can be viewed a s an eff!ci@ncy factor. I s seen to hakfe
h c r e a s e d a s maximum pile-head acceleration increased. For condi:ions of easy
drix-ing (the condillon most favorable for the vibro-driver in terms of pile-head energy
r ~ q u i r e d to install the pLle). the average value of Ph /P l was approximately 0.45 (four
da ta points in F!g.: 5.2 lor the lowest accelerations). For condltlons of hard dri~ring
(remaining points In Fig. 5 . 2 ) , the average ratio was 0.75. A llnear rzgression a ~ a l y s i s
of the da ta given in Fig. 23 Lndicatrs (shown by the solid lLne In that figure1 leads to the
followir,g equatlon,
I t is important to note tha t the cons tants tha t appear Ln thls relationship are
most probably vibrator-speclf!~, a n d quite possibly pfle-specific. so that Eq. (5.6)
should be reevaluated for a variety of vibro-drivers and pfles be:ore any des!gn method
developed from this laboratory study c a n be applled successfully In the f!eld. Further
use will be made of the observed relatlonshlp Lr, the developme~t of a design procedure.
The theoretical energy for the impact hammer (ram weight tlrnes drop height].
a s operated during the labontory study. was 810 ft-lb. The average ratlo of plle-head
e n e r a (Tables 5.2 - 5.6) to this theoretlcal energ l was conslstently apprcxdmately 0.46.
regardless of the conditions of the sou or the na tu re of the impact (continuous driving
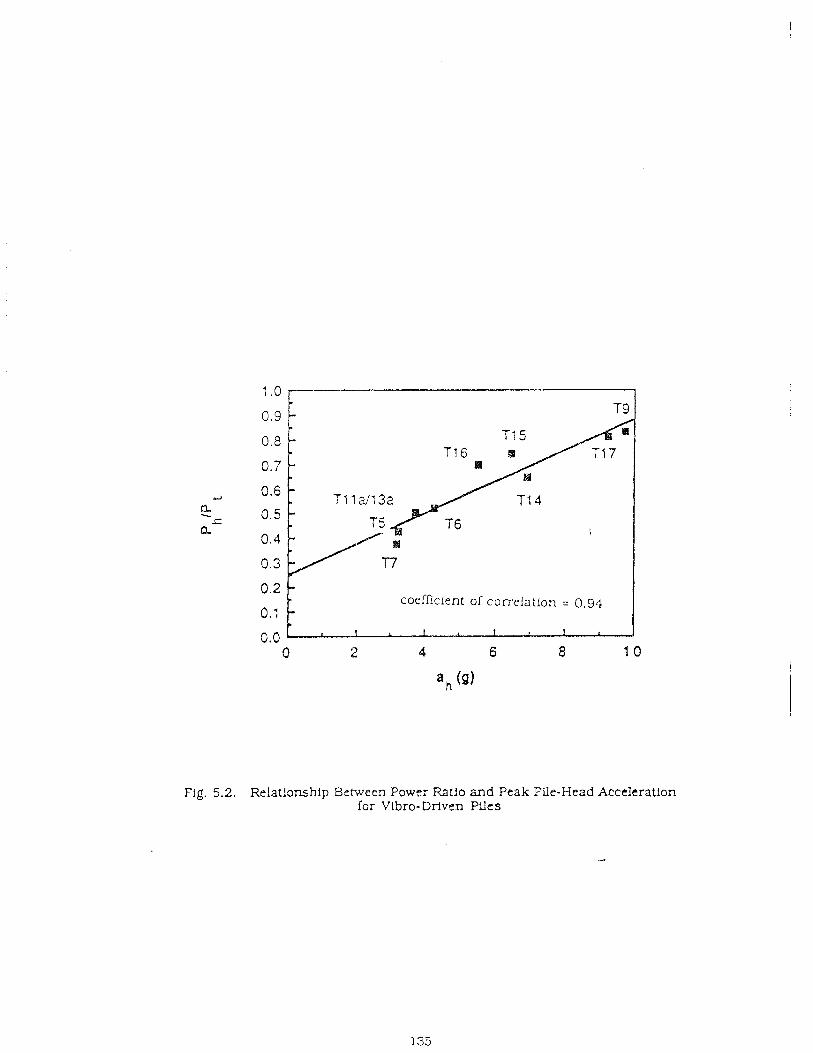
Fig. 5.2. Relationship Between Power Ratlo znd Peak File-Head Acceleration for Vlbro-Driven Pges
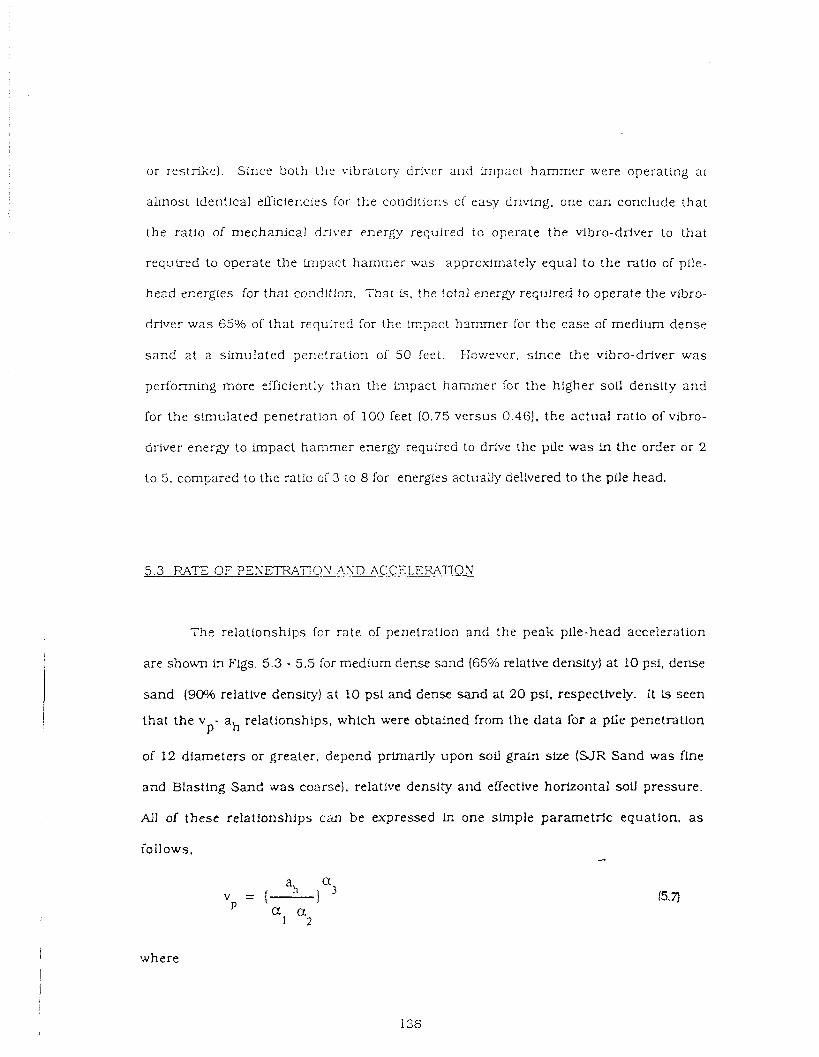
or restrike). Since bo:h the vibraiory driver and impact hammer were operating ar
almost identical efficiencies for the conditicns of easy driving, one can conclude that
the ratio of mechanical driver energy required to operate the vibro-driver to that
r e q u t r ~ d to operate the Impact hammer was approximately equal to the ratio of ptle-
head energies ior that coildition. That is, the total energy requlred to operate the vibro-
driver was 65%0 of that required for the i m p c t h s n m e r for the case of medium dense
sand at a simuIated penetration of 50 feel. Kovrever, since the vibro-driver was
performiiig more efficie~tly than the lmpact hammer for the higher sol! density and
for the simulated penetration of 100 feet (0.75 versus 0.46). the actual ratio of vibro-
driver energy to impact hammer energy required to drive the pLle was in the order or 2
to 5, compared to the rat!o of 3 :o 8 for energies actually delivered to the pile head.
5.3 RATE OF PESETR\TTOX' A-YD ACCELERATION
The relationships for rate of penetration and the peak pile-head acceleration
are shown in Fgs . 5 .3 - 5.5 for medium derise s a d (65% relative density) at 10 psi, dense
sand (90% relative density) at 10 psi and dense sand at 20 psi. respectively. I t ls seen
that the v - ah relationships, which were obtained from the data for a pile penetration P
of 12 diameters or greater, depend primarily upon soil g r a b size (SJR Sand was fine
and Blasting Sand was coarse]. relative density and effective horizontal sou gressure.
A11 of these relationships can be expressed in one simple parametric equation, a s
follows.
where
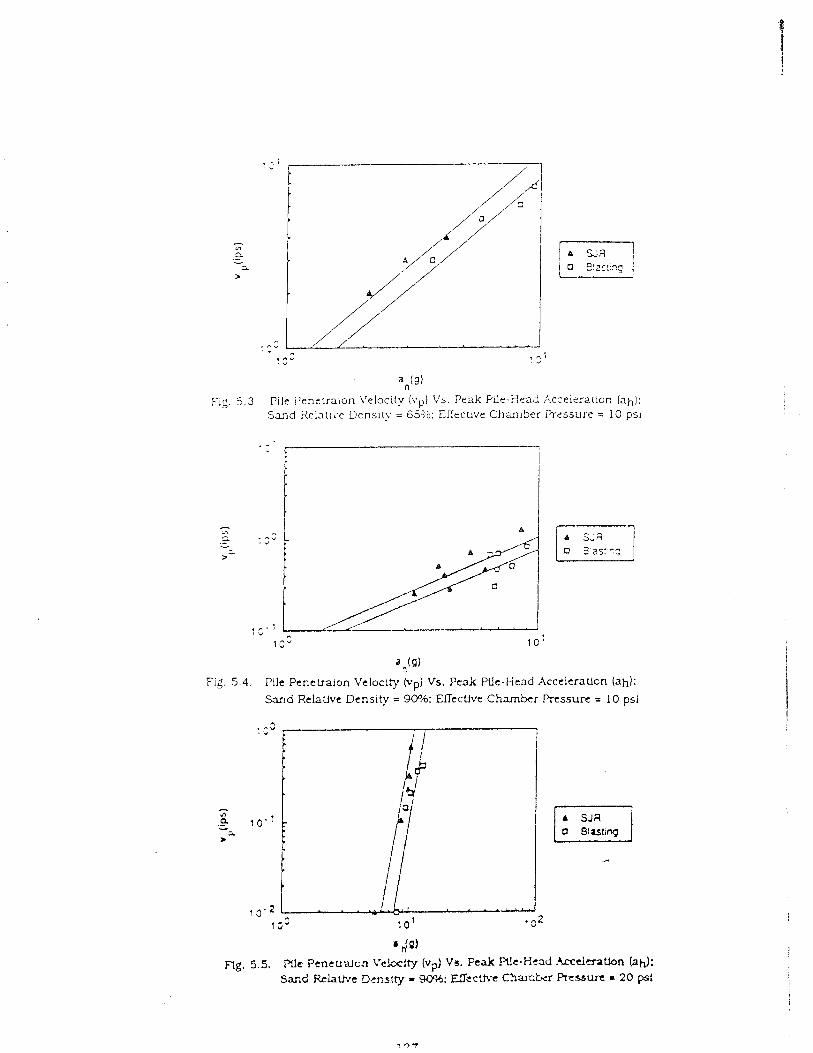
F1g. 5 3 P ~ l e Penctraion \ 'eloc~ty (vp) Vs. P e a k W e - 3 e a d Ac:eisrat~on (ah): Sand Re1nt1i.e Denslcy = 6330: EKecr~ve C h m b e r 13cssure = 10 p s ~
1 c b 1 0 '
a
Fig. 5.4. Pile Penctraion Velocity (vp) Vs. Peak We-Head Acccleraucn (ah);
Sand RelaUve Density = 90%: Eficttvc Chamber Prrssurr = 10 psi
a JQ)
ng. 5.5. H e P e n t t r a c n Vc!ccity (vd Vs. Feak .We-H-d .kcdmt lon (ah): Sar.d RcLaUvt Dcnslty 1 LO%; ETeclfvc C S a n k r Pressure = 20 psi
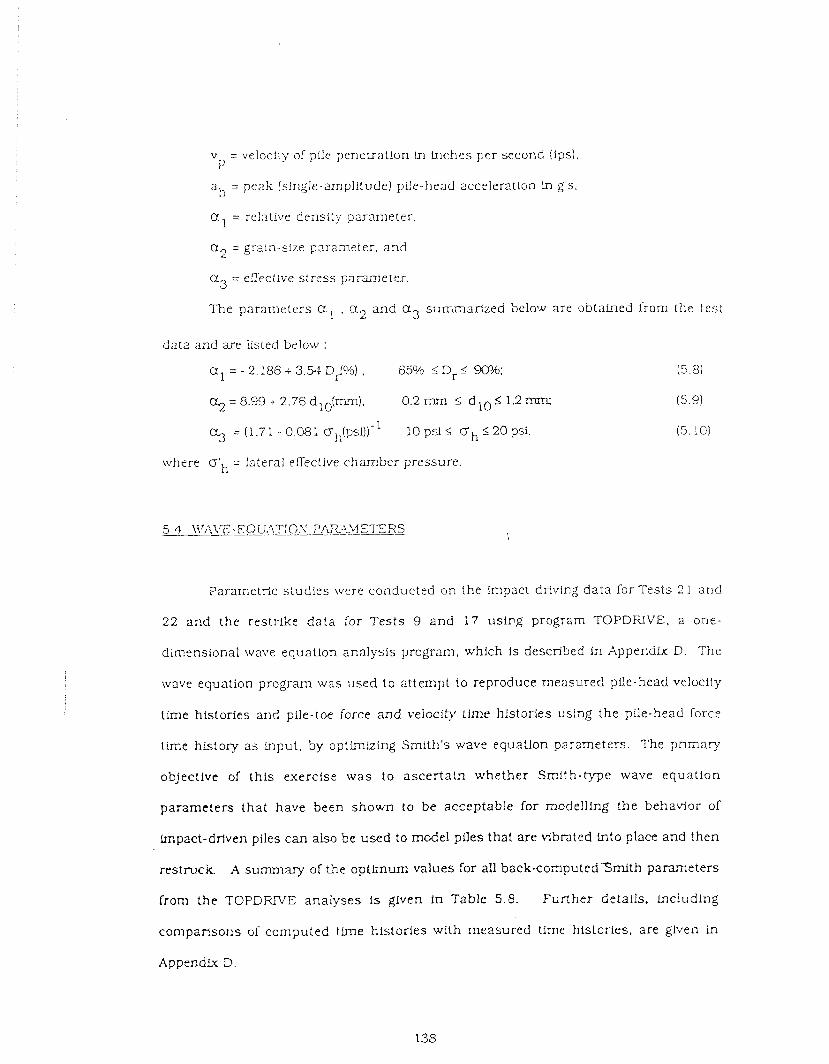
v = velocity of pile penetration h h c h e s per second (Ips), P
ah = peak (single-amplitude) pile-head acceleration ln g's.
a l = relative density parameter
a2 = grain-slze parameter, and
Cr3 = ezectlve stress parameter.
The parameters a l . a2 and a3 si~rnmrlrized belo5A! are obtained from the test
data and are listed below :
a , = - 2.186 + 3.5-1 DJ%) . 65% r D, 5 w?:
% = 8.99 + 2.76 dlO(mm), 0.2mrn 5 d I 0 < 1 . 2 m
% = (1 . 7 l - 0 . 0 8 M ~ p s i ) ) - l o p s i d b h S 2 0 p s i .
where OSh = lateral effective chamber pressure.
Parametric s tudies were conducted on the impact d r i v i ~ g da ta for Tests 2 i and
22 and the restrike da t a for Tests 9 a n d 1'7 using program TOPDRIVE, a one-
dimensional wave equation analysis prcgram, which is described in Appendk D. T h e
wave equation program was used to attempt to reproduce measured pile-head ve!ocity
time histories and pile-toe force and velocity time hlstories using the pile-head force
time history as input , by o p t b ~ i z i n g Smith 's wave equatlon parameters . The primary
objective of th is exercise w a s to ascer ta in whether Smi th- type wave equat ion
parameters that have been shown to be acceptable for modelling the behavlor of
impact-drfven piles can also be used to model piles that are vibrated into place and then
restruck. A summary of the optimum values for all back-computedSmlth parameters
from the TOPDFUVE analyses is given in Table 5.8. Fur ther details, including
compafisons of computed time histories with measured tlme historbes. are given in
Appendtx D.
Fcr those tests, values ci quake a n d d a r n p i ~ g a re noi z tnhng ly di[rerent ~ h . , ~
the pile was driven by Lqbraticn and by ccntlnu.;bs i?lpact. fn?onfi the tests conducted
i? S a n Jacinto R ~ e r Sand , i k e z t i o of static !oe h r c e to to:d force is F.lghest for Test 9,
ttie resWce test, but i t c a i be a r ~ u r d that that ratio is high due to Uie fact that in Test g a
penetration of o d y 57 ir.c!les i i3.25 pile diemeters) was achizved. It estimated from
s m p i z proporlions that had the ?~!e been vibro-driver! to a penetration of 77 h?ches.
which 1s con?arable to the gene!r?,tion achieved for the lmpact dnven pges under the
s a m e rondiiions, [hat ratio tvould have been about 0.35, urh!ch LS generally coasistent
:vith t he 1-atios fro= the cont:ncous impact driving tests in the S a n J a c h t o Rve r Sand,
I t & also observed, t? compcir~!g Tests 2 1 and 22 in Table 5.8, that the effect of KO on the
Smi th pa rame te r s for impact-ciriiren piles w a s relativzly minor , a l thgugh solrle
dll^lerences, particularly In the rat!o of shaft darnpin,: to toe darnping and in the value
of shaft and toe qcake , are e\?i<ent.
In the test in coarse 2izs:iPig Sand (Test 17). dLCTerences with respect to the other
t e s t s in fine sand are evldeni. The ratio of s ta t ic toe resistance to total resistance was
relatwely hlgher t h a n Ln either the vlbrat ion/restr ike o r con t inuous impact driving
tes t s In S a n Jac in to Rve r Sand when the corrected resistance ratio of 0.35. desci-lbed
above. w a s assumed for Test 9. The quake values a r e also noticeably higher than for
the tes t s in San Jacinto River Sand.
The values of quake that appear ln Table 5.8 are consistently lower t h a n the
va lues t h a t a r e ordlnarfly recommended for analysis of ptle-driving ln the field, and
therefore thek d h c t use is not recommended. The shaft damping values are generally
consis tent wlth values that are recommended for analysis of full-scale piles. while the
average toe d m p i n g is about one-half of t he v d u e rmonmiended far field use. The low
quake values a re most proSab!y associated with t he efrects of geometrlc scale (pile
diameter cf 4 inches versus i'uy-scale ?Lie diameters of at least 2.5 tfrnes of tha t value!.
despite the mode!ling of soil eirective s t resses in this s tady . The presence of reflected
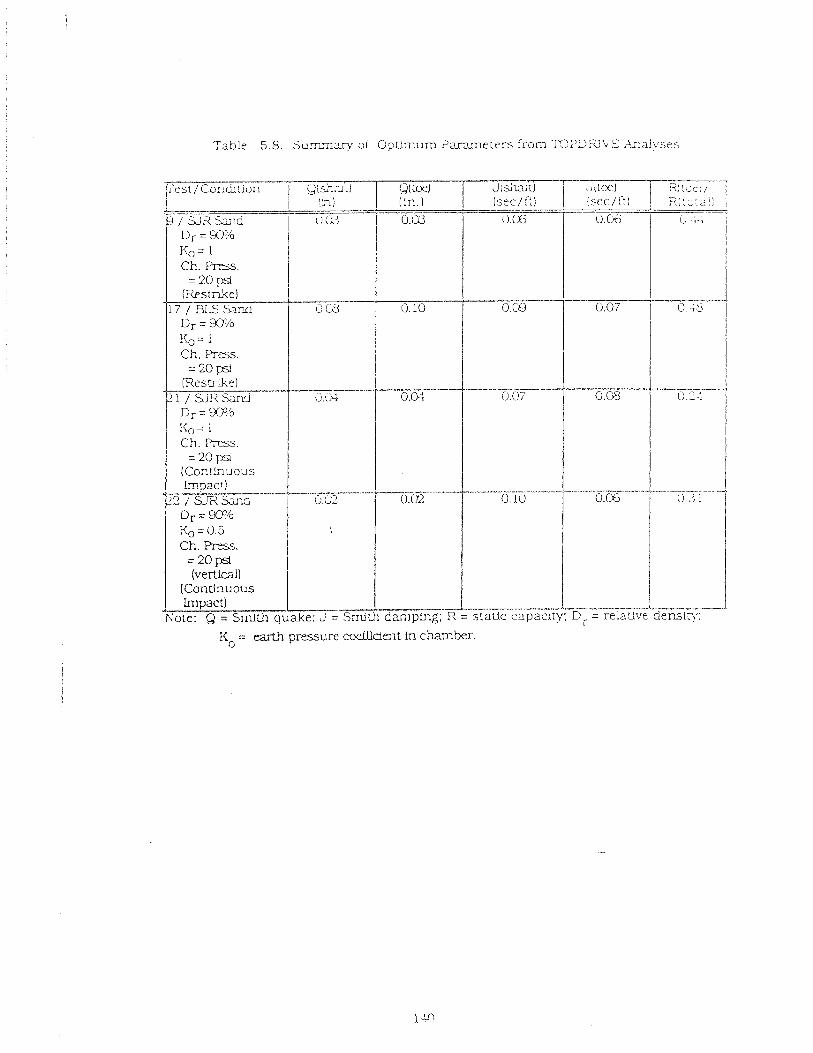
Table 5 .8 . S u i r i r z ? v o i 0 p t L n ~ l m P m r i l e t e r s from n ? D R b X r L d y s e s
.----.a-
---.-. = staUc capac
KO = tzmh p m u r c m d k i e n t in chamber.
- -- I 1
.- rty
e r , s r a from the base o i the rharnber could accouct for the low toe dampi_n.g, but no
analysis of this eflect was conducted. a l i h o ~ ~ h some discussion of the elfect I s provided
in AppendLx C.
Analyses using program JVEXP86, a FHWA standard wave equation prcgram
developed for the microcomputer, were also conducted for Tests 2 1 and 22 with the
opt imum yarameters developed from TOPDRIVE to a s ses s the effect of different
computat ional algorithms. Results from i K A P S 6 are compared with those from
TOPDRWE in A p ~ e n d i v D, along with the results of and a SensiCivity s tudy of cushion
stdfness in JVEAP 86.
5.5 LOAD-;\IOFl2?/IE\T EL4TIONSHIP
One cf the principal objectives of the s tudy was to de t e rmhe the relationship
between static bearing capacity achieved by impact driving and by vtbro-driving, ul th
and without restrike. Descriptions of procedures for conductkg the static load tests are
provided in Appendb E. S h c e plungfng failure (or the equivalent thereof for uplFft
loading) was r a r e b achieved, it was necessary to deflne failurz load by some consistent
method involving the pattern of deflection of the ptie. Five n e t h o d s were hvestigated
in this eflort. and the results are presented In Tables 5.9 (compression loadlngl and 5.10
(uplift l oad i r ?? . The methods are discussed in AppendLx E. Upon txarninatlon of all of
the load-movement curves and the summary data con tahed in Tables 5.9 and 5.10, it
was decided that failure load would be interpreted consistently among the various tests
for purposes of c ~ m p a r i s o n as the value of load corresponding to a movement of the pile
head of 1% of the plle diameter (0.4 inch for the model pile used in this study). I t is
tmmedfately obvious L? Tables 5.9 and 5.10 that the uplgt capacity of the pile was
always considerably jess thzn the compression capacity. Analysis of the load transfer
da:a. which are addressed the next subsection. lndicate that average unit side shear
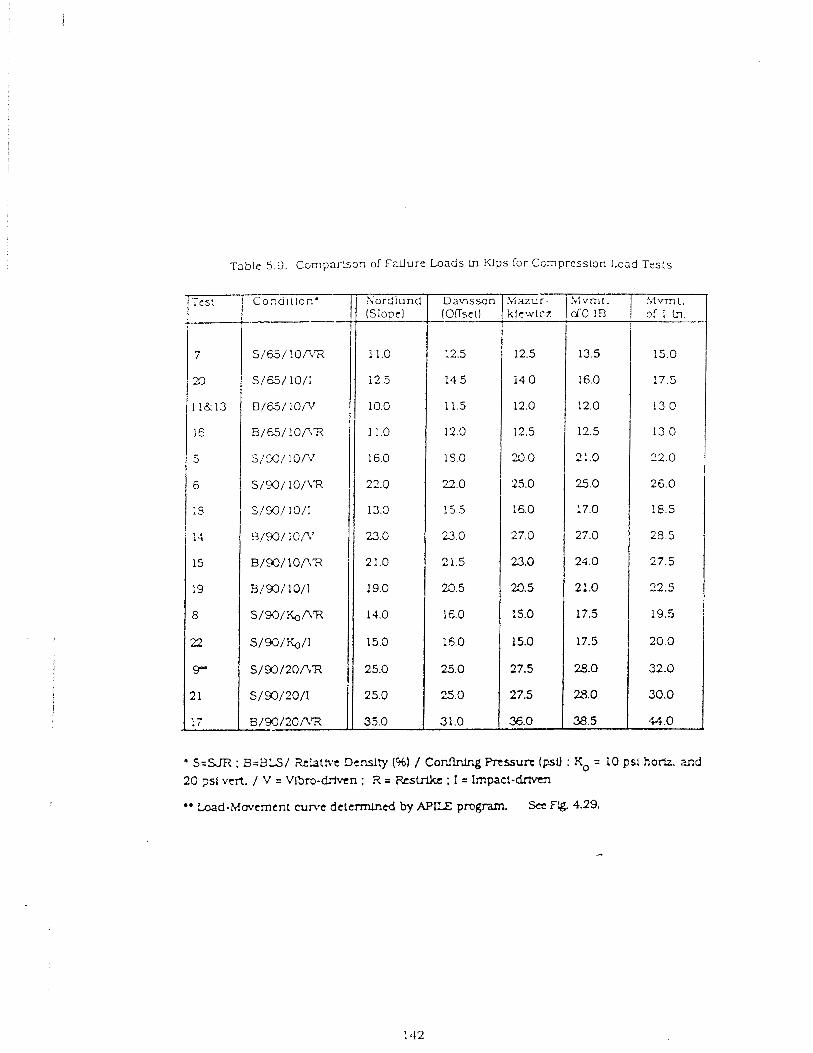
Table 5.9. Camparison of y u u r e Loads Ln u p s for C G X ~ ~ ~ S S ! O ~ Load Tests
*' bad-Movcment cume determlntd by A P I E prcgrarn See Flg. 4.29.
Dawsson (OKseO
Sordiund (Sloue)
- 1 CSl .Mazur-
klcwtcz Co.?uil!on'
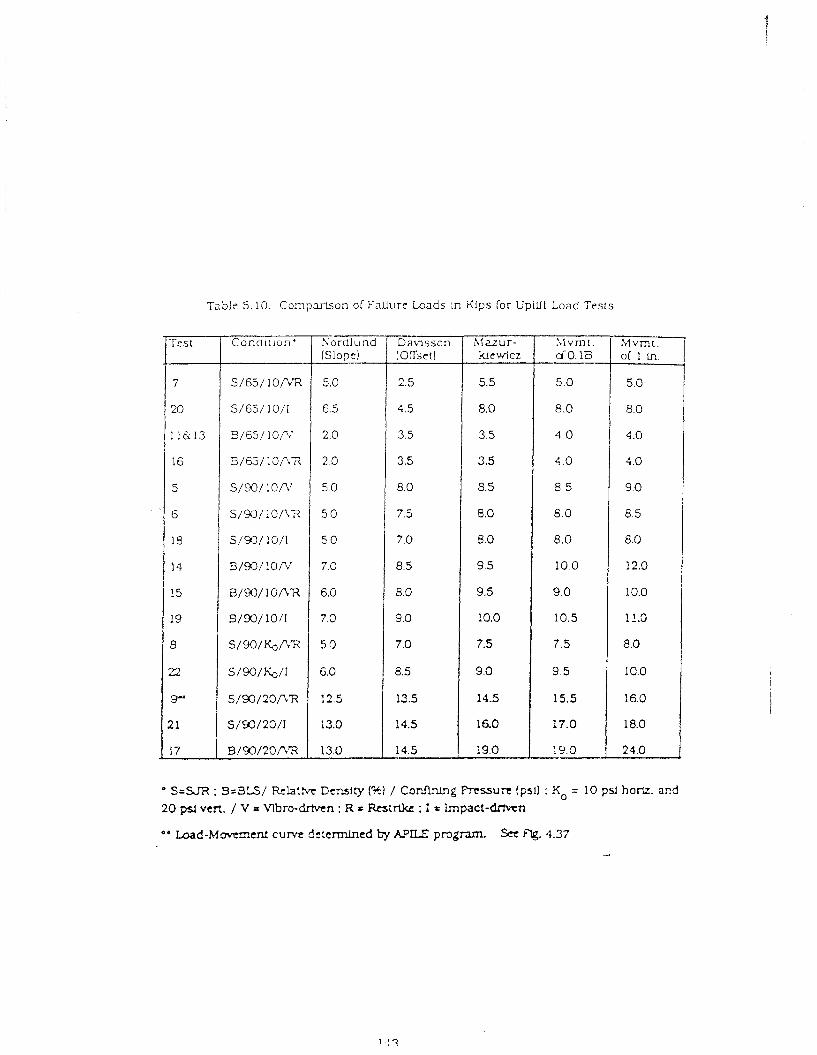
Table 5.13. Co.~?arLson of Fnllure Loads In iUps for Upiffl Load Tests
" S=SJR ; B=BLS/ Rrlatfvc Density (45) / ConfFnLng Prcssurc !psi) : KO = 10 psl horlz. and 20 psi vert. / V .r Vlbro-dr!vtn : R = b t r k : I r Impact-dfiwn
"" Laad-Mcmmcnt curve dctcrmlned by APEX p m g m Set flg. 4.37
A
that was developed in upU't was ccns!stenr!y less than that developed in compression
fc.r all methods of instal!ation.
The compression capacities of the vibro-driven pile i s comparzd w!th that of t l ;?
continuously myact-driven pile in Fig. 5.6 fcr all seven pairs of tests in the laboratory
study ~n which conditions were otherwise identical. and for which dh-ect comparisons
can therefore be made. Five of these palred tests involved vibro-driven piles that were
restruck and the other two pairs :nvolved \",bra-driven piles only. It appears that the
capacity of the vibro-driven pile, with or without restrike. was essentially equal to or
greater than that of the continuously impact-driven pile ln sand cf 90% relative density
(open data points in Fig. 5.6). Ho:vever, the capacity of the vibro-driven pile was not
greater than that of impact-driven pile in sand of 65% relative density (solid data point
In Fig. 5.6).
5.6 STATTC UXrT LOAD TFMSSFER RELATIONSHIPS
Relationships of static unlt shalt snearing resistance (0 to local pile movemerlt
(w) and unit toe bear-ng resistance (ql to toe movement (w) for all static load tests are
presented graphically In th is section. Such information is useful In visually
interpreting the maximum load transler in both shalt shear and toe bearing and the
shear and bearing s t f lness at the pile-sou interface, particulariy in terms of the
relative effects of the test parameters. Experimentally derived unlt load transfer
relationships will be used to synthesize the statlc axld behavior of piles of dlmenslons
. different from those employed in this s tudy, providing the effective stresses in the - system are scaled. which was done tn this study.
In order to develop the relationships o f f to w and q to w, It is necessary first to
dctermtne the load dlstribut1on relationships along the pile. This was acconpllshed
for every test by using the cahbrated output of the strzin gages mounted alcng tne !ength
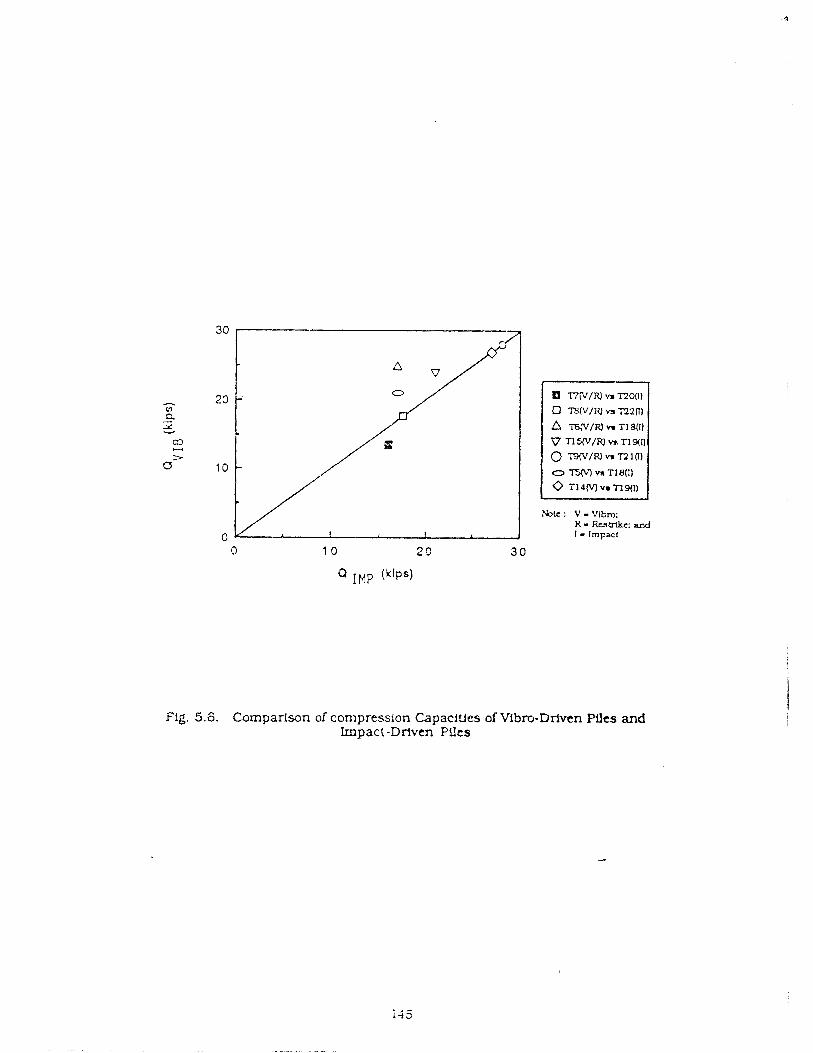
Nok: V - Vibm: R - Rclbikc: and I - Impact
Fig. 5.6. Comparison of compresslon Capacities d Vibm-Drfvtn Piles and Impact -Driven Piles
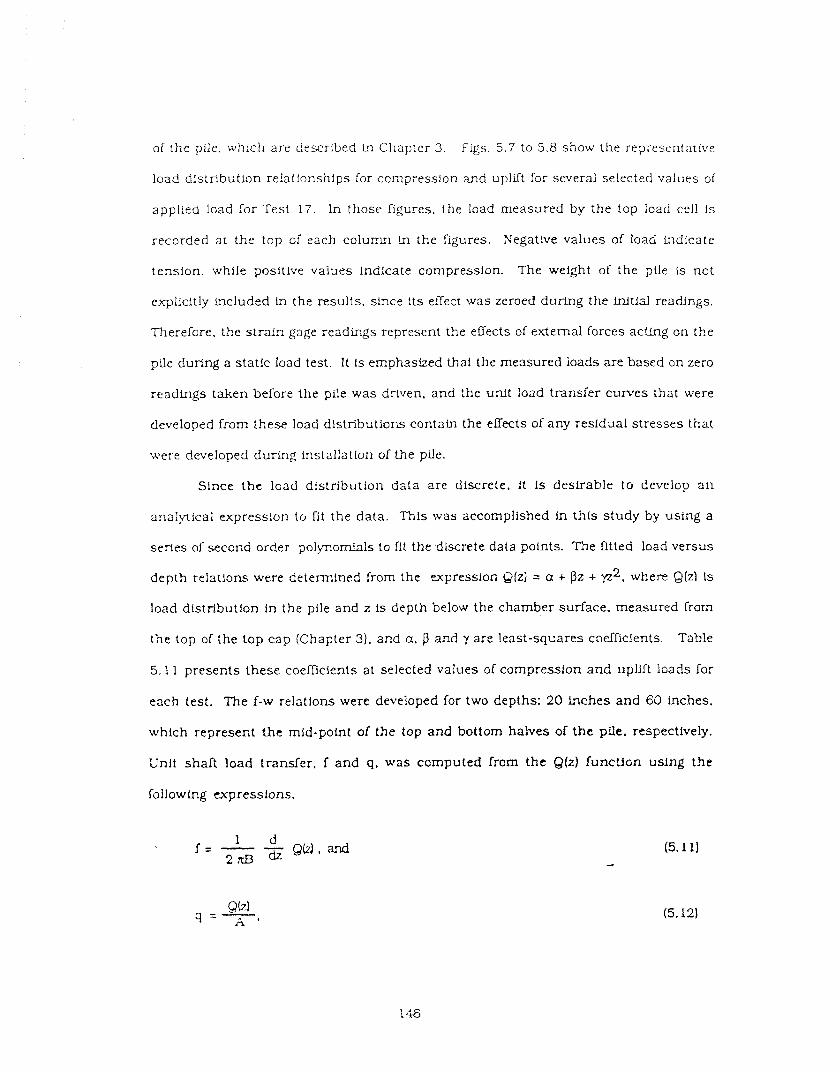
of the pde. which are descnbed tr Chapter 3. Figs. 5.7 to 5.8 show the representative
load distnbution re la t io~ships lor compression and uplift for several selected values of
applied load for Test 17. In those figures. the load measured by the top lead cell is
recorded at the top of each column ln the figures. Negative values of load Lndicate
tension. while positive vaiues Indlcate compression. The weight of the pfle is not
explicitly included ln the results. since its effect was zeroed durtng the Fnitlal readings.
Therefore, the straln gage readlngs represent the effects of external forces acting on the
pfle durlng a static load test. I t is emphasized that the measured ioacis are based on zero
readings taken before the pile was driven. and :he unlt load transfer curves that were
developed from these load distributions contain the eEects of any residual stresses that
were developed during installation of the pile.
Since the load distributlon data are discrete, it is desirable to develop a n
analyticai expression to f i t the data. Thls was accomplished in this study by using a
series of second order polynomials to f l t the d k r e t e data points. The fltted load versus
depth relations were determined from the pxpression Qlzi = a + Bz + yz2. where Q(zl is
load distribution in the pile and z is depth below the chamber surface, measured from
the top of the top cap (Chapter 3). and a, P and y are l eas t - sq~ares coefncients. Table
5.11 presents these coefficients at selected values of compression and uplift loads lor
each test. The f-w relations were developed for two depths: 20 laches and 60 inches,
which represent the mid-point of the top and bottom halves of the pfle, respectively.
Unit shaft load transfer, f and q. was computed from the 812) f u n c t i ~ n uslng t h e
following expressions,
1 d f = - -
2rcB dZ QkI, and
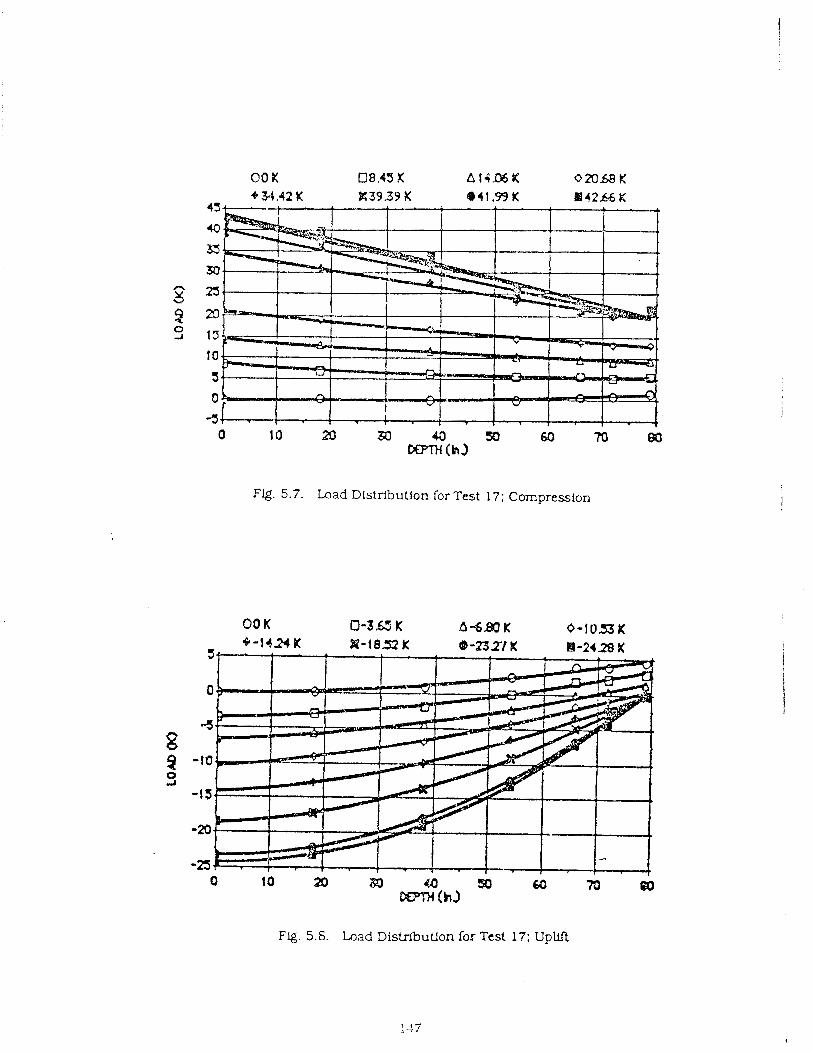
Flg. 5.7. Load Distribution for Test 17; Compression
Fig. 5.6. Load DistribuUon for Test 17; Upllft
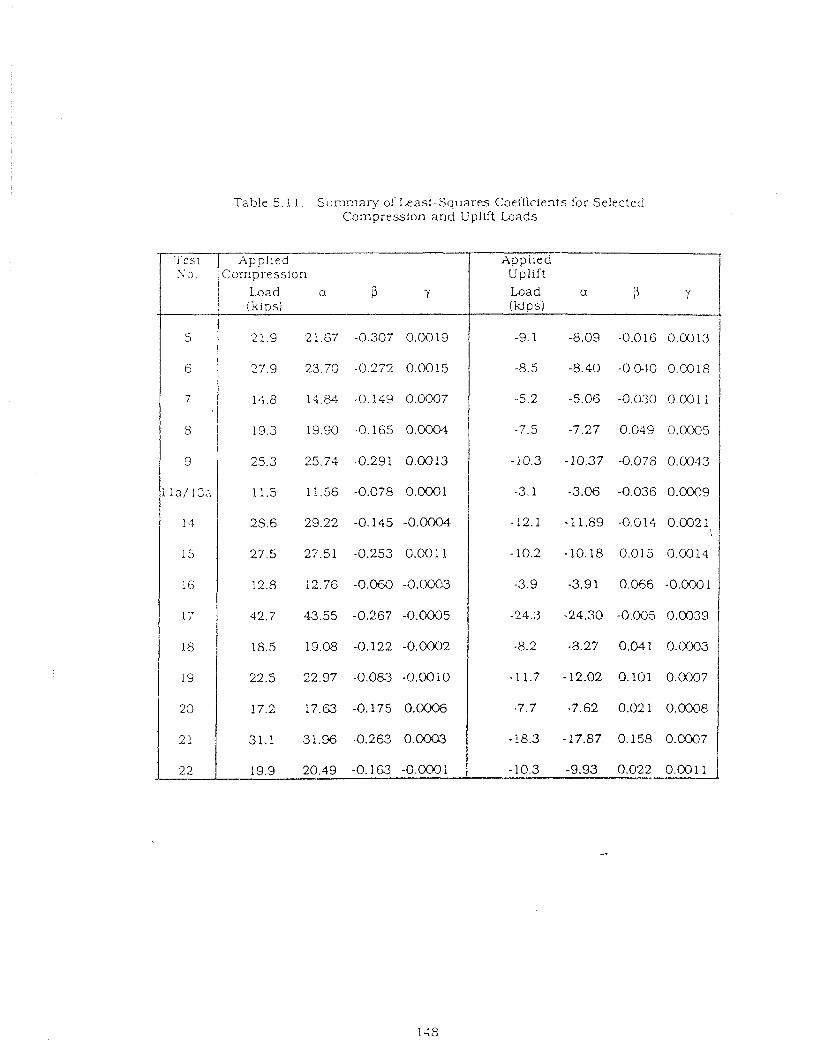
Table 5.1 1 . S c ~ m m a r y of Least-Squares Coefficients lor Selected Compress ion and Liplift Loads
Appl ied C c m p r e s s i o n Up l i f t
1 Load a I3 Y Load a 5 Y i ( k p s ) (k ips )
7
A = cross sectional area of pilz
The corresponding w value was calculnted by using the following relationship,
1 z
W = W O - dQ(z) dr . (5.13;
wo = measured pile head moveinent. and
A_E = product of Young's modulus and cross-sectional area of the pile.
This process was repeated for zach of the several functions to develop sets of
polnts defiriliig the f-w and q-w relatlons. Flgures 5.9 - 5.16 present the experimental f-
w and q-w relat ionsh~ps far each of the capacity tests . Negative values of w lndlcate
upward movement of the pile rela!l\.e to the soil, while positlve values represent
down*.vard movemen:. Corres?ondingly. negative values of f represent dow-nward-
dLtect shea r s tresses on the face of the p!le shaft . while positive values represent
upward-directed shear stresses. Positive q indicates compressive load on the pile toe.
The unit loads and movements from these re1ationsh:p.s were then normalJzed by the
eirective horizonla1 chamber pressure ( ~ ' h ) and pile diameter (B), respectively. and tests
were grouped tcgether zccordlng to sand graln s k e and method of installation, except
that tests conducted at 65% relative density were grouped in terms of grain size only.
Average relationships for smcra! groupings o l tes t s were produced. Those groupings
are, h order. (a) all tests conducted b SJR Sand at 65Oh relatfve density; (b) all tests on
impact-driven pilp SJR Sand at 900%~ relative density; (c) all tests on ~qbrc-driven pile
m SLQ Sand at 909.6 relative d e m i v , (dl all tests o a vibro-driven pile PA ELS Sand at
65% relative density (no impact tes t performed for th is condillon); (e) all tes t s on
impact-driven pUe at 9% relatfve density: and (0 all tests on vfbro-driyen pile at 90??
relat!ve density. Figures 5.17 - 5.22 present the f-w relatlons in this order, and Figs.
5 2 3 - 5.28 present the corresponding q-w reia!ions. Residua; s t resses after
ir?stallation a n mclu5ed in these graphs; kowever, the residual s tresses at the end of
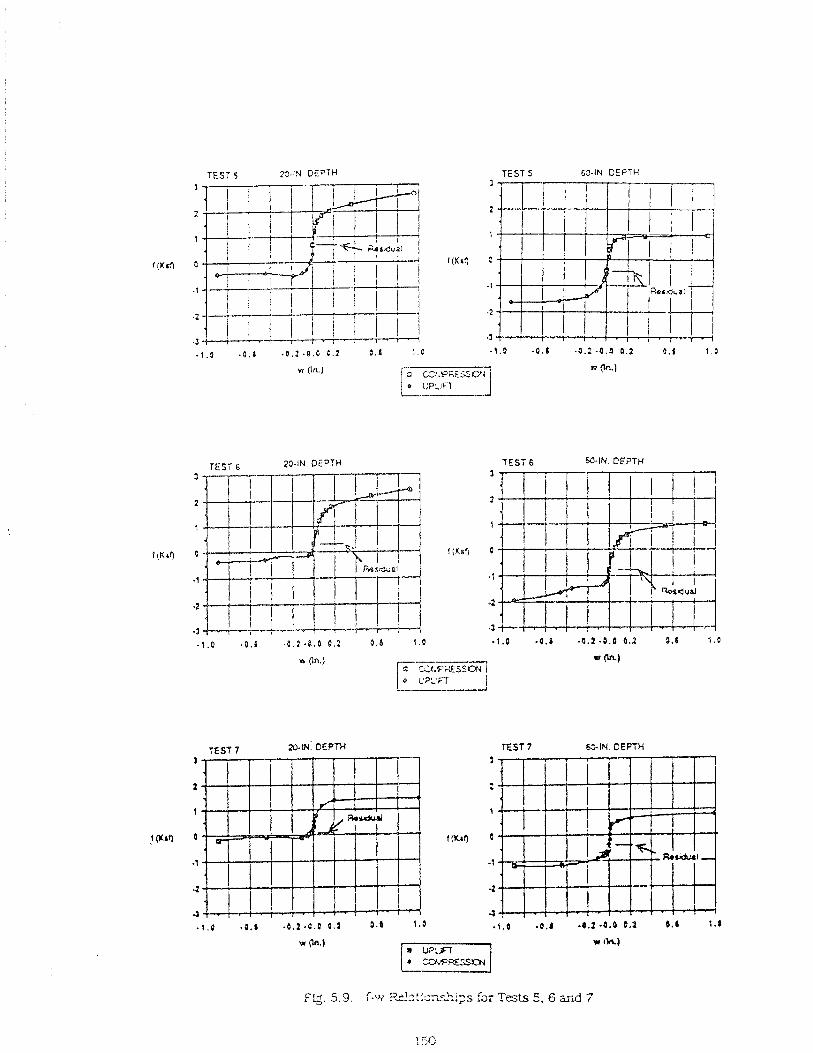
TEST 5 TEST 5 63-IN DEPTH
TEST 6 23-IN DEPTH 3
2
t
0
-1
.2
. 3 1 . 0 -0.6 - B . I . B . O O . Z 0.) 1 . 0
TEST 7 22-tN: D E P M
UPLIFT
TEST 6 3
TEST 7 -IN. DEPTH
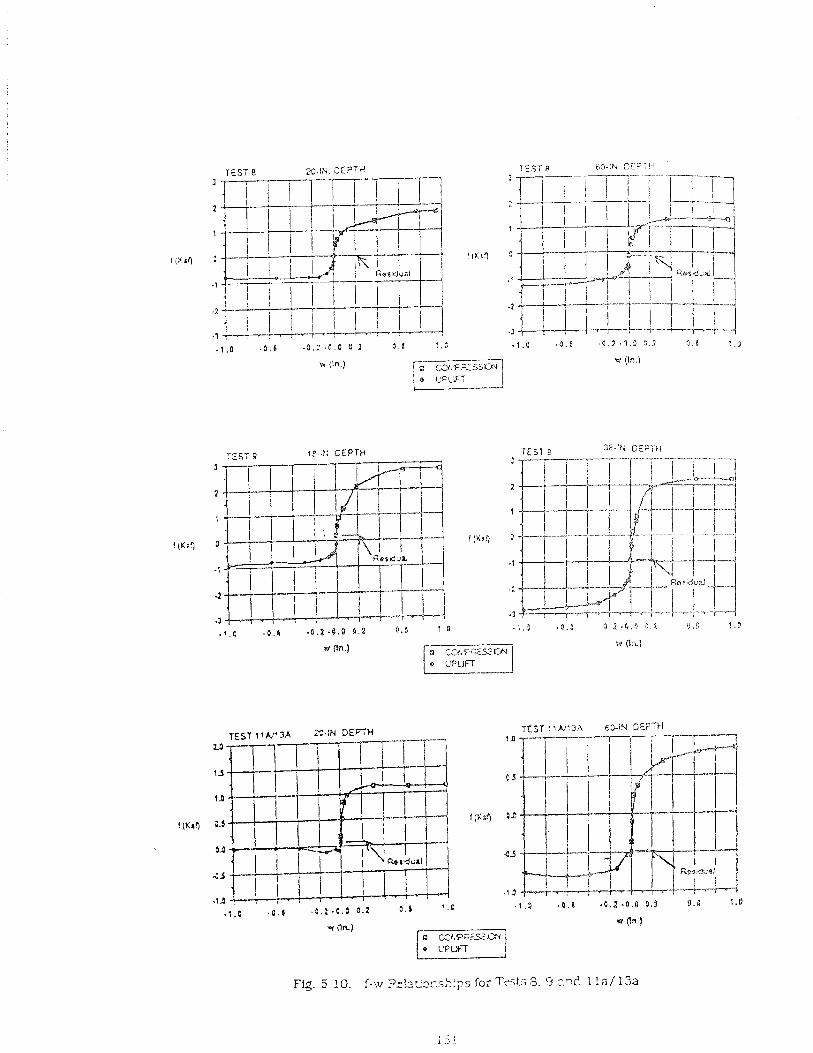
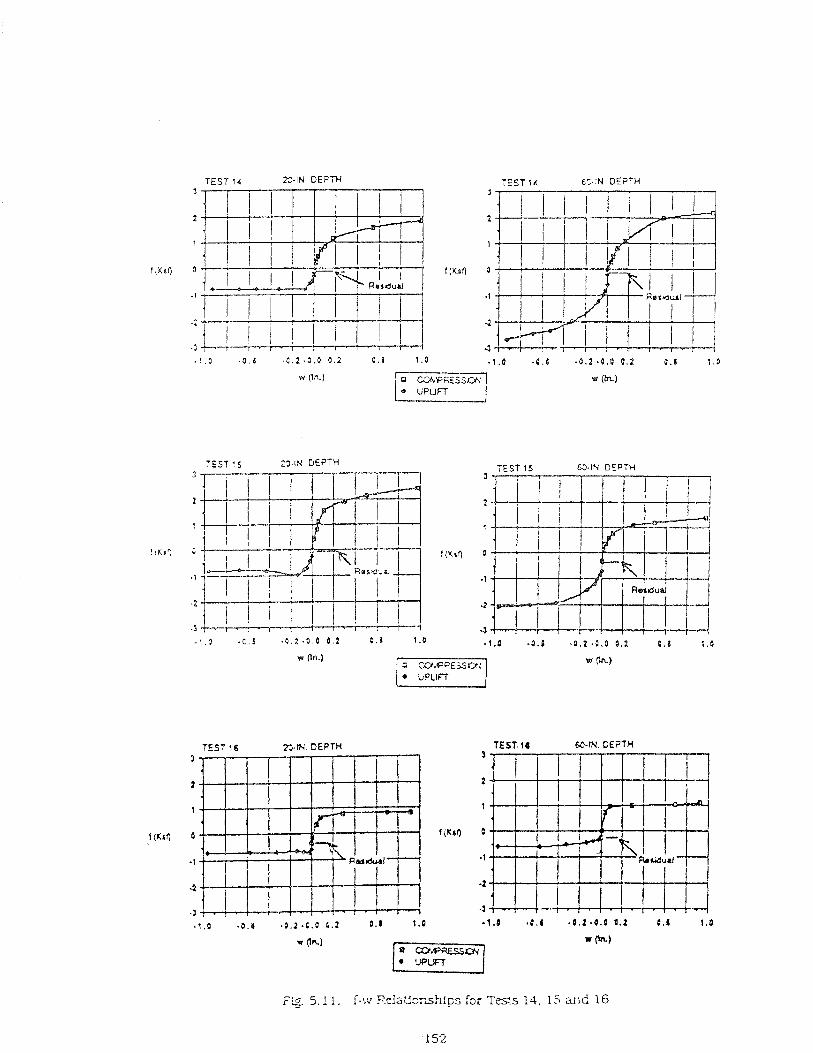
TEST 14 T,-IN. DE?;W TEST l A 6;-:N D E ? T i
w (In.)
TEST ' S ::.IN DE?TH
TEST 16 ?&tK DEQYU
TEST 15 65.1Y DEPTH
TEST. 16 60-M DE?TH
r"g. 5. ! 1. i-w ?.eiaUmxsh!ps for Tas 14, 15 and 16
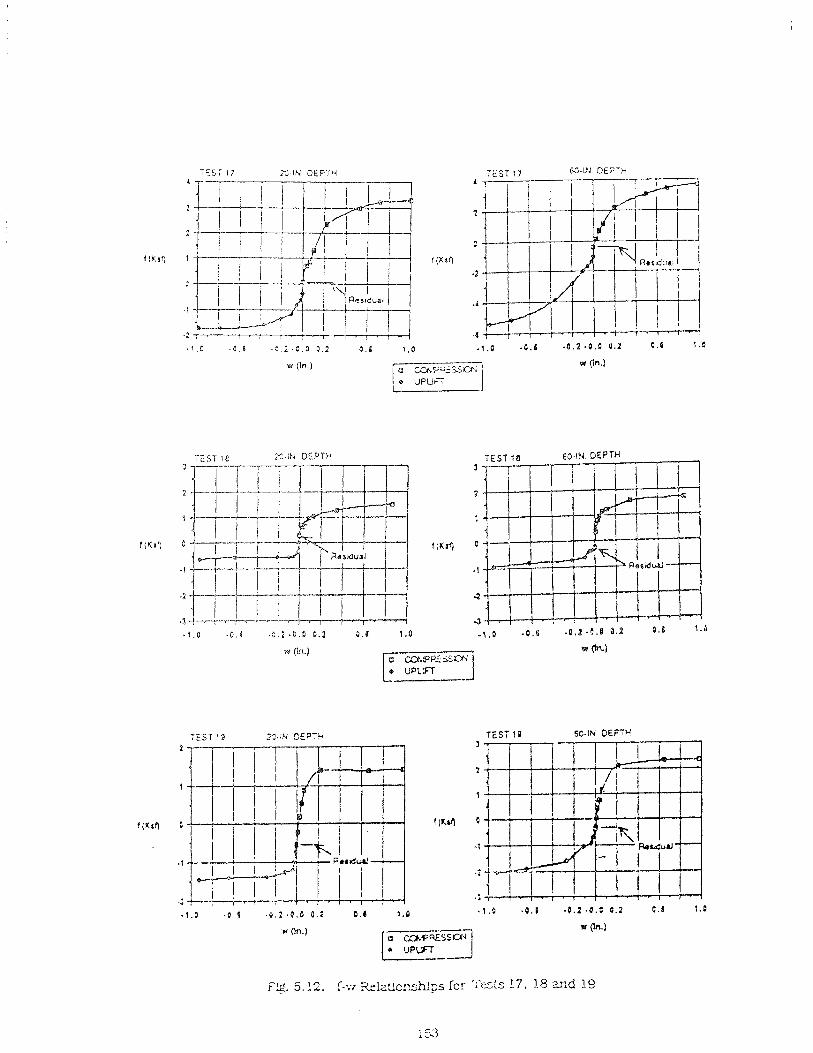
w (In.)
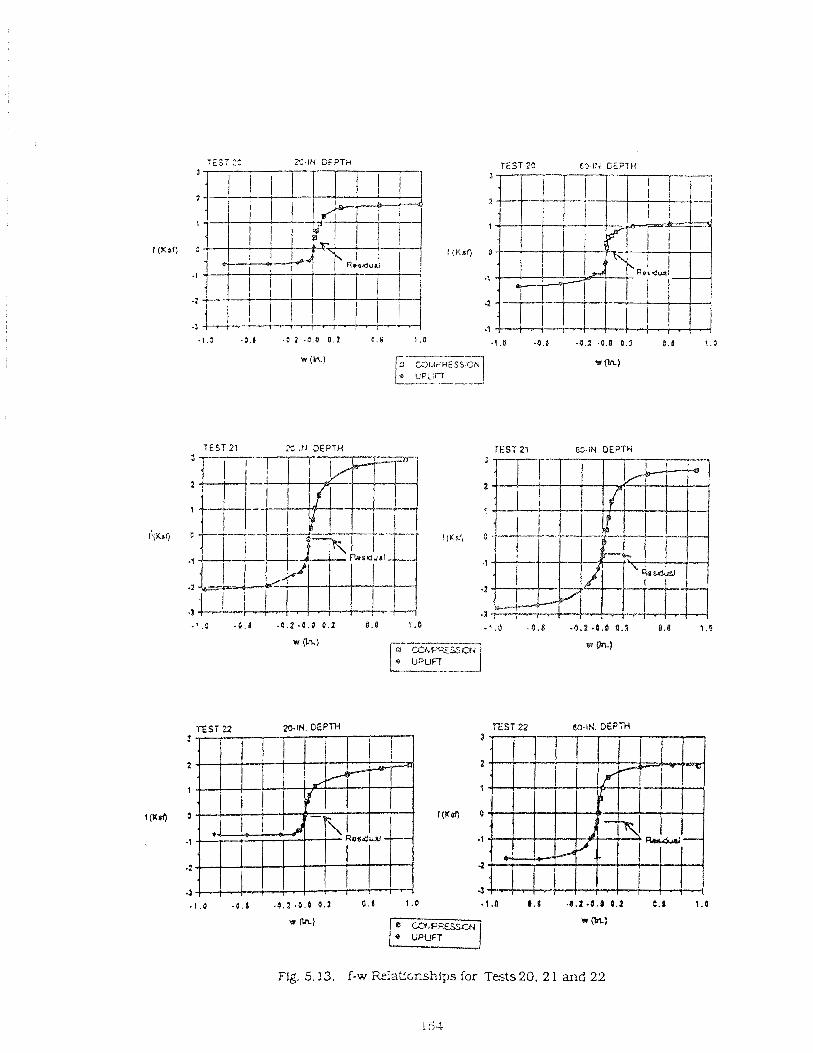
TEST 20 €3-i!i GEPTH
T E S T 21 TEST 21 69.1~. DEPTH
Fig. 5.13. f-w &iationships for Tests 20, 2 1 and 22
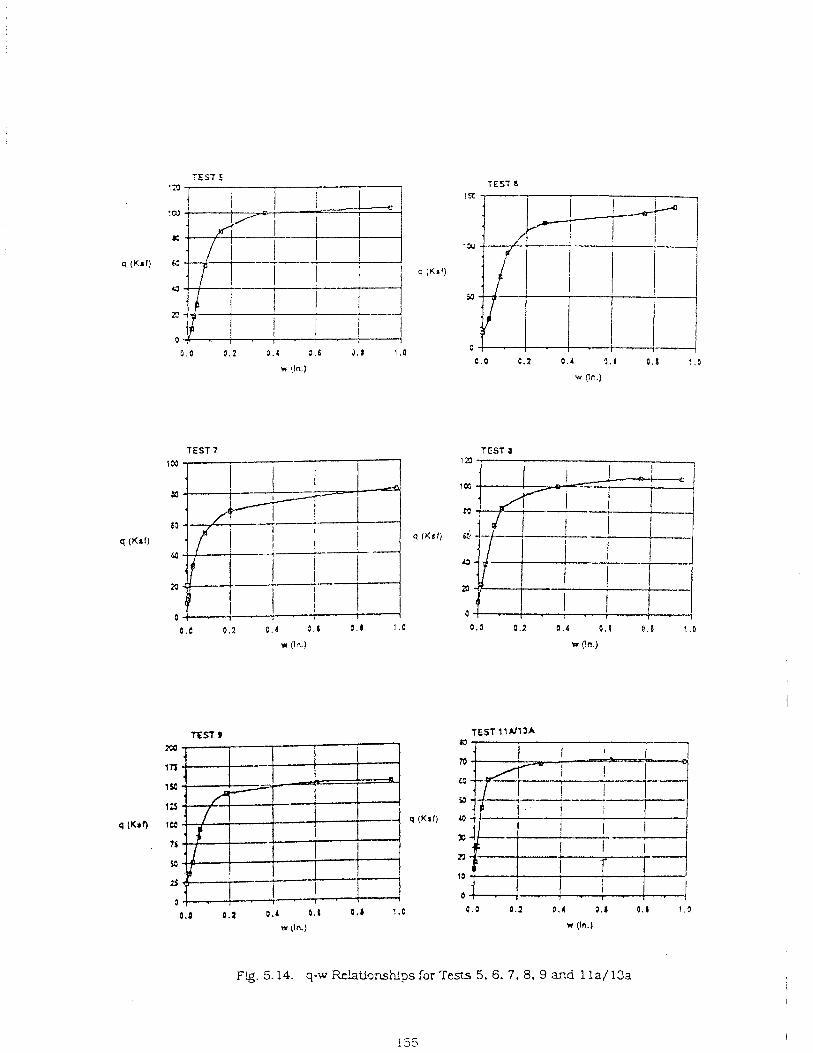
TEST t TEST 8
0.0 0 . 2 0.4 3.6 J.1 I . O
w {In.)
TEST 7 TEST 8 t z l -T
TEST IlUlaA 6)
m
LO
sa
40
x1
M
1 a
0
0.0 0.2 0 . 1 3 . 4 4 . 8 1 . 9
w (m.)
F!g. 5.14. q-w XelaUonships for Tests 5, 6. 7 , 8. 9 and 1 la / 13a
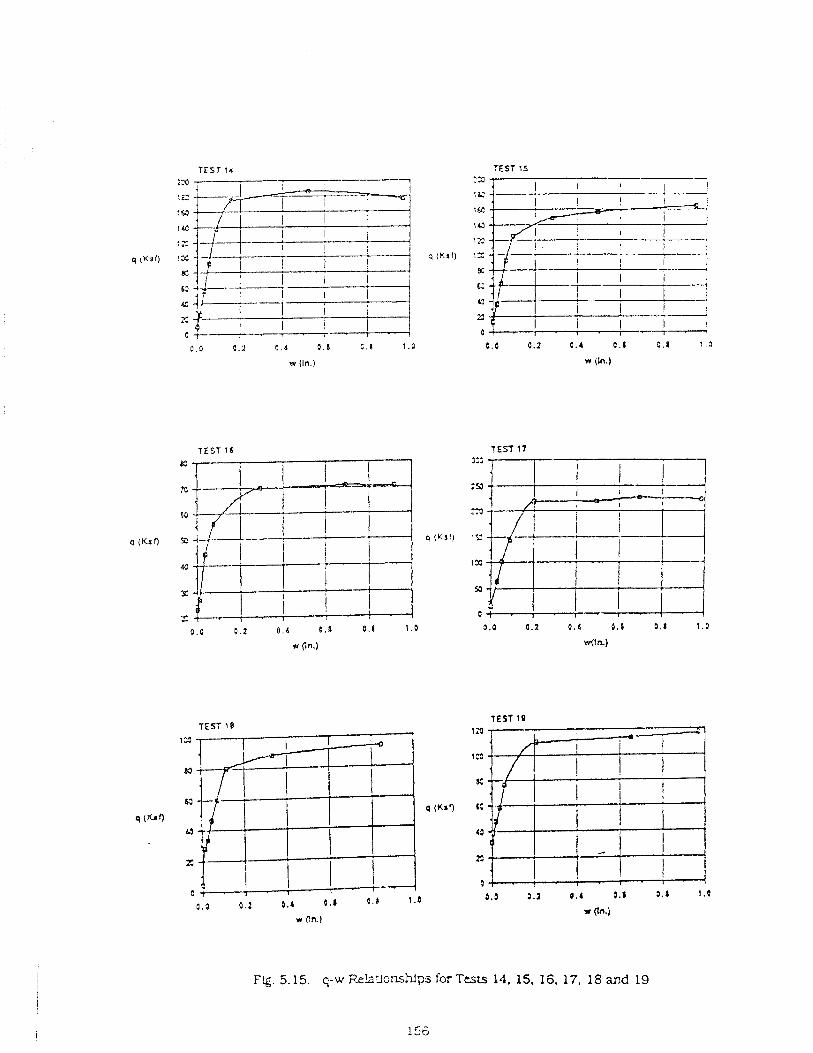
I I I C t------7---~-- 0.0 9 . 2 8.6 0.6 5 . 1 1 . 3
w (In.)
TEST 15
='I I I I I I
TEST 16 T E S Y 11
h9 31:
Tc 2%
KJ 3
Q(Gr) 2 q ( s f 'J:
do 1 P
E 54
c z 0 . 0 0.2 0 . 4 0 . 0 0 . 8 9.0 3.0 0 .2 0.4 0.6 0 . 8 1.0
On.) **On)
~ i g . 5.15. q-w Pzlagonsldps for Tests 14. 15. 16. 17. 18 and 19
156
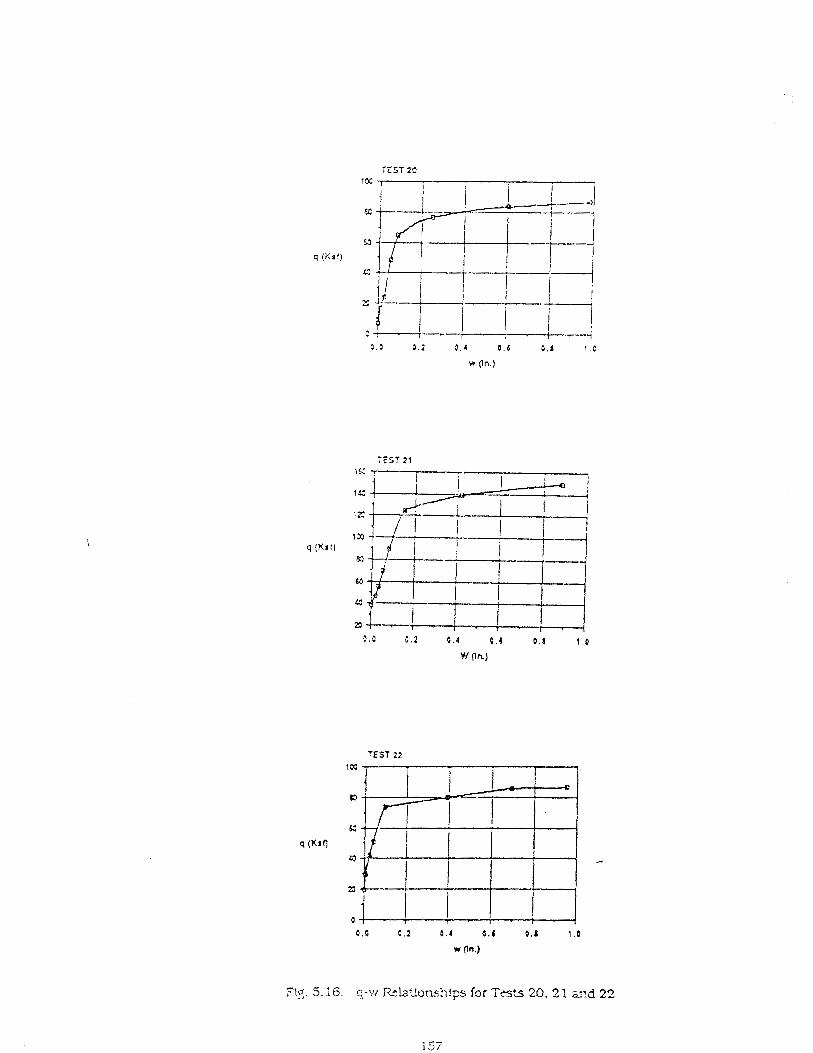
TEST 22
$ o(*o 4
0.G 6 . 2 6 . 4 $ . I 0.4 1 . 0
w (In)
Ti;. 5.36. q-w F-~!a'Jor,ch!ps fsrTmis 20. 21 &?ci 22
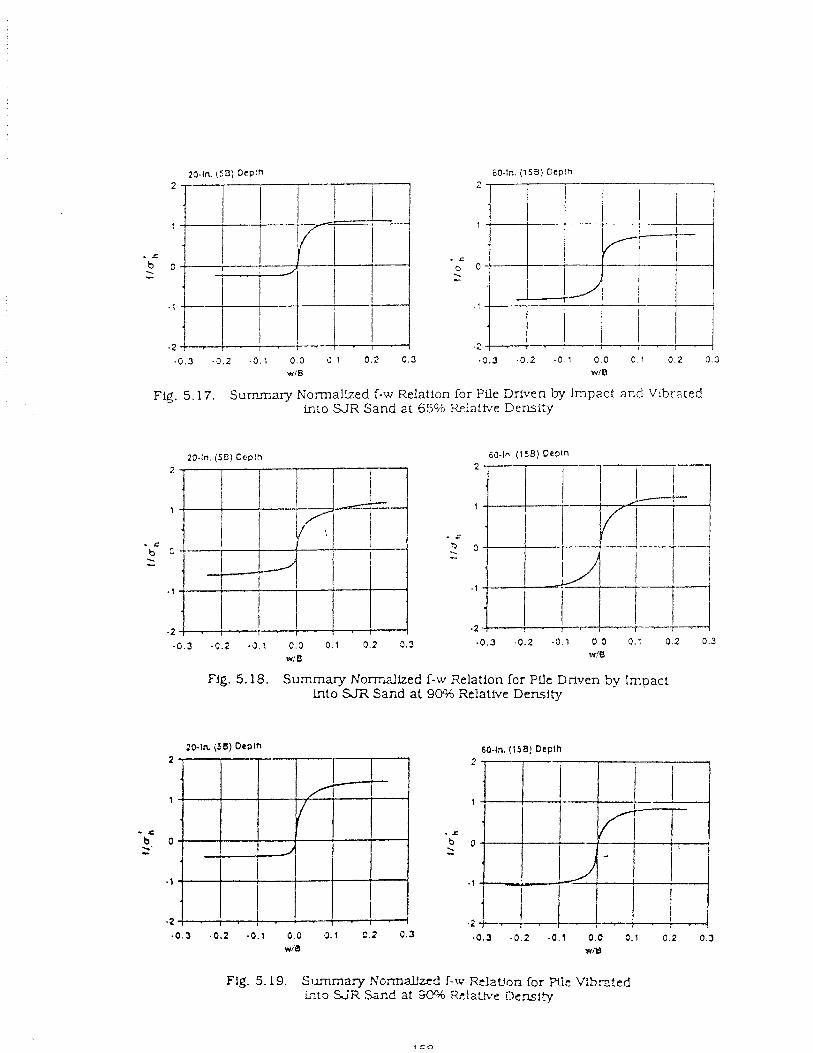
20-In (5B) Depth 60-In. ( 1 5 8 ) Depth
Fig. 5.17. Surnmary Xormallzed f-w Relation for Pile Driven by Impact and Vibrated into S J R Sand at 65Oh Rplathre Density
20-In. (5B) Ocplh 2
Fig. 5.18. Summary Normallzed f-w Relation for Pfle Driven Sy Impact lnto SJR Sand at 90% Relative Density
20-1% (35) OePlh 60-In. (158: Deplh
Fig. 5.19. Summary NomaLfitd f-w e la t Jon for Pile Vib=-._!ed i l t o S j R -d at -3% Pzlamo Ders i ty
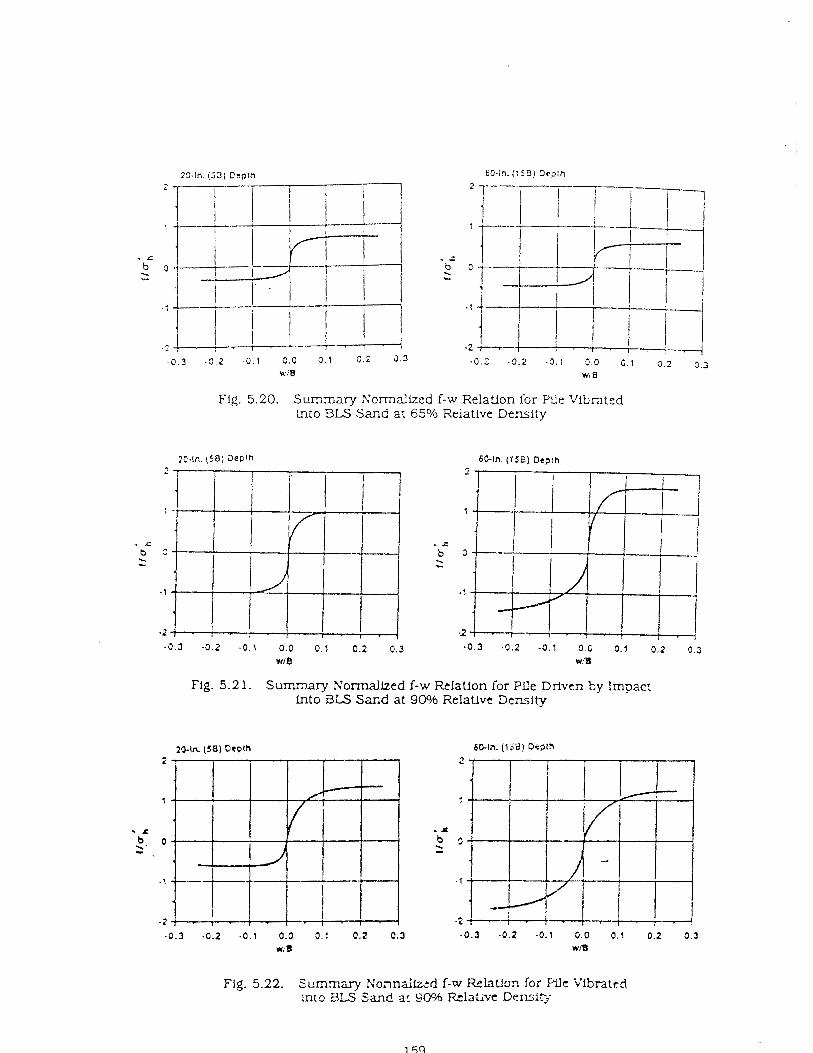
Fig. 5.20. Summary Normallzed f-w Relation for Pile Vibrated Lqto BLS Sand at 65% Reiative Density
Fig. 5.21. Summary Normallzed f-w Relation for Pfle Driven by Impact into BLS Sand at 9W RelaUvc Densi ty
Fig. 5.22. Sc?mmsry h'oandiz,-d f-w Reht ion for FLlc Vibrated into Y S Siind a: YCCh Rclat'ic Demi?j
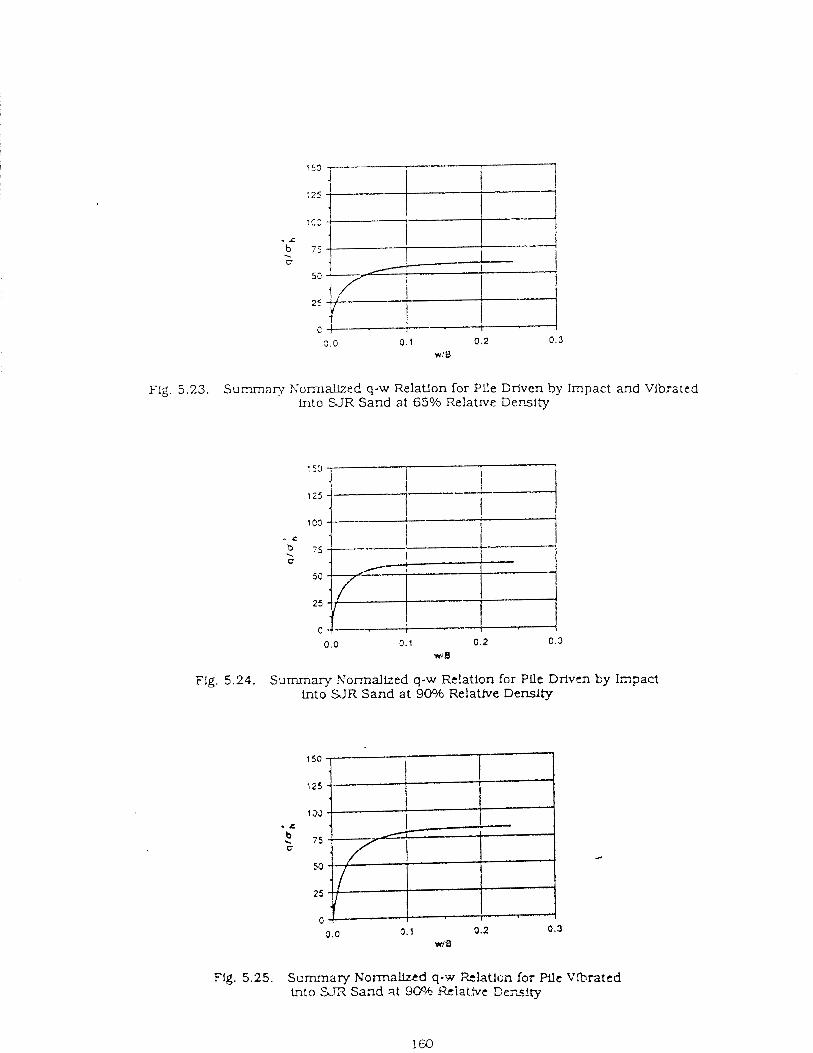
~ l g . 5 .23 . S u m m q Normallzed q-w Relatlon for Plle Driven by Impact and Vibrated into S J R Sand at 65% Relative Density
Fig. 5.24. Summary h'ormalized q-w Relation for Pile Driven by Impact lnto S J R Sand at 90% Relative Density
Fig. 5.25. Scrnmary Normallzed q-w Relatlcn for H e Vibrated tqto S T X Sand at 3CQh Rciattve Cersity
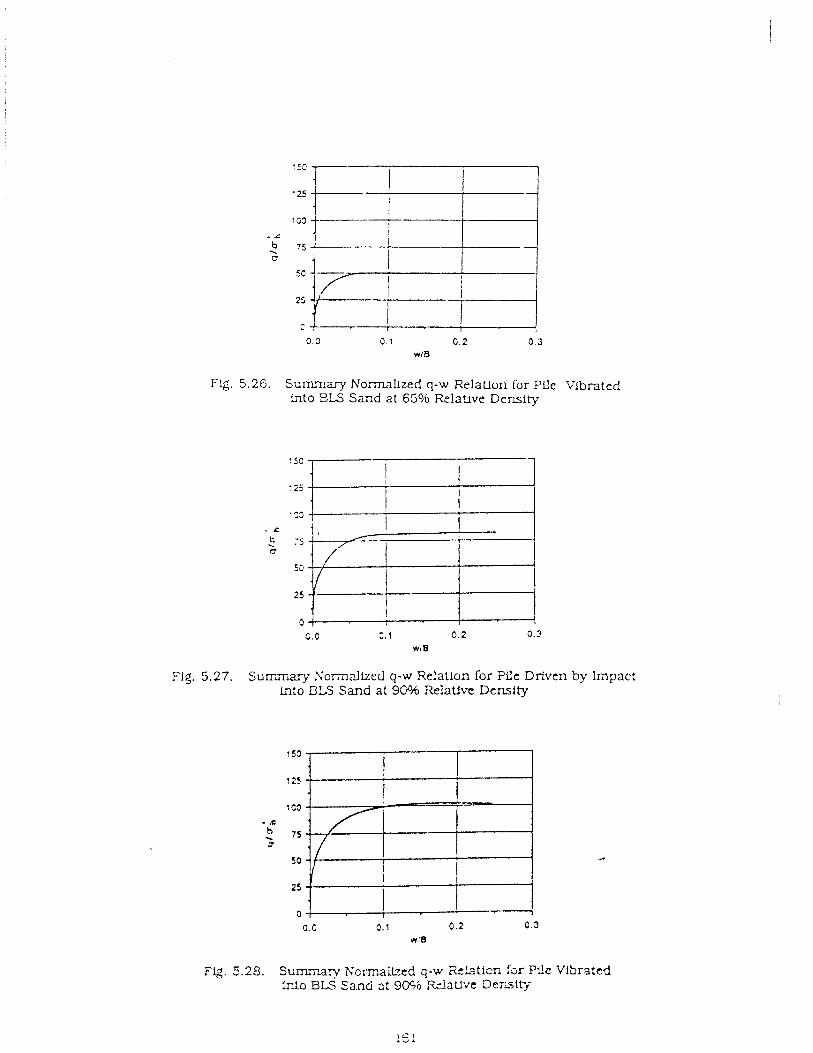
Fig. 5.26. Summary Normallzed q-w Relatlon for Pile Vibrated into ELS Sand at 6596 Relatlve Density
Fig. 5 .27 . S u r i i a r y rv'crmdlzed q-w Relation for Pile Driven by Impact Lnto BLS Sand a t 9G% Relative Density
Flg. 5.28. Summary : iormahd q-w iielaticn f ~ r Pile Vlbratcd lnto BLS Sand z! 9% ,%!auvc Derst ty
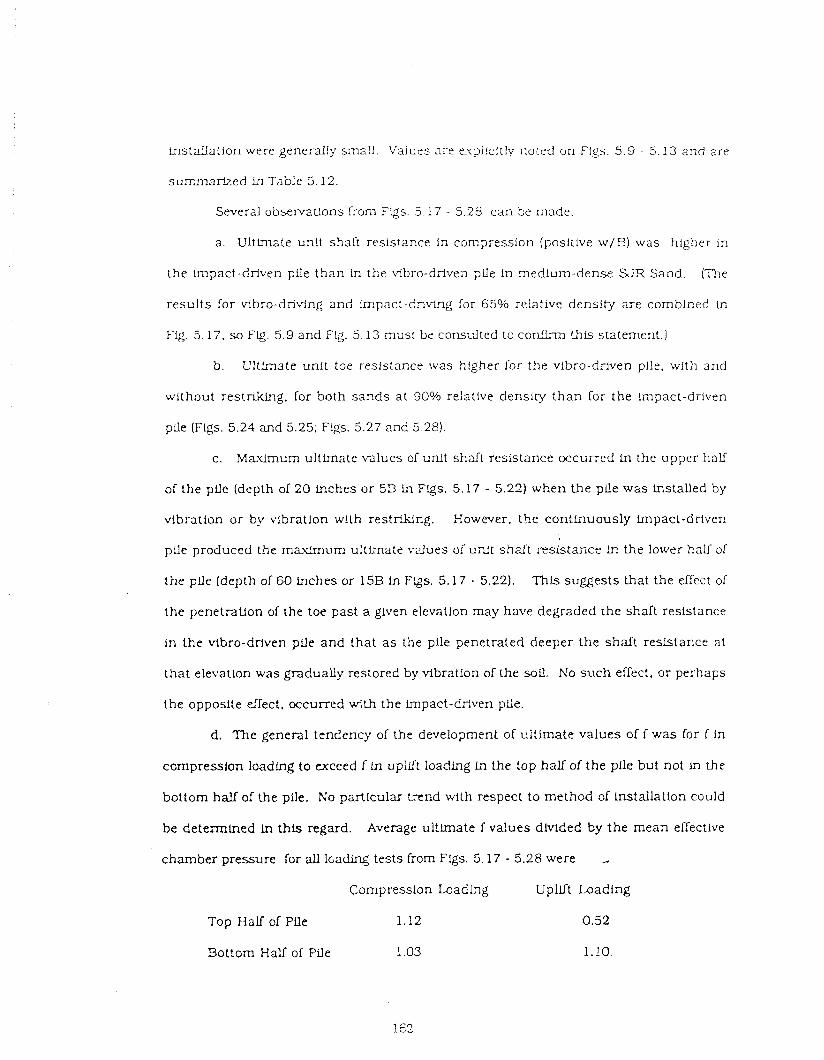
Installation were generally small. Valcrs are eupl!cirfy zoied on Flgs. 5.9 - 5.13 and are
summarized Ln Tabie 5.12.
Several observations from Fgs . 5 ! 7 - 5 23 can be made.
a. Ultimate unit shaft resistance in compression (positive w/B) was higher in
the lmpact-driven ptle than in the vibro-driven pile in medium-dense Sjfi Sand. (The
results for vtbro-driclng and impact-driving ior 6590 relative density are combined in
Fig. 5.17. so F g . 5.9 and Flg. 5.13 must be consdted tc; conflrm this statement.)
b. L'ltlmate unit toe resistance was higher for the vibro-drlven plle. with and
without restriking, for both sands at 90% relative density than for the Impact-driven
pile (Figs. 5.24 and 5.25; Figs. 5.27 and 5.28).
c. Maximum ultlmate values of unlt shaft resistance occurred ln the upper hall
of the pLle (depth of 20 inches'or 5 3 in Flgs. 5.17 - 5.22) when the pile was installed by
vibration or by blbratlon with restPAng. Xowever. the continuously lmpact-driven
pile produced the maximum u1tLma:e vdues of urdt shaft XsLtarice Lr. the lower half of
the plle (depth of 60 lnches or 15B in Fgs. 5.17 - 5.22). Thls suggests that the effect ol
the penetrauon of the toe past a given elevation may have degraded the shaft resistance
in the vibro-driven pile and that as the pfle penetrated deeper the shaft resistance at
that elevation was gradually restored by vibration of the sou. No such effect, or perhaps
the opposite eifect, occurred with the Impact-driven pCe.
d. The general tendency of the development of uitimate values o f f was for f in
compression loadfng to exceed f m upiLrt loading In the top half of the plle but not in the
bottom half of the plle. No particular trend with respect to method of installation could
be determined in this regard. Average ultimate f v d u e s divided by the mean effective
chamber pressure for all 1oadLr-g tests from Figs. 5.17 - 5.28 were
Compression Loading Uplllt Loading
Top Half of Pfle 1.12 0.52
3ottom Hall of Pile 1 .03 1.10.
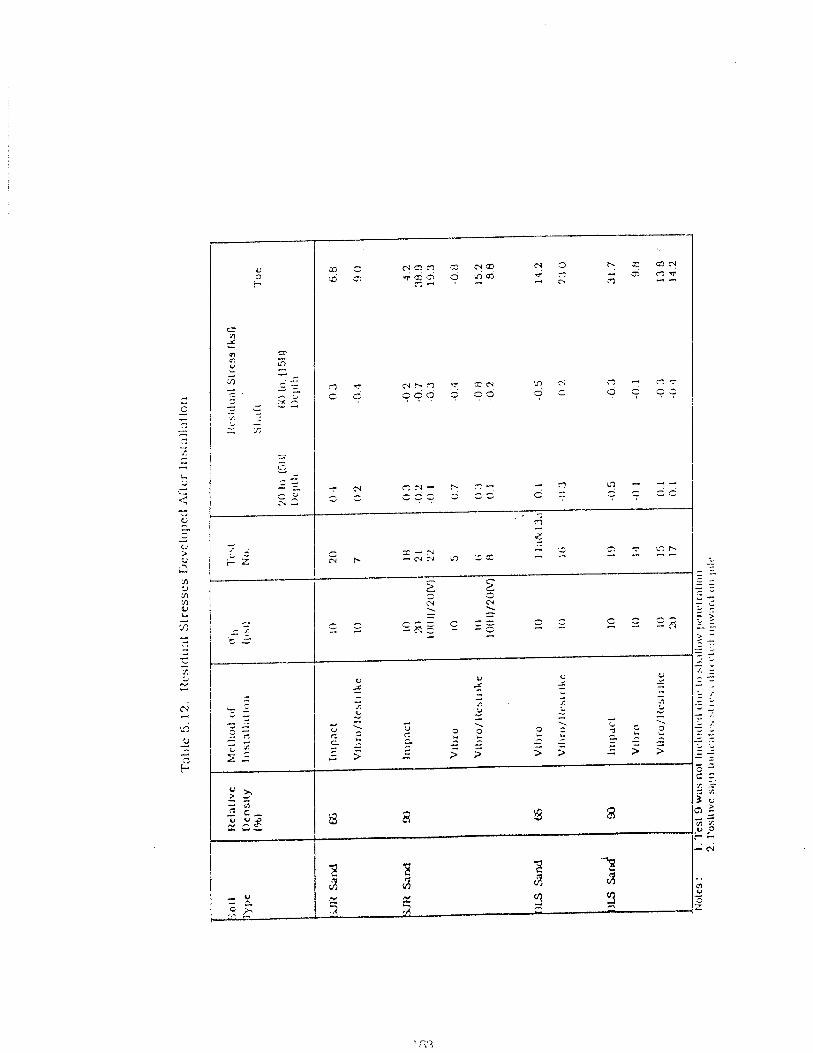
These data suggest that a s ~ ~ r f a c e effect evisted during uplift loa&!g, whereby the free.
pressurized surface of the s a n d within the chamber permitted development cf shea r
planes a t a n angle to the interface, which possessed a lower shear strength than the
interface plane and whlch Lherefore pemlltted [allure to occur at a lower s h e a l n g stress
during uplift loading than during compressiorl loading. For this reason no attempt was
made to cornpare uplift capacities for various methods of lnsrallation in the way in
which compression czpacities were compared.
e. The ultlmate value of f was, on the average for all tests. 8GVo of the lateral
eflectfve chamber pressure for Dr of 65% and 120941 of the lateral effective chamber
pressure for Dr of 9096. Since the angle of interface shear varjed from 25" to 30" (Fig.
4.11). It can be demonstrated that the insertion of the pile into the chamber produced a n
increase in !he horizontal efrective s t r e s s !n the chamber at the pile-soil interface.
iissurring that f = o ' ~ 'an 8, where o ' ~ is the horizontal efTec!ive stress at rhe pde- m 5 ~
soil interface, and 8 is the angle of interface shear (average value of 27.5"). the average
horizontal efrective s tress at the pile-soil interface can be computed to be 0.8 / tan 27.5"
which is 1.5 times the simulated horizontal in-sltu (lateral effecrlve chamber) pressure
for Dr of 65% and 1.2 / tan 27.5" which is 2 . 3 times the simulated horizontal In-situ
pressure for Dr of 90%. The pile, whether vibrated or impacted Wito place, therefore
mus t have served to increase the efrective s tress In the sou Fmrnediately surrounding
the pfle.
f. The ultimate values of both f and q were generally about 80% fu!ly developed
a t a local dlsplamment of 5% of the pfle diameter but continued to increase slightly a t
larger displacements. Deformation softening behavior was not observed in either
shaft or toe resistance when ttle pl!e was installed either by vibro-drlvhg or by Impact-
driving.
Further insight &to the behavior of the test pile during vibratory d m . $ can be
gained by observing unit load t r a ~ s l e r relations (f-w and q -w curves) that developed
dur ing vibro-drlvlng and comparing [hose relations with the equivalent relations
developed during subsequent static load testing, as described in the preceding section.
The d lnamic unit load transfer curves were determined from the digitized time
histories of force and acceleratiofi. Three to f ~ u r cycles of load were selected from
analog records, and the pile-head and pile-toe force records a n d t h e pile-head
acceleration record were dlgftized (512 poin ts for each record). The pile-head
acceIcra!lon record w a s fntegrated once, a s described above. 1: necessary, the resulting
digitized velocity record was shifted one o r two time s teps so tha t the pile-head force
and velocity records began to rise on the first cycle a t the same time. The pile-head
velocity record was integrated again to obtain pile-head displacement record wm(t) by
using the trapezoidal rule for numerical evr!uation and 512 Ume steps.
Test dara hdica te that the plle. during vibratory lnstallatlon. behaved a s a
rigid body, so that the value of w,(t) was assumed to apply all along the pLle at any
given instant of t i m e . At this same ins tv l t af t lme the value of dlgltlzed toe force
divided by toe area (12.57 square inches) was taken to be qlt). Cor~es$ondlng values of
w,(t) and qlt) were then graphed a s unl t load transfer curves that occurred dxrlng
vibro-driving.
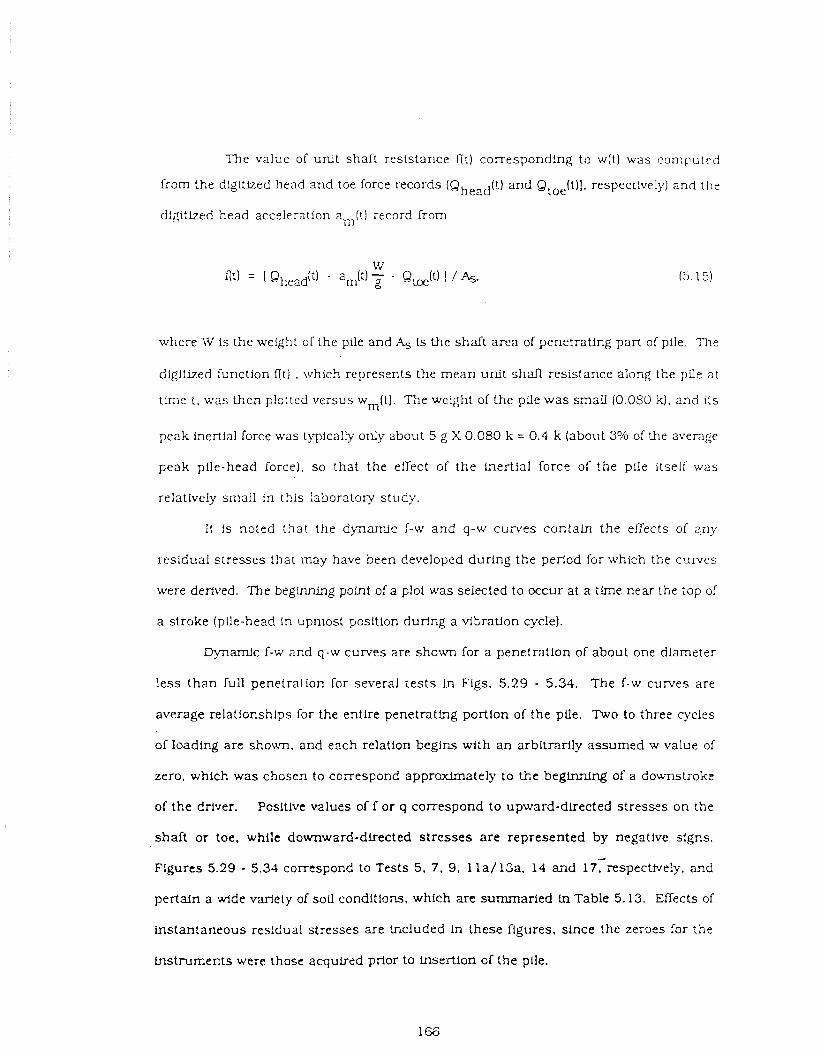
The value of unit shaft resistance f i t ) correspond!ng to w(t) was computed
from the digitized head and toe force records (Qhead(t) and Qtoe(t)!. respectlvely) and t h e
digitized head acceleration a,(t) record from
Q,(tIl/ As.
where IV is the weight of the pile and A, is the shaft area of penetrating part of pile. The
digitized functlon f [ t ) . which represents the mean unit shaft resistance along the pile at
time 1, was then plotted versus wmltl. The weight of the pile was small (0.080 d. and its
peak inertial force was typically only about 5 g X 0.080 k = 0.4 k (about 3% of the avenge
peak plle-head force), so that the effect of the inertial f o r e of the pile itseIf was
relatively srnall in this !aboratory study.
I f is noted that the djnamic f-w and q-w curves contain the efrects of qny
residual stresses that may have been developed during the period for which the cunres
were derived. The beginning polnt of a plot was selected to occur at a tfme near !he top of
a stroke (pile-head in upmost position during a vi5raUon cycle).
Dynamic f-w and q-w curves are shown for a penetration of about one diameter
less than full penetration for several tests in Figs. 5.29 - 5.34. The f-w curves are
average ~ I a U o n s h i p s for the entire penetrating portion of the pfle. Two to three cycles
of loading are shown. and each relation begins with an arbitrarily assumed w value of
zero, which was chosen to correspond a p p r m a t e l y to t h e beginning of a downstroke
of the driver. Posltlve values off or q correspond to upward-directed stresses on the
shaft or toe. while downward-directed stresses are represented by negative signs.
Figures 5.29 - 5.34 correspond to Tests 5. 7, 9, 1 l a /13a , 14 a i d 17~respectively. and
pertaln a wide variety of SOU conditions, which are sumrnaried ln Table 5.13. Effects of
instantaneous residual stresses are included In these figures, since !he zeroes for the
instruments were those acquired prlor to insertion GT the pile.
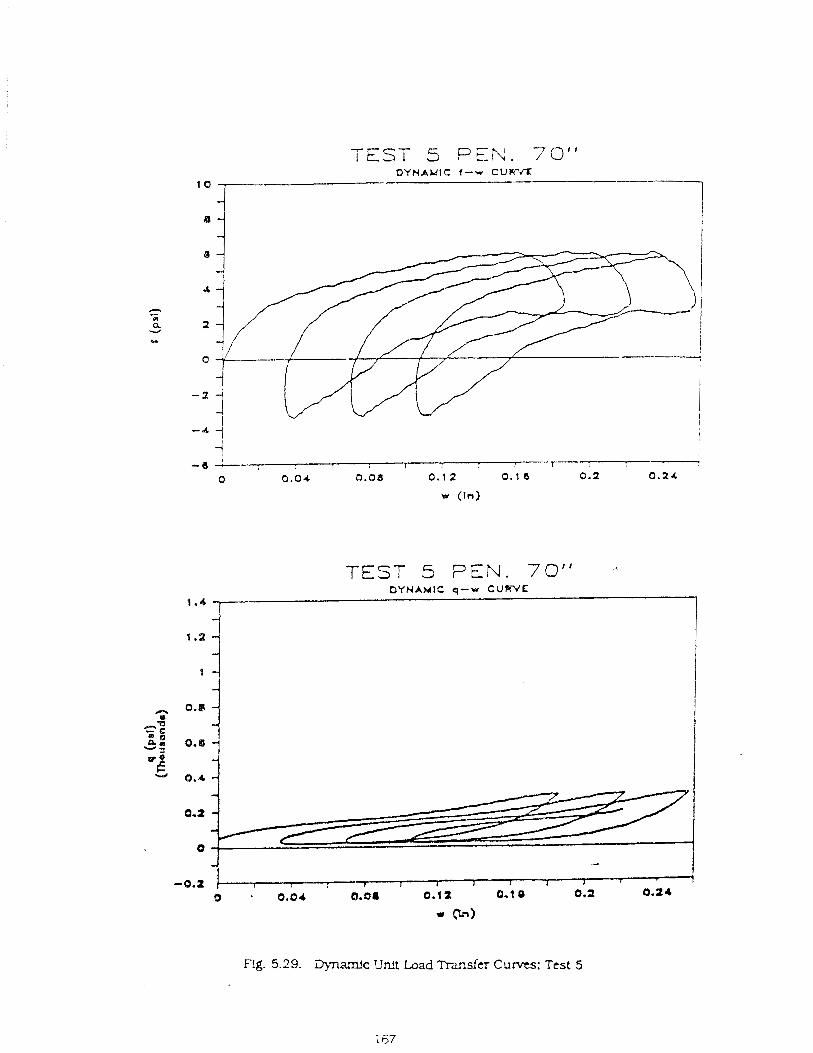
TEST 5 PEN. 70" DYNAMIC f -w CUPT(X
l o I 1
TEST 5 PEN. 70" DYNAMIC q -w CURVE
1.4 [
Flg. 5.29. 3yxunic 'Jnit Load m d c r C u m : Test 5
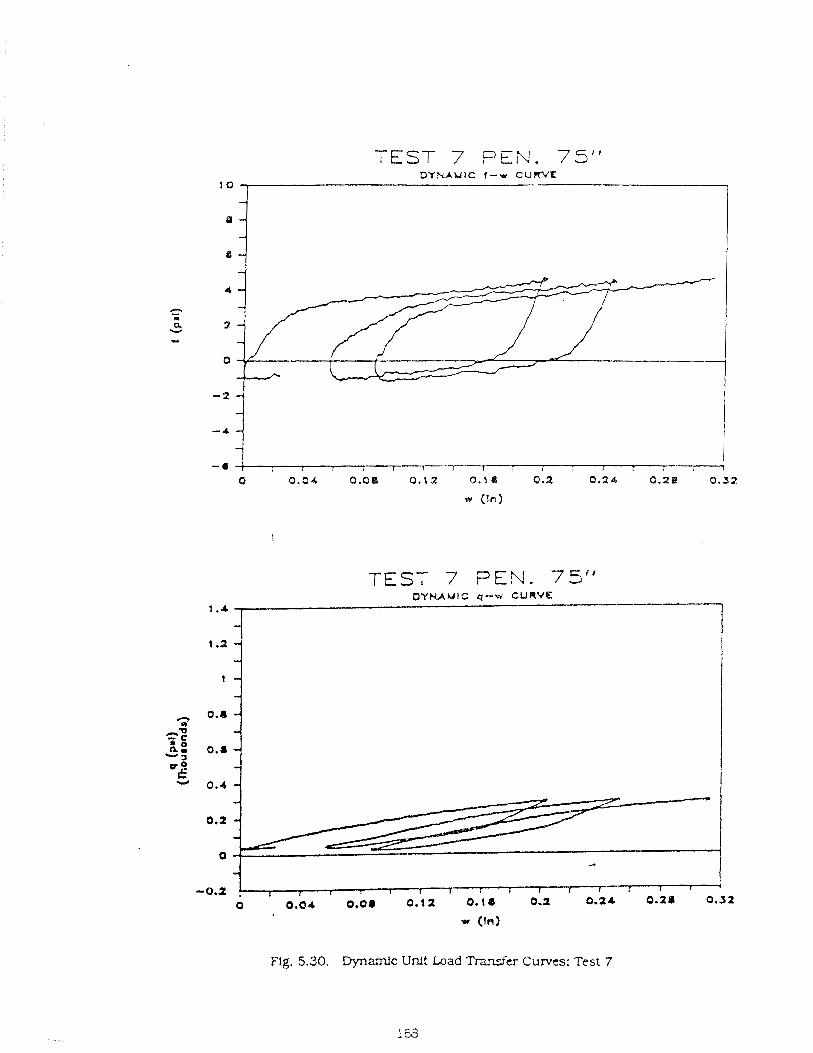
TEST 7 PEN. 75" D Y . W U l C I - w CURVE
10 , 1
Flg. 5.30. Dynamic Unit Load M e r Curvcs: Test 7
TEST 7 PEN. 75" DYNAMIC q -w CURVE
1 .* - 1.2 - -
1 -
I

7-7-P-
i I 9 PEN. 49'' O Y N A U l C I-w CURVE
I
F!g. 5.3 1. Dynamc Unit Load ?Yansfer Curves: Test 9
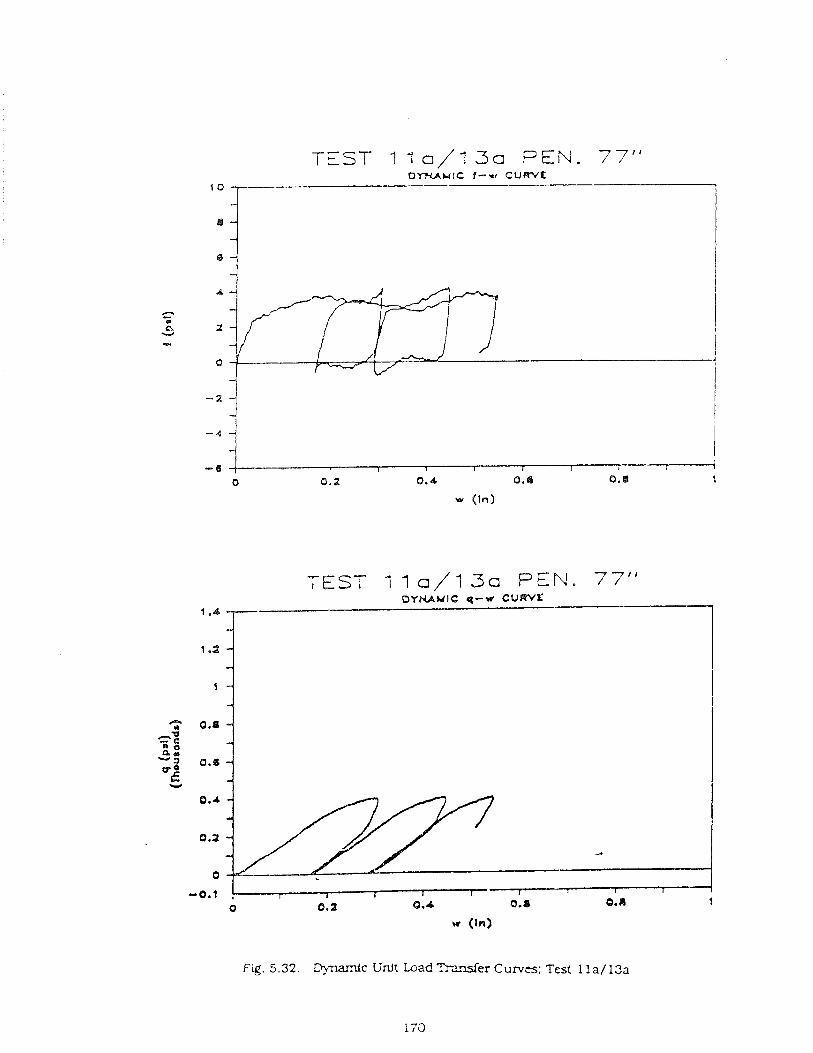
TEST 1 1 a/13a PEN. 77" OYKAMIC q-w cUWg
1.4
1.2
1
I
TEST 1 1 a/13a P E N . 77" QYNAUlC I - r r C U W f
' " a dB
d
4
2
0
- 2
I I -4 -i I
Fig. 5.32. Dynamic Unit Load h r e r Curves: Test 1 1 a/ 13a
- -4
I 1 I I I I I f
0 0.2 0.4 0. a 0.BI 1
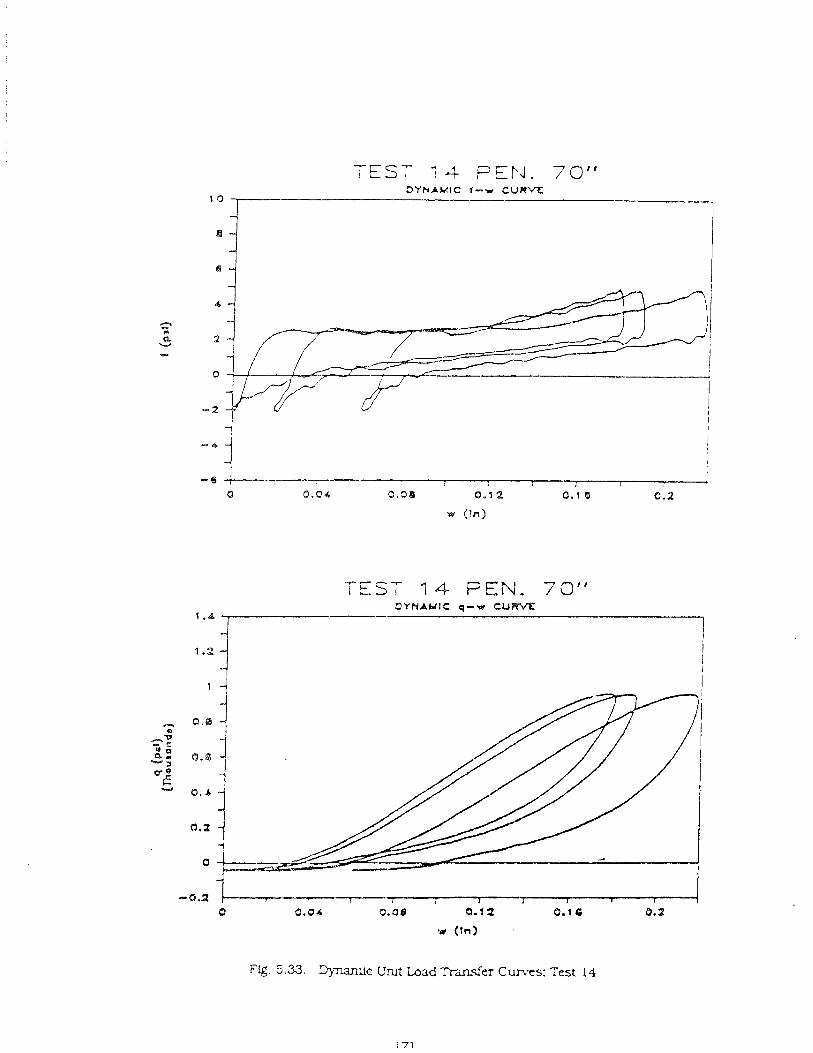
TEST 1 4 PEPJ. 70" D Y N A M I C I -w CURVE
1 0 , I
Fig. 5.33. 3 j m c Umt L a d Trdn.fer Cumes: Test 14
TEST 14 P E E . 77" OYNAMIC q-w C U M
l.A -. - 1.2 -
-.
1 7
I I I
I
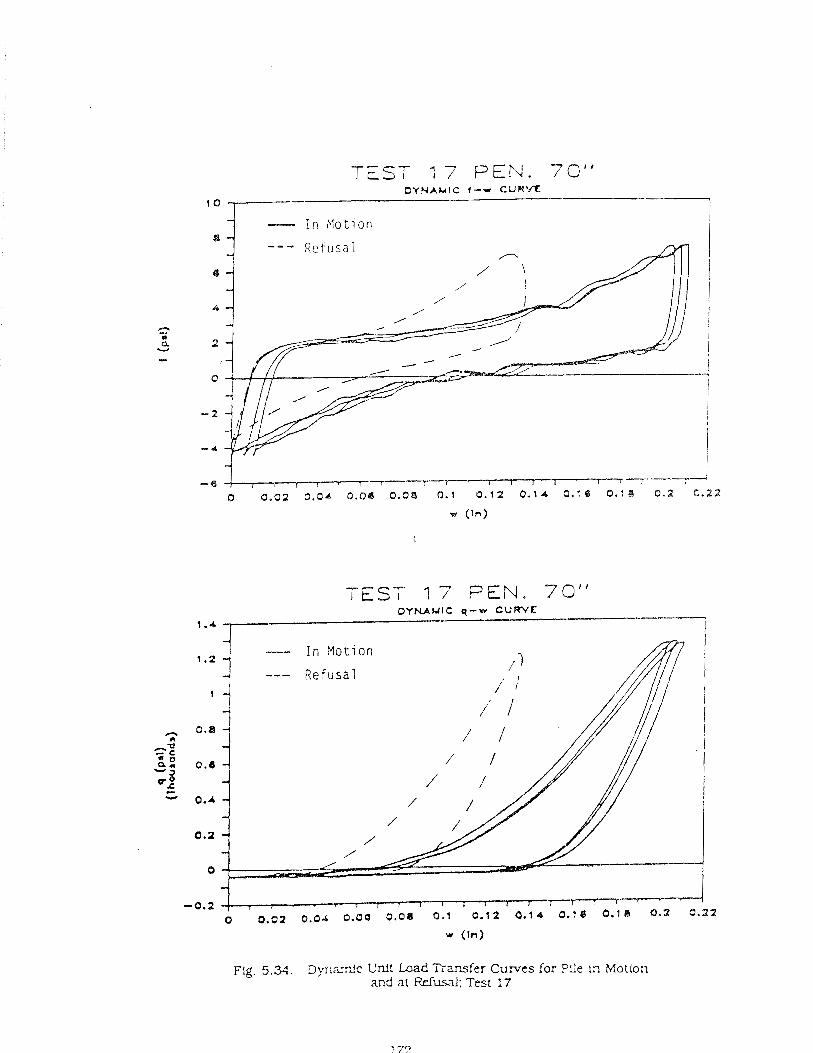
TEST 17 PEN. 7G" DYNAMIC 1-w CUR-
'O -?.---- I I 1 - I n M o t i o n I
.a (In)
F L ~ . 5 .34 . D y n a ~ J c Unit L a d Eansfer Curves for PUe Ln Motlon and at Rd&: Test 17
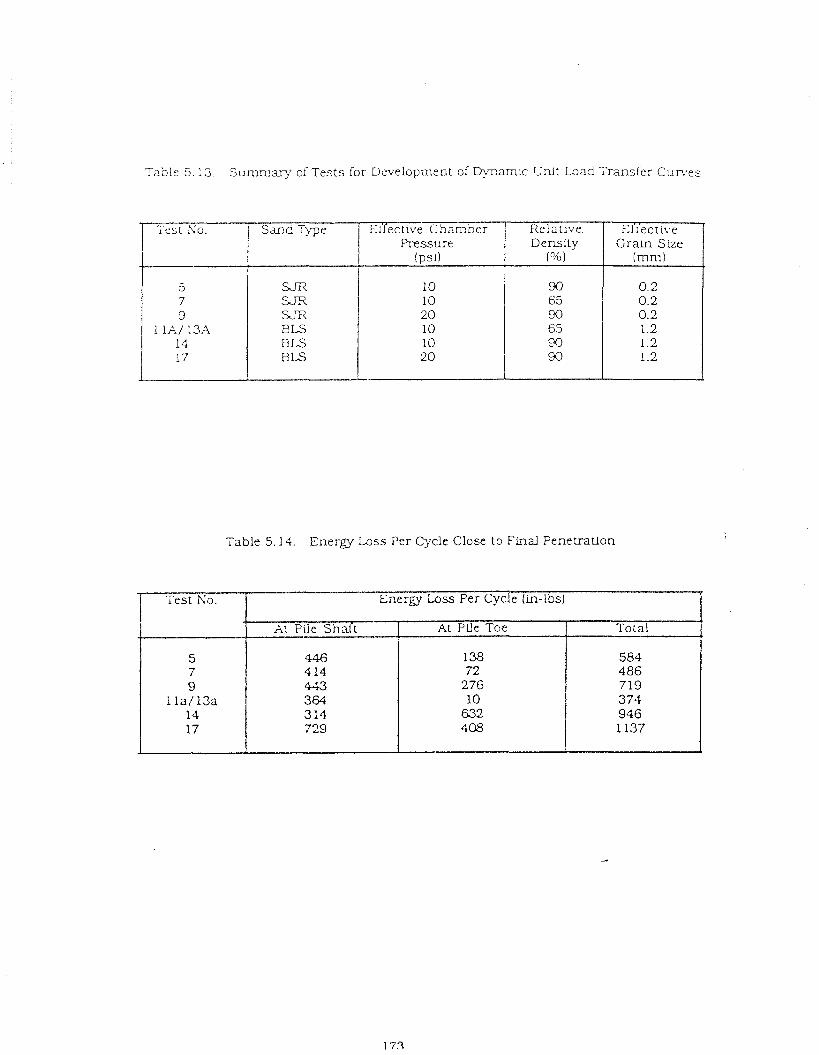
Takle 5.13 Sumary of Tests for Development of R ~ m i c TLnlt Load Transfer C :~n / e s
Table 5.14. E n e r a Loss Per Cycle Close to Final Penet ra t ion
- I ~ S I So .
5 7 9
1 lA/ 13A 14 17
Relarive. Densi ty
I O/o
90 65 90 65 90 90
Eir'ective G r a i n She
(mm)
0.2 0.2 0.2 1.2 1.2 1.2
Sand ? B e
SJR sJri S,T BLS ELS B LS
Euective Chamber Pressure
(pst )
10 10 2 0 10 10 20
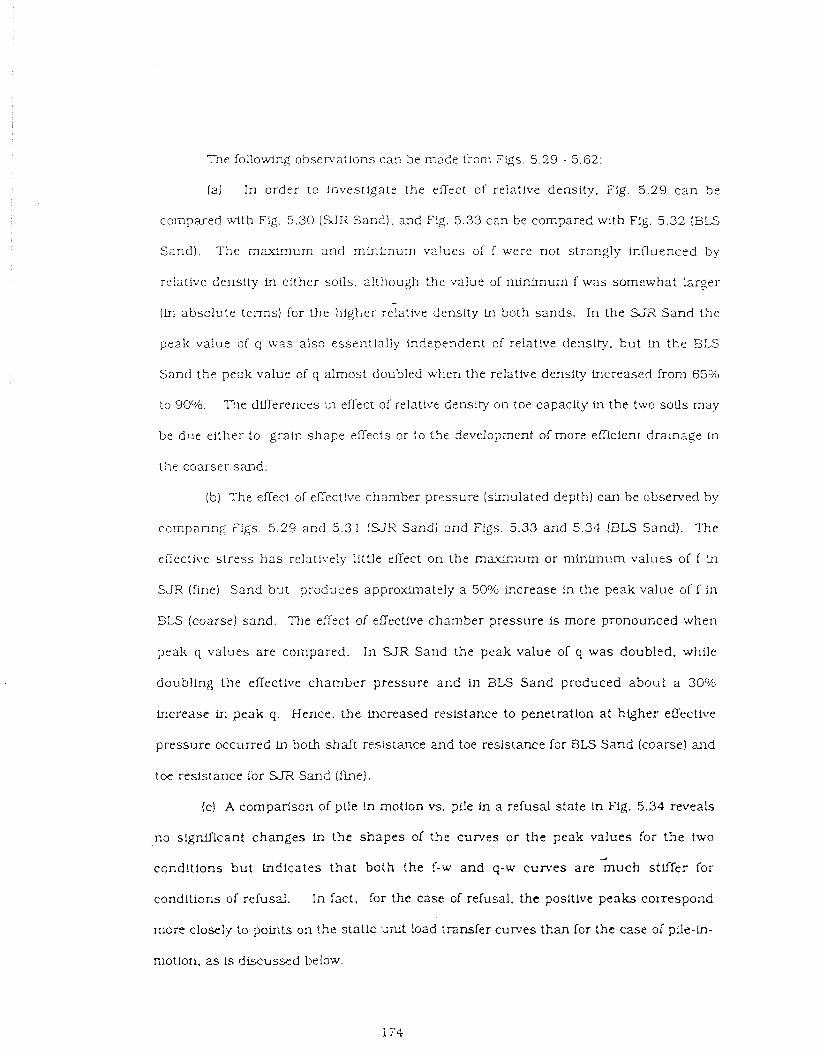
The following obsen7at10ns can be made from F g s . 5.29 - 5.62:
la) In order tc Fnvestlgate the effect of relative d e n s ~ t y , Fig. 5.29 c a n be
compared with Fig. 5.30 ( S J F I s a n d ) , and Fig. 5.33 can be compared with Fig. 5.32 {BLS
S a n d ) . The maxlmum and minLmum va,ues of f were not strongly innuenced by
relative density Fn either soils, a!though the value of minimum f was somewhat larger -
(in absolute terms) for the higher relative density in both sands. In the Fix Sand the
peak value of q was also essentially independent of relative density, bu t Fn the EiLS
Sand the peak value of q almost doubled when the relative density increased from 65%
to 900h. The dmerenczs In effect oi relatlve density on toe capacity in the two solls may
be due either to grain shape effects or to the development of more efTicient drainage in
the coarser sand.
(5) The eflect of effect!ve chamber pressure (simulated depth) can be observed by
comparing Figs. 5.29 and 5.3 1 (SJR Sand) and Figs. 5.33 and 5.34 (BLS Sand) . The
eZective s tress h a s relat i~~ely little effect on the maximum or mintmum values of f in
S J R (fine) Sand but produces approximately a 50°/o imrease in the peak value o f f i n
3125 (coarse) sand. The effect of effective chamber pressure is more pronounced when
peak q values are compared. In SJR Sand the peak value of q was doubled, while
doubling the effective chamber pressure and in BLS Sand produced about a 30°!
increase In peak q. Hence, the increased resistance to penetration a t higher efTective
pressure occurred in both s h d t resistance and toe resistance for BLS Sand (coarse) and
toe resistance for SJR Sand (L?e).
(c) A comparison of pile in motfon vs. pLle in a refusal state in Fig. 5.34 reveals
no signlflcant changes in the shapes of the curves or the peak values for the two
conditions bu t indicates t h a t both the f-w and q-w curves a re m u c h stlffer for
conditions of refusal. In fact. for the case of refusal, the posltlve peaks c o r ~ e s p o n d
ncre closely to points on !he static mi! load transfer curves than for the case of pile-in-
notion. a s 1s discussed below.
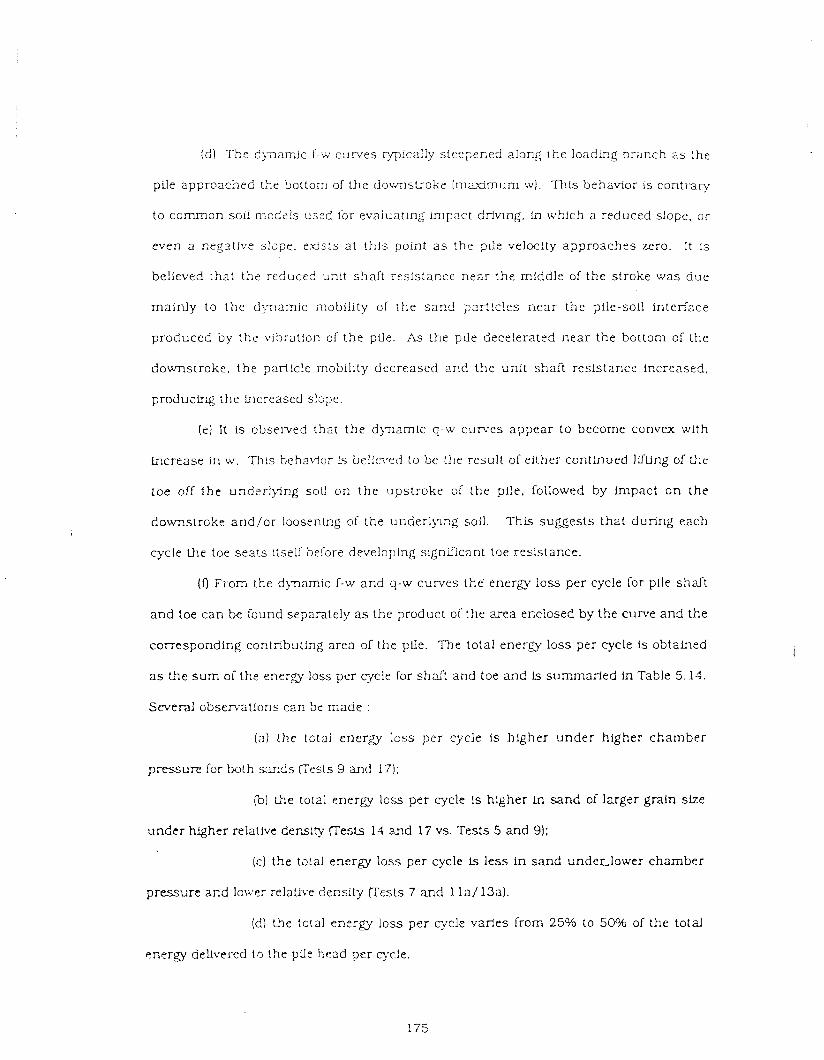
16) T ~ P 6 j ~ a m i c f - i ~ curves typically steepeced along the l o a d h g branch a s the
pile approached the bo:tom of t he downstroke (mz&murn w). Thls behavior is contrary
t o common soil modt!s c s - d for evaluating impact driving, In which a reduced slope, or
even a nrgstlve s lspe. eris:s a t ?h is point a s the pile velocity approaches zero. It is
believed that the reduced unit shaft resistafice near t he middle of the stroke was dlue
maln ly to t he d>?iamic mobility of t he s a n d >lr',!c!es nea r the pile-soil interface
produced by :he vibrat!on of t he pile. As !he pde decelerated near the bottom of the
downstroke, t he partlc!e inobility decreased a n d the ua l t shaft resistance Increased.
producirii the Increased slope.
(e) It is observed that t h e d j n a m i c q - w curves appear t o become convex with
lncrease in w. This bchair!or is be!ie\,ed to be the result of either continued lifting of t'le
toe off t he underlying soil on t he upstroke of t he pile. followed by impact o n t he
downstroke a n d / o r loosening of the u11derl)~ng soil. Thls suggests that during each
cycle the toe s ea t s itself before developing sfgnilicant toe resistance.
(0 From the dqnarnic f-w a n d q-w curves the, energy loss per cycle for pLle s h d t
and toe can be found separately a s the product of the area enciosed by the curve and the
corresponding contributing area of the ~ l l e . The total energy loss per cycle is obtained
as t5e sum of the energy loss per cycle for shaft and toe and Is summarled in Table 5.13.
Several obsena t lons can be n a d e :
(a) the t ~ t a l energy loss per cycle Is higher u n d e r higher chamber
pressure for both m d s r e s t s 9 and 17);
(b) the totai energy loss per cycle !s higher Ln sand of larger grain size
under higher relative density r r e s l 14 and 17 vs. Tests 5 and 9):
(c) t h e tstal energy loss per cycle is less in sand undeclower chamber
p r e s s u n and lower relative density Kests 7 and l l a / 13a).
(6) the total energy loss per cycle varies from 25% to 50036 of the total
pnrrgy delivered to the pile head per c).c!e.
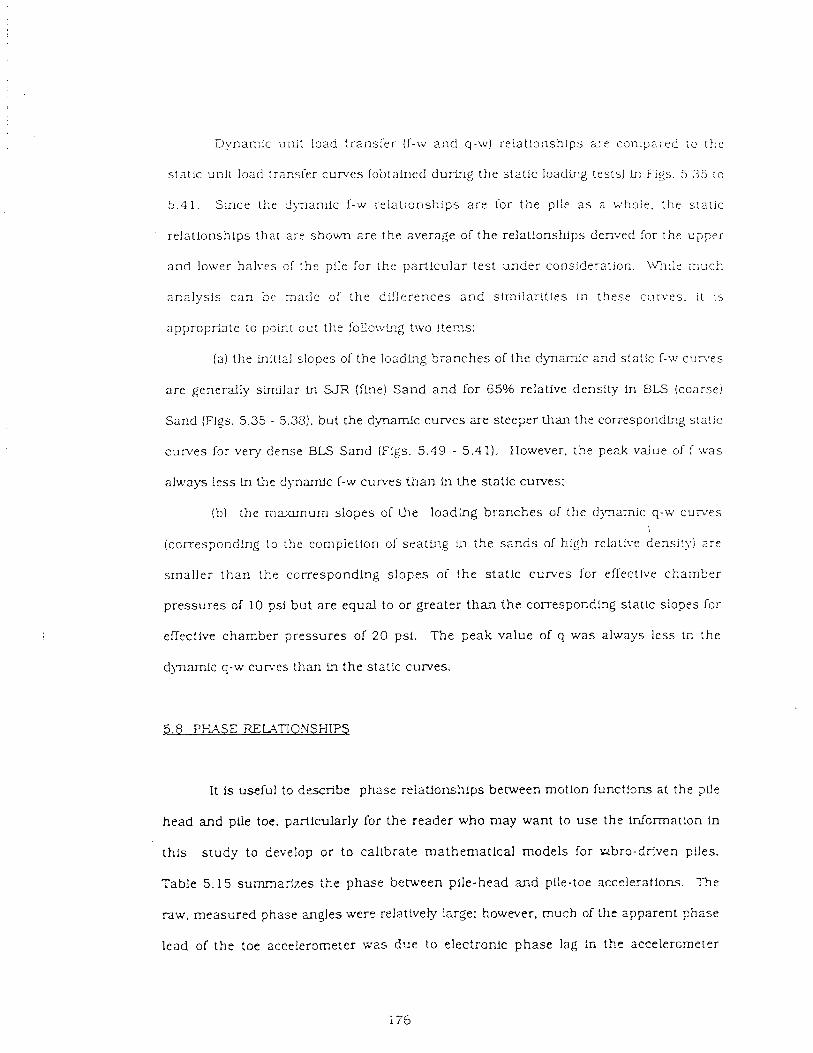
Dynamlc ~1st load t ransfer (f-w a n d q-w) relationships arc coil:pa;ed :c the
static urJt load transfer curves (obtained during the static loadirlg tests) in F!gs. 5 35 to
5 .41 . Since the dbnamic f-w relations hi?^ a r e for t he pile a s a whole, the static
relationships that arc shown are the average of t he relationships denved for the o p p e r
and lower hal:.es CC the ptle for the part icular test unde r considera:ion. \Wli:r z u c h
ana lys i s c a n bc made of t h e differences a n d s imilar i t ies in thcse curves. i t is
appropriate lo point out the foL!cw!~f two I!en?s:
(a) the in it!^] slopes of the losdlng b ~ a n c h e s of the dynamic and static f-w c u n r e s
a r e generally similar S J R ( [he) S a n d a n d for 65% relative density in BLS (coarse)
Sand (Flgs. 5.35 - 5.33). but the dynamic curves are steeper than the correspondl?g sta!ic
curves for very dense BLS Sand (Figs. 5.49 - 5.41). However. the peak value o f f was
always less in #e d)marnlc f-w curves t h a n ln the static curves:
(b) the maximum slopes of the loadlng branches of the dynamic q-w c u n r e s
(correspcnd!ng 19 the cornpielion of seat ing in the s a n d s of high relative density) 2re
smal le r t h a n the corresponding s lopes of the s tat lc c u n 7 e s for effective chamber
pressures of 10 psi bu t are equal to or greater t h a n the corresponding statlc slopes for
effective chamber pressures of 2 0 psi. The peak value of q was always less in t he
d~marnlc q-w curves than ln t he static curves.
5.8 PHASE RELATIONSHIPS
I t is useful to describe phase relationships between motion fxnct!3ns at the ?ilc
head and pile toe. particularly for + b e reader who may want to use t he Lnfcrmat!on in
th i s s t u d y to develop o r to calibrate mathemat ica l models for uibro-driven p!!es.
Table 5.15 summarizes +he phase between plle-head and pile-toe accelerations. The
raw, measured phase angles were relatively large: however. much of L h t apparent 2hase
lead of t he toe accelerometer w a s d-e to electronic phase lag in the accelercmeter
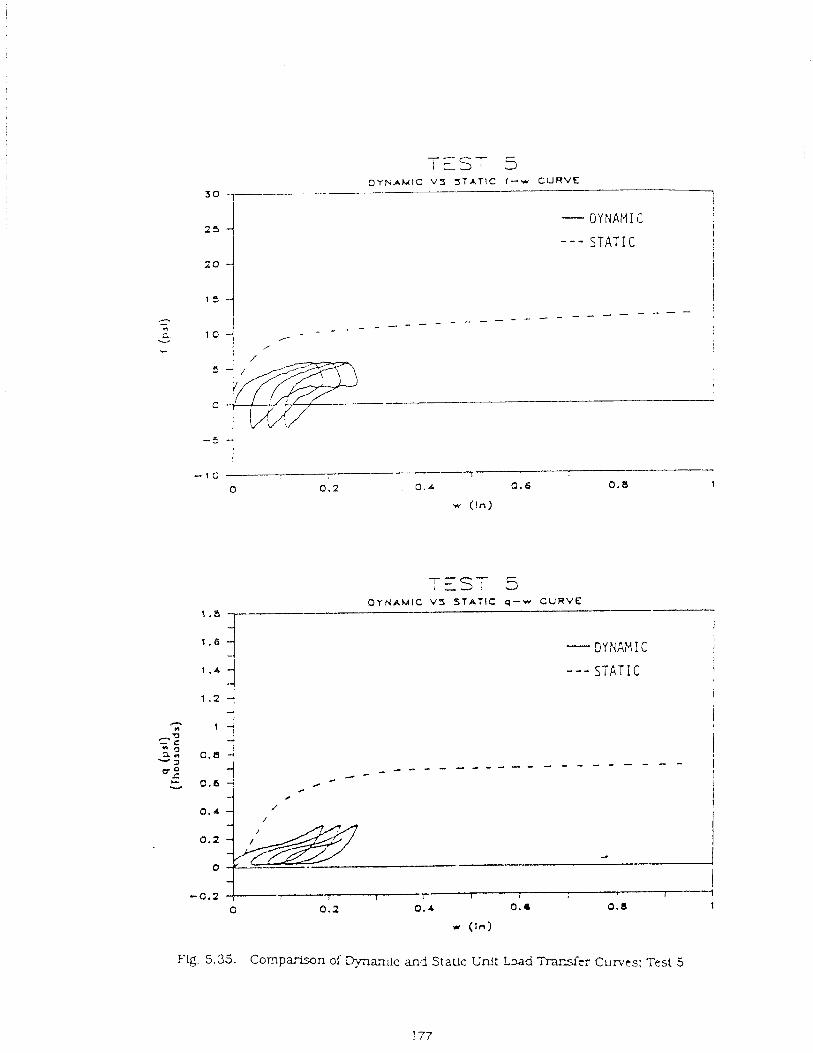
TEST 5 D Y N A M I C V Z S T A T I C q - w C U R V E
9.8 -7 I
- - - STATIC
Fig. 5.35. Comp5ison of Dynan~lc and Static Unit h d ?hrsfer C I I N C S : Test 5

TEST 7 O Y N A H I C V 3 S T A T I C I - w CURVE
3 0 , i i I - DYNAMIC I
I - - - STATIC I
I
I 15 2 Q i i
I !
i _ _ _ - _ _ _ - - - - - - _ - - - - - _ - - - .
i
O - - !
I 1
TEST 7 DYNAMIC V% S T A T I C 9 - w c U R V E
7-
1 I I
- DY !;AM I C I
I - - - STATIC I
1 .2 I
4 I - ,a a K
I
wp'go 0.8
_ _ _ _ _ _ _ I _ _ C _ _ _ _ - - - - - - - - -
i I I
4 I
- 0 . 2 I I !
I 1 I I I 1
0 , i
0.1 0. a 0.4 0.e 1
w (In)
F!g. 5.36. Com~ut_wn of Eynamk a d Static Unit Load Transfer Curves; Test 7
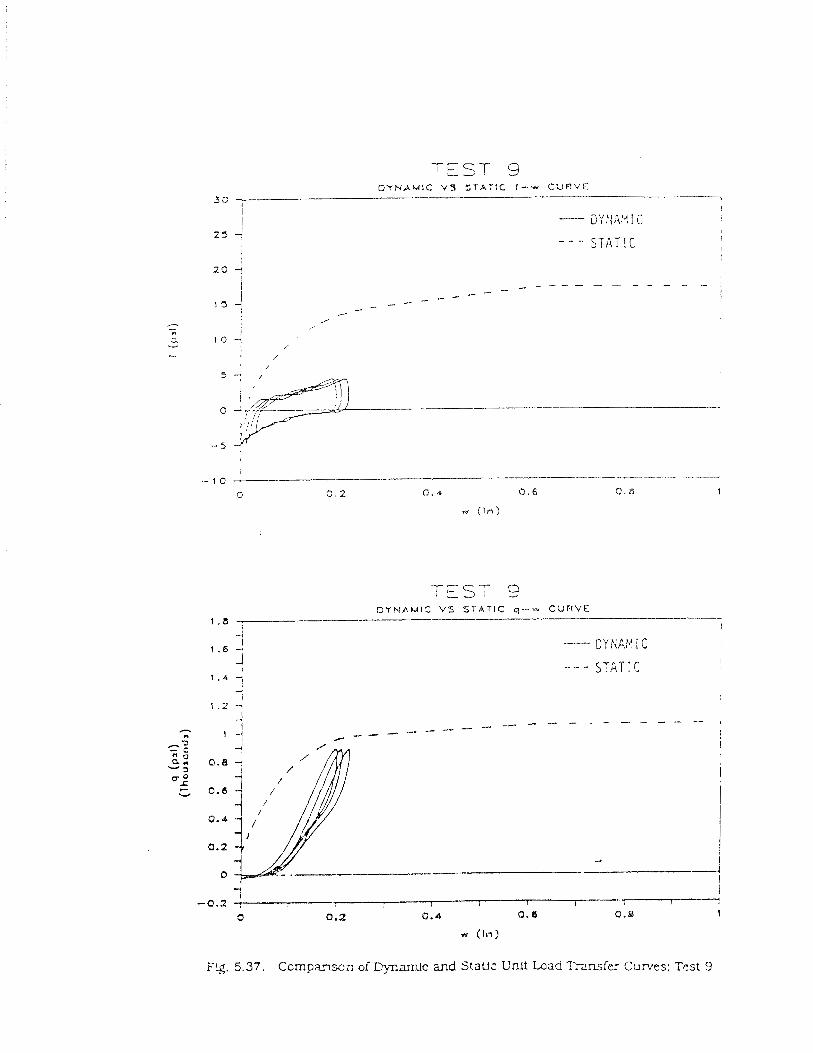
- a V h { " U T 1 1 A I I I L
- - - STAT! C
--: z- S T rs - D Y N A M I C VS S T h l l C q - w C U R V E ---
I . a , I
TLg. 5.37. C a m p a w n of Dynamic and S t a W Uni t Load Trarsfer Cumes: Test 9
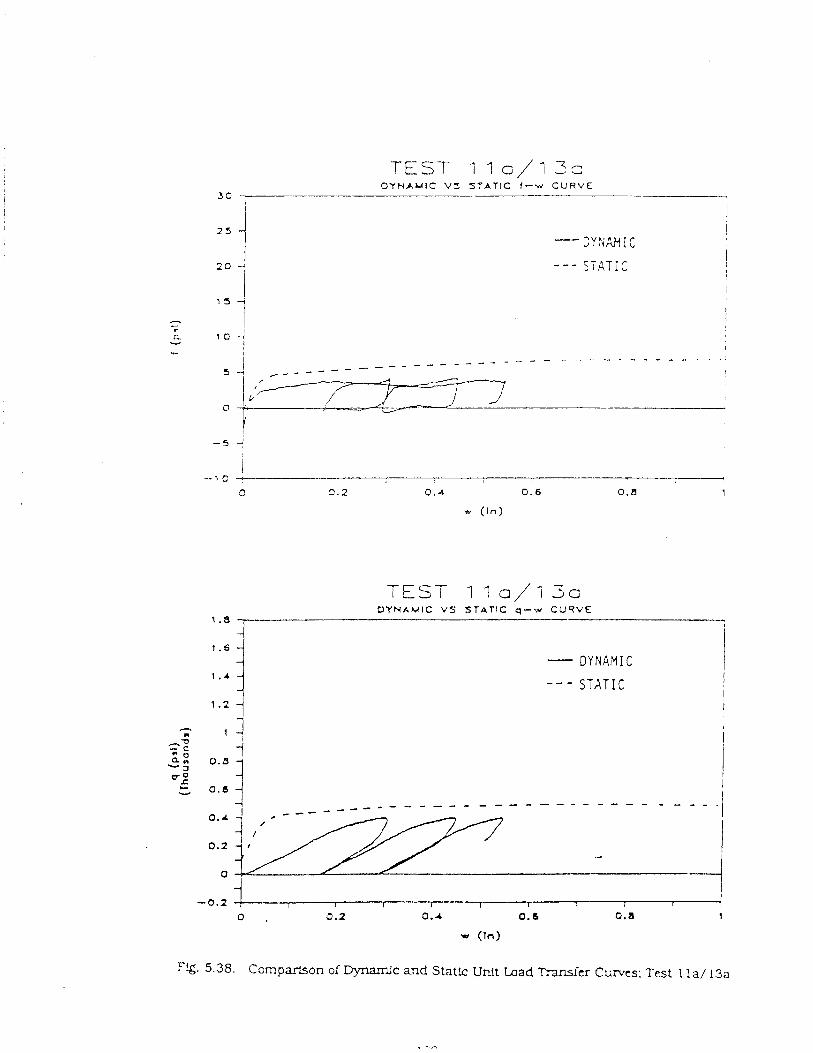
TEST 1 lo/i3c O Y H A M I C V Z S T A T I C f -w C U R V E
3 0 ,
F!g. 5.38. Comparison of Dynamjc and Static Urrit Load Transicr C ~ r v t s ; Test 1 l a / 13a
TEST 1 1 a/; 30 D Y N A M I C V S S T A T I C q - w C U R V E
1 . a -
1 . 6 - -
1.4 - -
1.2 -
- DYNAlYIC - - - STAT I C I
I I
- - - - .
! i
... -4 - I
-0.2 ; I 1 I I I I i I r 1
0 . 0.2 0.4 0.6 0.8 1
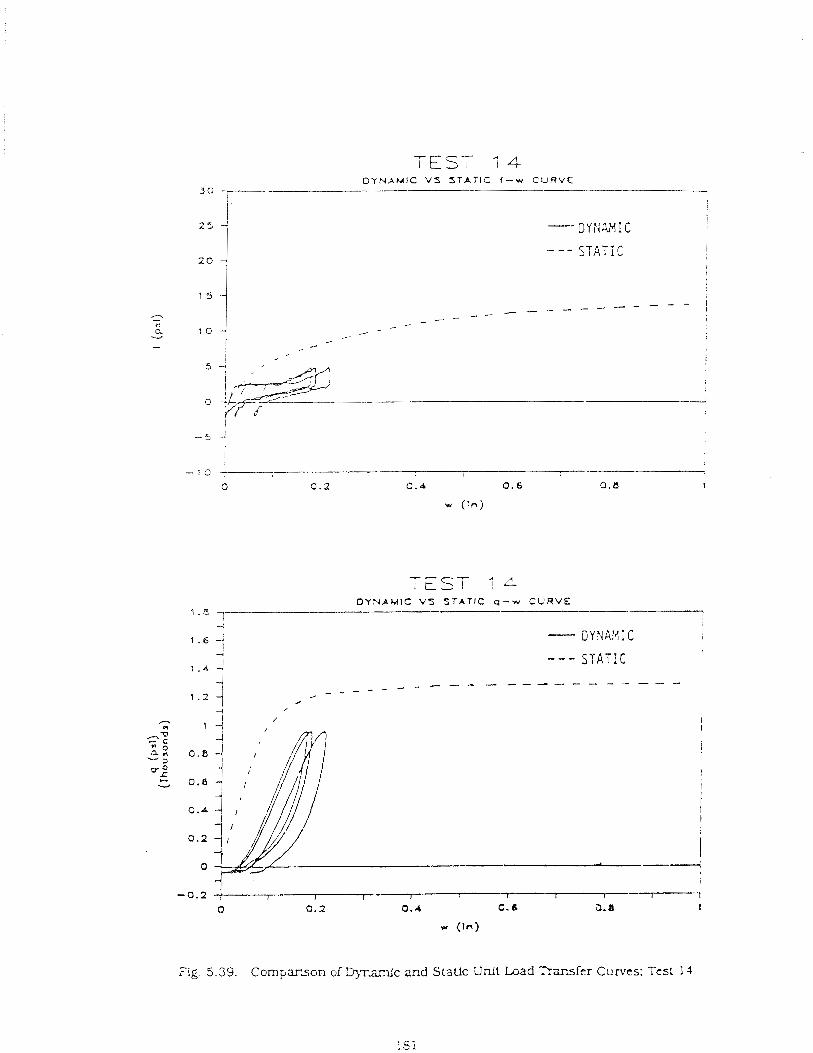
D Y N A M I C V 5 S T A T I C f - w C U R V E 3 0 ,
TEST lk DYNAMIC V S S T A T I C 4 - w C U R V E
1 . B -v I 7 I
- - - S T A T I C
Fig. 5.39. Comparison of wramjc and Static Unlt Load Transfcr Cumcs: Tcst 13
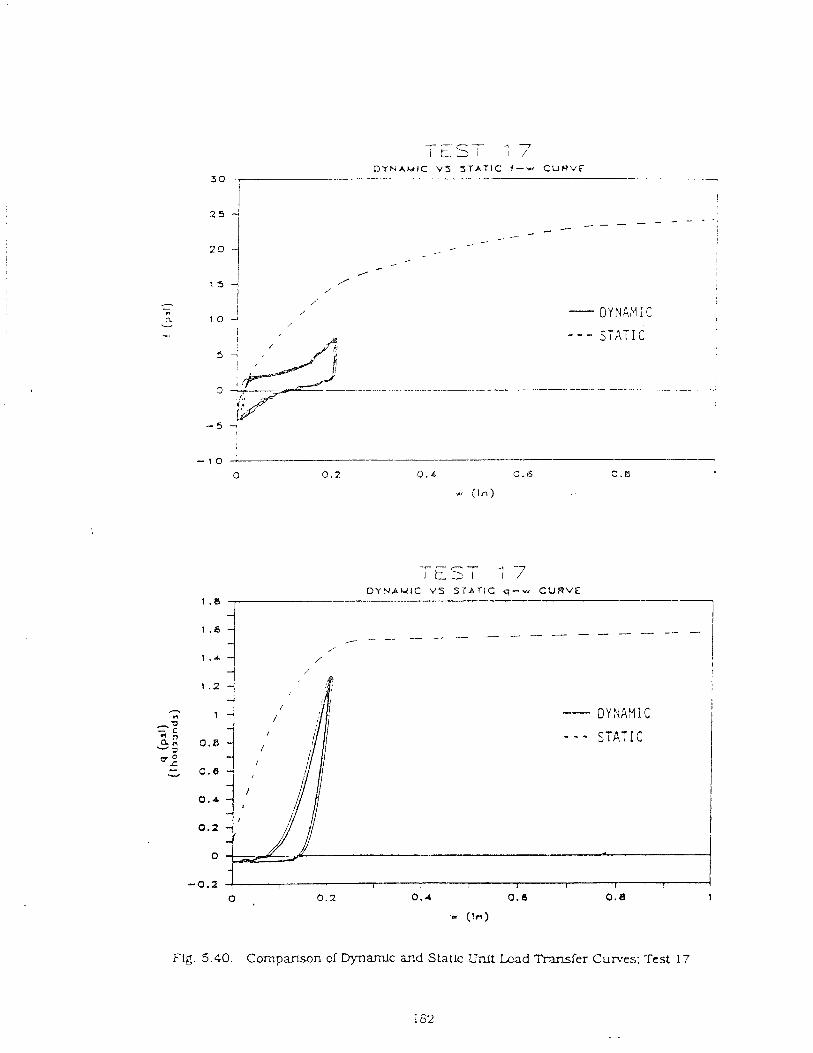
D Y N A M I C V S S T A T I C 1-w C U R V E
D Y N A M I C V"5 S T A T I C q-x, C U R V E 1 . a
Fig. 5.40. Comparison of J3ynamlc and Statlc Unit Lead Transfer Cumes: Test 17
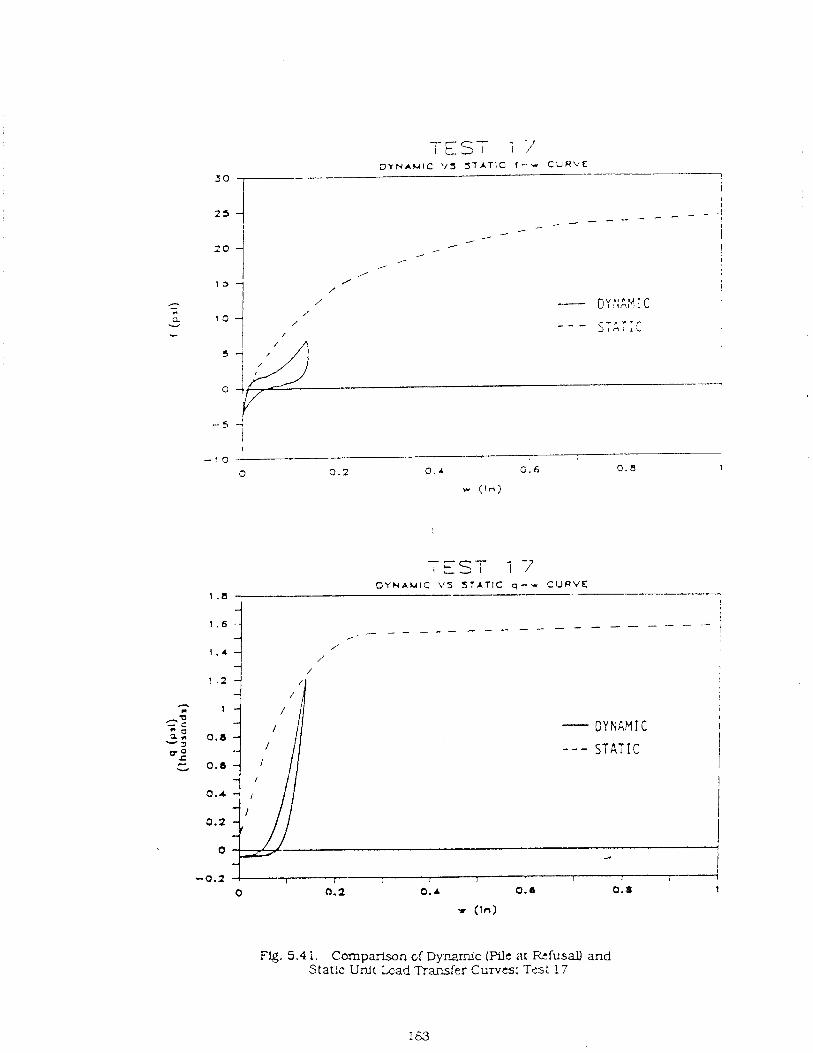
?-EST 7 7 D Y N A M I C \/J S T A T I C f-.I C L l H V f
'O 0- 1
i I
O Y H A U l C \'5 S T A T I C q - u C U R V E 1 .a ,
- D Y t i A M I C - - - S T A T I C
Fg. 5.4 i. Comparison cf D y m c (We iir Rrfusall and Stat!c U n l t Lcad Pansfer Curves; Test ! 7
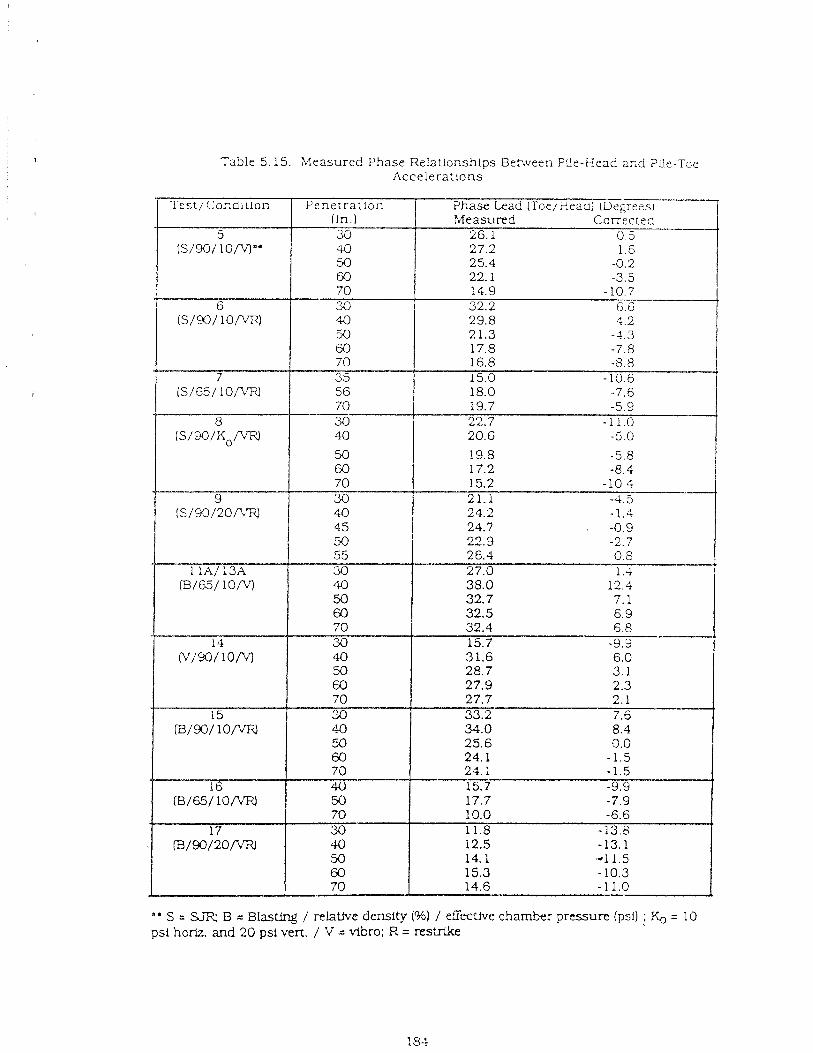
Table 5.15. Measured Phase Relationships Between P2e-Head aiid Pile-Tce Accelerations
" S = B = BlasUng / relattve density (%I / elTectWe chamber pressure (psi) : 1% = 10 psi horlz. and 20 psi vert. / V = vibro: R = r e s + h e
circuits 2t the pCe head. Once this el-ctronic lag was corrected, a s described in Chapier
3, the measured phase between the head and toe accelerations was generally 3 0 " or
less , with an avenge absolute value of 7" at 70 inches of penetration. 7unhcrmore.
s ince the maximum driving s t ress ' ln the pi!e dur:ng vibro-driving ranged from 3 to 9
k t (80h to 25% of thc yield strength of steel) while that for Lmpact driving was about 18
h i (5O0/0 of the yield strength of steel), the small s t ress level induced negligible strain to
the vibro-driven pile. I t c an be i n l e ~ e d from the above observations that the test pile
behaved generally a s a rigid body.

C W E R 6
ESTIMATION OF B-G CAPACITY iWi) S E ~ I O N OF VIBRO-DXFER
The major objective of thls chapter is to model the load-movement relationship
and predict the static bearing capacity of a vibro-driven pile. Seiective modelings of
impact-driven piles are also included for comparison purposes. Several methods are
proposed lo predict the load-movement behavior and the bearing capacity of vibro-
driven piles. Important soil parameters and driver parameters are Incorporated into
the bearing capacity formulation. The unit load transfer relationships are moaeied
using Ramberg-Osgood, eupo;ler,tinl and power relationships. In the Unit Load
Transfer Method (ULT Method) the unjt load transfer models are used to predict load-
movement relationshlps for vibro-driven and impact-driven piles. In the Power
Transfer Method (PT Method) nondlrnensional analysis is used to relate the power
transfered to the ptle head from the driver, static compression capacity and pile
penetration velocity under varlous pile and soll parameters. These nondfrnension21
relationships are also used Ln selecting a n appropriate \lbro-dxlver to achieve desired
bearing capacity. In the Ncrmallzed Capacity Method (NC Methcxl) a direct relationship
between b e a r - capacity and ptle penetration velocity h a s been established, which is
analogous to relating bearing capacity d Impact-driven piles to blow count. In the
-Ultimate Resistance Method LT7 Method) maxliinum unlt shaft and toe rtslstances are A
used to estlmate the static bearing capacity. I t should be noted that . while the
experiments a t t exp ted to model eaective s t resses in the soll and appropriate
unbalanced rorce and bias (quasi-static] force of the vlbro-drlver to represent fleld
cor.d!tions, no assurance e*sts that the predicti~re rnethods given !n tnis chapter can be
scaled directly to full-size. Ia fact. upscaling of t h e soil-pile behavior is not
recommended unless other.s,!se veflLieci in the fie!d. I t is believed. however. that the
parameters controlling the !sad-movement of displacement pilcs installed in sand by
v~bra tory driving have been identified and that :he general re la t lonshi?~ proposed are
considered a s:ep closer to better understanding and amproved modeling.
Various bearing capacity formulae for vlbro-driven piles have been discussed in
Chapter 2. Fig. 6.1 compares the measured bearing capacity for the test program urith
the capacity predicted by Schrnid's and Davisson's fonnulae. These bearing capaciiy
formulae tend to 01:erpredicl the bearing capacity but show the proper trend in the
relationship beiween bearing capacity and rate ol penetration a s observed in the
experiments. The other f o ~ ~ . u i a e (Chapter 2) are not included Ln LL7f.s con~parlson s t udy
because n l p ' s f o m u l a does not relate the bearing capacity to penetratlon veloclty and
Benlhard 's l o m u l a predcicts increasing bear!.ng capacity with lnc reashg penetratlon
i*elocity.
The load-movement relatlonshlp for piles can be predicted using the unit load
transfer relationships (unit shaft vs. pLle movement. f-w, and unit toe resistance vs. toe
mov?ment, q- iv) . Table 6.1 s u m m r j e s the relationships used by other researchers to
determine the unit load t . n ~ s f e r curves for Lrnpact-driven ptles in sand . It includes
power, exponential and modified Hsmberg-Osgood relationships. I.lowever. none of
these methods exp!lcltly tekes into account t he Ln-situ stress, relative density and grain
slze of sand. Furthermore. there is no method available to predlct the unit load transfer
curves for vibro-driven plles.
Pge drtvl?g fonnulae have been used to predict :he bearing capac!ty of !maact-
drfvtn piles since a s eariy as 1520 (20). Q1 the several formulae. the Hiley formula (5) Is
of greatest Interest and is expressed a s f~llows.
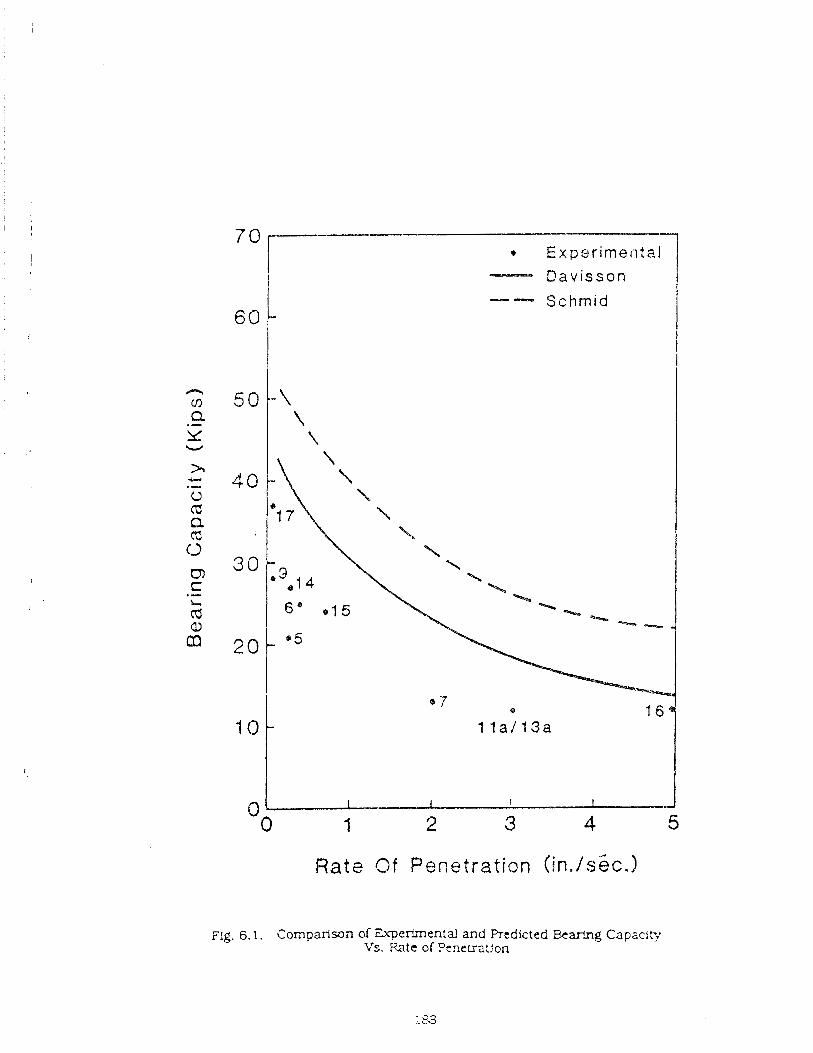
9 E x p e r i m e n t a l Qav isson
60
Rate Of Penetration (in./sGc.)
~ i g . 6.1. Comparison of Experimental and Predicted Bear!!g Capacity Vs. Rate of Pcne~a: jon
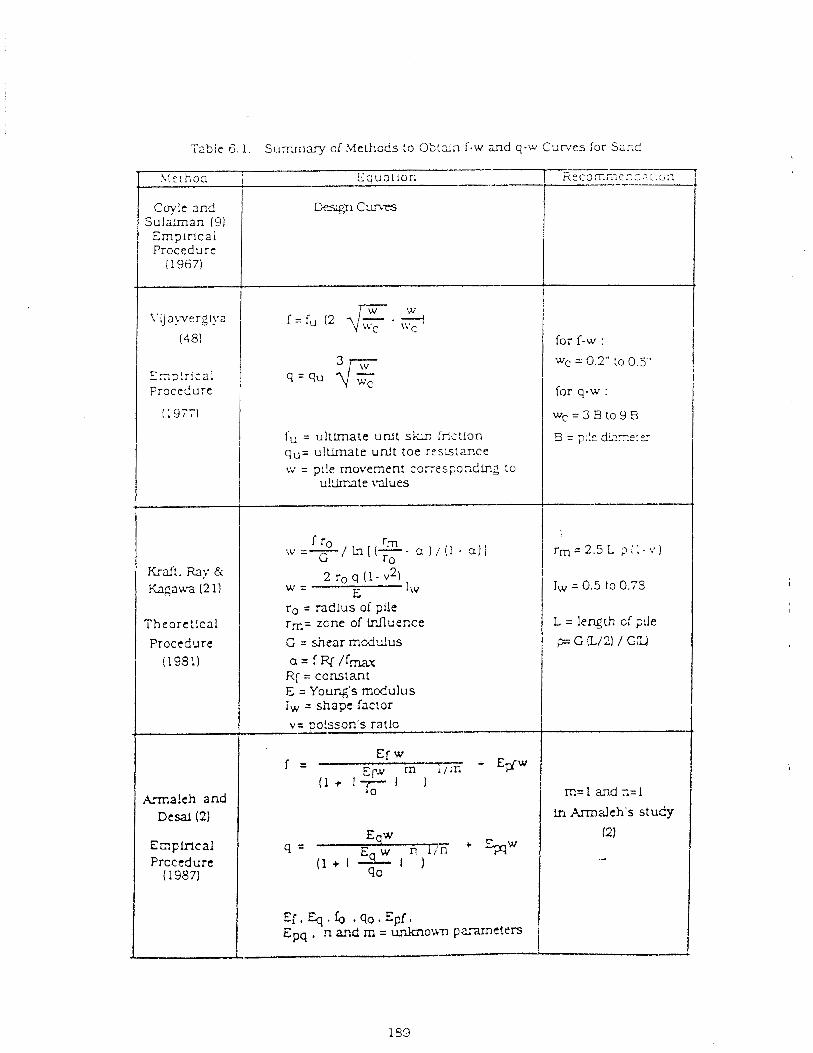
Tzble 6.1. Surriar)l of Llethcds Lo 05!211 f-w and q -w Czrves for S3r.d
qu= ultimate unlt toe ress tance w = pl!e rnovenent cor;es;;ondLng :o
u ! m t e \ d u e s
Procedure (1991)
- tiPcOm~T.cc,~::S;I
for f-w :
Wc = 0.2" :O 0.5"
for q-w :
w c = 3 ? 3 t 0 5 3
> ~ , P : ~ o c I
Coylc and S u ! r n a n (9)
Zrnplrlcal Procedure
( 1 967)
\'ij al;vergiya
(48)
E z z l r i c a l Procedure
I i 9771
2 ro q (1- v 2 ) W = E I \v
ro = radlus of ptle rm= zcne of influence
Equation
D* Gun=
f = f u (2 E-3
C = shear modulus a=fFir/f-x R[ = constant E = Young's modulus iw = shape factor
E f ? E q . f o . q o . E p f . Zpq , n and m = u n k n o w ~ paaInl!ers
Empirical Prcc tdur t
( 1987)
m= 1 and := 1 7 Eqw
9 = E w P 1;n + h w ( 1 + I L 1 I
qo
in m t i l e h ' s study
(21
4
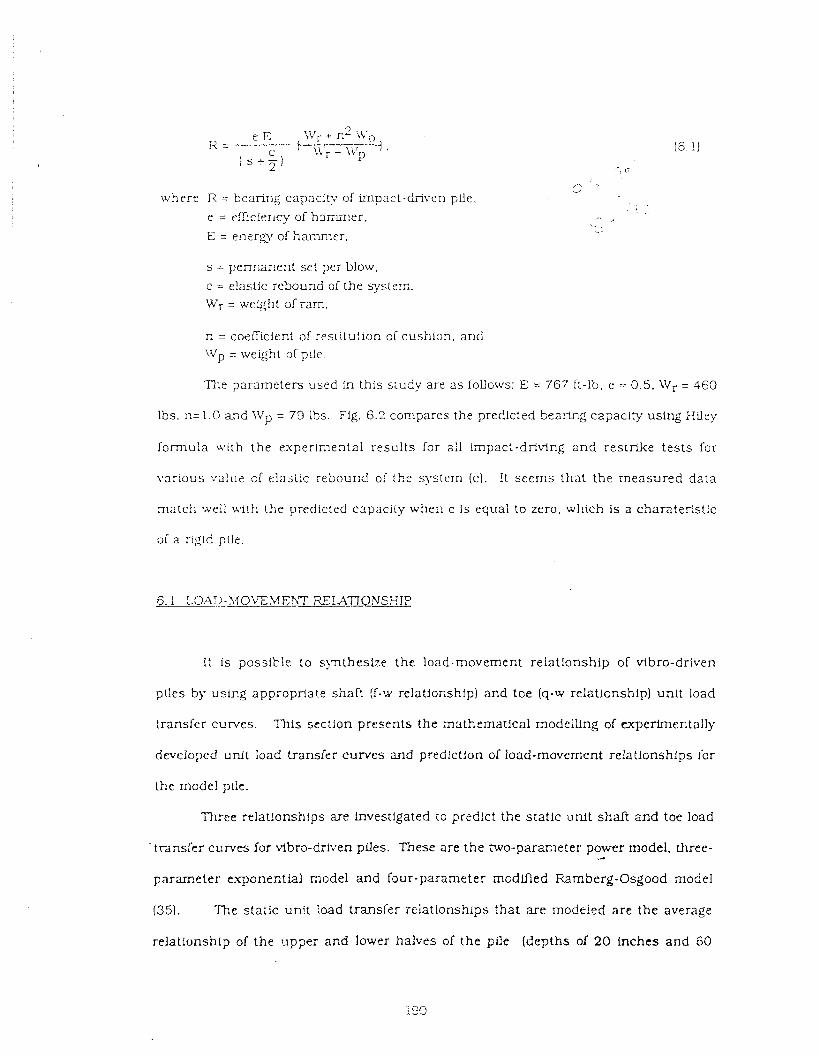
where R = bearing capacit.,. of impact-dnven pile e = rff!ciency of h x x . . e r .
E = energ. of hammer.
s = p e n a ~ e n t s e t per blow, c = elastic rebound of the system. Wr = weight of ram.
n = coenicient of resritulion of cushion. and \Vp = weight oC pile.
The parameters used in this scudy are a s follows: E = 767 ft-lb. e I- Q.5. Wr = 363
lbs, n= I .O and TVp = 79 lbs. Fig. 6.2 conlpares the predicted bearlng cagaclty using Hiley
formula with the experimental results for ail t ipac t -dr iv ing and restrike tes t s for
various ..,a!uz of elastic rebound of the system Ic). !t seems that the measured data
match *.veil wt!h the predicted cclpacily wher! c Is equal to zero, which Is a cfiarateris!:~
of a rigid pile.
I t is possible to synthesize the load-movement relationship of vibro-driven
pUes by us1r.g appropriate shaft If-sv relationshtpl and toe (q-w re!atlonshlp) unit load
transfer curves. This section presents the mathematical modelling of e.uy,erimentally
developed unit load transfer curves and predlctlon of load-movement relatlonshfps for
the model pile.
Three relationsh!ps are investfgated to predict the static un i t shaft a n d toe load
transfer curves for vibro-dIrtven piles. These are the avo-parameter power model. three- 4
parameter exponential model and four-parameter inodlfied Ramberg-Osgood model
(351. The staiic u w t load transler ieiationshlps that are modeled are the average
relationship of the upper and lower halves of the pile (deyths of 20 inches and 60
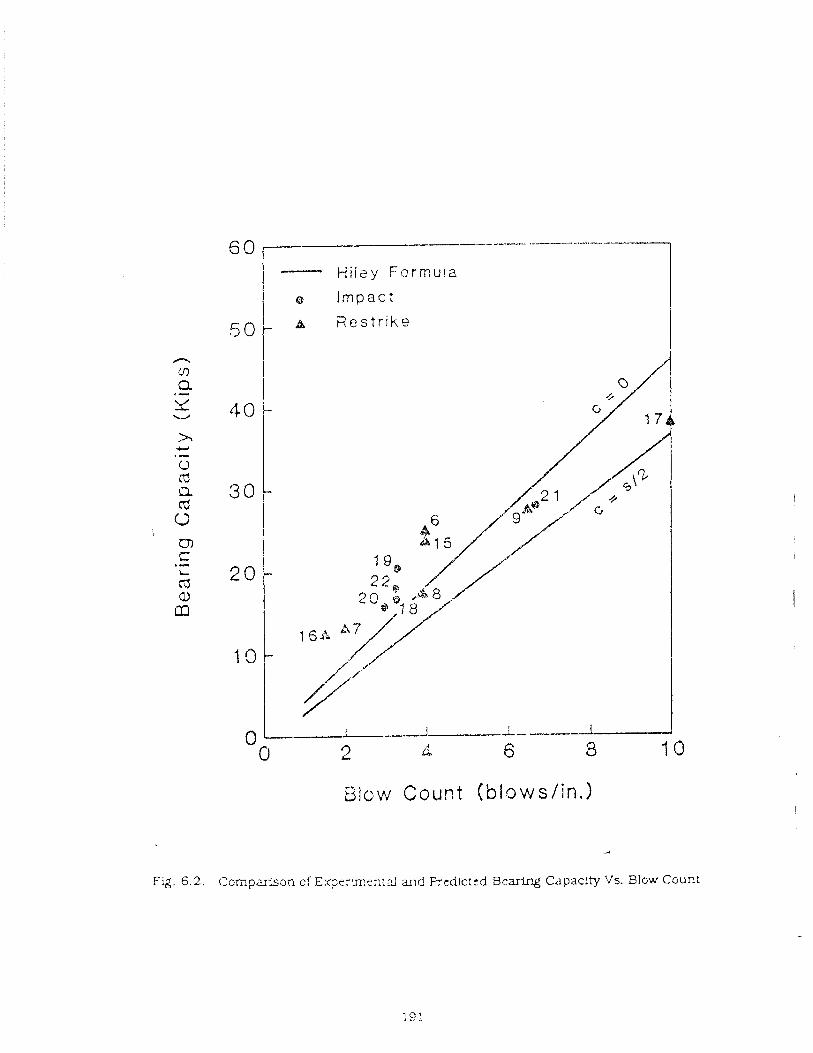
60 1 ---.- ----.-- --
- H i l s y F'orrnuia
I m p a c t
~ i o w Count (b lows/ in. )
.A
Fig. 6.2. Cornpaison cf E-rYnentd a n d Frcdctcd Bearing Capacity Vs. Blow C 0 u ~ t
inches: a s used ir, Chapter 5 for comparison uri!h the dynamic unit load t rar~sfcr cui-:e
of vibro-driven piles). I t should be noted that all the parameters !n the x o d e l s are
related to the test variables such a s horizontal in-situ s t ress (10 psi 2 0 'h 520 psi), grain
size (0 2 rnrn < d l 0 5 1.2 rrm) and relative density (0 .65 5 Dr 5 0.90).
The measured residual stresses, which are s r n a l d u e to low driving s t resses and
a relatively rigid pi!e, are nonetheless taken Lnto accouni In rhe modeling. I t !S found
that the res!dual stresses d~:c!=ged a! t h e tce ar,d the shafl (a! 2 0 kches a n 3 5 0 !r.c.?~si
for vibro-driven piles are relarive!y constant (Tests 5. 6 . 7 . 9, 1 l a / 1 3 a , 14. 15 w:d i 7 ) .
The average value of residual s t ress aiong the s h d r . f,. is - 1 .32 psi, where the negative
sign m e a n s friction directed downward along the shaft. T h e average residual s t ress for
t he pile toe, qr, Is 8 6 psi. It is shown later that these values prcvide reasonably good
predict ion.
T\D-Parametcr Model
As shown in Table 6.1. Vgapergtya (17) expressed the I'-w and q - w rt.lat~onsi-:ips
by a power function of 1 / 2 and 1/3 respectfvely. The power funceion here Is descnbed in
t e rms of the tests variables. The two-parameter power rxlationship for 1-w and q-w can
where f is the unit shaft resistance (psi ) , q is the uni t toe resistance (psi) and w Is :he
local pile movement (in.). kf, kq, bf a n d bq are pile-sou sys tem parameters . The
relat ionship between system parameters and test variables can be represented a s
follows.
a
Q(pl = f i (di0If2 IDr)f=,(a 'h)fi(dlODi-)f5(dioa'hlf~(Dro'h). (6.4)
where p Is kf, kq. bf or bq. t'sing the test da ta , functional relationships, fi/$ (I= 1 to 6)
were determined. T h e least squares method was used to determine the constants of the
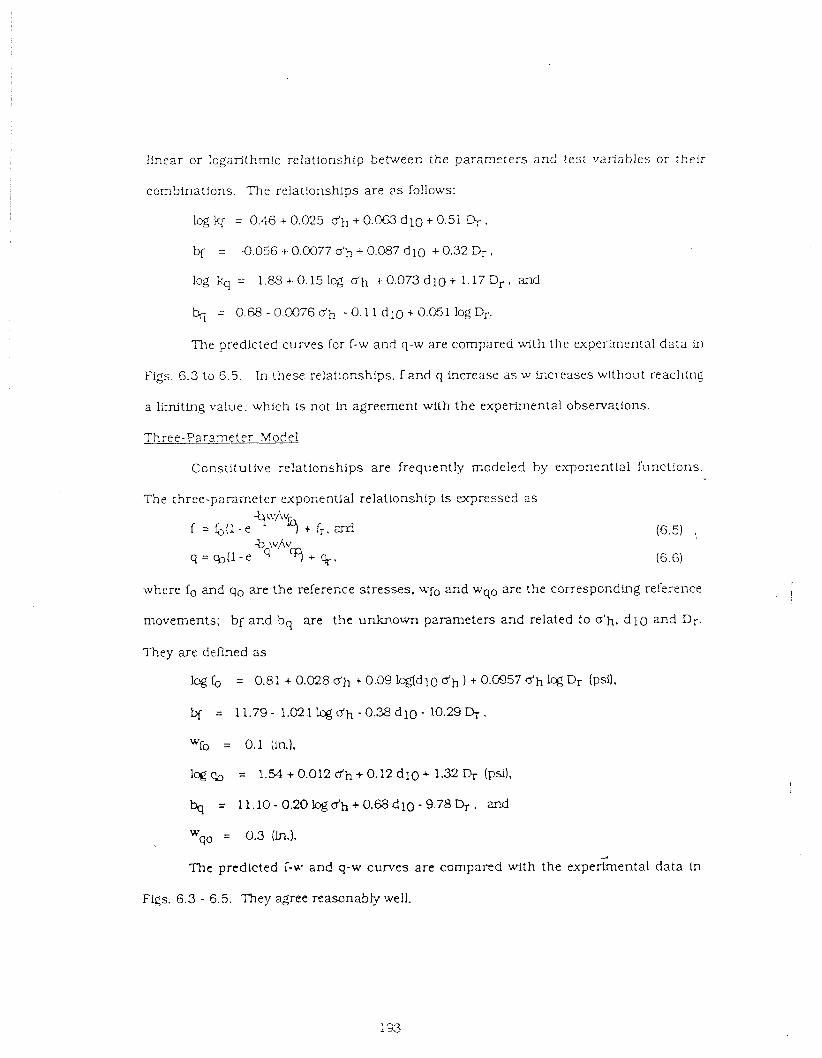
Iinear or logarithm!^ relationship between the parameters and test varisbles or their
combinations. The relationships are 2 s follows:
1% kf = 0.46 + 0.025 a'h + 0.063 d l 0 + 0.51 @ .
bf = -0.056 + 0.0077 d h + 0.087 d l 0 + 0.32 a. log kq = 1.88+0.151cg dh +0 .073d10+ 1.17Dr. and
The predicted curves for f-w and q-w are cornpared with the experimental data in
Figs. 6.3 to 6.5. In these relationships, f and q lncrease a s w kcreases without reaching
a limitlng value. which Is not tn agreement with the experimental observations
Three-Parameter Model
Constitutlve relationships are frequently modeled by exponentlal functions. -
The three-parameter exponential relationship is expressed a s
where fo and qo are the reference stresses. wfo and wqo are the corresponding reference
movements: bf and bq are the unknown parameters and related to o'h, d l 0 and Dr.
They are defined a s
lag b = 0.8: + 0.028 b h + 0.09 lcg(dl0 d h ) + 0.0957 d h 1% Dr (psi).
& = 11.79- 1 . 0 2 1 @ d h - 0 . 3 8 d 1 0 - 10.29Dy.
wro = 0.1 (lrl.1,
log% = 1 . !%+0 .012dh+O. l2d l0+ 1.324- (psi),
bq = 1 1 . 1 0 - 0 . 2 0 ~ d h + 0 . 6 8 d ~ 0 - 9 . 7 8 D f . znd
wqo = 0.3 (Ln.). 4
The predicted f-w7 and q-w curves a re c o r n p a ~ ~ d with the experimental data in
FIgs. 6.3 - 6.5. They agree reasonably well.
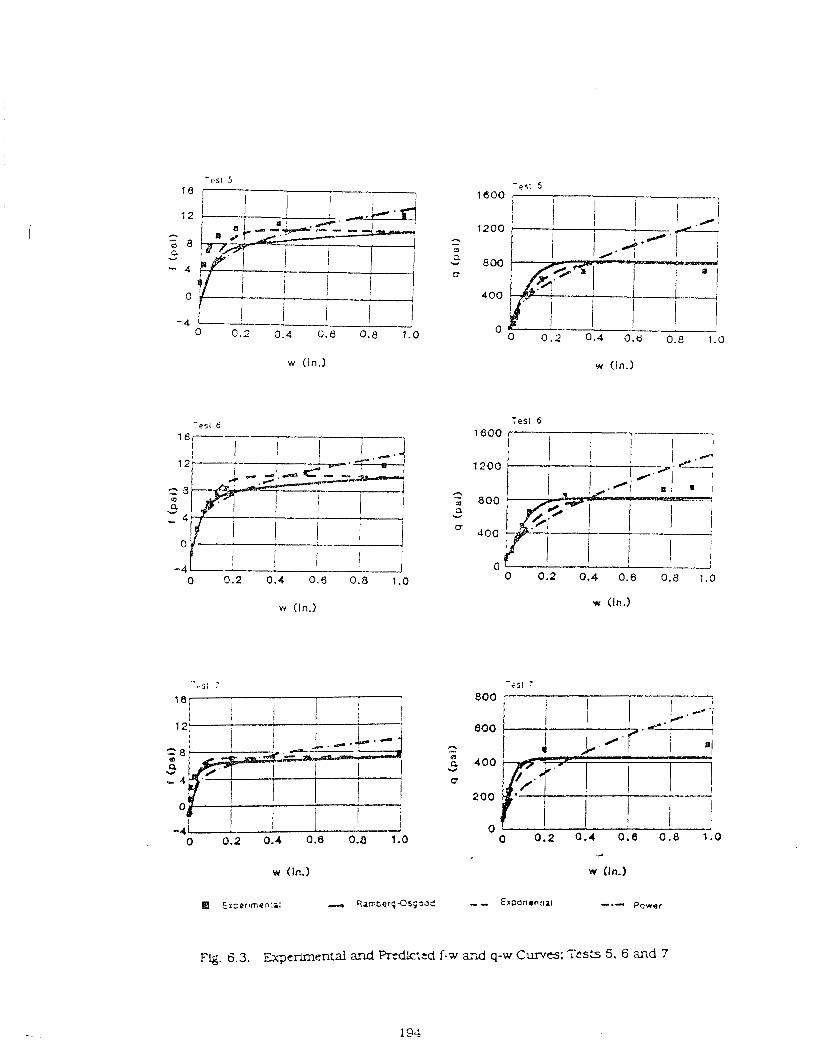
Tes: 5 1800 <
w (In.) w (in.)
Test 6
1200
800
aoo
0
w (In.) w (In.)
4
w (In.)
Fg. 6.3. Eqm-irnen:al &?xi PrtdCcteb f-w arLd q-w Curves; Tests 5. 6 and 7
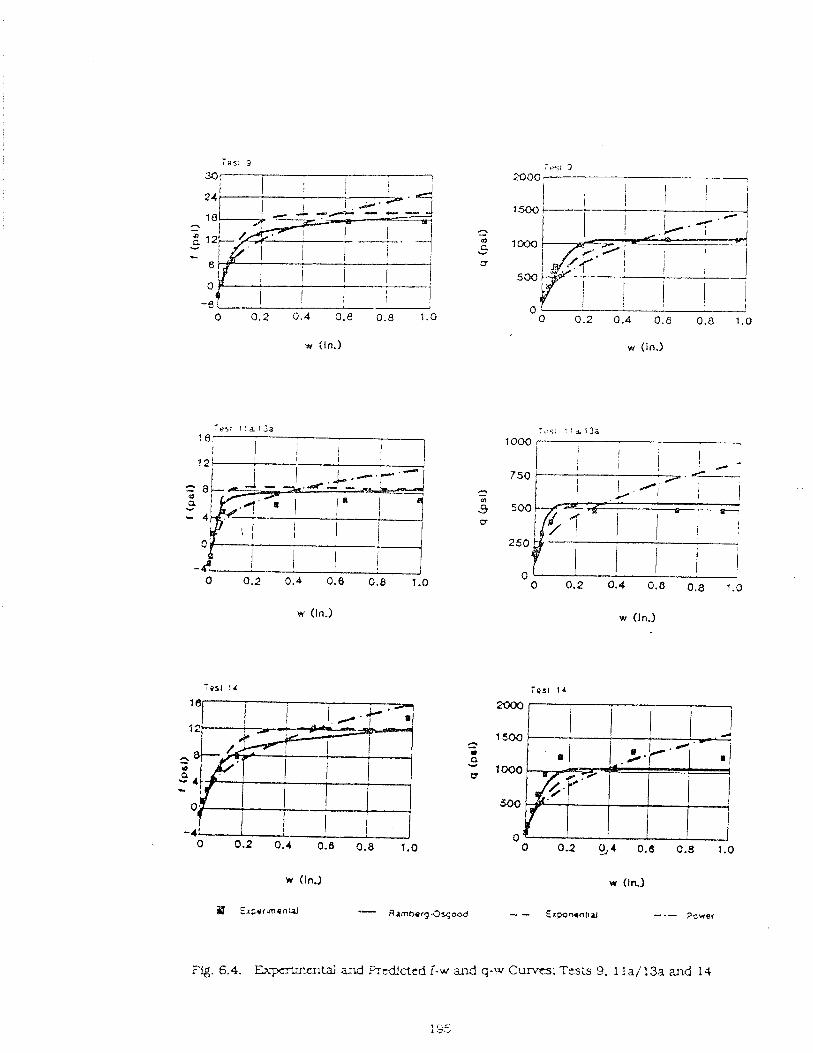
w (In.) w (In.)
0 0.2 0.4 0.8 0.8 1.0
w (In.)
Flg. 6.4. Ejc3e9ii~fl.ta-l ad . W c t e d i -w and q-Y Curws: Tests 9, 1 !a/ 13a and 14
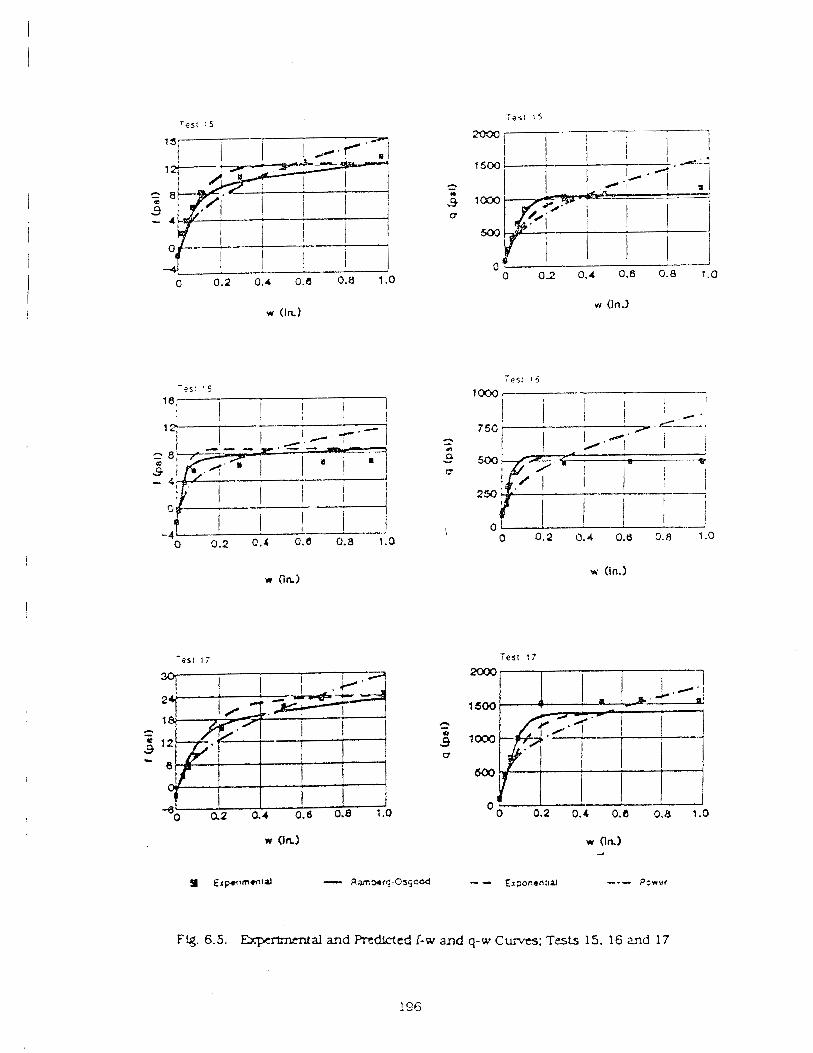
w (In.)
Test 17
I I I I 1
Flg. 6.5. Ekpemnmtal and Predicted 1-w and q-w Curves; T e s l 15. 16 u l d 17
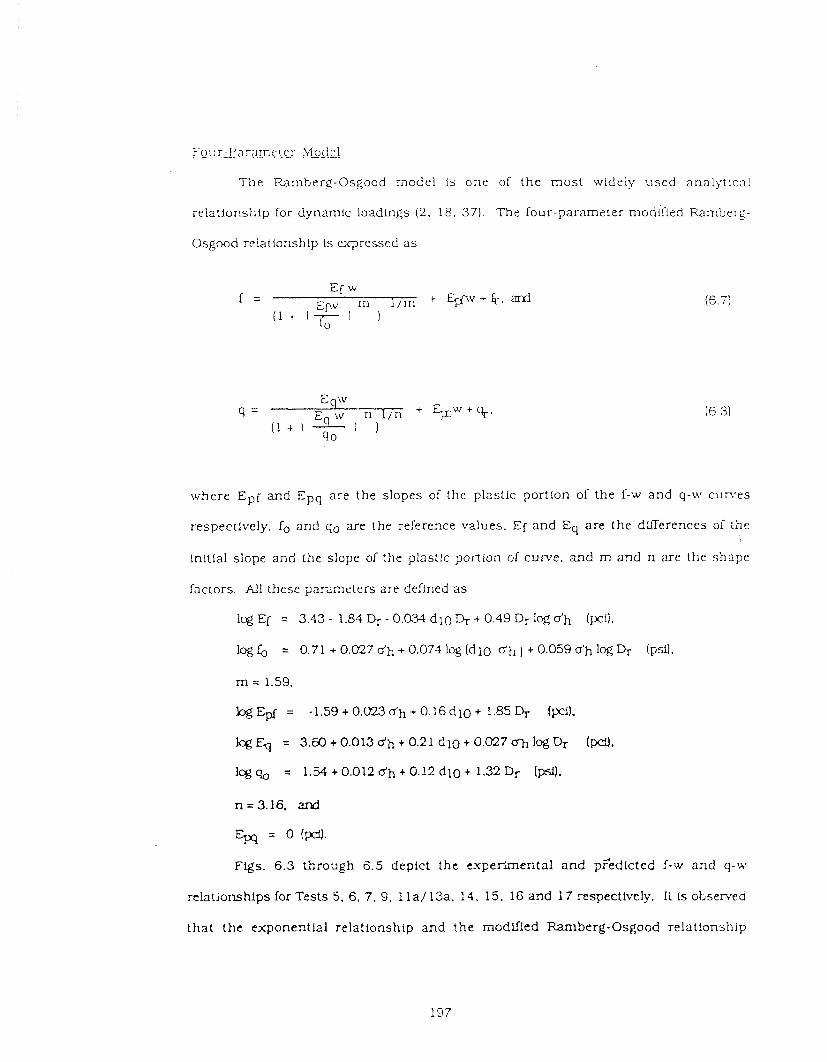
Foc:r-?rlrnmere: ?IIsde]
The Ramberg-Osgood model Is one of t he most widely used analytica!
relationship for dynamic loadbgs ( 2 . 18. 371. The four-parameter modtfied Ramberg-
Osgood relationship is e x ~ r e s s e d a s
where Epr and Epq are the slopes of the plastic portton of the f-w and q-up c u r e s
respectlvely, fo and q , are the reference values. Ef and Eq are the dne rences of the
initial slope and the slope of the p1as:lc portion of curve. and m a n d n are the shape
factors. All these parameters are defined a s
1% El = 3.43 - 1.84 E+ - 0.034 dl0 & + 0.49 Dr 1% dh (wi),
log b = 0.71 + 0.027 d h + 0.074 log (dl0 d l l ) + 0.059 dh log 4- (psi).
m = 1.59.
bg Epf = - 1.59 + 0.023 dh + 0.16 d 10 + ! .85 Q (PI).
kg E+ = 3 . a + 0.013 dh + 0.2 1 d l 0 + 0.027 log 4- (pd,
kg q, = 1 . S + 0.012 + 0.12 dl0 + 1.32 I& [psi).
n=3.16. and
Epq = 0 (m. Figs. 6 . 3 throzgh 6.5 depict the e.uperimenta1 and pFeedicted f-w and q-w
relatlonshlps for Tests 5, 6. 7, 9. i la/ 13a. 14. 15. 16 and 17 respectlvely. I t Is obsened
tha t t he exponentizl relationship and t h e modified Ramberg-Osgood relat!onshlp
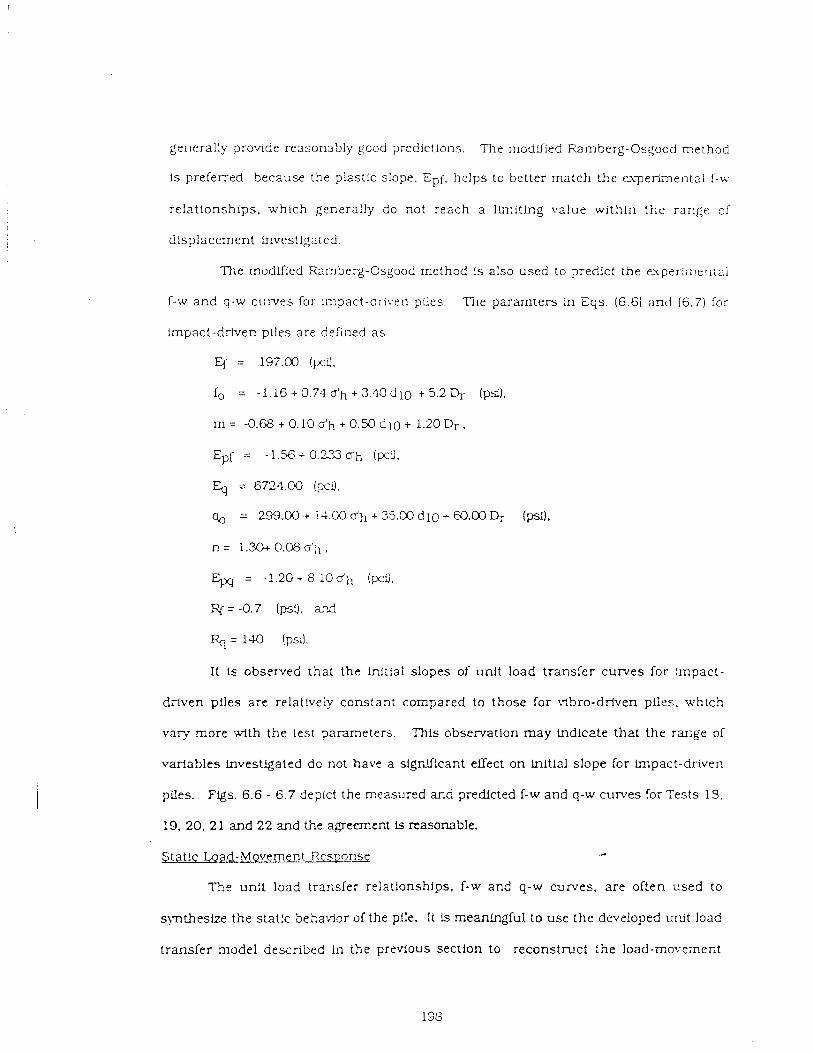
gel~erally provide reasonably gcod predictions. The rnodiiied Ramberg-Osgocd method
i s preierred because the plastic slcpe. Epf, helps to better match the experimental f-w
relat ionships. which generally do not reach a lli-niting value within t h e range 3l
displacement invesagatea
The modified bmberg-Osgood method is also used to predict the euperimeniai
i-w and q-w curves for impact-dnven ptles. The paramters in Eqs. (6 .6) and (6.7) lor
impact-driven piles are deliiied a s
= 197.00 (pi).
fo = -1.16 + 0.74 ash + 3.40 d l 0 + 5.2 Q- (psi).
m = 4.68 + 0.10 d h + 0.50 d l 0 + 1.20 Dr.
Ep[ = -1.56+0. 'L%dh ( ~ 3 ,
Eq = 6724.00 (y~"!).
q, 1- 299.00 + i4.0 d h a 3S.W d l 0 + W.CO & (psi).
% = 140 (psi)
It is observed that the t i t la1 slopes of unit load transfer curves for Fmpact-
diiven ptles a r t relatively constant compared to those for 1qSx-o-driven piles, which
vary more .Kith the test parameters. This obsemation m a y lndlczte that the rar,ge of
variables investigated do not have a significant effect on Initial slope for impact-driven
pi!es. Figs. 6.6 - 6.7 depict the measured and predicted f-w and q-w curves for Tests 13.
19. 20. 21 and 22 and the agreement is reasonable.
!jtat!c bad-Movement R~SDQPS
The unit load transfer relationships, f-w and q-w curves, a re often used to
s?nthesize the static behavior of the pile. !t is meaningful. to use the developed urJt load
transfer model described In the previous section to reconsiruct :he l o a d - m o v m t e ~ t
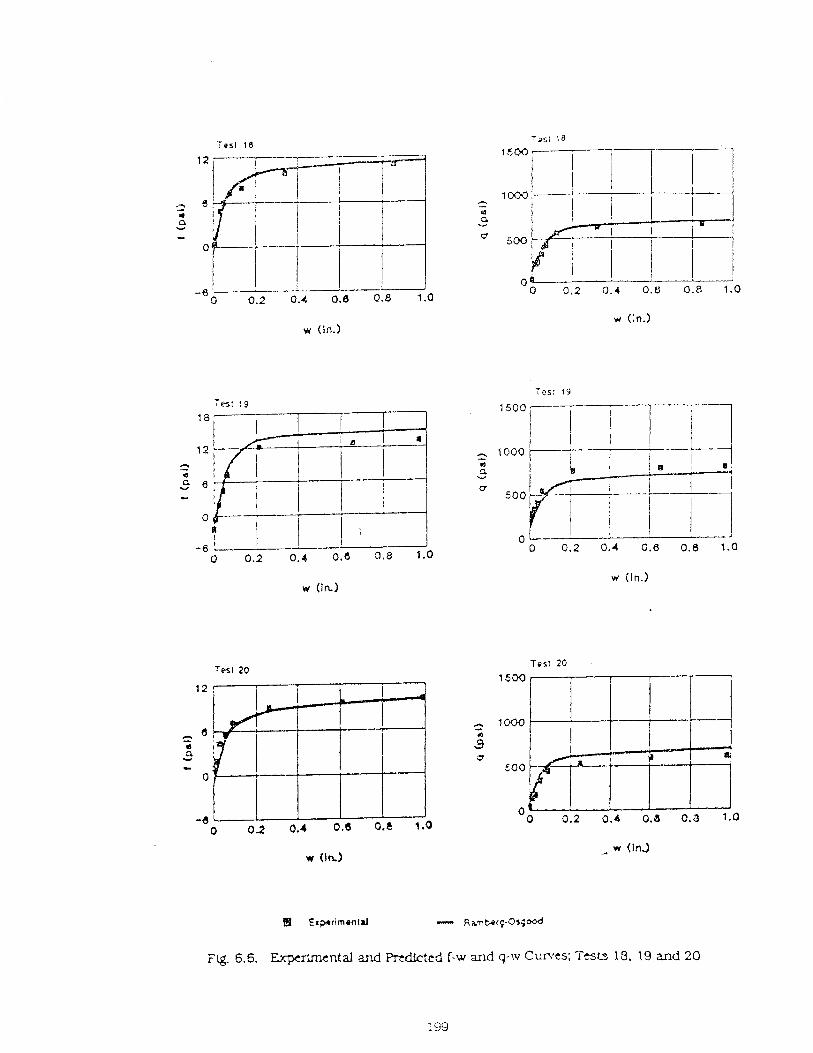
w (In.)
FQ 6.6. Ex;xr'mcntaJ and Prcdlctcd f-w and q-l.v Ccnfes; i 'rsl 18, I 9 and 20
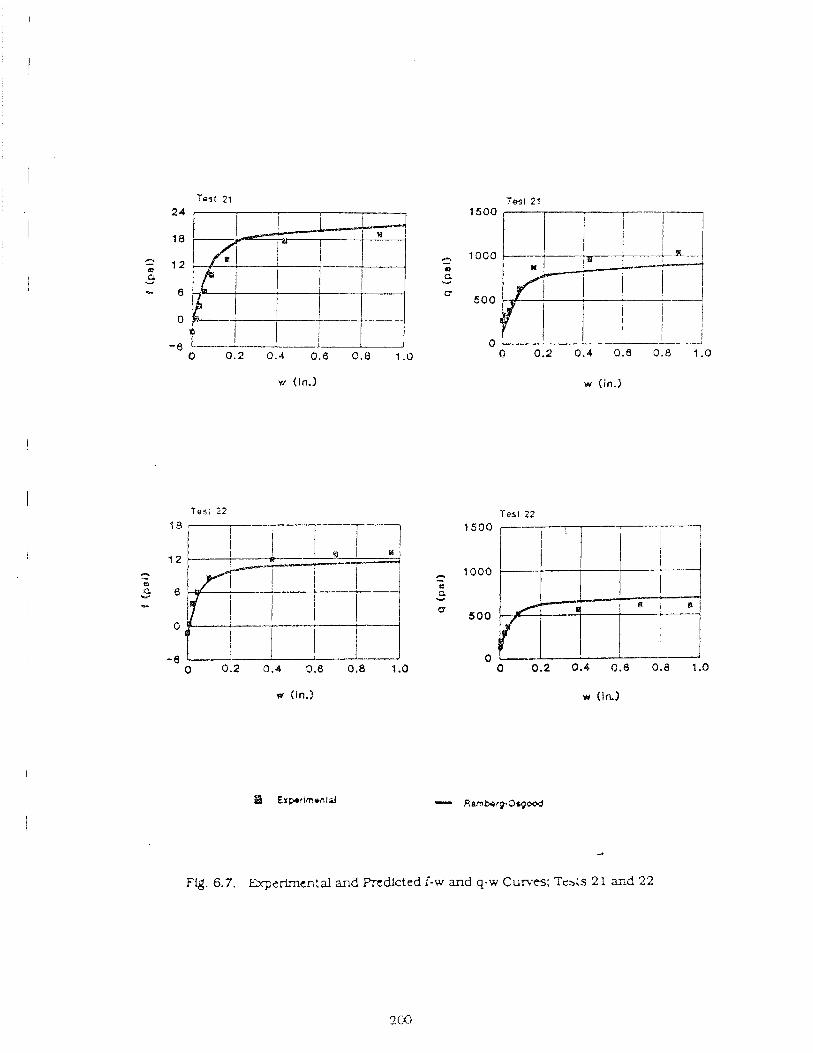
w (in.)
Test 22 Test 22
Fig. 6.7. Expcrlrnen:al and PrtOlcted f-w and q-w Curves: Trs~s 21 and 22
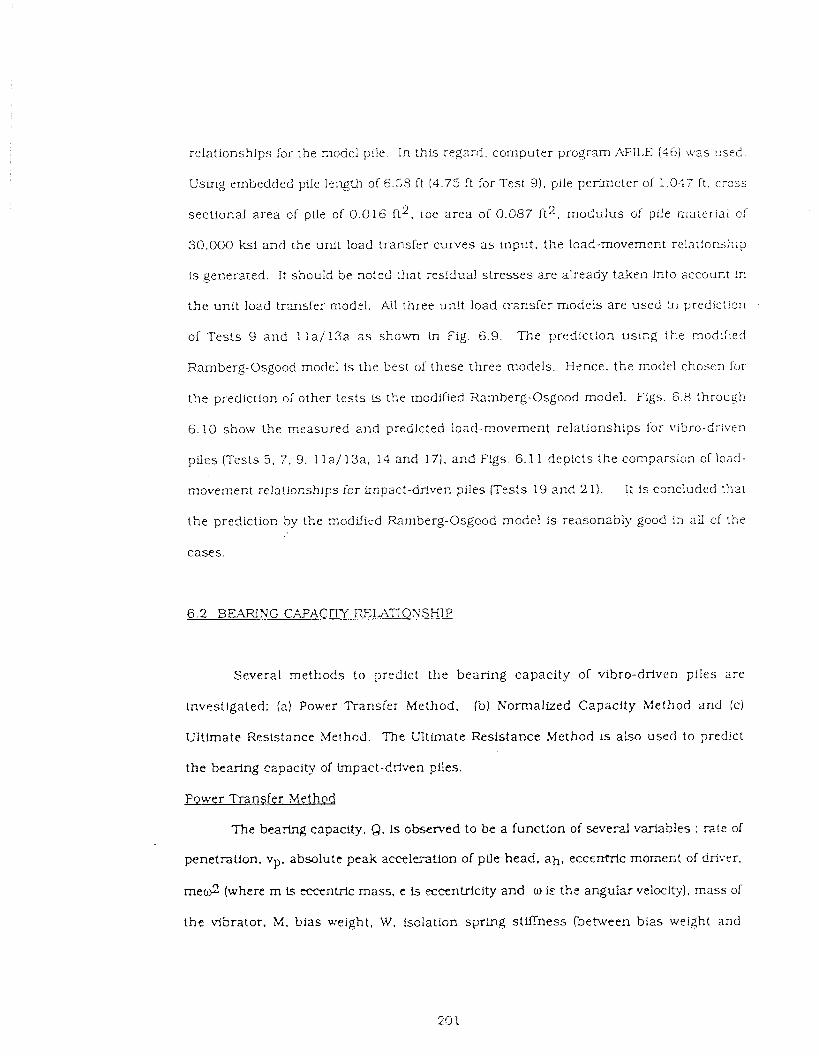
relationships ;ar the xloae; p!le. In :his regard. computer p r o g m APILE (46) w a s u sed
Using embedded pile length of 6.58 It (4.75 !t far Test 3 ) . pile perimeter of 1.047 f t , cross
sectional area of pile of 0 .016 ft2. toe a rea of 0.057 ft2. modulus of pile material 3 f
30.000 ksl and the un!t load transfer curves a s input. the load-movement re!ar!or?;?i?
is generated. I t should be noted that residua! stresses are already taken irito accouxi Lr
the unit load transfer modzl. All t ~ r e e urLt load transfer rrlociels are used in predic:!o~i
of Tes ts 9 and 1 l a / 1 3 a as shown L n Fig. 6.9. The predicrion usicg the rnodu'led
Ramberg-Osgood model is the best of these three models. Hence, the node1 chosen for
the prediction o; other tests is the modified Ramberg-Osgood model. Figs. 6.8 through
6.10 show the measured and predicted load-movement relationships for !?ibro-driven
piles (Tests 5. 7. 9. 11a/13a. 14 and 17). and Figs. 6.1 1 depicts the cornparsion of load-
movement re la t io~ships for impact-driver. piles (Tests 19 and 2 1). 1; is concluded thzt
the pre4iction by the xodifird Ramberg-Osgcod mode! is reasoxabiy good in all cf rne
cases.
6 . 2 BEARING CAPACITY PXLATONSHIP
Several methods to predict t he bearing capacity of vibro-driven piles are
investigated: (a1 Power Transfer Method. (bl Normalized Capacity Method and (4
Ul!lmate Resistance Method. The Ultlmate Resistance Method is also used to predict
the bearing capacity of lmpact-driven piles.
Power Transfer Method
h e bearing capacity. Q, Is observed to be a function o i several variables : rate of
penetrallon, vp. absolute peak acceleration of pile head, ah, eccenZric moment of driver.
me& (where m is eccentric mass, e is eccentricity and o Q LFle angular velocity), mass of
the vibrator, M , bias weight. W. isolation spring stiifness (between bias weight and
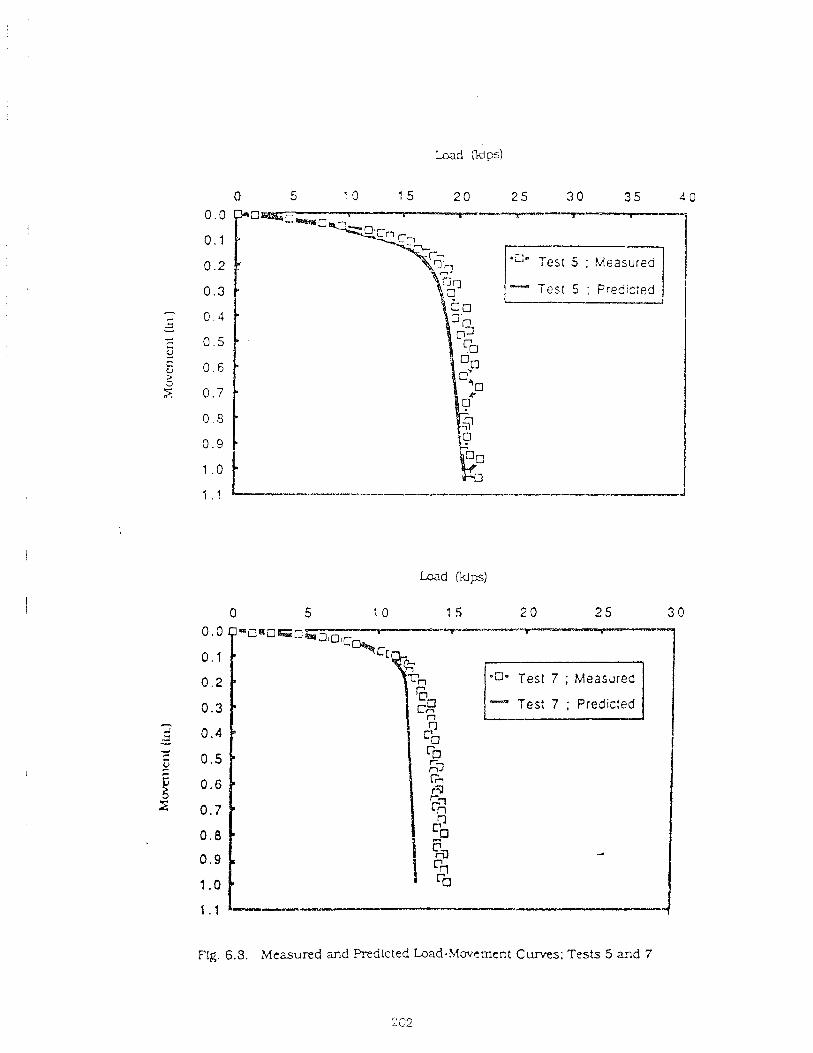
I . 4 I
Flg. 6.3. Measured m d Predicted bad-Mwemect Curves; Tests 5 and 7
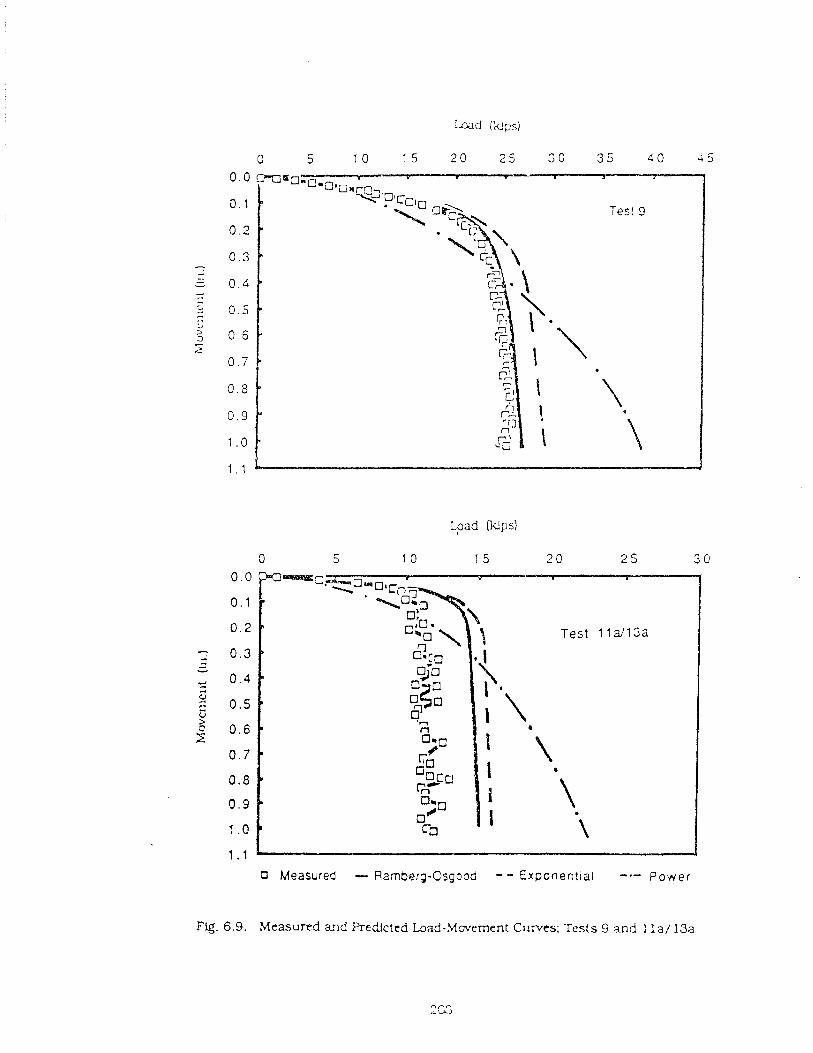
0 Measured - Ramberg-Osgc~od - - Exponect ia l -.- Power
Test 11d13a
Fig. 6.9. Measured a ? d PreCtctcd bad-Mwement Curves; Tests 9 a d 1 l a / 13a
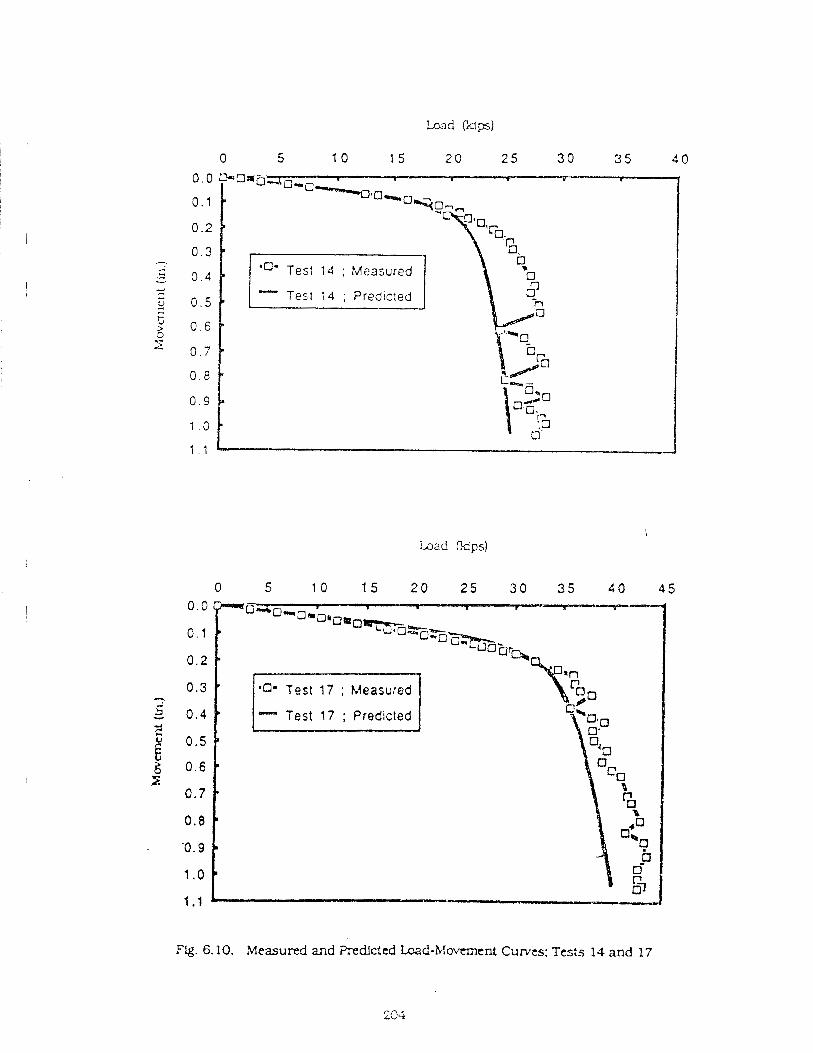
Load Cdps)
5 1 0 15 2 0 2 5 30 3 5 4 0 4 5
F f g . 6.10. Measured and Predicted Load-Movacnt Cumts; Tests 14 and 17
204
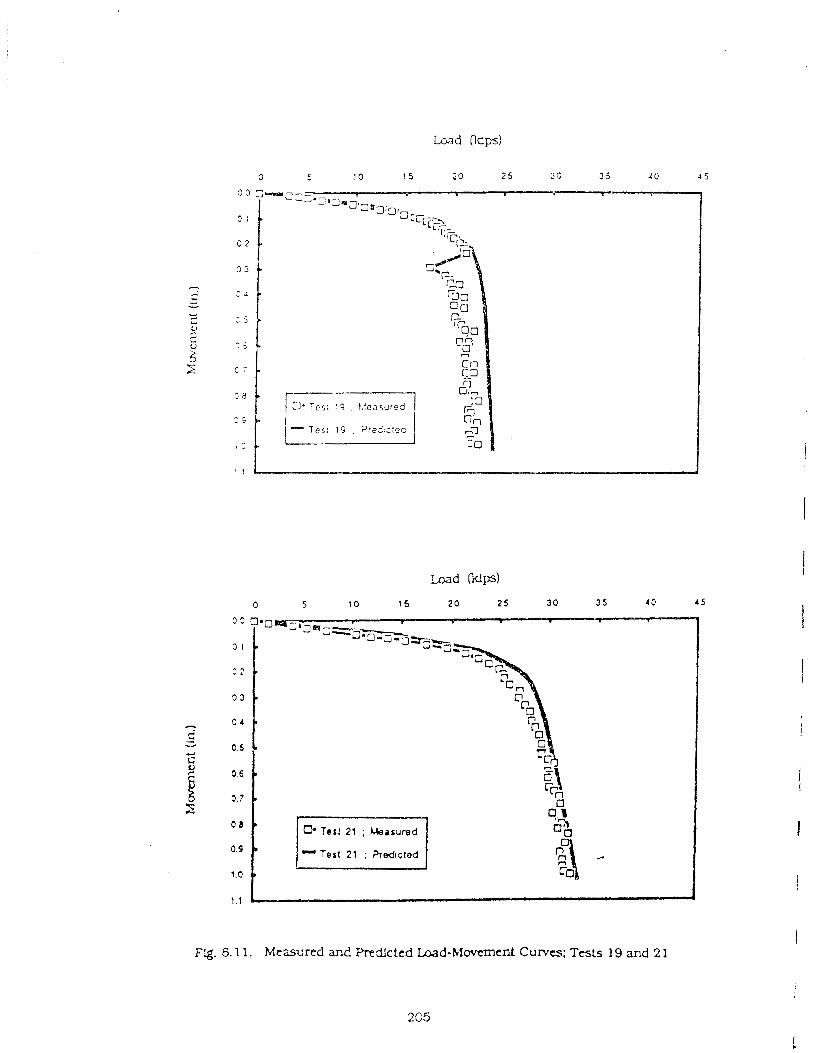
Fig. 5.1 1. Measured and I'redlcted Load-h-Iovement Curves: Tests 19 and 2 1
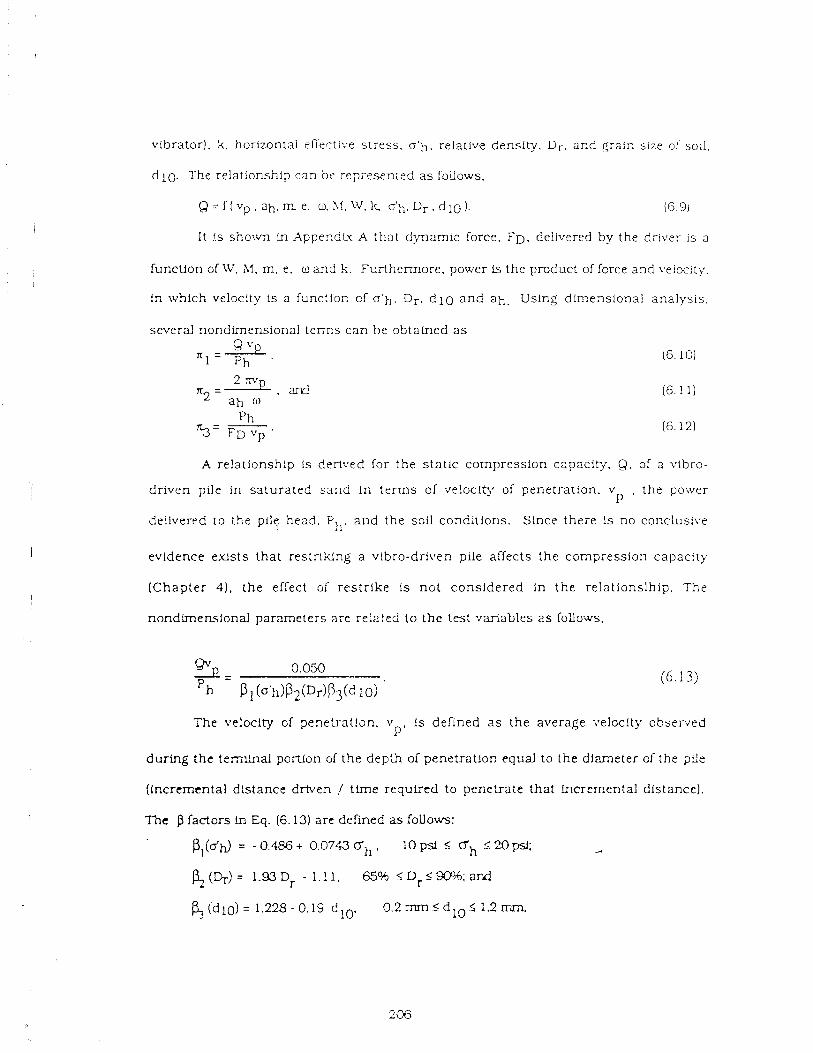
vibrator]. k, horizontal eKective s tress . o ' h , relative density. Dr. and grain s u e of soil.
d 10. relationship can bt. repr~sen:ed a s follows,
Q = f ( v p , a h S n e , o,h~i.!V,lc c ' h . D r . d l o ) . (6 91
It !s shown in XppendL~ A that dynamic force. FD. delivered by the drivzr is a
function of it'. Xf. m, e, o and k. Furthermore. power is the product of fcrce and veicc:ty.
In which velocity is a hnc:ior, cf o ' h . Dr. d l 0 a n d a h . Using dLrr,ensional analysis.
several nondknensional terms can be otztafned a s 9 vp
n l = Ph *
A relationship is derived for t he s tat ic compresslon capacity. Q. of a vibro-
d r i v ~ n pile In saturated sand in te rms of veloclty of penetratlon. v . the power P
delivered to the pile head. P h . and the soil conditions. Since there is no conclusi\.e
evidence exists that restriking a v!bro-dri\.en pile afrects the compression capacity
(Chap te r 4) . the effect of restr ike is not considered in the relatlonslhip. The
nondirnensional parameters are related to the test variables a s follows.
The velocity of penetrat!on, v i s derined a s the average irelocity cbserved P '
during the terminal portlon of the dep'lh of penrtratlor, equal to the diameter cf the pGe
(Incremental distance driven ! tfme required to penetrate that incremental distance).
The $ factors in Eq. (6.13) are defined as follows:
P,(dh) = - 0.486 + 0.0743 bh , 10 psi 5 bh 5 20 pst
( ) 1 . - 1 . 1 65% <DrS9@%;r;nd
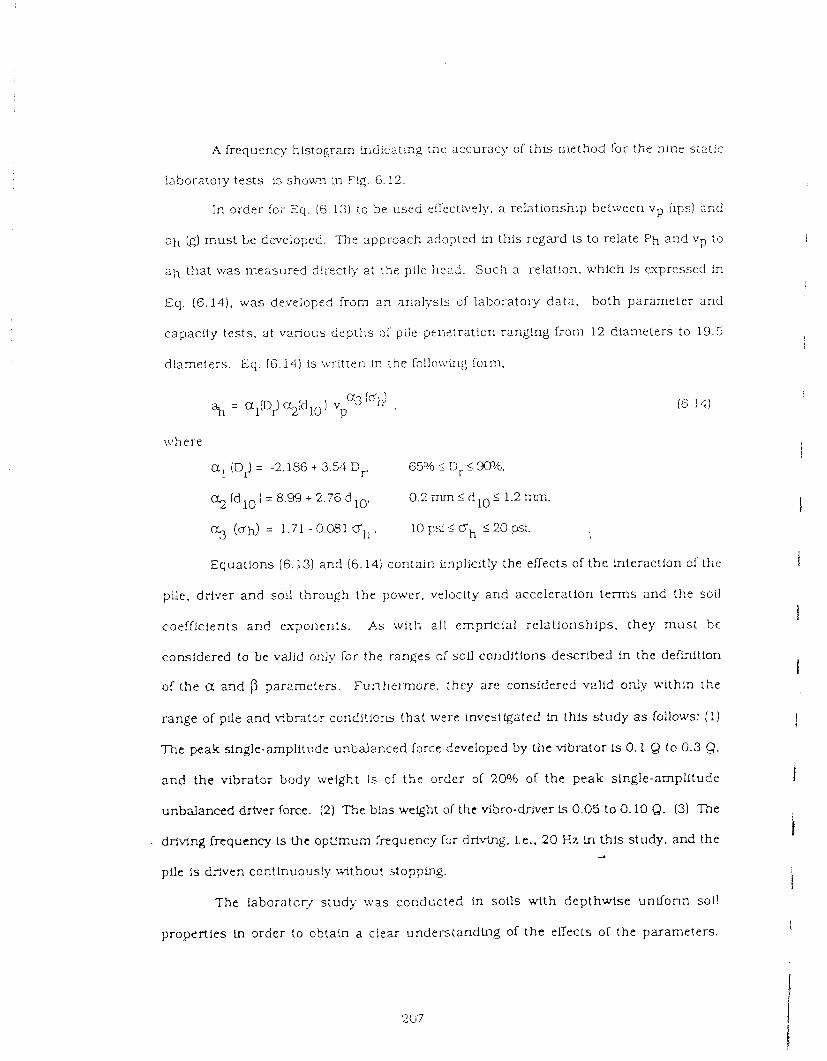
A frequmcy histogram 4sidicaLing r h e accuracy of i h i ~ method for the nine s;;lt!c
laboratory tests is s h o u a in Fg. 6.12.
In order for Eq. (6.13) to be used elTectivcly, a relationsnlp between vp (ips) and
ah (g) mus t t e developed. The approach adopted in this regard is to relate Ph and v:, to
ah that was measured directly at the pile head. Such a relation. which is expressed b.
Eq. (6.14). was deveioped from a n analysls of laboratory data. both pararrieter and
capacity tests. at various depths oT ptle penetration ranging frorri 12 diameters to 19.5
diameters. Eq. (6.1-1) is \.tTitren In :he follo\i8ing f c m ,
ivh ere
a , (D,) = -2.156-1 3.54 D,. 6596 S D, $ W / o .
3 (d ) = 8.99 + 2.76 d 0.2 mm 5 d10 2 1.2 m,
(dd = 1.71 - 0.%1 bh . 10 psi 5 Oh 5 20 pst.
Equations (6.13) and (6.14) contain implicitly the eaects of the interaction of the
pile. driver and sod through the power. velocity and acceleration te rms and the soil
coefficients a n d exponents. As ;vfth all emprlcial relat lonships. they rnust be
considered to be v a l ~ d only for the ranges of sou conditions described in the definition
of the a and p parameters. Funhelmore . they are considered vzlid only within the
range of pile and vibrator conditicns that were investtgated Fn this s tudy as follows: ( I )
T h c pea! sfngle.ampiitude unbal=ced force developed by the vibrator Is 0.1 Q to 0.3 Q.
and the vibrator body weight Is of tk,e order of 20% of the peak single-amplitude
unbalmced driver force. ( 2 ) The blas weight of the vibro-driver is 0.05 to 0.10 Q. (3) The
devtng fnequency is the opcr .um :requency fsr drivlag, 1.e.. 20 Hz in this study. and the 4
pile is driven contlnuo~~s!y ul thout i t o p p k ' .
The laborator] s tudy uras cor,duc!ed in soils with depthwise unlfonn soi!
properties in order to o h t a b a clear understandtng of the effects of the parameters.
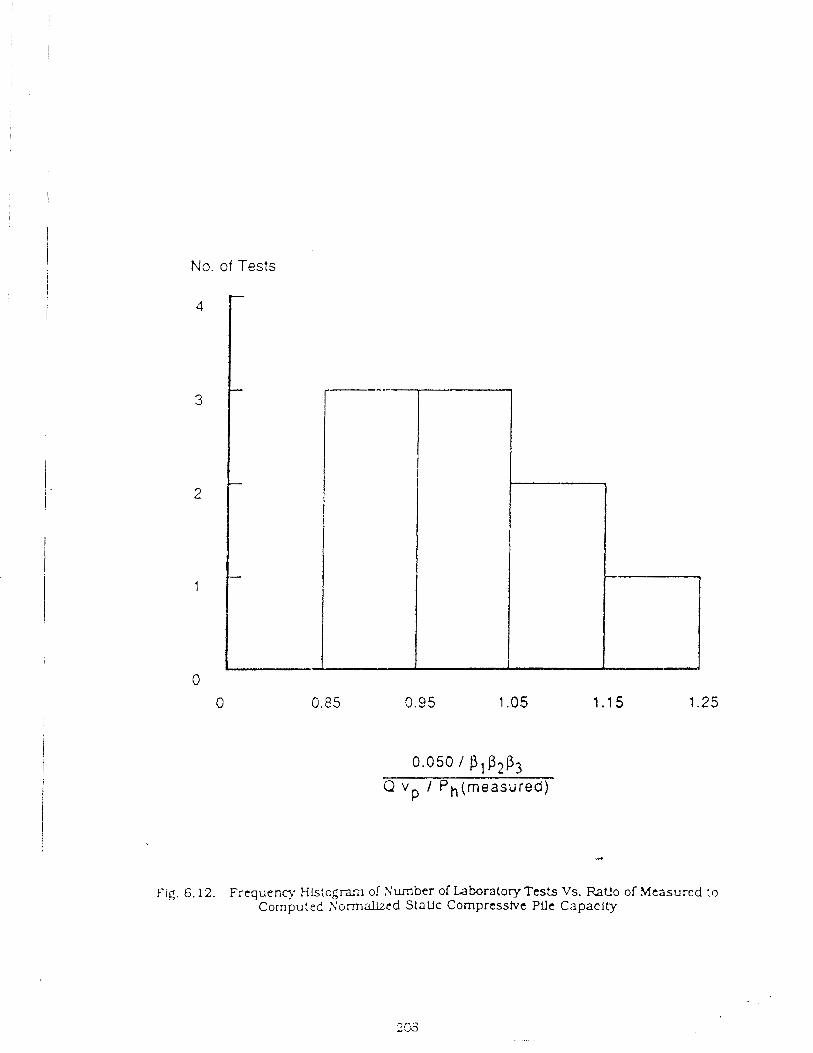
No. of Tests
Fig. 6.12. Frequenq H l s : o g m o i Surnber of Laboratory Tests Vs. RaUo of Measured ro Computed Sormallzed StaUc Cornpressbe Plle Capacity
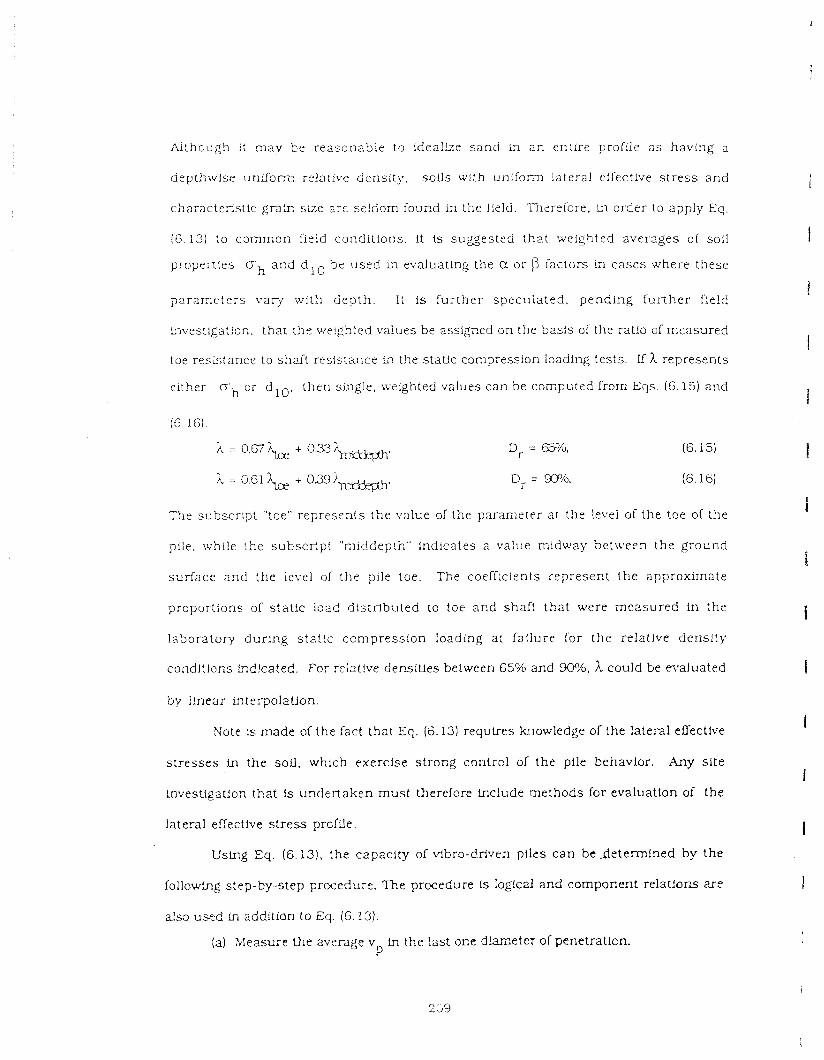
d c h c u g h i t mav be reasonable t.s idealize sand LT a n erlrire profile a s having a
aepthwlse uniform relcltive density, soils with u n l i o m lateral effective s t ress and
chaiac:er',stic gm31 size are se!dgm fouild In the field. Thc r~ fo re , in order to apply Eq.
(6 .13) to common field c o n d i t i o ~ s , it ts su_ggested that weighted averages of soil
propeittes Gh ar,d d10 bt. used in evaluating the C or P factors i? cases where these
parameters vary with d e p t h . I t is fur ther speculated. pending fur ther field
hves!igat!on, that t h ~ weighted values be assigned on the bas:s 01 the ratio of rneasured
toe rcsLstance to shaft res!stallce m the stat?c compression loading tests. If h represents
elther o ' ~ or d l O , then shg le , ~veighted values can be computed from Eqs. (6.15) and
The subscript ' toe" represents the value of the parameter at the levei of the toe of the
pile, while ?he subscript "~xiddepth" indicates a value midway between the ground
surface and the level of the pile toe. The coerflcients represent t he approximate
proportions of s tat ic load distributed to toe and shaft that were measured in the
laboratory dur ing stat ic ccmpression loading a: failure for the relative density
condftioris lnd!cated. For reizt!ve denslues belween 65% and 9096, h could be evaluated
by linear InterpolaUon.
Note Is made of the fact that Eq. (6.13) requlres 'mowledge of the lateral effectbe
s t resses in the SOU. which exercise s trocg control of the pile behavior. Any site
investigation that is undertaken mus t therdore Fnclude methods for evaluation of the
lateral eirect!ve stress prcfile.
Uslng Eq. (6.13), the capacity of tlbro-driven piles can bede te rmined by the
fo l loWg step-by-step prwedure. The procedure is logical and component relations are
al,w used in addition to Eq. (6.13).
(a) bieasure the average v ln the last or,e d m e t e r of penetraticn. ?
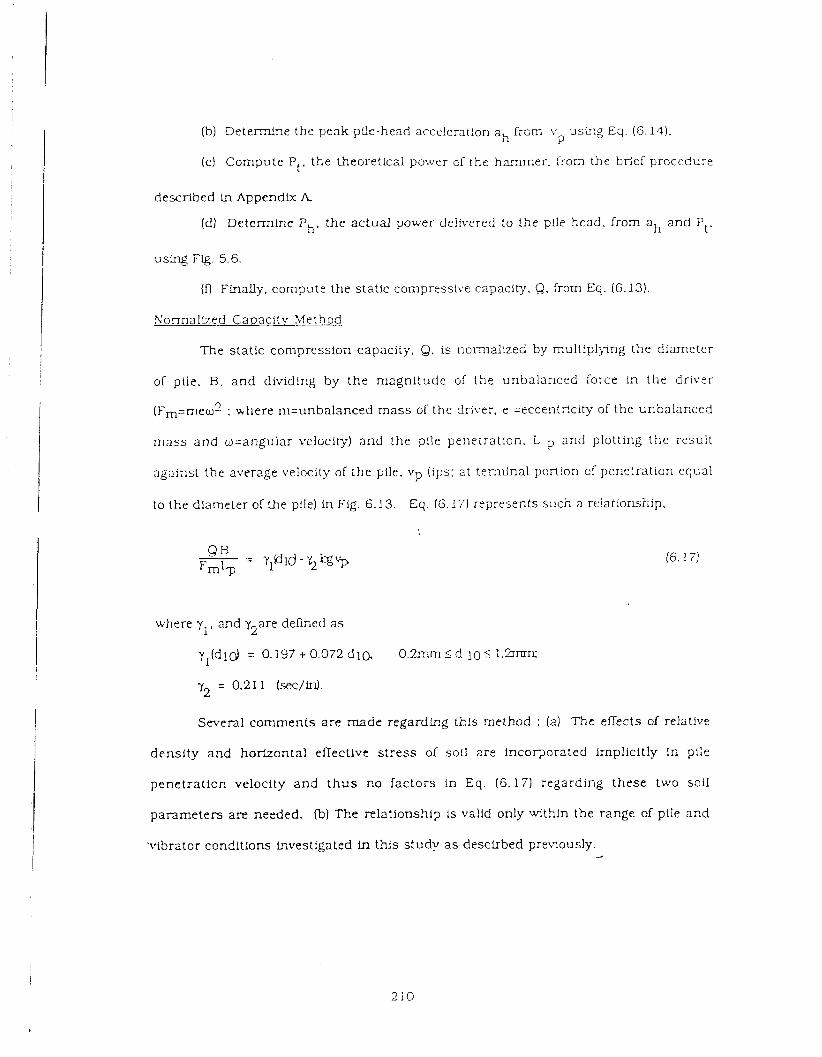
Ibl DetermtTle the peak pGr-head acce!ernCon ah f r ~ m v usiqg Eq. (6.14). P
(c) Compute Pt. the theoreucal power cf the hammer. from the brief procedure
described in Appendlx A
(dl Determine Ph, the actual power delivered to the pile head, from a h and Pt.
using Fg. 5.6.
(0 Finally, computc the static compressive capacity. 9, from Eq. (6.13).
Normallzed Capacity hlethod
The static compression capacirq., Q, is ~orma l i zed by multiplying the diameter
of pile. B , a n d divid!ng by the magnitude of the unbalanced force in the driver
( ~ , = r n e o ~ ; where m=unbalanced mass of the driver, e =eccentr!city of the unbalanced
mass and o=angular velocity) and the pile penetration. L and plotting the result
against !he average velccity of the pile. vp (ips: at terminal portion cf penetration equal
to the diameter of the plle) in Fig. 6.13. Eq. (6.17) represents such a re!ationship.
where y and y2are defined a s i '
y l (d ld = O.i97+0.072d10. 0 . 2 7 5 d 105 1.-
y2 = 0.21 1 (seclLr3.
Several comments a r e made regardkg this method : (a) The effects of relatlve
densi ty and horizontal effective s t r e s s of soil 2re incorporated implicitly in pile
penetrat ion velocity a n d t h u s no factors In Eq. (6.17) regarding these two soil
parameters are needed. Ib) The relationship is valid only within the range of pile and
vibrator conditions investigated in this s tudy a s descirbed pre\-iously.
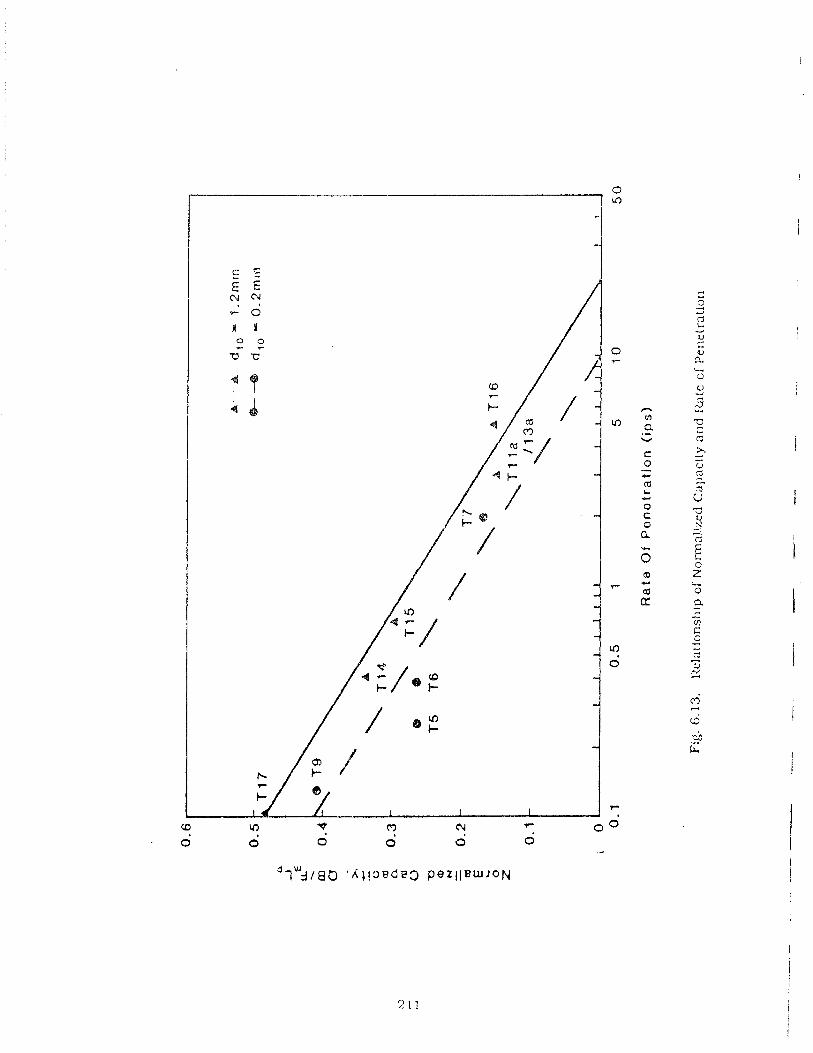
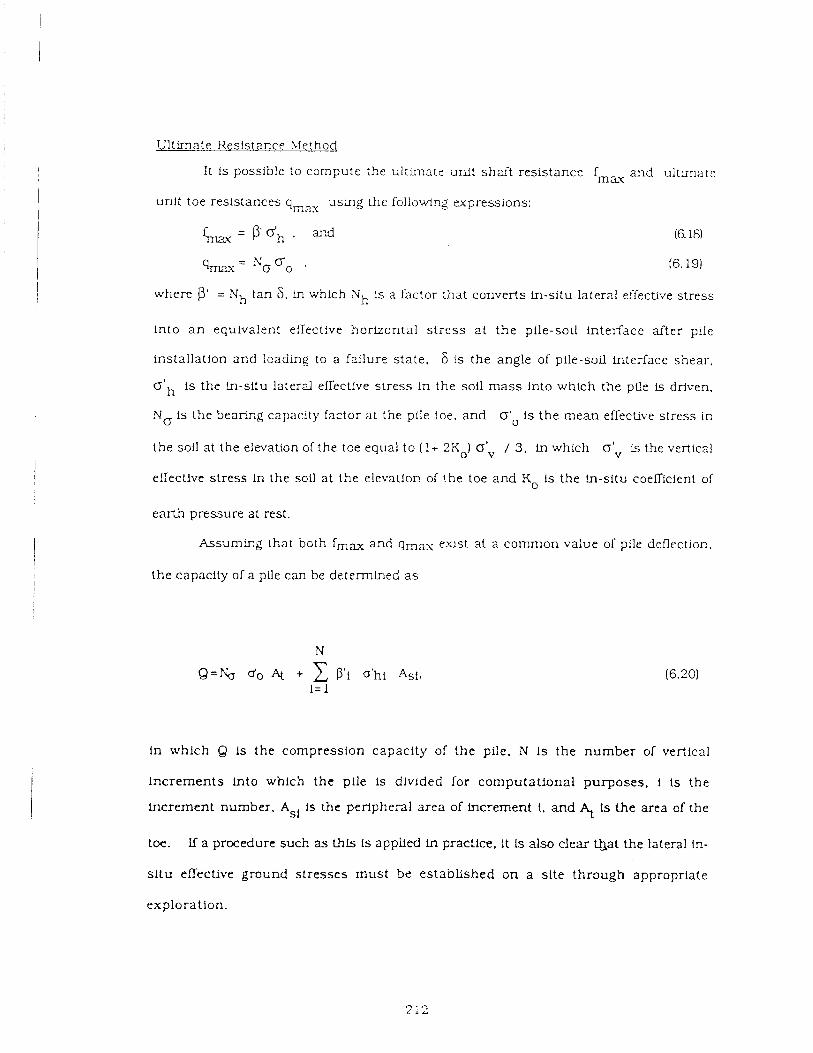
L'ltlmate Resistacce Llethod
It is possible to compute the ultimate unit shait resistance fm, and uitimare
unit toe resistances qn &K
u s n g Ihe following expressions:
where p' = Nh tan 6. in which Nh is a factor :hat converts in-situ lateral effective stress
into a n equivalent efrective horizontal s t ress a t the pile-sou interface after pile
installation and leading to a failure state, 6 is the angle of pile-soil Lrterface shear.
oIh is the in-situ lateral effective stress in the sou mass lnto which the pLle is driven.
No is the bearing capacity factor at the pile toe. and G'o is the mean effective stress in
the sofl at the elevation of the toe equal to ( 1 + 2Ko) C T ' ~ / 3 , in which c s I v is the vertical
efiectlve stress In the soil at the eleva~ior? of !he toe and KO is the Ln-situ coefficient of
earth pressure at rest.
Assun15g Lhat both fmz and qmax e.ust at a common value of pile deflection.
the capacity of a pile can be determined as
in which Q is the compression capacity of the pile, N is the number of vertical
increments lnto which the pile is divided for computatlonal purposes. 1 is the
increment number, Asi is the peripheral area of increment I, and At is the area of the
toe. If a procedure such a s this is applled in practice. i t is also cle= Qat the lateral in-
situ efiective ground stresses must be established on a site through appropriate
exploration.
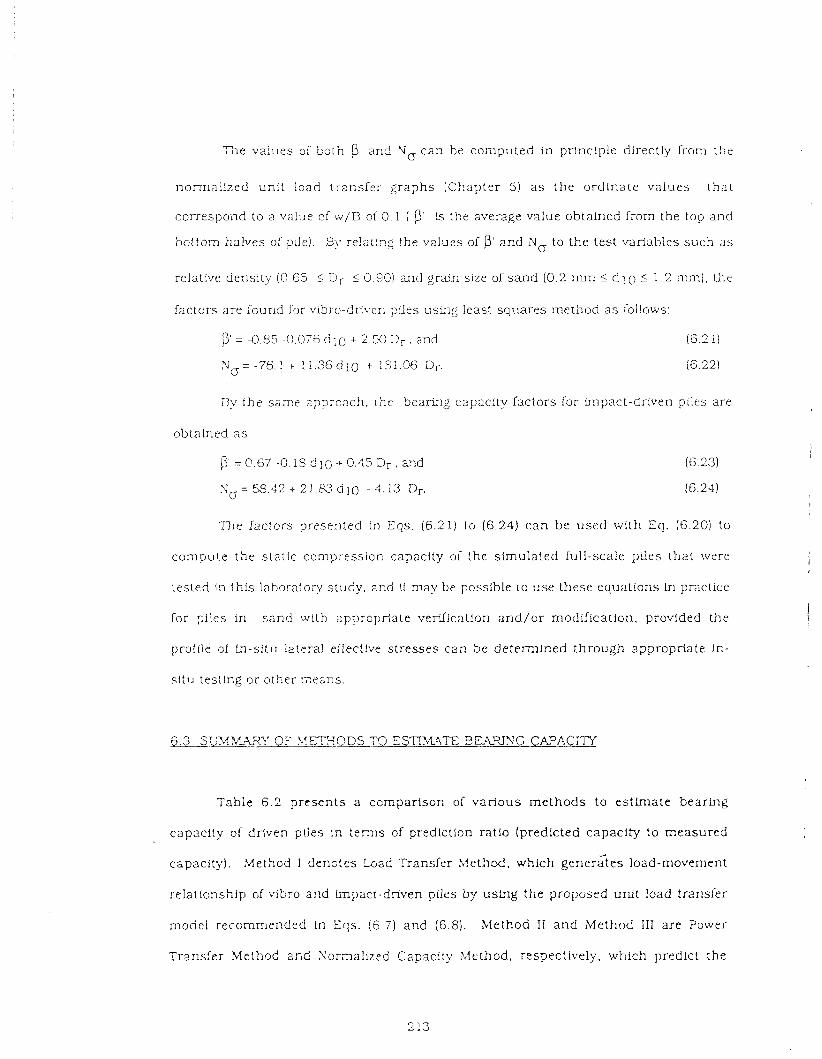
The values of both 3' and No c a n be computed i n princlplr: directly from the
nonnai ized uni t load t r a ~ s f e r g r aphs (Chapter 5) a s t he ord ina te va iues t ha t
correspond to a value of w /B of 0.1 ( P' 's the average value obtained from the top and
bottom halves of pile). 3 ~ 1 relati-rlg the values of P' and No to t he test variables such a s
relative density (0.65 5 Dr S 0.90) and grain size of s a n d (0.2 rnrn i d l 0 i 1.2 m i , the
fzctors a re fcund for x?bro-dri~~en piles usiqg least squares merhod a s follows:
p' = -0.85 -0.076 d l 0 i 2.53 2, , and (5.21)
No= -76.1 i 11.36d10 + !Si.G6 Dr. i6.22)
By the same approach. :he bearing capacity factors for impact-driven piles are
obtained a s
p = 0.67 -0.19 d 10 0.45 a r . a?d
N,=Fi,!.i:Z-ZI L U d l 0 - 4 . 1 3 Dr.
The lactors ?resented In Eqs. (6.21) lo (6.24) c a n be used with Eq. (6.201 to
compute t he s tat ic compression capacity of !he s imulated full-scale piles tha t were
tested Ln this laboratory s tudy, and I t may be possible 10 u se these equat ions h practice
for ?iles in sand with appropriate veriflcat!on a n d / o r modification, provided the
proille of i n - s l t u lateral effective stresses can be d e t e r m l ~ e d through appropriate In-
situ testing o r other r;:ear,s.
Table 6 2 presen ts a comparison of var ious m e t h o d s t o e s thna t e beartng
capacity oT driven ptjes in : e m s of prediction ratio (predicted capaci ty to measured
capacity) Methcd I denctes b a d Transfer >!ethod. which generTttes load-movement
relationship of wbro and impact-dnven pl1t.s by using the proposed uni t load t n n s l e r
model recommended ir, Eqs (5 71 and (6 8) Method I1 a n d Method 111 are Power
Transier >lethod and Soma l l zed Capacity !dcthod, respect~vely. which predict the
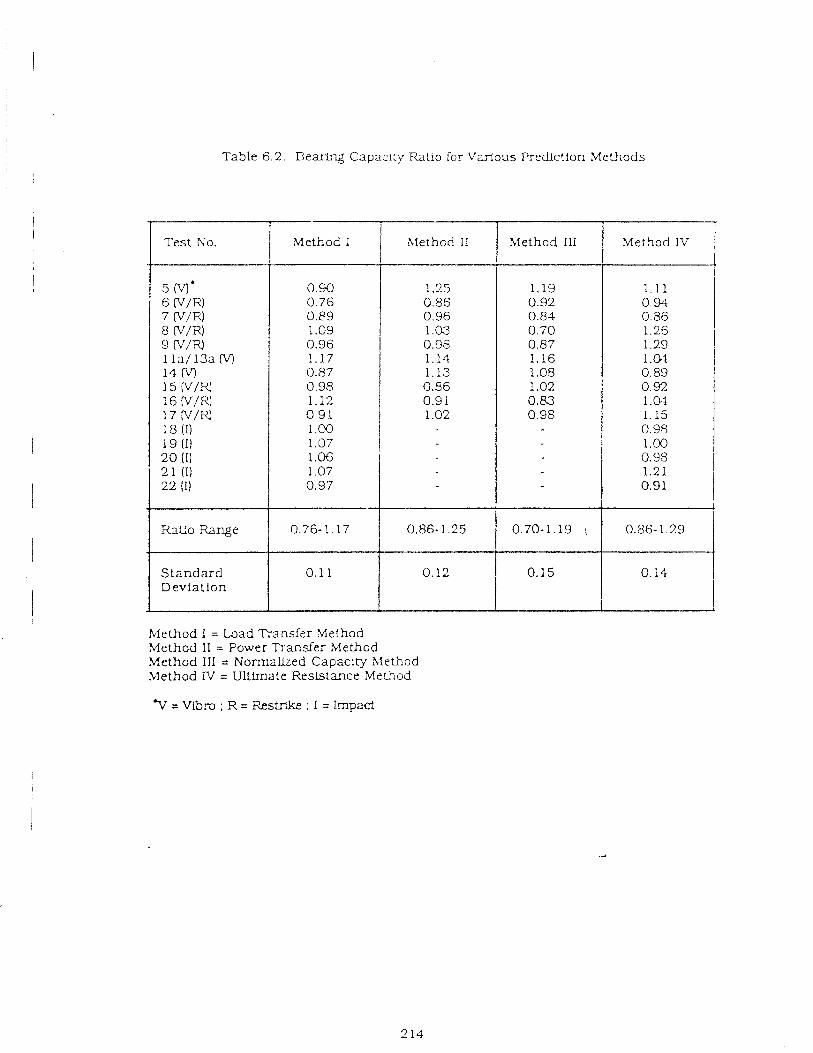
Table 6.2. Beark- Capaci? Ratio for Various Prediction ,Methods
1 Test No. Method 111
S t a n d a r d Deviat ion
Method I Met?od IV
Ratio Range
Method I = Load Transfer Method Method I1 = Power Transfer Method Method 111 = Normallzed Capacity Llethod &lethod TV = Ultimate Resistance Method
& , l e t h ~ d I1
0.~16- 1.29 I
0.76-1.17 1 0.86-1.25 I
0.70-1.19 :
'oeazng c a p a c i b of vibro-dr',ven piles only. Method W is :I:e U!timate Resis tance
&lethod which compu te s ul t imate bear -hg capacity of piles us ing Eq. (6.20) is.ith
r e c a n m e n d e d fac tors NG a n d P ' . The range of prediction rat ios a n d s t anda rd
dmiation. a. for biethods I . 11. I11 m d W 2re, respectively. 0 .76 to 1.17 (a = 0 . 1 1). 0 . 8 6 to
1.25 (cr= 0.12). 0 . 70 to 1.19 ( a= 0. i5) and 0.86 to 1.29 (a = 0.14) . I t is concluded that the
propcsed methods prct"le reasonably gocd estimation of b e e n g capacity of the model
pile.
In order to select the vibro-driver to a t ta in the necessary pile penetrat lon a n d
capacity, a s tep-by-step procedure based on the Power T ~ a n s f e r Method for estimation
of capaclly is r e c o n ~ x ~ n d e d as follows:
(a) Check the required c3pacity of the pile. 9, with attainable Limits usir:g either
the Ultimate Resistance Xfsthod (Eq. (6.20)) or Unit Tbad T r a ~ s f e r Method ( s ~ n t h e s i s of
:cad-movement re!ationshlp using Eqs. (6.7) a n d (6.8)). Eq. (6 .20) is shown aga in a s
rollows,
(b) Selec: a target value of v at fu!l penetration. v = 0.1 In / sec represents P P
refusal.
(c) Compute the required power at the plle head . Ph, a: full penet,-aUon from Eq. a
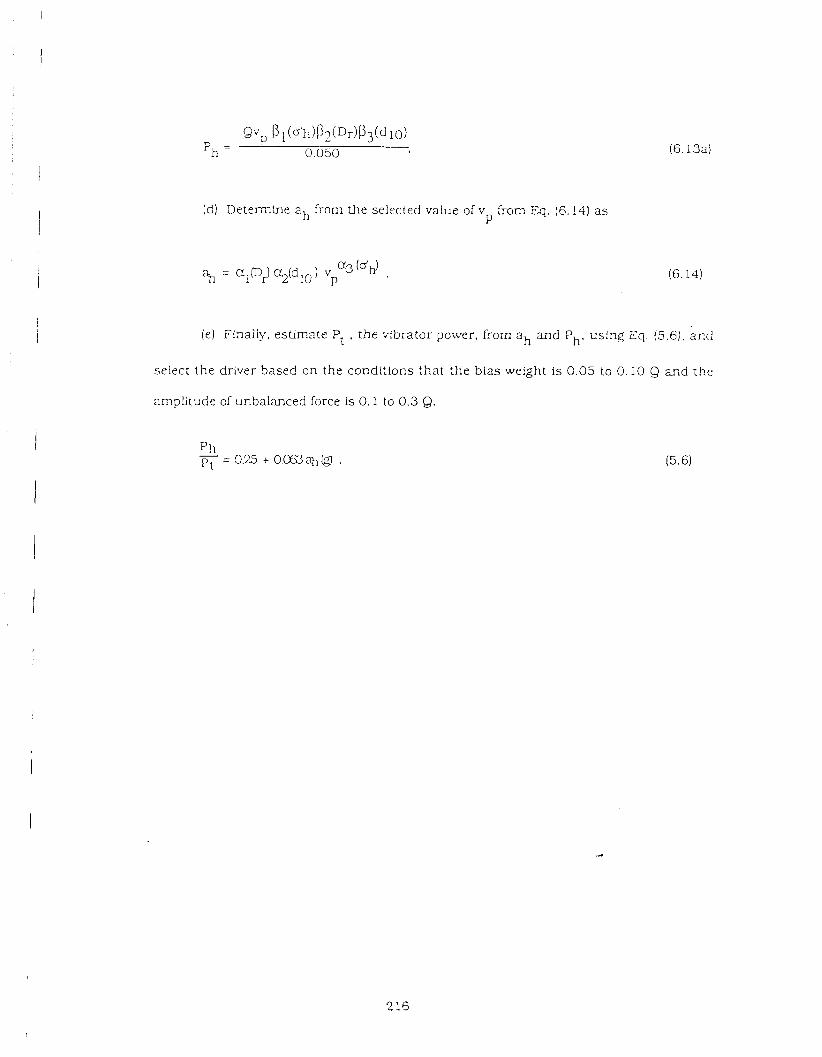
(dl Determine ah from the selected value of v from Eq. (6.141 a s P
(el FL~ally. esllrnate Pi , the vibrator power, from ah and Ph, using E q (5.6). ;El:
select the driver based on the conditions that the bias we!ght is 0 . 0 5 to 0 .10 Q and the
amplitude of unbalanced force is 0 .1 to 0.3 Q.
There is a f ~ n d a ~ e n t a . 1 ddrercnce be:ween the drivwg m e c h a n i s m ccl impact-
d r l ~ ~ e n piles and vibro-dri\,en plles Pile drib-ing by a n lmpact hammer Is usua:ly
regarded a s a p r ~ b l e m of st;ess wave propa2a:ion along a n e!astic rod. One dimensional
wave equation arialjrsis h a s been widely used to model impact-driven piles. On the
other hand, pile drivinz \!sing a \qbratory d n r e r is observed to more closely resemble
s teady state vibration of a rigid red. Atternpcs have also been made to apply wave
equation analysis to \ibro-driven piles (8. 27) . Table 7.1 summaries the proposed wave
equztion and ~ [ h e i soluti=iris found :n the literature. However, none of these solutions
incorpora tes directly the relevant soil fac tors , s o t h a t a more ratlonal and
fundamentally correct model for vtbl-o-driven piles is warranted to predlct !he observed
behavior .
mode!ing of \-~bro-driven piles described In this chapter is developed with
the assumption that the relevant mechanlcs hvoives a one dimensional steady state
vibration of a rigid rod. The success of the proposed model relies heavily on the
modeling of the vibro-driver and t h e pile-sofl interacilon. A vibro-drlving model
which incorporates the vlbro-driver, sol1 behavior and radiation damping through the
soil around the pile is developed. Fksponses predicted by the proposed vibro-driving
model are then compared with the measured responses in this study. A Wave equation
analysis is also performed to compa-e the predicted with the measured responses.
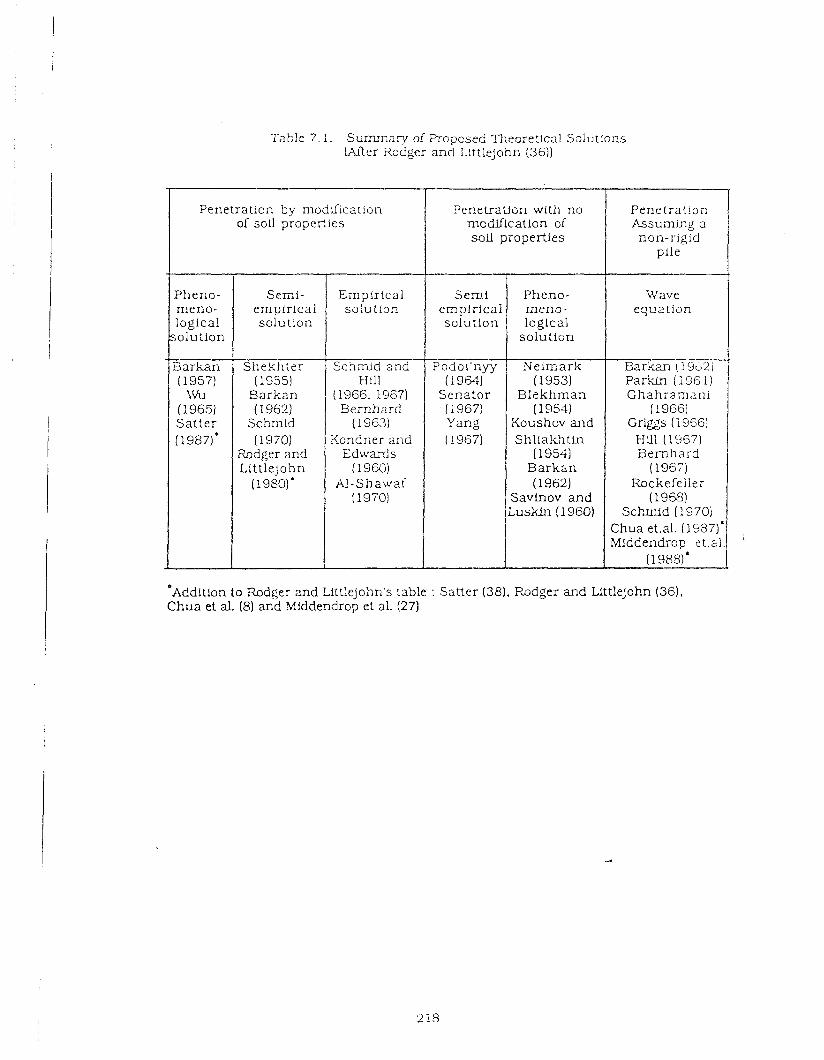
Table 7.1. Surrm,zry of Prcpcsed Theoretical Solutions Miter R=cger and Littlejohn !36)1
' ~ d d l t l o n to Rodger and Littlejohn's table : Satter (381, Fbdger and Littlejohn (361, Chua et al. (8) and Middendrop et al. (27)
-. Penetration by modllicat!on
of soil properties Penetrat ion k s u i n i n g a non-rigid
pile
Wave equation
Bar!- ( 1 1 c3Z i Parkin (1961) Chahraman i
( 19661 Griggs (i966)
Hill (1'367) Se rnha rd
(1967) Rockefeiler
(1968) Schxnid (1970)
Chua et.al. 11'357)' M!ddendrop e t . d .
(1 988) A
Penetration with no mcdLflcation of sofl properties
Empirical so!utian
Sc.i;nid and Hill
(1966, 1967) Bernhard
( 1963) Kondner and
Edwards ( 196G)
N - S h a w a f 1 1970)
Pheno- meno- logical
so lu t ion
Barkan (1957)
TNU (1965) Sa t t e r 11987)'
Semi empirical solut ion
Podol'nyy ( 19%)
Senator ( 1 967) Yang (1967)
S e n i - empirical solut ion
Snekhter (1955)
Barkan (1 962)
Schmid 11970)
Rodger and Littlejohn
(1980)'
Pheno- meno- logical
so lu t ion
Xeimark (1953)
B lekhman ( 1953)
Koushov and Shllalc\tin
[ 1954) B a r k a n (1962)
Savirlov and i u s k t n (1960)
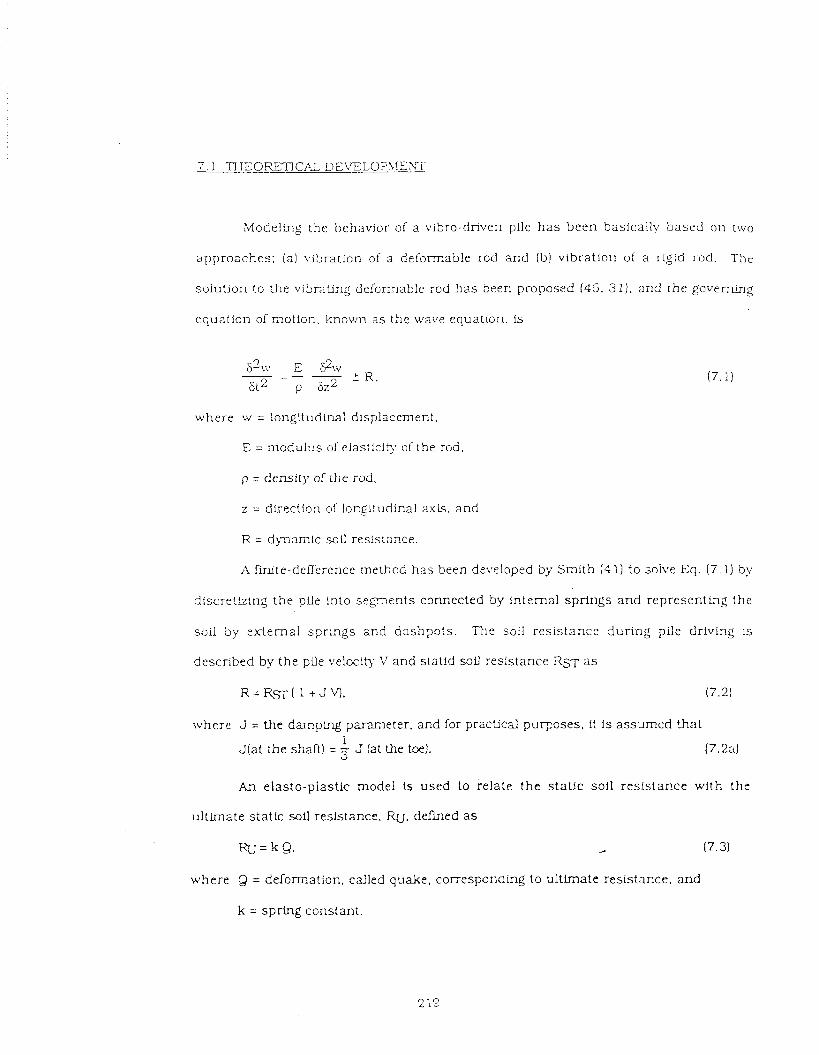
Modeling the behavior of a vibro-driven pile h a s been basically based on two
approaches; (a) \ribration of a defoxmable rod and Ib) vibratlon of a rigid rod. The
solution to the vibrating deformable rod h a s been proposed (45, 31). and the governing
equaticn of motion. L~lovm as the wave equation. 1s
where w = long!tudina: displacement.
E = modulus of elasCci9 of the rod.
p = density of the rod.
z = dlrectlon of longitudinal axis, and
R = dymarnlc sou resistance.
A finite-denerenee method h a s been deireloped by Smith (41) to soive Eq. (7.1) by
discret9ing the pile into segments cmnected by internal springs and representing the
soil by external springs and dashpots . The soil resistance during pile driving is
described by the pile veloci& V and statid sou resistance RST a s
R=RsT( 1 +JV. (7 .2 )
where J = the darnping panmeter . and for practical purposes, it is assumed +hat 1
J (a t the shaft) = 3 J ((at the tce). (7.24
An elasto-plastic model is used to relate the stat!c soil resls tance with the
ultimate static soil resistance, Ru. d e h e d a s
FQ=kQ. .A (7.3)
where Q = delormation. called quake. corresponding to ultimate resistance, and
k = spring constant.
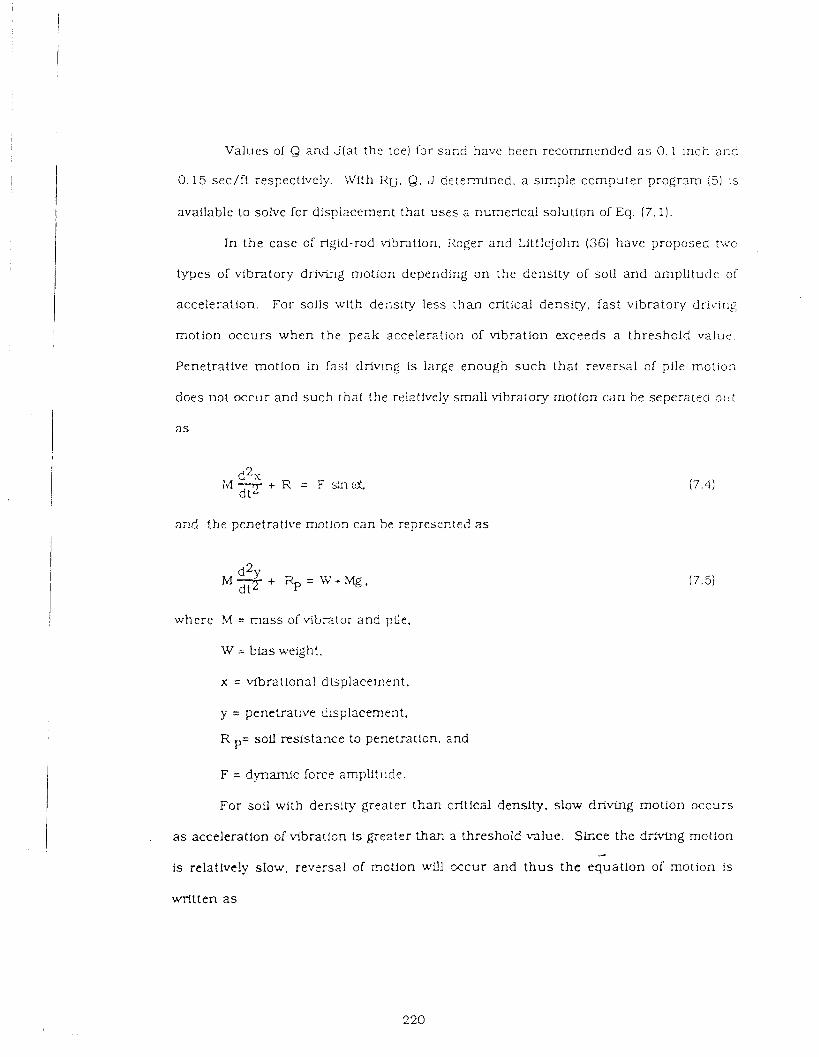
Values of Q and J ( a t the toe) for sand have been recommended a s 0.1 inch ai:S
0.15 sec/ft respectively. '1Vith RTJ. Q. J c e ~ e m e d , a simple computer p r o g r m (5) :s
available to solve for displacement that uses a numerical solution of Eq. (7.1).
In the case o: rigid-rod vibration. i?oger and Littlejohn (36) have proposed t ~ v c
types of vibratory drivL7g motion depending on the density of soil and amplitude of
acceleration. For soils with density less than critical density. fast vibratory d f i i ? ~ g
motion occurs when the peak acceleration of vibration exceeds a threshold value.
Penetrative motion in fast d r i v i ~ g is large enough s u c h that reversal of pile motion
does not occur and such that the relatively small vibratory motion can be seperated out
a s
and the penetntfve rnouon can he represen:?\! a s
where M = m a s s of vibrator and plle,
W = bias weight,
x = vibrational dlsplacement.
y = penetratjve displacement.
R p= soil resfstance to penetration, and
F = dynamic force amplitude.
For soil with density greater t han cri t icd density. slow driving motion occurs
as acceleration of 'v ibra t i~n is greater than a threshold ~ a l u e . Slnce the drlvtng motion 4
is relatively slow, reversal of motion will x c u r and thus the equation of motion is
written a s
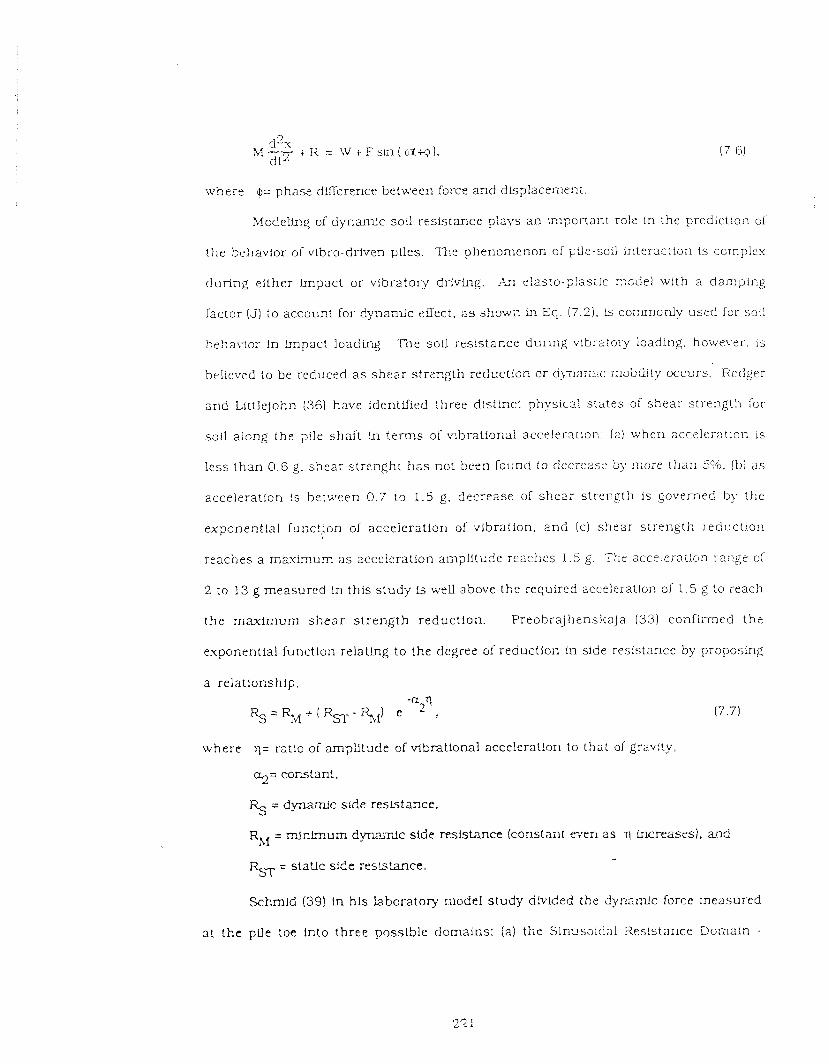
where @= phase due rencc b e m e e n force and dtsplacement.
hlodeltng of dynanllc soil resistance plays a n importanr ro!r in the prediction of
the behavior of vibro-driven piles. T h e phenomenon of ~i l t r -soi l interactiori is co~np1e.u
dur ing ei ther impact o r Mbratory driving. .Azz e!z?sto-;>!astic r n ~ d e i with a d a r r i p i ~ g
factor (J) to account for dynarnic effect. a s shomq in Eq. (7.2) . is comn~only used for so2
behab9or in impact loading. The soil resistance during \?bratory ioading, hoxvever. is
believed to be reduced a s shea r s t rength reduction or d>m3~11c moblliiy occurs. Rcdger
and Littlejohn (36) have identified three distinct physical s ta tes of shea r s t rength Sor
soil a lcng the pile shaft in t e rms of l ibrat ional acceleration: ( a ) when accelerat io~i is
less t h a n 0 .6 g , shear s t renght h a s not Seen found lo decrease by inore than 501s. (b) as
acceleration ! s hetween 0.7 to 1.5 g. decrease of shea r s t rength Is governed by the
exponential func!)on of acceleration of vibration. a n d (c) shea r st^-ength i.eduction
rcaches a maximum a s acceleration arnplltcde reaches 1.5 g. The acceleration range of
2 to 13 g measured In this s tudy is well above the required accelerallon of 1.5 g to reach
the max imum s h e a r s t r eng th reduc t ion . Preobrajhenskaja (33) confi lmed t he
e .qonent ial function relatlng to the degree of reduction in side resistance: by proposing
where q= mtlo of amplitude of vibrational acceleration to that of gravity,
%= constan!.
% = dynamic side reslstance.
R&i = r m u m d y n a i c side rrsistancc (constazt men a s q increases). and
.-. RST = static side reslstance.
Schmid (39) Ln his laboratory model s tudy d!vlded the dyriamtc forre measured
a t the pUe toe into three possiSle dcmains: (a) the Sinusoldal Resistance Domain -
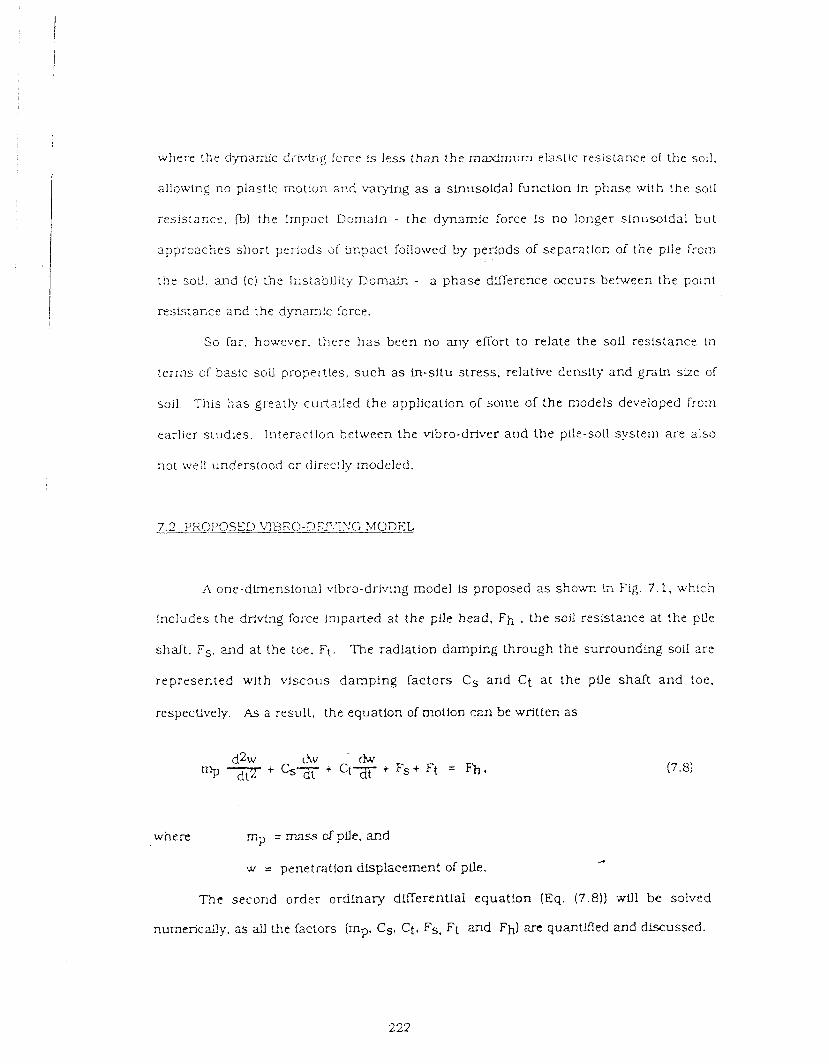
where the c l jm rn l c di-ivtr~g f c r c ~ is less than the maximum elastic resistance of the soil.
allowing no plast!c rnot!on and varying a s a sinusoidal function in phase with the soil
re ,s;s!acce, - . (b) the Impact Domain - the dynam:c force is no longer sinusoidal but
approaches short periods of .fi,pact followed by perfods of separatlor, of the pl!e from
tke sou. and (c) the Instablli~y Clomain - a phase dflerence occurs between the polnt
resistance and the dqnanllc force.
So far, hou-ever. there h a s been no any effort to relate the soil resistance In
terms of basic soil properties, such a s Fn-situ s tress , relative density and gram size of
soil. This h a s greatly curtailed the application ~i some of the models developed from
earlier studies. Interaction between the vibro-drlver and the pile-soil system are also
not we!l understood or directly modeled.
7 2 PROPOSED \,T3KO-DDLX'.TiSG MODEL -
A one-dimensional vibro-driving model is proposed a s shown Li Fig. 7.1, which
includes the driving force imparted a t the pLle head, Fh . the soil resistance at the pze
shaft. Fs, and at the toe. Ft. The radiation damping through the surroundLng soil are
represented with vlscous damping factors Cs and Ct at the pile shaft and toe.
respectively. As a result, the equation of motion ca be written a s
where rn? = mass cf pue,
.A
w = penetration dlspiacement of pile.
The second order ordinary dLfferential equation (Eq. (7.8)) will be solved
numericaily. 2s all the [actors (my, Cs, Ct, Fs, Ft and Fh) an quantified and discussed.
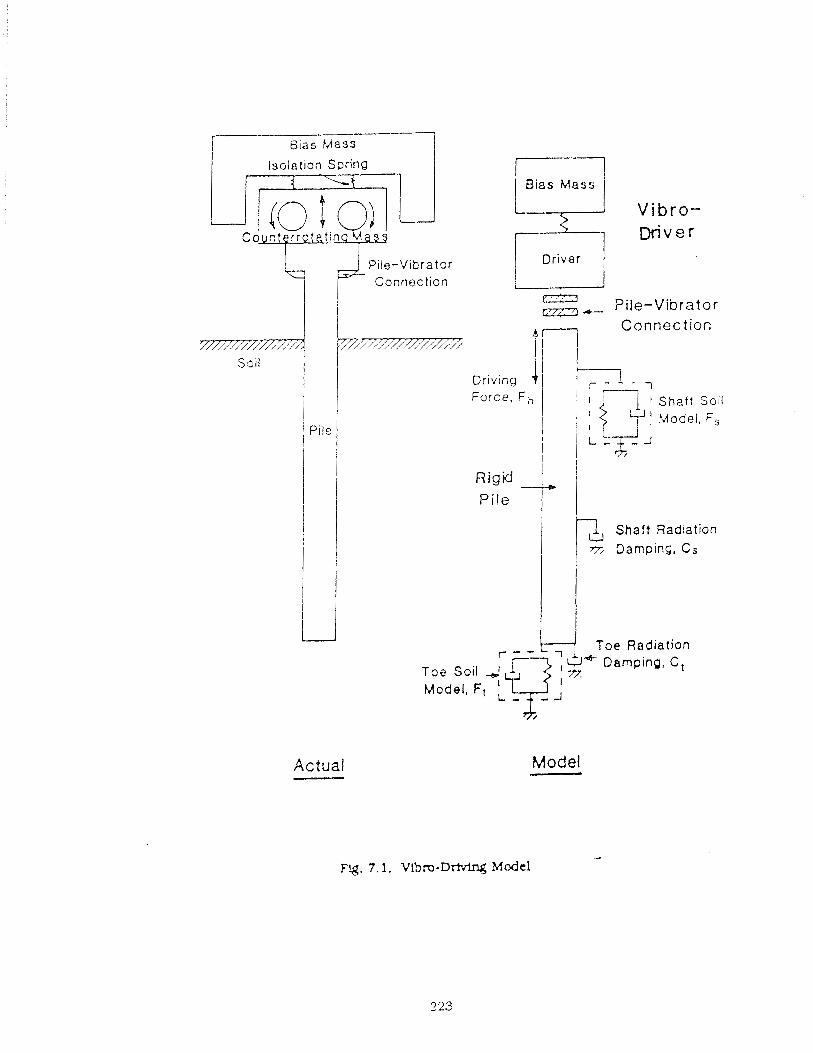
r B ~ a s Mass 1 Isolation Spring
C o nt r: t in
Pile-Vibrator Connection
Bias Mass m Vibro- Driver
es=3 Pile-Vibrator - Connect ion ~ / 7 % . , m 5 q
Rigid 1 I Pile I I n. Shaft Radiation
u - Toe Radiation r - ' &"
Toe Soil +! ,- x Damping, C,
Actual Model
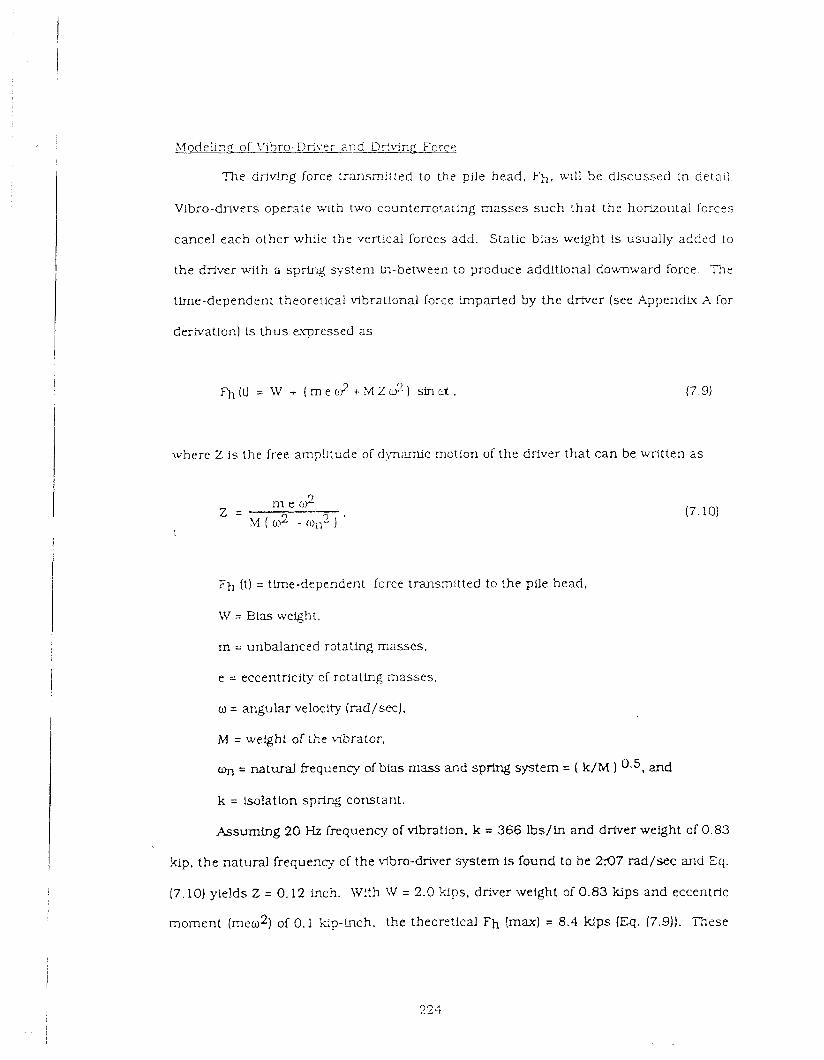
hlode!ing of ?'ibro-=fiver aiicl D?v:nc Force
The driving force trmsmit:ed to the pile head, Fh . will he discussed in detail.
Vlbro-drivers operzite w ~ t h two counterrotating masses such that the horizolltal forces
cancel each other wh:le the vertical forces add. Static b ias -&eight is usually added to
the driver with a sprtrd system L?-between to produce additional downward force. The
time-dependent theoretical ~ lb ra t iona l force imparted by the driver (see AppendLx X for
derivauon) is t hus expressed a s
lvhere Z is the free amplitude of dhnamlc motion of the driver that can be urritten a s
r'h (t) = time-dependent force transrrdtted to the pile head.
W = Elas weight,
m = unbalanced rotating masses.
e = eccentricity of rotating masses.
o = angular velocity (rad/secl,
M = weight of the vibrator.
= natural frequency of bias mass and spring system = ( k / M ) 0.5, and
k = isolation spring constant.
Assuming 20 Hz frequency of vibration, k = 366 1bs/in and driver weight of 0.83
h p , the natural frequency of the \lbro-driver system is found to be 2337 rad/sec and Eq.
(7.10) yields 2 = 0.12 Inch. Wlth JV = 2.0 kips, driver weight of 0.83 kips and eccentric
moment (me&) of 0 .1 Kp-Lnch. the theoretical Fh !max) = 8.4 kips (Eq. (7.9)). These
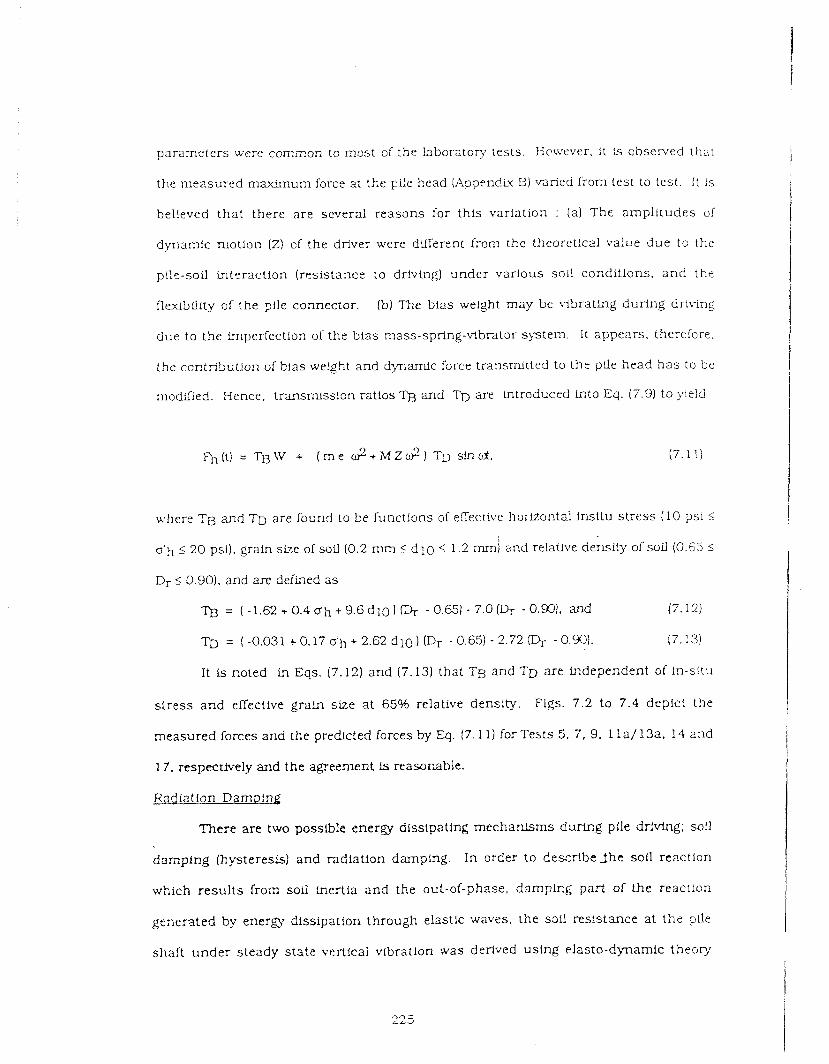
parameters were common to most of the laboratory tests. Hov..ever, it Ls observed [ h a t
the measured maximum force at tke pi:e head (App~ndiu E) varied frorn test to test. I t is
bel!eved tha t there a re several reasons ior this variation : (a ) The ampli tudes of
dparn!c motion (2) cf the driver were dilferent frorn the theoretical value due to the
pflc-soil interaction (resistance to driving) under various soil conditions. a n d the
flexibtiity of the ~ F l e connector. (b) The bias welght may be vibrating during dri~ving
due to the imperfection of the bias mass-spring-vibrator system. It appears , therefore.
the contribution of bias weight and dynarntc force transmitted to thc pile head h a s to be
modaied. Hence. transmission ratios Tg and Tb are lntroduced tnto Eq. (7.9) to )ir!d
where Tg and Tg are found to be functions of effective horizontai insitu s tress (10 psi 5
0.5 < 20 psi), grain s k e of wFl (0.2 mm < d l 0 5 1.2 mmj and reIaUve density of soil (0.65 2
Dr i 0.90). and are defined a s
Tg = ( - 1 . 6 2 . r 0 . 4 d h + 9 . 6 d 1 0 ] (4- -0.651 - 7.0Dr -0.m). and (7.12)
TD = ( - 0 . 0 3 1 + 0 . 1 7 d h + 2 . 6 2 d l 0 ) ( D ~ -0.65)-2.7214- -0.90). (7.13)
I t is r,oted in Eqs. (7.12) and (7.13) that Tg and TD are lndependent of in-situ
s t ress and effective grain size at 65% relative density. Figs. 7.2 to 7.4 depict the
measured forces and the predcted forces by Eq. (7.11) for Tests 5, 7, 9. 1 l a j l 3 a . 14 and
1 7 , respectively and the agreement Is reasorable.
Radiat Ion Damolng
There are two posstble energy dissipating mechanisms during pFle driving; SOU
damping (hysteresis) and radlatlon darnpmg. In order to describeJhc sol1 reaction
which resul t s from soil inertia and the out-of-phase, damping part of the reactlon
gexerated by e n e r a dissipation through elastic waves, t he soil resistance at the pile
shaft u n d e r steady state vertical vibration was derived ustng elasto-dynamic t h e o q
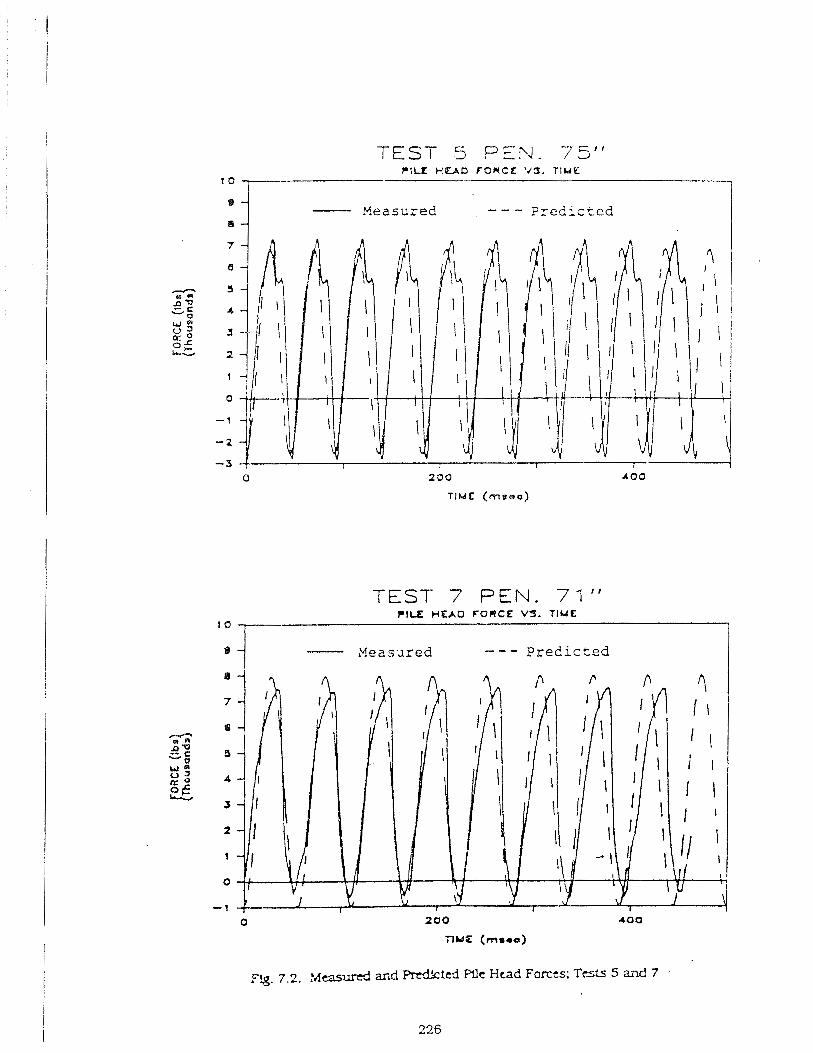
TEST 5 PEN. 75" PlLf +!IUD F O R C E ' d 3 . T I M E
l o 7 i - Measured - - - Predicted
TEST 7 PEN. 71" P I S HEAD FORCE VS. TIME
10 r 1
- Measured - - - Predicted
~ l g . 7.2. :,feas& and Fllc Head Forccs: Tests 5 and 7
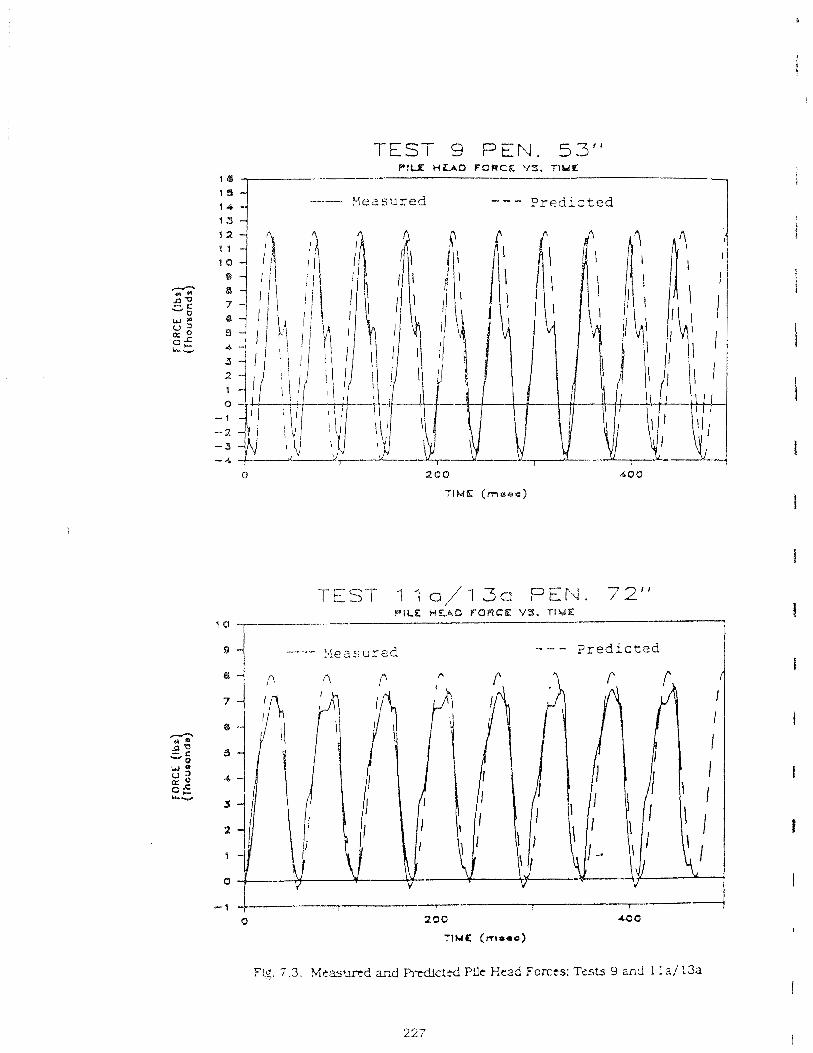
TEST 9 PEN. 53"
- M e z s u r e d - - - Predicted
TEST 1 1 o/13a PEN. 72" PILE HEAD F'BRCC VS. TIME
l a --r------- P - - - P r e d i c t e d
- 1 t 1 I I
0 200 40 0
TIME (mraa)
3 2 . 7.3. Mc.as*~md arid PrcdlcttO Pile Head Fcrccs: Tcsts 9 a d 1 la! 13a
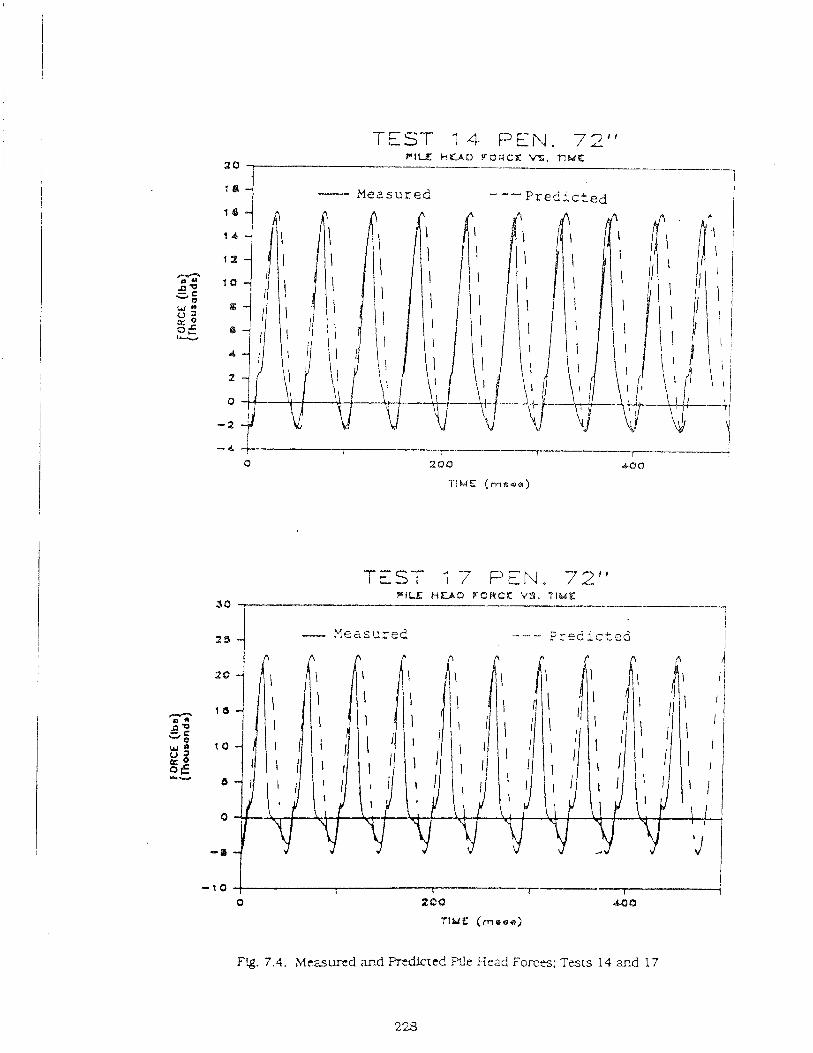
TEST 14- PEN. 72" PIE HCACl YORCJ: VS. T I W E
2 0 1
--
l a i - Measured - -- Predic-d i
- 4 t I I I I 1 o aoo 4-00
TIME ( m e e e )
TEST 77 PEN. 72" F l u WEAD FQWCK '43. TIME
SO -- --i I 1 - ~Yeasu red - - -n P r e d i c t e d
F!g. 7.4. hteasurtd ar.d F?~dicrcb Pile Scad Forces; Tests 14 m.d 17
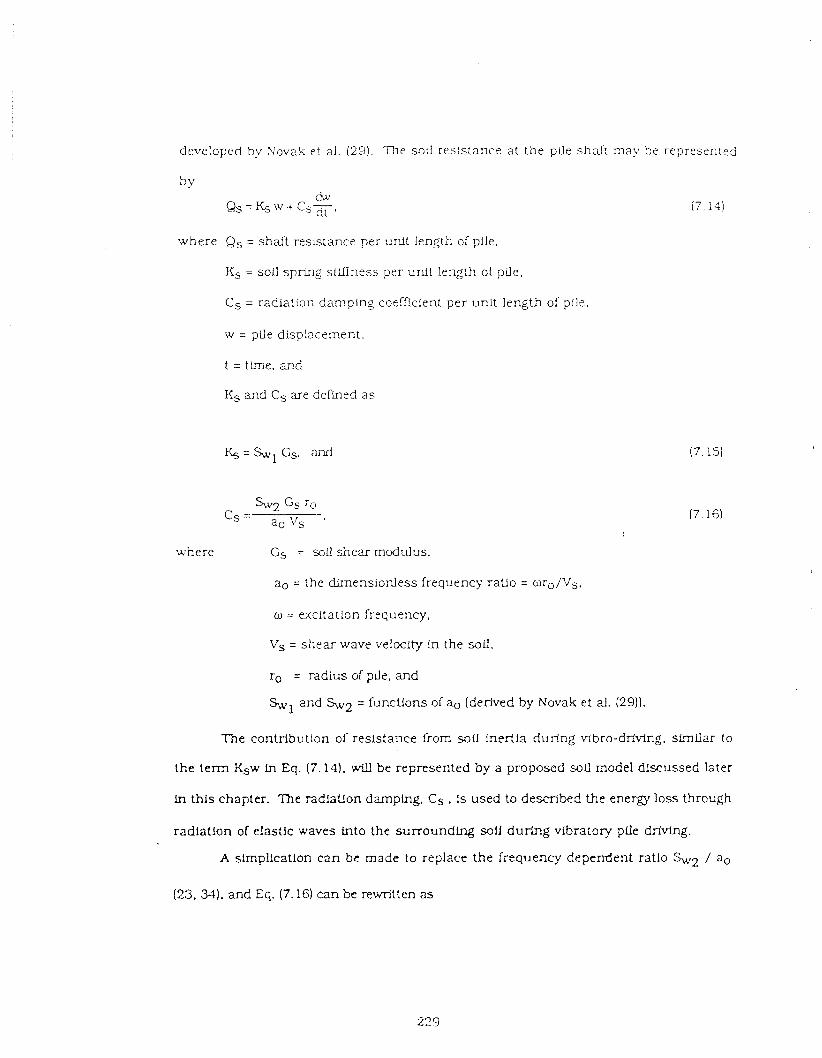
developed by Novak c.t 21. (29). 'me sol1 resistance a t the pile s h d ? may be represer,:r_d
where Qs = shaft resistance per lurdt length of pfle,
K, = soil spr'ng stltlness per unit length of pile.
Cs = radiation damplng coelficient per unit length of pile.
w = pile disp!acement.
t = time. and
Ks and Cs are defined a s
&'Swl Cs, and
%v2 Cs To Cs = a. Vs '
where Cs = soil shear modulus.
a. = the dlrnensiorJess frequency ratio = wro/Vs.
o = excitation frequency.
V, = shear wave velocity In the soil,
ro = radius of pile, and
SW1 and h2 = functions of a. (derived by Novak et al. (29)).
The contribution of resistance from sou inertfa during vlbro-drlmg. similar to
the term Ksw In Eq. (7.14). will be represented by a proposed soi: model discussed later
In this chapter. The radlatlon damplng, Cs , is used to desczbed t h e energy loss through
radiation of elastlc waves into the surrounding soil during vibratory pffe driving.
A smpiicatfon can be made to replace the frequency dependent ratio SLr2 / a.
(25. 33). and Eq. (7.16) can be rewritten as
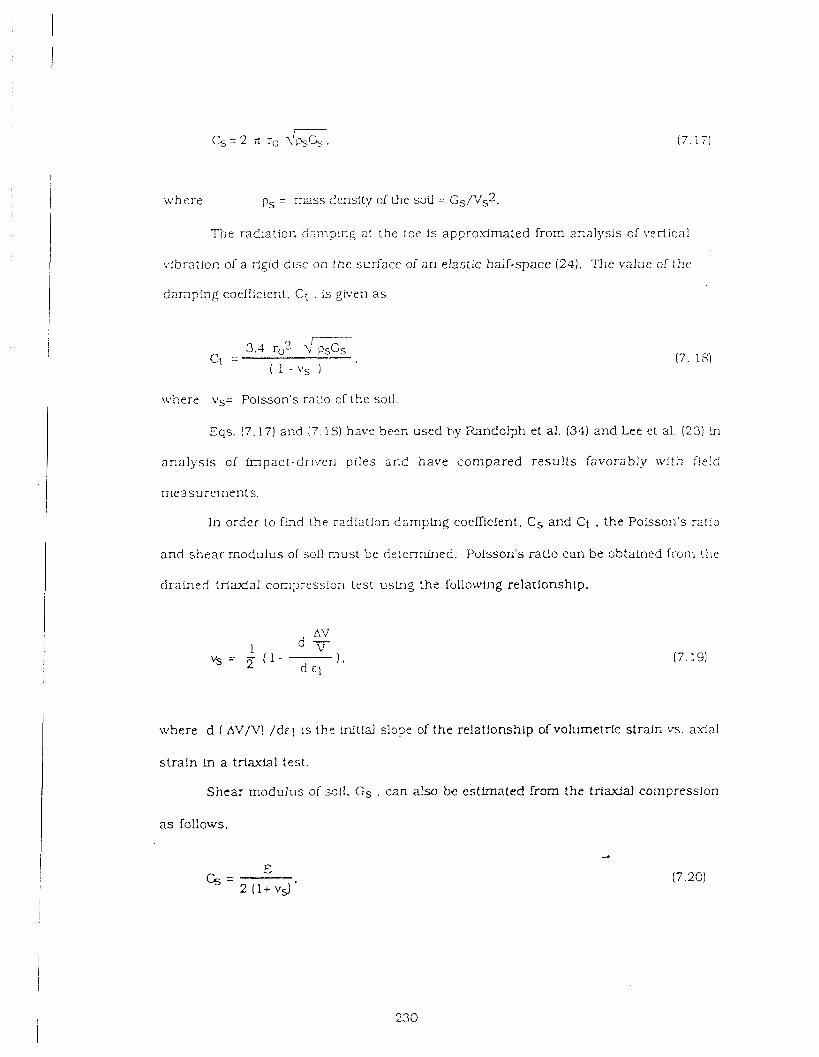
where ps = PASS density of the sou = C ~ / V , ~ .
The radiation da rnphg at the tor is appro.dmated from acalysis of vertical
kdbration of a ggld disc on the surface of an elastic half-space (24). The value of t h e
darnplng coefficient. Ct . is given a s
uphere vs= Poisson's mtio of the sou.
Eqs. (7.17) and (7 .18) have b e ~ n used hy Randolph et al. (34) and Lee et al. (23) in
analysis of impact-driven piles a n d have compared results favorably with fie!d
measurements .
In order to f h r ! the radiation damplng coefficient. Cs and Ct , the PoFsson's ra:io
and shear rnodulus of soil must be dr te rnf r~ed. Polsson's ratio can be obtalned from !k:e
drained triaxial compression test u s b g the following relationship.
where d I AV/V /dc l is t h t initial slope of the relat!onshlp of volumetric straixi vs. a..al
strain in a triaxial test.
Shear modulus of soil. C s . can also be estimated from the triaxlal compression
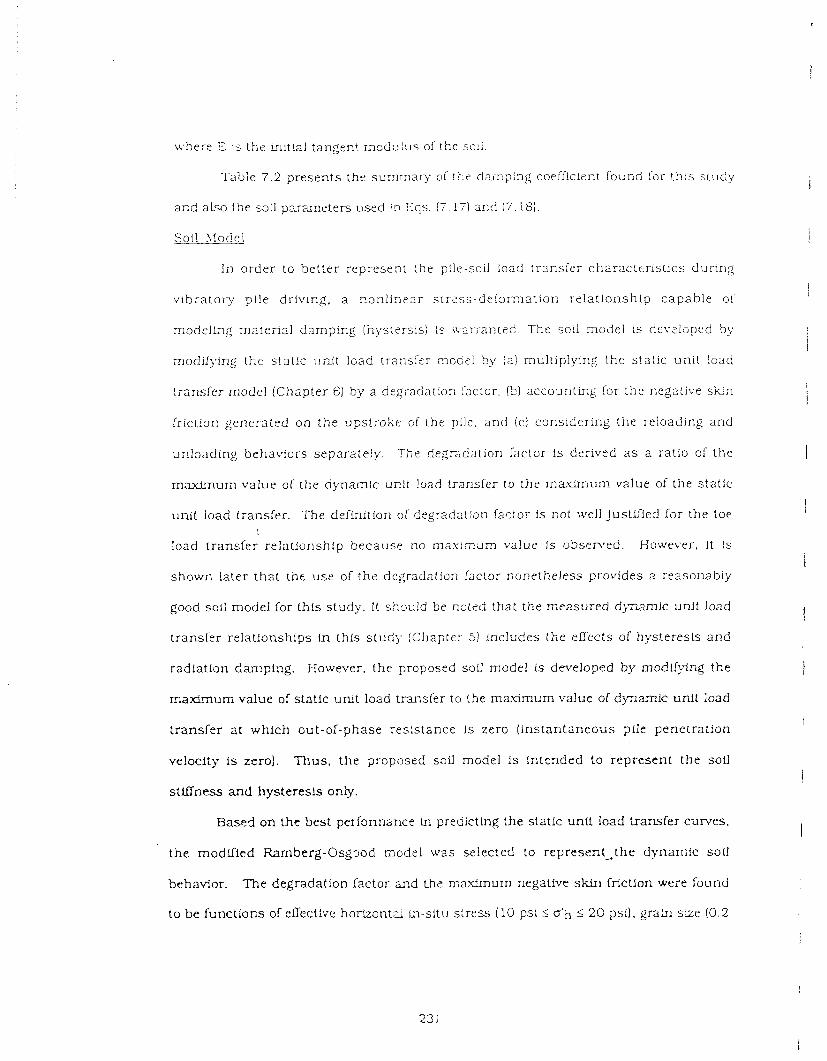
u,here "3 b tkiz mitial tangent r n s d u i u s of the so:i.
Table 7 .2 presents the summary of !t.e dainpirlg coefficierlt found for this s t u d y
acd al-so the sou parameters used !P Eqs. (7 17) acd (7.18).
Sot1 > i c ) ~ i ~ 1
in order to better represent the pile-soil load transler characteristics during
vibratory pile driving, a panlinear s trzss-deformation relat ionship capable of
modeling maLena1 damping (hystersis) is uzr ranted . The soil model is dev~ loped by
rnodiiying the stat!c u n i t load transfer mode! by (a) multiplying the static unit load
transfer model (Chapter 6) by a degradation iaclor. 15) accounting fer thz negative s k n
f r ic~ion generated on the upstroke oi the pils, and ic) cocsidering t he reloading and
unloading behaviors separate!^. The degradation factor is derived a s a ratio of the
maximum value of the dynamic unit !oad transfer to the maximum value of the static
unit load transfer, T h e definition of degradation fzrtor 1s not well Jus t i f ed for the toe
load transfer relationship because no mau?mum value Is obseived. However, It is
shown later tha t t h t use of the degradatiorl {actor nonetheless provides a reasonably
good soil model for this s t u d y . It sh3uld be noted that the measured d j m i c unlt load
transfer relat io~lships Fn thfs s tudy (Cliapter 5) h c l u d e s the effects of hysteresis and
radiation danlpizg. However, the proposed soil model is developed by modFTyFng the
maximum value of static unit load transfer to the m-um value of dynamlc unit ioad
transfer at which out-of-phase resistance is zero ( Ins tantaneous pile penetration
velocity is zero). Thus . the proposed sou model is intended to represent the soil
stiffness and hysteresis only.
Based on the best performance trl predlctlng the static unit load transfer curves.
the modlfied Rarnberg-Osg~od model was selected to r e p r e s e ~ t ~ t h e dynamfc soil
behavior. The degradation factor and the m a d m u m negative sk ln friction were Sound
to be functions o!'effectivt horimntcl ln-situ stress (10 psi 5 a'h 6 20 psi), g r a b size (0.2
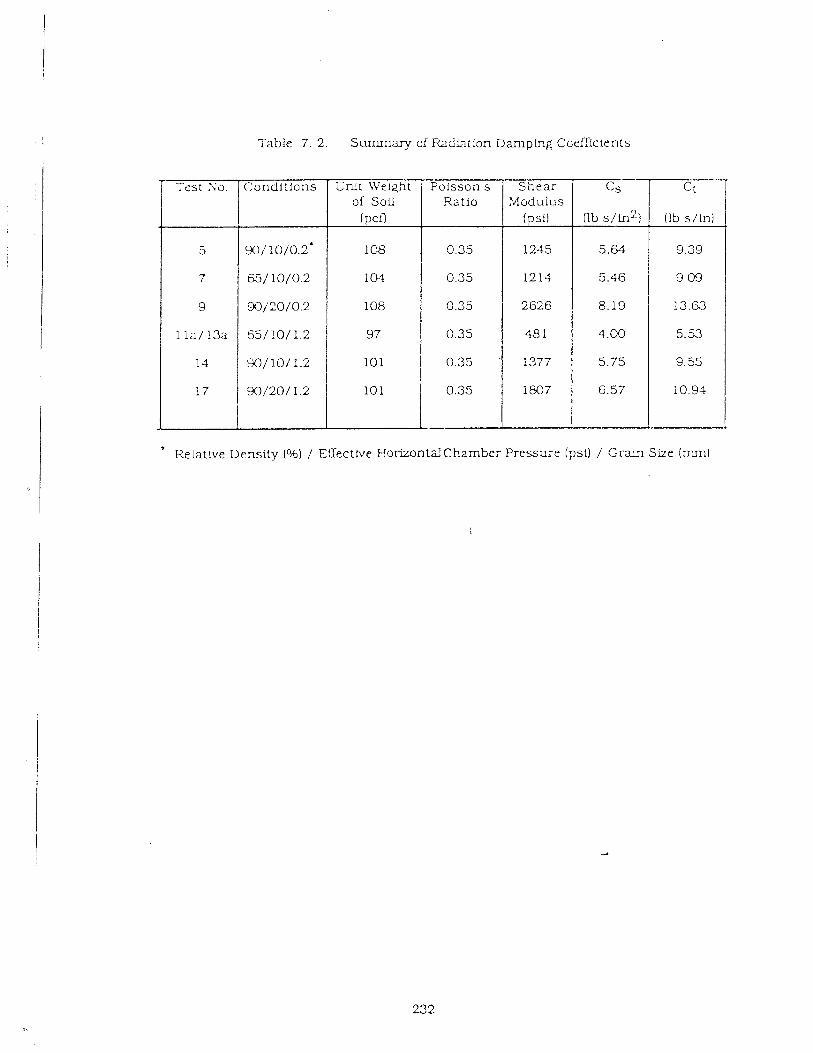
Table 7. 2. Summary of IiaCiation Damping Ccefficients
* Relative Density ( O h ) / EEecttve HorizontdCharnber Pressur ,~ (psi) / C r L ? Size (rrm)
Lnlt !Ve:ght of Sofl
( pcfl .b
Poisson s Rat io
Condit ions "
cs
(lb s/ln2)
Shea r ?Aodulus
(ps i )
Test So. ct
ilb s /~n i
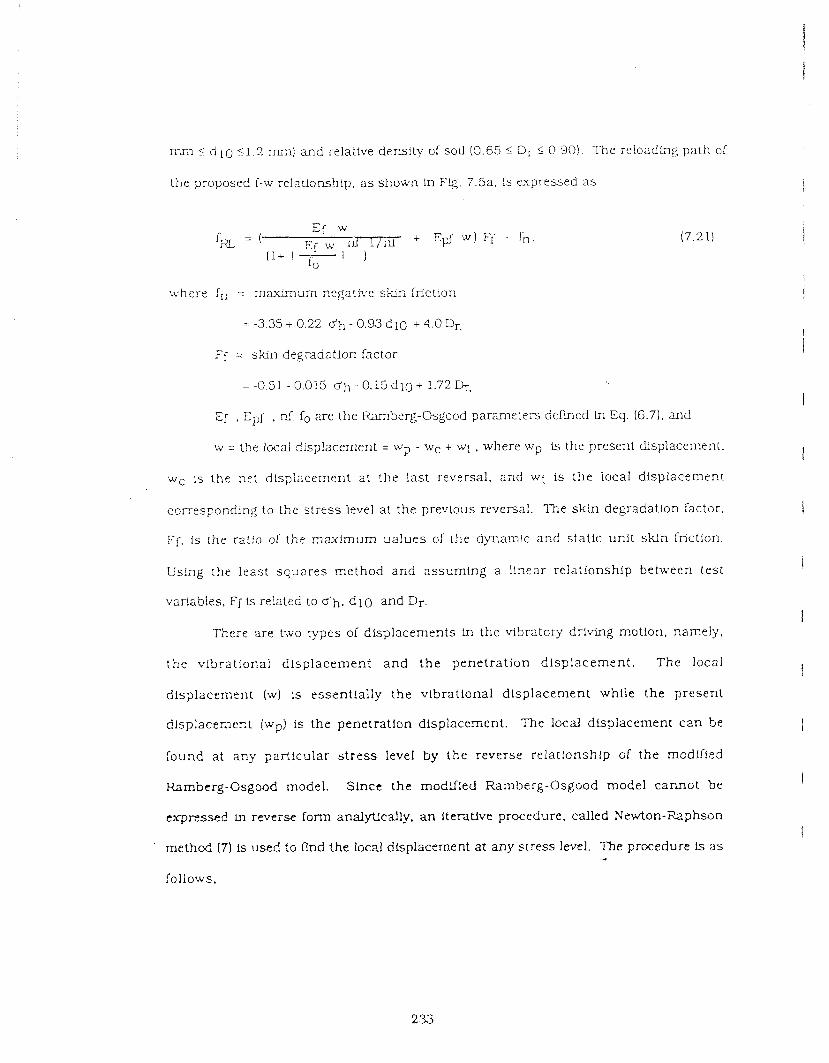
nvrl 5 d 10 1 1 . 2 m) and re1a;ive d e ~ s ! t y of soil (0.65 5 Dr 5 0.90). The reloacil~g path oi
the proposed i-w relathns5ip. a s shown ln F!g. 7.5a. is e>rpressed a s
fa = ( Ef
E l w d m - + Ep- w ) Fi - fn . ( l + I - I 1
'0
where f, = maximurn negative skin friction
= -3.35 + 0.22 d h - 0.93 d l ~ + 4.0 I&-.
Ff = sMn degradation factor
= 4 . 5 1 - 0.015 d h - 0 .15d lo+ 1.72 4..
Ef , Epf . d, fo u e the Ramberg-Osgood panmete;s de f i ed Ln Eq. (6.71, a d
w = the local displacement = w? - wc + wt , where wp is the present displacement.
wc :S the net dlsg!acenent at !he last reversal. and wt is the local displacement
correspor,dLn.g to the s tress level at the previous reversal. The skin degradation factor.
Ff. ts the ratio oi the maximum ua!ues of the djna!nic and static unit skin fnctlon.
Using rhe least squares method and assuming a !!near reIationship between test
variables. Ff Is related to a'h. d l 0 and Dr.
There are two types 01 displacements In the vibratory driving motion. namely.
t he vibrationai d isp lacement a n d t h e penet ra t ion d isp lacement . The local
displacement (w) is essentially the vibrational displacement while the present
d1spiacemer.t (wp) is the penetration displacement. The local displacement c a n be
found at any part!cl-llar s t r e s s level by the reverse relatlonshlp of the mcdlfied
Ramberg-Osgood model. SLnct the modLTled Ramberg-Osgood model cannot be
expressed tn reverse form analytically, an iterative procedure, called Newton-Fkphson
m e t h d (7) is used :o rind the local displacement at any stress level. The procedure is a s .A
follows,
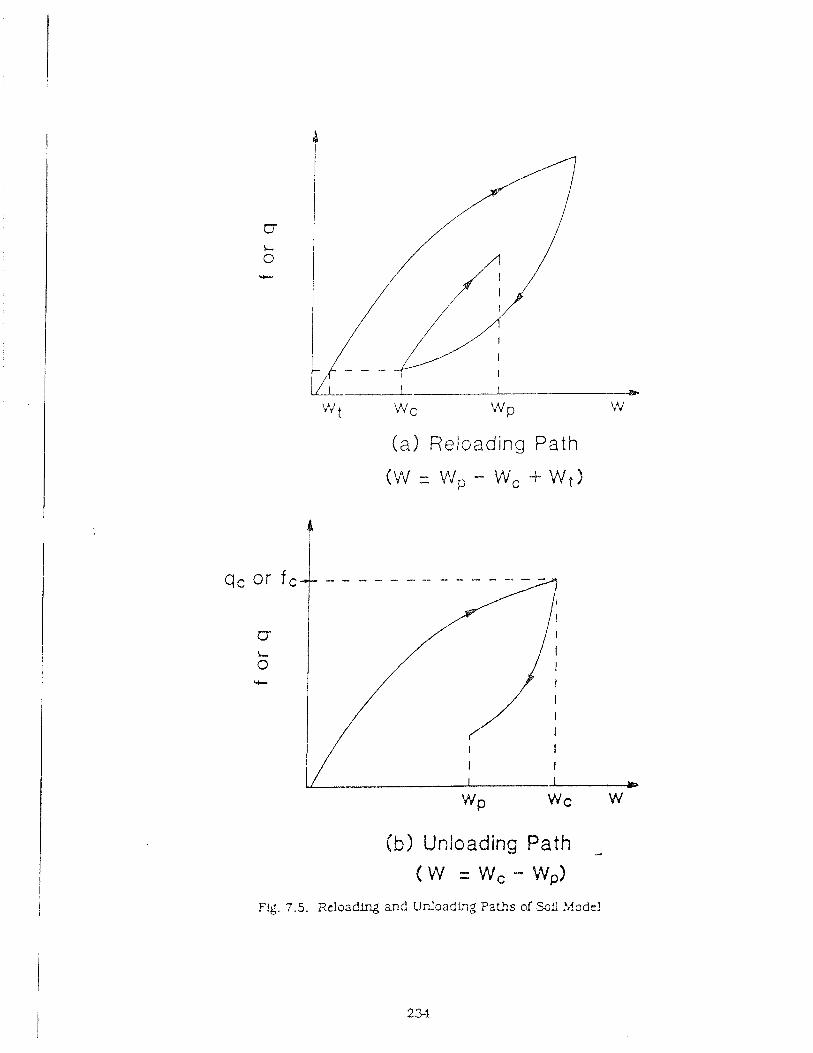
\rJt w c ";YP W
(a3 Reloading Path
(W r: W p - WC + S Y t )
(b) Unloading Path A
( W = W , - W,)
Flg. 7.5. Reloading and Urioadlng Paths of .%fl ?dodc!
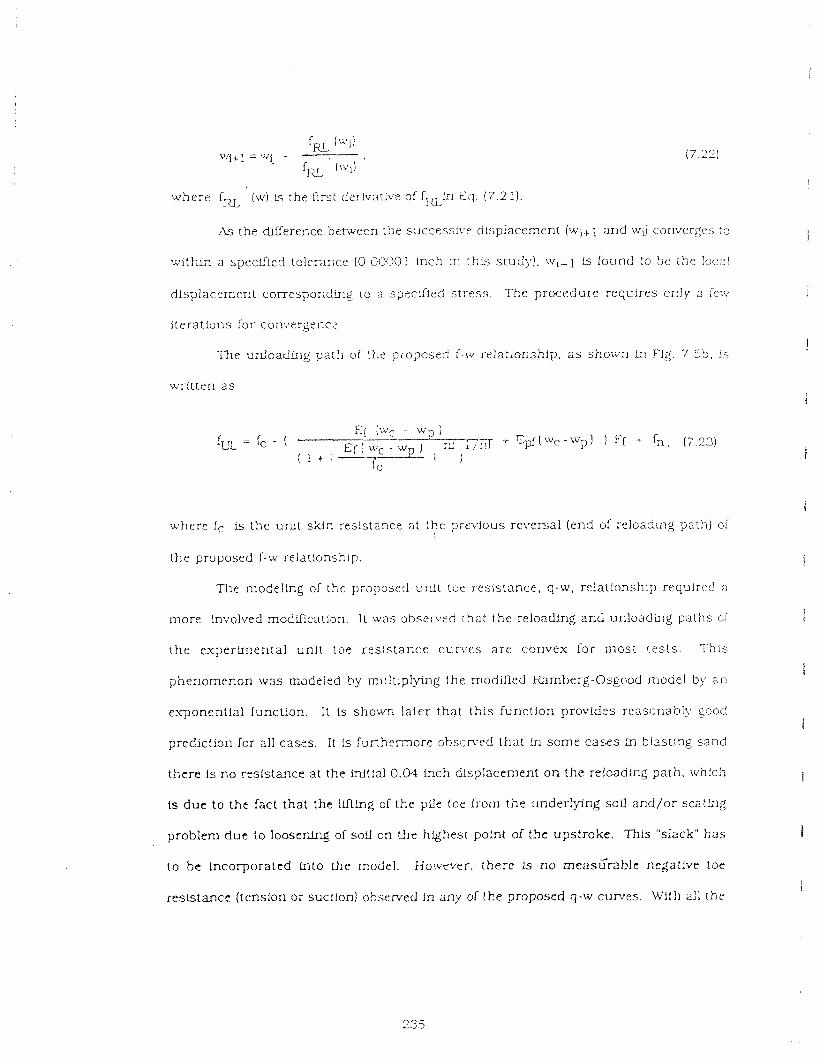
where fRI, (w) is :he Si r s t dzriv;i:?:: oL fRLin Eq. (7 .2 1 ) .
2 s the dnerence between the c.uccessi\.r dispiacernent (wi+l and wij converges :o
withir, a specified tolerance (0 9~3301 inch :ri :!;is study]. wi-1 Is round tn be t h e local
dlsplacrment correspondiiig to a specLlle.3 s tress . The procedure requires cniy a re:v
iterations for corn.ergenc?
The udoading path of t h e proposed f-rv rela:lonzhip, a s sho rm in Fig. 7.5b, is
written a s
where fc is the unit sk in res!stance at t h e previous reversal (end of reloading pa!:^) of
the proposed S-w relationship.
The modelhg of the proposed unlt toe resistance, q-w, relationship required a
more involved modllicatian. I t was observed t h a t the reloading and anloadtng paths or
t h e expertnlen!al unit toe resis tance curves a re convex for most tes t s . This
p h e n o m e ~ o n was modeled by rr,u!tlplying the modified Ramberg-Osgood model by an
exponential function. It is shown later that this function prov1d:s reasonably goo(.!
prediction for all cases. I t is :unh~rmore obscrved that in some cases in blasting sand
there Is no resistance at the initial 0.04 inch displacement o n the reloading path, which
I s d u e to the fact that the llfting of the pile toe rrom the underlying sofl and /o r seatlqg
problem d u e to locsenIn4, of soil on the highest point of the upstroke. This "slack" h a s
to be incorporated fnlo the model. However. there Is no measGrable negative toe
resfstancc (tension or suc!lonJ observed tn any of the proposed q-w curves. With all the
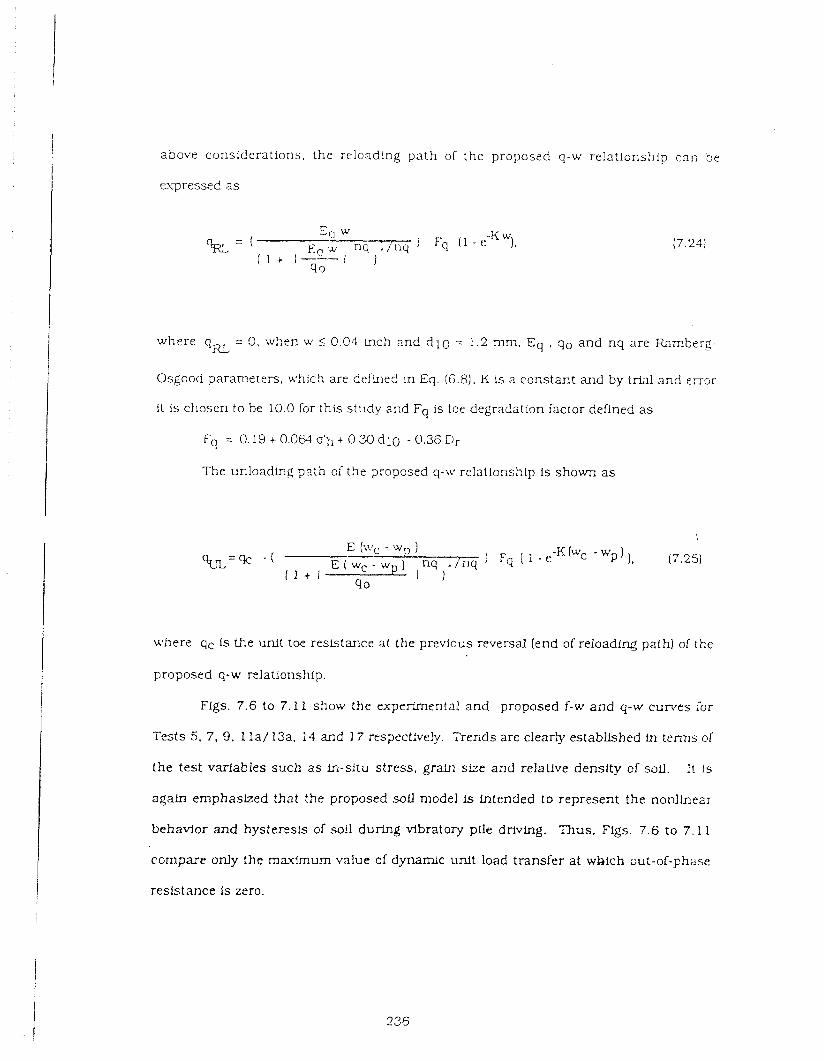
above considerations, the reload!ng path of the proposed q -w re!a:ionship can be
expressed a s
where q = 9 , when w 5 0.04 Lnch and d l 0 = 1.2 mm, Eq , qo and nq are Ramberg- RL
Osgood parameters, uVhich are defhed in Eq. (6.8). K is a constant and by trial and error
11 is chosen to be 10.0 for this study and Fq is toe degradation {actor defined a s
Fq = 0.19 + 0.064 ~ ' h + 0.30 d l 9 - 0.36 Dr
The unloading path 0: the proposed q-u7 relationship Is shown a s
where qc is the unit toe resistance at the previous reversal (end of reloading path1 of the
proposed q-w relationshfp.
Flgs. 7.6 to 7.1 1 show the experimental and proposed f-w and q-w curves for
Tests 5. 7, 9, 1 l a / 13a. 14 and 17 respect*ely. Trends are clearly established in t e r n s of
the test variables such a s in-situ stress. grain size and relative density of SOU. :t Is
agafn emphasized that the proposed soil model is intended to represent the nonlhear
behavior and hysteresis of soil during vibratory pile driving. Thus. Flgs. 7.6 to 7.1 1
compare only the max!mum value of dynamic unit load transfer at which out-of-phase
resistance is zem.
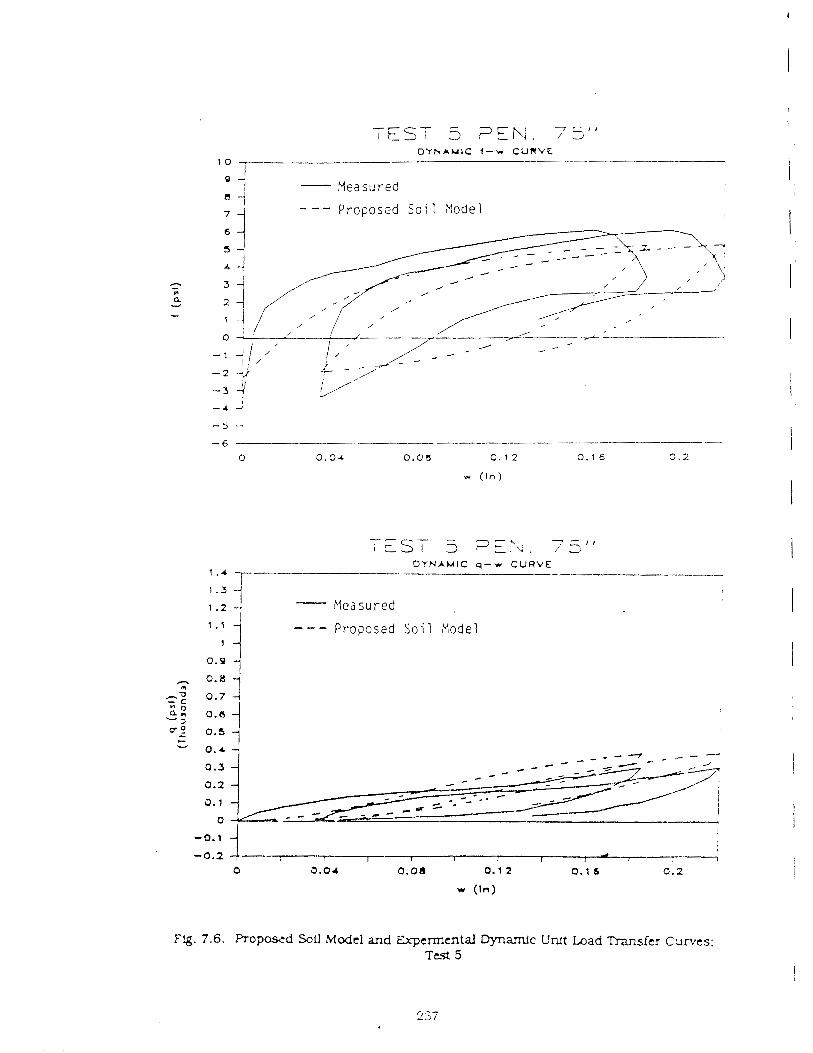
TEST 5 ,?EN. 75" D Y N A U l C f - w C U R V E
1 0 .
Q 4 i - Measured I
I - - - P r o p o s e d S o i 1 !Yodel
- - - P r o p o s e d S o i 1 y o d e l
0.9
- 7 7 ; = S T ! 75" L , .
D Y N A M I C q - w C U R V E 1 . 4
Fig. 7.6. Proposed SQU Model and Expcrmcntal W a m l c UNt Load Transfcr Curves: Test 5
1.3 - 1.2 - - Measured
i s reachu-$ the nead of the nGe before the rr?&xIrmrn cofnpress:on I b r c t due to Lipact
would have been achieved had the pfle been ccnslderably longer. This behavior
observed in the mode! pile is ngt consistent with the behavior of relatively longer plies
in the fle!d bclt is generally carisistent m o n g all of the tests conducted in this study.
wh:ch suggests that conclusions drawn regarding the relattve effects of Lrnpact drivlng
versus restiiklr-g are vdld . The conslstent time cf initial departure of the two traces
from one anoikzr also sugzests that neither impact drivLng nor vibi-atory driking had
prod::ced drzstlczily dsereri t values of statlc shaft resistance.
2 . h relaUvely strong s t rond pos!tive peak occurs Ln the force trace and Ln the
velocity-impedance trace: at the pile head 3.0 to 4.9 milliseconds after the tnitial peaks
produced by the impact of the r m . These times correlate closely to the times that are
required for a compression (p) wave to travel down the pfle, through the sofl below the
pile toe and be reflected back to thc toe and u p thc pfle, Sased o n the sol1 modull
measured in the resopant column test (Chapter 41. For the pfles installed by vibration.
the srcond peak occurs at a m e lapse that Is about double that which is computed using
rhe s5ear rnodull from the resonant column test at a shear s t r a h magnitude of 1ge2%
lor the sl tuatlons &I whlch the relative density was 65% and the efiective lateral
conflrLig pressure was 10 psi (Figs. (2.2 and C.6). Otherwise the !apses for the vlbro-
2 driven plles conputed using shear modull at a shear str- magnitude of 10' ?6 are
within 5 to 10 percent of those that are obtained from the t h e histories. Ti-~s behavior
sugges ts either a possible !oosenLng effect, generation of very high mean sofl s t r a h s , or
installation-induced reduction in effectlvc soil s t r e s s below the pile toe for the
conditions of 65% rela?lve aens!ty and 10 psi effectiv:: lateral pressure. but not for other
test conditions. For t t i e impacidriven pflc tests. the observed t h e k p s e was always
20% to 4046 greater thal the computed value, which suggests that one of the p h e n o m e r ~
speculated above cccurred for all Lmpact-dr-iven piles, regardless of soil density or
corS~ntng pressure.
suite of blows that was applled to the pFle can be obtaixed by comparing the blow
numbers on the respective flgures with the drivina records (lmpact-driven rides) or
number of blows for each inch of restrike driving (vibro-dris7en-and-restruck plles)
shown in Chapter 4.
Wave propagation theory indicates that ln a n infinitely 1or.g plle that !s not
supported by sac. +he force time history shculd correspond to the vclcxity t!me history
provided that the velocity is multiplied by the mechanical impedance of the pUe. which
is characterized t;j- the term AE/c, where A = the cross-sectional area of the pile
material (2.251 square inches for the test pile used in this study). E = the Young's
6 modulus of elast!c!ty of the pile (29 X 10 psl (steel) for the test pfle used in this study).
and c = the compression wave velocity of the material out of whlch the pfle Is made
( 2 0 1 . 0 lnches per second for the test pUe). Ln a pile of flrilte length interacting with
the scpporting soil. the wave f o ~ s & I l l deviate from one another a: some point in the
Urne history when D-waves reflected from the toe cf the pUe or p-waves produced by
transfer of energy lnto the soil along the shaft through shearlng at the s h d i - s o u
interface return to the head of the pile.
In Flgs. C . l - C. 11 the time scale is dLre:t, in mflllseconds; however. the
magnitude cf a quzntdty shown a s 2L/c is also shown o n Lhe graphs for the pi!e-head
time nistorfes. In this expression L Is the length of the pile (&stance from the pile-head
force and accelcratlon transducers to the toe of the pile; Chapter 3). Therefore. 2L/c
rcpresents the required for a wave to trzvel down to the toe of the plle and kc
reflected back to the transducers at the head. The value of 2L/c for the model test pile
was approximately 0.80 millisecond.
4
Several observations can be made from Fgs. C. 1 - C. 1 1:
1. The force and velocity-lmpedmce traces at the pUe head depart from each
other at a time of 2L/c from the time of initial rise. with the fcrce generally dropplng ol'f
more rapidly than the velocity-impedance, Lndlcatlng that the returning tension wave
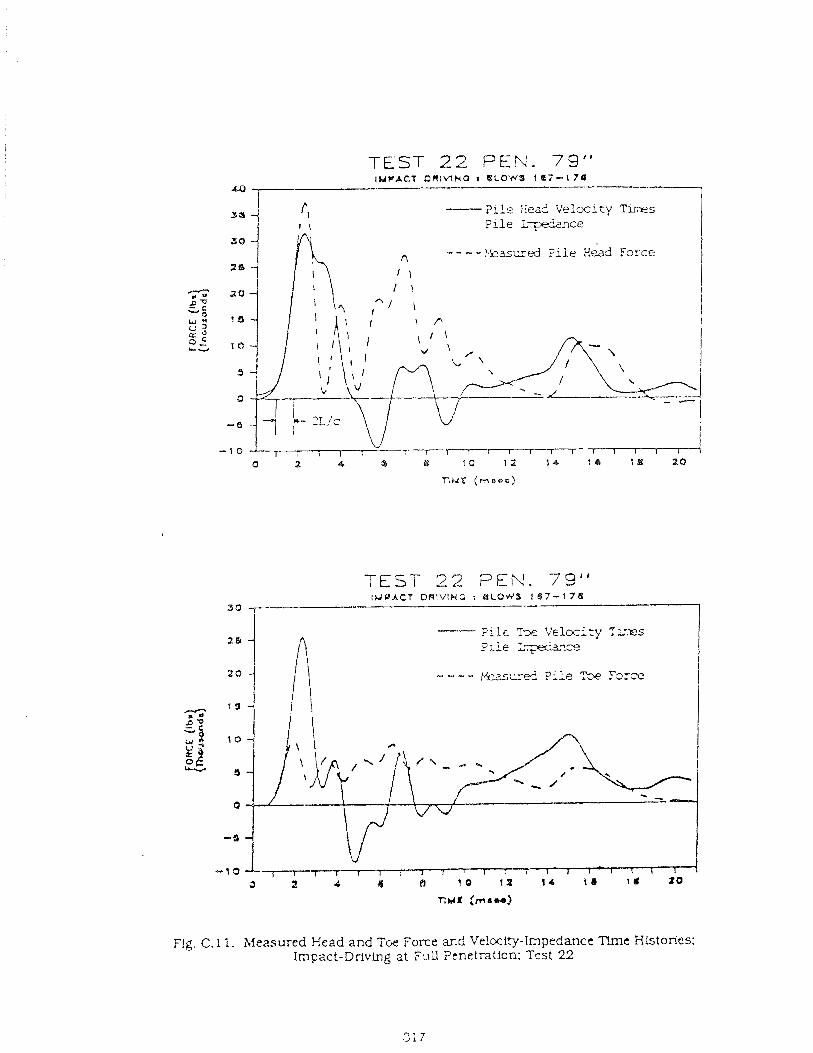
TEST 22 PEr\l. 79" IUFACT artlviwa I SLDUS 1 a ? - i 7 a
p i l e Hea? Velocity T i r e s P l l e i-ce
- - - - .?!esurec! F i l e Head Force
r : ~ ~ ~ ~ ~ ~ l ~ ~ ~ ~ ' ~ ~ ~ ' ~ i
0 1 4 3 63 10 92 I 4 1 1 1 10
YlkdC ( m e s a )
--- P i l e T x Veloc i ty ?Lx?s P i l e Lq3k..?~?ce
F!g. C. 1 1. Measured Head and Tcx Force and Velocity-Impedance Tlmc Histories: Impact-Drlvlng a t Full ?tnemtlon: Test 22
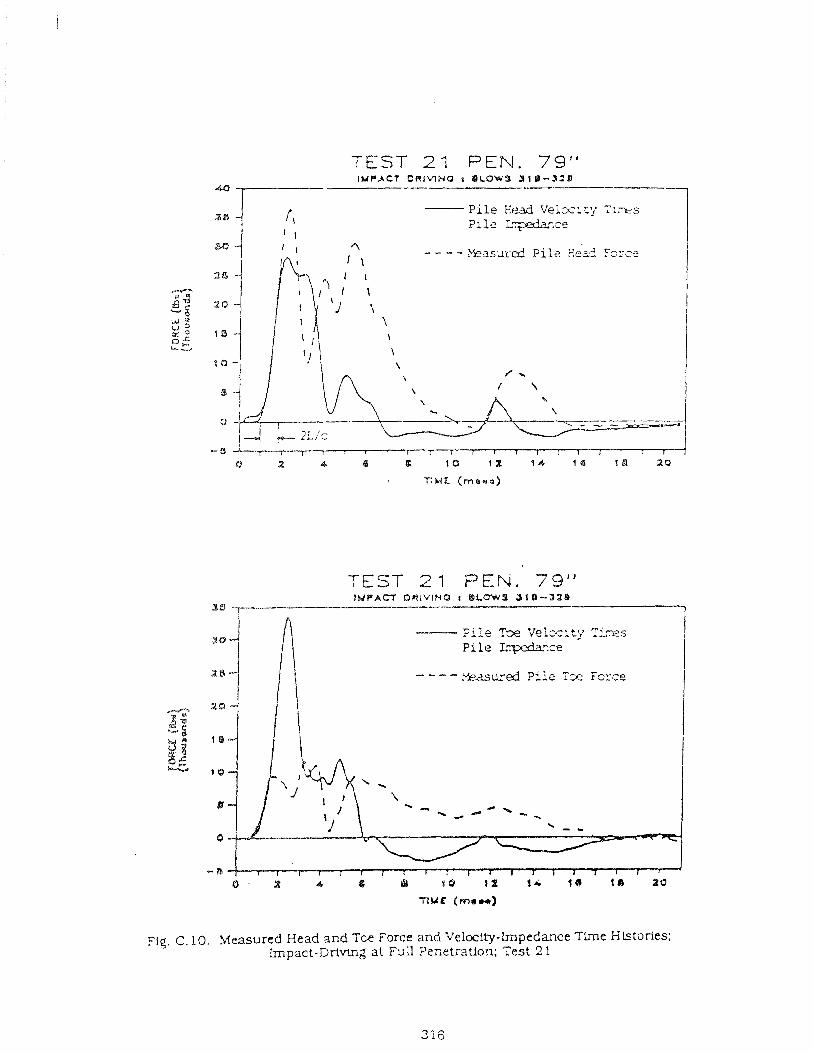
TEST 21 PEN. 79" I Y P A C T O W l W N O I OLOW3 5 1 8 - 3 2 1
-1 Plle H P A V e i x l t j ' YLXS Pl le LqAir ,ce
- - - - Y e a s u r d Piis He& Force
n M f (mra-aa)
TEST 24 PEN. -79" IMPACT ORlVlNQl 1 BLOWS $19-32hB
38 ?---- ________7
"1e Re Velcclty T ~ Y S P i l e I,rpda-".ze
- - - - ;-wed P i l e Tze Force
n M K (ma-)
f ip. C, 10. Measured Head and Tee Force and Vela-ity-Impedance TLne Histories: Impact-Drivtng at Full Pcnetnt ion; Test 2 1
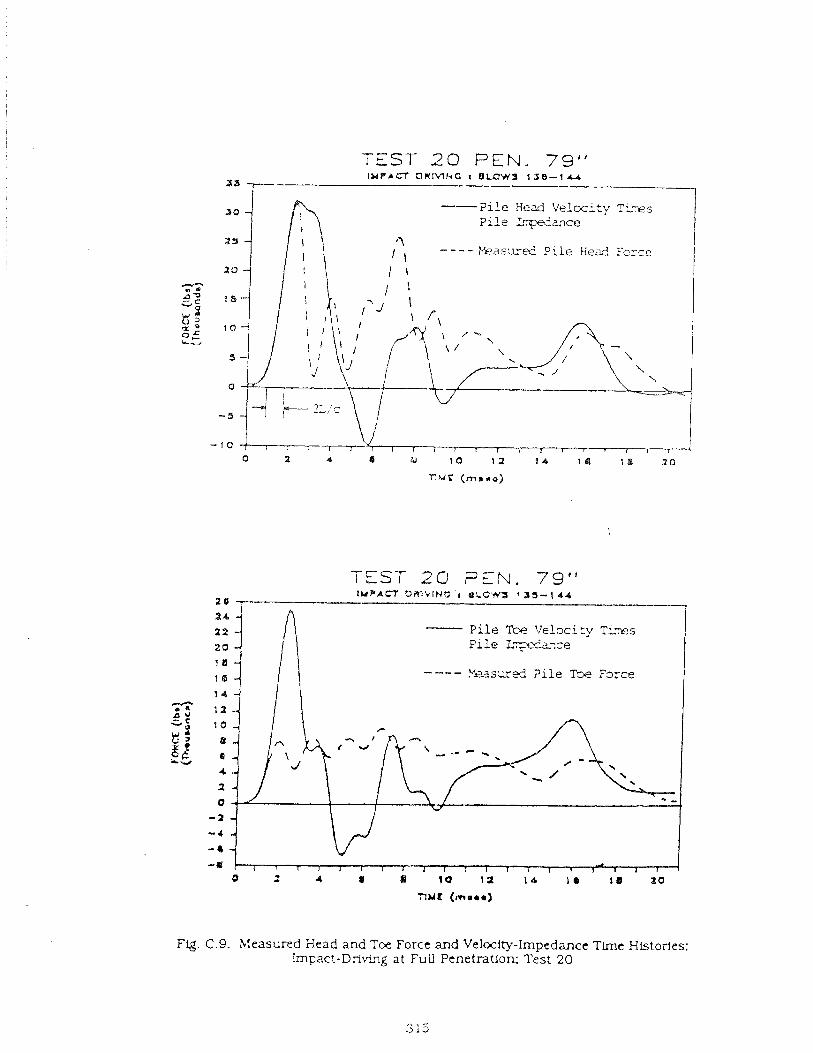
T E S T 20 PEN. 79" IB lF 'ACl D K M H C I DLCWS 1 9 8 - 1 U
3s ?- - I
-- P i l e Head Velocity T i r e s P i l e L w a n c e
- - - - lYElasqxed P i l e Aead Fcrce
0 4 6) 10 12 14 1a (€3 t o
TlMt ( m m a o )
TEST 20 FEN. 79"
- P i l e Toe Velocity T i r e s
---- ? i s * x d P i l e 'ke F3rce
- 4 - 0
T l l 1 1 1 ' 2 4 s D 10 12 la 1 6 10 10
R Y t (msaa)
Fig. C.9. hzeasured Head and Toe Force and Velocity-Impedance Tlme Histories; Impact-Drivilng at Ful! Penetration; Test 20
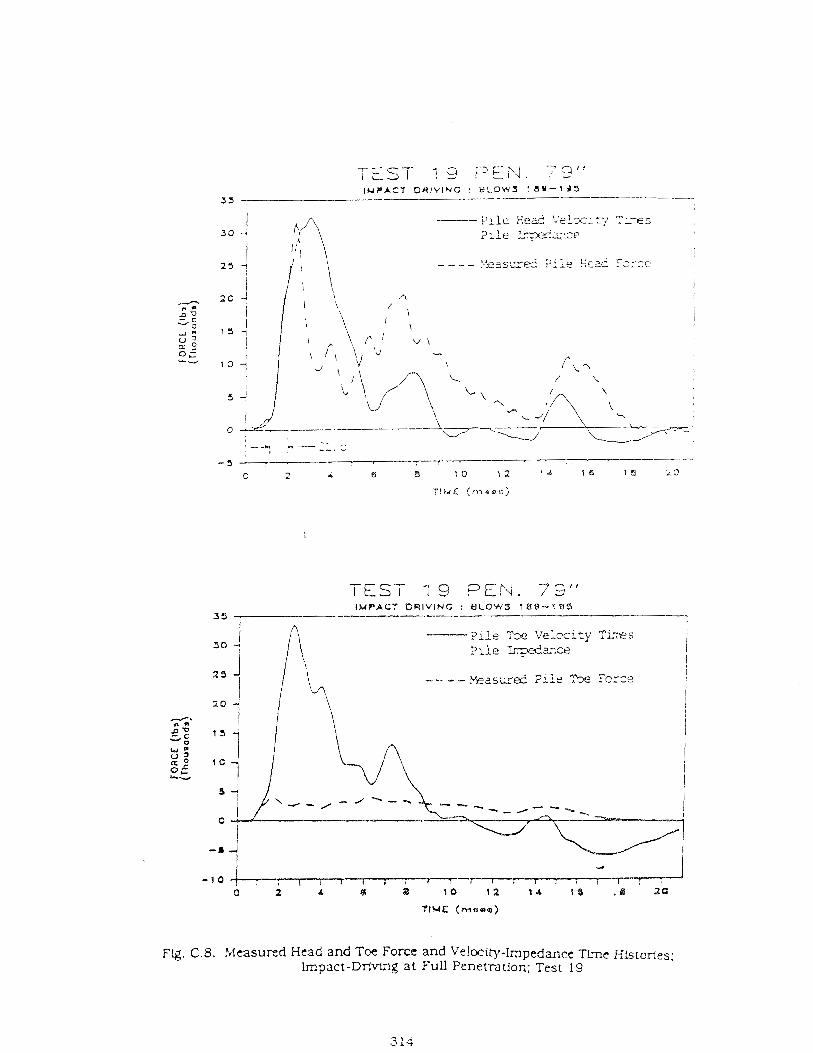
TEST 19 FEN. 7'9"
-- F i l e 2x Velacity TLXS
? ~ l e E W , - . c e
~ l g . C.8. !deasured Head and Toe Force and Velocity-Impedance TLme HLsforles: Impact-Driving at Full Penetration: Test 19
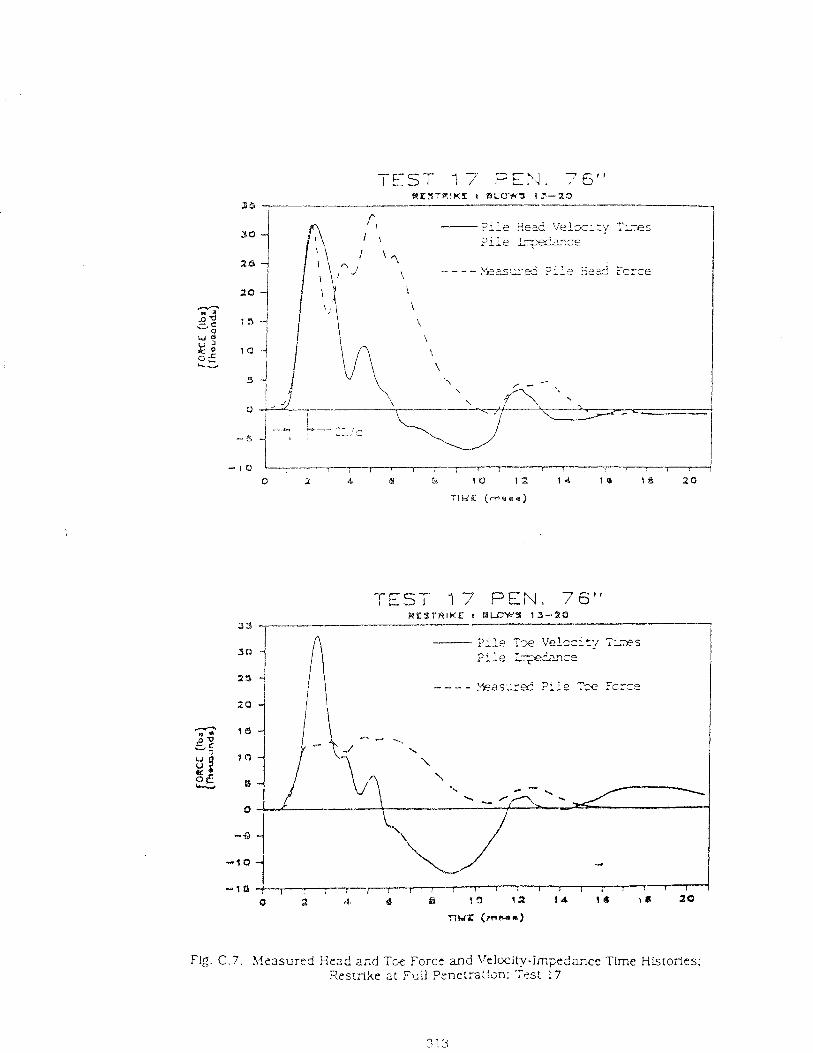
TEST 17 P E N . 76"
TEST 17 PEN. 76"
Flg. C.7 . !v{e=tsured Head and Toe Forcc m d Vtlwitv-im-,ec'ance Time HLsrories: Res?fike at Fid11 Prne:.zitl;n: Tzs! 17
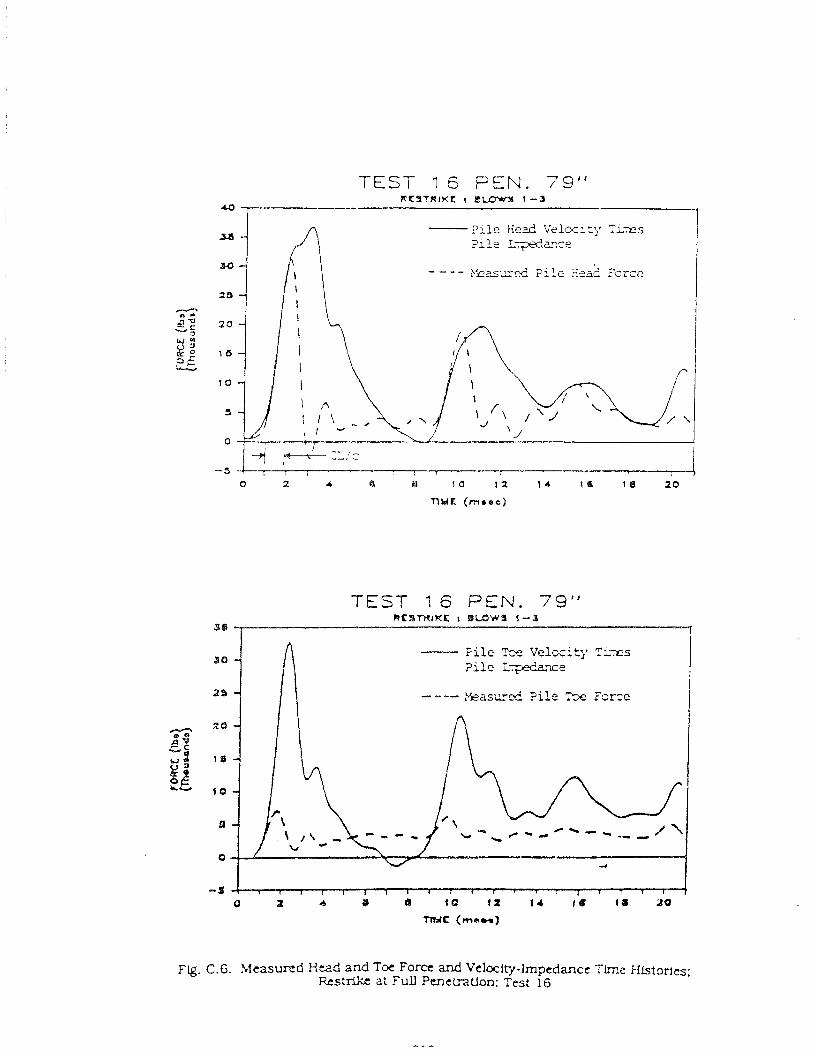
TEST 1 6 PEN. 79" R K S T R I K K I BUS&% 1 - 3
40 7 1
- - - - Y ~ z - L - ~ F i l s :-:3& 'crce
I
- 3 , , , , . , , , , a
o 2 A rb da t o 1 2 1 4 1 6 ca 20
Y l M K ( m o e o )
TEST 1 6 PEN. 79" R t S m r K L I SLOWS 3-l
3 , I
F i l e ?EX? Velocity T i ~ s Pile i-e
~ g . c.6. Measured Hmd and Toe Form and Velocity-Impedance Tlme Histories; Restrike a: Full Pmctration: Test 16
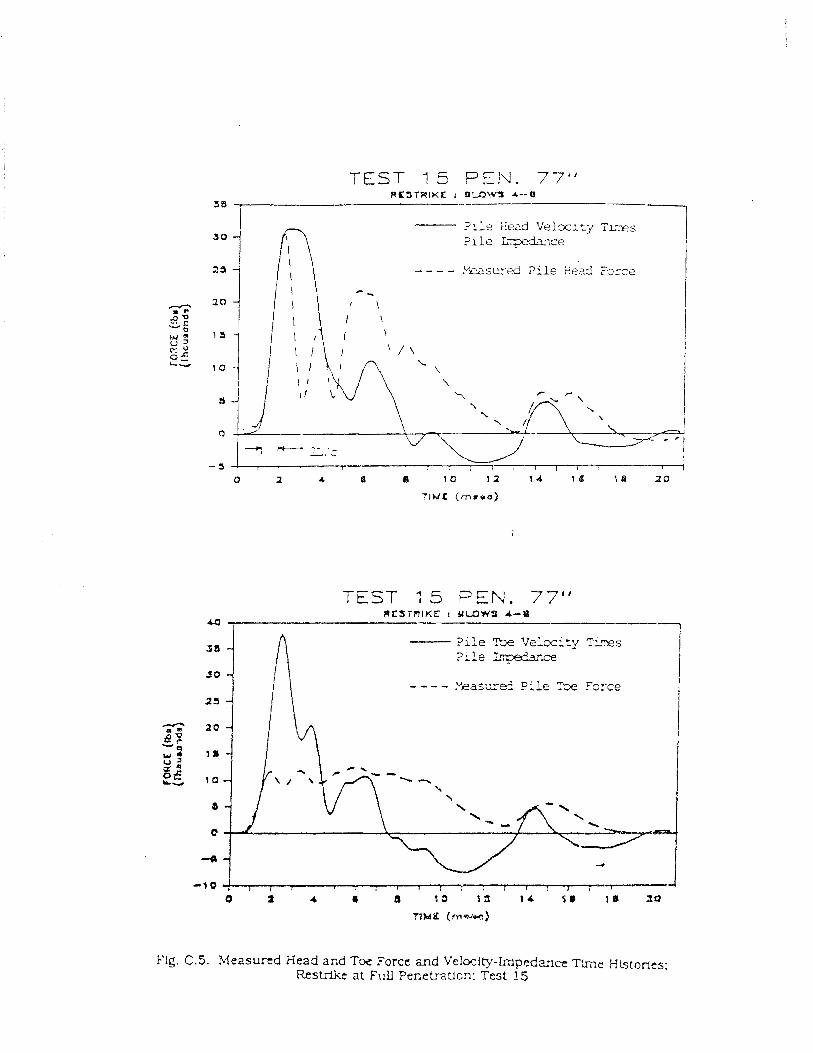
TEST 15 PEN. 77" RL3TRIKL: 1 U f - D W 4-0
stl ,
I
25{ 1 ; \ - - - - ~ e s z e d P i l e Lea2 Farce
TEST 1 5 FEN. 77" RESTRIKE I B L O W 3 4-a
a , 1
- - - - ?&as=& Pile %e F3rce
Fig. C.5. Measured Xead and Toe Force znd Vekity-Impedance Time Elstode-; Restrike at Full Penetraticn: Test 15
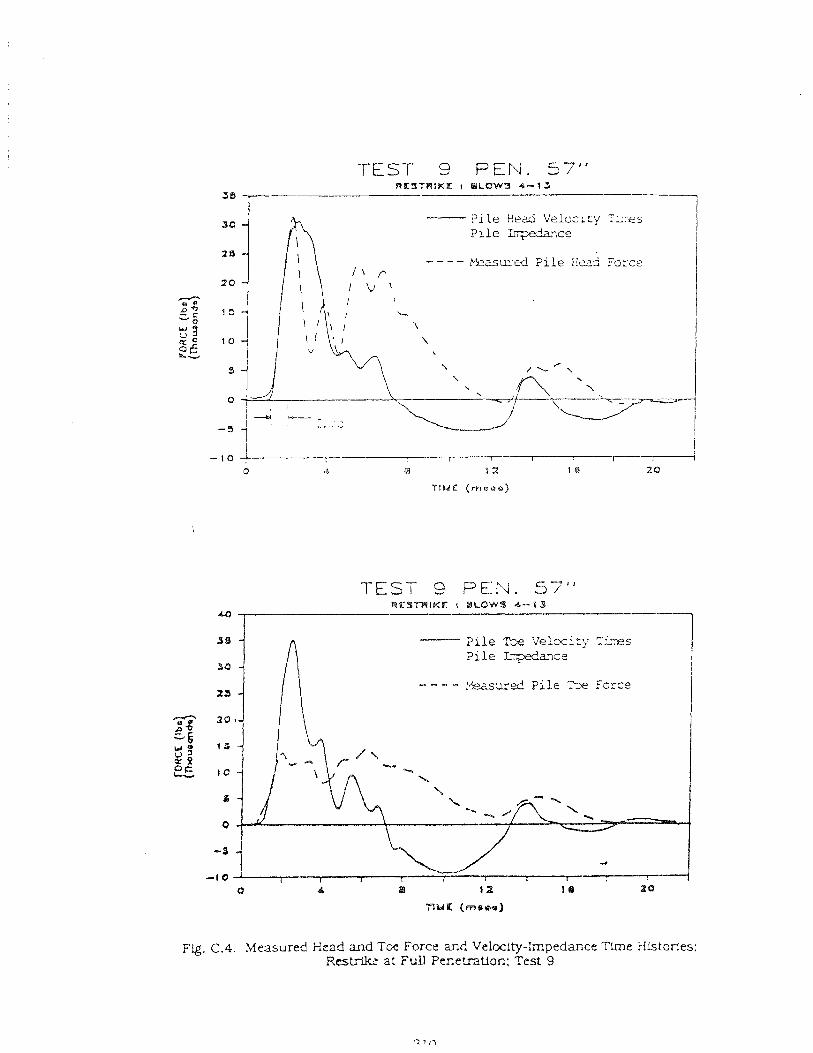
TEST 9 PEN. 57"
P i l e I r pedmce i h ?lie Head Veloc~zy T z e s I
- - - - k 'et~~urr j . Pile Eel2 Fcrce I
TEST 9 PEN. 57" R C S Y H I K E I BLOWS e-t a
- - - - .%-~rec! Pile 2~ Force
FQ. C.4. Measured Head and TGC Force a ~ ~ d Velocity-Impedance Time Histories: Rest* at Full Per,etraUon: Test 9
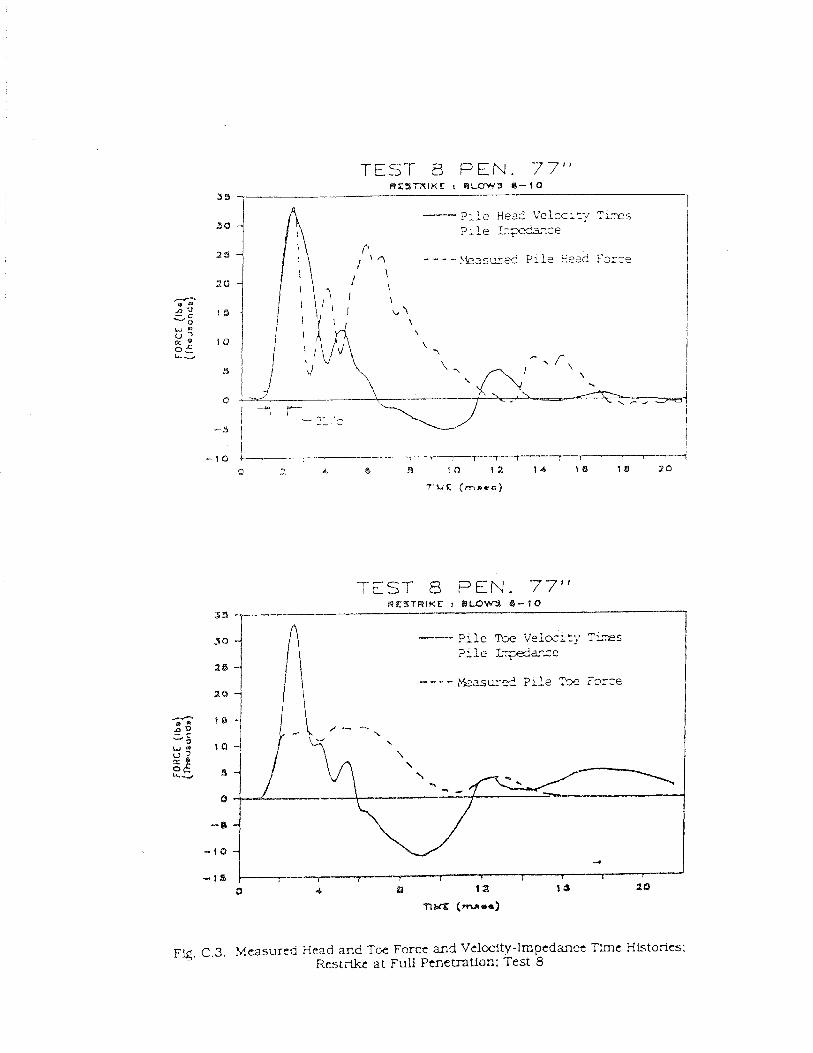
TEST F1 PEN. 77" R T S I T X I K E t B L O W S 8-1 0
1
TEST 8 PEN. 77" Ba%STRIKt t B L B W 6 - 1 0
31 -7
P i l e Tee Veloc i ty T i r e s Tile LT&E-L,P
- - - - Yeasure? Pile ;5e F3r:e
FQ. c.3. &feasurcd Head and Toe Force and Velocity-Impedance Tme Histories: Rest-ikc at Full Ptnetration: Test 8
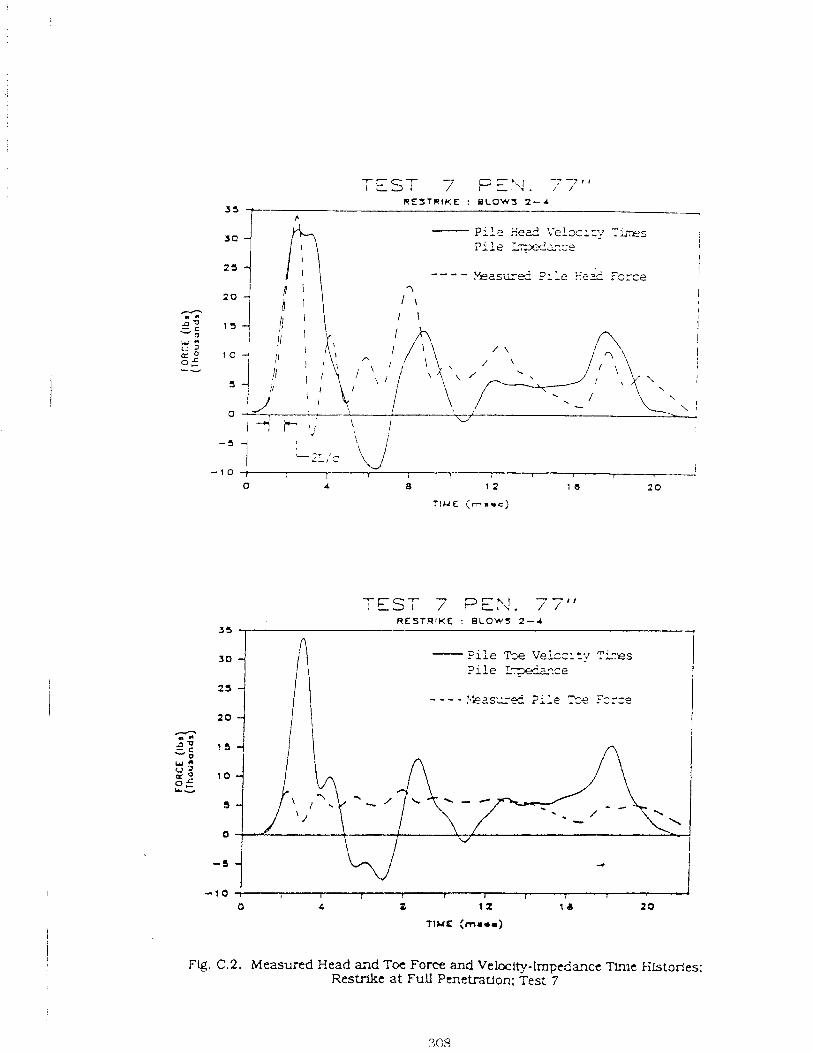
TEST 7 PEK. 77" R E S T R I K E : BLOW^ 2-4
3 5
Pile Ee& L-elx lzy TL-s I
J C I
Pile L-&?ce , 2 5 - - - - I
-3:ie K 3 2 d C3rce I
2 0 I I \ I - n i
I
! -- i \ ! , ! ;
\
0 \
, I ?- tj' ' - 1 0 ,
0 1 a 1 2 1 6 2 0
TIME ( m s r c )
TEST 7 PEP<. 77" R E S T R I K E : B L O W S 2-4
3s ,
Flg. C.2. Measured Head a i d Toe Force and Veioclty-Impedance Tlme tiistories: Restrike at FuU Penetration: Test 7
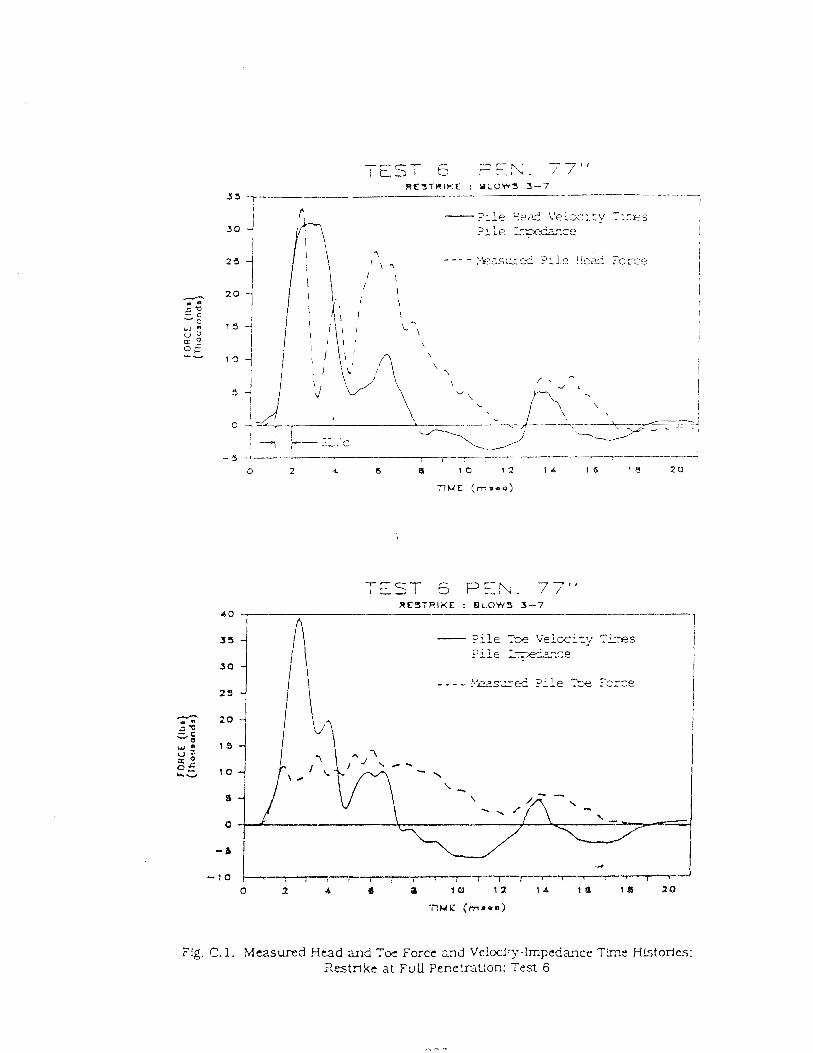
R E S T R I K E : B L O W S 5-7
A 1
Fig. C. 1. Measurtld Hcad and Toe Force a d Velwiy-Impedance Tm.? Hktor ies : 2estrlke a t Full P e n e t ~ G o n : T e a 6

TL9AE HISTORES AT F L U E h m m T X O N F 3 R LWACT AW RESTRIKE TESTS
Time histories of pi!e-head and p!le toe-force superimposed on tinie his:orfes of
piie-head a n d pile-toe velocities for the average of several blows of the impact hammer
are shawl in Figs. C . 1 .- C. 1 1 . These figures represent all capacity tests that involved
only impact driving of the pile or that !nvol\.ed restriking the pile after the pile had
been driven to within one-half diameter of full penetration by vibration. The forces
t h a t a re s h o u n in these rigcres are those that were measured directly from the strain
gages at the head of the pile or the load cell a t the tm of the pup. The velocities were
obtained from integration of the average accelerometer signal from t h e pile-head
accelerometers a n d from the slngle high-g accelerometer al the toe of t he pile, as
described for the cornpuration of energy in Ckapter 5. (description of these instruments
and instrument calibration procedures are presented in Chapter 3) The ve1ocit.j traces
have been shifted to account (or the phase lag L? rhe averag!rrg circuit for the pile-head
accelerometers described in Chapter 3.
The purpose of dweioptng these records was to provide z b a s h for determining
whether vibrated-and-restruck piles (Figs. C. 1 - (2.7) exhibited dynarnlc charac!eris:!cs
sjgntncantly dilferent irom Impact-driven plles (Figs. C.8 - C.11) when being s t ruck
.with an impact harnriier. Because the application of the first blow, o r first several 4
blows in the derlser sand at high chamber pressure, produced very little permanent set.
only the final three !o ten blows were included in the averaged records. iW. exception to
this rule is Test 16, for which all res:rike blows Ithre:: in all) were averaged. The blows
for which !he average traces presented in this zppendtu are given relative to the en!ire

higher mtes of penetraaon of the pile in the medium-dense s a n d compared to those in
dense s a n d , where no ambient p o ~ pressure change was indicated during v ib ro -ch -~ng .
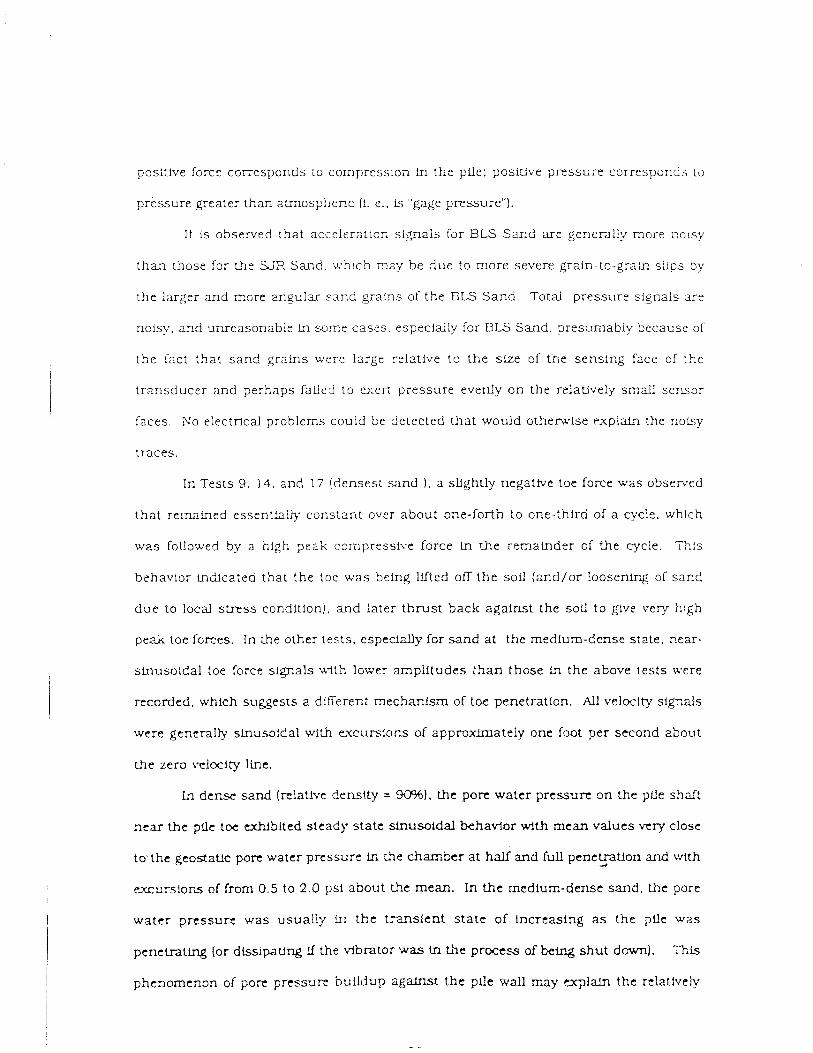
positive forct: corresponds to conprcss lon ln the plle: positive pressure correspcnds ro
pressure p a t e r than ariilospheric (i. e.. b "gage pressure").
It is observed that acc~lerat iori signals for BLS Sand are generall:.~ more r,clsy
than chose for the Sjii S d . ~ . ~ h ! c h n u y be due to more severe grair-to-graLq sslips by
the larger , X E ~ more u lgular sand gralns of the BLS S a n d . Total pressure signals are
noisy, and unreasonable in some cas r s . especially for BLS Sand. presumably because of
the fact that s a n d grains were large relative to t h e size of the sens ing face of the
t ransducer and perhaps falied to exen pressure everrly on the relatively sna l l sensor
faces. Xo electrical problems could be detected tha t would otherwise rxplain the notsy
traces.
In Tests 9. 14, and 17 (densest sand 1, a slightly negative toe force was observed
b a t remained essential& co~lstar i t over about one-forth to one-third of a cycle. which
was followed by a high peak ccrnpressive force in the rematnder of the cycle. This
behavior indicated that the toe w a s being llfted off t he sofl ( and /o r !oosen~ng of s and
d u e to local stress condltfon), and later t h r u s t back against the sofl to give very h!gh
peak toe forces. In the other tests. especially for sand a t the medlum-dense state , near-
sinusoidal toe force signals hlth lower ampli tudes t h a n those In the above tes t s were
recorded. wh!ch suggests a dae ren : mechanism of toe penetratlon. All velocity s i g ~ a l s
were generally stnuso1dal with excursions of apptaxtmately one foot per second about
the zero veioclty h e .
In den-- sand (relative density = 90%). the po r t water pressure on the pile shaft
nea r the pile toe &~Slted steady state sinusoidal behavior with mean values wry close
to.the gmstatLc pore water pressure Fn t?e chmber a t half and full penetration and with 4
m u m i o n s of from 0.5 to 2.0 psi about the mean. In the medium-dense sand . the pore
water prtssurr : was usually ?I1 the tnnslent s t a t e of increasing as the pile was
p c n e m t q (or dissipating d the vibrator was in Lie process of being s h u t down). This
phcnomcnon of port p r e s s u ~ @hudup agaFnst the pl!e wall may ocplaln thc rclatlvciy
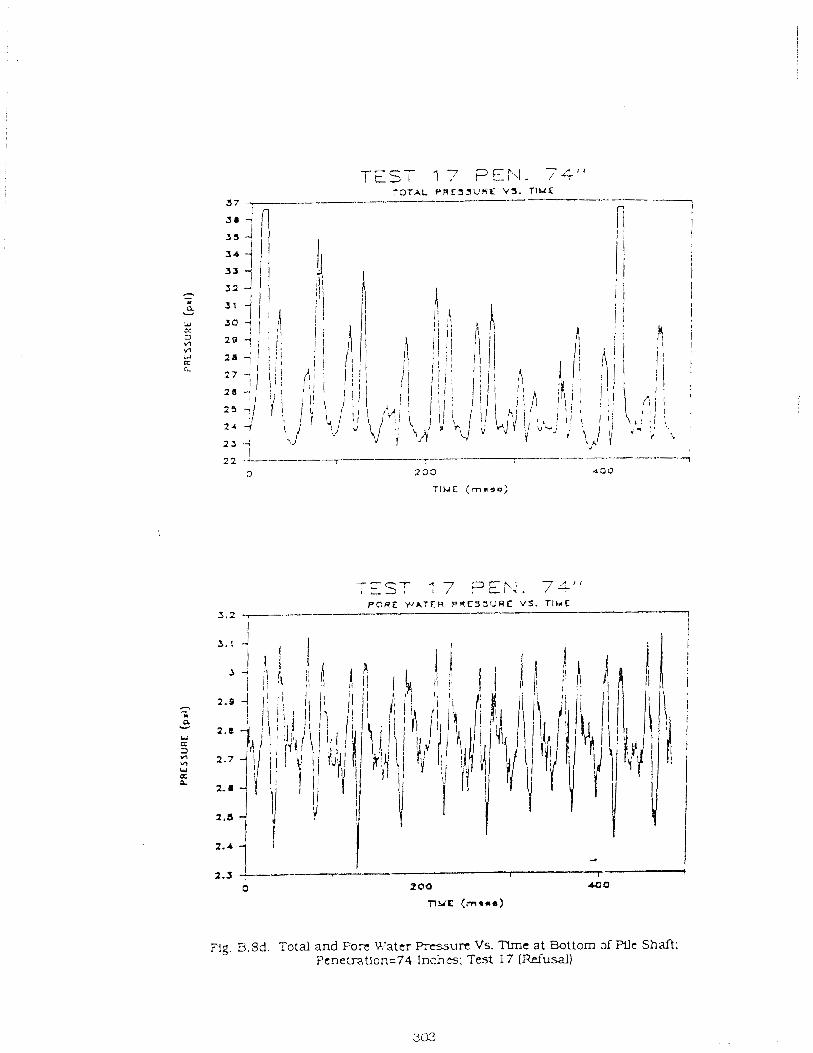
TEST 17 ?Er\l. 74" T O T A L P R E S L I U H E VS. T I M E
37 . n I
I
- - - ; --ST ; 7 3EF1. / L i t
FORE W A T E R ~ r g E 3 3 f J R E V S . T I M E 3.2 7 I
i
Pig. B.Sd Totai and Pore U7ater FYcssurr Vs. T l m e at Bottom d Pllc Shaft: PcnetraUon=74 I n c n ~ : Test 17 (;iei~d)
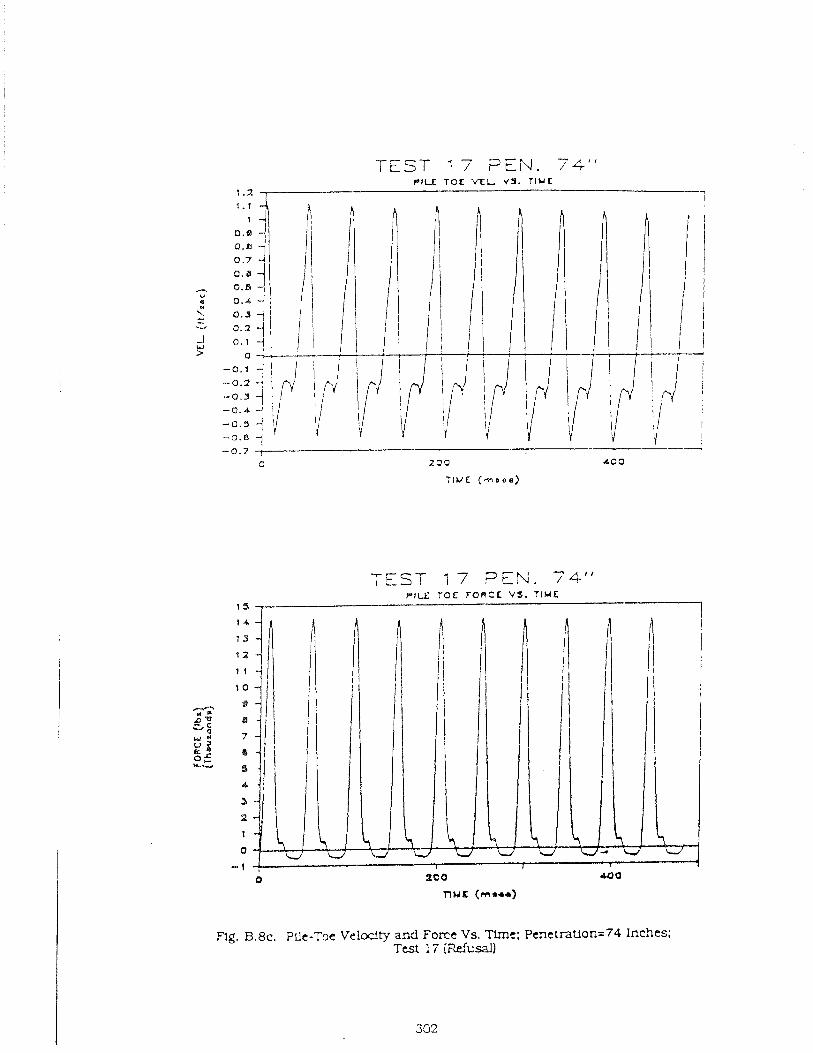
TEST i 7 ?EN. 74" PILE T O E VEL V¶. T l W C
1
TEST 17 ?EN. 74'' Pllf TOE F O R C E VS. T I M E
1
.%. B.8c. P L ~ c - T ~ ~ Velcclty and Force Vs. Time: Penetratlor,=74 Inches; Test 17 \m~sall
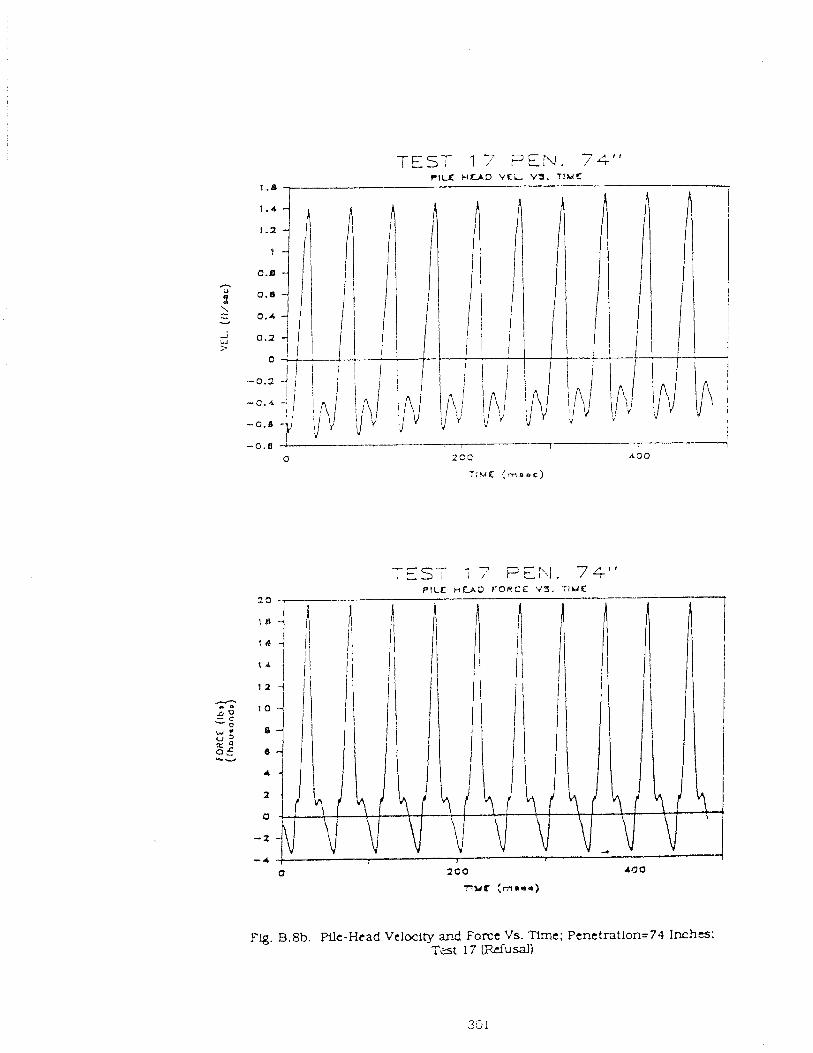
TEST 17 [PEN. 74" P l U H-0 V C L '43. TIME
-- a - 7 - ; t S T i , r t b l . 74" BILE u U O F O R C E V3. T l u E
Fg. B.8b. Pile-Head Velwity ar?d Force Vs. Tlrne; Penttntlon=74 Inches; T=t 17 ( i idusal)
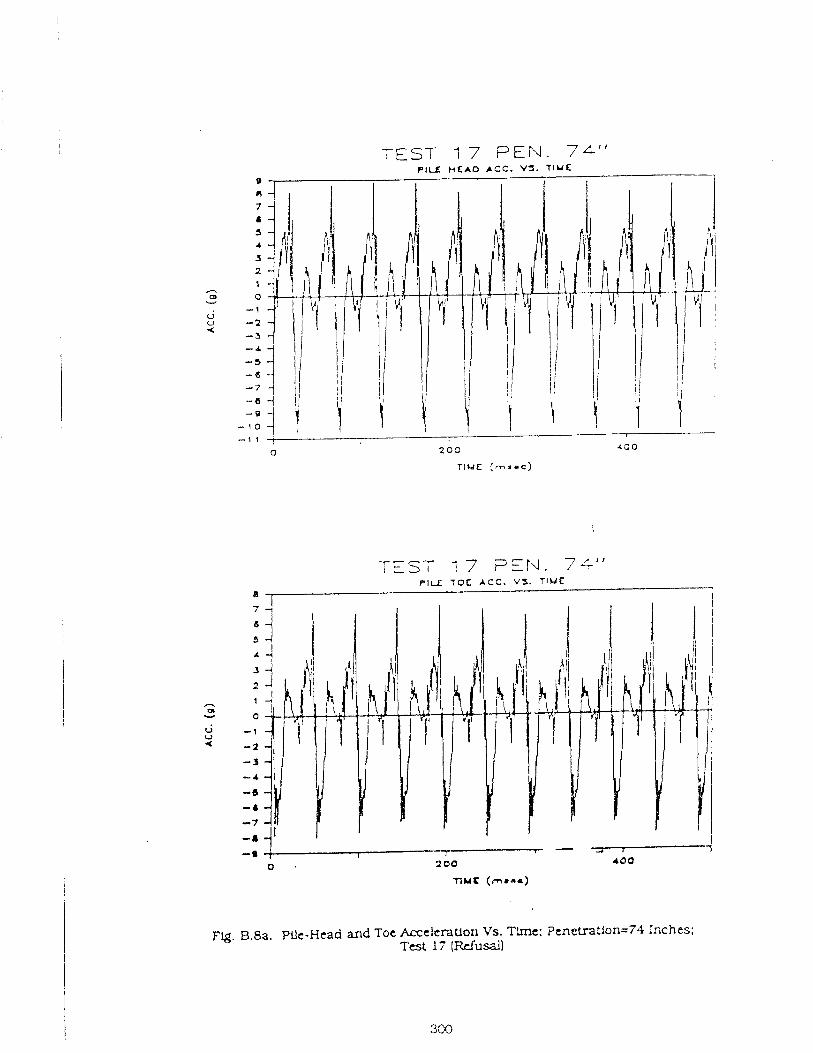
TEST 17 ?EN. 74" PlLf H E A D ACC. VS. T I M E
TEST 1 7 FErq. 7 4 1 1 PILE T O C A C C . VS. T I M E
I
nuf ( m a r a )
FQ. B.8a. Pflc-Head and Toe Acceleration Vs. Tlmc: Penetration=74 Inches: Test 17 (Refusal)
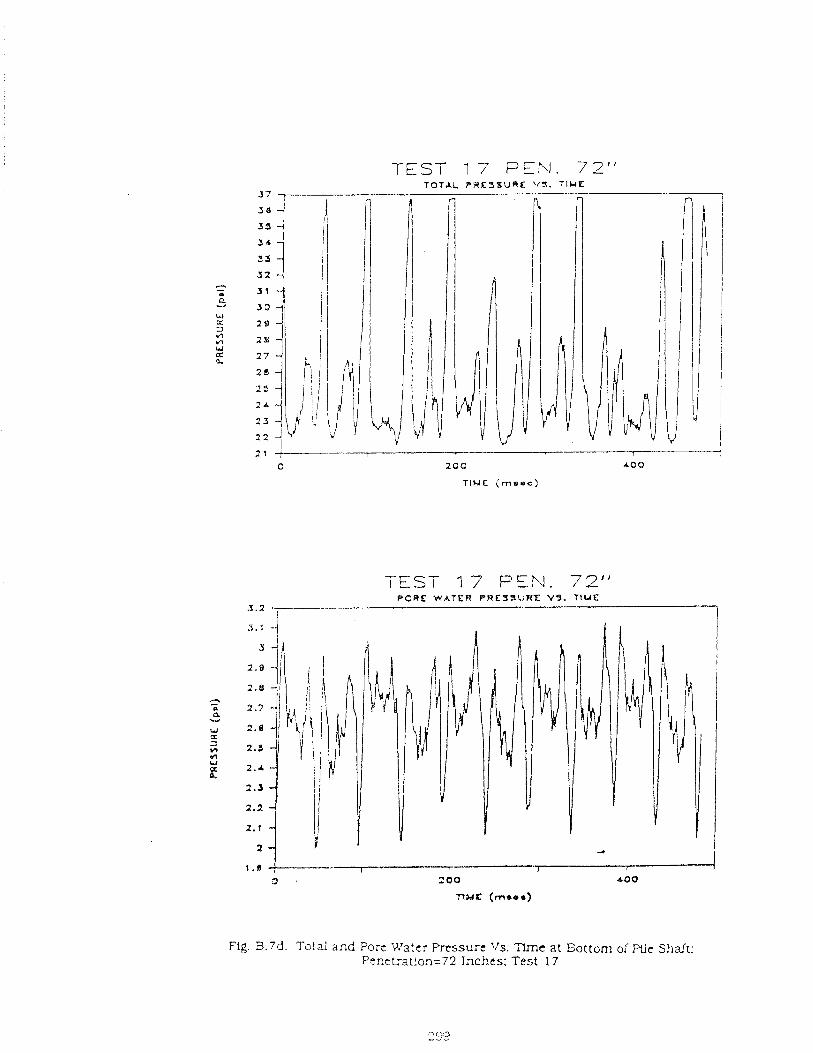
TEST 17 PEN. 72" T O T A L PIYEJXUf4I: V I . TIkdL
2 1 f 0 2 0 0 r o o
TIME j r n o o c )
TEST 17 FEN. 7'2" $OWE W A T E R PRES3UKX VS. TIME
3.2 I 1
1 . s -+- 1 1
280 1
3 . roo n 9 d C (merr)
Flg. 3.7d. Tctai and Port %'a:cr Prcssux Vs. TIme at Bottom o; Pile Shaft: Penetrat!cn=72 Inches: Test 17
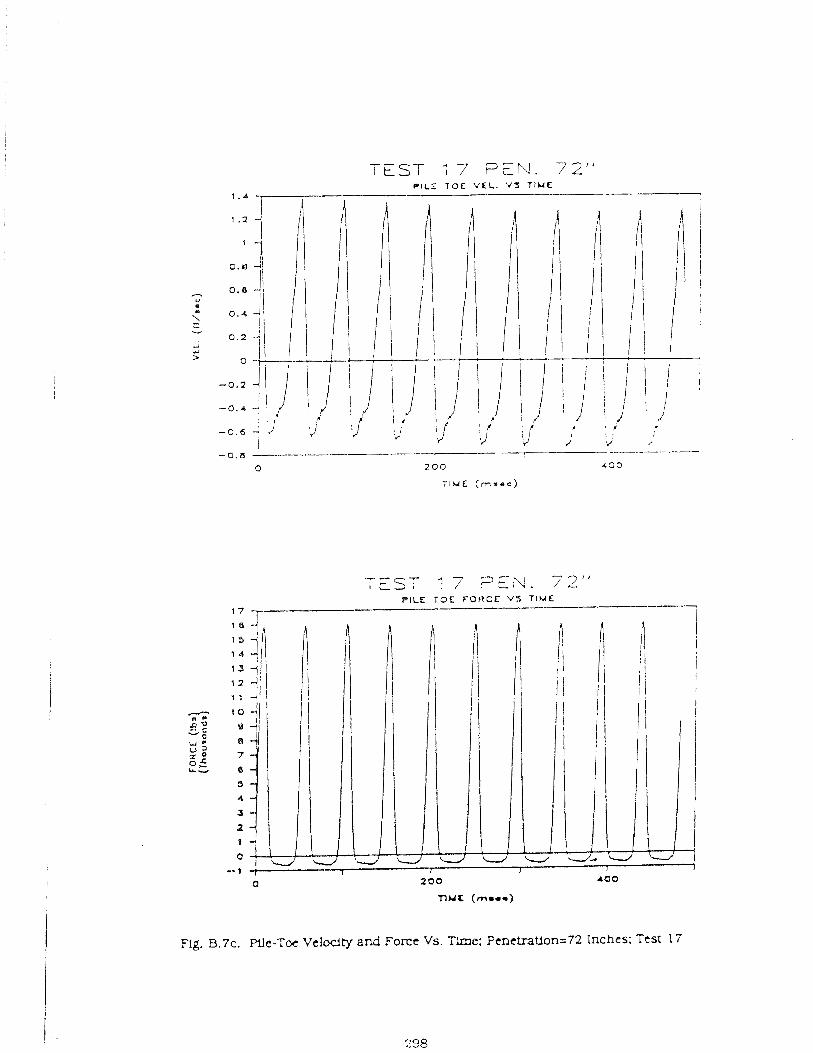
TEST 77 P E N . 72'' p11-5 T O E VEL. V > TIME
I ' I
I : ,
1
2 0 0 4 3 0 0
TIME ( r n v e c )
- - - ; :ST 7 7 .FEN. 1'2''
PILE T O T F O R C E V S TIME 17 , -
I
¶ME (mar-)
~ l g . 3.7~. He-Tw Ve]&ty and Force Vs. Tlme: Penetratlon=72 hches: Test 17
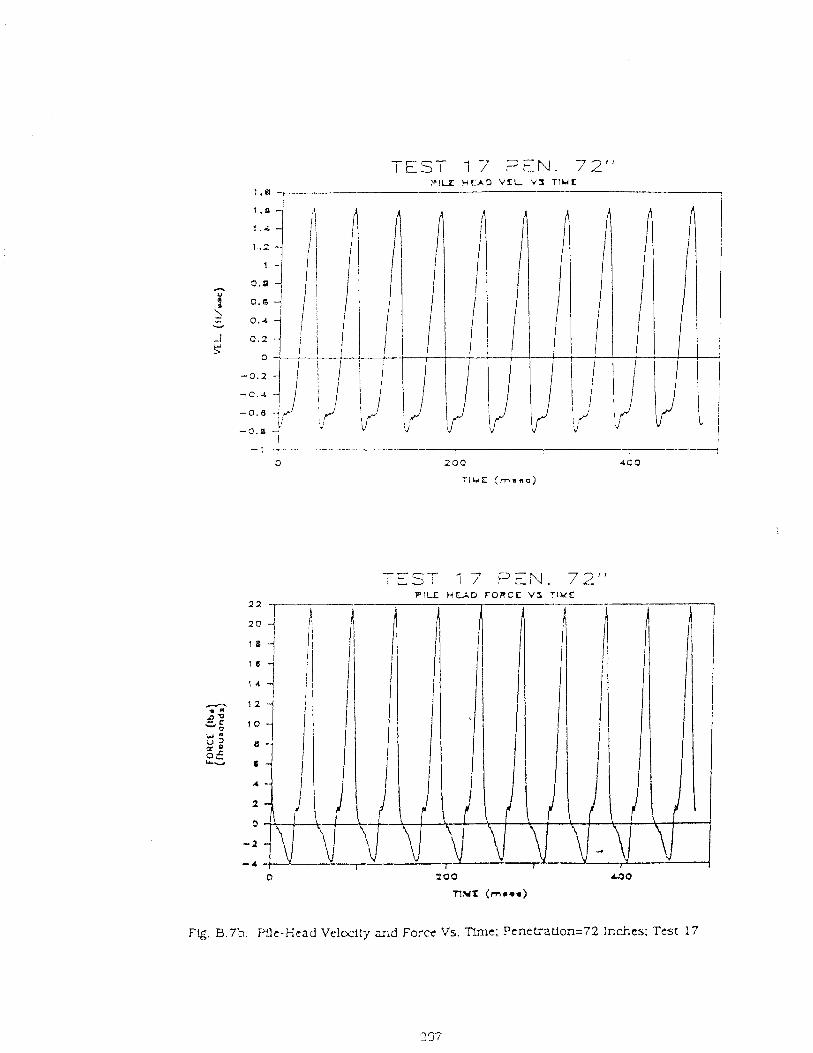
TEST 17 ,FEN. 72" VILX HUO v r L v x T I M E
1.a -.
-- I t S T i 7 FEN. 72"
PILE H F A D F O R C E V S T I M E
Fg. B . 2 . Pllc-Ficad Velcxipy X-,d Form Vs. Tlmc; PenetraUon=72 Inches; Test 17
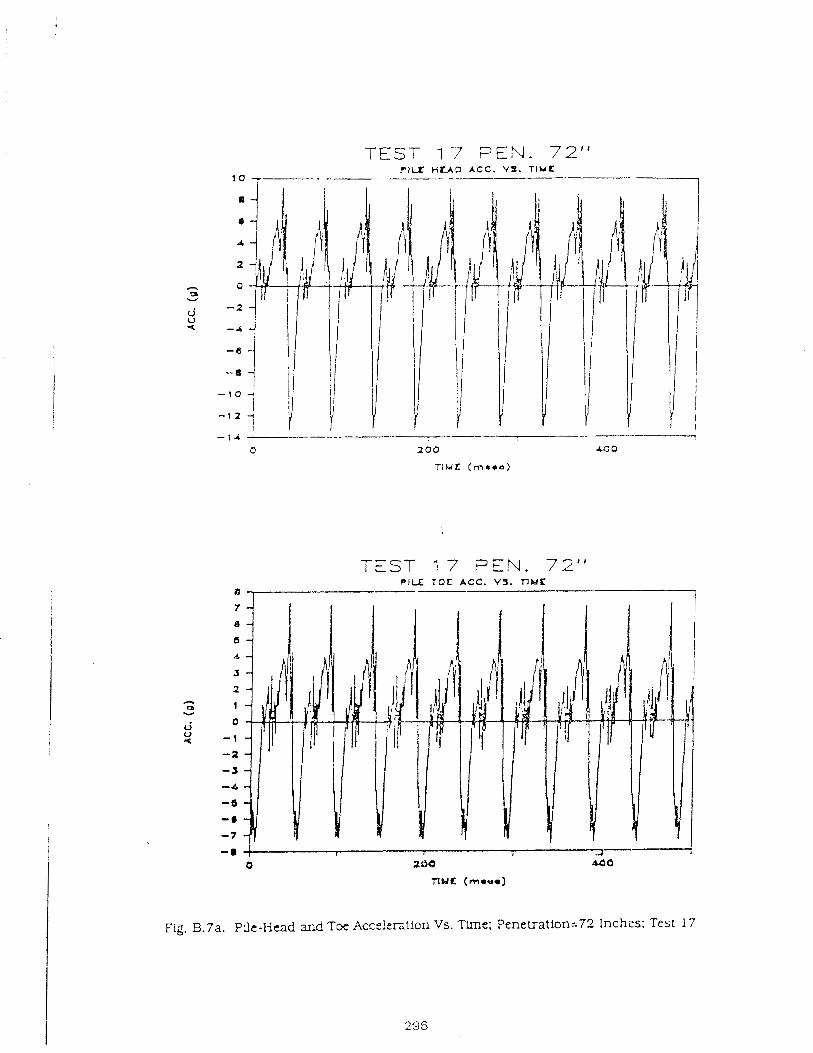
TEST 17 FEN. 72" PlUT H E A D ACC. V4. T l Y C
10 . - I
TEST 17 FEN, 72" r r u TDI: ACC. VJ. ~ Y C
a .
Fig. B,7a. Pfle-Hcad and Tce Acce!czUon Vs. Tme: Peneuation=72 Inches; Test 17
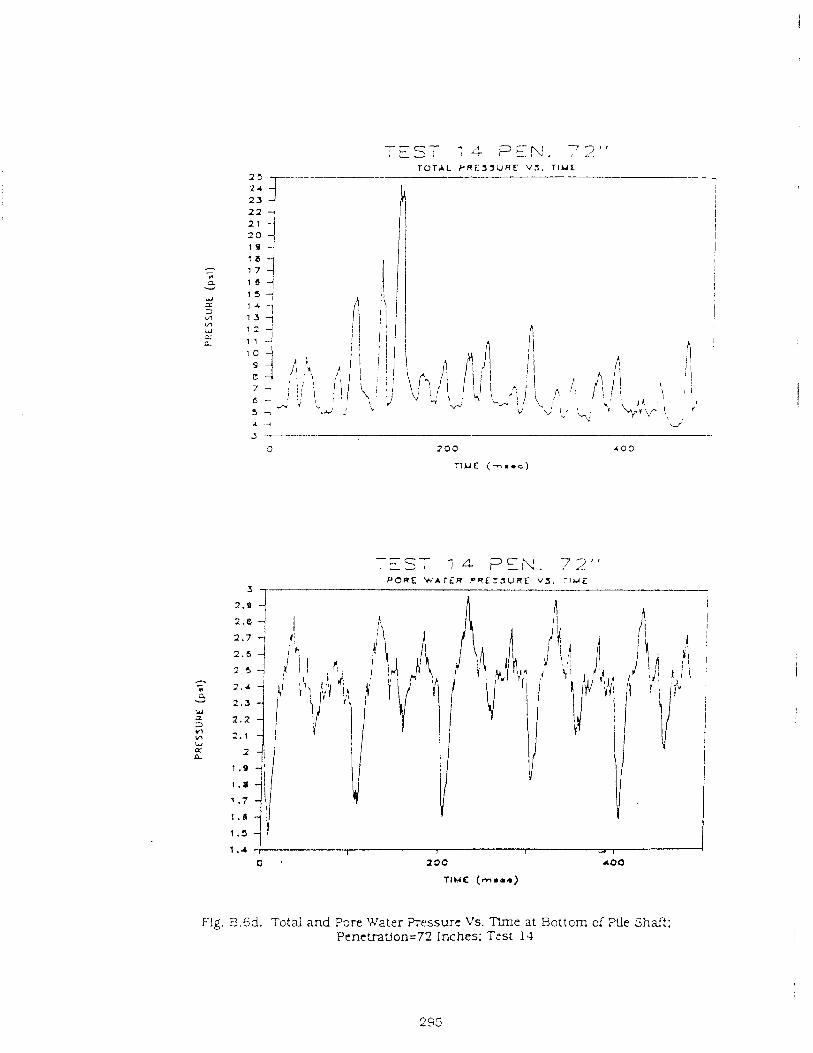
-- --7
; t S T : 6 F E N . , 2" T O T A L P R E J 5 U R E '43. T I M E
i I
1 I
!
2 0 i I I !
- 17
4 1 j W ' 5 1 LL 3
I * 1 ~n 13 4 ,A
! W - 1 2 4 ... n
I 1 1 -
7 - 6 - 3 -. 4 + 3
---- , r > , j 4- F E N . 72"
P O R E W'ATCF? P R E Z S U R C V S . T l u E
Fig. B.Sd. Total and Pore Water Wssure Vs. Tlme at Bottom cf We Shaf:; Penc+ration=72 Inches; TESL 1.1
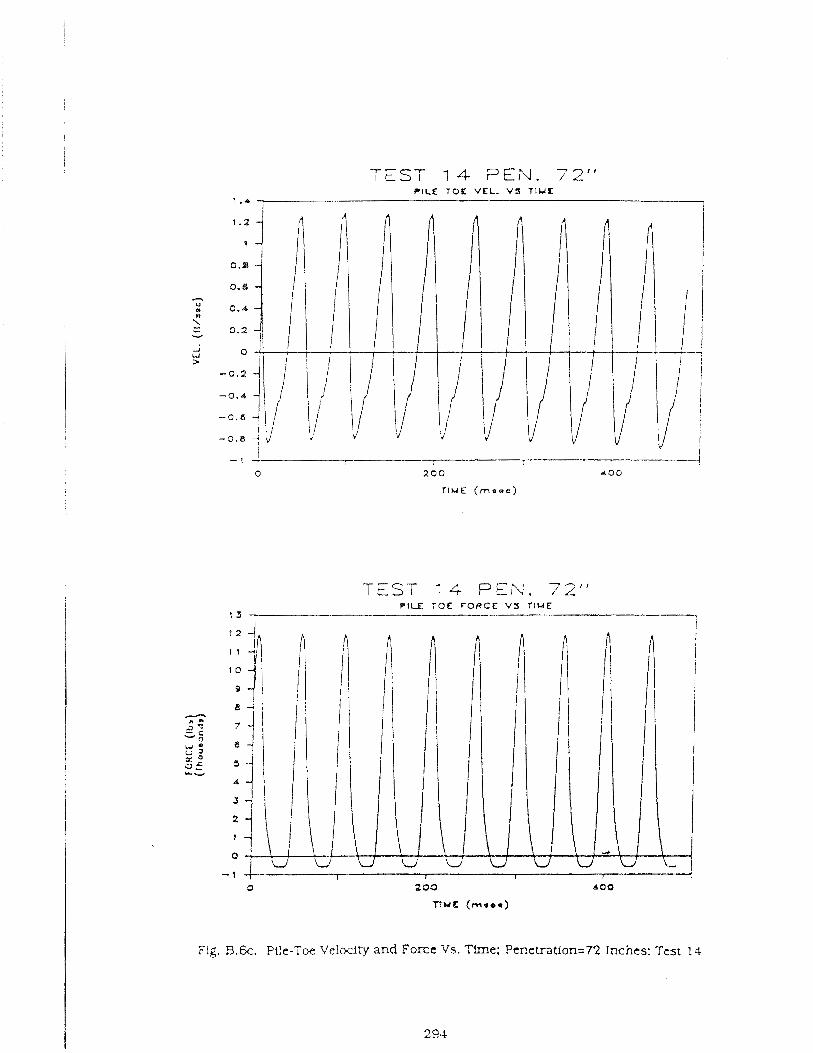
TC I t S T 1 4 PEN. 72"
PILE YOlC VEL. '43 T I U I : 1
TEST 14 PEN. 72" r lu T O E F O R C E v s T I M E
13 ,
Fig. B.6c. Pile-Toe Velocity and Force Vs. Time; Pcnetration=72 Inches: Test 13
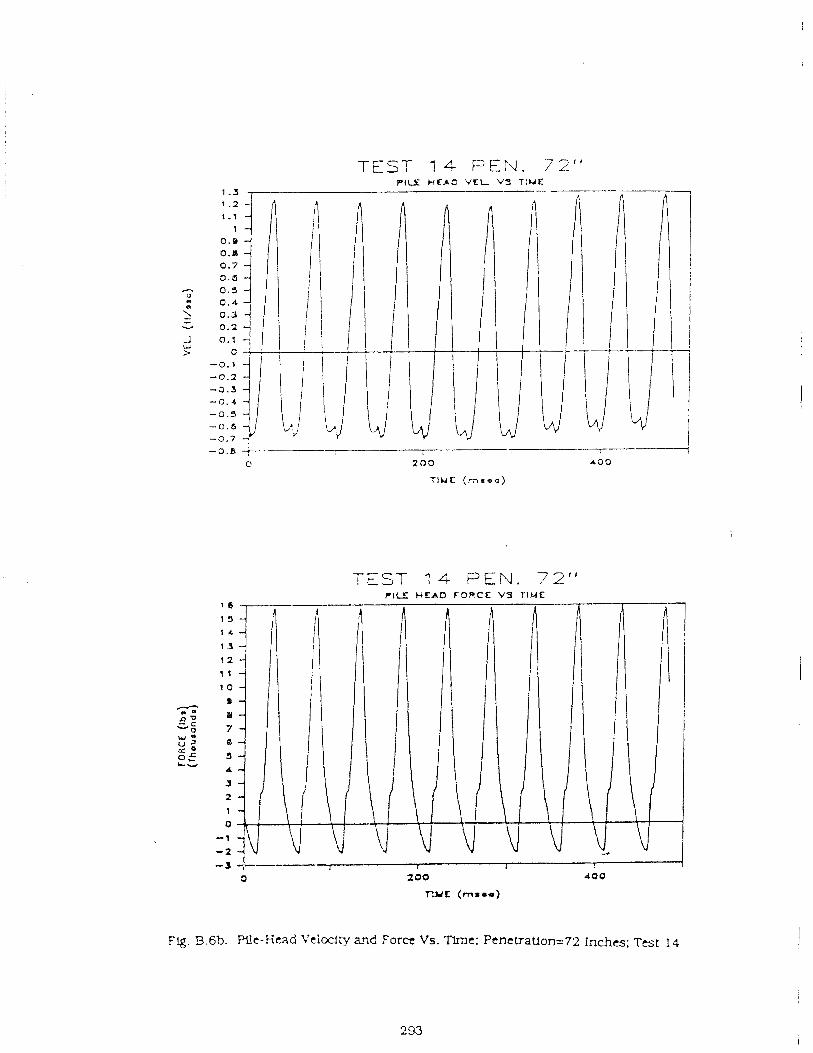
TEST 1 4 PEN. 72" PILX H-0 V C L V 3 TIME
TEST 1 4 PEN. 72" PILE HEAD FO R C E VS TIME
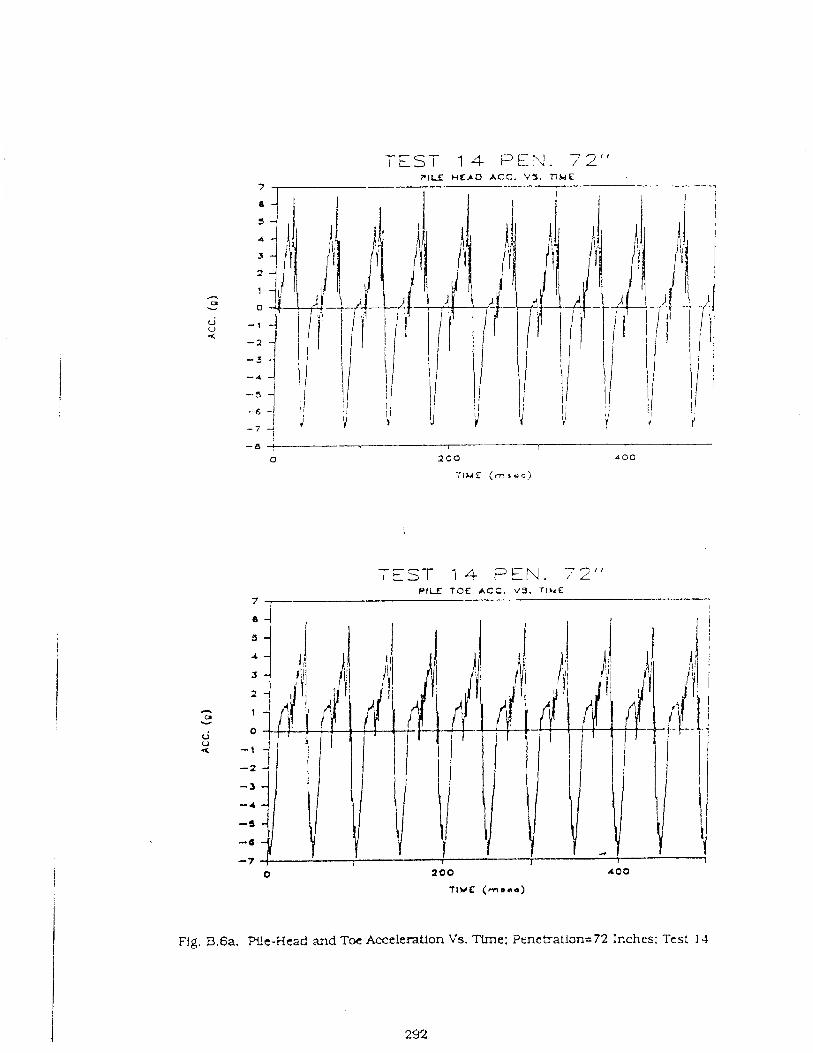
TEST 1 4 PEN. 72''
PILE TOE A C C . VS. T l k E 7 ,
Ng. B.6a. We-Head and Toe Acceleration Vs. Time: Pcnctration=72 Inches: Test : 4
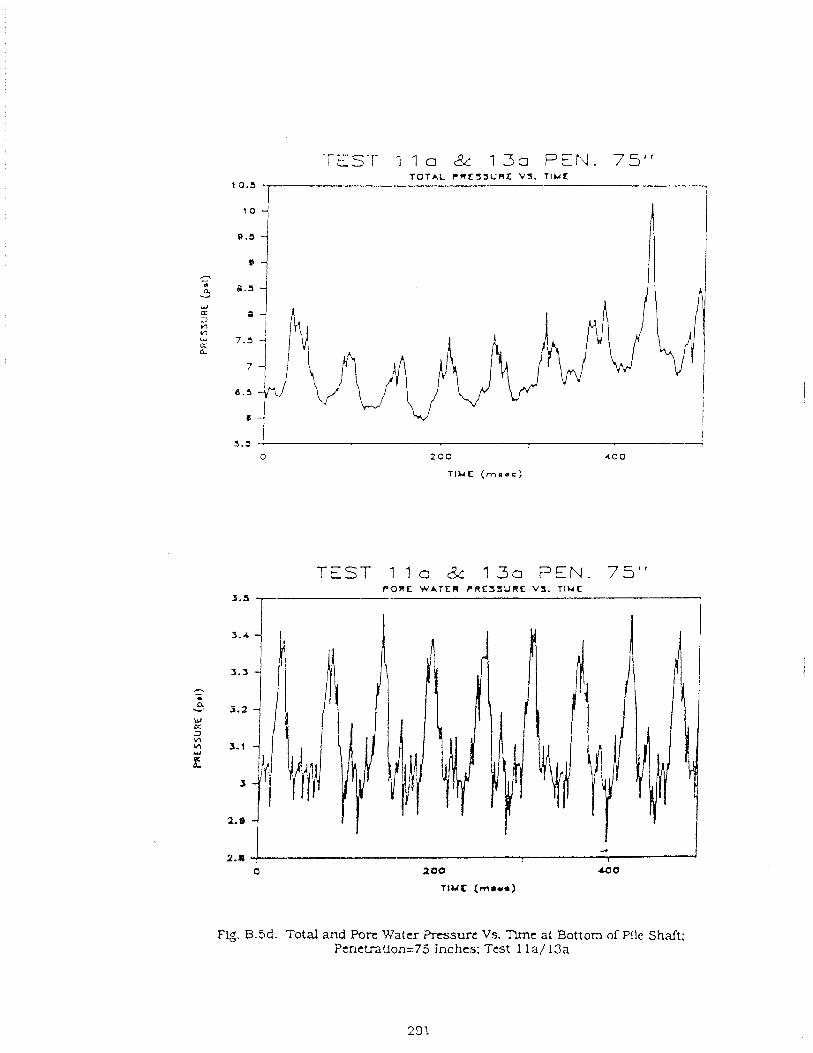
TEST I la &: 1 3 3 PEN. 75" T O T A L P R L S J l J R L V3 . T I M E
10.3
I 5 . 5 :
0 200 A 0 0
T I M E ( m a r c )
TEST 1 1 o & 13a FEN. 75" PORE W A T E R PWCSSURL: VS. T I N E
'-= 7-
4 J I
0 100 a0
TlMC (moue)
Flg. B.5d. Total and ?on Water iJrcssure Vs. Tlme at Bottom of Pile Shaft; PtnctraUon=75 inches; Test 1 l a / 13a
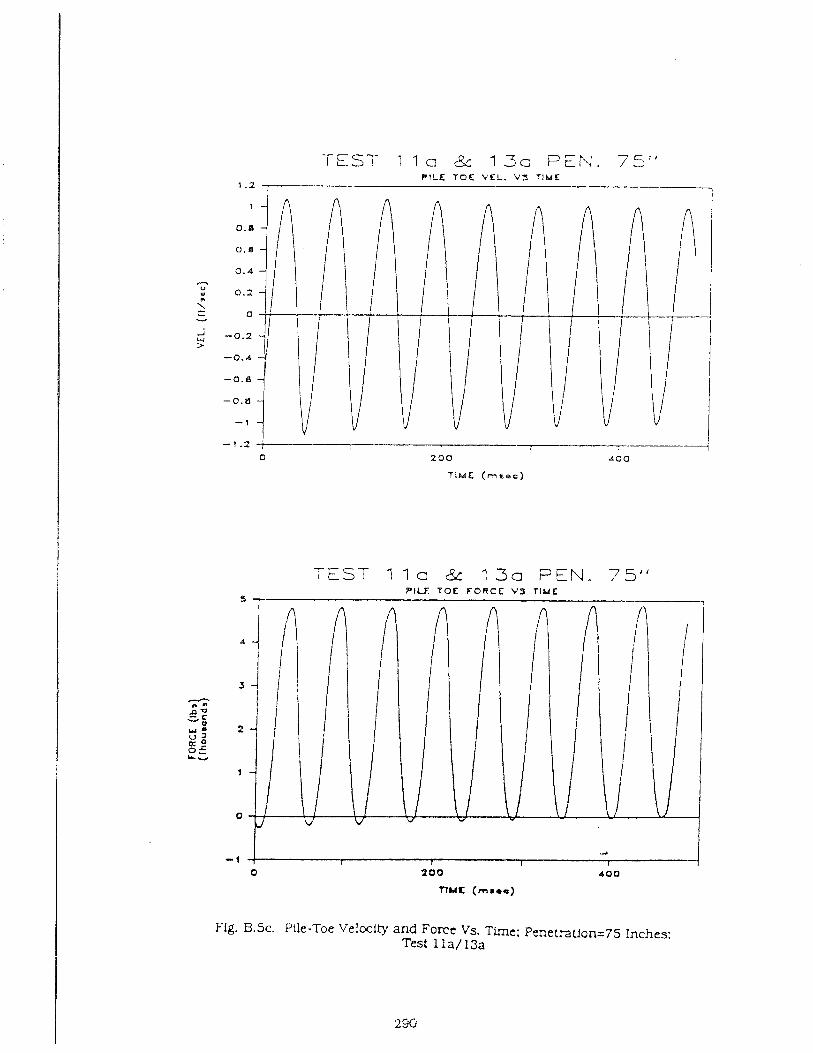
TEST 1 la Sc 13c PEN. 75" PlLE TOE V E L V S T I M E
- 1 . 2 i I , o ZOO a00
T I M E ( r n n r a c )
TEST 1 1 a & 13a F E N . 75" PILE T O E F O R C E V S T IME
~ i g . 8 . 5 ~ . Pfle-Toe Velocity and Force Vs. T h e : PenetraUon=75 Incnes: Test 1 la/ 13a
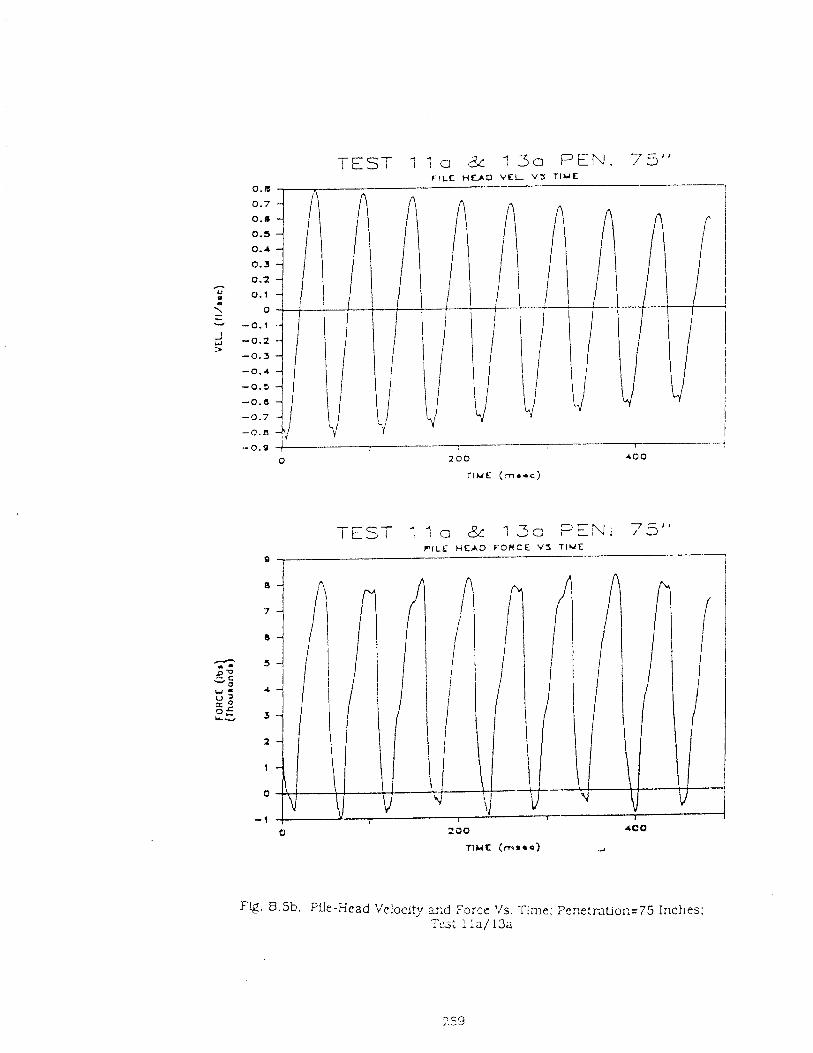
T E S T ; ; a & 130 PEN. 75'' PILE H E A D V E L V J T I Y E
i
!
i 1 I
0 2 0 0 r o o
T I M E ( m a r c )
r-. 7 7 - 1 1
TEST i 1 o & 13c , ~ t N i , 3 P I L E H E A D F O R C E V S T I W E
I
F&. B.5b. We-Head Ve!oclty w,d Force \ is . TLne; ?cne:ntion=75 Inches: TG: : la/13a
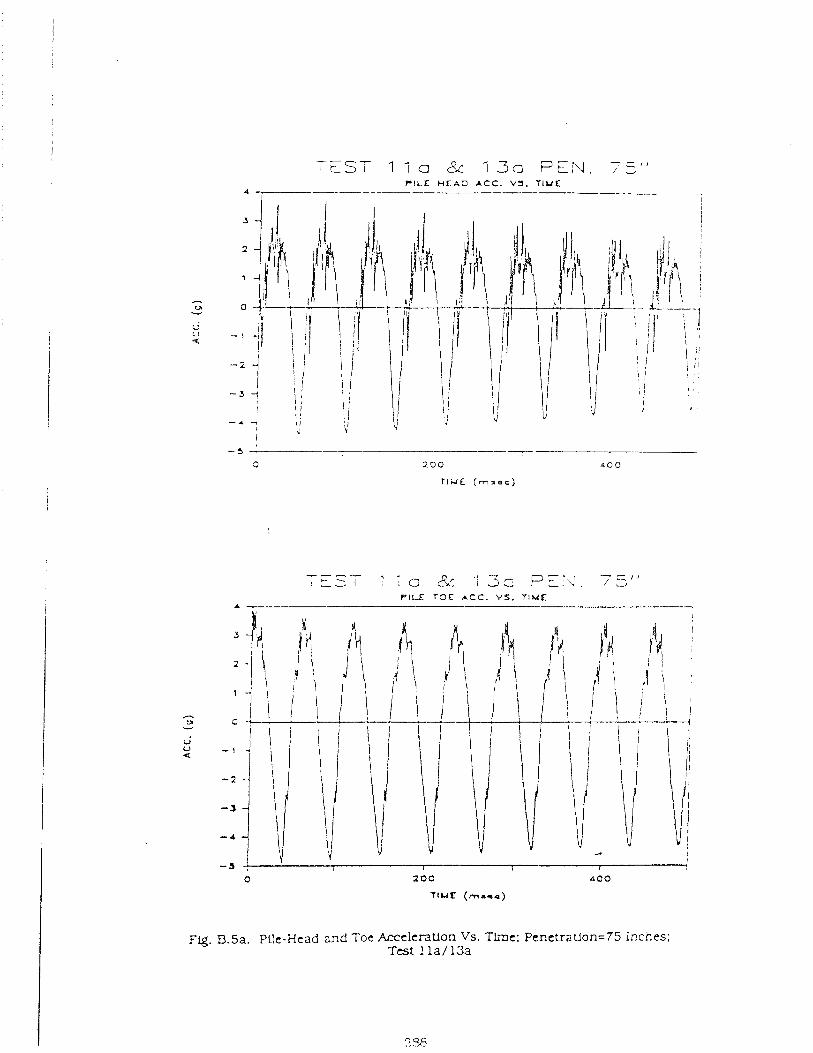
...-.--- - - ! tZ. I 1 ; a & ?E.:\:, /zl'
PILr TOE A C C . Y S . T l U C A
Fg . B.5a. Pile-Head and Toe Acceleration VS. Time: PcnetraUon=75 Inches; Ttst ! la/13a
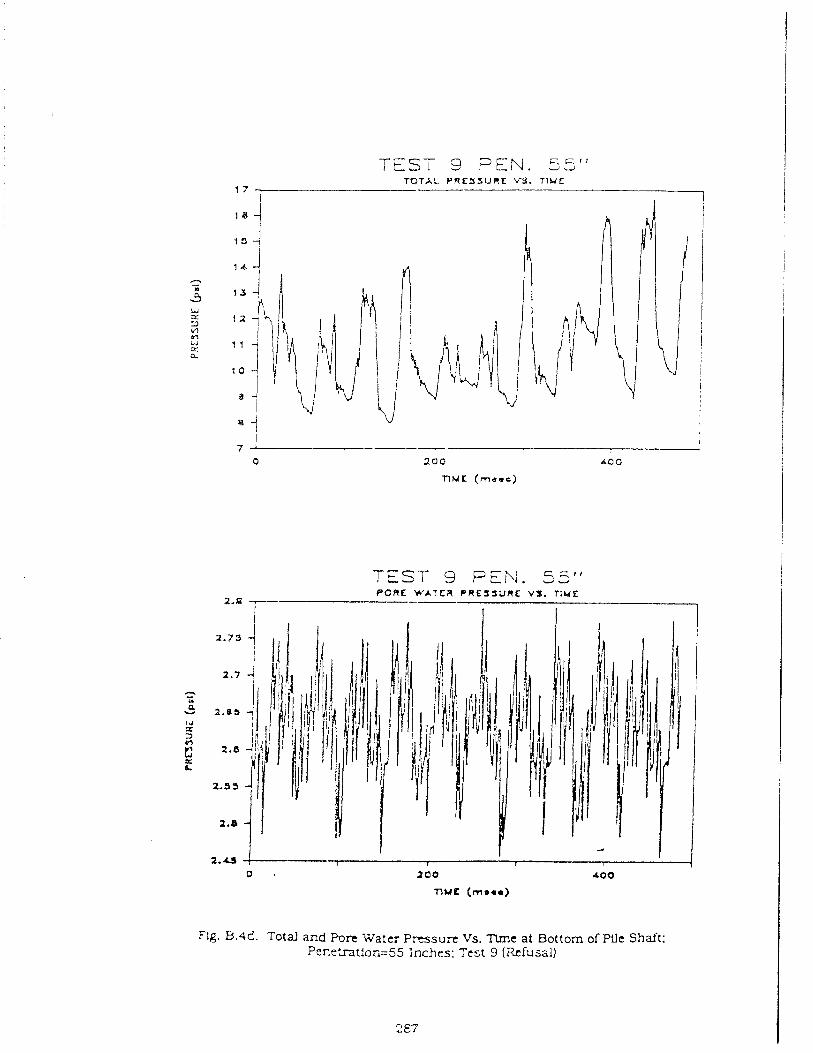
- TEST 9 PEN. 25''
TOTAL PRESSURE VK. T I M E 17 1-
" 1 V
I 7 '
I
o Z O O roo TlMK ( r n a a o )
TEST 9 PEN. 55" P O R E W A T E R PRESSURE '4%. T I M E
r- -- I I 1
Fig. B.4d. Total and Pan Water p m s u ; t Vs. Tlme at Bottom of Pile Shaft: Pcnetrat:or,=55 Inches: Tcst 9 Ifitfusal)
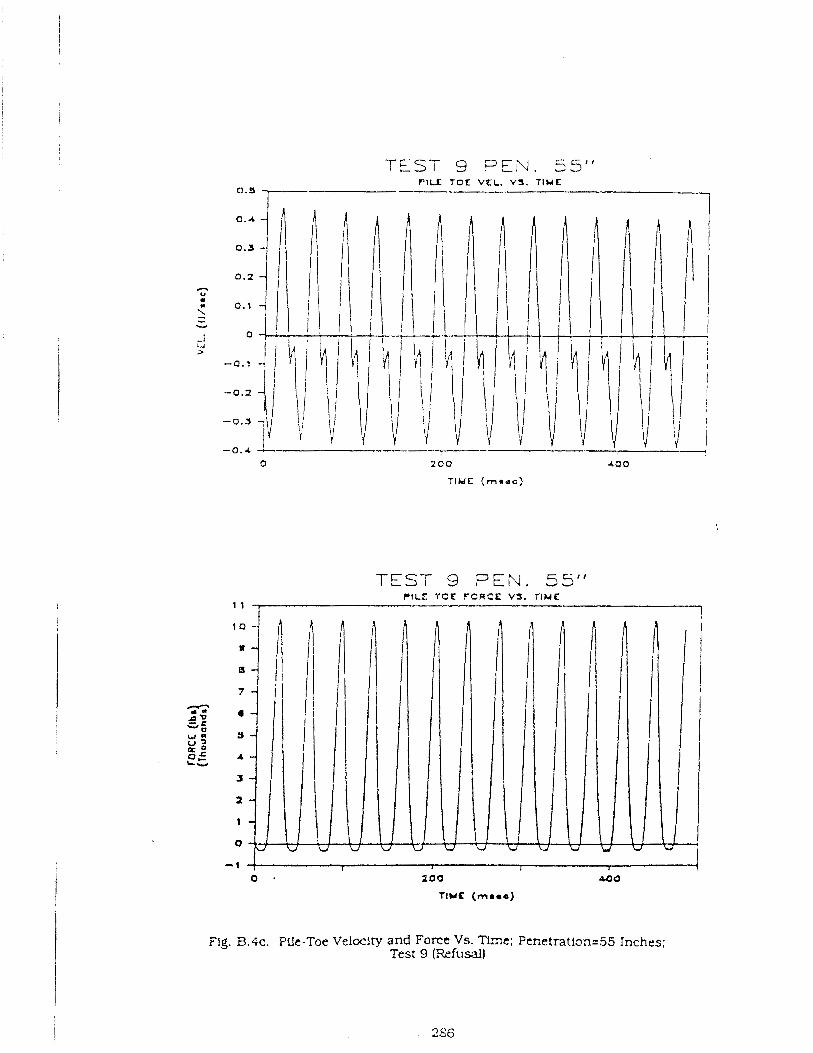
TEST 9 PEN. 55" PILE TOL VCL. V 3 . T I W E
0.5 7
TEST 9 PEN. 55" PILE TOE FORCE V9. TIME
1 1 [ I
Flg. B.4c. Pile-Toe Velocity and Force Vs. TL?c; Penetration=55 Inches: Test 9 (Refusal)
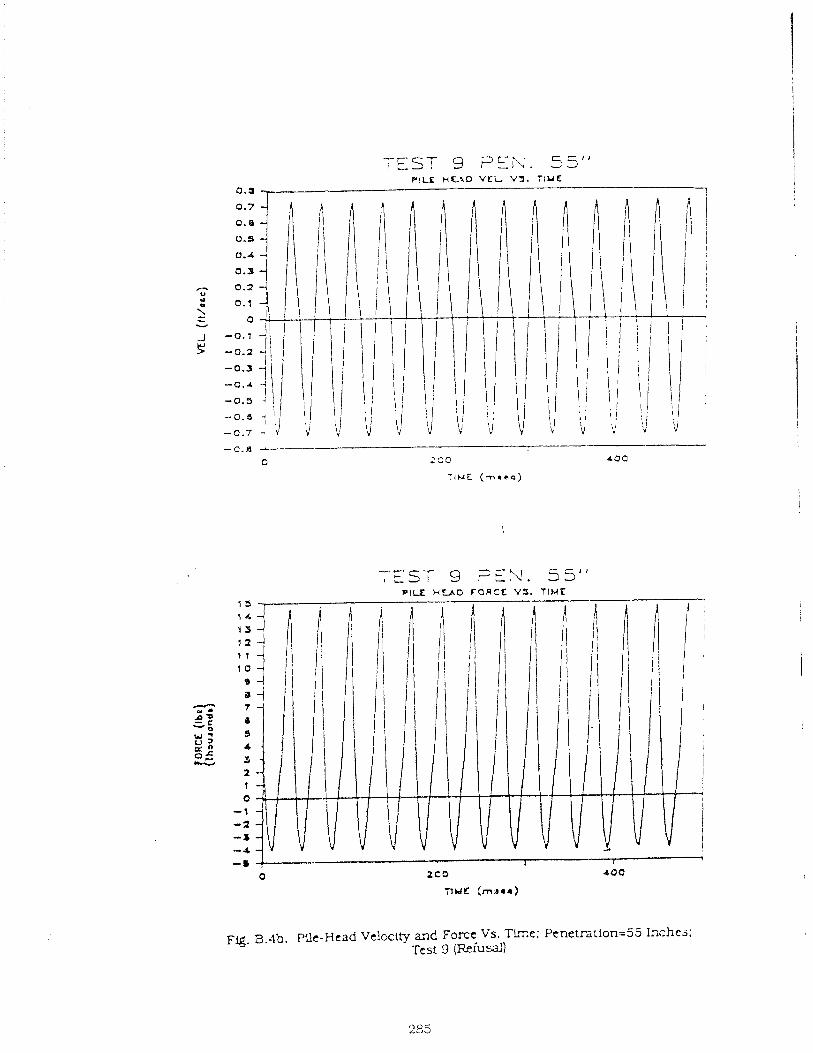
TEST 9 ?Ei\J. 55" PILE H L ~ D VZL v3. r ~ u e
0.9 7 I
-- - - t S i 9 r t N . 55'' PILE H U D F O R C E VS. TIME
~ g . p,.4b. Pfle-Head Veiccify m d Force VS. firr.e; Pcnetration=55 Inches: Tcst 9 ( R e i u d )
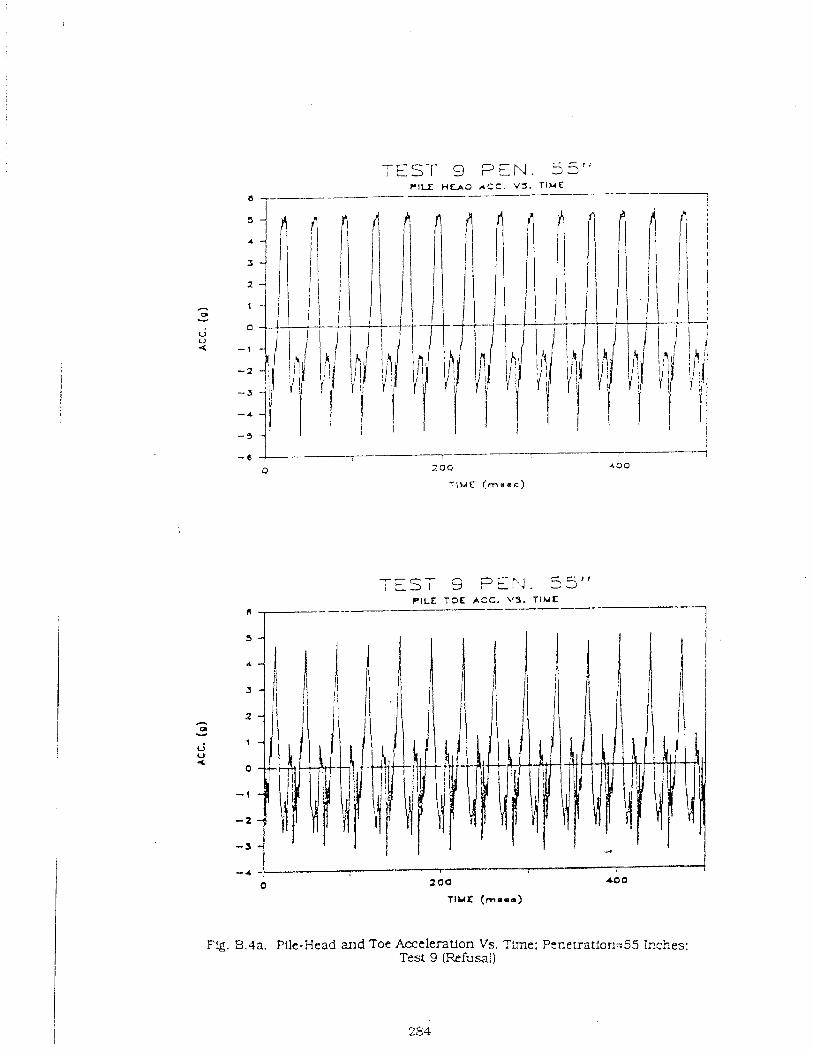
T E S T 9 F E N . 55'' rlu HEAD A C C . vs. T I M E -- _ _ _ _ - i
-7 ;tST 9 PEN. 55" PILE: T O E ACC. V"f. T I M E - ---
a I-----
- 4 -, I
0 2 0 0 400
TlLIt (msea)
Ftg. B.4a. Pile-Xead arld Toe Accclerauon Vs. ?me: Penerration=SS I ~ c n e s : Test 9 ( R e f u d )
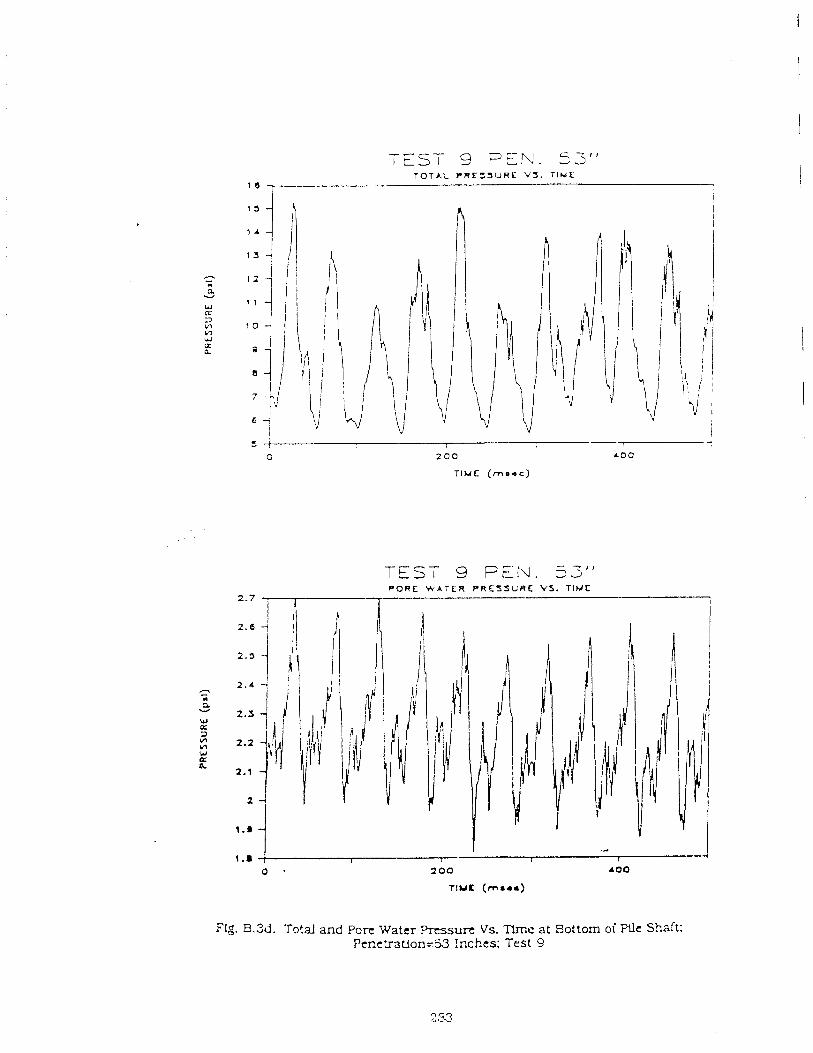
-- i t S T 9 ?EN. 53" T O T A L P R E Z J U R E V S . T I M E
1 6 - I
TEST 9 PEN. 53" P O R E W A T E R P R E S S U R E V S . T I H E
2.7 I !
1.8 f I I I
6 2 00 -0
T l Y K ( m a a r )
Fig. B.3d. To td and p o x Water ~rtssure Vs. Tlmc at Bottom oi Pile Shaft; Penetration=% ?nchts: Test 9

TEST 9 ,?EN. 53" P I L L T O E V C L V 3 T I M E
---- - - 5 ,ZEr\!. 22" I E l l d
PILE T O E f O R C E V 3 T I M E
FQ. B.3c. Pile-Toc Veiocity and Force Vs. Tlmc: Penetratlon=53 Inches; Test 9
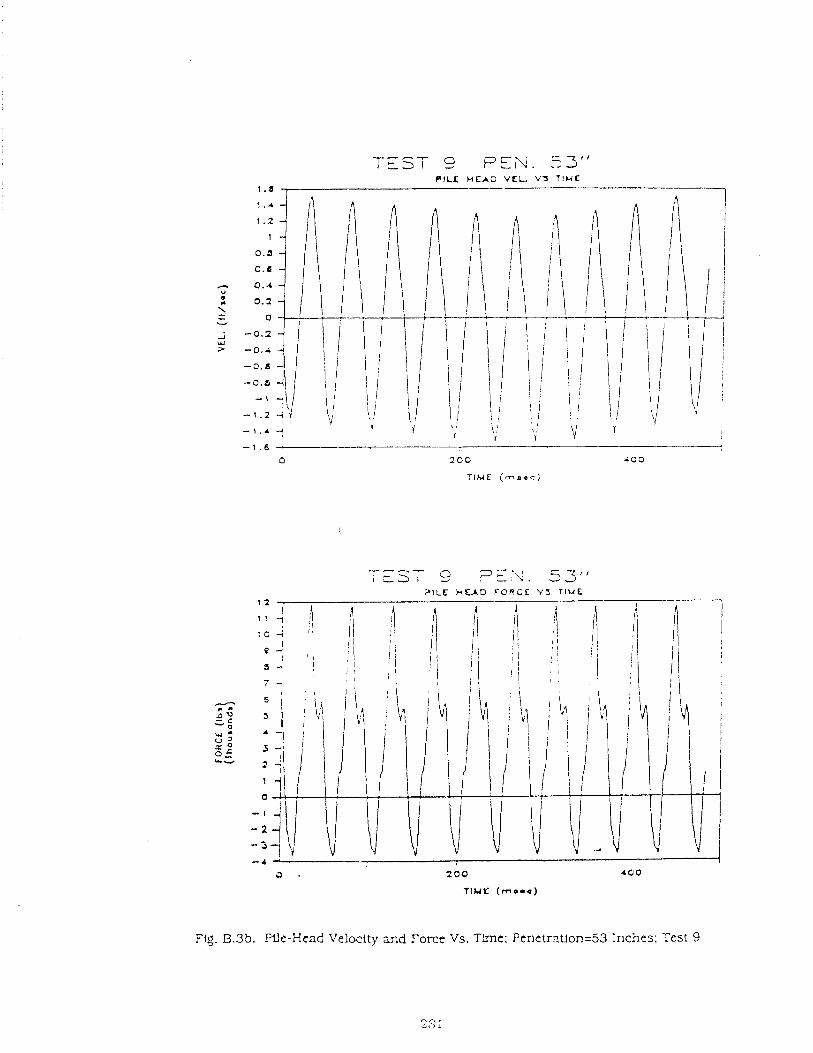
---- , E L , 9 ;>C,.<. 53" P I L E H E A D F O R C E V S T l U E
Ftg. B.3b. Flle-Hcad Velocity and Y o r e Vs. Time; Penetratlon=53 Inches; Test 9
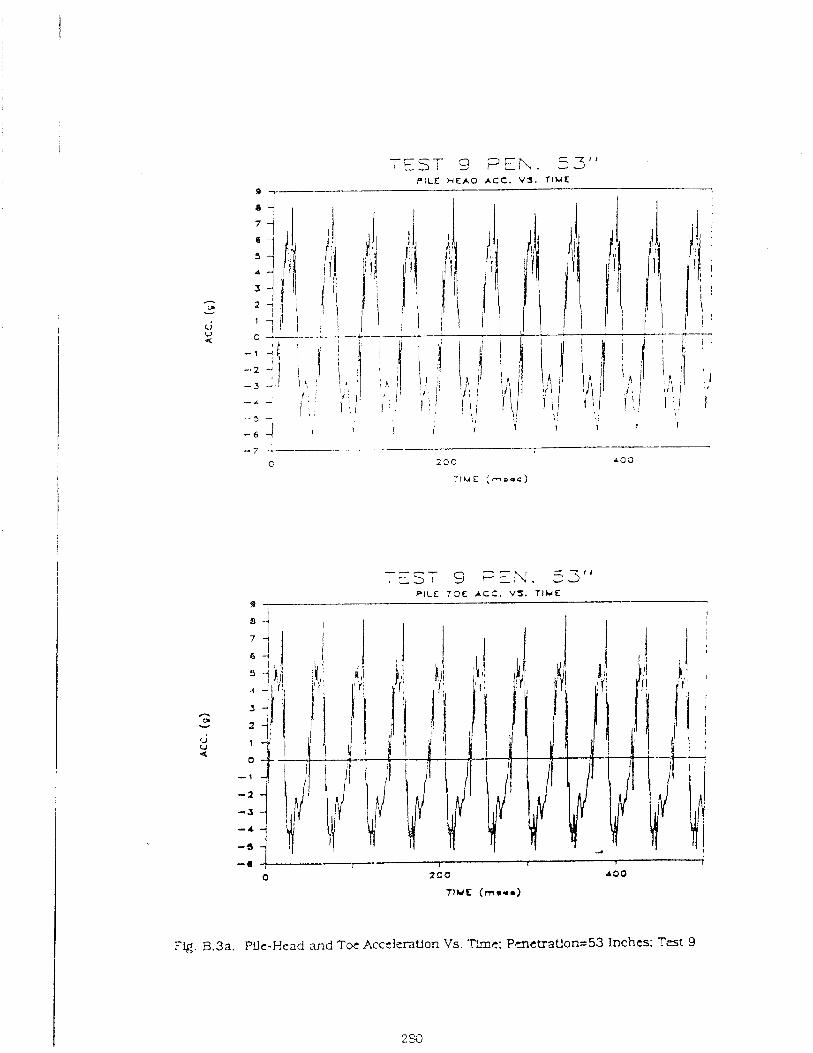
-7 l t S T 9 PEN. 53" PILE H E A O A C C . V S . T I M E
8 7-
7 - - -
, t>, g ;=EX. 53" P I L E T O E A C C . VS. TIME
-(I I I I I 1
0 zoo r o o T l w r ( r n w r * )
Fig. B.3a. Pile-Head and Toe Acctlzration Vs. Tlm~: Pmetratlon=53 Inches; Test 9
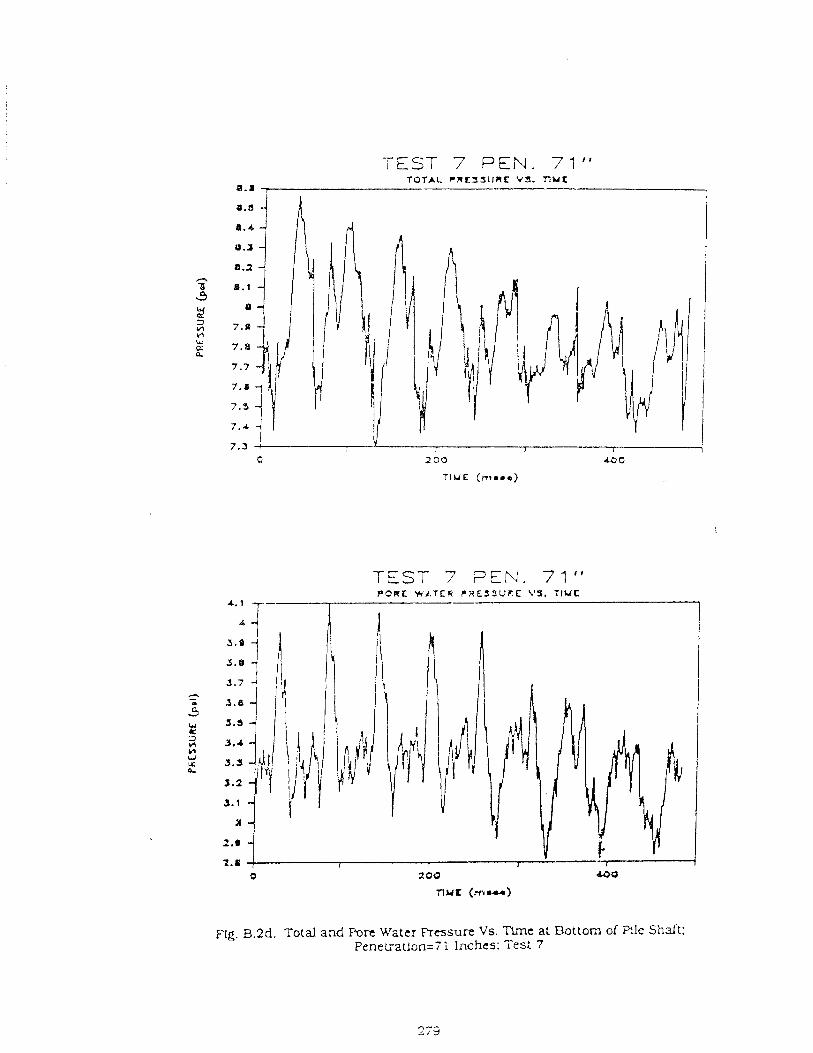
TEST 7 PEN. 71" TOTAL P R L S J L I N S vn. nuc
0 2 00
TEST 7 F E N . 7 1 "
Fig. B.2d. Total and FOR Water F~essure Vs. Tliinc at Bottom of Plle Shalt: Penetiatlon=7 i Inches; Tes: 7
*-- s l y
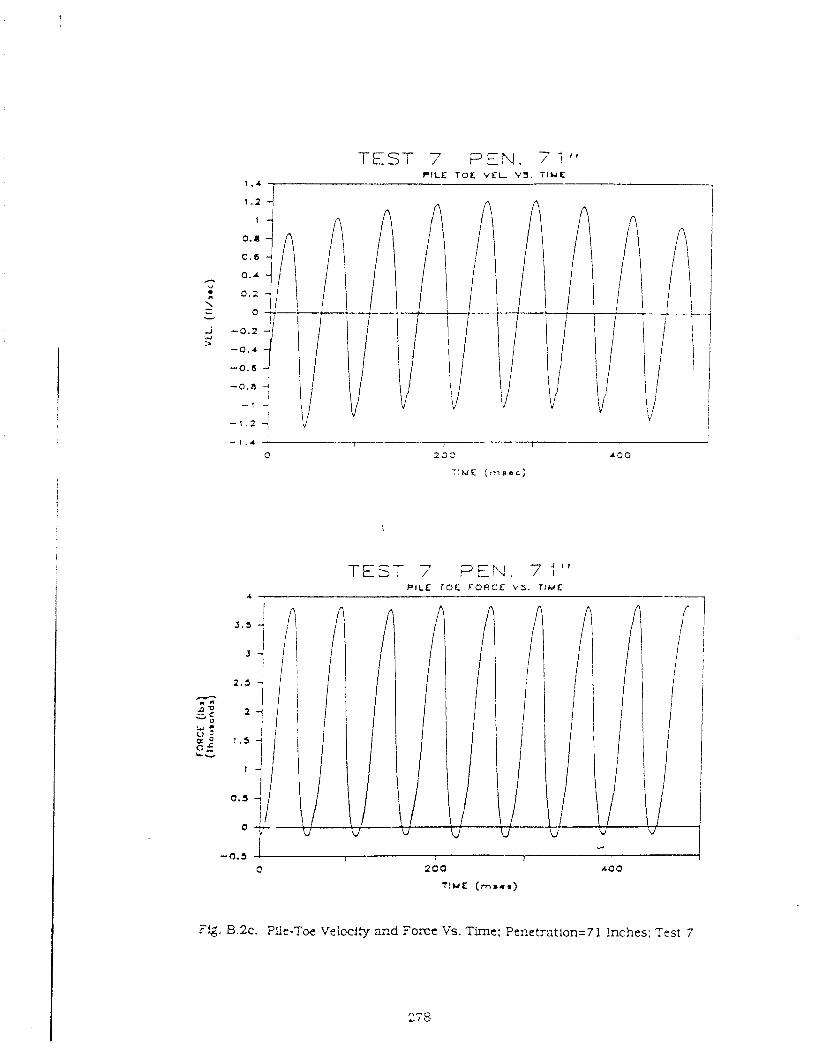
TEST 7 FEN. 77" PILE T O E V r L V J . T I M E
' I 1
PILE T O E F O R C E V S . T I M E 4
a
-0.5 I i I o 2 00 r o o
T I M E (mnrs)
Fig. 8.2~. Pile-Toe Veiocity mad Force Vs. Time: Penetration-71 !riches; Test 7
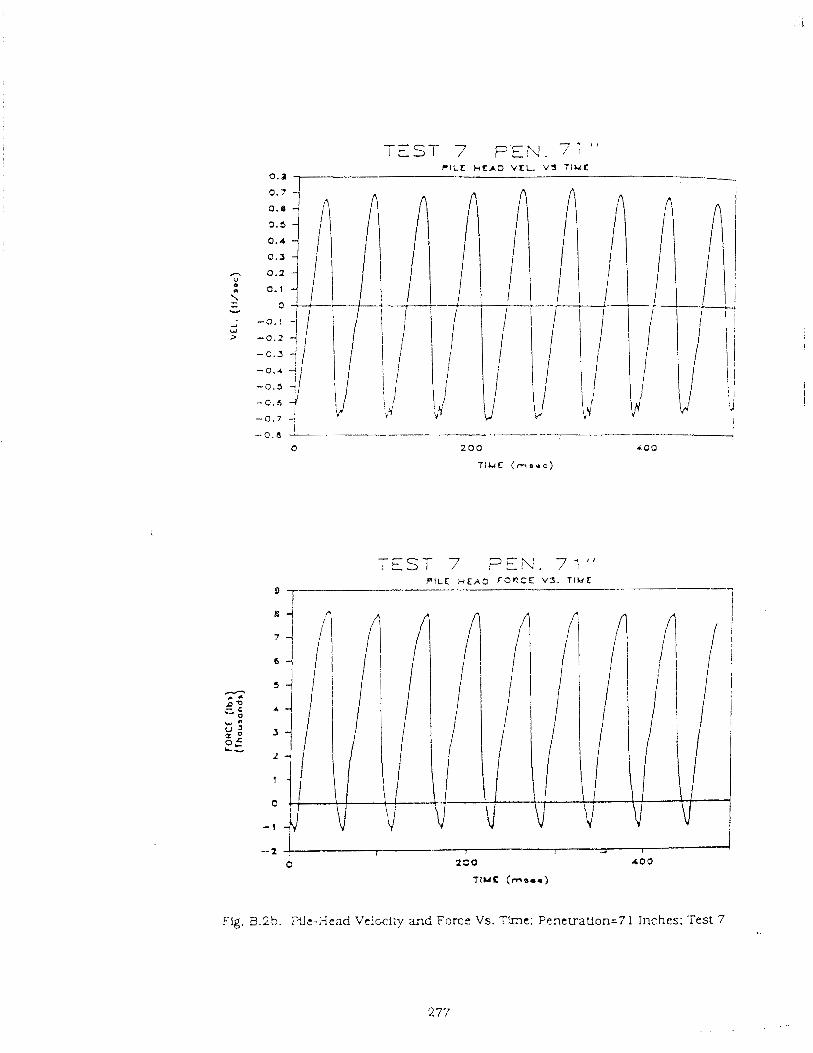
- 4 , , TEST 7 PEN.
PILE H C A O V E L V S T I u C o.a ,
-- I t S T 7 P E N . 71"
F!g. B.25. Xe-Xead Velccliy and Fcrce VS. TJAne; Pene t ra~on=7 1 Inches; Test 7
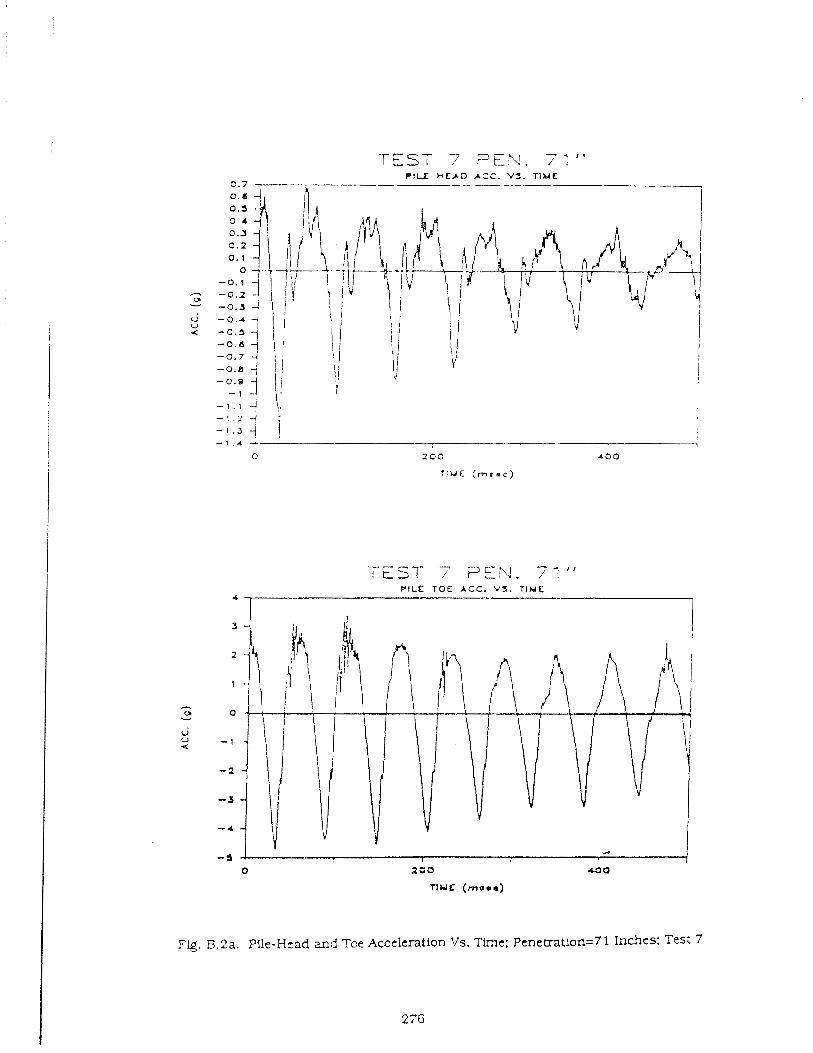
--- I LLT 7 FEN. 71"
PILE T O E A C C . V 5 . T I M E 1
F!g B . 2 a Pile-Hrad and Toe Acceleration Vs. Tlmc: Pcnetratlon=71 Inches: Tesr 7
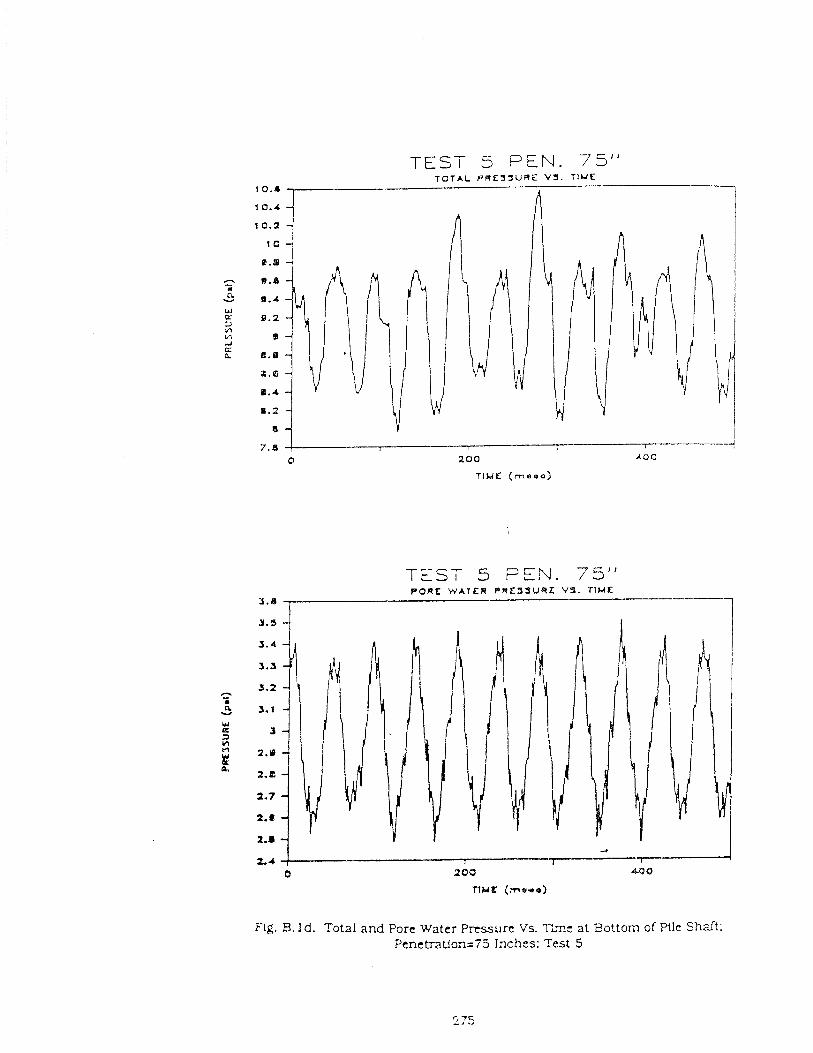
TEST 5 PEN. 75" T O T A L P R E 3 3 U R E V S . T I N E
n
8 v 7.8 1 I I
0 100 400
TIME ( m s e o )
TEST 5 FEN. 75" PORE WATER P W E S S U W Z V9. T IME
3.8
Fig. El. Id. Total and Pore Water p ~ s s u r c Vs. Tm.: at Bottom of Pllc Shaft: Penetration=75 Inchs ; Test 5
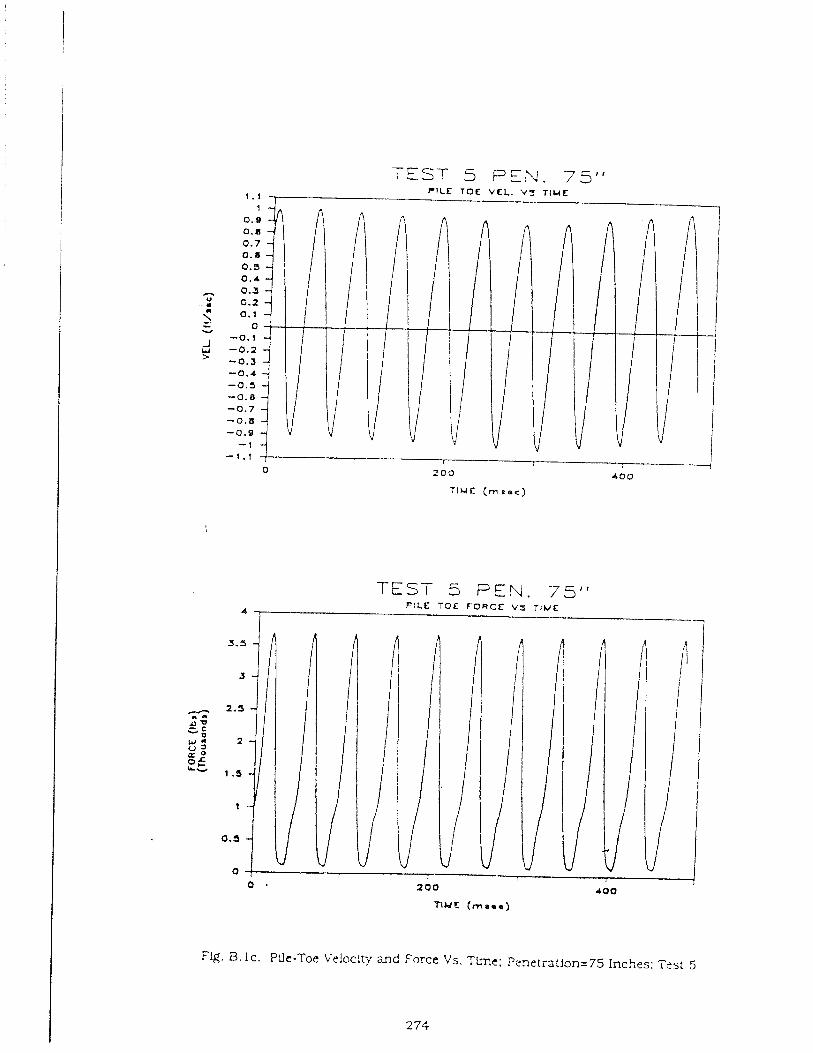
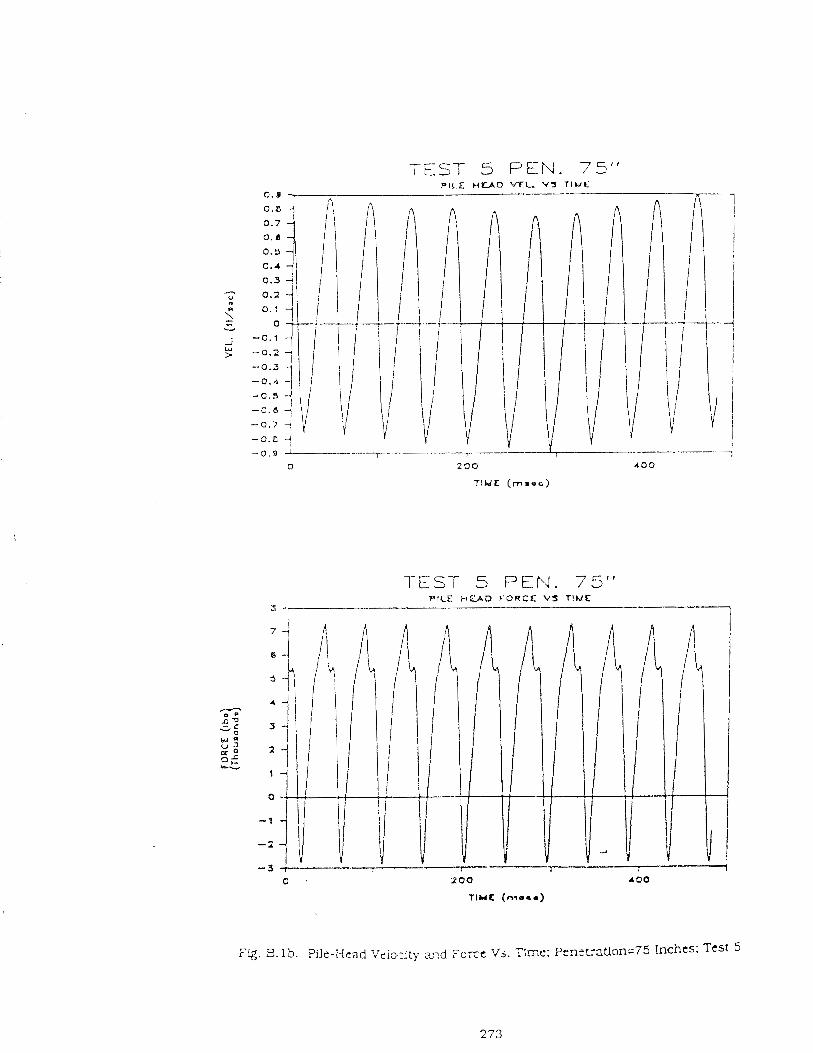
TEST 5 PEN. 75" P I L E H E A D FORCE VJ TIME -
I
F Q . 9. Ib. %e-licad '/eio :it). x ~ d Fo;cc V j . Tmx: ? e n ~ t ~ t i o n = 7 5 Inches: Test 5
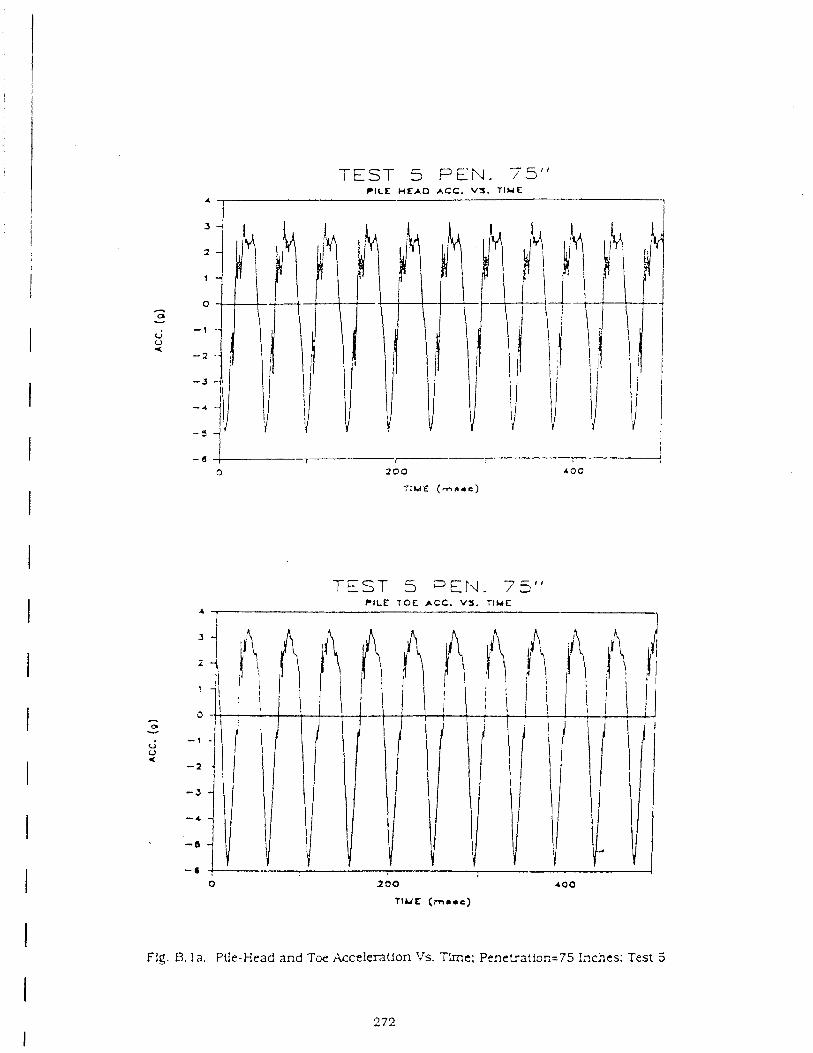
TEST 5 PEN. 75" PILE HEAD ACC. VS. T I Y E
4 , 1
TEST 5 PEN. 75" PILE T O E ACC. V f . TIME
4 .
Fig. B. l a . Pile-Head and TM Acceleration Vs. Tlmc: Ptsnetratlcr,=75 !n&?es: Test 5
Tl3E TO^ AT FULL PILE PENETRA'EO?! FOR V I B R O - D W G TESTS
Xepsesen:ative graphs of half-second tLme h i s t c ~ e s of accelerzt!on, velocity,
force. gore and total pressure signals measured on the pile during vibro-dri\?nq a t
pene:rations into the chamber near full penetration (about eightern pile diameters) for
each "capacity" test. All signals presented are direct, uncorrected output from the
indicated ins t ruments , exce7t for the velocity s i g n a ! ~ . which were obtained by
numerically integrating the measured average acceleration signal at the pile head and
the single acceleration signal at the plle toe. The signals presented have been filtered
and/or nmplliied as described ir Chapter 3. For eac:h reccrd, except a s described below,
the pile was in mctlon (had not met reiusal!.
Tlme htstorles are arranged in Flgs. B. la - B.8d for Tests 5, 7 , 9, 1 l a /13a . 14 and
17 tn the following order: pile-head and pile-toe acceleration. plle-head velocity and
iorce, pile-toe v e i o c i ~ . and force, and total and pore -.vater pressure signals obtained
from the pressure t ra r~sducers al the bottom of the pile. For Tes:s 9 ar,d 17 data were
recorded when the pile was a t a s ta te of refusal (was not penetrating while under
vibratory load). and additional time histories are tncluded for those tes t s for that
condition. Time histories for the other tests can be found in the project report of th!s
study (301.
The sign conl~rtntior, for the signals is as f o l l ~ w s . Positive acceleration *
corresponds to the accelzratlon during the bottom half of the downstroke and so !s
actually dece!eration; positive velocity c o ~ e s p o n d s !o dawnward movement of the plle:
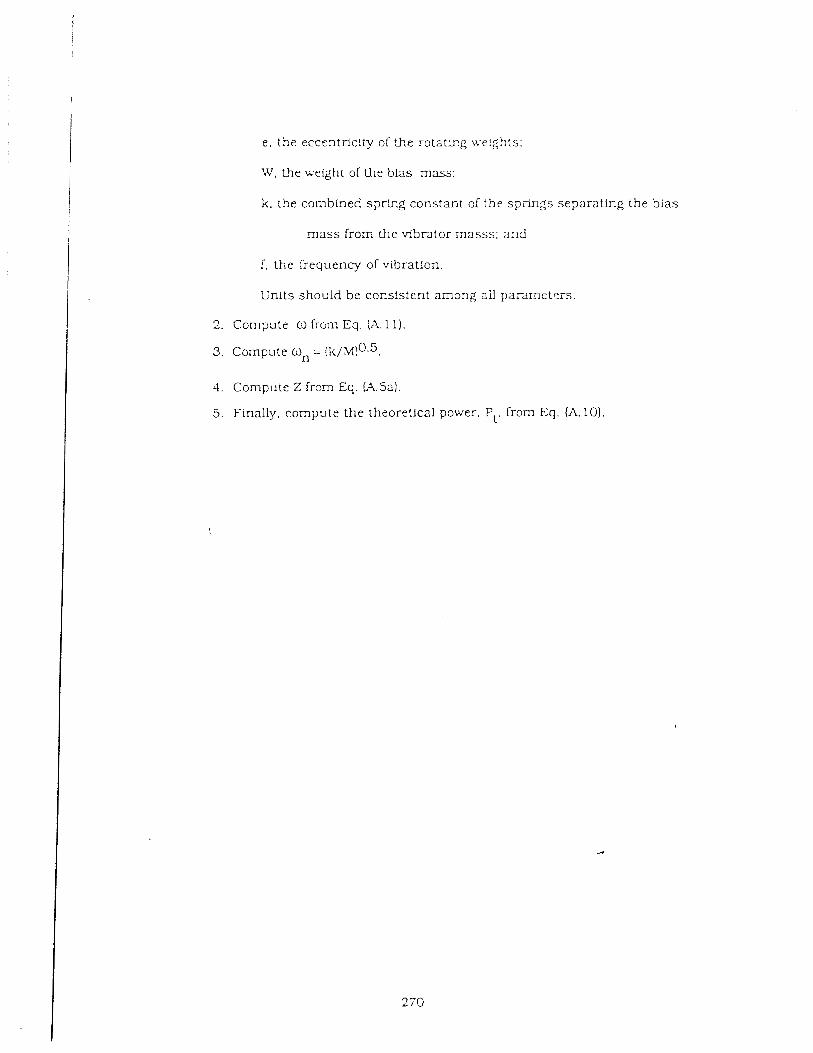
e, the eccentriciiy of +he ro ta tkg weights;
W, the weight of the blas mass;
k. the combined spring constant of 'he springs separating the bias
nlass from the vibrator m a s s ; and
f , the frequency of vibration
Units should be consistent among ail panmetc r s .
2. Compute O from Eq. M 11).
3. Compu:e an = !k/~i1!0.5.
4. Compute Zfrom Eq. h . 5 a ) .
5. Finally, compute the theoretical power. PI, from Eq. (A.10).
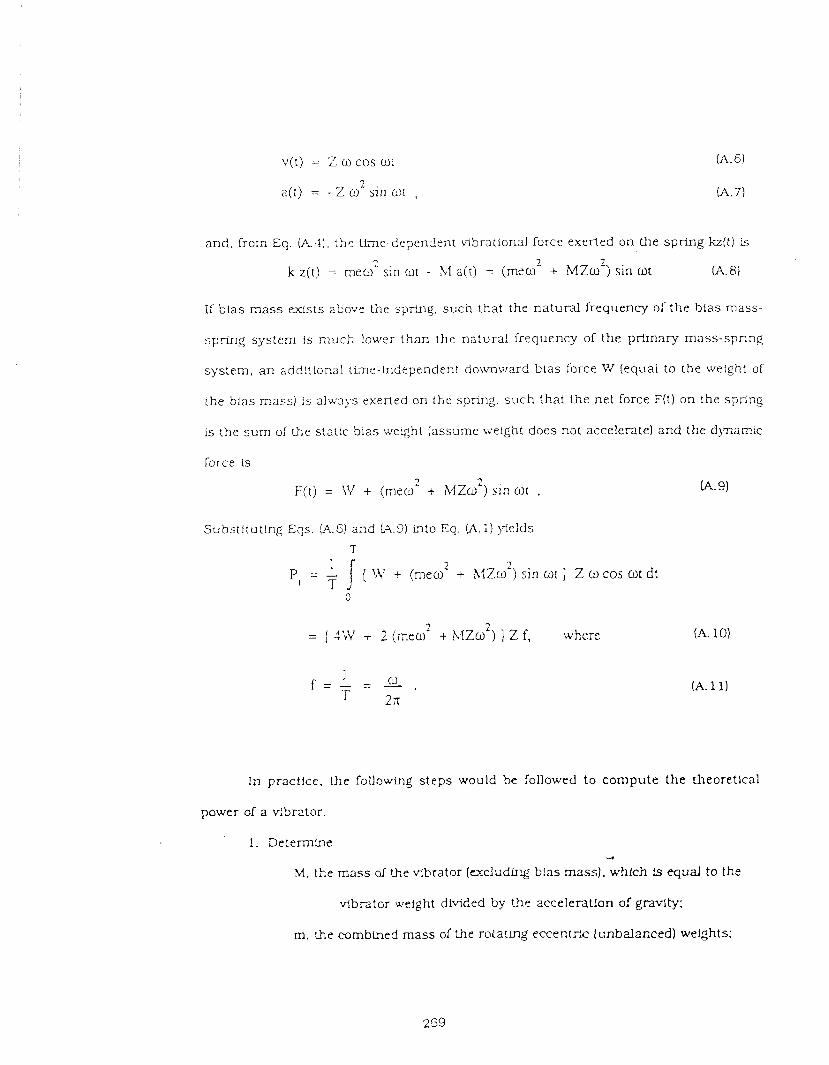
v(t) = Z o cos ol (A. 61
a(t) = - Z oL sin wt , (-4.7)
and. frorn Eq. (A-1). t h e time-dependent ~ lbra t lonal force exerted on the spring kz(t) is
2 2 . k z(t) = rneo2 sin tot - Xi a(() = (mew + MZw ) s ~ n wt (A.8)
If blas m a s s c d s t s above the spring, such that the natural frequency of the bias mass-
spring system is much !ower than the natural frequency of the primary mass-spring
system, an additior.al t t ne -hd rpenden t downward blas force W (equal to the we!ght of
rhe bias mass) !s alwa1.s exerted on the spnng, such !h3t the net force F(t) on the spring
is the s u m of h e statlc bias weght (assume weight does not accelerate) and the dynamic
force is
2 F(i) = \V i (rnco + hlZu2) sin or .
Substi:uUng Eqs. C4.6) and (A.9) trto Eq. (A. ;) yields
T 1
P = - [ ?il + (rneo2 I hlzco2) sin il,i ] Z o cos at dt [ T
2 2 = [ 4')V + 2 (meo + kIZw ) ] Z f, where (A. 10)
In practice. the followhg steps would be followed to compute the theoretical
power of a ebr2 tor .
1. Iletermine 4
& I , the mass of the vibrator (w-cludfrg b!as mass), which is equal to the
vibrator weight divided by t h e acceleration 0,' gravity:
m. the mmbined mass of the roca!in,d eccentr ' ,~ (cnbalanced) weights;

each have mass m / 2 and rotate with a n eccentricity e in opposite directicns wi th
angular veloclty w. The Sre?-body diagrams of the system are shown in Fig. A.2. 7%::
hor&ontal components of Corce always balance each other , s o that only the vertical
components need be considered. From Fig. A.2a the equation of motion for a n eccentric
m a s s undergoing I..amon!c excitation can be written as
In Eq. A.2 z is x'e13icaI displacement and a is vertical acceleration. From Fig. A.2b the
equation of motion lor (fie entire vibrator can be wdt ten a s
- 2 F - k z(:) = (3.1 - m) a([) . (A.3)
Conbinir,g Eqs. (A.2) 2nd W.3) ytelds
2 IM a(t) i- k z(t) = rn e w sin wt ,
The steady state response solution of Eq. (A.4) Is
z(t) = Z sin mt ,
where Z is the amplitude of dynamic motion of the drlver. which can be e-qressed a s
2 m e o z =
m which wn is the natural frequency of the primary mass and spring system. C K / ! V I ) ~ . ~
Thc velocity and accelerat!ori can then be expressed a s A
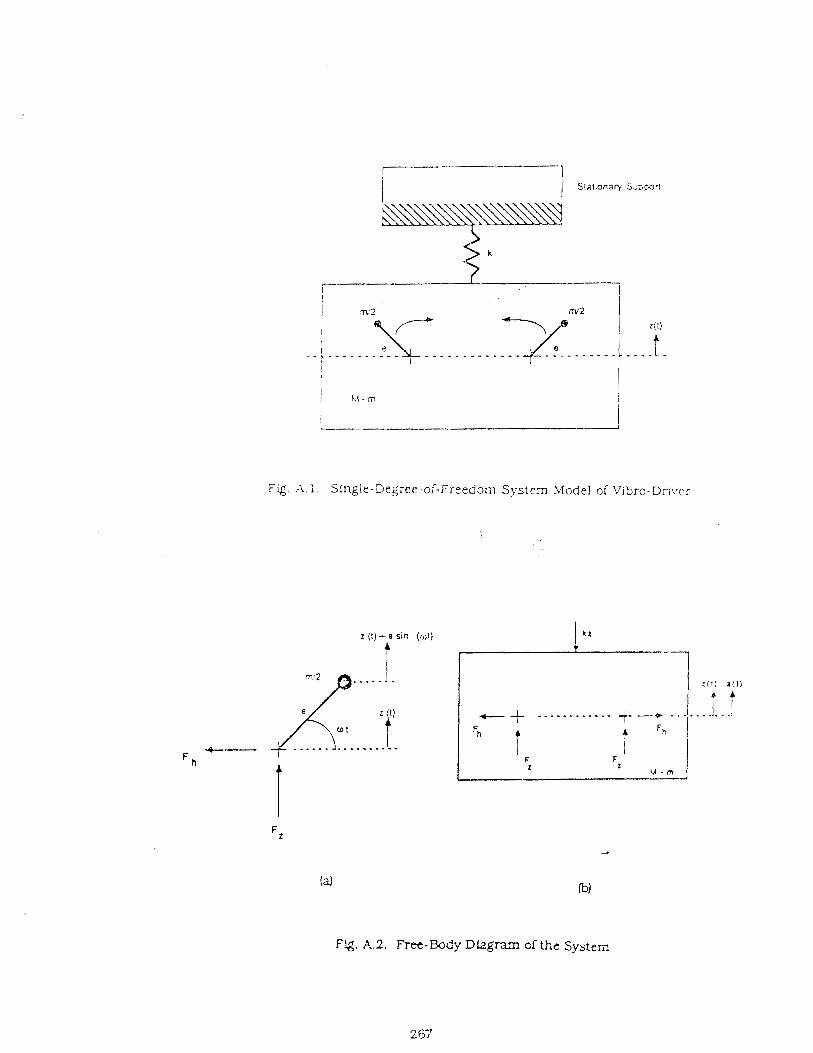
Fig. A. 1 . Single-Degree-of-Freedom System Model of Vibro-Dnver
2 ( 1 ) + o sin (wl)
i
Flg. A.2. Re-Body Dhgmn cf the System
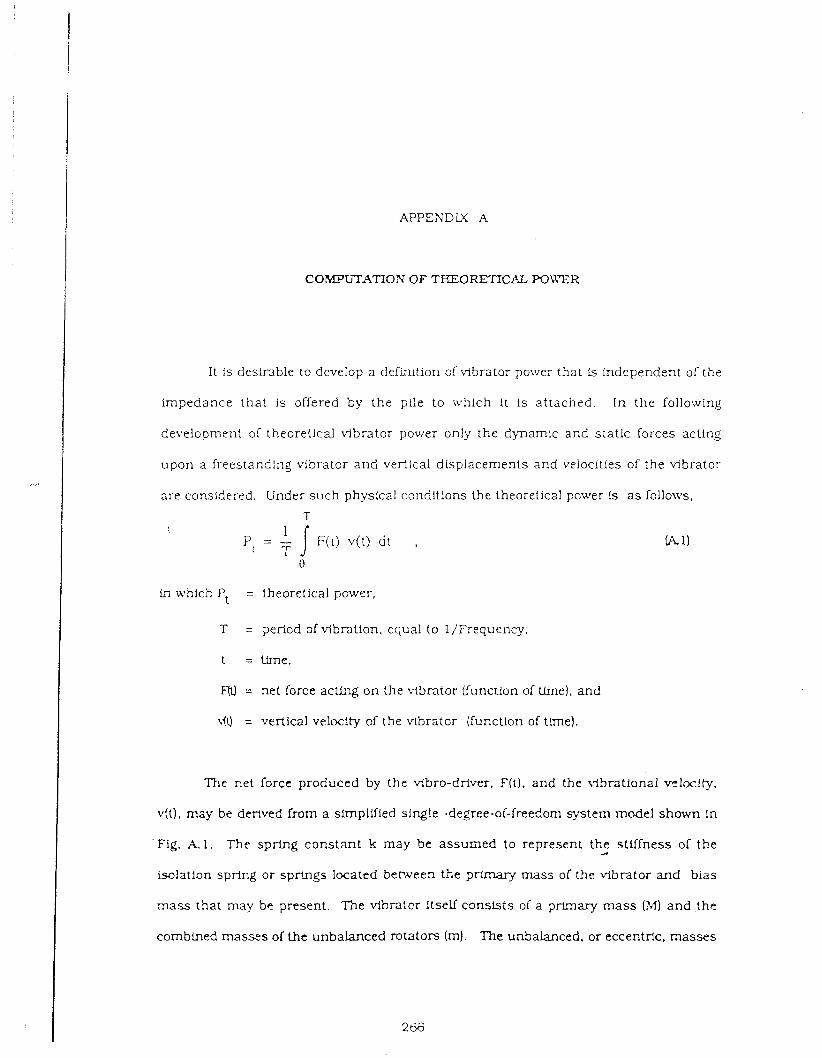
APPENDIX A
COMPUTATION OF THEORETICAL POWER
It is desirable to develop a definition of blbrator power t5at is independent of the
impedance that is offered by the pile to which it is attached. In the following
development oi theoretical vibrator power only the dynamic and static forces acting
upon a freestanding vibrator and vertlcal displacements and velocities of the vibrator
are considered. Under such physical conditions the theoretical pourer is a s follows,
in which Pt = theoretical power.
T = period of vibration. equal to IjFrequency,
t = tlme,
FW = net force acting on the vibrator (functfon of time), and
\(U = vertical velocity of the vibrator (function of tlrne).
The net force produced by the vibro-driver. F(t1, and the Llbrational vclocfty,
v(t), may be derived from a simplified single -degree-of-freedom system model shown in
'Fig. h l . The spring constant k may be assumed to represent the stiffness of the 4
isolation spring or springs located between the primary mass of the vibrator and bias
mass that may be present. The vibrator itself consists of a primary mass (>I ) and the
combined masses of the unbalanced rotators (m). The unbalanced. or eccentric. n- A asses
( - ! G ) Tucker.L., Program MILE. Notes from a Short C o u ~ s e on " Computer Programs for
Ceotechnical Engbleers," Texas A and 51 'iiniversity (1987).
(47) 'Vibratory Hammer Study: Field Measurements." Prellrninary Report Prepared fcr
Deep Fol.lndations Institute by Coldberg-Zolno & Associates. Inc.. Newton Upper
Falls, Massachusets , FCe Xo. B-7946 (1 987). 42 pp.
(48) Vfjavergiya. V . N.. " Lead-blovement Cha-acteristic of Piles," Roc.. 4th Symposium
on Wzterways, Ports, Costal & Ocean Di-.%ions, Val. 2 , S C E (1977). pp. 269-284.
(49) Wor,g. D.,"Design and m a l y s i s of'An -4pparatus to SLmulate rjensity and Stresses
in Deep Deposits of Granular Sofls." M.S. Thesis, Departmen: cf Clvfl Engineering,
UrLverslty of Houston (1985). pp. 53-55.
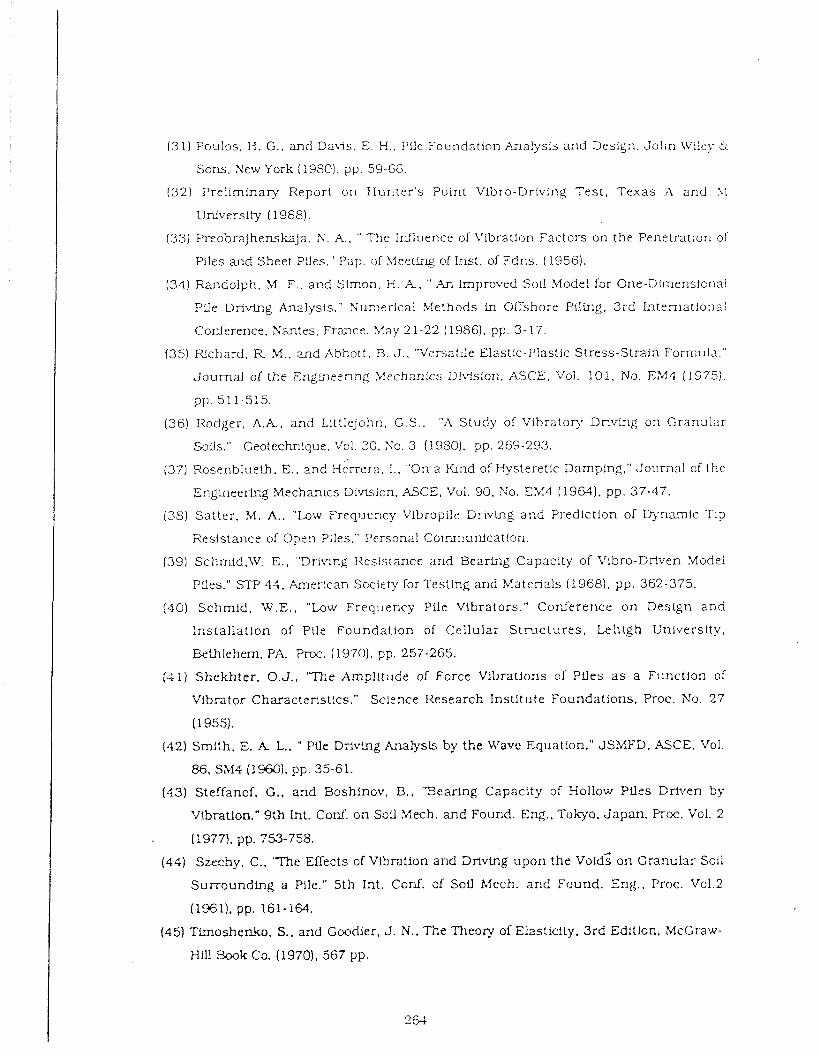
131) Po~-llos, H. C.. and DaL-is. E. H.. Pile Foundation Ana!ysis and Design. J o h n Wi!ey d:
Sons. New York (1980). pp. 59-66.
( 3 2 ) Preliminary Report on Hur:ter's Point Vibro-Driving Test . Texas A and .\!
University ( 1988).
(33) Pr~.obrafhenskaja. N. A,. " The Innuence of Vibration Factors on the Penetration ol
Piles and Sheet Pfles." Pap. of LleetFng of Inst. of Fdns. (1956).
(33) Randolph. 5.i. F.. a ~ d S t n o n . I i . A , " An Improved Soil Model for One-Dimensicnai
Pge Dr ivkg Analysis." Numerical Methods in Onshore Piling. 3 rd Internationai
Conference, Nantss, France. STay 2 1-22 (1986). pp. 3- 17.
(35) Richard. R 51.. and Abbott. B. J . , 'Vcrsatde Elastlc-Plastic Stress-Strain Formula."
Jou rna l of the EngLneering Mechanics Dlv',sion. ASCE. Vol. 101. No. E,M4 (1975).
pp. 511-515.
(36) Rodger. A . A , and Lit:lejohn. C . S . . "A Study of V ib ra tov Drivlng on Granular
Soils." GeotecWJque, Vol. 30. So. 3 (1980). pp. 269-293.
(37) Rosenblueth. E.. 2nd Henera . I . , "On a Kind of Hysteretic Damping." Jo~!rnal of the
E n g b e e r h g Mechanics Division, ASCE, Vol. 30. NO. EM4 (1964). pp. 37-47.
(38) Satter , M. A.. "Low Freq1.1ency Vlbropi!e Driving and Prediction of w n a r n i c Ti?
Resistance of Open PLles." Personal Coim.unication.
(39) Schm1d.W. E. , "Drldng Resistance and Bearing Capacity of Vlbro-Driven Sfode1
Pfles." SIT 43. Anerican Society for Testing and Materials (1968), pp. 362-375.
(GO) Schmid. W . E . , "Low Frequency Plle Vibrators." Conference on Design and
Instal lat ion of Plle Foundat ion of Cellular S t ruc tu re s . Lehigh L'niversity.
Bethlehem. P A P m . (1970). pp. 257-265.
(41) Shekhter . O.J.. 'The Amplitude of Force Vibrations of Pfles a s a Function of
Vlbrator Charactzristics." Science Research Institute Foundations. R o c . No. 27
(1 955).
(42) SrnIth. E. A. L., " Pfle Dri\Wg Analysis by the U'ave Equation." JSMFD. ASCE, Vol.
86, S M 4 (1960). pp. 35-61.
(43) Steffanof, G.. and Boshinov, B.. 'Bearing Capacity of Hollow Piles Driven by
Vibration." 9th Int. Conf. on Soil Xech. and Found. Eng.. Tokyo. Japan, Proc. Vol. 2
(1977). pp. 753-755.
(44) Szechy. C.. 'me Effects of Vibration and 3rlvFng upon !he old; on Granular Soil
Surrounding a Pile." 5th Int. Conf. of Sou hlech. and Found. Eng.. R o c . Vo1.2
(1961). pp. 161-16.1.
(45) Timoshenko. S . , and Goodier. J. N., The Theory of Elas!icity. 3 rd Edition. McCraw-
HilJ Book Co. (19701, 567 pp.
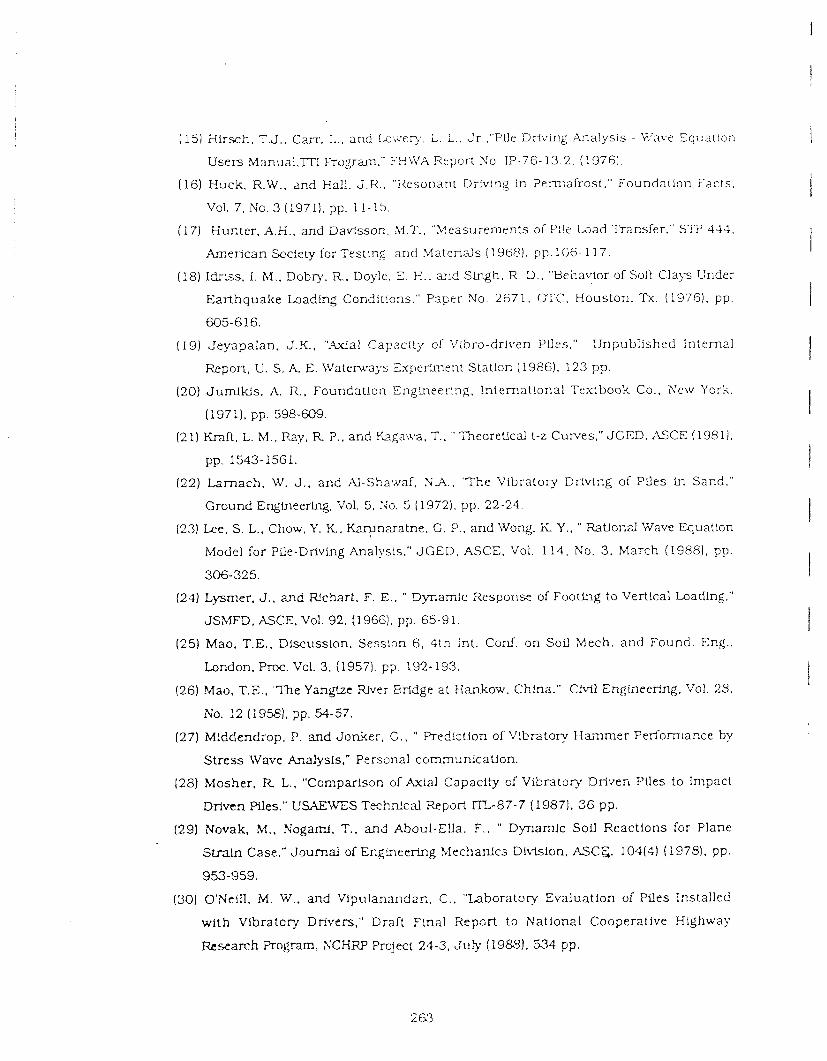
(15) Hirsch, T.J.. Can.. L., and h:;erq.. L. L.. Jr, ,"Plle Driving A~a!ys i s - V!avs Equat ion
Users Manua1 .m F ~ o ~ p r n , " F%irA Report So . IP-76-13.2, (19761.
(16) Euck. R.W., and Hall. J .R . "Resonant Drivirg in Pemaf ros t . " Foundation Facts.
Val. 7, NO. 3 (1971). pp. 11-15,
(17) Huxter. AH., and Davisson. !.I.?'.. ">?easurements of Pile h a d P a n s i e r , " STF 444.
American Scciety for Test&& and Materials ( 1 968). pp. 1C6- 1 17.
(is) Idriss, I . M.. Dcbry, R. Doyle. E. H., aqd SLngh, R. D., 'Behavior of Soft Cla3-s Gfider
Earthquake Loading Cond!t!ons." Pzper No. 2671. m C . Houston. Tx. (1975). pp.
605-616.
(19) JeyapaIan, J . K . . "Ada1 Capaci ty of Vibro-drlven PLIes." Unpublished Internal
Report. U. S. A E. \Vatenr.ays Z.uperbnent Statlan (1986). 123 pp.
(20) JumIkLs. A. R.. Foundatlon Zngineerlng. !nternational Textbook Co.. Xew York.
(197 1). pp. 598-609.
(21) Kraft. L. M.. Ray. R P., and &gau,a. T.. "Theoretical t-z Curves,"JCED. ASCE (1981).
pp. 1543- 1561.
(22) Larnach. W. 3,. and A l - S h a ~ ~ d . N A . . ' The Vibratory Driving of Piles ln Sand,"
Ground Engineering. 'v'ol. 5. So. 5 (1972). pp. 22-24.
(23) Lee. S. L.. Chow. Y. K. Karynaratne. C . P.. and JVong. K Y . . " Ratlonal Wave EquaClon
Model for Pile-Driving Analysis.'' JCED. ASCE. Val. 1 1 4 . No. 3 . March (19881. pp.
306-325.
(24) Lysmer. J., and Rchar t . F. E.. " r)ynmic Response of Footing to Vertical Loading,"
JSMFD, S C E , Vol. 92, (1 966), pp. 65-9 1.
(25) Mao. T.E.. Discussion. Session 6. 4th Inl. Conl. on Soil Mech. and Found. Eng..
London. Pnx. Vol. 3, (1957). pp. 192- 193.
(26) Mao, T.E.. 'The Yangtze a v e r Eridge at Hankow, China." Civil Engineering. Vol. 23.
NO. 12 (19%). pp. 54-57.
(27) Middendrop. P. and Jonker, C. . " Prcdktion of Vibratory Hammer Perfomlance by
Stress Wave Analysis," Personal cornmunlcatlon.
(28) Mosher. R L.. "Comparison of Axial Capacity of Vibratory Driven Piles to Impact
Driven Piles." USAE\\TS Technicxi a p o r t ITr,-87-7 (1987). 36 ~ p .
(29) Novak. M., Kogaml. T.. a n d Aboul-Ella. F.. " Dynamlc Sol1 Reactions for Plane
Straln Case." JourEal of Eng i~ee r ing %Iechanlcs Division. ASCE;. 104(4) (19781, pp.
953-959.
(30) O'Xefl1. M. W., and Vipulanandar,, C . , "Laboratory Evaluation of Piles Installed
with Vibrato?: Drivers," Dral: FLnal R e p ~ r t to National Cooperatlve Highway
&search Program, SCHEiP Project 24-3, J u l y ((19831. 534 p~
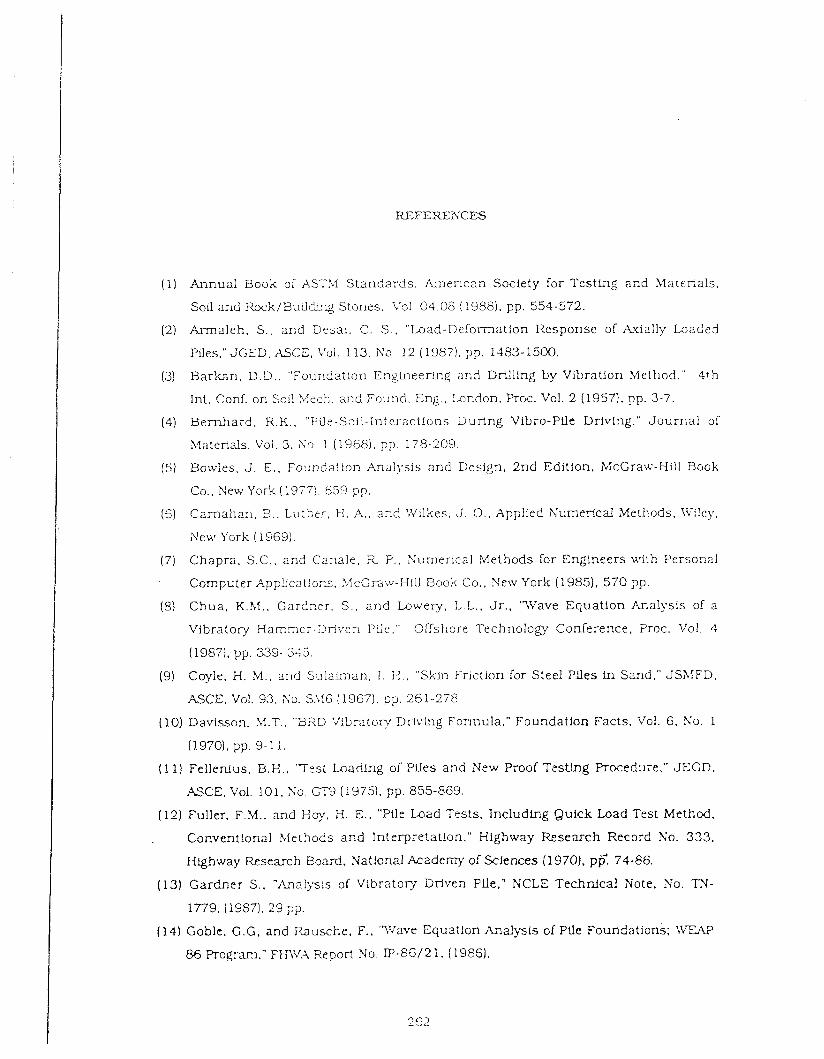
(1) Annual Book of ASTXI Staridards, Aner ican Society for Testing and Materials.
Soil and Rock/Budck4 S:ones. V31. C 4 . 0 8 ( i988) . pp. 554-572.
(2) h a l e h . S., ar,d Desal. C. S. , "Load-Delormatfon Response of Axially b a d e d
Piles," JCED, A X E . Vol. 113. Xa. 12 (1987). pp. 1383-1500.
(3) Barkan, D.D., "Fouildztion E n g i n e e r i ~ g and Drilling by Vibration Method." 41h
h t . Conf. on Soil X l e c h . and Found. Eng.. Tandon , Prw. Vol. 2 (1957). pp. 3-7.
(4) Bernhard . R.K.. "File-Sail-Interactions During Vibro-Pfle Brivlng." Jou rna l of
Materials, Vol. 3. So. 1 (1965). pp. 178-209.
(5) Bowles, J. E., Foundation Anal)rsis and Design, 2nd Edition. McCraw-Hill Book
Co., New York (19771. 659 pp.
(6) Camahan . 5.. Lu:her, 13. A, . and Wilkes, J. 0.. Applied NumericaI Methods. \Vile).,
New York ( 1 969).
(7) Chapra, S .C . . and Canale, R P.. Numerical Methods for Engineers with Personal
Computer Appl!cat:cns. YlcGraw-Hill Book Co., New York (1985). 570 pp.
(8) C h u a , K..?/I.. Cardner. S . , and Lowery. L.L., J r . . '?lTave Equation Analys!s of a
Vibratory Hammer-2riven Pile," Offshore Technology Conference, Proc. Vol. 4
(1987). pp. 339- 345.
(9) Coyle. H. M . , and Sulairnan. I . H.. "Skin Fnc:ion for Steel Plles ln Sand." JSXIFD.
ASCE, YO]. 93, SO. S.ii6 ( 1.967), pp. 261-278.
(10) Davisson, 5I.T.. "BXE '+'!bratory Driving Formula." Foundation Facts. Vol. 6. NO. 1
(19701. pp. 9-! 1.
(1 1) Fellenlus. B.H.. 'T-st Lcadlng of Piles and New Proof TcstLng Procedu~e," JECD.
&CE, Vol. 101, SO. G?9 (19751. pp. 855-869.
(12) Fuller. F .M. . and iioy. 3. E., "We Load Tests. Including Quick Load Test Method.
Conventional Methods and Interpretation," Hlghway Research Record No. 333,
Highway -search Board, Natlonal Academy of Sciences (1970). p g 74-86.
(13) Gardner S., "Analysis of Vibratory Driven Pfle," NCLE Technical Note. Yo. TX-
1779. (19S71, 29 ?p.
( 1 4 ) Goble, C.G. and Rausche. F., 'TVave Equatlon Analysis of Pfle Founc!ations; \ 'vrCE
86 Program." FH\V.?I Report No. 3'-86/2 1. (1985).
Genetrative ~ 3 t i i ) i l of v:bro-driven d i s ~ l a c e m e n t pile in suSmergt.d s a ~ ~ d a t 3r.y
penetra:ion under any soil c o n d ~ l l o n s Lnvzstlfiated In t h i s s tudy .
!vfethods to est!mate the bear ing capacl ty of vibro-driven piles a n d model the
v i b r o - d r i v ~ ~ g of d:splacement pile were verliied u s i n g t h e laboratory d a t a . The
foiicu~~r!g r e c o m n e n d a t ~ o n s a re needed to verily or modily the proposed methods a n d
:nodeis.
( 1 ) Fie:d tes:s a re necessa ry t o cover all combina t ions of pa ramete rs u n d e r
Invesrlgaiion in this s:udy in order to verify the proposed bearing capacity methods and
vlbro-drli-ing model.
(2) Pi!e groups inst2l;ed by vibratory dri\?ng should be s tudied LO investigate the
efJec!s of the 1rl:ernc:ian between the pLles in t h e g roup !a t e r n s of dr?veabllity and load
t ransler charac:erisi:cs.
(3) LaSor2t3n ' and field s t u d i e s related to nondisplacement ptles using vibro-
dri1:er are recommended.
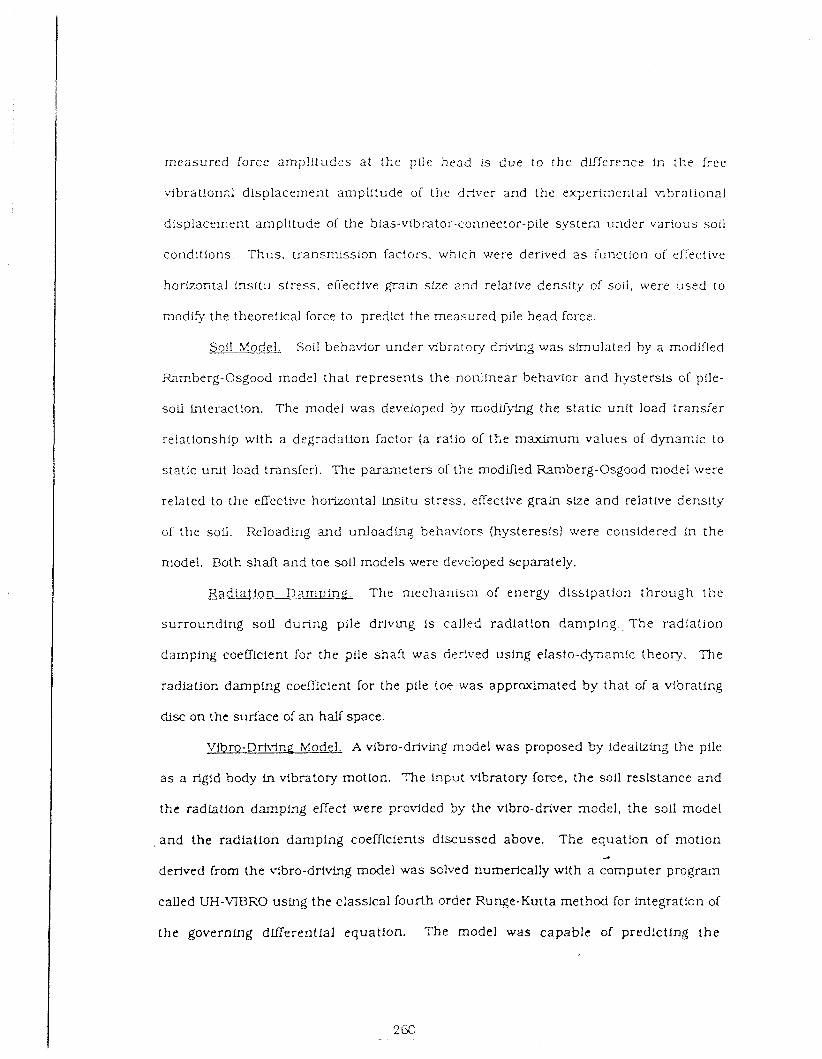
measured force amplitudes at the pfle head is due to the difference in the free
\lbration;,l displacement amplitude of the driver and the experiinental vibrational
displacement amplitude of the bias-vibrator-connector-pile system under various soil
conditions. Thus , transmission factors. which were derived a s function of effective
horimfital Fnsitu stress, euectfve graln size and relative density of soil, were used to
m o m the theoretical force to predict the measured pile head force.
Soil Model. Soil behavior under vibratory driving was stmulated by a modified
Ramberg-Osgood model that represents the nonlinear behavior and hystersls of pile-
soil intei'action. The model was developed by modifying the static unit load transfer
relationship with a degradation factor (a ratio of tt.e maximum values of dynamic to
static unit load transfer). The parameters of the modfled Rarnberg-Osgood model were
related to the effective horizontal insitu stress, effect:ve graln slze and relative density
cf the sofl. Reloading and udoading behaviors (hysteresis) were considered in the
model. Both shaft and toe soil models were developed separately.
Radiation Damping. The mechanism of energy dissipation through the
surrounding sou during pile driving is called radiation damping., The radiation
damping coefficient for the pile shaft was derived using elasto-dqzamic theory. The
radiation damping coefficient for the pile toe was appraxt ia ted by that of a vibrating
disc on the surface of an half space.
Vibro-Driving Model. A vibro-driving model was proposed by idealizing the pile
a s a rigid body in vibratory motion. The Lqput vibratory force, the soil resistance and
the radiation damping effect were provided by the vibro-drlver model, the soil model
. a n d the radiation damping coefficients discussed above. The equation of motion 2
derived from the vibro-driving model was sclved nurnerfcal!y with a computer program
called UH-VIBRO using the classical fourth order Runge-Kurta method for integraticn of
the governing dLfferentia1 equation. The model was capable of predicting the
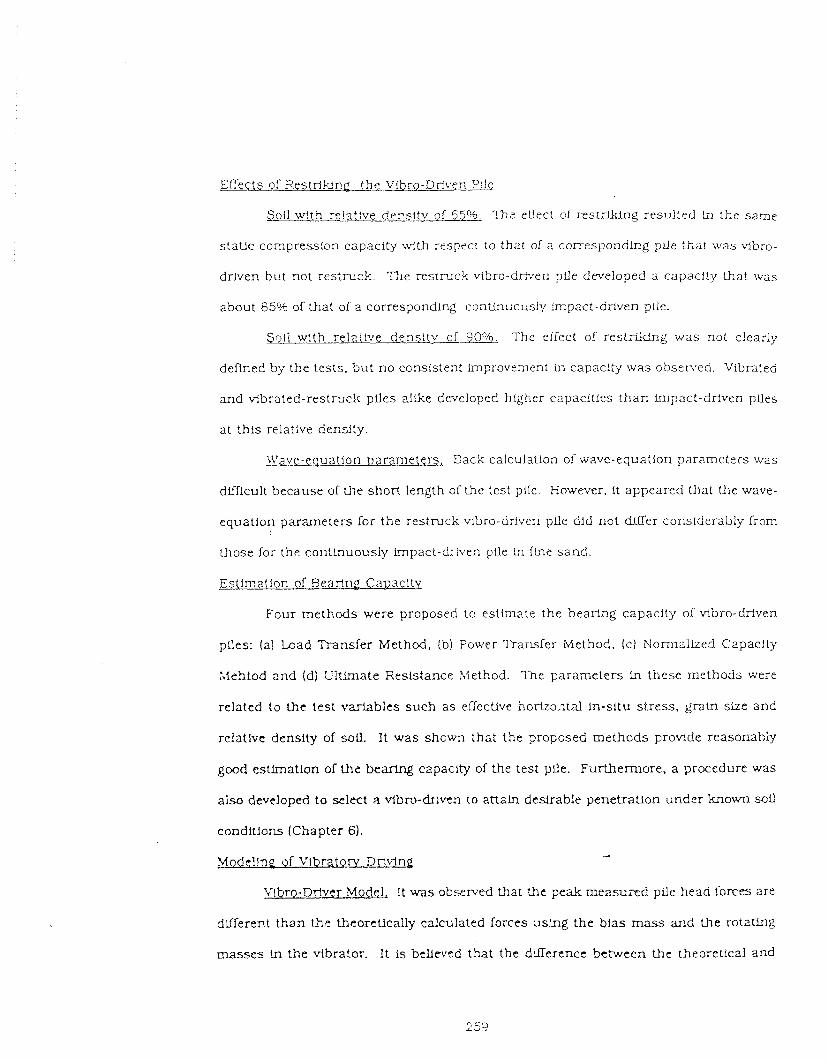
Erects of X;iestrlk>ng the.Vibt-Q-Driven ?!lg
Sol1 w!th rz!at:ve ders l tv of 55%. Th? effect of restriking r e s u l t ~ d In the same
static compression capacity wfth respect to that of a corresponding pile that was vibro-
driven but not restruck. The restruck vibro-brr:en plle developed a capacity that was
about 85% of that of a corresponding continuously Impact-driven pLle.
S ~ i i with relartve densitv of 9O0h. The eifect of restriking w a s not clearly
defined by the tests. bu t no consistent Improvement ln capaclty was obsemed. Vibrated
and bebrated-restruck piles alike developed higher capacities than Fnlpact-driven ptles
at this relative density.
Jt'ave-eauatlon nararnekrs, Back calculation of wave-equation p a r m e t e r s was
difficult because of the short length of the test pfle. However. It appeared that the wave-
equation parameters for the restruck vibro-drlven pfle dld not U e r considerably from
those for the co~lt lnuously Impact-driven pile t-1 fine sand.
Estlmatfon of Bearing Cawacity
Four methods were proposed to estimate the be&lng capacity of vihro-driven
pfles: (a) Load Tmnsfer Method, (b) Power T r a r ~ f e r Method. (c) Nornlallzed Capaclty
;Aehtod and (d) Ultimate Resistance Method. The parameters in these methods were
related to the test variables such as dec l lve horizontal In-situ stress, gram size and
relative density of soil. It was shcwn that the 7roposed methcds provide seasonably
good estlmauon of the bearlng capacity of the test pLle. Furthermore, a procedure was
aiso developed to select a vibro-driven to attain desirable penetration under known sou
conditions (Chapter 61.
d
Mcdc!!nc of Vlbntont Dritlng
Vlbro-Drfv~r Model, !t was observed t!at the peak m e a s u ~ d pile head !bmes are
dfferent 'than the theoretically calculated forces using the bias mass and the rotating
masses i n the vibrator. It believed that the difference between the theoretical and
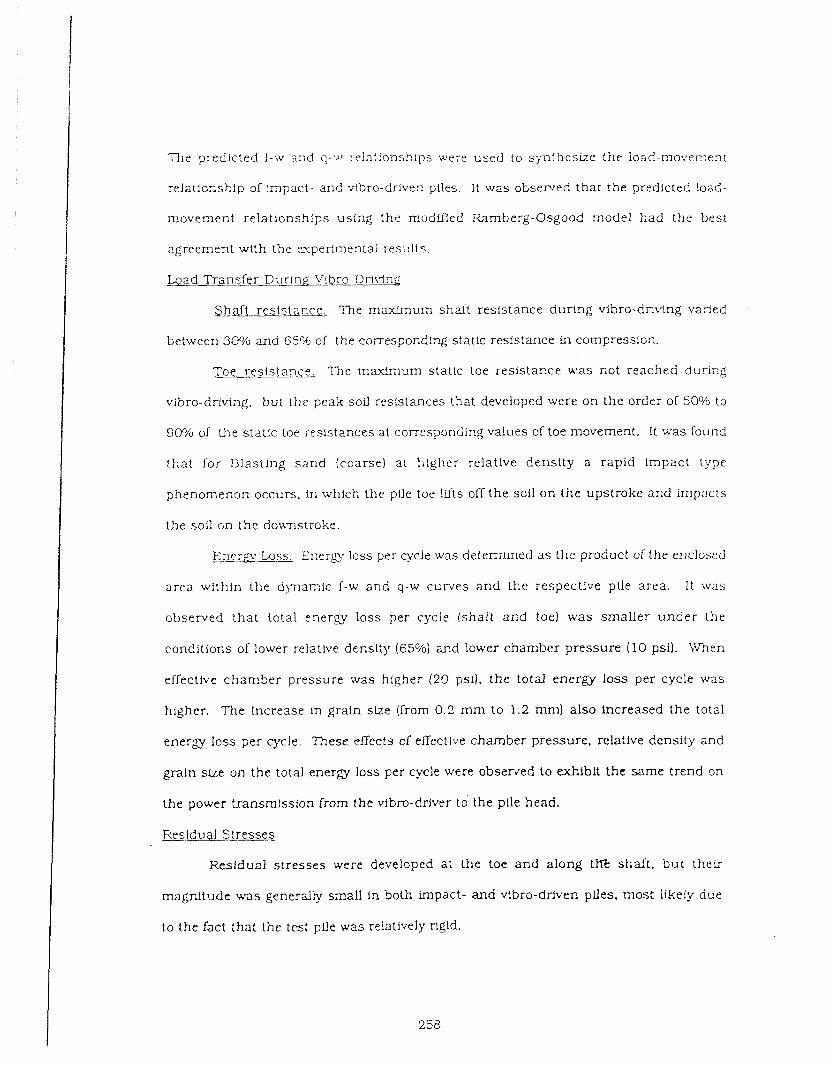
The predicted f-w ar.d q - . s relationships were used to sj-nthesize the lozd-moverrent
relationship of Impact- and -4bro-driver. piles. It was observed that the predicted load-
movement relationships using the rnodLfied Xamberg-Osgood model had the bes:
agreement with the experimental results.
M a d Transfer Dur ing V i $ r o - D r i ~ l n ~
Shaft resistance. The maximum s h d t resistance during vlbro-drixmg varied
between 30% and 65Oh of the corresponding static resistance in compression.
Toe resis tance. The maximum statlc toe resistance was not reached during
vibro-driving. but t h e peak sou resistances that developed were on the order of 50°/o to
900/0 of the static toe resistances at corresponding values of toe movement. it was found
tha t for Blastlng sand (coarse) at higher relatlve density a rapid impact type
phenomenon occurs, in which the pile toe lilts off the soil on the upstroke and impacts
the sofl c;n the downstroke.
E n e r n Lass. E n e r B loss per q c I e was determined as the product of the enclosed
area within the d ~ n a m i c f-w and q-w curves a n d the respective pile area. I t was
observed tha t total energy loss per cycle (shaft and toe) was smaller u n d e r the
conditions of lower relattve density (65%) lower chamber pressure (10 psi). \\'hen
effective chamber pressure was higher (20 psl). the total energy loss per cyc!e was
higher. The increase In grain slze (from 0 . 2 m m to 1.2 mm) also increased the total
energy loss per cycle. These effects of el'fectlve chamber pressure, relative density and
graln size on the total energy loss per cycle were observed to exhibit the same trend on
the power transrnIssfon from the t-ibro-driver to the pile head.
Residual S!resse$
Residual s t resses were developed at the toe a n d along tH% shaft. b u t their
magnitude was generally s n a i l Ln 30th Impact- and vibro-driven pfles, most likely due
to the fact that the t e s t pile was relathely figid.

Effect of S ~ i 1 Parameters gn \;ivrg-Driveabilitv -
J?~lat!ve densitv, The rate of penetration. v decreased with lncrezshg ielaiive P'
density. Thls parameter had the most important d e c t on rate of penetnuon.
m z c n t a ! e!rftlct:ve tress (simulated v decreased with lncreas~qg P
horii;ontal eiiectlve stress, but the effect of this pardmeter was less pronoucced than
that of relatlvc density.
Coeff!c!ent cf p 2 5 h preyjurc at rest , KO had l!ttle effect on driveabtllty. Tho,
control!i~g factor was horizontal effective skess .
Effect 01 Vlbro-Driving on Static Behador -
The most important parameter in relatlng comparative capacities of ptles
driven by vibration and by impact was found to be its relative density, and by
implication. its volume-charge characteristics. The following trends were observed :
Sol1 with relativ: der.sttv of 65516, The impact-driven pL!e developed 2596
hIgher m a m u m average unlt shaft resistance ln compression and 15 - 2004~ higher
maximum unit toe res!stance than the vibro-driven pile. This finding is in general
agreement with the recent stlldy of fleld tests by the Corps of Engineers (28).
Soil with relative denslty ~f 90'34~~ The lmpact-drlven pile developed 20 - 300h
lower rnaxlrnum average unit shdl resistmce ln compression and approxF.7nately 300h
lower m a d m u m unit toe r e s i s t a ~ , ~ e thzt the vibro-driven pile.
Mdcl lne of S!a:ic L'nlt b a d Transfer Chilracterist!~~.
m o - p a r a m e t e r power, three-parameter q o r , e n t i a l a n d four-parameter
modifred Rarnbcrg-Osgood models were used to predicted the static f-w and q-w cumes.
The parameters ln each model are related to effectlve horizontal In-sltu stress, effective
graln size and relative density of thc soil. In the power model;.predictlon of f and q
would Fxrease without reachlng a llmltlng valilue as w increased. which does not agree
with ~xper imenta l observation. The predictions by t5.z c.qonentia1 model and
rnodlfied &aherg-Osgocd rncdc: agree reasorably well with *.e ~xper imenta l results.

larger the vzlue of biased weight, the greater t he ra te of penetration. The v a i u e
associated wirh the eccentric moment and vibrator weight described abovc was 2,600
lb. or 5 to 10% of the static pile capacity. It is clear that the values of the bias mass
we!ght. unbalmced moment and vibratory body weight are coupled -xlth rcspect to Lhei;
ability to produce pile penetration.
Vibrator power and Dower transmission. The total theoretical pcwer developed
by the ~ i b r a t o r was not transmitted to the yile head . The ratio of pil2-head power ro
power produced by the vibraror appea r s to be related to t he maximurn value of
acceleration (more precisely, deceleration) t ha t w a s observed at the plle-head or, the
downstroke (Eq. (6.14)). which could. in turn . be related to soil parameters (Eq. 15 6)).
The minimum power transfer was approximately 40% of the theoretical vlbratcr power
during d r i ~ l n g in mediurn dense condition (relative density of 65Oh;. this power transley
occured at a peak pCe-head acceleration of 3 g, which appears to be a piactical threshold
from the perspective of power. Practical refusal d u e % vibro-d;ivtng could be consider
to correspond to a rate of penetration of 0.1 lnch per second.
C o m ~ a r a t l v ~ total energy for vibro-driving and i m ~ a c t - d r i v i n g The vibro-
driver-installed pile required about 65% of the total energy required for the impact-
driven pile at the lower relative density (65%). in te rms of mechanical energy produced
by the driver, for the easiest driving conditions (10 psi effective chamber pressure; 1. e.,
sknulated toe depth of 50 feet in terms of effective soil stresses) but required 200 - SCXIok,
more energy than the impact driver at t he higher relative density (90%) and 20 psl
effective chamber pressure (100 feet s imulated toe depth) . Somewhat less vibrator
power was required to install the pile in coarse s a n d t h a n in fine s a n d . For all
cocciitions. however. vibro-driving produced cons:derably lower str'esses in the pile
than did impact drivhg.
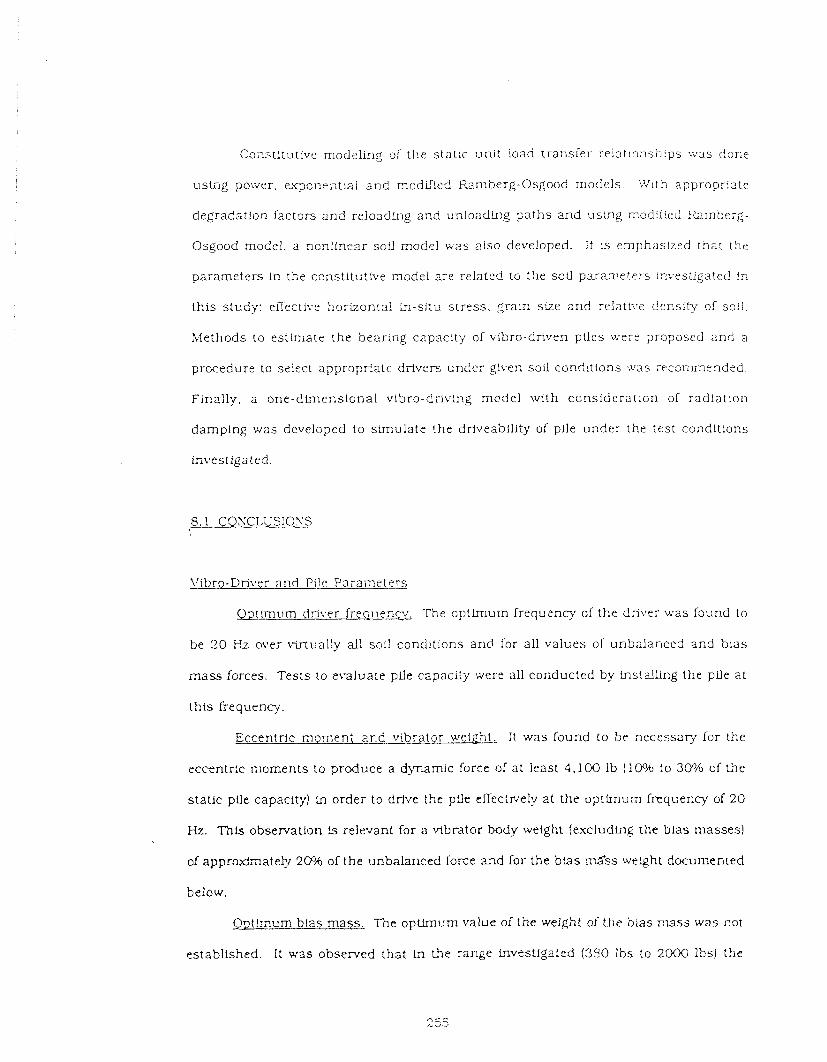
Constitutive rnodrlling of the static unit load t ransfer re!nti3nships was d o ~ e
using power, ex?cnriltial a n d moddied Ramberg-Osgood models. With appropca te
degradation factors a n 3 reloadLng and unloadLng g a t h s and using mcdU*!ed i a m b e r g -
Osgood model, a nonlfnear soil model w a s also developed. I t Is en~phas lzed that the
parameters In the constitutive model =e related to the sou parameters in:,es:igated i i?
th i s s tudy: el-fectivc horizontal in-sttil s t ress . $rain size a n d relative density of soil.
h,lethods to estimate the bearing czpacity of vibro-driven piles werz proposed and a
procedure to select a?propriate drivers under given soil conditions .x7as xcornmended.
Flnally, a one-dlrner,slonal vibro-driving model with c c n s i d e r a ~ l o n of radiat ion
damping was developed to s imulate !he driveabllity of pile under the test conditions
i n~~es t fga t ed .
Lribro-Driver and Pi!e Para ine t r r s
The cp t lmum frequency of the driver was found to
be 30 1-12 over virtually all soil conditions and for all values of unbalanced and bias
mass forces. Tests l o evaluate pile c a p a c i v were all cofiducted by installing the pLle at
th i s frequency.
Eccentric mornen; 2nd vibrator u ~ e t p h t ~ I t was found to be necessary for the
eccent r !~ moments to produce a dynamic force of a t least 4.100 Ib (10% to 30% of the
static pfle capacity) In order to drive the p9e ellec:rvel:r a t the opt imum frequency of 20
Hz. This observation !s relevant for a vibrator body weight (e?tcluding the blas masses)
of appro>ctqately 2C46 of the unbalanced force and for the bias d s s we!ght documenred
below.
Ogt!mum bras mass . The optknurn value o i the weight of the bias mass was not
established. It was observed that h the rar-ige In.~estlgated (350 ibs to 2000 lbs) the
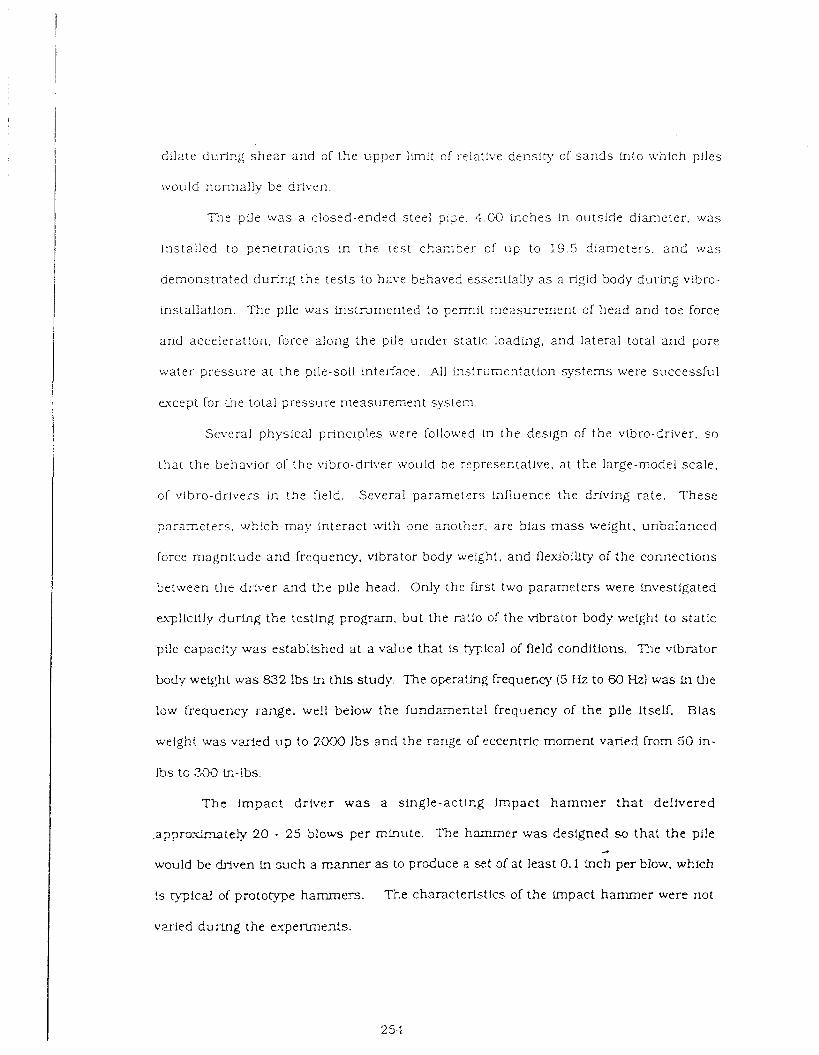
&late d u w g shear and of the upper ;knit of relatlve density of s ands Into :vhich p!les
would normally be driven.
The pile was a closed-ended steel p:r,e. 4.GO izches in outside diameter, was
installed to penetrat ions in the test chamber of u p to 19 5 diameters . a n d was
demonstrated during the tests to have behaved esser;tlally a s a rigid body during vibro-
installation. The pile was l n s t r ~ m e n t e d to permit measurenent of head and toe force
and accelerat!on, force along the pile under static loading, and lateral total and pore
water pressure at the pile-sol1 interface. All Lystrilmentation systems were successful
except for the total pressure measurement system.
Several physical pr inc~ples were followed in the design of the vibro-driver, so
that the behavior of the vibro-driver would be representative, at the large-model scale.
of vibro-drivers in !he field. Several parameters influence the driving rate. These
paramzters . which may Interact n l th one anoiher. are bias mass weight. unbala:lced
force magnitude and frequency. vibrator body weight. and fle.xlbillty of the connections
between the driver and ihe pfle head. Only the first two parameters were k~vestigated
q l i c i t l y d u r h g the testing program, but the ratio of the vlbraror body weight to static
pile capacity was establkhed at a value that is typical of fleld conditions. The vibrator
body weght was 832 Ibs in this study. The operating frequescy (5 Hz to 60 Hz) was in the
low frequency range, well below the fundamental frequency of the pile itself. Bias
weight was v d - e d u p to 2000 15s and the range of eccentric moment varied from 50 in-
Ibs to in-lbs.
The impact driver w a s a single-acting impact h a m m e r t h a t delivered
.appraxknately 20 - 25 blows per minute. The hainmer was designed so that the pLle J
wouId be driven Ln sxch a manner as to produce a set of at Ieast 0.1 inch per blow, which
!s typical of p r o t o m e hammers. T i e characteristic> of the impact hammer were not
vx-ied d u m g the e-er i rnexts .
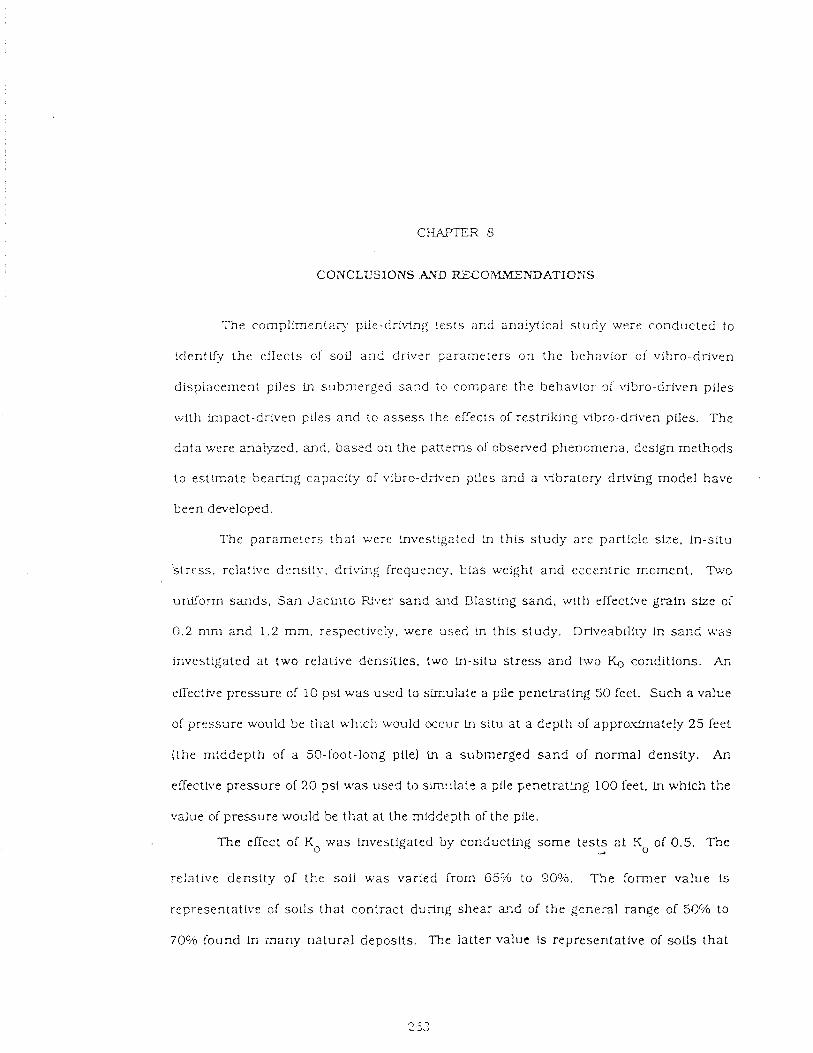
CONCLUSIONS ATTD R Z C O ~ r X 3 E ~ A T I O : i S
The cornplimen!aq pile-driving tests and analytical s tudy were conducted to
identify the effects of soil and driver parameters on the behavior o i vibro-driven
displacement piles Ln submerged sand io compare the behavior of vibro-driven piles
with Impact-driven piles and to assess the effects of restriking Nbro-driven piles. The
data were analyzed, and , based on the patterns of observed phenomena, design methods
to estlmate bearing capacity of vlbro-dfiven piles ar,d a tibratory driving model have
been dmeloped.
The parameters that were hvestigated in this s tudy are particle size. in-situ
s t ress , relative density, dri~Ti~,g frequency, blas weight and ezcentric moment. n o
u n i f o m ~ sands . S a n Jacinto River sand and B1ast:r.g sand, with effective grain slze of
0 . 2 mm zr.d 1.2 m m , respect!vely, were used in this study. Driveabili~y in s a n d was
investigated at two relative densities. two Ln-situ s t ress and two & conditions. An
effective pressure of 10 psi was used to simulate a pile penet ra tbg 50 feet. Such a value
of prczsare wouid be that which would occur tn situ a t a depth of appro.uimate!y 25 feet
( the middepth of a 50-foot-long pile) L~I a submerged sand of normal density. An
effectixre pressure of 20 psi UQS used to slmulatz a pLle penetrzting 100 feet. ln which the
value of pressure wocld be that at the mddepth of t?e pile.
The effect of KO was Investigated by conducting some a t Xo of 0.5. The
relative densi ty of the soil was varied from 65% to 909.0. The former value is
representative of soi:s that contract during shear a r ~ d of the general range of 50Ch to
70°h found Fn inany natural deposits. The latter value Is representative of soils that
2 0 0
T I H E ( m a r c )
Fig. 7. 18. hfeasurcd and Predicted Displacement Tline Histories of Vlbro-Driven Pile by LX-VIB3O and T O P D W T
The purpose of this sec::on is to investigate the validity of wave equation
algorithm for \-ibratory 6ri:tng ::,st 7 uras s:adied using computer program TOPDFUL",
(Appendix D!. Because c;i the Lnstabtlity cf [he soluiion with too many ptle elements !i.e.
time s t ep is u r ~ r e a l i s t i c a i l ~ ~ srna!] ) , t he pile was f!nally d i sc re tked into 2 elements
interconnected by plle "s?iings" s t e p oi 0.00005 sec) . The input forcing function
was the measured pfle head force rLrne history in place of the u sua l drisring mechan i sn .
The valus of Smi th ' s s h d t quake . Qs , and toe quake , Qp . were estimated from the
dy~ iamic load transfer r? l~ t ionsh i? (Fig 5.301 to be 0.03 In. a n d 0 .12 in. respect!vely.
Parametric studies using the TOPDRqX program were conducted on Test 7, and
Js and Jp were found to ke 0.038 =/in. and 0.024 sec / i n respectively.
Fig. 7.18 depicts :he c o r r p x i s c n of measured displacement- t ime h1s:ory wiLh
predicted ttme histories \>sing UH-\?Bi?O ar.d TOPDFJVE for Test 7. I t Is observed that
TOPDRIVE predicts much lower overall pile penetration over' a halt 'second p ~ r o i d and a
more erratic trace of dlsp!acement-t.me his:ory. Furthermore. the UH-'JIBRO program
is more efficient, a s !t requires only abcu t one - t en th t h e compu te r t ime of the
T O P D I V E p r o g m to predict the hail-second displacement time history.
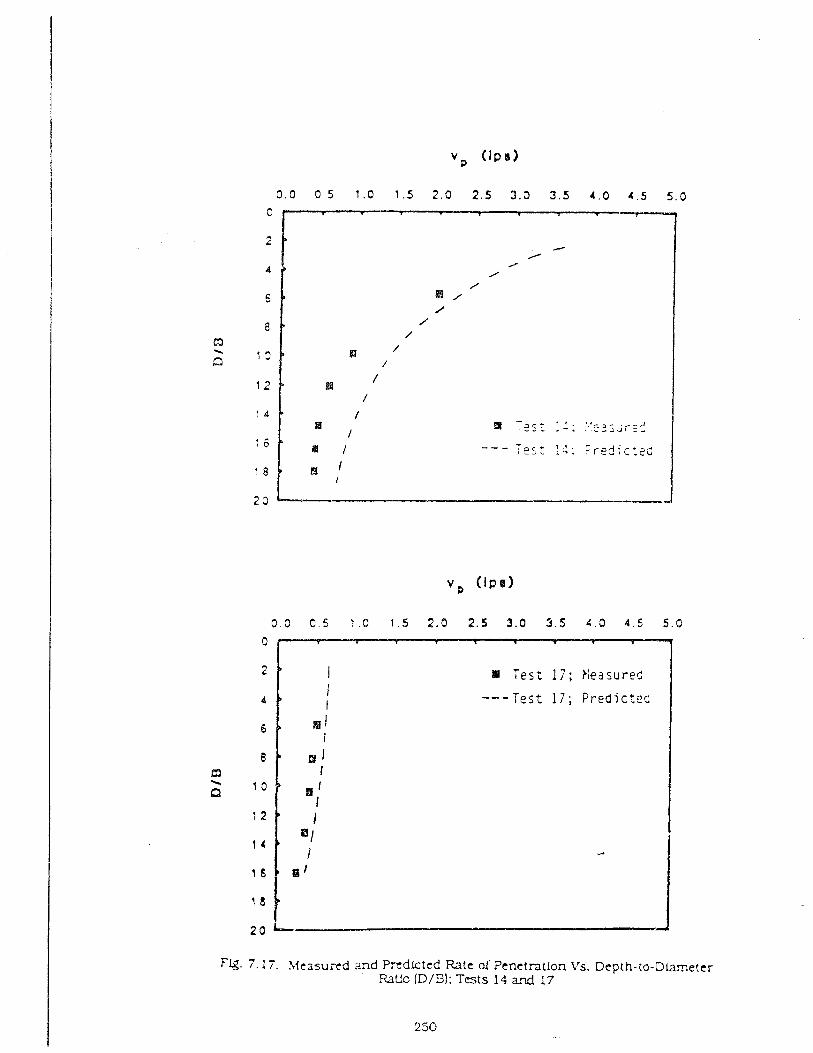
Flg. 7 .17. .?,feasuxd m d Prtdkted Rate of Penetration Vs. Depth-to-Dtametcr FiaCc (D/E): Tests 14 and 17

FQ. 7.16. 51easured znd kcd!ctcd mtc of Pcr,e:rat.!cn Vs. Grpth-to-Diamcier &!LC (D;S); T e s s 9 a d 1 !a!!3a
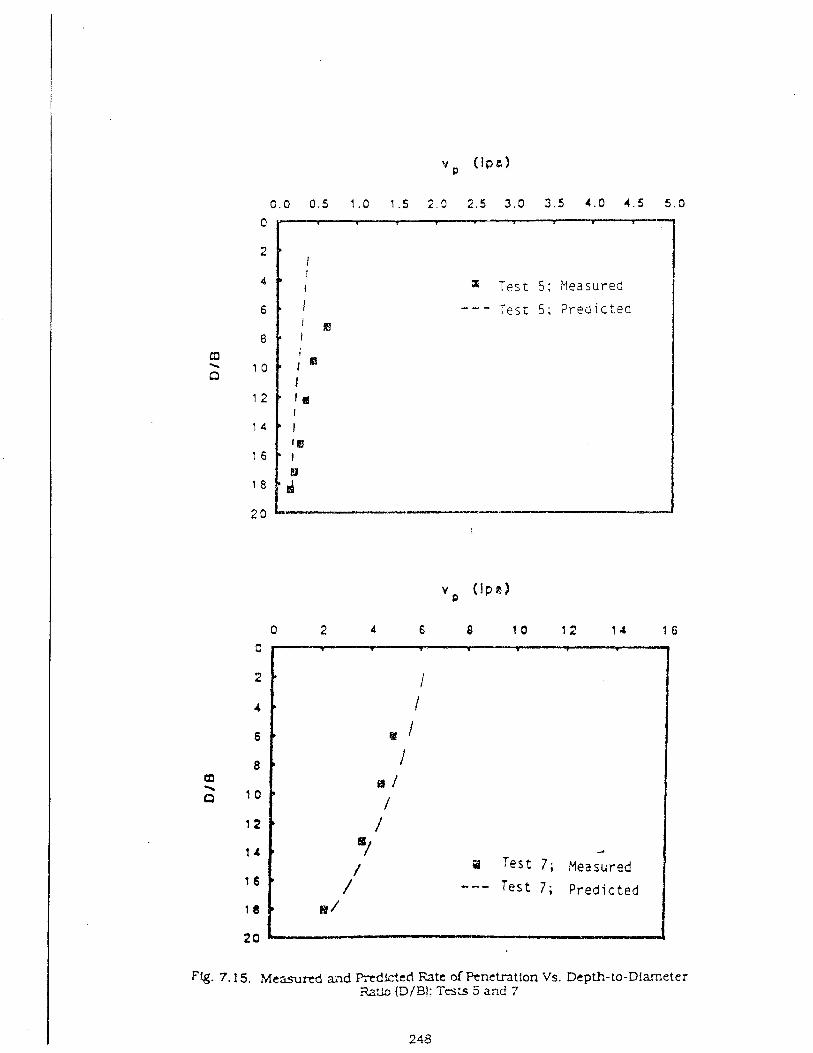
P T e s t 7 ; Measured --- Tes t 7; Predicted
Fig. 7.15. ;Lie=u& a ~ d Prcdk?cd Rate of Pcnetratlon Vs. Depth-to-Diameter %tlo [T3/B!: Trs's 5 and 7
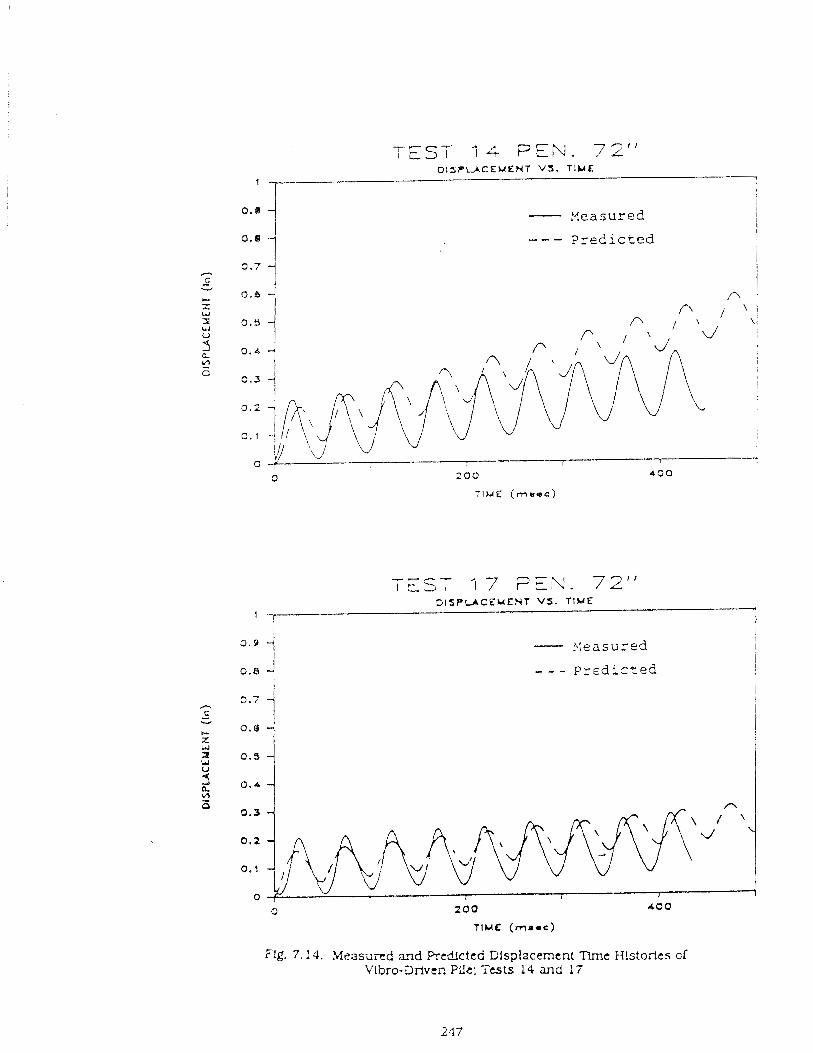
TEST 1.1 PEN. 72" O I ~ P L A C E M E N T VS. T!ME
- ,?easured i
0.8 --- ?redicted I
TEST 17 FEN. 72" 31s P U C E M E H T V S . T I M E
1 j I
Flg. 7.14. Measuxd aqd Predlctcd Dlsplacemcnt TLrne H!storlcs cf Vlbro-Driver. PGt; Tests 14 and 17
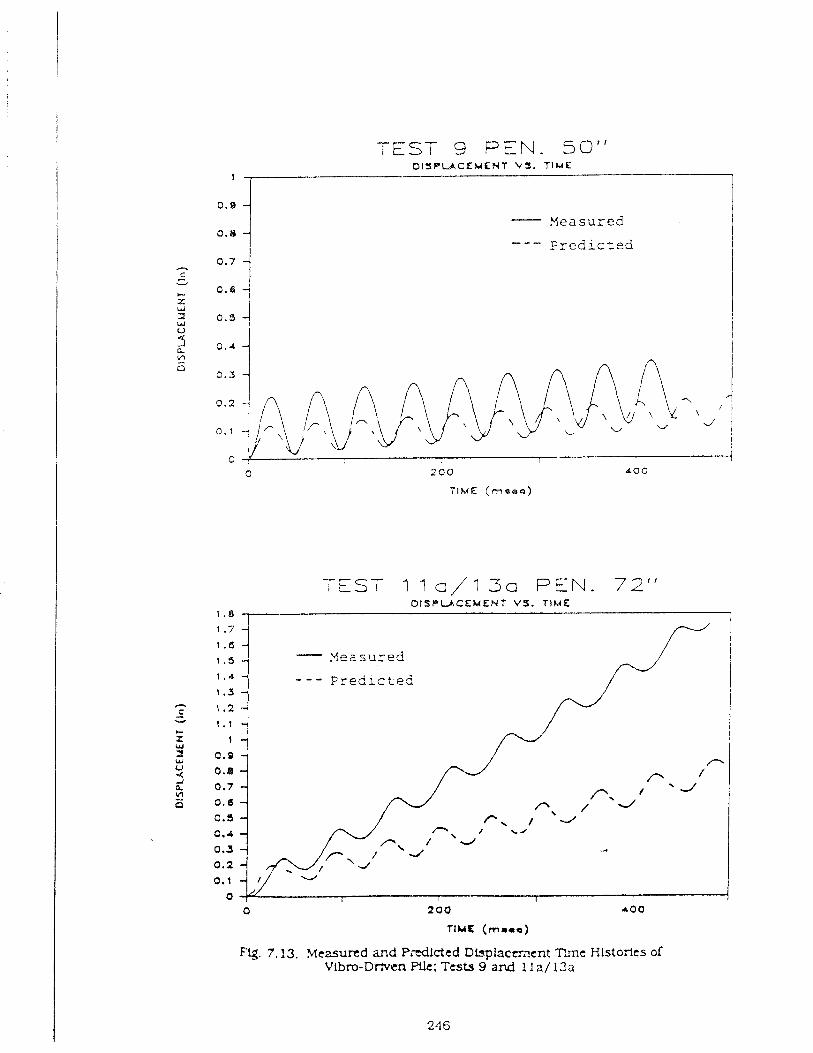
TEST 9 PEN. 50" DISPLACEMENT va. T I M E
1 ,
- Measured
--- P r e d i c t e d
- - i t S T 1 1 a/13a F E N . 72"
D I S P C A C E M E N T VS. TIME 1.8 , 1
Flg. 7.13. ~ c z s u n d and Predicted Dlsplaceri?ent TY~c H l s t o r ! ~ ~ of Vlbro-Driven Tests 9 and 1 l a / 13a
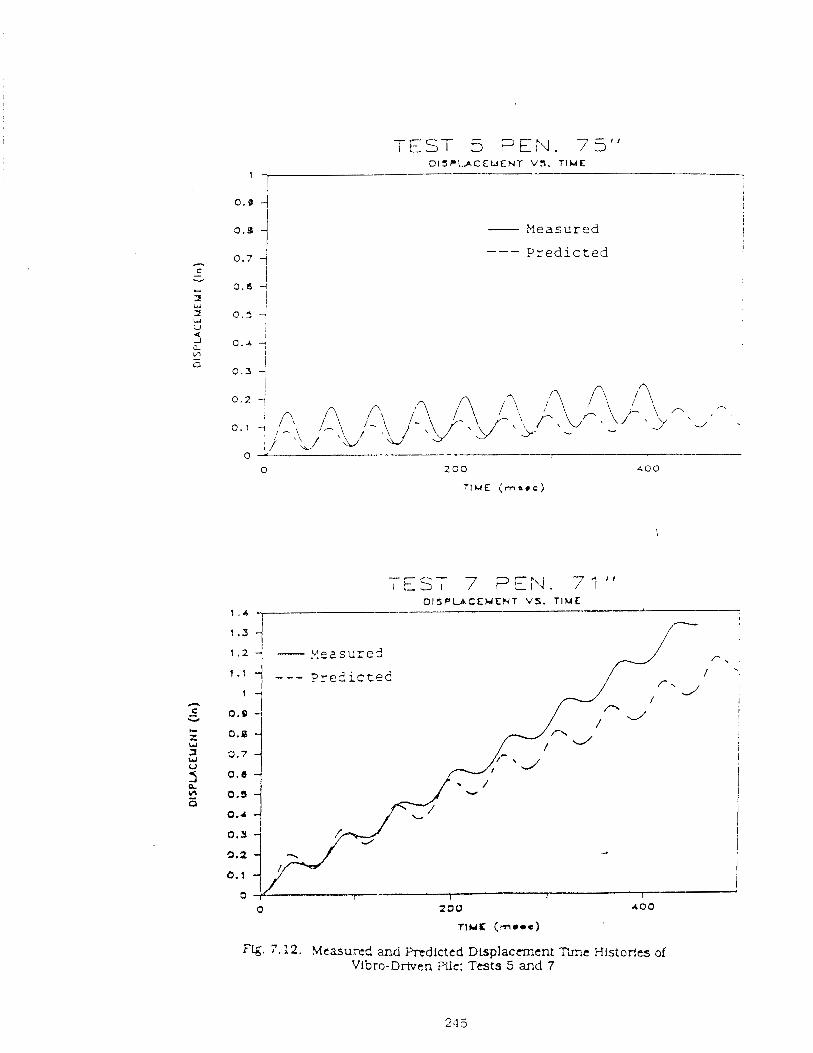
- Measured --- P r e d i c t e d
- - . - w e -
I t > ~ 7 FEN. 71" O I S P U C E M E N T VS. T I M E
F"15. 7.12. Mcasurrd and Predicted DLsplacment Tlme Hlstorfes of Vibro-Drtven We: Tests 5 and 7
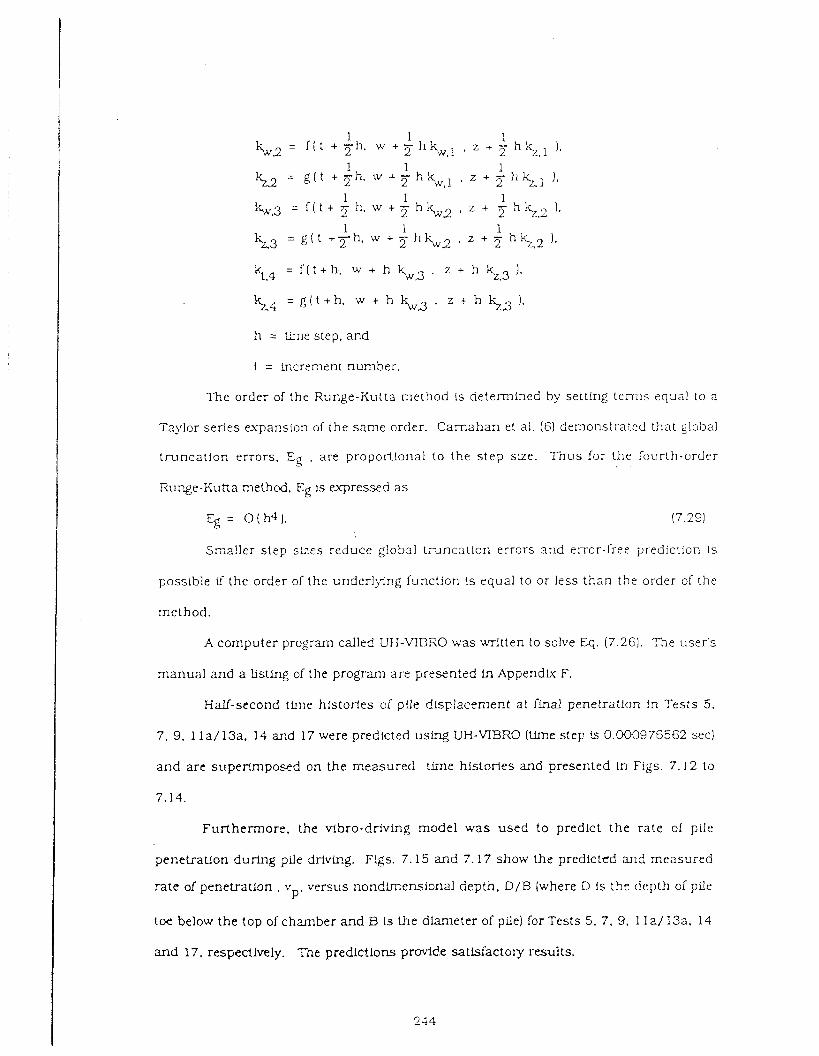
1 1 1 kt3 = g ( t + ~ h . w + 3 h L 2 , z + ~ h k . , ~ I ,
"'t.4 = f ( t + h , w + h Lkn3 . z + h kZg ).
Q4 = g ( t + h . w + h b 3 , z + h s 3 ) .
h = txre step, and
i = increment number.
The order of the Runge-Kutta method Is determined by setting ten-rls equal to a
.- I aylor series expansion of the same order. Carnahan et al. (6) demonstrated that global
t runcat ion errors. Eg . are proportional to the s tep s k e . Thus lor the Courth-ordfr
Runge-Kutta method. Eg Is expressed a s
Eg = O ( h 4 ) . (7.29)
Sma!ler step sQes reduce global trunc3tion errors and error-free prediction is
possible if the order of the under1)ing function is equal to or less than the order of the
method.
A computer program called UH-VIBRO was written to solve Eq. (7.26). The user 's
manual and a Listlng of the program are presented in Appendk F.
Half-second time h!storfes of plle dfsp!acement at final penet-ation t.1 Tests 5,
7. 9, 1 la/13a. 14 and 17 were predicted using UH-VISRO (m.e step ts 0.000976562 sec)
and are superimposed on the mezsured time histories and presented In Figs. 7.12 to
7.14.
Furthermore. the vibro-driving model was used to predict t he rate of pile
penetration durlng pile d m - g . F!gs. 7.15 and 7.17 show the predicted and measured
rate of penetration , v versus nondirnensfonal depth. D /B (where D is thc depth of pile P'
toe below the top of c h m b e r and B is Ule diameter of pile) for Tests 5, 7, 9. 1 l a / 13a, 14
and 17, respectively. The predictlons prwi6.e satisfactory results.
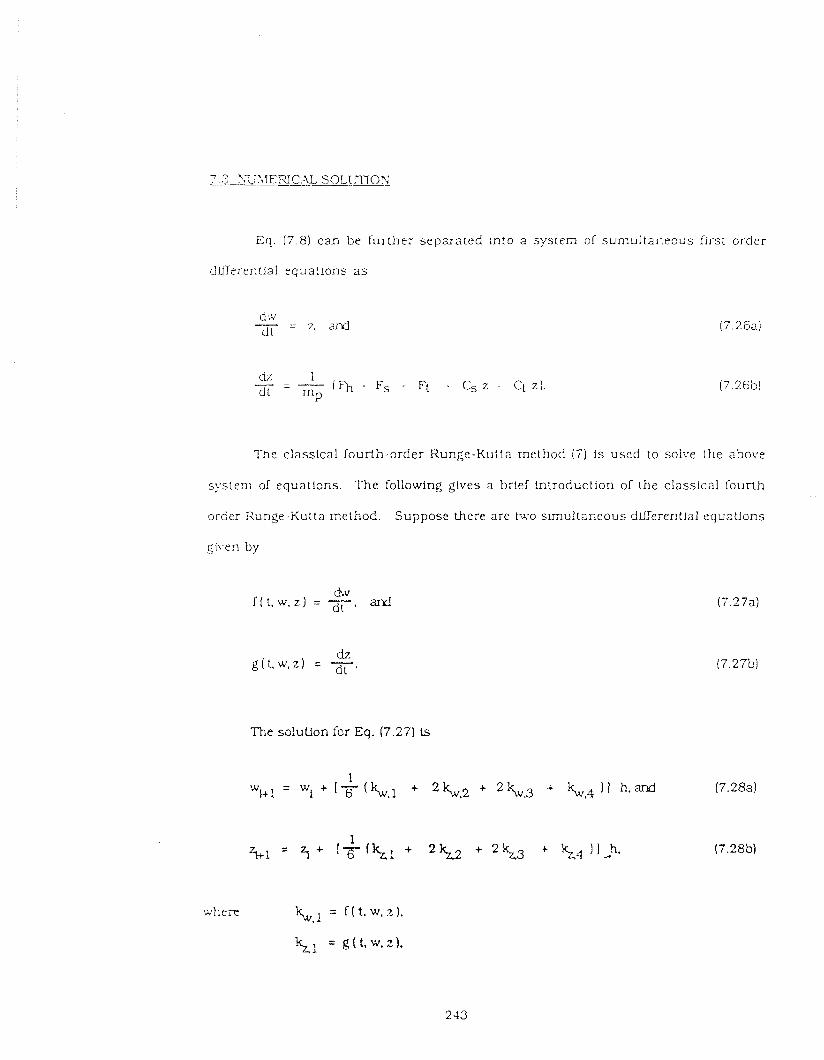
Eq. (7.8) can be furthe; s e p a a t e d Into a system or sumul t aneous first order
dUTerentla1 equat ions a s
The classical fourth-.order Runge-Kutta method (7 ) is used to solve the abo1.e
system of equations. The following gives a brief introduction of the classical fourth
order Runge-Kutta method. Suppose there are tu70 simultaneous dneren t la l equations
gl\'en by
where
The solution for Eq. (7.27) is
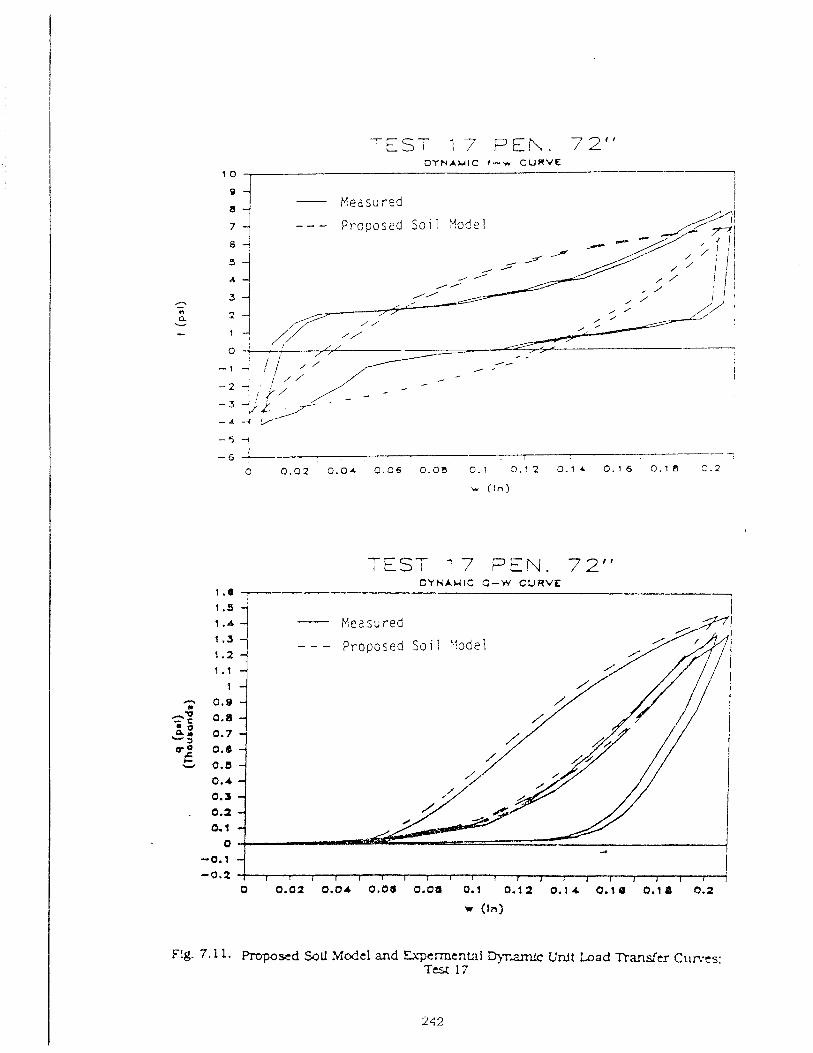
TEST 77 PEN. 72" D Y W A U I C I - w C U R V E
1
- Measured
., (In)
TEST 17 P Z N . 72" C Y N A S I C 0 - W CURVE
1 .Q
F:g. 7.11. &posed SOU Model and Ex-permentaI Q~iaxnic Uni t Load Transfer Cumcs; Tcst 17
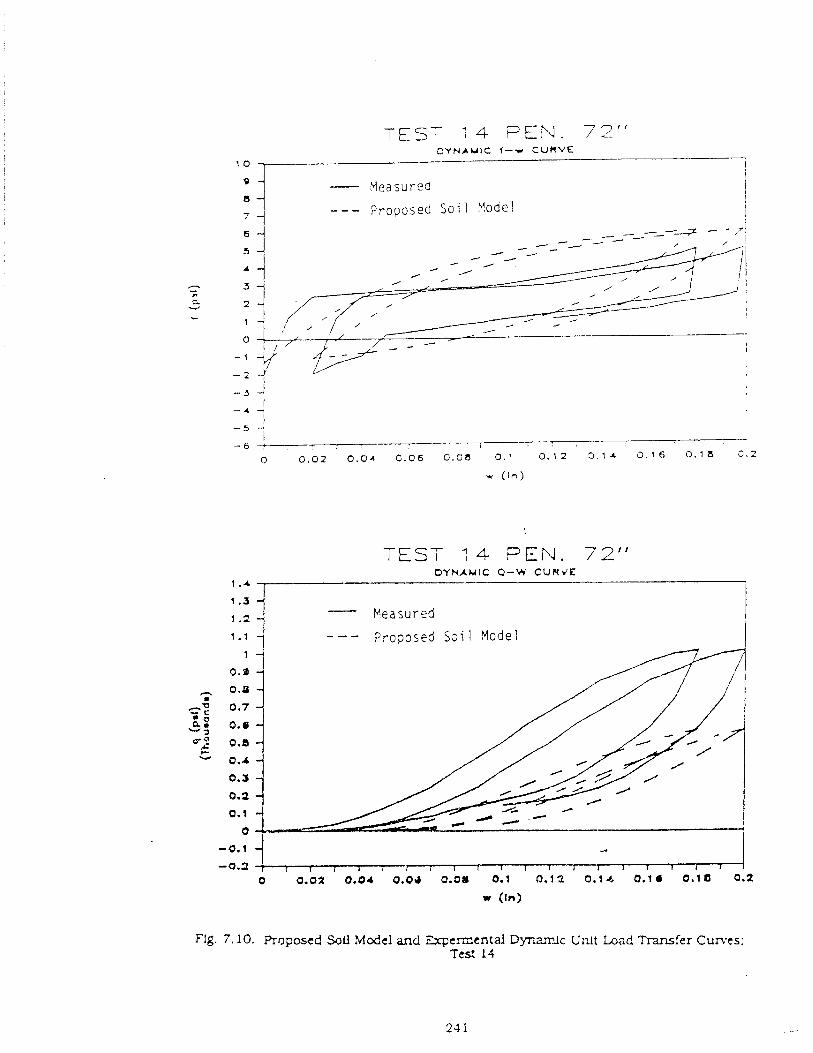
-1 TEST 7 4 PEN. /2" D Y N A M I C f - v C U 1 ( V E
1 0 7 !
- Measured P r g p o j e d S o i l ?!ode\
TEST 1 4 I . 72" DYHAUIC 0 - W C U R V E
I 1.2 Reasured 1 I.l r ? t o p o s e d S a i l Model
Flg. 7.10. Proposed Soll Model and Expermental Dynm-!!c Unlt Load Transfer Curves: Test 14
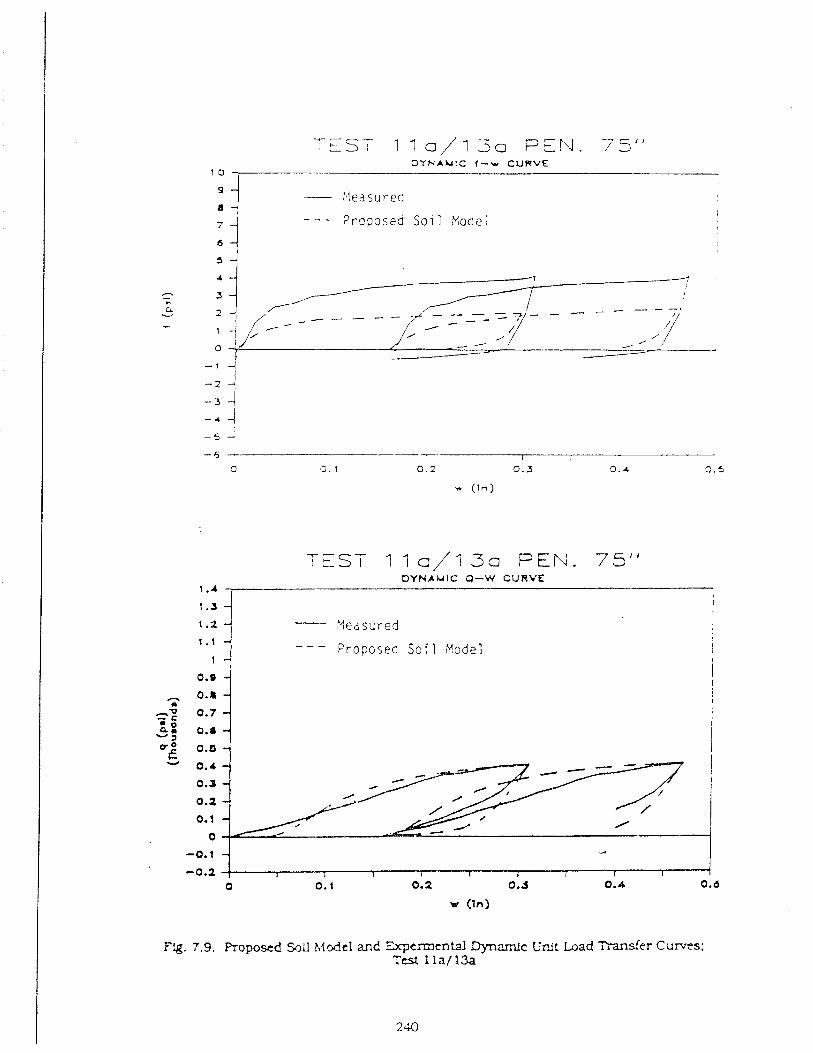
7---.--
, L I 1 1 o/13a P E N . 75" D Y N A U I C f - w C U R V E
'0 ,
- :-ieasured ...-- Prcposed So i 1 #ode1
TEST 1 1 a/? 3a PEN. 75" D Y N A M I C Q-W CURVE
1.4 j I
1 . 1 I - - - Proposed S o i l Model ! 1
0.0 i I - 0.8 I
a cz 0.7 I I
2: o.r :; 0.6 w
I 0.4
0.3
0.2
0. f
0
F!g. 7.9. Proposed Soil Mcde l and "rjrpcrmental ~ n a m f c U r ~ t Load Transfer Curves: T& 1 l a / 13a

TEST 9 P E I N . 52" D Y N A M I C f - w CURVE
10 I
I ~Veas i l r ed I a I
i I - - A P r c o o s e a S o i 1 Model !
TEST 9 PEN. 52" DYNAMIC Q-W CUXVE
1 .* t . 3 1 I I
I . " 'I :lez s u r e d I I
- - - i Propozed S o i 1 :.lode1 I
1 I . ' 1 i
Fig. 7.8. Proposed 5011 M d t l ar.d rqennrntd r ) y n m ? c Unlt L a d T r a n s f e r CunPcs: Test 9
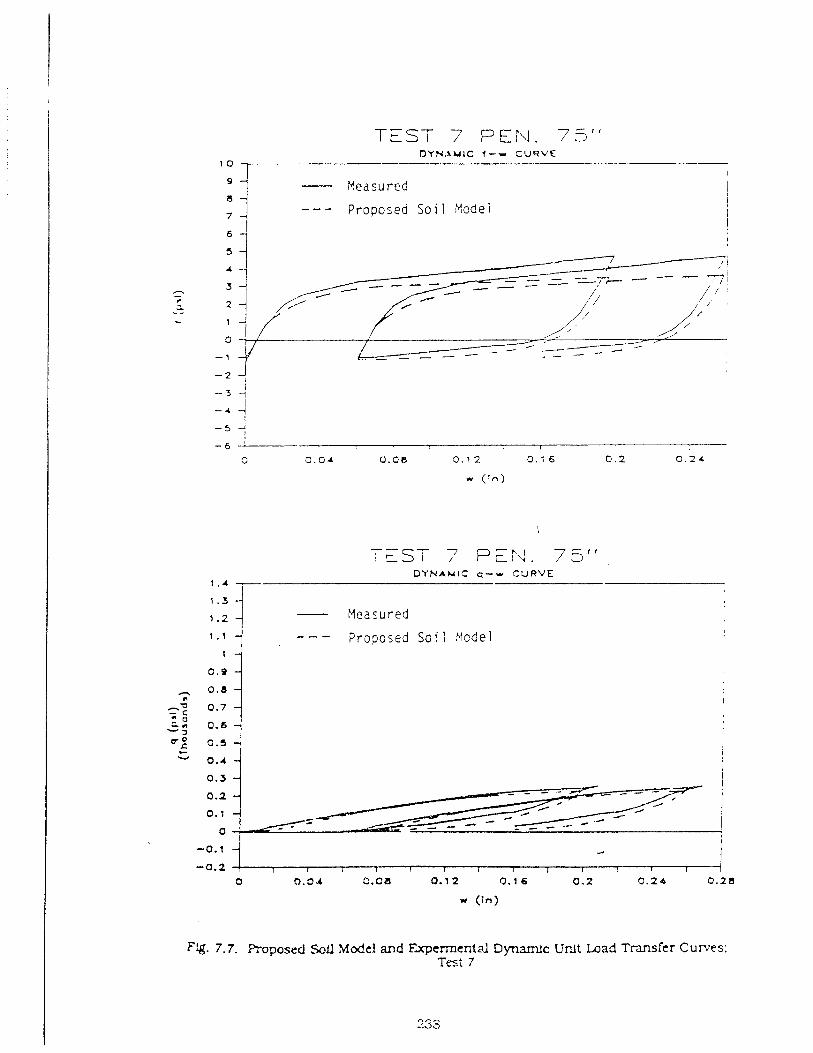
TEST 7 PEN. 73" DYNZIUIC 1-w C U R V E
1 0 :
- Measured - - - Proposed Soi 1 1Yode1
'5- - : = S T 7' ; 7 P E " J . 75" D Y N A M I C q - w C U R V E
- 1 . 2 Measured
- - - Proposed S o i l nzde l
0.9
Fg. 7.7. Proposed Soil Modd and Expenncntal Dynamlc Unit Load ~ransfcr Curves: T c i 7
3. Under similar soil cond1t:ors the measured peak toe forces were geneni iy
slrnilar, regardless of whether t he plies were fmpact-driven or vibro-driven, although
some differences Ln the wave forms are observed. For euam~;le. Flgs. C. 1 and C. I I . C.2
and C.9, and C . 3 and C.10, and C.5 and C.8 can be compared. Thts observatton may
suggest that there were no large effects due to method of Lnstallat!on on toe capac!ty.
APPENDLY D
OiNE-DIMENSION,45 WAVE EQUATIOX Aep\iALYSIS
One-dimensionai wave eqluatlon anaiyses were used to ascer ta in whether
differences could be o b s e r i ~ d In Smith ' s parameters for plles t ha t were driven by
impact a n d thcse that were dr;.ven by >?bration . v i t h rcstrilkhg. This was accomplished
with a digital coniputer progrui1 er,:it!ed TOPDXJJ'E, u7h!ch back-computed the various
soil parameters .
TOPDFIJIE Alporit h m
The T O P D W L algorithin used for back-computing the soil characterist1,cs for
lmpacl and restrike tests is based on a finite aiflerence solut ior~ t 3 the one-dimensional
wave equation. specifica!ly or] t h e version developed by the Texas Transportat ion
Inst i tute (TI31 (151. The program Incorporates all of the assurnpt ions in the TTl
algori thm and models the so!l according to the E. A. L. Smi th elast ic-plast ic
representation with veloc!ty-tndepefident vlscous damping constants . The soil is t h u s
charactertzed by a maximum statlc sh* resistance, a maximum stallc toe resistance, a
shaft quakc iQs) (yield pot?!), a toe quake rQp) , a value of shaft damping (J,), a value of
toe darnplng (Jp) a d a ratio of toe resistance to total resistance (Rp/RT). The pile is
characterized by e!astic s tf lness (EX). length, number c f increments (for numerical
colnputatlon purposes), weight of each increment, c!rcumference of the pile. and cross-
sectional area. The cf the Lncrernent r-presenting the part of thFpile nearest the
toe was increased In this s tudy to account for the added weight of t he toe load cell
(approximately 8 :b). The sha l t resistance may vary in any prescribed manner from
head to toe.
The input forcing function is a force-time his!ory. applied a t the ?op of the pfle.
ln place of the usual drivFng mechanisin (e. 9.. ram impact velccity, weight and cushion
and helmet properties). The input function for this s tudy is a force-time history
measured by straln gage level 1 (averaged over several blows). The static and dynamic
soil reactions. pile forces, dlsp~acernents and ve1oc:ties are computed a t ?rcscnbed t-me
steps. When the program-computed lntegratlon t m e s tep (0.0000156 sec.) is smaller
than the t w e step of the input force-t?me history at the pile head (O.COU078125 see.), the
input forces are kterpolated llnearly with respect to t h e .
For a n y glven se t of sofl inputs (such a s Qs, Q P J,, Jp, a n d R p / R v a n d
distributions of plle stiffness m d mass, the following information I s output:
a. Permanent s e t of the plle head.
b. Velocity and force tLme histories at any pile segment (viz.. velocity at the
pile head, velocity a t the pile toe, and force at the pile toe, which were compared with
ineasurements),
c. Maximum forcrs and dlsplacernents at all pfle segments.
Fifteen pfle segments were used in the calculations descrfbed In thls study. ana the wave
equation computations were stoppecl (plle permanent set achieved) when t h e pile head
motlon stopped (20 to 25 rnsec after inltlal impact). This lnvolved the u s e of more
number of tlme steps than ~orrnally used in the wave equaUon analysts. No residual
forces were considered in the analyses described, so the back-corriputed values of quake.
damplng and resistance ratio must be considered approprtate for the condition of a n
assumed Initially stress-free plle.
Values of the sou parameters were varied systematically, and the results
(pile-head and toe vejocity. pfle-toe force, and permanent set) were'compared with
measurcd values in order to arrive at the set cf sou parsmeters tha t most closely
satisfied the three tlme histories described above and the permanent set. This
variation was accomplbhed by making separate r u n s with numerous combFiatlons of
?he pararr,e::rs and manually corAlparhg L5e outps! with the physica! measurzments .
O~t!;~.L7atlon S tudy
Tests 9 ( vibration with restrtke). 17 (vlbratlon uith restr-Lkel. 2 1 ( L ~ p a c t ) and 22
( impact) wlere s tudied using TOT-7DFWE. It was a s sumed lnltlally t h a t t h e shaf t
res!star,ce w a s uniform with depth . a reasonable a s sunp t lon based on analysls of the
s i a t ! ~ test data Ln Chapter 5. Shaft and toe qu*. shal l and toe damping and shaft a d
toe sta:lc resistpnce were varied, a n d pile-head set. and time histofies of pile-head
velocity, pile-toe velcc!ty a n d pile-toe force were computed a n d compared with
measured values un&! an optLmum set of Lnputs was found. The results are summartzed
Ln Tzbles D. 1 - D.4 . ln whlch only the maximum vel~cl t lcs and force outputs are given.
Graphs of the veiocity and force traces. both compbted and measured , are compared in
Figs. D. 1. - D . 8 for the set of parameters that were selected a s optimum. Because the test
pile w a s ve ry short and wave return times could not be scaled. very compiex force a n d
veiocicy traces developed once the reflected tension wave began LnterferLng with the
tncicient compression wave. In fact. I t appears that LIe incident compress:on wave was
not fully deve!oped at the pile head before effects of the return wave were felt. For tha t
r e a w n , emphas ls was placed on matching measured and computed wave forms for the
flrst 3 t o 4 mtlllseconds after impact. where ptle velocities were highest. me time
requlred for a s t ress wave to travel down the pile and re tu rn (2 X pfle length /
rompresslon wave velocity in steel) was abaut 0.8 milliseconds.] The comparisons of
meesured and computed wave forms should be considered satisfactory for the case of
the: vpry short pLle utflized tn this s tudy.
POP Tes ts 2 1 and 22. soiutlons from program WGZP 86 (14). a n Industrial-type
program for a r a l y s b of ptlc drhlng. were also obtalqed with the opt?;;lum set of input
pnrzimeten derived from ?Y)PT)FtrL'E and are compared with the measured traces a n d
~9th TOPDRY2 solutions in Figs. D.5 - D.8. I t was necessary to input L3e ram weight
and drop he!ght tha t produced the s a x e energy tha t wzs rncasured at the pflc head Into
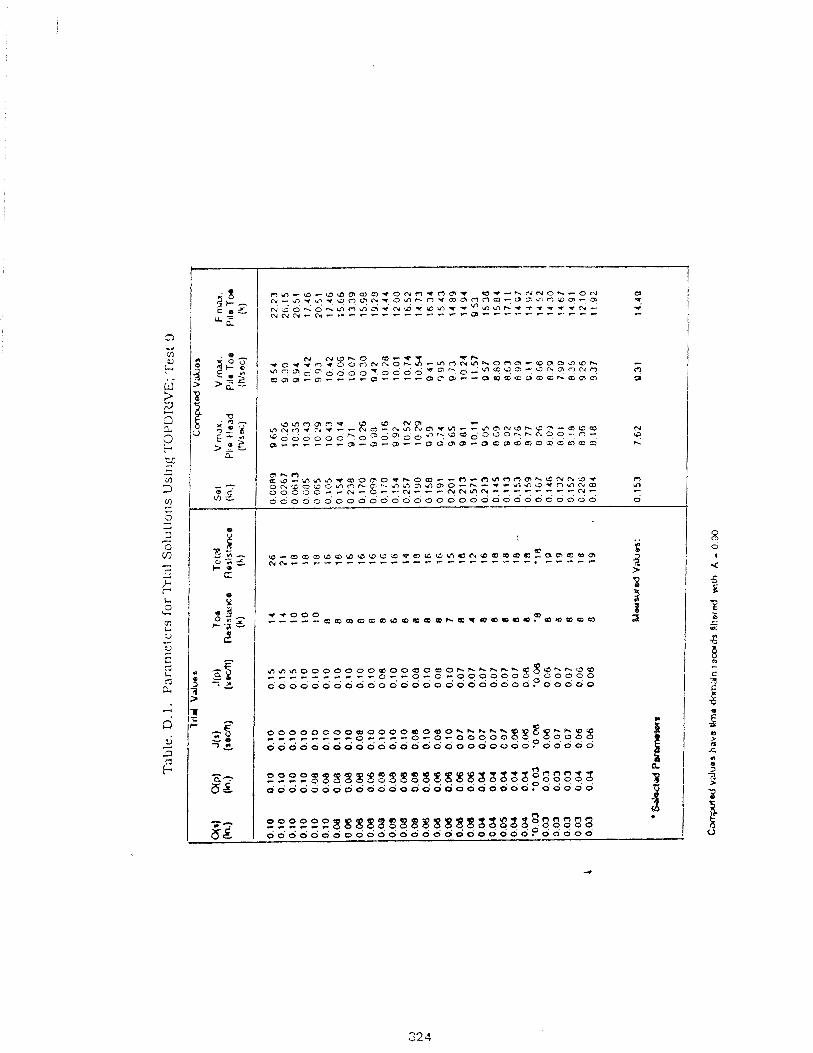
E . . 8 f 0 - ~ - ~ ~ ~ ~ r D ~ ~ ~ ~ i O ~ ~ i c ~ ~ ~ , ~ ~ a ~ ) m ~ ) ~ ' $ ~ r n r n a ) ~ ~
O n & & N - - c - r - " " " " - - - - - * - - . - - P F - 3 I
> 4 t- 0 c
3 3 S :
- r - o o o 3 3 e d 0;- ~ ~ , - - m Q ) m g a ~ ~ ~ u ~ w ~ Q t c D Q ~ Q ~ ? 9 P m Q Q 3. - i; - 'E' ts
S g
I I a$ -. - L : ~ ~ : ~ ~ ~ z n ~ ~ ~ g ~ ; ~ ~ : 8 ? g g ~ g x d d d d d d d d d o o d d o o d o o o o d o o o o o
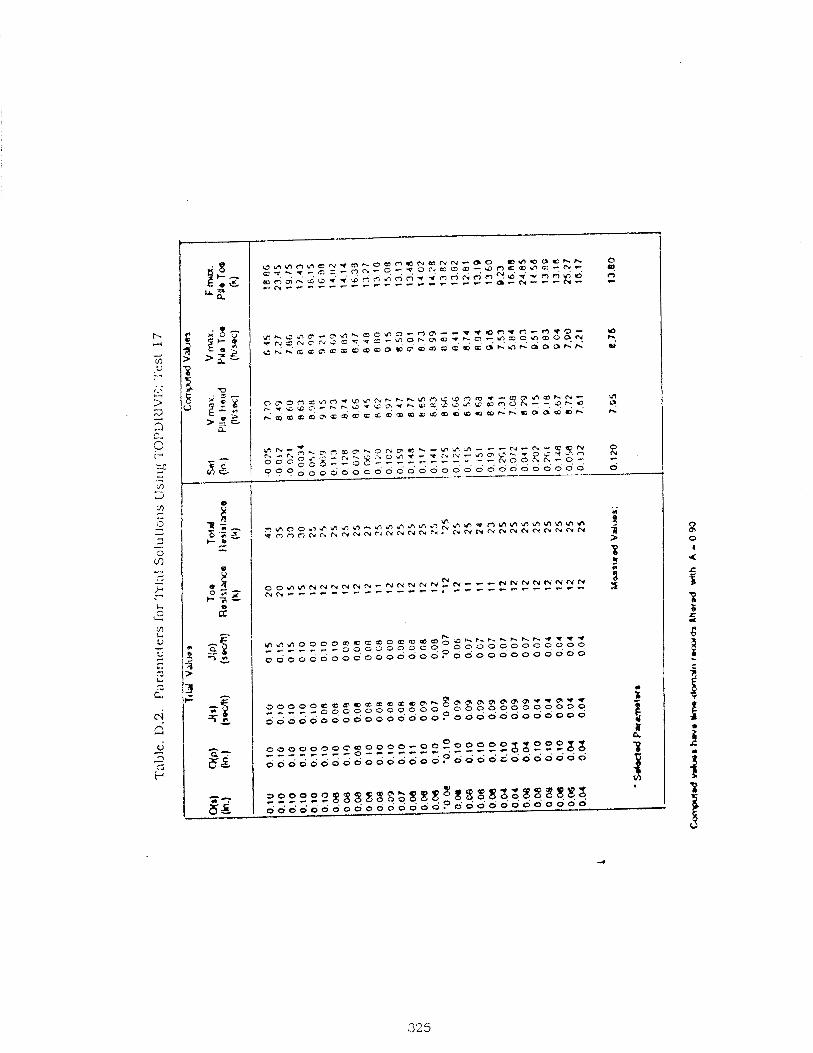
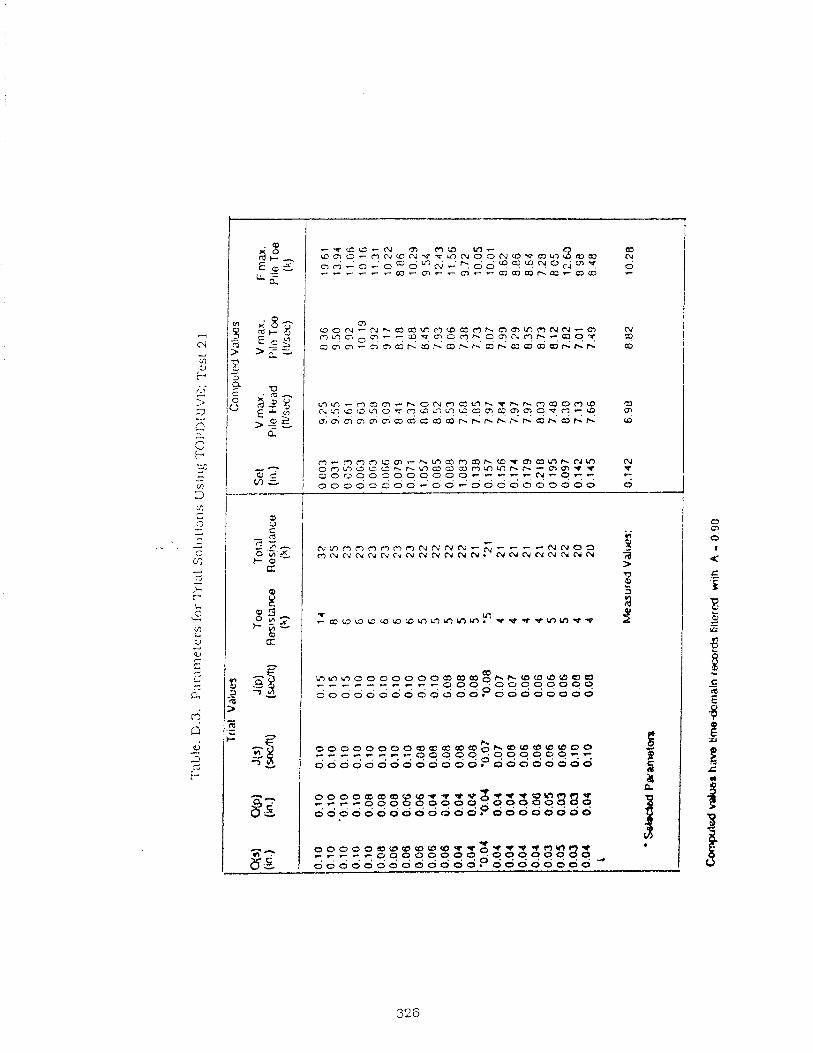
0) 0 0 N - N h m ~ W 0 D Q 0 h O ~ W ~ N N - ~ N
=?
Yl ,., 3 I r- . . 'A > 2 .... fl - ? - '=c - - V?
3 a c
$ > = --. a
- A
aJ c
i l m - 0 3 0 - h O N m 1 4 f i h t ~ h O Q O O r O 63 h ~ ~ w o ~ ? o t n o o + w o ~ m p q q q q ~ . q c , m m c m m m a Q a a b + b b ~ b a b a b b @
m - m m , ~ ~ ~ - h m ~ ~ ~ ~ ~ t r n ~ m ~ c ~ m PJ 0 0 ~ ? 0 0 U h h 0 Q ~ Q O O O h h - ~ ~ V V V 0 0 0 0 0 ~ 0 0 0 0 0 0 - - - - - W - O - - - - - v-
0 3 ; i ~ 0 o o s o o o - ' o o - d o o o 6 o i o d o o
0 m 0
a a: f. '5
H Q - A
r
?3
c - 10
2 Y
C ) - 8 -4 C - . d
- n . - .-?. -
C -
cr) 0 i- a
+ 0: 5 - i- r L.
2 8 2 3 + % - 2
'3 d
&:
2 t:
.- N ~ O O O O O ~ N N N W - - - - - N N 0 3 , N N N N N C d N N N N N W ? m W N N N N m N 2
P
~ m o o u ~ ~ a m ~ ~ m m m ~ s a v w m m ~ ~ 2
-3 g
C
L .
? a . w -
s- 3%
d d d d d d d o o o d ~ w ~ o o o o o o o o
~ ~ o o a a m ~ w t v * * B - r ~ . - , r r - g q q q q q q q d q q 4 ? g a 2 5 o o p o o o o o o o o o o . 000000~0
2 -'- m > - CO .= P
~ , d d d d d d o a d d d P o o o o o o o o
f
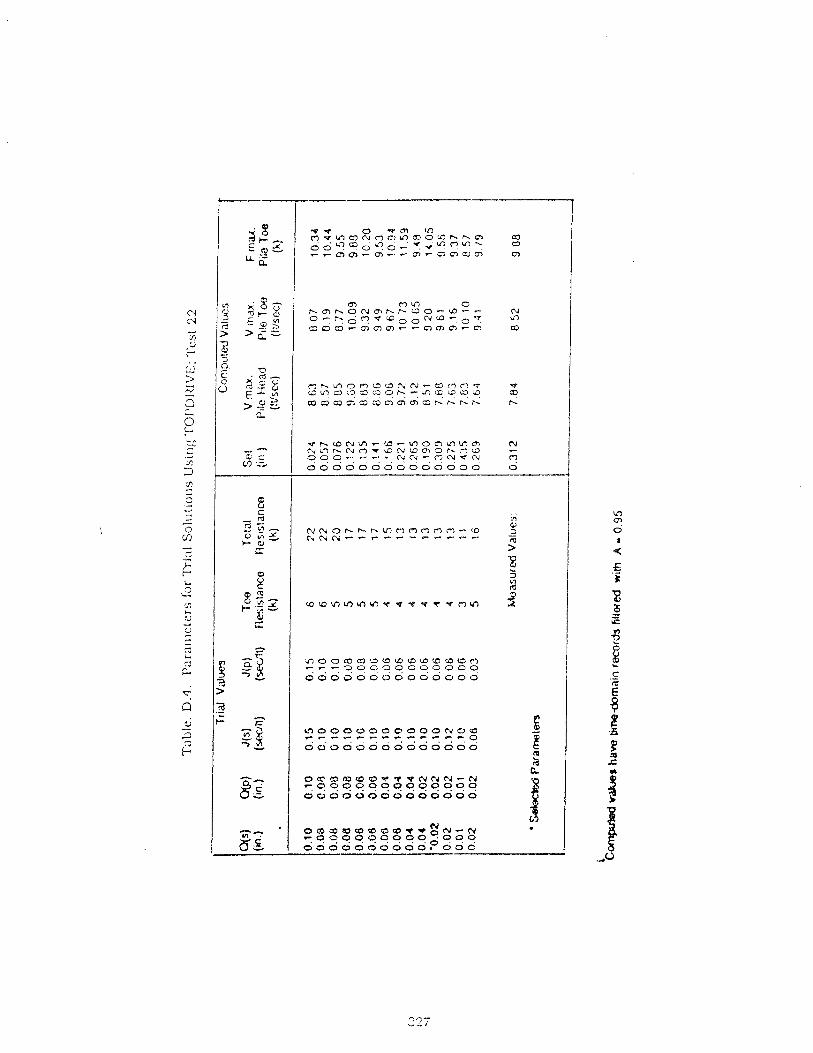
O R m w ~ a t l P N w e 4 - N ~ , '=?4999*9*99=?9=? O O Q O O O O O O O O O O O
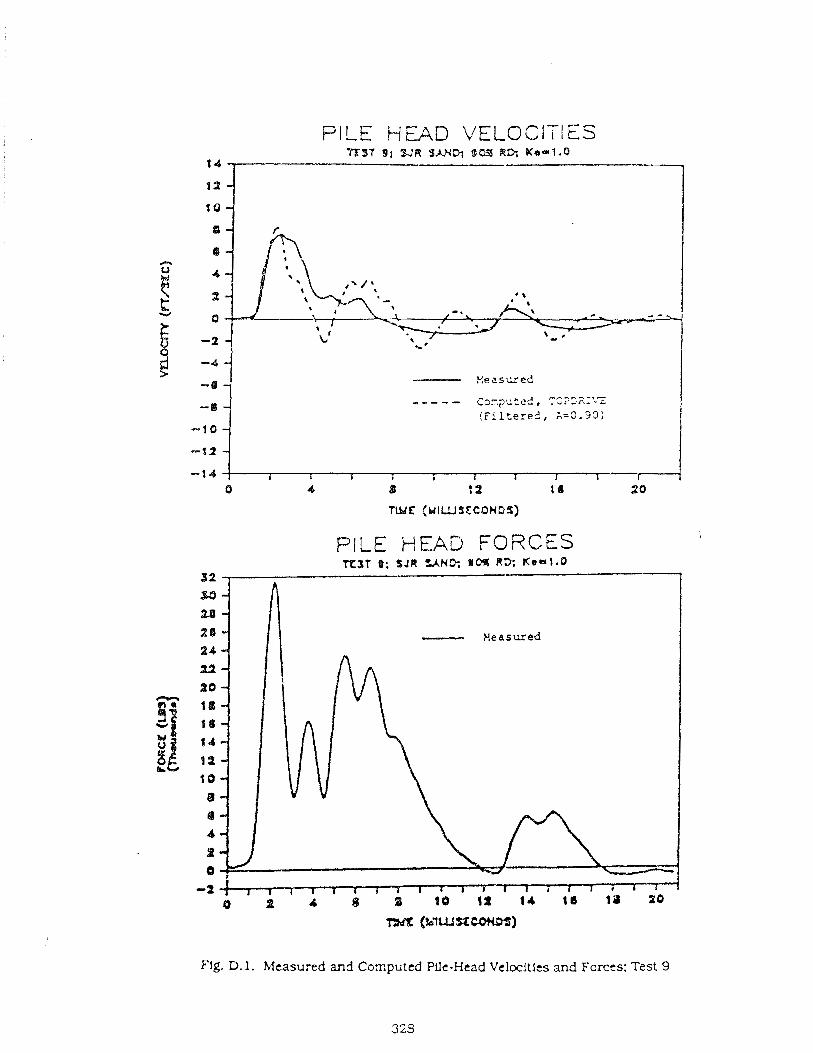
PILE H m D VELOCITIES
- - - - cor.pu:ed, TST22.155
( F i l t e r e d , A=0.93)
PILE HEAD FORCES
Flg. D. 1. Measured and Computed We-Head Velocities and Fcrces: Test 9
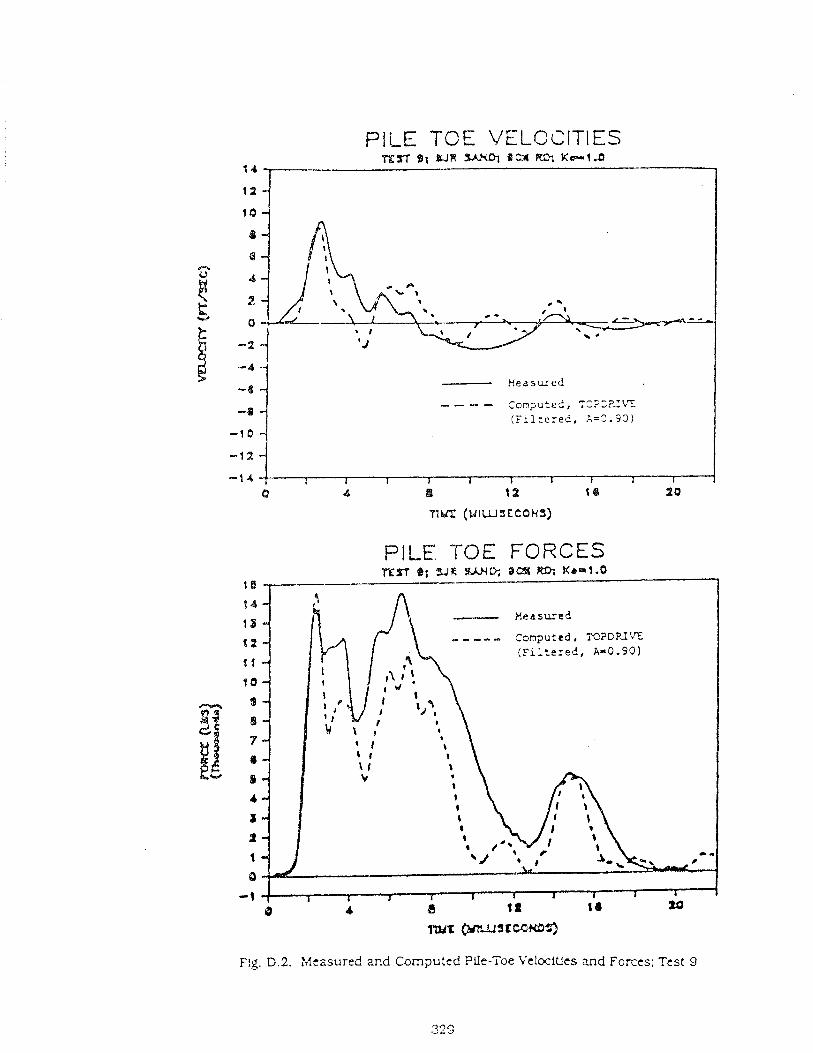
PlbE TCE VELOCITIES
PILE TOE FORCES "PfltT @I 3 J R WD; Dm RC% X o ~ 1 . 0
1
~ ! g . D.2. Measured ar.d Compu:ed Pile-Toe VelociUcs and Forces; Test 9
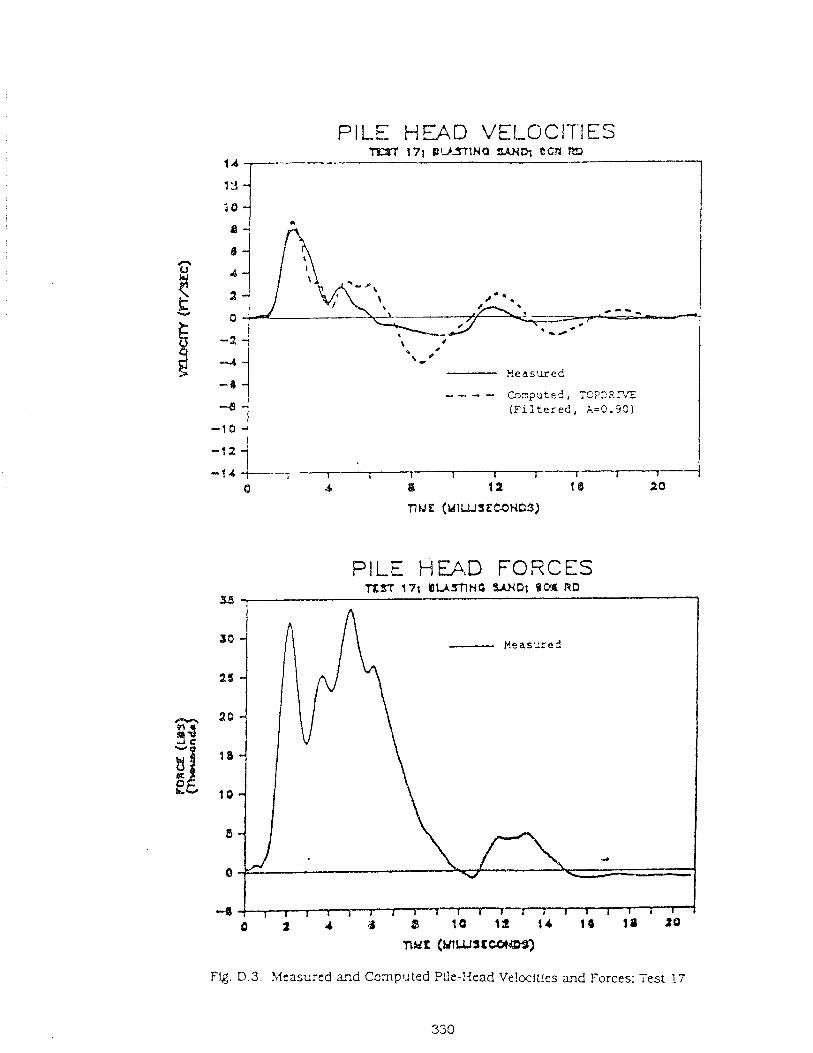
PILE HFAD VELOCITIES
- - - - C x y o t e r ? , T C F X F T Z
(Filtered, A = 0 . 9 0 )
PILE HE3.D FOECES
nwr ( M U J S Z ~
FQ. D.3 . 3ltasured aqd Computed Pdt-Head Ve!cci:les and Forces; Test 17
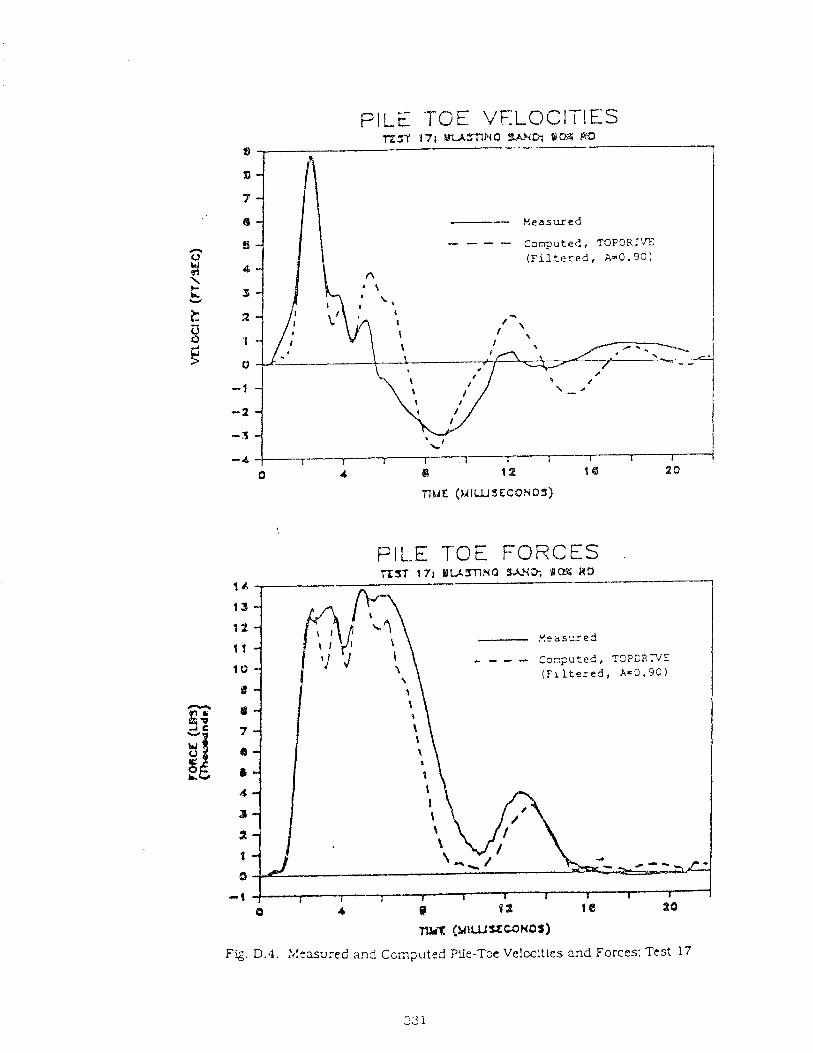
PILE 'TGE VFLOClTlES T257 171 W T P 4 Q W, PC24 RD
- - - - Computed, T O P C R Z m
(Plltered, A10.90)
PILE TOE FORCES .
n3-T 171 I 1 u m N a WD; P r n WD 1 4
1 a 12
1 1 - - - - Con?ute<, TC??aRTVE 10 (filtered, As3.90)
0
0
7
6
L
4
24
a 0
8
F g . D.4. !,!eaured and Ccm;;uted Pile-Tce Velocities znd Forces; Test 17
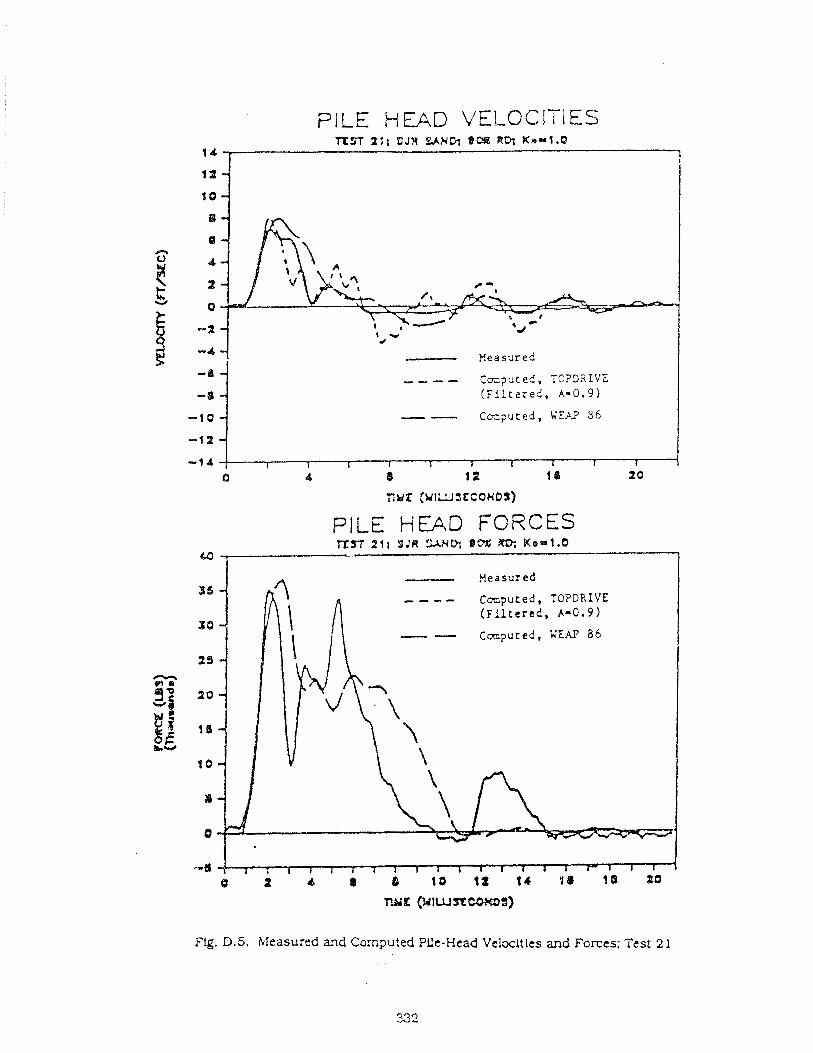
PILE HEAD VELOClTlES
I
B h
8 B 2 k u 6
-2
-4 - Measured - @ - - - - C m p u t ed, TO?I)RIV': -B (FiltzieC, A-0.9)
-91 0 - - C u z p u t e d , LEA? 36
-14 ! I I I I I I r I I I
8 4 8 12 1 I 2 0
nve (MIU~~COMDI)
PILE h'EAD F O R C E S
-- yeasured
_ - - - C m p u t e d , TOPDRIVE ( F i l t e r e d , A m 0 . 9 )
-- C m p u t e d , LEAP 86
Fig. D.5. Measured arid Corriputed Pile-Head Velxl t ies and Forces; Test 2 1
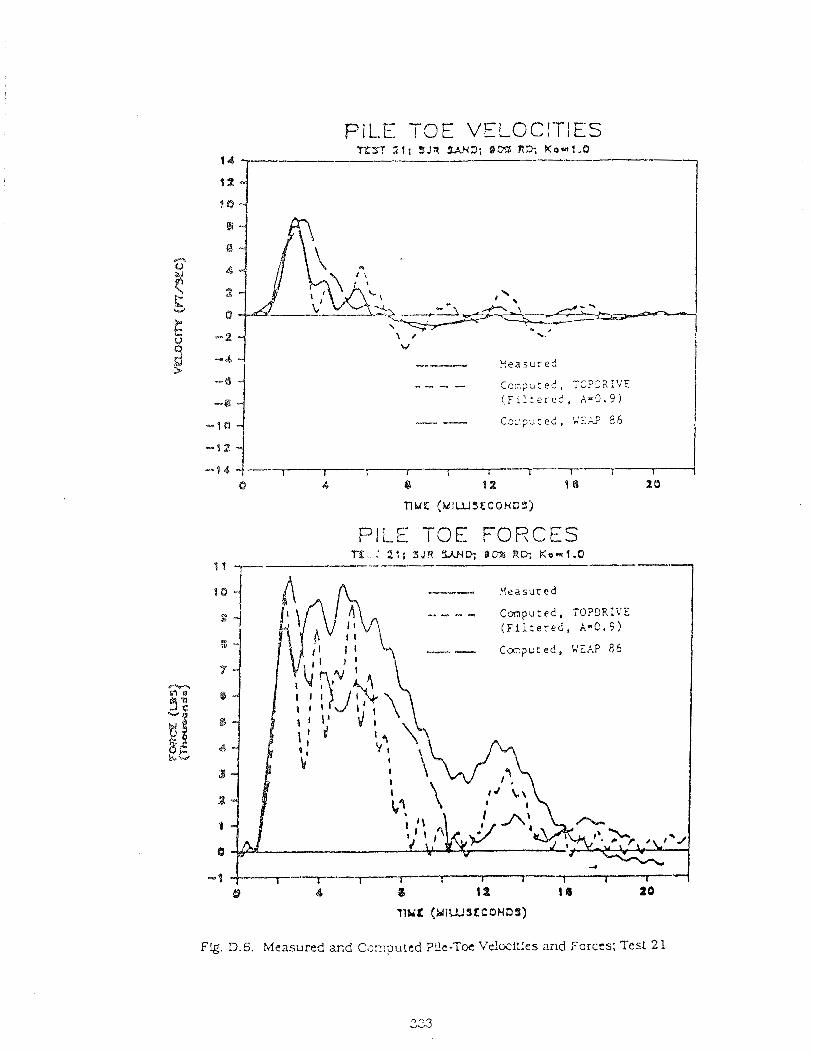
PILE T 3 E VELOCITIES T T X 111 3 J R W 3 ; 90'3 R P , #e.al ,O
- - - - Cocpu: e d , TC?3a :VE (F:L:e:?d* A - 9 . 9 )
-- C 3 r - , - : e c , K E . 2 9 5
PILE TOE FORCES m. : 21; SJR WD; O C Z i RD; Ko=31.L% - 1
Fg . D.6. Measured and To--.pu!ed Pile-Toc Ve!ocitles and Farccs: Test 21
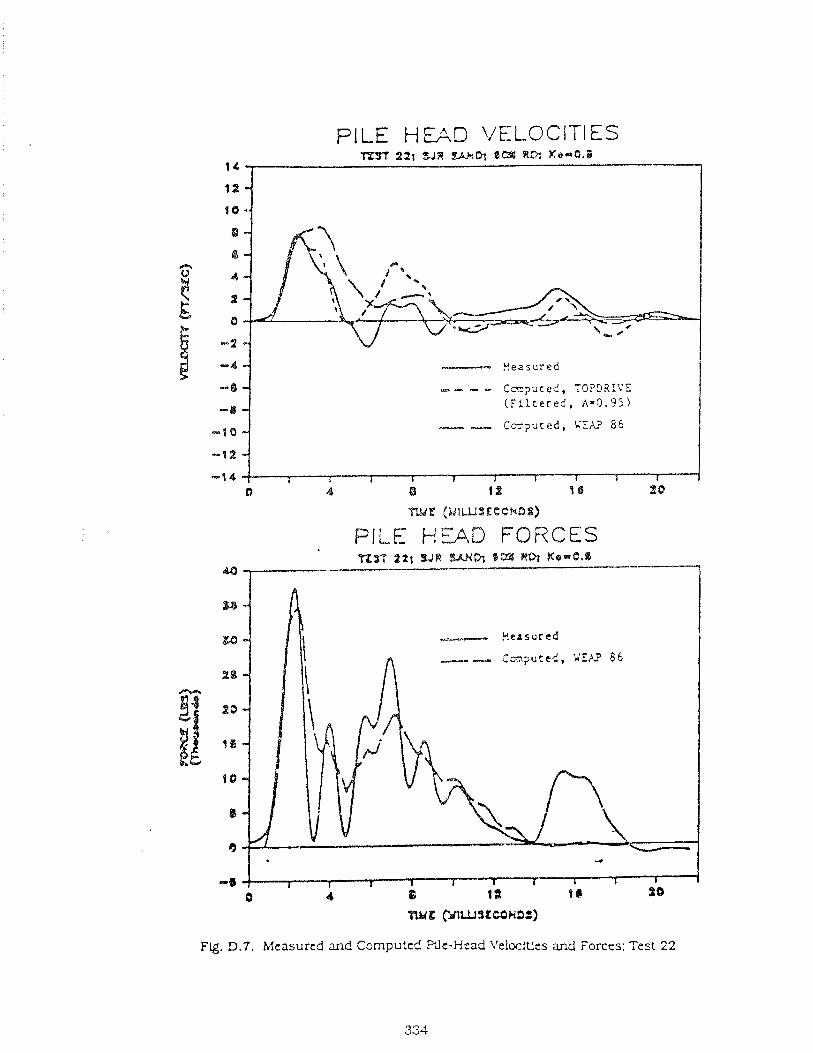
PILE HC&D VELOCITIES T911T 22; U R %bV1fa 0- OL31 #*-0.a
14
12
10
8
I
4
2
0
-9
-4 --.-------- Z e a s u r e d
--a - - - - Cmpuced, T C P 3 X I V E
-I ( F i l t e r e d , ~ ~ 0 . 9 5 )
-1 8 - -...-. C m p u t e d , KEk' 8 6
-q2
-1 4 9 1 3 0 P 0
PILE PiWD F O R C E S 4.0
ew
2L-O --.-.-- Hcasured
.--= -.- Cm,puted, E;W 8 6 $1 0
9 8
B
4
-a
Fig. D.7. Measured and Computed We-Head Velwit!ts and Forces: Test 22
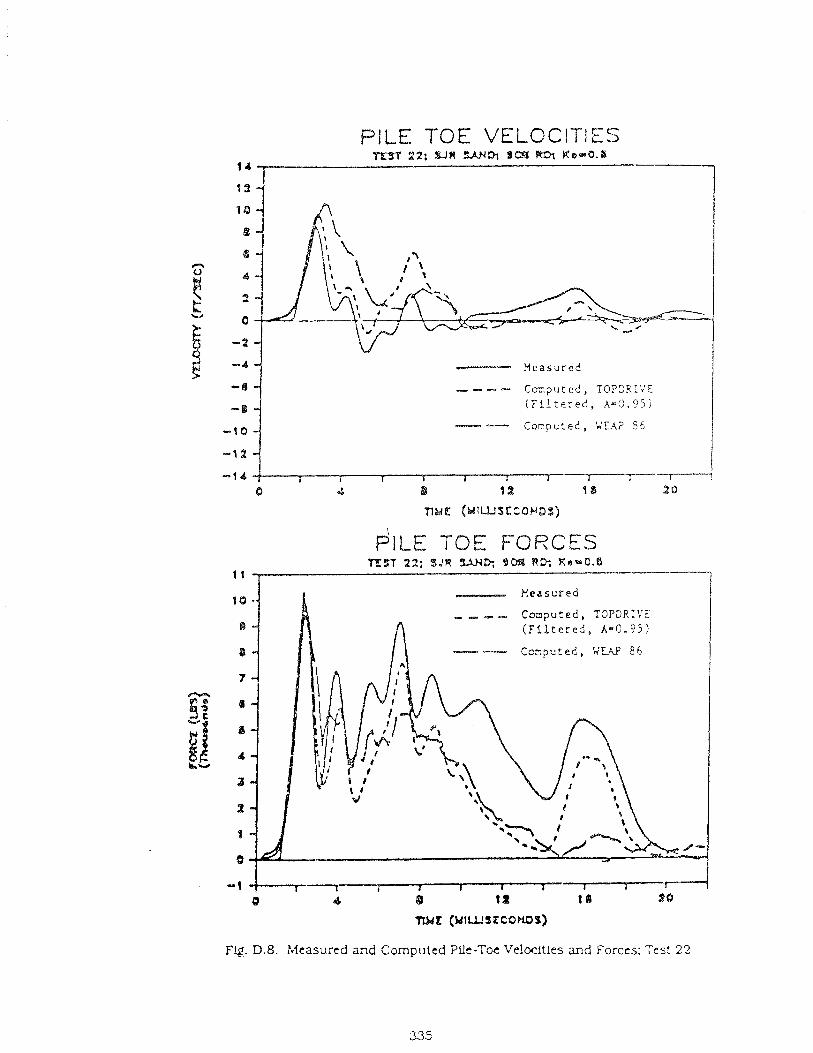
PILE TOE VELOCITIES
--% ---- CC,?U: ed , TOP~RI 'V '? .
-I ( F i l t e r e d , A m 0 . 9 5 j -- -1 0 Cocpucec!, W E . U 86
-12
- 1 4 ---r--Y
Q a t 2 0
PILE TOE FORCES
Flg. D.8. :~icasurcd and Computed Pile-Toe V e l d t i e s and Forces: Test 22
! V W 86, resulllng Ln a hammer efficiency o i a p p r o x a a t e l y 85%. rzther than
measured plle-head force-time hlstory. the stiffness of the plywood cushion ( 1 100
k/ lnch. a s measured Ln static tests on the plywood cushlcn] and the coefficient of
restl!utton for the cushion recommended by Gobi- and Rausche (14) (0.50). Therefcrr.
the boundzry conditions for &e +avo solutions were not identical. and Identical results
were not obt-ed. However. the results compared well enough to prcvide conf ide~ce
that results obtained u s h g TOPDIirVE could be a2plied to \EAP 36.
' f i e computed results that are presented Ln t5ls apprndlx are filtered wiLh a
Qigital fi!ter to remove the eflect of mathematical nolse that cnay have resuited from
modelling of a pUe of very short length. The dlgltal filter is of the Sype described by Eq.
D.1.
in which g 1s the flltered value of the function belng plotted. f is the xnfUtered value of
the function, n Is the Ume step number, and A is the filter c m ~ c i e n l . Values of X are
designated Lr Figs. D. 1 to D. 16.
The optimum Srnlth-type sol1 parameters obtained from the TOPDRIYE study
are tabulated in Table D.5 .
3ensttivity Analvsed
The sensitivity of the TOPDFWE solution to the variation of certat? Input
parameters was studied through a further analysb of Test 9. This study was conducted
to determine the effects of parameters tha t were not generally varied in the
optirnkzation study described In the precediiig section, specifically, distr;lbutlon of shaft
resistance along the pile, dlstribution of weight along the pile (particularly. !he
addition of extra weight to the toe to s l au la te soil that mlght be rn0tir.g in phase with
U-,e pUe) and the length of the triteeration Ume step. 7% conditrons for the SensltMty
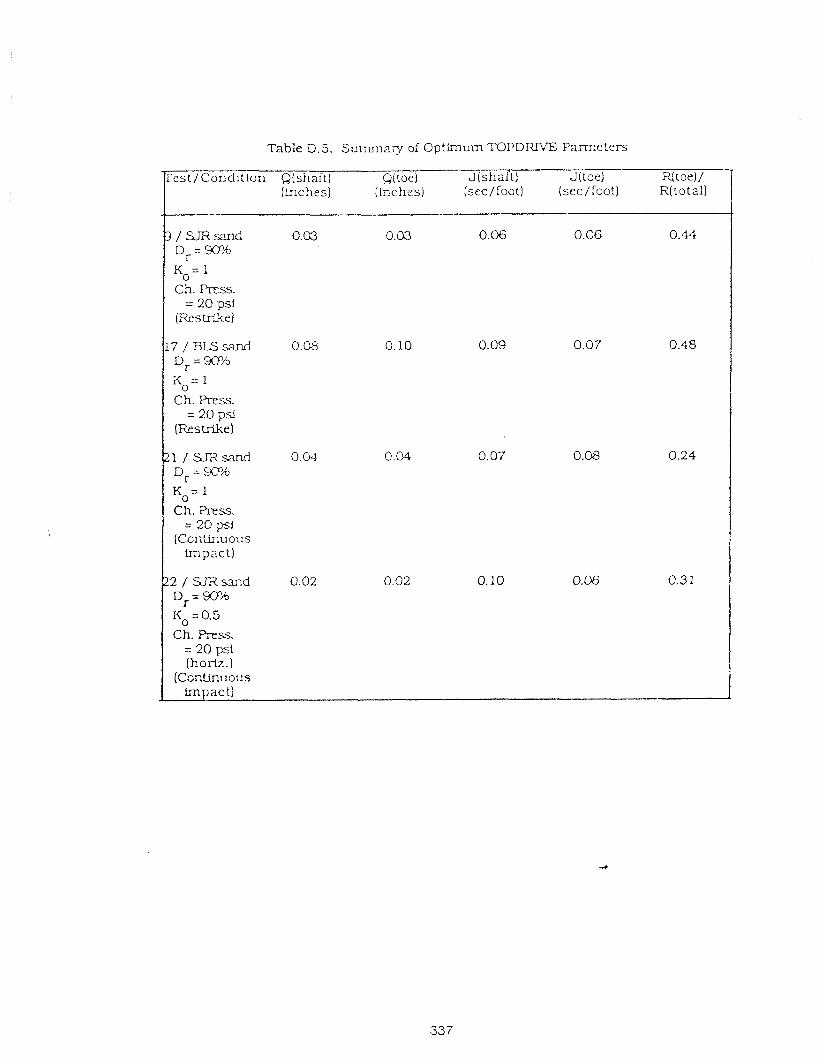
Table D.S. Summary of Optlmum T O P D R N E Pam-eters
Z ' e s t / ~ o n d i t i o n Q(snait) Q(toe1 ~ j s h a l t ) J(toe) RLtoe)/ ( h c h e s ) (Lqches) :sec/foot) (sec/:oot) R(tota1)
3 / SJR sand 0.03 0.03 0.06 0.06 0.44 D,= W ?
K = 1 0
Ch. h s s . = 20 psl
(RestrLke)
17 / BLS sand 0.08 0.48 D, = 3CP/o
ii = 1 0
Ch. Press. = 20 p i
(Restrike)
21 / S r i i d 0.04 0.24 Dr = 'D? KO" l Ch. Rcss.
= 20 psi (ContLnu ous
impact )
p2 / S R s m d 0.02 C.3 1 D, = W h
KO = 0.5
C h. Press. = 20 psi (fioriz.)
(Cc.nllnuou% impact) A
1
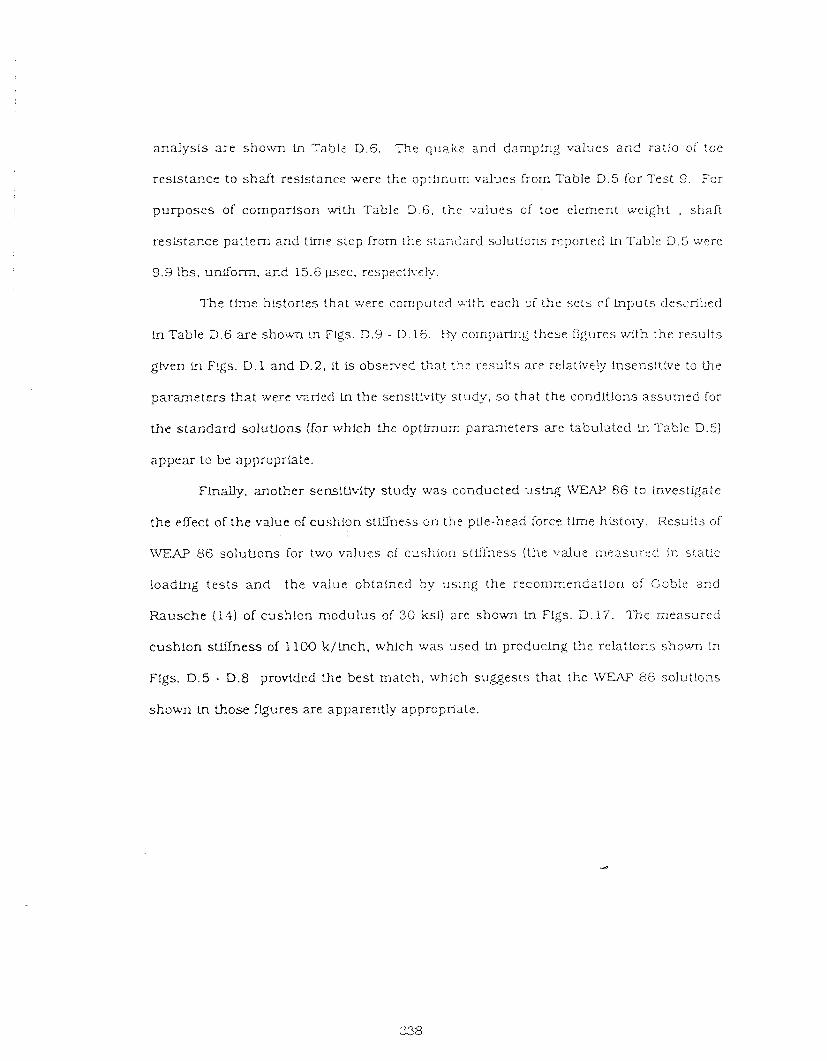
analys is a r e shown ln Table D.G. The q~~a ic , - and demplqg values and ra:!o of :oe
resis tance to shaf t resistance were the optilxurn V ~ ' J ~ S from Table D.5 for Test 9. For
pu rposes of comparison with Table 9.6. t h e values of toe element weight , shaft
resistance pat tern and tFm- s tep from the s t m d z r d solutlorls reported Ln Table D.5 were
9.9 Ibs, u d o r m . and 15.6 met, respectively.
The time hLstorIes that were cornputed with each sf the se ts o l lnputs described
in Table D . 6 are shown t? Figs. D.9 - D . 16. By comparing these figures with the results
gtven in Flgs. D . l and D.2, it i s obsenfed that r:?e restllts are relatively Lnsens1l:ve to the
parameters that were varied In the sens l t l~ l ty s t udy , so t h a t the conditions a s u r n e d for
the standard solutions (for which the optimum parameters a re tabulated in 'Table D.5)
appear to be approprkte.
Fw,ally, another sensi t l~l ty s tudy was conducted using JVEAP 86 to hvest lgate
the effect of the value of cushlon stLClness on the pile-head force time hbtory . Kesu!ts of
W W 86 solut lons for two values of c . ~ s h i o n stlfiness ( t he va l~ ie rneasurec\ in static
loading t e s t s and the value obtained by using the recommendation of C;c;ble a ~ d
Rausche (14) of cushicn modulus of 30 ksl) are shown In Flgs. D.17. ?'he measured
cushlon stLffness of 1100 k/lnch. which was used in producing t h e relations s h o ~ n in
Flgs. D.5 - D.8 provided the best match , whlch suggests that the L V E , V 86 solutlons
shown Ln those figures are apparently appropriate.
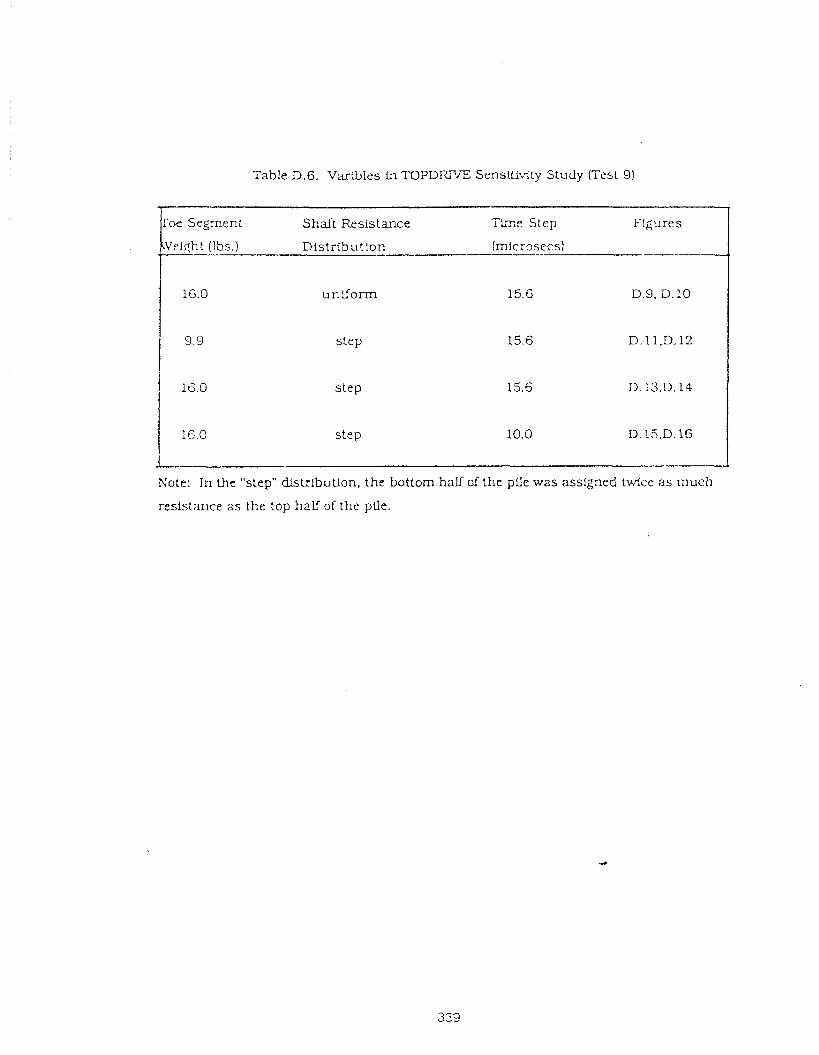
Table D.6. Varibles in T O P D W E Sensitivity Study (Test 91
step
step
Toe Segment Shaft Resistance Time Step Figures
Ve!qht (Ibs.) Distribut!on (mfcrosecs)
1 16.0 step 10.0 D. 15.D. 16 I
I
Note: in the "step" dlstrlbutlon. the bottom half of the piIe was asslgned W c e a s much
resistance a s the top half of the ptle.
PILE HEAD VELOClTiES f I S T a
I
- Heasured
- - - Computed, TOPSRIVE ( ? ~ l : e r e i . A = 0 . 3 0 1
nlec (MILUSECOHOS)
PILE TOE VELOCITIES YfST s
10
0
I - geasured
- - - C3r .=? l ted , T3F;X;VE 7 (Frltered, A'3.92)
I W
S 2 W
4
BI ! 2
!i 1
Q
-1
-2
-3
Fig. D.9. TOPDRIVE Analysis of Test 9; Increased Toe Weight; V = l ~ l t i e s
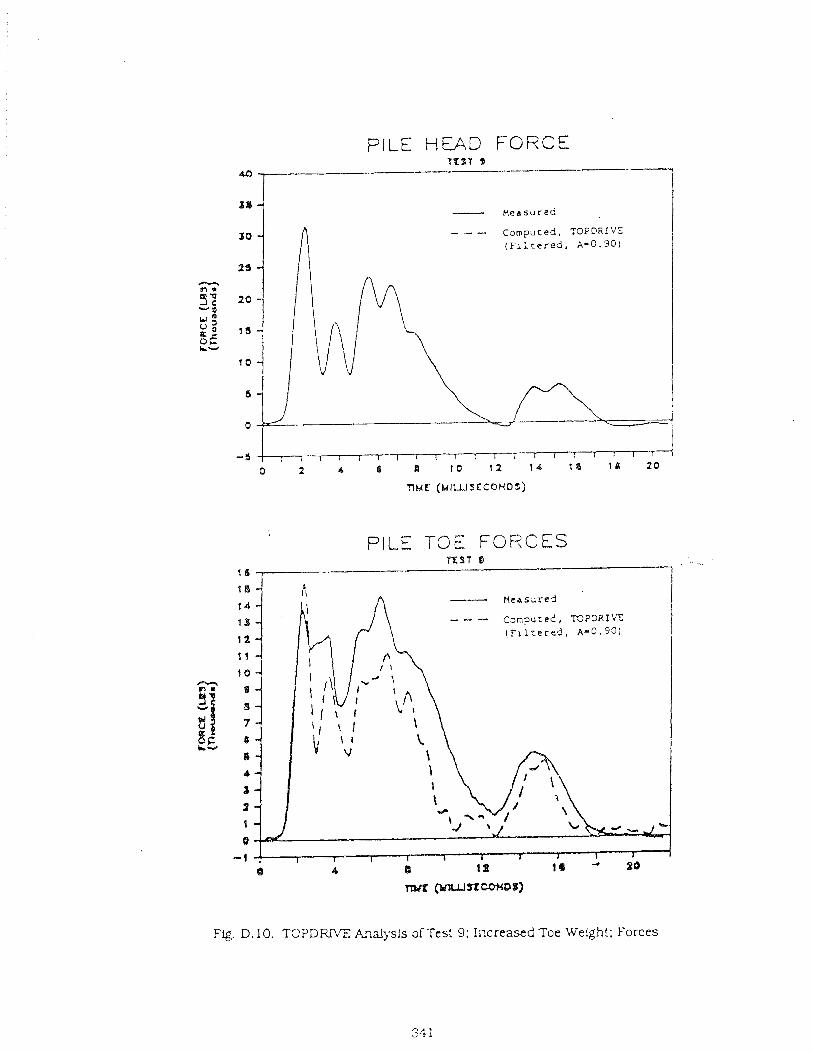
PILE TOE FORCES T X f T 8
I
nM (IdtU,1O]ICMdDB)
Fig. D. 10. T C P D R W Analjsls of Test 9; Increased Toe We!ght: Forces
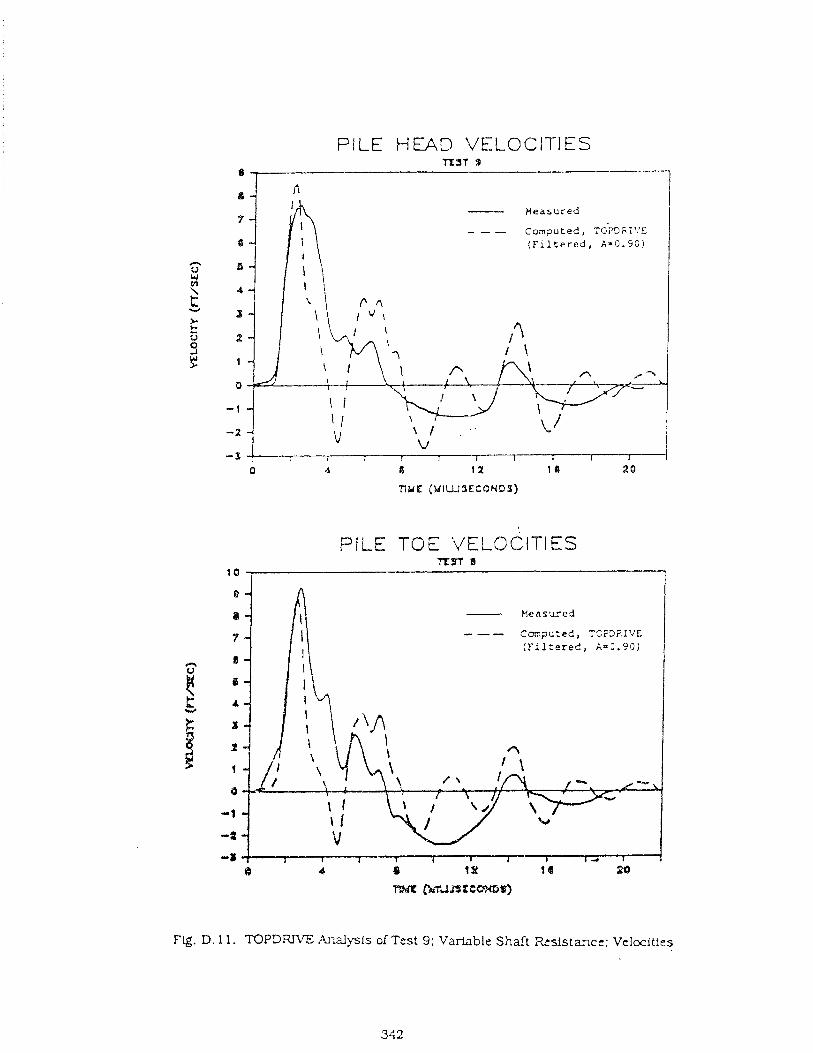
F I L E HE3D VELOCII-IES R S T 3
8 , 7- I
FILE TOE VELOCITIES Trn s
10
€3
1 - Measured
I - - - C c ~ ~ ? U t e e , TZT32IVF. (Filtered, kx2.90)
(I
B
4
I
2
I
a - 1
-2
- 0 i3 4 B 1%
mfa g.a?L1azcmfl
~ g . D. 11. TOPDW'C, Xnalys1.s of Test 9; \'artable Shaft ,~ s l s t z?ce : Velocitks
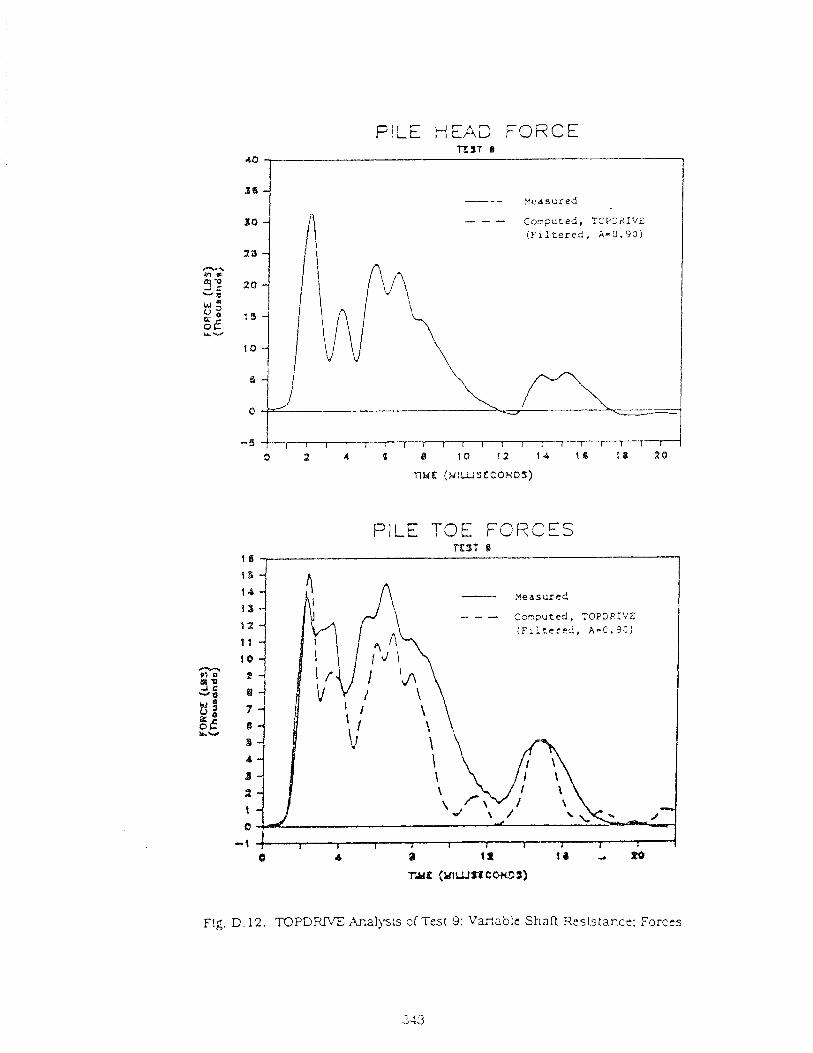
PILE TOE FORCES TEST I
1
FILE HEAL) FCIRCE TBST 8
40
Flg. D. 12. TOPDRIVE Ana1)sL.s 31Test 9; Vazable Shal? Rcslstance; Forces
sr) - Heasured
- - - Computed, T S P 2 A i V E
( F r l e e r e d , A-0 .90 )
2. a
10
a
- J , ~ i r i i i i i ~ r ~ ; i l t r r r l r
0 2 4 1 10 12 14 18 I1 40

PILE hEAD VELOCiTlES
PILE TCE VELOCITIES
- -. - Conput e l , ';,^P3RIVE: (FiLtereZ, A = C . S C )
Fg. D. 13. TOPL)FUVE AIX@,~'s of Test 9: Increased Toe Weight and Variable Shzft Resistance; Velcc!tles
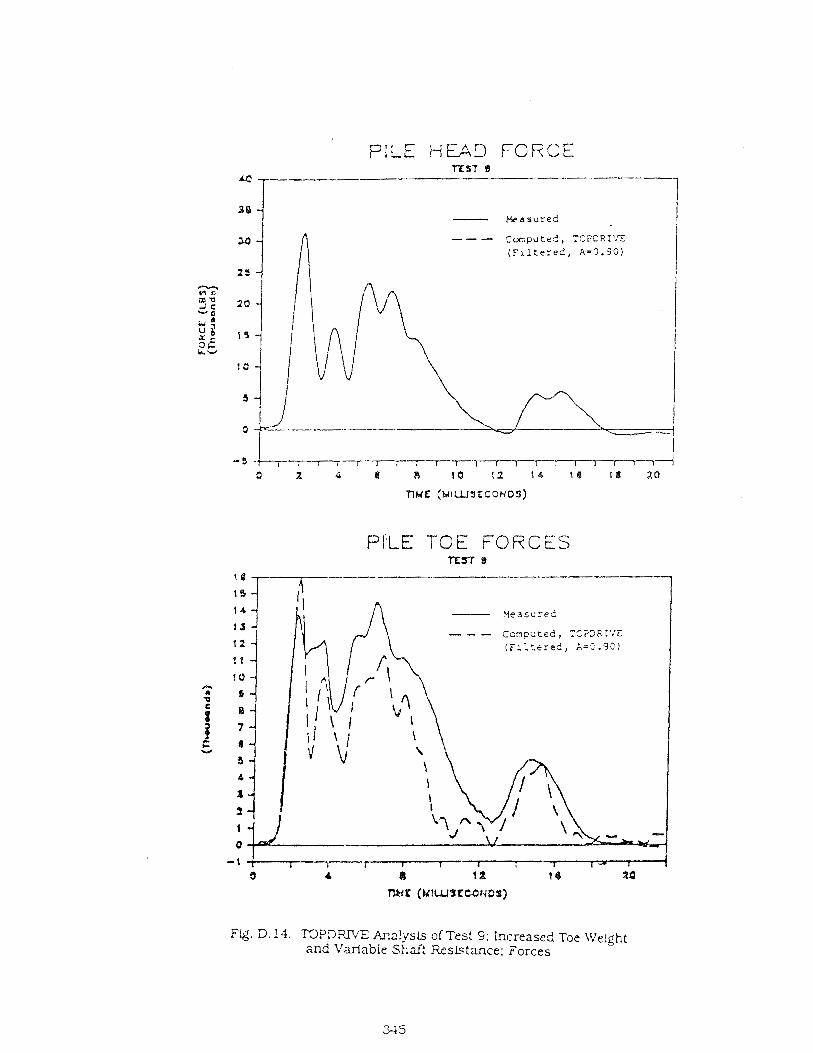
PILE H F O R C E TXST e,
"7- I
FM. 0.14. TJPDFXVE Ar?.a!ysis of Test 9: Increased Toe Weight 2nd Variable S h d t Resistance: Forces
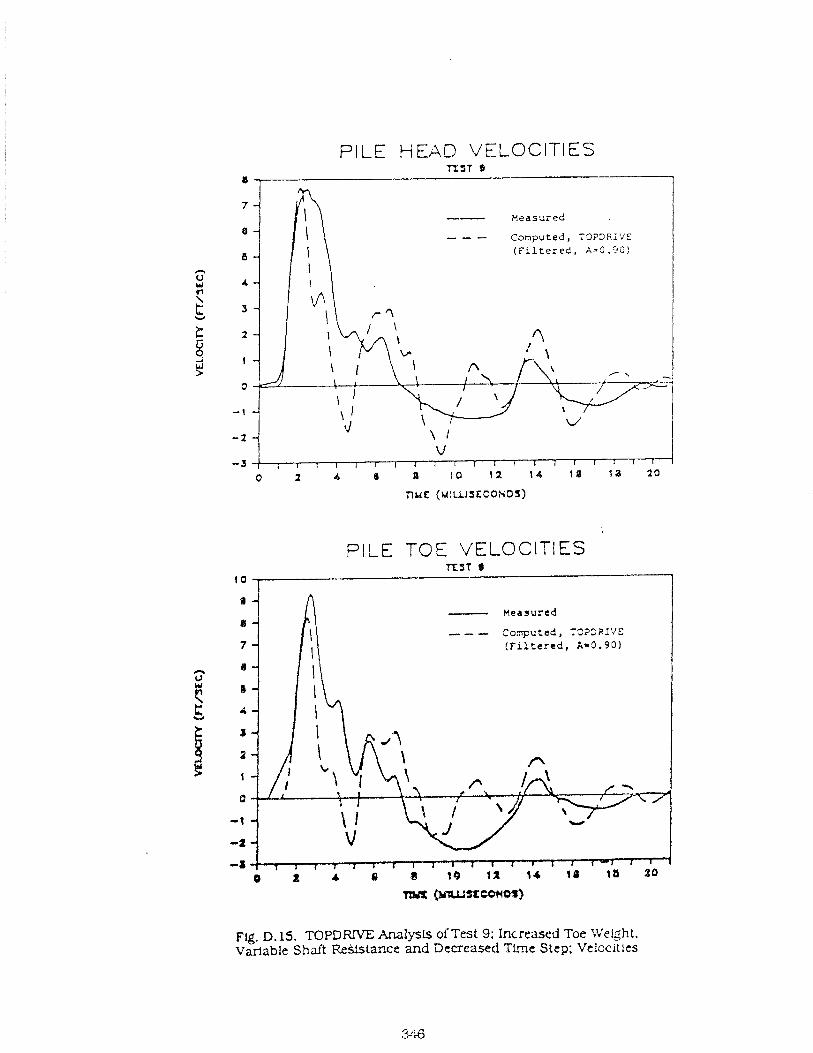
PlLE YEAD VELOCITIES
-- M e a s x e d
--- Computed , T 2 P 3 R i ' J E
( F i l t e r e d , A - 3 . 9 0 )
4 -
- 1 -
PlLE TOE VELOCIT1ES
- - - Coqnputed, :O?>RI'JE (Filtered, A = 0 . 9 0 )
F@. D.15. TOPDRNE Analysis ofTest 9; Increased Toe Welght. Varfable Shaft %Sfstance and Decreased TL-e Step; Veiccities
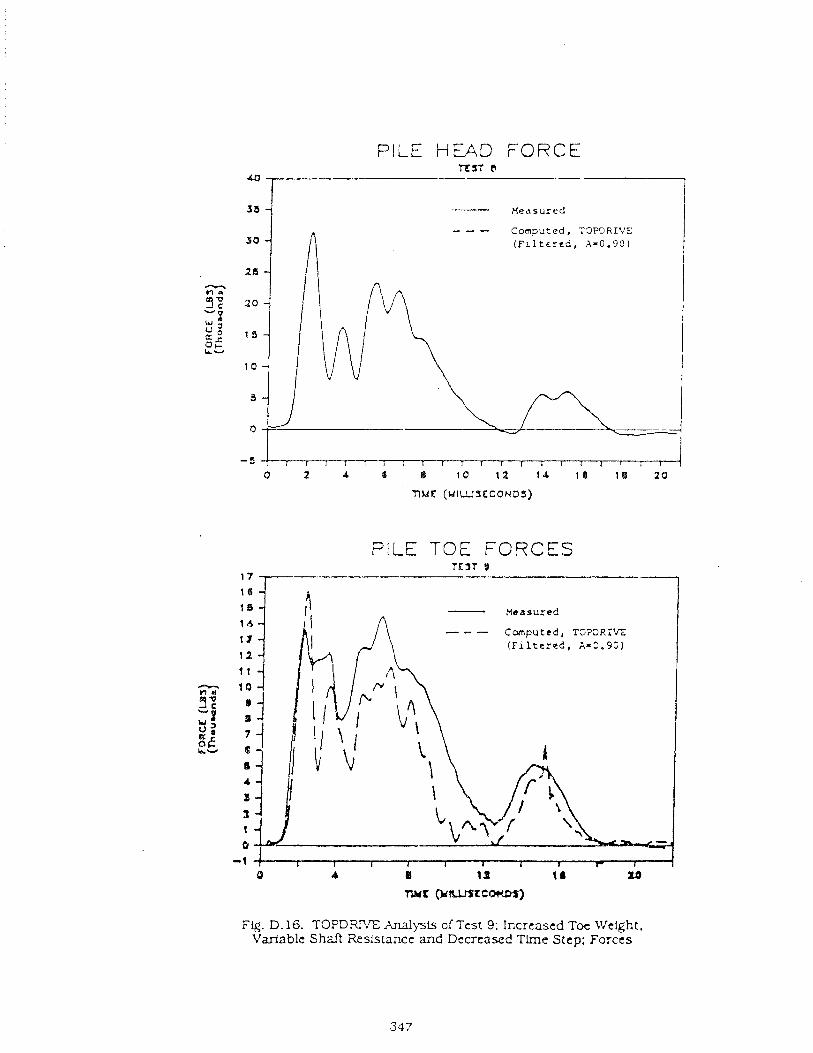
FILE HrAD FORCE
Measured
Fig, D. 16. TOPDRPJE Analysis of Test 9: Increased Toe Weight. Variable S . h d 2s:srance and Dccrcaxd Tlme Step: Forces
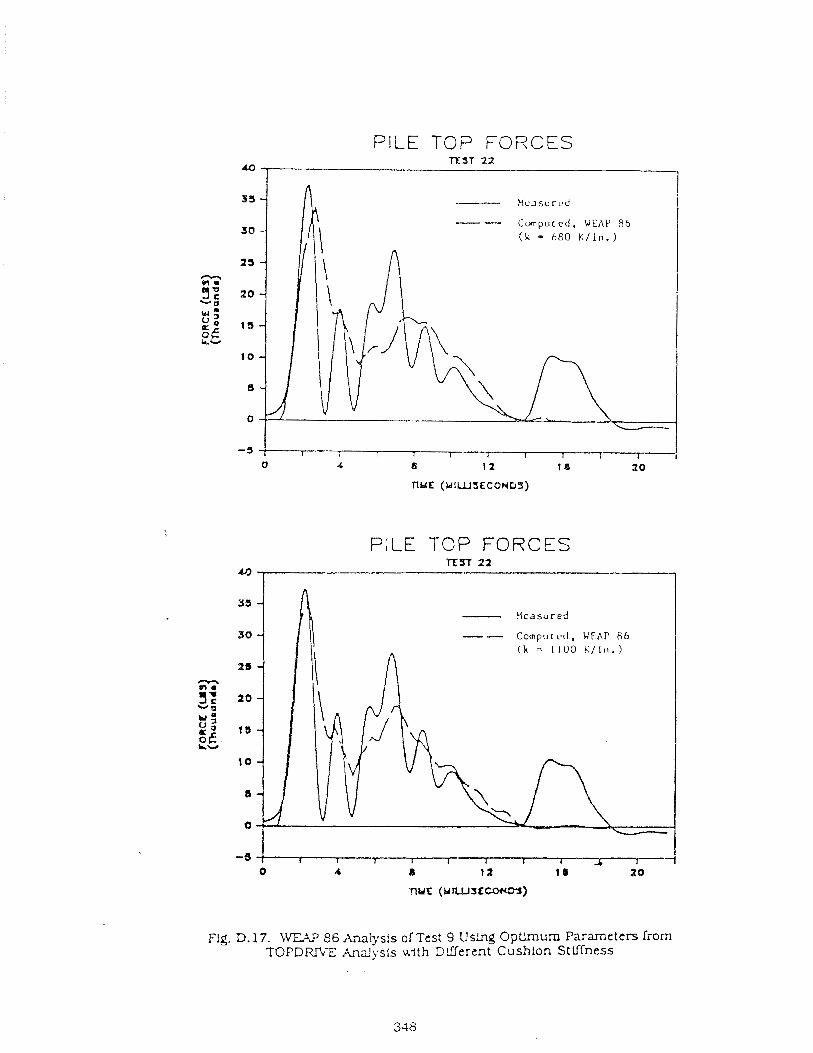
PlLE TOP FOZCES
PlLE TOP FORCES 22
1
i I 1 I 1 1 I I 1 1 0 4 I 12 18 2 0
J
nur (ufu~3ccocolr)
Flg. D. 17. i C W 86 Aaalysls of Test 9 U s a g Optlmum Parameters from TOPDF3VE Analysis wth Dffferznt Cush!on Stllfness
STATIC LOAD TESTING AW FXZL'URE LOADS
This appendix describes briefly the procedures used to conduct the staUc l o a d i ~ g
tes t s , which were performed In conrlection with the "capacity" tes t s on vibro-driven
piles, vihro-driven ptles ~srith restriking and impact-dr:ven piles described in tables 1 . 1
through 1 3 (static load-movement relations are presented in Chapter 4) and discusses
the interpretation of failure loads.
T ? s ~ lnP Procedures
The following testing protocol was folloureY:
a . JV+.ile the pile was sitting vertically on top of the sand column, unstressed
e.uce?t for Its own dead weight. all s train gages, pressure cells and load cells were read.
These readings constituted the zeroes for all static rest data. so ;hat all data taken alter
installation and during static testing contain the eflects of residual s tresses that emsted
In the pile al ter installation. The instrument leads remained connected to the s tat ic
da ta scanner. a s well a s the dynamic da ta acquisition sys tem, from the time the
predrlve zeroes were taken throughout lnstallation and testing, slnce the s tat ic da ta
acquislCon system scanner a n d microcomputer had a very 'nigh electrical impedance
and did not therefore sect the performance of the dynamic d a t a acquisition system.
b. Once the pile had been drh..en to its full penetrat!on, the lrnpact hammer or 4
~:bro-d;ivcr was removed. and the pfle head was recoxrlgared for static testing. Th!s
s tep included. fist. the r e a d k g of all instruments to check operability wi:h the s tat ic
da t a acquhit ion system a d then the remcval of the articulated connection (vibratory
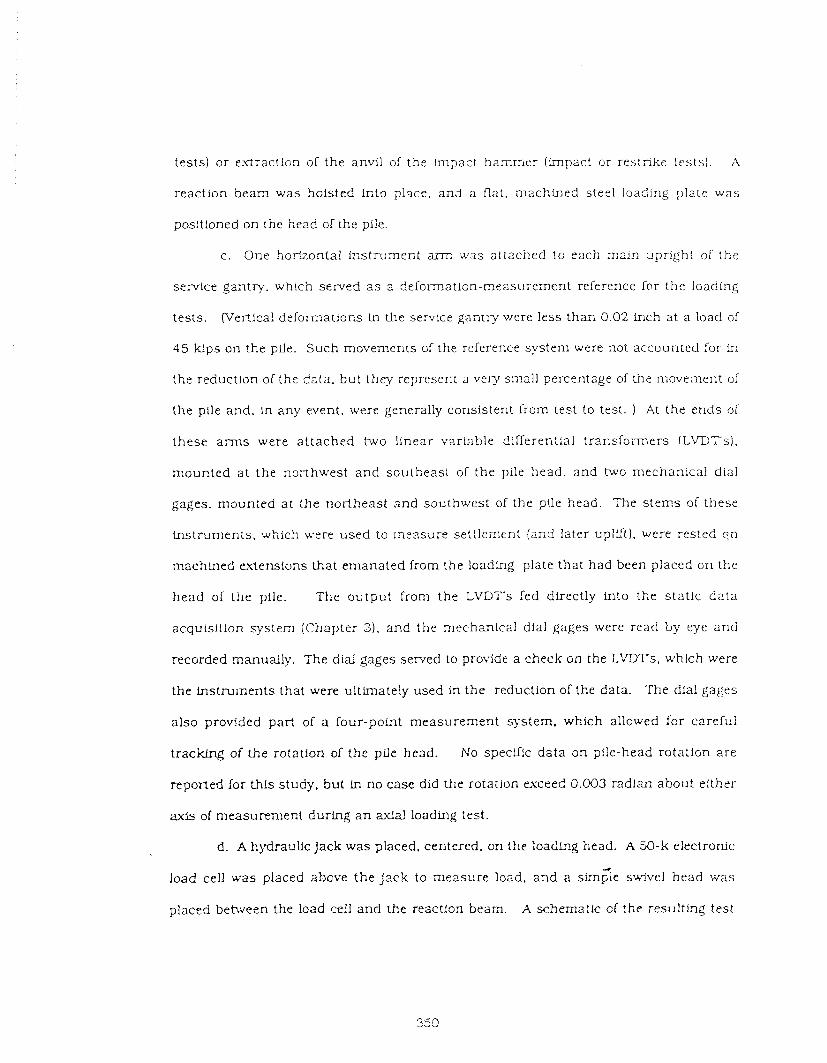
tests) or e.xtractiGn of the anvil of the Lmpact hammer (lmpac! or restrike tests) . A
reaction beam was hoisted k.to pl3ce, a n 3 a flat. machined steel loading plate was
positfoned on the head of the pile.
c. One horfzontal instrument arm w a s attached to each rr,ain uprlght of the
service gantry. which served a s a deiomation-measurement reference for the loading
tests. (Ver?ica! deformations in the service gantry were less than 0.02 inch at a load of
4 5 klps on the pile. Such movements of the reference system were not accounted for !n
the reduction of the data. but they represerit a very small percentage of tne movement of
the pile and. in any went . were generally corlsistent from test to test. 1 At the ends of
these a r m s were at tached two linear variable dirreren::al transfoimers fLVDT4s).
r n o u ~ t e d at the northwest and southeast of the pile head, and two mechanical dial
gages, mounted at the northeast and southwest of the pile head. The s tems of these
tnstruments. which were used to rneasure se t t len~rnt (and later uplift), were rested q n
machined extensions that emanated from the loading plate that had been placed on the
head ol the pile. The output from the LVDT's fed directly into the stat ic data
acquisition system (Chapter 3 ) . and the mechanical dial gages were read by eye and
recorded manually. The dial gages served to prohqde a check on the L'DTs, whlch were
the ins t ru~nents that were ultimately used in the reduction of the data. The dial gages
also provided par: of a four-point measurement system, which allowed for careful
tracking of the rotation of the pile head. No specific data on p!le-head rota:ion are
reported for this study. but in no case did the rotation exceed 0.003 radian about either
axis of measurement during a n a..al loading test.
d. A hydraulic jack was placed, centered. on the loadlng head. A 50-k electronic
d
load ceii was placed above the jack to measure load, and a simple swivel head was
placed between the load cell and the reacuon beam. A schematic of the resulttqg test
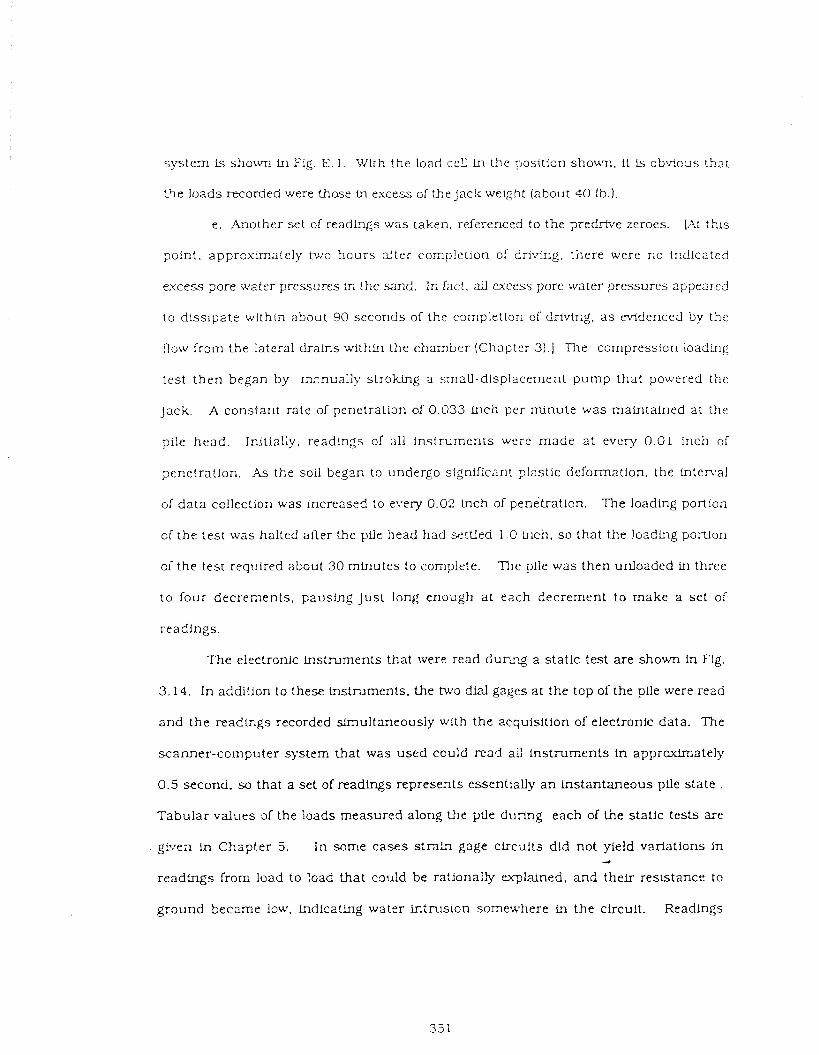
system ls shown Ln Fig. E. 1 . With !he load celi in the 3osttion shoun. it is obvicus tha t
tFle loads recorded were those In excess of t h e jack weight (about 40 Ib.).
e. Another set of readhgs was taken, referenced to the predrtve zeroes. bt this
point, apprcximately hvo hours alter completion of driving, tilere were no iridicated
excess pore water pressures ~n the sand. In fact, all excess pore water pressures appeared
to dissipate withtn about 90 seconds of the completion of d r fv i~g . a s evidenced by the
flow from the lateral drains within the chamber (Chapter 31.1 The compressicn loading
test then began by rnznua;ly stroking a small-displacement pump that powered the
jack. A constarlt rate of penetration of 0.033 lnch per minute was maintained at the
pile head. Initially, readings of all instruments were made at every 0.01 inch of
penetra tlon. As the soil began to undergo significant ylastic deformation. the internal
of data collection was increased to ex-ery 0.02 inch of penetration. The loadlng portion
of the lest was halted after the pfle head had settled l . C lnch, so that the loadlng portlon
oi the test required about 3 0 minutes to complete. The pile was then unloaded in three
to four decrements, pausing just long enough at each decrement to make a set of
readings.
The electronic lnstruments that were read d u q a static test are shown ln Fig.
3 .14 . In addillon to these instruments. the two dial gages a t the top of the plle were read
and the readings recorded simultaneously with the acquisition of electronic data. The
scanner-computer system that was used could read ail tnstruments in approxtmately
0.5 second, so that a set of readings represents essentially a n instantaneous plle state .
Tabular values -sf the loads measured along the ptle during each of the statlc tests are
g!ven in Chzpter 5. In some cases strain gage clrcuits did not yield variations ln 4
readings from load to load that could be ratlonaify explained. and their resistance to
ground became low. lndicatlng water intrusion somewliere in the clrcult. Readlngs
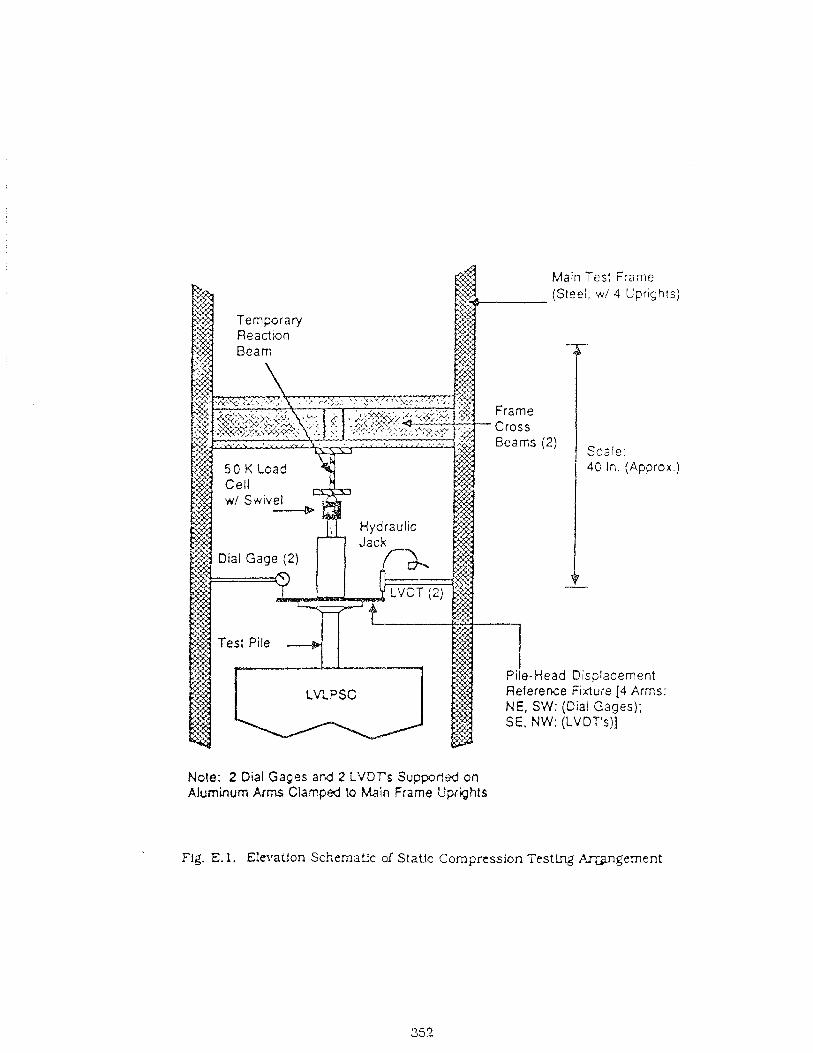
Main Test Frame (Stoel, w i 4 Uprights)
e Fixture (4 Arms: NE, SW: (Cial Gages); SE, NW: (LVDT's)]
Note: 2 Dial Gages and 2 LVDTs Supponed on Aluminum Arms Clamped to Main Frame Uprights
Flg. E. 1. E!oTaUon Schem3Uc af Static Comprcssion Testing Aqpgemen t
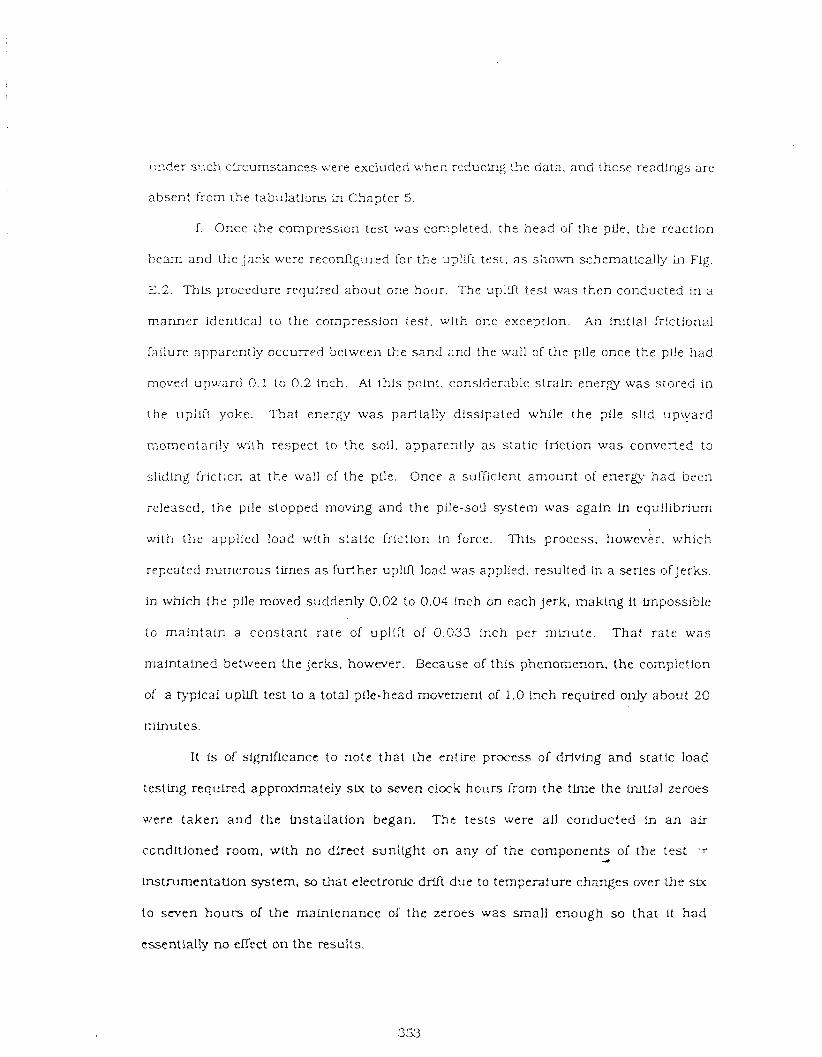
under s31ch ckcumstances were excluded when reducing the data. and those readings are
absent from the tabulations in Chapter 5.
f. Once ;he compression test was con:?leted, the head of the pfle. the react1011
beam and the jack were recorfgured for the uglifr tesr, a s shown schematically in Fig.
E.2. This procedure required about oze hour. The uplLft test was then conducted !n a
mariner identical to the com?ression test, with one exception. inn initial frictional
failure apparently occurred betweel; the sand and the wall of the plle once the pile had
moved upward 0.1 to 0 .2 lnch. At this polnt, considerable strain energy was stored in
the up;ift yoke. That energy was partially dissipated while the pile slid u p y a r d
momentarily with respect to !he soll, apparently a s static friction was converted to
sliding friction at the wall of the pile. Once a sufficient amount of energy had been
released. the pile stopped moving and the pile-soil system was zgain in equilibrium
with the applied load with static friction in force. This process, howevLr. which
repeated numerous times a s further uplut load was applied, resulted in a series ofjerks.
in which the pile moved suddenly 0.02 to 0.04 inch en each jerk. making it impossible
to mai r~ ta ln a constant rate of uplllt of 0.G33 inch per minute. That rate was
maintained between the jerks, however. Because of this phenomenon, the completion
of a typical upllft test to a total ?fie-head movement of 1.0 Lnch required o1G-y about 20
minutes.
I t is of significance to note that the entire process of driving and static load
testing required approximately six to seven clock hours from the time the Lnltial zeroes
were taken and the installation began. Thc tests were all conducted in a n a i r
ccndltioned room, with no direct sunlight on any of the components of the test - r 4
Lnstrumcntation system. so that electronic drift due to temperature chcmges over the six
to w e n hours of the maintenance of the zeroes was small enough so that It had
essentially no effect on the results.
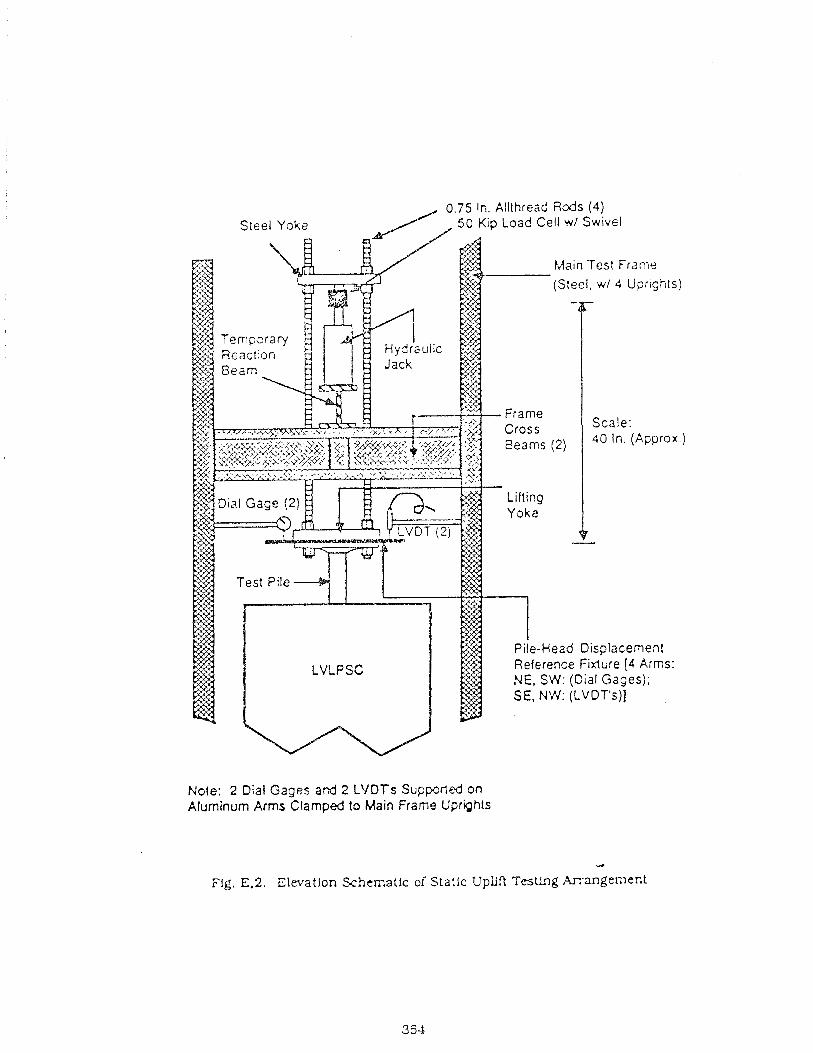
0.75 In. Allthread Rods (4) Steel Yake ip Load Cell wl Swivel
?.,lain Test Frame (S~eel , w/ 4 Uprishts)
Note: 2 Dial Gages a d 2 LYDTs Suppcrted on Aluminum Arms Clamped to Main Frame Uprights
4
F!g. E.2. Elevation Schematic of Statlc UpiLft Testing Arrangement
] n { y x r r t a : ! ~ n 3: F;?i!::r=J6:32,
Although the term "capacity" h a s been used loosely in the p r ~ c e d i n g section to
descrlbe the general t rends in :he test ing pr-ogram. precise deSinftlons of failure or
lbn-i!tLng :oads are cot readi!y obvious in the load-movement relat!onshlps presented In
Figs. 4 . 2 8 - 4.43 Thttrt,'ore, s-eral d r f i d t l o n s of lailure have S t e n employed and
compared In tabular iomi kn Chapter 5 for each of [he s tat ic load tests. Five methods
are pi-opcsed to SeIir~e slatic f a l l ~ r e load from the !oad-settlement data . In order to
eniploy t h c ~ e deTini:!ons, load-movement relations with co r i t l nuou~ ly ."?arying slopes
a;: required. \\"nere s ~ . ~ v t o o t h pa t te rns de~ieloped durIng a tes:. contLrluously sloping
cu rves were interpreted by ta-klns the upper emrelope to t he sawtooth curve. The
methods are s u r ~ n z r ~ , e 3 below.
(a ) The ofisel (or Davisson) method (1 1). tn which the iallure load is defined a s
t h e intersection o l t h e :!le-head load-movement curve a n d a line intersect ing the
nlovement axls ai a valu:: of 0.15 + 0.008338 Lnches (where B Is the plle dlameler) and
h a v b g a slope (movement/load) of L/AE where L, A and E are length. a-oss-sectional
area ancl Young's n:xlul~is of the plle material, respectively. LVhlle thfs method was
developed fcr ti.,? Interpre(al1on of compression loading tes t s , it h a s a!so been applied
In this s tudy to :he interpretztion of uplilt loading behavior.
(b) ?he slope (or Nordlund) method 112). where f d u r e Ls de fhed as the polnt on
load-movement cum? 2: \xh!ch i ts slope is 0.05 inch/ ton.
(c) The !vi.iazur'dtr$iia n-e'hod (1 1). which assumes tha! the load-movement curve
1s parabolic a t id lure . h set of load va lues are found from a correspondtng set of
equaliy spaced pile-head movement values that a re arbitrarily chosen. A 45' line is
d1-a- fro.- each Icad value on the load axis to intersect with a lin? drawn parallel to
[he movernext =is at the xext larger value of load . These fntersections a r e joined by a
straight line which Lqtersects the load That intersection is defined the izi!ure
load.
(dl Failure ioad defined a s the load corrusponding to a pile-head movement of
O10B.
(el Failure load deflned a s the !oad c o r r e s p o n d ~ g to a pile-head movement or
1 .O inch (0.25 B).

MPESDIX F
'USER'S ,%.4,XdAL iL'L1) LXSTPiG O F PROGRAM UH-WBRO
Th i s appendix d i scusses the r e q u ~ r e d information a n d i n p u t paran ie te rs ro
:lna!yse vibro-driven disp1ncemer;t pGes in sa tura ted s a n d using UW-WBRO interact::.:
progrzm. A 1istir.g oi the prognrn is &so provided.
T?le program Li-I-WBRO is written in FOR?%Y language a n d is ready to be used
i n IHhI PCs o r IBA1 compa[ibies. Input da ta can be entered with ei ther integer. or reai
m o d e s if no speciiication 1s made and they a r e not Ilrniied by a n y Mnd of iornlat.
I lowever, integer number is required If Integer mode is specified. Ou tpu t is optiorlal and
corisisis of t h e histories of pi!e acceleration, velocity and d isp lacement which a re
required to he specified in dmerent files unde r dirferent file n a m e s . Dimension of t h e
variables h the prograrn is se t u p fc;r output slgnal u p t o 520 d a t a pofnts. If more data
poh-~ts a re required. the dimenslorn of the variables in the program have to be changed.
The m p u t is compieted by answertrlg t he following ques t ions in sequence (9
m e a n s quest lon appearing o n the screen and the values used in this s t ~ ~ a y a r e gieren in
parenthesis) :
CJI : m R m UPVER LrMrr OF ??P6E IF(TEX;RATION (sec) :
Ente r ;he required time lirrcit (Fn seconds) for analysis.
(0.5 second In this study).
92 : E;'NF,R rTvTlxM??ON STEP (sec) :
Ente r the rime kcrernent (;n seconds).
(0.000976562 second in this s tudy) .
93 : GVTER THE m I G Z 0% P!LE (Ib) :
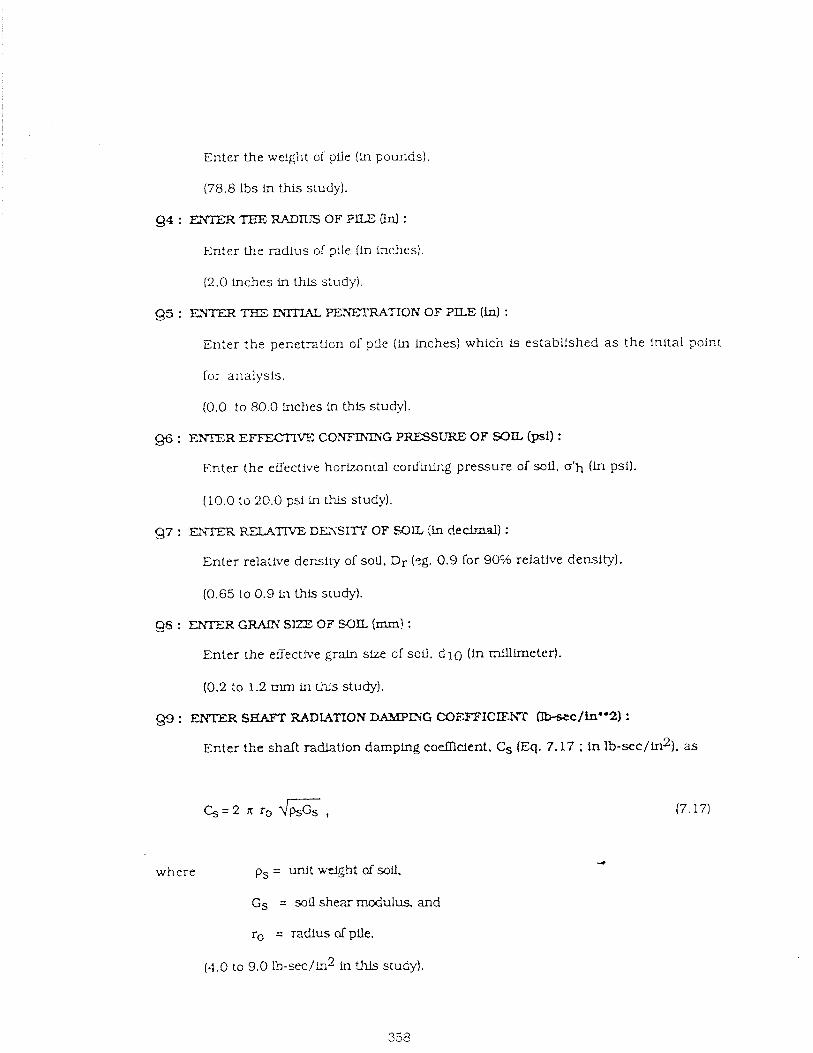
Enter the weight of piie (in pounds).
(78.8 lbs in this study).
94: ENTERTKETiADrUSOFPLllEw:
Enter the n d l u s of pile (in inches).
(2.0 inches in this s:udy).
Q5 : ENTER TEE DXMi1L PEXETRAXOIV OF ?EE (4 :
Enter th:: penetration ol pflc (a inches) whicn is established a s the Wta l point
for analysis.
(0.0 to 80.0 lnches in this study).
CJf3 : ENTER EFFECTTVE COhCTNIPiG PRESSURE OF SOIL @sl) :
Enter the effective horizontal confining pressure of soil, o'h (Fn psi).
(10.0 to 20.0 psi in this study).
97 : E ~ T E R R E t A m DLriSXTI OF ,SOL (in decim.11) :
Enter relative density of soil, Dr (eg. 0.9 for 90% relatjve density).
(0.65 to 0.9 Ln this study).
g8 : E . ? ? GRAlS SIZE OF fjOL (mm! :
Enter the effective graln size of soil, d l 0 (ln mllllmeter).
(0.2 to 1.2 mrn in this study).
gs : 33TER S m RADXATZON DAMPING COE1FFICILNT IIbsec/in"2) :
Enter t.he shaft radiation damping coefilcient, Cs (Eq. 7.17 : in lb-sec/ln2), as
where ps = unit we+t of mil,
Gs = sou shear modulus. and
ro = radius of pile.
(4.0 to 9.0 lb-sec/~q~ In this study).
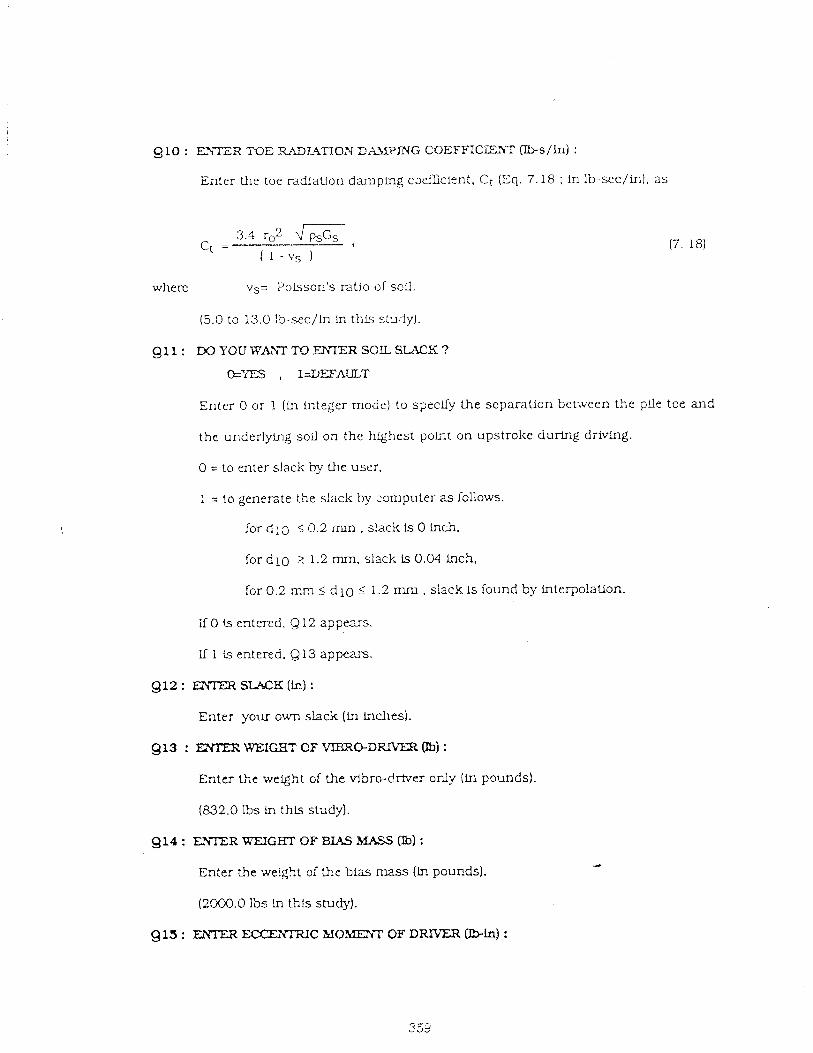
910 : E A T E X TOE .FL.IDL4TXON DA?d??MG COEFFICiEXT W/h) :
Enter the toe radiation damping c~eTicient, Ct (Eq. 7.18 : trl lb-sec/in). a s
wherc vs= Potsson's ratio of sou.
(5.0 to 13.Q Ib-secjln in thls ctudy)
Enter 0 or 1 (ln integer mode) to specify the separation beraeen the pfle toe and
the underlying soil on the highest p o k ~ t on upstroke during driving.
0 = to enter slack by the user.
1 = to generate the slack by computer as follows.
for d l 3 -< 0.2 m . slack is 0 inch,
for d l 0 2 1.2 mm, slack is 0.04 lnch,
for 0 .2 m 5 d 10 5 1.2 rnm . slack is found by interpolauon.
X 0 ts entered. Q 12 appears.
If 1 is e ~ t e r e d . Q 13 appears.
912 : E3TER SLACK (fr-1:
Enter your own slack (Fn inches).
913 : E-XEX WEJCST OF VE3R0-DRIVER (Ib) :
Enter t\e weight of the vlbro-driver only (hi pounds).
(832.0 Ibs in thLs study).
914: E ; ~ ~ R ~ G H T o F B I A ~ M A S S C ~ ~ ) :
Enter the welg5t of the bias mass (h p c u ~ d s ) .
(2000.0 Ibs In tNs study).
915 : ENTER ~ * ~ C M0.MEZ-r OF DF2rvER Win) :
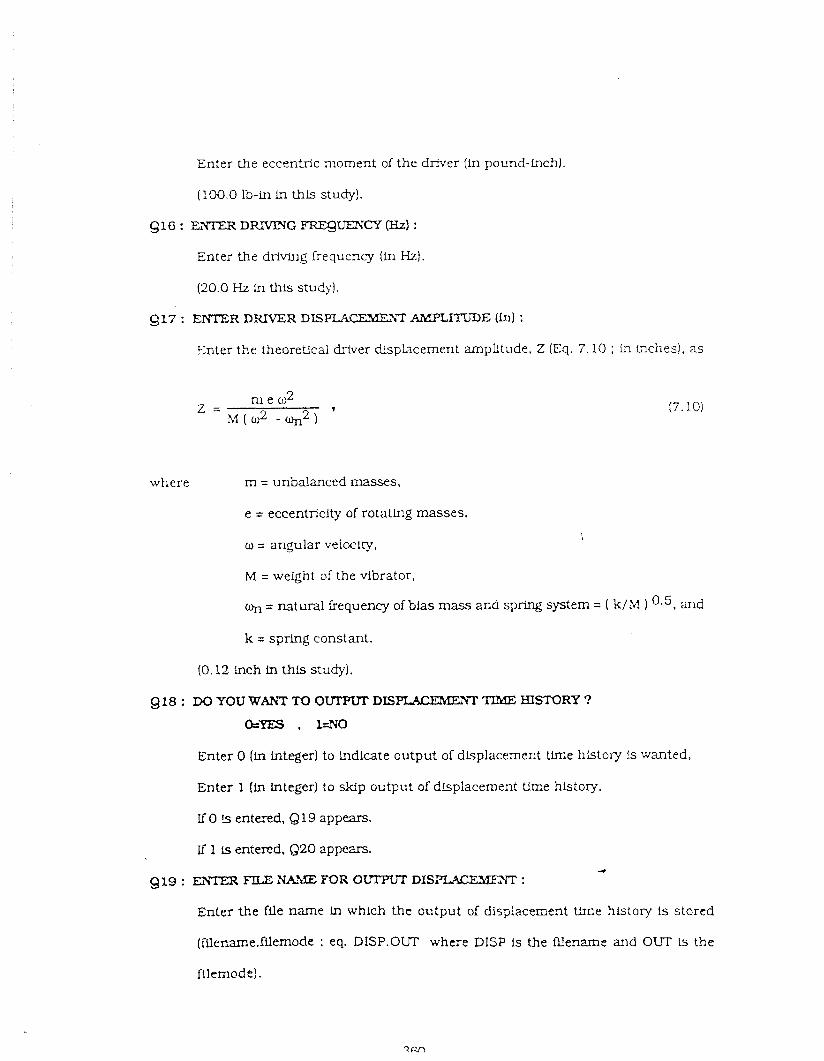
Enter the eccentric moment of the driver (ln pound-inch].
(100.0 lb-Ln in this study).
916 : EYTER DRIVING mWCP W ] :
Enter the drlvlng frequency [in Hz).
(20.0 Hz in this stuciy-I.
9 17 : ENTER DfiIVER DIS-T .UEPLIm70E (in) :
5nter t l e theoretical driver displacement mpl i tude. Z (Eq. 7.10 : in bches) . as
where m = unbalanced masses.
e = eccentricity of r0taUr.g masses.
o = angular velocity,
M = weight of the vibrator,
yl = natural frequency of bias mass and spring system = I k/M ) O s 5 , and
k = spring constant.
(0.12 inch in this study).
g 18 : DO YOU WANT TO OUTPUT DIS- T I X E ElIS?'ORY ?
ePES , k V 0
Enter 0 (in integer) to indicate output of displacement tlme hbtoly !s wanted,
Enter 1 (in integer) to skip output of dbplacement me history
If 0 s entered, Q 19 appears.
If 1 is entered, G20 appears. 4
919 : GNTER FTX;ENk?UE m R O L m DKSAPL%EZZ.EXT :
Enter the file name in which the output of displzcement W,,e history is stored
(Nename.fflemode : eq. DISP.OUT where DISP is the W e n m e and O L ! is the
filenode!.
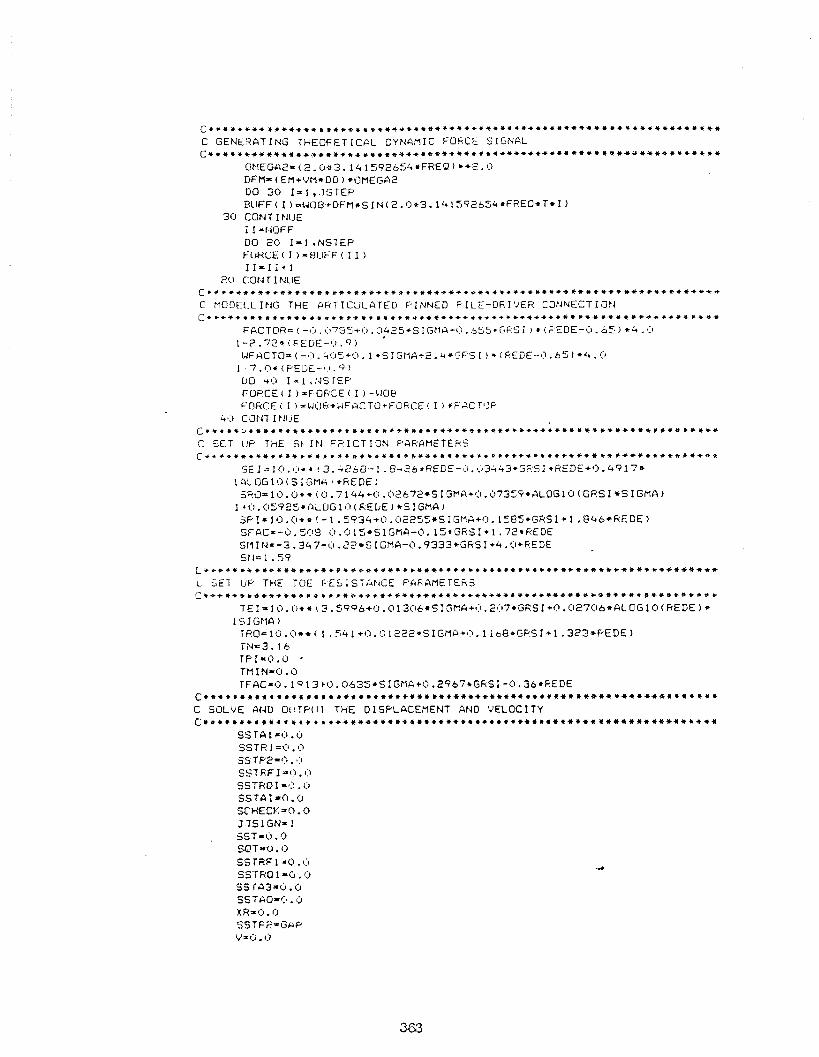
C ~ * + r + + + + r + + + + + + + * + + ~ * ~ ~ + + + t + + * r ) o + I I * + + * + * * o + + + * + + * + * + + * + + * + + * + + + + ~ * * * * +
C GENE8AT I N G THEOFET ICAL DYFI4MIC FORCE S I G N A L C l + t + * + * + + 4 1 ~ + ~ . ~ + + + * + * * d * * t + + + + Q 4 * + + t t I ) t + + + * * * + + + * * + + * * * Q * * * + V + * * + * * + * *
ONEGU2= ( 2 . 0 c 3 . 1 4 1 5 9 2 6 5 4 * F R E Q ) *+2. C? ~ f l = ( E f l + V f l * D D ) * U M E G A 2 DO 30 I = 1 ,.JSTEP P1IFF(I)~~0B+DFfl~SIN(2.0*3.141S92654*F?E0*T*1~
30 C O N 1 IFIUE i I= l4QFF DO 20 111 .NSlEP F G R C E ( I ) = B C I F F ( I I ) I I = I i + l
?cl CON r I NlIE Cl++++r+rs4a,++++**+1***+t++***a++*+++*++,**++b++*+E***+*+***+*+@+++*++
C flO!lEL-L I F I G THE A R T I C U L A T E D P I N N E D P I LE-Dt? I ' JER CONNECT IOFd C * ~ t + * + * t * * r * * * * * t * ~ + * * + * * * + * * + * * * * + * * * * + * ~ * ~ + ~ * + + * * * * * * ~ + * * + * * * * * * ~ * * *
F&CTOR= ( -<:I .<1755+0 . C I ~ Z ~ + S I G : I A + O . 5 , 5 5 + G F S i , + i FED€-<). 6 5 ) *L t - 1 1
1 -?. 72% i F'EDE-i:l. 9 )
WFACTOx (-43, j1 :15+i t . 1 *S IGf lA+2 .4*GF.S I ) *(RED€-c3, 6 5 ) * 4 . % 1 - 7 , 0 * ( F E U f - ' 1 . 9 )
DO 4 0 1 x 1 .lrlSrEF. F U P C E t I )=FORCE ( I ) - L I O P FORCEi I )=UOP*wFACTO+FORCE<I)*FACT~lP
4,:) COP17 I PJIIE ~ ~ t ~ + + ~ o + ~ + + + ~ ~ I b o ~ + ~ ~ ~ * ~ ~ C t ~ * ~ I ( ~ 6 ~ * + ~ + ~ o o * + b ~ ~ ~ * * * t * ~ ~ ~ * ~ + + + ~ ~ ~ * * b ~ ~ * +
C SET U P THE Sl. IF1 F F I C T I O N PARAMETERS ~ 4 1 ~ ~ ~ 0 + ~ ~ ~ 6 ~ ~ + ~ ~ t ~ r + ~ Q t ~ ~ ~ O ~ t ~ * ~ t ~ ~ t + ) L ~ D + + ~ ~ ~ ~ + ~ ~ + ~ + ~ ~ ~ + ~ ~ ~ * ~ ~ Q r ) + ~ ~ ~ ~ t
5E I = l Ct. <.I** ! 3 . 4 2 6 8 - 1 . 8 i 2 b r R E D E - 3 : 1 . : ,3443+GF:SI +FtEi)E+O. 4 9 1 7 s l A L O G l O ( S I G N 6 i I * R E D € ) SFd= 1 0 . 0 1 * ( 0 . 7 1 44+il. 0 2 6 7 2 ' S 1 5 M A + 0 . 0 7 3 5 9 + A L O G l O ( G R S I *S I GMA)
1 4 i l . O S 9 2 5 + A i O G 1 0 ( KELE 1 *S I G m A ) SF.I=1O.O+*!-l.5934+O.022CJS*SiGM~+O.15BS+GRSl+1.P46*REDE) S f A C = - u . 5 ~ ? 3 i~.Q15*5IGflA-O.l5*GHSI+l .72*REDE SfIIt4=-3.347+i1.2?*SIGMA-i7.9333*GRSI + 4 .Cl+FEDE Sti=l ..;9
~ * t + * * * t + * + + t * * * C * + O ~ + * r * * * ~ + ~ * ~ * ~ * + + ~ * I o * * o * * o * o + * + * * * + * + * * + * * + ~ + + * * ~ +
L 3 E 7 UP THE TOE F.ES1STAFcCE F'ARAP1ETEL'S C + ~ a * + ~ + s * ~ * ~ + + * + 6 ~ e Q b c I ( 4 t C * * ~ + ~ + + + + * + + + + + * t * + * + + + + * + * + 4 ~ i * + U E * * * * * t o * ~
T E I m 1 0 . i t + * ( ,7.599&+0.013C~6*SICM4+~:~.2<~7*GRSI+O. 0 2 7 0 & + A L @GlO(RECE ) * I k S I G M A )
If?@= 1 0 . 0 * + ( 1 . 74 1 + I > . 0 1 2 2 2 ~ 5 IG f lA+$? . 1 1 bB-cCPS I + 1 . 3 2 3 + F E D E )
TNr3. I 6 T P I = O . O , T M I N - 0 . 0 IFAC=0.1913~O.063S*SiGMA+O.2967+GRSI-O.36*REDE
C**.******.***i**.*+*++******t*t*~t**t+*ts+***+*********+********u**~++
C SOLVE At4U 0tITF.I IT THE D I S P L A C E M E N T AND 'JELOCI TY ~ ~ 1 0 + ~ ~ * ~ ~ ~ ~ 1 ~ l t B ~ + ~ * + ~ ~ ~ * * * * ~ * * + * * + ~ ~ ~ C b + * * + ~ ~ * 4 4 ~ * ~ ~ * * * * * * * * * ~ ~ * * ~ ~ V U
S S r A l = i ) . O SSTR I =<I. O 3STP2-15 . 8:) S S T K F I =O .0 S S T R O I = ~ 3 . 0 SSTA 1-0.0 SCHEC).:=O. 0 J 7SlGN= 1 351-v . 0 SOT =<I . 0 SSTRF 1 =0.0 SSTHQ 1 -G .O SS r A 3 4 . CI SSTUQ-O. O XR=O. O SSTF.?=GaP v=<:I . ( j
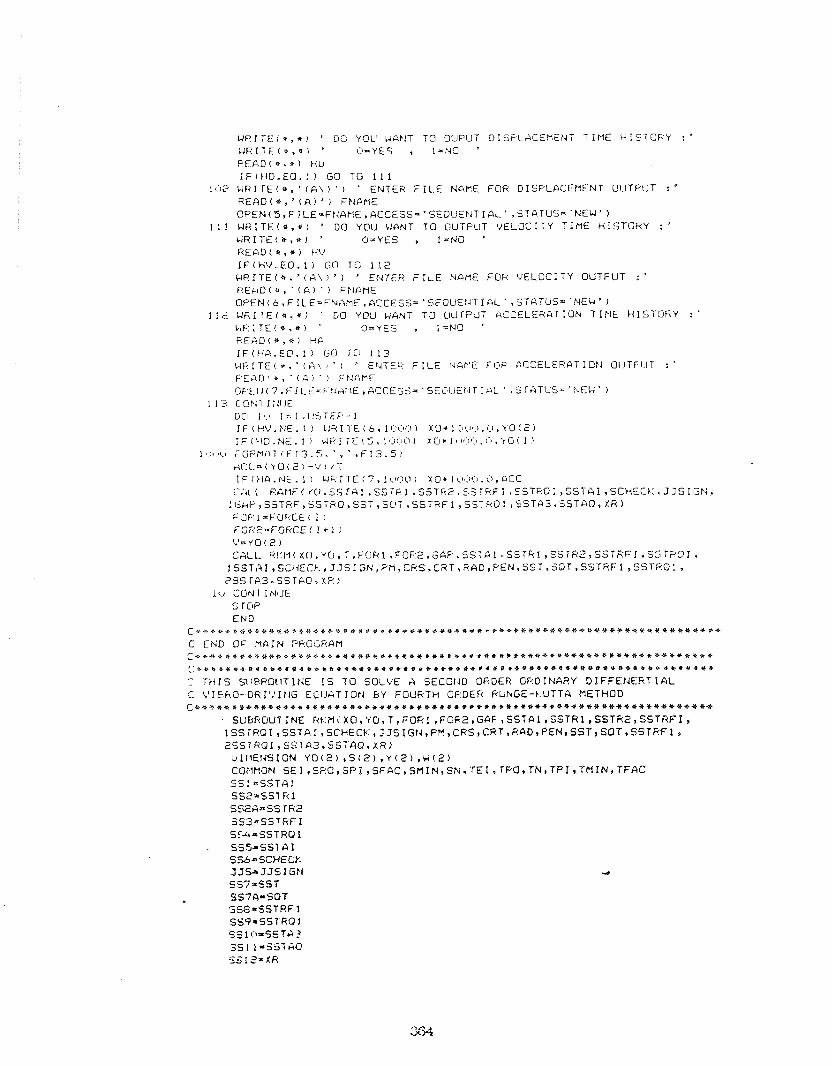
W R I T E ( s, 0 ) ' DO YOU WANT TO OUPUT D I 3 F L A C E M t N T T i V E H I S T O K Y : ' U R I l E ( * . a j ' O=YES , l = N O ' P E A D ( * , * ) H b IF(HD.EO.I) GO TO 1 1 1
lb.2 U R I T E ! * , ' ! A \ ) ' ) ' ENS€% F I L E NAnE FOR DISPLACEEENT OUTPUT : ' R E A D ( * , ' ( A ) ' ) FFIAME OPEN( 5 ,F ? L E = F t J A f l E , ACCESS- ' SEOUENT I Ai' , STATUSn 'NEW ' )
1 1 1 L I R I T E ( u , + ) ' DO YOU LIPNT TO OUTPUT V E L O C I T Y T I M E H I S T G K Y : ' U R I T E ( * , + I ' O=YES l = N O ' R E A D ( * , * ) HV I F ( H V . E Q . 1 ) GO TO 1 1 2 W P I T E ( e . ' ( A \ ) ' 1 ' ENTER F I L E NfiME FOR V E L O C I T Y OUTFUT : ' K E h D ( + , ' ( A ) ' ) FrIAME OPEN(b,FILE=FNAME,ACCESS='SEOUEf4TIACC,STfiTUS='N€W')
11 ; W f i I T E ( * , * ) ' GO Y O U WANT TO OUTPUT ACCELERATiON T I M E H I S T O R Y : ' WF::TE!v.*) ' O = Y E 3 , l = N O ' FEAD(*,al HA
I F ( H A . E O . 1 ) GO TCI 1 1 3 W R I T E ( + . ' ( A \ 8 ' t ' El4TEi i F I L E f . l&YE F i t ? GCCELERATION OIJTF1.IT : ' F f A D ' * , ' ! A j - I F N A F E QF.ElJ( 7 . F I L E = F t l A l l E ,ACCESS= 'SEi,LJEf.lT IuL ' . 3TATIJS.; 'NEW ' )
1 1 3 C GPll 1 :it I€
GCI 1 #.I I = 1 . I !STEP- 1 1 F ( t tV . PIE . I ) LJt3 11 E i 5 1 t:!l:ll:~ ) X C * 1 ':I<~#:I. <I , Y O ( 2 ) I F ( t l D .NE. 1 1 WP I T E ! 5 , 1ljt:lO) XG P 1 s.I~:~(:I. [:I, YE! 1
l ~ . ~ ~ ~ t . l P O 8 R A 7 ( F J 3 . 5 , ' , ' aF13.5) d C l . = i Y O < 2 ) - ' V l / T I F ( HA. Id€ . 1 1 biF: I TE ( ? , 1 i l r ? ~ 1 ) XO* 1 LI,:I<:I. ~ 3 , ACC
C:r( ( E&HF ( f C i . SS i A 1 . S S T F 1 . SSTFt2. SSTPF I .C,STF.O; SSTGI *SCHECE: J J S I G P i . : I J ~ P , S S T R F , S S T R O , S ~ T , S L ' T , S S T R F ~ , S S ~ F ~ O ~ , S S T d 3 . S S T A Q , X R ) F O R 1 =FORCE t I I FOR2=FGhCE( I + l ) C'= YO ! 2 ) C A L L H~:M!in,Y~,T,FGhl,FOF:;!,GCF,SSTAl.SSThl,SSTR%,SSTRFI.SST~OI~ ~ ~ S T ~ I , S C I ~ E C ~ . , J J S I G N , ~ ~ , ~ P S , C R T , ~ A D , P E N , S S T , ~ ~ T , S S T R F I , S S T R O : , ? 3 S f A 3 . S 3 1 A Q V X F ? )
Iv CON7 INlJE s r CIP END
C W * Q ~ Q C ~ ~ B + ~ ~ B ~ I B Q ~ B ~ E ) B ~ + ~ ) ~ + B + ~ ~ + + + + + ~ ~ Q - B * ~ ~ ~ ~ ~ + + + ~ * + ~ ~ * * + * ~ * ~ * ~ * * ~ ~ + ~ * C END O F M A I N PROGRAH C ~ o r r e s n a e a s ~ a + r ~ + a v ~ ~ e a 0 ~ 0 + e ~ d ~ ~ ( t e u v ~ + ~ ~ ~ a ~ e 0 u ~ + * ~ ~ ~ U e + * ~ ~ ~ ~ ~ u ~ ~ ~ ~ ~ % ~ ~
~ ~ s a ~ r ~ a e d r ~ ~ a e r r + s d u ~ a ~ ~ s ~ + t ~ ~ u b e ~ + c . ~ + 1 ) ~ # e o d e + e + e ~ u ~ ~ ~ ~ ~ ~ ) + u ~ ~ ~ 4 ~ ~ 0 ~ 4 ~ u
C T H I S 5 l l R P O l l T I N E IS T O SOLVE A SECGI4D ORDER ORDINAi iY D I F F E N E R T I A L C L ' ~ ~ k O - D R l ' , ' I t l G ECIJATIOPI 6'f FOURTH ORDER FiUkCE-k.UTTA PfETHaD C + I B B ~ B ~ ~ A ~ ~ B Q Q ~ ~ ~ ~ ~ + ( ~ ~ ~ O ~ ~ + + O + O + ~ ~ U ~ ~ O ~ + + ~ + + # ~ ~ ~ ~ ~ + V ~ ~ ~ ~ ~ ~ ~ ~ ~ ~ Q ~ ~ ~ ~ ~ + ~
SUbFtOUTINE Rt:MiXO,t 'G,T,FOF( l ,FOFt2,GAP,SSfAl,SSTRltSSTR2,SSTRFI, 1SSiRQI,SSTAI,SCHECYrJJS1GtJ,PM,CRS,CHT~RAT)tPEN~SST,SOT,SSTHFl, 2 S S I R O I , S S T A 3 , S S T A O s X R )
U I I t E I S S I O N Y O ( 2 ) p S ( 2 ) V Y ( 2 ) s W ( 2 ) COFIRON S E I s S R ~ , S ~ K ~ S F ~ C , S ~ I N , S M M M i E I ~ i F O ~ T N ~ Y P I ~ T H I N q T F A C SSI = S S T A l S S 2 = S S l R l S:G'A=SS TH2 S S 3 z S S T R F I S I 4 = S S T R O I
- EiSS~SS7 (11 S S = S C > I E C f . : JJS1JJSIGt l SS7=SST SS7AuSOT 593aSSTRFl SS4-SSTRQ1 S'j 1 ~ I = S S T A ~ 5s l 1-557 A 0 5; 121 iF (
DO ! I + : = I t 2 S(L:)=YO(K) YfK)=S(h) U(K)=S(I.:)
I 1 CONTINUE C;=o
F OR=FOR 1 C X L RAMF(Y.SS~,SS~,SS~A,SS~,SS~~SSS~SS~~JJS~GAP~STRFFVSTROQ~ 1SS7,SS7A,SS8,SS9,SS101SS11sSS12)
1 1 9 0 K=K+ 1 COCL EOUA(K,Y,F.STRFF,STF:OQ,PM,F@R,CRS,CRT,RAD~PEN) D = T * f u!t:)=u(k.)+Ll/e. Y(b:)=S(k:)+D/2. IF(E.LT.2) GO TO 1190 FOR=(FOR2+FORl)/?.9 I ..'.I SSl=SSIAl SS2=SS TR 1 - - > 2'h=SSl&,? 553=3S i i F 1 5S*=S'l F . 0 1 - .. L. ,-.2=S5 - rci I
> S o = S C H E C t . I.T;=J_?S I GI4 527=-;-;1 - -- :s :A=SGT SS6-SSTRFI 553=S;TF<Ol SS I O=SS1 A 3 33 1 1 =SS TAO SSlZ=XR CA4.L F.&MF!r'.SS1.SS;.,SS2A.SS3,SS4.SSS,SSarJJS,GAP,STRFF,STROO, ~ ~ ~ ~ , S S ~ A , ~ S ~ . S S ~ , S S ~ ~ I , ~ S ~ ~ , S S ~ ~ ~
127'1 t x t . + 1 CALL E O t i A ( r .Y.F,STRFi.STROQ,PM.FOF(.CRS.CRT.RAD.F'Ef.I) D=Tf fF
U O . ) = L J ( F ) + U J ~ . k4kJ.=S(k,)iDJ 2 . I F ; k . L 1 . 2 ) GO TO 12°C) FClR=(CCF.?*FORl ) / 2 . 0 t SSlmSSTAl S5FuSSTR I SS2A=SSTR2
, SS3-SSTRFI S5-r-SSTHO I 5 5 5 - S S T A I SS5-SCHECK JJS-JJSIGN SS7=SST SS7A-SGT SSR=SS T R F 1 SSS=SSTRQl SSlO=SSTA3 SSII-SSTAO 551?=XR CALL i?Ar!F(';.SSI rSS2.SS2A,CS3rSS4,SS5.SSb.JIS,GAP*STF.FF,STF(C3@r ISS7.SSiA,L~SS~SS9,SS10~SS11,SS12) 4
1 I+(-1 ! . = + . I 1 CALL EDUA(t',Y,F,STRFF,STROO,PMrFOR.CF:SrCliT,FtADrPEN) U p 1 *F U.t:I=W(k.)+~J/3. t ! i ) = 5 ! b ) t V
IFO:.LT.E) GLI TO 1340 FljF:=FQF;?

K-O SSl=SSTQl SS2=SSTH I SS2A-SS1 R 2 SS3sSSTRFI SS4=SSTRQl SSS-SSTA I SS5-SCHEW; J;TS-.~JSIG14 5S7=SST SS7Li-SOT SSE=SSI.S.C.I SS9=SSTf?O 1 SS13=SS1d3 SS11 =C,STUO SSI 2=ZR C U I PAi~F;Y.S51.SS'S~SS2AtSS3rSS.i,SS5rS56.ZJS,GAP,STFFFrSTFO@,
1 5 5 7 . S 5 7 A , S S 8 , S S ~ , 5 S l O , S S : 2 ) 142(.1 k =!:+I
A 1 ECil IC f t- . Y . F , S TRFF . SiF 'CO , Pf l ,FOP. CRS CRT. F:dD. PEI.1) c=t < F N i l ) = U O )+(1!6.
1F ( 1 - 1 1.2) GO TO 14F:i:)
@ ( I 12 i ~ 1 . 2 ' (0 i 1 ~ ) = W ! 1. )
12 CON; i 141 lE xn=xo+T F;ETCIRt,i EPlD
C + * * * * t + * + ~ * + w ~ * * * * + * * * + * * * + * + + I ) + * * * + * * + ~ * * * * * * * * * + ~ * * ~ + + + ~ * + * * ~ C THIS fUEcF.OCIT I N € IS TO CALCULATE THE St. IN AND TOE RESISTGFICE , Ct~+t.t**.*****~.I*+****~+i**wt***+**+***.*********R***********~*+*~+*~
SIJBROlllINE f?A~F!Y~STAl,STR!~STFi2~51RF~rSTFr@I~STAI~CHECl::,JSIGhi.GGF~~ 1SIRF.SrRO.SI . O T , S T R F l >ST3121 sSTG3-SrAOIXR) DlflEPISIClN Y(2) CiIEflOr4 SEI,5PO,S~I,SFAC,StlIN.St~l,fEI , T F C ! r T t . I , T P I , T M I N . T F A C STA2sY ( 1 ) C):I=STA2-STAI Ck.2=5TAl -CHECK CF.3-a : 1 *Cb.2 1F(Cb 3.GE.T) .0) G O TO 1 1 3 1 SlAI=STAl STROI=STRQl S rRFl-STRFl ?SIGN=-lrJ3IGN sr-0.0 QT-0.0 ! F ( J S I G ? J . E R , - 1 ) (30 TO 1191 XRmO. 0 CALL Nkfl(XR~ST,STRFI,SEI*SRO*SN,SPI) CALL ~H(XR,QT,STROI*TEI*TRO,TN,TP:) STR 1 =STA i -S7 STR2rSTGI - (?I I F ( S T R Q 1 .I E . o . 0 ) STR2=STR2+0AP STRO I=O. 0 STRF 1-0 .O
I 1 9 1 CHECK-STA~ S TA314BS ( S TA2-STA 1 +5T, IF(jSIGFI.EQ.-1) SfA3*48S(STfi2-3TAI) C N L RMS(STRF,STA3,SEI,SRQ,SN*SFvI) IF(JSIW4.E0.-1) GO TO 1104 I F ( S T A I . G T . S T R ? ) GO TO 1200 SlAO=AES(STA%-STAI+OT)-GAP [email protected]) 00 TO 1192 GO TO 1201
1200 Sl=-ABS(S?A2-STAI+OT)