dridietary reference intakes - National Agricultural Library
529
of Sciences. All rights reserved.
-
Upload
khangminh22 -
Category
Documents
-
view
0 -
download
0
Transcript of dridietary reference intakes - National Agricultural Library
Copyright © National Academy of Sciences. All rights reserved.
Copyright © National Academy of Sciences. All rights reserved.
A Report of thePanel on Dietary Antioxidants and Related Compounds,
Subcommittees on Upper Reference Levels of Nutrients andInterpretation and Uses of Dietary Reference Intakes, and the
Standing Committee on the Scientific Evaluation ofDietary Reference Intakes
Food and Nutrition BoardInstitute of Medicine
NATIONAL ACADEMY PRESSWashington, D.C.
DRIDIETARY REFERENCE INTAKES
FOR
Vitamin C,
Vitamin E,
Selenium, and
Carotenoids
Copyright © National Academy of Sciences. All rights reserved.
NATIONAL ACADEMY PRESS • 2101 Constitution Avenue, N.W. • Washington, DC 20418
NOTICE: The project that is the subject of this report was approved by the Governing Boardof the National Research Council, whose members are drawn from the councils of the Na-tional Academy of Sciences, the National Academy of Engineering, and the Institute of Med-icine. The members of the committee responsible for the report were chosen for their spe-cial competences and with regard for appropriate balance.
This project was funded by the U.S. Department of Health and Human Services Office ofDisease Prevention and Health Promotion, Contract No. 282-96-0033; Health Canada; theInstitute of Medicine; the Dietary Reference Intakes Private Foundation Fund, including theDannon Institute and the International Life Sciences Institute; and the Dietary ReferenceIntakes Corporate Donors’ Fund. Contributors to the Fund include Roche Vitamins Inc.;Mead Johnson Nutrition Group; Daiichi Fine Chemicals, Inc.; Kemin Foods, Inc.; M&MMars; Weider Nutrition Group; Nabisco Foods Group; U.S. Borax; and Natural Source Vita-min E Association. The opinions or conclusions expressed herein do not necessarily reflectthose of the funders.
Library of Congress Cataloging-in-Publication Data
Dietary reference intakes for vitamin C, vitamin E, selenium, and carotenoids : a reportof the Panel on Dietary Antioxidants and Related Compounds, Subcommitties on UpperReference Levels of Nutrients and of Interpretation and Use of Dietary ReferenceIntakes, and the Standing Committee on the Scientific Evaluation of Dietary ReferenceIntakes, Food and Nutrition Board, Institute of Medicine.
p. ; cm.Includes bibliographical references and index.ISBN 0-309-06949-1 (case) -- ISBN 0-309-06935-1 (paper) 1. Antioxidants. 2. Reference values (Medicine). 3. Vitamin C. 4. Vitamin E. 5.Carotenoids. I. Institute of Medicine (U.S.). Panel on Dietary Antioxidants and RelatedCompounds. [DNLM: 1. Nutritional Requirements. 2. Ascorbic Acid. 3. Carotenoids. 4. ReferenceValues. 5. Selenium. 6. Vitamin E. QU 145 D56566 2000]QP801.A66 D53 2000612.3′9--dc21 00-035521
This report is available for sale from the National Academy Press, 2101 Constitution Avenue,N.W., Box 285, Washington, DC 20055; call (800) 624-6242 or (202) 334-3313 (in the Wash-ington metropolitan area), or visit the NAP’s on-line bookstore at http://www.nap.edu.
For more information about the Institute of Medicine or the Food and Nutrition Board, visitthe IOM home page at http://www.iom.edu.
Copyright 2000 by the National Academy of Sciences. All rights reserved.
Printed in the United States of America
The serpent has been a symbol of long life, healing, and knowledge among almost all cul-tures and religions since the beginning of recorded history. The image adopted as a logotypeby the Institute of Medicine is based on a relief carving from ancient Greece, now held by theStaatliche Museen in Berlin.

Copyright © National Academy of Sciences. All rights reserved.
“Knowing is not enough; we must apply.Willing is not enough; we must do.”
—Goethe
Shaping the Future for Health
INSTITUTE OF MEDICINE

Copyright © National Academy of Sciences. All rights reserved. iv
The National Academy of Sciences is a private, nonprofit, self-perpetuat-ing society of distinguished scholars engaged in scientific and engineeringresearch, dedicated to the furtherance of science and technology and totheir use for the general welfare. Upon the authority of the charter grant-ed to it by the Congress in 1863, the Academy has a mandate that requiresit to advise the federal government on scientific and technical matters. Dr.Bruce M. Alberts is president of the National Academy of Sciences.
The National Academy of Engineering was established in 1964, under thecharter of the National Academy of Sciences, as a parallel organization ofoutstanding engineers. It is autonomous in its administration and in theselection of its members, sharing with the National Academy of Sciencesthe responsibility for advising the federal government. The National Acad-emy of Engineering also sponsors engineering programs aimed at meetingnational needs, encourages education and research, and recognizes thesuperior achievements of engineers. Dr. William A. Wulf is president ofthe National Academy of Engineering.
The Institute of Medicine was established in 1970 by the National Acade-my of Sciences to secure the services of eminent members of appropriateprofessions in the examination of policy matters pertaining to the healthof the public. The Institute acts under the responsibility given to the Na-tional Academy of Sciences by its congressional charter to be an adviser tothe federal government and, upon its own initiative, to identify issues ofmedical care, research, and education. Dr. Kenneth I. Shine is presidentof the Institute of Medicine.
The National Research Council was organized by the National Academy ofSciences in 1916 to associate the broad community of science and technol-ogy with the Academy’s purposes of furthering knowledge and advisingthe federal government. Functioning in accordance with general policiesdetermined by the Academy, the Council has become the principal oper-ating agency of both the National Academy of Sciences and the NationalAcademy of Engineering in providing services to the government, the pub-lic, and the scientific and engineering communities. The Council is ad-ministered jointly by both Academies and the Institute of Medicine. Dr.Bruce M. Alberts and Dr. William A. Wulf are chairman and vice chair-man, respectively, of the National Research Council.
Copyright © National Academy of Sciences. All rights reserved. v
PANEL ON DIETARY ANTIOXIDANTSAND RELATED COMPOUNDS
NORMAN I. KRINSKY (Chair), Department of Biochemistry, TuftsUniversity, Boston, Massachusetts
GARY R. BEECHER, U.S. Department of Agriculture Beltsville HumanNutrition Research Center, Beltsville, Maryland
RAYMOND F. BURK, Clinical Nutrition Unit, Vanderbilt UniversityMedical Center, Nashville, Tennessee
ALVIN C. CHAN, Department of Biochemistry, Microbiology, andImmunology, University of Ottawa, Ontario, Canada
JOHN W. ERDMAN, JR., Division of Nutritional Sciences, College ofAgricultural, Consumer and Environmental Sciences, University ofIllinois at Urbana-Champaign
ROBERT A. JACOB, U.S. Department of Agriculture Western HumanNutrition Research Center, University of California, Davis
ISHWARLAL JIALAL, Department of Pathology and Internal Medicine,University of Texas Southwestern Medical Center, Dallas
LAURENCE N. KOLONEL, Cancer Research Center, University ofHawaii, Honolulu
JAMES R. MARSHALL, Cancer Prevention and Control, Arizona CancerCenter, University of Arizona, Tucson
SUSAN TAYLOR MAYNE, Department of Epidemiology and PublicHealth, Yale University School of Medicine, New Haven, Connecticut
ROSS L. PRENTICE, Division of Public Health Sciences, FredHutchinson Cancer Research Center, Seattle, Washington
KATHLEEN B. SCHWARZ, Division of Pediatric GI/Nutrition, JohnsHopkins Hospital, Baltimore, Maryland
DANIEL STEINBERG, Division of Endocrinology and Metabolism,University of California, San Diego
MARET G. TRABER, Department of Nutrition and Food Management,Oregon State University, Corvallis
Food and Nutrition Board LiaisonCHARLES H. HENNEKENS, Boca Raton, Florida
Federal Project Steering Committee LiaisonLTC KARL FRIEDL, U.S. Army Medical Research and Materiel
Command, Ft. Detrick, Frederick, Maryland
Staff
SANDRA A. SCHLICKER, Study DirectorELISABETH A. REESE, Research AssociateALICE L. VOROSMARTI, Research AssociateMICHELE R. RAMSEY, Senior Project Assistant
Copyright © National Academy of Sciences. All rights reserved. vi
SUBCOMMITTEE ON UPPER REFERENCELEVELS OF NUTRIENTS
IAN C. MUNRO (Chair), CanTox, Inc., Mississauga, Ontario, CanadaGEORGE C. BECKING, Phoenix OHC, Kingston, Ontario, CanadaRENATE D. KIMBROUGH, Independent Consultant, Washington, D.C.RITA B. MESSING, Division of Environmental Health, Minnesota
Department of Health, St. PaulSANFORD A. MILLER, Graduate School of Biomedical Sciences,
University of Texas Health Sciences Center, San AntonioSUZANNE P. MURPHY, Cancer Research Center, University of Hawaii,
HonoluluHARRIS PASTIDES, School of Public Health, University of South
Carolina, ColumbiaJOSEPH V. RODRICKS, The Life Sciences Consultancy LLC,
Washington, D.C.IRWIN H. ROSENBERG, Jean Mayer U.S. Department of Agriculture
Human Nutrition Research Center on Aging, Tufts University,Boston, Massachusetts
STEVE L. TAYLOR, Department of Food Science and Technology andFood Processing Center, University of Nebraska, Lincoln
JOHN A. THOMAS, Retired, San Antonio, TexasGARY M. WILLIAMS, Department of Pathology, New York Medical
College, Valhalla
Staff
SANDRA A. SCHLICKER, Study DirectorELISABETH A. REESE, Research AssociateMICHELE R. RAMSEY, Senior Project Assistant
Copyright © National Academy of Sciences. All rights reserved. vii
SUBCOMMITTEE ON INTERPRETATION AND USES OFDIETARY REFERENCE INTAKES
SUZANNE P. MURPHY (Chair), Cancer Research Center, University ofHawaii, Honolulu
LENORE ARAB, Departments of Epidemiology and Nutrition, Universityof North Carolina School of Public Health, Chapel Hill
SUSAN I. BARR, Department of Nutrition, University of BritishColumbia, Vancouver, Canada
SUSAN T. BORRA, International Food Information Council,Washington, D.C.
ALICIA L. CARRIQUIRY, Department of Statistics, Iowa State University,Ames
BARBARA L. DEVANEY, Mathematica Policy Research, Princeton, NewJersey
JOHANNA T. DWYER, Frances Stern Nutrition Center, New EnglandMedical Center and Tufts University, Boston, Massachusetts
JEAN-PIERRE HABICHT, Division of Nutritional Sciences, CornellUniversity, Ithaca, New York
HARRIET V. KUHNLEIN, Centre for Indigenous Peoples’ Nutrition andEnvironment, McGill University, Ste. Anne de Bellevue, Quebec,Canada
Consultant
GEORGE BEATON, GHB Consulting, Willowdale, Ontario, Canada
Staff
MARY I. POOS, Study DirectorALICE L. VOROSMARTI, Research AssociateMICHELE R. RAMSEY, Senior Project Assistant
Copyright © National Academy of Sciences. All rights reserved. viii
STANDING COMMITTEE ON THE SCIENTIFICEVALUATION OF DIETARY REFERENCE INTAKES
VERNON R. YOUNG (Chair), Laboratory of Human Nutrition, School ofScience, Massachusetts Institute of Technology, Cambridge
JOHN W. ERDMAN, JR. (Vice-Chair), Division of Nutritional Sciences,College of Agricultural, Consumer and Environmental Sciences,University of Illinois at Urbana-Champaign
LINDSAY H. ALLEN, Department of Nutrition, University of California,Davis
STEPHANIE A. ATKINSON, Department of Pediatrics, McMasterUniversity, Hamilton, Ontario, Canada
ROBERT J. COUSINS, Center for Nutritional Sciences, University ofFlorida, Gainesville
JOHANNA T. DWYER, Frances Stern Nutrition Center, New EnglandMedical Center and Tufts University, Boston, Massachusetts
JOHN D. FERNSTROM, Western Psychiatric Institute and Clinic,University of Pittsburgh School of Medicine, Pittsburgh, Pennsylvania
SCOTT M. GRUNDY, Center for Human Nutrition, University of TexasSouthwestern Medical Center, Dallas
CHARLES H. HENNEKENS, Boca Raton, FloridaSANFORD A. MILLER, Graduate School of Biomedical Sciences,
University of Texas Health Sciences Center, San AntonioWILLIAM M. RAND, Department of Family Medicine and Community
Health, Tufts University School of Medicine, Boston, Massachusetts
U.S. Government Liaison
ELIZABETH CASTRO, Office of Disease Prevention and HealthPromotion, U.S. Department of Health and Human Services,Washington, D.C.
Canadian Government Liaison
PETER W.F. FISCHER, Nutrition Research Division, Health ProtectionBranch, Health Canada, Ottawa, Ontario, Canada
Staff
ALLISON A. YATES, Study DirectorGAIL E. SPEARS, Administrative Assistant
Copyright © National Academy of Sciences. All rights reserved. ix
FOOD AND NUTRITION BOARD
CUTBERTO GARZA (Chair), Division of Nutrition, Cornell University,Ithaca, New York
LARRY R. BEUCHAT, Center for Food Safety and QualityEnhancement, University of Georgia, Griffin
BENJAMIN CABALLERO, Center for Human Nutrition, Johns HopkinsSchool of Hygiene and Public Health, Baltimore, Maryland
FERGUS M. CLYDESDALE, Department of Food Science, University ofMassachusetts, Amherst
ROBERT J. COUSINS, Center for Nutritional Sciences, University ofFlorida, Gainesville
SCOTT M. GRUNDY, Center for Human Nutrition, University of TexasSouthwestern Medical Center, Dallas
ALFRED H. MERRILL, JR., Department of Biochemistry, Emory Centerfor Nutrition and Health Sciences, Emory University, Atlanta,Georgia
LYNN PARKER, Child Nutrition Programs and Nutrition Policy, FoodResearch and Action Center, Washington, D.C.
ROSS L. PRENTICE, Division of Public Health Sciences, FredHutchinson Cancer Research Center, Seattle, Washington
A. CATHARINE ROSS, Department of Nutrition, The Pennsylvania StateUniversity, University Park
ROBERT M. RUSSELL, Jean Mayer U.S. Department of AgricultureHuman Nutrition Research Center on Aging, Tufts University,Boston, Massachusetts
ROBERT E. SMITH, R.E. Smith Consulting, Inc., Newport, VermontVIRGINIA A. STALLINGS, Division of Gastroenterology and Nutrition,
The Children’s Hospital of Philadelphia, PennsylvaniaSTEVE L. TAYLOR, Department of Food Science and Technology and
Food Processing Center, University of Nebraska, Lincoln
Staff
ALLISON A. YATES, DirectorGAIL E. SPEARS, Administrative AssistantGARY WALKER, Financial Associate

Copyright © National Academy of Sciences. All rights reserved.
Copyright © National Academy of Sciences. All rights reserved. xi
Preface
This report is one of a series that presents a comprehensive set ofreference values for nutrient intakes for healthy U.S and Canadianpopulations. It is a product of the Food and Nutrition Board of theInstitute of Medicine working in cooperation with scientists fromCanada.
The report establishes a set of reference values for vitamin C,vitamin E, and selenium to replace previously published Recom-mended Dietary Allowances (RDAs) and Recommended NutrientIntakes (RNIs) for the United States and Canada and examinesdata about β-carotene and the other carotenoids (α-carotene, β-cryptoxanthin, lutein, lycopene, and zeaxanthin). Evidence hasbeen reviewed regarding the impact of these compounds on chron-ic disease along with their roles related to deficiency states. Al-though the reference values are based on data, the data were oftenscanty or drawn from studies that had limitations in addressing thevarious questions that needed to be dealt with in order to developreference values for these nutrients and food components. Thus,scientific judgment was required in setting the reference values.The reasoning used is described for each nutrient in Chapters 5through 8.
These compounds, vitamin C, vitamin E, selenium, β-carotene andother carotenoids, have been termed “dietary antioxidants” some-what loosely by many. There has been intense interest by the publicand the media in the possibility that increased intakes of dietaryantioxidants protect against chronic disease. Many research pro-grams are under way in this area.
Copyright © National Academy of Sciences. All rights reserved.
xii PREFACE
Epidemiological evidence suggests that the consumption of fruitsand vegetables reduces the risk of both cancer and cardiovasculardisease, and it has been hypothesized that this is due in part to thepresence of compounds with antioxidant properties found in thesefood groups. While dietary antioxidants is a convenient generic ti-tle, these compounds are multifunctional, and some of the actionsobserved in vivo may not represent an antioxidant function, eventhough the compounds have been frequently classified as antioxi-dant nutrients.
Although a definition of a dietary antioxidant is provided in thisreport at the specific request of the federal agencies, the abovecompounds were evaluated with respect to their role in human nu-trition, without limiting the criteria to antioxidant properties or toonly those compounds or nutrients which met the definition. Datawere reviewed regarding the minimum amount of these compoundsrequired to prevent deficiency diseases, as well as the amounts thatmight impact on chronic diseases regardless of whether or not theputatively protective mechanisms involved antioxidant properties.Thus, a major task of the Panel on Dietary Antioxidants and Relat-ed Compounds, the Subcommittee on Upper Reference Levels ofNutrients (UL Subcommittee), the Subcommittee on Interpreta-tion and Uses of Dietary Reference Intakes (Uses Subcommittee),and the Standing Committee on the Scientific Evaluation of DietaryReference Intakes (DRI Committee) was to analyze the evidence onbeneficial and adverse effects of various intakes of vitamin C, vita-min E, selenium, and β-carotene in the context of setting DietaryReference Intakes (DRIs) for these compounds.
Many of the questions raised about requirements for and recom-mended intakes of these nutrients cannot be answered fully be-cause of inadequacies in the present database. Apart from studies ofovert deficiency disease, there is a dearth of studies that addressspecific effects of inadequate intakes on specific indicators of healthstatus. For these compounds, there is no direct information thatpermits estimating the amounts required by children, adolescents,lactating women, and the elderly. For β-carotene, data useful forthe setting of Tolerable Upper Intake Levels (ULs) are inconsistentand for the other carotenoids data are sparse, precluding reliableestimates of the minimum intake above which there is the risk ofadverse effects. For some of these nutrients, there are questionsabout how much is contained in the food North Americans eat.Thus, another major task of the report was to outline a researchagenda to provide a basis for public policy decisions related to rec-
Copyright © National Academy of Sciences. All rights reserved.
PREFACE xiii
ommended intakes of vitamin C, vitamin E, selenium, and the caro-tenoids and ways to achieve those intakes.
The process for establishing DRIs is an iterative process and isthus evolving as the conceptual framework is applied to new nutri-ents and food components. With more experience, the proposedmodels for establishing reference intakes for use with nutrients andfood components that play a role in health will be refined. Also, asnew information or new methods of analysis are adopted, thesereference values undoubtedly will be reassessed.
Because the project is ongoing as indicated above, many com-ments were solicited and have been received on the two reportspreviously published (Dietary Reference Intakes for Calcium, Phosphorus,Magnesium, Vitamin D, and Fluoride and Dietary Reference Intakes forThiamin, Riboflavin, Niacin, Vitamin B6, Folate, Vitamin B12, Pantothen-ic Acid, Biotin, and Choline). Refinements have been included in thegeneral discussion regarding approaches used (Chapters 1 through4) and in the discussion of uses of DRIs (Chapter 9 in this report).For example, it is now clearly stated that animal data can be used asthe critical adverse effect in setting a UL for a nutrient.
Among the comments received to date have been requests foradditional guidance in the practical application of DRIs. The UsesSubcommittee, conceptually included since the beginning of theDRI process, was formed subsequent to the release of the first tworeports. Although their activities will involve reports specifically ad-dressing the rationale for using DRIs for assessing intake and plan-ning, in this report Chapter 9 addresses some of the major issuesthat relate to the anticipated uses and applications of referencevalues.
This report reflects the work of the Food and Nutrition Board’sDRI Committee, its expert Panel on Dietary Antioxidants and Relat-ed Compounds, UL Subcommittee, and Uses Subcommittee. It isimportant to acknowledge the support of the government of Cana-da and Canadian scientists in this initiative, which represents apioneering first step in the standardization of nutrient referenceintakes at least within a major part of one continent. A brief de-scription of the overall project of the DRI Committee and of thepanel’s task are given in Appendix A. It is hoped that the critical,comprehensive analyses of available information and of knowledgegaps in this initial series of reports will greatly assist the privatesector, foundations, universities, government laboratories, and oth-er institutions with the development of a productive research agen-da for the next decade.
Copyright © National Academy of Sciences. All rights reserved.
xiv PREFACE
The DRI Committee, the Panel on Dietary Antioxidants and Re-lated Compounds, the UL Subcommittee, and the Uses Subcom-mittee wish to extend sincere thanks to the many experts who haveassisted with this report by giving presentations, providing writtenmaterials, participating in discussions, analyzing data, and othermeans. Many, but far from all, of these people are named in Appen-dix B. Special thanks go to staff at the National Center for HealthStatistics, the Food Surveys Research Group of the Agricultural Re-search Service, and the Department of Statistics at Iowa State Uni-versity for extensive analyses of survey data.
The respective chairs and members of the panel and subcommit-tees have performed their work under great time pressure. Theirdedication made the completion of this report possible. All gave oftheir time willingly and without financial reward; both the scienceand practice of nutrition are major beneficiaries.
This report has been reviewed in draft form by individuals chosenfor their diverse perspectives and technical expertise, in accordancewith procedures approved by the National Research Council’s Re-port Review Committee. The purpose of this independent review isto provide candid and critical comments to assist the panel andsubcommittee members and the Institute of Medicine in makingthe published report as sound as possible and to ensure that thereport meets institutional standards for objectivity, evidence, andresponsiveness to the study charge.
The content of the final report is the responsibility of the Insti-tute of Medicine and the study panel and not the responsibility ofthe reviewers. The review comments and draft manuscript remainconfidential to protect the integrity of the deliberative process. Thepanel wishes to thank the following individuals, who are neitherofficials nor employees of the Institute of Medicine, for their partic-ipation in the review of this report: Bruce N. Ames, Ph.D., Universityof California at Berkeley; Dennis M. Bier, M.D., Baylor College ofMedicine; James R. Coughlin, Ph.D., Coughlin & Associates; BarryHalliwell, D.Sc., University of London, Kings College; John E. Halver,Ph.D., University of Washington; Richard J. Havel, M.D., Universityof California at San Francisco; Orville Levander, Ph.D., U.S. Depart-ment of Agriculture; Stanley D. Omaye, Ph.D., University of Nevada;Helmut Sies, M.D., Heinrich-Heine-Universität Düsseldorf; ThressaC. Stadtman, Ph.D., National Institutes of Health; and WalterWillett, M.D., Dr. P.H., Harvard School of Public Health.
The DRI Committee wishes to acknowledge, in particular, thecommitment shown by Norman Krinsky, chair of the panel, whosteered this difficult project through what at times seemed to some
Copyright © National Academy of Sciences. All rights reserved.
PREFACE xv
like “dangerous and uncharted waters.” His ability to keep the ef-fort and the various perspectives moving in a positive direction isvery much appreciated. Thanks also are due to DRI Committeemembers Scott Grundy and John Fernstrom, in-depth internal re-viewers for this report.
Special thanks go to the staff of the Food and Nutrition Boardand foremost to Sandra Schlicker, who was the study director forthe panel and without whose assistance, both intellectual and mana-gerial, this report would neither have been as polished nor as timelyin its release.
It is, of course, those at the Food and Nutrition Board who getmuch of the work completed and so the panel, subcommittees, andthe Food and Nutrition Board wish to thank Allison Yates, Directorof the Food and Nutrition Board, for constant assistance and it alsorecognizes, with appreciation, the contributions of Mary Poos,Elisabeth Reese, Alice Vorosmarti, Gail Spears, and Michele Ramsey.We also thank Florence Poillon and Sydne Newberry for editing themanuscript and Mike Edington and Claudia Carl for assistance withpublication.
Vernon YoungChair, Standing Committee on the Scientific
Evaluation of Dietary Reference Intakes
Cutberto GarzaChair, Food and Nutrition Board

Copyright © National Academy of Sciences. All rights reserved.
Copyright © National Academy of Sciences. All rights reserved. xvii
Contents
SUMMARY 1What Are Dietary Reference Intakes?, 2Approach for Setting Dietary Reference Intakes, 6Nutrient Functions and the Indicators Used to Estimate
Requirements for Vitamin C, Vitamin E, Selenium,and the Carotenoids, 12
Criteria and Proposed Values for Tolerable UpperIntake Levels, 13
Using Dietary Reference Intakes, 14Definition of a Dietary Antioxidant, 17Evidence of Oxidative Stress and the Risk of Chronic
Degenerative Disease, 17Recommendations, 19
1 INTRODUCTION TO DIETARY REFERENCEINTAKES 21What Are Dietary Reference Intakes?, 21Categories of Dietary Reference Intakes, 22Parameters for Dietary Reference Intakes, 27Summary, 33References, 33
Copyright © National Academy of Sciences. All rights reserved.
xviii CONTENTS
2 VITAMIN C, VITAMIN E, SELENIUM, ANDβββββ-CAROTENE AND OTHER CAROTENOIDS:OVERVIEW, ANTIOXIDANT DEFINITION, ANDRELATIONSHIP TO CHRONIC DISEASE 35Overview, 35Definition and Criteria for a Dietary Antioxidant, 42Oxidative Stress, Antioxidants, and Chronic Disease, 44Conclusions, 51References, 52
3 VITAMIN C, VITAMIN E, SELENIUM, ANDβββββ-CAROTENE AND OTHER CAROTENOIDS:METHODS 58Methodological Considerations, 58Estimates of Laboratory Values, 67Nutrient Intake Estimates, 67Dietary Intakes in the United States and Canada, 69Summary, 71References, 71
4 A MODEL FOR THE DEVELOPMENT OFTOLERABLE UPPER INTAKE LEVELS FORNUTRIENTS 73Background, 73Model for Derivation of Tolerable Upper
Intake Levels, 75Risk Assessment and Food Safety, 75Application of the Risk Assessment Model to
Nutrients, 80Steps in the Development of Tolerable Upper
Intake Levels, 84Intake Assessment, 92Risk Characterization, 92References, 94
5 VITAMIN C 95Summary, 95Background Information, 95Selection of Indicators for Estimating the
Requirement for Vitamin C, 101Factors Affecting the Vitamin C Requirement, 128Findings by Life Stage and Gender Group, 134Intake of Vitamin C, 154
Copyright © National Academy of Sciences. All rights reserved.
CONTENTS xix
Tolerable Upper Intake Levels, 155Research Recommendations for Vitamin C, 165References, 167
6 VITAMIN E 186Summary, 186Background Information, 187Selection of Indicators for Estimating the Requirement
for α-Tocopherol, 203Factors Affecting the Vitamin E Requirement, 224Findings by Life Stage and Gender Group, 226Intake of Vitamin E, 243Tolerable Upper Intake Levels, 249Research Recommendations for Vitamin E, 260References, 262
7 SELENIUM 284Summary, 284Background Information, 284Selection of Indicators for Estimating the
Requirement for Selenium, 287Factors Affecting the Selenium Requirement, 291Findings by Life Stage and Gender Group, 292Intake of Selenium, 308Tolerable Upper Intake Levels, 311Research Recommendations for Selenium, 318References, 319
8 βββββ-CAROTENE AND OTHER CAROTENOIDS 325Summary, 325Background Information, 326Selection of Possible Indicators for Estimating the
Requirement for β-Carotene and OtherCarotenoids, 331
Factors Affecting Carotenoid Bioavailability, 354Findings by Life Stage and Gender Group, 358Intake of Carotenoids, 360Tolerable Upper Intake Levels, 366Research Recommendations for β-Carotene and
Other Carotenoids, 371References, 372
Copyright © National Academy of Sciences. All rights reserved.
xx CONTENTS
9 USES OF DIETARY REFERENCE INTAKES 383Overview, 383Assessing Nutrient Intakes of Individuals, 384Assessing Nutrient Intakes of Groups, 387Planning Nutrient Intakes of Individuals, 392Planning Nutrient Intakes of Groups, 392Nutrient-Specific Considerations, 393Summary, 399References, 399
10 A RESEARCH AGENDA 401Approach, 401Major Knowledge Gaps, 402The Research Agenda, 406
APPENDIXESA Origin and Framework of the Development of Dietary
Reference Intakes, 409B Acknowledgments, 413C Dietary Intake Data from the Third National Health
and Nutrition Examination Survey (NHANES III),1988–1994, 416
D Dietary Intake Data from the Continuing Survey ofFood Intakes by Individuals (CSFII), 1994–1996, 432
E Canadian Dietary Intake Data, 1993, 1995, 438F Serum Values from the Third National Health and
Nutrition Examination Survey (NHANES III),1988–1994, 440
G Options for Dealing with Uncertainties, 458H Glossary and Acronyms, 463I Biographical Sketches of Panel and Subcommittee
Members, 469
INDEX 483
SUMMARY TABLE, Dietary Reference Intakes:Recommended Intakes for Individuals, 507
Copyright © National Academy of Sciences. All rights reserved.
DRIDIETARY REFERENCE INTAKES
FOR
Vitamin C,
Vitamin E,
Selenium, and
Carotenoids

Copyright © National Academy of Sciences. All rights reserved.
Copyright © National Academy of Sciences. All rights reserved. 1
Summary
This report provides quantitative recommendations for the intakeof vitamin C, vitamin E, and selenium. It also discusses β-caroteneand other carotenoids (α-carotene, β-cryptoxanthin, lutein, lyco-pene, and zeaxanthin) but does not provide quantitative recom-mendations for their intake. It is one volume in a series of reportsthat presents dietary reference values for the intake of nutrients byAmericans and Canadians. The development of Dietary ReferenceIntakes (DRIs) expands and replaces the series of RecommendedDietary Allowances (RDAs) in the United States and Recommend-ed Nutrient Intakes (RNIs) in Canada. The report includes currentconcepts about the roles vitamin C, vitamin E, selenium, and β-carotene and the other carotenoids play in long-term health, goingbeyond a review of the roles they are known to play in traditionaldeficiency diseases. A major impetus for the expansion of this re-view is the growing recognition of the many uses to which RDAsand RNIs have been applied, and a growing awareness that many ofthese uses require the application of statistically valid methods thatdepend on reference values other than recommended nutrient in-takes.
The overall project is a comprehensive effort undertaken by theStanding Committee on the Scientific Evaluation of Dietary Refer-ence Intakes (DRI Committee) of the Food and Nutrition Board,Institute of Medicine, the National Academies, with active involve-ment of Health Canada. (See Appendix A for a description of theoverall process and its origins.) This study was requested by theFederal Project Steering Committee for Dietary Reference Intakes
Copyright © National Academy of Sciences. All rights reserved.
2 DIETARY REFERENCE INTAKES
(see Appendix B for membership), which is coordinated by theOffice of Disease Prevention and Health Promotion of the U.S. De-partment of Health and Human Services, in collaboration withHealth Canada.
Major new recommendations in this report include the following:
• A definition of a dietary antioxidant is provided.• The Recommended Dietary Allowance (RDA) for vitamin E
and selenium is the same for adult men and women regardless ofage, representing the lack of specificity in data available.
• The Recommended Dietary Allowance (RDA) for vitamin Cis different for adult men and women due to women’s smaller leanbody mass.
• α-Tocopherol alone is used for estimating vitamin E require-ments and recommending daily vitamin E intake, since the othernaturally occurring forms of vitamin E (β-, γ-, and δ-tocopherolsand the tocotrienols) are not converted to α-tocopherol in the hu-man and are recognized poorly by the α-tocopherol transfer pro-tein in the liver.
• Tolerable Upper Intake Levels (ULs) for vitamin C, vitaminE, and selenium are established.
• Research recommendations for full-scale intervention trialsto test the preventive potential of vitamin C, vitamin E, selenium,and β-carotene and other carotenoids for chronic disease are out-lined. At the present time, there is no resolution of the possibleimpact of these nutrients or food components on chronic disease.
WHAT ARE DIETARY REFERENCE INTAKES?
Dietary Reference Intakes (DRIs) are reference values that are quanti-tative estimates of nutrient intakes to be used for planning andassessing diets for apparently healthy people. They include Recom-mended Dietary Allowances (RDAs) as well as three other types ofreference values (see Box S-1). Although the reference values arebased on published data, the data were often scanty or drawn fromstudies that had limitations in addressing the question. Thus, scien-tific judgment was required for evaluating the evidence and in set-ting the reference values and is delineated for each nutrient inChapters 5 through 8.
Recommended Dietary Allowances
The process for setting the RDA depends on being able to set anEstimated Average Requirement (EAR). Before setting the EAR, a spe-
Copyright © National Academy of Sciences. All rights reserved.
SUMMARY 3
cific criterion of adequacy is selected, based on a careful review ofthe literature. When selecting the criterion, reduction of diseaserisk is considered along with many other health parameters.
If the standard deviation (SD) of the EAR is available and therequirement for the nutrient is symmetrically distributed, the RDAis set at 2 SDs above the EAR:
RDA = EAR + 2 SDEAR.
If data about variability in requirements are insufficient to calcu-late an SD, a coefficient of variation (CV) for the EAR of 10 percentis ordinarily assumed, unless available data indicate a greater varia-tion is probable.
If 10 percent is assumed to be the CV, then twice that amountadded to the EAR is defined as equal to the RDA. The resultingequation for the RDA is then
RDA = 1.2 × EAR.
If the distribution of the nutrient requirement is known to beskewed for a population, other approaches are used to find theninety-seventh to ninety-eighth percentile to set the RDA. The RDAfor a nutrient is a value to be used as a goal for dietary intake for thehealthy individual. As discussed in Chapter 9 of this report, the
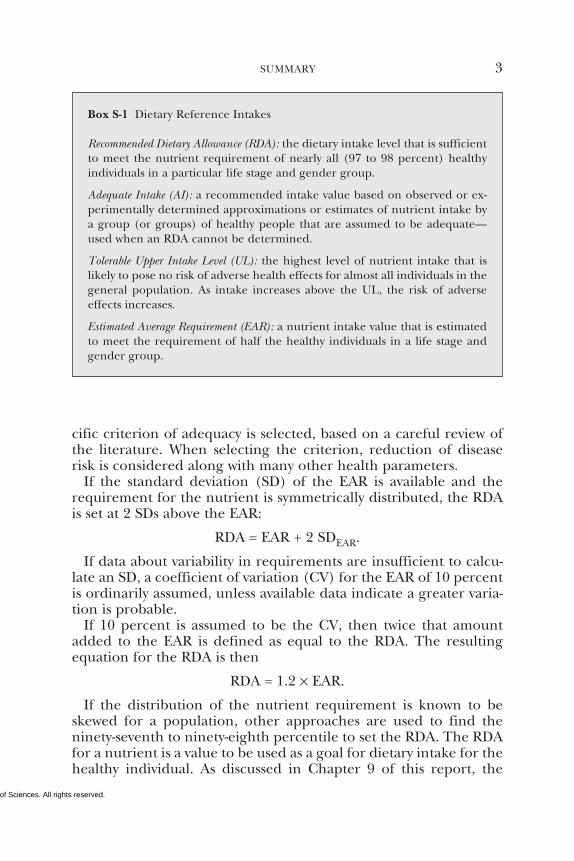
Box S-1 Dietary Reference Intakes
Recommended Dietary Allowance (RDA): the dietary intake level that is sufficientto meet the nutrient requirement of nearly all (97 to 98 percent) healthyindividuals in a particular life stage and gender group.
Adequate Intake (AI): a recommended intake value based on observed or ex-perimentally determined approximations or estimates of nutrient intake bya group (or groups) of healthy people that are assumed to be adequate—used when an RDA cannot be determined.
Tolerable Upper Intake Level (UL): the highest level of nutrient intake that islikely to pose no risk of adverse health effects for almost all individuals in thegeneral population. As intake increases above the UL, the risk of adverseeffects increases.
Estimated Average Requirement (EAR): a nutrient intake value that is estimatedto meet the requirement of half the healthy individuals in a life stage andgender group.
Copyright © National Academy of Sciences. All rights reserved.
4 DIETARY REFERENCE INTAKES
RDA is not intended to be used to assess the diets of either individ-uals or groups or to plan diets for groups.
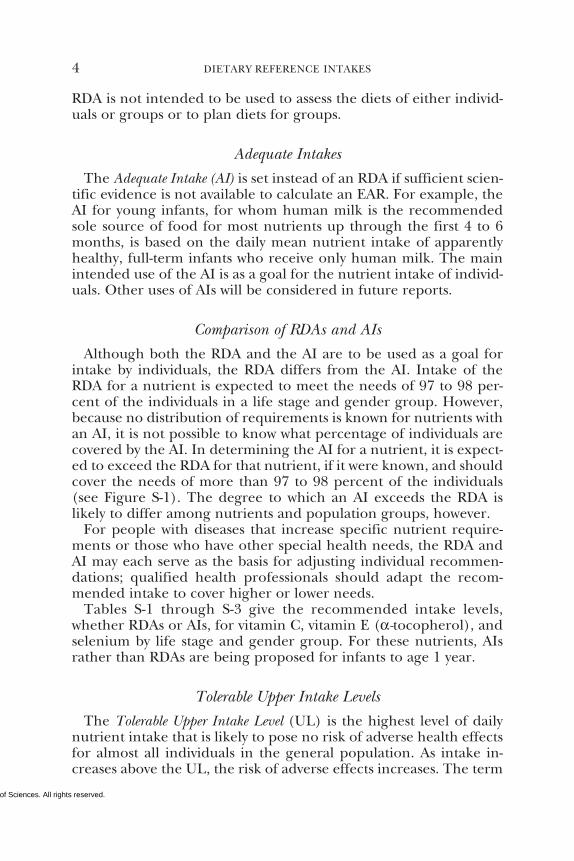
Adequate Intakes
The Adequate Intake (AI) is set instead of an RDA if sufficient scien-tific evidence is not available to calculate an EAR. For example, theAI for young infants, for whom human milk is the recommendedsole source of food for most nutrients up through the first 4 to 6months, is based on the daily mean nutrient intake of apparentlyhealthy, full-term infants who receive only human milk. The mainintended use of the AI is as a goal for the nutrient intake of individ-uals. Other uses of AIs will be considered in future reports.
Comparison of RDAs and AIs
Although both the RDA and the AI are to be used as a goal forintake by individuals, the RDA differs from the AI. Intake of theRDA for a nutrient is expected to meet the needs of 97 to 98 per-cent of the individuals in a life stage and gender group. However,because no distribution of requirements is known for nutrients withan AI, it is not possible to know what percentage of individuals arecovered by the AI. In determining the AI for a nutrient, it is expect-ed to exceed the RDA for that nutrient, if it were known, and shouldcover the needs of more than 97 to 98 percent of the individuals(see Figure S-1). The degree to which an AI exceeds the RDA islikely to differ among nutrients and population groups, however.
For people with diseases that increase specific nutrient require-ments or those who have other special health needs, the RDA andAI may each serve as the basis for adjusting individual recommen-dations; qualified health professionals should adapt the recom-mended intake to cover higher or lower needs.
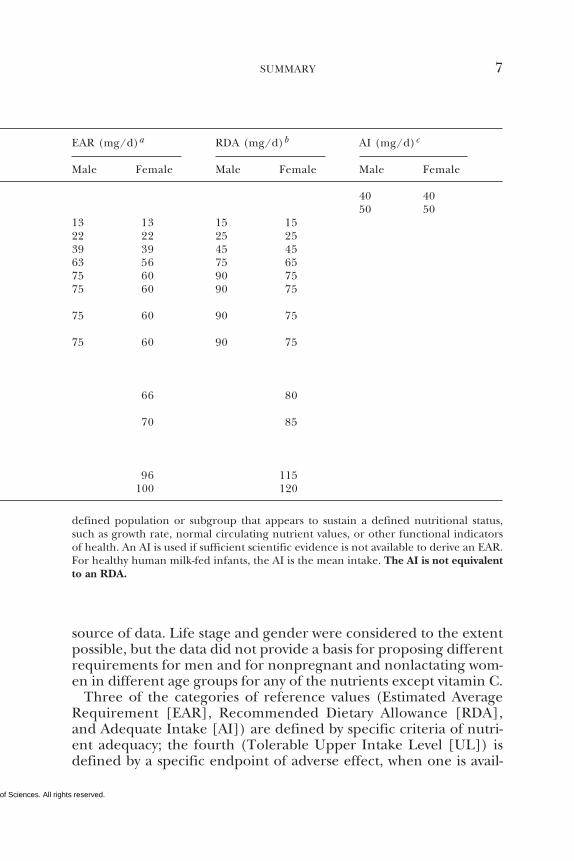
Tables S-1 through S-3 give the recommended intake levels,whether RDAs or AIs, for vitamin C, vitamin E (α-tocopherol), andselenium by life stage and gender group. For these nutrients, AIsrather than RDAs are being proposed for infants to age 1 year.
Tolerable Upper Intake Levels
The Tolerable Upper Intake Level (UL) is the highest level of dailynutrient intake that is likely to pose no risk of adverse health effectsfor almost all individuals in the general population. As intake in-creases above the UL, the risk of adverse effects increases. The term
Copyright © National Academy of Sciences. All rights reserved.
SUMMARY 5
“tolerable intake” was chosen to avoid implying a possible beneficialeffect. Instead, the term is intended to connote a level of intakethat can, with high probability, be tolerated biologically. The UL isnot intended to be a recommended level of intake. There is noestablished benefit for apparently healthy individuals if they con-sume nutrient intakes above the RDA or AI.
ULs are useful because of the increased interest in and availabilityof fortified foods and the increased use of dietary supplements. ULsare based on total intake of a nutrient from food, water, and supple-ments if adverse effects have been associated with total intake. How-ever, if adverse effects have been associated with intake from sup-plements or food fortificants only, the UL is based on nutrientintake from these sources only, rather than on total intake. The ULapplies to chronic daily use.
For some nutrients such as β-carotene and other carotenoids,there are insufficient data with which to develop a UL. This does
Observed Level of Intake
UL
Ris
k o
f In
ad
eq
ua
cy
Ris
k o
f Ad
ve
rse
Effe
cts
0 .5
1.0
0.
00
1.0
5
RDAEAR
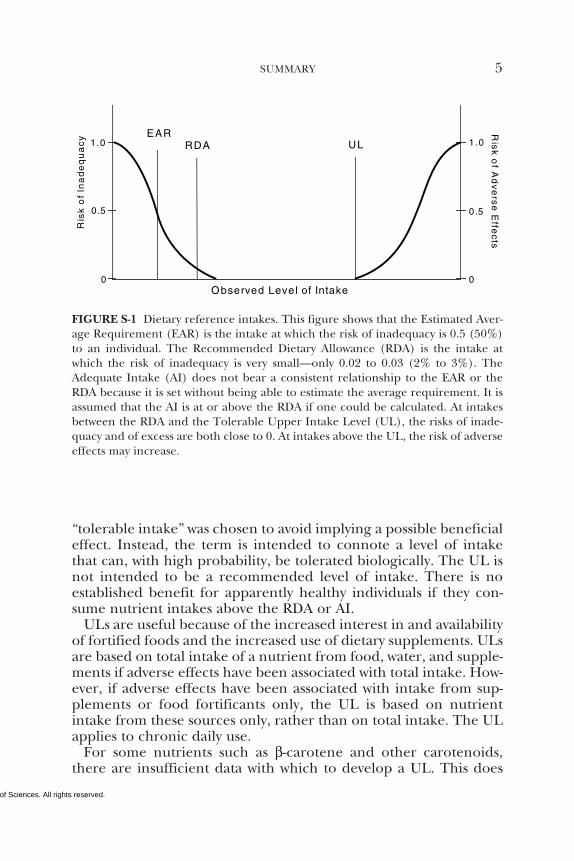
FIGURE S-1 Dietary reference intakes. This figure shows that the Estimated Aver-age Requirement (EAR) is the intake at which the risk of inadequacy is 0.5 (50%)to an individual. The Recommended Dietary Allowance (RDA) is the intake atwhich the risk of inadequacy is very small—only 0.02 to 0.03 (2% to 3%). TheAdequate Intake (AI) does not bear a consistent relationship to the EAR or theRDA because it is set without being able to estimate the average requirement. It isassumed that the AI is at or above the RDA if one could be calculated. At intakesbetween the RDA and the Tolerable Upper Intake Level (UL), the risks of inade-quacy and of excess are both close to 0. At intakes above the UL, the risk of adverseeffects may increase.
Copyright © National Academy of Sciences. All rights reserved.
6 DIETARY REFERENCE INTAKES
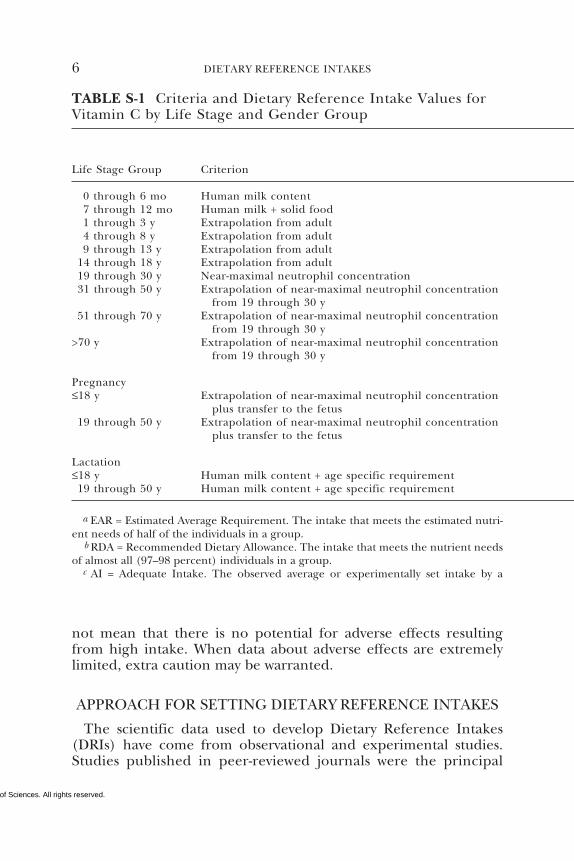
TABLE S-1 Criteria and Dietary Reference Intake Values forVitamin C by Life Stage and Gender Group
Life Stage Group Criterion
0 through 6 mo Human milk content7 through 12 mo Human milk + solid food1 through 3 y Extrapolation from adult4 through 8 y Extrapolation from adult9 through 13 y Extrapolation from adult
14 through 18 y Extrapolation from adult19 through 30 y Near-maximal neutrophil concentration31 through 50 y Extrapolation of near-maximal neutrophil concentration
from 19 through 30 y51 through 70 y Extrapolation of near-maximal neutrophil concentration
from 19 through 30 y>70 y Extrapolation of near-maximal neutrophil concentration
from 19 through 30 y
Pregnancy≤18 y Extrapolation of near-maximal neutrophil concentration
plus transfer to the fetus19 through 50 y Extrapolation of near-maximal neutrophil concentration
plus transfer to the fetus
Lactation≤18 y Human milk content + age specific requirement19 through 50 y Human milk content + age specific requirement
a EAR = Estimated Average Requirement. The intake that meets the estimated nutri-ent needs of half of the individuals in a group.
b RDA = Recommended Dietary Allowance. The intake that meets the nutrient needsof almost all (97–98 percent) individuals in a group.
c AI = Adequate Intake. The observed average or experimentally set intake by a
not mean that there is no potential for adverse effects resultingfrom high intake. When data about adverse effects are extremelylimited, extra caution may be warranted.
APPROACH FOR SETTING DIETARY REFERENCE INTAKES
The scientific data used to develop Dietary Reference Intakes(DRIs) have come from observational and experimental studies.Studies published in peer-reviewed journals were the principal
Copyright © National Academy of Sciences. All rights reserved.
SUMMARY 7
EAR (mg/d)a RDA (mg/d)b AI (mg/d)c
Male Female Male Female Male Female
40 4050 50
13 13 15 1522 22 25 2539 39 45 4563 56 75 6575 60 90 7575 60 90 75
75 60 90 75
75 60 90 75
66 80
70 85
96 115100 120
defined population or subgroup that appears to sustain a defined nutritional status,such as growth rate, normal circulating nutrient values, or other functional indicatorsof health. An AI is used if sufficient scientific evidence is not available to derive an EAR.For healthy human milk-fed infants, the AI is the mean intake. The AI is not equivalentto an RDA.
source of data. Life stage and gender were considered to the extentpossible, but the data did not provide a basis for proposing differentrequirements for men and for nonpregnant and nonlactating wom-en in different age groups for any of the nutrients except vitamin C.
Three of the categories of reference values (Estimated AverageRequirement [EAR], Recommended Dietary Allowance [RDA],and Adequate Intake [AI]) are defined by specific criteria of nutri-ent adequacy; the fourth (Tolerable Upper Intake Level [UL]) isdefined by a specific endpoint of adverse effect, when one is avail-
Copyright © National Academy of Sciences. All rights reserved.
8 DIETARY REFERENCE INTAKES
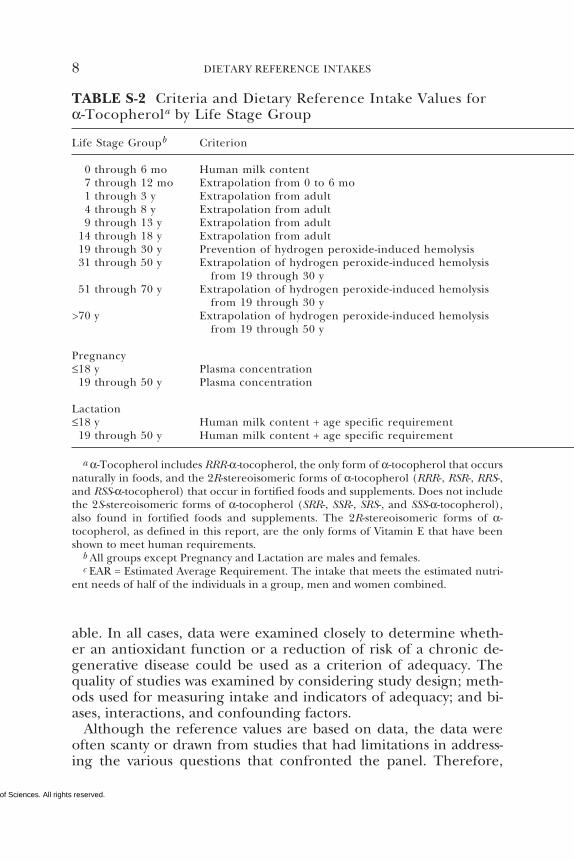
TABLE S-2 Criteria and Dietary Reference Intake Values forα-Tocopherola by Life Stage Group
Life Stage Groupb Criterion
0 through 6 mo Human milk content7 through 12 mo Extrapolation from 0 to 6 mo1 through 3 y Extrapolation from adult4 through 8 y Extrapolation from adult9 through 13 y Extrapolation from adult
14 through 18 y Extrapolation from adult19 through 30 y Prevention of hydrogen peroxide-induced hemolysis31 through 50 y Extrapolation of hydrogen peroxide-induced hemolysis
from 19 through 30 y51 through 70 y Extrapolation of hydrogen peroxide-induced hemolysis
from 19 through 30 y>70 y Extrapolation of hydrogen peroxide-induced hemolysis
from 19 through 50 y
Pregnancy≤18 y Plasma concentration
19 through 50 y Plasma concentration
Lactation≤18 y Human milk content + age specific requirement
19 through 50 y Human milk content + age specific requirement
a α-Tocopherol includes RRR-α-tocopherol, the only form of α-tocopherol that occursnaturally in foods, and the 2R-stereoisomeric forms of α-tocopherol (RRR-, RSR-, RRS-,and RSS-α-tocopherol) that occur in fortified foods and supplements. Does not includethe 2S-stereoisomeric forms of α-tocopherol (SRR-, SSR-, SRS-, and SSS-α-tocopherol),also found in fortified foods and supplements. The 2R-stereoisomeric forms of α-tocopherol, as defined in this report, are the only forms of Vitamin E that have beenshown to meet human requirements.
b All groups except Pregnancy and Lactation are males and females.c EAR = Estimated Average Requirement. The intake that meets the estimated nutri-
ent needs of half of the individuals in a group, men and women combined.
able. In all cases, data were examined closely to determine wheth-er an antioxidant function or a reduction of risk of a chronic de-generative disease could be used as a criterion of adequacy. Thequality of studies was examined by considering study design; meth-ods used for measuring intake and indicators of adequacy; and bi-ases, interactions, and confounding factors.
Although the reference values are based on data, the data wereoften scanty or drawn from studies that had limitations in address-ing the various questions that confronted the panel. Therefore,
Copyright © National Academy of Sciences. All rights reserved.
SUMMARY 9
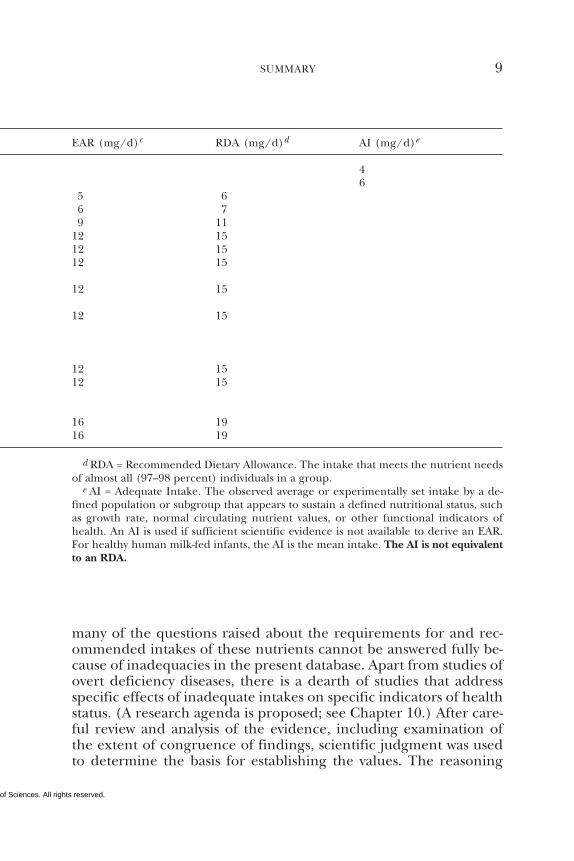
EAR (mg/d)c RDA (mg/d)d AI (mg/d)e
46
5 66 79 11
12 1512 1512 15
12 15
12 15
12 1512 15
16 1916 19
d RDA = Recommended Dietary Allowance. The intake that meets the nutrient needsof almost all (97–98 percent) individuals in a group.
e AI = Adequate Intake. The observed average or experimentally set intake by a de-fined population or subgroup that appears to sustain a defined nutritional status, suchas growth rate, normal circulating nutrient values, or other functional indicators ofhealth. An AI is used if sufficient scientific evidence is not available to derive an EAR.For healthy human milk-fed infants, the AI is the mean intake. The AI is not equivalentto an RDA.
many of the questions raised about the requirements for and rec-ommended intakes of these nutrients cannot be answered fully be-cause of inadequacies in the present database. Apart from studies ofovert deficiency diseases, there is a dearth of studies that addressspecific effects of inadequate intakes on specific indicators of healthstatus. (A research agenda is proposed; see Chapter 10.) After care-ful review and analysis of the evidence, including examination ofthe extent of congruence of findings, scientific judgment was usedto determine the basis for establishing the values. The reasoning
Copyright © National Academy of Sciences. All rights reserved.
10 DIETARY REFERENCE INTAKES
used is described for each nutrient in Chapters 5 through 8. Whilethe various recommendations are provided as single rounded num-bers for practical considerations, it is acknowledged that these val-ues imply a precision not fully justified by the underlying data inthe case of currently available human studies.
In this report, the scientific evidence related to the prevention ofchronic degenerative disease was judged to be too nonspecific to beused as the basis for setting any of the recommended levels of in-take. Furthermore, a quantitative relationship between the bio-markers of antioxidant function and the prevention of chronic
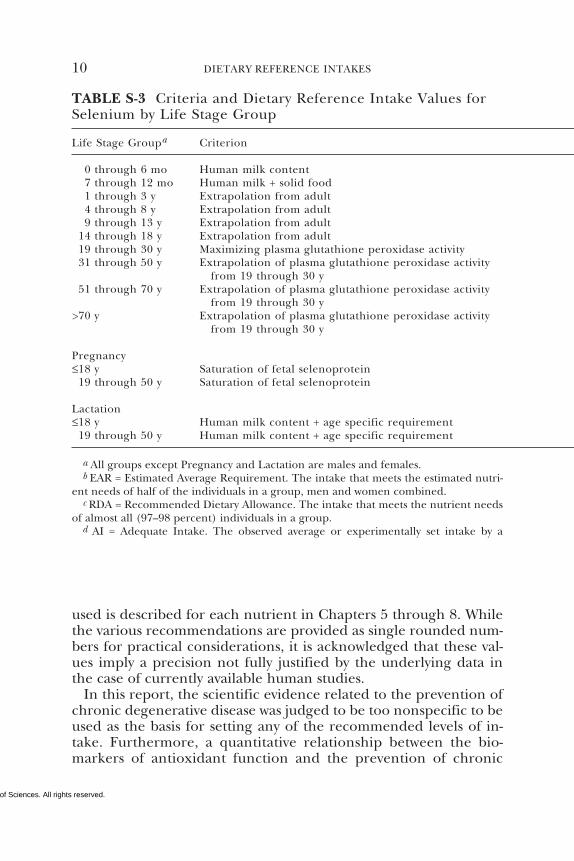
TABLE S-3 Criteria and Dietary Reference Intake Values forSelenium by Life Stage Group
Life Stage Groupa Criterion
0 through 6 mo Human milk content7 through 12 mo Human milk + solid food1 through 3 y Extrapolation from adult4 through 8 y Extrapolation from adult9 through 13 y Extrapolation from adult
14 through 18 y Extrapolation from adult19 through 30 y Maximizing plasma glutathione peroxidase activity31 through 50 y Extrapolation of plasma glutathione peroxidase activity
from 19 through 30 y51 through 70 y Extrapolation of plasma glutathione peroxidase activity
from 19 through 30 y>70 y Extrapolation of plasma glutathione peroxidase activity
from 19 through 30 y
Pregnancy≤18 y Saturation of fetal selenoprotein
19 through 50 y Saturation of fetal selenoprotein
Lactation≤18 y Human milk content + age specific requirement
19 through 50 y Human milk content + age specific requirement
a All groups except Pregnancy and Lactation are males and females.b EAR = Estimated Average Requirement. The intake that meets the estimated nutri-
ent needs of half of the individuals in a group, men and women combined.c RDA = Recommended Dietary Allowance. The intake that meets the nutrient needs
of almost all (97–98 percent) individuals in a group.d AI = Adequate Intake. The observed average or experimentally set intake by a
Copyright © National Academy of Sciences. All rights reserved.
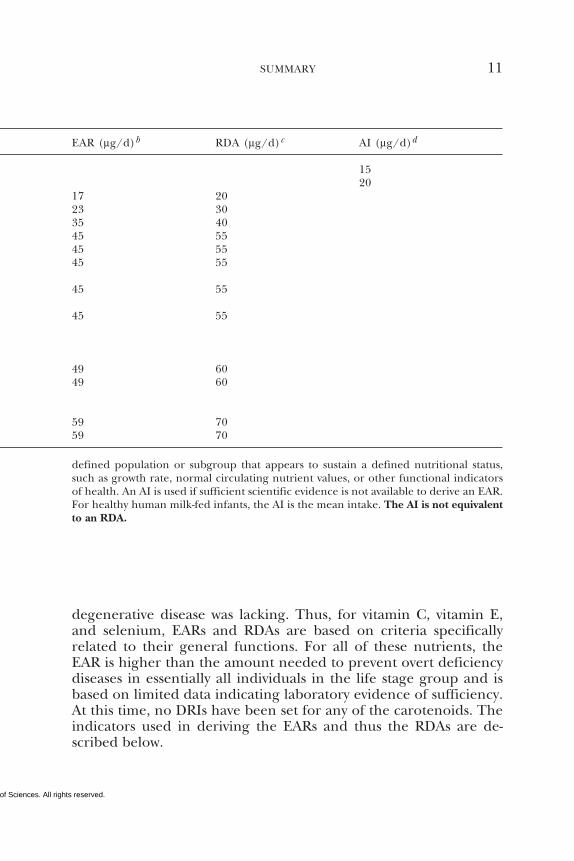
SUMMARY 11
EAR (µg/d)b RDA (µg/d)c AI (µg/d)d
1520
17 2023 3035 4045 5545 5545 55
45 55
45 55
49 6049 60
59 7059 70
defined population or subgroup that appears to sustain a defined nutritional status,such as growth rate, normal circulating nutrient values, or other functional indicatorsof health. An AI is used if sufficient scientific evidence is not available to derive an EAR.For healthy human milk-fed infants, the AI is the mean intake. The AI is not equivalentto an RDA.
degenerative disease was lacking. Thus, for vitamin C, vitamin E,and selenium, EARs and RDAs are based on criteria specificallyrelated to their general functions. For all of these nutrients, theEAR is higher than the amount needed to prevent overt deficiencydiseases in essentially all individuals in the life stage group and isbased on limited data indicating laboratory evidence of sufficiency.At this time, no DRIs have been set for any of the carotenoids. Theindicators used in deriving the EARs and thus the RDAs are de-scribed below.
Copyright © National Academy of Sciences. All rights reserved.
12 DIETARY REFERENCE INTAKES
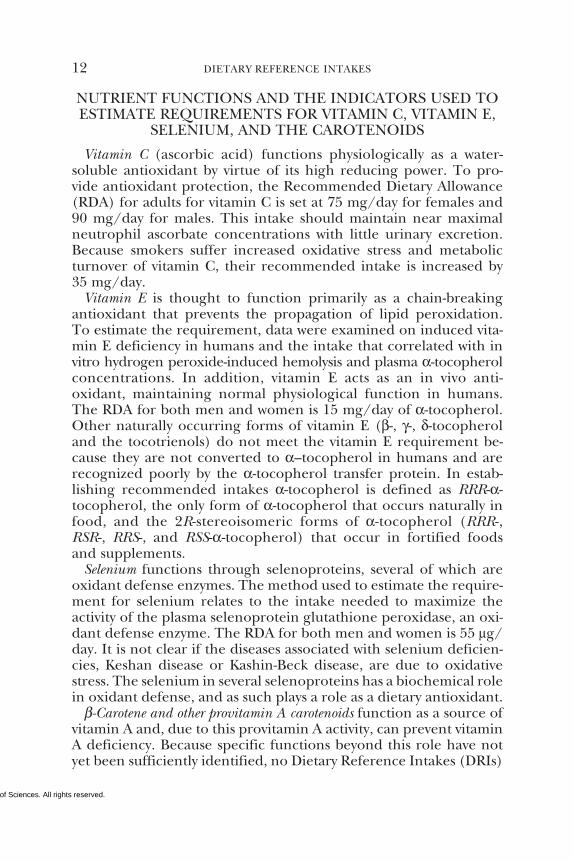
NUTRIENT FUNCTIONS AND THE INDICATORS USED TOESTIMATE REQUIREMENTS FOR VITAMIN C, VITAMIN E,
SELENIUM, AND THE CAROTENOIDS
Vitamin C (ascorbic acid) functions physiologically as a water-soluble antioxidant by virtue of its high reducing power. To pro-vide antioxidant protection, the Recommended Dietary Allowance(RDA) for adults for vitamin C is set at 75 mg/day for females and90 mg/day for males. This intake should maintain near maximalneutrophil ascorbate concentrations with little urinary excretion.Because smokers suffer increased oxidative stress and metabolicturnover of vitamin C, their recommended intake is increased by35 mg/day.
Vitamin E is thought to function primarily as a chain-breakingantioxidant that prevents the propagation of lipid peroxidation.To estimate the requirement, data were examined on induced vita-min E deficiency in humans and the intake that correlated with invitro hydrogen peroxide-induced hemolysis and plasma α-tocopherolconcentrations. In addition, vitamin E acts as an in vivo anti-oxidant, maintaining normal physiological function in humans.The RDA for both men and women is 15 mg/day of α-tocopherol.Other naturally occurring forms of vitamin E (β-, γ-, δ-tocopheroland the tocotrienols) do not meet the vitamin E requirement be-cause they are not converted to α–tocopherol in humans and arerecognized poorly by the α-tocopherol transfer protein. In estab-lishing recommended intakes α-tocopherol is defined as RRR-α-tocopherol, the only form of α-tocopherol that occurs naturally infood, and the 2R-stereoisomeric forms of α-tocopherol (RRR-,RSR-, RRS-, and RSS-α-tocopherol) that occur in fortified foodsand supplements.
Selenium functions through selenoproteins, several of which areoxidant defense enzymes. The method used to estimate the require-ment for selenium relates to the intake needed to maximize theactivity of the plasma selenoprotein glutathione peroxidase, an oxi-dant defense enzyme. The RDA for both men and women is 55 µg/day. It is not clear if the diseases associated with selenium deficien-cies, Keshan disease or Kashin-Beck disease, are due to oxidativestress. The selenium in several selenoproteins has a biochemical rolein oxidant defense, and as such plays a role as a dietary antioxidant.
β-Carotene and other provitamin A carotenoids function as a source ofvitamin A and, due to this provitamin A activity, can prevent vitaminA deficiency. Because specific functions beyond this role have notyet been sufficiently identified, no Dietary Reference Intakes (DRIs)
Copyright © National Academy of Sciences. All rights reserved.
SUMMARY 13
have been established for any of the carotenoids including thosewhich do not have provitamin A activity. In conjunction with thereview of vitamin A, efforts are under way to establish ratios for theprovitamin A carotenoids—β-carotene, α-carotene, and β-cryptox-anthin—based on their ability to be converted to vitamin A. A sub-sequent report will provide this analysis of the potential contribu-tions of the carotenoids to the requirement for vitamin A.
CRITERIA AND PROPOSED VALUES FOR TOLERABLEUPPER INTAKE LEVELS
A risk assessment model is used to derive Tolerable Upper IntakeLevels (ULs). The model consists of a systematic series of scientificconsiderations and judgments. The hallmark of the risk assessmentmodel is the requirement to be explicit in all the evaluations andjudgments made.
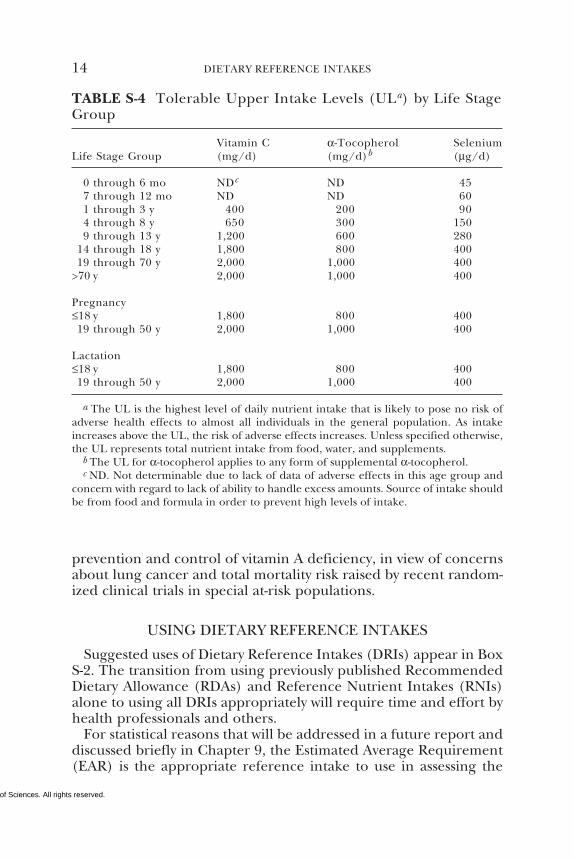
The ULs for adults for vitamin C (2,000 mg/day based on theadverse effect of osmotic diarrhea), vitamin E (1,000 mg/day of anyform of supplemental α-tocopherol based on the adverse effect ofincreased tendency to hemorrhage), and selenium (400 µg/daybased on the adverse effect of selenosis), shown in Table S-4, wereset to protect the most sensitive individuals in the general popula-tion (e.g., those who might be below reference adult weight). Mem-bers of the general apparently healthy population should be ad-vised not to exceed the UL routinely. However, intake above the ULmay be appropriate for investigation within well-controlled clinicaltrials to ascertain if such intakes are of benefit to health. Clinicaltrials of doses above the UL should not be discouraged because it isexpected that participation in these trials will require informed con-sent that will include discussion of the possibility of adverse effectsand will employ appropriate safety monitoring of trial subjects.
The ULs for vitamin C and selenium are based on intake fromdiet and supplements. Vitamin E ULs are based on intake fromsupplements only.
A UL could not be established for β-carotene because of inconsis-tent data and could not be set for other carotenoids because of alack of suitable data. In both cases, this signifies a need for addi-tional information. It does not necessarily signify that people cantolerate chronic intakes of these substances at high levels. Like allchemical agents, nutrients and other food components can pro-duce adverse effects if intakes are excessive. Therefore, when dataare extremely limited, extra caution may be warranted. In particu-lar, β-carotene supplementation is not advisable, other than for the
Copyright © National Academy of Sciences. All rights reserved.
14 DIETARY REFERENCE INTAKES
prevention and control of vitamin A deficiency, in view of concernsabout lung cancer and total mortality risk raised by recent random-ized clinical trials in special at-risk populations.
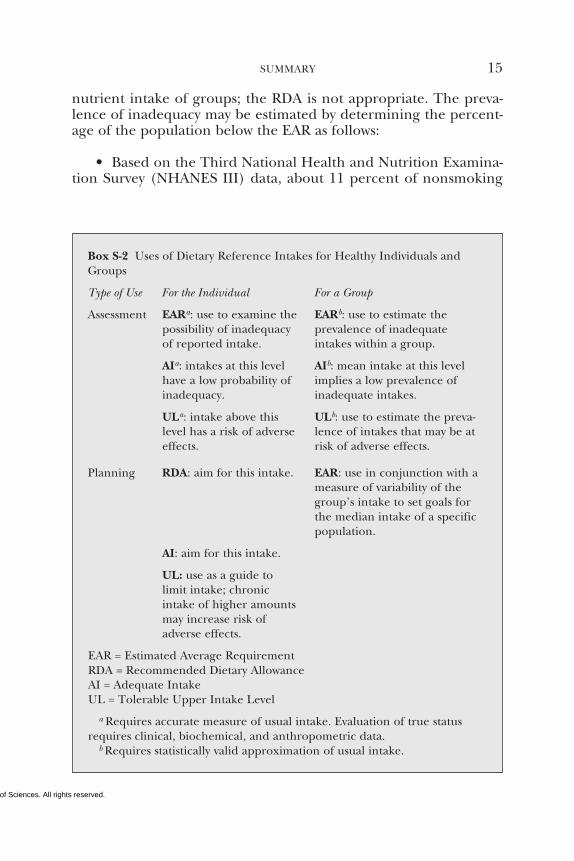
USING DIETARY REFERENCE INTAKES
Suggested uses of Dietary Reference Intakes (DRIs) appear in BoxS-2. The transition from using previously published RecommendedDietary Allowance (RDAs) and Reference Nutrient Intakes (RNIs)alone to using all DRIs appropriately will require time and effort byhealth professionals and others.
For statistical reasons that will be addressed in a future report anddiscussed briefly in Chapter 9, the Estimated Average Requirement(EAR) is the appropriate reference intake to use in assessing the
TABLE S-4 Tolerable Upper Intake Levels (ULa) by Life StageGroup
Vitamin C α-Tocopherol SeleniumLife Stage Group (mg/d) (mg/d)b (µg/d)
0 through 6 mo NDc ND 457 through 12 mo ND ND 601 through 3 y 400 200 904 through 8 y 650 300 1509 through 13 y 1,200 600 280
14 through 18 y 1,800 800 40019 through 70 y 2,000 1,000 400
>70 y 2,000 1,000 400
Pregnancy≤18 y 1,800 800 40019 through 50 y 2,000 1,000 400
Lactation≤18 y 1,800 800 40019 through 50 y 2,000 1,000 400
a The UL is the highest level of daily nutrient intake that is likely to pose no risk ofadverse health effects to almost all individuals in the general population. As intakeincreases above the UL, the risk of adverse effects increases. Unless specified otherwise,the UL represents total nutrient intake from food, water, and supplements.
b The UL for α-tocopherol applies to any form of supplemental α-tocopherol.c ND. Not determinable due to lack of data of adverse effects in this age group and
concern with regard to lack of ability to handle excess amounts. Source of intake shouldbe from food and formula in order to prevent high levels of intake.
Copyright © National Academy of Sciences. All rights reserved.
SUMMARY 15
nutrient intake of groups; the RDA is not appropriate. The preva-lence of inadequacy may be estimated by determining the percent-age of the population below the EAR as follows:
• Based on the Third National Health and Nutrition Examina-tion Survey (NHANES III) data, about 11 percent of nonsmoking
Box S-2 Uses of Dietary Reference Intakes for Healthy Individuals andGroups
Type of Use For the Individual For a Group
Assessment EARa: use to examine thepossibility of inadequacyof reported intake.
AIa: intakes at this levelhave a low probability ofinadequacy.
ULa: intake above thislevel has a risk of adverseeffects.
EARb: use to estimate theprevalence of inadequateintakes within a group.
AIb: mean intake at this levelimplies a low prevalence ofinadequate intakes.
ULb: use to estimate the preva-lence of intakes that may be atrisk of adverse effects.
Planning RDA: aim for this intake. EAR: use in conjunction with ameasure of variability of thegroup’s intake to set goals forthe median intake of a specificpopulation.
AI: aim for this intake.
UL: use as a guide tolimit intake; chronicintake of higher amountsmay increase risk ofadverse effects.
EAR = Estimated Average RequirementRDA = Recommended Dietary AllowanceAI = Adequate IntakeUL = Tolerable Upper Intake Level
a Requires accurate measure of usual intake. Evaluation of true statusrequires clinical, biochemical, and anthropometric data.
b Requires statistically valid approximation of usual intake.
Copyright © National Academy of Sciences. All rights reserved.
16 DIETARY REFERENCE INTAKES
adult women and 21 percent of nonsmoking adult men have dietaryintakes of vitamin C that are less than the EAR for this nutrient.
• Although dietary intakes of selenium depend on the seleni-um content of the soil where a plant was grown, adults in NorthAmerica are meeting their selenium needs, probably because foodin the United States and Canada is so widely distributed beyond theregion where it was grown.
• Only a small proportion of the adult men and women in thepopulation reportedly has a vitamin E intake from food and supple-ments greater than the EAR. However, estimates of vitamin E intakeare particularly difficult due to a propensity to underreport fat in-take which results in its underestimation (dietary fat serves as themajor carrier for vitamin E). In addition, the EARs for vitamin E arebased on α-tocopherol only and do not include amounts obtainedfrom the other seven naturally occurring forms of vitamin E (β-, γ-,δ-tocopherol and the four tocotrienols). Because the various formsof vitamin E cannot be interconverted in humans, EARs, RDAs, andAIs apply only to intake of the 2R-stereoisomeric forms of α-tocopherol from food, fortified foods, and multivitamins. Currently,most nutrient databases, as well as nutrition labels, do not distin-guish among the various tocopherols in food. They often presentthe data as α-tocopherol equivalents and include the contributionof all eight naturally occurring forms of vitamin E, after adjustmentfor bioavailability (e.g., γ-tocopherol is usually assumed to have only10 percent of the availability of α-tocopherol). Because these otherforms of vitamin E occur in foods (e.g., γ-tocopherol is present inwidely consumed oils such as soybean and corn oils), the intake ofα-tocopherol equivalents is greater than the intake of α-tocopherolalone. Based on NHANES III dietary intake data, approximately 80percent of the α-tocopherol equivalents from food are from α-tocopherol, and thus can contribute to the body’s requirement forvitamin E.
Data for intakes of vitamin C, vitamin E, and selenium from foodand supplements in the United States are provided in this report.Data from Canada are available only for vitamin C from food. De-tailed data for intakes of carotenoids from a recently released andexpanded food composition database in the United States are pres-ently being analyzed and are not available to be included in thisreport. Thus they will be included in the Appendix of a subsequentDRI report that will include vitamin A.
Copyright © National Academy of Sciences. All rights reserved.
SUMMARY 17
DEFINITION OF A DIETARY ANTIOXIDANT
A dietary antioxidant is a substance in foods that significantly decreasesthe adverse effects of reactive species, such as reactive oxygen and nitrogenspecies, on normal physiological function in humans. The definition isbased on several criteria: the substance is found in human diets, thecontent of the substance has been measured in foods commonlyconsumed, and the substance decreases the adverse effects of reac-tive species in vivo in humans. Vitamin C, vitamin E, and selenium(in the form of selenocysteine or selenomethionine) are the foodcomponents reviewed in this report that meet this definition of adietary antioxidant. The other food components covered in thisreport, β-carotene and the other carotenoids, do not meet the defi-nition but influence biochemical reactions that involve the oxida-tive process.
EVIDENCE OF OXIDATIVE STRESS AND THE RISK OFCHRONIC DEGENERATIVE DISEASE
There is a considerable body of biological evidence that, at highlevels, reactive oxygen and nitrogen species can be damaging tocells and thus may contribute to cellular dysfunction and disease.Hence, close attention has been given to evidence relating intake ofvitamin C, vitamin E, selenium, and β-carotene and other caro-tenoids to reduction of the risk of chronic disease. Since the entirepopulation is exposed to oxidative stresses through oxidative me-tabolism and only some develop a chronic disease, it is clear thatmore information is needed in order to understand how to evaluatethe role of oxidative stress in the development of chronic disease.The potential role of oxidative stress in six chronic disease relation-ships is briefly described below.
Cancer
One theory holds that oxidative damage contributes to carcino-genesis. A great deal of epidemiological evidence indicates that di-ets rich in fruits and vegetables are associated with a lower risk ofincurring a number of common cancers, especially cancers of thelung, oral cavity, pharynx, larynx, and cervix. However, these stud-ies provide only limited support for a protective association of indi-vidual food components categorized as antioxidants. Data regard-ing the protection by individual food components against cancer inhumans are not yet available.
Copyright © National Academy of Sciences. All rights reserved.
18 DIETARY REFERENCE INTAKES
Cardiovascular Disease
Of all the chronic diseases in which excess oxidative stress hasbeen implicated, cardiovascular disease has the strongest support-ing evidence. Oxidation of low-density lipoproteins may be a keystep in the development of coronary atherosclerosis. Epidemiologi-cal studies indicate that diets rich in fruits and vegetables, vitaminC, vitamin E, and carotenoids are associated with a decreased risk ofcoronary heart disease. However, no randomized prospective stud-ies have documented a favorable effect of vitamin C or carotenoidson cardiovascular morbidity and mortality. Four studies have exam-ined the effects of vitamin E; only one reported a positive benefitwhile the other three were neutral. Thus available data do not ade-quately substantiate the premise that increasing the intake of vita-min C, vitamin E, or β-carotene and other carotenoids will reducethe risk of coronary heart disease. Ongoing randomized trialsamong high-risk, apparently healthy individuals and among patientswith cardiovascular disease are expected to provide evidence usefulin resolving this issue.
Cataracts
A number of observational epidemiological studies have exam-ined the relationship between intakes of vitamin C, vitamin E, andcarotenoids and the presence of cataracts in humans. Several stud-ies indicate a lowered risk of cataracts associated with either anincreased serum level of these dietary components or supplementuse. These studies, since observational in nature, do not constituteat this time a sufficient basis for a conclusion that these dietarycomponents can prevent cataracts in humans.
Age-Related Macular Degeneration
Epidemiological studies find a decreased likelihood of age-relatedmacular degeneration (AMD) associated with higher intakes offruits and vegetables, especially those that are rich in the caro-tenoids lutein and zeaxanthin. Protective effects of lutein and zeax-anthin are biologically plausible because these carotenoids selec-tively accumulate as the pigment of the macular region of the retinaand account for the yellow color observed in this region. The associ-ation has also been observed in smokers, who have lower plasmalevels of carotenoids and are also at an increased risk of developingAMD. However, all reports are associative in nature and have not
Copyright © National Academy of Sciences. All rights reserved.
SUMMARY 19
established a causal relationship between intake or plasma concen-trations of lutein and/or zeaxanthin and risk for AMD.
Central Neurodegenerative Diseases
Increasing evidence suggests that a number of common neurode-generative diseases, such as Alzheimer’s, Parkinson’s, and amyo-trophic lateral sclerosis, may reflect adverse responses to oxidativestress. Small intervention trials with either vitamin C or vitamin Ehave reported symptomatic improvement in those already afflictedwith the disease. However, these preliminary findings do not consti-tute adequate proof of the usefulness of these antioxidants in de-creasing the development or delaying the onset of these diseases.
Diabetes Mellitus
Although some evidence suggests that modifications observed instructural proteins in patients with diabetes mellitus may be at-tributable to either an oxidative stress or a stress due to reactivecarbonyls, much of the research, with either single compounds orcombinations of specific food components that may function asantioxidants, has been inconclusive. In addition, no clinical inter-vention trials have tested directly whether provision of antioxidantscan defer the onset of the complications of diabetes.
RECOMMENDATIONS
Available Data on Food Composition
Because the various forms of vitamin E are not interconvertibleand because plasma concentrations of α-tocopherol are dependentupon the affinity of the hepatic α-tocopherol transfer protein forthe various forms, it is recommended that relative biological poten-cies of the various forms of vitamin E be reevaluated. Until this isdone, the actual concentrations of each of the various vitamin Eforms in food and biological samples should be reported separately,wherever possible.
Research
Five major types of information gaps were noted: (1) a dearth ofstudies designed specifically to estimate average requirements inapparently healthy humans; (2) a nearly complete lack of usable
Copyright © National Academy of Sciences. All rights reserved.
20 DIETARY REFERENCE INTAKES
data on the nutrient needs of infants, children, adolescents, andpregnant and lactating women; (3) a lack of definitive studies todetermine the role of these nutrients in lowering the risk of certainchronic diseases; (4) a lack of validated biomarkers to evaluate oxi-dative stress and the relationship between antioxidant intake andhealth and disease; and (5) a lack of studies designed to detectadverse effects of chronic high intakes of these nutrients.
Highest priority is thus given to research that has potential toprevent or retard human disease processes and to prevent deficien-cies with functional consequences as follows:
• Studies to provide the basic data for constructing risk curvesand benefit curves across the exposures to dietary and supplemen-tal intakes of vitamin C, vitamin E, selenium, and β-carotene andother carotenoids. Studies should be designed to determine therelationship of nutrient intakes to validated biomarkers of oxidativestress. These studies should be followed by nested case-control stud-ies to determine the relationship of the biomarkers of oxidativestress to chronic disease. Finally, full-scale intervention trials shouldbe done to establish the preventive potential of a nutrient for chron-ic disease.
• Investigations of gender specificity of the metabolism and re-quirements for vitamin C, vitamin E, selenium, and β-carotene andother carotenoids.
• Studies to validate methods and possible models for estimat-ing Dietary Reference Intakes (DRIs) in the absence of data forsome life stage groups, such as children, pregnant and lactatingwomen, and older adults.
• Research to determine the interactions and possible syner-gisms of vitamin C, vitamin E, selenium, and β-carotene with eachother, with other nutrients and food components, and with endoge-nous antioxidants. Multifactorial studies are needed to demonstratein vivo actions as well as synergisms that have been shown to occurin vitro.
• Studies to develop economical, sensitive, and specific methodsto assess the associations of vitamin C, vitamin E, selenium, and β-carotene and other carotenoids with the causation, prevalence, pre-vention, and treatment of specific viral or other infections.
• Investigations of the magnitude and role of genetic polymor-phisms in the mechanisms of actions of vitamin C, vitamin E, seleni-um, and β-carotene and other carotenoids.
Copyright © National Academy of Sciences. All rights reserved. 21
1Introduction to Dietary
Reference Intakes
The term Dietary Reference Intakes (DRIs) refers to a set of at leastfour nutrient-based reference values, each of which has special uses.The development of DRIs expands on the periodic reports calledRecommended Dietary Allowances, which have been published since1941 by the National Academy of Sciences. This comprehensive ef-fort is being undertaken by the Standing Committee on the Scien-tific Evaluation of Dietary Reference Intakes (DRI Committee) ofthe Food and Nutrition Board, Institute of Medicine, the NationalAcademies, with the active involvement of Health Canada. SeeAppendix A for a description of the overall process and its origins.
WHAT ARE DIETARY REFERENCE INTAKES?
The reference values, collectively called the Dietary Reference In-takes (DRIs), include the Recommended Dietary Allowance (RDA),the Adequate Intake (AI), the Tolerable Upper Intake Level (UL),and the Estimated Average Requirement (EAR).
A requirement is defined as the lowest continuing intake level ofa nutrient that, for a specified indicator of adequacy, will maintain adefined level of nutriture in an individual. The chosen criterion ofnutritional adequacy is identified in each nutrient chapter; notethat the criterion may differ for individuals at different life stages.Hence, particular attention is given throughout this report to thechoice and justification of the criterion used to establish require-ment values.
Copyright © National Academy of Sciences. All rights reserved.
22 DIETARY REFERENCE INTAKES
This approach differs somewhat from that used by the WorldHealth Organization, Food and Agriculture Organization, and In-ternational Atomic Energy Agency (WHO/FAO/IAEA) Expert Con-sultation on Trace Elements in Human Nutrition and Health (WHO,1996). That publication uses the term basal requirement to indicatethe level of intake needed to prevent pathologically relevant andclinically detectable signs of a dietary inadequacy. The term norma-tive requirement indicates the level of intake sufficient to maintain adesirable body store or reserve. In developing RDAs and AIs, em-phasis is placed instead on the reasons underlying the choice of thecriterion of nutritional adequacy used to establish the requirement.They have not been designated as basal or normative.
Unless otherwise stated, all values given for RDAs, AIs, and EARsrepresent the quantity of the nutrient or food component to besupplied by foods from a diet similar to those consumed in Canadaand the United States. If the food source of a nutrient is very differ-ent (as in the diets of some ethnic groups) or if the source is supple-ments, adjustments may have to be made for differences in nutrientbioavailability. When this is an issue, it is discussed for the specificnutrient in the section “Special Considerations.”
RDAs and AIs are levels of intake recommended for individuals.They should minimize the risk of developing a condition that isassociated with the nutrient in question and that has a negativefunctional outcome. The DRIs apply to the apparently healthy gen-eral population. Meeting the recommended intakes for vitamin C,vitamin E, selenium, and carotenoids would not necessarily provideenough for individuals who are already malnourished, nor wouldthey be adequate for certain disease states marked by increasedrequirements. Qualified medical and nutrition personnel musttailor recommendations for individuals who are known to have dis-eases that greatly increase requirements or who are at risk for devel-oping adverse effects associated with higher intakes. Although theRDA or AI may serve as the basis for such guidance, qualified per-sonnel should make necessary adaptations for specific situations.
CATEGORIES OF DIETARY REFERENCE INTAKES
Each type of Dietary Reference Intake (DRI) refers to averagedaily nutrient intake of individuals over time. In most cases, theamount taken from day to day may vary substantially without illeffect.
Copyright © National Academy of Sciences. All rights reserved.
INTRODUCTION 23
Recommended Dietary Allowance
The Recommended Dietary Allowance (RDA) is the average daily di-etary intake level that is sufficient to meet the nutrient requirementof nearly all (97 to 98 percent) apparently healthy individuals in aparticular life stage and gender group (see Figure 1-1). The RDA isintended to be used as a goal for daily intake by individuals. Theprocess for setting the RDA is described below; it depends on beingable to set an Estimated Average Requirement (EAR). That is, if anEAR cannot be set, no RDA will be set.
Estimated Average Requirement 1
The Estimated Average Requirement (EAR) is the daily intake valuethat is estimated to meet the requirement, as defined by the speci-fied indicator of adequacy, in half of the apparently healthy individ-uals in a life stage or gender group (see Figure 1-1). A normal orsymmetrical distribution (median and mean similar) is usually as-sumed for nutrient requirements. At this level of intake, the otherhalf of a specified group would not have its nutritional needs met.The general method used to set the EAR is the same for all of thenutrients in this report. The specific approaches, provided in Chap-ters 5 through 8, differ because of the different types of data avail-able.
Method for Setting the RDA
The EAR is used in setting the RDA as follows. If the standarddeviation (SD) of the EAR is available and the requirement for thenutrient is normally distributed, the RDA is defined as equal to theEAR plus 2 SDs of the EAR:
RDA = EAR + 2 SDEAR.
1 The definition of EAR implies a median as opposed to a mean, or average. Themedian and average would be the same if the distribution of requirements fol-lowed a symmetrical distribution and would diverge as a distribution becameskewed. Three considerations prompted the choice of the term EAR: data arerarely adequate to determine the distribution of requirements, precedent has beenset by other countries that have used EAR for reference values similarly derived(COMA, 1991), and the type of data evaluated makes the determination of a medi-an impossible or inappropriate.
Copyright © National Academy of Sciences. All rights reserved.
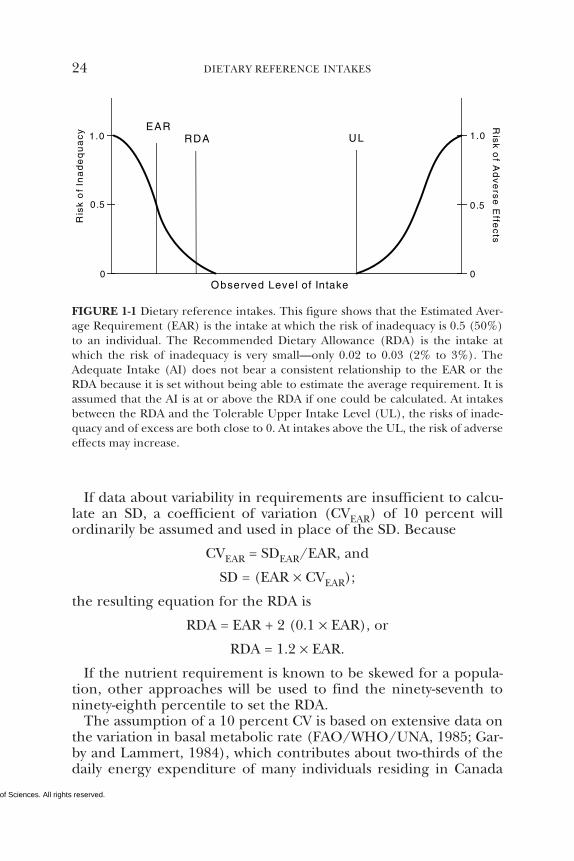
24 DIETARY REFERENCE INTAKES
If data about variability in requirements are insufficient to calcu-late an SD, a coefficient of variation (CVEAR) of 10 percent willordinarily be assumed and used in place of the SD. Because
CVEAR = SDEAR/EAR, and
SD = (EAR × CVEAR);
the resulting equation for the RDA is
RDA = EAR + 2 (0.1 × EAR), or
RDA = 1.2 × EAR.
If the nutrient requirement is known to be skewed for a popula-tion, other approaches will be used to find the ninety-seventh toninety-eighth percentile to set the RDA.
The assumption of a 10 percent CV is based on extensive data onthe variation in basal metabolic rate (FAO/WHO/UNA, 1985; Gar-by and Lammert, 1984), which contributes about two-thirds of thedaily energy expenditure of many individuals residing in Canada
Observed Level of Intake
UL
Ris
k o
f In
ad
eq
ua
cy
Ris
k o
f Ad
ve
rse
Effe
cts
0 .5
1.0
0.
00
1.0
5
RDAEAR
FIGURE 1-1 Dietary reference intakes. This figure shows that the Estimated Aver-age Requirement (EAR) is the intake at which the risk of inadequacy is 0.5 (50%)to an individual. The Recommended Dietary Allowance (RDA) is the intake atwhich the risk of inadequacy is very small—only 0.02 to 0.03 (2% to 3%). TheAdequate Intake (AI) does not bear a consistent relationship to the EAR or theRDA because it is set without being able to estimate the average requirement. It isassumed that the AI is at or above the RDA if one could be calculated. At intakesbetween the RDA and the Tolerable Upper Intake Level (UL), the risks of inade-quacy and of excess are both close to 0. At intakes above the UL, the risk of adverseeffects may increase.
Copyright © National Academy of Sciences. All rights reserved.
INTRODUCTION 25
and the United States (Elia, 1992) and on the similar CV of 12.5percent estimated for the protein requirements in adults (FAO/WHO/UNA, 1985). If there is evidence of greater variation, a larg-er CV will be assumed. In all cases, the method used to derive theRDA from the EAR is stated.
For vitamins C and E, and selenium, there are very few direct dataon the requirements of children. Thus, EARs and RDAs for chil-dren are based on extrapolations from adult values. The method isdescribed in Chapter 3.
Other Uses of the EAR
Together with an estimate of the variance of intake, the EAR mayalso be used in the assessment of the intake of groups or in plan-ning for the intake of groups (Beaton, 1994) (see Chapter 9).
Adequate Intake
If sufficient scientific evidence is not available to calculate an EAR,a reference intake called an Adequate Intake (AI) is provided insteadof an RDA. The AI is a value based on experimentally derived intakelevels or approximations of observed mean nutrient intakes by agroup (or groups) of apparently healthy people. In the judgment ofthe DRI Committee, the AI for children and adults is expected tomeet or exceed the amount needed to maintain a defined nutrition-al state or criterion of adequacy in essentially all members of a spe-cific, apparently healthy population, because it is set using presum-ably healthy populations. Examples of defined nutritional statesinclude normal growth, maintenance of normal circulating nutrientvalues, or other aspects of nutritional well-being or general health.
The AI is set when data are considered to be insufficient or inade-quate to establish an EAR on which an RDA would be based. Forexample, for young infants for whom human milk is the recom-mended sole food source for most nutrients in the first 4 to 6months, the AI is based on the daily mean nutrient intake suppliedby human milk for apparently healthy, full-term infants who are fedexclusively human milk.
Similarities Between the AI and the RDA
Both the AI and the RDA are to be used as a goal for individualintake. In general, the values are intended to cover the needs ofnearly all persons in a life stage group. (For infants, the AI is the
Copyright © National Academy of Sciences. All rights reserved.
26 DIETARY REFERENCE INTAKES
mean intake when infants in the age group are consuming humanmilk. Larger infants may have higher needs, which they meet byconsuming more milk.) As with RDAs, AIs for children and adoles-cents may be extrapolated from adult values if no other usable dataare available.
Differences Between the AI and the RDA
There is much less certainty about the AI value than about theRDA value. Because AIs depend on a greater degree of judgmentthan is applied in estimating the EAR and subsequently the RDA,the AI may deviate significantly from the RDA, if it could have beendetermined, and may be numerically higher than the RDA, if itwere known. For this reason, AIs must be used with greater carethan RDAs. Also, the RDA is always calculated from the EAR, usinga formula that takes into account the expected variation in the re-quirement for the nutrient (see previous section “Estimated Aver-age Requirement”).
Tolerable Upper Intake Level
The Tolerable Upper Intake Level (UL) is the highest level of dailynutrient intake that is likely to pose no risk of adverse health effectsin almost all individuals in the specified life stage group (see Figure1-1). As intake increases above the UL, the risk of adverse effectsincreases. The term tolerable intake was chosen to avoid implying apossible beneficial effect. Instead, the term is intended to connote alevel of intake that can, with high probability, be tolerated biologi-cally. The UL is not intended to be a recommended level of intake,and there is no established benefit for healthy individuals if theyconsume a nutrient in amounts exceeding the recommended in-take (the RDA or AI).
The UL is based on an evaluation conducted using the methodol-ogy for risk assessment of nutrients (see Chapter 4). The need forsetting ULs grew out of the increased fortification of foods and theuse of dietary supplements by more people and in larger doses. TheUL applies to chronic daily use. As in the case of applying AIs,professionals should avoid very rigid application of ULs and firstassess the characteristics of the individual or group of concern suchas source of nutrient, physiological state of the individual, length ofsustained high intakes, and so forth.
For vitamin C and selenium, the UL refers to total intakes—fromfood, fortified food, and nutrient supplements. In other instances
Copyright © National Academy of Sciences. All rights reserved.
INTRODUCTION 27
(e.g., vitamin E), it may refer only to intakes from supplements,food fortificants, pharmacological agents, or a combination of thethree. For some nutrients, such as β-carotene and other carotenoids,there may be inconsistent and insufficient data on which to developULs. This indicates the need for caution in consuming amountsgreater than the recommended intakes; it does not mean that highintakes pose no risk of adverse effects.
The safety of routine, long-term intake above the UL is not welldocumented. Although members of the general population shouldbe advised not to routinely exceed the UL, intake above the UL maybe appropriate for investigation within well-controlled clinical trials.Clinical trials of doses above the UL should not be discouraged aslong as subjects participating in these trials have signed informedconsent documents regarding possible toxicity and as long as thesetrials employ appropriate safety monitoring of trial subjects.
Determination of Adequacy
In the derivation of the EAR or AI, close attention has been paidto the determination of the most appropriate indicators of adequa-cy. A key question is, Adequate for what? In many cases, a continu-um of benefits may be ascribed to various levels of intake of thesame nutrient. One indicator may be deemed the most appropriateto determine the risk that an individual will become deficient in thenutrient, while another may relate to reducing the risk of chronicdegenerative disease such as common neurodegenerative diseases,cardiovascular disease, cancer, diabetes mellitus, cataracts, or age-related macular degeneration.
Each EAR or AI is described in terms of the selected criterion oroutcome. The potential role of vitamin C, vitamin E, selenium, andβ-carotene and other carotenoids in the reduction of disease riskwas considered in developing the EARs for this group of nutrients.With the acquisition of additional data relating intake to chronicdisease or disability, the choice of the criterion for setting the EARmay change. These nutrients, their role in health, and the types ofevidence considered are discussed in Chapter 2.
PARAMETERS FOR DIETARY REFERENCE INTAKES
Life Stage Categories
The life stage categories described below were chosen by keepingin mind all the nutrients to be reviewed, not only those included inthis report. Additional subdivisions within these groups may be add-
Copyright © National Academy of Sciences. All rights reserved.
28 DIETARY REFERENCE INTAKES
ed in later reports. If data are too sparse to distinguish differencesin requirements by life stage or gender group, the analysis may bepresented for a larger grouping.
InfancyInfancy covers the period from birth through 12 months of age
and is divided into two 6-month intervals. The first 6-month intervalwas not subdivided further because intake is relatively constant dur-ing this time. That is, as infants grow, they ingest more food; howev-er, on a body weight basis their intake remains the same. Duringthe second 6 months of life, growth velocity slows, and thus totaldaily nutrient needs on a body weight basis may be less than thoseduring the first 6 months of life.
For a particular nutrient, average intake by full-term infants whoare born to presumably healthy, well-nourished mothers and exclu-sively fed human milk has been adopted as the primary basis forderiving the Adequate Intake (AI) for most nutrients during thefirst 6 months of life. The value used is thus not an Estimated Aver-age Requirement (EAR); the extent to which intake of human milkmay result in exceeding the actual requirements of the infant is notknown, and ethics of experimentation preclude testing the levelsknown to be potentially inadequate. Therefore, the AI is not anEAR in which only half of the group would be expected to havetheir needs met.
Using the infant fed human milk as a model is in keeping with thebasis for estimating nutrient allowances for infants developed in thelast Recommended Dietary Allowances (NRC, 1989) and Recom-mended Nutrient Intake (Health Canada, 1990) reports. It also sup-ports the recommendation that exclusive human milk feeding isthe preferred method of feeding for normal full-term infants forthe first 4 to 6 months of life. This recommendation has also beenmade by the Canadian Paediatric Society (Health Canada, 1990),the American Academy of Pediatrics (AAP, 1997), and the Foodand Nutrition Board report Nutrition During Lactation (IOM, 1991).
In general, for this report, special consideration was not given topossible variations in physiological need during the first month af-ter birth or to the variations in intake of nutrients from human milkthat result from differences in milk volume and nutrient concentra-tion during early lactation. Specific Dietary Reference Intakes(DRIs) to meet the needs of formula-fed infants are not proposedin this report. The previously published RDAs and RNIs for infantshave led to much misinterpretation of the adequacy of human milkbecause of a lack of understanding about the derivation of these
Copyright © National Academy of Sciences. All rights reserved.
INTRODUCTION 29
values for young infants. Although they were based on the composi-tion of human milk and the volume of intake, the previous RDAand RNI values allowed for lower bioavailability of nutrients fromnonhuman milk.
Ages 0 through 6 Months. To derive the AI value for infants ages 0through 6 months, the mean intake of a nutrient was calculatedbased on the average concentration of the nutrient from 2 to 6months of lactation, using consensus values from several reportedstudies (Atkinson et al., 1995) and an average volume of milk intakeof 0.78 L/day as reported from studies of full-term infants by testweighing, a procedure in which the infant is weighed before andafter each feeding (Butte et al., 1984; Chandra, 1984; Hofvander etal., 1982; Neville et al., 1988). Because there is variation in both ofthese measures, the computed value represents the mean. It is ex-pected that infants will consume increased volumes of human milkas they grow.
Ages 7 through 12 Months. There is no evidence for markedlydifferent nutrient needs during the period of infants’ growth accel-eration and gradual weaning to a mixed diet of human milk andsolid foods from ages 7 through 12 months. The basis of the AIvalues derived for this age category was the sum of the specific nu-trient provided by 0.60 L/day of human milk, which is the averagevolume of milk reported from studies in this age category (Heiniget al., 1993), and that provided by the usual intakes of complemen-tary weaning foods consumed by infants in this age category (Speck-er et al., 1997). This approach is in keeping with the current recom-mendations of the Canadian Paediatric Society (Health Canada,1990), the American Academy of Pediatrics (AAP, 1997), and Nutri-tion During Lactation (IOM, 1991) for continued human milk feed-ing of infants through 9 to 12 months of age with appropriate intro-duction of solid foods.
One problem encountered in trying to derive intake data in in-fants was the lack of available data on total nutrient intake from acombination of human milk and solid foods in the second 6 monthsof life. Most intake survey data do not identify the milk source, butthe published values indicate that cow milk and cow milk formulawere most likely consumed.
Toddlers: Ages 1 through 3 YearsThe greater velocity of growth in height during ages 1 through 3
compared with ages 4 through 5 provides a biological basis for di-viding this period of life. Because children in the United States and
Copyright © National Academy of Sciences. All rights reserved.
30 DIETARY REFERENCE INTAKES
Canada from age 4 onwards begin to enter the public school sys-tem, ending this life stage prior to age 4 seemed appropriate. Dataare sparse for indicators of nutrient adequacy on which to deriveDRIs for these early years of life. In some cases, DRIs for this agegroup were derived from data extrapolated from studies of infantsor of adults aged 19 years or older.
Early Childhood: Ages 4 through 8 YearsBecause major physiological changes in velocity of growth and in
endocrine status occur during ages 4 through 8 or 9 years (thelatter depending on onset of puberty in each gender), the categoryof 4 through 8 years is appropriate. For many nutrients, a reason-able amount of data are available on nutrient intake and variouscriteria for adequacy (such as nutrient balance measured in youngchildren aged 5 through 7 years) that can be used as the basis forthe EARs for this life stage group.
Puberty/Adolescence: Ages 9 through 13 Years and 14 through18 Years
Recognizing that current data support younger ages for pubertaldevelopment, it was determined that the adolescent age groupshould begin at 9 years. The mean age of onset of breast develop-ment (Tanner Stage 2) for white females in the United States is10.0 ± 1.8 (standard deviation) years; this is a physical marker forthe beginning of increased estrogen secretion (Herman-Giddens etal., 1997). In African-American females, onset of breast develop-ment is earlier (mean 8.9 years ± 1.9). The reason for the observedracial differences in the age at which girls enter puberty is unknown.The onset of the growth spurt in girls begins before the onset ofbreast development (Tanner, 1990). The age group of 9 through 13years allows for this early growth spurt of females.
For males, the mean age of initiation of testicular development is10.5 to 11 years, and their growth spurt begins 2 years later (Tanner,1990). Thus, to begin the second age category at 14 years and tohave different EARs for females and males for some nutrients at thisage seems biologically appropriate. All children continue to grow tosome extent until as late as age 20; therefore, having these two agecategories span the period 9 through 18 years of age seems justified.
Young Adulthood and Middle Ages: Ages 19 through 30 Years and31 through 50 Years
The recognition of the possible value of higher nutrient intakesduring early adulthood on achieving optimal genetic potential for
Copyright © National Academy of Sciences. All rights reserved.
INTRODUCTION 31
peak bone mass was the reason for dividing adulthood into ages 19through 30 years and 31 through 50 years. Moreover, mean energyexpenditure decreases during this 30-year period, and needs fornutrients related to energy metabolism may also decrease. For somenutrients, the DRIs may be the same for the two age groups. Howev-er, for other nutrients, especially those related to energy metabo-lism, EARs (and RDAs) are likely to differ.
Adulthood and Older Adults: Ages 51 through 70 Years andGreater than 70 Years
The age period of 51 through 70 years spans active work years formost adults. After age 70, people of the same age increasingly dis-play variability in physiological functioning and physical activity. Acomparison of people over age 70 who are the same chronologicalage may demonstrate as much as a 15- to 20-year age-related differ-ence in level of reserve capacity and functioning. This is demon-strated by age-related declines in nutrient absorption and renalfunction. Because of the high variability in functional capacity ofolder adults, the EARs for this age group may reflect a greater vari-ability in requirements for the older age categories. This variabilitymay be most applicable to nutrients for which requirements arerelated to energy expenditure.
Pregnancy and Lactation
Recommendations for pregnancy and lactation may be subdivid-ed because of the many physiological changes and changes in nutri-ent needs that occur during these life stages. In setting EARs forthese life stages, however, consideration is given to adaptations toincreased nutrient demand, such as increased absorption, and togreater conservation of many nutrients. Moreover, some nutrientsmay undergo net losses due to physiological mechanisms regardlessof the nutrient intake. Thus, for some nutrients, there may not be abasis for EAR values that are different during these life stages thanthey are for other women of comparable age.
Reference Weights and Heights
The reference weights and heights selected for adults and chil-dren are shown in Table 1-1. The values are based on anthropomet-ric data collected from 1988–1994 as part of the Third NationalHealth and Nutrition Examination Survey (NHANES III) in theUnited States.
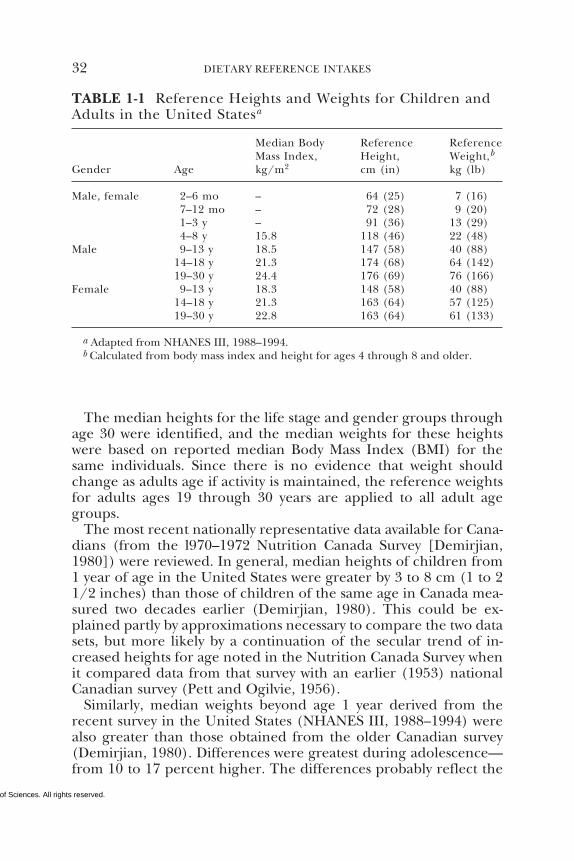
Copyright © National Academy of Sciences. All rights reserved.
32 DIETARY REFERENCE INTAKES
The median heights for the life stage and gender groups throughage 30 were identified, and the median weights for these heightswere based on reported median Body Mass Index (BMI) for thesame individuals. Since there is no evidence that weight shouldchange as adults age if activity is maintained, the reference weightsfor adults ages 19 through 30 years are applied to all adult agegroups.
The most recent nationally representative data available for Cana-dians (from the l970–1972 Nutrition Canada Survey [Demirjian,1980]) were reviewed. In general, median heights of children from1 year of age in the United States were greater by 3 to 8 cm (1 to 21/2 inches) than those of children of the same age in Canada mea-sured two decades earlier (Demirjian, 1980). This could be ex-plained partly by approximations necessary to compare the two datasets, but more likely by a continuation of the secular trend of in-creased heights for age noted in the Nutrition Canada Survey whenit compared data from that survey with an earlier (1953) nationalCanadian survey (Pett and Ogilvie, 1956).
Similarly, median weights beyond age 1 year derived from therecent survey in the United States (NHANES III, 1988–1994) werealso greater than those obtained from the older Canadian survey(Demirjian, 1980). Differences were greatest during adolescence—from 10 to 17 percent higher. The differences probably reflect the
TABLE 1-1 Reference Heights and Weights for Children andAdults in the United Statesa
Median Body Reference ReferenceMass Index, Height, Weight,b
Gender Age kg/m2 cm (in) kg (lb)
Male, female 2–6 mo – 64 (25) 7 (16)7–12 mo – 72 (28) 9 (20)1–3 y – 91 (36) 13 (29)4–8 y 15.8 118 (46) 22 (48)
Male 9–13 y 18.5 147 (58) 40 (88)14–18 y 21.3 174 (68) 64 (142)19–30 y 24.4 176 (69) 76 (166)
Female 9–13 y 18.3 148 (58) 40 (88)14–18 y 21.3 163 (64) 57 (125)19–30 y 22.8 163 (64) 61 (133)
a Adapted from NHANES III, 1988–1994.b Calculated from body mass index and height for ages 4 through 8 and older.
Copyright © National Academy of Sciences. All rights reserved.
INTRODUCTION 33
secular trend of earlier onset of puberty (Herman-Giddens et al.,1997), rather than differences in populations. Calculations of BMIfor young adults (e.g., a median of 22.6 for Canadian women com-pared with 22.8 for U.S. women) resulted in similar values, indicat-ing greater concordance between the two surveys by adulthood.
The reference weights chosen for this report were based on themost recent data set available from either country, recognizing thatearlier surveys in Canada indicated shorter stature and lower weightsduring adolescence compared with those from surveys in the Unit-ed States.
Reference weights are used primarily when setting the EAR orTolerable Upper Level Intake (UL) for children or when relatingthe nutrient needs of adults to body weight. For the 4- to 8-year-oldage group on an individual basis, a small 4-year-old child can beassumed to require less than the EAR and a large 8-year-old willrequire more than the EAR. However, the RDA or AI should meetthe needs of both.
SUMMARY
Dietary Reference Intakes (DRIs) is a generic term for a set of nutri-ent reference values that includes the Recommended Dietary Al-lowance, Adequate Intake, Tolerable Upper Intake Level, and Esti-mated Average Requirement. These reference values are beingdeveloped for life stage and gender groups in a joint U.S. and Cana-dian activity. This report, one volume in a series, covers the DRIsfor vitamin C, vitamin E, selenium, and β-carotene and the othercarotenoids.
REFERENCESAAP (American Academy of Pediatrics). 1997. Breastfeeding and the use of human
milk. Pediatrics 100:1035–1039.Atkinson SA, Alston-Mils BP, Lonnerdal B, Neville MC, Thompson MP. 1995. Ma-
jor minerals and ionic constituents of human and bovine milk. In: Jensen RJ,ed. Handbook of Milk Composition. California: Academic Press. Pp. 593–619.
Beaton GH. 1994. Criteria of an adequate diet. In: Shils ME, Olson JA, Shike M,eds. Modern Nutrition in Health and Disease, 8th edition. Philadelphia: Lea &Febiger. Pp. 1491–1505.
Butte NF, Garza C, Smith EO, Nichols BL. 1984. Human milk intake and growth inexclusively breast-fed infants. J Pediatr 104:187–195.
Chandra RK. 1984. Physical growth of exclusively breast-fed infants. Nutr Res 2:275–276.
COMA (Committee on Medical Aspects of Food Policy). 1991. Dietary ReferenceValues for Food Energy and Nutrients for the United Kingdom. Report on Healthand Social Subjects, No. 41. London: HMSO.
Copyright © National Academy of Sciences. All rights reserved.
34 DIETARY REFERENCE INTAKES
Demirjian A. 1980. Anthropometry Report. Height, Weight, and Body Dimensions: A Re-port from Nutrition Canada. Ottawa: Minister of National Health and Welfare,Health and Promotion Directorate, Health Services and Promotion Branch.
Elia M. 1992. Energy expenditure and the whole body. In: Kinney JM, Tucker HN,eds. Energy Metabolism: Tissue Determinants and Cellular Corollaries. New York:Raven Press. Pp. 19–59.
FAO/WHO/UNA (Food and Agriculture Organization of the United Nations/World Health Organization/United Nations). 1985. Energy and Protein Require-ments Report of a Joint FAO/WHO/UNA Expert Consultation. Technical ReportSeries, No. 724. Geneva: World Health Organization.
Garby L, Lammert O. 1984. Within-subjects between-days-and-weeks variation inenergy expenditure at rest. Hum Nutr Clin Nutr 38:395–397.
Health Canada. 1990. Nutrition Recommendations. The Report of the Scientific ReviewCommittee 1990. Ottawa: Canadian Government Publishing Centre.
Heinig MJ, Nommsen LA, Peerson JM, Lonnerdal B, Dewey KG. 1993. Energy andprotein intakes of breast-fed and formula-fed infants during the first year oflife and their association with growth velocity: The DARLING Study. Am J ClinNutr 58:152–161.
Herman-Giddens ME, Slora EJ, Wasserman RC, Bourdony CJ, Bhapkar MV, KochGG, Hasemeier CM. 1997. Secondary sexual characteristics and menses inyoung girls seen in office practice: A study from the Pediatric Research inOffice Settings network. Pediatrics 99:505–512.
Hofvander Y, Hagman U, Hillervik C, Sjolin S. 1982. The amount of milk con-sumed by 1–3 months old breast- or bottle-fed infants. Acta Paediatr Scand71:953–958.
IOM (Institute of Medicine). 1991. Nutrition During Lactation. Washington, DC:National Academy Press.
Neville MC, Keller R, Seacat J, Lutes V, Neifert M, Casey C, Allen J, Archer P. 1988.Studies in human lactation: Milk volumes in lactating women during the onsetof lactation and full lactation. Am J Clin Nutr 48:1375–1386.
NRC (National Research Council). 1989. Recommended Dietary Allowances, 10th edi-tion. Washington, DC: National Academy Press.
Pett LB, Ogilvie GH. 1956. The Canadian Weight-Height Survey. Hum Biol 28:177–188.
Specker BL, Beck A, Kalkwarf H, Ho M. 1997. Randomized trial of varying mineralintake on total body bone mineral accretion during the first year of life. Pediat-rics 99:E12.
Tanner JM. 1990. Growth at Adolescence. Oxford: Oxford University Press.WHO (World Health Organization). 1996. Trace Elements in Human Nutrition and
Health. Geneva: World Health Organization.
Copyright © National Academy of Sciences. All rights reserved. 35
2Vitamin C, Vitamin E,
Selenium, and β-Caroteneand Other Carotenoids:Overview, Antioxidant
Definition, and Relationshipto Chronic Disease
OVERVIEW
This report focuses on vitamin C, vitamin E, selenium, and β-carotene and other carotenoids (α-carotene, β-cryptoxanthin, lu-tein, lycopene, and zeaxanthin). These compounds have frequentlybeen called dietary antioxidants since in some cases they counteractoxidative damage to biomolecules (Halliwell, 1996), and the possi-bility exists that increased intakes of these compounds may protectagainst chronic disease. Although the term dietary antioxidants is aconvenient description, these compounds are multifunctional, andsome of the actions observed in vivo may not represent an antioxi-dant function, even though the compounds have been classified asantioxidant nutrients (Sies and Stahl, 1995).
Therefore, in this report the above compounds were evaluatedwith respect to their role in human nutrition, without limiting theinvestigation to antioxidant properties. Information was reviewedregarding the minimum amount of these nutrients required to pre-vent deficiency diseases, as well as the amounts that might impacton chronic diseases, regardless of whether the effect was an antioxi-dant effect or not. Resolution of any impact of these compounds onchronic disease will require evaluation of the many human inter-vention trials that are still under way (Table 2-1).
Four main tasks were assigned to the Dietary Reference IntakesPanel on Dietary Antioxidants and Related Compounds. The firsttask was to develop a definition of a dietary antioxidant; the second
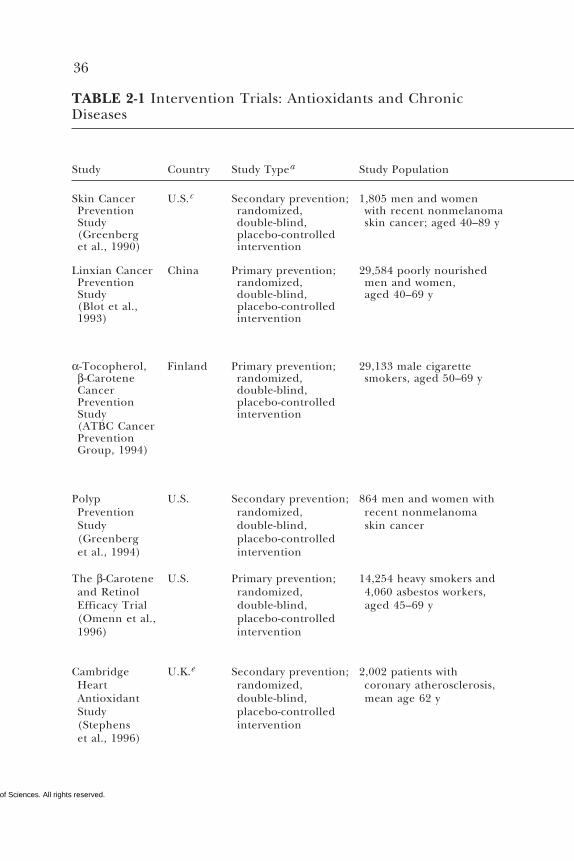
Copyright © National Academy of Sciences. All rights reserved.
36
TABLE 2-1 Intervention Trials: Antioxidants and ChronicDiseases
Study Country Study Typea Study Population
Skin Cancer U.S.c Secondary prevention; 1,805 men and womenPrevention randomized, with recent nonmelanomaStudy double-blind, skin cancer; aged 40–89 y(Greenberg placebo-controlledet al., 1990) intervention
Linxian Cancer China Primary prevention; 29,584 poorly nourishedPrevention randomized, men and women,Study double-blind, aged 40–69 y(Blot et al., placebo-controlled1993) intervention
α-Tocopherol, Finland Primary prevention; 29,133 male cigaretteβ-Carotene randomized, smokers, aged 50–69 yCancer double-blind,Prevention placebo-controlledStudy intervention(ATBC CancerPreventionGroup, 1994)
Polyp U.S. Secondary prevention; 864 men and women withPrevention randomized, recent nonmelanomaStudy double-blind, skin cancer(Greenberg placebo-controlledet al., 1994) intervention
The β-Carotene U.S. Primary prevention; 14,254 heavy smokers andand Retinol randomized, 4,060 asbestos workers,Efficacy Trial double-blind, aged 45–69 y(Omenn et al., placebo-controlled1996) intervention
Cambridge U.K.e Secondary prevention; 2,002 patients withHeart randomized, coronary atherosclerosis,Antioxidant double-blind, mean age 62 yStudy placebo-controlled(Stephens interventionet al., 1996)
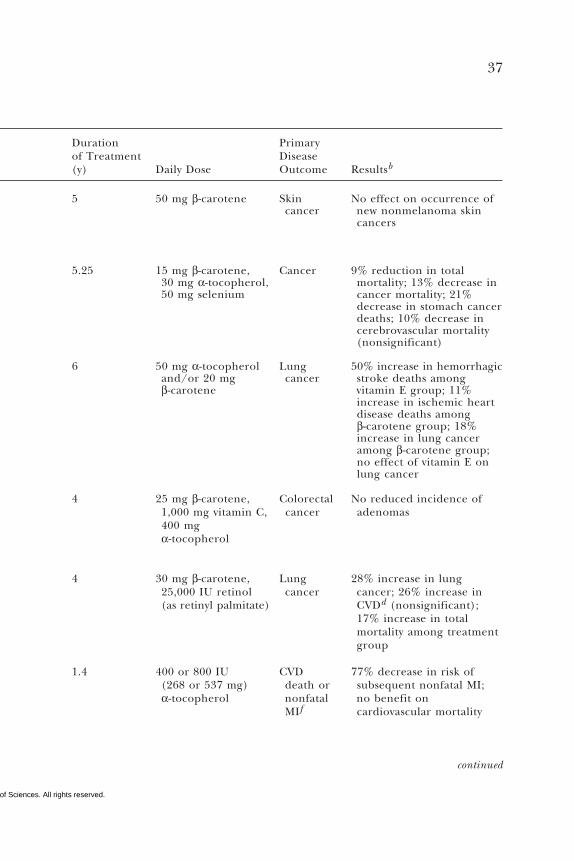
Copyright © National Academy of Sciences. All rights reserved.
37
Duration Primaryof Treatment Disease(y) Daily Dose Outcome Resultsb
5 50 mg β-carotene Skin No effect on occurrence ofcancer new nonmelanoma skin
cancers
5.25 15 mg β-carotene, Cancer 9% reduction in total30 mg α-tocopherol, mortality; 13% decrease in50 mg selenium cancer mortality; 21%
decrease in stomach cancerdeaths; 10% decrease incerebrovascular mortality(nonsignificant)
6 50 mg α-tocopherol Lung 50% increase in hemorrhagicand/or 20 mg cancer stroke deaths amongβ-carotene vitamin E group; 11%
increase in ischemic heartdisease deaths amongβ-carotene group; 18%increase in lung canceramong β-carotene group;no effect of vitamin E onlung cancer
4 25 mg β-carotene, Colorectal No reduced incidence of1,000 mg vitamin C, cancer adenomas400 mgα-tocopherol
4 30 mg β-carotene, Lung 28% increase in lung25,000 IU retinol cancer cancer; 26% increase in(as retinyl palmitate) CVDd (nonsignificant);
17% increase in totalmortality among treatmentgroup
1.4 400 or 800 IU CVD 77% decrease in risk of(268 or 537 mg) death or subsequent nonfatal MI;α-tocopherol nonfatal no benefit on
MIf cardiovascular mortality
continued
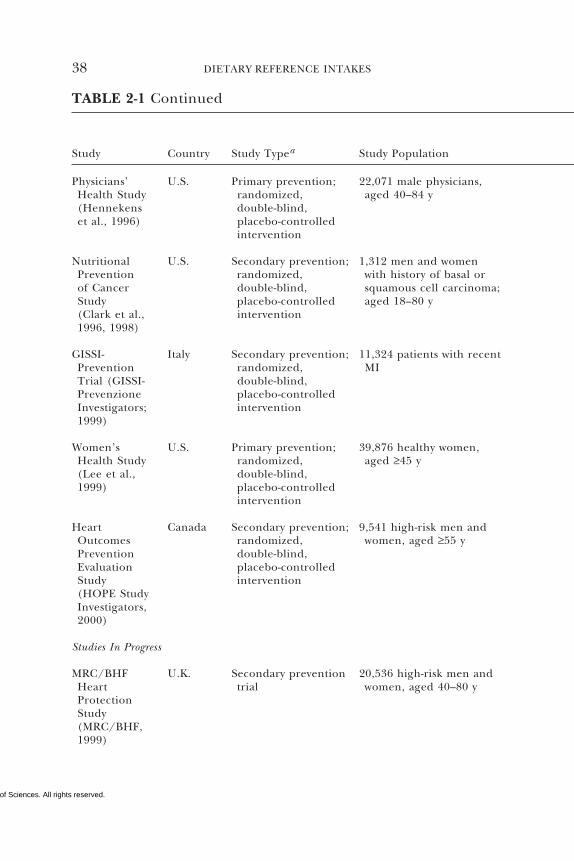
Copyright © National Academy of Sciences. All rights reserved.
38 DIETARY REFERENCE INTAKES
TABLE 2-1 Continued
Study Country Study Typea Study Population
Physicians’ U.S. Primary prevention; 22,071 male physicians,Health Study randomized, aged 40–84 y(Hennekens double-blind,et al., 1996) placebo-controlled
intervention
Nutritional U.S. Secondary prevention; 1,312 men and womenPrevention randomized, with history of basal orof Cancer double-blind, squamous cell carcinoma;Study placebo-controlled aged 18–80 y(Clark et al., intervention1996, 1998)
GISSI- Italy Secondary prevention; 11,324 patients with recentPrevention randomized, MITrial (GISSI- double-blind,Prevenzione placebo-controlledInvestigators; intervention1999)
Women’s U.S. Primary prevention; 39,876 healthy women,Health Study randomized, aged ≥45 y(Lee et al., double-blind,1999) placebo-controlled
intervention
Heart Canada Secondary prevention; 9,541 high-risk men andOutcomes randomized, women, aged ≥55 yPrevention double-blind,Evaluation placebo-controlledStudy intervention(HOPE StudyInvestigators,2000)
Studies In Progress
MRC/BHF U.K. Secondary prevention 20,536 high-risk men andHeart trial women, aged 40–80 yProtectionStudy(MRC/BHF,1999)
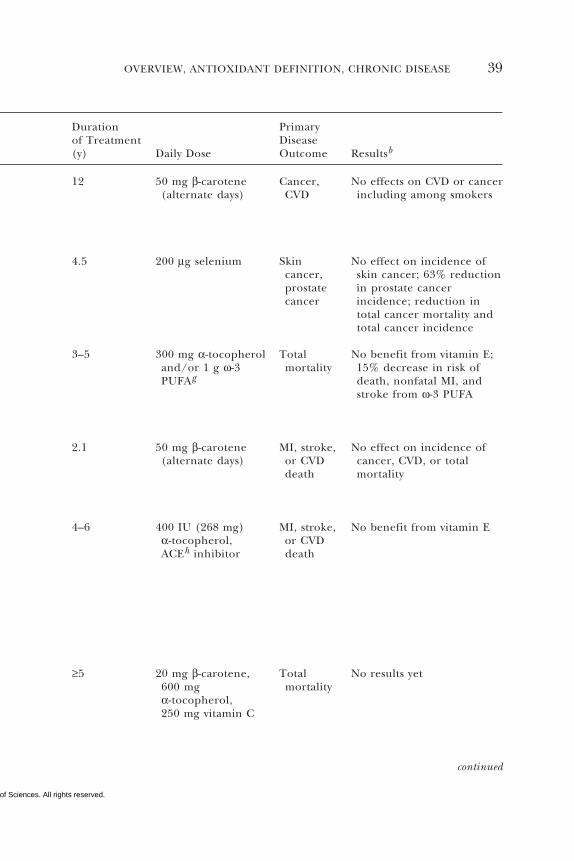
Copyright © National Academy of Sciences. All rights reserved.
OVERVIEW, ANTIOXIDANT DEFINITION, CHRONIC DISEASE 39
Duration Primaryof Treatment Disease(y) Daily Dose Outcome Resultsb
12 50 mg β-carotene Cancer, No effects on CVD or cancer(alternate days) CVD including among smokers
4.5 200 µg selenium Skin No effect on incidence ofcancer, skin cancer; 63% reductionprostate in prostate cancercancer incidence; reduction in
total cancer mortality andtotal cancer incidence
3–5 300 mg α-tocopherol Total No benefit from vitamin E;and/or 1 g ω-3 mortality 15% decrease in risk ofPUFAg death, nonfatal MI, and
stroke from ω-3 PUFA
2.1 50 mg β-carotene MI, stroke, No effect on incidence of(alternate days) or CVD cancer, CVD, or total
death mortality
4–6 400 IU (268 mg) MI, stroke, No benefit from vitamin Eα-tocopherol, or CVDACEh inhibitor death
≥5 20 mg β-carotene, Total No results yet600 mg mortalityα-tocopherol,250 mg vitamin C
continued
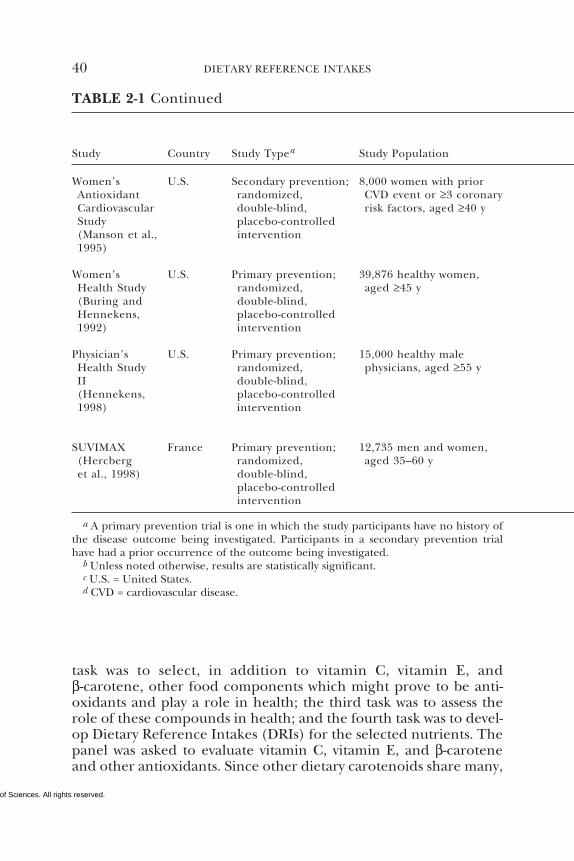
Copyright © National Academy of Sciences. All rights reserved.
40 DIETARY REFERENCE INTAKES
TABLE 2-1 Continued
Study Country Study Typea Study Population
Women’s U.S. Secondary prevention; 8,000 women with priorAntioxidant randomized, CVD event or ≥3 coronaryCardiovascular double-blind, risk factors, aged ≥40 yStudy placebo-controlled(Manson et al., intervention1995)
Women’s U.S. Primary prevention; 39,876 healthy women,Health Study randomized, aged ≥45 y(Buring and double-blind,Hennekens, placebo-controlled1992) intervention
Physician’s U.S. Primary prevention; 15,000 healthy maleHealth Study randomized, physicians, aged ≥55 yII double-blind,(Hennekens, placebo-controlled1998) intervention
SUVIMAX France Primary prevention; 12,735 men and women,(Hercberg randomized, aged 35–60 yet al., 1998) double-blind,
placebo-controlledintervention
a A primary prevention trial is one in which the study participants have no history ofthe disease outcome being investigated. Participants in a secondary prevention trialhave had a prior occurrence of the outcome being investigated.
b Unless noted otherwise, results are statistically significant.c U.S. = United States.d CVD = cardiovascular disease.
task was to select, in addition to vitamin C, vitamin E, andβ-carotene, other food components which might prove to be anti-oxidants and play a role in health; the third task was to assess therole of these compounds in health; and the fourth task was to devel-op Dietary Reference Intakes (DRIs) for the selected nutrients. Thepanel was asked to evaluate vitamin C, vitamin E, and β-caroteneand other antioxidants. Since other dietary carotenoids share many,
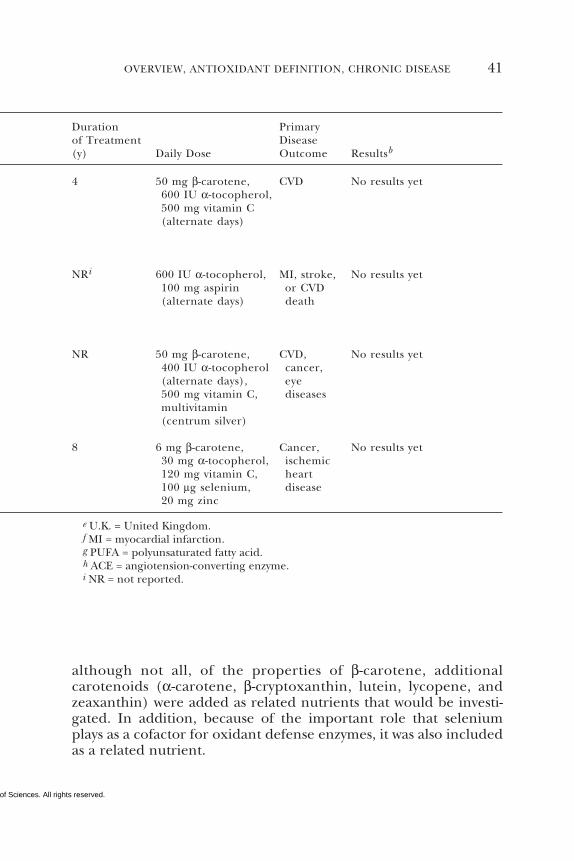
Copyright © National Academy of Sciences. All rights reserved.
OVERVIEW, ANTIOXIDANT DEFINITION, CHRONIC DISEASE 41
Duration Primaryof Treatment Disease(y) Daily Dose Outcome Resultsb
4 50 mg β-carotene, CVD No results yet600 IU α-tocopherol,500 mg vitamin C(alternate days)
NRi 600 IU α-tocopherol, MI, stroke, No results yet100 mg aspirin or CVD(alternate days) death
NR 50 mg β-carotene, CVD, No results yet400 IU α-tocopherol cancer,(alternate days), eye500 mg vitamin C, diseasesmultivitamin(centrum silver)
8 6 mg β-carotene, Cancer, No results yet30 mg α-tocopherol, ischemic120 mg vitamin C, heart100 µg selenium, disease20 mg zinc
e U.K. = United Kingdom.f MI = myocardial infarction.g PUFA = polyunsaturated fatty acid.h ACE = angiotension-converting enzyme.i NR = not reported.
although not all, of the properties of β-carotene, additionalcarotenoids (α-carotene, β-cryptoxanthin, lutein, lycopene, andzeaxanthin) were added as related nutrients that would be investi-gated. In addition, because of the important role that seleniumplays as a cofactor for oxidant defense enzymes, it was also includedas a related nutrient.
Copyright © National Academy of Sciences. All rights reserved.
42 DIETARY REFERENCE INTAKES
DEFINITION AND CRITERIA FOR A DIETARYANTIOXIDANT
Definition of a Dietary Antioxidant
The definition was based on several criteria: (1) the substance isfound in human diets; (2) the content of the substance has beenmeasured in foods commonly consumed; and (3) in humans, thesubstance decreases the adverse effects of reactive species, such asreactive oxygen and nitrogen species in vivo. Thus, the definition ofa dietary antioxidant is as follows:
A dietary antioxidant is a substance in foods that significantly decreasesthe adverse effects of reactive species, such as reactive oxygen and nitrogenspecies, on normal physiological function in humans.
This stringent definition, with supporting information, was slight-ly modified from the proposed definition published earlier (IOM,1998). The earlier report stated that the nutritional recommenda-tions that will be presented in the final report for some of thesedietary components may not be determined by or related to theirpossible action as antioxidants. The primary indicators for develop-ing the Dietary Reference Intakes (DRIs) are based on specific ac-tions and effects of the compounds that may or may not be attribut-ed to their antioxidant activity. In particular, criteria chosen uponwhich to base EARs and thus RDAs for any of the compounds inves-tigated are not related specifically to ameliorating chronic diseasesbecause a scientific justification for such a requirement was notfound.
The European Commission Concerted Action on Functional Foodalso adopted stringent criteria regarding the relationship betweenfree-radical events and human disease, and whether antioxidantsare capable of modulating these events and thus reducing the riskof disease (Diplock et al., 1998). The summary report concludedthat, “there is at present insufficient evidence available on which tobase a firm conclusion that antioxidants are capable of reducingrisk of disease” (Diplock, 1998). Recommendations for the nutri-ents in this report are similar. However, it should be pointed outthat a large number of human intervention studies are under wayusing the compounds discussed in this report, and the results ofthese studies may give rise to new conclusions.
Copyright © National Academy of Sciences. All rights reserved.
OVERVIEW, ANTIOXIDANT DEFINITION, CHRONIC DISEASE 43
Are Vitamin C, Vitamin E, Selenium, and β-Carotene and OtherCarotenoids Dietary Antioxidants?
Vitamin C functions physiologically as a water-soluble antioxidantby virtue of its very strong reducing power (high redox potential)and facile regeneration via ubiquitous reductants such as glutathione,nicotinamide adenine dinucleotide, and nicotinamide adeninedinucleotide phosphate. The primary method used to estimate therequirement relates to the vitamin C intake needed to maintainnear-maximal neutrophil ascorbate concentration with minimal uri-nary excretion. Because smokers suffer increased oxidative stressand metabolic turnover of vitamin C, their requirement is increased.Although there is ample evidence that vitamin C administrationcan result in decreases in markers of oxidative stress, a Recom-mended Dietary Allowance (RDA) derived from a direct antioxidantfunction of vitamin C could not be calculated because of the lack ofa quantitative relationship between this antioxidant function and ahealth-related endpoint. Since vitamin C reduces markers of oxida-tive stress, it meets the definition of a dietary antioxidant.
Vitamin E functions as a chain-breaking antioxidant that preventsthe propagation of lipid peroxidation. To estimate the requirement,data were examined on the intake of vitamin E that would preventhydrogen peroxide-induced lysis of erythrocytes. Under these cir-cumstances, vitamin E is acting as an ex vivo antioxidant, maintain-ing a normal physiological function in humans. Although it is notyet possible to relate vitamin E intake to a lowering of chronic dis-ease risk, it still meets the definition of a dietary antioxidant.
Selenium functions through selenoproteins, several of which areoxidant defense enzymes. The criterion used to estimate the re-quirement for selenium relates to the intake needed to maximizethe activity of the plasma selenoprotein glutathione peroxidase, anoxidant defense enzyme. It is not clear if the diseases associatedwith selenium deficiencies, Keshan disease or Kashin-Beck disease,are due to oxidative stress. The selenium in several selenoproteinshas a biochemical role in oxidant defense, thus maintaining normalphysiological function, and as such plays a role as a dietary antioxi-dant.
β-Carotene and other carotenoids function as sources of vitamin Aand, due to this provitamin A activity, can prevent vitamin A defi-ciency. Because no other specific nutrient functions have been iden-tified at this time, no requirements have been established for any ofthe carotenoids. β-Carotene and the other carotenoids display invitro antioxidant activity, but the evidence that they act as in vivo
Copyright © National Academy of Sciences. All rights reserved.
44 DIETARY REFERENCE INTAKES
antioxidants in humans is still controversial. Therefore, β-carotenedoes not meet the definition of a dietary antioxidant. Similar con-clusions have been drawn for α-carotene, β-cryptoxanthin, lycopene,lutein, and zeaxanthin.
OXIDATIVE STRESS, ANTIOXIDANTS, ANDCHRONIC DISEASE
Oxidative Stress
There have been many proposals as to how oxidative stress can bedefined. Because all cells are exposed to oxidants, generated eitherendogenously from metabolism or exogenously from a variety ofenvironmental insults, the problem arises as to what constitutes anoxidative stress. Furthermore, different cells can be exposed to thesame level of oxidants, but depending on the level of antioxidantsor protective mechanisms available to the cell, they may or may notexperience an oxidative stress. Sies (1985) defined oxidative stressas “a disturbance in the prooxidant-antioxidant balance in favor ofthe former.” Others have amplified this definition to include “short-and/or long-term disturbance of the prooxidant-antioxidant bal-ance resulting in adverse effects that are due either to impairedantioxidation or to favored prooxidation” (Biesalski et al., 1997).Here, oxidative stress is defined as an imbalance between the pro-duction of various reactive species and the ability of the organism’snatural protective mechanisms to cope with these reactive com-pounds and prevent adverse effects.
The primary reactive species include reactive oxygen species(ROS) and reactive nitrogen species (RNS). These in turn react inthe body and generate radical intermediates of lipids, proteins, andnucleic acids that ultimately form the chemical end products ofoxidative stress. The physiological consequences of these end prod-ucts have been hypothesized to be the causes of many chronic dis-eases as well as the natural aging process (Ames, 1998; Halliwell,1997). The protective mechanisms include protective enzymes, an-tioxidant or quenching compounds produced by the organism, andsimilar compounds made available in the diet. The evidence thatchronic disease results from an imbalance between formation andremoval of reactive species is discussed below.
The primary defensive compounds are antioxidants that can in-teract with and quench reactive radical species, and enzymes thatcan inactivate these species or their products. All of the compoundsin this report—vitamin C, vitamin E, selenium in the form of se-lenoproteins, and β-carotene and other carotenoids—are in vitro
Copyright © National Academy of Sciences. All rights reserved.
OVERVIEW, ANTIOXIDANT DEFINITION, CHRONIC DISEASE 45
antioxidants, and some evidence exists that they have in vivo antiox-idant actions. The protective enzymes include, among others, super-oxide dismutase, catalase, and selenium-containing glutathione per-oxidases and thioredoxin reductase. Other antioxidant mechanismsinclude stimulation of the expression of antioxidant or repair en-zymes, as well as chelation of transition metals. A recent review ofthe relationship between antioxidant supplementation and oxida-tive damage concludes that, with the exception of vitamin E andpossibly vitamin C reducing markers of lipid peroxidation, the evi-dence is insufficient that antioxidant supplementation leads to amaterial reduction in oxidative damage in humans (McCall andFrei, 1999).
Biomarkers of Oxidative Stress
There have been numerous tests described to evaluate the level ofmarkers of oxidative stress in living systems. Many of these markersrepresent oxidative breakdown products of normal tissue compo-nents and metabolites. Products derived from oxidized lipids in-clude age pigments (lipofuscin), aldehydes, alkanes, and pros-tanoids such as the F2-isoprostanes derived from unsaturated fattyacids. Oxidation of proteins produces protein carbonyls and aminoacid derivatives such as methionine sulfoxide and nitrotyrosine, de-rived from the reaction of peroxynitrite (ONOO–) with tyrosine.Purine and pyrimidine metabolites that are derived from oxidizednucleic acids can be detected in tissues and in urine. Since virtuallyall tissues are exposed to ROS and RNS, there will always be a base-line production of these biomarker molecules. What is important inevaluating the extent of oxidative stress is the change in the level ofthe biomarker compared to a baseline or steady-state level.
It is quite clear that dietary change can alter the levels of some ofthe biomarkers described above, and this phenomenon has beenreported when the dietary intake of fruits and vegetables has beenincreased. Examples of such studies include reductions in biomark-ers of deoxyribonucleic acid (DNA) damage (Pool-Zobel et al.,1997) or of lipid peroxidation (Miller et al., 1998), following con-sumption of diets rich in fruits and vegetables. Many of these stud-ies have been reviewed recently (Halliwell, 1999).
A major problem with the use of biomarkers such as those de-scribed above is not knowing whether they reflect processes in theinitiation of a disease state or whether they are products of a diseasestate. The validity of biomarkers, either intermediate or final, willnot be settled until they are evaluated as part of intervention trials.
Copyright © National Academy of Sciences. All rights reserved.
46 DIETARY REFERENCE INTAKES
A causal relationship between the formation of a biomarker of oxi-dant stress and a chronic disease has not yet been validated.
Some attempts have been made to determine a more global mea-sure of oxidative stress, such as TRAP (total radical-trapping antiox-idant capability) (Wayner et al., 1985), ORAC (oxygen radical ab-sorbance capacity) (Cao et al., 1993), TEAC (trolox equivalentantioxidant capacity) (Miller et al., 1993), and FOX (ferrous oxida-tion/xylenol orange) (Jiang et al., 1992) assays. However, becausethese markers do not measure the same oxidants or antioxidantdefenses (Cao and Prior, 1998), it is difficult to validate them asuseful markers of oxidant stress.
Evidence of Oxidative Stress and Chronic Disease
Aerobic metabolism produces energy, waste products such as car-bon dioxide, and a small, but steady stream of radical by-productsthat are capable of reacting with all of the body’s constituents toform oxidative damage products (Ames et al., 1993; Chance et al.,1979). Calculations have been made of the number of radical spe-cies formed per cell per day, but it is not at all clear how thesenumbers relate to diseases. Since the entire population is exposedto oxidative stresses and only a small fraction develops a chronicdisease, it is clear that at this time, it is not understood how toevaluate the role of oxidative stress in the development of chronicdisease. The potential role of oxidative stress in six chronic diseaseareas and aging is described briefly below.
Cancer
DNA is subject to damage, and either an exogenous or an endog-enous mutagen can produce damage at a faster rate than the nor-mal protective process of enzymatic repair (Ames et al., 1995). Un-der these circumstances, elevated levels of excision products willappear in the urine. The observation that 8-oxy-7,8-dihydro-2′-deox-yguanosine (8-oxodG) is a major urinary product of both oxidativedamage to DNA and damage by ionizing radiation that producesROS, has served as the basis for the hypothesis that oxidative DNAdamage is carcinogenic (Ames et al., 1995). The presence of 8-oxodG in DNA would lead to a guanine-to-thymine transversionthat would result in a DNA mutation and, depending on its loca-tion, an altered gene product. 8-OxodG is also produced by ioniz-ing radiation, and since this process can be carcinogenic, it hasbeen assumed that any condition that produces 8-oxodG will also
Copyright © National Academy of Sciences. All rights reserved.
OVERVIEW, ANTIOXIDANT DEFINITION, CHRONIC DISEASE 47
be carcinogenic. However, a causal relationship between oxidativestress to DNA and cancer in humans has not yet been established(Poulsen et al., 1998).
A great deal of evidence based on epidemiological studies indi-cates that consuming diets rich in fruits and vegetables is associatedwith both a decrease in oxidative damage to DNA (Halliwell, 1998)and a lower risk of a number of common cancers. There are severalmechanisms that could account for these observations, in additionto antioxidant components that scavenge radical intermediates.Other mechanisms include the modification of carcinogen acti-vation by the inhibition of phase 1 enzymes, modification of car-cinogen detoxification by phase 2 enzymes, and suppression of theabnormal proliferation associated with preneoplastic lesions (War-govich, 1997).
Cardiovascular Disease
Of all the chronic diseases in which excess oxidative stress hasbeen implicated, cardiovascular disease has the strongest support-ing evidence. A coherent pathogenetic mechanism has been devel-oped to account for the earliest stage in atherogenesis, namely, thedevelopment of the fatty streak lesion. Hypercholesterolemia and,particularly, increased concentrations of low-density lipoproteins(LDLs) cause the accumulation of cholesterol-loaded “foam cells”beneath the endothelial lining of major arteries, which in turn de-velop into a fatty streak. This lesion is clinically benign but is theprecursor of later lesions (the fibrous plaque and the complex le-sion) that ultimately give rise to clinical manifestations (angina pec-toris and myocardial infarction) (Steinberg and Witztum, 1990).
An elevated LDL cholesterol level sufficiently increases the risk ofcardiovascular disease. Brown and Goldstein (1986) demonstratedthat the molecular defect in individuals with familial hypercholes-terolemia was the absence of functional LDL receptors. The histo-logical lesions in these patients cannot be differentiated from thatof lesions in individuals who have normal LDL receptors. The im-plication therefore is that normal LDL taken up by way of the nor-mal LDL receptor cannot be the basis for the formation of foamcells. In other words, the LDL must first be modified somehow andthe modified form must be taken up into the monocytes or mac-rophages via one or more alternative receptors ultimately and de-velop into foam cells. One such modification, and the most exten-sively studied, is LDL oxidation, and several macrophage receptorshave been shown to take up oxidatively modified LDL (oxLDL) and
Copyright © National Academy of Sciences. All rights reserved.
48 DIETARY REFERENCE INTAKES
thus develop foam cells (Navab et al., 1995; Steinberg, 1997; Stein-berg and Witztum, 1990; Steinberg et al., 1989; Steinbrecher, 1997).
In addition to its ability to cause foam cell formation, oxLDL cancontribute to atherogenesis by virtue of a number of properties thatdiffer from those of normal LDL (reviewed in Steinberg, 1997).The key question is whether these potentially proatherogenic prop-erties of oxLDL are of sufficient importance that inhibition of thegeneration of oxLDL by antioxidants will have a significant impacton the rate of progression of atherosclerotic lesions.
The finding that a relationship existed between LDL levels andthe incidence of cardiovascular disease was followed by the observa-tion that oxLDL was associated with the development of atheroscle-rotic lesions in experimental animals. This association led to thehypothesis that oxLDL is the causative agent in the development ofcardiovascular disease (Steinberg et al., 1989). This hypothesis hasserved as the basis for a number of human intervention trials, test-ing whether antioxidant agents capable of decreasing the extent ofoxidation of LDL and thus decreasing oxLDL concentration mightprove useful in decreasing the incidence of cardiovascular disease.
Several biomarkers of oxidative stress have been used to evaluatethe extent of oxLDL formation and/or the extent of oxidative dam-age to lipids in general. OxLDL formation has been assessed aftertreating individuals with dietary antioxidants and evaluating thepresence of oxLDL. In addition there have been reports of a potenteffect of supplementary antioxidants in lowering the extent of exvivo oxLDL formation. The results are not consistent, and as such,it is still not possible to conclude that dietary antioxidants preventthe formation of oxLDL in vivo. In addition, this modulation ofLDL oxidation still must be validated as a marker of risk for cardio-vascular disease (Zock and Katan, 1998).
The appearance of F2-isoprostanes in urine has been suggested bya number of investigators as a reliable index of in vivo free radicalgeneration and oxidative lipid formation. There is very strong evi-dence from animal studies that F2-isoprostanes increase in plasmaand urine as a result of oxidative stress, and in humans, these prod-ucts are elevated in smokers (Morrow et al., 1995). Evidence is grad-ually accumulating that supplementary antioxidants, and vitamin Ein particular, can both affect the level of F2-isoprostanes in animalmodels of atherosclerosis and decrease the extent of arterial walllesions (Pratico et al., 1998). Similar results have been obtained inhumans (Hodis et al., 1995). Although some reviews point out thatthe protective role of antioxidants in animal models of atheroscle-rosis is only partially confirmed in human studies (Faggiotto et al.,
Copyright © National Academy of Sciences. All rights reserved.
OVERVIEW, ANTIOXIDANT DEFINITION, CHRONIC DISEASE 49
1998), others are much more supportive of a protective role forvitamin E in coronary heart disease (Pryor, 2000).
Cataracts
There have been a number of observational epidemiological stud-ies of the risk of developing cataracts in humans. Many of thesestudies indicate that the risk of cataracts may be inversely propor-tional to the serum level of antioxidants (Knekt et al., 1992; Tayloret al., 1995) or may be reduced by supplement use (Jacques et al.,1997). These studies, however, have been considered to be incon-clusive (Christen et al., 1996a; Leske et al., 1998). In the Alpha-Tocopherol, Beta-Carotene Cancer Prevention Study, 5 to 8 years ofdaily supplementation with either 50 mg of vitamin E or 20 mg of β-carotene or both resulted in no difference in the prevalence ofcataracts in the men in this study (Teikari et al., 1997).
Age-Related Macular Degeneration
This irreversible disease, which is the major form of blindness inthe elderly in the United States, Canada, and Europe, has beenrelated to antioxidants found in the diet. This is because the pig-ment in the macular region of the normal retina consists of the twoxanthophyll carotenoids, lutein and zeaxanthin (Bone et al., 1988;Handelman et al., 1988). This observation, coupled with the epide-miological observations of an inverse relationship between the riskof age-related macular degeneration (AMD) and the ingestion offruits and vegetables (Goldberg et al., 1988), led a number of groupsto propose that the basis of this chronic disease was a nutritionaldeficiency of green, leafy vegetables and yellow and orange fruitsand vegetables that were rich in lutein and zeaxanthin (EDCCSG,1992; Seddon et al., 1994; Snodderly, 1995). Another associationwas the observation that smokers, who have lower plasma levels ofcarotenoids, also have a lower macular pigment (lutein and zeaxan-thin) density (Hammond et al., 1996) and an increased risk of de-veloping AMD (Christen et al., 1996b). However, all of these re-ports are associative in nature and do not demonstrate a causalrelationship between deficiencies of lutein and zeaxanthin and de-velopment of AMD.
Copyright © National Academy of Sciences. All rights reserved.
50 DIETARY REFERENCE INTAKES
Central Neurodegenerative Diseases
There is increasing evidence that a number of common neuro-degenerative diseases, such as Alzheimer’s disease, Parkinson’s dis-ease, multiple sclerosis, and amyotrophic lateral sclerosis may in-clude adverse responses to oxidative stress. Small intervention trialsin patients with these diagnoses have reported some improvementwith either vitamin E (Muller, 1994; Sano et al., 1997) or vitamin C(Morris et al., 1998; Riviere et al., 1998), but it is still too early todraw any conclusions as to the usefulness of these compounds inthese diseases, or to their ability to delay onset of the disease.
Diabetes Mellitus
Cardiovascular complications are the major causes of death indiabetes. The incidence of coronary heart disease in type II diabe-tes is significantly higher than that in the general population (Kan-nel and McGee, 1979). In addition, individuals with diabetes expe-rience microvascular complications (retinopathy, neuropathy, andnephropathy) secondary to their hyperglycemia. Thus, oxidativeprocesses also may play an important role in the development orprogression of diabetes mellitus.
In vitro oxidation of LDL from patients with diabetes mellitusproceeds at an accelerated rate, which suggests that they are moresusceptible to the atherogenic process (Chisolm et al., 1992; Nishiga-ki et al., 1981; Reaven et al., 1995; Tsai et al., 1994). The several waysin which oxLDL is potentially more atherogenic than native LDLhave been discussed above (see section “Cardiovascular Disease”).
Diabetics tend to have smaller, denser LDL (associated with hy-pertriglyceridemia) and these LDLs are more susceptible to oxida-tive modification ex vivo (Feingold et al., 1992). The TRAP of plas-ma from patients with insulin-dependent diabetes is decreased (Tsaiet al. 1994), which may account in part for the greater susceptibilityof their LDL to oxidation.
Microvascular complications are believed to be the ultimate con-sequences of nonenzymatic glycosylation and the progressive accu-mulation of advanced glycosylation end products (AGEs). There isevidence that the formation of these complex carbohydrate-proteinand carbohydrate-lipid complexes is accompanied and acceleratedby oxidative processes, which may lead to diabetic complications(Brownlee et al., 1988; Dyer et al., 1993; Hunt et al., 1988; McCanceet al., 1993; Mullarkey et al., 1990). The glycosylation process isassociated with increased formation of free radicals, and the possi-
Copyright © National Academy of Sciences. All rights reserved.
OVERVIEW, ANTIOXIDANT DEFINITION, CHRONIC DISEASE 51
bility that treatment with antioxidants might slow the developmentof AGEs is under investigation.
The issue of whether modifications observed in plasma and tissueproteins in patients with diabetes are due to an oxidative stress or astress from reactive carbonyls has been discussed by Baynes andThorpe (1999). A number of studies have tried altering the patho-biology of diabetes by treating patients with either single antioxi-dant-type compounds or combinations of compounds with antioxi-dant properties. The results have been inconclusive, which mayreflect the fact that the underlying pathology is not caused exclu-sively by an oxidative stress, but by an inability to metabolize andinactivate reactive carbonyls appropriately. Under these circum-stances, the oxidative damage may be exacerbated, resulting in anincrease in many of the markers associated with oxidative stress butnot caused directly by oxidative stress (Baynes and Thorpe, 1999).
Aging
Aging is not in itself a chronic disease, but rather is characterizedby the active or passive presence of a chronic disease (cardiovascu-lar disease, cancer, cataracts, Alzheimer’s disease, etc.). It is notclear if an accumulation of chronic insults and weakened defensesrenders the aging individual more susceptible to various diseases.Do antioxidants play a role in preventing aging or prolonging life?There is no direct evidence in humans for such an effect, althoughvitamin E supplementation appears to improve some immune re-sponses in the elderly (Meydani et al., 1997). There have been sug-gestions that supplementing older animals with antioxidants mayimprove various physiological functions (Hagen et al., 1999), butthe only experimental intervention that has resulted in prolonga-tion of the life span of the animals has been the drastic reduction offood consumption (Pariza and Boutwell, 1987). Whether such aprotocol would delay aging in humans has not yet been studied.Whether dietary antioxidants can lead to healthier aging remains tobe proven.
CONCLUSIONS
There is little doubt that an imbalance in the production of freeradicals and other reactive species and the natural protective sys-tems available to organisms can lead to the production of oxidizedproducts of lipids, nucleic acids, and proteins. These oxidationproducts, or biomarkers of this imbalance, may be related to early
Copyright © National Academy of Sciences. All rights reserved.
52 DIETARY REFERENCE INTAKES
events in certain chronic diseases. However, they have not yet beenadequately validated as markers of the onset, progression, or regres-sion of any chronic diseases. Although vitamin C, vitamin E, andselenium have been shown to decrease the concentrations of someof the biomarkers associated with oxidative stress, the relationshipbetween such observations and chronic disease remain to be eluci-dated. As a consequence, it has not been possible to establish thatdietary antioxidants or other nutrients that can alter the levels ofthese biomarkers are themselves causally related to the develop-ment or prevention of chronic diseases.
REFERENCESAmes BN. 1998. Micronutrients prevent cancer and delay aging. Toxicol Lett 102–
103:5–18.Ames BN, Shigenaga MK, Hagen TM. 1993. Oxidants, antioxidants, and the de-
generative diseases of aging. Proc Natl Acad Sci USA 90:7915–7922.Ames BN, Gold LS, Willett WC. 1995. The causes and prevention of cancer. Proc
Natl Acad Sci USA 92:5258–5265.ATBC (Alpha-Tocopherol, Beta Carotene) Cancer Prevention Study Group. 1994.
The effect of vitamin E and beta carotene on the incidence of lung cancer andother cancers in male smokers. N Engl J Med 330:1029–1035.
Baynes JW, Thorpe SR. 1999. Role of oxidative stress in diabetic complications: Anew perspective on an old paradigm. Diabetes 48:1–9.
Biesalski HK, Böhles H, Esterbauer H, Fürst P, Gey F, Hundsdörfer G, Kasper H,Sies H, Weisburger J. 1997. Antioxidant vitamins in prevention. Clin Nutr16:151–155.
Blot WJ, Li J-Y, Taylor PR, Guo W, Dawsey S, Wang G-Q, Yang CS, Zheng S-F, GailM, Li G-Y, Yu Y, Liu B-Q, Tangrea J, Sun Y-H, Liu F, Fraumeni JF Jr, Zhang Y-H, Li B. 1993. Nutrition intervention trials in Linxian, China: Supplementa-tion with specific vitamin/mineral combinations, cancer incidence, and dis-ease-specific mortality in the general population. J Natl Cancer Inst 85:1483–1492.
Bone RA, Landrum JT, Fernandez L, Tarsis SL. 1988. Analysis of the macularpigment by HPLC: Retinal distribution and age study. Invest Ophthalmol Vis Sci29:843–849.
Brown MS, Goldstein JL. 1986. A receptor-mediated pathway for cholesterol ho-meostasis. Science 232:34–47.
Brownlee M, Cerami A, Vlassara H. 1988. Advanced glycosylation end products intissue and the biochemical basis of diabetic complications. N Engl J Med 318:1315–1321.
Buring JE, Hennekens CH. 1992. The Women’s Health Study: Summary of thestudy design. J Myocard Isch 4:27–29.
Cao G, Prior RL. 1998. Comparison of different analytical methods for assessingtotal antioxidant capacity of human serum. Clin Chem 44:1309–1315.
Cao G, Alessio HM, Cutler RG. 1993. Oxygen-radical absorbance capacity assay forantioxidants. Free Radic Biol Med 14:303–311.
Chance B, Sies H, Boveris A. 1979. Hydroperoxide metabolism in mammalianorgans. Physiol Rev 59:527–605.
Copyright © National Academy of Sciences. All rights reserved.
OVERVIEW, ANTIOXIDANT DEFINITION, CHRONIC DISEASE 53
Chisolm GM, Irwin KC, Penn MS. 1992. Lipoprotein oxidation and lipoprotein-induced cell injury in diabetes. Diabetes 41:61–66.
Christen WG, Glynn RJ, Hennekens CH. 1996a. Antioxidants and age-related eyedisease. Current and future perspectives. Ann Epidemiol 6:60–66.
Christen WG, Glynn RJ, Manson JE, Ajani UA, Buring JE. 1996b. A prospectivestudy of cigarette smoking and risk of age-related macular degeneration inmen. J Am Med Assoc 276:1147–1151.
Clark LC, Combs GF, Turnbull BW, Slate EH, Chalker DK, Chow J, Davis LS,Glover RA, Graham GF, Gross EG, Krongrad A, Lesher JL, Park HK, SandersBB, Smith CL, Taylor JR. 1996. Effects of selenium supplementation for can-cer prevention in patients with carcinoma of the skin. A randomized con-trolled trial. J Am Med Assoc 276:1957–1963.
Clark LC, Dalkin B, Krongrad A, Combs GF Jr, Turnbull BW, Slate EH, Withering-ton R, Herlong JH, Janosko E, Carpenter D, Borosso C, Falk S, Rounder J.1998. Decreased incidence of prostate cancer with selenium supplementation:Results of a double-blind cancer prevention trial. Br J Urol 81:730–734.
Diplock AT. 1998. Defense against reactive oxygen species. Free Rad Res 29:463–467.
Diplock AT, Charleux JL, Crozier-Willi G, Kok FJ, Rice-Evans C, Roberfroid M,Stahl W, Vina-Ribes J. 1998. Functional food science and defense against reac-tive oxidative species. Br J Nutr 80:S77–S112.
Dyer DG, Dunn JA, Thorpe SR, Bailie KE, Lyons TJ, McCance DR, Baynes JW.1993. Accumulation of Maillard reaction products in skin collagen in diabetesand aging. J Clin Invest 91:2463–2469.
EDCCSG (Eye Disease Case-Control Study Group). 1992. Risk factors for neovascu-lar age-related macular degeneration. Arch Ophthalmol 110:1701–1708.
Faggiotto A, Poli A, Catapano AL. 1998. Antioxidants and coronary artery disease.Curr Opin Lipidol 9:541–549.
Feingold KR, Grunfeld C, Pang M, Doerrler W, Krauss RM. 1992. LDL subclassphenotypes and triglyceride metabolism in non-insulin-dependent diabetes.Arterioscler Thromb 12:1496–1502.
GISSI-Prevenzione Investigators. 1999. Dietary supplementation with n-3 polyun-saturated fatty acids and vitamin E after myocardial infarction: Results of theGISSI-Prevenzione Trial. Lancet 354:447–455.
Goldberg J, Flowerdew G, Smith E, Brody JA, Tso MO. 1988. Factors associatedwith age-related macular degeneration. Am J Epidemiol 128:700–710.
Greenberg ER, Baron JA, Stukel TA, Stevens MM, Mandel JS, Spencer SK, EliasPM, Lowe N, Nierenberg DW, Bayrd G, Vance JC, Freeman DH, ClendenningWE, Kwan. 1990. A clinical trial of beta carotene to prevent basal-cell andsquamous-cell cancers of the skin. N Engl J Med 323:789–795.
Greenberg ER, Baron JA, Tosteson TD, Freeman DH, Beck GJ, Bond JH, Colac-chio TA, Coller JA, Frankl HD, Haile RW, Mandel JS, Nierenberg DW, Roth-stein R, Snover DC, Stevens MM, Summers RW, van Stolk RU. 1994. A clinicaltrial of antioxidant vitamins to prevent colorectal adenoma. N Engl J Med331:141–147.
Hagen TM, Ingersoll RT, Lykkesfeldt J, Liu J, Wehr CM, Vinarsky V, BartholomewJC, Ames AB. 1999. (R)-alpha-lipoic acid-supplemented old rats have improvedmitochondrial function, decreased oxidative damage, and increased metabol-ic rate. FASEB J 13:411–418.
Halliwell B. 1996. Antioxidants in human health and disease. Annu Rev Nutr 16:33–50.
Copyright © National Academy of Sciences. All rights reserved.
54 DIETARY REFERENCE INTAKES
Halliwell B. 1997. Antioxidants and human disease: A general introduction. NutrRev 55:S44–S52.
Halliwell B. 1998. Can oxidative DNA damage be used as a biomarker for cancerrisk in humans? Problems, resolutions and preliminary results from nutrition-al supplement studies. Free Radic Res 29:469-486.
Halliwell B. 1999. Antioxidant defence mechanisms: From the beginning to theend (of the beginning). Free Radic Res 31:261-272.
Hammond BR Jr, Wooten BR, Snodderly DM. 1996. Cigarette smoking and retinalcarotenoids: Implications for age-related macular degeneration. Vision Res36:3003–3009.
Handelman GJ, Dratz EA, Reay CC, Van Kuijk JG. 1988. Carotenoids in the humanmacula and whole retina. Invest Ophthalmol Vis Sci 29:850–855.
Hennekens CH. 1998. Antioxidant vitamins and cardiovascular disease: Currentknowledge and future directions. Nutrition 14:50–51.
Hennekens CH, Buring JE, Manson JE, Stampfer M, Rosner B, Cook NR, BelangerC, LaMotte F, Gaziano JM, Ridker PM, Willett W, Peto R. 1996. Lack of effectof long-term supplementation with beta carotene on the incidence of malig-nant neoplasms and cardiovascular disease. N Engl J Med 334:1145–1149.
Hercberg S, Galan P, Preziosi P, Roussel AM, Arnaud J, Richard MJ, Malvy D, Paul-Dauphin A, Briancon S, Favier A. 1998. Background and rational behind theSU.VI.MAX Study, a prevention trial using nutritional doses of a combinationof antioxidant vitamins and minerals to reduce cardiovascular diseases andcancers. SUpplementation en VItamines et Mineraux AntioXydants Study. IntJ Vitam Nutr Res 68:3–20.
Hodis HN, Mack WJ, LaBree L, Cashin-Hemphill L, Sevanian A, Johnson R, AzenSP. 1995. Serial coronary angiographic evidence that antioxidant vitamin in-take reduces progression of coronary artery atherosclerosis. J Am Med Assoc21:1849–1854.
HOPE (Heart Outcomes Prevention Evalulation) Study Investigators. 2000. Vita-min E supplementation and cardiovascular events in high-risk patients. N EnglJ Med 342:154–160.
Hunt JV, Dean RT, Wolff SP. 1988. Hydroxyl radical production and autoxidativeglycosylation. Glucose autoxidation as the cause of protein damage in theexperimental glycation model of diabetes mellitus and ageing. Biochem J 256:205–212.
IOM (Institute of Medicine). 1998. Dietary Reference Intakes. Proposed Definition andPlan for Review of Dietary Antioxidants and Related Compounds. Washington, DC:National Academy Press.
Jacques PF, Taylor A, Hankinson SE, Willett WC, Mahnken B, Lee Y, Vaid K, LahavM. 1997. Long-term vitamin C supplement use and prevalence of early age-related lens opacities. Am J Clin Nutr 66:911–916.
Jiang ZY, Hunt JV, Wolff SP. 1992. Ferrous ion oxidation in the presence of xylenolorange for detection of lipid hydroperoxide in low density lipoprotein. AnalBiochem 202:384–389.
Kannel WB, McGee DL. 1979. Diabetes and cardiovascular disease: The Framing-ham study. J Am Med Assoc 241:2035–2038.
Knekt P, Heliovaara M, Rissanen A, Aromaa A, Aaran RK. 1992. Serum antioxidantvitamins and risk of cataract. Br Med J 305:1392–1394.
Lee IM, Cook NR, Manson JE, Buring JE, Hennekens CH. 1999. β-Carotene sup-plementation and incidence of cancer and cardiovascular disease: The Wom-en’s Health Study. J Natl Cancer Inst 91:2102–2106.
Copyright © National Academy of Sciences. All rights reserved.
OVERVIEW, ANTIOXIDANT DEFINITION, CHRONIC DISEASE 55
Leske MC, Chylack LT Jr, He Q, Wu SY, Schoenfeld E, Friend J, Wolfe J. 1998.Antioxidant vitamins and nuclear opacities. The Longitudinal Study of Cata-ract. Ophthalmol 105:831–836.
Manson JE, Gaziano JM, Spelsberg A, Ridker PM, Cook NR, Buring JE, Willett WC,Hennekens CH. 1995. A secondary prevention trial of antioxidant vitaminsand cardiovascular disease in women. Rationale, design, and methods. AnnEpidemiol 5:261–269.
McCall MR, Frei B. 1999. Can antioxidant vitamins maternally reduce oxidativedamage in humans? Free Radic Biol Med 26:1034–1053.
McCance DR, Dyer DG, Dunn JA, Bailie KE, Thorpe SR, Baynes JW, Lyons TJ.1993. Maillard reaction products and their relation to complications in insu-lin-dependent diabetes mellitus. J Clin Invest 91:2470–2478.
Meydani SN, Meydani M, Blumberg JB, Leka LS, Siber G, Loszewski R, ThompsonC, Pedrosa MC, Diamond RD, Stollar BD. 1997. Vitamin E supplementationand in vivo immune response in healthy elderly subjects. A randomized con-trolled trial. J Am Med Assoc 277:1380–1386.
Miller ER III, Appel LJ, Risby TH. 1998. Effect of dietary patterns on measures oflipid peroxidation: Results from a randomized clinical trial. Circulation 98:2390–2395.
Miller NJ, Rice-Evans C, Davies MJ, Gopinathan V, Milner A. 1993. A novel methodfor measuring antioxidant capacity and its application to monitoring the anti-oxidant status in premature neonates. Clin Sci 84:407–412.
Morris MC, Beckett LA, Scherr PA, Hebert LE, Bennett DA, Field TS, Evans DA.1998. Vitamin E and vitamin C supplement use and risk of incident Alzheimerdisease. Alzheimer Dis Assoc Disord 12:121–126.
Morrow JD, Frei B, Longmire AW, Gaziano JM, Lynch SM, Shyr Y, Strauss WE,Oates JA, Roberts LJ II. 1995. Increase in circulating products of lipid peroxi-dation (F2-isoprostanes) in smokers. N Engl J Med 332:1198–1203.
MRC/BHF (Medical Research Council/British Heart Foundation). 1999. MRC/BHF Heart Protection Study of cholesterol-lowering therapy and of antioxi-dant vitamin supplementation in a wide range of patients at increased risk ofcoronary heart disease death: Early safety and efficacy experience. Eur Heart J20:725–741.
Mullarkey CJ, Edelstein D, Brownlee M. 1990. Free radical generation by earlyglycation products: A mechanism for accelerated atherogenesis in diabetes.Biochem Biophys Res Commun 173:932–939.
Muller DP. 1994. Vitamin E and other antioxidants in neurological function anddisease. In: Frei B, ed. Natural Antioxidants in Human Health and Disease. SanDiego: Academic Press. Pp. 535–565.
Navab M, Fogelman AM, Berliner JA, Territo MC, Demer LL, Frank JS, WatsonAD, Edwards PA, Lusis AJ. 1995. Pathogenesis of atherosclerosis. Am J Cardiol76:18C–23C.
Nishigaki I, Hagihara M, Tsunekawa H, Maseki M, Yagi K. 1981. Lipid peroxidelevels of serum lipoprotein fractions of diabetic patients. Biochem Med 25:373–378.
Omenn GS, Goodman GE, Thornquist MD, Balmes J, Cullen MR, Glass A, KeoghJP, Meyskens FL Jr, Valanis B, Williams JH Jr, Barnhart S, Cherniack MG,Brodkin CA, Hammar S. 1996. Risk factors for lung cancer and for interven-tion effects in CARET, the Beta-Carotene and Retinol Efficacy Trial. J NatlCancer Inst 88:1550–1559.
Copyright © National Academy of Sciences. All rights reserved.
56 DIETARY REFERENCE INTAKES
Pariza MW, Boutwell RK. 1987. Historical perspective: Calories and energy expen-diture in carcinogenesis. Am J Clin Nutr 45:151–156.
Pool-Zobel BL, Bub A, Muller H, Wollowski I, Rechkemmer G. 1997. Consumptionof vegetables reduces genetic damage in humans: First results of a humanintervention trial with carotenoid-rich foods. Carcinogenesis 18:1847–1850.
Poulsen HE, Prieme H, Loft S. 1998. Role of oxidative DNA damage in cancerinitiation and promotion. Eur J Cancer Prev 7:9–16.
Pratico D, Tangirala RK, Rader DJ, Rokach J, FitzGerald GA. 1998. Vitamin Esuppresses isoprostane generation in vivo and reduces atherosclerosis in ApoE-deficient mice. Nat Med 4:1189–1192.
Pryor WA. 2000. Vitamin E and heart disease: Basic science to clinical interventiontrials. Free Radic Biol Med 28:141–164.
Reaven PD, Herold DA, Barnett J, Edelman S. 1995. Effects of vitamin E on suscep-tibility of low-density lipoprotein and low-density lipoprotein subfractions tooxidation and on protein glycation in NIDDM. Diabetes Care 18:807–816.
Riviere S, Birlouez-Aragon I, Nourhashemi F, Vellas B. 1998. Low plasma vitamin Cin Alzheimer patients despite an adequate diet. Int J Geriatr Psychiatry 13:749–754.
Sano M, Ernesto C, Thomas RG, Klauber MR, Schafer K, Grundman M, WoodburyP, Growdon J, Cotman CW, Pfeiffer E, Schneider LS, Thal LJ. 1997. Acontrolled trial of selegiline, alpha-tocopherol, or both as treatment forAlzheimer’s disease. The Alzheimer’s Disease Cooperative Study. N Engl J Med336:1216–1222.
Seddon JM, Ajani UA, Sperduto RD, Hiller R, Blair N, Burton TC, Farber MD,Gragoudas ES, Haller J, Miller DT, Yannuzzi LA, Willett W. 1994. Dietarycarotenoids, vitamins A, C, and E, and advanced age-related macular degenera-tion. J Am Med Assoc 272:1413–1420.
Sies H. 1985. Oxidative stress. Introductory remarks. In: Sies H, ed. Oxidative Stress.London: Academic Press. Pp.1–8.
Sies H, Stahl W. 1995. Vitamins E and C, beta-carotene, and other carotenoids asantioxidants. Am J Clin Nutr 62:1315S–1321S.
Snodderly DM. 1995. Evidence for protection against age-related macular degener-ation by carotenoids and antioxidant vitamins. Am J Clin Nutr 62:1448S–1461S.
Steinberg D. 1997. Low density lipoprotein oxidation and its pathobiological sig-nificance. J Biol Chem 272:20963–20966.
Steinberg D, Witztum JL. 1990. Lipoproteins and atherogenesis. Current concepts.J Am Med Assoc 264:3047–3052.
Steinberg D, Parthasarathy S, Carew TE, Khoo JC, Witztum JL. 1989. Beyond cho-lesterol. Modifications of low-density lipoprotein that increase its atherogenic-ity. N Engl J Med 320:915–924.
Steinbrecher UP. 1997. Dietary antioxidants and cardioprotein—Fact or fallacy?Can J Physiol Pharmacol 75:228–233.
Stephens NG, Parsons A, Schofield PM, Kelly F, Cheeseman K, Mitchinson MJ.1996. Randomised controlled trial of vitamin E in patients with coronary dis-ease: Cambridge Heart Antioxidant Study (CHAOS). Lancet 347:781–786.
Taylor A, Jacques PF, Epstein EM. 1995. Relations among aging, antioxidant status,and cataract. Am J Clin Nutr 62:1439S–1447S.
Teikari JM, Virtamo J, Rautalahti M, Palmgren J, Liesto K, Heinonen OP. 1997.Long-term supplementation with alpha-tocopherol and beta-carotene and age-related cataract. Acta Ophthalmol Scand 75:634–640.
Copyright © National Academy of Sciences. All rights reserved.
OVERVIEW, ANTIOXIDANT DEFINITION, CHRONIC DISEASE 57
Tsai EC, Hirsch IB, Brunzell JD, Chait A. 1994. Reduced plasma peroxyl radicaltrapping capacity and increased susceptibility of LDL to oxidation in poorlycontrolled IDDM. Diabetes 43:1010–1014.
Wargovich MJ. 1997. Experimental evidence for cancer preventive elements infoods. Cancer Lett 114:11–17.
Wayner DD, Burton GW, Ingold KU, Locke S. 1985. Quantitative measurement ofthe total, peroxyl radical-trapping antioxidant capability of human blood plas-ma by controlled peroxidation. The important contributions made by plasmaproteins. FEBS Lett 187:33–37.
Zock PL, Katan MB. 1998. Diet, LDL oxidation, and coronary artery disease. Am JClin Nutr 68:759–760.
Copyright © National Academy of Sciences. All rights reserved. 58
3Vitamin C, Vitamin E,
Selenium, and β-Caroteneand Other Carotenoids:
Methods
METHODOLOGICAL CONSIDERATIONS
Types of Data Used
A number of disciplines have made key contributions to the evi-dence linking antioxidants to outcomes that may relate to humanhealth (e.g., Hennekens and Buring, 1987). Basic biological re-search often involving animal models, provides crucial informationon mechanisms that may link nutrient consumption to beneficial oradverse health outcomes. Clinical and epidemiological observation-al studies likewise play a valuable role in generating and testinghypotheses concerning the health risks and benefits of nutrient in-take patterns. Randomized clinical trials in population groups ofinterest have the potential to provide definitive comparisons be-tween selected nutrient intake patterns and subsequent health-related outcomes. Note, however, that randomized trials attempt-ing to relate diet to disease states also have important limitations,which are elaborated below.
Animal Models
Basic research using experimental animals affords considerableadvantage in terms of control of nutrient exposures, environmentalfactors, and even genetics. In contrast, the relevance to free-livinghumans may be unclear. In addition, dose levels and routes of ad-ministration that are practical and possible in animal experimentsmay differ greatly from those that are relevant to or possible with
Copyright © National Academy of Sciences. All rights reserved.
METHODS 59
humans. Nevertheless, results from animal feeding experimentsregarding vitamin C, vitamin E, selenium, and β-carotene and othercarotenoids were included in the evidence reviewed in developingthe decisions concerning the ability to specify the Dietary Refer-ence Intakes (DRIs) for these nutrients.
Human Feeding Studies
Controlled feeding studies, usually in a confined setting such as ametabolic ward, can yield valuable information on the relationshipbetween nutrient consumption and health-related biomarkers.Much of the understanding of human nutrient requirements to pre-vent deficiencies is based on studies of this type. Studies in whichthe subjects are confined allow for close control of both intake andactivities. Complete collections of nutrient losses through urine andfeces are possible, as is recurring sampling of biological materialssuch as blood. Nutrient balance studies measure nutrient status inrelation to intake, whereas depletion-repletion studies measure nu-trient status while subjects are maintained on diets containing mar-ginally low or deficient levels of a nutrient, followed by correctionof the deficit with measured amounts of the nutrient. However,these studies have several limitations: typically they are limited intime to a few days or weeks, so longer-term outcomes cannot bemeasured with the same level of accuracy. In addition, subjects maybe confined, and therefore findings cannot be generalized to free-living individuals. Finally, the time and expense involved in suchstudies usually limit the number of subjects and the number ofdoses or intake levels that can be tested.
In spite of these limitations, feeding studies play an importantrole in understanding nutrient needs and metabolism. Such datawere considered in the DRI process and were given particular atten-tion in the absence of reliable data with which to directly relatenutrient intake to disease risk.
Observational Studies
In comparison, observational epidemiological studies are fre-quently of direct relevance to free-living humans but lack the con-trolled setting of human feeding studies. Hence they may be able toestablish convincing evidence of an association between the con-sumption of a nutrient and disease risk, but they are limited in theirability to ascribe a causal relationship. A judgment of causality maybe supported by a consistency of association among studies in di-
Copyright © National Academy of Sciences. All rights reserved.
60 DIETARY REFERENCE INTAKES
verse populations and may be strengthened by the use of laborato-ry-based tools to measure exposures and confounding factors, rath-er than other means of data collection such as personal interviews.In recent years, rapid advances in laboratory technology have madepossible the increased use of biomarkers of exposure, susceptibility,and disease outcome in molecular epidemiological research. Forexample, one area of great potential in advancing current knowl-edge of the effects of diet on health is the study of genetic markersof disease susceptibility (especially polymorphisms in genes that en-code metabolizing enzymes) in relation to dietary exposures. Thisdevelopment is expected to provide more accurate assessments ofthe risk associated with different levels of intake of both nutrientsand nonnutritive food constituents.
While analytic epidemiological studies (studies that relate expo-sure to disease outcomes in individuals) have provided convincingevidence of an associative relationship between selected nondietaryexposures and disease risk, there are a number of other factors thatlimit study reliability in research relating nutrient intakes to diseaserisks. First, the variation in nutrient intake may be rather limited inpopulations selected for study. This feature alone may yield modestrelative risk trends across intake categories in the population, evenif the nutrient is an important factor in explaining large diseaserate variations among populations.
Second, the human diet is a complex mixture of foods and nutri-ents including many substances that may be highly correlated, whichgives rise to particular concerns about confounding. Third, manycohort and case-control studies have relied on self-reports of diet,typically food records, 24-hour recalls, or diet history questionnaires.Repeated application of such instruments to the same individualsshow considerable variation in nutrient consumption estimates fromone time to another with correlations often in the 0.3 to 0.7 range(e.g., Willett et al., 1985). In addition, there may be systematic biasin nutrient consumption estimates from self-reports because thereporting of food intakes and portion sizes may depend on individ-ual characteristics such as body mass, ethnicity, and age. For exam-ple, total energy consumption may tend to be substantially underre-ported (30 to 50 percent) among obese persons, with little or nounderreporting among lean persons (Heitmann and Lissner, 1995).Such systematic bias, in conjunction with random measurement er-ror and limited intake range, has the potential to greatly impactanalytic epidemiological studies based on self-reported dietary hab-its. Note that cohort studies using objective (biomarker) measuresof nutrient intake may have an important advantage concerning
Copyright © National Academy of Sciences. All rights reserved.
METHODS 61
the avoidance of systematic bias, although important sources of bias(e.g., confounding) may remain.
Randomized Clinical Trials
By allocating subjects to the (nutrient) exposure of interest atrandom, clinical trials eliminate the confounding that may be intro-duced in observational studies by self-selection. The unique strengthof randomized trials is that, if the sample is large enough, the studygroups will be comparable with respect not only to those confound-ing variables known to the investigators, but also to any unknownfactors that might be related to risk of the disease. Thus, random-ized trials achieve a degree of control of confounding that is simplynot possible with any observational design strategy and thus allowfor the testing of small effects that are beyond the ability of observa-tional studies to detect reliably.
Although randomized controlled trials represent the acceptedstandard for studies of nutrient consumption in relation to humanhealth, they too possess important limitations. Specifically, personsagreeing to be randomized may be a select subset of the populationof interest, which limits the generalization of trial results. For prac-tical reasons, only a small number of nutrients or nutrient combina-tions at a single intake level are generally studied in a randomizedtrial (although a small number of intervention trials to comparespecific dietary patterns have been initiated in recent years). In ad-dition, the follow-up period will typically be short relative to thepreceding period of nutrient consumption that may be relevant tothe health outcomes under study particularly if chronic disease end-points are sought. Also, dietary intervention or supplementationtrials tend to be costly and logistically difficult, and the mainte-nance of intervention adherence can be a particular challenge.
Because of the many complexities in conducting studies amongfree-living human populations and the attendant potential for biasand confounding, it is the totality of the evidence from both obser-vational and intervention studies, appropriately weighted, that mustform the basis for conclusions regarding causal relationships be-tween particular exposures and disease outcomes.
Weighing the Evidence
As a principle, only studies published in peer-reviewed journalshave been used in this report. However, studies published in otherscientific journals or readily available reports were considered ifthey appeared to provide important information not documented
Copyright © National Academy of Sciences. All rights reserved.
62 DIETARY REFERENCE INTAKES
elsewhere. To the extent possible, original scientific studies havebeen used to derive the DRIs. Based on a thorough review of thescientific literature, clinical and functional indicators of nutritionaladequacy and excess were identified for each nutrient.
The quality of the studies was considered in weighing the evi-dence. The characteristics examined included the study design andthe representativeness of the study population; the validity, reliabil-ity, and precision of the methods used for measuring intake andindicators of adequacy or excess; the control of biases and con-founding factors; and the power of the study to demonstrate a givendifference or correlation. Publications solely expressing opinionswere not used in setting DRIs. The assessment acknowledged theinherent reliability of each type of study design as described aboveand applied standard criteria concerning the strength, dose-re-sponse, and temporal pattern of estimated nutrient-disease or ad-verse effect associations; the consistency of associations among stud-ies of various types; and the specificity and biological plausibility ofthe suggested relationships (Hill, 1971). For example, biologicalplausibility would not be sufficient in the presence of a weak associ-ation and lack of evidence that exposure preceded the effect.
Data were examined to determine whether similar estimates ofthe requirement resulted from the use of different indicators anddifferent types of studies. For a single nutrient, the criterion forsetting the Estimated Average Requirement (EAR) may differ fromone life stage group to another because the critical function or therisk of disease may be different. When no or very poor data wereavailable for a given life stage group, extrapolation was made fromthe EAR or Adequate Intake (AI) set for another group, by makingexplicit and logical assumptions about relative requirements. Be-cause EARs can be used for multiple purposes, they were estab-lished whenever sufficient supporting data were available.
Data Limitations
Although the reference values are based on data, the data wereoften scanty or drawn from studies that had limitations in address-ing the various questions that confronted the panel. Therefore,many of the questions raised about the requirements for and rec-ommended intakes of these nutrients cannot be answered fully be-cause of inadequacies in the present database. Apart from studies ofovert deficiency diseases, there is a dearth of studies that addressspecific effects of inadequate intakes on specific indicators of healthstatus, and thus a research agenda is proposed (see Chapter 10).
Copyright © National Academy of Sciences. All rights reserved.
METHODS 63
Thus, after careful review and analysis of the evidence, includingexamination of the extent of congruent findings, scientific judg-ment was used to determine the basis for establishing the values.The reasoning used is described for each nutrient in Chapters 5through 8.
Pathways to Nutrient Requirements
The possible pathways that were considered in determining therequirement for each nutrient include the following:
1. The availability of a convincing totality of evidence, includingrandomized clinical trial data, that the nutrient reviewed reducesthe risk of important health outcomes—demonstration that a bio-marker of exposure influences a specific health outcome consti-tutes a key component of this body of evidence.
2. The availability of a convincing totality of evidence, includingrandomized clinical trial data, that the nutrient reviewed favorablyaffects a selected functional marker—this pathway was used withcaution in view of the many examples where intervention effects onan intermediate outcome (biomarker) proved to be inconsistentwith intervention effects on the chronic disease of interest.
3. The presence of a clinically important deficiency disease ornutritional syndrome that has been demonstrated to relate specifi-cally to an inadequate intake of the nutrient reviewed—this pathwayis facilitated by considering intakes needed to ensure adequate bodystores or reserves of the nutrient or of pertinent compounds that thebody produces in response to adequate intake of the nutrient.
Method to Determine the Adequate Intake for Infants
The AI for young infants is generally taken to be the averageintake by full-term infants who are born to apparently healthy, well-nourished mothers and are exclusively fed human milk. The extentto which the intake of a nutrient from human milk may exceed theactual requirements of infants is not known, and the ethics of ex-perimentation preclude testing the levels known to be potentiallyinadequate. Using the infant exclusively fed human milk as a modelis in keeping with the basis for earlier recommendations for intake(e.g., Health Canada, 1990; IOM, 1991). It also supports the recom-mendation that exclusive intake of human milk is the preferredmethod of feeding for normal full-term infants for the first 4 to 6months of life. This recommendation has been made by the Cana-
Copyright © National Academy of Sciences. All rights reserved.
64 DIETARY REFERENCE INTAKES
dian Paediatric Society (Health Canada, 1990), the American Acad-emy of Pediatrics (AAP, 1997), the Institute of Medicine (IOM,1991), and many other expert groups, even though most U.S. ba-bies no longer receive human milk by age 6 months.
In general, this report does not cover possible variations in physi-ological need during the first month after birth or the variations inintake of nutrients from human milk that result from differences inmilk volume and nutrient concentration during early lactation.
In keeping with the decision made by the Standing Committee onthe Scientific Evaluation of Dietary Reference Intakes, specific DRIsto meet the needs of formula-fed infants have not been proposed inthis report. The use of formula introduces a large number of com-plex issues, one of which is the bioavailability of different forms ofthe nutrient in different formula types.
Ages 0 through 6 Months
To derive the AI value for infants ages 0 through 6 months, themean intake of a nutrient was calculated based on (1) the averageconcentration of the nutrient from 2 to 6 months of lactation usingconsensus values from several reported studies, if possible, and (2)an average volume of milk intake of 0.78 L/day. This volume wasreported from studies that used test weighing of full-term infants.In this procedure, the infant is weighed before and after each feed-ing (Allen et al., 1991; Butte et al., 1984; Chandra, 1984; Hofvanderet al., 1982; Neville et al., 1988). Because there is variation in boththe composition of milk and the volume consumed, the computedvalue represents the mean. It is expected that infants will consumeincreased volumes of human milk during growth spurts.
Ages 7 through 12 Months
During the period of infant growth and gradual weaning to amixed diet of human milk and solid foods from ages 7 through 12months, there is no evidence for markedly different nutrient needsfor this group of nutrients. The basis of the AI values derived forthis age category was the sum of (1) the content of the nutrientprovided by 0.60 L/day of human milk, which is the average volumeof milk reported from studies of infants who receive only humanmilk in this age category (Heinig et al., 1993), and (2) that pro-vided by the usual intakes of complementary weaning foods con-sumed by infants in this age category. Such an approach is in keep-ing with current recommendations of the Canadian Paediatric
Copyright © National Academy of Sciences. All rights reserved.
METHODS 65
Society (Health Canada, 1990), the American Academy of Pediat-rics (AAP, 1997), and the Institute of Medicine (IOM, 1991) forcontinued feeding of infants with human milk through 9 to 12months of age, with appropriate introduction of solid foods. Seleni-um and vitamin C had published information about the intake fromsolid foods for infants aged 7 through 12 months, and thus followedthis method.
For vitamin E, which did not have intake data from solid foods,the AI was calculated by extrapolating upward from the AI for in-fants ages 0 through 6 months, adjusting for metabolic body sizeand growth, and adding a factor for variability. The method is de-scribed below.
Method for Extrapolating Data from Adults to Children
Setting the EAR or AI
For vitamin C, vitamin E, and selenium, data were not available toset the EAR and RDA for children ages 1 year and older and adoles-cents. Because vitamin C is a water-soluble vitamin and boys have alarger lean body mass and total body water than girls, the adult EARwas adjusted for children and adolescents on the basis of differenc-es in reference weights from Table 1-1. For vitamin E and selenium,the EAR has been extrapolated downward using an adjustment formetabolic body size and growth. The method relies on at least fourassumptions:
1. Maintenance needs for vitamin E and selenium expressedwith respect to body weight ([kilogram of body weight]0.75) are thesame for adults and children. Scaling requirements to the 0.75 pow-er of body mass adjusts for metabolic differences demonstrated tobe related to body weight, as described by Kleiber (1947) and ex-plored further by West et al. (1997). By this scaling, a child weigh-ing 22 kg would require 42 percent of what an adult weighing 70 kgwould require—a higher percentage than if the requirement werebased on body weight to a power of one.
2. The EAR for vitamin E and selenium for adults is an estimateof maintenance needs.
3. The percentage of extra vitamin E and selenium needed forgrowth is comparable with the percentage of extra protein neededfor growth.
4. On average, total needs do not differ substantially for malescompared to females until age 14, when reference weights differ.
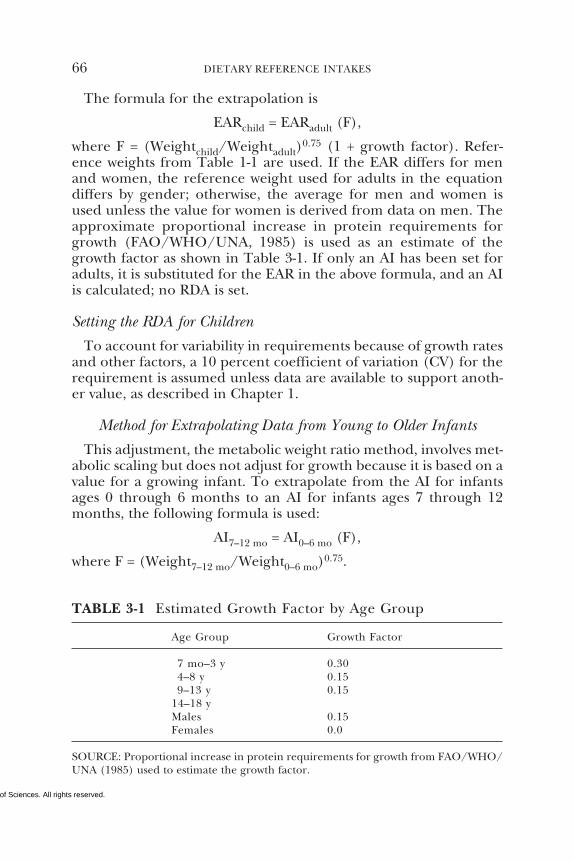
Copyright © National Academy of Sciences. All rights reserved.
66 DIETARY REFERENCE INTAKES
The formula for the extrapolation is
EARchild = EARadult (F),
where F = (Weightchild/Weightadult)0.75 (1 + growth factor). Refer-
ence weights from Table 1-1 are used. If the EAR differs for menand women, the reference weight used for adults in the equationdiffers by gender; otherwise, the average for men and women isused unless the value for women is derived from data on men. Theapproximate proportional increase in protein requirements forgrowth (FAO/WHO/UNA, 1985) is used as an estimate of thegrowth factor as shown in Table 3-1. If only an AI has been set foradults, it is substituted for the EAR in the above formula, and an AIis calculated; no RDA is set.
Setting the RDA for Children
To account for variability in requirements because of growth ratesand other factors, a 10 percent coefficient of variation (CV) for therequirement is assumed unless data are available to support anoth-er value, as described in Chapter 1.
Method for Extrapolating Data from Young to Older Infants
This adjustment, the metabolic weight ratio method, involves met-abolic scaling but does not adjust for growth because it is based on avalue for a growing infant. To extrapolate from the AI for infantsages 0 through 6 months to an AI for infants ages 7 through 12months, the following formula is used:
AI7–12 mo = AI0–6 mo (F),
where F = (Weight7–12 mo/Weight0–6 mo)0.75.
TABLE 3-1 Estimated Growth Factor by Age Group
Age Group Growth Factor
7 mo–3 y 0.304–8 y 0.159–13 y 0.15
14–18 yMales 0.15Females 0.0
SOURCE: Proportional increase in protein requirements for growth from FAO/WHO/UNA (1985) used to estimate the growth factor.
Copyright © National Academy of Sciences. All rights reserved.
METHODS 67
Methods for Determining Increased Needs for Pregnancy
It is known that the placenta actively transports vitamin C, vitaminE, and selenium from the mother to the fetus (Hytten and Leitch,1971). However, for these three nutrients, experimental data thatcould be used to set an EAR and RDA for pregnancy are lacking. Inthese cases the potential of increased need for these nutrients dur-ing pregnancy is based on theoretical considerations, includingobligatory fetal transfer, if data are available, and increased mater-nal needs related to increases in energy or protein metabolism, asapplicable.
Methods to Determine Increased Needs for Lactation
For vitamin C, vitamin E, and selenium, it is assumed that thetotal requirement of lactating women equals the requirement forthe nonpregnant, nonlactating woman of similar age plus an incre-ment to cover the amount of the nutrient needed for milk produc-tion. To allow for inefficiencies in use of these nutrients, the incre-ment may be somewhat greater than the amount of the nutrientcontained in the milk produced. Details are provided in each nutri-ent chapter.
ESTIMATES OF LABORATORY VALUES
Substantial changes in analytical methods have occurred duringthe more than 40 years of studies considered in this report. Al-though the requirement for vitamin C is based on recent data, thestudies that were utilized to determine the vitamin E requirementare 40 years old. Methodological problems have been documentedfor vitamin E intake assessment from food (see Chapter 6).
NUTRIENT INTAKE ESTIMATES
Reliable and valid methods of food composition analysis are cru-cial in determining the intake of a nutrient needed to meet a re-quirement. For vitamin E and selenium, analytic methods to deter-mine the content of the nutrient in food have serious limitations,the specifics of which are discussed in Chapters 5 through 8.
Methodological Considerations
The quality of nutrient intake data varies widely across studies.The most valid intake data are those collected from metabolic studyprotocols in which all food is provided by the researchers, amounts
Copyright © National Academy of Sciences. All rights reserved.
68 DIETARY REFERENCE INTAKES
consumed are measured accurately, and the nutrient compositionof the food is determined by reliable and valid laboratory analyses.Such protocols are usually possible with only a small number ofsubjects. Thus, in many studies, intake data are self-reported (e.g.,through 24-hour recalls of food intake, diet records, or food fre-quency questionnaires).
Potential sources of error in self-reported intake data include over-or underreporting of portion sizes and frequency of intake, omis-sion of foods, and inaccuracies related to the use of food composi-tion tables (Lichtman et al., 1992; Mertz et al., 1991). In addition,errors can occur due to a lack of information on how a food wasmanufactured, prepared, and served, because a high percentage ofthe food consumed in the United States and Canada is not pre-pared from scratch in the home. Therefore, the values reported bynationwide surveys or studies that rely on self-reporting may besomewhat inaccurate and possibly biased.
Four sources of measurement error are particularly importantwith regard to vitamin E intake: (1) energy intake is underreportedin national surveys (Mertz et al., 1991), and fat intake (which servesas a major carrier for vitamin E) is likely to be more underreportedthan energy intake in the Third National Health and Nutrition Ex-amination Survey (NHANES III) (Briefel et al., 1997); (2) theamount of fats and oils added during food preparation (and ab-sorbed into the cooked product) is difficult to assess using dietrecall methodologies, yet it contributes substantially to vitamin Eintake; (3) uncertainties about the particular fats or oils consumed,particularly when food labels do not indicate the specific fat or oilin the product (e.g. “this product may contain partially hydrogenat-ed soybean and/or cottonseed oil or vegetable oil”) necessitate areliance on default selections (and thus assumptions about the rela-tive content of α- and γ-tocopherols; and (4) due to the small num-ber of samples, the vitamin E content of food sources in the Con-tinuing Survey of Food Intakes by Individuals (CSFII) and NHANESIII databases is quite variable (J. Holden, Agricultural Research Ser-vice, USDA, personal communication, April 13, 1999).
Food composition databases that are used to calculate nutrientintake from self-reported and observed intake data introduce errorsdue to random variability, genetic variation in the nutrient content,analytical errors, and missing or imputed data. In general, whennutrient intakes for groups are estimated, the effect of errors in thecomposition data is probably considerably smaller than the effect oferrors in the self-reported intake data (NRC, 1986). It is not knownto what extent this is true for vitamin C, vitamin E, selenium, or β-
Copyright © National Academy of Sciences. All rights reserved.
METHODS 69
carotene and other carotenoids. However, adult men and womenparticipating in NHANES III underreported energy intake by about23 percent, as well as fat intake (which serves as a carrier for vitaminE) when expressed as a percentage of total energy intake (Briefel etal., 1997).
Adjusting for Day-to-Day Variation
Because of day-to-day variation in dietary intakes, the distributionof 1-day (or 2-day) intakes for a group is wider than the distributionof usual intakes even though the mean intake may be the same (forfurther elaboration, see Chapter 9). To reduce this problem, statis-tical adjustments have been developed (NRC, 1986; Nusser et al.,1996) that require at least 2 days of dietary data from a representa-tive subsample of the population of interest. However, no acceptedmethod is available to adjust for the underreporting of intake, whichmay average as much as 20 percent for energy (Mertz et al., 1991).
DIETARY INTAKES IN THE UNITED STATES AND CANADA
Sources of Dietary Intake Data
The major sources of current dietary intake data for the U.S. pop-ulation are the Third National Health and Nutrition ExaminationSurvey (NHANES III), which was conducted from 1988 to 1994 bythe U.S. Department of Health and Human Services, and the Con-tinuing Survey of Food Intakes by Individuals (CSFII), which wasconducted from 1994 to 1996 by the U.S. Department of Agricul-ture (USDA). NHANES III examined 30,000 subjects aged 2 monthsand older. A single 24-hour diet recall was collected for all subjects.A second recall was collected for a 5 percent nonrandom subsam-ple to allow adjustment of intake estimates for day-to-day variation.The 1994 to 1996 CSFII collected two nonconsecutive 24-hour re-calls from approximately 16,000 subjects of all ages. Both surveysused the food composition database developed by USDA to calcu-late nutrient intakes (Perloff et al., 1990). National survey data forCanada are not currently available, but data for vitamin C havebeen collected in Québec and Nova Scotia. The extent to whichthese data are applicable nationwide is not known.
Appendix D gives the mean and the first through ninety-ninthpercentiles of dietary intakes of vitamin C and vitamin E by agefrom the CSFII, adjusted for day-to-day variation by the method ofNusser et al. (1996). Appendix C provides comparable information
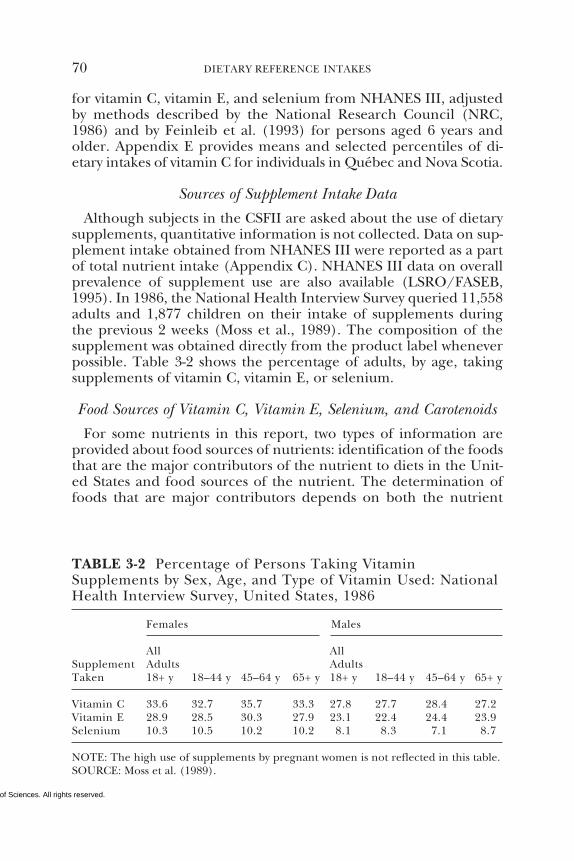
Copyright © National Academy of Sciences. All rights reserved.
70 DIETARY REFERENCE INTAKES
for vitamin C, vitamin E, and selenium from NHANES III, adjustedby methods described by the National Research Council (NRC,1986) and by Feinleib et al. (1993) for persons aged 6 years andolder. Appendix E provides means and selected percentiles of di-etary intakes of vitamin C for individuals in Québec and Nova Scotia.
Sources of Supplement Intake Data
Although subjects in the CSFII are asked about the use of dietarysupplements, quantitative information is not collected. Data on sup-plement intake obtained from NHANES III were reported as a partof total nutrient intake (Appendix C). NHANES III data on overallprevalence of supplement use are also available (LSRO/FASEB,1995). In 1986, the National Health Interview Survey queried 11,558adults and 1,877 children on their intake of supplements duringthe previous 2 weeks (Moss et al., 1989). The composition of thesupplement was obtained directly from the product label wheneverpossible. Table 3-2 shows the percentage of adults, by age, takingsupplements of vitamin C, vitamin E, or selenium.
Food Sources of Vitamin C, Vitamin E, Selenium, and Carotenoids
For some nutrients in this report, two types of information areprovided about food sources of nutrients: identification of the foodsthat are the major contributors of the nutrient to diets in the Unit-ed States and food sources of the nutrient. The determination offoods that are major contributors depends on both the nutrient
TABLE 3-2 Percentage of Persons Taking VitaminSupplements by Sex, Age, and Type of Vitamin Used: NationalHealth Interview Survey, United States, 1986
Females Males
All AllSupplement Adults AdultsTaken 18+ y 18–44 y 45–64 y 65+ y 18+ y 18–44 y 45–64 y 65+ y
Vitamin C 33.6 32.7 35.7 33.3 27.8 27.7 28.4 27.2Vitamin E 28.9 28.5 30.3 27.9 23.1 22.4 24.4 23.9Selenium 10.3 10.5 10.2 10.2 8.1 8.3 7.1 8.7
NOTE: The high use of supplements by pregnant women is not reflected in this table.SOURCE: Moss et al. (1989).
Copyright © National Academy of Sciences. All rights reserved.
METHODS 71
content of a food and the total consumption of that food (amountand frequency). Therefore, a food that has a relatively low concen-tration of the nutrient might still be a large contributor to totalintake if it is consumed in relatively large amounts. In contrast, thefood sources listed are those with the highest concentration of thenutrient; no consideration is given to the amount consumed.
SUMMARY
General methods for examining and interpreting the evidence onrequirements for vitamin C, vitamin E, and selenium, with specialattention given to infants, children, and pregnant and lactatingwomen; methodological problems; and dietary intake data are pre-sented in this chapter. Relevant detail is provided in the nutrientchapters.
REFERENCESAAP (American Academy of Pediatrics). 1997. Breastfeeding and the use of human
milk. Pediatrics 100:1035–1039.Allen JC, Keller RP, Archer P, Neville MC. 1991. Studies in human lactation: Milk
composition and daily secretion rates of macronutrients in the first year oflactation. Am J Clin Nutr 54:69–80.
Briefel RR, Sempos CT, McDowell MA, Chien S, Alaimo K. 1997. Dietary methodsresearch in the Third National Health and Nutrition Examination Survey:Underreporting of energy intake. Am J Clin Nutr 65:1203S–1209S.
Butte NF, Garza C, Smith EO, Nichols BL. 1984. Human milk intake and growth inexclusively breast-fed infants. J Pediatr 104:187–195.
Chandra RK. 1984. Physical growth of exclusively breast-fed infants. Nutr Res 2:275–276.
FAO/WHO/UNA (Food and Agriculture Organization of the United Nations/World Health Organization/United Nations). 1985. Energy and Protein Require-ments Report of a Joint FAO/WHO/UNA Expert Consultation. Technical ReportSeries. No. 724. Geneva: World Health Organization.
Feinleib M, Rifkind B, Sempos C, Johnson C, Bachorik P, Lippel K, Carroll M,Ingster-Moore L, Murphy R. 1993. Methodological issues in the measurementof cardiovascular risk factors: Within-person variability in selected serum lipidmeasures—Results from the Third National Health and Nutrition Survey(NHANES III). Can J Cardiol 9:87D–88D.
Health Canada. 1990. Nutrition Recommendations. The Report of the Scientific ReviewCommittee 1990. Ottawa: Canadian Government Publishing Centre.
Heinig MJ, Nommsen LA, Peerson JM, Lonnerdal B, Dewey KG. 1993. Energy andprotein intakes of breast-fed and formula-fed infants during the first year oflife and their association with growth velocity: The DARLING Study. Am J ClinNutr 58:152–161.
Heitmann BL, Lissner L. 1995. Dietary underreporting by obese individuals—Is itspecific or non-specific? Br Med J 311:986–989.
Copyright © National Academy of Sciences. All rights reserved.
72 DIETARY REFERENCE INTAKES
Hennekens C, Buring JE. 1987. Need for large sample sizes in randomized trials.Pediatrics 79:569–571.
Hill AB. 1971. Principles of Medical Statistics, 9th edition. New York: Oxford UniversityPress.
Hofvander Y, Hagman U, Hillervik C, Sjolin S. 1982. The amount of milk con-sumed by 1–3 months old breast- or bottle-fed infants. Acta Paediatr Scand71:953–958.
Hytten FE, Leitch I. 1971. The Physiology of Human Pregnancy, 2nd edition. Oxford:Blackwell Scientific Publications.
IOM (Institute of Medicine). 1991. Nutrition During Lactation. Washington, DC:National Academy Press.
Kleiber M. 1947. Body size and metabolic rate. Physiol Rev 27:511–541.Lichtman SW, Pisarska K, Berman ER, Pestone M, Dowling H, Offenbacher E,
Weisel H, Heshka S, Matthews DE, Heymsfield SB. 1992. Discrepancy betweenself-reported and actual caloric intake and exercise in obese subjects. N Engl JMed 327:1893–1898.
LSRO/FASEB (Life Sciences Research Office/Federation of American Societiesfor Experimental Biology). 1995. Third Report on Nutrition Monitoring in theUnited States. Washington DC: US Government Printing Office.
Mertz W, Tsui JC, Judd JT, Reiser S, Hallfrisch J, Morris ER, Steele PD, Lashley E.1991. What are people really eating? The relation between energy intake de-rived from estimated diet records and intake determined to maintain bodyweight. Am J Clin Nutr 54:291–295.
Moss AJ, Levy AS, Kim I, Park YK. 1989. Use of Vitamin and Mineral Supplements in theUnited States: Current Users, Types of Products, and Nutrients. Advance Data, Vitaland Health Statistics of the National Center for Health Statistics. Number 174.Hyattsville, MD: National Center for Health Statistics.
Neville MC, Keller R, Seacat J, Lutes V, Neifert M, Casey C, Allen J, Archer P. 1988.Studies in human lactation: Milk volumes in lactating women during the onsetof lactation and full lactation. Am J Clin Nutr 48:1375–1386.
NRC (National Research Council). 1986. Nutrient Adequacy. Assessment Using FoodConsumption Surveys. Washington, DC: National Academy Press.
Nusser SM, Carriquiry AL, Dodd KW, Fuller WA. 1996. A semiparametric transfor-mation approach to estimating usual daily intake distributions. J Am Stat Assoc91:1440–1449.
Perloff BP, Rizek RL, Haytowitz DB, Reid PR. 1990. Dietary intake methodology. II.USDA’s Nutrient Data Base for Nationwide Dietary Intake Surveys. J Nutr120:1530–1534.
West GB, Brown JH, Enquist BJ. 1997. A general model for the origin of allometricscaling laws in biology. Science 276:122–126.
Willett WC, Sampson L, Stampfer MJ, Rosner B, Bain C, Witschi J, Hennekens CH,Speizer FE. 1985. Reproducibility and validity of a semiquantitative food fre-quency questionnaire. Am J Epidemiol 122:51–65.
Copyright © National Academy of Sciences. All rights reserved. 73
4A Model for the Development
of Tolerable Upper IntakeLevels for Nutrients
BACKGROUND
The Tolerable Upper Intake Level (UL) is the highest level of dailynutrient intake that is likely to pose no risk of adverse health effectsto almost all individuals in the general population. As intake in-creases above the UL, the risk of adverse effects increases. The termtolerable is chosen because it connotes a level of intake that can, withhigh probability, be tolerated biologically by individuals; it does notimply acceptability of this level in any other sense. The setting of aUL does not indicate that nutrient intakes greater than the Recom-mended Dietary Allowance (RDA) or Adequate Intake (AI) are rec-ommended as being beneficial to an individual. Many individualsare self-medicating with nutrients for perceived prophylactic or cur-ative purposes. It is beyond the scope of the model at this time toaddress whether there are benefits of higher nutrient intakes thatmay offset the risk of adverse effects. The UL is not meant to applyto individuals who are being treated with the nutrient or food com-ponent under medical supervision or to individuals with predispos-ing conditions that modify their sensitivity to the nutrient or foodcomponent. This chapter describes a model for developing ULs.
The term adverse effect is defined as any significant alteration inthe structure or function of the human organism (Klaassen et al.,1986) or any impairment of a physiologically important functionthat could lead to a health effect that is adverse. This is in accor-dance with the definition set by the joint World Health Organiza-tion, Food and Agriculture Organization of the United Nations,
Copyright © National Academy of Sciences. All rights reserved.
74 DIETARY REFERENCE INTAKES
and International Atomic Energy Agency Expert Consultation inTrace Elements in Human Nutrition and Health (WHO, 1996). In thecase of nutrients, it is exceedingly important to consider the possi-bility that the excessive intake of one nutrient may alter in detri-mental ways the health benefits conferred by another. Any suchalteration (referred to as an adverse nutrient-nutrient interaction)is considered an adverse health effect. When evidence for such ad-verse interactions is available, it is considered in establishing a nu-trient’s UL.
ULs are useful because of the increased interest in and availabilityof fortified foods, the increased use of dietary supplements, and thegrowing recognition of the health consequences of excesses, as wellas inadequacies of nutrient intakes. ULs are based on total intake ofa nutrient from food, water, and supplements if adverse effects havebeen associated with total intake. However, if adverse effects havebeen associated with intake from supplements or food fortificantsonly, the UL is based on nutrient intake from these sources only,not on total intake. The UL applies to chronic daily use.
For many nutrients, there are insufficient data on which to devel-op a UL. This does not mean that there is no potential for adverseeffects resulting from high intake. When data about adverse effectsare extremely limited, extra caution may be warranted.
Like all chemical agents, nutrients can produce adverse healtheffects if intakes from any combination of food, water, nutrient sup-plements, and pharmacological agents are excessive. Some lowerlevel of nutrient intake will ordinarily pose no likelihood (or risk)of adverse health effects in normal individuals even if the level isabove that associated with any benefit. It is not possible to identify asingle risk-free intake level for a nutrient that can be applied withcertainty to all members of a population. However, it is possible todevelop intake levels that are unlikely to pose risk of adverse healtheffects for most members of the general population, including sen-sitive individuals. For some nutrients or food components, theseintake levels may however pose a risk for subpopulations with ex-treme or distinct vulnerabilities.
Whether routine, long-term intake above the UL is safe is not welldocumented. Although members of the general population shouldnot routinely exceed the UL, intake above the UL may be appropri-ate for investigation within well-controlled clinical trials. Clinicaltrials of doses above the UL should not be discouraged, as long assubjects participating in these trials have signed informed consentdocuments regarding possible toxicity and as long as these trialsemploy appropriate safety monitoring of trial subjects.
Copyright © National Academy of Sciences. All rights reserved.
MODEL FOR DEVELOPMENT OF ULS 75
MODEL FOR DERIVATION OF TOLERABLEUPPER INTAKE LEVELS
The possibility that the methodology used to derive TolerableUpper Intake Levels (ULs) might be reduced to a mathematicalmodel that could be generically applied to all nutrients was consid-ered. Such a model might have several potential advantages, includ-ing ease of application and assurance of consistent treatment of allnutrients. It was concluded, however, that the current state of scien-tific understanding of toxic phenomena in general, and nutrienttoxicity in particular, is insufficient to support the development ofsuch a model. Scientific information regarding various adverse ef-fects and their relationships to intake levels varies greatly amongnutrients and depends on the nature, comprehensiveness, and qual-ity of available data. The uncertainties associated with the unavoid-able problem of extrapolating from the circumstances under whichdata are developed (e.g., the laboratory or clinic) to other circum-stances (e.g., the apparently healthy population) adds to this com-plexity.
Given the current state of knowledge, any attempt to capture in amathematical model all the information and scientific judgmentsthat must be made to reach conclusions regarding ULs would notbe consistent with contemporary risk assessment practices. Instead,the model for the derivation of ULs consists of a set of scientificfactors that always should be considered explicitly. The frameworkunder which these factors are organized is called risk assessment. Riskassessment (NRC, 1983, 1994) is a systematic means of evaluatingthe probability of occurrence of adverse health effects in humansfrom excess exposure to an environmental agent (in this case, anutrient or food component) (FAO/WHO, 1995; Health Canada,1993). The hallmark of risk assessment is the requirement to beexplicit in all the evaluations and judgments that must be made todocument conclusions.
RISK ASSESSMENT AND FOOD SAFETY
Basic Concepts
Risk assessment is a scientific undertaking having as its objective acharacterization of the nature and likelihood of harm resulting fromhuman exposure to agents in the environment. The characteriza-tion of risk typically contains both qualitative and quantitative infor-mation and includes a discussion of the scientific uncertainties inthis information. In the present context, the agents of interest are
Copyright © National Academy of Sciences. All rights reserved.
76 DIETARY REFERENCE INTAKES
nutrients, and the environmental media are food, water, and non-food sources such as nutrient supplements and pharmacologicalpreparations.
Performing a risk assessment results in a characterization of therelationships between exposure to an agent and the likelihood thatadverse health effects will occur in members of exposed populations.Scientific uncertainties are an inherent part of the risk assessmentprocess and are discussed below. Deciding whether the magnitudeof exposure is acceptable or tolerable in specific circumstances is not acomponent of risk assessment; this activity falls within the domain ofrisk management. Risk management decisions depend on the resultsof risk assessments but may also involve the public health signifi-cance of the risk, the technical feasibility of achieving various de-grees of risk control, and the economic and social costs of this con-trol. Because there is no single, scientifically definable distinctionbetween safe and unsafe exposures, risk management necessarilyincorporates components of sound, practical decision making thatare not addressed by the risk assessment process (NRC, 1983, 1994).
A risk assessment requires that information be organized in rath-er specific ways but does not require any specific scientific evalua-tion methods. Rather, risk assessors must evaluate scientific infor-mation using what they judge to be appropriate methods and mustmake explicit the basis for their judgments, the uncertainties in riskestimates, and when appropriate, alternative scientifically plausibleinterpretations of the available data (NRC, 1994; OTA, 1993).
Risk assessment is subject to two types of scientific uncertainties:those related to data and those associated with inferences that arerequired when directly applicable data are not available (NRC,1994). Data uncertainties arise during the evaluation of informa-tion obtained from the epidemiological and toxicological studies ofnutrient intake levels that are the basis for risk assessments. Exam-ples of inferences include the use of data from experimental ani-mals to estimate responses in humans and the selection of uncer-tainty factors to estimate inter- and intraspecies variabilities inresponse to toxic substances. Uncertainties arise whenever estimatesof adverse health effects in humans are based on extrapolations ofdata obtained under dissimilar conditions (e.g., from experimentalanimal studies). Options for dealing with uncertainties are discussedbelow and in detail in Appendix G.
Steps in the Risk Assessment ProcessThe organization of risk assessment is based on a model proposed
by the National Research Council (1983, 1994) that is widely used
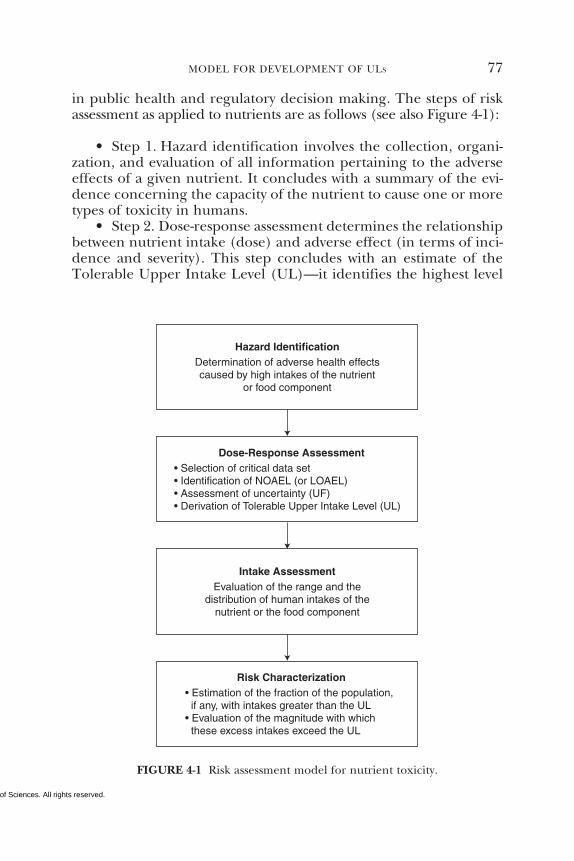
Copyright © National Academy of Sciences. All rights reserved.
MODEL FOR DEVELOPMENT OF ULS 77
in public health and regulatory decision making. The steps of riskassessment as applied to nutrients are as follows (see also Figure 4-1):
• Step 1. Hazard identification involves the collection, organi-zation, and evaluation of all information pertaining to the adverseeffects of a given nutrient. It concludes with a summary of the evi-dence concerning the capacity of the nutrient to cause one or moretypes of toxicity in humans.
• Step 2. Dose-response assessment determines the relationshipbetween nutrient intake (dose) and adverse effect (in terms of inci-dence and severity). This step concludes with an estimate of theTolerable Upper Intake Level (UL)—it identifies the highest level
Hazard IdentificationDetermination of adverse health effectscaused by high intakes of the nutrient
or food component
Dose-Response Assessment• Selection of critical data set• Identification of NOAEL (or LOAEL)• Assessment of uncertainty (UF)• Derivation of Tolerable Upper Intake Level (UL)
Risk Characterization• Estimation of the fraction of the population, if any, with intakes greater than the UL• Evaluation of the magnitude with which these excess intakes exceed the UL
Intake AssessmentEvaluation of the range and the
distribution of human intakes of thenutrient or the food component
FIGURE 4-1 Risk assessment model for nutrient toxicity.
Copyright © National Academy of Sciences. All rights reserved.
78 DIETARY REFERENCE INTAKES
of daily nutrient intake that is likely to pose no risk of adverse healtheffects to almost all individuals in the general population. DifferentULs may be developed for various life stage groups.
• Step 3. Intake assessment evaluates the distribution of usualtotal daily nutrient intakes among members of the general popula-tion. In cases where the UL pertains only to supplement use, anddoes not pertain to usual food intakes of the nutrient, the assess-ment is directed at supplement intakes only. It does not depend onstep 1 or 2.
• Step 4. Risk characterization summarizes the conclusionsfrom steps 1 and 2 with step 3 to determine the risk. The risk isgenerally expressed as the fraction of the exposed population, ifany, having nutrient intakes (step 3) in excess of the estimated UL(steps 1 and 2). If possible, scientific characterization also coversthe magnitude of any such excesses. Scientific uncertainties associ-ated with both the UL and the intake estimates are described sothat risk managers understand the degree of scientific confidencethey can place in the risk assessment.
The risk assessment contains no discussion of recommendationsfor reducing risk; these are the focus of risk management.
Thresholds
A principal feature of the risk assessment process for noncarcino-gens is the long-standing acceptance that no risk of adverse effectsis expected unless a threshold dose (or intake) is exceeded. Theadverse effects that may be caused by a nutrient or food componentalmost certainly occur only when the threshold dose is exceeded(NRC, 1994; WHO, 1996). The critical issues concern the methodsused to identify the approximate threshold of toxicity for a largeand diverse human population. Because most nutrients are not con-sidered to be carcinogenic in humans, approaches used for carcino-genic risk assessment are not discussed here.
Thresholds vary among members of the general population (NRC,1994). For any given adverse effect, if the distribution of thresholdsin the population could be quantitatively identified, it would bepossible to establish ULs by defining some point in the lower tail ofthe distribution of thresholds that would be protective for somespecified fraction of the population. The method for identifyingthresholds for a general population described here is designed toensure that almost all members of the population will be protected,but it is not based on an analysis of the theoretical (but practically
Copyright © National Academy of Sciences. All rights reserved.
MODEL FOR DEVELOPMENT OF ULS 79
unattainable) distribution of thresholds. By using the model to de-rive the threshold, however, there is considerable confidence thatthe threshold, which becomes the UL for nutrients or food compo-nents, lies very near the low end of the theoretical distribution andis the end representing the most sensitive members of the popula-tion. For some nutrients, there may be subpopulations that are notincluded in the general distribution because of extreme or distinctvulnerabilities to toxicity. Data relating to effects observed in thesegroups are not used to derive ULs. Such distinct groups, whoseconditions warrant medical supervision, may not be protected bythe UL.
The joint Food and Agricultural Organization-World Health Or-ganization (FAO/WHO) Expert Committee on Food Additives andvarious national regulatory bodies have identified factors (calleduncertainty factors [UFs]) that account for interspecies and intraspe-cies differences in response to the hazardous effects of substancesand for other uncertainties (WHO, 1987). Uncertainty factors areused to make inferences about the threshold dose of substances formembers of a large and diverse human population from data onadverse effects obtained from epidemiological or experimental stud-ies. These factors are applied consistently when data of specific typesand quality are available. They are typically used to derive accept-able daily intakes for food additives and other substances for whichdata on adverse effects are considered sufficient to meet minimumstandards of quality and completeness (FAO/WHO, 1982). Theseadopted or recognized UFs have sometimes been coupled with oth-er factors to compensate for deficiencies in the available data andother uncertainties regarding data.
When possible, the UL is based on a no-observed-adverse-effectlevel (NOAEL), which is the highest intake (or experimental oraldose) of a nutrient at which no adverse effects have been observedin the individuals studied. This is identified for a specific circum-stance in the hazard identification and dose-response assessmentsteps of the assessment of risk. If there are no adequate data dem-onstrating a NOAEL, then a lowest-observed-adverse-effect level(LOAEL) may be used. A LOAEL is the lowest intake (or experi-mental oral dose) at which an adverse effect has been identified.The derivation of a UL from a NOAEL (or LOAEL) involves a se-ries of choices about what factors should be used to deal with uncer-tainties. Uncertainty factors are applied in an attempt to deal bothwith incomplete gaps in data and with incomplete knowledge re-garding the inferences required (e.g., the expected variability inresponse within the human population). The problems of both data
Copyright © National Academy of Sciences. All rights reserved.
80 DIETARY REFERENCE INTAKES
and inference uncertainties arise in all steps of the risk assessment.A discussion of options available for dealing with these uncertain-ties is presented below and in greater detail in Appendix G.
A UL is not, in itself, a description or estimate of human risk. It isderived by application of the hazard identification and dose-re-sponse evaluation steps (steps 1 and 2) of the risk assessment mod-el. To determine whether populations are at risk requires an intakeor exposure assessment (step 3, evaluation of intakes of the nutri-ent by the population) and a determination of the fractions of thesepopulations, if any, whose intakes exceed the UL. In the intakeassessment and risk characterization steps (steps 3 and 4), the distri-bution of actual intakes for the population is used as a basis fordetermining whether and to what extent the population is at risk(Figure 4-1). A discussion of other aspects of the risk characteriza-tion that may be useful in judging the public health significance ofthe risk and in risk management decisions is provided in the finalsection of this chapter “Risk Characterization.”
APPLICATION OF THE RISK ASSESSMENT MODELTO NUTRIENTS
This section provides guidance for applying the risk assessmentframework (the model) to the derivation of Tolerable Upper In-take Levels (ULs) for nutrients.
Special Problems Associated with Substances Requiredfor Human Nutrition
Although the risk assessment model outlined above can be ap-plied to nutrients to derive ULs, it must be recognized that nutri-ents possess some properties that distinguish them from the typesof agents for which the risk assessment model was originally devel-oped (NRC, 1983). In the application of accepted standards for riskassessment of environmental chemicals to risk assessment of nutri-ents and food components, a fundamental difference between thetwo categories must be recognized: within a certain range of in-takes, many nutrients are essential for human well-being and usual-ly for life itself. Nonetheless, they may share with other chemicalsthe production of adverse effects at excessive exposures. Becausethe consumption of diets with variable levels of nutrients and foodcomponents is considered to be consistent with the developmentand survival of humankind over many millennia, there is generallyless need for the large uncertainty factors that have been used in
Copyright © National Academy of Sciences. All rights reserved.
MODEL FOR DEVELOPMENT OF ULS 81
assessing risk of nonessential chemicals. In addition, if data on theadverse effects of nutrients are available primarily from studies inhuman populations, there will be less uncertainty than is associatedwith the types of data available on nonessential chemicals.
There is no evidence to suggest that nutrients consumed at therecommended intake (the Recommended Dietary Allowance [RDA]or Adequate Intake [AI]) present a risk of adverse effects to thegeneral population.1 It is clear, however, that the addition of nutri-ents to a diet through the ingestion of large amounts of highlyfortified food, nonfood sources such as supplements, or both, may(at some level) pose a risk of adverse health effects. The UL is thehighest level of daily nutrient intake that is likely to pose no risk ofadverse health effects to almost all individuals in the general popu-lation. As intake increases above the UL, the risk of adverse effectsincreases.
If adverse effects have been associated with total intake, ULs arebased on total intake of a nutrient from food, water, and supple-ments. For cases in which adverse effects have been associated withintake only from supplements and fortified food, the UL is based onintake from these sources only, rather than total intake. The effectsof nutrients from fortified foods or supplements may differ fromthose of naturally occurring constituents of foods because of thechemical form of the nutrient, the timing of the intake and amountconsumed in a single bolus dose, the matrix supplied by the food,and the relation of the nutrient to the other constituents of the diet.Nutrient requirements and food intake are related to the metaboliz-ing body mass, which is also at least an indirect measure of the spacein which the nutrients are distributed. This relation between foodintake and space of distribution supports homeostasis, which main-tains nutrient concentrations in this space within a range compati-ble with health. However, excessive intake of a single nutrient fromsupplements or fortificants may compromise this homeostatic mech-anism. Such elevations alone may pose risks of adverse effects; im-balances among the vitamins or other nutrients may also be possi-ble. These reasons and those discussed previously support the needto include the form and pattern of consumption in the assessmentof risk from high nutrient or food component intake.
1It is recognized that possible exceptions to this generalization relate to specificgeochemical areas with excessive environmental exposures to certain trace ele-ments (e.g., selenium) and to rare case reports of adverse effects associated withhighly eccentric consumption of specific foods. Data from such findings are gener-ally not useful for setting ULs for the general North American population.
Copyright © National Academy of Sciences. All rights reserved.
82 DIETARY REFERENCE INTAKES
Consideration of Variability in Sensitivity
The risk assessment model outlined in this chapter is consistentwith classical risk assessment approaches in that it must considervariability in the sensitivity of individuals to adverse effects of nutri-ents or food components. A discussion of how variability is dealtwith in the context of nutritional risk assessment follows.
Physiological changes and common conditions associated withgrowth and maturation that occur during an individual’s life spanmay influence sensitivity to nutrient toxicity. For example, sensitivi-ty increases with declines in lean body mass and with declines inrenal and liver function that occur with aging; sensitivity changes indirect relation to intestinal absorption or intestinal synthesis of nu-trients; in the newborn infant, sensitivity is also increased becauseof rapid brain growth and limited ability to secrete or biotransformtoxicants; and sensitivity increases with decreases in the rate of me-tabolism of nutrients. During pregnancy, the increase in total bodywater and glomerular filtration results in lower blood levels of watersoluble vitamins for a given dose, such as vitamin C, and thereforereduces susceptibility to potential adverse effects. However, in theunborn fetus this may be offset by active placental transfer, accumu-lation of certain nutrients in the amniotic fluid, and rapid develop-ment of the brain. Examples of life stage groups that may differ interms of nutritional needs and toxicological sensitivity include in-fants and children, the elderly, and women during pregnancy andlactation.
Even within relatively homogeneous life stage groups, there is arange of sensitivities to toxic effects. The model described belowaccounts for normally expected variability in sensitivity, but it ex-cludes subpopulations with extreme and distinct vulnerabilities.Such subpopulations consist of individuals needing medical super-vision; they are better served through the use of public healthscreening, product labeling, or other individualized health carestrategies. (Such populations may not be at negligible risk when theirintakes reach the UL developed for the apparently healthy popula-tion.) The decision to treat identifiable vulnerable subgroups asdistinct (not protected by the UL) is a matter of judgment and isdiscussed in individual nutrient chapters, as applicable.
Bioavailability
In the context of toxicity, the bioavailability of an ingested nutri-ent can be defined as its accessibility to normal metabolic and phys-
Copyright © National Academy of Sciences. All rights reserved.
MODEL FOR DEVELOPMENT OF ULS 83
iological processes. Bioavailability influences a nutrient’s beneficialeffects at physiological levels of intake and also may affect the na-ture and severity of toxicity due to excessive intakes. Factors thataffect bioavailability include the concentration and chemical formof the nutrient, the nutrition and health of the individual, and ex-cretory losses. Bioavailability data for specific nutrients must be con-sidered and incorporated by the risk assessment process.
Some nutrients may be less readily absorbed when they are part ofa meal than when taken separately. Supplemental forms of somenutrients may require special consideration if they have higher bio-availability and therefore may present a greater risk of producingadverse effects than equivalent amounts from the natural formfound in food.
Nutrient-Nutrient Interactions
A diverse array of adverse health effects can occur as a result ofthe interaction of nutrients. The potential risk of adverse nutrient-nutrient interactions increases when there is an imbalance in theintake of two or more nutrients. Excessive intake of one nutrientmay interfere with absorption, excretion, transport, storage, func-tion, or metabolism of a second nutrient. Possible adverse nutrient-nutrient interactions are considered as a part of setting a UL. Nutri-ent-nutrient interactions may be considered either as a criticalendpoint on which to base a UL or as supportive evidence for a ULbased on another endpoint.
Other Relevant Factors Affecting Bioavailability of Nutrients
In addition to nutrient interactions, other considerations havethe potential to influence nutrient bioavailability, such as the nutri-tional status of an individual and the form of intake. These issuesare considered in the risk assessment. With regard to the form ofintake, fat-soluble vitamins such as vitamin E are more readily ab-sorbed when they are part of a meal that is high in fat. ULs musttherefore be based on nutrients as part of the total diet, includingthe contribution from water. Nutrient supplements that are takenseparately from food require special consideration, because theyare likely to have different bioavailabilities and therefore may rep-resent a greater risk of producing adverse effects.
Copyright © National Academy of Sciences. All rights reserved.
84 DIETARY REFERENCE INTAKES
STEPS IN THE DEVELOPMENT OF TOLERABLEUPPER INTAKE LEVELS
Hazard Identification
Based on a thorough review of the scientific literature, the hazardidentification step describes the adverse health effects that havebeen demonstrated to be caused by the nutrient or food compo-nent.
In vivo studies in humans and animals are the primary types ofdata used as background for identifying nutrient hazards in hu-mans:
• Human studies. Human data provide the most relevant kind ofinformation for hazard identification, and, when they are of suffi-cient quality and extent, are given greatest weight. However, thenumber of controlled human toxicity studies conducted in a clini-cal setting is very limited because of ethical reasons. Such studiesare generally most useful for identifying very mild (and ordinarilyreversible) adverse effects. Observational studies that focus on well-defined populations with clear exposures to a range of nutrientintake levels are useful for establishing a relationship between ex-posure and effect. Observational data in the form of case reports oranecdotal evidence are used for developing hypotheses that canlead to knowledge of causal associations. Sometimes a series of casereports, if it shows a clear and distinct pattern of effects, may bereasonably convincing on the question of causality.
• Animal data. Most of the available data used in risk assess-ments come from controlled laboratory experiments in animals,usually mammalian species other than humans (e.g., rodents). Suchdata are used in part because human data on nonessential chemi-cals are generally very limited. Moreover, there is a long-standinghistory of the use of animal studies to identify the toxic propertiesof chemical substances, and there is no inherent reason why animaldata should not be relevant to the evaluation of nutrient toxicity.Animal studies offer several advantages over human studies. Theycan, for example, be readily controlled so that causal relationshipscan be recognized. It is possible to identify the full range of toxiceffects produced by a chemical, over a wide range of exposures, andto establish dose-response relationships. The effects of chronic ex-posures can be identified in far less time than they can using epide-miological methods. All of these advantages of animal data, howev-er, may not always overcome the fact that species differences inresponse to chemical substances can sometimes be profound, and
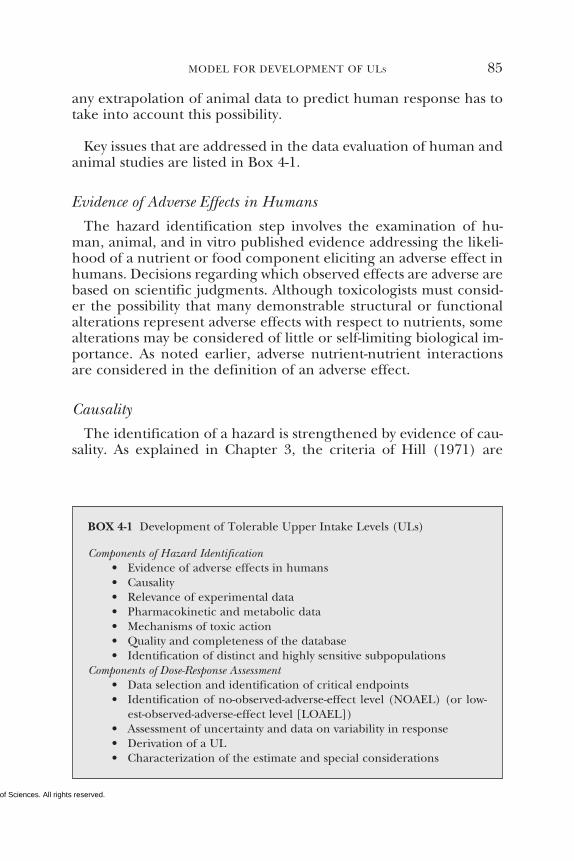
Copyright © National Academy of Sciences. All rights reserved.
MODEL FOR DEVELOPMENT OF ULS 85
any extrapolation of animal data to predict human response has totake into account this possibility.
Key issues that are addressed in the data evaluation of human andanimal studies are listed in Box 4-1.
Evidence of Adverse Effects in Humans
The hazard identification step involves the examination of hu-man, animal, and in vitro published evidence addressing the likeli-hood of a nutrient or food component eliciting an adverse effect inhumans. Decisions regarding which observed effects are adverse arebased on scientific judgments. Although toxicologists must consid-er the possibility that many demonstrable structural or functionalalterations represent adverse effects with respect to nutrients, somealterations may be considered of little or self-limiting biological im-portance. As noted earlier, adverse nutrient-nutrient interactionsare considered in the definition of an adverse effect.
Causality
The identification of a hazard is strengthened by evidence of cau-sality. As explained in Chapter 3, the criteria of Hill (1971) are
BOX 4-1 Development of Tolerable Upper Intake Levels (ULs)
Components of Hazard Identification• Evidence of adverse effects in humans• Causality• Relevance of experimental data• Pharmacokinetic and metabolic data• Mechanisms of toxic action• Quality and completeness of the database• Identification of distinct and highly sensitive subpopulations
Components of Dose-Response Assessment• Data selection and identification of critical endpoints• Identification of no-observed-adverse-effect level (NOAEL) (or low-
est-observed-adverse-effect level [LOAEL])• Assessment of uncertainty and data on variability in response• Derivation of a UL• Characterization of the estimate and special considerations
Copyright © National Academy of Sciences. All rights reserved.
86 DIETARY REFERENCE INTAKES
considered in judging the causal significance of an exposure-effectassociation indicated by epidemiological studies.
Relevance of Experimental Data on Nutrient Toxicity
Consideration of the following issues can be useful in assessingthe relevance of experimental data.
Animal Data. Some animal data may be of limited utility in judg-ing the toxicity of nutrients because of highly variable interspeciesdifferences in nutrient requirements. Nevertheless, relevant animaldata are considered in the hazard identification and dose-responseassessment steps where applicable and, in general, are used for haz-ard identification unless there are data demonstrating they are notrelevant to human beings or it is clear that the available humandata are sufficient.
Route of Exposure.2 Data derived from studies involving oral expo-sure (rather than parenteral, inhalation, or dermal exposure) aremost useful for the evaluation of nutrients and food components.Data derived from studies involving parenteral, inhalation, or der-mal routes of exposure may be considered relevant if the adverseeffects are systemic and data are available to permit interroute ex-trapolation.
Duration of Exposure. Because the magnitude, duration, and fre-quency of exposure can vary considerably in different situations,consideration must be given to the relevance of the exposure sce-nario (e.g., chronic daily dietary exposure versus short-term bolusdoses) to dietary intakes by human populations.
Pharmacokinetic and Metabolic Data
When available, data regarding the rates of nutrient absorption,distribution, metabolism, and excretion may be important in deri-vation of Tolerable Upper Intake Levels (ULs). Such data may pro-vide significant information regarding interspecies differences andsimilarities in nutrient behavior, and so may assist in identifying
2The terms route of exposure and route of intake refer to how a substance enters thebody (e.g., by ingestion, injection, or dermal absorption). These terms should notbe confused with form of intake, which refers to the medium or vehicle used (e.g.,supplements, food, or drinking water).
Copyright © National Academy of Sciences. All rights reserved.
MODEL FOR DEVELOPMENT OF ULS 87
relevant animal data. They may also assist in identifying life stagedifferences in response to nutrient toxicity.
In some cases, there may be limited or even no significant datarelating to nutrient toxicity. It is conceivable that in such cases,pharmacokinetic and metabolic data may provide valuable insightsinto the magnitude of the UL. Thus, if there are significant phar-macokinetic and metabolic data over the range of intakes that meetnutrient requirements, and if it is shown that this pattern of phar-macokinetic and metabolic data does not change in a range of in-takes greater than those required for nutrition, it may be possible toinfer the absence of toxic risk in this range. In contrast, an alter-ation of pharmacokinetics or metabolism may suggest the potentialfor adverse effects. There has been no case encountered thus far inwhich sufficient pharmacokinetic and metabolic data are availablefor establishing ULs in this fashion, but it is possible such situationsmay arise in the future.
Mechanisms of Toxic Action
Knowledge of molecular and cellular events underlying the pro-duction of toxicity can assist in dealing with the problems of extrap-olation between species and from high to lower doses. It may alsoaid in understanding whether the mechanisms associated with tox-icity are those associated with deficiency. In most cases, however,because knowledge of the biochemical sequence of events resultingfrom toxicity and deficiency is still incomplete, it is not yet possibleto state with certainty whether or not these sequences share a com-mon pathway.
Quality and Completeness of the Database
The scientific quality and quantity of the database are evaluated.Human or animal data are reviewed for suggestions that the sub-stances have the potential to produce additional adverse health ef-fects. If suggestions are found, additional studies may be recom-mended.
Identification of Distinct and Highly Sensitive Subpopulations
The ULs are based on protecting the most sensitive members ofthe general population from adverse effects of high nutrient orfood component intake. Some highly sensitive subpopulations haveresponses (in terms of incidence, severity, or both) to the agent of
Copyright © National Academy of Sciences. All rights reserved.
88 DIETARY REFERENCE INTAKES
interest that are clearly distinct from the responses expected for thepresumably healthy population. The risk assessment process recog-nizes that there may be individuals within any life stage group whoare more biologically sensitive than others, and thus their extremesensitivities do not fall within the range of sensitivities expected forthe general population. The UL for the general population maynot be protective for these subgroups. As indicated earlier, the ex-tent to which a distinct subpopulation will be included in the deri-vation of a UL for the general population is an area of judgment tobe addressed on a case-by-case basis.
Dose-Response Assessment
The process for deriving the UL is described in this section andoutlined in Box 4-1. It includes selection of the critical data set,identification of a critical endpoint with its no-observed-adverse-effect level (NOAEL) or lowest-observed-adverse-effect level (LOAEL),and assessment of uncertainty.
Data Selection and Identification of Critical Endpoints
The data evaluation process results in the selection of the mostappropriate or critical data sets for deriving the UL. Selecting thecritical data set includes the following considerations:
• Human data, when adequate to evaluate adverse effects, arepreferable to animal data, although the latter may provide usefulsupportive information.
• In the absence of appropriate human data, information froman animal species whose biological responses are most like those ofhumans is most valuable. Pharmacokinetic, metabolic, and mecha-nistic data may be available to assist in the identification of relevantanimal species.
• If it is not possible to identify such a species or to select suchdata, data from the most sensitive animal species, strain, or gendercombination are given the greatest emphasis.
• The route of exposure that most resembles the route of ex-pected human intake is preferable. This includes considering thedigestive state (e.g., fed or fasted) of the subjects or experimentalanimals. Where this is not possible, the differences in route of expo-sure are noted as a source of uncertainty.
• The critical data set defines a dose-response relationship be-tween intake and the extent of the toxic response known to be most
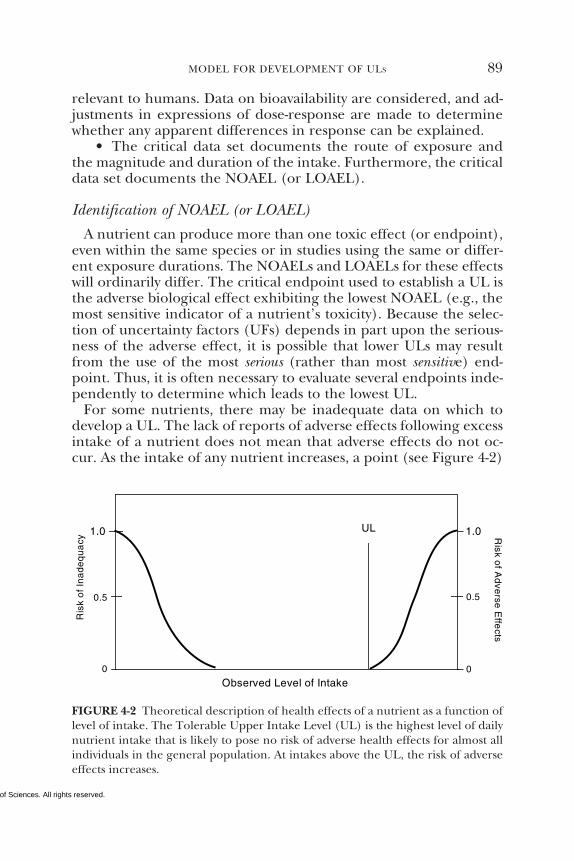
Copyright © National Academy of Sciences. All rights reserved.
MODEL FOR DEVELOPMENT OF ULS 89
relevant to humans. Data on bioavailability are considered, and ad-justments in expressions of dose-response are made to determinewhether any apparent differences in response can be explained.
• The critical data set documents the route of exposure andthe magnitude and duration of the intake. Furthermore, the criticaldata set documents the NOAEL (or LOAEL).
Identification of NOAEL (or LOAEL)
A nutrient can produce more than one toxic effect (or endpoint),even within the same species or in studies using the same or differ-ent exposure durations. The NOAELs and LOAELs for these effectswill ordinarily differ. The critical endpoint used to establish a UL isthe adverse biological effect exhibiting the lowest NOAEL (e.g., themost sensitive indicator of a nutrient’s toxicity). Because the selec-tion of uncertainty factors (UFs) depends in part upon the serious-ness of the adverse effect, it is possible that lower ULs may resultfrom the use of the most serious (rather than most sensitive) end-point. Thus, it is often necessary to evaluate several endpoints inde-pendently to determine which leads to the lowest UL.
For some nutrients, there may be inadequate data on which todevelop a UL. The lack of reports of adverse effects following excessintake of a nutrient does not mean that adverse effects do not oc-cur. As the intake of any nutrient increases, a point (see Figure 4-2)
Observed Level of Intake
UL
Ris
k o
f In
ad
eq
ua
cyR
isk of A
dve
rse E
ffects
0.5
0
0.
0
5
1.01.0
FIGURE 4-2 Theoretical description of health effects of a nutrient as a function oflevel of intake. The Tolerable Upper Intake Level (UL) is the highest level of dailynutrient intake that is likely to pose no risk of adverse health effects for almost allindividuals in the general population. At intakes above the UL, the risk of adverseeffects increases.
Copyright © National Academy of Sciences. All rights reserved.
90 DIETARY REFERENCE INTAKES
is reached at which intake begins to pose a risk. Above this point,increased intake increases the risk of adverse effects. For some nu-trients, and for various reasons, there are inadequate data to identi-fy this point, or even to make any estimate of its location.
Because adverse effects are almost certain to occur for any nutri-ent at some level of intake, it should be assumed that such effectsmay occur for nutrients for which a scientifically documented ULcannot now be derived. Until a UL is set or an alternative approachto identifying protective limits is developed, intakes greater thanthe Recommended Dietary Allowance (RDA) or Adequate Intake(AI) should be viewed with caution.
The absence of data sufficient to establish a UL points to the needfor studies suitable for developing ULs.
Uncertainty Assessment
Several judgments must be made regarding the uncertainties andthus the uncertainty factor (UF) associated with extrapolating fromthe observed data to the general population (see Appendix G).Applying a UF to a NOAEL (or LOAEL) results in a value for thederived UL that is less than the experimentally derived NOAEL,unless the UF is 1.0. The greater the uncertainty, the larger the UFand the smaller the resulting UL. This is consistent with the ulti-mate goal of the risk assessment: to provide an estimate of a level ofintake that will protect the health of virtually all members of thegeneral population (Mertz et al., 1994).
Although several reports describe the underlying basis for UFs(Dourson and Stara, 1983; Zielhuis and van der Kreek, 1979), thestrength of the evidence supporting the use of a specific UF willvary. Because the imprecision of the UFs is a major limitation of riskassessment approaches, considerable leeway must be allowed forthe application of scientific judgment in making the final determi-nation. Because data are generally available regarding intakes ofnutrients and food components by human populations, the data onnutrient toxicity may not be subject to the same uncertainties asdata on nonessential chemical agents, resulting in UFs for nutrientsand food components typically less than the factors of 10 oftenapplied to nonessential toxic substances. The UFs are lower withhigher quality data and when the adverse effects are extremely mildand reversible.
In general, when determining an uncertainty factor, the followingpotential sources of uncertainty are considered and combined intothe final UF:
Copyright © National Academy of Sciences. All rights reserved.
MODEL FOR DEVELOPMENT OF ULS 91
• Interindividual variation in sensitivity. Small UFs (close to 1)are used to represent this source of uncertainty if it is judged thatlittle population variability is expected for the adverse effect, andlarger factors (close to 10) are used if variability is expected to begreat (NRC, 1994).
• Extrapolation from experimental animals to humans. A UF to ac-count for the uncertainty in extrapolating animal data to humans isgenerally applied to the NOAEL when animal data are the primarydata set available. While a default UF of 10 is often used to extrapo-late animal data to humans for nonessential chemicals, a lower UFmay be used because of data showing some similarities between theanimal and human responses (NRC, 1994). For example, in thisreport a UF of 3 was utilized to extrapolate from animal data tohumans for vitamin E.
• LOAEL instead of NOAEL. If a NOAEL is not available, a UFmay be applied to account for the uncertainty in deriving a ULfrom the LOAEL. The size of the UF applied involves scientificjudgment based on the severity and incidence of the observed ef-fect at the LOAEL and the steepness (slope) of the dose response.
• Subchronic NOAEL to predict chronic NOAEL. When data arelacking on chronic exposures, scientific judgment is necessary todetermine whether chronic exposure is likely to lead to adverseeffects at lower intakes than those producing effects after subchron-ic exposures (exposures of shorter duration).
Derivation of a UL
The UL is derived by dividing the NOAEL (or LOAEL) by a singleUF that incorporates all relevant uncertainties. ULs, expressed asamount per day, are derived for various life stage groups using rele-vant databases, NOAELs and LOAELs, and UFs. In cases where nodata exist with regard to NOAELs or LOAELs for the group underconsideration, extrapolations from data in other age groups or ani-mal data are made on the basis of known differences in body size,physiology, metabolism, absorption, and excretion of the nutrient.
Generally, age group adjustments are based solely on differencesin body weight, unless there are data demonstrating age-related dif-ferences in nutrient pharmacokinetics, metabolism, or mechanismof action.
The derivation of a UL involves the use of scientific judgment toselect the appropriate NOAEL (or LOAEL) and UF. The risk assess-ment requires explicit consideration and discussion of all choicesmade, regarding both the data used and the uncertainties account-
Copyright © National Academy of Sciences. All rights reserved.
92 DIETARY REFERENCE INTAKES
ed for. These considerations are discussed in the chapters on nutri-ents and food components. In this report, because of lack of consis-tency in the data, ULs could not be set for β-carotene. In addition,ULs could not be established for the other carotenoids due to alack of suitable data.
Characterization of the Estimate and Special Considerations
If the data review reveals the existence of subpopulations havingdistinct and exceptional sensitivities to a nutrient’s toxicity, thesesubpopulations are explicitly discussed and concerns related to ad-verse effects are noted; however, the use of the data is not includedin the identification of the NOAEL or LOAEL, upon which the ULfor the general population is based.
INTAKE ASSESSMENT
In order to assess the risk of adverse effects, information on therange of nutrient intakes in the general population is required. Asnoted earlier, in cases where the Tolerable Upper Intake Level (UL)pertains only to supplement use, and does not pertain to usual foodintakes of the nutrient, the assessment is directed at supplementintakes only.
RISK CHARACTERIZATION
As described earlier, the question of whether nutrient intakes cre-ate a risk of adverse effects requires a comparison of the range ofnutrient intakes (food, supplements, and other sources or supple-ments alone, depending upon the basis for the Tolerable UpperLevel Intake [UL]) with the UL.
Figure 4-3 illustrates a distribution of chronic nutrient intakes in apopulation; the fraction of the population experiencing chronicintakes above the UL represents the potential at-risk group. A poli-cy decision is needed to determine whether efforts should be madeto reduce this risk. No precedents are available for such policy choic-es, although in the area of food additive or pesticide regulations,federal regulatory agencies have generally sought to ensure that theninetieth or ninety-fifth percentile intakes fall below the UL (or itsapproximate equivalent measure of risk). If this goal is achieved,the fraction of the population remaining above the UL is likely toexperience intakes only slightly greater than the UL and is likely tobe at little or no risk.
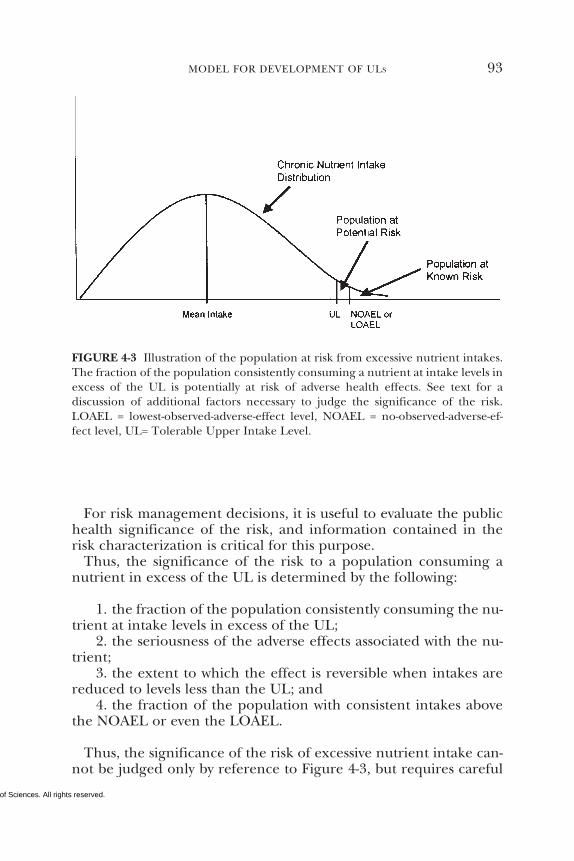
Copyright © National Academy of Sciences. All rights reserved.
MODEL FOR DEVELOPMENT OF ULS 93
FIGURE 4-3 Illustration of the population at risk from excessive nutrient intakes.The fraction of the population consistently consuming a nutrient at intake levels inexcess of the UL is potentially at risk of adverse health effects. See text for adiscussion of additional factors necessary to judge the significance of the risk.LOAEL = lowest-observed-adverse-effect level, NOAEL = no-observed-adverse-ef-fect level, UL= Tolerable Upper Intake Level.
For risk management decisions, it is useful to evaluate the publichealth significance of the risk, and information contained in therisk characterization is critical for this purpose.
Thus, the significance of the risk to a population consuming anutrient in excess of the UL is determined by the following:
1. the fraction of the population consistently consuming the nu-trient at intake levels in excess of the UL;
2. the seriousness of the adverse effects associated with the nu-trient;
3. the extent to which the effect is reversible when intakes arereduced to levels less than the UL; and
4. the fraction of the population with consistent intakes abovethe NOAEL or even the LOAEL.
Thus, the significance of the risk of excessive nutrient intake can-not be judged only by reference to Figure 4-3, but requires careful
Copyright © National Academy of Sciences. All rights reserved.
94 DIETARY REFERENCE INTAKES
consideration of all of the above factors. Information on these fac-tors is contained in this report’s sections describing the basis foreach of the ULs.
REFERENCESDourson ML, Stara JF. 1983. Regulatory history and experimental support of un-
certainty (safety) factors. Regul Toxicol Pharmacol 3:224–238.FAO/WHO (Food and Agriculture Organization of the United Nations/World
Health Organization). 1995. The Application of Risk Analysis to Food StandardIssues. Recommendations to the Codex Alimentarius Commission (ALINORM95/9, Appendix 5). Geneva: World Health Organization.
FAO/WHO (Food and Agriculture Organization of the United Nations/WorldHealth Organization). 1982. Evaluation of Certain Food Additives and Contami-nants. Twenty-sixth report of the Joint FAO/WHO Expert Committee on FoodAdditives. WHO Technical Report Series No. 683. Geneva: World Health Or-ganization.
Health Canada. 1993. Health Risk Determination—The Challenge of Health Protection.Ottawa: Health Canada, Health Protection Branch.
Hill AB. 1971. Principles of Medical Statistics, 9th edition. New York: Oxford Universi-ty Press.
Klaassen CD, Amdur MO, Doull J. 1986. Casarett and Doull’s Toxicology: The BasicScience of Poisons, 3rd edition. New York: Macmillan.
Mertz W, Abernathy CO, Olin SS. 1994. Risk Assessment of Essential Elements. Wash-ington, DC: ILSI Press.
NRC (National Research Council). 1983. Risk Assessment in the Federal Government:Managing the Process. Washington, DC: National Academy Press.
NRC (National Research Council). 1994. Science and Judgment in Risk Assessment.Washington, DC: National Academy Press.
OTA (Office of Technology Assessment). 1993. Researching Health Risks. Washing-ton, DC: Office of Technology Assessment.
WHO (World Health Organization). 1987. Principles for the Safety Assessment of FoodAdditives and Contaminants in Food. Environmental Health Criteria 70. Geneva:World Health Organization.
WHO (World Health Organization). 1996. Trace Elements in Human Nutrition andHealth. Geneva: World Health Organization.
Zielhuis RL, van der Kreek FW. 1979. The use of a safety factor in setting health-based permissible levels for occupational exposure. Int Arch Occup Environ Hth42:191–201.
Copyright © National Academy of Sciences. All rights reserved. 95
5Vitamin C
SUMMARY
Vitamin C functions physiologically as a water-soluble antioxidantby virtue of its high reducing power. It is a cofactor for enzymesinvolved in the biosynthesis of collagen, carnitine, and neurotrans-mitters in vitro, and it can quench a variety of reactive oxygenspecies and reactive nitrogen species in aqueous environments.Evidence for in vivo antioxidant functions of ascorbate includethe scavenging of reactive oxidants in activated leukocytes, lung,and gastric mucosa, and diminished lipid peroxidation as mea-sured by urinary isoprostane excretion. To provide antioxidantprotection, a Recommended Dietary Allowance (RDA) of 90 mg/day for adult men and 75 mg/day for adult women is set based onthe vitamin C intake to maintain near-maximal neutrophil con-centration with minimal urinary excretion of ascorbate. Becausesmoking increases oxidative stress and metabolic turnover of vita-min C, the requirement for smokers is increased by 35 mg/day.Estimates of median dietary intakes of vitamin C for adults are 102mg/day and 72 mg/day in the United States and Canada, respec-tively. The Tolerable Upper Intake Level (UL) for adults is set at 2g/day; the adverse effects upon which the UL is based are osmoticdiarrhea and gastrointestinal disturbances.
BACKGROUND INFORMATION
Vitamin C is a water-soluble vitamin that is essential for all humansand a few other mammals that lack the ability to biosynthesize thecompound from glucose because they lack the enzyme gulono-
Copyright © National Academy of Sciences. All rights reserved.
96 DIETARY REFERENCE INTAKES
lactone oxidase. The term vitamin C refers to both ascorbic acidand dehydroascorbic acid (DHA), since both exhibit anti-scorbuticactivity. Ascorbic acid, the functional and primary in vivo form ofthe vitamin, is the enolic form of an α-ketolactone (2,3-didehydro-L-threo-hexano-1,4-lactone). The two enolic hydrogen atoms give thecompound its acidic character and provide electrons for its func-tion as a reductant and antioxidant. Its one-electron oxidation prod-uct, the ascorbyl radical, readily dismutates to ascorbate and DHA,the two-electron oxidation products. Both the ascorbyl radical andDHA are readily reduced back to ascorbic acid in vivo. However,DHA can be hydrolyzed irreversibly to 2,3-diketogulonic acid. Themolecular structure of ascorbic acid contains an asymmetric carbonatom that allows two enantiomeric forms, of which the L form isnaturally occurring (the D-form, isoascorbic or erythorbic acid, pro-vides antioxidant but little or no anti-scorbutic activity), as shown inFigure 5-1.
Function
The biological functions of ascorbic acid are based on its ability toprovide reducing equivalents for a variety of biochemical reactions.Because of its reducing power, the vitamin can reduce most physio-logically relevant reactive oxygen species (Buettner, 1993). As such,the vitamin functions primarily as a cofactor for reactions requiringa reduced iron or copper metalloenzyme and as a protective antiox-idant that operates in the aqueous phase both intra- and extracellu-larly (Englard and Seifter, 1986; Halliwell and Whiteman, 1997;Tsao, 1997). Both the one- and the two-electron oxidation productsof the vitamin are readily regenerated in vivo—chemically and enzy-matically—by glutathione, nicotinamide adenine dinucleotide(NADH), and nicotinamide adenine dinucleotide phosphate (NAD-PH) dependent reductases (May et al., 1998; Park and Levine, 1996).
Vitamin C is known to be an electron donor for eight humanenzymes. Three participate in collagen hydroxylation; two in car-nitine biosynthesis; and three in hormone and amino acid biosyn-thesis. The three enzymes that participate in hormone and aminoacid biosynthesis are dopamine-β-hydroxylase, necessary for the bio-synthesis of the catecholamines norepinephrine and epinephrine;peptidyl-glycine monooxygenase, necessary for amidation of pep-tide hormones; and 4-hydroxyphenylpyruvatedioxygenase, involvedin tyrosine metabolism. Ascorbate’s action with these enzymes in-
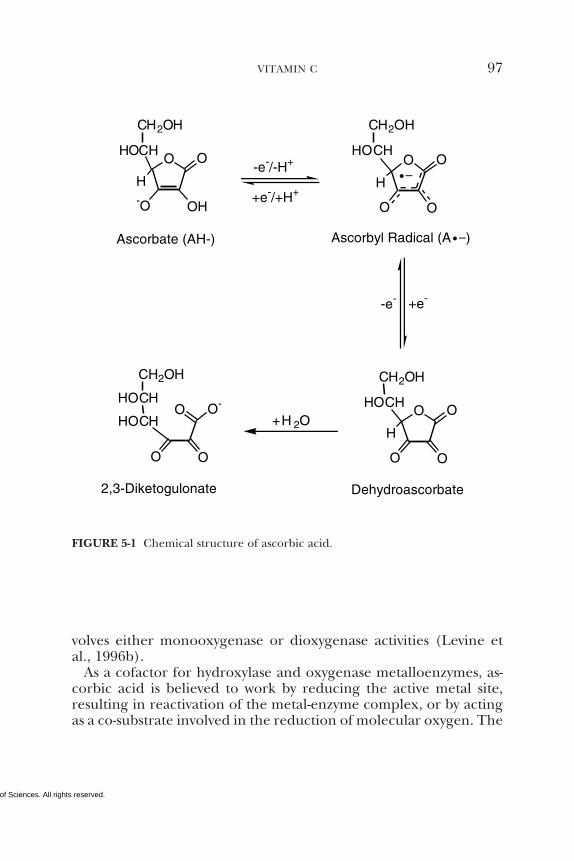
Copyright © National Academy of Sciences. All rights reserved.
VITAMIN C 97
FIGURE 5-1 Chemical structure of ascorbic acid.
O O
OH-O
H
HOCH
CH2OH
O O
OO
H
HOCH
CH2OH
O O
OO
H
HOCH
CH2OH
O O-
OO
HOCH
HOCH
CH2OH
Ascorbate (AH-) Ascorbyl Radical (A )
Dehydroascorbate2,3-Diketogulonate
-e-/-H+
+e-/+H+
+e--e-
+H 2O
• –
• –
volves either monooxygenase or dioxygenase activities (Levine etal., 1996b).
As a cofactor for hydroxylase and oxygenase metalloenzymes, as-corbic acid is believed to work by reducing the active metal site,resulting in reactivation of the metal-enzyme complex, or by actingas a co-substrate involved in the reduction of molecular oxygen. The
Copyright © National Academy of Sciences. All rights reserved.
98 DIETARY REFERENCE INTAKES
best known of these reactions is the posttranslational hydroxylationof peptide-bound proline and lysine residues during formation ofmature collagen. In these reactions, ascorbate is believed to reacti-vate the enzymes by reducing the metal sites of prolyl (iron) andlysyl (copper) hydroxylases (Englard and Seifter, 1986; Tsao, 1997).
Evidence also suggests that ascorbate plays a role in or influencescollagen gene expression, cellular procollagen secretion, and thebiosynthesis of other connective tissue components besides col-lagen, including elastin, fibronectin, proteoglycans, bone matrix,and elastin-associated fibrillin (Ronchetti et al., 1996). The primaryphysical symptoms of ascorbic acid’s clinical deficiency disease, scur-vy, which involves deterioration of elastic tissue, illustrate the im-portant role of ascorbate in connective tissue synthesis.
Ascorbic acid is involved in the synthesis and modulation of somehormonal components of the nervous system. The vitamin is a co-factor for dopamine-β-hydroxylase, which catalyzes hydroxylation ofthe side chain of dopamine to form norepinephrine, and α-amidat-ing monooxygenase enzymes, involved in the biosynthesis of neu-ropeptides. Other nervous system components modulated by as-corbate concentrations include neurotransmitter receptors, thefunction of glutamatergic and dopaminergic neurons, and synthesisof glial cells and myelin (Englard and Seifter, 1986; Katsuki, 1996).
Because of its ability to donate electrons, ascorbic acid is an effec-tive antioxidant. The vitamin readily scavenges reactive oxygen spe-cies (ROS) and reactive nitrogen species (RNS) (e.g., hydroxyl, per-oxyl, superoxide, peroxynitrite, and nitroxide radicals) as well assinglet oxygen and hypochlorite (Frei et al., 1989; Halliwell andWhiteman, 1997; Sies and Stahl, 1995). The one- and two-electronoxidation products of ascorbate are relatively nontoxic and easilyregenerated by the ubiquitous reductants glutathione and NADH orNAD-PH. The relatively high tissue levels of ascorbate provide sub-stantial antioxidant protection: in the eye, against photolytically gen-erated free-radical damage; in neutrophils, against ROS producedduring phagocytosis; and in semen, against oxidative damage tosperm deoxyribonucleic acid (DNA) (Delamere, 1996; Fraga et al.,1991; Levine et al., 1994). Ascorbic acid protects against plasma andlow-density lipoprotein (LDL) oxidation by scavenging ROS in theaqueous phase before they initiate lipid peroxidation (Frei et al.,1988; Jialal et al., 1990) and possibly by sparing or regeneratingvitamin E (Halpner et al., 1998). Evidence suggests that ascorbate
Copyright © National Academy of Sciences. All rights reserved.
VITAMIN C 99
also provides antioxidant protection indirectly by regenerating oth-er biological antioxidants such as glutathione and α-tocopherol backto their active state (Jacob, 1995).
Ascorbic acid functions as a reducing agent for mixed-functionoxidases in the microsomal drug-metabolizing system that inacti-vates a wide variety of substrates, such as endogenous hormones orxenobiotics (i.e., other chemical compounds such as drugs, pesti-cides, or carcinogens that are foreign to humans) (Tsao, 1997).The activity of both microsomal drug-metabolizing enzymes andcytochrome P-450 electron transport is lowered by ascorbate defi-ciency. The vitamin is involved in the biosynthesis of corticosteroidsand aldosterone and in the microsomal hydroxylation of cholester-ol in the conversion of cholesterol to bile acids. In reactions similarto the hydroxylation of proline for collagen synthesis, ascorbate isrequired along with iron at two steps in the pathway of carnitinebiosynthesis. Ascorbic acid modulates iron absorption, transport,and storage (Gosiewska et al., 1996). Limited data suggest that as-corbate modulates prostaglandin synthesis and thus exerts bron-chodilatory and vasodilatory as well as anticlotting effects (Horrobin,1996).
Physiology of Absorption, Metabolism, and Excretion
Absorption and Transport
Intestinal absorption of ascorbic acid occurs through a sodium-dependent active transport process that is saturable and dose de-pendent (Rumsey and Levine, 1998; Tsao, 1997). At low gastrointes-tinal ascorbate concentrations, active transport predominates, whilesimple diffusion occurs at high concentrations. Some 70 to 90 per-cent of usual dietary intakes of ascorbic acid (30 to 180 mg/day) areabsorbed; however, absorption falls to about 50 percent or less withincreasing doses above 1 g/day (Kallner et al., 1979). The bioavail-abilities of the vitamin from foods and supplements are not signifi-cantly different (Johnston and Luo, 1994; Mangels et al., 1993).
Cellular transport of ascorbic acid and DHA is mediated by trans-porters that vary by cell type (Jacob, 1999; Tsao, 1997). DHA is theform of the vitamin that primarily crosses the membranes of bloodand intestinal cells, after which it is reduced intracellularly to ascor-bic acid. Accumulation of ascorbate into neutrophils and lympho-
Copyright © National Academy of Sciences. All rights reserved.
100 DIETARY REFERENCE INTAKES
cytes is mediated by both high- and low-affinity transporters, andthe vitamin is localized mostly in the cytosol. Intracellularly and inplasma, vitamin C exists predominately in the free reduced form asascorbate monoanion, as shown in Figure 5-1 (Levine et al., 1994).
Metabolism and Excretion
Since the immediate oxidized forms of vitamin C are readily re-duced back to ascorbic acid, relatively small amounts of the vitaminare lost through catabolism. The primary products of oxidation be-yond DHA include oxalic and threonic acids, L-xylose, and ascor-bate 2-sulfate (Jacob, 1999). With large intakes of the vitamin, unab-sorbed ascorbate is degraded in the intestine, a process that mayaccount for the diarrhea and intestinal discomfort sometimes re-ported by persons ingesting large doses (see section on “AdverseEffects”).
Besides dose-dependent absorption, a second primary mechanismfor regulation of body ascorbate content is renal action to conserveor excrete unmetabolized ascorbate. Recent studies have shown thatlittle unmetabolized ascorbate is excreted with dietary intakes up toabout 80 mg/day and that renal excretion of ascorbate increasesproportionately with higher intakes (Blanchard et al., 1997; Melethilet al., 1986).
Body Stores
Dose-dependent absorption and renal regulation of ascorbate al-low conservation of the vitamin by the body during low intakes andlimitation of plasma levels at high intakes. Tissue-specific cellulartransport systems allow for wide variation of tissue ascorbate con-centrations. High levels are maintained in the pituitary and adrenalglands, leukocytes, eye tissues and humors, and the brain, while lowlevels are found in plasma and saliva (Hornig, 1975). Due to ho-meostatic regulation, the biological half-life of ascorbate varies wide-ly from 8 to 40 days and is inversely related to the ascorbate bodypool (Kallner et al., 1979). Similarly, catabolic turnover varies wide-ly, about 10 to 45 mg/day, over a wide range of dietary intakes dueto body pool size. A total body pool of less than 300 mg is associatedwith scurvy symptoms (Baker et al., 1971), while maximum bodypools are limited to about 2 g (Kallner et al., 1979). At very lowascorbate intakes, essentially no ascorbate is excreted unchangedand a minimal loss occurs.
Copyright © National Academy of Sciences. All rights reserved.
VITAMIN C 101
Clinical Effects of Inadequate Intake
Scurvy, the classic disease of severe vitamin C deficiency, is charac-terized by symptoms related to connective tissue defects. Scurvy usu-ally occurs at a plasma concentration of less than 11 µmol/L (0.2mg/dL). Clinical features of scurvy include follicular hyperkerato-sis, petechiae, ecchymoses, coiled hairs, inflamed and bleedinggums, perifollicular hemorrhages, joint effusions, arthralgia, andimpaired wound healing (Baker et al., 1971; Chazan and Mistilis,1963; Levine et al., 1996b). Other symptoms include dyspnea, ede-ma, Sjögren’s syndrome (dry eyes and mouth), weakness, fatigue,and depression. In experimental subjects made vitamin C deficientbut not frankly scorbutic, gingival inflammation (Leggott et al.,1986) and fatigue (Levine et al., 1996a) were among the most sensi-tive markers of deficiency. Vitamin C deficiency in infants may re-sult in bone abnormalities such as impaired bone growth and dis-turbed ossification, hemorrhagic symptoms, and resultant anemia(Jacob, 1999).
Lack of ascorbate-related hydroxyproline and hydroxylysine for-mation needed for collagen cross-linking may explain many of theconnective tissue and hemorrhagic manifestations of scurvy, howev-er, the specific histologic defects have not been identified. Oxidativedegradation of some blood coagulation factors due to low plasmaascorbate concentrations may contribute to hemorrhagic symptoms(Parkkinen et al., 1996).
Scurvy is rare in developed countries but is occasionally seen inindividuals who consume few fruits and vegetables, peculiar or re-stricted diets, or in those who abuse alcohol or drugs. In the UnitedStates, low blood ascorbate concentrations are more prevalent inmen, especially elderly men, than in women and are more preva-lent in populations of lower socioeconomic status (LSRO/FASEB,1989). Infantile scurvy is rarely seen, because human milk providesan adequate supply of vitamin C and infant formulas are fortifiedwith the vitamin.
SELECTION OF INDICATORS FOR ESTIMATING THEREQUIREMENT FOR VITAMIN C
Antioxidant Functions
There is much support for the role of increased oxidative stress inthe pathogenesis of cardiovascular disease (Jialal and Devaraj, 1996;Witztum and Steinberg, 1991). The most plausible and biologically
Copyright © National Academy of Sciences. All rights reserved.
102 DIETARY REFERENCE INTAKES
relevant hypothesis is that the oxidative modification of low-densitylipoprotein (LDL) and other lipoproteins promote atherogenesis(Berliner and Heinecke, 1996; Devaraj and Jialal, 1996; Witztumand Steinberg, 1991). Several lines of evidence suggest that oxi-dized LDL (oxLDL) is pro-atherogenic. Furthermore, data supportthe in vivo existence of oxLDL (Berliner and Heinecke, 1996; Witz-tum and Steinberg, 1991). In vitro studies have clearly shown thatvitamin C at concentrations greater than 40 µmol/L (0.8 mg/dL)inhibits the oxidation of isolated LDL induced by transition metals,free-radical initiators, and activated human neutrophils and mac-rophages (Jialal and Grundy, 1991; Jialal et al., 1990; Scaccini andJialal, 1994). This is because vitamin C effectively scavenges aque-ous reactive oxygen species (ROS) and reactive nitrogen species(RNS), which prevents them from attacking LDL. Thus, in vitrovitamin C clearly functions as an antioxidant.
Studies shown in Table 5-1 examined the effect of vitamin C sup-plementation alone on biomarkers of lipid peroxidation. Of the 13studies, 7 showed that vitamin C supplementation resulted in a sig-nificant decrease in lipid oxidation products in plasma, LDL, orurine. The vitamin C supplements that resulted in positive effectsranged from 500 to 2,000 mg/day. The most convincing evidencethat vitamin C functions as an antioxidant in vivo is the study byReilly et al. (1996) showing that supplementation of smokers with2.0 g vitamin C for 5 days was associated with a significant reductionin urinary isoprostanes, an indicator of oxidative stress. In the re-maining six studies in which vitamin C was supplemented in amountsranging from 500 to 6,000 mg/day, there was no significant effect ofvitamin C supplementation on lipid oxidation products in plasma,urine, or plasma LDL.
Carr and Frei (1999) examined the effect on LDL oxidation ofsupplementation with vitamin C in combination with vitamin E andβ-carotene. Although these investigators have clearly shown that thesupplements decrease LDL oxidation, it is difficult to assess thecontribution of vitamin C alone.
Vitamin C supplementation (2,000 mg/day for 4 to 12 months) in41 patients with non-atrophic gastritis decreased gastric mucosalnitrotyrosine, a measure of RNS activity (Table 5-2) (Mannick et al.,1996). Thus, from this study and the study by Reilly et al. (1996), itcan be concluded that supplementation with vitamin C results in anantioxidant effect in vivo because it significantly reduces nitroty-rosine and urinary isoprostanes.
However, with respect to the effect of vitamin C on LDL oxida-tion, the data are inconclusive. This could be explained by the fact
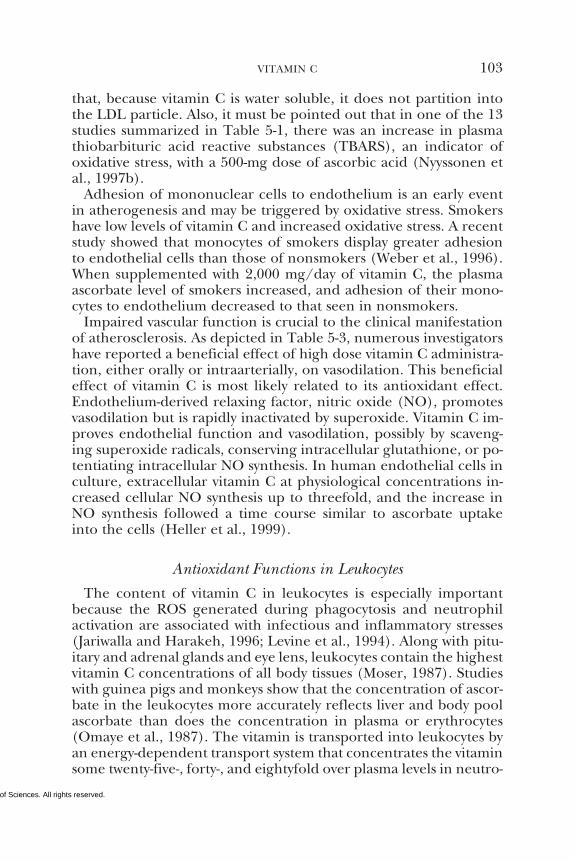
Copyright © National Academy of Sciences. All rights reserved.
VITAMIN C 103
that, because vitamin C is water soluble, it does not partition intothe LDL particle. Also, it must be pointed out that in one of the 13studies summarized in Table 5-1, there was an increase in plasmathiobarbituric acid reactive substances (TBARS), an indicator ofoxidative stress, with a 500-mg dose of ascorbic acid (Nyyssonen etal., 1997b).
Adhesion of mononuclear cells to endothelium is an early eventin atherogenesis and may be triggered by oxidative stress. Smokershave low levels of vitamin C and increased oxidative stress. A recentstudy showed that monocytes of smokers display greater adhesionto endothelial cells than those of nonsmokers (Weber et al., 1996).When supplemented with 2,000 mg/day of vitamin C, the plasmaascorbate level of smokers increased, and adhesion of their mono-cytes to endothelium decreased to that seen in nonsmokers.
Impaired vascular function is crucial to the clinical manifestationof atherosclerosis. As depicted in Table 5-3, numerous investigatorshave reported a beneficial effect of high dose vitamin C administra-tion, either orally or intraarterially, on vasodilation. This beneficialeffect of vitamin C is most likely related to its antioxidant effect.Endothelium-derived relaxing factor, nitric oxide (NO), promotesvasodilation but is rapidly inactivated by superoxide. Vitamin C im-proves endothelial function and vasodilation, possibly by scaveng-ing superoxide radicals, conserving intracellular glutathione, or po-tentiating intracellular NO synthesis. In human endothelial cells inculture, extracellular vitamin C at physiological concentrations in-creased cellular NO synthesis up to threefold, and the increase inNO synthesis followed a time course similar to ascorbate uptakeinto the cells (Heller et al., 1999).
Antioxidant Functions in Leukocytes
The content of vitamin C in leukocytes is especially importantbecause the ROS generated during phagocytosis and neutrophilactivation are associated with infectious and inflammatory stresses(Jariwalla and Harakeh, 1996; Levine et al., 1994). Along with pitu-itary and adrenal glands and eye lens, leukocytes contain the highestvitamin C concentrations of all body tissues (Moser, 1987). Studieswith guinea pigs and monkeys show that the concentration of ascor-bate in the leukocytes more accurately reflects liver and body poolascorbate than does the concentration in plasma or erythrocytes(Omaye et al., 1987). The vitamin is transported into leukocytes byan energy-dependent transport system that concentrates the vitaminsome twenty-five-, forty-, and eightyfold over plasma levels in neutro-
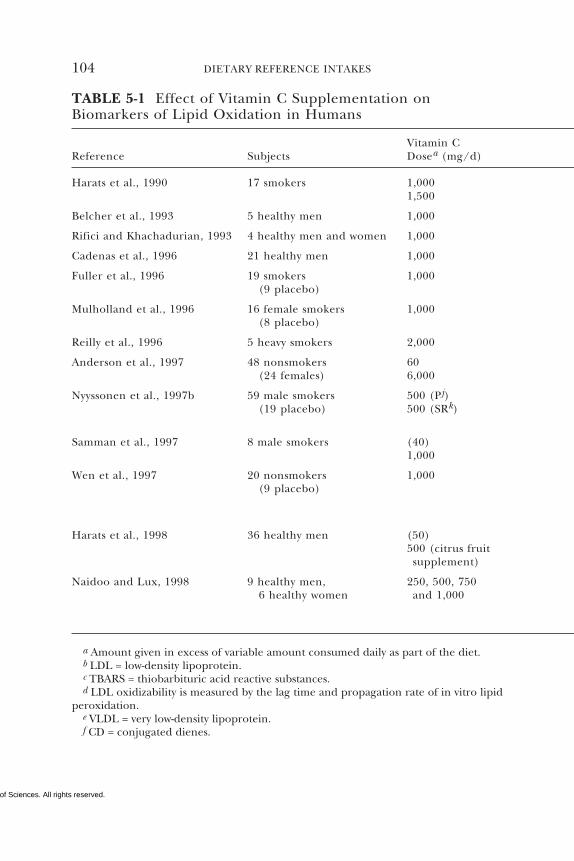
Copyright © National Academy of Sciences. All rights reserved.
104 DIETARY REFERENCE INTAKES
TABLE 5-1 Effect of Vitamin C Supplementation onBiomarkers of Lipid Oxidation in Humans
Vitamin CReference Subjects Dosea (mg/d)
Harats et al., 1990 17 smokers 1,0001,500
Belcher et al., 1993 5 healthy men 1,000
Rifici and Khachadurian, 1993 4 healthy men and women 1,000
Cadenas et al., 1996 21 healthy men 1,000
Fuller et al., 1996 19 smokers 1,000(9 placebo)
Mulholland et al., 1996 16 female smokers 1,000(8 placebo)
Reilly et al., 1996 5 heavy smokers 2,000
Anderson et al., 1997 48 nonsmokers 60(24 females) 6,000
Nyyssonen et al., 1997b 59 male smokers 500 (Pj)(19 placebo) 500 (SRk)
Samman et al., 1997 8 male smokers (40)1,000
Wen et al., 1997 20 nonsmokers 1,000(9 placebo)
Harats et al., 1998 36 healthy men (50)500 (citrus fruitsupplement)
Naidoo and Lux, 1998 9 healthy men, 250, 500, 7506 healthy women and 1,000
a Amount given in excess of variable amount consumed daily as part of the diet.b LDL = low-density lipoprotein.c TBARS = thiobarbituric acid reactive substances.d LDL oxidizability is measured by the lag time and propagation rate of in vitro lipid
peroxidation.e VLDL = very low-density lipoprotein.f CD = conjugated dienes.
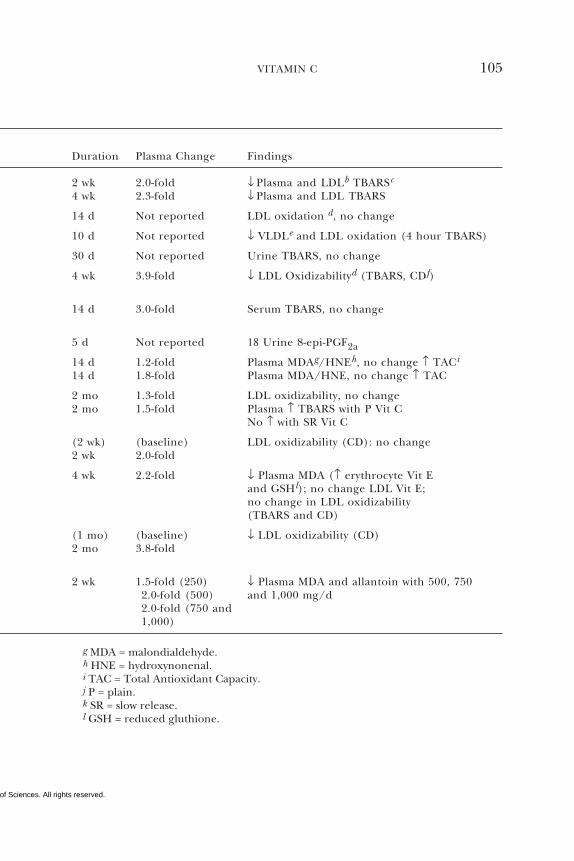
Copyright © National Academy of Sciences. All rights reserved.
VITAMIN C 105
Duration Plasma Change Findings
2 wk 2.0-fold ↓ Plasma and LDLb TBARSc
4 wk 2.3-fold ↓ Plasma and LDL TBARS
14 d Not reported LDL oxidation d, no change
10 d Not reported ↓ VLDLe and LDL oxidation (4 hour TBARS)
30 d Not reported Urine TBARS, no change
4 wk 3.9-fold ↓ LDL Oxidizabilityd (TBARS, CDf)
14 d 3.0-fold Serum TBARS, no change
5 d Not reported 18 Urine 8-epi-PGF2a
14 d 1.2-fold Plasma MDAg/HNEh, no change ↑ TACi
14 d 1.8-fold Plasma MDA/HNE, no change ↑ TAC
2 mo 1.3-fold LDL oxidizability, no change2 mo 1.5-fold Plasma ↑ TBARS with P Vit C
No ↑ with SR Vit C
(2 wk) (baseline) LDL oxidizability (CD): no change2 wk 2.0-fold
4 wk 2.2-fold ↓ Plasma MDA (↑ erythrocyte Vit Eand GSHl); no change LDL Vit E;no change in LDL oxidizability(TBARS and CD)
(1 mo) (baseline) ↓ LDL oxidizability (CD)2 mo 3.8-fold
2 wk 1.5-fold (250) ↓ Plasma MDA and allantoin with 500, 7502.0-fold (500) and 1,000 mg/d2.0-fold (750 and1,000)
g MDA = malondialdehyde.h HNE = hydroxynonenal.i TAC = Total Antioxidant Capacity.j P = plain.k SR = slow release.l GSH = reduced gluthione.
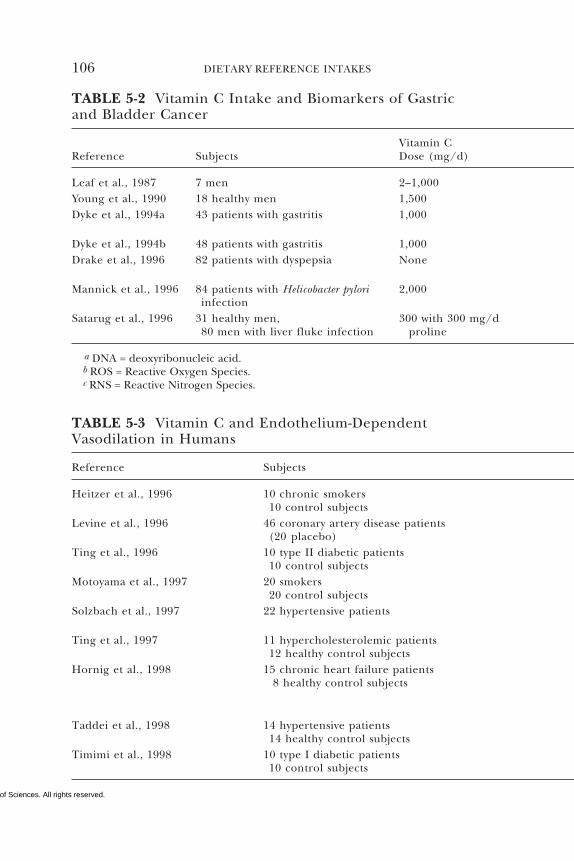
Copyright © National Academy of Sciences. All rights reserved.
106 DIETARY REFERENCE INTAKES
TABLE 5-2 Vitamin C Intake and Biomarkers of Gastricand Bladder Cancer
Vitamin CReference Subjects Dose (mg/d)
Leaf et al., 1987 7 men 2–1,000Young et al., 1990 18 healthy men 1,500Dyke et al., 1994a 43 patients with gastritis 1,000
Dyke et al., 1994b 48 patients with gastritis 1,000Drake et al., 1996 82 patients with dyspepsia None
Mannick et al., 1996 84 patients with Helicobacter pylori 2,000infection
Satarug et al., 1996 31 healthy men, 300 with 300 mg/d80 men with liver fluke infection proline
a DNA = deoxyribonucleic acid.b ROS = Reactive Oxygen Species.c RNS = Reactive Nitrogen Species.
TABLE 5-3 Vitamin C and Endothelium-DependentVasodilation in Humans
Reference Subjects
Heitzer et al., 1996 10 chronic smokers10 control subjects
Levine et al., 1996 46 coronary artery disease patients(20 placebo)
Ting et al., 1996 10 type II diabetic patients10 control subjects
Motoyama et al., 1997 20 smokers20 control subjects
Solzbach et al., 1997 22 hypertensive patients
Ting et al., 1997 11 hypercholesterolemic patients12 healthy control subjects
Hornig et al., 1998 15 chronic heart failure patients 8 healthy control subjects
Taddei et al., 1998 14 hypertensive patients14 healthy control subjects
Timimi et al., 1998 10 type I diabetic patients10 control subjects
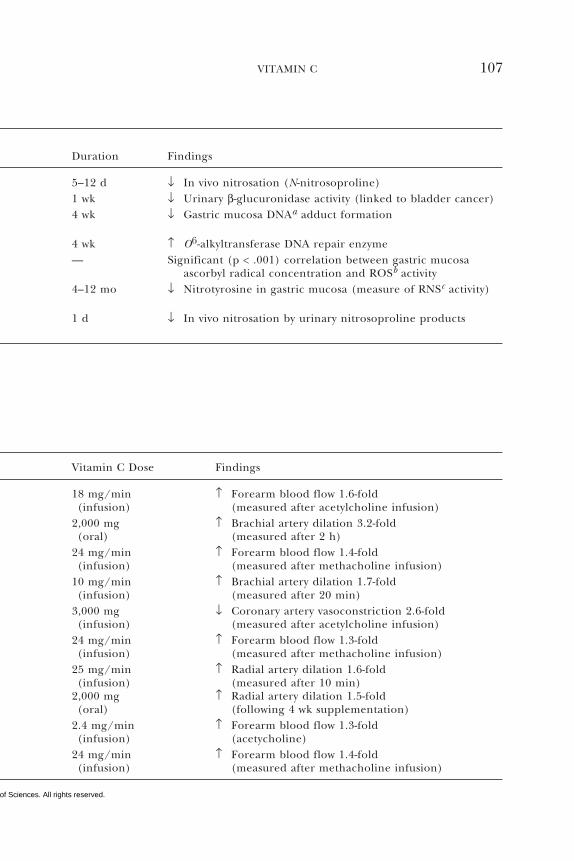
Copyright © National Academy of Sciences. All rights reserved.
VITAMIN C 107
Duration Findings
5–12 d ↓ In vivo nitrosation (N-nitrosoproline)1 wk ↓ Urinary β-glucuronidase activity (linked to bladder cancer)4 wk ↓ Gastric mucosa DNAa adduct formation
4 wk ↑ O6-alkyltransferase DNA repair enzyme— Significant (p < .001) correlation between gastric mucosa
ascorbyl radical concentration and ROSb activity4–12 mo ↓ Nitrotyrosine in gastric mucosa (measure of RNSc activity)
1 d ↓ In vivo nitrosation by urinary nitrosoproline products
Vitamin C Dose Findings
18 mg/min ↑ Forearm blood flow 1.6-fold(infusion) (measured after acetylcholine infusion)
2,000 mg ↑ Brachial artery dilation 3.2-fold(oral) (measured after 2 h)
24 mg/min ↑ Forearm blood flow 1.4-fold(infusion) (measured after methacholine infusion)
10 mg/min ↑ Brachial artery dilation 1.7-fold(infusion) (measured after 20 min)
3,000 mg ↓ Coronary artery vasoconstriction 2.6-fold(infusion) (measured after acetylcholine infusion)
24 mg/min ↑ Forearm blood flow 1.3-fold(infusion) (measured after methacholine infusion)
25 mg/min ↑ Radial artery dilation 1.6-fold(infusion) (measured after 10 min)
2,000 mg ↑ Radial artery dilation 1.5-fold(oral) (following 4 wk supplementation)
2.4 mg/min ↑ Forearm blood flow 1.3-fold(infusion) (acetycholine)
24 mg/min ↑ Forearm blood flow 1.4-fold(infusion) (measured after methacholine infusion)
Copyright © National Academy of Sciences. All rights reserved.
108 DIETARY REFERENCE INTAKES
phils, platelets, and lymphocytes, respectively (Evans et al., 1982;Jacob et al., 1992; Levine et al., 1996a). Metabolic priority for main-tenance of intracellular lymphocyte ascorbate levels was demonstrat-ed by its lower depletion rates compared to plasma and semen ascor-bate levels during controlled vitamin C deficiency (intake of 5 mg/day) and faster recovery during vitamin repletion at 60 mg/day(Jacob et al., 1992). Intracellular ascorbate recycling (the intracellu-lar regeneration of oxidized extracellular ascorbate) provides a cel-lular reservoir of reducing capacity (electrons) that can be transmit-ted both into and across the cell membrane (May et al., 1999).
The high intracellular concentration of ascorbate in leukocytesprovides cellular protection against oxidant damage associated withthe respiratory burst. In isolated neutrophils, ascorbate recycling isincreased up to thirtyfold upon exposure of the cells to microbialpathogens (Wang et al., 1997b). Ascorbate effectively neutralizesphagocyte-derived oxidants without inhibiting the bactericidal activ-ity of the phagosome (Anderson and Lukey, 1987). Evidence thatascorbate modulates leukocyte phagocytic action, blastogenesis, im-munoglobulin production, chemotaxis, and adhesiveness has beenreported in vitro, although evidence for the latter two functions hasbeen mixed (Evans et al., 1982; Jariwalla and Harakeh, 1996).
Concentrations of ascorbate normally found in plasma (22 to 85µmol/L [0.4 to 1.7 mg/dL]) were shown to neutralize hypochlor-ous acid (HOCl), one of many powerful oxidants generated by my-eloperoxidase in activated neutrophils and monocytes (Halliwell etal., 1987; Heinecke, 1997). This action was hypothesized to protectα-1-antiprotease against inactivation by HOCl and thereby preventproteolytic damage at inflamed sites such as the rheumatoid joint(Halliwell et al., 1987). Indeed, the ratio of oxidized to reducedascorbate was found to be increased in the knee synovial fluid ofactive rheumatoid arthritis patients, which suggests that ascorbate isacting to scavenge phagocyte-derived oxidants in this locally in-flamed area (Lunec and Blake, 1985). Similarly, increased ascor-bate oxidation in the plasma of patients with adult respiratory dis-tress syndrome (Cross et al., 1990) and in smokers (Lykkesfeldt etal., 1997) indicates protection against oxidant damage from activat-ed neutrophils and other sources in the lung. Exposure of nineapparently healthy adults to 2,000 parts per billion (ppb) of ozone,an environmental pollutant, for 2 hours resulted in increased my-eloperoxidase and decreased ascorbate concentrations in broncho-alveolar lavage fluid. These results imply that ascorbate protectsagainst inflammatory oxidative stress induced by ozone (Mudway etal., 1999).
Copyright © National Academy of Sciences. All rights reserved.
VITAMIN C 109
Ascorbate scavenging of myeloperoxidase-derived oxidants fromphagocytic white cells may also be protective against in vivo LDLoxidation because HOCl-oxidized proteins have been identified inhuman atherosclerotic lesions (Hazell et al., 1996). In an in vitrosystem, ascorbate at a physiologically relevant concentration of 50µmol/L (0.9 mg/dL) was the most effective antioxidant for pre-venting LDL oxidation due to myeloperoxidase-derived RNS (Byunet al., 1999).
Oxidative Deoxyribonucleic Acid and Chromosome Damage
Cellular Deoxyribonucleic Acid (DNA) Damage
Table 5-4 summarizes the results of five experimental human stud-ies in which cellular markers of DNA damage were measured aftervarious vitamin C intakes. Three of the studies varied vitamin Calone, while the other two studies varied vitamin C and other micro-nutrients.
Of the three studies that varied only vitamin C intake, one showedthat 60 or 250 mg/day decreased sperm 8-hydroxy-7, 8-dihydro-2′-deoxyguanosine (8-oxodG), a measure of oxidative stress, but didnot affect lymphocyte or urine 8-oxodG or DNA strand breaks (Fra-ga et al., 1991). In contrast, the second study showed no effect ofeither 60 or 6,000 mg/day vitamin C on lymphocyte DNA or chro-mosome damage as measured by comet assay (Anderson et al.,1997). The third study showed both decreases and increases in mea-sures of lymphocyte DNA oxidative damage after vitamin C supple-mentation of 500 mg/day (Podmore et al., 1998). In a subsequentreport of results from the study of Podmore et al. (1998), the inves-tigators hypothesized that increases in serum and urine 8-oxodGfollowing the decreases of lymphocyte 8-oxoguanine and 8-oxodGsuggest a role for vitamin C in the repair of oxidant-damaged DNA(Cooke et al., 1998).
The two studies that co-supplemented with vitamin E and β-caro-tene (Duthie et al., 1996) or iron (Rehman et al., 1998) demon-strated mixed results in that both decreases and increases in lym-phocyte DNA oxidant damage measures. Since the contribution ofvitamin C alone to the results of these studies cannot be deter-mined, these studies cannot be used to estimate a vitamin C re-quirement. Results of the latter study involving supplementation ofapparently healthy individuals with both vitamin C and iron arediscussed in the section “Tolerable Upper Intake Levels.”
Inverse correlations of lymphocyte ascorbate and glutathione con-
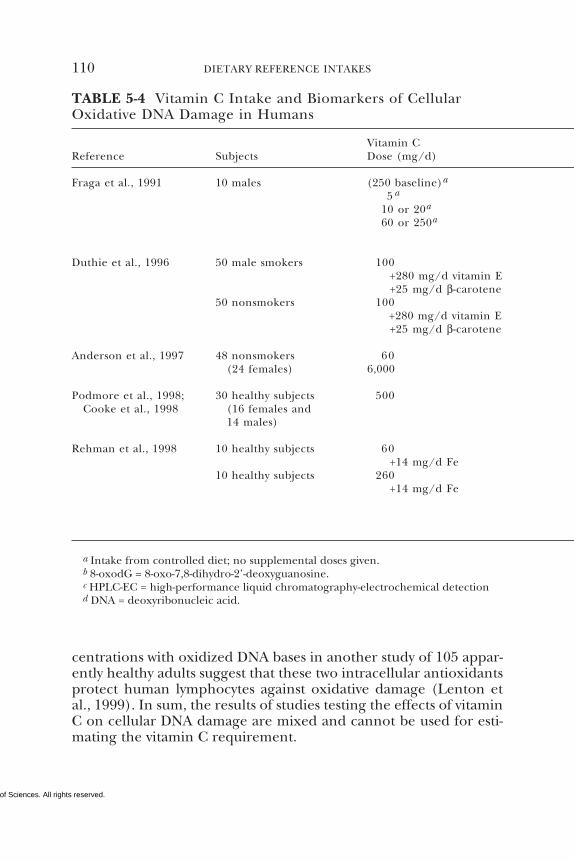
Copyright © National Academy of Sciences. All rights reserved.
110 DIETARY REFERENCE INTAKES
TABLE 5-4 Vitamin C Intake and Biomarkers of CellularOxidative DNA Damage in Humans
Vitamin CReference Subjects Dose (mg/d)
Fraga et al., 1991 10 males (250 baseline)a
5 a
10 or 20a
60 or 250a
Duthie et al., 1996 50 male smokers 100+280 mg/d vitamin E+25 mg/d β-carotene
50 nonsmokers 100+280 mg/d vitamin E+25 mg/d β-carotene
Anderson et al., 1997 48 nonsmokers 60(24 females) 6,000
Podmore et al., 1998; 30 healthy subjects 500Cooke et al., 1998 (16 females and
14 males)
Rehman et al., 1998 10 healthy subjects 60+14 mg/d Fe
10 healthy subjects 260+14 mg/d Fe
a Intake from controlled diet; no supplemental doses given.b 8-oxodG = 8-oxo-7,8-dihydro-2’-deoxyguanosine.c HPLC-EC = high-performance liquid chromatography-electrochemical detectiond DNA = deoxyribonucleic acid.
centrations with oxidized DNA bases in another study of 105 appar-ently healthy adults suggest that these two intracellular antioxidantsprotect human lymphocytes against oxidative damage (Lenton etal., 1999). In sum, the results of studies testing the effects of vitaminC on cellular DNA damage are mixed and cannot be used for esti-mating the vitamin C requirement.
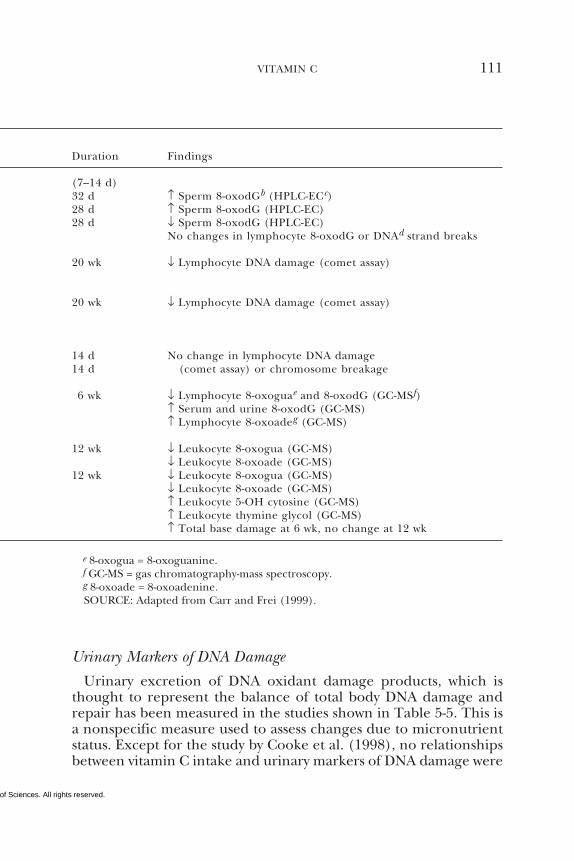
Copyright © National Academy of Sciences. All rights reserved.
VITAMIN C 111
Duration Findings
(7–14 d)32 d ↑ Sperm 8-oxodGb (HPLC-ECc)28 d ↑ Sperm 8-oxodG (HPLC-EC)28 d ↓ Sperm 8-oxodG (HPLC-EC)
No changes in lymphocyte 8-oxodG or DNAd strand breaks
20 wk ↓ Lymphocyte DNA damage (comet assay)
20 wk ↓ Lymphocyte DNA damage (comet assay)
14 d No change in lymphocyte DNA damage14 d (comet assay) or chromosome breakage
6 wk ↓ Lymphocyte 8-oxoguae and 8-oxodG (GC-MSf)↑ Serum and urine 8-oxodG (GC-MS)↑ Lymphocyte 8-oxoadeg (GC-MS)
12 wk ↓ Leukocyte 8-oxogua (GC-MS)↓ Leukocyte 8-oxoade (GC-MS)
12 wk ↓ Leukocyte 8-oxogua (GC-MS)↓ Leukocyte 8-oxoade (GC-MS)↑ Leukocyte 5-OH cytosine (GC-MS)↑ Leukocyte thymine glycol (GC-MS)↑ Total base damage at 6 wk, no change at 12 wk
e 8-oxogua = 8-oxoguanine.f GC-MS = gas chromatography-mass spectroscopy.g 8-oxoade = 8-oxoadenine.SOURCE: Adapted from Carr and Frei (1999).
Urinary Markers of DNA Damage
Urinary excretion of DNA oxidant damage products, which isthought to represent the balance of total body DNA damage andrepair has been measured in the studies shown in Table 5-5. This isa nonspecific measure used to assess changes due to micronutrientstatus. Except for the study by Cooke et al. (1998), no relationshipsbetween vitamin C intake and urinary markers of DNA damage were
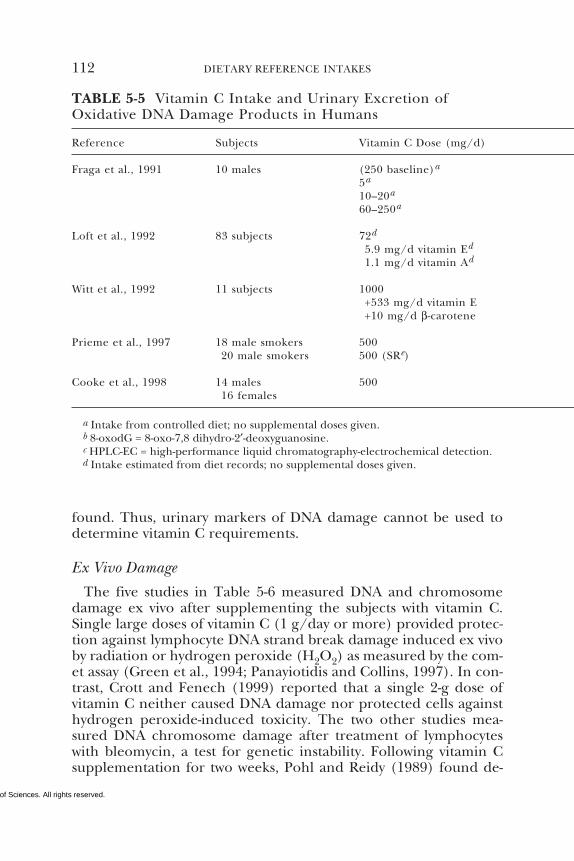
Copyright © National Academy of Sciences. All rights reserved.
112 DIETARY REFERENCE INTAKES
TABLE 5-5 Vitamin C Intake and Urinary Excretion ofOxidative DNA Damage Products in Humans
Reference Subjects Vitamin C Dose (mg/d)
Fraga et al., 1991 10 males (250 baseline)a
5a
10–20a
60–250a
Loft et al., 1992 83 subjects 72d
5.9 mg/d vitamin Ed
1.1 mg/d vitamin Ad
Witt et al., 1992 11 subjects 1000+533 mg/d vitamin E+10 mg/d β-carotene
Prieme et al., 1997 18 male smokers 50020 male smokers 500 (SRe)
Cooke et al., 1998 14 males 50016 females
a Intake from controlled diet; no supplemental doses given.b 8-oxodG = 8-oxo-7,8 dihydro-2′-deoxyguanosine.c HPLC-EC = high-performance liquid chromatography-electrochemical detection.d Intake estimated from diet records; no supplemental doses given.
found. Thus, urinary markers of DNA damage cannot be used todetermine vitamin C requirements.
Ex Vivo Damage
The five studies in Table 5-6 measured DNA and chromosomedamage ex vivo after supplementing the subjects with vitamin C.Single large doses of vitamin C (1 g/day or more) provided protec-tion against lymphocyte DNA strand break damage induced ex vivoby radiation or hydrogen peroxide (H2O2) as measured by the com-et assay (Green et al., 1994; Panayiotidis and Collins, 1997). In con-trast, Crott and Fenech (1999) reported that a single 2-g dose ofvitamin C neither caused DNA damage nor protected cells againsthydrogen peroxide-induced toxicity. The two other studies mea-sured DNA chromosome damage after treatment of lymphocyteswith bleomycin, a test for genetic instability. Following vitamin Csupplementation for two weeks, Pohl and Reidy (1989) found de-
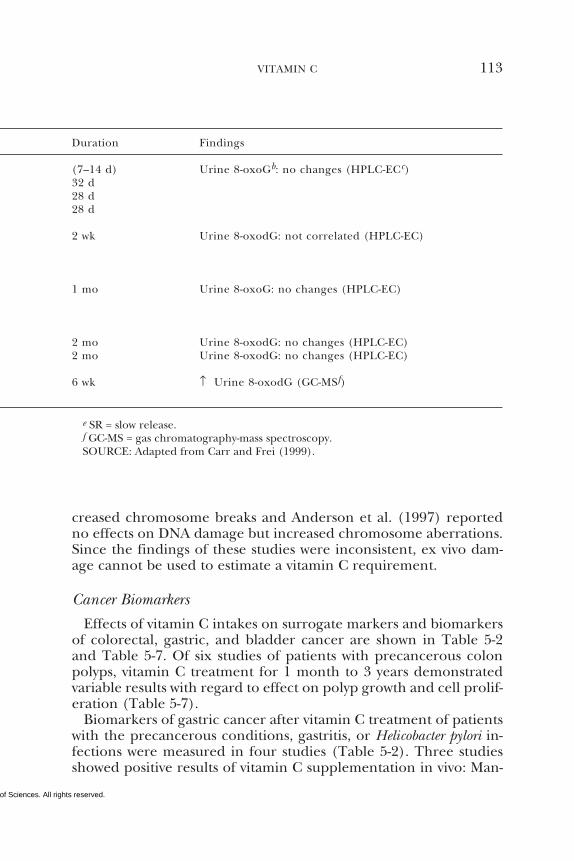
Copyright © National Academy of Sciences. All rights reserved.
VITAMIN C 113
Duration Findings
(7–14 d) Urine 8-oxoGb: no changes (HPLC-ECc)32 d28 d28 d
2 wk Urine 8-oxodG: not correlated (HPLC-EC)
1 mo Urine 8-oxoG: no changes (HPLC-EC)
2 mo Urine 8-oxodG: no changes (HPLC-EC)2 mo Urine 8-oxodG: no changes (HPLC-EC)
6 wk ↑ Urine 8-oxodG (GC-MSf)
e SR = slow release.f GC-MS = gas chromatography-mass spectroscopy.SOURCE: Adapted from Carr and Frei (1999).
creased chromosome breaks and Anderson et al. (1997) reportedno effects on DNA damage but increased chromosome aberrations.Since the findings of these studies were inconsistent, ex vivo dam-age cannot be used to estimate a vitamin C requirement.
Cancer Biomarkers
Effects of vitamin C intakes on surrogate markers and biomarkersof colorectal, gastric, and bladder cancer are shown in Table 5-2and Table 5-7. Of six studies of patients with precancerous colonpolyps, vitamin C treatment for 1 month to 3 years demonstratedvariable results with regard to effect on polyp growth and cell prolif-eration (Table 5-7).
Biomarkers of gastric cancer after vitamin C treatment of patientswith the precancerous conditions, gastritis, or Helicobacter pylori in-fections were measured in four studies (Table 5-2). Three studiesshowed positive results of vitamin C supplementation in vivo: Man-
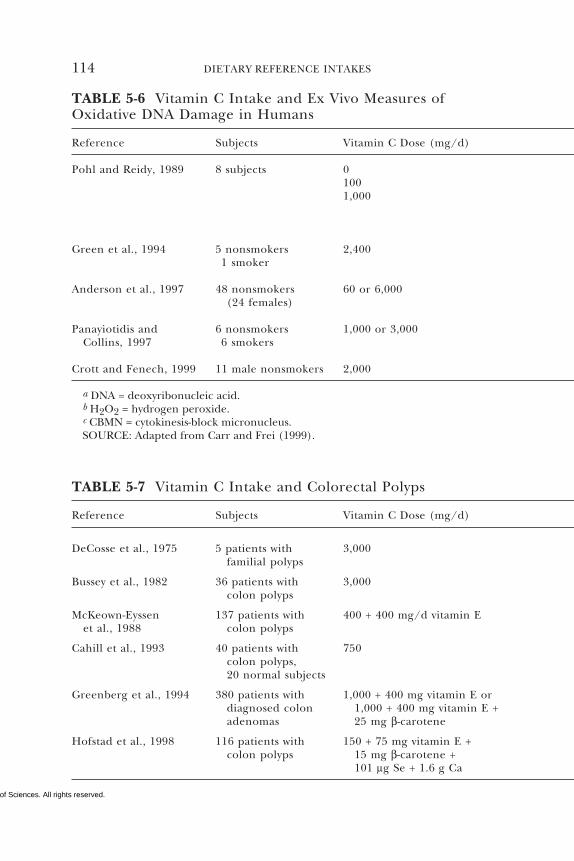
Copyright © National Academy of Sciences. All rights reserved.
114 DIETARY REFERENCE INTAKES
TABLE 5-7 Vitamin C Intake and Colorectal Polyps
Reference Subjects Vitamin C Dose (mg/d)
DeCosse et al., 1975 5 patients with 3,000familial polyps
Bussey et al., 1982 36 patients with 3,000colon polyps
McKeown-Eyssen 137 patients with 400 + 400 mg/d vitamin Eet al., 1988 colon polyps
Cahill et al., 1993 40 patients with 750colon polyps,20 normal subjects
Greenberg et al., 1994 380 patients with 1,000 + 400 mg vitamin E ordiagnosed colon 1,000 + 400 mg vitamin E +adenomas 25 mg β-carotene
Hofstad et al., 1998 116 patients with 150 + 75 mg vitamin E +colon polyps 15 mg β-carotene +
101 µg Se + 1.6 g Ca
TABLE 5-6 Vitamin C Intake and Ex Vivo Measures ofOxidative DNA Damage in Humans
Reference Subjects Vitamin C Dose (mg/d)
Pohl and Reidy, 1989 8 subjects 01001,000
Green et al., 1994 5 nonsmokers 2,4001 smoker
Anderson et al., 1997 48 nonsmokers 60 or 6,000(24 females)
Panayiotidis and 6 nonsmokers 1,000 or 3,000Collins, 1997 6 smokers
Crott and Fenech, 1999 11 male nonsmokers 2,000
a DNA = deoxyribonucleic acid.b H2O2 = hydrogen peroxide.c CBMN = cytokinesis-block micronucleus.SOURCE: Adapted from Carr and Frei (1999).
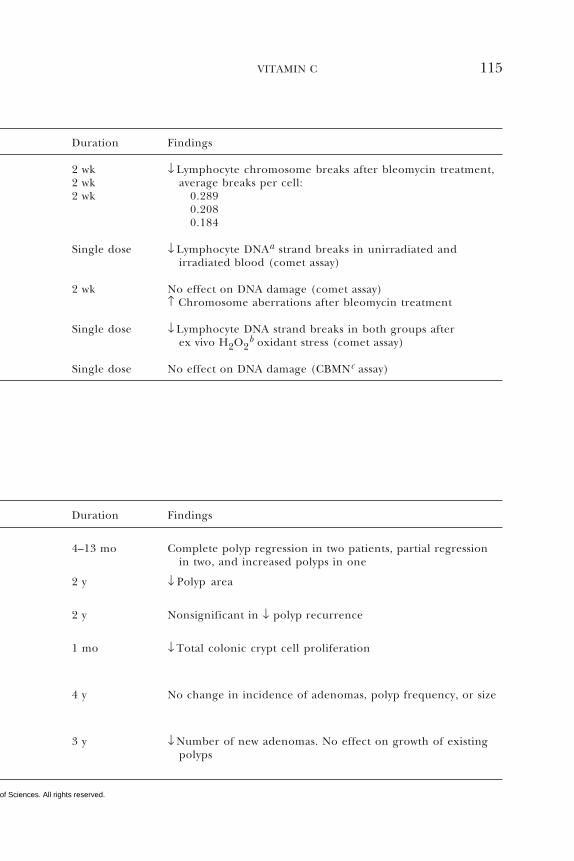
Copyright © National Academy of Sciences. All rights reserved.
VITAMIN C 115
Duration Findings
4–13 mo Complete polyp regression in two patients, partial regressionin two, and increased polyps in one
2 y ↓ Polyp area
2 y Nonsignificant in ↓ polyp recurrence
1 mo ↓ Total colonic crypt cell proliferation
4 y No change in incidence of adenomas, polyp frequency, or size
3 y ↓ Number of new adenomas. No effect on growth of existingpolyps
Duration Findings
2 wk ↓ Lymphocyte chromosome breaks after bleomycin treatment,2 wk average breaks per cell:2 wk 0.289
0.2080.184
Single dose ↓ Lymphocyte DNAa strand breaks in unirradiated andirradiated blood (comet assay)
2 wk No effect on DNA damage (comet assay)↑ Chromosome aberrations after bleomycin treatment
Single dose ↓ Lymphocyte DNA strand breaks in both groups afterex vivo H2O2
b oxidant stress (comet assay)
Single dose No effect on DNA damage (CBMNc assay)
Copyright © National Academy of Sciences. All rights reserved.
116 DIETARY REFERENCE INTAKES
nick et al. (1996) reported decreased gastric mucosal nitrotyrosine(a measure of RNS activity); Dyke et al. (1994a) reported decreasedmucosal DNA damage in one group of gastric cancer patients andsubsequently found increased mucosal O6-alkyltransferase, a DNArepair enzyme in a second group of patients with gastric cancer(Dyke et al. 1994b). Leaf et al. (1987) found decreased nitrosationin men after vitamin C supplementation. Drake et al. (1996) usedelectron paramagnetic resonance to demonstrate the presence ofthe ascorbyl radical in 82 unsupplemented patients with dyspepsiaand showed that ascorbyl radical concentrations correlated withROS activity. Gastric muscosal concentrations of ascorbyl radical,ROS, and malondialdehyde (a measure of lipid peroxidation) werehigher in patients with gastritis and Helicobacter pylori infections com-pared to patients with normal mucosal histology. Young et al. (1990)found decreased β-glucuronidase activity (linked to bladder can-cer) after in vivo supplementation of apparently healthy men with1,500 mg/day of vitamin C for 1 week.
Summary
For the three studies shown in Table 5-4 in which only vitamin Cintake was varied, some markers of cellular DNA damage showedno change with increased vitamin C intake, two markers decreased,and one increased. Urinary measures of oxidized DNA productsshowed no change attributable to vitamin C intake (Table 5-5). Twoof three studies of ex vivo DNA damage showed a benefit of vitaminC supplementation (Table 5-6); however, the relation of these re-sults to the in vivo situation is uncertain. Studies of surrogate mark-ers and biomarkers in precancerous colonic and gastric patientsshow beneficial or no effects of vitamin C supplementation. Howev-er, the interpretation of these endpoints and the relevance of theresults to apparently healthy individuals are questionable. The studyof dyspepsia patients indicates that vitamin C acts as an antioxidantin the gastric mucosa and prevents oxidative damage by scavengingROS (Drake et al., 1996). This is consistent with previous findingsthat substantial amounts of ascorbic acid are secreted into the di-gestive tract (Dabrowski, 1990; Waring et al., 1996) and that vitaminC supplementation decreases gastric mucosal DNA adduct forma-tion (Dyke et al., 1994a).
Overall, the results do not provide compelling evidence that vita-min C intakes of 60 to 6,000 mg/day reduce in vivo DNA oxidativedamage in apparently healthy individuals. Hence, present data can-
Copyright © National Academy of Sciences. All rights reserved.
VITAMIN C 117
not be used to estimate a vitamin C requirement using the end-point of reduction of oxidative damage to DNA and chromosomes.
Immune Function
As summarized in Table 5-8, vitamin C has been shown to affectvarious components of the human immune response, including an-timicrobial and natural killer cell activities, lymphocyte prolifera-tion, chemotaxis, and delayed dermal sensitivity (DDS). Except forthe metabolic unit study of Jacob et al. (1991) and the study ofpatients with furunculosis (Levy et al., 1996), the studies involvedapparently healthy free-living populations supplemented with from200 mg/day to 6 g/day of vitamin C in addition to dietary vitaminintake. Hence, the results relate largely to the pharmacologicalrange of vitamin C intakes rather than the nutritional range of in-takes usually provided from food alone.
As seen from analysis of Table 5-8, vitamin C supplementationresulted about equally in improved or little change in frequentlyused measures of immune function: lymphocyte proliferation,chemotaxis, and DDS response. The decrease in DDS during vita-min C depletion of men in a metabolic unit cannot be ascribedsolely to changes in ascorbate status because the DDS did not in-crease again upon repletion for 4 weeks with 60 to 250 mg/day ofthe vitamin (Jacob et al., 1991). The only negative effect of intakesin the range of 600 to 10,000 mg/day was the decrease in ex vivobactericidal activity found after apparently healthy men received2,000 (but not 200) mg/day of the vitamin for 4 weeks (Shilotri andBhat, 1977).
Few controlled studies of the effect of vitamin C intake on infec-tious episodes in humans have been reported, except for studies ofthe common cold (covered later under “Common Cold” in the section“Relationship of Vitamin C Intake to Chronic Disease”). Peters etal. (1993) reported a significantly decreased incidence of post-raceupper respiratory infections in marathon runners receiving 600 mg/day of vitamin C compared to control runners taking a placebo.
Results from some studies show improvement in indices of im-mune function due to increased vitamin C intake, whereas otherstudies show no effect. The lack of effect may be due to the use ofsubject populations whose baseline vitamin C status is already ade-quate, because leukocytes saturate with vitamin C at a lower intakethan is required to saturate plasma, about 100 mg/day (Levine etal., 1996a). Nevertheless, the existing data do not provide convinc-ing evidence that supplemental vitamin C has a significant effect on
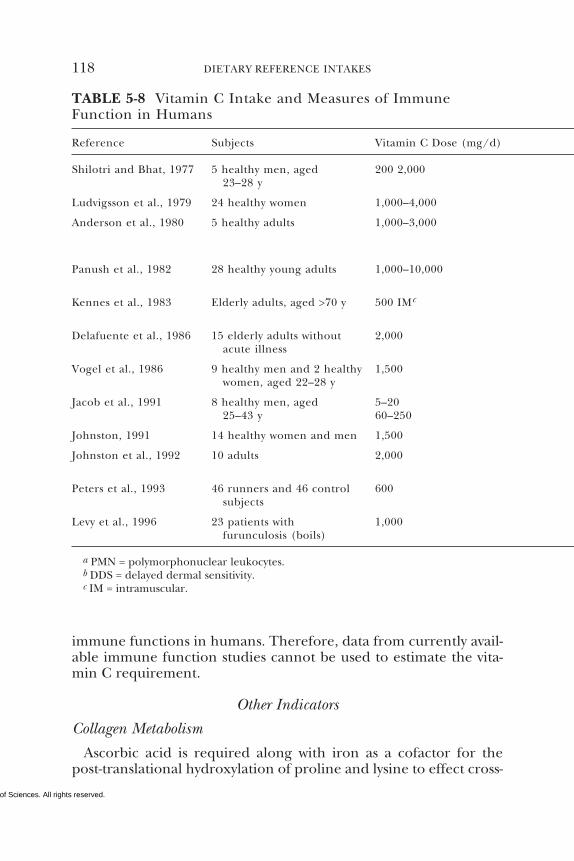
Copyright © National Academy of Sciences. All rights reserved.
118 DIETARY REFERENCE INTAKES
TABLE 5-8 Vitamin C Intake and Measures of ImmuneFunction in Humans
Reference Subjects Vitamin C Dose (mg/d)
Shilotri and Bhat, 1977 5 healthy men, aged 200 2,00023–28 y
Ludvigsson et al., 1979 24 healthy women 1,000–4,000
Anderson et al., 1980 5 healthy adults 1,000–3,000
Panush et al., 1982 28 healthy young adults 1,000–10,000
Kennes et al., 1983 Elderly adults, aged >70 y 500 IMc
Delafuente et al., 1986 15 elderly adults without 2,000acute illness
Vogel et al., 1986 9 healthy men and 2 healthy 1,500women, aged 22–28 y
Jacob et al., 1991 8 healthy men, aged 5–2025–43 y 60–250
Johnston, 1991 14 healthy women and men 1,500
Johnston et al., 1992 10 adults 2,000
Peters et al., 1993 46 runners and 46 control 600subjects
Levy et al., 1996 23 patients with 1,000furunculosis (boils)
a PMN = polymorphonuclear leukocytes.b DDS = delayed dermal sensitivity.c IM = intramuscular.
immune functions in humans. Therefore, data from currently avail-able immune function studies cannot be used to estimate the vita-min C requirement.
Other Indicators
Collagen Metabolism
Ascorbic acid is required along with iron as a cofactor for thepost-translational hydroxylation of proline and lysine to effect cross-
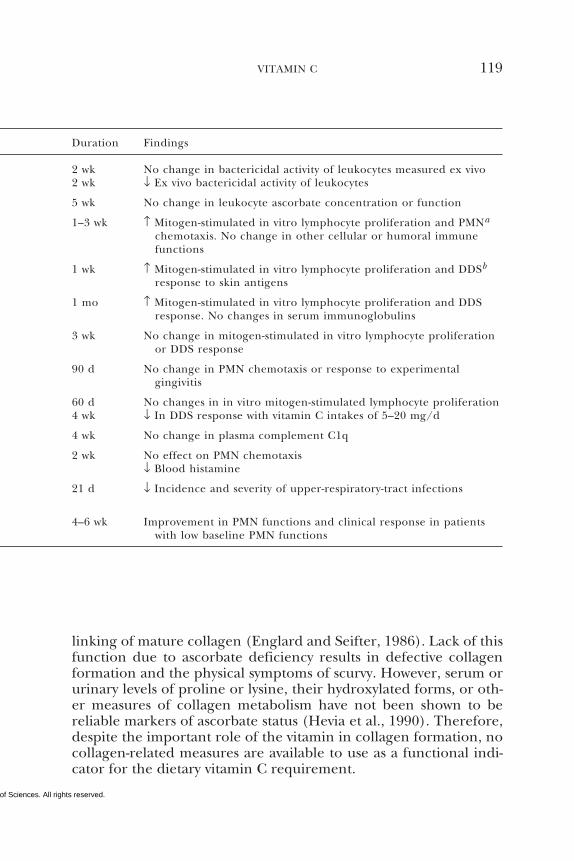
Copyright © National Academy of Sciences. All rights reserved.
VITAMIN C 119
Duration Findings
2 wk No change in bactericidal activity of leukocytes measured ex vivo2 wk ↓ Ex vivo bactericidal activity of leukocytes
5 wk No change in leukocyte ascorbate concentration or function
1–3 wk ↑ Mitogen-stimulated in vitro lymphocyte proliferation and PMNa
chemotaxis. No change in other cellular or humoral immunefunctions
1 wk ↑ Mitogen-stimulated in vitro lymphocyte proliferation and DDSb
response to skin antigens
1 mo ↑ Mitogen-stimulated in vitro lymphocyte proliferation and DDSresponse. No changes in serum immunoglobulins
3 wk No change in mitogen-stimulated in vitro lymphocyte proliferationor DDS response
90 d No change in PMN chemotaxis or response to experimentalgingivitis
60 d No changes in in vitro mitogen-stimulated lymphocyte proliferation4 wk ↓ In DDS response with vitamin C intakes of 5–20 mg/d
4 wk No change in plasma complement C1q
2 wk No effect on PMN chemotaxis↓ Blood histamine
21 d ↓ Incidence and severity of upper-respiratory-tract infections
4–6 wk Improvement in PMN functions and clinical response in patientswith low baseline PMN functions
linking of mature collagen (Englard and Seifter, 1986). Lack of thisfunction due to ascorbate deficiency results in defective collagenformation and the physical symptoms of scurvy. However, serum orurinary levels of proline or lysine, their hydroxylated forms, or oth-er measures of collagen metabolism have not been shown to bereliable markers of ascorbate status (Hevia et al., 1990). Therefore,despite the important role of the vitamin in collagen formation, nocollagen-related measures are available to use as a functional indi-cator for the dietary vitamin C requirement.
Copyright © National Academy of Sciences. All rights reserved.
120 DIETARY REFERENCE INTAKES
Carnitine Biosynthesis
Ascorbate is required along with iron at two steps in the pathwayof carnitine biosynthesis in reactions similar to the hydroxylation ofproline during collagen formation. Muscle carnitine is significantlydepleted in scorbutic guinea pigs, suggesting that loss of energyderived from carnitine-related β-oxidation of fatty acids may explainthe fatigue and muscle weakness observed in human scurvy (Jacoband Pianalto, 1997; Rebouche, 1995). However, neither guinea pignor human studies show a consistent relationship between vitaminC status and carnitine levels (Davies et al., 1987; Jacob and Pianalto,1997; Johnston et al., 1996). Although vitamin C deficiency appearsto alter carnitine metabolism, the specific interactions and theirrelevance to functional carnitine status in humans are unclear.Therefore, measures of carnitine status cannot be used as an indica-tor for estimating the vitamin C dietary requirement.
Periodontal Health
The gingival and dental pathology that accompanies scurvy hasprompted numerous investigations of the relationship between as-corbic acid and periodontal health. Epidemiological studies havefailed to demonstrate an association between vitamin C intake andperiodontal disease (Alvares, 1997; Russell, 1967). Controlled ex-perimental studies of patients with gingivitis and apparently healthyadults with vitamin C intakes of 5 to 1,500 mg/day have shownmixed results with regard to the influence of vitamin C status onperiodontal integrity (Leggott et al., 1986, 1991; Vogel et al., 1986;Woolfe et al., 1984). Other studies, with animals and humans, haveshown that vitamin C intake can affect the structural integrity ofgingival tissue, including permeability of the gingival sulcular epi-thelium (Alvares, 1997).
Overall, while evidence suggests that vitamin C deficiency is linkedto some aspects of periodontal disease, the relationship of vitaminC intake to periodontal health in the population at large is unclear.Beyond the amount needed to prevent scorbutic gingivitis (less than10 mg/day) (Baker et al., 1971), the results from current studiesare not sufficient to reliably estimate the vitamin C requirement forapparently healthy individuals based on oral health endpoints.
Copyright © National Academy of Sciences. All rights reserved.
VITAMIN C 121
Relationship of Vitamin C Intake to Chronic Disease
Cardiovascular Disease
As suggested earlier, there is reason to expect that the antioxi-dant vitamins should decrease the risk of cardiovascular disease(Gey, 1995; Jha et al., 1995; Simon, 1992). Several studies have con-sidered the association between vitamin C concentrations in bloodand the risk of cardiovascular disease. Singh et al. (1995) foundthat the risk of coronary artery disease was approximately two timesless among the top compared to the bottom quintile of plasma vita-min C concentrations in Indian subjects. A prospective study of1,605 Finnish men showed that those with increased plasma vitaminC (greater than 11.4 µmol/L [0.2 mg/dL]) had a 60 percent de-creased risk of coronary heart disease (Nyyssonen et al., 1997a).The Basel Prospective Study of 2,974 Swiss men reported that plas-ma vitamin C concentrations greater than 23 µmol/L (0.4 mg/dL)were associated with nonsignificant reductions in the risk of coro-nary artery disease (Eichholzer et al., 1992) and stroke (Gey et al.,1993). In a 20-year follow-up of 730 elderly adults in Britain, plasmavitamin C concentrations greater than 28 µmol/L (0.5 mg/dL) wereassociated with a 30 percent decreased risk of death from strokecompared with concentrations less than 12 µmol/L (0.2 mg/dL)(Gale et al., 1995). In a similar study, cross-sectional in design, in6,624 men and women in the Second National Health and Nutri-tion Examination Survey, the relative risk of coronary heart diseaseand stroke was decreased about 26 percent with serum vitamin Cconcentrations of 63 to 153 µmol/L (1.1 to 2.7 mg/dL) comparedwith concentrations of 6 to 23 µmol/L (0.1 to 0.4 mg/dL) (Simonet al., 1998).
In addition, several prospective cohort studies have shown thatvitamin C intakes between 45 and at least 113 mg/day are associat-ed with reduced risk of cardiovascular disease (Gale et al., 1995;Knekt et al., 1994; Pandey et al., 1995). Gale et al. (1995) reportedthat in 730 elderly British men and women, vitamin C intakesgreater than 45 mg/day were associated with a 50 percent lowerrisk of stroke than were intakes less than 28 mg/day. There was anonsignificant 20 percent decrease in the risk of coronary arterydisease in this study. Knekt et al. (1994) studied more than 5,000Finnish men and women and found that women consuming morethan 91 mg/day vitamin C had a lower risk of coronary artery dis-ease than those consuming less than 61 mg/day. However, a simi-lar association was not found in the men. In the Western Electric
Copyright © National Academy of Sciences. All rights reserved.
122 DIETARY REFERENCE INTAKES
study in Chicago, a cohort of 1,556 middle-aged men consuminggreater than 113 mg/day of vitamin C had a 25 percent lower riskof coronary artery disease than those consuming less than 82 mg/day (Pandey et al., 1995).
Other prospective studies have looked at higher levels of vitaminC intake and have reported similar findings. The First NationalHealth and Nutrition Examination Survey Epidemiologic Follow-upStudy cohort of more than 11,000 adults showed a reduction incardiovascular disease of 45 percent in men and 25 percent in wom-en whose vitamin C intakes were approximately 300 mg/day fromfood and supplements (Enstrom et al., 1992). Sahyoun et al. (1996)studied 725 elderly Massachusetts adults and reported a 62 percentlower risk of cardiovascular disease in those whose vitamin C in-takes were more than 388 mg/day compared to those whose intakeswere less than 90 mg/day. Kritchevsky et al. (1995) reported a neg-ative association between vitamin C intake and carotid artery wallthickness in men and women more than 55 years of age in theAtherosclerosis Risk in Communities Study. Women consumingmore than 728 mg/day and men consuming at least 982 mg/day ofvitamin C had decreased intima thickness compared to women withintakes of less than 64 mg/day and men with intakes of less than 56mg/day vitamin C.
In contrast to the above studies, several studies have reported noassociation between vitamin C intake and risk of cardiovascular dis-ease. In a cohort composed of 3,119 residents of Alameda County,California, vitamin C intakes were not associated with a reductionin risk for cardiovascular disease (Enstrom et al., 1986). In the Es-tablished Populations for Epidemiologic Studies of the Elderly withmore than 11,000 adults 65 years of age and older (Losonczy et al.,1996) and in the Iowa Women’s Heath Study of 34,486 postmeno-pausal women (Kushi et al., 1996b), vitamin C intake was not associ-ated with an alteration in risk of coronary heart disease mortality inthese older age groups. Similarly, the U.S. Health Professionals Fol-low-up Study of nearly 40,000 male health professionals found thatincreased intakes of vitamin C (ranging from 92 to 1,162 mg/day)were not associated with a lower risk of coronary heart disease(Rimm et al., 1993).
Although many of the above studies suggest a protective effect ofvitamin C against cardiovascular disease, the data are not consistentor specific enough to estimate a vitamin C requirement based onany of these specific biomarkers for cardiovascular disease.
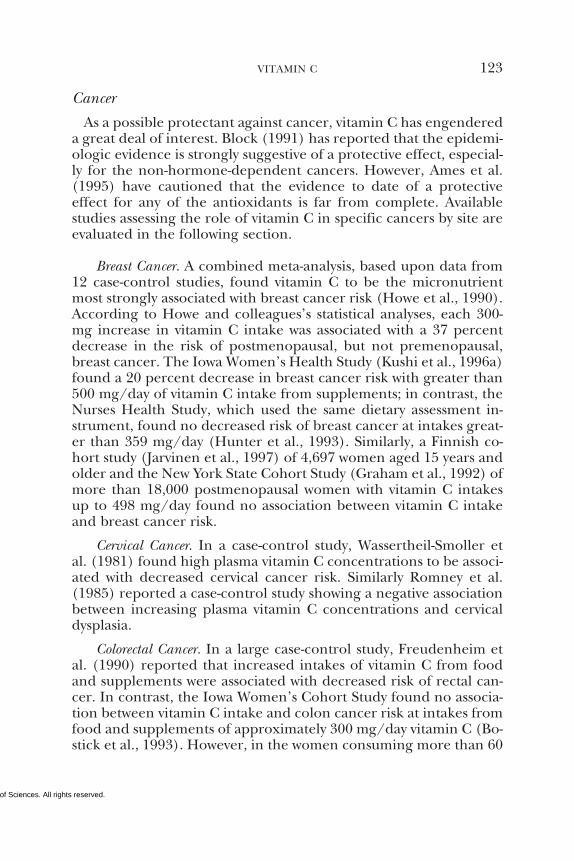
Copyright © National Academy of Sciences. All rights reserved.
VITAMIN C 123
Cancer
As a possible protectant against cancer, vitamin C has engendereda great deal of interest. Block (1991) has reported that the epidemi-ologic evidence is strongly suggestive of a protective effect, especial-ly for the non-hormone-dependent cancers. However, Ames et al.(1995) have cautioned that the evidence to date of a protectiveeffect for any of the antioxidants is far from complete. Availablestudies assessing the role of vitamin C in specific cancers by site areevaluated in the following section.
Breast Cancer. A combined meta-analysis, based upon data from12 case-control studies, found vitamin C to be the micronutrientmost strongly associated with breast cancer risk (Howe et al., 1990).According to Howe and colleagues’s statistical analyses, each 300-mg increase in vitamin C intake was associated with a 37 percentdecrease in the risk of postmenopausal, but not premenopausal,breast cancer. The Iowa Women’s Health Study (Kushi et al., 1996a)found a 20 percent decrease in breast cancer risk with greater than500 mg/day of vitamin C intake from supplements; in contrast, theNurses Health Study, which used the same dietary assessment in-strument, found no decreased risk of breast cancer at intakes great-er than 359 mg/day (Hunter et al., 1993). Similarly, a Finnish co-hort study (Jarvinen et al., 1997) of 4,697 women aged 15 years andolder and the New York State Cohort Study (Graham et al., 1992) ofmore than 18,000 postmenopausal women with vitamin C intakesup to 498 mg/day found no association between vitamin C intakeand breast cancer risk.
Cervical Cancer. In a case-control study, Wassertheil-Smoller etal. (1981) found high plasma vitamin C concentrations to be associ-ated with decreased cervical cancer risk. Similarly Romney et al.(1985) reported a case-control study showing a negative associationbetween increasing plasma vitamin C concentrations and cervicaldysplasia.
Colorectal Cancer. In a large case-control study, Freudenheim etal. (1990) reported that increased intakes of vitamin C from foodand supplements were associated with decreased risk of rectal can-cer. In contrast, the Iowa Women’s Cohort Study found no associa-tion between vitamin C intake and colon cancer risk at intakes fromfood and supplements of approximately 300 mg/day vitamin C (Bo-stick et al., 1993). However, in the women consuming more than 60
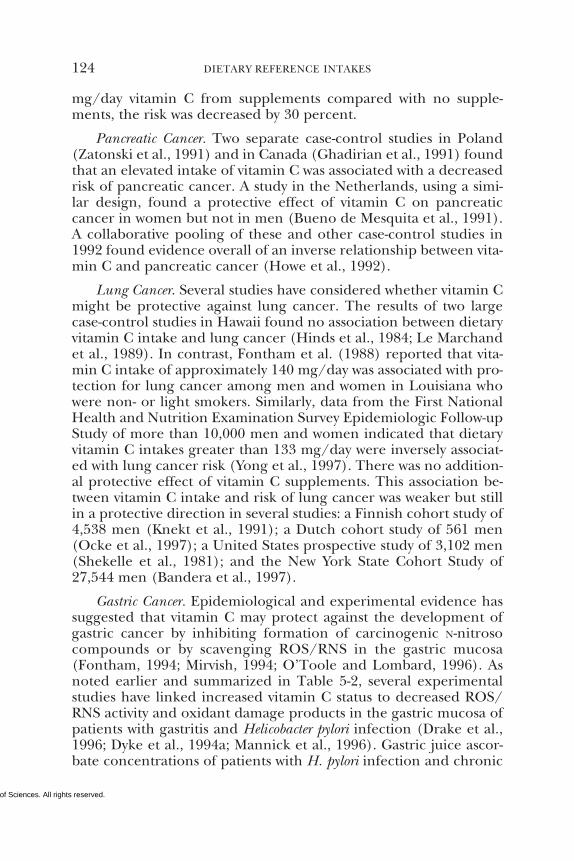
Copyright © National Academy of Sciences. All rights reserved.
124 DIETARY REFERENCE INTAKES
mg/day vitamin C from supplements compared with no supple-ments, the risk was decreased by 30 percent.
Pancreatic Cancer. Two separate case-control studies in Poland(Zatonski et al., 1991) and in Canada (Ghadirian et al., 1991) foundthat an elevated intake of vitamin C was associated with a decreasedrisk of pancreatic cancer. A study in the Netherlands, using a simi-lar design, found a protective effect of vitamin C on pancreaticcancer in women but not in men (Bueno de Mesquita et al., 1991).A collaborative pooling of these and other case-control studies in1992 found evidence overall of an inverse relationship between vita-min C and pancreatic cancer (Howe et al., 1992).
Lung Cancer. Several studies have considered whether vitamin Cmight be protective against lung cancer. The results of two largecase-control studies in Hawaii found no association between dietaryvitamin C intake and lung cancer (Hinds et al., 1984; Le Marchandet al., 1989). In contrast, Fontham et al. (1988) reported that vita-min C intake of approximately 140 mg/day was associated with pro-tection for lung cancer among men and women in Louisiana whowere non- or light smokers. Similarly, data from the First NationalHealth and Nutrition Examination Survey Epidemiologic Follow-upStudy of more than 10,000 men and women indicated that dietaryvitamin C intakes greater than 133 mg/day were inversely associat-ed with lung cancer risk (Yong et al., 1997). There was no addition-al protective effect of vitamin C supplements. This association be-tween vitamin C intake and risk of lung cancer was weaker but stillin a protective direction in several studies: a Finnish cohort study of4,538 men (Knekt et al., 1991); a Dutch cohort study of 561 men(Ocke et al., 1997); a United States prospective study of 3,102 men(Shekelle et al., 1981); and the New York State Cohort Study of27,544 men (Bandera et al., 1997).
Gastric Cancer. Epidemiological and experimental evidence hassuggested that vitamin C may protect against the development ofgastric cancer by inhibiting formation of carcinogenic N-nitrosocompounds or by scavenging ROS/RNS in the gastric mucosa(Fontham, 1994; Mirvish, 1994; O’Toole and Lombard, 1996). Asnoted earlier and summarized in Table 5-2, several experimentalstudies have linked increased vitamin C status to decreased ROS/RNS activity and oxidant damage products in the gastric mucosa ofpatients with gastritis and Helicobacter pylori infection (Drake et al.,1996; Dyke et al., 1994a; Mannick et al., 1996). Gastric juice ascor-bate concentrations of patients with H. pylori infection and chronic
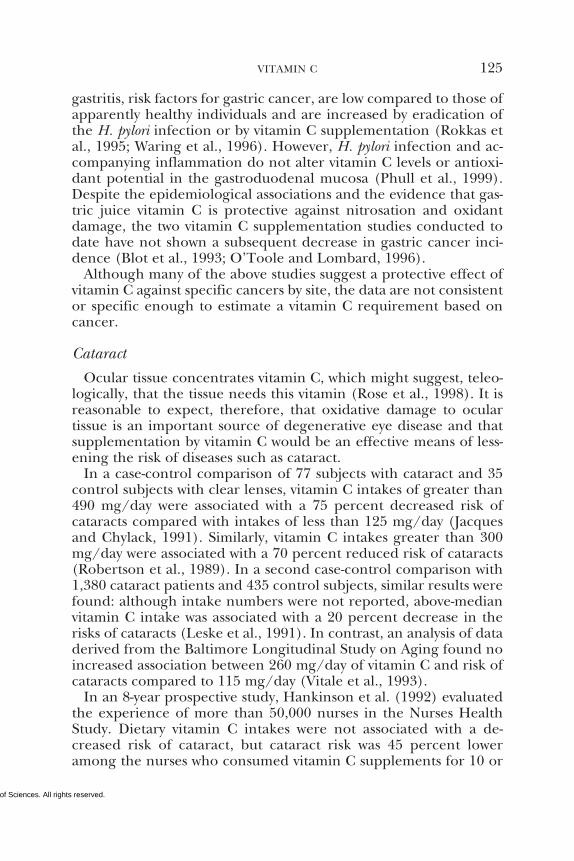
Copyright © National Academy of Sciences. All rights reserved.
VITAMIN C 125
gastritis, risk factors for gastric cancer, are low compared to those ofapparently healthy individuals and are increased by eradication ofthe H. pylori infection or by vitamin C supplementation (Rokkas etal., 1995; Waring et al., 1996). However, H. pylori infection and ac-companying inflammation do not alter vitamin C levels or antioxi-dant potential in the gastroduodenal mucosa (Phull et al., 1999).Despite the epidemiological associations and the evidence that gas-tric juice vitamin C is protective against nitrosation and oxidantdamage, the two vitamin C supplementation studies conducted todate have not shown a subsequent decrease in gastric cancer inci-dence (Blot et al., 1993; O’Toole and Lombard, 1996).
Although many of the above studies suggest a protective effect ofvitamin C against specific cancers by site, the data are not consistentor specific enough to estimate a vitamin C requirement based oncancer.
Cataract
Ocular tissue concentrates vitamin C, which might suggest, teleo-logically, that the tissue needs this vitamin (Rose et al., 1998). It isreasonable to expect, therefore, that oxidative damage to oculartissue is an important source of degenerative eye disease and thatsupplementation by vitamin C would be an effective means of less-ening the risk of diseases such as cataract.
In a case-control comparison of 77 subjects with cataract and 35control subjects with clear lenses, vitamin C intakes of greater than490 mg/day were associated with a 75 percent decreased risk ofcataracts compared with intakes of less than 125 mg/day (Jacquesand Chylack, 1991). Similarly, vitamin C intakes greater than 300mg/day were associated with a 70 percent reduced risk of cataracts(Robertson et al., 1989). In a second case-control comparison with1,380 cataract patients and 435 control subjects, similar results werefound: although intake numbers were not reported, above-medianvitamin C intake was associated with a 20 percent decrease in therisks of cataracts (Leske et al., 1991). In contrast, an analysis of dataderived from the Baltimore Longitudinal Study on Aging found noincreased association between 260 mg/day of vitamin C and risk ofcataracts compared to 115 mg/day (Vitale et al., 1993).
In an 8-year prospective study, Hankinson et al. (1992) evaluatedthe experience of more than 50,000 nurses in the Nurses HealthStudy. Dietary vitamin C intakes were not associated with a de-creased risk of cataract, but cataract risk was 45 percent loweramong the nurses who consumed vitamin C supplements for 10 or
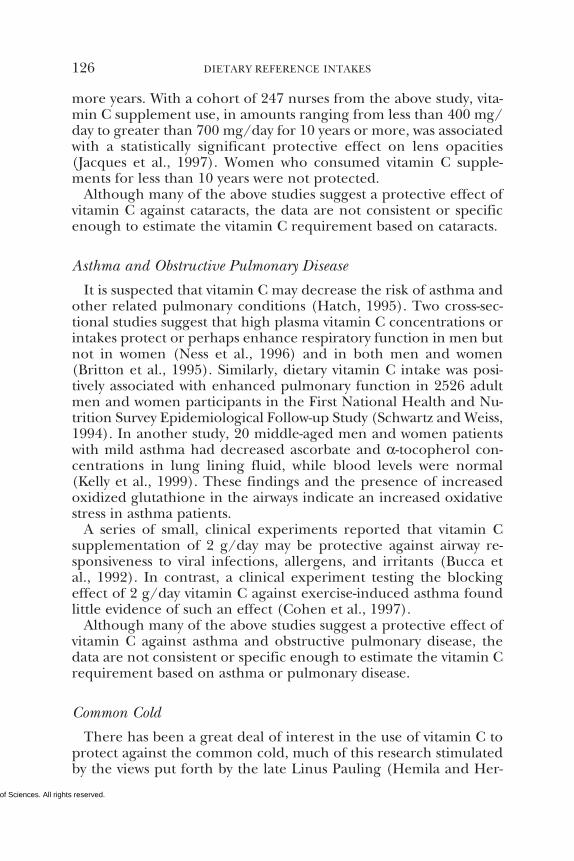
Copyright © National Academy of Sciences. All rights reserved.
126 DIETARY REFERENCE INTAKES
more years. With a cohort of 247 nurses from the above study, vita-min C supplement use, in amounts ranging from less than 400 mg/day to greater than 700 mg/day for 10 years or more, was associatedwith a statistically significant protective effect on lens opacities(Jacques et al., 1997). Women who consumed vitamin C supple-ments for less than 10 years were not protected.
Although many of the above studies suggest a protective effect ofvitamin C against cataracts, the data are not consistent or specificenough to estimate the vitamin C requirement based on cataracts.
Asthma and Obstructive Pulmonary Disease
It is suspected that vitamin C may decrease the risk of asthma andother related pulmonary conditions (Hatch, 1995). Two cross-sec-tional studies suggest that high plasma vitamin C concentrations orintakes protect or perhaps enhance respiratory function in men butnot in women (Ness et al., 1996) and in both men and women(Britton et al., 1995). Similarly, dietary vitamin C intake was posi-tively associated with enhanced pulmonary function in 2526 adultmen and women participants in the First National Health and Nu-trition Survey Epidemiological Follow-up Study (Schwartz and Weiss,1994). In another study, 20 middle-aged men and women patientswith mild asthma had decreased ascorbate and α-tocopherol con-centrations in lung lining fluid, while blood levels were normal(Kelly et al., 1999). These findings and the presence of increasedoxidized glutathione in the airways indicate an increased oxidativestress in asthma patients.
A series of small, clinical experiments reported that vitamin Csupplementation of 2 g/day may be protective against airway re-sponsiveness to viral infections, allergens, and irritants (Bucca etal., 1992). In contrast, a clinical experiment testing the blockingeffect of 2 g/day vitamin C against exercise-induced asthma foundlittle evidence of such an effect (Cohen et al., 1997).
Although many of the above studies suggest a protective effect ofvitamin C against asthma and obstructive pulmonary disease, thedata are not consistent or specific enough to estimate the vitamin Crequirement based on asthma or pulmonary disease.
Common Cold
There has been a great deal of interest in the use of vitamin C toprotect against the common cold, much of this research stimulatedby the views put forth by the late Linus Pauling (Hemila and Her-
Copyright © National Academy of Sciences. All rights reserved.
VITAMIN C 127
man, 1995). Reviews of numerous studies generally conclude thatvitamin C megadoses have no significant effect on incidence of thecommon cold, but do provide a moderate benefit in terms of theduration and severity of episodes in some groups (Chalmers, 1975;Jariwalla and Harakeh, 1996; Ludvigsson et al., 1977). The often-reported improvement in severity of colds after vitamin C ingestionmay be due to the antihistaminic action of the vitamin at pharmaco-logical doses (Johnston et al., 1992). One early study comparing 44school-aged twins in vulnerability to colds found no significant over-all treatment effect of vitamin C intakes at doses of 500 to 1,000mg/day (Miller et al., 1977). Other trials came to similar conclu-sions (Coulehan et al., 1976; Ludvigsson et al., 1977). Some reviewshave stated that any impact of vitamin C is slight or that it is protec-tive only among some subgroups of people (Hemila, 1996, 1997).Others view the accumulated results as so incomplete and flawed asto offer no evidence of protective effects (Herbert, 1995). Thus, thedata are not consistent or specific enough to estimate the vitamin Crequirement based on the common cold.
Cognitive Function and Memory
Although vitamin C’s role as an antioxidant and cofactor for cate-cholamine biosynthesis might suggest that it protects cognitive func-tion, there is little valid evidence that it does. One study found noassociation between cognitive function and vitamin C intake (range84 to 147 mg/day) in 5,182 Dutch residents aged 55 to 95 years(Jama et al., 1996). Another study of 442 men and women, aged 65to 94 years, reported that higher plasma ascorbate levels were asso-ciated with better memory performance (Perrig et al., 1997).
Summary
Although several studies have reported an inverse correlation be-tween vitamin C intake and cardiovascular disease, some types ofcancer, and cataracts, others have failed to do so. Very little varia-tion in risk is seen based on the intake of vitamin C for chronicobstructive pulmonary disease, cold or infectious disease, or cogni-tive function and memory. Also it is important that, for all theirpower, human-based observational or epidemiological studies im-ply but do not prove cause and effect. Such studies do not rule outthe impact of unidentified factors. In a recent review of epidemio-logical studies, Gey (1998) suggested that plasma vitamin C concen-trations as low as 50 µmol/L (1.0 mg/dL) provide the optimal ben-
Copyright © National Academy of Sciences. All rights reserved.
128 DIETARY REFERENCE INTAKES
efits with regard to cardiovascular disease and cancer. This plasmavitamin C concentration is achieved at a dietary intake of approxi-mately 90 mg/day vitamin C (Levine et al., 1996a). Thus, in theUnited States or Canada, it may be difficult to do a large-scale trialthat demonstrates a health benefit for vitamin C unless the subjectsare prescreened to have dietary intakes less than 90 mg/day andplasma levels less than than 50 µmol/L (1.0 mg/dL) of vitamin C.
FACTORS AFFECTING THE VITAMIN C REQUIREMENT
Bioavailability
Some 70 to 90 percent of usual dietary intakes of ascorbic acid(30 to 180 mg/day) are absorbed, although absorption decreases toabout 50 percent and less with single doses above 1 g (Kallner et al.,1979; Levine et al., 1996b). The type of food consumed has notbeen shown to have a significant effect on absorption of either in-trinsic or supplemental vitamin C. The bioavailability of the vitaminnaturally found in foods or in the form of a supplement has notbeen shown to be significantly different from that of pure syntheticascorbic acid (Johnston and Luo, 1994; Mangels et al., 1993).
Nutrient-Nutrient Interactions
Vitamin C participates in redox reactions with many other dietaryand physiological compounds, including glutathione, tocopherol,flavonoids, and the trace metals iron and copper (Jacob, 1995).
Glutathione
Interactions of ascorbate with the endogenous antioxidant glu-tathione have been shown in both rodents and humans. In appar-ently healthy men fed a low-ascorbate diet of 5 to 20 mg/day, plas-ma total glutathione (reduced [GSH] and oxidized [GSSG] forms)and the ratio of GSH/GSSG, both indicators of oxidative stress,were significantly decreased (Henning et al., 1991). In apparentlyhealthy adults supplemented with 500 mg/day of ascorbic acid,erythrocyte glutathione rose significantly (Johnston et al., 1993).The results indicate that ascorbate may contribute to antioxidantprotection by maintaining reduced glutathione.
Copyright © National Academy of Sciences. All rights reserved.
VITAMIN C 129
Tocopherol and Flavonoids
Evidence from in vitro and animal studies has shown that vitaminC can regenerate or spare α-tocopherol (Halpner et al., 1998), butstudies in guinea pigs and humans have not confirmed that thisinteraction occurs to a significant extent in vivo (Jacob et al., 1996).Calculation of redox potentials indicates that ascorbate can recyclethe flavonoid radical (Bors et al., 1995), and Skaper et al. (1997)showed that ascorbic acid acts synergistically with the flavonoid quer-cetin, to protect cutaneous tissue cells in culture against oxidativedamage induced by glutathione deficiency.
Iron and Copper
A variety of interactions of ascorbate with the redox-active tracemetals iron and copper have been reported (the potential pro-oxi-dant effects are discussed later in the section “Pro-oxidant Effects”).Ascorbic acid is involved in the regulation of iron metabolism at anumber of points. Ascorbate-related reduction of iron to the fer-rous state is involved in iron transfer and storage pathways. Ascorbicacid added to meals facilitates intestinal absorption of nonhemeiron, possibly due to lowering of gastrointestinal iron to the moreabsorbable ferrous state or amelioration of the effect of dietary ironabsorption inhibitors (Hallberg, 1985). However, studies in whichthe vitamin is added to meals over long periods have not shownsignificant improvement of body iron status, indicating that ascor-bic acid has less effect on iron bioavailability than has been predict-ed from tests with single meals (Hunt et al., 1994).
Some evidence indicates that excess ascorbic acid intake may af-fect copper metabolism in a variety of ways, including inhibition ofintestinal absorption and ceruloplasmin oxidase activity and labili-zation of ceruloplasmin-bound copper for cellular transport (Har-ris and Percival, 1991). High concentrations of plasma ascorbate inpremature infants has been suggested to decrease ceruloplasminferroxidase activity and thereby compromise antioxidant protection(Powers et al., 1995). However, the significance of these effects inhumans is questionable, because high ascorbate intakes among menon a metabolic unit did not inhibit copper absorption (Jacob et al.,1987b). In addition, the findings of decreased ceruloplasmin fer-roxidase activity due to high physiologic ascorbate concentrationshave been attributed to an artifact of nonphysiological assay pH(Løvstad, 1997).
Copyright © National Academy of Sciences. All rights reserved.
130 DIETARY REFERENCE INTAKES
Smoking
Nearly all studies show that smokers have decreased plasma andleukocyte ascorbate levels compared to nonsmokers. Part of thisdifference may be attributable to a lower intake of fruits and vegeta-bles among smokers than among nonsmokers (Dallongeville et al.,1998; Marangon et al., 1998). However, studies that have adjustedfor differences in vitamin C intake (Marangon et al., 1998) andthose which have assessed populations with similar fruit and vegeta-ble intakes (Lykkesfeldt et al., 2000) still find that smokers havelower plasma vitamin C concentrations than nonsmokers. This indi-cates that smoking per se predisposes to lower vitamin C status.
Vitamin C Turnover
The mechanism by which smoking compromises vitamin C statushas not been well established. A radioisotope-labeled ascorbic aciddilution study showed that the metabolic turnover of the vitamin insmokers averaged about double that of nonsmokers: 70.0 versus35.7 mg/day (Kallner et al., 1981). Increased ascorbate turnover insmokers is likely due to the increased oxidative stress from substanc-es in smoke that are directly oxidizing or that stimulate oxidizinginflammatory responses (Elneihoum et al., 1997; Lehr et al., 1997;Pryor, 1997). This hypothesis is supported by the finding that theratio of dehydroascorbic acid (DHA) to ascorbate in plasma ofsmokers is increased compared to that in nonsmokers (Lykkesfeldtet al., 1997).
Most studies have found that smokers suffer increased in vivo oxi-dation of susceptible biological molecules, including lipids (Mor-row et al., 1995; Reilly et al., 1996), lipoproteins (Sasaki et al., 1997),and deoxyribonucleic acid (DNA) (Asami et al., 1997; Panayiotidisand Collins, 1997). In many but not all of these studies, interven-tion with administration of vitamin C or cessation of smoking de-creased the oxidant damage measured. Supplementation of smok-ers with vitamin C (2 g/day) reduced elevated levels of urinaryisoprostanes, a measure of in vivo lipid peroxidation (Reilly et al.,1996). This is consistent with earlier findings that either endoge-nous or in vitro added ascorbic acid uniquely protected plasma lip-ids against oxidative damage caused by cigarette smoke (Frei et al.,1991). Large doses of vitamin C (1 g/day or more) provided protec-tion against lymphocyte DNA strand break damage induced ex vivoby radiation with H2O2 (hydrogen peroxide) (Green et al., 1994;
Copyright © National Academy of Sciences. All rights reserved.
VITAMIN C 131
Panayiotidis and Collins, 1997). Endogenous DNA strand breaks(in the absence of added H2O2) were not different between smok-ers and nonsmokers; however, DNA damage due to ex vivo H2O2addition was significantly greater in smokers than in nonsmokers.Vitamin C at 1 g/day decreased ex vivo DNA damage by about 20percent in both groups (Panayiotidis and Collins, 1997).
A few studies have shown no effect of smoking or vitamin C sup-plementation on oxidizable biomolecules (Marangon et al., 1997,1998). Supplementation of 21 male smokers with 500 mg/day ofvitamin C for 2 months had no effect on urinary excretion of 8-hydroxy-7, 8-dihydro-2′-deoxyguanosine (8-oxodG), a product ofoxidative DNA damage (Prieme et al., 1997).
Endothelial and Hemostatic Dysfunction
Smokers also suffer from endothelial and hemostatic dysfunctionsthat are reported to be ameliorated by vitamin C. Some evidencesuggests that ascorbate in neurons modulates synthesis of the va-sodilator nitric oxide (NO) (Millar, 1995). Since endothelium-de-pendent, but not endothelium-independent, vasodilation was im-proved by vitamin C administration in smokers, Heitzer et al. (1996)concluded that vitamin C acts to decrease oxidative stress within thevasculature of smokers by directly scavenging reactive oxygen spe-cies (ROS), thereby protecting the endogenous vasodilator NO,among other hypothesized effects. Vitamin C in physiologicalamounts has been shown to increase by threefold the synthesis ofNO by human endothelial cells in culture (Heller et al., 1999).Motoyama et al. (1997) reported that vitamin C infusion improvedimpaired endothelium-dependent vasodilation in the brachial ar-teries of smokers, along with a decrease in plasma thiobarbituticacid reactive substances (TBARS), a nonspecific measure of lipidperoxidation. Smokers with low levels of plasma vitamin C com-pared to nonsmokers also had increased monocyte adhesion to en-dothelial cells, which was normalized to that of nonsmokers afteroral supplementation with 2 g/day of vitamin C (Weber et al., 1996).A mechanism for the effect of vitamin C on diminishing leukocyteor platelet adhesion and aggregation in smokers is suggested byfindings in hamsters, in which the vitamin decreases formation ofoxidized phospholipids that induce intravascular adhesion, aggre-gation, and inflammation (Lehr et al., 1997).
Copyright © National Academy of Sciences. All rights reserved.
132 DIETARY REFERENCE INTAKES
Pregnancy
Cigarette smoking also promotes oxidant damage and disturbsvitamin C nutriture in pregnant women. Although vitamin C in-takes and serum concentrations were not different between thirdtrimester smokers compared to nonsmokers; breath ethane, a mea-sure of lipid peroxidation, was increased in the smokers and corre-lated inversely with serum vitamin C in the smokers but not thenonsmokers (Schwarz et al., 1995). There are more than 1015 or-ganic free radicals per puff in gas-phase cigarette smoke (Pryor,1992). Given the time elapsed between the last cigarette smokedand the breath collection as well as the absence of correlation be-tween breath ethane values and hours since the last cigarettesmoked, the breath ethane in pregnant smokers was thought tooriginate from peroxidation of the smoker’s body lipids rather thanthe smoke itself. In Spanish women in their third trimester, serumvitamin C levels were not different between smokers and nonsmok-ers, but vitamin C levels were lower in the smokers’ milk after partu-rition (Ortega et al., 1998).
Environmental Tobacco Smoke
Increased oxidative stress and ascorbate turnover have also beenshown in nonsmoking individuals who are regularly exposed to to-bacco smoke in their environment. Environmental or sidestreamtobacco smoke provokes oxidant damage similar to mainstream cig-arette smoke (Bermudez et al., 1994; Pryor et al., 1983). Plasmaascorbate concentrations of passive smokers were intermediate be-tween those of active smokers and nonsmokers who were not ex-posed to environmental tobacco smoke, despite similar vitamin Cintakes (Tribble et al., 1993). Hypovitaminosis C (plasma ascorbateconcentrations less than 23 µmol/L [0.5 mg/dL]) was found in 24percent of the active smokers and 12 percent of passive smokersand indicated that both passive and active smoke exposure loweredbody ascorbate pools. Exposure of nonsmokers to secondhandsmoke for 30 minutes in a smoke-filled room resulted in a signifi-cant decline in serum ascorbate, increased lipid peroxidation, andoxidatively modified low-density lipoprotein (LDL) (Valkonen andKuusi, 1998). Although the above data are insufficient to estimate aspecial requirement for nonsmokers regularly exposed to tobaccosmoke, these individuals are urged to ensure that they meet theRecommended Dietary Allowance (RDA) for vitamin C.
Copyright © National Academy of Sciences. All rights reserved.
VITAMIN C 133
Gender
In both observational and intervention studies, human plasma orserum ascorbate levels are usually found to be higher in femalesthan in males of the same population. Serum ascorbate concentra-tions of adult females aged 19 and older were greater than those ofmales in the same age category as reported in the Third NationalHealth and Nutrition Examination Survey (NHANES III) (Appen-dix Table F-1). A minority of studies has reported no gender differ-ence in plasma vitamin C levels (Johnston and Thompson, 1998).Although the reported gender differences in blood vitamin C con-centrations may be attributed in part to differences in vitamin Cintake, studies of elderly populations show that the difference existsover a wide range of vitamin C intakes and remains significant whenmales and females consuming similar amounts of the vitamin arecompared (Garry et al., 1982; Itoh et al., 1989; Jacob et al., 1988;VanderJagt et al., 1987). In a population of elderly English adults(75 years and older), higher fruit consumption by women contrib-uted to but did not entirely account for their higher plasma andleukocyte ascorbate levels compared to men (Burr et al., 1974).However, the latter finding of higher leukocyte ascorbate in womencompared to men was not confirmed in a subsequent study, whichfound no gender differences in leukocyte ascorbate concentrations(Evans et al., 1982).
Part of the gender difference could be attributed to the largerbody and fat-free mass of men compared to women (Baker et al.,1962; Blanchard, 1991a,b; Jacob et al., 1987a). However, since dif-ferences in fat-free mass accounted for only 10 to 31 percent of thevariation in plasma vitamin C parameters, other unknown gender-related variables such as hormonal or metabolic effects are neededto explain fully the observed gender differences in vitamin C me-tabolism (Blanchard, 1991a). The differences are not explained byrenal handling of ascorbic acid, since renal clearance parameters ofascorbic acid for both young and elderly adults showed no gender-related differences (Oreopoulos et al., 1993).
Overall, the data indicate that women maintain higher plasmaascorbate levels than men at a given vitamin C intake. Althoughstudies were not found that directly compare the vitamin C require-ments for men and women, a difference in average vitamin C re-quirements of men and women is assumed based on mean differ-ences in body size, total body water, and lean body mass.
Copyright © National Academy of Sciences. All rights reserved.
134 DIETARY REFERENCE INTAKES
FINDINGS BY LIFE STAGE AND GENDER GROUP
Infants Ages 0 through 12 Months
Method Used to Set the Adequate Intake
No functional criteria of vitamin C status have been demonstratedthat reflect response to dietary intake in infants. Thus, recommend-ed intakes of vitamin C are based on an Adequate Intake (AI) thatreflects the observed mean vitamin C intake of infants fed principal-ly with human milk.
Human Milk. Human milk is recognized as the optimal milksource for infants throughout at least the first year of life; it is rec-ommended as the sole nutritional milk source for infants duringthe first 4 to 6 months of life (IOM, 1991). Therefore determina-tion of the AI for vitamin C for infants is based on data from infantsfed human milk as the principal fluid during the periods 0 through6 months and 7 through 12 months of age. The AI is set at themean value for observed intakes as determined from studies inwhich the intake of human milk was measured by test weighingvolume and the intake of food was determined by dietary records.
A number of reports of vitamin C content of human milk areavailable (Table 5-9). In mothers not taking vitamin C supplements,vitamin C in human milk in the first 6 months of lactation variedfrom 34 mg/L (Bates et al., 1982) to 83 mg/L (Byerley and Kirksey,1985). In mothers taking vitamin C supplements ranging from 45 togreater than 1,000 mg/day, vitamin C content of human milk var-ied from 45 to 115 mg/L (Byerley and Kirksey, 1985; Udipi et al.,1985). Thus, the influence of maternal vitamin C intake and itseffect on the vitamin C content of human milk are inconclusive(Byerley and Kirksey, 1985; Sneed et al., 1981; Thomas et al., 1979,1980). The vitamin C content of human milk appears to declineduring the first year of life so that by the twelfth month of lactationthe vitamin C content is about 8 to 12 percent lower (Karra et al.,1986; Salmenpera, 1984).
In a study of infantile vitamin C intake during prolonged lacta-tion, mean human milk vitamin C concentration decreased from49.7 ± 10.6 mg/L (SD) at at 4 months of lactation to 44.6 ± 5.6 mg/L (SD) at 9 months of lactation (Salmenpera, 1984). Calculatedfrom the milk concentrations and volumes, the average daily vita-min C intake by these infants was 36 mg/day at 4 and 6 months, and42 mg/day at 9 months. The plasma concentrations of vitamin C of
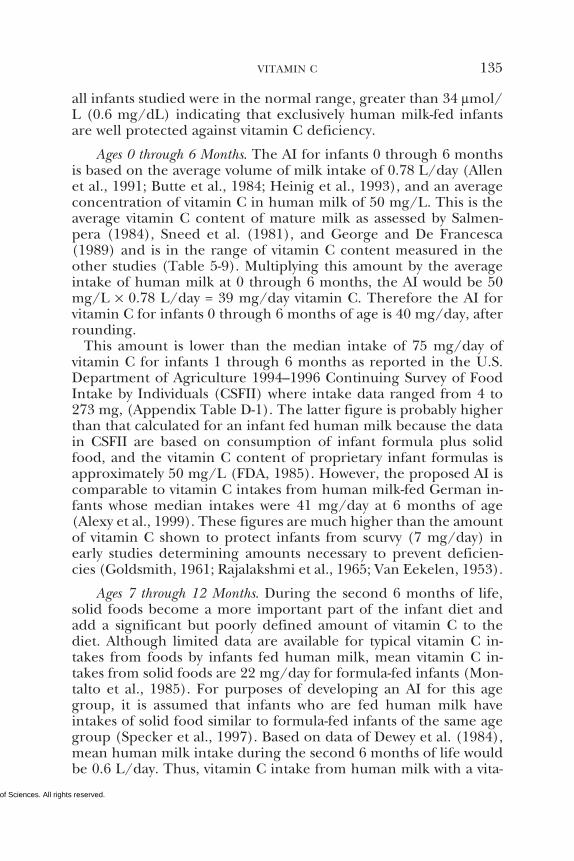
Copyright © National Academy of Sciences. All rights reserved.
VITAMIN C 135
all infants studied were in the normal range, greater than 34 µmol/L (0.6 mg/dL) indicating that exclusively human milk-fed infantsare well protected against vitamin C deficiency.
Ages 0 through 6 Months. The AI for infants 0 through 6 monthsis based on the average volume of milk intake of 0.78 L/day (Allenet al., 1991; Butte et al., 1984; Heinig et al., 1993), and an averageconcentration of vitamin C in human milk of 50 mg/L. This is theaverage vitamin C content of mature milk as assessed by Salmen-pera (1984), Sneed et al. (1981), and George and De Francesca(1989) and is in the range of vitamin C content measured in theother studies (Table 5-9). Multiplying this amount by the averageintake of human milk at 0 through 6 months, the AI would be 50mg/L × 0.78 L/day = 39 mg/day vitamin C. Therefore the AI forvitamin C for infants 0 through 6 months of age is 40 mg/day, afterrounding.
This amount is lower than the median intake of 75 mg/day ofvitamin C for infants 1 through 6 months as reported in the U.S.Department of Agriculture 1994–1996 Continuing Survey of FoodIntake by Individuals (CSFII) where intake data ranged from 4 to273 mg, (Appendix Table D-1). The latter figure is probably higherthan that calculated for an infant fed human milk because the datain CSFII are based on consumption of infant formula plus solidfood, and the vitamin C content of proprietary infant formulas isapproximately 50 mg/L (FDA, 1985). However, the proposed AI iscomparable to vitamin C intakes from human milk-fed German in-fants whose median intakes were 41 mg/day at 6 months of age(Alexy et al., 1999). These figures are much higher than the amountof vitamin C shown to protect infants from scurvy (7 mg/day) inearly studies determining amounts necessary to prevent deficien-cies (Goldsmith, 1961; Rajalakshmi et al., 1965; Van Eekelen, 1953).
Ages 7 through 12 Months. During the second 6 months of life,solid foods become a more important part of the infant diet andadd a significant but poorly defined amount of vitamin C to thediet. Although limited data are available for typical vitamin C in-takes from foods by infants fed human milk, mean vitamin C in-takes from solid foods are 22 mg/day for formula-fed infants (Mon-talto et al., 1985). For purposes of developing an AI for this agegroup, it is assumed that infants who are fed human milk haveintakes of solid food similar to formula-fed infants of the same agegroup (Specker et al., 1997). Based on data of Dewey et al. (1984),mean human milk intake during the second 6 months of life wouldbe 0.6 L/day. Thus, vitamin C intake from human milk with a vita-

Copyright © National Academy of Sciences. All rights reserved.
136 DIETARY REFERENCE INTAKES
TABLE 5-9 Vitamin C Content in Human Milk
Stage of Lactation Vitamin C Content Maternal Vitamin CReference (mg/d) in Milk (mg/L) Intake (mg/d)
Thomas et al., 1 and 6 wk ppa 68b 190 (diet only)1979 73b 148 (diet) + 90
(supplement)
Thomas et al., 6 mo pp 35.2 ± 12.0 (SDd) 131 (diet only)1980c 38.4 ± 12.3 (SD) 153 (diet) + 90
(supplement)
Sneed et al., 1 and 6 wk pp 57b 118 (diet only)b
1981 68b 108 (diet) + 90(supplement)
Bates et al., Not Reported 34 No diet intake data1982 45 reported
35 as supplement
Salmenpera, 3–4 d pp 61.8 ± 0.99 (SD) 48–277 (mean 138)1984 2 mo 59.1 ± 1.18 (SD) (no supplements
4 mo 49.7 ± 1.06 (SD) were taken)6 mo 46.8 ± 1.02 (SD)9 mo 44.6 ± 0.56 (SD)
12 mo 41.4 ± 1.13 (SD)
Byerley and 7–13 wk lactation 83.3 <100Kirksey, 1985c 104.1 100–999
114.7 ≥1,000
Udipi et al., 1–6 d lactation 90b 198, range 60–2701985 7–10 d 95b (extradietary
13–15 d 105b intake only)20–22 d 120b
28–31 d 115b
Karra et al., 7–12 mo lactation 90b Not reported1986
a pp = postpartum.b Values were estimated from graphs.c Lack of correlation between maternal intake and breast milk concentration of vita-
min C in human milk.d SD = standard deviation.
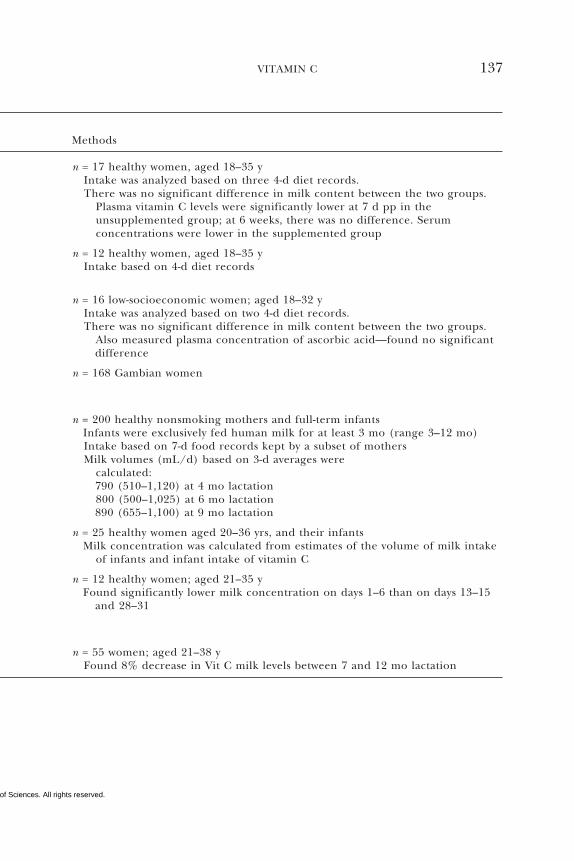
Copyright © National Academy of Sciences. All rights reserved.
VITAMIN C 137
Methods
n = 17 healthy women, aged 18–35 yIntake was analyzed based on three 4-d diet records.There was no significant difference in milk content between the two groups.
Plasma vitamin C levels were significantly lower at 7 d pp in theunsupplemented group; at 6 weeks, there was no difference. Serumconcentrations were lower in the supplemented group
n = 12 healthy women, aged 18–35 yIntake based on 4-d diet records
n = 16 low-socioeconomic women; aged 18–32 yIntake was analyzed based on two 4-d diet records.There was no significant difference in milk content between the two groups.
Also measured plasma concentration of ascorbic acid—found no significantdifference
n = 168 Gambian women
n = 200 healthy nonsmoking mothers and full-term infantsInfants were exclusively fed human milk for at least 3 mo (range 3–12 mo)Intake based on 7-d food records kept by a subset of mothersMilk volumes (mL/d) based on 3-d averages were
calculated:790 (510–1,120) at 4 mo lactation800 (500–1,025) at 6 mo lactation890 (655–1,100) at 9 mo lactation
n = 25 healthy women aged 20–36 yrs, and their infantsMilk concentration was calculated from estimates of the volume of milk intake
of infants and infant intake of vitamin C
n = 12 healthy women; aged 21–35 yFound significantly lower milk concentration on days 1–6 than on days 13–15
and 28–31
n = 55 women; aged 21–38 yFound 8% decrease in Vit C milk levels between 7 and 12 mo lactation
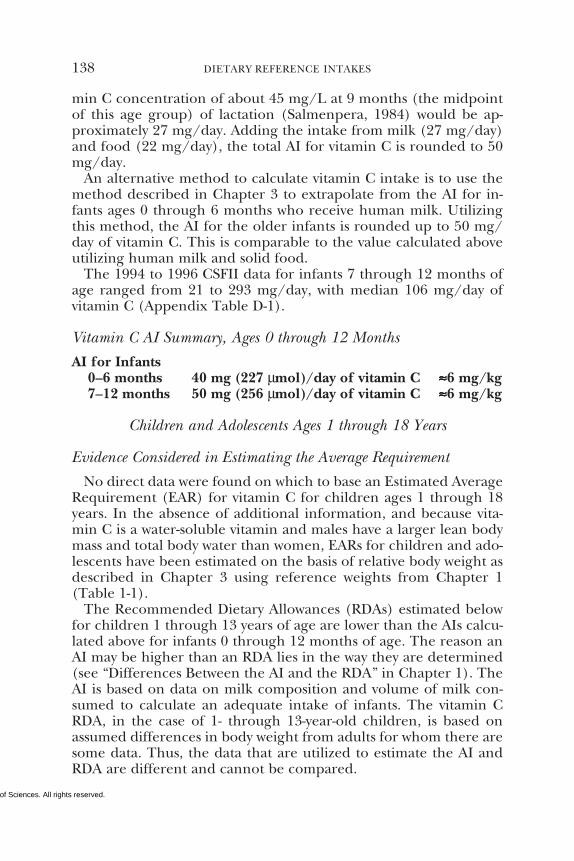
Copyright © National Academy of Sciences. All rights reserved.
138 DIETARY REFERENCE INTAKES
min C concentration of about 45 mg/L at 9 months (the midpointof this age group) of lactation (Salmenpera, 1984) would be ap-proximately 27 mg/day. Adding the intake from milk (27 mg/day)and food (22 mg/day), the total AI for vitamin C is rounded to 50mg/day.
An alternative method to calculate vitamin C intake is to use themethod described in Chapter 3 to extrapolate from the AI for in-fants ages 0 through 6 months who receive human milk. Utilizingthis method, the AI for the older infants is rounded up to 50 mg/day of vitamin C. This is comparable to the value calculated aboveutilizing human milk and solid food.
The 1994 to 1996 CSFII data for infants 7 through 12 months ofage ranged from 21 to 293 mg/day, with median 106 mg/day ofvitamin C (Appendix Table D-1).
Vitamin C AI Summary, Ages 0 through 12 Months
AI for Infants0–6 months 40 mg (227 µmol)/day of vitamin C ≈≈≈≈≈6 mg/kg7–12 months 50 mg (256 µmol)/day of vitamin C ≈≈≈≈≈6 mg/kg
Children and Adolescents Ages 1 through 18 Years
Evidence Considered in Estimating the Average Requirement
No direct data were found on which to base an Estimated AverageRequirement (EAR) for vitamin C for children ages 1 through 18years. In the absence of additional information, and because vita-min C is a water-soluble vitamin and males have a larger lean bodymass and total body water than women, EARs for children and ado-lescents have been estimated on the basis of relative body weight asdescribed in Chapter 3 using reference weights from Chapter 1(Table 1-1).
The Recommended Dietary Allowances (RDAs) estimated belowfor children 1 through 13 years of age are lower than the AIs calcu-lated above for infants 0 through 12 months of age. The reason anAI may be higher than an RDA lies in the way they are determined(see “Differences Between the AI and the RDA” in Chapter 1). TheAI is based on data on milk composition and volume of milk con-sumed to calculate an adequate intake of infants. The vitamin CRDA, in the case of 1- through 13-year-old children, is based onassumed differences in body weight from adults for whom there aresome data. Thus, the data that are utilized to estimate the AI andRDA are different and cannot be compared.
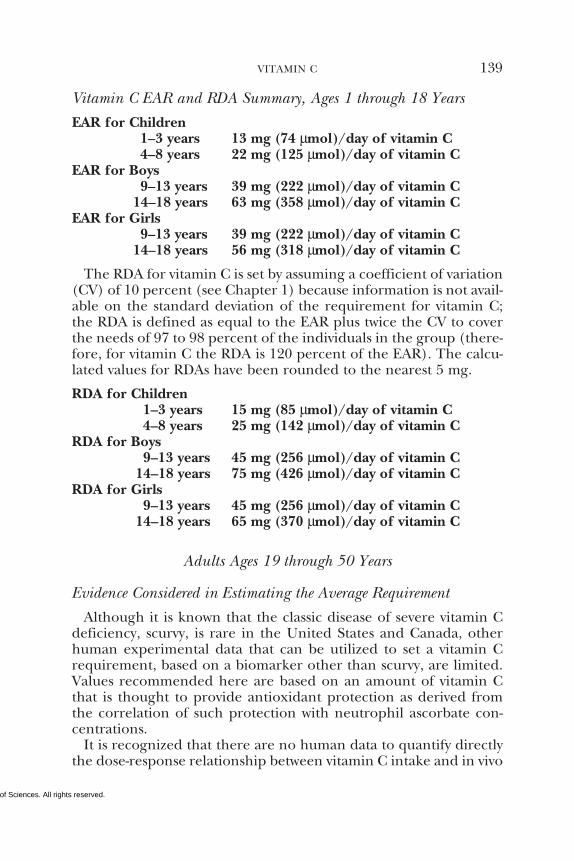
Copyright © National Academy of Sciences. All rights reserved.
VITAMIN C 139
Vitamin C EAR and RDA Summary, Ages 1 through 18 Years
EAR for Children1–3 years 13 mg (74 µmol)/day of vitamin C4–8 years 22 mg (125 µmol)/day of vitamin C
EAR for Boys9–13 years 39 mg (222 µmol)/day of vitamin C
14–18 years 63 mg (358 µmol)/day of vitamin CEAR for Girls
9–13 years 39 mg (222 µmol)/day of vitamin C14–18 years 56 mg (318 µmol)/day of vitamin C
The RDA for vitamin C is set by assuming a coefficient of variation(CV) of 10 percent (see Chapter 1) because information is not avail-able on the standard deviation of the requirement for vitamin C;the RDA is defined as equal to the EAR plus twice the CV to coverthe needs of 97 to 98 percent of the individuals in the group (there-fore, for vitamin C the RDA is 120 percent of the EAR). The calcu-lated values for RDAs have been rounded to the nearest 5 mg.
RDA for Children1–3 years 15 mg (85 µmol)/day of vitamin C4–8 years 25 mg (142 µmol)/day of vitamin C
RDA for Boys9–13 years 45 mg (256 µmol)/day of vitamin C
14–18 years 75 mg (426 µmol)/day of vitamin CRDA for Girls
9–13 years 45 mg (256 µmol)/day of vitamin C14–18 years 65 mg (370 µmol)/day of vitamin C
Adults Ages 19 through 50 Years
Evidence Considered in Estimating the Average Requirement
Although it is known that the classic disease of severe vitamin Cdeficiency, scurvy, is rare in the United States and Canada, otherhuman experimental data that can be utilized to set a vitamin Crequirement, based on a biomarker other than scurvy, are limited.Values recommended here are based on an amount of vitamin Cthat is thought to provide antioxidant protection as derived fromthe correlation of such protection with neutrophil ascorbate con-centrations.
It is recognized that there are no human data to quantify directlythe dose-response relationship between vitamin C intake and in vivo
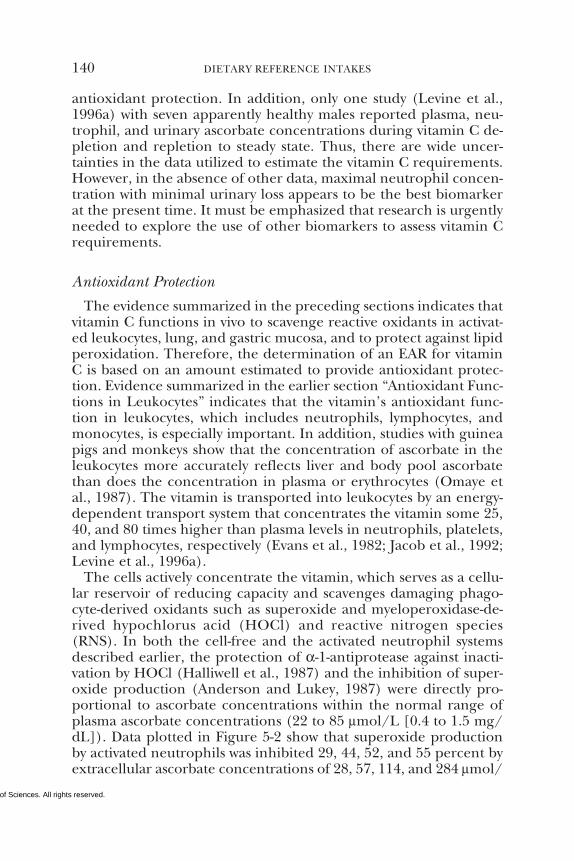
Copyright © National Academy of Sciences. All rights reserved.
140 DIETARY REFERENCE INTAKES
antioxidant protection. In addition, only one study (Levine et al.,1996a) with seven apparently healthy males reported plasma, neu-trophil, and urinary ascorbate concentrations during vitamin C de-pletion and repletion to steady state. Thus, there are wide uncer-tainties in the data utilized to estimate the vitamin C requirements.However, in the absence of other data, maximal neutrophil concen-tration with minimal urinary loss appears to be the best biomarkerat the present time. It must be emphasized that research is urgentlyneeded to explore the use of other biomarkers to assess vitamin Crequirements.
Antioxidant Protection
The evidence summarized in the preceding sections indicates thatvitamin C functions in vivo to scavenge reactive oxidants in activat-ed leukocytes, lung, and gastric mucosa, and to protect against lipidperoxidation. Therefore, the determination of an EAR for vitaminC is based on an amount estimated to provide antioxidant protec-tion. Evidence summarized in the earlier section “Antioxidant Func-tions in Leukocytes” indicates that the vitamin’s antioxidant func-tion in leukocytes, which includes neutrophils, lymphocytes, andmonocytes, is especially important. In addition, studies with guineapigs and monkeys show that the concentration of ascorbate in theleukocytes more accurately reflects liver and body pool ascorbatethan does the concentration in plasma or erythrocytes (Omaye etal., 1987). The vitamin is transported into leukocytes by an energy-dependent transport system that concentrates the vitamin some 25,40, and 80 times higher than plasma levels in neutrophils, platelets,and lymphocytes, respectively (Evans et al., 1982; Jacob et al., 1992;Levine et al., 1996a).
The cells actively concentrate the vitamin, which serves as a cellu-lar reservoir of reducing capacity and scavenges damaging phago-cyte-derived oxidants such as superoxide and myeloperoxidase-de-rived hypochlorus acid (HOCl) and reactive nitrogen species(RNS). In both the cell-free and the activated neutrophil systemsdescribed earlier, the protection of α-1-antiprotease against inacti-vation by HOCl (Halliwell et al., 1987) and the inhibition of super-oxide production (Anderson and Lukey, 1987) were directly pro-portional to ascorbate concentrations within the normal range ofplasma ascorbate concentrations (22 to 85 µmol/L [0.4 to 1.5 mg/dL]). Data plotted in Figure 5-2 show that superoxide productionby activated neutrophils was inhibited 29, 44, 52, and 55 percent byextracellular ascorbate concentrations of 28, 57, 114, and 284 µmol/
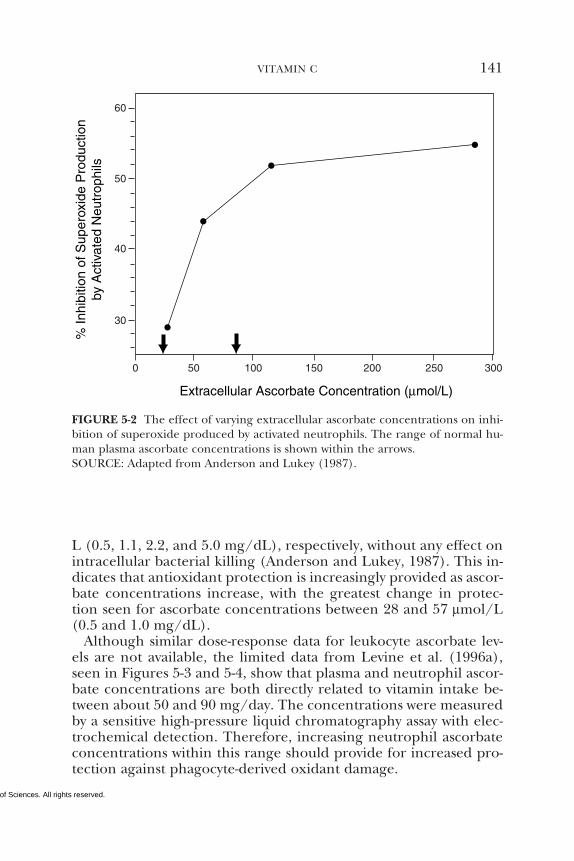
Copyright © National Academy of Sciences. All rights reserved.
VITAMIN C 141
FIGURE 5-2 The effect of varying extracellular ascorbate concentrations on inhi-bition of superoxide produced by activated neutrophils. The range of normal hu-man plasma ascorbate concentrations is shown within the arrows.SOURCE: Adapted from Anderson and Lukey (1987).
60
50
40
30
0 50 100 150 200 250 300
Extracellular Ascorbate Concentration (µmol/L)
% In
hibi
tion
of S
uper
oxid
e P
rodu
ctio
nby
Act
ivat
ed N
eutr
ophi
ls
L (0.5, 1.1, 2.2, and 5.0 mg/dL), respectively, without any effect onintracellular bacterial killing (Anderson and Lukey, 1987). This in-dicates that antioxidant protection is increasingly provided as ascor-bate concentrations increase, with the greatest change in protec-tion seen for ascorbate concentrations between 28 and 57 µmol/L(0.5 and 1.0 mg/dL).
Although similar dose-response data for leukocyte ascorbate lev-els are not available, the limited data from Levine et al. (1996a),seen in Figures 5-3 and 5-4, show that plasma and neutrophil ascor-bate concentrations are both directly related to vitamin intake be-tween about 50 and 90 mg/day. The concentrations were measuredby a sensitive high-pressure liquid chromatography assay with elec-trochemical detection. Therefore, increasing neutrophil ascorbateconcentrations within this range should provide for increased pro-tection against phagocyte-derived oxidant damage.
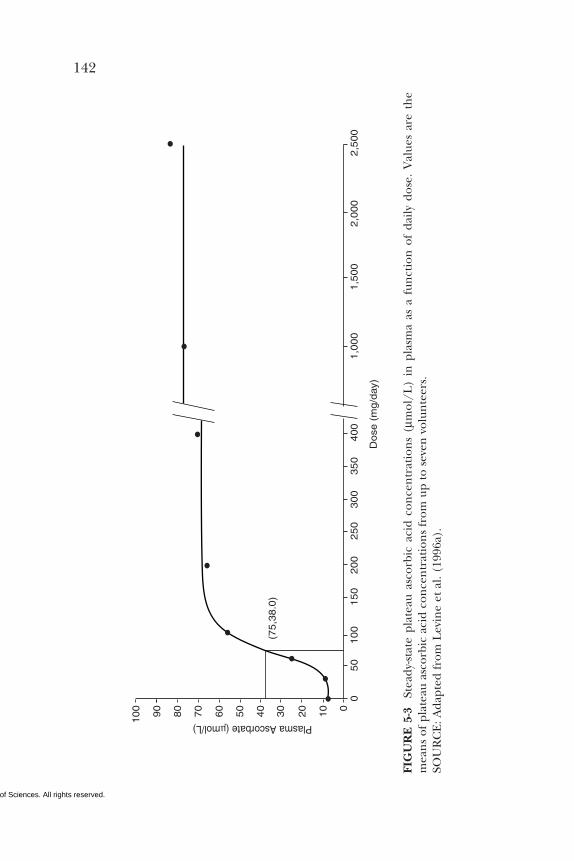
Copyright © National Academy of Sciences. All rights reserved.
142
90
80
100
70
60
50
40
30
20
10
50
100
150
200
250
300
350
400
1,0
00
1,5
00
2,0
00
2,5
00
00
Dose
(m
g/d
ay)
Plasma Ascorbate (µmol/L)
(75,3
8.0
)
FIG
UR
E 5
-3
Stea
dy-s
tate
pla
teau
asc
orbi
c ac
id c
once
ntr
atio
ns
(µm
ol/L
) in
pla
sma
as a
fun
ctio
n o
f da
ily d
ose.
Val
ues
are
the
mea
ns
of p
late
au a
scor
bic
acid
con
cen
trat
ion
s fr
om u
p to
sev
en v
olun
teer
s.SO
UR
CE
: Ada
pted
fro
m L
evin
e et
al.
(199
6a).
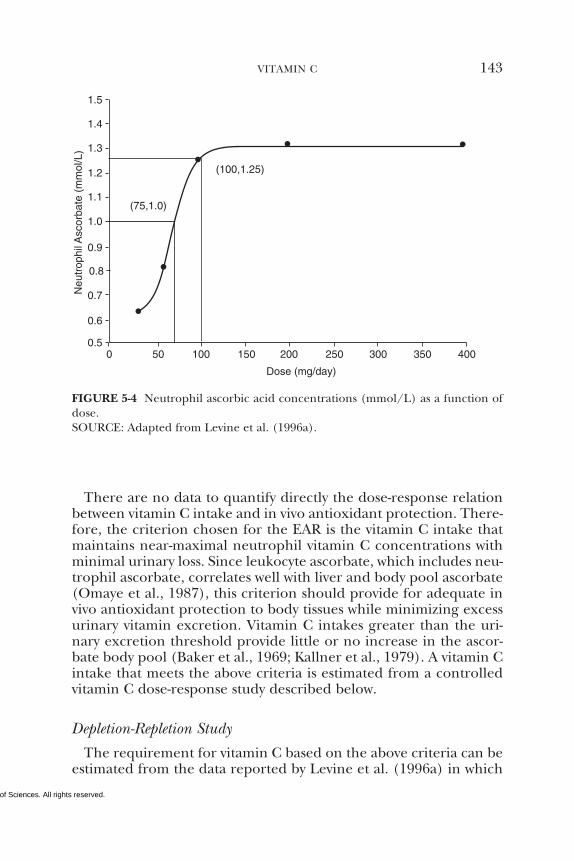
Copyright © National Academy of Sciences. All rights reserved.
VITAMIN C 143
There are no data to quantify directly the dose-response relationbetween vitamin C intake and in vivo antioxidant protection. There-fore, the criterion chosen for the EAR is the vitamin C intake thatmaintains near-maximal neutrophil vitamin C concentrations withminimal urinary loss. Since leukocyte ascorbate, which includes neu-trophil ascorbate, correlates well with liver and body pool ascorbate(Omaye et al., 1987), this criterion should provide for adequate invivo antioxidant protection to body tissues while minimizing excessurinary vitamin excretion. Vitamin C intakes greater than the uri-nary excretion threshold provide little or no increase in the ascor-bate body pool (Baker et al., 1969; Kallner et al., 1979). A vitamin Cintake that meets the above criteria is estimated from a controlledvitamin C dose-response study described below.
Depletion-Repletion Study
The requirement for vitamin C based on the above criteria can beestimated from the data reported by Levine et al. (1996a) in which
1.5
1.4
1.1
1.2
1.3
1.0
0.9
0.8
0.7
0.6
50 100 150 200 250 300 350 40000.5
Dose (mg/day)
Neu
trop
hil A
scor
bate
(m
mol
/L)
(100,1.25)
(75,1.0)
FIGURE 5-4 Neutrophil ascorbic acid concentrations (mmol/L) as a function ofdose.SOURCE: Adapted from Levine et al. (1996a).
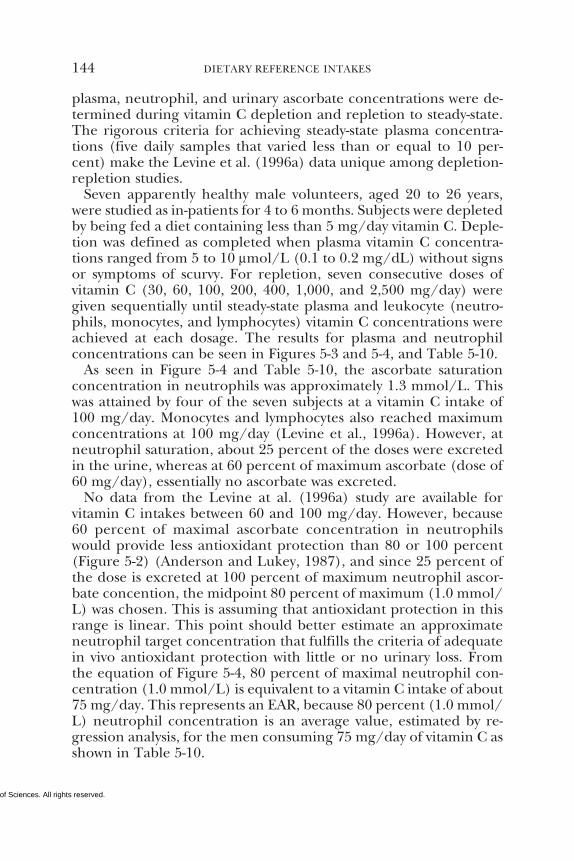
Copyright © National Academy of Sciences. All rights reserved.
144 DIETARY REFERENCE INTAKES
plasma, neutrophil, and urinary ascorbate concentrations were de-termined during vitamin C depletion and repletion to steady-state.The rigorous criteria for achieving steady-state plasma concentra-tions (five daily samples that varied less than or equal to 10 per-cent) make the Levine et al. (1996a) data unique among depletion-repletion studies.
Seven apparently healthy male volunteers, aged 20 to 26 years,were studied as in-patients for 4 to 6 months. Subjects were depletedby being fed a diet containing less than 5 mg/day vitamin C. Deple-tion was defined as completed when plasma vitamin C concentra-tions ranged from 5 to 10 µmol/L (0.1 to 0.2 mg/dL) without signsor symptoms of scurvy. For repletion, seven consecutive doses ofvitamin C (30, 60, 100, 200, 400, 1,000, and 2,500 mg/day) weregiven sequentially until steady-state plasma and leukocyte (neutro-phils, monocytes, and lymphocytes) vitamin C concentrations wereachieved at each dosage. The results for plasma and neutrophilconcentrations can be seen in Figures 5-3 and 5-4, and Table 5-10.
As seen in Figure 5-4 and Table 5-10, the ascorbate saturationconcentration in neutrophils was approximately 1.3 mmol/L. Thiswas attained by four of the seven subjects at a vitamin C intake of100 mg/day. Monocytes and lymphocytes also reached maximumconcentrations at 100 mg/day (Levine et al., 1996a). However, atneutrophil saturation, about 25 percent of the doses were excretedin the urine, whereas at 60 percent of maximum ascorbate (dose of60 mg/day), essentially no ascorbate was excreted.
No data from the Levine at al. (1996a) study are available forvitamin C intakes between 60 and 100 mg/day. However, because60 percent of maximal ascorbate concentration in neutrophilswould provide less antioxidant protection than 80 or 100 percent(Figure 5-2) (Anderson and Lukey, 1987), and since 25 percent ofthe dose is excreted at 100 percent of maximum neutrophil ascor-bate concention, the midpoint 80 percent of maximum (1.0 mmol/L) was chosen. This is assuming that antioxidant protection in thisrange is linear. This point should better estimate an approximateneutrophil target concentration that fulfills the criteria of adequatein vivo antioxidant protection with little or no urinary loss. Fromthe equation of Figure 5-4, 80 percent of maximal neutrophil con-centration (1.0 mmol/L) is equivalent to a vitamin C intake of about75 mg/day. This represents an EAR, because 80 percent (1.0 mmol/L) neutrophil concentration is an average value, estimated by re-gression analysis, for the men consuming 75 mg/day of vitamin C asshown in Table 5-10.
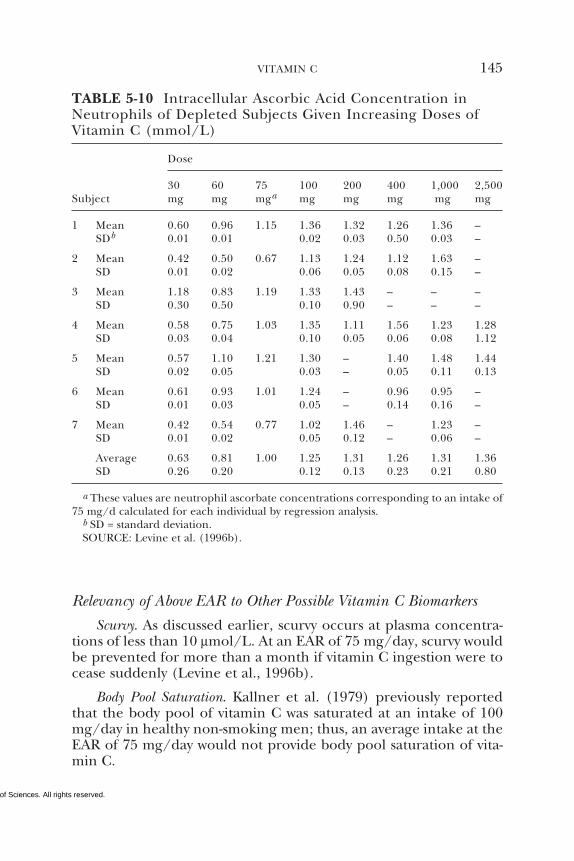
Copyright © National Academy of Sciences. All rights reserved.
VITAMIN C 145
Relevancy of Above EAR to Other Possible Vitamin C Biomarkers
Scurvy. As discussed earlier, scurvy occurs at plasma concentra-tions of less than 10 µmol/L. At an EAR of 75 mg/day, scurvy wouldbe prevented for more than a month if vitamin C ingestion were tocease suddenly (Levine et al., 1996b).
Body Pool Saturation. Kallner et al. (1979) previously reportedthat the body pool of vitamin C was saturated at an intake of 100mg/day in healthy non-smoking men; thus, an average intake at theEAR of 75 mg/day would not provide body pool saturation of vita-min C.
TABLE 5-10 Intracellular Ascorbic Acid Concentration inNeutrophils of Depleted Subjects Given Increasing Doses ofVitamin C (mmol/L)
Dose
30 60 75 100 200 400 1,000 2,500Subject mg mg mga mg mg mg mg mg
1 Mean 0.60 0.96 1.15 1.36 1.32 1.26 1.36 –SDb 0.01 0.01 0.02 0.03 0.50 0.03 –
2 Mean 0.42 0.50 0.67 1.13 1.24 1.12 1.63 –SD 0.01 0.02 0.06 0.05 0.08 0.15 –
3 Mean 1.18 0.83 1.19 1.33 1.43 – – –SD 0.30 0.50 0.10 0.90 – – –
4 Mean 0.58 0.75 1.03 1.35 1.11 1.56 1.23 1.28SD 0.03 0.04 0.10 0.05 0.06 0.08 1.12
5 Mean 0.57 1.10 1.21 1.30 – 1.40 1.48 1.44SD 0.02 0.05 0.03 – 0.05 0.11 0.13
6 Mean 0.61 0.93 1.01 1.24 – 0.96 0.95 –SD 0.01 0.03 0.05 – 0.14 0.16 –
7 Mean 0.42 0.54 0.77 1.02 1.46 – 1.23 –SD 0.01 0.02 0.05 0.12 – 0.06 –
Average 0.63 0.81 1.00 1.25 1.31 1.26 1.31 1.36SD 0.26 0.20 0.12 0.13 0.23 0.21 0.80
a These values are neutrophil ascorbate concentrations corresponding to an intake of75 mg/d calculated for each individual by regression analysis.
b SD = standard deviation.SOURCE: Levine et al. (1996b).
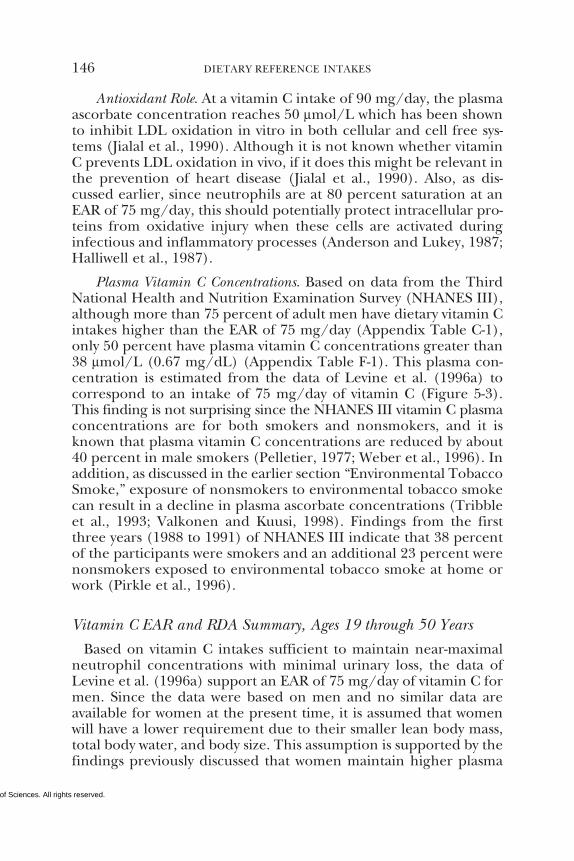
Copyright © National Academy of Sciences. All rights reserved.
146 DIETARY REFERENCE INTAKES
Antioxidant Role. At a vitamin C intake of 90 mg/day, the plasmaascorbate concentration reaches 50 µmol/L which has been shownto inhibit LDL oxidation in vitro in both cellular and cell free sys-tems (Jialal et al., 1990). Although it is not known whether vitaminC prevents LDL oxidation in vivo, if it does this might be relevant inthe prevention of heart disease (Jialal et al., 1990). Also, as dis-cussed earlier, since neutrophils are at 80 percent saturation at anEAR of 75 mg/day, this should potentially protect intracellular pro-teins from oxidative injury when these cells are activated duringinfectious and inflammatory processes (Anderson and Lukey, 1987;Halliwell et al., 1987).
Plasma Vitamin C Concentrations. Based on data from the ThirdNational Health and Nutrition Examination Survey (NHANES III),although more than 75 percent of adult men have dietary vitamin Cintakes higher than the EAR of 75 mg/day (Appendix Table C-1),only 50 percent have plasma vitamin C concentrations greater than38 µmol/L (0.67 mg/dL) (Appendix Table F-1). This plasma con-centration is estimated from the data of Levine et al. (1996a) tocorrespond to an intake of 75 mg/day of vitamin C (Figure 5-3).This finding is not surprising since the NHANES III vitamin C plasmaconcentrations are for both smokers and nonsmokers, and it isknown that plasma vitamin C concentrations are reduced by about40 percent in male smokers (Pelletier, 1977; Weber et al., 1996). Inaddition, as discussed in the earlier section “Environmental TobaccoSmoke,” exposure of nonsmokers to environmental tobacco smokecan result in a decline in plasma ascorbate concentrations (Tribbleet al., 1993; Valkonen and Kuusi, 1998). Findings from the firstthree years (1988 to 1991) of NHANES III indicate that 38 percentof the participants were smokers and an additional 23 percent werenonsmokers exposed to environmental tobacco smoke at home orwork (Pirkle et al., 1996).
Vitamin C EAR and RDA Summary, Ages 19 through 50 Years
Based on vitamin C intakes sufficient to maintain near-maximalneutrophil concentrations with minimal urinary loss, the data ofLevine et al. (1996a) support an EAR of 75 mg/day of vitamin C formen. Since the data were based on men and no similar data areavailable for women at the present time, it is assumed that womenwill have a lower requirement due to their smaller lean body mass,total body water, and body size. This assumption is supported by thefindings previously discussed that women maintain higher plasma
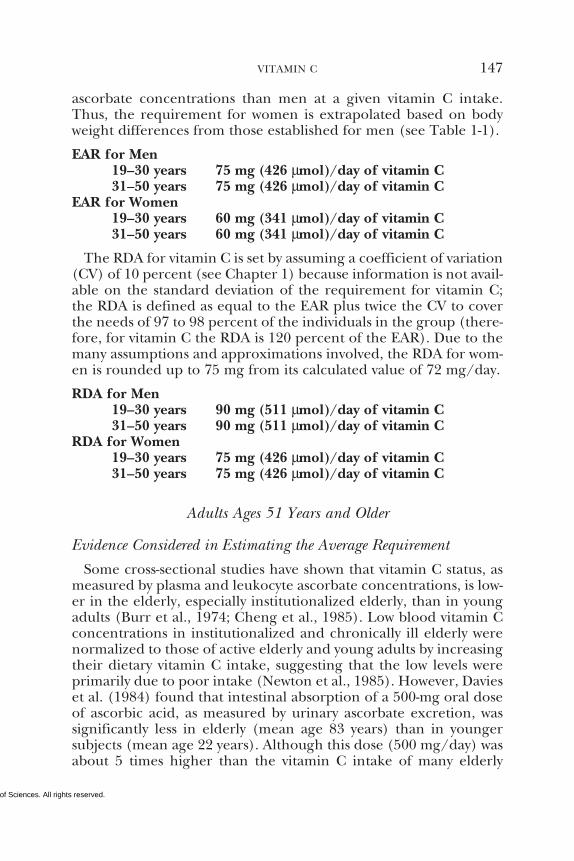
Copyright © National Academy of Sciences. All rights reserved.
VITAMIN C 147
ascorbate concentrations than men at a given vitamin C intake.Thus, the requirement for women is extrapolated based on bodyweight differences from those established for men (see Table 1-1).
EAR for Men19–30 years 75 mg (426 µmol)/day of vitamin C31–50 years 75 mg (426 µmol)/day of vitamin C
EAR for Women19–30 years 60 mg (341 µmol)/day of vitamin C31–50 years 60 mg (341 µmol)/day of vitamin C
The RDA for vitamin C is set by assuming a coefficient of variation(CV) of 10 percent (see Chapter 1) because information is not avail-able on the standard deviation of the requirement for vitamin C;the RDA is defined as equal to the EAR plus twice the CV to coverthe needs of 97 to 98 percent of the individuals in the group (there-fore, for vitamin C the RDA is 120 percent of the EAR). Due to themany assumptions and approximations involved, the RDA for wom-en is rounded up to 75 mg from its calculated value of 72 mg/day.
RDA for Men19–30 years 90 mg (511 µmol)/day of vitamin C31–50 years 90 mg (511 µmol)/day of vitamin C
RDA for Women19–30 years 75 mg (426 µmol)/day of vitamin C31–50 years 75 mg (426 µmol)/day of vitamin C
Adults Ages 51 Years and Older
Evidence Considered in Estimating the Average Requirement
Some cross-sectional studies have shown that vitamin C status, asmeasured by plasma and leukocyte ascorbate concentrations, is low-er in the elderly, especially institutionalized elderly, than in youngadults (Burr et al., 1974; Cheng et al., 1985). Low blood vitamin Cconcentrations in institutionalized and chronically ill elderly werenormalized to those of active elderly and young adults by increasingtheir dietary vitamin C intake, suggesting that the low levels wereprimarily due to poor intake (Newton et al., 1985). However, Davieset al. (1984) found that intestinal absorption of a 500-mg oral doseof ascorbic acid, as measured by urinary ascorbate excretion, wassignificantly less in elderly (mean age 83 years) than in youngersubjects (mean age 22 years). Although this dose (500 mg/day) wasabout 5 times higher than the vitamin C intake of many elderly
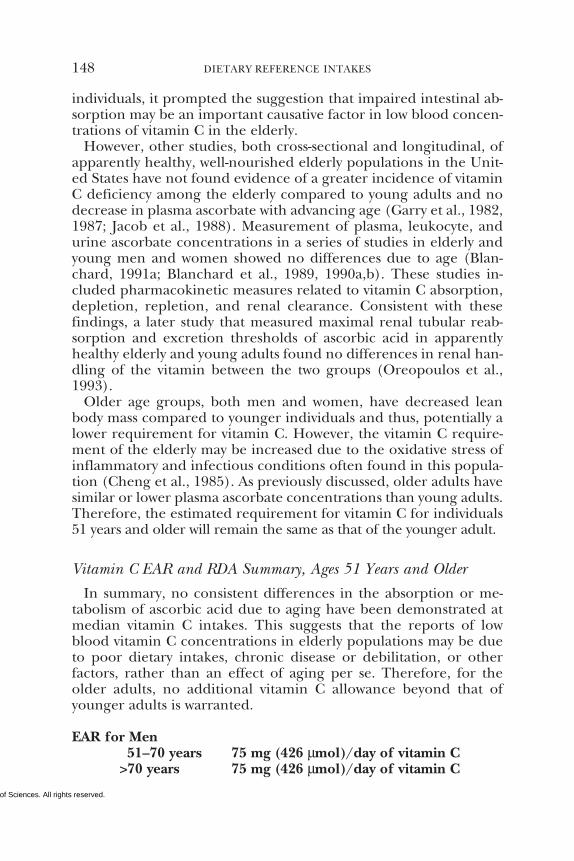
Copyright © National Academy of Sciences. All rights reserved.
148 DIETARY REFERENCE INTAKES
individuals, it prompted the suggestion that impaired intestinal ab-sorption may be an important causative factor in low blood concen-trations of vitamin C in the elderly.
However, other studies, both cross-sectional and longitudinal, ofapparently healthy, well-nourished elderly populations in the Unit-ed States have not found evidence of a greater incidence of vitaminC deficiency among the elderly compared to young adults and nodecrease in plasma ascorbate with advancing age (Garry et al., 1982,1987; Jacob et al., 1988). Measurement of plasma, leukocyte, andurine ascorbate concentrations in a series of studies in elderly andyoung men and women showed no differences due to age (Blan-chard, 1991a; Blanchard et al., 1989, 1990a,b). These studies in-cluded pharmacokinetic measures related to vitamin C absorption,depletion, repletion, and renal clearance. Consistent with thesefindings, a later study that measured maximal renal tubular reab-sorption and excretion thresholds of ascorbic acid in apparentlyhealthy elderly and young adults found no differences in renal han-dling of the vitamin between the two groups (Oreopoulos et al.,1993).
Older age groups, both men and women, have decreased leanbody mass compared to younger individuals and thus, potentially alower requirement for vitamin C. However, the vitamin C require-ment of the elderly may be increased due to the oxidative stress ofinflammatory and infectious conditions often found in this popula-tion (Cheng et al., 1985). As previously discussed, older adults havesimilar or lower plasma ascorbate concentrations than young adults.Therefore, the estimated requirement for vitamin C for individuals51 years and older will remain the same as that of the younger adult.
Vitamin C EAR and RDA Summary, Ages 51 Years and Older
In summary, no consistent differences in the absorption or me-tabolism of ascorbic acid due to aging have been demonstrated atmedian vitamin C intakes. This suggests that the reports of lowblood vitamin C concentrations in elderly populations may be dueto poor dietary intakes, chronic disease or debilitation, or otherfactors, rather than an effect of aging per se. Therefore, for theolder adults, no additional vitamin C allowance beyond that ofyounger adults is warranted.
EAR for Men51–70 years 75 mg (426 µmol)/day of vitamin C
>70 years 75 mg (426 µmol)/day of vitamin C
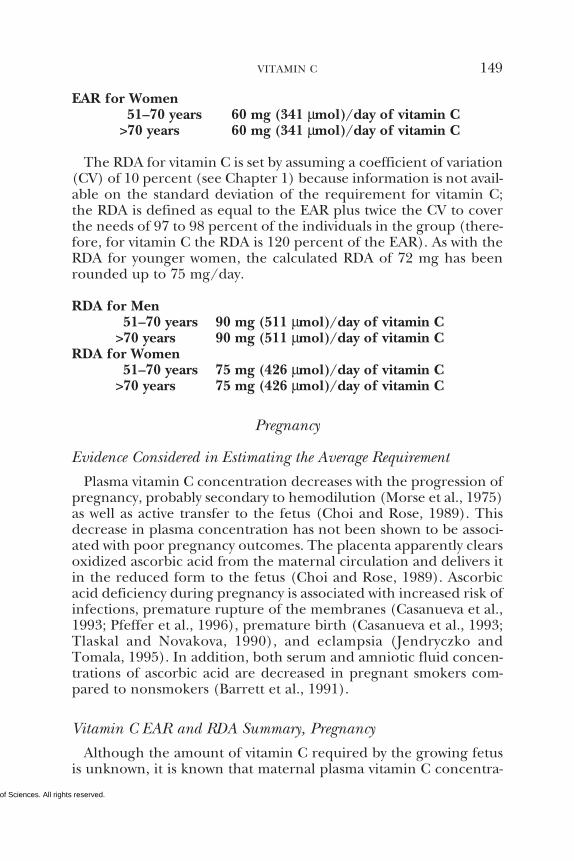
Copyright © National Academy of Sciences. All rights reserved.
VITAMIN C 149
EAR for Women51–70 years 60 mg (341 µmol)/day of vitamin C
>70 years 60 mg (341 µmol)/day of vitamin C
The RDA for vitamin C is set by assuming a coefficient of variation(CV) of 10 percent (see Chapter 1) because information is not avail-able on the standard deviation of the requirement for vitamin C;the RDA is defined as equal to the EAR plus twice the CV to coverthe needs of 97 to 98 percent of the individuals in the group (there-fore, for vitamin C the RDA is 120 percent of the EAR). As with theRDA for younger women, the calculated RDA of 72 mg has beenrounded up to 75 mg/day.
RDA for Men51–70 years 90 mg (511 µmol)/day of vitamin C
>70 years 90 mg (511 µmol)/day of vitamin CRDA for Women
51–70 years 75 mg (426 µmol)/day of vitamin C>70 years 75 mg (426 µmol)/day of vitamin C
Pregnancy
Evidence Considered in Estimating the Average Requirement
Plasma vitamin C concentration decreases with the progression ofpregnancy, probably secondary to hemodilution (Morse et al., 1975)as well as active transfer to the fetus (Choi and Rose, 1989). Thisdecrease in plasma concentration has not been shown to be associ-ated with poor pregnancy outcomes. The placenta apparently clearsoxidized ascorbic acid from the maternal circulation and delivers itin the reduced form to the fetus (Choi and Rose, 1989). Ascorbicacid deficiency during pregnancy is associated with increased risk ofinfections, premature rupture of the membranes (Casanueva et al.,1993; Pfeffer et al., 1996), premature birth (Casanueva et al., 1993;Tlaskal and Novakova, 1990), and eclampsia (Jendryczko andTomala, 1995). In addition, both serum and amniotic fluid concen-trations of ascorbic acid are decreased in pregnant smokers com-pared to nonsmokers (Barrett et al., 1991).
Vitamin C EAR and RDA Summary, Pregnancy
Although the amount of vitamin C required by the growing fetusis unknown, it is known that maternal plasma vitamin C concentra-
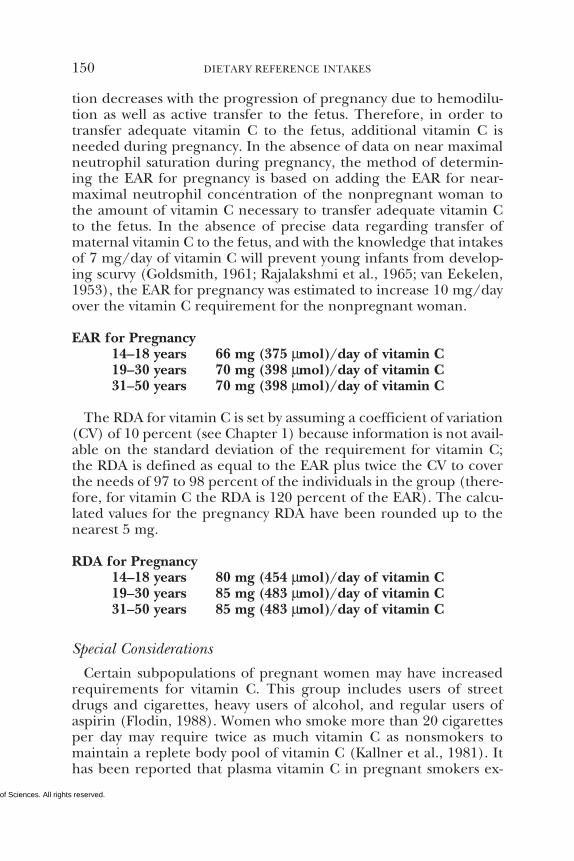
Copyright © National Academy of Sciences. All rights reserved.
150 DIETARY REFERENCE INTAKES
tion decreases with the progression of pregnancy due to hemodilu-tion as well as active transfer to the fetus. Therefore, in order totransfer adequate vitamin C to the fetus, additional vitamin C isneeded during pregnancy. In the absence of data on near maximalneutrophil saturation during pregnancy, the method of determin-ing the EAR for pregnancy is based on adding the EAR for near-maximal neutrophil concentration of the nonpregnant woman tothe amount of vitamin C necessary to transfer adequate vitamin Cto the fetus. In the absence of precise data regarding transfer ofmaternal vitamin C to the fetus, and with the knowledge that intakesof 7 mg/day of vitamin C will prevent young infants from develop-ing scurvy (Goldsmith, 1961; Rajalakshmi et al., 1965; van Eekelen,1953), the EAR for pregnancy was estimated to increase 10 mg/dayover the vitamin C requirement for the nonpregnant woman.
EAR for Pregnancy14–18 years 66 mg (375 µmol)/day of vitamin C19–30 years 70 mg (398 µmol)/day of vitamin C31–50 years 70 mg (398 µmol)/day of vitamin C
The RDA for vitamin C is set by assuming a coefficient of variation(CV) of 10 percent (see Chapter 1) because information is not avail-able on the standard deviation of the requirement for vitamin C;the RDA is defined as equal to the EAR plus twice the CV to coverthe needs of 97 to 98 percent of the individuals in the group (there-fore, for vitamin C the RDA is 120 percent of the EAR). The calcu-lated values for the pregnancy RDA have been rounded up to thenearest 5 mg.
RDA for Pregnancy14–18 years 80 mg (454 µmol)/day of vitamin C19–30 years 85 mg (483 µmol)/day of vitamin C31–50 years 85 mg (483 µmol)/day of vitamin C
Special Considerations
Certain subpopulations of pregnant women may have increasedrequirements for vitamin C. This group includes users of streetdrugs and cigarettes, heavy users of alcohol, and regular users ofaspirin (Flodin, 1988). Women who smoke more than 20 cigarettesper day may require twice as much vitamin C as nonsmokers tomaintain a replete body pool of vitamin C (Kallner et al., 1981). Ithas been reported that plasma vitamin C in pregnant smokers ex-
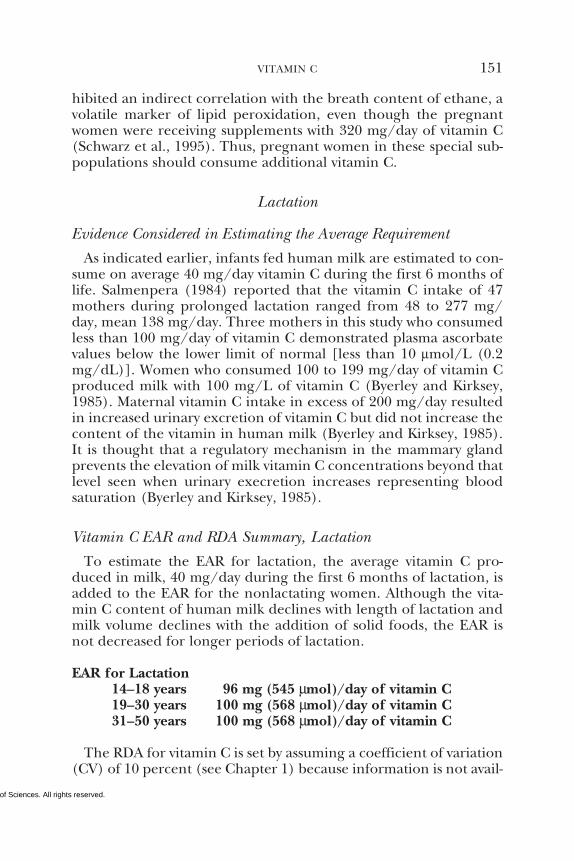
Copyright © National Academy of Sciences. All rights reserved.
VITAMIN C 151
hibited an indirect correlation with the breath content of ethane, avolatile marker of lipid peroxidation, even though the pregnantwomen were receiving supplements with 320 mg/day of vitamin C(Schwarz et al., 1995). Thus, pregnant women in these special sub-populations should consume additional vitamin C.
Lactation
Evidence Considered in Estimating the Average Requirement
As indicated earlier, infants fed human milk are estimated to con-sume on average 40 mg/day vitamin C during the first 6 months oflife. Salmenpera (1984) reported that the vitamin C intake of 47mothers during prolonged lactation ranged from 48 to 277 mg/day, mean 138 mg/day. Three mothers in this study who consumedless than 100 mg/day of vitamin C demonstrated plasma ascorbatevalues below the lower limit of normal [less than 10 µmol/L (0.2mg/dL)]. Women who consumed 100 to 199 mg/day of vitamin Cproduced milk with 100 mg/L of vitamin C (Byerley and Kirksey,1985). Maternal vitamin C intake in excess of 200 mg/day resultedin increased urinary excretion of vitamin C but did not increase thecontent of the vitamin in human milk (Byerley and Kirksey, 1985).It is thought that a regulatory mechanism in the mammary glandprevents the elevation of milk vitamin C concentrations beyond thatlevel seen when urinary execretion increases representing bloodsaturation (Byerley and Kirksey, 1985).
Vitamin C EAR and RDA Summary, Lactation
To estimate the EAR for lactation, the average vitamin C pro-duced in milk, 40 mg/day during the first 6 months of lactation, isadded to the EAR for the nonlactating women. Although the vita-min C content of human milk declines with length of lactation andmilk volume declines with the addition of solid foods, the EAR isnot decreased for longer periods of lactation.
EAR for Lactation14–18 years 96 mg (545 µmol)/day of vitamin C19–30 years 100 mg (568 µmol)/day of vitamin C31–50 years 100 mg (568 µmol)/day of vitamin C
The RDA for vitamin C is set by assuming a coefficient of variation(CV) of 10 percent (see Chapter 1) because information is not avail-
Copyright © National Academy of Sciences. All rights reserved.
152 DIETARY REFERENCE INTAKES
able on the standard deviation of the requirement for vitamin C;the RDA is defined as equal to the EAR plus twice the CV to coverthe needs of 97 to 98 percent of the individuals in the group (there-fore, for vitamin C the RDA is 120 percent of the EAR).
RDA for Lactation14–18 years 115 mg (653 µmol)/day of vitamin C19–30 years 120 mg (682 µmol)/day of vitamin C31–50 years 120 mg (682 µmol)/day of vitamin C
Special Considerations
Smokers
Evidence that smokers have lower vitamin C status than nonsmok-ers, even with comparable vitamin C intakes, is summarized in thepreceding section “Factors Affecting the Vitamin C Requirement.”The data also show that the metabolic turnover of ascorbate in smok-ers is about 35 mg/day greater than in nonsmokers (Kallner et al.,1981), apparently due to increased oxidative stress and other meta-bolic differences. These findings indicate that smokers need addi-tional vitamin C to provide comparable nutriture to nonsmokers.
From analysis of NHANES II data on vitamin C intakes and serumconcentrations, Schectman et al. (1991) estimated that the averageintake of smokers needed to be at least 200 mg/day of vitamin C inorder to attain serum ascorbate concentrations equivalent to thoseof nonsmokers who meet the 1989 RDA of 60 mg/day (NRC, 1989).Use of population survey data to estimate an increased ascorbaterequirement for smokers is questionable, because the cause andsignificance of the observed differences in serum ascorbate concen-trations between smokers and nonsmokers are largely unknown.
From in vitro data on the loss of ascorbate in plasma exposed tocigarette smoke, it was estimated that one cigarette may consumeabout 0.8 mg of ascorbate, or about 32 mg/day for a two-pack-a-daysmoker (Cross and Halliwell, 1993). More precise data were ob-tained from an experimental study of 17 apparently healthy malesmokers who were administered radiolabeled tracer ascorbic acid atsteady-state intakes of 30 to 180 mg/day to allow kinetic calcula-tions of ascorbate metabolism and body pools. Results were com-pared with a similar protocol for nonsmokers (Kallner et al., 1979,1981). Metabolic turnover of the vitamin was about 35 mg/daygreater in smokers than in nonsmokers. Thus, to obtain a near max-imal steady-state ascorbate body pool equivalent to that of nonsmok-
Copyright © National Academy of Sciences. All rights reserved.
VITAMIN C 153
ers, smokers would require an additional 35 mg/day of vitamin Cover that needed by nonsmokers.
Passive Smokers
Environmental or sidestream tobacco smoke provokes oxidantdamage similar to mainstream cigarette smoke (Bermudez et al.,1994; Pryor et al., 1983). Hypovitaminosis C (plasma ascorbate con-centrations less than 23 µmol/L [0.5 mg/dL]) was found in 24percent of the active smokers and 12 percent of passive smokersand indicated that both passive and active smoke exposure loweredbody ascorbate pools (Tribble et al., 1993). Exposure of nonsmok-ers to secondhand smoke for 30 minutes in a smoke-filled roomresulted in a significant decline in serum ascorbate, increased lipidperoxidation, and oxidatively modified low-density lipoprotein(LDL) (Valkonen and Kuusi, 1998). Although the above data areinsufficient to estimate a special requirement for nonsmokers regu-larly exposed to tobacco smoke, these individuals are urged to en-sure that they meet the Recommended Dietary Allowance (RDA)for vitamin C.
Exercise and Stress
The role of ascorbate as a cofactor for biosynthesis of carnitine,steroid hormones, and neurotransmitters provides a theoretical ba-sis for increased requirements of the vitamin in persons under ex-cessive physical and emotional stress. Studies of vitamin C statusand physical activity in humans have shown mixed results, such thatno definitive conclusion regarding vitamin C and exercise can bederived (Keith, 1994). For example, Fishbaine and Butterfield(1984) reported that blood vitamin C was higher in runners com-pared to sedentary control subjects, while a later study found thatthe vitamin C status of highly trained athletes was not significantlydifferent from control subjects (Rokitzki et al., 1994). A cross-sec-tional study of physical activity, fitness, and serum ascorbate in 1,600apparently healthy Irish adults provided no evidence that active peo-ple had different ascorbate status than inactive, and thus no justifi-cation for supplementation of exercisers (Sharpe et al., 1994). Nosubstantial evidence that mental or emotional stress increases vita-min C turnover or requirement in apparently healthy persons hasbeen reported. In sum, none of the above types of stress has beendemonstrated to affect the human requirement for vitamin C.
Copyright © National Academy of Sciences. All rights reserved.
154 DIETARY REFERENCE INTAKES
INTAKE OF VITAMIN C
Food Sources
Almost 90 percent of vitamin C in the typical diet comes fromfruits and vegetables, with citrus fruits, tomatoes and tomato juice,and potatoes being major contributors (Sinha et al., 1993). Othersources include brussel sprouts, cauliflower, broccoli, strawberries,cabbage, and spinach. Vitamin C is also added to some processedfoods as an antioxidant. Values for the vitamin C content of foodscan vary depending on the growing conditions, season of the year,stage of maturity, location, cooking practices, and storage time pri-or to consumption (Erdman and Klein, 1982).
Dietary Intake
Data from nationally representative U.S. and Canadian surveysare available to estimate vitamin C intakes (Appendix Tables C-1, D-1, and E-1). In the United States, the median dietary intake of vita-min C by adult men from 1988 to 1994 was about 105 mg (596µmol)/day and median total intake (including supplements, seeAppendix Table C-2) is about 120 mg (682 µmol)/day. For women,the median intake was estimated to be 90 mg (511 µmol)/day andmedian total intake (including supplements) is about 108 mg (613µmol)/day. (See Chapter 9 for vitamin C intake of men and womenwho smoke.) In Canada, the median dietary intake of vitamin C foradult men and woman was lower than in the United States withintake estimated to be about 70 mg (397 µmol)/day (AppendixTable E-1). Although most Americans consume fewer than the min-imum of five daily servings of fruits and vegetables recommendedby the U.S. Department of Agriculture and the National CancerInstitute, estimated median daily vitamin C consumption is abovethe Estmated Average Requirement (EAR). Five servings of mostfruits and vegetables provide more than 200 mg (1,136 µmol)/dayof vitamin C per day.
The Boston Nutritional Status Survey of the Elderly estimated thatamong this relatively advantaged group of people over aged 60,those who were not taking supplements had a median vitamin Cintake of 132 mg/day for males and 128 mg/day for females (Hartzet al., 1992).
Copyright © National Academy of Sciences. All rights reserved.
VITAMIN C 155
Intake from Supplements
Information from the Boston Nutritional Status Survey of the Eld-erly estimated that 35 and 44 percent of the males and females,respectively, took some form of vitamin C supplements; while 19percent of males and 15 percent of females surveyed who took sup-plements had intakes greater than 1,000 mg (5,680 µmol)/day. Ap-proximately 31 percent of all adults in one 1986 survey reportedtaking a vitamin C supplement (Moss et al., 1989). Total vitamin Cintakes from food plus supplements from the Third National Healthand Nutrition Examination Survey (NHANES III) are found in Ap-pendix Table C-2.
TOLERABLE UPPER INTAKE LEVELS
The Tolerable Upper Intake Level (UL) is the highest level ofdaily nutrient intake that is likely to pose no risk of adverse healtheffects in almost all individuals. Although members of the generalpopulation should be advised not to exceed the UL routinely, in-take above the UL may be appropriate for investigation within well-controlled clinical trials. In light of evaluating possible benefits tohealth, clinical trials of doses above the UL should not be discour-aged, as long as subjects participating in these trials have signedinformed consent documents regarding possible toxicity and as longas these trials employ appropriate safety monitoring of trial sub-jects. Also, the UL is not meant to apply to individuals who arereceiving vitamin C under medical supervision.
Hazard Identification
Adverse Effects
Many people believe vitamin C to be nontoxic and beneficial tohealth; therefore, the vitamin is often taken in large amounts. Thereis no evidence suggesting that vitamin C is carcinogenic or teratoge-nic or that it causes adverse reproductive effects. Reviews of highvitamin C intakes have indicated low toxicity (Johnston, 1999); ad-verse effects have been reported primarily after very large doses(greater than 3 g/day). Data show little increase in plasma steady-state concentrations at intakes above 200 mg/day (Figure 5-3), andsaturable intestinal absorption and renal tubular reabsorption datasuggest that overload of ascorbic acid is unlikely in humans (Blan-chard et al., 1997; Levine et al., 1996a). Possible adverse effectsassociated with very high intakes have been reviewed and include:
Copyright © National Academy of Sciences. All rights reserved.
156 DIETARY REFERENCE INTAKES
diarrhea and other gastrointestinal disturbances, increased oxalateexcretion and kidney stone formation, increased uric acid excre-tion, pro-oxidant effects, systemic conditioning (“rebound scurvy”),increased iron absorption leading to iron overload, reduced vita-min B12 and copper status, increased oxygen demand, and erosionof dental enamel (Hornig and Moser, 1981; Rivers, 1987). The dataon these adverse effects are reviewed below. The UL for vitamin Capplies to intake from both food and supplements.
Gastrointestinal Effects. Gastrointestinal disturbances such as nau-sea, abdominal cramps, and diarrhea are the most common adverseeffects of high vitamin C intake (Hoffer, 1971). These effects areattributed to the osmotic effect of unabsorbed vitamin C passingthrough the intestine. Intestinal absorption of ascorbic acid occursby a saturable process (Rumsey and Levine, 1998; Tsao, 1997). Theremainder is not absorbed and is eliminated in the stool. The evi-dence of gastrointestinal disturbances following high vitamin Cintakes is primarily from uncontrolled case reports (Hoffer, 1971;Hoyt, 1980). However, some studies have been conducted to evalu-ate gastrointestinal effects. Cameron and Campbell (1974) report-ed diarrhea, transient colic, and flatulent distension in normalhealthy volunteers at doses of 3 to 4 g/day. Another study, whichevaluated the adverse effects of 1-, 5-, and 10-g/day supplementalascorbate for 5 days in apparently healthy adults, reported diarrheain 2 of 15 subjects at 10 g/day (Wandzilak et al., 1994). Stein et al.(1976) reported mild diarrhea in one of three subjects followingingestion of 4 g of ascorbic acid.
Increased Oxalate Excretion and Kidney Stone Formation. Controver-sy exists as to whether increased intake of vitamin C can significant-ly increase urinary excretion of oxalate and, therefore, lead to anincrease in the potential for renal calcium oxalate stone formation.The findings from studies evaluating the effect of vitamin C intake(0.03 to 10 g/day) on urinary oxalate excretion in apparentlyhealthy individuals are conflicting (Hughes et al., 1981; Lamdenand Chrystowski, 1954; Levine et al., 1996a; Mitch et al., 1981;Schmidt et al., 1981; Tiselius and Almgard, 1977; Tsao and Salimi,1984; Wandzilak et al., 1994). An intervention study by Hughes etal. (1981) reported significant increases in mean urinary oxalateexcretion in 39 apparently healthy adults consuming 1, 3, 6, and 9g/day of ascorbic acid. However, Tsao and Salimi (1984) reportednormal plasma oxalate concentrations in healthy subjects ingesting3–10 g/day of ascorbic acid for at least two years, and no significant
Copyright © National Academy of Sciences. All rights reserved.
VITAMIN C 157
change in urinary oxalate excretion in five of six subjects who con-sumed 10 g/day of vitamin C over 1 day. Levine et al. (1996a)showed increased urinary oxalate excretion in apparently healthymale volunteers consuming 1 g/day of ascorbic acid; however, meanoxalate concentrations remained within the reference range. Noneof these studies showed oxalate excretion above normal.
Reports of kidney stone formation associated with excess ascorbicacid intake are limited to individuals with renal disease (see Sauber-lich, 1994 for a review). Data from epidemiological studies do notsupport an association between excess ascorbic acid intake and kid-ney stone formation in apparently healthy individuals (Curhan etal., 1996, 1999; Fellstrom et al., 1989). A prospective cohort study byCurhan et al. (1996) of 45,000 men aged 40 to 70 years with nohistory of renal calculi showed that vitamin C intake was not signifi-cantly associated with the risk of stone formation. In fact, the age-adjusted relative risk for men consuming 1,500 mg/day or morecompared to less than 250 mg/day was 0.78. In addition, vitamin Cintake was not associated with kidney stone formation in women(Curhan et al., 1999). The lack of findings on oxalate excretion andkidney stone formation may be explained by the limited absorptionof vitamin C at doses greater than 200 mg/day (Levine et al., 1996a).Because of the limited intestinal absorption, limited amounts ofvitamin C are metabolized to oxalate in the urine. In addition, thelarge majority of excess absorbed vitamin C is excreted in the urineas ascorbic acid rather than its degradation products.
Increased Uric Acid Excretion. Similarly, the effect of high ascorbicacid intake on urate excretion has been studied (Berger et al., 1977;Fituri et al., 1983; Hatch et al., 1980; Herbert, 1978; Levine et al.,1996a; Mitch et al., 1981; Schmidt et al., 1981; Stein et al., 1976).Theoretically, increased uric acid excretion could be an importantfactor in the formation of uric acid stones especially in subjects whonormally excrete large amounts of uric acid. The findings are con-flicting. Levine et al. (1996a) reported significantly increased uricacid excretion above the normal range following ascorbic acid in-takes of 1 g/day or more in 7 apparently healthy male subjects.Another study reported a 70 to 90 percent increase in the fractionalclearance of uric acid following a single 4-g dose in nine subjects(Stein et al., 1976). Other studies have shown no significant effectof ascorbic acid intakes up to 12 g/day on uric acid excretion inapparently healthy subjects (Fituri et al., 1983; Hatch et al., 1980;Herbert, 1978; Mitch et al., 1981; Schmidt et al., 1981).
Copyright © National Academy of Sciences. All rights reserved.
158 DIETARY REFERENCE INTAKES
Excess Iron Absorption. Another possible adverse effect of highvitamin C intake is enhanced iron absorption leading to iron over-load. Bendich and Cohen (1990) evaluated 24 studies to determinewhether daily ascorbic acid intakes (ranging from 1 to 1,000 mg,with most in the 10- to 100-mg range) could increase iron storesabove recommended levels in apparently healthy individuals. Theyfound that vitamin C intakes did not increase the number of highiron absorbers, and limited data involving ascorbic acid intakesabove 100 mg/day showed no change in iron absorption values.Another study by Cook et al. (1984) showed no increase in ironstores following vitamin C intakes up to 2 g/day (taken with mealsfor 20 months) in iron-replete subjects who consumed foods thatcontain iron. This suggests that vitamin C does not induce excessiron absorption in apparently healthy individuals. However, it isunknown if individuals with hereditary hemochromatosis, which af-fects between 1 in 200 and 1 in 400 persons of northern Europeandescent (Bacon et al., 1999), could be adversely affected by long-term ingestion of large doses of vitamin C (McLaran et al., 1982).
Lowered Vitamin B12 Levels. An in vitro study showed that increas-ing destruction of vitamin B12 was associated with increasing vita-min C levels (Herbert and Jacob, 1974). However, when this studywas performed using different analytical procedures, no loss of vita-min B12 was observed (Newmark et al., 1976). In a review of thestability of cobalamins under varying conditions, Hogenkamp(1980) found that only aquocobalamin was decreased and destroyedby ascorbic acid. Aquocobalamin is not a major cobalamin in bio-logical tissues. Furthermore, results of in vivo studies in human sub-jects have shown that vitamin C intakes up to 4 g/day did not in-duce vitamin B12 deficiency (Afroz et al., 1975; Ekvall et al., 1981).
Systemic Conditioning. Evidence of systemic conditioning (the ac-celerated metabolism or excretion of ascorbic acid) exists from un-controlled observations in humans following abrupt discontinua-tion of prolonged, high-dose vitamin C supplementation (Rheadand Schrauzer, 1971; Siegel et al., 1982). Omaye et al. (1986)showed increased turnover of plasma ascorbic acid in apparentlyhealthy human adults who abruptly decreased their vitamin C in-take from 605 to 5 mg/day. Two other studies showed that highintakes resulted in increased clearance but did not result in bloodlevels lower than normal (Schrauzer and Rhead, 1973; Tsao andLeung, 1988). Other studies have reported no rebound scurvy orexcessive lowering of ascorbate blood levels after cessation of high
Copyright © National Academy of Sciences. All rights reserved.
VITAMIN C 159
intakes (Hoffer, 1973; Ludvigsson et al., 1979). Evidence that re-bound scurvy may appear in infants whose mothers ingested largedoses of vitamin C during pregnancy is limited to one anecdotalreport of 2 infants (Cochrane, 1965). Overall, the evidence is in-consistent and does not suggest that systemic conditioning occursto any significant extent in infants and adults.
Pro-oxidant Effects. Under certain conditions, ascorbate can actas a pro-oxidant by reducing iron and copper ions, which catalyzeproduction of the hydroxyl radical via Fenton chemistry (Buettnerand Jurkiewicz, 1996). The combination of ascorbic acid and redox-active (non-protein-bound) iron can promote lipid peroxidation invitro (Laudicina and Marnett, 1990). In vivo however, iron is boundto proteins such as transferrin and ferritin and therefore is notnormally available for such catalytic functions. Nevertheless, thestrong pro-oxidant nature of the iron-ascorbate complex in vitroraises concern that consumption of vitamin C supplements by indi-viduals with high iron stores may contribute to oxidative damage invivo. In addition, dietary ascorbic acid can enhance the intestinalabsorption of nonheme iron (Hallberg, 1985).
Concerns for a possible in vivo pro-oxidant effect of the iron-ascorbate couple were heightened by the report of a fatal cardiomy-opathy in a patient with hemochromatosis who ingested excessivevitamin C (McLaran et al., 1982). Also, an association between myo-cardial infarctions and serum ferritin levels has been reported in aFinnish population (Salonen et al., 1992). Other studies have notsupported the latter finding that high iron stores were associatedwith increased risk of heart disease (Baer et al., 1994) and have notindicated that excess vitamin C intakes have contributed significant-ly to iron overload or oxidant damage in normal healthy people.Controlled human studies in which supplemental vitamin C wasadded to the meals of apparently healthy adults for periods of up to2 years showed little or no change in iron status measures includingserum ferritin (Cook et al., 1984; Hunt et al., 1994). Data on iron-ascorbate combinations in the plasma of normal healthy adults andpreterm infants with high plasma ascorbate levels showed that highplasma ascorbate concentrations in the presence of redox-activeiron did not cause either lipid or protein oxidation. In addition, theendogenous ascorbate prevented rather than promoted lipid per-oxidation in iron-overloaded plasma (Berger et al., 1997).
Similarly, concern for an in vivo pro-oxidant action of vitamin Cin concert with copper has been suggested but not substantiated.Possible increased oxidant damage in premature infants had been
Copyright © National Academy of Sciences. All rights reserved.
160 DIETARY REFERENCE INTAKES
attributed to the effect of high serum ascorbate levels inhibitingceruloplasmin ferroxidase activity, thereby creating an excess of re-active ferrous ions (Powers et al., 1995). This result and other re-ports of ascorbate inhibition of ceruloplasmin ferroxidase activity(Gutteridge, 1991) have subsequently been attributed to an artifactof using a nonphysiological pH buffer in the ceruloplasmin ferroxi-dase assay (Løvstad, 1997).
Results of studies testing the effects of supplemental vitamin Cintake on markers of oxidant damage to deoxyribonucleic acid(DNA) and chromosomes are discussed in an earlier section andare summarized in Tables 5-4, 5-5, and 5-6. The results are mixed,with studies showing a decrease, increase, or no change in oxidantdamage measures. A study of 30 apparently healthy adults supple-mented with 500 mg/day of vitamin C for 6 weeks reported anincrease in 8-oxoadenine, but a decrease in the more mutagenicDNA lesion, 8-oxoguanine (Podmore et al., 1998). Supplementa-tion of apparently healthy volunteers with vitamin C and iron result-ed in increases in some DNA damage markers, decreases in others,and a rise in total DNA base damage at 6 weeks, which disappearedat 12 weeks (Rehman et al., 1998). Other evidence from in vitroand in vivo data as well as epidemiological studies have not shownincreased oxidative DNA damage or increased cancer risk associat-ed with high intakes of vitamin C (Block, 1991; Fontham, 1994;Fraga et al., 1991; Rifici and Khachadurian, 1993).
Other Adverse Effects. Other adverse effects observed followinghigh vitamin C intakes include diminished high-altitude resistance(Schrauzer et al., 1975), delayed-type allergic response (Metz et al.,1980), and erosion of dental enamel (Giunta, 1983). Additionalstudies confirming these findings were not found.
Identification of Distinct and Highly Sensitive Subpopulations. Datashow that individuals with hemochromatosis, glucose-6-phosphatedehydrogenase deficiency, and renal disorders may be susceptibleto adverse effects from excess vitamin C intake. Vitamin C may en-hance iron absorption and exacerbate iron-induced tissue damagein individuals with hemochromatosis (McLaran et al., 1982). Indi-viduals with renal disorders may have increased risk of oxalate kid-ney stone formation from excess vitamin C intake (Auer et al., 1998;Ono, 1986; Urivetzky et al., 1992). Hemolysis has been associatedwith ascorbic acid administration in newborns with glucose-6-phos-phate dehydrogenase deficiency and in normal premature infants(Ballin et al., 1988; Mentzer and Collier, 1975). There is also anec-dotal evidence of hemolysis following ascorbic acid intake in adults
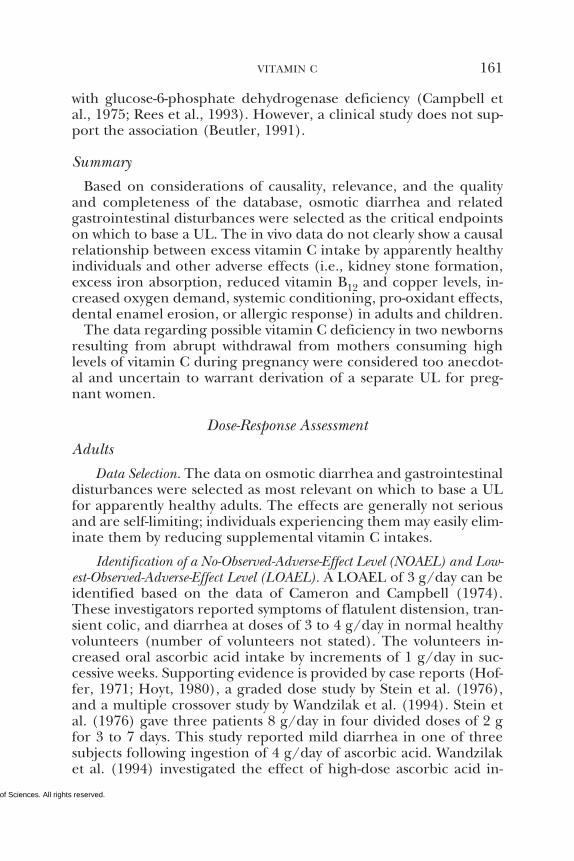
Copyright © National Academy of Sciences. All rights reserved.
VITAMIN C 161
with glucose-6-phosphate dehydrogenase deficiency (Campbell etal., 1975; Rees et al., 1993). However, a clinical study does not sup-port the association (Beutler, 1991).
Summary
Based on considerations of causality, relevance, and the qualityand completeness of the database, osmotic diarrhea and relatedgastrointestinal disturbances were selected as the critical endpointson which to base a UL. The in vivo data do not clearly show a causalrelationship between excess vitamin C intake by apparently healthyindividuals and other adverse effects (i.e., kidney stone formation,excess iron absorption, reduced vitamin B12 and copper levels, in-creased oxygen demand, systemic conditioning, pro-oxidant effects,dental enamel erosion, or allergic response) in adults and children.
The data regarding possible vitamin C deficiency in two newbornsresulting from abrupt withdrawal from mothers consuming highlevels of vitamin C during pregnancy were considered too anecdot-al and uncertain to warrant derivation of a separate UL for preg-nant women.
Dose-Response Assessment
Adults
Data Selection. The data on osmotic diarrhea and gastrointestinaldisturbances were selected as most relevant on which to base a ULfor apparently healthy adults. The effects are generally not seriousand are self-limiting; individuals experiencing them may easily elim-inate them by reducing supplemental vitamin C intakes.
Identification of a No-Observed-Adverse-Effect Level (NOAEL) and Low-est-Observed-Adverse-Effect Level (LOAEL). A LOAEL of 3 g/day can beidentified based on the data of Cameron and Campbell (1974).These investigators reported symptoms of flatulent distension, tran-sient colic, and diarrhea at doses of 3 to 4 g/day in normal healthyvolunteers (number of volunteers not stated). The volunteers in-creased oral ascorbic acid intake by increments of 1 g/day in suc-cessive weeks. Supporting evidence is provided by case reports (Hof-fer, 1971; Hoyt, 1980), a graded dose study by Stein et al. (1976),and a multiple crossover study by Wandzilak et al. (1994). Stein etal. (1976) gave three patients 8 g/day in four divided doses of 2 gfor 3 to 7 days. This study reported mild diarrhea in one of threesubjects following ingestion of 4 g/day of ascorbic acid. Wandzilaket al. (1994) investigated the effect of high-dose ascorbic acid in-
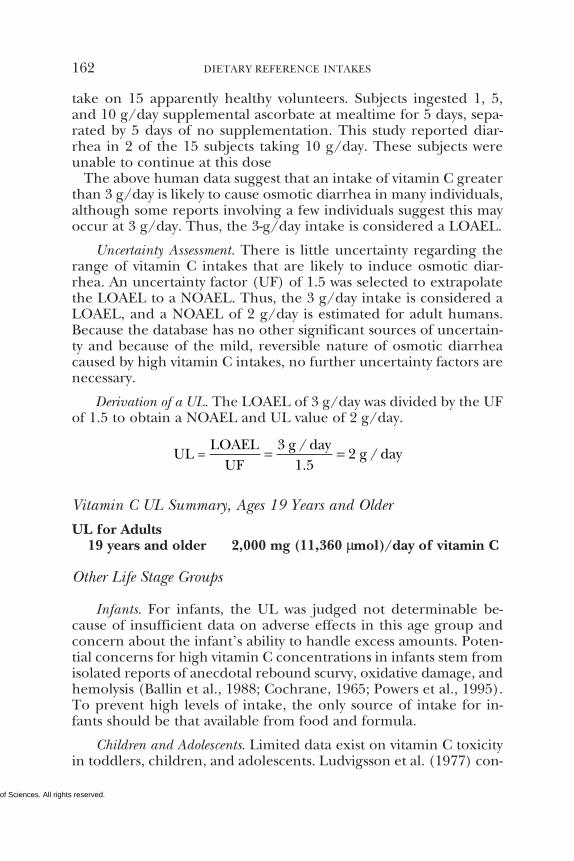
Copyright © National Academy of Sciences. All rights reserved.
162 DIETARY REFERENCE INTAKES
take on 15 apparently healthy volunteers. Subjects ingested 1, 5,and 10 g/day supplemental ascorbate at mealtime for 5 days, sepa-rated by 5 days of no supplementation. This study reported diar-rhea in 2 of the 15 subjects taking 10 g/day. These subjects wereunable to continue at this dose
The above human data suggest that an intake of vitamin C greaterthan 3 g/day is likely to cause osmotic diarrhea in many individuals,although some reports involving a few individuals suggest this mayoccur at 3 g/day. Thus, the 3-g/day intake is considered a LOAEL.
Uncertainty Assessment. There is little uncertainty regarding therange of vitamin C intakes that are likely to induce osmotic diar-rhea. An uncertainty factor (UF) of 1.5 was selected to extrapolatethe LOAEL to a NOAEL. Thus, the 3 g/day intake is considered aLOAEL, and a NOAEL of 2 g/day is estimated for adult humans.Because the database has no other significant sources of uncertain-ty and because of the mild, reversible nature of osmotic diarrheacaused by high vitamin C intakes, no further uncertainty factors arenecessary.
Derivation of a UL. The LOAEL of 3 g/day was divided by the UFof 1.5 to obtain a NOAEL and UL value of 2 g/day.
UL =LOAEL
UF g / day
1.52 g / day= =3
Vitamin C UL Summary, Ages 19 Years and Older
UL for Adults19 years and older 2,000 mg (11,360 µmol)/day of vitamin C
Other Life Stage Groups
Infants. For infants, the UL was judged not determinable be-cause of insufficient data on adverse effects in this age group andconcern about the infant’s ability to handle excess amounts. Poten-tial concerns for high vitamin C concentrations in infants stem fromisolated reports of anecdotal rebound scurvy, oxidative damage, andhemolysis (Ballin et al., 1988; Cochrane, 1965; Powers et al., 1995).To prevent high levels of intake, the only source of intake for in-fants should be that available from food and formula.
Children and Adolescents. Limited data exist on vitamin C toxicityin toddlers, children, and adolescents. Ludvigsson et al. (1977) con-
Copyright © National Academy of Sciences. All rights reserved.
VITAMIN C 163
ducted a double-blind, 7-week pilot study and a 3-month main studyevaluating the prophylactic effect of 1,000 mg/day of vitamin C oncolds in 172 and 642 children, respectively, ages 8 to 9 years. Re-ported side effects, including stomach pains, skin rash, headache,diarrhea, and nausea, were observed in about 3 percent of the chil-dren, which was no different from the control group and was notdose related. Therefore, this study could be used to support a NOA-EL of 1,000 mg/day.
Another study tested the effectiveness of a megavitamin regimenincluding 3 g/day of ascorbic acid for 3 months on attention deficitdisorder (ADD) in 41 children ages approximately 7 to 11 years(Haslam et al., 1984). Forty-two percent of the children developedelevation of serum aminotransferases, and it was concluded that theregimen (which was ineffective) should not be used to treat ADD. Itis unlikely that the increases in serum aminotransferases were dueto the high acsorbic acid intake since no such effects of high vita-min C intakes have been reported by other investigators. Neverthe-less, this study appears consistent with the adult data indicating aLOEAL at intakes of 3 g/day. However, this study cannot be utilizedto establish a UL for children as the vitamin C was part of a mega-vitamin and the contribution of vitamin C to the results cannot bedetermined.
Because the results of these studies (particularly the study by Lud-vigsson et al., 1977) are consistent with the data on adverse effectsin adults on a body weight basis, the UL values for toddlers, chil-dren, and adolescents are extrapolated based on body weight differ-ences from those established for adults as described in Chapter 4using reference weights from Chapter 1 (Table 1-1). The calculatedUL is rounded to the nearest 50 mg.
Pregnancy. No evidence of maternal toxicity of excess vitamin Cintakes was found. However, because vitamin C is actively transport-ed from maternal to fetal blood, there could be a potential formaternal intake of megadoses of vitamin C during pregnancy tolead to markedly elevated concentrations of vitamin C in the fetus.There is one anecdotal report (Cochrane, 1965) of possible fetalvitamin C dependence induced in utero in two infants, whose moth-ers consumed 400 mg/day of vitamin C during pregnancy. Althoughthe infants developed scurvy during the first few weeks of life, theobservation was complicated by the relatively high incidence of scur-vy in the region of Canada in which the infants were born. Otherconcerns for high vitamin C concentrations in infants stem fromreports of hemolysis (Ballin et al., 1988) and possible increased
Copyright © National Academy of Sciences. All rights reserved.
164 DIETARY REFERENCE INTAKES
oxidative damage (Powers et al., 1995) in premature infants. How-ever, these effects are not well documented, and do not warrant aseparate UL for pregnant females.
Lactation. Byerley and Kirksey (1985) noted that the vitamin Ccomposition of human milk was not affected by maternal vitamin Cintake ranging from 156 to 1,123 mg/day and that urinary excre-tion increased as intake increased over 200 mg/day, suggesting thatmammary tissue becomes saturated with vitamin C. One womaningested 4,000 mg/day of vitamin C as a supplement; no toxic ef-fects of the excess vitamin intake were noted in the mother. Hermilk content of vitamin C was 100.5 mg/L, which was on the highend of values reported for human milk, but not reflective of thehigh intake (Anderson and Pittard, 1985). Based on these findings,the ULs for lactating adolescents and women are not different fromthose of nonlactating females.
Vitamin C UL Summary, Ages 1 through 18 Years, Pregnancy,Lactation
UL for Infants0–12 months Not possible to establish; source of intake
should be formula and food onlyUL for Children
1–3 years 400 mg (2,272 µmol)/day of vitamin C4–8 years 650 mg (3,692 µmol)/day of vitamin C9–13 years 1,200 mg (6,816 µmol)/day of vitamin C
UL for Adolescents14–18 years 1,800 mg (10,224 µmol)/day of vitamin C
UL for Pregnancy14–18 years 1,800 mg (10,224 µmol)/day of vitamin C19 years and older 2,000 mg (11,360 µmol)/day of vitamin C
UL for Lactation14–18 years 1,800 mg (10,224 µmol)/day of vitamin C19 years and older 2,000 mg (11,360 µmol)/day of vitamin C
Special Considerations
Individuals with hemochromatosis, glucose-6-phosphate dehy-drogenase deficiency, and renal disorders may be especially suscep-tible to adverse effects of excess vitamin C intake and thereforeshould be cautious about ingesting more vitamin C than theRecommended Dietary Allowance (RDA). Vitamin C intakes of 250
Copyright © National Academy of Sciences. All rights reserved.
VITAMIN C 165
mg/day or higher have been associated with false-negative resultsfor detecting stool and gastric occult blood (Gogel et al., 1989; Jaffeet al., 1975). Therefore, high-dose vitamin C supplements shouldbe discontinued at least 2 weeks before physical exams because theymay interfere with blood and urine tests.
Intake Assessment
Based on data from the Third National Health and Nutrition Ex-amination Survey (NHANES III), the highest mean intake of vita-min C from diet and supplements for any gender and lifestagegroup was estimated to be about 200 mg (1,136 µmol)/day (Appen-dix Table C-2). This was the intake of males aged 51 through 70years and females aged 51 years and older. The highest reportedintake at the ninety-ninth percentile was greater than 1,200 mg(6,816 µmol)/day in males aged 31 through 70 years and in femalesaged 51 through 70 years (Appendix Table C-2).
Risk Characterization
The risk of adverse effects resulting from excess intake of vitaminC from food and supplements appears to be very low at the highestintakes noted above. Although members of the general populationshould be advised not to exceed the UL routinely, intake greaterthan the UL may be appropriate for investigation within well-con-trolled clinical trials. Clinical trials of doses above the UL shouldnot be discouraged, as long as subjects participating in these trialshave signed informed consent documents regarding possible toxic-ity and as long as these trials employ appropriate safety monitoringof trial subjects. In addition, the UL is not meant to apply to indi-viduals who are receiving vitamin C under medical supervision.
RESEARCH RECOMMENDATIONS FOR VITAMIN C
• Despite the many known biochemical roles of ascorbic acid,no reliable biochemical or physiologically based functional mea-sures of vitamin C nutriture have been established. As a result, vita-min C intake requirements in adults have been based on estimatesof body pool or tissue ascorbate deemed adequate to provide anti-oxidant protection. Knowledge of vitamin C intakes needed to ful-fill specific functional roles of ascorbate will allow more accurateand precise determinations of the individual and average popula-tion requirements of the vitamin. Some current candidates that
Copyright © National Academy of Sciences. All rights reserved.
166 DIETARY REFERENCE INTAKES
could be used as functional measures include pathways related tocollagen and carnitine metabolism, oxidative damage, and oralhealth indices; however, research on new functions of the vitamin isalso needed. Determination of vitamin C requirements based onantioxidant functions will require development of more reliabletests for in vivo oxidative damage and further understanding of theinteractions of ascorbate with other physiological antioxidants. Ad-ditionally, a practical method for measuring the vitamin C bodypool is needed as a standard of comparison against proposed func-tional measures and measures of health or disease endpoints.
• Since the requirements for children ages 1 through 18 yearsare extrapolated from the adult Estimated Average Requirements(EARs), it is critically important to conduct large-scale studies withchildren using state-of-the-art biomarkers to assess their vitamin Crequirement.
• Many studies that provided vitamin C supplements to appar-ently healthy well-nourished populations were investigating phar-macological (at or above the point where body tissues are saturat-ed) rather than nutritional effects of the vitamin. This may obscurepossible relationships between vitamin C intake and disease risk inthe range of dietary intakes. Therefore, population studies on therelationship of vitamin C nutriture and chronic disease should fo-cus more on individuals or populations who eat few fruits and vege-tables and are marginally deficient in vitamin C. Attention also hasto be given to methods for sorting out the effects of vitamin Cintake from those of other dietary and life-style factors that may alsoaffect disease risk.
• While the evidence of adverse effects due to intakes of vita-min C supplements is at this time limited to osmotic diarrhea andgastrointestinal disturbances which are self-limiting, the frequencyof high intakes of the vitamin in the North American populationwarrants further investigation. The well known pro-oxidant effectsof the iron-ascorbate couple in vitro suggest that further researchbe done on possible related in vivo reactions—for example, duringsimultaneous supplement ingestion, iron overload, and inflamma-tion or tissue trauma where non-protein-bound iron may be re-leased.
• A small number of isolated reports raise concern that highvitamin C intakes during pregnancy may expose the fetus or neo-nate to risks of withdrawal symptoms, hemolysis, or oxidant dam-age. Further research is needed to confirm or refute these con-cerns.
Copyright © National Academy of Sciences. All rights reserved.
VITAMIN C 167
REFERENCESAfroz M, Bhothinard B, Etzkorn JR, Horenstein S, McGarry JD. 1975. Vitamins C
and B12. J Am Med Assoc 232:246.Alexy U, Kersting M, Sichert-Hellert W, Manz F, Schöch G. 1999. Vitamin intake of
3- to 36-month-old German infants and children—Results of the DONALDstudy. Int J Vitam Nutr Res 69:285–291.
Allen JC, Keller RP, Archer P, Neville MC. 1991. Studies in human lactation: Milkcomposition and daily secretion rates of macronutrients in the first year oflactation. Am J Clin Nutr 54:69–80.
Alvares O. 1997. Ascorbic acid and periodontal disease. In: Packer L, Fuchs J, eds.Vitamin C in Health and Disease. New York: Marcel Dekker. Pp. 505–516.
Ames BN, Gold LS, Willett WC. 1995. The causes and prevention of cancer. ProcNatl Acad Sci USA 92:5258–5265.
Anderson D, Phillips BJ, Yu T, Edwards AJ, Ayesh R, Butterworth KR. 1997. Theeffects of vitamin C supplementation on biomarkers of oxygen radical gener-ated damage in human volunteers with “low” or “high” cholesterol levels. Envi-ron Mol Mutagen 30:161–174.
Anderson DM, Pittard WB. 1985. Vitamin E and C concentrations in human milkwith maternal megadosing. A case report. J Am Diet Assoc 85:715–717.
Anderson R, Lukey, PT. 1987. A biological role for ascorbate in the selective neu-tralization of extracellular phagocyte-derived oxidants. Ann NY Acad Sci 498:229–247.
Anderson R, Oosthuizen R, Maritz R, Theron A, Van Rensburg AJ. 1980. Theeffects of increasing weekly doses of ascorbate on certain cellular and humor-al immune function in normal volunteers. Am J Clin Nutr 33:7l–76.
Asami S, Manabe H, Miyake J, Tsurudome Y, Hirano T, Yamaguchi R, Itoh H, KasaiH. 1997. Cigarette smoking induces an increase in oxidative DNA damage, 8-hydroxydeoxyguanosine, in a central site in the human lung. Carcinogenesis18:1763–1766.
Auer BL, Auer D, Rodgers AL. 1998. Relative hyperoxaluria, crystalluria and hae-maturia after megadose ingestion of vitamin C. Eur J Clin Invest 28:695–700.
Bacon BR, Olynyk JK, Brunt EM, Britton RS, Wolff RK. 1999. HFE genotype inpatients with hemochromatosis and other liver diseases. Ann Int Med 130:953–962.
Baer DM, Tekawa IS, Hurley LB. 1994. Iron stores are not associated with acutemyocardial infarction. Circulation 89:2915–2918.
Baker EM, Sauberlich HE, Wolfskill SJ, Wallace WT, Dean EE. 1962. Tracer studiesof vitamin C utilization in men: Metabolism of D-glucuronolactone-6-C14, D-glucuronic-6-C14 acid and L-ascorbic-1-C14 acid. Proc Soc Exp Biol Med 109:737–741.
Baker EM, Hodges RE, Hood J, Sauberlich HE, March SC. 1969. Metabolism ofascorbic-1-C14 acid in experimental human scurvy. Am J Clin Nutr 22:549–558.
Baker EM, Hodges RE, Hood J, Sauberlich HE, March SC, Canham JE. 1971.Metabolism of 14C- and 3H-labeled L-ascorbic acid in human scurvy. Am J ClinNutr 24:444–454.
Ballin A, Brown EJ, Koren G, Zipursky A. 1988. Vitamin C-induced erythrocytedamage in premature infants. J Pediatr 113:114–120.
Bandera EV, Freudenheim JL, Marshall JR, Zielezny M, Priore RL, Brasure J, Bap-tiste M, Graham S. 1997. Diet and alcohol consumption and lung cancer riskin the New York State Cohort. Cancer Causes Control 8:828–840.
Copyright © National Academy of Sciences. All rights reserved.
168 DIETARY REFERENCE INTAKES
Barrett B, Gunter E, Jenkins J, Wang M. 1991. Ascorbic acid concentration inamniotic fluid in late pregnancy. Biol Neonate 60:333–335.
Bates CJ, Prentice AM, Prentice A, Paul AA, Whitehead RG. 1982. Seasonal varia-tions in ascorbic acid status and breast milk ascorbic acid levels in rural Gam-bian women in relation to dietary intake. Trans Royal Soc Trop Med Hyg 76:341–347.
Belcher JD, Balla J, Balla G, Jacobs DR Jr, Gross M, Jacob HS, Vercellotti GM. 1993.Vitamin E, LDL, and endothelium. Brief oral vitamin supplementation pre-vents oxidized LDL-mediated vascular injury in vitro. Arterioscler Thromb 13:1779–1789.
Bendich A, Cohen M. 1990. Ascorbic acid safety: Analysis of factors affecting ironabsorption. Toxicol Lett 51:189–201.
Berger L, Gerson CD, Yu TF. 1977. The effect of ascorbic acid on uric acid excre-tion with a commentary on the renal handling of ascorbic acid. Am J Med62:71–76.
Berger TM, Polidori MC, Dabbagh A, Evans PJ, Halliwell B, Morrow JD, Roberts LJII, Frei B. 1997. Antioxidant activity of vitamin C in iron-overloaded humanplasma. J Biol Chem 272:15656–15660.
Berliner JA, Heinecke JW. 1996. The role of oxidized lipoproteins in atherogene-sis. Free Radic Biol Med 20:707–727.
Bermudez E, Stone K, Carter KM, Pryor WA. 1994. Environmental tobacco smokeis just as damaging to DNA as mainstream smoke. Environ Hlth Perspect 102:870–874.
Beutler E. 1991. Glucose-6-phosphate dehydrogenase deficiency. N Engl J Med324:169–174.
Blanchard J. 1991a. Depletion and repletion kinetics of vitamin C in humans. JNutr 121:170–176.
Blanchard J. 1991b. Effects of gender on vitamin C pharmacokinetics in man. J AmColl Nutr 10:453–459.
Blanchard J, Conrad KA, Watson RR, Garry PJ, Crawley JD. 1989. Comparison ofplasma, mononuclear and polymorphonuclear leucocyte vitamin C levels inyoung and elderly women during depletion and supplementation. Eur J ClinNutr 43:97–106.
Blanchard J, Conrad KA, Garry PJ. 1990a. Effects of age and intake on vitamin Cdisposition in females. Eur J Clin Nutr 44:447–460.
Blanchard J, Conrad KA, Mead RA, Garry PJ. 1990b. Vitamin C disposition inyoung and elderly men. Am J Clin Nutr 51:837–845.
Blanchard J, Tozer TN, Rowland M. 1997. Pharmacokinetic perspectives on mega-doses of ascorbic acid. Am J Clin Nutr 66:1165–1171.
Block G. 1991. Vitamin C and cancer prevention: The epidemiologic evidence. AmJ Clin Nutr 53:270S–282S.
Blot WJ, Li J-Y, Taylor PR, Guo W, Dawsey S, Wang G-Q, Yang CS, Zheng S-F, GailM, Li G-Y, Yu Y, Liu B-Q, Tangrea J, Sun Y-H, Liu F, Fraumeni JF Jr, Zhang Y-H, Li B. 1993. Nutrition intervention trials in Linxian, China: Supplementa-tion with specific vitamin/mineral combinations, cancer incidence, and dis-ease-specific mortality in the general population. J Natl Cancer Inst 85:1483–1492.
Bors W, Michel C, Schikora S. 1995. Interaction of flavonoids with ascorbate anddetermination of their univalent redox potentials: A pulse radiolysis study. FreeRadic Biol Med 19:45–52.
Copyright © National Academy of Sciences. All rights reserved.
VITAMIN C 169
Bostick RM, Potter JD, McKenzie DR, Sellers TA, Kushi LH, Steinmetz KA, FolsomAR. 1993. Reduced risk of colon cancer with high intake of vitamin E: TheIowa Women’s Health Study. Cancer Res 53:4230–4237.
Britton JR, Pavord ID, Richards KA, Knox AJ, Wisniewski AF, Lewis SA, TattersfieldAE, Weiss ST. 1995. Dietary antioxidant vitamin intake and lung function inthe general population. Am J Respir Crit Care Med 151:1383–1387.
Bucca C, Rolla G, Farina JC. 1992. Effect of vitamin C on transient increase ofbronchial responsiveness in conditions affecting the airways. Ann NY Acad Sci669:175–187.
Bueno de Mesquita HB, Maisonneuve P, Runia S, Moerman CJ. 1991. Intake offoods and nutrients and cancer of the exocrine pancreas: A population-basedcase-control study in The Netherlands. Int J Cancer 48:540–549.
Buettner GR. 1993. The pecking order of free radicals and antioxidants: Lipidperoxidation, alpha-tocopherol, and ascorbate. Arch Biochem Biophys 300:535–543.
Buettner GR, Jurkiewicz BA. 1996. Catalytic metals, ascorbate and free radicals:Combinations to avoid. Radiat Res 145:532–541.
Burr ML, Elwood PC, Hole DJ, Hurley RJ, Hughes RE. 1974. Plasma and leukocyteascorbic acid levels in the elderly. Am J Clin Nutr 27:144–151
Bussey HJ, DeCosse JJ, Deschner EE, Eyers AA, Lesser ML, Morson BC, Ritchie SM,Thomson JP, Wadsworth J. 1982. A randomized trial of ascorbic acid in poly-posis coli. Cancer 50:1434–1439.
Butte NF, Garza C, Smith EO, Nichols BL. 1984. Human milk intake and growth inexclusively breast-fed infants. J Pediatr 104:187–195.
Byerley LO, Kirksey A. 1985. Effects of different levels of vitamin C intake on thevitamin C concentration in human milk and the vitamin C intakes of breast-fed infants. Am J Clin Nutr 41:665–671.
Byun J, Mueller DM, Fabjan JS, Heinecke JW. 1999. Nitrogen dioxide radical gen-erated by the myeloperoxidase-hydrogen peroxide-nitrite system promotes lip-id peroxidation of low density lipoprotein. FEBS Lett 455:243–246.
Cadenas S, Rojas C, Méndez J, Herrero A, Barja G. 1996. Vitamin E decreases urinelipid peroxidation products in young healthy human volunteers under nor-mal conditions. Pharmacol Toxicol 79:247–253.
Cahill RJ, O’Sullivan KR, Mathias PM, Beattie S, Hamilton H, O’Morain C. 1993.Effects of vitamin antioxidant supplementation on cell kinetics of patientswith adenomatous polyps. Gut 34:963–967.
Cameron E, Campbell A. 1974. The orthomolecular treatment of cancer. II. Clini-cal trial of high-dose ascorbic acid supplements in advanced human cancer.Chem Biol Interact 9:285–315.
Campbell GD Jr, Steinberg MH, Bower JD. 1975. Ascorbic acid-induced hemolysisin G-6-PD deficiency. Ann Intern Med 82:810.
Carr AC, Frei B. 1999. Toward a new recommended dietary allowance for vitaminC based on antioxidant and health effects in humans. Am J Clin Nutr 69:1086–1087.
Casanueva E, Polo E, Tejero E, Meza C. 1993. Premature rupture of amnioticmembranes as functional assessment of vitamin C status during pregnancy.Ann NY Acad Sci 678:369–370.
Chalmers TC. 1975. Effects of ascorbic acid on the common cold. An evaluation ofthe evidence. Am J Med 58:532–536.
Chazan JA, Mistilis SP. 1963. The pathophysiology of scurvy. Am J Med 34:350–358.
Copyright © National Academy of Sciences. All rights reserved.
170 DIETARY REFERENCE INTAKES
Cheng L, Cohen M, Bhagavan HN. 1985. Vitamin C and the elderly. In: WatsonRR, ed. CRC Handbook of Nutrition in the Aged. Boca Raton, FL: CRC Press. Pp.157–185.
Choi JL, Rose RC. 1989. Transport and metabolism of ascorbic acid in humanplacenta. Am J Physiol 257:C110–C113.
Cochrane WA. 1965. Overnutrition in prenatal and neonatal life: A problem? CanMed Assoc J 93:893–899.
Cohen HA, Neuman I, Nahum H. 1997. Blocking effect of vitamin C in exercise-induced asthma. Arch Pediatr Adolesc Med 151:367–370.
Cook JD, Watson SS, Simpson KM, Lipschitz DA, Skikne BS. 1984. The effect ofhigh ascorbic acid supplementation on body iron stores. Blood 64:721–726.
Cooke MS, Evans MD, Podmore ID, Herbert KE, Mistry N, Mistry P, Hickenboth-am PT, Hussieni A, Griffiths HR, Lunec J. 1998. Novel repair action of vitaminC upon in vivo oxidative DNA damage. FEBS Lett 439:363–367.
Coulehan JL, Eberhard S, Kapner L, Taylor F, Rogers K, Garry P. 1976. Vitamin Cand acute illness in Navajo school children. N Engl J Med 295:973–977.
Cross CE, Halliwell B. 1993. Nutrition and human disease: How much extra vita-min C might smokers need? Lancet 341:1091.
Cross CE, Forte T, Stocker R, Louie S, Yamamoto Y, Ames BN, Frei B. 1990. Oxida-tive stress and abnormal cholesterol metabolism in patients with adult respira-tory distress syndrome. J Lab Clin Med 115:396–404.
Crott JW, Fenech M. 1999. Effect of vitamin C supplementation on chromosomedamage, apoptosis and necrosis ex vivo. Carcinogenesis 20:1035–1041.
Curhan GC, Willett WC, Rimm EB, Stampfer MJ. 1996. A prospective study of theintake of vitamins C and B6, and the risk of kidney stones in men. J Urol155:1847–1851.
Curhan GC, Willett WC, Speizer FE, Stampfer MJ. 1999. Intake of vitamins B6 andC and the risk of kidney stones in women. J Am Soc Nephrol 10:840–845.
Dabrowski K. 1990. Gastro-intestinal circulation of ascorbic acid. Comp Biochem Phys-iol 95A:481–486.
Dallongeville J, Marécaux N, Fruchart J-C, Amouyel P. 1998. Cigarette smoking isassociated with unhealthy patterns of nutrient intake: A meta-analysis. J Nutr128:1450–1457.
Davies HE, Davies JE, Hughes RE, Jones E. 1984. Studies on the absorption of L-xyloascorbic acid (vitamin C) in young and elderly subjects. Hum Nutr ClinNutr 38C:463–471.
Davies HE, Gruffudd S, Hughes RE, Jones E. 1987. Ascorbic acid and carnitine inman. Nutr Report Int 36:941–948.
DeCosse JJ, Adams MB, Kuzma JF, LoGerfo P, Condon RE. 1975. Effect of ascorbicacid on rectal polyps of patients with familial polyposis. Surgery 78:608–612.
Delafuente JC, Prendergast JM, Modigh A. 1986. Immunologic modulation by vita-min C in the elderly. Int J Immunopharmacol 8:205–211.
Delamere NA. 1996. Ascorbic acid and the eye. Subcell Biochem 25:313–329.Devaraj S, Jialal I. 1996. Oxidized low-density lipoprotein and atherosclerosis. Int J
Clin Lab Res 26:178–184.Dewey KG, Finley DA, Lonnerdal B. 1984. Breast milk volume and composition
during late lactation (7–20 months). J Pediatr Gastroenterol Nutr 3:713–720.Drake IM, Davies MJ, Mapstone NP, Dixon MF, Schorah CJ, White KLM, Chalmers
DM, Axon ATR. 1996. Ascorbic acid may protect against human gastric cancerby scavenging mucosal oxygen radicals. Carcinogenesis 17:559–562.
Copyright © National Academy of Sciences. All rights reserved.
VITAMIN C 171
Duthie SJ, Ma A, Ross MA, Collins AR. 1996. Antioxidant supplementation de-creases oxidative DNA damage in human lymphocytes. Cancer Res 56:1291–1295.
Dyke GW, Craven JL, Hall R, Garner RC. 1994a. Effect of vitamin C supplementa-tion on gastric mucosal DNA damage. Carcinogenesis 15:291–295.
Dyke GW, Craven JL, Hall R, Garner RC. 1994b. Effect of vitamin C upon gastricmucosal O6-alkyltransferase activity and on gastric vitamin C levels. Cancer Lett86:159–165.
Eichholzer M, Stahelin HB, Gey KF. 1992. Inverse correlation between essentialantioxidants in plasma and subsequent risk to develop cancer, ischemic heartdisease and stroke respectively: 12-year follow-up of the Prospective BaselStudy. Exp Suppl 62:398–410.
Ekvall S, Chen IW, Bozian R. 1981. The effect of supplemental ascorbic acid onserum vitamin B12 levels in myelomenigocele patients. Am J Clin Nutr 34:1356–1361.
Elneihoum AM, Falke P, Hedblad B, Lindgarde F, Ohlsson K. 1997. Leukocyteactivation in atherosclerosis: Correlation with risk factors. Atherosclerosis 131:79–84.
Englard S, Seifter S. 1986. The biochemical functions of ascorbic acid. Annu RevNutr 6:365–406.
Enstrom JE, Kanim LE, Breslow L. 1986. The relationship between vitamin C in-take, general health practices, and mortality in Alameda County, California.Am J Pub Hlth 76:1124–1130.
Enstrom JE, Kanim LE, Klein MA. 1992. Vitamin C intake and mortality among asample of the United States population. Epidemiology 3:194–202.
Erdman JW Jr, Klein BP. 1982. The influence of harvesting, processing, and cook-ing on vitamin C in foods. In: Seib PA, Tolbert BM, eds. Ascorbic Acid: Chemis-try, Metabolism and Uses. Washington, DC: American Chemical Society. Pp. 499–532.
Evans RM, Currie L, Campbell A. 1982. The distribution of ascorbic acid betweenvarious cellular components of blood in normal individuals, and its relation tothe plasma concentration. Br J Nutr 47:473–482.
FDA (Food and Drug Adminstration). 1985. Nutrient requirements for infant for-mulas. Fed Regis 50:45106–45108.
Fellstrom B, Danielson BG, Karlstrom B, Lithell H, Ljunghall S, Vessby B. 1989.Dietary habits in renal stone patients compared with healthy subjects. Br J Urol63:575–580.
Fishbaine B, Butterfield G. 1984. Ascorbic acid status of running and sedentarymen. Int J Vitam Nutr Res 54:273.
Fituri N, Allawi N, Bentley M, Costello J. 1983. Urinary and plasma oxalate duringingestion of pure ascorbic acid: A re-evaluation. Eur Urol 9:312–315.
Flodin NW. 1988. Pharmacology of Micronutrients. New York: Alan R. Liss. Pp. 201–244.
Fontham ET. 1994. Vitamin C, vitamin C-rich foods, and cancer: Epidemiologicstudies. In: Frei B, ed. Natural Antioxidants in Human Health and Disease. SanDiego: Academic Press. Pp. 157–197.
Fontham ET, Pickle LW, Haenszel W, Correa P, Lin YP, Falk RT. 1988. Dietaryvitamins A and C and lung cancer risk in Louisiana. Cancer 62:2267–2273.
Fraga CG, Motchnik PA, Shigenaga MK, Helbock HJ, Jacob RA, Ames BN. 1991.Ascorbic acid protects against endogenous oxidative DNA damage in humansperm. Proc Natl Acad Sci USA 88:11003–11006.
Copyright © National Academy of Sciences. All rights reserved.
172 DIETARY REFERENCE INTAKES
Frei B, Stocker R, Ames BN. 1988. Antioxidant defenses and lipid peroxidation inhuman blood plasma. Proc Natl Acad Sci USA 85:9748–9752.
Frei B, England L, Ames BN. 1989. Ascorbate is an outstanding antioxidant inhuman blood plasma. Proc Natl Acad Sci USA 86:6377–6381.
Frei B, Forte TM, Ames BN, Cross CE. 1991. Gas phase oxidants of cigarette smokeinduce lipid peroxidation and changes in lipoprotein properties in humanblood plasma. Protective effects of ascorbic acid. Biochem J 277:133–138.
Freudenheim JL, Graham S, Marshall JR, Haughey BP, Wilkinson G. 1990. A case-control study of diet and rectal cancer in western New York. Am J Epidemiol131:612–624.
Fuller CJ, Grundy SM, Norkus EP, Jialal I. 1996. Effect of ascorbate supplementa-tion on low density lipoprotein oxidation in smokers. Atherosclerosis 119:139–150.
Gale CR, Martyn CN, Winter PD, Cooper C. 1995. Vitamin C and risk of deathfrom stroke and coronary heart disease in cohort of elderly people. Br Med J310:1563–1566.
Garry PJ, Goodwin JS, Hunt WC, Gilbert BA. 1982. Nutritional status in a healthyelderly population: Vitamin C. Am J Clin Nutr 36:332–339.
Garry PJ, Vanderjagt DJ, Hunt WC. 1987. Ascorbic acid intakes and plasma levels inhealthy elderly. Ann NY Acad Sci 498:90–99.
George DR, De Francesca BA. 1989. Human milk in comparison to cow milk. In:Lebenthal E, ed. Textbook of Gastroenterology and Nutrition in Infancy and Child-hood, 2nd edition. New York: Raven Press. Pp. 242–243.
Gey KF. 1995. Ten-year retrospective on the antioxidant hypothesis of arterioscle-rosis: Threshold plasma levels of antioxidant micronutrients related to mini-mum cardiovascular risk. Nutr Biochem 6:206–236.
Gey KF. 1998. Vitamins E plus C and interacting conutrients required for optimalhealth. A critical and constructive review of epidemiology and supplementa-tion data regarding cardiovascular disease and cancer. Biofactors 7:113–174.
Gey KF, Stahelin HB, Eichholzer M. 1993. Poor plasma status of carotene andvitamin C is associated with higher mortality from ischemic heart disease andstroke: Basel Prospective Study. Clin Invest 71:3–6.
Ghadirian P, Boyle P, Simard A, Baillargeon J, Maisonneuve P, Perret C. 1991.Reported family aggregation of pancratic cancer within a population-basedcase-control study in the francophone community in Montreal, Canada. Int JPancreatol 10:183–196.
Giunta JL. 1983. Dental erosion resulting from chewable vitamin C tablets. J AmDent Assoc 107:253–256.
Gogel HK, Tandberg D, Strickland RG. 1989. Substances that interfere with guaiaccard tests: Implications for gastric aspirate testing. Am J Emerg Med 7:474–480.
Goldsmith GA. 1961. Human requirements for vitamin C and its use in clinicalmedicine. Ann NY Acad Sci 92:230–245.
Gosiewska A, Mahmoodian F, Peterkofsky B. 1996. Gene expression of iron-relatedproteins during iron deficiency caused by scurvy in guinea pigs. Arch BiochemBiophys 325:295–303.
Graham S, Zielezny M, Marshall J, Priore R, Freudenheim J, Brasure J, Haughey B,Nasca P, Zdeb M. 1992. Diet in the epidemiology of postmenopausal breastcancer in the New York State Cohort. Am J Epidemiol 136:1327–1337.
Green MHL, Lowe JE, Waugh APW, Aldridge KE, Cole J, Arlett CF. 1994. Effect ofdiet and vitamin C on DNA strand breakage in freshly-isolated human whiteblood cells. Mutat Res 316:91–102.
Copyright © National Academy of Sciences. All rights reserved.
VITAMIN C 173
Greenberg ER, Baron JA, Tosteson TD, Freeman DH, Beck GJ, Bond JH, Colac-chio TA, Coller JA, Frankl HD, Haile RW, Mandel JS, Nierenberg DW, Roth-stein R, Snover DC, Stevens MM, Summers RW, van Stolk RU. 1994. A clinicaltrial of antioxidant vitamins to prevent colorectal adenoma. N Engl J Med331:141–147.
Gutteridge JMC. 1991. Plasma ascorbate levels and inhibition of the antioxidantactivity of caeruloplasmin. Clin Sci 81:413–417.
Hallberg L. 1985. The role of vitamin C in improving the critical iron balancesituation in women. Int J Vitam Nutr Res 27:177–187.
Halliwell B.1998. Can oxidative DNA damage be used as a biomarker of cancer riskin humans? Free Radic Res 29:469–486.
Halliwell B, Whiteman M. 1997. Antioxidant and prooxidant properties of vitaminC. In: Packer L, Fuchs J, eds. Vitamin C in Health and Disease. New York: MarcelDekker. Pp. 59–73.
Halliwell B, Wasil M, Grootveld M. 1987. Biologically significant scavenging of themyeloperoxidase-derived oxidant hypochlorous acid by ascorbic acid. FEBSLett 213:15–17.
Halpner AD, Handelman GJ, Belmont CA, Harris JM, Blumberg JB. 1998. Protec-tion by vitamin C of oxidant-induced loss of vitamin E in rat hepatocytes. JNutr Biochem 9:355–359.
Hankinson SE, Stampfer MJ, Seddon JM, Colditz GA, Rosner B, Speizer FE, WillettWC. 1992. Nutrient intake and cataract extraction in women: A prospectivestudy. Br Med J 305:335–339.
Harats D, Ben-Naim M, Dabach Y, Hollander G, Havivi E, Stein O, Stein Y. 1990.Effect of vitamin C and E supplementation on susceptibility of plasma lipopro-teins to peroxidation induced by acute smoking. Atherosclerosis 85:47–54.
Harats D, Chevion S, Nahir M, Norman Y, Sagee O, Berry EM. 1998. Citrus fruitsupplementation reduces lipoprotein oxidation in young men ingesting a diethigh in saturated fat: Presumptive evidence for an interaction between vita-mins C and E in vivo. Am J Clin Nutr 67:240–245.
Harris ED, Percival SS. 1991. A role for ascorbic acid in copper transport. Am J ClinNutr 54:1193S–1197S.
Hartz SC, Russell RM, Rosenberg IH. 1992. Nutrition in the Elderly. The Boston Nutri-tional Status Survey. London: Smith-Gordon. P. 38.
Haslam RH, Dalby JT, Rademaker AW. 1984. Effects of megavitamin therapy onchildren with attention deficit disorders. Pediatrics 74:103–111.
Hatch GE. 1995. Asthma, inhaled oxidants, and dietary antioxidants. Am J ClinNutr 61:625S–630S.
Hatch M, Mulgrew S, Bourke E, Keogh B, Costello J. 1980. Effect of megadoses ofascorbic acid on serum and urinary oxalate. Eur Urol 6:166–169.
Hazell LJ, Arnold L, Flowers D, Waeg G, Malle E, Stocker R. 1996. Presence ofhypochlorite-modified proteins in human atherosclerotic lesions. J Clin Invest97:1535–1544.
Heinecke JW. 1997. Pathways for oxidation of low density lipoprotein by myeloper-oxidase: Tyrosyl radical, reactive aldehydes, hypochlorous acid and molecularchlorine. BioFactors 6:145–155.
Heinig MJ, Nommsen LA, Peerson JM, Lonnerdal B, Dewey KG. 1993. Energy andprotein intakes of breast-fed and formula-fed infants during the first year oflife and their association with growth velocity: The DARLING Study. Am J ClinNutr 58:152–161.
Copyright © National Academy of Sciences. All rights reserved.
174 DIETARY REFERENCE INTAKES
Heitzer T, Just H, Munzel T. 1996. Antioxidant vitamin C improves endothelialdysfunction in chronic smokers. Circulation 94:6–9.
Heller R, Munscher-Paulig F, Grabner R, Till U. 1999. L-Ascorbic acid potentiatesnitric oxide synthesis in endothelial cells. J Biol Chem 274:8254–8260.
Hemila H. 1996. Vitamin C, the placebo effect, and the common cold: A case studyof how preconceptions influence the analysis of results. J Clin Epidemiol 49:1079–1084.
Hemila H. 1997. Vitamin C intake and susceptibility to the common cold. Br J Nutr77:59–72.
Hemila H, Herman ZS. 1995. Vitamin C and the common cold: A retrospectiveanalysis of Chalmers’ review. J Am Coll Nutr 14:116–123.
Henning SM, Zhang JZ, McKee RW, Swendseid ME, Jacob RA. 1991. Glutathioneblood levels and other oxidant defense indices in men fed diets low in vitaminC. J Nutr 121:1969–1975.
Herbert V. 1978. Risk of oxalate stones from large doses of vitamin C. N Engl J Med298:856.
Herbert V. 1995. Vitamin C supplements and disease—Counterpoint. J Am CollNutr 14:112–113.
Herbert V, Jacob E. 1974. Destruction of vitamin B12 by ascorbic acid. J Am MedAssoc 230:241–242.
Hevia P, Omaye ST, Jacob RA. 1990. Urinary hydroxyproline excretion and vita-min C status in healthy young men. Am J Clin Nutr 51:644–648.
Hinds MW, Kolonel LN, Hankin JH, Lee J. 1984. Dietary vitamin A, carotene,vitamin C and risk of lung cancer in Hawaii. Am J Epidemiol 119:227–237.
Hoffer A. 1971. Ascorbic acid and toxicity. N Engl J Med 285:635–636.Hoffer A. 1973. Vitamin C and infertility. Lancet 2:1146.Hofstad B, Almendingen K, Vatn M, Andersen S, Owen R, Larsen S, Osnes M.
1998. Growth and recurrence of colorectal polyps: A double-blind 3-year inter-vention with calcium and antioxidants. Digestion 59:148–156.
Hogenkamp HP. 1980. The interaction between vitamin B12 and vitamin C. Am JClin Nutr 33:1–3.
Hornig B, Arakawa N, Kohler C, Drexler H. 1998. Vitamin C improves endothelialfunction of conduit arteries in patients with chronic heart failure. Circulation97:363–368.
Hornig D. 1975. Distribution of ascorbic acid, metabolites and analogues in manand animals. Ann NY Acad Sci 258:103–118.
Hornig DH, Moser U. 1981. The safety of high vitamin C intakes in man. In:Counsell JN, Hornig DH, eds. Vitamin C (Ascorbic Acid). London: AppliedScience. Pp. 225–248.
Horrobin DF. 1996. Ascorbic acid and prostaglandin synthesis. Subcell Biochem25:109–115.
Howe GR, Hirohata T, Hislop TG, Iscovich JM, Yuan JM, Katsouyanni K, Lubin F,Marubini E, Modan B, Rohan T. 1990. Dietary factors and risk of breast can-cer: Combined analysis of 12 case-control studies. J Natl Cancer Inst 82:561–569.
Howe GR, Ghadirian P, Bueno de Mesquita HB, Zatonski WA, Baghurst PA, MillerAB, Simard A, Baillargeon J, de Waard F, Przewozniak K. 1992. A collaborativecase-control study of nutrient intake and pancreatic cancer within the searchprogramme. Int J Cancer 51:365–372.
Hoyt CJ. 1980. Diarrhea from vitamin C. J Am Med Assoc 244:1674.
Copyright © National Academy of Sciences. All rights reserved.
VITAMIN C 175
Hughes C, Dutton S, Truswell AS. 1981. High intakes of ascorbic acid and urinaryoxalate. J Hum Nutr 35:274–280.
Hunt JR, Gallagher SK, Johnson LK. 1994. Effect of ascorbic acid on apparent ironabsorption by women with low iron stores. Am J Clin Nutr 59:1381–1385.
Hunter DJ, Manson JE, Colditz GA, Stampfer MJ, Rosner B, Hennekens CH, Speiz-er FE, Willett WC. 1993. A prospective study of the intake of vitamins C, E, andA and the risk of breast cancer. N Engl J Med 329:234–240.
IOM (Institute of Medicine). 1991. Nutrition During Lactation. Washington, DC:National Academy Press. P. 179.
Itoh R, Yamada K, Oka J, Echizen H, Murakami K. 1989. Sex as a factor in levels ofserum ascorbic acid in a healthy elderly population. Int J Vitam Nutr Res 59:365–372.
Jacob RA. 1995. The integrated antioxidant system. Nutr Res 15:755–766.Jacob RA. 1999. Vitamin C. In: Shils ME, Olson JA, Shike M, Ross AC, eds. Modern
Nutrition in Health and Disease, 9th edition. Baltimore, MD: Williams & Wilkins.Pp. 467–483.
Jacob RA, Pianalto FS. 1997. Urinary carnitine excretion increases during experi-mental vitamin C depletion of healthy men. J Nutr Biochem 8:265–269.
Jacob RA, Skala JH, Omaye ST. 1987a. Biochemical indices of human vitamin Cstatus. Am J Clin Nutr 46:818–826.
Jacob RA, Skala JH, Omaye ST, Turnlund JR. 1987b. Effect of varying ascorbic acidintakes on copper absorption and ceruloplasmin levels of young men. J Nutr117:2109–2115.
Jacob RA, Otradovec CL, Russell RM, Munro HN, Hartz SC, McGandy RB, MorrowFD, Sadowski JA. 1988. Vitamin C status and nutrient interactions in a healthyelderly population. Am J Clin Nutr 48:1436–1442.
Jacob RA, Kelley DS, Pianalto FS, Swendseid ME, Henning SM, Zhang JZ, AmesBN, Fraga CG, Peters JH. 1991. Immunocompetence and oxidant defenseduring ascorbate depletion of healthy men. Am J Clin Nutr 54:1302S–1309S.
Jacob RA, Pianalto FS, Agee RE. 1992. Cellular ascorbate depletion in healthymen. J Nutr 122:1111–1118.
Jacob RA, Kutnink MA, Csallany AS, Daroszewska M, Burton GW. 1996. Vitamin Cnutriture has little short-term effect on vitamin E concentrations in healthywomen. J Nutr 126:2268–2277.
Jacques PF, Chylack LT Jr. 1991. Epidemiologic evidence of a role for the antioxi-dant vitamins and carotenoids in cataract prevention. Am J Clin Nutr 53:352S–355S.
Jacques PF, Taylor A, Hankinson SE, Willett WC, Mahnken B, Lee Y, Vaid K, LahavM. 1997. Long-term vitamin C supplement use and prevalence of early age-related lens opacities. Am J Clin Nutr 66:911–916.
Jaffe RM, Kasten B, Young DS, MacLowry JD. 1975. False-negative stool occultblood tests caused by ingestion of ascorbic acid (vitamin C). Ann Intern Med83:824–826.
Jama JW, Launer LJ, Witteman JC, den Breeijen JH, Breteler MM, Grobbee DE,Hofman A. 1996. Dietary antioxidants and cognitive function in a population-based sample of older persons. The Rotterdam Study. Am J Epidemiol 144:275–280.
Jariwalla RJ, Harakeh S. 1996. Antiviral and immunomodulatory activities of ascor-bic acid. Subcell Biochem 25:213–231.
Jarvinen R, Knekt P, Seppanen R, Teppo L. 1997. Diet and breast cancer risk in acohort of Finnish women. Cancer Lett 114:251–253.
Copyright © National Academy of Sciences. All rights reserved.
176 DIETARY REFERENCE INTAKES
Jendryczko A, Tomala J. 1995. The total free radical trapping ability of blood plas-ma in eclampsia. Zentralbl Gynakol 117:126–129.
Jha P, Flather M, Lonn E, Farkouh M, Yusuf S. 1995. The antioxidant vitamins andcardiovascular disease. A critical review of epidemiologic and clinical trial data.Ann Intern Med 123:860–872.
Jialal I, Devaraj S. 1996. The role of oxidized low density lipoprotein in atherogen-esis. J Nutr 126:1053S–1057S.
Jialal I, Grundy SM. 1991. Preservation of the endogenous antioxidants in lowdensity lipoprotein by ascorbate but not probucol during oxidative modifica-tion. J Clin Invest 87:597–601.
Jialal I, Vega GL, Grundy SM. 1990. Physiologic levels of ascorbate inhibit theoxidative modification of low density lipoprotein. Atherosclerosis 82:185–191.
Johnston CS. 1991. Complement component C1q unaltered by ascorbate supple-mentation in healthy men and women. J Nutr Biochem 2:499–501.
Johnston CS. 1999. Biomarkers for establishing a tolerable upper intake level forvitamin C. Nutr Rev 57:71–77.
Johnston CS, Luo B. 1994. Comparison of the absorption and excretion of threecommercially available sources of vitamin C. J Am Diet Assoc 94:779–781.
Johnston CS, Thompson LL. 1998. Vitamin C status of an outpatient population. JAm Coll Nutr 17:366–370.
Johnston CS, Martin LJ, Cai X. 1992. Antihistamine effect of supplemental ascor-bic acid and neutrophil chemotaxis. J Am Coll Nutr 11:172–176.
Johnston CS, Meyer CG, Srilakshmi JC. 1993. Vitamin C elevates red blood cellglutathione in healthy adults. Am J Clin Nutr 58:103–105.
Johnston CS, Solomon E, Corte C. 1996. Vitamin C depletion is associated withalterations in blood histamine and plasma free carnitine in adults. J Am CollNutr 15:586–591.
Kallner A, Hartmann D, Hornig D. 1979. Steady-state turnover and body pool ofascorbic acid in man. Am J Clin Nutr 32:530–539.
Kallner AB, Hartmann D, Hornig DH. 1981. On the requirements of ascorbic acidin man: Steady-state turnover and body pool in smokers. Am J Clin Nutr 34:1347–1355.
Karra MV, Udipi SA, Kirksey A, Roepke JL. 1986. Changes in specific nutrients inbreast milk during extended lactation. Am J Clin Nutr 43:495–503.
Katsuki H. 1996. Vitamin C and nervous tissue: In vivo and in vitro aspects. SubcellBiochem 25:293–311.
Keith RE. 1994. Vitamins and physical activity. In: Wolinsky I, Hickson JF, eds.Nutrition in Exercise and Sport, 2nd edition. Boca Raton, FL: CRC Press. Pp.159–183.
Kelly FJ, Mudway I, Blomberg A, Frew A, Sandstrom T. 1999. Altered lung antioxi-dant status in patients with mild asthma. Lancet 354:482–483.
Kennes B, Dumont I, Brohee D, Hubert C, Neve P. 1983. Effect of vitamin Csupplements on cell-mediated immunity in old people. Gerontology 29:305–310.
Knekt P, Jarvinen R, Seppanen R, Rissanen A, Aromaa A, Heinonen OP, AlbanesD, Heinonen M, Pukkala E, Teppo L. 1991. Dietary antioxidants and the riskof lung cancer. Am J Epidemiol 134:471–479.
Knekt P, Reunanen A, Jarvinen R, Seppanen R, Heliovaara M, Aromaa A. 1994.Antioxidant vitamin intake and coronary mortality in a longitudinal popula-tion study. Am J Epidemiol 139:1180–1189.
Copyright © National Academy of Sciences. All rights reserved.
VITAMIN C 177
Kritchevsky SB, Shimakawa T, Tell G, Dennis B, Carpenter M, Eckfeldt JH, Peach-er-Ryan H, Heiss G. 1995. Dietary antioxidants and carotid artery wall thick-ness. The ARIC Study. Circulation 92:2142–2150.
Kushi LH, Fee RM, Sellers TA, Zheng W, Folsom AR. 1996a. Intake of vitamins A,C, and E and postmenopausal breast cancer. The Iowa Women’s Health Study.Am J Epidemiol 144:165–174.
Kushi LH, Folsom AR, Prineas RJ, Mink PJ, Wu Y, Bostick RM. 1996b. Dietaryantioxidant vitamins and death from coronary heart disease in postmenopaus-al women. N Engl J Med 334:1156–1162.
Lamden MP, Chrystowski GA. 1954. Urinary oxalate excretion by man followingascorbic acid ingestion. Proc Soc Exp Biol Med 85:190–192.
Laudicina DC, Marnett LJ. 1990. Enhancement of hydroperoxide-dependent lipidperoxidation in rat liver microsomes by ascorbic acid. Arch Biochem Biophys278:73–80.
Leaf CD, Vecchio AJ, Roe DA, Hotchkiss JH. 1987. Influence of ascorbic acid doseon N-nitrosoproline formation in humans. Carcinogenesis 8:791–795.
Leggott PJ, Robertson PB, Rothman DL, Murray PA, Jacob RA. 1986. The effect ofcontrolled ascorbic acid depletion and supplementation on periodontalhealth. J Periodontol 57:480–485.
Leggott PJ, Robertson PB, Jacob RA, Zambon JJ, Walsh M, Armitage GC. 1991.Effects of ascorbic acid depletion and supplementation on periodontal healthand subgingival microflora in humans. J Dent Res 70:1531–1536.
Lehr HA, Weyrich AS, Saetzler RK, Jurek A, Arfors KE, Zimmerman GA, PrescottSM, McIntyre TM. 1997. Vitamin C blocks inflammatory platelet-activatingfactor mimetics created by cigarette smoking. J Clin Invest 99:2358–2364.
Le Marchand L, Yoshizawa CN, Kolonel LN, Hankin JH, Goodman MT. 1989.Vegetable consumption and lung cancer risk: A population-based case-controlstudy in Hawaii. J Natl Cancer Inst 81:1158–1164.
Lenton KJ, Therriault H, Fulop T, Payette H, Wagner JR. 1999. Glutathione andascorbate are negatively correlated with oxidative DNA damage in humanlymphocytes. Carcinogenesis 20:607–613.
Leske MC, Chylack LT Jr, Wu SY. 1991. The Lens Opacities Case-Control Study.Risk factors for cataract. Arch Ophthalmol 109:244–251.
Levine GN, Frei B, Koulouris SN, Gerhard MD, Keaney JF Jr, Vita JA. 1996. Ascor-bic acid reverses endothelial vasomotor dysfunction in patients with coronaryartery disease. Circulation 93:1107–1113.
Levine M, Dhariwal KR, Wang Y, Park JB, Welch RW. 1994. Ascorbic acid in neu-trophils. In: Frei B, ed. Natural Antioxidants in Health and Disease. San Diego:Academic Press. Pp. 469–488.
Levine M, Conry-Cantilena C, Wang Y, Welch RW, Washko PW, Dhariwal KR, ParkJB, Lazarev A, Graumlich JF, King J, Cantilena LR. 1996a. Vitamin C pharma-cokinetics in healthy volunteers: Evidence for a recommended dietary allow-ance. Proc Natl Acad Sci USA 93:3704–3709.
Levine M, Rumsey S, Wang Y, Park J, Kwon O, Xu W, Amano N. 1996b. Vitamin C.In: Ziegler EE, Filer LJ Jr, eds. Present Knowledge in Nutrition, 7th edition. Wash-ington, DC: ILSI Press. Pp. 146–159.
Levy R, Shriker O, Porath A, Riesenberg K, Schlaeffer F. 1996. Vitamin C for thetreatment of recurrent furunculosis in patients with impaired neutrophil func-tions. J Infect Dis 173:1502–1505.
Copyright © National Academy of Sciences. All rights reserved.
178 DIETARY REFERENCE INTAKES
Loft S, Vistisen K, Ewertz M, Tjonneland A, Overvad K, Poulsen HE. 1992. Oxida-tive DNA damage estimated by 8-hydroxydeoxyguanosine excretion in hu-mans: Influence of smoking, gender and body mass index. Carcinogenesis 13:2241–2247.
Losonczy KG, Harris TB, Havlik RJ. 1996. Vitamin E and vitamin C supplement useand risk of all-cause and coronary heart disease mortality in older persons:The Established Populations for Epidemiologic Studies of the Elderly. Am JClin Nutr 64:190–196.
Løvstad RA. 1997. A study on ascorbate inhibition of ceruloplasmin ferroxidaseactivity. BioMetals 10:123–126.
LSRO/FASEB (Life Sciences Research Office/ Federation of American Societiesfor Experimental Biology). 1989. Nutrition Monitoring in the United States: AnUpdate Report on Nutrition Monitoring. Prepared for the U.S. Department ofAgriculture and the U.S. Department of Health and Human Services. DHHSPublication No. (PHS) 89-1255. Washington, DC: U.S. Government PrintingOffice.
Ludvigsson J, Hansson LO, Tibbling G. 1977. Vitamin C as a preventive medicineagainst common colds in children. Scand J Infect Dis 9:91–98.
Ludvigsson J, Hansson LO, Stendahl O. 1979. The effect of large doses of vitaminC on leukocyte function and some laboratory parameters. Int J Vitam Nutr Res49:160–165.
Lunec J, Blake DR. 1985. The determination of dehydroascorbic acid and ascorbicacid in the serum and synovial fluid of patients with rheumatoid arthritis. FreeRadic Res Commun 1:31–39.
Lykkesfeldt J, Loft S, Nielsen JB, Poulsen HE. 1997. Ascorbic acid and dehydro-ascorbic acid as biomarkers of oxidative stress caused by smoking. Am J ClinNutr 65:959–963.
Lykkesfeldt J, Christen S, Wallock LM, Change HH, Jacob RA, Ames BN. 2000.Ascorbate is depleted by smoking and repleted by moderate supplementation:A study in male smokers and nonsmokers with matched dietary antioxidantintakes. Am J Clin Nutr 71:530–536.
Mangels AR, Block G, Frey CM, Patterson BH, Taylor PR, Norkus EP, LevanderOA. 1993. The bioavailability to humans of ascorbic acid from oranges, or-ange juice and cooked broccoli is similar to that of synthetic ascorbic acid. JNutr 123:1054–1061.
Mannick EE, Bravo LE, Zarama G, Realpe JL, Zhang XJ, Ruiz B, Fontham ETH,Mera R, Miller MJS, Correa P. 1996. Inducible nitric oxide synthase, nitroty-rosine, and apoptosis in Helicobacter pylori gastritis: Effect of antibiotics andantioxidants. Cancer Res 56:3238–3243.
Marangon K, Herbeth B, Artur Y, Esterbauer H, Siest G. 1997. Low and very lowdensity lipoprotein composition and resistance to copper-induced oxidationare not notably modified in smokers. Clin Chim Acta 265:1–12.
Marangon K, Herbeth B, Lecomte E, Paul-Dauphin A, Grolier P, Chancerelle Y,Artur Y. 1998. Diet, antioxidant status, and smoking habits in French men. AmJ Clin Nutr 67: 231–239.
May JM, Cobb CE, Mendiratta S, Hill KE, Burk RF. 1998. Reduction of the ascorbylfree radical to ascorbate by thioredoxin reductase. J Biol Chem 273:23039–23045.
May JM, Mendiratta S, Qu ZC, Loggins E. 1999. Vitamin C recycling and functionin human monocytic U-937 cells. Free Radic Biol Med 26:1513–1523.
Copyright © National Academy of Sciences. All rights reserved.
VITAMIN C 179
McKeown-Eyssen G, Holloway C, Jazmaji V, Bright-See E, Dion P, Bruce WR. 1988.A randomized trial of vitamins C and E in the prevention of recurrence ofcolorectal polyps. Cancer Res 48:4701–4705.
McLaran CJ, Bett JHN, Nye JA, Halliday JW. 1982. Congestive cardiomyopathy andhaemochromatosis—Rapid progression possibly accelerated by excessive in-gestion of ascorbic acid. Aust NZ J Med 12:187–188.
Melethil S, Mason WD, Chang C-J. 1986. Dose-dependent absorption and excre-tion of vitamin C in humans. Int J Pharmaceut 31:83–89.
Mentzer WC, Collier E. 1975. Hydrops fetalis associated with erythrocyte G-6-PDdeficiency and maternal ingestion of fava beans and ascorbic acid. J Pediatr86:565–567.
Metz J, Hundertmark U, Pevny I. 1980. Vitamin C allergy of the delayed type.Contact Dermatitis 6:172–174.
Millar J. 1995. The nitric oxide/ascorbate cycle: How neurones may control theirown oxygen supply. Med Hypoth 45:21–26.
Miller JZ, Nance WE, Norton JA, Wolen RL, Griffith RS, Rose RJ. 1977. Therapeu-tic effect of vitamin C. A co-twin control study. J Am Med Assoc 237:248–251.
Mirvish SS. 1994. Experimental evidence for inhibition of N-nitroso compoundformation as a factor in the negative correlation between vitamin C consump-tion and the incidence of certain cancers. Cancer Res 54:1948S–1951S.
Mitch WE, Johnson MW, Kirshenbaum JM, Lopez RE. 1981. Effect of large oraldoses of ascorbic acid on uric acid excretion by normal subjects. Clin PharmcolTher 29:318–321.
Montalto MB, Benson JD, Martinez GA. 1985. Nutrient intakes of formula-fed in-fants and infants fed cow’s milk. Pediatrics 75:343–351.
Morrow JD, Frei B, Longmire AW, Gaziano JM, Lynch SM, Shyr Y, Strauss WE,Oates JA, Roberts LJ II. 1995. Increase in circulating products of lipid peroxi-dation (F2-isoprostanes) in smokers. N Engl J Med 332:1198–1203.
Morse EH, Clark RP, Keyser DE, Merrow SB, Bee DE. 1975. Comparison of thenutritional status of pregnant adolescents with adult pregnant women. I. Bio-chemical findings. Am J Clin Nutr 28:1000–1013.
Moser U. 1987. Uptake of ascorbic acid by leukocytes. Ann NY Acad Sci 498:200–215.
Moss AJ, Levy AS, Kim I, Park YK. 1989. Use of Vitamin and Mineral Supplements in theUnited States: Current Users, Types of Products, and Nutrients. Advance Data, Vitaland Health Statistics of the National Center for Health Statistics. Number 174.Hyattsville, MD: National Center for Health Statistics. Pp. 1–19.
Motoyama T, Kawano H, Kugiyama K, Hirashima O, Ohgushi M, Yoshimura M,Ogawa H, Yasue H. 1997. Endothelium-dependent vasodilation in the brachialartery is impaired in smokers: Effect of vitamin C. Am J Physiol 273:H1644–H1650.
Mudway IS, Krishna MT, Frew AJ, MacLeod D, Sandstrom T, Holgate ST, Kelly FJ.1999. Compromised concentrations of ascorbate in fluid lining the respiratorytract in human subjects after exposure to ozone. Occup Environ Med 56:473–481.
Mulholland CW, Strain JJ, Trinick TR. 1996. Serum antioxidant potential, andlipoprotein oxidation in female smokers following vitamin C supplementa-tion. Int J Food Sci Nutr 47:227–231.
Naidoo D, Lux O. 1998. The effect of vitamin C and E supplementation on lipidand urate oxidation products in plasma. Nutr Res 18:953–961.
Copyright © National Academy of Sciences. All rights reserved.
180 DIETARY REFERENCE INTAKES
Ness AR, Khaw KT, Bingham S, Day NE. 1996. Vitamin C status and respiratoryfunction. Eur J Clin Nutr 50:573–579.
Newmark HL, Scheiner MS, Marcus M, Prabhudesai M. 1976. Stability of vitaminB12 in the presence of ascorbic acid. Am J Clin Nutr 29:645–649.
Newton HM, Schorah CJ, Habibzadeh N, Morgan DB, Hullin RP. 1985. The causeand correction of low blood vitamin C concentrations in the elderly. Am J ClinNutr 42:656–659.
NRC (National Research Council). 1989. Recommended Dietary Allowances, 10th edi-tion. Washington, DC: National Academy Press.
Nyyssonen K, Parviainen MT, Salonen R, Tuomilehto J, Salonen JT. 1997a. Vita-min C deficiency and risk of myocardial infarction: Prospective populationstudy of men from eastern Finland. Br Med J 314:634–638.
Nyyssonen K, Poulsen HE, Hayn M, Agerbo P, Porkkala-Sarataho E, Kaikkonen J,Salonen R, Salonen JT. 1997b. Effect of supplementation of smoking menwith plain or slow release ascorbic acid on lipoprotein oxidation. Eur J ClinNutr 51:154–163.
Ocke MC, Bueno-de-Mesquita HB, Feskens EJ, van Staveren WA, Kromhout D.1997. Repeated measurements of vegetables, fruits, beta-carotene, and vita-mins C and E in relation to lung cancer. Am J Epidemiol 145:358–365.
Omaye ST, Skala JH, Jacob RA. 1986. Plasma ascorbic acid in adult males: Effectsof depletion and supplementation. Am J Clin Nutr 44:257–264.
Omaye ST, Schaus EE, Kutnink MA, Hawkes WC. 1987. Measurement of vitamin Cin blood components by high-performance liquid chromatography. Implica-tion in assessing vitamin C status. Ann NY Acad Sci 498:389–401.
Ono K. 1986. Secondary hyperoxalemia caused by vitamin C supplementation inregular hemodialysis patients. Clin Nephrol 26:239–243.
Oreopoulos DG, Lindeman RD, VanderJagt DJ, Tzamaloukas AH, Bhagavan HN,Garry PJ. 1993. Renal excretion of ascorbic acid: Effect of age and sex. J AmColl Nutr 12:537–542.
Ortega RM, Lopez-Sobaler AM, Quintas ME, Martinez RM, Andres P. 1998. Theinfluence of smoking on vitamin C status during the third trimester of preg-nancy and on vitamin C levels in maternal milk. J Am Coll Nutr 17:379–384.
O’Toole P, Lombard M. 1996. Vitamin C and gastric cancer: Supplements forsome or fruit for all? Gut 39:345–347.
Panayiotidis M, Collins AR. 1997. Ex vivo assessment of lymphocyte antioxidantstatus using the comet assay. Free Rad Res 27:533–537.
Pandey DK, Shekelle R, Selwyn BJ, Tangney C, Stamler J. 1995. Dietary vitamin Cand beta-carotene and risk of death in middle-aged men. The Western Elec-tric Study. Am J Epidemiol 142:1269–1278.
Panush RS, Delafuente JC, Katz P, Johnson J. 1982. Modulation of certain immu-nologic responses by vitamin C. III. Potentiation of in vitro and in vivo lym-phocyte responses. Int J Vitam Nutr Res Suppl 23:35–47.
Park JB, Levine M. 1996. Purification, cloning and expression of dehydroascorbicacid-reducing activity from human neutrophils: Identification as glutaredox-in. Biochem J 315:931–938.
Parkkinen J, Vaaranen O, Vahtera E. 1996. Plasma ascorbate protects coagulationfactors against photooxidation. Thromb Haemost 75:292–297.
Pelletier O. 1977. Vitamin C and tobacco. Int J Vitam Nutr Res Suppl 16:147–170.Perrig WJ, Perrig P, Stahelin HB. 1997. The relation between antioxidants and
memory performance in the old and very old. J Am Geriatr Soc 45:718–724.
Copyright © National Academy of Sciences. All rights reserved.
VITAMIN C 181
Peters EM, Goetzsche JM, Grobbelaar B, Noakes TD. 1993. Vitamin C supplemen-tation reduces the incidence of postrace symptoms of upper-respiratory-tractinfection in ultramarathon runners. Am J Clin Nutr 57:170–174.
Pfeffer F, Valdes-Ramos R, Avila-Rosas H, Meza C, Casanueva E. 1996. Iron, zincand vitamin C nutritional status is not related to weight gain in pregnantwomen. Nutr Res 16:555–564.
Phull PS, Price AB, White KL, Schorah CJ, Jacyna MR. 1999. Gastroduodenal mu-cosal vitamin-C levels in Helicobacter pylori infection. Scand J Gastroenterol 34:361–366.
Pirkle JL, Flegal KM, Bernert JT, Brody DJ, Etzel RA, Maurer KR. 1996. Exposureof the US population to environmental tobacco smoke: The Third NationalHealth and Nutrition Examination Survey, 1988 to 1991. J Am Med Assoc 275:1233–1240.
Podmore ID, Griffiths HR, Herbert KE, Mistry N, Mistry P, Lunec J. 1998. VitaminC exhibits pro-oxidant properties. Nature 392:559.
Pohl H, Reidy JA. 1989. Vitamin C intake influences the bleomycin-induced chro-mosome damage assay: Implications for detection of cancer susceptibility andchromosome breakage syndromes. Mutat Res 224:247–252.
Powers HJ, Loban A, Silvers K, Gibson AT. 1995. Vitamin C at concentrationsobserved in premature babies inhibits the ferroxidase activity of caeruloplas-min. Free Radic Res 22:57–65.
Prieme H, Loft S, Nyyssonen K, Salonen JT, Poulsen HE. 1997. No effect of supple-mentation with vitamin E, ascorbic acid, or coenzyme Q10 on oxidative DNAdamage estimated by 8-hydroxy-7,8-dihydro-2'-deoxyguanosine excretion insmokers. Am J Clin Nutr 65:503–507.
Pryor WA. 1992. Biological effects of cigarette smoke, wood smoke, and the smokefrom plastics: The use of electron spin resonance. Free Radic Biol Med 13:659–676.
Pryor WA. 1997. Cigarette smoke radicals and the role of free radicals in chemicalcarcinogenicity. Environ Hlth Perspect 105:875–882.
Pryor WA, Prier DG, Church DF. 1983. Electron-spin resonance study of main-stream and sidestream cigarette smoke: Nature of the free radicals in gas-phase smoke and in cigarette tar. Environ Hlth Perspect 47:345–355.
Rajalakshmi R, Deodhar AD, Ramarkrishnan CV. 1965. Vitamin C secretion duringlactation. Acta Paediatr Scand 54:375–382.
Rebouche CJ. 1995. Renal handling of carnitine in experimental vitamin C defi-ciency. Metabolism 44:1639–1643.
Rees DC, Kelsey H, Richards JDM. 1993. Acute haemolysis induced by high doseascorbic acid in glucose-6-phosphate dehydrogenase deficiency. Br Med J 306:841–842.
Rehman A, Collis CS, Yang M, Kelly M, Diplock AT, Halliwell B, Rice-Evans C.1998. The effects of iron and vitamin C co-supplementation on oxidative dam-age to DNA in healthy volunteers. Biochem Biophys Res Commun 246:293–298.
Reilly M, Delanty N, Lawson JA, Fitzgerald GA. 1996. Modulation of oxidant stressin vivo in chronic cigarette smokers. Circulation 94:19–25.
Rhead WJ, Schrauzer GN. 1971. Risks of long-term ascorbic acid overdosage. NutrRev 29:262–263.
Rifici VA, Khachadurian AK. 1993. Dietary supplementation with vitamins C and Einhibits in vitro oxidation of lipoproteins. J Am Coll Nutr 12:631–637.
Copyright © National Academy of Sciences. All rights reserved.
182 DIETARY REFERENCE INTAKES
Rimm EB, Stampfer MJ, Ascherio A, Giovannucci E, Colditz GA, Willett WC. 1993.Vitamin E consumption and the risk of coronary heart disease in men. N EnglJ Med 328:1450–1456.
Rivers, JM. 1987. Safety of high-level vitamin C ingestion. Ann NY Acad Sci 498:445–454.
Robertson JM, Donner AP, Trevithick JR. 1989. Vitamin E intake and risk of cata-racts in humans. Ann NY Acad Sci 570:372–382.
Rokitzki L, Hinkel S, Klemp C, Cufi D, Keul J. 1994. Dietary, serum and urineascorbic acid status in male athletes. Int J Sports Med 15:435–440.
Rokkas T, Papatheodorou G, Karameris A, Mavrogeorgis A, Kalogeropoulos N,Giannikos N. 1995. Helicobacter pylori infection and gastric juice vitamin C lev-els. Impact of eradication. Dig Dis Sci 40:615–621.
Romney SL, Duttagupta C, Basu J, Palan PR, Karp S, Slagle NS, Dwyer A, Wasser-theil-Smoller S, Wylie-Rosett J. 1985. Plasma vitamin C and uterine cervicaldysplasia. Am J Obstet Gynecol 151:976–980.
Ronchetti IP, Quaglino D Jr, Bergamini G. 1996. Ascorbic acid and connectivetissue. Subcell Biochem 25:249–264.
Rose RC, Richer SP, Bode AM. 1998. Ocular oxidants and antioxidant protection.Proc Soc Exp Biol Med 217:397–407.
Rumsey SC, Levine M. 1998. Absorption, transport, and disposition of ascorbicacid in humans. J Nutr Biochem 9:116–130.
Russell AL. 1967. Epidemiology of periodontal disease. Int Dent J 17:282–296.Sahyoun NR, Jacques PF, Russell RM. 1996. Carotenoids, vitamins C and E, and
mortality in an elderly population. Am J Epidemiol 144:501–511.Salmenpera L. 1984. Vitamin C nutrition during prolonged lactation: Optimal in
infants while marginal in some mothers. Am J Clin Nutr 40:1050–1056.Salonen JT, Salonen R, Nyyssonen K, Korpela H. 1992. Iron sufficiency is associat-
ed with hypertension and excess risk of myocardial infarction: The KuopioIschemic Heart Disease Risk Factor Study (KIHD). Circulation 85:864–876.
Samman S, Brown AJ, Beltran C, Singh S. 1997. The effect of ascorbic acid onplasma lipids and oxidisability of LDL in male smokers. Eur J Clin Nutr 51:472–477.
Sasaki A, Kondo K, Sakamoto Y, Kurata H, Itakura H, Ikeda Y. 1997. Smokingcessation increases the resistance of low-density lipoprotein to oxidation. Ath-erosclerosis 130:109–111.
Satarug S, Haswell-Elkins MR, Tsuda M, Mairiang P, Sithithaworn P, Mairiang E,Esumi H, Sukprasert S, Yongvanit P, Elkins DB. 1996. Thiocyanate-indepen-dent nitrosation in humans with carcinogenic parasite infection. Carcinogenesis17:1075–1081.
Sauberlich HE. 1994. Pharmacology of vitamin C. Annu Rev Nutr 14:371–391.Scaccini C, Jialal I. 1994. LDL Modification by activated polymorphonuclear leuko-
cytes: A cellular model of mild oxidative stress. Free Radic Biol Med 16:49–55.Schectman G, Byrd JC, Hoffmann R. 1991. Ascorbic acid requirements for smok-
ers: Analysis of a population survey. Am J Clin Nutr 53:1466–1470.Schmidt KH, Hagmaier V, Hornig DH, Vuilleumier JP, Rutishauser G. 1981. Uri-
nary oxalate excretion after large intakes of ascorbic acid in man. Am J ClinNutr 34:305–311.
Schrauzer GN, Rhead WJ. 1973. Ascorbic acid abuse: Effects on long-term inges-tion of excessive amounts on blood levels and urinary excretion. Int J VitamNutr Res 43:201–211.
Copyright © National Academy of Sciences. All rights reserved.
VITAMIN C 183
Schrauzer GN, Ishmael D, Kiefer GW. 1975. Some aspects of current vitamin Cusage: Diminished high-altitude resistance following overdosage. Ann NY AcadSci 258:377–381.
Schwartz J, Weiss ST. 1994. Relationship between dietary vitamin C intake andpulmonary function in the First National Health and Nutrition ExaminationSurvey (NHANES I). Am J Clin Nutr 59:110–114.
Schwarz KB, Cox J, Sharma S, Witter F, Clement L, Sehnert SS, Risby TH. 1995.Cigarette smoking is pro-oxidant in pregnant women regardless of antioxi-dant nutrient intake. J Nutr Environ Med 5:225–234.
Sharpe PC, MacAuley D, McCrum EE, Stott G, Evans AE, Mulholland C, BorehamCA, Duly E, Trinick TR. 1994. Ascorbate and exercise in the Northern Irelandpopulation. Int J Vitam Nutr Res 64:277–282.
Shekelle RB, Lepper M, Liu S, Maliza C, Raynor WJ, Rossof AH. 1981. Dietaryvitamin A and risk of cancer in the Western Electric Study. Lancet 2:1185–1190.
Shilotri PG, Bhat KS. 1977. Effect of mega doses of vitamin C on bactericidalactivity of leukocytes. Am J Clin Nutr 30:1077–1081.
Siegel C, Barker B, Kunstadter M. 1982. Conditioned oral scurvy due to megavita-min C withdrawal. J Periodontol 53:453–455.
Sies H, Stahl W. 1995. Vitamins E and C, beta-carotene, and other carotenoids asantioxidants. Am J Clin Nutr 62:1315S–1321S.
Simon JA. 1992. Vitamin C and cardiovascular disease: A review. J Am Coll Nutr11:107–125.
Simon JA, Hudes ES, Browner WS. 1998. Serum ascorbic acid and cardiovasculardisease prevalence in US adults. Epidemiology 9:316–321.
Singh RB, Ghosh S, Niaz MA, Singh R, Beegum R, Chibo H, Shoumin Z, Postigli-one A. 1995. Dietary intake, plasma levels of antioxidant vitamins, and oxida-tive stress in relation to coronary artery disease in elderly subjects. Am J Cardiol76:1233–1238.
Sinha R, Block G, Taylor PR. 1993. Problems with estimating vitamin C intakes. AmJ Clin Nutr 57:547–550.
Skaper SD, Fabris M, Ferrari V, Carbonare MD, Leon A. 1997. Quercetin protectscutaneous tissue-associated cell types including sensory neurons from oxida-tive stress induced by glutathione depletion: Cooperative effects of ascorbicacid. Free Radic Biol Med 22:669–678.
Sneed SM, Zane C, Thomas MR. 1981. The effects of ascorbic acid, vitamin B6,vitamin B12, and folic acid supplementation on the breast milk and maternalnutritional status of low socioeconomic lactating women. Am J Clin Nutr 34:1338–1346.
Solzbach U, Hornig B, Jeserich M, Just H. 1997. Vitamin C improves endothelialdysfunction of epicardial coronary arteries in hypertensive patients. Circulation96:1513–1519.
Specker BL, Beck A, Kalkwarf H., Ho M. 1997. Randomized trial of varying mineralintake on total body bone mineral accretion during the first year of life. Pediat-rics 99:e12.
Stein HB, Hasan A, Fox IH. 1976. Ascorbic acid-induced uricosuria. Ann Intern Med84:385–388.
Taddei S, Virdis A, Ghiadoni L, Magagna A, Salvetti A. 1998. Vitamin C improvesendothelium-dependent vasodilation by restoring nitric oxide activity in es-sential hypertension. Circulation 97:2222–2229.
Copyright © National Academy of Sciences. All rights reserved.
184 DIETARY REFERENCE INTAKES
Thomas MR, Kawamoto J, Sneed SM, Eakin R. 1979. The effects of vitamin C,vitamin B6, and vitamin B12 supplementation on the breast milk and maternalstatus of well-nourished women. Am J Clin Nutr 32:1679–1685.
Thomas MR, Sneed SM, Wei C, Nail PA, Wilson M, Sprinkle EE. 1980. The effectsof vitamin C, vitamin B6, vitamin B12, folic acid, riboflavin, and thiamin onthe breast milk and maternal status of well-nourished women at 6 monthspostpartum. Am J Clin Nutr 33:2151–2156.
Timimi FK, Ting HH, Haley EA, Roddy MA, Ganz P, Creager MA. 1998. Vitamin Cimproves endothelium-dependent vasodilation in patients with insulin-depen-dent diabetes mellitus. J Am Coll Cardiol 31:552–557.
Ting HH, Timimi FK, Boles KS, Creager SJ, Ganz P, Creager MA. 1996. Vitamin Cimproves endothelium-dependent vasodilation in patients with non-insulin-dependent diabetes mellitus. J Clin Invest 97:22–28.
Ting HH, Timimi FK, Haley EA, Roddy MA, Ganz P, Creager MA. 1997. Vitamin Cimproves endothelium-dependent vasodilation in forearm resistance vessels ofhumans with hypercholesterolemia. Circulation 95:2617–2622.
Tiselius HG, Almgard LE. 1977. The diurnal urinary excretion of oxalate and theeffect of pyridoxine and ascorbate on oxalate excretion. Eur Urol 3:41–46.
Tlaskal P, Novakova V. 1990. Vitamins C and E in neonates and their mothers. CeskPediatr 45:339–343.
Tribble DL, Giuliano LJ, Fortmann SP. 1993. Reduced plasma ascorbic acid con-centrations in nonsmokers regularly exposed to environmental tobacco smoke.Am J Clin Nutr 58:886–890.
Tsao CS. 1997. An overview of ascorbic acid chemistry and biochemistry. In: PackerL, Fuchs J, eds. Vitamin C in Health and Disease. New York: Marcel Dekker. Pp.25–58.
Tsao CS, Leung PY. 1988. Urinary ascorbic acid levels following the withdrawal oflarge doses of ascorbic acid in guinea pigs. J Nutr 118:895–900.
Tsao CS, Salimi SL. 1984. Effect of large intake of ascorbic acid on urinary andplasma oxalic acid levels. Int J Vitam Nutr Res 54:245–249.
Udipi SA, Kirksey A, West K, Giacoia G. 1985. Vitamin B6, vitamin C and folacinlevels in milk from mothers of term and preterm infants during the neonatalperiod. Am J Clin Nutr 42:522–530.
Urivetzky M, Kessaris D, Smith AD. 1992. Ascorbic acid overdosing: A risk factorfor calcium oxalate nephrolithiasis. J Urol 147:1215–1218.
Valkonen M, Kuusi T. 1998. Passive smoking induces atherogenic changes in low-density lipoprotein. Circulation 97:2012–2016.
VanderJagt DJ, Garry PJ, Bhagavan HN. 1987. Ascorbic acid intake and plasmalevels in healthy elderly people. Am J Clin Nutr 46:290–294.
Van Eekelen M. 1953. Occurrence of vitamin C in foods. Proc Nutr Soc 12:228–232.Vitale S, West S, Hallfrisch J, Alston C, Wang F, Moorman C, Muller D, Singh V,
Taylor HR. 1993. Plasma antioxidants and risk of cortical and nuclear cata-ract. Epidemiology 4:195–203.
Vogel RI, Lamster IB, Wechsler SA, Macedo B, Hartley LJ, Macedo JA. 1986. Theeffects of megadoses of ascorbic acid on PMN chemotaxis and experimentalgingivitis. J Periodontol 57:472–479.
Wandzilak TR, D’Andre SD, Davis PA, Williams HE. 1994. Effect of high dosevitamin C on urinary oxalate levels. J Urol 151:834–837.
Wang Y, Russo TA, Kwon O, Chanock S, Rumsey SC, Levine M. 1997. Ascorbaterecycling in human neutrophils: Induction by bacteria. Proc Natl Acad Sci USA94:13816–13819.
Copyright © National Academy of Sciences. All rights reserved.
VITAMIN C 185
Waring AJ, Drake IM, Schorah CJ, White KL, Lynch DA, Axon AT, Dixon MF.1996. Ascorbic acid and total vitamin C concentrations in plasma, gastric juice,and gastrointestinal mucosa: Effects of gastritis and oral supplementation. Gut38:171–176.
Wassertheil-Smoller S, Romney SL, Wylie-Rosett J, Slagle S, Miller G, Lucido D,Duttagupta C, Palan PR. 1981. Dietary vitamin C and uterine cervical dyspla-sia. Am J Epidemiol 114:714–724.
Weber C, Wolfgang E, Weber K, Weber PC. 1996. Increased adhesiveness of isolat-ed monocytes to endothelium is prevented by vitamin C intake in smokers.Circulation 93:1488–1492.
Wen Y, Cooke T Feely, J. 1997. The effect of pharmacological supplementationwith vitamin C on low-density lipoprotein oxidation. Br J Clin Pharmacol 44:94–97.
Witt EH, Reznick AZ, Viguie CA, Starke-Reed P, Packer L. 1992. Exercise, oxidativedamage and effects of antioxidant manipulation. J Nutr 122:766–773.
Witztum JL, Steinberg D. 1991. Role of oxidized low density lipoprotein in athero-genesis. J Clin Invest 88:1785–1792.
Woolfe SN, Kenney EB, Hume WR, Carranza FA Jr. 1984. Relationship of ascorbicacid levels of blood and gingival tissue with response to periodontal therapy. JClin Periodontol 11:159–165.
Yong LC, Brown CC, Schatzkin A, Dresser CM, Slesinski MJ, Cox CS, Taylor PR.1997. Intake of vitamins E, C, and A and risk of lung cancer. The NHANES IEpidemiologic Followup Study. Am J Epidemiol 146:231–243.
Young JC, Kenyon EM, Calabrese EJ. 1990. Inhibition of beta-glucuronidase inhuman urine by ascorbic acid. Hum Exp Toxicol 9:165–170.
Zatonski W, Przewozniak K, Howe GR, Maisonneuve P, Walker AM, Boyle P. 1991.Nutritional factors and pancreatic cancer: A case-control study from south-west Poland. Int J Cancer 48:390–394.
Copyright © National Academy of Sciences. All rights reserved. 186
6Vitamin E
SUMMARY
Vitamin E is thought to function primarily as a chain-breakingantioxidant that prevents the propagation of lipid peroxidation.Overt deficiency is very rare, seen only in individuals unable toabsorb the vitamin or with inherited abnormalities that preventthe maintenance of normal blood concentrations. Thus, currentdietary patterns appear to provide sufficient vitamin E to preventdeficiency symptoms such as peripheral neuropathy. Estimates ofvitamin E intake are underreported, due in part to underreportingof amounts of dietary fat consumed and lack of specificity of sourcesin the diet. Data on human experimental vitamin E deficiency arevery limited but provide some guidance as to the appropriate Rec-ommended Dietary Allowance (RDA). The values recommendedhere are based largely on induced vitamin E deficiency in humansand the correlation between hydrogen peroxide-induced erythro-cyte lysis and plasma α-tocopherol concentrations. The RDA forboth men and women is 15 mg (35 µmol)/day of α-tocopherol.Vitamin E activity of α-tocopherol as defined in this report islimited to that available from the naturally occuring form (RRR-)and the other three synthetic 2R-stereoisomer forms (RSR-, RRS-,and RSS-) of α-tocopherol for purposes of establishing the humanrequirement for vitamin E. Other naturally occurring forms ofvitamin E (β-, γ-, and δ-tocopherols and the tocotrienols) do notcontribute toward meeting the vitamin E requirement because(although absorbed) they are not converted to α-tocopherol byhumans and are recognized poorly by the α-tocopherol transferprotein (α-TTP) in the liver. Therefore, the RDA is based only onthe α-tocopherol form of vitamin E which represents a change
Copyright © National Academy of Sciences. All rights reserved.
VITAMIN E 187
from most recent recommendations. A large and growing body ofexperimental evidence suggests that high intakes of vitamin E maylower the risk of some chronic diseases, especially heart disease.However, the limited and discordant clinical trial evidence avail-able precludes recommendations at this time of higher vitamin Eintakes to reduce chronic disease risk. The Tolerable Upper IntakeLevel (UL) for adults is set at 1,000 mg (2,325 µmol)/day of anyform of supplemental α-tocopherol based on the adverse effect ofincreased tendency to hemorrhage.
BACKGROUND INFORMATION
Definition of Vitamin E
Of the eight naturally occurring forms of vitamin E (see sectionon “Naturally Occurring Forms” and Figure 6-1) only the α-tocopherolform of the vitamin is maintained in human plasma (Traber, 1999).Furthermore, the only forms of α-tocopherol that are maintainedin plasma are RRR-α-tocopherol [2,5,7,8-tetramethyl-2R-(4′R, 8′R,12′ trimethyltridecyl)-6-chromanol], the form of α-tocopherol thatoccurs naturally in foods, and the 2R-stereoisomeric forms of α-tocopherol (RRR-, RSR-, RRS-, and RSS-α-tocopherol) present in syn-thetic all racemic- (all rac-) α-tocopherol [2,5,7,8-tetramethyl-2RS-(4′RS, 8′RS, 12′ trimethyltridecyl)-6-chromanol (Traber, 1999)(Figure 6-2). Since the 2S-stereoisomers of α-tocopherol (SRR-, SSR-,SRS-, and SSS-α-tocopherol), part of the synthetic all rac-α-tocopherol,are not maintained in human plasma (Acuff et al., 1994; Kiyose etal., 1997; Traber, 1999) or tissues (Burton et al., 1998), they are notincluded in the definition of active components of vitamin E forhumans. Therefore, vitamin E is defined in this report as limited tothe 2R-stereoisomeric forms of α-tocopherol to establish recom-mended intakes. All forms of supplemental α-tocopherol are usedas the basis of establishing the Tolerable Upper Intake Level (UL)for vitamin E. These recommended intakes and ULs are at variancewith past definitions and recommendations for vitamin E (NRC,1989).
Structure
Naturally Occurring Forms
Naturally occurring structures (Figure 6-1) classified in the past ashaving vitamin E antioxidant activity include 4 tocopherols (α-tocopherol, trimethyl [3 methyl groups on the chromanol ring]; β-
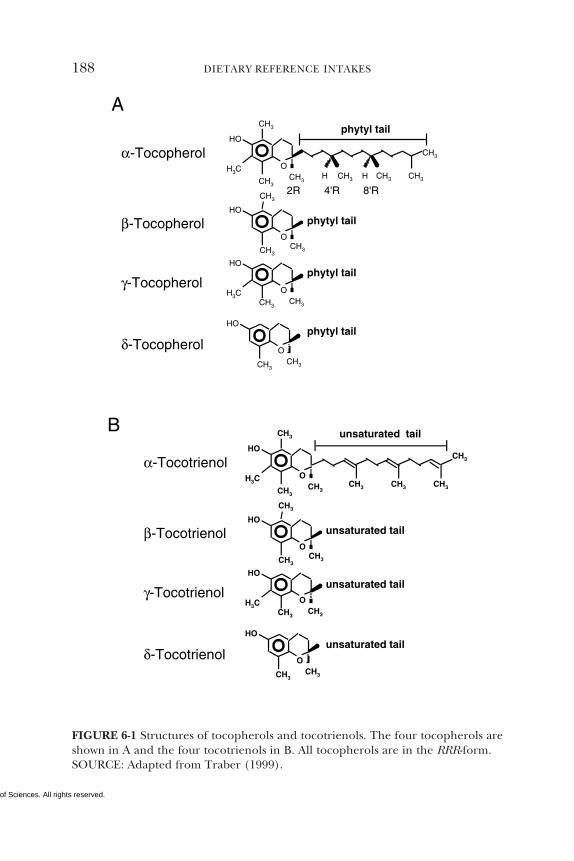
Copyright © National Academy of Sciences. All rights reserved.
188 DIETARY REFERENCE INTAKES
B CH3
CH3CH3
HO
H3CO
CH3
α-Tocotrienol
β-Tocotrienol
γ-Tocotrienol
δ-Tocotrienol
CH3CH3
CH3
HO
O
unsaturated tail
unsaturated tail
unsaturated tail
CH3
HO
H3CO
CH3CH3
HO
O
CH3
unsaturated tail
CH3
CH3CH3
ACH3
CH3
CH3
H CH3CH3CH3CH3H
HO
H3CO
CH3
α-Tocopherol
β-Tocopherol
γ-Tocopherol
δ-Tocopherol
phytyl tail
CH3CH3
CH3
HO
O
phytyl tail
CH3
HO
H3CO
phytyl tail
CH3CH3
HO
O
phytyl tail
2R 4'R 8'R
FIGURE 6-1 Structures of tocopherols and tocotrienols. The four tocopherols areshown in A and the four tocotrienols in B. All tocopherols are in the RRR-form.SOURCE: Adapted from Traber (1999).
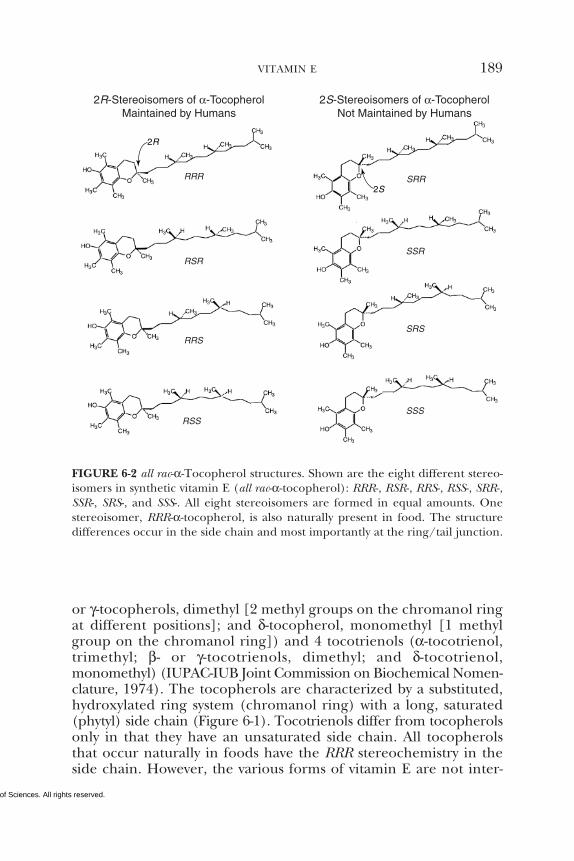
Copyright © National Academy of Sciences. All rights reserved.
VITAMIN E 189
FIGURE 6-2 all rac-α-Tocopherol structures. Shown are the eight different stereo-isomers in synthetic vitamin E (all rac-α-tocopherol): RRR-, RSR-, RRS-, RSS-, SRR-,SSR-, SRS-, and SSS-. All eight stereoisomers are formed in equal amounts. Onestereoisomer, RRR-α-tocopherol, is also naturally present in food. The structuredifferences occur in the side chain and most importantly at the ring/tail junction.
2R-Stereoisomers of α-TocopherolMaintained by Humans
2S-Stereoisomers of α-TocopherolNot Maintained by Humans
RRR
RSR
RRS
SRR
SSR
SRS
SSSRSS
2R
2S
or γ-tocopherols, dimethyl [2 methyl groups on the chromanol ringat different positions]; and δ-tocopherol, monomethyl [1 methylgroup on the chromanol ring]) and 4 tocotrienols (α-tocotrienol,trimethyl; β- or γ-tocotrienols, dimethyl; and δ-tocotrienol,monomethyl) (IUPAC-IUB Joint Commission on Biochemical Nomen-clature, 1974). The tocopherols are characterized by a substituted,hydroxylated ring system (chromanol ring) with a long, saturated(phytyl) side chain (Figure 6-1). Tocotrienols differ from tocopherolsonly in that they have an unsaturated side chain. All tocopherolsthat occur naturally in foods have the RRR stereochemistry in theside chain. However, the various forms of vitamin E are not inter-
Copyright © National Academy of Sciences. All rights reserved.
190 DIETARY REFERENCE INTAKES
convertible in the human and thus do not behave the same meta-bolically.
Synthetic Vitamin E
Synthetic forms of α-tocopherol are present in fortified foods andin vitamin supplements. Vitamin E supplements are sold as esters ofeither the natural RRR- or the synthetic mixture (all rac-) forms ofα-tocopherol. Because α-tocopherol has three asymmetric carbonatoms, it has eight possible stereoisomers, seven of which are onlyfound in synthetic preparations. Synthetic vitamin E, all rac-α-tocopherol (historically and incorrectly labeled dl-α-tocopherol)(Horwitt, 1976),1 is produced by coupling trimethylhydroquinonewith isophytol; it contains all eight stereoisomers in equal amounts(Figure 6-2). Four of the stereoisomers are in the 2R-stereoisomericform (RRR-, RSR-, RRS-, and RSS-α-tocopherol) and four are in the2S-stereoisomeric form (SRR- SSR-, SRS-, and SSS-α-tocopherol).Although RRR-α-tocopherol is the most biologically active of theeight stereoisomers in rats, the other 2R-stereoisomers generallyhave a higher activity than the 2S stereoisomers (Weiser and Vecchi,1982; Weiser et al., 1986).
The naturally occurring stereoisomer is RRR-α-tocopherol (his-torically and incorrectly labeled d-α-tocopherol) (Horwitt, 1976).RRR-α-Tocopherol can be derived by methylating γ-tocopherol iso-lated from vegetable oil. This is labeled “natural source” vitamin Ewhen marketed.
Esterification of the labile hydroxyl (OH) group on the chro-manol ring of vitamin E prevents its oxidation and extends its shelflife. This is why esters of α-tocopherol are often used in vitamin Esupplements and in fortified foods. In apparently healthy humans,
1The original international standard for vitamin E, dl-α-tocopheryl acetate (oneasymmetric carbon atom in the 2 position on the chromal ring, ambo-α-tocopherylacetate) is no longer commercially available. It was synthesized from natural phytoland was a mixture of two stereoisomers of α-tocopherols, RRR-α-tocopheryl acetateand SRR-α-tocopheryl acetate (Horwitt, 1976). For practical purposes at the time,the activity of 1 mg of dl-α-tocopheryl acetate was defined as equivalent to one IUof vitamin E. The dl-α-tocopheryl acetate of commerce currently available is synthe-sized from synthetic isophytol, has eight stereoisomers, and is labeled as dl-α-tocopheryl acetate. However, it is more accurately called all rac-α-tocopheryl acetate(AIN, 1990; IUPAC, 1974) because it contains three asymmetric carbon atoms inthe 2, 4', and 8' positions (2RS, 4'RS, 8'RS-α-tocopherol). The all rac and ambo-α-tocopheryl acetates were shown to have the same biological activity in rats (Weiseret al., 1986).
Copyright © National Academy of Sciences. All rights reserved.
VITAMIN E 191
the esters (e.g., α-tocopheryl acetate or α-tocopheryl succinate) arehydrolyzed and absorbed as efficiently as α-tocopherol (Cheesemanet al., 1995).
Interconversion of Vitamin E Units
Before 1980, for pharmacological uses, one international unit(IU) of vitamin E activity was defined as 1 mg of all rac-α-tocopherylacetate by the United States Pharmacopeia (USP) (USP, 1979).Using the rat fetal resorption assay, 1 mg of RRR-α-tocopherol wascalculated to be equivalent to 1.49 IU of vitamin E (Weiser andVecchi, 1981).
After 1980, the IU was changed to the USP unit where one USPunit of vitamin E was still defined as having the activity of 1 mg of allrac-α-tocopheryl acetate, 0.67 mg RRR-α-tocopherol, or 0.74 mgRRR-α-tocopheryl acetate (USP, 1980). Although IUs are no longerrecognized, many fortified foods and supplements still retain thisterminology while USP units are now generally used by the pharma-ceutical industry in labeling vitamin E supplements. Both systemsare based on the same equivalency.
Since the USP unit was defined before studies were publishedindicating that the 2S-stereoisomers of all rac-α-tocopherol were notmaintained in human plasma (Acuff et al., 1994; Kiyose et al., 1997:Traber, 1999) or in tissues (Burton et al., 1998), it is recommendedthat the present equivalency used in the USP system be redefinedbased on the definition presented in this report of what contributesto the active form of vitamin E in humans. Vitamin E is definedhere as limited to the 2R-stereoisomeric forms of α-tocopherol(RRR-, RSR-, RRS-, and RSS-α-tocopherol) to establish recommendedintakes. Based on this definition, all rac-α-tocopherol has one-halfthe activity of RRR-α-tocopherol found in foods or present with theother 2R stereoisomeric forms (RSR-, RRS- and RSS-) of α-tocopherolin fortified foods and supplements. Thus to achieve the RDArecommended in this report of 15 mg/day of α-tocopherol, aperson can consume 15 mg/day of RRR-α-tocopherol or 15 mg/dayof the 2R-stereoisomeric forms of α-tocopherol (e.g., 30 mg/day ofall rac-α-tocopherol) or a combination of the two. The factors nec-essary to convert RRR- and all rac-α-tocopherol and their esters basedon this new definition of vitamin E to USP units (IUs) are shown inTable 6-1.
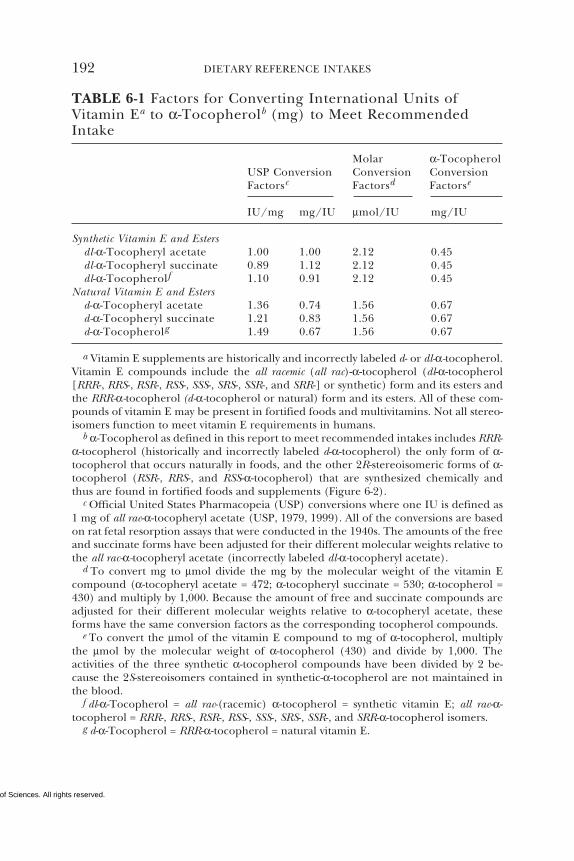
Copyright © National Academy of Sciences. All rights reserved.
192 DIETARY REFERENCE INTAKES
TABLE 6-1 Factors for Converting International Units ofVitamin Ea to α-Tocopherolb (mg) to Meet RecommendedIntake
Molar α-TocopherolUSP Conversion Conversion ConversionFactorsc Factorsd Factorse
IU/mg mg/IU µmol/IU mg/IU
Synthetic Vitamin E and Estersdl-α-Tocopheryl acetate 1.00 1.00 2.12 0.45dl-α-Tocopheryl succinate 0.89 1.12 2.12 0.45dl-α-Tocopherolf 1.10 0.91 2.12 0.45
Natural Vitamin E and Estersd-α-Tocopheryl acetate 1.36 0.74 1.56 0.67d-α-Tocopheryl succinate 1.21 0.83 1.56 0.67d-α-Tocopherolg 1.49 0.67 1.56 0.67
a Vitamin E supplements are historically and incorrectly labeled d- or dl-α-tocopherol.Vitamin E compounds include the all racemic (all rac)-α-tocopherol (dl-α-tocopherol[RRR-, RRS-, RSR-, RSS-, SSS-, SRS-, SSR-, and SRR-] or synthetic) form and its esters andthe RRR-α-tocopherol (d-α-tocopherol or natural) form and its esters. All of these com-pounds of vitamin E may be present in fortified foods and multivitamins. Not all stereo-isomers function to meet vitamin E requirements in humans.
b α-Tocopherol as defined in this report to meet recommended intakes includes RRR-α-tocopherol (historically and incorrectly labeled d-α-tocopherol) the only form of α-tocopherol that occurs naturally in foods, and the other 2R-stereoisomeric forms of α-tocopherol (RSR-, RRS-, and RSS-α-tocopherol) that are synthesized chemically andthus are found in fortified foods and supplements (Figure 6-2).
c Official United States Pharmacopeia (USP) conversions where one IU is defined as1 mg of all rac-α-tocopheryl acetate (USP, 1979, 1999). All of the conversions are basedon rat fetal resorption assays that were conducted in the 1940s. The amounts of the freeand succinate forms have been adjusted for their different molecular weights relative tothe all rac-α-tocopheryl acetate (incorrectly labeled dl-α-tocopheryl acetate).
d To convert mg to µmol divide the mg by the molecular weight of the vitamin Ecompound (α-tocopheryl acetate = 472; α-tocopheryl succinate = 530; α-tocopherol =430) and multiply by 1,000. Because the amount of free and succinate compounds areadjusted for their different molecular weights relative to α-tocopheryl acetate, theseforms have the same conversion factors as the corresponding tocopherol compounds.
e To convert the µmol of the vitamin E compound to mg of α-tocopherol, multiplythe µmol by the molecular weight of α-tocopherol (430) and divide by 1,000. Theactivities of the three synthetic α-tocopherol compounds have been divided by 2 be-cause the 2S-stereoisomers contained in synthetic-α-tocopherol are not maintained inthe blood.
f dl-α-Tocopherol = all rac-(racemic) α-tocopherol = synthetic vitamin E; all rac-α-tocopherol = RRR-, RRS-, RSR-, RSS-, SSS-, SRS-, SSR-, and SRR-α-tocopherol isomers.
g d-α-Tocopherol = RRR-α-tocopherol = natural vitamin E.
Copyright © National Academy of Sciences. All rights reserved.
VITAMIN E 193
Units of Vitamin E Activity
It is now known that vitamin E forms are not interconvertible inthe human and that their plasma concentrations are dependent onthe affinity of hepatic α-tocopherol transfer protein (α-TTP) forthem (see section on “Hepatic α-Tocopherol Transfer Protein”).Kinetic studies have shown that while RRR-α-tocopherol concentra-tions are maintained in human plasma, the same is not true foreither synthetic SRR-α-tocopherol or natural γ-tocopherol (Traberet al., 1990a, 1992). These compounds are efficiently absorbed anddelivered to the liver in chylomicrons but are packaged poorly intonewly secreted lipoproteins for delivery to peripheral tissues (seesection on “Preferential Secretion of α-Tocopherol from the Liver”).In light of these new findings in humans, it becomes necessary toreevaluate the relative biological potencies of different forms ofvitamin E. Therefore, it is best to measure and report the actualconcentrations of each of the various vitamin E forms in food andbiological samples.
Current information suggests that the number of methyl groupsand the stereochemistry of the phytyl tail at the point where it meetsthe chromanol ring (2 position) determine the affinity of the α-TTP for the vitamin E form and that this protein in turn determinesthe effective vitamin E biological activity (Hosomi et al., 1997). Sincethe 2S-stereoisomers (Figure 6-2) are not maintained in humanplasma or in tissues, the difference in relative activity of all rac-α-tocopherol compared to RRR-α-tocopherol is 50 percent as demon-strated in Figure 6-3.
Vitamin E activity in food is often reported as α-tocopherol equiv-alents (α-TE) (Bieri and Evarts, 1973, 1974; Eitenmiller and Landen,1995) as have been dietary recommendations (NRC, 1989). Previ-ously, factors for the conversion of the tocopherols and tocotrienolsto α-TE units were based on the biological activity of the variousforms as determined using the rat fetal resorption assay (Bieri andMcKenna, 1981). α-TEs were defined as α-tocopherol, mg × 1.0; β-tocopherol, mg × 0.5; γ-tocopherol, mg × 0.1; δ-tocopherol, mg ×0.03; α-tocotrienol, mg × 0.3; and β-tocotrienol, mg × 0.05 (NRC,1989). The biological activities of γ- and δ-tocotrienol were belowdetection.
Based on a review of the data, the 2R-stereoisomeric forms of α-tocopherol (RRR-, RSR-, RRS-, and RSS-α-tocopherol) are now usedto estimate the vitamin E requirement. The 2S-stereoisomeric formsof α-tocopherol and the other tocopherols (β-, γ-,and δ-tocopherol)and the tocotrienols are not used to estimate the vitamin E require-
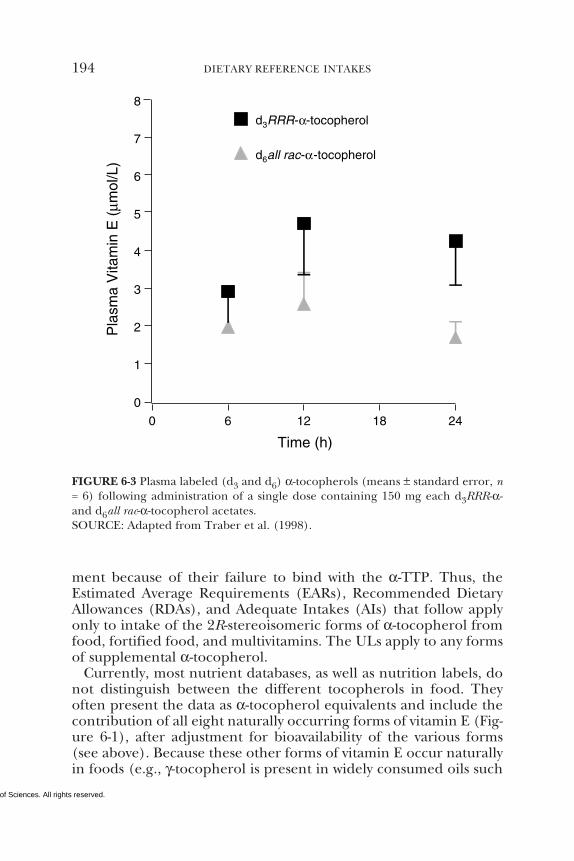
Copyright © National Academy of Sciences. All rights reserved.
194 DIETARY REFERENCE INTAKES
ment because of their failure to bind with the α-TTP. Thus, theEstimated Average Requirements (EARs), Recommended DietaryAllowances (RDAs), and Adequate Intakes (AIs) that follow applyonly to intake of the 2R-stereoisomeric forms of α-tocopherol fromfood, fortified food, and multivitamins. The ULs apply to any formsof supplemental α-tocopherol.
Currently, most nutrient databases, as well as nutrition labels, donot distinguish between the different tocopherols in food. Theyoften present the data as α-tocopherol equivalents and include thecontribution of all eight naturally occurring forms of vitamin E (Fig-ure 6-1), after adjustment for bioavailability of the various forms(see above). Because these other forms of vitamin E occur naturallyin foods (e.g., γ-tocopherol is present in widely consumed oils such
FIGURE 6-3 Plasma labeled (d3 and d6) α-tocopherols (means ± standard error, n= 6) following administration of a single dose containing 150 mg each d3RRR-α-and d6all rac-α-tocopherol acetates.SOURCE: Adapted from Traber et al. (1998).
8
7
6
5
4
3
2
1
0
0 6 12 18 24
d3RRR-α-tocopherol
d6all rac-α-tocopherol
Time (h)
Pla
sma
Vita
min
E (
µmol
/L)
Copyright © National Academy of Sciences. All rights reserved.
VITAMIN E 195
as soybean and corn oils), the intake of α-tocopherol equivalents isgreater than the intake of α-tocopherol (2R-stereoisomeric forms)alone (see later section “Intake of Vitamin E” for suggested conver-sion factor).
Function
Unlike most nutrients, a specific role for vitamin E in a requiredmetabolic function has not been found. Vitamin E’s major functionappears to be as a non-specific chain-breaking antioxidant.
Antioxidant Activity
Vitamin E is a chain-breaking antioxidant that prevents the prop-agation of free-radical reactions (Burton and Ingold, 1986; Burtonet al., 1983; Ingold et al., 1987; Kamal-Eldin and Appelqvist, 1996;Packer, 1994; Tappel, 1962). The vitamin is a peroxyl radicalscavenger and especially protects polyunsaturated fatty acids(PUFAs) within membrane phospholipids and in plasma lipopro-teins (Burton et al., 1983). Peroxyl radicals (abbreviated ROO•)react with vitamin E (abbreviated Vit E-OH) 1,000 times morerapidly than they do with PUFA (abbreviated RH) (Packer, 1994).The phenolic hydroxyl group of tocopherol reacts with an organicperoxyl radical to form the corresponding organic hydroperoxideand the tocopheroxyl radical (Vit E-O•) (Burton et al., 1985):
In the presence of vitamin E: ROO• + Vit E-OH → ROOH +Vit E-O•
In the absence of vitamin E: ROO• + RH → ROOH + R•
R• + O2 → ROO•
The tocopheroxyl radical can then undergo several possible fates.It can (1) be reduced by other antioxidants to tocopherol (seesection on “Antioxidant Interactions”), (2) react with anothertocopheroxyl radical to form non-reactive products such as tocopheroldimers, (3) undergo further oxidation to tocopheryl quinone (seesection on “Metabolism”), and (4) act as a prooxidant and oxidizeother lipids (see section on “Antioxidant Interactions”).
Biochemical and Molecular Biologic Activities
In addition to its direct antioxidant function, α-tocopherol re-portedly has specific molecular functions. α-Tocopherol inhibits
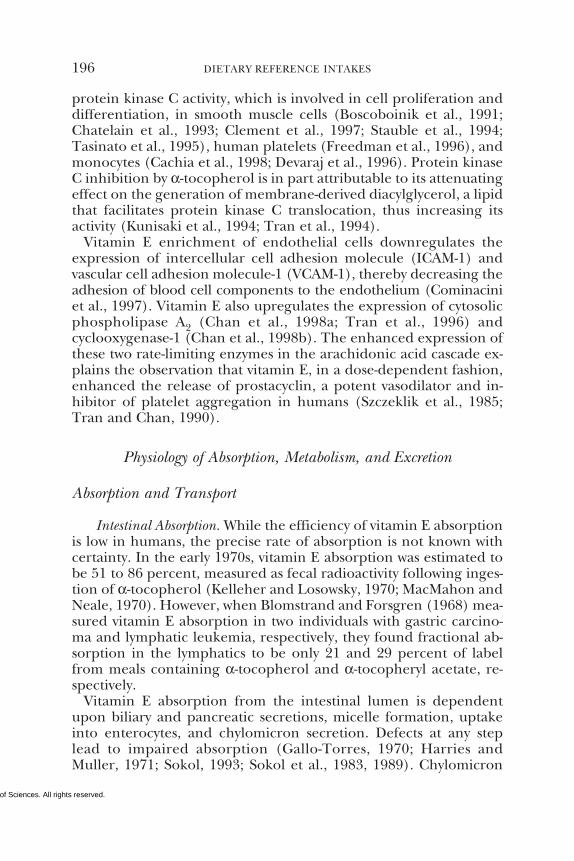
Copyright © National Academy of Sciences. All rights reserved.
196 DIETARY REFERENCE INTAKES
protein kinase C activity, which is involved in cell proliferation anddifferentiation, in smooth muscle cells (Boscoboinik et al., 1991;Chatelain et al., 1993; Clement et al., 1997; Stauble et al., 1994;Tasinato et al., 1995), human platelets (Freedman et al., 1996), andmonocytes (Cachia et al., 1998; Devaraj et al., 1996). Protein kinaseC inhibition by α-tocopherol is in part attributable to its attenuatingeffect on the generation of membrane-derived diacylglycerol, a lipidthat facilitates protein kinase C translocation, thus increasing itsactivity (Kunisaki et al., 1994; Tran et al., 1994).
Vitamin E enrichment of endothelial cells downregulates theexpression of intercellular cell adhesion molecule (ICAM-1) andvascular cell adhesion molecule-1 (VCAM-1), thereby decreasing theadhesion of blood cell components to the endothelium (Cominaciniet al., 1997). Vitamin E also upregulates the expression of cytosolicphospholipase A2 (Chan et al., 1998a; Tran et al., 1996) andcyclooxygenase-1 (Chan et al., 1998b). The enhanced expression ofthese two rate-limiting enzymes in the arachidonic acid cascade ex-plains the observation that vitamin E, in a dose-dependent fashion,enhanced the release of prostacyclin, a potent vasodilator and in-hibitor of platelet aggregation in humans (Szczeklik et al., 1985;Tran and Chan, 1990).
Physiology of Absorption, Metabolism, and Excretion
Absorption and Transport
Intestinal Absorption. While the efficiency of vitamin E absorptionis low in humans, the precise rate of absorption is not known withcertainty. In the early 1970s, vitamin E absorption was estimated tobe 51 to 86 percent, measured as fecal radioactivity following inges-tion of α-tocopherol (Kelleher and Losowsky, 1970; MacMahon andNeale, 1970). However, when Blomstrand and Forsgren (1968) mea-sured vitamin E absorption in two individuals with gastric carcino-ma and lymphatic leukemia, respectively, they found fractional ab-sorption in the lymphatics to be only 21 and 29 percent of labelfrom meals containing α-tocopherol and α-tocopheryl acetate, re-spectively.
Vitamin E absorption from the intestinal lumen is dependentupon biliary and pancreatic secretions, micelle formation, uptakeinto enterocytes, and chylomicron secretion. Defects at any steplead to impaired absorption (Gallo-Torres, 1970; Harries andMuller, 1971; Sokol, 1993; Sokol et al., 1983, 1989). Chylomicron
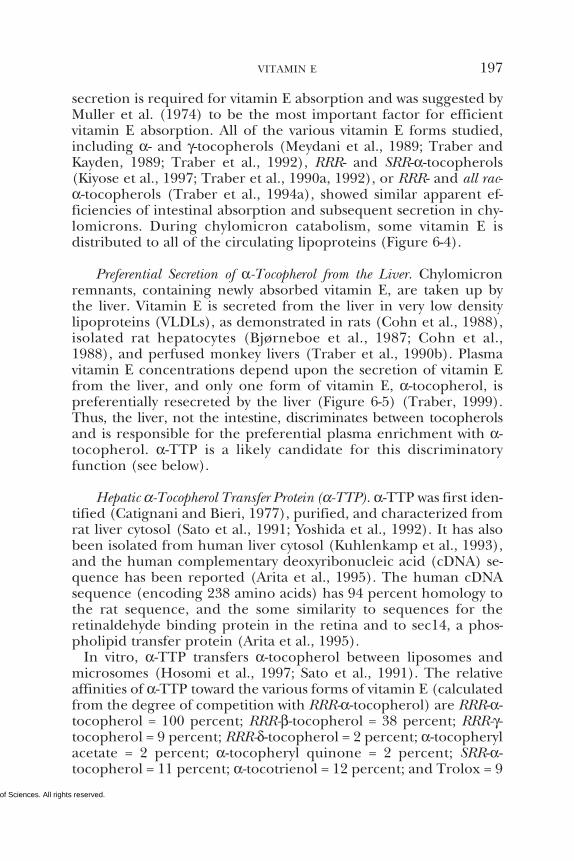
Copyright © National Academy of Sciences. All rights reserved.
VITAMIN E 197
secretion is required for vitamin E absorption and was suggested byMuller et al. (1974) to be the most important factor for efficientvitamin E absorption. All of the various vitamin E forms studied,including α- and γ-tocopherols (Meydani et al., 1989; Traber andKayden, 1989; Traber et al., 1992), RRR- and SRR-α-tocopherols(Kiyose et al., 1997; Traber et al., 1990a, 1992), or RRR- and all rac-α-tocopherols (Traber et al., 1994a), showed similar apparent ef-ficiencies of intestinal absorption and subsequent secretion in chy-lomicrons. During chylomicron catabolism, some vitamin E isdistributed to all of the circulating lipoproteins (Figure 6-4).
Preferential Secretion of α-Tocopherol from the Liver. Chylomicronremnants, containing newly absorbed vitamin E, are taken up bythe liver. Vitamin E is secreted from the liver in very low densitylipoproteins (VLDLs), as demonstrated in rats (Cohn et al., 1988),isolated rat hepatocytes (Bjørneboe et al., 1987; Cohn et al.,1988), and perfused monkey livers (Traber et al., 1990b). Plasmavitamin E concentrations depend upon the secretion of vitamin Efrom the liver, and only one form of vitamin E, α-tocopherol, ispreferentially resecreted by the liver (Figure 6-5) (Traber, 1999).Thus, the liver, not the intestine, discriminates between tocopherolsand is responsible for the preferential plasma enrichment with α-tocopherol. α-TTP is a likely candidate for this discriminatoryfunction (see below).
Hepatic α-Tocopherol Transfer Protein (α-TTP). α-TTP was first iden-tified (Catignani and Bieri, 1977), purified, and characterized fromrat liver cytosol (Sato et al., 1991; Yoshida et al., 1992). It has alsobeen isolated from human liver cytosol (Kuhlenkamp et al., 1993),and the human complementary deoxyribonucleic acid (cDNA) se-quence has been reported (Arita et al., 1995). The human cDNAsequence (encoding 238 amino acids) has 94 percent homology tothe rat sequence, and the some similarity to sequences for theretinaldehyde binding protein in the retina and to sec14, a phos-pholipid transfer protein (Arita et al., 1995).
In vitro, α-TTP transfers α-tocopherol between liposomes andmicrosomes (Hosomi et al., 1997; Sato et al., 1991). The relativeaffinities of α-TTP toward the various forms of vitamin E (calculatedfrom the degree of competition with RRR-α-tocopherol) are RRR-α-tocopherol = 100 percent; RRR-β-tocopherol = 38 percent; RRR-γ-tocopherol = 9 percent; RRR-δ-tocopherol = 2 percent; α-tocopherylacetate = 2 percent; α-tocopheryl quinone = 2 percent; SRR-α-tocopherol = 11 percent; α-tocotrienol = 12 percent; and Trolox = 9
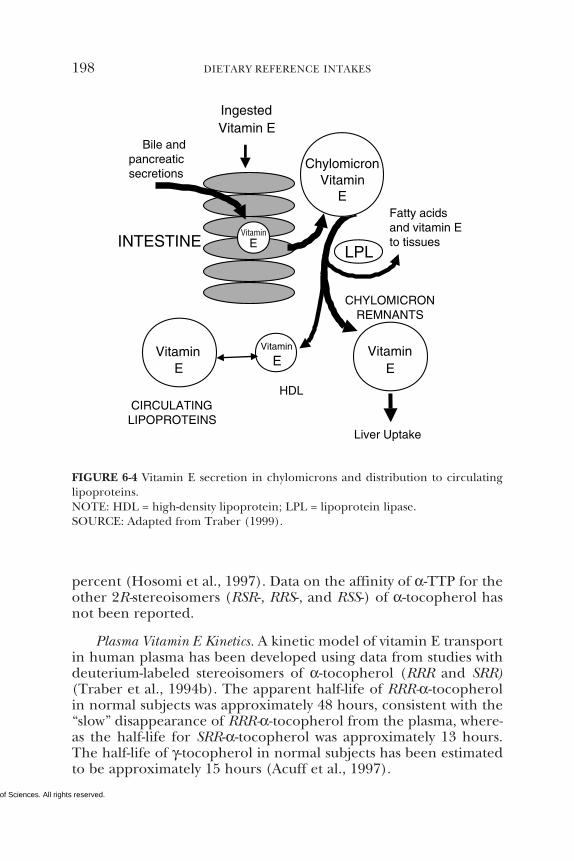
Copyright © National Academy of Sciences. All rights reserved.
198 DIETARY REFERENCE INTAKES
percent (Hosomi et al., 1997). Data on the affinity of α-TTP for theother 2R-stereoisomers (RSR-, RRS-, and RSS-) of α-tocopherol hasnot been reported.
Plasma Vitamin E Kinetics. A kinetic model of vitamin E transportin human plasma has been developed using data from studies withdeuterium-labeled stereoisomers of α-tocopherol (RRR and SRR)(Traber et al., 1994b). The apparent half-life of RRR-α-tocopherolin normal subjects was approximately 48 hours, consistent with the“slow” disappearance of RRR-α-tocopherol from the plasma, where-as the half-life for SRR-α-tocopherol was approximately 13 hours.The half-life of γ-tocopherol in normal subjects has been estimatedto be approximately 15 hours (Acuff et al., 1997).
FIGURE 6-4 Vitamin E secretion in chylomicrons and distribution to circulatinglipoproteins.NOTE: HDL = high-density lipoprotein; LPL = lipoprotein lipase.SOURCE: Adapted from Traber (1999).
INTESTINELPL
Fatty acids and vitamin Eto tissues
Chylomicron
Vitamin E
Bile andpancreaticsecretions
VitaminE
CIRCULATING LIPOPROTEINS
Vitamin E
CHYLOMICRONREMNANTS
Liver Uptake
Vitamin E
Vitamin
E
HDL
IngestedVitamin E
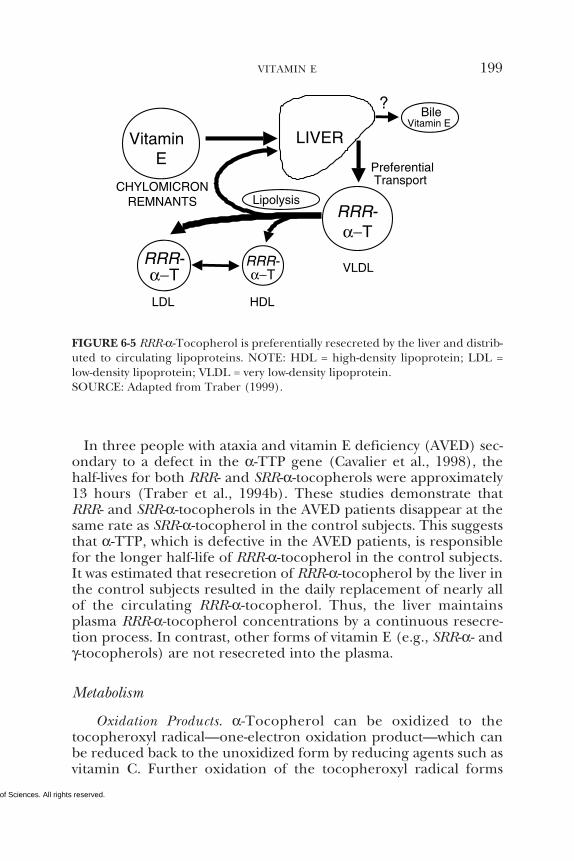
Copyright © National Academy of Sciences. All rights reserved.
VITAMIN E 199
In three people with ataxia and vitamin E deficiency (AVED) sec-ondary to a defect in the α-TTP gene (Cavalier et al., 1998), thehalf-lives for both RRR- and SRR-α-tocopherols were approximately13 hours (Traber et al., 1994b). These studies demonstrate thatRRR- and SRR-α-tocopherols in the AVED patients disappear at thesame rate as SRR-α-tocopherol in the control subjects. This suggeststhat α-TTP, which is defective in the AVED patients, is responsiblefor the longer half-life of RRR-α-tocopherol in the control subjects.It was estimated that resecretion of RRR-α-tocopherol by the liver inthe control subjects resulted in the daily replacement of nearly allof the circulating RRR-α-tocopherol. Thus, the liver maintainsplasma RRR-α-tocopherol concentrations by a continuous resecre-tion process. In contrast, other forms of vitamin E (e.g., SRR-α- andγ-tocopherols) are not resecreted into the plasma.
Metabolism
Oxidation Products. α-Tocopherol can be oxidized to thetocopheroxyl radical—one-electron oxidation product—which canbe reduced back to the unoxidized form by reducing agents such asvitamin C. Further oxidation of the tocopheroxyl radical forms
CHYLOMICRONREMNANTS
Vitamin E
VLDL
LDL HDL
RRR-α−T
RRR-α−T
PreferentialTransport
LipolysisRRR-α−T
LIVER
BileVitamin E
?
FIGURE 6-5 RRR-α-Tocopherol is preferentially resecreted by the liver and distrib-uted to circulating lipoproteins. NOTE: HDL = high-density lipoprotein; LDL =low-density lipoprotein; VLDL = very low-density lipoprotein.SOURCE: Adapted from Traber (1999).
Copyright © National Academy of Sciences. All rights reserved.
200 DIETARY REFERENCE INTAKES
tocopheryl quinone, the two-election oxidation product. Thetocopheryl quinone is not converted in any physiologically signifi-cant amounts back to tocopherol (Moore and Ingold, 1997). Otheroxidation products, including dimers and trimers as well as adducts(Kamal-Eldin and Appelqvist, 1996), are formed during in vitrooxidation; their importance in vivo is unknown.
Other Metabolites. Vitamin E metabolites in human urine includeboth 2,5,7,8-tetramethyl-2-(2′-carboxyethyl)-6-hydroxychroman (α-CEHC) derived from α-tocopherol (Schultz et al., 1995, 1997) and2,7,8-trimethyl-2-(2′-carboxyethyl)-6-hydroxychroman (γ-CEHC)derived from γ-tocopherol (Murray et al., 1997; Wechter et al.,1996). These metabolites result from degradation of the phytyl tail;the chromanol ring is unchanged and thus they are not oxidationproducts of vitamin E. It is unknown where these metabolites areformed.
Excretion
Urinary Excretion. Increasing doses of supplemental vitamin E inhumans result in increasing urinary excretion of the α-CEHCmetabolite (Schultz et al., 1995). Interestingly, three times as muchall rac-α-tocopherol as compared with RRR-α-tocopherol is excretedas α-CEHC, while twice as much RRR-α-tocopherol is found in theplasma (Traber et al., 1998), suggesting that these urinary metabo-lites may be indicators of nonpreferentially utilized vitamin E forms.Indeed, Swanson et al. (1998, 1999) showed that about half of theingested γ-tocopherol is metabolized and excreted as γ-CEHC. Thismetabolite has been reported to inhibit the potassium channel andincrease urinary sodium excretion (Kantoci et al., 1997; Murray etal., 1997; Wechter et al., 1996). Thus, urinary excretion of CEHCmay indicate excess vitamin E intake. However, this has yet to bedefinitively demonstrated, and no physiological role for the in vivoeffects of γ-CEHC have been established.
Fecal Excretion. The major route of excretion of ingested vitaminE is fecal elimination because of its relatively low intestinal absorp-tion. Excess α-tocopherol, as well as forms of vitamin E not prefer-entially used, are probably excreted unchanged in bile (Traber andKayden, 1989). Leo et al. (1995) report α-tocopherol concentra-tions in human bile of 8.4 ± 0.9 (SD) µmol/L (361 ± 38.7 µg/dL)compared with 23.2 ± 1.7 (SD) µmol/L (998 ± 73 µg/dL) in plasma.
Copyright © National Academy of Sciences. All rights reserved.
VITAMIN E 201
Storage
Tissues are dependent upon uptake of vitamin E from plasma(Traber, 1999). No specific plasma transport proteins have beendescribed; therefore, it is likely that the mechanisms of lipoproteinmetabolism determine the delivery of vitamin E to tissues. Tissuesprobably acquire vitamin E by several major routes: (1) during lipo-protein lipase mediated triglyceride-rich lipoprotein catabolism; (2)during low-density lipoprotein (LDL) uptake via the LDL receptor;(3) via high-density lipoprotein (HDL)-mediated delivery systems;and (4) by nonspecific transfers between lipoproteins and tissues.Vitamin E rapidly transfers between various lipoproteins and alsobetween lipoproteins and membranes, which may enrich mem-branes with vitamin E. The human plasma phospholipid transferprotein accelerates this process (Kostner et al., 1995).
Human tissue vitamin E contents have been reported mostly fromrelatively easy-to-sample tissues (e.g., adipose tissue and buccal mu-cosal cells) (Handelman et al., 1994; Kayden et al., 1983; Parker,1988; Peng et al., 1994; Traber and Kayden, 1987; Traber et al.,1987). To obtain a variety of human tissues, Burton et al. (1998)enlisted two terminally ill subjects who agreed to daily supplementa-tion with deuterated (d3-RRR- and d6-all rac) α-tocopherols. At death,an autopsy was performed to obtain various tissues. One subjecttook 15 mg (32 µmol) d3-RRR- and 15 mg (32 µmol) d6-all rac-α-tocopheryl acetate for 361 days, while the other took 150 mg (320µmol) d3-RRR- plus 150 mg (320 µmol) d6-all rac-α-tocopheryl ace-tates for 615 days. Tissue unlabeled α-tocopherol concentrationswere generally similar in both patients. In the patient who con-sumed 30 mg (64 µmol)/day labeled vitamin E for 1 year, about 5.9± 2.2 (SD) percent of the tissue vitamin E was labeled, while about65 ± 10 (SD) percent was labeled in the patient who consumed atotal of 300 mg (640 µmol) daily for 2 years. The RRR/all rac ratiosin plasma and tissues at autopsy were similar in both patients (2.06and 1.71 ± 0.24 (SD), respectively, on the lower dose and 2.11 and2.01 ± 0.17 (SD), respectively, on the higher dose).
The results indicate that the RRR-stereoisomer has roughly twicethe availability of the all rac forms. The effect of 300 mg vitamin Esupplementation was to increase plasma α-tocopherol concentra-tions threefold and to at least double most tissue concentrations,while supplementation with 30 mg had little effect on either plasmaor tissue α-tocopherol concentrations. These data suggest that tis-sue α-tocopherol concentrations largely reflect changes in plasmaconcentrations of α-tocopherol and that larger doses increase tissue
Copyright © National Academy of Sciences. All rights reserved.
202 DIETARY REFERENCE INTAKES
α-tocopherol concentrations, including those in the nervous tissues(Burton et al., 1998). Importantly, the lower dose, even thoughgiven for more than a year and a half, did not increase tissue α-tocopherol concentrations.
Clinical Effects of Inadequate Intake
Prevalence of Vitamin E Deficiency
Vitamin E deficiency occurs only rarely in humans, and overt defi-ciency symptoms in normal individuals consuming diets low in vita-min E have never been described. Vitamin E deficiency occurs onlyas a result of genetic abnormalities in α-TTP, as a result of variousfat malabsorption syndromes (Rader and Brewer, 1993; Sokol,1993), or as a result of protein-energy malnutrition (Kalra et al.,1998; Laditan and Ette, 1982).
Only a handful of families with clinically evident vitamin E defi-ciency due to a mutation of the α-TTP have been described (Cava-lier et al., 1998). The prevalence of less drastic abnormalities in α-TTP, or the occurrence of heterozygotes for α-TTP gene defects, isnot known. It is important to note that symptoms associated with α-TTP defects and malabsorption syndromes can be reversed by vita-min E supplementation if it is provided before irreversible neuro-logical injury occurs (Kohlschütter et al., 1988; Muller et al., 1985;Schuelke et al., 1999; Sokol et al., 1985, 1988).
Clinical Signs of Deficiency
The primary human vitamin E deficiency symptom is a peripheralneuropathy characterized by the degeneration of the large-caliberaxons in the sensory neurons (Sokol, 1988). Other vitamin E defi-ciency symptoms observed in humans include spinocerebellar atax-ia, skeletal myopathy, and pigmented retinopathy (Sokol, 1993).Typical symptoms of vitamin E deficiency are given in Table 6-2.
A distinct pattern in the progression of neurologic symptomsresulting from vitamin E deficiency in humans has been described(Sokol, 1993). By the end of the first decade of life untreated pa-tients with chronic cholestatic hepatobiliary disease have a combi-nation of spinocerebellar ataxia, neuropathy, and ophthalmoplegia.However, the progression of neurological symptoms is slower inchildren with cystic fibrosis and abetalipoproteinemia. The symp-tomatology of vitamin E deficiency in AVED is similar to that foundin these latter patients (Amiel et al., 1995; Sokol et al., 1988). These
Copyright © National Academy of Sciences. All rights reserved.
VITAMIN E 203
observations suggest that in patients with cholestatic liver disease,there is increased oxidative stress, perhaps as a result of copperaccumulation in the liver (Bayliss et al., 1995).
Hemolysis, using hydrogen peroxide or other oxidants added invitro, has been used as a test for vitamin E adequacy in subjectsthought to be at risk for vitamin E deficiency (Boda et al., 1998;Farrell et al., 1977). These tests suggest that plasma α-tocopherolconcentrations of 14 µmol/L (600 µg/dL) are sufficient to preventhemolysis (Farrell et al., 1977).
SELECTION OF INDICATORS FOR ESTIMATING THEREQUIREMENT FOR α-TOCOPHEROL
Lipid Peroxidation Markers
Several biomarkers measured in plasma, urine, or breath havebeen used to reflect the degree of lipid peroxidation in vivo. Theseinclude thiobarbituric acid reactive substances (TBARS), malondi-aldehyde, conjugated dienes, pentane, ethane, and the F2-isopros-tanes.
Quantification of F2-isoprostanes, isomers of prostaglandin F2, hasbeen suggested by a number of investigators as the most reliableindex of in vivo free-radical generation and oxidative lipid damage(Morrow et al., 1999). The F2-isoprostanes are formed in mem-branes from arachidonyl-containing lipids largely as a result of freeradical-catalyzed lipid peroxidation (Klein et al., 1997; Moore andRoberts, 1998). The F2-isoprostanes are increased in vitamin E-defi-cient rats (Awad et al., 1994). Importantly, their excretion was de-pressed in humans by consuming antioxidant vitamin supplements(Delanty et al., 1996; Reilly et al., 1996). Furthermore, in an animalatherosclerosis model, the apoE-deficient mouse, vitamin E supple-mentation not only suppressed F2-isoprostane production but alsodecreased atherosclerotic lesion formation (Pratico et al., 1998).
In general, lipid peroxidation markers are elevated during vita-min E depletion and their levels can be normalized upon vitamin Erepletion. However, these markers are not necessarily specific tovitamin E, since changes in intake of other antioxidants can alsochange the levels of these markers. At present, there is no evidencethat lowering lipid peroxidation marker levels is associated withhealth benefits. Therefore, estimates of lipid peroxidation productshave not been used for establishing α-tocopherol requirements.
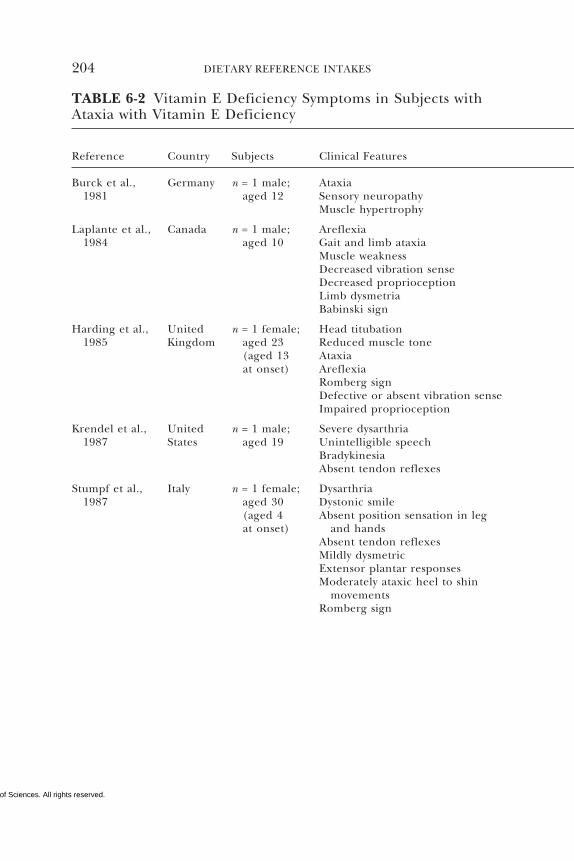
Copyright © National Academy of Sciences. All rights reserved.
204 DIETARY REFERENCE INTAKES
TABLE 6-2 Vitamin E Deficiency Symptoms in Subjects withAtaxia with Vitamin E Deficiency
Reference Country Subjects Clinical Features
Burck et al., Germany n = 1 male; Ataxia1981 aged 12 Sensory neuropathy
Muscle hypertrophy
Laplante et al., Canada n = 1 male; Areflexia1984 aged 10 Gait and limb ataxia
Muscle weaknessDecreased vibration senseDecreased proprioceptionLimb dysmetriaBabinski sign
Harding et al., United n = 1 female; Head titubation1985 Kingdom aged 23 Reduced muscle tone
(aged 13 Ataxiaat onset) Areflexia
Romberg signDefective or absent vibration senseImpaired proprioception
Krendel et al., United n = 1 male; Severe dysarthria1987 States aged 19 Unintelligible speech
BradykinesiaAbsent tendon reflexes
Stumpf et al., Italy n = 1 female; Dysarthria1987 aged 30 Dystonic smile
(aged 4 Absent position sensation in legat onset) and hands
Absent tendon reflexesMildly dysmetricExtensor plantar responsesModerately ataxic heel to shin
movementsRomberg sign
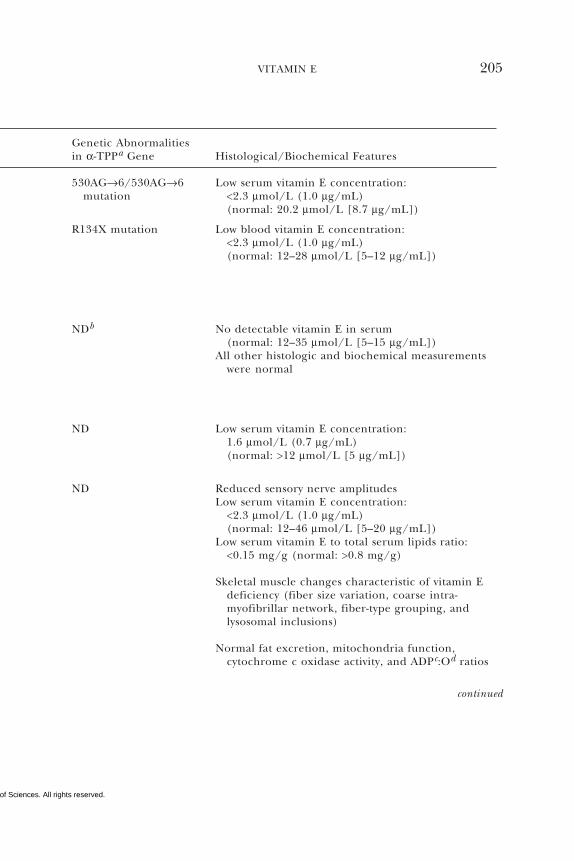
Copyright © National Academy of Sciences. All rights reserved.
VITAMIN E 205
continued
Genetic Abnormalitiesin α-TPPa Gene Histological/Biochemical Features
530AG→6/530AG→6 Low serum vitamin E concentration:mutation <2.3 µmol/L (1.0 µg/mL)
(normal: 20.2 µmol/L [8.7 µg/mL])
R134X mutation Low blood vitamin E concentration:<2.3 µmol/L (1.0 µg/mL)(normal: 12–28 µmol/L [5–12 µg/mL])
NDb No detectable vitamin E in serum(normal: 12–35 µmol/L [5–15 µg/mL])
All other histologic and biochemical measurementswere normal
ND Low serum vitamin E concentration:1.6 µmol/L (0.7 µg/mL)(normal: >12 µmol/L [5 µg/mL])
ND Reduced sensory nerve amplitudesLow serum vitamin E concentration:
<2.3 µmol/L (1.0 µg/mL)(normal: 12–46 µmol/L [5–20 µg/mL])
Low serum vitamin E to total serum lipids ratio:<0.15 mg/g (normal: >0.8 mg/g)
Skeletal muscle changes characteristic of vitamin Edeficiency (fiber size variation, coarse intra-myofibrillar network, fiber-type grouping, andlysosomal inclusions)
Normal fat excretion, mitochondria function,cytochrome c oxidase activity, and ADPc:Od ratios
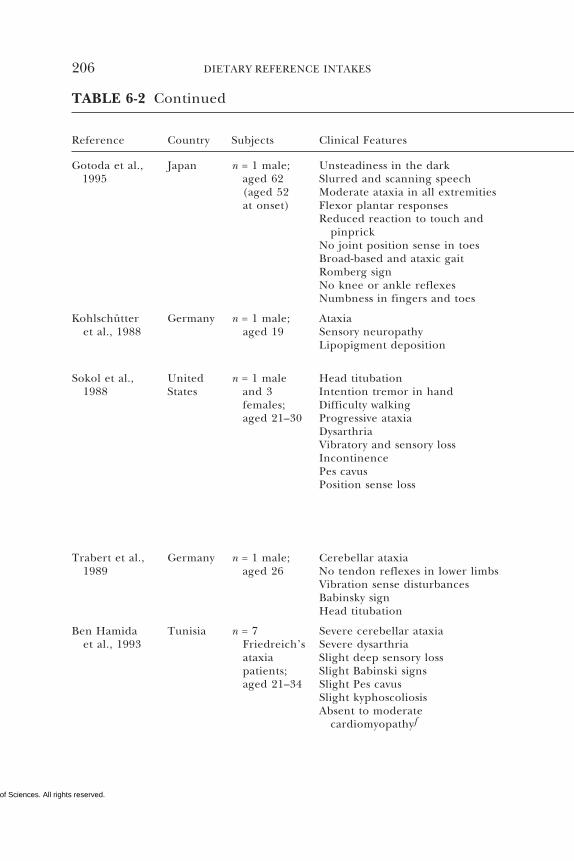
Copyright © National Academy of Sciences. All rights reserved.
206 DIETARY REFERENCE INTAKES
TABLE 6-2 Continued
Reference Country Subjects Clinical Features
Gotoda et al., Japan n = 1 male; Unsteadiness in the dark1995 aged 62 Slurred and scanning speech
(aged 52 Moderate ataxia in all extremitiesat onset) Flexor plantar responses
Reduced reaction to touch and pinprick
No joint position sense in toesBroad-based and ataxic gaitRomberg signNo knee or ankle reflexesNumbness in fingers and toes
Kohlschütter Germany n = 1 male; Ataxiaet al., 1988 aged 19 Sensory neuropathy
Lipopigment deposition
Sokol et al., United n = 1 male Head titubation1988 States and 3 Intention tremor in hand
females; Difficulty walkingaged 21–30 Progressive ataxia
DysarthriaVibratory and sensory lossIncontinencePes cavusPosition sense loss
Trabert et al., Germany n = 1 male; Cerebellar ataxia1989 aged 26 No tendon reflexes in lower limbs
Vibration sense disturbancesBabinsky signHead titubation
Ben Hamida Tunisia n = 7 Severe cerebellar ataxiaet al., 1993 Friedreich’s Severe dysarthria
ataxia Slight deep sensory losspatients; Slight Babinski signsaged 21–34 Slight Pes cavus
Slight kyphoscoliosisAbsent to moderate
cardiomyopathyf
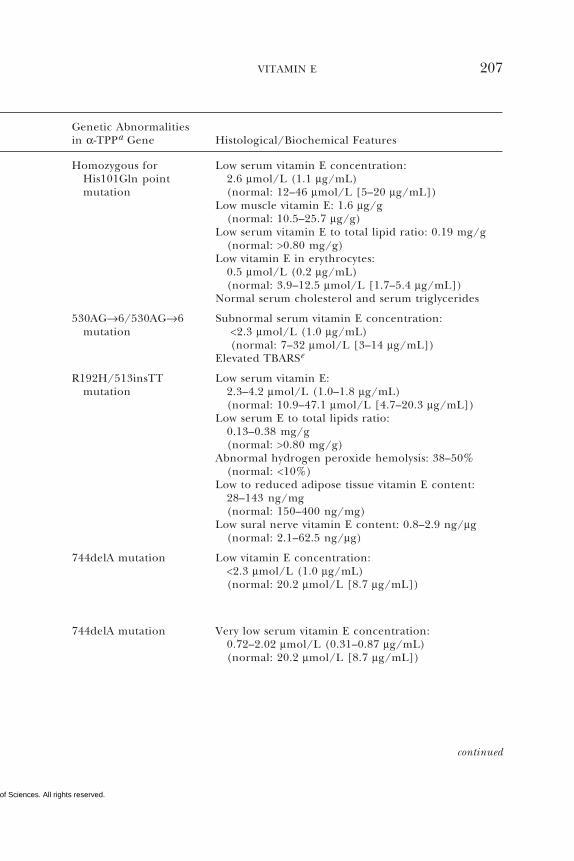
Copyright © National Academy of Sciences. All rights reserved.
VITAMIN E 207
continued
Genetic Abnormalitiesin α-TPPa Gene Histological/Biochemical Features
Homozygous for Low serum vitamin E concentration:His101Gln point 2.6 µmol/L (1.1 µg/mL)mutation (normal: 12–46 µmol/L [5–20 µg/mL])
Low muscle vitamin E: 1.6 µg/g (normal: 10.5–25.7 µg/g)
Low serum vitamin E to total lipid ratio: 0.19 mg/g(normal: >0.80 mg/g)
Low vitamin E in erythrocytes:0.5 µmol/L (0.2 µg/mL)(normal: 3.9–12.5 µmol/L [1.7–5.4 µg/mL])
Normal serum cholesterol and serum triglycerides
530AG→6/530AG→6 Subnormal serum vitamin E concentration:mutation <2.3 µmol/L (1.0 µg/mL)
(normal: 7–32 µmol/L [3–14 µg/mL])Elevated TBARSe
R192H/513insTT Low serum vitamin E:mutation 2.3–4.2 µmol/L (1.0–1.8 µg/mL)
(normal: 10.9–47.1 µmol/L [4.7–20.3 µg/mL])Low serum E to total lipids ratio:
0.13–0.38 mg/g(normal: >0.80 mg/g)
Abnormal hydrogen peroxide hemolysis: 38–50%(normal: <10%)
Low to reduced adipose tissue vitamin E content:28–143 ng/mg(normal: 150–400 ng/mg)
Low sural nerve vitamin E content: 0.8–2.9 ng/µg(normal: 2.1–62.5 ng/µg)
744delA mutation Low vitamin E concentration:<2.3 µmol/L (1.0 µg/mL)(normal: 20.2 µmol/L [8.7 µg/mL])
744delA mutation Very low serum vitamin E concentration:0.72–2.02 µmol/L (0.31–0.87 µg/mL)(normal: 20.2 µmol/L [8.7 µg/mL])
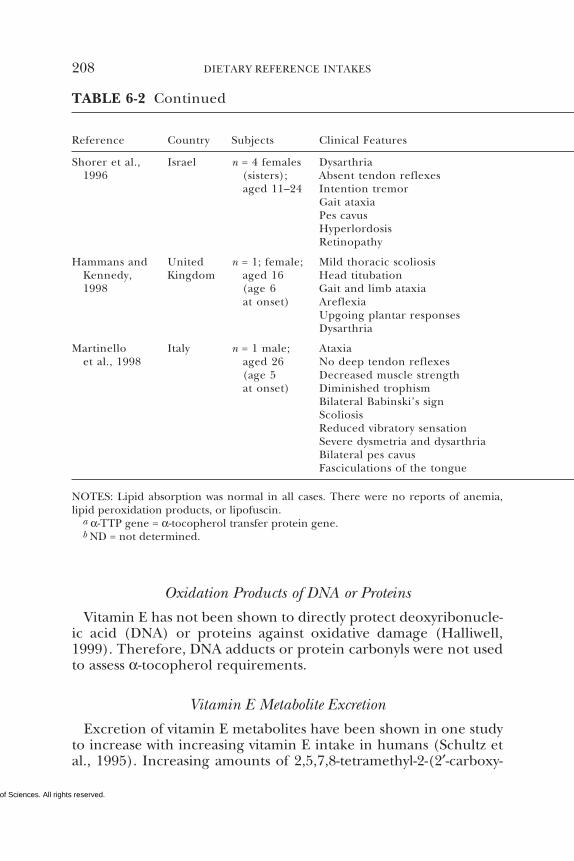
Copyright © National Academy of Sciences. All rights reserved.
208 DIETARY REFERENCE INTAKES
Shorer et al., Israel n = 4 females Dysarthria1996 (sisters); Absent tendon reflexes
aged 11–24 Intention tremorGait ataxiaPes cavusHyperlordosisRetinopathy
Hammans and United n = 1; female; Mild thoracic scoliosisKennedy, Kingdom aged 16 Head titubation1998 (age 6 Gait and limb ataxia
at onset) AreflexiaUpgoing plantar responsesDysarthria
Martinello Italy n = 1 male; Ataxiaet al., 1998 aged 26 No deep tendon reflexes
(age 5 Decreased muscle strengthat onset) Diminished trophism
Bilateral Babinski’s signScoliosisReduced vibratory sensationSevere dysmetria and dysarthriaBilateral pes cavusFasciculations of the tongue
TABLE 6-2 Continued
Reference Country Subjects Clinical Features
NOTES: Lipid absorption was normal in all cases. There were no reports of anemia,lipid peroxidation products, or lipofuscin.
a α-TTP gene = α-tocopherol transfer protein gene.b ND = not determined.
Oxidation Products of DNA or Proteins
Vitamin E has not been shown to directly protect deoxyribonucle-ic acid (DNA) or proteins against oxidative damage (Halliwell,1999). Therefore, DNA adducts or protein carbonyls were not usedto assess α-tocopherol requirements.
Vitamin E Metabolite Excretion
Excretion of vitamin E metabolites have been shown in one studyto increase with increasing vitamin E intake in humans (Schultz etal., 1995). Increasing amounts of 2,5,7,8-tetramethyl-2-(2′-carboxy-
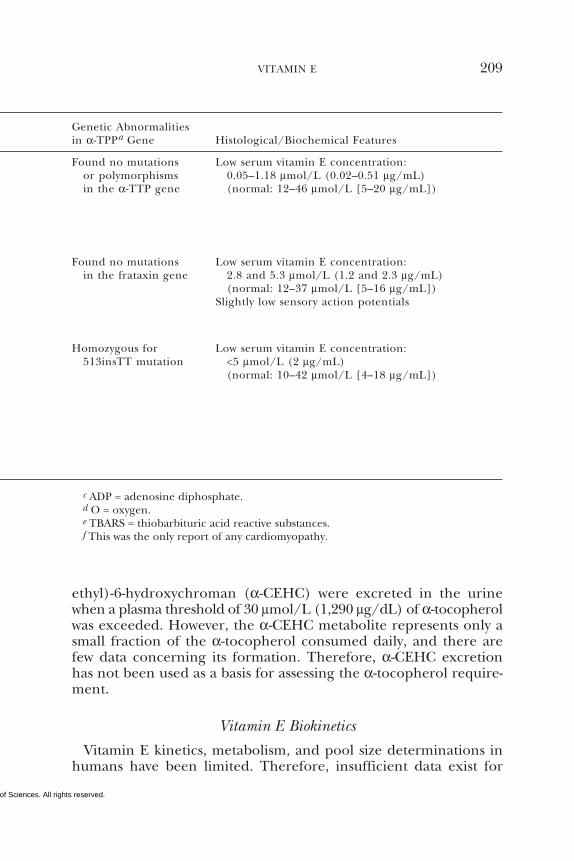
Copyright © National Academy of Sciences. All rights reserved.
VITAMIN E 209
c ADP = adenosine diphosphate.d O = oxygen.e TBARS = thiobarbituric acid reactive substances.f This was the only report of any cardiomyopathy.
ethyl)-6-hydroxychroman (α-CEHC) were excreted in the urinewhen a plasma threshold of 30 µmol/L (1,290 µg/dL) of α-tocopherolwas exceeded. However, the α-CEHC metabolite represents only asmall fraction of the α-tocopherol consumed daily, and there arefew data concerning its formation. Therefore, α-CEHC excretionhas not been used as a basis for assessing the α-tocopherol require-ment.
Vitamin E Biokinetics
Vitamin E kinetics, metabolism, and pool size determinations inhumans have been limited. Therefore, insufficient data exist for
Found no mutations Low serum vitamin E concentration:or polymorphisms 0.05–1.18 µmol/L (0.02–0.51 µg/mL)in the α-TTP gene (normal: 12–46 µmol/L [5–20 µg/mL])
Found no mutations Low serum vitamin E concentration:in the frataxin gene 2.8 and 5.3 µmol/L (1.2 and 2.3 µg/mL)
(normal: 12–37 µmol/L [5–16 µg/mL])Slightly low sensory action potentials
Homozygous for Low serum vitamin E concentration:513insTT mutation <5 µmol/L (2 µg/mL)
(normal: 10–42 µmol/L [4–18 µg/mL])
Genetic Abnormalitiesin α-TPPa Gene Histological/Biochemical Features
Copyright © National Academy of Sciences. All rights reserved.
210 DIETARY REFERENCE INTAKES
assessing human requirements for the amounts needed to maintainbody pools. Almost no data exist on pool sizes or tissue concentra-tions of vitamin E, especially the various forms of vitamin E. Studiesusing isotope-labeled vitamin E may provide kinetic data that can beused to determine daily α-tocopherol requirements in the future.
Vitamin E Deficiency Symptoms
Overt vitamin E deficiency is so rare in humans that signs of defi-ciency (e.g., neurological abnormalities) and comparisons of defi-ciency signs with dietary intakes are simply not available to serve asa basis for estimating requirements.
Plasma α-Tocopherol Concentration
Several studies have reported the determinants of plasma α-tocopherol, as measured by high-performance liquid chromatogra-phy methods, and provided mathematical models that attempted tocorrelate usual vitamin E intakes with normal plasma concentra-tions (Ascherio et al., 1992; Gascón-Vila et al., 1997; Kardinaal etal., 1995; Stryker et al., 1988). Kardinaal et al. (1995) reported thatplasma α-tocopherol concentrations were not associated with dietaryintake, whereas others (Ascherio et al., 1992; Stryker et al., 1988)report that associations seen were largely due to vitamin E supple-ment intake. Recently, Ford and Sowell (1999) reported that plasmaα-tocopherol concentrations in the Third National Health andNutrition Examination Survey (NHANES III) did not correlate withthe 24-hour dietary recall data. In any case, the correlation betweenintake and normal vitamin E plasma concentrations (greater than16 µmol/L [688 µg/dL]) is not strong and could not be used as thebasis for estimating the α-tocopherol requirement. However, invitamin E-depleted subjects a linear increase in plasma α-tocopherolconcentration was found with increasing vitamin E intake up to 17mg (39.5 µmol)/day (Horwitt, 1960).
Hydrogen Peroxide-Induced Hemolysis
Studies in children with cystic fibrosis and in vitamin E-depletedadults provide evidence for the relationship between vitamin Estatus, plasma α-tocopherol concentrations, and erythrocyte suscep-tibility to hydrogen peroxide-induced lysis (Farrell et al., 1977;Horwitt, 1960). The children become vitamin E deficient becausethe impaired secretion of pancreatic digestive enzymes causessteatorrhea and vitamin E malabsorption, even when pancreatic
Copyright © National Academy of Sciences. All rights reserved.
VITAMIN E 211
enzyme supplements are administered orally. More severe vitaminE deficiency symptoms, including neurological abnormalities, oc-cur if bile secretion is also impaired in the children (Cynamon etal., 1988; Elias et al., 1981; Farrell et al., 1977; Sokol et al., 1989;Stead et al., 1986; Winklhofer-Roob et al., 1996a,b). Breath ethane,a lipid peroxidation marker, and erythrocyte susceptibility to in vit-ro hydrogen peroxide lysis have been inversely correlated with plas-ma α-tocopherol concentrations in children and adults with vita-min E deficiency as defined by low plasma vitamin E concentrations(Refat et al., 1991). Moreover, both the markers (breath ethaneconcentrations and erythrocyte lysis) and the symptoms of neuro-logical abnormality can be corrected with supplemental vitamin E.
Relationship of Vitamin E Intake to Chronic Diseases
Cardiovascular Disease
The hypothesis that oxidized low-density lipoprotein (oxLDL) is acausative agent in the development of cardiovascular disease (Stein-berg et al., 1989) continues to dominate experimental protocolsaimed at understanding the cause, and potentially the prevention,of cardiovascular disease.
Vitamin E does inhibit LDL oxidation whether induced by cells inculture (Steinbrecher et al., 1984) or by copper ion in vitro (Die-ber-Rotheneder et al., 1991; Jialal et al., 1995; Reaven et al., 1993).In addition, vitamin E could affect atherogenesis at a number ofsteps, based on the following in vitro observations:
• Vitamin E inhibits smooth muscle cell proliferation throughthe inhibition of protein kinase C (Azzi et al., 1995; Boscoboinik etal., 1991; Chatelain et al., 1993).
• Vitamin E inhibits platelet adhesion, aggregation, and plate-let release reactions (Freedman et al., 1996; Higashi and Kikuchi,1974; Ishizuka et al., 1998; Steiner and Anastasi, 1976).
• Vitamin E inhibits plasma generation of thrombin, a potentendogenous hormone that binds to platelet receptors and inducesaggregation (Rota et al., 1998).
• Vitamin E decreases monocyte adhesion to the endotheliumby downregulating expression of adhesion molecules (Devaraj etal., 1996; Faruqi et al., 1994; Islam et al., 1998; Martin et al., 1997;Molenaar et al., 1989) and decreasing monocyte superoxide pro-duction (Cachia et al., 1998; Islam et al., 1998).
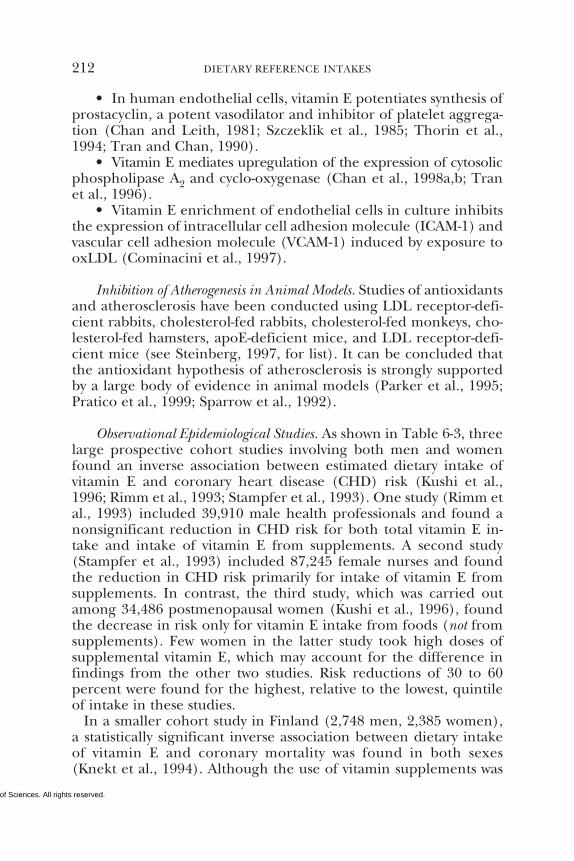
Copyright © National Academy of Sciences. All rights reserved.
212 DIETARY REFERENCE INTAKES
• In human endothelial cells, vitamin E potentiates synthesis ofprostacyclin, a potent vasodilator and inhibitor of platelet aggrega-tion (Chan and Leith, 1981; Szczeklik et al., 1985; Thorin et al.,1994; Tran and Chan, 1990).
• Vitamin E mediates upregulation of the expression of cytosolicphospholipase A2 and cyclo-oxygenase (Chan et al., 1998a,b; Tranet al., 1996).
• Vitamin E enrichment of endothelial cells in culture inhibitsthe expression of intracellular cell adhesion molecule (ICAM-1) andvascular cell adhesion molecule (VCAM-1) induced by exposure tooxLDL (Cominacini et al., 1997).
Inhibition of Atherogenesis in Animal Models. Studies of antioxidantsand atherosclerosis have been conducted using LDL receptor-defi-cient rabbits, cholesterol-fed rabbits, cholesterol-fed monkeys, cho-lesterol-fed hamsters, apoE-deficient mice, and LDL receptor-defi-cient mice (see Steinberg, 1997, for list). It can be concluded thatthe antioxidant hypothesis of atherosclerosis is strongly supportedby a large body of evidence in animal models (Parker et al., 1995;Pratico et al., 1999; Sparrow et al., 1992).
Observational Epidemiological Studies. As shown in Table 6-3, threelarge prospective cohort studies involving both men and womenfound an inverse association between estimated dietary intake ofvitamin E and coronary heart disease (CHD) risk (Kushi et al.,1996; Rimm et al., 1993; Stampfer et al., 1993). One study (Rimm etal., 1993) included 39,910 male health professionals and found anonsignificant reduction in CHD risk for both total vitamin E in-take and intake of vitamin E from supplements. A second study(Stampfer et al., 1993) included 87,245 female nurses and foundthe reduction in CHD risk primarily for intake of vitamin E fromsupplements. In contrast, the third study, which was carried outamong 34,486 postmenopausal women (Kushi et al., 1996), foundthe decrease in risk only for vitamin E intake from foods (not fromsupplements). Few women in the latter study took high doses ofsupplemental vitamin E, which may account for the difference infindings from the other two studies. Risk reductions of 30 to 60percent were found for the highest, relative to the lowest, quintileof intake in these studies.
In a smaller cohort study in Finland (2,748 men, 2,385 women),a statistically significant inverse association between dietary intakeof vitamin E and coronary mortality was found in both sexes(Knekt et al., 1994). Although the use of vitamin supplements was
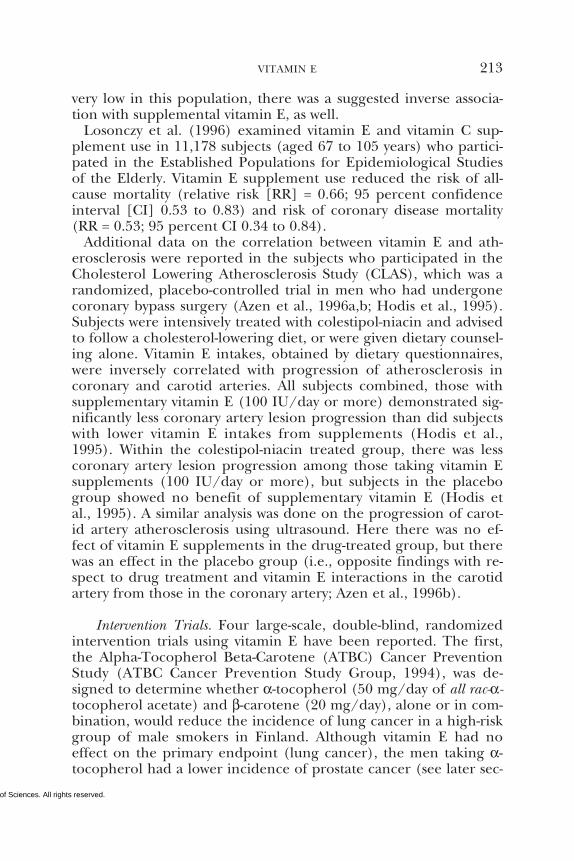
Copyright © National Academy of Sciences. All rights reserved.
VITAMIN E 213
very low in this population, there was a suggested inverse associa-tion with supplemental vitamin E, as well.
Losonczy et al. (1996) examined vitamin E and vitamin C sup-plement use in 11,178 subjects (aged 67 to 105 years) who partici-pated in the Established Populations for Epidemiological Studiesof the Elderly. Vitamin E supplement use reduced the risk of all-cause mortality (relative risk [RR] = 0.66; 95 percent confidenceinterval [CI] 0.53 to 0.83) and risk of coronary disease mortality(RR = 0.53; 95 percent CI 0.34 to 0.84).
Additional data on the correlation between vitamin E and ath-erosclerosis were reported in the subjects who participated in theCholesterol Lowering Atherosclerosis Study (CLAS), which was arandomized, placebo-controlled trial in men who had undergonecoronary bypass surgery (Azen et al., 1996a,b; Hodis et al., 1995).Subjects were intensively treated with colestipol-niacin and advisedto follow a cholesterol-lowering diet, or were given dietary counsel-ing alone. Vitamin E intakes, obtained by dietary questionnaires,were inversely correlated with progression of atherosclerosis incoronary and carotid arteries. All subjects combined, those withsupplementary vitamin E (100 IU/day or more) demonstrated sig-nificantly less coronary artery lesion progression than did subjectswith lower vitamin E intakes from supplements (Hodis et al.,1995). Within the colestipol-niacin treated group, there was lesscoronary artery lesion progression among those taking vitamin Esupplements (100 IU/day or more), but subjects in the placebogroup showed no benefit of supplementary vitamin E (Hodis etal., 1995). A similar analysis was done on the progression of carot-id artery atherosclerosis using ultrasound. Here there was no ef-fect of vitamin E supplements in the drug-treated group, but therewas an effect in the placebo group (i.e., opposite findings with re-spect to drug treatment and vitamin E interactions in the carotidartery from those in the coronary artery; Azen et al., 1996b).
Intervention Trials. Four large-scale, double-blind, randomizedintervention trials using vitamin E have been reported. The first,the Alpha-Tocopherol Beta-Carotene (ATBC) Cancer PreventionStudy (ATBC Cancer Prevention Study Group, 1994), was de-signed to determine whether α-tocopherol (50 mg/day of all rac-α-tocopherol acetate) and β-carotene (20 mg/day), alone or in com-bination, would reduce the incidence of lung cancer in a high-riskgroup of male smokers in Finland. Although vitamin E had noeffect on the primary endpoint (lung cancer), the men taking α-tocopherol had a lower incidence of prostate cancer (see later sec-
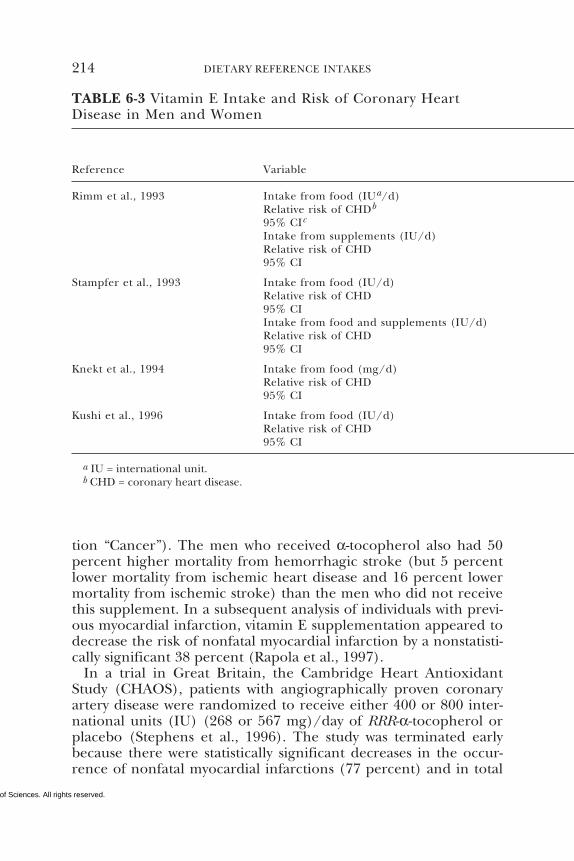
Copyright © National Academy of Sciences. All rights reserved.
214 DIETARY REFERENCE INTAKES
TABLE 6-3 Vitamin E Intake and Risk of Coronary HeartDisease in Men and Women
Reference Variable
Rimm et al., 1993 Intake from food (IUa/d)Relative risk of CHDb
95% CIc
Intake from supplements (IU/d)Relative risk of CHD95% CI
Stampfer et al., 1993 Intake from food (IU/d)Relative risk of CHD95% CIIntake from food and supplements (IU/d)Relative risk of CHD95% CI
Knekt et al., 1994 Intake from food (mg/d)Relative risk of CHD95% CI
Kushi et al., 1996 Intake from food (IU/d)Relative risk of CHD95% CI
tion “Cancer”). The men who received α-tocopherol also had 50percent higher mortality from hemorrhagic stroke (but 5 percentlower mortality from ischemic heart disease and 16 percent lowermortality from ischemic stroke) than the men who did not receivethis supplement. In a subsequent analysis of individuals with previ-ous myocardial infarction, vitamin E supplementation appeared todecrease the risk of nonfatal myocardial infarction by a nonstatisti-cally significant 38 percent (Rapola et al., 1997).
In a trial in Great Britain, the Cambridge Heart AntioxidantStudy (CHAOS), patients with angiographically proven coronaryartery disease were randomized to receive either 400 or 800 inter-national units (IU) (268 or 567 mg)/day of RRR-α-tocopherol orplacebo (Stephens et al., 1996). The study was terminated earlybecause there were statistically significant decreases in the occur-rence of nonfatal myocardial infarctions (77 percent) and in total
a IU = international unit.b CHD = coronary heart disease.
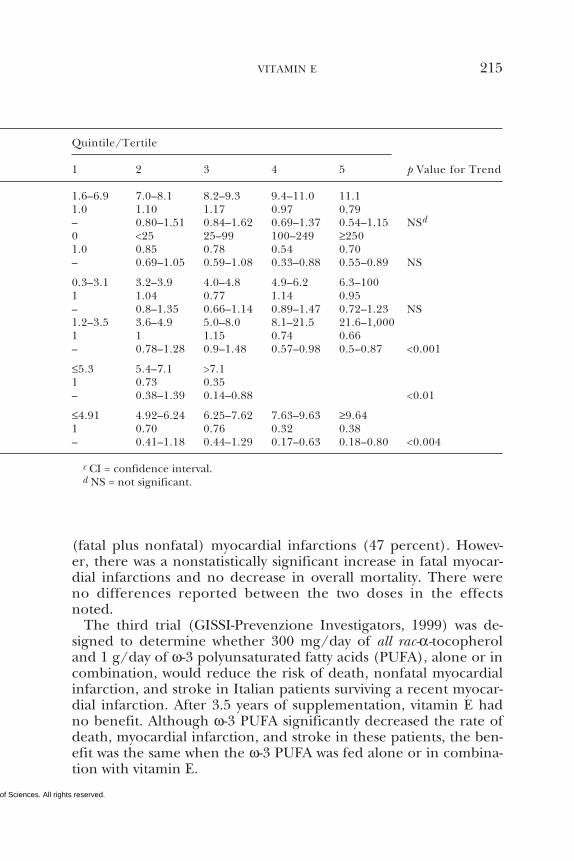
Copyright © National Academy of Sciences. All rights reserved.
VITAMIN E 215
(fatal plus nonfatal) myocardial infarctions (47 percent). Howev-er, there was a nonstatistically significant increase in fatal myocar-dial infarctions and no decrease in overall mortality. There wereno differences reported between the two doses in the effectsnoted.
The third trial (GISSI-Prevenzione Investigators, 1999) was de-signed to determine whether 300 mg/day of all rac-α-tocopheroland 1 g/day of ω-3 polyunsaturated fatty acids (PUFA), alone or incombination, would reduce the risk of death, nonfatal myocardialinfarction, and stroke in Italian patients surviving a recent myocar-dial infarction. After 3.5 years of supplementation, vitamin E hadno benefit. Although ω-3 PUFA significantly decreased the rate ofdeath, myocardial infarction, and stroke in these patients, the ben-efit was the same when the ω-3 PUFA was fed alone or in combina-tion with vitamin E.
Quintile/Tertile
1 2 3 4 5 p Value for Trend
1.6–6.9 7.0–8.1 8.2–9.3 9.4–11.0 11.11.0 1.10 1.17 0.97 0.79– 0.80–1.51 0.84–1.62 0.69–1.37 0.54–1.15 NSd
0 <25 25–99 100–249 ≥2501.0 0.85 0.78 0.54 0.70– 0.69–1.05 0.59–1.08 0.33–0.88 0.55–0.89 NS
0.3–3.1 3.2–3.9 4.0–4.8 4.9–6.2 6.3–1001 1.04 0.77 1.14 0.95– 0.8–1.35 0.66–1.14 0.89–1.47 0.72–1.23 NS1.2–3.5 3.6–4.9 5.0–8.0 8.1–21.5 21.6–1,0001 1 1.15 0.74 0.66– 0.78–1.28 0.9–1.48 0.57–0.98 0.5–0.87 <0.001
≤5.3 5.4–7.1 >7.11 0.73 0.35– 0.38–1.39 0.14–0.88 <0.01
≤4.91 4.92–6.24 6.25–7.62 7.63–9.63 ≥9.641 0.70 0.76 0.32 0.38– 0.41–1.18 0.44–1.29 0.17–0.63 0.18–0.80 <0.004
c CI = confidence interval.d NS = not significant.
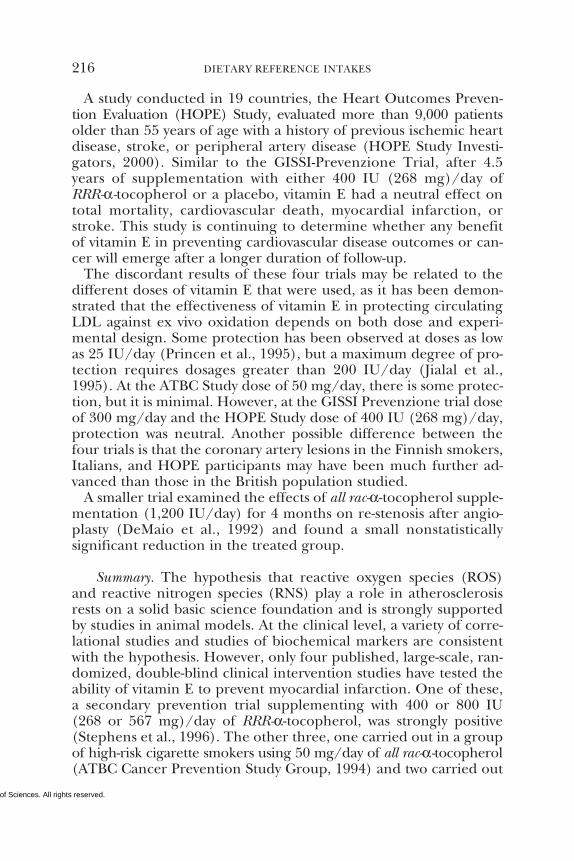
Copyright © National Academy of Sciences. All rights reserved.
216 DIETARY REFERENCE INTAKES
A study conducted in 19 countries, the Heart Outcomes Preven-tion Evaluation (HOPE) Study, evaluated more than 9,000 patientsolder than 55 years of age with a history of previous ischemic heartdisease, stroke, or peripheral artery disease (HOPE Study Investi-gators, 2000). Similar to the GISSI-Prevenzione Trial, after 4.5years of supplementation with either 400 IU (268 mg)/day ofRRR-α-tocopherol or a placebo, vitamin E had a neutral effect ontotal mortality, cardiovascular death, myocardial infarction, orstroke. This study is continuing to determine whether any benefitof vitamin E in preventing cardiovascular disease outcomes or can-cer will emerge after a longer duration of follow-up.
The discordant results of these four trials may be related to thedifferent doses of vitamin E that were used, as it has been demon-strated that the effectiveness of vitamin E in protecting circulatingLDL against ex vivo oxidation depends on both dose and experi-mental design. Some protection has been observed at doses as lowas 25 IU/day (Princen et al., 1995), but a maximum degree of pro-tection requires dosages greater than 200 IU/day (Jialal et al.,1995). At the ATBC Study dose of 50 mg/day, there is some protec-tion, but it is minimal. However, at the GISSI Prevenzione trial doseof 300 mg/day and the HOPE Study dose of 400 IU (268 mg)/day,protection was neutral. Another possible difference between thefour trials is that the coronary artery lesions in the Finnish smokers,Italians, and HOPE participants may have been much further ad-vanced than those in the British population studied.
A smaller trial examined the effects of all rac-α-tocopherol supple-mentation (1,200 IU/day) for 4 months on re-stenosis after angio-plasty (DeMaio et al., 1992) and found a small nonstatisticallysignificant reduction in the treated group.
Summary. The hypothesis that reactive oxygen species (ROS)and reactive nitrogen species (RNS) play a role in atherosclerosisrests on a solid basic science foundation and is strongly supportedby studies in animal models. At the clinical level, a variety of corre-lational studies and studies of biochemical markers are consistentwith the hypothesis. However, only four published, large-scale, ran-domized, double-blind clinical intervention studies have tested theability of vitamin E to prevent myocardial infarction. One of these,a secondary prevention trial supplementing with 400 or 800 IU(268 or 567 mg)/day of RRR-α-tocopherol, was strongly positive(Stephens et al., 1996). The other three, one carried out in a groupof high-risk cigarette smokers using 50 mg/day of all rac-α-tocopherol(ATBC Cancer Prevention Study Group, 1994) and two carried out
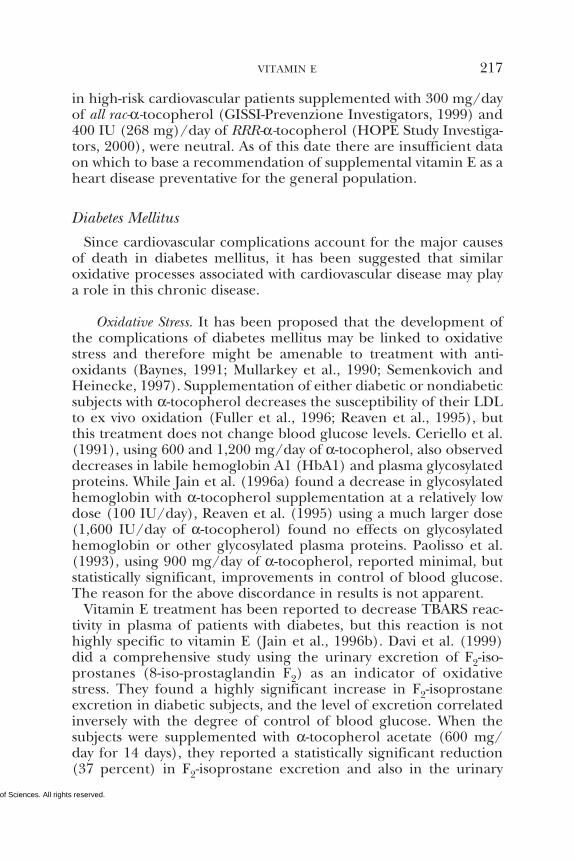
Copyright © National Academy of Sciences. All rights reserved.
VITAMIN E 217
in high-risk cardiovascular patients supplemented with 300 mg/dayof all rac-α-tocopherol (GISSI-Prevenzione Investigators, 1999) and400 IU (268 mg)/day of RRR-α-tocopherol (HOPE Study Investiga-tors, 2000), were neutral. As of this date there are insufficient dataon which to base a recommendation of supplemental vitamin E as aheart disease preventative for the general population.
Diabetes Mellitus
Since cardiovascular complications account for the major causesof death in diabetes mellitus, it has been suggested that similaroxidative processes associated with cardiovascular disease may playa role in this chronic disease.
Oxidative Stress. It has been proposed that the development ofthe complications of diabetes mellitus may be linked to oxidativestress and therefore might be amenable to treatment with anti-oxidants (Baynes, 1991; Mullarkey et al., 1990; Semenkovich andHeinecke, 1997). Supplementation of either diabetic or nondiabeticsubjects with α-tocopherol decreases the susceptibility of their LDLto ex vivo oxidation (Fuller et al., 1996; Reaven et al., 1995), butthis treatment does not change blood glucose levels. Ceriello et al.(1991), using 600 and 1,200 mg/day of α-tocopherol, also observeddecreases in labile hemoglobin A1 (HbA1) and plasma glycosylatedproteins. While Jain et al. (1996a) found a decrease in glycosylatedhemoglobin with α-tocopherol supplementation at a relatively lowdose (100 IU/day), Reaven et al. (1995) using a much larger dose(1,600 IU/day of α-tocopherol) found no effects on glycosylatedhemoglobin or other glycosylated plasma proteins. Paolisso et al.(1993), using 900 mg/day of α-tocopherol, reported minimal, butstatistically significant, improvements in control of blood glucose.The reason for the above discordance in results is not apparent.
Vitamin E treatment has been reported to decrease TBARS reac-tivity in plasma of patients with diabetes, but this reaction is nothighly specific to vitamin E (Jain et al., 1996b). Davi et al. (1999)did a comprehensive study using the urinary excretion of F2-iso-prostanes (8-iso-prostaglandin F2) as an indicator of oxidativestress. They found a highly significant increase in F2-isoprostaneexcretion in diabetic subjects, and the level of excretion correlatedinversely with the degree of control of blood glucose. When thesubjects were supplemented with α-tocopherol acetate (600 mg/day for 14 days), they reported a statistically significant reduction(37 percent) in F2-isoprostane excretion and also in the urinary
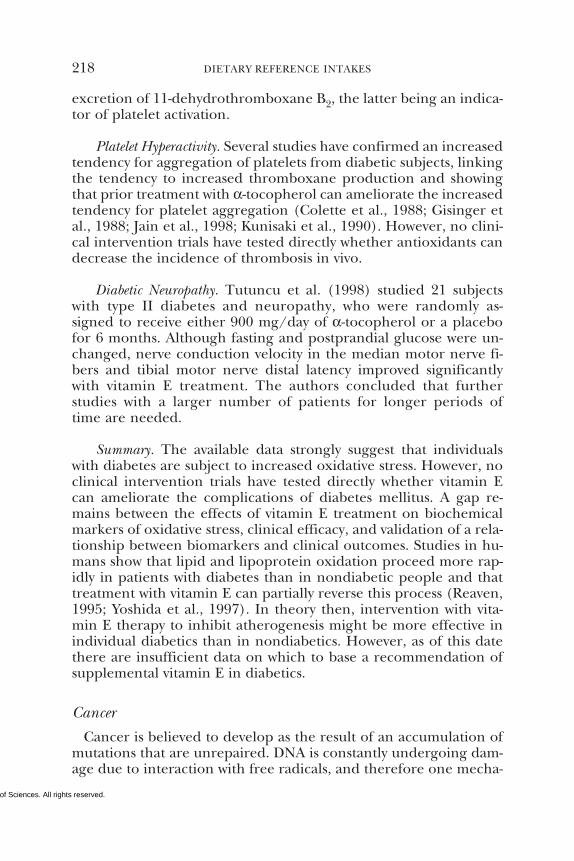
Copyright © National Academy of Sciences. All rights reserved.
218 DIETARY REFERENCE INTAKES
excretion of 11-dehydrothromboxane B2, the latter being an indica-tor of platelet activation.
Platelet Hyperactivity. Several studies have confirmed an increasedtendency for aggregation of platelets from diabetic subjects, linkingthe tendency to increased thromboxane production and showingthat prior treatment with α-tocopherol can ameliorate the increasedtendency for platelet aggregation (Colette et al., 1988; Gisinger etal., 1988; Jain et al., 1998; Kunisaki et al., 1990). However, no clini-cal intervention trials have tested directly whether antioxidants candecrease the incidence of thrombosis in vivo.
Diabetic Neuropathy. Tutuncu et al. (1998) studied 21 subjectswith type II diabetes and neuropathy, who were randomly as-signed to receive either 900 mg/day of α-tocopherol or a placebofor 6 months. Although fasting and postprandial glucose were un-changed, nerve conduction velocity in the median motor nerve fi-bers and tibial motor nerve distal latency improved significantlywith vitamin E treatment. The authors concluded that furtherstudies with a larger number of patients for longer periods oftime are needed.
Summary. The available data strongly suggest that individualswith diabetes are subject to increased oxidative stress. However, noclinical intervention trials have tested directly whether vitamin Ecan ameliorate the complications of diabetes mellitus. A gap re-mains between the effects of vitamin E treatment on biochemicalmarkers of oxidative stress, clinical efficacy, and validation of a rela-tionship between biomarkers and clinical outcomes. Studies in hu-mans show that lipid and lipoprotein oxidation proceed more rap-idly in patients with diabetes than in nondiabetic people and thattreatment with vitamin E can partially reverse this process (Reaven,1995; Yoshida et al., 1997). In theory then, intervention with vita-min E therapy to inhibit atherogenesis might be more effective inindividual diabetics than in nondiabetics. However, as of this datethere are insufficient data on which to base a recommendation ofsupplemental vitamin E in diabetics.
Cancer
Cancer is believed to develop as the result of an accumulation ofmutations that are unrepaired. DNA is constantly undergoing dam-age due to interaction with free radicals, and therefore one mecha-
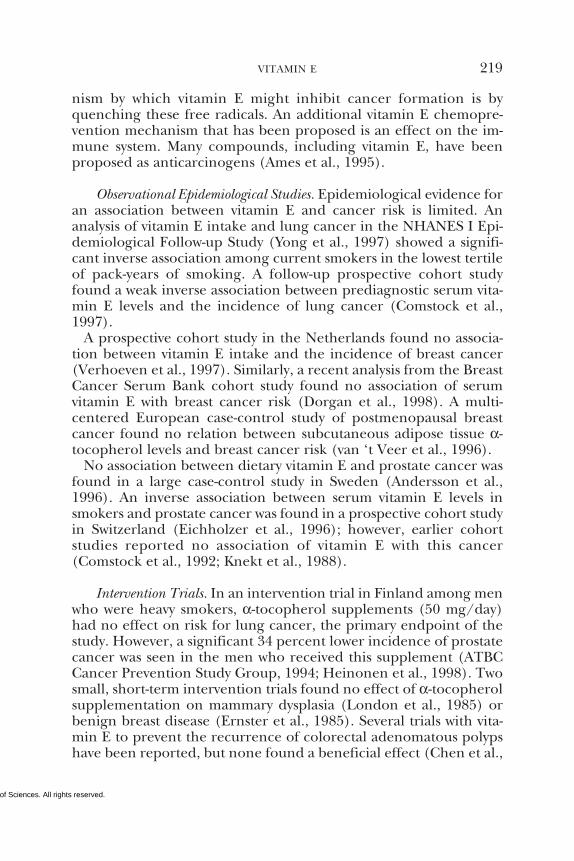
Copyright © National Academy of Sciences. All rights reserved.
VITAMIN E 219
nism by which vitamin E might inhibit cancer formation is byquenching these free radicals. An additional vitamin E chemopre-vention mechanism that has been proposed is an effect on the im-mune system. Many compounds, including vitamin E, have beenproposed as anticarcinogens (Ames et al., 1995).
Observational Epidemiological Studies. Epidemiological evidence foran association between vitamin E and cancer risk is limited. Ananalysis of vitamin E intake and lung cancer in the NHANES I Epi-demiological Follow-up Study (Yong et al., 1997) showed a signifi-cant inverse association among current smokers in the lowest tertileof pack-years of smoking. A follow-up prospective cohort studyfound a weak inverse association between prediagnostic serum vita-min E levels and the incidence of lung cancer (Comstock et al.,1997).
A prospective cohort study in the Netherlands found no associa-tion between vitamin E intake and the incidence of breast cancer(Verhoeven et al., 1997). Similarly, a recent analysis from the BreastCancer Serum Bank cohort study found no association of serumvitamin E with breast cancer risk (Dorgan et al., 1998). A multi-centered European case-control study of postmenopausal breastcancer found no relation between subcutaneous adipose tissue α-tocopherol levels and breast cancer risk (van ‘t Veer et al., 1996).
No association between dietary vitamin E and prostate cancer wasfound in a large case-control study in Sweden (Andersson et al.,1996). An inverse association between serum vitamin E levels insmokers and prostate cancer was found in a prospective cohort studyin Switzerland (Eichholzer et al., 1996); however, earlier cohortstudies reported no association of vitamin E with this cancer(Comstock et al., 1992; Knekt et al., 1988).
Intervention Trials. In an intervention trial in Finland among menwho were heavy smokers, α-tocopherol supplements (50 mg/day)had no effect on risk for lung cancer, the primary endpoint of thestudy. However, a significant 34 percent lower incidence of prostatecancer was seen in the men who received this supplement (ATBCCancer Prevention Study Group, 1994; Heinonen et al., 1998). Twosmall, short-term intervention trials found no effect of α-tocopherolsupplementation on mammary dysplasia (London et al., 1985) orbenign breast disease (Ernster et al., 1985). Several trials with vita-min E to prevent the recurrence of colorectal adenomatous polypshave been reported, but none found a beneficial effect (Chen et al.,
Copyright © National Academy of Sciences. All rights reserved.
220 DIETARY REFERENCE INTAKES
1988; DeCosse et al., 1989; Greenberg et al., 1994; Hofstad et al.,1998; McKeown-Eyssen et al., 1988).
Summary. Overall, the epidemiological evidence for an effect ofvitamin E on cancer risk is weaker than that for vitamin E and car-diovascular disease. Observational epidemiological studies provideonly limited evidence for a protective association and only for somecancer sites. At present, the data from intervention trials are mostsuggestive for the ability of vitamin E to prevent prostate cancer,but only a single trial has yet been reported, and prostate cancerwas not the primary endpoint of that study.
Immune Function
It has been established that several aspects of immune functiondecline with increasing age (Bendich, 1994). Moreover, supplemen-tation with vitamin E is able to reverse these deficits in some indi-viduals. Meydani et al. (1997) studied a total of 88 free-living, appar-ently healthy subjects at least 65 years of age, who were randomlyassigned to a placebo group or to groups consuming 60, 200, or 800mg/day of vitamin E for 235 days. Subjects in the upper tertile ofserum α-tocopherol concentrations (greater than 48.4 µmol/L [2.08mg/dL] or approximately twice normal values) after supplementa-tion with 200 or 800 mg/day of vitamin E had higher antibodyresponses to hepatitis B vaccine and delayed-type hypersensitivity(DTH) skin response. The 200-mg/day group also had a significantincrease in antibody titer to tetanus vaccine. Recently, Pallast et al.(1999) reported that supplementation with 100 mg/day of vitaminE for 6 months may improve cellular immune function in apparent-ly healthy elderly, but that the effect may be more pronounced incertain subgroups such as those who were physically less active orthose with low baseline DTH reactivity.
Five subjects with tropical sprue for 8 to 10 years were found tohave an abnormal delayed hypersensitivity response as well (Gha-laut et al., 1995). Moreover, their plasma vitamin E concentrationswere approximately one-tenth of normal, and the subjects had asensory neuropathy characteristic of vitamin E deficiency. Parenter-al vitamin E therapy increased serum vitamin E concentrations tonormal and improved neurological responses and response to theimmune function skin test, suggesting that vitamin E may be impor-tant in immune function.
Whether or not increases in vitamin E intake have any effect onimmune function in younger populations remains uncertain. How-
Copyright © National Academy of Sciences. All rights reserved.
VITAMIN E 221
ever, the evidence is strong enough to warrant continued investi-gation.
Cataracts
There is a sound biochemical basis for the notion that the accu-mulation of damaged proteins in the lens leads to cataract forma-tion and that free-radical damage contributes to this protein dam-age (Taylor, 1993). Studies in experimental animals show thatantioxidant vitamins, including vitamin E, can protect against lensdamage (Jacques et al., 1994).
At the epidemiological level, there have been nine studies relat-ing vitamin E status to risk of at least one type of cataract. Fivereported a protective association (Jacques and Chylack, 1991; Knektet al., 1992; Leske et al., 1991; Robertson et al., 1989; Vitale et al.,1993), while four reported no association (Hankinson et al., 1992;Mares-Perlman et al, 1994a,b; Mohan et al., 1989).
Only one intervention study has been carried out to test the ef-fects of α-tocopherol alone on the prevalence of cataracts (Teikariet al., 1998). A subgroup of men participating in the Finnish ATBCstudy were examined at the end of that study for cataracts. Therewere no differences in the prevalence of nuclear, cortical, or poste-rior subcapsular cataracts between control subjects and those tak-ing 50 mg/day of α-tocopherol.
Central Nervous System Disorders
The most characteristic manifestation of vitamin E deficiency inhumans is neuropathy affecting both the central and the peripheralnervous systems, particularly sensory axons (Sokol, 1988). The neu-ropathology associated with frank vitamin E deficiency has beendiscussed above. The discussion that follows focuses on neurologi-cal diseases in which free-radical damage has been proposed to playa role and in which vitamin E might therefore play a protective role.
Parkinson’s Disease. Parkinson’s disease is characterized by dopa-minergic cell death in the substantia nigra. Reported local changesin the substantia nigra compatible with a role for oxidative stress inParkinson’s disease include signs of increases in lipid peroxidation,increases in iron concentration, and decreases in some of the anti-oxidant defense mechanisms (Muller, 1994). However, a placebo-controlled, double-blind study of 800 patients given 2,000 IU/dayof all rac-α-tocopherol failed to show any beneficial effect (Parkin-
Copyright © National Academy of Sciences. All rights reserved.
222 DIETARY REFERENCE INTAKES
son Study Group, 1993). Follow-up publications reported again thatα-tocopherol had no benefit (Shoulson, 1998) and had no effect onmortality (Parkinson Study Group, 1998). This did not appear to bea result of poor compliance because increases in vitamin E in cere-brospinal fluid in response to the supplement were reported(Vatassery et al., 1998).
Alzheimer’s Disease and Down’s Syndrome. Alzheimer’s disease is aneurodegenerative disorder that appears to have an oxidative stresscomponent; it is not clear if this is a cause or a consequence of thedisease. The disease may be potentiated by an accumulation of re-dox-active metals (Cornett et al., 1998), especially iron (Smith etal., 1997). Additionally, amyloid β-peptide is a key factor in theneurotoxicity of Alzheimer’s disease because it can initiate proteinoxidation and lipid peroxidation (Keller et al., 1997), eventuallyleading to neuronal cell death. The free-radical dependence of β-amyloid-associated toxicity was confirmed by the ability of vitamin Eto prevent the toxic effects of amyloid β-peptide in vitro (Subrama-niam et al., 1998). These data are compatible with an etiology thatincludes oxidative damage, but other hypotheses are possible.
In a 2-year, double-blind, placebo-controlled, randomized, multi-center trial in 341 patients with moderately severe impairment fromAlzheimer’s disease, treatment with all rac-α-tocopherol (2,000 IU/day) significantly slowed the progression of disease (Sano et al.,1997).
A case can be made for a link between oxidative stress and neuro-pathology in Alzheimer’s disease and Down’s syndrome (Muller,1994). In individuals dying from either disease, abnormalities inbrain histology are remarkably similar. Down’s syndrome is due totrisomy of chromosome 21, which carries the gene for superoxidedismutase (SOD). Interestingly, overexpression of human SOD intransgenic mice is associated with increased lipid peroxidation inthe brain (Ceballos-Picot et al., 1991), perhaps secondary to SOD-induced conversion of the superoxide anion to hydrogen peroxideand water. Although these results are promising, it is still too earlyto draw any conclusions about the usefulness of vitamin E inAlzheimer’s disease and Down’s syndrome.
Tardive Dyskinesia (TD). TD is a neurologic disorder that devel-ops in about 20 percent of patients treated long term with neuro-leptic drugs. These drugs increase the turnover of brain catechola-mines, particularly the neurotransmitter dopamine, and these arecompounds that can give rise to ROS. TD is characterized by a
Copyright © National Academy of Sciences. All rights reserved.
VITAMIN E 223
variety of involuntary movements, especially of the face. It has beenreported that the cerebrospinal fluid of patients with TD containshigher-than-normal concentrations of lipid peroxidation products(Lohr et al., 1990), and more recently, plasma also was found tohave lipid peroxidation products (Brown et al., 1998). However, acausal relationship between these indicators of oxidative stress andthe incidence or severity of tardive dyskinesia has not been estab-lished.
Some have reported short-term supplementation of TD patientswith vitamin E (Egan et al., 1992; Elkashef et al., 1990; Lohr et al.,1987). The beneficial effects were minor, mostly limited to patientswith recent onset of the disease, and the number of subjects wasvery small. Recently, in 40 patients who were supplemented with1,600 IU/day of α-tocopherol or placebo for up to 36 weeks, therewas a significant difference in mean Abnormal Involuntary Move-ments Scale scores, in those receiving vitamin E after 10 weeks oftreatment (Adler et al., 1998).
Summary
A large number of studies have been carried out in the past de-cade that directly or indirectly concern the relationship betweenvitamin E intake and chronic disease. Among the effects of vitaminE intakes from supplements are inhibition of LDL oxidation bothin vitro and in vivo; inhibition of smooth muscle cell proliferationthrough inhibition of protein kinase C; inhibition of platelet adhe-sion, aggregation, and platelet release reactions; and inhibition ofplasma generation of thrombin. In addition, supplemental intakesof vitamin E decrease monocyte adhesion to endothelium, decreasemonocyte superoxide production, potentiate the synthesis of pros-tacyclin, upregulate the expression of phospholipase A2 and cyclo-oxygenase, and inhibit the expression of ICAM-1 and VCAM-1 in-duced by exposure to oxLDL. Many of these effects have beenshown only in tissue culture and have not been studied in vivo. Allof these actions could have an influence on health and the develop-ment of chronic disease. Some of these effects appear to be inde-pendent of the antioxidant properties of vitamin E. Thus, it mustbe recognized that consumption of large quantities of vitamin E willlead to multiple metabolic and cellular changes in humans. An im-portant question is whether the net result of these changes will bebeneficial when large amounts of vitamin E are consumed on along-term basis.
Clinical trials are currently under way to determine whether high
Copyright © National Academy of Sciences. All rights reserved.
224 DIETARY REFERENCE INTAKES
intakes of vitamin E will reduce the risk for certain diseases. Still,even a positive outcome of these trials may not necessarily lead to achange in recommended individual intakes for the whole popula-tion. These trials generally are targeting groups at high risk forparticular diseases. If the results of these studies are positive, it islikely that initial recommendations for higher intakes will be limit-ed in their application to high-risk populations. Because of the myr-iad of actions of high doses of vitamin E, recommendations of high-er intakes for the general population undoubtedly will requireextensive investigation of the long-term consequences of the multi-ple metabolic and cellular modifications.
FACTORS AFFECTING THE VITAMIN E REQUIREMENT
Bioavailability
Most dietary vitamin E is found in food that contains fat. It is clearthat vitamin E absorption requires micelle formation and chylomi-cron secretion by the intestine (Muller et al, 1974), although theoptimal amount of fat to enhance vitamin E absorption has notbeen reported. This is probably a more important issue for vitaminE supplement users than for nonsupplement users where all of thevitamin E is in a dietary fat-rich environment.
Nutrient-Nutrient Interactions
Antioxidant Interactions
When vitamin E intercepts a radical, a tocopheroxyl radical isformed (Burton and Ingold, 1981). This radical can be reduced byascorbic acid or other reducing agents (Doba et al., 1985; Niki etal., 1982), thereby oxidizing the latter and returning vitamin E to itsreduced state.
The ability of one antioxidant to regenerate another oxidizedspecies is dependent on the redox potential of the antioxidant(Buettner, 1993). Biologically relevant electron donors that havebeen shown to regenerate α-tocopherol effectively from the α-tocopheroxyl radical include vitamin C (McCay, 1985), glutathione(Niki, 1987), and ubiquinols (Stoyanovsky et al., 1995). (For furtherinformation see “Nutrient-Nutrient Interactions” in Chapter 5.) Cel-lular redox cycling is coupled with the energy status of the organ-ism. Thus, it can be expected that during prolonged energy deficitor inadequate production of nicotinamide adenine dinucleotide
Copyright © National Academy of Sciences. All rights reserved.
VITAMIN E 225
(NADH), nicotinamide adenine dinucleotide phosphate (NADPH)or glutathione [GSSG] reductase due to dietary deficiencies of nia-cin (component of NADP or NADPH) or riboflavin (cofactor forGSSG reductase), the ability of the organism to produce sufficientreducing equivalents for recycling oxidized products will be com-promised. Conversely, intakes of plant phenolic compounds andflavonoids may add to the total antioxidant pool (de Vries et al.,1998; Manach et al., 1998). The extent, involvement, and contribu-tion of these newer compounds which may be acting as antioxi-dants to the redox cycling reactions in vitro and in vivo remain tobe determined.
The regeneration of α-tocopherol from the α-tocopheroxyl radi-cal may be faster than the further oxidation of the α-tocopheroxylradical. The extent to which vitamin E is recycled in humans andwhich antioxidant species are preferentially used for recycling arenot known. In human platelet homogenates, distinct chemical andenzymatic pathways for the regeneration of oxidized tocopherol,afforded by vitamin C and glutathione, have been identified (Chanet al., 1991). A metabolic study in humans designed to demonstratethe occurrence of vitamin E recycling by vitamin C had limitationssince the body pools of vitamin C and E cannot be totally depleted(Jacob et al., 1996). Although the data were inconclusive, the au-thors did comment that there is “a trend towards sparing of tissuetocopherol by vitamin C” and that more study was warranted. Thisis an important area of investigation because the tocopheroxyl radi-cal has been shown in vitro to increase lipid peroxidation in theabsence of water-soluble antioxidants, and it has been proposedthat this mechanism may be an important factor in potentiating invivo atherogenesis (Stocker, 1999; Upston et al., 1999). However,there are still no data to determine whether this mechanism is oper-ative in vivo.
Dietary Polyunsaturated Fat
Vitamin E requirements have been reported to increase when in-takes of polyunsaturated fatty acids (PUFAs) are increased (Dam,1962; Horwitt, 1962). Based on these data it was suggested that aratio of at least 0.4 mg (1 µmol) α-tocopherol per gram of PUFAshould be consumed by adults (Bieri and Evarts, 1973; Horwitt,1974; Witting and Lee, 1975). However, the method of determiningthe vitamin E requirement generated by PUFA intakes is not univer-sally accepted because the amount of vitamin E required to stabilizePUFAs in tissues is influenced to a greater extent by their degree of
Copyright © National Academy of Sciences. All rights reserved.
226 DIETARY REFERENCE INTAKES
unsaturation than by their mass (Draper, 1993). Moreover, PUFAsare not deposited in the tissues in the same proportions that theyoccur in the diet. Finally, dietary PUFAs are modified by elongationand desaturation and are catabolized to various degrees dependingon energy status (Jones and Kubow, 1999).
There are also data to suggest that low-density lipoprotein (LDL)oxidation susceptibility in vitro is dependent upon its PUFA con-tent. A 10 percent PUFA diet with 34 percent of calories from fatincreased LDL oxidation susceptibility compared to a 19 percentmonosaturated fatty acid (MUFA) diet with 40 percent of the calo-ries from fat, without changing the α-tocopherol content of theLDL (Schwab et al., 1998a). In a double-blind crossover trial in 48postmenopausal women, supplementation with fish oil increasedLDL oxidation susceptibility, while supplementation with both fishoil and α-tocopheryl acetate significantly decreased it (Wander etal., 1996).
The effect of the fatty acid composition of reduced-fat diets onthe in vitro oxidation of LDL was also examined in 14 moderatelyhypercholesterolemic (LDL greater than 3.36 mmol/L) female andmale subjects (aged 44 to 78 years). Each subject consumed each offive reduced-fat diets (30 percent of energy from total fat, 17 per-cent from protein, and 53 percent from carbohydrate) which in-cluded 20 percent of energy from beef tallow, canola oil, corn oil,olive oil, or rice bran oil for a period of 32 days. When the datafrom all dietary phases were pooled, LDL α-tocopherol levels andplasma 18:1/18:2 ratios were positively related to LDL oxidationresistance (Schwab et al., 1998b).
Although it is clear that the relationship between dietary PUFAand vitamin E needs is not simple, high PUFA intakes should cer-tainly be accompanied by increased vitamin E intakes.
FINDINGS BY LIFE STAGE AND GENDER GROUP
Infants Ages 0 through 12 Months
Method Used to Set the Adequate Intake
No functional criteria of vitamin E status have been demonstratedwhich reflect response to dietary intake in infants. Thus recom-mended intakes of vitamin E are based on an Adequate Intake (AI)that reflects a calculated mean vitamin E intake of infants fed prin-cipally with human milk.
Copyright © National Academy of Sciences. All rights reserved.
VITAMIN E 227
Human Milk. Human milk is recognized as the optimal milksource for infants throughout at least the first year of life and isrecommended as the sole nutritional milk source for infants duringthe first 4 to 6 months of life (IOM, 1991). Therefore, determina-tion of the AI for vitamin E for infants is based on data from infantsfed human milk as the principal fluid during the periods 0 through6 and 7 through 12 months of age. The AI is set for ages 0 through6 months at the mean value calculated from studies in which theintake of human milk was measured by test weighing volume, andthe average concentration of the nutrient in human milk was deter-mined using average values from several reported studies.
In general, the total vitamin E content of colostrum is high (aver-age content ranges from 6.8–23 mg/L) (Ali et al., 1986; Boersma etal., 1991; Chappell et al., 1985; Jansson et al., 1981; Kobayashi et al.,1975; Thomas et al., 1981); the concentration decreases in transi-tional milk, sampled at 6–10 days, and further decreases in maturemilk, as shown in Table 6-4. The range of vitamin E concentrationsin mature human milk after approximately 30 days of lactation var-ies from 1.8 mg/L (Kobayashi et al., 1975) to approximately 9 mg/L (Thomas et al., 1981).
Vitamin E concentrations are most accurately analyzed by high-performance liquid chromatography (HPLC). Therefore, reportsof vitamin E concentrations in human milk utilizing non-HPLCmethods (Ali et al., 1986; Kobayashi et al., 1975; and Thomas et al.,1981) are not used in this assessment. HPLC measurements of theaverage α-tocopherol content of mature human milk have yieldedvalues of 2.3 (Lammi-Keefe et al., 1990), 3.5 (Chappell et al., 1985),3.7 ± 0.6 (SD) (Lammi-Keefe et al., 1985), 7.2 ± 3.9 (SD) (Janssonet al., 1981), and 8 ± 5 mg/L (SD) (Boersma et al., 1991). Thelatter authors reported that the α-tocopherol amounts in humanmilk were nearly identical to the α-tocopherol equivalent amounts.
Data suggest that there is no difference in milk vitamin E contentbetween mothers with preterm and term births (Lammi-Keefe etal., 1985; Thomas et al., 1981). In addition, there is no significantdiurnal variation in the vitamin E content of human milk (Chappellet al., 1985).
Ages 0 through 6 Months. This recommendation is based on themean volume of human milk intake of 0.78 L/day (Allen et al.,1991; Butte et al., 1984; Heinig et al., 1993), consumed by infantsages 0 through 6 months. The average concentration of α-tocopherolin human milk is approximately 4.9 mg/L as assessed by HPLC inthe five studies cited above. If this amount is multiplied by the aver-
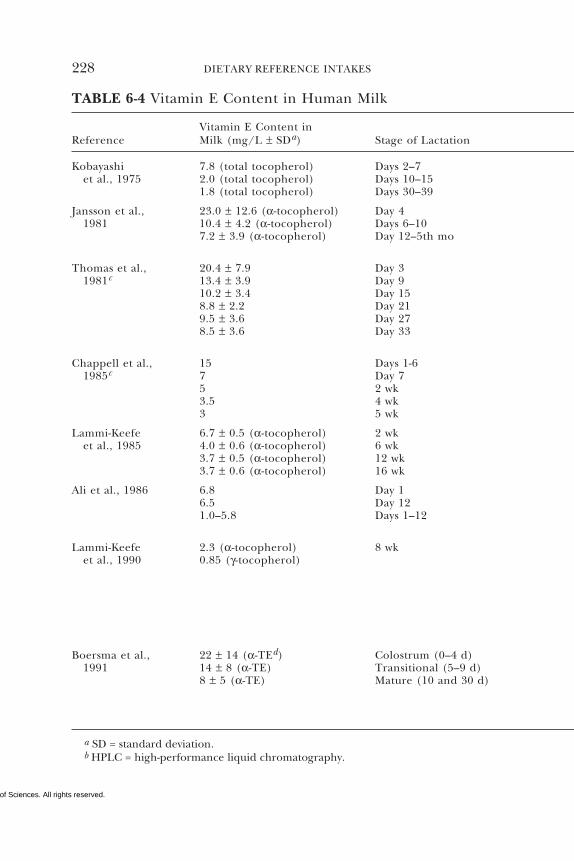
Copyright © National Academy of Sciences. All rights reserved.
228 DIETARY REFERENCE INTAKES
TABLE 6-4 Vitamin E Content in Human Milk
Vitamin E Content inReference Milk (mg/L ± SDa) Stage of Lactation
Kobayashi 7.8 (total tocopherol) Days 2–7et al., 1975 2.0 (total tocopherol) Days 10–15
1.8 (total tocopherol) Days 30–39
Jansson et al., 23.0 ± 12.6 (α-tocopherol) Day 41981 10.4 ± 4.2 (α-tocopherol) Days 6–10
7.2 ± 3.9 (α-tocopherol) Day 12–5th mo
Thomas et al., 20.4 ± 7.9 Day 31981c 13.4 ± 3.9 Day 9
10.2 ± 3.4 Day 158.8 ± 2.2 Day 219.5 ± 3.6 Day 278.5 ± 3.6 Day 33
Chappell et al., 15 Days 1-61985c 7 Day 7
5 2 wk3.5 4 wk3 5 wk
Lammi-Keefe 6.7 ± 0.5 (α-tocopherol) 2 wket al., 1985 4.0 ± 0.6 (α-tocopherol) 6 wk
3.7 ± 0.5 (α-tocopherol) 12 wk3.7 ± 0.6 (α-tocopherol) 16 wk
Ali et al., 1986 6.8 Day 16.5 Day 121.0–5.8 Days 1–12
Lammi-Keefe 2.3 (α-tocopherol) 8 wket al., 1990 0.85 (γ-tocopherol)
Boersma et al., 22 ± 14 (α-TEd) Colostrum (0–4 d)1991 14 ± 8 (α-TE) Transitional (5–9 d)
8 ± 5 (α-TE) Mature (10 and 30 d)
a SD = standard deviation.b HPLC = high-performance liquid chromatography.
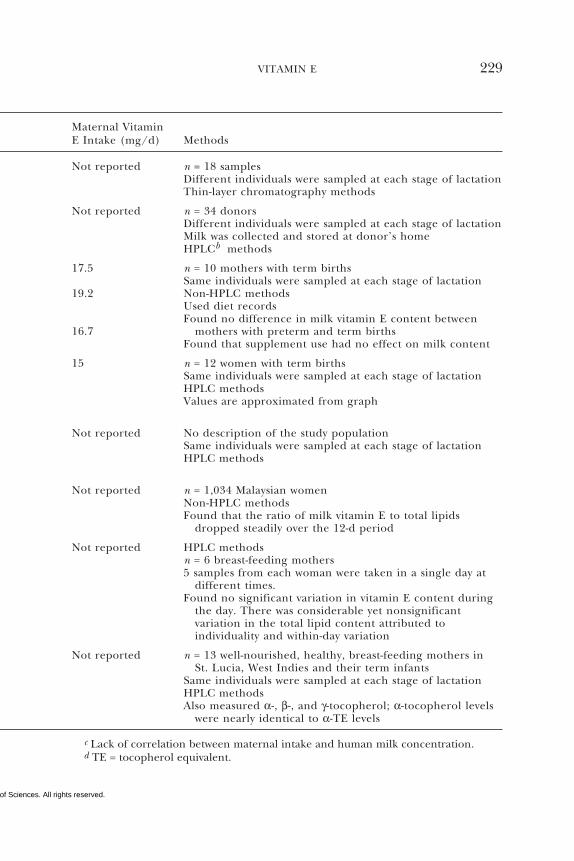
Copyright © National Academy of Sciences. All rights reserved.
VITAMIN E 229
c Lack of correlation between maternal intake and human milk concentration.d TE = tocopherol equivalent.
Maternal VitaminE Intake (mg/d) Methods
Not reported n = 18 samplesDifferent individuals were sampled at each stage of lactationThin-layer chromatography methods
Not reported n = 34 donorsDifferent individuals were sampled at each stage of lactationMilk was collected and stored at donor’s homeHPLCb methods
17.5 n = 10 mothers with term birthsSame individuals were sampled at each stage of lactation
19.2 Non-HPLC methodsUsed diet recordsFound no difference in milk vitamin E content between
16.7 mothers with preterm and term birthsFound that supplement use had no effect on milk content
15 n = 12 women with term birthsSame individuals were sampled at each stage of lactationHPLC methodsValues are approximated from graph
Not reported No description of the study populationSame individuals were sampled at each stage of lactationHPLC methods
Not reported n = 1,034 Malaysian womenNon-HPLC methodsFound that the ratio of milk vitamin E to total lipids
dropped steadily over the 12-d period
Not reported HPLC methodsn = 6 breast-feeding mothers5 samples from each woman were taken in a single day at
different times.Found no significant variation in vitamin E content during
the day. There was considerable yet nonsignificantvariation in the total lipid content attributed toindividuality and within-day variation
Not reported n = 13 well-nourished, healthy, breast-feeding mothers inSt. Lucia, West Indies and their term infants
Same individuals were sampled at each stage of lactationHPLC methodsAlso measured α-, β-, and γ-tocopherol; α-tocopherol levels
were nearly identical to α-TE levels
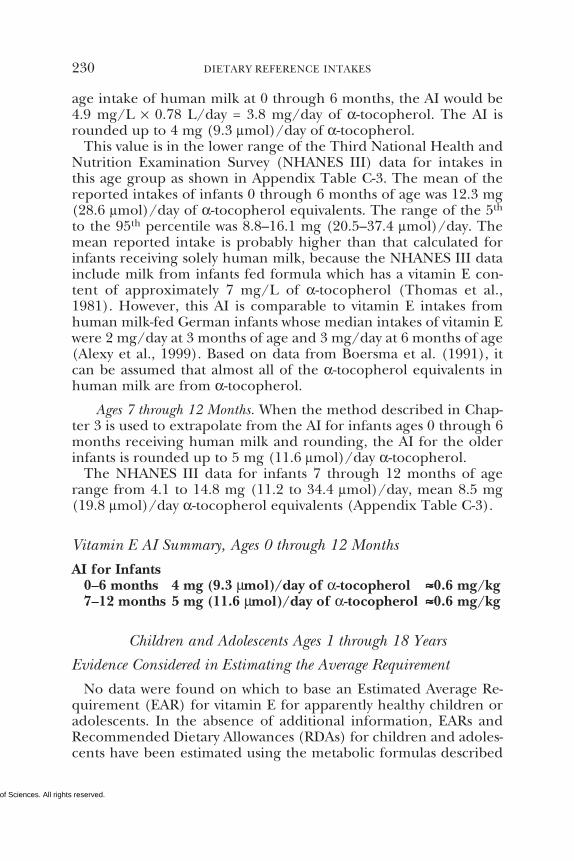
Copyright © National Academy of Sciences. All rights reserved.
230 DIETARY REFERENCE INTAKES
age intake of human milk at 0 through 6 months, the AI would be4.9 mg/L × 0.78 L/day = 3.8 mg/day of α-tocopherol. The AI isrounded up to 4 mg (9.3 µmol)/day of α-tocopherol.
This value is in the lower range of the Third National Health andNutrition Examination Survey (NHANES III) data for intakes inthis age group as shown in Appendix Table C-3. The mean of thereported intakes of infants 0 through 6 months of age was 12.3 mg(28.6 µmol)/day of α-tocopherol equivalents. The range of the 5th
to the 95th percentile was 8.8–16.1 mg (20.5–37.4 µmol)/day. Themean reported intake is probably higher than that calculated forinfants receiving solely human milk, because the NHANES III datainclude milk from infants fed formula which has a vitamin E con-tent of approximately 7 mg/L of α-tocopherol (Thomas et al.,1981). However, this AI is comparable to vitamin E intakes fromhuman milk-fed German infants whose median intakes of vitamin Ewere 2 mg/day at 3 months of age and 3 mg/day at 6 months of age(Alexy et al., 1999). Based on data from Boersma et al. (1991), itcan be assumed that almost all of the α-tocopherol equivalents inhuman milk are from α-tocopherol.
Ages 7 through 12 Months. When the method described in Chap-ter 3 is used to extrapolate from the AI for infants ages 0 through 6months receiving human milk and rounding, the AI for the olderinfants is rounded up to 5 mg (11.6 µmol)/day α-tocopherol.
The NHANES III data for infants 7 through 12 months of agerange from 4.1 to 14.8 mg (11.2 to 34.4 µmol)/day, mean 8.5 mg(19.8 µmol)/day α-tocopherol equivalents (Appendix Table C-3).
Vitamin E AI Summary, Ages 0 through 12 Months
AI for Infants0–6 months 4 mg (9.3 µmol)/day of α-tocopherol ≈≈≈≈≈0.6 mg/kg7–12 months 5 mg (11.6 µmol)/day of α-tocopherol ≈≈≈≈≈0.6 mg/kg
Children and Adolescents Ages 1 through 18 Years
Evidence Considered in Estimating the Average Requirement
No data were found on which to base an Estimated Average Re-quirement (EAR) for vitamin E for apparently healthy children oradolescents. In the absence of additional information, EARs andRecommended Dietary Allowances (RDAs) for children and adoles-cents have been estimated using the metabolic formulas described
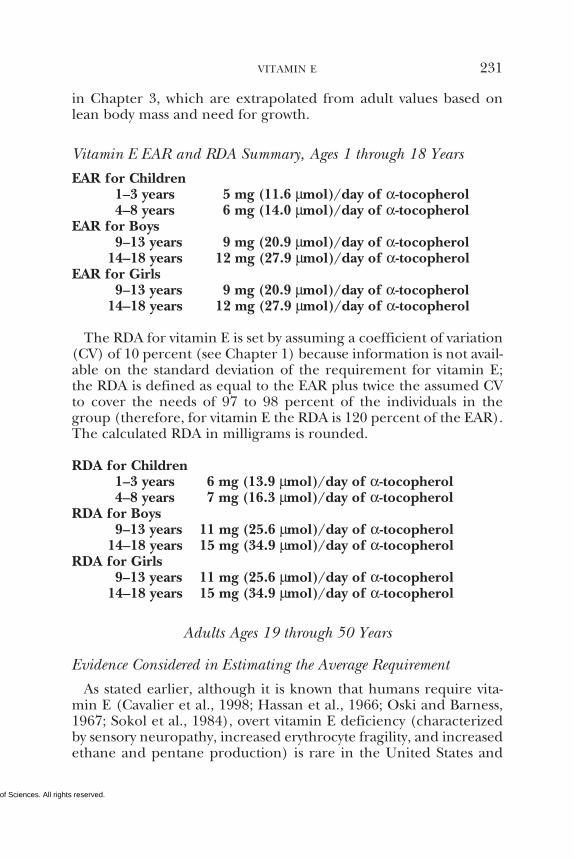
Copyright © National Academy of Sciences. All rights reserved.
VITAMIN E 231
in Chapter 3, which are extrapolated from adult values based onlean body mass and need for growth.
Vitamin E EAR and RDA Summary, Ages 1 through 18 Years
EAR for Children1–3 years 5 mg (11.6 µmol)/day of α-tocopherol4–8 years 6 mg (14.0 µmol)/day of α-tocopherol
EAR for Boys9–13 years 9 mg (20.9 µmol)/day of α-tocopherol
14–18 years 12 mg (27.9 µmol)/day of α-tocopherolEAR for Girls
9–13 years 9 mg (20.9 µmol)/day of α-tocopherol14–18 years 12 mg (27.9 µmol)/day of α-tocopherol
The RDA for vitamin E is set by assuming a coefficient of variation(CV) of 10 percent (see Chapter 1) because information is not avail-able on the standard deviation of the requirement for vitamin E;the RDA is defined as equal to the EAR plus twice the assumed CVto cover the needs of 97 to 98 percent of the individuals in thegroup (therefore, for vitamin E the RDA is 120 percent of the EAR).The calculated RDA in milligrams is rounded.
RDA for Children1–3 years 6 mg (13.9 µmol)/day of α-tocopherol4–8 years 7 mg (16.3 µmol)/day of α-tocopherol
RDA for Boys9–13 years 11 mg (25.6 µmol)/day of α-tocopherol
14–18 years 15 mg (34.9 µmol)/day of α-tocopherolRDA for Girls
9–13 years 11 mg (25.6 µmol)/day of α-tocopherol14–18 years 15 mg (34.9 µmol)/day of α-tocopherol
Adults Ages 19 through 50 Years
Evidence Considered in Estimating the Average Requirement
As stated earlier, although it is known that humans require vita-min E (Cavalier et al., 1998; Hassan et al., 1966; Oski and Barness,1967; Sokol et al., 1984), overt vitamin E deficiency (characterizedby sensory neuropathy, increased erythrocyte fragility, and increasedethane and pentane production) is rare in the United States and
Copyright © National Academy of Sciences. All rights reserved.
232 DIETARY REFERENCE INTAKES
Canada. Thus, current dietary patterns appear to provide sufficientvitamin E to prevent deficiency symptoms such as peripheral neur-opathy. However, since vitamin E intakes are underestimated, par-ticularly with respect to estimates of intake associated with fats (seelater section “Underreporting in Dietary Surveys”), an AI could notbe reliably determined from the available data on intakes.
Data on human experimental vitamin E deficiency are very limit-ed but do provide some guidance in estimating a requirement. Thevalues recommended here are based largely on studies of inducedvitamin E deficiency in humans and the correlation with hydrogenperoxide-induced erythrocyte lysis and plasma α-tocopherol con-centrations.
Only one study has been carried out in apparently healthy humanadults who were depleted of vitamin E over 6 years and then replet-ed (Horwitt, 1960, 1962; Horwitt et al., 1956). In response to vita-min E deficiency, increased erythrocyte fragility (as assessed by anin vitro test of hydrogen peroxide-induced hemolysis) was observed,which was reversed by vitamin E supplementation.
The hydrogen peroxide-induced hemolysis test has drawbacks inthat it is critically dependent upon the concentration of hydrogenperoxide used, the erythrocyte content of catalase and antioxidants,and the precise incubation conditions. Nonetheless, it is one of thefew tests in which the marker (erythrocyte lysis) has been correlatedwith a health deficit (decreased erythrocyte survival) that has beenshown to be corrected by supplemental vitamin E. Therefore, thedata from this study were used to estimate intakes for α-tocopherolrequirements.
It is recognized that there are great uncertainties in the data uti-lized to set the α-tocopherol requirements. However, in the absenceof other scientifically sound data, hydrogen peroxide-inducedhemolysis is the best marker at the present time. It should be em-phasized that research is urgently needed to explore the use ofother biomarkers to assess vitamin E requirements.
Plasma α-Tocopherol Concentrations and Hydrogen Peroxide-Induced Hemolysis
The requirements for vitamin E intakes are therefore based pri-marily on studies in which plasma α-tocopherol concentrations andcorresponding hydrogen peroxide-induced erythrocyte lysis weredetermined (Horwitt, 1960, 1962, 1974; Horwitt et al., 1956, 1963,1972). Vitamin E depletion in 19 normal, adult men was studied byfeeding them a 2,200-kcal diet containing 3 mg (7 µmol)/day (range
Copyright © National Academy of Sciences. All rights reserved.
VITAMIN E 233
2 to 4 mg [4.7 to 9.3 µmol]) of α-tocopherol and 55 g/day of fat (30g from vitamin E-free lard) for 2.5 years. After the first 2.5 years,serum α-tocopherol levels decreased further when thermally oxi-dized corn oil with the α-tocopherol removed was substituted forlard. By replacing lard with corn oil, the total intake of polyunsatu-rated fatty acids (PUFAs) was increased, thereby increasing the oxi-dant burden on the available vitamin E stores. Subjects were fol-lowed on the vitamin E-depleted diet for more than 6 years.
To establish a criterion for estimating the EAR, the biomarkerselected was the plasma α-tocopherol concentration that limitedhydrogen peroxide-induced hemolysis to 12 percent or less. Differ-ences up to this amount are not significant unless special precau-tions are taken to age and standardize the hydrogen peroxide solu-tions (Horwitt et al., 1963). The data in Figure 6-6 comparinglong-term vitamin E-depletion in four subjects (depleted for morethan 72 months) with six control subjects (Horwitt et al., 1963)show that at some concentration of plasma α-tocopherol between 6µmol/L (258 µg/dL) and 12 µmol/L (516 µg/dL), an increase inhydrogen peroxide-induced hemolysis above 12 percent was ob-served in vitro. Averaging the α-tocopherol concentrations in thesix subjects with hemolysis values of 12 percent or less in Figure 6-6results in an average α-tocopherol concentration of 16.2 µmol/L(697 µg/dL). This is higher than the results of Farrell et al. (1977),who suggested that plasma α-tocopherol concentrations of 14 µmol/L (600 µg/dL) are sufficient to prevent hydrogen peroxide-inducedhemolysis. Although the exact plasma α-tocopherol concentrationthat allows hemolysis to take place is unknown, it appeared to beprudent to estimate the lowest known plasma α-tocopherol concen-tration as that cutoff point where hemolysis would take place in 50percent of the population. Thus, a plasma concentration of 12µmol/L (516 µg/dL) was chosen as the concentration of plasma α-tocopherol associated with normal in vitro hydrogen peroxide-induced hemolysis. Based on NHANES III data (Appendix TableF-2), more than 95 percent of the population surveyed would haveplasma concentrations greater than 12 µmol/L (516 µg/dL), thusindicating that the American public is not vitamin E deficient bythis criterion.
Plasma α-Tocopherol Repletion
The effect of vitamin E repletion of depleted subjects has beenstudied. Horwitt (1960) conducted a study in which each subjectreceived a different amount of vitamin E supplement, ranging from
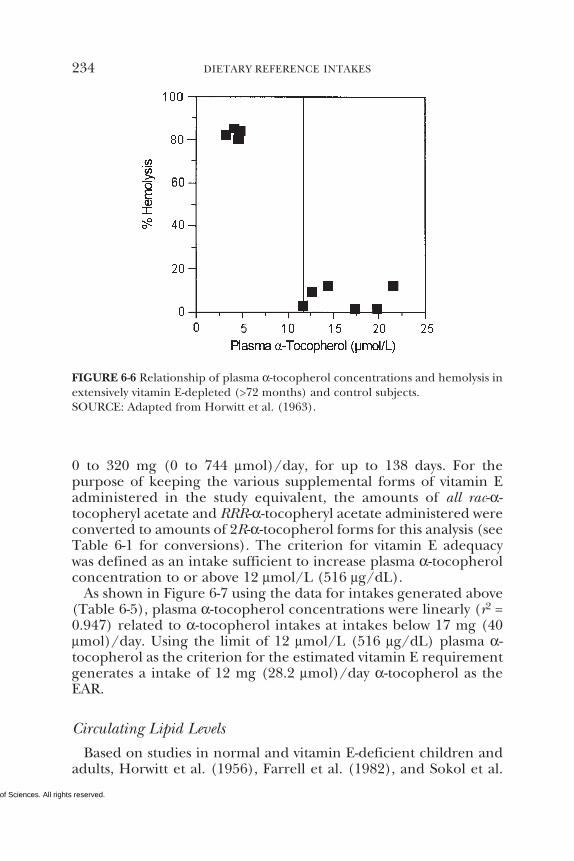
Copyright © National Academy of Sciences. All rights reserved.
234 DIETARY REFERENCE INTAKES
FIGURE 6-6 Relationship of plasma α-tocopherol concentrations and hemolysis inextensively vitamin E-depleted (>72 months) and control subjects.SOURCE: Adapted from Horwitt et al. (1963).
0 to 320 mg (0 to 744 µmol)/day, for up to 138 days. For thepurpose of keeping the various supplemental forms of vitamin Eadministered in the study equivalent, the amounts of all rac-α-tocopheryl acetate and RRR-α-tocopheryl acetate administered wereconverted to amounts of 2R-α-tocopherol forms for this analysis (seeTable 6-1 for conversions). The criterion for vitamin E adequacywas defined as an intake sufficient to increase plasma α-tocopherolconcentration to or above 12 µmol/L (516 µg/dL).
As shown in Figure 6-7 using the data for intakes generated above(Table 6-5), plasma α-tocopherol concentrations were linearly (r2 =0.947) related to α-tocopherol intakes at intakes below 17 mg (40µmol)/day. Using the limit of 12 µmol/L (516 µg/dL) plasma α-tocopherol as the criterion for the estimated vitamin E requirementgenerates a intake of 12 mg (28.2 µmol)/day α-tocopherol as theEAR.
Circulating Lipid Levels
Based on studies in normal and vitamin E-deficient children andadults, Horwitt et al. (1956), Farrell et al. (1982), and Sokol et al.
Copyright © National Academy of Sciences. All rights reserved.
VITAMIN E 235
(1984) concluded that plasma tocopherol concentrations alone maybe misleading in assessing human vitamin E status because theirdata have indicated a dependence of plasma tocopherol concentra-tions on the amount of circulating lipids. Moreover, Winklhofer-Roob et al. (1997) found that age was a significant predictor ofplasma α-tocopherol concentrations in 208 Swiss subjects aged 0.4to 38.7 years. This apparent relationship was attributed to an age-related increase in serum cholesterol concentrations. Sokol et al.(1993) reported that, because of the extremely high serum lipids inchildren with cholestasis, a ratio of serum α-tocopherol to serumtotal lipids of less than 0.6 mg/g indicated vitamin E deficiency,regardless of serum α-tocopherol concentrations.
When evaluating the vitamin E status of an individual, plasmalipid levels should be taken into account because all of the plasmavitamin E is transported in plasma lipoproteins (Traber et al., 1993).In subjects with normal serum lipid concentrations (328 to 573 mg/dL) (Sokol et al., 1984), corrections are not necessary to assesswhether α-tocopherol concentrations are within the normal range.
PUFA Intake
As described earlier, high intakes of PUFAs are typically accompa-nied by increased vitamin E intakes. Using data from NHANES II,Murphy et al. (1990) reported that the mean PUFA intake in theUnited States was 16.3 g/day for men and 10.8 g/day for women.Based on a ratio of at least 1 µmol (0.4 mg) α-tocopherol per gramof PUFA when the primary dietary PUFA is linoleic acid, as in mostU.S. diets (Bieri and Evarts, 1973; Horwitt, 1974; Witting and Lee,1975), and a mean intake of 16.3 g PUFA, the lower boundary ofrequired α-tocopherol intake is estimated to be 7 mg (16 µmol)/day. Thus, the amount of α-tocopherol required daily based onPUFA intakes would be met by the EAR of 12 mg (28.2 µmol)/dayof α-tocopherol.
Vitamin E EAR and RDA Summary, Ages 19 through 50 Years
Based on the criterion of vitamin E intakes sufficient to preventhydrogen peroxide-induced hemolysis, the data of Horwitt (1960)support an EAR of 12 mg (27.9 µmol) of α-tocopherol. The datawere derived from studies in men only, and no similar data areavailable for women. However, there is no scientific basis for assum-ing different requirements for men and women, and although body
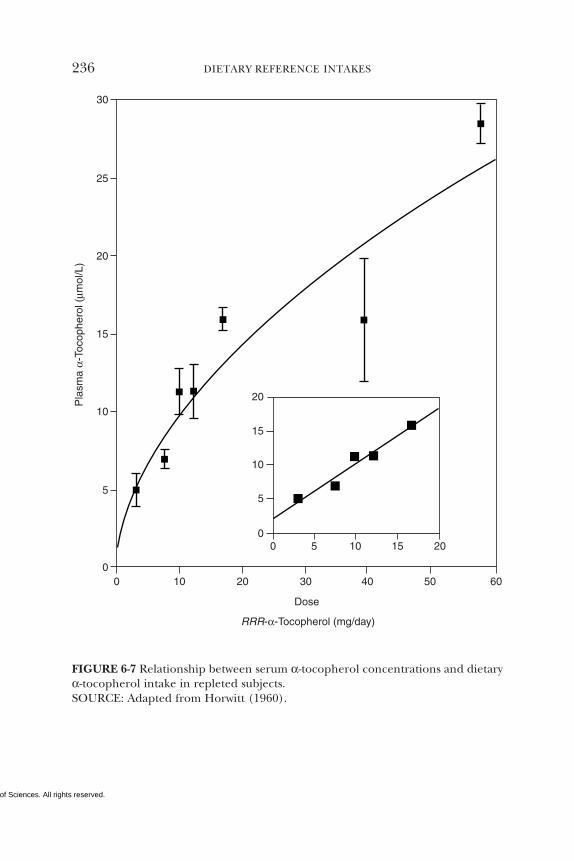
Copyright © National Academy of Sciences. All rights reserved.
236 DIETARY REFERENCE INTAKES
20
15
10
5
00 5 10 15 20
30
25
20
15
10
5
00 10 20 30 40 50 60
Dose
RRR-α-Tocopherol (mg/day)
Pla
sma
α-To
coph
erol
(µm
ol/L
)
FIGURE 6-7 Relationship between serum α-tocopherol concentrations and dietaryα-tocopherol intake in repleted subjects.SOURCE: Adapted from Horwitt (1960).
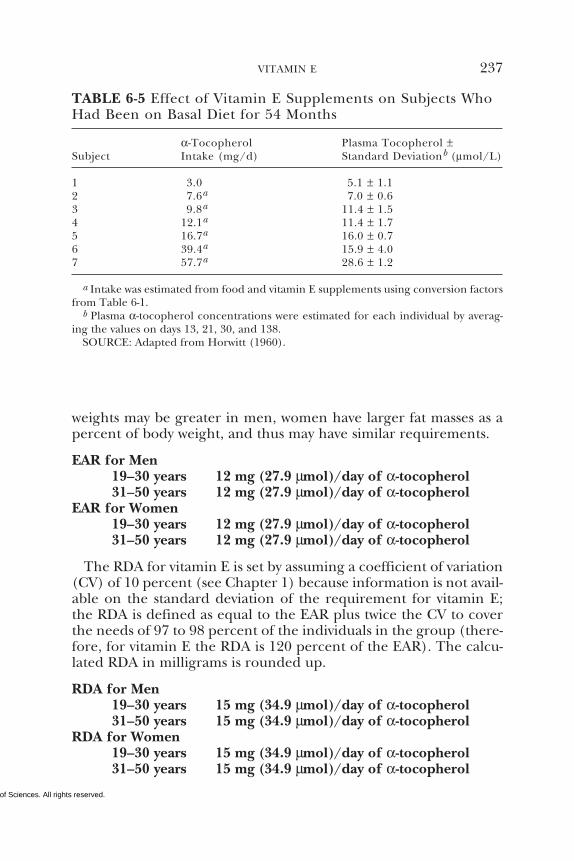
Copyright © National Academy of Sciences. All rights reserved.
VITAMIN E 237
weights may be greater in men, women have larger fat masses as apercent of body weight, and thus may have similar requirements.
EAR for Men19–30 years 12 mg (27.9 µmol)/day of α-tocopherol31–50 years 12 mg (27.9 µmol)/day of α-tocopherol
EAR for Women19–30 years 12 mg (27.9 µmol)/day of α-tocopherol31–50 years 12 mg (27.9 µmol)/day of α-tocopherol
The RDA for vitamin E is set by assuming a coefficient of variation(CV) of 10 percent (see Chapter 1) because information is not avail-able on the standard deviation of the requirement for vitamin E;the RDA is defined as equal to the EAR plus twice the CV to coverthe needs of 97 to 98 percent of the individuals in the group (there-fore, for vitamin E the RDA is 120 percent of the EAR). The calcu-lated RDA in milligrams is rounded up.
RDA for Men19–30 years 15 mg (34.9 µmol)/day of α-tocopherol31–50 years 15 mg (34.9 µmol)/day of α-tocopherol
RDA for Women19–30 years 15 mg (34.9 µmol)/day of α-tocopherol31–50 years 15 mg (34.9 µmol)/day of α-tocopherol
TABLE 6-5 Effect of Vitamin E Supplements on Subjects WhoHad Been on Basal Diet for 54 Months
α-Tocopherol Plasma Tocopherol ±Subject Intake (mg/d) Standard Deviationb (µmol/L)
1 3.0 5.1 ± 1.12 7.6a 7.0 ± 0.63 9.8a 11.4 ± 1.54 12.1a 11.4 ± 1.75 16.7a 16.0 ± 0.76 39.4a 15.9 ± 4.07 57.7a 28.6 ± 1.2
a Intake was estimated from food and vitamin E supplements using conversion factorsfrom Table 6-1.
b Plasma α-tocopherol concentrations were estimated for each individual by averag-ing the values on days 13, 21, 30, and 138.
SOURCE: Adapted from Horwitt (1960).
Copyright © National Academy of Sciences. All rights reserved.
238 DIETARY REFERENCE INTAKES
Adults Ages 51 Years and Older
Evidence Considered in Estimating the Average Requirement
As discussed earlier, although vitamin E has been hypothesized toprevent myocardial infarction at the clinical level, only one of thefour published large-scale, randomized, double-blind clinical sec-ondary intervention studies that tested the ability of vitamin E to dothis has been supportive of that hypothesis. This secondary preven-tion trial using 400 or 800 international units (IU) (268 or 567mg)/day of RRR-α-tocopherol, was strongly positive (Stephens etal., 1996). The other three, one carried out in a group of high-riskcigarette smokers and using 50 mg/day of all-rac-α-tocopherol(ATBC Cancer Prevention Study Group, 1994) and two carried withgroups of high-risk cardiovascular disease patients and using 300mg/day of all rac-α-tocopherol (GISSI-Prevenzione Investigators,1999) or 400 IU (268 mg)/day of RRR-α-tocopherol (HOPE StudyInvestigators, 2000), were neutral, with respect to coronary heartdisease.
The limited clinical trial evidence precludes recommendationsfor higher vitamin E intakes at this time. Thus, adults ages 51 yearsand older appear to have the same vitamin E requirement as young-er adults.
Vitamin E EAR and RDA Summary, Ages 51 Years and Older
There is no evidence that the aging process impairs vitamin Eabsorption or utilization. Therefore, for the age group 51 years andolder an EAR of 12 mg (27.9 µmol)/day of α-tocopherol, the sameas younger adults, is warranted.
EAR for Men51–70 years 12 mg (27.9 µmol)/day of α-tocopherol
>70 years 12 mg (27.9 µmol)/day of α-tocopherolEAR for Women
51–70 years 12 mg (27.9 µmol)/day of α-tocopherol>70 years 12 mg (27.9 µmol)/day of α-tocopherol
The RDA for vitamin E is set by assuming a coefficient of variation(CV) of 10 percent (see Chapter 1) because information is not avail-able on the standard deviation of the requirement for vitamin E.The RDA is defined as equal to the EAR plus twice the assumed CVto cover the needs of 97 to 98 percent of the individuals in the
Copyright © National Academy of Sciences. All rights reserved.
VITAMIN E 239
group (therefore, for vitamin E the RDA is 120 percent of the EAR).The calculated RDA in milligrams is rounded up.
RDA for Men51–70 years 15 mg (34.9 µmol)/day of α-tocopherol
>70 years 15 mg (34.9 µmol)/day of α-tocopherolRDA for Women
51–70 years 15 mg (34.9 µmol)/day of α-tocopherol>70 years 15 mg (34.9 µmol)/day of α-tocopherol
Pregnancy
Evidence Considered in Estimating the Average Requirement
In contrast to the case for most nutrients, the blood concentra-tion of α-tocopherol increases during pregnancy, in parallel with anincrease in total lipids (Horwitt et al., 1972). Placental transfer ofvitamin E from mother to fetus appears to be relatively constant aspregnancy progresses (Abbasi et al., 1990). Although vitamin E de-ficiency can occur in premature newborns, precipitating a hemolyt-ic anemia (Oski and Barness, 1967; Ritchie et al., 1968), there areno reports of vitamin E deficiency during pregnancy and no evi-dence that maternal supplementation with vitamin E would preventdeficiency symptoms in premature offspring. Given the absence ofdata, it would appear that vitamin E supplementation of pregnantfemales is unwarranted.
Vitamin E EAR and RDA Summary, Pregnancy
Since there is no evidence at this time that the EAR for womenduring pregnancy should be increased above the level recommend-ed for women in the nonpregnant state, the EAR for pregnancy isassumed to be the same and thus is 12 mg (27.9 µmol)/day of α-tocopherol.
EAR for Pregnancy14–18 years 12 mg (27.9 µmol)/day of α-tocopherol19–30 years 12 mg (27.9 µmol)/day of α-tocopherol31–50 years 12 mg (27.9 µmol)/day of α-tocopherol
The RDA for vitamin E is set by assuming a coefficient of variation(CV) of 10 percent (see Chapter 1) because information is not avail-able on the standard deviation of the requirement for vitamin E;the RDA is defined as equal to the EAR plus twice the assumed CV
Copyright © National Academy of Sciences. All rights reserved.
240 DIETARY REFERENCE INTAKES
to cover the needs of 97 to 98 percent of the individuals in thegroup (therefore, for vitamin E the RDA is 120 percent of the EAR).The calculated RDA in milligrams is rounded up.
RDA for Pregnancy14–18 years 15 mg (34.9 µmol)/day of α-tocopherol19–30 years 15 mg (34.9 µmol)/day of α-tocopherol31–50 years 15 mg (34.9 µmol)/day of α-tocopherol
Lactation
Evidence Considered in Estimating the Average Requirement
As indicated earlier in the section on infants, the estimated aver-age amount of α-tocopherol secreted daily in human milk in thefirst 6 months of life is 4 mg (9.3 µmol). Thus, addition of thisfigure to the EAR for α-tocopherol for women, 12 mg (28.2 µmol)/day, would provide an EAR of 16 mg (37.5 µmol)/day of α-toco-pherol in a lactating female.
The EAR is in excess of the median intake of 8.4 mg (19.5 µmol)/day for lactating women reported in the U.S. Department of Agri-culture Continuing Survey of Food Intake by Individuals (CSFII)(Appendix Table D-2). Because estimates of vitamin E intake areunderreported and vitamin E deficiency in infants receiving humanmilk is extremely rare, it is logical to postulate that lactating womenare consuming more vitamin E than reported and that ingestion ofsupplements is unnecessary during lactation.
Vitamin E EAR and RDA Summary, Lactation
To estimate the EAR for lactation, the average vitamin E secretedin human milk, 4 mg (9.3 µmol) of α-tocopherol, is added to theEAR for the nonlactating woman, giving an EAR of 16 mg (37.2µmol)/day of α-tocopherol.
EAR for Lactation14–18 years 16 mg (37.2 µmol)/day of α-tocopherol19–30 years 16 mg (37.2 µmol)/day of α-tocopherol31–50 years 16 mg (37.2 µmol)/day of α-tocopherol
The RDA for vitamin E is set by assuming a coefficient of variation(CV) of 10 percent (see Chapter 1) because information is not avail-able on the standard deviation of the requirement for vitamin E;the RDA is defined as equal to the EAR plus twice the assumed CVto cover the needs of 97 to 98 percent of the individuals in the
Copyright © National Academy of Sciences. All rights reserved.
VITAMIN E 241
group (therefore, for vitamin E the RDA is 120 percent of the EAR).The calculated RDA in milligrams is rounded down.
RDA for Lactation14–18 years 19 mg (44.2 µmol)/day of α-tocopherol19–30 years 19 mg (44.2 µmol)/day of α-tocopherol31–50 years 19 mg (44.2 µmol)/day of α-tocopherol
Special Considerations
Chronic Diseases
Data related to the effects of vitamin E on morbidity and mortalityfrom chronic disease in the United States and Canada are limited.The evidence is strongest for prevention of coronary heart disease(CHD). However, even for this outcome, four double-blind, place-bo-controlled trials have been reported, and only one of four, theCambridge Heart Antioxidant Study (CHAOS) (Stephens et al.,1996), with prevention of heart disease as its primary aim, had apositive outcome. Two of the other trials, the GISSI-PrevenzioneTrial and the Heart Outcomes Prevention Evaluation (HOPE) Study(GISSI-Prevenzione Investigators, 1999; HOPE Study Investigators,2000), with prevention of heart disease as their primary aim, hadneutral results. Similarly, the fourth trial, the Alpha-TocopherolBeta-Carotene (ATBC) Cancer Prevention Study (ATBC Cancer Pre-vention Study Group, 1994), which had lung cancer as its primaryoutcome, reported no beneficial effect of vitamin E on myocardialinfarction rates. Thus, a recommendation of high vitamin E intakesfor the general population to decrease CHD risk is considered pre-mature.
Some physicians caring for patients with coronary artery diseaseare already prescribing vitamin E at doses used in the CHAOS study,400 or 800 IU (268 or 567 mg)/day of RRR-α-tocopherol. Preciselyhow vitamin E works at these high doses is not known but couldinclude both antioxidant and nonantioxidant mechanisms. This isan active research area at both the molecular and the clinical levels,and further research is needed.
Currently, a number of other double-blind, placebo-controlledintervention trials of the efficacy of vitamin E to prevent or amelio-rate CHD are in progress. If these studies result in positive out-comes, it may become necessary to review the recommendations forvitamin E intakes in some subgroups of the adult populations, espe-cially those in the groups over 50 years of age because increasingage is an important risk factor for heart disease. Although there is a
Copyright © National Academy of Sciences. All rights reserved.
242 DIETARY REFERENCE INTAKES
large and growing body of experimental evidence suggesting thatvitamin E supplementation may reduce the risk of some chronicdiseases, especially heart disease, the results of the GISSI Prevenzi-one Trial (GISSI-Prevenzione Investigators, 1999), the Heart Out-comes Prevention Evaluation (HOPE) study (HOPE Study Investi-gators, 2000), and the Alpha-Tocopherol Beta-Carotene (ATBC)Cancer Prevention Study (ATBC Cancer Prevention Study Group,1994) preclude recommendations for higher vitamin E intakes atthis time.
Exercise
High levels of physical activity and sports might increase oxidativedamage and thus increase needs for antioxidants. It is unknownwhether or the extent to which increased oxidative damage occursin physical exercise. However, the Boston Nutritional Status Surveyreported that plasma vitamin E concentrations increased slightlywith regular exercise in adults 60 years of age and older (Hartz etal., 1992). It is, therefore, not known if any adjustment in vitamin Erequirements is needed in response to strenuous or regular exercise.
Extreme Body Size and Composition
Given the minimal data available to develop the EAR, adjustingany recommendations for vitamin E requirements to meet expect-ed needs for individuals with extreme variation for reference bodysize or composition must await additional data.
Cigarette Smokers
Potentially injurious free radicals are present in cigarette tar andsmoke (Church and Pryor, 1985; Pryor and Stone, 1993). In addi-tion, cigarette smokers have increased phagocyte activities (Eiserichet al., 1997). Smokers are therefore under a high and sustainedfree-radical load, both from cigarette smoke itself and from oxi-dants produced by activated phagocytes (Cross et al., 1997; Duthieet al., 1991; Eiserich et al., 1995).
Exposure to cigarette smoke damages antioxidant defenses. Lowblood levels of vitamin C are a characteristic feature of heavy smok-ers (Duthie et al., 1995, 1996; Mezzetti et al., 1995; Ross et al., 1995).Cigarette smoke also damages low molecular weight thiols and es-pecially thiol-containing proteins in human plasma (O’Neill et al.,
Copyright © National Academy of Sciences. All rights reserved.
VITAMIN E 243
1994) and white blood cells (Tsuchiya et al., 1992). Plasma vitaminE is not routinely depleted in cigarette smokers relative to non-smokers. However, vitamin E supplementation of smokers has beenshown to reduce indicators of lipid peroxidation (Mezzetti et al.,1995; Morrow et al., 1995; Pratico et al., 1998; Reilly et al., 1996),suggesting that plasma vitamin E may not be indicative of tissuestores.
It is unknown if any adjustment in vitamin E requirements is need-ed in those who smoke or are routinely exposed to smoke.
INTAKE OF VITAMIN E
As stated earlier, the Dietary Reference Intakes (DRIs) for vitaminE are based on α-tocopherol only and do not include amounts ob-tained from the other seven naturally occurring forms historicallycalled vitamin E (β-, γ-, δ-tocopherol and the four tocotrienols).Because the different forms of vitamin E cannot be interconvertedin the human, the Estimated Average Requirements (EARs), Rec-ommended Dietary Allowances (RDAs), and Adequate Intakes (AIs)apply only to the intake of RRR-α-tocopherol from food and the 2R-stereoisomeric forms of α-tocopherol (RRR-, RSR-, RRS-, and RSS-α-tocopherol) that occur in fortified foods and supplements. Al-though both α- and γ-tocopherols are absorbed, only α-tocopherolis preferentially secreted by the liver into the plasma (because α-tocopherol transfer protein [α-TTP] recognizes only α-tocopherol)for transport to tissues while γ-tocopherol is preferentially metabo-lized and excreted. This implies that the body requires α-tocopherolfor some special (as yet undefined) need and other forms of vita-min E do not qualify.
Currently, most nutrient databases, as well as nutrition labels, donot distinguish among the different tocopherols in food. Thus, thedata below on intakes from surveys and nutrient content of foodsare presented as α-tocopherol equivalents (α-TE) and thus includethe contribution of all eight naturally occurring forms of vitamin E,after adjustment for bioavailability using previously determinedequivalency (e.g., γ-tocopherol was assumed to have only 10 percentof the availability of α-tocopherol) based on fetal resorption assays(see earlier section on “Units of Vitamin E Activity”). Because otherforms of vitamin E occur in foods (e.g., γ-tocopherol is present inwidely consumed oils such as soybean and corn oils), the intake ofα-TE is greater than the intake of α-tocopherol alone.
Copyright © National Academy of Sciences. All rights reserved.
244 DIETARY REFERENCE INTAKES
Vitamin E Conversion Factors
Food Sources of Vitamin E
The reported median vitamin E intake in the United States of allindividuals surveyed in 1988 to 1994 in the Third National Healthand Nutrition Examination Survey (NHANES III) was 9 mg (21µmol)/day of α-TE (see Appendix Table C-3). Additional data fromthe NHANES III database indicate that α-tocopherol from food asdefined in this report (the RRR-form) contributed approximately 7mg/day of the 9 mg/day median intake of total α-TE (see Appen-dix Table C-4). Thus, based on NHANES III, approximately 80 per-cent of the α-TE from foods in the survey are reported to be con-tributed by foods containing α-tocopherol. Thus, to estimate theα-tocopherol intake from food surveys in the United States in whichfood intake data are presented as α-TE, the α-TE should be multi-plied by 0.8:
mg of α-tocopherol in a meal =mg of α-tocopherol equivalents in a meal × 0.8.
If diets vary considerably from what might be considered typicalin the United States and Canada, other factors may be more appro-priate to use in place of 0.8.
Vitamin E Supplements
To determine the number of milligrams of α-tocopherol in a mul-tiple-vitamin supplement labeled in international units (IUs), oneof two conversion factors is used. If the form of the supplement is“natural” or RRR-α-tocopherol (historically and incorrectly labeledd-α-tocopherol) (Horwitt, 1976), the correct factor is 0.67 mg/IU(USP, 1999). Thus, 30 IUs of RRR-α-tocopherol (labeled as d-α-tocopherol) in a multivitamin supplement would equate to 20 mgof α-tocopherol (30 × 0.67). The same factor would be used for 30IUs of either RRR-α-tocopherol acetate or RRR-α-tocopherol succi-nate, because the amount in grams of these forms in a capsule hasbeen adjusted based on their molecular weight. If the form of thesupplement is all rac-α-tocopherol (historically and incorrectly la-beled dl-α-tocopherol) (Horwitt, 1976), the appropriate factor is0.45 mg/IU, reflecting the inactivity of the 2S-stereoisomers. Thus,30-IU of all rac-α-tocopherol (labeled as dl-α-tocopherol) in a multi-vitamin supplement would equate to 13.5 mg of α-tocopherol (30 ×
Copyright © National Academy of Sciences. All rights reserved.
VITAMIN E 245
0.45). The same factor would be used for the all rac-α-tocopherolacetate and succinate forms as well. See Table 6-1 for more informa-tion on the derivation of these conversion factors to be used whenestimating intake from these forms of α-tocopherol to meet require-ments.
mg of α-tocopherol in food, fortified food, or multivitamin= IU of the RRR-α-tocopherol compound × 0.67.
or= IU of the all rac-α-tocopherol compound × 0.45.
Food Sources
The various vitamin E forms occur in different proportions infoods. The main dietary sources of vitamin E are edible vegetableoils (Dial and Eitenmiller, 1995; McLaughlin and Weihrauch, 1979;Sheppard et al., 1993) (Figure 6-8). At least half of the tocopherolcontent of wheat germ oil, sunflower oil, cottonseed oil, saffloweroil, canola oil, and olive oil is in the form of α-tocopherol. Soybeanand corn oils contain about 10 times as much γ-tocopherol as α-tocopherol. Palm and rice bran oils contain high proportions of α-tocopherol, as well as various tocotrienols (Dial and Eitenmiller,1995). Other foods providing vitamin E include unprocessed cerealgrains, nuts, fruits, vegetables, and meats, especially the fatty por-tion. As stated previously, all of the α-tocopherol present in theseunfortified foods would be in the natural form, RRR-α-tocopheroland would contribute toward meeting the recommended dietaryallowance. The other non-α-tocopherol forms of vitamin E presentin food would not.
Dietary Intake
Dietary Surveys
According to the 1994 to 1996 Continuing Survey of Food Intakesby Individuals (CSFII) (Appendix Table D-2), the median reporteddietary intakes of men and women aged 31 through 50 years are 9.3mg (21.6 µmol)/day and 6.8 mg (15.8 µmol)/day, respectively, ofα-TE. Using the factor (0.8) derived from NHANES III data to de-termine α-tocopherol intake from α-TE, the adjusted intakes wouldbe 7.5 mg (17.4 µmol)/day for men (9.3 × 0.8) and 5.4 mg (12.6µmol)/day for women (6.8 × 0.8).
Data from NHANES III (Appendix Tables C-3 and C-5) indicate a
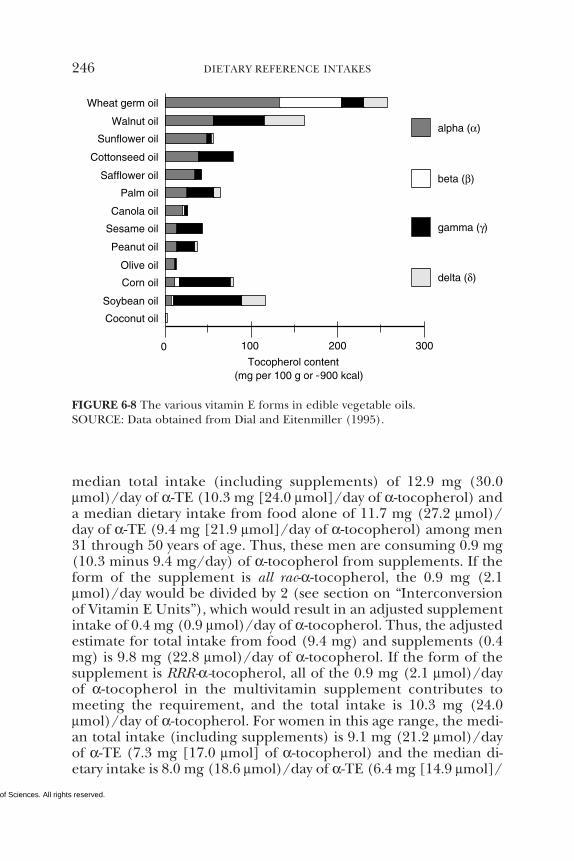
Copyright © National Academy of Sciences. All rights reserved.
246 DIETARY REFERENCE INTAKES
Coconut oil
Soybean oil
Corn oil
Olive oil
Peanut oil
Sesame oil
Canola oil
Palm oil
Safflower oil
Cottonseed oil
Sunflower oil
Walnut oil
Wheat germ oil
0 100 200 300
Tocopherol content(mg per 100 g or ˜900 kcal)
alpha (α)
beta (β)
gamma (γ)
delta (δ)
FIGURE 6-8 The various vitamin E forms in edible vegetable oils.SOURCE: Data obtained from Dial and Eitenmiller (1995).
median total intake (including supplements) of 12.9 mg (30.0µmol)/day of α-TE (10.3 mg [24.0 µmol]/day of α-tocopherol) anda median dietary intake from food alone of 11.7 mg (27.2 µmol)/day of α-TE (9.4 mg [21.9 µmol]/day of α-tocopherol) among men31 through 50 years of age. Thus, these men are consuming 0.9 mg(10.3 minus 9.4 mg/day) of α-tocopherol from supplements. If theform of the supplement is all rac-α-tocopherol, the 0.9 mg (2.1µmol)/day would be divided by 2 (see section on “Interconversionof Vitamin E Units”), which would result in an adjusted supplementintake of 0.4 mg (0.9 µmol)/day of α-tocopherol. Thus, the adjustedestimate for total intake from food (9.4 mg) and supplements (0.4mg) is 9.8 mg (22.8 µmol)/day of α-tocopherol. If the form of thesupplement is RRR-α-tocopherol, all of the 0.9 mg (2.1 µmol)/dayof α-tocopherol in the multivitamin supplement contributes tomeeting the requirement, and the total intake is 10.3 mg (24.0µmol)/day of α-tocopherol. For women in this age range, the medi-an total intake (including supplements) is 9.1 mg (21.2 µmol)/dayof α-TE (7.3 mg [17.0 µmol] of α-tocopherol) and the median di-etary intake is 8.0 mg (18.6 µmol)/day of α-TE (6.4 mg [14.9 µmol]/
Copyright © National Academy of Sciences. All rights reserved.
VITAMIN E 247
day of α-tocopherol) from food alone. Thus, the adjusted medianreported intake for these women would be 0.9 mg (7.3 minus 6.4mg/day) of α-tocopherol from supplements. If the supplement isall rac-α-tocopherol, the 0.9 mg (2.1 µmol)/day would be divided by2 (see section on “Interconversion of Vitamin E Units”), resultingin an adjusted median intake from supplements of 0.4 mg (0.9µmol)/day of α-tocopherol. Thus, the total adjusted median intakereported from food (6.4 mg) and supplements (0.4 mg) is 6.8 mg(15.8 µmol)/day of α-tocopherol. Again, if the form of the supple-ment is RRR-α-tocopherol, all of the 0.9 mg (2.1 µmol)/day ofα-tocopherol from the multivitamin supplement would contributeto meeting the requirement, and the total intake from diet andsupplements remains 7.3 mg (17.0 µmol)/day of α-tocopherol.
Underreporting in Dietary Surveys
The above CSFII and NHANES III intake estimates may be lowdue to four sources of measurement error that are important withregard to vitamin E intake: (1) energy intake is underreported inthe national surveys (Mertz et al., 1991), and fat intake (which servesas a major carrier for vitamin E) is likely to be more underreportedthan energy intake in the NHANES III survey (Briefel et al., 1997);(2) the amount of fats and oils added during food preparation (andabsorbed into the cooked product) is difficult to assess using dietrecall methodologies, yet contributes substantially to vitamin E in-take; (3) uncertainties about the particular fats or oils consumed,particularly when food labels do not provide the specific fat or oil inthe product (e.g., “this product may contain partially hydrogenatedsoybean and/or cottonseed oil or vegetable oil”) necessitate a reli-ance on default selections (and thus assumptions about the relativecontent of α- and γ-tocopherols); and (4) because of the small num-ber of samples, the vitamin E content of food sources in the CSFIIand NHANES III databases are very variable (J. Holden, AgriculturalResearch Service, USDA, personal communication, April 13, 1999).
Recently, Haddad et al. (1999) reported vitamin E intakes of 25vegans (defined as those who excluded all animal products fromtheir diets) and 20 nonvegans between the ages of 20 and 60 years.The reported vitamin E intakes, based on 4-day food records, were17 to 23 mg (40 to 53 µmol)/day of α-tocopherol equivalents. Usingthe factor (0.8) from NHANES III data to adjust for α-tocopherolequivalents, the above estimated intakes would equate to 13.6 to18.4 mg (31.6 to 42.8 µmol)/day of α-tocopherol. Van het Hof et al.(1999) reported that conventional Dutch menus contained 20.9 mg
Copyright © National Academy of Sciences. All rights reserved.
248 DIETARY REFERENCE INTAKES
(48.7 µmol)/day of α-tocopherol when these diets were analyzedchemically. These two studies indicate that vitamin E intakes fromthe CSFII and NHANES III surveys are probably underestimatedeven with the adjustment factor (0.8) and suggest that mean intakesof apparently healthy adults in the United States and Canada arelikely to be above the RDA of 15 mg (34.9 µmol)/day of α-tocopherol.
Most dietary vitamin E is present in fats and its oils (Sheppard etal., 1993); therefore, changes in dietary habits to decrease fat intakemay have deleterious effects on vitamin E intake (Adam et al., 1995;Bae et al., 1993; Retzlaff et al., 1991; Sarkkinen et al., 1993; Velthuis-te Wierik et al., 1996). Patients with coronary artery disease, whodid not take vitamin supplements, had average dietary vitamin Eintakes of 5.8 mg (13.4 µmol)/day of α-tocopherol equivalents(adjusted to 4.6 mg [10.8 µmol]/day of α-tocopherol) in a 25 per-cent fat diet containing 2,058 kcal (Mandel et al., 1997). This exam-ple demonstrates that low-fat diets can substantially decrease vita-min E intakes if food choices are not carefully made to enhanceα-tocopherol intakes.
Dietary Vitamin E Sources
Murphy et al. (1990) evaluated vitamin E intakes from NHANESII. Fats and oils used as spreads, etc. contributed 20.2 percent of thetotal vitamin E; vegetables, 15.1 percent; meat, poultry, and fish,12.6 percent; desserts, 9.9 percent; breakfast cereals, 9.3 percent;fruit, 5.3 percent; bread and grain products, 5.3 percent; dairy prod-ucts, 4.5 percent; mixed main dishes, 4.0 percent; nuts and seeds,3.8 percent; eggs, 3.2 percent; salty snacks, 3 percent; legumes, 2.1percent; and soups, sauces, and gravies, 1.7 percent.
As indicated previously, estimation of dietary vitamin E intake isdifficult because the source of oil is often not known with certainty.Lehmann et al. (1986) analyzed the foods used in a human dietstudy for vitamin E content. Each menu was designed to contain2,400 kcal with 35 percent fat calories and included either 10 or 30g/day of linoleic acid and 500 mg/day of cholesterol; the highlinoleic acid diet contained 10 g of safflower oil. As shown in Figure6-9, substituting various oils for the 10 g of safflower oil resulted invitamin E intakes that varied from 6.9 to 13.8 mg (16 to 32 µmol)/day of α-TE depending on the source of the vegetable oil (vitamin Econtents were estimated from Lehmann et al., 1986, and Dial andEitenmiller, 1995).
Copyright © National Academy of Sciences. All rights reserved.
VITAMIN E 249
Intake from Supplements
Vitamin E supplement use is high in the U.S. population (Hartzet al., 1988; Slesinski et al., 1996). Information from the BostonNutritional Status Survey on use of supplemental vitamin E by afree-living population, 60 years of age and older, indicated that 38percent of the men took a nutritional supplement and 68 percentof these users took a vitamin E supplement. Of the women, 49 per-cent used supplements with 73 percent of them taking a vitamin Esupplement (Hartz et al., 1992). In the earlier 1986 National HealthInterview Survey, 26 percent of all adults reported use of supple-ments containing vitamin E (Moss et al., 1989). Slesinski et al.(1996) examined supplement usage in over 11,000 adults who par-ticipated in the 1992 National Health Interview Survey Epidemiolo-gy Supplement and reported that diets of women utilizing supple-ments that contained vitamin E were higher in vitamin E comparedwith those of nonsupplement users. No differences in vitamin Eintake were found in the men participating in the survey.
TOLERABLE UPPER INTAKE LEVELS
The Tolerable Upper Intake Level (UL) is the highest level ofdaily nutrient intake that is likely to pose no risk of adverse healtheffects in almost all individuals. Although members of the generalpopulation should be advised not to exceed the UL for vitamin Eroutinely, intake above the UL may be appropriate for investigationwithin well-controlled clinical trials. In light of evaluating possiblebenefits to health, clinical trials of doses above the UL should notbe discouraged, as long as subjects participating in these trials havesigned informed consent documents regarding possible toxicity, andas long as these trials employ appropriate safety monitoring of trialsubjects. Also, the UL is not meant to apply to individuals who arereceiving vitamin E under medical supervision.
Hazard Identification
Adverse Effects
There is no evidence of adverse effects from the consumption ofvitamin E naturally occurring in foods. Therefore, this review islimited to evidence concerning intake of α-tocopherol as a supple-ment, food fortificant, or pharmacological agent. RRR-α-tocopherylacetate (historically and incorrectly labeled d-α-tocopheryl acetate)
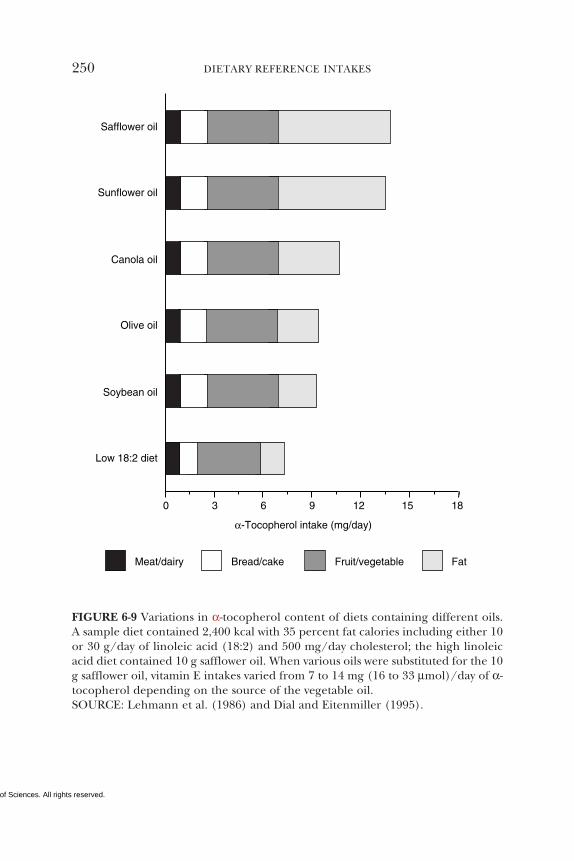
Copyright © National Academy of Sciences. All rights reserved.
250 DIETARY REFERENCE INTAKES
Low 18:2 diet
Soybean oil
Olive oil
Canola oil
Sunflower oil
Safflower oil
0 3 6 9 12 15 18
α-Tocopherol intake (mg/day)
Meat/dairy Bread/cake Fruit/vegetable Fat
FIGURE 6-9 Variations in α-tocopherol content of diets containing different oils.A sample diet contained 2,400 kcal with 35 percent fat calories including either 10or 30 g/day of linoleic acid (18:2) and 500 mg/day cholesterol; the high linoleicacid diet contained 10 g safflower oil. When various oils were substituted for the 10g safflower oil, vitamin E intakes varied from 7 to 14 mg (16 to 33 µmol)/day of α-tocopherol depending on the source of the vegetable oil.SOURCE: Lehmann et al. (1986) and Dial and Eitenmiller (1995).
Copyright © National Academy of Sciences. All rights reserved.
VITAMIN E 251
(Horwitt, 1976) and all rac-α-tocopheryl acetate (historically andincorrectly labeled dl-α-tocopheryl acetate) (Horwitt, 1976) are theforms of synthetic vitamin E used almost exclusively in supplements,food fortification, and pharmacologic agents.
Animal studies show that α-tocopherol is not mutagenic, carcino-genic, or teratogenic (Abdo et al., 1986; Dysmsza and Park, 1975;Krasavage and Terhaar, 1977). Animals fed extremely high doses ofα-tocopherol or α-tocopheryl acetate have been shown to experi-ence a variety of adverse effects, but the relevance of some of thisinformation to the human situation is questionable.
Little information exists on the adverse effects to humans thatmight result from ingestion of other forms of tocopherol, such as γ- orβ-tocopherol, in amounts exceeding the levels normally found infoods. One study in humans given supplements of either all rac -α-tocopherol, RRR-α-tocopherol, or mixed tocopherols (α, β, and γ-tocopherol) demonstrated that all supplements yielded the sameplasma α- and γ-tocopherol concentrations (Chopra and Bhagavan,1999). Some data are available from animal studies, however. Clementand Bourre (1997) found that rats fed large amounts of γ-tocopherolhad increased concentrations of α-tocopherol in plasma and tissues.Although the fractional absorption of α-tocopherol was decreasedwhen α-tocopherol supplements were given to thoracic duct-cannulated rats, no decrease was seen in γ-tocopherol absorption(Traber et al., 1986). Thus, it appears that absorption of the variousforms of vitamin E is independent and unaffected by the presenceof large amounts of the other forms.
Plasma α-tocopherol concentrations are not informative for assess-ing adverse effects because plasma concentrations reach a similarplateau (approximately 3 to 4 times unsupplemented concentra-tions) when humans consume supplements containing at least 200mg (465 µmol)/day of either RRR- or all rac-α-tocopherol (Chopraand Bhagavan, 1999; Devaraj et al., 1997; Dimitrov et al., 1991, 1996;Jialal et al., 1995; Meydani et al., 1998; Princen et al., 1995). How-ever, since all forms of vitamin E are absorbed, although are notmaintained in the plasma (as discussed in the earlier section“Absorption and Transport” [Kiyose et al., 1997; Meydani et al.,1989; Traber and Kayden, 1989a; Traber et al., 1992, 1994a]), theyall could contribute to vitamin E toxicity. These observations sug-gest that at doses at which adverse effects are observed, all the stereo-isomers of α-tocopherol should be considered equivalent. A reviewof vitamin E toxicity studies concluded that humans show few sideeffects following supplemental doses below 2,100 mg (4,885 µmol)/day of RRR-α-tocopherol (Kappus and Diplock, 1992). However, most
Copyright © National Academy of Sciences. All rights reserved.
252 DIETARY REFERENCE INTAKES
studies of the possible effects of supplemental α-tocopherol (allforms) on human health have been conducted over periods of afew weeks to a few months, so the possible chronic effects of life-time exposures to high supplemental levels of α-tocopherol remainuncertain.
Hemorrhagic Toxicity—Humans. Three large-scale intervention tri-als, one supplementing with 400 or 800 IU (268 or 567 mg)/day ofRRR-α-tocopherol for 1.4 years (Stephens et al., 1996), another sup-plementing with 300 mg/day of all rac-α-tocopherol for 3.5 years(GISSI-Prevenzione Investigators, 1999), and the third supplement-ing with 400 IU (268 mg)/day of RRR-α-tocopherol for 4.5 years(HOPE Study Investigators, 2000), reported no increased risk ofstroke. However, another large-scale randomized trial, the Alpha-Tocopherol, Beta Carotene (ATBC) Cancer Prevention Study, inFinnish male smokers consuming 50 mg/day of all rac-α-tocopherolfor 6 years, reported a significant 50 percent increase in mortalityfrom hemorrhagic stroke (66 versus 44 strokes in the supplementedversus the control group) (ATBC Cancer Prevention Study Group,1994). An increase in hemorrhagic strokes was not observed in an-other study that was designed to evaluate neurological function in85 patients with Alzheimer’s disease consuming 2,000 IU/day ofsupplemental all rac-α-tocopherol for 2 years (Sano et al., 1997).The number of subjects in this trial or the length of the trial mayhave been insufficient to detect an effect. The unexpected result inthe ATBC study requires confirmation or additional refutation fromseveral other ongoing, large-scale trials including the Women’sHealth Study, the Physicians’ Health Study II, and the Women’sAntioxidant Cardiovascular Study. If most of the evidence that de-velops from these ongoing randomized trials indicates an increasedrisk of hemorrhagic stroke from α-tocopherol, the recommendedUL for α-tocopherol will have to be revised.
Hemorrhagic Toxicity—Animals. α-Tocopherol can cause hemor-rhage, increase prothrombin time, and interrupt blood coagulationin experimental animals, but very high doses are required. The hem-orrhagic toxicity of α-tocopherol has been observed in chicks(March et al., 1973) and rats (Abdo et al., 1986; Mellette and Le-one, 1960; Takahashi et al., 1990; Wheldon et al., 1983; Yang andDesai, 1977). However, in both species, high doses of 500 mg/kg/day or more of RRR-α-tocopheryl acetate were necessary to inducethe effects. Also, the hemorrhagic effects could be reversed by theadministration of supplemental vitamin K (Abdo et al., 1986; March
Copyright © National Academy of Sciences. All rights reserved.
VITAMIN E 253
et al., 1973; Wheldon et al., 1983). Presumably, these hemorrhagiceffects seen in experimental animals are relevant to humans, be-cause similar abnormal blood coagulation has been observed in apatient receiving chronic warfarin therapy, which would interferewith vitamin K status (Corrigan and Marcus, 1974).
Platelet Effects. Evidence suggests that α-tocopherol inhibits plate-let aggregation and adhesion in vitro (Calzada et al., 1997; Freed-man et al., 1996; Higashi and Kikuchi, 1974; Steiner and Anastasi,1976). However, it is not clear that these effects on platelet functionare deleterious in normal healthy individuals at any dose. Oral ad-ministration of up to 600 mg/day of α-tocopherol up to three yearsdid not result in any adverse blood coagulation effects in apparentlyhealthy volunteers (Farrell and Bieri, 1975; Kitagawa and Mino,1989). However, special consideration should be given to individu-als who are deficient in vitamin K or who are on anticoagulanttherapy. Administration of high doses of α-tocopherol may exacer-bate the coagulation defects in these individuals (Corrigan and Mar-cus, 1974).
Other Adverse Effects in Humans. Uncontrolled studies have re-ported various other adverse effects associated with excess intakeof α-tocopherol. These include fatigue, emotional disturbances,thrombophlebitis, breast soreness, creatinuria, altered serum lipidand lipoprotein levels, gastrointestinal disturbances, and thyroideffects (Anderson and Reid, 1974; Bendich and Machlin, 1988;Machlin, 1989; Tsai et al., 1978). However, none of these reportedeffects have been consistently observed or shown in controlled tri-als. Although side effects have been reported with extended in-takes of 1,100 to 2,100 mg/day of RRR-α-tocopherol (Kappus andDiplock, 1992), these effects are not severe and subside rapidly uponreducing the dosage or discontinuing the administration of α-tocopherol. The lack of systematic observations of such effects incontrolled clinical trails prevents any judgments regarding the riskof such effects in the normal healthy human population.
Adverse Effects in Premature Infants. In addition to the hemorrhag-ic effects described previously, an increased incidence of necrotiz-ing enterocolitis (NEC) was observed in premature infants withbirth weights of 1.5 kg or less who were given 200 mg/day of α-tocopheryl acetate (Finer et al., 1984). Johnson et al. (1985) alsodemonstrated an association between high serum vitamin E con-centrations and increased incidence of sepsis and late-onset NEC in
Copyright © National Academy of Sciences. All rights reserved.
254 DIETARY REFERENCE INTAKES
infants of less than 1.5-kg birth weight who were supplemented withα-tocopheryl acetate.
The incidence of intracranial hemorrhage in premature infantsreceiving supplemental intravenous or oral α-tocopheryl acetate hasbeen reported as increased (Phelps et al., 1987), unchanged (Speeret al., 1984), or decreased (Speer et al., 1984) depending on theseverity of the hemorrhage. It may well be that the small prematureinfant is particularly vulnerable to the toxic effects of vitamin E andthat intravenous vitamin E is more toxic than the oral preparation.
Other Adverse Effects Seen in Animals. Many other adverse effectshave been noted in various animal studies. For example, Abdo et al.(1986) observed lung lesions (chronic interstitial inflammation andadenomatous hyperplasia) in Fischer 344 rats in all treatmentgroups receiving α-tocopheryl acetate by gavage at doses as low as125 mg/kg/day for 13 weeks. It is possible that the lung lesions maybe the result of infusions into the lung from the gavage, rather thana vitamin E effect. However, this toxic effect was considered lessrelevant than the hemorrhagic effects seen because similar effectsin the lung have not been noted in human trials or other animalstudies.
Summary
Based on considerations of causality, relevance, and the qualityand completeness of the database, hemorrhagic effects were select-ed as the critical endpoint on which to base the UL for vitamin Efor adults. There is some evidence of an increased incidence ofhemorrhagic effects in premature infants receiving supplemental α-tocopherol. However, the human data fail to demonstrate consis-tently a causal association between excess α-tocopherol intake innormal, apparently healthy individuals and any adverse health out-come. The unexpected finding of an increase in hemorrhagic strokein the ATBC study was considered preliminary and provocative, butnot convincing until it can be corroborated or refuted in furtherlarge-scale clinical trials. The human data demonstrating the safetyof supplemental α-tocopherol have been accumulated primarily insmall groups of individuals receiving supplemental doses of 3,200mg/day of α-tocopherol or less (usually less than 2,000 mg/day) forrelatively short periods of time (weeks to a few months). Thus, somecaution must be exercised in judgments regarding the safety of sup-plemental doses of α-tocopherol over multiyear periods.
The hemorrhagic effects seen in experimental animals are en-
Copyright © National Academy of Sciences. All rights reserved.
VITAMIN E 255
countered only with very high doses of α-tocopherol and can becorrected by administration of supplemental vitamin K. Similarly, itappears that in vitamin K-deficient humans these effects could occurif sufficiently high doses were obtained to overwhelm the protectiveeffects of vitamin K. However, there is no direct evidence regardingthe doses that might put normal apparently healthy humans at riskfor such effects; these data show that individuals who are deficient invitamin K are at increased risk of coagulation defects.
Adults
Data Selection. In the absence of human data pertaining to dose-response relationships, the data sets used to identify a no-observed-adverse-effect level (NOAEL) for α-tocopherol include studies show-ing hemorrhagic toxicity in rats (Abdo et al., 1986; Takahashi et al.,1990; Wheldon et al., 1983).
Dose-Response Assessment
Identification of NOAEL and Lowest-Observed-Adverse-Effect Level(LOAEL). A LOAEL of 500 mg/kg body weight/day can be identi-fied based on a critical evaluation by Wheldon et al. (1983). Theyfed all rac-α-tocopheryl acetate to Charles River CD strain rats atlevels of 500, 1,000, or 2,000 mg/kg body weight/day for 104 weeks.Hemorrhages from the gut, the urinary tract, the orbit and mening-es, and the claws were observed in male rats only by week 15 in thehighest-dose group, by week 16 in the intermediate-dose group, andby week 18 in the low-dose group. Prothrombin times were pro-longed in males of all three treatment groups by week 4. However,additional vitamin K supplementation of the diets was initiated atweek 24 and prothrombin times returned to normal by week 26.Although this was a chronic, 104-week study, the correction of vita-min K levels in the diet at week 24 means that the combined vita-min E-vitamin K effect was evaluated only on a subchronic basis.
Takahashi et al. (1990) supplemented the diets of male Sprague-Dawley rats with 600 or 1,000 mg/kg body weight/day RRR-α-tocopheryl acetate for 7 days. Despite the short duration of thefeeding trial, a dose-dependent increase in prothrombin time andpartial thromboplastin time was noted in rats receiving 600 and1,000 mg/kg/day. The number of animals with hemorrhages wassimilar in both dose groups. No supplementation of vitamin K wasattempted in this experiment. This study would yield a LOAEL of
Copyright © National Academy of Sciences. All rights reserved.
256 DIETARY REFERENCE INTAKES
600 mg/kg/day but is compromised by its short duration and bythe fact that lower doses were not utilized.
Abdo et al. (1986) conducted a 13-week study administering RRR-α-tocopheryl acetate in corn oil by gavage to Fischer 344 rats atdoses of 125, 500, and 2,000 mg/kg body weight/day. In males,high levels of RRR-α-tocopheryl acetate (2,000 mg/kg/day) causedprolongation of both prothrombin time and activated partial throm-boplastin time (APTT), reticulocytosis, and a decrease in hemat-ocrit values and hemoglobin concentrations. APTT was also length-ened in females at this dose level. Hemorrhagic diathesis wasobserved in both males and females at the highest dosage level(2,000 mg/kg/day). However, no adverse hemorrhagic effects, oth-er than a minimal increase in activated partial thromboplastin time,were observed at a dose of 500 mg/kg/day.
While some differences were encountered among the results ofthese three key studies, they could be attributed to the dosage ap-proach (gavage versus diet), the time period of dosing, the strain ofrats, and possibly the level of vitamin K supplementation. The dataof Wheldon et al. (1983) demonstrate that the hazard posed byexcessive dietary intake of all rac-α-tocopheryl acetate can be over-come by administration of additional vitamin K. The Wheldon et al.(1983) study is considered the most definitive estimate because ofthe long exposure period of the dosage via diet. The LOAEL in thisstudy was 500 mg/kg/day, the lowest dose tested. Thus, a preciseNOAEL cannot be determined from the experiment. However, thisLOAEL is consistent with the results of the shorter-term feedingstudy of Takahashi et al. (1990) with a LOAEL at 600 mg/kg/day,the lowest dose tested, and the gavage study of Abdo et al. (1986)with no adverse hemorrhagic effects at 125 mg/kg/day and only aminimal increase in activated partial thromboplastin time at 500mg/kg/day of RRR-α-tocopherol acetate.
Uncertainty Assessment. When determining an uncertainty factor(UF) for α-tocopherol, several sources of uncertainty were consid-ered and combined into the final UF (Table 6-6). A UF of 2 wasused to extrapolate the LOAEL to a NOAEL. The severity of hemor-rhagic effects justifies a UF greater than 1; however, the results ofAbdo et al. (1986) showing no adverse effects at 125 mg/kg/day forhemorrhagic effects justify a UF of 2 to extrapolate from the LOA-EL of 500 mg/kg body weight/day to the NOAEL of 250 mg/kgbody weight/day. A UF of 2 was selected to extrapolate from sub-chronic to chronic intake, and a UF of 3 was selected to extrapolatefrom experimental animals to humans because of data showing
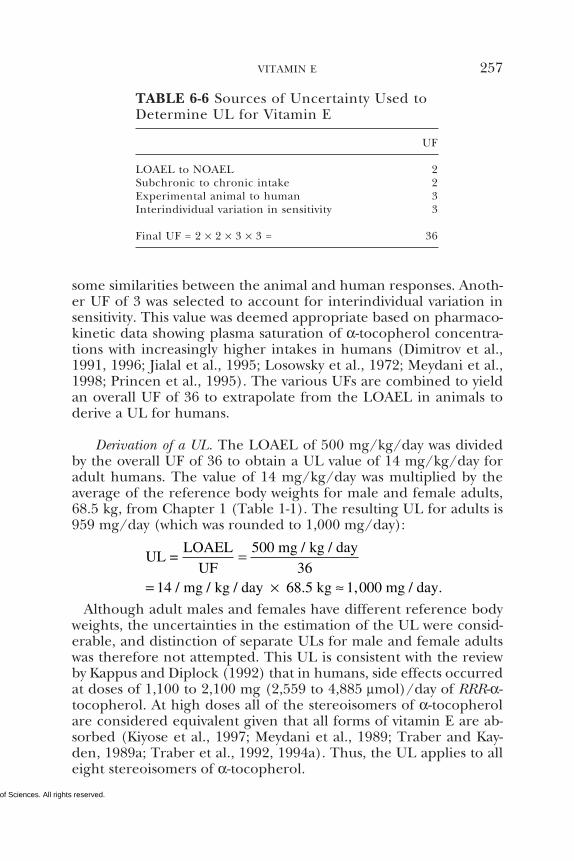
Copyright © National Academy of Sciences. All rights reserved.
VITAMIN E 257
some similarities between the animal and human responses. Anoth-er UF of 3 was selected to account for interindividual variation insensitivity. This value was deemed appropriate based on pharmaco-kinetic data showing plasma saturation of α-tocopherol concentra-tions with increasingly higher intakes in humans (Dimitrov et al.,1991, 1996; Jialal et al., 1995; Losowsky et al., 1972; Meydani et al.,1998; Princen et al., 1995). The various UFs are combined to yieldan overall UF of 36 to extrapolate from the LOAEL in animals toderive a UL for humans.
Derivation of a UL. The LOAEL of 500 mg/kg/day was dividedby the overall UF of 36 to obtain a UL value of 14 mg/kg/day foradult humans. The value of 14 mg/kg/day was multiplied by theaverage of the reference body weights for male and female adults,68.5 kg, from Chapter 1 (Table 1-1). The resulting UL for adults is959 mg/day (which was rounded to 1,000 mg/day):
UL =LOAEL
UF500 mg / kg / day
3614 / mg / kg / day 68.5 kg 1,000 mg / day.
=
= × ≈Although adult males and females have different reference body
weights, the uncertainties in the estimation of the UL were consid-erable, and distinction of separate ULs for male and female adultswas therefore not attempted. This UL is consistent with the reviewby Kappus and Diplock (1992) that in humans, side effects occurredat doses of 1,100 to 2,100 mg (2,559 to 4,885 µmol)/day of RRR-α-tocopherol. At high doses all of the stereoisomers of α-tocopherolare considered equivalent given that all forms of vitamin E are ab-sorbed (Kiyose et al., 1997; Meydani et al., 1989; Traber and Kay-den, 1989a; Traber et al., 1992, 1994a). Thus, the UL applies to alleight stereoisomers of α-tocopherol.
TABLE 6-6 Sources of Uncertainty Used toDetermine UL for Vitamin E
UF
LOAEL to NOAEL 2Subchronic to chronic intake 2Experimental animal to human 3Interindividual variation in sensitivity 3
Final UF = 2 × 2 × 3 × 3 = 36
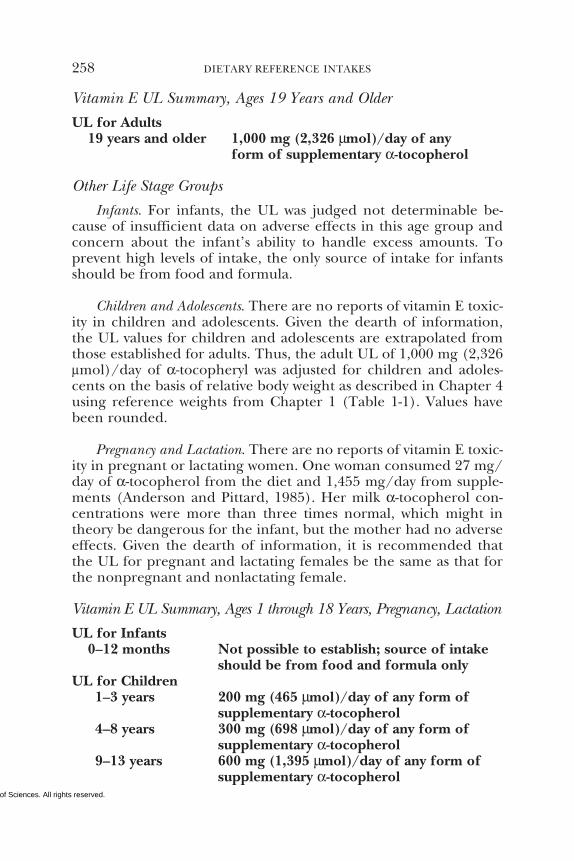
Copyright © National Academy of Sciences. All rights reserved.
258 DIETARY REFERENCE INTAKES
Vitamin E UL Summary, Ages 19 Years and Older
UL for Adults19 years and older 1,000 mg (2,326 µmol)/day of any
form of supplementary α-tocopherol
Other Life Stage Groups
Infants. For infants, the UL was judged not determinable be-cause of insufficient data on adverse effects in this age group andconcern about the infant’s ability to handle excess amounts. Toprevent high levels of intake, the only source of intake for infantsshould be from food and formula.
Children and Adolescents. There are no reports of vitamin E toxic-ity in children and adolescents. Given the dearth of information,the UL values for children and adolescents are extrapolated fromthose established for adults. Thus, the adult UL of 1,000 mg (2,326µmol)/day of α-tocopheryl was adjusted for children and adoles-cents on the basis of relative body weight as described in Chapter 4using reference weights from Chapter 1 (Table 1-1). Values havebeen rounded.
Pregnancy and Lactation. There are no reports of vitamin E toxic-ity in pregnant or lactating women. One woman consumed 27 mg/day of α-tocopherol from the diet and 1,455 mg/day from supple-ments (Anderson and Pittard, 1985). Her milk α-tocopherol con-centrations were more than three times normal, which might intheory be dangerous for the infant, but the mother had no adverseeffects. Given the dearth of information, it is recommended thatthe UL for pregnant and lactating females be the same as that forthe nonpregnant and nonlactating female.
Vitamin E UL Summary, Ages 1 through 18 Years, Pregnancy, Lactation
UL for Infants0–12 months Not possible to establish; source of intake
should be from food and formula onlyUL for Children
1–3 years 200 mg (465 µmol)/day of any form ofsupplementary α-tocopherol
4–8 years 300 mg (698 µmol)/day of any form ofsupplementary α-tocopherol
9–13 years 600 mg (1,395 µmol)/day of any form ofsupplementary α-tocopherol
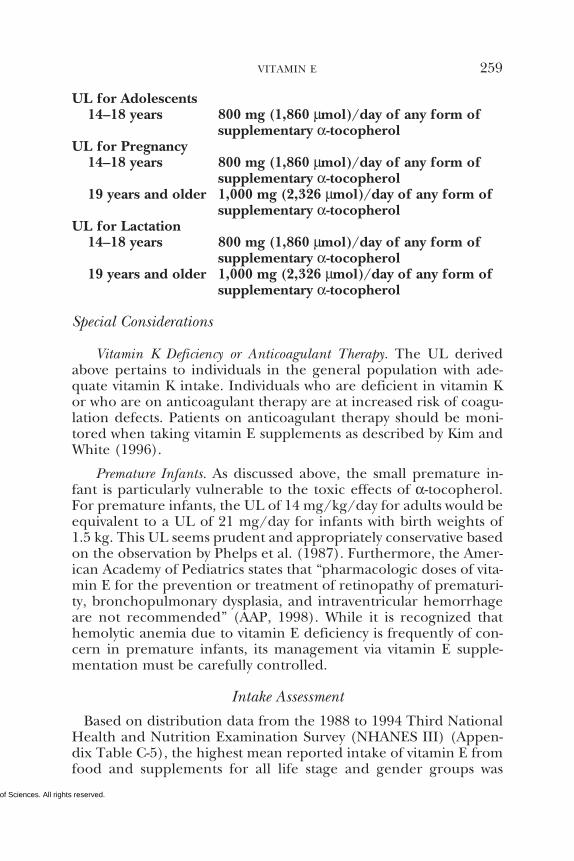
Copyright © National Academy of Sciences. All rights reserved.
VITAMIN E 259
UL for Adolescents14–18 years 800 mg (1,860 µmol)/day of any form of
supplementary α-tocopherolUL for Pregnancy
14–18 years 800 mg (1,860 µmol)/day of any form ofsupplementary α-tocopherol
19 years and older 1,000 mg (2,326 µmol)/day of any form ofsupplementary α-tocopherol
UL for Lactation14–18 years 800 mg (1,860 µmol)/day of any form of
supplementary α-tocopherol19 years and older 1,000 mg (2,326 µmol)/day of any form of
supplementary α-tocopherol
Special Considerations
Vitamin K Deficiency or Anticoagulant Therapy. The UL derivedabove pertains to individuals in the general population with ade-quate vitamin K intake. Individuals who are deficient in vitamin Kor who are on anticoagulant therapy are at increased risk of coagu-lation defects. Patients on anticoagulant therapy should be moni-tored when taking vitamin E supplements as described by Kim andWhite (1996).
Premature Infants. As discussed above, the small premature in-fant is particularly vulnerable to the toxic effects of α-tocopherol.For premature infants, the UL of 14 mg/kg/day for adults would beequivalent to a UL of 21 mg/day for infants with birth weights of1.5 kg. This UL seems prudent and appropriately conservative basedon the observation by Phelps et al. (1987). Furthermore, the Amer-ican Academy of Pediatrics states that “pharmacologic doses of vita-min E for the prevention or treatment of retinopathy of prematuri-ty, bronchopulmonary dysplasia, and intraventricular hemorrhageare not recommended” (AAP, 1998). While it is recognized thathemolytic anemia due to vitamin E deficiency is frequently of con-cern in premature infants, its management via vitamin E supple-mentation must be carefully controlled.
Intake Assessment
Based on distribution data from the 1988 to 1994 Third NationalHealth and Nutrition Examination Survey (NHANES III) (Appen-dix Table C-5), the highest mean reported intake of vitamin E fromfood and supplements for all life stage and gender groups was
Copyright © National Academy of Sciences. All rights reserved.
260 DIETARY REFERENCE INTAKES
around 45 mg (104.7 µmol)/day of α-tocopherol equivalents. Thiswas the mean intake reported by women 51 through 70 years of age.However, the intake distribution from food and supplements is ex-tremely skewed because the median intake of these women wasabout 9 mg (20.9 µmol)/day in comparison with a mean intake of45 mg (104.7 µmol)/day. This group also had the highest reportedintake at the ninety-ninth percentile of 508 mg (1,181 µmol)/day ofα-tocopherol equivalents, which is well below the UL of 1,000 mg/day of any form of α-tocopherol. Vitamin E supplement use is highin the U.S. population (Hartz et al., 1988; Slesinski et al., 1996). Inthe 1986 National Health Interview Survey, supplements containingvitamin E were used by 37 percent of young children, 23 percent ofmen, and 29 percent of all women in the United States (Moss et al.,1989).
Risk Characterization
The risk of adverse effects resulting from excess intake of α-tocopherol from food and supplements appears to be very low at thehighest intakes noted above. Although members of the general pop-ulation should be advised not to exceed the UL routinely, intakesabove the UL for vitamin E may be appropriate for investigationwithin well-controlled clinical trials. In light of evaluating possiblebenefits to health, clinical trials of doses of α-tocopherol above theUL should not be discouraged, as long as subjects participating inthese trials have signed informed consent documents regarding pos-sible toxicity and as long as these trials employ appropriate safetymonitoring of trial subjects. Also, the UL is not meant to apply toindividuals who are receiving vitamin E under medical supervision.
RESEARCH RECOMMENDATIONS FOR VITAMIN E
• Biomarkers are needed for use in assessment of vitamin Eintake and vitamin E status. What are the determinants of plasmaconcentrations of α-tocopherol, and are these concentrations regu-lated? Are plasma α-tocopherol concentrations the best parameterfor assessing adequate plasma vitamin E status in apparently healthyindividuals? Does an α-tocopherol/lipid (e.g., total lipid, triglycer-ide, or cholesterol) ratio better reflect optimal plasma vitamin Estatus?
• Since the Recommended Dietary Allowances (RDAs) for chil-dren ages 1 through 18 years are extrapolated from the adult RDAs,
Copyright © National Academy of Sciences. All rights reserved.
VITAMIN E 261
it is critically important to conduct large-scale studies with childrenusing state-of-the-art biomarkers to assess their vitamin E requirements.
• Valid estimates are needed of vitamin E intakes. These esti-mates require identification of the specific fats and oils consumed,in addition to careful tabulation of all of the foods consumed, be-cause the vitamin E content of various fats and oils differs widelyand because vitamin E is widely distributed in many foods. Mostindividual foodstuffs consumed account for less than 1 percent ofthe daily intake of α-tocopherol. Calories are frequently underre-ported, as is dietary fat, and the form and quantity of fat consumedare unknown. Better methods for estimating vitamin E intakes areneeded.
• Information on the relationship between oxidative stress andvitamin E status is needed. Some information is available about thedosage of vitamin E needed to achieve plasma levels that protectcirculating low-density lipoprotein (LDL) from ex vivo oxidation.However, there are scant data on tissue levels of vitamin E at differ-ent levels of intake. Do the large doses that confer protection ofcirculating LDL also confer protection within tissues against lipidperoxidation or other manifestations of reactive oxygen species gen-eration? Are there markers of oxidative stress that can be related tovitamin E status?
• Vitamin E kinetics and metabolism are promising areas ofresearch. Can estimates of α-tocopherol requirements be made us-ing stable isotopes? Are balance studies feasible that measure intakeand output of stable isotope-labeled vitamin E? What is the turn-over of α-tocopherol in various human tissues? In which tissues is itdegraded and how rapidly? What are the major metabolic interme-diates during degradation, and do they have biological function?
• Determination of the effects of vitamin E intake on the pre-vention of chronic disease is needed. There is a great deal of sug-gestive or indirect evidence that vitamin E intakes above those thatcan reasonably be obtained from foods may confer health benefits.Before clinical intervention trials can be interpreted properly, moreknowledge about the relationship of vitamin E dosage to level ofprotection, or level of protection to plasma cholesterol or lipopro-tein levels, is needed. Additional clinical trials to test directly wheth-er or not supplementation with vitamin E can reduce the risk ofcoronary heart disease are needed. A number of trials already inprogress are evaluating vitamin E effects in well over 100,000 indi-viduals. However, whether the results are positive or negative, addi-tional studies will be needed. For example, if the results are nega-tive, the question will arise of whether treatment was instituted early
Copyright © National Academy of Sciences. All rights reserved.
262 DIETARY REFERENCE INTAKES
enough and whether even longer trials starting at an earlier age arenecessary to test the hypothesis properly. If the results are positive,the issue of dosage will arise. Most of these studies are supplement-ing with more than 200 mg/day of α-tocopherol, but this may beunnecessarily high. Again, if the results are positive, indicating thatvitamin E does indeed offer protection, it will be important to de-termine if combinations of antioxidants in various dosages can fur-ther increase the beneficial effect. Possible interactions betweencholesterol-lowering and antioxidant treatments should be studiedto find the best algorithm for preventive management.
• More information is needed on the mechanisms of vitamin Efunction. It is unknown whether vitamin E functions solely as a rela-tively nonspecific antioxidant compound or whether it has somevery specific modes of action, for which the precise structure of α-tocopherol is required. The mechanisms for regulation of tissue α-tocopherol are unknown. In fact, it is not known whether they areregulated at all. The relatively uniform concentrations in tissuesfrom different individuals suggest that there may be regulation, butthis may reflect differences in fat concentration. Additionally, theexistence of α-tocopherol binding proteins in tissues other than theliver is being investigated. Do differences in depletion rates amongvarious tissues reflect the functions of other tissue α-tocopherolbinding proteins?
• More information is needed on the other forms of vitamin E.What is the biological potency of forms of vitamin E other than α-tocopherol in humans? Does γ-tocopherol have a role in humans?Does it function to act as a nitric oxide scavenger? What is themetabolic fate of γ-tocopherol in humans?
REFERENCESAAP (American Academy of Pediatrics). 1998. Pediatric Nutrition Handbook, 4th
edition. Elk Grove Village, IL: AAP. P. 67.Abbasi S, Ludomirski A, Bhutani VK, Weiner S, Johnson L. 1990. Maternal and
fetal plasma vitamin E to total lipid ratio and fetal RBC antioxidant functionduring gestational development. J Am Coll Nutr 9:314–319.
Abdo KM, Rao G, Montgomery CA, Dinowitz M, Kanagalingam K. 1986. Thirteen-week toxicity study of d-alpha-tocopheryl acetate (vitamin E) in Fischer 344rats. Food Chem Toxicol 24:1043–1050.
Acuff RV, Thedford SS, Hidiroglou NN, Papas AM, Odom TA. 1994. Relative bio-availability of RRR- and all-rac-alpha-tocopheryl acetate in humans: Studiesusing deuterated compounds. Am J Clin Nutr 60:397–402.
Acuff RV, Webb LW, Brooks LJ, Papas AM, Lane JR. 1997. Pharmacokinetics ofRRR-gamma-tocopherol in humans after a single dose administration of deu-terium-labeled gamma-tocopherol in humans. FASEB J 11:A449.
Copyright © National Academy of Sciences. All rights reserved.
VITAMIN E 263
Adam O, Lemmen C, Kless T, Adam P, Denzlinger C, Hailer S. 1995. Low fat dietdecreases alpha-tocopherol levels, and stimulates LDL oxidation and eico-sanoid biosynthesis in man. Eur J Med Res 1:65–71.
Adler LA, Edson R, Lavori P, Peselow E, Duncan E, Rosenthal M, Rotrosen J. 1998.Long-term treatment effects of vitamin E for tardive dyskinesia. Biol Psychiatry43:868–872.
AIN (American Institute of Nutrition). 1990. Nomenclature policy: Genericdescriptors and trivial names for vitamins and related compounds. J Nutr120:12–19.
Ali J, Kader HA, Hassan K, Arshat H. 1986. Changes in human milk vitamin E andtotal lipids during the first twelve days of lactation. Am J Clin Nutr 43:925–930.
Alexy U, Kersting M, Sichert-Hellert W, Manz F, Schöch G. 1999. Vitamin intake of3- to 36-month-old German infants and children—Results of the DONALD-study. Int J Vitam Nutr Res 69:285–291.
Allen JC, Keller RP, Archer P, Neville MC. 1991. Studies in human lactation: Milkcomposition and daily secretion rates of macronutrients in the first year oflactation. Am J Clin Nutr 54:69–80.
Ames BN, Gold LS, Willett WC. 1995. The causes and prevention of cancer. ProcNatl Acad Sci USA 92:5258–5265.
Amiel J, Maziere J, Beucler I, Koenig M, Reutenauer L, Loux N, Bonnefont D, FeoC, Landrieu P. 1995. Familial isolated vitamin E deficiency. Extensive study ofa large family with a 5-year therapeutic follow-up. J Inherit Metab Dis 18:333–340.
Anderson DM, Pittard WB. 1985. Vitamin E and C concentrations in human milkwith maternal megadosing. A case report. J Am Diet Assoc 85:715–717.
Anderson TW, Reid DB. 1974. A double-blind trial of vitamin E in angina pectoris.Am J Clin Nutr 27:1174–1178.
Andersson SO, Wolk A, Bergstrom R, Giovannucci E, Lindgren C, Baron J, AdamiHO. 1996. Energy, nutrient intake and prostate cancer risk: A population-based case-control study in Sweden. Int J Cancer 68:716–722.
Arita M, Sato Y, Miyata A, Tanabe T, Takahashi E, Kayden H, Arai H, Inoue K.1995. Human alpha-tocopherol transfer protein: cDNA cloning, expressionand chromosomal localization. Biochem J 306:437–443.
Ascherio A, Stampfer MJ, Colditz GA, Rimm EB, Litin L, Willett WC. 1992. Correla-tions of vitamin A and E intakes with the plasma concentrations of carotenoidsand tocopherols among American men and women. J Nutr 122:1792–1801.
ATBC (Alpha-Tocopherol, Beta Carotene) Cancer Prevention Study Group. 1994.The effect of vitamin E and beta carotene on the incidence of lung cancer andother cancers in male smokers. N Engl J Med 330:1029–1035.
Awad JA, Morrow JD, Hill KE, Roberts LJ II, Burk RF. 1994. Detection and localiza-tion of lipid peroxidation in selenium- and vitamin E-deficient rats using F2-isoprostanes. J Nutr 124:810–816.
Azen SP, Mack WJ, Cashin-Hemphill L, LaBree L, Shircore AM, Selzer RH, Blan-kenhorn DH, Hodis HN. 1996a. Progression of coronary artery disease pre-dicts clinical coronary events. Long-term follow-up from the Cholesterol Low-ering Atherosclerosis Study. Circulation 93:34–41.
Azen SP, Qian D, Mack WJ, Sevanian A, Selzer RH, Liu CR, Liu CH, Hodis HN.1996b. Effect of supplementary antioxidant vitamin intake on carotid arterialwall intima-media thickness in a controlled clinical trial of cholesterol lower-ing. Circulation 94:2369–2372.
Copyright © National Academy of Sciences. All rights reserved.
264 DIETARY REFERENCE INTAKES
Azzi A, Boscoboinik D, Marilley D, Ozer NK, Stauble B, Tasinato A. 1995. VitaminE: A sensor and an information transducer of the cell oxidation state. Am JClin Nutr 62:1337S–1346S.
Bae CY, Keenan JM, Fontaine P, Wenz J, Ripsin CM, McCaffrey DJ. 1993. Plasmalipid response and nutritional adequacy in hypercholesterolemic subjects onthe American Heart Association Step-One Diet. Arch Fam Med 2:765–772.
Bayliss EA, Hambidge KM, Sokol RJ, Stewart B, Lilly JR. 1995. Hepatic concentra-tions of zinc, copper and manganese in infants with extrahepatic biliary atre-sia. J Trace Elem Med Biol 9:40–43.
Baynes JW. 1991. Role of oxidative stress in development of complications in dia-betes. Diabetes 40:405–412.
Bendich A. 1994. Role of antioxidants in the maintenance of immune functions.In: Frei B, ed. Natural Antioxidants in Human Health and Disease. San Diego:Academic Press. Pp. 447–467.
Bendich A, Machlin LJ. 1988. Safety of oral intake of vitamin E. Am J Clin Nutr48:612–619.
Ben Hamida M, Belal S, Sirugo G, Ben Hamida C, Panayides K, Ionannou P,Beckmann J, Mandel JL, Hentati F, Koenig M, Middleton L. 1993. Friedreich’sataxia phenotype not linked to chromosome 9 and associated with selectiveautosomal recessive vitamin E deficiency in two inbred Tunisian families. Neu-rology 43:2179–2183.
Bieri JG, Evarts RP. 1973. Tocopherols and fatty acids in American diets. Therecommended allowance for vitamin E. J Am Diet Assoc 62:147–151.
Bieri JG, Evarts RP. 1974. Gamma-tocopherol: Metabolism, biological activity andsignificance in human vitamin E nutrition. Am J Clin Nutr 27:980–986.
Bieri JG, McKenna MC. 1981. Expressing dietary values for fat-soluble vitamins:Changes in concepts and terminology. Am J Clin Nutr 34:289–295.
Bjørneboe A, Bjørneboe GE, Hagen BF, Nossen JO, Drevon CA. 1987. Secretion ofalpha-tocopherol from cultured rat hepatocytes. Biochim Biophys Acta 922:199–205.
Blomstrand R, Forsgren L. 1968. Labelled tocopherols in man. Intestinal absorp-tion and thoracic-duct lymph transport of dl-alpha-tocopheryl-3,4-14C2 ace-tate dl-alpha-tocopheramine-3,4-14C2 dl-alpha-tocopherol-(5-methyl-3H) andN-(methyl-3H)-dl-gamma-tocopheramine. Z Vitaminforsch 38:328–344.
Boda V, Finckh B, Durken M, Commentz J, Hellwege HH, Kohlschutter A. 1998.Monitoring erythrocyte free radical resistance in neonatal blood microsam-ples using a peroxyl radical-mediated haemolysis test. Scand J Clin Lab Invest58:317–322.
Boersma ER, Offringa PJ, Muskiet FA, Chase WM, Simmons IJ. 1991. Vitamin E,lipid fractions, and fatty acid composition of colostrum, transitional milk, andmature milk: An international comparative study. Am J Clin Nutr 53:1197–1204.
Boscoboinik D, Szewczyk A, Hensey C, Azzi A. 1991. Inhibition of cell proliferationby alpha-tocopherol. Role of protein kinase C. J Biol Chem 266:6188–6194.
Briefel RR, Sempos CT, McDowell MA, Chien S, Alaimo K. 1997. Dietary methodsresearch in the Third National Health and Nutrition Examination Survey:Underreporting of energy intake. Am J Clin Nutr 65:1203S–1209S.
Brown K, Reid A, White T, Henderson T, Hukin S, Johnstone C, Glen A. 1998.Vitamin E, lipids, and lipid peroxidation products in tardive dyskinesia. BiolPsychiatry 43:863–867.
Copyright © National Academy of Sciences. All rights reserved.
VITAMIN E 265
Buettner GR. 1993. The pecking order of free radicals and antioxidants: Lipidperoxidation, alpha-tocopherol, and ascorbate. Arch Biochem Biophys 300:535–543.
Burck U, Goebel HH, Kuhlendahl HD, Meier C, Goebel KM. 1981. Neuromyopa-thy and vitamin E deficiency in man. Neuropediatrics 12:267–278.
Burton GW, Ingold KU. 1981. Autoxidation of biological molecules. I. The antiox-idant activity of vitamin E and related chain-breaking phenolic antioxidants invitro. J Am Chem Soc 103:6472–6477.
Burton GW, Ingold KU. 1986. Vitamin E: Application of the principles of physicalorganic chemistry to the exploration of its structure and function. Acc ChemRes 19:194–201.
Burton GW, Joyce A, Ingold KU. 1983. Is vitamin E the only lipid-soluble, chain-breaking antioxidant in human blood plasma and erythrocyte membranes?Arch Biochem Biophys 221:281–290.
Burton GW, Doba T, Gabe EJ, Hughes L, Lee FL, Prasad L, Ingold KU. 1985.Autoxidation of biological molecules. 4. Maximizing the antioxidant activityof phenols. J Am Chem Soc 107:7053–7065.
Burton GW, Traber MG, Acuff RV, Walters DN, Kayden H, Hughes L, Ingold KU.1998. Human plasma and tissue alpha-tocopherol concentrations in responseto supplementation with deuterated natural and synthetic vitamin E. Am J ClinNutr 67:669–684.
Butte NF, Garza C, Smith EO, Nichols BL. 1984. Human milk intake and growth inexclusively breast-fed infants. J Pediatr 104:187–195.
Cachia O, Benna JE, Pedruzzi E, Descomps B, Gougerot-Pocidalo MA, Leger CL.1998. Alpha-tocopherol inhibits the respiratory burst in human monocytes.Attenuation of p47(phox) membrane translocation and phosphorylation. JBiol Chem 273:32801–32805.
Calzada C, Bruckdorfer R, Rice-Evans CA. 1997. The influence of antioxidant nu-trients on platelet function in healthy volunteers. Atherosclerosis 128:97–105.
Catignani GL, Bieri JG. 1977. Rat liver alpha-tocopherol binding protein. BiochimBiophys Acta 497:349–357.
Cavalier L, Ouahchi K, Kayden HJ, DiDonato S, Reutenauer L, Mandel J-L, KoenigM. 1998. Ataxia with isolated vitamin E deficiency: Heterogeneity of mutationsand phenotypic variability in a large number of families. Am J Hum Genet62:301–310.
Ceballos-Picot I, Nicole A, Briand P, Grimber G, Delacourte A, Defossez A, Javoy-Agid F, Lafon M, Blouin JL, Sinet PM. 1991. Neuronal-specific expression ofhuman copper-zinc superoxide dismutase gene in transgenic mice: Animalmodel of gene dosage effects in Down’s syndrome. Brain Res 552:198–214.
Ceriello A, Giugliano D, Quatraro A, Donzella C, Dipalo G, Lefebvre PJ. 1991.Vitamin E reduction of protein glycosylation in diabetes. New prospect forprevention of diabetic complications? Diabetes Care 14:68–72.
Chan AC, Leith MK. 1981. Decreased prostacyclin synthesis in vitamin E-deficientrabbit aorta. Am J Clin Nutr 34:2341–2347.
Chan AC, Tran K, Raynor T, Ganz PR, Chow CK. 1991. Regeneration of vitamin Ein human platelets. J Biol Chem 266:17290–17295.
Chan AC, Wagner M, Kennedy C, Chen E, Lanuville O, Mezl VA, Tran K, Choy PC.1998a. Vitamin E up-regulates arachidonic acid release and phospholipase A2
in megakaryocytes. Mol Cell Biochem 189:153–159.
Copyright © National Academy of Sciences. All rights reserved.
266 DIETARY REFERENCE INTAKES
Chan AC, Wagner M, Kennedy C, Mroske C, Proulx P, Laneuville O, Tran K, ChoyPC. 1998b. Vitamin E up-regulates phospholipase A2, arachidonic acid releaseand cyclooxygenasein endothelial cells. Akt Ernahr-Med 23:1–8.
Chappell JE, Francis T, Clandinin MT. 1985. Vitamin A and E content of humanmilk at early stages of lactation. Early Hum Devel 11:157–167.
Chatelain E, Boscoboinik DO, Bartoli GM, Kagan VE, Gey F, Packer L, Azzi A.1993. Inhibition of smooth muscle cell proliferation and protein kinase Cactivity by tocopherols and tocotrienols. Biochim Biophys Acta 1176:83–89.
Cheeseman KH, Holley AE, Kelly FJ, Wasil M, Hughes L, Burton G. 1995. Biokinet-ics in humans of RRR-alpha-tocopherol: The free phenol, acetate ester, andsuccinate ester forms of vitamin E. Free Radic Biol Med 19:591–598.
Chen LH, Boissonneault GA, Glauert HP. 1988. Vitamin C, vitamin E and cancer.Anticancer Res 8:739-748.
Chopra RK, Bhagavan HN. 1999. Relative bioavailabilities of natural and syntheticvitamin E formulations containing mixed tocopherols in human subjects. Int JVitam Nutr Res 69:92–95.
Church DF, Pryor WA. 1985. Free-radical chemistry of cigarette smoke and itstoxicological implications. Environ Hlth Perspect 64:111–126.
Clement M, Bourre JM. 1997. Graded dietary levels of RRR-gamma-tocopherolinduce a marked increase in the concentrations of alpha- and gamma-tocopherol in nervous tissues, heart, liver and muscle of vitamin-E-deficientrats. Biochim Biophys Acta 1334:173–1781.
Clement S, Tasinato A, Boscoboinik D, Azzi A. 1997. The effect of alpha-tocopherolon the synthesis, phosphorylation and activity of protein kinase C in smoothmuscle cells after phorbol 12-myristate 13-acetate down-regulation. Eur JBiochem 246:745–749.
Cohn W, Loechleiter F, Weber F. 1988. Alpha-tocopherol is secreted from rat liverin very low density lipoproteins. J Lipid Res 29:1359–1366.
Colette C, Pares-Herbute N, Monnier LH, Cartry E. 1988. Platelet function in typeI diabetes: Effects of supplementation with large doses of vitamin E. Am J ClinNutr 47:256–261.
Cominacini L, Garbin U, Pasini AF, Davoli A, Campagnola M, Contessi GB, Pastori-no AM, Lo Cascio V. 1997. Antioxidants inhibit the expression of intercellularcell adhesion molecule-1 and vascular cell adhesion molecule-1 induced byoxidized LDL on human umbilical vein endothelial cells. Free Radic Biol Med22:117–127.
Comstock GW, Bush TL, Helzlsouer K. 1992. Serum retinol, beta-carotene, vitaminE, and selenium as related to subsequent cancer of specific sites. Am J Epidemi-ol 135:115–121.
Comstock GW, Alberg AJ, Huang HY, Wu K, Burke AE, Hoffman SC, Norkus EP,Gross M, Cutler RG, Morris JS, Spate VL, Helzlsouer KJ. 1997. The risk ofdeveloping lung cancer associated with antioxidants in the blood: Ascorbicacid, carotenoids, alpha-tocopherol, selenium, and total peroxyl radical ab-sorbing capacity. Cancer Epidemiol Biomarkers Prev 6:907–916.
Cornett CR, Markesbery WR, Ehmann WD. 1998. Imbalances of trace elementsrelated to oxidative damage in Alzheimer’s disease brain. Neurotoxicology 19:339–345.
Corrigan JJ Jr, Marcus FI. 1974. Coagulopathy associated with vitamin E ingestion.J Am Med Assoc 230:1300–1301.
Copyright © National Academy of Sciences. All rights reserved.
VITAMIN E 267
Cross CE, Eiserich JP, Halliwell B. 1997. General biological consequences of in-haled environmental toxicants. In: Crystal RG, West JB, Barnes PJ, Weibel ER,eds. The Lung: Scientific Foundations, 2nd edition. Philadelphia: Lippincott-Raven. Pp. 2421–2437.
Cynamon HA, Milov DE, Valenstein E, Wagner M. 1988. Effect of vitamin E defi-ciency on neurologic function in patients with cystic fibrosis. J Pediatr 113:637–640.
Dam H. 1962. Interrelations between vitamin E and polyunsaturated fatty acids inanimals. Vitam Horm 20:527–540.
Davi G, Ciabattoni G, Consoli A, Mezzetti A, Falco A, Santarone S, Pennese E,Vitacolonna E, Bucciarelli T, Costantini F, Capani F, Patrono C. 1999. In vivoformation of 8-iso-prostaglandin F2a and platelet activation in diabetes melli-tus. Effects of improved metabolic control and vitamin E supplementation.Circulation 99:224–229.
DeCosse JJ, Miller HH, Lesser ML. 1989. Effect of wheat fiber and vitamins C and Eon rectal polyps in patients with familial adenomatous polyposis. J Natl CancerInst 81:1290–1297.
Delanty N, Reilly M, Pratico D, FitzGerald DJ, Lawson JA, FitzGerald GA. 1996. 8-Epi PGF2 alpha: Specific analysis of an isoeicosanoid as an index of oxidantstress in vivo. Br J Clin Pharmacol 42:15–19.
DeMaio SJ, King SB 3rd, Lembo NJ, Roubin GS, Hearn JA, Bhagavan HN, SgoutasDS. 1992. Vitamin E supplementation, plasma lipids and incidence of resteno-sis after percutaneous transluminal coronary angioplasty (PTCA). J Am CollNutr 11:68–73.
Devaraj S, Li D, Jialal I. 1996. The effects of alpha tocopherol supplementation onmonocyte function. Decreased lipid oxidation, interleukin 1b secretion, andmonocyte adhesion to endothelium. J Clin Invest 98:756–763.
Devaraj S, Adams-Huet B, Fuller CJ, Jialal I. 1997. Dose-response comparison ofRRR-alpha-tocopherol and all-racemic alpha-tocopherol on LDL oxidation.Arterioscler Thromb Vasc Biol 17:2273–2279.
de Vries JH, Hollman PC, Meyboom S, Buysman MN, Zock PL, van Staveren WA,Katan MB. 1998. Plasma concentrations and urinary excretion of the antioxi-dant flavonols quercetin and kaempferol as biomarkers for dietary intake. AmJ Clin Nutr 68:60–65.
Dial S, Eitenmiller RR. 1995. Tocopherols and tocotrienols in key foods in the U.S.diet. In: Ong ASH, Niki E, Packer L, eds. Nutrition, Lipids, Health, and Disease.Champaign, IL: AOCS Press. Pp. 327–342.
Dieber-Rotheneder M, Puhl H, Waeg G, Striegl G, Esterbauer H. 1991. Effect oforal supplementation with d-alpha-tocopherol on the vitamin E content ofhuman low density lipoproteins and resistance to oxidation. J Lipid Res 32:1325–1332.
Dimitrov NV, Meyer C, Gilliland D, Ruppenthal M, Chenoweth W, Malone W.1991. Plasma tocopherol concentrations in response to supplemental vitaminE. Am J Clin Nutr 53:723–729.
Dimitrov NV, Meyer-Leece C, McMillan J, Gilliland D, Perloff M, Malone W. 1996.Plasma alpha-tocopherol concentrations after supplementation with water- andfat-soluble vitamin E. Am J Clin Nutr 64:329–335.
Doba T, Burton GW, Ingold KU. 1985. Antioxidant and co-antioxidant activity ofvitamin C. The effect of vitamin C, either alone or in the presence of vitaminE or a water-soluble vitamin E analogue, upon the peroxidation of aqueousmultilamellar phospholipid liposomes. Biochim Biophys Acta 835:298–303.
Copyright © National Academy of Sciences. All rights reserved.
268 DIETARY REFERENCE INTAKES
Dorgan JF, Sowell A, Swanson CA, Potischman N, Miller R, Schussler N, Stephen-son HE. 1998. Relationships of serum carotenoids, retinol, alpha-tocopherol,and selenium with breast cancer risk: Results from a prospective study in Co-lumbia, Missouri (United States). Cancer Causes Control 9:89–97.
Draper HH. 1993. Interrelationships of vitamin E with other nutrients. In: PackerL, Fuchs J, eds. Vitamin E in Health and Disease. New York: Marcel Dekker. Pp.53–61.
Duthie GG, Arthur JR, James WP. 1991. Effects of smoking and vitamin E on bloodantioxidant status. Am J Clin Nutr 53:1061S–1063S.
Duthie SJ, Ross M, Collins AR. 1995. The influence of smoking and diet on thehypoxanthine phosphoribosyltransferase (hprt) mutant frequency in circulat-ing T lymphocytes from a normal human population. Mutat Res 331:55–64.
Duthie SJ, Ma A, Ross MA, Collins AR. 1996. Antioxidant supplementation de-creases oxidative DNA damage in human lymphocytes. Cancer Res 56:1291–1295.
Dysmsza HA, Park J. 1975. Excess dietary vitamin E in rats. Fed Am Soc Exp Biol34:912.
Egan MF, Hyde TM, Albers GW, Elkashef A, Alexander RC, Reeve A, Blum A,Saenz RE, Wyatt RJ. 1992. Treatment of tardive dyskinesia with vitamin E. Am JPsychiatry 149:773–777.
Eichholzer M, Stahelin HB, Gey KF, Ludin E, Bernasconi F. 1996. Prediction ofmale cancer mortality by plasma levels of interacting vitamins: 17-year follow-up of the prospective Basel study. Int J Cancer 66:145–150.
Eiserich JP, van der Vliet A, Handelman GJ, Halliwell B, Cross CE. 1995. Dietaryantioxidants and cigarette smoke-induced biomolecular damage: A complexinteraction. Am J Clin Nutr 62:1490S–1500S.
Eiserich JP, Cross CE, Van der Vliet A. 1997. Nitrogen oxides are important con-tributors to cigarette smoke-induced ascorbate oxidation. In: Packer L, FuchsJ, eds. Vitamin C in Health and Disease. New York: Marcel Dekker. Pp. 399–412.
Eitenmiller RR, Landen WO Jr. 1995. Vitamins. In: Jeon IJ, Ikins WG, eds. Analyz-ing Food for Nutrition Labeling and Hazardous Contaminants. New York: MarcelDekker. Pp. 195–281.
Elias E, Muller DP, Scott J. 1981. Association of spinocerebellar disorders withcystic fibrosis or chronic childhood cholestasis and very low serum vitamin E.Lancet 2:1319–1321.
Elkashef AM, Ruskin PE, Bacher N, Barrett D. 1990. Vitamin E in the treatment oftardive dyskinesia. Am J Psychiatry 147:505–506.
Ernster VL, Goodson WH, Hunt TK, Petrakis NL, Sickles EA, Miike R. 1985. Vita-min E and benign breast “disease”: A double-blind, randomized clinical trial.Surgery 97:490–494.
Farrell PM, Bieri JG. 1975. Megavitamin E supplementation in man. Am J Clin Nutr28:1381–1386.
Farrell PM, Bieri JG, Fratantoni JF, Wood RE, Di Sant’Agnese PA. 1977. The occur-rence and effects of human vitamin E deficiency. A study in patients withcystic fibrosis. J Clin Invest 60:233–241.
Farrell PM, Mischler EH, Gutcher GR. 1982. Evaluation of vitamin E deficiency inchildren with lung disease. Ann NY Acad Sci 393:96–108.
Faruqi R, de la Motte C, DiCorleto PE. 1994. Alpha-tocopherol inhibits agonist-induced monocytic cell adhesion to cultured human endothelial cells. J ClinInvest 94:592–600.
Copyright © National Academy of Sciences. All rights reserved.
VITAMIN E 269
Finer, NN, Peters, KL, Hayek, Z, Merkel, CL. 1984. Vitamin E and necrotizingenterocolitis. Pediatrics 73:387-93.
Ford ES, Sowell A. 1999. Serum alpha-tocopherol status in the United States popu-lation: Findings from the Third National Health and Nutrition ExaminationSurvey. Am J Epidemiol 150:290–300.
Freedman JE, Farhat JH, Loscalzo J, Keaney JF Jr. 1996. Alpha-tocopherol inhibitsaggregation of human platelets by a protein kinase C-dependent mechanism.Circulation 94:2434–2440.
Fuller CJ, Chandalia M, Garg A, Grundy SM, Jialal I. 1996. RRR-alpha-Tocopherylacetate supplementation at pharmacologic doses decreases low-density-lipo-protein oxidative susceptibility but not protein glycation in patients with dia-betes mellitus. Am J Clin Nutr 63:753–759.
Gallo-Torres HE. 1970. Obligatory role of bile for the intestinal absorption ofvitamin E. Lipids 5:379–384.
Gascón-Vila P, Garcia-Closas R, Serra-Majem L, Pastor MC, Ribas L, Ramon JM,Marine-Font A, Salleras L. 1997. Determinants of the nutritional status of vita-min E in a non-smoking Mediterranean population. Analysis of the effect ofvitamin E intake, alcohol consumption and body mass index on the serumalpha-tocopherol concentration. Eur J Clin Nutr 51:723–728.
Ghalaut VS, Ghalaut PS, Kharb S, Singh GP. 1995. Vitamin E in intestinal fatmalabsorption. Ann Nutr Metab 39:296–301.
Gisinger C, Jeremy J, Speiser P, Mikhailidis D, Dandona P, Schernthaner G. 1988.Effect of vitamin E supplementation on platelet thromboxane A2 productionin type I diabetic patients. Double-blind crossover trial. Diabetes 37:1260–1264.
GISSI-Prevenzione Investigators. 1999. Dietary supplementation with n-3 polyun-saturated fatty acids and vitamin E after myocardial infarction: Results of theGISSI-Prevenzione Trial. Lancet 354:447–455.
Gotoda T, Arita M, Arai H, Inoue K, Yokota T, Fukuo Y, Yazaki Y, Yamada N. 1995.Adult-onset spinocerebellar dysfunction caused by a mutation in the gene forthe alpha-tocopherol-transfer protein. N Engl J Med 333:1313–1318.
Greenberg ER, Baron JA, Tosteson TD, Freeman DH, Beck GJ, Bond JH, Colac-chio TA, Coller JA, Frankl HD, Haile RW, Mandel JS, Nierenberg DW, Roth-stein R, Snover DC, Stevens MM, Summers RW, van Stolk RU. 1994. A clinicaltrial of antioxidant vitamins to prevent colorectal adenoma. N Engl J Med331:141–147.
Haddad EH, Berk LS, Kettering JD, Hubbard RW, Peters WR. 1999. Dietary intakeand biochemical, hematologic, and immune status of vegans compared withnonvegetarians. Am J Clin Nutr 70:586S–593S.
Halliwell B. 1999. Establishing the significance and optimal intake of dietary anti-oxidants: The biomarker concept. Nutr Rev 57:104–113.
Hammans SR, Kennedy CR. 1998. Ataxia with isolated vitamin E deficiency pre-senting as mutation negative Friedreich’s ataxia. J Neurol Neurosurg Psychiatry64:368–370.
Handelman GJ, Epstein WL, Peerson J, Spiegelman D, Machlin LJ, Dratz EA. 1994.Human adipose alpha-tocopherol and gamma-tocopherol kinetics during andafter 1 y of alpha-tocopherol supplementation. Am J Clin Nutr 59:1025–1032.
Hankinson SE, Stampfer MJ, Seddon JM, Colditz GA, Rosner B, Speizer FE, WillettWC. 1992. Nutrient intake and cataract extraction in women: A prospectivestudy. Br Med J 305:335–339.
Copyright © National Academy of Sciences. All rights reserved.
270 DIETARY REFERENCE INTAKES
Harding AE, Matthews S, Jones S, Ellis CJ, Booth IW, Muller DP. 1985. Spinocere-bellar degeneration associated with a selective defect of vitamin E absorption.N Engl J Med 313:32–35.
Harries JT, Muller DP. 1971. Absorption of different doses of fat soluble and watermiscible preparations of vitamin E in children with cystic fibrosis. Arch DisChild 46:341–344.
Hartz SC, Otradovec CL, McGandy RB, Russell RM, Jacob RA, Sahyoun N, PetersH, Abrams D, Scura LA, Whinston-Perry RA. 1988. Nutrient supplement useby healthy elderly. J Am Coll Nutr 7:119–128.
Hartz SC, Russell RM, Rosenberg IH. 1992. Nutrition in the Elderly. The Boston Nutri-tional Status Survey. London: Smith-Gordon. P. 106–108.
Hassan H, Hashim SA, Van Itallie TB, Sebrell WH. 1966. Syndrome in prematureinfants associated with low plasma vitamin E levels and high polyunsaturatedfatty acid diet. Am J Clin Nutr 19:147–157.
Heinig MJ, Nommsen LA, Peerson JM, Lonnerdal B, Dewey KG. 1993. Energy andprotein intakes of breast-fed and formula-fed infants during the first year oflife and their association with growth velocity: The DARLING Study. Am J ClinNutr 58:152–161.
Heinonen OP, Albanes D, Virtamo J, Taylor PR, Huttunen JK, Hartman AM, Haa-pakoski J, Malila N, Rautalahti M, Ripatti S, Mäenpää H, Teerenhovi L, Koss L,Virolainen M, Edwards BK. 1998. Prostate cancer and supplementation withalpha-tocopherol and beta-carotene: Incidence and mortality in a controlledtrial. J Natl Cancer Inst 90:440–446.
Higashi O, Kikuchi Y. 1974. Effects of vitamin E on the aggregation and the lipidperoxidation of platelets exposed to hydrogen peroxide. Tohoku J Exp Med112:271–278.
Hodis HN, Mack WJ, LaBree L, Cashin-Hemphill L, Sevanian A, Johnson R, AzenSP. 1995. Serial coronary angiographic evidence that antioxidant vitamin in-take reduces progression of coronary artery atherosclerosis. J Am Med Assoc273:1849–1854.
Hofstad B, Almendingen K, Vatn M, Andersen S, Owen R, Larsen S, Osnes M.1998. Growth and recurrence of colorectal polyps: A double-blind 3-year inter-vention with calcium and antioxidants. Digestion 59:148–156.
HOPE Study Investigators. 2000. Vitamin E supplementation and cardiovascularevents in high-risk patients. N Engl J Med 342:154–160.
Horwitt MK. 1960. Vitamin E and lipid metabolism in man. Am J Clin Nutr 8:451–461.
Horwitt MK. 1962. Interrelations between vitamin E and polyunsaturated fatty ac-ids in adult men. Vitam Horm 20:541–558.
Horwitt MK. 1974. Status of human requirements for vitamin E. Am J Clin Nutr27:1182–1193.
Horwitt MK. 1976. Vitamin E: A reexamination. Am J Clin Nutr 29:569–578.Horwitt MK, Harvey CC, Duncan GD, Wilson WC. 1956. Effects of limited tocopherol
intake in man with relationships to erythrocyte hemolysis and lipid oxidations.Am J Clin Nutr 4:408–419.
Horwitt MK, Century B, Zeman AA. 1963. Erythrocyte survival time and reticulo-cyte levels after tocopherol depletion in man. Am J Clin Nutr 12:99–106.
Horwitt MK, Harvey CC, Dahm CH, Searcy MT. 1972. Relationship betweentocopherol and serum lipid levels for determination of nutritional adequacy.Ann NY Acad Sci 203:223–236.
Copyright © National Academy of Sciences. All rights reserved.
VITAMIN E 271
Hosomi A, Arita M, Sato Y, Kiyose C, Ueda T, Igarashi O, Arai H, Inoue K. 1997.Affinity for alpha-tocopherol transfer protein as a determinant of the biologi-cal activities of vitamin E analogs. FEBS Lett 409:105–108.
Ingold KU, Webb AC, Witter D, Burton GW, Metcalfe TA, Muller DPR. 1987.Vitamin E remains the major lipid-soluble, chain-breaking antioxidant in hu-man plasma even in individuals suffering severe vitamin E deficiency. ArchBiochem Biophys 259:224–225.
IOM (Institute of Medicine). 1991. Nutrition During Lactation. Washington, DC:National Academy Press. P. 179.
Ishizuka T, Itaya S, Wada H, Ishizawa M, Kimura M, Kajita K, Kanoh Y, Miura A,Muto N, Yasuda K. 1998. Differential effect of the antidiabetic thiazolidinedi-ones troglitazone and pioglitazone on human platelet aggregation mecha-nism. Diabetes 47:1494–1500.
Islam KN, Devaraj S, Jialal I. 1998. Alpha-tocopherol enrichment of monocytesdecreases agonist-induced adhesion to human endothelial cells. Circulation98:2255–2261.
IUPAC-IUB Commission on Biochemical Nomenclature. 1974. Nomenclature oftocopherols and related compounds. Recommendations 1973. Eur J Biochem46:217–219.
Jacob RA, Kutnink MA, Csallany AS, Daroszewska M, Burton GW. 1996. Vitamin Cnutriture has little short-term effect on vitamin E concentrations in healthywomen. J Nutr 126:2268–2277.
Jacques PF, Chylack LT Jr. 1991. Epidemiologic evidence of a role for the antioxi-dant vitamins and carotenoids in cataract prevention. Am J Clin Nutr 53:352S–355S.
Jacques PF, Chylack LT Jr, Taylor A. 1994. Relationships between natural antioxi-dants and cataract formation. In: Frei B, ed. Natural Antioxidants in HumanHealth and Disease. San Diego: Academic Press. Pp. 515–529.
Jain SK, McVie R, Jaramillo JJ, Palmer M, Smith T. 1996a. Effect of modest vitaminE supplementation on blood glycated hemoglobin and triglyceride levels andred cell indices in type I diabetic patients. J Am Coll Nutr 15:458–461.
Jain SK, McVie R, Jaramillo JJ, Palmer M, Smith T, Meachum ZD, Little RL. 1996b.The effect of modest vitamin E supplementation on lipid peroxidation prod-ucts and other cardiovascular risk factors in diabetic patients. Lipids 31:S87–S90.
Jain SK, Krueger KS, McVie R, Jaramillo JJ, Palmer M, Smith T. 1998. Relationshipof blood thromboxane-B2 (TxB2) with lipid peroxides and effect of vitamin Eand placebo supplementation on TxB2 and lipid peroxide levels in type 1diabetic patients. Diabetes Care 21:1511–1516.
Jansson L, Akesson B, Holmberg L. 1981. Vitamin E and fatty acid composition ofhuman milk. Am J Clin Nutr 34:8–13.
Jialal I, Fuller CJ, Huet BA. 1995. The effect of alpha-tocopherol supplementationon LDL oxidation. A dose-response study. Arterioscler Thromb Vasc Biol 15:190–198.
Johnson L, Bowen FW, Abbasi S, Herrmann N, Weston M, Sacks L, Porat R, StahlG, Peckham G, Delivoria-Papadopoulos M, Quinn G, Schaffer D. 1985. Rela-tionship of prolonged pharmacologic serum levels of vitamin E to incidenceof sepsis and necrotizing enterocolitis in infants with birth weight 1,500 gramsor less. Pediatrics 75:619–638.
Copyright © National Academy of Sciences. All rights reserved.
272 DIETARY REFERENCE INTAKES
Jones PJH, Kubow S. 1999. Lipids, sterols and their metabolism. In: Shils ME,Olson JA, Shike M, Ross AC, eds. Modern Nutrition in Health and Disease, 9thedition. Baltimore, MD: Williams & Wilkins. Pp. 347–362.
Kalra V, Grover J, Ahuja GK, Rathi S, Khurana DS. 1998. Vitamin E deficiency andassociated neurological deficits in children with protein-energy malnutrition.J Trop Pediatr 44:291–295.
Kamal-Eldin A, Appelqvist LA. 1996. The chemistry and antioxidant properties oftocopherols and tocotrienols. Lipids 31:671–701.
Kantoci D, Wechter WJ, Murray ED Jr, Dewind SA, Borchardt D, Khan SI. 1997.Endogenous natriuretic factors 6: The stereochemistry of a natriuretic gam-ma-tocopherol metabolite LLU-alpha. J Pharmacol Exp Ther 282:648–656.
Kappus H, Diplock AT. 1992. Tolerance and safety of vitamin E: A toxicologicalposition report. Free Radic Biol Med 13:55–74.
Kardinaal AF, van ‘t Veer P, Brants HA, van den Berg H, van Schoonhoven J,Hermus RJ. 1995. Relations between antioxidant vitamins in adipose tissue,plasma, and diet. Am J Epidemiol 141:440–450.
Kayden HJ, Hatam LJ, Traber MG. 1983. The measurement of nanograms oftocopherol from needle aspiration biopsies of adipose tissue: Normal andabetalipoproteinemic subjects. J Lipid Res 24:652–656.
Kelleher J, Losowsky MS. 1970. The absorption of alpha-tocopherol in man. Br JNutr 24:1033–1047.
Keller JN, Pang Z, Geddes JW, Begley JG, Germeyer A, Waeg G, Mattson MP. 1997.Impairment of glucose and glutamate transport and induction of mitochon-drial oxidative stress and dysfunction in synaptosomes by amyloid beta-pep-tide: Role of the lipid peroxidation product 4-hydroxynonenal. J Neurochem69:273–284.
Kim JM, White RH. 1996. Effect of vitamin E on the anticoagulant response towarfarin. Am J Cardiol 77:545–546.
Kitagawa M, Mino M. 1989. Effects of elevated alpha (RRR)-tocopherol dosage inman. J Nutr Sci Vitaminol 35:133–142.
Kiyose C, Muramatsu R, Fujiyama-Fujiwara Y, Ueda T, Igarashi O. 1995. Biodis-crimination of alpha-tocopherol stereoisomers during intestinal absorption.Lipids 30:1015–1018.
Kiyose C, Muramatsu R, Kameyama Y, Ueda T, Igarashi O. 1997. Biodiscriminationof alpha-tocopherol stereoisomers in humans after oral administration. Am JClin Nutr 65:785–789.
Klein T, Reutter F, Schweer H, Seyberth HW, Nusing RM. 1997. Generation of theisoprostane 8-epi-prostaglandin F2alpha in vitro and in vivo via the cyclooxy-genases. J Pharmacol Exp Ther 282:1658–1665.
Knekt P, Aromaa A, Maatela J, Aaran RK, Nikkari T, Hakama M, Hakulinen T, PetoR, Saxen E, Teppo L. 1988. Serum vitamin E and risk of cancer among Finnishmen during a 10-year follow-up. Am J Epidemiol 127:28–41.
Knekt P, Heliovaara M, Rissanen A, Aromaa A, Aaran RK. 1992. Serum antioxidantvitamins and risk of cataract. Br Med J 305:1392–1394.
Knekt P, Reunanen A, Jarvinen R, Seppanen R, Heliovaara M, Aromaa A. 1994.Antioxidant vitamin intake and coronary mortality in a longitudinal popula-tion study. Am J Epidemiol 139:1180–1189.
Kobayashi H, Kanno C, Yamauchi K, Tsugo T. 1975. Identification of alpha-, beta-,gamma-, and delta-tocopherols and their contents in human milk. BiochimBiophys Acta 380:282–290.
Copyright © National Academy of Sciences. All rights reserved.
VITAMIN E 273
Kohlschütter A, Hubner C, Jansen W, Lindner SG. 1988. A treatable familial neu-romyopathy with vitamin E deficiency, normal absorption, and evidence ofincreased consumption of vitamin E. J Inher Metab Dis 11:149–152.
Kostner GM, Oettl K, Jauhiainen M, Ehnholm C, Esterbauer H, Dieplinger H.1995. Human plasma phospholipid transfer protein accelerates exchange/transfer of alpha-tocopherol between lipoproteins and cells. Biochem J 305:659–667.
Krasavage WJ, Terhaar CJ. 1977. d-alpha-Tocopheryl poly(ethylene glycol) 1000succinate. Acute toxicity, subchronic feeding, reproduction, and teratologicstudies in the rat. J Agric Food Chem 25:273–278.
Krendel DA, Gilchrist JM, Johnson AO, Bossen EH. 1987. Isolated deficiency ofvitamin E with progressive neurologic deterioration. Neurology 37:538–540.
Kuhlenkamp J, Ronk M, Yusin M, Stolz A, Kaplowitz N. 1993. Identification andpurification of a human liver cytosolic tocopherol binding protein. ProteinExpr Purif 4:382–389.
Kunisaki M, Umeda F, Inoguchi T, Watanabe J, Nawata H. 1990. Effects of vitaminE administration on platelet function in diabetes mellitus. Diabetes Res 14:37–42.
Kunisaki M, Bursell SE, Umeda F, Nawata H, King GL. 1994. Normalization ofdiacylglycerol-protein kinase C activation by vitamin E in aorta of diabetic ratsand cultured rat smooth muscle cells exposed to elevated glucose levels. Diabe-tes 43:1372–1377.
Kushi LH, Folsom AR, Prineas RJ, Mink PJ, Wu Y, Bostick RM. 1996. Dietary antiox-idant vitamins and death from coronary heart disease in postmenopausal wom-en. N Engl J Med 334:1156–1162.
Laditan AA, Ette SI. 1982. Plasma alpha-tocopherol (vitamin E) levels andtocopherol-lipid ratio among children with protein-energy malnutrition(PEM). Ann Trop Paediatr 2:85–88.
Lammi-Keefe CJ, Jensen RG, Clark RM, Ferris AM. 1985. Alpha tocopherol, totallipid and linoleic acid contents of human milk at 2, 6, 12, and 16 weeks. In:Schaub J, ed. Composition and Physiological Properties of Human Milk. New York:Elsevier Science. Pp. 241–245.
Lammi-Keefe CJ, Ferris AM, Jensen RG. 1990. Changes in human milk at 0600,1000, 1400, 1800, and 2200 h. J Pediatr Gastroenterol Nutr 11:83–88.
Laplante P, Vanasse M, Michaud J, Geoffroy G, Brochu P. 1984. A progressiveneurological syndrome associated with an isolated vitamin E deficiency. Can JNeurol Sci 11:561–564.
Lehmann J, Martin HL, Lashley EL, Marshall MW, Judd JT. 1986. Vitamin E infoods from high and low linoleic acid diets. J Am Diet Assoc 86:1208–1216.
Leo MA, Ahmed S, Aleynik SI, Siegel JH, Kasmin F, Lieber CS. 1995. Carotenoidsand tocopherols in various hepatobiliary conditions. J Hepatol 23:550–556.
Leske MC, Chylack LT Jr, Wu SY. 1991. The Lens Opacities Case-Control Study.Risk factors for cataract. Arch Ophthalmol 109:244–251.
Lohr JB, Cadet JL, Lohr MA, Jeste DV, Wyatt RJ. 1987. Alpha-tocopherol in tardivedyskinesia. Lancet 1:913–914.
Lohr JB, Kuczenski R, Bracha HS, Moir M, Jeste DV. 1990. Increased indices offree radical activity in the cerebrospinal fluid of patients with tardive dyskine-sia. Biol Psychiatry 28:535–539.
London RS, Sundaram GS, Murphy L, Manimekalai S, Reynolds M, Goldstein PJ.1985. The effect of vitamin E on mammary dysplasia: A double-blind study.Obstet Gynecol 65:104–106.
Copyright © National Academy of Sciences. All rights reserved.
274 DIETARY REFERENCE INTAKES
Losonczy KG, Harris TB, Havlik RJ. 1996. Vitamin E and vitamin C supplement useand risk of all-cause and coronary heart disease mortality in older persons:The Established Populations for Epidemiologic Studies of the Elderly. Am JClin Nutr 64:190–196.
Losowsky MS, Kelleher J, Walker BE, Davies T, Smith CL. 1972. Intake and absorp-tion of tocopherol. Ann NY Acad Sci 203:212–222.
Machlin LJ. 1989. Use and safety of elevated dosages of vitamin E in adults. Int JVitam Nutr Res 30:56-68.
MacMahon MT, Neale G. 1970. The absorption of alpha-tocopherol in controlsubjects and in patients with intestinal malabsorption. Clin Sci 38:197–210.
Manach C, Morand C, Crespy V, Demigne C, Texier O, Regerat F, Remesy C. 1998.Quercetin is recovered in human plasma as conjugated derivatives which re-tain antioxidant properties. FEBS Lett 426:331–336.
Mandel CH, Mosca L, Maimon E, Sievers J, Tsai A, Rock CL. 1997. Dietary intakeand plasma concentrations of vitamin E, vitamin C, and beta carotene in pa-tients with coronary artery disease. J Am Diet Assoc 97:655–657.
March BE, Wong E, Seier L, Sim J, Biely J. 1973. Hypervitaminosis E in the chick. JNutr 103:371–377.
Mares-Perlman JA, Brady WE, Klein R, Klein BE, Palta M, Bowen P, Stacewicz-Sapuntzakis M. 1994a. Serum levels of carotenoids and tocopherols in peoplewith age-related maculopathy. Invest Ophthalmol Vis Sci 35:2004.
Mares-Perlman JA, Klein BE, Klein R, Ritter LL. 1994b. Relation between lensopacities and vitamin and mineral supplement use. Ophthalmology 101:315–325.
Martin A, Foxall T, Blumberg JB, Meydani M. 1997. Vitamin E inhibits low-densitylipoprotein-induced adhesion of monocytes to human aortic endothelial cellsin vitro. Arterioscler Thromb Vasc Biol 17:429–436.
Martinello F, Fardin P, Ottina M, Ricchieri GL, Koenig M, Cavalier L, Trevisan CP.1998. Supplemental therapy in isolated vitamin E deficiency improves the pe-ripheral neuropathy and prevents the progression of ataxia. J Neurol Sci 156:177–179.
McCay PB. 1985. Vitamin E: Interactions with free radicals and ascorbate. AnnuRev Nutr 5:323–340.
McKeown-Eyssen G, Holloway C, Jazmaji V, Bright-See E, Dion P, Bruce WR. 1988.A randomized trial of vitamins C and E in the prevention of recurrence ofcolorectal polyps. Cancer Res 48:4701–4705.
McLaughlin PJ, Weihrauch JL. 1979. Vitamin E content of foods. J Am Diet Assoc75:647–665.
Mellette SJ, Leone LA. 1960. Influence of age, sex, strain of rat and fat solublevitamins on hemorrhagic syndromes in rats fed irradiated beef. New AspectsNutr 19:1045–1049.
Mertz W, Tsui JC, Judd JT, Reiser S, Hallfrisch J, Morris ER, Steele PD, Lashley E.1991. What are people really eating? The relation between energy intake de-rived from estimated diet records and intake determined to maintain bodyweight. Am J Clin Nutr 54:291–295.
Meydani M, Cohn JS, Macauley JB, McNamara JR, Blumberg JB, Schaefer EJ. 1989.Postprandial changes in the plasma concentration of alpha- and gamma-tocopherol in human subjects fed a fat-rich meal supplemented with fat-soluble vitamins. J Nutr 119:1252–1258.
Copyright © National Academy of Sciences. All rights reserved.
VITAMIN E 275
Meydani SN, Meydani M, Blumberg JB, Leka LS, Siber G, Loszewski R, ThompsonC, Pedrosa MC, Diamond RD, Stollar BD. 1997. Vitamin E supplementationand in vivo immune response in healthy elderly subjects. A randomized con-trolled trial. J Am Med Assoc 277:1380–1386.
Meydani SN, Meydani M, Blumberg JB, Leka LS, Pedrosa M, Diamond R, SchaeferEJ. 1998. Assessment of the safety of supplementation with different amountsof vitamin E in healthy older adults. Am J Clin Nutr 68:311–318.
Mezzetti A, Lapenna D, Pierdomenico SD, Calafiore AM, Costantini F, Riario-Sfor-za G, Imbastaro T, Neri M, Cuccurullo F. 1995. Vitamins E, C and lipid perox-idation in plasma and arterial tissue of smokers and non-smokers. Atherosclero-sis 112:91–99.
Mohan M, Sperduto R, Angra S, Milton R, Mathur R, Underwood B, Jaffery N,Pandya C, Chhabra V, Vajpayee RB. 1989. India-US case-control study of age-related cataracts. India-US Case-Control Study Group. Arch Ophthalmol 107:670–676.
Molenaar R, Visser WJ, Verkerk A, Koster JF, Jongkind JF. 1989. Peroxidative stressand in vitro ageing of endothelial cells increases the monocyte-endothelialcell adherence in a human in vitro system. Atherosclerosis 76:193–202.
Moore AN, Ingold KU. 1997. Alpha-tocopheryl quinone is converted into vitaminE in man. Free Radic Biol Med 22:931–934.
Moore K, Roberts LJ II. 1998. Measurement of lipid peroxidation. Free Radic Res28:659–671.
Morrow JD, Frei B, Longmire AW, Gaziano JM, Lynch SM, Shyr Y, Strauss WE,Oates JA, Roberts LJ II. 1995. Increase in circulating products of lipid peroxi-dation (F2-isoprostanes) in smokers. N Engl J Med 332:1198–1203.
Morrow JD, Zackert WE, Yang JP, Kurhts EH, Callewaert D, Dworski R, Kanai K,Taber D, Moore K, Oates JA, Roberts LJ. 1999. Quantification of the majorurinary metabolite of 15-F2t-isoprostane (8-iso-PGF2alpha) by a stable isotopedilution mass spectrometric assay. Anal Biochem 269:326–331.
Moss AJ, Levy AS, Kim I, Park YK. 1989. Use of Vitamin and Mineral Supplements in theUnited States: Current Users, Types of Products, and Nutrients. Advance Data, Vitaland Health Statistics of the National Center for Health Statistics. Number 174.Hyattsville, MD: National Center for Health Statistics.
Mullarkey CJ, Edelstein D, Brownlee M. 1990. Free radical generation by earlyglycation products: A mechanism for accelerated atherogenesis in diabetes.Biochem Biophys Res Commun 173:932–939.
Muller DP. 1994. Vitamin E and other antioxidants in neurological function anddisease. In: Frei B, ed. Natural Antioxidants in Human Health and Disease. SanDiego: Academic Press. Pp. 535–565.
Muller DP, Harries JT, Lloyd JK. 1974. The relative importance of the factorsinvolved in the absorption of vitamin E in children. Gut 15:966–971.
Muller DP, Lloyd JK, Wolff OH. 1985. The role of vitamin E in the treatment of theneurological features of abetalipoproteinaemia and other disorders of fat ab-sorption. J Inherit Metab Dis 8:88–92.
Murphy SP, Subar AF, Block G. 1990. Vitamin E intakes and sources in the UnitedStates. Am J Clin Nutr 52:361–367.
Murray ED Jr, Wechter WJ, Kantoci D, Wang WH, Pham T, Quiggle DD, GibsonKM, Leipold D, Anner B. 1997. Endogenous natriuretic factors 7: Biospecifici-ty of a natriuretic gamma-tocopherol metabolite LLU-alpha. J Pharmacol ExpTher 282:657–662.
Niki E. 1987. Antioxidants in relation to lipid peroxidation. Chem Phys Lipids 44:227–253.
Copyright © National Academy of Sciences. All rights reserved.
276 DIETARY REFERENCE INTAKES
Niki E, Tsuchiya J, Tanimura R, Kamiya Y. 1982. Regeneration of vitamin E fromalpha-chromanoxyl radical by glutathione and vitamin C. Chem Lett 6:789–792.
NRC (National Research Council). 1989. Recommended Dietary Allowances, 10th edi-tion. Washington, DC: National Academy Press.
O’Neill CA, Halliwell B, van der Vliet A, Davis PA, Packer L, Tritschler H, Strohm-an WJ, Rieland T, Cross CE, Reznick AZ. 1994. Aldehyde-induced proteinmodifications in human plasma: Protection by glutathione and dihydrolipoicacid. J Lab Clin Med 124:359–370.
Oski FA, Barness LA. 1967. Vitamin E deficiency: A previously unrecognized causeof hemolytic anemia in the premature infant. J Pediatr 70:211–220.
Packer L. 1994. Vitamin E is nature’s master antioxidant. Sci Am Sci Med 1:54–63.Pallast EG, Schouten EG, de Waart FG, Fonk HC, Doekes G, von Blomberg BM,
Kok FJ. 1999. Effect of 50- and 100-mg vitamin E supplements on cellularimmune function in noninstitutionalized elderly persons. Am J Clin Nutr 69:1273–1281.
Paolisso G, D’Amore A, Galzerano D, Balbi V, Giugliano D, Varricchio M,D’Onofrio F. 1993. Daily vitamin E supplements improve metabolic controlbut not insulin secretion in elderly type II diabetic patients. Diabetes Care16:1433–1437.
Parker RA, Sabrah T, Cap M, Gill BT. 1995. Relation of vascular oxidative stress,alpha-tocopherol, and hypercholesterolemia to early atherosclerosis in ham-sters. Arterioscler Thromb Vasc Biol 15:349–358.
Parker RS. 1988. Carotenoid and tocopherol composition of human adipose tis-sue. Am J Clin Nutr 47:33–36.
Parkinson Study Group. 1993. Effects of tocopherol and deprenyl on the progres-sion of disability in early Parkinson’s disease. N Engl J Med 328:176–183.
Parkinson Study Group. 1998. Mortality in DATATOP: A multicenter trial in earlyParkinson’s disease. Ann Neurol 43:318–325.
Peng Y-S, Peng Y-M, McGee D, Alberts D. 1994. Carotenoids, tocopherols, andretinoids in human buccal mucosal cells: Intra- and interindividual variabilityand storage stability. Am J Clin Nutr 59:636–643.
Phelps DL, Rosenbaum AL, Isenberg SJ, Leake RD, Dorey FJ. 1987. Tocopherolefficacy and safety for preventing retinopathy of prematurity: A randomized,controlled, double-masked trial. Pediatrics 79:489–500.
Pratico D, Tangirala RK, Rader DJ, Rokach J, FitzGerald GA. 1998. Vitamin Esuppresses isoprostane generation in vivo and reduces atherosclerosis in ApoE-deficient mice. Nat Med 4:1189–1192.
Pratico D, Rokach J, Tangirala RK. 1999. Brains of aged apolipoprotein E-deficientmice have increased levels of F2-isoprostanes, in vivo markers of lipid peroxi-dation. J Neurochem 73:736–741.
Princen HMG, van Duyvenvoorde W, Buytenhek R, van der Laarse A, van PoppelG, Gevers Leuven JA, van Hinsbergh VWM. 1995. Supplementation with lowdoses of vitamin E protects LDL from lipid peroxidation in men and women.Arterioscler Thromb Vasc Biol 15:325–333.
Pryor WA, Stone K. 1993. Oxidants in cigarette smoke. Radicals, hydrogen perox-ide, peroxynitrate, and peroxynitrite. Ann NY Acad Sci 686:12–27.
Rader DJ, Brewer HB. 1993. Abetalipoproteinemia. New insights into lipoproteinassembly and vitamin E metabolism from a rare genetic disease. J Am MedAssoc 270:865–869.
Copyright © National Academy of Sciences. All rights reserved.
VITAMIN E 277
Rapola JM, Virtamo J, Ripatti S, Huttunen JK, Albanes D, Taylor PR, HeinonenOP. 1997. Randomised trial of alpha-tocopherol and beta-carotene supple-ments on incidence of major coronary events in men with previous myocardialinfarction. Lancet 349:1715–1720.
Reaven P. 1995. Dietary and pharmacologic regimens to reduce lipid peroxidationin non-insulin-dependent diabetes mellitus. Am J Clin Nutr 62:1483S–1489S.
Reaven PD, Khouw A, Beltz WF, Parthasarathy S, Witztum JL. 1993. Effect of di-etary antioxidant combinations in humans. Protection of LDL by vitamin Ebut not by beta-carotene. Arterioscler Thromb 13:590–600.
Reaven PD, Herold DA, Barnett J, Edelman S. 1995. Effects of vitamin E on suscep-tibility of low-density lipoprotein and low-density lipoprotein subfractions tooxidation and on protein glycation in NIDDM. Diabetes Care 18:807–816.
Refat M, Moore TJ, Kazui M, Risby TH, Perman JA, Schwarz KB. 1991. Utility ofbreath ethane as a noninvasive biomarker of vitamin E status in children.Pediatr Res 30:396–403
Reilly M, Delanty N, Lawson JA, Fitzgerald GA. 1996. Modulation of oxidant stressin vivo in chronic cigarette smokers. Circulation 94:19–25.
Retzlaff BM, Dowdy AA, Walden CE, McCann BS, Gey G, Cooper M, Knopp RH.1991. Changes in vitamin and mineral intakes and serum concentrationsamong free-living men on cholesterol-lowering diets: The Dietary AlternativesStudy. Am J Clin Nutr 53:890–898.
Rimm EB, Stampfer MJ, Ascherio A, Giovannucci E, Colditz GA, Willett WC. 1993.Vitamin E consumption and the risk of coronary heart disease in men. N EnglJ Med 328:1450–1456.
Ritchie JH, Fish MB, McMasters V, Grossman M. 1968. Edema and hemolytic ane-mia in premature infants. A vitamin E deficiency syndrome. N Engl J Med279:1185–1190.
Robertson JM, Donner AP, Trevithick JR. 1989. Vitamin E intake and risk of cata-racts in humans. Ann NY Acad Sci 570:372–382.
Ross MA, Crosley LK, Brown KM, Duthie SJ, Collins AC, Arthur JR, Duthie GG.1995. Plasma concentrations of carotenoids and antioxidant vitamins in Scot-tish males: Influences of smoking. Eur J Clin Nutr 49:861–865.
Rota S, McWilliam NA, Baglin TP, Byrne CD. 1998. Atherogenic lipoproteins sup-port assembly of the prothrombinase complex and thrombin generation: Mod-ulation by oxidation and vitamin E. Blood 91:508–515.
Sano M, Ernesto C, Thomas RG, Klauber MR, Schafer K, Grundman M, WoodburyP, Growdon J, Cotman CW, Pfeiffer E, Schneider LS, Thal LJ. 1997. A controlledtrial of selegiline, alpha-tocopherol, or both as treatment for Alzheimer’s dis-ease. The Alzheimer’s Disease Cooperative Study. N Engl J Med 336:1216–1222.
Sarkkinen ES, Uusitupa MI, Nyyssonen K, Parviainen M, Penttila I, Salonen JT.1993. Effects of two low-fat diets, high and low in polyunsaturated fatty acids,on plasma lipid peroxides and serum vitamin E levels in free-living hypercho-lesterolaemic men. Eur J Clin Nutr 47:623–630.
Sato Y, Hagiwara K, Arai H, Inoue K. 1991. Purification and characterization of thealpha-tocopherol transfer protein from rat liver. FEBS Lett 288:41–45.
Schuelke M, Mayatepek E, Inter M, Becker M, Pfeiffer E, Speer A, Hubner C,Finckh B. 1999. Treatment of ataxia in isolated vitamin E deficiency caused byalpha-tocopherol transfer protein deficiency. J Pediatr 134:240–244.
Copyright © National Academy of Sciences. All rights reserved.
278 DIETARY REFERENCE INTAKES
Schultz M, Leist M, Petrzika M, Gassmann B, Brigelius-Flohé R. 1995. Novel uri-nary metabolite of alpha-tocopherol, 2,5,7,8-tetramethyl-2(2′-carboxyethyl)-6-hydroxychroman, as an indicator of an adequate vitamin E supply? Am J ClinNutr 62:1527S–1534S.
Schultz M, Leist M, Elsner A, Brigelius-Flohé R. 1997. Alpha-carboxyethyl-6-hy-droxychroman as urinary metabolite of vitamin E. Methods Enzymol 282:297–310.
Schwab US, Sarkkinen ES, Lichtenstein AH, Li Z, Ordovas JM, Schaefer EJ, Uusitu-pa MI. 1998a. The effect of quality and amount of dietary fat on the suscepti-bility of low density lipoprotein to oxidation in subjects with impaired glucosetolerance. Eur J Clin Nutr 52:452–458.
Schwab US, Vogel S, Lammi-Keefe CJ, Ordovas JM, Schaefer EJ, Li Z, Ausman LM,Gualtieri L, Goldin BR, Furr HC, Lichtenstein AH. 1998b. Varying dietary fattype of reduced-fat diets has little effect on the susceptibility of LDL to oxida-tive modification in moderately hypercholesterolemic subjects. J Nutr 128:1703–1709.
Semenkovich CF, Heinecke JW. 1997. The mystery of diabetes and atherosclerosis:Time for a new plot. Diabetes 46:327–334.
Sheppard AJ, Pennington JAT, Weihrauch JL. 1993. Analysis and distribution ofvitamin E in vegetable oils and foods. In: Packer L, Fuchs J, eds. Vitamin E inHealth and Disease. New York: Marcel Dekker. Pp. 9–31.
Shorer Z, Parvari R, Bril G, Sela BA, Moses S. 1996. Ataxia with isolated vitamin Edeficiency in four siblings. Pediatr Neurol 15:340–343.
Shoulson I. 1998. DATATOP: A decade of neuroprotective inquiry. Parkinson StudyGroup. Deprenyl and Tocopherol Antioxidative Therapy of Parkinsonism. AnnNeurol 44:S160–S166.
Slesinski MJ, Subar AF, Kahle LL. 1996. Dietary intake of fat, fiber and othernutrients is related to the use of vitamin and mineral supplements in theUnited States: The 1992 National Health Interview Survey. J Nutr 126:3001–3008.
Smith MA, Harris PL, Sayre LM, Perry G. 1997. Iron accumulation in Alzheimerdisease is a source of redox-generated free radicals. Proc Natl Acad Sci USA94:9866–9868.
Sokol RJ. 1988. Vitamin E deficiency and neurologic disease. Annu Rev Nutr 8:351–373.
Sokol RJ. 1993. Vitamin E deficiency and neurological disorders. In: Packer L,Fuchs J, eds. Vitamin E in Health and Disease. New York: Marcel Dekker. Pp.815–849.
Sokol RJ, Heubi JE, Iannaccone S, Bove KE, Balistreri WF. 1983. Mechanism caus-ing vitamin E deficiency during chronic childhood cholestasis. Gastroenterology85:1172–1182.
Sokol RJ, Heubi JE, Iannaccone ST, Bove KE, Balistreri WF. 1984. Vitamin E defi-ciency with normal serum vitamin E concentrations in children with chroniccholestasis. N Engl J Med 310:1209–1212.
Sokol RJ, Guggenheim M, Iannaccone ST, Barkhaus PE, Miller C, Silverman A,Balistreri WF, Heubi JE. 1985. Improved neurologic function after long-termcorrection of vitamin E deficiency in children with chronic cholestasis. N EnglJ Med 313:1580–1586.
Sokol RJ, Kayden HJ, Bettis DB, Traber MG, Neville H, Ringel S, Wilson WB,Stumpf DA. 1988. Isolated vitamin E deficiency in the absence of fat malab-sorption—Familial and sporadic cases: Characterization and investigation ofcauses. J Lab Clin Med 111:548–559.
Copyright © National Academy of Sciences. All rights reserved.
VITAMIN E 279
Sokol RJ, Reardon MC, Accurso FJ, Stall C, Narkewicz M, Abman SH, HammondKB. 1989. Fat-soluble-vitamin status during the first year of life in infants withcystic fibrosis identified by screening of newborns. Am J Clin Nutr 50:1064–1071.
Sokol RJ, Butler-Simon N, Conner C, Heubi JE, Sinatra FR, Suchy FJ, Heyman MB,Perrault J, Rothbaum RJ, Levy J, Iannaccone ST, Shneider BL, Koch TK,Narkewicz MR. 1993. Multicenter trial of d-alpha-tocopheryl polyethylene gly-col 1000 succinate for treatment of vitamin E deficiency in children withchronic cholestasis. Gastroenterology 104:1727–1735.
Sparrow CP, Doebber TW, Olszewski J, Wu MS, Ventre J, Stevens KA, Chao YS.1992. Low density lipoprotein is protected from oxidation and the progres-sion of atherosclerosis is slowed in cholesterol-fed rabbits by the antioxidantN,N’-diphenyl-phenylenediamine. J Clin Invest 89:1885–1891.
Speer ME, Blifeld C, Rudolph AJ, Chadda P, Holbein ME, Hittner HM. 1984.Intraventricular hemorrhage and vitamin E in the very low-birth-weight infant:Evidence for efficacy of early intramuscular vitamin E administration. Pediat-rics 74:1107–1112.
Stampfer MJ, Hennekens CH, Manson JE, Colditz GA, Rosner B, Willett WC. 1993.Vitamin E consumption and the risk of coronary disease in women. N Engl JMed 328:1444–1449.
Stauble B, Boscoboinik D, Tasinato A, Azzi A. 1994. Modulation of activator pro-tein-1 (AP-1) transcription factor and protein kinase C by hydrogen peroxideand d-alpha-tocopherol in vascular smooth muscle cells. Eur J Biochem 226:393–402.
Stead RJ, Muller DP, Matthews S, Hodson ME, Batten JC. 1986. Effect of abnormalliver function on vitamin E status and supplementation in adults with cysticfibrosis. Gut 27:714–718.
Steinberg D. 1997. Oxidative modification of LDL and atherogenesis. Circulation95:1062–1071.
Steinberg D, Parthasarathy S, Carew TE, Khoo JC, Witztum JL. 1989. Beyond cho-lesterol. Modifications of low-density lipoprotein that increase its atherogenic-ity. N Engl J Med 320:915–924.
Steinbrecher UP, Parthasarathy S, Leake DS, Witztum JL, Steinberg D. 1984. Mod-ification of low density lipoprotein by endothelial cells involves lipid peroxida-tion and degradation of low density lipoprotein phospholipids. Proc Natl AcadSci USA 81:3883–3887.
Steiner M, Anastasi J. 1976. Vitamin E. An inhibitor of the platelet release reaction.J Clin Invest 57:732–737.
Stephens NG, Parsons A, Schofield PM, Kelly F, Cheeseman K, Mitchinson MJ.1996. Randomised controlled trial of vitamin E in patients with coronary dis-ease: Cambridge Heart Antioxidant Study (CHAOS). Lancet 347:781–786.
Stocker R. 1999. The ambivalence of vitamin E in atherogenesis. Trends Biochem Sci24:219–223.
Stoyanovsky DA, Osipov AN, Quinn PJ, Kagan VE. 1995. Ubiquinone-dependentrecycling of vitamin E radicals by superoxide. Arch Biochem Biophys 323:343–351.
Stryker WS, Kaplan LA, Stein EA, Stampfer MJ, Sober A, Willett WC. 1988. Therelation of diet, cigarette smoking, and alcohol consumption to plasma beta-carotene and alpha-tocopherol levels. Am J Epidemiol 127:283–296.
Stumpf DA, Sokol R, Bettis D, Neville H, Ringel S, Angelini C, Bell R. 1987. Fried-reich’s disease: V. Variant form with vitamin E deficiency and normal fatabsorption. Neurology 37:68–74.
Copyright © National Academy of Sciences. All rights reserved.
280 DIETARY REFERENCE INTAKES
Subramaniam R, Koppal T, Green M, Yatin S, Jordan B, Drake J, Butterfield DA.1998. The free radical antioxidant vitamin E protects cortical synaptosomalmembranes from amyloid beta-peptide(25–35) toxicity but not from hydrox-ynonenal toxicity: Relevance to the free radical hypothesis of Alzheimer’s dis-ease. Neurochem Res 23:1403–1410.
Swanson JE, Ben R, Burton GW, Parker RS. 1998. Urinary excretion of 2,7,8-trimethyl-2-(beta-carboxyethyl)-6-hydroxychroman (gamma-CEHC) represents a majorpathway of elimination of gamma-tocopherol in humans. FASEB J 12:A658.
Swanson JE, Ben RN, Burton GW, Parker RS. 1999. Urinary excretion of 2,7,8-trimethyl-2-(beta-carboxyethyl)-6-hydroxychroman is a major route of elimina-tion of gamma-tocopherol in humans. J Lipid Res 40:665–671.
Szczeklik A, Gryglewski RJ, Domagala B, Dworski R, Basista M. 1985. Dietary sup-plementation with vitamin E in hyperlipoproteinemias: Effects on plasma lip-id peroxides, antioxidant activity, prostacyclin generation and platelet aggre-gability. Thromb Haemostasis 54:425–430.
Takahashi O, Ichikawa H, Sasaki M. 1990. Hemorrhagic toxicity of d-alpha-tocopherol in the rat. Toxicology 63:157–165.
Tappel AL. 1962. Vitamin E as the biological lipid antioxidant. Vitam Horm 20:493–510.
Tasinato A, Boscoboinik D, Bartoli G, Maroni P, Azzi A. 1995. d-Alpha-tocopherolinhibition of vascular smooth muscle cell proliferation occurs at physiologicalconcentrations, correlates with protein kinase C inhibition, and is indepen-dent of its antioxidant properties. Proc Natl Acad Sci USA 92:12190–12194.
Taylor A. 1993. Cataract: Relationship between nutrition and oxidation. J Am CollNutr 12:138–146.
Teikari JM, Rautalahti M, Haukka J, Jarvinen P, Hartman AM, Virtamo J, AlbanesD, Heinonen O. 1998. Incidence of cataract operations in Finnish male smok-ers unaffected by alpha tocopherol or beta carotene supplements. J EpidemiolCommunity Health 52:468–472.
Thomas MR, Pearsons MH, Demkowicz M, Chan IM, Lewis CG. 1981. Vitamin Aand vitamin E concentration of the milk from mothers of pre-term infants andmilk of mothers of full term infants. Acta Vitaminol Enzymol 3:135–144.
Thorin E, Hamilton CA, Dominiczak MH, Reid JL. 1994. Chronic exposure ofcultured bovine endothelial cells to oxidized LDL abolishes prostacyclin re-lease. Arterioscler Thromb 14:453–459.
Traber MG. 1999. Vitamin E. In: Shils ME, Olson JA, Shike M, Ross AC, eds. ModernNutrition in Health and Disease, 9th edition. Baltimore, MD: Williams & Wilkins.P. 347–362.
Traber MG, Kayden HJ. 1987. Tocopherol distribution and intracellular localiza-tion in human adipose tissue. Am J Clin Nutr 46:488–495.
Traber MG, Kayden HJ. 1989. Preferential incorporation of alpha-tocopherol vsgamma-tocopherol in human lipoproteins. Am J Clin Nutr 49:517–526.
Traber MG, Kayden HJ, Green JB, Green MH. 1986. Absorption of water-miscibleforms of vitamin E in a patient with cholestasis and in thoracic duct-cannulat-ed rats. Am J Clin Nutr 44:914–923.
Traber MG, Sokol RJ, Ringel SP, Neville HE, Thellman CA, Kayden HJ. 1987. Lackof tocopherol in peripheral nerves of vitamin E-deficient patients with periph-eral neuropathy. N Engl J Med 317:262–265.
Traber MG, Burton GW, Ingold KU, Kayden HJ. 1990a. RRR- and SRR-alpha-toco-pherols are secreted without discrimination in human chylomicrons, but RRR-alpha-tocopherol is preferentially secreted in very low density lipoproteins. JLipid Res 31:675–685.
Copyright © National Academy of Sciences. All rights reserved.
VITAMIN E 281
Traber MG, Rudel LL, Burton GW, Hughes L, Ingold KU, Kayden HJ. 1990b.Nascent VLDL from liver perfusions of cynomolgus monkeys are preferential-ly enriched in RRR- compared with SRR-alpha tocopherol: Studies using deu-terated tocopherols. J Lipid Res 31:687–694.
Traber MG, Burton GW, Hughes L, Ingold KU, Hidaka H, Malloy M, Kane J,Hyams J, Kayden HJ. 1992. Discrimination between forms of vitamin E byhumans with and without genetic abnormalities of lipoprotein metabolism. JLipid Res 33:1171–1182.
Traber MG, Cohn W, Muller DP. 1993. Absorption, transport and delivery to tis-sues. In: Packer L, Fuchs J, eds. Vitamin E in Health and Disease. New York:Marcel Dekker. Pp. 35–51.
Traber MG, Rader D, Acuff R, Brewer HB, Kayden HJ. 1994a. Discrimination be-tween RRR- and all racemic-alpha-tocopherols labeled with deuterium by pa-tients with abetalipoproteinemia. Atherosclerosis 108:27–37.
Traber MG, Ramakrishnan R, Kayden HJ. 1994b. Human plasma vitamin E kineticsdemonstrate rapid recycling of plasma RRR-alpha-tocopherol. Proc Natl AcadSci USA 91:10005–10008.
Traber MG, Elsner A, Brigelius-Flohé R. 1998. Synthetic as compared with naturalvitamin E is preferentially excreted as alpha-CEHC in human urine: Studiesusing deuterated alpha-tocopheryl acetates. FEBS Lett 437:145–148.
Trabert W, Stober T, Mielke U, Heck FS, Schimrigk K. 1989. Isolated vitamin Edeficiency. Fortschr Neurol Psychiatr 57:495–501.
Tran K, Chan AC. 1990. R,R,R-alpha-tocopherol potentiates prostacyclin release inhuman endothelial cells. Evidence for structural specificity of the tocopherolmolecule. Biochim Biophys Acta 1043:189–197.
Tran K, Proulx P, Chan AC. 1994. Vitamin E suppresses diacylglycerol (DAG) levelin thrombin-stimulated endothelial cells through an increase of DAG kinaseactivity. Biochim Biophys Acta 1212:193–202.
Tran K, Wong JT, Lee E, Chan AC, Choy PC. 1996. Vitamin E potentiates arachido-nate release and phospholipase A2 activity in rat heart myoblastic cells. Bio-chem J 319:385–391.
Tsai AC, Kelley JJ, Peng B, Cook N. 1978. Study on the effect of megavitamin Esupplementation in man. Am J Clin Nutr 31:831–837.
Tsuchiya M, Thompson DF, Suzuki YJ, Cross CE, Packer L. 1992. Superoxideformed from cigarette smoke impairs polymorphonuclear leukocyte activeoxygen generation activity. Arch Biochem Biophys 299:30–37.
Tutuncu NB, Bayraktar M, Varli K. 1998. Reversal of defective nerve conductionwith vitamin E supplementation in type 2 diabetes: A preliminary study. Diabe-tes Care 21:1915–1918.
USP (The United States Pharmacopeia). 1979. The United States Pharmacopeia. Na-tional Formulary. Rockville, MD: United States Pharmacopeial Convention.
USP (The United States Pharmacopeia). 1980. The United States Pharmacopeia. Na-tional Formulary. Rockville, MD: United States Pharmacopeial Convention.
USP (The United States Pharmacopeia). 1999. The United States Pharmacopeia 24.National Formulary 19. Rockville, MD: United States Pharmacopeial Conven-tion.
Upston JM, Terentis AC, Stocker R. 1999. Tocopherol-mediated peroxidation oflipoproteins: Implications for vitamin E as a potential antiatherogenic supple-ment. FASEB J 13:977–994.
Copyright © National Academy of Sciences. All rights reserved.
282 DIETARY REFERENCE INTAKES
van het Hof KH, Brouwer IA, West CE, Haddeman E, Steegers-Theunissen RPM,van Dusseldorp M, Weststrate JA, Eskes TKAB, Hautvast JGAJ. 1999. Bioavail-ability of lutein from vegetables is 5 times higher than that of β-carotene. Am JClin Nutr 70:261–268.
van ‘t Veer P, Strain JJ, Fernandez-Crehuet J, Martin BC, Thamm M, Kardinaal AF,Kohlmeier L, Huttunen JK, Martin-Moreno JM, Kok FJ. 1996. Tissue antioxi-dants and postmenopausal breast cancer: The European Community Multi-centre Study on Antioxidants, Myocardial Infarction, and Cancer of the Breast(EURAMIC). Cancer Epidemiol Biomarkers Prev 5:441–447.
Vatassery GT, Fahn S, Kuskowski MA. 1998. Alpha tocopherol in CSF of subjectstaking high-dose vitamin E in the DATATOP study. Parkinson Study Group.Neurology 50:1900–1902.
Velthuis-te Wierik EJ, van den Berg H, Weststrate JA, van het Hof KH, de Graaf C.1996. Consumption of reduced-fat products: Effects on parameters of anti-oxidative capacity. Eur J Clin Nutr 50:214–219.
Verhoeven DT, Assen N, Goldbohm RA, Dorant E, van ‘t Veer P, Sturmans F,Hermus RJ, van den Brandt PA. 1997. Vitamins C and E, retinol, beta-caroteneand dietary fibre in relation to breast cancer risk: A prospective cohort study.Br J Cancer 75:149–155.
Vitale S, West S, Hallfrisch J, Alston C, Wang F, Moorman C, Muller D, Singh V,Taylor HR. 1993. Plasma antioxidants and risk of cortical and nuclear cata-ract. Epidemiology 4:195–203.
Wander RC, Du SH, Ketchum SO, Rowe KE. 1996. Effects of interaction of RRR-alpha-tocopheryl acetate and fish oil on low-density-lipoprotein oxidation inpostmenopausal women with and without hormone-replacement therapy. AmJ Clin Nutr 63:184–193.
Wechter WJ, Kantoci D, Murray ED, D’Amico DC, Jung ME, Wang W-H. 1996. Anew endogenous natriuretic factor: LLU-alpha. Proc Natl Acad Sci USA 93:6002–6007.
Weiser H, Vecchi M. 1981. Stereoisomers of alpha-tocopheryl acetate. Character-ization of the samples by physico-chemical methods and determination ofbiological activities in the rat resorption-gestation test. Int J Vitam Nutr Res51:100–113.
Weiser H, Vecchi M. 1982. Stereoisomers of alpha-tocopheryl acetate. II. Biopoten-cies of all eight stereoisomers, individually or in mixtures, as determined byrat resorption-gestation tests. Int J Vitam Nutr Res 52:351–370.
Weiser H, Vecchi M, Schlachter M. 1986. Stereoisomers of alpha-tocopheryl ace-tate. IV. USP units and alpha-tocopherol equivalents of all-rac-, 2-ambo- andRRR-alpha-tocopherol evaluated by simultaneous determination of resorption-gestation, myopathy and liver storage capacity in rats. Int J Vitam Nutr Res56:45–56.
Wheldon GH, Bhatt A, Keller P, Hummler H. 1983. D,1-alpha-tocopheryl acetate(vitamin E): A long term toxicity and carcinogenicity study in rats. Int J VitamNutr Res 53:287–296.
Winklhofer-Roob BM, Tuchschmid PE, Molinari L, Shmerling DH. 1996a. Re-sponse to a single oral dose of all-rac-alpha-tocopheryl acetate in patients withcystic fibrosis and in healthy individuals. Am J Clin Nutr 63:717–721.
Winklhofer-Roob BM, van’t Hof MA, Shmerling DH. 1996b. Long-term oral vita-min E supplementation in cystic fibrosis patients: RRR-alpha-tocopherol com-pared with all-rac-alpha-tocopheryl acetate preparations. Am J Clin Nutr 63:722–728.
Copyright © National Academy of Sciences. All rights reserved.
VITAMIN E 283
Winklhofer-Roob BM, van’t Hof MA, Shmerling DH. 1997. Reference values forplasma concentrations of vitamin E and A and carotenoids in a Swiss popula-tion from infancy to adulthood, adjusted for seasonal influences. Clin Chem43:146–153.
Witting LA, Lee L. 1975. Dietary levels of vitamin E and polyunsaturated fatty acidsand plasma vitamin E. Am J Clin Nutr 28:571–576.
Yang NY, Desai ID. 1977. Effect of high levels of dietary vitamin E on hematologi-cal indices and biochemical parameters in rats. J Nutr 107:1410–1417.
Yong LC, Brown CC, Schatzkin A, Dresser CM, Slesinski MJ, Cox CS, Taylor PR.1997. Intake of vitamins E, C, and A and risk of lung cancer. The NHANES IEpidemiologic Followup Study. Am J Epidemiol 146:231–243.
Yoshida H, Yusin M, Ren I, Kuhlenkamp J, Hirano T, Stolz A, Kaplowitz N. 1992.Identification, purification and immunochemical characterization of atocopherol-binding protein in rat liver cytosol. J Lipid Res 33:343–350.
Yoshida H, Ishikawa T, Nakamura H. 1997. Vitamin E/lipid peroxide ratio andsusceptibility of LDL to oxidative modification in non-insulin-dependent dia-betes mellitus. Arterioscler Thromb Vasc Biol 17:1438–1446.
Copyright © National Academy of Sciences. All rights reserved. 284
7Selenium
SUMMARY
Selenium functions through selenoproteins, several of which areoxidant defense enzymes. The Recommended Dietary Allowance(RDA) for selenium is based on the amount needed to maximizesynthesis of the selenoprotein glutathione peroxidase, as assessedby the plateau in the activity of the plasma isoform of this enzyme.The RDA for both men and women is 55 µg (0.7 µmol)/day. Themajor forms of selenium in the diet are highly bioavailable. Sele-nium intake varies according to geographic location, but there isno indication of average intakes below the RDA in the UnitedStates or Canada. A study done in Maryland reported that adultsconsumed an average of 81 µg (1.0 µmol)/day of selenium (Welshet al., 1981). A Canadian survey reported selenium intakes of 113to 220 µg (1.4 to 2.8 µmol)/day (Thompson et al., 1975). TheTolerable Upper Intake Level (UL) for adults is set at 400 µg (5.1µmol)/day based on selenosis as the adverse effect.
BACKGROUND INFORMATION
Most selenium in animal tissues is present as selenomethionine orselenocysteine. Selenomethionine, which cannot be synthesized byhumans and is initially synthesized in plants, is incorporated ran-domly in place of methionine in a variety of proteins obtained fromplant and animal sources. Selenium is present in varying amountsin these proteins, which are called selenium-containing proteins.
Copyright © National Academy of Sciences. All rights reserved.
SELENIUM 285
Selenomethionine is not known to have a physiological functionseparate from that of methionine.
Selenocysteine is present in animal selenoproteins that have beencharacterized (see below) and is the form of selenium that accountsfor the biological activity of the element. In contrast to selenome-thionine, there is no evidence that selenocysteine substitutes forcysteine in humans.
Function
Selenium functions largely through an association with proteins,known as selenoproteins (Stadtman, 1991), and disruption of theirsynthesis is lethal for embryos (Bösl et al., 1997). A selenoprotein isa protein that contains selenium in stoichiometric amounts. Four-teen selenoproteins have been characterized to date in animals.The four known selenium-dependent glutathione peroxidases des-ignated as GSHPx 1 through 4 defend against oxidative stress (Flo-he, 1988). Selenoproteins P and W are postulated to do so as well(Arteel et al., 1998; Burk et al., 1995; Saito et al., 1999; Sun et al.,1999). Three selenium-dependent iodothyronine deiodinases regu-late thyroid hormone metabolism (Berry and Larsen, 1992). Threethioredoxin reductases have been identified (Sun et al., 1999).Their functions include reduction of intramolecular disulfide bondsand regeneration of ascorbic acid from its oxidized metabolites(May et al., 1998). The selenium-dependent isoform of selenophos-phate synthetase participates in selenium metabolism (Guimaraeset al., 1996). Other selenoproteins have not yet been characterizedto the same extent with respect to function (Behne et al., 1997).Thus, the known biological functions of selenium include defenseagainst oxidative stress, regulation of thyroid hormone action, andregulation of the redox status of vitamin C and other molecules.
Physiology of Absorption, Metabolism, and Excretion
Absorption
Absorption of selenium is efficient and is not regulated. Morethan 90 percent of selenomethionine, the major dietary form of theelement, is absorbed by the same mechanism as methionine itself(Swanson et al., 1991). Although little is known about selenocys-teine absorption, it appears to be absorbed very well also.
An inorganic form of selenium, selenate (SeO42–), is absorbed
almost completely, but a significant fraction of it is lost in the urinebefore it can be incorporated into tissues. Another inorganic form
Copyright © National Academy of Sciences. All rights reserved.
286 DIETARY REFERENCE INTAKES
of selenium, selenite (SeO32-), has a more variable absorption, prob-
ably related to interactions with substances in the gut lumen, but itis better retained, once absorbed, than is selenate (Thomson andRobinson, 1986). Absorption of selenite is generally greater than 50percent (Thomson and Robinson, 1986). Although selenate andselenite are not major dietary constituents, they are commonly usedto fortify foods and as selenium supplements.
Body Stores
Two pools of reserve selenium are present in humans and ani-mals. One of them, the selenium present as selenomethionine,depends on dietary intake of selenium as selenomethionine(Waschulewski and Sunde, 1988). The amount of selenium madeavailable to the organism from this pool is a function of turnoverof the methionine pool and not the organism’s need for selenium.
The second reserve pool of selenium is the selenium present inliver glutathione peroxidase (GSHPx-1). In rats, 25 percent of totalbody selenium is present in this pool (Behne and Wolters, 1983). Asdietary selenium becomes limiting for selenoprotein synthesis, thispool is downregulated by a reduction of GSHPx-1 messenger ribo-nucleic acid (RNA) concentration (Sunde, 1994). This makes sele-nium available for synthesis of other selenoproteins.
Metabolism
Selenomethionine, derived mainly from plants, enters the me-thionine pool in the body and shares the fate of methionine untilcatabolized by the transsulfuration pathway. The resulting free sele-nocysteine is further broken down with liberation of a reduced formof the element, which is designated selenide (Esaki et al., 1982).Ingested selenite, selenate, and selenocysteine are all apparentlymetabolized directly to selenide. This selenide may be associatedwith a protein that serves as a chaperone (Lacourciere and Stadt-man, 1998). The selenide can be metabolized to selenophosphate,the precursor of selenocysteine in selenoproteins (Ehrenreich etal., 1992) and of selenium in transfer RNA (Veres et al., 1992), or itcan be converted to excretory metabolites (Mozier et al., 1988),some of which have been characterized as methylated forms.
Excretion
The mechanism that regulates production of excretory metabo-lites has not been elucidated, but excretion has been shown to beresponsible for maintaining selenium homeostasis in the animal
Copyright © National Academy of Sciences. All rights reserved.
SELENIUM 287
(Burk et al., 1972). The excretory metabolites appear in the urineprimarily, but when large amounts of selenium are being excreted,the breath also contains volatile metabolites (e.g., dimethylselenide)(McConnell and Portman, 1952).
Clinical Effects of Inadequate Intake
In experimental animals, selenium deficiency decreases selenoen-zyme activities, but if the animals are otherwise adequately nour-ished, it causes relatively mild clinical symptoms. However, certaintypes of nutritional, chemical, and infectious stresses lead to seriousdiseases in selenium-deficient animals. For example, induction ofvitamin E deficiency in selenium-deficient animals causes lipid per-oxidation and liver necrosis in rats and pigs and cardiac injury inpigs, sheep, and cattle (Van Vleet, 1980). Another example of thisphenomenon is the conversion of a nonpathogenic strain of cox-sackie B3 virus to a pathogenic one that causes myocarditis when itinfects selenium-deficient mice (Beck and Levander, 1998).
Keshan disease, a cardiomyopathy that occurs only in selenium-deficient children, appears to be triggered by an additional stress,possibly an infection or a chemical exposure (Ge et al., 1983). Clin-ical thyroid disorders have not been reported in selenium-deficientindividuals with adequate iodine intake, but based on observationsin Africa, it has been postulated that infants born to mothers defi-cient in both selenium and iodine are at increased risk of cretinism(Vanderpas et al., 1992).
Kashin-Beck disease, an endemic disease of cartilage that occursin preadolescence or adolescence, has been reported in some ofthe low-selenium areas of Asia (Yang et al., 1988). It is possible thatthis disease, like Keshan disease, occurs only in selenium-deficientpeople. However, there has been no demonstration that improve-ment of selenium nutritional status can prevent Kashin-Beck dis-ease, so involvement of selenium deficiency in its pathogenesis re-mains uncertain.
These considerations indicate that selenium deficiency seldomcauses overt illness when it occurs in isolation. However, it leads tobiochemical changes that predispose to illness associated with otherstresses.
SELECTION OF INDICATORS FOR ESTIMATING THEREQUIREMENT FOR SELENIUM
A search of the literature revealed several indicators that could beconsidered as the basis for deriving an Estimated Average Require-
Copyright © National Academy of Sciences. All rights reserved.
288 DIETARY REFERENCE INTAKES
ment (EAR) for selenium in adults. These included prevention ofKeshan disease or various chronic diseases; concentration of seleni-um in blood, hair, and nails; concentration of selenoproteins inblood; and urinary excretion of the element.
Keshan Disease
Keshan disease, a cardiomyopathy that occurs almost exclusivelyin children, is the only human disease that is firmly linked to seleni-um deficiency (Keshan Disease Research Group, 1979). In additionto a low selenium intake, low blood and hair selenium concentra-tions are associated with Keshan disease. The disease occurs withvarying frequency in areas of China where the population is severe-ly selenium deficient (Ge et al., 1983). Based on these observations,the occurrence of Keshan disease in a population would indicatethat the population is selenium deficient.
Selenium in Hair and Nails
Although the forms of selenium in hair and nails have not beencharacterized, some correlations between dietary intake of the ele-ment and hair and nail concentrations of selenium have been dem-onstrated. However, the use of hair and nail selenium as markers ofselenium status has been limited because factors such as the form ofselenium fed, the methionine content of the diet, and the color ofthe hair affect the deposition of selenium in these tissues (Salbeand Levander, 1990). In addition, some shampoos in the UnitedStates and Canada contain selenium. Therefore, only well-con-trolled studies can make use of hair and nail selenium concentra-tions, and these markers are of little value in determining seleniumrequirements across population groups.
Selenium in Blood
Several forms of selenium are present in blood and in metaboliz-ing tissues; thus, they can be discussed together. Physiologically ac-tive forms include the selenoproteins and some as yet uncharacter-ized forms that are present in low abundance. These forms ofselenium are under physiological regulation. Within a specific rangeof dietary selenium intakes, selenoprotein concentrations are a func-tion of selenium intake. Above this range of intakes, selenoproteinconcentrations become regulated only by genetic and environmen-tal factors. This lack of selenium effect implies that the selenium
Copyright © National Academy of Sciences. All rights reserved.
SELENIUM 289
requirement for selenoprotein synthesis has been met (Yang et al.,1987). At this plateau point, human plasma selenoproteins contain0.8 to 1.1 µmol/L (7 to 9 µg/dL) of selenium (Hill et al., 1996).Thus, when tissue concentrations of selenium are below the level atwhich selenoproteins have plateaued, it can be stated with confi-dence that selenium supplies are limiting. Under these conditions,tissue (plasma) concentrations of the element are useful as indicesof nutritional selenium status.
Above plateau concentration, however, the chemical form of sele-nium ingested and other factors become important in determiningthe tissue selenium concentration. Tissue (plasma) concentrationsof selenium do not always correlate with selenium intake underthese conditions (concentration greater than the plateau). As stat-ed earlier, much of the dietary selenium supply is selenomethion-ine, which is synthesized by plants and appears to enter the me-thionine pool in animals where it is incorporated into proteinrandomly at methionine sites. Since selenomethionine is not sub-ject to homeostatic regulation, blood levels of selenium will gener-ally be higher when this form is consumed (Burk and Levander,1999). The selenium released by the catabolism of selenomethio-nine will be present as selenocysteine in selenoproteins.
Based on these considerations, plasma selenium concentrationhas utility in assessing selenium intake of all forms of the elementonly when it is less than 0.8 µmol/L (7 µg/dL). Such values indicatethat the synthesis of selenoproteins has not yet plateaued. Abovethese values, the plasma selenium concentration is highly depen-dent on the chemical form of the element ingested.
Glutathione Peroxidases and Selenoprotein P in Blood
Several selenoproteins are present in blood. Plasma contains theextracellular glutathione peroxidase (GSHPx-3) and selenoproteinP. Erythrocytes and platelets contain the most abundant form ofselenium-containing glutathione peroxidase, intracellular gluta-thione peroxidase (GSHPx-1). Other selenoproteins have not beenidentified in blood. All three of these blood selenoproteins (GSH-Px-3, selenoprotein P, and GSHPx-1) have been used to assess sele-nium status, but plasma GSHPx-3 has been preferred in recent yearsbecause its determination is more accurate than the determinationof the erythrocyte enzyme GSHPx-1. Since hemoglobin interfereswith the measurement of GSHPx-1 in the erythrocyte, use of thismarker is problematic and consequently few data are available thatcan be used to set a selenium requirement. Also studies indicate
Copyright © National Academy of Sciences. All rights reserved.
290 DIETARY REFERENCE INTAKES
that plasma GSHPx-3 activity reflects the activity of tissue selenoen-zymes better than does GSHPx-1 activity in erythrocytes (Cohen etal., 1985).
The limited information available on selenoprotein P indicatesthat it is the major form of selenium in plasma and suggests that itwill be as good an indicator of selenium status as plasma GSHPx-3(Hill et al., 1996). However, since an assay for it is not widely avail-able at present, the data for selenoprotein P are insufficient to useit to estimate a dietary requirement.
Cancer
In some animal models, high selenium intakes reduce the inci-dence of cancer (Ip, 1998). In these studies, selenium was fed inamounts greater than that needed to support maximum concentra-tions of selenoproteins. In humans, some but not all observationalstudies have shown that individuals who self-select diets that pro-duce high plasma and nail selenium tend to have a lower incidenceof cancer (Clark et al., 1991).
Randomized trial data are limited to three studies, one conductedwith poorly nourished rural Chinese (Blot et al., 1995), anotherwith U.S. patients with a history of treated nonmelanoma skin can-cer (Clark et al., 1996), and a third with participants in the HealthProfessional Follow-up Study (Yoshizawa et al., 1999). In the Chinatrial, among eight combinations tested, subjects assigned a dailycombination of selenium (50 µg [0.6 µmol]), β-carotene (15 mg),and α-tocopherol (30 mg) achieved a significant (21 percent) de-crease in gastric cancer mortality, resulting in a significant 9 per-cent decline in total all-cause mortality. However, these resultscannot be attributed to selenium alone, because the individuals con-sumed selenium in combination with β-carotene and vitamin E.
In the second trial, 200 µg (2.5 µmol)/day of selenium adminis-tered in the form of yeast showed no effect on recurrence of non-melanoma skin cancer compared to a similar placebo group (Clarket al., 1996). Although the numbers of subjects were small (1,312patients randomly assigned to the supplement or a placebo, ≈ 75%male) and the outcomes not prespecified, significantly lower ratesof prostate, colon, and total cancer were observed among thoseassigned to the selenium group.
Similar prostate cancer results were reported from a nested case-control design within the Health Professionals Follow-up Study; therisk of prostate cancer for men receiving 200 µg (2.5 µmol)/day ofselenium was one-third that of men receiving the placebo (Yoshiza-
Copyright © National Academy of Sciences. All rights reserved.
SELENIUM 291
wa et al., 1999). The inverse association seen between the seleniumlevel in toenail clippings and the risk of advanced prostate cancerwas not confounded by age, other dietary factors, smoking, bodymass index, geographic region, family history of prostate cancer, orvasectomy.
Results of these three studies are compatible with the possibilitythat intakes of selenium above those needed to maximize seleno-proteins have an anticancer effect in humans. These findings sup-port the need for large-scale trials. They can not, however, serve asthe basis for determining dietary selenium requirements at thistime.
Other Measurements
Urine
Attempts have been made to use urinary selenium excretion as anindex of selenium status. While excretion of the element is propor-tional to selenium status, excretion is also sensitive to short-termchanges in selenium intake (Burk et al., 1972). Thus, urinary excre-tion in selenium deficiency may reflect immediate selenium intakemore than nutritional selenium status. This limits the utility of uri-nary selenium measurements.
Labeled Selenium
Uptake of selenium-75 (75Se) by erythrocytes in vitro has beenstudied (Wright and Bell, 1963) as an indicator of selenium status.Although this method showed validity in sheep (Wright and Bell,1963), its value in other species, including humans, has not beendemonstrated (Burk et al., 1967).
FACTORS AFFECTING THE SELENIUM REQUIREMENT
Bioavailability
Most dietary selenium is highly bioavailable. Selenomethionine,which is estimated to account for at least half of the dietary seleni-um, is absorbed by the same mechanism as methionine, and itsselenium is made available for selenoprotein synthesis when it iscatabolized via the transsulfuration pathway (Esaki et al., 1982). Thebioavailability of selenium in the form of selenomethionine is great-er than 90 percent (Thomson and Robinson, 1986). The selenium
Copyright © National Academy of Sciences. All rights reserved.
292 DIETARY REFERENCE INTAKES
in selenocysteine, another significant dietary form, is also highlybioavailable (Swanson et al., 1991). There appear to be some minordietary forms of selenium (especially present in fish) that have rela-tively low bioavailability, but these forms have not been identified(Cantor and Tarino, 1982). Selenate and selenite, two inorganicforms of selenium, have roughly equivalent bioavailability whichgenerally exceeds 50 percent (Thomson and Robinson, 1986). Al-though they are not major dietary constituents, these inorganicforms are commonly used as selenium supplements.
Gender
Earlier reports from China (Ge et al., 1983), from a time whenselenium deficiency was more severe than in recent years, indicatedthat women of childbearing age were susceptible to developing Kes-han disease, whereas men were resistant. However, cases of the dis-ease reported in the past 20 years appear to be limited to children,with equal prevalence in boys and girls (Cheng and Qian, 1990).Thus, a gender effect in susceptibility to this disease may be presentat extremely low selenium intakes, but no such effect has been dem-onstrated at current intakes. Given women’s apparently increasedsusceptibility to Keshan disease, selenium requirements for the var-ious age groups are based on male reference weights.
FINDINGS BY LIFE STAGE AND GENDER GROUP
Infants Ages 0 through 12 Months
Method Used to Set the Adequate Intake
No functional criteria of selenium status have been demonstratedthat reflect response to dietary intake in infants. Thus, recommend-ed intakes of selenium are based on an Adequate Intake (AI) thatreflects the observed mean selenium intake of infants fed principal-ly with human milk.
Human milk is recognized as the optimal milk source for infantsthroughout at least the first year of life and is recommended as thesole nutritional milk source for infants during the first 4 to 6 monthsof life (IOM, 1991). Therefore, determination of the AI for seleni-um for infants is based on data from infants fed human milk as theprincipal fluid during periods 0 through 6 and 7 through 12 monthsof age. The AI is the mean value of observed intakes as calculated
Copyright © National Academy of Sciences. All rights reserved.
SELENIUM 293
from data on the selenium content of human milk and other stud-ies which estimated the volume typically consumed as determinedby test weighing of infants in the age category. In the age group 7through 12 months, an amount is added for the contribution tointake of selenium obtained from weaning foods.
Average selenium concentrations of human milk consumed byinfants at different ages are shown in Table 7-1. In general, theselenium content of human milk is highest in colostrum (33 to 80µg [0.4 to 1.0 µmol]/L) (Ellis et al., 1990; Higashi et al., 1983; Hojo,1986; Smith et al., 1982), whereas concentrations in transitionalmilk at 1 week (18 to 29 µg [0.2 to 0.4 µmol]/L) are less than halfthose of colostrum (Ellis et al., 1990; Higashi et al., 1983; Hojo,1986). There is wide interindividual variation in the selenium con-tent of human milk (Higashi et al., 1983), and the selenium con-tent of hind milk (milk at the end of an infant feeding) is greaterthan that of the fore milk (milk at the beginning of the feeding)(Smith et al., 1982).
Selenium is also present in human milk in extracellular glu-tathione peroxidase (GSHPx-3) (Avissar et al., 1991), but the distri-bution of selenium among milk proteins needs further character-ization. It is also likely that a large and variable fraction of milkselenium is present as selenomethionine substituting for methio-nine as has been described for plasma.
The average selenium content of mature human milk sampledbetween 2 and 6 months lactation appears to be relatively constantwithin a population group (Debski et al., 1989; Funk et al., 1990).However, human milk selenium varies with maternal selenium in-take. Selenium concentrations in mature human milk in Finnishwomen consuming 30, 50, or 100 µg (0.4, 0.6, or 1.3 µmol)/day ofselenium were 6, 11, or 14 µg (0.08, 0.14, or 0.18 µmol)/L of seleni-um, respectively (Kumpulainen et al., 1983, 1984, 1985). Other stud-ies reported average selenium concentrations of mature humanmilk of 10 to 23 µg/L (with a range of 6 to 39 µg/L) (Cumming etal., 1992; Debski et al., 1989; Ellis et al., 1990; Funk et al., 1990;Higashi et al., 1983; Hojo, 1986; Levander et al., 1987; Mannan andPicciano, 1987; Smith et al., 1982).
The average selenium content of human milk from mothers inCanada and the United States was 15 to 20 µg (0.19 to 0.25 µmol)/L (Levander et al., 1987; Mannan and Picciano, 1987; Smith et al.,1982). An older study analyzed human milk samples from womenliving in 17 states in the United States. The authors reported meanmilk selenium values to be 28 µg (0.35 µmol)/L in areas with highsoil selenium content and 13 µg (0.16 µmol)/L in areas with low
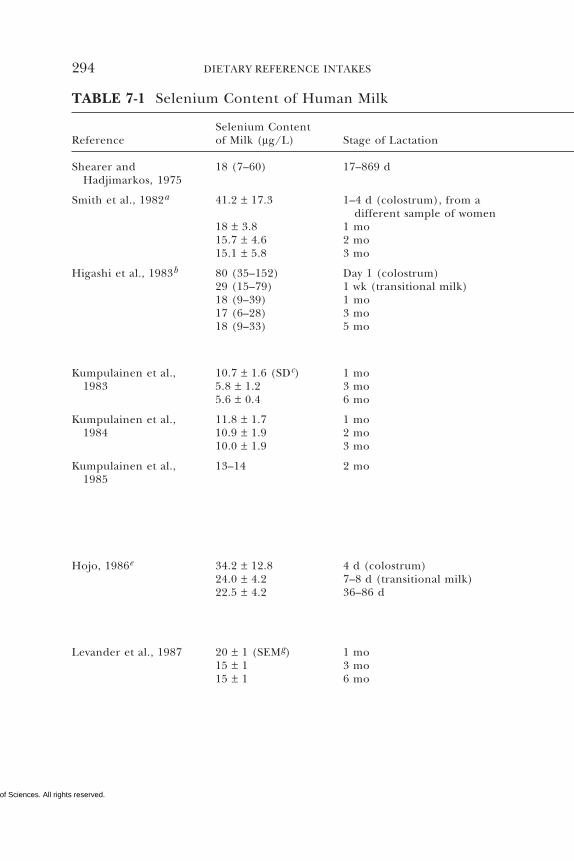
Copyright © National Academy of Sciences. All rights reserved.
294 DIETARY REFERENCE INTAKES
TABLE 7-1 Selenium Content of Human Milk
Selenium ContentReference of Milk (µg/L) Stage of Lactation
Shearer and 18 (7–60) 17–869 dHadjimarkos, 1975
Smith et al., 1982a 41.2 ± 17.3 1–4 d (colostrum), from adifferent sample of women
18 ± 3.8 1 mo15.7 ± 4.6 2 mo15.1 ± 5.8 3 mo
Higashi et al., 1983b 80 (35–152) Day 1 (colostrum)29 (15–79) 1 wk (transitional milk)18 (9–39) 1 mo17 (6–28) 3 mo18 (9–33) 5 mo
Kumpulainen et al., 10.7 ± 1.6 (SDc) 1 mo1983 5.8 ± 1.2 3 mo
5.6 ± 0.4 6 mo
Kumpulainen et al., 11.8 ± 1.7 1 mo1984 10.9 ± 1.9 2 mo
10.0 ± 1.9 3 mo
Kumpulainen et al., 13–14 2 mo1985
Hojo, 1986e 34.2 ± 12.8 4 d (colostrum)24.0 ± 4.2 7–8 d (transitional milk)22.5 ± 4.2 36–86 d
Levander et al., 1987 20 ± 1 (SEMg) 1 mo15 ± 1 3 mo15 ± 1 6 mo
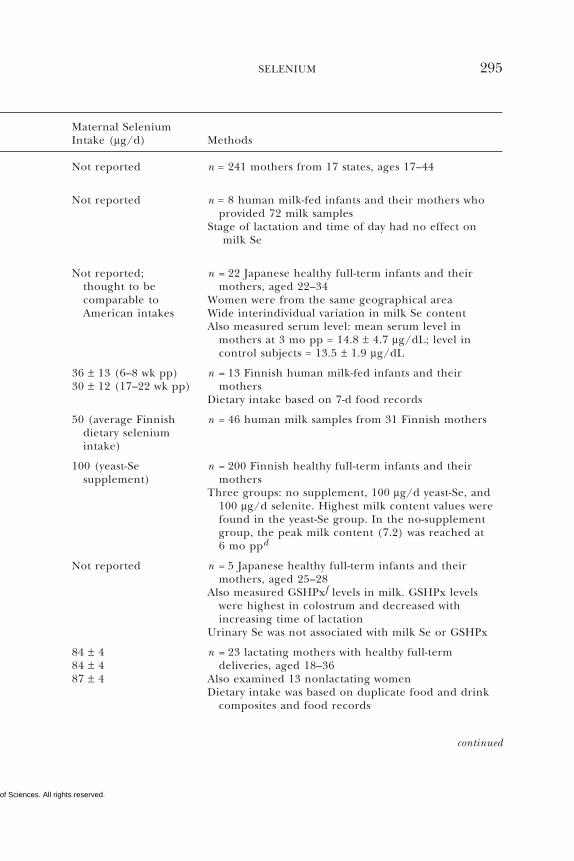
Copyright © National Academy of Sciences. All rights reserved.
SELENIUM 295
Maternal SeleniumIntake (µg/d) Methods
Not reported n = 241 mothers from 17 states, ages 17–44
Not reported n = 8 human milk-fed infants and their mothers whoprovided 72 milk samples
Stage of lactation and time of day had no effect on milk Se
Not reported; n = 22 Japanese healthy full-term infants and theirthought to be mothers, aged 22–34comparable to Women were from the same geographical areaAmerican intakes Wide interindividual variation in milk Se content
Also measured serum level: mean serum level inmothers at 3 mo pp = 14.8 ± 4.7 µg/dL; level incontrol subjects = 13.5 ± 1.9 µg/dL
36 ± 13 (6–8 wk pp) n = 13 Finnish human milk-fed infants and their30 ± 12 (17–22 wk pp) mothers
Dietary intake based on 7-d food records
50 (average Finnish n = 46 human milk samples from 31 Finnish mothersdietary seleniumintake)
100 (yeast-Se n = 200 Finnish healthy full-term infants and theirsupplement) mothers
Three groups: no supplement, 100 µg/d yeast-Se, and100 µg/d selenite. Highest milk content values werefound in the yeast-Se group. In the no-supplementgroup, the peak milk content (7.2) was reached at6 mo ppd
Not reported n = 5 Japanese healthy full-term infants and theirmothers, aged 25–28
Also measured GSHPxf levels in milk. GSHPx levelswere highest in colostrum and decreased withincreasing time of lactation
Urinary Se was not associated with milk Se or GSHPx
84 ± 4 n = 23 lactating mothers with healthy full-term84 ± 4 deliveries, aged 18–3687 ± 4 Also examined 13 nonlactating women
Dietary intake was based on duplicate food and drinkcomposites and food records
continued
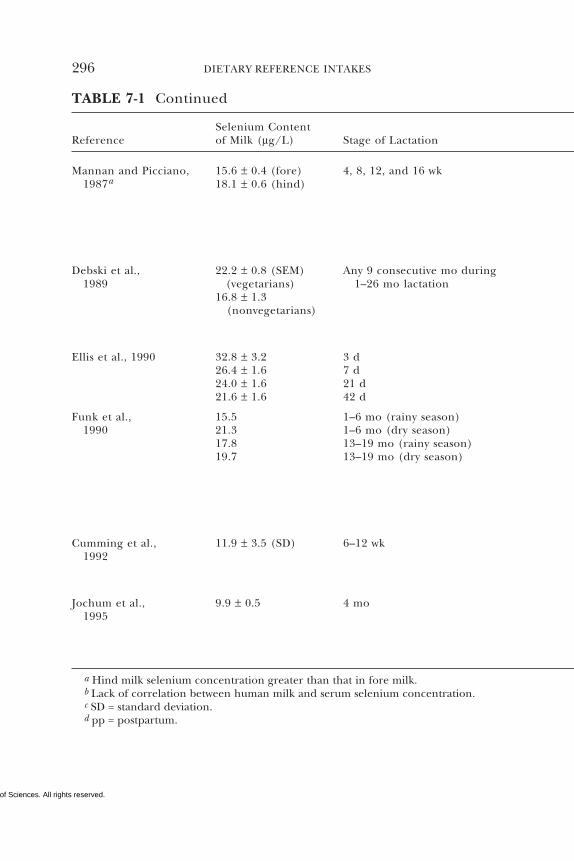
Copyright © National Academy of Sciences. All rights reserved.
296 DIETARY REFERENCE INTAKES
TABLE 7-1 Continued
Selenium ContentReference of Milk (µg/L) Stage of Lactation
Mannan and Picciano, 15.6 ± 0.4 (fore) 4, 8, 12, and 16 wk1987a 18.1 ± 0.6 (hind)
Debski et al., 22.2 ± 0.8 (SEM) Any 9 consecutive mo during1989 (vegetarians) 1–26 mo lactation
16.8 ± 1.3(nonvegetarians)
Ellis et al., 1990 32.8 ± 3.2 3 d26.4 ± 1.6 7 d24.0 ± 1.6 21 d21.6 ± 1.6 42 d
Funk et al., 15.5 1–6 mo (rainy season)1990 21.3 1–6 mo (dry season)
17.8 13–19 mo (rainy season)19.7 13–19 mo (dry season)
Cumming et al., 11.9 ± 3.5 (SD) 6–12 wk1992
Jochum et al., 9.9 ± 0.5 4 mo1995
a Hind milk selenium concentration greater than that in fore milk.b Lack of correlation between human milk and serum selenium concentration.c SD = standard deviation.d pp = postpartum.
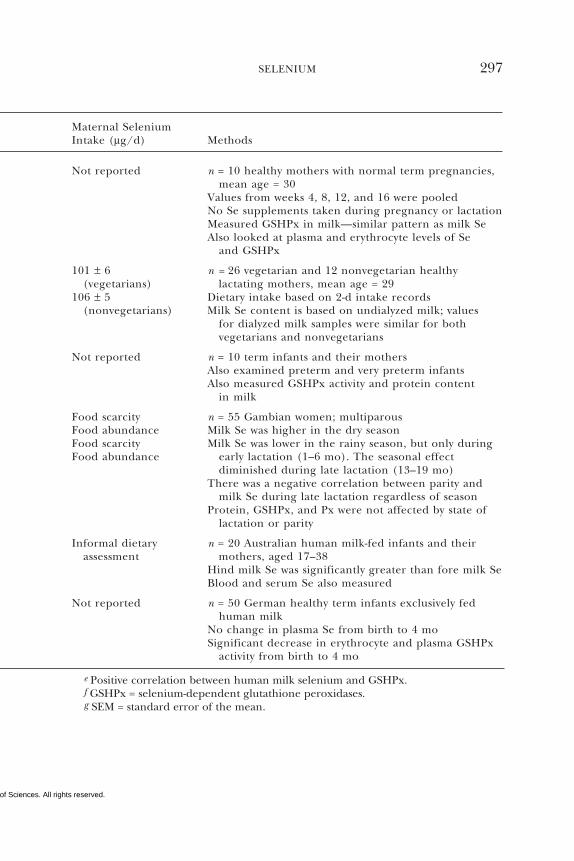
Copyright © National Academy of Sciences. All rights reserved.
SELENIUM 297
Maternal SeleniumIntake (µg/d) Methods
Not reported n = 10 healthy mothers with normal term pregnancies,mean age = 30
Values from weeks 4, 8, 12, and 16 were pooledNo Se supplements taken during pregnancy or lactationMeasured GSHPx in milk—similar pattern as milk SeAlso looked at plasma and erythrocyte levels of Se
and GSHPx
101 ± 6 n = 26 vegetarian and 12 nonvegetarian healthy(vegetarians) lactating mothers, mean age = 29
106 ± 5 Dietary intake based on 2-d intake records(nonvegetarians) Milk Se content is based on undialyzed milk; values
for dialyzed milk samples were similar for bothvegetarians and nonvegetarians
Not reported n = 10 term infants and their mothersAlso examined preterm and very preterm infantsAlso measured GSHPx activity and protein content
in milk
Food scarcity n = 55 Gambian women; multiparousFood abundance Milk Se was higher in the dry seasonFood scarcity Milk Se was lower in the rainy season, but only duringFood abundance early lactation (1–6 mo). The seasonal effect
diminished during late lactation (13–19 mo)There was a negative correlation between parity and
milk Se during late lactation regardless of seasonProtein, GSHPx, and Px were not affected by state of
lactation or parity
Informal dietary n = 20 Australian human milk-fed infants and theirassessment mothers, aged 17–38
Hind milk Se was significantly greater than fore milk SeBlood and serum Se also measured
Not reported n = 50 German healthy term infants exclusively fedhuman milk
No change in plasma Se from birth to 4 moSignificant decrease in erythrocyte and plasma GSHPx
activity from birth to 4 mo
e Positive correlation between human milk selenium and GSHPx.f GSHPx = selenium-dependent glutathione peroxidases.g SEM = standard error of the mean.
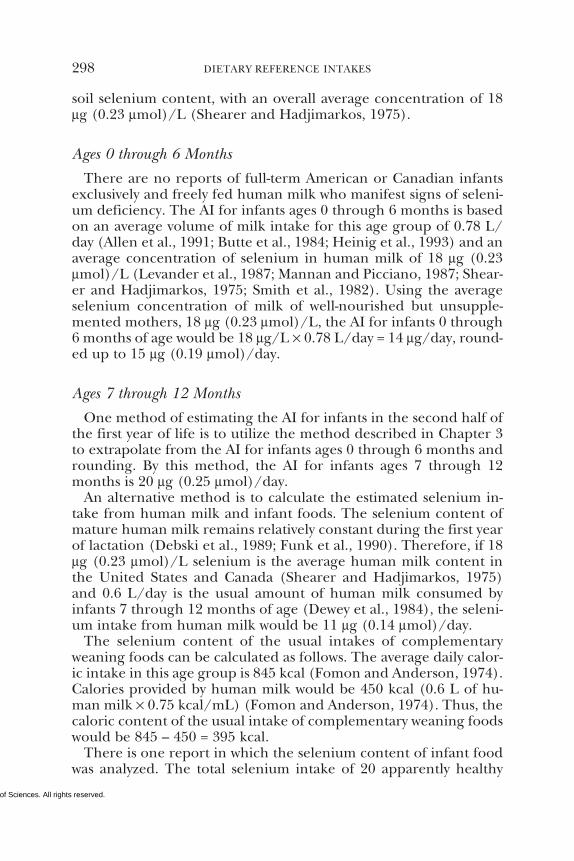
Copyright © National Academy of Sciences. All rights reserved.
298 DIETARY REFERENCE INTAKES
soil selenium content, with an overall average concentration of 18µg (0.23 µmol)/L (Shearer and Hadjimarkos, 1975).
Ages 0 through 6 Months
There are no reports of full-term American or Canadian infantsexclusively and freely fed human milk who manifest signs of seleni-um deficiency. The AI for infants ages 0 through 6 months is basedon an average volume of milk intake for this age group of 0.78 L/day (Allen et al., 1991; Butte et al., 1984; Heinig et al., 1993) and anaverage concentration of selenium in human milk of 18 µg (0.23µmol)/L (Levander et al., 1987; Mannan and Picciano, 1987; Shear-er and Hadjimarkos, 1975; Smith et al., 1982). Using the averageselenium concentration of milk of well-nourished but unsupple-mented mothers, 18 µg (0.23 µmol)/L, the AI for infants 0 through6 months of age would be 18 µg/L × 0.78 L/day = 14 µg/day, round-ed up to 15 µg (0.19 µmol)/day.
Ages 7 through 12 Months
One method of estimating the AI for infants in the second half ofthe first year of life is to utilize the method described in Chapter 3to extrapolate from the AI for infants ages 0 through 6 months androunding. By this method, the AI for infants ages 7 through 12months is 20 µg (0.25 µmol)/day.
An alternative method is to calculate the estimated selenium in-take from human milk and infant foods. The selenium content ofmature human milk remains relatively constant during the first yearof lactation (Debski et al., 1989; Funk et al., 1990). Therefore, if 18µg (0.23 µmol)/L selenium is the average human milk content inthe United States and Canada (Shearer and Hadjimarkos, 1975)and 0.6 L/day is the usual amount of human milk consumed byinfants 7 through 12 months of age (Dewey et al., 1984), the seleni-um intake from human milk would be 11 µg (0.14 µmol)/day.
The selenium content of the usual intakes of complementaryweaning foods can be calculated as follows. The average daily calor-ic intake in this age group is 845 kcal (Fomon and Anderson, 1974).Calories provided by human milk would be 450 kcal (0.6 L of hu-man milk × 0.75 kcal/mL) (Fomon and Anderson, 1974). Thus, thecaloric content of the usual intake of complementary weaning foodswould be 845 – 450 = 395 kcal.
There is one report in which the selenium content of infant foodwas analyzed. The total selenium intake of 20 apparently healthy
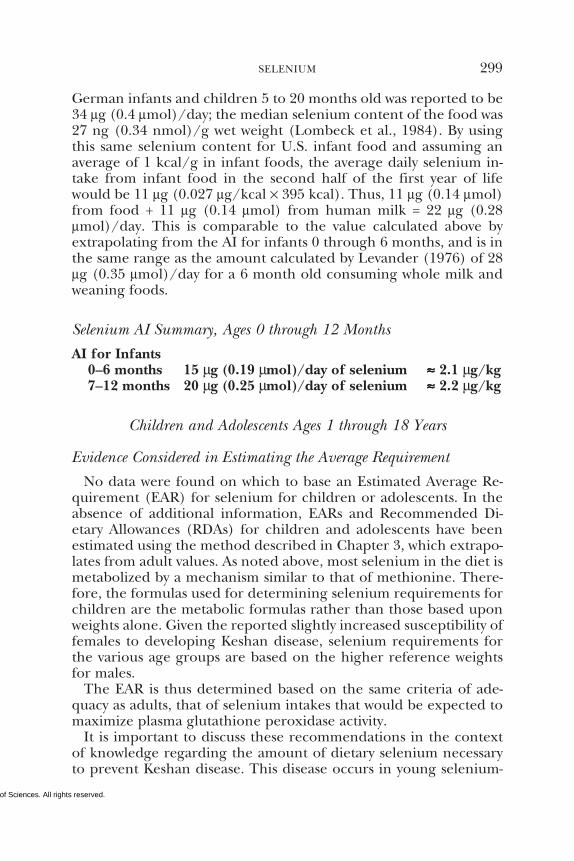
Copyright © National Academy of Sciences. All rights reserved.
SELENIUM 299
German infants and children 5 to 20 months old was reported to be34 µg (0.4 µmol)/day; the median selenium content of the food was27 ng (0.34 nmol)/g wet weight (Lombeck et al., 1984). By usingthis same selenium content for U.S. infant food and assuming anaverage of 1 kcal/g in infant foods, the average daily selenium in-take from infant food in the second half of the first year of lifewould be 11 µg (0.027 µg/kcal × 395 kcal). Thus, 11 µg (0.14 µmol)from food + 11 µg (0.14 µmol) from human milk = 22 µg (0.28µmol)/day. This is comparable to the value calculated above byextrapolating from the AI for infants 0 through 6 months, and is inthe same range as the amount calculated by Levander (1976) of 28µg (0.35 µmol)/day for a 6 month old consuming whole milk andweaning foods.
Selenium AI Summary, Ages 0 through 12 Months
AI for Infants0–6 months 15 µg (0.19 µmol)/day of selenium ≈≈≈≈≈ 2.1 µg/kg7–12 months 20 µg (0.25 µmol)/day of selenium ≈≈≈≈≈ 2.2 µg/kg
Children and Adolescents Ages 1 through 18 Years
Evidence Considered in Estimating the Average Requirement
No data were found on which to base an Estimated Average Re-quirement (EAR) for selenium for children or adolescents. In theabsence of additional information, EARs and Recommended Di-etary Allowances (RDAs) for children and adolescents have beenestimated using the method described in Chapter 3, which extrapo-lates from adult values. As noted above, most selenium in the diet ismetabolized by a mechanism similar to that of methionine. There-fore, the formulas used for determining selenium requirements forchildren are the metabolic formulas rather than those based uponweights alone. Given the reported slightly increased susceptibility offemales to developing Keshan disease, selenium requirements forthe various age groups are based on the higher reference weightsfor males.
The EAR is thus determined based on the same criteria of ade-quacy as adults, that of selenium intakes that would be expected tomaximize plasma glutathione peroxidase activity.
It is important to discuss these recommendations in the contextof knowledge regarding the amount of dietary selenium necessaryto prevent Keshan disease. This disease occurs in young selenium-
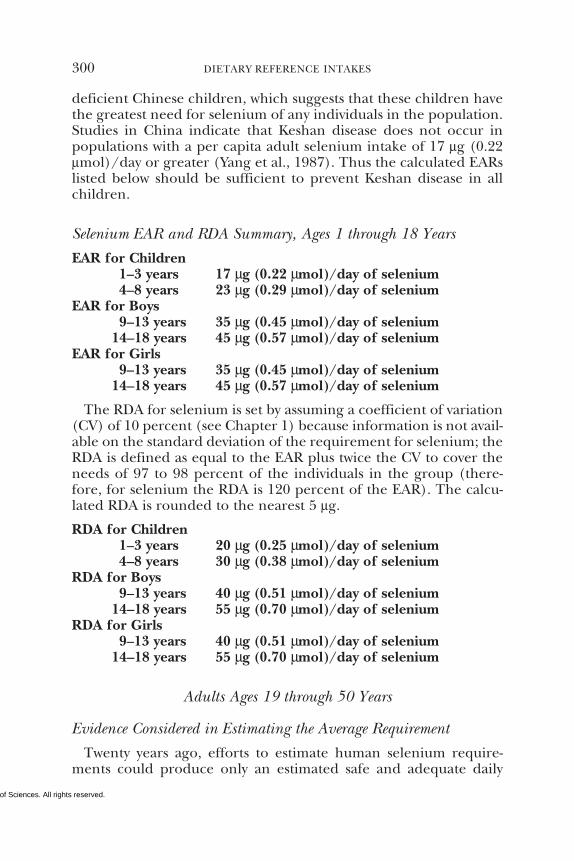
Copyright © National Academy of Sciences. All rights reserved.
300 DIETARY REFERENCE INTAKES
deficient Chinese children, which suggests that these children havethe greatest need for selenium of any individuals in the population.Studies in China indicate that Keshan disease does not occur inpopulations with a per capita adult selenium intake of 17 µg (0.22µmol)/day or greater (Yang et al., 1987). Thus the calculated EARslisted below should be sufficient to prevent Keshan disease in allchildren.
Selenium EAR and RDA Summary, Ages 1 through 18 Years
EAR for Children1–3 years 17 µg (0.22 µmol)/day of selenium4–8 years 23 µg (0.29 µmol)/day of selenium
EAR for Boys9–13 years 35 µg (0.45 µmol)/day of selenium
14–18 years 45 µg (0.57 µmol)/day of seleniumEAR for Girls
9–13 years 35 µg (0.45 µmol)/day of selenium14–18 years 45 µg (0.57 µmol)/day of selenium
The RDA for selenium is set by assuming a coefficient of variation(CV) of 10 percent (see Chapter 1) because information is not avail-able on the standard deviation of the requirement for selenium; theRDA is defined as equal to the EAR plus twice the CV to cover theneeds of 97 to 98 percent of the individuals in the group (there-fore, for selenium the RDA is 120 percent of the EAR). The calcu-lated RDA is rounded to the nearest 5 µg.
RDA for Children1–3 years 20 µg (0.25 µmol)/day of selenium4–8 years 30 µg (0.38 µmol)/day of selenium
RDA for Boys9–13 years 40 µg (0.51 µmol)/day of selenium
14–18 years 55 µg (0.70 µmol)/day of seleniumRDA for Girls
9–13 years 40 µg (0.51 µmol)/day of selenium14–18 years 55 µg (0.70 µmol)/day of selenium
Adults Ages 19 through 50 Years
Evidence Considered in Estimating the Average Requirement
Twenty years ago, efforts to estimate human selenium require-ments could produce only an estimated safe and adequate daily
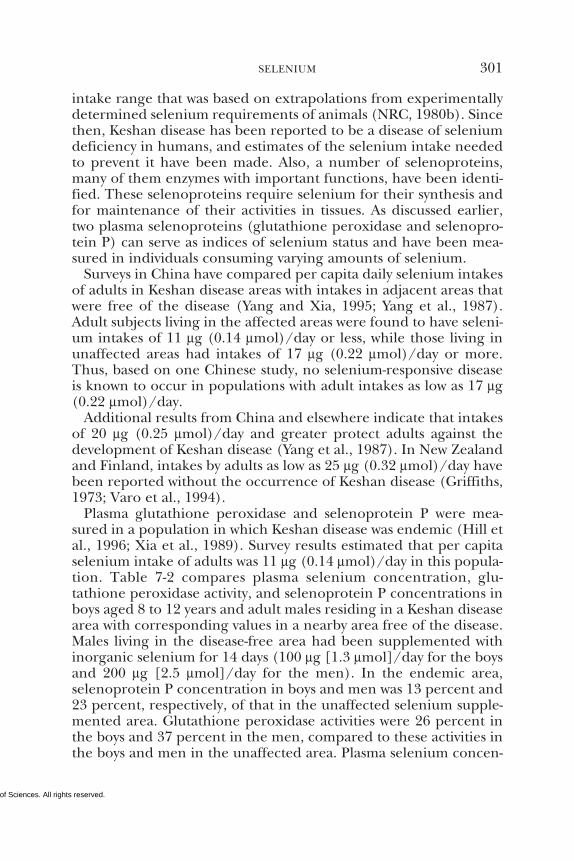
Copyright © National Academy of Sciences. All rights reserved.
SELENIUM 301
intake range that was based on extrapolations from experimentallydetermined selenium requirements of animals (NRC, 1980b). Sincethen, Keshan disease has been reported to be a disease of seleniumdeficiency in humans, and estimates of the selenium intake neededto prevent it have been made. Also, a number of selenoproteins,many of them enzymes with important functions, have been identi-fied. These selenoproteins require selenium for their synthesis andfor maintenance of their activities in tissues. As discussed earlier,two plasma selenoproteins (glutathione peroxidase and selenopro-tein P) can serve as indices of selenium status and have been mea-sured in individuals consuming varying amounts of selenium.
Surveys in China have compared per capita daily selenium intakesof adults in Keshan disease areas with intakes in adjacent areas thatwere free of the disease (Yang and Xia, 1995; Yang et al., 1987).Adult subjects living in the affected areas were found to have seleni-um intakes of 11 µg (0.14 µmol)/day or less, while those living inunaffected areas had intakes of 17 µg (0.22 µmol)/day or more.Thus, based on one Chinese study, no selenium-responsive diseaseis known to occur in populations with adult intakes as low as 17 µg(0.22 µmol)/day.
Additional results from China and elsewhere indicate that intakesof 20 µg (0.25 µmol)/day and greater protect adults against thedevelopment of Keshan disease (Yang et al., 1987). In New Zealandand Finland, intakes by adults as low as 25 µg (0.32 µmol)/day havebeen reported without the occurrence of Keshan disease (Griffiths,1973; Varo et al., 1994).
Plasma glutathione peroxidase and selenoprotein P were mea-sured in a population in which Keshan disease was endemic (Hill etal., 1996; Xia et al., 1989). Survey results estimated that per capitaselenium intake of adults was 11 µg (0.14 µmol)/day in this popula-tion. Table 7-2 compares plasma selenium concentration, glu-tathione peroxidase activity, and selenoprotein P concentrations inboys aged 8 to 12 years and adult males residing in a Keshan diseasearea with corresponding values in a nearby area free of the disease.Males living in the disease-free area had been supplemented withinorganic selenium for 14 days (100 µg [1.3 µmol]/day for the boysand 200 µg [2.5 µmol]/day for the men). In the endemic area,selenoprotein P concentration in boys and men was 13 percent and23 percent, respectively, of that in the unaffected selenium supple-mented area. Glutathione peroxidase activities were 26 percent inthe boys and 37 percent in the men, compared to these activities inthe boys and men in the unaffected area. Plasma selenium concen-
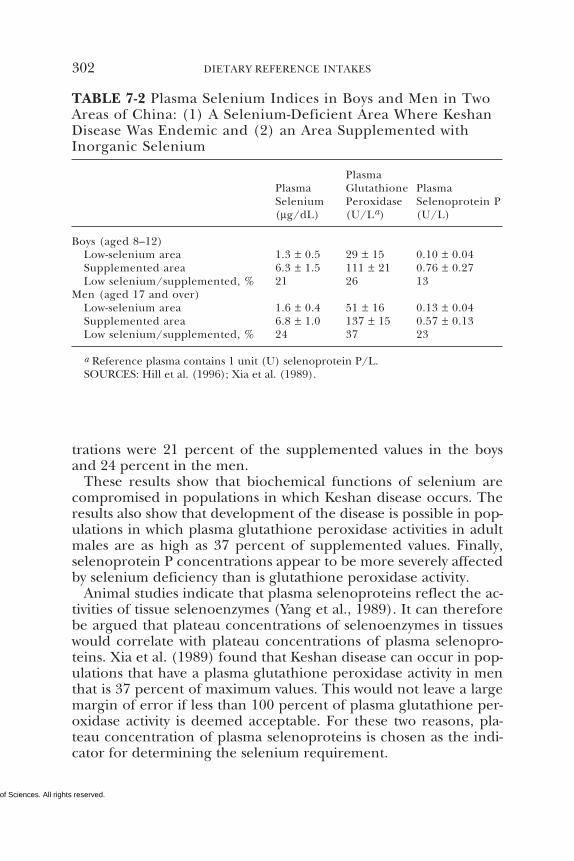
Copyright © National Academy of Sciences. All rights reserved.
302 DIETARY REFERENCE INTAKES
TABLE 7-2 Plasma Selenium Indices in Boys and Men in TwoAreas of China: (1) A Selenium-Deficient Area Where KeshanDisease Was Endemic and (2) an Area Supplemented withInorganic Selenium
PlasmaPlasma Glutathione PlasmaSelenium Peroxidase Selenoprotein P(µg/dL) (U/La) (U/L)
Boys (aged 8–12)Low-selenium area 1.3 ± 0.5 29 ± 15 0.10 ± 0.04Supplemented area 6.3 ± 1.5 111 ± 21 0.76 ± 0.27Low selenium/supplemented, % 21 26 13
Men (aged 17 and over)Low-selenium area 1.6 ± 0.4 51 ± 16 0.13 ± 0.04Supplemented area 6.8 ± 1.0 137 ± 15 0.57 ± 0.13Low selenium/supplemented, % 24 37 23
a Reference plasma contains 1 unit (U) selenoprotein P/L.SOURCES: Hill et al. (1996); Xia et al. (1989).
trations were 21 percent of the supplemented values in the boysand 24 percent in the men.
These results show that biochemical functions of selenium arecompromised in populations in which Keshan disease occurs. Theresults also show that development of the disease is possible in pop-ulations in which plasma glutathione peroxidase activities in adultmales are as high as 37 percent of supplemented values. Finally,selenoprotein P concentrations appear to be more severely affectedby selenium deficiency than is glutathione peroxidase activity.
Animal studies indicate that plasma selenoproteins reflect the ac-tivities of tissue selenoenzymes (Yang et al., 1989). It can thereforebe argued that plateau concentrations of selenoenzymes in tissueswould correlate with plateau concentrations of plasma selenopro-teins. Xia et al. (1989) found that Keshan disease can occur in pop-ulations that have a plasma glutathione peroxidase activity in menthat is 37 percent of maximum values. This would not leave a largemargin of error if less than 100 percent of plasma glutathione per-oxidase activity is deemed acceptable. For these two reasons, pla-teau concentration of plasma selenoproteins is chosen as the indi-cator for determining the selenium requirement.
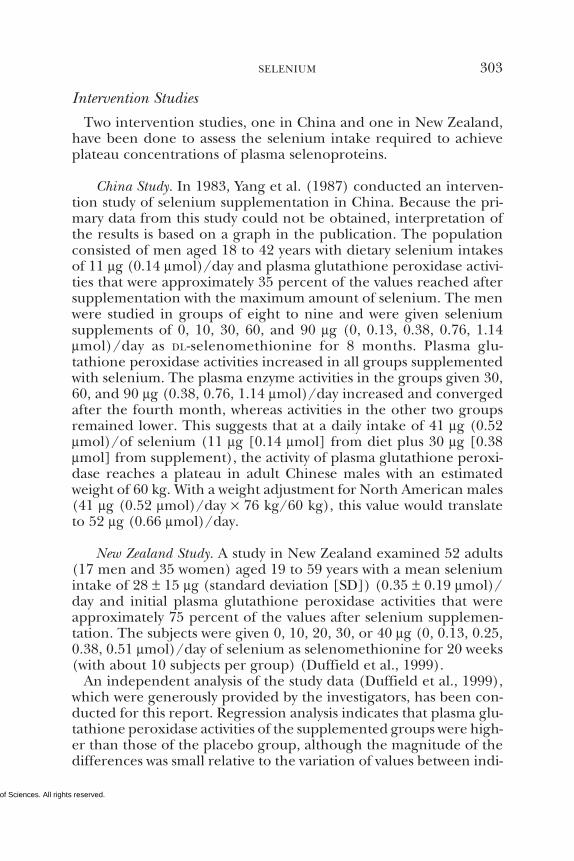
Copyright © National Academy of Sciences. All rights reserved.
SELENIUM 303
Intervention Studies
Two intervention studies, one in China and one in New Zealand,have been done to assess the selenium intake required to achieveplateau concentrations of plasma selenoproteins.
China Study. In 1983, Yang et al. (1987) conducted an interven-tion study of selenium supplementation in China. Because the pri-mary data from this study could not be obtained, interpretation ofthe results is based on a graph in the publication. The populationconsisted of men aged 18 to 42 years with dietary selenium intakesof 11 µg (0.14 µmol)/day and plasma glutathione peroxidase activi-ties that were approximately 35 percent of the values reached aftersupplementation with the maximum amount of selenium. The menwere studied in groups of eight to nine and were given seleniumsupplements of 0, 10, 30, 60, and 90 µg (0, 0.13, 0.38, 0.76, 1.14µmol)/day as DL-selenomethionine for 8 months. Plasma glu-tathione peroxidase activities increased in all groups supplementedwith selenium. The plasma enzyme activities in the groups given 30,60, and 90 µg (0.38, 0.76, 1.14 µmol)/day increased and convergedafter the fourth month, whereas activities in the other two groupsremained lower. This suggests that at a daily intake of 41 µg (0.52µmol)/of selenium (11 µg [0.14 µmol] from diet plus 30 µg [0.38µmol] from supplement), the activity of plasma glutathione peroxi-dase reaches a plateau in adult Chinese males with an estimatedweight of 60 kg. With a weight adjustment for North American males(41 µg (0.52 µmol)/day × 76 kg/60 kg), this value would translateto 52 µg (0.66 µmol)/day.
New Zealand Study. A study in New Zealand examined 52 adults(17 men and 35 women) aged 19 to 59 years with a mean seleniumintake of 28 ± 15 µg (standard deviation [SD]) (0.35 ± 0.19 µmol)/day and initial plasma glutathione peroxidase activities that wereapproximately 75 percent of the values after selenium supplemen-tation. The subjects were given 0, 10, 20, 30, or 40 µg (0, 0.13, 0.25,0.38, 0.51 µmol)/day of selenium as selenomethionine for 20 weeks(with about 10 subjects per group) (Duffield et al., 1999).
An independent analysis of the study data (Duffield et al., 1999),which were generously provided by the investigators, has been con-ducted for this report. Regression analysis indicates that plasma glu-tathione peroxidase activities of the supplemented groups were high-er than those of the placebo group, although the magnitude of thedifferences was small relative to the variation of values between indi-
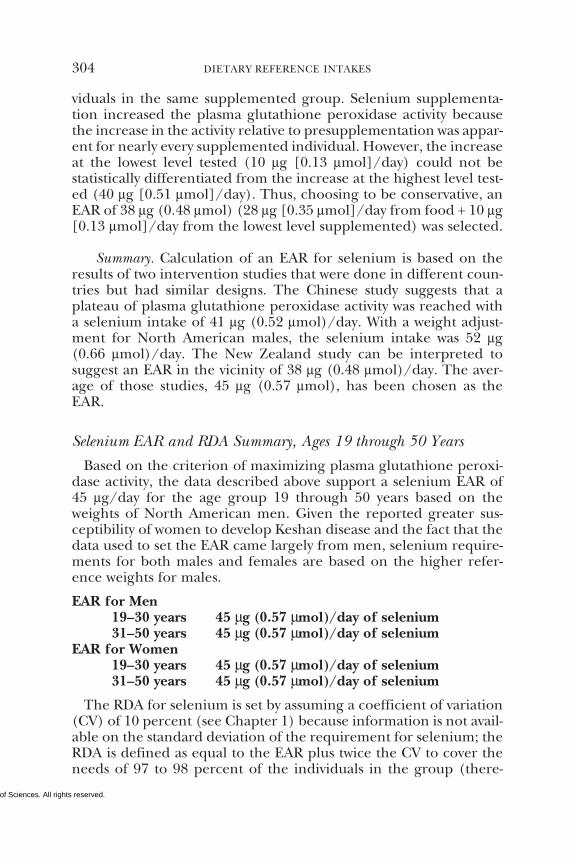
Copyright © National Academy of Sciences. All rights reserved.
304 DIETARY REFERENCE INTAKES
viduals in the same supplemented group. Selenium supplementa-tion increased the plasma glutathione peroxidase activity becausethe increase in the activity relative to presupplementation was appar-ent for nearly every supplemented individual. However, the increaseat the lowest level tested (10 µg [0.13 µmol]/day) could not bestatistically differentiated from the increase at the highest level test-ed (40 µg [0.51 µmol]/day). Thus, choosing to be conservative, anEAR of 38 µg (0.48 µmol) (28 µg [0.35 µmol]/day from food + 10 µg[0.13 µmol]/day from the lowest level supplemented) was selected.
Summary. Calculation of an EAR for selenium is based on theresults of two intervention studies that were done in different coun-tries but had similar designs. The Chinese study suggests that aplateau of plasma glutathione peroxidase activity was reached witha selenium intake of 41 µg (0.52 µmol)/day. With a weight adjust-ment for North American males, the selenium intake was 52 µg(0.66 µmol)/day. The New Zealand study can be interpreted tosuggest an EAR in the vicinity of 38 µg (0.48 µmol)/day. The aver-age of those studies, 45 µg (0.57 µmol), has been chosen as theEAR.
Selenium EAR and RDA Summary, Ages 19 through 50 Years
Based on the criterion of maximizing plasma glutathione peroxi-dase activity, the data described above support a selenium EAR of45 µg/day for the age group 19 through 50 years based on theweights of North American men. Given the reported greater sus-ceptibility of women to develop Keshan disease and the fact that thedata used to set the EAR came largely from men, selenium require-ments for both males and females are based on the higher refer-ence weights for males.
EAR for Men19–30 years 45 µg (0.57 µmol)/day of selenium31–50 years 45 µg (0.57 µmol)/day of selenium
EAR for Women19–30 years 45 µg (0.57 µmol)/day of selenium31–50 years 45 µg (0.57 µmol)/day of selenium
The RDA for selenium is set by assuming a coefficient of variation(CV) of 10 percent (see Chapter 1) because information is not avail-able on the standard deviation of the requirement for selenium; theRDA is defined as equal to the EAR plus twice the CV to cover theneeds of 97 to 98 percent of the individuals in the group (there-
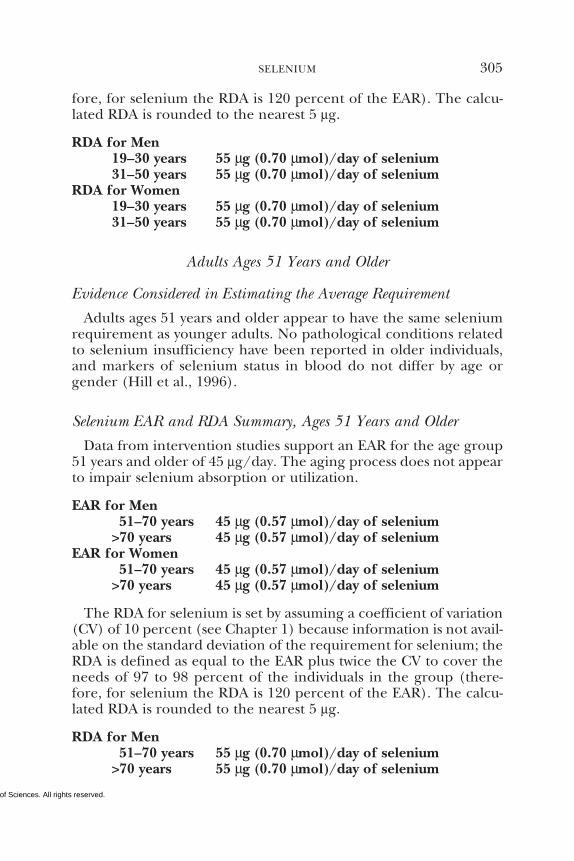
Copyright © National Academy of Sciences. All rights reserved.
SELENIUM 305
fore, for selenium the RDA is 120 percent of the EAR). The calcu-lated RDA is rounded to the nearest 5 µg.
RDA for Men19–30 years 55 µg (0.70 µmol)/day of selenium31–50 years 55 µg (0.70 µmol)/day of selenium
RDA for Women19–30 years 55 µg (0.70 µmol)/day of selenium31–50 years 55 µg (0.70 µmol)/day of selenium
Adults Ages 51 Years and Older
Evidence Considered in Estimating the Average Requirement
Adults ages 51 years and older appear to have the same seleniumrequirement as younger adults. No pathological conditions relatedto selenium insufficiency have been reported in older individuals,and markers of selenium status in blood do not differ by age orgender (Hill et al., 1996).
Selenium EAR and RDA Summary, Ages 51 Years and Older
Data from intervention studies support an EAR for the age group51 years and older of 45 µg/day. The aging process does not appearto impair selenium absorption or utilization.
EAR for Men51–70 years 45 µg (0.57 µmol)/day of selenium
>70 years 45 µg (0.57 µmol)/day of seleniumEAR for Women
51–70 years 45 µg (0.57 µmol)/day of selenium>70 years 45 µg (0.57 µmol)/day of selenium
The RDA for selenium is set by assuming a coefficient of variation(CV) of 10 percent (see Chapter 1) because information is not avail-able on the standard deviation of the requirement for selenium; theRDA is defined as equal to the EAR plus twice the CV to cover theneeds of 97 to 98 percent of the individuals in the group (there-fore, for selenium the RDA is 120 percent of the EAR). The calcu-lated RDA is rounded to the nearest 5 µg.
RDA for Men51–70 years 55 µg (0.70 µmol)/day of selenium
>70 years 55 µg (0.70 µmol)/day of selenium
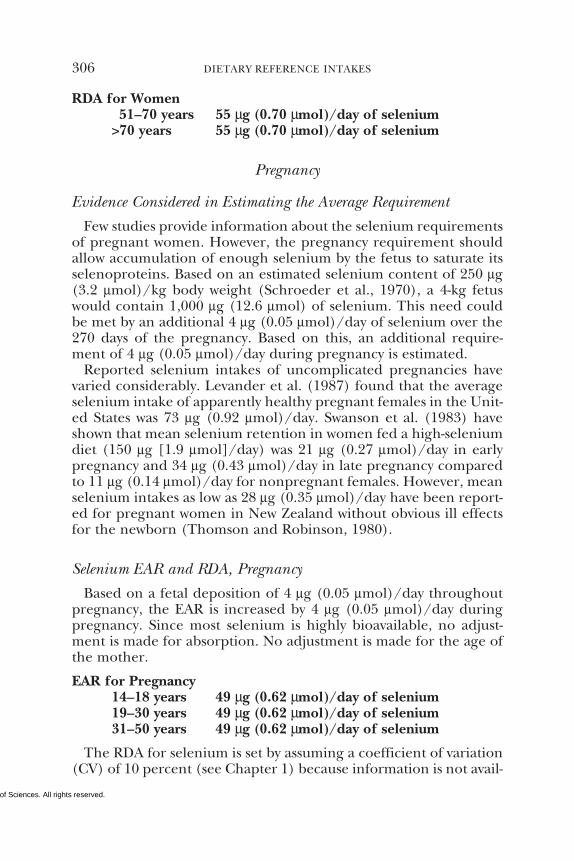
Copyright © National Academy of Sciences. All rights reserved.
306 DIETARY REFERENCE INTAKES
RDA for Women51–70 years 55 µg (0.70 µmol)/day of selenium
>70 years 55 µg (0.70 µmol)/day of selenium
Pregnancy
Evidence Considered in Estimating the Average Requirement
Few studies provide information about the selenium requirementsof pregnant women. However, the pregnancy requirement shouldallow accumulation of enough selenium by the fetus to saturate itsselenoproteins. Based on an estimated selenium content of 250 µg(3.2 µmol)/kg body weight (Schroeder et al., 1970), a 4-kg fetuswould contain 1,000 µg (12.6 µmol) of selenium. This need couldbe met by an additional 4 µg (0.05 µmol)/day of selenium over the270 days of the pregnancy. Based on this, an additional require-ment of 4 µg (0.05 µmol)/day during pregnancy is estimated.
Reported selenium intakes of uncomplicated pregnancies havevaried considerably. Levander et al. (1987) found that the averageselenium intake of apparently healthy pregnant females in the Unit-ed States was 73 µg (0.92 µmol)/day. Swanson et al. (1983) haveshown that mean selenium retention in women fed a high-seleniumdiet (150 µg [1.9 µmol]/day) was 21 µg (0.27 µmol)/day in earlypregnancy and 34 µg (0.43 µmol)/day in late pregnancy comparedto 11 µg (0.14 µmol)/day for nonpregnant females. However, meanselenium intakes as low as 28 µg (0.35 µmol)/day have been report-ed for pregnant women in New Zealand without obvious ill effectsfor the newborn (Thomson and Robinson, 1980).
Selenium EAR and RDA, Pregnancy
Based on a fetal deposition of 4 µg (0.05 µmol)/day throughoutpregnancy, the EAR is increased by 4 µg (0.05 µmol)/day duringpregnancy. Since most selenium is highly bioavailable, no adjust-ment is made for absorption. No adjustment is made for the age ofthe mother.
EAR for Pregnancy14–18 years 49 µg (0.62 µmol)/day of selenium19–30 years 49 µg (0.62 µmol)/day of selenium31–50 years 49 µg (0.62 µmol)/day of selenium
The RDA for selenium is set by assuming a coefficient of variation(CV) of 10 percent (see Chapter 1) because information is not avail-
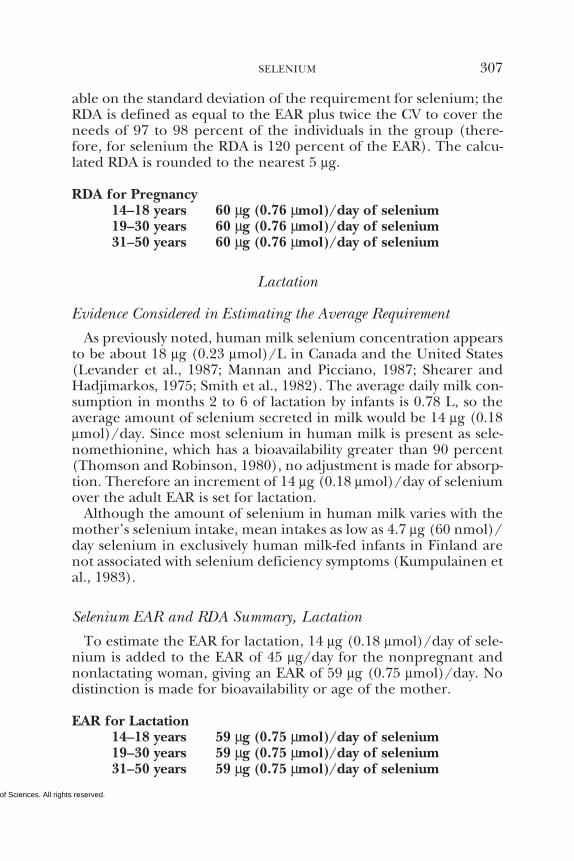
Copyright © National Academy of Sciences. All rights reserved.
SELENIUM 307
able on the standard deviation of the requirement for selenium; theRDA is defined as equal to the EAR plus twice the CV to cover theneeds of 97 to 98 percent of the individuals in the group (there-fore, for selenium the RDA is 120 percent of the EAR). The calcu-lated RDA is rounded to the nearest 5 µg.
RDA for Pregnancy14–18 years 60 µg (0.76 µmol)/day of selenium19–30 years 60 µg (0.76 µmol)/day of selenium31–50 years 60 µg (0.76 µmol)/day of selenium
Lactation
Evidence Considered in Estimating the Average Requirement
As previously noted, human milk selenium concentration appearsto be about 18 µg (0.23 µmol)/L in Canada and the United States(Levander et al., 1987; Mannan and Picciano, 1987; Shearer andHadjimarkos, 1975; Smith et al., 1982). The average daily milk con-sumption in months 2 to 6 of lactation by infants is 0.78 L, so theaverage amount of selenium secreted in milk would be 14 µg (0.18µmol)/day. Since most selenium in human milk is present as sele-nomethionine, which has a bioavailability greater than 90 percent(Thomson and Robinson, 1980), no adjustment is made for absorp-tion. Therefore an increment of 14 µg (0.18 µmol)/day of seleniumover the adult EAR is set for lactation.
Although the amount of selenium in human milk varies with themother’s selenium intake, mean intakes as low as 4.7 µg (60 nmol)/day selenium in exclusively human milk-fed infants in Finland arenot associated with selenium deficiency symptoms (Kumpulainen etal., 1983).
Selenium EAR and RDA Summary, Lactation
To estimate the EAR for lactation, 14 µg (0.18 µmol)/day of sele-nium is added to the EAR of 45 µg/day for the nonpregnant andnonlactating woman, giving an EAR of 59 µg (0.75 µmol)/day. Nodistinction is made for bioavailability or age of the mother.
EAR for Lactation14–18 years 59 µg (0.75 µmol)/day of selenium19–30 years 59 µg (0.75 µmol)/day of selenium31–50 years 59 µg (0.75 µmol)/day of selenium
Copyright © National Academy of Sciences. All rights reserved.
308 DIETARY REFERENCE INTAKES
The RDA for selenium is set by assuming a coefficient of variation(CV) of 10 percent (see Chapter 1) because information is not avail-able on the standard deviation of the requirement for selenium; theRDA is defined as equal to the EAR plus twice the CV to cover theneeds of 97 to 98 percent of the individuals in the group (there-fore, for selenium the RDA is 120 percent of the EAR). The calcu-lated RDA is rounded to the nearest 5 µg.
RDA for Lactation14–18 years 70 µg (0.89 µmol)/day of selenium19–30 years 70 µg (0.89 µmol)/day of selenium31–50 years 70 µg (0.89 µmol)/day of selenium
INTAKE OF SELENIUM
Food Sources
The selenium content of food varies depending on the seleniumcontent of the soil where the animal was raised or the plant wasgrown: organ meats and seafood, 0.4 to 1.5 µg/g; muscle meats, 0.1to 0.4 µg/g; cereals and grains, less than 0.1 to greater than 0.8 µg/g; dairy products, less than 0.1 to 0.3 µg/g; and fruits and vegeta-bles, less than 0.1 µg/g (WHO, 1987). Thus the same foodstuffsmay have more than a ten-fold difference in selenium content.Plants do not appear to require selenium and most selenium me-tabolism by plants occurs through sulfur pathways in which seleni-um substitutes for sulfur. Thus, plant content of selenium dependson the availability of the element in the soil where the plant wasgrown. This means that wheat grown in a low-selenium soil will havea low selenium content, whereas the same wheat variety grown in ahigh-selenium soil will have a high selenium content. For this rea-son, food tables that reflect average selenium contents are unreli-able. Much plant selenium is in the form of selenomethionine, sele-nocysteine, or selenocysteine metabolites. Other organic forms ofthe element are known to exist, including some that have not yetbeen identified.
Unlike plants, animals require selenium. Meat and seafood aretherefore reliable dietary sources of selenium. Meat and seafoodcontain selenium in its functional form as selenoproteins. Virtuallyall animal proteins contain selenomethionine obtained when theanimal consumes selenium from plants. This means that meat var-ies in its selenium content depending largely on the selenomethio-nine intake of the animal.
Copyright © National Academy of Sciences. All rights reserved.
SELENIUM 309
Dietary Intake
Intake from Food
The dietary selenium intakes in the United States and Canadahave been estimated in several studies. A detailed evaluation of di-ets consumed by 22 Maryland residents (using direct selenium anal-ysis) indicated that selenium intake was 81 ± 41 (SD) µg (1.0 ± 0.5µmol)/day (Welsh et al., 1981). The Food and Drug Administrationanalyzed food items purchased in different regions of the UnitedStates over the period 1982 to 1991 and calculated dietary seleniumintake from those results (Pennington and Schoen, 1996). The me-dian calculated intake was 87 µg (1.1 µmol)/day with a range of 79to 104 µg (1.0 to 1.3 µmol)/day in different years. These resultssupport those of the Maryland study generally, but do not providean indication of the extremes of selenium intake in the UnitedStates.
The Third National Health and Nutrition Examination Survey(NHANES III) intake data (Appendix Tables C-6 and C-7) reportedhigher median selenium intakes of 106 µg (1.3 µmol)/day fromfood and 108 µg (1.4 µmol)/day from food and supplements for allindividuals based on dietary recall and food tables, but this methodhas low accuracy as discussed earlier. Selenium intake in Canadahas been reported to be somewhat higher than U.S. intake, 113 to220 µg (1.4 to 2.8 µmol)/day (Thompson et al., 1975).
Dietary intake of selenium varies tremendously among differentpopulations. Factors that affect the intake include the geographicorigin of the food items and the meat content of the diet. Thelowest selenium intakes are in populations that eat vegetarian dietsconsisting of plants grown in low-selenium areas. Selenium-deficientChinese populations live in low-selenium areas and are generallytoo poor to eat meat or to purchase food grown in other regions.Dietary intake of selenium in the United States and Canada variesby region but is buffered by the food distribution system. Thus,extensive transport of food throughout Canada and the UnitedStates prevents low-selenium geographic areas from having low di-etary selenium intakes.
Intake from Water
Drinking water has been analyzed in the United States and severalcountries and does not supply nutritionally significant amounts ofselenium (Bratakos et al., 1988; NRC, 1980a; Robberecht et al.,
Copyright © National Academy of Sciences. All rights reserved.
310 DIETARY REFERENCE INTAKES
1983). Tap water is routinely used throughout the United Statesand Canada to raise selenium-deficient experimental animals. Thisis evidence that it contains very little selenium. In specific locales,however, water wells have been shown to supply much greateramounts of selenium. This is thought to result from irrigation prac-tices, mining, or the presence of selenium-containing rocks (Valen-tine et al., 1978). Such high-selenium water supplies appear to bevery limited and do not contribute to the selenium intake of largenumbers of people (NRC, 1976).
Serum Concentrations
Information from NHANES III on serum selenium concentrationsin a free-living population is given in Appendix Table F-3. Serum orplasma selenium concentrations greater than the 0.8 to 1.1 µmol/L(7 to 9 µg/dL) plateau concentration are associated with maximiza-tion of plasma selenoproteins (Hill et al., 1996). The NHANES IIImedian serum selenium concentration was 1.4 µmol/L (12.4 µg/dL) for 17,630 subjects aged 9 to more than 70 years. The firstpercentile was 1.1 µmol/L (9.5 µg/dL) and the ninety-ninth per-centile was 1.9 µmol/L (16.3 µg/dL). This shows that at least 99percent of these subjects should have had maximal concentrationsof plasma selenoproteins. Thus, the NHANES III serum data anddietary intake data (based on food tables) collected from 1988 to1992 indicate that the selenium requirement of its participants wasbeing met.
Intake from Supplements
In the United States or Canada, food is generally not fortifiedwith selenium. An exception is proprietary infant formula that isdesigned to be the sole source of nutrients for the infant. Commer-cial formula manufacturers typically add selenium to ensure thatinfants consuming them will have an adequate selenium intake.Total selenium intakes from food plus supplements reported inNHANES III are found in Appendix Table C-7.
Selenium supplements of many strengths and types are availablefor purchase, and some popular multivitamin preparations containselenium. However, according to NHANES III, selenium intakefrom both food (Appendix Table C-6) and food plus supplements(Appendix Table C-7) is above the EAR for most age groups in theUnited States. In the 1986 National Health Interview Survey, 9 per-
Copyright © National Academy of Sciences. All rights reserved.
SELENIUM 311
cent of all adults reported use of supplements containing selenium(Moss et al., 1989).
TOLERABLE UPPER INTAKE LEVELS
Hazard Identification
The Tolerable Upper Intake Level (UL) is the highest level ofdaily nutrient intake that is likely to pose no risk of adverse healtheffects in almost all individuals. Although members of the generalpopulation should be advised not to exceed the UL for seleniumroutinely, intake above the UL may be appropriate for investigationwithin well-controlled clinical trials. In light of evaluating possiblebenefits to health, clinical trials of doses above the UL should notbe discouraged, as long as subjects participating in these trials havesigned informed consent documents regarding possible toxicity andas long as these trials employ appropriate safety monitoring of trialsubjects. Also, the UL is not meant to apply to individuals who arereceiving selenium under medical supervision.
Adverse Effects
The Tolerable Upper Intake Level (UL) for selenium pertains toselenium intake from food and supplements. As discussed earlier,drinking water does not contain nutritionally significant amountsof selenium. The data on chronic selenosis, acute toxicity, and bio-chemical indicators of toxicity are reviewed.
Chronic Selenosis. Chronic toxicity of selenium has been studiedin animals and has been observed in humans. The limited dataavailable in humans suggest that chronic toxicities from inorganicand organic forms have similar clinical features but differ in rapidi-ty of onset and relationship to tissue selenium concentrations.
The most frequently reported features of selenosis (chronic toxic-ity) are hair and nail brittleness and loss (Yang et al., 1983). Otherreported signs include gastrointestinal disturbances, skin rash, gar-lic breath odor (caused by selenium compounds), fatigue, irritabili-ty, and nervous system abnormalities (CDC, 1984; Helzlsouer et al.,1985; Jensen et al., 1984; Yang et al., 1983; G.-Q. Yang et al., 1989a).
The high prevalence of selenosis in Enshi, South China, providedan opportunity to study approximately 380 people with high seleni-um intakes (Yang and Zhou, 1994; G.-Q. Yang et al., 1989a, 1989b).Toxic effects occurred with increasing frequency in people with a
Copyright © National Academy of Sciences. All rights reserved.
312 DIETARY REFERENCE INTAKES
blood selenium concentration greater than 12.7 µmol/L (100 µg/dL), corresponding to a selenium intake above 850 µg/day.
Acute Toxicity Effects. There are a few reports in the literature ofacute fatal or near-fatal selenium poisoning with either accidentalor suicidal ingestion of selenium, usually in the form of gun blueingsolution or sheep drench. Gun blue is a lubricant solution contain-ing selenious acid, nitric acid, and copper nitrate (Ruta and Haid-er, 1989). Ingestion of this liquid, which would result in ingestionof gram quantities of selenium, is typically followed by severe gas-trointestinal and neurological disturbances, acute respiratory dis-tress syndrome, myocardial infarction, and renal failure (Carter,1966; Lombeck et al., 1987; Matoba et al., 1986; Nantel et al., 1985;Pentel et al., 1985). Autopsy revealed necrosis of gut and kidney,cardiomyopathy, and severe pulmonary edema.
Biochemical Indicators of Selenium Toxicity. Biochemical assessmentof high selenium intakes is more difficult than assessment of lowintakes. The selenoproteins are maximized when nutritional re-quirements of the element have been met and do not rise furtherwith additional increments in selenium intake. Thus, measurementof selenoproteins is not useful in assessing potential toxicity.
Measurement of total selenium concentrations in tissue (includ-ing plasma and blood) is helpful in assessing the risk of toxicityfrom dietary selenium. Chinese investigators have correlated bloodselenium concentrations with dietary intakes from high-seleniumfoodstuffs (Yang and Zhou, 1994).
High intakes of selenium in the form of selenomethionine, themajor form of selenium in food, lead to large increases in tissueselenium concentrations. These increases are caused by the ran-dom incorporation of selenomethionine into proteins in place ofmethionine as discussed earlier. In contrast, inorganic forms of se-lenium, usually present in supplements, typically do not cause suchhigh tissue concentrations because these forms of selenium cannotenter the methionine pool. However, inorganic selenium can causetoxicity at tissue levels of selenium much lower than seen with simi-lar intakes of dietary selenium as selenomethionine. Severe toxicitywas reported from selenite ingestion that increased blood concen-trations by only a small amount (CDC, 1984). Thus, it is necessaryto know the chemical form of selenium being ingested in order touse the tissue level of the element to estimate selenium intake dueto release of selenium as a result of normal protein metabolism.
Copyright © National Academy of Sciences. All rights reserved.
SELENIUM 313
Incorporation of dietary selenomethionine into protein delays se-lenium toxicity. This storage has created the impression that pro-tein-bound dietary selenium is less toxic than inorganic selenium.Although inorganic selenium has greater immediate toxicity thandoes selenomethionine, both forms are likely to have similar toxici-ties under conditions of chronic intake.
Methylated selenium metabolites appear in the breath when largequantities of the element are ingested (McConnell and Portman,1952). These metabolites are responsible for a garlic odor of thebreath. Measurement of excretory metabolites of selenium, whetherurinary or breath, is subject to significant error, because excretionby these routes is a function of recent intake as well as long-termselenium status. For example, selenium-deficient rats given a singlelarge dose of selenium excrete part of that dose in the breath (Burket al., 1972). In addition, quantitation of breath selenium excretionhas never been linked to selenium toxicity. Based on these consider-ations, breath selenium cannot be used as an index of seleniumtoxicity at present, and urinary selenium excretion can be used asan index of toxicity only under carefully controlled conditions.
Summary
Based on considerations of causality, relevance, and the qualityand completeness of the database, hair and nail brittleness and losswere selected as the critical endpoints on which to base a UL. Hairand nail brittleness and loss have been reported more frequentlythan other signs and symptoms of chronic selenosis. Biochemicalmarkers have too much variation to be reliable except under con-trolled conditions.
Dose-Response Assessment
Adults
Data Selection. A useful data set for determining dose-response ofselenium toxicity from food sources was reported by Chinese inves-tigators (Yang and Zhou, 1994). That report consisted of a reexam-ination (in 1992) of five patients previously found (in 1986) to haveovert signs of selenosis: hair loss and nail sloughing. Because thesame patients were studied at different times while consuming thesame food form of selenium, blood levels of selenium can be com-pared and dietary intakes can be inferred from blood selenium con-centrations.
Copyright © National Academy of Sciences. All rights reserved.
314 DIETARY REFERENCE INTAKES
Identification of a No-Observed-Adverse-Effect Level (NOAEL) and aLowest-Observed-Adverse-Effects Level (LOAEL). The lowest blood levelof selenium measured in the five subjects at initial examination was13.3 µmol/L (105 µg/dL), corresponding to a selenium intake of913 µg (12 µmol)/day (range: 913 to 1,907 µg [12 to 24 µmol]/day). The average blood selenium level was 16.9 µmol/L (135 µg/dL). At the time of reexamination in 1992, all five patients weredescribed as recovered from selenium poisoning, although theirfingernails reportedly appeared brittle. The mean blood seleniumlevel had decreased to 12.3 µmol/L (97 µg/dL), corresponding to aselenium intake of about 800 µg (10 µmol)/day (range 654 to 952µg [8.3 to 12 µmol]/day). The lower limit of the 95 percent confi-dence interval was 600 µg (7.6 µmol)/day.
Yang and Zhou (1994) therefore suggested that 913 µg (12 µmol)/day of selenium intake represents an individual marginal toxic dailyselenium intake or LOAEL. They further suggested that the meanselenium intake upon reexamination (800 µg [10 µmol]/day), rep-resented a NOAEL, while 600 µg (7.6 µmol)/day of selenium intakewas the lower 95 percent confidence limit for the NOAEL. Thesevalues appear reasonable, although the number of subjects wassmall. Nevertheless, the LOAEL for selenosis in this small data setappears to be representative of the larger data set, and the reexam-ination of the subjects provides valuable dose-response data. Uncer-tainty occurs because of the smallness of the data set and becausethe Chinese subjects may not be typical (e.g., they may be more orless sensitive to selenium than other populations).
Longnecker et al. (1991) studied 142 ranchers, both men andwomen, from eastern Wyoming and western South Dakota who wererecruited to participate and were suspected of having high seleni-um intakes based on the occurrence of selenosis in livestock raisedin that region. Average selenium intake was 239 µg (3 µmol)/day.Dietary intake and selenium in body tissues (whole blood, serum,urine, toenails) were highly correlated. Blood selenium concen-trations in this western U.S. population were related to seleniumintake in a similar manner to that found in the Chinese studies,presumably because the form of selenium ingested was seleno-methionine. No evidence of selenosis was reported, nor were thereany alterations in enzyme activities, prothrombin times, or hematol-ogy that could be attributed to selenium intake. The highest seleni-um intake in the study was 724 µg (9 µmol)/day.
It thus appears that a UL based on the Chinese studies is protec-tive for the population in the United States and Canada. Thereforea NOAEL of 800 µg (10 µmol)/day is selected.
Copyright © National Academy of Sciences. All rights reserved.
SELENIUM 315
Uncertainty Assessment. An uncertainty factor (UF) of 2 was se-lected to protect sensitive individuals. The toxic effect is not severe,but may not be readily reversible, so a UF greater than 1 is needed.
Derivation of a UL. The NOAEL of 800 µg/day was divided by aUF of 2 to obtain a UL for adults as follows:
NOAELUF
800 g / day2
400 g / day.= =µµ
Selenium UL Summary, Ages 19 Years and Older
UL for Adults19 years and older 400 µg (5.1 µmol)/day of selenium
Pregnancy and Lactation
Brätter et al. (1996) studied the effects of selenium intake onmetabolism of thyroid hormones in lactating mothers in selenifer-ous regions in the foothills of the Venezuelan Andes. Selenium in-takes ranged from 170 to 980 µg (2.2 to 12.4 µmol)/day. An inversecorrelation between selenium intake and free triiodothyronine(FT3) was observed, but all values were found to be within the nor-mal range.
There are no reports of teratogenicity or selenosis in infants bornto mothers with high but not toxic intakes of selenium. Therefore,ULs for pregnant and lactating women are the same as for nonpreg-nant and nonlactating women (400 µg [5.1 µmol]/day).
Selenium UL Summary, Pregnancy and Lactation
UL for Pregnancy14–18 years 400 µg (5.1 µmol)/day of selenium19 years and older 400 µg (5.1 µmol)/day of selenium
UL for Lactation14–18 years 400 µg (5.1 µmol)/day of selenium19 years and older 400 µg (5.1 µmol)/day of selenium
Infants and Children
Data Selection. There are several approaches for estimating a ULin human milk-fed infants (Levander, 1989). However, the mostconservative approach is to use the data of Shearer and Hadjimar-kos (1975).
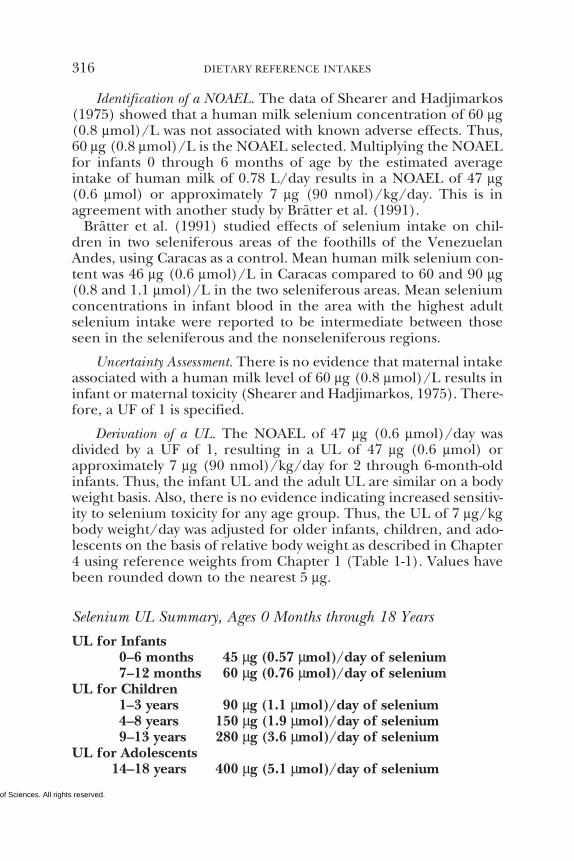
Copyright © National Academy of Sciences. All rights reserved.
316 DIETARY REFERENCE INTAKES
Identification of a NOAEL. The data of Shearer and Hadjimarkos(1975) showed that a human milk selenium concentration of 60 µg(0.8 µmol)/L was not associated with known adverse effects. Thus,60 µg (0.8 µmol)/L is the NOAEL selected. Multiplying the NOAELfor infants 0 through 6 months of age by the estimated averageintake of human milk of 0.78 L/day results in a NOAEL of 47 µg(0.6 µmol) or approximately 7 µg (90 nmol)/kg/day. This is inagreement with another study by Brätter et al. (1991).
Brätter et al. (1991) studied effects of selenium intake on chil-dren in two seleniferous areas of the foothills of the VenezuelanAndes, using Caracas as a control. Mean human milk selenium con-tent was 46 µg (0.6 µmol)/L in Caracas compared to 60 and 90 µg(0.8 and 1.1 µmol)/L in the two seleniferous areas. Mean seleniumconcentrations in infant blood in the area with the highest adultselenium intake were reported to be intermediate between thoseseen in the seleniferous and the nonseleniferous regions.
Uncertainty Assessment. There is no evidence that maternal intakeassociated with a human milk level of 60 µg (0.8 µmol)/L results ininfant or maternal toxicity (Shearer and Hadjimarkos, 1975). There-fore, a UF of 1 is specified.
Derivation of a UL. The NOAEL of 47 µg (0.6 µmol)/day wasdivided by a UF of 1, resulting in a UL of 47 µg (0.6 µmol) orapproximately 7 µg (90 nmol)/kg/day for 2 through 6-month-oldinfants. Thus, the infant UL and the adult UL are similar on a bodyweight basis. Also, there is no evidence indicating increased sensitiv-ity to selenium toxicity for any age group. Thus, the UL of 7 µg/kgbody weight/day was adjusted for older infants, children, and ado-lescents on the basis of relative body weight as described in Chapter4 using reference weights from Chapter 1 (Table 1-1). Values havebeen rounded down to the nearest 5 µg.
Selenium UL Summary, Ages 0 Months through 18 Years
UL for Infants0–6 months 45 µg (0.57 µmol)/day of selenium7–12 months 60 µg (0.76 µmol)/day of selenium
UL for Children1–3 years 90 µg (1.1 µmol)/day of selenium4–8 years 150 µg (1.9 µmol)/day of selenium9–13 years 280 µg (3.6 µmol)/day of selenium
UL for Adolescents14–18 years 400 µg (5.1 µmol)/day of selenium
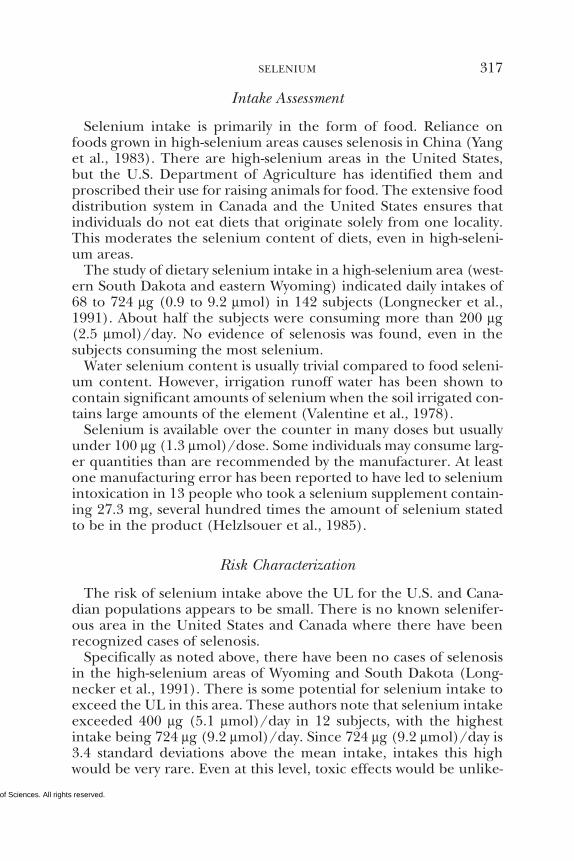
Copyright © National Academy of Sciences. All rights reserved.
SELENIUM 317
Intake Assessment
Selenium intake is primarily in the form of food. Reliance onfoods grown in high-selenium areas causes selenosis in China (Yanget al., 1983). There are high-selenium areas in the United States,but the U.S. Department of Agriculture has identified them andproscribed their use for raising animals for food. The extensive fooddistribution system in Canada and the United States ensures thatindividuals do not eat diets that originate solely from one locality.This moderates the selenium content of diets, even in high-seleni-um areas.
The study of dietary selenium intake in a high-selenium area (west-ern South Dakota and eastern Wyoming) indicated daily intakes of68 to 724 µg (0.9 to 9.2 µmol) in 142 subjects (Longnecker et al.,1991). About half the subjects were consuming more than 200 µg(2.5 µmol)/day. No evidence of selenosis was found, even in thesubjects consuming the most selenium.
Water selenium content is usually trivial compared to food seleni-um content. However, irrigation runoff water has been shown tocontain significant amounts of selenium when the soil irrigated con-tains large amounts of the element (Valentine et al., 1978).
Selenium is available over the counter in many doses but usuallyunder 100 µg (1.3 µmol)/dose. Some individuals may consume larg-er quantities than are recommended by the manufacturer. At leastone manufacturing error has been reported to have led to seleniumintoxication in 13 people who took a selenium supplement contain-ing 27.3 mg, several hundred times the amount of selenium statedto be in the product (Helzlsouer et al., 1985).
Risk Characterization
The risk of selenium intake above the UL for the U.S. and Cana-dian populations appears to be small. There is no known selenifer-ous area in the United States and Canada where there have beenrecognized cases of selenosis.
Specifically as noted above, there have been no cases of selenosisin the high-selenium areas of Wyoming and South Dakota (Long-necker et al., 1991). There is some potential for selenium intake toexceed the UL in this area. These authors note that selenium intakeexceeded 400 µg (5.1 µmol)/day in 12 subjects, with the highestintake being 724 µg (9.2 µmol)/day. Since 724 µg (9.2 µmol)/day is3.4 standard deviations above the mean intake, intakes this highwould be very rare. Even at this level, toxic effects would be unlike-
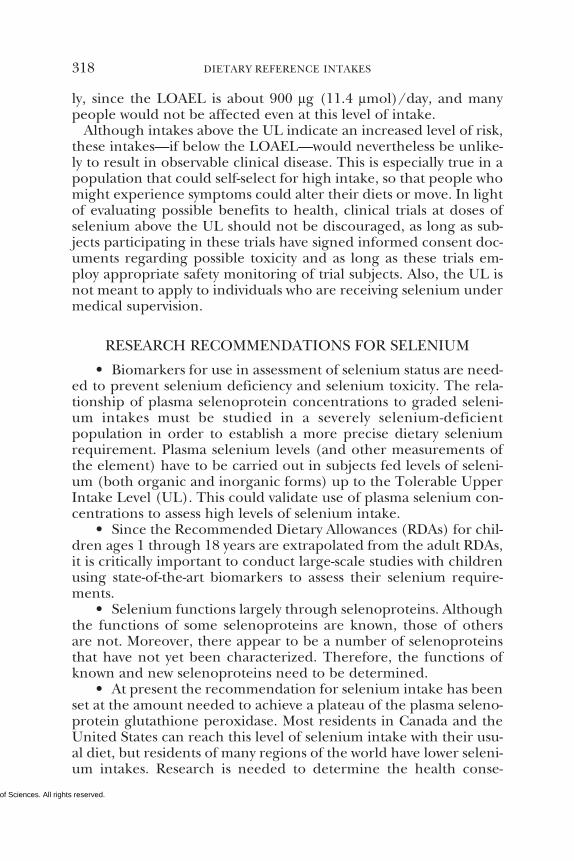
Copyright © National Academy of Sciences. All rights reserved.
318 DIETARY REFERENCE INTAKES
ly, since the LOAEL is about 900 µg (11.4 µmol)/day, and manypeople would not be affected even at this level of intake.
Although intakes above the UL indicate an increased level of risk,these intakes—if below the LOAEL—would nevertheless be unlike-ly to result in observable clinical disease. This is especially true in apopulation that could self-select for high intake, so that people whomight experience symptoms could alter their diets or move. In lightof evaluating possible benefits to health, clinical trials at doses ofselenium above the UL should not be discouraged, as long as sub-jects participating in these trials have signed informed consent doc-uments regarding possible toxicity and as long as these trials em-ploy appropriate safety monitoring of trial subjects. Also, the UL isnot meant to apply to individuals who are receiving selenium undermedical supervision.
RESEARCH RECOMMENDATIONS FOR SELENIUM
• Biomarkers for use in assessment of selenium status are need-ed to prevent selenium deficiency and selenium toxicity. The rela-tionship of plasma selenoprotein concentrations to graded seleni-um intakes must be studied in a severely selenium-deficientpopulation in order to establish a more precise dietary seleniumrequirement. Plasma selenium levels (and other measurements ofthe element) have to be carried out in subjects fed levels of seleni-um (both organic and inorganic forms) up to the Tolerable UpperIntake Level (UL). This could validate use of plasma selenium con-centrations to assess high levels of selenium intake.
• Since the Recommended Dietary Allowances (RDAs) for chil-dren ages 1 through 18 years are extrapolated from the adult RDAs,it is critically important to conduct large-scale studies with childrenusing state-of-the-art biomarkers to assess their selenium require-ments.
• Selenium functions largely through selenoproteins. Althoughthe functions of some selenoproteins are known, those of othersare not. Moreover, there appear to be a number of selenoproteinsthat have not yet been characterized. Therefore, the functions ofknown and new selenoproteins need to be determined.
• At present the recommendation for selenium intake has beenset at the amount needed to achieve a plateau of the plasma seleno-protein glutathione peroxidase. Most residents in Canada and theUnited States can reach this level of selenium intake with their usu-al diet, but residents of many regions of the world have lower seleni-um intakes. Research is needed to determine the health conse-
Copyright © National Academy of Sciences. All rights reserved.
SELENIUM 319
quences of selenium intakes inadequate to allow full selenoproteinexpression.
• Limited evidence has been presented that intakes of seleni-um greater than the amount needed to allow full expression ofselenoproteins may have chemopreventive effects against cancer.Controlled intervention studies are needed to fully evaluate seleni-um as a cancer chemopreventive agent.
REFERENCESAllen JC, Keller RP, Archer P, Neville MC. 1991. Studies in human lactation: Milk
composition and daily secretion rates of macronutrients in the first year oflactation. Am J Clin Nutr 54:69–80.
Arteel GE, Mostert V, Oubrahim H, Briviba K, Abel J, Sies H. 1998. Protection byselenoprotein P in human plasma against peroxynitrite-mediated oxidationand nitration. Biol Chem 379:1201–1205.
Avissar N, Slemmon JR, Palmer IS, Cohen HJ. 1991. Partial sequence of humanplasma glutathione peroxidase and immunologic identification of milk glu-tathione peroxidase as the plasma enzyme. J Nutr 121:1243–1249.
Beck MA, Levander OA. 1998. Dietary oxidative stress and the potentiation of viralinfection. Annu Rev Nutr 18:93–116.
Behne D, Wolters W. 1983. Distribution of selenium and glutathione peroxidase inthe rat. J Nutr 113:456–461.
Behne D, Kyriakopoulos A, Kalcklosch M, Weiss-Nowak C, Pfeifer H, Gessner H,Hammel C. 1997. Two new selenoproteins found in the prostatic glandularepithelium and in the spermatid nuclei. Biomed Environ Sci 10:340–345.
Berry MJ, Larsen PR. 1992. The role of selenium in thyroid hormone action. En-docr Rev 13:207–219.
Blot WJ, Li JY, Taylor PR, Guo W, Dawsey SM, Li B. 1995. The Linxian trials:Mortality rates by vitamin-mineral intervention group. Am J Clin Nutr 62:1424S–1426S.
Bösl MR, Takaku K, Oshima M, Nishimura S, Taketo MM. 1997. Early embryoniclethality caused by targeted disruption of the mouse selenocysteine tRNA gene(Trsp). Proc Natl Acad Sci USA 94:5531–5534.
Bratakos MS, Zafiropoulos TF, Siskos PA, Ioannou PV. 1988. Total selenium con-centration in tap and bottled drinking water and coastal waters of Greece. SciTotal Environ 76:49–54.
Brätter P, Negretti de Brätter VE. 1996. Influence of high dietary selenium intakeon the thyroid hormone level in human serum. J Trace Elem Med Biol 10:163–166.
Brätter P, Negretti de Brätter VE, Jaffe WG, Mendez Castellano H. 1991. Seleniumstatus of children living in seleniferous areas of Venezuela. J Trace Elem Electro-lytes Hlth Dis 5:269–270.
Burk RF, Brown DG, Seely RJ, Scaief CC III. 1972. Influence of dietary and injectedselenium on whole-body retention, route of excretion, and tissue retention of75SeO3
2- in the rat. J Nutr 102:1049–1055.Burk RF, Hill KE, Awad JA, Morrow JD, Kato T, Cockell KA, Lyons PR. 1995.
Pathogenesis of diquat-induced liver necrosis in selenium-deficient rats. As-
Copyright © National Academy of Sciences. All rights reserved.
320 DIETARY REFERENCE INTAKES
sessment of the roles of lipid peroxidation and selenoprotein P. Hepatology21:561–569.
Burk RF, Levander OA. 1999. Selenium. In: Shils ME, Olson JA, Shike M, Ross AC,eds. Modern Nutrition in Health and Disease, 9th edition. Baltimore, MD: Will-iams & Wilkins. Pp. 265–276.
Burk RF, Pearson WN, Wood RP II, Viteri F. 1967. Blood selenium levels and invitro red blood cell uptake of 75Se in kwashiorkor. Am J Clin Nutr 20:723–733.
Butte NF, Garza C, Smith EO, Nichols BL. 1984. Human milk intake and growth inexclusively breast-fed infants. J Pediatr 104:187–195.
Cantor AH, Tarino JZ. 1982. Comparative effects of inorganic and organic dietarysources of selenium on selenium levels and selenium-dependent glutathioneperoxidase activity in blood of young turkeys. J Nutr 112:2187–2196.
Carter RF. 1966. Acute selenium poisoning. Med J Aust 1:525–528.CDC (Centers for Disease Control and Prevention). 1984. Selenium intoxication—
New York. Morbid Mortal Wkly Rep 33:157–158.Cheng Y-Y, Qian P-C. 1990. The effect of selenium-fortified table salt in the preven-
tion of Keshan disease on a population of 1.05 million. Biomed Environ Sci3:422–428.
Clark LC, Cantor KP, Allaway WH. 1991. Selenium in forage crops and cancermortality in U.S. counties. Arch Environ Health 46:37–42.
Clark LC, Combs GF, Turnbull BW, Slate EH, Chalker DK, Chow J, Davis LS,Glover RA, Graham GF, Gross EG, Krongrad A, Lesher JL, Park HK, SandersBB, Smith CL, Taylor JR. 1996. Effects of selenium supplementation for can-cer prevention in patients with carcinoma of the skin. A randomized con-trolled trial. J Am Med Assoc 276:1957–1963.
Cohen HJ, Chovaniec ME, Mistretta D, Baker SS. 1985. Selenium repletion andglutathione peroxidase—Differential effects on plasma and red blood cell en-zyme activity. Am J Clin Nutr 41:735–747.
Cumming FJ, Fardy JJ, Woodward DR. 1992. Selenium and human lactation inAustralia: Milk and blood selenium levels in lactating women, and seleniumintakes of their breast-fed infants. Acta Paediatr 81:292–295.
Debski B, Finley DA, Picciano MF, Lonnerdal B, Milner J. 1989. Selenium contentand glutathione peroxidase activity of milk from vegetarian and nonvegetari-an women. J Nutr 119:215–220.
Dewey KG, Finley DA, Lonnerdal B. 1984. Breast milk volume and compositionduring late lactation (7–20 months). J Pediatr Gastroenterol Nutr 3:713–720.
Duffield AJ, Thomson CD, Hill KE, Williams S. 1999. An estimation of seleniumrequirements for New Zealanders. Am J Clin Nutr 70:896–903.
Ehrenreich A, Forchhammer K, Tormay P, Veprek B, Böck A. 1992. Selenoproteinsynthesis in E. coli. Purification and characterization of the enzyme catalysingselenium activation. Eur J Biochem 206:767–773.
Ellis L, Picciano MF, Smith AM, Hamosh M, Mehta NR. 1990. The impact of gesta-tional length on human milk selenium concentration and glutathione peroxi-dase activity. Pediatr Res 27:32–35.
Esaki N, Nakamura T, Tanaka H, Soda K. 1982. Selenocysteine lyase, a novel en-zyme that specifically acts on selenocysteine. Mammalian distribution and pu-rification and properties of pig liver enzyme. J Biol Chem 257:4386–4391.
Flohe L. 1988. Glutathione peroxidase. Basic Life Sci 49:663–668.Fomon SJ, Anderson TA. 1974. Infant Nutrition, 2nd edition. Philadelphia: WB
Saunders. Pp. 104–111.
Copyright © National Academy of Sciences. All rights reserved.
SELENIUM 321
Funk MA, Hamlin L, Picciano MF, Prentice A, Milner JA. 1990. Milk selenium ofrural African women: Influence of maternal nutrition, parity, and length oflactation. Am J Clin Nutr 51:220–224.
Ge K, Xue A, Bai J, Wang S. 1983. Keshan disease—An endemic cardiomyopathy inChina. Virchows Arch A Pathol Anat Histopathol 401:1–15.
Griffiths NM. 1973. Dietary intake and urinary excretion of selenium in some NewZealand women. Proc Univ Otago Med Sch 51:8–9.
Guimaraes MJ, Peterson D, Vicari A, Cocks BG, Copeland NG, Gilbert DJ, JenkinsNA, Ferrick DA, Kastelein RA, Bazan JF, Zlotnik A. 1996. Identification of anovel selD homolog from eukaryotes, bacteria, and archaea: Is there an auto-regulatory mechanism in selenocysteine metabolism? Proc Natl Acad Sci USA93:15086–15091.
Heinig MJ, Nommsen LA, Peerson JM, Lonnerdal B, Dewey KG. 1993. Energy andprotein intakes of breast-fed and formula-fed infants during the first year oflife and their association with growth velocity: The DARLING Study. Am J ClinNutr 58:152–161.
Helzlsouer K, Jacobs R, Morris S. 1985. Acute selenium intoxication in the UnitedStates. Fed Proc 44:1670.
Higashi A, Tamari H, Kuroki Y, Matsuda I. 1983. Longitudinal changes in seleniumcontent of breast milk. Acta Paediatr Scand 72:433–436.
Hill KE, Xia Y, Åkesson B, Boeglin ME, Burk RF. 1996. Selenoprotein P concentra-tion in plasma is an index of selenium status in selenium-deficient and seleni-um-supplemented Chinese subjects. J Nutr 126:138–145.
Hojo Y. 1986. Sequential study on glutathione peroxidase and selenium contentsof human milk. Sci Total Environ 52:83–91.
IOM (Institute of Medicine). 1991. Nutrition During Lactation. Washington, DC:National Academy Press.
Ip C. 1998. Lessons from basic research in selenium and cancer prevention. J Nutr128:1845–1854.
Jensen R, Closson W, Rothenberg R. 1984. Selenium intoxication—New York.Morbid Mortal Wkly Rep 33:157–158.
Jochum F, Fuchs A, Cser A, Menzel H, Lombeck I. 1995. Trace mineral status offull-term infants fed human milk, milk-based formula or partially hydrolysedwhey protein formula. Analyst 120:905–909.
Keshan Disease Research Group. 1979. Observations on effect of sodium selenitein prevention of Keshan disease. Chin Med J 92:471–476.
Kumpulainen J, Vuori E, Kuitunen P, Makinen S, Kara R. 1983. Longitudinal studyon the dietary selenium intake of exclusively breast-fed infants and their moth-ers in Finland. Int J Vitam Nutr Res 53:420–426.
Kumpulainen J, Vuori E, Siimes MA. 1984. Effect of maternal dietary seleniumintake on selenium levels in breast milk. Int J Vitam Nutr Res 54:251–255.
Kumpulainen J, Salmenpera L, Siimes MA, Koivistoinen P, Perheentupa J. 1985.Selenium status of exclusively breast-fed infants as influenced by maternalorganic or inorganic selenium supplementation. Am J Clin Nutr 42:829–835.
Lacourciere GM, Stadtman TC. 1998. The NIFS protein can function as a selenidedelivery protein in the biosynthesis of selenophosphate. J Biol Chem 273:30921–30926.
Levander OA. 1976. Selenium in foods. In: Proceedings of the Symposium on Selenium-Tellurium in the Environment. South Bend, IN: University of Notre Dame.
Levander OA. 1989. Upper limit of selenium in infant formulas. J Nutr 119:1869–1873.
Copyright © National Academy of Sciences. All rights reserved.
322 DIETARY REFERENCE INTAKES
Levander OA, Moser PB, Morris VC. 1987. Dietary selenium intake and seleniumconcentrations of plasma, erythrocytes, and breast milk in pregnant and post-partum lactating and nonlactating women. Am J Clin Nutr 46:694–698.
Lombeck I, Ebert KH, Kasperek K, Feinendegen LE, Bremer HJ. 1984. Seleniumintake of infants and young children, healthy children and dietetically treatedpatients with phenylketonuria. Eur J Pediatr 143:99–102.
Lombeck I, Menzel H, Frosch D. 1987. Acute selenium poisoning of a 2-year oldchild. Eur J Pediatr 146:308–312.
Longnecker MP, Taylor PR, Levander OA, Howe M, Veillon C, McAdam PA, Patter-son KY, Holden JM, Stampfer MJ, Morris JS, Willett WC. 1991. Selenium indiet, blood, and toenails in relation to human health in a seleniferous area.Am J Clin Nutr 53:1288–1294.
Mannan S, Picciano MF. 1987. Influence of maternal selenium status on humanmilk selenium concentration and glutathione peroxidase activity. Am J ClinNutr 46:95–100.
Matoba R, Kimura H, Uchima E, Abe T, Yamada T, Mitsukuni Y, Shikata I. 1986.An autopsy case of acute selenium (selenious acid) poisoning and seleniumlevels in human tissues. Forensic Sci Int 31:87–92.
May JM, Cobb CE, Mendiratta S, Hill KE, Burk RF. 1998. Reduction of the ascorbylfree radical to ascorbate by thioredoxin reductase. J Biol Chem 273:23039–23045.
McConnell KP, Portman OW. 1952. Excretion of dimethyl selenide by the rat. J BiolChem 195:277–282.
Moss AJ, Levy AS, Kim I, Park YK. 1989. Use of Vitamin and Mineral Supplements in theUnited States: Current Users, Types of Products, and Nutrients. Advance Data, Vitaland Health Statistics of the National Center for Health Statistics. Number 174.Hyattsville, MD: National Center for Health Statistics.
Mozier NM, McConnell KP, Hoffman JL. 1988. S-Adenosyl-L-methionine:thioetherS-methyltransferase, a new enzyme in sulfur and selenium metabolism. J BiolChem 263:4527–4531.
Nantel AJ, Brown M, Dery P, Lefebvre M. 1985. Acute poisoning by selenious acid.Vet Hum Toxicol 27:531–533.
NRC (National Research Council). 1976. Selenium. Washington, DC: National Acad-emy of Sciences.
NRC (National Research Council). 1980a. Drinking Water and Health, Volume 3.Washington, DC: National Academy Press.
NRC (National Research Council). 1980b. Recommended Dietary Allowances, 9th edi-tion. Washington, DC: National Academy Press.
Pennington JA, Schoen SA. 1996. Total diet study: Estimated dietary intakes ofnutritional elements, 1982–1991. Int J Vitam Nutr Res 66:350–362.
Pentel P, Fletcher D, Jentzen J. 1985. Fatal acute selenium toxicity. J Forensic Sci30:556–562.
Robberecht H, Van Grieken R, Van Sprundel M, Vanden Berghe D, Deelstra H.1983. Selenium in environmental and drinking waters of Belgium. Sci TotalEnviron 26:163–172.
Ruta DA, Haider S. 1989. Attempted murder by selenium poisoning. Br Med J299:316–317.
Saito Y, Hayashi T, Tanaka A, Watanabe Y, Suzuki M, Saito E, Takahashi K. 1999.Selenoprotein P in human plasma as an extracellular phospholipid hydroper-oxide glutathione peroxidase. Isolation and enzymatic characterization of hu-man selenoprotein P. J Biol Chem 274:2866–2871.
Copyright © National Academy of Sciences. All rights reserved.
SELENIUM 323
Salbe AD, Levander OA. 1990. Effect of various dietary factors on the deposition ofselenium in the hair and nails of rats. J Nutr 120:200–206.
Schroeder HA, Frost DV, Balassa JJ. 1970. Essential trace metals in man: Selenium.J Chronic Dis 23:227–243.
Shearer RR, Hadjimarkos DM. 1975. Geographic distribution of selenium in hu-man milk. Arch Environ Hlth 30:230–233.
Smith AM, Picciano MF, Milner JA. 1982. Selenium intakes and status of humanmilk and formula fed infants. Am J Clin Nutr 35:521–526.
Stadtman TC. 1991. Biosynthesis and function of selenocysteine-containing en-zymes. J Biol Chem 266:16257–16260.
Sun QA, Wu Y, Zappacosta F, Jeang KT, Lee BJ, Hatfield DL, Gladyshev VN. 1999.Redox regulation of cell signaling by selenocysteine in mammalian thioredox-in reductases. J Biol Chem 274:24522–24530.
Sunde RA. 1994. Intracellular glutathione peroxidases—Structure, regulation, andfunction. In: Burk RF, ed. Selenium in Biology and Human Health. New York:Springer Verlag. Pp. 45–78.
Swanson CA, Reamer DC, Veillon C, King JC, Levander OA. 1983. Quantitativeand qualitative aspects of selenium utilization in pregnant and nonpregnantwomen: An application of stable isotope methodology. Am J Clin Nutr 38:169–180.
Swanson CA, Patterson BH, Levander OA, Veillon C, Taylor PR, Helzlsouer K,McAdam PA, Zech LA. 1991. Human [74Se]selenomethionine metabolism: Akinetic model. Am J Clin Nutr 54:917–926.
Thompson JN, Erdody P, Smith DC. 1975. Selenium content of food consumed byCanadians. J Nutr 105:274–277.
Thomson CD, Robinson MF. 1980. Selenium in human health and disease withemphasis on those aspects peculiar to New Zealand. Am J Clin Nutr 33:303–323.
Thomson CD, Robinson MF. 1986. Urinary and fecal excretions and absorption ofa large supplement of selenium: Superiority of selenate over selenite. Am JClin Nutr 44:659–663.
Valentine JL, Kang HK, Spivey GH. 1978. Selenium levels in human blood, urine,and hair in response to exposure via drinking water. Environ Res 17:347–355.
Vanderpas JB, Dumont JE, Contempre B, Diplock AT. 1992. Iodine and seleniumdeficiency in northern Zaire. Am J Clin Nutr 56:957–958.
Van Vleet JF. 1980. Current knowledge of selenium-vitamin E deficiency in domes-tic animals. J Am Vet Med Assoc 176:321–325.
Varo P, Alfthan G, Huttunen JK, Aro A. 1994. Nationwide selenium supplementa-tion in Finland—Effects on diet, blood and tissue levels, and health. In: BurkRF, ed. Selenium in Biology and Human Health. New York: Springer Verlag. Pp.197–218.
Veres Z, Tsai L, Scholz TD, Politino M, Balaban RS, Stadtman TC. 1992. Synthesisof 5-methylaminomethyl-2-selenouridine in tRNAs: 31P NMR studies show thelabile selenium donor synthesized by the selD gene product contains seleni-um bonded to phosphorus. Proc Natl Acad Sci USA 89:2975–2979.
Waschulewski IH, Sunde RA. 1988. Effect of dietary methionine on tissue seleniumand glutathione peroxidase (EC 1.11.1.9) activity in rats given selenomethion-ine. Br J Nutr 60:57–68.
Welsh SO, Holden JM, Wolf WR, Levander OA. 1981. Selenium in self-selecteddiets of Maryland residents. J Am Diet Assoc 79:277–285.
Copyright © National Academy of Sciences. All rights reserved.
324 DIETARY REFERENCE INTAKES
WHO (World Health Organization). 1987. Selenium. A Report of the InternationalProgramme on Chemical Safety. Environmental Health Criteria 58. Geneva: WHO.
Wright PL, Bell MC. 1963. Selenium and vitamin E influence upon the in vitrouptake of Se75 by ovine blood cells. Proc Soc Exp Biol Med 114:379–382 .
Xia YM, Hill KE, Burk RF. 1989. Biochemical studies of a selenium-deficient popu-lation in China: Measurement of selenium, glutathione peroxidase, and otheroxidant defense indices in blood. J Nutr 119:1318–1326.
Yang G-Q, Xia YM. 1995. Studies on human dietary requirements and safe range ofdietary intakes of selenium in China and their application in the prevention ofrelated endemic diseases. Biomed Environ Sci 8:187–201.
Yang G-Q, Zhou R-H. 1994. Further observations on the human maximum safedietary selenium intake in a seleniferous area of China. J Trace Elem ElectrolytesHlth Dis 8:159–165.
Yang G-Q, Wang S-Z, Zhou R-H, Sun S-Z. 1983. Endemic selenium intoxication ofhumans in China. Am J Clin Nutr 37:872–881.
Yang G-Q, Zhu L-Z, Liu S-J, Gu L-Z, Qian P-C, Huang J-H, Lu M-D. 1987. Humanselenium requirements in China. In: Combs GF Jr, Levander OA, Spallholz JE,Oldfield JE, eds. Selenium in Biology and Medicine. New York: Avi. Pp. 589–607.
Yang G-Q, Ge K, Chen J, Chen X. 1988. Selenium-related endemic diseases and thedaily selenium requirement of humans. World Rev Nutr Diet 55:98–152.
Yang G-Q, Yin S, Zhou R-H, Gu L, Yan B, Liu Y, Liu Y. 1989a. Studies of safemaximal daily dietary Se-intake in a seleniferous area in China. II. Relationbetween Se-intake and the manifestation of clinical signs and certain biochem-ical alterations in blood and urine. J Trace Elem Electrolytes Hlth Dis 3:123–130.
Yang G-Q, Zhou R, Yin S, Gu L, Yan B, Liu Y, Liu Y, Li X. 1989b. Studies of safemaximal daily dietary selenium intake in a seleniferous area in China. I. Sele-nium intake and tissue selenium levels of the inhabitants. J Trace Elem Electro-lytes Hlth Dis 3:77–87.
Yang JG, Hill KE, Burk RF. 1989. Dietary selenium intake controls rat plasma sele-noprotein P concentration. J Nutr 119:1010–1012.
Yoshizawa K, Willett WC, Morris SJ, Stampfer MJ, Spiegelman D, Rimm EB, Gio-vannucci E. 1999. Study of prediagnostic selenium level in toenails and therisk of advanced prostate cancer. J Natl Cancer Inst 90:1219–1224.
Copyright © National Academy of Sciences. All rights reserved. 325
8β-Carotene and Other
Carotenoids
SUMMARY
Blood concentrations of carotenoids are the best biological markersfor consumption of fruits and vegetables. A large body of observa-tional epidemiological evidence suggests that higher blood con-centrations of β-carotene and other carotenoids obtained fromfoods are associated with lower risk of several chronic diseases.This evidence, although consistent, cannot be used to establish arequirement for β-carotene or carotenoid intake because the ob-served effects may be due to other substances found in carotenoid-rich food, or to other behavioral correlates of increased fruit andvegetable consumption. While there is evidence that β-carotene isan antioxidant in vitro, its importance to health is not known. Theone clear function of certain carotenoids that is firmly linked to ahealth outcome is the provitamin A activity of some dietary caro-tenoids (α-carotene, β-carotene, and β-cryptoxanthin) and theirrole in the prevention of vitamin A deficiency. Establishment of arequirement for carotenoids based upon vitamin A activity mustbe done in concert with the evaluation of Dietary Reference In-takes (DRIs) for vitamin A, which was not included in this report,but will be addressed in a subsequent DRI report. Although noDRIs are proposed for β-carotene or other carotenoids at thepresent time, existing recommendations for increased consump-tion of carotenoid-rich fruits and vegetables are supported. Basedon evidence that β-carotene supplements have not been shown toconfer any benefit for the prevention of the major chronic diseasesand may cause harm in certain subgroups, it is concluded that β-carotene supplements are not advisable, other than as a provitamin
Copyright © National Academy of Sciences. All rights reserved.
326 DIETARY REFERENCE INTAKES
A source and for the prevention and control of vitamin A deficiencyin at-risk populations.
BACKGROUND INFORMATION
The most prevalent carotenoids in North American diets includethe following: α-carotene, β-carotene, lycopene, lutein, zeaxanthin,and β-cryptoxanthin. The structures of these carotenoids are shownin Figure 8-1. Three of these carotenoids, namely α-carotene, β-carotene, and β-cryptoxanthin, can be converted into retinol andare thus referred to as provitamin A carotenoids. Lycopene, lutein,and zeaxanthin have no vitamin A activity and are thus referred toas nonprovitamin A carotenoids. Most naturally occurring caro-tenoids are in the all-trans-configuration; but under conditions ofheating, for example, cis-isomers such as 13-cis-β-carotene (Figure 8-1)are formed.
Functions and Actions
The various biological effects of carotenoids can be classified intofunctions, actions, and associations. Carotenoids function in plantsand in photosynthetic bacteria as accessory pigments in photosyn-thesis and protect against photosensitization in animals, plants, andbacteria. In humans, the only known function of carotenoids is vita-min A activity (provitamin A carotenoids only).
Carotenoids also are thought to have a variety of different actions,including possible antioxidant activity, immunoenhancement, inhi-bition of mutagenesis and transformation, inhibition of premalig-nant lesions, quenching of nonphotochemical fluorescence, andactivity as a pigment in primate macula (Olson, 1999). Carotenoidshave also been associated with various health effects: decreased riskof macular degeneration and cataracts, decreased risk of some can-cers, and decreased risk of some cardiovascular events (Olson, 1999).
However, as described above, the only known function of carotenoidsin humans is to act as a source of vitamin A in the diet. This function,as well as carotenoid actions and associations, is reviewed elsewhere(Krinsky, 1993; Olson, 1989) and discussed in subsequent sections.
Physiology of Absorption, Metabolism, and Excretion
Absorption
The intestinal absorption of dietary carotenoids is facilitated by
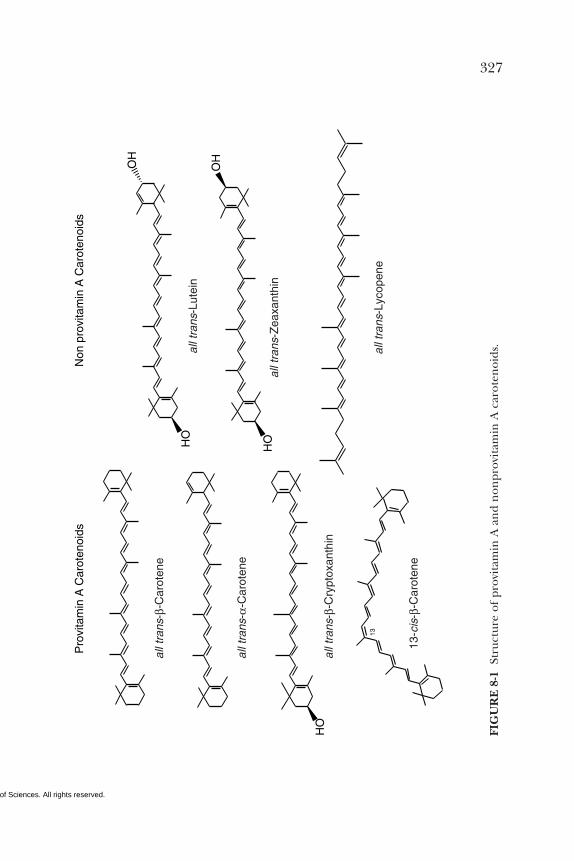
Copyright © National Academy of Sciences. All rights reserved.
327
HO
OHOH
HO
Pro
vita
min
A C
arot
enoi
ds
13
HO
Non
pro
vita
min
A C
arot
enoi
ds
all t
rans
-β-C
arot
ene
all t
rans
-Lut
ein
all t
rans
-Lyc
open
e
all t
rans
-Zea
xant
hin
all t
rans
-β-C
rypt
oxan
thin
all t
rans
-α-C
arot
ene
13-c
is-β
-Car
oten
e
FIG
UR
E 8
-1 S
truc
ture
of
prov
itam
in A
an
d n
onpr
ovit
amin
A c
arot
enoi
ds.
Copyright © National Academy of Sciences. All rights reserved.
328 DIETARY REFERENCE INTAKES
the formation of bile acid micelles. The hydrocarbon backbone ofthe carotenoids makes them insoluble in water, and like other non-polar lipids, they must be solubilized within micelles in the gas-trointestinal tract to allow for absorption. Micellar solubilizationfacilitates the diffusion of lipids across the unstirred water layer.The presence of fat in the small intestine stimulates the secretion ofbile acids from the gall bladder and improves the absorption ofcarotenoids by increasing the size and stability of micelles, thus al-lowing more carotenoids to be solubilized. The uptake of β-caro-tene by the mucosal cell is believed to occur by passive diffusion(Hollander and Ruble, 1978). Uptake by these cells, however, is notsufficient for absorption to be completed. Once inside the mucosalcell, carotenoids or their metabolic products (e.g., vitamin A) mustalso be incorporated into chylomicrons and released into the lym-phatics. When mucosal cells are sloughed off due to cell turnover,spilling their contents into the lumen of the gastrointestinal tract,carotenoids that have been taken up by the cells but not yet incor-porated into chylomicrons are lost into the lumen (Boileau et al.,1999).
Metabolism, Transport, and Excretion
Carotenoids may be either absorbed intact, or in the case of thosepossessing vitamin A activity, cleaved to form vitamin A prior tosecretion into lymph. Portal transport of carotenoids is minimaldue to the lipophilic nature of their structures. Some portal trans-port of more polar metabolites, such as retinoic acid, can occur(Olson, 1999).
Carotenoid cleavage is accomplished either by the intestinal mu-cosal enzyme β-carotene 15,15′-dioxygenase (EC 1.13.11.21) or bynoncentral cleavage mechanisms (Boileau et al., 1999; Olson, 1999;Parker, 1996; Wang, 1994). The extent of conversion of a highlybioavailable source of dietary β-carotene to vitamin A in humanshas been shown to be between 60 and 75 percent, with an addition-al 15 percent of the β-carotene absorbed intact (Goodman et al.,1966). However, absorption of most carotenoids from foods is con-siderably lower and can be as low as 2 percent (Rodriguez and Ir-win, 1972). The effects of dietary and nondietary factors on theefficiency of carotenoid absorption are reviewed later.
Noncentral (or excentric) cleavage of carotenoids yields a widevariety of metabolic products, some of which are further metabo-lized. These cleavage products include aldehyde, acid, alcohol, andepoxide derivatives (Parker, 1996; Wang, 1994). Isomerization of
Copyright © National Academy of Sciences. All rights reserved.
β-CAROTENE AND OTHER CAROTENOIDS 329
carotenoids or their metabolic products may occur in vivo becauseisomers have been found upon extraction of carotenoids from hu-man tissues (Clinton et al., 1996). Although little attention has beengiven to the study of carotenoid excretion pathways, epoxides andcarotenoid metabolic products with less than 15 carbon chainlengths would presumably have no vitamin A activity. It is assumedthat bile and urine would be excretion routes for metabolites (Ol-son, 1999).
The carotenoids are transported in blood exclusively by lipopro-teins. The carotenoid content of individual lipoprotein classes isnot homogeneous. In the fasted state, the hydrocarbon carotenoidssuch as α-carotene, β-carotene, and lycopene are carried predomi-nantly by low-density lipoprotein. The remaining carotenoids, in-cluding the more polar xanthophylls such as lutein and zeaxanthin,are carried by high-density lipoprotein (HDL) and, to a lesserextent, by very low-density lipoprotein (Johnson and Russell, 1992;Parker, 1996; Traber et al., 1994). It is thought that β-carotene andother hydrocarbon carotenoids reside in the hydrophobic core ofthe particles, whereas the more polar xanthophylls reside closer tothe surface (Parker, 1996).
β-Carotene is the most studied carotenoid in terms of metabolismand its potential effects on health. Lycopene, lutein, zeaxanthin,and α-carotene have received increasing attention in recent years.Much remains to be learned, however, about the relative metaboliceffects of these carotenoids.
Body Stores
Recently, 34 carotenoids were identified in human serum andmilk (Khachik et al., 1997b). Of these, 13 were geometrical isomersof their all-trans parent structures and 8 were metabolites. This find-ing is in contrast to the up to 50 carotenoids that have been identi-fied in the U.S. diet and the more than 600 found in nature. Themost prevalent carotenoids in human serum (Khachik et al., 1997b)are the same as those most commonly found in the diet: β-carotene,lycopene, and lutein (Nebeling et al., 1997). Cis-isomers of lyco-pene are commonly found in the serum and in fact have beenshown to constitute more than 50 percent of the total serum lyco-pene (Stahl et al., 1992). In contrast, cis-isomers of β-carotene areconsiderably less common in serum with the trans-isomers beingmore common. In addition to these forms of α-carotene, β-caro-tene, lycopene, and zeaxanthin are also major serum carotenoids.The concentrations of various carotenoids in human serum and
Copyright © National Academy of Sciences. All rights reserved.
330 DIETARY REFERENCE INTAKES
tissues are highly variable and likely depend on a number of factorssuch as food sources, efficiency of absorption, amount of fat in thediet, and so forth (Table 8-1).
The serum concentration of carotenoids after a single dose peaksat 24 to 48 hours post dose (Johnson and Russell, 1992). The earli-est postprandial serum appearance of carotenoids is in the chylomi-cron fraction. It has been proposed that the increase in carotenoidsin the triglyceride-rich lipoprotein fraction (primarily chylomi-crons) be used for quantitating carotenoid absorption (van Vliet etal., 1995). This would provide a more direct measure of absorptionbecause total serum carotenoid content is not an exclusive measureof newly absorbed carotenoids.
Data from the Third National Health and Nutrition ExaminationSurvey (NHANES III) demonstrate the variability of normal serumcarotenoid concentrations (Appendix Tables F-4 through F-8). Thisvariability is attributed to a variety of life-style and physiological fac-tors. In a recent population-based study, Brady et al. (1996) report-ed that lower serum concentrations of α-carotene, β-carotene, β-cryptoxanthin, lutein, and zeaxanthin, but not lycopene, weregenerally associated with male gender, smoking, younger age, lowernon-HDL cholesterol, greater ethanol consumption, and higherbody mass index.
The delivery of carotenoids to extrahepatic tissue is accomplishedthrough the interaction of lipoprotein particles with receptors andthe degradation of lipoproteins by extrahepatic enzymes such aslipoprotein lipase. Carotenoids are present in a number of humantissues including adipose, liver, kidney, and adrenal, but adiposetissue and liver appear to be the main storage sites (Parker, 1996).However, based on a wet tissue weight, the liver, adrenal gland, andtestes contain the highest per-gram concentrations (Stahl et al.,1992). Similar to what is reported in serum, β-carotene, lutein, andlycopene are the main tissue carotenoids, although α-carotene, β-cryptoxanthin, and zeaxanthin are also present (Boileau et al.,1999). In contrast to serum profiles, 9-cis-β-carotene is consistentlypresent in storage tissues. In both serum and tissue storage, lyco-pene cis-isomers constitute greater than 50 percent of the total lyco-pene present (Clinton et al., 1996; Stahl et al., 1992).
Clinical Effects of Inadequate Intake
If adequate retinol is provided in the diet, there are no knownclinical effects of consuming diets low in carotenes over the shortterm. One study of premenopausal women consuming low-carotene
Copyright © National Academy of Sciences. All rights reserved.
β-CAROTENE AND OTHER CAROTENOIDS 331
diets in a metabolic ward reported skin lesions (Burri et al., 1993).However, this effect was not observed after 60 days of depletion in asubsequent β-carotene depletion study by the same group of investi-gators (Lin et al., 1998). These studies of carotene-deficient dietswere reported to increase various measures of oxidative susceptibil-ity (Dixon et al., 1994, 1998; Lin et al., 1998), but as discussed be-low, this is of uncertain relevance with regard to clinical outcomes.
SELECTION OF POSSIBLE INDICATORS FOR ESTIMATINGTHE REQUIREMENT FOR β-CAROTENE AND OTHER
CAROTENOIDS
Vitamin A Equivalency
Vitamin A equivalency is a possible indicator for establishing re-quirements for provitamin A carotenoids. However, any such es-tablishment of requirements for carotenoids based on vitamin Aactivity must be considered in concert with the evaluation of re-quirements for vitamin A. This information will be presented in alater Dietary Reference Intakes report.
Markers of Antioxidant Activity
The effect of increasing β-carotene intake on several markers ofantioxidant activity has been investigated in a series of studies in-volving humans. These studies have examined antioxidant markeractivity in apparently healthy men and women as well as in subjectswho were physiologically challenged (i.e., smokers and patients withcoronary disease or cystic fibrosis).
Studies of the effect of β-carotene intake on measures of antioxi-dant activity are summarized in Table 8-2. The dietary source of β-carotene ranged from modification of diets with normally consumedfoods to giving supplements that provided as much as 120 mg/dayof a highly bioavailable preparation. In general, subjects in moststudies consumed β-carotene in amounts that would be difficult toachieve from foods alone and, as a result, relate to the pharmaco-logical range of intakes.
The findings reported in Table 8-2 indicate that β-carotene sup-plementation did not alter, or inconsistently alter, markers of anti-oxidant activity, which were somewhat dependent on β-caroteneintake. In studies in which subjects were fed less than 25 mg/day ofβ-carotene, either from foods or as a supplement, changes in themarkers for antioxidant activity were minimal. Exceptions noted
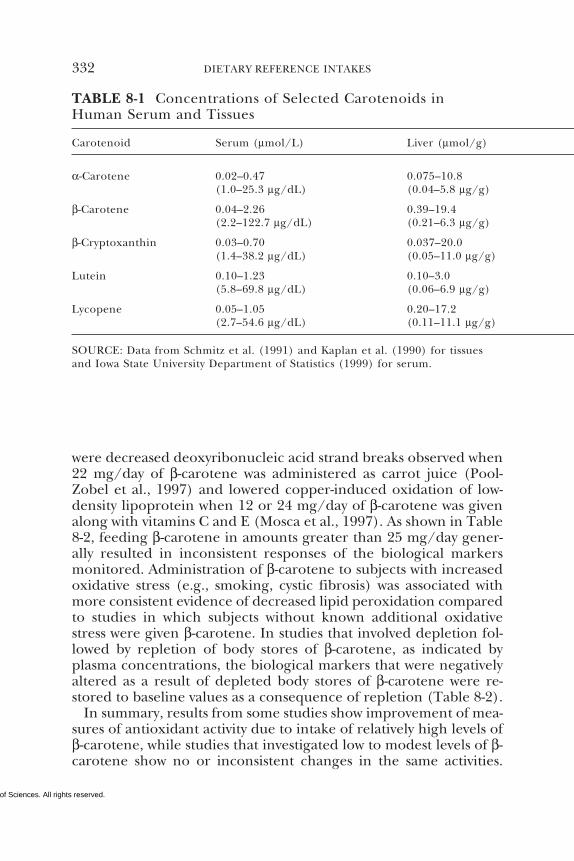
Copyright © National Academy of Sciences. All rights reserved.
332 DIETARY REFERENCE INTAKES
TABLE 8-1 Concentrations of Selected Carotenoids inHuman Serum and Tissues
Carotenoid Serum (µmol/L) Liver (µmol/g)
α-Carotene 0.02–0.47 0.075–10.8(1.0–25.3 µg/dL) (0.04–5.8 µg/g)
β-Carotene 0.04–2.26 0.39–19.4(2.2–122.7 µg/dL) (0.21–6.3 µg/g)
β-Cryptoxanthin 0.03–0.70 0.037–20.0(1.4–38.2 µg/dL) (0.05–11.0 µg/g)
Lutein 0.10–1.23 0.10–3.0(5.8–69.8 µg/dL) (0.06–6.9 µg/g)
Lycopene 0.05–1.05 0.20–17.2(2.7–54.6 µg/dL) (0.11–11.1 µg/g)
were decreased deoxyribonucleic acid strand breaks observed when22 mg/day of β-carotene was administered as carrot juice (Pool-Zobel et al., 1997) and lowered copper-induced oxidation of low-density lipoprotein when 12 or 24 mg/day of β-carotene was givenalong with vitamins C and E (Mosca et al., 1997). As shown in Table8-2, feeding β-carotene in amounts greater than 25 mg/day gener-ally resulted in inconsistent responses of the biological markersmonitored. Administration of β-carotene to subjects with increasedoxidative stress (e.g., smoking, cystic fibrosis) was associated withmore consistent evidence of decreased lipid peroxidation comparedto studies in which subjects without known additional oxidativestress were given β-carotene. In studies that involved depletion fol-lowed by repletion of body stores of β-carotene, as indicated byplasma concentrations, the biological markers that were negativelyaltered as a result of depleted body stores of β-carotene were re-stored to baseline values as a consequence of repletion (Table 8-2).
In summary, results from some studies show improvement of mea-sures of antioxidant activity due to intake of relatively high levels ofβ-carotene, while studies that investigated low to modest levels of β-carotene show no or inconsistent changes in the same activities.
SOURCE: Data from Schmitz et al. (1991) and Kaplan et al. (1990) for tissuesand Iowa State University Department of Statistics (1999) for serum.
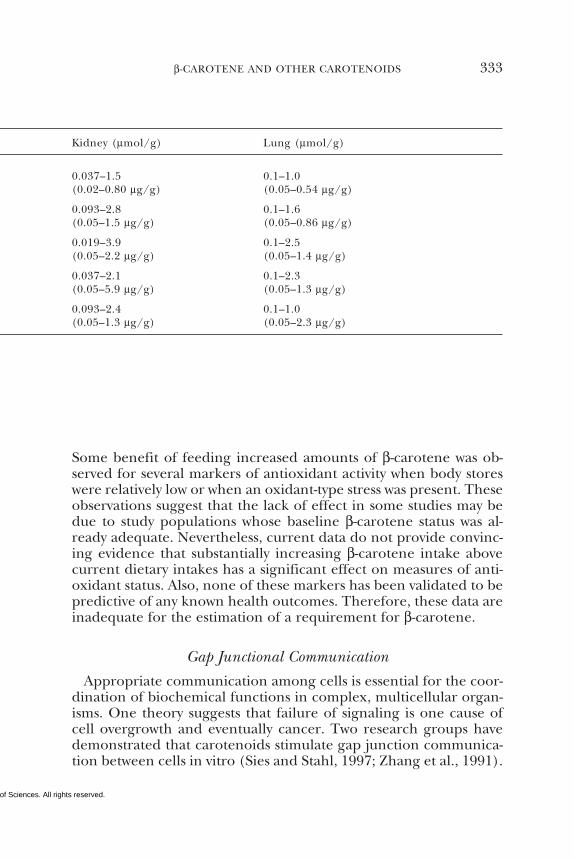
Copyright © National Academy of Sciences. All rights reserved.
β-CAROTENE AND OTHER CAROTENOIDS 333
Some benefit of feeding increased amounts of β-carotene was ob-served for several markers of antioxidant activity when body storeswere relatively low or when an oxidant-type stress was present. Theseobservations suggest that the lack of effect in some studies may bedue to study populations whose baseline β-carotene status was al-ready adequate. Nevertheless, current data do not provide convinc-ing evidence that substantially increasing β-carotene intake abovecurrent dietary intakes has a significant effect on measures of anti-oxidant status. Also, none of these markers has been validated to bepredictive of any known health outcomes. Therefore, these data areinadequate for the estimation of a requirement for β-carotene.
Gap Junctional Communication
Appropriate communication among cells is essential for the coor-dination of biochemical functions in complex, multicellular organ-isms. One theory suggests that failure of signaling is one cause ofcell overgrowth and eventually cancer. Two research groups havedemonstrated that carotenoids stimulate gap junction communica-tion between cells in vitro (Sies and Stahl, 1997; Zhang et al., 1991).
Kidney (µmol/g) Lung (µmol/g)
0.037–1.5 0.1–1.0(0.02–0.80 µg/g) (0.05–0.54 µg/g)
0.093–2.8 0.1–1.6(0.05–1.5 µg/g) (0.05–0.86 µg/g)
0.019–3.9 0.1–2.5(0.05–2.2 µg/g) (0.05–1.4 µg/g)
0.037–2.1 0.1–2.3(0.05–5.9 µg/g) (0.05–1.3 µg/g)
0.093–2.4 0.1–1.0(0.05–1.3 µg/g) (0.05–2.3 µg/g)
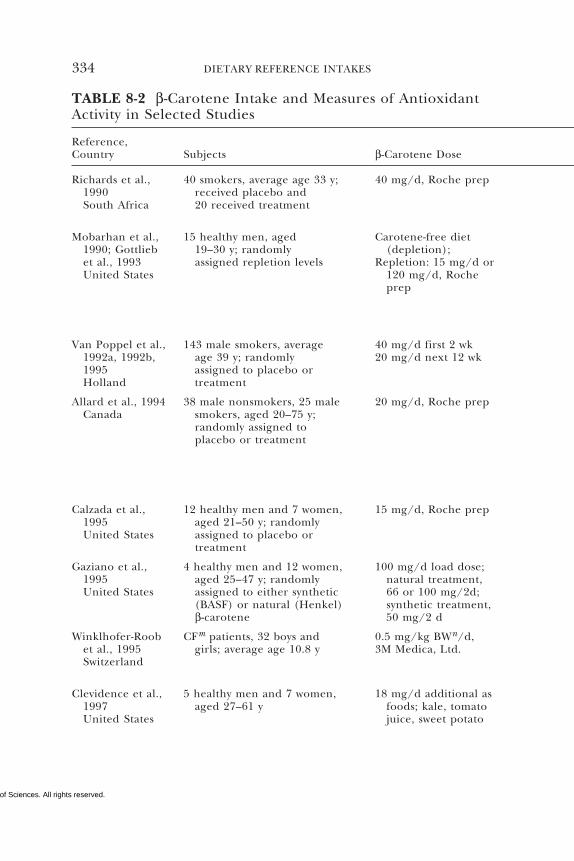
Copyright © National Academy of Sciences. All rights reserved.
334 DIETARY REFERENCE INTAKES
TABLE 8-2 β-Carotene Intake and Measures of AntioxidantActivity in Selected Studies
Reference,Country Subjects β-Carotene Dose
Richards et al., 40 smokers, average age 33 y; 40 mg/d, Roche prep1990 received placebo andSouth Africa 20 received treatment
Mobarhan et al., 15 healthy men, aged Carotene-free diet1990; Gottlieb 19–30 y; randomly (depletion);et al., 1993 assigned repletion levels Repletion: 15 mg/d orUnited States 120 mg/d, Roche
prep
Van Poppel et al., 143 male smokers, average 40 mg/d first 2 wk1992a, 1992b, age 39 y; randomly 20 mg/d next 12 wk1995 assigned to placebo orHolland treatment
Allard et al., 1994 38 male nonsmokers, 25 male 20 mg/d, Roche prepCanada smokers, aged 20–75 y;
randomly assigned toplacebo or treatment
Calzada et al., 12 healthy men and 7 women, 15 mg/d, Roche prep1995 aged 21–50 y; randomlyUnited States assigned to placebo or
treatment
Gaziano et al., 4 healthy men and 12 women, 100 mg/d load dose;1995 aged 25–47 y; randomly natural treatment,United States assigned to either synthetic 66 or 100 mg/2d;
(BASF) or natural (Henkel) synthetic treatment,β-carotene 50 mg/2 d
Winklhofer-Roob CFm patients, 32 boys and 0.5 mg/kg BWn/d,et al., 1995 girls; average age 10.8 y 3M Medica, Ltd.Switzerland
Clevidence et al., 5 healthy men and 7 women, 18 mg/d additional as1997 aged 27–61 y foods; kale, tomatoUnited States juice, sweet potato
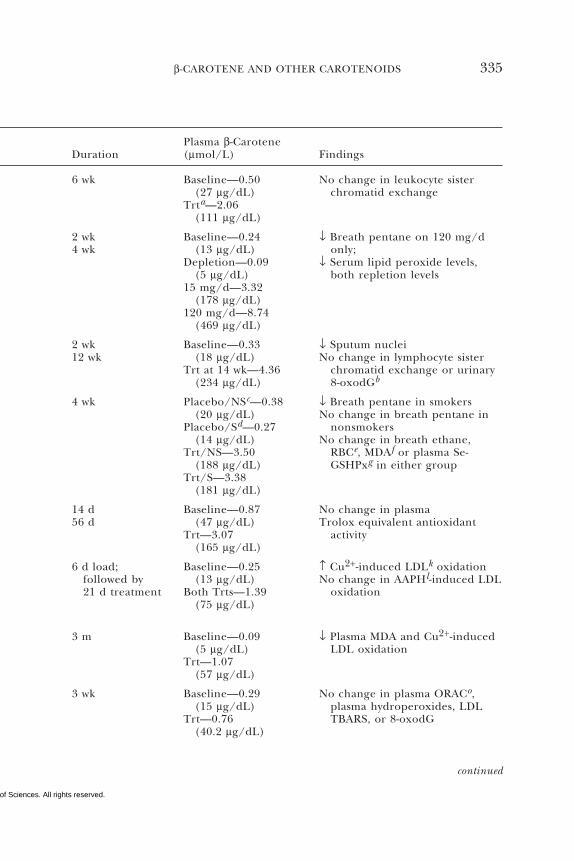
Copyright © National Academy of Sciences. All rights reserved.
β-CAROTENE AND OTHER CAROTENOIDS 335
continued
Plasma β-CaroteneDuration (µmol/L) Findings
6 wk Baseline—0.50 No change in leukocyte sister(27 µg/dL) chromatid exchange
Trta—2.06(111 µg/dL)
2 wk Baseline—0.24 ↓ Breath pentane on 120 mg/d4 wk (13 µg/dL) only;
Depletion—0.09 ↓ Serum lipid peroxide levels,(5 µg/dL) both repletion levels
15 mg/d—3.32(178 µg/dL)
120 mg/d—8.74(469 µg/dL)
2 wk Baseline—0.33 ↓ Sputum nuclei12 wk (18 µg/dL) No change in lymphocyte sister
Trt at 14 wk—4.36 chromatid exchange or urinary(234 µg/dL) 8-oxodGb
4 wk Placebo/NSc—0.38 ↓ Breath pentane in smokers(20 µg/dL) No change in breath pentane in
Placebo/Sd—0.27 nonsmokers(14 µg/dL) No change in breath ethane,
Trt/NS—3.50 RBCe, MDAf or plasma Se-(188 µg/dL) GSHPxg in either group
Trt/S—3.38(181 µg/dL)
14 d Baseline—0.87 No change in plasma56 d (47 µg/dL) Trolox equivalent antioxidant
Trt—3.07 activity(165 µg/dL)
6 d load; Baseline—0.25 ↑ Cu2+-induced LDLk oxidationfollowed by (13 µg/dL) No change in AAPHl-induced LDL21 d treatment Both Trts—1.39 oxidation
(75 µg/dL)
3 m Baseline—0.09 ↓ Plasma MDA and Cu2+-induced(5 µg/dL) LDL oxidation
Trt—1.07(57 µg/dL)
3 wk Baseline—0.29 No change in plasma ORACo,(15 µg/dL) plasma hydroperoxides, LDL
Trt—0.76 TBARS, or 8-oxodG(40.2 µg/dL)
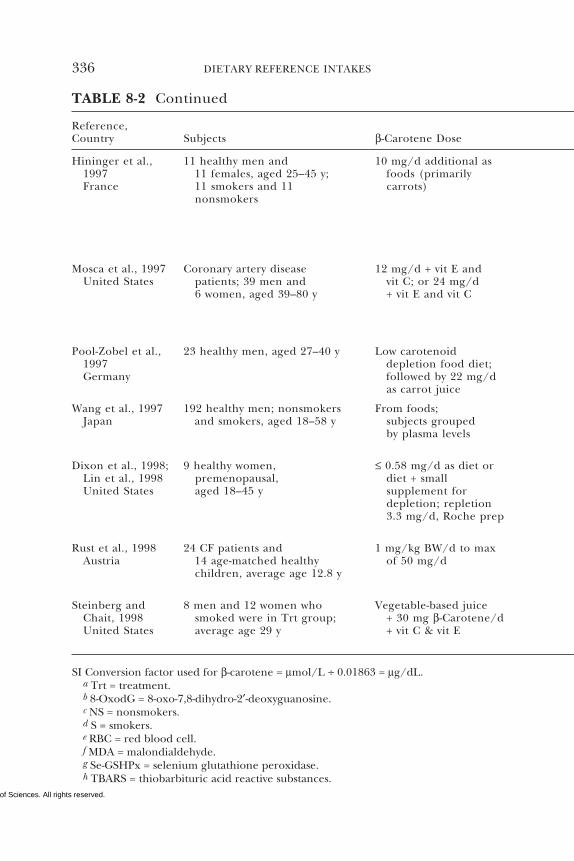
Copyright © National Academy of Sciences. All rights reserved.
336 DIETARY REFERENCE INTAKES
TABLE 8-2 Continued
Reference,Country Subjects β-Carotene Dose
Hininger et al., 11 healthy men and 10 mg/d additional as1997 11 females, aged 25–45 y; foods (primarilyFrance 11 smokers and 11 carrots)
nonsmokers
Mosca et al., 1997 Coronary artery disease 12 mg/d + vit E andUnited States patients; 39 men and vit C; or 24 mg/d
6 women, aged 39–80 y + vit E and vit C
Pool-Zobel et al., 23 healthy men, aged 27–40 y Low carotenoid1997 depletion food diet;Germany followed by 22 mg/d
as carrot juice
Wang et al., 1997 192 healthy men; nonsmokers From foods;Japan and smokers, aged 18–58 y subjects grouped
by plasma levels
Dixon et al., 1998; 9 healthy women, ≤ 0.58 mg/d as diet orLin et al., 1998 premenopausal, diet + smallUnited States aged 18–45 y supplement for
depletion; repletion3.3 mg/d, Roche prep
Rust et al., 1998 24 CF patients and 1 mg/kg BW/d to maxAustria 14 age-matched healthy of 50 mg/d
children, average age 12.8 y
Steinberg and 8 men and 12 women who Vegetable-based juiceChait, 1998 smoked were in Trt group; + 30 mg β-Carotene/dUnited States average age 29 y + vit C & vit E
SI Conversion factor used for β-carotene = µmol/L ÷ 0.01863 = µg/dL.a Trt = treatment.b 8-OxodG = 8-oxo-7,8-dihydro-2′-deoxyguanosine.c NS = nonsmokers.d S = smokers.e RBC = red blood cell.f MDA = malondialdehyde.g Se-GSHPx = selenium glutathione peroxidase.h TBARS = thiobarbituric acid reactive substances.
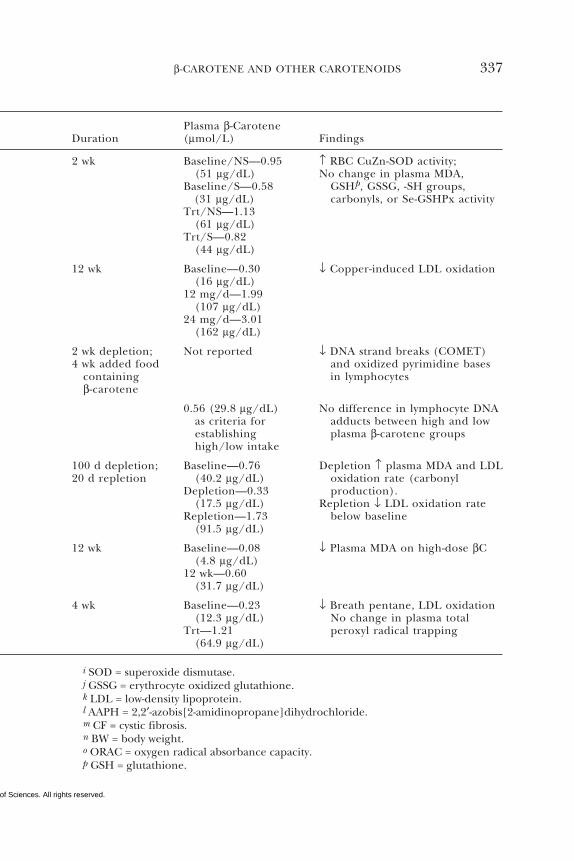
Copyright © National Academy of Sciences. All rights reserved.
β-CAROTENE AND OTHER CAROTENOIDS 337
i SOD = superoxide dismutase.j GSSG = erythrocyte oxidized glutathione.k LDL = low-density lipoprotein.l AAPH = 2,2′-azobis[2-amidinopropane]dihydrochloride.m CF = cystic fibrosis.n BW = body weight.o ORAC = oxygen radical absorbance capacity.p GSH = glutathione.
Plasma β-CaroteneDuration (µmol/L) Findings
2 wk Baseline/NS—0.95 ↑ RBC CuZn-SOD activity;(51 µg/dL) No change in plasma MDA,
Baseline/S—0.58 GSHp, GSSG, -SH groups,(31 µg/dL) carbonyls, or Se-GSHPx activity
Trt/NS—1.13(61 µg/dL)
Trt/S—0.82(44 µg/dL)
12 wk Baseline—0.30 ↓ Copper-induced LDL oxidation(16 µg/dL)
12 mg/d—1.99(107 µg/dL)
24 mg/d—3.01(162 µg/dL)
2 wk depletion; Not reported ↓ DNA strand breaks (COMET)4 wk added food and oxidized pyrimidine bases
containing in lymphocytesβ-carotene
0.56 (29.8 µg/dL) No difference in lymphocyte DNAas criteria for adducts between high and lowestablishing plasma β-carotene groupshigh/low intake
100 d depletion; Baseline—0.76 Depletion ↑ plasma MDA and LDL20 d repletion (40.2 µg/dL) oxidation rate (carbonyl
Depletion—0.33 production).(17.5 µg/dL) Repletion ↓ LDL oxidation rate
Repletion—1.73 below baseline(91.5 µg/dL)
12 wk Baseline—0.08 ↓ Plasma MDA on high-dose βC(4.8 µg/dL)
12 wk—0.60(31.7 µg/dL)
4 wk Baseline—0.23 ↓ Breath pentane, LDL oxidation(12.3 µg/dL) No change in plasma total
Trt—1.21 peroxyl radical trapping(64.9 µg/dL)
Copyright © National Academy of Sciences. All rights reserved.
338 DIETARY REFERENCE INTAKES
It is not known whether the parent carotenoids or their metabolitesare the active factors (Hanusch et al., 1995), nor is it known whethercarotenoids influence this communication process in vivo. Morestudy is needed to ascertain whether carotenoids play a direct rolein cell-cell communication and, if so, what health outcomes areinfluenced by this action.
Immune Function
There has been great interest in the potential role of carotenoidsin enhancement of the immune response. Children with vitamin Adeficiency suffer from compromised immunity and have difficultyprotecting themselves from infections. It is important to remember,however, that studies conducted with provitamin A carotenoids mayyield results that are attributable to the conversion of carotenoids tovitamin A or other retinoids, not to the effects of the intact caro-tenoid.
Santos et al. (1996) showed that long-term β-carotene supplemen-tation enhanced natural killer cell activity in men 65 to 86 years ofage, but not in men 51 to 64 years of age; enhancement by β-caro-tene in this age group was confirmed in a subsequent study (Santoset al., 1998). Hughes et al. (1997) evaluated mechanisms by whichβ-carotene might enable immune cells to act more efficiently. Sub-jects were supplemented for 26 days with either 15 mg of β-caroteneor a placebo. Subjects receiving the β-carotene treatment hadincreases in expression of adhesion molecules by monocytes, in exvivo secretion of tumor necrosis factor-α, and in the percentage ofmonocytes expressing major histocompatibility complex II, a cellsurface molecule responsible for presenting antigen to T-helpercells.
Other immunological effects that carotenoids are reported to in-crease are lymphocyte response to mitogens (Kramer and Burri,1997) and total white blood cells and helper T cells in human im-munodeficiency virus-infected humans (Coodley et al., 1993).Whether these and the other effects noted are specific to caro-tenoids and are important in overall immunity is not confirmed.Therefore the usefulness of these as markers for disease has yet tobe established.
Relationship of Carotenoid Intake to Chronic Disease
A vast number of observational studies, including both case-con-trol and cohort studies, of carotenoids and chronic disease risk have
Copyright © National Academy of Sciences. All rights reserved.
β-CAROTENE AND OTHER CAROTENOIDS 339
been conducted. Many of the studies are based upon estimatedintake of carotenoids in the diet, while many include biochemicalevaluation of carotenoid concentrations in blood. Because the di-etary intake data are generally obtained via food frequency ques-tionnaires, they do not provide quantitative estimates of carotenoidintake, but rather allow for relative ranking of carotenoid intakeswithin a population. The blood concentration data, however, aremore quantitative and generally more comparable across studies.
Prospective blood carotenoid concentration studies may be par-ticularly informative because blood samples are generally obtainedseveral years prior to the clinical detection of disease. Thus, for thepurposes of evaluating the association between quantitative caro-tenoid exposure and risk of chronic disease, the prospective bloodconcentration studies are most useful and are given the greatestweight in the analysis that follows. The studies in which food intakeswere the basis for evaluating risk of disease are less useful due to theinherent problems in adequately estimating carotenoid intake.These studies, however, may give support to the overall evaluationof the role of carotenoids in chronic disease. The following sectionbriefly summarizes some key research findings from observationalstudies of the relationship between carotenoids and chronic diseaserisk.
Mortality
Greenberg et al. (1996) obtained blood samples from 1,188 menand 532 women enrolled in a skin cancer prevention trial and ex-amined the relationship between plasma β-carotene concentrationsat entry and subsequent mortality over a median follow-up periodof 8.2 years (Table 8-3). Persons in the lowest quartile of plasma β-carotene had a significant increase in their risk of dying comparedto those with higher plasma concentrations of β-carotene. The ad-justed relative risk was lowest for persons with plasma β-caroteneconcentrations in the range of 0.34 to 0.53 µmol/L (18 to 28 µg/dL) (quartile 3), with a risk reduction (compared to the lowestquartile) of 43 percent for total deaths, 43 percent for cardiovascu-lar disease deaths, and 51 percent for cancer deaths. The relativerisk for overall mortality was 38 percent lower for persons who hadplasma β-carotene concentrations in the highest quartile comparedto the lowest quartile (relative risk [RR] = 0.62; 95 percent confi-dence interval [CI] = 0.44–0.87). Thus, these results suggest thatplasma β-carotene concentrations in the range of 0.34 to 0.53 µmol/L (18 to 28 µg/dL) are associated with the lowest risk of all-cause
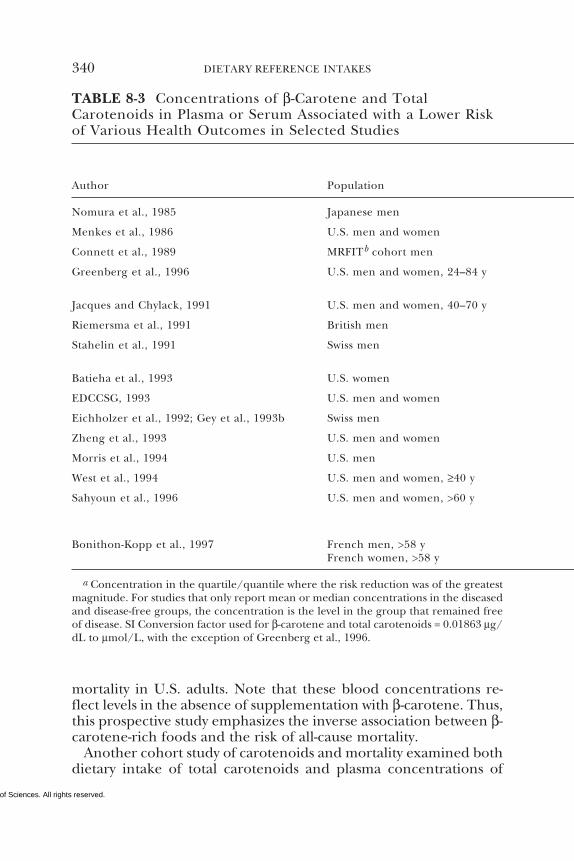
Copyright © National Academy of Sciences. All rights reserved.
340 DIETARY REFERENCE INTAKES
TABLE 8-3 Concentrations of β-Carotene and TotalCarotenoids in Plasma or Serum Associated with a Lower Riskof Various Health Outcomes in Selected Studies
Author Population
Nomura et al., 1985 Japanese men
Menkes et al., 1986 U.S. men and women
Connett et al., 1989 MRFITb cohort men
Greenberg et al., 1996 U.S. men and women, 24–84 y
Jacques and Chylack, 1991 U.S. men and women, 40–70 y
Riemersma et al., 1991 British men
Stahelin et al., 1991 Swiss men
Batieha et al., 1993 U.S. women
EDCCSG, 1993 U.S. men and women
Eichholzer et al., 1992; Gey et al., 1993b Swiss men
Zheng et al., 1993 U.S. men and women
Morris et al., 1994 U.S. men
West et al., 1994 U.S. men and women, ≥40 y
Sahyoun et al., 1996 U.S. men and women, >60 y
Bonithon-Kopp et al., 1997 French men, >58 yFrench women, >58 y
a Concentration in the quartile/quantile where the risk reduction was of the greatestmagnitude. For studies that only report mean or median concentrations in the diseasedand disease-free groups, the concentration is the level in the group that remained freeof disease. SI Conversion factor used for β-carotene and total carotenoids = 0.01863 µg/dL to µmol/L, with the exception of Greenberg et al., 1996.
mortality in U.S. adults. Note that these blood concentrations re-flect levels in the absence of supplementation with β-carotene. Thus,this prospective study emphasizes the inverse association between β-carotene-rich foods and the risk of all-cause mortality.
Another cohort study of carotenoids and mortality examined bothdietary intake of total carotenoids and plasma concentrations of
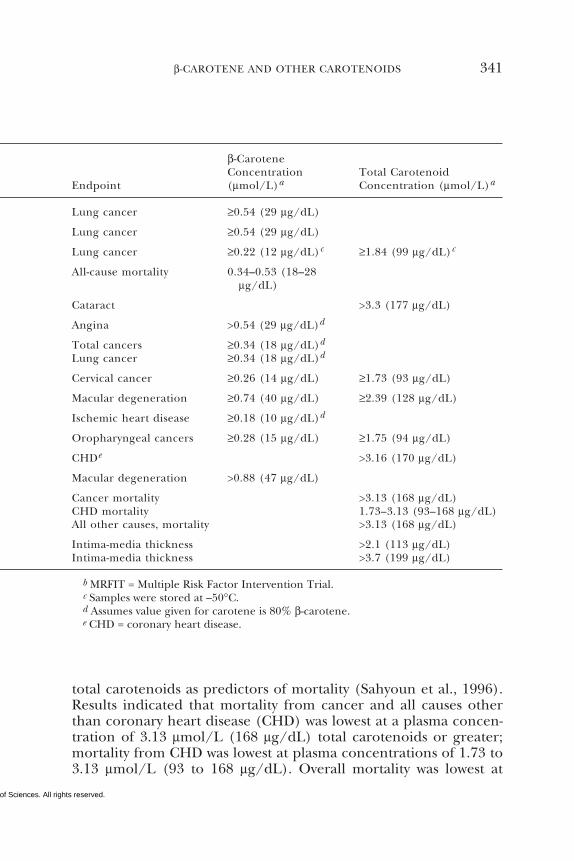
Copyright © National Academy of Sciences. All rights reserved.
β-CAROTENE AND OTHER CAROTENOIDS 341
b MRFIT = Multiple Risk Factor Intervention Trial.c Samples were stored at –50°C.d Assumes value given for carotene is 80% β-carotene.e CHD = coronary heart disease.
total carotenoids as predictors of mortality (Sahyoun et al., 1996).Results indicated that mortality from cancer and all causes otherthan coronary heart disease (CHD) was lowest at a plasma concen-tration of 3.13 µmol/L (168 µg/dL) total carotenoids or greater;mortality from CHD was lowest at plasma concentrations of 1.73 to3.13 µmol/L (93 to 168 µg/dL). Overall mortality was lowest at
β-CaroteneConcentration Total Carotenoid
Endpoint (µmol/L)a Concentration (µmol/L)a
Lung cancer ≥0.54 (29 µg/dL)
Lung cancer ≥0.54 (29 µg/dL)
Lung cancer ≥0.22 (12 µg/dL)c ≥1.84 (99 µg/dL)c
All-cause mortality 0.34–0.53 (18–28µg/dL)
Cataract >3.3 (177 µg/dL)
Angina >0.54 (29 µg/dL)d
Total cancers ≥0.34 (18 µg/dL)d
Lung cancer ≥0.34 (18 µg/dL)d
Cervical cancer ≥0.26 (14 µg/dL) ≥1.73 (93 µg/dL)
Macular degeneration ≥0.74 (40 µg/dL) ≥2.39 (128 µg/dL)
Ischemic heart disease ≥0.18 (10 µg/dL)d
Oropharyngeal cancers ≥0.28 (15 µg/dL) ≥1.75 (94 µg/dL)
CHDe >3.16 (170 µg/dL)
Macular degeneration >0.88 (47 µg/dL)
Cancer mortality >3.13 (168 µg/dL)CHD mortality 1.73–3.13 (93–168 µg/dL)All other causes, mortality >3.13 (168 µg/dL)
Intima-media thickness >2.1 (113 µg/dL)Intima-media thickness >3.7 (199 µg/dL)
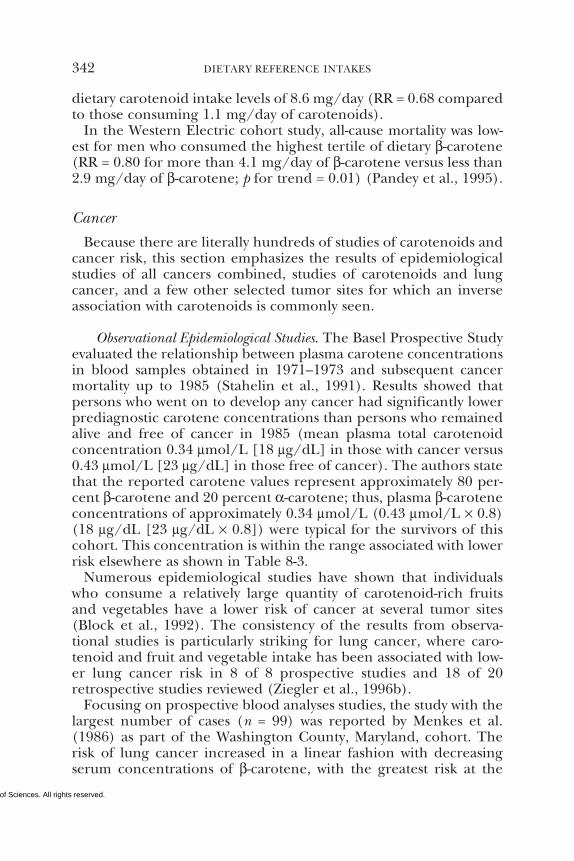
Copyright © National Academy of Sciences. All rights reserved.
342 DIETARY REFERENCE INTAKES
dietary carotenoid intake levels of 8.6 mg/day (RR = 0.68 comparedto those consuming 1.1 mg/day of carotenoids).
In the Western Electric cohort study, all-cause mortality was low-est for men who consumed the highest tertile of dietary β-carotene(RR = 0.80 for more than 4.1 mg/day of β-carotene versus less than2.9 mg/day of β-carotene; p for trend = 0.01) (Pandey et al., 1995).
Cancer
Because there are literally hundreds of studies of carotenoids andcancer risk, this section emphasizes the results of epidemiologicalstudies of all cancers combined, studies of carotenoids and lungcancer, and a few other selected tumor sites for which an inverseassociation with carotenoids is commonly seen.
Observational Epidemiological Studies. The Basel Prospective Studyevaluated the relationship between plasma carotene concentrationsin blood samples obtained in 1971–1973 and subsequent cancermortality up to 1985 (Stahelin et al., 1991). Results showed thatpersons who went on to develop any cancer had significantly lowerprediagnostic carotene concentrations than persons who remainedalive and free of cancer in 1985 (mean plasma total carotenoidconcentration 0.34 µmol/L [18 µg/dL] in those with cancer versus0.43 µmol/L [23 µg/dL] in those free of cancer). The authors statethat the reported carotene values represent approximately 80 per-cent β-carotene and 20 percent α-carotene; thus, plasma β-caroteneconcentrations of approximately 0.34 µmol/L (0.43 µmol/L × 0.8)(18 µg/dL [23 µg/dL × 0.8]) were typical for the survivors of thiscohort. This concentration is within the range associated with lowerrisk elsewhere as shown in Table 8-3.
Numerous epidemiological studies have shown that individualswho consume a relatively large quantity of carotenoid-rich fruitsand vegetables have a lower risk of cancer at several tumor sites(Block et al., 1992). The consistency of the results from observa-tional studies is particularly striking for lung cancer, where caro-tenoid and fruit and vegetable intake has been associated with low-er lung cancer risk in 8 of 8 prospective studies and 18 of 20retrospective studies reviewed (Ziegler et al., 1996b).
Focusing on prospective blood analyses studies, the study with thelargest number of cases (n = 99) was reported by Menkes et al.(1986) as part of the Washington County, Maryland, cohort. Therisk of lung cancer increased in a linear fashion with decreasingserum concentrations of β-carotene, with the greatest risk at the
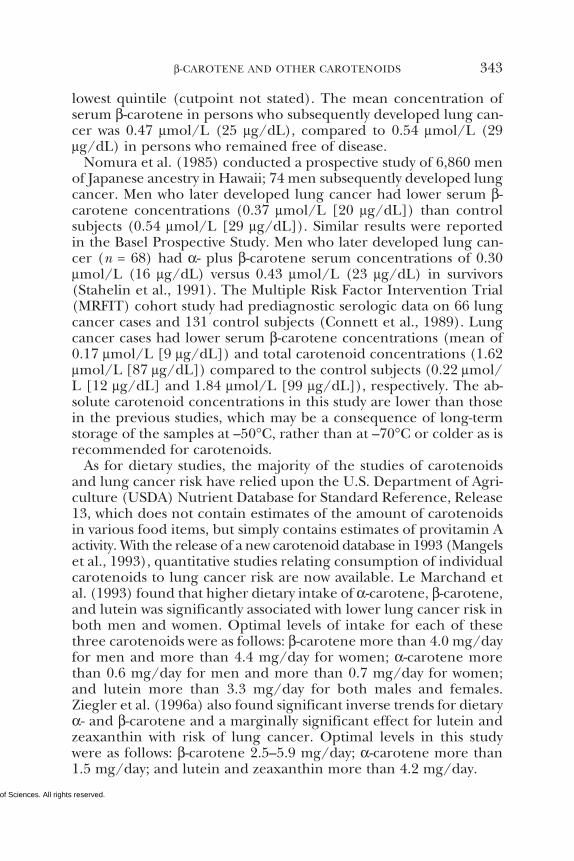
Copyright © National Academy of Sciences. All rights reserved.
β-CAROTENE AND OTHER CAROTENOIDS 343
lowest quintile (cutpoint not stated). The mean concentration ofserum β-carotene in persons who subsequently developed lung can-cer was 0.47 µmol/L (25 µg/dL), compared to 0.54 µmol/L (29µg/dL) in persons who remained free of disease.
Nomura et al. (1985) conducted a prospective study of 6,860 menof Japanese ancestry in Hawaii; 74 men subsequently developed lungcancer. Men who later developed lung cancer had lower serum β-carotene concentrations (0.37 µmol/L [20 µg/dL]) than controlsubjects (0.54 µmol/L [29 µg/dL]). Similar results were reportedin the Basel Prospective Study. Men who later developed lung can-cer (n = 68) had α- plus β-carotene serum concentrations of 0.30µmol/L (16 µg/dL) versus 0.43 µmol/L (23 µg/dL) in survivors(Stahelin et al., 1991). The Multiple Risk Factor Intervention Trial(MRFIT) cohort study had prediagnostic serologic data on 66 lungcancer cases and 131 control subjects (Connett et al., 1989). Lungcancer cases had lower serum β-carotene concentrations (mean of0.17 µmol/L [9 µg/dL]) and total carotenoid concentrations (1.62µmol/L [87 µg/dL]) compared to the control subjects (0.22 µmol/L [12 µg/dL] and 1.84 µmol/L [99 µg/dL]), respectively. The ab-solute carotenoid concentrations in this study are lower than thosein the previous studies, which may be a consequence of long-termstorage of the samples at –50°C, rather than at –70°C or colder as isrecommended for carotenoids.
As for dietary studies, the majority of the studies of carotenoidsand lung cancer risk have relied upon the U.S. Department of Agri-culture (USDA) Nutrient Database for Standard Reference, Release13, which does not contain estimates of the amount of carotenoidsin various food items, but simply contains estimates of provitamin Aactivity. With the release of a new carotenoid database in 1993 (Mangelset al., 1993), quantitative studies relating consumption of individualcarotenoids to lung cancer risk are now available. Le Marchand etal. (1993) found that higher dietary intake of α-carotene, β-carotene,and lutein was significantly associated with lower lung cancer risk inboth men and women. Optimal levels of intake for each of thesethree carotenoids were as follows: β-carotene more than 4.0 mg/dayfor men and more than 4.4 mg/day for women; α-carotene morethan 0.6 mg/day for men and more than 0.7 mg/day for women;and lutein more than 3.3 mg/day for both males and females.Ziegler et al. (1996a) also found significant inverse trends for dietaryα- and β-carotene and a marginally significant effect for lutein andzeaxanthin with risk of lung cancer. Optimal levels in this studywere as follows: β-carotene 2.5–5.9 mg/day; α-carotene more than1.5 mg/day; and lutein and zeaxanthin more than 4.2 mg/day.
Copyright © National Academy of Sciences. All rights reserved.
344 DIETARY REFERENCE INTAKES
As reviewed elsewhere, retrospective and prospective epidemio-logical studies of diet and serum carotenoids strongly indicate thatgreater consumption of fruits, vegetables, and carotenoids is inverse-ly associated with risk of cancers of the oral cavity, pharynx, andlarynx (Mayne, 1996; Mayne and Goodwin, 1993). In a review (Blocket al., 1992), 13 of 13 studies indicated that fruit and vegetableintake was associated with reduced risk of cancers of the oral cavity,pharynx, and larynx. As for prospective serologic studies, Zheng etal. (1993) conducted a nested case-control study of serum micronu-trients and subsequent risk of oral and pharyngeal cancer. Bloodsamples were collected and stored in 1974 from a cohort of 25,802adults in Maryland. Over the next 15 years, 28 individuals devel-oped oral or pharyngeal cancer. Serum analyses indicated that pre-diagnostic serum concentrations of all the major individual caro-tenoids, particularly β-carotene, were lower among the case groupthan among control subjects selected from the same cohort. β-Caro-tene concentrations in persons who later developed these cancerswere 0.21 µmol/L (11 µg/dL) versus 0.28 µmol/L (15 µg/dL) incontrol subjects (mean; p = 0.03). Adjustment for smoking, which isknown to be associated with lower serum carotenoid concentrations,attenuated the protective association slightly. The unadjusted andadjusted relative odds of oral or pharyngeal cancer, comparing theupper tertile of serum β-carotene concentrations (cutpoints not giv-en) versus the lower tertile, were 0.50 and 0.69, respectively.
One recent prospective cohort study (Giovannucci et al., 1995)evaluated 47,894 participants in the Health Professionals Follow-upStudy, 812 of whom were diagnosed with prostate cancer during the6-year follow-up. Intake of tomato-based foods (tomato sauce, toma-toes, and pizza—but not tomato juice) and lycopene, which is foundpredominantly in tomato products, was associated with significantlylower prostate cancer risk. Risk was lowest for those who were esti-mated to consume more than 6.46 mg/day of lycopene. The lack ofassociation for tomato juice may reflect the fact that lycopene ismore bioavailable from processed tomato products than from freshtomatoes (Gartner et al., 1997).
A prospective study of serum micronutrients and prostate cancerin Japanese men in Hawaii, however, found no difference in pre-diagnostic serum lycopene concentrations in 142 cases versus 142matched control subjects (Nomura et al., 1997). The lack of effectseen in this study could possibly relate to the fact that serum lyco-pene concentrations were relatively low in this population (median0.25 µmol/L [13 µg/dL]). This is likely a consequence of the fact
Copyright © National Academy of Sciences. All rights reserved.
β-CAROTENE AND OTHER CAROTENOIDS 345
that tomato products are not widely consumed in the Asian diet(thus the range of exposure may have been limited). Comprehen-sive reviews of the relationship between lycopene and prostatecancer have been published elsewhere (Clinton, 1998; Giovannucci,1999).
Consumption of fruits and vegetables also has been reported tobe inversely associated with cervical cancer risk in a number of stud-ies. Batieha et al. (1993) conducted a nested case-control study,analyzing a variety of carotenoids in sera stored from 50 womenwho had developed either invasive cervical cancer or carcinoma insitu during a 15-year follow-up and in 99 control women pair-matched to the cases. The risk of cervical cancer was significantlyhigher among women with the lowest prediagnostic serum concen-trations of total carotenoids (odds ratio [OR] = 2.7; 95 percent CI =1.1–6.4), α-carotene (OR = 3.1; 95 percent CI = 1.3–7.6), and β-carotene (OR = 3.1; 95 percent CI = 1.2–8.1) compared to womenin the upper tertiles. Mean serum concentrations of β-cryptoxanthinwere also lower among cases relative to control subjects (p = 0.03).Optimal concentrations of these carotenoids for reducing the riskof cervical cancer were as follows: total carotenoids greater than1.88 µmol/L (101 µg/dL); α-carotene greater than 0.05 µmol/L(2.7 µg/dL); β-carotene greater than 0.26 µmol/L (14 µg/dL); andcryptoxanthin greater than 0.17 µmol/L (9 µg/dL).
Intervention Trials. Three major double-blind, randomized inter-vention trials have been conducted using high-dose β-carotene sup-plements, either alone or in combination with other agents, in anattempt to evaluate any protective role in the development of lungor total cancers. In none of these studies was there any evidence ofa protective role for supplementary β-carotene.
In current smokers participating in the Alpha-Tocopherol, Beta-Carotene (ATBC) Cancer Prevention Study, supplementation with20 mg/day of β-carotene (with or without 50 mg of α-tocopherol)for 5 to 8 years led to a higher incidence in lung cancer but had noeffect on the incidence of other major cancers occurring in thispopulation (prostate, bladder, colon or rectum, or stomach) (ATBCCancer Prevention Study Group, 1994). In addition, the Caroteneand Retinol Efficacy Trial (CARET) used a nutrient combination ofβ-carotene (30 mg/day) plus retinyl palmitate (25,000 internation-al units [IU]/day) versus placebo in asbestos workers and smokers(Omenn et al., 1996a, 1996b). This study reported more lung can-cer cases in the supplemented group. The Physicians’ Health Study(PHS) of supplemental β-carotene versus placebo in 22,071 male
Copyright © National Academy of Sciences. All rights reserved.
346 DIETARY REFERENCE INTAKES
U.S. physicians reported no significant effect of 12 years of supple-mentation of β-carotene (50 mg every other day) on cancer or totalmortality (Hennekens et al., 1996).
Summary. Higher consumption of carotenoid-containing fruitsand vegetables and higher plasma concentrations of several caro-tenoids, including β-carotene, are associated with a lower risk ofmany different cancers, especially lung, oral cavity, pharyngeal,laryngeal, and cervical cancers. These prospective blood concentra-tion studies show that β-carotene concentrations in the range of0.28 µmol/L (15 µg/dL) or less are associated with higher risk ofmany cancers (Table 8-3), whereas concentrations greater than 0.28to 0.37 µmol/L (15 to 20 µg/dL) are associated with reduced risk ofmany cancers. This approximate threshold for cancer risk reductionis concordant with that for the prevention of all-cause mortality,given above. Furthermore, these studies show that increased con-sumption of foods containing these carotenoids, including caro-tenoids lacking vitamin A activity, is associated with risk reduction.However, in three large randomized clinical trials using high-doseβ-carotene supplements (20 or 30 mg/day or 50 mg given everyother day) for 4 to 12 years, no protection was reported with respectto lung cancer, or any other cancer.
Cardiovascular Disease
Epidemiological studies, including descriptive, cohort, and case-control studies, suggest that carotenoid- and β-carotene-rich dietsare associated with a reduced risk of cardiovascular disease (Gazianoand Hennekens, 1993; Kohlmeier and Hastings, 1995; Manson etal., 1993). Beginning with biochemical epidemiological studies ofplasma carotenoids, Gey et al. (1993a) reported data from the Vita-min Substudy of the World Health Organization’s MonitoringCardiovascular (WHO/MONICA) Project, in which plasma wasobtained from approximately 100 apparently healthy men fromeach of 16 study sites within Europe. A comparison between medianplasma β-carotene concentrations and ischemic heart disease mor-tality revealed no association when all 16 study sites were consid-ered (r2 = 0.04). However, a reasonably strong inverse associationwas evident (r2 = 0.50) when three study sites, all apparent outliers(and all Finnish sites), were excluded from the analysis.
Men in the Basel Prospective Study, who had low blood concen-trations of β-carotene and vitamin C initially and who were followedfor 12 years, had a significantly higher risk of subsequent ischemic
Copyright © National Academy of Sciences. All rights reserved.
β-CAROTENE AND OTHER CAROTENOIDS 347
heart disease (RR = 1.96; p = 0.022) and stroke (RR = 4.17; p =0.002) (Eichholzer et al., 1992; Gey et al., 1993b). Based upon theseand other data, Gey et al. (1993a) proposed that more than 0.4 to0.5 µmol/L (21 to 27 µg/dL) α-plus β-carotene or 0.3 to 0.4 µmol/L (16 to 21 µg/dL) β-carotene is needed to reduce the risk of is-chemic heart disease.
Total serum carotenoids, measured at baseline in the placebogroup of the Lipid Research Clinics Coronary Primary PreventionTrial, were inversely related to subsequent coronary heart diseaseevents (Morris et al., 1994). Men in the highest quartile of totalserum carotenoids (more than 3.16 µmol/L [172 µg/dL]) had anadjusted relative risk of 0.64 (95 percent CI = 0.44–0.92); amongthose who never smoked, the relative risk was 0.28 (95 percent CI =0.11–0.73). Riemersma et al. (1991) reported that persons with plas-ma carotene concentrations in the lowest quintile (less than 0.26µmol/L [14 µg/dL]) had 2.64 times the risk of angina pectoris.Adjustment for smoking reduced the magnitude of risk. However,because smoking may be part of the causal path, adjustment maynot be appropriate.
The U.S. Health Professionals Follow-up Study of over 39,000 menreported a relative risk for coronary heart disease of 0.71 (95 per-cent CI = 0.55–0.92) for those at the top quintile of total caroteneintake relative to the lowest quintile of intake (Rimm et al., 1993).The effect of β-carotene varied by smoking status: among currentsmokers, the relative risk was 0.30 (95 percent CI = 0.11–0.82);among former smokers, the risk was 0.60 (95 percent CI = 0.38–0.94), and among nonsmokers, the risk was 1.09 (95 percent CI =0.66–1.79). A prospective cohort study of postmenopausal womenfound that the lowest risk of coronary heart disease was found fordietary carotenoid intakes greater than 8,857 IU/day (RR = 0.77; p= NS) (Kushi et al., 1996). A case-control study in 10 Europeancountries found that lycopene concentrations, but not other caro-tenoid concentrations, in adipose tissue were inversely associatedwith the risk of myocardial infarction (Kohlmeier et al., 1997).
Cardiovascular epidemiology studies are now pursuing the use ofintermediate endpoints, such as intima-media thickness, which canbe estimated via ultrasonography as a measure of atherosclerosis.Bonithon-Kopp et al. (1997) reported a decrease in the intima-me-dia thickness of the common carotid arteries with increasing con-centrations of total plasma carotenoids in both men and women.Plasma carotenoid concentrations in excess of 2.07 µmol/L (111µg/dL) were optimal for men; concentrations in excess of 3.73µmol/L (200 µg/dL) were optimal for women. Salonen et al. (1993)
Copyright © National Academy of Sciences. All rights reserved.
348 DIETARY REFERENCE INTAKES
evaluated the change in the intima-media thickness as a measure ofatherosclerotic progression and reported that progression was 92percent greater in the lowest (less than or equal to 0.27 µmol/L [14µg/dL]) versus the highest (more than or equal to 0.64 µmol/L [34µg/dL]) quartile of plasma β-carotene.
Age-Related Macular Degeneration
Dietary carotenoids have been suggested to decrease the risk ofage-related macular degeneration (AMD), the most common causeof irreversible blindness in people over age 65 in the United States,Canada, and Europe (Seddon et al., 1994; Snodderly, 1995). Themacula lutea (macula) is a bright yellow spot in the center of theretina and is specialized and functions to maintain acute centralvision. Of all the carotenoids circulating in the body, only two polarspecies, lutein and zeaxanthin, are contained in the macula (Boneet al., 1985; Handelman et al., 1988). Two groups of investigatorshave suggested pathways by which these two carotenoids are bio-chemically interchanged in the macula (Bone et al., 1993; Khachiket al., 1997a).
The potential role of carotenoids in the prevention of AMD hasbeen comprehensively reviewed (Snodderly, 1995). Seddon et al.(1994) analyzed the association between carotenoid intake and ad-vanced AMD in a large, multicenter, case-control study involving356 cases and 520 control subjects with other ocular conditions.Those in the highest quintile of dietary carotenoid intake had a 43percent lower risk for macular degeneration compared with thosein the lowest (OR = 0.57; 95 percent CI = 0.35–0.92). Among thespecific carotenoids, intake of lutein and zeaxanthin (grouped inthe carotenoid food composition database) was most strongly associ-ated with decreased risk. Those in the highest quintile of intake hada 60 percent lower risk compared to the lowest quintile of intake.
Some, but not all, studies using blood carotenoid concentrationsalso suggest protective effects against risk of AMD. The Eye DiseaseCase-Control Study (EDCCSG, 1993) measured serum carotenoidsin 391 cases with neovascular AMD and 577 control subjects. Thestudy reported protective effects of total carotenoids, α-carotene, β-carotene, β-cryptoxanthin, and lutein and zeaxanthin, with oddsratios ranging from 0.3 to 0.5 for the high group (more than theeightieth percentile) versus the low group (less than the twentiethpercentile). Carotenoid concentrations associated with the lowestrisk are shown in Table 8-4.
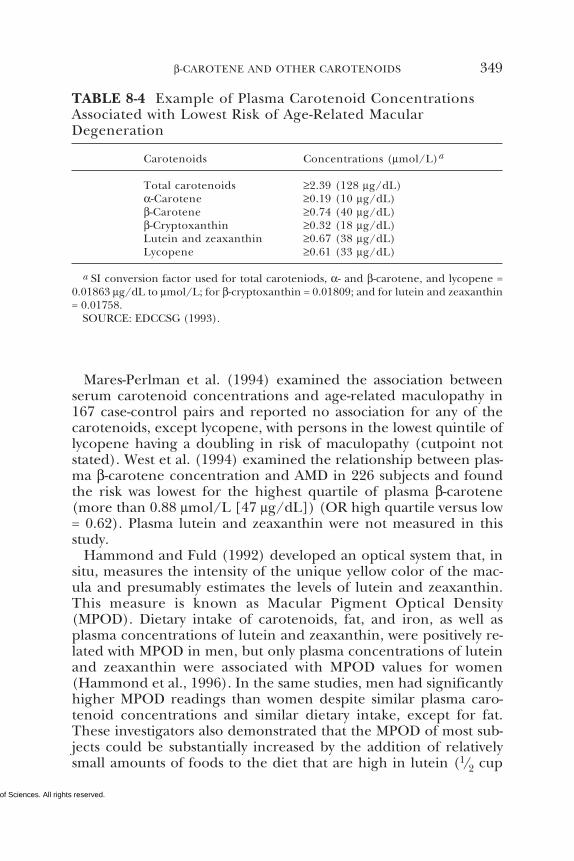
Copyright © National Academy of Sciences. All rights reserved.
β-CAROTENE AND OTHER CAROTENOIDS 349
Mares-Perlman et al. (1994) examined the association betweenserum carotenoid concentrations and age-related maculopathy in167 case-control pairs and reported no association for any of thecarotenoids, except lycopene, with persons in the lowest quintile oflycopene having a doubling in risk of maculopathy (cutpoint notstated). West et al. (1994) examined the relationship between plas-ma β-carotene concentration and AMD in 226 subjects and foundthe risk was lowest for the highest quartile of plasma β-carotene(more than 0.88 µmol/L [47 µg/dL]) (OR high quartile versus low= 0.62). Plasma lutein and zeaxanthin were not measured in thisstudy.
Hammond and Fuld (1992) developed an optical system that, insitu, measures the intensity of the unique yellow color of the mac-ula and presumably estimates the levels of lutein and zeaxanthin.This measure is known as Macular Pigment Optical Density(MPOD). Dietary intake of carotenoids, fat, and iron, as well asplasma concentrations of lutein and zeaxanthin, were positively re-lated with MPOD in men, but only plasma concentrations of luteinand zeaxanthin were associated with MPOD values for women(Hammond et al., 1996). In the same studies, men had significantlyhigher MPOD readings than women despite similar plasma caro-tenoid concentrations and similar dietary intake, except for fat.These investigators also demonstrated that the MPOD of most sub-jects could be substantially increased by the addition of relativelysmall amounts of foods to the diet that are high in lutein (1/2 cup
TABLE 8-4 Example of Plasma Carotenoid ConcentrationsAssociated with Lowest Risk of Age-Related MacularDegeneration
Carotenoids Concentrations (µmol/L)a
Total carotenoids ≥2.39 (128 µg/dL)α-Carotene ≥0.19 (10 µg/dL)β-Carotene ≥0.74 (40 µg/dL)β-Cryptoxanthin ≥0.32 (18 µg/dL)Lutein and zeaxanthin ≥0.67 (38 µg/dL)Lycopene ≥0.61 (33 µg/dL)
a SI conversion factor used for total caroteniods, α- and β-carotene, and lycopene =0.01863 µg/dL to µmol/L; for β-cryptoxanthin = 0.01809; and for lutein and zeaxanthin= 0.01758.
SOURCE: EDCCSG (1993).
Copyright © National Academy of Sciences. All rights reserved.
350 DIETARY REFERENCE INTAKES
spinach per day) or lutein and zeaxanthin (1 cup of corn per day)(Hammond et al., 1997). Interestingly, when MPOD was enhancedfollowing dietary modification, it was maintained at that level forseveral months despite resumption of an unmodified diet.
In summary, results of studies that have investigated MPOD as abiological indicator of carotenoid adequacy suggest that it has sub-stantial potential as an indicator for estimating the requirementsfor lutein and zeaxanthin. Because of the unique metabolism ofcarotenoids in the macula, this technique will be useful in associat-ing dietary intakes of lutein and zeaxanthin with the health of themacula. However, insufficient MPOD studies have been conductedto date to make recommendations relative to the dietary intakes oflutein and zeaxanthin.
Cataracts
Cataracts are also problematic, with cataract extraction being themost frequently performed surgical procedure in the elderly (Tay-lor, 1993). Although the etiology of this condition is not known,oxidative processes may play a role. Cataracts are thought to resultfrom photo-oxidation of lens proteins, resulting in protein damage,accumulation, aggregation, and precipitation in the lens (Taylor,1993). The cornea and lens filter out ultraviolet light, but visibleblue light reaches the retina and may contribute to photic damageor other oxidative insults (Seddon et al., 1994).
Higher dietary intake of carotenoids or higher blood concentra-tions of carotenoids have been found to be inversely associated withthe risk of various forms of cataract in some, but not all, studies.Jacques and Chylack (1991) reported that subjects with low plasmacarotenoid concentrations (those with concentrations less than thetwentieth percentile: less than 1.7 µmol/L [90 µg/dL]) had a 5.6-fold increased risk of any senile cataract and a 7.2-fold increasedrisk of cortical cataract, compared with subjects with high plasmatotal carotenoid concentrations (greater than the eightieth percen-tile; more than 3.3 µmol/L [177 µg/dL]). Mares-Perlman et al.(1995) performed a cross-sectional analysis of serum α-carotene, β-carotene, β-cryptoxanthin, lutein and zeaxanthin, and lycopene ver-sus the severity of nuclear and cortical opacities, and found thathigher concentrations of individual or total carotenoids were notassociated with the severity of nuclear or cortical opacities overall.However, higher serum β-carotene (highest quintile median con-centration 0.32 µmol/L [17 µg/dL]) was associated with less opacityin men, and higher concentrations of α-carotene (highest quintile
Copyright © National Academy of Sciences. All rights reserved.
β-CAROTENE AND OTHER CAROTENOIDS 351
median 0.14 µmol/L [7.5 µg/dL]), β-cryptoxanthin (highest quin-tile median 0.31 µmol/L [17 µg/dL]), and lutein (highest quintilemedian 0.44 µmol/L [25 µg/dL]) were associated with less nuclearsclerosis in men who smoked. In women, however, higher concen-trations of some carotenoids (highest quintile median 2.19 µmol/L[118 µg/dL]) were associated with an increased severity of nuclearsclerosis.
Recently, the U.S. Health Professionals Follow-up Study reporteda relative risk for cataract extraction in men of 0.81 (95 percent CI= 0.65–1.01) for those at the top quintile of lutein and zeaxanthinintake (median intake of 6.87 mg/day) relative to the lowest quin-tile of intake (Brown et al., 1999). Similar inverse associations fordietary lutein and zeaxanthin were seen in the Nurses’ Health Studycohort, with a relative risk of 0.78 (95 percent CI = 0.63–0.95) forthose at the top quintile of total lutein and zeaxanthin intake (me-dian intake of 11.68 mg/day) relative to the lowest quintile of in-take (Chasan-Taber et al., 1999). This decreased risk of cataracts(severe enough to require extraction) with higher intakes of luteinand zeaxanthin was not found with higher intakes of other caro-tenoids (α-carotene, β-carotene, lycopene, and β-cryptoxanthin) ineither of these studies.
Plasma and Tissue Concentrations
As just detailed, plasma and tissue concentrations of carotenoidshave been associated with a variety of health outcomes; that is,higher concentrations are associated with a lower risk of cancer,coronary heart disease, and all-cause mortality. This could be usedas a possible indicator for establishing requirements for caro-tenoids. However, the limitation of this approach is that it is notclear whether observed health benefits are due to carotenoids perse or to other substances found in carotenoid-rich foods.
Thus, these data are suggestive of prudent intake levels, not re-quired levels of intake. Recommendations have been made by anumber of federal agencies and other organizations with regard tofruit and vegetable intake. Nutrient analysis of menus adhering tothe U.S. Dietary Guidelines and the National Cancer Institute’sFive-a-Day for Better Health Program, for example, indicates thatpersons following these diets would be consuming approximately5.2 to 6.0 mg/day provitamin A carotenes on average if a variety offruits and vegetables were consumed (Lachance, 1997). Similar lev-els would be obtained by following Canada’s Food Guide for
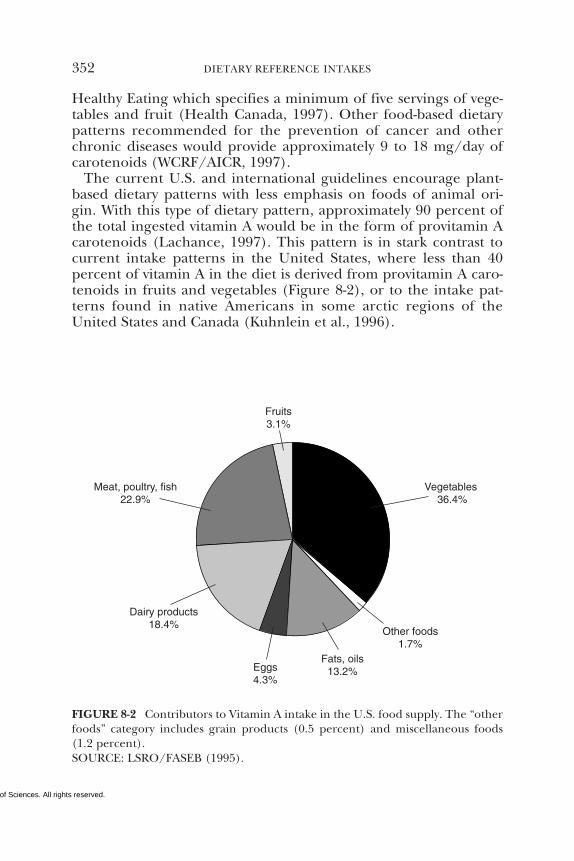
Copyright © National Academy of Sciences. All rights reserved.
352 DIETARY REFERENCE INTAKES
Vegetables 36.4%
Fruits3.1%
Eggs4.3%
Fats, oils13.2%
Other foods1.7%
Meat, poultry, fish22.9%
Dairy products18.4%
FIGURE 8-2 Contributors to Vitamin A intake in the U.S. food supply. The “otherfoods” category includes grain products (0.5 percent) and miscellaneous foods(1.2 percent).SOURCE: LSRO/FASEB (1995).
Healthy Eating which specifies a minimum of five servings of vege-tables and fruit (Health Canada, 1997). Other food-based dietarypatterns recommended for the prevention of cancer and otherchronic diseases would provide approximately 9 to 18 mg/day ofcarotenoids (WCRF/AICR, 1997).
The current U.S. and international guidelines encourage plant-based dietary patterns with less emphasis on foods of animal ori-gin. With this type of dietary pattern, approximately 90 percent ofthe total ingested vitamin A would be in the form of provitamin Acarotenoids (Lachance, 1997). This pattern is in stark contrast tocurrent intake patterns in the United States, where less than 40percent of vitamin A in the diet is derived from provitamin A caro-tenoids in fruits and vegetables (Figure 8-2), or to the intake pat-terns found in native Americans in some arctic regions of theUnited States and Canada (Kuhnlein et al., 1996).
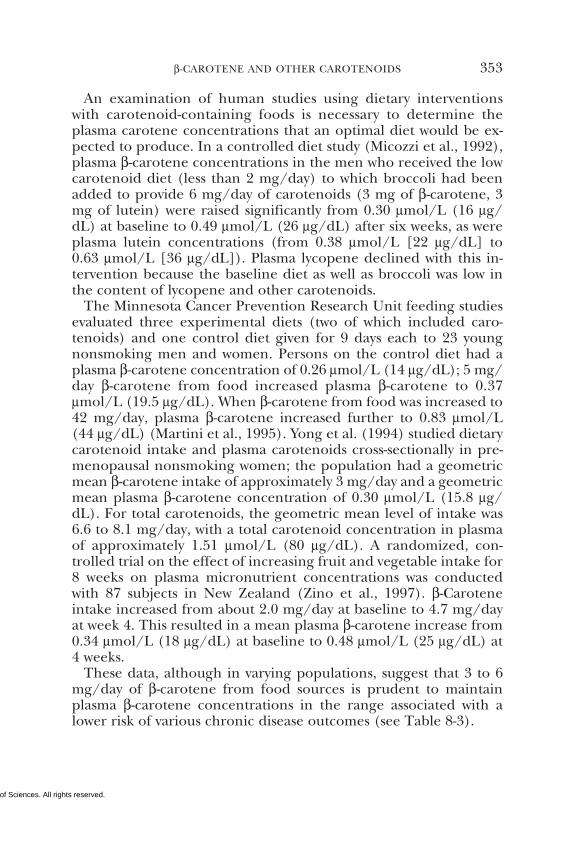
Copyright © National Academy of Sciences. All rights reserved.
β-CAROTENE AND OTHER CAROTENOIDS 353
An examination of human studies using dietary interventionswith carotenoid-containing foods is necessary to determine theplasma carotene concentrations that an optimal diet would be ex-pected to produce. In a controlled diet study (Micozzi et al., 1992),plasma β-carotene concentrations in the men who received the lowcarotenoid diet (less than 2 mg/day) to which broccoli had beenadded to provide 6 mg/day of carotenoids (3 mg of β-carotene, 3mg of lutein) were raised significantly from 0.30 µmol/L (16 µg/dL) at baseline to 0.49 µmol/L (26 µg/dL) after six weeks, as wereplasma lutein concentrations (from 0.38 µmol/L [22 µg/dL] to0.63 µmol/L [36 µg/dL]). Plasma lycopene declined with this in-tervention because the baseline diet as well as broccoli was low inthe content of lycopene and other carotenoids.
The Minnesota Cancer Prevention Research Unit feeding studiesevaluated three experimental diets (two of which included caro-tenoids) and one control diet given for 9 days each to 23 youngnonsmoking men and women. Persons on the control diet had aplasma β-carotene concentration of 0.26 µmol/L (14 µg/dL); 5 mg/day β-carotene from food increased plasma β-carotene to 0.37µmol/L (19.5 µg/dL). When β-carotene from food was increased to42 mg/day, plasma β-carotene increased further to 0.83 µmol/L(44 µg/dL) (Martini et al., 1995). Yong et al. (1994) studied dietarycarotenoid intake and plasma carotenoids cross-sectionally in pre-menopausal nonsmoking women; the population had a geometricmean β-carotene intake of approximately 3 mg/day and a geometricmean plasma β-carotene concentration of 0.30 µmol/L (15.8 µg/dL). For total carotenoids, the geometric mean level of intake was6.6 to 8.1 mg/day, with a total carotenoid concentration in plasmaof approximately 1.51 µmol/L (80 µg/dL). A randomized, con-trolled trial on the effect of increasing fruit and vegetable intake for8 weeks on plasma micronutrient concentrations was conductedwith 87 subjects in New Zealand (Zino et al., 1997). β-Caroteneintake increased from about 2.0 mg/day at baseline to 4.7 mg/dayat week 4. This resulted in a mean plasma β-carotene increase from0.34 µmol/L (18 µg/dL) at baseline to 0.48 µmol/L (25 µg/dL) at4 weeks.
These data, although in varying populations, suggest that 3 to 6mg/day of β-carotene from food sources is prudent to maintainplasma β-carotene concentrations in the range associated with alower risk of various chronic disease outcomes (see Table 8-3).
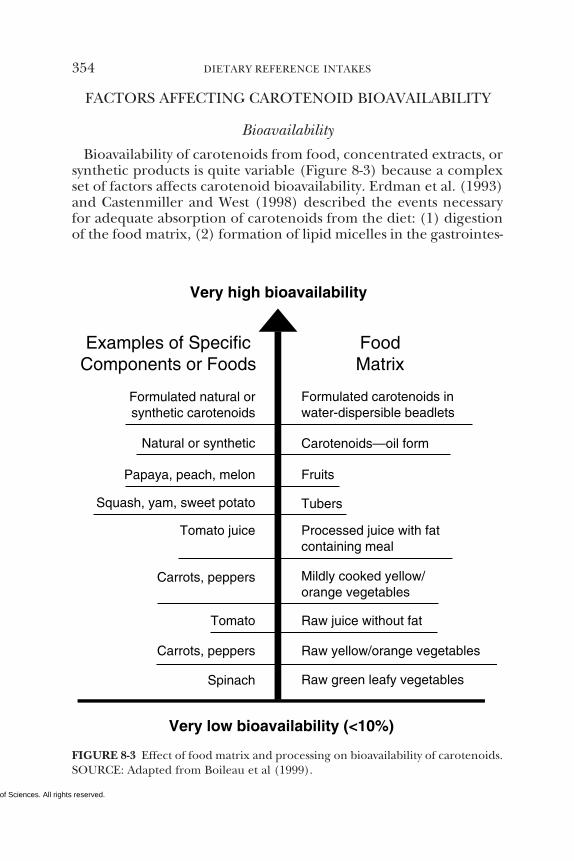
Copyright © National Academy of Sciences. All rights reserved.
354 DIETARY REFERENCE INTAKES
Very high bioavailability
Very low bioavailability (<10%)
Formulated natural orsynthetic carotenoids
Natural or synthetic
Papaya, peach, melon
Squash, yam, sweet potato
Tomato juice
Carrots, peppers
Tomato
Carrots, peppers
Spinach
Formulated carotenoids inwater-dispersible beadlets
Carotenoids—oil form
Fruits
Tubers
Processed juice with fatcontaining meal
Mildly cooked yellow/orange vegetables
Raw juice without fat
Raw yellow/orange vegetables
Raw green leafy vegetables
Examples of SpecificComponents or Foods
FoodMatrix
FIGURE 8-3 Effect of food matrix and processing on bioavailability of carotenoids.SOURCE: Adapted from Boileau et al (1999).
FACTORS AFFECTING CAROTENOID BIOAVAILABILITY
Bioavailability
Bioavailability of carotenoids from food, concentrated extracts, orsynthetic products is quite variable (Figure 8-3) because a complexset of factors affects carotenoid bioavailability. Erdman et al. (1993)and Castenmiller and West (1998) described the events necessaryfor adequate absorption of carotenoids from the diet: (1) digestionof the food matrix, (2) formation of lipid micelles in the gastrointes-
Copyright © National Academy of Sciences. All rights reserved.
β-CAROTENE AND OTHER CAROTENOIDS 355
tinal tract, (3) uptake of carotenoids by intestinal mucosal cells, and(4) transport of carotenoids and their metabolic products to thelymph or portal circulation.
Food Matrix
Of the factors that affect carotenoid bioavailability, the food ma-trix effects on carotenoid absorption are generally the most critical.The absorption of β-carotene supplements that are solubilized withemulsifiers and protected by antioxidants can be 70 percent ormore. In contrast, less than 5 percent bioavailability of caroteneshas been reported from raw foods such as carrots (Rodriguez andIrwin, 1972). Recently, van het Hof et al. (1999) reported substan-tial differences between the relative bioavailabilities of β-carotene(14 percent) compared to lutein (67 percent) when feeding a high-vegetable diet (490 g of vegetables without supplements) and com-paring it to a low-vegetable diet (130 g of vegetables) supplementedwith β-carotene (6 mg/day) or lutein (9 mg/day), both of whichwere assumed to be 100 percent bioavailable. These differences werebased on changes in plasma concentration of β-carotene or lutein.
Daily supplementation of dark-green leafy vegetables rich in caro-tenoids to lactating Indonesian women with low vitamin A statusdid not increase vitamin A status, whereas a similar amount of β-carotene given in a wafer supplement led to a significant increase inplasma retinol (de Pee et al., 1995). More recently, the same group(de Pee et al., 1998) studied anemic school children in Indonesiaand calculated the relative vitamin A equivalency of β-carotene fromdifferent food sources. The calculated equivalencies were as fol-lows: 26 µg of β-carotene from leafy vegetables and carrots corre-sponded to 12 µg of β-carotene from fruit, and equaled 1 µg ofpreformed vitamin A in vitamin A-rich foods. In contrast, Mahapatraand Manorama (1997), in a small study with vitamin A-deficientschool children in India, concluded that β-carotene from red palmoil was as bioavailable as preformed vitamin A.
β-Carotene in the form of supplements has a much higher bio-availablity than β-carotene from foods. Micozzi et al. (1992) demon-strated that 30 mg/day of supplemental all-trans β-carotene pro-duced more than a fivefold increase in plasma β-carotene comparedto 29 mg/day of β-carotene from carrots. The relatively low bioavail-ability of plant carotenoids may be due to the fact that they can bebound in carotenoproteins and are often associated with the plantmatrix. Typically in green leafy vegetables, carotenoids are foundbound in chloroplasts where they play roles in photosynthesis. In
Copyright © National Academy of Sciences. All rights reserved.
356 DIETARY REFERENCE INTAKES
carrot root, α- and β-carotene are largely in crystal forms. In bothcases, the carotenoids are not easily solubilized out of these tissuesby the digestive process.
Cooking
The hypothesis that cooking may improve the bioavailability ofcarotenoids has been tested. The bioavailability of lycopene fromtomato juice is vastly improved by heat treatment in the presence ofoil (Gartner et al., 1997; Stahl and Sies, 1992). When subjects con-sumed tomato juice (equivalent to a single lycopene dose of 2.5µmol/kg body weight) that had been heated at 100°C for 1 hourwith oil, they experienced a serum lycopene peak at 24 to 48 hours.In contrast, equivalent doses that were not heat treated did notresult in an increase in serum lycopene. Steaming has also beenshown to increase the amount of extractable carotenoids in spinachand carrots (Dietz et al., 1988). In contrast to steaming, more pro-longed exposure to high temperatures (boiling) can reduce thecarotenoid availability of vegetables by increasing the production ofisomers or oxidation products. For example, canned carrots contain73 percent all-trans β-carotene, 19 percent 13-cis-β-carotene, and 8percent 9-cis-β-carotene, while fresh carrots contain 100 percent ofthe β-carotene in the all-trans configuration (Chandler and Schwartz,1987). The relative vitamin A values of cis isomers of β-carotenecompared to all-trans β-carotene is an active area of research.
Dietary Fat
Many research groups have shown that to optimize carotenoidabsorption, dietary fat must be consumed during the same eatingperiod as the carotenoid. Roels et al. (1958) demonstrated that inboys with vitamin A deficiency in an African village, supplementa-tion of their carotene-sufficient but low-fat diets with 18 g/day ofolive oil improved carotene absorption from 5 to 25 percent. Morerecently, Jalal et al. (1998) studied the roles of β-carotene-rich meals(mostly red sweet potatoes), extra dietary fat (15 g/day), and de-worming on serum retinol concentrations of children in Sumatra.Prior to the intervention, these children all had intestinal infesta-tions and were consuming diets with about 7 percent of caloriesfrom fat. A 3-week intervention of β-carotene-rich meals alone im-proved vitamin A status without added fat or deworming, but thecombination of all three measures—β-carotene meals, added fat,and deworming—provided the greatest increase in serum retinol.
Copyright © National Academy of Sciences. All rights reserved.
β-CAROTENE AND OTHER CAROTENOIDS 357
Other Factors
Lipid-lowering drugs have been shown to decrease serum caro-tenoids dramatically (Elinder et al., 1995). In a double-blind, ran-domized trial, treatment with cholestyramine (a lipid-lowering res-in) for 4 months and probucol (antioxidant and lipid-lowering drug)for 2 months resulted in a 65 percent reduction in serum β-caroteneand a 51 percent reduction in lycopene. The reductions were attrib-uted to reduced intestinal absorption of lipids by cholestyramineand reduced lipoprotein particle number and size by probucol. Su-crose polyester (olestra), the nonabsorbable fat substitute, loweredcarotenoid absorption when consumed at the same time as caro-tenoids (Koonsvitsky et al., 1997; Weststrate and van het Hof, 1995).Plant sterol-enriched margarines (Weststrate and Meijer, 1998) anddietary pectin supplementation also decreased β-carotene absorp-tion (Rock and Swendseid, 1992).
Nutrient-Nutrient Interactions
Competitive interactions among different carotenoids during theabsorptive process have been studied. Recipients of daily β-carotenesupplements in either 12-mg or 30-mg capsules for 6 weeks hadsignificantly lower plasma lutein concentrations than subjects whoconsumed both β-carotene and lutein from food sources (Micozziet al., 1992). In addition, plasma β-carotene was higher in thesubjects receiving β-carotene as supplements rather than as food,demonstrating the greater bioavailability of this source. Interactionsbetween β-carotene and lutein have also been described by otherinvestigators. When subjects were given purified crystalline β-caro-tene and crystalline lutein in a combined dose, β-carotene signifi-cantly reduced the serum area under the curve (AUC) value (ameasure of total absorption) for lutein (Kostic et al., 1995). Luteinin a combined dose with β-carotene significantly enhanced β-caro-tene AUC in those subjects whose AUC for β-carotene (when dosedalone) was the lowest.
These studies (White et al., 1994) indicate that two carotenoidsadministered concurrently in controlled settings can affect the ab-sorption of each other. Several investigators have examined the ef-fect of daily supplementation with high-dose β-carotene on plasmaconcentrations of other carotenoids in participants in multiyearcancer prevention intervention trials (Albanes et al., 1997; Mayne etal., 1998; Nierenberg et al., 1997; Wahlqvist et al., 1994). Thesestudies suggest no overall adverse effect on other carotenoids with
Copyright © National Academy of Sciences. All rights reserved.
358 DIETARY REFERENCE INTAKES
high-dose supplementation of β-carotene daily for several years.This finding is not inconsistent with the results of the metabolicstudies, because the trials were done in free-living individuals takinga supplement of β-carotene each day, which most likely is not con-sumed concurrently with an entire day’s intake of other carotenoidsfrom food.
FINDINGS BY LIFE STAGE AND GENDER GROUP
As discussed elsewhere in this document, this report does not estab-lish a requirement for β-carotene or other carotenoids for any genderor life stage group. This issue will be considered in a subsequentreport when addressing vitamin A. However, the following summa-rizes findings regarding carotenoid status, as measured by serumcarotenoid concentrations, in different groups of the population.
Special Populations
If plasma carotenoid concentrations are considered as an indica-tor of adequacy with regard to reducing risk of chronic disease, itbecomes apparent that certain subgroups of the population areknown to have notably lower circulating concentrations of caro-tenoids. Thus, consumption of carotenoid-containing foods mayhave to be greater in these groups in order to achieve plasma caro-tenoid concentrations that are associated with a reduced risk ofchronic disease (Table 8-3).
Adolescents
Serum carotenoid concentrations were measured in the ThirdNational Health and Nutrition Examination Survey (NHANES III).As shown in Appendix Table F-4, serum β-carotene concentrationswere lower during the period of adolescence and early adulthood inthis U.S. population survey. The average concentration in childrenwas approximately 0.34 µmol/L (18 µg/dL), which dropped to 0.28µmol/L (15 µg/dL) or less in teenagers and did not return to child-hood concentrations until the fourth decade (the thirties) forwomen, and the fifth decade (the forties) for men. This lower levelduring adolescence is also evident for α-carotene (Appendix TableF-5), β-cryptoxanthin (Appendix Table F-6), and lutein/zeaxanthin(Appendix Table F-7), but not lycopene (Appendix Table F-8). Thismay reflect relatively greater consumption of tomato products com-pared to other vegetables by adolescents in the United States.
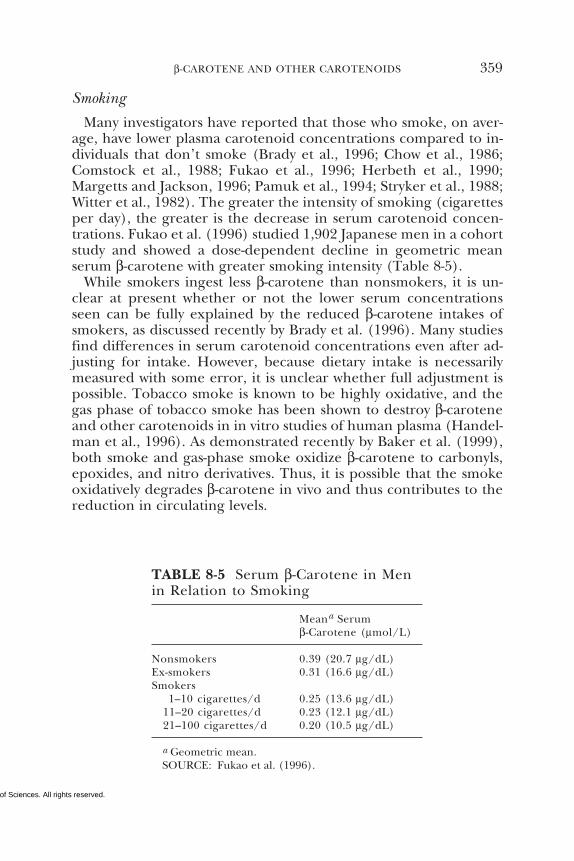
Copyright © National Academy of Sciences. All rights reserved.
β-CAROTENE AND OTHER CAROTENOIDS 359
Smoking
Many investigators have reported that those who smoke, on aver-age, have lower plasma carotenoid concentrations compared to in-dividuals that don’t smoke (Brady et al., 1996; Chow et al., 1986;Comstock et al., 1988; Fukao et al., 1996; Herbeth et al., 1990;Margetts and Jackson, 1996; Pamuk et al., 1994; Stryker et al., 1988;Witter et al., 1982). The greater the intensity of smoking (cigarettesper day), the greater is the decrease in serum carotenoid concen-trations. Fukao et al. (1996) studied 1,902 Japanese men in a cohortstudy and showed a dose-dependent decline in geometric meanserum β-carotene with greater smoking intensity (Table 8-5).
While smokers ingest less β-carotene than nonsmokers, it is un-clear at present whether or not the lower serum concentrationsseen can be fully explained by the reduced β-carotene intakes ofsmokers, as discussed recently by Brady et al. (1996). Many studiesfind differences in serum carotenoid concentrations even after ad-justing for intake. However, because dietary intake is necessarilymeasured with some error, it is unclear whether full adjustment ispossible. Tobacco smoke is known to be highly oxidative, and thegas phase of tobacco smoke has been shown to destroy β-caroteneand other carotenoids in in vitro studies of human plasma (Handel-man et al., 1996). As demonstrated recently by Baker et al. (1999),both smoke and gas-phase smoke oxidize β-carotene to carbonyls,epoxides, and nitro derivatives. Thus, it is possible that the smokeoxidatively degrades β-carotene in vivo and thus contributes to thereduction in circulating levels.
TABLE 8-5 Serum β-Carotene in Menin Relation to Smoking
Meana Serumβ-Carotene (µmol/L)
Nonsmokers 0.39 (20.7 µg/dL)Ex-smokers 0.31 (16.6 µg/dL)Smokers
1–10 cigarettes/d 0.25 (13.6 µg/dL)11–20 cigarettes/d 0.23 (12.1 µg/dL)21–100 cigarettes/d 0.20 (10.5 µg/dL)
a Geometric mean.SOURCE: Fukao et al. (1996).
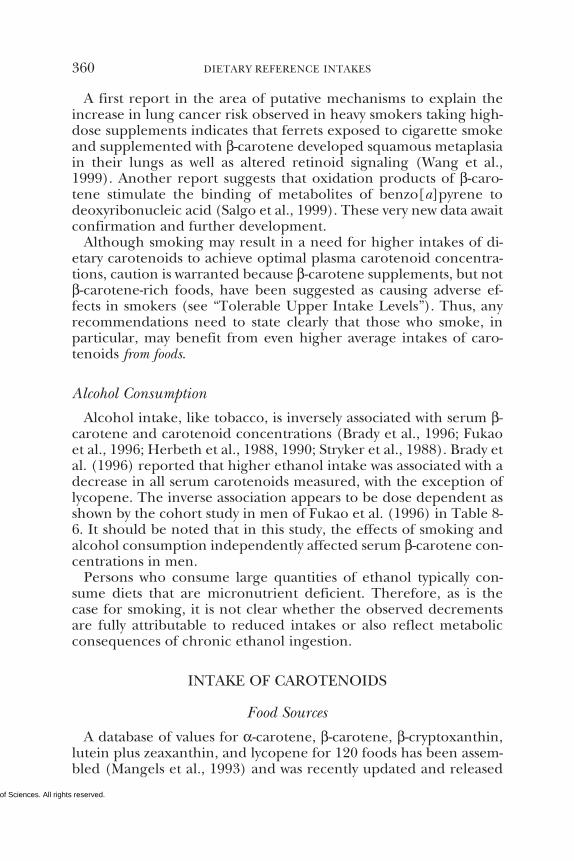
Copyright © National Academy of Sciences. All rights reserved.
360 DIETARY REFERENCE INTAKES
A first report in the area of putative mechanisms to explain theincrease in lung cancer risk observed in heavy smokers taking high-dose supplements indicates that ferrets exposed to cigarette smokeand supplemented with β-carotene developed squamous metaplasiain their lungs as well as altered retinoid signaling (Wang et al.,1999). Another report suggests that oxidation products of β-caro-tene stimulate the binding of metabolites of benzo[a]pyrene todeoxyribonucleic acid (Salgo et al., 1999). These very new data awaitconfirmation and further development.
Although smoking may result in a need for higher intakes of di-etary carotenoids to achieve optimal plasma carotenoid concentra-tions, caution is warranted because β-carotene supplements, but notβ-carotene-rich foods, have been suggested as causing adverse ef-fects in smokers (see “Tolerable Upper Intake Levels”). Thus, anyrecommendations need to state clearly that those who smoke, inparticular, may benefit from even higher average intakes of caro-tenoids from foods.
Alcohol Consumption
Alcohol intake, like tobacco, is inversely associated with serum β-carotene and carotenoid concentrations (Brady et al., 1996; Fukaoet al., 1996; Herbeth et al., 1988, 1990; Stryker et al., 1988). Brady etal. (1996) reported that higher ethanol intake was associated with adecrease in all serum carotenoids measured, with the exception oflycopene. The inverse association appears to be dose dependent asshown by the cohort study in men of Fukao et al. (1996) in Table 8-6. It should be noted that in this study, the effects of smoking andalcohol consumption independently affected serum β-carotene con-centrations in men.
Persons who consume large quantities of ethanol typically con-sume diets that are micronutrient deficient. Therefore, as is thecase for smoking, it is not clear whether the observed decrementsare fully attributable to reduced intakes or also reflect metabolicconsequences of chronic ethanol ingestion.
INTAKE OF CAROTENOIDS
Food Sources
A database of values for α-carotene, β-carotene, β-cryptoxanthin,lutein plus zeaxanthin, and lycopene for 120 foods has been assem-bled (Mangels et al., 1993) and was recently updated and released
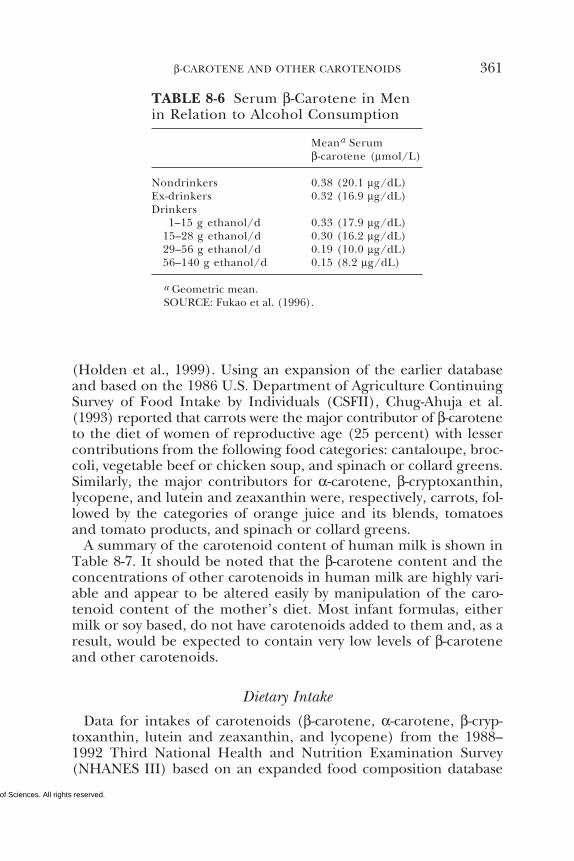
Copyright © National Academy of Sciences. All rights reserved.
β-CAROTENE AND OTHER CAROTENOIDS 361
(Holden et al., 1999). Using an expansion of the earlier databaseand based on the 1986 U.S. Department of Agriculture ContinuingSurvey of Food Intake by Individuals (CSFII), Chug-Ahuja et al.(1993) reported that carrots were the major contributor of β-caroteneto the diet of women of reproductive age (25 percent) with lessercontributions from the following food categories: cantaloupe, broc-coli, vegetable beef or chicken soup, and spinach or collard greens.Similarly, the major contributors for α-carotene, β-cryptoxanthin,lycopene, and lutein and zeaxanthin were, respectively, carrots, fol-lowed by the categories of orange juice and its blends, tomatoesand tomato products, and spinach or collard greens.
A summary of the carotenoid content of human milk is shown inTable 8-7. It should be noted that the β-carotene content and theconcentrations of other carotenoids in human milk are highly vari-able and appear to be altered easily by manipulation of the caro-tenoid content of the mother’s diet. Most infant formulas, eithermilk or soy based, do not have carotenoids added to them and, as aresult, would be expected to contain very low levels of β-caroteneand other carotenoids.
Dietary Intake
Data for intakes of carotenoids (β-carotene, α-carotene, β-cryp-toxanthin, lutein and zeaxanthin, and lycopene) from the 1988–1992 Third National Health and Nutrition Examination Survey(NHANES III) based on an expanded food composition database
TABLE 8-6 Serum β-Carotene in Menin Relation to Alcohol Consumption
Meana Serumβ-carotene (µmol/L)
Nondrinkers 0.38 (20.1 µg/dL)Ex-drinkers 0.32 (16.9 µg/dL)Drinkers
1–15 g ethanol/d 0.33 (17.9 µg/dL)15–28 g ethanol/d 0.30 (16.2 µg/dL)29–56 g ethanol/d 0.19 (10.0 µg/dL)56–140 g ethanol/d 0.15 (8.2 µg/dL)
a Geometric mean.SOURCE: Fukao et al. (1996).
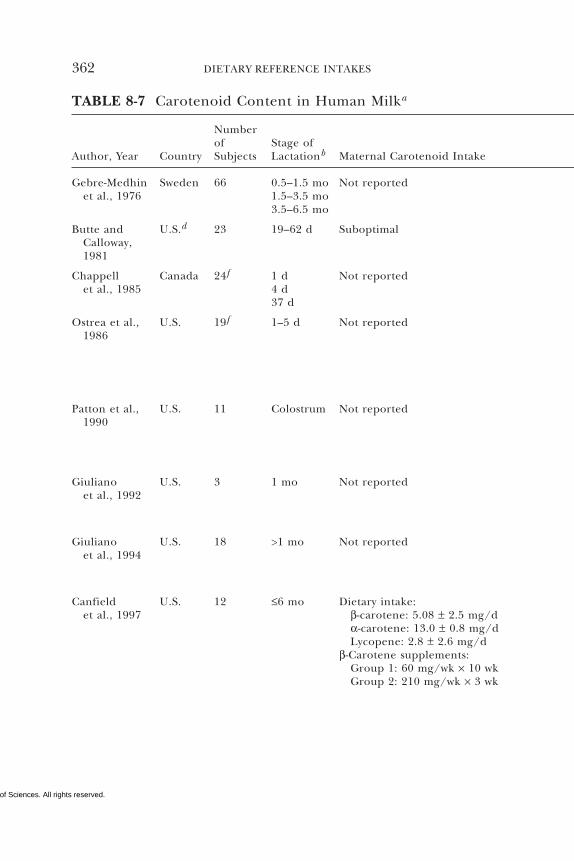
Copyright © National Academy of Sciences. All rights reserved.
362 DIETARY REFERENCE INTAKES
TABLE 8-7 Carotenoid Content in Human Milka
Numberof Stage of
Author, Year Country Subjects Lactationb Maternal Carotenoid Intake
Gebre-Medhin Sweden 66 0.5–1.5 mo Not reportedet al., 1976 1.5–3.5 mo
3.5–6.5 mo
Butte and U.S.d 23 19–62 d SuboptimalCalloway,1981
Chappell Canada 24f 1 d Not reportedet al., 1985 4 d
37 d
Ostrea et al., U.S. 19f 1–5 d Not reported1986
Patton et al., U.S. 11 Colostrum Not reported1990
Giuliano U.S. 3 1 mo Not reportedet al., 1992
Giuliano U.S. 18 >1 mo Not reportedet al., 1994
Canfield U.S. 12 ≤6 mo Dietary intake:et al., 1997 β-carotene: 5.08 ± 2.5 mg/d
α-carotene: 13.0 ± 0.8 mg/dLycopene: 2.8 ± 2.6 mg/d
β-Carotene supplements:Group 1: 60 mg/wk × 10 wkGroup 2: 210 mg/wk × 3 wk
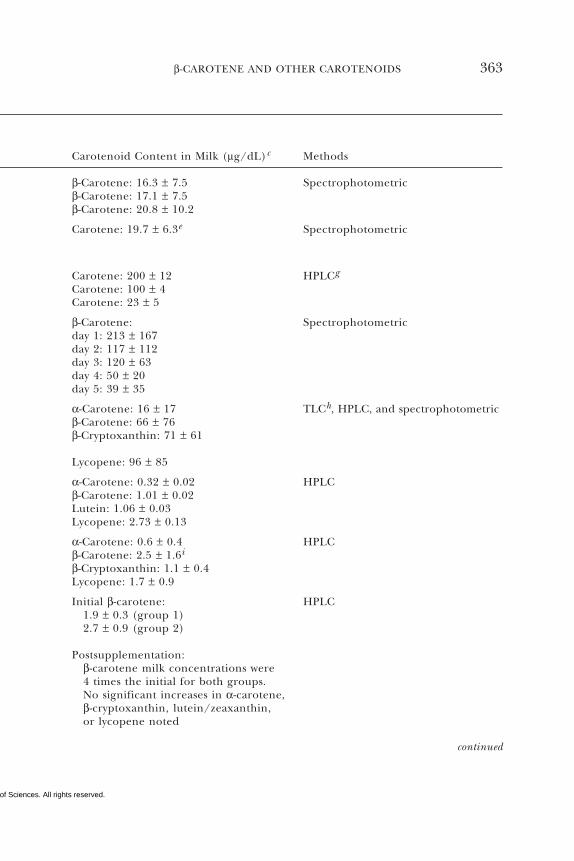
Copyright © National Academy of Sciences. All rights reserved.
β-CAROTENE AND OTHER CAROTENOIDS 363
continued
Carotenoid Content in Milk (µg/dL)c Methods
β-Carotene: 16.3 ± 7.5 Spectrophotometricβ-Carotene: 17.1 ± 7.5β-Carotene: 20.8 ± 10.2
Carotene: 19.7 ± 6.3e Spectrophotometric
Carotene: 200 ± 12 HPLCg
Carotene: 100 ± 4Carotene: 23 ± 5
β-Carotene: Spectrophotometricday 1: 213 ± 167day 2: 117 ± 112day 3: 120 ± 63day 4: 50 ± 20day 5: 39 ± 35
α-Carotene: 16 ± 17 TLCh, HPLC, and spectrophotometricβ-Carotene: 66 ± 76β-Cryptoxanthin: 71 ± 61
Lycopene: 96 ± 85
α-Carotene: 0.32 ± 0.02 HPLCβ-Carotene: 1.01 ± 0.02Lutein: 1.06 ± 0.03Lycopene: 2.73 ± 0.13
α-Carotene: 0.6 ± 0.4 HPLCβ-Carotene: 2.5 ± 1.6i
β-Cryptoxanthin: 1.1 ± 0.4Lycopene: 1.7 ± 0.9
Initial β-carotene: HPLC1.9 ± 0.3 (group 1)2.7 ± 0.9 (group 2)
Postsupplementation:β-carotene milk concentrations were4 times the initial for both groups.No significant increases in α-carotene,β-cryptoxanthin, lutein/zeaxanthin,or lycopene noted
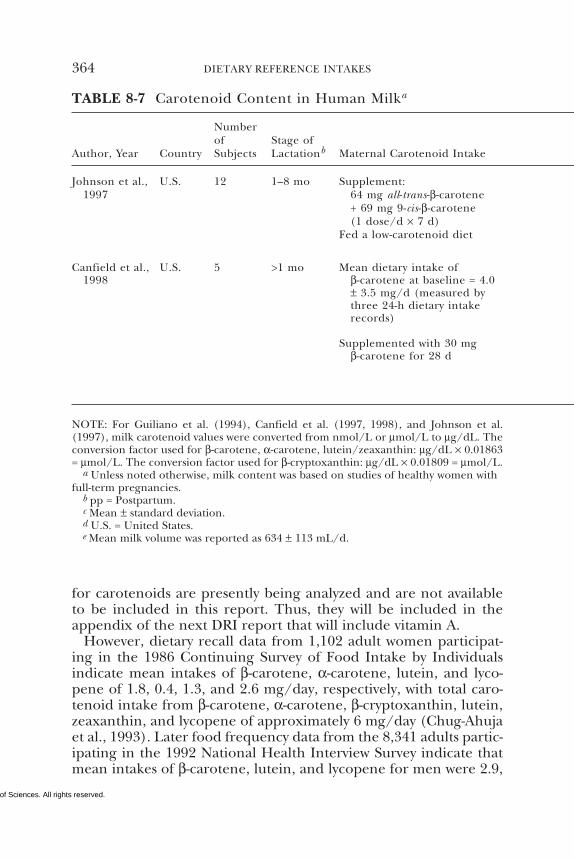
Copyright © National Academy of Sciences. All rights reserved.
364 DIETARY REFERENCE INTAKES
Johnson et al., U.S. 12 1–8 mo Supplement:1997 64 mg all-trans-β-carotene
+ 69 mg 9-cis-β-carotene(1 dose/d × 7 d)
Fed a low-carotenoid diet
Canfield et al., U.S. 5 >1 mo Mean dietary intake of1998 β-carotene at baseline = 4.0
± 3.5 mg/d (measured bythree 24-h dietary intakerecords)
Supplemented with 30 mgβ-carotene for 28 d
TABLE 8-7 Carotenoid Content in Human Milka
Numberof Stage of
Author, Year Country Subjects Lactationb Maternal Carotenoid Intake
NOTE: For Guiliano et al. (1994), Canfield et al. (1997, 1998), and Johnson et al.(1997), milk carotenoid values were converted from nmol/L or µmol/L to µg/dL. Theconversion factor used for β-carotene, α-carotene, lutein/zeaxanthin: µg/dL × 0.01863= µmol/L. The conversion factor used for β-cryptoxanthin: µg/dL × 0.01809 = µmol/L.
a Unless noted otherwise, milk content was based on studies of healthy women withfull-term pregnancies.
b pp = Postpartum.c Mean ± standard deviation.d U.S. = United States.e Mean milk volume was reported as 634 ± 113 mL/d.
for carotenoids are presently being analyzed and are not availableto be included in this report. Thus, they will be included in theappendix of the next DRI report that will include vitamin A.
However, dietary recall data from 1,102 adult women participat-ing in the 1986 Continuing Survey of Food Intake by Individualsindicate mean intakes of β-carotene, α-carotene, lutein, and lyco-pene of 1.8, 0.4, 1.3, and 2.6 mg/day, respectively, with total caro-tenoid intake from β-carotene, α-carotene, β-cryptoxanthin, lutein,zeaxanthin, and lycopene of approximately 6 mg/day (Chug-Ahujaet al., 1993). Later food frequency data from the 8,341 adults partic-ipating in the 1992 National Health Interview Survey indicate thatmean intakes of β-carotene, lutein, and lycopene for men were 2.9,
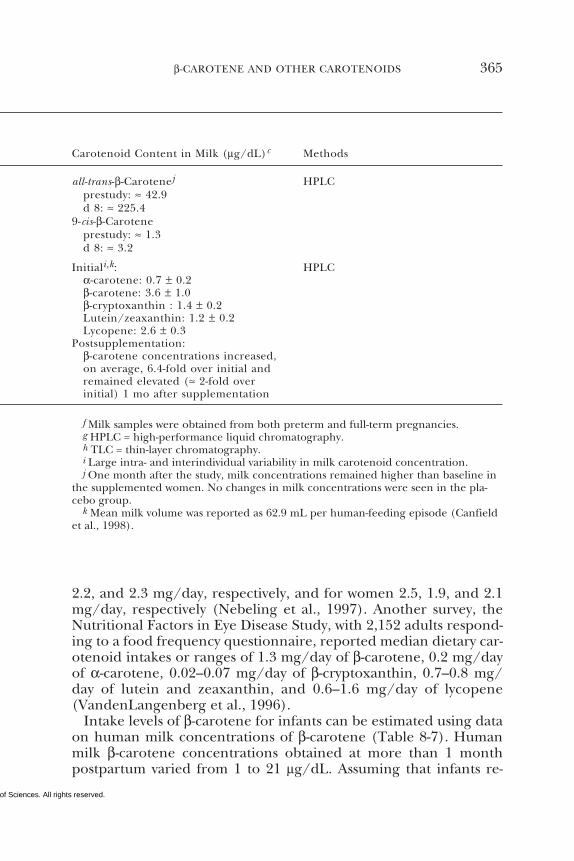
Copyright © National Academy of Sciences. All rights reserved.
β-CAROTENE AND OTHER CAROTENOIDS 365
f Milk samples were obtained from both preterm and full-term pregnancies.g HPLC = high-performance liquid chromatography.h TLC = thin-layer chromatography.i Large intra- and interindividual variability in milk carotenoid concentration.j One month after the study, milk concentrations remained higher than baseline in
the supplemented women. No changes in milk concentrations were seen in the pla-cebo group.
k Mean milk volume was reported as 62.9 mL per human-feeding episode (Canfieldet al., 1998).
2.2, and 2.3 mg/day, respectively, and for women 2.5, 1.9, and 2.1mg/day, respectively (Nebeling et al., 1997). Another survey, theNutritional Factors in Eye Disease Study, with 2,152 adults respond-ing to a food frequency questionnaire, reported median dietary car-otenoid intakes or ranges of 1.3 mg/day of β-carotene, 0.2 mg/dayof α-carotene, 0.02–0.07 mg/day of β-cryptoxanthin, 0.7–0.8 mg/day of lutein and zeaxanthin, and 0.6–1.6 mg/day of lycopene(VandenLangenberg et al., 1996).
Intake levels of β-carotene for infants can be estimated using dataon human milk concentrations of β-carotene (Table 8-7). Humanmilk β-carotene concentrations obtained at more than 1 monthpostpartum varied from 1 to 21 µg/dL. Assuming that infants re-
all-trans-β-Carotenej HPLCprestudy: ≈ 42.9d 8: ≈ 225.4
9-cis-β-Caroteneprestudy: ≈ 1.3d 8: ≈ 3.2
Initiali,k: HPLCα-carotene: 0.7 ± 0.2β-carotene: 3.6 ± 1.0β-cryptoxanthin : 1.4 ± 0.2Lutein/zeaxanthin: 1.2 ± 0.2Lycopene: 2.6 ± 0.3
Postsupplementation:β-carotene concentrations increased,on average, 6.4-fold over initial andremained elevated (≈ 2-fold overinitial) 1 mo after supplementation
Carotenoid Content in Milk (µg/dL)c Methods
Copyright © National Academy of Sciences. All rights reserved.
366 DIETARY REFERENCE INTAKES
ceiving human milk consume 0.78 L/day on average in the first 6months (Chapter 2); this would result in β-carotene intake levels of8 to 163 µg/day.
Intake from Supplements
β-Carotene, α-carotene, lutein and zeaxanthin, and lycopene areavailable as dietary supplements. There are no reliable estimates ofthe amount of these dietary supplements consumed by individualsin the United States or Canada.
TOLERABLE UPPER INTAKE LEVELS
Hazard Identification
Adverse Effects
No adverse effects other than carotenodermia have been report-ed from the consumption of β-carotene or other carotenoids infood. Carotenodermia is a harmless but clearly documented biolog-ical effect of high carotenoid intake. It is characterized by a yellow-ish discoloration of the skin that results from an elevation of caro-tene concentrations.
β-Carotene is used therapeutically, at extremely high doses (ap-proximately 180 mg/day), for the treatment of erythropoietic pro-toporphyria, a photosensitivity disorder. No toxic side effects havebeen observed at these doses. There is no evidence that β-caroteneor other carotenoids are teratogenic, mutagenic, or carcinogenic inlong-term bioassays in experimental animals (Heywood et al., 1985).In addition, long-term supplementation with β-carotene to personswith adequate vitamin A status does not increase the concentrationof serum retinol (Nierenberg et al., 1997). However, two recentclinical trials reported an increase in lung cancer associated withsupplemental β-carotene in current smokers (ATBC Cancer Preven-tion Study Group, 1994; Omenn et al., 1996a,b). These effects arediscussed below.
Lung Cancer. The Alpha-Tocopherol, Beta-Carotene (ATBC)Cancer Prevention Study showed a significantly higher incidence oflung cancer (relative risk [RR] = 1.18; 95 percent confidence inter-val [CI] = 1.03–1.36) and total mortality (RR = 1.08; 95 percent CI =1.01–1.16) in current smokers supplemented with 20 mg/day β-carotene (with or without 50 mg of α-tocopherol) for 5 to 8 years
Copyright © National Academy of Sciences. All rights reserved.
β-CAROTENE AND OTHER CAROTENOIDS 367
compared to the placebo group (ATBC Cancer Prevention StudyGroup, 1994). Supplemental β-carotene had no significant effecton the incidence of other major cancers occurring in this popula-tion (prostate, bladder, colon or rectum, stomach). In addition, theCarotene and Retinol Efficacy Trial (CARET), a multicenter lungcancer prevention trial of a nutrient combination versus placebo inasbestos workers and smokers (Omenn et al., 1996a,b) reportedmore lung cancer cases in the supplemented group. The nutrientcombination used in CARET included supplemental β-carotene (30mg/day) plus retinol (25,000 international units [IU]/day). BothCARET and ATBC included β-carotene in the intervention and re-ported similar effects on lung cancer. However, it should be notedthat CARET used a nutrient combination, without a factorial de-sign, and it is not clear whether the reported effects were attribut-able to β-carotene, retinol, or both acting in concert.
In contrast, the Physicians’ Health Study of supplemental β-caro-tene versus placebo in 22,071 male U.S. physicians reported no sig-nificant effect of 12 years of supplementation with β-carotene (50mg every other day) on cancer or total mortality (Hennekens et al.,1996). With regard to lung cancer, there was no indication of ex-cess lung cancer in the β-carotene-supplemented individuals, evenamong smokers who took the supplements for up to 12 years.
One additional trial, which was not designed as a lung cancerprevention trial, nonetheless produced results that are of relevanceto the topic of lung cancer prevention. The trial tested the efficacyof four different nutrient combinations in inhibiting the develop-ment of esophageal and gastric cancers in 30,000 men and womenaged 40 to 69 years living in Linxian County, China (Blot et al.,1993). One of the nutrient supplements was a combination of β-carotene, selenium, and vitamin E. After a 5-year intervention peri-od, those who were given this combination had a 13 percent reduc-tion in cancer deaths (RR = 0.87; 95 percent CI = 0.75–1.00), a 9percent reduction in total deaths (RR = 0.91; 95 percent CI = 0.84–0.99), a 4 percent reduction in esophageal cancer deaths (RR =0.96; 95 percent CI = 0.78–1.18), and a 21 percent reduction ingastric cancer deaths (RR = 0.79; 95 percent CI = 0.64–0.99). Forlung cancer, this trial had limited statistical power, with only 31 totallung cancer deaths (Blot et al., 1994). However, the relative risk ofdeath from lung cancer was 0.55 (95 percent CI = 0.26–1.14) amongthose receiving the combination of β-carotene, α-tocopherol, andselenium. The smoking prevalence, including individuals who hadever smoked cigarettes for 6 or more months, was 30 percent.
At the present time, the data pertaining to a possible adverse ef-
Copyright © National Academy of Sciences. All rights reserved.
368 DIETARY REFERENCE INTAKES
fect of β-carotene in smokers are somewhat conflicting. The resultsof ongoing studies may help resolve this issue. There also appearsto be a relationship between the adverse effects of β-carotene andboth smoking and alcohol consumption in the ATBC and CARETtrials. In the ATBC trial, only those men who consumed more than11 g/day of alcohol (approximately one drink per day) showed anadverse response to β-carotene supplementation (Albanes et al.,1996). In the CARET study, adverse effects were associated with theindividuals in the highest quartile of alcohol intake (Omenn et al.,1996a).
Carotenodermia. Carotenodermia is characterized by yellowish dis-coloration of the skin that results from an elevation of plasma caro-tene concentrations. This condition has been reported in adultstaking supplements containing 30 mg/day or more of β-carotenefor long periods of time or consuming high levels of carotenoid-rich foods such as carrots (Bendich, 1988) and is the primary effectof excess carotenoid intake noted in infants, toddlers, and youngchildren (Lascari, 1981). Carotenodermia is distinguished fromjaundice in that the ocular sclera are yellowed in jaundiced subjectsbut not in those with carotenodermia. Carotenodermia is consid-ered harmless and is readily reversible when carotene ingestion isdiscontinued.
Lycopenodermia. Lycopenodermia results from high intakes of ly-copene-rich foods such as tomatoes and is characterized by a deeporange discoloration of the skin. Lycopene is a more intensely col-ored pigment than carotene and may cause discoloration at lowerconcentrations than other carotenoids (Lascari, 1981).
Other Adverse Effects. Allergic reactions, increased incidence ofprostate cancer, retinopathy, leukopenia, and reproductive disor-ders have been associated anecdotally with high carotene consump-tion (Bendich, 1988; Kobza et al., 1973; Shoenfeld et al., 1982).None of these effects has been confirmed by clinical trials. There isno evidence of hypervitaminosis A in individuals consuming highlevels of β-carotene or other carotenoids (up to 180 mg/day) (Lewis,1972; Mathews-Roth, 1986; Mathews-Roth et al., 1972, 1974).
Dose-Response Assessment
The data on the potential for β-carotene to produce increasedlung cancer rates in smokers are conflicting and not sufficient for a
Copyright © National Academy of Sciences. All rights reserved.
β-CAROTENE AND OTHER CAROTENOIDS 369
dose-response assessment and derivation of a Tolerable Upper In-take Level (UL) for this endpoint. Supplements of 30 mg/day ormore of β-carotene for long periods of time may be associated withcarotenodermia, but this effect is more cosmetic than adverse andcan be considered harmless and readily reversible. Because of theinconsistent data on adverse effects of β-carotene, a UL cannot beestablished at this time. ULs are not established for other caro-tenoids due to a lack of suitable data.
Intake Assessment
Data for intakes of carotenoids (β-carotene, α-carotene, β-crypto-xanthin, lutein and zeaxanthin, and lycopene) from the 1988–1992Third National Health and Nutrition Examination Survey(NHANES III) based on an expanded food composition databasefor carotenoids are presently being analyzed and are not availableto be included in this report. Thus, they will be included in theappendix of the next DRI report that will include vitamin A.
Risk Characterization
A possible increase in lung cancer incidence has been noted onlyin smokers taking high-dose supplements of β-carotene (20 mg/dayor greater). As discussed earlier, supplemental forms of β-carotenehave markedly greater bioavailability than β-carotene from foods.The bioavailability of β-carotene from supplements can also be vari-able depending on the formulation, nutritional status of the personor population, and dietary intake pattern (e.g., fat intake). Giventhese substantial differences in bioavailability, it is perhaps logicalto characterize the risk as a function of plasma β-carotene concen-tration (see Figure 8-4). Median serum β-carotene concentrationsin the participants receiving 20 mg/day of β-carotene in the Finnishtrial rose from 0.32 µmol/L (17 µg/dL) at baseline to 5.66 µmol/L(300 µg/dL) at 3 years; this blood concentration was associated withan adverse effect (ATBC Cancer Prevention Study Group, 1994). InCARET, the median postintervention plasma concentration of β-carotene was 3.96 µmol/L (210 µg/dL); this blood concentrationalso was reported to be associated with an adverse effect (Omenn etal., 1996a). The first to ninety-ninth percentile for plasma β-caro-tene from NHANES III is also indicated in Appendix Table F-4.These data suggest that the concentrations associated with possibleadverse effects on lung cancer are well beyond the concentrationsachieved via dietary intake.
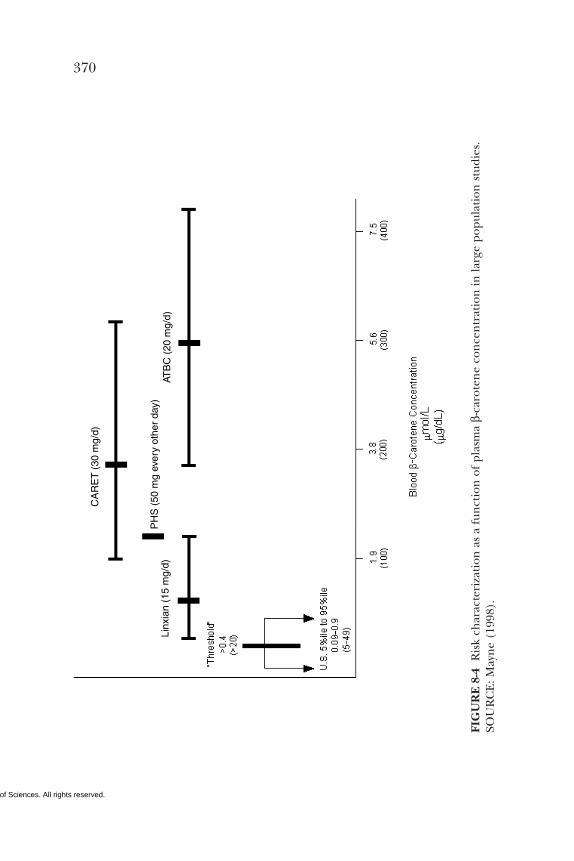
Copyright © National Academy of Sciences. All rights reserved.
370
CA
RE
T (
30 m
g/d)
ATB
C (
20 m
g/d)
PH
S (
50 m
g ev
ery
othe
r da
y)Li
nxia
n (1
5 m
g/d)
FIG
UR
E 8
-4 R
isk
char
acte
riza
tion
as
a fu
nct
ion
of
plas
ma
β-ca
rote
ne
con
cen
trat
ion
in la
rge
popu
lati
on s
tudi
es.
SOU
RC
E: M
ayn
e (1
998)
.
Copyright © National Academy of Sciences. All rights reserved.
β-CAROTENE AND OTHER CAROTENOIDS 371
Thus, while 20 mg/day of β-carotene in the form of a supplementis sufficient to raise blood concentrations to a range reported to beassociated with an increase in lung cancer risk, the same amount ofβ-carotene in foods is not. Micozzi et al. (1992) demonstrated that30 mg/day of supplemental β-carotene produced more than a five-fold increase in plasma β-carotene compared to 29 mg/day of β-carotene from carrots.
Based on these considerations, the existing recommendation forconsumption of five or more servings of fruits and vegetables perday is supported because this would provide 3 to 6 mg/day of β-carotene. A UL has not been set for β-carotene or carotenoids. In-stead, it is concluded that β-carotene supplements are not advisablefor the general population. This conclusion is based on a totality ofevidence that includes several large-scale randomized trials of sup-plemental β-carotene. These trials indicate a lack of evidence ofoverall benefit on total cancer or cardiovascular disease and possi-ble harm in certain subgroups such as current smokers or asbestos-exposed subjects. This advisement does not pertain to the possibleuse of supplemental β-carotene as a provitamin A source or for theprevention of vitamin A deficiency in populations with inadequatevitamin A nutriture or in patients suffering from erythropoietic pro-toporphyria.
RESEARCH RECOMMENDATIONS FOR β-CAROTENE ANDOTHER CAROTENOIDS
• As described earlier, β-carotene and other carotenoids havebeen shown to modulate a variety of intermediate endpoints. How-ever, studies validating that changes in an intermediate endpointare predictive of changes in a health outcome are critically needed.As an example, macular pigment optical density (MPOD) is a prom-ising intermediate marker for age-related macular degeneration(AMD), but human studies validating this endpoint prospectivelyare needed, as are studies demonstrating that changes in MPODare predictive of changes in risk of macular degeneration.
• As a corollary, studies are needed on the effects of long-termdepletion of β-carotene and subsequent repletion, with an evalua-tion of validated intermediate endpoints.
• Significantly more research is needed on health effects ofdietary carotenoids other than β-carotene. Possible associations be-tween lycopene and decreased prostate cancer risk, between luteinand zeaxanthin and lowered risk of AMD, and between α-caroteneor lutein and various cancers have to be evaluated in additional
Copyright © National Academy of Sciences. All rights reserved.
372 DIETARY REFERENCE INTAKES
observational studies, in animal models, and in human interventiontrials, if justified. Studies should consider not only the other caro-tenoids, but also the cis- versus trans-configuration of the carotenoid.
• Since the data from the human intervention trials of β-caro-tene are contradictory, additional data are needed from interven-tion trials involving β-carotene, several of which are ongoing. Anexamination is needed of health effects in populations with varyingbaseline risk profiles and, in particular, of studies evaluating inter-ventions in populations with poor baseline nutritional status. Post-trial follow-up of completed β-carotene trials is also needed.
• Studies aimed at the identification of correlates of higher β-carotene intake and plasma concentrations, which might help toexplain the lower risks of cancer associated with carotene-rich diets,are needed.
• Additional research is needed that targets putative mecha-nisms to explain a possible increase in lung cancer risk in heavysmokers taking high-dose β-carotene supplements (animal studies,biochemical studies, and molecular studies). In particular, confir-mation and extension of findings such as those of recent reportsregarding lung metaplasia (Wang et al., 1999) and carotenoid oxi-dation products (Salgo et al., 1999), and their relevance to cancerdevelopment in humans, are needed.
• Surveys are needed that routinely assess and report dietaryintakes of individual food carotenoids from large, representativepopulation samples. Intakes from both foods and dietary supple-ments must be considered.
• Efforts should be directed toward evaluating equivalency anddemonstrating efficacy of carotenoids in foods to meet vitamin Aneeds in vitamin A-deficient populations, in order to develop sus-tainable strategies to eradicate this worldwide public health problem.
REFERENCESAlbanes D, Heinonen OP, Taylor PR, Virtamo J, Edwards BK, Rautalahti M, Hart-
man AM, Palmgren J, Freedman LS, Haapakoski J, Barrett MJ, Pietinen P,Malila N, Tala E, Liippo K, Salomaa ER, Tangrea JA, Teppo L, Askin FB,Taskinen E, Erozan Y, Greenwald P, Huttunen JK. 1996. α-Tocopherol and ß-carotene supplements and lung cancer incidence in the Alpha-TocopherolBeta-Carotene Prevention Study: Effects of base-line characteristics and studycompliance. J Natl Cancer Inst 88:1560–1570.
Albanes D, Virtamo J, Taylor PR, Rautalahti M, Pietinen P, Heinonen OP. 1997.Effects of supplemental beta-carotene, cigarette smoking, and alcohol con-sumption on serum carotenoids in the Alpha-Tocopherol, Beta-Carotene Can-cer Prevention Study. Am J Clin Nutr 66:366–372.
Copyright © National Academy of Sciences. All rights reserved.
β-CAROTENE AND OTHER CAROTENOIDS 373
Allard JP, Royall D, Kurian R, Muggli R, Jeejeebhoy KN. 1994. Effects of beta-carotene supplementation on lipid peroxidation in humans. Am J Clin Nutr59:884–890.
ATBC (Alpha-Tocopherol, Beta Carotene) Cancer Prevention Study Group. 1994.The effect of vitamin E and beta carotene on the incidence of lung cancer andother cancers in male smokers. N Engl J Med 330:1029–1035.
Baker DL, Krol ES, Jacobsen N, Liebler DC. 1999. Reactions of beta-carotene withcigarette smoke oxidants. Identification of carotenoid oxidation products andevaluation of the prooxidant/antioxidant effect. Chem Res Toxicol 12:535–543.
Batieha AM, Armenian HK, Norkus EP, Morris JS, Spate VE, Comstock GW. 1993.Serum micronutrients and the subsequent risk of cervical cancer in a popula-tion-based nested case-control study. Cancer Epidemiol Biomarkers Prev 2:335–339.
Bendich A. 1988. The safety of beta-carotene. Nutr Cancer 11:207–214.Block G, Patterson B, Subar A. 1992. Fruit, vegetables, and cancer prevention: A
review of the epidemiological evidence. Nutr Cancer 18:1–29.Blot WJ, Li J-Y, Taylor PR, Guo W, Dawsey S, Wang G-Q, Yang CS, Zheng S-F, Gail
M, Li G-Y, Yu Y, Liu B-Q, Tangrea J, Sun Y-H, Liu F, Fraumeni JF Jr, Zhang Y-H, Li B. 1993. Nutrition intervention trials in Linxian, China: Supplementa-tion with specific vitamin/mineral combinations, cancer incidence, and dis-ease-specific mortality in the general population. J Natl Cancer Inst 85:1483–1492.
Blot WJ, Li J-Y, Taylor PR, Li B. 1994. Lung cancer and vitamin supplementation. NEngl J Med 331:614.
Boileau TW, Moore AC, Erdman JW Jr. 1999. Carotenoids and vitamin A. In: PapasAM, ed. Antioxidant Status, Diet, Nutrition, and Health. Boca Raton, FL: CRCPress. Pp. 133–158.
Bone RA, Landrum JT, Tarsis SL. 1985. Preliminary identification of the humanmacular pigment. Vision Res 25:1531–1535.
Bone RA, Landrum JT, Hime GW, Cains A, Zamor J. 1993. Stereochemistry of thehuman macular carotenoids. Invest Ophthalmol Vis Sci 34:2033–2040.
Bonithon-Kopp C, Coudray C, Berr C, Touboul P-J, Feve JM, Favier A, DucimetiereP. 1997. Combined effects of lipid peroxidation and antioxidant status oncarotid atherosclerosis in a population aged 59–71 y: The EVA Study. Am J ClinNutr 65:121–127.
Brady WE, Mares-Perlman JA, Bowen P, Stacewicz-Sapuntzakis M. 1996. Humanserum carotenoid concentrations are related to physiologic and lifestyle fac-tors. J Nutr 126:129–137.
Brown L, Rimm EB, Seddon JM, Giovannucci EL, Chasan-Taber L, Spiegelman D,Willett WC, Hankinson SE. 1999. A prospective study of carotenoid intake andrisk of cataract extraction in US men. Am J Clin Nutr 70:517–524.
Burri BJ, Dixon ZR, Fong AK, Kretsch MJ, Clifford AJ, Erdman JW Jr. 1993. Possi-ble association of skin lesions with a low-carotene diet in premenopausal wom-en. Ann NY Acad Sci 691:279–280.
Butte NF, Calloway DH. 1981. Evaluation of lactational performance of Navajowomen. Am J Clin Nutr 34:2210–2215.
Calzada C, Bizzotto M, Paganga G, Miller NJ, Bruckdorfer KR, Diplock AT, Rice-Evans CA. 1995. Levels of antioxidant nutrients in plasma and low densitylipoproteins: A human volunteer supplementation study. Free Radic Res 23:489–503.
Copyright © National Academy of Sciences. All rights reserved.
374 DIETARY REFERENCE INTAKES
Canfield LM, Giuliano AR, Neilson EM, Yap HH, Graver EJ, Cui HA, Blashill BM.1997. Beta-carotene in breast milk and serum is increased after a single beta-carotene dose. Am J Clin Nutr 66:52–61.
Canfield LM, Giuliano AR, Neilson EM, Blashil BM, Graver EJ, Yap HH. 1998.Kinetics of the response of milk and serum beta-carotene to daily beta-caro-tene supplementation in healthy, lactating women. Am J Clin Nutr 67: 276–283.
Castenmiller JJ, West CE. 1998. Bioavailability and bioconversion of carotenoids.Annu Rev Nutr 18:19–38.
Chandler LA, Schwartz SJ. 1987. HPLC separation of cis-trans carotene isomers infresh and processed fruits and vegetables. J Food Sci 52:669–672.
Chappell JE, Francis T, Clandinin MT. 1985. Vitamin A and E content of humanmilk at early stages of lactation. Early Hum Devel 11:157–167.
Chasan-Taber L, Willett WC, Seddon JM, Stampfer M, Rosner B, Colditz GA, Speiz-er FE, Hankinson SE. 1999. A prospective study of carotenoid and vitamin Aintakes and risk of cataract extraction in US women. Am J Clin Nutr 70:509–516.
Chow CK, Thacker RR, Changchit C, Bridges RB, Rehm SR, Humble J, Turbek J.1986. Lower levels of vitamin C and carotenes in plasma of cigarette smokers.J Am Coll Nutr 5:305–312.
Chug-Ahuja JK, Holden JM, Forman MR, Mangels AR, Beecher GR, Lanza E. 1993.The development and application of a carotenoid database for fruits, vegeta-bles, and selected multicomponent foods. J Am Diet Assoc 93:318–323.
Clevidence BA, Khachik F, Brown ED, Nair PP, Wiley ER, Prior RL, Cao G, MorelDW, Stone W, Gross M, Kramer TR. 1997. Human consumption of carotenoid-rich vegetables. In: Aruoma OI, Cuppett SL, eds. Antioxidant Methodology: InVivo and In Vitro Concepts. Champaign, IL: AOCS Press. Pp 53–63.
Clinton SK. 1998. Lycopene: Chemistry, biology, and implications for humanhealth and disease. Nutr Rev 56:35–51.
Clinton SK, Emenhiser C, Schwartz S, Bostwick DG, Williams AW, Moore BJ, Erd-man JW Jr. 1996. Cis-trans lycopene isomers, carotenoids, and retinol in thehuman prostate. Cancer Epidemiol Biomarkers Prev 5:823–833.
Comstock GW, Menkes MS, Schober SE, Vuilleumier J-P, Helsing KJ. 1988. Serumlevels of retinol, beta-carotene, and alpha-tocopherol in older adults. Am JEpidemiol 127:114–123.
Connett JE, Kuller LH, Kjelsberg MO, Polk BF, Collins G, Rider A, Hulley SB.1989. Relationship between carotenoids and cancer. The Multiple Risk FactorIntervention Trial (MRFIT) Study. Cancer 64:126–134.
Coodley GO, Nelson HD, Loveless MO, Folk C. 1993. Beta-carotene in HIV infec-tion. J Acquir Immune Defic Syndr 6:272–276.
de Pee S, West CE, Muhilal, Karyadi D, Hautvast J. 1995. Lack of improvement invitamin A status with increased consumption of dark-green leafy vegetables.Lancet 346:75–81.
de Pee S, West CE, Permaesih D, Martuti S, Muhilal, Hautvast J. 1998. Orange fruitis more effective than are dark-green, leafy vegetables in increasing serumconcentrations of retinol and beta-carotene in schoolchildren in Indonesia.Am J Clin Nutr 68:1058–1067.
Dietz JM, Kantha SS, Erdman JW Jr. 1988. Reversed phase HPLC analysis of alpha-and beta-carotene from selected raw and cooked vegetables. Plant Food HumNutr 38:333–341.
Copyright © National Academy of Sciences. All rights reserved.
β-CAROTENE AND OTHER CAROTENOIDS 375
Dixon ZR, Burri BJ, Clifford A, Frankel EN, Schneeman BO, Parks E, Keim NL,Barbieri T, Wu M-M, Fong AK, Kretsch MJ, Sowell AL, Erdman JW Jr. 1994.Effects of a carotene-deficient diet on measures of oxidative susceptibility andsuperoxide dismutase activity in adult women. Free Radic Biol Med 17:537–544.
Dixon ZR, Shie F-S, Warden BA, Burri BJ, Neidlinger TR. 1998. The effect of a lowcarotenoid diet on malondialdehyde-thiobarbituric acid (MDA-TBA) concen-trations in women: A placebo-controlled double-blind study. J Am Coll Nutr17:54–58.
EDCCSG (Eye Disease Case-Control Study Group). 1993. Antioxidant status andneovascular age-related macular degeneration. Arch Ophthalmol 111:104–109.
Eichholzer M, Stahelin HB, Gey KF. 1992. Inverse correlation between essentialantioxidants in plasma and subsequent risk to develop cancer, ischemic heartdisease and stroke respectively: 12-year follow-up of the Prospective BaselStudy. Exp Suppl 62:398–410.
Elinder LS, Hadell K, Johansson J, Molgaard J, Holme I, Olsson AG, Walldius G.1995. Probucol treatment decreases serum concentrations of diet-derived anti-oxidants. Arterioscler Thromb Vasc Biol 15:1057–1063.
Erdman JW Jr, Bierer TL, Gugger ET. 1993. Absorption and transport of caro-tenoids. Ann NY Acad Sci 691:76–85.
Fukao A, Tsubono Y, Kawamura M, Ido T, Akazawa N, Tsuji I, Komatsu S, MinamiY, Hisamichi S. 1996. The independent association of smoking and drinkingwith serum beta-carotene levels among males in Miyagi, Japan. Int J Epidemiol25:300–306.
Gartner C, Stahl W, Sies H. 1997. Lycopene is more bioavailable from tomato pastethan from fresh tomatoes. Am J Clin Nutr 66:116–122.
Gaziano JM, Hennekens CH. 1993. The role of beta-carotene in the prevention ofcardiovascular disease. Ann NY Acad Sci 691:148–155.
Gaziano JM, Hatta A, Flynn M, Johnson EJ, Krinsky NI, Ridker PM, HennekensCH, Frei B. 1995. Supplementation with beta-carotene in vivo and in vitrodoes not inhibit low density lipoprotein oxidation. Atherosclerosis 112:187–195.
Gebre-Medhin M, Vahlquist A, Hofvander Y, Uppsall L, Vahlquist B. 1976. Breastmilk composition in Ethiopian and Swedish mothers. I. Vitamin A and beta-carotene. Am J Clin Nutr 29:441–451.
Gey KF, Moser UK, Jordan P, Stahelin HB, Eichholzer M, Ludin E. 1993a. In-creased risk of cardiovascular disease at suboptimal plasma concentrations ofessential antioxidants: An epidemiological update with special attention tocarotene and vitamin C. Am J Clin Nutr 57:787S–797S.
Gey KF, Stähelin HB, Eichholzer M. 1993b. Poor plasma status of carotene andvitamin C is associated with higher morbidity from ischemic heart disease andstroke: Basel Prospective Study. Clin Invest 71:3–6.
Giovannucci E. 1999. Tomatoes, tomato-based products, lycopene, and cancer:Review of the epidemiologic literature. J Natl Cancer Inst 91:317–331.
Giovannucci E, Ascherio A, Rimm EB, Stampfer MJ, Colditz GA, Willett WC. 1995.Intake of carotenoids and retinol in relation to risk of prostate cancer. J NatlCancer Inst 87:1767–1776.
Giuliano AR, Neilson EM, Kelly BE, Canfield LM. 1992. Simultaneous quantitationand separation of carotenoids and retinol in human milk by high-performanceliquid chromatography. Methods Enzymol 213:391–399.
Giuliano AR, Neilson SM, Yap H-H, Baier M, Canfield LM. 1994. Quantitation ofand inter/intra-individual variability in major carotenoids of mature humanmilk. J Nutr Biochem 5:551–556.
Copyright © National Academy of Sciences. All rights reserved.
376 DIETARY REFERENCE INTAKES
Goodman DS, Blomstrand R, Werner B, Huang HS, Shiratori T. 1966. The intesti-nal absorption and metabolism of vitamin A and beta-carotene in man. J ClinInvest 45:1615–1623.
Gottlieb K, Zarling EJ, Mobarhan S, Bowen P, Sugerman S. 1993. Beta-carotenedecreases markers of lipid peroxidation in healthy volunteers. Nutr Cancer19:207–212.
Greenberg ER, Baron JA, Karagas MR, Stukel TA, Nierenberg DW, Stevens MM,Mandel JS, Haile RW. 1996. Mortality associated with low plasma concentra-tion of beta carotene and the effect of oral supplementation. J Am Med Assoc275:699–703.
Hammond BR Jr, Fuld K. 1992. Interocular differences in macular pigment densi-ty. Invest Ophthalmol Vis Sci 33:350–355.
Hammond BR Jr, Curran-Celentano J, Judd S, Fuld K, Krinsky NI, Wooten BR,Snodderly DM. 1996. Sex differences in macular pigment optical density: Re-lation to plasma carotenoid concentrations and dietary patterns. Vision Res36:2001–2012.
Hammond BR Jr, Johnson EJ, Russell RM, Krinsky NI, Yeum K-J, Edwards RB,Snodderly DM. 1997. Dietary modification of human macular pigment densi-ty. Invest Ophthalmol Vis Sci 38:1795–1801.
Handelman GJ, Dratz EA, Reay CC, Van Kuijk JG. 1988. Carotenoids in the humanmacula and whole retina. Invest Ophthalmol Vis Sci 29:850–855.
Handelman GJ, Packer L, Cross CE. 1996. Destruction of tocopherols, carotenoids,and retinol in human plasma by cigarette smoke. Am J Clin Nutr 63:559–565.
Hanusch M, Stahl W, Schulz WA, Sies H. 1995. Induction of gap junctional com-munication by 4-oxoretinoic acid generated from its precursor canthaxanthin.Arch Biochem Biophys 317:423–428.
Health Canada. 1997. Canada’s Food Guide to Healthy Eating. Minister of PublicWorks and Government Services Canada.
Hennekens CH, Buring JE, Manson JE, Stampfer M, Rosner B, Cook NR, BelangerC, LaMotte F, Gaziano JM, Ridker PM, Willett W, Peto R. 1996. Lack of effectof long-term supplementation with beta carotene on the incidence of malig-nant neoplasms and cardiovascular disease. N Engl J Med 334:1145–1149.
Herbeth B, Didelot-Barthelemy L, Lemoine A, Le Devehat C. 1988. Plasma fat-soluble vitamins and alcohol consumption. Am J Clin Nutr 47:343–344.
Herbeth B, Chavance M, Musse N, Mejean L, Vernhes G. 1990. Determinants ofplasma retinol, beta-carotene, and alpha-tocopherol. Am J Epidemiol 132:394–396.
Heywood R, Palmer AK, Gregson RL, Hummler H. 1985. The toxicity of beta-carotene. Toxicology 36:91–100.
Hininger I, Chopra M, Thurnham DI, Laporte F, Richard M-J, Favier A, Roussel A-M. 1997. Effect of increased fruit and vegetable intake on the susceptibility oflipoprotein to oxidation in smokers. Eur J Clin Nutr 51:601–606.
Holden JM, Eldridge AL, Beecher GR, Buzzard M, Bhagwat S, Davis CS, DouglassLW, Gebhardt S, Haytowitz D, Schakel S. 1999. Carotenoid content of U.S.foods: an update of the database. Food Comp Anal 12:169–196.
Hollander D, Ruble RE. 1978. Beta-carotene intestinal absorption: bile, fatty acid,pH, and flow rate effects on transport. Am J Physiology. 235: e686–e691.
Hughes DA, Wright AJ, Finglas PM, Peerless AC, Bailey AL, Astley SB, Pinder AC,Southon S. 1997. The effect of beta-carotene supplementation on the im-mune function of blood monocytes from healthy male nonsmokers. J Lab ClinMed 129:309–317.
Copyright © National Academy of Sciences. All rights reserved.
β-CAROTENE AND OTHER CAROTENOIDS 377
Jacques PF, Chylack LT Jr. 1991. Epidemiologic evidence of a role for the antioxi-dant vitamins and carotenoids in cataract prevention. Am J Clin Nutr 53:352S–355S.
Jalal F, Nesheim MC, Agus Z, Sanjur D, Habicht JP. 1998. Serum retinol concentra-tions in children are affected by food sources of beta-carotene, fat intake, andanthelmintic drug treatment. Am J Clin Nutr 68:623–629.
Johnson EJ, Russell RM. 1992. Distribution of orally administered beta-caroteneamong lipoproteins in healthy men. Am J Clin Nutr 56:128–135.
Johnson EJ, Qin J, Krinsky NI, Russell RM. 1997. Beta-carotene isomers in humanserum, breast milk and buccal mucosa cells after continuous oral doses of all-trans and 9-cis beta-carotene. J Nutr 127:1993–1999.
Kaplan LA, Lau JM, Stein EA. 1990. Carotenoid composition, concentrations, andrelationships in various human organs. Clin Physiol Biochem 8:1–10.
Khachik F, Bernstein PS, Garland DL. 1997a. Identification of lutein and zeaxan-thin oxidation products in human and monkey retinas. Invest Ophthalmol VisSci 38:1802–1811.
Khachik F, Spangler CJ, Smith JC, Canfield LM, Steck A, Pfander H. 1997b. Identi-fication, quantification, and relative concentrations of carotenoids and theirmetabolites in human milk and serum. Anal Chem 69:1873–1881.
Kobza A, Ramsay CA, Magnus IA. 1973. Oral carotene therapy in actinic reticuloidand solar urticaria. Failure to demonstrate a photoprotective effect againstlong wave ultraviolet and visible radiation. Br J Dermatol 88:157–166.
Kohlmeier L, Hastings SB. 1995. Epidemiologic evidence of a role of carotenoidsin cardiovascular disease prevention. Am J Clin Nutr 62:1370S–1376S.
Kohlmeier L, Kark JD, Gomez-Gracia E, Martin BC, Steck SE, Kardinaal AF, Ring-stad J, Thamm M, Masaev V, Riemersma R, Martin-Moreno JM, Huttunen JK,Kok FJ. 1997. Lycopene and myocardial infarction risk in the EURAMIC Study.Am J Epidemiol 146:618–626.
Koonsvitsky BP, Berry DA, Jones MB, Lin PY, Cooper DA, Jones DY, Jackson JE.1997. Olestra affects serum concentrations of alpha-tocopherol and caro-tenoids but not vitamin D or vitamin K status in free-living subjects. J Nutr127:1636S–1645S.
Kostic D, White WS, Olson JA. 1995. Intestinal absorption, serum clearance, andinteractions between lutein and beta-carotene when administered to humanadults in separate or combined oral doses. Am J Clin Nutr 62:604–610.
Kramer TR, Burri BJ. 1997. Modulated mitogenic proliferative responsiveness oflymphocytes in whole-blood cultures after a low-carotene diet and mixed-caro-tenoid supplementation in women. Am J Clin Nutr 65:871–875.
Krinsky NI. 1993. Actions of carotenoids in biological systems. Annu Rev Nutr13:561–587.
Kuhnlein HV, Soueida R, Receveur O. 1996. Dietary nutrient profiles of CanadianBaffin Island Inuit differ by food source, season, and age. J Am Diet Assoc96:155-162.
Kushi LH, Folsom AR, Prineas RJ, Mink PJ, Wu Y, Bostick RM. 1996. Dietary antiox-idant vitamins and death from coronary heart disease in postmenopausal wom-en. N Engl J Med 334:1156–1162.
Lachance PA. 1997. Nutrient addition to foods: The public health impact in coun-tries with rapidly westernizing diets. In: Bendich A, Deckelbaum RJ, eds. Pre-ventive Nutrition: The Comprehensive Guide for Health Professionals. Totowa, NJ:Humana Press. Pp. 441–454.
Lascari AD. 1981. Carotenemia. A review. Clin Pediatr 20:25–29.
Copyright © National Academy of Sciences. All rights reserved.
378 DIETARY REFERENCE INTAKES
Le Marchand L, Hankin JH, Kolonel LN, Beecher GR, Wilkens LR, Zhao LP. 1993.Intake of specific carotenoids and lung cancer risk. Cancer Epidemiol BiomarkersPrev 2:183–187.
Lewis MB. 1972. The effect of beta-carotene on serum vitamin A levels in erythro-poietic protoporphyria. Australas J Dermatol 13:75–78.
Lin Y, Burri BJ, Neidlinger TR, Muller HG, Dueker SR, Clifford A. 1998. Estimat-ing the concentration of beta-carotene required for maximal protection oflow-density lipoproteins in women. Am J Clin Nutr 67:837–845.
LSRO/FASEB (Life Sciences Research Office/Federation of American Societiesfor Experimental Biology). 1995. Third Report on Nutrition Monitoring in theUnited States. Washington, DC: US Government Printing Office.
Mahapatra S, Manorama R. 1997. The protective effect of red palm oil in compar-ison with massive vitamin A dose in combating vitamin A deficiency in Orissa,India. Asia Pacific J Clin Nutr 6:246–250.
Mangels AR, Holden JM, Beecher GR, Forman MR, Lanza E. 1993. Carotenoidcontent of fruits and vegetables: An evaluation of analytic data. J Am Diet Assoc93:284–296.
Manson JE, Gaziano JM, Jonas MA, Hennekens CH. 1993. Antioxidants and cardio-vascular disease: A review. J Am Coll Nutr 12:426–432.
Mares-Perlman JA, Brady WE, Klein R, Klein BE, Palta M, Bowen P, Stacewicz-Sapuntzakis M. 1994. Serum levels of carotenoids and tocopherols in peoplewith age-related maculopathy. Invest Ophthalmol Vis Sci 35:2004.
Mares-Perlman JA, Brady WE, Klein BE, Klein R, Palta M, Bowen P, Stacewicz-Sapuntzakis M. 1995. Serum carotenoids and tocopherols and severity of nu-clear and cortical opacities. Invest Ophthalmol Vis Sci 36:276–288.
Margetts BM, Jackson AA. 1996. The determinants of plasma beta-carotene: Inter-action between smoking and other lifestyle factors. Eur J Clin Nutr 50:236–238.
Martini MC, Campbell DR, Gross MD, Grandits GA, Potter JD, Slavin JL. 1995.Plasma carotenoids as biomarkers of vegetable intake: The University of Min-nesota Cancer Prevention Research Unit Feeding Studies. Cancer EpidemiolBiomarkers Prev 4:491–496.
Mathews-Roth MM. 1986. Beta-carotene therapy for erythropoietic protoporphyriaand other photosensitivity diseases. Biochimie 68:875–884.
Mathews-Roth MM, Pathak MA, Parrish J, Fitzpatrick TB, Kass EH, Toda K, Clem-ens W. 1972. A clinical trial of the effects of oral beta-carotene on the respons-es of human skin to solar radiation. J Invest Dermatol 59:349–353.
Mathews-Roth MM, Pathak MA, Fitzpatrick TB, Harber LC, Kass EH. 1974. Beta-carotene as an oral photoprotective agent in erythropoietic protoporphyria. JAm Med Assoc 228:1004–1008.
Mayne ST. 1996. Beta-carotene, carotenoids, and disease prevention in humans.FASEB J 10:690–701.
Mayne ST. 1998. Beta-carotene, Carotenoids and Cancer Prevention. In: DeVitaVT Jr, Hellman S, Rosenberg SA, eds. Principles and Practice of Oncology (PPO),5th Edition Updates. Philadelphia, PA: Lippincott-Raven Publishers. Pp. 12:1–15.
Mayne ST, Goodwin WJ Jr. 1993. Chemoprevention of head and neck cancer.Current Opinion Otolaryn Head Neck Surg 1:126–132.
Mayne ST, Cartmel B, Silva F, Kim CS, Fallon BG, Briskin K, Zheng T, Baum M,Shor-Posner G, Goodwin WJ Jr. 1998. Effect of supplemental beta-carotene onplasma concentrations of carotenoids, retinol, and alpha-tocopherol in hu-mans. Am J Clin Nutr 68:642–647.
Copyright © National Academy of Sciences. All rights reserved.
β-CAROTENE AND OTHER CAROTENOIDS 379
Menkes MS, Comstock GW, Vuilleumier JP, Helsing KJ, Rider AA, Brookmeyer R.1986. Serum beta-carotene, vitamins A and E, selenium, and the risk of lungcancer. N Engl J Med 315:1250–1254.
Micozzi MS, Brown ED, Edwards BK, Bieri JG, Taylor PR, Khachik F, Beecher GR,Smith JC. 1992. Plasma carotenoid response to chronic intake of selectedfoods and beta-carotene supplements in men. Am J Clin Nutr 55:1120–1125.
Mobarhan S, Bowen P, Andersen B, Evans M, Stacewicz-Sapuntzakis M, SugermanS, Simms P, Lucchesi D, Friedman H. 1990. Effects of beta-carotene repletionon beta-carotene absorption, lipid peroxidation, and neutrophil superoxideformation in young men. Nutr Cancer 14:195–206.
Morris DL, Kritchevsky SB, Davis CE. 1994. Serum carotenoids and coronary heartdisease: The Lipid Research Clinics Coronary Primary Prevention Trial andFollow-up Study. J Am Med Assoc 272:1439–1441.
Mosca L, Rubenfire M, Mandel C, Rock C, Tarshis T, Tsai A, Pearson T. 1997.Antioxidant nutrient supplementation reduces the susceptibility of low densi-ty lipoprotein to oxidation in patients with coronary artery disease. J Am CollCardiol 30:392–399.
Nebeling LC, Forman MR, Graubard BI, Snyder RA. 1997. Changes in carotenoidintake in the United States: The 1987 and 1992 National Health InterviewSurveys. J Am Diet Assoc 97:991–996.
Nierenberg DW, Dain BJ, Mott LA, Baron JA, Greenberg ER. 1997. Effects of 4 y oforal supplementation with beta-carotene on serum concentrations of retinol,tocopherol, and five carotenoids. Am J Clin Nutr 66:315–319.
Nomura AM, Stemmermann GN, Heilbrun LK, Salkeld RM, Vuilleumier JP. 1985.Serum vitamin levels and the risk of cancer of specific sites in men of Japaneseancestry in Hawaii. Cancer Res 45:2369–2372.
Nomura AM, Stemmermann GN, Lee J, Craft NE. 1997. Serum micronutrients andprostate cancer in Japanese Americans in Hawaii. Cancer Epidemiol BiomarkersPrev 6:487–491.
Olson JA. 1989. Biological actions of carotenoids. J Nutr 119:94–95.Olson JA. 1994. Absorption, transport, and metabolism of carotenoids in humans.
Pure Appl Chem 66:1011–1016.Olson JA. 1999. Carotenoids. In: Shils ME, Olson JA, Shike M, Ross AC, eds. Mod-
ern Nutrition in Health and Disease, 9th edition. Baltimore, MD: Williams &Wilkins. Pp. 525–541.
Omenn GS, Goodman GE, Thornquist MD, Balmes J, Cullen MR, Glass A, KeoghJP, Meyskens FL Jr, Valanis B, Williams JH Jr, Barnhart S, Cherniack MG,Brodkin CA, Hammar S. 1996a. Risk factors for lung cancer and for interven-tion effects in CARET, the Beta-Carotene and Retinol Efficacy Trial. J NatlCancer Inst 88:1550–1559.
Omenn GS, Goodman GE, Thornquist MD, Balmes J, Cullen MR, Glass A, KeoghJP, Meyskens FL Jr, Valanis B, Williams JH Jr, Barnhart S, Hammar S. 1996b.Effects of a combination of beta carotene and vitamin A on lung cancer andcardiovascular disease. N Engl J Med 334:1150–1155.
Ostrea EM Jr, Balun JE, Winkler R, Porter T. 1986. Influence of breast-feeding onthe restoration of the low serum concentration of vitamin E and beta-carotenein the newborn infant. Am J Obstet Gynecol 154:1014–1017.
Pamuk ER, Byers T, Coates RJ, Vann JW, Sowell AL, Gunter EW, Glass D. 1994.Effect of smoking on serum nutrient concentrations in African-American wom-en. Am J Clin Nutr 59:891–895.
Copyright © National Academy of Sciences. All rights reserved.
380 DIETARY REFERENCE INTAKES
Pandey DK, Shekelle R, Selwyn BJ, Tangney C, Stamler J. 1995. Dietary vitamin Cand beta-carotene and risk of death in middle-aged men. The Western Elec-tric Study. Am J Epidemiol 142:1269–1278.
Parker RS. 1988. Carotenoid and tocopherol composition of human adipose tis-sue. Am J Clin Nutr 47:33–36.
Parker RS. 1996. Absorption, metabolism, and transport of carotenoids. FASEB J10:542–551.
Patton S, Canfield LM, Huston GE, Ferris AM, Jensen RG. 1990. Carotenoids ofhuman colostrum. Lipids 25:159–165.
Pool-Zobel BL, Bub A, Muller H, Wollowski I, Rechkemmer G. 1997. Consumptionof vegetables reduces genetic damage in humans: First results of a humanintervention trial with carotenoid-rich foods. Carcinogenesis 18:1847–1850.
Richards GA, Theron AJ, Van Rensburg CE, Van Rensburg AJ, Van der Merwe CA,Kuyl JM, Anderson R. 1990. Investigation of the effects of oral administrationof vitamin E and beta-carotene on the chemiluminescence responses and thefrequency of sister chromatid exchanges in circulating leukocytes from ciga-rette smokers. Am Rev Respir Dis 142:648–654.
Riemersma RA, Wood DA, Macintyre CC, Elton RA, Gey KF, Oliver MF. 1991. Riskof angina pectoris and plasma concentrations of vitamins A, C, and E andcarotene. Lancet 337:1–5.
Rimm EB, Stampfer MJ, Ascherio A, Giovannucci E, Colditz GA, Willett WC. 1993.Vitamin E consumption and the risk of coronary heart disease in men. N EnglJ Med 328:1450–1456.
Rock CL, Swendseid ME. 1992. Plasma beta-carotene response in humans aftermeals supplemented with dietary pectin. Am J Clin Nutr 55:96–99.
Rodriguez MS, Irwin MI. 1972. A conspectus of research on vitamin A require-ments of man. J Nutr 102:909–968.
Roels OA, Trout M, Dujacquier R. 1958. Carotene balances on boys in Ruandawhere vitamin A deficiency is prevalent. J Nutr 65:115–127.
Rust P, Eichler I, Renner S, Elmadfa I. 1998. Effects of long-term oral beta-caro-tene supplementation on lipid peroxidation in patients with cystic fibrosis. IntJ Vitam Nutr Res 68:83–87.
Sahyoun NR, Jacques PF, Russell RM. 1996. Carotenoids, vitamins C and E, andmortality in an elderly population. Am J Epidemiol 144:501–511.
Salgo MG, Cueto R, Winston GW, Pryor WA. 1999. Beta carotene and its oxidationproducts have different effects on microsome mediated binding of benzo-[a]pyrene to DNA. Free Radic Biol Med 26:162–173.
Salonen JT, Nyyssonen K, Parviainen M, Kantola M, Korpela H, Salonen R. 1993.Low plasma beta-carotene, vitamin E and selenium levels associate with accel-erated carotid atherogenesis in hypercholesterolemic eastern Finnish men.Circulation 87:678.
Santos MS, Meydani SN, Leka L, Wu D, Fotouhi N, Meydani M, Hennekens CH,Gaziano JM. 1996. Natural killer cell activity in elderly men is enhanced bybeta-carotene supplementation. Am J Clin Nutr 64:772–777.
Santos MS, Gaziano JM, Leka LS, Beharka AA, Hennekens CH, Meydani SN. 1998.Beta-carotene-induced enhancement of natural killer cell activity in elderlymen: An investigation of the role of cytokines. Am J Clin Nutr 68:164–170.
Schmitz HH, Poor CL, Wellman RB, Erdman JW Jr. 1991. Concentrations of select-ed carotenoids and vitamin A in human liver, kidney and lung tissue. J Nutr121:1613–1621.
Copyright © National Academy of Sciences. All rights reserved.
β-CAROTENE AND OTHER CAROTENOIDS 381
Seddon JM, Ajani UA, Sperduto RD, Hiller R, Blair N, Burton TC, Farber MD,Gragoudas ES, Haller J, Miller DT, Yannuzzi LA, Willett W. 1994. Dietarycarotenoids, vitamins A, C, and E, and advanced age-related macular degener-ation. J Am Med Assoc 272:1413–1420.
Shoenfeld Y, Shaklai M, Ben-Baruch N, Hirschorn M, Pinkhaus J. 1982. Neutrope-nia induced by hypercarotenaemia. Lancet 1:1245.
Sies H, Stahl W. 1997. Carotenoids and intercellular communication via gap junc-tions. Int J Vitam Nutr Res 67:364–367.
Snodderly DM. 1995. Evidence for protection against age-related macular degener-ation by carotenoids and antioxidant vitamins. Am J Clin Nutr 62:1448S–1461S.
Stahelin HB, Gey KF, Eichholzer M, Ludin E, Bernasconi F, Thurneysen J, Bru-bacher G. 1991. Plasma antioxidant vitamins and subsequent cancer mortalityin the 12-year follow-up of the Prospective Basel Study. Am J Epidemiol 133:766–775.
Stahl W, Sies H. 1992. Uptake of lycopene and its geometrical isomers is greaterfrom heat-processed than from unprocessed tomato juice in humans. J Nutr122:2161–2166.
Stahl W, Schwarz W, Sundquist AR, Sies H. 1992. Cis-trans isomers of lycopene andbeta-carotene in human serum and tissues. Arch Biochem Biophys 294:173–177.
Steinberg FM, Chait A. 1998. Antioxidant vitamin supplementation and lipid per-oxidation in smokers. Am J Clin Nutr 68:319–327.
Stryker WS, Kaplan LA, Stein EA, Stampfer MJ, Sober A, Willett WC. 1988. Therelation of diet, cigarette smoking, and alcohol consumption to plasma beta-carotene and alpha-tocopherol levels. Am J Epidemiol 127:283–296.
Taylor A. 1993. Cataract: Relationship between nutrition and oxidation. J Am CollNutr 12:138–146.
Taylor A, Jacques PF, Epstein EM. 1995. Relations among aging, antioxidant status,and cataract. Am J Clin Nutr 62:1439S–1447S.
Traber MG, Diamond SR, Lane JC, Brody RI, Kayden HJ. 1994. Beta-carotenetransport in human lipoproteins. Comparisons with alpha-tocopherol. Lipids29:665–669.
VandenLangenberg GM, Brady WE, Nebeling LC, Block G, Forman M, Bowen PE,Stacewicz-Sapuntzakis M, Mares-Perlman JA. 1996. Influence of using differ-ent sources of carotenoid data in epidemiologic studies. J Am Diet Assoc96:1271–1275.
van het Hof KH, Brouwer IA, West CE, Haddeman E, Steegers-Theunissen RP, vanDusseldorp M, Weststrate JA, Eskes TK, Hautvast JG. 1999. Bioavailability oflutein from vegetables is 5 times higher than that of beta-carotene. Am J ClinNutr 70:261–268.
van Poppel G, Kok FJ, Duijzings P, de Vogel N. 1992a. No influence of beta-caro-tene on smoking-induced DNA damage as reflected by sister chromatid ex-changes. Int J Cancer 51:355–358.
van Poppel G, Kok FJ, Hermus RJ. 1992b. Beta-carotene supplementation in smok-ers reduces the frequency of micronuclei in sputum. Br J Cancer 66:1164–1168.
van Poppel G, Poulsen H, Loft S, Verhagen H. 1995. No influence of beta caroteneon oxidative DNA damage in male smokers. J Natl Cancer Inst 87:310–311.
van Vliet T, Schreurs WH, van Den Berg H. 1995. Intestinal beta-carotene absorp-tion and cleavage in men: Response of beta-carotene and retinyl esters in thetriglyceride-rich lipoprotein fraction after a single oral dose of beta-carotene.Am J Clin Nutr 62:110–116.
Copyright © National Academy of Sciences. All rights reserved.
382 DIETARY REFERENCE INTAKES
Wahlqvist ML, Wattanapenpaiboon N, Macrae FA, Lambert JR, MacLennan R,Hsu-Hage BH. 1994. Changes in serum carotenoids in subjects with colorectaladenomas after 24 mo of beta-carotene supplementation. Australian PolypPrevention Project Investigators. Am J Clin Nutr 60:936–943.
Wang X-D. 1994. Absorption and metabolism of beta-carotene. J Am Coll Nutr13:314–325.
Wang X-D, Liu C, Bronson RT, Smith DE, Krinsky NI, Russell RM. 1999. Retinoidsignaling and activator protein-1 expression in ferrets given beta-carotene sup-plements and exposed to tobacco smoke. J Natl Cancer Inst 91:60–66.
Wang Y, Ichiba M, Oishi H, Iyadomi M, Shono N, Tomokuni K. 1997. Relationshipbetween plasma concentrations of beta-carotene and alpha-tocopherol andlife-style factors and levels of DNA adducts in lymphocytes. Nutr Cancer 27:69–73.
West S, Vitale S, Hallfrisch J, Munoz B, Muller D, Bressler S, Bressler NM. 1994.Are antioxidants or supplements protective for age-related macular degenera-tion? Arch Ophthalmol 112:222–227.
Weststrate JA, Meijer GW. 1998. Plant sterol-enriched margarines and reduction ofplasma total- and LDL-cholesterol concentrations in normocholesterolaemicand mildly hypercholesterolaemic subjects. Eur J Clin Nutr 52:334–343.
Weststrate JA, van het Hof KH. 1995. Sucrose polyester and plasma carotenoidconcentrations in healthy subjects. Am J Clin Nutr 62:591–597.
White WS, Stacewicz-Sapuntzakis M, Erdman JW Jr, Bowen PE. 1994. Pharmacoki-netics of beta-carotene and canthaxanthin after ingestion of individual andcombined doses by human subjects. J Am Coll Nutr 13:665–671.
Winklhofer-Roob BM, Puhl H, Khoschsorur G, van’t Hof MA, Esterbauer H, Sh-merling DH. 1995. Enhanced resistance to oxidation of low density lipopro-teins and decreased lipid peroxide formation during beta-carotene supple-mentation in cystic fibrosis. Free Radic Biol Med 18:849–859.
Witter FR, Blake DA, Baumgardner R, Mellits ED, Niebyl JR. 1982. Folate, caro-tene, and smoking. Am J Obstet Gynecol 144:857.
WCRF/AICR (World Cancer Research Fund/American Institute for Cancer Re-search). 1997. Food, Nutrition and the Prevention of Cancer: A Global Perspective.Menasha, WI: BANTA Book Group.
Yong LC, Forman MR, Beecher GR, Graubard BI, Campbell WS, Reichman ME,Taylor PR, Lanza E, Holden JM, Judd JT. 1994. Relationship between dietaryintake and plasma concentrations of carotenoids in premenopausal women:Application of the USDA-NCI carotenoid food-composition database. Am JClin Nutr 60:223–230.
Zhang L-X, Cooney RV, Bertram JS. 1991. Carotenoids enhance gap junctionalcommunication and inhibit lipid peroxidation in C3H/10T1/2 cells: Rela-tionship to their cancer chemopreventive action. Carcinogenesis 12:2109–2114.
Zheng W, Blot WJ, Diamond EL, Norkus EP, Spate V, Morris JS, Comstock GW.1993. Serum micronutrients and the subsequent risk of oral and pharyngealcancer. Cancer Res 53:795–798.
Ziegler RG, Colavito EA, Hartge P, McAdams MJ, Schoenberg JB, Mason TJ, Frau-meni JF Jr. 1996a. Importance of alpha-carotene, beta-carotene, and otherphytochemicals in the etiology of lung cancer. J Natl Cancer Inst 88:612–615.
Ziegler RG, Mayne ST, Swanson CA. 1996b. Nutrition and lung cancer. CancerCauses Control 7:157–177.
Zino S, Skeaff M, Williams S, Mann J. 1997. Randomised controlled trial of effectof fruit and vegetable consumption on plasma concentrations of lipids andantioxidants. Br Med J 314:1787–1791.
Copyright © National Academy of Sciences. All rights reserved. 383
9Uses of
Dietary Reference Intakes
OVERVIEW
The Dietary Reference Intakes (DRIs) may be used for many pur-poses. These fall into two broad categories: assessing nutrient in-takes and planning for nutrient intakes. Each category may be fur-ther subdivided into uses for individual diets and uses for diets ofgroups (Figure 9-1).
For example, the Estimated Average Requirement (EAR) and Tol-erable Upper Intake Level (UL) may be used as components of adietary assessment of an individual client in a health care clinic; theRecommended Dietary Allowance (RDA) and Adequate Intake (AI)may be used as components to plan an improved diet for the sameclient. Likewise, the EARs and ULs may be used to assess the nutri-ent quality of a group of individuals participating in a dietary survey(such as those regularly conducted as part of the National NutritionMonitoring System) or to plan nutritionally adequate diets forgroups of people receiving meals in nursing homes, schools, andother group-feeding settings.
In the past, RDAs in the United States and Recommended Nutri-ent Intakes (RNIs) in Canada were the primary values available tohealth professionals for planning and assessing the diets of individ-uals and of groups and as a basis for making judgments about inad-equate or excessive intake. However, these former RDAs and RNIswere not ideally suited for many of these purposes (IOM, 1994).The DRIs provide a more complete set of reference values. Thetransition from using RDAs or RNIs alone to using each different
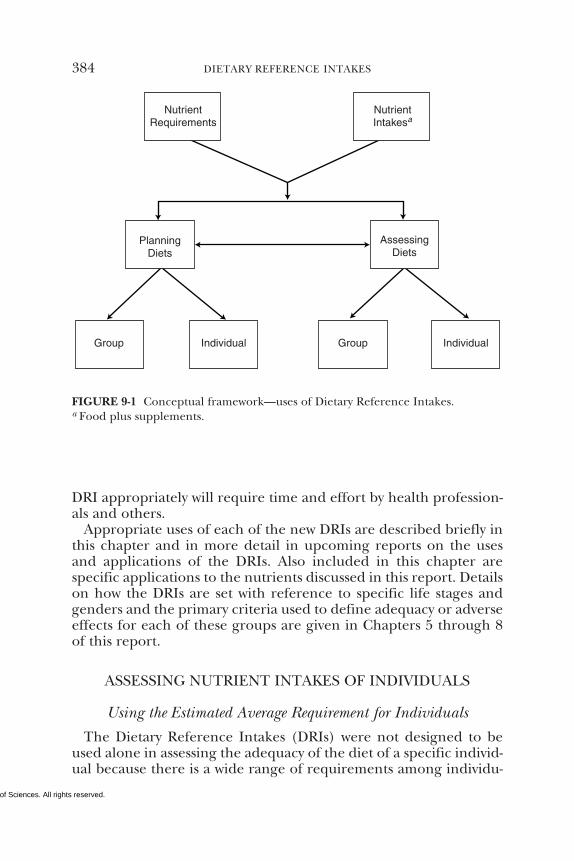
Copyright © National Academy of Sciences. All rights reserved.
384 DIETARY REFERENCE INTAKES
DRI appropriately will require time and effort by health profession-als and others.
Appropriate uses of each of the new DRIs are described briefly inthis chapter and in more detail in upcoming reports on the usesand applications of the DRIs. Also included in this chapter arespecific applications to the nutrients discussed in this report. Detailson how the DRIs are set with reference to specific life stages andgenders and the primary criteria used to define adequacy or adverseeffects for each of these groups are given in Chapters 5 through 8of this report.
ASSESSING NUTRIENT INTAKES OF INDIVIDUALS
Using the Estimated Average Requirement for Individuals
The Dietary Reference Intakes (DRIs) were not designed to beused alone in assessing the adequacy of the diet of a specific individ-ual because there is a wide range of requirements among individu-
NutrientRequirements
NutrientIntakesa
AssessingDiets
PlanningDiets
Individual IndividualGroupGroup
FIGURE 9-1 Conceptual framework—uses of Dietary Reference Intakes.a Food plus supplements.
Copyright © National Academy of Sciences. All rights reserved.
USES OF DIETARY REFERENCE INTAKES 385
als. The Estimated Average Requirement (EAR) estimates the medi-an requirement of a distribution of requirements for a life stage orgender group, but it is not possible to know where an individualfalls on this distribution without further physiological or biochemi-cal measures. Thus, from dietary data alone, it is only possible toestimate the likelihood of nutrient adequacy. Furthermore, it is rareto have precise and representative data on usual intake of an indi-vidual, which adds additional uncertainty to the evaluation of anindividual’s dietary adequacy. Thus, true nutrient status can usuallybe determined only by obtaining physiological and biochemical datafor the individual, and not from dietary assessment alone.
There are a number of inherent inaccuracies in dietary assess-ment methods. One is that individuals often underreport their in-takes (Briefel et al., 1997; Mertz et al., 1991), and it appears thatobese individuals do so to a greater extent than normal-weight indi-viduals (Heitmann and Lissner, 1995). Furthermore, large day-to-day variations in intake, which occur for almost all individuals, ne-cessitate many days of measurement to approximate usual intake.As a result, substantial caution must be used when interpreting nu-trient assessments based on self-reported dietary data covering rela-tively few days of intake. Given the difficulties in accurately estimat-ing usual intake, as well as the variance in requirements, a qualitativeinterpretation is recommended as described below:
• If usual intake of an individual is greater than or equal to theRecommended Dietary Allowance (RDA), there is little likelihood thatintake is inadequate. Intake at this level is expected to be inade-quate for fewer than 2 to 3 percent of individuals (IOM, 1997, 1998).
• If usual intake is between the RDA and the EAR, there is agreat deal of uncertainty about whether that intake is inadequateand additional information about the individual may be needed.Usual intake between the RDA and the EAR is inadequate for about3 to 50 percent of the individuals in the life stage group. If theseindividuals maintained intakes at this level over a prolonged timeperiod, they might demonstrate the signs of inadequacy used toestablish the EAR. For example, inadequate intake of vitamin Cwould lead to low ascorbate saturation of neutrophils.
• If usual intake is less than the EAR, there is a high likelihoodthat intake is inadequate. Usual intake at the EAR is expected to beinadequate for at least 50 percent of individuals.
• Because usual intakes are so difficult to measure, and becausean individual’s actual requirement is usually unknown, evaluation
Copyright © National Academy of Sciences. All rights reserved.
386 DIETARY REFERENCE INTAKES
based on dietary assessment should be confirmed by other mea-sures, especially when a high likelihood of inadequacy is suspected.
For example, a 30-year-old woman who consumes an average of55 mg/day of vitamin C from her food and takes a multiple vitaminfour times a week containing 60 mg of vitamin C would average 89mg/day (55 mg + [60 mg × 4/7]). Thus, her diet alone would puther at high likelihood of inadequacy, since it is below the EAR of 60mg/day. Addition of the supplement, however, would add up to asum on average above the RDA of 75 mg/day for adult women, thussuggesting little likelihood that intake is inadequate if the dietaryassessment represents her true usual intake.
Using the Adequate Intake for Individuals
For vitamin C, vitamin E, and selenium, Adequate Intakes (AIs),rather than EARs or RDAs, have been set only for infants. By defini-tion and observation, healthy infants who are exclusively fed humanmilk for the first 6 months of life by apparently healthy mothers areconsuming an adequate amount of these nutrients. Infants who areconsuming formulas with a nutrient profile similar to human milk(after adjustment for differences in bioavailability) for these threenutrients are also consuming adequate levels. In the case where aninfant formula contains a lower level of these nutrients than humanmilk, the likelihood of nutrient adequacy for infants consumingthis formula cannot be determined as data on infants at lower con-centrations of intake are not available for review.
Using the Tolerable Upper Intake Level for Individuals
The Tolerable Upper Intake Level (UL) is used to determine thepossibility of overconsumption of a nutrient. If an individual’s usualnutrient intake remains below the UL, there is little risk of adverseeffects from excessive intake. At intakes above the UL, the risk ofadverse effects increases. However, the intake at which a given indi-vidual will develop adverse effects as a result of taking large amountsof a nutrient is not known with certainty. For example, an individu-al consuming supplements of vitamin C that exceed 2,000 mg/daymay be at increased risk of adverse effects. In the case of vitamin C,the first adverse effects are osmotic diarrhea and gastrointestinaldisturbances. It should be noted that there is no established benefitfor presumably healthy individuals in consuming amounts of nutri-ents that exceed the RDA or AI.
Copyright © National Academy of Sciences. All rights reserved.
USES OF DIETARY REFERENCE INTAKES 387
ASSESSING NUTRIENT INTAKES OF GROUPS
Using the Estimated Average Requirement for Groups
The prevalence of nutrient inadequacy for a group of individualsmay be estimated by comparing the distribution of usual intakeswith the distribution of requirements. The Estimated Average Re-quirement (EAR) is the appropriate Dietary Reference Intake (DRI)to use for this purpose. In most situations, a cutpoint approach maybe used to estimate the prevalence of inadequate intakes within thepopulation group under study; this approach is a simplification ofthe full probability method of calculating the prevalence of inade-quacy described by the National Research Council (NRC, 1986).The cutpoint approach allows the prevalence of inadequate nutri-ent intakes in a population to be approximated by determining thepercentage of the individuals in the group whose usual intakes areless than the EAR for the nutrient of interest. This approach as-sumes that the intake and requirement distributions are indepen-dent, that the variability of intakes among individuals within thegroup under study is greater than the variability of their require-ments, and that the requirement distributions are symmetrical.1
Before determining the percentage of the group whose intake isbelow the EAR, the intake distribution should be adjusted to re-move the effect of day-to-day variation in intake (Nusser et al., 1996).This can be accomplished by collecting dietary data for each in-dividual over many days or by statistical adjustments to the dis-tribution that are based on information or assumptions about theday-to-day variation (Nusser et al., 1996). When this adjustment isperformed (and intakes are thus more representative of the usualdiet), the intake distribution narrows and gives a more precise esti-mate of the proportion of the group with usual intakes below theEAR. An explanation of an adjustment procedure was presented bythe National Research Council (NRC, 1986) and is also describedin the upcoming report on using DRIs for dietary assessment.
Figures 9-2 and 9-3 are a graphical representation of this ap-proach for vitamin C. They compare the adjusted distribution ofintakes of vitamin C for men and women 19 years of age and olderfrom the Third National Health and Nutrition Examination Survey
1For free-living populations, it is reasonable to assume that the variability inrequirements is smaller than the variability in intakes. For vitamin C, vitamin E,and selenium, requirement distributions are assumed to be symmetrical, and theintake and requirement distributions are thought to be independent.
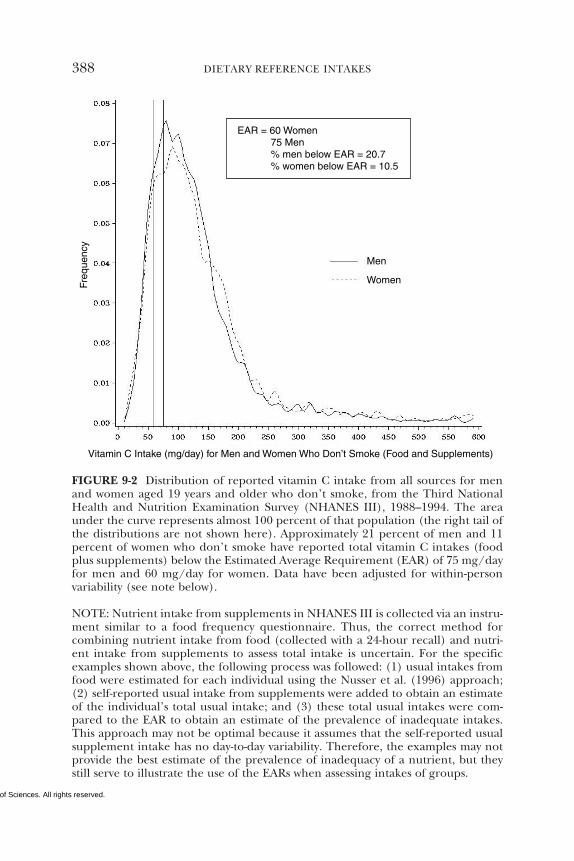
Copyright © National Academy of Sciences. All rights reserved.
388 DIETARY REFERENCE INTAKES
FIGURE 9-2 Distribution of reported vitamin C intake from all sources for menand women aged 19 years and older who don’t smoke, from the Third NationalHealth and Nutrition Examination Survey (NHANES III), 1988–1994. The areaunder the curve represents almost 100 percent of that population (the right tail ofthe distributions are not shown here). Approximately 21 percent of men and 11percent of women who don’t smoke have reported total vitamin C intakes (foodplus supplements) below the Estimated Average Requirement (EAR) of 75 mg/dayfor men and 60 mg/day for women. Data have been adjusted for within-personvariability (see note below).
NOTE: Nutrient intake from supplements in NHANES III is collected via an instru-ment similar to a food frequency questionnaire. Thus, the correct method forcombining nutrient intake from food (collected with a 24-hour recall) and nutri-ent intake from supplements to assess total intake is uncertain. For the specificexamples shown above, the following process was followed: (1) usual intakes fromfood were estimated for each individual using the Nusser et al. (1996) approach;(2) self-reported usual intake from supplements were added to obtain an estimateof the individual’s total usual intake; and (3) these total usual intakes were com-pared to the EAR to obtain an estimate of the prevalence of inadequate intakes.This approach may not be optimal because it assumes that the self-reported usualsupplement intake has no day-to-day variability. Therefore, the examples may notprovide the best estimate of the prevalence of inadequacy of a nutrient, but theystill serve to illustrate the use of the EARs when assessing intakes of groups.
Men
WomenFreq
uenc
y
Vitamin C Intake (mg/day) for Men and Women Who Don’t Smoke (Food and Supplements)
EAR = 60 Women 75 Men% men below EAR = 20.7% women below EAR = 10.5
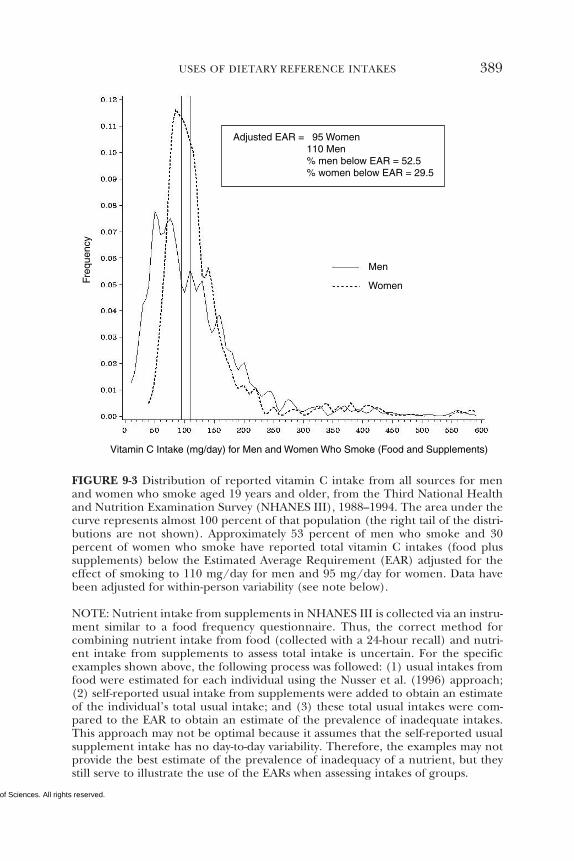
Copyright © National Academy of Sciences. All rights reserved.
USES OF DIETARY REFERENCE INTAKES 389
FIGURE 9-3 Distribution of reported vitamin C intake from all sources for menand women who smoke aged 19 years and older, from the Third National Healthand Nutrition Examination Survey (NHANES III), 1988–1994. The area under thecurve represents almost 100 percent of that population (the right tail of the distri-butions are not shown). Approximately 53 percent of men who smoke and 30percent of women who smoke have reported total vitamin C intakes (food plussupplements) below the Estimated Average Requirement (EAR) adjusted for theeffect of smoking to 110 mg/day for men and 95 mg/day for women. Data havebeen adjusted for within-person variability (see note below).
NOTE: Nutrient intake from supplements in NHANES III is collected via an instru-ment similar to a food frequency questionnaire. Thus, the correct method forcombining nutrient intake from food (collected with a 24-hour recall) and nutri-ent intake from supplements to assess total intake is uncertain. For the specificexamples shown above, the following process was followed: (1) usual intakes fromfood were estimated for each individual using the Nusser et al. (1996) approach;(2) self-reported usual intake from supplements were added to obtain an estimateof the individual’s total usual intake; and (3) these total usual intakes were com-pared to the EAR to obtain an estimate of the prevalence of inadequate intakes.This approach may not be optimal because it assumes that the self-reported usualsupplement intake has no day-to-day variability. Therefore, the examples may notprovide the best estimate of the prevalence of inadequacy of a nutrient, but theystill serve to illustrate the use of the EARs when assessing intakes of groups.
Freq
uenc
y
Vitamin C Intake (mg/day) for Men and Women Who Smoke (Food and Supplements)
Men
Women
Adjusted EAR = 95 Women 110 Men% men below EAR = 52.5% women below EAR = 29.5
Copyright © National Academy of Sciences. All rights reserved.
390 DIETARY REFERENCE INTAKES
(NHANES III) with the EARs for vitamin C. These data includeintake from both food and supplements. Although the NHANESfood intake data are based on a single 24-hour recall for all individ-uals, replicate 24-hour recalls were conducted on a subset of theparticipants, and these estimates of day-to-day variation derivedfrom this subset have been used to adjust the intake distributions(see Appendix Tables C-1 and C-2).
The EARs for vitamin C are 60 mg/day for women and 75 mg/day for men. Based on the U.S. population that doesn’t smoke,approximately 11 percent of women and 21 percent of men did notconsume adequate amounts of vitamin C (from food sources andsupplements) (Figure 9-2).
Those who smoke require an additional 35 mg/day of vitamin C,which would result in an adjusted average requirement of 95 mg/day for females and 110 mg/day for males. This is shown in Figure9-3, in which a higher prevalence of inadequacy is estimated forsmokers compared to nonsmokers. Even when vitamin C supple-ments are included, 53 percent of men and 30 percent of womenwho smoke were below the requirement. These prevalences indi-cate that a substantial percentage of Americans who smoke mayhave inadequate intakes of vitamin C and thus would be expectedto have less than optimal ascorbate saturation of neutrophils.
The assessment of nutrient adequacy for groups of people re-quires unbiased, quantitative information on the intake of the nu-trient of interest by individuals in the group. Care must be taken toensure the quality of the information on which assessments arebased, so they are not underestimates or overestimates of total nu-trient intake. Estimates of total nutrient intake, including amountsobtained from supplements, should be acquired. It is also impor-tant to use appropriate food composition data with valid nutrientvalues for the foods consumed. In the example for vitamin C in-takes, a database of vitamin C values for all foods that contributesubstantially to the intakes of this nutrient, as well as a database withthe vitamin C composition of the supplements consumed by thepopulation under study, are required.
Overestimates of the prevalence of inadequate intakes could re-sult if the data used are based on intakes that are systematicallyunderreported or if foods rich in vitamin C are underreported.Conversely, underestimates of the prevalence of inadequacy wouldresult if vitamin C-rich foods were overreported. A more extensivediscussion of potential sources of error in self-reported dietary datacan be found in the upcoming report on using DRIs in dietaryassessment.
Copyright © National Academy of Sciences. All rights reserved.
USES OF DIETARY REFERENCE INTAKES 391
Using the Recommended Dietary Allowances for Groups
The Recommended Dietary Allowances (RDAs) are not useful inestimating the prevalence of inadequate intakes for groups. As de-scribed above, the EAR should be used for this purpose.
Using the Adequate Intake for Groups
In this report, Adequate Intakes (AIs) are assigned only for in-fants and reflect the average intake of the nutrient from humanmilk. Human milk and, in the case of nutrients reviewed in thisreport, infant formulas with the same nutrient composition as hu-man milk (after adjustment for bioavailability) provide the appro-priate levels of nutrients for infants of presumably healthy well-nour-ished mothers. Groups of infants consuming formulas with lowerlevels of nutrients than human milk may be at some risk of inade-quacy, but the prevalence of inadequacy cannot be quantified.
Using the Tolerable Upper Intake Level for Groups
The proportion of the population with usual intakes below theTolerable Upper Intake Level (UL) is likely to be at no risk ofadverse effects due to overconsumption, while the proportion abovethe UL may be at some risk. In the case of vitamin C, the UL is2,000 mg/day for adults; the NHANES III data in Figures 9-2 and9-3, which include reported intake from supplements, illustrate thatthe U.S. adult population did not exceed this UL at the time of thesurvey.
In typical food-based diets, ULs for vitamin C, vitamin E, andselenium can rarely be exceeded. Supplement use would be theprimary way to exceed these ULs.
The mean intake of a population cannot be used to evaluate theprevalence of intakes above the UL. A distribution of usual intakes,including intakes from supplements, is required in order to assessthe proportion of the population that may be at risk of overcon-sumption.
Copyright © National Academy of Sciences. All rights reserved.
392 DIETARY REFERENCE INTAKES
PLANNING NUTRIENT INTAKES OF INDIVIDUALS
Using the Recommended Dietary Allowance for Individuals
Individuals should use the Recommended Dietary Allowance(RDA) as the target for their daily nutrient intakes. For example, toincrease their vitamin C consumption to the RDA level (75 mg/dayfor women and 90 mg/day for men), adults can increase their in-take of foods that provide ascorbate, such as citrus fruits, broccoli,or tomatoes. An 8-ounce glass of orange juice (from frozen concen-trate) supplies about 100 mg of vitamin C (USDA, 1991).
Using the Adequate Intake for Individuals
For the nutrients in this report, vitamin C, vitamin E, and selenium,Adequate Intakes (AIs) are set only for infants. Human milk con-tent for these nutrients should supply the AI, so it is not necessaryto plan additional sources of intakes for infants exclusively fed hu-man milk. Likewise, for these nutrients, an infant formula with anutrient profile similar to human milk (after adjustment for anydifferences in bioavailability) should supply adequate nutrients foran infant.
PLANNING NUTRIENT INTAKES OF GROUPS
The Estimated Average Requirement (EAR) may be used as abasis for planning or making recommendations for the nutrientintakes of groups. The mean intake of a group should be highenough so that only a small percentage of the group would haveintakes below the EAR, thus indicating a low prevalence of dietaryinadequacy.
Using the EAR and Tolerable Upper Intake Level (UL) in plan-ning intakes of groups involves a number of key decisions and theanalysis of issues such as the following:
• determination of the current nutrient intake distribution ofthe group of interest;
• an evaluation of interventions to shift the current distribu-tion, if necessary, so there is an acceptably low prevalence of intakesbelow the EAR, as well as an acceptably low prevalence of intakesabove the UL (some interventions may increase the intake of thosemost at risk of inadequacy—usually by individual intervention—whereas others may increase the intake of the entire group [e.g.,fortification of the food supply]); and
Copyright © National Academy of Sciences. All rights reserved.
USES OF DIETARY REFERENCE INTAKES 393
• the selection of the degree of risk that can be tolerated whenplanning for the group (e.g., a 2 to 3 percent prevalence versus ahigher or lower prevalence).
NUTRIENT-SPECIFIC CONSIDERATIONS
Vitamin C
The effect of cigarette smoking on vitamin C status has led torecommending an increase to cover the higher vitamin C require-ments for those who smoke. Thus, smoking status has to be consid-ered in assessing and planning ascorbate intakes. Another consider-ation in evaluating vitamin C intake is the variability in the foodsupply and the loss during cooking of this water-soluble and heat-labile vitamin. Destruction of vitamin C in processing and cooking(Williams and Erdman, 1999) may be different than assumed by thevalues in the food composition tables resulting in an over- or under-estimation of the population at risk, while underreporting of di-etary intakes in general may lead to an overestimate of the popula-tion at risk.
The Tolerable Upper Intake Level (UL) for vitamin C for adultsis 2,000 mg/day. Sensitive individuals who regularly consume morethan 2,000 mg/day may be at risk of osmotic diarrhea and gas-trointestinal disturbances.
Vitamin E
The Estimated Average Requirements (EARs), RecommendedDietary Allowances (RDAs), and Adequate Intakes (AIs) for vitaminE are based on α-tocopherol only and do not include amounts ob-tained from the other seven naturally occurring forms of vitamin E(β-, γ-, δ- tocopherol and the four tocotrienols). Although absorbed,these forms do not contribute to meeting the vitamin E requirementbecause they are not converted to α-tocopherol. Only the 2R-stereo-isomeric forms of α-tocopherol are preferentially secreted by theliver into the plasma for transport to tissues. Since the 2S-stereo-isomeric forms of α-tocopherol are not maintained in human plasmaor tissues, vitamin E is defined in this report as limited to the 2R-stereoisomeric forms of α-tocopherol to establish recommendedintakes. However, all eight stereoisomers of supplemental α-tocopherol are used as the basis for establishing the Tolerable UpperIntake Level (UL) for vitamin E.
Currently, most nutrient databases, as well as nutrition labels, do
Copyright © National Academy of Sciences. All rights reserved.
394 DIETARY REFERENCE INTAKES
not distinguish among all the different forms of vitamin E (Figure6-1) in food. These databases often present the data as α-tocopherolequivalents (α-TE) and thus include the contribution of all eightnaturally occurring forms of vitamin E, after adjustment for bio-availability using previously determined equivalencies (e.g., γ-tocopherol has been usually assumed to have only 10 percent of theavailability of α-tocopherol) based on fetal resorption assays. Thisreport (see Chapter 6) recommends that the use of α-TE be aban-doned due to the lack of evidence of bioavailability via transport inplasma or tissues. Because these other forms of vitamin E occur infoods (e.g., γ-tocopherol is present in widely consumed oils such assoybean and corn oils), the intake of α-TE is greater than the intakeof α-tocopherol alone.
All α-tocopherol in foods is RRR-α-tocopherol, but the all rac-α-tocopherol in fortified foods and supplements is an equal mix ofthe 2R- and 2S-stereoisomers. The EARs, RDAs, and AIs given inChapter 6 apply only to the intake of the RRR-α-tocopherol fromfood and the 2R-stereoisomeric forms of α-tocopherol (RRR-, RSR-,RRS-, and RSS-α-tocopherol) that occur in fortified foods and sup-plements (see Chapter 6, Figure 6-2). The UL applies to all eightstereoisomeric forms of α-tocopherol that occur in fortified foodsand supplements.
Conversion Factor for Vitamin E in Food and Supplements
The reported median vitamin E intake in the United States of allindividuals surveyed in the Third National Health and NutritionExamination Survey (NHANES III) was 9 mg (21 µmol)/day of α-TE (see Appendix Table C-3). Additional data from the NHANESIII database indicate that α-tocopherol contributed 7 mg/day of the9 mg/day median intake of total α-TE from food (see AppendixTable C-4). Thus, based on NHANES III, approximately 80 percentof the α-TE from foods in the survey are reported to be contributedby α-tocopherol. So to estimate the α-tocopherol intake from foodsurveys in the United States in which food intake data are presentedas α-TE, the α-TE should be multiplied by 0.8.
mg of α-tocopherol in a meal =mg of α-tocopherol equivalents in a meal × 0.8.
In addition, the amount of chemically synthesized all rac-α-tocopherol compounds added to foods and multivitamin supple-ments in milligrams should be estimated at 50 percent to calculate
Copyright © National Academy of Sciences. All rights reserved.
USES OF DIETARY REFERENCE INTAKES 395
the intake of the 2R-stereoisomers of α-tocopherol when assessingintakes to meet requirements.
If vitamin E in foods, fortified foods, and multivitamin supple-ments is reported in international units (IUs), the activity in milli-grams of α-tocopherol may be calculated by multiplying the numberof IUs by 0.67 if the form of vitamin E is RRR-α-tocopherol (naturalvitamin E) (historically and incorrectly labeled d-α-tocopherol)(Horwitt, 1976), and by 0.45 if the form is all rac-α-tocopherol (syn-thetic vitamin E) (historically and incorrectly labeled dl-α-tocopherolcompounds) (Horwitt, 1976)2 (see Chapter 6, Table 6-1).
mg of α-tocopherol in food, fortified food, or multivitamin
= IU of the RRR-α-tocopherol compound × 0.67.or
= IU of the all rac-α-tocopherol compound × 0.45.
For example, a person with intake from food of 15 mg/day of α-TE would have consumed approximately 12 mg/day of α-tocopherol(15 × 0.8 = 12). If this person took a daily multivitamin supplementwith 30 IU of RRR-α-tocopheryl acetate, an additional 20 mg/day ofα-tocopherol would have been consumed (30 × 0.67 = 20). Thus,this person would have an effective total intake of 32 mg/day of α-tocopherol (12 + 20). If the daily multivitamin supplement con-tained 30 IU of all rac-α-tocopherol, it would be equivalent to 13.5mg/day of α-tocopherol (30 × 0.45 = 13.5), and the person’s totalintake of α-tocopherol would be 25.5 mg/day (12 + 13.5).
Vitamin E Intake from Food
Estimation of vitamin E intake is difficult. There is a propensity to
2The original international standard for vitamin E, dl-α-tocopheryl acetate (oneasymmetric carbon atom in the 2 position on the chromal ring, ambo-α-tocopherylacetate) is no longer commercially available. It was synthesized from natural phytoland was a mixture of two stereoisomers of α-tocopherols, RRR-α-tocopheryl acetateand SRR-α-tocopheryl acetate (Horwitt, 1976). For practical purposes at the time,the activity of 1 mg of dl-α-tocopheryl acetate was defined as equivalent to one IUof vitamin E. The dl-α-tocopheryl acetate of commerce currently available is syn-thesized from synthetic isophytol, has eight stereoisomers, and is labeled as dl-α-tocopheryl acetate. However, it is more accurately called all rac-α-tocopheryl acetate(AIN, 1990; IUPAC, 1974) because it contains three asymmetric carbon atoms inthe 2, 4', and 8' positions (2RS, 4'RS, 8'RS-α-tocopherol). The all rac and ambo-α-tocopheryl acetates were shown to have the same biological activity in rats (Weiseret al., 1986).
Copyright © National Academy of Sciences. All rights reserved.
396 DIETARY REFERENCE INTAKES
underreport energy intake in national surveys, and fat intake is moreunderreported than energy intake in the NHANES III survey (Brief-el et al., 1997). Since vitamin E is associated with fat in the foodmatrix, underreporting of the total intake of fat also results in theunderreporting of vitamin E intake. Furthermore, there are uncer-tainties in the amount of α-tocopherol in fats and oils consumed,particularly when food labels do not provide the specific fat or oilused (e.g., “this product may contain partially hydrogenated soy-bean and/or cottonseed oil or vegetable oil”); in addition, becauseof the small number of samples, the vitamin E content of the foodsin the Continuing Survey of Food Intake of Individuals (CSFII) andNHANES III databases are very variable (J. Holden, AgriculturalResearch Service, U.S. Department of Agriculture, personal com-munication, April 13, 1999). Finally, the amounts of fats and oilsadded during food preparation (and absorbed into the cookedproduct) is difficult to assess using diet recall methodologies, yetmay contribute substantially to vitamin E intake.
UL for Vitamin E
The UL for α-tocopherol for adults is 1,000 mg/day of all eightstereoisomers of α-tocopherol. This UL is based on the intake of α-tocopherol from supplements only, because there is no evidence ofadverse effects from the consumption of vitamin E naturally occur-ring in foods. In addition, the UL was based on animal studiesfeeding either RRR-α-tocopherol (natural vitamin E) or all rac-α-tocopherol (synthetic vitamin E), both of which had equivalentadverse effects. Although adults should not exceed the UL of 1,000mg/day of any form of supplemental α-tocopherol, intakes abovethis amount may be appropriate for investigation in well-controlledclinical trials.
Sources of vitamin E available as supplements are usually labeledas international units (IUs) of natural vitamin E and its esters or assynthetic vitamin E and its esters. Table 9-1 shows the IUs of varioussources of supplemental vitamin E that are equivalent to the UL foradults of 1,000 mg/day of any form of supplemental α-tocopherol.
Recommendation
Because the various forms of vitamin E are not interconvertible inhumans, it is recommended that nutrient databases be specificenough to identify and report α-tocopherol intake separately fromintake of other tocopherols. However, until this is done, it is possi-
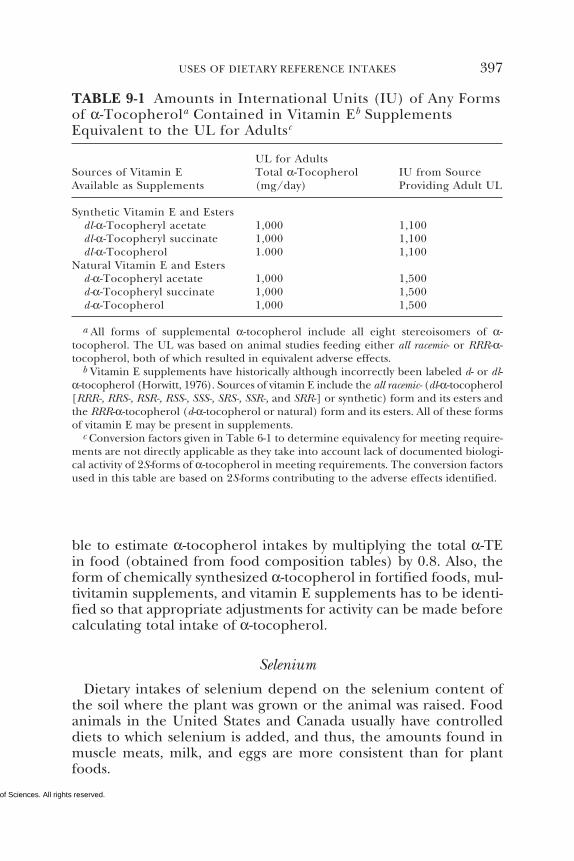
Copyright © National Academy of Sciences. All rights reserved.
USES OF DIETARY REFERENCE INTAKES 397
ble to estimate α-tocopherol intakes by multiplying the total α-TEin food (obtained from food composition tables) by 0.8. Also, theform of chemically synthesized α-tocopherol in fortified foods, mul-tivitamin supplements, and vitamin E supplements has to be identi-fied so that appropriate adjustments for activity can be made beforecalculating total intake of α-tocopherol.
Selenium
Dietary intakes of selenium depend on the selenium content ofthe soil where the plant was grown or the animal was raised. Foodanimals in the United States and Canada usually have controlleddiets to which selenium is added, and thus, the amounts found inmuscle meats, milk, and eggs are more consistent than for plantfoods.
TABLE 9-1 Amounts in International Units (IU) of Any Formsof α-Tocopherola Contained in Vitamin Eb SupplementsEquivalent to the UL for Adultsc
UL for AdultsSources of Vitamin E Total α-Tocopherol IU from SourceAvailable as Supplements (mg/day) Providing Adult UL
Synthetic Vitamin E and Estersdl-α-Tocopheryl acetate 1,000 1,100dl-α-Tocopheryl succinate 1,000 1,100dl-α-Tocopherol 1.000 1,100
Natural Vitamin E and Estersd-α-Tocopheryl acetate 1,000 1,500d-α-Tocopheryl succinate 1,000 1,500d-α-Tocopherol 1,000 1,500
a All forms of supplemental α-tocopherol include all eight stereoisomers of α-tocopherol. The UL was based on animal studies feeding either all racemic- or RRR-α-tocopherol, both of which resulted in equivalent adverse effects.
b Vitamin E supplements have historically although incorrectly been labeled d- or dl-α-tocopherol (Horwitt, 1976). Sources of vitamin E include the all racemic- (dl-α-tocopherol[RRR-, RRS-, RSR-, RSS-, SSS-, SRS-, SSR-, and SRR-] or synthetic) form and its esters andthe RRR-α-tocopherol (d-α-tocopherol or natural) form and its esters. All of these formsof vitamin E may be present in supplements.
c Conversion factors given in Table 6-1 to determine equivalency for meeting require-ments are not directly applicable as they take into account lack of documented biologi-cal activity of 2S-forms of α-tocopherol in meeting requirements. The conversion factorsused in this table are based on 2S-forms contributing to the adverse effects identified.
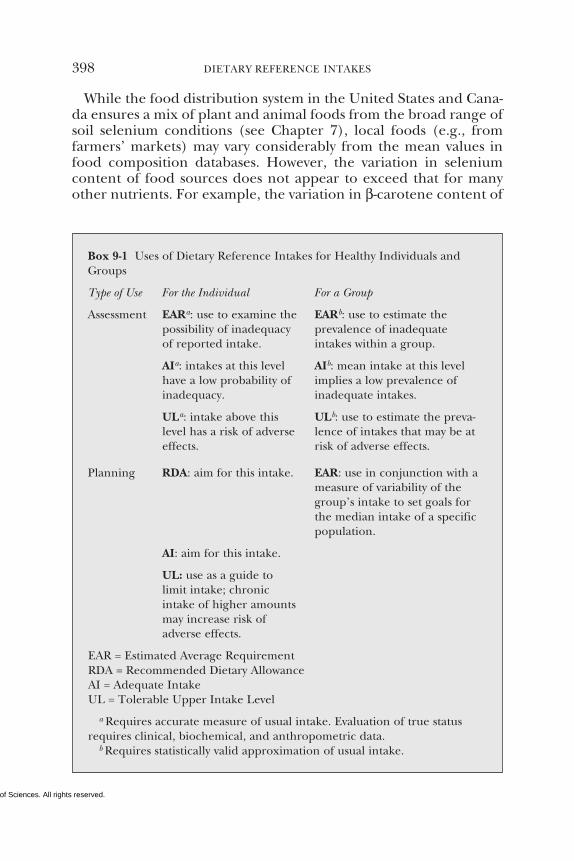
Copyright © National Academy of Sciences. All rights reserved.
398 DIETARY REFERENCE INTAKES
While the food distribution system in the United States and Cana-da ensures a mix of plant and animal foods from the broad range ofsoil selenium conditions (see Chapter 7), local foods (e.g., fromfarmers’ markets) may vary considerably from the mean values infood composition databases. However, the variation in seleniumcontent of food sources does not appear to exceed that for manyother nutrients. For example, the variation in β-carotene content of
Box 9-1 Uses of Dietary Reference Intakes for Healthy Individuals andGroups
Type of Use For the Individual For a Group
Assessment EARa: use to examine thepossibility of inadequacyof reported intake.
AIa: intakes at this levelhave a low probability ofinadequacy.
ULa: intake above thislevel has a risk of adverseeffects.
EARb: use to estimate theprevalence of inadequateintakes within a group.
AIb: mean intake at this levelimplies a low prevalence ofinadequate intakes.
ULb: use to estimate the preva-lence of intakes that may be atrisk of adverse effects.
Planning RDA: aim for this intake. EAR: use in conjunction with ameasure of variability of thegroup’s intake to set goals forthe median intake of a specificpopulation.
AI: aim for this intake.
UL: use as a guide tolimit intake; chronicintake of higher amountsmay increase risk ofadverse effects.
EAR = Estimated Average RequirementRDA = Recommended Dietary AllowanceAI = Adequate IntakeUL = Tolerable Upper Intake Level
a Requires accurate measure of usual intake. Evaluation of true statusrequires clinical, biochemical, and anthropometric data.
b Requires statistically valid approximation of usual intake.
Copyright © National Academy of Sciences. All rights reserved.
USES OF DIETARY REFERENCE INTAKES 399
food sources is similar to that of selenium (J. Holden, AgriculturalResearch Service, U.S. Department of Agriculture, personal com-munication, April 13, 1999).
Infant formulas are often fortified with selenium, and seleniumsupplements for adults (usually inorganic selenium salts) are be-coming more common. The bioavailability of selenate and selenite,the two inorganic forms of selenium commonly used for supple-mentation, is roughly equivalent and generally exceeds 50 percent(Thomson and Robinson, 1986). Selenium found naturally in foodsis primarily in the forms of selenomethionine and selenocysteine,which are organic selenium compounds. The bioavailability of sele-nium in the form of selenomethionine is greater than 90 percent(Thomson and Robinson, 1986). The selenium in selenocysteine isalso highly bioavailable (Swanson et al., 1991). Thus selenium sup-plements with yeast as the selenium source have higher bioavailabil-ity than inorganic supplements. In general, food composition tablesdo not distinguish these sources. Estimated intakes through self-selected diets are shown in Appendix Table C-6, and total intakes(food and supplements) according to NHANES III are shown inAppendix Table C-7.
The contribution of water to selenium intakes is generally trivialin comparison to food selenium (NRC, 1980) and does not have tobe added to intake assessments, unless water from an area known tobe high in selenium is consumed.
The UL for adults for selenium is 400 µg/day. Individuals whoregularly consume more than 400 µg/day may be at risk of adverseeffects that include brittle nails and hair loss.
SUMMARY
With careful consideration to the points mentioned above, thevarious Dietary Reference Intakes (DRIs) may be used to assess aswell as to plan nutrient intakes. Box 9-1 summarizes the appropri-ate uses of the DRIs for individuals and groups.
REFERENCESAIN (American Institute of Nutrition). 1990. Nomenclature policy: Generic de-
scriptors and trivial names for vitamins and related compounds. J Nutr 120:12–19.
Briefel RR, Sempos CT, McDowell MA, Chien S, Alaimo K. 1997. Dietary methodsresearch in the third National Health and Nutrition Examination Survey: Un-derreporting of energy intake. Am J Clin Nutr 65:1203S–1209S.
Copyright © National Academy of Sciences. All rights reserved.
400 DIETARY REFERENCE INTAKES
Heitmann BL, Lissner L. 1995. Dietary underreporting by obese individuals—Is itspecific or non-specific? Br Med J 311:986–989.
Horwitt MK. 1976. Vitamin E: A reexamination. Am J Clin Nutr 29:569–578.IOM (Institute of Medicine). 1994. How Should the Recommended Dietary Allowances be
Revised? Washington, DC: National Academy Press.IOM (Institute of Medicine). 1997. Dietary Reference Intakes for Calcium, Phosphorus,
Magnesium, Vitamin D, and Fluoride. Washington, DC: National Academy Press.IOM (Institute of Medicine). 1998. Dietary Reference Intakes for Thiamin, Riboflavin,
Niacin, Vitamin B6, Folate, Vitamin B12, Pantothenic Acid, Biotin, and Choline.Washington, DC: National Academy Press.
IUPAC-IUB Commission on Biochemical Nomenclature. 1974. Nomenclature oftocopherols and related compounds. Recommendations 1973. Eur J Biochem46:217–219.
Mertz W, Tsui JC, Judd JT, Reiser S, Hallfrisch J, Morris ER, Steele PD, Lashley E.1991. What are people really eating? The relation between energy intake de-rived from estimated diet records and intake determined to maintain bodyweight. Am J Clin Nutr 54:291–295.
NRC (National Research Council). 1980. Drinking Water and Health, Volume 3.Washington, DC: National Academy Press.
NRC (National Research Council). 1986. Nutrient Adequacy. Assessment Using FoodConsumption Surveys. Washington, DC: National Academy Press.
Nusser SM, Carriquiry AL, Dodd KW, Fuller WA. 1996. A semiparametric transfor-mation approach to estimating usual daily intake distributions. J Am Stat Assoc91:1440–1449.
Swanson CA, Patterson BH, Levander OA, Veillon C, Taylor PR, Helzlsouer K,McAdam PA, Zech LA. 1991. Human [74Se]selenomethionine metabolism: Akinetic model. Am J Clin Nutr 54:917–926.
Thomson CD, Robinson MF. 1986. Urinary and fecal excretions and absorption ofa large supplement of selenium: Superiority of selenate over selenite. Am JClin Nutr 44:659–663.
USDA (U.S. Department of Agriculture). 1999. USDA Nutrient Database for Stan-dard Reference, Release, [Online]. Available: http://www.nal.usda.gov/fnic/foodcomp.
Weiser H, Vecchi M, Schlachter M. 1986. Stereoisomers of alpha-tocopherol ace-tate. IV. USP units and alpha-tocopherol equivalents of all-rac-, 2-ambo- andRRR-alpha-tocopherol evaluated by simultaneous determination of resorption-gestation, myopath and liver storage capacity in rats. Int J Vitam Nutr Res 56:45–56.
Williams AW, Erdman JW Jr. 1999. In: Shils ME, Olson JA, Shike M, Ross AC, eds.Modern Nutrition in Health and Disease. Baltimore, MD: Williams and Wilkins. P.181.
Copyright © National Academy of Sciences. All rights reserved. 401
10A Research Agenda
The Panel on Antioxidants and Related Compounds and theStanding Committee on the Scientific Evaluation of Dietary ReferenceIntakes (DRI Committee) and its subcommittees were charged withdeveloping a research agenda to provide a basis for public policydecisions related to recommended intakes of vitamin C, vitamin E,selenium, and β-carotene and other carotenoids, and ways toachieve them. This chapter describes the approach used to developthe research agenda, briefly summarizes gaps in knowledge, andpresents a prioritized research agenda. A section at the end of eachnutrient chapter (Chapters 5 through 8) presents a prioritized listof research topics for each nutrient.
APPROACH
The following approach resulted in the research agenda identi-fied in this chapter:
1. Identify gaps in knowledge;2. Examine data to identify any major discrepancies between
intake and the Estimated Average Requirements (EARs); considerpossible reasons for such discrepancies;
3. Consider the need to protect individuals with extreme or dis-tinct vulnerabilities due to genetic predisposition or disease condi-tions; and
4. Weigh alternatives and set priorities based on expert judg-ment.
Copyright © National Academy of Sciences. All rights reserved.
402 DIETARY REFERENCE INTAKES
As a result of this approach, the following four areas were identi-fied:
• nutrient requirements,• methodological problems related to the assessment of intake
of these nutrients and to the assessment of adequacy of intake,• relationships of nutrient intake to public health, and• adverse effects of nutrients.
MAJOR KNOWLEDGE GAPS
Requirements
To derive an Estimated Average Requirement (EAR), the criteri-on must be known for a particular status indicator or combinationof indicators that is consistent with impaired status as defined bysome clinical consequence. For the nutrients considered in this re-port, there is a dearth of information on the biochemical valuesthat reflect abnormal function. A priority should be the determina-tion of the relationship of existing status indicators to clinical end-points in the same subjects to determine if a correlation exists. Forsome nutrients, either new clinical endpoints or intermediate end-points of impaired function have to be identified and related tostatus indicators.
The depletion-repletion research paradigms that are often usedin studies of requirements, although not ideal, are still probably thebest approach to determining nutrient requirements. However,these studies should be designed to meet three important criteria:
1. An indicator of nutrient status is needed for which a cutoffpoint has been identified, below which nutrient status is document-ed to be impaired. (In the case of vitamin E, values are based oninduced vitamin E deficiency and the correlation with hydrogenperoxide-induced hemolysis and plasma α-tocopherol concentra-tions, because there is little information relating levels of status in-dicators to functional sufficiency or insufficiency. Also with vitaminC, there is little information relating levels of status indicators tofunctional sufficiency or insufficiency, because dose-dependent ab-sorption and renal regulation of ascorbate allow body conservationduring low intakes and limitation of plasma levels at high intakes.)
2. The depletion and repletion periods should be sufficientlylong to allow a new steady state to be reached. This can be veryproblematic for vitamin C because biological half-life ranges from
Copyright © National Academy of Sciences. All rights reserved.
A RESEARCH AGENDA 403
8 to 40 days and is inversely related to ascorbate body pool. For β-carotene and other carotenoids, no long-term depletion-repletionstudies with validated intermediate endpoints exist. Study designshould allow examination of the effects of initial status on responseto maintenance or depletion-repletion.
3. Repletion regimen intakes should bracket the expected EARintake to assess the EAR more accurately and to allow for a measureof variance. In addition, an accurate assessment of variance requiresa sufficient number of subjects.
A relatively new and increasingly popular approach to determin-ing requirements is kinetic modeling of body pools, using steady-state compartmental analyses. Although this approach is unlikely tosupplant depletion-repletion studies, it may be the only techniqueavailable to obtain this type of information, despite a number ofdrawbacks. A number of assumptions that cannot be tested experi-mentally are often needed, and the estimates obtained for bodypool sizes are inherently imprecise. Even if accurate assessments ofbody pools were possible and were obtained, such informationwould be useful in setting a requirement only if one could establishthe body pool size at which functional deficiency occurs. Theamount needed for restoration of biochemical status indicators tobaseline values is not necessarily equivalent to the requirement forthe nutrient.
For vitamin C, vitamin E, selenium, and β-carotene and othercarotenoids, useful data are seriously lacking for setting require-ments for infants, children, adolescents, pregnant and lactatingwomen, and the elderly. Studies should use graded levels of nutri-ent intake and a combination of response indices, and should con-sider other points raised above. For some of these nutrients, studiesshould examine whether or not the requirement varies substantiallyby trimester of pregnancy. In addition, more information is neededfor groups at increased risk for oxidative stress, especially those whosmoke or who are subjected to second-hand smoke, athletes, andindividuals living at high altitudes.
Data are lacking about gender issues with respect to metabolismand requirements of these nutrients. For example, women and chil-dren with low intakes of selenium are at higher risk of Keshan dis-ease than are men with similar intakes. Women are at higher risk ofmacular degeneration even at similar plasma concentrations ofcarotenoids.
The understanding of the health effects of carotenoids is rudi-mentary compared with that of the other nutrients in this report.
Copyright © National Academy of Sciences. All rights reserved.
404 DIETARY REFERENCE INTAKES
Little information is available on bioavailability, toxicity, and ef-fects of these compounds, apart from β-carotene. Although theonly known validated function for carotenoids in humans is to actas a source of vitamin A in the diet, little is known about the rela-tive contribution of dietary provitamin A carotenoids to vitamin Astatus.
Research to date has indicated little cause for concern about theadequacy of vitamin E intake for apparently healthy people; defi-ciency states can be produced only as a result of genetic abnormali-ties in α-tocopherol transfer protein, as a result of various fat malab-sorption syndromes, or as a result of protein-energy malnutrition.However, the prevalence of these genetic abnormalities is unknown.
A growing number of studies suggest that there are complex in-terrelationships among nutrients, particularly those involved in pro-tecting against oxidation (e.g., vitamin C, vitamin E, and selenium),but these are not well understood in relation to the maintenance ofnormal nutritional status and to the prevention of chronic degener-ative disease. These interactions may affect the intake level for oneor more of the nutrients.
Methodology
For some nutrients, serious limitations exist in the methods avail-able to analyze laboratory values indicative of nutrient status, todetermine the nutrient content of foods, or both. These limitationshave slowed progress in conducting or interpreting studies of nutri-ent requirements. Although the analytical methodology for serumcarotenoid status is becoming more routine, methods for the analy-sis of the major dietary carotenoids remain as a limiting method-ological factor. A related gap, which is not strictly methodological,is the bioavailability of the various isomers of vitamin E. Major needsinclude: (1) a comparison of the biological potencies of the variousforms of food vitamin E from mixed diets; (2) validation of dietaryintake instruments to assess intake of vitamin E and of the majorcarotenoids in food; and (3) an examination of the mechanisms bywhich bioavailability is altered by food matrices.
Relationships of Intake to Public Health
Although interest is high and numerous studies have been con-ducted, serious gaps still exist in knowledge of the relationship ofintakes of vitamin C, vitamin E, selenium, and β-carotene and othercarotenoids to the risk of coronary heart disease, cancer, and other
Copyright © National Academy of Sciences. All rights reserved.
A RESEARCH AGENDA 405
chronic degenerative diseases. An imbalance in oxidant stress anddefenses can lead to the formation and excretion of oxidized prod-ucts of nucleic acids, lipids, and proteins, which may play a role inchronic disease.
Many of these studies have been conducted with supplementalintakes that are far above those that can be obtained from food,and some questions and controversy remain regarding the linkageof these antioxidant nutrients with increased risk of chronic dis-ease. For example, some clinical intervention trials have shown thatin male long-term smokers, high doses of β-carotene supplementsdid not decrease and may have increased their risk of lung cancer.
Multiple factors are probably involved in disease, but in somecases, one particular nutrient may contribute significantly. For ex-ample, vitamin E is known to protect ex vivo low-density lipoproteinoxidation, whereas β-carotene offers no protection. Questions thathave to be answered include the following: (1) what are the tissueuptake and subcellular distributions of these nutrients in humans;(2) what is the mechanism by which these nutrients are taken upand regulated by the cells; (3) what is the turnover of these nutri-ents in the various tissues; (4) in which tissues are they degradedand how rapidly; and (5) what are the major metabolic intermedi-ates during degradation and do they have biological function?
Additional randomized clinical trials are needed to test whetheror not supplementation with vitamin C, vitamin E, selenium, and/or β-carotene and other carotenoids can reduce the risk of chronicdisease. A number of clinical intervention trials involving more than100,000 people are in progress. However, whether the results arepositive or negative, additional studies will be necessary. For exam-ple, if the results are negative, the question will arise as to whethertreatment was instituted early enough and whether even longertrials starting at an earlier age are needed to test the hypothesisproperly. If the results are positive, the relative importance of vita-min C, vitamin E, selenium, and β-carotene will have to be sortedout, because they are being used in combination in several of thestudies. Also, the issue of dose will arise. Most of these studies areusing doses that may be unnecessarily high. The questions of whoshould be treated, at what dosage, and at what age will have to beaddressed, along with the impact of treatment on various subgroups(older adults, those who smoke, those with other chronic diseasessuch as diabetes, etc.). Again, if the results are positive, indicatingthat antioxidants do indeed offer protection, it will be important todetermine if combinations of antioxidants in various doses can fur-ther increase the beneficial effect.
Copyright © National Academy of Sciences. All rights reserved.
406 DIETARY REFERENCE INTAKES
Adverse Effects
Considering these nutrients as a group, only a few studies havebeen conducted that were explicitly designed to address adverseeffects of chronically high intake. Thus, information on which tobase Tolerable Upper Intake Levels (ULs) is extremely limited. Al-though an unexpected result of the Alpha-Tocopherol, Beta-Caro-tene Cancer Prevention Study was a non-prespecified 50 percentincrease in mortality from hemorrhagic stroke in Finnish men whosmoked and were supplemented with 50 mg/day of vitamin E, addi-tional randomized trial evidence is needed for confirmation or ref-utation of this result. Because data on the potential for β-caroteneto produce increased lung cancer rates in smokers are conflicting,ongoing studies are needed to help resolve this issue.
THE RESEARCH AGENDA
Reporting Data
Because the various forms of vitamin E are not interconvertibleand because plasma concentrations of vitamin E depend on theaffinity of hepatic α-tocopherol transfer protein for the variousforms, it is recommended that the relative biological potencies ofthe different forms of vitamin E be reevaluated. Until this is done,the actual concentrations of each of the various vitamin E forms infood and biological samples should be reported separately when-ever possible.
Research
Five major types of information gaps were noted: (1) a dearth ofstudies designed specifically to estimate average requirements inpresumably healthy humans; (2) a nearly complete lack of usabledata on the nutrient needs of infants, children, adolescents, andpregnant women; (3) a lack of definitive studies to determine therole of these nutrients in reducing the risk of certain chronic dis-eases; (4) a lack of validated biomarkers to evaluate oxidative stressand the relationship between antioxidant intake and health anddisease; and (5) a lack of studies designed to detect adverse effectsof chronic high intakes of these nutrients.
Highest priority is thus given to research that has the potential toprevent or retard human disease processes and to prevent deficien-cies with functional consequences. The following six areas for re-
Copyright © National Academy of Sciences. All rights reserved.
A RESEARCH AGENDA 407
search were assigned the highest priority (other research recom-mendations are found at the end of Chapters 5 through 8):
• Studies to provide the basic data for constructing risk curvesand benefit curves across the exposures to dietary and supplemen-tal intakes of vitamin C, vitamin E, selenium, β-carotene and othercarotenoids. Studies should be designed to determine the relation-ship of nutrient intakes to validated biomarkers of oxidative stress.These studies should be followed by nested case-control studies todetermine the relationship of the biomarkers of oxidative stress tochronic disease. Finally, full-scale intervention trials should be doneto establish the preventive potential of a nutrient for chronic dis-ease.
• Investigations of the gender specificity of the metabolism andrequirements for vitamin C, vitamin E, selenium, and β-caroteneand the other carotenoids.
• Studies to validate methods and possible models for deter-mining Dietary Reference Intakes in the absence of data for somelife stage groups, such as children, pregnant and lactating women,and older adults.
• Research to determine the interactions and possible syner-gisms of vitamin C, vitamin E, selenium, and β-carotene with eachother, with other nutrients and other food components, and withendogenous antioxidants. Multifactorial studies are needed to dem-onstrate in vivo actions as well as synergisms that have been shownin vitro.
• Studies to develop economical, sensitive, and specific meth-ods to assess the associations of vitamin C, vitamin E, selenium, andβ-carotene and the other carotenoids with the causation, preva-lence, prevention, and treatment of specific viral or other infec-tions.
• Investigations of the magnitude and role of genetic polymor-phisms in the mechanisms of actions of vitamin C, vitamin E, seleni-um, and β-carotene and the other carotenoids.
Because of inconsistent data, a Tolerable Upper Intake Level (UL)could not be established for β-carotene, and due to a lack of suffi-cient data, ULs could not be set for other carotenoids from food.Thus, research is needed concerning the ULs for the carotenoids.In addition, research would be helpful relative to the adverse effectsof vitamin C, vitamin E, and selenium. However, it was concludedthat higher priority should be given to the areas listed above be-cause of the possibility of adverse effects at intakes consumed fromfood and supplements in the United States and Canada.

Copyright © National Academy of Sciences. All rights reserved.
Copyright © National Academy of Sciences. All rights reserved. 409
AOrigin and Framework of the
Development of DietaryReference Intakes
This report is the third in a series of publications resulting fromthe comprehensive effort being undertaken by the Food and Nutri-tion Board’s (FNB’s) Standing Committee on the Scientific Evalua-tion of Dietary Reference Intakes (DRI Committee) and its panelsand subcommittees.
ORIGIN
This initiative began in June 1993, when the Food and NutritionBoard (FNB) organized a symposium and public hearing entitled“Should the Recommended Dietary Allowances Be Revised?” Short-ly thereafter, to continue its collaboration with the larger nutritioncommunity on the future of the Recommended Dietary Allowances(RDAs), the FNB took two major steps: (1) it prepared, published,and disseminated the paper “How Should the Recommended Di-etary Allowances Be Revised?” (IOM, 1994), which invited commentsregarding the proposed concept; and (2) it held several symposia atnutrition-focused professional meetings to discuss its tentative plansand receive responses to this initial concept. Many aspects of theconceptual framework of DRIs came from the report Dietary Refer-ence Values for Food Energy and Nutrients for the United Kingdom (COMA,1991).
The five general conclusions presented in the FNB’s 1994 paperare as follows:
1. Sufficient new information has accumulated to support a re-assessment of the RDAs.
Copyright © National Academy of Sciences. All rights reserved.
410 DIETARY REFERENCE INTAKES
2. Where sufficient data for efficacy and safety exist, reductionin the risk of chronic degenerative disease is a concept that shouldbe included in the formulation of future recommendations.
3. Upper levels of intake should be established where data existregarding risk of toxicity.
4. Components of food of possible benefit to health, althoughnot meeting the traditional concept of a nutrient, should be re-viewed, and if adequate data exist, reference intakes should be es-tablished.
5. Serious consideration must be given to developing a new for-mat for presenting future recommendations.
Subsequent to the symposium and the release of the paper, theFNB held workshops at which invited experts discussed many issuesrelated to the development of nutrient-based reference values, andFNB members have continued to provide updates and engage indiscussions at professional meetings. In addition, the FNB gave at-tention to the international uses of the earlier RDAs and the expec-tation that the scientific review of nutrient requirements should besimilar for comparable populations.
Concurrently, Health Canada and Canadian scientists were review-ing the need for revision of the Recommended Nutrient Intakes (RNIs)(Health Canada, 1990). The consensus following a symposium forCanadian scientists cosponsored by the Canadian National Instituteof Nutrition and Health Canada in April 1995 was that the Canadiangovernment should pursue the extent to which involvement with thedeveloping FNB process would be of benefit to both Canada and theUnited States in terms of leading toward harmonization.
Based on extensive input and deliberations, the FNB initiated ac-tion to provide a framework for the development and possible in-ternational harmonization of nutrient-based recommendations thatwould serve, where warranted, for all of North America. To thisend, in December 1995, the FNB began a close collaboration withthe government of Canada and took action to establish the Stand-ing Committee on the Scientific Evaluation of Dietary ReferenceIntakes.
THE CHARGE TO THE COMMITTEE
In 1995, the Standing Committee on the Scientific Evaluation ofDietary Reference Intakes (DRI Committee) was appointed to over-see and conduct this project. To accomplish this task, the DRI Com-mittee devised a plan involving the work of seven or more expertnutrient group panels and two overarching subcommittees (Figure
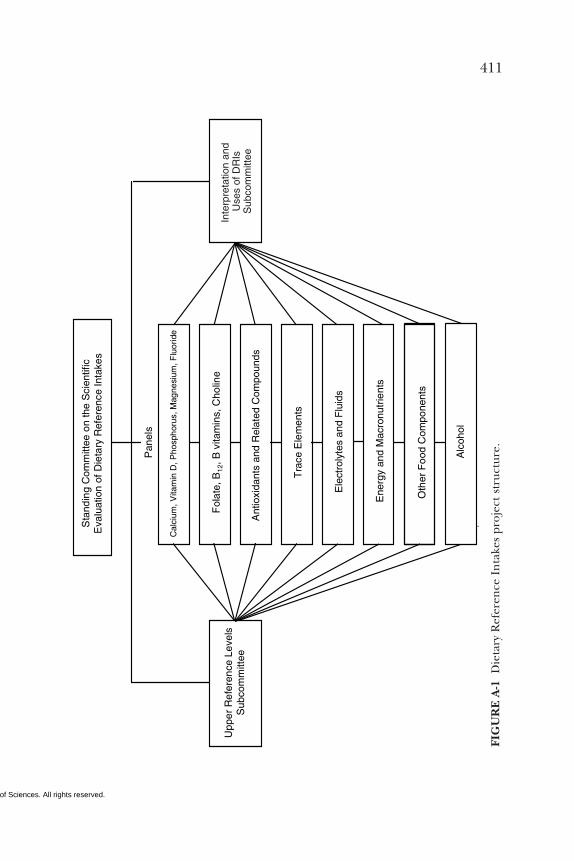
Copyright © National Academy of Sciences. All rights reserved.
411
Upp
er R
efer
ence
Lev
els
Sub
com
mitt
ee
Sta
ndin
g C
omm
ittee
on
the
Sci
entif
icE
valu
atio
n of
Die
tary
Ref
eren
ce In
take
s
Pan
els
Cal
cium
, Vita
min
D, P
hosp
horu
s, M
agne
sium
, Fl u
orid
e
Fol
ate,
B12
, B v
itam
ins,
Cho
line
Ant
ioxi
dant
s an
d R
elat
ed C
ompo
unds
Tra
ce E
lem
ents
Ele
ctro
lyte
s an
d F
luid
s
Alc
ohol
Ene
rgy
and
Mac
ronu
trie
nts
Oth
er F
ood
Com
pone
nts
149-
01
.
Inte
rpre
tatio
n an
d U
ses
of D
RIs
Sub
com
mitt
ee
FIG
UR
E A
-1 D
ieta
ry R
efer
ence
In
take
s pr
ojec
t st
ruct
ure.
Copyright © National Academy of Sciences. All rights reserved.
412 DIETARY REFERENCE INTAKES
A-1). The process described below is expected to be used for subse-quent reports as well.
The Panel on Dietary Antioxidants and Related Compounds, com-posed of experts on these nutrients, has been responsible for thefollowing: (1) propose a definition of a dietary antioxidant; (2) reviewthe scientific literature concerning antioxidant nutrients and selectedcomponents of foods that may influence the bioavailability of thesenutrients; (3) develop dietary reference levels of intake for the se-lected dietary antioxidants that are compatible with good nutritionthroughout the life span and that may decrease the risk of develop-mental abnormalities and chronic disease; (4) address the safety ofhigh intakes of these dietary antioxidants and, when appropriate,determine Tolerable Upper Intake Levels (ULs); and (5) identify aresearch agenda to provide a basis for public policy decisions relatedto recommended intakes and ways to achieve these intakes.
The panel was charged with analyzing the literature, evaluatingpossible criteria or indicators of adequacy, and providing substan-tive rationales for their choices of each criterion. Using the criteri-on chosen for each stage of the lifespan, the panel estimated theaverage requirement for each nutrient or food component re-viewed, assuming that adequate data were available. As panel mem-bers reviewed data on ULs, they interacted with the Subcommitteeon Upper Reference Levels of Nutrients, which assisted the panel inapplying the risk assessment model to each selected nutrient. Thepanel also worked with the Subcommittee on Interpretation andUses of Dietary Reference Intakes to determine appropriate exam-ples for using the Recommended Dietary Allowances, EstimatedAverage Requirements, Adequate Intakes, and ULs. The DietaryReference Intake values in this report are a product of the jointefforts of the DRI Committee, the Panel on Dietary Antioxidantsand Related Compounds, the Subcommittee on Upper ReferenceLevels of Nutrients, and the Subcommittee on Interpretation andUses of Dietary Reference Intakes, all under the oversight of theFood and Nutrition Board.
REFERENCESCOMA (Committee on Medical Aspects of Food Policy). 1991. Dietary Reference
Values for Food Energy and Nutrients for the United Kingdom. Report on Healthand Social Subjects, No. 41. London: Her Majesty’s Stationery Office.
Health Canada. 1990. Nutrition Recommendations. The Report of the Scientific ReviewCommittee 1990. Ottawa: Canadian Government Publishing Centre.
IOM (Institute of Medicine). 1994. How Should the Recommended Dietary Allowances beRevised? Washington, DC: National Academy Press.
Copyright © National Academy of Sciences. All rights reserved. 413
BAcknowledgments
The Panel on Dietary Antioxidants and Related Compounds, theSubcommittee on Upper Reference Levels of Nutrients, the Sub-committee on Interpretation and Uses of Dietary Reference Intakes,the Standing Committee on the Scientific Evaluation of Dietary Ref-erence Intakes, and the Food and Nutrition Board (FNB) staff aregrateful for the time and effort of the many contributors to thisreport and the workshops and meetings leading up to the report.Through openly sharing their considerable expertise and differentoutlooks, these individuals and organizations brought clarity andfocus to the challenging task of defining dietary antioxidants anddeveloping vitamin C, vitamin E, β-carotene, and selenium DRIs forhumans. The list below mentions those individuals with whom weworked closely, but many others also deserve our heartfelt thanks.These individuals, whose names we do not know, made importantcontributions to the report by offering suggestions and opinions atthe many professional meetings and workshops the committeemembers attended. The panel, subcommittee, and committee mem-bers, as well as FNB staff, thank the following named (as well asunnamed) individuals and organizations:
INDIVIDUALS
G. H. AndersonDouglas BalentineAdrianne BendichBernice Berg
Mary Ellen CamireLarry ClarkSteven ClintonWilliam Cohn
Hans BiesalskiJeffrey BlumbergLuke BucciGraham Burton

Copyright © National Academy of Sciences. All rights reserved.
414 DIETARY REFERENCE INTAKES
Paul ConnettJohn CordaroMichael DoursonGary FlammBalz FreiBernard GoldsteinGary GoodmanE. Robert GreenbergRoger HammondSuzanne HarrisJohn HathcockHarri HemiläMax Horwitt
Debra JahnerCarol JohnstonJohn LandrumOrville LevanderMark LevineBernadette MarriottThomas McClureSimin MeydaniAnna MosesAlanna MoshfeghGilbert OmennLester PackerSharon Ross
Robert RussellEtta SaltosHelmut SiesMax SnodderlyThressa StadtmanDan SteffenManfred SteinerRoger SundeThomas TozerDiane TribbleGeorge TruscottRon Walker
FEDERAL PROJECT STEERING COMMITTEE
Barbara BowmanElizabeth CastroMargaret CheneyCarolyn CliffordPaul CoatesRebecca CostelloKathleen EllwoodNancy Ernst
Peter FischerElizabeth FrazaoKarl FriedlNancy GastonJay HirschmanVan HubbardClifford JohnsonChristine LewisJean Lloyd
Melvin MathiasLinda MeyersEsther MyersCynthia OgdenSusan PilchPamela Starke-ReedJacqueline WrightElizabeth Yetley
DRI CORPORATE DONOR FUND REPRESENTATIVES
Rodney AusichKati ChevauxDavid CookMark Dreher
Timothy JacobsonMaureen LennonDavid MastroianniDebra Ponder
Vishwa SinghWalter WhitehillCindy Yablonski
Copyright © National Academy of Sciences. All rights reserved.
APPENDIX B 415
ORGANIZATIONS
American Academy of NeurologyAmerican Academy of PediatricsAmerican College of Obstetricians and GynecologistsAmerican Dietetic AssociationAmerican Society for Nutrition SciencesAmerican Medical AssociationCanadian Paediatric SocietyCanadian Society for Nutritional SciencesCenter for Science in the Public InterestCouncil for Responsible NutritionThe Dannon InstituteFederation of American Scientists for Experimental BiologyHealth CanadaInstitute of Food TechnologistsInteragency Human Nutrition Research CouncilInternational Life Sciences InstituteLife Sciences Research OrganizationNational Institute for Nutrition, Canada
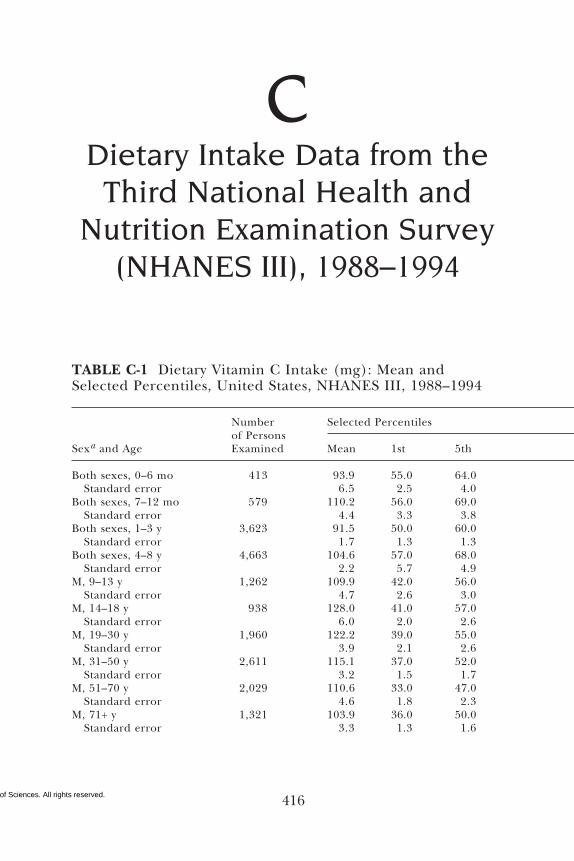
Copyright © National Academy of Sciences. All rights reserved. 416
CDietary Intake Data from the
Third National Health andNutrition Examination Survey
(NHANES III), 1988–1994
TABLE C-1 Dietary Vitamin C Intake (mg): Mean andSelected Percentiles, United States, NHANES III, 1988–1994
Number Selected Percentilesof Persons
Sexa and Age Examined Mean 1st 5th
Both sexes, 0–6 mo 413 93.9 55.0 64.0Standard error 6.5 2.5 4.0
Both sexes, 7–12 mo 579 110.2 56.0 69.0Standard error 4.4 3.3 3.8
Both sexes, 1–3 y 3,623 91.5 50.0 60.0Standard error 1.7 1.3 1.3
Both sexes, 4–8 y 4,663 104.6 57.0 68.0Standard error 2.2 5.7 4.9
M, 9–13 y 1,262 109.9 42.0 56.0Standard error 4.7 2.6 3.0
M, 14–18 y 938 128.0 41.0 57.0Standard error 6.0 2.0 2.6
M, 19–30 y 1,960 122.2 39.0 55.0Standard error 3.9 2.1 2.6
M, 31–50 y 2,611 115.1 37.0 52.0Standard error 3.2 1.5 1.7
M, 51–70 y 2,029 110.6 33.0 47.0Standard error 4.6 1.8 2.3
M, 71+ y 1,321 103.9 36.0 50.0Standard error 3.3 1.3 1.6
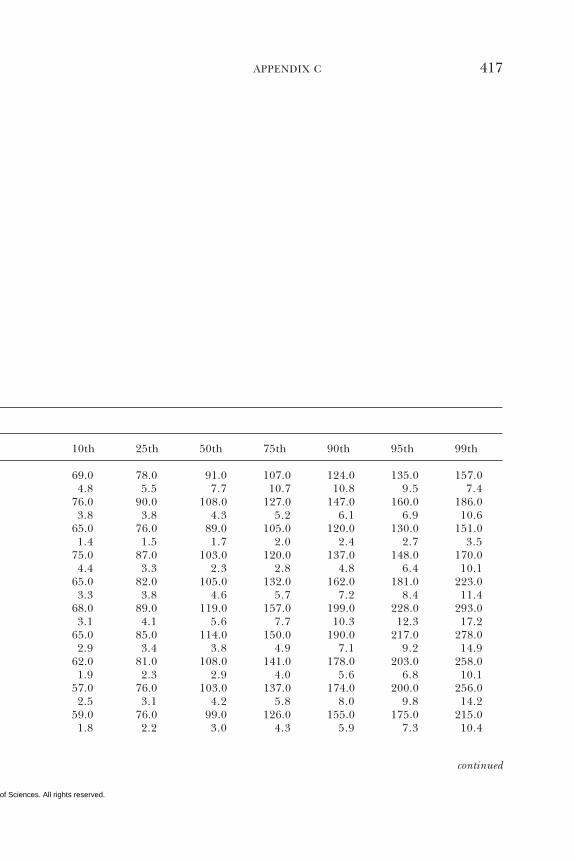
Copyright © National Academy of Sciences. All rights reserved.
APPENDIX C 417
10th 25th 50th 75th 90th 95th 99th
69.0 78.0 91.0 107.0 124.0 135.0 157.04.8 5.5 7.7 10.7 10.8 9.5 7.4
76.0 90.0 108.0 127.0 147.0 160.0 186.03.8 3.8 4.3 5.2 6.1 6.9 10.6
65.0 76.0 89.0 105.0 120.0 130.0 151.01.4 1.5 1.7 2.0 2.4 2.7 3.5
75.0 87.0 103.0 120.0 137.0 148.0 170.04.4 3.3 2.3 2.8 4.8 6.4 10.1
65.0 82.0 105.0 132.0 162.0 181.0 223.03.3 3.8 4.6 5.7 7.2 8.4 11.4
68.0 89.0 119.0 157.0 199.0 228.0 293.03.1 4.1 5.6 7.7 10.3 12.3 17.2
65.0 85.0 114.0 150.0 190.0 217.0 278.02.9 3.4 3.8 4.9 7.1 9.2 14.9
62.0 81.0 108.0 141.0 178.0 203.0 258.01.9 2.3 2.9 4.0 5.6 6.8 10.1
57.0 76.0 103.0 137.0 174.0 200.0 256.02.5 3.1 4.2 5.8 8.0 9.8 14.2
59.0 76.0 99.0 126.0 155.0 175.0 215.01.8 2.2 3.0 4.3 5.9 7.3 10.4
continued
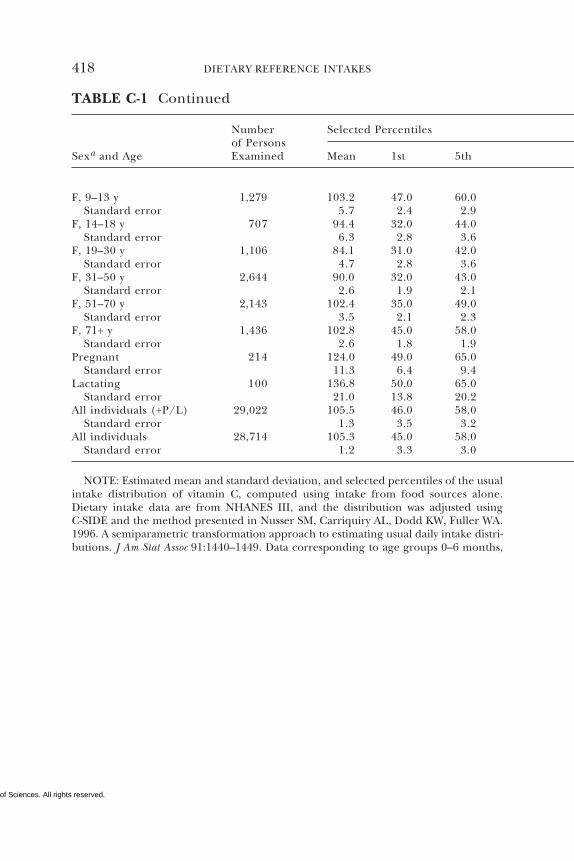
Copyright © National Academy of Sciences. All rights reserved.
418 DIETARY REFERENCE INTAKES
Number Selected Percentilesof Persons
Sexa and Age Examined Mean 1st 5th
TABLE C-1 Continued
F, 9–13 y 1,279 103.2 47.0 60.0Standard error 5.7 2.4 2.9
F, 14–18 y 707 94.4 32.0 44.0Standard error 6.3 2.8 3.6
F, 19–30 y 1,106 84.1 31.0 42.0Standard error 4.7 2.8 3.6
F, 31–50 y 2,644 90.0 32.0 43.0Standard error 2.6 1.9 2.1
F, 51–70 y 2,143 102.4 35.0 49.0Standard error 3.5 2.1 2.3
F, 71+ y 1,436 102.8 45.0 58.0Standard error 2.6 1.8 1.9
Pregnant 214 124.0 49.0 65.0Standard error 11.3 6.4 9.4
Lactating 100 136.8 50.0 65.0Standard error 21.0 13.8 20.2
All individuals (+P/L) 29,022 105.5 46.0 58.0Standard error 1.3 3.5 3.2
All individuals 28,714 105.3 45.0 58.0Standard error 1.2 3.3 3.0
NOTE: Estimated mean and standard deviation, and selected percentiles of the usualintake distribution of vitamin C, computed using intake from food sources alone.Dietary intake data are from NHANES III, and the distribution was adjusted usingC-SIDE and the method presented in Nusser SM, Carriquiry AL, Dodd KW, Fuller WA.1996. A semiparametric transformation approach to estimating usual daily intake distri-butions. J Am Stat Assoc 91:1440–1449. Data corresponding to age groups 0–6 months,
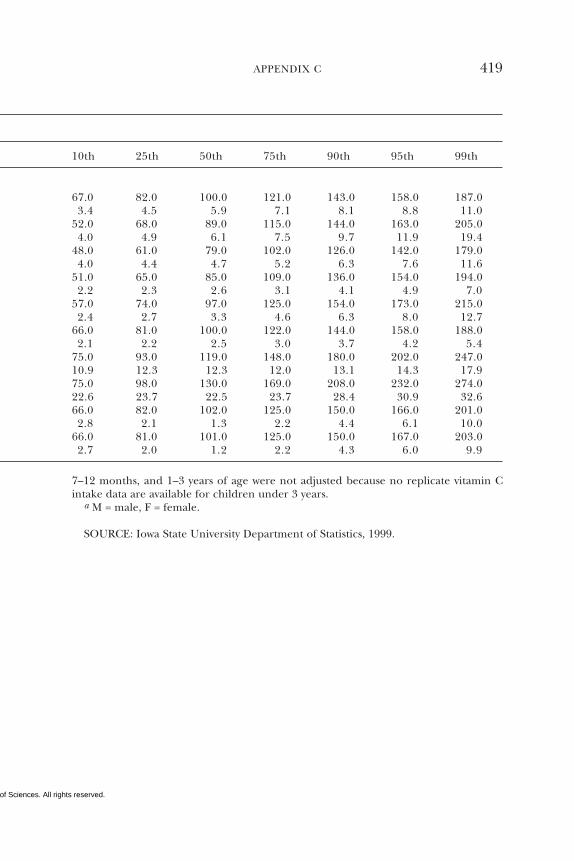
Copyright © National Academy of Sciences. All rights reserved.
APPENDIX C 419
10th 25th 50th 75th 90th 95th 99th
67.0 82.0 100.0 121.0 143.0 158.0 187.03.4 4.5 5.9 7.1 8.1 8.8 11.0
52.0 68.0 89.0 115.0 144.0 163.0 205.04.0 4.9 6.1 7.5 9.7 11.9 19.4
48.0 61.0 79.0 102.0 126.0 142.0 179.04.0 4.4 4.7 5.2 6.3 7.6 11.6
51.0 65.0 85.0 109.0 136.0 154.0 194.02.2 2.3 2.6 3.1 4.1 4.9 7.0
57.0 74.0 97.0 125.0 154.0 173.0 215.02.4 2.7 3.3 4.6 6.3 8.0 12.7
66.0 81.0 100.0 122.0 144.0 158.0 188.02.1 2.2 2.5 3.0 3.7 4.2 5.4
75.0 93.0 119.0 148.0 180.0 202.0 247.010.9 12.3 12.3 12.0 13.1 14.3 17.975.0 98.0 130.0 169.0 208.0 232.0 274.022.6 23.7 22.5 23.7 28.4 30.9 32.666.0 82.0 102.0 125.0 150.0 166.0 201.02.8 2.1 1.3 2.2 4.4 6.1 10.0
66.0 81.0 101.0 125.0 150.0 167.0 203.02.7 2.0 1.2 2.2 4.3 6.0 9.9
7–12 months, and 1–3 years of age were not adjusted because no replicate vitamin Cintake data are available for children under 3 years.
a M = male, F = female.
SOURCE: Iowa State University Department of Statistics, 1999.
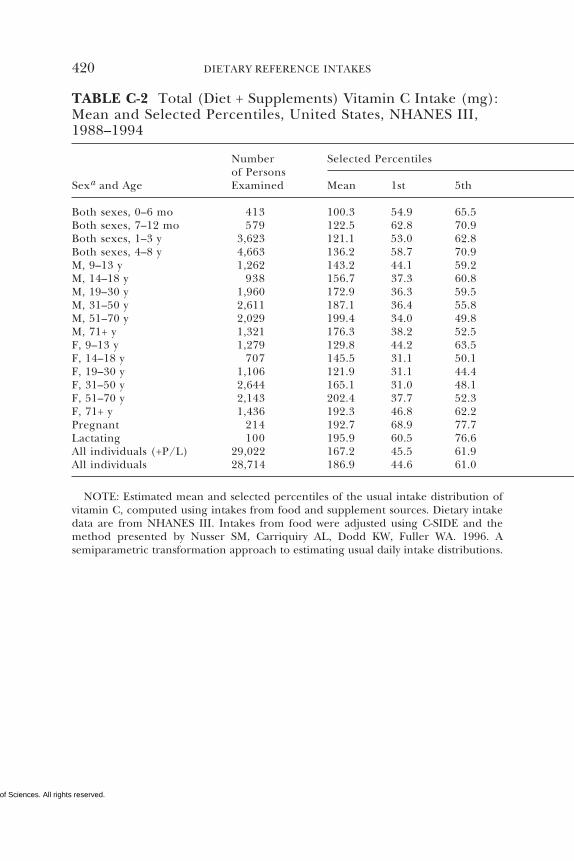
Copyright © National Academy of Sciences. All rights reserved.
420 DIETARY REFERENCE INTAKES
TABLE C-2 Total (Diet + Supplements) Vitamin C Intake (mg):Mean and Selected Percentiles, United States, NHANES III,1988–1994
Number Selected Percentilesof Persons
Sexa and Age Examined Mean 1st 5th
Both sexes, 0–6 mo 413 100.3 54.9 65.5Both sexes, 7–12 mo 579 122.5 62.8 70.9Both sexes, 1–3 y 3,623 121.1 53.0 62.8Both sexes, 4–8 y 4,663 136.2 58.7 70.9M, 9–13 y 1,262 143.2 44.1 59.2M, 14–18 y 938 156.7 37.3 60.8M, 19–30 y 1,960 172.9 36.3 59.5M, 31–50 y 2,611 187.1 36.4 55.8M, 51–70 y 2,029 199.4 34.0 49.8M, 71+ y 1,321 176.3 38.2 52.5F, 9–13 y 1,279 129.8 44.2 63.5F, 14–18 y 707 145.5 31.1 50.1F, 19–30 y 1,106 121.9 31.1 44.4F, 31–50 y 2,644 165.1 31.0 48.1F, 51–70 y 2,143 202.4 37.7 52.3F, 71+ y 1,436 192.3 46.8 62.2Pregnant 214 192.7 68.9 77.7Lactating 100 195.9 60.5 76.6All individuals (+P/L) 29,022 167.2 45.5 61.9All individuals 28,714 186.9 44.6 61.0
NOTE: Estimated mean and selected percentiles of the usual intake distribution ofvitamin C, computed using intakes from food and supplement sources. Dietary intakedata are from NHANES III. Intakes from food were adjusted using C-SIDE and themethod presented by Nusser SM, Carriquiry AL, Dodd KW, Fuller WA. 1996. Asemiparametric transformation approach to estimating usual daily intake distributions.
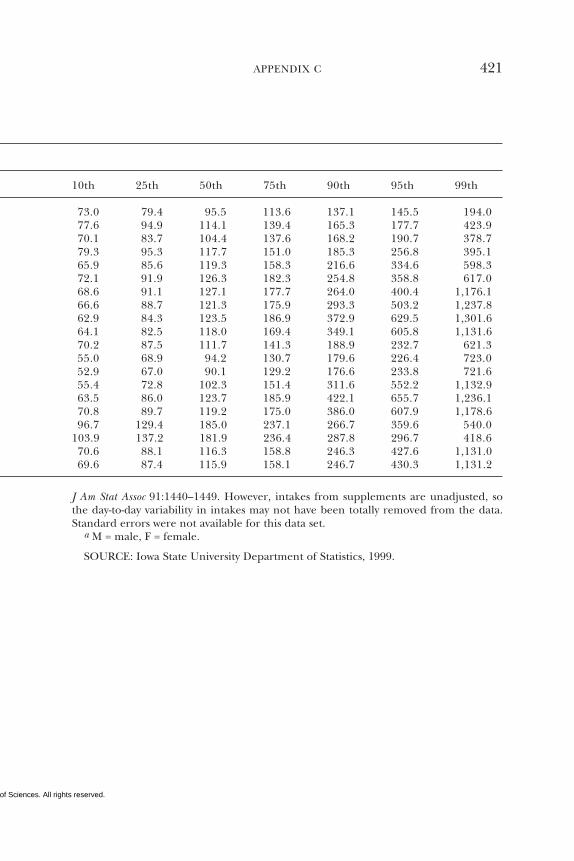
Copyright © National Academy of Sciences. All rights reserved.
APPENDIX C 421
10th 25th 50th 75th 90th 95th 99th
73.0 79.4 95.5 113.6 137.1 145.5 194.077.6 94.9 114.1 139.4 165.3 177.7 423.970.1 83.7 104.4 137.6 168.2 190.7 378.779.3 95.3 117.7 151.0 185.3 256.8 395.165.9 85.6 119.3 158.3 216.6 334.6 598.372.1 91.9 126.3 182.3 254.8 358.8 617.068.6 91.1 127.1 177.7 264.0 400.4 1,176.166.6 88.7 121.3 175.9 293.3 503.2 1,237.862.9 84.3 123.5 186.9 372.9 629.5 1,301.664.1 82.5 118.0 169.4 349.1 605.8 1,131.670.2 87.5 111.7 141.3 188.9 232.7 621.355.0 68.9 94.2 130.7 179.6 226.4 723.052.9 67.0 90.1 129.2 176.6 233.8 721.655.4 72.8 102.3 151.4 311.6 552.2 1,132.963.5 86.0 123.7 185.9 422.1 655.7 1,236.170.8 89.7 119.2 175.0 386.0 607.9 1,178.696.7 129.4 185.0 237.1 266.7 359.6 540.0
103.9 137.2 181.9 236.4 287.8 296.7 418.670.6 88.1 116.3 158.8 246.3 427.6 1,131.069.6 87.4 115.9 158.1 246.7 430.3 1,131.2
J Am Stat Assoc 91:1440–1449. However, intakes from supplements are unadjusted, sothe day-to-day variability in intakes may not have been totally removed from the data.Standard errors were not available for this data set.
a M = male, F = female.
SOURCE: Iowa State University Department of Statistics, 1999.
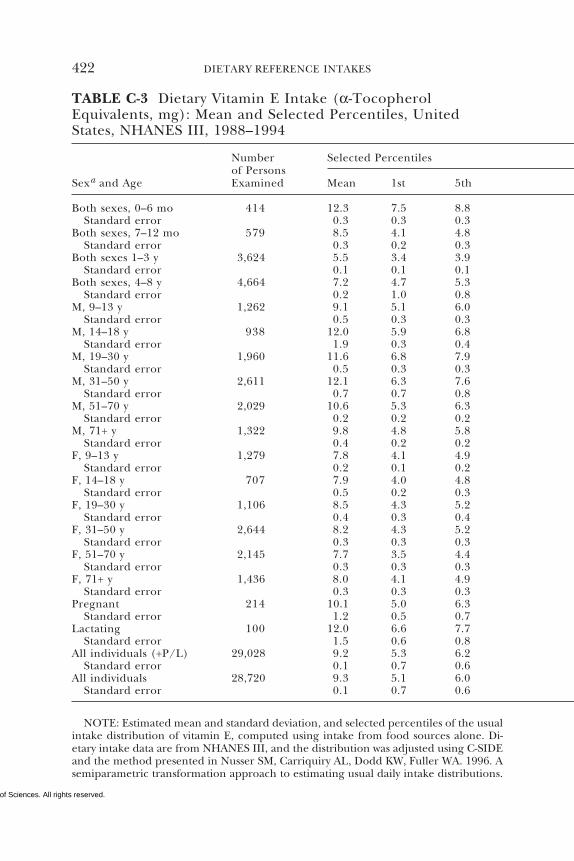
Copyright © National Academy of Sciences. All rights reserved.
422 DIETARY REFERENCE INTAKES
TABLE C-3 Dietary Vitamin E Intake (α-TocopherolEquivalents, mg): Mean and Selected Percentiles, UnitedStates, NHANES III, 1988–1994
Number Selected Percentilesof Persons
Sexa and Age Examined Mean 1st 5th
Both sexes, 0–6 mo 414 12.3 7.5 8.8Standard error 0.3 0.3 0.3
Both sexes, 7–12 mo 579 8.5 4.1 4.8Standard error 0.3 0.2 0.3
Both sexes 1–3 y 3,624 5.5 3.4 3.9Standard error 0.1 0.1 0.1
Both sexes, 4–8 y 4,664 7.2 4.7 5.3Standard error 0.2 1.0 0.8
M, 9–13 y 1,262 9.1 5.1 6.0Standard error 0.5 0.3 0.3
M, 14–18 y 938 12.0 5.9 6.8Standard error 1.9 0.3 0.4
M, 19–30 y 1,960 11.6 6.8 7.9Standard error 0.5 0.3 0.3
M, 31–50 y 2,611 12.1 6.3 7.6Standard error 0.7 0.7 0.8
M, 51–70 y 2,029 10.6 5.3 6.3Standard error 0.2 0.2 0.2
M, 71+ y 1,322 9.8 4.8 5.8Standard error 0.4 0.2 0.2
F, 9–13 y 1,279 7.8 4.1 4.9Standard error 0.2 0.1 0.2
F, 14–18 y 707 7.9 4.0 4.8Standard error 0.5 0.2 0.3
F, 19–30 y 1,106 8.5 4.3 5.2Standard error 0.4 0.3 0.4
F, 31–50 y 2,644 8.2 4.3 5.2Standard error 0.3 0.3 0.3
F, 51–70 y 2,145 7.7 3.5 4.4Standard error 0.3 0.3 0.3
F, 71+ y 1,436 8.0 4.1 4.9Standard error 0.3 0.3 0.3
Pregnant 214 10.1 5.0 6.3Standard error 1.2 0.5 0.7
Lactating 100 12.0 6.6 7.7Standard error 1.5 0.6 0.8
All individuals (+P/L) 29,028 9.2 5.3 6.2Standard error 0.1 0.7 0.6
All individuals 28,720 9.3 5.1 6.0Standard error 0.1 0.7 0.6
NOTE: Estimated mean and standard deviation, and selected percentiles of the usualintake distribution of vitamin E, computed using intake from food sources alone. Di-etary intake data are from NHANES III, and the distribution was adjusted using C-SIDEand the method presented in Nusser SM, Carriquiry AL, Dodd KW, Fuller WA. 1996. Asemiparametric transformation approach to estimating usual daily intake distributions.
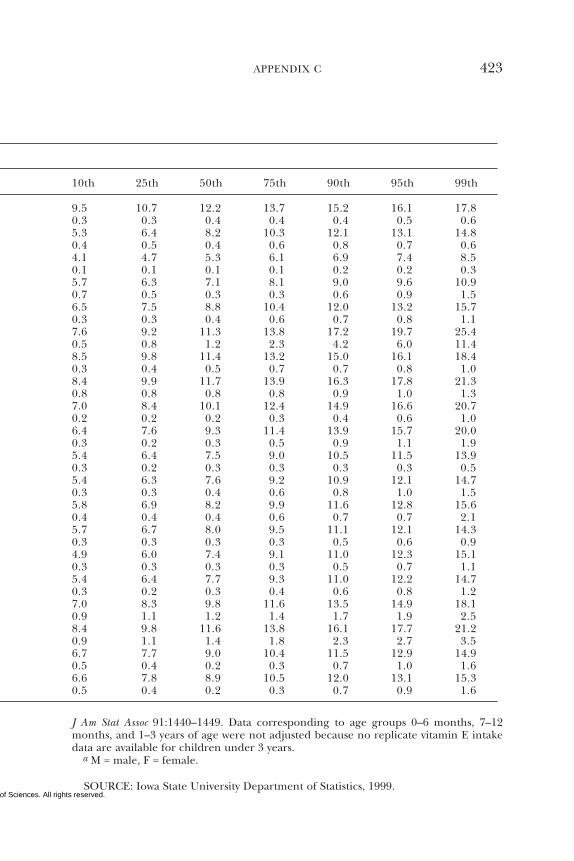
Copyright © National Academy of Sciences. All rights reserved.
APPENDIX C 423
10th 25th 50th 75th 90th 95th 99th
9.5 10.7 12.2 13.7 15.2 16.1 17.80.3 0.3 0.4 0.4 0.4 0.5 0.65.3 6.4 8.2 10.3 12.1 13.1 14.80.4 0.5 0.4 0.6 0.8 0.7 0.64.1 4.7 5.3 6.1 6.9 7.4 8.50.1 0.1 0.1 0.1 0.2 0.2 0.35.7 6.3 7.1 8.1 9.0 9.6 10.90.7 0.5 0.3 0.3 0.6 0.9 1.56.5 7.5 8.8 10.4 12.0 13.2 15.70.3 0.3 0.4 0.6 0.7 0.8 1.17.6 9.2 11.3 13.8 17.2 19.7 25.40.5 0.8 1.2 2.3 4.2 6.0 11.48.5 9.8 11.4 13.2 15.0 16.1 18.40.3 0.4 0.5 0.7 0.7 0.8 1.08.4 9.9 11.7 13.9 16.3 17.8 21.30.8 0.8 0.8 0.8 0.9 1.0 1.37.0 8.4 10.1 12.4 14.9 16.6 20.70.2 0.2 0.2 0.3 0.4 0.6 1.06.4 7.6 9.3 11.4 13.9 15.7 20.00.3 0.2 0.3 0.5 0.9 1.1 1.95.4 6.4 7.5 9.0 10.5 11.5 13.90.3 0.2 0.3 0.3 0.3 0.3 0.55.4 6.3 7.6 9.2 10.9 12.1 14.70.3 0.3 0.4 0.6 0.8 1.0 1.55.8 6.9 8.2 9.9 11.6 12.8 15.60.4 0.4 0.4 0.6 0.7 0.7 2.15.7 6.7 8.0 9.5 11.1 12.1 14.30.3 0.3 0.3 0.3 0.5 0.6 0.94.9 6.0 7.4 9.1 11.0 12.3 15.10.3 0.3 0.3 0.3 0.5 0.7 1.15.4 6.4 7.7 9.3 11.0 12.2 14.70.3 0.2 0.3 0.4 0.6 0.8 1.27.0 8.3 9.8 11.6 13.5 14.9 18.10.9 1.1 1.2 1.4 1.7 1.9 2.58.4 9.8 11.6 13.8 16.1 17.7 21.20.9 1.1 1.4 1.8 2.3 2.7 3.56.7 7.7 9.0 10.4 11.5 12.9 14.90.5 0.4 0.2 0.3 0.7 1.0 1.66.6 7.8 8.9 10.5 12.0 13.1 15.30.5 0.4 0.2 0.3 0.7 0.9 1.6
J Am Stat Assoc 91:1440–1449. Data corresponding to age groups 0–6 months, 7–12months, and 1–3 years of age were not adjusted because no replicate vitamin E intakedata are available for children under 3 years.
a M = male, F = female.
SOURCE: Iowa State University Department of Statistics, 1999.
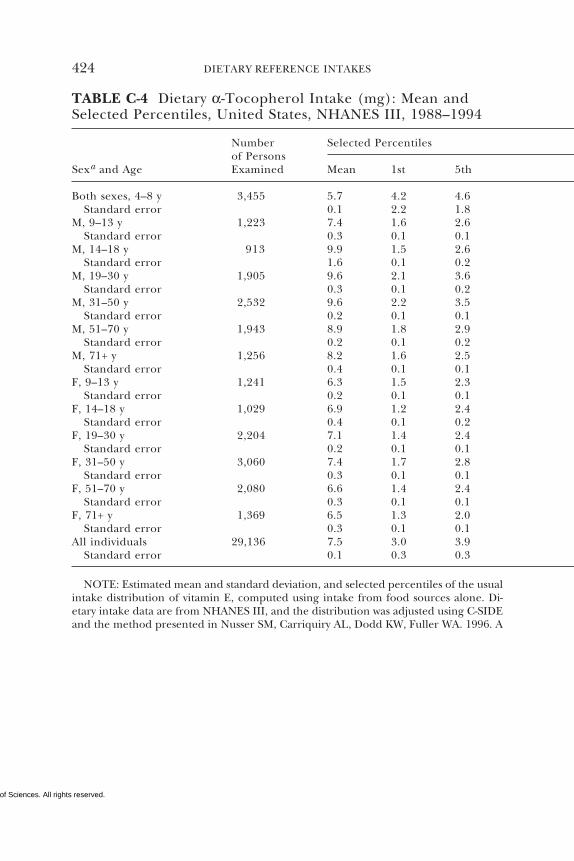
Copyright © National Academy of Sciences. All rights reserved.
424 DIETARY REFERENCE INTAKES
TABLE C-4 Dietary α-Tocopherol Intake (mg): Mean andSelected Percentiles, United States, NHANES III, 1988–1994
Number Selected Percentilesof Persons
Sexa and Age Examined Mean 1st 5th
Both sexes, 4–8 y 3,455 5.7 4.2 4.6Standard error 0.1 2.2 1.8
M, 9–13 y 1,223 7.4 1.6 2.6Standard error 0.3 0.1 0.1
M, 14–18 y 913 9.9 1.5 2.6Standard error 1.6 0.1 0.2
M, 19–30 y 1,905 9.6 2.1 3.6Standard error 0.3 0.1 0.2
M, 31–50 y 2,532 9.6 2.2 3.5Standard error 0.2 0.1 0.1
M, 51–70 y 1,943 8.9 1.8 2.9Standard error 0.2 0.1 0.2
M, 71+ y 1,256 8.2 1.6 2.5Standard error 0.4 0.1 0.1
F, 9–13 y 1,241 6.3 1.5 2.3Standard error 0.2 0.1 0.1
F, 14–18 y 1,029 6.9 1.2 2.4Standard error 0.4 0.1 0.2
F, 19–30 y 2,204 7.1 1.4 2.4Standard error 0.2 0.1 0.1
F, 31–50 y 3,060 7.4 1.7 2.8Standard error 0.3 0.1 0.1
F, 51–70 y 2,080 6.6 1.4 2.4Standard error 0.3 0.1 0.1
F, 71+ y 1,369 6.5 1.3 2.0Standard error 0.3 0.1 0.1
All individuals 29,136 7.5 3.0 3.9Standard error 0.1 0.3 0.3
NOTE: Estimated mean and standard deviation, and selected percentiles of the usualintake distribution of vitamin E, computed using intake from food sources alone. Di-etary intake data are from NHANES III, and the distribution was adjusted using C-SIDEand the method presented in Nusser SM, Carriquiry AL, Dodd KW, Fuller WA. 1996. A
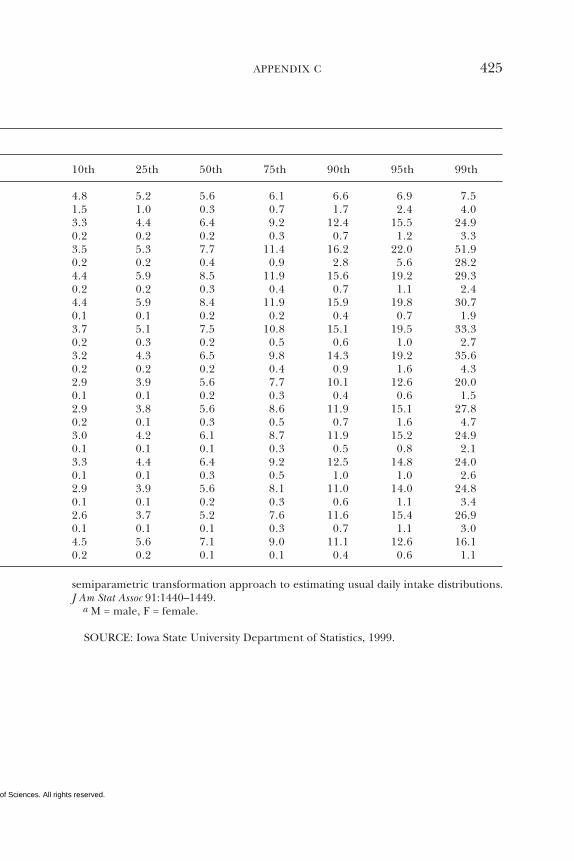
Copyright © National Academy of Sciences. All rights reserved.
APPENDIX C 425
10th 25th 50th 75th 90th 95th 99th
4.8 5.2 5.6 6.1 6.6 6.9 7.51.5 1.0 0.3 0.7 1.7 2.4 4.03.3 4.4 6.4 9.2 12.4 15.5 24.90.2 0.2 0.2 0.3 0.7 1.2 3.33.5 5.3 7.7 11.4 16.2 22.0 51.90.2 0.2 0.4 0.9 2.8 5.6 28.24.4 5.9 8.5 11.9 15.6 19.2 29.30.2 0.2 0.3 0.4 0.7 1.1 2.44.4 5.9 8.4 11.9 15.9 19.8 30.70.1 0.1 0.2 0.2 0.4 0.7 1.93.7 5.1 7.5 10.8 15.1 19.5 33.30.2 0.3 0.2 0.5 0.6 1.0 2.73.2 4.3 6.5 9.8 14.3 19.2 35.60.2 0.2 0.2 0.4 0.9 1.6 4.32.9 3.9 5.6 7.7 10.1 12.6 20.00.1 0.1 0.2 0.3 0.4 0.6 1.52.9 3.8 5.6 8.6 11.9 15.1 27.80.2 0.1 0.3 0.5 0.7 1.6 4.73.0 4.2 6.1 8.7 11.9 15.2 24.90.1 0.1 0.1 0.3 0.5 0.8 2.13.3 4.4 6.4 9.2 12.5 14.8 24.00.1 0.1 0.3 0.5 1.0 1.0 2.62.9 3.9 5.6 8.1 11.0 14.0 24.80.1 0.1 0.2 0.3 0.6 1.1 3.42.6 3.7 5.2 7.6 11.6 15.4 26.90.1 0.1 0.1 0.3 0.7 1.1 3.04.5 5.6 7.1 9.0 11.1 12.6 16.10.2 0.2 0.1 0.1 0.4 0.6 1.1
semiparametric transformation approach to estimating usual daily intake distributions.J Am Stat Assoc 91:1440–1449.
a M = male, F = female.
SOURCE: Iowa State University Department of Statistics, 1999.
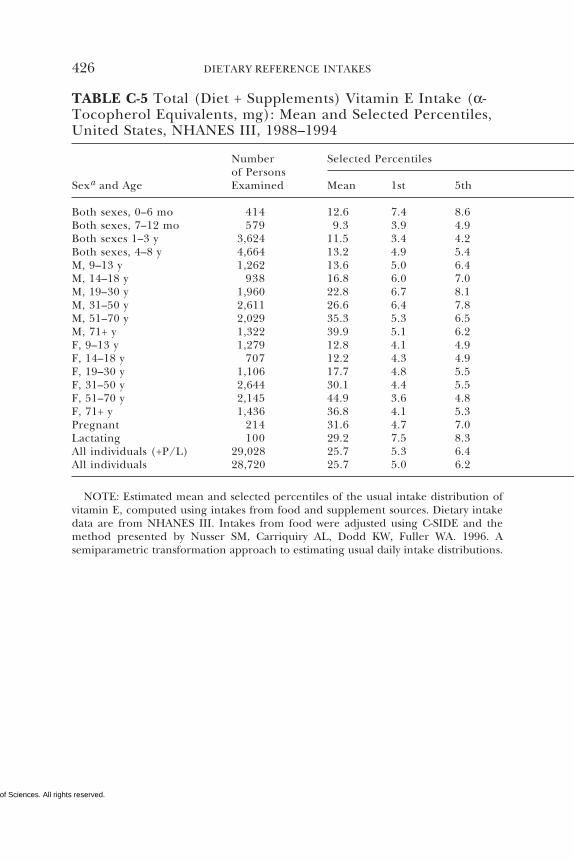
Copyright © National Academy of Sciences. All rights reserved.
426 DIETARY REFERENCE INTAKES
TABLE C-5 Total (Diet + Supplements) Vitamin E Intake (α-Tocopherol Equivalents, mg): Mean and Selected Percentiles,United States, NHANES III, 1988–1994
Number Selected Percentilesof Persons
Sexa and Age Examined Mean 1st 5th
Both sexes, 0–6 mo 414 12.6 7.4 8.6Both sexes, 7–12 mo 579 9.3 3.9 4.9Both sexes 1–3 y 3,624 11.5 3.4 4.2Both sexes, 4–8 y 4,664 13.2 4.9 5.4M, 9–13 y 1,262 13.6 5.0 6.4M, 14–18 y 938 16.8 6.0 7.0M, 19–30 y 1,960 22.8 6.7 8.1M, 31–50 y 2,611 26.6 6.4 7.8M, 51–70 y 2,029 35.3 5.3 6.5M, 71+ y 1,322 39.9 5.1 6.2F, 9–13 y 1,279 12.8 4.1 4.9F, 14–18 y 707 12.2 4.3 4.9F, 19–30 y 1,106 17.7 4.8 5.5F, 31–50 y 2,644 30.1 4.4 5.5F, 51–70 y 2,145 44.9 3.6 4.8F, 71+ y 1,436 36.8 4.1 5.3Pregnant 214 31.6 4.7 7.0Lactating 100 29.2 7.5 8.3All individuals (+P/L) 29,028 25.7 5.3 6.4All individuals 28,720 25.7 5.0 6.2
NOTE: Estimated mean and selected percentiles of the usual intake distribution ofvitamin E, computed using intakes from food and supplement sources. Dietary intakedata are from NHANES III. Intakes from food were adjusted using C-SIDE and themethod presented by Nusser SM, Carriquiry AL, Dodd KW, Fuller WA. 1996. Asemiparametric transformation approach to estimating usual daily intake distributions.
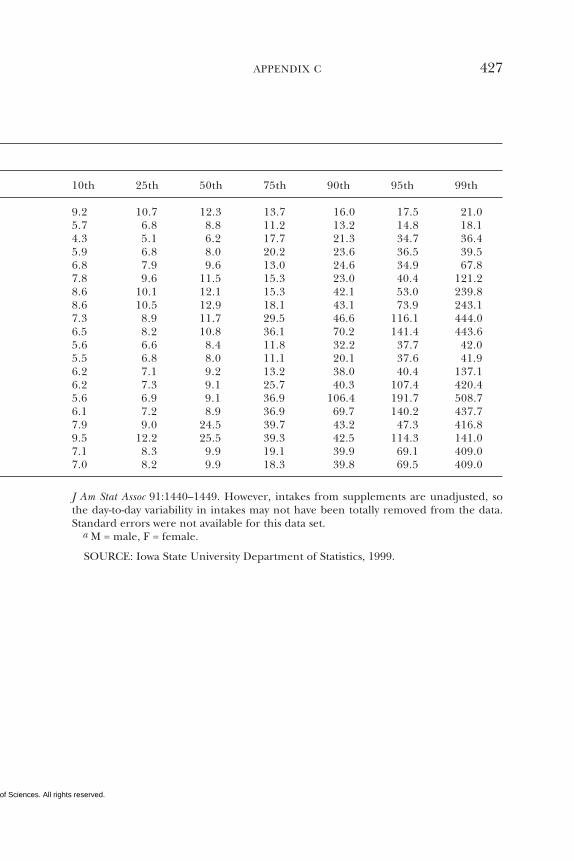
Copyright © National Academy of Sciences. All rights reserved.
APPENDIX C 427
10th 25th 50th 75th 90th 95th 99th
9.2 10.7 12.3 13.7 16.0 17.5 21.05.7 6.8 8.8 11.2 13.2 14.8 18.14.3 5.1 6.2 17.7 21.3 34.7 36.45.9 6.8 8.0 20.2 23.6 36.5 39.56.8 7.9 9.6 13.0 24.6 34.9 67.87.8 9.6 11.5 15.3 23.0 40.4 121.28.6 10.1 12.1 15.3 42.1 53.0 239.88.6 10.5 12.9 18.1 43.1 73.9 243.17.3 8.9 11.7 29.5 46.6 116.1 444.06.5 8.2 10.8 36.1 70.2 141.4 443.65.6 6.6 8.4 11.8 32.2 37.7 42.05.5 6.8 8.0 11.1 20.1 37.6 41.96.2 7.1 9.2 13.2 38.0 40.4 137.16.2 7.3 9.1 25.7 40.3 107.4 420.45.6 6.9 9.1 36.9 106.4 191.7 508.76.1 7.2 8.9 36.9 69.7 140.2 437.77.9 9.0 24.5 39.7 43.2 47.3 416.89.5 12.2 25.5 39.3 42.5 114.3 141.07.1 8.3 9.9 19.1 39.9 69.1 409.07.0 8.2 9.9 18.3 39.8 69.5 409.0
J Am Stat Assoc 91:1440–1449. However, intakes from supplements are unadjusted, sothe day-to-day variability in intakes may not have been totally removed from the data.Standard errors were not available for this data set.
a M = male, F = female.
SOURCE: Iowa State University Department of Statistics, 1999.
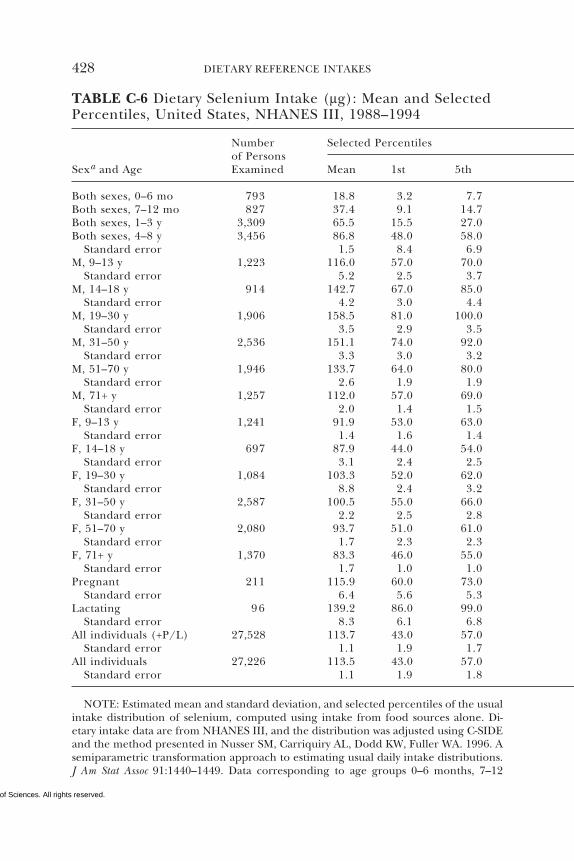
Copyright © National Academy of Sciences. All rights reserved.
428 DIETARY REFERENCE INTAKES
TABLE C-6 Dietary Selenium Intake (µg): Mean and SelectedPercentiles, United States, NHANES III, 1988–1994
Number Selected Percentilesof Persons
Sexa and Age Examined Mean 1st 5th
Both sexes, 0–6 mo 793 18.8 3.2 7.7Both sexes, 7–12 mo 827 37.4 9.1 14.7Both sexes, 1–3 y 3,309 65.5 15.5 27.0Both sexes, 4–8 y 3,456 86.8 48.0 58.0
Standard error 1.5 8.4 6.9M, 9–13 y 1,223 116.0 57.0 70.0
Standard error 5.2 2.5 3.7M, 14–18 y 914 142.7 67.0 85.0
Standard error 4.2 3.0 4.4M, 19–30 y 1,906 158.5 81.0 100.0
Standard error 3.5 2.9 3.5M, 31–50 y 2,536 151.1 74.0 92.0
Standard error 3.3 3.0 3.2M, 51–70 y 1,946 133.7 64.0 80.0
Standard error 2.6 1.9 1.9M, 71+ y 1,257 112.0 57.0 69.0
Standard error 2.0 1.4 1.5F, 9–13 y 1,241 91.9 53.0 63.0
Standard error 1.4 1.6 1.4F, 14–18 y 697 87.9 44.0 54.0
Standard error 3.1 2.4 2.5F, 19–30 y 1,084 103.3 52.0 62.0
Standard error 8.8 2.4 3.2F, 31–50 y 2,587 100.5 55.0 66.0
Standard error 2.2 2.5 2.8F, 51–70 y 2,080 93.7 51.0 61.0
Standard error 1.7 2.3 2.3F, 71+ y 1,370 83.3 46.0 55.0
Standard error 1.7 1.0 1.0Pregnant 211 115.9 60.0 73.0
Standard error 6.4 5.6 5.3Lactating 96 139.2 86.0 99.0
Standard error 8.3 6.1 6.8All individuals (+P/L) 27,528 113.7 43.0 57.0
Standard error 1.1 1.9 1.7All individuals 27,226 113.5 43.0 57.0
Standard error 1.1 1.9 1.8
NOTE: Estimated mean and standard deviation, and selected percentiles of the usualintake distribution of selenium, computed using intake from food sources alone. Di-etary intake data are from NHANES III, and the distribution was adjusted using C-SIDEand the method presented in Nusser SM, Carriquiry AL, Dodd KW, Fuller WA. 1996. Asemiparametric transformation approach to estimating usual daily intake distributions.J Am Stat Assoc 91:1440–1449. Data corresponding to age groups 0–6 months, 7–12
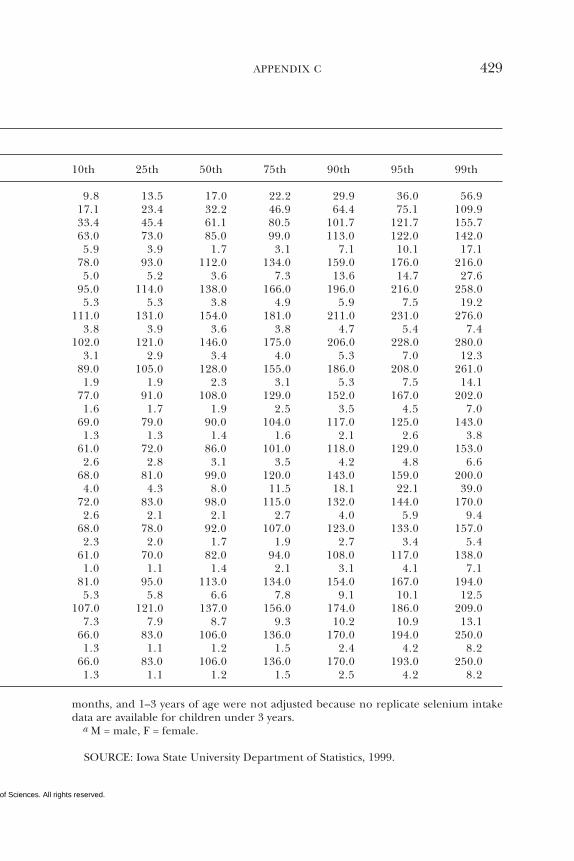
Copyright © National Academy of Sciences. All rights reserved.
APPENDIX C 429
10th 25th 50th 75th 90th 95th 99th
9.8 13.5 17.0 22.2 29.9 36.0 56.917.1 23.4 32.2 46.9 64.4 75.1 109.933.4 45.4 61.1 80.5 101.7 121.7 155.763.0 73.0 85.0 99.0 113.0 122.0 142.05.9 3.9 1.7 3.1 7.1 10.1 17.1
78.0 93.0 112.0 134.0 159.0 176.0 216.05.0 5.2 3.6 7.3 13.6 14.7 27.6
95.0 114.0 138.0 166.0 196.0 216.0 258.05.3 5.3 3.8 4.9 5.9 7.5 19.2
111.0 131.0 154.0 181.0 211.0 231.0 276.03.8 3.9 3.6 3.8 4.7 5.4 7.4
102.0 121.0 146.0 175.0 206.0 228.0 280.03.1 2.9 3.4 4.0 5.3 7.0 12.3
89.0 105.0 128.0 155.0 186.0 208.0 261.01.9 1.9 2.3 3.1 5.3 7.5 14.1
77.0 91.0 108.0 129.0 152.0 167.0 202.01.6 1.7 1.9 2.5 3.5 4.5 7.0
69.0 79.0 90.0 104.0 117.0 125.0 143.01.3 1.3 1.4 1.6 2.1 2.6 3.8
61.0 72.0 86.0 101.0 118.0 129.0 153.02.6 2.8 3.1 3.5 4.2 4.8 6.6
68.0 81.0 99.0 120.0 143.0 159.0 200.04.0 4.3 8.0 11.5 18.1 22.1 39.0
72.0 83.0 98.0 115.0 132.0 144.0 170.02.6 2.1 2.1 2.7 4.0 5.9 9.4
68.0 78.0 92.0 107.0 123.0 133.0 157.02.3 2.0 1.7 1.9 2.7 3.4 5.4
61.0 70.0 82.0 94.0 108.0 117.0 138.01.0 1.1 1.4 2.1 3.1 4.1 7.1
81.0 95.0 113.0 134.0 154.0 167.0 194.05.3 5.8 6.6 7.8 9.1 10.1 12.5
107.0 121.0 137.0 156.0 174.0 186.0 209.07.3 7.9 8.7 9.3 10.2 10.9 13.1
66.0 83.0 106.0 136.0 170.0 194.0 250.01.3 1.1 1.2 1.5 2.4 4.2 8.2
66.0 83.0 106.0 136.0 170.0 193.0 250.01.3 1.1 1.2 1.5 2.5 4.2 8.2
months, and 1–3 years of age were not adjusted because no replicate selenium intakedata are available for children under 3 years.
a M = male, F = female.
SOURCE: Iowa State University Department of Statistics, 1999.

Copyright © National Academy of Sciences. All rights reserved.
430 DIETARY REFERENCE INTAKES
TABLE C-7 Total (Diet + Supplements) Selenium Intake (µg):Mean and Selected Percentiles, United States, NHANES III,1988–1994
Number Selected Percentilesof Persons
Sexa and Age Examined Mean 1st 5th
Both sexes, 0–6 mo 793 35.3 17.2 24.0Both sexes, 7–12 mo 827 49.7 25.7 31.8Both sexes, 1–3 y 3,309 69.2 32.7 43.3Both sexes, 4–8 y 3,456 87.0 49.4 58.2M, 9–13 y 1,223 116.6 58.2 72.4M, 14–18 y 914 143.8 68.7 87.9M, 19–30 y 1,906 160.9 81.6 103.4M, 31–50 y 2,536 154.1 74.2 94.3M, 51–70 y 1,946 136.2 65.8 80.9M, 71+ y 1,257 116.4 57.8 71.4F, 9–13 y 1,241 92.5 53.6 65.3F, 14–18 y 697 88.7 41.6 56.4F, 19–30 y 1,084 105.1 53.9 63.9F, 31–50 y 2,587 103.5 56.7 67.0F, 51–70 y 2,080 98.4 53.6 63.3F, 71+ y 1,370 87.7 47.0 56.5Pregnant 211 123.9 52.0 82.5Lactating 96 132.9 79.3 97.4All individual (+P/L) 27,528 116.1 42.9 57.7All individuals 27,226 116.0 43.1 57.8
NOTE: Estimated mean and standard deviation, and selected percentiles of the usualintake distribution of selenium, computed using intakes from food and supplementsources. Dietary intake data are from NHANES III. Intakes from food were adjustedusing C-SIDE and the method presented by Nusser SM, Carriquiry AL, Dodd KW, FullerWA. 1996. A semiparametric transformation approach to estimating usual daily intake
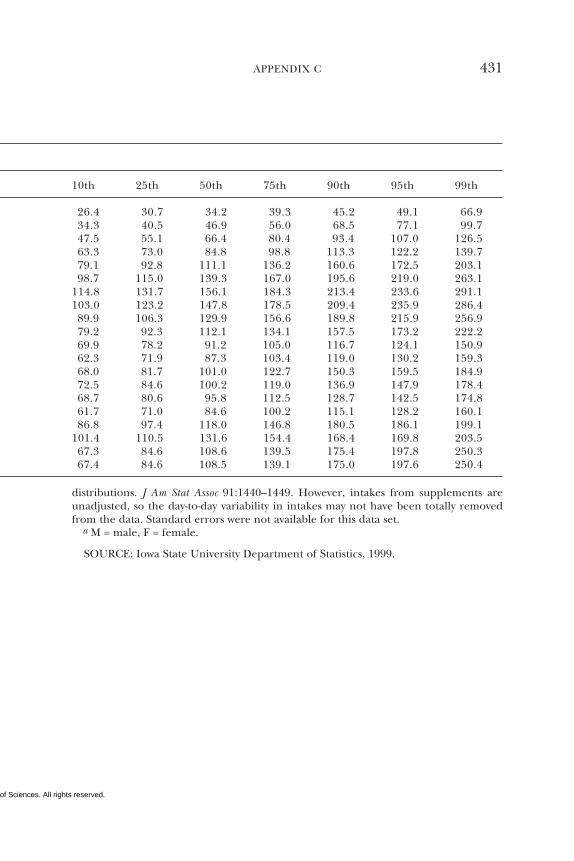
Copyright © National Academy of Sciences. All rights reserved.
APPENDIX C 431
10th 25th 50th 75th 90th 95th 99th
26.4 30.7 34.2 39.3 45.2 49.1 66.934.3 40.5 46.9 56.0 68.5 77.1 99.747.5 55.1 66.4 80.4 93.4 107.0 126.563.3 73.0 84.8 98.8 113.3 122.2 139.779.1 92.8 111.1 136.2 160.6 172.5 203.198.7 115.0 139.3 167.0 195.6 219.0 263.1
114.8 131.7 156.1 184.3 213.4 233.6 291.1103.0 123.2 147.8 178.5 209.4 235.9 286.489.9 106.3 129.9 156.6 189.8 215.9 256.979.2 92.3 112.1 134.1 157.5 173.2 222.269.9 78.2 91.2 105.0 116.7 124.1 150.962.3 71.9 87.3 103.4 119.0 130.2 159.368.0 81.7 101.0 122.7 150.3 159.5 184.972.5 84.6 100.2 119.0 136.9 147.9 178.468.7 80.6 95.8 112.5 128.7 142.5 174.861.7 71.0 84.6 100.2 115.1 128.2 160.186.8 97.4 118.0 146.8 180.5 186.1 199.1
101.4 110.5 131.6 154.4 168.4 169.8 203.567.3 84.6 108.6 139.5 175.4 197.8 250.367.4 84.6 108.5 139.1 175.0 197.6 250.4
distributions. J Am Stat Assoc 91:1440–1449. However, intakes from supplements areunadjusted, so the day-to-day variability in intakes may not have been totally removedfrom the data. Standard errors were not available for this data set.
a M = male, F = female.
SOURCE: Iowa State University Department of Statistics, 1999.
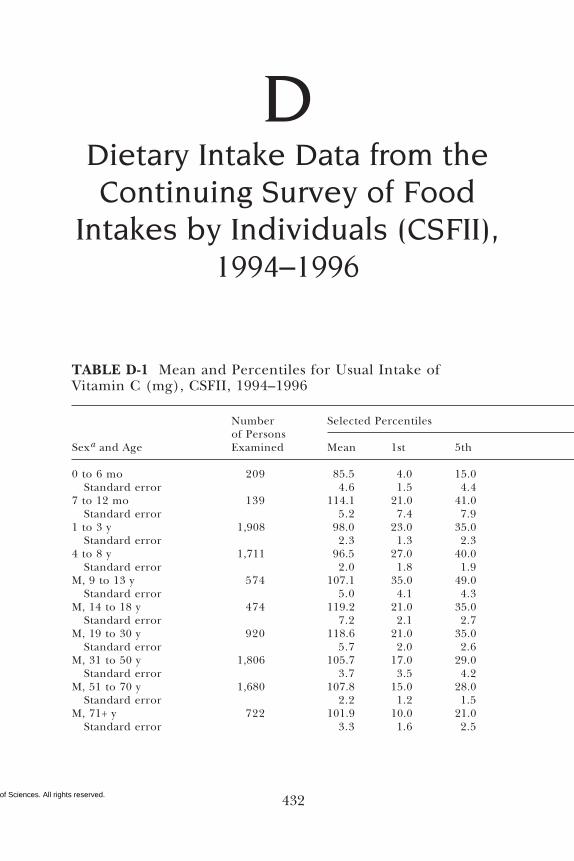
Copyright © National Academy of Sciences. All rights reserved. 432
TABLE D-1 Mean and Percentiles for Usual Intake ofVitamin C (mg), CSFII, 1994–1996
DDietary Intake Data from theContinuing Survey of Food
Intakes by Individuals (CSFII),1994–1996
Number Selected Percentilesof Persons
Sexa and Age Examined Mean 1st 5th
0 to 6 mo 209 85.5 4.0 15.0Standard error 4.6 1.5 4.4
7 to 12 mo 139 114.1 21.0 41.0Standard error 5.2 7.4 7.9
1 to 3 y 1,908 98.0 23.0 35.0Standard error 2.3 1.3 2.3
4 to 8 y 1,711 96.5 27.0 40.0Standard error 2.0 1.8 1.9
M, 9 to 13 y 574 107.1 35.0 49.0Standard error 5.0 4.1 4.3
M, 14 to 18 y 474 119.2 21.0 35.0Standard error 7.2 2.1 2.7
M, 19 to 30 y 920 118.6 21.0 35.0Standard error 5.7 2.0 2.6
M, 31 to 50 y 1,806 105.7 17.0 29.0Standard error 3.7 3.5 4.2
M, 51 to 70 y 1,680 107.8 15.0 28.0Standard error 2.2 1.2 1.5
M, 71+ y 722 101.9 10.0 21.0Standard error 3.3 1.6 2.5
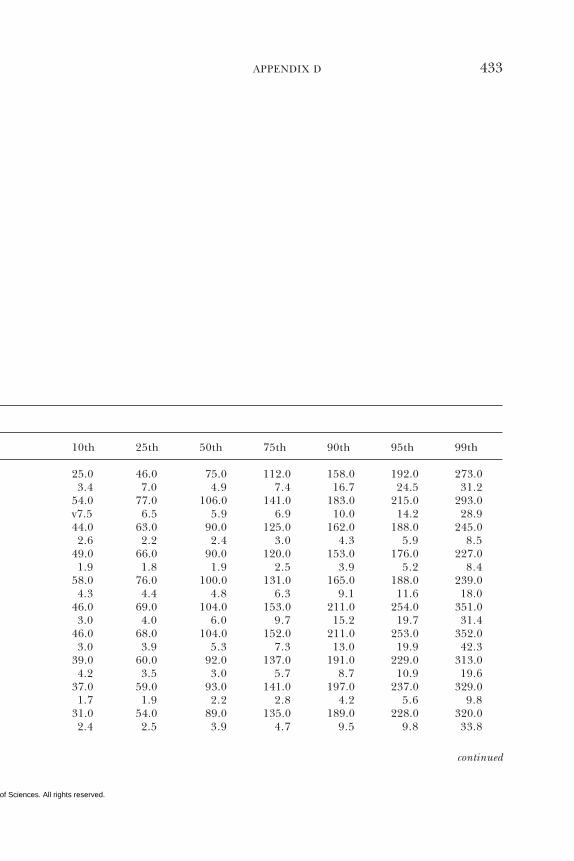
Copyright © National Academy of Sciences. All rights reserved.
APPENDIX D 433
10th 25th 50th 75th 90th 95th 99th
25.0 46.0 75.0 112.0 158.0 192.0 273.03.4 7.0 4.9 7.4 16.7 24.5 31.2
54.0 77.0 106.0 141.0 183.0 215.0 293.0v7.5 6.5 5.9 6.9 10.0 14.2 28.944.0 63.0 90.0 125.0 162.0 188.0 245.02.6 2.2 2.4 3.0 4.3 5.9 8.5
49.0 66.0 90.0 120.0 153.0 176.0 227.01.9 1.8 1.9 2.5 3.9 5.2 8.4
58.0 76.0 100.0 131.0 165.0 188.0 239.04.3 4.4 4.8 6.3 9.1 11.6 18.0
46.0 69.0 104.0 153.0 211.0 254.0 351.03.0 4.0 6.0 9.7 15.2 19.7 31.4
46.0 68.0 104.0 152.0 211.0 253.0 352.03.0 3.9 5.3 7.3 13.0 19.9 42.3
39.0 60.0 92.0 137.0 191.0 229.0 313.04.2 3.5 3.0 5.7 8.7 10.9 19.6
37.0 59.0 93.0 141.0 197.0 237.0 329.01.7 1.9 2.2 2.8 4.2 5.6 9.8
31.0 54.0 89.0 135.0 189.0 228.0 320.02.4 2.5 3.9 4.7 9.5 9.8 33.8
continued
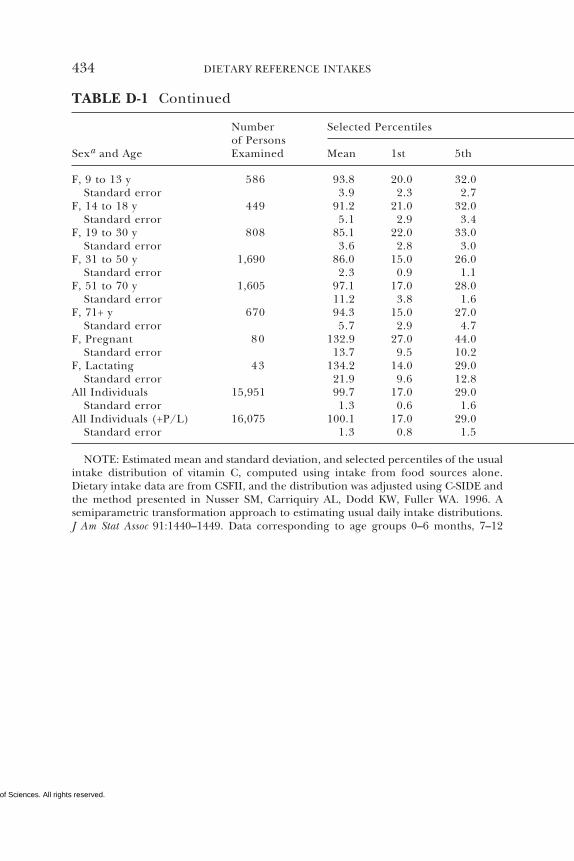
Copyright © National Academy of Sciences. All rights reserved.
434 DIETARY REFERENCE INTAKES
F, 9 to 13 y 586 93.8 20.0 32.0Standard error 3.9 2.3 2.7
F, 14 to 18 y 449 91.2 21.0 32.0Standard error 5.1 2.9 3.4
F, 19 to 30 y 808 85.1 22.0 33.0Standard error 3.6 2.8 3.0
F, 31 to 50 y 1,690 86.0 15.0 26.0Standard error 2.3 0.9 1.1
F, 51 to 70 y 1,605 97.1 17.0 28.0Standard error 11.2 3.8 1.6
F, 71+ y 670 94.3 15.0 27.0Standard error 5.7 2.9 4.7
F, Pregnant 80 132.9 27.0 44.0Standard error 13.7 9.5 10.2
F, Lactating 43 134.2 14.0 29.0Standard error 21.9 9.6 12.8
All Individuals 15,951 99.7 17.0 29.0Standard error 1.3 0.6 1.6
All Individuals (+P/L) 16,075 100.1 17.0 29.0Standard error 1.3 0.8 1.5
TABLE D-1 Continued
Number Selected Percentilesof Persons
Sexa and Age Examined Mean 1st 5th
NOTE: Estimated mean and standard deviation, and selected percentiles of the usualintake distribution of vitamin C, computed using intake from food sources alone.Dietary intake data are from CSFII, and the distribution was adjusted using C-SIDE andthe method presented in Nusser SM, Carriquiry AL, Dodd KW, Fuller WA. 1996. Asemiparametric transformation approach to estimating usual daily intake distributions.J Am Stat Assoc 91:1440–1449. Data corresponding to age groups 0–6 months, 7–12
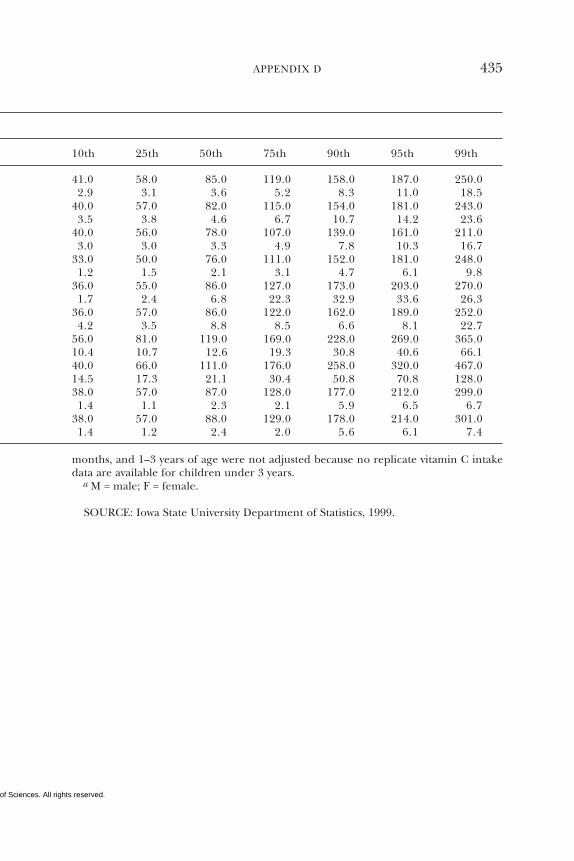
Copyright © National Academy of Sciences. All rights reserved.
APPENDIX D 435
41.0 58.0 85.0 119.0 158.0 187.0 250.02.9 3.1 3.6 5.2 8.3 11.0 18.5
40.0 57.0 82.0 115.0 154.0 181.0 243.03.5 3.8 4.6 6.7 10.7 14.2 23.6
40.0 56.0 78.0 107.0 139.0 161.0 211.03.0 3.0 3.3 4.9 7.8 10.3 16.7
33.0 50.0 76.0 111.0 152.0 181.0 248.01.2 1.5 2.1 3.1 4.7 6.1 9.8
36.0 55.0 86.0 127.0 173.0 203.0 270.01.7 2.4 6.8 22.3 32.9 33.6 26.3
36.0 57.0 86.0 122.0 162.0 189.0 252.04.2 3.5 8.8 8.5 6.6 8.1 22.7
56.0 81.0 119.0 169.0 228.0 269.0 365.010.4 10.7 12.6 19.3 30.8 40.6 66.140.0 66.0 111.0 176.0 258.0 320.0 467.014.5 17.3 21.1 30.4 50.8 70.8 128.038.0 57.0 87.0 128.0 177.0 212.0 299.01.4 1.1 2.3 2.1 5.9 6.5 6.7
38.0 57.0 88.0 129.0 178.0 214.0 301.01.4 1.2 2.4 2.0 5.6 6.1 7.4
10th 25th 50th 75th 90th 95th 99th
months, and 1–3 years of age were not adjusted because no replicate vitamin C intakedata are available for children under 3 years.
a M = male; F = female.
SOURCE: Iowa State University Department of Statistics, 1999.
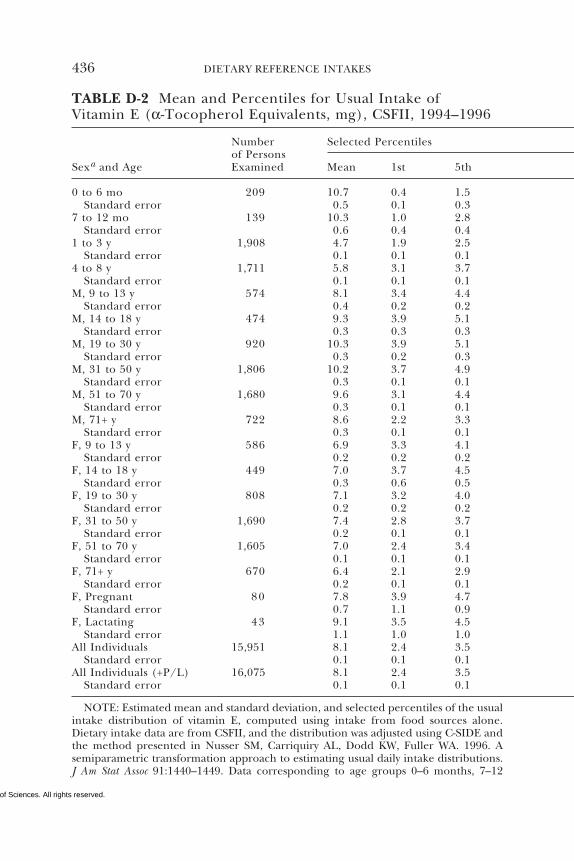
Copyright © National Academy of Sciences. All rights reserved.
436 DIETARY REFERENCE INTAKES
TABLE D-2 Mean and Percentiles for Usual Intake ofVitamin E (α-Tocopherol Equivalents, mg), CSFII, 1994–1996
Number Selected Percentilesof Persons
Sexa and Age Examined Mean 1st 5th
0 to 6 mo 209 10.7 0.4 1.5Standard error 0.5 0.1 0.3
7 to 12 mo 139 10.3 1.0 2.8Standard error 0.6 0.4 0.4
1 to 3 y 1,908 4.7 1.9 2.5Standard error 0.1 0.1 0.1
4 to 8 y 1,711 5.8 3.1 3.7Standard error 0.1 0.1 0.1
M, 9 to 13 y 574 8.1 3.4 4.4Standard error 0.4 0.2 0.2
M, 14 to 18 y 474 9.3 3.9 5.1Standard error 0.3 0.3 0.3
M, 19 to 30 y 920 10.3 3.9 5.1Standard error 0.3 0.2 0.3
M, 31 to 50 y 1,806 10.2 3.7 4.9Standard error 0.3 0.1 0.1
M, 51 to 70 y 1,680 9.6 3.1 4.4Standard error 0.3 0.1 0.1
M, 71+ y 722 8.6 2.2 3.3Standard error 0.3 0.1 0.1
F, 9 to 13 y 586 6.9 3.3 4.1Standard error 0.2 0.2 0.2
F, 14 to 18 y 449 7.0 3.7 4.5Standard error 0.3 0.6 0.5
F, 19 to 30 y 808 7.1 3.2 4.0Standard error 0.2 0.2 0.2
F, 31 to 50 y 1,690 7.4 2.8 3.7Standard error 0.2 0.1 0.1
F, 51 to 70 y 1,605 7.0 2.4 3.4Standard error 0.1 0.1 0.1
F, 71+ y 670 6.4 2.1 2.9Standard error 0.2 0.1 0.1
F, Pregnant 80 7.8 3.9 4.7Standard error 0.7 1.1 0.9
F, Lactating 43 9.1 3.5 4.5Standard error 1.1 1.0 1.0
All Individuals 15,951 8.1 2.4 3.5Standard error 0.1 0.1 0.1
All Individuals (+P/L) 16,075 8.1 2.4 3.5Standard error 0.1 0.1 0.1
NOTE: Estimated mean and standard deviation, and selected percentiles of the usualintake distribution of vitamin E, computed using intake from food sources alone.Dietary intake data are from CSFII, and the distribution was adjusted using C-SIDE andthe method presented in Nusser SM, Carriquiry AL, Dodd KW, Fuller WA. 1996. Asemiparametric transformation approach to estimating usual daily intake distributions.J Am Stat Assoc 91:1440–1449. Data corresponding to age groups 0–6 months, 7–12
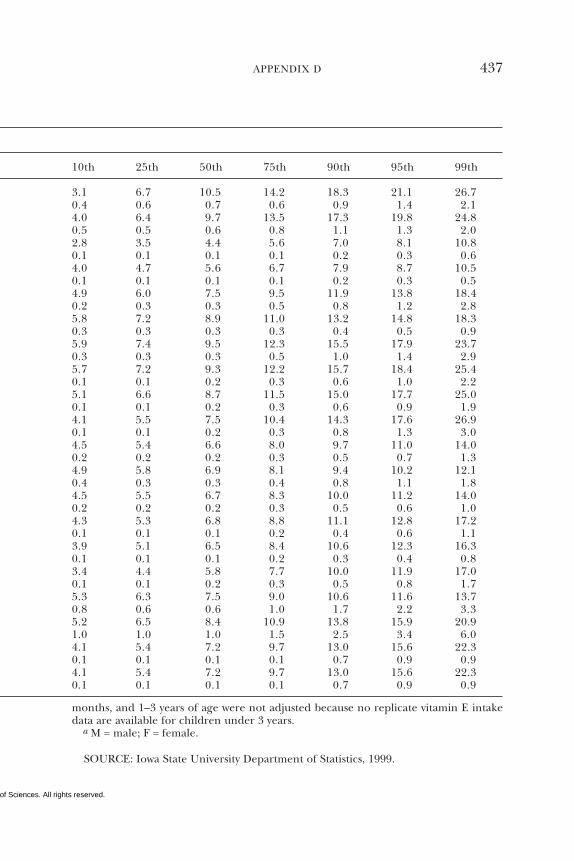
Copyright © National Academy of Sciences. All rights reserved.
APPENDIX D 437
10th 25th 50th 75th 90th 95th 99th
3.1 6.7 10.5 14.2 18.3 21.1 26.70.4 0.6 0.7 0.6 0.9 1.4 2.14.0 6.4 9.7 13.5 17.3 19.8 24.80.5 0.5 0.6 0.8 1.1 1.3 2.02.8 3.5 4.4 5.6 7.0 8.1 10.80.1 0.1 0.1 0.1 0.2 0.3 0.64.0 4.7 5.6 6.7 7.9 8.7 10.50.1 0.1 0.1 0.1 0.2 0.3 0.54.9 6.0 7.5 9.5 11.9 13.8 18.40.2 0.3 0.3 0.5 0.8 1.2 2.85.8 7.2 8.9 11.0 13.2 14.8 18.30.3 0.3 0.3 0.3 0.4 0.5 0.95.9 7.4 9.5 12.3 15.5 17.9 23.70.3 0.3 0.3 0.5 1.0 1.4 2.95.7 7.2 9.3 12.2 15.7 18.4 25.40.1 0.1 0.2 0.3 0.6 1.0 2.25.1 6.6 8.7 11.5 15.0 17.7 25.00.1 0.1 0.2 0.3 0.6 0.9 1.94.1 5.5 7.5 10.4 14.3 17.6 26.90.1 0.1 0.2 0.3 0.8 1.3 3.04.5 5.4 6.6 8.0 9.7 11.0 14.00.2 0.2 0.2 0.3 0.5 0.7 1.34.9 5.8 6.9 8.1 9.4 10.2 12.10.4 0.3 0.3 0.4 0.8 1.1 1.84.5 5.5 6.7 8.3 10.0 11.2 14.00.2 0.2 0.2 0.3 0.5 0.6 1.04.3 5.3 6.8 8.8 11.1 12.8 17.20.1 0.1 0.1 0.2 0.4 0.6 1.13.9 5.1 6.5 8.4 10.6 12.3 16.30.1 0.1 0.1 0.2 0.3 0.4 0.83.4 4.4 5.8 7.7 10.0 11.9 17.00.1 0.1 0.2 0.3 0.5 0.8 1.75.3 6.3 7.5 9.0 10.6 11.6 13.70.8 0.6 0.6 1.0 1.7 2.2 3.35.2 6.5 8.4 10.9 13.8 15.9 20.91.0 1.0 1.0 1.5 2.5 3.4 6.04.1 5.4 7.2 9.7 13.0 15.6 22.30.1 0.1 0.1 0.1 0.7 0.9 0.94.1 5.4 7.2 9.7 13.0 15.6 22.30.1 0.1 0.1 0.1 0.7 0.9 0.9
months, and 1–3 years of age were not adjusted because no replicate vitamin E intakedata are available for children under 3 years.
a M = male; F = female.
SOURCE: Iowa State University Department of Statistics, 1999.
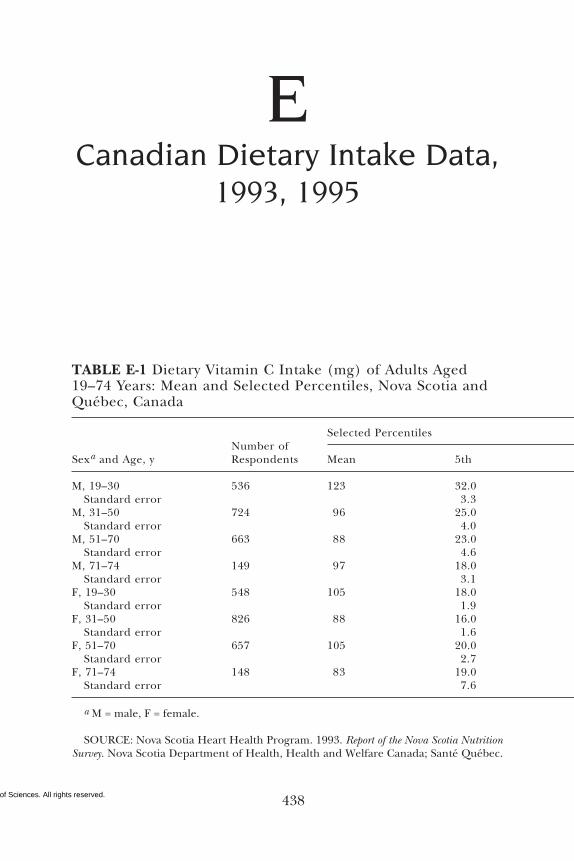
Copyright © National Academy of Sciences. All rights reserved. 438
TABLE E-1 Dietary Vitamin C Intake (mg) of Adults Aged19–74 Years: Mean and Selected Percentiles, Nova Scotia andQuébec, Canada
ECanadian Dietary Intake Data,
1993, 1995
Selected PercentilesNumber of
Sexa and Age, y Respondents Mean 5th
M, 19–30 536 123 32.0Standard error 3.3
M, 31–50 724 96 25.0Standard error 4.0
M, 51–70 663 88 23.0Standard error 4.6
M, 71–74 149 97 18.0Standard error 3.1
F, 19–30 548 105 18.0Standard error 1.9
F, 31–50 826 88 16.0Standard error 1.6
F, 51–70 657 105 20.0Standard error 2.7
F, 71–74 148 83 19.0Standard error 7.6
a M = male, F = female.
SOURCE: Nova Scotia Heart Health Program. 1993. Report of the Nova Scotia NutritionSurvey. Nova Scotia Department of Health, Health and Welfare Canada; Santé Québec.
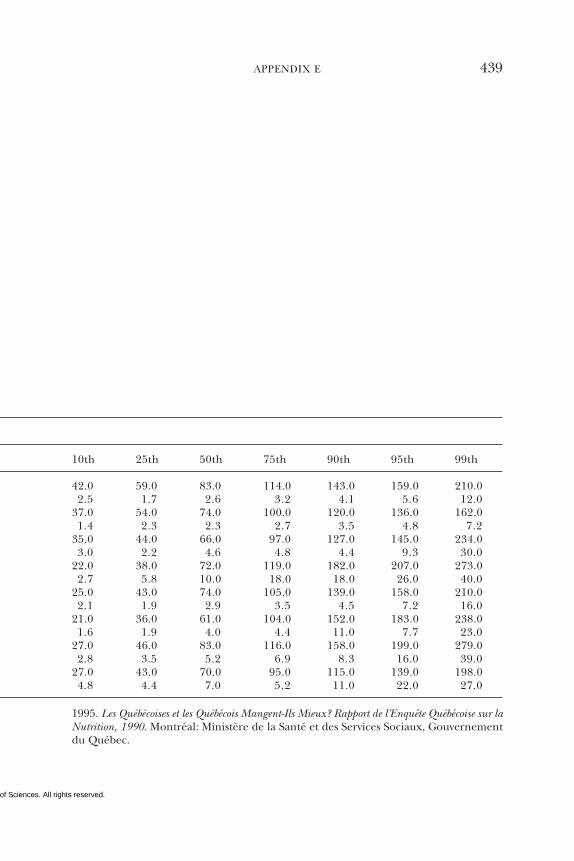
Copyright © National Academy of Sciences. All rights reserved.
APPENDIX E 439
10th 25th 50th 75th 90th 95th 99th
42.0 59.0 83.0 114.0 143.0 159.0 210.02.5 1.7 2.6 3.2 4.1 5.6 12.0
37.0 54.0 74.0 100.0 120.0 136.0 162.01.4 2.3 2.3 2.7 3.5 4.8 7.2
35.0 44.0 66.0 97.0 127.0 145.0 234.03.0 2.2 4.6 4.8 4.4 9.3 30.0
22.0 38.0 72.0 119.0 182.0 207.0 273.02.7 5.8 10.0 18.0 18.0 26.0 40.0
25.0 43.0 74.0 105.0 139.0 158.0 210.02.1 1.9 2.9 3.5 4.5 7.2 16.0
21.0 36.0 61.0 104.0 152.0 183.0 238.01.6 1.9 4.0 4.4 11.0 7.7 23.0
27.0 46.0 83.0 116.0 158.0 199.0 279.02.8 3.5 5.2 6.9 8.3 16.0 39.0
27.0 43.0 70.0 95.0 115.0 139.0 198.04.8 4.4 7.0 5.2 11.0 22.0 27.0
1995. Les Québécoises et les Québécois Mangent-Ils Mieux? Rapport de l’Enquête Québécoise sur laNutrition, 1990. Montréal: Ministère de la Santé et des Services Sociaux, Gouvernementdu Québec.
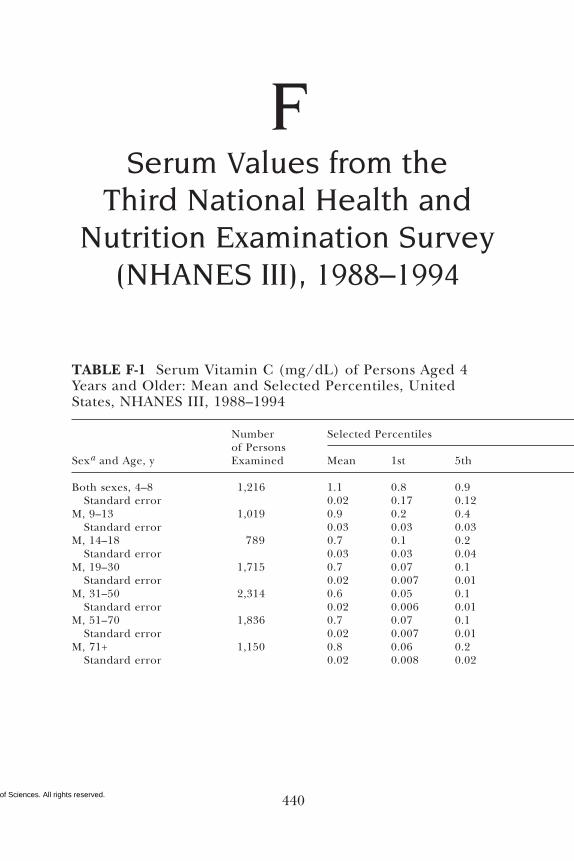
Copyright © National Academy of Sciences. All rights reserved. 440
Number Selected Percentilesof Persons
Sexa and Age, y Examined Mean 1st 5th
Both sexes, 4–8 1,216 1.1 0.8 0.9Standard error 0.02 0.17 0.12
M, 9–13 1,019 0.9 0.2 0.4Standard error 0.03 0.03 0.03
M, 14–18 789 0.7 0.1 0.2Standard error 0.03 0.03 0.04
M, 19–30 1,715 0.7 0.07 0.1Standard error 0.02 0.007 0.01
M, 31–50 2,314 0.6 0.05 0.1Standard error 0.02 0.006 0.01
M, 51–70 1,836 0.7 0.07 0.1Standard error 0.02 0.007 0.01
M, 71+ 1,150 0.8 0.06 0.2Standard error 0.02 0.008 0.02
FSerum Values from the
Third National Health andNutrition Examination Survey
(NHANES III), 1988–1994
TABLE F-1 Serum Vitamin C (mg/dL) of Persons Aged 4Years and Older: Mean and Selected Percentiles, UnitedStates, NHANES III, 1988–1994
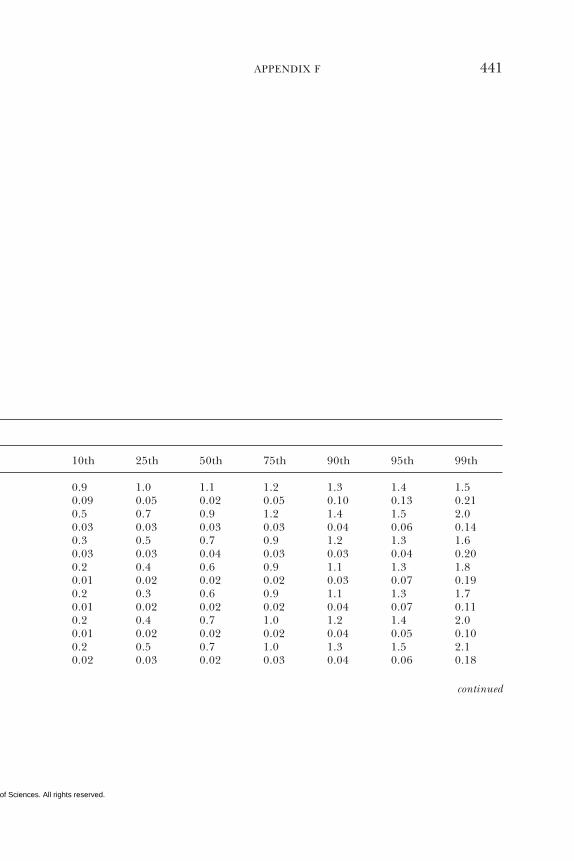
Copyright © National Academy of Sciences. All rights reserved.
APPENDIX F 441
10th 25th 50th 75th 90th 95th 99th
0.9 1.0 1.1 1.2 1.3 1.4 1.50.09 0.05 0.02 0.05 0.10 0.13 0.210.5 0.7 0.9 1.2 1.4 1.5 2.00.03 0.03 0.03 0.03 0.04 0.06 0.140.3 0.5 0.7 0.9 1.2 1.3 1.60.03 0.03 0.04 0.03 0.03 0.04 0.200.2 0.4 0.6 0.9 1.1 1.3 1.80.01 0.02 0.02 0.02 0.03 0.07 0.190.2 0.3 0.6 0.9 1.1 1.3 1.70.01 0.02 0.02 0.02 0.04 0.07 0.110.2 0.4 0.7 1.0 1.2 1.4 2.00.01 0.02 0.02 0.02 0.04 0.05 0.100.2 0.5 0.7 1.0 1.3 1.5 2.10.02 0.03 0.02 0.03 0.04 0.06 0.18
continued
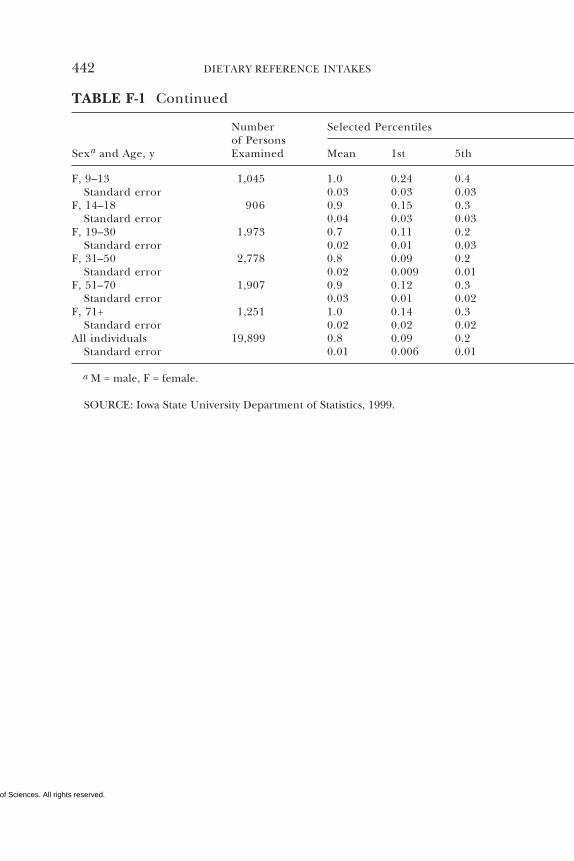
Copyright © National Academy of Sciences. All rights reserved.
442 DIETARY REFERENCE INTAKES
F, 9–13 1,045 1.0 0.24 0.4Standard error 0.03 0.03 0.03
F, 14–18 906 0.9 0.15 0.3Standard error 0.04 0.03 0.03
F, 19–30 1,973 0.7 0.11 0.2Standard error 0.02 0.01 0.03
F, 31–50 2,778 0.8 0.09 0.2Standard error 0.02 0.009 0.01
F, 51–70 1,907 0.9 0.12 0.3Standard error 0.03 0.01 0.02
F, 71+ 1,251 1.0 0.14 0.3Standard error 0.02 0.02 0.02
All individuals 19,899 0.8 0.09 0.2Standard error 0.01 0.006 0.01
a M = male, F = female.
SOURCE: Iowa State University Department of Statistics, 1999.
TABLE F-1 Continued
Number Selected Percentilesof Persons
Sexa and Age, y Examined Mean 1st 5th
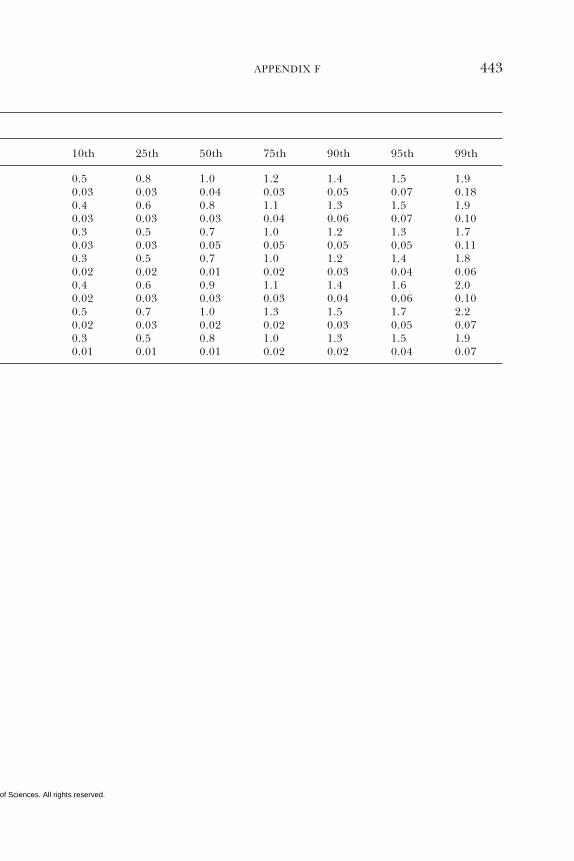
Copyright © National Academy of Sciences. All rights reserved.
APPENDIX F 443
0.5 0.8 1.0 1.2 1.4 1.5 1.90.03 0.03 0.04 0.03 0.05 0.07 0.180.4 0.6 0.8 1.1 1.3 1.5 1.90.03 0.03 0.03 0.04 0.06 0.07 0.100.3 0.5 0.7 1.0 1.2 1.3 1.70.03 0.03 0.05 0.05 0.05 0.05 0.110.3 0.5 0.7 1.0 1.2 1.4 1.80.02 0.02 0.01 0.02 0.03 0.04 0.060.4 0.6 0.9 1.1 1.4 1.6 2.00.02 0.03 0.03 0.03 0.04 0.06 0.100.5 0.7 1.0 1.3 1.5 1.7 2.20.02 0.03 0.02 0.02 0.03 0.05 0.070.3 0.5 0.8 1.0 1.3 1.5 1.90.01 0.01 0.01 0.02 0.02 0.04 0.07
10th 25th 50th 75th 90th 95th 99th
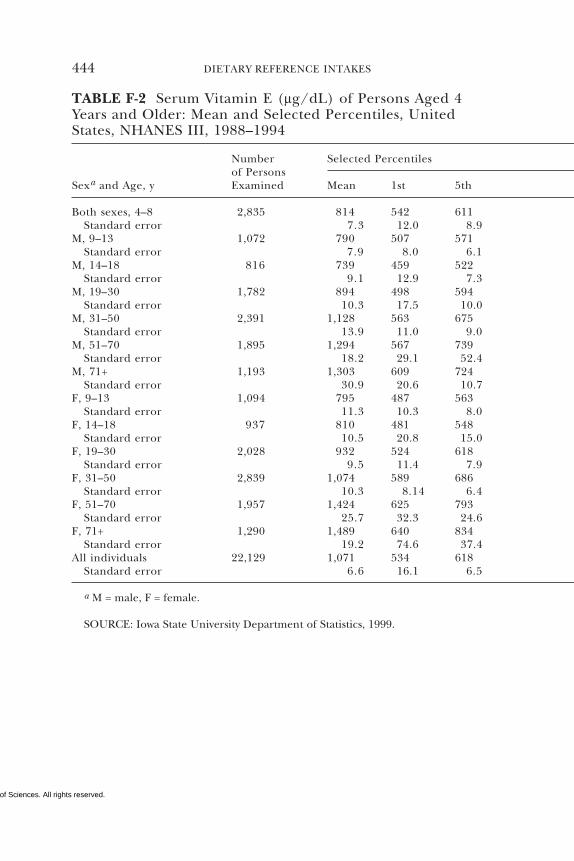
Copyright © National Academy of Sciences. All rights reserved.
444 DIETARY REFERENCE INTAKES
TABLE F-2 Serum Vitamin E (µg/dL) of Persons Aged 4Years and Older: Mean and Selected Percentiles, UnitedStates, NHANES III, 1988–1994
Number Selected Percentilesof Persons
Sexa and Age, y Examined Mean 1st 5th
Both sexes, 4–8 2,835 814 542 611Standard error 7.3 12.0 8.9
M, 9–13 1,072 790 507 571Standard error 7.9 8.0 6.1
M, 14–18 816 739 459 522Standard error 9.1 12.9 7.3
M, 19–30 1,782 894 498 594Standard error 10.3 17.5 10.0
M, 31–50 2,391 1,128 563 675Standard error 13.9 11.0 9.0
M, 51–70 1,895 1,294 567 739Standard error 18.2 29.1 52.4
M, 71+ 1,193 1,303 609 724Standard error 30.9 20.6 10.7
F, 9–13 1,094 795 487 563Standard error 11.3 10.3 8.0
F, 14–18 937 810 481 548Standard error 10.5 20.8 15.0
F, 19–30 2,028 932 524 618Standard error 9.5 11.4 7.9
F, 31–50 2,839 1,074 589 686Standard error 10.3 8.14 6.4
F, 51–70 1,957 1,424 625 793Standard error 25.7 32.3 24.6
F, 71+ 1,290 1,489 640 834Standard error 19.2 74.6 37.4
All individuals 22,129 1,071 534 618Standard error 6.6 16.1 6.5
a M = male, F = female.
SOURCE: Iowa State University Department of Statistics, 1999.
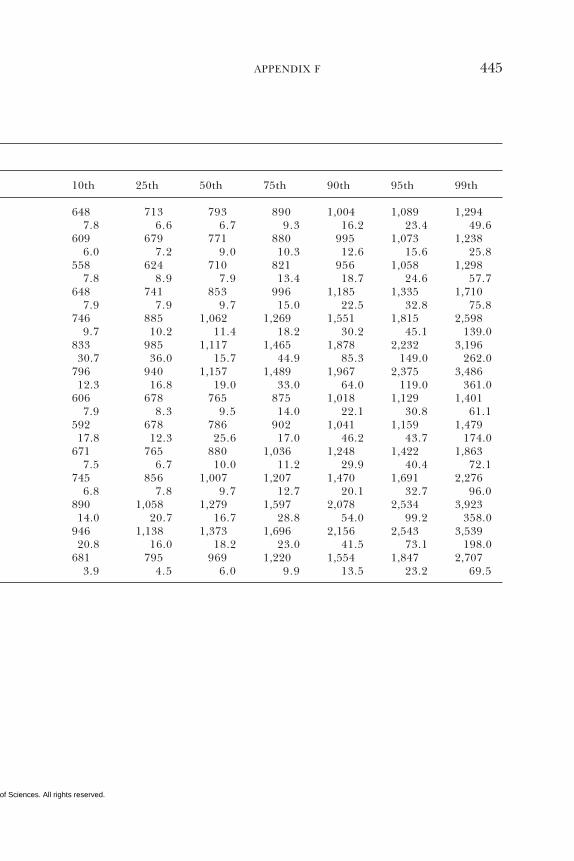
Copyright © National Academy of Sciences. All rights reserved.
APPENDIX F 445
10th 25th 50th 75th 90th 95th 99th
648 713 793 890 1,004 1,089 1,2947.8 6.6 6.7 9.3 16.2 23.4 49.6
609 679 771 880 995 1,073 1,2386.0 7.2 9.0 10.3 12.6 15.6 25.8
558 624 710 821 956 1,058 1,2987.8 8.9 7.9 13.4 18.7 24.6 57.7
648 741 853 996 1,185 1,335 1,7107.9 7.9 9.7 15.0 22.5 32.8 75.8
746 885 1,062 1,269 1,551 1,815 2,5989.7 10.2 11.4 18.2 30.2 45.1 139.0
833 985 1,117 1,465 1,878 2,232 3,19630.7 36.0 15.7 44.9 85.3 149.0 262.0
796 940 1,157 1,489 1,967 2,375 3,48612.3 16.8 19.0 33.0 64.0 119.0 361.0
606 678 765 875 1,018 1,129 1,4017.9 8.3 9.5 14.0 22.1 30.8 61.1
592 678 786 902 1,041 1,159 1,47917.8 12.3 25.6 17.0 46.2 43.7 174.0
671 765 880 1,036 1,248 1,422 1,8637.5 6.7 10.0 11.2 29.9 40.4 72.1
745 856 1,007 1,207 1,470 1,691 2,2766.8 7.8 9.7 12.7 20.1 32.7 96.0
890 1,058 1,279 1,597 2,078 2,534 3,92314.0 20.7 16.7 28.8 54.0 99.2 358.0
946 1,138 1,373 1,696 2,156 2,543 3,53920.8 16.0 18.2 23.0 41.5 73.1 198.0
681 795 969 1,220 1,554 1,847 2,7073.9 4.5 6.0 9.9 13.5 23.2 69.5
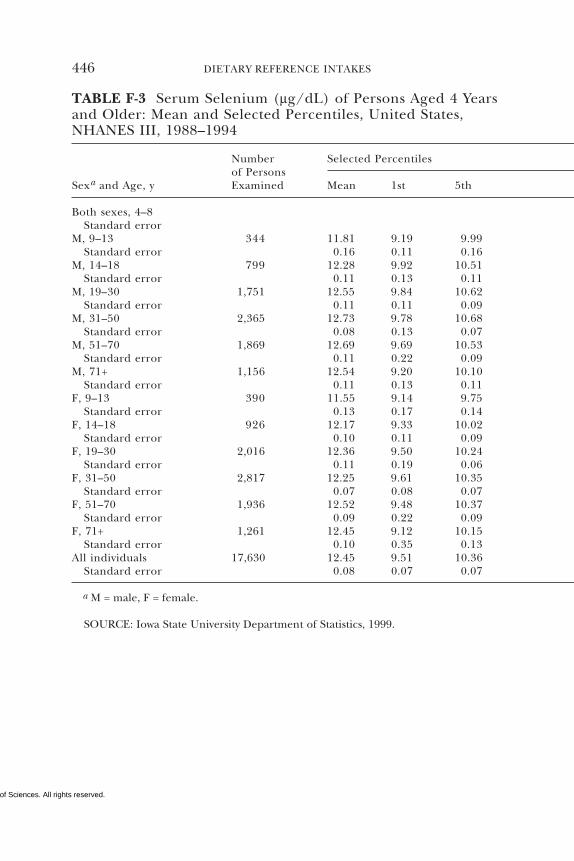
Copyright © National Academy of Sciences. All rights reserved.
446 DIETARY REFERENCE INTAKES
TABLE F-3 Serum Selenium (µg/dL) of Persons Aged 4 Yearsand Older: Mean and Selected Percentiles, United States,NHANES III, 1988–1994
Number Selected Percentilesof Persons
Sexa and Age, y Examined Mean 1st 5th
Both sexes, 4–8Standard error
M, 9–13 344 11.81 9.19 9.99Standard error 0.16 0.11 0.16
M, 14–18 799 12.28 9.92 10.51Standard error 0.11 0.13 0.11
M, 19–30 1,751 12.55 9.84 10.62Standard error 0.11 0.11 0.09
M, 31–50 2,365 12.73 9.78 10.68Standard error 0.08 0.13 0.07
M, 51–70 1,869 12.69 9.69 10.53Standard error 0.11 0.22 0.09
M, 71+ 1,156 12.54 9.20 10.10Standard error 0.11 0.13 0.11
F, 9–13 390 11.55 9.14 9.75Standard error 0.13 0.17 0.14
F, 14–18 926 12.17 9.33 10.02Standard error 0.10 0.11 0.09
F, 19–30 2,016 12.36 9.50 10.24Standard error 0.11 0.19 0.06
F, 31–50 2,817 12.25 9.61 10.35Standard error 0.07 0.08 0.07
F, 51–70 1,936 12.52 9.48 10.37Standard error 0.09 0.22 0.09
F, 71+ 1,261 12.45 9.12 10.15Standard error 0.10 0.35 0.13
All individuals 17,630 12.45 9.51 10.36Standard error 0.08 0.07 0.07
a M = male, F = female.
SOURCE: Iowa State University Department of Statistics, 1999.
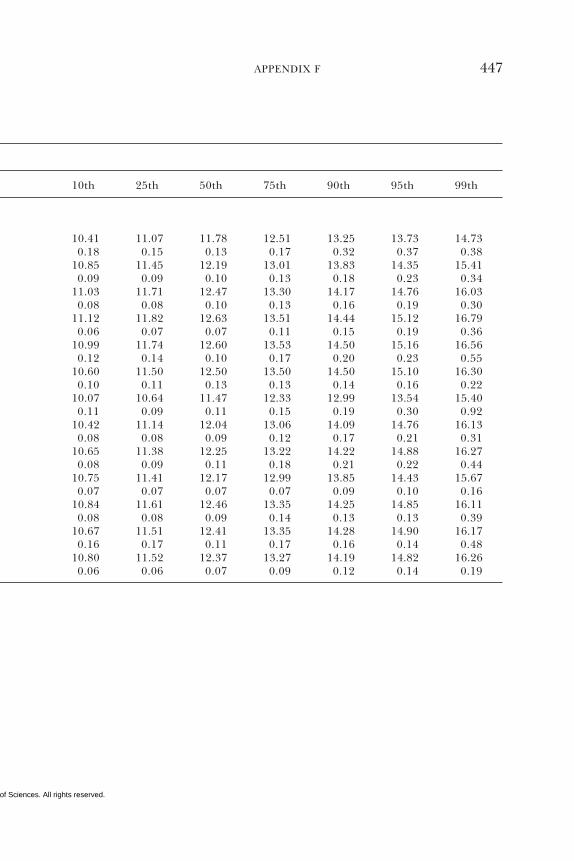
Copyright © National Academy of Sciences. All rights reserved.
APPENDIX F 447
10th 25th 50th 75th 90th 95th 99th
10.41 11.07 11.78 12.51 13.25 13.73 14.730.18 0.15 0.13 0.17 0.32 0.37 0.38
10.85 11.45 12.19 13.01 13.83 14.35 15.410.09 0.09 0.10 0.13 0.18 0.23 0.34
11.03 11.71 12.47 13.30 14.17 14.76 16.030.08 0.08 0.10 0.13 0.16 0.19 0.30
11.12 11.82 12.63 13.51 14.44 15.12 16.790.06 0.07 0.07 0.11 0.15 0.19 0.36
10.99 11.74 12.60 13.53 14.50 15.16 16.560.12 0.14 0.10 0.17 0.20 0.23 0.55
10.60 11.50 12.50 13.50 14.50 15.10 16.300.10 0.11 0.13 0.13 0.14 0.16 0.22
10.07 10.64 11.47 12.33 12.99 13.54 15.400.11 0.09 0.11 0.15 0.19 0.30 0.92
10.42 11.14 12.04 13.06 14.09 14.76 16.130.08 0.08 0.09 0.12 0.17 0.21 0.31
10.65 11.38 12.25 13.22 14.22 14.88 16.270.08 0.09 0.11 0.18 0.21 0.22 0.44
10.75 11.41 12.17 12.99 13.85 14.43 15.670.07 0.07 0.07 0.07 0.09 0.10 0.16
10.84 11.61 12.46 13.35 14.25 14.85 16.110.08 0.08 0.09 0.14 0.13 0.13 0.39
10.67 11.51 12.41 13.35 14.28 14.90 16.170.16 0.17 0.11 0.17 0.16 0.14 0.48
10.80 11.52 12.37 13.27 14.19 14.82 16.260.06 0.06 0.07 0.09 0.12 0.14 0.19
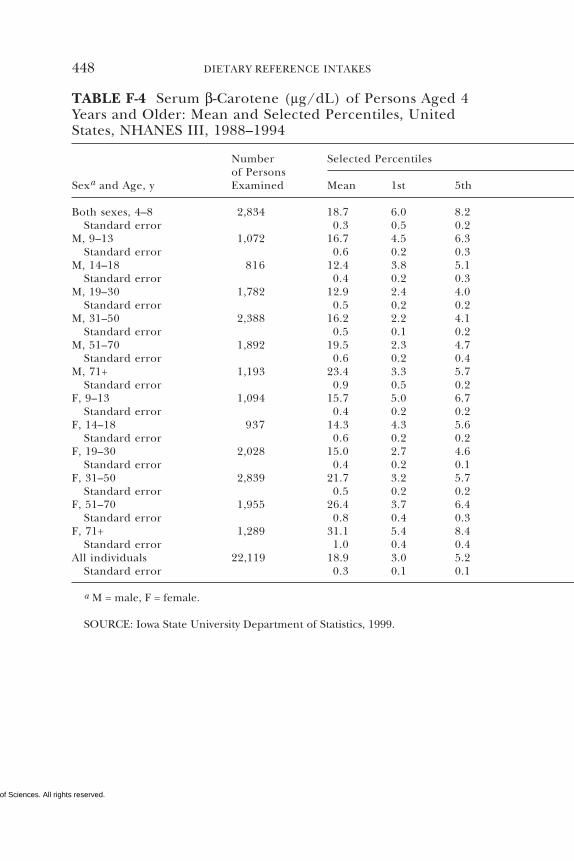
Copyright © National Academy of Sciences. All rights reserved.
448 DIETARY REFERENCE INTAKES
TABLE F-4 Serum β-Carotene (µg/dL) of Persons Aged 4Years and Older: Mean and Selected Percentiles, UnitedStates, NHANES III, 1988–1994
Number Selected Percentilesof Persons
Sexa and Age, y Examined Mean 1st 5th
Both sexes, 4–8 2,834 18.7 6.0 8.2Standard error 0.3 0.5 0.2
M, 9–13 1,072 16.7 4.5 6.3Standard error 0.6 0.2 0.3
M, 14–18 816 12.4 3.8 5.1Standard error 0.4 0.2 0.3
M, 19–30 1,782 12.9 2.4 4.0Standard error 0.5 0.2 0.2
M, 31–50 2,388 16.2 2.2 4.1Standard error 0.5 0.1 0.2
M, 51–70 1,892 19.5 2.3 4.7Standard error 0.6 0.2 0.4
M, 71+ 1,193 23.4 3.3 5.7Standard error 0.9 0.5 0.2
F, 9–13 1,094 15.7 5.0 6.7Standard error 0.4 0.2 0.2
F, 14–18 937 14.3 4.3 5.6Standard error 0.6 0.2 0.2
F, 19–30 2,028 15.0 2.7 4.6Standard error 0.4 0.2 0.1
F, 31–50 2,839 21.7 3.2 5.7Standard error 0.5 0.2 0.2
F, 51–70 1,955 26.4 3.7 6.4Standard error 0.8 0.4 0.3
F, 71+ 1,289 31.1 5.4 8.4Standard error 1.0 0.4 0.4
All individuals 22,119 18.9 3.0 5.2Standard error 0.3 0.1 0.1
a M = male, F = female.
SOURCE: Iowa State University Department of Statistics, 1999.
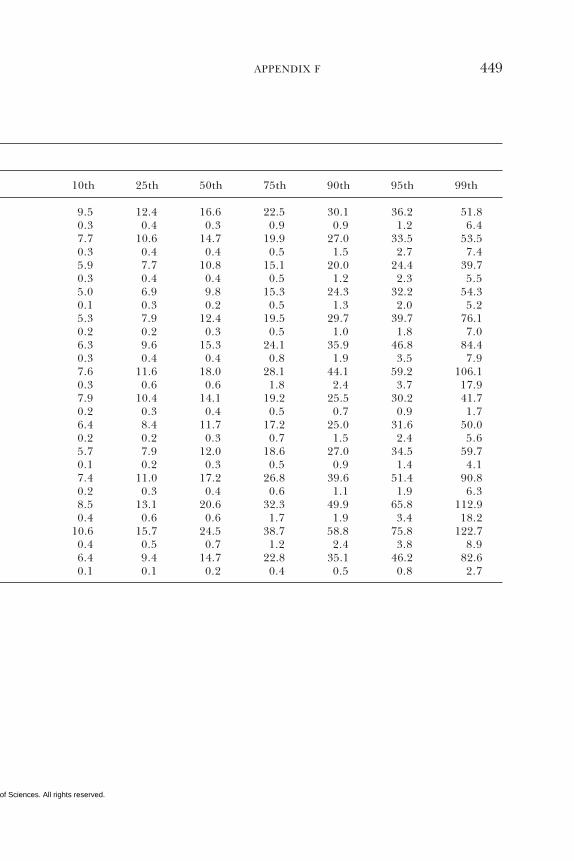
Copyright © National Academy of Sciences. All rights reserved.
APPENDIX F 449
10th 25th 50th 75th 90th 95th 99th
9.5 12.4 16.6 22.5 30.1 36.2 51.80.3 0.4 0.3 0.9 0.9 1.2 6.47.7 10.6 14.7 19.9 27.0 33.5 53.50.3 0.4 0.4 0.5 1.5 2.7 7.45.9 7.7 10.8 15.1 20.0 24.4 39.70.3 0.4 0.4 0.5 1.2 2.3 5.55.0 6.9 9.8 15.3 24.3 32.2 54.30.1 0.3 0.2 0.5 1.3 2.0 5.25.3 7.9 12.4 19.5 29.7 39.7 76.10.2 0.2 0.3 0.5 1.0 1.8 7.06.3 9.6 15.3 24.1 35.9 46.8 84.40.3 0.4 0.4 0.8 1.9 3.5 7.97.6 11.6 18.0 28.1 44.1 59.2 106.10.3 0.6 0.6 1.8 2.4 3.7 17.97.9 10.4 14.1 19.2 25.5 30.2 41.70.2 0.3 0.4 0.5 0.7 0.9 1.76.4 8.4 11.7 17.2 25.0 31.6 50.00.2 0.2 0.3 0.7 1.5 2.4 5.65.7 7.9 12.0 18.6 27.0 34.5 59.70.1 0.2 0.3 0.5 0.9 1.4 4.17.4 11.0 17.2 26.8 39.6 51.4 90.80.2 0.3 0.4 0.6 1.1 1.9 6.38.5 13.1 20.6 32.3 49.9 65.8 112.90.4 0.6 0.6 1.7 1.9 3.4 18.2
10.6 15.7 24.5 38.7 58.8 75.8 122.70.4 0.5 0.7 1.2 2.4 3.8 8.96.4 9.4 14.7 22.8 35.1 46.2 82.60.1 0.1 0.2 0.4 0.5 0.8 2.7
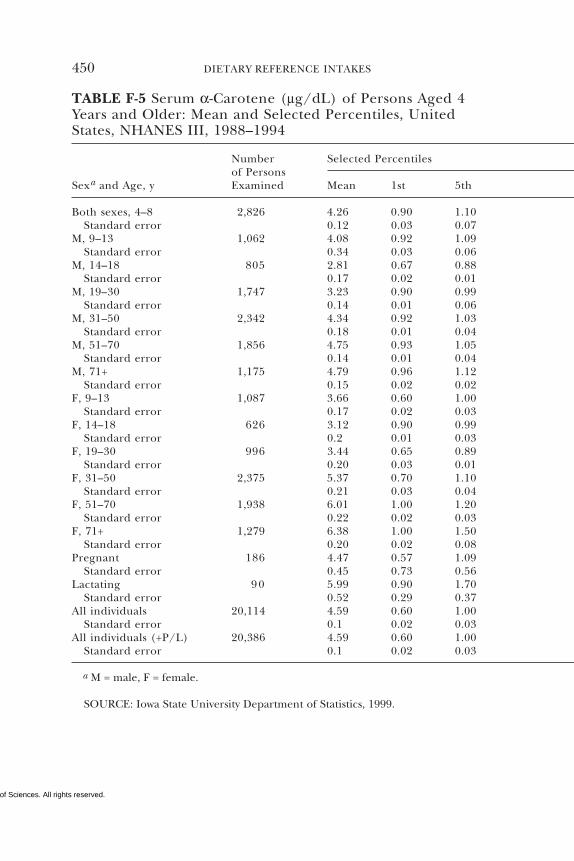
Copyright © National Academy of Sciences. All rights reserved.
450 DIETARY REFERENCE INTAKES
Number Selected Percentilesof Persons
Sexa and Age, y Examined Mean 1st 5th
Both sexes, 4–8 2,826 4.26 0.90 1.10Standard error 0.12 0.03 0.07
M, 9–13 1,062 4.08 0.92 1.09Standard error 0.34 0.03 0.06
M, 14–18 805 2.81 0.67 0.88Standard error 0.17 0.02 0.01
M, 19–30 1,747 3.23 0.90 0.99Standard error 0.14 0.01 0.06
M, 31–50 2,342 4.34 0.92 1.03Standard error 0.18 0.01 0.04
M, 51–70 1,856 4.75 0.93 1.05Standard error 0.14 0.01 0.04
M, 71+ 1,175 4.79 0.96 1.12Standard error 0.15 0.02 0.02
F, 9–13 1,087 3.66 0.60 1.00Standard error 0.17 0.02 0.03
F, 14–18 626 3.12 0.90 0.99Standard error 0.2 0.01 0.03
F, 19–30 996 3.44 0.65 0.89Standard error 0.20 0.03 0.01
F, 31–50 2,375 5.37 0.70 1.10Standard error 0.21 0.03 0.04
F, 51–70 1,938 6.01 1.00 1.20Standard error 0.22 0.02 0.03
F, 71+ 1,279 6.38 1.00 1.50Standard error 0.20 0.02 0.08
Pregnant 186 4.47 0.57 1.09Standard error 0.45 0.73 0.56
Lactating 90 5.99 0.90 1.70Standard error 0.52 0.29 0.37
All individuals 20,114 4.59 0.60 1.00Standard error 0.1 0.02 0.03
All individuals (+P/L) 20,386 4.59 0.60 1.00Standard error 0.1 0.02 0.03
a M = male, F = female.
SOURCE: Iowa State University Department of Statistics, 1999.
TABLE F-5 Serum α-Carotene (µg/dL) of Persons Aged 4Years and Older: Mean and Selected Percentiles, UnitedStates, NHANES III, 1988–1994
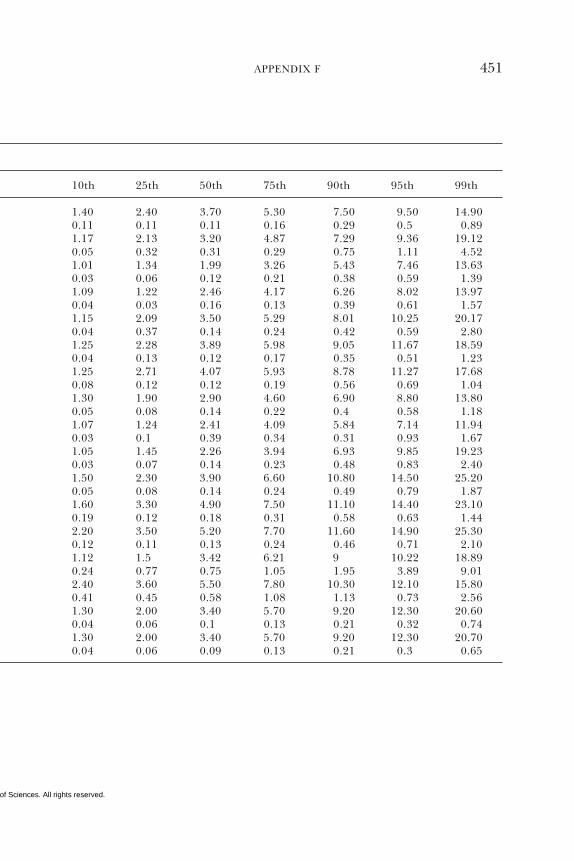
Copyright © National Academy of Sciences. All rights reserved.
APPENDIX F 451
10th 25th 50th 75th 90th 95th 99th
1.40 2.40 3.70 5.30 7.50 9.50 14.900.11 0.11 0.11 0.16 0.29 0.5 0.891.17 2.13 3.20 4.87 7.29 9.36 19.120.05 0.32 0.31 0.29 0.75 1.11 4.521.01 1.34 1.99 3.26 5.43 7.46 13.630.03 0.06 0.12 0.21 0.38 0.59 1.391.09 1.22 2.46 4.17 6.26 8.02 13.970.04 0.03 0.16 0.13 0.39 0.61 1.571.15 2.09 3.50 5.29 8.01 10.25 20.170.04 0.37 0.14 0.24 0.42 0.59 2.801.25 2.28 3.89 5.98 9.05 11.67 18.590.04 0.13 0.12 0.17 0.35 0.51 1.231.25 2.71 4.07 5.93 8.78 11.27 17.680.08 0.12 0.12 0.19 0.56 0.69 1.041.30 1.90 2.90 4.60 6.90 8.80 13.800.05 0.08 0.14 0.22 0.4 0.58 1.181.07 1.24 2.41 4.09 5.84 7.14 11.940.03 0.1 0.39 0.34 0.31 0.93 1.671.05 1.45 2.26 3.94 6.93 9.85 19.230.03 0.07 0.14 0.23 0.48 0.83 2.401.50 2.30 3.90 6.60 10.80 14.50 25.200.05 0.08 0.14 0.24 0.49 0.79 1.871.60 3.30 4.90 7.50 11.10 14.40 23.100.19 0.12 0.18 0.31 0.58 0.63 1.442.20 3.50 5.20 7.70 11.60 14.90 25.300.12 0.11 0.13 0.24 0.46 0.71 2.101.12 1.5 3.42 6.21 9 10.22 18.890.24 0.77 0.75 1.05 1.95 3.89 9.012.40 3.60 5.50 7.80 10.30 12.10 15.800.41 0.45 0.58 1.08 1.13 0.73 2.561.30 2.00 3.40 5.70 9.20 12.30 20.600.04 0.06 0.1 0.13 0.21 0.32 0.741.30 2.00 3.40 5.70 9.20 12.30 20.700.04 0.06 0.09 0.13 0.21 0.3 0.65
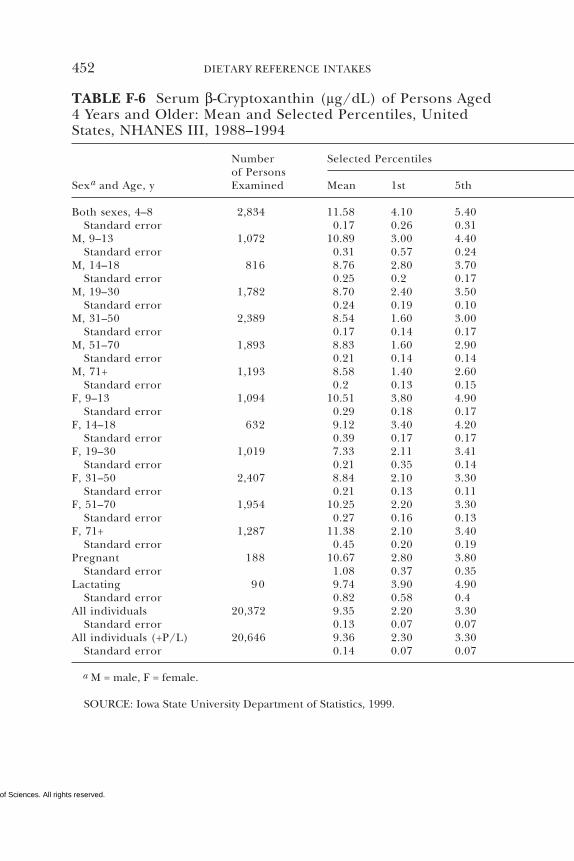
Copyright © National Academy of Sciences. All rights reserved.
452 DIETARY REFERENCE INTAKES
Number Selected Percentilesof Persons
Sexa and Age, y Examined Mean 1st 5th
Both sexes, 4–8 2,834 11.58 4.10 5.40Standard error 0.17 0.26 0.31
M, 9–13 1,072 10.89 3.00 4.40Standard error 0.31 0.57 0.24
M, 14–18 816 8.76 2.80 3.70Standard error 0.25 0.2 0.17
M, 19–30 1,782 8.70 2.40 3.50Standard error 0.24 0.19 0.10
M, 31–50 2,389 8.54 1.60 3.00Standard error 0.17 0.14 0.17
M, 51–70 1,893 8.83 1.60 2.90Standard error 0.21 0.14 0.14
M, 71+ 1,193 8.58 1.40 2.60Standard error 0.2 0.13 0.15
F, 9–13 1,094 10.51 3.80 4.90Standard error 0.29 0.18 0.17
F, 14–18 632 9.12 3.40 4.20Standard error 0.39 0.17 0.17
F, 19–30 1,019 7.33 2.11 3.41Standard error 0.21 0.35 0.14
F, 31–50 2,407 8.84 2.10 3.30Standard error 0.21 0.13 0.11
F, 51–70 1,954 10.25 2.20 3.30Standard error 0.27 0.16 0.13
F, 71+ 1,287 11.38 2.10 3.40Standard error 0.45 0.20 0.19
Pregnant 188 10.67 2.80 3.80Standard error 1.08 0.37 0.35
Lactating 90 9.74 3.90 4.90Standard error 0.82 0.58 0.4
All individuals 20,372 9.35 2.20 3.30Standard error 0.13 0.07 0.07
All individuals (+P/L) 20,646 9.36 2.30 3.30Standard error 0.14 0.07 0.07
a M = male, F = female.
SOURCE: Iowa State University Department of Statistics, 1999.
TABLE F-6 Serum β-Cryptoxanthin (µg/dL) of Persons Aged4 Years and Older: Mean and Selected Percentiles, UnitedStates, NHANES III, 1988–1994
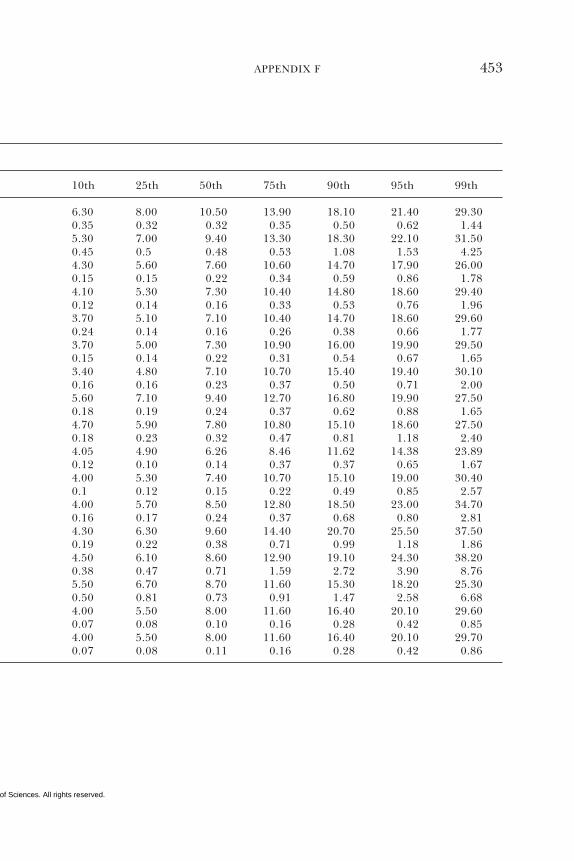
Copyright © National Academy of Sciences. All rights reserved.
APPENDIX F 453
10th 25th 50th 75th 90th 95th 99th
6.30 8.00 10.50 13.90 18.10 21.40 29.300.35 0.32 0.32 0.35 0.50 0.62 1.445.30 7.00 9.40 13.30 18.30 22.10 31.500.45 0.5 0.48 0.53 1.08 1.53 4.254.30 5.60 7.60 10.60 14.70 17.90 26.000.15 0.15 0.22 0.34 0.59 0.86 1.784.10 5.30 7.30 10.40 14.80 18.60 29.400.12 0.14 0.16 0.33 0.53 0.76 1.963.70 5.10 7.10 10.40 14.70 18.60 29.600.24 0.14 0.16 0.26 0.38 0.66 1.773.70 5.00 7.30 10.90 16.00 19.90 29.500.15 0.14 0.22 0.31 0.54 0.67 1.653.40 4.80 7.10 10.70 15.40 19.40 30.100.16 0.16 0.23 0.37 0.50 0.71 2.005.60 7.10 9.40 12.70 16.80 19.90 27.500.18 0.19 0.24 0.37 0.62 0.88 1.654.70 5.90 7.80 10.80 15.10 18.60 27.500.18 0.23 0.32 0.47 0.81 1.18 2.404.05 4.90 6.26 8.46 11.62 14.38 23.890.12 0.10 0.14 0.37 0.37 0.65 1.674.00 5.30 7.40 10.70 15.10 19.00 30.400.1 0.12 0.15 0.22 0.49 0.85 2.574.00 5.70 8.50 12.80 18.50 23.00 34.700.16 0.17 0.24 0.37 0.68 0.80 2.814.30 6.30 9.60 14.40 20.70 25.50 37.500.19 0.22 0.38 0.71 0.99 1.18 1.864.50 6.10 8.60 12.90 19.10 24.30 38.200.38 0.47 0.71 1.59 2.72 3.90 8.765.50 6.70 8.70 11.60 15.30 18.20 25.300.50 0.81 0.73 0.91 1.47 2.58 6.684.00 5.50 8.00 11.60 16.40 20.10 29.600.07 0.08 0.10 0.16 0.28 0.42 0.854.00 5.50 8.00 11.60 16.40 20.10 29.700.07 0.08 0.11 0.16 0.28 0.42 0.86
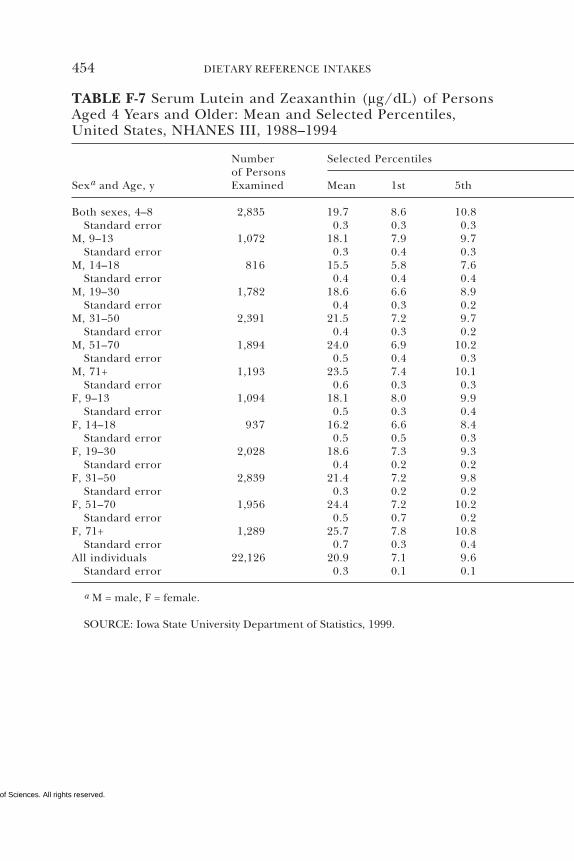
Copyright © National Academy of Sciences. All rights reserved.
454 DIETARY REFERENCE INTAKES
Number Selected Percentilesof Persons
Sexa and Age, y Examined Mean 1st 5th
Both sexes, 4–8 2,835 19.7 8.6 10.8Standard error 0.3 0.3 0.3
M, 9–13 1,072 18.1 7.9 9.7Standard error 0.3 0.4 0.3
M, 14–18 816 15.5 5.8 7.6Standard error 0.4 0.4 0.4
M, 19–30 1,782 18.6 6.6 8.9Standard error 0.4 0.3 0.2
M, 31–50 2,391 21.5 7.2 9.7Standard error 0.4 0.3 0.2
M, 51–70 1,894 24.0 6.9 10.2Standard error 0.5 0.4 0.3
M, 71+ 1,193 23.5 7.4 10.1Standard error 0.6 0.3 0.3
F, 9–13 1,094 18.1 8.0 9.9Standard error 0.5 0.3 0.4
F, 14–18 937 16.2 6.6 8.4Standard error 0.5 0.5 0.3
F, 19–30 2,028 18.6 7.3 9.3Standard error 0.4 0.2 0.2
F, 31–50 2,839 21.4 7.2 9.8Standard error 0.3 0.2 0.2
F, 51–70 1,956 24.4 7.2 10.2Standard error 0.5 0.7 0.2
F, 71+ 1,289 25.7 7.8 10.8Standard error 0.7 0.3 0.4
All individuals 22,126 20.9 7.1 9.6Standard error 0.3 0.1 0.1
a M = male, F = female.
SOURCE: Iowa State University Department of Statistics, 1999.
TABLE F-7 Serum Lutein and Zeaxanthin (µg/dL) of PersonsAged 4 Years and Older: Mean and Selected Percentiles,United States, NHANES III, 1988–1994
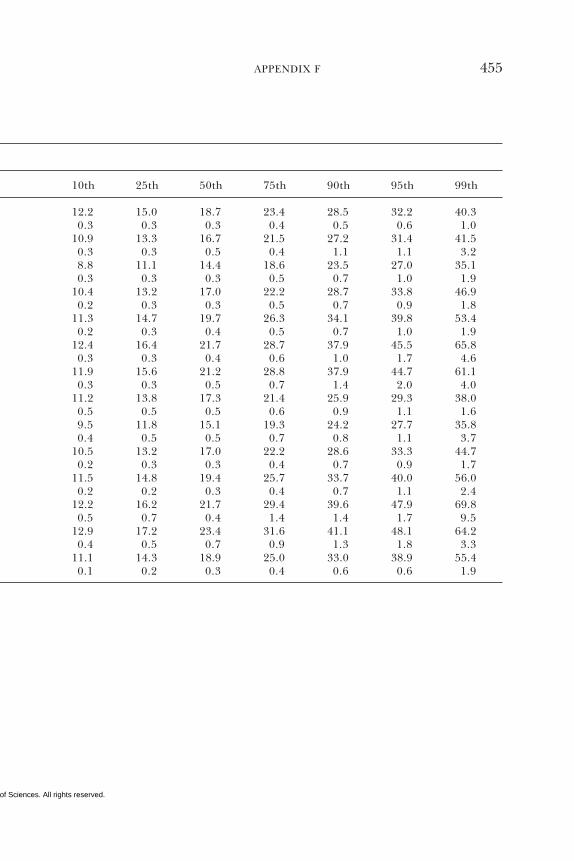
Copyright © National Academy of Sciences. All rights reserved.
APPENDIX F 455
10th 25th 50th 75th 90th 95th 99th
12.2 15.0 18.7 23.4 28.5 32.2 40.30.3 0.3 0.3 0.4 0.5 0.6 1.0
10.9 13.3 16.7 21.5 27.2 31.4 41.50.3 0.3 0.5 0.4 1.1 1.1 3.28.8 11.1 14.4 18.6 23.5 27.0 35.10.3 0.3 0.3 0.5 0.7 1.0 1.9
10.4 13.2 17.0 22.2 28.7 33.8 46.90.2 0.3 0.3 0.5 0.7 0.9 1.8
11.3 14.7 19.7 26.3 34.1 39.8 53.40.2 0.3 0.4 0.5 0.7 1.0 1.9
12.4 16.4 21.7 28.7 37.9 45.5 65.80.3 0.3 0.4 0.6 1.0 1.7 4.6
11.9 15.6 21.2 28.8 37.9 44.7 61.10.3 0.3 0.5 0.7 1.4 2.0 4.0
11.2 13.8 17.3 21.4 25.9 29.3 38.00.5 0.5 0.5 0.6 0.9 1.1 1.69.5 11.8 15.1 19.3 24.2 27.7 35.80.4 0.5 0.5 0.7 0.8 1.1 3.7
10.5 13.2 17.0 22.2 28.6 33.3 44.70.2 0.3 0.3 0.4 0.7 0.9 1.7
11.5 14.8 19.4 25.7 33.7 40.0 56.00.2 0.2 0.3 0.4 0.7 1.1 2.4
12.2 16.2 21.7 29.4 39.6 47.9 69.80.5 0.7 0.4 1.4 1.4 1.7 9.5
12.9 17.2 23.4 31.6 41.1 48.1 64.20.4 0.5 0.7 0.9 1.3 1.8 3.3
11.1 14.3 18.9 25.0 33.0 38.9 55.40.1 0.2 0.3 0.4 0.6 0.6 1.9
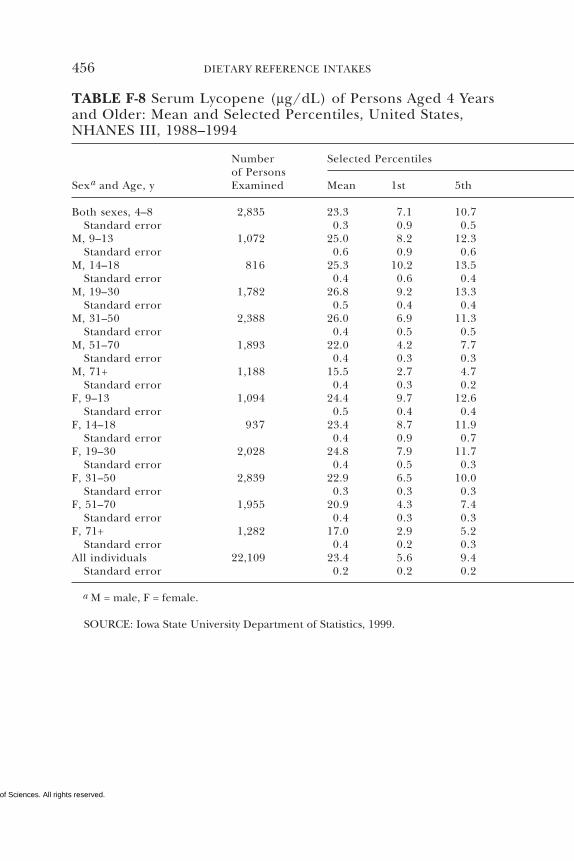
Copyright © National Academy of Sciences. All rights reserved.
456 DIETARY REFERENCE INTAKES
Number Selected Percentilesof Persons
Sexa and Age, y Examined Mean 1st 5th
Both sexes, 4–8 2,835 23.3 7.1 10.7Standard error 0.3 0.9 0.5
M, 9–13 1,072 25.0 8.2 12.3Standard error 0.6 0.9 0.6
M, 14–18 816 25.3 10.2 13.5Standard error 0.4 0.6 0.4
M, 19–30 1,782 26.8 9.2 13.3Standard error 0.5 0.4 0.4
M, 31–50 2,388 26.0 6.9 11.3Standard error 0.4 0.5 0.5
M, 51–70 1,893 22.0 4.2 7.7Standard error 0.4 0.3 0.3
M, 71+ 1,188 15.5 2.7 4.7Standard error 0.4 0.3 0.2
F, 9–13 1,094 24.4 9.7 12.6Standard error 0.5 0.4 0.4
F, 14–18 937 23.4 8.7 11.9Standard error 0.4 0.9 0.7
F, 19–30 2,028 24.8 7.9 11.7Standard error 0.4 0.5 0.3
F, 31–50 2,839 22.9 6.5 10.0Standard error 0.3 0.3 0.3
F, 51–70 1,955 20.9 4.3 7.4Standard error 0.4 0.3 0.3
F, 71+ 1,282 17.0 2.9 5.2Standard error 0.4 0.2 0.3
All individuals 22,109 23.4 5.6 9.4Standard error 0.2 0.2 0.2
a M = male, F = female.
SOURCE: Iowa State University Department of Statistics, 1999.
TABLE F-8 Serum Lycopene (µg/dL) of Persons Aged 4 Yearsand Older: Mean and Selected Percentiles, United States,NHANES III, 1988–1994
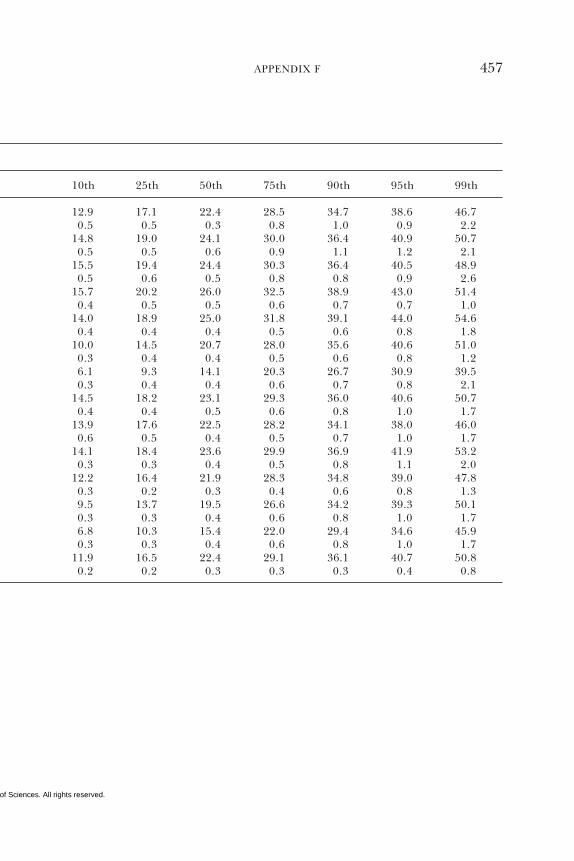
Copyright © National Academy of Sciences. All rights reserved.
APPENDIX F 457
10th 25th 50th 75th 90th 95th 99th
12.9 17.1 22.4 28.5 34.7 38.6 46.70.5 0.5 0.3 0.8 1.0 0.9 2.2
14.8 19.0 24.1 30.0 36.4 40.9 50.70.5 0.5 0.6 0.9 1.1 1.2 2.1
15.5 19.4 24.4 30.3 36.4 40.5 48.90.5 0.6 0.5 0.8 0.8 0.9 2.6
15.7 20.2 26.0 32.5 38.9 43.0 51.40.4 0.5 0.5 0.6 0.7 0.7 1.0
14.0 18.9 25.0 31.8 39.1 44.0 54.60.4 0.4 0.4 0.5 0.6 0.8 1.8
10.0 14.5 20.7 28.0 35.6 40.6 51.00.3 0.4 0.4 0.5 0.6 0.8 1.26.1 9.3 14.1 20.3 26.7 30.9 39.50.3 0.4 0.4 0.6 0.7 0.8 2.1
14.5 18.2 23.1 29.3 36.0 40.6 50.70.4 0.4 0.5 0.6 0.8 1.0 1.7
13.9 17.6 22.5 28.2 34.1 38.0 46.00.6 0.5 0.4 0.5 0.7 1.0 1.7
14.1 18.4 23.6 29.9 36.9 41.9 53.20.3 0.3 0.4 0.5 0.8 1.1 2.0
12.2 16.4 21.9 28.3 34.8 39.0 47.80.3 0.2 0.3 0.4 0.6 0.8 1.39.5 13.7 19.5 26.6 34.2 39.3 50.10.3 0.3 0.4 0.6 0.8 1.0 1.76.8 10.3 15.4 22.0 29.4 34.6 45.90.3 0.3 0.4 0.6 0.8 1.0 1.7
11.9 16.5 22.4 29.1 36.1 40.7 50.80.2 0.2 0.3 0.3 0.3 0.4 0.8
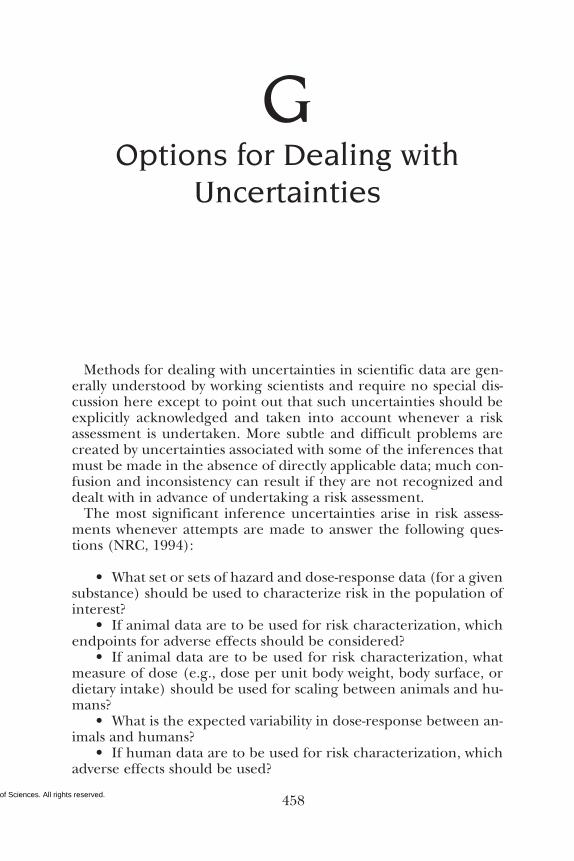
Copyright © National Academy of Sciences. All rights reserved. 458
GOptions for Dealing with
Uncertainties
Methods for dealing with uncertainties in scientific data are gen-erally understood by working scientists and require no special dis-cussion here except to point out that such uncertainties should beexplicitly acknowledged and taken into account whenever a riskassessment is undertaken. More subtle and difficult problems arecreated by uncertainties associated with some of the inferences thatmust be made in the absence of directly applicable data; much con-fusion and inconsistency can result if they are not recognized anddealt with in advance of undertaking a risk assessment.
The most significant inference uncertainties arise in risk assess-ments whenever attempts are made to answer the following ques-tions (NRC, 1994):
• What set or sets of hazard and dose-response data (for a givensubstance) should be used to characterize risk in the population ofinterest?
• If animal data are to be used for risk characterization, whichendpoints for adverse effects should be considered?
• If animal data are to be used for risk characterization, whatmeasure of dose (e.g., dose per unit body weight, body surface, ordietary intake) should be used for scaling between animals and hu-mans?
• What is the expected variability in dose-response between an-imals and humans?
• If human data are to be used for risk characterization, whichadverse effects should be used?
Copyright © National Academy of Sciences. All rights reserved.
APPENDIX G 459
• What is the expected variability in dose-response among mem-bers of the human population?
• How should data from subchronic exposure studies be usedto estimate chronic effects?
• How should problems of differences in route of exposurewithin and between species be dealt with?
• How should the threshold dose be estimated for the humanpopulation?
• If a threshold in the dose-response relationship seems unlike-ly, how should a low-dose risk be modeled?
• What model should be chosen to represent the distributionof exposures in the population of interest when data relating toexposures are limited?
• When interspecies extrapolations are required, what shouldbe assumed about relative rates of absorption from the gastrointes-tinal tract of animals and of humans?
• For which percentiles on the distribution of population expo-sures should risks be characterized?
At least partial, empirically based answers to some of these ques-tions may be available for some of the nutrients under review, butin no case is scientific information likely to be sufficient to providea highly certain answer; in many cases there will be no relevant datafor the nutrient in question.
It should be recognized that for several of these questions, certaininferences have been widespread for long periods of time; thus, itmay seem unnecessary to raise these uncertainties anew. When sev-eral sets of animal toxicology data are available, for example, anddata are not sufficient for identifying the set (i.e., species, strain,and adverse effects endpoint) that best predicts human response, ithas become traditional to select that set in which toxic responsesoccur at lowest dose (the most sensitive set). In the absence of defin-itive empirical data applicable to a specific case, it is generally as-sumed that there will not be more than a ten-fold variation in re-sponse among members of the human population. In the absenceof absorption data, it is generally assumed that humans will absorbthe chemical at the same rate as the animal species used to modelhuman risk. In the absence of complete understanding of biologicalmechanisms, it is generally assumed that, except possibly for certaincarcinogens, a threshold dose must be exceeded before toxicity isexpressed. These types of long-standing assumptions, which are nec-essary to complete a risk assessment, are recognized by risk assessorsas attempts to deal with uncertainties in knowledge (NRC, 1994).
Copyright © National Academy of Sciences. All rights reserved.
460 DIETARY REFERENCE INTAKES
A past National Research Council (NRC) report (1983) recom-mended adoption of the concepts and definitions that have beendiscussed in this report. The NRC committee recognized thatthroughout a risk assessment, data and basic knowledge will be lack-ing and risk assessors will be faced with several scientifically plausi-ble options (called inference options by the NRC) for dealing withquestions such as those presented above. For example, several sci-entifically supportable options for dose scaling across species andfor high- to low-dose extrapolation will exist, but there will be noready means to identify those that are clearly best supported. TheNRC committee recommended that regulatory agencies in the Unit-ed States identify the needed inference options in risk assessmentand specify, through written risk assessment guidelines, the specificoptions that will be used for all assessments. Agencies in the UnitedStates have identified the specific models to be used to fill gaps indata and knowledge; these have come to be called default options(EPA, 1986).
The use of defaults to fill knowledge and data gaps in risk assess-ment has the advantage of ensuring consistency in approach (thesame defaults are used for each assessment) and minimizing or elim-inating case-by-case manipulations in the conduct of risk assessmentto meet predetermined risk management objectives. The major dis-advantage of the use of defaults is the potential for displacement ofscientific judgment by excessively rigid guidelines. A remedy forthis disadvantage was also suggested by the NRC committee: riskassessors should be allowed to replace defaults with alternative fac-tors in specific cases of chemicals for which relevant scientific dataare available to support alternatives. The risk assessors’ obligationin such cases is to provide explicit justification for any such depar-ture. Guidelines for risk assessment issued by the U.S. Environmen-tal Protection Agency (EPA, 1986), for example, specifically allowfor such departures.
The use of preselected defaults is not the only way to deal withmodel uncertainties. Another option is to allow risk assessors com-plete freedom to pursue whatever approaches they judge applica-ble in specific cases. Because many of the uncertainties cannot beresolved scientifically, case-by-case judgments without some guid-ance on how to deal with them will lead to difficulties in achievingscientific consensus, and the results of the assessment may not becredible.
Another option for dealing with uncertainties is to allow risk as-sessors to develop a range of estimates based on application of bothdefaults and alternative inferences that, in specific cases, have some
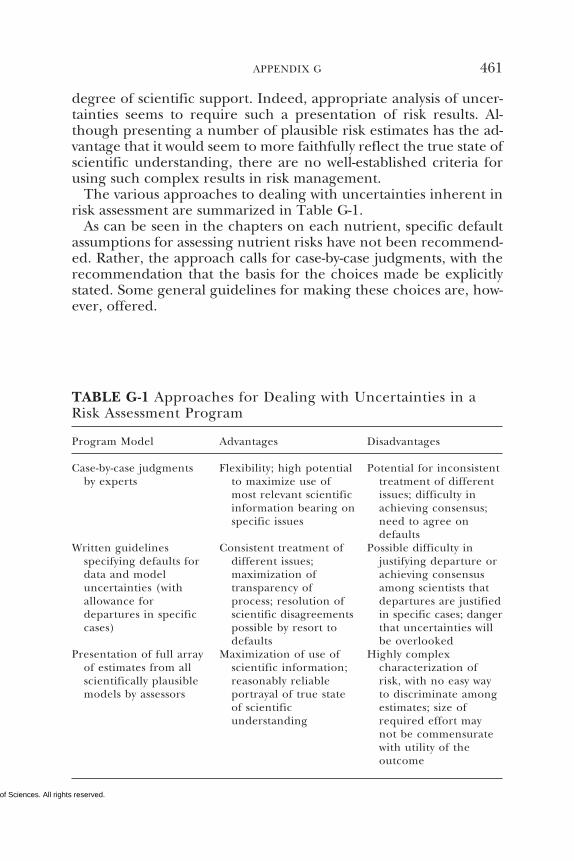
Copyright © National Academy of Sciences. All rights reserved.
APPENDIX G 461
degree of scientific support. Indeed, appropriate analysis of uncer-tainties seems to require such a presentation of risk results. Al-though presenting a number of plausible risk estimates has the ad-vantage that it would seem to more faithfully reflect the true state ofscientific understanding, there are no well-established criteria forusing such complex results in risk management.
The various approaches to dealing with uncertainties inherent inrisk assessment are summarized in Table G-1.
As can be seen in the chapters on each nutrient, specific defaultassumptions for assessing nutrient risks have not been recommend-ed. Rather, the approach calls for case-by-case judgments, with therecommendation that the basis for the choices made be explicitlystated. Some general guidelines for making these choices are, how-ever, offered.
TABLE G-1 Approaches for Dealing with Uncertainties in aRisk Assessment Program
Program Model Advantages Disadvantages
Case-by-case judgmentsby experts
Flexibility; high potentialto maximize use ofmost relevant scientificinformation bearing onspecific issues
Potential for inconsistenttreatment of differentissues; difficulty inachieving consensus;need to agree ondefaults
Written guidelinesspecifying defaults fordata and modeluncertainties (withallowance fordepartures in specificcases)
Consistent treatment ofdifferent issues;maximization oftransparency ofprocess; resolution ofscientific disagreementspossible by resort todefaults
Possible difficulty injustifying departure orachieving consensusamong scientists thatdepartures are justifiedin specific cases; dangerthat uncertainties willbe overlooked
Presentation of full arrayof estimates from allscientifically plausiblemodels by assessors
Maximization of use ofscientific information;reasonably reliableportrayal of true stateof scientificunderstanding
Highly complexcharacterization ofrisk, with no easy wayto discriminate amongestimates; size ofrequired effort maynot be commensuratewith utility of theoutcome
Copyright © National Academy of Sciences. All rights reserved.
462 DIETARY REFERENCE INTAKES
REFERENCESEPA (U.S. Environmental Protection Agency). 1986. Proposed guidelines for car-
cinogen risk assessment. Fed Regist 51:33992–34003.NRC (National Research Council). 1983. Risk Assessment in the Federal Government:
Managing the Process. Washington, DC: National Academy Press.NRC (National Research Council). 1994. Science and Judgment in Risk Assessment.
Washington, DC: National Academy Press.
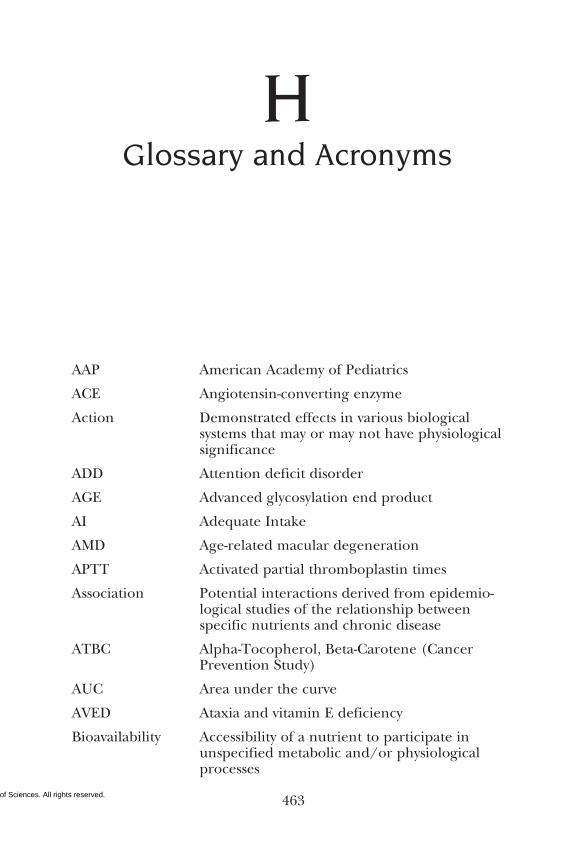
Copyright © National Academy of Sciences. All rights reserved. 463
HGlossary and Acronyms
AAP American Academy of Pediatrics
ACE Angiotensin-converting enzyme
Action Demonstrated effects in various biologicalsystems that may or may not have physiologicalsignificance
ADD Attention deficit disorder
AGE Advanced glycosylation end product
AI Adequate Intake
AMD Age-related macular degeneration
APTT Activated partial thromboplastin times
Association Potential interactions derived from epidemio-logical studies of the relationship betweenspecific nutrients and chronic disease
ATBC Alpha-Tocopherol, Beta-Carotene (CancerPrevention Study)
AUC Area under the curve
AVED Ataxia and vitamin E deficiency
Bioavailability Accessibility of a nutrient to participate inunspecified metabolic and/or physiologicalprocesses
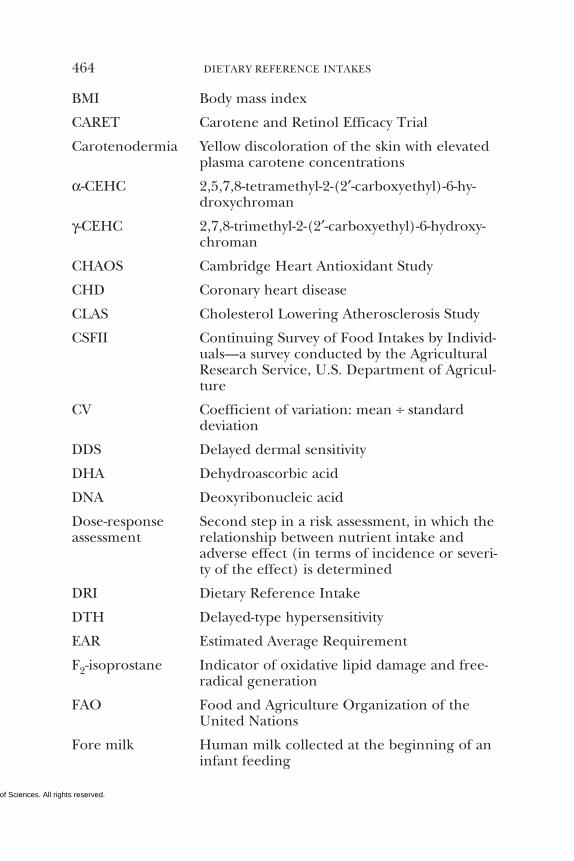
Copyright © National Academy of Sciences. All rights reserved.
464 DIETARY REFERENCE INTAKES
BMI Body mass index
CARET Carotene and Retinol Efficacy Trial
Carotenodermia Yellow discoloration of the skin with elevatedplasma carotene concentrations
α-CEHC 2,5,7,8-tetramethyl-2-(2′-carboxyethyl)-6-hy-droxychroman
γ-CEHC 2,7,8-trimethyl-2-(2′-carboxyethyl)-6-hydroxy-chroman
CHAOS Cambridge Heart Antioxidant Study
CHD Coronary heart disease
CLAS Cholesterol Lowering Atherosclerosis Study
CSFII Continuing Survey of Food Intakes by Individ-uals—a survey conducted by the AgriculturalResearch Service, U.S. Department of Agricul-ture
CV Coefficient of variation: mean ÷ standarddeviation
DDS Delayed dermal sensitivity
DHA Dehydroascorbic acid
DNA Deoxyribonucleic acid
Dose-response Second step in a risk assessment, in which theassessment relationship between nutrient intake and
adverse effect (in terms of incidence or severi-ty of the effect) is determined
DRI Dietary Reference Intake
DTH Delayed-type hypersensitivity
EAR Estimated Average Requirement
F2-isoprostane Indicator of oxidative lipid damage and free-radical generation
FAO Food and Agriculture Organization of theUnited Nations
Fore milk Human milk collected at the beginning of aninfant feeding
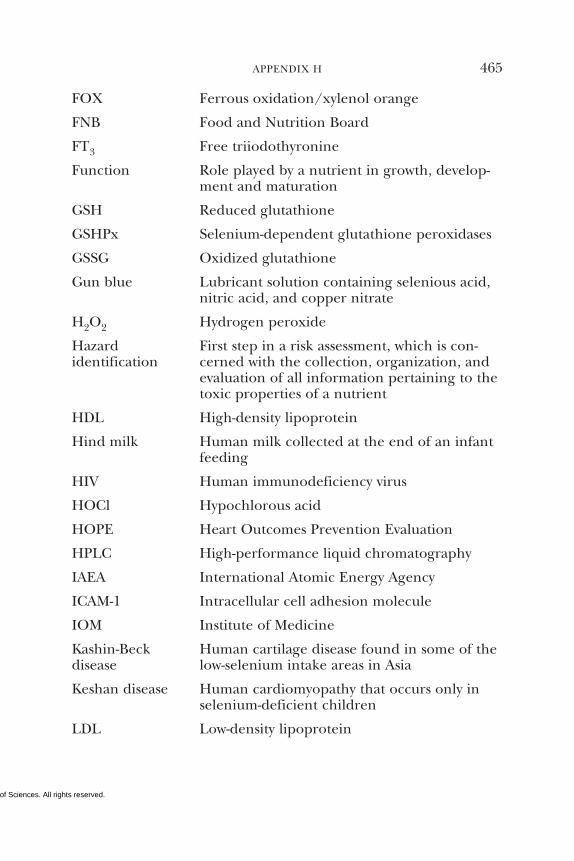
Copyright © National Academy of Sciences. All rights reserved.
APPENDIX H 465
FOX Ferrous oxidation/xylenol orange
FNB Food and Nutrition Board
FT3 Free triiodothyronine
Function Role played by a nutrient in growth, develop-ment and maturation
GSH Reduced glutathione
GSHPx Selenium-dependent glutathione peroxidases
GSSG Oxidized glutathione
Gun blue Lubricant solution containing selenious acid,nitric acid, and copper nitrate
H2O2 Hydrogen peroxide
Hazard First step in a risk assessment, which is con-identification cerned with the collection, organization, and
evaluation of all information pertaining to thetoxic properties of a nutrient
HDL High-density lipoprotein
Hind milk Human milk collected at the end of an infantfeeding
HIV Human immunodeficiency virus
HOCl Hypochlorous acid
HOPE Heart Outcomes Prevention Evaluation
HPLC High-performance liquid chromatography
IAEA International Atomic Energy Agency
ICAM-1 Intracellular cell adhesion molecule
IOM Institute of Medicine
Kashin-Beck Human cartilage disease found in some of thedisease low-selenium intake areas in Asia
Keshan disease Human cardiomyopathy that occurs only inselenium-deficient children
LDL Low-density lipoprotein
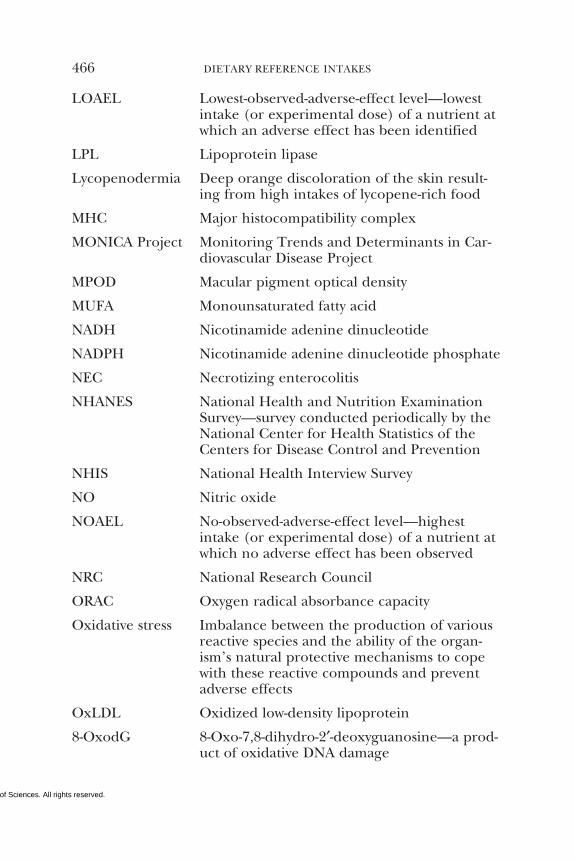
Copyright © National Academy of Sciences. All rights reserved.
466 DIETARY REFERENCE INTAKES
LOAEL Lowest-observed-adverse-effect level—lowestintake (or experimental dose) of a nutrient atwhich an adverse effect has been identified
LPL Lipoprotein lipase
Lycopenodermia Deep orange discoloration of the skin result-ing from high intakes of lycopene-rich food
MHC Major histocompatibility complex
MONICA Project Monitoring Trends and Determinants in Car-diovascular Disease Project
MPOD Macular pigment optical density
MUFA Monounsaturated fatty acid
NADH Nicotinamide adenine dinucleotide
NADPH Nicotinamide adenine dinucleotide phosphate
NEC Necrotizing enterocolitis
NHANES National Health and Nutrition ExaminationSurvey—survey conducted periodically by theNational Center for Health Statistics of theCenters for Disease Control and Prevention
NHIS National Health Interview Survey
NO Nitric oxide
NOAEL No-observed-adverse-effect level—highestintake (or experimental dose) of a nutrient atwhich no adverse effect has been observed
NRC National Research Council
ORAC Oxygen radical absorbance capacity
Oxidative stress Imbalance between the production of variousreactive species and the ability of the organ-ism’s natural protective mechanisms to copewith these reactive compounds and preventadverse effects
OxLDL Oxidized low-density lipoprotein
8-OxodG 8-Oxo-7,8-dihydro-2′-deoxyguanosine—a prod-uct of oxidative DNA damage
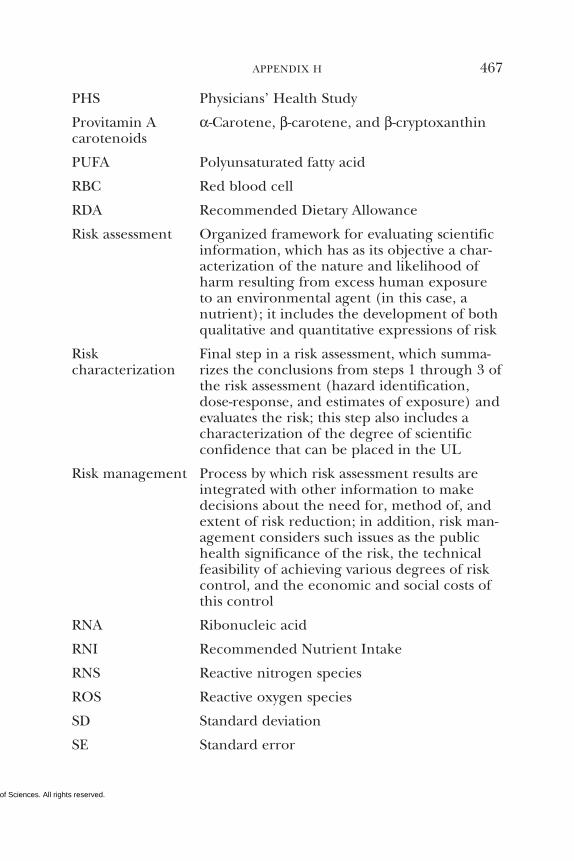
Copyright © National Academy of Sciences. All rights reserved.
APPENDIX H 467
PHS Physicians’ Health Study
Provitamin A α-Carotene, β-carotene, and β-cryptoxanthincarotenoids
PUFA Polyunsaturated fatty acid
RBC Red blood cell
RDA Recommended Dietary Allowance
Risk assessment Organized framework for evaluating scientificinformation, which has as its objective a char-acterization of the nature and likelihood ofharm resulting from excess human exposureto an environmental agent (in this case, anutrient); it includes the development of bothqualitative and quantitative expressions of risk
Risk Final step in a risk assessment, which summa-characterization rizes the conclusions from steps 1 through 3 of
the risk assessment (hazard identification,dose-response, and estimates of exposure) andevaluates the risk; this step also includes acharacterization of the degree of scientificconfidence that can be placed in the UL
Risk management Process by which risk assessment results areintegrated with other information to makedecisions about the need for, method of, andextent of risk reduction; in addition, risk man-agement considers such issues as the publichealth significance of the risk, the technicalfeasibility of achieving various degrees of riskcontrol, and the economic and social costs ofthis control
RNA Ribonucleic acid
RNI Recommended Nutrient Intake
RNS Reactive nitrogen species
ROS Reactive oxygen species
SD Standard deviation
SE Standard error
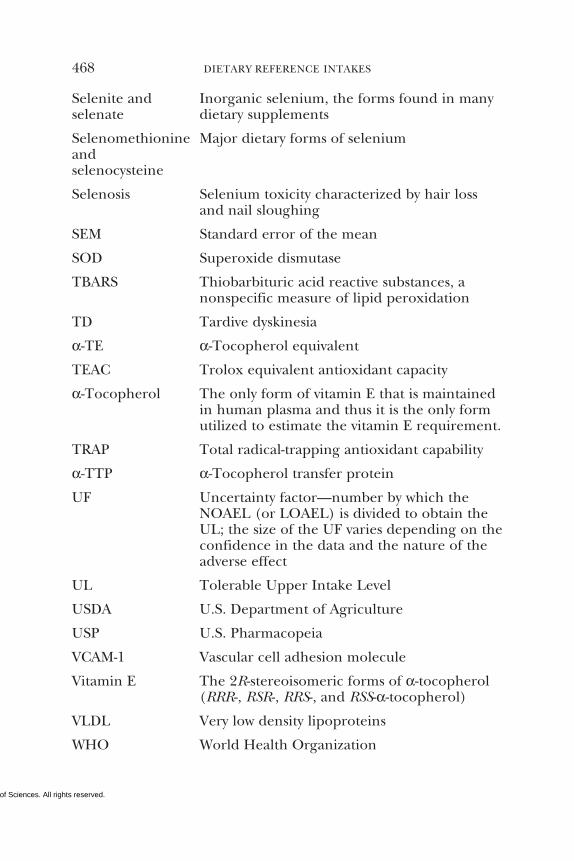
Copyright © National Academy of Sciences. All rights reserved.
468 DIETARY REFERENCE INTAKES
Selenite and Inorganic selenium, the forms found in manyselenate dietary supplements
Selenomethionine Major dietary forms of seleniumandselenocysteine
Selenosis Selenium toxicity characterized by hair lossand nail sloughing
SEM Standard error of the mean
SOD Superoxide dismutase
TBARS Thiobarbituric acid reactive substances, anonspecific measure of lipid peroxidation
TD Tardive dyskinesia
α-TE α-Tocopherol equivalent
TEAC Trolox equivalent antioxidant capacity
α-Tocopherol The only form of vitamin E that is maintainedin human plasma and thus it is the only formutilized to estimate the vitamin E requirement.
TRAP Total radical-trapping antioxidant capability
α-TTP α-Tocopherol transfer protein
UF Uncertainty factor—number by which theNOAEL (or LOAEL) is divided to obtain theUL; the size of the UF varies depending on theconfidence in the data and the nature of theadverse effect
UL Tolerable Upper Intake Level
USDA U.S. Department of Agriculture
USP U.S. Pharmacopeia
VCAM-1 Vascular cell adhesion molecule
Vitamin E The 2R-stereoisomeric forms of α-tocopherol(RRR-, RSR-, RRS-, and RSS-α-tocopherol)
VLDL Very low density lipoproteins
WHO World Health Organization

Copyright © National Academy of Sciences. All rights reserved. 469
IBiographical Sketches
of Panel andSubcommittee Members
LENORE ARAB, Ph.D., is a professor of epidemiology and nutri-tion in the Departments of Epidemiology and Nutrition at the Uni-versity of North Carolina at Chapel Hill, Schools of Medicine andPublic Health. Dr. Arab’s main research interests are anticarcino-gens in foods, heterocyclic amines, breast cancer incidence and sur-vival, the relationship of diet to athersclerosis, antioxidant nutrientsin various diseases, iron nutriture, and multi-media approaches todietary assessment. She has published over 140 original papers aswell as numerous book chapters and monographs. Dr. Arab servesas a nutrition advisor to the World Health Organization (WHO)and is the founding director of the WHO Collaborating Center forNutritional Epidemiology in Berlin. She is the North AmericanEditor of the journal Public Health Nutrition and sits on the editorialboards of the European Journal of Clinical Nutrition, Journal of ClinicalEpidemiology, Nutrition in Clinical Care, and Nutrition and Cancer: AnInternational Journal. She is the program director for nutritionalepidemiology and leader of a training program and NCI-sponsoredtraining grant in that field. Dr. Arab received her M.Sc. from HarvardSchool of Public Health and her Ph.D. in nutrition from JustusLiebig University in Giessen, Germany.
SUSAN I. BARR, Ph.D., is a professor of nutrition at the Universityof British Columbia. She received a Ph.D. in human nutrition fromthe University of Minnesota and is a registered dietitian in Canada.Her research interests focus on the associations among nutrition,physical activity and bone health in women, and she has authored
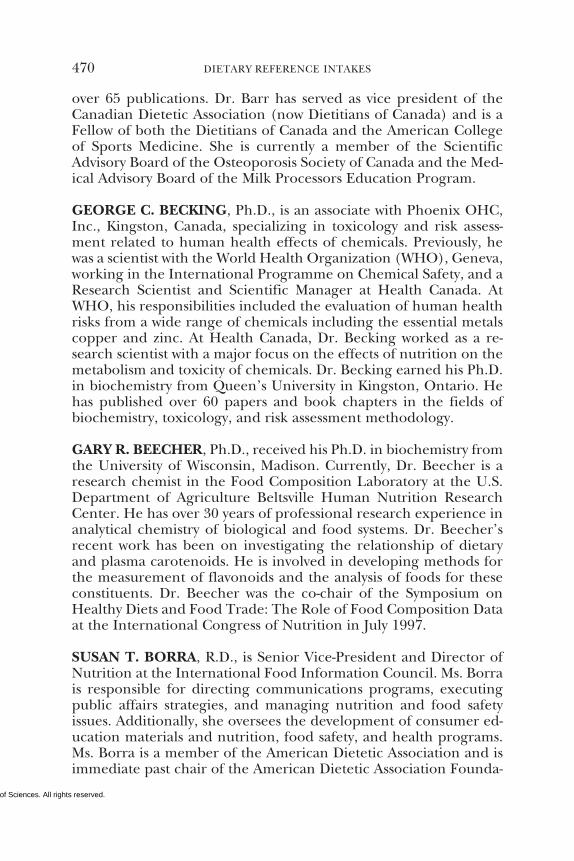
Copyright © National Academy of Sciences. All rights reserved.
470 DIETARY REFERENCE INTAKES
over 65 publications. Dr. Barr has served as vice president of theCanadian Dietetic Association (now Dietitians of Canada) and is aFellow of both the Dietitians of Canada and the American Collegeof Sports Medicine. She is currently a member of the ScientificAdvisory Board of the Osteoporosis Society of Canada and the Med-ical Advisory Board of the Milk Processors Education Program.
GEORGE C. BECKING, Ph.D., is an associate with Phoenix OHC,Inc., Kingston, Canada, specializing in toxicology and risk assess-ment related to human health effects of chemicals. Previously, hewas a scientist with the World Health Organization (WHO), Geneva,working in the International Programme on Chemical Safety, and aResearch Scientist and Scientific Manager at Health Canada. AtWHO, his responsibilities included the evaluation of human healthrisks from a wide range of chemicals including the essential metalscopper and zinc. At Health Canada, Dr. Becking worked as a re-search scientist with a major focus on the effects of nutrition on themetabolism and toxicity of chemicals. Dr. Becking earned his Ph.D.in biochemistry from Queen’s University in Kingston, Ontario. Hehas published over 60 papers and book chapters in the fields ofbiochemistry, toxicology, and risk assessment methodology.
GARY R. BEECHER, Ph.D., received his Ph.D. in biochemistry fromthe University of Wisconsin, Madison. Currently, Dr. Beecher is aresearch chemist in the Food Composition Laboratory at the U.S.Department of Agriculture Beltsville Human Nutrition ResearchCenter. He has over 30 years of professional research experience inanalytical chemistry of biological and food systems. Dr. Beecher’srecent work has been on investigating the relationship of dietaryand plasma carotenoids. He is involved in developing methods forthe measurement of flavonoids and the analysis of foods for theseconstituents. Dr. Beecher was the co-chair of the Symposium onHealthy Diets and Food Trade: The Role of Food Composition Dataat the International Congress of Nutrition in July 1997.
SUSAN T. BORRA, R.D., is Senior Vice-President and Director ofNutrition at the International Food Information Council. Ms. Borrais responsible for directing communications programs, executingpublic affairs strategies, and managing nutrition and food safetyissues. Additionally, she oversees the development of consumer ed-ucation materials and nutrition, food safety, and health programs.Ms. Borra is a member of the American Dietetic Association and isimmediate past chair of the American Dietetic Association Founda-
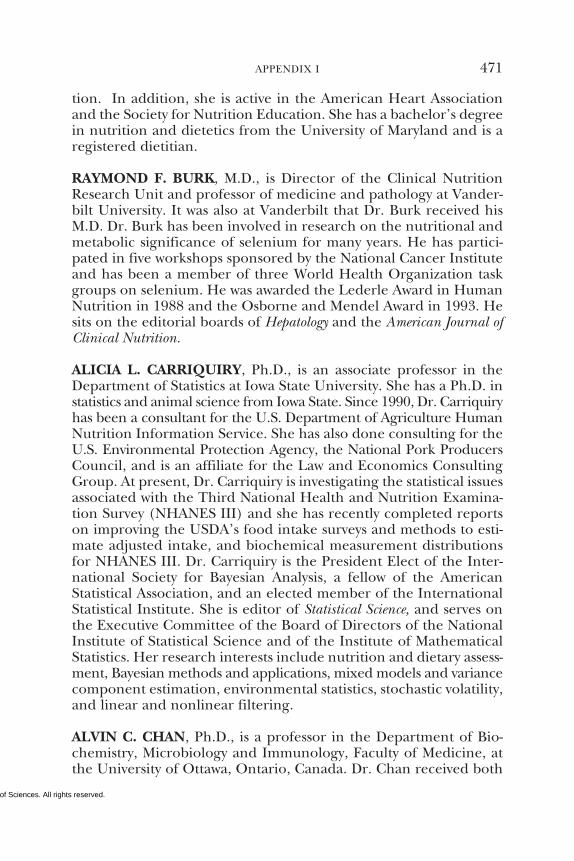
Copyright © National Academy of Sciences. All rights reserved.
APPENDIX I 471
tion. In addition, she is active in the American Heart Associationand the Society for Nutrition Education. She has a bachelor’s degreein nutrition and dietetics from the University of Maryland and is aregistered dietitian.
RAYMOND F. BURK, M.D., is Director of the Clinical NutritionResearch Unit and professor of medicine and pathology at Vander-bilt University. It was also at Vanderbilt that Dr. Burk received hisM.D. Dr. Burk has been involved in research on the nutritional andmetabolic significance of selenium for many years. He has partici-pated in five workshops sponsored by the National Cancer Instituteand has been a member of three World Health Organization taskgroups on selenium. He was awarded the Lederle Award in HumanNutrition in 1988 and the Osborne and Mendel Award in 1993. Hesits on the editorial boards of Hepatology and the American Journal ofClinical Nutrition.
ALICIA L. CARRIQUIRY, Ph.D., is an associate professor in theDepartment of Statistics at Iowa State University. She has a Ph.D. instatistics and animal science from Iowa State. Since 1990, Dr. Carriquiryhas been a consultant for the U.S. Department of Agriculture HumanNutrition Information Service. She has also done consulting for theU.S. Environmental Protection Agency, the National Pork ProducersCouncil, and is an affiliate for the Law and Economics ConsultingGroup. At present, Dr. Carriquiry is investigating the statistical issuesassociated with the Third National Health and Nutrition Examina-tion Survey (NHANES III) and she has recently completed reportson improving the USDA’s food intake surveys and methods to esti-mate adjusted intake, and biochemical measurement distributionsfor NHANES III. Dr. Carriquiry is the President Elect of the Inter-national Society for Bayesian Analysis, a fellow of the AmericanStatistical Association, and an elected member of the InternationalStatistical Institute. She is editor of Statistical Science, and serves onthe Executive Committee of the Board of Directors of the NationalInstitute of Statistical Science and of the Institute of MathematicalStatistics. Her research interests include nutrition and dietary assess-ment, Bayesian methods and applications, mixed models and variancecomponent estimation, environmental statistics, stochastic volatility,and linear and nonlinear filtering.
ALVIN C. CHAN, Ph.D., is a professor in the Department of Bio-chemistry, Microbiology and Immunology, Faculty of Medicine, atthe University of Ottawa, Ontario, Canada. Dr. Chan received both
Copyright © National Academy of Sciences. All rights reserved.
472 DIETARY REFERENCE INTAKES
his M.Sc. and Ph.D. in nutrition from the University of Minnesota.His primary research interest is to elucidate the function of vitaminE in the turnover of arachidonic acid and membrane phospholipids,the role of vitamin E in free radical formation during oxidativestress, and the relationship of antioxidants to atherogenesis. Dr. Chanhas spoken at numerous national and international conferences andhas authored four book chapters and over 40 recent publicationsrelating to vitamin E function and interaction with other antioxi-dants. He served as consultant for Health and Welfare Canada inthe review of Canada’s Nutrition Recommendations in 1990. Hehas been on the editorial board of the Journal of Nutrition from1995–present.
BARBARA L. DEVANEY, Ph.D., is a senior fellow at MathematicaPolicy Research Inc. where she has specialized in designing andconducting program evaluations. She recently completed a studythat produced a comprehensive and rigorous evaluation design forevaluating the impacts of a Universal-Free School Breakfast Pro-gram on dietary and educational outcomes of children. She cur-rently is completing an evaluation of the effects of an infant mortal-ity demonstration program, Healthy Start, and is involved in a studyexamining the impacts of child WIC participation on health careutilization and costs. She also is a co-investigator of a large nationalevaluation of abstinence education programs funded under the wel-fare reform legislation. Dr. Devaney was a member of the Instituteof Medicine’s Committee on Scientific Evaluation of WIC NutritionRisk Criteria. She received her Ph.D. in economics from the Univer-sity of Michigan.
JOHANNA T. DWYER, D.Sc., R.D., is director of the Frances SternNutrition Center at New England Medical Center and professor inthe Departments of Medicine and of Community Health at the TuftsMedical School and School of Nutrition Science and Policy in Boston.She is also senior scientist at the Jean Mayer U.S. Department ofAgriculture Human Nutrition Research Center on Aging at TuftsUniversity. Dr. Dwyer’s work centers on life-cycle related concernssuch as the prevention of diet-related disease in children and ado-lescents and maximization of quality of life and health in the elderly.She also has a long-standing interest in vegetarian and other alter-native lifestyles. Dr. Dwyer is currently the editor of Nutrition Todayand on the editorial boards of Family Economics and Nutrition Reviews.She received her D.Sc. and M.Sc. from the Harvard School of PublicHealth, an M.S. from the University of Wisconsin, and completed
Copyright © National Academy of Sciences. All rights reserved.
APPENDIX I 473
her undergraduate degree with distinction from Cornell University.She is a member of the Food and Nutrition Board and its StandingCommittee on Scientific Evaluation of Dietary Reference Intakes,and the Technical Advisory Committee of the Nutrition ScreeningInitiative, and is past president of the American Society for NutritionSciences, past secretary of the American Society for Clinical Nutri-tion, and a past president of the Society for Nutrition Education.
JOHN W. ERDMAN, JR., Ph.D., is a professor of nutrition in theDepartment of Food Science and Human Nutrition and in InternalMedicine at the University of Illinois at Urbana-Champaign. Hisresearch interests are the effects of food processing upon nutrientretention, the metabolic roles of vitamin A and carotenoids, andthe bioavailability of minerals from foods. His research regardingsoy protein has extended into studies on the impact of non-nutrientcomponents of foods such as phytoestrogens on chronic disease.He is vice-chair of the Standing Committee on the Scientific Evalua-tion of Dietary Reference Intakes and a former member of the Foodand Nutrition Board’s Committee on Opportunities in the Nutri-tion and Food Sciences; the Committee on the Nutrition Compo-nents of Food Labeling; and the Subcommittee on Bioavailability ofNutrients of the Committee on Animal Nutrition, Board on Agri-culture. Dr. Erdman presently serves on the Scientific AdvisoryBoards of the Mars Nutrition Research Council and the United Soy-bean Board.
JEAN-PIERRE HABICHT, M.D., Ph.D., is professor of nutritionalepidemiology in the Division of Nutrition Sciences at Cornell Uni-versity. His professional experience includes serving as special assis-tant to the director of the Division of Health Examination Statisticsat the National Center for Health Statistics, World Health Organiza-tion (WHO) medical officer at the Instituto de Nutricion de CentroAmerica y Panama, and professor of maternal and child health atthe University of San Carlos in Guatemala. Currently, Dr. Habichtserves as an advisor to United Nations (UN) and government healthand nutrition agencies. He is a member of the Expert Advisory Panelon Nutrition, WHO, and is past chairman of the United Nations’Advisory Group on Nutrition. He has consulted to the UN’s WorldFood Program and is involved in research with the UN High Com-mission for Refugees about the adequacy of food rations in refugeecamps. Dr. Habicht has served on numerous Institute of Medicinecommittees advising the U.S. Agency for International Developmentabout issues in international nutrition. He served as a member of
Copyright © National Academy of Sciences. All rights reserved.
474 DIETARY REFERENCE INTAKES
the IOM’s Food and Nutrition Board (1981–1984) and as a memberand past chair of the Committee on International Nutrition Pro-grams. Dr. Habicht chaired the National Research Council’s Coor-dinating Committee on Evaluation of Food Consumption Surveys,which produced the 1986 NRC report, Nutrient Adequacy: AssessmentUsing Food Consumption Surveys.
ROBERT A. JACOB, Ph.D., F.A.C.N., obtained a Ph.D. degree in1970 in inorganic and analytical chemistry from Southern IllinoisUniversity, Carbondale. Currently, Dr. Jacob is a research chemistat the U.S. Department of Agriculture (USDA) Western HumanNutrition Research Center (WHNRC) in Davis, California. Dr. Jacobhas been engaged in nutritional biochemistry research for 23 years,20 years as a chemist or research chemist with the USDA AgriculturalResearch Service. His area of research has been the metabolism andnutritional requirements for vitamins and trace minerals, and bio-chemical assessment of nutritional status. At WHNRC, his primaryfocus has been on requirements for vitamin C, folic acid, and niacinand the role of diet in antioxidant protection. He has publishedover 110 related articles in scientific journals and textbooks.
ISHWARLAL JIALAL, M.D., Ph.D., is Professor of Internal Medi-cine and Pathology, Director of the Division of Clinical Biochemis-try and Human Metabolism, Co-director of the Lipid Clinic, andAttending Physician, Division of Endocrinology and Metabolism atthe University of Texas Southwestern Medical Center at Dallas. Healso holds the C. Vincent Prothro Chair in Human Nutrition Re-search. To date Dr. Jialal has published over 216 original papersand invited reviews in the areas of nutrition, atherolsclerosis,metabolism, and endocrinology. He has received numerous awardsfor his work including the AHA Young Investigator Award; Fellow,Council of Arteriosclerosis, AHA; George Grannis Award, NationalAcademy of Clinical Biochemistry; the VERIS Award for nutritionresearch; the Outstanding Clinical Chemist Award from the TexasSection, American Association of Clinical Chemistry and the Inter-national Hermes Prize for Vitamin Research, The Bennie Zak Awardfor Outstanding Research, Lipids and Lipoproteins Division, AACC.He received his M.D. and Ph.D. from the University of Natal MedicalSchool, Natal, South Africa. Presently, his major research interestsare atherosclerosis, antioxidants, hyperlipidemia, and diabetes.
RENATE D. KIMBROUGH, M.D., presently works as an indepen-dent consultant. From 1991 to 1999 she served as senior medical
Copyright © National Academy of Sciences. All rights reserved.
APPENDIX I 475
associate at the Institute for Evaluating Health Risks (IEHR). Sheearned her M.D. from the University of Goettingen in Germany. Atthe IEHR, Dr. Kimbrough conducted several studies and consultedon a variety of matters involving environmental contamination andhuman health effects. Dr. Kimbrough has served previously as theDirector for Health and Risk Capabilities and as Advisor on MedicalToxicology and Risk Evaluation for the U.S. Environmental Protec-tion Agency’s Office of the Administrator and as medical toxicolo-gist for the Centers for Disease Control and Prevention. She hasover 130 scientific publications in the fields of toxicology and riskassessment. Dr. Kimbrough is certified as a diplomate for the Amer-ican Board of Toxicology and an honorary fellow of the AmericanAcademy of Pediatrics. In 1991, she received the American Confer-ence on Governmental Industrial Hygienists’ Herbert E. StokingerAward for outstanding achievement in industrial toxicology. Shealso has served on the Scientific Advisory Board, United States AirForce, and the American Board of Toxicology.
LAURENCE N. KOLONEL, M.D., Ph.D., M.P.H., is Deputy CenterDirector and Director of the Cancer Etiology Program at the CancerResearch Center of the University of Hawaii. Dr. Kolonel is a formermember of the Food and Nutrition Board and has served on theCommittee on Diet, Nutrition and Cancer; the Committee on Dietand Health; and the Committee on Comparative Toxicity of Natu-rally Occurring Carcinogens. Dr. Kolonel recently served on theNational Cancer Institute Subcommittee on Prevention and Con-trol, is on the advisory board of the Center for Communications,Health and the Environment, and is associate editor of Cancer Epide-miology Biomarkers and Prevention and Cancer Research. Recently, Dr.Kolonel has published on the relationship of dietary intake andracial variations to prostate and other types of cancer. Dr. Kolonelreceived his M.P.H. and Ph.D. in epidemiology from the Universityof California at Berkeley and his M.D. from Harvard Medical School.
NORMAN I. KRINSKY, Ph.D., received his Ph.D. in biochemistryfrom the University of Southern California. He is currently a profes-sor in the Department of Biochemistry at Tufts University School ofMedicine and a scientist at the Jean Mayer U.S. Department of Agri-culture Human Nutrition Research Center on Aging, Tufts Univer-sity. Dr. Krinsky is a member of the Advisory Committee of theInternational Antioxidant Research Centre at King’s College inLondon. He is also the president of the New England Free Radical/Oxygen Society. Currently, Dr. Krinsky’s research is directed at ex-
Copyright © National Academy of Sciences. All rights reserved.
476 DIETARY REFERENCE INTAKES
amining the metabolism of carotenoids to retinoids and retinoicacid, the role of carotenoids in human vision, and the function ofantioxidants.
HARRIET V. KUHNLEIN, Ph.D., R.D., is professor of human nutri-tion at McGill University and founding director of the Centre forIndigenous Peoples’ Nutrition and Environment. She is a registereddietitian in Canada, and holds a Ph.D. in nutritional sciences fromthe University of California at Berkeley. The focus of Dr. Kuhnlein’sresearch is on the nutrition, food patterns, and environment ofindigenous peoples. Specifically, her work examines the traditionalfoods of indigenous peoples, nutrient and contaminant levels inindigenous food systems, and nutrition promotion programs forindigenous peoples. She has published numerous articles on thesesubjects. Dr. Kuhnlein is a member of both the American and Cana-dian Societies of Nutritional Sciences, the Society for InternationalNutrition Research, the Canadian Dietetic Association, and the Societyfor Nutrition Education. She serves on the Advisory Council of theHerb Research Foundation, and is a former co-chair of the Com-mittee on Nutrition and Anthropology of the International Unionof Nutritional Sciences. Dr. Kuhnlein is a member of the editorialboards of Ecology of Food and Nutrition, Journal of Food Composition andAnalysis, International Journal of Circumpolar Health, and Journal ofEthnobiology.
JAMES R. MARSHALL, Ph.D., is a professor of public health andassociate director of Cancer Prevention and Control at the ArizonaCancer Center. He received his Ph.D. in sociology from the Univer-sity of California at Los Angeles. Dr. Marshall is currently involvedin a colon cancer prevention program project and is principal in-vestigator for a collaborative project to assemble a multi-state regis-try of familial colon cancer. Additionally, Dr. Marshall is involved inresearch focused on diet in the epidemiology of prostate cancer.His work on measurement error in epidemiology has emphasizedthe use of nutrient indices. He has been the invited speaker at theAmerican Cancer Society Workshop on Nutrition and Cancer, theAmerican Dietetic Association, and the Second International Con-ference on Dietary Assessment Methods.
SUSAN TAYLOR MAYNE, Ph.D., is an associate professor in chron-ic disease epidemiology at Yale University School of Medicine andassociate director of the Yale Comprehensive Cancer Center forwhich she leads the Cancer Prevention and Control Research Pro-
Copyright © National Academy of Sciences. All rights reserved.
APPENDIX I 477
gram. The primary focus of Dr. Mayne’s research is in the area ofnutrition and cancer prevention. Currently, she directs a large can-cer prevention clinical trial to determine whether supplemental β-carotene reduces the incidence of cancer. Additionally, she partici-pated in the working group on carotenoids and cancer of theInternational Agency for Research on Cancer and the Steering Com-mittee of the Carotenoid/Vitamin A Research Interaction Group.She was chair of the Carotenoid Research Interaction Group AnnualConference at Federation of American Societies for ExperimentalBiology in 1996. Dr. Mayne has a Ph.D. in nutritional biochemistrywith minors in biochemistry and toxicology from Cornell University.
RITA B. MESSING, Ph.D., received her Ph.D. in physiological psy-chology from Princeton University and did postdoctoral research inthe Department of Nutrition and Food Science at MassachusettsInstitute of Technology in the Laboratory of Neuroendocrine Regula-tion. Dr. Messing has been in the Department of Pharmacology,University of Minnesota Medical School since 1981, and is currentlyan associate professor. Since 1990 her primary employment hasbeen at the Minnesota Department of Health in EnvironmentalToxicology, where she supervises the Site Assessment and Consulta-tion Unit, which conducts public health activities at hazardous wastesites and other sources of uncontrolled toxic releases. Dr. Messinghas 70 publications in toxicology and risk assessment, neurophar-macology, psychobiology, and experimental psychology. She hastaught at Rutgers University, Northeastern University, University ofCalifornia at Irvine, and the University of Minnesota, and has hadvisiting appointments at Organon Pharmaceuticals in the Nether-lands and the University of Paris.
SANFORD A. MILLER, Ph.D., is dean of the Graduate School ofBiomedical Sciences and professor in the Departments of Biochem-istry and Medicine at The University of Texas Health Science Cen-ter at San Antonio. He is the former director of the Center for FoodSafety and Applied Nutrition at the Food and Drug Administration.Previously, he was professor of Nutritional Biochemistry at the Mas-sachusetts Institute of Technology. Dr. Miller has served on manynational and international government and professional society ad-visory committees, including the Federation of American Societiesfor Experimental Biology Expert Committee on GRAS Substances,the National Advisory Environmental Health Sciences Council ofthe National Institutes of Health, the Food and Nutrition Boardand its Food Forum, the Joint World Health Organization (WHO)/
Copyright © National Academy of Sciences. All rights reserved.
478 DIETARY REFERENCE INTAKES
Food and Agriculture Organization (FAO) of the United NationsExpert Advisory Panel on Food Safety (chairman), and the SteeringCommittees of several WHO/FAO panels. He also served as chair ofthe Joint FAO/WHO Expert Consultation on the Application ofRisk Analysis to Food Standards Issues. He is author or co-author ofmore than 200 original scientific publications. Dr. Miller received aB.S. in chemistry from the City College of New York, and an M.S.and Ph.D. from Rutgers University in physiology and biochemistry.
IAN C. MUNRO, Ph.D., is a consultant toxicologist and principalfor CanTox, Inc., in Ontario, Canada. He is a leading authority ontoxicology and has over 30 years experience in dealing with com-plex regulatory issues related to product safety. He has in excess of150 scientific publications in the fields of toxicology and risk assess-ment. Dr. Munro formerly held senior positions at Health and Wel-fare Canada as director of the Bureau of Chemical Safety and direc-tor general of the Food Directorate, Health Protection Branch. Hewas responsible for research and standard setting activities relatedto microbial and chemical hazards in food and the nutritional qual-ity of the Canadian food supply. He has contributed significantly tothe development of risk assessment procedures in the field of publichealth, both nationally and internationally, through membership onvarious committees dealing with the regulatory aspects of risk assess-ment and risk management of public health hazards. Dr. Munro is agraduate of McGill University in biochemistry and nutrition and holdsa Ph.D. from Queen’s University in pharmacology and toxicology.He is a fellow of the Royal College of Pathologists, London, and afellow of the Academy of Toxicological Sciences. He also was a formerdirector of the Canadian Centre for Toxicology at Guelph, Ontario.
SUZANNE P. MURPHY, Ph.D., R.D., is a nutrition researcher (pro-fessor) at the Cancer Research Center of Hawaii at the University ofHawaii, Honolulu. She received her B.S. in mathematics fromTemple University and her Ph.D. in nutrition from the Universityof California at Berkeley. Dr. Murphy’s research interests includedietary assessment methodology, development of food compositiondatabases, and nutritional epidemiology. She is a member of theNational Nutrition Monitoring Advisory Council and the Year 2000Dietary Guidelines Advisory Committee, and serves on editorialboards for the Journal of Nutrition, Journal of Food Composition andAnalysis, Family Economics and Nutrition Review, and Nutrition Today.Dr. Murphy is a member of numerous professional organizationsincluding the American Dietetic Association, American Society forNutritional Sciences, American Public Health Association, American
Copyright © National Academy of Sciences. All rights reserved.
APPENDIX I 479
Society for Clinical Nutrition, and Society for Nutrition Education.She has over 50 publications on dietary assessment methodologyand has lectured nationally and internationally on this subject.
HARRIS PASTIDES, Ph.D., is dean of the University of South Caro-lina’s School of Public Health and professor in the Department ofEpidemiology and Biostatistics. Previously, he was chair and a pro-fessor of epidemiology in the Department of Biostatistics and Epi-demiology at the School of Public Health and Health Sciences atthe University of Massachusetts at Amherst. Dr. Pastides is a consult-ant to the World Health Organization’s Program in EnvironmentalHealth and a fellow of the American College of Epidemiology. Hehas published widely and is the co-author of several books. He was aFulbright Senior Research Fellow and visiting professor at the Uni-versity of Athens Medical School in Greece from 1987–1988. Dr.Pastides earned his M.P.H. and his Ph.D. from Yale University; hehas been a principal investigator or co-investigator on over 30 exter-nally funded research grants, results of which have been publishedin numerous peer-reviewed journals. He previously served on theNational Academy of Sciences’ Committee on Pediatric RespiratoryInfections in Developing Nations.
ROSS L. PRENTICE, Ph.D., is director of the Division of PublicHealth Science of the Fred Hutchinson Cancer Research Centerand professor of biostatistics, University of Washington. He has ex-pertise in the areas of statistics, biostatistics, nutrition, health pro-motion and disease prevention, and epidemiology, and is principalinvestigator of the Women’s Health Initiative Clinical CoordinatingCenter. Dr. Prentice received his Ph.D. in statistics from the Univer-sity of Toronto. He currently serves as a member on the Food andNutrition Board and is a member of the Institute of Medicine.
JOSEPH V. RODRICKS, Ph.D., is the managing director of TheLife Sciences Consultancy LLC. He is one of the founding princi-pals of the ENVIRON Corporation, with internationally recognizedexpertise in assessing the risks to human health of exposure to toxicsubstances. He received his B.S. from Massachusetts Institute ofTechnology and his Ph.D. in biochemistry from the University ofMaryland. Dr. Rodricks is certified as a diplomate of the AmericanBoard of Toxicology. Before working as a consultant, he spent 15years at the Food and Drug Administration (FDA). In his final 3years at the FDA, he was Deputy Associate Commissioner for Science,with special responsibility for risk assessment. He was a member ofthe National Academy of Sciences (NAS) Board on Toxicology and
Copyright © National Academy of Sciences. All rights reserved.
480 DIETARY REFERENCE INTAKES
Environmental Health Hazards, and has also served on or chairedten other NAS Committees. He has more than 100 scientific publica-tions on food safety and risk assessment and has lectured nationallyand internationally on these subjects. He is the author of CalculatedRisks, a nontechnical introduction to toxicology and risk assessment.
IRWIN H. ROSENBERG, M.D., is an internationally recognizedleader in nutrition science who serves as professor of physiology,medicine and nutrition at Tufts University School of Medicine andSchool of Nutrition, as well as director, Jean Mayer U.S. Depart-ment of Agriculture Human Nutrition Research Center on Aging atTufts University and dean for nutrition sciences, Tufts University.He is the first holder of the Jean Mayer Chair in Nutrition at Tufts.Prior to joining Tufts, Dr. Rosenberg held faculty positions at HarvardMedical School and the University of Chicago where he served asthe first director of the Clinical Nutrition Research Center. As aclinical nutrition investigator, he has helped develop a nutritionalfocus within the field of gastroenterology with his primary researchinterest being in the area of folate metabolism. His research for thepast decade has focused on nutrition and the aging process. Amonghis many honors are the Josiah Macy Faculty Award, Grace Gold-smith Award of the American College of Nutrition, Robert H. HermanMemorial Award of the American Society of Clinical Nutrition, theJonathan B. Rhoads Award of the American Society for Parenteraland Enteral Nutrition, and the 1994 W.O. Atwater Memorial Lecture-ship of the USDA. Dr. Rosenberg was elected to the Institute ofMedicine in 1994 and he recently received the Bristol MyersSquibb/Mead Johnson Award for Distinguished Achievement inNutrition Research, 1996.
KATHLEEN B. SCHWARZ, M.D., is director of the Pediatric LiverCenter and chief of the Division of Pediatric Gastroenterology andNutrition at Johns Hopkins University. She received her M.D. fromWashington University School of Medicine and completed her resi-dency in pediatrics at St. Louis Children’s Hospital. She is a mem-ber of the editorial board of the Journal of Pediatric Gastroenterologyand Nutrition and the Children’s Liver Council of the AmericanLiver Foundation. Dr. Schwarz has been involved in research on theeffects of antioxidants in infants, children, and pregnant women.
DANIEL STEINBERG, M.D., Ph.D., is a biochemist and clinicianwith the Division of Endocrinology and Metabolism in the Schoolof Medicine at the University of California, San Diego. His researchinterests are in the area of lipid and lipoprotein metabolism associ-
Copyright © National Academy of Sciences. All rights reserved.
APPENDIX I 481
ated with disease, and his major focus in recent years has been theinteraction of lipoproteins with cells and how this relates to athero-genesis. He holds an M.D. from Wayne University School of Medi-cine and a Ph.D. in biological chemistry from Harvard MedicalSchool. He has served on numerous committees of the AmericanHeart Association and is a member of the National Academy ofSciences’ Section on Medical Physiology and Metabolism.
STEVE L. TAYLOR, Ph.D., serves as professor and head of theDepartment of Food Science and Technology and director of theFood Processing Center at the University of Nebraska. He also main-tains an active research program in the area of food allergies throughthe Food Allergy Research & Resource Program at the University ofNebraska. He received his B.S. and M.S. in food science and tech-nology from Oregon State University and his Ph.D. in biochemistryfrom the University of California at Davis. Dr. Taylor’s primaryresearch interests involve naturally occurring toxicants in foods,especially food allergens. His research involves the development ofimmunoassays for the detection of residues of allergenic foods con-taminating other foods, the effect of processing on food allergens,and the assessment of the allergenicity of genetically engineeredfoods. Dr. Taylor has over 160 publications. He is a member ofnumerous professional associations including Institute of FoodTechnologists, American Chemical Society, American Academy ofAllergy, Asthma, and Immunology, and Society of Toxicology.
JOHN A. THOMAS, Ph.D., received his undergraduate degree atthe University of Wisconsin and his M.A. and Ph.D. degrees at theUniversity of Iowa. He has held professorships in departments ofpharmacology and toxicology in several medical schools includingIowa, Virginia, and West Virginia. From 1973 to 1982 he served asAssociate Dean of the School of Medicine at West Virginia University.In 1982 Dr. Thomas became Vice President for Corporate Researchat Baxter Healthcare. Dr. Thomas served as vice president at theUniversity of Texas Health Science Center at San Antonio from1988–1998. Professor Thomas serves on several editorial boards ofbiomedical journals and serves as chairman of the Society of Toxi-cology Education Committee, chairman of the Expert AdvisoryCommittee of the Canadian Network of Toxicology Centers, andvice president of the Academy of Toxicology. He is a diplomate,fellow, and member of the Board of Trustees in the Academy ofToxicological Sciences, and serves on many scientific boards andcommittees in the chemical and the pharmaceutical industry. Hehas been named the 1999 recipient of the Distinguished Service
Copyright © National Academy of Sciences. All rights reserved.
482 DIETARY REFERENCE INTAKES
Award from the American College of Toxicology. He is the recipi-ent of several national awards including the Merit Award from theSociety of Toxicology, Certificate of Scientific Service (U.S. Envi-ronmental Protection Agency), Distinguished Lecturer in MedicalSciences (American Medical Association), Distinguished Service Awardfrom the Texas Society for Biomedical Research. He is an electedforeign member of the Russian Academy of Medical Sciences. Dr.Thomas is the author of over a dozen textbooks and research mono-graphs and has published over 350 scientific articles.
MARET G. TRABER, Ph.D., is principal investigator for the LinusPauling Institute and an associate professor in the Department ofNutrition and Food Management at the Oregon State University inCorvallis as well as an associate research biochemist in the Depart-ment of Internal Medicine at the University of California School ofMedicine at Davis. Formerly she was associate research biochemistin the Departments of Molecular and Cell Biology at the Universityof California at Berkeley. Dr. Traber received her Ph.D. in nutritionfrom the University of California at Berkeley. Her research is focusedon lipid and lipoprotein metabolism and vitamin E deficiency inhumans. Presently, Dr. Traber is principal investigator on a projectexamining the role of tocopherol transfer protein in vitamin E trans-port. She is the current chair of the Vitamin E Task Force of theFood and Nutrition Science Associations and is associate editor ofLipids. In 1993, Dr. Traber received the Henkel Vitamin E ResearchInformation Award.
GARY M. WILLIAMS, M.D., is professor in the Department ofPathology and Director of Environmental Pathology and Toxicologyat New York Medical College. He also serves as head of the Programon Medicine, Food and Chemical Safety. Previously, Dr. Williamsserved as director of the Naylor Dana Institute and chief of theDivision of Pathology and Toxicology at the American Health Foun-dation. He earned his M.D. from the University of Pittsburgh. Dr.Williams received numerous honors including the Arnold J. LehmanAward of the Society of Toxicology and the Sheard-Sandford Awardof the American Society of Clinical Pathologists. He has served onthe editorial boards for many scientific reports and journals. He isthe author or co-author of over 430 scientific publications. He pre-viously served on the Committee on Research Opportunities andPriorities for the Environmental Protection Agency and the Com-mittee on the Carcinogenecity of Cyclamates for the National Acad-emy of Sciences.
Copyright © National Academy of Sciences. All rights reserved. 483
Index
AAbetalipoproteinemia, 202Abnormal Involuntary Movements Scale
score, 223Absorption of nutrients. See also
Bioavailability of nutrients;Malabsorption syndromes
aging and, 31, 147-148, 238, 305alpha-tocopherol, 196-198, 238, 251carotenoids, 326, 328, 330, 354, 355,
356food matrix and, 355form of nutrient and, 191, 355iron, 129, 158, 159, 161selenium, 285-286, 306vitamin C, 99-100, 103, 108, 128, 140,
147-148, 155, 157vitamin E (all forms), 191, 193, 196,
243Adequate intakes (AIs). See also individual
nutrientsdefined, 3, 4, 7, 22, 25extrapolation from other age groups,
26, 65-66, 138methods used to set, 6-11, 22, 63-66RDA compared, 4, 25-26uses, 4, 15, 25, 383, 386, 391, 392,
398
Adolescents, ages 14 through 18 years. Seealso Life-stage groups; Puberty,pubertal development; individualnutrients
EARs, 65-66growth factors, 66Kashin-Beck disease, 287lactation, 151-152, 163-164, 240-241,
258-259, 307-308, 315pregnancy, 149-150, 163-164, 239-240,
258-259, 306-307, 315RDAs, 66reference weights and heights, 32-33special considerations, 358ULs, 14
Adults, 19 through 50 years. See also Life-stage groups; individual nutrients
circulating lipid levels, 234-235depletion/repletion studies, 143-145,
233-234, 236EARs, 31peak bone mass, 30-31PUFA intake, 235reference weights and heights, 32supplement use, 70ULs, 14
Adults, 51+ years. See also Life-stagegroups; individual nutrients
absorption of nutrients, 31, 147-148
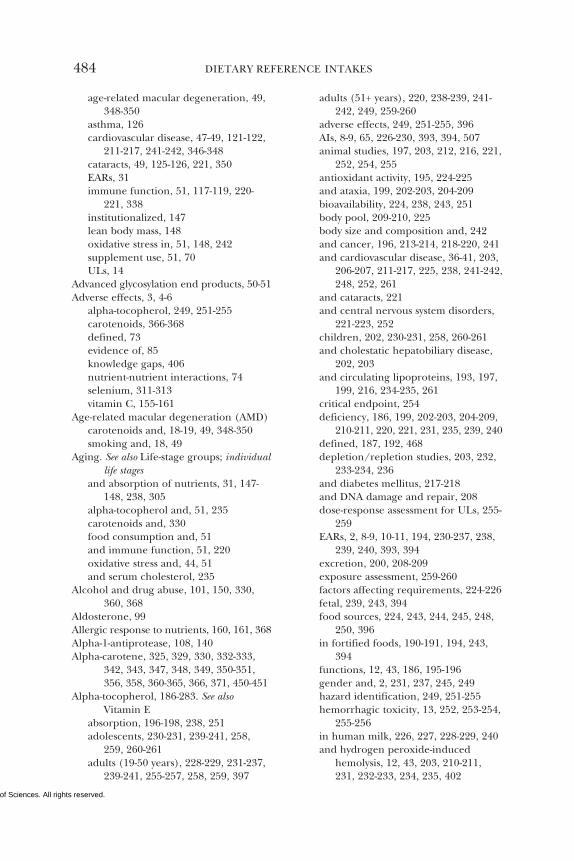
Copyright © National Academy of Sciences. All rights reserved.
484 DIETARY REFERENCE INTAKES
age-related macular degeneration, 49,348-350
asthma, 126cardiovascular disease, 47-49, 121-122,
211-217, 241-242, 346-348cataracts, 49, 125-126, 221, 350EARs, 31immune function, 51, 117-119, 220-
221, 338institutionalized, 147lean body mass, 148oxidative stress in, 51, 148, 242supplement use, 51, 70ULs, 14
Advanced glycosylation end products, 50-51Adverse effects, 3, 4-6
alpha-tocopherol, 249, 251-255carotenoids, 366-368defined, 73evidence of, 85knowledge gaps, 406nutrient-nutrient interactions, 74selenium, 311-313vitamin C, 155-161
Age-related macular degeneration (AMD)carotenoids and, 18-19, 49, 348-350smoking and, 18, 49
Aging. See also Life-stage groups; individuallife stages
and absorption of nutrients, 31, 147-148, 238, 305
alpha-tocopherol and, 51, 235carotenoids and, 330food consumption and, 51and immune function, 51, 220oxidative stress and, 44, 51and serum cholesterol, 235
Alcohol and drug abuse, 101, 150, 330,360, 368
Aldosterone, 99Allergic response to nutrients, 160, 161, 368Alpha-1-antiprotease, 108, 140Alpha-carotene, 325, 329, 330, 332-333,
342, 343, 347, 348, 349, 350-351,356, 358, 360-365, 366, 371, 450-451
Alpha-tocopherol, 186-283. See alsoVitamin E
absorption, 196-198, 238, 251adolescents, 230-231, 239-241, 258,
259, 260-261adults (19-50 years), 228-229, 231-237,
239-241, 255-257, 258, 259, 397
adults (51+ years), 220, 238-239, 241-242, 249, 259-260
adverse effects, 249, 251-255, 396AIs, 8-9, 65, 226-230, 393, 394, 507animal studies, 197, 203, 212, 216, 221,
252, 254, 255antioxidant activity, 195, 224-225and ataxia, 199, 202-203, 204-209bioavailability, 224, 238, 243, 251body pool, 209-210, 225body size and composition and, 242and cancer, 196, 213-214, 218-220, 241and cardiovascular disease, 36-41, 203,
206-207, 211-217, 225, 238, 241-242,248, 252, 261
and cataracts, 221and central nervous system disorders,
221-223, 252children, 202, 230-231, 258, 260-261and cholestatic hepatobiliary disease,
202, 203and circulating lipoproteins, 193, 197,
199, 216, 234-235, 261critical endpoint, 254deficiency, 186, 199, 202-203, 204-209,
210-211, 220, 221, 231, 235, 239, 240defined, 187, 192, 468depletion/repletion studies, 203, 232,
233-234, 236and diabetes mellitus, 217-218and DNA damage and repair, 208dose-response assessment for ULs, 255-
259EARs, 2, 8-9, 10-11, 194, 230-237, 238,
239, 240, 393, 394excretion, 200, 208-209exposure assessment, 259-260factors affecting requirements, 224-226fetal, 239, 243, 394food sources, 224, 243, 244, 245, 248,
250, 396in fortified foods, 190-191, 194, 243,
394functions, 12, 43, 186, 195-196gender and, 2, 231, 237, 245, 249hazard identification, 249, 251-255hemorrhagic toxicity, 13, 252, 253-254,
255-256in human milk, 226, 227, 228-229, 240and hydrogen peroxide-induced
hemolysis, 12, 43, 203, 210-211,231, 232-233, 234, 235, 402
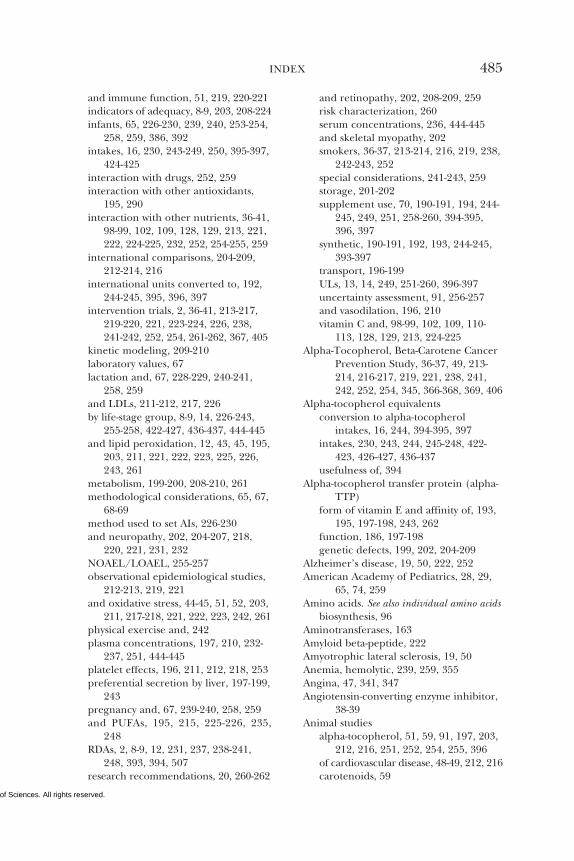
Copyright © National Academy of Sciences. All rights reserved.
INDEX 485
and immune function, 51, 219, 220-221indicators of adequacy, 8-9, 203, 208-224infants, 65, 226-230, 239, 240, 253-254,
258, 259, 386, 392intakes, 16, 230, 243-249, 250, 395-397,
424-425interaction with drugs, 252, 259interaction with other antioxidants,
195, 290interaction with other nutrients, 36-41,
98-99, 102, 109, 128, 129, 213, 221,222, 224-225, 232, 252, 254-255, 259
international comparisons, 204-209,212-214, 216
international units converted to, 192,244-245, 395, 396, 397
intervention trials, 2, 36-41, 213-217,219-220, 221, 223-224, 226, 238,241-242, 252, 254, 261-262, 367, 405
kinetic modeling, 209-210laboratory values, 67lactation and, 67, 228-229, 240-241,
258, 259and LDLs, 211-212, 217, 226by life-stage group, 8-9, 14, 226-243,
255-258, 422-427, 436-437, 444-445and lipid peroxidation, 12, 43, 45, 195,
203, 211, 221, 222, 223, 225, 226,243, 261
metabolism, 199-200, 208-210, 261methodological considerations, 65, 67,
68-69method used to set AIs, 226-230and neuropathy, 202, 204-207, 218,
220, 221, 231, 232NOAEL/LOAEL, 255-257observational epidemiological studies,
212-213, 219, 221and oxidative stress, 44-45, 51, 52, 203,
211, 217-218, 221, 222, 223, 242, 261physical exercise and, 242plasma concentrations, 197, 210, 232-
237, 251, 444-445platelet effects, 196, 211, 212, 218, 253preferential secretion by liver, 197-199,
243pregnancy and, 67, 239-240, 258, 259and PUFAs, 195, 215, 225-226, 235,
248RDAs, 2, 8-9, 12, 231, 237, 238-241,
248, 393, 394, 507research recommendations, 20, 260-262
and retinopathy, 202, 208-209, 259risk characterization, 260serum concentrations, 236, 444-445and skeletal myopathy, 202smokers, 36-37, 213-214, 216, 219, 238,
242-243, 252special considerations, 241-243, 259storage, 201-202supplement use, 70, 190-191, 194, 244-
245, 249, 251, 258-260, 394-395,396, 397
synthetic, 190-191, 192, 193, 244-245,393-397
transport, 196-199ULs, 13, 14, 249, 251-260, 396-397uncertainty assessment, 91, 256-257and vasodilation, 196, 210vitamin C and, 98-99, 102, 109, 110-
113, 128, 129, 213, 224-225Alpha-Tocopherol, Beta-Carotene Cancer
Prevention Study, 36-37, 49, 213-214, 216-217, 219, 221, 238, 241,242, 252, 254, 345, 366-368, 369, 406
Alpha-tocopherol equivalentsconversion to alpha-tocopherol
intakes, 16, 244, 394-395, 397intakes, 230, 243, 244, 245-248, 422-
423, 426-427, 436-437usefulness of, 394
Alpha-tocopherol transfer protein (alpha-TTP)
form of vitamin E and affinity of, 193,195, 197-198, 243, 262
function, 186, 197-198genetic defects, 199, 202, 204-209
Alzheimer’s disease, 19, 50, 222, 252American Academy of Pediatrics, 28, 29,
65, 74, 259Amino acids. See also individual amino acids
biosynthesis, 96Aminotransferases, 163Amyloid beta-peptide, 222Amyotrophic lateral sclerosis, 19, 50Anemia, hemolytic, 239, 259, 355Angina, 47, 341, 347Angiotensin-converting enzyme inhibitor,
38-39Animal studies
alpha-tocopherol, 51, 59, 91, 197, 203,212, 216, 251, 252, 254, 255, 396
of cardiovascular disease, 48-49, 212, 216carotenoids, 59
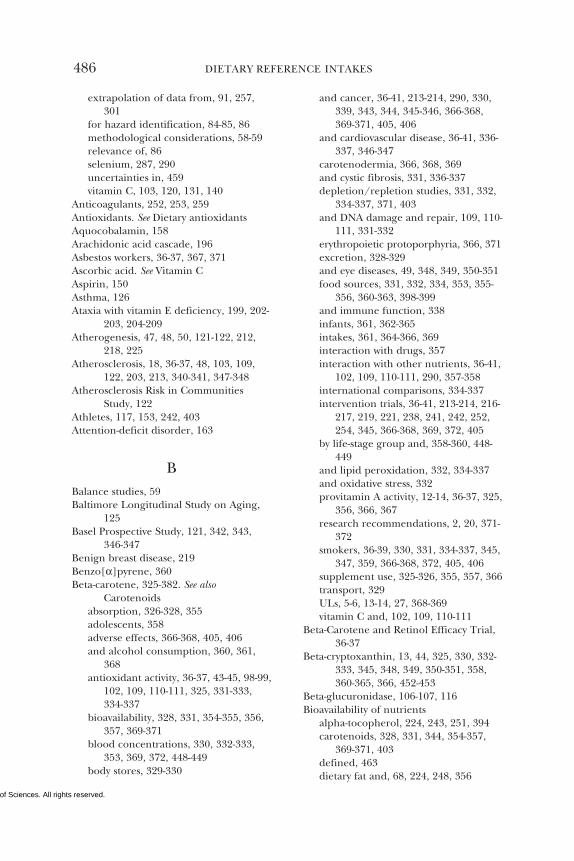
Copyright © National Academy of Sciences. All rights reserved.
486 DIETARY REFERENCE INTAKES
extrapolation of data from, 91, 257,301
for hazard identification, 84-85, 86methodological considerations, 58-59relevance of, 86selenium, 287, 290uncertainties in, 459vitamin C, 103, 120, 131, 140
Anticoagulants, 252, 253, 259Antioxidants. See Dietary antioxidantsAquocobalamin, 158Arachidonic acid cascade, 196Asbestos workers, 36-37, 367, 371Ascorbic acid. See Vitamin CAspirin, 150Asthma, 126Ataxia with vitamin E deficiency, 199, 202-
203, 204-209Atherogenesis, 47, 48, 50, 121-122, 212,
218, 225Atherosclerosis, 18, 36-37, 48, 103, 109,
122, 203, 213, 340-341, 347-348Atherosclerosis Risk in Communities
Study, 122Athletes, 117, 153, 242, 403Attention-deficit disorder, 163
BBalance studies, 59Baltimore Longitudinal Study on Aging,
125Basel Prospective Study, 121, 342, 343,
346-347Benign breast disease, 219Benzo[α]pyrene, 360Beta-carotene, 325-382. See also
Carotenoidsabsorption, 326-328, 355adolescents, 358adverse effects, 366-368, 405, 406and alcohol consumption, 360, 361,
368antioxidant activity, 36-37, 43-45, 98-99,
102, 109, 110-111, 325, 331-333,334-337
bioavailability, 328, 331, 354-355, 356,357, 369-371
blood concentrations, 330, 332-333,353, 369, 372, 448-449
body stores, 329-330
and cancer, 36-41, 213-214, 290, 330,339, 343, 344, 345-346, 366-368,369-371, 405, 406
and cardiovascular disease, 36-41, 336-337, 346-347
carotenodermia, 366, 368, 369and cystic fibrosis, 331, 336-337depletion/repletion studies, 331, 332,
334-337, 371, 403and DNA damage and repair, 109, 110-
111, 331-332erythropoietic protoporphyria, 366, 371excretion, 328-329and eye diseases, 49, 348, 349, 350-351food sources, 331, 332, 334, 353, 355-
356, 360-363, 398-399and immune function, 338infants, 361, 362-365intakes, 361, 364-366, 369interaction with drugs, 357interaction with other nutrients, 36-41,
102, 109, 110-111, 290, 357-358international comparisons, 334-337intervention trials, 36-41, 213-214, 216-
217, 219, 221, 238, 241, 242, 252,254, 345, 366-368, 369, 372, 405
by life-stage group and, 358-360, 448-449
and lipid peroxidation, 332, 334-337and oxidative stress, 332provitamin A activity, 12-14, 36-37, 325,
356, 366, 367research recommendations, 2, 20, 371-
372smokers, 36-39, 330, 331, 334-337, 345,
347, 359, 366-368, 372, 405, 406supplement use, 325-326, 355, 357, 366transport, 329ULs, 5-6, 13-14, 27, 368-369vitamin C and, 102, 109, 110-111
Beta-Carotene and Retinol Efficacy Trial,36-37
Beta-cryptoxanthin, 13, 44, 325, 330, 332-333, 345, 348, 349, 350-351, 358,360-365, 366, 452-453
Beta-glucuronidase, 106-107, 116Bioavailability of nutrients
alpha-tocopherol, 224, 243, 251, 394carotenoids, 328, 331, 344, 354-357,
369-371, 403defined, 463dietary fat and, 68, 224, 248, 356
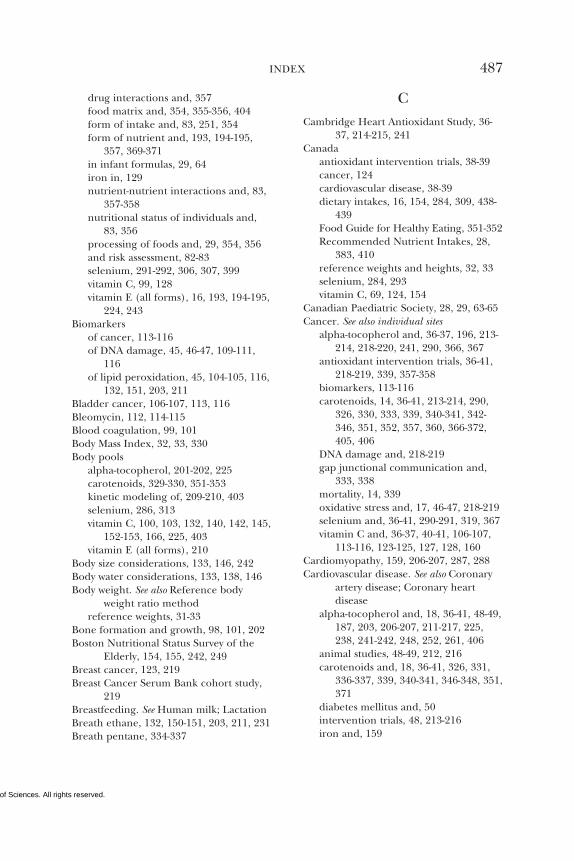
Copyright © National Academy of Sciences. All rights reserved.
INDEX 487
drug interactions and, 357food matrix and, 354, 355-356, 404form of intake and, 83, 251, 354form of nutrient and, 193, 194-195,
357, 369-371in infant formulas, 29, 64iron in, 129nutrient-nutrient interactions and, 83,
357-358nutritional status of individuals and,
83, 356processing of foods and, 29, 354, 356and risk assessment, 82-83selenium, 291-292, 306, 307, 399vitamin C, 99, 128vitamin E (all forms), 16, 193, 194-195,
224, 243Biomarkers
of cancer, 113-116of DNA damage, 45, 46-47, 109-111,
116of lipid peroxidation, 45, 104-105, 116,
132, 151, 203, 211Bladder cancer, 106-107, 113, 116Bleomycin, 112, 114-115Blood coagulation, 99, 101Body Mass Index, 32, 33, 330Body pools
alpha-tocopherol, 201-202, 225carotenoids, 329-330, 351-353kinetic modeling of, 209-210, 403selenium, 286, 313vitamin C, 100, 103, 132, 140, 142, 145,
152-153, 166, 225, 403vitamin E (all forms), 210
Body size considerations, 133, 146, 242Body water considerations, 133, 138, 146Body weight. See also Reference body
weight ratio methodreference weights, 31-33
Bone formation and growth, 98, 101, 202Boston Nutritional Status Survey of the
Elderly, 154, 155, 242, 249Breast cancer, 123, 219Breast Cancer Serum Bank cohort study,
219Breastfeeding. See Human milk; LactationBreath ethane, 132, 150-151, 203, 211, 231Breath pentane, 334-337
CCambridge Heart Antioxidant Study, 36-
37, 214-215, 241Canada
antioxidant intervention trials, 38-39cancer, 124cardiovascular disease, 38-39dietary intakes, 16, 154, 284, 309, 438-
439Food Guide for Healthy Eating, 351-352Recommended Nutrient Intakes, 28,
383, 410reference weights and heights, 32, 33selenium, 284, 293vitamin C, 69, 124, 154
Canadian Paediatric Society, 28, 29, 63-65Cancer. See also individual sites
alpha-tocopherol and, 36-37, 196, 213-214, 218-220, 241, 290, 366, 367
antioxidant intervention trials, 36-41,218-219, 339, 357-358
biomarkers, 113-116carotenoids, 14, 36-41, 213-214, 290,
326, 330, 333, 339, 340-341, 342-346, 351, 352, 357, 360, 366-372,405, 406
DNA damage and, 218-219gap junctional communication and,
333, 338mortality, 14, 339oxidative stress and, 17, 46-47, 218-219selenium and, 36-41, 290-291, 319, 367vitamin C and, 36-37, 40-41, 106-107,
113-116, 123-125, 127, 128, 160Cardiomyopathy, 159, 206-207, 287, 288Cardiovascular disease. See also Coronary
artery disease; Coronary heartdisease
alpha-tocopherol and, 18, 36-41, 48-49,187, 203, 206-207, 211-217, 225,238, 241-242, 248, 252, 261, 406
animal studies, 48-49, 212, 216carotenoids and, 18, 36-41, 326, 331,
336-337, 339, 340-341, 346-348, 351,371
diabetes mellitus and, 50intervention trials, 48, 213-216iron and, 159
Copyright © National Academy of Sciences. All rights reserved.
488 DIETARY REFERENCE INTAKES
LDLs and, 47-48, 50, 211-212lipid peroxidation and, 225mortality, 339observational studies, 212-213oxidative stress and, 18, 47-49, 50, 101-
102, 225RNA/ROS and, 216selenium and, 40-41, 287, 288smokers, 37-39, 48-49, 103, 106-107,
216, 238, 252, 347vitamin C and, 18, 38-41, 101-102, 106-
107, 109, 121-122, 127, 128, 346-347women, 38-41, 121, 122, 212, 347
Carnitine biosynthesisiron and, 120vitamin C and, 95, 96, 99, 120, 153,
166Carotene and Retinol Efficacy Trial
(CARET), 36, 345, 367, 368, 369Carotenodermia, 366, 368, 464Carotenoids, 325-382. See also Beta-
carotene; other individual carotenoidsabsorption, 326, 328, 330, 354, 355, 356adolescents, 355, 358adults (19-50 years), 330-331, 334-337,
339-345, 364-365adults (51+ years), 336-337, 338, 340-
341, 347, 348-351adverse effects, 366-368, 405, 406and age-related macular degeneration,
18-19, 49, 326, 340-341, 348-350,371, 403
aging and, 330alcohol consumption and, 330, 360,
361, 368allergic reactions, 368antioxidant activity, 36-37, 43-45, 98-99,
102, 109, 110-111, 325, 326, 331-333, 334-337
bioavailability, 328, 331, 344, 354-357,369-371
blood concentrations, 329-330, 332-333, 338, 346, 351-353, 358, 368,448-457
body mass index and, 330body stores, 329-330, 351-353and cancer, 36-41, 213-214, 290, 326,
330, 333, 339, 340-341, 342-346, 351,352, 357, 360, 366-372, 405, 406
and cardiovascular disease, 18, 36-41,326, 331, 336-337, 340-341, 346-348,351, 371
and cataracts, 18, 326, 340-341, 350-351children, 338, 355, 356, 358, 368cholesterol and, 330and cystic fibrosis, 331, 336-337depletion/repletion studies, 331, 332,
334-337, 371, 403dietary fat and, 356and DNA damage and repair, 109, 110-
111, 331-332, 336-337dose-response assessment for ULs, 368-
369DRIs, 12-13, 16, 325excretion, 328-329exposure assessment, 369fat substitutes and, 357food sources, 325, 331, 332, 334, 342,
344-345, 346, 349-350, 351-352, 353,354, 355-356, 360-363, 368, 371,398-399
functions, 12, 43, 325, 326and gap junctional communication,
333, 338gender and, 330, 351, 364-365hazard identification, 366-368health effects, 326, 338-351, 403-404in human milk, 361, 362-366and immune function, 326, 338indicators of adequacy, 325, 331-353infants, 361, 362-366, 368intakes, 361, 364-366, 369interactions with drugs, 357interactions with other nutrients, 36-
41, 102, 109, 110-111, 290, 325,326, 327, 328, 330, 331, 332, 338,343, 352, 355, 356, 357-358, 366,367
international comparisons, 334-337intervention trials, 2, 14, 36-41, 213-
214, 216-217, 219, 221, 238, 241,242, 252, 254, 345-346, 353, 366-368, 369, 372, 405
lactation, 355, 362, 363by life-stage group and, 358-360, 448-
457and lipid peroxidation, 332, 334-337lipoproteins and, 329, 330, 332, 334-337
Copyright © National Academy of Sciences. All rights reserved.
INDEX 489
metabolism, 328-329methodological issues, 16, 68-69, 339,
359, 404and mortality from chronic disease, 14,
339-342, 351nonprovitamin A, 326, 327, 346, 351observational epidemiological studies,
338-339, 342-345, 346-347and oxidative stress, 332provitamin A activity, 12-14, 36-37, 43-
44, 325, 326, 327, 328, 330, 331,338, 343, 352, 355, 356, 366, 367,371, 372, 403, 467
research recommendations, 2, 20, 371-372, 403-404
risk characterization, 369-371smokers, 18, 36-39, 49, 330, 331, 334-
337, 344, 345, 347, 351, 359, 366-371, 372, 405, 406
special considerations, 358-360structure, 326, 327supplement use, 325-326, 355, 357, 366transport, 329ULs, 5-6, 13-14, 27, 366-371, 407
Catalase, 45Cataracts, 18, 49, 340-341
alpha-tocopherol and, 18, 49, 221carotenoids and, 18, 326, 340-341, 350-
351oxidative stress and, 18, 49, 350smoking and, 351vitamin C and, 18, 98, 125-126, 127
Catecholamines, 96, 127, 222-223Central nervous system disorders, 19, 50,
127, 221-223Ceruloplasmin oxidase activity, 129, 160Cervical cancer, 17, 123, 340-341, 345, 346Children, ages 1 through 13 years. See also
Life-stage groups; individual nutrientsabetalipoproteinemia, 202AIs, 65-66anemia, 355attention-deficit disorder, 163cardiomyopathy, 287, 288, 292cholestasis, 235common colds, 163cystic fibrosis, 202, 210-211, 336-337EARs, 30, 33, 65-66growth factors, 66Keshan disease, 287, 288, 292, 299-300,
301-302reference weights and heights, 31-32
supplement use, 163, 260ULs, 14, 33vitamin A deficiency, 338, 356
Cholestasis, 235Cholestatic hepatobiliary disease, 202, 203Cholesterol
aging and, 235carotenoids and, 330dietary, 99, 248LDL, 47, 330serum, 235vitamin C and, 99
Cholesterol Lowering AtherosclerosisStudy, 213
Cholestyramine, 357Chromosomal damage and aberrations,
109, 110-111, 112, 114-115Chronic cholestatic hepatobiliary disease,
202, 203Chronic obstructive pulmonary disease,
126, 127Chylomicron secretion, 196-197, 224, 330Circulating lipid levels, 234-235Cobalamins, vitamin C and, 158Cognitive function, 19, 50, 127Collagen metabolism
iron and, 118-119vitamin C and, 95, 96, 98, 99, 101, 118-
119, 166Colorectal cancer, 36-37, 113, 116, 123-
124Colorectal polyps, 113, 114-115, 219-220Common cold, 117, 126-127Complementary DNA (cDNA), 197Conjugated dienes, 104-105, 203Connective tissue synthesis, 98, 101Continuing Survey of Food Intakes by
Individuals (CSFII)alpha-tocopherol, 68, 240, 245, 247,
248, 396, 436-437carotenoids, 361, 364design, 69vitamin C, 135, 138, 432-435
Copperinfants, 129, 159-160and LDL oxidation, 211metabolism, 129and oxidative stress, 203vitamin C and, 96, 97-98, 128, 129,
156, 159-160, 161Coronary artery disease, 106-107, 121, 122,
241, 248, 336-337
Copyright © National Academy of Sciences. All rights reserved.
490 DIETARY REFERENCE INTAKES
Coronary heart disease, 18, 49, 121, 122,212, 214-215, 238, 241, 261, 341,347, 351
Corticosteroids, 99Coxsackie B3 virus, 287Cretinism, 287Critical endpoints, identification of, 88-89,
254, 313CSFII. See Continuing Survey of Food
Intakes by IndividualsCyclooxygenase-1, 196, 212, 223Cystic fibrosis, 202, 210-211, 331, 336-337
DData and database issues
alpha-tocopherol, 232, 243-248, 255,393-396
for dose-response assessment for ULs,88-89, 161, 255, 313, 315
food compostion data, 16, 19, 67-68,309, 360-361, 393-394, 396-397, 398,399
nutrient intakes, 16, 68, 69-70, 194-195,243, 309, 385
quality and completeness of data, 8-9,61-62, 67-68, 87, 309, 385, 390
selenium, 309, 310, 398-399supplement use, 70types of data used, 58-63vitamin C, 139-140, 143, 161vitamin E. See Alpha-tocopherol
Dehydroascorbic acid (DHA)absorption and transport, 99chemical structure, 96, 97in smokers, 130
Delayed dermal sensitivity, 117, 118-119,220
Dental enamel erosion, 156, 160, 161Depletion/repletion studies
alpha-tocopherol, 203, 232, 233-234,236, 402
carotenoids, 331, 332, 334-337, 371limitations of, 59, 402-403vitamin C, 108, 117, 140, 143-145, 402-
403Diabetes mellitus
alpha-tocopherol and, 217-218cardiovascular complications, 50LDLs and, 50oxidative stress and, 19, 50-51, 217-218
and platelet hyperactivity, 218type I, 106-107type II, 50, 106-107
Diabetic neuropathy, 218Diacylglycerol, 196Diarrhea. See Osmotic diarrheaDietary antioxidants
alpha-tocopherol activity, 43, 44-45, 98-99, 102, 109, 110-113, 186, 195,224-225
carotenoid activity, 36-37, 43-45, 98-99,325, 326, 331-333, 334-337
criteria for, 43-44defined, 17, 42and immune function, 407interaction among, 195, 224-225, 290,
332, 367, 404intervention trials, 36-41, 50, 219-220,
339, 348-350, 357-358mechanisms of action, 44-46selenoprotein activity, 43, 44-45, 284,
285supplement efficacy, 45, 48, 49vitamin C activity, 43, 44-45, 96, 98-99,
101-109, 116, 124-125, 139-143, 146,154, 166
Dietary intakes. See also Canada; Foodsources of nutrients; Nutrientintakes; Supplements; individualnutrients
data and database issues, 16, 68, 69-70,194-195, 243, 309, 385
day-to-day variation, 69, 385infants, 28, 65, 135, 138, 230, 307measurement errors, 68, 69, 313, 359,
385-386research recommendations, 165-166,
406self-reported, 60, 68, 385, 396smokers, 130, 359, 360survey data, 245-247underreporting of, 16, 60, 68, 69, 186,
232, 240, 247-248, 385, 390, 393,395-396
Dietary Reference Intakes (DRIs)applicable population, 22categories, 2, 3, 22-27; see also
Adequate Intakes; EstimatedAverage Requirements;Recommended Dietary Allowances;Tolerable Upper Intake Levels
criteria for, 6-11, 12-13, 42
Copyright © National Academy of Sciences. All rights reserved.
INDEX 491
defined, 2-6, 21-22, 33extrapolation from other age groups,
65-67, 91framework, 384, 410-412group applications, 14-16, 25, 387-391,
392-393, 398individual applications, 4, 15, 22, 384-
386, 392, 398nutrient-specific considerations, 393-399origin, 409-410parameters for, 27-33; see also Life-stage
groups; Reference weights andheights
precision of values, 8-11risk of inadequacy, 15-16sources of data, 6-7; see also
Methodological considerationsuses, 4, 14-16, 383-399
DNA damage and repairadduct formation, 106-107, 116, 208alpha-tocopherol and, 109, 110-113, 208biomarkers of, 45, 46-47, 109-111, 116and cancer, 46-47, 113-116, 218-219carotenoids and, 109, 110-111, 331-
332, 336-337, 360ex vivo, 112-113, 114-115, 116, 130in gastric mucosa, 106-107, 116glutathione and, 109-110ionizing radiation and, 46, 112, 130iron and, 109, 160lymphocytes, 110-111, 112, 114-115oxidative stress and, 46-47, 109repair enzymes, 106-107, 116RNS and, 116smoking and, 110-113, 130-131, 360vitamin A and, 112-113vitamin C and, 98, 109-115, 116, 130-
131, 160Dopamine, 222-223Dopamine-β-hydroxylase, 96, 98Dose-response assessment for ULs
adolescents, 162-164, 258, 315-316adults (19-50 years), 161-162, 255-257,
313-315alpha-tocopherol, 255-259carotenoids, 368-369children, 162-164, 258, 315-316components and process, 85, 88-92critical endpoints, 88-89, 161, 254, 313data selection, 88-89, 161, 255, 313, 315defined, 77-78, 464
infants, 162, 258, 315-316lactation, 164, 258, 315NOAEL/LOAEL identification, 89-90,
161-162, 255-256, 314, 316pregnancy, 163-164, 258, 315selenium, 313-316special considerations, 92, 164-165, 259UL derivation from, 91-92, 162, 257,
315, 316uncertainty assessment, 90-91, 162,
256-257, 315, 316vitamin C, 161-165vitamin E. See Alpha-tocopherol
Down’s syndrome, 222Drinking water, 309-310, 311, 317, 399Drug abuse. See Alcohol and drug abuseDrug interactions
with alpha-tocopherol, 40-41, 252, 259with carotenoids, 357with vitamin C, 99, 150
Dyspepsia, 106-107, 116
EElastin, 98Elderly people. See Adults, 51+ yearsEmbryogenesis, 285Emotional stress, 153Endothelial cells
dysfunction, 103, 106-107, 131monocyte adhesion to, 103
Endothelium-dependent vasodilation, 106-107, 131
Endothelium-derived relaxing factor, 103Energy expenditures, 24-25Energy intakes, 60, 68, 69, 247, 396Energy status
and antioxidant interactions, 224-225and PUFA metabolism, 226
Epinephrine, 96Erythrocyte
glutathione, 128hydrogen peroxide-induced lysis, 210-
211, 231vitamin C, 140
Erythropoietic protoporphyria, 366, 371Esophageal cancer, 367Established Populations for
Epidemiological Studies of theElderly, 122, 213
Copyright © National Academy of Sciences. All rights reserved.
492 DIETARY REFERENCE INTAKES
Estimated Average Requirements (EARs).See also individual nutrients
children, 30, 33, 65-66coefficient of variation, 3, 24-25criteria used to derive, 6-7, 8-11defined, 3, 5, 23, 24evidence considered, 10-11, 25extrapolation to/from other age
groups, 65-66group applications, 15, 387-390, 392knowledge gaps, 402-404methods used to set, 25, 43, 65-66, 402-
404and RDA, 2-4, 23-25reference weight and height and, 31-
33risk of inadequacy, 24standard deviation, 3, 23-24uses, 15, 23, 25, 383, 384-386, 387-390,
392-393Ethane, 132, 150-151, 203, 211, 231Ethical considerations, 84European Commission Concerted Action
on Fundamental Food, 42Exposure
duration of, 86route of, 86, 256
Exposure assessmentalpha-tocopherol, 259-260carotenoids, 369defined, 77, 78process, 92selenium, 317supplements, 92vitamin C, 165
Extrapolation of datafrom animal studies, 91, 257body weight basis, 65-66, 138-139, 163-
164, 230-231, 258-259, 299-300, 315-316
from one gender group to another,146-147, 235, 237
from other age groups, 25, 26, 65-66,138-139, 163-164, 166, 230, 231,258-259, 299-300, 315-316
NOAEL from LOAEL, 162, 256-257from subchronic to chronic intake, 257
Eye Disease Case-Control Study, 348Eye diseases. See also Age-related macular
degeneration; Cataractsalpha-tocopherol and, 18, 49, 221
antioxidant intervention trials, 40-41,348-350
carotenoids and, 49, 348, 349, 350-351vitamin C and, 18, 125-126
FFamilial hypercholesterolemia, 47Fat, dietary
and alpha-tocopherol, 68, 225-226,235, 248, 396
and carotenoid, 356intakes, 16, 68, 69, 232, 247, 248, 261,
396malabsorption syndromes, 202, 404and MOPD, 349
Fat substitutes, 357Fatty streak lesions, 47F2-isoprostanes, 45, 48, 203, 217-218, 464Ferritin, 159Ferrous oxidation/xylenol orange (FOX)
assay, 46Fetal nutrition. See also Pregnancy
alpha-tocopherol, 67, 239, 243, 258, 394selenium, 67, 306, 315vitamin C, 67, 149, 150, 163
Fibrillin, 98Fibronectin, 98Flavonoids, 98-99, 102, 128, 129, 225Foam cells, 47-48Food and Agriculture Organization, 22,
73-74, 79Food and Drug Administration, 309Food composition data
analytical methods, 67carotenoids, 360-361, 364-365, 369quality and completeness of, 68-69,
309, 390, 393-394, 399recommendations, 19, 396-397selenium, 309, 398-399vitamin C, 154, 390vitamin E, 19, 68-69, 244-248, 393-394
Food matrix and bioavailability ofnutrients, 250, 354, 355-356, 404
Food sources. See also Fortified foodsalpha-tocopherol, 224, 243, 244, 245,
248, 250, 396carotenoids, 325, 331, 332, 334, 342,
344-345, 346, 349-350, 351-352, 353,354, 355-356, 360-363, 368, 371,398-399
Copyright © National Academy of Sciences. All rights reserved.
INDEX 493
selenium, 286, 292, 298-299, 308, 309,397
vitamin C, 101, 130, 154, 392Formulas, infant
AIs, 386, 391, 392alpha-tocopherol, 230bioavailability of nutrients, 29, 64carotenoids, 361DRIs, 28-29selenium, 310, 399vitamin C, 101, 135
Fortified foods. See also Formulas, infantalpha-tocopherol in, 12, 16, 190-191,
243, 394selenium in, 286ULs and, 5, 26, 74
Fruits and vegetables, 17, 18, 45, 47, 130,133, 154, 245, 342, 344-345, 346,351, 353, 355, 368, 371
Furunculosis, 117, 118-119
GGastric cancer, 36-37, 106-107, 113, 114-
115, 116, 124-125, 196, 290, 367Gastric mucosa
DNA damage, 106-107, 116nitrotyrosine, 102, 106-107, 116oxidant scavengers, 95, 102, 116, 124
Gastritis, 102, 106-107, 113, 116, 124-125Gastrointestinal effects
of vitamin C, 95, 100, 102, 106-107, 124-125, 156, 161-162, 163, 166, 386, 393
Gender. See also Men; Women; individualnutrients
and cataracts, 351dietary intakes, 15-16, 154, 165, 245-
247, 259-260, 364-365extrapolation of data on basis of, 146-
147, 235, 237and Keshan disease, 299, 304and lean body mass, 2, 65, 146-147and metabolism, 20, 133, 403, 407reference weights and heights, 32and relative body weight, 65-66, 138and supplement use, 70, 260
Genetic defects, in alpha-TTP, 199, 202,204-209
Genetic markers of disease susceptibility,60
Geographic differences in nutrientintakes, 309, 311-312, 315, 316, 317,318-319
Gingivitis, 120GISSI Prevention Trial, 38-39, 215, 216,
217, 238, 241, 242, 252Glial cells, 98Glucose-6-phosphate dehydrogenase
deficiency, 160-161, 164Glutathione
and asthma, 126deficiency, 128and DNA damage, 109-110erythrocyte, 128and oxidative stress, 128, 129, 224reduced, 104-105, 128, 225vitamin C and, 43, 96, 98, 99, 103, 105,
109-110, 126, 128, 129Glutathione peroxidase activity, 12, 45,
284, 285, 286, 289-290, 293, 299,301-302, 303, 304, 318
Growth factors, 66Growth velocity, 28, 64Gulonolactone oxidase, 95-96Gun blue, 312, 465
HHazard identification
adverse effects, 85, 155-161, 249, 251-255, 311-313, 366-368
alpha-tocopherol, 249, 251-255animal studies, 84-85, 86carotenoids, 366-368causality, 85-86components of, 85-88data quality and completeness and, 87data sources, 84-85defined, 77, 465experimental data on nutrient toxicity
and, 86mechanisms of toxicity and, 87pharmacokinetic and metabolic data
and, 86-87selenium, 311-313sensitive subpopulations, 87-88vitamin C, 155-161
Health Canada, 410, 438-439Heart Outcomes Prevention Evaluation
Study, 38-39, 216, 217, 241, 242, 252
Copyright © National Academy of Sciences. All rights reserved.
494 DIETARY REFERENCE INTAKES
Helicobacter pylori infection, 106-107, 113,116, 124-125
Hemochromatosis, 158, 159, 160, 164Hemolysis
hydrogen peroxide-induced, 12, 43,186, 203, 210-211, 231, 232-233,234, 235, 402
in infants, 162, 163-164, 166Hemorrhagic toxicity, 13, 252, 253-254,
255-256Hemostatic dysfunction, 131High-altitude resistance, 160High-density lipoproteins, 329Human immunodeficiency virus (HIV),
338Human milk. See also Lactation
alpha-tocopherol in, 226, 227, 228-229,240, 386
analysis of nutrient content, 227carotenoids in, 361, 362-366colostrum, 227, 293, 294fore milk, 293, 464hind milk, 293, 465intakes, 28, 65, 135, 138, 151, 227, 230,
298, 307, 391interindividual variation in nutrients,
293, 295selenium in, 292-298, 307, 315, 316smokers, 132vitamin C in, 101, 132, 134-138, 151,
164, 386vitamin E (all forms), 227, 228-229
Human studiesethical considerations, 84for hazard identification, 84methodological considerations, 59
Hydrogen peroxide, 112, 130-131Hydrogen peroxide-induced hemolysis,
12, 43, 186, 203, 210-211, 231, 232-233, 234, 235, 402
Hydroxynonenal, 104-1054-Hydroxyphenylpyruvatedioxygenase, 968-Hydroxy-7,8-dihydro-2´-deoxyguanosine
(8-oxoxdG), 109, 110-113, 131Hypercholesterolemia, 47, 106-107, 226Hypertension, 106-107Hypertriglyceridemia, 50Hypervitaminosis A, 368Hypochlorous acid (HOCl), 108, 140Hypovitaminosis C, 132, 153
IImmune function
aging and, 51, 220alpha-tocopherol, 51, 220-221assessment of antioxidant role, 407carotenoids and, 326, 338measures of, 118-119vitamin C and, 108, 117-119, 127
Indicators of nutrient adequacy. See alsospecific indicators, life stages, andnutrients
defined, 27risk reduction-based, 3, 27, 42
Infants, premature, 129, 159-160, 227,239, 253-254, 259
Infants, 0 to 12 months. See also Formulas,infant; Human milk
ages 0 through 6 months, 29, 64, 66ages 7 through 12 months, 29, 64-65, 66AI derivation for, 4, 28-29, 63-65, 391,
392cretinism, 287dietary intakes, 28, 65, 135, 138, 227,
230, 298, 307, 391growth velocity, 28, 64hemolysis, 162, 163-164, 166methodological considerations, 63-65,
66oxidant damage, 162, 166recommended food sources, 28-29reference weight, 32scurvy, 135, 159, 161, 162, 163-164, 166solid foods, 29, 64, 151, 293, 298-299special considerations, 160, 259ULs, 14
Infectious and inflammatory stresses, 103,108, 130
Intake assessment to derive ULs. SeeExposure assessment
Interactions. See Nutrient-nutrientinteractions
Intercellular cell adhesion molecule(ICAM-1), 196, 212, 223
International Atomic Energy Agency(IAEA), 22, 74
International comparisonsalpha-tocopherol, 204-209, 212-214, 216antioxidant intervention trials, 36-41cardiovascular disease, 121carotenoids, 334-337vitamin C, 121, 123, 124, 127, 135, 153
Copyright © National Academy of Sciences. All rights reserved.
INDEX 495
Intervention trialsalpha-tocopherol, 2, 36-41, 213-217,
219-220, 221, 223-224, 226, 238,241-242, 252, 254, 261-262, 367,405
antioxidants, 36-41, 50, 218-220, 339,357-358
cancer, 36-41, 219-220, 345-346cardiovascular disease, 36-41, 213-217carotenoids, 2, 14, 36-41, 213-214, 216-
217, 219, 221, 238, 241, 242, 252,254, 345-346, 353, 366-368, 369,372, 405
eye diseases, 40-41, 348-350intakes above ULs, 13, 27, 74, 155, 165,
249, 260methodological issues, 58, 61selenium, 36-41, 290, 303-304, 311,
318, 319, 367, 405vitamin C, 38-39, 405
Intestinal parasites, 356Intracellular glutathione peroxidase, 289Intracellular recycling, 108Iodothyronine deiodinases, 285Iowa Women’s Health Study, 122, 123Iron
absorption, 129, 158, 159, 161bioavailability, 129cardiovascular disease, 159and carnitine biosynthesis, 120and collagen metabolism, 118-119and DNA damage and repair, 109, 160infants, 159and lipid peroxidation, 159, 221metabolism, 129and MOPD, 349and neurodegenerative diseases, 221overload, 158, 166transfer and storage, 129and vitamin C, 96, 97-98, 99, 109, 118-
119, 120, 128, 129, 158, 159, 160,161, 164, 166
Ischemic heart disease, 36-37, 214, 216,341, 346-347
Isoprostane excretion, 95, 102, 130
KKashin-Beck disease, 12, 43, 287, 465Keshan disease, 12, 43, 287, 288, 292, 299-
300, 301-302, 304, 465
Kidney stones, 156, 157, 160Kinetic modeling of body pools, 209-210,
403
LLaboratory values
analytical considerations, 62-63, 139-140, 143, 231-232
estimates of, 67, 404Lactation. See also Human milk; individual
nutrientsderivation of DRIs for, 31length of, 134-135, 151methodological considerations, 67preterm delivery and, 227stage of, 228-229, 293, 294-297ULs, 82
Laryngeal cancer, 17Latinos, vitamin C, 132Lean body mass, 133, 138, 146, 148Leukocytes, vitamin C in, 43, 95, 103, 108-
109, 110-111, 130, 133, 139, 140,141, 142, 144, 146, 147, 148, 150
Leukopenia, 368Life-stage groups. See also Adolescents;
Adults; Children; Infants; Lactation;Pregnancy; individual nutrients
Body Mass Index by categories, 27-31and derivation of DRIs, 27-31intakes of nutrients by, 416-439serum nutrient values by, 440-457supplement use by, 70ULs by, 14
Linoleic acid, 235, 248Linxian Cancer Prevention Study, 36-37Lipid-lowering drugs, 357Lipid peroxidation
alpha-tocopherol and, 12, 43, 45, 186,195, 203, 211, 221, 222, 223, 225,226, 243, 261, 405
biomarkers/measures of, 45, 104-105,116, 132, 151, 203, 211
and cardiovascular disease, 225carotenoids and, 332, 334-337iron and, 159, 221and neurodegenerative diseases, 221-
222in passive smokers, 153pregnancy and, 150-151selenium and, 287
Copyright © National Academy of Sciences. All rights reserved.
496 DIETARY REFERENCE INTAKES
in smokers, 104-105, 130, 131, 132,150-151, 153
vitamin C and, 45, 95, 98, 102, 104-105, 109, 116, 130, 131, 132, 146,150-151, 153, 159
Lipid Research Clinics Coronary PrimaryPrevention Trial, 347
Lipoprotein lipase, 330Lipoproteins. See also High-denisty
lipoproteins; Low-densitylipoproteins
alpha-tocopherol and, 193, 197, 199,216, 234-235, 261, 405
carotenoids and, 329, 330Liver fluke infection, 106-107Liver necrosis, 287Low-density lipoproteins (LDLs)
alpha-tocopherols and, 211, 217, 226and cardiovascular disease, 47-48, 50,
211-212carotenoids and, 329, 332, 334-337copper and, 211defined, 79, 466and diabetes mellitus, 50oxidation, 18, 47-48, 50, 211, 226, 405smoking and, 130, 132, 153vitamin C and, 98, 101-102, 104-105,
109, 132, 153Low-fat diets, 226, 248, 356Lowest-Observed-Adverse-Effect Level
(LOAEL)alpha-tocopherol, 255-257extrapolation of NOAEL from, 162,
256-257identification of, 89-90, 161-162, 255-
256, 314instead of NOAEL, 91selenium, 314, 318sensitive subpopulations and, 92vitamin C, 161-162, 163
Lung cancerbeta-carotene and, 13-14, 340-341, 342-
343, 345-346smoking and, 36-39, 124, 213-214, 219,
360, 366-371, 372, 405, 406Lung lesions, 254
oxidant scavengers, 95, 108Lutein, 18, 44, 49, 329, 330, 332-333, 343,
348, 349, 350-351, 353, 355, 357,358, 360-365, 366, 371, 454-455
Lycopene, 44, 329, 332-333, 344-345, 347,349, 350, 353, 356, 357, 358, 360-365, 366, 368, 371, 456-457
Lycopenodermia, 368, 466Lymphatic leukemia, 196Lymphocytes
DNA damage, 110-111, 112, 114-115vitamin C in, 99-100
Lysine, 98, 118-119
MMacular Pigment Optical Density
(MOPD), 349-350, 371Major histocompatibility complex II, 338Malabsorption syndromes, 202, 210-211,
404Malnutrition, protein-energy, 202, 404Malondialdehyde, 104-105, 116, 203, 334-
335Marathon runners, 117, 118-119Margarine, plant sterol-enriched, 357Men. See also Gender
alcohol consumption, 361, 368alpha-tocopherol, 49, 232-233, 235,
237, 245, 249, 260carotenoids, 49, 338, 349, 351, 353,
359, 361, 368cataracts, 49, 351dietary intakes, 154, 165, 245immune response, 338Keshan disease, 301-302kidney stone formation, 157MOPD values, 349smokers, 359supplement use, 249, 260vitamin C, 95, 117, 118-119, 121, 126,
133, 146, 148, 149, 154, 157, 165Metabolism of nutrients
aerobic, 46alpha-tocopherol, 195, 199-200, 208-
210, 261basal rate considerations, 24-25carotenoids, 328-329, 350copper, 129drug, 99gender differences, 20, 133, 292, 403,
407iron, 129
Copyright © National Academy of Sciences. All rights reserved.
INDEX 497
selenium, 285, 286, 299, 308vitamin C, 12, 43, 95, 100, 108, 130,
133, 148, 152-153, 157, 158Metalloenzyme reduction, 96, 97-98Methionine, 284Methionine sulfoxide, 45Methodological considerations. See also
Data and database issues;Extrapolation of data; Indicators ofnutrient adequacy; Uncertainty
AIs, 63-66alpha-tocopherol, 59, 65, 67, 68-69animal studies, 58-59, 459carotenoids, 16, 68-69, 339, 359, 404children, 65-66data limitations, 62-63depletion/repletion studies, 59, 402-403dietary intakes, 68, 69, 313, 359, 385-
386EARs, 65-66, 402-404epidemiological studies, 127-128in extrapolation of data, 62, 65-66human feeding studies, 59infants, 63-65, 66intervention trials, 58, 61kinetic modeling of body pools, 209-
210, 403laboratory assays, 67, 160, 404lactation, 67measurement errors, 68, 69, 313, 359,
385-386nutrient intake estimates, 67-69, 247,
339, 385, 404-405observational studies, 59-61, 127-128pathways to nutrient requirements, 63pregnancy, 67randomized clinical trials, 61RDAs, 66in risk assessment, 458-461types of data used, 58-63vitamin C, 67, 68-69, 127-128, 139-140weighing the evidence, 61-62
Minnesota Cancer Prevention ResearchUnit, 353
Monocyte adhesion, 103Monounsaturated fatty acids, 226Mortality from chronic disease, 14, 339-
342, 351MRC/BHF Heart Protection Study, 38-39Multiple Risk Factor Intervention Trial,
343Multiple sclerosis, 50
Myelin, 98Myeloperoxidase, 108, 109, 140Myocardial infarction, 36-41, 47, 159, 214-
215, 216, 238, 241, 312, 347Myocarditis, 287
NNational Cancer Institute, 154
Five-a-Day for Better Health Program,351
National Health and NutritionExamination Survey I (NHANES I),Epidemiological Follow-up Study,122, 124, 126, 219
National Health and NutritionExamination Survey II (NHANESII), 121, 152, 235, 248
National Health and NutritionExamination Survey III (NHANESIII)
anthropometric data, 31, 32-33carotenoids, 330, 358, 361, 364, 369,
448-457defined, 466design, 69energy intakes, 68, 69fat intakes, 68, 69, 247, 396selenium, 16, 69-70, 309, 310, 399, 428-
431, 446-447serum values of nutrients, 440-457supplement data, 70total intakes, 388, 389, 420-421, 426-
427, 430-431vitamin C, 15-16, 69-70, 133, 155, 165,
387-390, 391, 416-421, 440-443vitamin E (all forms), 16, 68, 69-70,
210, 230, 233, 244, 245-246, 247,248, 259-260, 394, 422-427, 444-445
National Health Interview Survey, 70, 249,260, 310-311, 364-365
National Health Interview SurveyEpidemiological Supplement, 249
National Nutrition Monitoring System, 383Necrotizing enterocolitis, 253Nervous system, 19, 50, 96, 98, 131, 153, 202Neurodegenerative diseases
alpha-tocopherol and, 19, 50, 186, 202,204-207, 218, 220, 221, 222, 231, 232
iron and, 221lipid peroxidation and, 221-223
Copyright © National Academy of Sciences. All rights reserved.
498 DIETARY REFERENCE INTAKES
oxidative stress and, 19, 50, 221-222ROS and, 222-223
Neuroleptic drugs, 222-223Neurons, 98, 131, 202Neuropeptide biosynthesis, 98Neurotransmitters, 95, 98, 153, 222-223Neutrophils
vitamin C in, 12, 43, 95, 98, 99-100,139, 140, 141, 143, 144-146, 150, 385
New York State Cohort Study, 123, 124Niacin, 225Nicotinamide adenine dinucleotide
(NADH), 43, 96, 98, 224-225Nicotinamide adenine dinucleotide
phosphate (NADPH), 43, 96, 98,224-225
Nitric oxide scavengers, 262Nitric oxide synthesis, 103Nitrosoproline, 106-107Nitrotyrosine, 45, 102, 106-107, 116No-Observed-Adverse-Effect Level
(NOAEL)alpha-tocopherol, 255-257defined, 79, 466extrapolation from LOAEL, 162, 256-
257identification of, 89-90, 255-256, 316LOAEL used instead of, 91selenium, 314, 316sensitive subpopulations and, 92subchronic to predict chronic, 91vitamin C, 163
Norepinephrine, 96, 98Normative requirement, 22Nurses Health Study, 123, 125-126, 212, 351Nutrient intakes. See also Dietary intakes;
Exposure assessment; individualnutrients
Canadian, 69, 154, 309, 438-439cooking losses, 154, 356day-to-day variation adjustments, 69,
385, 387, 390extrapolation from subchronic to
chronic, 257form of, 83geographic differences in, 284, 288,
309, 311-312, 315, 316, 317, 318-319interpretation of, 385-359methodological considerations, 67-69,
247, 339, 385, 404-405public health implications, 404-405
quality of data, 385, 390from supplements, 70, 155, 244-245,
249, 366total calculated, 388, 389U.S., 70, 416-431, 432-437
Nutrient-nutrient interactions. See alsospecific entries under individualnutrients
adverse, 74and bioavailability of nutrients, 83,
357-358energy status and, 224-225research recommendations, 20, 407risk assessment, 83
Nutrition Canada Survey, 32Nutrition During Lactation report, 28, 29Nutrition labels, 16, 68, 194, 243, 393-394,
396Nutritional Factors in Eye Disease Study,
365Nutritional Prevention of Cancer Study,
38-39
OO6-alkyltransferase, 106-107, 116Obese individuals, 60, 385Observational studies
alpha-tocopherol, 212-213, 219, 221cancer, 219of cardiovascular disease, 212-213carotenoids, 338-339, 342-345, 346-347hazard identification, 84methodological issues, 59-61, 127-128
Oils, edible, 16, 68, 245, 246, 250, 396Olestra, 357Ophthalmoplegia, 202Oropharyngeal cancers, 17, 341, 344, 346Osmotic diarrhea, 13, 95, 100, 154, 161-
162, 163, 166, 386, 393Oxalate excretion, 156Oxidant damage, 44-51Oxidant scavengers, 95, 102, 108, 116, 124Oxidative stress
in adults (51+ years), 51, 148, 242and age-related macular degeneration,
18-19, 49aging and, 44, 51alpha-tocopherol and, 44-45, 51, 52,
203, 211, 217-218, 221, 222, 223,242, 261
Copyright © National Academy of Sciences. All rights reserved.
INDEX 499
and asthma, 126and cancer, 17, 46-47, 218-219and cardiovascular disease, 18, 47-49,
50, 101-102, 225carotenoids and, 332and cataracts, 18, 49, 350cholestatic liver disease and, 202, 203copper and, 203defined, 44, 466and diabetes mellitus, 19, 50-51, 217-218and DNA damage, 46-47, 109glutathione and, 128, 129, 244indicators of, 20, 45-52, 102, 103, 109,
126, 128, 203, 217, 223, 407mechanisms in, 44-45, 46, 47, 50and neurodegenerative disease, 19, 50,
221-222physical exercise and, 242protective enzymes, 45selenium, 41, 43, 44-45, 52, 285smoking and, 43, 48, 102, 130, 131, 132vitamin C and, 12, 43, 95, 101-102,
109, 126, 128, 130, 131, 132, 148,152, 162, 166
8-Oxy-7,8-dihydro-2´-deoxyguanosine (8-oxodG), 46, 110, 112, 466
Oxygen demand, 156, 161Oxygen radical absorbance capacity
(ORAC) assay, 46Ozone, 108
PPancreatic cancer, 124Parkinson’s disease, 19, 50, 221-222Passive smokers, 132, 146, 153Pauling, Linus, 126-127Pectin, 357Pentane, 203, 231, 334-337Peptide hormones, amidation of, 96, 98Peptidyl-glycine monoxygenase, 96Periodontal health, 120, 156, 160, 161, 166Peripheral artery disease, 216Peroxynitrate, 45Phospholipase A2, 196, 212, 223Phospholipid transfer protein, 197Photosensitivity disorders, 366Physical exams, 164Physical exercise, 153, 242Physicians’ Health Study I, 38-39, 345-346,
367
Physicians’ Health Study II, 40-41, 252Plant phenolic compounds, 225Plasma concentration of nutrients. See
individual nutrientsPlatelet effects, 196, 211, 212, 218, 253Polyp Prevention Study, 36-37Polyunsaturated fatty acids (PUFAs)
alpha-tocopherol and, 38-39, 195, 215,225-226, 233, 235, 248
metabolism, 226Pregnancy. See also Lactation; individual
nutrientsalcohol and drug abuse, 150aspirin use, 150derivation of DRIs for, 67eclampsia, 149lipid peroxidation and, 150-151methodological considerations, 67premature birth, 149and smoking, 132, 149, 150-151special considerations, 150-151ULs, 82
Probucol, 357Proline, 98, 99, 106-107, 118-119Pro-oxidant effects of nutrients, 129, 156,
159-160, 161, 166Prostacyclin, 196, 212, 223Prostaglandin synthesis, 99Prostate cancer, 213-214, 219, 220, 290-
291, 344-345, 368, 371Protein, dietary
oxidation, 222requirements for growth, 66
Protein-energy malnutrition, 202, 404Protein kinase C inhibitors, 196, 211, 223Proteoglycans, 98Puberty. See also Adolescents
pubertal development, 30, 33
QQuercetin, 129
RRace/ethnicity
and puberty onset, 30and smoking, 132and vitamin C, 132
Radiation, ionizing, 46, 112, 130
Copyright © National Academy of Sciences. All rights reserved.
500 DIETARY REFERENCE INTAKES
Randomized clinical trials, 61Reactive nitrogen species (RNS)
and cardiovascular disease, 216and DNA damage, 116measure of activity, 102, 106-107, 116mechanism of action, 44myeloperoxidase-derived, 109, 140vitamin C and, 98, 102, 106-107, 109,
124, 140Reactive oxygen species (ROS)
and cardiovascular disease, 216and gastric cancer, 106-107, 116, 124and infectious and inflammatory
stresses, 103mechanism of action, 44and neurodegenerative diseases, 222-223smoking and, 131sources of, 46vitamin C and, 98, 102, 103, 106-107,
116, 124, 131Recommendations. See also Research
recommendationsfood composition data, 19, 396-397
Recommended Dietary Allowances(RDAs). See also individual nutrients
AI compared, 4, 25-26, 138children, 66coefficient of variation, 66criteria used to derive, 10-11defined, 3, 5, 7, 22, 23, 24EAR and, 2-4, 23-25indicators of nutrient adequacy, 6-13method used to set, 23-25, 66uses, 4, 15, 23, 383, 391, 392
Recommended Dietary Allowances (reports),21
Reference body weight ratio method, 65-66alpha-tocopherol, 231selenium, 299vitamin C, 138
Reference weights and heights, 31-32Renal disease/failure, 31, 50, 312
vitamin C and, 157, 160, 164Reproductive disorders, 368Requirement, defined, 21Research recommendations
adverse effects, 21, 406alpha-tocopherol, 2, 20, 260-262, 406-407approach to setting, 19-20, 401-402carotenoids, 2, 20, 371-372, 403-404,
406-407
dietary intakes, 165-166, 406kinetic modeling of body pools, 403priorities, 20, 140, 406-407selenium, 2, 20, 318-319, 406-407vitamin C, 2, 20, 140, 165-166, 406-407
Respiratory burst, 108Respiratory distress syndrome, 108, 312Retinaldehyde binding protein, 197Retinol/retinoic acid, 36-37, 328, 332,
355, 356, 367Retinopathy, 50, 202, 208-209, 259, 368Rheumatoid arthritis, 108Riboflavin, 225Risk assessment, defined, 75, 467Risk assessment models. See also Dose-
response assessment; Exposureassessment; Hazard identification;Risk characterization
application to nutrients, 80-83basic concepts, 13, 75-76bioavailability considerations, 82-83default options, 460defined, 75, 467and food safety, 75-80inference options, 460methodological considerations, 458-461nutrient interactions, 83process, 76-78sensitivity of individuals, 82special problems with nutrients, 80-81thresholds, 78-80uncertainties, 76, 79-80, 458-461
Risk characterization, 92-94alpha-tocopherol, 260carotenoids, 369-371defined, 75, 77, 78, 467process, 92-93selenium, 13, 317-318vitamin C, 165
Risk management, 76, 467
SScurvy
infants, 135, 159, 161, 162, 163-164,166
rebound, 156, 158-159, 162, 163, 166vitamin C deficiency and, 98, 100, 101,
119, 120, 135, 139, 145, 150, 156,158-159, 162, 163, 166
Copyright © National Academy of Sciences. All rights reserved.
INDEX 501
Selenium, 284-324absorption, 285-286, 306adolescents, 287, 299-300, 306, 307,
308, 315-316adults (19-50 years), 284, 300-305, 306-
308, 313-315, 399adults (51+ years), 70, 305-306adverse effects, 284, 311-313, 399, 407AIs, 10-11, 65, 292-299, 507animal studies, 287, 290, 301, 302bioavailability, 284, 291-292, 306, 307,
399in blood, 288-289, 301-302, 310, 312,
313, 314, 318, 446-447body stores, 286, 313breath excretion, 313and cancer, 36-41, 290-291, 319, 367and cardiovascular disease, 40-41, 287,
288children, 25, 65, 287, 288, 292, 299-
300, 301-302, 315-316, 318, 403critical endpoint, 313deficiency, 43, 287, 298dose-response assessment, 313-316in drinking water, 309-310, 311, 317,
399EARs, 10-11, 25, 299-304, 305, 306, 307excretion, 285, 286-287, 291, 313exposure assessment, 317factors affecting requirements, 291-292fetal, 67, 306food sources, 286, 292, 298-299, 308,
309, 397forms of, 285-286, 308, 312, 314, 468in fortified foods, 286, 310, 399functions, 43, 284, 285, 302gender and, 292, 299, 403geographic differences, 284, 309, 311-
312, 315, 316, 317, 318-319in hair and nails, 288, 313, 399hazard identification, 311-313in human milk, 292-298, 307, 315, 316,
386indicators of adequacy, 10-11, 12, 43,
287-291, 301-302, 312-313, 318infants, 65, 287, 292-299, 307, 315-316,
386, 392, 399intakes, 16, 284, 308-311, 317, 397-399,
428-431interaction with other nutrients, 36-37,
40-41, 285, 290, 367
intervention studies, 2, 36-41, 290, 303-304, 311, 318, 319, 367, 405
and Kashin-Beck disease, 12, 43, 287,465
and Keshan disease, 12, 43, 287, 288,292, 299-300, 301-302, 304, 403,465
lactation, 67, 293, 294-297, 307-308,315
by life-stage group, 10-11, 14, 292-308,313-316, 428-431, 446-447
and lipid peroxidation, 287metabolism, 285, 286, 299, 308method used to set AI, 65, 292-298NOAEL/LOAEL, 314, 316, 318and oxidative stress, 41, 43, 44-45, 52,
285pregnancy, 67, 287, 306-307, 315radiolabeled, 291RDAs, 2, 10-11, 12, 284, 300, 304-307,
308, 318, 507research recommendations, 20, 318-
319smokers, 367soil content, 16, 293, 298, 308, 397supplements, 286, 292, 310-311, 312,
317, 399and thyroid disorders, 287ULs, 13, 14, 26-27, 284, 311-318, 391,
399uncertainty assessment, 314, 315, 316
Selenocysteine, 284, 285, 286, 289, 291-292, 308, 399, 468
Selenomethionine, 284-285, 286, 289, 291,303, 307, 308, 312, 313, 314, 399,468
Selenophosphate synthetase, 285Selenoprotein P, 289, 290, 301-302Selenoproteins
absorption, 285antioxidant role, 41, 44-45, 284, 285in blood, 288, 289-290, 303, 304, 310defined, 285functions, 12, 43, 285, 318as indices of selenium status, 12, 43,
301-302, 312-313sources, 284-285synthesis, 286, 289, 291, 301
Selenosis, 284acute, 312biochemical indicators of, 312-313, 315
Copyright © National Academy of Sciences. All rights reserved.
502 DIETARY REFERENCE INTAKES
chronic, 311-312defined, 468form of intake and, 312, 314overt signs of, 315risk characterization, 13, 317-318
Semen, 98Sensitivity
delayed dermal, 117, 118-119, 220interindividual variability, 91, 82, 257
Sepsis, 253Serum
alpha-carotene, 450-451alpha-tocopherol, 236, 444-445beta-carotene, 448-449beta-cryptoxanthin, 452-453cholesterol, 235lutein and zeaxanthin, 454-455lycopene, 456-457vitamin C, 121, 132, 133, 152, 153, 156,
440-443vitamin E (all forms), 444-445
Sjögren’s syndrome, 101Skeletal myopathy, 202Skin cancer, 36-39, 290, 339Skin Cancer Prevention Study, 36-37Smokers and smoking
and alpha-tocopherol, 36-37, 213-214,216, 219, 238, 242-243, 252, 367, 406
AMD, 18, 49cardiovascular disease, 37-39, 48-49,
103, 106-107, 131, 216, 238, 252,347
and carotenoids, 18, 36-39, 49, 330,331, 334-337, 344, 345, 347, 351,359, 366-371, 372, 405, 406
cataracts, 351dietary intakes, 130, 359, 360DNA damage, 110-113, 130-131, 360endothelium-dependent vasodilation,
106-107, 131lactating, 132LDLs, 130, 132, 153lipid peroxidation, 104-105, 130, 131,
132, 150-151lung cancer, 36-39, 124, 213-214, 219,
360, 366-371, 372, 405, 406metabolism of nutrients, 43organic free radicals per puff, 132and oropharyngeal cancers, 344oxidative stress, 43, 48, 102, 130, 131,
132
passive, 132, 146, 153pregnant, 132, 149, 150-151prostate cancer, 219racial/ethnic differences, 132research needs, 403and ROS, 131and selenium, 367special considerations, 150-151, 152-
153, 160-161, 164-165and vitamin C, 12, 43, 95, 102, 103,
104-105, 108, 110-113, 124, 130-132,146, 149, 150-151, 152-153, 242,390, 393
Socioeconomic status, and nutrient status,101, 136-137
Special considerationsadolescents, 358alcohol and drug abusers, 150, 360alpha-tocopherol, 241-243, 259body size and composition extremes,
242cancer, 241cardiovascular disease, 241-242carotenoids, 358-360drug interactions, 150, 259emotional stress, 153glucose-6-phosphate dehydrogenase
deficiency, 160-161, 164hemochromatosis, 160, 164identification of, 87-88infants, 160, 259and NOAEL/LOAEL, 92passive smokers, 153physical exercise, 153, 242in pregnancy, 150renal disorders, 160, 164smokers, 150-151, 152-153, 242-243,
359-360ULs, 87-88, 92, 164-165, 259vitamin C, 150-151, 152-153, 160-161,
164-165vitamin K deficiency, 259
Sperm, 8-oxodG, 109, 110-111Spinocerebellar ataxia, 202Steroid hormone biosynthesis, 96, 98, 99,
153Stomach cancer. See Gastric cancerStroke, 36-41, 121, 214, 216, 252, 254, 346-
347, 406Superoxide, 103, 140-141, 211, 223Superoxide dismutase, 45, 222
Copyright © National Academy of Sciences. All rights reserved.
INDEX 503
Supplements, dietary. See also individualnutrients
bioavailability of nutrients, 191, 224,251, 355, 357, 399
data sources on intake, 70form of nutrient in, 192, 251, 286, 292,
312, 399gender differences, 70, 246-247, 260intakes from, 70, 155, 244-245, 249,
310-311multivitamin, 244, 246-247, 310, 386, 395quality of, 317shelf life, 190-191ULs and, 5, 26, 74, 155, 165, 249, 259,
310, 317, 396, 397units, 191, 244-245, 394-397usage, 70
SUVIMAX, 40-41Systemic conditioning, 156, 158-159, 161
TTardive dyskinesia (TD), 222-223Teratogenicity of nutrients, 315Thiobarbituric acid reactive substances
(TBARS), 45, 103, 104-105, 131,203, 217, 334-335, 468
Thioredoxin reductases, 285Thrombin, 211, 223Thrombophlebitis, 253Thromboxane, 217Thyroid disorders, 287, 315Tocopherol. See Alpha-tocopherol;
Vitamin ETocotrienols. See Vitamin EToddlers, 29-30Tolerable, defined, 26, 73Tolerable Upper Intake Levels. See also
Dose-response assessment; Hazardidentification; Risk assessmentmodels; individual nutrients
appropropriateness of intakes above,13, 27, 74, 155, 165, 249, 260, 311,317-318, 369-371
children, 33critical endpoints, 88-89defined, 3, 4, 5, 7-8, 26, 73, 91-92, 468derivation of, 7-8, 13, 26, 75, 80-83, 91-
92, 162, 257, 315, 316development steps, 84-92fortification of foods and, 5, 26, 74
by life-stage groups, 14supplement use and, 5, 26-27, 80-81uses, 5-6, 15, 74, 383, 386, 391, 392-
393, 398Total Antioxidant Capacity, 104-105Total radical-trapping antioxidant
capability (TRAP) assay, 45Toxicity
experimental data, 86mechanism of action, 87
Triiodothyronine, 315Trolox equivalent antioxidant capacity
(TEAC) assay, 46Tropical sprue, 220Tumor necrosis factor-alpha, 338Tyrosine metabolism, 45, 96
UUbiquinols, 224Uncertainty
alpha-tocopherol, 91, 231-232, 256-257assessment, 90-91, 162, 256-257, 315,
316dose-response assessment for ULs, 88-
92in dietary assessment methods, 68, 248,
385, 396extrapolation from experimental
animals to humans, 76, 79, 91factor, 79, 89, 90-91, 162, 256-257, 315,
468in risk assessment, 76, 79-80, 458-461selenium, 315, 316sources of, 256, 314, 386vitamin C data, 139-140, 162
United States Pharmacopeia, 191Uric acid excretion, 156, 157U.S. Department of Agriculture, 69, 135,
154, 343, 361U.S. Department of Health and Human
Services, 69U.S. Dietary Guidelines, 351U.S. Health Professionals Follow-up Study,
122, 290, 344, 347, 351
VVascular cell adhesion molecule-1 (VCAM-
1), 196, 212, 223
Copyright © National Academy of Sciences. All rights reserved.
504 DIETARY REFERENCE INTAKES
Vasodilationalpha-tocopherol and, 196, 210endothelium-dependent, 106-107, 131smoking and, 131vitamin C and, 103, 106-107, 131
Vegans/vegetarians, 247, 297, 309Vegetables. See Fruits and vegetablesVery low density lipoproteins, 104-105,
197Vitamin A
carotenoids and, 12-14, 36-37, 43-44,325, 326, 327, 328, 330, 331, 338,343, 352, 355, 356, 366, 367, 371,372, 403, 467
children, 338, 356deficiency, 43, 325, 338, 356, 371and DNA damage and repair, 112-113intakes, 352and lactation, 355vitamin C and, 112-113
Vitamin B12, 156, 158, 161Vitamin C (ascorbic acid), 95-185. See also
Dehydroascorbic acidabsorption and transport, 99-100, 103,
108, 128, 140, 147-148, 155, 157adolescents, 65, 138-139, 149-151, 162-
163adults (19-50 years), 12, 95, 121-122,
126, 139-147, 149-151, 154, 157,161-162, 386, 387-390, 391, 392,393, 438-439
adults (55+ years), 101, 118-119, 121,133, 147-149, 154, 155, 157, 438-439
adverse effects, 13, 95, 100, 155-161,386, 407
AIs, 6-7, 134-138, 507and alcohol/drug abuse, 101, 150allergic response, 160, 161animal studies, 59, 103, 120, 131, 140antioxidant role, 43, 44-45, 52, 95, 96,
98-99, 101-109, 116, 124-125, 139-143, 146, 154, 166
and asthma, 126and attention-deficit disorder, 163and beta-carotene, 102, 109, 110-111bioavailability, 99, 128and blood coagulation, 99, 101body pool, 100, 103, 132, 140, 142,
145, 152-153, 166, 225, 403and bone growth, 101
and cancer, 36-37, 40-41, 106-107, 113-116, 123-125, 127, 128, 160
and cardiovascular disease, 18, 38-41,101-102, 103, 106-107, 109, 121-122,127, 128, 131, 346-347
and carnitine biosynthesis, 95, 96, 99,120, 153, 166
and cataracts, 18, 98, 125-126, 127chemistry, 95-96, 97children, 25, 65, 138-139, 161, 162-163,
166and cholesterol, 99and chronic obstructive pulmonary
disease, 126, 127and cognitive function, 19, 50, 127and collagen metabolism, 95, 96, 98,
99, 101, 118-119, 166and common cold, 117, 126-127, 163and connective tissue synthesis, 98, 101and copper, 96, 97-98, 128, 129, 156,
159-160, 161data selection, 161deficiency effects, 98, 99, 101, 108,
119, 120, 145, 148, 149and dental enamel erosion, 156, 160,
161dependence, 156, 158-159, 162, 163,
166depletion/repletion studies, 108, 117,
140, 143-145, 148, 402-403and DNA damage and repair, 98, 106-
107, 109-115, 116, 130-131, 160dose-response assessment for ULs, 161-
165EARs, 6-7, 23, 45, 65, 139, 146-151, 390emotional stress and, 153and endothelial dysfunction, 103, 106-
107, 131erythrocyte, 140excretion, 12, 43, 95, 100, 140, 142,
144, 147, 148, 151, 157, 158, 164exposure assessment, 165and factors affecting requirement, 128-
133fetal, 67, 149, 150, 163, 166and flavonoids, 98-99, 102, 128, 129food sources, 101, 130, 154, 392functions, 12, 43, 95, 96-99, 165-166gastrointestinal effects, 95, 100, 102,
106-107, 124-125, 156, 161-162, 163,166, 386, 393
Copyright © National Academy of Sciences. All rights reserved.
INDEX 505
gender and, 2, 12, 65, 95, 101, 121,122, 124, 126, 133, 146-147, 154,387-390
and glucose-6-phosphatedehydrogenase deficiency, 160-161,164
and glutathione, 43, 96, 98, 99, 103,105, 109-110, 126, 128, 129
hazard identification, 155-161and hemostatic dysfunction, 131and high-altitude resistance, 160in human milk, 101, 132, 134-138, 151,
164, 386and immune function, 108, 117-119, 127indicators of adequacy, 6-7, 11, 101-128infants, 65, 101, 129, 134-138, 159-160,
161, 162, 163-164, 386, 392and inflammatory stress, 103, 108, 130intakes, 15-16, 95, 135, 138, 154-155,
165-166, 387-390, 393, 416-421, 432-435, 438-439
interaction with drugs, 99, 150interaction with other nutrients, 38-41,
96, 97-99, 102, 109, 110-113, 118-119, 120, 128-129, 156, 158, 159,160, 161, 164, 166, 224-225, 285, 332
international comparisons, 121, 123,124, 127, 135, 153
intervention trials, 38-39, 405intracellular recycling, 108and iron, 96, 97-98, 99, 109, 118-119,
120, 128, 129, 158, 159, 160, 161,164, 166
and kidney stone formation, 156, 157,160, 161
laboratory values, 67and lactation, 67, 134-135, 136-137,
151-152, 164and LDLs, 98, 101-102, 104-105, 109,
132, 153in leukocytes, 43, 95, 103, 108-109,
110-111, 130, 133, 139, 140, 141,142, 144, 146, 147, 148, 150
by life-stage group, 6-7, 14, 134-153,161-164, 416-421, 432-435, 440-443
and lipid peroxidation, 45, 95, 98, 102,104-105, 109, 116, 130, 131, 132,146, 150-151, 153, 159
in lymphocytes, 99-100metabolism, 12, 43, 95, 100, 108, 130,
133, 148, 152-153, 157, 158
method used to set AIs, 134-138method used to set EARs, 139-145,
147-148, 149-151methodological issues, 67, 68-69, 127-
128, 402-403and nervous system, 19, 50, 96, 98,
131, 153in neutrophils, 12, 43, 95, 98, 99-100,
139, 140, 141, 144, 145, 146, 150,385
NOAEL/LOAEL, 161-162, 163and osmotic diarrhea, 13, 95, 100, 154,
161-162, 163, 166, 386, 393and oxalate excretion, 156and oxidative stress, 12, 43, 95, 101-
102, 109, 126, 128, 130, 131, 132,148, 152, 162, 166
and oxygen demand, 156, 161passive smokers, 132, 146, 153and periodontal health, 120, 156, 160,
161, 166and physical exams, 164and physical exercise, 153plasma concentrations, 100, 101, 121,
123, 126, 127, 128, 130, 132, 133,134-135, 140, 141, 142, 144, 146,147, 148, 155, 158
and pregnancy, 67, 82, 132, 149-151,159, 161, 163-164, 166
pro-oxidant effects, 129, 156, 159-160,161, 166
race/ethnicity and, 132RDAs, 2, 6-7, 12, 43, 95, 138, 139, 147,
149, 150, 151-152, 386, 392, 507and renal disease, 157, 160, 164research recommendations, 2, 20, 140,
165-166and respiratory distress syndrome, 108and rheumatoid arthritis, 108risk characterization, 165RNS/ROS and, 98, 102, 103, 106-107,
109, 116, 124, 131, 140and scurvy, 98, 100, 101, 119, 120, 135,
139, 145, 150, 156, 158-159, 162,163, 166
serum concentrations, 121, 132, 133,152, 153, 156, 440-443
smokers, 12, 43, 95, 102, 103, 104-105,108, 110-113, 124, 130-132, 146, 149,150-151, 152-153, 242, 390, 393
Copyright © National Academy of Sciences. All rights reserved.
506 DIETARY REFERENCE INTAKES
socioeconomic status and, 101, 136-137
special considerations, 150-151, 152-153, 160-161, 164-165
and steroid hormone biosynthesis, 96,98, 99, 153
supplements, 70, 155systemic conditioning, 156, 158-159,
161turnover, 43, 95, 130-131, 152-153, 158ULs, 13, 14, 26-27, 82, 95, 155-165,
391, 393uncertainties in data, 140, 162and uric acid excretion, 156, 157and vitamin A, 112-113vitamin E and, 98-99, 102, 109, 110-
113, 128, 129, 213, 224-225and vitamin B12, 156, 158, 161
Vitamin E (all forms), 186-293. See alsoAlpha-tocopherol
absorption, 191, 193, 196, 243affinity of alpha-TTP to forms of, 2, 12,
19, 193, 195, 197-198, 243, 262bioavailability, 193, 194-195, 243, 404body pools, 210conversion factors, 244-245, 394-395defined, 187, 393food composition data, 68-69, 393-394forms of, 2, 12, 16, 186, 187-190, 193,
194-195, 210, 243, 262, 393-394,404, 406
in human milk, 227, 228-229intakes, 68, 69-70, 186, 194, 232, 243,
393-394, 395-396, 404, 406, 422-423interconversion of units, 191-192, 244,
246serum values, 444-445shelf life, 190-191structure, 187-195units of activity, 186, 190 n.1, 191-195
Vitamin K, 252, 254-255, 256, 259
WWarfarin therapy, 252Weight. See Body weight; Reference
weights and heights
Western Electric cohort study, 121-122,341
Women. See also Gender; Lactation;Pregnancy
alpha-tocopherol, 40-41, 212, 219, 226,237, 245, 246-247, 249, 259-260
aspirin, 40-41breast cancer, 123, 219cardiovascular disease, 38-41, 121, 122,
212, 347carotenoids, 38-41, 330-331, 349, 351cataracts, 126, 351cervical cancer, 17, 123, 340-341, 345,
346dietary intakes, 154, 165, 245fish oil supplements, 226Keshan disease, 292, 304kidney stone formation, 157MOPD values, 349postmenopausal, 122, 123, 212, 219,
226, 259-260, 330-331, 347selenium, 292supplement use, 249, 260vitamin C, 40-41, 95, 118-119, 122, 123,
126, 133, 146-147, 149, 154, 157,165, 386
Women’s Antioxidant CardiovascularStudy, 40-41, 252
Women’s Health Study, 40-41, 252World Health Organization
definition of adverse effect, 73Monitoring Cardiovascular Project,
Vitamin Substudy, 346uncertainty factors, 79
XXanthophylls, 329, 330
ZZeaxanthin, 18, 44, 49, 329, 330, 348, 349,
350, 351, 358, 360-361, 364, 366,371, 454-455
Zinc, 40-41