DRC-IHPplus Year Two Quarter Three Report: January 1, 2017
207
DRC-IHPplus Year Two Quarter Three Report: January 1, 2017 -March 31, 2017 Page 1 of 126 DRC-IHPplus Quarterly Report: Year 2 Quarter 3 (January 1, 2017 - March 31, 2017) Subagreement Number OAA-A-11-00024-01-MSH under USAID Cooperative Agreement Number AID-OAA-A-11-00024 Submitted to USAID/DRC on May 15, 2017
-
Upload
khangminh22 -
Category
Documents
-
view
4 -
download
0
Transcript of DRC-IHPplus Year Two Quarter Three Report: January 1, 2017

DRC-IHPplus Year Two Quarter Three Report: January 1, 2017 -March 31, 2017 Page 1 of 126
DRC-IHPplus Quarterly Report: Year 2 Quarter 3 (January 1, 2017 - March 31, 2017) Subagreement Number OAA-A-11-00024-01-MSH under
USAID Cooperative Agreement Number AID-OAA-A-11-00024 Submitted to USAID/DRC on May 15, 2017

DRC-IHPplus Year Two Quarter Three Report: January 1, 2017 -March 31, 2017 Page 2 of 126
Caption: A child in the Bilomba health zone washes his hands after using the latrine, at a hand washing post constructed by community members with local materials. Project Name: Integrated Health Project Plus (IHPplus) in the Democratic Republic of Congo, Subagreement No. OAA-A-11-00024-01-MSH, Under Cooperative Agreement Number: AID-OAA-A-11-00024 Contact information in DRC: Avenue des Citronniers, No. 4, Commune Gombe, Kinshasa Chief of Party: Dr. Ousmane Faye, +243 0992006180 Contact information in the U.S: 200 Rivers Edge Drive Medford, MA 02155 Regional Director: Kristin Cooney, Tel: +1 617-250-9168

DRC-IHPplus Year Two Quarter Three Report: January 1, 2017 -March 31, 2017 Page 3 of 126
Table of Contents ACRONYMS ....................................................................................................................................................... 4
PROJECT BACKGROUND ................................................................................................................................... 6
EXECUTIVE SUMMARY ..................................................................................................................................... 9
PROJECT PERFORMANCE ............................................................................................................................. 9
KEY ACHIEVEMENTS ................................................................................................................................... 13
KEY CHALLENGES AND WAY FORWARD ..................................................................................................... 15
PROJECT PERFORMANCE ............................................................................................................................... 16
Component 1: Health Services ................................................................................................................... 16
Intermediate Result 1 (IR1): Access to and availability of Minimum Package of Activities (MPA) and Complementary Package of Activities (CPA) services and products in target health zones increased . 19
Intermediate Result 2: Quality of key family health care services in target health zones increased .... 47
Intermediate Result 3: Knowledge, attitudes, and practices to support health-seeking behaviors increased in target health zones .......................................................................................................... 110
Component 2: Health Systems Strengthening ......................................................................................... 119
Intermediate Result 4: Health sector leadership and governance in target provinces improved ....... 119
PROJECT MANAGEMENT .............................................................................................................................. 122
FAMILY PLANNING AND HIV AND AIDS STATUTORY REQUIREMENTS......................................................... 123
ENVIRONMENTAL MONITORING AND MITIGATION PLAN .......................................................................... 124
CHALLENGES ENCOUNTERED ....................................................................................................................... 125
WAY FORWARD: PLANNED ACTIVITIES FOR NEXT QUARTER ...................................................................... 126
LIST OF APPENDICES ..................................................................................................................................... 126

DRC-IHPplus Year Two Quarter Three Report: January 1, 2017 -March 31, 2017 Page 4 of 126
ACRONYMS ACT Artemisinin-Based Combination
Therapy AMC Average Monthly Consumption AMTSL Active Management of Third
Stage Labor ANC Antenatal Care AOP Annual Operational Plan APS Assistant psycho-social
(psychosocial assistant) ARI Acute Respiratory Infection ART Antiretroviral Therapy ARV Antiretroviral BCC Behavior Change
Communication BCG Bacillus Calmette–Guérin BCZS Bureau cadre de zone de santé
(health zone management office)
CAD Club des Amis de Damien CBD Community-Based Distribution
or Community-Based Distributor CBO Community-Based Organization i-CCM Integrated Community Case
Management CDR Centrale de Distribution
Régionale (Regional Distribution Center)
CHW Community Health Worker CLTS Community-Led Total Sanitation CODESA Comité de Développement
Sanitaire (Health Development Committee)
CLTS Community-Led Total Sanitation CPA Complementary Package of
Activities CPLT Coordination Provinciale Lèpre et
Tuberculose (Coordination Unit for Leprosy and TB)
CSDT Centre de Santé de Diagnostic et Traitement (Diagnostic and Treatment Health Center)
CTX Cotrimoxazole CYP Couple Years of Protection
DOTS Directly Observed Treatment Short Course
DPS Division Provinciale de la Santé (Provincial Health Division)
DQI Demarche Qualité Intégré (Integrated Quality Approach)
DRC Democratic Republic of Congo DSSP Direction des Soins de Santé
Primaire (Primary Health Care Directorate)
DSSS Division des Stratégies des Soins de Santé (Division of Health Care Strategies)
DTP HepB-Hib1 and Hib3 Diphtheria Tetanus Polio
Hepatitis B Haemophilus Influenzae type B1 and B3
E2A Evidence to Action EGM Essential Generic Medicines EPI Expanded Program on
Immunization ETAT Emergency Triage Assessment
and Treatment ETL Education Through Listening FOSACOF Formation Sanitaire
Complètement Fonctionnelle (Fully Functional Service Delivery Point)
FP Family Planning GAVI Global Alliance for Vaccines and
Immunization GHSC-PSM Global Health Supply Chain-
Procurement and Supply Management
GRH General Referral Hospital HBB Helping Babies Breathe HIV Human Immunodeficiency Virus HZMT Health Zone Management
Teams i-CCM Integrated community case
management IHP Integrated Health Project IMCI Integrated Management of

DRC-IHPplus Year Two Quarter Three Report: January 1, 2017 -March 31, 2017 Page 5 of 126
Childhood Illness INH Isoniazid IPTp Intermittent Preventive
Treatment (of malaria) in pregnancy
IYCF Infant and young child feeding LAM Lactational amenorrhea method LDP Leadership Development
Program LiST Lives Saved Tool LLIN Long-lasting insecticide-treated
net LARC Long-acting Reversible
Contraception MDR-TB Multidrug-resistant Tuberculosis M&E Monitoring and evaluation MICROLUT Oral progesterone pill packets MOH Ministry Of Health MONUSCO United Nations Organization
Stabilization Mission in the Democratic Republic of the Congo
MNCH Maternal, Newborn, and Child Health
MPA Minimum Package of Activities MSH Management Sciences for Health MTCT Mother to Child Transmission NGO Nongovernmental Organization ORS Oral Rehydration Solution OSC Overseas Strategic Consulting,
Ltd. OTSS Outreach training and
supportive supervision PCV Pneumococcal Conjugate
Vaccine PEPFAR President’s Emergency Plan for
AIDS Relief PIRS Performance Indicator Reference
Sheet PLHIV People Living with HIV PMI President’s Malaria Initiative PMP Performance Monitoring Plan PMTCT Prevention of Mother-to-Child
Transmission PNDS Plan National de Développement
Sanitaire (National Health Development Plan)
PNLP Programme National de Lutte Contre le Paludisme (National Malaria Control Program) PNLS Programme National de Lutte
contre le SIDA (National AIDS Control Program)
PNLT Plan National de Lutte contre la Tuberculose (National Tuberculosis Control Program)
POC Point Of Care PRONANUT Programme National de
Nutrition (National Nutrition Program)
ProVIC Integrated HIV Program PSC Preschool Consultation OPV Oral Poliovirus Vaccine RBF Results-based financing RDT Rapid Diagnostic Test RR Rifampicin Resistant RUMER Registre d'utilisation des
médicaments essentiels et des recettes (essential medicines usage and proceeds register)
SBA Skilled Birth Attendant SGBV Sexual and Gender-Based
Violence SIAPS Systems for Improved Access to
Pharmaceuticals and Services SNIS Système National d’Information
Sanitaire (National Health Information System)
SP Sulfadoxine Pyrimethamine T&C Testing and Counseling TB Tuberculosis UNICEF United Nations Children's Fund USAID United States Agency for
International Development USG United States Government WASH Water, sanitation, and hygiene WHO World Health Organization XDR Ultra-resistant strains

DRC-IHPplus Year Two Quarter Three Report: January 1, 2017 -March 31, 2017 Page 6 of 126
PROJECT BACKGROUND This report covers the third quarter (January 1-March 31, 2017) of year two of the US Agency for International Development (USAID)-funded Integrated Health Project Plus (IHPplus) in the Democratic Republic of Congo (DRC). Implemented by Management Sciences for Health (MSH) and Overseas Strategic Consulting, Ltd (OSC) under a subcontract via Pathfinder/Evidence to Action (E2A), IHPplus is a two-year “bridge” to avoid a gap in services in USAID-supported health zones upon completion of the USAID Health Office’s five-year flagship Integrated Health Project (IHP) in September 2015. The original, five-year DRC-IHP worked closely with the Government of the DRC to strengthen the country’s health system at every level and achieve the Ministry of Health (MOH) target of saving the lives of 437,000 mothers and children over five years. Data modeling using the Lives Saved Tool (LiST) shows that DRC-IHPplus interventions saved the lives of more than 41,524 children (38,497 children between 1-59 months of age and 3,027 children between 0-1 month of age). The number of lives saved from IHP PY2 through IHPplus PY1 is now estimated at more than 192,400. The project improved health services for more than 22 million people—31 percent of the Congolese population.
Continuing the work of DRC-IHP, IHPplus addresses “Services” and “Other Health Systems” to create better conditions for, and increase the availability and use of, high-impact health services, products, and practices in 126 health zones (the original 78 of IHP, 40 President's Malaria Initiative [PMI]-focused zones, and eight Global Fund-focused zones), within nine Divisions Provinciales de Santé (DPS, or Provincial Health Divisions). These are: 1) Kasaï; 2) Kasaï Central; 3) Lomami; 4) Kasaï Oriental; 5) Sankuru; 6) Haut Lomami; 7) Lualaba; 8) Sud Kivu, and 9) Haut Katanga (formerly the four provinces of Kasaï Occidental, Kasaï Oriental, Katanga, and Sud Kivu). IHPplus provides varying levels of support to 2,443 health facilities: 2,312 health centers and 126 general referral hospitals (GRHs). In addition to maintaining a project
office in Kinshasa to facilitate communication with the MOH, other host government authorities, and USAID, IHPplus has eight coordination offices that facilitate activity implementation at the field level (see box below). To ensure consistency and continuity of data analysis, IHPplus reports its achievements based on the coordination “clusters” of Bukavu, Kamina, Kolwezi, Lodja, Luiza, Mwene Ditu, Tshumbe, and Uvira, the same clusters it used under the previous IHP.
Bukavu Representation and Coordination Office - 28 health zones Kamina Coordination Office - 16 health zones Kananga Representation and Coordination Office - 12 health zones Mwene Ditu Coordination Office - 15 health zones Lodja Coordination Office - 16 health zones Kolwezi Coordination Office - 14 health zones Lubumbashi Representation Office - 25 health zones Mbuji Mayi Representation Office Total population served: 22,261,910

DRC-IHPplus Year Two Quarter Three Report: January 1, 2017 -March 31, 2017 Page 7 of 126
The project’s vision is that: ● People in the 126 project health zones will continue to participate more fully in determining
their health outcomes by virtue of greater access to higher quality comprehensive care; ● Service delivery systems will be accountably and effectively managed in their interests; ● Family-centered communication will reflect healthy behaviors that people understand and can
act on in their daily lives.
The overarching objective of the project is to improve the enabling environment for, and increase the availability and use of, high-impact services, products, and practices for family planning; maternal, newborn, and child health (MNCH); nutrition; malaria; tuberculosis (TB); Human Immunodeficiency Virus (HIV) and AIDS; and water/sanitation/hygiene (WASH) in target health zones (see Figure 1).
Figure 1: IHPplus objective and focus areas IHPplus’ people- and team-centered approach aims to strengthen the health system in DRC by focusing on the four intermediate results detailed in Table 1 below. USAID/DRC designed a new portfolio of programs to assure the programmatic continuity of its two recently concluded flagship service delivery programs: the Integrated HIV Program (ProVIC) and IHP. Since these two programs ended before the new programs could be launched, to avoid major disruptions in services, the mission continued key activities from both of these programs through the USAID/ Washington-managed mechanism, E2A. E2A serves as a crucial “bridge mechanism.” The prime implementing agencies for IHP and ProVIC, MSH and PATH, respectively, are both members of the E2A consortium.

DRC-IHPplus Year Two Quarter Three Report: January 1, 2017 -March 31, 2017 Page 8 of 126
Table 1: DRC-IHPplus Results Framework Component 1: Services Strategies by Sub-IR Intermediate Result 1: Access to and availability of Minimum Package of Activities (MPA) and Complementary Package of Activities (CPA) services and products in target health zones increased
IR 1.1: Increased facility-based health care services/products ● Provide materials and equipment ● Provide essential medicines, commodities, and
materials IR 1.2: Increased community-based health care services/ products
● Integrated Community Case Management (i-CCM) at community treatment sites
● Comité de Développement Sanitaire or health development committee (CODESA) - collaborative strategy at the community level
IR 1.3 Effectively engaged provincial management ● Leadership Development Program
Intermediate Result 2: Quality of key family health care services (MPA/CPA) in target health zones increased
IR 2.1: Clinical and managerial capacity of health care providers
● Training, supportive supervision IR 2.2: Minimum quality standards
● Fully Functional Service Delivery Point (FOSACOF) ● Results-based financing (RBF)
IR 2.3: PHC referral system for prevention, care, and treatment Intermediate Result 3: Knowledge, attitudes, and practices to support health-seeking behaviors increased in target health zones
IR 3.1: Health sector-community outreach linkages ● CODESA ● Youth outreach groups
IR 3.2: Health advocacy/community mobilization organizations ● Education Through Listening ● CODESA
IR 3.3 Behavior change campaigns ● Behavior change communication (BCC) messaging ● Mini-campaigns ● Champion Communities
Component 2: Other Health Systems Intermediate Result 4: Health sector leadership and governance in target provinces improved
IR 4.1: Health sector policy alignment IR 4.2: Evidence-based strategic planning and decision-making IR 4.3: Community involvement in health policy/service delivery

DRC-IHPplus Year Two Quarter Three Report: January 1, 2017 -March 31, 2017 Page 9 of 126
EXECUTIVE SUMMARY PROJECT PERFORMANCE IHPplus continues to track results for 15 groups of technical area indicators according to the project’s Performance Monitoring Plan (PMP). These areas include the following:
• Family planning • Maternal, newborn, and child health
(MNCH) • Nutrition • TB • HIV and AIDS • Malaria • WASH • Leadership, management, and
governance (LMG)
• Sexual and gender and gender-based violence (SGBV)
• Referral systems • Stock-outs of pharmaceuticals • Health service quality and availability • Community mobilization • BCC • Project management
Of the 83 IHPplus indicators in PY2Q3, 58 were achieved at the 75% or greater level; of these, 34 achieved or exceeded their targets at the 100% level. Two WASH indicators did not have targets for the quarter as activities were not planned and one HIV indicator (Tx_RET) is reported on an annual basis. IHPplus made notable improvements in increasing facility-based health care services and products in target health zones. Almost all targeted health centers are providing the MPA (99%), and 88% of general referral hospitals (GRHs) are providing the CPA (achievement rates of 99% and 97%, respectively, compared with project targets). The health services utilization rate for each of the eight coordination zones was 45%, falling slightly below the newly-established national average of 50%. IHPplus continued to help increase the availability of essential generic medicines (EGM) at all IHPplus-supported sites. IHPplus continued to implement activities from the Supply Chain Management System (SCMS) and Systems for Improved Access to Pharmaceuticals and Services (SIAPS) projects to continue providing the essential health activities and services of those projects upon their completion (further details provided later in the report). IHPplus continued to monitor its project year one (PY1) pharmaceutical orders 1 and 2 with several suppliers (IDA, IMRES, MEG, and ASRAMES). IHPplus monitored the process of obtaining documents to facilitate the customs clearance process and the transportation of goods to IHPplus-supported regional distribution centers (CDRs).To date, the CDRs and warehouses have received 93% of the IHPplus PY1 first order and 99% of the second order. To complete order 1, IHPplus is following up on replacement products for goods damaged during transport to Mbuji Mayi and Lodja health zones, as well as replacement of insoluble injectable hydrocortisone delivered to Bukavu, Mbuji Mayi, Lodja, and Kananga health zones. The remaining goods for order 2 include parcels of psychotropic drugs that were lost before arriving in DRC. Discussions are ongoing between ASRAMES, the MSH home office, and the supplier to resolve the situation. Project performance was lower than the previous quarter in the area of reducing stock-outs for tracer medicines, including iron-folate, Artemisinin-based Combination Therapy (ACT), Oral Rehydration Solution (ORS), and Depo-Provera. The highest performing indicator was iron-folate stock-outs with an achievement rate of 113% (221 stock-outs compared to 250). The project almost reached the target for

DRC-IHPplus Year Two Quarter Three Report: January 1, 2017 -March 31, 2017 Page 10 of 126
the number of ACT stock-outs with an achievement rate of 87% (173 stock-outs compared to 150); however, project results fell significantly below targets for the number of ORS and Depo-Provera stock-outs with achievement rates of 66% (183 compared to 120) and 43% (187 compared to 80), respectively. Factors contributing to this performance are explained later in this report. The i-CCM strategy remains effective for increasing community-based health care services. IHPplus is currently supporting 839 community care sites in 64 health zones. In total, 57,311 cases of malaria (25,725), pneumonia (12,626), and diarrhea (18,960) were treated during the quarter at these sites. IHPplus continued to treat cases of childhood pneumonia, diarrhea, and malaria in all United States Government (USG)-supported facilities. A total of 128,040 children with pneumonia were treated with antibiotics (112% of the target); 156,221 new cases of childhood diarrhea were treated with packs of combined ORS and zinc supplements (97% of the target); and 590,797 children with malaria were treated (a significant increase [48%] over the number of cases treated in the previous quarter). Health Development Committees (CODESAs) continue to play an important role in increasing the use of community health care services. IHPplus identified 1,398 CODESAs this year; of those, 1,319 were reported as active during the quarter (102% compared to the project’s target). In addition, 97% of these active CODESAs have communication action plans for addressing health problems through locally-proposed solutions. Overall, project performance related to increasing community-based WASH services was stronger than the previous quarter. IHPplus provided access to improved drinking water supply to 130,611 of the targeted 74,294 people (176%) and improved sanitation facilities to 52,614 of the targeted 74,294 people (71%). In addition, the project renovated 97% the planned 140 water sources, a significant increase from the 10% during the previous quarter, and 56% of the planned 5,568 sanitation facilities. Results from the provincial teams participating in the Leadership Development Program (LDP) were similar to the previous quarter, and just fell below the project target. Of the 69 teams that implemented LDP projects that were evaluated during the quarter, 47 teams (68%) achieved at least 80% of their desired measurable result. Compared to the PMP target of 76%, this represents an achievement rate of 89%. While performance was lower in coordinations such as Luiza and Uvira, other coordinations (Bukavu and Kamina) improved performance from the previous quarter. Project performance remains strong in improving quality health care services. Results were stronger in the areas of MNCH, gender-based services, and HIV. The project met or exceeded targets for MNCH indicators related to pregnant women attending at least one antenatal care (ANC) visit (106% achievement rate), newborns receiving essential newborn care (101% achievement rate), pregnant women receiving a uterotonic immediately after birth (100% achievement rate), deliveries with a skilled birth attendant (SBA) (97% achievement rate), number of newborns who were resuscitated (123% achievement rate), and number of postpartum/newborn visits within three days of birth (102% achievement rate). The project achieved more than 75% of its target for the percent of pregnant women attending at least four ANC visits (86% achievement rate). Performance was lower for the number of newborns receiving antibiotic treatment for infections (67% achievement rate).

DRC-IHPplus Year Two Quarter Three Report: January 1, 2017 -March 31, 2017 Page 11 of 126
Vaccination coverage rates remain high, as six out of seven vaccines had a coverage rate of 95% or greater (Diphtheria Tetanus Polio Hepatitis B Haemophilus influenzae B1 and B3 [DTP HepB-Hib1 and Hib3], Tetanus vaccine 2+, Bacillus Calmette–Guérin [BCG], oral poliovirus vaccine [OPV]3, and measles). The coverage rate for the pneumococcal conjugate vaccine [PCV] 13_13 was 93%, a slight increase from the previous quarter. These results contribute to improved child health in IHPplus-supported health zones. In family planning, the project achieved a couple-years of protection (CYP) of 50,915, compared to the target of 159,538 (32% achievement rate). The number of counseling visits for family planning and reproductive health decreased during the quarter (achievement rate of 79% compared to 90% in PY2Q2) due to lower performance in Kamina and Kolwezi. In the area of nutrition, a total of 213,883 pregnant women out of 138,130 (155%) received iron-folate supplements. The number of mothers who received nutritional counseling for their children and the number of people trained on child health and nutrition fell below the project target: 215,450 mothers received nutritional counseling for their children under 24 months old (58% achievement rate) and 112 of the targeted 465 people were trained (an achievement rate of 24%). Overall, project performance in improving malaria prevention and treatment was lower than PY2Q2. Two indicators exceeded project targets: the percent of pregnant women who received at least two doses of Sulfadoxine-Pyrimethamine (SP) for intermittent preventive treatment (IPTp) (achievement rate of 108%), and the number of ACT treatments purchased with USG funds that were distributed (194%). The project almost achieved the target for the number of SP tablets purchased with USG funds that were distributed to health facilities (89% achievement rate). Project performance was lower for indicators related to the distribution of long-lasting insecticide-treated nets (LLINs) (52% achievement rate), health workers trained in IPTp (52% achievement rate), case management with ACTs (43% achievement rate), and RDTs (42% achievement rate), and distribution of RDTs (72% achievement rate). IHPplus exceeded, met, or almost met targets for the majority of HIV prevention and treatment indicators. IHPplus exceeded targets for the percentage of HIV-positive pregnant women who received antiretrovirals to reduce risk for mother-to-child transmission (MTCT) (103% achievement rate), number of individuals who received Testing and Counseling (T&C) services for HIV (194% achievement rate), number of HIV positive adults and children who received at least a clinical assessment (WHO staging), CD4 count, or viral load (DSD) (459% achievement rate), and number of HIV- infected adults and children receiving antiretroviral therapy (448% achievement rate), among others. Project performance was lower for the number of infants born to HIV-positive women who were started on Cotrimoxazole (CTX) prophylaxis within two months of birth (47% achievement rate) and number of HIV exposed infants with a documented outcome by 18 months of age (60% achievement rate). Due to stock-outs of HIV testing reagents, viral load counts were not available during the quarter. As a result the achievement rates for indicators related to viral load counts were 0% (PMTCT_EID, Tx_UNDETECT, and Tx_RET). The project contributed to improving HIV and TB co-infection. The proportion of registered TB cases that are HIV-positive that are on ART exceeded the target during the quarter (101% achievement rate), and 64% of HIV-positive patients were screened for TB through USG- supported programs (achievement rate of 91% compared to the target).

DRC-IHPplus Year Two Quarter Three Report: January 1, 2017 -March 31, 2017 Page 12 of 126
Project performance for indicators related to tuberculosis (TB) notification and treatment significantly improved during the quarter compared to previous quarters, as over 70% of the indicators had achievement rates greater than 75%. IHPplus exceeded the target related to the percentage of TB cases detected among HIV-positive patients (126% achievement rate).The therapeutic success rate for new smear positive TB cases was 94% (99% achievement rate), and multi-drug resistant (MDR-TB) was 67% (89% achievement rate). Project performance was lower for case notification rate in new sputum smear positive pulmonary tuberculosis (TB) cases (103 per 100,000 inhabitants, comparted to the target of 150) and the number of MDR-TB cases detected (9 of 43, or 21%). Project performance remains strong in the area of sexual and gender-based violence (SGBV). The total number of people reached by a USG-supported intervention providing SGBV health services reached 814. Compared to the PMP target of 725, this represents an achievement rate of 112%. IHPplus continues to implement the Formation Sanitaire Complètement Fonctionnelle (Fully Functional Service Delivery Point, or FOSACOF) and results-based financing (RBF) approaches to promote the adoption of minimum quality standards at health facilities and improve the quality of care. During PY2Q3, 433 of the total 799 health facilities (or 55%) completed an evaluation of the nine FOSACOF criteria. Results from these evaluations indicate that most facilities meet 50-80% of the criteria, and additional support is needed to increase performance. RBF evaluations demonstrated that the RBF approach contributed to increases in the quality of health center and GRH services. There was an increase in the usage rate of curative services during the quarter within RBF facilities, from 42% to 49%. IHPplus continues to implement the RBF program in five health zones in Kolwezi to improve HIV indicators. The RBF program contributed to strong results in certain health zones in the proportion of women receiving family planning counseling who knew their HIV status (average result increased from 24% to 29% during the quarter). Results for other indicators, such as the proportion of people testing positive for HIV with a known status, decreased slightly (from 49% to 42%) due to stock-outs of Determine and absence of head nurses from facilities. Increasing the number of patient referrals to health facilities is an important aspect of improving the quality of health services provided to the community. During PY2Q3, the percentage of patients referred to GRHs and health centers after being seen by a community health worker (CHW) or health care provider was 4% (80% achievement rate) and 23% (155% achievement rate), respectively. Project performance in increasing knowledge, attitudes, and practices to support health-seeking behaviors was strong. The project met or exceeded targets for indicators related to the number of youth organizations participating in youth education outreach strategy, the number of BCC campaigns launched to deliver key health messages, and the number of educational SMS messages sent during project-supported BCC campaigns or mini-campaigns. The number of functional Champion Communities increased from 57 to 59. There are now 22 autonomous Champion Communities, and 29 Champion Communities are officially recognized as non-governmental organizations (NGOs. Figure 2 on the following page presents an overview of project performance during PY2Q3.

DRC-IHPplus Year Two Quarter Three Report: January 1, 2017 -March 31, 2017 Page 13 of 126
Figure 2: Project performance overview, PY2Q3
KEY ACHIEVEMENTS Figure 3 on the following page presents key achievements from PY2Q3.
0 2 4 6 8 10 12 14 16 18 20
Health services quality
Referral system
Availability of CPA/MPA
Stock-outs
L+M+G
WASH
BCC
Sexual and gender-based violence services
Nutrition
TB
Community mobilization
Family planning
MNCH
Malaria
HIV
Target achieved (100% or >) Almost achieved (between 75%-99%) Target not achieved (<75%)

DRC-IHPplus Year Two Quarter Three Report: January 1, 2017 -March 31, 2017 Page 14 of 126
Figure 3: IHPplus PY2Q3 key achievements
Child health
Maternal health
Neonatal health
WASH
Family planning
HIV & AIDS
TB
Nutrition
Malaria
• 128,040 child pneumonia cases were treated with antibiotics • 156,221 child diarrhea cases were treated with ORS/ORS zinc • 590,791 child malaria cases were treated with ACT
• 146,441 out of 138,130 (106%) expected pregnant women attended at least one antenatal care visit (ANC1)
• 82,733 out of 138,130 (60%) expected pregnant women attended at least four antenatal care visits (ANC4) • 121,842 out of 138,130 (88%) expected deliveries occurred with an skilled birth attendant (SBA)
• 120,000 out of 121,291 (99%) expected newborns received essential newborn care • 5,445 newborns received antibiotic treatment for infection • 112,586 children less than 12 months of age received DTP-HepB-HIB3 (96% coverage) • 107,673 children less than 12 months of age received measles vaccine (92% coverage)
• 130,611 people in target areas had first-time access to improved drinking water supply • 52,614 people in target areas had first-time access to improved sanitation facilities
• 50,915 CYP • 167,552 family planning/ reproductive health counseling visits occurred • 2,154 out of 2,027 (106%) of all service delivery sites planned to receive USG assistance over life of
project have provided family planning counseling and/or services
• 16,736 individuals received T&C for HIV and received results • 4,722 HIV-positive adults and children received a minimum of one clinical HIV service • 48 out of 50 (96%) expected TB-registered patients with documented HIV-positive status
were on ART
• 3,054 out of 3,234 (94%) of all expected patients with new smear positive TB treated have recovered
from TB or completed their treatment • 454 out of 1,199 (38%) of all expected registered patients living with HIV were detected for TB
• 213,883 out of 138,130 (155%) expected pregnant women received iron-folate tablets to prevent
anemia during the last five months of pregnancy • 221 health facilities experienced stock-outs of iron-folate tablets out of the expected 300
• 136,092 out of 168,690 (81%) pregnant women attending first ANC visits received two doses of SP for IPTp • 188,450 LLINs were distributed at the first ANC visit and preschool consultation (PSC) • 404,001 SP tablets, 1,082,958 RDTs, and 2,340,641 ACT treatments purchased with USG funds were distributed to
health facilities

DRC-IHPplus Year Two Quarter Three Report: January 1, 2017 -March 31, 2017 Page 15 of 126
KEY CHALLENGES AND WAY FORWARD
1. Challenge: IHPplus fell short of its targets for five malaria indicators in PY2Q3, including all three indicators related to health staff training (on IPTp, ACT, and RDT) and those for the number of RDTs and LLINs purchased with USG funds that were distributed. A total of 250 health care providers in four health zones of the Sud Kivu province were trained in the management of malaria using all three commodities, including 204 men and 36 women. Compared to their respective PMP targets of 485, 586, and 599 people trained, the project achieved performance rates of only 52%, 43%, and 42%, respectively. Performance declined for the number of providers trained in malaria prevention and management compared to PY2Q2 (250 compared to 327 providers) because the security situation in Kasaï Central province did not permit planned trainings to take place, and two health zones in the highlands of Sud Kivu could not be accessed during the rainy season. In terms of RDT and LLIN distribution, 188,450 LLINs were distributed against a target of 360,684, and 1,082,958 RDTs were distributed against a target of 1,514,209, representing achievement rates of 52% and 42%, respectively. In principle, with a positivity rate of about 71% of RDTs in the health zones under IHPplus, the RDTs and ACT should be distributed with a ratio of 1 ACT dose for 1.4 RDTs. There is currently a stock of 413,268 RDTs, which represents less than one month’s supply. Outbreaks of insecurity in the province have disrupted LLIN distribution in Central Kasaï. In the Haut Lomami province, IHPplus discovered that some health zone central offices (BCZS) were withholding commodities from health facilities that did not reinvest funds, resulting in shortages of LLINs. Way forward: In PY2Q4, IHPplus will hold health staff trainings in the two remaining health zones of Sud Kivu and in four health zones of Kasaï Central. These trainings will occur during the dry season to minimize access difficulties. Health zone management teams (HZMTs) will be sensitized on the need to respect the ratio of one dose of ACT per 1.4 RDTs when they make orders to the RDCs. IHPplus will follow up with the BCZS so that the intra-zone distribution of LLINs is total in Haut Lomami and Central Kasaï, and will find other methods of delivering commodities at the health zone level in insecure regions. Negotiations are underway with MONUSCO for helicopter transport with the DPS.
2. Challenge: IHPplus did not meet targets for four family planning indicators during this reporting period: number of CHWs providing family planning information, referrals, and/or services; number of health facilities experiencing stock-outs of Depo-Provera; couple years of protection (CYP); and CYP after exclusion of Lactational Amenorrhea Method (LAM) and self-observation methods. A total of 866 CHWs provided family planning in PY2Q3, representing an achievement rate of 49% of the target. This low performance can be attributed to mass immunization campaigns which interrupted family planning activities, and to insecurity in some provinces due to the presence of the Kamwina Nsapu militia. The number of CYP drastically decreased from 167,381 in PY2Q2 to 50,915 this quarter, for an achievement of 32% against the target of 159,538. This decrease is related to a correction made in the calculation of the number of couple-years of protection (CYP). During this quarter, the project started implementing the recommendations from its capacity assessment conducted last quarter and from USAID to support the MOH DHIS2 in order to further strengthen the Système National d’Information Sanitaire (National Health Information System, or SNIS) and improve data quality. During the process of revising the Performance Indicator Reference and Tracking Sheets (PIRTS), which

DRC-IHPplus Year Two Quarter Three Report: January 1, 2017 -March 31, 2017 Page 16 of 126
include the definition and calculation of indicators, we discovered that the conversion factor used for calculating the CYP for two methods was incorrect: for LAM (changed from 2 to .25) and oral progesterone pills (Microlut) (changed from 3.5 to 0.067) (please refer to M&E narrative under Project Management for further details). Once these calculation errors were corrected, the number of CYP sharply decreased compared to previous quarters during which data were incorrectly calculated. Way Forward: In PY2Q4, IHPplus will focus on family planning activities during monitoring and supportive supervision visits to clinical providers and community-based distributors (CBDs) conducting these activities, and will provide post-training follow-up for trained CBDs in the Lomela, Wembonyama, Minova, Dilala, Manika, and Nundu health zones. The project will compile all issues with indicators and request a meeting with USAID to discuss and agree on the best way to address them.
3. Challenge: In PY2Q3, project performance for two nutrition indicators fell below 60% of the target: the number of mothers of children two years or less receiving nutritional counseling for their children was 58%, and the number of people trained in child health and nutrition through USG support was 24%. The first indicator decreased from 68% in PY2Q2 due to the poor performance of the coordinations of Kamina, Kole, Kolwezi, and Tshumbe, which all had an achievement rate of less than 60%. Factors leading to this under-performance included irregular follow-up of IYCF support groups and non-revitalization of support groups in some health zones due to a lack of leadership among HZMTs, as well as difficulties in scaling up nutrition activities in health zones not yet trained in IYCF and preschool consultation (PSC). The second indicator increased from 18% in PY2Q2 but still fell significantly below the target. A total of 112 people were trained on Integrated Management of Childhood Illness (IMCI) or the revitalized PSC curriculum across the Kolwezi and Mwene Ditu coordinations. The other coordinations did not organize nutrition trainings during the quarter. Given the limited financial resources allocated to the nutrition component of the project, it is challenging to expand trainings on IYCF and redesigned PSC in all project-supported health zones. Way Forward: To improve the rate of nutritional counseling in PY2Q4, IHPplus will re-energize the IYCF groups and equip them with guidance cards, organize formal supervision of health facility providers during PSC sessions, organize joint HZMT/IHPplus supervision missions to monitor IYCF support group activities, and discuss the possibility of collecting information on curative consultations, ANC, and PSC on an ongoing basis with HZMT in the Kananga coordination. In addition, the project will conduct nutrition trainings on the following topics: (1) revitalized PSC curriculum in the following health zones: Kalole, Kamituga, Kinkondja, Lulingu, and Malemba; (2) community IMCI in the following health zones: Kabongo, Kayamba, Kitenge, and Songa; and (3) IYCF in the following health zones: Dibindi, Luputa, Mwene Ditu, and Wikong.
PROJECT PERFORMANCE COMPONENT 1: HEALTH SERVICES DRC’s health sector faces significant challenges, with a high burden of infectious disease, insecurity in many areas, and poor infrastructure. While maternal and infant mortality rates are dropping, they remain a project priority, along with the related challenges of high rates of fertility, domestic violence, malnutrition, and poor access to services. IHPplus is helping to increase access to and availability of low-

DRC-IHPplus Year Two Quarter Three Report: January 1, 2017 -March 31, 2017 Page 17 of 126
cost, high-impact health services in 126 targeted health zones. Based on innovative, evidence-based strategies, our assistance to the service delivery sector focuses on the primary health care and community levels. Activities for the quarter are summarized in table 2 below. Table 2: PY2Q3 health service key activities at a glance
IR Strategy Key activities Targeted zones 1 Provision of
drugs, commodities, and products
• Monitored pharmaceutical management All coordination offices • Conducted health zone inventory data
checks All coordination offices
• Delivered EGM Centres de Distribution Régionale (CDRs): APAMESK, DCMP, 8eCEPAC, BDOM, CEDIMEK, CADIMEK, CADMEKO, FODESA
• Procured EGM and PMI commodities All coordination offices
• Procured PEPFAR commodities Kinshasa, Kolwezi, and Lubumbashi coordinations
Reinforcement of community care sites/ collaborative approach
• Provided EGM drugs and management tools to community care sites
All supported health zones
• Supervised community care sites
Health zones supported by Mwene Ditu, Kamina, Tshumbe, and Bukavu coordinations
• Conducted awareness-raising campaigns on World Pneumonia Day
Mwene Ditu coordination
Community-led total sanitation (CLTS)- WASH
• Rehabilitated 136 new water sources Luiza and Mwene Ditu coordinations
• Constructed 3,121 new latrines Luiza and Mwene Ditu coordinations
LDP • 69 LDP teams implemented projects All health zones RBF • Led a workshop to develop guides to
implementing RBF activities in collaboration with the MOH and other partners
All 12 health zones with RBF programs
2 MNCH • Provided ANC and delivery services to pregnant women (e.g., delivery with skilled birth attendants, administration of uterotonic)
• Provided essential newborn care • Trained 113 health providers in MNCAH in
the Kanzenze, Lualaba, Dilala, and Manika health zones
All supported health zones if not otherwise specified

DRC-IHPplus Year Two Quarter Three Report: January 1, 2017 -March 31, 2017 Page 18 of 126
• Conducted routine supervision • Trained 50 health providers on clinical
integrated management of childhood illness and neonatal resuscitation in Fungurume, Lubudi, and Bunkeya
• Trained 293 health providers on neonatal resuscitation, partogram use and post-partum hemorrhage care in eight health zones in Kamina coordination
• Donated neonatal equipment and materials as well as posters on HBB and helping mothers survive child birth to 115 health facilities
Vaccination • Provided materials to support the functioning of the cold chain
• Transported vaccines and syringes to Expanded Program on Immunization (EPI) points of service in hard-to-reach health zones
• Distributed copies of the community-based monitoring modules to all health areas
All health zones
• Monitored the quality of routine immunization data and provided coordinated technical and financial support during international immunization days
Bukavu and Uvira coordinations
• Briefed eight core team members of each BCZS on community-based monitoring
Uvira and Ruzizi health zones
Family planning • Conducted family planning counseling visits • Provided contraceptive methods to health
facilities
All health zones
Nutrition • Distributed iron-folate supplements and routine vitamin A
• Printed 4,539 nutrition counseling cards and distributed them along with communication materials (consulting cards, pamphlets, etc.) to community health workers (CHW) and health facilities
• Distributed nutrition materials (PSC cards, registers)
All health zones
Malaria • Distributed LLINs, ACTs, and RDTs to health facilities
All health zones
HIV and AIDS • Conducted a campaign to determine the viral load of patients on ARVs
• Provided HIV T&C services
Kolwezi coordination

DRC-IHPplus Year Two Quarter Three Report: January 1, 2017 -March 31, 2017 Page 19 of 126
Intermediate Result 1 (IR1): Access to and availability of Minimum Package of Activities (MPA) and Complementary Package of Activities (CPA) services and products in target health zones increased Key IHPplus performance results, compared to targets set forth in the PMP, for IR1 during PY2Q3, are summarized in Table 3 below and discussed in detail in the following section. Table 3: Summary of IR 1 key results for PY2Q3 IHPplus by Sub-IR Sub-IR Key Indicators Results* 1.1 Facility-based services and products
Utilization of health care services Availability of CPA/MPA Availability of medicines and equipment (stock-outs)
1.2 Community-based services and products
i-CCM - Pneumonia i-CCM—Diarrhea CLTS-WASH
1.3 Leadership practices
LDP-desired measurable results achieved
*Green = achievement rate against the PMP target of 100% and above; Yellow = achievement rate against the PMP target between 75 -99%; Red = achievement rate against the PMP target under 75% IR 1.1: Facility-based health care services and products (provincial hospitals and health zone health centers) in target health zones increased Utilization of health care services: During PY2Q3, project performance, with a combined 45% for all eight coordinations, fell below the national target of 50% (see Table 4 and Figure 4). Kole (54%) and
• Provided ARV and ART treatment • Conducted TB screening for HIV-positive
patients TB • Confirmed new cases of smear-positive
pulmonary TB and MDR-TB All health zones
FOSACOF • Conducted evaluations of FOSACOF criteria at health facilities
All health zones
• Conducted routine supervision visits Kolwezi coordination
• Supported five health zones implementing HIV-focused RBF to start using the FOSACOF approach
Kolwezi coordination
Referral system • Referred patients to health centers and GRHs
All health zones
3 BCC • Held 11 mini-campaigns on WASH, pneumonia, gender, TB, family planning, and prenatal consultations
Five coordination offices
Community mobilization
• Sent 202,952 awareness-raising text messages through FrontLine SMS
All health zones with cell network

DRC-IHPplus Year Two Quarter Three Report: January 1, 2017 -March 31, 2017 Page 20 of 126
Uvira (56%) exceeded the national target, and Kamina, at 38%, brought down the project’s overall performance. Compared to PY2Q2, five coordinations reported lower utilization rates: Kamina (from 45% to 38%), Kole (from 58% to 54%), Kolwezi (from 46% to 45%), Mwene Ditu (from 48% to 41%) and Tshumbe (from 44% to 42%). Bukavu was the only coordination reporting a stable performance (45%). Uvira reported the best performance this quarter due to an increase in the use of health services in Lemera, Nundu, Ruzizi, and Uvira health zones by the refugees fleeing insecurity in neighboring Burundi. To serve this population influx, international non-profit organizations partnered with health facilities in these health zones to cover the fees of the health services used by refugees, making them free of charge for the patients. Another positive factor was the improved level of reporting at the community care site level in these health zones. Kole’s performance, while higher than the national target, was lower than PY2Q2. This was due to an increase in the number of EGM stock-outs reported at the health facility level and lack of or incomplete reporting from some health facilities in Dibele, Lodja, Lomela, Kole, and Omendjadi health zones. The increase in the number of EGM stock-outs in health facilities located in Kabongo, Kayamba, Kitenge, Malemba Nkulu, Mukanga, and Songa health zones is also the reason for Kamina’s low performance. The CDR was unable to deliver commodities to these health zones because of the insecurity increase in Haut Lomami caused by the resurgence of Maï-Maï militia activities. In Mwene Ditu, four health zones brought down the coordination average (Kamiji, Kalenda, Mwene Ditu, and Wikong). This was due to a resurgence in armed conflict in Kasaï Oriental between a militia formed by a tribal chief and the Congolese army, which disrupted health service delivery. Additionally, several high-volume private facilities have not yet been integrated into the national health information system as they were not compliant with the MOH norms. This is an issue that the MOH is dealing with at the national level and for which the project is unable to find a definite solution at this time. Figure 4: Health service utilization rate (%) by coordination office for PY2Q3
0
10
20
30
40
50
60
70
Jan-17
Feb-17
Mar-17
Total performance PY2Q3
National target

DRC-IHPplus Year Two Quarter Three Report: January 1, 2017 -March 31, 2017 Page 21 of 126
Table 4: Curative services utilization by coordination area during PY2Q3 Coordination Jan-17 (%) Feb-17
(%) Mar-17 (%) Total PY2Q3 (%) National
standard (%) Bukavu 50 44 43 46 50 Kamina 38 39 39 38 50 Kole 54 52 55 54 50 Kolwezi 36 43 56 45 50 Luiza 43 45 38 42 50 Mwene Ditu 43 41 40 41 50 Tshumbe 41 42 43 42 50 Uvira 57 54 58 56 50 During the next quarter, the project will support Bukavu, Kamina, Kolwezi, Luiza, Mwene Ditu, and Tshumbe coordinations to address challenges in improving their performance through the following actions:
• Continue to organize joint (DPS/HZMT or HZMT/IHPplus) supportive supervision visits; • Organize a joint meeting with the Sankuru Provincial Drug Committee, the CDR, and the DPS; • Provide community care sites with drugs and reporting tools and monitor their proper use; • Provide additional technical support to drug quantification committees to accurately forecast
drug needs at the health facility level; • Organize data analysis and validation meetings between health facilities and HZMTs; • Organize regular meetings on drug management at the health zone management office level; • Provide support to the MOH on drafting national norms on health services pricing and distribute
them to project-supported DPS and health zones. Availability of Health Services - Facility-based Minimum Package of Activities/Complementary Package of Activities: Building the capacity of health centers and hospitals to offer the full spectrum of health services is a key project priority. During PY2Q3, IHPplus reported that 88% (69/78) of GRHs were implementing CPA, against a target of 91%, representing a 97% achievement rate (see Table 5 below). Compared to PY2Q2, the project reported a decrease from its 99% achievement rate. The Bilomba GRH was raided by armed men in the Bilomba health zone, which left the hospital without equipment or commodities to function properly. Additionally, the project did not distribute equipment and materials to additional GRHs that are not yet implementing CPA. Table 5: Number and percent of GRH implementing a CPA by coordination during PY2Q3 Coordination
# of GRHs implementing CPA Total # of GRHs
% of GRHs implementing CPA
Target (%)
Achievement rate (%) Jan-17
(%) Feb-17 (%)
Mar-17 (%)
Total PY2Q3 (%)
Bukavu 21 21 21 21 22 95 91 104 Kamina 6 6 6 6 9 67 91 74
Kole 7 7 7 7 8 88 91 97 Kolwezi 7 7 7 7 8 88 91 97

DRC-IHPplus Year Two Quarter Three Report: January 1, 2017 -March 31, 2017 Page 22 of 126
Luiza 9 9 8 8 9 89 91 98
Mwene Ditu 8 8 8 8 9 89 91 98
Tshumbe 8 8 8 8 8 100 91 110 Uvira 4 4 4 4 5 80 91 88
Total 70 70 69 69 78 88 91 97
*Numbers may not match exactly due to rounding. During PY2Q4, the project plans to replace the Bilomba GRH’s missing equipment and commodities, provide financial support to make the repairs for looting damage, and support joint supervision visits with the HZMTs and the DPS team to make sure the hospital is restored to full functioning. The project reported that 99% of the supported health centers (1,390/1,398) offered MPA, against the target of 100%, representing an achievement rate of 99% (see Table 6 below). The total number of health centers offering MPA decreased by five compared to the previous quarter. At the end of the quarter, five health facilities were burned down during violent clashes between local militia and the Congolese army in the Luiza (Kalenga Mayi health center in Yangala health zone and Lupungu health center in Luambo health zone) and Mwene Ditu coordinations (Kabwe, Nyemba, and Tshilundu health centers in the Kalenda health zone). During PY2Q4, IHPplus will rehabilitate the five health centers and donate equipment and commodities to them so they are able to provide health services again in a timely manner. Additionally, the project is planning joint site visits with the HZMTs to track the progress accomplished in their rehabilitation. Finally, the project plans to work jointly with the DPS to identify solutions for addressing the lack of qualified personnel at GRHs and health centers. Table 6: Number and percentage of health centers implementing MPA by coordination during PY2Q3 Coordination # of health centers implementing
MPA Total # of health centers
% of health centers implementing MPA
Target (%)
Achievement rate (%)
Jan-17 (%)
Feb-17 (%)
Mar-17 (%)
Total PY2Q3 (%)
Bukavu 399 399 399 399 399 100 100 100 Kamina 201 201 201 201 202 100 100 100 Kole 129 129 129 129 129 100 100 100
Kolwezi 105 105 105 105 106 99 100 99
Luiza 170 170 168 168 170 99 100 99
Mwene Ditu 171 171 168 168 171 98 100 98
Tshumbe 118 118 118 118 119 99 100 99 Uvira 102 102 102 102 102 100 100 100
Total 1,395 1,395 1,390 1,390 1,398 99 100 99
*Numbers may not match exactly due to rounding.

DRC-IHPplus Year Two Quarter Three Report: January 1, 2017 -March 31, 2017 Page 23 of 126
Availability of medicines, commodities, and equipment: At USAID request, IHPplus incorporated activities from SCMS and SIAPS projects into its PY2 workplan, in order to continue to provide the essential health activities and services of those projects. The staff from these two projects joined the IHPplus team on November 23, 2016, to help ensure the continued availability of effective and high-quality pharmaceutical products and services at all IHPplus-supported sites. IHPplus has ensured the continuity of these projects by building on their accomplishments and sustaining USAID investments. The project implemented the following activities related to the pharmaceutical supply chain in PY2Q3. Ensured the availability of medications in IHPplus- supported health facilities: IHPplus supervised the delivery of the second PY1 order in collaboration with ASRAMES. The completion of this second order, supplied by Missionpharma, included receipt of the last delivery of psychotropic drugs, including to Mbuji Mayi and Bukavu health zones. This last delivery brought the delivery rate to 99% (see Appendix 4: Monitoring of Missionpharma Deliveries for IHPplus 2 (TO #902), March 2017 (Ref # CD208-1HP151130)). Table 7: Commodities expected for IHPplus PY1, order #2 (supplier: Missionpharma) Province Warehouse
(CDR) Total order value (USD)
Order delivered as of March 2017 (USD)
Order delivered (%)*
Order remaining to deliver as of March 2017 (USD)
Order remaining to deliver (%)*
Sud Kivu APAMESK, DCMP 8eCEPAC, and BDOM
$1,087,276 $1,085,808 >99 $1,467 < 1
Katanga CEDIMEK $453,503 $442,219 98 $11,284 2
Kolwezi $238,549 $234,355 98 $4,194 2
Kasaï Occidental
CADIMEK $404,024 $395,422 87 $8,602 23
Kasaï Oriental
CADMEKO $573,591 $572,942 >99 $649 < 1
FODESA $487,647 $480,332 99 $7,315 1
Order/delivery total $3,244,590 $3,211,080 99 $33,511 1 * Numbers may not add exactly due to rounding. The quantities not delivered (about 1%) include parcels of psychotropic drugs that were lost before arriving in DRC. Discussions are ongoing between ASRAMES, the MSH home office, and the supplier to clarify the situation. Regarding the first IHPplus order, the project is still waiting for the following replacements:
• Products that were damaged during transport to Lodja and Mbuji Mayi health zones. The MSH home office requested a quote from ASRAMES to procure these products.

DRC-IHPplus Year Two Quarter Three Report: January 1, 2017 -March 31, 2017 Page 24 of 126
• Insoluble injectable hydrocortisone delivered to Bukavu, Kananga, Lodja, and Mbuji Mayi health zones. The project sent the import permit to the MSH home office in March 2017 and is expecting the replacement from IMRES during this quarter.
Due to E2A ceiling issues, IHPplus agreed with USAID that IHPplus order #3 would be made through the Global Health Supply Chain-Procurement and Supply Management (GHSC-PSM) Project implemented by Chemonics. As indicated in PY2Q2, this order is important to avoid stock-outs after June 2017.
Regarding the malaria component, on March 7 and 8, 2017, IHPplus participated in a workshop on country needs quantification of antimalarial commodities for the 2018-2020 period, for Global Fund, PMI, and the Department for International Development (DFID) planning purposes. During this exercise, some proposals expressed by the Programme National de Lutte Contre le Paludisme (PNLP, or National Malaria Control Program) drug working group, were considered. The inclusion of the health care service utilization rate in each province instead of the national average was greatly biasing the quantification. Consequently, needs for RDTs and ACT were based on the total number of fever cases (suspected malaria cases) reported in 2016 instead of on the total population, used in the past. Appendix 5 shows the malaria commodity situation at the end of March 2017. For TB control, the unit monitored the anti-TB product order for the treatment of pre-extensively drug resistant TB (pre-XDR) and extensively drug resistant TB (XDR). Its first shipment, containing Bedaquilin, cleared customs and was delivered to the Plan National de lutte contre la Tuberculose (PNLT, or National TB Control Program) on March 17, 2017. A total of 182 boxes of 188 tablets each, weighing a total of 35 kg, made up this delivery. Two additional deliveries, containing Linozelide, Amikacine, Levofloxacin, and Isoniazid, are currently in customs.
For HIV control (PEPFAR), since the first quarter of the current fiscal year, IHPplus has placed four orders of laboratory inputs on behalf of GHSC-PSM. One of them is an emergency order for HIV viral load tests and early diagnostic tests for children born to HIV-infected mothers. It was placed with Wagenia (a local supplier) at an estimated cost of $1,400,000. This emergency order has already been fully delivered. The other orders will be delivered at the latest by August 2017. Finally, as it did in earlier quarters, the unit continued its regular support to CDRs and DPS for the monitoring of drug distribution from the CDRs to the health zones. This support focused on the analysis of orders, the development of distribution plans, and the monitoring of deliveries to the health zones. More specifically, the unit supported the DPS, including the PNLP provincial coordination units, in the distribution process of anti-malarial inputs to all health zones supported by IHPplus (i.e., all health zones that formerly received Global Fund support). It should be noted that, for the Kasaï Central Province, these were deliveries dating from the previous quarter that were delayed at CADIMEK following its closing by the Congolese tax authorities in December 2016. In addition to anti-malarial drug distribution, the Supply Chain Unit supported the CDR and Lubumbashi and Kolwezi warehouse in distribution of HIV commodity distribution to 75 locations in Lubumbashi supported by the Integrated HIV/AIDS Project in the DRC (ProVIC), 55 locations supported by ICAP in nine health zones of the city of Lubumbashi, four health zones in Likasi supported by Rural Health Program (Projet Santé Rurale) of the Centers for Disease Control (CDC), and 46 care sites in Kolwezi.

DRC-IHPplus Year Two Quarter Three Report: January 1, 2017 -March 31, 2017 Page 25 of 126
Strengthen the management of essential medicines and medical consumables: In January 2017, the unit completed one supportive supervision visit to the IHPplus partner CDR. This visit focused particularly on:
• Updating inventories and tracking of product use in health zones; • Revising the product distribution electronic tracking tool (developed by a French medical
procurement company, DISMED) between the CDRs and the health zones; • Identifying the need for drug management tools for health facilities; and • Tracking the distribution of equipment recently supplied by IHPplus to health zones.
Appendix 6 (Follow-up assignment report on recommendations to CDR and warehouses, February 2017) presents the findings and next steps of this assignment. As part of malaria control product management, the unit supported a meeting of the PNLP drug task force on March 2, 2017. During this meeting, the stock level and pipeline quantities of antimalarial drugs were assessed relative to the DRC PMI target. During the meeting, the task force also studied the assumptions used for quantifying antimalarial drugs in the upcoming concept note for the new Global Fund financing mechanism and in the PMI Operational Plan. Potentially problematic assumptions were highlighted and concrete proposals were made to the PNLP leadership to improve them. Since the inventory analysis had pointed out the unequal distribution of stocks among provinces and PMI partner warehouses, minor ACT and RDT redeployments were implemented from Kinshasa to Bukavu and between the three Bukavu warehouses. The unit helped also distribute ACT and RDTs inherited from the Global Fund in (the former provinces of) Kasaï Oriental and Kasaï Central. As part of its technical assistance to DPS, the unit helped DPS convene Technical Medicine Group meetings in all but the Kasaï Oriental and Lualaba DPS. These meeting focused mainly on coordinating pharmaceutical supplies to ensure availability in health facilities and to avoid overstocks in CDRs. During the quarter, the unit provided technical support to the PNLT for the annual TB drug stock inventory on January 12 and 13, 2017. It provided an overview of the stock at the central level and enabled the unit to develop a distribution plan in response to TB medicine needs in the PNLT provincial coordination units. The unit also provided technical support for the development of the 2018-20 TB/HIV concept note during a workshop held from February 27 to March 12, as part of the Product Supply Management (PSM) component. At that time, drug and input needs for these diseases were quantified. As part of provider and health zones leadership team capacity building, IHPplus provided technical and financial support to the PNLP in the Haut Katanga province for training in new malaria management techniques in the Kipushi and Sakania health zones. A total of 51 participants were trained (42 men and nine women). This was the first training in these health zones since the latest revision of the malaria management guide for DRC. For the Sankuru province, technical and financial support was provided to the DPS for the training in drug management in the Lusambo, Ototo, Pania Mutombo, and Vangakete health zones. A total of 63 providers and HZMTs members were trained, including 21 women. From February 14 to 18, 2017, IHPplus provided support to the Programme National de Lutte contre le SIDA (PNLS, or National AIDS Control Program) and Haut Katanga and Kolwezi DPS for the training and implementation of the Electronic Drug Dispensing Tool. In Haut Katanga, training was provided to GRH Kenya, GRH Kamalondo, Centre d’Excellence Sendwe and Clinique Universitaires de Lubumbashi. In

DRC-IHPplus Year Two Quarter Three Report: January 1, 2017 -March 31, 2017 Page 26 of 126
Lualaba, training was provided for Hôpital du Personnel de la Gécamines Kolwezi and GRH Mwangezi. This training was accompanied by the installation of a computer kit and a solar battery in each site. A total of 17 participants were trained, including 12 women (see Appendix 7: Final Report on the Electronic Drug Dispensing Tool Training). Support quarterly visits to supervise medicine management in the health zones, health facilities, and CDRs supported by IHPplus: The IHPplus Supply Chain Unit provided technical and financial support to the organization of supervision and monitoring visits for drug management in health zones:
• January 2-24, 2017, in the Haut Lomami DPS, Kaniama, Baka, and Nkinda health zones; and March 1-4, 2017, in the Songa health zone. During these supervision visits, these health zones were provided with drug management tools;
• March 4-6, 2017, in the Lomami DPS, in the Kamiji health zone; • January 26-March 25, 2017, in the Lualaba DPS, in the Manika, Dilala, Lualaba, Fungurume,
Bunkeya, Mutshatsha, and Kanzenze health zones.
In Lualaba, supervision focused on the monitoring of the reinvestment of funds generated by the sale of medicines in health facilities. To date, it appears that the health center nurses generally remit the funds to the BCZS but that the HZMTs use these funds for other purposes. This amounts to misappropriation of funds. There are no bank accounts to maintain the funds generated by the health facilities; they are held at the BCZS, and their management is not transparent. In view of the situation, as described in Table 12 below, the project recommended that the DPS carry out an audit, to better define individual responsibilities and implement necessary discipline measures. Table 12: Reinvestment of funds generated by the sale of medicines in health facilities Health facility Amount paid Comments GRH Kanzenze $800 These facilities remitted the funds to the BCZS, but the
funds have been used for unknown purposes to date. Kolwezi staff hospital $3,097 GRH Dipeta $2,000 GRH Kanzenze $988 Fungurume health zone $7,131 N/A Lualaba health zone $667 N/A Kanzenze health zone $1,581 N/A Bunkenya health zone N/A These health zones do not have revolving cash funds, yet
they demand that the health facilities remit their reinvestment funds to resupply them with drugs.
Mutshatsha health zone N/A Dilala health zone N/A Manika health zone N/A Minimize tracer medicine stock-outs: As shown in Figure 5 below, during PY2Q3, the only tracer drug that registered good performance is iron-folate, with a 113% achievement rate (221 stock-outs vs. a target of 250). ACT almost achieved its target (173 stock-outs vs. 150) and reported an 87% achievement rate. Both ORS and Depo-Provera were far from achieving their respective targets this quarter, with 66% (182 vs. 120) and 43% (187 vs. 80), respectively. Compared to the previous quarter, the performance unilaterally decreased. The number of stock-outs increased for all indicators: from 121 to 187 for Depo-Provera, 122 to 183 and 182 for ORS, from 162 to 221 for iron-folate, and from 75 to 173 for ACT. Since

DRC-IHPplus Year Two Quarter Three Report: January 1, 2017 -March 31, 2017 Page 27 of 126
the PMP targets are set to decrease from each quarter to the next, the achievement rate also decreased for all indicators (from 83% to 43% for Depo-Provera, from 123% to 66% for ORS, from 185% to 113% for iron-folate, and from 200% to 87% for ACT). Figure 5: Stock-outs of tracer medicines during PY2Q3 Stock-outs of Depo-Provera Stock-outs of iron-folate Stock-outs of ORS Stock-outs of ACT The red line on each figure represents the target for each indicator. As shown in Tables 13a and 13b below, Kolwezi reported the lowest number of stock-outs for Depo-Provera (1) and iron-folate (7). Uvira reported the lowest number of stock-outs for ORS (0) and ACT (2). For the second consecutive quarter, Kamina reported the lowest performance on all four tracer drugs: iron-folate (95), Depo-Provera (89), ORS (89), and ACT (70). On the positive side, the number of stock-
182 165
152
183
0
50
100
150
200
Jan-17 Feb-17 Mar-17 PY2Q3
Stock-outs of ORS
187 182
112
187
0
50
100
150
200
Jan-17 Feb-17 Mar-17 PY2Q3
Stock-outs of Depo-Provera
212 221 189
221
0
50
100
150
200
250
Jan-17 Feb-17 Mar-17 PY2Q3
Stock-outs of folic acid
173
147
154
173
130
140
150
160
170
180
Jan-17 Feb-17 Mar-17 PY2Q3
Stock-outs of ACT

DRC-IHPplus Year Two Quarter Three Report: January 1, 2017 -March 31, 2017 Page 28 of 126
outs reported in this coordination decreased compared to PY2Q2 for tracer drugs (iron-folate from 144, Depo-Provera from 142, and ORS from 112). Factors explaining the underperformance for each indicator and the specific coordinations that decreased performance are presented below. Table 13a: Stock-outs of tracer medicines (Depo-Provera and iron-folate) by coordination office (by month) Depo-Provera Iron-folate
Coordination Jan-17 Feb-17 Mar-17 Jan-17 Feb-17 Mar-17 Bukavu 35 43 5 15 8 10 Kamina 89 88 41 76 95 52 Kole 8 9 10 36 37 40 Kolwezi 0 1 0 3 7 7 Luiza 25 4 21 27 17 33 Mwene Ditu 18 22 21 15 17 16 Tshumbe 8 11 14 22 28 31 Uvira 4 4 0 18 12 0 Total 187 182 112 212 221 189 Table 13b: Stock-outs of tracer medicines (ORS and ACT 1-5) by coordination office (by month) ORS ACT 1-5 Coordination Jan-17 Feb-17 Mar-17 Jan-17 Feb-17 Mar-17 Bukavu 15 12 5 4 2 1 Kamina 71 89 38 70 63 13 Kole 18 15 23 34 28 29 Kolwezi 1 1 2 2 5 10 Luiza 24 11 41 47 25 60 Mwene Ditu 27 10 13 0 3 28 Tshumbe 26 27 30 15 19 13 Uvira 0 0 0 1 2 0 Total 182 165 152 173 147 154 Depo-Provera: While the product is available in the warehouse of the health zone central office, 187 health facilities have experienced stock-outs. The Kamina coordination had the largest number of points of service with stock-outs during PY2Q3. The coordination’s swamps, coupled with rainy season, limited vehicle circulation and mobility. Additionally, there are long distances between the health centers and central offices, as well as roads in disrepair. Despite the project’s efforts to address ongoing challenges, health centers are still ordering commodities late, and BCZS continue to refuse to supply any drugs to health facilities that do not remit their 30% share for the revolving drug fund. In the Bukavu coordination, syringes were missing from the Depo-Provera package (triclofem), so the product was not distributed from the central offices to the health facilities. Some health facilities note that Depo-Provera

DRC-IHPplus Year Two Quarter Three Report: January 1, 2017 -March 31, 2017 Page 29 of 126
needs were underestimated (Mpokolo and Dibindi). Kolwezi registered the best performance, with only one stock-out reported, thanks to its easily accessible health facilities (80% of the coordination is an urban area) and its dynamic and efficient management drug committee. Next steps:
• Supply health facilities in health zones in the Kamina coordination that are experiencing stock-outs with family planning products;
• Order additional syringes for the Depo-Provera packages lacking them. Iron-folate: The number of health facilities reporting stock-outs of iron-folate was the highest (221) in February 2017, which was still under the target of 300 for the quarter. This number is higher than PY2Q2 (155) and reflects the total number of health facilities experiencing stock-outs, with the highest monthly result reported. Five coordination offices demonstrated strong results compared with their monthly target: Bukavu (15/81), Kolwezi (7/22), Mwene Ditu (17/51), Tshumbe (31/31), and Uvira (18/22). Other coordinations (Kamina, Kole, and Luiza) far exceeded their target during at least one month of the quarter. This overall performance results from IHPplus providing iron-folate to the health zone through the CDRs and joint monitoring of this commodity as well as other EGM in health facilities by IHPplus staff and health zone managers. High numbers of stock-outs are discussed by coordination, below.
• Kananga: A violent militia uprising in Kasaï Central, as mentioned under the Key Challenges section, has contributed to instability in the Dibaya, Lubondaie, and Yangala health zones Nevertheless, the coordination office managed, towards the end of the quarter, to supply EGMs, including iron-folate, to Bilomba, Kalomba, Luambo, Ndekesha, Dibaya, and Lubondaie health zones, with the assistance of the HZMTs, which made their vehicles available for the transport of these EGMs.
• Kole: There is a breakdown in the supply chain between the three levels involved in the supply of EGM, particularly between the BCZS and the health facilities, which wait until the end of the month to pick up the drugs at the offices. The supply chain in the province starts with the CDR, which delivers the drugs to the BCZS where the health facilities (health centers and hospitals) pick them up each month; three levels are therefore involved: CDR, BCZS, and health facilities. Each level sends an order for drugs to the next level up. In most health zones facilities give little attention to drugs provided free to the population (e.g., iron-folate). Therefore, stock-outs of these commodities have been reported at the health facility but not at the CDR or BCZS level.
• Kamina: The health zones along the river are the most affected as deliveries have been slightly delayed because of lack of road accessibility; products are transported first by river and then by road to the BCZS, which then distributes them to the health facilities. Some health zones with a large number of health facilities reporting stock-outs received their last delivery only at the end of February 2017 (Kinkondja, Malemba Nkulu, Mukanga, and Mulongo health zones); this is again a “fake” stock-out because the BCZS had the products but did not provide them to heath facilities that had not remitted the 30% share for the revolving drug fund.
• Tshumbe: Commodities were supplied late to some facilities. • Kolwezi: Orders from facilities to BCZS with iron-folate available in their warehouses were not
prepared and sent. This was the case in Dilala, with two health areas; Manika, with one health area; and Mutshatsha, with four health areas.

DRC-IHPplus Year Two Quarter Three Report: January 1, 2017 -March 31, 2017 Page 30 of 126
• Mwene Ditu: There was a delay in supplies from CADMEKO to the health zones and from the BCZS to the health facilities.
Kolwezi continues to report by far the fewest stock outs (seven) and therefore the best results of all coordinations. These health zones have demonstrated strong results since the beginning of IHP. They received large quantities of iron-folate from the AXxes project (the USAID-funded project that preceded IHP). Their stock has always been successfully renewed under IHP and IHPplus. Moreover, management of this commodity at the health facility level is regularly monitored by HZMTs, and periodically by the DPS and IHPplus staff. Challenges shared by all coordination offices:
• Poor pharmacy management (average monthly consumption, quantities used, buffer inventory); • Late transmission of orders from health center to BCZS; • Poor monitoring of commodity management in hard-to-reach health areas in Bukavu
coordination; • Geographic remoteness (roads in disrepair), especially in Kamina coordination; • Insecurity in Luiza coordination: it is difficult to keep iron-folate available at the health facility in
view of transport difficulties in some health zones because of insecurity; • Reduction of the EGM delivery times from CADMEKO to health zone while drugs are available at
the CDR. Overall assessment
• In Kamina, poor road conditions this time of the year complicate the supply of EGMs and other commodities to the health zones;
• In Kananga, no monitoring by the HZMT of EGM management in health facilities and insecurity increase EGM/iron-folate stock-outs in some health facilities.
Next steps:
• Organize joint IHPplus and DPS visits to monitor drug management; • Provide support to BCZS to accelerate EGM delivery to health centers.
ORS: The Kamina coordination had the largest number of facilities with stock-outs, in the Kabongo, Mukanga, and Mulongo health zones, because of delayed supply (primarily because of the reasons discussed above under iron-folate--namely there are “fake” stock-outs because the BCZS were not supplying any drugs to health facilities that had not remitted their 30% shares to the revolving drug fund); followed by the Luiza, Mwene Ditu, Kole, and Tshumbe health zones. The security situation in the Kasaï Central province, described above, and in a few health zones in the Mwene Ditu coordination (Wikong, Kamiji), hinders the supply of EGMs, including ORS, to facilities. As discussed, while facilities report stock-outs, the products actually are available in the CDRs. The project organized awareness and outreach initiatives at the BCZS level to promote the use of medicines that save the lives of mothers and children, including ORS, and efforts are underway to increase supply to health facilities. Since December 2016, the Kamina coordination has reported the highest number of facilities with stock-outs of ORS, followed by Mwene Ditu, Tshumbe, Kole, Luiza, and Bukavu. At the same time, CDRs in

DRC-IHPplus Year Two Quarter Three Report: January 1, 2017 -March 31, 2017 Page 31 of 126
Bukavu, Kamina, and Mbuji Mayi have overstocks of OSR-zinc close to their expiration date. Supervision visits to these coordinations are scheduled starting in April 2017 to improve supply to health facilities and the use of these products. Stock-outs in Luiza stem from insecurity issues (caused by the militia) that make CDRs reluctant to deliver commodities to health facilities for fear of armed robbery. Next steps:
● Monitor the supply and use of these medications in the Kamina, Bukavu, and Mwene Ditu coordinations;
● Conduct awareness and outreach initiatives to promote the use of the medicines. ACT: During PY2Q3, 173 heath facilities experienced stock-outs of ACT 1 to 5 years. Compared to the previous quarter (PY2Q2), performance has worsened for this indicator. This indicates reduced ACT availability in health facilities. Only the Bukavu, Uvira, and Kolwezi coordinations reported very good results. In the Bukavu and Uvira coordinations, the three CDRs that serve 28 health zones use all transport means to deliver medicines and inputs to health zones, even hard to reach ones, via air and road on the Shabunda line, for instance. In the highlands, supplies are carried by hand up the hills. In the Kolwezi coordination, the CDR achieved regular commodity supply with joint monitoring from the IHPplus team and the DPS. Average results worsened in the other coordinations: Kamina reported 70 health facilities with stock-outs, primarily because of the reason discussed above--namely that the BCZS were not supplying any drugs to health facilities that had not remitted their 30% share for the revolving drug fund. As discussed earlier, the stock-out in Luiza is due to the security situation in the province.
Mwene Ditu went from reporting no stock-outs to 28, due to a stock-out in the Mwene Ditu health zone (23 health facilities from the GF malaria component) because of late order that resulted in a delay in supply. The CDR just supplied the zone on April 26, 2017. Four health structures in the Kamiji health zone did not report back because of insecurity. In the Wikong health zone, the issue is one of internal redistribution. The BCZS has been notified that this health facility needs to be supplied. IR 1.2: Community-based health care services and products in target health zones increased Malaria, diarrhea, and pneumonia are the three main killers of children under five in DRC. For this reason, the MOH has adopted the i-CCM strategy as the main approach to reducing the child mortality rate. IHPplus supports MOH efforts to implement this strategy. Integrated Community Case Management: i-CCM is an equity-based strategy to increase access to effective case management for children suffering from malaria, pneumonia, and diarrhea, especially in hard-to-reach areas and among vulnerable populations. Through i-CCM programs, CHWs are equipped, trained, supported, and supervised. IHPplus currently supports 839 community care sites in 64 health zones where 953,152 people live (representing 7% of the total population supported by the project). In three health zones (Miabi, Kasansa, and Kabinda), IHPplus provides support only on malaria-related activities. However, these zones have 42 community care sites which offer services for diarrhea and pneumonia in addition to malaria. During this quarter, the project inaugurated 45 new community care sites in Kasaji, Kalamba, and Kafakumba health zones in the Kolwezi coordination.

DRC-IHPplus Year Two Quarter Three Report: January 1, 2017 -March 31, 2017 Page 32 of 126
During PY2Q3, the 839 IHPplus-supported community care sites treated 57,311 disease cases, including 25,725 of malaria, 12,626 of pneumonia, and 18,960 of diarrhea (see Tables 15a and 15b below). The project reported a 28% decrease in the number of cases of all diseases treated compared to PY2Q2 (80,048). For malaria, the number of cases decreased from 40,092 to 25,725; for pneumonia, from 15,093 to 12,626; and for diarrhea, from 24,863 to 18,960. Table 14 below shows the utilization rates for i-CCM interventions for all three diseases compared to their respective targets, per coordination: 56% of all expected cases (101,647) were treated at the community level (121% of all expected diarrhea cases, 90% of all expected pneumonia cases, and 36% of all expected malaria cases). Malaria is the least treated disease at the community level, especially in Mwene Ditu and Kole coordinations. Community care sites located in Mwene Ditu and Kanda Kanda health zones (Mwene Ditu coordination) and Kole, Bena Dibele, Wembo Nyama, and Omenjadi (Kole coordination) health zones were receiving joint support for their activities. While Projet de Santé Rurale (Rural Health Project, or SANRU) and the Global Fund were providing technical and financial support to malaria activities (including malaria commodities procurement), IHPplus was responsible for supporting diarrhea and pneumonia activities. However, there were often stock-outs of malaria commodities in the supported i-CCM sites, due to the lack of training of CHWs in managing their stock and properly calculating their monthly average use to place their orders in a timely manner. When the rationalization process was completed during this quarter, IHPplus inherited the malaria component of these sites, along with their stock-out challenges. Additionally, the project also noted that the completeness of data reporting at the community level in these health zones was very low. During PY2Q4, the project is planning to lead joint monitoring visits with HZMTs to these i-CCM sites in order to provide guidance to the CHWs on how to properly manage their malaria commodities stock and how to report data in a more accurate and complete way. Another key takeaway from table 14 is that Tshumbe is the coordination where most of the expected cases of all three diseases were treated at the community level (81%), while Kolwezi (47%), Mwene Ditu (45%), and Uvira (43%) were the coordinations with the lowest i-CCM intervention utilization rate. The reasons underlying stronger performance in Tshumbe and underperformance in Kolwezi, Mwene Ditu, and Uvira at the community level will be better defined by the project in PY2Q4 through monitoring visits to the community care sites in these health zones to determine the factors that are positively and negatively impacting performance. Table 14: Utilization rates for i-CCM interventions during PY2Q3 Coordination Total
IHPplus PY2Q3
Bukavu Kamina Kole Kolwezi Luiza Mwene Ditu Tshumbe Uvira
Number of i-CCM sites
71 183 102 114 117 156 69 27 839
Population covered by CHW
103,143 166,948 133,374 95,260 143,227 224,331 51,278 35,591 953,152
% covered population <5
19,494 31,553 25,208 18,004 27,070 42,399 9,692 6,727 180,146

DRC-IHPplus Year Two Quarter Three Report: January 1, 2017 -March 31, 2017 Page 33 of 126
% covered population <5 (quarterly)
4,874 7,888 6,302 4,501 6,767 10,600 2,423 1,682 4,036
# expected malaria cases
7,798 12,621 10,083 7,202 10,828 16,959 3,877 2,691 72,058
# malaria cases seen (PY2Q3)
5,327 5,225 1,669 2,549 5,527 2,900 1,630 898 25,725
Malaria utilization rate
68% 41% 17% 35% 51% 17% 42% 33% 36%
# expected acute respiratory infection (ARI) cases
1,511 2,445 1,954 1,395 2,098 3,286 751 521 13,961
# pneumonia cases seen (PY2Q3)
730 2,001 2,121 879 2,063 3,399 1,153 280 12,626
Pneumonia utilization rate
48% 82% 109% 63% 98% 103% 154% 54% 90%
# expected diarrhea cases
1,691 2,737 2,187 1,562 2,348 3,678 841 584 15,628
# diarrhea cases seen (PY2Q3)
1,376 2,767 4,633 1,365 2,270 4,420 1,671 458 18,960
Diarrhea utilization rate
81% 101% 212% 87% 97% 120% 199% 78% 121%
# expected cases for all three diseases
11,000 17,804 14,223 10,159 15,274 23,923 5,468 3,796 101,647
Total number of cases
7,433 9,993 8,423 4,793 9,860 10,719 4,454 1,636 57,311
Average utilization rate for all three diseases
68% 56% 59% 47% 65% 45% 81% 43% 56%
The calculation method for i-CCM utilization rate was determined by dividing the total number of cases treated at the community level by the total number of expected cases for all three diseases combined. The latter is calculated by multiplying the total population covered by the project by the percentage of children under five (which is 18.9%, according to the national health information system), then

DRC-IHPplus Year Two Quarter Three Report: January 1, 2017 -March 31, 2017 Page 34 of 126
multiplying this number by the disease incidence data for ARI (0.31 episodes per child per year), diarrhea (3.47 episodes per child per year), and malaria (four episodes of fever per child per year multiplied by 40% which is equivalent to the RDT positivity rate). Table 15a: Pneumonia, diarrhea, and malaria cases treated through i-CCM sites during PY2Q3 (by month) Diarrhea Pneumonia Malaria Coordination Jan-17 Feb-17 Mar-17 Jan-17 Feb-17 Mar-17 Jan-17 Feb-17 Mar-17
Bukavu 451 461 464 284 233 213 1,514 1,897 1,916
Kamina 805 746 1,216 538 803 660 1,710 1,476 2,039
Kole 1,524 1,804 1,305 744 683 694 242 612 815
Kolwezi 476 528 361 279 402 198 686 1,168 695
Luiza 886 713 671 521 662 880 1,852 2,382 1,293
Mwene Ditu 1,722 1,539 1,159 1,305 1,179 915 1,034 1,000 866
Tshumbe 534 592 545 436 491 226 504 653 473 Uvira 195 124 139 96 99 85 274 279 345 Total 6,593 6,507 5,860 4,203 4,552 3,871 7,816 9,467 8,442
Table 15b: Pneumonia, diarrhea, and malaria cases treated through i-CCM sites during PY2Q3 (total) Diarrhea Pneumonia Malaria Coordination Total PY2Q3 Bukavu 1,376 730 5,327 Kamina 2,767 2,001 5,225 Kole 4,633 2,121 1,669 Kolwezi 1,365 879 2,549 Luiza 2,270 2,063 5,527 Mwene Ditu 4,420 3,399 2,900 Tshumbe 1,671 1,153 1,630 Uvira 458 280 898 Total 18,960 12,626 25,725
Pneumonia: During PY2Q3, health providers in project-supported health facilities or community care sites treated 128,040 children under five years of age with antibiotics (250 mg amoxicillin tablets). Compared to the PMP target of 114,028, this represents an achievement rate of 112% (see Table 16, below). Compared to PY2Q2, the number of pneumonia cases treated increased by 10% from 115,206, and the achievement rate also increased (from 101% to 112%). Of the total cases, 10% (12,626) were treated at community care sites, a percentage that fell slightly from PY2Q2 (13%).

DRC-IHPplus Year Two Quarter Three Report: January 1, 2017 -March 31, 2017 Page 35 of 126
Table 16: Number of cases of childhood pneumonia treated with antibiotics in USG-supported facilities and i-CCM sites during PY2Q3 Coordination Jan-17 Feb-17 Mar-17 Total PY2Q3 Target Achievement
rate (%) Health facilities
i-CCM sites
Total
Bukavu 12,472 10,897 10,691 33,330 730 34,060 32,481 105 Kamina 5,395 6,300 6,314 16,008 2,001 18,009 22,248 81 Kole 3,965 3,586 3,995 9,425 2,121 11,546 11502 100 Kolwezi 1,482 2,427 2,717 5,747 879 6,626 4,758 139 Luiza 5,837 6,180 6,176 16,130 2,063 18,193 8,787 207 Mwene Ditu 7,276 6,966 6,943 17,786 3,399 21,185 18,708 113 Tshumbe 2,519 2,757 2,415 6,538 1,153 7,691 7,744 99 Uvira 2,794 3,345 4,591 10,450 280 10,730 8,448 127
Total 41,740 42,458 43,842 115,414 12,626 128,040 114,028 112 *The figures in this column were rounded to the nearest whole number. Six out of eight coordinations exceeded their target numbers (Bukavu, Kole, Kolwezi, Luiza, Mwene Ditu, and Uvira). Tshumbe was short only by one percentage point of meeting its target, while Kamina reported the lowest performance, with an 81% achievement rate. Compared to PY2Q2, six coordinations improved their performance (Bukavu, Kole, Kolwezi, Luiza, Tshumbe, and Uvira) while Mwene Ditu stabilized (at 113% achievement rate). Only Kamina reported a lower performance (which decreased from 144% and a total number or cases treated that decreased by 36%). The increase in the number of EGM stock-outs in health facilities located in Kabongo, Kayamba, Kitenge, Malemba Nkulu, Mukanga, and Songa health zones contribute to Kamina’s low performance. The CDR was unable to deliver commodities to these health zones because of the increased insecurity in Haut Lomami caused by the resurgence of Maï-Maï militia activities. Insecurity prevalent in the region also discouraged mothers and guardians to take children to i-CCM sites to seek care. Factors contributing to strong performance in Luiza and Mwene Ditu included routine distribution of EGM and management tools (including IMCI forms and partograms) to health facilities and community care sites, organization of monthly data reviews by the HZMTs with analysis of performance against expected targets at the health facility level, CHW community awareness sessions on the danger signs of pneumonia and the need to seek care with the closest health provider, and integration of the complete IMCI package at the health facility and community care site level. Luiza should be further assessed, as it is not clear how the services were provided to the displaced population fleeing armed conflict between the Nsapu militia and the Congolese army. Uvira reported the best performance over the quarter, due to the organization of regular supervision visits from head nurses to community care sites and the greater involvement of CHWs in active pneumonia case seeking through household visits. Bukavu’s performance resulted from regular distribution of EGM, management tools, and commodities (including respiratory rate timers); routine supervision of CHWs by head nurses; SMS messages to mothers in the community encouraging them to seek care if they detect pneumonia symptoms in their children; and regular monitoring of indicators during RBF technical verification visits.

DRC-IHPplus Year Two Quarter Three Report: January 1, 2017 -March 31, 2017 Page 36 of 126
Kolwezi reported the greatest improvement compared to PY2Q2, when it had the lowest quarterly performance, at 80%. To redress this performance, in November 2016 IHPplus distributed respiratory rate timers and amoxicillin and supported DPS and HZMT supervision visits to health facilities and community care sites focusing on IMCI. These corrective measures enabled the coordination to report a 139% achievement rate during this quarter. Other overall factors that favorably impacted project performance during this quarter include the following: improved level of data completion during collection, through DHIS2; briefings for health providers and HZMTs by project team during monthly data review meetings and annual operational plan workshops; and regular monitoring of indicators during RBF technical verification visits. Diarrhea: During PY2Q3, a total of 156,221 cases of diarrhea were treated with packs of ORS and zinc supplements (see Table 17 below). IHPplus fell slightly below the PMP target of 160,789, representing an achievement rate of 97%. Of the total number of cases treated, 18,960 (12%) were treated at community care sites, so mothers did not have to travel long distances to reach health care services. The number of diarrhea cases treated decreased from PY2Q2 (170,956) along with the achievement rate (from 106% to 97%). Table 17: Number of cases of child diarrhea treated in USG-supported facilities and i-CCM sites during PY2Q3 Coordination Jan-17 Feb-17 Mar-
17 Total PY2Q3 Target Achievement
rate (%) Health facilities
i-CCM sites
Total
Bukavu 13,691 14,360 10,638 37,313 1,376 38,689 48,324 80
Kamina 6,254 6,338 7,212 17,037 2,767 19,804 29,922 66
Kole 6,066 6,544 6,973 14,950 4,633 19,583 11,172 175
Kolwezi 3,120 2,873 3,147 7,775 1,365 9,140 5,859 156
Luiza 5,881 6,235 5,453 15,299 2,270 17,569 14,115 124
Mwene Ditu 10,626 8,621 8,878 23,705 4,420 28,125 22,044 128
Tshumbe 3,616 3,740 3,443 9,128 1,671 10,799 11,257 96
Uvira 4,861 3,857 3,794 12,054 458 12,512 18,096 69
Total 54,115 52,568 49,538 137,261 18,960 156,221 160,789 97
*The figures in this table were rounded to the nearest whole number. Half of the coordinations exceeded their target, with achievements ranging from 124% in Luiza to 175% in Kole. Tshumbe (96%) and Bukavu (80%) almost met their respective targets. Uvira and Kamina reported the lowest performance, with achievement rates of 69% and 68%, respectively. Luiza’s performance in the context of insecurity should be further assessed. One possible factor may be related to the continuous availability of ORS packets in every health zone, which were delivered by HZMT vehicles along with other EGM.

DRC-IHPplus Year Two Quarter Three Report: January 1, 2017 -March 31, 2017 Page 37 of 126
As identified during supervision visits, strong performance in Mwene Ditu, despite security issues caused by clashes between local militia and the Congolese army, can be attributed to the regular distribution and availability of diarrhea job aids during monthly data review meetings in Kalenda and Mwene Ditu health zones and during annual operational plan workshops organized in all nine health zones. Finally, this indicator was among those selected for the RBF program, which means that it was monitored carefully during RBF technical verification visits in Kanda Kanda and Bibanga health zones. In Kolwezi, the number of diarrhea cases treated increased by 16% compared to the previous quarter. This is due to the implementation of 45 new community care sites in January 2017. The project then delivered reporting tools, job aids, and EGM to these sites. IHPplus also trained health providers in Bunkeya, Fungurume, and Lubudi health zones on clinical IMCI interventions. Underperformance in Kamina is essentially reported from seven health zones (Kabongo, Kitenge, Kayamba, Kinkondja, Lwamba, Malemba, and Mukanga) out of the nine included in this coordination area, due to an increase of ORS stock-outs reported in both health facilities and community care sites during January and February. CDRs were unable to deliver the commodities to health facilities due to rainy weather conditions. The coordination also lacks health providers trained on IMCI, especially in Kayamba, Lwamba, Malemba Nkulu, and Mukanga health zones, combined with a high level of incorrect usage of diarrhea treatment protocol, also due to the lack of training. The underperformance in Bukavu (specifically in the Katudu, Ibanda, Kamituga, and Shabunda health zones) and Uvira is due to the low level of integration of data from private health facilities into the national reporting system. However, both Bukavu and Uvira improved their performance compared to PY2Q2 (from respectively 77% to 80% and 68% to 69%). The project was able to report better results in these two coordinations due to the following: improvement in data collection and completeness through DHIS2; procurement of Orazinc combined packs for health facilities and community care sites; monthly supervisory visits of community care sites by motivated head nurses (who were reimbursed for their expenses); increased availability of the project-supported data reporting template at the community care sites by providing financial support for their printing ; and selection of this indicator—the percentage of cases of diarrhea treated with packs of ORS and zinc supplements—for the RBF program in both Lemera and Nundu health zones. The indicator was monitored carefully during RBF technical verification visits. In the Lemera health zone, the World Bank RBF program is further decreasing health service fees. In PY2Q4, IHPplus will continue to strengthen joint supervision (DPS, health zone management teams, and IHPplus); improve regular distribution of ORS and zinc supplement kits at the community care site level and to CODESAs; and provide reporting tools. Malaria: In PY2Q3, 590,797 cases of malaria were treated with ACT at health facilities (565,072 or 96%) and community care sites (25,725 or 4%). This is a significant increase (48%) in the number of treated cases compared to PY2Q2 (306,725). However, the percentage of cases treated in the community care sites decreased (from 13%).

DRC-IHPplus Year Two Quarter Three Report: January 1, 2017 -March 31, 2017 Page 38 of 126
Table 18: Number of children under five years old with malaria treated in USG-supported facilities and i-CCM sites during PY2Q3 Coordination Jan-17 Feb-17 Mar-17 Total PY2Q3
Health facilities
i-CCM sites Total
Bukavu 69,560 51,435 49,484 165,152 5,327 170,479
Kamina 52,149 28,042 40,787 115,753 5,225 120,978
Kole 7,944 7,538 13,361 27,174 1,669 28,843
Kolwezi 11,700 10,918 17,564 37,633 2,549 40,182
Luiza 26,710 30,583 19,632 71,398 5,527 76,925
Mwene Ditu 18,445 18,367 20,401 54,313 2,900 57,213
Tshumbe 18,061 14,451 7,700 38,582 1,630 40,212
Uvira 19,489 16,846 19,630 55,067 898 55,965
Total 224,058 178,180 188,559 565,072 25,725 590,797
Bukavu continues to report the highest number of malaria cases treated (170,479) for the second consecutive quarter, while Kole reported the lowest (28,843). However, compared to the previous quarter, all the coordinations have reported higher results, thanks to regular joint supervision and monitoring visits led by the DPS, HZMTs, IHPplus, and the NMCP in all the coordination health zones; proper functioning of community care sites; health providers and CHWs respecting the strict national malaria care protocol; strong lobbying efforts with village authorities and community leaders to gain their support for the local community care sites; and enforcement of free health services at the community care sites for children under five. The poor results reported for Kole, Kolwezi, and Tshumbe are primarily due to ACT (primarily for infants between two and 11 months) and other commodity stock-outs at community care sites. While stock-outs are sometimes attributable to delivery delays caused by the poor road system, more important reasons are that health facilities did not account for malaria commodity needs when placing orders, and both health facilities and community care sites did not report malaria commodity consumption data. Challenges: Medicines and management/reporting tools must be available in health facilities; the number of health providers and CHWs trained in IMCI needs to be increased; and data collection, completion, and analysis must be improved (particularly around drug management and consumption data at the health facility and community care site levels). Next steps: IHPplus will implement the following actions to strengthen IMCI results in PY2Q4:
● Continue the regular distribution of medicines, commodities, management tools, and job aids; ● Monitor the status of EGM procurement orders USAID transferred to GHSC-PSM; ● Train providers and CHWs to improve data completion and accuracy to reach 100% completion
and accuracy through job aid distribution and explanation (which helps classify malaria cases and clearly define each indicator and which data to collect), especially in health zones assumed from the rationalization process with the Global Fund/SANRU;

DRC-IHPplus Year Two Quarter Three Report: January 1, 2017 -March 31, 2017 Page 39 of 126
● Conduct post-training monitoring and supportive supervision visits to Kole, Tshumbe, and Bukavu;
● Train providers on drug management, ordering, and use (particularly on the calculation of average monthly consumption) in Kamina, Bukavu, and Mwene Ditu;
● Promote adherence to IMCI standards and practices through use of job aids; ● Use SMS campaigns to raise awareness among mothers of danger signs; ● Conduct joint supportive supervision visits (DPS, health zone management teams, and IHPplus)
at health facilities and community care sites, especially in Kolwezi, Bukavu, Tshumbe, and Kole; ● Conduct training on IMCI at community care sites, promoting key practices; and ● Continue to implement the Emergency Triage Assessment and Treatment (ETAT) strategy to
strengthen urgent pediatric case management practices. CODESA: CODESA activities—such as leading awareness-raising and community mobilization activities and providing referrals to local health centers—contribute significantly to increasing the use of community health care services and products in target health zones. To facilitate these activities, IHPplus provides regular financial support to all CODESAs in its target regions through fixed grants, as well as managerial support to assist CODESAs in monitoring their activities and conducting monthly meetings. This support is essential to CODESA functionality in IHPplus target communities. CODESA members dedicate a percentage of their time to health activities by planning communication activities and organizing lectures on healthy behaviors and the need for communities to be responsible for their own development. By mobilizing populations to take part in all steps of community development, CODESA members ensure cooperation among stakeholders. When developing integrated communications plans, they consult with the head nurses of health centers to determine priority issues. Through awareness-raising techniques and activities that encourage community participation, CODESA members contribute to behavior change, help prevent health problems, and improve community health. IHPplus continues to provide support for all of these activities through innovative BCC methods, including Champion Communities, Education through Listening (ETL), and mHealth.
In PY2Q3, the number of revitalized CODESAs (1,319) increased by 19 since last quarter (see Table 19 below). Compared to the PMP target of 92%, this represents an achievement rate of 102%. Additional details related to CODESA activities and achievements during the quarter, and challenges and lessons learned, are presented in IR 3. Table 19: Number and percent of CODESAs that are revitalized and functional in PY2Q3 Coordination # of CODESAS
identified # of active CODESAs
% of active CODESAs
Target (%)
Achievement rate (%)
Bukavu 399 399 100 92 109 Kamina 202 190 94 92 102
Kole 129 129 100 92 109 Kolwezi 106 94 89 92 97 Luiza 170 170 100 92 109 Mwene Ditu 171 171 100 92 109

DRC-IHPplus Year Two Quarter Three Report: January 1, 2017 -March 31, 2017 Page 40 of 126
Tshumbe 119 86 72 92 79 Uvira 102 80 78 92 85
Total 1,398 1,319 94 92 102 Evidence-based WASH activities: From the beginning of IHP, one of the project’s strategies was to focus on health areas with large populations, a high prevalence of diarrheal diseases, and a strong community commitment to contribute to the construction of the infrastructure and to its subsequent maintenance and repair. One of the consequences of this strategy is that, over time, the number of villages or health areas meeting these conditions decreased to finally include only small villages and therefore smaller population numbers per water source. More work would be needed to cover a significant percentage of the population compared to when the project started. During PY2Q1 and PY2Q2, performance on indicators for the water, sanitation, and hygiene (WASH) program was generally poor, because of logistical issues worsened by prevailing insecurity that prevented transport companies from taking materials to the project sites in Kasaï Central and Lomami. In addition, a truck carrying medical materials to Sankuru caught fire. This had a negative impact on activities because, in addition to the loss of the materials, the project had to become even more selective in its choice of transporters. This has created a bottleneck because most of the transporters in the area do not have the required license and insurance. In Kasaï Central, for security reasons, truck drivers refused to drive to Ndekesha and Luambo after signing POs with IHPplus. Implementation of water source and latrine activities improved considerably during PY2Q3, due to measures taken both at the national and coordination office levels, including the following:
• Regular communication between the Senior Technical Advisor at the country level and WASH specialists as well as with logistics coordinators in the field, via calls and field visits;
• Proactive placement of orders for materials and transport services; • Two field visits to the Kananga and Mwene Ditu coordinations and to the Luputa health zone, to
carry out an assessment that led to a better understanding of the obstacles preventing implementation of planned activities;
• Authorization of a special order for suitable nominal pressure pipes on the local market, which saved time.
These measures were undertaken to address delays experienced during preceding quarters. During PY2Q3, after more than 15 months without any WASH personnel at the project coordination level, the arrival of three new staff members allowed the Kamina and Bukavu coordination offices to follow up on WASH structures built between 2012 and 2015 and to launch new activities after assessments were carried out. The vacancies in Lodja and Kolwezi still need to be filled when funds are available. Tables 20a and 20b below present the project results over the past three quarters (from PY2Q1 to PY2Q3). Significantly more progress was achieved during the third quarter than during the first two quarters of the fiscal year, especially compared with the second quarter that was greatly affected by the episodes of armed conflict in Kasaï Central and Lomami. In terms of physical structures built, the lowest rates were reported during PY2Q2 for water sources (12%) and latrines (5%). In terms of population coverage, the lowest rates were reported during the same period: 10% for access to improved drinking

DRC-IHPplus Year Two Quarter Three Report: January 1, 2017 -March 31, 2017 Page 41 of 126
water supply and 25% for access to improved latrines. The political and military unrest in the second quarter and a three-week work stoppage in all provinces of the project and in Kinshasa had a negative impact on implementation. Table 20a: Project results for drinking water access over the past three quarters (from PY2Q1 to PY2Q3) Project quarters Planned
renovated water
sources
Renovated water
sources achieved
Realization rate (%)
Number of people in
target areas (drinking
water)
Number of people reached with first time
access to improved
drinking water
Realization rate (%)
PY2Q3 140 136 97 74,294 130,611 176
PY2Q2 50 6 12 74,294 7,726 10
PY2Q1 50 50 100 74,294 38,326 52
Total 240 192 80 222,882 176,663 79
Table 20b: Project results for access to sanitation facilities over the past three quarters (from PY2Q1 to PY2Q3) Project quarters
Planned renovated
latrines
Renovated latrines
achieved
Realization rate (%)
Number of people in
target areas (sanitation facilities)
Number of people reached with first-time
access to improved sanitation facilities
Realization rate (%)
PY2Q3 49,529 7,863 16 74,294 52,614 71
PY2Q2 49,529 2,687 5 74,294 18,726 25
PY2Q1 49,529 9,125 18 74,294 69,925 94
Total 148,587 19,675 13 222,882 141,265 63
Improved water sources and sanitation facilities during PY2Q3: As shown in table 21 below, the indicator that reports the number of people gaining first-time access to improved drinking water supply as a result of USG support in target area exceeded its PMP target with a 176% achievement rate; it reached 130,611 vs. 74,294 planned, albeit with significant variations among health zones and coordinations.

DRC-IHPplus Year Two Quarter Three Report: January 1, 2017 -March 31, 2017 Page 42 of 126
Table 21: WASH indicator results per coordination for PY2Q3 Coordination Number of
people in target areas (drinking water)
First-time access to improved drinking water supply as a result of USG support in target area
Number of people in target areas (sanitation facilities)
First-time access to improved sanitation facilities as a result of USG support in target area
# Achievement rate (%)
# Achievement rate (%)
Luiza 33,408 53,005 159 33,408 21,263 64
Mwene Ditu 40,884 77,606 190 40,884 31,351 77
Total PY2Q3 74,292 130,611 176 74,292 52,614 71
Table 22: Number of renovated water sources and latrines in PY2Q3 Coordination Renovated water sources Renovated latrines
Planned Achieved % achievement Planned Achieved % achievement
Luiza 40 49 123 3,555 1,270 36
Mwene Ditu 100 87 87 2,013 1,851 92 Total PY2Q3 140 136 97 5,568 3,121 56 No work was implemented in the Ndekesha health zone during the first two quarters of the fiscal year. This zone is in the conflict area between the Kamwina Nsapu rebel forces and the DRC defense forces, which has been affected by insecurity since August 2016, including looting of some health facilities and a lack of building materials. Consequently, the IHPplus team took precautions to ensure the safekeeping of the materials and delivered small amounts at a time to avoid attracting attention to large convoys. The team also relied on available central office staff in the health zone and already trained local masons who were not disturbed by militia since they belonged to the local community. The Ndekesha health zone has implemented 45 water supply improvements vs. 20 planned, and reached a population of 48,939 vs. 12,077 targeted, for an achievement rate of 405%. This high performance level reflects the fact that the conflicts had caused the IHPplus team to reduce the targets by a larger number than was ultimately warranted. In fact, since the materials had already been ordered, funds to pay labor were available, and safe periods occurred, field teams managed to renovate more water sources than anticipated. On the other hand, the Luambo health zone, also located in Kasai Central, registered an achievement rate of only 19% in terms of population coverage and of 20% in terms of numbers of improved water sources, because of persistent supply issues. As of late March, Luambo had finally received all renovation materials, and work in the area is ongoing. The average achievement rate for targeted populations in the Luiza coordination (Kananga) was 159%. The Kanda Kanda health zone renovated 36 out of 50 planned water sources and reached a population of 39,464 vs. 18,258 projected, for an achievement rate of 216%. The Luputa health zone achievement rate for target population coverage was 169%, reaching 38,142 people vs. 22,628 planned. The project planned to renovate 50 sources, and 51 were completed. As shown in table 22 above, the average

DRC-IHPplus Year Two Quarter Three Report: January 1, 2017 -March 31, 2017 Page 43 of 126
achievement rate for the Mwene Ditu coordination was 190% for targeted population and 87% for planned sources. These solid performances regarding sources in the Kanda Kanda and Luputa health zones were achieved because the IHPplus and health zone teams improved monitoring of the security situation and implemented measures to protect the materials and their transport to the work sites. As in Kasaï Central, the IHPplus team relied on central office staff and on local masons who were not disturbed by militia since they belonged to the local community. Aggregate data for WASH in the four health zones show satisfactory results for the third quarter:
• 97% of planned sources were renovated (136 out of 140); • 130,611 people gained access to improved water supply vs. 74,294 targeted, for an achievement
rate of 176%. This was a major improvement over the previous quarter, which had a 10% achievement rate, with 7,726 people gaining access vs. 74,294 targeted.
In terms of annual targets for PY2 in the four health zones, the achievement rate for coverage of the targeted population with access to a drinkable water source was 59%. That is, 176,663 people gained access out of the 297,176 targeted. The total number of renovated water sources stood at 192 out of the 250 planned. In addition, 80 renovations are under way in Kanda Kanda and Luputa, and five more are underway in Ndekesha, since they will be built with material purchased when the price of cement fell at the end 2016. There are also plans to extend interventions in more secure communities, including support for about 50 source renovations and 5,000 to 10,000 latrines in the Bibanga health zone in Kasaï Oriental. If these prove successful, WASH will for the first time exceed its annual targets. As presented in table 21 above, the achievement rate for the population gaining access to improved latrines during the third quarter compared with the PMP target was 71%--that is, some 52,614 people were reached out of 74,294 targeted, with major variations between health zones and between the two coordination offices. This is a clear improvement compared with PY2Q2, when only 23,131 people gained access to improved latrines compared with a PMP target of 74,294). Other activities related to the water, sanitation, and hygiene component: Preparations for a study of the use of WASH services started during PY2Q3 to determine whether the improved water sources and improved latrines are being used by the intended populations. Its results will help refine the strategies and techniques for advocacy and outreach, as well as, more generally, for BCC. This study will provide some indicators that cannot be routinely collected and serve as a baseline for future interventions. Its progress might be impeded by the difficult security situation. Challenges: The quality of latrines is a major challenge in remote rural areas where building supplies are sparse. The biggest challenge is to convince communities to stop defecating outdoors, and to progressively lead those who have accepted the idea of building latrines with their own meager resources to improve the convenience, safety, and sustainability of these facilities. Next steps: The security situation in this area is paramount and must be continuously monitored to determine where it is possible to operate without excessive risk to staff and partners. Several measures can be undertaken regarding the ongoing logistical and supply constraints:

DRC-IHPplus Year Two Quarter Three Report: January 1, 2017 -March 31, 2017 Page 44 of 126
• Implement one annual procurement of renovation materials: prepare a list of several suppliers, transporters, and other prequalified providers with standby contracts to facilitate procurement and transport of materials;
• Procure special nominal pressure pipes in Kinshasa (not available in the field); • Identify more secure sites for additional water sources and latrine construction to meet or
exceed targets for the year 2016-2017; • Make health zones more accountable for ensuring the availability of government counterparts
(HZMTs and head nurses), as well as local artisans, CHWs, members of Champion Communities, and others who are known to the community and can carry out their work even during times of conflict when providers from outside the health zones cannot.
Lessons Learned: With proper vigilance and ongoing monitoring, it may be possible to implement activities in insecure health zones with the help of government counterparts and local qualified providers (bricklayers, carpenters, RECOs for outreach, local leaders, and so on). In order to continue the work, it may be useful to be flexible in the interpretation and implementation of logistical rules—without, of course, breaking them.
Management of biomedical waste: During this quarter, 433 health centers and 25 hospitals located in 78 health zones received joint visits from MOH partners and project staff to monitor management of biomedical waste during FOSACOF assessments. In health zones with RBF, all 148 health centers and 12 hospitals were visited during the RBF technical verification missions. Health facilities not subject to RBF were visited if issues were identified during past supervision visits. Community-based nutrition activities Number of mothers of children two years of age or younger who have received nutritional counseling for their children: During PY2Q3, 215,450 of the 372,000 expected mothers with children two years of age or younger received counseling (58% achievement rate). This is a decrease compared to the previous quarter for both the result and achievement rate reported (252,393 mothers counseled and 68% achievement rate). More details related to this indicator are presented in IR2.1. IR 1.3 Provincial management more effectively engaged with health zones and facilities to improve service delivery Leadership Development Program: LDP participants work in teams, learning to lead and manage collaboratively and effectively. Teams develop a shared vision, identify long-term strategies, and commit to short-term results. They analyze what stands in the way of progress and create opportunities to practice their new skills at every step. Their superiors are fully aligned with the program and hold the teams accountable for intended results. Teams receive support from facilitators and coaches. Whether they are health officials, nurses, or volunteers, participants tend to emerge from the program with increased skills, commitment, confidence, and a sense of power. This method of leadership development goes

DRC-IHPplus Year Two Quarter Three Report: January 1, 2017 -March 31, 2017 Page 45 of 126
beyond leadership theory and helps teams apply their new knowledge through practice, so they can obtain measurable results for their organizations. To demonstrate their commitment to improving health service delivery, DPS management teams carried out monitoring and supervision visits to the health zone management teams supported by IHPplus as part of their routine activities. IHPplus continued to provide financial and technical support to provincial management teams to enable them to coach LDP teams as they improve health service delivery. LDP focal points within the coordination offices benefited from a refresher training on the LDP process (project selection, planning, implementation, and follow-up) during PY2Q3. IHPplus also continued to accompany DPS management teams (particularly in Bukavu and Uvira) through supervision visits to ensure that they regularly implement leadership projects to progressively overcome the challenges they face. Teams that participated in the LDP implemented leadership projects lasting between six and eight months, collaborating with other stakeholders involved in improving public health. From October 2015 to March 2017, IHPplus continued its support of the 78 health zone management teams participating in the LDP process. Between July and September 2016, 69 of these 78 teams (88%) began to implement LDP projects, whose results were evaluated against their set target during PY2Q3. Of these 69 teams, 45 (65%) focused their LDP projects on maternal and child health, and 47 (68%) achieved at least 80% of their desired measurable result after 6 to 8 months of implementation. Table 23 below presents the number and proportion of LDP teams that achieved at least 80% of their target six months after the LDP. Table 23: Proportion of senior LDP teams that have achieved at least 80% of their desired performance during PY2Q3 Coordination Number of senior
LDP teams that have developed a leadership project during PY2Q3
Number of teams that have achieved at least 80% of their desired performance
Proportion (%) of senior LDP teams that have achieved at least 80% of their desired performance
Target (%) Achievement rate (%)
Bukavu 17 8 47 76 62 Kamina 9 7 78 76 103 Kole 7 6 86 76 113 Kolwezi 8 7 88 76 116 Luiza 9 5 56 76 74 Mwene Ditu 8 7 88 76 116 Tshumbe 6 5 83 76 109 Uvira 5 2 40 76 53 Total 69 47 68 76 89

DRC-IHPplus Year Two Quarter Three Report: January 1, 2017 -March 31, 2017 Page 46 of 126
The proportion of senior LDP teams that achieved at least 80% of their desired performance decreased from 75% in PY2Q2 to 68% in PY2Q3. This proportion is lower than the PMP target of 76% (with an achievement rate of 89%). This weak performance is related to the low level of achievement of LDP teams in the Bukavu, Luiza, and Uvira coordination offices. Although financial and technical support provided to the newly-established provincial management teams, refresher training of focal points during routine supervision visits, and support to the HZMT in Sud Kivu (Bukavu and Uvira) enabled LDP projects with realistic challenges, the presence of the militia in the Luiza coordination and the ongoing insecurity in Bukavu and Uvira prevented the LDP teams from adequately monitoring project implementation and reaching their objectives. Table 24 below shows the distribution of leadership projects being implemented by LDP teams by area of intervention. Table 24: LDP projects per technical area Focus area Indicator areas # of projects
implemented by LDP teams since July 2016
# of projects that have achieved at least 80% of their desired performance between Jan-Mar 2017*
Achievement rate (%)
MNCH ANC 1 5 5 100 ANC 4 7 5 71 Assisted deliveries 4 3 75 More than two PSC 1 1 100 Immunization/PENTA-3 3 2 67 Immunization/OPV3 2 2 100
Immunization/VAT 2+ 3 2 67 Immunization/PCV-13 2 2 100 Malaria/IPT 2+ 5 3 60 PSC (12-59 months) 2 2 100 i-CCM malaria 2 2 100 i-CCM diarrhea 5 4 80 i-CCM pneumonia 4 2 50
Nutrition Pregnant women who received iron-folate
2 2 100
Family planning
Availability of contraceptives
8 3 38
LMG Referral rate 2 1 50 Health service utilization rate
2 1 50
Rate of post-op infection 1 0 0 TB Cure rate 3 1 33
Detection rate 6 4 67 Total 45 69 47

DRC-IHPplus Year Two Quarter Three Report: January 1, 2017 -March 31, 2017 Page 47 of 126
*LDP projects are usually six to eight months long; therefore, the projects evaluated this quarter were the ones implemented between July and September 2016. Challenges:
• Engage the MOH’s new provincial teams to ensure that they effectively accompany LDP teams to improve the performance of health services, despite militia presence and ongoing insecurity in certain supported health zones;
• Encourage LDP teams to implement the activities in their leadership project, despite volatile security conditions.
Lessons learned:
• Support provided to provincial teams and HZMTs has been successful, as demonstrated by the results achieved by the Bukavu coordination, where the number of teams implementing LDP projects increased from 55% in PY2Q1 and 50% in PY2Q2, to 77% in PY2Q3;
• In the coordination offices that were not affected by the presence of militia or ongoing insecurity, review of project objectives during supervision visits enabled LDP teams in the Kole, Kolwezi, and Mwene Ditu coordinations to achieve at least 80% of their desired measurable results.
Next steps:
• During PY2Q4, IHPplus will continue to provide financial and technical support to provincial management teams to conduct joint supervision visits of HZMT to ensure that they regularly implement leadership projects to progressively overcome the challenges they face.
Intermediate Result 2: Quality of key family health care services in target health zones increased Increasing access to quality health services is a key objective of IHPplus. While the project continues to experience challenges with some indicators—particularly those related to TB—progress has been made in the areas of maternal and child health, HIV and AIDS, and referral systems and quality of care, among others. Details are presented by sector in Table 25, below. Table 25: Summary of key IR 2 2esults for PY2Q3
Sub-IR Focus area Key Indicators Results
2.1 Clinical and Management Capacity
Maternal health
Service delivery (ANC 1, ANC 4)
Service delivery (SBA)
Quality of care (AMTSL)
Neonatal health
Neonates receiving essential care
Newborns receiving antibiotics for infection
Child health Vaccinations (under 12 months)
Pneumonia, diarrhea, malaria treatment

DRC-IHPplus Year Two Quarter Three Report: January 1, 2017 -March 31, 2017 Page 48 of 126
Family planning
Service delivery (counseling)
CYP
Service delivery points
Nutrition Pregnant women receiving iron-folate
Nutritional counseling
Malaria Service delivery (IPTp)
Commodities distributed
Health workers trained
HIV and AIDS Service delivery (testing and counseling, HIV services, ART, new enrollees)
Service delivery and prevention (known status, key populations reached)
Service delivery (% ART, prevention of mother-to-child transmission [PMTCT], TB screen, TB ART, lab)
TB HIV testing of TB patients
New TB case detection rate
Therapeutic success rate (new smear positive TB cases)
SGBV SGBV service delivery
SGBV BCC campaigns 2.2 Minimum Quality FOSACOF Health centers that completed an
evaluation of the nine minimum FOSACOF standards
GRHs that completed an evaluation of the nine minimum FOSACOF standards
2.3 Referral Systems Referrals Patients referred to health center Patients referred to GRH
*Green = achievement rate against the PMP target of 100% and above; Yellow = achievement rate against the PMP target between 75- 99%; Red = achievement rate against the PMP target under 75%. IR 2.1: Clinical and managerial capacity of health care providers increased Maternal, newborn, and child health: During PY2Q3, IHPplus helped the Government of DRC to achieve Sustainable Development Objective (SDO) 3, especially to reduce the maternal mortality rate to under 70 per 100,000 live births and the rate of avoidable newborn and under five deaths to under 25 per 1,000 live births. With the MOH, IHPplus implemented preventive, curative, and promotional activities as well as activities required to make health service delivery available for the population and improve quality of health care.

DRC-IHPplus Year Two Quarter Three Report: January 1, 2017 -March 31, 2017 Page 49 of 126
The main activities implemented during the quarter for maternal and newborn survival included: (1) training of 113 clinical providers in MNCAH (post-abortion care; health care for victims of sexual violence; essential obstetric care; emergency obstetric care, including maternal resuscitation and essential and emergency newborn care) in the Lualaba, Dialala, and Manika health zones; training of 50 providers in neonatal resuscitation in the Fungurume, Lubudi, and Bunkeya health zones of the Kolwezi coordination; (2) training of 293 providers in neonatal resuscitation, partograph use, and postpartum hemorrhage management in eight health zones in Kinkondja, Malemba, Mulongo, Mukanga, and Lwamba (Kamina coordination); and (3) supply of neonatal resuscitation equipment and commodities as well as posters for HBB and helping mothers survive to 115 health facilities. Five of eight PMP indicators related to maternal and newborn health reached or exceeded the target: (1) Percent of pregnant women attending at least one ANC visit with a skilled provider from USG-supported health facility; (2) number of women giving birth who received uterotonics in the third stage of labor (or immediately after birth) through USG-supported programs; (3) number of postpartum/ newborn visits within three days of birth in USG-supported programs; (4) number of newborns not breathing at birth who were resuscitated in USG-supported programs; (5) percent of newborns receiving essential newborn care through USG-supported programs. Two indicators are close to their target (percent of pregnant women attending at least four ANC visits with a skilled provider at 86% achievement rate and percent of deliveries with a SBA at 97% achievement rate). One indicator reached less than 80% of its PMP target (number of newborns receiving antibiotic treatment for infection from trained health care workers through USG-supported programs). Percent pregnant women attending ANC 1 visits: The monitoring of pregnant women during ANC visits helps prevent risks and complications during pregnancy and delivery. To be efficient, antenatal care must start early in the pregnancy and, most importantly, continue regularly until childbirth. The DRC MOH recommends at least four antenatal consultations during pregnancy, during which quality interventions and care are provided to pregnant women. Data in Table 26 show that 146,441 pregnant women attended at least one antenatal consultation, i.e., 106% of target. Compared with PY2Q2, the number of new cases increased slightly from 143,157 to 146,441 in PY2Q3. Results by coordination show that five coordinations met or exceeded their PMP target. The Kolwezi coordination reported the highest achievement rate (123%), while three coordinations did not meet their target. The Kolwezi coordination results were linked to mini ANC campaigns in the Dilala and Manika health zones where free ANC services were offered in all health facilities in addition to MNCAH competency-based training. Lower achievement reported in the Mwene Ditu and Luiza coordinations stemmed from insecurity in the region caused by the Kamwena Nsapu militia that impacted health care services in Dibaya, Bilomba, Luiza, Kalomba, Kamiji, and Wikong health zones, among others.

DRC-IHPplus Year Two Quarter Three Report: January 1, 2017 -March 31, 2017 Page 50 of 126
Table 26: Number and percent of pregnant women attending ANC1 visit by skilled providers from USG-supported health facilities in PY2Q3
Coor
dina
tion Number of pregnant women
attending at least one ANC visit (ANC1)
Number of expected pregnancies (4% of pop)
% women attending ANC1
Target Achievement (%)
Jan -17
Feb-17
Mar-17
Total PY2Q3
Bukavu 15,697 14,495 14,680 44,872 39,556 113 100 113 Kamina 6,920 7,371 7,413 21,704 21,772 100 100 100 Kole 3,876 3,804 4,360 12,040 10,212 118 100 118 Kolwezi 3,054 4,310 4,224 11,588 9,430 123 100 123 Luiza 5,032 5,126 4,932 15,090 15,269 99 100 99 Mwene Ditu
7,055 6,981 6,950 20,986 22,558 93 100 93
Tshumbe 2,884 3,158 2,926 8,968 9,383 96 100 96 Uvira 3,409 3,821 3,963 11,193 9,950 112 100 112 Total 47,927 49,066 49,448 146,441 138,130 106 100 106 To maintain ANC1 attendance, IHPplus will continue to support health zones to provide interventions recommended by ANC, such as free distribution of LLINs, iron-folate, and IPTp with SP. Percent pregnant women attending at least four ANC visits (ANC4): As shown in Table 27 below, only 82,733 pregnant women attended at least four ANC visits, i.e., 86% of the project target. The number increased from 81,155 in PY2Q2 to 82,733 in PY2Q3. Only the Kole and Luiza coordinations reached their target. Except for Mwene Ditu, which did not reach its target for security reasons, several other coordinations (except for Kamina and Luiza), while not meeting their target, did show improvements compared with the previous quarter. Table 27: Number and percent of pregnant women attending ANC4 visit by skilled providers from USG-supported health facilities in PY2Q3
Coor
dina
tion
Number of pregnant women attending at least four ANC visits (ANC4)
Num
ber o
f ex
pect
ed
preg
nanc
ies
(4%
of p
op)
% women attending ANC4
Target Achievement (%)
Jan-17 Feb-17
Mar-17
Total PY2Q3
Bukavu 6,808 7,230 6,856 20,894 39,556 53 70 75
Kamina 3,888 3,860 3,923 11,671 21,772 54 70 77
Kole 2,887 2,956 3,380 9,223 10,212 90 70 129
Kolwezi 1,240 1,430 1,342 4,012 9,430 43 70 61
Luiza 3,926 3,949 3,944 11,819 15,269 77 70 110

DRC-IHPplus Year Two Quarter Three Report: January 1, 2017 -March 31, 2017 Page 51 of 126
Mwene Ditu
4,713 4,624 4,600 13,937 22,558 62 70 89
Tshumbe 2,068 2,179 2,012 6,259 9,383 67 70 96
Uvira 1,567 1,690 1,661 4,918 9,950 49 70 70
Total 27,097 27,918 27,718 82,733 138,130 60 70 86
Strategies contributing to this performance included: outreach to CHWs and active Champion Communities, including SMS campaigns (Tshumbe, Luiza); local adoption of this indicator (by those implementing an LDP challenge, for example) in some health zones; and RBF activities (Luiza). In the Kolwezi coordination, during the mini-campaign and its follow-up, it was reported that 60% of women start ANC during the second trimester of pregnancy. Reasons cited by pregnant women for this late start of care were the high cost of ANC and payment at each visit. In the Bukavu coordination, in addition to cost outlays for each ANC visit, long distances between some villages and health care centers, as well as the tradition of starting ANC after the pregnancy is showing, lead to late use of ANC services and therefore fewer than four visits. The Lualaba DPS (Kolwezi coordination) is working with the health facilities to make ANC more affordable and therefore accessible. Mini-ANC campaigns will continue to boost visits. Advanced strategies for ANC (outreach, for instance) might improve ANC services. Nurses will organize monthly ANC in remote villages. Deliveries by SBAs: Skilled delivery assistance includes basic and emergency health care for women and their newborns during delivery (through use of the partograph) and postpartum period by qualified staff: a doctor, midwife, nurse, or other health care professional. Table 28 below shows that 121,842 deliveries were attended by skilled birth attendants, i.e., 97% of the PMP target. The number of deliveries remained essentially the same as in PY2Q2 (121,614 deliveries). Three coordinations (Kole, Kolwezi, Luiza) achieved their target. In the Bukavu coordination, the Mulungu health zone did not fully report for this quarter (this health zone is remote, with pockets of insecurity in some health areas) as was the case for some private facilities. In Kamina, heavy rains from January to March made access to health facilities difficult and led to many missed opportunities and home deliveries with traditional birth attendants. Table 28: Number and percent of deliveries with a SBA in USG-supported facilities in PY2Q3
Coor
dina
tion # of deliveries with a SBA Number of
expected pregnancies (4% of pop)
Portion of deliveries with a SBA (%)
Target Achievement (%)
Jan-17 Feb-17
Mar-17
Total PY2Q3
Bukavu 11,193 10,825 10,719 32,737 39,556 83 91 91 Kamina 5,686 5,815 5,819 17,320 21,772 80 91 87 Kole 3,508 3,513 3,956 10,977 10,212 107 91 118 Kolwezi 3,016 3,513 3,276 9,805 9,430 104 91 114

DRC-IHPplus Year Two Quarter Three Report: January 1, 2017 -March 31, 2017 Page 52 of 126
Luiza 4,744 4,930 4,835 14,509 15,269 95 91 104 Mwene Ditu
6,626 6,619 6,668 19,913 22,558 88 91 97
Tshumbe 2,600 2,699 2,673 7,972 9,383 85 91 93 Uvira 2,763 2,865 2,981 8,609 9,950 87 91 95 Total 40,136 40,779 40,927 121,842 138,130 88 91 97 Women receiving an uterotonic immediately after birth (an essential element of AMTSL): The use of oxytocin within one minute of delivery is the first step in the active management of the third stage of labor, largely preventing postpartum hemorrhage--one of the leading causes of maternal death. As presented in Table 29 below, 116,366 out of 121,842 (96%) mothers received oxytocin within a minute of delivery. This achieved 100% of the PMP target. This figure is about the same as during the second quarter. The Kole, Kolwezi, Mwene Ditu, and Luiza coordinations reached their target with good performances compared with PY2Q2. The Bukavu, Uvira, Kamina, and Tshumbe coordinations did not achieve their target but reported improved results. The high number of C-sections in Sud Kivu (Bukavu and Uvira coordinations) explains the gap between the overall number of deliveries and the number of women receiving AMTSL. Achievement of the target for this indicator depends mainly on the availability of oxytocin in the IHPplus-supported health facilities and on capacity building of providers through MNCH training, briefings during supportive supervision visits, and monitoring meetings. Table 29: Number of women giving birth who received an uterotonic in the third stage of labor (or immediately after birth) through USG-supported programs during PY2Q3
Coor
dina
tion
Number of women giving birth who received a uterotonic in the third stage of labor (or immediately after birth)
Total birth
Percentage of women giving birth who received a uterotonic in the third stage of labor (or immediately after birth)
Target Achievement rate (%)
Jan-17 Feb-17
Mar-17
Total PY2Q3
Bukavu 9,899 9,824 9,514 29,237 32,737 89 32,893 89
Kamina 5,604 5,828 5,759 17,191 17,320 99 18,359 94
Kole 3,391 3,093 3,843 10,327 10,977 94 8,709 119
Kolwezi 3,000 3,484 3,273 9,757 9,805 100 7,726 126
Luiza 4,736 4,930 4,602 14,268 14,509 98 12,512 114

DRC-IHPplus Year Two Quarter Three Report: January 1, 2017 -March 31, 2017 Page 53 of 126
Mwene Ditu
6,621 6,554 6,603 19,778 19,913 99 19,035 104
Tshumbe 2,570 2,648 2,593 7,811 7,972 98 8,217 95
Uvira 2,571 2,671 2,755 7,997 8,609 93 8,563 93
Total 38,392 39,032 38,942 116,366 121,842 96 116,014 100
Newborns receiving essential newborn care: Essential care encompasses basic care that all newborn babies need to survive, which includes the following in the DRC: maintaining a normal temperature, umbilical cord care, eye care, early initiation of breastfeeding, and provision of vitamin K1. Table 30 shows that out of 121,291 live births, 120,000 newborns received essential newborn care, i.e., 99% of all births and 101% of the project’s PMP target. This was the same pattern as PY2Q2. All coordinations achieved or were close to the project target. Table 30: Number and percentage of newborns receiving essential newborn care through USG-supported programs during PY2Q3
Coor
dina
tion
Jan-17 Feb-17 Mar-17 Total PY2Q3
Total live births in PY2Q3
% of newborns who received essential newborn care
Target (%)
Achievement rate (%)
Bukavu 11,103 10,773 9,996 31,872 32,108 99 98 101 Kamina 5,660 5,832 5,753 17,245 17,508 98 98 101 Kole 3,279 3,440 3,895 10,614 10,945 97 98 99 Kolwezi 2,985 3,415 3,223 9,623 9,800 98 98 100 Luiza 4,702 4,899 4,820 14,421 14,469 100 98 102 Mwene Ditu
6,644 6,601 6,561 19,806 19,915 99 98 101
Tshumbe 2,566 2,681 2,593 7,840 7,967 98 98 100 Uvira 2,757 2,861 2,961 8,579 8,579 100 98 102 Total 39,696 40,502 39,802 120,000 121,291 99 98 101 Newborns receiving antibiotic treatment for infection from appropriate health workers: Antibiotics save the lives of newborns with neonatal infections. During PY2Q3, 5,445 newborns received antibiotic treatment at birth due to suspected neonatal infections (67% of the PMP target). The number of newborns receiving antibiotic treatment dropped considerably compared with PY2Q2, especially in the Kolwezi and Luiza coordinations, but also in the Bukavu, Kamina, Kole, and Mwene Ditu coordinations. Only the Tshumbe and Uvira coordinations achieved their target (see Table 31 below). The Kolwezi coordination achievement rate dropped from 368% in PY2Q2 to 84% in PY2Q3. An MNCH training and a supervision and monitoring visit explained to health care providers the correct use of

DRC-IHPplus Year Two Quarter Three Report: January 1, 2017 -March 31, 2017 Page 54 of 126
antibiotics for newborns, especially in the Dilala and Manika health zones, for good neonatal infection management practices. Previously, providers would systematically administer antibiotics to newborns at birth, but now they do it when appropriate. Briefings, the availability of drugs, including antibiotics, in the health facilities, and capacity building of providers through training in identifying infection signs in newborns have contributed to achievements for this indicator. Table 31: Number of newborns receiving antibiotic treatment for infection from appropriate health workers through USG-supported programs during PY2Q3 Coordination Jan-17 Feb-
17 Mar-17
Total Target Achievement (%)
Bukavu 591 523 620 1,734 2,339 74 Kamina 367 148 165 680 1,287 53 Kole 225 129 137 491 604 81 Kolwezi 925 623 505 2,053 558 368 Luiza 634 233 250 1,117 903 124 Mwene Ditu 339 424 360 1,123 1,334 84 Tshumbe 37 150 402 589 556 106 Uvira 192 183 192 567 588 96 Total 3,310 2,413 2,631 8,354 8,169 102 To improve treatment of neonatal sepsis, IHPplus will collaborate with the MOH, WHO, and the Kinshasa School of Public Health, to integrate the WHO simplified therapeutic protocol for sick newborns with possible serious bacterial infections in the Walungu and Katana health zones. Community health workers will be trained to visit newborns three times at home and to detect danger signs. The first monitoring is scheduled in June. This approach will result in improved treatment in zones where training has been provided. Helping babies breathe: As shown in Table 32 below, during this quarter, 1,500 newborns with asphyxia were resuscitated during the quarter, of which 1,322 (90%) were saved, compared to a PMP target of 1,075 newborns saved, for a target achievement rate of 123%. Capacity building of providers through various MNCAH competency-based trainings, as well as gradual supply of neonatal resuscitation equipment, have contributed to the results in these coordinations. IHPplus will continue to train providers in neonatal resuscitation and maternal survival, and supply resuscitation material in the Bukavu coordination. In Tshumbe, along with the MOH and WHO, the project will brief providers in PY2Q4 in neonatal resuscitation and in sepsis treatment according to the WHO protocol. WHO already has funds available that IHPplus can use.

DRC-IHPplus Year Two Quarter Three Report: January 1, 2017 -March 31, 2017 Page 55 of 126
Table 32: Number of newborns not breathing at birth who were resuscitated in USG-supported programs during PY2Q3 Coordination Number of babies with
neonatal asphyxia Number of babies resuscitated using the HBB method
% of babies resuscitated using the HBB method
Bukavu 425 361 64 Kamina 188 160 28 Kole 104 101 3 Kolwezi 149 139 10 Luiza 234 210 24 Mwene Ditu 200 178 22 Tshumbe 38 37 1 Uvira 159 158 1 Total 1,497 1,344 153 Challenges:
• The ongoing insecurity in some of Mwene Ditu and Luiza health zones continues to negatively impact the project’s results
• ANC4 rates are persistently low • Pregnant women do not initiate ANC visits until they are at an advanced stage of their
pregnancy (late ANC initiation) • Private facilities have a low level of data reporting, mainly because the majority of them are not
fully integrated into the national health system • Because of heavy rains affecting Kamina coordination from January to March, access to health
facilities was very difficult and led to many missed opportunities and home deliveries with traditional birth attendants
• Health providers are not consistently giving oxytocin to new mothers within a minute following delivery, mainly due to the high number of C-sections in Sud Kivu province (Bukavu and Uvira coordinations), the lack of availability of oxytocin at the health facility level, and the gap in MNCAH training of health providers
• Health providers are not using antibiotics to treat newborns with infections due to the lack of MNCH training combined with supervision and monitoring visits
• In Tshumbe, not enough providers are trained in neonatal resuscitation to meet the needs of the population served.
Next steps: • Conduct joint supervision visits in the Tshumbe and Bukavu coordinations to identify the causes
of poor rates of ANC4, AMTSL, deliveries by skilled attendants, and HBB • Increase community outreach, especially to pregnant (particularly multiparous) women through
CHWs and psychosocial assistants (APS) to promote ANC and deliveries in health facilities • Help health facilities carry out advanced strategy for ANC visits in all coordinations • Continue the HBB briefing and the distribution of neonatal resuscitation kits in all coordinations • During monitoring and supervision visits, review AMTSL and essential newborn care in all
coordinations to improve these indicators further

DRC-IHPplus Year Two Quarter Three Report: January 1, 2017 -March 31, 2017 Page 56 of 126
• Plan training in neonatal sepsis treatment at health center level (new WHO protocol) when referral is not possible
Expanded Program on Immunization (EPI): To increase accountability of all stakeholders involved in immunization, IHPplus supports the Reach Every Health Zone approach focused on reaching every community and child. This approach aims to improve the organization of immunization services, optimize the use of available resources, and ensure sustainable and fair vaccination coverage for all pregnant women and children in all supported health zones. IHPplus distributed copies of the community-based monitoring modules to all health areas in supported health zones. Technical advisors with EPI monitored the quality of routine immunization data and provided coordinated technical and financial support during international immunization days in Bukavu and Uvira. IHPplus organized a briefing on community-based monitoring in the Uvira and Ruzizi health zones for eight core team members of each BCZS: 44 participants, including 22 registered nurses and CODESA presidents, attended from the Uvira health zone. IHPplus continued to provide logistical support to health facilities and EPI offices. The project met or exceeded two of the three PMP target indicators for children immunization (101% target achievement for DTC-HepB-HIB3 vaccination coverage, and 100% for the DTC-HepB-HIB 3 non-completion rate), and one was almost achieved (97% target achievement for VAR vaccination coverage). Vaccination coverage has decreased for all antigens between PY2Q2 and PY2Q3: Tetanus from 100 to 93%, BCG from 115 to 92%, DTP HIB1 from 113 to 100%, DTP HIB3 from 110 to 96%, OPV3 from 112 to 98%, PCV13 from 92 to 88% and measles from 99 to 92%. However, it should be noted that despite the overall decrease, all vaccination coverage rates remained above the 90% mark, except for the PCV13-3 coverage, which stood at 88%. Health zones under four coordination offices (Luiza, Mwene Ditu, Kamina, and Tshumbe) achieved very low vaccination coverage rates. Their poor performance decreases the overall performance for the project this quarter. This includes the Luiza coordination office (Bilomba, Lubondaie, and Yangala health zones), the Mwene Ditu coordination office (Mpokolo, Kalenda, Kamiji, and Luputa health zones), the Kamina coordination office (Songa, Kabongo, Mulongo, and Kinkondja health zones) and the Tshumbe coordination office (Ndjalo Djeka, Dikungu, Minga, Lusambo, and Pania Mutombo health zones). These health zones reported that one reason for their poor performance is the irregularity of immunization sessions (for both fixed and advanced strategy). Routine immunization is carried out according to strategies. A fixed immunization session is held at the health facility (the health facility team waits for parents to bring their children and for pregnant women to come to be immunized, and the approach is intended for a population living less than an hour’s walk away, i.e., within three miles). By contrast, with an advanced vaccination strategy, the health facility team travels out into the community more than three miles away (this definition has evolved and takes into consideration not only distance but also all obstacles: geographic, cultural, conflicts between villages, etc.). The advanced strategy is proactive and covers populations that do not come to use the services at the health facility. Poor performance by health areas is due to insecurity and internal displacement in the health zones reporting to the Luiza and Mwene Ditu coordination offices. For the health zones reporting to the

DRC-IHPplus Year Two Quarter Three Report: January 1, 2017 -March 31, 2017 Page 57 of 126
Kamina and Tshumbe coordination offices, the immunization irregularity stems from a vaccine supply issue due to access difficulties during the rainy season. The low PCV13 vaccination coverage is attributable to poor availability of the vaccine in two DPS, Sankuru and Haut Lomami. The inadequate supply of this vaccine was due to two factors: the difficulty of supplying these two hard-to-reach DPS and a reduced PCV13 stock during the quarter in the central warehouse/EPI in Kinshasa. A major challenge project-wide remains the lack of PCV13 vaccine and other immunization commodities at the country and province level and in the EPI or DPS branches. Currently, routine vaccines enter the country through a single channel: the EPI central office in Kinshasa. Purchasing is currently made through the United Nations Children’s Fund (UNICEF). Funds for vaccine purchases are co-financed by the Global Alliance for Vaccines and Immunization (Gavi) and the government. The government’s co-financing share is between 5 and 15% of the total purchase cost, while Gavi covers between 85 and 95% of it. However, the government does often not remit its co-financing share in time, which leads to frequent delays in purchases and acquisitions by EPI/management, and in turn stock-outs at the national level—with consequences for the DPS and health zones. Another issue is the difficulties encountered in supplying some DPS like Sankuru by air because of the scarcity of flights. The project supports the transport of vaccines from DPS to hard-to-reach health zones. The EPI Advisor works frequently at the national level to improve communication/advocacy and with the Interagency Coordinating Committee. Table 33: Vaccination coverage per antigen and per coordination during PY2Q3 Coordination Tetanus
vaccine 2+ (%) BCG (%)
DTP HepB-Hib1 (%)
DTP HepB-Hib3 (%)
OVP3 (%)
PCV13_3 (%) Measles (%)
Bukavu 95 91 94 90 92 88 89 Kamina 90 134 122 113 108 91 104 Kole 95 93 107 104 111 103 97 Kolwezi 99 77 110 104 104 104 97 Luiza 93 96 89 83 87 78 87 Mwene Ditu 87 88 91 88 87 83 88 Tshumbe 105 83 111 107 105 96 110 Uvira 75 71 83 78 79 29 65 PY2Q3 IHPplus 93 92 100 96 98 88 92 Target PMP 95 95 95 95 95 95 95 Achievement rate (%)
98 97 105 101 103 93 97
Table 33 above shows that several DPS have not achieved planned results: the Sankuru DPS (Tshumbe and Kole coordination office for some antigens), Haut Lomami DPS (Kamina coordination office), Kasaï Central DPS (Luiza coordination office), Kasaï Oriental DPS, and Lomami DPS (Mwene Ditu coordination office). Field teams will need to organize, jointly with communities (community health workers and Champion Communities), recovery immunization sessions for non-vaccinated children. IHPplus will also focus proactively on procurement issues at the national level.

DRC-IHPplus Year Two Quarter Three Report: January 1, 2017 -March 31, 2017 Page 58 of 126
As in PY2Q2, the average non-completion rate for the project remained at a satisfactory level, around 5%, and most health zones achieved a good performance compared with their 5% PMP target (see Figure 6 below). The WHO and MOH norm establishes good performance for non-completion at between 0 and 10%. The best performance was reported for Bukavu, with a non-completion rate of only 2.9%. Four coordinations reported non-completion rates higher than 5%: Kolwezi (7%), Kamina (6%), Tshumbe (5.9%), and Uvira (5.7%). In Bukavu, some health areas registered non-completion rates close to 0% after community health workers participated in actively searching for dropouts after vaccination sessions in the Katana health zone. Figure 6: DTP-HepB-HiB3 drop-out rate, PY2Q3
The national immunization schedule requires that children receive the DTP-HepB-Hib3, OPV3, and PCV13-3 vaccines at the same time; therefore, performance data should be identical. However, as shown in Figure 7 below, OPV3 was the most widely available vaccine in health zones across all coordination areas, while PCV13 was the least available antigen. During this quarter, Uvira reported the best performance with the same coverage rate for all three antigens (104%). On the other hand, Tshumbe (78% for DTP HepB-Hib3, 79% for OPV3, and 29% for PCV 13-3), Kolwezi (113,108, and 91% respectively) and Kamina (83%, 87%, and 78%, respectively) reported the greatest gap between the coverage rate of DTP-HepB-HiB3, OPV3, and PCV13. The Tshumbe coordination office is reporting the largest gap between PCV13 and the other antigens, which confirms that the health zones in this IHPplus coordination are poorly supplied. The infrequent flights to the Sankuru DPS explain the lack of vaccine supplies and other immunization inputs. When supplies are available, the Kole health zones are the first to receive them because the plane lands in Lodja where the PEV branch is located. The remaining products coming from Kinshasa are then sent to Tshumbe, an intermediary warehouse for the health zone, which therefore gets fewer vaccines and immunization commodities. As for the Kolwezi and Kamina coordinations, the non-availability or stock-out of certain antigens explains the gaps. By contrast, Uvira had all three antigens available in sufficient quantities to cover its needs during the period, which explains its good performance. An effort must be made to improve the availability at all level of all antigens on the vaccination schedule.
0.01.02.03.04.05.06.07.08.0
DTP-HepB-HiB3 drop-out rate
Target

DRC-IHPplus Year Two Quarter Three Report: January 1, 2017 -March 31, 2017 Page 59 of 126
Figure 7: DTP-HepB-HiB3, OPV3, and PCV13-3 coverage rate, PY2Q3
Fight against poliovirus: In general, two to three cases of acute flaccid paralysis are expected for every 100,000 children under the age of 15 in DRC. We should therefore expect to be notified of approximately one case per quarter for each zone. During this quarter, however, only 23 health zones reported a case of acute flaccid paralysis (Lwamba, Songa, Ototo, Manika, Lemera, Bunyakiri, Miti Murhesa, Mulongo, Ototo, Kalonge, Kitutu, Nundu, Nyangezi, Bibanga, Katana, Mwange, Kayamba, Omendjadi, Mutshatsha, Mwana, Uvira, Malemba Nkulu, and Kayamba). Active searches will be undertaken in non-reporting health zones to improve the rate of notification. The project, together with teams from the DPS/Ministry of Health, has briefed eight members of the Ruzizi health zone core team on the community-based monitoring guide. They have, in turn, briefed 24 registered nurses and 24 CODESA presidents during the national polio vaccination days organized nationally on April 9-11, the results of which will be shared in the next quarterly report. Next steps: To maintain its strong performance in this area, IHPplus will:
• Conduct joint data monitoring missions (data quality self-assessment/routine data quality assessments) and hold meetings to monitor, analyze, and validate data;
• Support facilities to procure quality vaccines and other inputs at the provincial, health zone, and health area levels on a timely basis;
• Ensure preventive and curative maintenance of the cold chain for vaccines; • Ensure provision of immunization services in health zones and health areas; • Strengthen surveillance of vaccine-preventable diseases by training and supporting community-
based actors to implement the community-based monitoring guide.
Family planning: IHPplus continues to implement family planning activities in health zones in line with the 2014-2020 multisectoral family planning strategy, which aims to increase modern contraceptive prevalence from 6.5% to at least 19% by 2020, and to ensure access to and use of modern contraceptives for at least 2.1 million more women by 2020. Project activities are also in line with the FP2020 indicators, which are integrated into the family planning estimation tool adopted by the MOH.
0
20
40
60
80
100
120
DTC-Hib-Hep-B3
VPO3
PCV13 - 3

DRC-IHPplus Year Two Quarter Three Report: January 1, 2017 -March 31, 2017 Page 60 of 126
To comply with the legal requirements and abortion policies governing United States Government (USG) foreign assistance in family planning, over 125 staff from IHPplus and the Ministry of Health participated in the online course offered by USAID Global Health Learning. During PY2Q3, the project trained 47 family planning providers in the Lualaba and Kanzenze health zones, provided work kits to community health workers (CHWs) in the Minova and Nundu health zones, monitored CBD activities in the Katana, Dilala, and Manika health zones, and integrated family planning and HIV activities in the Manika health zone. Additionally, the project continued to supply health facilities with such family planning commodities as Jadelle, Implanon Classic, Implanon NXT, Sayana® Press, and Tiahrt posters. During this quarter, two of the six family planning indicators (percent of USG-assisted service delivery sites providing FP counseling and/or services, and number of counseling visits for family planning/reproductive health as a result of USG support), almost reached their targets, with 79% and 78% completion rates, respectively. Targets were not met on the other four family planning indicators during this reporting period: number of USG-assisted community health workers (CHWs) providing family planning information, referrals, and/or services during the year, number of USG-assisted health facilities experiencing stock-outs of Depo-Provera during the quarter, couple years of protection (CYP) in USG-supported programs, and CYP after exclusion of Lactational Amenorrhea Method and self-observation methods (NFP) for family planning in USG-supported programs. Couple Years of Protection: As shown in Table 34 below, the number of CYP drastically decreased from 167,381 in PY2Q2 to 50,915 this quarter, as determined by the volume of contraceptives dispensed, for an achievement of 32% of the PMP target of 159,538. This decrease is related to an error in the calculation of the number of protection years, as discussed previously. Please refer to the M&E Section under Project Management for more detail. Table 34: CYP in USG-supported programs during PY2Q3 Coordination Jan-17 Feb-17 Mar-17 Total
PY2Q3 Target Achievement
rate (%) Bukavu 4,739 5,425 4,379 14,544 45,000 32 Kamina 1,286 1,115 1,437 3,838 21,000 18 Kole 1,467 1,231 1,305 4,003 10,346 39 Kolwezi 1,961 2,866 2,323 7,149 23,133 31 Luiza 1,984 2,277 3,944 8,206 18,651 44 Mwene Ditu 2,334 2,248 2,285 6,867 25,257 27 Tshumbe 818 1,069 754 2,641 10,169 26 Uvira 1,129 1,291 1,249 3,668 5,982 61 Total 15,717 17,521 17,677 50,915 159,538 32 Challenges: In addition to the reasons mentioned above, the project was also challenged by higher targets, insecurity caused by the presence of the Kamwina Nsapu militia in some health zones in the DPS of Lomami and Central Kasaï, and several concurrent activities, such as vaccination campaigns. These

DRC-IHPplus Year Two Quarter Three Report: January 1, 2017 -March 31, 2017 Page 61 of 126
campaigns are time- and resource-intensive with a preparatory phase during which nurses are invited by the health zone central office to provide a briefing on the campaign, an implementation phase during which everyone is mobilized to vaccinate, and an evaluation phase during which providers are invited to present the results of the campaign. Health centers and CHWs are motivated by payment for immunization activities. These various factors worked together to contribute to poor performance on this indicator during the reporting period. Next steps:
• The project will compile all issues with indicators and request a meeting with USAID to discuss and agree on the best way to address them.
• IHPplus will assess the previous approved reports that need to be corrected whenever they are affected by the correction of error found in the CYP conversion factors.
• Conduct post-training follow-up of trained CBDs in the Lomela, Wembonyama, Minova, Dilala, Manika, and Nundu health zones;
• Provide regular supervision of clinical providers and CBDs conducting family planning activities; • Supply health facilities in health zones in the Kamina coordination that are experiencing stock-
outs with family planning products; • Order additional syringes for the Depo-Provera packages lacking them.
Number of family planning counseling visits: Counseling is critical to successful family planning use, because each couple must select and continue to use the contraceptive method that is personally and medically appropriate for them. For this quarter, as shown in Tables 35a and 35b below, a total of 167,552 counseling sessions were conducted, of which 23% were by community-based distributors (CBD). This represents a completion rate of 79% of the PMP target. Compared to the previous quarter, the number of counseling sessions decreased slightly from 192,189 to 167,552. Uvira reported the best performance with a 98% completion rate. Poor performance of the Kamina (61% completion rate) and Kolwezi (59% completion rate) coordinations lowered overall performance. Compared to the previous quarter, the decline is most evident among health facilities in the Luiza and Mwene Ditu coordinations, where attrition rates for family planning counseling visits exceeded 30%, compared with PY2Q2. Attrition can be largely attributed to the insecurity caused by the Kamwina Nsapu militia in several health zones in these provinces. Although still low, the number of family planning counseling visits increased by 8% in the Kolwezi coordination compared to PY2Q2 due to the work of trained CBDs. The overall low performance on this indicator can be attributed to mass immunization activities and insecurity in some provinces. Table 35a: Family planning counseling visits during PY2Q3
Coordination
January 2017 February 2017 March 2017 Community Health
center Community Health
center Community Health
center Bukavu 309 9,389 419 7,779 247 11,062 Kamina 284 7,288 65 5,317 62 6,856 Kole 1,096 3,472 1,505 5,244 1,393 5,477

DRC-IHPplus Year Two Quarter Three Report: January 1, 2017 -March 31, 2017 Page 62 of 126
Kolwezi 1,051 1,496 1,997 4,849 113 3,866 Luiza 4,147 5,194 4,862 6,181 4,445 5,488 Mwene Ditu 3,357 7,837 3,757 6,745 4,926 6,405
Tshumbe 1,221 3,996 947 3,562 917 2,719 Uvira 818 2,595 372 3,106 465 2,854 Total 12,283 41,267 13,924 42,783 12,568 44,727 Table 35b: Family planning counseling visits during PY2Q3
Coordination PY2Q3 Total Target Achievement rate (%) Community Health
center Total
Bukavu 975 28,230 29,205 36,073 81
Kamina 411 19,461 19,872 32,571 61
Kole 3,994 14,193 18,187 22,184 82
Kolwezi 3,161 10,211 13,372 22,809 59
Luiza 13,454 16,863 30,317 35,674 85
Mwene Ditu 12,040 20,987 33,027 36,377 91
Tshumbe 3,085 10,277 13,362 16,436 81
Uvira 1,655 8,555 10,210 10,380 98
Total 38,775 128,777 167,552 212,504 79
Challenges:
• Insufficient supervision visits to DPS and BCZS teams that focus on family planning • Insufficient CBD of family planning commodities in the health zones • Weak analysis of family planning data during monitoring meetings • Delayed ordering of family planning commodities by health facility providers
Next steps:
• Participate actively in monthly reviews of data in accessible health zones • Reinforce family planning activities at all supervisory opportunities, follow-up visits, and
monitoring
Monitoring of CBD activities: As presented in Table 36 below, IHPplus monitored activities of 54 CBDs in the Dilala, Manika, and Katana health zones during this quarter. In total, these CBDs completed 3,704 counseling visits, including 2,292 new family planning users. In the Katana health zone, three CBDs administered Sayana® Press and two CBDs inserted NXT implants. Based on the recommendations from the Sayana® Press study, the project worked with CHWs with a medical background. CHWs without a medical background are responsible for counseling and referrals to nurses. In the Dilala and Manika health zones, CBDs initiated counseling for 74 clients who had NXT implants inserted by the nurses, and follow-up visits were conducted for 2,074 clients using various contraceptive methods. IHPplus will have more data to report on this effort in PY2Q4.

DRC-IHPplus Year Two Quarter Three Report: January 1, 2017 -March 31, 2017 Page 63 of 126
Table 36: CBD activities in the Dilala, Manika, and Katana health zones, PY2Q3
Activity Dilala health zone
Manika health zone
Katana health zone
Total
Number of CBDs monitored 18 24 12 54
Number of counseling visits completed 550 2,428 726 3,704
Number of new family planning users 1,195 888 209 2,292
Number of new Sayana® Press users 0 0 13 13
Number of new users of NXT implants 47 27 3 77
Number of new users of oral combined contraceptives
321 299 28 648
Number of new users of progestin-only oral pills
186 189 1 376
Number of new users of male condoms 952 2,195 156 3,303
Number of new users of female condoms
122 285 0 407
Number of new users of CycleBeads 144 127 22 293
Number of new users of Lactational Amenorrhea Method (LAM)
0 113 10 123
Number of new users of self-observation method
0 0 0 0
Number of contraceptive clients monitored
1,145 878 51 2,074
Next steps:
• Reinforce family planning activities at all supervisory opportunities, follow-up visits, and monitoring
• Ensure post-training follow-up of trained CBDs in the Lomela, Wembonyama, Minova, Dilala, Manika, and Nundu health zones
• Provide regular supervision of clinical providers and CBDs conducting family planning activities Nutrition: Malnutrition is an underlying cause of infectious disease deaths in children in the DRC. Malnutrition is the result of an inadequate diet due to unsuitable dietary practices and infectious and parasitic diseases that develop from poor environmental, individual, and collective hygiene. IHPplus supports nutrition activities in the following areas: infant and young child feeding (IYCF) promotion, pre-school consultation (PSC), and IMCI.

DRC-IHPplus Year Two Quarter Three Report: January 1, 2017 -March 31, 2017 Page 64 of 126
Performance on the four nutrition indicators reported and analyzed in this report (the number of pregnant women who received iron and iron-folate supplements, the number of mothers of children two years or less receiving nutritional counseling for their children, the number of people trained in child health and nutrition, and the number of health facilities reporting iron-folate stock-outs) depends on procurement of nutrition commodities, capacity building, monitoring, and community strengthening. During PY2Q3, the following activities were conducted to improve nutrition practices:
• Distributed iron-folate supplements and routine vitamin A; • Distributed communication materials (consulting cards, pamphlets, etc.) to CHWs and health
facilities; • Distributed nutrition materials (PSC cards, registers); • Raised awareness on nutrition activities among managers of the Kasaï Oriental and Lomami DPS.
During PY2Q3, two indicators surpassed their respective targets (the number of pregnant women who received iron-folate supplements and the number of health facilities reporting iron-folate stock-outs). Project performance for the number of mothers of children two years or less receiving nutritional counseling for their children and the number of people trained in child health and nutrition through USG-supported programs fell below 60% of the target. Proportion of pregnant women who received iron-folate tablets to prevent anemia during the last five months of pregnancy: During the quarter, 155% of pregnant women received iron and iron-folate supplements (see Table 37 below). This value exceeds the target of 100% of pregnant women in all IHPplus coordinations. This strong performance is due to the availability of iron-folate in health facilities and the implementation of recommendations following supervision visits focused on the importance of pregnant women receiving iron-folate during prenatal consultations. Table 37: Number and percent of pregnant women who received iron-folate to prevent anemia during PY2Q3 Coordination # pregnant women receiving iron-folate # of
expected pregnancies (4% of pop)
% pregnant women
receiving iron-folate
Target Achievement rate (%)
Jan-17 Feb-17 Mar-17 Total PY2Q3
Bukavu 17,807 18,958 28,442 65,207 39,556 165 100 165
Kamina 7,357 7,011 8,341 22,709 21,772 104 100 104
Kole 5,684 5,149 6,474 17,307 10,212 169 100 169
Kolwezi 4,777 5,103 6,269 16,149 9,430 171 100 171
Luiza 7,963 8,268 9,774 26,005 15,269 170 100 170
Mwene Ditu 12,667 13,191 12,170 38,028 22,558 169 100 169
Tshumbe 5,176 3,458 3,731 12,365 9,383 132 100 132
Uvira 3,835 5,642 6,636 16,113 9,950 162 100 162
Total 65,266 66,780 81,837 213,883 138,130 155 100 155
*Numbers may not add exactly due to rounding.

DRC-IHPplus Year Two Quarter Three Report: January 1, 2017 -March 31, 2017 Page 65 of 126
In the Luiza coordination, community groups such as Champion Communities and CHWs are involved in encouraging women to attend ANC during home visits. Challenges:
• Insecurity in the Bilomba health zone prevented women from attending ANC visits to receive iron-folate supplements;
• Some health zones have not yet integrated data in the SNIS for the number of women who received the third dose of iron-folate supplements as expected;
• The indicator on the number of women who have received the third dose of iron-folate supplements is not systematically analyzed by all health zones during monitoring meetings;
• Given the insecurity in the Central Kasaï province, the Luiza coordination is struggling to maintain sufficient stock of iron-folate supplements in the health areas;
• The Tshumbe coordination experienced an irregular supply of iron-folate supplements in all health zones. Health centers and health zone central offices prioritize the procurement of commercial medicines over those given free of charge (such as iron-folate), even though these commodities are sufficiently available at health zone central offices and at the Fonds de Développement du Sankuru (FODESA) warehouse;
• The Bukavu coordination is trying to identify ways to maintain high performance in all health zones, and make iron-folate supplements available in 100% of remote and difficult to access health facilities, such as those in the Nundi health zone.
Lessons learned:
• Regular availability of iron-folate, as well as frequent monitoring and supervision, have contributed to the improvement of the indicator.
Next steps: • Negotiate the signing of a circular note by the Secretary General to clarify the collection of data
for this indicator; • The IHPplus monitoring and evaluation unit will instruct the coordinating offices to modify the
definition and mode of data collection for this indicator to prevent counting pregnant women who receive iron-folate each month three times. In collaboration with the Ministry, the project decided that the health zones would report only the third dose (during either ANC 3 or 4), to prevent over-counting;
• Conduct Routine Data Quality Analysis (RDQA) missions in health zones to ensure data reliability;
• Continue to supply health facilities with iron-folate after evaluation of their stock; • Organize joint missions with PRONANUT to monitor the management of nutrition commodities
(iron-folate, vitamin A, etc.); • Organize support missions to during monitoring meetings and ANC sessions to promote the use
of iron-folate and the correct mode of data collection for this indicator in all health zones; • In the Luiza coordination, work with the Yangala HZMT to define modes of transport of
medicines in the health zone.

DRC-IHPplus Year Two Quarter Three Report: January 1, 2017 -March 31, 2017 Page 66 of 126
Number of mothers of children two years of age or younger who have received nutritional counseling for their children: As shown in table 38 below, 215,450 mothers received nutritional counseling for their children under 24 months old (58% achievement rate), representing a decrease from PY2Q2 when 252,393 mothers received counseling (68% achievement). Coordination offices that did not perform well compared to quarterly targets include: Tshumbe (17%), Kolwezi (35%), Kole (42%), Kamina (33%), Uvira (61%), and Luiza (64%). The Bukavu and Mwene Ditu offices achieved 114% and 102%, respectively. Table 38: Number of mothers of children two years of age or younger who have received nutritional counseling for their children during PY2Q3 Coordination Jan-17 Feb-17 Mar-17 Total Target Achievement
rate (%) Kamina 7,072 8,080 6,882 22,034 66,000 33
Luiza 9,423 9,617 7,872 26,912 42,000 64
Kole 3,688 3,897 5,059 12,644 30,000 42
Bukavu 22,871 18,312 17,138 58,321 51,000 114
Tshumbe 3,354 2,555 2,979 8,888 51,000 17
Kolwezi 5,775 5,045 6,929 17,749 51,000 35
Mwene Ditu 16,852 15,419 16,588 48,859 48,000 102
Uvira 5,942 7,230 6,871 20,043 33,000 61
Total 74,977 70,155 70,318 215,450 372,000 58
The weak performance can be attributed to the following factors in each coordination:
• Uvira: The Hauts Plateaux health zone draws this indicator downwards with the non-integration of nutrition activities at the community level. Further, IYCF support groups are not functional since CHWs are not motivated or monitored by HZMT members. Additionally, providers are not trained in revitalized PSC, which provides an opportunity to advise mothers on child nutrition based on their growth.
• Tshumbe: Poor performance in this coordination can be attributed to the irregular follow-up of IYCF support groups and the lack of nutrition promotion at health centers during preventive (PSC, ANC) and curative services.
• Kananga/Luiza: With the exception of the Dibaya health zone, which has reached its quarterly target, the remaining eight health zones are below their quarterly targets due to the insecurity caused by the fighting between the militia and the army.
• Kolwezi: Underperformance in this coordination can be attributed to non-reporting on this indicator by health providers in the Fungurume, Kanzenze, and Lubudi health zones. IHPplus is exploring this data reporting issue with the chief doctors in the health zones.
Challenges:
• Irregular follow-up of support groups and need to revitalize IYCF support groups in some health zones (such as Mpanya-Mutombo and Lusambo) due to a lack of leadership among HZMTs;
• Untrained CHWs in revitalized PSCs in health zones and insecurity (combat between militia and

DRC-IHPplus Year Two Quarter Three Report: January 1, 2017 -March 31, 2017 Page 67 of 126
army/police) in the Kananga coordination; • Difficulties in scaling up nutrition activities in health zones not yet trained in IYCF and PSC.
Next steps:
• Revitalize the IYCF groups and equip them with guidance cards; • Organize formal supervision of health facility providers during PSC sessions; • Organize joint HZMT/IHPplus supervision missions to monitor IYCF support group activities; • Discuss the possibility of collecting information on curative consultations, ANC, and PSC on an
ongoing basis with HZMT in the Kananga coordination. Number of people trained in child health and nutrition through USG support: During the quarter, 112 staff were trained, representing an achievement rate of 24% (see Table 39). This performance is lower than the quarterly target, but higher than PY2Q2 (18%). Table 39: Number of people trained in child health and nutrition Coordination Jan-17 Feb-17 Mar-17 Total Kamina 0 0 0 0 Luiza 0 0 0 0 Kole 0 0 0 0 Bukavu 0 0 0 0 Tshumbe 0 0 0 0 Kolwezi 0 0 50 50 Mwene Ditu 0 16 46 62 Uvira 0 0 0 0 Total 0 16 96 112 During PY2Q3, two coordination offices organized two types of training. In the Mwene Ditu coordination, 62 providers were trained in the revitalized PSC approaches in the health zones of Dibindi, Bibanga, and Mwene Ditu. PRONANUT experts provided training at the national and provincial levels. The overall objective of the training was to strengthen the capacity of health zone managers to deliver the revitalized PSC approaches. As a result of the training, participants have the knowledge and capacity to conduct all PSC-related tasks from preparation to reporting of PSC indicators. In the Kolwezi coordination, 50 health care providers from Fungurume, Lubudi, and Bunkeya were trained in IMCI. As a result of the training, participants are able to diagnose and treat sick children, counsel their mothers, and conduct pharmacovigilance. This training focused on recognizing the five general signs of danger and corresponding symptoms, which is a crucial step in identifying very sick children who are at risk of dying if urgent action is not taken. The other coordinations did not organize health and nutrition training because they were not planned during the quarter. Challenges: It is difficult to expand training on IYCF and redesigned PSC in all project-supported health zones in a context of uncertainty of available project funding for the upcoming quarters.

DRC-IHPplus Year Two Quarter Three Report: January 1, 2017 -March 31, 2017 Page 68 of 126
Lessons learned: Capacity building of health providers in the field through training and technical assistance improves their on-the-job performance. Next steps:
• Conduct post-training follow-up for health zones trained in clinical IMCI (Fungurume, Lubudi, and Bunkeya) and revitalized PSC (Dibindi, Bibanga, and Mwene Ditu);
• Ensure that PSC activities are supported by both MNCH and nutrition funding since PSCs are primarily IMCI-related activities;
• Monitor IYCF and PSC activities in Kabongo, Songa, Kayamba, and Kitenge health zones; • Support training of providers on IYCF in Dibindi, Luputa, Mwene Ditu, and Wikong health zones.
Malaria Prevention: During PY2Q3, a total of 136,092 pregnant women benefitted from IPT2 among 168,690 pregnant women attending ANC1, or 81%, against a target of 75%. There was a slight (two percentage point) improvement compared to PY2Q2 (113,493 pregnant women among 143,157 attending ANC1 received IPT2, or 79%). The result for PY2Q3 represents an achievement of 108%. As Table 40 below indicates, the results are mainly due to performance in the coordinations of Bukavu (74% - achieved the same results: Mwene Ditu (86%) and Kamina (80%); and two others performed better in PY2Q2: Kolwezi (76% - 57%) and Tshumbe (91% - 88%). Table 40: Number and percentage of pregnant women who received at least two doses of SP during ANC visits during PY2Q3
Coo
rdin
atio
n
Number of pregnant women who received at
least two doses of SP during ANC
visits
Total number of expected
pregnancies in USG-assisted
health facilities (ANC1)
Percentage of pregnant
women who received at
least two doses of SP (%)
Target (%)
Achievement rate (%)
PY2Q2 PY2Q3 PY2Q2 PY2Q3 PY2Q2 PY2Q3 Bukavu 29,950 31,857 41,226 43,307 73 74 75 98 Kamina 19,236 17,272 23,951 21,704 80 80 75 106 Kole 9,546 12,631 11,149 11,366 86 111 75 148 Kolwezi 8,490 6,555 11,125 11,588 76 57 75 75 Haut Katanga N/A 19,903 N/A 24,194 N/A 82 75
110 Luiza 13,244 13,859 15,399 15,039 86 92 75 123 Mwene- Ditu 18,462 18,105 21,433 20,986 86 86 75 115
Tshumbe 7,591 8,180 8,366 9,313 91 88 75 117 Uvira 6,974 7,730 10,508 11,193 66 69 75 92 Total 113,493 136,092 143,157 168,690 79 81 75 108

DRC-IHPplus Year Two Quarter Three Report: January 1, 2017 -March 31, 2017 Page 69 of 126
This level of IPT2 coverage among pregnant women was achieved through various approaches. IHPplus staff monitored needed supplies for the health zones at the CDRs. With the DPS, IHPplus staff conducted joint post-training missions to strengthen the capacity of health care providers in administering IPT to pregnant women and in reporting data. The project conducted missions in 22 health zones in five DPS: Sud Kivu (4), Kasaï Central (5), Lomami (4), Haut Katanga (3), and Sankuru (6). Staff noted the presence of a health care provider trained in malaria prevention in each health facility who then trained other health care providers. They also used supportive supervision as an opportunity for training. Referral records are available, but the availability of counter-referral records remains a serious gap. Although commodities were available at the level of the BCZS, the project noted a stock-out of LLINs and SP in health facilities in the Malemba and Mpokolo health zones. The BCZS was immediately asked to identify all of the health facilities with stock-outs and to serve them according to their needs. Seventy-five percent of the health facilities visited in the Lomami health zone do not have the standard Registre d'utilisation des médicaments essentiels et des recettes (RUMER) but attempt to record the data in other types of registers. In 50% of the facilities, RUMER were not updated. With the support of the project, management reporting tools are being printed to be available in the health facilities, and each mission to a health facility must review the RUMER to improve the quality of the reported data.
The project organized a mini-campaign in three health zones in the Sankuru DPS (Katako Kombe, Tshumbe, and Dikungu). During the campaign, 1,500 prevention messages were sent to community members via cellphone; two radio spots were broadcast on prevention and malaria management; six community leaders and six administrative-political authorities were engaged in the sensitization on the importance of pregnant women visiting health facilities as soon as they know they are pregnant; fifteen education through listening sessions of at least 30 people each were held; visits were conducted to 1,050 households, including 862 that had an LLIN for pregnant women and for children under five (although only 687 used it correctly); CHWs oriented 476 pregnant women to health facilities to attend ANC, and 394 of them received IPT. These women were encouraged to continue ANC. Activities will continue to encourage pregnant women to quickly initiate ANC and benefit from all of the recommended doses of SP, as per national policy. At the community level, these efforts include sending educational messages by SMS, conducting home visits, carrying out education through listening, and selecting Champion Communities. At the health facility level, IHPplus will continue to conduct supportive supervision missions, build the capacity of health care providers to better administer SP, and raise awareness among pregnant women. The project noted that in five out of eight coordinations, the number of pregnant women (4% of the general population or 138,130 for the quarter) was less than the number of pregnant women who received ANC1 (146,441). It appears the general population is underestimated. There was double registering of pregnant women coming for ANC1 to the health facility and the GRH. The project has also noted a growing number of adolescent pregnancies. To respond to these issues, the project is planning RDQA missions at the health zone level to monitor these indicators. Additionally, during this quarter, 404,001 SP tablets were distributed by the CDRs to the 126 health zones in the nine DPS, which compared to a PMP target of 456,420, for an achievement rate of 89%. The quantity of SP in stock at the end of March represented an average of three months’ supply. The CDRs of Sankuru, Lualaba, and Haut Katanga have no SP stock. The next CDR delivery CDR is planned for June.

DRC-IHPplus Year Two Quarter Three Report: January 1, 2017 -March 31, 2017 Page 70 of 126
As Table 41 below shows, during PY2Q3, CDRs distributed 188,450 LLINs to health zones in nine DPS. Compared to the target of 360,684, the project only reached a 52% achievement rate. At the end of March 2017, there were 387,615 LLIN in stock, or on average three months’ supply. The CDRs of CAMELU Lubumbashi and CADIMEK are out of stock, and the next resupply is planned for June 2017. To avoid a stock-out in the health zones that it serves, the project asked the Supply Chain team that handles orders and purchases of PMI commodities to speed up the acquisition process for LLIN. Of the 16 health zones served by the Haut Lomami warehouse, located in Kamina, nine received commodities in September 2016 sufficient for six months; therefore, the next supply will be in May 2017. The three health zones inherited from the GF will also be supplied in May, as the GF had left a stock of three months at the end of December 2016.
Table 41: Number of LLINs purchased with USG funds that were distributed to CDRs DPS Total number of
LLINs required for ANC and PSC (forecasted)
Quarterly target
Quantity distributed from January - March 2017
Achievement Stock at the end of March 2017
Bukavu 279,492 69,873
80,650
95%
112,290 Uvira 61,606 15,402 Kamina 225,930 56,483 3,450 6% 108,081 Kole 23,486 5,871
50,100
191%
46,700 Tshumbe 81,615 20,404 Kolwezi 132,230 33,057 4,900 15% 50,700 Lubumbashi 281,984 70,496 5,900 8% 0 Luiza/Kananga 100,391 25,098 12,500 50% 69,844 Mbuji Mayi 104,383 26,096
30,950
48%
0 Mwene Ditu 151,618 37,905 Total 1,442,735 360,684 188,450 52% 387,615 At the CADMEKO CDR, which serves the health zones of Central Kasaï, insecurity in the province disrupted commodity distribution. In the DPS of Haut Lomami, during an integrated supervision visit with the DPS along the river (health zones of Kabongo, Kitenge, Songa, and Kayamba), shortages of drugs and commodities as well as LLINs at the health facility level were reported to the BCZS. After analysis, it appeared that the BCZS retained the drugs of the facilities that did not pay the 30% committed for the revolving drug fund. The immediate action was to instruct the BCZS to serve the health facilities and set up a follow-up commission at the level of the DPS.
IHPplus technical staff, in collaboration with MOH staff, conducted follow-up visits to manage malaria commodities and LLINs, to ensure proper management of LLINs at the health facility level, ensure that the most vulnerable populations benefit, and improve data quality. Health zones send a malaria commodity management report to the coordination level, including the quantities received, distributed, and the balance for each health facility.

DRC-IHPplus Year Two Quarter Three Report: January 1, 2017 -March 31, 2017 Page 71 of 126
Challenge: Follow up with the BCZS so that the intra-zone distribution is completed in the Haut Lomami DPS and the Central Kasaï DPS, and explore other ways to deliver commodities at the health zone level in insecure regions. Correctly managing malaria cases in health facilities through training and distribution of medicine and commodities (ACTs, RDTs, and supervision): In PY2Q3, CDRs distributed 2,340,641 doses of ACT (all ages) to project-supported health zones in nine DPS (see Table 42 on next page). Compared to the target of 1,206,609, the project reached an achievement rate of 194%. Nevertheless, health facilities continued to experience stock-outs in ACT for children aged 1 to 5 years. In Haut Lomami, for example, there was a discrepancy between the amount of ACT distributed to cover the needs of all of the health zones (220,504 doses) and the number of health facilities reporting stock-outs of ACT for children aged 1-5 years from January to March (respectively 70, 63, and 13). As previously cited, the BCZS held back the commodities since the health facilities had not contributed their 30% remittance to the revolving drug fund. To mitigate this issue, the DPS now accompanies IHPplus staff on joint supervision visits. Due to the security situation, in Kasaï Central DPS, stock-outs at the health facility level increased from January to March 2017 (47, 25, and 60, respectively). MOH partners helped to transport some medicines and commodities, including ACT and RDTs, to some health zones. With IHPplus support for fuel, the Lubondaie, Kalomba, and Luiza EPI antenna vehicles helped to transport commodities to Dibaya, Bilomba and Ndekesha, and Luiza, respectively. At the security meeting, negotiations between MONUSCO, the DPS, and IHPplus were initiated with MONUSCO to help transport drugs and commodities by helicopter. To maintain the achievements in management of malaria, IHPplus supported the MOH to monitor commodity management and compliance with the national protocol through supportive supervision missions using the outreach training and supportive supervision (OTSS) tool. In PY2Q3, these supportive supervisions were organized in 17 health zones in the following DPS: Kamina, Mwene Ditu, Kolwezi, and Haut Katanga. Observations made during these visits included the following:
• Health care providers have been trained or received refresher training in malaria management • 100% of health facilities have technical guides on malaria care • More than 30% of the health facilities visited in the Haut Lomami DPS had stock-outs of ACT for
children aged 1 to 5 years and 2 to 11 months (already discussed above), leading providers to give quinine drops
• 90% of malaria cases detected with positive RDT results received ACT in accordance with national policy
• In 6% of health facilities visited in the Kasaï Oriental DPS, providers routinely conduct RDT for any patient who comes to the clinic, without following the care protocol; these providers were briefed on the protocol for simple malaria care.
• Stock records of available commodities show calculations for average monthly consumption and are updated for ACT and RDT but not injectable artesunate, artesunate suppository, and SP.
• Medicines and commodities can generally be traced by cross-checking the information contained in the delivery notes, records of receipt, and up-to-date stock records.
• ACT used in the treatment of severe malaria is not being reported, so IHPplus reminded health providers of this requirement.

DRC-IHPplus Year Two Quarter Three Report: January 1, 2017 -March 31, 2017 Page 72 of 126
In collaboration with the DPS, the project is working on identifying model health zones that perform the best in terms of commodity forecasting and management, to identify best practices that might be shared to help underperforming health zones during supervision visits.
Table 42: Number of ACT treatments purchased with USG funds that were distributed to CDRs DPS Forecasted/quarterly
target for ACT Quantity distributed from January – March 2017
Achievement (%)
Stock available at the end of March 2017
Bukavu 233,749 501,149 176 1,096,638
Uvira 51,523
Kamina 188,953 404,053 214 220,504
Kole 19,642 76,014 86 42,410
Tshumbe 68,257
Kolwezi 110,588 85,850 78 146,046
Lubumbashi 235,833 581,875 247 55,485
Luiza/Kananga 83,961 505,050 602 1,245,657
Mbuji Mayi 87,299 186,650 87 533,575
Mwene Ditu 126,803
Total 1,206,609 2,340,641 194 3,340,315
In some provinces, CDRs distribute anti-malarials to health zones covered by more than one coordination bureau. This accounts for the aggregation of the distribution data of two coordinations as is the case for Bukavu and Uvira, Tshumbe and Kole, and Mbuji Mayi and Mwene Ditu. These figures show that the quantity of ACT distributed to the health zones under IHPplus represent 194%, or nearly double the target. Health zones had indicated their needs to the CDR based on a morbidity-based quantification using their total populations as a starting point. Targets were updated at the beginning of March 2017 as part of a country quantification that served both for the new financing mechanism of the GF (concept note) and the development of the Malaria Operational Plan (MOP). In the country quantification, the calculations are based on the total number of suspected malaria cases of 2016 plus 16%, which is lower than the total population figures used by the health zones to date. In PY2Q2, 13,363 RDTs were distributed in the Kole coordination compared to 71,657 RDTs distributed this quarter. This increase is related to applying lessons learned from a successful experience in the Ototo health zone in the Sankuru DPS that worked at the community level to improve patient referrals by traditional health practitioners. The HZMT participated in the IHPplus-supported Leadership Development Program, and as part of its action plan, conducted meetings with 12 traditional health practitioners in PY2Q3 to improve their collaboration with health care workers–particularly for referrals to health facilities for suspected malaria cases. This experience was shared with other health zones in the Kole coordination. To address severe malaria cases at the referral facilities, PMI distributed 74,701 vials of injectable artesunate. At the end of March 2017, 40,075 remained, which corresponds to an average of less than

DRC-IHPplus Year Two Quarter Three Report: January 1, 2017 -March 31, 2017 Page 73 of 126
two months of available supply. The Kolwezi CDR had no remaining stock at the end of March 2017. This situation is likely to cause problems for the proper management of severe malaria in the coming months since the CDRs at the end of March would normally have enough stock for a quarter, and PMI has not announced yet the next supply date. During supportive supervision visits, the project noted that health care providers prefer to use injectable artesunate with cases of simple malaria. This leads to an over-use of artesunate. Health care providers in referral facilities were asked to respect national policy. Each quarter, the number of RDTs distributed by the CDR in the health zones improves. As presented in Table 43 below, a total of 1,082,958 RDTs were distributed in the CDRs of the nine DPS during this quarter, representing an achievement rate of 72% for all of the IHPplus-supported health zones. This is not yet in full compliance with NMCP guidelines, which require that any suspected case of malaria be confirmed biologically. In principle, with a positivity rate of about 71% of RDTs in the IHPplus health zones, RDTs and ACT should be distributed with a ratio of one ACT dose for 1.4 RDTs. A balance of 413,268 RDTs remains in stock, which corresponds to less than an average of one month’s supply.
Table 43: Number of USG-funded malaria RDTs that were distributed during PY2Q3 to CDRs DPS Forecast/quarterly
RDT target Amount distributed from January-March 2017
Achievement (%)
Available stock, end of Mars 2017
Bukavu 293,338 238,075 67 97,375 Uvira 64,658 Kamina 237,123 134,750 57 64,175
Kole 24,649 164,383 149 85,375
Tshumbe 85,658
Kolwezi 138,781 44,875 32 119,193
Lubumbashi 295,954 278,075 94 -
Luiza/Kananga 105,365 44,200 42 45,925
Mbuji Mayi 109,554 178,600 66 1,225
Mwene Ditu 159,129
Total 1,514,209 1,082,958 72 413,268
In general, like all of the other antimalarial commodities, unless the CDR supply process accelerates, some health zones will be out of stock in PY2Q4. Supportive supervision visits have helped strengthen the capacity of health care providers with respect to the national protocol on CCM. During these visits, all of the cases received are tested except when there are stock-outs. Supervisors observed in some health centers that health care workers did not read the result of the RDT properly. These health care providers were briefed on how to use the RDT and on the malaria case management algorithm. During this quarter, the DPS of Sankuru organized open door days and a mini-campaign in three health zones: Katako Kombe, Tshumbe, and Dikungu. Results showed that 2,638 cases of fever were referred to nine health care centers by community links, and 2,011 had a positive RDT and benefited from ACT. Next steps:
• The project will extend the organization of malaria open door days in the coordinations to increase the use of RDTs, ACT, and accessing services at the health center level.

DRC-IHPplus Year Two Quarter Three Report: January 1, 2017 -March 31, 2017 Page 74 of 126
• Health zone management teams will be sensitized on the need to respect the ratio of one dose of ACT per 1.4 RDTs when they make orders to the CDR, to promote the confirmation of malaria diagnosis through the use of RDTs.
Strengthening the capacity of health providers in malaria case management: The project trained 250 providers (204 men and 46 women) on the use of IPTp, ACT, and RDTs. Compared to the project’s target of 485, this represents an achievement rate of 52% for the number of providers trained for IPTp, 43% for the number of providers trained for ACT (586), and 42% for the number of providers trained for RDTs (599). Four out of six health zones in Sud Kivu have now received training. Health care providers in six health zones of Sud Kivu DPS and four health zones in Kasaï Central DPS remain to be trained. The security situation in Central Kasaï province prevented training from taking place during this quarter. In Sud Kivu, some planned training did not occur because health zones in the Hauts Plateaux are difficult to access, especially during the rainy season. The training will be organized in PY2Q4 during the dry season. The Mulungu health zone is accessible by air and by road. The cost of training is very expensive ($34,000). The DPS and the project are in the process of negotiating with the health zone to reduce the cost of training, for example, by training one provider per health area instead of two. Next steps
• Continue training in the two remaining health zones of Bukavu coordination and the four health zones of the Kasaï Central DPS
• Reinforce the supportive supervision visits of health care providers already trained to build capacity in the workplace
• Reinforce training of trainers at the BCZS level to generalize the practice of quantifying ACTs and RDTs from suspected malaria cases and not from the total population
Studies in progress: The final report on the evaluation of the feasibility of the use of rectal artesunate in community settings was produced, and the project submitted two abstracts at the scientific days organized by the PNLP on April 27-28, 2017, in Kinshasa in honor of World Malaria Day. The first one was entitled: “The consequences of integrating treatment at the pre-referral level to treat severe case of malaria within the community care sites in the DRC,” and the second one was entitled: “Perceptions of mothers and guardians of children under five on severe malaria and consequences on the pre-referral treatment in community care sites in DRC.” The first abstract won the first prize for oral presentation, which provided the project a grant to present the abstract to any international conference of its choice. In order to organize a BCC campaign in two health zones of Sud Kivu, the project carried out a baseline survey to measure the impact of BCC on malaria case management. The report will be finalized in May when the four-month campaign begins.
Central-level support to the PNLP: In April 2017, the project is supporting the PNLP to celebrate World Malaria Day at the national and DPS levels.
HIV and AIDS: IHPplus continued to support the MOH in DRC to fight HIV and AIDS in 45 HIV health care sites in eight health zones in the Lualaba province. The minimum package of services provided remained the same as previous quarters and included HIV testing and counseling, PMTCT, ART treatment and treatment of opportunistic infections, HIV-TB co-infection (HIV/TB screening, TB

DRC-IHPplus Year Two Quarter Three Report: January 1, 2017 -March 31, 2017 Page 75 of 126
diagnosis using the Ziehl methodology and GeneExpert), TB testing for HIV-positive patients, the integration of HIV and family planning services, strengthening the links between the facility and community, and laboratory services. IHPplus continued to promote PEPFAR’s “test and treat” strategy, beginning ARV treatment as soon as testing reveals an HIV-positive result—rather than waiting to confirm the CD4 count. Patients previously waiting to begin treatment in project-supported sites were able to begin ART immediately. Percentage of PEPFAR-supported sites achieving 90% ARV or ART coverage for HIV+ pregnant women: During PY2Q3, 81% (22/27) of PEPFAR-funded HIV sites achieved at least 90% ARV or ART coverage for HIV+ pregnant women. This represents a decrease from PY2Q2 and PY2Q1, when 100% of PEPFAR-funded HIV sites achieved at least 90% coverage. Compared to the PMP target of 91%, this represents an achievement rate of 89%. Many HIV+ pregnant women attending ANC visits do not begin ARV or ART coverage as recommended and request additional time for reflection before returning for treatment, which contributes to the weaker performance. Table 44 below illustrates the number of HIV+ women that began treatment in PY2Q3 as well as the number of women that are tracked by health facilities for follow-up treatment. At the five HIV sites that did not achieve at least 90% coverage, 81% (26/32) of HIV+ women began coverage and 19% (6/32) must be monitored by the facilities to begin treatment. To prevent mother-to-child transmission of HIV, IHPplus will implement the “mentor mothers strategy” to monitor these HIV+ pregnant women and encourage them to begin treatment. Disclosing the status of HIV+ women to their husbands also helps to facilitate starting ARV and ART treatment. IHPplus also verified that health providers trained in HIV counseling and Option B+ are still present at these health facilities. Table 44: Health facilities tracking HIV+ pregnant women to begin ARV or ART treatment in PY2Q3 Health zone
Health facility
Number of HIV+ pregnant women
Number of HIV+ pregnant women placed on treatment
Number of HIV+ pregnant women tracked/followed to begin treatment
Fungurume Kakanda hospital
9 7 2
Shaloom health center
4 3 1
Lualaba Kawama health center
4 3 1
Manika Mwangeji GRH
6 5 1
Kasulo health center
9 8 1
Total 32 26 6 Number and percentage of pregnant women with known status (includes women who were tested for HIV and received their results): During PY2Q3, 91% (6,100/6,668) of pregnant women tested for HIV knew their HIV status after HIV counseling and testing and received their results during ANC visits and in the labor and delivery ward. This represents a slight increase in the total number of pregnant women with known status from PY2Q2 (5,458) and PY2Q1 (4,994).Compared to the PMP target of 97%, this

DRC-IHPplus Year Two Quarter Three Report: January 1, 2017 -March 31, 2017 Page 76 of 126
represents an achievement rate of 94%. The seropositivity rate among pregnant women in the 45 HIV sites is 2.3% (138/6,100). This rate is higher than the seropositivity rate reported in PY2Q2 (1.6%) and similar to the seropositivity rate reported in PY1Q1 (2.3%). The seropositivity rate among pregnant women includes the number of known cases (29) plus the number of newly-registered positive cases (109), and is higher than the PNLS sero-surveillance data in 2013 that reported a 1.8% HIV prevalence rate for pregnant women attending ANC visits (PNLS annual report, 2015). However, when considering only the new positive cases, the seropositivity rate is the same as the 1.8% rate of 2013. This strong performance is linked to the high quality of counseling offered by trained HIV health care providers, adherence to the testing circuit, and the availability of HIV testing and treatment commodities. Percentage of HIV-positive pregnant women who received antiretrovirals to reduce risk for MTCT during pregnancy and delivery: In PY2Q3, 97% (134/138) of HIV-positive pregnant women received ARVs to reduce the risk of MTCT during pregnancy, labor, or through breastfeeding. Performance decreased slightly from PY2Q2 when 100% of HIV-positive pregnant women received ARVs. Compared to the PMP target of 94%, the project’s achievement rate is 103%. According to the 2015 PNLS annual report, only 77% of HIV-positive pregnant women receive the recommended Option B+ treatment according to international norms, and 23% receive Option A. With PEPFAR funding, IHPplus exceeded the national norms, and 97% of HIV-positive pregnant women were treated with Option B+. This strong performance is linked to the availability of ARVs and the implementation of Option B+ by well-trained and well-supervised health providers. IHPplus and MOH staff from health zone central offices conducted joint supervision of HIV health providers. Number of individuals who received testing and counseling (T&C) services for HIV and received their test results: In total, 16,736 individuals received T&C services for HIV and received their results. IHPplus greatly exceeded the PMP target of 8,609, for an achievement rate of 194%. The number of individuals who received T&C services for HIV and received their results increased slightly from the 16,371 reported in PY2Q2. The results, disaggregated by sex, age, and HIV status, are presented in Table 45 below. Table 45: Number of individuals who received T&C services for HIV and received their test results, disaggregated by sex, age, and HIV status during PY2Q3 Coordination Sex Age HIV status Total
F M Under 15 years
15 years+ HIV-positive HIV-negative
Kolwezi 12,252 (73%)
4,484 (27%)
1,676 (10%)
15,060 (90%)
843 (5%) 15,893 (95%) 16,736 (100%)
The seropositivity rate of individuals receiving T&C services from the 45 sites in Kolwezi is 5% (843/16,736), which is significantly higher than the national average of 3%. The results demonstrate a continued need for PEPFAR support to fight HIV in the new province of Lualaba/Kolwezi. The service delivery points for T&C services varied. The number of clients tested from the various service delivery points is presented in Table 46.

DRC-IHPplus Year Two Quarter Three Report: January 1, 2017 -March 31, 2017 Page 77 of 126
Table 46: Number clients receiving T&C services at service delivery points in Kolwezi in PY2Q3 Service delivery point
Clients receiving T&C services
HIV-positive cases
Seropositivity rate (%) - # tested cases/per service delivery point
Seropositivity rate (%) - # HIV+ cases at each point of service/total # of HIV+ cases
ANC visits and maternity wards
6,100 (36%) 109 2 13
TB consultations 422 (3%) 50 12 6 Sexually transmitted infection consultations
602 (4%) 11 2 1
Malnutrition 44 (<1%) 3 7 <1 Out-patient consultations
4,702 (28%) 370 8 44
In-patient consultations
1,111 (7%) 86 8 11
Voluntary T&C 2,013 (12%) 181 9 21 Family planning 1,531 (9%) 14 <1% 2 Under five clinics 163 (<1%) 2 1 <1 Index cases 48 (<1%) 17 35 2 Total 16,736 843 *All percentages in this table are calculated based on the total number of individuals tested (16,736). Provider-initiated testing and counseling is implemented at all service delivery points cited above, except voluntary T&C. The majority of clients received T&C services during ANC visits and in maternity wards (6,100 clients, or 36%) and out-patient consultations (4,702 clients, or 28%). Additionally, 12% of clients received T&C services through voluntary T&C, 9% through family planning services, 7% during in-patient consultations, 4% during sexually transmitted infection consultations, and 3% during TB consultations. The service delivery points of malnutrition, under five clinics, and index cases reported the fewest number of clients receiving T&C services (<1%). When comparing the number of HIV-positive cases at each service delivery point compared to the total number of HIV-positive cases, the highest seropositivity rates were registered during out-patient consultations (44%), voluntary T&C (21%), ANC visits and maternity wards (13%), and in-patient consultations (11%). For the total number of clients that received T&C services per service delivery point, the highest seropositivity rates were registered in index cases (35%), TB consultations (12%), voluntary T&C (9%), in-patient and out-patient consultations (8%), malnutrition (7%). Some of the lowest seropositivity rates were reported in ANC visits and maternity wards and during sexually transmitted infection consultations (2%), under five clinics (1%), and family planning consultations (<1%). During PY2Q3, IHPplus reported two new service delivery points that were strongly supported by USAID and PEPFAR’s HIV teams: (1) index cases, where 17 HIV-positive cases were reported among the 48 tested (strong seropositivity rate of 35%); and (2) under five clinics, where only two HIV-positive cases were reported among the 163 tested (weak seropositivity rate of 1%).

DRC-IHPplus Year Two Quarter Three Report: January 1, 2017 -March 31, 2017 Page 78 of 126
The strong performance during the quarter is linked to the increased HIV T&C and “test and start” targets in the DRC’s FY16 Country Operational Plan (COP16), which recommend aggressive testing at various service delivery entry points to eradicate HIV and AIDS by 2030. Other contributing factors include the availability of HIV tests, implementation of the provider-initiated T&C strategy, and joint supervision by MOH and IHPplus staff. These successes were achieved within the context of the mining boom in Kolwezi, which often increases the health risks of the population frequenting mining sites. Number of HIV-positive adults and children who received at least one of the following during the reporting period: clinical assessment (WHO staging) or CD4 count or viral load: 4,722 people living with HIV (PLHIV) received at least one clinical assessment (WHO staging), CD4 count, or viral load of the infection’s progress, representing a slight increase from the PY2Q2 result of 4,053 PLHIV and PY2Q1 result of 3,648 PLHIV. IHPplus exceeded the PMP target of 1,029, for an achievement rate of 459%. This strong performance is linked to an underestimated COP16 target, the availability of cotrimoxazole and other commodities for treating opportunistic infections, PIMA equipment, and CD4 testing kits provided to health facilities by IHPplus. Also during the quarter, PLHIV supported by the project in two urban health zones (Dilala and Manika), and the semi-urban health zone of Fungurume provided sampling for viral load counts. TB/HIV: Percent of HIV-positive patients who were screened for TB in HIV care or treatment setting: A total of 64% (2,629/4,121) of HIV-positive adults and children were screened for TB in HIV care or treatment settings. The percent of patients screened for TB in PY2Q3 decreased slightly from PY2Q2, when 68% (2,209/3,253) of HIV-positive patients were screened for TB. In PY2Q1 60% (1,462/2,438) of HIV-positive patients were screened for TB. Some health providers at HIV sites did not document TB screenings in patient files, which contributed to this decrease. This negligence is often observed during time periods when the DPS organizes vaccination campaigns for children under five, and health providers are compensated for their participation. Of the 2,629 PLHIV screened, 2,159 patients (82%) tested negative for TB and 470 PLHIV (18%) were suspected TB-positive cases. All patients with negative TB tests received the isoniazid (INH) regimen to prevent TB, and the 470 suspected cases completed additional testing to confirm their status (GeneExpert, Ziehl methodology, and clinical testing); of these, 72 (15%) were confirmed TB-positive and received anti-TB treatment. These results align with the WHO's findings, which state that for individuals with latent or new mycobacterium TB infections, the risk of developing TB is 20-37 times higher among PLHIV (WHO, HIV/TB 2011). The project’s achievement rate is 91% compared to the PMP target of 70%. The overall strong performance is linked to trainings on HIV-TB co-infection at all 45 HIV care sites, coaching and technical assistance provided to health providers at HIV care sites by CPLT and IHPplus staff, and the availability of the TB screening tool provided by the project. Number of adults and children receiving antiretroviral therapy (ART): During PY2Q3, 4,607 HIV-positive adults and children received ART, which is an increase from the results of the previous two quarters (4,053 HIV-positive adults and children in PY2Q2 and 3,502 in PY2Q1). IHPplus exceeded the PMP target

DRC-IHPplus Year Two Quarter Three Report: January 1, 2017 -March 31, 2017 Page 79 of 126
of 1,029 for an achievement rate of 448%. This strong performance is primarily linked to the under-estimation of the COP16 target and the introduction of PEPFAR’s innovative “test and treat” approach. Other contributing factors include the availability of commodities in all health facilities providing HIV care, the administration of Option B+, and technical support provided to health providers by health zone central office and IHPplus staff. These successes were achieved within the challenging context of the mining boom in Lualaba, which often increases the health risks of the population frequenting mining sites. IHPplus also contracted five organisations d’assisse communautaire (community-based organizations, or CBOs), to improve adherence to treatment by identifying infants for early HIV diagnostic (EID) screening and PMTCT testing, tracking PLHIV that are lost to follow up, and organizing support groups in health facilities and within communities. Number of HIV-infected adults and children newly enrolled in clinical care during the reporting period who received at least one of the following at enrollment: clinical assessment (WHO staging), CD4 count, or viral load: A total of 831 HIV-positive adults and children newly enrolled in clinical care received at least one clinical assessment (WHO staging), CD4 count, or viral load. This represents an increase from the 765 individuals reported in PY2Q2 and 639 individuals reported in PY2Q1. The project exceeded the PMP target of 231 with an achievement rate of 360%. The strong performance is linked to three primary factors: the under-estimation of the COP16 target; implementation of the “test and treat” strategy; and the synergistic work with FHI360’s LINKAGES project to sensitize and test key populations, and orient those with positive tests to project-supported health facilities for ART. These successes were achieved within the challenging context of the mining boom in Kolwezi, which often increases the health risks of neighboring populations. Proportion of registered TB cases that are HIV-positive who are on ART: In PY2Q3, 96% of the registered TB cases among PLHIV (48/50) are on ART. This represents a slight decrease from 100% of cases in PY2Q2.The project exceeded the PMP target of 95%, an achievement rate of 101%. The distribution of these results by sex, age, and time between anti-TB and ART treatment is presented in Table 47 below. Table 47: Number and percent of TB and HIV co-infection patients distributed by sex, age, and time between anti-TB and ART treatment Sex Age Time between anti-TB and ART
F M Above 15 years
Under 15 years
ART initiation > 8 weeks of start of TB treatment
ART initiation <= 8 weeks of start of TB treatment
Total 27 (56%)
21 (44%)
45 (94%) 3 (6%) 0 (0%) 48 (100%)
Factors contributing to this strong performance include training on the complete package of HIV and HIV/TB co-infection services, availability of anti-TB and HIV testing and treatment commodities,

DRC-IHPplus Year Two Quarter Three Report: January 1, 2017 -March 31, 2017 Page 80 of 126
implementation of the “test and treat” strategy, and distribution of co-infection management tools to HIV care sites by the project. The mining boom, which is associated with increased promiscuity among individuals living close to mining sites, may increase the risk of contracting HIV and TB. Percentage of laboratories and point of care (POC) testing sites that perform HIV diagnostic testing that participate and successfully pass in an analyte-specific proficiency testing (PT) program: As in the two previous quarters, a total of 55 out of the 55 laboratories (100%) in eight health zones (Lualaba province) continued to participate in the complete HIV quality control process during PY2Q3. The project met the PMP target of 100%, an achievement rate of 100%. IHPplus and PNLS Lubumbashi jointly organized follow-up missions to all project-supported HIV care sites to monitor lab technicians’ work and practices following their training and to evaluate the quality of HIV tests and the correct collection of viral load samples. Family planning and HIV integration: Number of HIV service delivery points supported by PEPFAR that are directly providing integrated voluntary family planning services: With IHPplus support, 44 of the 45 functional HIV service delivery points systematically integrate family planning and safe motherhood services. This represents an achievement rate of 98% against the PMP target of 45, and an increase from the 43 sites reported in PY2Q2. IHPplus distributed family planning products to all HIV service delivery sites, with the exception of the Mariapolis health center, which does not provide ANC or maternity health services, as well as the AFIA Manika health center. The AFIA Manika health center, which does not provide family planning services due to its Catholic church affiliation, worked with the Manika HZMT to identify another health facility in the same health area to provide family planning services (KLM health center). The project provided coaching and technical assistance to the head nurse from KLM health center on the Tiahrt regulations. IHPplus continued trainings for health providers on service provision, counseling, and modern family planning methods. Health zone central office staff conducted supervision visits to health facilities. IHPplus distributed contraceptives and reporting tools, and communicated with HIV care sites regarding family planning on a regular basis. PMTCT_CTX Number of infants born to HIV-positive women who were started on Cotrimoxazole (CTX) prophylaxis within two months of birth at USG-supported sites within the reporting period: In total, 27 infants exposed to HIV received CTX prophylaxis to reduce the risk of opportunistic infections. This represents a significant decrease from the 56 infants reported in PY2Q2 and 89 infants reported in PY2Q1. Compared to the PMP target of 58, this represents an achievement rate of 47%. This decline is caused by the drop in number of new HIV-positive pregnant women giving birth in health facilities, which varies each quarter. PMTCT_EID Number of infants who had a virologic HIV test within 12 months of birth during the reporting period: During PY2Q3, 53 HIV-exposed infants were tested for HIV in the first 12 months after birth; however, the results of these tests were not made available to the families. As a result, the project’s achievement rate was 0% compared to the target of 58. The PNLS laboratories in Kinshasa and Lubumbashi reported stock-outs of EID reagents, which prevented the labs from completing the tests and obtaining the results of the infants’ samples. The PNLS laboratories recently received the needed

DRC-IHPplus Year Two Quarter Three Report: January 1, 2017 -March 31, 2017 Page 81 of 126
EID reagents, and are in the process of analyzing the test results. PMTCT_FO Number of HIV exposed infants with a documented outcome by 18 months of age disaggregated by outcome type: During PY2Q3, 30 infants exposed to HIV have a documented outcome by the age of 12-24 months disaggregated by type of result. This represents an increase from the 19 infants reported in PY2Q2 and nine infants reported in PY2Q1. Of the 30 infants exposed to HIV and tested, three are HIV-positive (a seropositivity rate of 10%, or 3/30). Compared to the PMP target of 50%, the project’s achievement rate is 60%. The involvement of APS from CBOs in the tracking of exposed infants aged 12-18 months is one factor contributing to improved performance for this indicator. Other factors include coaching on Nutrition Counseling and Support (NACS) provided to health providers to improve nutritional guidance for mothers with infants exposed to HIV (with a negative EID result) and prevent transmission through breastfeeding. TX_NEW Number of adults and children newly enrolled on ART: As indicated in Table 48 below, a total of 809 new PLHIV received ART treatment during PY2Q3. This represents an increase from the 765 adults and children reported in PY2Q2 and 627 adults and children reported in PY2Q1. The project exceeded the PMP target of 231, an achievement rate of 350%. Table 48: Number and percent of adults and children newly enrolled on ART during PY2Q3 (disaggregated by sex and age) Sex Age Total newly enrolled on ART
F M 15 year + Under 15 years Total 551
(68%) 258 (32%) 741 (92%) 68 (8%) 809
The strong performance is linked to three primary factors: the underestimated target in the COP16, implementation of the “test and treat” strategy, and the synergistic work with FHI360’s LINKAGES project to sensitize and test key populations and orient those with positive tests to project-supported health facilities for ART. These successes were achieved within the challenging context of the mining boom in Kolwezi, which often increases the health risks of the population in neighboring populations. Tx_VIRAL Number of adults and pediatric ART patients with a viral load result documented in the patient medical record within the past 12 months: During PY2Q3, the CDC and PEPFAR team responsible for laboratory activities convened the various PEPFAR implementing partners to discuss revisions to the quarterly targets for this indicator. The annual target was increased to 2,322 patients with a viral load result documented, and the quarterly target is now 580 adults and children, which is double the PY2Q2 target of 290. Of the 580 PLHIV with a viral load count, the project collected a total of 577 viral load count samples (99% of the PMP target). However, none of the patients received their documented results due to stock-outs in viral load reagents. Viral load samples were collected from patients in the four IHPplus Lualaba health zones (Dilala, Manika, Fungurume, and Lualaba) that are easily accessible. The PNLS laboratories recently received viral load reagents, and are in the process of analyzing the test results.

DRC-IHPplus Year Two Quarter Three Report: January 1, 2017 -March 31, 2017 Page 82 of 126
TX_UNDETECT Number of viral load tests from adult and pediatric ART patients conducted in the past 12 months with a viral load < 1,000 copies/ml: As mentioned above, it was not possible to conduct viral load tests during PY2Q3. CARE_COM Number of HIV infected adults and children receiving care and support services outside of the health facility: IHPplus contracted five CBOs (Gazelle de Fungurume, Adas de Luilu, Mapendo, Muungano, and Ushindi de Manika) to provide psychosocial and clinical services to PLHIV in their respective communities. A total of 1,761 PLHIV were visited by 50 APS in five health zones (Manika, Dilala, Fungurume, Lualaba, and Lubudi), compared to PY2Q2 when no PLHIV benefited from this service. These five health zones are also RBF health zones. The project supported three other non-RBF health zones (Bunkeya, Kanzenze, and Mutshatsha) to strengthen the capacity of APS to fulfill their roles in their communities. Compared to the PMP target of 500, this represents an achievement rate of 352%. Factors contributing to this strong performance include the implementation of RBF, participation of the PNLS, and technical assistance provided by IHPplus. The different community activities conducted by the five CBOs are summarized in table 49 below: Table 49: Community activities conducted by the five CBOs Activities conducted by CBOs
Mapendo/ Manika
Adas/ Luilu-Dilala
Ushindi/Dilala
Gazelle/ Fungurume and Lubudi
Muungano Manika and Lualaba
Total
Number of APS group meetings
4 3 4 3 0 14
Number of participants in APS group meetings
70 93 138 32 0 333
Number of PLHIV visited in their homes that received psychosocial care
188 188 602 194 589 1,761
TB/VIH_TB aggregated outcomes of TB treatment among registered new and relapsed TB cases that are HIV-positive in the treatment cohort: In total, 68 TB/HIV patients had their results at the end of their treatment documented, which is a slight decrease from the 72 patients reported in PY2Q2. Of the 68 patients, the following results were reported: 30 TB/HIV patients were declared cured (44%), 15 patients completed treatment (22%), four patients’ treatment was not evaluated (6%), two patients were lost to follow up (3%), and 17 deaths were reported (25%). Treatment failure was not recorded. There was a much higher percentage of deaths among the patients in treatment during this quarter compared to PY2Q2, when only 4% if patients died, and PY2Q1, when none died. According to health providers responsible for TB/HIV co-infection at the sites where deaths were reported (HPK Dilala and Mwangeji GRH), these deaths are attributable to late transfer to the two referral facilities.

DRC-IHPplus Year Two Quarter Three Report: January 1, 2017 -March 31, 2017 Page 83 of 126
Compared to the PMP target of 92%, the project’s achievement rate is 109%. With support from the CPLT, PNLS, HZMT, and IHPplus, health providers working at HIV care sites offering TB/HIV co-infection services succeeded in establishing a circuit of health services delivery that enables each patient co-infected with TB and HIV to receive TB and HIV care at the same time. This contributes significantly to the improved quality of health services provided to beneficiaries. Tuberculosis: TB remains a public health problem in DRC. To reduce TB-related morbidity and mortality, as outlined in the National Tuberculosis Strategic Plan (NTSP), IHPplus is supporting 293 TB health centers for diagnosis and treatment (CSDT in French) in 78 health zones. Directly Observed Treatment Strategy TB (DOTS) coverage during this quarter is estimated at 13,542,673 people, which represents approximately 90% of the total population in the health zones. The performance and results of the TB program outlined below are analyzed on the basis of the population targeted by the DOTS strategy. It is important to note that the total number of CSDTs in the project-supported health zones increased from 290 last quarter to 293 this quarter following the creation of three new CSDTs with the Sud Kivu Coordination Provinciale Lèpre-Tuberculose (CPLT) to improve access to TB services and care in this province with historically weak TB detection. Number of total presumed and registered TB cases: During PY2Q3, of the total 26,570 suspected TB patients that were tested, 5,196 cases of TB were registered in the 78 health zones (see Table 50 below). Among the 5,196 cases, 3,492 new cases were bacteriologically confirmed TB (NP TP+). Performance improved from PY2Q2, as the number of registered TB cases and the number of new NP TP+ cases increased from 4,066 to 5,196 and from 2,014 to 3,492, respectively. During the quarter, all health zones completed TB reports, which contributed to the improved performance. For example, Bukavu and Uvira coordinations submitted timely epidemiological TB reports including data for all 27 health zones; in PY2Q2, only nine of these health zones submitted timely reports. Another factor contributing to this quarter’s improved performance is the engagement of community health agents in referring suspected TB patients to CSDTs for testing. Of the 26,570 suspected TB patients that were tested, 6,408 patients (24%) were referred for testing by community health agents. This represents a significant increase from the 7% reported in PY2Q2. Furthermore, of the 5,196 registered TB cases, 1,812 (35%) were referred to CSDTs by community health agents (see Table 47 below). Community health agents play a key role in raising awareness on TB testing, promoting active screening of patients coming into contact with TB, and recommending therapeutic services for new patients. Of the 1,812 TB patients detected during the quarter who started TB treatment, 1,293—or 71%—received support from community health agents. The coordinations of Bukavu, Uvira, Mwene Ditu, and Luiza had the highest number of suspected TB patients referred by community health agents, whereas less than 10% of suspected TB patients were referred to CSDTs in the coordinations of Kolwezi, Kamina, Kole, and Tshumbe. WHO operational guidelines recommend the integration of community activities to fight TB (ENGAGE-TB approach). Accordingly, IHPplus promotes increased involvement of community participation in TB prevention and care activities through community-based groups such as groups of former TB patients (or Club des Amis Damien [CAD] in French), community health workers, Ambassadors in the fight against

DRC-IHPplus Year Two Quarter Three Report: January 1, 2017 -March 31, 2017 Page 84 of 126
TB (ALTB), and Champion Communities. Despite these efforts, there is still poor coverage of community-based TB services, and it is necessary to extend this coverage to other health zones supported by the project. IHPplus supported the establishment of 15 CAD groups in the Bilomba, Lubondaie, and Yangala health zones in the Luiza coordination to increase the active TB case detection activities among community members. It also implemented other approaches such as investigating cases of individuals who have come into contact with TB patients. Table 50: Number of total presumed and registered TB cases and the proportion of these case identified and supported by community health agents during PY2Q3
Coor
dina
tion
Population covered by Directly Observed Treatment Short Course (DOTS)
Total presumed cases of TB
Presumed TB cases identified by community health agents
Total # of registered TB cases
Total # of registered TB cases identified by community health agents
Total # of patients beginning TB treatment that received support from community health agents
Number (#)
Percent (%)
Number (#)
Percent (%)
Kolwezi 921,180 2,801 0 0 580 281 48 91 Kamina 2,179,261 4,628 395 9 1171 395 34 395 Kole 1,145,563 4,338 55 1.3 601 55 9 4 Tshumbe 857,044 3,480 16 <1 306 16 5 0 Bukavu 3,840,394 3,870 2,404 62 851 564 66 208 Uvira 966,036 1,740 661 38 311 142 46 72 Mwene Ditu
2,211,769 3,188 1,603 50 1,009 229 23 342
Luiza 1,421,426 2,525 1,274 50 367 130 35 181 Total 13,542,673 26,570 6,408 24 5,196 1,812 35 1,293 Of the 5,196 cases of registered TB, 653 cases (13%) were children aged 0 to 14 years (see Table 51). This proportion is lower than in PY2Q2 (17%), but higher than the national average, estimated at 13% in 2016 by WHO. Nevertheless, it is still lower than the expected rate of 20%. Bukavu and Mwene Ditu recorded the highest percentages of childhood TB cases registered, at 18% and 17% respectively. The strong performance in Bukavu is linked to the technical assistance provided to health providers during supervision visits, briefings on using the Keith Edouard scorecard, and support to CSDTs to analyze TB data on a monthly basis by age. The strong performance in Mwene Ditu is linked to the technical assistance provided to the 43 CSDTs in nine health zones on using TB testing algorithms. The Luiza coordination recorded the lowest percentage of childhood TB cases (7%), which is due to the ongoing insecurity in the majority of health zones in this coordination. In order to improve the detection of childhood TB cases, IHPplus recommends strengthening the capacity of health providers to use TB testing algorithms, particularly for health workers providing care to children, and supporting the transport of samples to testing sites.

DRC-IHPplus Year Two Quarter Three Report: January 1, 2017 -March 31, 2017 Page 85 of 126
Table 51: Number and percent of registered TB cases among children aged 0-14 years during PY2Q3 Coordination Total
recorded TB cases
Total TP+ cases recorded (children 0-14)
Total TP- cases recorded (children 0-14)
Total extra pulmonary TB cases recorded (children 0-14)
Total TB cases recorded (children 0-14)
Percentage of TB cases recorded (children 0-14) (%)
Kolwezi 580 12 13 31 56 10 Kamina 1,171 34 5 67 106 9 Kole 601 54 10 14 78 13 Tshumbe 306 29 0 0 29 10 Bukavu 851 53 45 54 152 18 Uvira 311 6 13 21 40 13 Mwene Ditu 1,009 30 28 110 168 17 Luiza 367 16 2 6 24 7 Total 5,196 234 116 303 653 13 Notification rate for new cases of smear-positive pulmonary TB in USAID-supported health zones: Of the 293 CSDTs in the 78 project-supported health zones, 287 (98%) reported on TB activities in PY2Q3. A total of 3,492 new sputum smear-positive pulmonary TB cases were reported in the 78 health zones--a rate of 103 new TP+ patients per 100,000 people (Table 52). This rate is higher than the 85 per 100,000 people in PY2Q2 and represents an achievement rate of 69% compared to the PMP target of 150 per 100,000 people. Table 52: New TB cases notification rates during PY2Q3
Coor
dina
tion Population
covered by DOTS
# of new bacteriologically confirmed pulmonary TB patients (NP TP+)
Notification rate NP TB+
(per 100,000)
Target (per
100,000)
Achi
evem
ent
rate
(%)
# of women
# of men
Total Ratio (female:
male)
Kolwezi 921,180 161 213 374 0.8 162 150 108 Kamina 2,179,261 404 512 916 0.8 168 150 112 Kole 1,145,563 180 204 384 0.9 134 150 89 Tshumbe 857,044 113 135 248 0.8 116 150 77 Bukavu 3,840,394 222 333 555 0.7 58 150 39 Uvira 966,036 73 126 199 0.6 82 150 55 Mwene Ditu 2,211,769 289 227 516 1.3 93 150 62 Luiza 1,421,426 137 163 300 0.8 84 150 56 Total 13,542,673 1,579 1,913 3,492 0.8 103 150 69 The Kamina and Kolwezi coordinations recorded the highest notification rates, with 168 and 162 cases per 100,000, respectively. Kole and Tshumbe recorded notification rates that fell slightly below the

DRC-IHPplus Year Two Quarter Three Report: January 1, 2017 -March 31, 2017 Page 86 of 126
target (134 and 116 per 100,000, respectively). The performance in Luiza remains consistently under par, with a notification rate of 84 cases per 100,000 people. It recorded 83 cases per 100,000 in PY2Q2 and 85 cases per 100,000 in PY2Q1; in the last quarter of PY1 it recorded 95 cases per 100,000 people. This poor performance can be explained by the ongoing armed conflict in the Kasaï Central (Kananga) province, which caused commodity stock-outs in the Ziehl laboratory in the Luambo and Luiza health zones and resulted in the closure of the CSDT hospital in Bilomba. Bukavu and Uvira coordinations in Sud Kivu also recorded low notification rates, with 58 and 82 cases per 100,000 inhabitants. However, compared to PY2Q2, the notification rates there increased from 16 and 31 cases per 100,000 inhabitants, respectively. This increase is linked to the technical assistance provided by IHPplus to the CPLT in Sud Kivu to hold monthly TB monitoring meetings at CSDTs with participation from CST satellites, as well as supportive supervision provided in certain health zones. The ratio of females to males among the new TP+ patients is less than one (0.8). This result is aligned with global and national data indicating that tuberculosis affects more men than women. However, the Mwene Ditu coordination recorded a higher ratio of females to men (1.3), which is largely explained by the successful active case finding of TB by community agents in the Mpokolo health zone. It is necessary to strengthen active case finding in households during the next quarter, with a specific focus on women. To improve performance in notifying TB cases in IHPplus-supported areas, IHPplus conducted the following activities in PY2Q3:
• Using the CSDT approach, conducted an evaluation of activities and verified TB data, particularly during monthly monitoring meetings with participation from head nurses from CSDTs and CST satellites;
• Provided technical and financial support to conduct quarterly data validation meetings in the CPLTs, with a particular focus on Kananga, Kamina, and Kolwezi ;
• Conducted active case finding for TB cases in all health zones with weak TB detection, with the systematic participation of community health agents (CHWs and CAD members);
• Organized regular supervision visits with CPLT in health zones and CSDTs; • Transported laboratory commodities to difficult-to-reach health zones, particularly in the
Kamina, Tshumbe, and Kole coordinations, to prevent stock-outs. Number of multi-drug resistant (MDR) TB/RR cases detected in USG-supported health zones: Of the 230 presumed cases of MDR-TB/RR tested using GeneXpert this quarter (174 new cases and 56 relapsed cases), nine cases of MDR-TB/RR were confirmed (see Table 53 below). Compared to the PMP target of 43 cases, this represents an achievement rate of 21%. Compared to PY2Q2, the number of presumed MDR-TB/RR cases tested decreased from 297 to 230, and the number of cases detected decreased from 21 to nine. The majority of presumed MDR-TB/RR cases were recorded in Kole and Uvira.

DRC-IHPplus Year Two Quarter Three Report: January 1, 2017 -March 31, 2017 Page 87 of 126
Table 53: Number of MDR-TB cases detected during PY2Q3 Co
ordi
natio
n Population covered by
DOTS
# of presumed MDR-TB/RR cases
# of confirmed MDR-TB/RR cases
Target
Achi
evem
ent
rate
(%)
New
pa
tient
s (w
ith
Rela
psed
pa
tient
s Total
New
pa
tient
s (w
ith
Rela
psed
pa
tient
s Total
Kolwezi 921,180 16 25 41 0 0 0 7 0 Kamina 2,179,261 0 0 0 0 0 0 9 0 Kole 1,145,563 54 3 57 0 0 0 4 0 Tshumbe 857,044 0 0 0 0 0 0 2 0 Bukavu 3,840,394 21 6 27 3 1 4 7 57 Uvira 966,036 53 7 60 1 0 1 2 50 Mwene Ditu
2,211,769 24 7 31 3 1 4 8 50
Luiza 1,421,426 6 8 14 0 0 0 4 0 Total 13,542,673 174 56 230 7 2 9 43 21 Seven MDR-TB/RR cases were confirmed among the total number of new TB patients tested (7/174, or 4%), which is higher than the national average of 2.2% in 2015. Of the total number of relapsed TB patients tested, cases of MDR-TB/RR were confirmed in 2 out of 56 instances, which is also significantly lower than the national average of 11% in 2015. Of the nine total MDR-TB/RR cases confirmed, two cases (2/9, or 22%), were first-time relapsed patients. This situation can be explained by poor coordination of the transport of suspected MDR-TB/RR samples to testing sites (resulting from earlier delays in reimbursing transport fees, which demotivated personnel involved in the activity). Also, the guidelines for active collection of samples were not fully applied by health zone personnel and CPLTs during routine visits to CSDTs/CSTs. To improve the detection of MDR-TB/RR cases in PY2Q4, IHPplus will work with other USG partners, such as the Global Fund and Challenge TB project, as well as with the CPLTs, to improve the coordination of transport for suspected MDR-TB/RR samples and by promoting active investigation of individuals coming into contact with confirmed MDR-TB/RR patients, including family members. During PY2Q3, there were no cases of pre-extensive drug resistant tuberculosis (pre-XDR-TB) or extensively drug-resistant TB (XDR-TB) recorded in project-supported health zones. Therapeutic success rate (bacteriologically confirmed pulmonary TB cases) in USG-supported health zones: Out of 3,234 NP TP+ cases evaluated during PY2Q3 (which includes patients that started treatment during the past year), 2,912 patients were reported cured (90%) and 142 patients completed treatment, representing a therapeutic success rate of 94%. This represents a slight decrease from the therapeutic success rate of 96% reported in PY2Q2. The project exceeded the PMP target of 95%, with an achievement rate of 99% (see Table 54).

DRC-IHPplus Year Two Quarter Three Report: January 1, 2017 -March 31, 2017 Page 88 of 126
Tshumbe, Kole, Kamina, and Luiza recorded the highest therapeutic success rates (all greater than 95%). Kolwezi, Bukavu, and Mwene Ditu recorded therapeutic success rates below the target due to irregular biological monitoring of the patients being treated, most likely due to their mobility between these mining areas. Despite these encouraging results, CPLTs are faced with significant challenges related to the strict application of DOTS in health centers. These challenges explain, in part, subpar recovery and therapeutic success rates and the occurrence of strains resistant to first-line treatment. To reverse the trend, IHPplus should continue to facilitate the transportation of medications and laboratory facilities to remote health zones. CPLTs should promote the expansion of community-based DOTS and increase the use of timetables and recovery measures for patients who did not return for monitoring or treatment. Table 54: Therapeutic success rates (new smear positive TB cases) in PY2Q3
Coor
dina
tion
# of TB patients starting
treatment during
the corresponding quarter a year
earlier
# NP TP+ patients declared
cured
# TP patients
that completed treatment
Recovery rate (NP
TP+ patients declared
cured) (%)
Therapeutic success rate
(%)
Target (%)
Achi
evem
ent r
ate
(%
)
Kolwezi 344 294 6 85 87 95 92 Kamina 745 731 7 98 99 95 104 Kole 293 280 4 96 97 95 102 Tshumbe 183 182 0 99 99 95 105 Bukavu 461 366 49 79 90 95 95 Uvira 137 119 10 87 94 95 99 Mwene Ditu
669 571 52 85 93 95 98
Luiza 402 369 14 92 95 95 100 Total 3,234 2,912 142 90 94 95 99 Therapeutic success rate for MDR-TB/RR cases in USG-supported health zones: Of the 12 MDR-TB/RR patients from the second line cohort (PY1Q3 – 2015 and 2016) who were evaluated during PY2Q3, six were reported cured and two were reported to have completed treatment--a 67% therapeutic success rate (Table 55). Compared to the PMP target of 75%, this represents an achievement rate of 89%. Performance drastically increased from the therapeutic success rate of 25% for MDR-TB/RR reported during PY2Q2. Both Bukavu and Mwene Ditu reported results of 100%, which can be explained by the improvement in TB patient follow-up by health providers and CHWs as well as by better data reporting. Kolwezi, with only a 25% therapeutic success rate, brought down the project average for this quarter. Poor and late submission of TB data by the health zones and insufficient follow-up of patients

DRC-IHPplus Year Two Quarter Three Report: January 1, 2017 -March 31, 2017 Page 89 of 126
undergoing treatment are the likely reasons for this under-performance. To improve the therapeutic management of MDR-TB/RR patients, the PNLT should take the following actions:
• Ensure the application of DOTS-plus, including community-based DOTS-plus. This will help to reduce the number of MDR/RR patients who do not return for follow-up treatment;
• Provide targeted advice to patients before, during, and after treatment; • Strengthen quarterly joint supervision visits (IHPplus, CPLT, and health zones) focused on MDR-
TB; • Encourage CSDT managers to organize monthly TB data monitoring meetings in collaboration
with community agents (CAD and CHWs) to ensure MDR patient follow-up. Table 55: Therapeutic success rates (MDR-TB/RR) in PY2Q23 Coordination # of MDR-TB/RR
patients starting treatment during
the corresponding
quarter 1/2 year(s) ago
# MDR-TB/RR
patients declared
cured
# of MDR-TB/RR
patients that completed treatment
MDR-TB/RR therapeutic success rate
(%)
Target (%)
Achievement rate (%)
Kolwezi 4 0 1 25 75 33 Kamina 0 0 0 - 75 -
Kole 0 0 0 - 75 - Tshumbe 0 0 0 - 75 -
Bukavu 3 3 0 100 75 133 Uvira 3 2 0 67 75 89
Mwene Ditu 2 1 1 100 75 133 Luiza 0 0 0 - 75 - Total 12 6 2 67 75 89
Percentage of HIV-positive patients screened for TB in USG-supported health zones: As shown in Table 56, 78% (1,199/1,547) PLHIV who received care from the targeted health zones were screened for TB in PY2Q2. This represents an increase from PY2Q2, when 51% of PLHIV were screened. Compared with the PMP target of 100%, the project’s achievement rate is 78%. Kole, Tshumbe, Luiza, and Kolwezi achieved 100% of their target. Uvira and Mwene Ditu almost achieved their target (with 80% and 89%, respectively). Kolwezi, which received HIV and ARV tests as part of PEPFAR assistance, recorded a significant number PLHIV screened for TB (831). Kole also reported good results for this indicator due to the training provided by the project during PY2Q2 to the HZMT and the health providers on TB/HIV co-infection care and service delivery. Bukavu brought the overall project performance down with an achievement rate of 32%. This reflects poor integration of TB-HIV co-infection activities at the operational level and weak coverage of the HIV program. Only a little more than half of the CSDTs (192 out of 293) in all IHPplus-supported health zones have integrated TB/HIV co-infection. Health facilities that do not have a supply of ARVs often do not test

DRC-IHPplus Year Two Quarter Three Report: January 1, 2017 -March 31, 2017 Page 90 of 126
patients for TB, as all PLHIV that are TB-positive must immediately receive ARVs. To reverse the trend and improve the identification of TB among PLHIV, the project will take the following steps:
• Increase collaboration between the PNLT and PNLS by organizing regular meetings with the TB-HIV provincial task force;
• Improve detection rates by incorporating TB-HIV co-infection activities into existing facilities by training HIV care workers on active and systematic TB detection among PLHIV. This will allow health facilities to reduce TB transmission among PLHIV through improved early management;
• Make the guidelines and tools developed by both programs available in all HIV centers; • Transport specimens of suspected TB among PLHIV from health facilities to the GeneXpert MTB
test sites. Table 56: Percentage of PLHIV screened for TB during PY2Q3 Coordination # PLHIV
receiving care # PLHIV screened for TB
% PLHIV screened for TB
Target (%) Achievement rate (%)
Kolwezi 831 831 100 100 100 Kamina 0 0 - 100 - Kole 23 23 100 100 100 Tshumbe 50 50 100 100 100 Bukavu 478 153 32 100 32 Uvira 70 56 80 100 80 Mwene Ditu 85 76 89 100 89 Luiza 10 10 100 100 100 Total 1,547 1,199 78 100 78 Out of 5,193 new TB patients registered during the quarter, 3,013 (58%) took an HIV test and know their serological status (Table 57); 196 were confirmed HIV positive (6%). Of those who tested positive, 173 (88%) were put on ARVs, which is an improvement compared to the previous quarter (71%). Kole, Bukavu, Uvira, and Luiza recorded the highest percentage compared to other coordinations. Table 57: Percentage of TB patients tested for HIV and placed on ARVs during PY2Q3 Coordination Population Total #
of TB patients
TB patients tested for HIV
TB patients testing HIV-positive
TB/HIV-positive patients receiving ARVs
# % # % # % Kolwezi 92,1180 580 525 91 64 12 51 80 Kamina 2,179,261 1,170 706 60 13 2 12 92 Kole 1,145,563 601 262 44 11 4 11 100 Tshumbe 857,044 304 113 37 1 1 0 0 Bukavu 3,840,394 851 643 76 64 10 64 100 Uvira 966,036 311 161 52 4 3 4 100

DRC-IHPplus Year Two Quarter Three Report: January 1, 2017 -March 31, 2017 Page 91 of 126
Mwene Ditu 2,211,769 1,009 507 50 33 7 25 76 Luiza 1,421,426 367 96 26 6 6 6 100 Total 13,542,673 5,193 3,013 58 196 6 173 88 Percentage of TB cases diagnosed among HIV-positive patients in USG-supported health zones: Of a total of 1,199 PLHIV screened for TB in PY2Q3, 454 (38%) tested positive for TB (see Table 58 below). Compared to the PMP target of 30%, this represents an achievement rate of 126%. Project performance more than doubled compared to PY2Q2, during which 18% of PLHIV tested positive for TB (with 59% achievement rate). However, this percentage varies among project coordinations according to the coverage of the HIV program and collaboration between HIV and TB programs. Kolwezi reported by far the highest number of PLHIV screened and diagnosed with TB, compared to the previous quarter. This is mainly due to the recovery of Kolwezi mining activities–which attracted back more seasonal workers– after a slowdown following the period of political uncertainty related to the national elections. The poor performance in the other coordinations is linked to the fact that while all the CSDTs in the eight coordinations have GeneXpert machines allowing them to perform quick and reliable TB screening, health providers do not systematically screen PLHIV that are suspected to have TB. This is due to the lack of coordination between HIV and TB activities. To improve TB detection among PLHIV in IHPplus-supported health zones, it is vital to intensify support to the PNLT program to expand coverage of TB/HIV activities and to continue providing transport for samples from health centers to GeneXpert sites. Table 58: Percentage of TB cases detected among HIV-positive patients in PY2Q3 Coordination #
PLHIV receiving care
# PLHIV screened for TB
% PLHIV screened for TB
# PLHIV with expected TB diagnosis
# PLHIV diagnosed with TB
% PLHIV diagnosed with TB
Target (%)
Achievement rate (%)
Kolwezi 831 831 100 249 409 49 30 164 Kamina 0 0 - 0 0 - 30 - Kole 23 23 100 7 2 9 30 29 Tshumbe 50 50 100 15 2 4 30 13 Bukavu 478 153 32 143 20 13 30 14 Uvira 70 56 80 21 4 7 30 19 Mwene Ditu 85 76 89 26 16 21 30 63 Luiza 10 10 100 3 1 10 30 33 Total 1,547 1,199 78 464 454 38 30 126 Percentage of HIV-positive patients without TB receiving INH prophylaxis through USG- supported programs: Out of a total of 745 PLHIV who were not TB positive, 599 (80%) were placed on INH prophylaxis during PY2Q3, representing 80% against the 100% PMP target (Table 59). Project performance improved from the 47% of patients reported in PY2Q2. Overall, 20% of TB-negative PLHIV did not receive INH prophylaxis, largely due to inadequate collaboration between the TB and HIV

DRC-IHPplus Year Two Quarter Three Report: January 1, 2017 -March 31, 2017 Page 92 of 126
programs at the operational level. Kolwezi reported by far the highest number of PLHIV without TB receiving INH prophylaxis (422), which is due to the fact that the coordination received HIV and ARV tests as part of PEPFAR assistance. On the other hand, Bukavu brought down the project performance (34% achievement rate) and also reported the biggest decrease compared to PY2Q2 (from an 85% achievement rate). This is due to the lack of availability of INH at the HIV care site level combined with the lack of compliance with the INH procurement process by the health providers at these sites. To improve TB prevention among PLHIV in IHPplus-supported health zones, the project must provide intense technical support to ensure collaboration between the two programs at both the provincial (CPLT and BCP PNLS provincial coordination office) and operational levels. The updated guidelines on INH prophylaxis should also be made available, and community-based organizations targeting TB-HIV co-infection should be supported. Table 59: Percent of PLHIV without TB receiving INH prophylaxis during PY2Q3 Coordination #
PLHIV receiving treatment
# PLHIV screened for TB
# PLHIV testing negative for TB
# PLHIV without TB placed on INH
% PLHIV without TB placed on INH
Target (%)
Achievement rate (%)
Kolwezi 831 831 422 422 100 100 100 Kamina 0 0 0 0 - 100 0 Kole 23 23 21 21 100 100 100 Tshumbe 50 50 48 34 71 100 71 Bukavu 478 153 133 45 34 100 34 Uvira 70 56 52 42 81 100 81 Mwene Ditu 85 76 60 30 50 100 50 Luiza 10 10 9 5 56 100 56 Total 1,547 1,199 745 599 80 100 80 As shown above, TB indicators performance for PY2Q3 have dramatically improved compared to PY2Q2, with one indicator exceeding its target, four indicators almost achieving their targets (with achievement rates ranging between 78% and 99%) and two indicators not achieving their targets. To build on these promising results next quarter, IHPplus will continue to intensify the following strategies:
• Reinforce TB notification rates by emphasizing active detection approaches including investigating TB/MDR-TB index-case contacts through mini-research campaigns led by CHWs during home visits at the community level. People living in the same household with a TB patient will be encouraged to either get tested at their closest CSDT, or have CHW volunteers transport their samples to the CSDT;
• Conduct joint supervisory visits (CPLT, PNLS, and IHPplus) to strengthen health care providers’ capacity to adhere to new guidelines defined in the Integrated Tuberculosis Program for Basic Care (PATI V);
• Engage CBOs in organizing active TB screening campaigns as well as supporting the transport of suspected MDR-TB sputum samples;
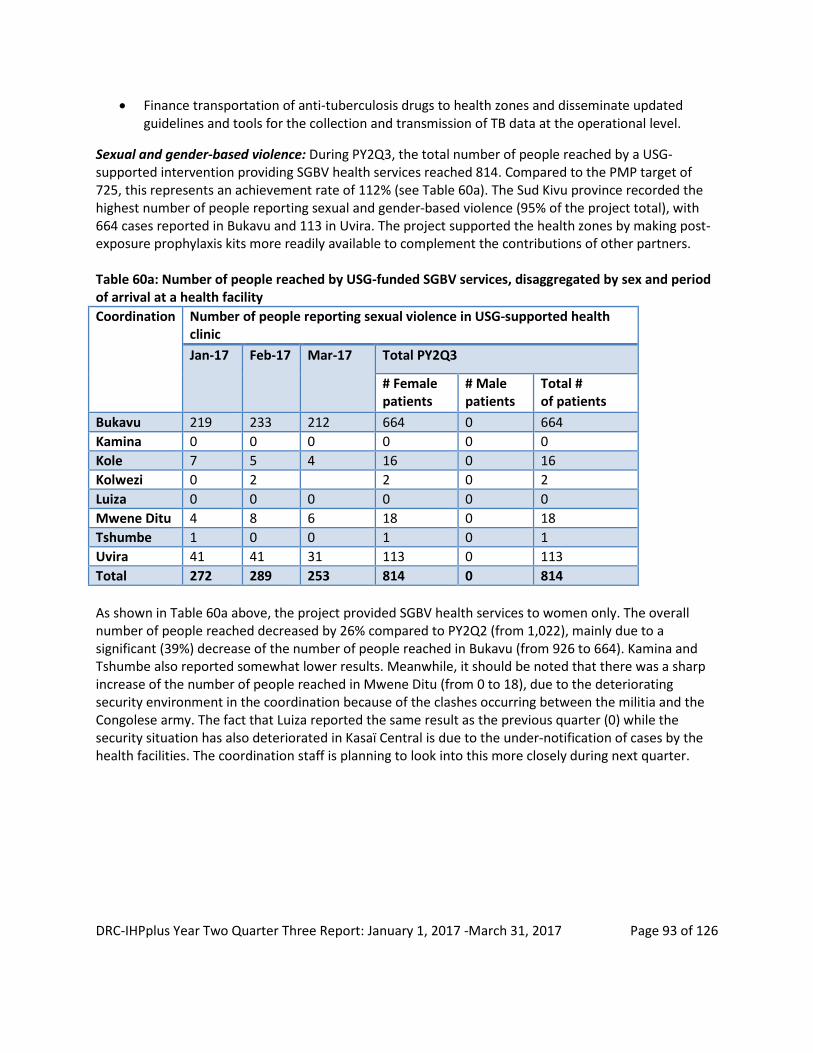
DRC-IHPplus Year Two Quarter Three Report: January 1, 2017 -March 31, 2017 Page 93 of 126
• Finance transportation of anti-tuberculosis drugs to health zones and disseminate updated guidelines and tools for the collection and transmission of TB data at the operational level.
Sexual and gender-based violence: During PY2Q3, the total number of people reached by a USG-supported intervention providing SGBV health services reached 814. Compared to the PMP target of 725, this represents an achievement rate of 112% (see Table 60a). The Sud Kivu province recorded the highest number of people reporting sexual and gender-based violence (95% of the project total), with 664 cases reported in Bukavu and 113 in Uvira. The project supported the health zones by making post-exposure prophylaxis kits more readily available to complement the contributions of other partners. Table 60a: Number of people reached by USG-funded SGBV services, disaggregated by sex and period of arrival at a health facility Coordination Number of people reporting sexual violence in USG-supported health
clinic Jan-17 Feb-17 Mar-17 Total PY2Q3
# Female patients
# Male patients
Total # of patients
Bukavu 219 233 212 664 0 664 Kamina 0 0 0 0 0 0 Kole 7 5 4 16 0 16 Kolwezi 0 2 2 0 2 Luiza 0 0 0 0 0 0 Mwene Ditu 4 8 6 18 0 18 Tshumbe 1 0 0 1 0 1 Uvira 41 41 31 113 0 113 Total 272 289 253 814 0 814 As shown in Table 60a above, the project provided SGBV health services to women only. The overall number of people reached decreased by 26% compared to PY2Q2 (from 1,022), mainly due to a significant (39%) decrease of the number of people reached in Bukavu (from 926 to 664). Kamina and Tshumbe also reported somewhat lower results. Meanwhile, it should be noted that there was a sharp increase of the number of people reached in Mwene Ditu (from 0 to 18), due to the deteriorating security environment in the coordination because of the clashes occurring between the militia and the Congolese army. The fact that Luiza reported the same result as the previous quarter (0) while the security situation has also deteriorated in Kasaï Central is due to the under-notification of cases by the health facilities. The coordination staff is planning to look into this more closely during next quarter.

DRC-IHPplus Year Two Quarter Three Report: January 1, 2017 -March 31, 2017 Page 94 of 126
Table 60b: Number of people reached by USG-funded SGBV services, disaggregated by sex and period of arrival at a health facility (detailed)
Coor
dina
tion
Number of people reporting sexual and gender-based violence in USG-supported clinic within 72 hours
Number of people reporting sexual and gender-based violence in USG-supported clinic between 72 and 120 hours
Number of people reporting sexual and gender-based violence in USG-supported clinic given ARVs
Number of people reporting sexual and gender-based violence in USG-supported clinic given emergency contraceptive
Number of people reporting sexual and gender-based violence in USG-supported clinic given Celixime
Number of people reporting sexual and gender-based violence in USG-supported clinic given Azithromycin
Number of people reporting sexual and gender-based violence in USG-supported clinic who received psycho-social support
Bukavu 254 410 253 365 610 612 500 Kamina 0 0 0 0 0 0 0 Kole 7 9 12 12 0 12 13 Kolwezi 2 0 1 1 0 1 0 Luiza 0 0 0 0 0 0 0 Mwene Ditu
18 0 16 14 16 16 18
Tshumbe 1 0 1 1 0 0 0 Uvira 103 10 103 113 113 113 40 Total 385 429 386 506 739 754 571 As shown in Table 60b, among the 814 survivors of SGBV, 385 (47%) sought care at a facility within 72 hours, and 429 (53%) between 72 and 120 hours, which is better than the previous quarter (where respectively 34% and 66% sought care within 72 hours and between 72 and 120 hours). This improvement could be attributable to the SGBV awareness sessions led by Champion Communities and CHWs with women and young girls. They recommended that survivors seek care within 72 hours to receive the complete SGBV care package, which includes clinical exam, collection of forensic evidence, preventive and curative care, and psychological support. It should also be noted that the majority of the survivors (345) who reported SGBV in USG-supported clinics between 72 and 120 hours were reported at Panzi referral hospital, to which they were referred by other health facilities (second referral). During this quarter, 386 (47%) of survivors received ARVs, 506 (62%) received emergency contraceptives, 739 (91%) received Celixime (an antibiotic used to treat gonorrhea and urinary tract infection), 754 (93%) received Azithromycin (another antibiotic used to treat sexually transmitted infections), and 571 (70%) received psychosocial support. Compared to the previous quarter, the project’s results in every category of SGBV care has drastically improved (compared to respectively 33%,

DRC-IHPplus Year Two Quarter Three Report: January 1, 2017 -March 31, 2017 Page 95 of 126
55%, 52%, and 49%). This is the direct result of IHPplus effort to build health facility staff capacity for the complete SGBV care package. The remaining gap between the number of cases reported in USG-supported health clinics and others (like the ones mentioned earlier) can be explained by the lack of respect for the SGBV care protocol by some health providers and delays on the part of survivors in seeking care at the health facility level in time to receive ARV (within 72 hours) and emergency contraceptives (within 120 hours). Next steps: The project plans to organize SGBV awareness sessions and build health facility staff capacity for the complete SGBV care package (including psycho-social support) in Bukavu and Kamina coordinations. In addition, the project will continue to procure post-exposure prophylaxis kits and management tools for health facilities in Bukavu. Finally, the project is also planning a monitoring visit to Panzi referral hospital to verify the double-reporting of second referral cases.
Fistula: IHPplus supports Kaziba GRH in providing fistula operations (vesico-vaginal and recto-vaginal) as well as uterine and rectal prolapsus repair to women living in the Bukavu coordination area. During PY2Q3, among the 60 female patients who were treated at the hospital after consulting about urinary incontinence, 42 (40%) were diagnosed with urogenital fistula, 12 (20%) were diagnosed with stage 3 bladder prolapsus and stage 3 uterine prolapsus, and six (10%) with recto-vaginal fistulas. Among the urogenital fistula repairs, 29 were new cases and 13 were relapse. No cases of both recto-vaginal and urogenital fistula were reported this quarter. Overall, 41 patients were released from the hospital with their fistula repair fully closed and dry; another seven were released with their fistula repair closed and non-dry. The 12 other cases of prolapsus were reported as cured. Among the 60 fistula patients receiving operations, the primary causes were obstructed labor (48%) and home births (32%). There were no failed operations or deaths reported this quarter (see Table 61 below). Table 61: Fistula repair at Kaziba GRH during PY2Q3 Total PY2Q3 Number of operations 60 Causes Home birth 19
Obstructed labor 29 Stage 3 bladder prolapsus (cystocele) and stage 3 uterine prolapsus
12
Type of operation Urogenital fistula 42 Recto-vaginal fistula 6 Recto and urogenital fistula 0 Stage 3 bladder prolapsus (cystocele) and stage 3 uterine prolapsus
12
Operation outcome Successful 60 Failed 0 Death 0
To improve its support to Kaziba GRH in delivering fistula care and identifying the places of origin of the majority of the patients seeking fistula repairs to ensure better data tracking, the project led a

DRC-IHPplus Year Two Quarter Three Report: January 1, 2017 -March 31, 2017 Page 96 of 126
supervision visit to Kaziba health zone during this quarter. Data analysis completed onsite revealed that the majority of the patients came from neighboring health zones that were not supported by the project such as Fizi, Itombwe, Kimbi Lulenge, and Minembwe, and were the overwhelming majority of babies delivered at home. Kaziba GRH successfully leads sensitization and patient research activities through CHWs and head nurses in neighboring health zones in order to reach those most in need for its services. Next steps:
● Conduct supportive supervision visits on partogram usage in the Kaziba health zone to help service providers quickly decide whether to refer women with obstructed labor to the GRH;
● Organize awareness-raising activities in the health zone and surrounding areas to encourage women to attend the fourth ANC visit and give birth at the health facility rather than at home.
IR 2.2: Minimum quality standards for health facilities (general referral hospitals and health zone health centers) and services developed and adopted FOSACOF approach: At the end of PY2Q3, IHPplus had trained 734 managers (including DPS, IHPplus coordination offices, and health zone managers), 1,549 health care providers, and 3,735 community leaders to implement FOSACOF. Additionally, 839 health facilities--including 799 health centers and 40 GRHs--are now using FOSACOF throughout the 126 health zones supported by IHPplus. From PY2Q2 to PY2Q3, 63 new health centers integrated the FOSACOF approach in the coordinations of Bukavu, Kole, Uvira, and Mwene Ditu. As planned in PY2Q2, IHPplus conducted routine supervision visits to the coordination offices during PY2Q3. Technical assistance provided during these visits helped the offices improve their ability to monitor the quality of care and services they provide the population, by administering FOSACOF evaluations and implementing improvement plans. However, meetings to evaluate implementation and share successes from HZMTs in other coordinations did not occur due to the presence of militants in Luiza, Mwene Ditu, and Tshumbe; and to ongoing insecurity in Bukavu and Uvira. Table 62 below presents the percentage of health centers that completed a FOSACOF evaluation and their results, by coordination. During PY2Q3, the project evaluated 433 of the 799 health centers implementing FOSACOF, or 54%; against a PMP target of 78%, this represents an achievement rate of 70%. This represents a slight improvement from PY2Q2, when 51% of health centers (66% of the PMP target) completed the evaluation. The table also shows that 9% of the health centers evaluated are fully functional (class A); almost half (48%) are moderately functional (class B); 32% are not very functional (class C); and 11% are poorly functional (class D). The coordination with the highest number of fully functioning health centers was Kolwezi. This achievement was due to improvements in the health centers’ infrastructure maintenance, inventory monitoring systems, commodities management, waste management, and community participation. In addition, the Kolwezi DPS organized joint supervision visits to the HZMTs with IHPplus, and HZMTs in Kolwezi supported providers to implement improvement plans. The same degree of support could not be provided to the other coordination offices, due to the problems with insecurity mentioned above.

DRC-IHPplus Year Two Quarter Three Report: January 1, 2017 -March 31, 2017 Page 97 of 126
Table 62: Percentage of health centers that completed an evaluation of the nine FOSACOF minimum standards during PY2Q3 and their results Coordination # of health centers
with FOSACOF implemented
# of health centers implementing FOSACOF that were evaluated during PY2Q3
Evaluation results Class D (0<25%)
Class C (25<50%)
Class B (50<80%)
Class A (≥80%)
Bukavu 201 92 9 31 49 3 Kamina 77 26 0 10 13 3 Kole 59 24 3 2 15 4 Kolwezi 114 77 8 28 31 10 Luiza 93 52 0 3 43 6 Mwene Ditu 103 81 18 47 13 3 Tshumbe 93 23 4 4 8 7 Uvira 59 58 5 14 37 2 Total 799 433 47 139 209 38 Ratio (%) 100 54% 11% 32% 48% 9% Of the 433 health centers implementing FOSACOF, 143 (or 33%) were evaluated during quarterly data audits as part of the RBF program. During PY2Q3, 25 of the 40 GRHs implementing the FOSACOF approach (63%) completed an evaluation, compared to the PMP target of 100% (see Table 63 below). This is a significant improvement from the previous quarter, when only 45% of GRHs completed an evaluation. The coordination with the highest number of fully functioning GRHs was Kolwezi. Similar to its health centers, Kolwezi’s GRHs achieved high quality scores by improving their infrastructure maintenance, inventory monitoring systems, commodities management, waste management, and quality of clinical services. Of the 40 GRH implementing FOSACOF, 12 (or 30%) were assessed during the quarterly RBF audit visits. Table 63: Percentage of GRHs that completed an evaluation of the nine FOSACOF minimum standards during PY2Q3 and their results Coordination # of GRHs with
FOSACOF implemented
# of GRHs implementing FOSACOF that were evaluated during PY2Q3
Evaluation results Class D (0<25%)
Class C (25<50%)
Class B (50<80%)
Class A (≥80%)
Bukavu 10 6 0 0 6 0 Kamina 3 1 0 0 0 1 Kole 4 3 1 1 0 1 Kolwezi 5 5 0 1 1 3 Luiza 5 1 0 0 0 1 Mwene Ditu 5 5 0 1 3 1 Tshumbe 5 2 0 1 0 1 Uvira 3 2 0 0 2 0 Total 40 25 1 4 12 8 Ratio (%) 100 63% 4% 16% 48% 32%

DRC-IHPplus Year Two Quarter Three Report: January 1, 2017 -March 31, 2017 Page 98 of 126
During PY2Q3, health facilities in five health zones of the Kolwezi coordination implementing HIV-focused RBF also began using the FOSACOF approach with support from IHPplus. The five health zones are Dilala, Manika, Lualaba, Fungurume, and Lubudi. Figures 8 and 9 below show the progression in quality of these health centers and GRHs. Figure 8: Evolution in the average FOSACOF score of health centers implementing the HIV-focused RBF approach, by health zone
Figure 8, above, shows that the average FOSACOF score for health centers implementing the HIV-focused RBF approach has steadily increased over the past two quarters, since the approach was first implemented in August 2016. As for health centers without RBF, this achievement was due to improvements in the health centers’ infrastructure maintenance, inventory monitoring systems, commodity management, waste management, and community participation. Despite this global improvement, the health centers in Lubudi reported a decrease in performance from 84% in PY2Q2 to 70% in PY2Q3. This decrease can be explained by the prolonged annual leave of the head nurse at the Kalonga health center, resulting in decreased community participation. Figure 9: Evolution in the FOSACOF score of hospitals implementing the HIV-focused RBF approach
41%
24% 30%
24%
60%
36% 45%
51% 46%
32%
84%
52% 47%
58% 52%
41%
70%
54
0%10%20%30%40%50%60%70%80%90%
100%
Manika healthcenters
Dilala healthcenters
Fungurumehealth centers
Lualaba healthcenters
Lubudi healthcenters
Average IHPplus
Baseline PY2Q2 PY2Q3
39% 43%
66%
27%
47% 45% 43%
73% 70%
46%
64% 59%
53%
85% 83%
52%
70% 69%
0%10%20%30%40%50%60%70%80%90%
100%
Manika GRH Dilala GRH Fungurume GRH Lualaba GRH Lubudi GRH Average IHPplus
Baseline PY2Q2 PY2Q3

DRC-IHPplus Year Two Quarter Three Report: January 1, 2017 -March 31, 2017 Page 99 of 126
Figure 9 above shows that the FOSACOF score for hospitals implementing the HIV-focused RBF approach has also progressively increased from the baseline through PY2Q2 and PY2Q3, from 45% to 69%. In fact, FOSACOF scores have increased across all health zones each quarter. The FOSACOF approach offers an opportunity to promote hygienic practices in the supported health zones, through joint supervision visits by MOH and IHPplus staff to health centers and GRHs. If routine supervision visits do not allow for systematic collection of hospital hygiene information, the information can be collected during FOSACOF evaluations. Table 64 below presents a sample of hygiene data reported from monitoring visits by IHPplus and MOH staff in the 433 health facilities evaluated this quarter. Of these facilities, 148 health centers and 12 GRH were evaluated during quarterly data audits as part of the RBF program. The facilities without RBF were visited to monitor issues reported during past supervision visits. Table 64: Percentage of health facilities with hygiene equipment Equipment monitored for infection prevention practices
Incinerator (applicable for the 25 GRHs visited this quarter only)
Garbage pit in the 433 health facilities visited
Placenta pit in the 433 health facilities visited
Sharps disposal containers in the 433 health facilities visited
Latrines with hand washing stations for patients in the 433 health facilities visited
Latrines with hand washing stations for staff in the 433 health facilities visited
Facilities with hygiene equipment
18 432 430 416 420 430
% of facilities with hygiene equipment
72 99 99 96 97 99
Facilities where staff use hygiene equipment correctly
17 428 425 408 405 418
% of facilities where staff use hygiene equipment correctly
94 99 99 98 96 97
Table 61 shows that the majority of health facilities have sufficient equipment for infection prevention, and that personnel in health facilities correctly use hygiene equipment. Nearly all health facilities have placenta and garbage pits and containers for disposing of sharp items (99%, 99%, and 96%, respectively), and a large number of staff at the facilities know how to use them correctly (99%, 99%, and 98%, respectively). In addition, 97% of facilities had latrines with hand washing stations for patients, and 99% of facilities had latrines with hand washing stations for staff. Since an incinerator is considered expensive equipment requiring significant maintenance costs, only GRHs were evaluated on this

DRC-IHPplus Year Two Quarter Three Report: January 1, 2017 -March 31, 2017 Page 100 of 126
criterion. In this quarter, 18 out of 25 (72%) GRHs visited had an incinerator. On average, 97% of facility staff use all hygiene equipment correctly.
Challenge: Ensure that HZMTs and trained service providers organize evaluation meetings and share successes, despite ongoing insecurity in Luiza, Mwene Ditu, Tshumbe, Bukavu, and Uvira.
Next steps: In PY2Q4, IHPplus will continue to provide technical support to the coordination offices through routine supervision visits, and will collaborate with the HZMTs to plan meetings to evaluate implementation and share successes from HZMTs in other coordinations, to encourage lower-performing teams and provide them with possible methods of improving their performance. Results-based financing (RBF): RBF provides incentives to health service providers to improve performance. Facilities receive payments based on achievement of agreed-upon targets, rather than for inputs or processes, as in traditional financing. Relative to other interventions, RBF has been shown to increase the availability and quality of health services; motivate health personnel; contribute to more efficient allocation of resources; improve data quality (through technical and community verification) and data-based decision-making; and strengthen the links between health facilities and their communities. During PY2Q3, the project implemented the following RBF activities, with full ownership by the MOH:
• Technical verification of data • Community verification of data • Development of guides to implementing RBF activities • Working sessions on the Demarche Qualité Intégré (Integrated Quality Approach, or DQI) with
the Division des Stratégies des Soins de Santé (Division of Health Care Strategies, or DSSS) of the Direction des Soins de Santé Primaire (Primary Health Care Directorate, or DSSP) of the MOH.
1. Technical and administrative data verification in 12 health zones Technical verification included data from quarter 13 of RBF implementation (PY2Q3) for seven traditional (non-HIV-focused) RBF health zones of seven coordination offices, as well as data from quarter 2 (PY2Q3) of implementing the HIV-focused RBF approach for five health zones (Dilala, Manika, Lualaba, Fungurume, and Lubudi) in the Kolwezi coordination. IHPplus performed technical verification of RBF-HIV health zones with support from the RBF Technical Unit of the MOH, the DSSP, and the PNLS provincial coordination unit. Tables 65a and 65b present the RBF-contracted facilities and the HIV-focused RBF-contracted facilities where data were verified, organized by coordination office: Table 65a: Number of RBF traditional-contracted facilities where data were verified during PY2Q3 N° Coordination office Health zone Health center GRH Health zone management office 1 Mwene Ditu Bibanga 17 1 1 2 Uvira Nundu 21 1 1 3 Kamina Kayamba 13 1 1 4 Kolwezi Kanzenze 15 1 1

DRC-IHPplus Year Two Quarter Three Report: January 1, 2017 -March 31, 2017 Page 101 of 126
5 Luiza Luiza 18 1 1 6 Kole Lomela 19 1 1 7 Tshumbe Wembonyama 15 1 1 Total 118 7 7
Table 65b: Number of HIV-focused RBF-contracted structures where data were verified during PY2Q3 N° Coordination office Health zone Health center GRH Health zone management office
1 Kolwezi Dilala 4 1 1 2 Kolwezi Fungurume 6 1 1 3 Kolwezi Lualaba 6 1 1 4 Kolwezi Lubudi 3 1 1 5 Kolwezi Manika 6 1 1 Total 25 5 5
a. Traditional RBF health zones As shown in Table 66 and Figure 10 below, the utilization rate of curative services in health centers increased from Q12 to Q13, from 42% to 49%. The quality of health care services offered by providers in health facilities also slightly improved during this period. The FOSACOF health center score rose from 79% to 80%, and the FOSACOF GRH score increased from 83% to 85%. The increased utilization rate and quality scores can be attributed to monitoring of the implementation of the health facility business plans, and to supervision visits conducted in all health zones during Q13. Table 66: Progress of RBF results over 13 quarters of implementation in seven traditional RBF health zones Baseline Year 1 Year 2 Year 3 Year 4
Q1 Q2 Q3 Q4 Q5 Q6 Q7 Q8 Q9 Q10 Q11 Q12 Q13 Utilization rate of curative services (%)
21 37 32 31 30 39 43 44 43 46 42 46 42 49
FOSACOF health center score (%)
33 31 50 50 54 55 62 70 73 68 73 77 79 80
FOSACOF GRH score (%)
39 57 71 73 75 78 81 85 89 83 87 80 83 85

DRC-IHPplus Year Two Quarter Three Report: January 1, 2017 -March 31, 2017 Page 102 of 126
Figure 10: Progress of RBF results over 13 quarters of implementation in seven traditional RBF health zones
Figure 11 below presents the results of RBF during quarter 13 for each coordination. Health facilities in the coordinations of Kamina, Uvira, and Kolwezi achieved particularly large increases in the utilization rate of curative services. In Kamina and Uvira, the volume of data reported by health facilities that was invalidated later by the RBF verification process was substantially reduced from the previous quarter. In Kolwezi, two factors contributed to the increased utilization rate: the change of seasons led to a higher incidence of malaria and other illnesses, and the Promesse health center reopened after being temporarily shut down in PY2Q2. Figure 11: Results of RBF during quarter 13 by coordination
21
37 32 31 30
39 43 44 43
46 42
46 42
49
33 31
50 50 54 55
62
70 73
68 73
77 79 80
39
57
71 73 75 78
81 85
89 83
87 80
83 85
0
10
20
30
40
50
60
70
80
90
100
Utilizationrate ofcurativeservices (%)
FOSACOFhealth centerscore (%)
FOSACOF GRHscore (%)
46% 56%
51% 50% 48% 49% 40%
49%
79% 72%
84% 82% 81% 80% 79% 80% 83% 84% 85% 84% 85% 86% 85% 85%
0%
20%
40%
60%
80%
100%
Kamina Kole Kolwezi Luiza Mwene Ditu Tshumbe Uvira AverageIHPplus
Utilization rate of curative services (%) FOSACOF health center score (%)
FOSACOF GRH score (%)

DRC-IHPplus Year Two Quarter Three Report: January 1, 2017 -March 31, 2017 Page 103 of 126
b. HIV-focused RBF health zones In August 2016, at the request of PEPFAR, IHPplus began implementing RBF in five health zones (Lualaba, Fungurume, Manika, Dilala, and Lubudi) in the Kolwezi coordination where the project is implementing HIV activities. Figure 12 below shows the percentage of people testing positive for HIV who knew their HIV status during the second quarter of RBF implementation in these health zones. Figure 12: Proportion of people testing positive for HIV who knew their HIV status, PY2Q3 (%)
As shown in Figure 12, the average result for this indicator fell from 49% to 42% between Q1 and Q2. In fact, performance on this indicator decreased in all health zones except for Manika, where the percentage of people testing positive for HIV who knew their HIV status increased dramatically, from 42% to 79%. Manika’s health centers improved their performance through increased awareness-raising activities and supportive supervision of providers, as well as a timely supply of Determine and other commodities. The poor performance of the other four health zones can be attributed to the following factors: (1) health centers in Fungurume and Lualaba experienced a stock-out of Determine when the new supply arrived late; and (2) the head nurses at the Uzima health center in Dilala and the Kalonga health center in Lubudi, who took their annual leave during Q2 , were the only staff trained in their respective health centers to use a Determine test. Figure 13 below shows the proportion of women receiving family planning counseling who knew their HIV status. The target for this indicator varied by health zone.
22%
6%
21%
43% 39%
26%
42% 38% 48%
73%
45% 49%
79%
6%
29%
67%
30%
42%
0%10%20%30%40%50%60%70%80%90%
100%
Manikahealth centers
Lubudihealth centers
Lualabahealth centers
Fungurumehealth centers
Dilalahealth centers
AverageIHPplus
Baseline Q1 Q2 Target

DRC-IHPplus Year Two Quarter Three Report: January 1, 2017 -March 31, 2017 Page 104 of 126
Figure 13: Proportion of women receiving family planning or counseling who knew their HIV status, PY2Q3 (%)
The average result for this indicator increased from 24% to 29% from Q1 (PY2Q2) to Q2 (PY2Q3). The main contributor to this growth was the health zone of Fungurume, where the proportion of women receiving family planning or counseling who knew their HIV status increased from 48% to 60% during this period. Two other health zones also improved their results in Q2: Manika, where the proportion increased from 25% to 31%; and Lualaba, which reported a significant increase from 1% to 21%. Fungurume’s strong performance was mainly due to the integration of family planning activities in 14 health areas in July 2016 and to E2A’s support for these activities. In Manika and Lualaba, joint DPS-IHPplus supportive supervision visits to providers contributed to the improvements. As indicated in Figure 14 below, the average proportion of new HIV+ cases screened for TB decreased from 49% to 36% from Q1 to Q2. In fact, three of the five health zones performed more poorly in Q2 than in Q1. The two exceptions were the Manika and Fungurume health zones, where supportive supervision of providers contributed to improved results. The decreased performance of health centers in Lubudi, Lualaba, and Dilala was the result of difficulties with orienting HIV+ patients toward TB screening. According to the most recent PNLS supervision reports, providers in these health zones did not systematically counsel HIV+ patients about their risk for TB, or systematically orient them toward TB screening services.
2% 1% 0% 6% 4% 3%
25%
13%
1%
48%
33%
24% 31%
6%
21%
60%
26% 29%
0%
10%
20%
30%
40%
50%
60%
70%
80%
90%
100%
Manikahealth centers
Lubudihealth centers
Lualabahealth centers
Fungurumehealth centers
Dilalahealth centers
AverageIHPplus
Baseline Q1 Q2

DRC-IHPplus Year Two Quarter Three Report: January 1, 2017 -March 31, 2017 Page 105 of 126
Figure 14: Proportion of new HIV+ cases screened for TB, PY2Q3 (%)
2. Community-led verification
During PY2Q3, six of the seven health zones (all except Luiza) implementing traditional RBF that performed technical data verification also organized community-led verification by local CBOs. Community-led verification in Luiza could not be completed due to insecurity linked to the presence of militia, which has been described elsewhere in this report. 3. Development of guides to implementing RBF activities The workshop to develop guides to implementing RBF activities, which had been planned since October 2016, took place in Matadi in January 2017. This workshop brought together experts from the MOH’s RBF technical unit, partners (including the World Bank and the SANRU Rural Health Program), and the public service institutions of Moanda and Sud Kivu, which had previously worked with UNICEF and Cordaid. During the workshop, participants developed guides to the following subjects:
• Technical verification • Community-led verification • Creating invoices • Validating data in the RBF web portal
Workshop participants also reviewed the sample compilation sheet to be used for community verification. 4. Working sessions on the DQI The project participated in several working sessions on implementing the DQI with the MOH (DSSS of the DSSP). During the working sessions, the MOH and its partners agreed on the following actions:
3% 2%
17%
29%
15% 13%
45%
17%
45%
62% 55%
49% 56%
6%
27%
63%
26%
36%
0%
10%
20%
30%
40%
50%
60%
70%
80%
90%
100%
Manika healthcenters
Lubudi healthcenters
Lualaba healthcenters
Fungurumehealth centers
Dilala healthcenters
AverageIHPplus
Baseline Q1 Q2 Target

DRC-IHPplus Year Two Quarter Three Report: January 1, 2017 -March 31, 2017 Page 106 of 126
• Disseminate the approach: Conduct a training of trainers on the DQI at the central level. These new trainers will train trainers at the provincial level, who will then build capacity to implement the approach at the operational level. The MOH operations unit and RBF technical unit are still determining the logistics of conducting the series of trainings in order to finalize this activity.
• Reproduce the therapeutic guides: DYNAPRINT has been selected to print the guides. The MOH shared the budget with a breakdown by level, and IHPplus is currently revising the budget before reproducing the guides at the central level.
• Monitor health zone performance: to monitor the performance of health zones implementing the DQI, participants discussed developing a DHIS 2 module that would track this performance. The project’s IT specialist will continue working with the MOH to determine if this solution is technically feasible.
5. Other activities The following additional activities were carried out during PY2Q3:
• IHPplus and MOH staff presented “The involvement of community-based organizations: a major factor in the success of results-based financing projects” at the Institutionalizing Community Health Conference (ICHC) in Johannesburg from March 27-30, 2017.
• A third working session on the DQI took place at the DSSP, following two sessions during PY2Q2. The first session focused on preparing a training of trainers on the DQI; the second on discussing the process of reproducing normative quality-related tools; and the third session addressed final plans to conduct the training of trainers who will train provincial-level staff.
• Since the IHPplus contract with the HIV-focused RBF health centers ends on May 30, 2017, the project will perform technical verification in June before paying out premiums. IHPplus is preparing to hand over activities to the Integrated HIV & AIDS Program awarded to PATH.
Challenges: • It is difficult for the project to pay premiums on time when health facilities enter their data late
in the RBF web portal; • One way for contracting heath facilities to improve their performance is to implement their
business plans. However, this is not done consistently (if at all).
Lessons learned: • Supportive supervision of providers, combined with timely payment of premiums, improves
implementation of quarterly workplan activities and implementation of the RBF program.
Next steps: • Conduct joint IHPplus-MOH supervision visits to the coordination offices to help their staff to
improve the promptness of data entry and improve performance through implementation of business plans
• Support regular data collection in the comparison health zones • Organize technical verification at the level of the health zone central office in Luiza, due to
ongoing insecurity in the health areas

DRC-IHPplus Year Two Quarter Three Report: January 1, 2017 -March 31, 2017 Page 107 of 126
• Recruit verifiers to perform community verification in health zones where the CBOs have been suspended1
IR 2.3: Referral system for primary health care prevention, care, and treatment between community and health facilities (district and provincial levels) institutionalized During PY2Q3, 4% of patients were referred to GRHs after being seen by a CHW or health care provider, against a PMP target of 5%, which represents an 80% achievement rate (as presented in Table 67 below). Compared to PY2Q2, the project performance remained almost unchanged. Table 67: Number and percentage of patients referred to GRHs Coordination # of patients (adults and children)
referred to GRHs by a CHW or health care provider
Total number of patients seen by a CHW or health care provider
% patients referred to GRH
Target (%)
Achievement rate (%)
Jan-17 Feb-17 Mar-17 Total PY2Q3
Bukavu 6,370 5,361 6,126 17,857 453,242 4 5 79 Kamina 1,474 1,350 1,527 4,351 208,763 2 5 42 Kole 3,002 2,978 3,145 9,125 142,210 6 5 128 Kolwezi 435 427 301 1,163 106,585 1 5 22 Luiza 1,342 1,682 1,600 4,624 153,897 3 5 60 Mwene Ditu 3,891 3,733 3,450 11,074 232,913 5 5 95 Tshumbe 2,400 2,201 2,365 6,966 97,864 7 5 142 Uvira 2,239 2,108 2,049 6,396 140,105 5 5 91 Total 21,153 19,840 20,563 61,556 1,535,579 4 5 80 *The figures in this table were rounded to the nearest whole number. Two coordination areas (Kole and Tshumbe, with respectively 128% and 142% achievement rate) met or exceeded the PMP target, while three (Mwene Ditu with 95%, Uvira with 91%, and Bukavu with 79%) almost reached it. Three coordinations (Kamina, Kolwezi, and Luiza) under-performed, with an achievement rate ranging between 22% and 60%. Strong performance in Kole and Tshumbe is due to the regular provision of medicines, commodities, and management tools (including referral forms) by the project, combined with the continuing monitoring of community care sites by head nurses and the high level of CHW motivation, encouraged by fixed-price grants. Additionally, head nurses consistently use health care ordinograms to refer patients on time to seek appropriate care. 1 In Luiza, the project decided to suspend one of the two contracted CBOs (CEPO) after internal audit documented fraudulent practice. This incident was officially reported to both USAID and the Office of the Inspector General.

DRC-IHPplus Year Two Quarter Three Report: January 1, 2017 -March 31, 2017 Page 108 of 126
While some challenges are common across coordinations, others are specific to a location, as described below:
• Bukavu: health providers do not systematically use health care ordinograms to refer patients on time to seek appropriate care
• Luiza: the presence of militia in Dibaya, Lubondaie, and Luiza health zones led to a decline in the security situation and adversely affected the proper functioning of health facilities, as well as discouraged patients to walk long distances to reach the GRH. Another challenge is the lack of use of health service ordinogram by providers, as they have a tendency to treat all patients on site, whether they have the appropriate resources to do so or not.
• Kamina: health providers do not systematically use health service ordinograms or provide preferential pricing for cases referred to the GRH by health center providers or CHWs
• Kolwezi: Eighty percent of Kolwezi coordination territory is urban, and Lualaba DPS has more than 60% of private health facilities integrated into the national health system in Manika, Dilala, and Fungurume health zones. Practitioners working in this area--particularly those working in private health facilities--tend not to respect the referral system and health pyramid, preferring to directly provide some services that are traditionally part of the CPA, such as small surgeries and dystocic deliveries, leading to under-performance on referrals.
Next Steps: During the next quarter, the project will undertake the following corrective actions:
● Ensure procurement of EGM for GRHs; ● Work with HZMTs during supervision visits to health centers and GRHs to provide guidance to
head nurses, CHWs, and nurses working in community care sites on the use of flow charts and meeting planning and coordination;
● Brief head nurses working in health centers on how to properly use the coaching checklist with CHWs that work in community care sites;
● Conduct supervision missions on drug procurement and use in Bukavu, Kolwezi, Kamina, and Luiza;
● Lead follow-up post training missions in Bukavu, Kolwezi, Kamina, and Luiza. During PY2Q3, CHWs referred 23% of patients to health centers. Compared to the PMP target of 15%, the project reached a 155% achievement rate this quarter (see Table 68 on the next page). Compared to the previous quarter, the project reported slightly lower results (down from 26%).
Table 68: Number and percentage of patients referred to health centers Coordination # of patients (adults and children)
referred to health centers by a CHW
Total number of patients seen by a CHW or health care provider
% patients referred to health centers
Target (%)
Achievement rate (%)
Jan-17 Feb-17 Mar-17
Total PY2Q3
Bukavu 177 190 88 455 8,389 5 15 36

DRC-IHPplus Year Two Quarter Three Report: January 1, 2017 -March 31, 2017 Page 109 of 126
Kamina 425 554 886 1,865 12,318 15 15 101 Kole 341 397 635 1,373 12,561 11 15 73 Kolwezi 348 252 233 833 4,297 19 15 129 Luiza 906 1,830 1,341 4,077 8,518 48 15 319 Mwene Ditu 1,739 1,394 2,077 5,210 17,126 30 15 203
Tshumbe 977 431 487 1,895 5,001 38 15 253 Uvira 287 83 124 494 1,561 32 15 211 Total 5,200 5,131 5,871 16,202 69,771 23 15 155 *The figures in this table were rounded to the nearest whole number. During this quarter, six coordination areas (Luiza with 319%, Tshumbe with 253%, Uvira with 211%, Mwene Ditu with 203%, Kolwezi with 129%, and Kamina with 101%) all exceeded or met their PMP targets; two others (Kole with 73%, and Bukavu with 36%) brought down the project’s overall performance for this indicator. Compared to the previous quarter, six coordinations improved their results and achievement rate (Mwene Ditu, Uvira, Tshumbe, Luiza, Kolwezi, and Kamina) while the three remaining reported lower performance (Kole and Bukavu). Bukavu was the coordination which reported the biggest decrease, from 15% patients referred to health centers during PY2Q2 to only 5% during PY2Q3. Bukavu’s sharp decrease in performance can be explained by several factors:
• IHPplus stopped providing support to two health zones (Bunyakiri and Minova) where several community care sites were located;
• Health facilities in this coordination are particularly vulnerable due to the competition from several popular traditional healers and private health facilities that are not integrated in the national health system, that do not follow the national protocol for referral and that offer services at a non-negotiated rate;
• incomplete data reporting from community care sites and CHWs. The coordination areas that met or exceeded their PMP target engaged in supervision visits focused on the referral system provided by the HZMTs to health providers, community care sites, CHWs, and CODESAs. These visits re-invigorated the CODESAs with the participation of the local communities and HZMTs. Health providers—such as head nurses—also led supervision visits to community care sites, CHWs, and CODESAs to reinforce their capacity to refer patients to health centers. As a result of this close follow-up, health providers and CHWs were able to put into practice the feedback and teaching they received. In addition, the project ensured procurement of referral tools and forms for health centers and community care sites. Kole experienced a low level of community involvement, in part because the CHWs were already involved with the organization and implementation of measles immunization campaign. Additionally, Both Kole and Kolwezi experienced incomplete data reporting from the community care sites and CHWs, due to a stock-out of case recording forms at the community care site level. This situation also led to more people seeking care directly at the health center without being referred by a CHW. Finally, the higher number of ACT stock-outs reported during this quarter--especially at the community care site level--in these two coordinations also led to decreased visits from patients to CHWs who preferred to

DRC-IHPplus Year Two Quarter Three Report: January 1, 2017 -March 31, 2017 Page 110 of 126
seek treatment directly at their closest health center (where quinine was available to treat patients, given the absence of ACT). Next Steps: To improve performance in the next quarter, the project plans to implement strategies that were successful in the six other coordination areas:
● Ensure regular drug procurement for health centers, including community care sites; ● Increase the number of supportive supervision visits by health providers, such as head nurses, to
community care sites, CHWs, and CODESAs; ● Increase the procurement of referral tools and forms for health facilities, community care sites,
and CODESAs; ● Lead more community awareness campaigns (and involve community leaders and village chiefs)
to encourage patients to seek care first at their community care site, where they can receive free medicines.
Intermediate Result 3: Knowledge, attitudes, and practices to support health-seeking behaviors increased in target health zones Community participation is one of nine principles of primary health care included in the Plan National de Développement Sanitaire (PNDS or National Health Development Plan). IHPplus uses approaches such as Champion Communities, ETL, and mHealth to encourage exchange of health knowledge, change attitudes harmful to health, and help communities support healthy behaviors and use of health care services. Through these approaches, IHPplus helps maximize health sector-community outreach linkages, foster health advocacy and community mobilization, and facilitate BCC (see Table 69). Table 69: Summary of IR 3 key results for PY2Q3 by Sub-IR Sub-IR Key Indicators Results 3.1 Health sector-community outreach linkages
Youth and vulnerable group NGO participation Active Champion Communities
3.2 Health advocacy and community mobilization
Rehabilitated CODESAs
3.3 BCC Functional CODESAs with communication action plans
mHealth text messaging *Green = achievement rate against the PMP target of 100% and above; Yellow = achievement rate against the PMP target between 75- 99%; Red = achievement rate against the PMP target under 75% IR 3.1: Evidence-based health sector-community outreach linkages—especially for women, youth, and vulnerable populations—established CODESA: CODESAs are health development committees that serve as an intermediary between health professionals, social services, and communities. CODESAs serve individuals, families, and communities through communications campaigns, such as ETL, and through referrals to medical services to improve the health of the communities they serve. IHPplus, as a part of its community engagement approach, provides technical and financial support to CODESAs in the project’s target coordinations.

DRC-IHPplus Year Two Quarter Three Report: January 1, 2017 -March 31, 2017 Page 111 of 126
In PY2Q3 the number of revitalized CODESAs (1,319) increased by 19 since last quarter (see Table 70 below). Compared to the PMP target of 92%, this represents an achievement rate of 102%. Table 70: Number and percent of CODESAs that are revitalized and functional in PY2Q3 Coordination # of
CODESAS identified
# of active CODESAs
% of active CODESAs
Target (%)
Achievement rate (%)
Bukavu 399 399 100 92 109 Kamina 202 190 94 92 102 Kole 129 129 100 92 109 Kolwezi 106 94 89 92 97 Luiza 170 170 100 92 109 Mwene Ditu 171 171 100 92 109 Tshumbe 119 86 72 92 79 Uvira 102 80 78 92 85 Total 1,398 1,319 94 92 102 IR 3.1: Evidence-based health sector-community outreach linkages—especially for women, youth, and vulnerable populations—established Youth associations: During PY2Q3, the number of NGOs and active youth organizations increased to 199 (see Table 71 on the following page). This is an achievement rate of 158% against the PMP target of 126. The increase was largely due to partnerships between civil society, community, and traditional leaders, the health zones, and project staff that worked to develop youth associations in Luiza and Uvira. The project continued to support peer youth education on sexual and reproductive health practices. Table 71: Number of youth organizations conducting awareness-raising activities # of youth
associations identified
# of active associations Percent (%)
Bukavu 28 10 36 Kamina 13 13 100 Kole 38 35 92 Kolwezi 10 7 70 Luiza 49 49 100 Mwene Ditu 55 49 89 Tshumbe 8 8 100 Uvira 38 28 74 Total 239 199 83

DRC-IHPplus Year Two Quarter Three Report: January 1, 2017 -March 31, 2017 Page 112 of 126
The following activities were achieved during PY2Q3: • Kolwezi, Kamina, Luiza, Tshumbe, and Mwene Ditu coordinations: A total of 4,251 adolescents
and youth were sensitized on early marriage, unsafe abortions, rape, and early pregnancy. Challenges:
• Insecurity, especially in Luiza coordination, prevented youth association meetings and activities
• Insufficient communications support for activities and informational sessions • Insufficient number of trainers for communications techniques and lack of access to support
structures and communications materials created by the Programme National des Jeunes et Adolescents (PNSA) but not yet made available to IHPplus
Lessons Learned:
• Greater individual contact with adolescents and youth increases trust and uptake of healthy behavior changes
Next Steps:
• Jointly organize communications technique trainings and use of communications support structures
• Contact the PNSA to request the use of training and informational materials
BCC campaigns (mini-campaigns): Mini-communications campaigns use simple communications techniques and tools to produce positive change in individuals and groups. They generally aim to inform the population about health risks, encourage beneficial habits, and increase the use of services.
During the quarter, 11 mini-campaigns on WASH, pneumonia, gender, TB, family planning, and prenatal consultations were held in five coordinations (see Table 72). Compared to the PMP target of 3, this represents an achievement rate of 367%.
Table 72: Mini-campaigns conducted during PY2Q3
Coordination WASH Pneumonia Gender TB Family planning
Prenatal consultations Total
Kamina 1 0 0 0 1 1 3 Kolwezi 0 0 0 1 1 1 3 Mwene Ditu 2 2 0 0 0 0 4 Kole 0 0 1 0 0 0 1
Total 3 2 1 1 2 2 11
Challenges:
• Lack of effort by unmotivated community leaders in health areas slows down the organization and implementation of mini-campaigns
• Mini-campaign reports are occasionally not sent by coordinations by the deadlines

DRC-IHPplus Year Two Quarter Three Report: January 1, 2017 -March 31, 2017 Page 113 of 126
Next Steps: • Request coordination offices to report on mini-campaigns within established deadlines • In conjunction with the DPS and HZMT, identify strategies for motivating local leaders and
stakeholders IR 3.2 Health advocacy and community mobilization organizations strengthened As previously noted, 1,319 IHPplus-supported communities have CODESAs that are actively involved in managing priority health activities. Compared to the previous quarter, an additional 13 CODESAs in the Luiza and Kolwezi coordinations developed workplans. The total number of CODESAs with workplans for PY2Q3 is 1,251 (see Table 73 below), or an achievement rate of 97% against the PMP target of 1,284. Table 73: Number of CODESAs with communication action plans during PY2Q3
Coordinations Number of active CODESAs Number of active CODESAs with an action plan
Bukavu 399 380 Kamina 190 179 Kole 129 129 Kolwezi 94 91 Luiza 170 169 Mwene Ditu 171 149 Tshumbe 86 74 Uvira 80 80 Total 1,319 1,251 (97%)
The following CODESA activities were completed in the below health zones with IHPplus assistance during PY2Q3:
• Bukavu and Uvira: CODESAs contributed to an infant (newborn to five-years) vaccination campaign against polio that sensitized and mobilized local populations to have children immunized
• Katana and Miti Murhesa: With IHPplus assistance, CODESAs signed partnership agreements with Oxfam through the Agence d’Achat des Performances (AAP) for the implementation of WASH activities through the Champion Community in Mwana
• Mwana: With IHPplus assistance, four CODESAs (Mulambi, Kashadu, Kakwende, and Luciga health areas) signed partnership agreements with GIZ (Deutsche Gesellschaft für Internationale Zusammenarbeit) through the BCZS to implement community sensitization activities related to healthy behaviors through their associated Champion Communities
• Luiza: CODESAs participated in youth vaccination campaigns for measles (February 14-19). The campaign took place in all IHPplus supported health areas in Luiza.

DRC-IHPplus Year Two Quarter Three Report: January 1, 2017 -March 31, 2017 Page 114 of 126
Challenges: • Security issues, especially in Bukavu and Luiza, impede CODESA field activities and work • Low participation by women in CODESA activities • Refusal of HZMTs to provide support in conflict areas
Lessons Learned:
• Overrepresentation of males in CODESAs and sexism make it difficult for female members to participate in discussions and the development of activities. Male members do not accord an equivalent amount of floor time to their female colleagues, and often dismiss their views. This is especially true in rural areas.
Next Steps:
• Use CBOs to encourage women to actively participate in community activities • Work with CODESAs through Champion Men to address gender equity issues as they pertain to
participation in development IR 3.3: Behavior change campaigns involving opinion leaders and cultural influences (people and technologies) launched Behavior Change Communication Champion Communities: The Champion Community method empowers communities and emphasizes community participation, leadership and self-reliance. The method encourages communities to plan and implement their own development and improve community health. During PY2Q3, IHPplus provided continued assistance to accelerate positive behavior changes through the Champion Communities. The number of functional Champion Communities increased from 57 to 59 compared to the previous quarter. Of the 59 functional Champion Communities, 37 were implemented by IHPplus, while 22 are autonomous community-driven Champion Communities that are mentored by other IHPplus Champion Communities. IHPplus achieved a 103% achievement rate against the PMP target of 36 project implemented Champion Communities. All 37 functional IHPplus Champion Communities have workplans (see Table 74 below). Table 74: Champion Community creation as of the end of PY2Q3 Coordination # of
functional IHPplus Champion Communities
# of functional autonomous Champion Communities
# of autonomous Champion Communities in process
# of non-functional Champion Communities IHPplus
Total # of functional Champion Communities
Health zones with Champion Communities
Bukavu 4 0 0 1 (Walungu) 4 Katana (2) Walungu (2) Mwana (1)
Kamina 3 5 6 0 8 Kabongo (5) Malemba (5) Songa (4)

DRC-IHPplus Year Two Quarter Three Report: January 1, 2017 -March 31, 2017 Page 115 of 126
Kole/Lodja 3 4 0 0 7 Lodja (3) Kole (2) Lomela (2)
Kolwezi 8 2 1 1 (Lualaba) 10 Dilala (3) Fungurume (3) Kanzenze (2) Manika (2) Lualaba (1)
Luiza 8 6 0 0 14 Bilomba (2) Luiza (2) Dibaya (4) Ndekesha (2) Luambo (2) Kalomba (2)
Mwene Ditu 4 3 2 0 7 Bibanga (2) Kalenda (2) Kanda Kanda (2) Wikong (1) Mwene Ditu (2)
Tshumbe 2 1 1 1 (Dikungu) 3 Djalo (1) Dikungu (1) Minga (1) Tshumbe (1) Katako Kombe (1)
Uvira 5 1 0 0 6 Nundu(1) Ruzizi (3) Uvira(2)
Total 37 22 10 3 59 33 health zones
During PY2Q3, the number of Champion Communities with NGO status increased to 29. Two additional Champion Communities started in Mwene Ditu since last quarter. Of the 29 NGO Champion Communities, 11 received grants this quarter to implement MNCH sensitization activities ($9,000 USD in grants will fund activities over a 9-month period). Each recipient Champion Community will receive its grant funds in two payments. The following activities were achieved during PY2Q3:
• Uvira coordination: Mwangaza NGO Champion Community referred 1,087 children for routine vaccines and 218 women to prenatal consultations, and sensitized 11,802 people on WASH. The Champion Community also financed school for 15 Burundian youth refugees (about 450,000 CDF) and ensured these children were up-to-date with their immunizations. In Ruzizi health zone, the Mulangaliro NGO Champion Community had four women members speak about the importance of exclusive breastfeeding on Sange community radio. In Nundu health zone, the Amkeni NGO Champion Community received funding ($1,047 USD) from the World Bank to verify health data in neighboring Fizi health zone.

DRC-IHPplus Year Two Quarter Three Report: January 1, 2017 -March 31, 2017 Page 116 of 126
• Bukavu coordination: The NGO Champion Communities Rhusimane and Tuwe Mfano continued their partnership with GIZ to provide youth with skills and training in a youth center in Kashadu and Luciga. The two Champion Communities also continued to work with IMA’s USHINDI project to implement sensitization activities and advocate against SGBV in Katana. Rhuismane NGO Champion Community also sensitized 21 local leaders on hygiene, HIV and AIDS, and family planning in a mining center. IHPplus provided the Tuwe Mfano, Kenguka, Bololoke, and Rhusimane NGO Champion Communities with a smartphone each to submit data on their BCC activities.
• Luiza coordination: Koleshayi NGO Champion Community provided technical support to the Ndekesha health zone to organize a mini-campaign targeting the 127 couples of the Réseau pour la protection des droits de l’enfant et de la femme (REFEDEF), a network advocating women’s and children’s rights. The mini-campaign emphasized the importance of quickly consulting medical services at signs of a fever, especially for pregnant women and infants (newborn to five years old). The mini-campaign referred 664 pregnant women, 1,240 children between the ages of zero and five, and 485 other community members to health facilities. The Koleshayi Champion Community continued its development and sustainability efforts by acquiring two pigs and a cow for breeding, providing 150 families with malnourished children with 75 chickens and 75 rabbits for breeding, and helping 640 households build latrines. In Kafuba health area, the autonomous Dilubuluka Champion Community contributed $800 USD worth of materials for the creation of 14 wells. Dilubuluka autonomous Champion Community also built the capacity of WASH committees in 32 villages to manage their water wells.
• Kole coordination: Lonya Lo Lonya NGO Champion Community coordinated a WASH sensitization week in villages of the Lomela health zone. The campaign included 450 household visits. Of the 450 households visited, 110 built latrines (with lids), and 80 set up hand washing stations. More activities are planned in the villages with a target of visiting 80% of households.
Challenges:
• Insecurity in Bukavu and Luiza coordinations impeded Champion Community activities • The distance between health areas covered by Champion Communities slows down activity
implementation Lessons Learned:
• Active Champion Community participation in health clinic meetings on progress monitoring pushes Champion Communities to implement workplan activities
Next Steps:
• Set up knowledge-sharing meetings for the Champion Communities • Implement training programs to strengthen NGO Champion Community work cohesion • Examine the possibility of merging Walungu Champion Community with one of the functioning
Bukavu Champion Communities • Create a workplan to revive the Dikungu and Lualaba non-functioning Champion Communities

DRC-IHPplus Year Two Quarter Three Report: January 1, 2017 -March 31, 2017 Page 117 of 126
mHealth: SMS messaging allows IHPplus to communicate targeted health messages in large numbers. IHPplus target populations have expressed their desire for more SMS messaging. The combination of these two factors makes SMS messaging a powerful means of communications for IHPplus. During PY2Q3, IHPplus sent 202,952 SMS messages. This is an achievement rate of 161% against the PMP target of 126,000. SMS messages were disseminated at the coordination, health zone, and NGO Champion Community level. Table 75 provides the number of SMS messages sent by health topic and coordination. Table 75: Number of SMS messages sent by health topic and coordination during PY2Q3
Health topic Bukavu Kamina Kole Kolwezi Luiza Mwene Ditu Tshumbe Uvira Total
Malaria 4,507 - 2,914 8,915 6,650 1,004 1,098 850 25,938
Family planning
8,065 - 2,102 - 6500 2,448 606 - 19,721
WASH 9,936 9,581 1,788 - 4,450 3,887 526 9,992 40,160 MNCH - 7734 1,718 11,150 708 514 - 21,824 TB - - 1,036 5,373 4,450 1004 386 - 12,249
Exclusive breastfeeding
6,993 - - - 4,750 - - - 11,743
IYCF 2,799 - - - - - - - 2,799 ANC1 - 13,274 - 1,741 5,050 - - - 20,065 ANC4 - - 2,484 - 5,650 - 690 - 8,824 Vaccination - - 5,064 - 8800 6,494 1,452 15163 36,973
Diarrhea - - - - - 1,217 - - 1,217 Pneumonia - - - - - 1,439 - - 1,439
Total 32,300 30,589 17,106 27,179 46,300 18,201 5,272 26,005 202,952 The messages are shared and utilized in different community forums as described below.
• Kamina and Mwene Ditu coordination: The project supported 452 group discussion sessions based on the SMS messaging information for men, women, and youth. The discussions emphasized WASH and the importance of maintaining wells and water infrastructure. Contributions of $400 USD were made in Luputa health zone by community members for the maintenance of wells. The same strategy is being implemented in Kamiji health zone.
• Luiza and Kolwezi coordination: The participation of 21 traditional chiefs and their advisors in community debates on the importance of prenatal consultations and family planning based on SMS messaging stimulated greater community interest, especially among males. Of the 249 invited males, 137 participated in the discussions. Those participating stated their understanding of the importance of the information discussed, and 46 were favorable to their wives choosing a contraceptive method.

DRC-IHPplus Year Two Quarter Three Report: January 1, 2017 -March 31, 2017 Page 118 of 126
Challenges: • Airtel network issues impeded SMS messaging
Lessons Learned:
• Health SMS messages serve as references for health information for communities • Several Champion Communities have started SMS messaging using their income generation
funds or with outside funding Next Steps:
• Provide community organizations with a collection of the key educational SMS messages • Document successes achieved with SMS health information by following up with recipients and
inquiring about behavior changes Champion Men initiative: IHPplus continues to implement the Champion Men approach, a subgroup of the Champion Community initiative, to change men’s perceptions on the roles of women in their families and communities. The initiative strives to achieve gender equality, reduce SGBV, and increase balanced decision making within the family in regards to children’s education, health care, and finances. Champion Men are taught to resolve issues within the family through discussion. Champion Men are expected to have a positive influence on the behaviors of the men in their community. The following behaviors and values are targeted during Champion Men activities:
• Participation of women in management of family finances • Gender neutral school attendance • Joint family planning • Gender equality • Equitable division of household tasks (food preparation, baby rearing, cleaning, etc.)
The following results were obtained through the Champion Men initiative:
• Luiza coordination: In the Kuikodishila and Tuikonkany Champion Communities (Luambo health zone), 178 members of the local Champion Men initiatives contributed to the training of 443 youth on adolescent and youth sexual and reproductive health; helped 676 households build latrines; accompanied 641 pregnant women to prenatal care consultations; and provided assistance to families that resulted in the vaccination of 308 children against yellow fever.
• Bukavu coordination: In Katana, the Champion Men initiative continued to expand, with 58 new Champion Men (10 in Mugeri, 25 in Kabushwa, 15 in Kabamba, and 8 in Nuru).
Challenges:
• Some men continue to believe that women are inferior to men Lessons Learned:
• The Champion Men initiative increases male participation in household tasks and changes behavior with regard to negative cultural norms.

DRC-IHPplus Year Two Quarter Three Report: January 1, 2017 -March 31, 2017 Page 119 of 126
Next Steps: • Integrate traditional leaders in the implementation process of the Champion Men initiative • Implement the Champion Men initiative in Walungu and Mwana
COMPONENT 2: HEALTH SYSTEMS STRENGTHENING Table 76: Summary of key IR 4 results for PY2Q3 Sub-IR Key Indicators Results*
4.1 Provincial health sector policies aligned with national policy
Health zones with annual operational plans (AOPs) based on national policy
Health zone management teams with appropriate management system tools
*Green = achievement rate against the PMP target of 100% and above; Yellow = achievement rate against the PMP target between 75- 99%; Red = achievement rate against the PMP target under 75%. Intermediate Result 4: Health sector leadership and governance in target provinces improved IR 4.1: Provincial and national level health sector policies aligned Annual Operational Plans: As shown in Table 74 below, all health zones located in Kolwezi, Kole, and Tshumbe validated their respective AOPs for 2017. In Bukavu, 14 health zones out of 22 (64%) validated their AOP, and in Mwene Ditu, six out of nine health zones (64%) validated their AOP. Overall, 44 health zones out of 78 (56%) supported by the project on this activity were able to validate their AOP during this quarter. Compared to the PMP target of 100%, this represents a 56% achievement rate. None of the health zones in three coordinations (Luiza, Kamina, and Uvira) was able to organize their respective board meeting to validate their AOP. In Luiza, the security situation described elsewhere in this report restricted the population’s movement. In Kamina and Uvira, the HZMTs had a competing priority as the MOH organized a mass measles vaccination campaign during this quarter. Table 77: Number and percentage of AOP drafts developed and validated by province and field offices Health zones with AOP
validated during PY2Q3 Total number of health zones in the coordination
Percentage (%)
Province Coordination Jan-17
Feb-17
Mar-17
Total
Kasaï Occidental
Luiza 0 0 0 0 9 0
Kasaï Oriental and Lomami
Mwene Ditu 0 0 6 6 9 67
Sankuru
Kole 0 0 8 8 8 100
Tshumbe 0 0 8 8 8 100

DRC-IHPplus Year Two Quarter Three Report: January 1, 2017 -March 31, 2017 Page 120 of 126
Haut Lomami
Kamina 0 0 0 0 9 0
Lualaba Kolwezi 0 0 8 8 8 100
Sud Kivu
Bukavu 0 0 14 14 22 64
Uvira 0 0 0 0 5 0
Next steps: The three remaining health zones in Mwene Ditu (Luputa, Kamiji, and Wikong) have already planned to organize their board meetings by mid-May. The remaining eight health zones in Bukavu, all five health zones in Uvira, and nine health zones in Kamina have also scheduled their board meeting by mid-May. The situation in Luiza is still uncertain, and the project is closely monitoring the security situation. IR 4.2: Evidence-based tools for strategic planning and management decision-making adopted During PY2Q3, IHPplus continued to provide financial support to the MOH to conduct regular monitoring meetings at the health facility level. Additionally, IHPplus provided financial support to conduct monthly reviews of health zone data. Apart from continued support to conducting these monitoring meetings, IHPplus successfully conducted three other monitoring and evaluation activities, specifically: (1) provided technical support to integrating the DHIS2 system of the MoH into the SNIS; (2) provided technical support to evaluate health data quality from the health coordination areas of Kole, Tshumbe, and Bukavu to help improve management of the project; and (3) developed the evaluation protocol and tools to evaluate the project’s two qualitative WASH indicators. Support to the MoH’s DHIS2 system to improve the quality of data and reinforce the SNIS: The SNIS remains the principal source for information concerning performance management of IHPplus. The quality of the roll-out of project activities is directly linked to the quality of data generated by and through this information system. For this reason, the M&E unit of IHPplus undertook an evaluation of the M&E capacity of the project in February 2017. With the Direction du Système National d’Information Sanitaire (Directorate of the national health information system, or DSNIS), IHPplus traveled to Lualaba DPS to identify roadblocks that impede the effective use of the MoH’s DHIS2 program. The IHPplus M&E team also verified the availability of existing data to help ensure better management of project performance, as well as to build its decision-making capacity. Following the recommendations made during this mission, IHPplus M&E staff and the DSNIS agreed upon the following action items:
• Equip health zones covered by IHPplus with IT equipment as well as a consistent internet connection to ensure ongoing use of the MoH DHIS2 system.
• Develop a complementary module within the MOH’sDHIS2 system that allows for the collection of data related to project indicators that are not currently captured in the SNIS.
• Create interoperability between the project’s and the MOH’s DHIS2 systems. Each of the agreed upon action items are currently underway, and will be completed in future reporting periods. The project ordered 99 laptops to be distributed among project-supported health zones and DPS that did not already have them. The IHPplus team provided technical support to successfully create a complementary module for the MoH’s DHIS2 system that incorporates all project-specific data and formulas to properly calculate project indicators that are not currently captured by the SNIS. In

DRC-IHPplus Year Two Quarter Three Report: January 1, 2017 -March 31, 2017 Page 121 of 126
collaboration with a technical contractor, BAO Systems, IHPplus worked on the interoperability of the MoH and IHPplus DHIS2. Start-up of the interoperability is ongoing. IHPplus’ technical support to health zones will improve their capacity to collect and enter high-quality data into the MoH’s DHI2 system. The IHPplus M&E team will continue to focus on data analysis, reinforcing capacity to make evidence-based decisions, and improving the quality of project activity implementation. Data quality evaluation and revision of Performance Indicator Reference and Tracking Sheets (PIRTS): During the reporting period, the IHPplus M&E team reviewed all 83 project PMP indicators, including definitions, data collection sources, calculation methods, and frequency of data collection. This task will be completed through RDQA missions already planned in the field that will allow the project to identify the gaps in data collection and reporting related to PMP indicators. The project will use these revised and updated PIRTS to identify and discuss “challenging” indicators with USAID and other stakeholders to achieve a common understanding of all indicators as well as a standardized reporting system for the project. The implementation of the DHIS2 integration and the revision of the PIRTS already enabled the M&E team to successfully identify and correct gaps in terms of definition and calculation methods of certain indicators, notably CYP, the estimated protection provided by family planning services during a one-year period. The conversion factors of two family planning methods used by the project--oral progesterone pill packets (Microlut) and LAM—have been updated: for Microlut, the review updated the conversion factor from 3.5 to 0.067. For LAM, the conversion factor changed from 2 to .25. Quality evaluation of reported data: During the reporting period, IHPplus supported project partners to conduct RDQA in 12 health areas and four health zone central offices in the Bukavu coordination area. Specifically, RDQAs were conducted in the health zones of Nyagezi, Kaziba, Mwana, and Kaniola. IHPplus also conducted RDQAs in 16 health areas and six health zone central offices in the health coordination areas of Kole and Tshumbe. Specifically, RDQAs were conducted in the health zones of Lodja, Ototo, Omendjadi, Vangakete, Lomela, Wembonyama, Dikungu, and Tshumbe. Research and evaluation: IHPplus successfully developed the protocol and inquiry tools to evaluate the project’s two qualitative WASH indicators. Specifically, the protocol will evaluate the quality and use of water supply points and latrines within the coordination health areas of Luiza and Mwene Ditu. The evaluation will be conducted once the security situation in the affected health zones improves.
Starting in PY2Q2, USAID/DRC requested that DRC-IHPplus indicate which activities contribute to achieving USAID/DRC’s strategic objectives and intermediate results using the USAID/DRC Country Development Cooperation Strategy results framework and report on the progress of selected indicators contained in the USAID/DRC Country Development Cooperation Strategy PMP (see Appendices 8 and 9, respectively). IR 4.3: Community involvement in health policy and service delivery institutionalized During PY2Q3, 1,319 CODESAs were actively involved in managing priority health activities. In addition, 95% of these active CODESAs have integrated communications plans to address health problems through locally-proposed solutions. Through communications techniques and activities that encourage

DRC-IHPplus Year Two Quarter Three Report: January 1, 2017 -March 31, 2017 Page 122 of 126
community participation, CODESA members have contributed to the adoption of positive healthy behaviors by increasing prevention and community-based promotion activities and using health services to improve community health. Moreover, CODESAs helped mobilize the community for the development of drinking water sources in Luiza and Mwene Ditu. The project built the capacity of 199 youth organizations to continue to play an essential role in promoting healthy practices and behaviors. In Kolwezi, Kamina, Luiza, Tshumbe, and Mwene Ditu coordinations, a total of 4,251 adolescents and youth were sensitized on early marriage, unsafe abortions, rape, and early pregnancy. Challenges:
• Insecurity, especially in the Luiza coordination, prevented youth association meetings and activities;
• Insufficient communications support for activities and informational sessions; • Insufficient number of trainers for communications techniques and lack of access to support
structures and communications materials created by PNSA but not yet made available to IHPplus.
Lessons Learned:
• Greater individual contact with adolescents and youth increases trust and uptake of healthy behavior changes
Next Steps: • Jointly organize training on communications techniques and the use of communications
support structures; • Contact the PNSA to request the use of training and informational materials.
PROJECT MANAGEMENT Success stories: The project produced eight success stories, meeting its quarterly target of eight. These stories are found in the last section of the report. The topics covered are HIV (two), MNCH (two), BCC (one), nutrition (one), WASH (one), and TB (one). During the next quarter, the project will develop more success stories on RBF, LDP, access to care, malaria, and SGBV to ensure fair representation of each health topic across the project. Cost share: As indicated in Modification 22, dated December 2, 2016, the ceiling of IHPplus increased to $53,933,157. Therefore, the total cost share requirement for IHPplus increased to $1,617,994.71. To date, the project has booked $1,072,205.92. This amount combines $23,860 booked through Brother's Brother Foundation during PY1Q3, $1,038,181.92 booked through the UNICEF-funded Health for Poorest Populations project on October 14, 2016, and $10,164 booked through Vitamin Angels on May 2, 2017. Finally, the project is finalizing shipping arrangements for its cost share opportunity with Project C.U.R.E., a U.S.-based gift-in-kind donation agency, which is planning on donating six 40-foot containers of medical equipment and supplies to GRHs in Bukavu, for an estimated value of $375,000 per container and a total value of $2,250,000, which should enable the project to exceed its cost share requirement.

DRC-IHPplus Year Two Quarter Three Report: January 1, 2017 -March 31, 2017 Page 123 of 126
Status of pharmaceutical procurement order #1: The first order has been delivered to all final destinations. At the time that this report was written, the last shipment of cloxacillin was on its way to its final destination. In regard to the previously reported damages that occurred during the delivery of the goods to their final destinations in Lodja and Mbuji Mayi, we are working with ASRAMES for the replacement of the goods, which should be covered by insurance.
Status of pharmaceutical procurement order #2: The second order of pharmaceuticals was placed with Missionpharma in December 2015. All shipments from countries of origin to Goma, DRC, have been managed and delivered by Bollore, Missionpharma’s freight forwarder, and distributed to final destinations by ASRAMES. At the time that this report was written, the last palette of three items that was missing in the last delivery of narcotics is on its way to the final destination. FAMILY PLANNING AND HIV AND AIDS STATUTORY REQUIREMENTS To ensure that USAID’s regulations concerning family planning and HIV and AIDS were followed, IHPplus led the following activities during PY2Q3: Family planning: On January 23, 2017, the U.S. President reinstated the Mexico City policy, also known as the “global gag rule,” which bans U.S. federal funding for any international health organizations or NGOs around the world that counsel women on family planning options that include access to safe abortion. To remain compliant with the most recent family planning statutory requirements, the project staff took part in the French Global Gag Rule webinar organized by MSH on March 23, 2017. Additionally, the project also ensured that 125 staff from IHPplus and the MOH retook the most updated version of the USAID online class on USG family planning regulations. Moreover, IHPplus staff verified during joint supervision visits to health facilities and through RBF verification activities that providers at service delivery points provided systematic counseling before offering family planning methods. Clients could readily access information about each method and freely decide which method to adopt. During a visit led on March 2017 in Lualaba province, the project and DPS staff found out that Mwangeji GRH family planning department was charging patients for donated contraceptive implants. In response to this violation, the joint team held a staff meeting with the entire family planning department to remind them about the necessity of compliance with both the national policy on family planning and the Tiahrt amendment which require the delivery of contraceptive commodities free of charge to every patient. Moreover, the project also distributed more Tiahrt posters to the hospital and made sure they were displayed where both clients and providers could see them. The project distributed a wide selection of contraceptives to IHPplus-supported family planning service delivery sites (CycleBeads, masculine and feminine condoms, Depo-Provera, Intrauterine device copper T Pre-loaded TCU 380A, Implanon, Microlut pill, Microgynon pill, and Sayana Press). During counseling visits, providers were able to present to clients a large selection of contraceptives and explain their methodology and benefits. Therefore, patients were able to freely decide which method to adopt.
HIV and AIDS: During PY2Q3, the project trained 60 health providers from HIV care sites located in Manika and Dilala health zones and two management staff from Kolwezi PNLS provincial office on

DRC-IHPplus Year Two Quarter Three Report: January 1, 2017 -March 31, 2017 Page 124 of 126
USAID’s regulations concerning family planning and HIV and AIDS. The project insisted on the necessity of respecting Tiahrt and HIV regulations and offering family planning services for free in all HIV care sites that receive USAID-funded family planning commodities. Providers at IHPplus-supported HIV and AIDS care sites continued to observe and enforce infection-control regulations by taking universal personal precautions (washing hands and wearing masks and gloves), observing administrative precautions (properly ventilating workplaces, spacing out medical visits for TB patients and people living with HIV and AIDS), and undertaking environmental precautions (properly managing biomedical waste, specifically by sorting waste and using incinerators). Additionally, the staff provided counseling sessions before and after testing patients for HIV and before putting them on ARVs, if their results came back positive. Moreover, condoms distributed at IHPplus HIV care sites were accompanied by accurate and specific medical information, including public health benefits of condom utilization and failure rate. Finally, the only health providers that delivered services to HIV patients were the ones that were properly trained on HIV care. Next steps:
● Continue to monitor adherence to the USG family planning and HIV and AIDS regulations during supervision visits;
● Ensure that all IHPplus field staff members that still have not taken the online course on HIV and AIDS Legal and Policy Requirements do so during PY2Q4.
ENVIRONMENTAL MONITORING AND MITIGATION PLAN During PY2Q2, the MOH and IHPplus conducted joint FOSACOF evaluation visits in 458 health facilities (433 health centers and 25 GRH) in 78 health zones. During these missions, supervision teams assessed the ability of these facilities to properly dispose of biohazard and biomedical waste and monitored health staff individual hygiene practices to ensure their compliance with MOH policies and standards. According to these FOSACOF evaluations, the majority of health facilities have sufficient equipment for infection prevention, and personnel in health facilities correctly use hygiene equipment. A high percentage of health facilities have placenta and garbage pits, and containers for disposing sharp items, and a large number of staff at the facilities know how to use them correctly. The project only evaluated the presence and use of incinerators at GRHs, as incinerators are more expensive equipment requiring significant maintenance costs, and are therefore predominately located in these facilities. In PY2Q3, 17 out of 25 (72%) GRHs had an incinerator. The GRHs that did not have one used other techniques to manage their biomedical waste, including burning sharp disposal containers and other medical waste in protected garbage pits for burning. In general the existing medical waste means are properly used in 98% of health facilities visited. On average, 97% of facility staff uses hygiene equipment correctly. During this quarter, communities in Ndekesha, Luambo, Kanda Kanda, and Luputa health zones constructed 7,863 household latrines. As a result of IHPplus technical support through CLTS, 74,294 people had first- time access to an improved sanitation facility. The project provided access to improved drinking water supply to 130,601 people, by renovating 136 water sources. The training the project conducted in previous quarters for WASH focal points of the HZMTs, WASH committees, and local

DRC-IHPplus Year Two Quarter Three Report: January 1, 2017 -March 31, 2017 Page 125 of 126
masons empower them to renovate and manage water sources, including water quality testing and promoting hygiene and sanitation practices. Mitigating risks requires a high level of ownership, not only by health staff but also local political and administrative authorities who officially own the rural infrastructure. Their leadership is crucial for mobilizing communities to protect and maintain water wells, latrines, and hand washing stations. During PY2Q3, IHPplus continued supporting the HZMTs to implement the following actions:
● Through Champion Communities and CODESAs, assisted health facilities to mobilize local resources to increase availability of hygiene hardware and improve recommended hygiene practices;
● Verified that all water wells were protected against pollution caused by soil erosion and rainfall. Protecting the catchment perimeter of the spring and planting grass in the protection area are mandatory;
● Placed fences made with local materials around the spring catchment area to protect water quality from animals and vandals;
● Continued to evaluate health facilities and sensitize head nurses during the HZMT monthly supervision visits on the importance of compliance with recommended biohazard waste management and individual and facility hygiene practices during the monthly monitoring meetings and field visits;
● Encouraged communities to improve physical access to rehabilitated springs. Most springs are currently situated in deep valleys, and access paths are rough and difficult to navigate.
CHALLENGES ENCOUNTERED The main challenges that the project experienced during PY2QQ3 included the following: Supply Chain Management System: The main challenge is the surplus of some under-used commodities in the CDRs, which are at risk of expiring (see Appendix 6 of the report). The project is taking action to distribute and use these commodities until the entire stock is removed from the CDRs. The other challenge is the need to obtain reimbursement for commodities that were damaged during transport, which is still in progress. Data Quality: Despite successive investments in improving data quality, it remains a challenge that the project continues to address through both isolated and ongoing strategies and actions. These challenges are particularly related to the capacity of health facility providers to enter data in the SNIS form correctly, the frequency and quality of data monitoring meetings, the timely and complete integration of reported data into the DHIS 2, and the availability of data at the project coordination office level. Security: During this quarter, as indicated elsewhere in the report, armed groups continued to be active in Sud Kivu, Kasaï Central, and Lomami, where militia disrupted health service delivery, especially in the health zones of Yangala, Lubondaie, Luambo, Luiza, and Mwene Ditu. In Katanga, IHPplus was not able to complete field visits or complete other project deliverables during the quarter due to the security situation. Based on the contingency plan developed in December 2016, non-native staff working in the

DRC-IHPplus Year Two Quarter Three Report: January 1, 2017 -March 31, 2017 Page 126 of 126
region were relocated to their initial place of recruitment for safety precautions. Around 14 Katanga office staff and their families were relocated to other IHPplus coordination offices where they are working on provisional assignments from a distance. IHPplus continues to work closely with the health zones and health authorities in the affected health zones to make sure that basic support is provided to health facilities, including the timely delivery of essential medicines and commodities to maintain the cold chain for vaccines, as well as ongoing grants to health zone management teams and DPS. To increase safety and address security challenges, MSH’s security officer in the affected zones and the office director monitor the security situation daily. IHPplus implemented recommendations from the MSH security officer to further improve the organization’s security system. In addition, IHPplus receives almost daily updates on security-related events from the International NGO Safety Organization (INSO) DRC, particularly in Nord and Sud Kivu, as well as specific safety recommendations for our staff and properties. IHPplus participated in the technical working group comprised of emergency and development NGOs to implement coordinated support for the Kasais. During this quarter, IHPplus participated in four important meetings on this topic organized by partners including USAID. WAY FORWARD: PLANNED ACTIVITIES FOR NEXT QUARTER Please refer to Appendix 10: Way Forward: DRC-IHPplus PY2Q4 planned activities. LIST OF APPENDICES Appendix 1: DRC-IHPplus Performance Monitoring Plan, PY2Q3 Appendix 2: DRC-IHPplus International Travel (STTA Plan)* Appendix 3: DRC-IHPplus Organizational Chart Appendix 4: Delivery Tracker for Missionpharma Order 2 for IHPplus (TO #902), Mars 2017 (Ref # CD208-1HP151130) Appendix 5: Malaria commodity situation at the end of March 2017 Appendix 6: Follow-up assignment report on recommendations to CDR and warehouses February 2017 Appendix 7: Final Report on the Electronic Drug Dispensing Tool Training in Lubumbashi, February 2017 Appendix 8: IHPplus PY2Q3 report on CDCS Results Framework - Activity Crosswalk Appendix 9: USAID-DRC Country Development Cooperation Strategy Progress Monitoring Plan PY2Q3 Appendix 10: DRC-IHPplus PY2Q4 planned activities* *Appendices 2, 4, and 10 are attached separately as Excel files.
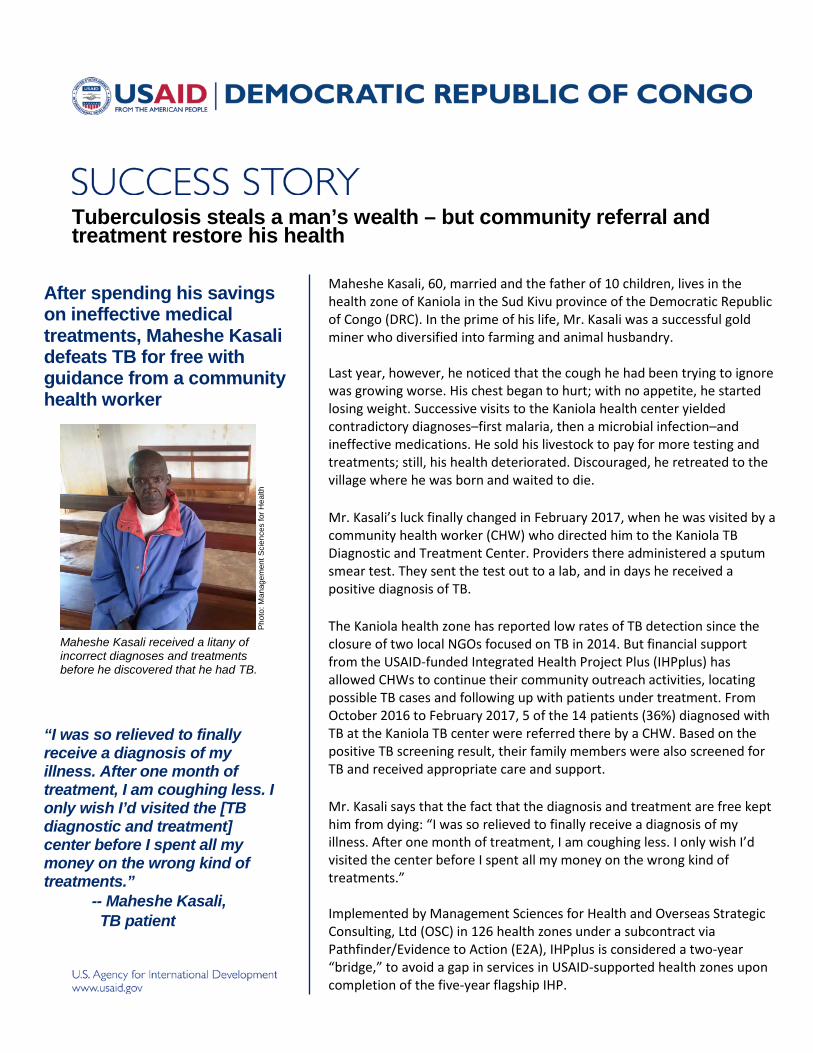
Tuberculosis steals a man’s wealth – but community referral and treatment restore his health
After spending his savings on ineffective medical treatments, Maheshe Kasali defeats TB for free with guidance from a community health worker
“I was so relieved to finally receive a diagnosis of my illness. After one month of treatment, I am coughing less. I only wish I’d visited the [TB diagnostic and treatment] center before I spent all my money on the wrong kind of treatments.”
-- Maheshe Kasali, TB patient
Phot
o: M
anag
emen
t Sci
ence
s fo
r Hea
lth
Maheshe Kasali received a litany of incorrect diagnoses and treatments before he discovered that he had TB.
Maheshe Kasali, 60, married and the father of 10 children, lives in the health zone of Kaniola in the Sud Kivu province of the Democratic Republic of Congo (DRC). In the prime of his life, Mr. Kasali was a successful gold miner who diversified into farming and animal husbandry. Last year, however, he noticed that the cough he had been trying to ignore was growing worse. His chest began to hurt; with no appetite, he started losing weight. Successive visits to the Kaniola health center yielded contradictory diagnoses–first malaria, then a microbial infection–and ineffective medications. He sold his livestock to pay for more testing and treatments; still, his health deteriorated. Discouraged, he retreated to the village where he was born and waited to die. Mr. Kasali’s luck finally changed in February 2017, when he was visited by a community health worker (CHW) who directed him to the Kaniola TB Diagnostic and Treatment Center. Providers there administered a sputum smear test. They sent the test out to a lab, and in days he received a positive diagnosis of TB. The Kaniola health zone has reported low rates of TB detection since the closure of two local NGOs focused on TB in 2014. But financial support from the USAID-funded Integrated Health Project Plus (IHPplus) has allowed CHWs to continue their community outreach activities, locating possible TB cases and following up with patients under treatment. From October 2016 to February 2017, 5 of the 14 patients (36%) diagnosed with TB at the Kaniola TB center were referred there by a CHW. Based on the positive TB screening result, their family members were also screened for TB and received appropriate care and support. Mr. Kasali says that the fact that the diagnosis and treatment are free kept him from dying: “I was so relieved to finally receive a diagnosis of my illness. After one month of treatment, I am coughing less. I only wish I’d visited the center before I spent all my money on the wrong kind of treatments.” Implemented by Management Sciences for Health and Overseas Strategic Consulting, Ltd (OSC) in 126 health zones under a subcontract via Pathfinder/Evidence to Action (E2A), IHPplus is considered a two-year “bridge,” to avoid a gap in services in USAID-supported health zones upon completion of the five-year flagship IHP.

The “water glass test” challenges traditional attitudes to improve hygiene practices
When a sanitation and hygiene survey in the Walungu health zone showed poor results, one local leader jumped into action.
Maman Namunene speaks passionately to her community members about the importance of hygienic behaviors.
“Who here will drink this water? Who here thinks this is good to drink?”
--Maman Al Degonde Namunene, local leader and WASH educator
Phot
o: M
anag
emen
t Sci
ence
s fo
r Hea
lth
Maman Al Degonde Namunene holds up a glass of dirty water and tells her fellow village residents that it comes from a stream that runs near a clearing in the woods where people go to defecate. “Who here is prepared to drink this water?” she says. “Who thinks this is good to drink?” Several dozen villagers, who have assembled under the shade of a tree to listen to the talk, titter nervously. The leader of a group of villages in the Walungu health zone, Maman Namunene has been using her influence in the community to promote clean water and good hygiene practices since the beginning of 2017. In December 2016, a water, sanitation and hygiene (WASH) survey of Walungu, conducted by staff from the USAID-funded Integrated Health Project Plus (IHPplus) in conjunction with local authorities, revealed just how acute the need is for better hygiene. In the 12 villages surveyed, 70 households lacked hygienic latrines; 352 latrines were in poor condition; 216 households practiced open-air defecation; and 423 households lacked hand washing posts. In response, IHPplus financed a mini-campaign to promote positive WASH practices – featuring dramatic demonstrations like Maman Namunene’s water glass test and a walk of shame through the village to point out places where people have defecated in the open air. The results collected during the mini-campaign have been positive: from mid-January to mid-March 2017, 157 new latrines were built in Walungu; 99 latrines were rehabilitated; 65 hand washing stations were installed; and 216 households stopped defecating in the open air. As for Maman Namunene, she is just grateful for the opportunity to make a difference. “I know how important good sanitation is--and I’m delighted to be working with IHPplus to organize and run these vital campaigns.” Implemented by Management Sciences for Health and Overseas Strategic Consulting, Ltd (OSC) in 126 health zones under a subcontract via Pathfinder/Evidence to Action (E2A), IHPplus is considered a two-year “bridge,” to avoid a gap in services in USAID-supported health zones upon completion of the five-year flagship IHP.

On World Pneumonia Day, mini-campaigns encourage parents to seek screening and treatment for their children
This hard-to-detect disease is the second leading cause of childhood death in the country – but parents are growing wise to its tricks
Families with young children wait to receive screening for pneumonia during the IHPplus mini-campaign.
“After the mini-campaign, I decided to take [my children] to the health center, where I learned that all three were suffering from pneumonia. They’ve received the necessary drugs and are recovering well.”
-- Mother of three children treated for pneumonia, Mwene Ditu
Phot
o: M
anag
emen
t Sci
ence
s fo
r Hea
lth
More children under five die in the Democratic Republic of Congo (DRC) each year than in any country except India and Nigeria. Of these deaths, 18 percent are attributable to one disease: pneumonia. Lowering that rate is a priority for the DRC Ministry of Health, which is working in conjunction with the USAID-funded Integrated Health Project Plus (IHPplus) to develop new ways of combatting this ancient killer. One challenge is that pneumonia is a hard disease to detect. Many of the infected shrug it off as a persistent cough. In fact, it is estimated that only 42 percent of people living with pneumonia in the DRC receive treatment--making its spread hard to contain. In November 2016, IHPplus organized an awareness-raising mini-campaign around World Pneumonia Day in the health zones of Mwene Ditu and Kanda Kanda. The project briefed 36 community health workers (CHWs) on active pneumonia case-finding, transmitted information about pneumonia symptoms via SMS and local radio broadcasts, and selected five health centers to offer free treatment of pneumonia cases.
The campaign was a major success: In three days, 430 new cases of pneumonia were screened and treated in Mwene Ditu and 1,042 new cases were screened and treated in Kanda Kanda. “My three children kept coughing, and I thought it was a common cold,” said one area mother. “But after the mini-campaign, I decided to take them to the health center, where I learned that all three were suffering from pneumonia. They’ve received the necessary drugs and are recovering well.” Implemented by Management Sciences for Health and Overseas Strategic Consulting, Ltd (OSC) in 126 health zones under a subcontract via Pathfinder/Evidence to Action (E2A), IHPplus is considered a two-year “bridge,” to avoid a gap in services in USAID-supported health zones upon completion of the five-year flagship IHP.

On the border, a life is saved from eclampsia
Lessons from an IHPplus training are put to the test when a mother goes into convulsions during delivery
Nahomie and her healthy new baby.
“My only regret is that we didn’t receive this training earlier: I think about the lives we might have saved.”
-- Rita Lapeta, head nurse
Phot
o: M
anag
emen
t Sci
ence
s fo
r Hea
lth
Married to a patrol agent and the mother of three, Nahomie Mbuyi lives in Kalamba Mbuji, one of 20 health areas that comprise the health zone of Luambo in the Democratic Republic of Congo (DRC), bordering Angola. During her third pregnancy, Nahomie was found to have high blood pressure. Referred to the hospital for further review, she received a diagnosis of pre-eclampsia and strict guidelines for her delivery.
Eclampsia is a disorder that can induce seizures, coma, or cardiac arrest. Sadly, those symptoms are traditionally viewed as indications that the woman is a witch or an adulterer, or that she has in some other way offended the ancestors. Instead of receiving care, a woman might be ostracized and, in the most dire of circumstances, die during childbirth.
In 2015 alone, four women in Kalamba Mbuji died as a result of eclampsia. In July 2016, the USAID-funded Integrated Health Project Plus (IHPplus) strengthened the capacities of health providers in Luambo, including doctors, nurses and midwives, in the management of obstetric emergencies and newborn care. The project provided medical supplies, including blood pressure monitors, for trained providers to use with their new skills.
In October 2016, Nahomie went into labor early. She made it to the local health center, but the nearest hospital was 25 kilometers away--a three- hour-drive on dirt roads that flood in the rainy season. When Nahomie went into convulsions, the head of the maternity ward called for help: the health center’s entire medical team arrived, administered magnesium sulfate to reduce her convulsions, and helped her give birth safely.
Afterwards, the team was exultant. Rita Lapeta, the head nurse, said that she only regretted the many pregnant women they might have helped earlier, had they received the proper training. "We are delighted to have been strengthened in the capacity to deal with obstetric emergencies by IHPplus, and we are proud to have saved the life of this young lady."
As of April 2017, no mother in Kalamba Mbuji has died giving birth since the IHPplus training took place.
Implemented by Management Sciences for Health and Overseas Strategic Consulting, Ltd (OSC) in 126 health zones under a subcontract via Pathfinder/Evidence to Action (E2A), IHPplus is considered a two-year “bridge,” to avoid a gap in services in USAID-supported health zones upon completion of the five-year flagship IHP.

Nutrition education sessions reach hundreds of mothers in Lualaba: “Today, I know what my children need to thrive”
In Lualaba, fighting malnutrition means going door-to-door with information about proper food preparation techniques
A community health worker in Lualaba leads a cooking demonstration with nutritious local foods.
“I am thankful my child is doing well now. I couldn’t understand why she wasn’t growing properly. Today, thanks to the IYCF session, I know what my children need to thrive.”
-- Fanie Mumba, support group member
Phot
o: M
anag
emen
t Sci
ence
s fo
r Hea
lth
The major childhood killers in the Democratic Republic of Congo (DRC) are even more dangerous because of one underlying condition--perilously high rates of malnutrition. Even when it does not kill, malnutrition leaves children physically and intellectually stunted. According to the DHS 2013-14, a dismal 43 percent of children under five in the DRC suffer from malnutrition; some 23 percent suffer from severe malnutrition. In response, the DRC Ministry of Health, working with the USAID-funded Integrated Health Project Plus (IHPplus), has set up a variety of nutrition education programs aimed at local communities. For instance, in the health zone of Lualaba, IHPplus has established 15 Infant and Young Child Feeding (IYCF) support groups. Led by a community health worker (CHW) with support from the head nurse of a local health center, the support groups meet regularly to share successful breastfeeding experiences and give cooking demonstrations using nutritious local ingredients. Noticing that promotion of IYCF practices remained low in Lualaba, IHPplus supported additional trainings for health zone management teams, health center providers, and CHWs on the IYCF program. The project also scheduled regular monitoring visits to IYCF support groups, trained CHWs on conducting door-to-door outreach, and organized large-scale IYCF sessions and cooking demonstrations jointly led by a CHW and a head nurse. As a result, 426 mothers of children under five were educated on IYCF practices – including Fanie Mumba, a 23-year-old mother of three children. When her youngest child was nearly two, she weighed just over fifteen pounds and was often listless. Six months later, thanks to a diet of corn flour, soybeans, caterpillar meal, and protein-rich soup, she weighs nearly 30 pounds. “I am thankful my child is doing well now,” said Ms. Mumba. “I couldn’t understand why she wasn’t growing properly. Today, thanks to the IYCF session, I know what my children need to thrive.” Implemented by Management Sciences for Health and Overseas Strategic Consulting, Ltd (OSC) in 126 health zones under a subcontract via Pathfinder/Evidence to Action (E2A), IHPplus is considered a two-year “bridge,” to avoid a gap in services in USAID-supported health zones upon completion of the five-year flagship IHP.

A young woman finds a way forward with HIV
“Test and Treat” offers a promising new way to reach millions of previously untreated people living with the virus
Marceline Kashali is a provider at the Luilu health center where Ms. Kijana received HIV treatment.
“I thank everybody--God, my mother, my nurse, the support-group organizers--who helped me recover from this terrible disease and start a new life.”
-- Elizabeth Kijana, HIV and AIDS support group member
Phot
o: M
anag
emen
t Sci
ence
s fo
r Hea
lth
In 2013, the government of the Democratic Republic of Congo (DRC) approved a new WHO initiative called “Test and Treat.” This initiative aims to reduce the number of people who are not on treatment for their HIV/AIDS infection by eliminating several criteria for initiating anti-retroviral treatment (ART). In October 2016, the initiative took effect at HIV care sites in the province of Lualaba through the USAID-financed, PEPFAR-supported Integrated Health Project Plus (IHPplus). Elizabeth Kijana, an unmarried 25-year-old, was first admitted to the hospital in February 2015. For three months she was treated for jaundice and prolonged fever. She recovered briefly, but when she fell ill again, her parents brought in traditional healers and prophets. Finally, in December 2016, Ms. Kijana arrived at the Luilu HIV health center of the Dilala health zone. At that point, she weighed barely 70 pounds. The criteria for initiating ART used to entail collecting a patient’s CD4 count to measure the progression of the disease. The process takes two to four months – time that Ms. Kijana did not have – and the Luilu health center was not equipped with a PIMA CD4 analyzer. But with “Test and Treat,” when Ms. Kijana’s HIV test came back positive, the nurse could put her on ART immediately. Because she was by then too weak to care for herself, the nurse counseled her mother on how to administer her treatment. The Luilu HIV health center where Ms. Kijana received treatment is only the second in Dilala to offer the “Test and Treat” approach, and it is clearly filling a need: From January to March 2017, the center treated 1,369 HIV-positive patients, most of whom had not been receiving care previously. In February 2017, two months after her admission, Ms. Kijana had gained back 35 pounds and was enjoying life again. She has joined a local HIV and AIDS support group and admits to taking pleasure in confounding her neighbors: “They were sure that I was dying,” she says. “I thank everybody--God, my mother, my nurse, the support-group organizers--who helped me recover from this terrible disease and start a new life.” Implemented by Management Sciences for Health and Overseas Strategic Consulting, Ltd (OSC) in 126 health zones under a subcontract via Pathfinder/Evidence to Action (E2A), IHPplus is considered a two-year “bridge,” to avoid a gap in services in USAID-supported health zones upon completion of the five-year flagship IHP.

A door-to-door campaign to promote antenatal care becomes a life-line for a teenager in need
A 16 year-old-girl is raped, and more bad news follows – but antenatal care from IHPplus provides hope for her future
A nurse in Manika prepares to conduct a group education session on antenatal care, as part of the awareness campaign that helped Brigitte access the care she needed.
“I hope that the program continues to expand, because without it women like me have the terrible prospect of passing [HIV] onto our children.”
-- Brigitte, 16-year-old survivor of sexual assault
Phot
o: M
anag
emen
t Sci
ence
s fo
r Hea
lth
When her rapist was arrested, 16-year old Brigitte* thought the worst was behind her. But when she discovered she was pregnant, she had little choice but to drop out of school and work the family fields in her village, in the Manika health zone of the Democratic Republic of Congo (DRC). She certainly could not afford antenatal care (ANC) visits. The DRC government has made maternal health one of its highest priorities, and partners like the USAID-funded Integrated Health Project Plus (IHPplus) have collaborated with the Ministry of Health to make that vision a reality. Knowing that ANC visits are out-of-reach for many women, IHPplus subsidizes free and reduced-cost care for expectant mothers. And knowing that many women are not aware of the benefits of ANC visits, IHPplus has organized a variety of campaigns to educate mothers-to-be. During one such door-to-door campaign, Brigitte learned about the prospect of receiving free ANC visits. When she visited the local referral health center, she barely had time to register the good news--that her pregnancy, then in its 17th week, was progressing normally--before she got another devastating report: she was HIV-positive. Fortunately, providers at the health site referred Brigitte for HIV treatment and appropriate care and support, including psychosocial support and education on appropriate infant feeding to avoid mother-to-child transmission. Today she has a healthy young baby who was born HIV-free, thanks to the anti-retroviral treatment (ART) she continues to receive. Brigitte now knows that sexual assault survivors have options to avoid pregnancy and HIV infection, including the emergency contraceptive pill and post-exposure prophylaxis with ART. She has enrolled in a training program to learn how to promote ANC visits and looks forward to educating other women about receiving the care they need. “I hope that the program continues to expand, because without it women like me have the terrible prospect of passing the disease onto our children.” Implemented by Management Sciences for Health and Overseas Strategic Consulting, Ltd (OSC) in 126 health zones under a subcontract via Pathfinder/Evidence to Action (E2A), IHPplus is considered a two-year “bridge,” to avoid a gap in services in USAID-supported health zones upon completion of the five-year flagship IHP.
*A pseudonym for privacy

“Youth, take responsibility for your actions” – reversing youth delin-quency in Dibaya, DRC
Tuibake NGO Champion Community is fighting juvenile delinquency in Dibaya health zone with education through listening and youth clubs. Tuibake’s efforts help troubled youth reintegrate into society.
Tuibake youth club members work on the club’s tilapia fish farm, instead of making trouble in their communities.
“We were lost and rebelling against our parents. We had no notion of how to develop ourselves until Tuibake Champion Community helped us. We have stopped misbehaving and improved our image in Dibaya.”
-- Ndaye Lukuni and Grâce Mputu, members of the Tuibake youth club
Phot
o: O
vers
eas
Stra
tegi
c C
onsu
lting
, Ltd
. Youth delinquency, drinking, and drug abuse are common problems across the world, and often coincide with school absenteeism, unemployment, estranged family relations, and legal issues. But in the Dibaya health zone of the Democratic Republic of Congo, these behaviors have found a formidable foe: the Tuibake NGO Champion Community. Established by the USAID-funded Integrated Health Project Plus (IHPplus), the Champion Community implements behavior change communication and mobilization activities to achieve self-determined goals based on their community’s needs. In January 2017, the Champion Community teamed up with local authorities and 20 young church leaders and initiated a rehabilitation program for ten groups of adolescents and youth with criminal records or histories of irresponsible behavior. Program activities featured the slogan “Youth, Take Responsibility for Your Actions.” To understand the causes of delinquency, the NGO Champion Community first held focus group discussions with 34 youth known to lead groups of young troublemakers. Reasons cited in the discussions were: desire for money, lack of leisure activities, family issues and abuse, misguidance, unemployment, and imitation of poor role models from TV and the news. The Champion Community then conducted 32 education through listening sessions with the identified groups of disaffected youth, explaining the harmful effects of alcohol and drug use. The NGO Champion Community held follow-up sessions to share further advice, and three marches were organized to celebrate the participants’ reintegration into the community. The Champion Community also created a Tuibake youth club to prevent further detrimental behavior and to rehabilitate and reintegrate juvenile offenders. Using their own funding, they set up a soccer field, a theater group, and a fish farm that provides income generation. Since its founding, the Tuibake youth club has reintegrated 106 youth into society: all are either enrolled in school or have joined the workforce. In March 2017, a second club, named Dikolelayi, was created with 78 members. Implemented by Management Sciences for Health and Overseas Strategic Consulting, Ltd (OSC) in 126 health zones under a subcontract via Pathfinder/Evidence to Action (E2A), IHPplus is considered a two-year “bridge” to avoid a gap in services in USAID-supported health zones upon completion of the five-year flagship IHP.

Jan‐17 Feb‐17 Mar‐17Total Result
PY2Q3Target
Achievement rate (%)
1 FP: Couple years of protection (CYP) in USG‐supported programs
The estimated protection provided by family planning (FP) services during a one‐year period, based upon the volume of all contraceptives provided to clients at health facilities and at the community level in the IHPplus target areas during that period
21,179 22,569 23,423 50,915 159,538 32
1.1 FP: Couple years of protection (CYP) after exclusion of LAM and self‐observation methods (NFP) for FP in USG‐supported programs
The estimated protection provided by FP services during a one‐year period, based upon the volume of all contraceptives provided to clients (exclusion of LAM and NFP) in the IHPplus target areas during that period
17,363 18,991 18,903 55,256 76,201 73
2 FP: Number of counseling visits for FP/ reproductive health (RH) as result of USG support
Number of FP/RH counseling visits at USG‐supported service delivery points
53,550 56,707 57,295 167,552 212,504 79
Numerator: Number of USG‐assisted service delivery sites providing FP information and/or services
2154 2154 2154 2,154 2,027
Denominator: Number of service delivery sites planned to receive USG assistance over life of project
2,027 2,027 2,027 2,027 2,027
Numerator/Denominator (in percentage) 106% 106% 106% 106% 100% 106
4 FP: Number of USG‐assisted community health workers (CHWs) providing FP information, referrals, and/or services during the year
USG‐assisted: Funded with congressionally‐earmarked FP funds for any kind of assistanceCHW: Any type of CHW as defined by country programFP Information: FP information and/or FP counseling provided by a CHW FP referrals: FP referrals to public or private sector services provided by a CHW FP Services: FP contraceptive services provided by a
1,116 1,116 1,116 1,116 1,760 63
5 FP: Number of USG‐assisted health facilities experiencing stock‐outs of Depo‐Provera during the quarter
Maximum number of USG‐supported health facilities experiencing stock‐outs of Depo‐Provera during the quarter
187 182 111 187 80 43
Appendix 1 ‐ PY2Q3 PMP
USAID/DRC/IHPplus Objective: Improve the enabling environment for, and increase the availability and use of, high‐impact health services, products, and practices for FP, MNCH, nutrition, malaria, TB, HIV and AIDS, and WASH in target health zones
TOTAL_IHPplus
Indicator Definition
FP: Percent of USG‐assisted service delivery sites providing FP counseling and/or services
3

Numerator: # of pregnant women attending at least one ANC visit with a skilled provider from USG‐supported health facilities
47,927 49,066 49,448 146,441 138,130
Denominator: # of expected pregnancies in USG‐supported health facilities (4% of total population)
46,043 46,043 46,043 138,130 138,130
Numerator/ Denominator (in percentage) 104% 107% 107% 106% 100% 106
Numerator: # of pregnant women attending at least four ANC visits with a skilled provider from USG‐
27,097 27,918 27,718 82,733 96,691
Denominator: # of expected pregnancies in USG‐assisted health facilities (4% of total population)
46,043 46,043 46,043 138,130 138,130
Numerator/Denominator (in percentage) 59% 61% 60% 60% 70% 86
Numerator: # of deliveries with a SBA in USG‐supported facilities
40,136 40,779 40,927 121,842 125,698
Denominator: # of expected deliveries in USG‐supported health facilities (4% of total population)
46,043 46,043 46,043 138,130 138,130
Numerator/Denominator (in percentage) 87% 89% 89% 88% 91% 979 MNCH: Number of women giving birth who received uterotonic in the third stage of labor (OR immediately after birth) through USG‐supported programs
Number of women who gave birth who received a uterotonic in the third stage of labor (OR immediately after birth) supplied by a USG‐assisted program or with assistance of a health worker trained by a USG‐assisted program. Uterotonic could include oxytocin or misoprostol. Uterotonics represent one element of active management of third stage of labor (AMTSL).
38,392 39,032 38,942 116,366 116,014 100
10 MNCH: Number of postpartum/newborn visits within three days of birth in USG‐supported programs
Number of postpartum/newborn visits within three days of birth (Includes all skilled attendant deliveries plus facility or outreach postpartum/ newborn visits for mothers/newborns who did not have SBA delivery) (4% of total population)
39,606 40,006 39,650 119,262 116,856 102
11 MNCH: Number of newborns not breathing at birth who were resuscitated in USG‐supported programs
Number of newborns not breathing at birth who were resuscitated with stimulation and/or bag and mask provided by a USG‐assisted program, or by a health worker trained in resuscitation by USG‐assisted program
N/A N/A N/A 1,322 1,075 123
Numerator: Number of newborn infants who received essential newborn care from trained facility, outreach or community health workers through USG‐supported programs/IHPplus target area
39,696 40,502 39,802 120,000 116,012
Denominator: # of newborns delivered in the IHPplus target areas (3.49% of total population)
40,185 40,720 40,386 121,291 118,380
Numerator/Denominator (in percentage) 99% 99% 99% 99% 98% 101
MNCH: Percent of deliveries with a skilled birth attendant (SBA) in USG‐supported facilities
MNCH: Percent of newborns receiving essential newborn care through USG‐supported programs
8
12
MNCH: Percent of pregnant women attending at least one antenatal care (ANC) visit with a skilled provider from USG‐supported health facilities
MNCH: Percent of pregnant women attending at least four ANC visits with a skilled provider from USG‐supported health facilities
6
7

13 MNCH: Number of newborns receiving antibiotic treatment for infection from trained health workers through USG‐supported programs
Number of newborn infants identified as having possible infection who received antibiotic treatment from appropriately trained facility, outreach or community health workers through USG‐supported programs/IHPplus target area (4% of total population *6% Infection rate‐MICS 2010)
1,821 1,958 1,666 5,445 8,167 67
14 MNCH: Number of child pneumonia cases treated with antibiotics by trained facility or community health workers in USG‐supported programs
Number of children under five years old with pneumonia treated with antibiotics by trained facility or community health workers in USG‐supported programs/IHPplus target area (20% of total population*6%= infection rate‐MICS 2010)
41,740 42,458 43,842 128,040 114,028 112
15 MNCH: Number of cases of child diarrhea treated in USG‐supported programs
Number of oral rehydration solution (ORS) packets distributed through USG‐assisted programs (this is a proxy indicator for the number of cases of child diarrhea treated in USG‐assisted programs)
54,115 52,568 49,538 156,221 160,789 97
Numerator: Number of children less than 12 months who received DPT‐HepB‐Hib1‐3 vaccine from USG‐supported programs/IHPplus target areas
38,029 39,350 35,207 112,586 111,159
Denominator: # of children less than 12 months of age in the IHPplus target areas (3.49% of total population ‐ Ref : Expanded Program of Immunization)
39,003 39,003 39,003 117,009 117,009
Numerator/Denominator (in percentage) 98% 101% 90% 96% 95% 101Numerator: Number of children less than 12 months who did not complete the full regimen of DPT‐HepB‐Hib1‐3 vaccination
1,519 2,035 1,768 5,322 5,536
Denominator: All children less than 12 months who received DPT‐HepB‐Hib1
39,548 41,385 36,975 117,908 110,728
Numerator/Denominator (in percentage) 4% 5% 5% 5% 5% 100
Numerator: Number of children less than 12 months of age who received measles vaccine from USG‐supported programs/IHPplus target areas
35,032 37,540 35,101 107,673 111,159
Denominator: # of children less than 12 months of age in the IHPplus target areas (3.49% of total population ‐ Ref : Expanded Program of Immunization)
39,003 39,003 39,003 117,009 117,009
Numerator/Denominator (in percentage) 90% 96% 90% 92% 95% 9719 MNCH: Number of USG‐assisted health
facilities experiencing stock‐outs of ORS during the quarter
Maximum number of USG‐assisted health facilities experiencing stock‐outs of ORS during the quarter
182 165 149 182 120 66
17 MNCH: Drop‐out rate in DPT‐HepB‐Hib3 among children less than 12 months of age
MNCH: Percent of children less than 12 months of age who received measles vaccine from USG‐supported programs
18
16 MNCH: Percent of children less than 12 months of age who received three doses of Diphtheria, Tetanus, Pertussis (DTP), Hepatitis B (HepB) and Haemophilus Influenza type B (Hib) (or DPT‐HepB‐Hib1‐3) from USG‐supported programs

Numerator: Number of pregnant women who have received iron‐folate tablets to prevent anemia during the last five months of pregnancy
65,266 66,780 81,837 213,883 138,130
Denominator: # of expected pregnancies in USG‐assisted health facilities (4% of total population)
46,043 46,043 46,043 138,130 138,130
Numerator/Denominator (in percentage) 142% 145% 178% 155% 100% 155
21 NUTRITION: Number of mothers of children 2 years of age or less who have received nutritional counseling for their children
Number of mothers of children 2 years of age or less who have received nutritional education within group support (8% of total population * 15%=Malnutrition Prevalence Rate)
74,977 70,155 70,318 215,450 372,000 58
22 NUTRITION: Number of people trained in child health and nutrition through USG‐supported programs
This indicator measures the number of people trained in child health and nutrition through USG‐supported programs
0 16 96 112 465 24
23 NUTRITION: Number of USG‐supported health facilities experiencing stock‐outs of iron‐folate tablets during the quarter
Maximum number of USG‐supported health facilities that experienced stock‐outs of iron‐folate tablets during the quarter
212 221 188 221 250 113
Numerator: Number of new sputum smear positive pulmonary TB cases reported in the past year (150 cases for 100,000 people)
N/A N/A N/A 3492 5,078
Denominator: Total population in the specified geographical area
N/A N/A N/A 13,542,673 13,542,673
Numerator/Denominator (per 100,000 people) N/A N/A N/A 103 150 6925 TB: Number of multi‐drug resistant (MDR) TB
cases detected Number of TB cases with multi‐drug resistance registered in USG‐supported facilities
N/A N/A N/A 9 43 21
Numerator: Number of patients recovered + number of patients with treatment completed
N/A N/A N/A 3,054 4,849
Denominator: Number of new smear positive TB cases treated(1 year ago)
N/A N/A N/A 3,234 5,104
Numerator/ =Denominator (in percentage) N/A N/A N/A 94% 95% 99
Numerator: Number of MDR‐TB patients recovered plus the number of MDR‐TB patients with treatment
N/A N/A N/A 8 7
Denominator: Number of MDR‐TB patients for which a treatment has been initiated(1‐2 years ago)
N/A N/A N/A 12 9
Numerator/Denominator (in percentage) N/A N/A N/A 67% 75% 89
Numerator: Number of HIV‐positive patients screened for TB
N/A N/A N/A 1199 TBD
Denominator: Number of registered patients living with HIV
N/A N/A N/A 1547 TBD
Numerator/Denominator (in percentage) N/A N/A N/A 78% 100% 78
Numerator: Number of TB cases detected among HIV‐positive patients
N/A N/A N/A 454 TBD
20
TB: Percentage of TB cases detected among HIV‐positive patients through USG‐
29
TB: Percentage of HIV‐positive patients screened for TB through USG‐ supported programs
NUTRITION: Proportion of pregnant women who received iron‐folate to prevent anemia
28
24
27
26 TB: Therapeutic success rate (new smear positive TB cases)
TB: Therapeutic success rate for MDR‐TB
TB: Case notification rate in new sputum smear positive pulmonary tuberculosis (TB) cases per 100,000 population in USG‐supported areas
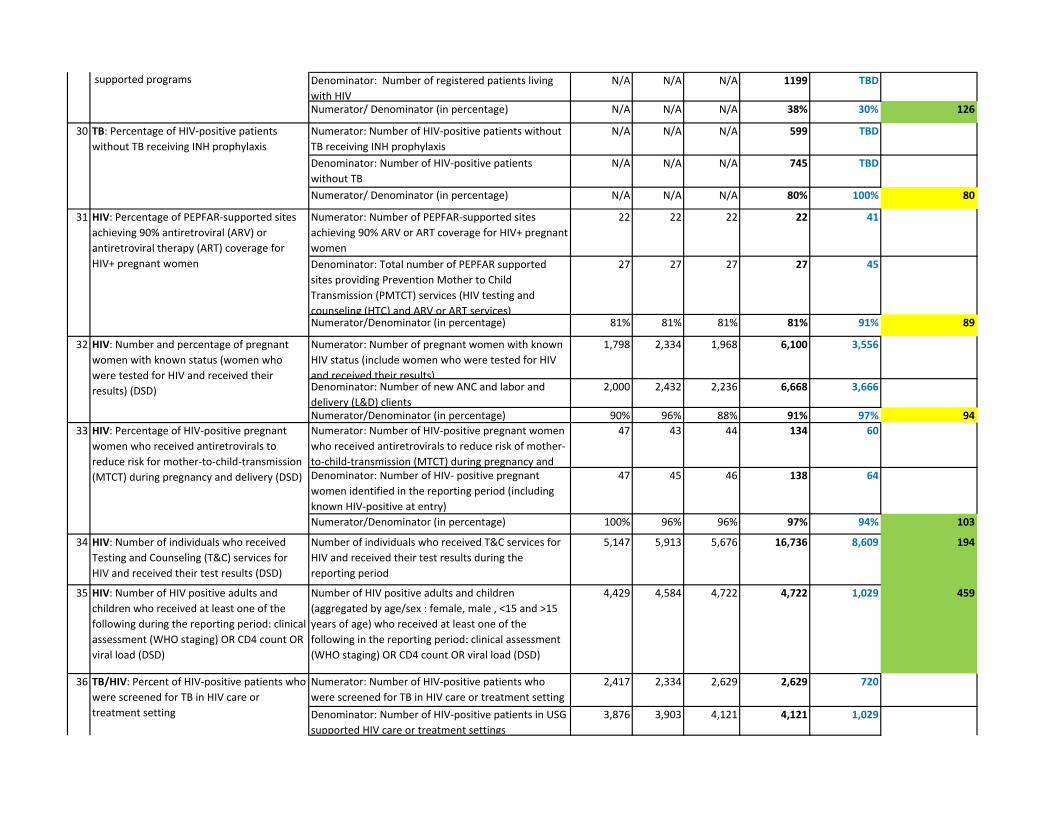
Denominator: Number of registered patients living with HIV
N/A N/A N/A 1199 TBD
Numerator/ Denominator (in percentage) N/A N/A N/A 38% 30% 126
Numerator: Number of HIV‐positive patients without TB receiving INH prophylaxis
N/A N/A N/A 599 TBD
Denominator: Number of HIV‐positive patients without TB
N/A N/A N/A 745 TBD
Numerator/ Denominator (in percentage) N/A N/A N/A 80% 100% 80
Numerator: Number of PEPFAR‐supported sites achieving 90% ARV or ART coverage for HIV+ pregnant women
22 22 22 22 41
Denominator: Total number of PEPFAR supported sites providing Prevention Mother to Child Transmission (PMTCT) services (HIV testing and counseling (HTC) and ARV or ART services)
27 27 27 27 45
Numerator/Denominator (in percentage) 81% 81% 81% 81% 91% 89
Numerator: Number of pregnant women with known HIV status (include women who were tested for HIV and received their results)
1,798 2,334 1,968 6,100 3,556
Denominator: Number of new ANC and labor and delivery (L&D) clients
2,000 2,432 2,236 6,668 3,666
Numerator/Denominator (in percentage) 90% 96% 88% 91% 97% 94Numerator: Number of HIV‐positive pregnant women who received antiretrovirals to reduce risk of mother‐to‐child‐transmission (MTCT) during pregnancy and
47 43 44 134 60
Denominator: Number of HIV‐ positive pregnant women identified in the reporting period (including known HIV‐positive at entry)
47 45 46 138 64
Numerator/Denominator (in percentage) 100% 96% 96% 97% 94% 103
34 HIV: Number of individuals who received Testing and Counseling (T&C) services for HIV and received their test results (DSD)
Number of individuals who received T&C services for HIV and received their test results during the reporting period
5,147 5,913 5,676 16,736 8,609 194
35 HIV: Number of HIV positive adults and children who received at least one of the following during the reporting period: clinical assessment (WHO staging) OR CD4 count OR viral load (DSD)
Number of HIV positive adults and children (aggregated by age/sex : female, male , <15 and >15 years of age) who received at least one of the following in the reporting period: clinical assessment (WHO staging) OR CD4 count OR viral load (DSD)
4,429 4,584 4,722 4,722 1,029 459
Numerator: Number of HIV‐positive patients who were screened for TB in HIV care or treatment setting
2,417 2,334 2,629 2,629 720
Denominator: Number of HIV‐positive patients in USG supported HIV care or treatment settings
3,876 3,903 4,121 4,121 1,029
supported programs
TB: Percentage of HIV‐positive patients without TB receiving INH prophylaxis
30
TB/HIV: Percent of HIV‐positive patients who were screened for TB in HIV care or treatment setting
31
32
33
36
HIV: Percentage of PEPFAR‐supported sites achieving 90% antiretroviral (ARV) or antiretroviral therapy (ART) coverage for HIV+ pregnant women
HIV: Number and percentage of pregnant women with known status (women who were tested for HIV and received their results) (DSD)
HIV: Percentage of HIV‐positive pregnant women who received antiretrovirals to reduce risk for mother‐to‐child‐transmission (MTCT) during pregnancy and delivery (DSD)

Numerator/Denominator (in percentage) 62% 60% 64% 64% 70% 91
37 HIV: Number of HIV infected adults and children receiving antiretroviral therapy during the reporting period (current) DSD
Number of HIV infected adults and children receiving antiretroviral therapy during the reporting period (current) DSD
4,254 4,420 4,607 4,607 1,029 448
38 HIV: Number of HIV‐infected adults and children newly enrolled in clinical care during the reporting period receiving at least one of the following at enrollment: clinical assessment (WHO staging) OR CD4 count OR viral load
Number of HIV‐infected adults and children newly enrolled in clinical care (aggregated by age/sex , female, male , <15 and >15) during the reporting period receiving at least one of the following at enrollment: clinical assessment (WHO staging) OR CD4 count OR viral load
263 267 301 831 231 360
Numerator: The number of registered TB cases with documented HIV‐positive status who start or continue ART during the reporting period
14 18 16 48 78
Denominator: The number of registered TB cases with documented HIV‐positive status during the reporting period
14 19 17 50 83
Numerator/Denominator (in percentage) 100% 95% 94% 96% 95% 101
Numerator: Number of PEPFAR‐supported laboratories and testing sites that participate and perform analyte‐specific testing on HIV serologic/diagnostic testing , CD4, EID, and TB diagnostic
55 55 55 55 45
Denominator: Total number of laboratories and testing sites
55 55 55 55 45
Numerator/Denominator (in percentage) 100% 100% 100% 100% 100% 100
41 Family Planning and HIV Integration: Number of supported HIV service delivery point that are directly providing integrated voluntary FP service
Number of supported HIV service delivery points that directly provide integrated voluntary FP service
44 44 44 44 45 98
42 PMTCT_CTX: Number of infants born to HIV‐positive women who were started on Cotrimoxazole (CTX) prophylaxis within two months of birth at USG supported sites within the reporting period
CTX prophylaxis is a simple and cost‐effective intervention to prevent Pneumocystis pneumonia (PCP) among HIV‐exposed and ‐infected infants. PCP is the leading cause of serious respiratory disease among young HIV‐infected infants in resource‐limited countries and often occurs before HIV infection can be diagnosed. The indicator is the sum of infants having received CTX within 2 months of birth during the reporting period at PEPFAR‐supported facilities.
4 16 7 27 58 47
43 PMTCT_EID: Number of infants who had a virologic HIV test within 12 months of birth during the reporting period
This indicator measures the extent to which infants born to HIV‐positive women receive virologic testing to determine their HIV status within the first 12 months of life
0 0 0 0 58 0
40 HIV: Percentage of laboratories and POC testing sites that perform HIV diagnostic testing that participate and successfully pass in an analyte‐specific proficiency testing (PT) program
HIV/TB: Proportion of registered TB cases who are HIV‐positive who are on ART
39

44 PMTCT_FO: Number of HIV exposed infants with a documented outcome by 18 months of age disaggregated by outcome type
In settings where national guidelines support breastfeeding of HIV‐exposed infants, antibody testing of all HIV‐exposed children at 18 months of age and/or 6 weeks after cessation of breastfeeding is recommended to determine final HIV status (‘final outcome’/FO) of HIV‐exposed children. In settings where national guidelines recommend HIV‐antibody testing at 18 months of life, this indicator measures progress toward ensuring that all infants born to HIV‐positive women have an outcome documented.
18 6 6 30 50 60
45 Tx_NEW: Number of adults and children newly enrolled on ART
The indicator measures the ongoing scale up and uptake of ART programs. The numerator can be generated by counting the number of adults and children who are newly enrolled in ART in the reporting period, in accordance with the nationally
d l ( WHO/UNAIDS
263 256 290 809 231 350
46 Tx_VIRAL: Number of adults and pediatric ART patients with a viral load result documented in the patient medical record within the past 12 months
This indicator monitors the proportion of adult and pediatric patients on ART who have received a viral load test within the recommended testing interval (i.e., 12 months)
0 0 0 0 580 0
47 Tx_UNDETECT: Number of viral load tests from adult and pediatric ART patients conducted in the past 12 months with a viral load inferior to 1000 copies/ml.
ART is viewed by the scientific community and PEPFAR not only as essential for decreasing morbidity and mortality, but also as a highly effective approach to prevent HIV transmission. This indicator monitors the proportion of viral load tests from adult and pediatric ART patients with an undetectable results
0 0 0 0 116 0
48 Tx_RET: Number of adults and children who are still alive and on treatment at 12 months after initiating ART
The indicator measures the proportion of individuals who have retained on antiretroviral therapy (ART). Death and loss to follow‐up are the two highest causes of patient attrition from ART, especially in the first few months after initiating on ART. High
N/A N/A N/A N/A N/A N/A
49 CARE_COM: Number of HIV infected adults and children receiving care and support services outside of the health facility
The purpose of this indicator is to determine how many PLHIV receive care and support services outside of the health facilities where they are registered for HIV care and treatment. Data collected through this indicator will inform PEPFAR country programs about the scale‐up and coverage of community care services.
0 902 859 1,761 500 352
Numerator: Number of patients co‐infected HIV/TB with result of end of treatment documented
15 35 18 68 1250 TB/HIV_ TB outcome: Aggregated outcome of TB treatment among registered new and relapsed TB cases who are HIV‐positive in

Denominator: Total # of HIV/TB co‐infected patient, with TB treatment completed
15 35 18 68 13
Numerator/Denominator (in percentage) 100% 100% 100% 100% 92% 109
Numerator: # of GRHs implementing CPA 70 70 69 69 71
Denominator: Total # of GRHs 78 78 78 78 78
Numerator/Denominator (in percentage) 90% 90% 88% 88% 91% 97
Numerator: # of health centers implementing MPA 1,395 1,395 1,390 1,390 1,398
Denominator: Total # of health centers 1,398 1,398 1,398 1,398 1,398
Numerator/ Denominator (in percentage) 100% 100% 99% 99.4% 100% 99
Numerator: Number of pregnant women who received at least two doses of SP for IPT during ANC visits
37,778 36,690 42,586 136,092 93,335
Denominator: Total number of pregnant women attending ANC visits in the reporting period (12 months)
47,927 49,066 49,448 168,690 124,446
Numerator/ Denominator (in percentage) 79% 75% 86% 81% 75% 108
54 MALARIA: Number of USG‐supported service delivery points experiencing stock‐outs of Artemisinin‐based combination therapy (ACT) for 1‐5 year old
Number of USG‐assisted service delivery points (SDPs) experiencing stock‐outs of ACT for 1 – 5 years at any time during the defined reporting period
173 147 154 173 150 87
Number of LLINs purchased with USG funds that were distributed
N/A N/A N/A 188,450 360,684 52
(a) through campaigns 0 0 0 0 n/a
(b) through health facilities N/A N/A N/A 188,450 119,502
(c) through the private/commercial sector 0 0 0 0 n/a
(d) through other distribution channels 0 n/a
( e ) through voucher schemes 0 0 0 0 n/a
Number of health workers (doctor, nurse, nurse’s assistant, clinical officer) trained in IPTp with USG funds
492 1,312 593 250 485 52
Male 383 390 488 204 323Female 109 922 105 46 162
55
p pthe treatment cohort
MALARIA: Number of health workers trained in IPTp with USG funds (disaggregated by gender)
IR 1: Access to and availability of Minimum Package of Activities (MPA) and Complementary Package of Activities (CPA) services and products in target health zones increased
IR 1.1: Facility‐based health care services and products (provincial hospitals and health zone health centers) in target health zones increased
56
51 ***L+M+G: % of general reference hospitals (GRHs) implementing complementary package of activities (CPA)
52
53
MALARIA: Number of long lasting insecticide treated nets (LLINs) purchased with USG funds that were distributed (disaggregated in 5 sub‐categories)
MALARIA: Percent of pregnant women who received at least two doses of SP for Intermittent Preventive Treatment (IPT) during ANC visits
***L+M+G: % of health centers implementing minimum package of activities (MPA)
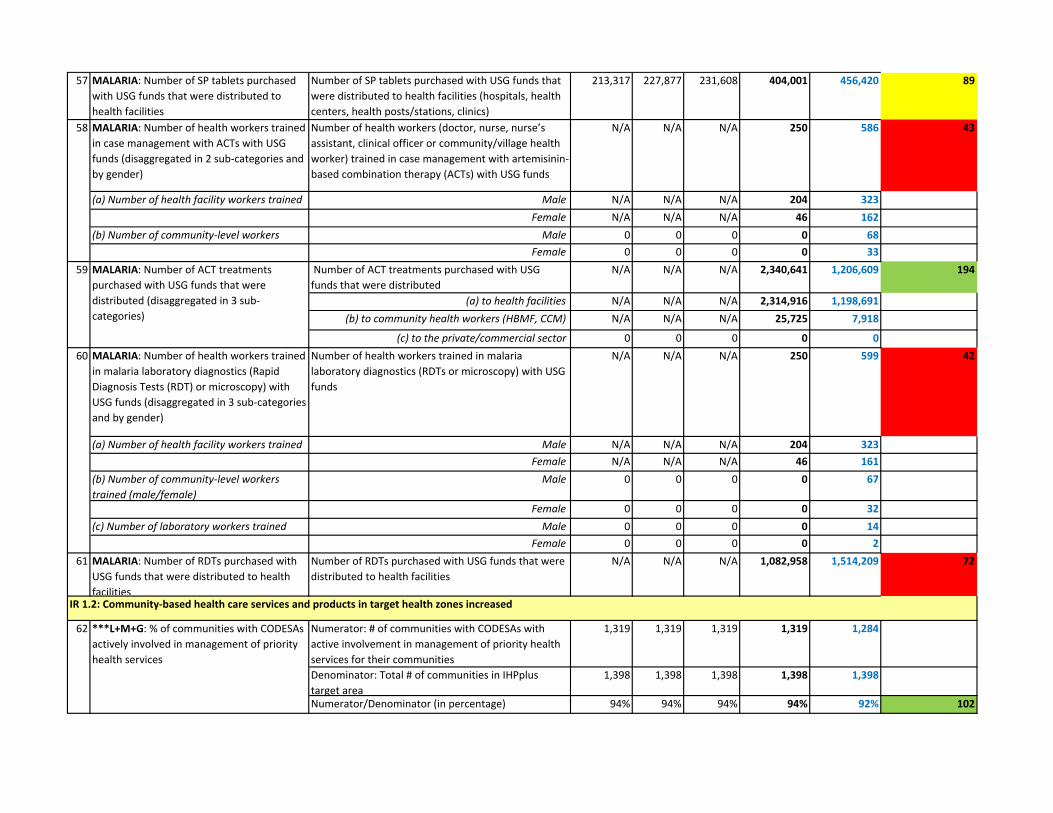
57 MALARIA: Number of SP tablets purchased with USG funds that were distributed to health facilities
Number of SP tablets purchased with USG funds that were distributed to health facilities (hospitals, health centers, health posts/stations, clinics)
213,317 227,877 231,608 404,001 456,420 89
MALARIA: Number of health workers trained in case management with ACTs with USG funds (disaggregated in 2 sub‐categories and by gender)
Number of health workers (doctor, nurse, nurse’s assistant, clinical officer or community/village health worker) trained in case management with artemisinin‐based combination therapy (ACTs) with USG funds
N/A N/A N/A 250 586 43
(a) Number of health facility workers trained Male N/A N/A N/A 204 323Female N/A N/A N/A 46 162
(b) Number of community‐level workers Male 0 0 0 0 68Female 0 0 0 0 33
Number of ACT treatments purchased with USG funds that were distributed
N/A N/A N/A 2,340,641 1,206,609 194
(a) to health facilities N/A N/A N/A 2,314,916 1,198,691(b) to community health workers (HBMF, CCM) N/A N/A N/A 25,725 7,918
(c) to the private/commercial sector 0 0 0 0 0MALARIA: Number of health workers trained in malaria laboratory diagnostics (Rapid Diagnosis Tests (RDT) or microscopy) with USG funds (disaggregated in 3 sub‐categories and by gender)
Number of health workers trained in malaria laboratory diagnostics (RDTs or microscopy) with USG funds
N/A N/A N/A 250 599 42
(a) Number of health facility workers trained Male N/A N/A N/A 204 323Female N/A N/A N/A 46 161
(b) Number of community‐level workers trained (male/female)
Male 0 0 0 0 67
Female 0 0 0 0 32(c) Number of laboratory workers trained Male 0 0 0 0 14
Female 0 0 0 0 261 MALARIA: Number of RDTs purchased with
USG funds that were distributed to health facilities
Number of RDTs purchased with USG funds that were distributed to health facilities
N/A N/A N/A 1,082,958 1,514,209 72
Numerator: # of communities with CODESAs with active involvement in management of priority health services for their communities
1,319 1,319 1,319 1,319 1,284
Denominator: Total # of communities in IHPplus target area
1,398 1,398 1,398 1,398 1,398
Numerator/Denominator (in percentage) 94% 94% 94% 94% 92% 102
62
60
IR 1.2: Community‐based health care services and products in target health zones increased
58
59 MALARIA: Number of ACT treatments purchased with USG funds that were distributed (disaggregated in 3 sub‐categories)
***L+M+G: % of communities with CODESAs actively involved in management of priority health services

63 WASH: Number of people gaining access to an improved drinking water source as a result of USG support
Number of people gaining access to an improved drinking water source (improved drinking water technologies are those more likely to provide safe drinking water)
N/A N/A N/A 130,611 74,294 176
Numerator: Number of people using an improved drinking water source
N/A N/A N/A N/A TBD
Denominator: Total population targeted for the given period
N/A N/A N/A N/A TBD
Numerator/Denominator (in percentage) N/A N/A N/A N/A TBD
65 WASH: Number of people gaining access to an improved sanitation facility as a result of USG support
Number of people gaining access to an improved sanitation facility (Improved sanitation facilities include those more likely to ensure privacy and hygienic use, e.g., connection to a public sewer, connection to a septic system, pour‐flush latrine, simple pit latrine, and ventilated improved pit [VIP] latrine)
N/A N/A N/A 52,614 74,294 71
Numerator: Number of people using an improved sanitation facility
N/A N/A N/A N/A TBD
Denominator: Total population targeted for the given period
N/A N/A N/A N/A TBD
Numerator/Denominator (in percentage) N/A N/A N/A N/A TBD
Numerator: # of senior LDP teams that have achieved at least 80% of their desired performance according to indicators in their action plans within six months of completing the LDP
47 47 47 47 n/a
Denominator: Number of health zones with leadership that has undergone LDP training
69 69 69 69 n/a
Numerator/Denominator (in percentage) 68% 68% 68% 68% 76% 89
Numerator: # health zones with validated actions plans
31 24 43 43 78
Denominator: Total # health zones in IHPplus target 78 78 78 78 78
Numerator/ Denominator (in percentage) 40% 31% 55% 55% 100% 55
64
67
68 ***L+M+G: Percent of health zones with validated action plans
WASH: Percent of the population using an improved drinking water source as a result of USG support
66 WASH: Percent of the population using an improved sanitation facility as a result of USG support
***L+M+G: % of senior Leadership Development Program (LDP) teams that have achieved at least 80% of their desired performance according to indicators in their action plans within six months of completing the LDP. LDP team are made up of senior health managers working towards improving organizational performance and service delivery of health zones and facilities in their respective health zones/areas
IR 1.3: Provincial management more effectively engaged with health zones and facilities to improve service delivery
IR 2: Quality of key family health care services (MPA/CPA) in target health zones increased (Component 1)
IR 2.1: Clinical and managerial capacity of health care providers increased

Numerator: Number of health centers with up‐to‐date and accurate record of inventory of essential drugs and supplies (“accurate” means that the records correctly reflect the inventory of essential drugs and supplies that are currently in stock)
990 1,024 945 1,024 n/a
Denominator: Total number of health centers in IHPplus areas
1,398 1,398 1,398 1,398 n/a
Numerator/ Denominator (in percentage) 71% 73% 68% 73% 97% 99Numerator: Number of hospitals with up‐to‐date and accurate record of inventory of essential drugs and supplies ("accurate" means that the records correctly reflect the inventory of essential drugs and supplies that are currently in stock)
70 79 89 75 n/a
Denominator: Total number of hospitals in IHPplus areas
78 78 78 78 n/a
Numerator/Denominator (in percentage) 90% 101% 114% 96% 100% 9871 GENDER: Number of people reached by a
USG‐supported intervention providing GBV services (e.g., health, legal, psycho‐social counseling shelters hotlines other)
Number of people reached by a USG‐supported intervention providing GBV health services
272 289 253 814 725 112
72 GENDER: # of BCC campaigns launched delivering key health messages targeting women and girls as primary audience
# of BCC campaigns developed and launched with key prevention priority messages for FP, nutrition, malaria, and WASH within the IHPplus target areas
9 1 1 11 3 367
Numerator: # of health centers and GRH that completed an evaluation of the nine FOSACOF minimum standards
458 458 458 458 583
Denominator: Total # of health facilities implementing the FOSACOF approach
839 839 839 839 737
Numerator/ Denominator (in percentage) 55% 55% 55% 55% 79% 69
Numerator: # of health centers that completed an evaluation of the nine FOSACOF minimum standards
433 433 433 433 545
Denominator: Total # of health centers implementing the FOSACOF approach
799 799 799 799 699
Numerator/ Denominator (in percentage) 54% 54% 54% 54% 78% 70
Numerator: # of GRH that completed an evaluation of the nine FOSACOF minimum standards
25 25 25 25 38
Denominator: Total # of GRH integrating the FOSACOF approach
40 40 40 40 38
Numerator/ Denominator (in percentage) 63% 63% 63% 63% 100% 63
69 ***L+M+G: Percent of health centers with accurate and up‐to‐date inventory records
70
73
73
73
*L+M+G: % of general reference hospital that completed an evaluation of the nine FOSACOF minimum standards
*L+M+G: % of health facilities that completed an evaluation of the nine FOSACOF minimum standards
***L+M+G: Percent of hospitals with accurate and up‐to‐date inventory records
*L+M+G: % of health centers that completed an evaluation of the nine FOSACOF minimum standards
IR 2.2: Minimum quality standards for health facilities (general referral hospitals and health zone health centers) and services developed and adopted

Numerator: # of patients (adults and children) referred to health centers by a CHW
5,200 5,131 5,871 16,202 9,830
Denominator: Total # of patients seen by a CHW 23,468 23,747 22,556 69,771 65,532
Numerator/Denominator (in percentage) 22% 22% 26% 23% 15% 155
Numerator: # of patients (adults and children) referred to GRHs by a CHW or health care provider
21,153 19,840 20,563 61,556 77,877
Denominator: Total number of patients seen by a CHW or health care provider
524,412 503,601 507,566 1,535,579 1,557,537
Numerator/Denominator (in percentage) 4% 4% 4% 4% 5% 80
Numerator: # of NGOs representing women, youth, and vulnerable groups attending NGO coordination meetings during the quarter
261 261 261 261 124
Denominator: # of NGOs representing women, youth and vulnerable groups registered in DRC
372 372 372 301 207
Numerator/Denominator (in percentage) 70% 70% 70% 87% 60% 145
77 ***L+M+G: # Community Champions achieving the deliverables set in their signed fixed amount awards (FAAs)
# community Champions achieving the deliverables set in their signed fixed amount awards (FAAs)
N/A N/A N/A 59 36 164
78 ***L+M+G: # youth organizations participating in youth education outreach strategy
# youth organizations conducting member outreach and health education as part of IHPplus youth health education strategy
N/A N/A N/A 199 126 158
79 BCC: # of CODESAs supported by IHPplus which have a “communications action plan”
# of CODESAs supported by IHPplus within the IHPplus target areas which have a “communications action plan” developed
1,218 1,205 1,251 1,251 1,284 97
80 BCC: # of educational SMS messages during BCC campaigns or mini‐campaigns on malaria, nutrition, FP, WASH, etc.
Key messages targeted to select groups (mothers, caretakers, partners, etc.) sent via SMS in FP, nutrition, malaria, WASH, etc., within the IHPplus target areas (annual targets will be based on pilot studies in PY2 as included in the workplan)
N/A N/A N/A 202,952 126,000 161
Numerator: # of health zones with an annual operational plan based on National Development Plan ("PNDS")
44 44 44 44 n/a81 ***L+M+G: % of health zones with an annual operational plan based on National Development Plan ("PNDS")
% of patients referred to GRHs by a CHW or health care provider, disaggregated by gender, and age groups (< 5 years; 5‐14 years; >15 years)
74
75
% of patients referred to health centers by a CHW, disaggregated by gender, and age groups (< 5 years; 5‐14 years; >15 years)
76
IR 2.3: Referral system for primary health care prevention, care, and treatment between community structures and health zone health facilities institutionalized
IR 3: Knowledge, attitudes, and practices to support health‐seeking behaviors increased in target health zones (Component 1)
IR 3.1: Evidence‐based health sector‐community outreach linkages—especially for women, youth, and vulnerable populations‐‐established
IR 3.3: Behavior change campaigns involving opinion leaders and cultural influences (people and technologies) launched
IR 4: Health sector leadership and governance in target provinces improved (Component 2)
IR 4.1: Provincial health sector policies and national level policies aligned
***L+M+G: % of NGOs representing women, youth and vulnerable groups participating in coordination meetings

Denominator: Total # of health zones 78 78 78 78 n/a
Numerator/Denominator (in percentage) 56% 56% 56% 56% 100% 56
Numerator: # of health zone management teams with a performance management system that includes any of the three essential components: 1) up‐to‐date job descriptions and organigrams, 2) work plans (including supervision plan and guide), and 3) performance review reports
78 78 78 78 n/a
Denominator: Total # of health zones 78 78 78 78 n/a
Numerator/Denominator (in percentage) 100% 100% 100% 100% 100% 100
83 PM: Number of success stories developed Number of success stories developed disaggregated by technical components and sub‐components where applicable (HIV/AIDS, TB, malaria, MNCH, FP/RH, nutrition, WASH, GBV, gender, HSS, BCC, commodities, coordination, M&E, etc.)
1 4 3 8 8 100
82 ***L+M+G: % of health zone management teams with a performance management system that includes essential components
Project Management

Project Director Ousmane Faye
COMU Director Rood Merveille
Deputy Project Director
Hortense Angoran-Bénié
M&E Senior Manager
Moussa Traore
Communication Manager
Landry Malaba
GENDER Technical Advisor Isabelle
Mashagiro
MNH Technical Advisor
Joseph Fataki
CH/IMCI STA Wivine
Mbwebwe
EPI/PEV Technical Advisor
Joseph Kongolo
Nutrition Technical Advisor
Matthieu Koy
WASH Technical Advisor
Deo Mirindi
RMNCAH Director
Narcisse Naia Embeke
Malaria Technical Advisor
Jeanine Musau
TB Technical Advisor
Modeste Kesereka
HIV Technical Advisor
Dorah Kashosi
Fin &Cap Building Director/
Augustin Mwala
M&E Advisor Alidor
Kuamba
M&E Advisor Sam
Mbuyamba
BCC Technical Advisor OSC
Jean Baptiste Mputu
RBF Technical Advisor
Didace Demba
Capacity Building Technical Advisor Freddy Tshamala
HMIS/Web Specialist
Derek Kahongo
Katanga Provincial Rep & FOS Kamina
Doudou Tubaya FOS Mwene Ditu
Matthieu Koy
FOS Kolwezi & Kamina
(Based in Kinshasa) Jonathan Matala
Country Representative
Philippe Tshiteta
COMU See Page 2
Heath Syst TA Jeremie Fikiri
Specialiste Log
Serge Nyembwe
Technical Associate/Health
products Christian Kisimba
Technical Associate
Jean Claude
FOS Bukavu Dorah Kashosi
FOS Lodja Raphael Tshinzela Prog
Assistant TBD
Senior Finance Manager
Désiré Zongo
STA relation with MOH
Jean Jacques Mpiana
M&E Advisor
Marc Basua
Supply Chain Management/ T.L Ruphin Mulongo
Provincial Coordinator
Robert Tuala Tuala
Senior Technical Advisor/TB Julie Mbo
Senior Technical Advisor/ Malaria
Jules Mwenze
Senior Technical Advisor/TB Julie Mbo
Pharmaceuticals & Logistics Manager Antoine Masekwe
Warehouse Manager Scholastique
Ngansho Laboratory Advisor TimotheManager STA/ FP & RH
Cyrille Massamba
Management Specialist
Ciryl Mabingo
STA/ TB & VIH Jean Pierre
Simelo
Technical Specialist
Emery Kapingani
M&E Advis Willy
Kunkadi
Senior Tech Advisor
Serge Kalume
Sen Program
Assistant Patricia
Ndangano
Supply Chain Advisor
TBD
STA Relation with MOH
Faustin Bushabu
FOS Kananga Sam Mbuyamba
Appendix 3: DRC-IHPplus Organizational Chart

Senior Contract
specialist Nathalie Mansubi
Kinshasa Office (Country Operations Management Unit - COMU – page 2)
HR Country Manager TBD
Office Assistant
Costa Kabeya
Finance Manager Marius Mie Toko
Senior Accountant Cecile Kambeya
Accountant I (3) Jean Reddy Anke Lucette Mwanza
Flory Dikala
Accounting Assistant
TBD
Senior Operations Manager
Justin Mukoka
Drivers
Francois Makinu Jean Kongolo
Guy Tshisuaka Joseph Ipoma
Transport & Logistics Coordinator Junior Kiama
Contracts Manager Joel Amisi Mugeni
Administrative Assistant
Yves Ladjou
IT Manager Patrick Maheshe
Financial Analyst Moise Kapend
IT Specialist TBD
IT Coordinator William Mawikila
Administrative Coordinator
Diogène Nshue
Log Assistant / Driver
Daniel Ali
Country Operations Management Unit (COMU) Director
Rood Merveille
Contract Specialist
Patricia Kakassi
Receptionist
Laetitia Kikongi
Financial Analyst Celestin Mbuyi
Accountant I Jolie Kaja
Accountant I Délice Katshiki
Procurement Associate Viviane Bonga
Archiviste Doc. Patrick Ntabudi
Administrative Coordinator
Astrid Dinganga
HR Assistant Esthel Likaka
Senior Executive Assistant
Evelyne Mayolo
Senior Finance
Manager Desiré Zongo
Internal Auditor Jacques Kabeya
Chargé de
Conformité Darly Kazu
Assistant aux Contrats Jean Paul
Mungomba

Tech. Advisor/
IH Field Director Sylvain Kasonga
Senior Technical Advisor/Field Office
Supervisor Sam Mbuyamba
(based in Kinshasa)
IHPplus Field Office: Kananga, Kasaï Central
M&E Specialist William Mpata
Technical Associate/WASH (2)
Pius Kinumbe Patrice Wembolenga
Technical Advisor (3)
Bob Kitu Joseph Ekandji
Senior Technical Coordinator(4)
Jeannot Kayembe, Jean Felix Mubayi
Francois Tukumbane Severin Bushiri
Logistics Assistant/Driver Daniel Mpumbu
Driver s (3) Joseph Kongolo
Nkongolo Benjamin
BCC Expert Anny Kaja
Technical Officer
Eddy Kipoke
Senior Tech. Advisor/
Provincial Rep TBD
Accountant Pierre
Kadiebue
Operations Coordinator
Anicet Balandeke
Finance Manager
Marius Mie (Kinshasa)
Operations Manager Justin
Mukoka (Kinshasa)
Technical Specialist Jean Benoit Mutshe
Jean Marc Ngoy Charles Muhadila
Provincial Cordinator
Robert Tuala Tuala (Kinshasa)
Provincial Cordinator
Robert Tuala Tuala (Kinshasa)

Senior Tech. Advisor/FOS Mathieu KOY
(based in Kinshasa)
IHPplus Field Office: Lodja, Sankuru
M&E Specialist
Kabuyaya Andre Mass Mashimambo
Technical Advisor
Patrick Luyeye
Senior Technical Coordinator (6)
Charlotte Awondjo Richard Lokosu
Daniel Omambo Daniel Shongo Evariste Kalonji
Richard Batulenga
Accounting Coordinator
Any Lushimba
Driver (2) Leon Ankese Denis Ikopo
Alphonse Kenemo Albert Omokamba
Senior Technical Advisor/
IH Field Director Freddy Mbuse
BCC Specialist OSC (2) Francois
Tshibangu Augustin
Mudibantu
Senior Technical Advisor/Provincial Representative
TBD
Grant
Coordinator Jean Benoit
Kalambi
Finance Manager
Marius Mie (Kinshasa)
Operations Manager
Justin Mukoka
(Kinshasa)
Contract and Compliance
Manager Joel Amisi (Kinshasa)
Technicale Specialist
Williajm Kabomgo Fernand katembwe
Raymond Bigomokero
Provinccial
Coordinator Robert Tuala
Tuala (Kinshasa)
Provincial Technical
Coordinator Godefroid
Muala

Senior Technical Advisor/
IH Field Director Emmanuel Mulunda
Senior Tech. Advisor/Field Office
Supervisor Mathieu Koy
(based in Kinshasa)
IHPplus Field Office: Mwene-Ditu, Lomami
M&E Specialist
Jean Pierre Bianga
Technical Associate/WASH
Jean Claude Lubamba
Financial Analyst Bernardin Ngwamashi
BCC Specialist Tony Ngandu
Senior Technical Coordinator (2)
1.Severin Bushiri
2. Emmanuel Tshibanda
Operations Coordinator
Alphonse Tshibangu
Driver (2) Balthazar Tshibanda
Benoit Mutuapi
Senior Technical Advisor/Provincial
Representative TBD
Grant Coordinator Frederic Malungu
Technical Specialist J. Michel Mutombo
Merveille Kombo Felly Otshudi
Finance Manager
Marius Mie
Contract and Compliance
Manager Joel Amisi
Operations Manager
Justin Mukoka
Provincial Coordinator Robert Tuala
Tuala
Provincial Technical Coordinator
Bony Muya
IT Manager Patrick
Maheshe
IT Specialist Daniel Kienge
Accountant Moise Musa Kalikule

IHPplus Field Satellite Office: Mbuji-Mayi, Kasai-Oriental
Senior Technical Advisor/ Provincial Representative
Adamo Fumie (based in Mbuji-Mayi)
Driver/Log Assistant Olivier Yakabue
Senior Technical
Coordinator Evariste Kalonji
Senior Technical Advisor/ Field Office Supervisor
Matthieu Koy (based in Kinshasa)
Technical
Associate/WASH Deca Banza
Provincial Technical
Advisor Romain Mbo

IHPplus Field Satellite Office: Lubumbashi, Katanga
Senior Technical Advisor/ Haut Katanga Provincial Representative
Doudou Tubaya (based in Lubumbashi)
Accounting Coordinator
Jeanne Mutombo
Operation Associate
Etienne Ndiwulu
Administrative Assistante
Pierrette Kasindi
é
Driver Patrick Nkolomonyi
Operations Manager
Justin Mukoka
(Kinshasa)
Finance Manager
Marius Mie (Kinshasa)
Provincial Coordination Robert Tuala
Tuala
Provincial Technical Coordinator
Pacifique Bwenge Moise Kazadi

Senior Technical Advisor/
IH Field Director a.i. Doudou Tubaya
IHPplus Field Office: Kamina, Haut Lomami
M&E Specialist Alexis Ndumbi
Accountant
Pepe Mugalu
Technical Advisor (2)
Amide Ngongo Freddy Bayakwa
Senior Technical Coordinator (1)
Paul Olongo Jean Paul Kasongo John TALUHAMBA
Platon Hababwema
Operations Coordinator
Blaise Mana Mana
Driver (2) Jacques Kasongo
Emmanuel Mukadi
Field Office Supervisor/Kamina Provincial
Representative Doudou Tubaya
(Based in Lubumbashi)
BCC Specialist Gustave Numbi
Finance Manager
Marius Mie (Kinshasa)
Operations Manager
Justin Mukoka (Kinshasa)
Technicale Specialist
Leon Luanbwa Jean Bertin Ndongozi
Provincial Technical
Coordination Adolphe
Marhegeko
Provincial Coordinator Robert Tuala
Tuala (Kinshasa)
Operations Coordinator
Barthelemy Lusuna
WASH Technical Advisor
Deo Mirindi (Kinshasa)
Wash Specialist
Jacques Amani
Associé Technique Chargé de Dépôt
Willy Umba

IHP Coordinator Thierry Salamu
M&E Officer
TBD
Accountant Christian
Mpembele
Technical Specialist Eric Lukwete Arlette Lybia
Gaston Muvudi Julien Saleh Kusuba
Senior technical Coordinator(4)
1. Crispin Mboyi 2. Charles Mbuyu 3. Antoine Miaka 4. Albert Caleb Koyelongo
IHPplus Field Office: Kolwezi, Lualaba
Operations Coordinator
Bodel Ali
Senior Technical Coordinator (1)
Gaetan Ngoyi
Drivers (2) 1. Valentin Kapondo Kapini 2. Manasse Mazau
BCC Specialist--
OSC Delphin Kabakila
HIV Technical Advisor
Emmanuel Mulowayi
Willy Nfumi
Senior Technical Advisor/Field Office Supervisor Jonathan Matala
(Based in Kinshasa)
Grant Coordinator
Gabriel Unega
Finance Manager
Marius Mie (Kinshasa)
Operations Manager
Justin Mukoka (Kinshasa)
Contract and Compliance
Manager Joel Amisi (Kinshasa)
Provincial Technical Coordinator
Bavon Ngoy Moise Kazadi
Provincial Coordinator Robert Tuala
Tuala (Kinshasa)
Logistics Assistant Ali Ngongo Daniel

IHP Coordinator/TA Janvier Barhobagayana
M&E Officer
Vincent Witumbula Willy Ngoy
Technical Specialist (2) Rose Bokashanga
Jean Ngoy
Senior Technical Coordinator (6)
1. Parfaitine Chirhalwirwa
2. Yissa Zagabe 3. Dieudonné Cigajra 4. Iyungamo Isa 5. Luc Mweze 6. Benjamin
Mushagalusha
IHPplus Field Office: Bukavu, Sud Kivu
Operations Coordinator
Dieudonne Zirirane
Grants Coordinator Sauli Lubanda Fidele
Accountant Joseph Mselu
BCC Specialist—OSC
1. Zacharie Mudosa 2. Theodore Kabuta
Kabua
Security Officer
Franck Mukosa
Field Office Supervisor Dorah Kashosi
(based in Kinshasa)
Sud Kivu Provincial Representative
Janvier Barhobagayana
Drivers (4)
1. Gaston Musulu. 2. Dodo Ilolwa Mulenda 3. Evariste Kabala 4. Yves Chishugi
Accountant Assistant II
TBD
Finance Manager
Marius Mie (Kinshasa)
Operations Manager
Justin Mukoka (Kinshasa)
Contract and Compliance
Manager Joel Amisi (Kinshasa)
Technical Specialist 1. Jean Paul Beya 2. Noe Assukulu
Provincial Coordinator Robert Tuala
Tuala (Kinshasa)
Techncal Adv/Provoncial
Technical Coordinator
Cesar Kasongo
Contract and Compliance
Manager Joel Amisi (Kinshasa)
Wash Specialist
1. Jean Berchmans 2. Idelfonse Kamate

Appendix 5: Malaria commodity situation at the end of March 2017
Table 1: ACT stock status by the end of PY2Q3
Province Total number of ACT distributed to health zones
ACTstock end-March 2017
Estimated month(s) of stock available (EMS)
Haut Katanga 581,875 55,485 0.3
Haut Lomami 404,053 220,504 1.6
Kasai Central 505,050 1,245,657 7.4
Kasai Oriental & Lomami
186,650 533,575 8.6
Kinshasa 0 95,625 N/A
Lualaba 85,850 146,046 5.1
Sankuru 76,014 42,410 1.7
Sud Kivu 501,149 1,096,638 6.6
Total 2,340,641 3,435,940 4.4
Table 2: RDT stock status by the end of PY2Q3
Province Total RDT distributed to health zones
RDT stock end-March 2017
Estimated EMS
Haut Katanga 278,075 0 0.0
Haut Lomami 134,750 64,175 1.4
Kasai Central 44,200 45,925 3.1
Kasai Oriental & Lomami
178,600 1,225 0.0
Kinshasa 0 73,400 N/A
Lualaba 44,875 119,193 8.0
Sankuru 164,383 85,375 1.6
Sud Kivu 238,075 97,375 1.2
Total 1,082,958 486,668 1.3
Table 3: SP stock status by the end of PY2Q3
Province Total SP distributed to healt zones
SP stock end-March 2017
Estimated EMS
Haut Katanga 213,000 0 0.0
Haut Lomami 281,000 512,000 5.5
Kasai Central 59,000 165,000 8.4
Kasai Oriental & Lomami
106,000 182,000 5.2
Lualaba 20,000 0 0.0
Sankuru 18,000 0 0.0
Sud Kivu 515,000 340,000 2.0
Total 1,212,000 1,199,000 3.0

RAPPORT DE MISSION DE SUIVI DESRECOMMANDATIONS FAITES AUX
CDR/DEPOTS PARTENAIRES DE MSH DANS LES PROVINCES DU SANKURU, SUD‐KIVU, KASAI‐OR, HAUT KATANGA ET LUALABA
Décembre 2016 ‐ Février 2017
Par :
Serge NYEMBWE, Health Commodities Logistics Specialist, IHPplus
Albert KALONJI, Deputy Provincial Coordinator, IHPplus
Jérémie FIKIRI, Senior Technical Advisor, Health Commodities Supply chain, IHPplus
ssadiq
Typewritten Text
ssadiq
Typewritten Text
ssadiq
Typewritten Text
Appendix 6: Follow-up assignment report on recommendations to CDR and warehouses, February 2017
ssadiq
Typewritten Text
ssadiq
Typewritten Text
ssadiq
Typewritten Text
ssadiq
Typewritten Text
ssadiq
Typewritten Text
ssadiq
Typewritten Text
ssadiq
Typewritten Text
ssadiq
Typewritten Text
ssadiq
Typewritten Text
ssadiq
Typewritten Text
ssadiq
Typewritten Text
ssadiq
Typewritten Text

1. Résume exécutif des termes de référence de la mission
Noms et fonctions des participants
Serge NYEMBWE, Health Commodities Logistics Specialist
Albert KALONJI, Deputy provincial Coordinator
Jérémie FIKIRI, Senior Technical Advisor, Health Commodities Supply chain
N° de l’ordre de mission
N°0270/MSH/IHPplus/2016, №0272/MSH/IHPplus/2016,
Destination(s) et transit
Axe I : Kinshasa ‐ Lodja ‐ Bukavu ‐ Goma ‐ Kinshasa ‐ Mbujimayi ‐ Kinshasa, du 03
décembre 2016 au 09 février 2017
Axe II : Kinshasa ‐ Lubumbashi ‐ Kolwezi ‐ Lubumbashi ‐ Kinshasa, du 13 au 29/01/2017
Période de la mission Du 03 décembre 2016 au 09 février 2017
Bénéficiaire(s) /partenaire (s) visités
1. Fondation pour le Développement du Sankuru « FODESA »
2. Association Provinciale d’Approvisionnement en Médicaments Essentiels au Sud Kivu
« APAMESK »
3. Dépôt Central Médico‐pharmaceutique de la 8e CEPAC « DCMP 8eCEPAC Sud Kivu
4. Bureau Diocésain des Œuvres Médicales « BDOM » au Sud Kivu
5. Centrale d’Approvisionnement en Médicaments Essentiels de Lubumbashi
« CAMELU », extension de Kolwezi
6. Centrale d’Approvisionnement en Médicaments Essentiels de Lubumbashi
« CAMELU », Siège de Lubumbashi
7. Central d’Achat et de Distribution de Médicaments Essentiels du Kasaï‐Or
« CADMEKO »
8. Equipes des DPS (Divisions Provinciales de la Santé) des provinces visitées

Contexte et justification
Du 22 juin au 04 septembre 2016, SIAPS et IHPplus ont appuyé une mission d’accompagnement des CDR dans la réconciliation des commandes IHP et IHPplus. Cette mission consistait spécifiquement à : Fournir aux CDR le support nécessaire pour leur permettre de clôturer leurs
rapports de réception ; Actualiser les états de stocks ; Rafraichir les CDRs sur les procédures minimales de gestion des médicaments et
sur les clauses contractuelles ; Vérifier la conformité des entrepôts aux bonnes pratiques de gestion
d’entreposage des médicaments ; Echanger avec les DPS sur leur implication dans la gestion des
médicaments fournis par l’USAID à travers MSH aux zones de santé. Les principaux résultats obtenus à l’issue de cette mission étaient les suivants : Le contenu de chaque commande a été identifié et lié au Task Order
correspondant ; Les PV définitifs de réception ont été élaborés et les demandes de paiement de
frais de gestion sont adressées à MSH ; Les Etats de stock ont été élaborés et utilisés pour finaliser la quantification de
besoins pour la 3e commande de IHPplus ; Les CDR ont été suffisamment orientées sur les procédures mises en place pour
la gestion optimale des médicaments et sur les clauses contractuelles; Elles ont été également briefées sur le processus de dédouanement et sur le
circuit de transmission des documents commerciaux ; Des conseils pratiques ont été prodigués notamment sur : L’analyse des
réquisitions des Zones de Santé, la tenue des outils de gestion, la réalisation des inventaires, le suivi de température et de l’humidité relative, l’emplacement des extincteurs et sur leur utilisation, le rangement du stock ;
A l’issues des réunions tenues avec chaque DPS, ces dernières se sont engagées pour :
o Plus d’implication dans l’analyse des réquisitions transmises par les ZS aux CDR et dans l’élaboration des plans de distribution aux ZS ;
o Plus d’implication dans la quantification des besoins en médicaments ; o La sensibilisation des ZS sur l’utilisation des produits en risque de
péremption dans les CDR ; o Le suivi de lignes de crédit octroyées aux ZS et la remontée des fonds
de recyclage ; o Sanctionner les ZS qui feront preuve de mégestion des médicaments.
Le rapport de cette mission a énuméré 33 ACTIONS à mener pour améliorer la prestation des CDR ainsi que la disponibilité des médicaments dans les FOSA. Pour ne pas interrompre cet élan, le projet IHPplus envisage un accompagnement régulier pour s’assurer que ces 33 actions définies soient réellement appliquées sur terrain.
Objet/But de la mission
L’objectif de cette mission est d’assurer le suivi des recommandations de la mission
d’accompagnement des CDR effectuée de juin à septembre 2016

Objectifs spécifiques/ livrables
De manière spécifique, la mission compte se pencher sur les actions suivantes : 1. Calculer le stock utilisable de : Orazinc, Chlorhexidine 7.1%, AS Lysine, Lidocaïne
2%, Sulfate de Magnésium, Benzoate de benzyle,… dégager le surstock à redéployer (éventuellement), ainsi que les Etats de stock actualisés.
2. Uniformiser les versions du fichier DISMED dans toutes les CDR, et y insérer les alertes Péremption et MAD. Uniformiser aussi le fichier de suivi des lignes de crédit (SULIC) ;
3. Avec les DPS, évaluer les autres recommandations adressées à chaque CDR ; 4. Discuter la/les thématique (s) des prochaines missions de supervisions
conjointes DPS‐MSH dans les ZS ; 5. Compiler les états de besoin en Outils de gestion pour les FOSA ; 6. Faire le suivi des équipements récemment fournis par IHPplus aux ZS. 7. Trouver des justifications des écarts trouvés dans la réception des équipements.
2. Approches méthodologiques principales utilisées
Stratégies Oui Non Bref commentaire et précisions utiles
Revue documentaire X Partage du tableau des recommandations aux CDR/ Dépôts,
Interviews/entretiens et réunions/ateliers
X Echange avec partenaires sur l’objet de la mission, le circuit de la documentation notamment les factures commerciales, la tenue des outils de gestion et sur les bonnes pratiques de gestion ainsi que l’évaluation de l’exécution des recommandations faites pendant la mission précédente.
Visites de terrains X Visites des tous les entrepôts et entrepôts annexes. Visites de quelques FoSa bénéficiaires des équipements
3. Déroulement des activités
Période Lieux Activités clés et constats majeurs
Du 03 décembre 2016 au 09 Février 2017
DPS et CDR de : Sankuru (FODESA) Bukavu (DCMP 8e CEPAC, BDOM et APAMESK) Kasaï‐Oriental CADMEKO
Briefing de la Mission à l’équipe de Coordination MSH dès l’arrivée dans chaque province : Présentation des TDR et Harmonisation du programme. Cette étape était chaque fois suivie du Briefing à la Division Provinciale de la Santé. A l’issue de ce briefing, la DPS détachait un délégué pour accompagner la mission dans la CDR et sur terrain dans les ZS. Au sein des CDR et dépôts visités, la mission a abordé 2 aspects à savoir, les recommandations faites lors de la mission de réconciliation des commandes et la réception et distribution des équipements médicaux. Les résultats au regard de chaque Objectif spécifique sont énumérés dans les sections ci‐bas.

4. Principaux résultats obtenus
4.1. Résultats ‐ Objectif 1 : Calcul du stock utilisable de certains produits sous consommés (en risque de péremption)
A ce stade, partant des dernières données de consommation (données approximatives), nous avons dégagé, pour chaque CDR, une liste de produits et les quantités à redéployer pour éviter la péremption. Il s’agit essentiellement de 11 produits ci‐après : Amoxicilline dispersible, SRO‐Zinc, Acétyle Salicylate de Lysine, Lidocaïne 2%, Sulfate de Magnésium, Chlorhexidine digluconate 7.1%, Benzoate de benzyle, Test d’hépatite C, Test d’hépatite B et Test Syphilis RPR. Une attention particulière a été également portée sur l’Ocytocine.
N° DESIGNATION Prix
unitaire (en USD)
Quantités à redéployer
(En unités simples)
VALEUR (USD)
PRODUITS ORAUX 0
1 Amoxicilline, 250mg, Dispersible tab, 100 (ou 1000), Vrac $0.0198 20,836,469 $412,562.09
2 SRO 20.5g + Zinc Sulfate 20mg (2 sachets + 10 cp), kit $0.3000 609,907 $182,972.02
PRODUITS INJECTABLES
5 Acetyl Salicylate de Lysine, 1g $0.4106 4,555,227 $1,870,376.21
9 Lidocaïne chlorhydrate, 2%, 20 ml, Vial, Unité $0.7190 82,786 $59,522.94
10 Oxytocine, 10UI/ml, 1ml, Amp, Unité $0.1252 296,935 $37,176.31
11 Sulfate de Magnésium, 500mg, 10ml, Amp, Unité $0.7040 765,951 $539,229.50
PRODUITS ANTISEPTIQUES ET DESINFECTANTS
12 Chlorhexidine + Cetrimide, 1.5% + 15%, 1 l, flacon, Unité $3.3030 2,879 $9,507.69
13 Chlorhexidine digluconate 7,1%, 10gr, gel, tube, Unité $0.2600 25,897 $6,733.22
PRODUITS A USAGE EXTERNE
14 Benzoate de benzyle, 25%, 1litre, flacon, Unité $3.0900 2,910 $8,991.90
TESTS DIAGNOSTICS
15 Test, hépatite B, rapide, Détermine, Flacon 100 tests, Unité $1.2854 33,390 $42,919.51
16 Test, hépatite C, rapide, Détermine, Flacon 100 tests, Unité $2.6333 72,995 $192,217.73
17 Test, Syphilis, RPR, 250 tests $0.1265 31,579 $3,994.71
$3,366,203.82 Les détails par produits et par CDR sont présentés dans le fichier annexe « Produits sous consommés dans les CDRs ». En plus des produits ci‐haut énumérés, nous avons noté un sur stockage d’autres items tels que : 1. Quinine bichlorhydrate : 24597 ampoules, date de péremption 7/2017 qui risquent de périmer au dépôt
BDOM/Bukavu
2. Solutés massifs à la CADMEKO/Mbuji‐Mayi : ‐ 30000 poches de Dextrose 5%,500 ml, date de péremption 10/2017 ‐ 33499 poches de Solution physiologique 0,9%, date de péremption 10/2018

4.2. Résultats ‐ Objectif 2 : Uniformiser les versions du fichier DISMED dans toutes les CDR, et y insérer les
alertes Péremption et MAD. Uniformiser aussi le fichier de suivi des lignes de crédit (SULIC)
Durant cette mission, nous avons procédé à la révision et à l’installation d’une nouvelle version des fichiers DISMED UNIFORMISEE qui sera d'application dès ce mois de janvier 2017 dans toutes les CDR. Il s'agit ici des DISMED pour les MEG IHPplus, pour PMI et pour les Contraceptifs. Cet outil a été révisé afin d'aider à répondre aux recommandations du DQA (Data Quality Assessment) conduit par l’USAID avec les trois principaux objectifs ci‐après : 1. Assurer le suivi des produits pharmaceutiques livrés depuis les CDR/Dépôts vers les BCZS ou vers les autres
partenaires ; 2. Faciliter les Inventaires périodiques des produits pharmaceutiques ; 3. Alerter sur le risque de péremption des produits pharmaceutiques. Il sera mis à jour par le gestionnaire à chaque mouvement du stock, et sera transmis au Responsable chargé du Supply Chain au bureau de MSH en province. Ce dernier effectuera la première analyse (DQA) et transmettra le feedback à la CDR/Dépôt. Après cette étape, il transmettra l'outil à l'équipe Supply Chain du niveau national. A son tour, l'équipe nationale procèdera au DQA en collaboration avec l'Unité Contrat, puis transmettra le feedback aux bureaux de Coordination MSH en province. Enfin, l'équipe ne procèdera à la validation des données que lorsque toutes les zones d'ombre seront levées.
4.3. Résultats ‐ Objectif 3 : Etats de besoins en Outils de gestion pour les FOSA ; A ce jour, tous les bureaux de coordinations ont élaboré les états des besoins en outils de gestion des médicaments et le processus de reproduction est déjà en cours. Tous ces outils devront être disponibles dans les FOSA à la fin du mois de février 2017. Pour rappel, les outils à reproduire en priorité sont les suivants :
1. Fiches de stock (recto‐verso) ; 2. RUMER ; 3. Bon de commande ; 4. Fiche de suivi des consommations journalières pour HGR ; 5. Fiche de rapport mensuel de gestion des médicaments.
4.4. Résultats ‐ Objectif 4 : Faire le suivi de distribution des équipements récemment fournis par IHPplus
aux ZS.
D’une manière générale la distribution des équipements est en cours pour la plupart des coordinations visitées.
COORDINATION DE LODJA/SANKURU
Le bureau de coordination de Lodja a reçu les équipements via la CADMEKO/Mbuji‐Mayi, le premier lot des
équipements reçu est entreposé au BC IHPplus et aucune ZS n’est encore servie. Par ailleurs nous avons appris
sans aucun détail que le camion acheminant le complément d’équipements à Lodja aurait pris feu sur le trajet
entre Mbuji‐Mayi et Lodja.

COORDINATION DE BUKAVU/SUD‐KIVU
1. DEPOT APAMESK
Aucune ZS n’a encore été servie. APAMESK qui sert certaines ZS à Haut risque sécuritaire et difficilement
accessibles telle que la ZS des hauts plateaux, dit ne pas etre a mesure de livrer les équipements jusqu’à
destination finale. Pour d’autres ZS, APAMESK a déjà soumis le budget de transport qui attend l’approbation.
2. DEPOT BDOM
La plupart des ZS desservies par ce dépôt ont été servies en équipements.
3. DEPOT 8e CEPAC (DCMP)
La plupart des ZS desservies par ce dépôt ont été servies en équipements.
COORDINATION DE MBUJI‐MAYI /KASAI‐ORIENTAL ET LOMAMI
Le premier lot constitué de lits d’accouchement et des tables d’examen a été distribué aux ZS. Nous avons vérifié
l’effectivité de cette distribution dans quelques FoSa des ZS de Dibindi, Mpokolo, Mwene‐Ditu, Kalenda et
KandaKanda.
Les lits d’hospitalisation trainent encore à la CDR et le processus pour l’obtention des fonds est en cours pour
amorcer une deuxième vague de distribution.
Par ailleurs nous avons relevé quelques problèmes ci‐après :
‐ Dans toutes les structures de la ZS de KandaKanda, la visibilité du Projet est totalement absente sur les
équipements
‐ Dans d’autres structures, les équipements se trouvent encore dans leurs emballages d’origine, entreposés
dans un coin de la structure qui continue à utiliser les anciens équipements.
‐ D’autres structures encore ne sont pas arrivées à installer lesdits équipements, suite à la perte de certaines
pièces, comme des traverses. Et nous avons demandé que les structures fassent fabriquer localement pour
palier à ce problème.
COORDINATION DE KOLWEZI
Sur les 8 ZS de Lualaba, 5ZS ont été déjà servies. Il reste 3 ZS à savoir ZS de Mutshiatshia, ZS de Lubudi et ZS de
Bunkeya.

4.5. Résultats ‐ Objectif 5 : Trouver des justifications des écarts trouvés dans la réception des équipements
A ce jour nous ne disposons d’aucune documentation renseignant sur les quantités des équipements destinés aux
différentes coordinations. Nous attendons cette documentation du COMU pour permettre aux coordinations de
dégager les éventuels écarts et clôturer le processus de réception.
Cependant certaines ZS ont émis des plaintes en rapport avec la répartition desdits équipements. En effet certaines
structures ont reçu des tables d’examen alors qu’elles avaient besoin des lits d’accouchement.
4.6. Autres réalisations, constats et difficultés rencontrées:
Autres réalisations : Participation à la réunion de l’équipe cadre provinciale de la DPS Sankuru :
Au cours de cette réunion nous avons apporté les précisions à certaines préoccupations de la DPS en rapport avec l’approvisionnement en intrants notamment les intrants de la sécurité transfusionnelle.
Participation à la réunion de l’équipe cadre provinciale restreinte sur la cohabitation d’un projet de la Banque mondiale avec IHPplus dans 5ZS de la province du Sud‐Kivu.
Constats :
La distribution de l’insuline ne se fait pas sur base des besoins réels de ZS ou suivant la cartographie des malades diabétiques, ce qui ne nécessite toujours le redéploiement (Cas des ZS servies par le dépôt BDOM/Bukavu)
Les DPS apposent seulement les signatures sur les réquisitions de ZS sans avoir fait une analyse avec comme conséquences une sous‐utilisation des certains produits se trouvant dans les dépôts/CDR conduisant à des ruptures de stock dans les FoSa ; et sur estimation de certains autres items.
Présence des solutés massifs (Ringer lactate, Glucosé 5% et Solution physiologique) sans aucune mention sur les emballages (donc produits sans étiquette) a la CADMEKO. Nous soupçonnons le transporteur qui doit avoir changé des emballages de produits qui ont été souillés avec du gasoil et par conséquent nous avons demandé à la CDR de documenter cette situation et de les comptabiliser parmi les produits à détruire.
Certains dépôts des BCZs continuent à séquestrer les médicaments pendant que les FoSa accusent des ruptures de stock, cas de la ZS de Mpokolo au Kasaï‐Oriental. En effet nous avons trouvé dans ce BCZ des médicaments servis depuis novembre 2016 par la CADMEKO mais non encore livrés aux FoSa. Séance tenante nous avons exigé que ces médicaments soient livrés aux FoSa, et ceci a été fait avant notre départ de la ZS.
D’autres ZS accusent des lacunes/retard dans la documentation des livraisons effectuées vers les ZS, cas de la ZS de Dilala dans la province de Lualaba ou certaines livraisons effectuées vers les FoSa manquent de soubassements au BCZ.
Les deux frigos dotés à la CADMEKO pour la conservation des produits thermolabiles sont en panne.
Difficultés rencontrées :
Interruption de la mission suite à la situation politique imprévisible au pays qui a conduit au report de l’étape de la province du Kasaï‐Oriental et au Kasaï‐Central.

5. SUIVI DES RECOMMANDATIONS FAITES AUX DPS, CDR ET DEPOTS LORS DE LA MISSION DE JUIN –SEPTEMBRE 2016
Tableau synthèse sur le suivi de recommandations
DPS/CDR ou DEPOT Nbre de
recommandations
Nbre recommandations
exécutées
Nbre recommandations non exécutées
Nbre recommandations
en cours d’exécution
Taux d’exécution des
recommandations
FODESA/DPS SANKURU 15 5 7 3 33%
8 e CAPAC/DPS SUD‐KIVU 11 4 6 1 36%
APAMESK/DPS SUD‐KIVU 15 4 10 1 27%
BDOM/DPS SUD‐KIVU 12 3 6 3 25%
CADMEKO/DPS KASAI‐OR,LOMAMI 17 8 8 1 47%
CAMELU/DPS LUALABA 13 7 4 2 54%
6. Prochaines étapes (Next steps):
Actions à mener Responsable (s) Echéance
1. Signaler systématiquement à MSH (Logistic specialist) tout cas de livraison reçue aux CDR sans documents commerciaux
Toutes les CDR et dépôts
A chaque livraison
2. Partager la situation de stock disponible aux ZS pour faciliter l’élaboration des réquisitions (sans préciser la quantité disponible)
Toutes les CDR et dépôts
Chaque fin du trimestre
3. Rembourser aux CDR les dépenses engagées pour le transport des médicaments vers les ZS
MSH (Unité contrat) 1 mois après la facturation
4. Impliquer les CDR dans l’analyse des réquisitions des ZS DPS et staff SC Chaque trimestre
5. Préciser les soubassements à fournir par les CDR pour demander le remboursement des dépenses effectuées lors de la distribution des médicaments par les CDR aux ZS
MSH (Unité contrat) A chaque distribution
6. Transmettre le TO aux CDR au moins deux semaines avant le début de la livraison des commandes pour leur faciliter la réception
MSH (Unité contrat) A chaque commande
7. Annoncer toujours les livraisons aux CDR au moins une semaine avant pour permettre d’apprêter les espaces de stockage
MSH (Logistic specialist)
A chaque livraison

8. Sensibiliser les FOSA pour l’utilisation des produits sous‐consommés dans les CDR tels que les 13 médicaments qui sauvent les vies des femmes et des enfants
DPS et IHPplus Sans délais
9. Organiser trimestriellement des supervisions conjointes DPS‐MSH dans les BCZS, collecter et analyser les besoins de FOSA avec les BCZS, s’assurer qu’il n’y ait pas des colis destinés aux FOSA qui trainent au BCZS afin d’éviter les ruptures récurrentes de stock dans les FOSA. Une note circulaire sera élaborée à ce sujet
IHPplus et DPS Chaque trimestre.
10. Partager trimestriellement le rapport DISMED à MSH et à la DPS Toutes les CDR et dépôts
Chaque fin du trimestre
11. Installer un logiciel de gestion de stock dans les CDR qui n’en ont pas FODESA, CAMELU Kolwezi et APAMESK
Juin 2017
12. Améliorer les conditions de stockage et faire le suivi de la température et l’humidité dans les entrepôts annexes.
CADMEKO, APAMESK et FODESA
Mai 2017
13. Accompagner APAMESK pour l’amélioration des conditions de stockage Staff SC Sud Kivu Mai 2017
14. Acquérir les extincteurs restant et former tous les staffs à l’utilisation FODESA et APAMESK
Mars 2017
15. Placer les thermo‐hygromètres dans les entrepôts et dans les emplacements bien définis
FODESA et APAMESK
Mai 2017
16. Remplacer ou faire réparer les frigos en panne au dépôt MSH Kamina et ceux dotés a la CADMEKO
MSH (COMU) Juin 2017
17. Organiser des réunions trimestrielles entre la DPS, MSH et la CDR DPS pour convocation
Chaque trimestre
18. Acquérir 2 détecteurs de fumée et les placer dans les entrepôts FODESA Mars 2017
19. Ranger les MIILD en ordre des tas de 200 ballots afin de permettre un comptage
facile et rapide FODESA Mars 2017
20. Modifier les fiche de prélèvement de température dans tous les entrepôts et les
placer à côté de chaque thermo‐hygromètre digital dont FODESA doit se
procurer FODESA Mars 2017
21. Engager un pharmacien à temps plein pour compléter la structure de gestion APAMESK Mars 2017

22. Ajouter aux produits à détruire, les cartons des solutés massifs non étiquetés,
livrés par le Transitaire parce qu’ils sont impropre à la consommation. Ils sont
soupçonné d’appartenir aux lots des produits souillés par du carburant livrés par
le même transitaire
CADMEKO Février 2017
23. Suivre les solutés massifs en sur stock avec une attention particulière pour éviter
la péremption.
Staff SC, DPS et CADMEKO
Juin 2017
24. En attendant le déplacement des produits se trouvant dans les dépôts annexes
da la CADMEKO, les produits sont stockés dans les pires conditions et la CDR en
est conscient. Nous recommandons d’ouvrir les portes de ces dépôts au moins
pendant une heure chaque jour
CADMEKO Chaque jour aux heures de pointe
25. Renseigner les lots et dates de péremption sur toutes les fiches de stock
CADMEKO
Février 2017
26. Mettre à la disposition des bureaux de coordination toute la documentation concernant la liste et les quantités des équipements destinés à chaque bureau de coordination.
COMU Février 2017
27. Documenter la situation des solutés massifs sans étiquettes livrés par le transitaire GTM et comptabiliser ces produits parmi des produits à détruire.
CADMEKO Urgent
28. Prendre des mesures urgentes et proposer des actions concrètes pour
l’utilisation de la quinine injectable en sur stock au dépôt BDOM/Bukavu Staff MSH Bukavu Urgent
29. Prendre des mesures urgentes et proposer des actions concrètes pour
l’utilisation des solutés massifs en sur stock à CADMEKO Staff MSH Mbuji‐Mayi
Urgent

30. Contacts /personnes clés /responsables rencontrées
Noms Organisation Fonctions Téléphone
1. Pépin NABUGOBE DPS Sud Kivu Chef de division
2. ZOZO MUSAFIRI DPS Sud Kivu Chef de bureau Appui technique
3. Richard NECI DCMP 8e CEPAC Bukavu Directeur
4. Desmond KASHOSI APAMESK Bukavu Directeur
5. Emmanuel BASHAGALUKE BDOM Bukavu Responsable dépôt
6. Placide WELO DPS Sankuru Chef de division
7. Sr Mado ALOKA DPS Sankuru Chef de bureau Appro.
8. Albert DIWOKO FODESA dépôt Gestionnaire
9. François OSAKOLONGO FODESA Pharmacien responsable.
10. Janvier BARHOBAGAYANA MSH Bukavu
Directeur bureau IHPplus
11. Rose BOKASHANGA Conseiller technique
12. William KABONGO
MSH Sankuru
Directeur bureau IHPplus
13. Godefroid MUALA Conseiller technique
14. Barthelemy LUSUNA Logisticien
15. Romain MBO
MSH Kasaï‐Oriental
TA supply chain
16. Bony MUYA TA supply chain
17. Emmanuel MULUNDA Directeur bureau IHPplus de M‐Ditu
18. Stéphane KOLONGO CADMEKO Directeur
19. Daniel MBIKAYI CADMEKO Gestionnaire Pharmaceutique
20. Pierre KABEYA CADMEKO Gestionnaire de stock
21. Carl KAYIJ DPS Lualaba Chef de bureau Approv.
22. Adelard KAZADI CDR CAMELU Directeur
23. Pascaline Mampasa CDR CAMELU Gestionnaire
24. Bavon Ngoyi MSH Lualaba Conseiller technique
25. Thierry Salumu MSH Lualaba Directeur bureau IHPplus
26. Doudou TUBAYA MSH Haut Katanga Directeur bureau IHPplus
27. Moise KAZADI MSH Haut Katanga Conseiller technique
28. Pacifique BWENGE MSH Haut Katanga Conseiller technique
29. DPS Lualalba MCZ Dilala
30. DPS Lualaba Gestionnaire pharmacie Polyclinique Methodiste
31. Description des documents et supports annexes du rapport de mission (disponibles pour détails)
Nom/intitulé du fichier Thème/sujet Type
1. Termes de référence
2. Tableau de suivi des recommandations
3. Plan de distribution des équipements
4. Liste des produits sous utilisés a redéployer.
5. Photos

ANNEXE
LISTE DES EQUIPIMENT LIVRES DANS LES DIFFERENTES COORDINATIONS
# Description Dimension Details/ propiétés Poids max à supporter
BUKAVU MBUJIMAYI KANANGA L'SHI TOTAUX
1 Table d'examen 1,80 cm X 80 cm Tube d'acier, appui‐tête ajustable
150 Kg 280 225 137 120 762
2 Table d'accouchement 1,80 cm X 60 cm X 78 cm 3 plans, démontable, avec matelas
150 Kg 280 225 137 120 762
3 Lit d'hospitalisation sans roulettes 190 cm X 80 cm X 50 cm Tube d'acier, rectangular box, appui‐tête ajustable
150 Kg 1900 1318 800 700 4718
4 Matelas d'hospitalisation 190 cm X 80 cm X 15 cm 20 450 0 0 0 450
5 Matelas de Centre de Santé 18 1450 0 0 0 1450

PHOTOS

1 | P a g e
REPUBLIQUE DEMOCRATIQUE DU CONGO MINISTERE DE SANTE PUBLIQUE
PROGRAMME NATIONALE DE LUTTE CONTRE LE VIH/SIDA ET LES IST
Rapport de la formation sur l’utilisation de l’outil de dispensation électronique (ODE) à Lubumbashi
Appuyée par Management Sciences for Health (MSH)
Février 2017
ssadiq
Typewritten Text
Appendix 7-Final Report on the Electronic Drug Dispensing Tool Training

2 | P a g e
Table des matieres I. CONTEXTE ET JUSTIFICATION ...................................................................................................................... 3
II. OBJECTIFS .................................................................................................................................................... 3
II.1 Objectif Général......................................................................................................................................... 3
II.2 Objectifs spécifiques .................................................................................................................................. 3
III. METHODOLOGIE ...................................................................................................................................... 4
IV. DEROULEMENTS DES ACTIVITES.............................................................................................................. 4
V. RESULTATS ATTEINTS ................................................................................................................................ 10
V.1 Travaux préparatoires réalisés avec la Coordination Provinciale du PNLS et la DPS ............................. 10
V.2 Prestataires formés sur l’utilisation de l’ODE ......................................................................................... 10
V.3 L’ODE déployés dans six sites de traitement antirétroviral .................................................................... 10
V.4 Analyse du circuit de patients aux niveaux de sites visités ..................................................................... 11
VI. EVALUATION GENERALE DE LA FORMATION PAR LES PARTICIPANTS .................................................. 12
VII. ANALYSE DE FORCES ET POINTS D’AMELIORATION DE LA FORMATION, AINSI QUE LE DEFI A RELEVER 14
VII.1 Points forts ............................................................................................................................................ 14
VII.2 Points à améliorer ................................................................................................................................. 14
VII.3 Défis à relever ....................................................................................................................................... 14
VIII. RECOMMANDATIONS/SUGGESTIONS ................................................................................................... 14
IX. CONCLUSION ......................................................................................................................................... 15
X. ANNEXES .................................................................................................................................................... 16

3 | P a g e
I. CONTEXTE ET JUSTIFICATION
La disponibilité et l’accès permanents aux antirétroviraux (ARV) et autres intrants VIH dépendent de la bonne gestion des données et information sur les patients et médicaments ARVs nécessaire pour la réussite des programmes de traitement antirétroviral dans les formations sanitaires (FOSA).. Dans le souci d’améliorer l’acces aux traitement ARV et d’offrir des services de qualité aux malades, il s’avère important de doter les FOSAs qui prennent en charge les PVVIH/SIDA d’un outil de gestion données de malades et médicaments afin d’améliorer la prise de décisions relatives au traitement ARV. Ainsi, en rapport avec son plan d’action FY5, les programmes SIAPS au départ, et PROSANIplus après mis en œuvre par MSH, ont reçu, parmi tant d’autres, mandat d’appuyer la chaine d’approvisionnement des intrants de lutte contre le VIH dans les zones de sante sous appui PEPFAR dans les provinces du haut Katanga et Lualaba. Conjointement avec le PNLS, PEPFAR a demandé à SIAPS de mettre en œuvre l’outil de dispensation électronique (ODE) dans les sites de prise en charge de PVVIH en vue d’améliorer la disponibilité de commodités de lutte contre les VIH/Sida dans les provinces précitées. Une mission d’identification et d’évaluation de sites de prise en charge où devrait se dérouler la mise en œuvre pilote de l’ODE avait eu lieu en Septembre dernier et avait abouti à la confirmation de 4 sites de prise en charge de PVVIH dans le Haut Katanga (Centre d’excellence Sendwe, HGR de la Kenya, HGR Kamalondo et les cliniques Universitaires) et 2 sites dans le Lualaba (HPK, et HGR Mwangezi). La mission du 13 au 19 Février 2017 avait comme objectif de de former les parties prenantes sur l’utilisation de l’ODE et déployer l’ODE dans les 6 sites identifies.
II. OBJECTIFS
II.1 Objectif Général.
Cette formation avait pour objectif de contribuer au renforcement des capacités sur la gestion de l’information sanitaire dans les zones de sante appuyées par PEPFAR dans la DPS du Haut-Katanga et Lualaba
II.2 Objectifs spécifiques
Les objectifs spécifiques de la formation ont été les suivants : Travailler avec la Coordination Provinciale du PNLS et la DPS pour préparer la
formation ; Former les prestataires sur l’utilisation de l’ODE en les familiarisant avec les principales
notions de pratiques de dispensation et de gestion pharmaceutique, en les dotant de connaissances de l’outil électronique et autres moyens techniques leur permettant de mieux collecter et gérer les données des patients et des produits ARVs et de générer les informations nécessaires au bon fonctionnement de leur formation sanitaire ; Assurer le suivi post formation de l’ODE.

4 | P a g e
III. METHODOLOGIE Pour atteindre nos objectifs, nous avons procédé à des réunions préparatoires, à la formation proprement dite en utilisant les techniques suivantes :
• les exposés illustrés ; • le brainstorming ; • les démonstrations ; • travaux en groupe et discussions ; puis déploiement de l’ODE dans les sites de prise
en charge et enfin aux visites de suivi post-formation. • Les visites de suivi post-formation ont permis d’accompagner les prestataires à
encoder les données des produits et des patients dans l’ODE.
IV. DEROULEMENTS DES ACTIVITES
Tableau I. Chronogramme du déroulement de la mission de formation des sur l’utilisation de l’ODE N° Jour et date Activités 1 Lundi
13/02/2017 • Voyage de l’équipe des facilitateurs constituée par un
expert PNLS et 3 partenaires MSH de Kinshasa vers Lubumbashi ;
• Logement de membre de l’équipe des facilitateurs ; • Présentation des civilités aux autorités sanitaires de la DPS
Haut-Katanga ; • Retour de chacun à sa résidence.
2 Mardi 14/02/2017
• Voyage d’un autre expert PNLS Kinshasa vers Lubumbashi ; • Organisation de la réunion pédagogique entre les experts
PNLS et les partenaires MSH ; • Installation de logiciel ODE dans les machines ; • Préparation de la salle de réunion Dr Franck FWAMBA
N’KULU où il s’est tenu la session de formation ; • Retour de chacun à sa résidence.
3 Mercredi 15/02/2017
• Jour 1, organisation de la session de formation sur l’outil de dispensation électronique (ODE) en suivant les étapes suivantes :
- La présentation des participants ; - La présentation du mot d’ouverture par le chef de
division de la DPS Haut-Katanga ; - La définition de conduite à suivre lors de la
formation ; - La formation proprement dite ; - L’évaluation de la journée par les facilitateurs ; - Le retour de chacun à sa résidence.

5 | P a g e
4 Jeudi 16/02/2017
• Jour 2, organisation de la session de formation sur l’outil de dispensation électronique (ODE) en suivant les étapes suivantes :
- La poursuite de la formation proprement dite ; - L’évaluation de la journée par les participants ; - L’évaluation de la journée par les facilitateurs ; - L’retour de chacun à sa résidence.
5 Vendredi 17/02/2017
• Jour 3, la descente sur terrain pour accompagner les gestionnaires de la dispensation des HGR Kenya et Kamalondo.
• L’installation de l’imprimante ; • Le début d’enregistrement des données dans l’ODE sur les
produits et les patients dans les différents HGR. 6 Samedi
18/02/2017 Le voyage de retour Lubumbashi vers Kinshasa par un expert PNLS
7 Dimanche 19/02/2017
Le voyage de retour Lubumbashi vers Kinshasa par un autre expert PNLS
Tableau II. Les facilitateurs à la formation des prestataires sur l’utilisation de l’ODE N° Nom et post-nom Institution Fonction Téléphone e-mail 1 Ph. MASEKE
MATONDO PNLS/DN CS/MED 0819437183 [email protected]
m 2 Dr. INGWE CHUY PNLS/DN CS/PEC 0817471991 [email protected] 3 Ph. BASUA Marc MSH/Kin STA/M&E [email protected] 4 Ph. TUALA Robert MSH/Kin STA/PC [email protected] 5 Dr. KANJINGA
KAKANDA MSH/Washington
6 Ph. KAZADI Moïse MSH/L’shi TA/SC [email protected] 7 Ph. BWENGE
Pacifique MSH/L’shi TA/SC [email protected]

6 | P a g e

7 | P a g e
Tableau III Les participants à la formation des prestataires sur l’utilisation de l’ODE
N° Title First Name Last Name Gender M/F
Tel e-mail Organisation
1 Pharmacien Evodie NUMBI F 812613664 [email protected] BCZS/LSHI
2 Prep Phcie Clémence KASHALA F 812053132 HGR/MJI
3 MCP BALTAS KABEYA M 9.913E+09 [email protected] PNLS/LLBA
4 Pharmacien XAVIER MUSANGWA M 840649192 HGR/CUL
5 S.E EDGARD KAZADI M 819651347 [email protected] PNLS/HK
6 GAS IRENE SAKADJENGU F 815360877 [email protected] PNLS/HK
7 IT/PEC JUDITH LUAISHA F 810529545 HPK
8 Pharmacien BABY KASONGO F 815056651 HGR/KENYA
9 Pharmacien INES NKULU F 997029115 [email protected] BCZS/KENYA
10 ASS PHCIE PASCALINE MBUYU F 995605614 HGR/KENYA

8 | P a g e
11 Pharmacien CYNTHIA KIBWE F 991238928 [email protected] HGR/KAMALONDO
12 INF PEC JULIE LUSANGA F 821317061 HGR/KAMALONDO
13 Pharmacien ELODIE LUMBU F 813501916 [email protected] BCZS/KAMALONDO
14 AT DODO MANDA M 997324120 CE/SENDWE
15 Pharmacien GUY KANDJA M 814826558 [email protected] CE/SENDWE
16 ass S.E ANNIE OMANDE F 995376980 PNLS/HK
17 Pharmacien NGOI WA NSENGA M 972616963 [email protected] MSH
18 Pharmacien KAYIJ KATSHIEZ KARL
M 999597210 [email protected] DPS/LLBA
19 INF PEC FRANCINE KARAJ F 993445440 HGR/CUL
20 Pharmacien JEAN CHRIST
KILOBWA M 812184751 [email protected] DPS/HK

9 | P a g e
21 Pharmacien Gracia MANYONGA F 0821737398 [email protected] CE/SENDWE
22 Infirmier Irene MWEPU F 0997291540 HGR/CUL

10 | P a g e
V. RESULTATS ATTEINTS
V.1 Travaux préparatoires réalisés avec la Coordination Provinciale du PNLS et la DPS Un travail a été réalisé en équipe (PNLS/DN, PNLS/Haut-Katanga et MSH) pour préparer la formation des gestionnaires des commodités avec l’outil de dispensation électronique. Les étapes suivantes ont été suivies :
• Réunion pédagogique sur le déroulement de la formation ; • La préparation de la salle de réunion Dr Franck FWAMBA N’KULU ; • Transport des desktops de bureau MSH vers la salle de réunion Franck FWAMBA N’KULU
où s’est tenue la formation ; • Installation des ordinateurs suivis d’arrangement de la salle.
L’esprit d’équipe crée pendant ces séances de travail a donné lieu un environnement propice pour la formation.
V.2 Prestataires formés sur l’utilisation de l’ODE
Un total de 22 prestataires (10 hommes et 12 femmes) ont été formés sur l’utilisation de l’outil de Dispensation Electronique. Ils ont acquis de nouvelles compétences en rapport avec :
- La réception des médicaments dans l’ODE - L’enregistrement de nouveaux patients - La dispensation des médicaments aux patients et la production de différents rapports de
gestion (patients et médicaments).
V.3 L’ODE déployés dans six sites de traitement antirétroviral
L’équipe de formateurs (IHPplus et PNLS composée de Marc Basua, Kanjinga Kakanda, Moise Kazadi, Pacifique Mbwenge, Robert Tuala, Richard Nshwe et Dieu merci) a procédé à l’installation de l’ODE dans les sites de la manière suivante :
Le 17 février 2017, l’équipe a installé l’ODE dans deux premiers sites pilotes à l’hôpital général de référence de la Kenya et à l’hôpital de Kamalondo.
Le 18 février 2017 l’installation et le suivi se sont faits au 3eme site pilote au centre d’excellence Sendwe, suivi de l’installation dans le 4 eme site aux cliniques universitaires de Lubumbashi.
Le 22 février 2017 l’installation s’est fait dans le 5eme site à l’hôpital général de référence de Mwangeji, à Kolwezi.
La dernière installation a eu lieu le 23 février 2017 à l’hôpital du personnel de Kolwezi (HPK)
Le 24 février 2017, l’équipe a continué le suivi dans les deux sites Mwangeji et HPK
Chaque site a reçu un kit d’équipement informatique et accumulateurs d’énergie pour faire face aux coupures intempestives de l’énergie électrique. Les prestataires impliques dans la dispensation des ARVs ont été coachés sur l’utilisation pratique de l’ODE (encodage de données de patients et médicaments, réception de nouveaux stock, enregistrement de nouveaux patients, dispensation, etc.

11 | P a g e
V.4 Analyse du circuit de patients aux niveaux de sites visités La Figure I ci-dessous résume le circuit de patients de l’accueil a la sortie au niveau des sites
Figure I : Circuit de patients au niveau de formations sanitaires et sites de prise en charge des PVVIH/SIDA
Consultation
Acceuil
Test VIH Positif?
Signes vitaux, Anamnese, DCIP, Prescription examens
(VIH, etc.)
Capture donnees demographiques
Depistage & Counseling
Oui Non
Pour autres investigations
PEC PVVIH
Acceuil Capture donnees demographiques
Consultation (1), (2), (3) etc.
Signes vitaux, Anamnese, Examens (CD4, CV, etc.), Prescription ARVs
Point (1) Dispensation
Point (3) Dispensation Point (2)
Dispensation
SORTIE
ODE (EDT)

12 | P a g e
Comme indiqué dans la Figure I, il y’a des sites avec un seul point de dispensation et d’autre avec plus d’un. Deux des sites visités (CUL et HPK Dilala) ont plus d’un point de dispensation des ARVs, mais les quatre autres ont un seul point de dispensation.
Le déploiement de l’ODE, à ce stade pilote, nécessite qu’il y ait un seul point de dispensation afin de permettre l’enregistrement et la capture de données de tous les patients sous ARV dans l’outil. Par ailleurs, comme pour les patients, tous les stocks de produits ARVs et autres produits IO présent au niveau du site doivent être enregistre dans l’outil.
Pour le cas de CUL et HPK Dilala ayant plus d’un point de dispensation, l’ODE a été installé au point ayant plus de patients (80% de patients) ; ainsi un mécanisme sera mis en place pour que les données de patients et de médicaments des autres points de dispensation soient régulièrement transférées à l’outil a posteriori. Il est important de signaler que la situation idéal serait de faire la capture de données a temps réel, c’est-à-dire directement pendant la dispensation. Pour ce faire, il faudrait mettre en place système de réseau pour la dispensation au diffèrent points. Pour l’instant, a l’absence de ce system de réseau, les points de dispensation secondaires devront remonter leurs données en utilisant un system de rapportage en dur ou électronique.
VI. EVALUATION GENERALE DE LA FORMATION PAR LES PARTICIPANTS
Au travers d’une évaluation générale de la formation, les participants ont exprimé leur perception sur les 4 paramètres suivants : 1) atteinte des objectifs du cours, 2) impression générale du cours, 3) contenu, format et matériaux du cours, et 4) organisation du cours. Le tableau ci-après résume la perception de participants sur cette formation
Tableau IV. Les résultats de l’évaluation générale de la formation sur l’utilisation de l’ODE par les participants
Légende : 4 = excellent, 3 = bien, 2 = assez bien et 1 = médiocre
Paramètres d’évaluation Cotation (Moyenne ; n=16)
Commentaire pertinent
4 3 2 1 1) Atteinte des objectifs du cours
Expliquer l’importance d’un système de gestion d’information sur les ARV dans les établissements de santé
X
Enregistrer les données des patients et les régimes utilisés dans l’ODE
X
Préparer des rapports types sur la dispensation dans les établissements de santé
X
Discuter les stratégies et plans d’action pour améliorer le système de saisie et de communication des données
X
2) Impression générale du cours Comment évalueriez-vous votre satisfaction générale avec le cours ?
X

13 | P a g e
Est-ce que le cours a répondu à vos attentes et vos besoins en matière de formation ? Veuillez expliquer votre réponse
X
Les formateurs ont-ils été clairs et faciles à comprendre
X Les formateurs ont été trop rapide le premier jour
3) Contenu, format, et matériaux du cours Le cours a-t-il couvert tous les besoins essentiels pour améliorer le système d’information de gestion pharmaceutique de votre clinique ?
X
Quelle est votre opinion des formats des différentes sessions, des études des cas, des exercices et des discussions. Veuillez expliquer votre réponse
X
Comment évalueriez-vous les matériaux du cours (ronéos, diapositives, copies, etc.) ? Veuillez expliquer votre réponse
X
Les idées discutées ont-elles été appropriées à vous et votre fonction actuelle ?
X
Comment évalueriez-vous le degré de difficulté du contenu du cours?
X Il faut augmenter le nombre de jours de formation
4) Organisation du cours • Gestion générale du cours
• Ponctualité • Quelle devrait être, selon vous, la
durée de ce cours ?
X
Temps assigné aux différentes sessions X Coordination des sessions (distribution des matériaux et outils utilisés au cours de la facilitation, etc.)
X
Structure et organisation du cours X Nourriture et logement X Salle de conférence X
Le Tableau IV indique que, selon la perception des participants, sur le 18 paramètres évalués, 5 (27%) ont reçu la mention ‘Excellent’, 12 (67%) ont reçu la mention ‘Bien’, et un seul paramètre (6%) a reçu la mention ‘Assez bien’. Cette mention (assez bien) était attribuée en réponse a la question ‘Comment évalueriez-vous le degré de difficulté du contenu du cours?’ qui était, selon les commentaires de quelques participants, peu compréhensible et quelque peu ambiguë.
Concernant les commentaires pertinents faits par le participants, le commentaire qui est revenu le plus est celui en rapport avec la durée de la formation estimée trop courte par la majorité de participants.

14 | P a g e
VII. ANALYSE DE FORCES ET POINTS D’AMELIORATION DE LA FORMATION, AINSI QUE LE DEFI A RELEVER
VII.1 Points forts
• L’implication des autorités sanitaires (chef de division Haut-Katanga, les MCP « Haut-Katanga et Lualaba », les médecins chef de zone) ;
• La participation des apprenants à la formation en apportant leurs contributions ; • L’appropriation de l’ODE par les gestionnaires de la dispensation ; • L’installation du logiciel et les accessoires dans les sites choisis ; • L’agenda de formation a été épuisé ; • L’opérationnalisation immédiate de l’ODE dans les FOSA.
VII.2 Points à améliorer • Le temps imparti (2 jour) pour la formation a été insuffisant ; • Le choix inapproprié des quelques participants qui semblés être à leurs première fois de
manipulation de l’outil informatique ; • Quelques failles logistiques.
VII.3 Défis à relever
• Que faire pour avoir la totalité d’informations dans l’ODE sur la gestion des patients dans le PODI ?
• Comment rassembler les données dans l’ODE sur la gestion des patients dans les FOSA où la dispensation des ARV se fait dans plusieurs portes ou points de dispensation?
• La nécessité de mettre en place des points de centralisation et le système de transmission des informations produites dans les FOSA qui utilisent l’ODE.
VIII. RECOMMANDATIONS/SUGGESTIONS • Prévoir 3 ou 4 jours à la formation sur l’utilisation de l’ODE ; • Respecter le profil des utilisateurs de l’ODE pour les prochaines formations
(l’importance de maitriser l’outil informatique pour participer à la formation) ; • Essayer les matériels d’apprentissage avant le début de la formation ; • Mettre en place le système de transmission et centralisation des informations produites
par les gestionnaires pharmaceutique en utilisant l’ODE ; • Instaurer les FBR (PBF) pour motiver les prestataires pour des meilleurs résultats

15 | P a g e
IX. CONCLUSION
Les bailleurs (PEPFAR, FM et autres Systèmes des Nations Unies) investissent une grande proportion des fonds au pays pour les achats des médicaments et autres intrants de lutte contre le VIH/Sida. Au terme de cette formation, nous voulons que le PNLS puisse s’approprier l’Outil de Dispensation Electronique (ODE) pour assurer une gestion efficace, efficiente et rationnelle des ARVs et autres intrants de lutte contre le VIH/Sida en vue d’améliorer la qualité de prise en charge des PVVIH.

16 | P a g e
X. ANNEXES ANNEXE 1
COMPTE RENDU DE LA PREMIERE JOURNEE DE FORMATION SUR L’OUTIL DE DISPENSATION ELECTRONIQUE DU 15 AU 16 FEVRIER 2017
Le premier jour a commencé par l’enregistrement et la présentation des participants et des facilitateurs, suivi du mot d’ouverture par le Chef de Division de la DPS Haut-Katanga,
Sous la conduite du modérateur un règlement d’ordre a été mis sur pieds et l’équipe de rapportage a été désignée.
La première présentation concernait les objectifs de la formation, ainsi donc les participants devront à la fin de cette formation être capables de:
• Expliquer l’importance d’un système de gestion de l’information au niveau des programmes de santé ;
• Enregistrer les données des patients et des intrants VIH et IO avec l’Outil de Dispensation Electronique (EDT) ;
• Produire divers rapports sur la gestion des intrants VIH et des patients sous traitement antirétroviral au sein de leurs institutions de santé ;
• Suggérer des solutions en vue d’améliorer le système de collecte des données et rapportage.
La seconde présentation était relative à l’introduction à l’outil de dispensation électronique, elle s’est focalisée sur la définition de l'Outil de Dispensation Electronique (ODE), les différentes fonctions de l’ODE, la mise en place de l’ODE, ce que l’ODE peut apporter et les pays dans lesquels l’ODE est utilisé.
La troisième présentation concernait la gestion de l’information pharmaceutique qui est capitale pour garantir une disponibilité efficiente des ARV et autres intrants de lutte contre le VIH/Sida et les IST, et encore pour éviter d’une part les ruptures de stock et d’autre part les pertes par péremption.
La quatrième présentation a été centrée sur la saisie des données. Pour ce faire, la démonstration d’utilisation de l’ODE, des exercices pratiques relatifs à l’installation et l’ouverture de l’ODE ainsi que la réception, la gestion, la saisie de données de nouveaux patients, la modification des données et la production des rapports a été exécutés.
La difficulté logistique a poussé les facilitateurs d’introduire une matière qui devait être présenté au 2ème jour de la formation d’utilisation de l’ODE. Il s’agit en fait de la présentation sur la révision du module rapport. Ainsi donc il a été démontré que l’ODE à l’aptitude de produire divers rapports GAS nécessaires pour la prise des décisions.
Après la reprise des exercices pratiques, la deuxième journée a pris fin avec un résumé fait par le modérateur suivi d’une évaluation de la journée par les facilitateurs.

17 | P a g e
COMPTE RENDU DE LA DEUXIEME JOURNEE DE FORMATION SUR L’OUTIL DE DISPENSATION ELECTRONIQUE DU 15 AU 16 FEVRIER 2017
La deuxième journée a débuté par la lecture du compte rendu du jour 1 qui a été adopté après amendement et il s’en est suivi des exercices pratiques sur la gestion des produits et de patient dans l’ODE. La journée a pris fin après les recommandations pratiques sur l’entretien des matériels informatiques et le programme de mise en œuvre dans les quatre sites de la DPS de Haut-Katanga pour les deux jours suivants.
Jour 4 (Vendredi 17 Février 2017)
Avant-midi : Installation des kits informatiques et autres matériel dans le site 1 accompagné du coaching des gestionnaires du site sur l’encodage des produits et des patients.
Après-midi : Installation des kits informatiques et autres matériel dans le site 2 accompagné du coaching des gestionnaires du site sur l’encodage des produits et des patients.
Jour 5 (Samedi 18 Février 2017)
Avant-midi : Installation des kits informatiques et autres matériel dans le site 3 accompagné du coaching des gestionnaires du site sur l’encodage des produits et des patients.
Après-midi : Installation des kits informatiques et autres matériel dans le site 4 accompagné du coaching des gestionnaires du site sur l’encodage des produits et des patients.

18 | P a g e
ANNEXE 2
AGENDA
Temps J1 – (Fev.) J2 – (Fev.) J3- (Fev.) J4 – (Fev.) J5 – (Fev.) FORMATION DES UTILISATEURS DEBUT DE LA MISE EN OEUVRE – visite des sites 9:00 – 9:30 - Réunion avec
l’équipe provinciale – Orientation sur EDT
-Enregistrement -Mot d’ouverture de la formation -Objectifs de la formation
RECAP Jour 1 Début de la mise en œuvre – SITE 1
Début de la mise en œuvre – SITE 3
9 :30 – 10 :00
Introduction à l’outil de dispensation électronique
Révision des exercices
10 :00 – 10 :30
La saisie des données Révision des exercices
10 :30 – 11 :00
PAUSE-CAFE PAUSE-CAFE
11 :00 – 12 :00
La saisie des données Exercice pratique
12 :00 -13 :00
Derniers préparatifs – y compris Salle/installation des ordinateurs, etc…
La saisie des données Discussion des résultats des exercices pratiques
Début de la mise en œuvre – SITE 2
Début de la mise en œuvre – SITE 4
13 :00 – 14 :00
DEJEUNER DEJEUNER
14 :00 – 14 :45
Exercices pratiques Révision du module Rapports
14:45 – 15 :45
Révision des exercices Evaluation - Etapes suivantes
15 :45 – 16 :00
PAUSE-CAFE PAUSE-CAFE
16 :00 – 16 :45
Exercices pratiques Etapes suivantes
16 :45 – 17 :00
Clôture de la journée Clôture de la formation

19 | P a g e
ANNEXE 3
Le calendrier de suivi post-formation
Mois et année Activités Indicateurs Niveau de réalisation C P N
Avril 2017
Evaluation des quantités des intrants de lutte contre le VIH/Sida et les IST ainsi que la TB reçues.
Pourcentage d’intrants reçus qui sont concordant dans les FOSA pendant la période de suivi
Disponibilité en intrants de lutte contre le VIH/Sida (ARV, Tests et médicaments IO).
Nombre de jour de rupture des intrants de lutte contre le VIH/Sida et les IST ainsi que la TB
Taux rétention des patients sous ARV pendant la période.
Pourcentage de perdu de vue dans la FOSA pendant la période de suivi.
Difficultés rencontrées dans l’utilisation de l’ODE
Les gestionnaires pharmaceutiques
Recommandations/suggestions Les gestionnaires pharmaceutiques
Juin 2017
Evaluation des quantités des intrants de lutte contre le VIH/Sida et les IST reçues.
Pourcentage d’intrant reçu qui est concordant dans les FOSA pendant la période de suivi
Disponibilité en intrants de lutte contre le VIH/Sida (ARV, Tests et médicaments IO).
Nombre de jour de rupture des intrants de lutte contre le VIH/Sida et les IST ainsi que la TB
Taux rétention des patients sous ARV pendant la période.
Pourcentage de perdu de vue dans la FOSA pendant la période de suivi.
Difficultés rencontrées dans l’utilisation de l’ODE
Aux gestionnaires pharmaceutiques
Recommandations/suggestions Aux gestionnaires pharmaceutiques
Aout 2017
Evaluation des quantités des intrants de lutte contre le VIH/Sida et les IST reçues.
Pourcentage d’intrant reçu qui est concordant dans les FOSA pendant la période de suivi
Disponibilité en intrants de lutte contre le VIH/Sida (ARV, Tests et médicaments IO).
Nombre de jour de rupture des intrants de lutte contre le VIH/Sida et les IST ainsi que la TB
Taux rétention des patients sous ARV Pourcentage de perdu de vue dans la FOSA

20 | P a g e
pendant la période. pendant la période de suivi. Difficultés rencontrées dans l’utilisation de l’ODE
Les gestionnaires pharmaceutiques
Recommandations/suggestions Les gestionnaires pharmaceutiques
Novembre 2017
Evaluation des quantités des intrants de lutte contre le VIH/Sida et les IST reçues.
Pourcentage d’intrant reçu qui est concordant dans les FOSA pendant la période de suivi
Disponibilité en intrants de lutte contre le VIH/Sida (ARV, Tests et médicaments IO).
Nombre de jour de rupture des intrants de lutte contre le VIH/Sida et les IST ainsi que la TB
Taux rétention des patients sous ARV pendant la période.
Pourcentage de perdu de vue dans la FOSA pendant la période de suivi.
Difficultés rencontrées dans l’utilisation de l’ODE
Les gestionnaires pharmaceutiques
Recommandations/suggestions Les gestionnaires pharmaceutiques
Février 2018
Evaluation des quantités des intrants de lutte contre le VIH/Sida et les IST reçues.
Pourcentage d’intrant reçu qui est concordant dans les FOSA pendant la période de suivi
Disponibilité en intrants de lutte contre le VIH/Sida (ARV, Tests et médicaments IO).
Nombre de jour de rupture des intrants de lutte contre le VIH/Sida et les IST ainsi que la TB
Taux rétention des patients sous ARV pendant la période.
Pourcentage de perdu de vue dans la FOSA pendant la période de suivi.
Difficultés rencontrées dans l’utilisation de l’ODE
Les gestionnaires pharmaceutiques
Recommandations/suggestions Les gestionnaires pharmaceutiques

Appendix 8: CDCS Results Framework – Activity Crosswalk
Using the USAID/DRC Country Development Cooperation Strategy results framework, please complete the matrix below to indicate which implementation activities contribute to achieving USAID/DRC’s strategic objectives and intermediate results. Fill out the table by listing activities in the first column and identifying the intermediate results (IR) number in the appropriate objective column. Please also include a page number reference in this report where more information can be found about each activity listed in the table.
Implementation Activities
PY2Q3 Report page number reference
Development Objective 1: Selected national-level institutions more effectively implementing their mandates
Development Objective 2: Lives improved through coordinated, sustainable development approaches in selected regions
Transition Objective 3: Foundation for durable peace strengthened in Eastern DRC
IR 1.1 Capacity to identify constraints to development and propose solutions increased.
IR 1.2 Capacity to create policy and legal frameworks in targeted sectors improved.
IR 1.3 Capacity to implement selected policies, laws, and programs enhanced.
IR 1.4 Congolese resources made available for selected sectors.
IR 2.1 Local service delivery institutions strengthened.
IR 2.2 Citizens empowered to access quality services.
IR 2.3 Provincial and local stakeholders adopt common goals and agenda for accountable governance.
IR 3.1 Practical solutions to specific drivers of conflict identified and accepted.
IR 3.2 Promising interventions to establish or solidify peace implemented.
IR 3.3 Humanitarian and protection services provided.
• Monitored pharmaceutical management p. 23-31 2.1; 2.2
• Conducted health zone inventory data checks p. 23-31 2.1; 2.2
• Delivered EGM p. 23-31 2.1; 2.2 • Procured EGM and PMI
commodities p. 23-31 2.1; 2.2
• Procured PEPFAR commodities p. 23-31 2.1; 2.2

• Provided EGM drugs and management tools to community care sites
p. 31-37 2.1; 2.2
• Supervised community care sites p. 31-37 2.1; 2.2
• Conducted awareness-raising campaigns on World Pneumonia Day
p. 31-37 2.1; 2.2
• Rehabilitated 136 new water sources p. 39-44 2.1; 2.2
• Constructed 3,121 new latrines p. 39-44 2.1; 2.2
• 69 LDP teams implemented projects p. 44-47 2.1; 2.2
• Led a workshop to develop guides to implementing RBF activities in collaboration with the MOH and other partners
p. 100-107 2.1; 2.2
• Provided ANC and delivery services to pregnant women (e.g., delivery with skilled birth attendants, administration of uterotonic)
• Provided essential newborn care
• Trained 113 health providers in MNCAH in the Kanzenze, Lualaba, Dilala, and Manika health zones
• Conducted routine supervision
p. 48-55 2.1; 2.2

• Trained 50 health providers on clinical integrated management of childhood illness and neonatal resuscitation in the Fungurume, Lubudi, and Bunkeya health zones
• Trained 293 health providers on neonatal resuscitation, partogram use and postpartum hemorrhage care in eight health zones in Kamina coordination
• Donated neonatal equipment and materials as well as posters on HBB and helping mothers survive child birth to 115 health facilities
• Provided materials to support the functioning of the cold chain
• Transported vaccines and syringes to Expanded Program on Immunization (EPI) points of service in hard-to-reach health zones
• Distributed copies of the community-based monitoring modules to all health areas
• Monitored the quality of routine immunization data
p. 55-59 2.1; 2.2

and provided coordinated technical and financial support during international immunization days
• Briefed eight core team members of each Central Office on community-based monitoring
• Conducted family planning counseling visits
• Provided contraceptive methods to health facilities
p. 59-63 2.1; 2.2
• Distributed iron-folate supplements and routine vitamin A
• Printed 4,539 nutrition counseling cards and distributed them along with communication materials (consulting cards, pamphlets, etc.) to community health workers (CHW) and health facilities
• Distributed nutrition materials (PSC cards, registers)
p. 63-68 2.1; 2.2
• Distributed LLINs, ACTs, and RDTs to health facilities p. 68-75 2.1; 2.2
• Conducted a campaign to determine the viral load of patients on ARVs
• Provided HIV T&C services • Provided ARV and ART
p. 75-83 2.1; 2.2
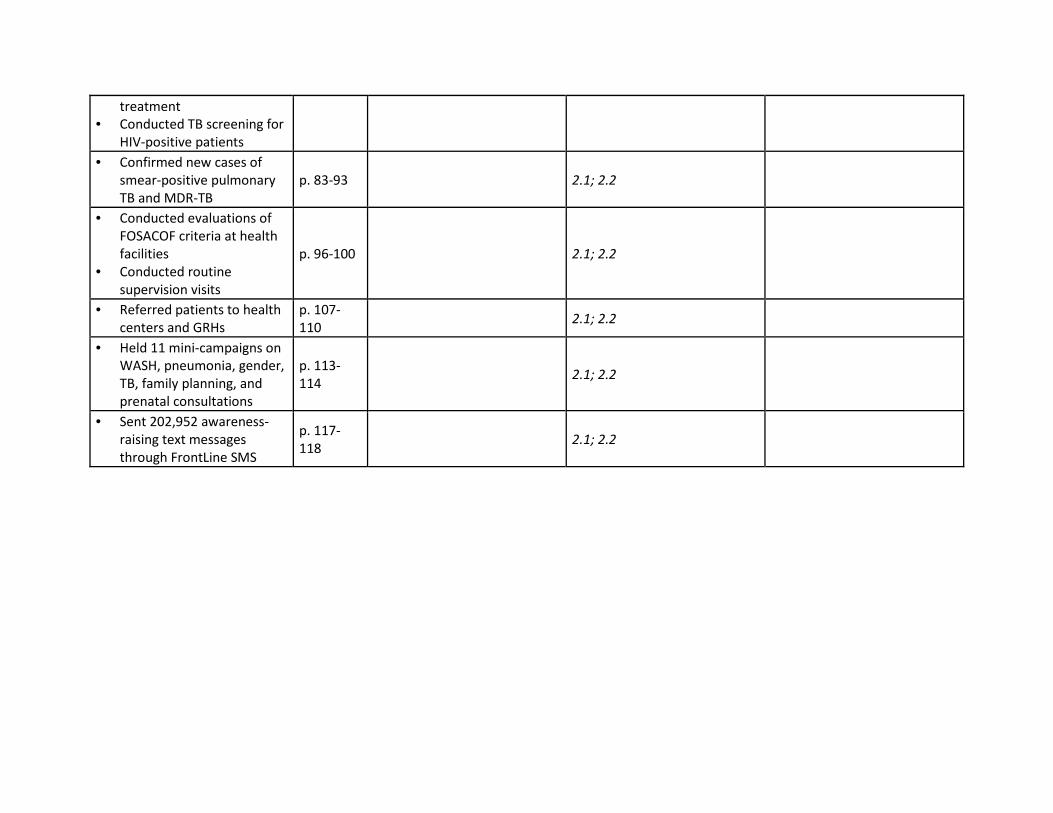
treatment • Conducted TB screening for
HIV-positive patients • Confirmed new cases of
smear-positive pulmonary TB and MDR-TB
p. 83-93 2.1; 2.2
• Conducted evaluations of FOSACOF criteria at health facilities
• Conducted routine supervision visits
p. 96-100 2.1; 2.2
• Referred patients to health centers and GRHs
p. 107-110 2.1; 2.2
• Held 11 mini-campaigns on WASH, pneumonia, gender, TB, family planning, and prenatal consultations
p. 113-114 2.1; 2.2
• Sent 202,952 awareness-raising text messages through FrontLine SMS
p. 117-118 2.1; 2.2

Province Other (Gender, Sector, Institution, Age, etc.)
Year Value Annual Planned Cumulative Target
Annual Cumulative Actual
Q1 Q2 Q3 Q4
Number of coalitions or networks strengthened to fulfill their mandates as a result of USG assistance Yes IHPplus quarterly
report Kasai orientale 2015 9 8 26 14 12 325%
Number of coalitions or networks strengthened to fulfill their mandates as a result of USG assistance Yes IHPplus quarterly
report Kasai 2015 2 2 3 3 0 150%
Number of coalitions or networks strengthened to fulfill their mandates as a result of USG assistance Yes IHPplus quarterly
report Kasai Central 2015 20 17 78 29 49 459%
Number of coalitions or networks strengthened to fulfill their mandates as a result of USG assistance Yes IHPplus quarterly
report Sankuru 2015 36 31 97 54 43 313%
Number of coalitions or networks strengthened to fulfill their mandates as a result of USG assistance Yes IHPplus quarterly
report Lualaba 2015 12 10 24 17 7 240%
Number of coalitions or networks strengthened to fulfill their mandates as a result of USG assistance Yes IHPplus quarterly
report Haut Lomami 2015 14 12 34 21 13 283%
Number of coalitions or networks strengthened to fulfill their mandates as a result of USG assistance Yes IHPplus quarterly
report Sud Kivu 2015 22 19 42 32 10 221%
Number of coalitions or networks strengthened to fulfill their mandates as a result of USG assistance Yes IHPplus quarterly
report Lomami 2015 31 27 82 45 37 304%
Number of person-days of USG-supported technical or managerial training and/or mentoring provided by national-level technical units to sub-national entities
Yes IHPplus quarterly report Kasai orientale 2015 24 36 0 50 0 139%
Number of person-days of USG-supported technical or managerial training and/or mentoring provided by national-level technical units to sub-national entities
Yes IHPplus quarterly report Kasai 2015 0 34 0 0 0 0%
Number of person-days of USG-supported technical or managerial training and/or mentoring provided by national-level technical units to sub-national entities
Yes IHPplus quarterly report Kasai Central 2015 46 125 28 28 0 22%
Number of person-days of USG-supported technical or managerial training and/or mentoring provided by national-level technical units to sub-national entities
Yes IHPplus quarterly report Sankuru 2015 192 1245 25 25 0 2%
Number of person-days of USG-supported technical or managerial training and/or mentoring provided by national-level technical units to sub-national entities
Yes IHPplus quarterly report Lualaba 2015 38 972 853 608 245 88%
Number of person-days of USG-supported technical or managerial training and/or mentoring provided by national-level technical units to sub-national entities
Yes IHPplus quarterly report Haut Lomami 2015 149 1412 507 25 482 36%
Number of person-days of USG-supported technical or managerial training and/or mentoring provided by national-level technical units to sub-national entities
Yes IHPplus quarterly report Sud Kivu 2015 110 1,188 0 373 325 31%
Number of person-days of USG-supported technical or managerial training and/or mentoring provided by national-level technical units to sub-national entities
Yes IHPplus quarterly report Lomami 2015 0 120 0 0 72 0%
Number of CSOs using accountability tools (such as scorecards and audit reports) to monitor and/or demand improvement of financial management and/or service delivery
Yes IHPplus quarterly report Kasai orientale 2015 34 36 68 34 34 189%
Number of CSOs using accountability tools (such as scorecards and audit reports) to monitor and/or demand improvement of financial management and/or service delivery
Yes IHPplus quarterly report Kasai 2015 14 15 30 15 15 200%
Number of CSOs using accountability tools (such as scorecards and audit reports) to monitor and/or demand improvement of financial management and/or service delivery
Yes IHPplus quarterly report Kasai Central 2015 130 139 287 132 155 206%
Number of CSOs using accountability tools (such as scorecards and audit reports) to monitor and/or demand improvement of financial management and/or service delivery
Yes IHPplus quarterly report Sankuru 2015 198 212 418 203 215 197%
Number of CSOs using accountability tools (such as scorecards and audit reports) to monitor and/or demand improvement of financial management and/or service delivery
Yes IHPplus quarterly report Lualaba 2015 87 93 183 89 94 197%
Number of CSOs using accountability tools (such as scorecards and audit reports) to monitor and/or demand improvement of financial management and/or service delivery
Yes IHPplus quarterly report Haut Lomami 2015 175 187 369 179 190 197%
Number of CSOs using accountability tools (such as scorecards and audit reports) to monitor and/or demand improvement of financial management and/or service delivery
Yes IHPplus quarterly report Sud Kivu 2015 450 482 950 471 479 197%
Number of CSOs using accountability tools (such as scorecards and audit reports) to monitor and/or demand improvement of financial management and/or service delivery
Yes IHPplus quarterly report Lomami 2015 112 120 252 115 137 210%
Number of new cases of tracked childhood diseases in children under 5 in targeted areas Yes IHPplus quarterly
report Kasai orientale 2015 54,042 61,577 72,437 20,477 51960 118%
Number of new cases of tracked childhood diseases in children under 5 in targeted areas Yes IHPplus quarterly
report Kasai 2015 54,027 40,502 20,078 14,395 5683 50%
Appendix 9 ‐ USAID/DRC Country Development Cooperation Strategy Progress Monitoring Plan PY2Q3Quarterly Results - FY2017Baseline value CommentsINDICATOR PMP
Indicator? (Y/N)
PPR Indicator?
(Y/N)
Data Source DISAGGREGATED BY Annual Performance
achieved to date (in %)
FY 2017

Quarterly Results - FY2017Baseline value CommentsINDICATOR PMP Indicator?
(Y/N)
PPR Indicator?
(Y/N)
Data Source DISAGGREGATED BY Annual Performance
achieved to date (in %)
FY 2017
Number of new cases of tracked childhood diseases in children under 5 in targeted areas Yes IHPplus quarterly
report Kasai Central 2015 162,081 121,506 124,037 42,470 81567 102%
Number of new cases of tracked childhood diseases in children under 5 in targeted areas Yes IHPplus quarterly
report Sankuru 2015 238,047 256,300 189,408 70,734 118,674 74%
Number of new cases of tracked childhood diseases in children under 5 in targeted areas Yes IHPplus quarterly
report Lualaba 2015 71,527 87,268 82,176 26,228 55948 94%
Number of new cases of tracked childhood diseases in children under 5 in targeted areas Yes IHPplus quarterly
report Haut Lomami 2015 281,774 308,488 305,379 146,588 158791 99%
Number of new cases of tracked childhood diseases in children under 5 in targeted areas Yes IHPplus quarterly
report Sud Kivu 2015 387,250 508,820 526,648 204,213 322,435 104%
Number of new cases of tracked childhood diseases in children under 5 in targeted areas Yes IHPplus quarterly
report Lomami 2015 180,926 204,364 145,939 67,782 78157 71%
Number of adults and children currenty receiving antiretroviral therapy (ART), disaggregated by adult/children Yes IHPplus quarterly
report Lualaba 2015 2,850 4,115 4,607 4,055 4607 112%
Number of adults and children initiating TB treatment as a result of USG assistance Yes IHPplus quarterly
report Kasai orientale 2015 1,134 778 286 126 160 37%
Number of adults and children initiating TB treatment as a result of USG assistance Yes IHPplus quarterly
report Kasai 2015 226 229 68 28 40 30%
Number of adults and children initiating TB treatment as a result of USG assistance Yes IHPplus quarterly
report Kasai Central 2015 2,031 2,061 610 248 362 30%
Number of adults and children initiating TB treatment as a result of USG assistance Yes IHPplus quarterly
report Sankuru 2015 2,896 2,939 1,099 623 476 37%
Number of adults and children initiating TB treatment as a result of USG assistance Yes IHPplus quarterly
report Lualaba 2015 1,394 1,414 647 303 344 46%
Number of adults and children initiating TB treatment as a result of USG assistance Yes IHPplus quarterly
report Haut Lomami 2015 3,218 3,266 1,576 831 745 48%
Number of adults and children initiating TB treatment as a result of USG assistance Yes IHPplus quarterly
report Sud Kivu 2015 1,529 7,426 829 231 598 11%
Number of adults and children initiating TB treatment as a result of USG assistance Yes IHPplus quarterly
report Lomami 2015 2,201 2,605 933 424 509 36%
Number of health care facilities supported and/or rehabilitated Yes IHPplus quarterly report Kasai orientale 2015 97 97 97 97 97 100%
Number of health care facilities supported and/or rehabilitated Yes IHPplus quarterly report Kasai 2015 20 20 20 20 20 100%
Number of health care facilities supported and/or rehabilitated Yes IHPplus quarterly report Kasai Central 2015 161 161 161 161 161 100%
Number of health care facilities supported and/or rehabilitated Yes IHPplus quarterly report Sankuru 2015 256 256 256 256 256 100%
Number of health care facilities supported and/or rehabilitated Yes IHPplus quarterly report Lualaba 2015 113 113 253 253 253 224%
Number of health care facilities supported and/or rehabilitated Yes IHPplus quarterly report Haut Lomami 2015 211 211 359 359 359 170%
Number of health care facilities supported and/or rehabilitated Yes IHPplus quarterly report Sud Kivu 2015 528 528 542 542 542 103%
Number of health care facilities supported and/or rehabilitated Yes IHPplus quarterly report Lomami 2015 167 167 167 167 167
Kasai orientale 44 44 49 49 48 110%
Numerator 2015 330,492 330,492 187,595 93,622 93,973
Denominator 2015 744,193 744,193 385,088 191,065 194,023
Kasai 50 50 46 48 44 91%
Numerator 2015 72,200 72,200 35,251 18,051 17,200
Denominator 2015 143,699 143,699 76,861 37,606 39,255
Kasai Central 35 35 41 40 42 116%
Numerator 2015 453,460 453,460 269,572 132,875 136,697
Denominator 2015 1,295,533 1,295,533 662,170 336,385 325,785
Sankuru 41 41 50 51 48 121%
Numerator 2015 756,247 756,247 486,430 245,489 240,941
Denominator 2015 1,847,112 1,847,112 980,623 481,351 499,272
Lualaba 66 66 45 46 45 69%
Numerator 2015 584,929 584,929 212,121 105,536 106,585
Denominator 2015 888,812 888,812 466,667 230,932 235,735
Haut Lomami 41 41 42 45 38 100%
Numerator 2015 850,363 850,363 447,869 239,106 208,763
Denominator 2015 2,052,277 2,052,277 1,075,662 531,347 544,315
Sud Kivu 50 50 48 47 49 95%
Numerator 2015 2,346,568 2,346,568 1,173,949 573,437 600,512
Denominator 2015 4,666,439 4,666,439 2,448,496 1,212,340 1,236,156
Lomami 43 43 42 47 38 99%
Numerator 2015 587,541 587,541 308,600 169,660 138,940
Denominator 2015 1,382,074 1,382,074 731,664 361,748 369,916
As this indicator is not reported as part of the project's PMP, the baseline figure has been
used as the annual cumulative target
As this indicator is not reported as part of the project's PMP, the baseline figure has been
used as the annual cumulative target
As this indicator is not reported as part of the project's PMP, the baseline figure has been
used as the annual cumulative target
As this indicator is not reported as part of the project's PMP, the baseline figure has been
used as the annual cumulative target
As this indicator is not reported as part of the project's PMP, the baseline figure has been
used as the annual cumulative target
As this indicator is not reported as part of the project's PMP, the baseline figure has been
used as the annual cumulative target
As this indicator is not reported as part of the project's PMP, the baseline figure has been
used as the annual cumulative target
As this indicator is not reported as part of the project's PMP, the baseline figure has been
used as the annual cumulative target
Percent of population who use selected facilities Yes
Percent of population who use selected facilities Yes IHPplus quarterly report
Percent of population who use selected facilities Yes IHPplus quarterly report
Percent of population who use selected facilities
IHPplus quarterly report
Percent of population who use selected facilities Yes IHPplus quarterly report
Percent of population who use selected facilities Yes
Percent of population who use selected facilities Yes IHPplus quarterly report
Yes IHPplus quarterly report
IHPplus quarterly report
Percent of population who use selected facilities Yes IHPplus quarterly report

Quarterly Results - FY2017Baseline value CommentsINDICATOR PMP Indicator?
(Y/N)
PPR Indicator?
(Y/N)
Data Source DISAGGREGATED BY Annual Performance
achieved to date (in %)
FY 2017
Female 2015 N/A 2,617 355 355 312 14%
Male 2015 N/A 2,515 754 754 831 30%
Female 2015 729,134 810,301 747,712 302,372 445,340 92%
Male 700,540 778,524 718,390 290,515 427,875 92%
Female 2015 1,454 2,099 9,215 2,773 9,215 439%
Male 2015 1,396 2,016 4,066 1,282 4,066 202%
Female N/A N/A N/A N/A N/A N/A Disaggregation by sex is not available for this indicator
Male N/A N/A N/A N/A N/A N/A Disaggregation by sex is not available for this indicator
Female N/A N/A N/A N/A N/A N/A Disaggregation by sex is not available for thisindicator
Numerator N/A N/A N/A N/A N/A
Denominator N/A N/A N/A N/A N/A
Male N/A N/A N/A N/A N/A N/A Disaggregation by sex is not available for this indicator
Numerator N/A N/A N/A N/A N/A
Denominator N/A N/A N/A N/A N/A
Children 2015 228 329 306 306 1,054 93%
Adults 2015 2,622 3,786 3,749 3,749 12,227 99%
Children 2015 3,657 5,180 1,125 705 420 22%
Adults 2015 10,972 15,539 4,923 2,109 2,814 32%
HL-1 Number of Universal Health Coverage (UHC) areas supported by USG investment Yes IHPplus quarterly
report Kasai orientale 2015 3 3 3 3 3 100%
HL-1 Number of Universal Health Coverage (UHC) areas supported by USG investment Yes IHPplus quarterly
report Kasai 2015 3 3 3 3 3 100%
HL-1 Number of Universal Health Coverage (UHC) areas supported by USG investment Yes IHPplus quarterly
report Kasai Central 2015 3 3 3 3 3 100%
HL-1 Number of Universal Health Coverage (UHC) areas supported by USG investment Yes IHPplus quarterly
report Sankuru 2015 3 3 3 3 3 100%
HL-1 Number of Universal Health Coverage (UHC) areas supported by USG investment Yes IHPplus quarterly
report Lualaba 2015 3 3 3 3 3 100%
HL-1 Number of Universal Health Coverage (UHC) areas supported by USG investment Yes IHPplus quarterly
report Haut Lomami 2015 3 3 3 3 3 100%
HL-1 Number of Universal Health Coverage (UHC) areas supported by USG investment Yes IHPplus quarterly
report Sud Kivu 2015 3 3 3 3 3 100%
HL-1 Number of Universal Health Coverage (UHC) areas supported by USG investment Yes IHPplus quarterly
report Lomami 2015 3 3 3 3 3 100%
HL-2 Presence of the Mission support to strengthen Human Resources for Health (HRH) Yes IHPplus quarterly
report Kasai orientale 2015 1 1 1 1 1 100%
HL-2 Presence of the Mission support to strengthen Human Resources for Health (HRH) Yes IHPplus quarterly
report Kasai 2015 1 1 1 1 1 100%
HL-2 Presence of the Mission support to strengthen Human Resources for Health (HRH) Yes IHPplus quarterly
report Kasai Central 2015 1 1 1 1 1 100%
HL-2 Presence of the Mission support to strengthen Human Resources for Health (HRH) Yes IHPplus quarterly
report Sankuru 2015 1 1 1 1 1 100%
HL-2 Presence of the Mission support to strengthen Human Resources for Health (HRH) Yes IHPplus quarterly
report Lualaba 2015 1 1 1 1 1 100%
HL-2 Presence of the Mission support to strengthen Human Resources for Health (HRH) Yes IHPplus quarterly
report Haut Lomami 2015 1 1 1 1 1 100%
HL-2 Presence of the Mission support to strengthen Human Resources for Health (HRH) Yes IHPplus quarterly
report Sud Kivu 2015 1 1 1 1 1 100%
HL-2 Presence of the Mission support to strengthen Human Resources for Health (HRH) Yes IHPplus quarterly
report Lomami 2015 1 1 1 1 1 100%
HL-3 Presence of mission support for integration of health information systems (HIS) Yes IHPplus quarterly
report Kasai orientale 2015 1 1 1 1 1 100%
HL-3 Presence of mission support for integration of health information systems (HIS) Yes IHPplus quarterly
report Kasai 2015 1 1 1 1 1 100%
IHPplus quarterly report
Yes
Yes
Number of adults and children initiating TB treatment as a result of USG assistance
Yes
Yes
Yes
Yes
Percent of population who use selected facilities Yes
Number of adults and children currenty receiving antiretroviral therapy (ART), disaggregated by adult/children
Number of adults and children initiating TB treatment as a result of USG assistance
IHPplus quarterly report
Number of adults and children currenty receiving antiretroviral therapy (ART), disaggregated by adult/children
Number of new cases of tracked childhood diseases in children under 5 in targeted areas
IHPplus quarterly report
IHPplus quarterly report
IHPplus quarterly report
IHPplus quarterly report
Only Lualaba is supported by HIV interventions
Number of person-days of USG-supported technical or managerial training and/or mentoring provided by national-level technical units to sub-national entities
IHPplus quarterly report

Quarterly Results - FY2017Baseline value CommentsINDICATOR PMP Indicator?
(Y/N)
PPR Indicator?
(Y/N)
Data Source DISAGGREGATED BY Annual Performance
achieved to date (in %)
FY 2017
HL-3 Presence of mission support for integration of health information systems (HIS) Yes IHPplus quarterly
report Kasai Central 2015 1 1 1 1 1 100%
HL-3 Presence of mission support for integration of health information systems (HIS) Yes IHPplus quarterly
report Sankuru 2015 1 1 1 1 1 100%
HL-3 Presence of mission support for integration of health information systems (HIS) Yes IHPplus quarterly
report Lualaba 2015 1 1 1 1 1 100%
HL-3 Presence of mission support for integration of health information systems (HIS) Yes IHPplus quarterly
report Haut Lomami 2015 1 1 1 1 1 100%
HL-3 Presence of mission support for integration of health information systems (HIS) Yes IHPplus quarterly
report Sud Kivu 2015 1 1 1 1 1 100%
HL-3 Presence of mission support for integration of health information systems (HIS) Yes IHPplus quarterly
report Lomami 2015 1 1 1 1 1 100%
3.1.2.1-5: National TB smear microscopy laboratory coverage Yes IHPplus quarterly report Kasai orientale 2015 100% 100% 100% 100% 100% 100%
3.1.2.1-5: National TB smear microscopy laboratory coverage Yes IHPplus quarterly report Kasai 2015 100% 100% 100% 100% 100% 100%
3.1.2.1-5: National TB smear microscopy laboratory coverage Yes IHPplus quarterly report Kasai Central 2015 100% 100% 100% 100% 100% 100%
3.1.2.1-5: National TB smear microscopy laboratory coverage Yes IHPplus quarterly report Sankuru 2015 100% 100% 100% 100% 100% 100%
3.1.2.1-5: National TB smear microscopy laboratory coverage Yes IHPplus quarterly report Lualaba 2015 100% 100% 100% 100% 100% 100%
3.1.2.1-5: National TB smear microscopy laboratory coverage Yes IHPplus quarterly report Haut Lomami 2015 100% 100% 100% 100% 100% 100%
3.1.2.1-5: National TB smear microscopy laboratory coverage Yes IHPplus quarterly report Sud Kivu 2015 100% 100% 100% 100% 100% 100%
3.1.2.1-5: National TB smear microscopy laboratory coverage Yes IHPplus quarterly report Lomami 2015 100% 100% 100% 100% 100% 100%
3.1.2.9-1: Number of individuals trained in any component of the WHO End TB Strategy with USG funding Yes IHPplus quarterly
report Kasai orientale 2015 0 8 3 0 3 38%
3.1.2.9-1: Number of individuals trained in any component of the WHO End TB Strategy with USG funding Yes IHPplus quarterly
report Kasai 2015 0 0 0 0 0 N/A
3.1.2.9-1: Number of individuals trained in any component of the WHO End TB Strategy with USG funding Yes IHPplus quarterly
report Kasai Central 2015 0 13 0 0 0 0%
3.1.2.9-1: Number of individuals trained in any component of the WHO End TB Strategy with USG funding Yes IHPplus quarterly
report Sankuru 2015 0 23 22 0 22 96%
3.1.2.9-1: Number of individuals trained in any component of the WHO End TB Strategy with USG funding Yes IHPplus quarterly
report Lualaba 2015 0 0 0 0 0 0%
3.1.2.9-1: Number of individuals trained in any component of the WHO End TB Strategy with USG funding Yes IHPplus quarterly
report Haut Lomami 2015 0 0 0 0 0 0%
3.1.2.9-1: Number of individuals trained in any component of the WHO End TB Strategy with USG funding Yes IHPplus quarterly
report Sud Kivu 2015 0 23 13 0 13 57%
3.1.2.9-1: Number of individuals trained in any component of the WHO End TB Strategy with USG funding Yes IHPplus quarterly
report Lomami 2015 0 8 7 0 7 88%
HL.2.4-1: Number of multi-drug resistant tuberculosis cases detected Yes IHPplus quarterly
report Kasai orientale 2015 40 44 10 10 0 23%
HL.2.4-1: Number of multi-drug resistant tuberculosis cases detected Yes IHPplus quarterly
report Kasai 2015 2 2 0 0 0 0%
HL.2.4-1: Number of multi-drug resistant tuberculosis cases detected Yes IHPplus quarterly
report Kasai Central 2015 16 17 0 0 0 0%
HL.2.4-1: Number of multi-drug resistant tuberculosis cases detected Yes IHPplus quarterly
report Sankuru 2015 10 11 0 0 0 0%
HL.2.4-1: Number of multi-drug resistant tuberculosis cases detected Yes IHPplus quarterly
report Lualaba 2015 29 32 6 6 0 19%
HL.2.4-1: Number of multi-drug resistant tuberculosis cases detected Yes IHPplus quarterly
report Haut Lomami 2015 18 20 2 2 0 10%
HL.2.4-1: Number of multi-drug resistant tuberculosis cases detected Yes IHPplus quarterly
report Sud Kivu 2015 70 76 8 3 5 10%
HL.2.4-1: Number of multi-drug resistant tuberculosis cases detected Yes IHPplus quarterly
report Lomami 2015 20 22 4 0 4 18%
HL.2.4-2: Number of multi-drug resistant tuberculosis cases that have initiated second line treatment Yes IHPplus quarterly
report Kasai orientale 2015 40 44 10 10 0 23%
HL.2.4-2: Number of multi-drug resistant tuberculosis cases that have initiated second line treatment Yes IHPplus quarterly
report Kasai 2015 2 2 0 0 0 0%
HL.2.4-2: Number of multi-drug resistant tuberculosis cases that have initiated second line treatment Yes IHPplus quarterly
report Kasai Central 2015 16 17 0 0 0 0%
HL.2.4-2: Number of multi-drug resistant tuberculosis cases that have initiated second line treatment Yes IHPplus quarterly
report Sankuru 2015 10 11 0 0 0 0%
HL.2.4-2: Number of multi-drug resistant tuberculosis cases that have initiated second line treatment Yes IHPplus quarterly
report Lualaba 2015 29 32 6 6 0 19%

Quarterly Results - FY2017Baseline value CommentsINDICATOR PMP Indicator?
(Y/N)
PPR Indicator?
(Y/N)
Data Source DISAGGREGATED BY Annual Performance
achieved to date (in %)
FY 2017
HL.2.4-2: Number of multi-drug resistant tuberculosis cases that have initiated second line treatment Yes IHPplus quarterly
report Haut Lomami 2015 18 20 2 2 0 10%
HL.2.4-2: Number of multi-drug resistant tuberculosis cases that have initiated second line treatment Yes IHPplus quarterly
report Sud Kivu 2015 70 76 3 3 5 4%
HL.2.4-2: Number of multi-drug resistant tuberculosis cases that have initiated second line treatment Yes IHPplus quarterly
report Lomami 2015 20 22 0 0 4 0%
HL.6.2-1: Number of women giving birth who received uterotonics in the third stage of labor (or immediately after birth) through USG-supported programs
Yes IHPplus quarterly report Kasai orientale 2015 59,665 58,284 17,230 9,759 7,471 30%
HL.6.2-1: Number of women giving birth who received uterotonics in the third stage of labor (or immediately after birth) through USG-supported programs
Yes IHPplus quarterly report Kasai 2015 5,280 3,600 4,837 4,000 837 134%
HL.6.2-1: Number of women giving birth who received uterotonics in the third stage of labor (or immediately after birth) through USG-supported programs
Yes IHPplus quarterly report Kasai Central 2015 47,520 44,292 23,497 10,710 12,787 53%
HL.6.2-1: Number of women giving birth who received uterotonics in the third stage of labor (or immediately after birth) through USG-supported programs
Yes IHPplus quarterly report Sankuru 2015 60,696 64,788 35,380 17,148 18,232 55%
HL.6.2-1: Number of women giving birth who received uterotonics in the third stage of labor (or immediately after birth) through USG-supported programs
Yes IHPplus quarterly report Lualaba 2015 40,007 29,568 19,376 9,619 9,757 66%
HL.6.2-1: Number of women giving birth who received uterotonics in the third stage of labor (or immediately after birth) through USG-supported programs
Yes IHPplus quarterly report Haut Lomami 2015 59,892 70,272 36,475 19,284 17,191 52%
HL.6.2-1: Number of women giving birth who received uterotonics in the third stage of labor (or immediately after birth) through USG-supported programs
Yes IHPplus quarterly report Sud Kivu 2015 155,003 168,681 73,586 35,802 37,784 44%
HL.6.2-1: Number of women giving birth who received uterotonics in the third stage of labor (or immediately after birth) through USG-supported programs
Yes IHPplus quarterly report Lomami 2015 17,416 24,568 22,307 10,000 12,307 91%
HL.6.3-1: Number of newborns not breathing at birth who were resuscitated in USG-supported programs Yes IHPplus quarterly
report Kasai orientale 2015 150 564 168 120 48 30%
HL.6.3-1: Number of newborns not breathing at birth who were resuscitated in USG-supported programs Yes IHPplus quarterly
report Kasai 2015 80 48 26 0 26 54%
HL.6.3-1: Number of newborns not breathing at birth who were resuscitated in USG-supported programs Yes IHPplus quarterly
report Kasai Central 2015 300 432 272 88 184 63%
HL.6.3-1: Number of newborns not breathing at birth who were resuscitated in USG-supported programs Yes IHPplus quarterly
report Sankuru 2015 299 600 216 98 118 36%
HL.6.3-1: Number of newborns not breathing at birth who were resuscitated in USG-supported programs Yes IHPplus quarterly
report Lualaba 2015 332 288 432 293 139 150%
HL.6.3-1: Number of newborns not breathing at birth who were resuscitated in USG-supported programs Yes IHPplus quarterly
report Haut Lomami 2015 122 672 360 200 160 54%
HL.6.3-1: Number of newborns not breathing at birth who were resuscitated in USG-supported programs Yes IHPplus quarterly
report Sud Kivu 2015 1,450 1,548 972 453 519 63%
HL.6.3-1: Number of newborns not breathing at birth who were resuscitated in USG-supported programs Yes IHPplus quarterly
report Lomami 2015 163 144 161 31 130 112%
3.1.6-62: Number of newborn infants receiving antibiotic treatment for infection through USG-supported programs Yes IHPplus quarterly
report Kasai orientale 2015 3,000 4,272 832 422 410 19%
3.1.6-62: Number of newborn infants receiving antibiotic treatment for infection through USG-supported programs Yes IHPplus quarterly
report Kasai 2015 406 412 185 106 79 45%
3.1.6-62: Number of newborn infants receiving antibiotic treatment for infection through USG-supported programs Yes IHPplus quarterly
report Kasai Central 2015 6,500 3,200 1,507 1,011 496 47%
3.1.6-62: Number of newborn infants receiving antibiotic treatment for infection through USG-supported programs Yes IHPplus quarterly
report Sankuru 2015 7,752 4,632 2,082 1,080 1002 45%
3.1.6-62: Number of newborn infants receiving antibiotic treatment for infection through USG-supported programs Yes IHPplus quarterly
report Lualaba 2015 7,760 2,232 2,524 2,053 471 113%
3.1.6-62: Number of newborn infants receiving antibiotic treatment for infection through USG-supported programs Yes IHPplus quarterly
report Haut Lomami 2015 3,594 5,148 1,252 680 572 24%

Quarterly Results - FY2017Baseline value CommentsINDICATOR PMP Indicator?
(Y/N)
PPR Indicator?
(Y/N)
Data Source DISAGGREGATED BY Annual Performance
achieved to date (in %)
FY 2017
3.1.6-62: Number of newborn infants receiving antibiotic treatment for infection through USG-supported programs Yes IHPplus quarterly
report Sud Kivu 2015 8,517 11,712 4,177 2,301 1,876 36%
3.1.6-62: Number of newborn infants receiving antibiotic treatment for infection through USG-supported programs Yes IHPplus quarterly
report Lomami 2015 1,222 1,060 1,240 701 539 117%
3.1.6-61: Number of children who received DPT3 by 12 months of age in USG-assisted programs Yes IHPplus quarterly
report Kasai orientale 2015 50,000 50,400 13,199 6,766 6,433 26%
3.1.6-61: Number of children who received DPT3 by 12 months of age in USG-assisted programs Yes IHPplus quarterly
report Kasai 2015 6,000 4,188 2,857 1,506 1,351 68%
3.1.6-61: Number of children who received DPT3 by 12 months of age in USG-assisted programs Yes IHPplus quarterly
report Kasai Central 2015 44,639 42,000 21,742 11,430 10,312 52%
3.1.6-61: Number of children who received DPT3 by 12 months of age in USG-assisted programs Yes IHPplus quarterly
report Sankuru 2015 60,375 61,248 21,846 5,944 15,902 36%
3.1.6-61: Number of children who received DPT3 by 12 months of age in USG-assisted programs Yes IHPplus quarterly
report Lualaba 2015 43,379 27,384 19,212 9,892 9,320 70%
3.1.6-61: Number of children who received DPT3 by 12 months of age in USG-assisted programs Yes IHPplus quarterly
report Haut Lomami 2015 69,200 65,868 29,188 13,414 15,774 44%
3.1.6-61: Number of children who received DPT3 by 12 months of age in USG-assisted programs Yes IHPplus quarterly
report Sud Kivu 2015 173,042 150,840 89,354 47,114 42,240 59%
3.1.6-61: Number of children who received DPT3 by 12 months of age in USG-assisted programs Yes IHPplus quarterly
report Lomami 2015 21,261 18,840 22,799 11,545 11,254 121%
HL.6.6-1: Number of cases of child diarrhea treated in USG-assisted programs Yes IHPplus quarterly
report Kasai orientale 2015 19,733 56,088 31,578 20,817 10,761 56%
HL.6.6-1: Number of cases of child diarrhea treated in USG-assisted programs Yes IHPplus quarterly
report Kasai 2015 4,139 8,460 2,000 2,000 1,284 24%
HL.6.6-1: Number of cases of child diarrhea treated in USG-assisted programs Yes IHPplus quarterly
report Kasai Central 2015 43,000 48,000 15,972 15,972 16,285 33%
HL.6.6-1: Number of cases of child diarrhea treated in USG-assisted programs Yes IHPplus quarterly
report Sankuru 2015 139,186 89,712 25,878 25,878 30,382 29%
HL.6.6-1: Number of cases of child diarrhea treated in USG-assisted programs Yes IHPplus quarterly
report Lualaba 2015 73,471 23,436 7,705 7,705 9,140 33%
HL.6.6-1: Number of cases of child diarrhea treated in USG-assisted programs Yes IHPplus quarterly
report Haut Lomami 2015 133,000 119,688 37,085 37,085 19,804 31%
HL.6.6-1: Number of cases of child diarrhea treated in USG-assisted programs Yes IHPplus quarterly
report Sud Kivu 2015 163,855 265,680 49,499 49,499 51,201 19%
HL.6.6-1: Number of cases of child diarrhea treated in USG-assisted programs Yes IHPplus quarterly
report Lomami 2015 43,146 32,092 12,000 12,000 17,364 37%
3.1.6-63: Number of children under five years of age with suspected pneumonia receiving antibiotics by trained facilities or community health workers in USG-assisted programs
Yes IHPplus quarterly report Kasai orientale 2015 55,448 44,832 14,125 14,125 6,792 32%
3.1.6-63: Number of children under five years of age with suspected pneumonia receiving antibiotics by trained facilities or community health workers in USG-assisted programs
Yes IHPplus quarterly report Kasai 2015 8,000 4,000 2,123 2,123 730 53%
3.1.6-63: Number of children under five years of age with suspected pneumonia receiving antibiotics by trained facilities or community health workers in USG-assisted programs
Yes IHPplus quarterly report Kasai Central 2015 40,226 31,148 11,000 11,000 17,463 35%
3.1.6-63: Number of children under five years of age with suspected pneumonia receiving antibiotics by trained facilities or community health workers in USG-assisted programs
Yes IHPplus quarterly report Sankuru 2015 75,930 76,984 17,353 17,353 19,237 23%
3.1.6-63: Number of children under five years of age with suspected pneumonia receiving antibiotics by trained facilities or community health workers in USG-assisted programs
Yes IHPplus quarterly report Lualaba 2015 17,497 19,032 3,829 3,829 6,626 20%
3.1.6-63: Number of children under five years of age with suspected pneumonia receiving antibiotics by trained facilities or community health workers in USG-assisted programs
Yes IHPplus quarterly report Haut Lomami 2015 80,512 86,400 24,568 24,568 18,009 28%
3.1.6-63: Number of children under five years of age with suspected pneumonia receiving antibiotics by trained facilities or community health workers in USG-assisted programs
Yes IHPplus quarterly report Sud Kivu 2015 155,809 163,716 35,208 35,208 44,790 22%
3.1.6-63: Number of children under five years of age with suspected pneumonia receiving antibiotics by trained facilities or community health workers in USG-assisted programs
Yes IHPplus quarterly report Lomami 2015 30,000 30,000 7,000 7,000 5,627 23%
HL.7.1-1: Couple Years protection in USG supported programs Yes IHPplus quarterly report Kasai orientale 2015 71,690 66,028 20,000 20,000 1,241 30%

Quarterly Results - FY2017Baseline value CommentsINDICATOR PMP Indicator?
(Y/N)
PPR Indicator?
(Y/N)
Data Source DISAGGREGATED BY Annual Performance
achieved to date (in %)
FY 2017
HL.7.1-1: Couple Years protection in USG supported programs Yes IHPplus quarterly report Kasai 2015 8,000 10,000 4,161 4,161 450 42%
HL.7.1-1: Couple Years protection in USG supported programs Yes IHPplus quarterly report Kasai Central 2015 58,449 64,604 28,000 28,000 7,756 43%
HL.7.1-1: Couple Years protection in USG supported programs Yes IHPplus quarterly report Sankuru 2015 84,496 82,060 24,664 24,664 6,644 30%
HL.7.1-1: Couple Years protection in USG supported programs Yes IHPplus quarterly report Lualaba 2015 56,199 92,532 20,451 20,451 7,149 22%
HL.7.1-1: Couple Years protection in USG supported programs Yes IHPplus quarterly report Haut Lomami 2015 84,496 84,000 23,690 23,690 3,838 28%
HL.7.1-1: Couple Years protection in USG supported programs Yes IHPplus quarterly report Sud Kivu 2015 171,799 203,928 34,781 34,781 18,212 17%
HL.7.1-1: Couple Years protection in USG supported programs Yes IHPplus quarterly report Lomami 2015 36,212 35,000 11,631 11,631 5,625 33%
HL.7.2-2: Number of USG-assisted community health workers (CHWs) providing Family Planning (FP) information, referrals and/or services during the year
Yes IHPplus quarterly report Kasai orientale 2015 83 194 76 76 76 39%
HL.7.2-2: Number of USG-assisted community health workers (CHWs) providing Family Planning (FP) information, referrals and/or services during the year
Yes IHPplus quarterly report Kasai 2015 12 12 19 19 19 158%
HL.7.2-2: Number of USG-assisted community health workers (CHWs) providing Family Planning (FP) information, referrals and/or services during the year
Yes IHPplus quarterly report Kasai Central 2015 123 503 300 300 300 60%
HL.7.2-2: Number of USG-assisted community health workers (CHWs) providing Family Planning (FP) information, referrals and/or services during the year
Yes IHPplus quarterly report Sankuru 2015 127 641 257 257 257 40%
HL.7.2-2: Number of USG-assisted community health workers (CHWs) providing Family Planning (FP) information, referrals and/or services during the year
Yes IHPplus quarterly report Lualaba 2015 24 273 51 172 172 19%
HL.7.2-2: Number of USG-assisted community health workers (CHWs) providing Family Planning (FP) information, referrals and/or services during the year
Yes IHPplus quarterly report Haut Lomami 2015 84 516 4 4 4 1%
HL.7.2-2: Number of USG-assisted community health workers (CHWs) providing Family Planning (FP) information, referrals and/or services during the year
Yes IHPplus quarterly report Sud Kivu 2015 177 906 51 205 205 6%
HL.7.2-2: Number of USG-assisted community health workers (CHWs) providing Family Planning (FP) information, referrals and/or services during the year
Yes IHPplus quarterly report Lomami 2015 52 152 83 83 83 55%
HL.8.1-1:Number of people gaining access to basic drinking water services as a result of USG assistance Yes IHPplus quarterly
report Kasai orientale 2015 N/A N/A N/A N/A N/A N/A This province is not targeted by WASH interventions
HL.8.1-1:Number of people gaining access to basic drinking water services as a result of USG assistance Yes IHPplus quarterly
report Kasai 2015 N/A N/A N/A N/A N/A N/A This province is not targeted by WASH interventions
HL.8.1-1:Number of people gaining access to basic drinking water services as a result of USG assistance Yes IHPplus quarterly
report Kasai Central 2015 90,915 133,640 60,731 7,726 53,005 45%
HL.8.1-1:Number of people gaining access to basic drinking water services as a result of USG assistance Yes IHPplus quarterly
report Sankuru 2015 N/A N/A N/A N/A N/A N/A This province is not targeted by WASH interventions
HL.8.1-1:Number of people gaining access to basic drinking water services as a result of USG assistance Yes IHPplus quarterly
report Lualaba 2015 N/A N/A N/A N/A N/A N/A This province is not targeted by WASH interventions
HL.8.1-1:Number of people gaining access to basic drinking water services as a result of USG assistance Yes IHPplus quarterly
report Haut Lomami 2015 N/A N/A N/A N/A N/A N/A This province is not targeted by WASH interventions
HL.8.1-1:Number of people gaining access to basic drinking water services as a result of USG assistance Yes IHPplus quarterly
report Sud Kivu 2015 N/A N/A N/A N/A N/A N/A This province is not targeted by WASH interventions
HL.8.1-1:Number of people gaining access to basic drinking water services as a result of USG assistance Yes IHPplus quarterly
report Lomami 2015 161,627 163,536 77,606 0 77,606 47%
HL.8.1-3: Number of people receiving improved service quality from an existing basic or safely managed drinking water service as a result of USG assistance
Yes IHPplus quarterly report Kasai orientale 2015 N/A N/A N/A N/A N/A N/A As this is an annual indicator, the figures will
be available only at the end of the fiscal year
HL.8.2-2:Number of people gaining access to a basic sanitation service as a result of USG assistance Yes IHPplus quarterly
report Kasai orientale 2015 N/A N/A N/A N/A N/A N/A This province is not targeted by WASH interventions

Quarterly Results - FY2017Baseline value CommentsINDICATOR PMP Indicator?
(Y/N)
PPR Indicator?
(Y/N)
Data Source DISAGGREGATED BY Annual Performance
achieved to date (in %)
FY 2017
HL.8.2-2:Number of people gaining access to a basic sanitation service as a result of USG assistance Yes IHPplus quarterly
report Kasai 2015 N/A N/A N/A N/A N/A N/A This province is not targeted by WASH interventions
HL.8.2-2:Number of people gaining access to a basic sanitation service as a result of USG assistance Yes IHPplus quarterly
report Kasai Central 2015 81,137 133,640 39,989 18,726 21,263 30%
HL.8.2-2:Number of people gaining access to a basic sanitation service as a result of USG assistance Yes IHPplus quarterly
report Sankuru 2015 N/A N/A N/A N/A N/A N/A This province is not targeted by WASH interventions
HL.8.2-2:Number of people gaining access to a basic sanitation service as a result of USG assistance Yes IHPplus quarterly
report Lualaba 2015 N/A N/A N/A N/A N/A N/A This province is not targeted by WASH interventions
HL.8.2-2:Number of people gaining access to a basic sanitation service as a result of USG assistance Yes IHPplus quarterly
report Haut Lomami 2015 N/A N/A N/A N/A N/A N/A This province is not targeted by WASH interventions
HL.8.2-2:Number of people gaining access to a basic sanitation service as a result of USG assistance Yes IHPplus quarterly
report Sud Kivu 2015 N/A N/A N/A N/A N/A N/A This province is not targeted by WASH interventions
HL.8.2-2:Number of people gaining access to a basic sanitation service as a result of USG assistance Yes IHPplus quarterly
report Lomami 2015 189,323 163,536 35,756 4,405 31,351 22%
HL.8.2-4: Number of basic sanitation facilities provided in institutional settings as a result of USG assistance Yes IHPplus quarterly
report 2015 N/A N/A N/A N/A N/A N/A This indicator is not reported by the project
3.1.8.3-1: Number of policies, laws, agreements, regulations, or investment agreements (public or private) that promote access to improved water supply and sanitation
Yes IHPplus quarterly report 2015 N/A N/A N/A N/A N/A N/A This indicator is not reported by the
project
HL.9-1: Number of children under five (0-59 months) reached by nutrition-specific interventions through USG-supported programs
Yes IHPplus quarterly report Kasai orientale 2015 4,183 4,183 29,027 15,706 13,321 694%
The specific nutrition interventions are related to vitamin A supplementation for children over six months of age, and the number of cases of childhood diarrhea treated in USG-supported programs as
proxy
As this indicator is no longer reported as part of the project's PMP, the baseline
figure has been used as the annual cumulative target
HL.9-1: Number of children under five (0-59 months) reached by nutrition-specific interventions through USG-supported programs
Yes IHPplus quarterly report Kasai 2015 4,000 4,000 1,799 29 1,770 45%
The specific nutrition interventions are related to vitamin A supplementation for children over six months of age, and the number of cases of childhood diarrhea treated in USG-supported programs as
proxy
As this indicator is no longer reported as part of projetc's PMP, The Baseline
figure has been used as annual cumulative target
HL.9-1: Number of children under five (0-59 months) reached by nutrition-specific interventions through USG-supported programs
Yes IHPplus quarterly report Kasai Central 2015 9,769 9,769 31,509 12,249 19,260 323%
The specific nutrition interventions are related to vitamine A supplementation for children beyond 6 month age. And
number of cases of child diarrhea treated in USG-supported programs as
proxy
As this indicator is no longer reported as part of the project's PMP, the baseline
figure has been used as the annual cumulative target

Quarterly Results - FY2017Baseline value CommentsINDICATOR PMP Indicator?
(Y/N)
PPR Indicator?
(Y/N)
Data Source DISAGGREGATED BY Annual Performance
achieved to date (in %)
FY 2017
HL.9-1: Number of children under five (0-59 months) reached by nutrition-specific interventions through USG-supported programs
Yes IHPplus quarterly report Sankuru 2015 22,492 22,492 37,051 2,881 34,170 165%
The specific nutrition interventions are related to vitamin A supplementation for children over six months of age, and the number of cases of childhood diarrhea treated in USG-supported programs as
proxy
As this indicator is no longer reported as part of projetc's PMP, The Baseline
figure has been used as annual cumulative target
HL.9-1: Number of children under five (0-59 months) reached by nutrition-specific interventions through USG-supported programs
Yes IHPplus quarterly report Lualaba 2015 23,559 23,559 18,439 4,839 13,600 78%
The specific nutrition interventions are related to vitamin A supplementation for children over six months of age, and the number of cases of childhood diarrhea treated in USG-supported programs as
proxy
As this indicator is no longer reported as part of the project's PMP, the baseline
figure has been used as the annual cumulative target
HL.9-1: Number of children under five (0-59 months) reached by nutrition-specific interventions through USG-supported programs
Yes IHPplus quarterly report Haut Lomami 2015 7,609 7,609 42,137 20,392 21,745 554%
The specific nutrition interventions are related to vitamine A supplementation for children beyond 6 month age. And
number of cases of child diarrhea treated in USG-supported programs as
proxy
As this indicator is no longer reported as part of the project's PMP, the baseline
figure has been used as the annual cumulative target
HL.9-1: Number of children under five (0-59 months) reached by nutrition-specific interventions through USG-supported programs
Yes IHPplus quarterly report Sud Kivu 2015 100,259 100,259 119,805 37,256 82,549 119%
The specific nutrition interventions are related to vitamin A supplementation for children over six months of age, and the number of cases of childhood diarrhea treated in USG-supported programs as
proxy
As this indicator is no longer reported as part of the project's PMP, the baseline
figure has been used as the annual cumulative target
HL.9-1: Number of children under five (0-59 months) reached by nutrition-specific interventions through USG-supported programs
Yes IHPplus quarterly report Lomami 2015 3,000 3,000 27,880 3,122 24,758 929%
The specific nutrition interventions are related to vitamin A supplementation for children over six months of age, and the number of cases of childhood diarrhea treated in USG-supported programs as
proxy
As this indicator is no longer reported as part of the project's PMP, the baseline
figure has been used as the annual cumulative target
HL.9-2: Number of children under two (0-23 months) reached with community-level nutrition interventions through USG-supported programs
Yes IHPplus quarterly report Kasai orientale 2015 100,000 140,000 36,184 17,881 18,303 26%
HL.9-2: Number of children under two (0-23 months) reached with community-level nutrition interventions through USG-supported programs
Yes IHPplus quarterly report Kasai 2015 5,000 20,000 2,213 1,185 1,028 11%
HL.9-2: Number of children under two (0-23 months) reached with community-level nutrition interventions through USG-supported programs
Yes IHPplus quarterly report Kasai Central 2015 47,554 184,000 58,582 32,698 25,884 32%
HL.9-2: Number of children under two (0-23 months) reached with community-level nutrition interventions through USG-supported programs
Yes IHPplus quarterly report Sankuru 2015 73,040 312,000 44,833 23,301 21,532 14%
HL.9-2: Number of children under two (0-23 months) reached with community-level nutrition interventions through USG-supported programs
Yes IHPplus quarterly report Lualaba 2015 44,699 204,000 48,605 30,856 17,749 24%
HL.9-2: Number of children under two (0-23 months) reached with community-level nutrition interventions through USG-supported programs
Yes IHPplus quarterly report Haut Lomami 2015 72,355 168,000 44,183 22,149 22,034 26%
HL.9-2: Number of children under two (0-23 months) reached with community-level nutrition interventions through USG-supported programs
Yes IHPplus quarterly report Sud Kivu 2015 279,618 396,000 173,236 94,872 78,364 44%

Quarterly Results - FY2017Baseline value CommentsINDICATOR PMP Indicator?
(Y/N)
PPR Indicator?
(Y/N)
Data Source DISAGGREGATED BY Annual Performance
achieved to date (in %)
FY 2017
HL.9-2: Number of children under two (0-23 months) reached with community-level nutrition interventions through USG-supported programs
Yes IHPplus quarterly report Lomami 2015 37,476 64,000 60,007 29,451 30,556 94%
HL.9-4: Number of individuals receiving nutrition-related professional training through USG-supported programs Yes IHPplus quarterly
report Kasai orientale 2015 7 100 0 0 0 0%
HL.9-4: Number of individuals receiving nutrition-related professional training through USG-supported programs Yes IHPplus quarterly
report Kasai 2015 2 30 0 0 0 0%
HL.9-4: Number of individuals receiving nutrition-related professional training through USG-supported programs Yes IHPplus quarterly
report Kasai Central 2015 30 430 85 85 0 20%
HL.9-4: Number of individuals receiving nutrition-related professional training through USG-supported programs Yes IHPplus quarterly
report Sankuru 2015 15 220 0 0 0 0%
HL.9-4: Number of individuals receiving nutrition-related professional training through USG-supported programs Yes IHPplus quarterly
report Lualaba 2015 13 180 50 0 50 28%
HL.9-4: Number of individuals receiving nutrition-related professional training through USG-supported programs Yes IHPplus quarterly
report Haut Lomami 2015 17 240 0 0 0 0%
HL.9-4: Number of individuals receiving nutrition-related professional training through USG-supported programs Yes IHPplus quarterly
report Sud Kivu 2015 34 480 0 0 0 0%
HL.9-4: Number of individuals receiving nutrition-related professional training through USG-supported programs Yes IHPplus quarterly
report Lomami 2015 13 180 62 0 62 34%
HL.9-5: A national multi-sectoral nutrition plan or policy is in place that includes responding to emergency nutrition needs (Yes=1; No=0)
IHPplus quarterly report 2015 N/A N/A N/A N/A N/A This indicator is not reported by the
project
3.1.9-1 Number of people trained in child health and nutrition through USG supported programs. Yes IHPplus quarterly
report Kasai orientale 2015 7 100 0 0 0 0%
3.1.9-1 Number of people trained in child health and nutrition through USG supported programs. Yes IHPplus quarterly
report Kasai 2015 2 30 0 0 0 0%
3.1.9-1 Number of people trained in child health and nutrition through USG supported programs. Yes IHPplus quarterly
report Kasai Central 2015 30 430 85 85 0 20%
3.1.9-1 Number of people trained in child health and nutrition through USG supported programs. Yes IHPplus quarterly
report Sankuru 2015 15 220 0 0 0 0%
3.1.9-1 Number of people trained in child health and nutrition through USG supported programs. Yes IHPplus quarterly
report Lualaba 2015 13 180 50 0 50 28%
3.1.9-1 Number of people trained in child health and nutrition through USG supported programs. Yes IHPplus quarterly
report Haut Lomami 2015 17 240 0 0 0 0%
3.1.9-1 Number of people trained in child health and nutrition through USG supported programs. Yes IHPplus quarterly
report Sud Kivu 2015 34 480 0 0 0 0%
3.1.9-1 Number of people trained in child health and nutrition through USG supported programs. Yes IHPplus quarterly
report Lomami 2015 13 180 62 0 62 34%
CUST: Number of acceptors new to modern contraception in USG-supported family planning (FP) service delivery points Yes IHPplus quarterly
report Kasai orientale 2015 20,000 20,000 5585 2941 2644 28%
As this indicator is no longer reported as part of the project's PMP, the baseline
figure has been used as the annual cumulative target
CUST: Number of acceptors new to modern contraception in USG-supported family planning (FP) service delivery points Yes IHPplus quarterly
report Kasai 2015 2,102 2,102 1136 564 572 54%
As this indicator is no longer reported as part of the project's PMP, the baseline
figure has been used as the annual cumulative target
CUST: Number of acceptors new to modern contraception in USG-supported family planning (FP) service delivery points Yes IHPplus quarterly
report Kasai Central 2015 20,000 20,000 8824 4425 4399 44%
As this indicator is no longer reported as part of the project's PMP, the baseline
figure has been used as the annual cumulative target
CUST: Number of acceptors new to modern contraception in USG-supported family planning (FP) service delivery points Yes IHPplus quarterly
report Sankuru 2015 27,188 27,188 13820 6604 7216 51%
As this indicator is no longer reported as part of the project's PMP, the baseline
figure has been used as the annual cumulative target
CUST: Number of acceptors new to modern contraception in USG-supported family planning (FP) service delivery points Yes IHPplus quarterly
report Lualaba 2015 18,522 18,522 7446 2262 5184 40%
As this indicator is no longer reported as part of the project's PMP, the baseline
figure has been used as the annual cumulative target
CUST: Number of acceptors new to modern contraception in USG-supported family planning (FP) service delivery points Yes IHPplus quarterly
report Haut Lomami 2015 32,683 32,683 13952 7125 6827 43%
As this indicator is no longer reported as part of the project's PMP, the baseline
figure has been used as the annual cumulative target
CUST: Number of acceptors new to modern contraception in USG-supported family planning (FP) service delivery points Yes IHPplus quarterly
report Sud Kivu 2015 30,486 30,486 12423 6969 5454 41%
As this indicator is no longer reported as part of the project's PMP, the baseline
figure has been used as the annual cumulative target
CUST: Number of acceptors new to modern contraception in USG-supported family planning (FP) service delivery points Yes IHPplus quarterly
report Lomami 2015 18,394 18,394 7311 3627 3684 40%
As this indicator is no longer reported as part of the project's PMP, the baseline
figure has been used as the annual cumulative target