Download - United Nations Digital Library System
338
-
Upload
khangminh22 -
Category
Documents
-
view
0 -
download
0
Transcript of Download - United Nations Digital Library System

Digitized by the Digitization and Microform Unit - UNOG Library

Blank page _____________
Page blanche
UNITED NATIONS CONFERENCE ON TRADE AND DEVELOPMENT Geneva
TRADE AND DEVELOPMENT
REPORT 1988
Report by the secretariat of the
United Nations Conference on Trade and Development
UNITED NATIONS New York, 1988
Note
• Symbols of United Nations documents are composed of capital letters combined with figures. Mention of such a symbol indicates a reference to a United Nations document.
The designations employed and the presentation of the material in this publication do not imply the expression of any opinion whatsoever on the part of the Secretariat of the United Nations concerning the legal status of any country, territory, city or area, or of its authorities, or concerning the delimitation of its frontiers or boundaries.
• Material in this publication may be freely quoted or reprinted, but acknowledgement is requested, together with a reference to the document number. A copy of the publication containing the quotation or reprint should be sent to the UNCTAD secretariat.
UNCTAD/TDR/8
UNITED NATIONS PUBLICATION Sales No.: E.88.II.D.8 ISBN 92-1-112248-1
ISSN 0255-4607 02000P
Contents
Page
Explanatory notes x Abbreviations xu
il UN CI AD l-XXl
Part One
DEBT, PAYMENTS IMBALANCES AND THE
GROWTH OF THE WORLD ECONOMY
Chapter I
CURRENT TRENDS AND OUTLOOK 3
A. Introduction 3 B. Developing countries 5
1. Overall developments 5 2. Latin America 8 3. Africa 12 4. Asia 16
C. China 19 D. Developed market-economy countries 21
1. Recent developments in demand and output 21 2. Salient features of macroeconomic policy measures 23 3. Short-term prospects for aggregate demand and output 25 4. import compression of developing countries and its effects
on economic activity in the DMECs 27 E. Socialist countries of Eastern Europe 27
Chapter II
UNPREDICTABLE MOVEMENTS OF ECONOMIC INDICATORS: RECENT EXPERIENCE 33
A. Introduction 33 B. Some recent experience of economic fluctuations 36 C. Sources and transmission of unpredictable changes: selected issues 40
it
Page
D. Functions and some consequences of techniques and instruments for reducing market instability 43 1. Commodity prices 44 2. Interest and exchange rates 45 3. Some aspects of the collapse of United States
equity prices in October 1987 47 4. The influence of protective instruments on market behaviour 48 5. Broader social costs 49
E. Illustrating unpredictable changes and their consequences 50 1. The contribution of unpredictable changes to the debt crisis of
developing countries 50 2. Increased transactions costs 51 3. Statistical estimates of effects of fluctuations in exchange rates
on international trade 52 4. Uncertainty over exchange rates as an impediment to investment 53 5. The aftermath of the fall in equity prices of October 1987 54 6. Variable levies to protect agriculture 55 7. Some large fluctuations in commodity futures prices and their
connections with the real sector 56 Chapter II: Notes and references 58
Chapter III
TRADE IMBALANCES ANO POLICIES IN THE DEVELOPED MARKET-ECONOMY COUNTRIES 61
A. Introduction 61 B. Trade imbalances among the developed market-economy countries 62
1. Introduction 62 2. The emergence of the United States current-account deficit:
the proximate causes 63 3. Trade adjustment: the experience to date 68 4. Trade adjustment: risks and opportunities 73
C. The evolution of trade policies in the developed market-economy countries 75 1. The longer-term view 75 2. Recent exchange-rate movements, foreign direct investment
and trade policies 84 3. Some policy implications 87
Chapter IV
DEBT AND DEVELOPMENT 91
A. The crisis and the strategy 91 1. The expansion of borrowing (1974-1979) 91 2. External shocks (1979-1982) 92 3. The design of the strategy 94 4. The record of the strategy 97 5. The external environment, financing and adjustment policies 101
m
Pa#e
B. The debt overhang and growth prospects / / / /. Highly-indebted countries 112 2. Sub-Saharan Africa 118
C. Towards a durable solution 120 1. Low-income debtors 120 2. Commercial bank debt 122 3. Options for commercial bank debt 125
Chapter IV: Notes and references 130
Part Two
SERVICES IN THE WORLD ECONOMY
Introduction 135
Chapter I
THE GROWTH OF SERVICES IN DEVELOPED MARKET-ECONOMY COUNTRIES 137
A. Introduction 137 B. The rise of services employment in the postwar years 139 C. Factors contributing to the growth of the services sector in
developed market economy countries 141 1. Theories on the growth of the service sector 141 2. Forces at work 144
D. Labour force composition 146 E. Location of production 147
Chapter II
TRADE IN SERVICES IN THE WORLD ECONOMY 149
A. Introduction 149 B. Profiles of the developed market-economy countries 150 C. Profiles of selected developing countries 153 D. Competitiveness in trade in services 154 E. Production and trade of producer services in Japan 156
Chapter III
THE STRATEGIC ROLE OF SERVICES 173
A. Introduction 173 B. The role of services in national policy 174
1. The role of information technology 174
IV
Page
C. The growth of knowledge intensive services 175 D. Internationalization of services and development strategics 178
1. The delivery of services to markets 179 2. Issues related to the mobility of capital 180 3. Issues arising from transborder data flows 181 4. Issues relating to the mobility of labour 183 5. Services requiring the mobility of the consumer 183
Chapter IV
SERVICES IN THE ECONOMIES OF THE SOCIALIST COUNTRIES OF EASTERN EUROPE 185
A. Perception of services in theory and practice 185 B. Services and the national economy 186 C. Trade in services 188
1. Exports of services by sectors 189 2. Foreign direct investment in services 189 3. Recent developments in the service sector 190 4. Services in Poland 191
Chapter V
SERVICES IN THE DEVELOPING COUNTRIES 193
A. Overview 193 B. Trends by region 195
1. Latin America and the Caribbean 195 2. Africa 196 3. Western Asia 197 4. Asia and the Pacific 198
C. Services in selected developing countries 200 1. Andean group 200 2. Mexico 205 3. Côte d'Ivoire 207 4. Tunisia 208
Chapter VI
SERVICE STRATEGIES FOR DEVELOPMENT 211
A. Recapitulation of findings 211 B. The need for national service policies 213 C. Service export strategies 215 D. Service import policies 217 E. Regional and subrcgional policy considerations 217 F. International policy considerations 218
V
Page
Annexes
Annex 1 Recent developments in commodity markets 223 Annex 2 Developments and issues in the Uruguay Round 231 Annex 3 World shipping and international trade 235 Annex 4 The insurance sector 245 Annex 5 Technology issues in information services 257 Annex 6 The construction and engineering design (CED) services sector:
some trade and development aspects 263 Annex 7 Statistical annex 271
VI
List of text tables
T.iL'i; Page
1 World output, 1980-1985, 1986 and 1987 and forecasts for 1988 and 1989 4 2 Output per capita and per economically active person, 1980-1985, 1986 and
1987 and projections for 1988 and 1989 6 World current-account balances, 1985, 1986 and 1987 and forecasts for 1988 and 1989 7
4 World trade, 1980-1985, 1986 and 1987 and forecasts for 1988 and 1989 9 5 Deficit of net debtor developing countries: sources of financing in
1985-1987 and forecasts for 1988 and 1989 10 6 Net debtor developing countries: outstanding debt, debt service and
debt-service ratios in 1985-1987 and forecasts for 1988 and 1989 11 7 Socialist countries of Eastern Europe: growth rates of exports and
imports (f.o.b.) by major areas of destination and origin, 1986-1987 30 8 Average growth of real GDP and coefficients of variation for selected
groups of countries, 1961-1972 and 1973-1985 38 Volatility of equity prices in the Federal Republic of Germany, Japan and the United States, 1973-1987 40
10 Relation between equity price movements in the United States and four other OECD countries, 1973-1987 42
11 United States: current-account balance and net foreign investment position, 1980-1986 63
12 Changes from 1980 to 1986 in bilateral trade balances in the United States, EEC and Japan 68
13 Major suppliers to the United States: export performance and real effective exchange-rate changes, 1980-1985 69
14 United States merchandise trade: quarterly changes in volumes, 1987 70 15 United States manufacturing: capacity utilization rates and shares of
exports in gross output, 1981 and 1985 73 16 United States: potential gains in export earnings in major markets,
1980-1986 76 17 Import penetration ratios and ratios of imports covered by non-tariff measures
(NTMs) in selected sectors in EEC, United States-Canada and Japan, 1980 and 1985 81
18 Indices of variability of exchange rates for selected currencies, 1973-1979 and 1980-1987 83
19 Developed market-economy countries: average annual rates of growth of manuiactured imports, 1980-1985 and 1985-1987 87
20 Highly-indebted developing countries: alternative growth paths 114 21 1 hghly-indebted countries: decomposition of the cumulative benefits of
debt relief 117 22 Unemployment, employment and GDP per person employed in selected
OECD countries 140 23 Share of employment by industry in selected OECD countries 141 24 Expenditure on producer services in manufacturing as a percentage of the value
of manufacturing output in four EEC countries 145 25 Women's participation in the labour force in selected DMECs, in selected years 147 26 Developing Africa: major components of the current-account balance 197 27 ESCWA countries: major components of the current-account balance 198 28 Andean countries: components of trade in services, 1980-1985 202 29 Côte d'Ivoire: major components of the current-account balance 209 30 Tunisia: major components of the current-account balance 210
vu
Table Page
List of tables in annexes 1-6
Annex I
Al World production, consumption and commercial stocks of selected metals,
1984-1987 229
Annex 3
A2 Balance of payments on shipping account for major country groups, 1979-1985 236
A3 Distribution of world tonnage (grt and dwt) by groups of countries of registration, 1970, 1986 and 1987 239
A4 The ratio of liner freight rates to prices of selected commodities, 1970 and 1982-1985 241 Annex 4
A5 Insurance density in selected countries 246 A6 Insurance density for 12 selected least developed countries in 1983 247 A7 Employment in the insurance sector as a percentage of the economically
active population in 1983 250 A8 Reliance on foreign reinsurance markets by developing countries 251 A9 Market share of world total insurance premiums, 1980-1985 254
A10 Concentration of the world reinsurance market in 1986 255
VIH
List of boxes and charts
Page
Main text
1 Import compression by developing countries and its effects on economic
activity in the developed market-economy countries 22 2 The widening United States deficit: a quantitative analysis 67 3 NTMs in food and agriculture 77 4 NTMs in non-food manufacturing sectors 80 5 German and Indonesian debts: two historic reschedulings 95 6 The scope for debt-equity swaps 107 7 Salient features of recent debt facility proposals 126 8 Debt relief and trade expansion 128 9 Conceptual problems in the definition and classification of services and
analysis of the interrelationship between services and the economy 138 10 Limitations to existing national accounts statistics for services 142 11 Current-account profiles: graphical presentations 151 12 World receipts in 1986 by major balance-of-payments exponents 152 13 Trade in services and comparative advantage 155 14 Characteristics of knowledge-based compared to tertiary services 176 15 "Locked-in" and "footloose" knowledge 779 16 Transborder data flows: Brazilian policy objectives 182 17 Classification of service activities in the socialist countries
of Eastern Europe 186 18 Services in the socialist countries of Eastern Europe: problems of
statistical and economic analysis 187 19 Bahrain: the "service-centre" approach 199 20 Promotion of services: new directions for the Singapore economy 201 21 Dominican Republic: diversification from goods to services 207 22 The externalization of Tunisian services for export 210
Annex 4
Al Measuring the concentration of an insurance market 252
Chart
Part One
I Selected nominal exchange rates, 1973-1987 36 II Movements of free market price indices of principal non-fuel primary
commodities of export interest to developing countries, 1962-1987 37 III Annual range of selected short-term and long-term interest rates in four
major OECD countries, 1960-1987 39 IV United States relative export performance in manufactures 64 V United States: current account and real trade balance, 1980-1987 65
IX
Page
VI Import coverage indices of selected NTMs applied by selected developed market-economy countries, all products excluding fuels 78
VII Import penetration ratios in manufacturing in EEC, United States-Canada and Japan 78
VIII Real effective exchange rates in selected countries, 1981-1987 86 IX Debt, interest payments and export prices in non-oil-exporting
developing countries 92 X Principal debt indicators for highly-indebted countries and sub-Saharan
Africa 100 XI Per capita income and investment in highly-indebted countries and
sub-Saharan Africa 101 XII Terms of trade for highly-indebted countries and sub-Saharan Africa 102
XIII Export and import volumes in highly-indebted countries and sub-Saharan Africa 102
XIV Net resource transfers from highly-indebted countries and sub-Saharan Africa 103
XV Changes in the external assets of banks in the BIS reporting area vis-à-vis 15 highly-indebted countries, 1980-1987 105
Part Two
Current-account profiles (Charts I-XXXVII) 158
Annex I
A-1 Quarterly indices of free market prices of primary commodities
exported by developing countries 224 A H Annual changes in free market prices of primary commodities
exported by developing countries 226
Annex 3
A-III World seaborne trade by country groups, 1986 238
Annex 4
A-IV Relationship between per capita non-life insurance premiums and per capita GDP in selected developed market-economy and developing countries in 1983 248
X
Explanatory notes
Classification of countries and territories
Unless otherwise indicated, the following classification of countries and territories has been used in this Report. It has been adopted for the purposes of statistical convenience only and does not necessarily imply any judgement concerning the stage of development of a particular country or territory:
Developed market-economy countries (DMECs): Australia, Austria, Belgium, Canada, Denmark, Faeroe Islands, Finland, France, Germany, Federal Republic of, Greece, Iceland, Ireland, Israel, Italy, Japan, Eiechtenstein, Luxembourg, Netherlands, New Zealand, Norway, Portugal, South Africa, Spain, Sweden, Switzerland, United Kingdom, United States.
Socialist countries of Eastern Europe: Albania, Bulgaria, Czechoslovakia, German Democratic Republic, Hungary, Poland, Romania, USSR.
Socialist countries of Asia: China, Democratic People's Republic of Korea, Mongolia.
Developing countries and territories: All other countries, territories or areas not specified above.
Generally speaking, sub-groupings within geographical regions and analytical groupings (e.g. Major petroleum exporters, Major exporters of manufactures, Least developed countries (LDCs) and Remaining countries) are those used in the UNCTAD Handbook of International Trade and Development Statistics, Supplement 1987.*
Latin America corresponds to the Handbook grouping "Developing America" and thus includes the Caribbean countries.
South Asia includes Afghanistan, Bangladesh, Burma, India, Nepal, Pakistan, Sri Lanka and East Asia includes all other countries in South and South-East Asia as well as countries in Oceania. In general, data for the People's Republic of China exclude Taiwan Province.
Commodity classification
Unless otherwise stated, the classification by commodity group used in this Report follows generally that employed in the Handbook of International Trade and Development Statistics, Supplement 1987.
* United Nations publication, Sales No. E/F.87.II.D.10.
XI
Other notes
In the tables and in the text: references to "countries" are to countries, territories or areas as appropriate; references to annex tables are to the tables in the statistical annex (annex 7). References to TDR are to the Trade and Development Report (of a particular year). For example, TDR 1987 refers to Trade and Development Report, 1987 (United Nations publication, Sales No. E.87.II.D.7).
The term dollar ($) refers to United States dollars, unless otherwise stated.
The term 'billion' signifies 1,000 million.
The term tons' refers to metric tons.
Annual rates of growth and change refer to compound rates.
Exports are valued f.o.b. and imports c.i.f., unless otherwise specified.
Use of a hyphen (-) between dates representing years, e.g. 1965-1966, signifies the full period involved, including the initial and final years.
An oblique stroke (/) between two years, e.g. 1980/81, signifies a fiscal or crop year.
One dot (.) indicates that the data are not applicable.
Two dots (..) indicate that the data are not available, or are not separately reported.
A dash (-) or a zero sign (0) indicates that the amount is nil or negligible.
A plus sign ( + ) before a figure indicates an increase; a minus sign (-) before a figure indicates a decrease.
Details and percentages do not necessarily add up to totals, owing to rounding.
XII
Abbreviations
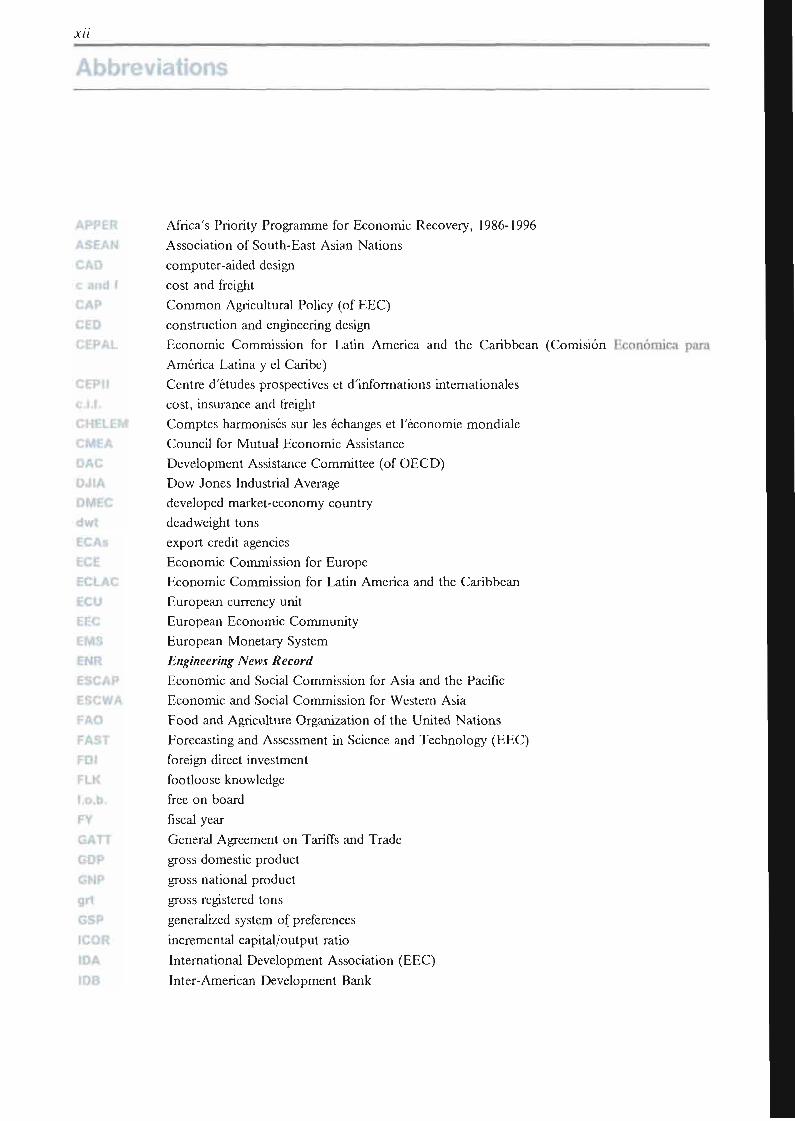
Africa's Priority Programme for Economic Recovery, 1986-1996
Association of South-East Asian Nations
computer-aided design
cost and freight
Common Agricultural Policy (of EEC)
construction and engineering design
Economic Commission for Latin America and the Caribbean (Comisión Económica para
América Latina y el Caribe)
Centre d'études prospectives et d'informations internationales
cost, insurance and freight
Comptes harmonisés sur les échanges et l'économie mondiale
Council for Mutual Economie Assistance
Development Assistance Committee (of OECD)
Dow Jones Industrial Average
developed market-economy country
deadweight tons
export credit agencies
Economic Commission for Europe
Economic Commission for Latin America and the Caribbean
European currency unit
European Economic Community
European Monetary System
Engineering News Record
Economic and Social Commission for Asia and the Pacific
Economic and Social Commission for Western Asia
Food and Agriculture Organization of the United Nations
Forecasting and Assessment in Science and Technology (EEC)
foreign direct investment
footloose knowledge
free on board
fiscal year
General Agreement on Tariffs and Trade
gross domestic product
gross national product
gross registered tons
generalized system of preferences
incremental capital/output ratio
International Development Association (EEC)
Inter-American Development Bank
Xlll
International Finance Corporation
International Labour Office
International Monetary Fund
National Institute of Intellectual Property (Brazil)
Integrated Programme for Commodities
International Standard Industrial Classification of All Economic Activities
International Telecommunication Union
Board of the Cartagena Agreement (Junta del Acuerdo de Cartagena)
least developed country
London Inter-Bank Offered Rate
locked-in knowledge
London Metal Exchange
Multi-Fibre Arrangement
Ministry of International Trade and Industry (Japan)
multilateral trade negotiations
multi-year rescheduling agreement
net material product
non-tariff barrier
non-tariff measure
New York Stock Exchange
official development assistance
official development finance
Organisation for Economic Co-operation and Development
Organization of the Petroleum Exporting Countries
Office of Technology Assessment (United States Congress)
research and development
structural adjustment loan
special drawing right
Special Secretariat for Information (Brazil)
Latin American Economic System (Sistema Económico Latinoamericano)
Standard International Trade Classification (revision 1)
small- and medium-size enterprises
transnational corporation
transfer of technology
United Nations Conference on Trade and Development
United Nations Centre on Transnational Corporations
United Nations Development Programme
XIV
UNIDO United Nations Industrial Development Organization
UN/PAAERD United Nations Programme of Action for African Economic Recovery and Development,
1986-1990
USTR United States Trade Representative
VER voluntary export restraint
WHO World Health Organization
WIDER World Institute for Development Economics Research
WIPO World Intellectual Property Organization
OVERVIEW by the
Secretary-General of UNCTAD
DEBT, PAYMENTS IMBALANCES AND THE GROWTH OF THE WORLD ECONOMY
Last year's Trade and Development Report warned that if its external balance did not improve fast enough, the. United States might be pushed by currency markets into raising interest rates sharply, thereby triggering a world recession. It noted in this context that price levels in the leading stock markets were extraordinarily high and vulnerable.
The response of payments imbalances to movements of exchange rates and policy actions did indeed disappoint the financial markets, and the collapse of equity prices in October 1987 was to a significant extent a refection of such sentiments. Fortunately, however, governments of the major market economies relaxed monetary policy in good time, and a rise in interest rates and the onslaught of recession were avoided. More recently, trade performance and stock market prices have improved.
Nevertheless, the imbalances still pose a threat. They need to be corrected, but not at the cost of world prosperity. The main routes should be import expansion by surplus countries and increases in the import capacity of deficit developing countries.
The import capacity of troubled debtors remains constrained despite the efforts and sacrifices they have made. It is in the interests of creditors as well as debtors and of the world economy generally to remove the debt overhang perpetuating the crisis of debt and development.
Further reduction in the United States budget deficit is needed to make room for stronger export demand and investment. Domestic demand is expanding in Japan and the depreciation of the dollar is increasingly directing the expansionary impact of the United States budget deficit toward the United States economy. Deflationary pressures continue to predominate, however, in Western Europe.
The unstable macro-economic environment and speculative behaviour in the foreign exchange and other financial markets have contributed to the growing resort to non-tariff measures and bilateralism which have been eroding the trading system. The Uruguay Round presents an opportunity for the international community to deal with this situation. The negotiations will have to bear in mind that improvements in market access for developing countries would be beneficial to the entire world economy.
Speculative activity in financial markets also reduces the usefulness to producers of market signals. In mid-1988, for example, the dollar appreciated substantially, triggered by some marginal improvement in the United States trade balance. The effect on the United States economy is to make exporting less attractive and importing more attractive at a time when the trade deficit is already large and unsustainable.
Governments of the major OECD countries are increasingly acknowledging that greater official intervention to establish appropriate frameworks and guidelines for markets and improved policy co-ordination are necessary if instability is to be reduced, but the actions taken to those ends have so far been limited. The framework of policy co-ordination needs to be extended to include a broader gamut of policy instruments, thus reducing current excessive reliance on monetary policies.
Il
Adjustment and adaptation in the world economy
The world economy in mid-1988 was continuing to expand at roughly the same pace as in 1987, and current expectations are that this trend will continue, so that for the year as a whole world output should be about 3 per cent higher than in 1986 (see box).
This global expansion masks a decided slackening of the growth of Latin American countries, which continue to labour under the weight of their external indebtedness; and most countries in Africa remain in the throes of a profound development crisis. Growth slackened in the socialist countries of Eastern Europe, but the economic plans of those countries envisage improvement in 1988.
The overall performance of the rest of the world economy is now widely regarded with some satisfaction - and with much relief. In early 1988, virtually all observers had expected a slowing down of growth in the developed market-economy countries, brought about by the combined impact of the stock market crash of October 1987 and the consequences of the persistent imbalances in payments among some of the major trading countries - the Federal Republic of Germany, Japan and the United States. By mid-1988, this danger appears to have been averted, at least for the time being. The collapse of equity prices has so far had little effect on consumption and investment in the developed market-economy countries, in part because the wealth that was destroyed by the collapse had been so recently created that it had not had time to become an important determinant of consumer and investor behaviour. More important, however, has been the success so far of the United States in making progress toward what, in another context, would be referred to as adjustment with growth.
Adjustment with growth in the developed market-economy countries
In mid-1986 the United States was faced with a situation not uncommon in the 1980s: the economy had grown rapidly but at the cost of incurring a large and unsustainable current-account deficit and a high and rising level of external indebtedness; in the course of that year it became the world's largest debtor.
A configuration of factors, some of domestic and others of foreign origin, brought about the deterioration of the United States current-account balance. The most important factors were:
The combination of an expansionary fiscal policy in the United States with highly restrictive stances in the other major developed market economies from 1982 to 1985, which resulted in large differentials in aggregate demand growth.
The appreciation of the dollar, which eroded the competitive position of United States industry during the first half of the 1980s.
The shrinkage of the import capacity of the developing countries, due to the sharp and continued deterioration in their terms of trade and the swing in the net transfer of resources associated with the debt overhang. This stemmed in large part from the weakness of world demand and the high level of interest rates brought about by the tight monetary policies pursued in the developed market-economy countries. The pattern of trade was such that the import cuts fell with particular severity on United States exports. United States exports to the highly indebted countries declined by about S10 billion from 1980 to 1986, i.e. over S6 billion more than the drop in that country's total exports in that period.
/ / /
THE OUTLOOK
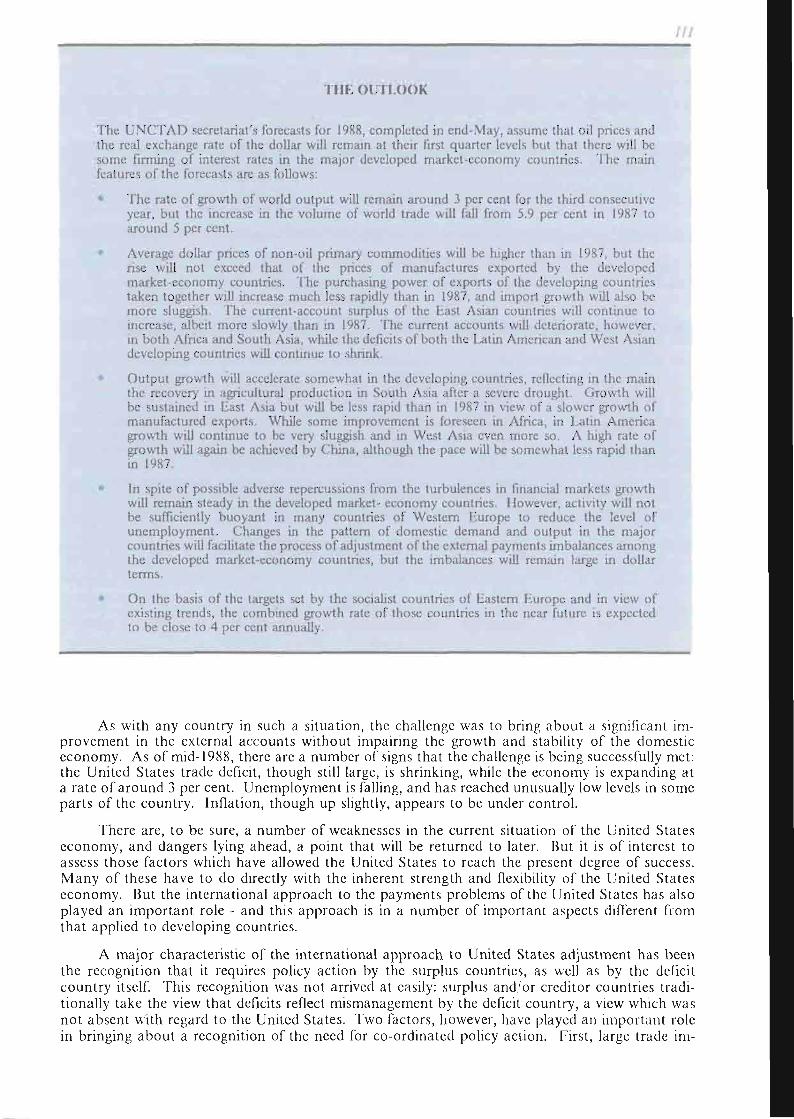
The UNCTAD secretariat's forecasts for 1988, completed in end-May, assume that oil prices and the real exchange rate of the dollar will remain at their first quarter levels but that there will be some firming of interest rates in the major developed market-economy countries. The main features of the forecasts are as follows:
The rate of growth of world output will remain around 3 per cent for the third consecutive year, but the increase in the volume of world trade will fall from 5.9 per cent in 1987 to around 5 per cent.
Average dollar prices of non-oil primary commodities will be higher than in 1987, but the rise will not exceed that of the prices of manufactures exported by the developed market-economy countries. The purchasing power of exports of the developing countries taken together will increase much less rapidly than in 1987, and import growth will also be more sluggish. The current-account surplus of the East Asian countries will continue to increase, albeit more slowly than in 1987. The current accounts will deteriorate, however, in both Africa and South Asia, while the deficits of both the Latin American and West Asian developing countries will continue to shrink.
Output growth will accelerate somewhat in the developing countries, reflecting in the main the recovery in agricultural production in South Asia after a severe drought. Growth will be sustained in East Asia but will be less rapid than in 1987 in view of a slower growth of manufactured exports. While some improvement is foreseen in Africa, in Latin America growth will continue to be very sluggish and in West Asia even more so. A high rate of growth will again be achieved by China, although the pace will be somewhat less rapid than in 1987.
In spite of possible adverse repercussions from the turbulences in financial markets growth will remain steady in the developed market- economy countries. However, activity will not be sufficiently buoyant in many countries of Western Europe to reduce the level of unemployment. Changes in the pattern of domestic demand and output in the major countries will facilitate the process of adjustment of the external payments imbalances among the developed market-economy countries, but the imbalances will remain large in dollar terms.
On the basis of the targets set by the socialist countries of Eastern Europe and in view of existing trends, the combined growth rate of those countries in the near future is expected to be close to 4 per cent annually.
As with any country in such a situation, the challenge was to bring about a significant improvement in the external accounts without impairing the growth and stability of the domestic economy. As of mid-1988, there are a number of signs that the challenge is being successfully met: the United States trade deficit, though still large, is shrinking, while the economy is expanding at a rate of around 3 per cent. Unemployment is falling, and has reached unusually low levels in some parts of the country. Inflation, though up slightly, appears to be under control.
There are, to be sure, a number of weaknesses in the current situation of the United States economy, and dangers lying ahead, a point that will be returned to later. But it is of interest to assess those factors which have allowed the United States to reach the present degree of success. Many of these have to do directly with the inherent strength and flexibility of the United States economy. But the international approach to the payments problems of the United States has also played an important role - and this approach is in a number of important aspects different from that applied to developing countries.
A major characteristic of the international approach to United States adjustment has been the recognition that it requires policy action by the surplus countries, as well as by the deficit country itself. This recognition was not arrived at easily: surplus and/or creditor countries traditionally take the view that deficits reflect mismanagement by the deficit country, a view which was not absent with regard to the United States. Two factors, however, have played an important role in bringing about a recognition of the need for co-ordinated policy action. First, large trade im-
h
balances have triggered trade conflicts and protectionist pressures, thereby threatening to disrupt the international trading system (see below). Second, exchange-rate movements did not promote a viable medium-term pattern of trade balances, but rather generated sharp swings in trade and capital flows with attendant consequences for monetary and financial stability, both because of the speculative nature of currency markets and because of disparities in the mix and stance of macro-economic policies (see below). A co-operative approach was also facilitated by the realization that adjustment of the United States trade deficit would inevitably slow the growth of the economies of the surplus countries. Concerted action has thus been taken in a number of areas, including macroeconomic and trade policies, exchange rates and the financing of the United States trade deficit.
While the need for expansionary policies to facilitate the United States balance-of-paymcnts adjustment has been recognized, macroeconomic policy action in the surplus countries has not always been adequate: in particular, the fiscal stance of the Federal Republic of Germany has remained rather restrictive. However, monetary relaxation in that country, combined with expansionary monetary and, in particular, fiscal policies in Japan, has made an important contribution. The effects of policy changes were particularly impressive in Japan, where aggregate domestic demand in 1987 grew by 5 per cent, and appeared set to continue expanding at roughly the same pace in 1988. This was fully 1 percentage point of GNP above the rate of growth of output, the difference taking the form of a swing in the real trade balance.
The expansion of domestic demand in the surplus countries has helped to bring about an adjustment of trade imbalances without excessive pressure on the dollar, and at higher rates of growth of demand and output in the United States than would otherwise have been the case. Among other things, this has helped to achieve a reduction of the United States fiscal balance without jeopardizing price stability and growth. Productive capacity has been expanding noticeably in the manufacturing sector; after years of hesitation during which investment efforts were directed more toward improving the efficiency of existing plants, United States firms appear to have finally started to make plans for plant expansion. For this trend to continue uninterrupted, it is essential that economic conditions remain favourable for a recovery of productive investment. This will require domestic demand growth in the United States to leave enough room for an export-led adjustment. With export growth making a significant contribution to aggregate demand, a further adjustment of the United States fiscal stance is in order; indeed, if external demand and private investment continue to strengthen, a sizeable reduction in the United States fiscal deficit will be essential if inflationary pressures are to be avoided.
In addition to macroeconomic management, a more symmetrical role for surplus and deficit countries has also emerged - at least in part - in international trade. Bilateral trade relations between the United States and Japan have been addressed in a manner that is relevant to their trade imbalance. Specifically, Japan has recently agreed to liberalize import restrictions on goods of particular export interest to the United States. Though such bilateral arrangements run counter to efforts to preserve a viable multilateral trading system, and may damage the trading interests of other countries, they do help ensure that adjustment occurs in an environment of trade expansion. During the first half of 1988, the volume of Japanese imports rose at an annual rate of about 14 per cent. Similar expansion by other surplus countries would make an important contribution to adjustment with growth.
Co-operative action with regard to exchange rates was also an important and much commented aspect of international co-operation for adjustment with growth. While the influence of governments of surplus and deficit countries on the exchange rates of their currencies was limited and remains so, that influence was used to help markets find a more realistic exchange rate of the dollar, and, later, to discourage markets from establishing a value for the dollar that was "too realistic" - that is, a rate below that which the authorities believed appropriate. For the United States, the change in the external value of the dollar had to be finely tuned; the depreciation had to be enough to bring about a significant response of imports and exports, but not so much as would rekindle inflation. For the surplus countries, the objective was to foster the exchange-rate changes needed to shift trade balances without inflicting unnecessary damage on the competitive positions of their domestic producers. From the standpoint of both surplus and deficit countries, then, there emerged a much greater willingness on the part of the authorities to take a position regarding the appropriate external value of their currencies, and to influence market behaviour accordingly. Lying behind all this was the view that adjustment should proceed at a moderate, steady pace.
f
A further prominent feature of the international strategy for dealing with trade imbalances among developed market-economy countries has been the way in which external finance has been managed. By and large, the private financial flows required to finance the United States deficit have been forthcoming, encouraged as necessary by interest rate differentials among the major money market centres. At certain times, however, private flows faltered, leaving a large gap to be financed in the United States balance of payments. On these occasions official action filled the emerging gap; and once decisions on appropriate ranges for exchange rates had been taken, central bank intervention in foreign-exchange markets in defence of those decisions provided, virtually automatically, financing through official channels roughly equivalent to any shortfall in private flows. Official financing of the United States deficit was important in 1987, amounting to at least S48 billion, or one third of the current-account deficit, and perhaps to substantially more. Thus, there was no question in this strategy of the dollar, United States monetary policy and interest rates adjusting further to encourage the necessary private finance and/or of reducing United States imports and the current-account deficit to levels that would match private capital inflows: rather, official flows expanded, in the context of co-operation among central banks, in defence of the pattern of exchange rates to the extent required by the deficit implied by those exchange rates. This, in turn, restored confidence to private lenders, and contributed to the restoration of private flows. How long unlimited official finance might otherwise have continued it is impossible to say.
Although co-ordinated actions on various fronts have helped to initiate an orderly reduction of trade imbalances among major market-economy countries, there are a number of risks and uncertainties that remain. The policies of the United States' major trading partners will be critically important. Although Japan's surplus with the United States has been declining steadily, it is important that policy should continue to be supportive of domestic demand in that country and that further efforts be made to increase its absorption of foreign goods and services, e.g. through the removal of trade barriers, in particular non-tariff barriers, and improvement of the domestic distribution network for foreign products.
Fligher absorption by other surplus countries is also essential, if only to prevent the reduction of the United States deficit from finding its counterpart in burgeoning deficits elsewhere. Reduction in the trade deficit and the depreciation of the dollar have been associated with growing payments imbalances among the Western European countries and increased strains in the European Monetary System (EMS); both the French franc and the Italian lira came under selling pressures and weakened vis-à-vis the deutsche mark, especially toward the end of the first quarter of 1988. In view of reduced demand stimulus from the United States and in the absence of adequate demand expansion in the Federal Republic of Germany, other Western European countries may face a substantial slowdown of economic activity that provides little scope for domestic expansion. Under these conditions, a revaluation of the deutsche mark within the EMS may become inevitable. However, this would only serve to reallocate among Western European countries the burden of the United States adjustment effort, rather than initiate a strong European recovery. The deflationary forces within the developed market-economy countries are now concentrated fully on Western Europe.
Increased absorption by developing countries with high levels of international reserves and large surpluses would also contribute to easing international payments imbalances. A few countries, especially those in East Asia, have accumulated large pools of reserves thanks to their recent good export performance. These reserves are valuable cushions against unexpected shocks. However, any excess can be better used on spending that improves the country's well-being and its productive capacity, both human and physical. Increased development expenditures may be a more efficient way to forestall foreign measures to curb their exports than blunting the export drive, which may jeopardize their growth prospects in the longer term.
Since import compression in debtor developing countries was an important element contributing to the payments imbalances of the United States, reversing this compression would make a large contribution to correcting the imbalances:
If the various trading partners of the United States had played the same relative roles as markets for United States exports in 1986 as in 1980, and total United States exports had grown at the same rate as world trade during 1980-1986, its earnings would have been about S50 billion higher than they actually were in 1986. More than half of the extra earnings would have come from the recovery of the share of developing country markets in United States exports, of which almost two-thirds would have been contributed by the highly-indebted developing countries.
VI
A 30 per cent reduction of the commercial bank debt of highly-indebted developing countries, combined with $5 billion of debt relief and new financial flows for sub-Saharan African countries, would result in annual increases in net import demand from debtor countries of $18 billion over the 1987 level. This extra stimulus to world trade would reduce the extent to which the trade surpluses of Japan and the Federal Republic of Germany would need to be cut to improve the trade balance of the United States. As much as $6 billion or more in annual imports could accrue to the United States as a direct result of those actions. If account is also taken of secondary effects due to the operation of trade multipliers, the eventual benefits to world trade would be much larger.
Debt and the developing countries
In contrast to the approach to the payments problems of the United States, symmetry in adjustment has not been an outstanding feature of the international strategy for dealing with the debt and balance-of-payments problems of developing countries. Their debt crisis is entering its seventh year without coming any closer to being resolved:
* The ratio of interest payments to exports has fallen somewhat since 1982 thanks to the decline of interest rates from record levels. But it is still too high, and the ratios of debt and of exports to GDP are even higher than before.
The growth momentum of troubled debtors remains stifled. For the 15 countries identified in the Baker initiative as "highly indebted", whose debts are mostly owed to commercial banks, output per head is still below the 1980 level; nine of them have had negative growth in at least one year since 1982, and in three real income per head has fallen every year. Troubled debtors that are middle-income countries and whose debts are mainly to official institutions, such as export credit agencies and multilateral agencies, have also fared badly. The growth record for the sub-Saharan African countries has been especially discouraging: real income per head has declined almost every year since the beginning of the decade and is about 14 per cent lower than in 1980.
The persistence of over-indebtedness has been reflected in a failure to normalize relations between debtors and creditors. Many developing countries have accumulated arrears, and a few have formally announced moratoria of one kind or another. No country that has renegotiated its foreign debt has been able to avoid doing so repeatedly.
The vicious circle of over-indebtedness and stagnation has continued because a paucity of resources has kept investment low. Net investment has been barely positive in some countries, which has made it extremely difficult to adjust in the true sense of the term, i.e. by continuously diversifying production and improving efficiency.
The burden of debt has also destabilized the internal economy in various ways, for instance by swelling the budget deficit, making it difficult to control the money supply and accentuating social conflicts. Expenditure on human resource development and physical infrastructure, which is vital for future development as well as for current levels of well-being, has also been severely affected.
Although the debt strategy has placed the weight of emphasis on changing domestic policies, an improved external environment was acknowledged at the outset as necessary, in order to provide the margin of manoeuvre required for growing out of debt starting from a situation of over-indebtedness and, in many cases, a narrow export base. It was also intended that external financial flows should be sustained at reasonable levels.
However, in practice commodity prices continued to be weak throughout most of the period since the outbreak of the debt crisis, despite recovery in the developed market economies, and the flow of external lending proved to be disappointing. The deterioration in the terms of trade has wiped out most or all of the gains from lower interest rates for countries mainly indebted to commercial banks, and has been especially severe for the low-income debtors. The continuous resource loss from the swing in net financial transfers and the constant deterioration of the terms of trade
Ill
have largely destroyed the chances of achieving the debt strategy's objectives without scaling down the claims of creditors.
When the technique of "concerted lending" was adopted, it was argued that although their exposure to troubled debtors had reached excessively high levels, banks had a collective self-interest in extending their exposure by modest amounts. New lending was needed to avoid pushing debtors into default in the short term, and to help them to strengthen their capacity to service their debts in the long term. By providing the liquidity needed by debtors to adjust, banks would improve the quality of their porfolios; they could reduce their vulnerability over time by increasing their capital base more rapidly than their exposure.
Commercial banks have indeed been able to reduce their exposure to troubled developing country debtors relative to their capital. This achievement, together with avoidance of international financial disruption, stands out as the main accomplishment of the strategy. However, they have become increasingly reluctant to provide new loans. At the same time, the failure of the debtors to make headway in achieving sustainable debt ratios is raising doubts whether over-indebtedness can be surmounted by adding to debt.
The markets' poor assessment of prospects is clearly reflected in the heavy discounts at which the paper of debtors is selling in secondary markets. Such discounts indicate an assessment that debtors will be unable fully to service their debts in the future. They imply that the probability of default has risen, even though banks have reduced their exposure.
Market expectations are in line with the UNCTAD secretariat's own estimates of what is in store for the "Baker 15" taken as a group under alternative scenarios:
Baseline scenario. This is constructed on the assumption that the terms of trade, interest rates and net lending will remain as they are, and that debtor countries will be able through appropriate policies to raise the efficiency of investment. However, no increase in the level of investment is assumed, since further cuts in living standards will be extremely difficult to attain and would not yield significant increases in the capacity to import investment goods. In this scenario, over the next five years per capita export volume would grow by no more than 0.8 per cent per annum and income by no more than 0.5 per cent. The debt indicators would barely show any improvement. Such an outcome would be superior to what has been achieved so far, but is bleak none the less, and implies an eventual breakdown in debtor-creditor relations.
New lending scenario. This assumes that the terms of trade and interest rates remain unchanged but that net capital flows are raised sufficiently to eliminate the foreign-exchange constraint on growth (i.e. to a level 2.4 times above the baseline figure). The levels of investment and income rise sharply. Income then grows at about 5.3 per cent (3.1 per cent per capita) over the next five years, and exports at about the same rate. However, the debt statistics show no improvement. New lending allows the pace of export and output growth to quicken, but not enough to reduce over-indebtedness. This result holds true even if the marginal savings rate (and with it the rate of investment and export growth) is raised as income growth accelerates.
These conclusions led the UNCTAD secretariat to explore what would be required by way of a once-and-for-all cut in the level of debt to creditors other than the multilateral agencies (or equivalent cut in interest rates on non-multilateral debt) in order to achieve a broadly satisfactory outcome. In this debt relief scenario it is assumed as before that interest rates and the terms of trade remain unchanged and that the efficiency of investment is improved. A 30 per cent cut in commercial bank debt, together with new lending by multilateral agencies and vigourous efforts by the debtors to invest and export, is estimated to be the minimum needed to remove the foreign-exchange constraint. After five years, income is 24 per cent and investment 36 per cent higher than in the baseline scenario, while the debt/GDP ratio is 17 percentage points and the debt export ratio 100 percentage points lower. Moreover, at the end of the period the GDP growth rate (of 5.3 per cent) is sustainable, and the debt statistics continue to improve. If the marginal savings rate were raised, growth would be accelerated further, and the debt statistics improved even more.
In short, if debtor countries are given relief equivalent to about one-half of the discount at which their debt is currently traded on secondary markets, they can break out of the vicious circle, and grow out of their debt problem.
I III
This debt relief option is not a "quick fix". The relief, which would vary from country to country according to circumstances, would serve to put in motion much the same process of growing out of over-indebtedness as is being sought under the current approach. The relief itself would improve the debt statistics, but would be followed by continuous adjustment as export growth is speeded up. Similarly, investment would be continuously raised as income grows and savings increase; consumption would advance at the same pace as output.
The fruits of such a process would be shared by creditors. Not only would they be relieved of their obligation to participate in "involuntary lending", but also the progressive strengthening of the debtor's debt-servicing capacity and its economy generally would reduce the credit risk, leading to a rise in prices on secondary markets. Besides, faster growth in the debtor countries would open up opportunities for commercial banks in traditional lines of business, as well as newer fee-earning activities.
The mutual interest of creditors and debtors in removing the debt overhang is not fully appreciated. For instance, the argument is still repeated that troubled debtors will be unable to restore creditworthiness unless they preserve their reputation for honouring obligations,. However, it is questionable whether many of these countries have a chance of re-establishing normal relations with their creditors unless their debt overhang is first lifted consensually.
The mutual interest is also ignored by banks. When they dispose at a discount of their claims on troubled debtors (for instance through equity conversion or collateralized bonds), their motive is not to strengthen the debtor countries' debt-servicing capacity, but to acquire assets with smaller credit risk. The main reason why they neglect the positive feedback from relief is that only a negligible portion accrues to the creditor providing it: other creditors can enjoy a "free-ride" unless the relief is concerted, which is not the case. Besides, the amount of relief which any single creditor, or homogeneous group of creditors, can provide will not reach the critical mass needed to allow the debtor to push investment strongly ahead on a broad front, as it must in order to achieve sustained growth.
Debtors' capacity to offer creditors alternative assets such as cash, equity or collateralized securities in exchange for discounts is on the whole relatively small, and inversely related to countries' need for relief. The ability of the present voluntary market-oriented approach to reduce the debt overhang is therefore very limited.
What is needed is to make the process of debt reduction concerted, and the process of lending voluntary. There are two avenues for arriving at such a result. One is for creditor governments and international financial agencies to meet creditors' demands for alternative assets by increasing their supply, through, for instance, an international debt facility. The other is for the banks themselves to reduce interest rates on their outstanding claims (and/or the volume of such claims) with a view to reducing the credit risk attached to their remaining claims.
These options have a number of similarities:
They involve an element of involuntarism, like the "concerted lending" that they would replace. This could be kept to a minimum if creditor governments provided suitable incentives and disincentives through their bank regulations and fiscal regimes, for instance by requiring claims on developing countries to be "marked to market" and allowing only those banks providing relief to write off the losses over a period of years.
s They require the debtor countries to pursue policies to enhance growth and adjustment, no less than at present. It would be in the interest of those countries to do so. Besides, they would continue to need fresh lending from international financial agencies, who would therefore be able to proffer policy advice. Additional means to ensure that relief was channelled into export growth could also be adopted.
Either option could be elaborated in such a way as to avoid the perceived risk of repeated claims for relief (the "slippery slope") and of countries' deliberately incurring difficulties in order to receive concessions ("moral hazard").
\
The two options do, however, differ in important ways:
• For the first option to be feasible, creditor governments must assume a financing role, either by paying in capital or assuming contingent liabilities, something which they have thus far ruled out.
• For the second option to be feasible creditors must recognize that the market price of their claims will rise with a reduction of the burden of accumulated debt. This would constitute a radical change of perception, but one which creditor governments and international financial agencies could foster, for instance by indicating their unwillingness to support excessive debt collection.
A number of specific schemes have been put forward by prominent individuals and institutions, most of which entail actions covered by the two options. The time is now ripe to give those actions more serious consideration. Commercial banks have not only greatly reduced their exposure rates but also much increased their provisions. They are therefore in a position, with the help of bank regulators, to absorb relief on the scale needed.
Measures by creditors and/or creditor governments to remove the debt overhang for countries requesting such action would not be a threat to case-by-case adjustment, since the rate of relief given would depend on factors specific to each country. Indeed, tailoring the interest burden to individual circumstances would strengthen the case-by-case approach.
Nor would the provision of relief endanger the international financial system. The real threat stems from the continuous postponement of development and the refusal to face the problem of solvency.
Over the past year, there has been a growing recognition by official creditors and donors that the debt-servicing problems of the poorer countries, particularly those in sub-Saharan Africa, require urgent and special attention. Following the recommendations by the 1987 Venice summit, a number of the poorest African countries were granted a significant lengthening of the repayment and grace periods in their Paris Club reschedulings. However, this move in itself did not give rise to concessionary, as market-related rates continued to be applied on rescheduled debt, with the exception of a few official creditors who began granting concessional interest rates to selected debtors in bilateral agreements. Other initiatives included forgiveness of ODA debt or debt payment owed by the least developed and some other poorer countries to OECD donors, along the lines of Trade and Development Board resolution 165 (S-IX); enhancement of IMF's structural adjustment facility; and the World Bank's cofinancing scheme with bilateral donors in support of adjustment programmes in sub-Saharan Africa. In addition, some developed country donors helped Bolivia buy back half of its commercial bank debt at the heavily discounted prices prevailing in the secondary market. A similar scheme was sponsored by the Netherlands for Zambia.
The need for genuine concessionality in Paris Club reschedulings for poorer countries has been at the centre of debate among official creditors following the proposal of the United Kingdom to give interest rate reductions to low-income debt-distressed countries undertaking adjustment efforts, and the proposal by the President of France to cancel one-third of debt service owed by the same countries. The outcome of these discussions was an agreement at the Toronto summit meeting in June 1988, which entailed a "menu" of options for official creditors, including "concessional interest rates on shorter maturities, longer repayment periods at commercial rates, partial write-offs of debt-service obligations during the consolidation period, or a combination of these options".
The consensus achieved at Toronto represents an important qualitative change in official creditors' stance with regard to non-concessional debt owed by poorer debtors and has the potential for easing their debt burden. There are, however, a number of questions that need to be addressed:
The degree of concessionality of the scheme would have to be defined within the Paris Club. It is hoped that the reduction in future debt service will be large enough to allow debtor countries eventually to avoid the capitalization of interest in future reschedulings. The sums involved are very small compared to the aid-giving capacity of donor countries. As an example, bilateral official debt of the poorest sub-Saharan countries amounts to S23 billion, a sum roughly equivalent to one-day's output of the seven largest developed market economies.
X
Comparability among the various options being chosen by official creditors also needs to be worked out by the Paris Club in order to determine the burden-sharing among creditors. Under the option involving longer repayment periods, it would be difficult to achieve a degree of concessionality which is comparable to that implied by the other two options, involving reduction in interest rates or in the stock of debt. Furthermore, the stretching of maturities will not improve the ex ante (i.e. before further rescheduling) cash-flow position of debtor countries during the grace period, which had already been extended to 10 years; financial benefits will accrue only thereafter. Conversely, the other two options, by reducing the debt-service obligations over the entire life of the loans concerned, have the potential to improve debt indicators and expected cash flow over the next few years and thus to contribute to breaking the snowball effect of interest capitalization. But none of the three options will avoid the need for repeated reschedulings, unless the consolidation period is lengthened accordingly.
The list of beneficiary countries appears to be limited to the poorest debt-distressed countries undertaking internationally-approved adjustment programmes. Consideration should be given to the possibility of widening the eligibility criteria in order to include other countries, that are less poor but still heavily indebted, as well as poorer countries which have, so far, been able to avoid Paris Club restucturings, but only at a high cost.
In order to help meet the huge financial requirements of beneficiary countries and of developing countries in general, the concessional resources provided under this initiative should be truly additional to aid allocations to such countries as well as to currently planned aid programmes.
The initiative taken at the Toronto summit needs to be complemented by further action on debt relief as well as additional concessional flows to the least developed and other poorer countries. The example already set by those donors that have forgiven ODA debt, or taken equivalent action, in accordance with Trade and Development Board resolution 165 (S-IX), should be followed by other donors. Furthermore, careful examination of export prospects and import requirements for growth is likely to lead to the conclusion that the cancellation of ODA debt is necessary for a broader group of countries than has so far benefited from such measures. Multilateral debt will account for about 20 per cent of total debt service by both low-income countries and sub-Saharan African countries in 1988-1990. Debt owed to multilateral institutions has not been rescheduled so far, mainly because of the perception that this would impair their own creditworthiness and so raise their funding costs on international capital markets. However, the time has come to find ways and means to overcome this problem. Among the possibilities that should be examined is establishing - with additional concessional resources - interest-subsidy schemes and refinancing mechanisms which would allow multilateral non-concessional loans to be converted into loans on IDA terms, along the lines of the proposal made by the Nordic countries.
It would be desirable to supplement official debt relief for the least developed and other poorer countries with buy-back programmes for their commercial bank debt, which is typically relatively small. Additional official support for these schemes should be considered. Since discounts in secondary markets for such debt are very large, relatively small sums of aid funds can provide considerable debt relief and promote the return to normal relations with commercial banks, including the re-establishment of short-term credit lines.
Measures to reduce the burden of debt to commerical banks could be linked to debt relief on official bilateral debt in a single scheme, along the lines of the recent proposal made by the African Development Bank. This plan involves the securitization of both kinds of debt, in which medium-term claims would be converted into 20-year bonds carrying a below-market interest rate. This proposal deserves to be further explored in the light of the action taken at the Toronto summit.
Even under the very optimistic assumptions regarding debt relief, the volume of external resources needed for adjustment and growth in poorer countries is of such magnitude as to require greatly increased concessional flows, both bilateral and multilateral, in addition to action to alleviate their debt burden. Furthermore, new aid flows need to be fast-disbursing and flexible so as to respond to changes in the external environment, which will remain a determining factor in these countries' efforts to recover. Creditor governments can improve the financial position of debtor countries by supporting their adjustment efforts both directly, through a subtantial increase in the currently planned aid budgets, and indirectly, by keeping the multilateral institutions adequately financed. In the Toronto summit declaration, it was stressed that "an increase in concessional re-
Y/
source flows is necessary to help the poorest developing countries resume sustained growth, especially in cases where it is extremely difficult for them to service their debts". These good intentions need to be put quickly into practice.
The debt-servicing problems of middle-income countries, whose debts are mostly to official institutions, also deserve much closer attention than they have received. The scope for alleviating the burden on such countries through relief by commercial banks is limited. Some of them could gain considerably from being included among the beneficiaries of the Toronto agreement on official bilateral debt, but in many cases much of the debt service is accounted for by multilateral debt. Refinancing such debt at concessional terms could provide a way out. For that to be possible without reducing the funds available to poorer countries (including those not facing debt-servicing difficulties but nevertheless having a great need for soft aid) the total volume of official development assistance would need to be enlarged accordingly.
Economic reform in the socialist countries of Eastern Europe
The question of economic reform has moved to the forefront of discussion in the socialist countries of Eastern Europe. Efforts at such reform are not in themselves new: during the 1960s a number of the socialist countries of Eastern Europe other than the USSR had undertaken reform measures, generally designed to bring about some decentralization of decision-making, particularly as regards industry.
During the 1980s, interest in the question of reform again intensified. This occurred against the backdrop of the increased integration of many of those countries in the world economy, both through an expansion of their trade, in particular with partners outside the CMEA area, and through borrowing abroad. As a consequence of this greater integration, a number of the smaller economies in the region were adversely affected by the rapid changes and recession in the world economy in the early 1980s, experiencing in particular a weakening in their terms of trade and, for some of them, overt difficulties in servicing external debt.
The difficulties in the external sector of these countries exacerbated a number of domestic impediments to growth. It was recognized that restoration of more rapid growth would require a significant rise in overall factor productivity. A greater capacity to exploit technological progress was also seen as important, as were measures to economize on the use of energy. Reform was seen as a key means for bringing about such changes.
Although situations varied among countries, and reform did not always follow a linear path within individual countries, the general thrust of reform efforts during the 1980s has been toward further decentralization and increased autonomy of individual enterprises. In some countries there has also been interest in securing an increased role for indirect regulators, such as monetary and fiscal measures. Attempts were also made to enhance the role of prices in indicating relative scarcities and the relative success of individual enterprises. Success in this domain, however, has been quite modest.
The most notable event in recent years, however, has been the emergence of reform as the central issue in the Soviet Union. The reforms already adopted and those presently envisaged are remarkable in their depth, breadth and overall comprehensiveness and are without precedent. The intention is to combine flexibly a centralized system of management and autonomous operation and planning of activities by enterprises. New arrangements are envisaged at all levels of the national economy. As regards enterprises, the following changes are proposed or discussed: reducing the number of centrally-determined plan targets; financing a larger proportion of current and capital outlays from their own revenues; and allowing greater latitude in determining levels of investment, wages and - at a later stage - prices and employment. The gradual introduction of wholesale trade in capital goods is to be achieved over the next several years. It is believed that these changes will contribute to the deep restructuring of the economy and a better use of the factors of production, thereby contributing to improved efficiency and competitiveness of the Soviet economy.
In 1986 and 1987 a number of measures were also taken designed to reform the mechanisms governing the external trade of the Soviet Union. These measures allowed some dozens of industrial ministries and enterprises to engage in foreign trade on their own account, and created the
XII
possibility of entering into joint ventures with both domestic and foreign partners. In mid-1988, the transition to this new regime was still incomplete; it is still premature to assess its likely impact on-the level, distribution and composition of Soviet trade, or its likely consequences for developing countries and for East-West relationships.
Unpedíctabílity
In recent years the world economy has been buffetted by a series of sudden and unexpected changes which have led to the spread of the belief that the world economy is becoming more unstable. A particularly dramatic example of such a change was the collapse of equity prices in October. Other examples of such changes during recent years include rises and falls in oil prices, periods of greatly increased fluctuations in interest rates, and the cycle in international bank lending to developing countries which spans the period since the early 1970s. Commodity prices have also experienced a sharp and unexpected decline to lower levels, and many individual commodities have been characterized by substantial price fluctuations.
Unpredictable changes in economic indicators include short-run movements usually characterized as "volatility", as well as longer-term swings, sometimes of a one-off nature and lasting for a substantial period. However, observed fluctuations do not always adequately indicate a variable's degree of unpredictability for the decision makers concerned. For example, if the prevailing pattern of balances in external payments and of associated international capital flows is unsustainable in the longer term, even relatively calm periods in the exchange markets may still be accompanied by sustantial unpredictability.
An important contribution to the greater frequency and scale of unpredictable changes during recent years can be attributed to shifts in economic policy since the late 1960s such as the floating of exchange rates and the adoption of variants of monetarism. Susceptibility to such changes has also been increased by progressive financial deregulation and certain other aspects of the greater reliance on free markets of which such deregulation is a constituent part. In combination with improved communications and developments in financial technique, these two trends have facilitated movements of money nationally and internationally.
Such movements need not in principle be a cause of unpredictable changes. However, the evidence points to recurring propensities to financial instability for both whole economies and sectors where speculative activities are important. The greater size and speed of movements of money have increased the frequency and amplitude of fluctuations of variables such as exchange rates and asset prices. These tendencies are enhanced by the "bandwagon" or follow-the-leader behaviour often observed among participants in financial and commodity futures markets. Such behaviour is capable of being triggered by types of information largely ignored much of the time, and of shifting its focus among different assets in unpredictable ways. During periods when follow-the-leader behaviour predominates, market participants become more concerned with forecasting each other's psychology than with fundamentals. The resulting movements of variables in the markets in question push them away from levels which might be considered normal or sustainable. Such instability is hard to reconcile with current notions that markets function efficiently if left to themselves.
The facility with which money can now be moved, and the proliferation of highly substitu-table financial instruments, have increased the scope for the transmission of instability among different markets. Few of the mechanisms through which the transmission operates, such as the use of commodity futures as a hedge against fluctuations in currency values, are entirely new. But the scale and swiftness of their results are often much greater. These results include closer connections between the volatility of exchange rates and the prices of many other assets.
The adverse consequences of the greater frequency and scale of unpredictable changes include increased difficulties for decision making by governments, producers and other types of firm, and higher costs of various kinds. Uncertainty concerning future levels of interest rates, exchange rates and prices more generally is likely to lead to greater reluctance among producers to make long-term commitments, and thus to slow the pace of investment in equipment and structures. Prolonged periods of instability may exacerbate the effects of uncertainty as perceptions become
Mil
blurred concerning the normal or sustainable levels of variables which are capable of serving as guidelines for several types of economic decision.
Many of the increased costs due to unpredictable changes are those of transactions. Some of these transactions costs are associated with the use of instruments such as futures and forward contracts designed to provide protection against the effects of such changes. Other examples are the rises in the costs of financing and payments arrangements resulting from the unfavourable effects of unpredictable changes on the creditworthiness of countries and firms. The costs also include the curtailment by producers of output, employment and productive capacity either as a direct result of the unpredictable changes themselves or as a consequence of governments' policy responses to them.
Volatile exchange rates have significant unfavourable effects on international trade. The channels through which such volatility reduces the growth of trade include not only higher prices and costs but also increased protectionism. As discussed in more detail in the next section, long-term movements of exchange rates leading to overvaluation frequently cause the introduction of protectionist measures which are not removed when currencies depreciate again. Owing to such asymmetrical effects, fluctuating exchange rates are thus capable of leading to progressively higher levels of protection.
Apart from its relation to fluctuating exchange rates, protectionism is an important independent source of unpredictability in the world economy. This unpredictability is due to degrees of restrictiveness which vary through time, and to the lack of a clear-cut consistent set of rules governing trade measures. An important example of increased unpredictability due to protectionism is provided by the effects of the system of variable levies of the Common Agricultural Policy of EEC. By shifting the residual net demand or supply of this group of countries onto world markets, this system has in several instances increased the volatility of world prices.
Techniques and instruments such as the futures and forward contracts already mentioned do exist to provide protection against fluctuations in some commodity prices and financial variables. But there are serious gaps in the coverage of the protective instruments. For example, commodity futures contracts are available only for limited future periods, and forward and futures markets are not well developed or are completely unavailable for many currencies. The gaps are particularly important in limiting the usefulness of the protective instruments with respect to longer-term fluctuations. As a result they have little effect on the tendency of unpredictable changes to reduce the pace of investment in equipment and structures.
The techniques and instruments are not equally accessible or useful to all economic agents, particularly those in developing countries. The reasons include not only the gaps in coverage but also the cost of the instruments, impediments to obtaining relevant information about them, and exchange controls in the agents' own countries. Moreover, firms in developing countries are less able to reduce their exposure to fluctuations in exchange rates through the geographical diversification of their operations. Furthermore, most of the protective instruments in the financial sphere are designed to handle unpredictable changes in the dollar exchange rates of the currencies of developed market-economy countries, or in other financial variables in such countries' markets.
Trading in some of the protective instruments is capable of adding to the instability of the very prices against which they are designed to provide protection. Such an effect was an outstanding feature of the collapse of equity prices in the United States in October 1987, when movements of money between the cash and futures markets increased the cumulative downward pressures on prices in both.
As mentioned earlier, an important contribution to the greater frequency and amplitude of unpredictable changes was made by actions taken by major OECD governments as part of a thrust towards greater reliance on free markets. There have recently been several indications of changes in the attitudes of these governments in this respect. In particular, more emphasis seems now to be given to the view that greater official intervention is required in establishing appropriate frameworks and guidelines for markets if they are to function efficiently, and if large unpredictable changes and their harmful effects are to be contained. An outstanding example is the acknowledgement by these governments since the Plaza Agreement of 1985 that a more co-ordinated approach to policy making is required for the achievement of greater stability in exchange markets and the avoidance of damaging rises in interest rates. Another example is the efforts made within the Committee on Banking Regulations and Supervisory Practices (Basle Committee) to strengthen
XIV
in accordance with agreed norms the capital bases of banks engaged in international business. A further step which might lead to greater stability in financial markets would be the imposition of various types of transactions taxes designed to slow speculative movements of funds.
Trade policies
In spite of repeated commitments by the major trading nations to "standstill and rollback", the extent to which international trade flows are managed has been on the increase. One-quarter of the non-fuel exports of developing countries to the developed market-economy countries is affected by a vast array of non-tariff measures (NTMs), such as para-tariff measures, quantitative restrictions, surveillance of import quantities and prices, non-automatic licensing, and "voluntary" export restraints. In contrast to tariffs, which apply equally to all trading partners, non-tariff measures, and particularly negotiated voluntary export restraints, can be targeted at individual trading partners. The gradual abandonment of multilateralism in favour of a bilateral approach to the resolution of trade conflicts is having serious consequences on the exports of developing countries, whose lack of bargaining power puts them at a clear disadvantage in bilateral negotiations.
During the 1980s, the major increases in imports affected by NTMs have been in North America and EEC. In Japan, the other large market for developing country exports, the incidence of NTMs has remained fairly constant. Because of its low share of imports in the consumption of manufactures, and their slow rate of increase, some observers have argued that certain features of the Japanese economy discourage imports in ways which escape measurement. However, there has been a movement to liberalize imports as part of the effort to orient the Japanese economy towards domestic sources of growth.
The proportion of trade affected by NTMs is particularly large in the case of exports from developing countries, partly because their exports of manufactures are concentrated in sectors where output and employment in the industrialized countries have long been declining. Protectionism tends to concentrate in sectors in which developing countries have or have gained a competitive advantage (e.g. food products, textiles and clothing, steel, electric goods) and, therefore, where imports are a relatively large percentage of consumption. These traditional manufacturing sectors also absorb relatively large amounts of employment. Trade tensions between Japan and its major trading partners have also been strong, but the sectors involved have tended to be more technology-intensive than those featured in trade disputes with developing countries. The United States and EEC have also been involved in many trade disputes.
During the 1980s, demand management policies aimed at controlling inflation, and the attendant slowdown in economic growth, have also contributed to the strengthening of protectionist forces. High rates of unemployment, particularly in Western Europe, which are concentrated in sectors experiencing strong import pressures, have made positive adjustment measures politically difficult to put in place.
Protectionism has also been a response to the wide fluctuations in exchange rates that have characterized the world economy since the mid-1970s. During periods of currency appreciation, there has tended to be a very rapid rise in import penetration ratios, which has led to strong protectionist pressures and to new trade restrictions. However, when overvaluation has been eventually reversed, protectionist pressures have not subsided correspondingly. It would seem that, in the highly uncertain environment of the 1980s, producers seek permanent trade restraints as a way of insulating themselves against unpredictable exchange rate fluctuations. The problem of growing protectionism is aggravated by international economic instability and slow world economic growth. If market forces are to operate effectively in international trade, a greater degree of international monetary and financial co-operation will be required.
Recent developments lend support to the notion that exchange rate instability has a ratchet effect on protectionism. In spite of the sharp depreciation of the dollar since early 1985, there has not been any visible lessening of protectionist pressures in the United States. In fact, the trade bill passed by Congress and vetoed by the President in mid-1988 is an indication that the political forces that are in favour of protectionism are still very strong. The trade bill contained provisions
XV
which would require mandatory action against trading partners perceived to be engaging in unfair trade practices. At the same time, in EEC, where currencies have appreciated significantly, protectionist pressures have been running high, and several new NTMs have been taken. A subject of deep interest in this respect is the proposed full economic integration of the Community which is to be achieved by 1992. Its implications for other countries, particularly developing countries, need to be considered.
Protectionism is a complex phenomenon, with multifaceted roots. Even if exchange-rate stability is achieved, the problem of incorporating the developing countries more fully as equal partners into the emerging international trading system will remain. Developing countries are increasingly becoming competitive exporters of manufactures to major international markets. And these exports are giving rise to increasing trade conflicts with, and adjustment pressures in, the industrialized countries. In the years to come, trade tensions could come to focus increasingly on the exports of manufactures from the developing countries. With the huge resources at their disposal, corporations based in the developed market-economy countries have the flexibility to switch from exporting to a certain market to producing domestically in that market via an affiliate. Thus, they are able to "skip over" trade barriers and, in fact, many already have done so. This is a possibility that is not open to the vast majority of firms from the developing countries.
In effect, one of the distinguishing features of the 1980s has been a surge in foreign direct investment in the industrial countries generally, and especially in the United States, by Japanese and Western European firms. The growing protectionist atmosphere in Western Europe and North America has certainly been a contributing factor. As a result of these investments, some exports which gave rise to trade disputes are being replaced by production within final markets. As this trend gathers momentum trade tensions among developed market-economy countries may be expected to subside somewhat.
It is therefore all the more important that the long-standing international policy commitment to "make room" for the exports of manufactures from developing countries should be fully implemented. Such a commitment needs to take concrete forms: a rollback of existing non-tariff barriers and other measures (including the lowering of tariffs on products of export interest to developing countries) so as to improve market access. The Uruguay Round of multilateral trade negotiations currently under way offers an opportunity to achieve these objectives.
However, the current environment of slow economic growth militates against the implementation of commitments to trade liberalization by the developed market-economy countries. Co-ordinated policies to achieve faster and more sustainable economic growth in those countries themselves would clearly facilitate trade liberalization and the structural adjustment that is its necessary adjunct. But as the experience of the postwar period amply demonstrates, there is also a strong positive relationship running from trade liberalization to economic growth. Therefore, the Uruguay Round holds out the promise that a reversal of the trend towards managed trade could help rein vigórate world economic growth.
By contrast with previous rounds, the Uruguay Round is dealing with a wide variety of subjects, some of them entirely new. The whole range of NTMs is to be examined, with the objective of rolling them back. In fact, commitments to achieve a standstill on new measures and to roll back existing ones are enshrined in the Punta del Este Ministerial Declaration, which launched the negotiations in September 1986. Other issues on the agenda, to which developing countries have been attaching great importance for a long time, are trade in textiles and clothing, trade in tropical products, agriculture, the remaining high tariffs in some sectors, and safeguards.
Trade liberalization in the areas of export interest to developing countries would relax their foreign-exchange constraint to growth. The developed countries would also gain. Since developing countries will tend to spend most, if not all, of their additional export earnings on imports, mainly of machinery and intermediate goods, a large share of which originates in the developed countries, trade liberalization in favour of developing countries is likely to result in a reallocation of resources within the developed market-economy countries in favour of those sectors with higher levels and rates of growth of factor productivity. However, the benefits of trade liberalization for the entire world economy are likely to go further. By improving the developing countries' debt-servicing capacity, it would also help resolve the debt problem and enhance external financial flows to developing countries generally, thus contributing towards raising the level of world demand.
XVI
SERVICES IN THE WORLD ECONOMY
// was concluded above that a resolution of the debt crisis, an effective roll back of non-tariff measures and a greater degree of stability in the world economy should contribute to the improvement of the environment that is conducive to development. But the development process also involves other long-term factors and forces which have structural implications, particularly for developing countries. One such factor that has recently acquired increasing importance is the evolution of the services sector.
In recent years, the role of services in development and policy issues related to international trade in services have attracted a great deal of attention from policy makers in both developed and developing countries. The growing interest in services has been due to the recognition - based mainly on the experience of the developed market-economy countries - that some services, particularly producer services and those associated with information technologies, are crucial for the dynamism of the entire economy. The strengthening of modern services in developing countries, where producer services and telematics are much less evolved, has emerged as a major development task with important implications for international trade in services.
Part Two of this Report is devoted to the role of services in the world economy and related policy issues at the national and international level.
Services in the national economy
The growing interest in the service sector was aroused by trends in the developed market-economy countries, where services have come to provide the majority of new employment opportunities. Services now account for between one-half and two-thirds of GDP in these countries, and the service sector has been growing in parallel with the manufacturing sector. The most rapid growth in both production and employment is now witnessed in the producer services sector, which is directly supportive of manufacturing. Within this category, which includes a variety of service inputs at various stages of production, there is a trend toward externalization, in that services formerly provided within firms are now purchased from outside suppliers. Information technology has enhanced the provision of many, if not most, services and has itself spawned a whole new data service industry. The debate as to the implications of these tendencies for economic growth, once polarized between those who feared "deindustrialization", and others who lauded the "new service economy", has now given way to a general recognition of the organic relationships between the service and manufacturing sectors.
The development of service industries, particularly "knowledge-intensive" services relying on information technologies, is seen as essential to international competitiveness in other sectors, particularly the manufacturing sector. These considerations are providing a new dynamism to the service sector in developed market-economy countries; however, in certain of those countries the service sector has taken on a two-tiered structure, with parallel growth in employment in services characterized by low productivity, low pay and job insecurity.
The service economy of developing countries is quite different. While services in these countries also account for a sizeable proportion of GDP, often exceeding 50 per cent, in most of them the expansion of service activities has been related to phenomena such as rapid urbanization, population growth, and the inability of the goods-producing sectors to absorb new entrants into the labour force. This has led to the growth of low-productivity services, including those in the so-called informal sector.
The contribution of services to efficiency and international competitiveness has been recognized in the socialist economies, where the role of services has been traditionally neglected. The
.VI 11
USSR and other socialist countries of Eastern Europe have included in their national plans policies aimed at stimulating both producer and consumer services. They are also aiming at increasing the already significant role of services as a source of foreign exchange.
International trade in services
The different roles of services in the domestic economies of developed and developing countries would appear to be reflected in international service transactions. In the case of the developed countries, there is a diversity of situations: some countries tend towards surpluses in a variety of services; and in many cases the relative positions of various services, and also of goods and services in the balance of payments, have changed significantly over time.
Most developing countries are in deficit in their service trade, which aggravates their balance-of-payments difficulties, particularly for those heavily indebted countries which have had to generate large trade surpluses in order to service their external debts. Trade in services has generally not made a significant contribution to alleviating the situation. Despite the expansion of the service sectors in developing countries, particularly in terms of employment, these have not generally been capable of supplying all the services required by other sectors of the economy, particularly those incorporating specialized expertise or even those linked to trade in goods. A few developing countries in East Asia stand out in that they appear to have become competitive exporters of both services and manufactures.
However, for a growing number of developing countries, tourism is providing a major source of foreign-exchange revenues. Countries wishing to expand their foreign exchange and income generation from this sector will have to take into account the problems and opportunities arising from the increasing dependence of the world tourism industry on the flow of information.
Many developing countries, including those relying on tourism exports, also receive considerable income from labour remittances, which together compensate for deficits in their goods and services trade. In effect, these countries export labour services and are thus dependent on the vagaries of the economies that are hosts to their nationals and on their employment and immigration policies. Some such countries have recently been faced with the need to re-absorb a large number of such migrants and to generate new sources of foreign exchange. The challenge facing these countries is to channel the acquired skills of returning migrants into new service exports which could help compensate for lower labour remittances.
Issues relating to the internationalization of services
The importance of the services sector is not confined to its contribution to the balance of payments, but extends to its strategic aspects. These include its traditional role with respect to national sovereignty, identity and security and to the provision of basic infrastructure for the needs of the population and the functioning of the economy. However, new strategic aspects recently have arisen in the sense that services have become a determining factor in the competitiveness of national firms in the world market and as a source of value added. They are also increasingly providing a medium for the development of human capital and the upgrading of employment opportunities. Moreover, they influence the location of production of goods and services, of investment and of decision-making functions. These factors explain to some extent the intensity of international debate on services, and the response of many governments to initiatives by certain countries seeking to improve the ability of their firms to penetrate foreign markets for services.
The questions of what is "trade" in services and what measures constitute "barriers" to such trade have become major issues in the Uruguay Round of multilateral trade negotiations. The concept of "modes of delivery" clarifies the issues involved by addressing the question as to what actually crosses national frontiers when foreign service markets are supplied. For an international service transaction to take place, one of the following - alone or in combination with others - must move across borders: (i) goods; (ii) persons; (iii) capital; and (iv) information.
\ VIH
Goods can cross borders to receive a service (e.g. repair and processing services) or to provide a service (e.g. the international leasing of machinery or chartering of transportation equipment). Persons can cross international frontiers either to provide services (e.g. labour services and consultancy services), or to receive services (as in the case of tourists, patients seeking health care abroad, and students going abroad to study). Capital can be involved in the provision of a service, e.g. through the establishment of agencies abroad. The flow of information across borders -transborder data flows - is a service in itself and is an essential ingredient contributing to the internationalization of many other service activities. The possible impact of such internationalization on the development prospects for national service sectors has contributed to the intense international debate on services and development.
National regulations on services may have a variety of objectives, including those of protecting domestic consumers and those related to the strategic considerations mentioned above. Such regulations, while considered necessary for the implementation of national policy objectives, may also impede trade in services.
Issues relating to the mobility of labour and capital
Access to international markets in service sectors which involve the movement of persons as providers of a service is severely hampered by stringent visa regulations and by varying professional requirements in different countries. In a number of such sectors a combination of relatively high skills and relatively low cost provides firms from developing countries with a clear competitive advantage. For example, construction firms from some developing countries have already become internationally competitive by combining access to low-cost labour with management and design capabilities. In other areas, requiring advanced skills, such as professional services (engineering, medical and legal services, etc.), developing countries may have the potential to capture a significant share of the world market.
Service exports from developing countries could be enhanced if regulations of developed countries were to permit firms and professionals from developing countries to enter these countries to provide specific services.
In certain sectors, the movement of capital abroad to establish a "presence" in the foreign market is a means of delivering services to foreign markets. Regulations on foreign direct investment, which are common in both developed and developing countries, have been considered by firms supplying such services as "barriers to trade" to the extent that they prevent the establishment of the "commercial presence" considered necessary for effective market access in the service sectors concerned. In this connection, it is important to address the question of where to draw the line between trade in services and investment.
In a large number of service sectors, services are provided to foreign markets through their affiliates established abroad. Data for the United States suggest that the sales of affiliates of United States corporations abroad are approximately five times the value of United States service export earnings. Foreign direct investment in services gives rise to a number of strategic development issues. While the importance of access to modern services for economic development is generally recognized, the question immediately arises as to how, by whom, and under what conditions should these services be supplied.
Decisions regarding whether countries should rely on foreign participation in the service sector or should reserve particular sectors for national producers imply considerations relating to the strategic role of services, as described above, and national development objectives. Foreign direct investment may, however, assist developing countries in strengthening their domestic service sectors and in becoming competitive producers of some services, if such investment meets overall development objectives, including access to foreign know-how and upgrading domestic skills. Appropriate criteria for foreign investors might be an effective means to implement the comprehensive strategies for the services sector discussed below, including measures aimed at maximizing the contribution of foreign direct investment to the strengthing of the domestic service sector and export of services.
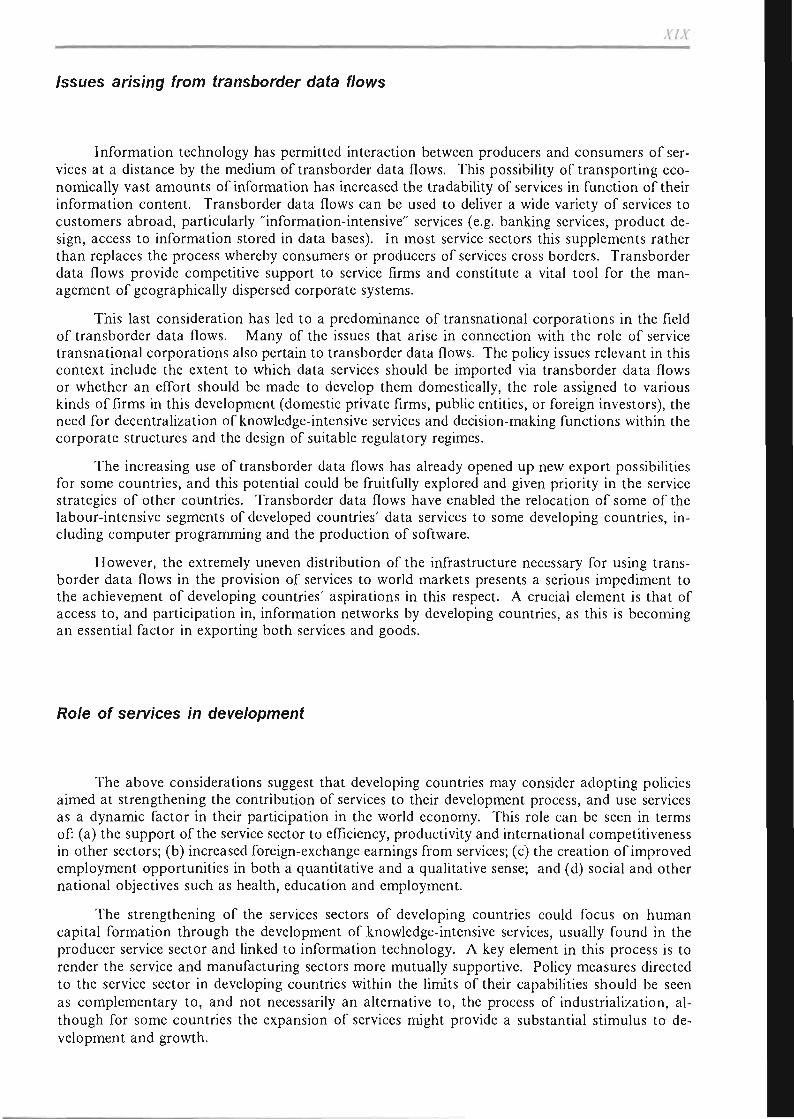
A - y ^
Issues arising from transborder data flows
Information technology has permitted interaction between producers and consumers of services at a distance by the medium of transborder data flows. This possibility of transporting economically vast amounts of information has increased the tradability of services in function of their information content. Transborder data flows can be used to deliver a wide variety of services to customers abroad, particularly "information-intensive" services (e.g. banking services, product design, access to information stored in data bases). In most service sectors this supplements rather than replaces the process whereby consumers or producers of services cross borders. Transborder data flows provide competitive support to service firms and constitute a vital tool for the management of geographically dispersed corporate systems.
This last consideration has led to a predominance of transnational corporations in the field of transborder data flows. Many of the issues that arise in connection with the role of service transnational corporations also pertain to transborder data flows. The policy issues relevant in this context include the extent to which data services should be imported via transborder data flows or whether an effort should be made to develop them domestically, the role assigned to various kinds of firms in this development (domestic private firms, public entities, or foreign investors), the need for decentralization of knowledge-intensive services and decision-making functions within the corporate structures and the design of suitable regulatory regimes.
The increasing use of transborder data flows has already opened up new export possibilities for some countries, and this potential could be fruitfully explored and given priority in the service strategies of other countries. Transborder data flows have enabled the relocation of some of the labour-intensive segments of developed countries' data services to some developing countries, including computer programming and the production of software.
However, the extremely uneven distribution of the infrastructure necessary for using trans-border data flows in the provision of services to world markets presents a serious impediment to the achievement of developing countries' aspirations in this respect. A crucial element is that of access to, and participation in, information networks by developing countries, as this is becoming an essential factor in exporting both services and goods.
Role of services in development
The above considerations suggest that developing countries may consider adopting policies aimed at strengthening the contribution of services to their development process, and use services as a dynamic factor in their participation in the world economy. This role can be seen in terms of: (a) the support of the service sector to efficiency, productivity and international competitiveness in other sectors; (b) increased foreign-exchange earnings from services; (c) the creation of improved employment opportunities in both a quantitative and a qualitative sense; and (d) social and other national objectives such as health, education and employment.
The strengthening of the services sectors of developing countries could focus on human capital formation through the development of knowledge-intensive services, usually found in the producer service sector and linked to information technology. A key element in this process is to render the service and manufacturing sectors more mutually supportive. Policy measures directed to the service sector in developing countries within the limits of their capabilities should be seen as complementary to, and not necessarily an alternative to, the process of industrialization, although for some countries the expansion of services might provide a substantial stimulus to development and growth.
XX
There are many unexplored opportunities to develop new service exports in developing countries. In their encouragement of such exports, governments could benefit from the experience of those countries which are already applying a variety of export strategies. A common element in such strategies is that of building on expertise, experience and knowledge that already exist, in that, such knowledge and expertise accumulated in the production and export of agricultural or mineral products can be "externalized" through new corporate structures and exported. A long experience in trading can be consolidated through the establishment of modern infrastructures and the attraction of a mutually supportive mix of service enterprises and industries. Advantages and experience in tourism can be expanded to cover medical, business or educational services. The rapidly growing trade in information services can offer new possibilities, particularly in the more labour-intensive segments of such services, and as a support to improving the competitive position of other goods and services.
Employment considerations would seem paramount for developing countries. The service sector can be expected to continue to be an important source of labour absorption and the key to integrating marginalized elements of the population, including those working in the "informal sector", as well as providing opportunities for upgrading of skills. The service sector may also be used to provide employment to the nationals returning from service jobs abroad.
The formation of human capital and its efficient application in the service industries requires an effective infrastructure. An advanced telecommunications system would seem fundamental to the effectiveness of transportation, education, financial, informa tic and other infrastructures.
Imports of services, as well as the foreign direct investment mentioned above, could contribute to development objectives. Service policies might encourage: (a) transfer of technology, particularly through training programmes; (b) contributions to infrastructures, particularly telematics infrastructures and information; (c) increasing competition and efficiency; (d) provision of higher-skilled employment opportunities; (e) access to, and participation in, international information networks; (f) the location of information resources and decision-making processes in the country; (g) access to downstream services for distribution, marketing and market intelligence for the export of national goods and services; and (h) use of local producer services.
Greater attention to services in integration arrangements among developing countries at the regional and subregional levels can serve to expand service exports, while also facilitating intrare-gional trade in goods. Pooling resources can also lead to common efforts at improving skills and infrastructures and in making more effective use of extraregional imports of services.
Multilateral framework for trade in services
Part II of the Ministerial Declaration on the Uruguay Round is aimed at the negotiations for a multilateral framework for trade in services with a view to the expansion of trade in services under conditions of transparency and progressive liberalization and as a means of promoting the economic growth of all trading partners, and the development of developing countries. These negotiations have addressed a number of issues mentioned above, including access to markets in the context of the objectives of national regulations, as well as the frontiers between "trade in services", on the one hand, and investment and immigration, on the other. Any liberalization measures would have to address the means of delivering services to markets and the importance to developing countries' firms of the movement of persons to supply services. It would also have to give adequate attention to sectors of special interest to developing countries. In addition, such a framework could not ignore the fact that developing countries face a variety of obstacles, regulatory and non-regulatory alike, in gaining entry to world service markets. In this context, ensuring effective access to, and participation in, information networks might be of particular importance.
Since the development of developing countries has been recognized as an objective of the framework for trade in services, it will be logical for the framework to address development issues

JfA7
directly, and not simply provide for special treatment for developing countries in the form of derogations from the general rules and principles. The framework could deal with the impact of service imports on development, recognizing that improvement of access to the markets of developing countries would, of necessity, be linked to the support that service imports would provide to the achievement of development objectives, within the context of the national policies of the countries concerned. The desired result of such policies would be the establishment of a stronger service sector which, in itself, could be a major attraction to foreign and domestic investors.
The framework could facilitate actions of the developing countries themselves to strengthen the contribution of services to their development process. Such actions, the essence of which is the development of human capital and its supportive infrastructure, merit the strong support, including financial support, of the international community.
K.K.S Dadzie

Blank page _____________
Page blanche
*art One
DEBT, PAYMENTS IMBALANCES AND THE GROWTH OF THE WORLD ECONOMY

Blank page _____________
Page blanche
Chapter I
CURRENT TRENDS AND OUTLOOK
A. Introduction
The world economy is presently characterized by considerable diversity. The output of developing countries in Africa, Latin America and West Asia is advancing only weakly, following declines in the rythm of activity in 1987. The impact of the debt crisis on economies and policies, bad harvests in some countries and the behaviour of export prices and volumes all contributed to this outcome. In Western Europe, also, growth appears to be lagging somewhat behind the already slow pace recorded in 1987 (see table 1), so that no significant improvement in unemployment levels is to be expected in most countries. For developing countries in the three above-mentioned regions taken as a whole, per capita output appears to be continuing the decline of 1987. The downward trend in per capita output that has characterized these regions during the 1980s is thus continuing (see table 2).
The economies of developing countries in East Asia, and of China, Japan and North America, on the other hand, are experiencing relatively robust expansion. For the developing countries of East Asia, the extraordinarily rapid expansion of exports experienced in 1987 continues to be the primary engine of growth. In China, a rapid expansion of domestic demand continues to drive the economy forward, and
government policy aims at moderating the expansion. In Japan, a buoyant rise in domestic demand is offsetting the relatively modest rise in net imports triggered by the appreciation of the yen; and for the United States, increased domestic demand and a revival of export growth, following the depreciation of the dollar, are continuing to provide a stimulus. Unemployment continues on a downward trend, and in some parts of the country has, for all practical purposes, disappeared.
Growth in the economies of the socialist countries of Eastern Europe and in the developing countries of South Asia is in a transitional phase. For each of these two groups of countries taken as a whole, growth in 1987 fell far short of earlier years, in large part because of poor harvests. In South Asia, this was primarily the result of drought, and the decline in agricultural output is expected to be rapidly reversed. In the socialist countries of Eastern Europe, weather was also a factor, but certain managerial and organizational deficiencies were also evident. The process of economic reform has accelerated markedly in the region, in particular, in the USSR.
The following sections take up these and related developments.
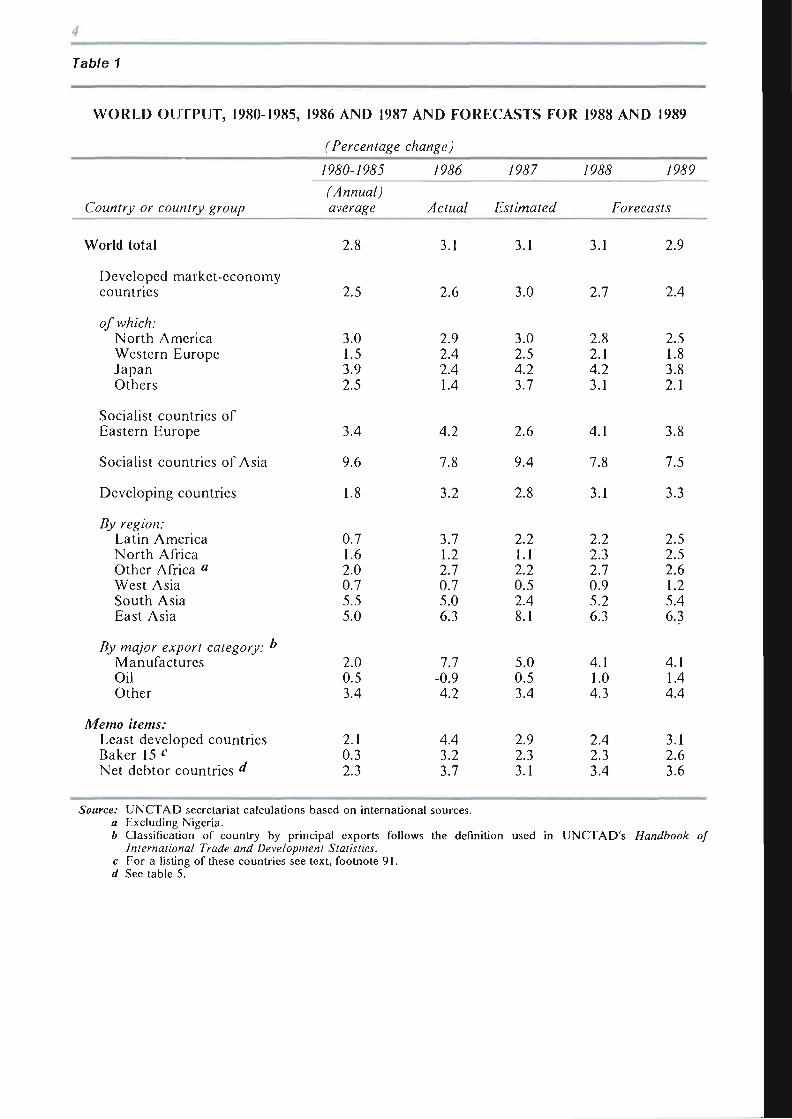
4
Table 1
WORLD OUTPUT, 1980-1985, 1986 AND 1987 AND FORECASTS FOR 1988 AND 1989
(Percentage change)
/&S0-79&5 /&96 /9<?7 /9&S /9&9
Country or country group (Annual) average Actual Estimated Forecasts
World total
Developed market-economy countries
of which: North America Western Europe Japan Others
Socialist countries of Eastern Europe
Socialist countries of Asia
Developing countries
By region: Latin America North Africa Other Africa « West Asia South Asia East Asia
By major export category: " Manufactures Oil Other
Memo items: Least developed countries Baker 1 5 c
Net debtor countries d
2.8
2.5
3.0 1.5 3.9 2.5
3.4
9.6
1.8
0.7 1.6 2.0 0.7 5.5 5.0
2.0 0.5 3.4
2.1 0.3 2.3
3.1
2.6
2.9 2.4 2.4 1.4
4.2
7.8
3.2
3.7 1.2 2.7 0.7 5.0 6.3
7.7 -0.9 4.2
4.4 3.2 3.7
3.1
3.0
3.0 2.5 4.2 3.7
2.6
9.4
2.8
2.2 1.1 2.2 0.5 2.4 8.1
5.0 0.5 3.4
2.9 2.3 3.1
3.1
2.7
2.8 2.1 4.2 3.1
4.1
7.8
3.1
2.2 2.3 2.7 0.9 5.2 6.3
4.1 1.0 4.3
2.4 2.3 3.4
2.9
2.4
2.5 1.8 3.8 2.1
3.8
7.5
3.3
2.5 2.5 2.6 1.2 5.4 6.3
4.1 1.4 4.4
3.1 2.6 3.6
Source: UNCTAD secretariat calculations based on international sources. a Excluding Nigeria. b Classification of country by principal exports follows the definition used in UNCTAD s Handbook of
International Trade and Development Statistics. c For a listing of these countries see text, footnote 91. d See table 5.
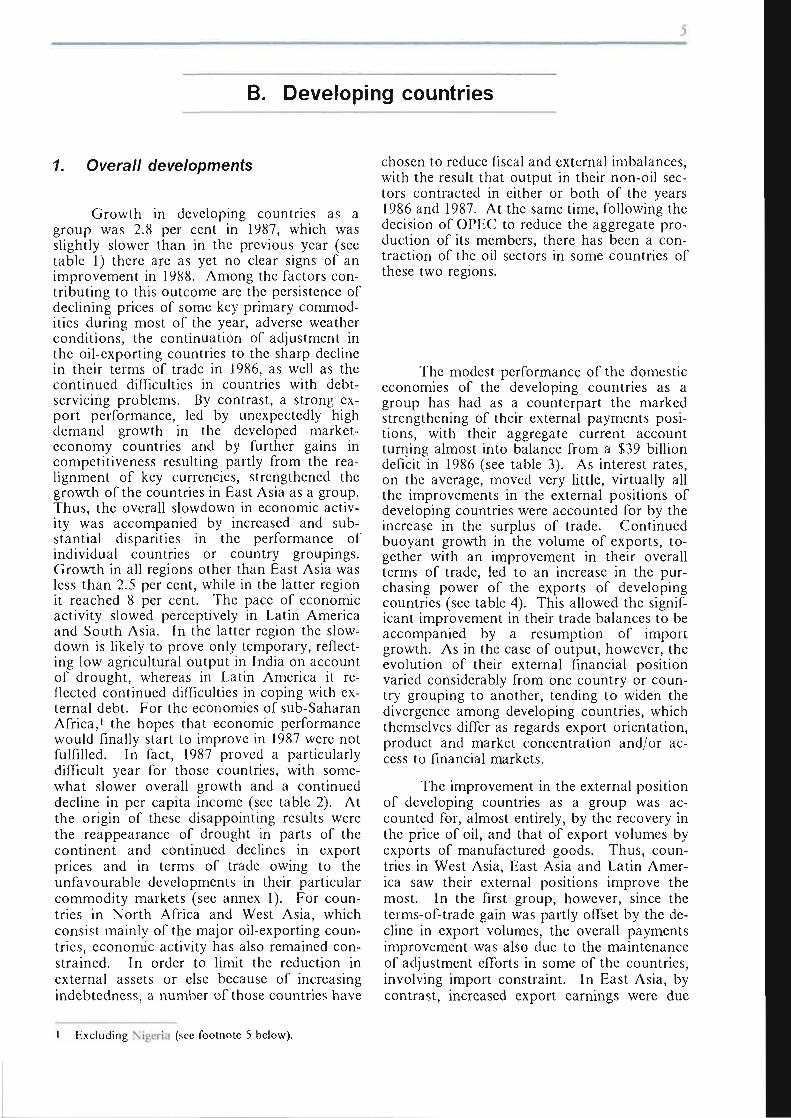
5
B. Developing countries
1. Overall developments
Growth in developing countries as a group was 2.8 per cent in 1987, which was slightly slower than in the previous year (see table 1) there are as yet no clear signs of an improvement in 1988. Among the factors contributing to this outcome are the persistence of declining prices of some key primary commodities during most of the year, adverse weather conditions, the continuation of adjustment in the oil-exporting countries to the sharp decline in their terms of trade in 1986, as well as the continued difficulties in countries with debt-servicing problems. By contrast, a strong export performance, led by unexpectedly high demand growth in the developed market-economy countries and by further gains in competitiveness resulting partly from the realignment of key currencies, strengthened the growth of the countries in East Asia as a group. Thus, the overall slowdown in economic activity was accompanied by increased and substantial disparities in the performance of individual countries or country groupings. Growth in all regions other than East Asia was less than 2.5 per cent, while in the latter region it reached 8 per cent. The pace of economic activity slowed perceptively in Latin America and South Asia. In the latter region the slowdown is likely to prove only temporary, reflecting low agricultural output in India on account of drought, whereas in Latin America it reflected continued difficulties in coping with external debt. For the economies of sub-Saharan Africa,1 the hopes that economic performance would finally start to improve in 1987 were not fulfilled. In fact, 1987 proved a particularly difficult year for those countries, with somewhat slower overall growth and a continued decline in per capita income (see table 2). At the origin of these disappointing results were the reappearance of drought in parts of the continent and continued declines in export prices and in terms of trade owing to the unfavourable developments in their particular commodity markets (see annex 1). For countries in North Africa and West Asia, which consist mainly of the major oil-exporting countries, economic activity has also remained constrained. In order to limit the reduction in external assets or else because of increasing indebtedness, a number of those countries have
chosen to reduce fiscal and external imbalances, with the result that output in their non-oil sectors contracted in either or both of the years 1986 and 1987. At the same time, following the decision of OPEC to reduce the aggregate production of its members, there has been a contraction of the oil sectors in some countries of these two regions.
The modest performance of the domestic economies of the developing countries as a group has had as a counterpart the marked strengthening of their external payments positions, with their aggregate current account turning almost into balance from a $39 billion deficit in 1986 (see table 3). As interest rates, on the average, moved very little, virtually all the improvements in the external positions of developing countries were accounted for by the increase in the surplus of trade. Continued buoyant growth in the volume of exports, together with an improvement in their overall terms of trade, led to an increase in the purchasing power of the exports of developing countries (see table 4). This allowed the significant improvement in their trade balances to be accompanied by a resumption of import growth. As in the case of output, however, the evolution of their external financial position varied considerably from one country or country grouping to another, tending to widen the divergence among developing countries, which themselves differ as regards export orientation, product and market concentration and/or access to financial markets.
The improvement in the external position of developing countries as a group was accounted for, almost entirely, by the recovery in the price of oil, and that of export volumes by exports of manufactured goods. Thus, countries in West Asia, East Asia and Latin America saw their external positions improve the most. In the first group, however, since the terms-of-trade gain was partly offset by the decline in export volumes, the overall payments improvement was also due to the maintenance of adjustment efforts in some of the countries, involving import constraint. In East Asia, by contrast, increased export earnings were due
I Excluding Nigeria (see footnote 5 below).
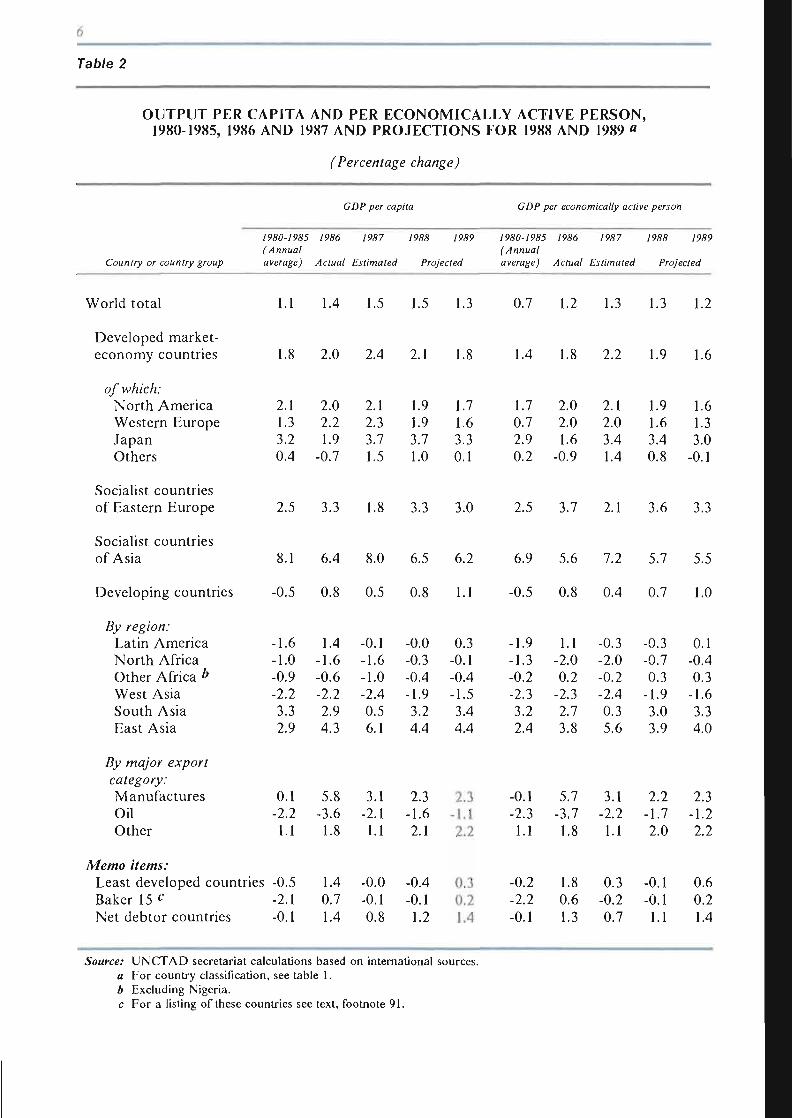
n
Table 2
OUTPUT PER CAPITA AND PER ECONOMICALLY ACTIVE PERSON, 1980-1985, 1986 AND 1987 AND PROJECTIONS FOR 1988 AND 1989 a
(Percentage change)
Country or country group
GDP per capita GDP per economically active person
1987 1988 1980-1985 1986 (Annual average) Actual Estimated Projected
1989 1987 1988 1980-1985 1986 (Annual average) Actual Estimated Projected
1989
World total 1.1 1.4 1.5 1.5 1.3 0.7 1.2 1.3 1.3 1.2
Developed market-economy countries
of which: North America Western Europe Japan Others
1.8
2.1 1.3 3.2 0.4
2.0
2.0 2.2 1.9
-0.7
2.4
2.1 2.3 3.7 1.5
2.1
1.9 1.9 3.7 1.0
1.8
1.7 1.6 3.3 0.1
1.4
1.7 0.7 2.9 0.2
1.8
2.0 2.0 1.6
-0.9
2.2
2.1 2.0 3.4 1.4
1.9
1.9 1.6 3.4 0.8
1.6
1.6 1.3 3.0
-0.1
Socialist countries of Eastern Europe 2.5 3.3 1.8 3.3 3.0 2.5 3.7 2.1 3.6 3.3
Socialist countries of Asia
Developing countries
By region: Latin America North Africa Other Africa b
West Asia South Asia East Asia
8.1
0.5
1.6 1.0 0.9 2.2 3.3 2.9
6.4
0.8
1.4 -1.6 -0.6 -2.2 2.9 4.3
8.0
0.5
-0.1 -1.6 -1.0 -2.4 0.5 6.1
6.5
0.8
-0.0 -0.3 -0.4 -1.9 3.2 4.4
6.2
1.1
0.3 -0.1 -0.4 -1.5 3.4 4.4
6.9
-0.5
-1.9 -1.3 -0.2 -2.3 3.2 2.4
5.6
0.8
1.1 -2.0 0.2
-2.3 2.7 3.8
7.2
0.4
-0.3 -2.0 -0.2 -2.4 0.3 5.6
5.7
0.7
-0.3 -0.7 0.3
-1.9 3.0 3.9
5.5
1.0
0.1 -0.4 0.3
-1.6 3.3 4.0
By major export category: Manufactures Oil Other
Memo items: Least developed countries Baker 15 c
Net debtor countries
0.1 -2.2 1.1
-0.5 -2.1 -0.1
5.8 -3.6 1.8
1.4 0.7 1.4
3.1 -2.1 1.1
-0.0 -0.1 0.8
2.3 -1.6 2.1
-0.4 -0.1 1.2
2.3 -1,1 2.2
0.3 0.2 1.4
-0.1 -2.3 1.1
-0.2 -2.2 -0.1
5.7 -3.7 1.8
1.8 0.6 1.3
3.1 -2.2 1.1
0.3 -0.2 0.7
2.2 -1.7 2.0
-0.1 -0.1 1.1
2.3 -1.2 2.2
0.6 0.2 1.4
Source: UNCTAD secretariat calculations based on international sources. a For country classification, see table 1. b Excluding Nigeria. c For a listing of these countries see text, footnote 91.
Table 3
WORLD CURRENT-ACCOUNT BALANCES, 1985, 1986 AND 1987 AND FORECASTS FOR 1988 AND 1989 «
(Billions of dollars)
Country or country group
/P&5
Actual
/%% /9<S7 /p&s /9&9
Actual Estimated Forecasts
Developed market-economy countries -25.6 13.6 -6.9 18.2 -35.9
of which: North America Western Europe Japan Others
Socialist countries of Eastern Europe
Socialist countries of Asia
Developing countries
By region: Latin America North Africa Other Africa b
West Asia South Asia East Asia
By major export category: Manufactures Oil Other
103.5 38.1 50.1
-10.3
1.6
-11.7
-21.5
-9.0 -0.9 -8.0 -3.6 -8.4 8.0
9.5 7.1
-38.0
134.0 71.5 86.7
-10.5
0.0
-7.3
-38.6
-22.0 -5.9 -9.0
-13.5 -8.7 20.7
16.8 -23.7 -30.5
-151.6 66.4 89.7
-11.5
5.8
0.0
-1.1
-9.9 -2.5
-11.6 -2.1 -9.3 33.7
28.9 -1.4
-26.6
-139.1 48.4 85.6
-13.0
5.6
-0.4
3.1
-6.3 -5.9
-13.1 -0.5
-10.7 39.7
37.8 -7.9
-26.8
-127.8 23.3 83.0
-14.5
6.2
-0.9
13.5
-2.4 -5.8
-13.3 5.5
-12.2 41.4
40.9 -1.0
-26.5
Statistical discrepancy -57.1 -32.3 -2.2 -9.9 -17.1
Memo items: Least developed countries Baker 15 c
Net debtor countries
-6.4 -0.6
-38.1
-6.2 -11.7 -47.4
-6.1 -4.4
-27.2
-6.7 -5.8
-29.6
-7.1 -2.8
-27.2
Source: UNCTAD secretariat calculations based on international sources. a For country classification, see table 1. 6 Excluding Nigeria. c For a listing of these countries see text, footnote 91.
8
largely to increases in export volume, particularly for manufactures. Some countries in the region also benefited from the rise in the price of oil and in the prices of agricultural raw materials. Notwithstanding the increase in the volume of imports, which was also quite large, the current-account surplus of countries exporters of manufactures in the region has continued to rise, contributing to the imbalances discussed below in some of the developed market economics. Measures intended to both curtail export growth and encourage import growth have met with only limited success (see subsection 4 below).
In Latin America, the overall improvement in the external position was also concentrated among the oil exporters and the exporters of manufactures, with little change on the whole in the other countries. The majority of Latin American countries face serious debt-servicing difficulties, and the improvement in 1987, with very few exceptions, represented only a partial recovery from the deterioration in their external positions that had occurred in 1986. On the whole, despite buoyant export growth in 1987, the level of exports in volume terms was barely higher than in 1985, reflecting the slow rate at which productive capacity has been increasing in recent years. Indeed, export growth in some countries was only possible through diversion of production from domestic consumption, which either declined or stagnated. Thus, despite the major effort undertaken by these countries, little has yet been achieved in laying the basis for a stable external position and more rapid growth of output.
The countries in sub-Saharan Africa (excluding Nigeria) have seen their external position deteriorate at an accelerated pace, despite continued adjustment efforts which have again resulted in a significant drop in import volumes. With their capacity to increase export volumes remaining limited, their external position has continued to be influenced by price movements which, for this group of countries, continued to be unfavourable in 1987. On account of the specific product composition of their exports, the countries of sub-Saharan Africa were not able to benefit from the overall recovery in prices of primary commodities. On the other hand, they felt the full impact on their imports of the increase in the price of oil and continued rises in the prices of manufactures (see subsection 3 below).
The much reduced current-account deficit of net debtor developing countries in spite of heavy repayments to the private sector allowed the level of official reserves to increase by almost S9 billion (see table 5). Buoyant export performance outpaced the growth of outstand
ing debt. This and continued low interest rates allowed the overall ratio of debt-service payments to exports to fall in 1987 to 28 per cent (see table 6).
2. Latin America
In 1987 the pace of output growth in Latin America slowed dramatically, and per capita output declined. At the same time inflation accelerated, with one or two notable exceptions. The overall current-account balance of the region, however, improved markedly.
The policy objectives of Latin American countries can be grouped under three headings: to service normally their external debt (and thus to generate the trade balance necessary to that end, given the level of capital inflows); to promote rapid rates of output growth; and to bring (or maintain) inflation under control. Since the outbreak of the debt crisis, no troubled debtor in the region has succeeded in making sustained progress on all three counts. In the face of conflicting and shifting pressures, policy-makers have been able to make progress on one, or at the most two, of these three fronts, but only at the cost of failure to meet objectives, or of outright retrogression, on the other(s). The experience of 1987 and the first half of 1988 was no exception to this rule.
In order to service their external debt, Latin American countries have to generate a surplus in the balance of goods and services (factor services excluded). This surplus implies, for the domestic economy, an equivalent surplus of saving over investment. Such a surplus can be obtained either by a relative expansion of saving (and thus a relative contraction of consumption) or by a relative contraction of investment. An analysis of the evolution of the current accounts of the balances of payments, financial balances of the private sector and national saving since the beginning of the decade indicates that the generation of the necessary external surplus has been mainly the result of a contraction of investment rather than of an expansion of saving. Consequently, the enlargement of productive capacities and the necessary shifts in the structure of production have been rather limited. Furthermore, in many countries investment was also directly constrained by the scarcity of foreign exchange, the more so since the import content of equipment expenditures is generally high. Thus, the need to service debt directly restrains the growth of output.
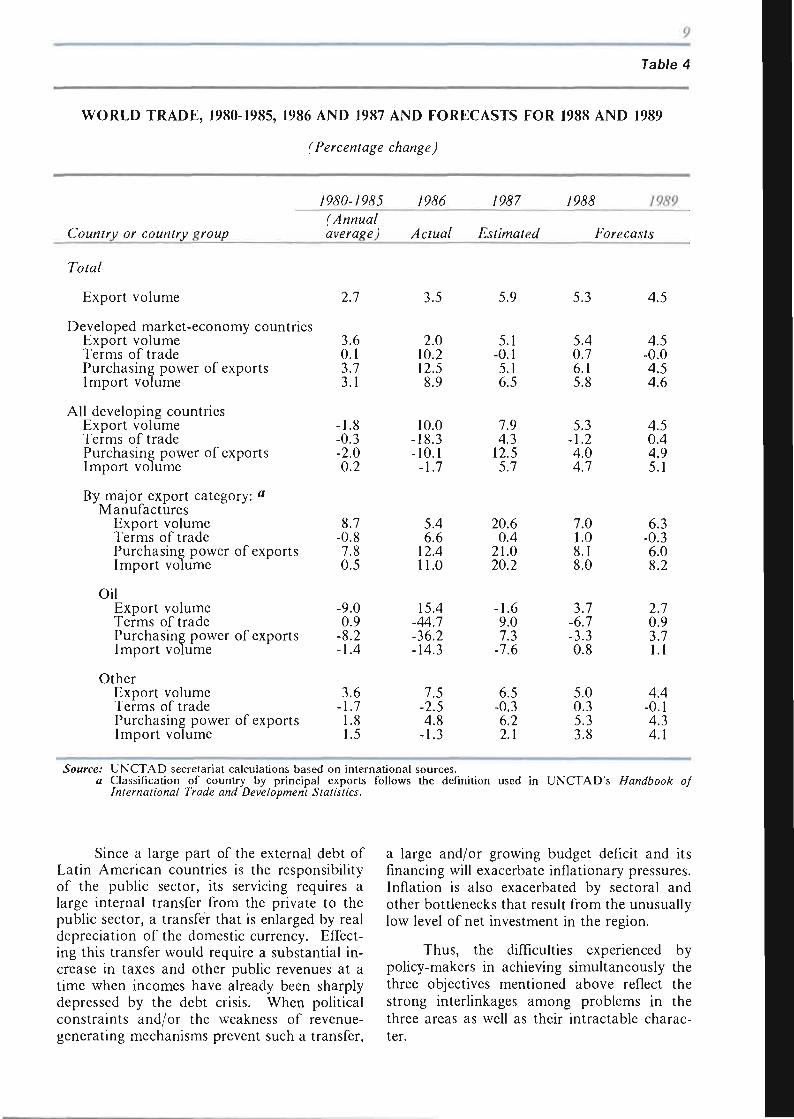
9
Table 4
WORLD TRADE, 1980-1985, 1986 AND 1987 AND FORECASTS FOR 1988 AND 1989
(Percentage change)
/P&0-/9&5
Country or country group (Annual average)
/9&S /&S7 /P&S 1989
Actual Estimated Forecasts
To/a/
Export volume 2.7
Developed market-economy countries Export volume 3.6 Terms of trade 0.1 Purchasing power of exports 3.7 Import volume 3.1
All developing countries Export volume -1.8 Terms of trade -0.3 Purchasing power of exports -2.0 Import volume 0.2
By major export category: a
Manufactures Export volume 8.7 Terms of trade -0.8 Purchasing power of exports 7.8 Import volume 0.5
Oil Export volume -9.0 Terms of trade 0.9 Purchasing power of exports -8.2 Import volume -1.4
Other Export volume 3.6 Terms of trade -1.7 Purchasing power of exports 1.8 Import volume 1.5
3.5 5.9
2.0 10.2 12.5 8.9
10.0 18.3 10.1 -1.7
5.4 6.6
12.4 11.0
15.4 44.7 36.2 14.3
7.5 -2.5 4.8
-1.3
5.1 -0.1 5.1 6.5
7.9 4.3
12.5 5.7
20.6 0.4
21.0 20.2
-1.6 9.0 7.3
-7.6
6.5 -0.3 6.2 2.1
5.3
5.4 0.7 6.1 5.8
5.3 -1.2 4.0 4.7
7.0 1.0 8.1 8.0
3.7 -6.7 -3.3 0.8
5.0 0.3 5.3 3.8
4.5
4.5 -0.0 4.5 4.6
4.5 0.4 4.9 5.1
6.3 -0.3 6.0 8.2
2.7 0.9 3.7 1.1
4.4 -0.1 4.3 4.1
Source: UNCTAD secretariat calculations based on international sources. a Classification of country by principal exports follows the definition used in UNCTAD's Handbook of
International Trade and Development Statistics.
Since a large part of the external debt of Latin American countries is the responsibility of the public sector, its servicing requires a large internal transfer from the private to the public sector, a transfer that is enlarged by real depreciation of the domestic currency. Effecting this transfer would require a substantial increase in taxes and other public revenues at a time when incomes have already been sharply depressed by the debt crisis. When political constraints and/or the weakness of revenue-generating mechanisms prevent such a transfer,
a large and/or growing budget deficit and its financing will exacerbate inflationary pressures. Inflation is also exacerbated by sectoral and other bottlenecks that result from the unusually low level of net investment in the region.
Thus, the difficulties experienced by policy-makers in achieving simultaneously the three objectives mentioned above reflect the strong interlinkages among problems in the three areas as well as their intractable character.
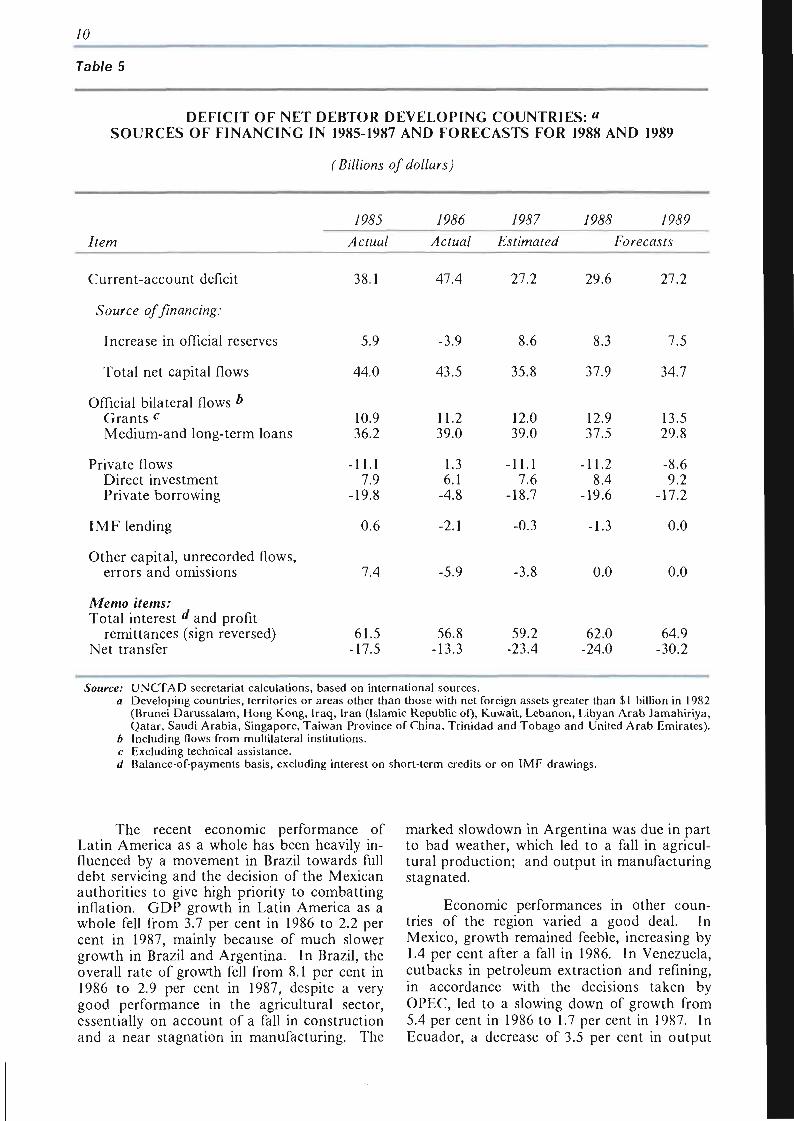
10
Table 5
DEFICIT OF NET DEBTOR DEVELOPING COUNTRIES: a
SOURCES OF FINANCING IN 1985-1987 AND FORECASTS FOR 1988 AND 1989
(Billions of dollars)
Item
Current-account deficit
Source of financing:
Increase in official reserves
Total net capital flows
Official bilateral flows b
Grants c
Medium-and long-term loans
Private flows Direct investment Private borrowing
IMF lending
Other capital, unrecorded flows, errors and omissions
/P&5
Actual
38.1
5.9
44.0
10.9 36.2
-11.1 7.9
-19.8
0.6
7.4
/&S6
Actual
47.4
-3.9
43.5
11.2 39.0
1.3 6.1
-4.8
-2.1
-5.9
/P&7
Estimated
27.2
8.6
35.8
12.0 39.0
-11.1 7.6
-18.7
-0.3
-3.8
yp&? 79699
Forecasts
29.6
8.3
37.9
12.9 37.5
-11.2 8.4
-19.6
-1.3
0.0
27.2
7.5
34.7
13.5 29.8
-8.6 9.2
-17.2
0.0
0.0
Memo items: Total interest d and profit
remittances (sign reversed) Net transfer
61.5 17.5
56.8 -13.3
59.2 -23.4
62.0 -24.0
64.9 -30.2
Source: UNCTAD secretariat calculations, based on international sources. a Developing countries, territories or areas other than those with net foreign assets greater than $1 billion in 1982
(Brunei Darussalam, Hong Kong, Iraq, Iran (Islamic Republic of), Kuwait, Lebanon, Libyan Arab Jamahiriya, Qatar, Saudi Arabia, Singapore, Taiwan Province of China, Trinidad and Tobago and United Arab Emirates).
b Including flows from multilateral institutions. c Excluding technical assistance. d Balance-of-payments basis, excluding interest on short-term credits or on IMF drawings.
The recent economic performance of Latin America as a whole has been heavily influenced by a movement in Brazil towards full debt servicing and the decision of the Mexican authorities to give high priority to combatting inflation. GDP growth in Latin America as a whole fell from 3.7 per cent in 1986 to 2.2 per cent in 1987, mainly because of much slower growth in Brazil and Argentina. In Brazil, the overall rate of growth fell from 8.1 per cent in 1986 to 2.9 per cent in 1987, despite a very good performance in the agricultural sector, essentially on account of a fall in construction and a near stagnation in manufacturing. The
marked slowdown in Argentina was due in part to bad weather, which led to a fall in agricultural production; and output in manufacturing stagnated.
Economic performances in other countries of the region varied a good deal. In Mexico, growth remained feeble, increasing by 1.4 per cent after a fall in 1986. In Venezuela, cutbacks in petroleum extraction and refining, in accordance with the decisions taken by OPEC, led to a slowing down of growth from 5.4 per cent in 1986 to 1.7 per cent in 1987. In Ecuador, a decrease of 3.5 per cent in output
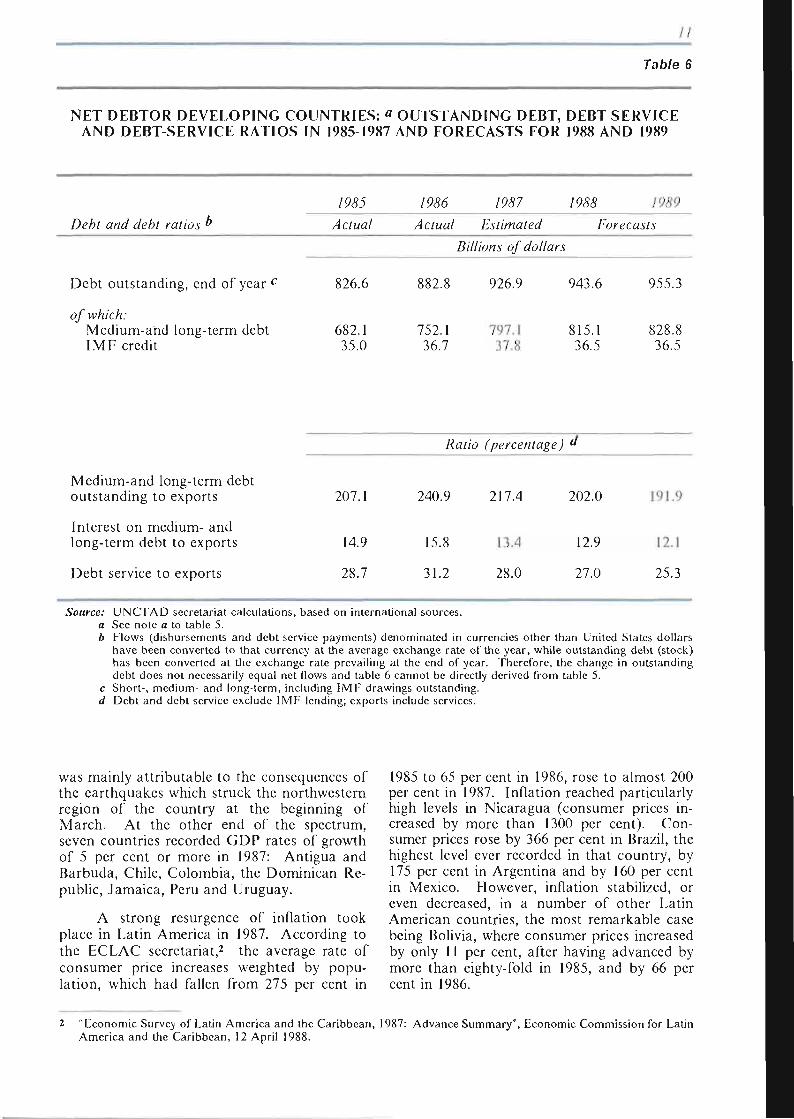
/ /
Table 6
NET DEBTOR DEVELOPING COUNTRIES: « OUTSTANDING DEBT, DEBT SERVICE AND DEBT-SERVICE RATIOS IN 1985-1987 AND FORECASTS FOR 1988 AND 1989
Debt and debt ratios &
/P&S
Actual
/9<96 /9&7 /%& /9W9
Actual Estimated Forecasts
Billions of dollars
Debt outstanding, end of year c 826.6 882.8 926.9 9416 955.3
of which: Medium-and long-term debt IMF credit
682.1 354
752.1 36.7
797.1 37.8
815.1 36.5
828.8 36.5
Ratio (percentage) d
Medium-and long-term debt outstanding to exports
Interest on medium- and long-term debt to exports
Debt service to exports
207.1 240.9 217.4 2010 191.9
14.9
28.7
15.8
31.2
13.4
28.0
12.9
27.0
12.1
25.3
Source: a b
UNCTAD secretariat calculations, based on international sources. See note a to table 5. Flows (disbursements and debt-service payments) denominated in currencies other than United States dollars have been converted to that currency at the average exchange rate of the year, while outstanding debt (stock) has been converted at the exchange rate prevailing at the end of year. Therefore, the change in outstanding debt does not necessarily equal net flows and table 6 cannot be directly derived from table 5. Short-, medium- and long-term, including IMF drawings outstanding. Debt and debt service exclude IMF lending; exports include services.
was mainly attributable to the consequences of the earthquakes which struck the northwestern region of the country at the beginning of March. At the other end of the spectrum, seven countries recorded GDP rates of growth of 5 per cent or more in 1987: Antigua and Barbuda, Chile, Colombia, the Dominican Republic, Jamaica, Peru and Uruguay.
A strong resurgence of inflation took place in Latin America in 1987. According to the EC LAC secretariat,2 the average rate of consumer price increases weighted by population, which had fallen from 275 per cent in
1985 to 65 per cent in 1986, rose to almost 200 per cent in 1987. Inflation reached particularly high levels in Nicaragua (consumer prices increased by more than 1300 per cent). Consumer prices rose by 366 per cent in Brazil, the highest level ever recorded in that country, by 175 per cent in Argentina and by 160 per cent in Mexico. However, inflation stabilized, or even decreased, in a number of other Latin American countries, the most remarkable case being Bolivia, where consumer prices increased by only 11 per cent, after having advanced by more than eighty-fold in 1985, and by 66 per cent in 1986.
2 "Economic Survey of Latin America and the Caribbean, 1987: Advance Summary", Economic Commission for Latin America and the Caribbean, 12 April 1988.
12
The marked improvement in the region's overall current-account deficit, which fell by S 12.1 billion to $9.9 billion, reflected a strong recovery of export earnings. The volume of Latin American exports grew by more than 6 per cent in 1987, after having declined in 1986. In the latter year, the volume of agricultural exports had declined in Brazil (coffee) and in Argentina (grains) as a result of a contraction of production due to poor climatic conditions, and potential exports of manufactures were absorbed domestically in those countries which experienced a high rate of growth of income and demand. As regards commodity exports, price increases of various magnitudes were registered in 1987 for petroleum, minerals and metals, agricultural raw materials and wheat (many of these increases, however, took place quite late in the year). However, the prices of tropical beverages went down, particularly the prices of coffee, which collapsed (see annex 1).
During 1987 these offsetting developments, together with a more rapid rise in imports, produced an improvement in the overall trade balance that was limited in size and concentrated on a small number of countries which experienced a significant improvement in their external payments positions. In the major oil-exporting countries, the combined effect of very fast growth in the value of exports and only small growth in the value of imports led to a significant expansion of the trade surplus. For Mexico, in particular, the recovery in the price of oil and the cutback in the volumes exported by the OPEC member countries in favour of non-OPFC producers led to a significant rise in oil revenues. With continued growth in the exports of manufactures, Mexico's export earnings rose by 31 per cent. At the same time, the anti-inflationary policies, which kept domestic demand down, limited the growth in the volume of imports. The result was a significant increase in the country's reserves. Among the non-oil-exporting countries, only Brazil was able to improve significantly its trade as well as its current-account balance. Following the difficulties of the first quarter, which led to the declaration of a moratorium on interest payments, the gradual slowdown in domestic demand led to a recovery of exports during the third and fourth quarters.3 Coffee exports, which had declined in 1986, picked up significantly and, despite, the sharp fall in coffee prices, also contributed to the faster growth of export earnings. At the same time, import growth was reduced to 2.7 per cent in volume
terms, also reflecting the slowdown of the growth of demand and output. Thus, Brazil was able to reduce the deficit in its current account by $2.4 billion to S 1.5 billion and to increase its reserves by SO.7 billion. The implied inflow of capital at the rate of $2.2 billion reflects, in large part, the non-payment of interest following the moratorium announced at the beginning of the year.4
The reduced deficit on the current account for Latin America as a whole, together with an increase in external financing, allowed the accumulation of reserves at the rate of $6.0 billion in 1987, as compared with a drop of $8.0 billion in 1986. The increase in external financing was associated with the debt renegotiations of Mexico and Argentina, an increase in official flows, some repatriation of capital by nationals and the non-payment of interests. While non-payment by Brazil accounted the most for this latter source of implicit financing, the phenomenon was also of importance in a significant number of smaller countries.
The performance of the region as a whole during 1988 will continue to be dominated by efforts to combat inflation and to avoid a new deterioration in external payments positions. Policy, therefore, would tend to restrict growth in domestic demand, particularly consumption, and to stimulate exports. In view of the large share, however, of domestic demand in total demand, the growth in exports alone will not be sufficient to accelerate output growth. Indeed, activity during the first few months of 1988 was stagnant in Mexico, although the anti-inflation programme had started to have some effect. Industrial activity in Argentina and Brazil continued to remain weak and upward pressures on prices were strong.
Africa
In 1983-1985 the African economies, after a particularly strong reaction to the decline in world economic activity between 1979 and 1982, suffered one of the severest periods of drought in the history of the continent. In July 1985, in the face of a weakening in the economic and social fabric, a weakening which, as discussed below, was not due solely to adverse climatic trends, the heads of State and Government of the Organization of African Unity
3 Exports during the first half of 1988 were down by 13.3 per cent from the same time a year before. For 1987 as a whole, however, they rose by 15.2 per cent.
4 The non-payment of interest is not subtracted from the payments on the current-account side of the balance of payments but is counted as an implicit capital inflow.
/.i
adopted Africa's Priority Programme for Economic Recovery 1986-1990 (AFTER). In June 1986, the General Assembly allied the international community with these efforts by adopting the United Nations Programme of Action for African Economic Recovery and Development (UN/PAAFRD). Meanwhile, many African countries embarked on ambitious programmes of structural adjustment, in most cases sponsored by IMF. Despite these efforts, which involved considerable social costs, growth in Africa was very modest in 1986. The expectation of better results in 1987 was not fulfilled. Indeed, 1987 proved to be a particularly difficult year, and per capita income continued to fall.
These disappointing results were again due to drought, which struck once more, particularly in the east and south of the continent. However, another important factor was the declining terms of trade of sub-Saharan countries. As will be seen below, these countries did not benefit from the small improvement in the terms of trade for the developing countries as a whole. Yet it would undoubtedly have been possible to overcome these difficulties, at least in part, if it had not been for Africa's external indebtedness, which despite many reschedulings still constitutes one of the most serious obstacles to development. At the same time, it should be stressed that experience differed from one country to another.
After near-stagnation in 1986, economic activity in North Africa revived only modestly in 1987. Agricultural output was affected by poor weather conditions in some countries and particularly in Morocco, which had had excellent harvests in 1986. Another factor affecting some countries was the return to a degree of discipline by OPEC countries, which lead to a firming of oil prices, and resulted in a contraction of oil output. The reduction of oil output, and hence of the volume of domestic output as a whole, was particularly marked in the case of the Libyan Arab Jamahiriya. Algeria was less seriously affected because of the large share of natural gas in its output and exports of fuel. Although not a member of OPEC, Egypt agreed to limit its oil production in 1984. FI owe ver, after a particularly low level of extraction in the second and third quarters of 1986, the return to a level close to the ceiling in 1987 helped to check the decline in economic activity caused by the poor performance of agriculture.
Of particular importance in the near-stagnation of the North African economy in recent years was the burden of debt service . Like most developing countries, the countries of North Africa were obliged, in order to meet their debt-service obligations, to cut imports so as to improve their current-account balance, with adverse consequences for investment and the availability of intermediate goods. For example, poor cotton harvests in Egypt in 1986/87 and 1987/88 seem to have been in part due to inadequate supplies of fertilizer. Egypt and Morocco were forced to negotiate the rescheduling of their debt in 1987 and to adopt structural adjustment programmes. Tunisia, on the other hand, spontaneously adopted a national economic recovery plan for 1987-1991, with apparently excellent results (5.5 per cent growth in GDP and a 17.5 per cent rise in agricultural output).
If the oil markets remain calm and climatic conditions are not unfavourable, economic activity in North Africa may begin to recover in 1988. Present indications are of good harvests in Morocco, but less so elsewhere. Despite large-scale efforts, the locust invasion has not been permanently halted. The expected recovery may well lead to a slight deterioration in the balance of payments, though it should prove possible to finance the deficit.
Economic activity in the countries of sub-Saharan Africa5 is largely determined by the agricultural sector, which in turn is subject to the vagaries of climate. In 1985, agriculture accounted for 31 per cent of the combined GDP of these countries (compared with only 16 per cent for the developing countries as a whole). The importance of agriculture is even greater than this figure suggests, since agricultural products constitute raw materials for much of industry (especially for the processing of agricultural products and textiles).
Whereas in 1985 and 1986 African farming seemed to be recovering from the earlier disastrous drought, drought struck again in 1987, affecting all the subregions to a greater or lesser degree but East Africa in particular. Export crops were less affected than crops for domestic consumption; output of coffee and cocoa in particular continued to rise in 1987, by 5.6 per cent and 3.6 per cent respectively. Sub-Saharan Africa was thus not able to achieve the target of self-sufficiency in food to which great importance is attached both by Africans themselves and by the international
S The discussion on sub-Saharan Africa in this sub-section excludes Nigeria, which, because of the size of its economy, weighs heavily in subregional averages that include that country. Furthermore, economic developments in Nigeria followed a somewhat different pattern, which is described separately.
14
community. Although it seems that the weather should be markedly better in 1988, higher rainfall in some regions has encouraged the proliferation of locusts which, though so far held in check, is now threatening Central and West Africa, and especially the Sahel.
These developments highlight the precariousness of African agriculture, which is due to a fragile environment ascribable, inter alia, to geographical and geological factors. However, as has been pointed out in a recent joint study carried out by the African Development Bank and the Economic Commission for Africa,6 poverty is a basic factor in the increasing fragility and deterioration of the environment, especially in regions experiencing high population growth, as in sub-Saharan Africa. To give only one example, the need to feed a growing population without adequate use of fertilizer leads, on the one hand, to a shortening of fallow periods and, on the other, to an expansion in cultivated area, particularly at the expense of forests, resulting in soil impoverishment, erosion and lateritization.
As noted above, the agricultural sector provides many of the inputs into manufacturing industries, which at present account for only a small share of GDP (8.7 per cent in 1985, compared with 17.5 per cent for the developing countries as a whole). Because of the poor harvests, these inputs were in short supply in the Sahelian countries in 1986. Consequently, there was a marked drop in manufacturing value added in West Africa, which accounts for around one third of the manufacturing output of sub-Saharan Africa, so that manufacturing output in sub-Saharan Africa as a whole rose by only 1.3 per cent in that year. There seems to have been a somewhat faster growth in 1987, over 3.5 per cent.
Many countries initiated industrial adjustment policies designed to raise productivity by reorganizing the price system and reorienting industrial strategies. Whatever their beneficial effects, these policies need to be supported by a considerable investment effort if the present very small industrial base is to be enlarged.
Trends in mining differed greatly from one product and one country to another. Oil production in 1987 (bearing in mind that Nigeria is excluded) fell in Gabon but rose in the non-OPEC producing countries. Figures for the output of other minerals and metals are not yet available; in 1986 their output rose by
4.2 per cent, despite declines for 9 of the 17 principal mining products in the region.
As regards trade and payments, the total volume of exports from the region, which had risen by 1.5 per cent in 1986, fell back by 1.7 per cent in 1987. The volume of imports, which had increased by 4.9 per cent in 1986, declined by 7.6 per cent because of the financing difficulties noted above. The fact that imports fell more than exports was not reflected in a corresponding improvement in the current trade balance because of a further deterioration in the terms of trade. As a result of the structure of its exports, sub-Saharan Africa did not benefit from the slight improvement in the terms of trade recorded for the developing countries as a whole. While many of the exports from sub-Saharan Africa consist of products whose prices are quoted in dollars, less than 10 per cent of its imports originate from North America. As a result, this region was worse hit than others by the dollar's decline. Furthermore, the composition of output and exports in sub-Saharan Africa was particularly unfavourable in 1987. It was noted above that export crops had better harvests than those for domestic consumption. In addition, they include several products for which movements in world prices were particularly adverse in 1987, notably coffee, cocoa and phosphates, the impact of which was not offset by the recovery in cotton prices.
For these reasons, and despite the painful efforts made by the countries of the region to reduce the level of imports further despite food shortages, the balance of payments worsened slightly in 1987, compounding the difficulties of debt service. In May 1987, Côte d'Ivoire, which was particularly affected by the fall in coffee and cocoa prices, was obliged to announce a temporary suspension of debt payments. Nine other countries were forced to seek the rescheduling of their public or publicly-guaranteed debt, which constitutes the bulk of the total debt of African countries.
Vital though these reschedulings might be, they have not enabled sub-Saharan to return to the path of sustained development. The problem of debt and development is treated in chapter III. Suffice it here, therefore, to underline that current rescheduling practices are inappropriate to sub-Saharan Africa. Briefly put, the essential purpose of these reschedulings and the associated structural adjustment programmes is to restore the borrowing country's short-term capacities to service its debt. This objective does not really seem to be attainable for African countries, as
6 Economic Repon on Africa 1988. A report of the Staffs of the African Economic Development Bank and Economic Commission for Africa.
15
witness the successive reschedulings to which many countries in the region have had to resort. In addition, and most importantly, such an approach rules out any prospects of development.
As already noted, and stressed by the African Development Bank and the Economic Commission for Africa in the report cited above, environmental conservation and improvement are an indispensable prerequisite for development in sub-Saharan Africa. This medium-to-long-term objective should be taken fully into consideration in the context of its debt problems. As has already been stated, poverty is a basic cause of the increasing fragility and deterioration of the environment. It should also be emphasized that, probably as a result of inadequate infrastructure, the short-term return on investment is lower in sub-Saharan Africa than in other regions. It is true that the share of gross fixed investment in GDP is below the 1975 -1980 average, but at around 18 per cent it remains relatively high, bearing in mind the standard of living in these countries, yet without so far having led to a resumption of development.
There appears to be growing awareness by creditor countries of the shortcomings of debt rescheduling practices used hitherto as they relate to the poorest countries, and hence the African countries in particular. For example, they have supported the initiative taken by the Government of Ghana and UNICEF in organizing the "Programme of Action to Mitigate the Social Costs of Adjustment" (PAMSCAD). This support, and the satisfactory response secured from lenders at the PAMSCAD Conference held in Geneva in February 1988, bear witness to the rich countries' awareness of the social costs of structural adjustment programmes.
The creditor countries also seem to have become aware that solutions to debt problems should be sought in a medium or long-term context. This need was already acknowledged at the Venice summit meeting of industrialized countries held in 1987, as a result of which certain practices of the Paris Club were modified and were reflected, for example, in the terms of the rescheduling agreements concluded with Somalia and Mozambique. The declaration of the recently held Toronto economic summit emphasizes:"The problems of many heavily-indebted developing countries are a cause of economic and political concern and can be a threat to political stability ..." and further stresses that "An increase in concessional resource flows is necessary to help the poorest developing countries resume sustained growth, especially in cases where it is extremely difficult
for them to service debt." Although several difficult issues are still to be resolved in the Paris Club, the seven industrialized countries committed themselves to step up assistance to the world's poorest and heavily indebted nations, particularly in sub-Saharan Africa.
While, there are thus grounds for hoping that in future the industrialized countries will play a more vigorous and more effective role in the development of sub-Saharan Africa, economic trends in the region in 1988 will remain very dependent on the weather. Precipitation appears to have been heavier at the beginning of 1988, but locusts continue to threaten crops in West Africa, and particularly the countries of the Sahel, which have already been affected by numerous attacks and are finding that the insects arc beginning to swarm there.
If the favourable rainfall forecasts are borne out, and if the locust invasion can be contained, GDP may rise slightly, by 2.5 or 3 per cent, but that would not suffice to arrest the decline of per capita GDP. The volume of exports may also rise slightly, and together with some improvement in the terms of trade, may lead to a rise of about 5 per cent in the purchasing power of exports. The volume of imports is also likely to rise somewhat after the sharp fall in 1987. There is likely to be a continued deterioration, however, in the overall current balance.
In Nigeria, despite a drop of around 12 per cent in oil production, GDP increased by about 1 per cent in 1987, principally as a result of growth in services and manufacturing, reaching 10 per cent in the latter case. The growth rate would have been higher had it not been for poor weather affecting agriculture, although farmers responded favourably to the inducements proposed under the structural adjustment programme. In this context, it should be underlined that, while oil exports have to date accounted for more than 95 per cent of total export revenue, the oil industry contributes only 17 per cent to GDP, compared with 19 per cent for trade and 2 per cent for agriculture. The Nigerian economy, despite the importance of oil, retains the characteristics of a sub-Saharan economy.
Although oil prices have firmed somewhat, Nigeria's external financial position remained precarious in 1987, owing essentially to the burden of debt service. After some difficulties, the creditor banks within the London Club and Nigeria finally signed a rescheduling agreement on 23 November 1987 relating to sums due in that year. In contrast, following delays in the payment of interest due on the debt rescheduled at the Paris Club in December
16
1986 - delays which seem to have resulted principally from a lack of qualified personnel in Nigeria - export credits have not regained the level envisaged at the time the agreement was signed.
The budget for 1988 aims to foster a slight recovery in domestic expenditure without burdening the economy with excessive risks of inflation. In this context, particular importance attaches to the innovative "special reflationary package" designed to mitigate the social impact of the structural adjustment programme: financing of the package is tied to rescheduling of the foreign debt. Assuming a degree of stability in the oil markets, and provided that the weather is not unfavourable, economic growth should continue or even accelerate slightly. Despite a growth of some 8 per cent in exports expressed in current dollars, which would lead to a surplus of about SI billion on the trade balance, the current balance is expected to record a deficit of around S860 million. In this context, meeting Nigeria's financial requirements will involve rescheduling that part of its foreign debt which falls due in 1988.
4. Asia
(a) East Asia
The vigourous growth in the volume of exports of manufactures and the strong recovery in the international prices of the main primary commodities exported by the region (e.g. oil, timber, palm oil, rubber and rice) contributed to the further improvement in East Asia's external position and to the growth in real output, which in 1987 rose to 8.1 per cent against 6.3 per cent in 1986. Output expanded particularly fast among the major exporters of manufactures, the majority of which registered double-digit growth. The sharp expansion of exports from these countries was accompanied by continued increases in investment and by stronger domestic consumption resulting from higher real wages and; or increased employment. For the other countries of the region the faster export growth in the volume of manufactures, albeit from a low base, and export-oriented investment underpinned the stronger than expected recovery in economic activity,
despite the slower growth of agricultural output, which suffered from adverse weather conditions in some countries.
Exports, which in 1987 surged by 24 per cent in volume,7 continued to provide the main stimulus to growth in economic activity among the exporters of manufactures in the region. As in the previous year, the Asian exporters of manufactures were able to increase their share in world markets through continued improvements in competitiveness resulting not only from higher productivity but also from the depreciation of the United States dollar in both years. Gains through this latter effect were partly offset, however, by revaluations in the Republic of Korea and in Taiwan Province of China; there were continued gains in competitiveness with Japan and European countries, reflected in the much faster growth of exports to those countries as compared to the United States. Export growth was fastest in Hong Kong and Singapore while the rapid growth in the Republic of Korea, which in response to pressures to reduce its trade surplus with the United States revalued its currency by 6.7 per cent in 1987, gave no signs of slowing down as its exports to Japan and Western Europe increased further. By contrast, in Taiwan Province of China, the sharp revaluation of the new Taiwan dollar, whose value against the United States dollar had risen by 15.7 per cent in 1987, resulted in a slower growth of exports, from 25.3 per cent in 1986 to 15.3 per cent in 1987. Furthermore, this slower export growth towards the end of the year was not fully compensated by faster growth of domestic demand, so that output growth also decelerated to an annual rate of 7.9 per cent during the last quarter of 1987. In the first quarter of 1988 the trade surplus with the United States was 29 per cent smaller than a year earlier as the share of its exports going to that country fell from 46 per cent to 42 per cent.
In both the Republic of Korea and Taiwan Province of China export performance in recent years has resulted in large and growing current-account surpluses and/or high levels of reserves that have become an important feature of the world economy (see below, and chapter II, section B).
High and rapidly rising investment underpinned the growing capacity of countries of the region to penetrate world markets through an increase in the output of exportable goods and in productivity; it also facilitated
1 This figure, which is calculated from balance-of-paymcnts data, may differ somewhat from that obtained from trade statistics. I he discussion is carried oui in payments terms for the sake oí comparability with the ensuing discussion of the balance of payments.
I?
shifts in the product composition of exports in response to market demand. Thus, increased investment led to the doubling of car exports and sustained growth of electronics and textiles in the Republic of Korea, helping to boost GDP growth to 111 per cent in 1987. In some countries foreign investment and policies related thereto were instrumental. For example, in Singapore, exports of electronics surged by more than 30 per cent following a sharp increase in direct investment by Japanese firms. This, in turn, had been encouraged by the adoption of measures more favourable to business enterprise.8 Overall, Singapore's volume of exports increased by 23.2 per cent in 1987 and economic activity, which had been depressed for two years, expanded by 8.8 per cent. Increased investment, particularly foreign direct investment by Japanese firms, has also contributed to faster growth in the exports of manufactures from other countries of the region. In 1987, a brisk rise in such exports contributed to the acceleration of growth in Thailand and in Malaysia, despite the weak performance of their agricultural sectors.
For the exporters of primary commodities, including the oil exporters of the region, and in particular for Indonesia and Malaysia, the particularly favourable price movements in the commodities exported by them was an equally important factor in the improvement of external positions and in the growth of their economies, which exceeded expectations.
The combination of higher export prices and higher export volumes produced a record increase in the value of exports, which in 1987 rose by 32 per cent for the region as a whole, against only 11 per cent in 1986, when export prices and export volumes moved in opposite directions. In that latter year, the collapse in the price of oil and the sharp declines in the prices of other primary commodities, combined with only marginal rises in the export unit values of the exporters of manufactures, resulted in a drop in average export prices in the region which partly offset the fast growth in the volume of exports. By contrast, in 1987, primary commodity prices and oil prices rose together with unit values of exports of manufactures, reinforcing the movement of export volumes, whose growth had started to taper off during the year.
In 1987, domestic consumption also gathered momentum in the region. In the Republic of Korea higher consumption was the result of the rise in real wages, low unemployment and the revaluation of the won and in Malaysia and Singapore of increased employment. The better performance of exports in the Philippines enabled the Government to follow a more expansionary policy, thus stimulating the economy, which after almost three years of contraction, grew by 4.5 per cent in 1987.
The sharp increase in exports, combined with increased public or private investment and stronger private consumption, induced buoyant import growth, in both value and volume terms, in most countries of East Asia. An important exception was Indonesia, an indebted country, whose external payments position deteriorated sharply in 1986 owing to the decline in oil prices. A devaluation of the currency against the dollar towards the end of that year resulted in a contraction of import volumes, while the value of imports remained unchanged. Together with a sharp increase in the value of exports, this led to an enlargement of the trade surplus and to a significant improvement in the current-account balance. Import growth was also limited in Singapore, mainly as a result of the slowdown in world oil trade in 1987, which influenced both its exports and its imports.9
Import volume growth in most of the remaining countries exceeded 15 per cent, and for the region as a whole, the value of imports rose by 30 per cent.
Led by a strong surge of exports, most countries in East Asia improved their balance on trade in goods and non-factor services in 1987. A reduction in net factor payments due to acccumulation of reserves in some countries and the reduction of indebtedness in others contributed further to an improvement in the external payments position of the region as a whole. The improvement was particularly large for Indonesia and Malaysia, both of which had been running current-account deficits, and for Taiwan Province of China and the Republic of Korea, which already had large surpluses.
In response to the growing pressures from its trade partners to reduce its payments surplus, the currency of Taiwan Province of China was sharply revalued in 1987. The higher trade surplus registered in that year is
To boost the economy, the Government implemented a series of cost-cutting measures in the spring of 1986 which included a two-year wage freeze; a cut in the corporate income tax rate from 40 per cent to 33 per cent; a temporary cut in employers' contributions to the Central Provision Fund (CPF) from 25 per cent to 10 per cent; and a temporary cut in the rentals of Government-owned industrial apartments and land (Nomura Quarterly Economic Review, May 1988, p. 25).
Since Singapore is a large centre for refining, its trade has been affected by conditions in the oil markets. In 1987 the volume of its oil imports declined by 10.6 per cent, and that of its exports by 13.6 per cent. By contrast, non-oil import volumes increased by 19.2 per cent and those of exports by 28 per cent.
18
considered temporary, reflecting mainly the impact on trade prices of the appreciation of the new Taiwan dollar: in volume terms export growth decelerated sharply, as mentioned above, and import growth was strong and rising. Import demand accelerated further during the first months of 1988, thanks to the lower prices resulting from the currency appreciation and sweeping tariff cuts. Furthermore, the authorities, concerned by the impact of the slowdown in exports on economic growth, have adopted a more expansionary fiscal policy. Public consumption in the new budget is 18 per cent higher than in the previous year and capital expenditure over 14 per cent higher. Faster growth in real incomes is also expected to stimulate imports.
For the Republic of Korea, improvement of the external payments position has been an objective of its development strategy for a number of years. The improvement was gradual up to 1985, when the deficit on current account had fallen to SO.9 bullion, against $5.4 billion in 1980, but substantial the following two years. The deficit turned into a large surplus in 1986, which was more than doubled in 1987, despite buoyant growth in the volume of imports in both years. Part of the surplus of the past two years has been used to reduce external debt by $11.9 billion, and to increase reserves by about $1.4 billion. Nevertheless, reserves still cover less than three months of (higher annual) imports. The size of the current-account surplus of the Republic of Korea has recently been called into question. Measures to stimulate domestic demand and imports may play a greater role in the future, though such measures would need to be balanced against the need to maintain a sound external financial position, including further debt reduction.
For 1988, the prospects for the region as a whole are for somewhat lower GDP growth and for relative payments stability. The currency revaluations of 1987 in some countries and the removal of Hong Kong, Republic of South Korea, Singapore and Taiwan Province of China from the list of beneficiaries of the United States GSP scheme10 as from January 1989 are likely to slow down the growth of exports of manufactures. However, the impact of these measures, and of possible further revaluations, as well as of protectionist policies by trading partners, is expected to be limited in the short run, owing to those countries' diversified export structures and the large size of their export markets. For the other countries
10 Preferential tariffs under the United States scheme are e S8.500.
of the region, more dependent on primary commodities, the improvement of commodity prices in 1988 (see annex 1) is not expected to parallel that of 1987. Together with continued high import growth associated with rising investment, this is likely to limit or even reverse the favourable movement in their external payments. Output growth, on the whole, should be sustained at much the same rate as in 1987.
(b) South Asia
The severe drought which affected the region interrupted the steady high growth of output in South Asia (with the exception of Pakistan) which slowed down to 2.4 per cent for the region as a whole. The slowdown was most marked in Bangladesh and India, which suffered their worst drought in recent years in terms of both intensity and geographical spread. In contrast, however, to past experience, the impact of drought on the economy has not been dramatic, due to progre_ss in making the economies less vulnerable to climatic conditions. In India, for instance, GDP rose 1.5 per cent in 1977, whereas after the drought of 1979 it declined by 4.8 per cent. In addition, a sharp deterioration in the country's external position was avoided, despite worsening terms of trade. A number of factors have contributed to this result. First, the direct impact on agricultural production has been mitigated owing to an extension of the irrigated area; also 23 million tons of Government-held buffer stocks have been available to meet the shortfall in food production, thus averting recourse to massive food imports. Secondly, and more importantly, the growth of non-agricultural output, whose share in total GDP has been steadily increasing, slowed only slightly, despite the significantly slower growth in those sectors affected by the drought either directly or through their linkages with the agricultural sector. Buoyant export growth (particularly of manufactures), the measures taken by the Government to compensate for losses in the purchasing power of the rural population and better than usual performance by infrastructure industries were important factors contributing to growth in the non-agricultural sectors (7.5 per cent in industry and 6 per cent in services).
Slower growth in the region was accompanied by an enlarged deficit in the current account of most countries, due mainly to a worsening of the trade balance, since trade in
tended to countries whose annual per capita income is below
!9
these countries is closely linked to agricultural output. For most countries the decline in the terms of trade, due mainly to higher import prices, reinforced the negative impact of the lower export volumes due to drought. No difficulty was experienced, however, in financing the overall balance and hence there was no payments constraint on growth.
For 1988, a significant improvement is expected for GDP growth, reflecting the impact of the recovery in agricultural production, although the lag effects of the drought will continue to be felt. The return to positive growth in agriculture during 1988, after the sharp decline in 1987, will have the effect of doubling the rate of overall output growth, despite some slowdown in other sectors. For instance, in India growth in industry is expected to decelerate by an additional 1-2 percentage points, on top of the slowdown suffered in 1987, due to reduced availability of raw materials and weaker domestic demand arising from reduced incomes. Export volumes in the region are also expected to experience the lag effects of the drought. Therefore, the improvement in output is not expected to be accompanied by an improvement in the regions' external payments position, and the deficit on current account in most countries in the region is expected to widen further in 1988.
(c) West Asia
Aggregate output growth in West Asia remained slightly positive for a second year running. The recovery in the price of oil and the near-completion of the adjustment process in some countries arrested the downward trend in the output of their non-oil sectors, compensating to some extent for the reduction of oil output that accompanied the increase in price.
Government policy in 1987 was directed mainly at the stabilization of the economy, which again showed signs of overheating, and at the correction of the external imbalances which had emerged in 1985 and 1986. At the same time, the process of economic reform already announced was continued.
Furthermore, the decision of OPEC to lower its aggregate level of output has not affected all countries in the same way. Thus, as a result of the reallocation of production quotas among the member countries and the decision of some countries to follow independent production policies, output in the oil sector in a number of them increased significantly, thus arresting the downward trend in overall economic activity. In addition, during the second half of the year, when it became apparent that the recovery in oil prices would not compensate for the drop in quantities exported, oil output rose again. The outcome was to maintain aggregate oil production in the region in 1987 at about the 1986 level, although by the end of the year there was again a cut-back following the new weakening of oil markets. Since average export prices were higher in 1987, there was a turnaround in the region's external payments position, and further cuts in the value of imports were avoided, although the declining trend in volume terms has continued. A modest growth in the volume of imports can, however, be expected for 1988 as more countries return to balanced external positions.
The prospects for 1988 are thus for a slightly higher growth in the region unless the weakness in oil prices in the first part of 1988 turns into a sharp decline. Despite the expected resumption of import growth, the overall payments position should remain roughly in balance because of improvements on invisible account; net transfers from the region are expected to stabilize at a lower level, following the reduced demand for foreign labour. With the return to a balanced position on current account the decline in net external assets should cease. The stabilization of the net asset position should lead to a rise in the net inflow of interest payments, if interest rates rise as expected.
Fuelled by continued growth in domestic demand and by the Government's export drive, industrial activity accelerated significantly during the first months of 1987. Tighter credit and fiscal policy, along with measures for better surveillance of investment projects, led to a slowing down of industrial growth by the end of the year. For the year as a whole, however,
C. China
20
the growth of industrial output (16.5 per cent) was higher than in 1986, thus accounting for much of the accelerated growth of the overall economy (a 9.4 per cent increase in GNP, compared with 7.8 per cent in 1986). Rapid industrial growth has continued to outstrip that of infrastructure despite improved electricity supplies and transport services. There have consequently been strains on these infrastructure services as well as on the supply of raw materials for industry, with inevitable inflationary effects.
An area in which government policy has continued to face difficulties has been investment in fixed assets, the excessive growth of which has placed heavy demand precisely on those sectors which have suffered from constant shortages. Attempts to change the structure of investment have been only partly successful. The initiation of projects not directly related to the productive process has continued unabated, creating shortages of funds for budgeted and other key projects. To curb such investment, the Government imposed a 30 per cent construction tax on "non-production related" projects that were not included in the State plan. For 1988 it also announced the establishment of a Central Construction Fund for improving the management of governmental funds. Since, however, 65 per cent of fixed investment is now financed by bank loans and internally generated funds of business enterprises, new tools are being sought for curbing and redirecting fixed investment. There has, however, already resulted a better balance between the growth of heavy and light industry. As in recent years, rising demand for consumer goods has led to a faster growth of light industry, which has been expanding at approximately the same rate as heavy industry.
The agricultural sector has also been receiving increased attention. Agricultural output in 1987 rose by 4.7 per cent, exceeding the plan figure, but agriculture is still one of the more slowly growing sectors of the Chinese economy. Furthermore, food production has lagged behind overall agricultural output, whereas demand for food has risen as a result of rising incomes and increasing population. In 1987, shortages and irregular supplies of non-staple goods have been one of the main sources of inflation. Increased investment in agriculture and aid for the poor regions, cash subsidies to consumers and efforts to diversify the national diet are among the solutions which are being envisaged and incorporated into government policy. Budget expenditure on agriculture increased by 8 per cent in 1987, compared to only a 3 per cent increase in total expenditure. Loans by banks and credit co
operatives rose by 30.2 per cent, while an additional 1.6 billion yuan was provided from extra-budgetary funds. Expenditure on agriculture is expected to again increase faster than total budget expenditure in 1988. Furthermore, subsidies compensating for price rises are expected to rise by almost 22 per cent.
After a fall to 6 per cent in 1986, the rate of inflation rose to 7.3 per cent in 1987, reflecting the supply difficulties described above, in face of continued strong demand growth. Food accounted for about 60 per cent of the overall price increase, with some non-staple food items registering double-digit increases, leading to a widening of the urban-rural price rise differential. Urban inflation rose 9.1 per cent in 1987 compared to 7.0 per cent in 1986, and rural inflation rose to 6.3 per cent from 5.0 per cent. Whereas in 1986 the fast growth of money incomes and the decline of urban inflation, due to the delay in price deregulation, led to an upsurge of urban private consumption, the reverse held in 1987: faster inflation was accompanied by a slower increase in urban money incomes, so that there was only a marginal increase (1.7 per cent) in real incomes. This in turn should have a dampening effect on the price level in 1988.
Despite the continued strength of domestic demand, the Government was able to redress completely the country's external payments position and to increase foreign-exchange reserves. After the swell of imports in 1985, there were two years of constrained import growth, and in 1987 imports grew by only about 2 per cent. At the same time, supported by more buoyant world trade, exports have grown in value by 29 per cent, leading to a substantial reduction of the trade deficit (only $2.4 billion in 1987, compared to $9.1 billion in 1986). Surpluses on trade in services and on private transfers more than compensated for the trade deficit, leading to an overall surplus on current account. In addition, net capital inflows have enabled foreign-exchange reserves to be built up.
For 1988, the prospects are for a continuation of these trends. Output growth is expected to remain strong, although somewhat less so than in 1987, as the Government continues its efforts to moderate consumer demand and investment in fixed assets in order to contain shortages and overcome inflation. However, the rate of inflation is not expected to be very different from that prevailing in 1987. As regards the external sector, a return to a small deficit on the current account can be expected as the Government relaxes its curbs on imports and export growth slows down, in line with the expected slower growth of world trade. More-
21
over, it is doubtful whether China can repeat its 1987 export performance, which was led by textiles, in view of the strong competition from other countries and of the possibility of protectionist measures in the United States.
1. Recent developments in demand and output
Real output of goods and services, responding in many developed market-economy countries to steady domestic demand growth, increased at rates somewhat faster than generally expected during the second half of 1987. Production was particularly high in the quarter just preceding the stock market crash of October, and in many instances activity was the most buoyant since 1984 as consumption recovered in hitherto sluggish economies, especially in Western Europe. The belated rebound might be the result in the main of the lagged effects of favourable factors, in particular gains in the terms of trade, which resulted in a marked expansion of private consumption in many countries, and above all in the Federal Republic of Germany and France.
Output in the developed market-economy countries as a whole rose about 3 per cent in 1987, which was somewhat faster than in 1986, reflecting in the main accelerated growth in Canada, Japan and the United Kingdom among the major economies and in Australia, Finland, Portugal and Spain among the others. Growth slowed down markedly, however, in the Federal Republic of Germany and to a lesser extent in France, while the United States economy grew at much the same pace as in the previous year. The growth of domestic demand also showed marked divergences among the major countries: the fastest expansion took place in Japan and the slowest in the United States, a reflection of the on-going adjustment of output and domestic absorption to correct external payments imbalances. The sustained, and in some important cases quite buoyant, levels of domestic activity resulted from delib-
In 1988, the Government is expected to accelerate the pace of economic reform, announced under the plan, in the conviction that the present imbalances are only transitional and can be corrected by the continued pursuit of reform over the next few years.
erate policy adopted to overcome the adverse effects of currency realignments. The most visible results were in Japan, where both personal consumption and business investment expanded rapidly throughout the year. The developed market economies continued to suffer from the impact of import compression in developing countries, especially by the major exporters of petroleum. The impact was particularly significant in the Western European countries, for whom the petroleum exporters are an important export market (see box I). Owing to adverse external influences, in terms both of stagnant or weak market growth and the loss of competitiveness caused by currency realignments, economic activity was particularly sluggish in many countries of Western Europe, especially during the first half of 1987."
For an economy well into its fifth year of recovery, activity in the United States continued to be brisk in 1987. From the fourth quarter of 1986 to the fourth quarter of 1987 real GNF rose by 4 per cent, i.e. twice as fast as a year earlier, in spite of a slowing down of consumer spending which appears to have been held back by both the rising consumer debt burden and the loss of wealth consequent on the stock market crash of October 1987. Real personal consumption expenditure (seasonally adjusted) declined 3.8 per cent in the fourth quarter of 1987 after increasing about 2 per cent and 5.5 per cent in the second and third quarters, respectively. The decline in consumption was confined mostly to the goods sector (both durable and non-durable); the service sector continued to grow, albeit much more slowly. While construction also showed some weakness due to the prevailing high interest rates, and investment in equipment fell sharply, GNP continued to expand rapidly in the fourth quarter, at a seasonally-adjusted an-
D. Developed market-economy countries
II In the Federal Republic of Germany, activity was also adversely affected by bad weather and real output actually declined by close to half of one percentage point from the second half of 1986 to the first half of 1987.
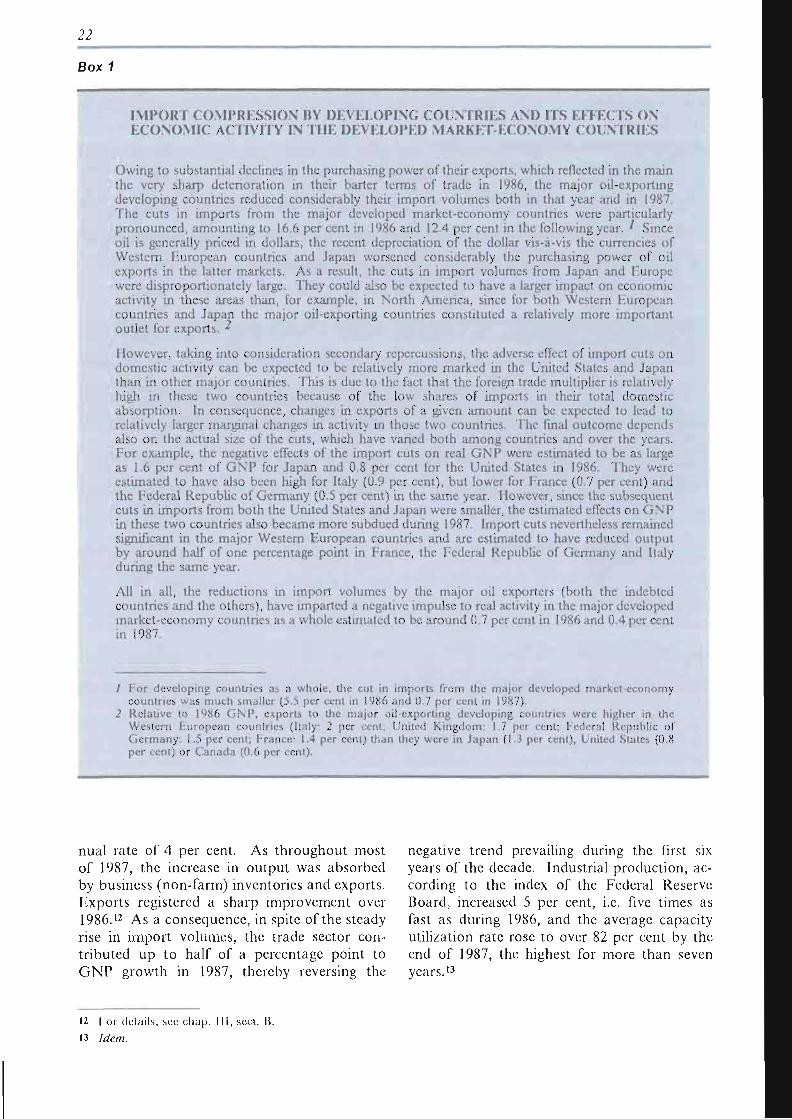
22
Box 1
IMPORT COMPRESSION BY DEVELOPING COUNTRIES AM) ITS EFFECTS ON ECONOMIC ACTIVITY IN THE DEVELOPED M ARRET-ECONOMY COUNTRIES
Owing to substantial declines in the purchasing power of their exports, which reflected in the main the very sharp deterioration in their barter terms of trade in 1986, the major oil-exporting developing countries reduced considerably their import volumes both in that year and in 1987. The cuts in imports from the major developed market-economy countries were particularly pronounced, amounting to 16.6 per cent in 1986 and 12.4 per cent in the following year. ' Since oil is generally priced in dollars, the recent depreciation of the dollar vis-à-vis the currencies of Western European countries and Japan worsened considerably the purchasing power of oil exports in the latter markets. As a result, the cuts in import volumes from Japan and Europe were disproportionately large. They could also be expected to have a larger impact on economic activity in these areas than, for example, in North America, since for both Western European countries and Japan the major oil-exporting countries constituted a relatively more important outlet for exports. ^
However, taking into consideration secondary repercussions, the adverse effect of import cuts on domestic activity can be expected to be relatively more marked in the United States and Japan than in other major countries. This is due to the fact that the foreign trade multiplier is relatively high in these two countries because of the low shares of imports in their total domestic absorption. In consequence, changes in exports of a given amount can be expected to lead to relatively larger marginal changes in activity in those two countries. The final outcome depends also on the actual size of the cuts, which have varied both among countries and over the years. For example, the negative effects of the import cuts on real GNP were estimated to be as large as 1.6 per cent of GNP for Japan and 0.8 per cent for the United States in 1986. They were estimated to have also been high for Italy (0.9 per cent), but lower for France (0.7 per cent) and the Federal Republic of Germany (0.5 per cent) in the same year. However, since the subsequent cuts in imports from both the United States and Japan were smaller, the estimated effects on GNP in these two countries also became more subdued during 1987. Import cuts nevertheless remained significant in the major Western European countries and are estimated to have reduced output by around half of one percentage point in France, the Federal Republic of Germany and Italy during the same year.
All in all, the reductions in import volumes by the major oil exporters (both the indebted countries and the others), have imparted a negative impulse to real activity in the major developed market-economy countries as a whole estimated to be around 0.7 per cent in 1986 and 0.4 per cent in 1987.
7 For developing countries as a whole, the cut in imports from the major developed market-economy countries was much smaller (5.5 per cent in 1986 and 0.7 per cent in 1987).
2 Relative to 1986 GNP, exports to the major oil exporting developing countries were higher in the Western European countries (Italy: 2 per cent; United Kingdom: 1.7 per cent; Federal Republic of Germany: 1.5 per cent; France: 1.4 per cent) than they were in Japan (1.3 per cent), United States (0.8 per cent) or Canada (0.6 per cent).
nual rate of 4 per cent. As throughout most of 1987, the increase in output was absorbed by business (non-farm) inventories and exports. Exports registered a sharp improvement over 1986.12 y\s a consequence, in spite of the steady rise in import volumes, the trade sector contributed up to half of a percentage point to G N P growth in 1987, thereby reversing the
negative trend prevailing during the first six years of the decade. Industrial production, according to the index of the Federal Reserve Board, increased 5 per cent, i.e. five times as fast as during 1986, and the average capacity utilization rate rose to over 82 per cent by the end of 1987, the highest for more than seven years.13
12 For details, see chap. Ill, sect. 15 13 Idem.
23
Fuelled by very buoyant domestic demand, real growth was particularly rapid in Japan in 1987. Foreign trade made a net positive contribution in the third quarter; there was a significant recovery of exports even though imports also continued to increase. For the year as a whole, supported by strong domestic demand growth which more than offset the negative contribution from the external trade sector, real output grew 4.2 per cent in 1987, a sharp improvement over the 1986 rate of 2.4 per cent. Household demand, in terms of housing starts as well as consumer spending on durables, was a major prop to overall activity during the year. Terms-of-trade gains, which were reflected in significant declines in wholesale prices, more than compensated for the slow growth of nominal personal incomes and contributed to the rise in consumer spending. Activity in the business sector was also brisk, as investment started to pick up, and exports of capital goods rose steadily, especially during the second half of the year, in response to the steady and substantial expansion of domestic demand and to the gain of competitiveness in foreign markets. Domestic demand in 1987 was more than 5 per cent higher than in 1986, whereas it had grown only 2.3 per cent annually during 1980-1984. The sluggish growth of the latter period reflected not only cuts in government programmes and the generally austere fiscal stance but also the uncertain situation regarding both employment and income. In consequence, the household savings rate rose by more than 2 percentage points between 1982 and 1987. The change to a less restrictive stance has altered considerably the overall economic climate during recent months. The public sector has also contributed directly to sustaining activity, especially through higher expenditure on public investment, a consequence of the Y 6 trillion (i.e. Y6,000 billion) stimulative package enacted during the year (see subsection 2 below). This spending package contained greater genuine real expenditure than usual and cuts in personal income tax raised disposable incomes. Private consumption and investment (including residential construction) were mainly responsible, in roughly equal proportions for the 4.2 per cent rise in real GDP in 1987.
In Western Europe real output growth barely exceeded 2 per cent in 1987, a much lower rate than in 1986. Although consumption was robust in many countries, including France, Italy and the United Kingdom, thanks to terms-of-trade gains and/or substantial increases in wages, activity was adversely affected by the feeble growth of export markets, espe
cially in the developing countries. In many countries, both import- and export-competing sectors also suffered from losses in competitiveness due to the devaluation of the dollar. Thus, in the Federal Republic of Germany, the growth of domestic demand, of nearly 3 per cent, was in itself insufficient to ofTset the negative contribution from the external trade sector. Real GDP is estimated to have grown by only 1.7 per cent, after the already low rate of 2.5 per cent in 1986. While domestic demand was much less buoyant than in 1986 (a fall of 3.8 per cent) it does not seem to have been affected by the stock market crash of October 1987. Business investment, especially in machinery and equipment, weakened during the year after an auspicious start in the early part of 1987. The expected continuation of modest growth may thus aggravate the external payments problems of the faster-growing economies in the region. In sharp contrast to most other Western European countries growth in the United Kingdom was relatively high in 1987, thanks largely to strongly rising consumption. Total consumption increased by more than 5 per cent and accounted for more than 3 per cent to the total rise in real GDP of 4.5 per cent. As with many countries in Western Europe, there was a leakage of demand into imports during 1987, but the negative contribution of the trade sector was relatively small in this case, thanks to a good export performance (a rise of about 5.5 per cent in real terms). Since the value of imports rose even faster than that of exports the trade deficit widened to about $15 billion in 1987, from S12.5 billion a year earlier.14
2. Salient features of macroeconomic policy measures
There was some convergence in fiscal policy stance among the major countries, reflecting to some extent measures taken both by countries with large budgetary deficits and by others. The budget deficit reduction by the United States was, however, accounted for by exceptional and temporary factors, including increases in tax receipts arising from the Tax Reform Act and asset sales. There was also a pause in the process of long-term budget deficit reduction, as was evidenced by the revision of the original Gramm-Rudman-FIollings targets in the course of the year. In spite of the agreed reduction that emerged from the conference between the Administration and Congress in
14 For more details on adjustment of the trade and payments imbalances, see chap. IN, sect. B.
24
the aftermath of the stock market crash, further reduction of the deficit is not expected from policies currently agreed or being implemented. At S148 billion, the fiscal deficit in 1987 was smaller than expected and came close to the original Gramm-Rudman-Hollings target of S144 billion. The post-market crash conference between Congress and the Administration reached an agreement involving cuts of $30 billion in fiscal year 1988 and S46 billion in 1989. Half of the reduction will be effected through spending cuts, a third through higher revenues and the rest through sales of Government assets. The Administration currently projects a baseline deficit of S148 billion for fiscal year 1988 (S4 billion in excess of the revised Gramm-Rudman-Hollings target) and a deficit of S139 billion for 1989 (S3 billion above the target).
Fhe Government of Japan adopted a supplementary budget for fiscal year 1987 (ending in March, 1988) of Y1.7 trillion which provided for additional public expenditure amounting to 0.5 per cent of GNP, as part of the Y6 trillion package announced in the spring of 1987. An important element of the package was also the reduction of marginal tax rates. Although this was offset to some extent by higher taxation of interest income, it nevertheless can be expected to provide some short-term stimulus to consumer expenditure. In an unprecedented move, the supplementary budget provided for an increase in non-interest expenditures of 1.8 per cent over the initial appropriation for fiscal year 1988. The effect of the budget may be neutral, but part of the appropriations made under fiscal year 1987 will be carried forward. No further budget stimulus in fiscal year 1988 appears to be envisaged, since domestic economic activity is considered to be sufficiently buoyant. However, the Government is expected to implement an additional package amounting to Y3 trillion in the fall of 1988. This may provide some expansionary effects in fiscal year 1989. As in the United States, monetary policy changed markedly in Japan after the stock market crash, with the same aim of injecting additional liquidity into the economy.
Fiscal policy appears to be moving towards a more restrictive stance in some countries, especially in Italy and France, where the financing of the rising deficits of the social security funds is a matter of concern. A major exception is the United Kingdom; having been moderately expansionary in 1987 the budget is expected to be more or less neutral in the current fiscal year. In that country, the fast growth of output in 1987 was an important factor contributing to the marked improvement
in the public sector finances, with the result that the Public Sector Borrowing Requirement (PSBR) has become negative for the first time since 1969/70. Other sources of increased tax revenue were higher corporate profits and higher oil prices. Receipts from the sale of Government-owned assets (privatization) were also much higher. (Even if such receipts are not treated as current income, the PSBR would still be much lower than in the preceding financial year.)
While exchange-rate movements have been the most prominent influence in the conduct of monetary policy, the aim of fiscal policy in the Federal Republic of Germany has been the consolidation of the budget. On a national accounts basis, the general government deficit rose by one half of a percentage point and reached around 1.8 per cent of GNP in 1987, reflecting the medium-term tax reduction strategy. The net tax relief granted, amounting to DM13.7 billion in 1988 and DM20 billion in 1989, should provide some needed stimulus to the economy. However, the recent fiscal stance was actually less expansionary than it appeared since it also reflected such non-discretionary factors as the sharp drop in Bundesbank profits which arose from unrealized capital losses on foreign-exchange holdings. Furthermore, the Government also envisages indirect tax increases and spending cuts in order to contain the deficit, which may worsen because of higher contributions to EEC.
In the aftermath of the world stock market crash, monetary authorities in the developed market-economy countries eased considerably their monetary supply in order to meet the increased demand for liquidity. As a consequence, short-term interest rates fell significantly in some major cases, particularly in the United States. In that country, interest rates had been rising steadily until the crash and differentials in short-term rates had widened significantly in favour of dollar-denominated assets, despite some sympathetic upward movements in rates in Japan and the Federal Republic of Germany. With the post-crash increase in liquidity there were widespread declines in rates. Accompanying these falls, there was some further widening of differentials, again in favour of dollar-denominated assets, thus contributing to some extent to stabilizing the dollar exchange rate following the sharp depreciation in late-December 1987. In general, the monetary authorities put less emphasis on monetary targeting because of the difficulty involved in predicting the movement of money aggregates and the priority accorded to stabilizing exchange rates.
25
3. Short-term prospects for aggregate demand and output
The assessment of the short-term outlook is inevitably subject to caution owing to uncertainties concerning future developments in both financial and exchange markets. In particular, the plausibility of assumptions made concerning the cross-exchange rates of the developed market-economy countries depends, to a very large extent, on the sustainability of the implicit exchange rate of the dollar. For the present purposes it has been assumed that real exchange rates will be relatively stable. As noted above, monetary policy was considerably eased after the stock market crash of October 1987. Subsequently, however, there was a commonly shared fear that the large-scale official interventions in the exchange markets were having undesirable effects on the money supply and monetary policy was tightened in some cases, with subsequent rises in interest rates. The calculations presented below therefore assume some firming of rates in the forecast period.
Real trade flows are expected to continue to adjust, in both 1988 and 1989, to the changes in competitiveness that have occurred with the realignment of exchange rates since 1985 and to changes in the pattern of domestic absorption and production in some major countries, especially the United States and Japan. Nevertheless, relative to the annual output of goods and services, the payments imbalances may remain large. Thus, in relation to GDP, the United States deficit can be expected in 1988 to stay above 3 per cent for the third consecutive year and in Japan it is expected to decline but to remain around 3 per cent. The surplus of the Federal Republic of Germany, on the other hand, could be a roughly unchanged proportion of GDP, at not much below 4 per cent. Furthermore, deficits and imbalances are likely to continue to prevail in many other Western European countries. To the extent that these deficits and imbalances are a constraint on growth there is likely to be a downward convergence of output growth rates in Western Europe in the near future.
It was generally expected that an immmediate consequence of the stock market crash would be a more cautious approach to spending both by consumers and by investors, particularly in the United States and Canada and to a lesser extent in the United Kingdom, where direct ownership of stock by individuals was more widespread than in Japan and the other developed market-economy countries. In general, the losses in wealth were expected to lead to higher savings, particularly in such
countries as the United States, where savings were already at very low levels and savings rates had fallen to record lows in recent months. This pessimism was, however, tempered by subsequent declines in interest rates in many countries. Nevertheless, it was feared that lower interest rates would not stimulate activity as quickly as the loss in consumer confidence would reduce it. Thus, in the most widely accepted scenario, it was expected that private consumption would be reduced because of the loss in wealth due to the decline in stock prices and that increased economic uncertainty would also reinforce the propensity to save as well as the propensity of business to invest. From their peak of August 1987, stock prices fell by about $1 trillion in the United States alone and the total loss for developed market-economy countries as a whole was half as much again. In consequence, the reduction in domestic expenditure in the United States should exceed largely that expected in most other developed market-economy countries. The projections presented below incorporate these general tendencies but they reflect a much less pessimistic outlook for business investment; surveys of business confidence carried out in the major countries suggest that in the event planned investment expenditure was not substantially altered after the stock market crash. The projections also incorporate the expectation of higher consumer savings, particularly in the United States. Personal savings in the United States have recently stabilized at a level about 1 per cent higher than in recent years (equivalent to a reduction in consumer spending of about $20 billion annually). The rise also reflects efforts to reduce the exceptionally high burden of servicing consumer debt, which in relation to incomes was steadily reaching new records.
Responding to improved competitiveness, activity in the United States has remained very buoyant so far in 1988, despite the potential effects of the stock market crash. The stimulus to exports may be even stronger in 1988 as markets react to the increased competitiveness of the United States. However, prospects remain uncertain and prognoses are difficult to make because the economy is going through marked changes, especially in the export sector. While some export industries have been operating at close to full capacity utilization, others have wide capacity margins. The likelihood of sluggish growth in the rest of the world also clouds the prospect for United States exports to lead the rest of the economy on a steady path. There has evidently, however, been a considerable strengthening of the competitiveness of the manufacturing sector, which was facilitated by a fall in labour costs
26
(at the end of 1987 unit labour costs were about 2 percentage points lower than a year earlier). Yet, since manufacturing accounts for only about one quarter of GDP, much still depends on how the rest of the economy performs and in particular on the behaviour of consumers, who account for two-thirds of domestic expenditure. Output continued to rise at a relatively steady rate in the early months of 1988 (3.6 per cent in the first quarter, at a seasonally adjusted rate), even though consumer savings also rose sharply. While growth was thus somewhat lower than during the second half of 1987, it was widely judged to be sufficient to overcome recessionary tendencies.
In Japan it is expected that the lagged effects of the fiscal measures taken in 1987 will prove beneficial to domestic activity and household spending, as should also be the lower interest rates and continued terms-of-trade gains. In particular, the effects of the income tax cuts in the second half of 1987 should be felt and higher employment will raise incomes. The continued strength of domestic demand during the early months of 1988 gives ground for optimism for the year as a whole. Thus, real growth may surpass the 4 per cent mark for the second consecutive year. It will undoubtedly contribute to reducing the large external surplus, which has been declining continuously over the ten months ending February 1988 (the latest month for which data are available).
In Western Europe output is expected to expand at somewhat more than 2 per cent annually in the coming two years. With only a slow growth of employment, unemployment will at best remain at its present high level, which is a major concern of macroeconomic policy, and the price level should remain relatively stable in most economies. The effects of the stock market crash are likely to be limited, unless negative impulses are transmitted from abroad. This overall outlook reflects both the depreciation of the dollar and the relatively slow export market growth facing most of these countries. Private consumption growth, which has been quite robust, may slow down in the near future as the effect of recent gains in terms of trade wears off and personal incomes rise more slowly. In spite of the recent lowering of interest rates and sustained high profits, business investment has continued to remain very subdued, largely because of the uncertainties surrounding both domestic and export demand. With unchanged policy, the prospects for increasing employment in Western Europe and reducing unemployment preventing its further growth are generally poor. As in the previous year, the foreign trade sector is expected to exert a negative influence on domestic activity in
1987 as imports continue to grow while exports may remain more or less constant. The United Kingdom stands out as a major exception; however, where growth in 1988 is likely once again to be well above the average for Western Europe. Consumer spending rose rapidly in the fourth quarter of 1987, by some 6 per cent, and shows no sign of slowing down. The faster rise of imports than of exports, exacerbated by the recent appreciation of the pound sterling, is likely to persist in 1988, with a futher widening of the trade deficit, but the continued relatively fast growth of the economy should lead to a significant reduction of unemployment.
In the Federal Republic of Germany, activity was subdued but steady in the aftermath of the stock market crash. Growth is estimated to have been close to 3 per cent during the first quarter of 1988, on which basis earlier forecasts for 1988 have been revised upwards. Domestic demand was relatively buoyant and exports performed better than expected. Other encouraging signs included orders for the manufacturing sector which were up 6 per cent during the first two months of 1988 over the same period of the previous year (domestic orders by 4.5 per cent and foreign orders by 7.5 per cent). While a slowdown cannot be ruled out for the immediate future, the steady rise of consumer spending may continue at close to 3 per cent in 1988 and should contribute to economic expansion. However, restrictive measures, including the planned introduction of a withholding tax, an increase in indirect taxes, and increased contributions for unemployment benefits may reduce domestic demand in the coming months to a growth below that of 2.9 per cent achieved in 1987. On the other hand, the negative contribution from net exports may be smaller, as recent data suggest a continued strong growth of exports. While inflation will probably continue to be low (averaging a mere 1 per cent), unemployment may exceed 9 per cent in 1988 of the decline in unemployment during the past few months. While no major slowdown of the economy is likely in the near future, growth is expected to remain very modest, at a rate somewhat above 2 per cent.
All in all, real GDP in the developed market-economy countries as a whole, may rise in 1988 at about the same rate as in 1987 (3 per cent - see table 1). This steady, but generally slower pace of activity, should not generate any inflationary pressures. In general, inflation rates continued to be relatively low despite accelerated output growth in the second half of 1987. Inflationary pressures remained very subdued in the first quarter of 1988, despite the fear that capacity shortage might raise production costs, especially in the United States, and that the recovery of commodity prices
27
might increase input costs in major importing countries. The risk remains, however, that inflation in the United States may accelerate, should the dollar exchange rate weaken markedly in the near future.
Import compression of developing countries and its effects on economic activity in the DMECs
Due to substantial declines in the purchasing power of their export earnings, which reflected in the main the very sharp deterioration in their barter terms of trade in 1986, the major oil exporting developing countries had reduced considerably their import volumes both in that year and in the following one. The cuts in the volumes of imports from the major developed market economy countries were particularly pronounced and amounted to 16.6 per cent in 1986 and 12.4 per cent in the following year.15 Since oil is generally priced in dollars, the recent depreciation of the United States currency vis-à-vis the currencies of European countries and Japan had contributed to worsen considerably the purchasing power of oil exports in the latter markets. As a result, the cuts in import volumes from Japan and Europe were disproportionally large. They could also be expected to have a larger impact on economic activity in these areas than, for example, in North America since for both Western European countries and Japan the major oil exporting countries constituted relatively more important outlet for export activity.16
However, taking into consideration secondary repercussions the adverse effects of a given amount of import cuts on domestic activity can be expected to be relatively more marked in the United States and Japan than in other major countries. This is due to that fact that the foreign trade multiplier is relatively high in these two countries because of the low shares of imports in their total domestic absorption. As a consequence changes in exports can be expected to lead to relatively larger marginal changes in activity in those two countries. The final outcome of course depends also on the actual size of the cuts which had varied both across countries and over the years. For example, the negative effects of the import cuts on real GNP were estimated to be as large as 1.6 per cent of Japan's GNP and 0.8 per cent of the United States in 1986. They were estimated to have been also high in the case of Italy (0.9 per cent) but much less so in France (0.7 per cent) and the Federal Republic of Germany (0.5 per cent) in the same year. But due to more moderate cuts in imports recorded subsequently from both the United States and Japan the estimated effects on GNP in these two countries also became more subdued during 1987. However, they remained significant in the major European countries and averaged around half of one percentage point in France, the Federal Republic of Germany, and Italy during the same year.
All in all, the reductions in import volumes on the part of the major oil exporters, both the indebted countries and the others, have imparted a negative impulse to real activity in the major developed market economy countries taken together estimated to be around 0.7 per cent of GNP in 1986 and 0.4 per cent of GNP in 1987.
E. Socialist countries of Eastern Europe
The process of economic reform initiated by many socialist countries of Eastern Europe over the past five years was continued in 1987. The development of the socialist economies was influenced, though still to a limited extent, by
policies and initiatives launched to further reform of the economic mechanism.
A major feature in 1987 was the acceleration of the reform process already initiated in the USSR and the introduction of far-reaching
is
16
For all developing countries taken together, the cuts in the volumes of imports from the major developed market economy countries were much less (5.5 per cent in 1986 and 0.7 per cent in 1987). Relative to 1986 GNP, exports to the major oil-exporting developing countries were higher in the European countries (Italy: 2 per cent; the United Kingdom: 1.7 per cent; the Federal Republic of Germany: 1.5 per cent; France: 1.4 per cent) than they were in Japan (1.3 per cent), the United States (0.8 per cent) or Canada (0.6 per cent).
26
measures with significant repercussions on the economic stance in the other socialist countries of Eastern Europe. As regards the USSR, a landmark in the policy of economic reform was the publication of the "Basic provisions for the radical restructuring of economic management", a document which was adopted at the June 1987 plenary meeting of the Central Committee of the Communist Party of the Soviet Union. The document sets out the aim of management restructuring as being "to reorient economic growth from intermediary to final, socially significant results and to public needs, promoting all-round development of the individual, making technology advance fundamental to economic growth, and creating a dependable cost-wise mechanism".17 Changes in the system of economic management have focused on the transition from administrative to mainly economic methods, which involves, inter alia, granting associations and enterprises full economic accountability, self-financing and self-management, as well as a major reform of planning, financing and credit in the economic system. The transition to wholesale trade in capital goods and industrial materials is to be achieved by 1990; already by that year 60 per cent of all products are to be sold on a wholesale basis. The principal features of the new economic mechanism are reflected in the Faw of the State Enterprise (Association) adopted in 1987. The Law sets out the principles of a flexible combination of the centralized system of management and the autonomous operation and planning of activities by enterprises which are carried out on the basis of target figures, State orders and long-term economic norms. The Law also makes provision for the foreign trade activities of enterprises, in particular concerning their possibility of direct access to international markets. An important step for further democratization of economic life was the adoption in May 1988 of the law concerning the development of co-operatives. Production and trade co-operatives have been established or revived in the food, manufacturing, services and other sectors of the economy.
These radical initiatives in the Soviet Union have served as a stimulus to other socialist countries of Eastern Europe in the search for new policy modalities and operational patterns which has been focused on the dual task of ensuring the acceleration of economic growth and promoting the modernization and structural readjustment of the economy, mainly through intensive application of new economic policy and management mechanisms. (In practice,
this docs not apply to the German Democratic Republic and Romania, which, on the whole, adhere to economic management practices and models introduced earlier).
For the socialist countries of Eastern Europe as a whole economic expansion was not sustained at the previous years' level having slowed down to 2.6 per cent in 1987. Both external and internal constraints were behind this slowdown. On the internal side, agricultural performance was weak and the gains achieved in other sectors from the application of economic incentives and other measures to improve efficiency were smaller than expected. On the external side, dollar depreciation and the deterioration of the terms of trade with developed market economies adversely affected foreign trade and the external financial position.
In agriculture, output in the socialist countries of Eastern Europe as a whole was virtually unchanged from the 1986 level, whereas a growth of 2.4 per cent had been envisaged. Both weather conditions and certain managerial and organizational deficiencies account for this performance. Because crop output did not reach target levels and imports of feeding stuffs could not fully compensate, output of the livestock sector suffered. The most serious situation was recorded in Bulgaria, Poland and Hungary, where gross agricultural production decreased by 4.3, 3.0 and 1.0 per cent, respectively. On the other hand, there was a continued and stable growth in the German Democratic Republic (with the best-ever harvest of cereals) and Romania. The rise in the USSR was marginal (0.2 per cent), after a considerable upsurge in 1986; the average increase over these two years was higher than in 1981-1985.
Despite these difficulties and setbacks, however, the agricultural sector and its potential appears to have strengthened to some extent in 1987, primarily due to the introduction of new managerial methods and instruments which started the process of operative autonomy and financial self-reliance of enterprises. Further implementation of agricultural reforms and modernization programmes in the years to come are likely to further strengthen the agricultural sector.
Total industrial output increased in the region by 3.7 per cent in 1987, which was broadly in line with plan figures, though there were deviations from target levels in some sub-sectors. The increase in the engineering and
17 M. Gorbachev, On the Tasks of the Party in the Radica! Restructuring of Economic Management, Novo sty Press Agency Publishing Mouse, Moscow 1987, p. 43.
29
metal-working industries averaged 6 per cent and in the chemical and petrochemical industries it was 4.5 per cent. There was a significant growth of production of the most technologically advanced machinery and equipment, especially in electronics and electronical engineering, which brought about an increase in export earnings. Output exceeded expectations in some of the most important sectors of the economy, such as fuel and energy in Poland and the USSR. For others, however, and especially machine-building, serious difficulties were faced in attempts to secure both a higher volume of output and better quality and technological standards. Thus, the output of machinery in the USSR grew by only 4.6 per cent, against a planned 7.3 per cent target.
These figures nevertheless mask a number of qualitative improvements. The whole of the rise in output in 1987 was due to higher productivity, whereas the productivity factor explained only 83 per cent of the output increase in 1981-1985. For the socialist countries of Eastern Europe as a whole there was a 3.9 per cent rise of labour productivity in industry in 1987. Other qualitative indicators (such as energy consumption per unit of output, raw materials utilization and the development of the intensive branches of the engineering industry) also point to an improved performance in 1987.
The foreign trade of the socialist countries of Eastern Europe also benefited in 1987 from the growing influence of new regulations and innovations introduced in most countries. These innovations reflected, inter alia, the enhanced acknowledgement of the importance of the external sector and the recognition of global interdependences and interlinkages. The foreign trade system underwent various measures of decentralization in different countries of the region, with a notable increase in the number of enterprises which were granted the right to engage directly in export-import activity. Various incentives for encouraging trade performance at the micro-economic level (including foreign-exchange retention formulas and also tax refunds) were introduced or strengthened, and a set of measures was adopted for stimulating cross-border as well as inter-enterprise links, including various co-operation and co-production schemes.
New legislation was also adopted to establish or liberalize provisions for joint ventures. The promulgation of joint venture legislation in the USSR in the beginning of 1987 generated additional interest in this form
of economic co-operation in other countries of the region. Although the first joint ventures in Eastern Europe with non-CMEA countries were set up as early as in the 1970s, they assumed greater importance in the 1980s. By the beginning of 1988 there were over 140 such ventures in operation or contracted in the socialist countries of Eastern Europe. In September 1987, some countries (for example, the USSR and Poland) amended their legislation in order to make the pertinent legal procedures more attractive to prospective foreign partners. The development of joint ventures among the socialist countries themselves also advanced. By March 1987, 29 such ventures had been established in CMEA18 countries and by the beginning of 1988 there were 13 in the USSR alone and 30 more were under discussion.
In 1987, there was a notable improvement in the foreign trade balance of the socialist countries of Eastern Europe as a whole, when a surplus of $16.3 billion was achieved, principally on account of the surplus of the USSR; the growth of Soviet exports in value terms, which took place in spite of the decline in the terms of trade, was coupled with a drop in imports from the developed market economies, with the result that a sizable Soviet deficit of trade with those countries was turned into a small surplus. The other countries of the region succeeded in reversing the fall of their total trade surplus, although not that of their trade with the developed market economies.
As in previous years, intraregional trade was predominant. Thus, for the socialist countries of Eastern Europe other than the USSR, intratrade accounted for more than 23 per cent of their overall trade turnover. The Soviet share of this total was as high as about 40 per cent. Conversely, 50 per cent of Soviet exports were to other socialist countries of the group, while the import share was even higher.
The trade turnover between the socialist countries of Eastern Europe and the developing countries increased by around 5 per cent in 1987 (3.5 per cent for exports and 6.7 per cent for imports, against 9 and -6 per cent, respectively, in 1986). These movements are largely explained by the trade performance of the USSR, whose imports from developing countries grew by 10 per cent in 1987 after an 8 per cent decline in 1986. For the other countries of the group, both exports to and imports from developing countries increased by approximately 1 per cent (as in 1986), though there was considerable variation among countries.
18 In addition to the socialist countries of Eastern Europe, the membership of CMEA comprises Cuba, Mongolia and Viet Nam.
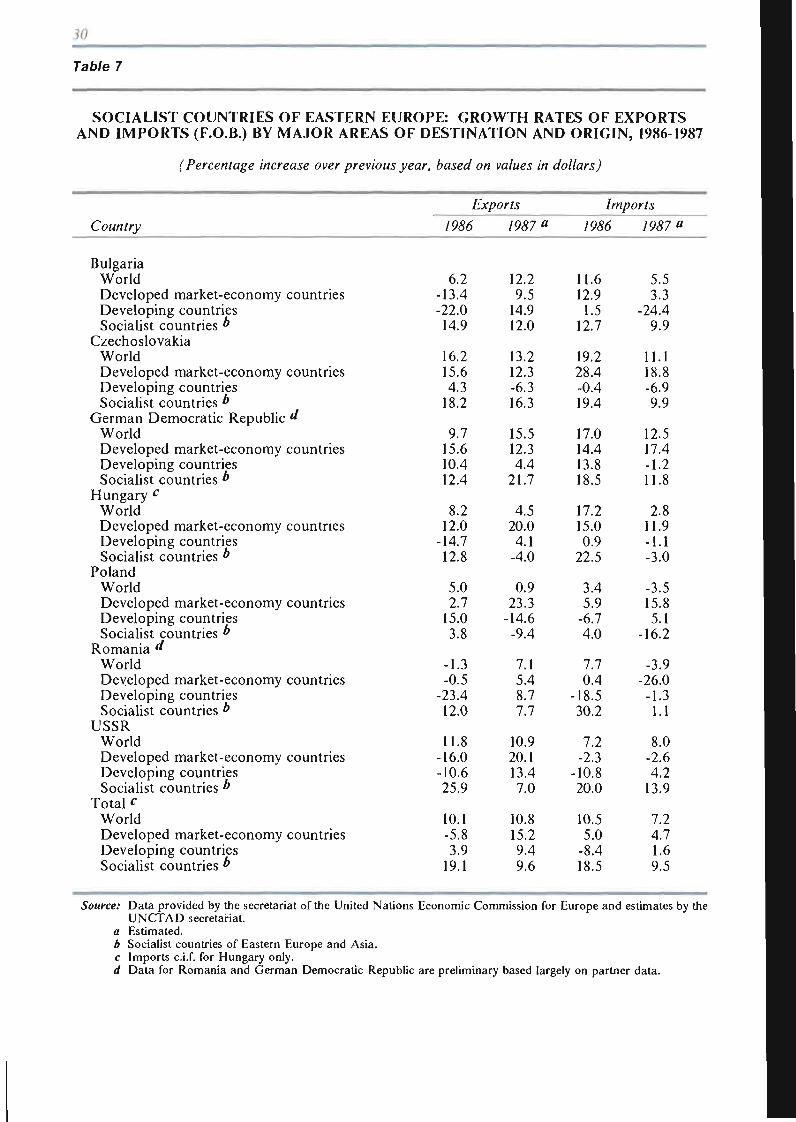
30
Table 7
SOCIALIST COUNTRIES OF EASTERN EUROPE: GROWTH RATES OF EXPORTS AND IMPORTS (F.O.B.) BY MAJOR AREAS OF DESTINATION AND ORIGIN, 1986-1987
(Percentage increase over previous year, based on values in dollars)
Country
Bulgaria World Developed market-economy countries Developing countries Socialist countries ^
Czechoslovakia World Developed market-economy countries Developing countries Socialist countries &
German Democratic Republic ^ World Developed market-economy countries Developing countries Socialist countries *
Hungary c
World Developed market-economy countries Developing countries Socialist countries *
Poland World Developed market-economy countries Developing countries Socialist countries *
Romania d World Developed market-economy countries Developing countries Socialist countries &
USSR World Developed market-economy countries Developing countries Socialist countries *
Total c
World Developed market-economy countries Developing countries Socialist countries &
Exports
/&%
6.2 -13.4 -22.0 14.9
16.2 15.6 4.3
18.2
9.7 15.6 10.4 12.4
8.2 12.0
-14.7 12.8
5.0 2.7
15.0 3.8
-1.3 -0.5
-23.4 12.0
11.8 -16.0 -10.6 25.9
10.1 -5.8 3.9
19.1
1987"
12.2 9.5
14.9 12.0
13.2 12.3 -6.3 16.3
15.5 12.3 4.4
21.7
4.5 20.0 4.1
-4.0
0.9 23.3
-14.6 -9.4
7.1 5.4 8.7 7.7
10.9 20.1 13.4 7.0
10.8 15.2 9.4 9.6
Imports
/&S6
11.6 12.9 1.5
12.7
19.2 28.4 -0.4 19.4
17.0 14.4 13.8 18.5
17.2 15.0 0.9
22.5
3.4 5.9
-6.7 4.0
7.7 0.4
-18.5 30.2
7.2 -2.3
-10.8 20.0
10.5 5.0
-8.4 18.5
1987 «
5.5 3.3
-24.4 9.9
11.1 18.8 -6.9 9.9
12.5 17.4 -1.2 11.8
2.8 11.9 -1.1 -3.0
-3.5 15.8 5.1
-16.2
-3.9 -26.0
-1.3 1.1
8.0 -2.6 4.2
13.9
7.2 4.7 1.6 9.5
Source: Data provided by the secretariat of the United Nations Economic Commission for Europe and estimates by the UNCTAD secretariat.
a Estimated. b Socialist countries of Eastern Europe and Asia. c Imports c.i.f. for Hungary only. d Data for Romania and German Democratic Republic are preliminary based largely on partner data.
w
East-West trade has been marked on the whole by a slow decline since 1980, and has failed to gain any new momentum since the peak reached at the end of the 1970s. This trend, characterized by relatively slow economic growth, fluctuations in exchange rates, increasing debt and consequent current-account imbalances, and falling commodity prices, especially those of fuels, basically continued in 1987. After a decline of 5.8 per cent in 1986, the dollar value of the exports of the socialist countries of Eastern Europe to the developed market economies increased in 1987 by about 15.2 per cent, while imports increased by around 4.7 per cent (after an increase of 5.0 per cent in 1986). Soviet exports to the developed market economies increased by about 20 per cent in 1987, whereas imports declined by 2.6 per cent (see table 7). For the other countries of the region there was a 7 per cent increase in exports and stability of imports.
Despite price changes, the movement of export and import values of the Soviet Union suggests that that country has successfully adjusted to the deteriorating external situation through an increase in the volume of exports and a contraction of imports, which more than offset the price changes. As to the other countries of the region, there have been noticeable fluctuations in their values and volumes of trade with the developed market economies, reflecting differences in their economic situations and in the geographical and commodity structure of their trade.
On the basis of the economic targets set by the socialist countries of Eastern Europe for the period up to 1990, and also taking into consideration the existing economic trends, the overall growth rate of economic activity of the region during the next 2-3 years is expected to be close to 4 per cent annually. Industry was set to grow in 1988 by 4.4 per cent, with special attention being paid to the promotion of those branches with the highest technological and export potential. Greater emphasis was placed on application of technologies which could secure better materials and energy conservation. The overall fuel and energy supply of the region is expected to grow by about 2 per cent, mostly due to an increase of Soviet oil and natural gas deliveries.
Further progress in structural adjustment and the process of modernization is expected to be achieved through a more rational and selective investment policy. Although all countries aim at a slower growth of investment than in previous years, the attainment of these objectives is expected to be achieved through an improvement in the technological structure and in the effectiveness of investment. In pursuing
this policy the USSR, for example, will aim first and foremost at modernizing fixed assets in the engineering industry, further strengthening the capital base of the fuel and energy sector and accelerating the development of social infrastructure. More emphasis will be placed on wider application of various economic and financial stimuli for optimizing and increasing the efficiency of investment.
As far as the prospects for foreign trade are concerned, a distinction has to be made between the short and the medium-to-long term. In the short run export prospects do not look very promising because of the quantitative and qualitative limitations on the supply side as well as of the slowdown in the economic growth of developed-market and developing countries and low commodities prices, particularly of oil. Sharp fluctuations in exchange rates, coupled with relatively high external indebtedness in some countries of the region, may put a brake on the expansion of their imports.
Medium-term prospects look more encouraging. On the one hand, the structural reforms carried out by the socialist countries of Eastern Europe could eventually open up new opportunities for further expansion of trade with both developing and developed market economies. On the other hand, the process of development and structural adjustment in developing countries will increase their requirements for various kinds of equipment, manufactures and other goods and, eventually, enhance their export capabilities. Accordingly, those countries are likely to show increasing interest in expanding and intensifying their industrial and economic co-operation with different trading partners.
Positive effects on the development of trade of the socialist countries of Eastern Europe with other countries, and especially of East-West trade, may be expected in connection with recent signs of political rapproachement between the USSR and the United States and prospects of détente in East-West relations. If this political trend continues it could prove to be one of the supportive factors for the expansion of East-West trade, particularly in the areas of energy and fuels, modern equipment and technology, agricultural products and services. There might also be wider scope for co-operation in the sphere of credit and finance. The fuller exploitation of these possibilities could be facilitated to some extent by the use of new forms and mechanisms of economic relations such as joint ventures, direct links between producers and consumers and production co-operation."

Blank page _____________
Page blanche
Chapter II
UNPREDICTABLE MOVEMENTS OF ECONOMIC INDICATORS: SOME ASPECTS OF RECENT EXPERIENCE
A. Introduction
There has recently been growing concern in many quarters about unpredictable movements of major economic indicators. The associated uncertainty is generally believed to make decision-making by governments, producers and other economic actors more difficult, and to be the source of various additional costs. The consequences include unfavourable effects for investment and impediments to the efficiency of the process of resource allocation more generally.
The unpredictable movements in question include relatively short-run fluctuations which can usually be characterized by the term "volatility", as well as longer-term swings, sometimes of a one-off nature, which may last for periods of up to several years. Such changes have tended to become more frequent in many parts of the world economy during recent years, and have led to the spread of the belief that it is becoming more unstable. Several features of these changes, especially those involving mutual interactions between real and financial variables, are not well understood. Nevertheless, there are good grounds for the view that an important contribution to the greater frequency of unpredictable movements has been made by economic policies and regulation since the late 1960s, in particular the adoption of variants of monetarism, the floating of exchange rates, and shifts towards fi
nancial deregulation and in general greater reliance on market forces.
The concept of unpredictability as regards movements of the variables which are the subject of this chapter is hard to specify precisely. In principle, it should refer only to that part of these movements which cannot be systematically explained by known economic factors with a regular pattern of occurrence. However, most of the variables covered here are difficult to forecast. This difficulty is exemplified by the failure in many cases of futures or forward prices to serve as good predictors of cash or spot prices, and by the indifferent overall record of forecasters of variables such as exchange and interest rates, especially at turning-points.19 Confirmation of the importance of unpredictability in practice is provided by the proliferation of techniques and instruments designed to give protection against fluctuations in certain variables.
Another point which must also be made about unpredictability in this context is that observed movements are not necessarily an adequate proxy for a variable's degree of unpredictability at all times. For example, relatively calm periods in the exchange markets may still be accompanied by substantial unpredictability for the relevant economic actors. As a recent article on this subject puts it, "even if variability - which can be measured only in the ex post
" Forward exchange rates have not proved to be unbiased estimates of future spot rates, a property necessary if they are to serve as proxies for the systematic component of fluctuations in exchange rates.
34
sense - is low, the ex ante uncertainty reflecting forecast errors may be very high."20
Certain points about the consequences of unpredictable changes also need to be made at the outset. These consequences include various costs and other difficulties, some of which are due to relations between unpredictable changes in, and normal or sustainable levels for, a variable. The costs and difficulties which are taken up in subsequent sections take several forms. In some cases these changes are the source of increases in transactions costs such as those of financing and payments arrangements or of the protective instruments just mentioned. Other types of cost (which may be due to governments' policy responses to unpredictable changes) are the result of effects on the real economy, including reductions in output, employment and productive capacity. In this context it should be noted that the increased fluctuations in economic variables in one part of the economy may be accompanied by a reduction of uncertainty elsewhere. In a full evaluation the benefits of such a reduction should be offset against the costs of the increased fluctuations. For example, the adoption by a country of a floating exchange rate may lead to greater costs in connection with international transactions, but reduce the uncertainties associated with the macroeco-nomic policies required to sustain a fixed-rate regime. Such a balancing of social costs and benefits presents very difficult problems in practice and is not attempted in any of the examples discussed in this chapter.
Further consequences of increased unpredictability discussed below are of a more general nature, and their importance in practice is sometimes hard to evaluate. For example, it is widely believed that the proliferation of techniques and instruments for protection against fluctuations in financial variables has contributed to a shift in the relative importance of financial and non-financial activities to the disadvantage of the latter. One frequently cited example of this shift is the increase in the opportunities provided by this proliferation for the absorption of additional skilled manpower by the financial sector. Another effect of greater unpredictability which is difficult to exemplify concretely is the blurring of perceptions as to what are variables' normal or sustainable levels, which are capable of serving as guide
lines for several types of economic decision. Here two problems in particular confront the seeker for supporting evidence. Firstly, such an effect is extremely difficult to isolate from other influences on decision making. Secondly, especially in the case of variables whose levels are set in financial markets, normal or sustainable levels are not easy to specify in any but a highly approximate way.
There is a widespread tendency among economists to identify such levels with the concept of equilibrium. This concept does not have a single generally agreed meaning in this context. But the different versions all assume a deterministic relation between equilibrium rates and certain fundamentals. For example, one formulation defines the "fundamental equilibrium exchange rate" to be "that which is expected to generate a current-account surplus or deficit equal to the underlying capital flow over the cycle, given that the country is pursuing internal balance' as best it can and not restricting trade for balance of payments reasons".21
However, the relevance of deterministic concepts of equilibrium to the study of market behaviour has been questioned by both economists and market participants. Their skepticism is due to doubts that the gravitational pull of fundamentals is strong enough to ensure that actual levels of variables usually tend towards equilibrium values defined in this way. Moreover, it has also been argued (for example, by the manager of a large investment fund in a recent book22) that deterministic versions of the concept ignore the dependence of movements of variables in financial markets on mutual feedback processes between the perceptions, imperfect understanding and decisions of participants on the one hand, and the course of events on the other.
While these criticisms are inspired by important features of the functioning of speculative markets (which are illustrated in the sequel), they are none the less compatible with the looser notion of a range of normal or sustainable levels for a variable. Even the investment manager just cited acknowledges that speculative rises and falls are sooner or later reversed as the resulting levels become increasingly vulnerable owing to their dependence on expectations of further movement in the same direction, in abstraction from infer-
in
21
22
M.A. Akhtar and R.S. Hilton, "Effects of exchange rate uncertainty on German and U.S. trade", Federal Reserve Bank of New York Quarterly Review (New York), Spring 1984, p. 9. J. Williamson, The Exchange Rate System, Policy Analyses in International Economics 5 (Washington, D C : Institute for International Economics, September 1983), p. 14. G. Soros, The Alchemy of Finance. Reading the Mind of the Market (London: VVeidenfeld and Nicholson, 1988), especially chaps. 1 and 16.
G
enees based on other relevant characteristics of the economic situation.23 A range of normal or sustainable values for a variable, which is necessarily a somewhat imprecise concept, can be defined as reflecting market participants' preponderant views as to the features of such a range. The fundamentals which underlie deterministic versions of the concept of equilibrium enter into this definition via their influence on these preponderant views. In the analysis and examples of this chapter the primary focus is on unpredictable movements of variables per se. However, at certain points the effects of deviations from normal or sustainable levels (for example, misalignments in the case of exchange rates) are also discussed.
There have recently been several indications of changes in the attitudes of major OECD governments towards the extent of their reliance on market mechanisms. This development appears to be associated with the view that greater official intervention is required in establishing appropriate frameworks and guidelines for markets if they are to function efficiently, and if large unpredictable changes and their harmful effects are to be contained. An outstanding instance was the intervention by central banks to support the liquidity of their financial systems in response to the collapses of equity prices in October 1987. Other recent examples are steps towards a more coordinated approach to policy making at the international level directed at achieving the broad objective of better macroeconomic balance among the major OECD countries, and actions designed to contain the external debt crisis among developing countries. The first of these two examples includes the intervention in the exchange markets since the Plaza Agreement of September 1985, and the subsequent public acknowledgement of the need for better international co-ordination of domestic macro-economic policies. One of the assumptions underlying the new attitudes is that the objective of better world macroeconomic balance entails, inter alia, greater stability of exchange rates and the avoidance of rises in interest rates. In the second example, the external debt crisis, the policy response of the governments of the principal creditor countries comprised massive bilateral and multilateral official intervention in international lending to developing countries and in the rescheduling of their private external debts. In this case an important motive for the actions taken was fear that the sharp fall in international lending to developing countries associated with the debt crisis might lead to wider financial collapse.
A notable feature of these actions was their ad hoc and partial character. There are few signs that they are associated with radical revision or the abandonment of the doctrinal framework which has played so prominent a role in underpinning economic and social policies in OECD countries during recent years. Many of the steps taken within this framework could also be justified on the basis of the situation actually prevailing in the part of the economy affected. For example, certain measures of financial deregulation in many countries are a rational response to new opportunities due to technical changes, especially in the field of communications, and to the imperatives of heightened competition among different types of financial institution. However, the analysis in this chapter of the increasing frequency of unpredictable changes in certain variables points to the dangers that can result from policies and regulations that accord free markets the status of a fetish.
These remarks should not be taken to imply that there exists an alternative set of general principles awaiting embodiment in policies in the areas covered by this chapter. There are indeed steps in some of these areas which immediately suggest themselves. For example, improved management of exchange rates in the context of policies designed to achieve better global macroeconomic balance qualify under this heading. So do measures designed to slow speculative movements of funds in financial markets (which might include various types of transaction tax). Moreover, regulatory frameworks for the financial sector need mechanisms for reining the pursuit by banks and other institutions of the excessive growth in lending which gives rise to the cycles that have long been a recurring feature of financial history at national and international levels. But with respect to many relevant matters, recommendations of a general nature are of limited utility owing to the need to take account of specific features of the positions of particular markets and national financial systems. Rather, the phenomena documented in the analysis below should serve as a caution against responding to evolving situations with attempts at solutions believed to be appropriate owing to their conformity with timeless, theoretical blueprints.
Since for the reasons given above it is not possible in practice to separate out the unpredictable component of movements in the variables discussed in this chapter, the review of the experience of recent years in the following section takes increases in the frequency and amplitude of variables' observed movements as an
23 Ibid., pp. 76-77.
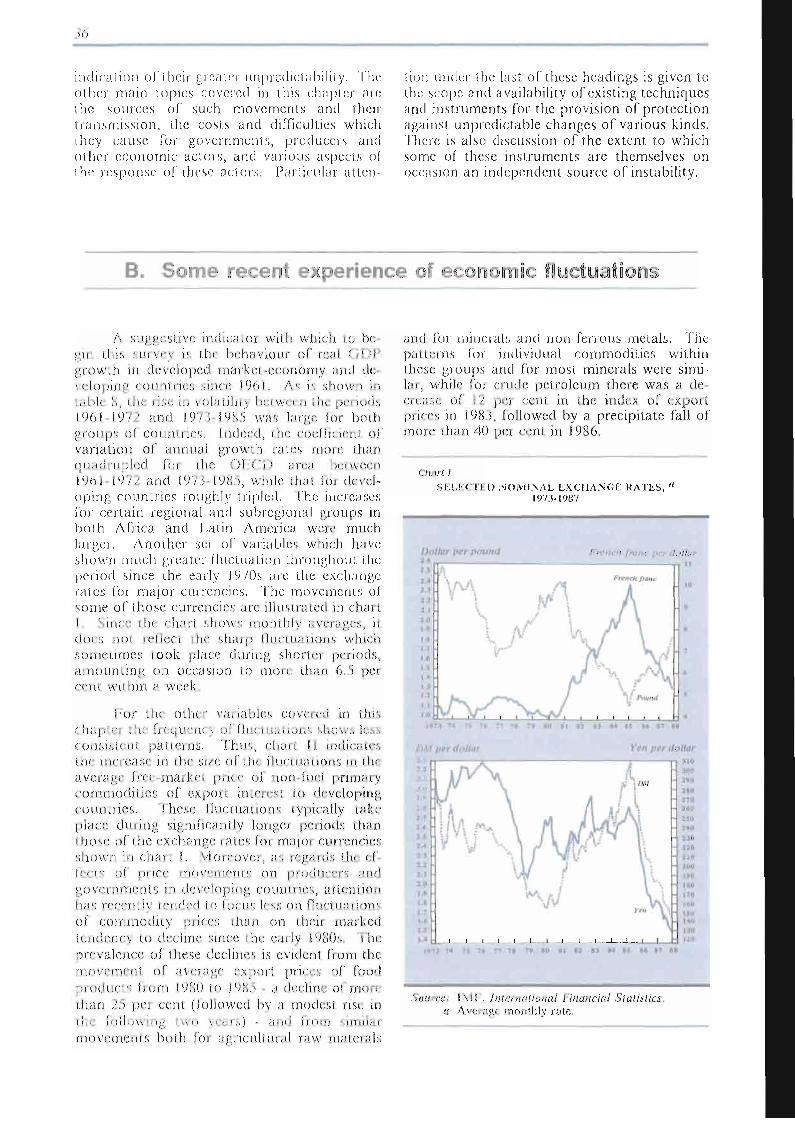
%
indication of their greatei unpredictability. The other main topics covered in this chapter are the sources of such movements and their transmission, the costs and difficulties which they cause fui governments, pioduccrs and other economic actors, and various aspects oí the response of these actors. Particular alten
tion under the last of these headings is given to the scope and availability of existing techniques and instruments for the provision of protection against unpredictable changes of various kinds. There is also discussion of the extent to which some of these instruments are themselves on occasion an independent source of instability.
B. Some recent: experience of economic fluctuations
A suggestive indicatoi wiih which to be gm i his survey is the behavioui of real UDP growth in developed market economy and dc vclopiug rnimines since l%l . As is shown in if-ble. T iii!-- rise in volatility between ¡he penóos )%) 1%// and )9/S l%6 was huge fo, both groups of room lies. Indeed, the rueffx.icui of variation of annual growth lates mote i lian quadrupled foi the OECD area between 1U61 19//. and l9 / j l9iio, while that fm devel oping roumncs roughly iripled. I'he increases foi certain regional and subregional groups in both Africa and Latin America wem much larger. Anothei SCL of variables which have shown much greatei fluctuation throughout the period since the early 1970s are the exchange rales for major currencies. The movements of some of those currencies are illustrated in chart I mnn- tfn chart shows monthly avnages, it does not relien ¡he sharp fluctuations which sometimes took place during shorter periods, amounung on occasion to mote than 6.3 pei rrni within a week
For the o the] variables covered in this rhajptn t.ltf fiequcum of fluctuaiiuu:, sknv.'.,k..,L, cuuwucul j;altmnt,. Thus, chait (1 indicates the mncase in the s</r of the llunuahmis m the average rre< markel price of ion iuei primary commodiiics of export inioest in developing coujiiries. Ihesc flnciuanoos typically cake place dining significantly lougm periods tlian those of the exchange rams fen m%|nr currencies shown in chart Í. Vloieovm, as tega,ds ihr. cl"-feci s of pnce movements on pmdnrr-m and governments m developing emmmes, atteulimt Itfis rrrcntly ¡ended to focus less on fluctuations of commodity uiircs théiu on theii marked teudencv to decline since the early l%0s. The prevalence of these declines is evident from the movement of aveiagr rxporl prirrs of food pioduns i;om 19110 to l911o a derlmr. ol mote than 2¿) pci cent (followed m, é) modest rise m the following two years) and from simitar movements both foi agricultural raw materais
and for minerals and non-ferrous mêlais. îl'ie patterns foi individual commodities within these groups and for most minerals were simi-lai, while fo; crude pclrolcum there wos a de ciease of f2 per cent in ¡hi: index of export prices in 198!), followed by o precipitate fall of more than 40 per cent in J986.
Chart ' SI.LICTl D NOMINAL EXCHANGE RATES, a
1973 1987
Dollar per pntiini French nunc per dallai J.«
J-J
1.4 1.1
3.3 2.1
! 0
1.» 1.» 1.1 I t 1.1 1.1
1.1
1.1 1.0
h
M tA I V J \ J\
: A A 1 k _ X—*«_ / V FoimJ , f ^ \ / ^ V /
- H s- -a it nit i i n t.i «4 S5 ts vr >
10
11
»
•
*
1
1
DA** per dollar Yen perdonar
z.i 2.1
Í.S J,7 Î . 4
3.4
1,4 I ,J 3.3 3.1
M I.»
I.« 1.3 1.0 l.> 1.4
J \ f là» \ . AM : Mm \ AwW\ * w \ 1 / \A --••; •: 1 / Sf V K
w f \ \ -V ^
• 1 1 1 1 1 1 1 1 1 -
'II
390
mo n o Idij l io 340
330 330 3 10 300
150
!T0 1*0
l i o
[30 I30
1913 M ' 7B ^9 SO 11 Hi S3 S* S i St S3 fll
Source; FM J , Inlet notional Financial Statistics. n Average monthly rate.
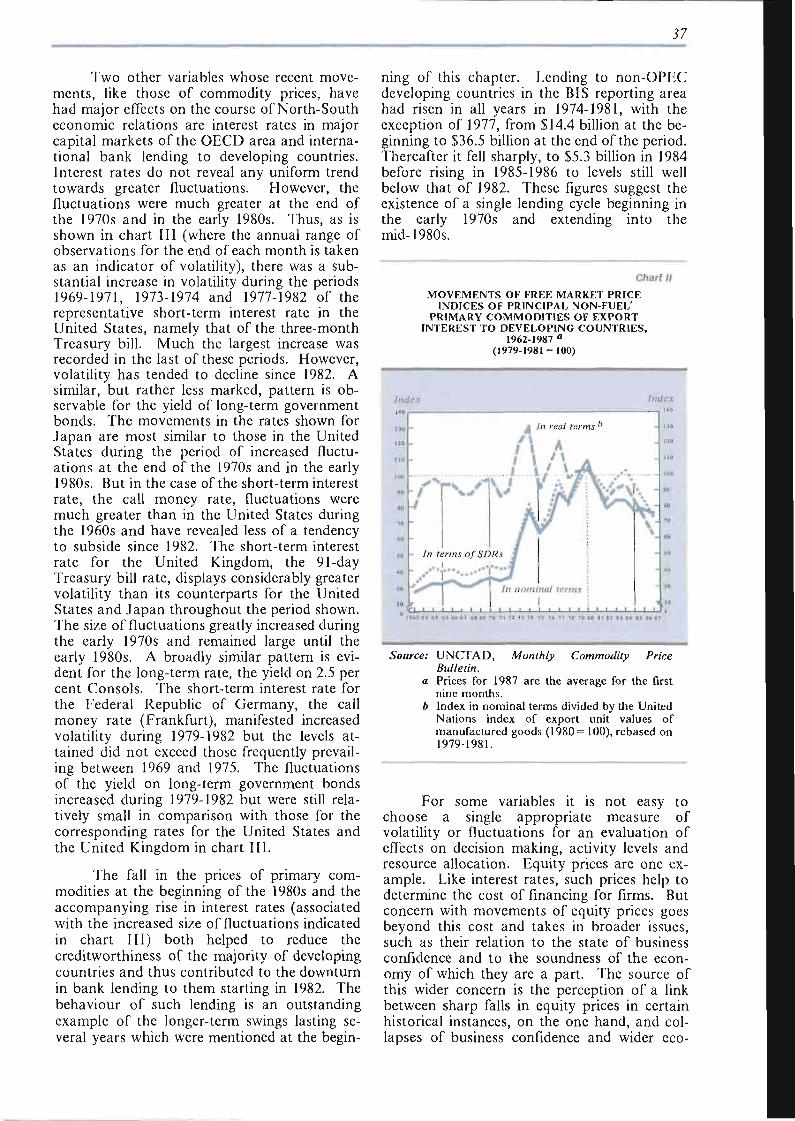
57
Two other variables whose recent movements, like those of commodity prices, have had major effects on the course of North-South economic relations are interest rates in major capital markets of the OECD area and international bank lending to developing countries. Interest rates do not reveal any uniform trend towards greater fluctuations. However, the fluctuations were much greater at the end of the 1970s and in the early 1980s. Thus, as is shown in chart III (where the annual range of observations for the end of each month is taken as an indicator of volatility), there was a substantial increase in volatility during the periods 1969-1971, 1973-1974 and 1977-1982 of the representative short-term interest rate in the United States, namely that of the three-month Treasury bill. Much the largest increase was recorded in the last of these periods. However, volatility has tended to decline since 1982. A similar, but rather less marked, pattern is observable for the yield of long-term government bonds. The movements in the rates shown for Japan are most similar to those in the United States during the period of increased fluctuations at the end of the 1970s and in the early 1980s. But in the case of the short-term interest rate, the call money rate, fluctuations were much greater than in the United States during the 1960s and have revealed less of a tendency to subside since 1982. The short-term interest rate for the United Kingdom, the 91-day Treasury bill rate, displays considerably greater volatility than its counterparts for the United States and Japan throughout the period shown. The size of fluctuations greatly increased during the early 1970s and remained large until the early 1980s. A broadly similar pattern is evident for the long-term rate, the yield on 2.5 per cent Consols. The short-term interest rate for the Federal Republic of Germany, the call money rate (Frankfurt), manifested increased volatility during 1979-1982 but the levels attained did not exceed those frequently prevailing between 1969 and 1975. The fluctuations of the yield on long-term government bonds increased during 1979-1982 but were still relatively small in comparison with those for the corresponding rates for the United States and the United Kingdom in chart III.
The fall in the prices of primary commodities at the beginning of the 1980s and the accompanying rise in interest rates (associated with the increased size of fluctuations indicated in chart III) both helped to reduce the creditworthiness of the majority of developing countries and thus contributed to the downturn in bank lending to them starting in 1982. The behaviour of such lending is an outstanding example of the longer-term swings lasting several years which were mentioned at the begin
ning of this chapter. Lending to non-OPEC developing countries in the BIS reporting area had risen in all years in 1974-1981, with the exception of 1977, from $14.4 billion at the beginning to $36.5 billion at the end of the period. Thereafter it fell sharply, to $5.3 billion in 1984 before rising in 1985-1986 to levels still well below that of 1982. These figures suggest the existence of a single lending cycle beginning in the early 1970s and extending into the mid-1980s.
Chart II
MOVEMENTS OF FREE MARKET PRICE INDICES OF PRINCIPAL NON-FUEL"
PRIMARY COMMODITIES OF EXPORT INTEREST TO DEVELOPING COUNTRIES,
1962-1987 a
(1979-1981 = 100)
Source: UNCTAD, Monthly Commodity Price Bulletin.
a Prices for 1987 are the average for the first nine months.
b Index in nominal terms divided by the United Nations index of export unit values of manufactured goods (1980= 100), rebased on 1979-1981.
For some variables it is not easy to choose a single appropriate measure of volatility or fluctuations for an evaluation of effects on decision making, activity levels and resource allocation. Equity prices are one example. Like interest rates, such prices help to determine the cost of financing for firms. But concern with movements of equity prices goes beyond this cost and takes in broader issues, such as their relation to the state of business confidence and to the soundness of the economy of which they are a part. The source of this wider concern is the perception of a link between sharp falls in equity prices in certain historical instances, on the one hand, and collapses of business confidence and wider eco-
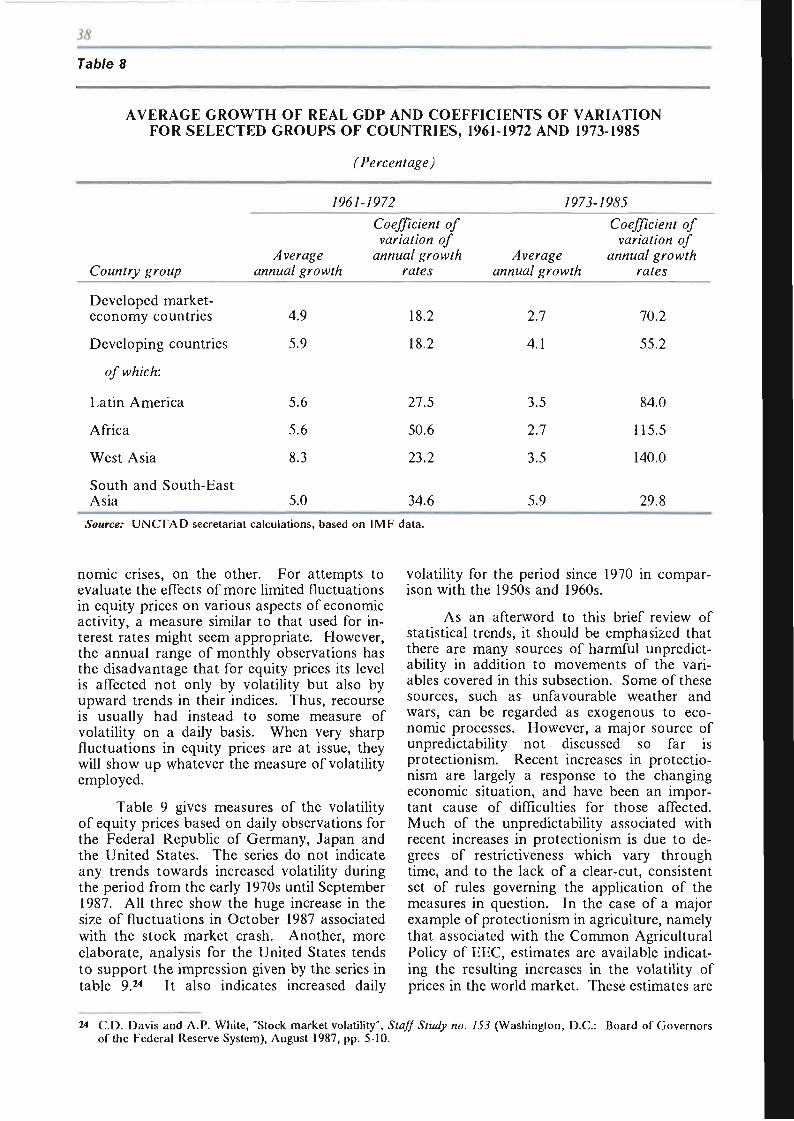
38
Table 8
AVERAGE GROWTH OF REAL GDP AND COEFFICIENTS OF VARIATION FOR SELECTED GROUPS OF COUNTRIES, 1961-1972 AND 1973-1985
Country group
Developed market-economy countries
Developing countries
of which:
Latin America
Africa
West Asia
South and South-East Asia
(Percentage)
1961-1972
A ver age annual growth
4.9
5.9
5.6
5.6
8.3
5.0
Coefficient of variation of
annual growth rates
18.2
18.2
27.5
50.6
23.2
34.6
/97J-/96J
A ver age annual growth
2.7
4.1
3.5
2.7
3.5
5.9
Coefficient of variation of
annual growth rates
70.2
55.2
84.0
115.5
140.0
29.8
Source: UNCTAD secretariat calculations, based on IMF data.
nomic crises, on the other. For attempts to evaluate the effects of more limited fluctuations in equity prices on various aspects of economic activity, a measure similar to that used for interest rates might seem appropriate. However, the annual range of monthly observations has the disadvantage that for equity prices its level is affected not only by volatility but also by upward trends in their indices. Thus, recourse is usually had instead to some measure of volatility on a daily basis. When very sharp fluctuations in equity prices are at issue, they will show up whatever the measure of volatility employed.
Table 9 gives measures of the volatility of equity prices based on daily observations for the Federal Republic of Germany, Japan and the United States. The series do not indicate any trends towards increased volatility during the period from the early 1970s until September 1987. All three show the huge increase in the size of fluctuations in October 1987 associated with the stock market crash. Another, more elaborate, analysis for the United States tends to support the impression given by the series in table 9.24 It also indicates increased daily
volatility for the period since 1970 in comparison with the 1950s and 1960s.
As an afterword to this brief review of statistical trends, it should be emphasized that there are many sources of harmful unpredictability in addition to movements of the variables covered in this subsection. Some of these sources, such as unfavourable weather and wars, can be regarded as exogenous to economic processes. However, a major source of unpredictability not discussed so far is protectionism. Recent increases in protectionism are largely a response to the changing economic situation, and have been an important cause of difficulties for those affected. Much of the unpredictability associated with recent increases in protectionism is due to degrees of restrictiveness which vary through time, and to the lack of a clear-cut, consistent set of rules governing the application of the measures in question. In the case of a major example of protectionism in agriculture, namely that associated with the Common Agricultural Policy of EEC, estimates are available indicating the resulting increases in the volatility of prices in the world market. These estimates are
•24 C D . Davis and A.P. White, "Stock market volatility'. Staff Study no. 153 (Washington, D C : Board of Governors of the Federal Reserve System), August 1987, pp. 5-10.
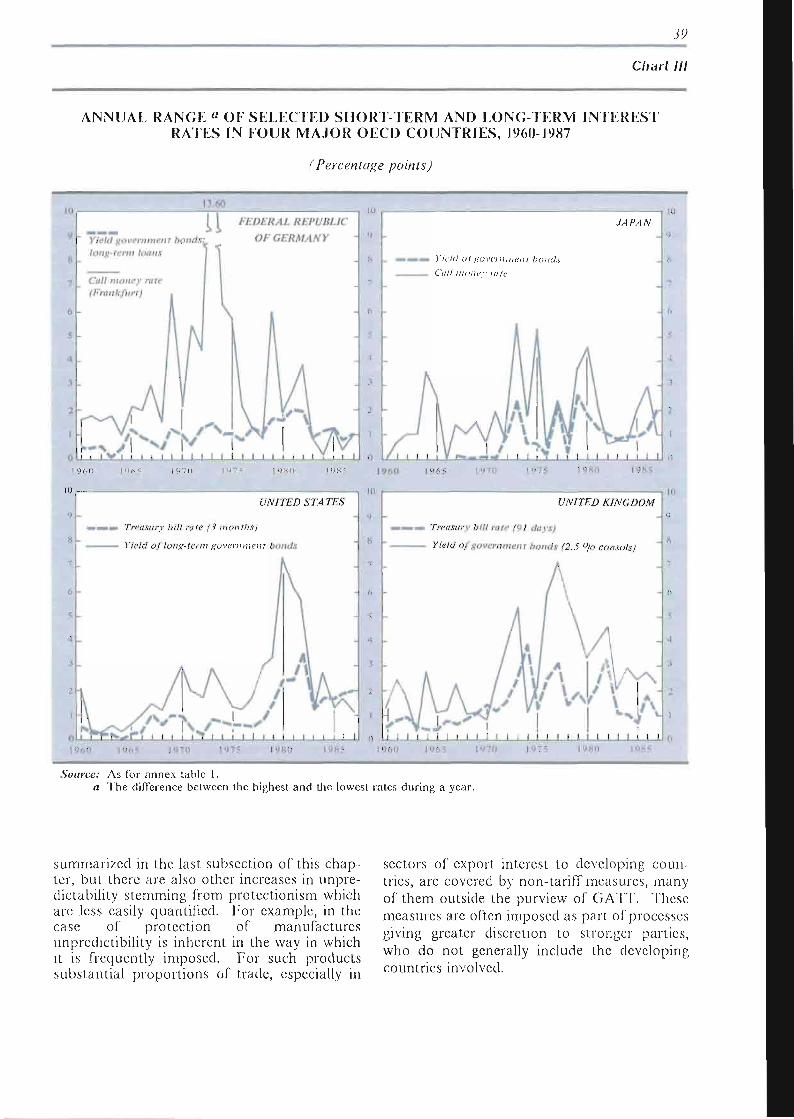
39
Chart III
ANNUAL RANGE « OF SELECTED SHORT-TERM AND LONG-TERM INTEREST RATES IN FOUR MAJOR OECD COUNTRIES, 1960-1987
''Percentage points)
, [ ^ FED1
Yield government honda. long-term loans 11
FEDERAL REPUBLIC
OF GERMANY
Call money rate (Frankf¡ir 11
JAPAN
Yield of government bonds Call monav tute
1960 1965 1970 1980 1960 1970 1980 I9R5
UNITED STATES
Treasury bill rate (3 months)
Yield oí long-term government bonds
rf"l I I I I I T I I I I 1 l_ l i t
UNITED KINGDOM
Ti easury bill rute ¡Ql days)
Yield qf government bands (2.5 °/o consols)
1960 1965 1970 19B< 1970 197 5 1980 1985
Source: As for annex tabic 1. a The difference between the highest and the lowest rates during a year.
summarized in the last subsection of this chapter, but there are also other increases in unpredictability stemming from protectionism which are less easily quantified. For example, in the case of protection of manufactures unprcdictibility is inherent in the way in which it is frequently imposed. For such products substantial proportions of trade, especially in
sectors of export interest to developing coun tries, are covered by non-tariff measures, many of them outside the purview of GATT. These measures are often imposed as part of processes giving greater discretion to stronger parties, who do not generally include the developing countries involved.
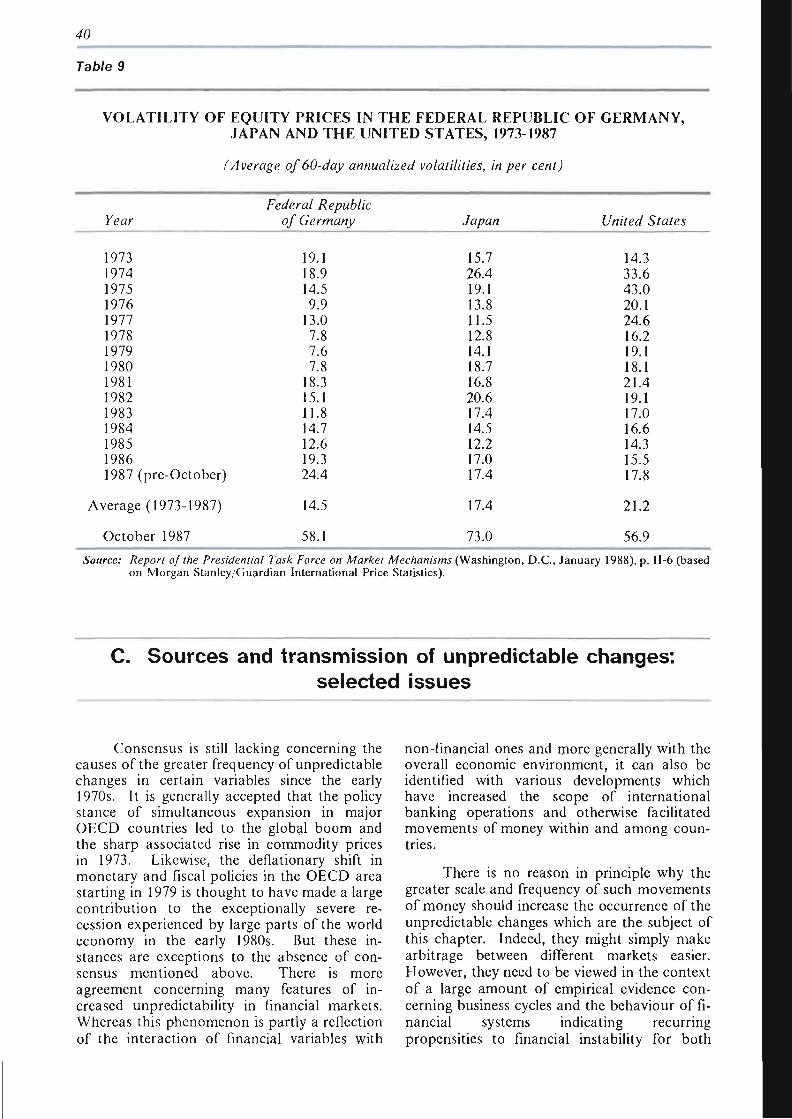
40
Table 9
VOLATILITY OF EQUITY PRICES IN THE FEDERAL REPUBLIC OF GERMANY, JAPAN AND THE UNITED STATES, 1973-1987
(Average of 60-day annualized volatilities, in per cent)
Year Federal Republic
of Germany Japan United States
1973 1974 1975 1976 1977 1978 1979 1980 1981 1982 1983 1984 1985 1986 1987 (pre -Oct
Average (1973-1
October 1987
ober)
987)
19.1 18.9 14.5 9.9 13.0 7.8 7.6 7.8 18.3 15.1 11.8 14.7 12.6 19.3 24.4
14.5
58.1
15.7 26.4 19.1 13.8 11.5 12.8 14.1 18.7 16.8 20.6 17.4 14.5 12.2 17.0 17.4
17.4
73.0
14.3 33.6 43.0 20.1 24.6 16.2 19.1 18.1 21.4 19.1 17.0 16.6 14.3 15.5 17.8
21.2
56.9
Source: Report of the Presidential Task Force on Market Mechanisms (Washington, D.C., January 1988), p. 11-6 (based on Morgan Stanley/Guardian International Price Statistics).
C. Sources and transmission of unpredictable changes: selected issues
Consensus is still lacking concerning the causes of the greater frequency of unpredictable changes in certain variables since the early 1970s. It is generally accepted that the policy stance of simultaneous expansion in major OECD countries led to the global boom and the sharp associated rise in commodity prices in 1973. Likewise, the deflationary shift in monetary and fiscal policies in the OECD area starting in 1979 is thought to have made a large contribution to the exceptionally severe recession experienced by large parts of the world economy in the early 1980s. But these instances are exceptions to the absence of consensus mentioned above. There is more agreement concerning many features of increased unpredictability in financial markets. Whereas this phenomenon is partly a reflection of the interaction of financial variables with
non-financial ones and more generally with the overall economic environment, it can also be identified with various developments which have increased the scope of international banking operations and otherwise facilitated movements of money within and among countries.
There is no reason in principle why the greater scale and frequency of such movements of money should increase the occurrence of the unpredictable changes which are the subject of this chapter. Indeed, they might simply make arbitrage between different markets easier. However, they need to be viewed in the context of a large amount of empirical evidence concerning business cycles and the behaviour of financial systems indicating recurring propensities to financial instability for both
41
whole economies and sectors where speculative activities are important. A significant impetus to • such instability has often been given by "bandwagon" or follow-the-leader behaviour among market participants (some evidence concerning recent instances of which is reviewed later in this subsection). Far from equalizing returns in different markets, by its effects on relative prices and expected profits, such behaviour is capable of increasing the degree of unpredictability of certain variables and of moving them away from levels which could be considered normal or sustainable in the sense described in the introduction to this chapter.
The key changes at the international level conducive to greater unpredictability in financial markets began with the progressive liberalization by major OECD countries of international capital movements since the end of the 1950s. The combination of such liberalization, the closely related development of the international interbank market, and improved and cheaper communications has resulted in a high degree of global integration for large parts of the world's financial system. As has been widely documented, international capital movements on the scale thus made possible played an important role in the breakdown of the pre-1971 system of fixed exchange rates. Such movements have also been associated with the subsequent large fluctuations in exchange rates to which reference was made earlier in this chapter.
The liberalization of international capital movements was accompanied by the development of international banking networks, the learning processes and the growth of more entrepreneurial attitudes among bank managements, and the changes in lending techniques which led to a major increase during the 1970s in the role of banks in the external financing of developing countries. Thus, for example, by 1975 transnational banks were represented by approximately 1,500 entities in developing countries which were not financial centres. The contact with these countries which is reflected in such figures helped to pave the way for the expansion of bank lending to them. This expansion was largely based on types of lending such as syndicated Eurocurrency credits which not only involved substantial advantages of convenience and flexibility to borrowers but also incorporated changes in the handling of different types of banking risk. Of particular importance among the latter changes in the context of the subsequent debt crisis of the 1980s was the use of variable interest rates. This practice allowed banks to eliminate risk arising out of differences between rates of interest on their borrowed funds and those on
their loans, but in such a way that the risk was transferred from lenders to borrowers, reduced interest-rate risk thus leading to increased credit risk.
At the national level in OECD countries the principal developments contributing to greater unpredictability of financial variables were the dismantling of controls over interest rates (typically associated with the adoption of monetary policies taking variants of the money supply rather than interest rates as their target) and the growth of competition in financial sectors. In part the latter phenomenon reflected the increased efforts of different types of financial institution to meet the various lending needs associated with long periods of economic expansion. But it was also stimulated by the widespread tendency among governments during the 1960s and 1970s to liberalize regulations contributing to the compartmentalization of financial sectors, under which different types of institution served primarily their own particular clienteles and specialized in limited types of liability and lending. There resulted in many many OECD countries an increase in the proportion of banks' liabilities remunerated on money-market terms. For some of these countries, such as Japan and Italy, the increases were relatively moderate. But for others they were much larger, the proportion of liabilities remunerated on money-market terms rising from 4 per cent in the early 1960s to 22 per cent in the early 1980s for member banks of the Federal Reserve System in the United States, and from 1 per cent to 35 per cent and from 12 per cent to 86 per cent for banks in France and the United Kingdom respectively during the same period.
Despite the trends discussed in this section, integration of the world's major financial markets is still highly partial. From the regulatory standpoint many countries now have two-tier banking systems: Eurocurrency and other offshore operations take place in the less regulated tier, while the second tier contains the more traditional parts of countries' financial sectors. The second tiers have experienced the effects of the deregulation and greater competition among financial institutions mentioned above, and their degree of insulation from offshore operations varies among countries. Nevertheless, practices and regulations in this tier typically continue to have many characteristics which reflect the particularities of countries' financial histories.
Although large price falls took place in all major equity markets in October 1987, here too earlier experience suggests that the degree of global integration is still limited. The liberalization of international capital movements
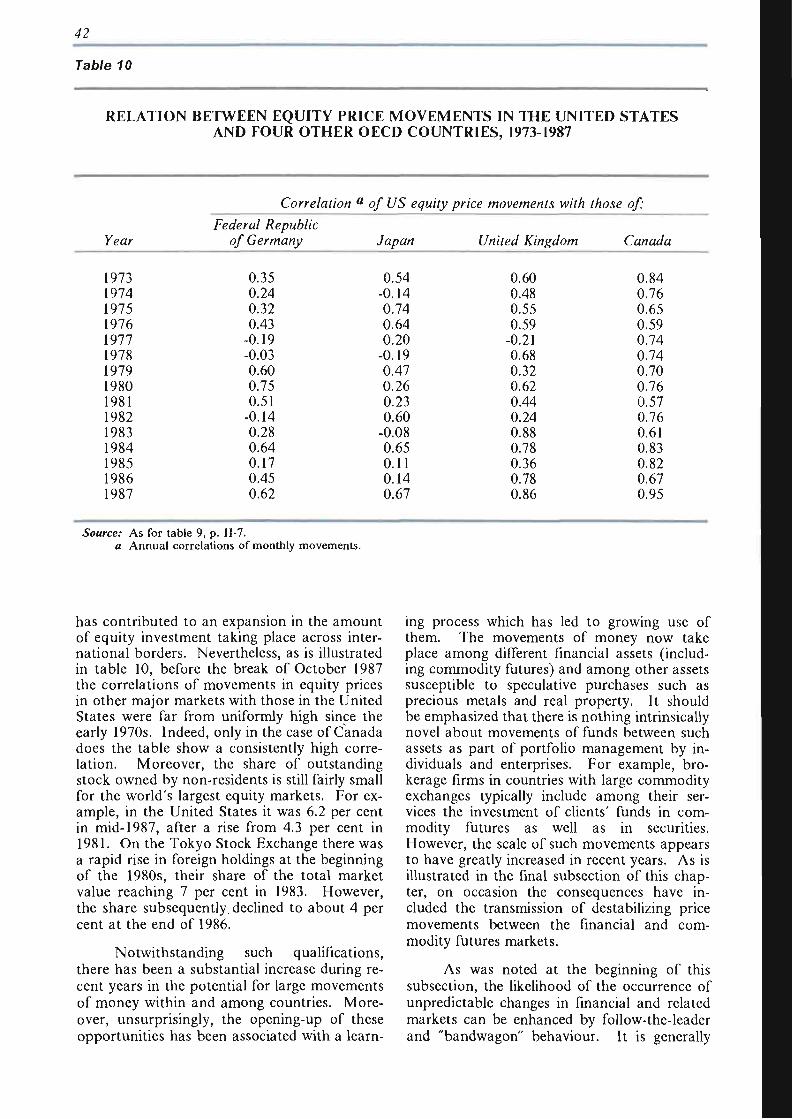
42
Table 10
RELATION BETWEEN EQUITY PRICE MOVEMENTS IN THE UNITED STATES AND FOUR OTHER OECD COUNTRIES, 1973-1987
Year
1973 1974 1975 1976 1977 1978 1979 1980 1981 1982 1983 1984 1985 1986 1987
Correlation a
Federal Republic of Germany
0.35 0.24 0.32 0.43
-0.19 -0.03 0.60 0.75 0.51
-0.14 0.28 0.64 0.17 0.45 0.62
of US equity price movements with those
Japan
0.54 -0.14 0.74 0.64 0.20
-0.19 0.47 0.26 0.23 0.60
-0.08 0.65 0.11 0.14 0.67
United Kingdom
0.60 0.48 0.55 0.59
-0.21 0.68 0.32 0.62 0.44 0.24 0.88 0.78 0.36 0.78 0.86
of:
Canada
0.84 0.76 0.65 0.59 0.74 0.74 0.70 0.76 0.57 0.76 0.61 0.83 0.82 0.67 0.95
Source: As for table 9, p. 11-7. a Annual correlations of monthly movements.
has contributed to an expansion in the amount of equity investment taking place across international borders. Nevertheless, as is illustrated in table 10, before the break of October 1987 the correlations of movements in equity prices in other major markets with those in the United States were far from uniformly high since the early 1970s. Indeed, only in the case of Canada does the table show a consistently high correlation. Moreover, the share of outstanding stock owned by non-residents is still fairly small for the world's largest equity markets. For example, in the United States it was 6.2 per cent in mid-1987, after a rise from 4.3 per cent in 1981. On the Tokyo Stock Exchange there was a rapid rise in foreign holdings at the beginning of the 1980s, their share of the total market value reaching 7 per cent in 1983. However, the share subsequently declined to about 4 per cent at the end of 1986.
Notwithstanding such qualifications, there has been a substantial increase during recent years in the potential for large movements of money within and among countries. Moreover, unsurprisingly, the opening-up of these opportunities has been associated with a learn
ing process which has led to growing use of them. The movements of money now take place among different financial assets (including commodity futures) and among other assets susceptible to speculative purchases such as precious metals and real property. It should be emphasized that there is nothing intrinsically novel about movements of funds between such assets as part of portfolio management by individuals and enterprises. For example, brokerage firms in countries with large commodity exchanges typically include among their services the investment of clients' funds in commodity futures as well as in securities. However, the scale of such movements appears to have greatly increased in recent years. As is illustrated in the final subsection of this chapter, on occasion the consequences have included the transmission of destabilizing price movements between the financial and commodity futures markets.
As was noted at the beginning of this subsection, the likelihood of the occurrence of unpredictable changes in financial and related markets can be enhanced by follow-the-leader and "bandwagon" behaviour. It is generally
43
agreed that such behaviour played an important role during the upswing and the downswing of the long cyclical movement of bank lending to developing countries. During the expansion phase a special fillip to this behaviour was given by the syndication of Eurocurrency credits, a practice which served as a vehicle for other banks to take advantage of the expertise of syndicates' leading members, generally institutions with substantial experience of international lending.
The importance of follow-the-leader or "bandwagon" behaviour in other financial operations remains more controversial. There are several statistical studies bearing on the extent to which speculative behaviour has generated patterns of booms and busts in the markets for financial assets. The general thrust of the results of these studies is to discount the prevalence of speculative behaviour tending to cause asset prices to be more unstable than is warranted by changes in underlying economic conditions. However, a review of this literature in a recent study of trading in futures and options prepared for the United States Congress concludes that "there remains much about the nature of factors influencing stock price fluctuations ... that is far from resolved. Moreover, it is important to emphasize that the statistical tests that have been conducted do not have the power to rule out the possibility that over certain isolated periods stock prices may indeed be subject to speculative bubbles."25
The views of many participants and other circumstantial evidence concerning the functioning of financial markets do point to widespread instances of follow-the-leader or "bandwagon" behaviour.26 The views of the manager of a large investment fund cited in the introduction to this chapter constitute an extreme case. Other examples concern the markets for foreign exchange, equities and commodity futures. Thus, according to a recent study, during the 1970s the traders at many banks were particularly sensitive to, and often tended to emulate, the positions taken by their counterparts at a major international bank with a large share of dealing in foreign exchange and a record of high profits from this side of its business. Survey evidence collected in connection with the break of October 1987 in the equity markets in the United States indicates that price declines fed on themselves. The high frequency with which investors in the sample checked prices and talked with each other on 19 October suggests the existence of two channels through which such feedback took place, firstly, a price-to-price channel and, secondly, a socio-psychological one through which investors reacted to each other. Likewise, a recent book on trading in commodity futures, which relies heavily on interviews with market participants, puts great stress on the role of group psychology in generating "bandwagon" movements in prices. While evaluation of the quantitative importance of "bandwagon" and follow-the-leader behaviour in determining particular price movements is generally difficult, particular cases discussed below show that it can play a large role.
Functions and some consequences of techniques and instruments for reducing market instability
Several techniques and instruments exist to provide protection against unpredictable movements of prices and financial variables such as interest and exchange rates, many of them of long standing. However, recent years have witnessed the introduction of a number of new instruments in response to the experience of greater volatility in financial variables.
As regards the issues considered in this chapter, the questions arise how extensive is the protection against unpredictable changes offered by existing techniques and instruments, and whether they are available at reasonable cost to the different types of decision maker affected. In the case of recently introduced financial instruments concern has also been
• A Study of the Effects on the Economy of Trading in Futures and Options, submitted to the Committee on Agriculture and the Committee on Energy and Commerce of the House of Representatives and to the Committee on Agriculture, Nutrition and Forestry and the Committee on Banking of the Senate by the Board of Governors of the Federal Reserve System, the Commodity Futures Trading Commission and the Securities and Exchange Commission, December 1984 (Washington, D C : U.S. Government Printing Office, 1985), pp. 208-209.
Id A study recently carried out for BIS draws attention to the views of many market participants that "bandwagon" behaviour by speculators does take place, at least at certain times. See Recent Innovatons in International Banking (prepared by a Study Group established by the Central Banks of the Group of Ten Countries) (Basle: Bank for International Settlements, 1986), p. 210.
44
expressed that these may actually add to the fluctuations of the very variables with respect to which they arc intended to provide protection, and that their growing use may involve the diversion of resources from other more socially profitable ends.
There will be no attempt here at an exhaustive treatment of these topics (which is scarcely possible in the existing state of knowledge). Rather, the selective discussion which follows is intended to illustrate ways in which existing techniques and instruments still leave many gaps, and to show that their cost and availability are such that recourse to them is difficult for many of those affected by unpredictable changes, especially in developing countries. Conclusions are harder to reach concerning the two latter topics mentioned in the previous paragraph. The protective instruments now available in financial markets are certainly capable of contributing to instability. The point is illustrated below in the case of the spectacular collapse of equity prices in the United States in October 1987. The role of such instruments in generating fluctuations during periods characterized by less pathological behaviour is not so clear-cut. It is less open to doubt that their proliferation is associated with a trend whose upshot is to enhance the importance of financial activities in comparison with those of the real economy.
1. Commodity prices
The best known instrument for offering individual producers protection against fluctuations of commodity prices is the futures contract. This instrument derives historically from forward contracts for future delivery already used in European countries and Japan hundreds of years ago. Futures contracts entail commitments to buy or sell an amount of a commodity of specified quality on a given date. The contracts are bought and sold at prices mostly determined in trading on exchanges. Hedging through such contracts is achieved through taking a position in the futures market opposite to that held in the market for the physical commodity. Thus, an individual or firm owning actual commodities or expecting to do so in the future would hedge by selling an equivalent amount of futures contracts. Protection against a fall in prices is achieved either through delivering the commodity at the price at which futures were sold or by making an offsetting purchase of futures during the pe
riod before the delivery date. In the latter case the hedger receives a sum determined by the difference between the price at which he originally sold futures and that at which he makes his offsetting purchase. Similarly, an individual or firm expecting to require commodities in the future is protected against a rise in prices by the right to take delivery at the price at which futures were purchased, or by the sum of money received after an offsetting sale of futures at the higher price. The great majority of futures contracts are settled by offsetting transactions rather than by actual delivery.
The protection against fluctuations in price afforded by futures contracts is limited in various ways. Contracts are not available for all commodities, and even when they are, they specify delivery only in a limited number of months during a period typically extending to a date not more than 18 months in the future. As a result, they cannot be used to hedge against fluctuations in prices covering periods of several years. A fortiori, they provide no protection against periods of depression or stagnation of prices such as prevailed for the majority of commodities throughout the first half of the 1980s.
For agricultural products available evidence suggests that few farmers hedge with futures contracts, their use for this purpose being more common among middle men. Moreover, the connections between the prices received by farmers in both developed and developing countries and those of the corresponding futures contracts on commodities exchanges are not necessarily close, although futures prices are sometimes used as a benchmark in delivery contracts for certain agricultural commodities. Producers of minerals participate in futures markets on a larger scale than those of agricultural products. The firms in question include both locally owned and transnational enterprises involved in the minerals sector in developing countries. Contracts are not available for all mineral products on commodity exchanges, but in cases where they are, the cash prices on such exchanges are frequently used as points of reference for price setting in supply contracts, but futures prices appear to play a less important role in this context.
There are various reasons for the limited participation in futures markets of producers in developing countries, other than those of certain minerals, many of which apply also to farmers in developed countries - for example, lack of familiarity with operations on futures markets and the costs of commissions and variation margins.27 But both of these consider-
27 Variation margins are the requests made to holders of positions in the futures markets to cover losses resulting from
45
ations are typically more important to a producer in a developing country who, except in the relatively small number of such countries with exchanges trading his product or products, will generally be located at a greater distance from the relevant futures market than his counterpart in a developed country. Moreover, the difficulty for a producer in a developing country of meeting the financial costs of participating in futures markets will frequently be exacerbated by the exchange control to which he is subject.
Other approaches to handling fluctuations in commodity prices involve various types of action to stabilize them. Attempts at such stabilization may be made either through cartels by suppliers themselves or through buffer stock arrangements (or through a combination of the two). These methods will not be discussed here. Long-term marketing contracts are common for minerals, for which investment in increased supply typically requires a long gestation period. Such contracts provide some guarantees as to sales volume, but the provisions as to prices generally involve links to market levels and thus still leave producers vulnerable to unpredictable movements in prices.
2. Interest and exchange rates
When techniques and instruments providing protection against the volatility of interest and exchange rates are considered, a sharper distinction needs to be made between firms and governments than was necessary under the heading of commodity prices. In the latter case the interests of producers and governments in countries exporting primary commodities are in many respects closely parallel. However, governments themselves exert a significant measure of control over several aspects of their countries' positions with respect to interest and exchange rates. This is self-evident for the relationship between monetary and financial policies on the one hand and levels of domestic interest rates on the other. Indeed, a large part of the increased volatility of interest rates in OECD countries during much of the period since the early 1970s reflects governments' own policies - i.e., the widespread shift to the use of variants of the money supply in place of inter
est rates as the principal target of monetary policy, and financial deregulation. Exchange rates occupy an intermediate place in the spectrum of governments' degree of control, their influence here being less than over domestic interest rates. International interest rates, on the other hand, are outside national control. Indeed, the effects of fluctuations in these rates on a country's external financial position are analogous in many ways to their impact on firms. Financial instruments recently introduced for providing protection against the volatility of exchange and interest rates are designed primarily for firms. Although some of these instruments could in principle be deployed also by governments in the context of managing their countries' external debt and payments, their newness and their limited scope restrict their usefulness for this purpose.
These points can be illustrated by a more detailed discussion of various aspects of the situations faced by governments and firms. For example, examination of a developing country's options as to its exchange-rate arrangement shows the limits on its ability to insulate itself from fluctuations in this variable. These options include pegging to a major currency or to a basket of currencies. Pegging to a major currency may be part of a broader regional monetary arrangement as in the case of the CFA franc used in the monetary unions of West and Central Africa. The first of the two pegging options eliminates fluctuations vis-à-vis the currency used for pegging, and the second reduces, but does not eliminate, them vis-à-vis the currencies in the basket. Under either option the country's currency can be expected to continue to fluctuate against those not included in its pegging arrangement. Thus, while such an arrangement may make possible greater stability in a country's overall effective exchange rate, producers who depend heavily on exports and imports denominated in a particular currency may not experience a reduction in the volatility of the exchange rates of most concern to them.
Attention was drawn earlier to the vulnerability of developing-country borrowers to fluctuations in the interest rates of major OECD countries resulting from their growing dependence on variable-rate lending, which played a large part in triggering the external debt crisis of such countries during the 1980s. New instruments such as financial futures28 for
unfavourable movements of prices on the exchanges. Such margins are typically assessed and called for on a daily basis.
28 Financial futures extend the principles underlying commodity futures to financial instruments. Thus a financial futures contract is a binding commitment to buy or sell a financial instrument during a specified month in the future, the price generally being determined by trading on an exchange. The first such contracts, dating from the early 1970s, were for foreign currencies. Subsequent contracts were introduced for various financial instruments such as Treasury bonds,
46
hedging the interest-rate risk on this borrowing were not available during the period when developing countries accumulated most of their external debt in this form. These instruments seem likely to remain of very minor importance for the majority of developing countries in the management of their external debt so long as the principal outstanding problem in this connection remains the difficulty of servicing previously accumulated liabilities.
For both financial and non-financial firms exposure to fluctuations in interest and exchange rates is due to the resulting unpredictability of their earnings. Attempts at achieving protection against such fluctuations are a standard part of financial management for both types of firm. However, for many there has been an increase during recent years in the extent to which policies as regards both variables are affected by the internationalization of business and banking operations. Internationalization has complicated the task of setting appropriate policies in this area but has also been associated with the availability to firms of many additional options. Different aspects of the international management of assets and liabilities are now covered under the subject known as international treasury management. The aspects dealing with the borrowing and investment of funds are closely related to those concerned with the handling of exposure to exchange rates. Many of the instruments and techniques available are long-standing but others were first introduced more recently.
For example, in the case of management of exposure to fluctuations in exchange rates
the long-established techniques and instruments include variations in the timing of receipts and payments, price adjustments, matching assets and liabilities in particular currencies, invoicing practices and covering in the markets for forward exchange. More recently there has been a rapid expansion in the use of various arrangements for swapping currencies, of currency options and of futures contracts in currencies.29 However, even with the availability of these techniques and instruments it is not possible to obtain complete protection against all the risks due to fluctuations of exchange rates. This impossibility is due partly to gaps in the coverage of instruments (for example, the lack of proper forward markets for the majority of currencies and the availability of financial futures contracts for only a limited range of currencies), and partly to the ways in which decisions concerning exposure to foreign exchange rates cannot be separated from risks bearing on firms' competitive positions.30
It should also be noted that many of the instruments for providing protection against unpredictable movements of exchange and interest rates are obtained at a cost, and are not necessarily equally available to all types of firm. These points are important in considering the likelihood of a differential impact of such movements on firms in developing countries. Thus, the large transnational enterprise will generally be in a superior position as regards hedging financial volatility. Its advantage will often be partly due to the geographical diversification of its operations that tends to provide it with a measure of protection against relative
notes and bills (in the United States), 20-year gilt-edged stocks (in the United Kingdom), and Eurodollar deposits. Most contracts can be settled at maturity by the delivery of actual financial instruments (although as for commodity futures the great majority of positions are closed by offsetting purchases or sales before maturity). However, stock index futures are a purely synthetic instrument, for which cash settlement at maturity consists of a sum of money times the equity index (for example, the Standard and Poor's 500 Index). Hedging takes place in a manner closely analogous to that for commodities. Thus, for example, a firm wishing to hedge a rise in an interest rate (or a fall in equity prices) sells a contract for the relevant financial instrument. If the interest rate does rise, the price of the future will fall, and when the hedger makes an offsetting purchase, he is compensated for the rise by the receipt of a sum determined by the difference between the prices at which he made his original and his offsetting transaction. The possibility of achieving a satisfactory hedge depends on the availability of a contract, the movements in whose price are closely correlated with those of the relevant interest rate.
29 Arrangements for swapping currencies consist of exchanges of liabilities denominated in different currencies. Various types of agreement are possible here, but a typical one might involve an initial exchange of principals, on which interest payments are made throughout the duration of the transaction, and which are re-exchanged at maturity at a predetermined exchange rate. Such arrangements evolved during the 1970s and are capable of serving purposes similar to those of forward transactions but over a longer term. Currency options are rights to buy or sell a specified amount of foreign currency at a particular exchange rate within, or at the end of, a given period. Such options have been available on an over-the-counter (OTC) basis from banks for many years. Since the late 1970s there has been a development of organized trading in options contracts on exchanges. OTC options are available for a large number of currencies, while exchange-traded ones exist only for certain major trading currencies.
30 This point can be illustrated with an example from D. Ross, I. Clark and S. Taiyeb, International Treasury Management (Cambridge: Woodhead-Faulkner, 1987), p. 77. Consider a hypothetical company which imports wine from country B into country A. Unlike its main competitors, it covers its requirements for B's currency early in a particular year in the forward market. However, during the year there is a depreciation of the spot rate for B's currency of about 25 per cent. The costs of the hypothetical company are locked in at the forward rale prevailing early in the year, while its competitors are in a position to sell at prices up to 25 per cent lower. As a result, the hypothetical company is forced out of business.
47
movements of exchange rates. Such an enterprise will also possess resources sufficient to allow it to develop a sophisticated internal system of treasury management. Smaller, less diversified enterprises will generally be less favourably placed. This statement will often be especially true for firms from developing countries for reasons such as the absence of forward markets in their own currencies and inferior access to other relevant financial information and instruments.
Some aspects of the collapse of United States equity prices in October 1987
During October 1987 equities in the world's major financial markets experienced an extraordinarily high degree of volatility in prices and in volumes of trading. In the United States the widely followed Dow Jones Industrial Average index (DJIA) of 30 stocks traded on the New York Stock Exchange (NYSE) reached an intra-day peak of 2746.65 on 25 August 1987. At its trough in the middle of the day on 20 October it had declined to 1708.70, a level 38 per cent below its August peak. On 19 October alone the DJIA fell more than 500 points. These movements of prices were accompanied by very large increases in the volumes of shares traded, the record of 344 million shares attained on the NYSE on 16 October being surpassed by figures of 608 million and 614 million shares on 19 and 20 October. The greatly increased fluctuations in volumes and prices in cash markets were matched by similar movements in the prices and trading volumes of the Standard and Poor's 500 Index futures contract. Some of the effects of these fluctuations in equity prices in both the United States and certain other countries are taken up below. Here the focus is on various aspects of the selling pressures leading to the market break in the United States. In particular, it is shown how the availability of instruments for hedging
stock prices is capable of increasing the size of fluctuations in equity markets. It should be emphasized that the ways in which selling pressures operated in different major equity markets during October 1987 were in certain respects unique, and that the features of the break in the United States to which special attention is given here were not matched elsewhere. Indeed, such matching would have been impossible owing to the absence or relatively underdeveloped state elsewhere of markets for stock index futures.31
Selling pressures during the October market break were broadly based. According to figures of the Securities Industry Association, 41 per cent of stock sales on the NYSE in that month were institutional in origin, while the proportion of sales accounted for by proprietary and retail sources was 27 per cent and 32 per cent respectively. However, sales by institutions were especially important during the massive fall in prices on 19 October, probably accounting for more than 50 per cent of the total. Furthermore, subsequent analyses of trading during the price declines beginning on 14 October attribute a substantial role to selling pressures resulting from the actions of a limited number of these institutions. Other notable features of trading during this period were times characterized by sharp discounts of the price of the Standard and Poor's 500 Index futures contract in relation to the value of its "cash index" (which represents the average price of the 500 stocks in the index), and the frequently close relationship of intra-day falls in the DJIA with concentrations of the same days' futures sales resulting from index arbitrage.32
This relationship raises the question of whether arbitrage between the cash and futures markets, so far from playing its normal role as the medium through which divergences between cash and futures prices are diminished, actually triggered a "cascade scenario". Under such a scenario sales in both futures and cash markets in response to some unfavourable development overwhelm the stabilizing influence of normal arbitrage operations, generating cu-
31 Thus, whereas trading volume in terms of dollars on the Tokyo stock exchange is of a similar order of magnitude to that on the NYSE, the value of futures traded on United States stocks is more than 60 times the corresponding figure for Japan. Trading volume on the International Stock Exchange in London is about 25 per cent of that on the NYSE but the value of trading in the stock index futures contract recently introduced on the London International Financial Futures Exchange is less than 2 per cent of the United States figure. The Federal Republic of Germany, France and Switzerland do not currently have stock index futures. In Hong Kong there is a futures exchange on which a substantial volume of trading takes place. Fears of heavy defaults on this exchange were a major factor in the decision to close the Hong Kong Stock Exchange for four days after a sharp fall in equity prices on 19 October.
32 Normally, the price of the index futures contract exceeds the "cash index" by a small amount reflecting differences between the costs of holding the two instruments. If the difference between the two prices becomes abnormal, index arbitrageurs attempt to profit either by simultaneously selling the portfolio of stocks belonging to the "cash index" and buying futures or doing the opposite. The great increase in computer capacity of recent years now makes it possible to respond with automated orders to price differences in very short spaces of time after they become evident. Such automated orders are a form of so-called programme trading.
4(9
mutative downward pressure in both markets. There do seem to have been periods during the October market break when, in the words of a Presidential Task Force, "the dynamics of trading in stocks and futures had become dysfunctional"33 in the sense denoted by the "cascade" scenario, especially on 19 October. However, it is difficult to assess how great a part of the responsibility for the collapse of prices should be attributed to this process. As already noted, selling pressure was not limited to institutions, the most important source of cash/futures arbitrage. The sample survey of investors' behaviour mentioned earlier in this chapter covered individuals as well as institutions, and the feedback processes involving social psychological and price-to-price sources of selling pressure among the former are capable of having played at least some independent role.
Despite questions as to the relative importance of different selling pressures, the events of October provide a powerful demonstration of the way in which the interaction of the trading strategies pursued by many institutional investors and the availability of stock index futures can generate large fluctuations in equity prices and exert a depressing influence on market psychology. During the 1980s there has been not only an increase in the market value of institutional holdings of outstanding stocks listed on the NYSE but also a rise in the relative importance of large block transactions of 10,000 or more shares, which are regarded as an indication of the degree of institutional participation in the market. Investment decisions of these institutions have increasingly been guided by so-called "passive asset management strategies" involving portfolios linked to stock indices such as the Standard and Poor's 500 Index. Implementation of these strategies is typically carried out through the block transactions in several stocks simultaneously to which reference has just been made, and has been accompanied by growing use of stock index futures for the purpose of portfolio
insurance34 or as part of other hedging strategies. The large scale of the transactions in both futures and cash markets by institutions which can result from the pursuit of such strategies was an outstanding feature of the extreme volatility in both markets in October 1987, and undoubtedly made a substantial contribution to it. It also appears to have contributed to the large discounts of the price of futures in relation to the value of the "cash index", which then became an additional source of pressure for the dysfunctional movements of funds between the two markets mentioned above.35
Furthermore, on the basis of information provided to it by market participants, the Securities and Exchange Commission has concluded that the potential selling pressure associated with the large resources and the trading strategies of institutional investors also had an independent adverse effect on market psychology, discouraging buying activity.
4. The influence of protective instruments on market behaviour
The contribution made by stock index futures to the collapse of equity prices in the United States in October 1987 raises the question whether instruments for protection against unpredictable changes manifest a more general tendency to accentuate the volatility of the prices or other variables in their respective markets. This question seems particularly pertinent in view of the recent proliferation of financial futures traded on exchanges which attract large volumes of speculative interest.36
The issue has long exercised those concerned with commodity futures markets. Attention was drawn above to evidence concerning the frequency of follow-the-leader or "bandwagon" behaviour capable of exacerbating fluctuations in the prices of such
33 Report of the Presidential Task Force on Market Mechanisms (Washington, D C , January 1988), p. 40. 34 Portfolio insurance is a trading strategy derived from models for the analysis of stock options, which compute optimal
ratios of stocks or stock index futures to cash holdings at various price levels for stocks. The strategy leads to purchases of stocks or stock index futures in a rising market and to sales in a falling one.
35 h has been argued that the large discount on stock index futures contracts in relation to the "cash index" at the beginning of the trading day on 19 October (which was regarded in some quarters as indicating that the declines in equity prices on that date were initiated in the futures market) was largely due to the different ways in which accumulations of sell orders prior to opening are handled in the two markets. However, this phenomenon cannot have accounted for the discount at other times during the collapse of prices.
3* There is a narrow, technical meaning of the term speculator in futures trading, namely a trader with no positions to hedge who is concerned solely with profiting from price fluctuations. It is a commonplace of accounts of futures trading that speculators arc essential to the functioning of futures markets owing to their willingness to assume risks from hedgers, and in their roles as arbitrageurs and providers of liquidity. However, it should be emphasized that the trading objectives of hedgers as well may have speculative components, and that both hedgers and speculators narrowly defined may engage in futures transactions which might be widely judged as excessively risky, and thus be described as speculative in the pejorative sense of the term.
49
futures contracts. Despite the volatility of prices in day-to-day trading on futures exchanges, it is difficult to demonstrate that such trading has on balance either a stabilizing or a destabilizing impact on cash prices. Moreover, so long as these fluctuations remain relatively small and are associated with relatively quick reversals of movements in a particular direction, it is doubtful that they are a source of serious difficulties to producers or processors. However, as a result of the prevalent tendencies towards "bandwagon" behaviour, the propensity for generating large price changes is present on commodity exchanges, thus making them vulnerable to destabilization by movements of money between markets. Some examples of the costs and other problems caused by large price changes in particular instances are given in section E below.
In the case of most financial futures it is also hard to identify an independent influence emanating from trading in them on the size of fluctuations of the relevant financial variables. Exchange rates, for example, had been subject to fluctuations with strongly speculative features before the trading of futures contracts in major currencies became widespread. The same point applies a fortiori to trading in foreign currency options. Replies to a survey conducted for the Group of Thirty suggest that these instruments may have accentuated the volatility of exchange rates, but firmer conclusions must await more systematic investigation. However, in the case of stock index futures, the Securities and Exchange Commission has come to the view that, even before the price collapse of October 1987, trading in these instruments was showing signs of being an independent source of volatility in the cash market.37 This tendency was associated with the growing attraction to investors of a market characterized by low margin requirements and the absence of certain regulations applying to the cash market. As a result, price fluctuations in futures had increasingly been playing a leading role in generating corresponding movements in the cash market. The resulting importance of futures in the provision of price signals had the
effect of slowing the buying and selling operations of participants in this market required to offset temporary imbalances between supply and demand.
Broader social costs
Several observers of recent trends in the relations between the financial and real sectors of the major OECD economies have recently pointed to shifts in the sectors' relative importance. Thus, a former chief economist at a large financial institution in New York recently wrote that until some years ago "people in the real world - those engaged in production and sales - ruled the roost, while finance took a low priority in business decision making...Today finance has been given a high priority in business. Investment management is extremely active, and performance is measured frequently. However, the results have not always been commensurate with the effort."38 The precise nature of the shifts encompassed by such generalizations are difficult to pin down. But the remarks just quoted clearly are concerned primarily with the criteria and time horizons used in business decisions as well as with other features of business culture.
The increased relative weight of financial considerations and activities is not evident solely in their relative importance in the process of decision making. Another, more tangible, facet of the same phenomenon is the size of the drain on resources, especially skilled manpower, into financial activities. This drain is to a significant degree associated with trends discussed in this chapter such as the great expansion in the financial activities of transnational enterprises and the proliferation of hedging instruments also capable of serving as vehicles for speculation. In so far as current practices in the financial sector are themselves a source of unpredictable changes, there must be strong doubts as to the net social benefits of the activities of the hordes of skilled manpower employed to handle the resulting problems.
3T This conclusion, which refers to both inter-day and intra-day volatility, is not in conflict with the analysis of Davis and White in the paper cited in footnote 6 above, where it was shown that, according to various measures, the volatility manifested by daily movements of equity prices on the NYSE during the period from the beginning of 1986 until May 1987 was not out of line with the historical experience of 1970-1985. However, the absolute value of the mean daily change on the NYSE during the first five months of 1987 (cited in table 1 of the paper) was higher than that of any of the annual figures for 1970-1986.
38 H. Kaufman, Interest Rates, the Markets, and the New Financial World (New York: Times Books, 1986), pp. 17-18. Similarly, in reviewing certain aspects of economic experience and policies during the 1980s George Soros (op. cit., p. 289) claims that "it is not unfair to say that the real economy is being sacrificed to keep the financial economy going".
50
E. Illustrating unpredictable changes and their consequences
Several of the consequences of unpredictable movements of economic variables have already been noted in this chapter, in particular in section D concerning techniques and instruments for protection against such movements. In this section an attempt is made to provide more concrete illustrations in recent instances of certain aspects of unpredictable changes such as their size and the costs and other difficulties to which they have tiven rise. But first certain preliminary points need to be made concerning the illustrations' coverage, the difficulty of identifying the consequences of unpredictable changes, and the connections between such consequences at the macroeconomic and microeconomic levels.
Concerning coverage it should be emphasized that several important facets of unpredictable changes are not covered in this chapter (and thus in the illustrations which follow), three of which deserve special mention. The first is the way in which such changes affect macroeconomic relations among countries. This subject includes the international transmission of their effects via the associated movements of prices, trade and levels of economic activity more generally. The second facet involves the many relations between unpredictable changes and economic policies other than these taken up above under interest and exchange rates. The third facet, which is closely connected to the second one, concerns the effects of instability of prices and output of primary commodities, effects which are particularly important for countries whose economies are heavily dependent on their production and export. It has been argued that these effects are capable of making a positive contribution to development owing to a resulting increase in the propensity to save for the countries in question. However, the possibility of such a positive effect has to be balanced against many possible negative consequences such as a more uncertain climate for investment and planning, the encouragement of a speculative mentality which reduces the productivity of investment, the need for the holding of higher reserves of foreign exchange than would otherwise be necessary, and the generation of inflationary pressures by large upswings in export earnings which can subsequently be brought under control only through costly measures of deflation. There will be no attempt here to review the
large literature on the empirical importance of these different effects.
There are several reasons for the difficulty of isolating the increased costs and other problems which unpredictable movements in economic variables have caused in actual fact to various categories of decision makers. For example, observed outcomes rarely reflect the influence of unpredictable changes alone. However, except in a limited number of cases, econometric estimates which separate out this influence are not available, or would be hard to make, owing to gaps in available information and in understanding of the underlying economic processes involved. Moreover, even when quantitative estimates of the impact on certain variables of fluctuations in others are available, its relation to the decision-making processes of firms or governments is still often hard to pin down.
The connections between macroeconomic and microeconomic consequences of unpredictable changes are often close. For example, as was mentioned in the previous section, there are analogies between the effects of fluctuations in the prices of primary commodities-on the financial positions of countries, on the one hand, and of producers, on the other. Moreover, deflationary adjustment at a macroeconomic level to a deterioration in the external payments position (such as that described in the first of the examples below) also has important micro-economic consequences, typically affecting profitability by contracting demand in the home market (an effect in some cases partly or wholly offset by expansion of export sales resulting from devaluation) and raising borrowing costs.
1. The contribution of unpredictable changes to the debt crisis of developing countries
An outstanding example of the adverse consequences of unpredictable movements in economic variables is afforded by the contribution of fluctuations in interest rates and the levels of economic activity, and of increased protectionism, to the debt crisis of developing countries, as is evident from consideration of
51
certain changes starting at the end of the 1970s. For example, if movements in the average rate of interest on six-month Eurodollar deposits are taken as an indication of those in the rate of interest on the variable-rate external debt of developing countries, the rise in the rate of interest of about 4 percentage points between 1978 and 1982 must have led to increased net interest payments for non-OPEC, non-OECD developing countries of about $6.8 billion (on total net variable-rate debt of S166 billion) in 1982, that is to say 0.37 per cent of these countries' GNP in that year. For many individual countries the cost in terms of GNP would have been much higher. Indeed, for certain major borrowers in Latin America it would have amounted to from 0.8 per cent to 1 per cent. As discussed in the more detailed treatment of the impact of adverse external shocks on developing countries, in section A.2 of chapter IV, the adverse effects of higher nominal interest rates were reinforced by declines in the prices of primary commodities. These changes were associated with deteriorating terms of trade for the majority of developing countries and a decline in their export earnings. Moreover, the same period witnessed an intensification of protectionist pressures against such countries' exports. For example, there was a sharp increase in the number of anti-dumping and countervailing-duty actions affecting these exports. The actions mostly involved a limited number of developing countries, but the group in question contained some of the major debtors affected by the higher rates of interest.
The main economic and social costs of the spread of external financial stringency arose from the deflation which followed, as governments undertook balance-of-payments adjustment. While fault can be found with various aspects of the policies of rapid additional borrowing by many countries during this period (including in several cases the uses made of the funds), it cannot easily be argued that governments in developing countries were well placed to anticipate, or protect themselves against, the effects of unfavourable changes in their external economic environment involving their terms of trade, their debt-service obligations and their access to markets in developed market-economy countries. For the reasons given in section A.2 of chapter IV, at the beginning of the 1980s their external debt position was generally regarded as sustainable, and global economic forecasts continued to be at least moderately optimistic. As for
protectionist measures, both their extent and their incidence are necessarily hard to predict in advance.
2. Increased transactions costs
As mentioned at the beginning of this chapter, transactions costs tend to rise with the frequency and size of unpredictable movements of economic variables. An obvious example of such increased costs is those associated with the use of many of the protective instruments described in the previous section. In the introduction to this chapter it was remarked that, in a complete evaluation, increased transactions costs due to more frequent and larger fluctuations of economic variables associated with a shift in. economic policy may need to be balanced against any benefits due to reduced uncertainties elsewhere in the economy. Such a balancing would in principle be desirable in an evaluation of the different effects of more volatile exchange rates since the early 1970s, including their impact on transactions costs mentioned in this subsection. However, in the other two examples of higher transactions costs taken up here, namely those due to greater fluctuations in equity prices and to the external financial stringency associated with the debt crisis of developing countries, there do not appear to have been any offsetting benefits.
Some of the increased transactions costs associated with unpredictable changes are of fairly minor importance or occur only infrequently. For example, increased volatility in exchange rates is typically associated with greater spreads between bid and offer rates, but the absolute amounts of money in question are small in relation to the value of transactions.39
Similarly, the recent greatly increased fluctuations of equity prices were widely accompanied by a widening of the bid-offer spread obtainable from market makers. Thus, the spreads in London on the most liquid (alpha) stocks increased by a factor of more than 2.5 between mid-October and early November 1987.
The increased transactions costs associated with unpredictable changes in the financial sphere, on the other hand, can be substantial. For parties whose creditworthiness is unfavourably affected by such changes, the consequences may include sharp increases in
39 Studies of the behaviour of bid-offer spreads since the advent of floating exchange rates suggest that they have risen by factors in the range of 5 to 10. However, bid-offer spreads are typically very small fractions of quotations for currencies.
52
the cost of financing (in the form of higher interest rates, etc.) and even the withdrawal of access to certain types of borrowing and related services from financial institutions. Effects of this kind were experienced by many developing countries after the outbreak of the debt crisis.
The process in question is described in detail in TDR 1986. Its major features are tendencies for a progressive increase in the costs of financing and closely related payments arrangements as the squeeze on a debtor country's external cash flows tightens. Various mechanisms are at work in this context, such as the breakdown of arrangements whereby imports are purchased on open account, rises in the costs and reductions in the availability of official insurance from export credit agencies for the financing of imports, increases in banks' charges for confirming letters of credit and in the rates on forfaiting (a financing technique used in connection with medium-term trade credits), and eventually exclusion for the debtors most severely affected from most of the normal arrangements for financing and payments in international trade.
3. Statistical estimates of effects of fluctuations in exchange rates on international trade
Econometric analysis of the effects of fluctuations in exchange rates has tended to concentrate on international trade. Estimating their impact on other real variables such as output and investment presents still greater difficulties of conceptualization and measurement, and little work has so far been done on the subject. This subsection contains a brief review of the estimates for trade. The following one is largely devoted to a discussion of reasons for thinking that uncertainty concerning exchange rates delayed the rise in manufacturing investment in the United States which might have been expected in response to the conditions created by the depreciation of the dollar from the second half of 1985 onwards.
The estimates of the effects of fluctuations in exchange rates on international trade are based on various different conceptualizations. Most of them focus on the effects of increased costs on the demand and supply sides due to the greater unpredictability of the results of engaging in foreign trade caused by such
fluctuations. However, there is a lack of consensus as to what proxy best represents this increased unpredictability. The proxy usually chosen is a measure of the variability of exchange rates over some past period, but studies differ in such respects as their use of real or nominal rates, different time periods and different functional forms for the measures. There arc also studies which focus on the relation between fluctuations in exchange rates and protectionism. Here the concern is not with volatility per se, but with longer-term fluctuations which cause exchange rates to deviate for substantial periods from the levels corresponding to purchasing power parities or fundamentals. The hypothesis (which is discussed in greater detail in chapter III, section C) is that such movements have asymmetrical effects in that protectionist measures introduced in response to pressures generated by overvalued currencies are not removed when exchange rates depreciate. Thus, fluctuating exchange rates are capable of leading to progressively greater levels of protection.
Many of the estimates fail to provide clear-cut results one way or the other. Nevertheless, some studies have found significant adverse effects of exchange-rate fluctuations on trade for a number of both developed and developing countries. The studies in question are mostly concerned with the first of the two hypotheses described above, namely that focusing on the increased costs ascribed to greater volatility of exchange rates. But one recent study uses cross-section data for the two periods 1960-1969 and 1973-1984 to estimate the effects of longer-run fluctuations on trade flows between ten developed market-economy countries. The results show such movements to have been responsible for significant shares of the declines in the growth of their trade (for example, about 20 per cent of the decline for the group as a whole). The estimates are interpreted as indicating the scale of the impact of increased protectionism due to the currency misalignments associated with these exchange-rate movements.40
It seems likely that the somewhat indecisive character of econometric results in this area is due to the difficulty of specifying equations which satisfactorily capture different aspects of relations between fluctuations of exchange rates and decision making at the enterprise level. For example, firms producing differentiated manufactured goods typically have some leeway in setting their prices to
40 The link between the fluctuations in exchange rates and increased protectionism is not itself the subject of any analysts in the study. I hus, the possibility cannot be excluded that part of the effect of these movements on the growth of trade was due to causes other than protectionism.
53
protect themselves against unpredictable movements of exchange rates. Moreover, during the period of floating there has been an expansion in the types of instrument available to provide a measure of insulation to firms against such movements as well as a learning process concerning their use. The relevant techniques are an important part of the field now known as international treasury management which was described earlier in this chapter. Miscellaneous evidence indicates that the use of such techniques is now widespread. Owing to difficulties as regards specification for econometric work in this area, a better understanding of the effects of exchange-rate fluctuations on trade probably requires surveys of enterprises which will supplement the econometric estimates by throwing more detailed light on the relevant decision-making processes.
4. Uncertainty over exchange rates as an impediment to investment
Conceptually, it is possible to visualize various possible effects of greater exchange-rate uncertainty on capital formation. These effects are due to a phenomenon mentioned in the previous section, namely firms' exposure to increased unpredictability of earnings. For example, investment might be depressed as businessmen hesitate to install long-lived equipment and other structures which might become temporarily or permanently uneconomic owing to unexpected movements of exchange rates. Moreover, if, as seems likely, the sectors of an economy which produce traded goods were those most unfavourably affected by exchange-rate uncertainty, and if these sectors were on average the most capital-intensive, the contraction of the relative share of their output might lead to a pace of investment lower than would otherwise have been the case.
Statistical testing of the importance of such effects has proved especially difficult owing to the problem mentioned earlier of isolating them from other influences on investment. In this context it is, however, of some interest to review some, admittedly incomplete, evidence concerning recent experience in the United States and the Federal Republic of Germany as illustrations of the way in which exchange-rate uncertainty appears to have affected the growth of productive capacity (and thus in the former country the speed of its structural adjustment to the large imbalance in its external payments).
Consider the example of the United States first. After an initially slow response to the depreciation of the dollar beginning in the summer of 1985, the growth of its volume of exports of goods accelerated in 1987 to 13 per cent. However, somewhat fragmentary evidence suggests that in parts of the manufacturing sector producers seemed reluctant to take advantage of the opportunities provided by the lower level of the dollar, and that this reluctance was to a significant degree due to uncertainties caused by recent volatility in the country's exchange rate.
This argument starts from recent trends in business investment and in figures for capacity utilization. These trends are then interpreted on the basis of more impressionistic sectoral evidence, including that based on commentaries provided by executives from the industries concerned. Investment in business equipment by the United States manufacturing sector remained relatively flat from the second half of 1985 (when the depreciation of the dollar started) until June 1987. It then began to rise, reaching in December of that year a level 9 per cent above its average in 1986. These figures were accompanied by a continuation of relatively low levels for total gross private fixed investment in structures, the 1987 figure of $134 billion falling well short of that of $153 billion attained in 1985. During this period the series of the Federal Reserve Board for the rate of capacity utilization for industry as a whole fluctuated within a narrow range, reaching a level of 82 per cent in the last quarter of 1987. However, the figures at a sectoral level point to much tighter positions in some cases. Thus, capacity utilization for the combined group, textiles, chemicals and paper, exceeded 90 per cent in this quarter, and the figure for steel rose sharply during 1987 to a level higher than that for industry as a whole.
The sectoral data for capacity utilization cannot be matched with corresponding sectoral series for investment in equipment. Thus, attention has focused instead on the slow response of such investment by manufacturing as a whole to rising trends in capacity utilization in major sectors, and to a demand situation characterized by favourable export prospects and relatively buoyant domestic conditions. This response no doubt reflects the influence of several factors. Nevertheless, some executives from major firms in the sectors in question have attributed a significant role in restraining capacity expansion to uncertainty as to whether the lower levels for the exchange rate of the dollar reached in 1987 were likely to continue, and to the failure of many of their competitors abroad to increase their prices in line with the appreciation of their countries'
54
currencies. This caution is also consistent with the relation between recent trends in investment by the manufacturing sector in equipment, on the one hand, and in total gross private fixed investment in structures, on the other. The low level for the latter in 1986-1987 points to the possibility of a greater emphasis in investment programmes on improving the productivity of existing operations than on expanding capacity. This caution seems to have been enhanced for several firms by the major exercises in industrial restructuring and reductions in capacity undertaken only a short time before, when the exchange rate for the dollar was much higher.
It should be emphasized that the above remarks are not applicable to the whole of the manufacturing sector. Moreover, the rise in equipment investment in manufacturing since the second half of 1987 and the recent acceleration of export volumes indicate that the influences described above may be becoming less important.
Uncertainty concerning exchange rates and international prices has also been cited as one of the reasons for the recent failure of business investment in the Federal Republic of Germany to expand as fast as might have been expected in view of the high profits earned in 1986. During this period the tendency of the deutsche mark to appreciate may have depressed the expected profits of firms dependent on exports. However, an additional downward influence on investment seems to have been exerted by a widespread belief that the rise in profits in 1986 reflected primarily the fall in prices of primary commodities and the decreases, in terms of local currency, of other imported inputs resulting from the appreciation of the deutsche mark. This new price structure was considered not to be lasting, and thus not to justify increases in capacity as large as might otherwise have been expected.
5. The aftermath of the fall in equity prices of October 1987
At the time of writing the full significance of the collapses in equity prices of October 1987 remains difficult to evaluate. Except in Japan, such prices are still far below their peaks of 1987. Yet the more generalized economic downturn which some feared has not materialized. As is explained below, there are various possible reasons why movements of equity prices may have a fairly limited impact on both consumption and investment expenditure.
However, there do appear to have been lasting effects on behaviour in most of the major equity markets, especially in the United States. As was described above, this was the main market where the potentially destabilizing effects of the interaction of cash and futures markets during a sharp downturn in prices had a chance to be felt. Regression analyses of the market break by the Securities and Exchange Commission in the report cited earlier also indicate that it was this market which provided the main initial impetus for the broader international decline in equity prices.
The reasons for the limited effects of the declines in equity prices on real economic activity are not entirely clear, but certain points are worthy of note. First, it can be assumed that the intervention by central banks in major OECD countries to support the liquidity of their financial systems not only contributed to containing the collapse of prices and reestablishing more orderly conditions in equity markets themselves, but also helped to prevent more general declines in confidence among businesses and consumers. Secondly, the connections between movements of equity prices and expenditure are not well understood, but there are reasons for believing that they may not be very strong so long as the effects on confidence are not too marked. In the case of investment the cost of equity is one of the factors influencing the cost of finance. For a given stream of current and future dividends, lower prices for stocks entail a higher cost for equity capital. LI owe ver, both the scale and timing of the effect of such an increase on investment are hard to estimate, and are likely to vary among countries owing to differences in prevailing financial arrangements. There is also doubt about the strength of the effects of declines in equity prices on consumers' expenditure. Declines of the size experienced in October 1987 lead to very large reductions in the nominal value of personal wealth. However, holdings of stock are typically concentrated among those with high incomes, who are best placed to insulate their spending from the impact of such reductions. For example, in the United States less than 1 per cent of the population owns 50 per cent of outstanding stocks, and 10 per cent owns 90 per cent. Thirdly, there is the nature of the increases which immediately preceded the fall in equity prices. These increases were rapid during much of 1987 in many of the world's major stock markets, and the subsequent falls in October merely had the effect in some cases of approximately reversing them, restoring average prices and other indicators of market positions to levels more in line with historical experience. In the United States, for example, not only did the market break reverse
JO
a large part of the rise during 1987 in the average price/earnings ratio but, according to a recent analysis, it also appears to have had a varying impact on different categories of stock, reducing prices most for the stocks that before the collapse were relatively overvalued, as measured by various fundamentals. Thus, there are grounds for thinking that the rises in equity values during 1987 took place too rapidly to have a major effect on expenditure before their reversal in October, and their effect may have been further limited by the widespread view of them as a speculative bubble. In that event, the relatively small impact on expenditure of the reversal in October is more easily explained.
Yet the absence of more serious and more widespread ill effects so far should not be taken to imply that the price collapse of October 1987 is of only limited significance. Behaviour in the markets still shows signs of the impact of the collapse, and its traces were left on financing in international, as well as national, capital markets. Moreover, most of the factors which contributed to its size and global character are still present, so that another similar decline in prices cannot be ruled out.
The effects on behaviour and financing are most evident in the United States. Here the aftermath of the market break included a sharp fall in gross issues of shares, especially by non-financial enterprises. Moreover, the liquidity of the country's equity market has been much reduced, with the result that significant price movements now take place on the basis of much lower volumes of transactions. In other major equity markets similar effects have been noticeable but not always so marked. Thus, declines in volumes of trading have been widespread, reflecting continued fragility of confidence among investors. Moreover, gross issues of shares were sharply down during the first quarter of 1988 in both the Federal Republic of Germany and the United Kingdom. The aftermath of the collapses of equity prices also had consequences for certain types of international lending. There was a decline in the value of issues of international bonds of almost $15 billion from the third to the fourth quarter of 1987, which was accounted for by a decrease from S 17.2 billion to $2.6 billion in equity-related issues (that is to say, convertible bonds and bonds with equity warrants). With the subsequent partial recovery of prices on stock markets, equity-related issues returned to their level of a year earlier in the first quarter of 1988. There was also a fall during the last quarter of 1987 in issues of Euronotes (short-term notes issued under Note Issuance and Eurocommercial Paper Facilities). This fall was due to a "shift to quality" leading to a tiering
of interest rates in international financial markets which made this type of financing unattractive to many lower-grade borrowers.
Another sharp decline in equity prices might well have effects on confidence and activity that would be harder to contain. Although, as was noted above, the collapse in October 1987 may to a large extent have reflected the elimination of the overvaluation of stocks due to the preceding speculative boom, evidence concerning the cumulative forces which generated the price declines does not point to the existence of floors at particular levels of prices in relation to fundamentals such as earnings. These forces involve both certain aspects of the functioning of equity markets (such as the propensity for large movements of money between cash and futures markets in the United States) and prevailing market psychology. In the United States the regulatory response so far to the October market break has included steps such as higher margins and limits on daily price movements for stock index futures which are designed to reduce the scale and effects of speculation in these contracts. It is not clear that these steps are capable of having more than a minor impact on the potential for destabilizing price movements. Moreover, the continuation of low levels of confidence among investors in many of the major markets (to which reference was made above) suggests that the psychological forces underlying the October price declines could easily return, with a similar outcome. Large swings in equity prices have recently been frequent in the United States, a drop of 4.5 per cent in the Standard and Poor's 500 Index, for example, following the publication of the country's trade figures in February. A short series of large price declines in the United States would appear easily capable of triggering similar movements elsewhere.
6. Variable levies to protect agriculture
Reference was made in section B of this chapter to the protection associated with the Common Agricultural Policy (CAP) of EEC as a source of volatility of prices in world markets. The central feature of this protection is the use of variable levies in support of a system of regulated internal prices. Historically, variable levies have at various times been a feature of the trade policies of certain countries, with the aim of providing a measure of insulation to their domestic markets for agricultural products from fluctuations in prices of external origin. However, the levies were not always associated
56
with measures for supporting internal prices, and were thus not necessarily successful in stabilizing them. Their use in conjunction with such measures, as part of the CAP, has significantly reduced price instability in EEC markets. However, with the exception of certain products during the sharp rise in world primary commodity prices during 1973-1974, this greater stability has been achieved at levels for internal prices in general substantially above world prices, and at the cost of transmitting to foreign markets the impact of differences between demand and supply at internal prices.
Since supply and demand in world markets are typically inelastic in the short run, the result has been increased price volatility. Thus, the effects of a rise in net demand for a product in EEC (resulting, for example, from bad harvests) typically show up mainly in world markets, forcing up prices there rather than in the Community's internal markets. Conversely, increases in net supply in the Community exert downward pressure on world prices. The downward pressure resulting from the contraction of the Community's net demand is frequently exacerbated by sales of its surpluses with the aid of export restitutions (which compensate exporters for the difference between the world price and the Community's internal price for the product in question).
Various econometric studies are now available of the effects of dismantling agricultural protection in different regions. These indicate that fluctuations of agricultural prices would be reduced if policies and trade in this sector were liberalized. One of the studies, covering the effects of the CAP on world demand and supply for five grain and meat products, estimates that it has increased the volatility of prices by from 30 to 100 per cent.
Some large fluctuations in commodity futures prices and their connections with the real sector
As was mentioned earlier, it is hard to identify serious adverse consequences to producers from the relatively small, short-term fluctuations in the prices of commodity futures contracts which are characteristic of day-to-day trading in these instruments. Indeed, the con
nections between such movements and the real sector are probably mostly rather tenuous.41
Where there are larger fluctuations in futures prices, the situation is different, and various aspects of their relations with the real sector are worthy of attention. For example, metal futures are apparently often used as hedges against fluctuations in currencies with the result that substantial movements in their prices may on occasion be perversely related to the underlying supply situation for the commodities in question. Moreover, major swings in prices on commodity exchanges are capable of exerting serious adverse effects on long-term demand and supply conditions for particular commodities.
These points can be illustrated from recent experience. For example, during the second half of 1982 there were marked increases in the volatility of the exchange rates for the yen and the deutsche mark vis-à-vis the United States dollar, while the sterling-dollar rate began a depreciation which was not checked until March 1983. These movements in the values of currencies were accompanied at the end of 1982 and in early 1983 by sharp upward movements in the prices of futures contracts for near months for copper, platinum and silver on major exchanges in the United States and the United Kingdom. The rises were not accompanied by signs of tightness of supply. Indeed, the stocks of the metals in exchange warehouses and certain other locations in the two countries were tending to increase. While prospects for a tighter future balance between supply and demand (due, for example, in the case of copper to improved prospects for sales of houses and motor vehicles in the United States) may have made some contribution to the price rises, there can be little doubt that an important part of the impetus was provided by movements of funds in search of a hedge against uncertainties concerning currency values. A full evaluation of the effects of these rises in futures prices in the real sector is not possible. But the indications which they gave during this period to the process of identifying appropriate prices for the terms of sales contracts appear to have been perverse in the light of underlying demand and supply positions.
Another instance of a movement in futures prices which seems to have had little relation to fundamentals is provided by the exceptionally sharp fluctuation in the prices of silver in 1979-1980. This was associated with a
Reference was made earlier to the use of commodity prices on exchanges as bench-marks in the setting of prices in sales contracts for certain commodities. I lowever, as the literature cited there makes clear, the process does not necessarily involve rigid links to price quotations on particular days Although there are gaps in the availability of relevant information, it would appear that the problems posed in this context by day-to-day volatility of prices may be solved by such devices as the use of trend values.
57
celebrated attempt to manipulate the market by members of a well known family in the United States and by other speculators from the Middle East and Latin America. The price of silver futures for the nearest month in New York rose from the range of $6-7 per ounce at the beginning of 1979 to more than $50 per ounce a year later before falling to the range of $10-15 per ounce in March 1980, while the cash price moved in a similar way.
The effects of this fluctuation on the real sector are better documented. For example, during the latter part of the rise in prices the disruption of silver-using activities was substantial, several thousand jobs being lost, for example, in the United States alone. Moreover, despite the subsequent fall in prices, the years after 1980 were marked by a large decrease in consumption (from figures above 450 million troy ounces in the latter half of the 1970s to a range of 350-385 million troy ounces in the first half of the 1980s). This fall was partly due to the effects of recession, but it is believed that the fluctuation in prices of 1979-1980 gave a fillip to efforts to economize on silver in such branches as photography, electrical equipment, and certain metal alloys.
The tin crisis which erupted in the autumn of 1985 provides another example of a large movement in prices on commodity exchanges causing serious difficulties for produc
ers. In this case (major features of which were discussed in box 2 of TDR 1986), the suspension of operations by the Buffer Stock Manager of the International Tin Agreement after a fall in tin prices of about 20 per cent from its 1985 peak was followed by further sharp declines in 1986. As a result, there were cuts in capacity, especially in South-East Asia. Some of these cuts may have involved high-cost producers who would have found it difficult to survive at prices lower than those prevailing in the late 1970s and at the beginning of the 1980s. But it is improbable that fluctuations in prices of the size experienced during this period provide good signals for efforts at rationalization designed to reduce capacity to a level appropriate to the longer term.
It should be emphasized that in each of the events described in this subsection the operations causing the large fluctuations in prices involved the cash as well as the futures markets. Furthermore, the movement in the price of tin was due to causes other than speculative behaviour. Nevertheless, both cases illustrate how large fluctuations in prices on commodity exchanges can have adverse consequences in the real sector for the commodities affected. It is an argument of this chapter that recent trends affecting financial and related markets have facilitated shifts of funds capable of triggering such fluctuations."
58
Chapter II: Notes and references
Section
A For illustrations of the relation between prices of commodity futures and cash prices see R.J. Teweles, C.V. Harlow and H.L. Stone, The Commodity Futures Game. Who Wins? Who Loses? Why? (New York: McGraw-Hill Book Company, 1974), pp. 46-48. Concerning the poor performance of forward exchange rates as predictors of future spot rates see The Exchange Rate System: Lessons of the Past and Options for the Future, IMF Occasional Paper No. 30 (Washington, D C , July 1984), p. 8. For a discussion of the forecasting performance for 1977-1981 of a sample of foreign-exchange advisory services see S. Bell and B. Kettell, Foreign Exchange Handbook (London: Graham and Trotman, 1983), pp. 167-175. Concerning the difficulties of the forecasting of interest rates see II. Kaufman, Interest Rales, the Markets, and the New Financial World (New York: Times Books, 1986), chaps. 11-14. There is a discussion of the management of exchange rates and measures designed to slow speculative movements of funds in financial markets in the study of the UNCTAD secretariat, "The exchange-rate system", in Compendium of Selected Studies on International Monetary and Financial Issues for the Developing Countries (UNCTAD/ST/MFD/4, United Nations publication, Sales No. E.87.II.D.3), sect. D.
B The figures for bank lending to non-OPEC developing countries are taken from BIS, International Banking Statistics 1973-/983 (Basle, 1984), table 4; id., International Banking Developments (Basle), various issues, table 4a.
C The role of international capital movements in the breakdown of the pre-1971 system of fixed exchange rates is discussed in TDR 1984, chap. IV, sect. A. The 1975 figure for entities of transnational banks in developing countries other than financial centres is taken from BIS, Forty-Eighth Annual Report (Basle, 1978), annex I, table 1-2. Concerning increased competition in the financial sector and its relation to regulatory trends see, for example, R. Harrington, Asset and Liability Management by Banks (Paris: OECD, 1987), pp. 20-21 and 40-45. The figures for percentages of liabilities remunerated on money market terms are taken from ibid., p. 44. The figures for the shares of the market values of equities held by foreigners are taken, for the United States, from Report of the Presidential Task Force on Market Mechanisms (Washington, D C , January 1988), p. 11.13, and, for Tokyo, from A. Rowley, Asian Stockmarkets. The Inside Story (Hong Kong: Far Eastern Economic Review, 1987), p. 25. Recent increases in the scale of movements of money between different types of financial asset, including commodity futures, are discussed in J. Edwards, "The commodity market: its development and function", in E. de Keyser (éd.), Guide to World Commodity Markets (London: Kogan Page; New York: Nichols Publishing Company, 1979), pp. 17-18. Patterns of emulation among dealers in foreign exchange are described in R.A. Hutchison, Off the Books. Citibank and the World's Biggest Money Game (New York: William Morrow and Company, 1986), pp. 70-1 and 85. For survey evidence collected in connection with the stock market crash of October 1987 in the United States see R.J. Shiller, "Investor behaviour in the October 1987 stock market crash: survey evidence", National Bureau of Economic Research Working Paper No. 2446 (Cambridge, Mass., November 1987), pp. 23-24. Group psychology and follow-the-leader behaviour in the commodity futures markets are described in B. Tamarkin, The New Gatsbys. Fortunes and Misfortunes of Commodity Traders (New York: William Morrow and Company, 1985), pp. 122-130, 144-145, and 152-157.
D.1 Concerning the limited use of commodity futures for hedging by farmers in developed and developing countries and by other categories of producer in the latter see "Commodity exchanges and their impact on the trade of developing countries" - report by the UNCTAD secretariat (TD/B/C. 1/248), paras. 18 and 117-159. The same study (paras. 30-31 and 47) discusses the use of futures prices as a benchmark in delivery contracts for certain agricultural commodities. The use of prices on commodity exchanges as points of reference for price setting in supply contracts for minerals is described in ibid., para. 29; "Contractual marketing of commodities" - report by the UNCTAD secretariat (TD/B/C. l/PSC/34 and Corr. 1 and 2), paras. 165-171; and Rudolf Wolff and Co. Limited, Wolffs Guide to the London Metal Exchange, 3rd edition (London, etc.: Metal Bulletin Books, 1987), pp. 60-61,68, 78 and 94.
59
D.2 For a fuller analysis of options as regards exchange-rate arrangements for developing countries and of differences among firms in their capacity to hedge fluctuations in exchange rates sec TDR 1984, paras. 387-391 and 393-395. For a recent treatment of international treasury management see D. Ross, I. Clark and S. Taiyeb, International Treasury Management (Cambridge: Woodhead-Faulkner, 1987). Arrangements for swapping currencies are described in Ross, Clark and Taiyeb, op. cit., pp. 90-91, 151-152 and 155-156; and B. Kettell, The Finance of International Business (London: Graham and Trotman, 1979), pp. 207-213.
D.3 The analysis of this subsection is based largely on Report of the Presidential Task Force on Market Mechanisms (Washington, D C , January 1988) (referred to hereafter as Brady); The October Market Break, A Report by the Division of Market Regulation, United States Securities and Exchange Commission (Washington, D C : US Government Printing Office, February 1988) (referred to hereafter as SEC); and Preliminary Report of the Committee of Enquiry Appointed by the Chicago Mercantile Exchange to Examine the Events Surrounding October 19, 1987 (Chicago, December 1987) (referred to hereafter as CMF). For analysis of the shares of different sources of sales of equities in October 1987 see SEC, pp. 2-8, 2-14 to 2-15 and 2-17 to 2-19, and Brady, pp. 15, 25 and 36. The sample survey of investors' behaviour is described in Shiller, op. cit., and the importance of sales by individuals during the October market break is emphasized in P L . and B.S. Bernstein, "Where the postcrash studies went wrong", Institutional Investor, April 1988. The view that it would be simplistic to attribute October's declines in equity prices exclusively to the operation of a "cascade scenario" is expressed in SEC, p. 3-11. The rise in the importance of institutional participation in the NYSE is described in ibid., pp. 3-1 to 3-2. On the "passive asset management" strategies of institutional investors and the associated use of futures markets see ibid., pp. 3-2 to 3-3. Concerning differences in the ways in which accumulations of sell orders prior to opening are handled in the cash and futures markets for stocks see CME, pp. 20-24, and SEC, pp. 2-14 to 2-15 and 2-44 to 2-45. The influence of the potential selling pressures associated with the resources and trading strategies of institutional investors are described in SEC, pp. 3-12 to 3-15.
D.4 The relation between the volatility of prices in day-to-day trading on futures exchanges and that of cash prices is discussed in Teweles, Harlow and Stone, op. cit., pp. 45-51. The rise of trading in futures contracts in different currencies is described in M.D. Fitzgerald, Financial Futures (London: Euromoney Publications, 1983), pp. 2 and 5. The replies to the survey of the Group of Thirty is described in The Foreign Exchange Markets in the 1980s. The Views of Market Participants (New York: The Group of Thirty, 1985), p. 27. The view of the United States Securities and Exchange Commission concerning the destabilizing influence of stock index futures before October 1987 is given in SEC, pp. 3-6 to 3-8.
For a survey of business strategies fashionable during recent years (including some which decry excessive emphasis on financial criteria) see K M . Davidson, Megamergers. Corporate America s Billion-Dollar Takeovers (Cambridge, Mass.: Ballinger Publishing Company, 1985), chap. 8. The point about the drain of skilled manpower into financial activities is emphasized in the 1984 Fred Hirsch Memorial Lecture of James Tobin, "On the efficiency of the financial system", reproduced in Lloyds Bank Review (London), No. 153, July 1984 (pp. 14-15).
E For a brief discussion of the literature on the effects on commodity-dependent countries of instability of prices and quantities of primary commodities sec "Compensatory financing of export earnings shortfalls" - background report by the UNCTAD secretariat (TD/B/AC.37/3 and Com 1), paras. 20-22.
E.1 The figures for the effects of a rise of four percentage points in the average 6-month Eurodollar rate of interest are based on OECD, External Debt of Developing Countries. 1982 Survey (Paris, 1982), table 8. Concerning anti-dumping and countervailing-duty actions affecting developing countries' exports see TDR 1985, paras. 306-307.
E.2 The evidence for increased bid-offer spreads in foreign exchange markets since the advent of floating exchange rates is reviewed in Kettell, op. cit., p. 189. On the rises in the bid-offer spreads obtainable from market makers in equity markets in the United States and in the International Stock Exchange in London see SEC, pp. 4-20 to 4-22 and 11-11, and Brady, p. 50. The increases in the costs of financing and closely related payments arrangements during a squeeze on a debtor country's external cash flows are discussed in TDR 1986, pp.75-76, and, in more detail, in "Trade financing for developing countries: some aspects of current difficulties and policy responses" - study by the UNCTAD secretariat (TD/B/C.3/212), paras. 18-27.
E.3 For surveys of estimates of the effects of fluctuations in exchange rates on international trade see Exchange Rate Volatility and World Trade, IMF Occasional Paper No. 28 (Washington, D C , July 1984), chaps. IV-VI, and the study by the UNCTAD secretariat, "The exchange-rate system", op. cit., sect. B. The study which estimates the effects via increased protectionism of longer-run fluctuations in exchange rates on international trade is that of P. De Grau we, "Exchange rate variability and the slowdown in the growth of international trade", IMF Staff Papers (Washington,
D.5
D C ) , vol. 35, No. I, March 1988. Concerning the spread of the use of instruments providing a measure of protection against fluctuations in exchange rates see, for example, Exchange Rate Volatility and World Trade, p. 21; The Foreign Exchange Market in the 1980s. The Views of Market Participants, p. 25; and S. Ilolbcrton, "Learning not to take a pounding", Financial Times, 14 April 1988.
The figure for the volume growth during 1987 of goods exports from the United States is taken from OECD Economic Outlook (Paris), no. 43, July 1988, p. 75. For examples of the argument that the hesitant response of the manufacturing sector in the United States to the decline in the value of the dollar was to a significant degree due to uncertainties caused by recent volatility in the country's exchange rates see A. Kaletsky, J. Buchan and D. Ilargreaves, "Bursting at the seams", Financial Times, 15 December 1987, and "Made in the the U.S.A.", Business Week, 29 February 1988. The figures for investment in business equipment and for rates of capacity utilization in industry as a whole and in textiles, chemicals and paper are taken from Federal Reserve Bulletin (Washington, D.C.), various issues, and that for the rate of capacity utilization in steel from Survey of Current Business (Washington, D C ) , various issues. Attention is drawn to the recent failure of manufacturing firms in the United States to expand investment at a pace consistent with its typical observed relationship to output since the early 1970s in the Report of the Joint Economic Committee, Congress of the United States, on the 1988 Economic Report of the President together with Minority and Additional Views (Washington, D C , 20 April 1988), pp. 29-30. The influence of uncertainty concerning exchange rates and international prices on investment in the Federal Republic of Germany is discussed in "Enterprises' profitability and financing in 1986", Monthly Report of the Deutsche Bundesbank, vol. 39, No. 11, November 1987, p. 13.
The regression analyses of the stock market crash by the United States Securities and Exchange Commission are to be found in SEC, pp. 11-5 to 11-9. Concerning the distribution of ownership of stocks in the United States see Brady, pp. VII-1 to VII-2. The analysis of the differential impact of the stock market crash for different categories of stock is that of A. Arbel, S. Carvell and E. Postnieks, "The smart crash of October 19th", Harvard Business Review, May-June 1988. The figures for the falls in gross issues of shares in the United States, the Federal Republic of Germany and the United Kingdom are taken from OECD, Financial Statistics Monthly. Section 2. Domestic Markets - Interest Rates (Paris), May 1988, tables D.l/01, D.l/07 and D.l/17. The consequences of the collapses of equity prices for certain categories of international lending are described in BIS, International Banking and Financial Market Developments (Basle), May 1988, pp. 11-17.
For a review of Britain's experience during the eighteenth and nineteenth centuries of variable levies on corn (accompanied at times by bounties on exports but not by other measures for supporting domestic prices) see A. Marshall, Industry and Trade, 4th edition (London: Macmillan, 1923), appendix E, sects. 1-2. The econometric studies of the effects of dismantling agricultural protection are reviewed in World Bank, World Development Report 1986 (New York: Oxford University -Press for the World Bank, 1986), pp. 127-132, and in S.J. Anjaria, N. Kirmani and A.B. Petersen, Trade Policy Issues and Developments, IMF Occasional Paper No. 38 (Washington, D C , 1985), p. 71. The study of the effects of the Common Agricultural Policy on world demand and supply for certain grain and meat products by K. Anderson and R. Tyers, "European Community grain and meat policies and U.S. retaliation: effects on international prices, trade and welfare", Centre for Economic Policy Research Discussion Paper No. 83 (Canberra: Australian National University, October 1983) is summarized in Anjaria et. al., op. cit.
The use of metal futures as hedges against currency fluctuations is described in Wolffs Guide to the London Metal Exchange, pp. 10-11 and 22. The account of the movements in futures prices and of supply conditions for copper, platinum and silver in late 1982 and early 1983 is based on 1984 Commodity Year Book (Jersey City: Commodity Research Bureau, 1984), pp. 112, 115, 268-269 and 309-310, and on Wolffs Guide to the London Metal Exchange, pp. 55 and 98. The movements in the price of silver futures in 1979-1980 are taken from 1981 Commodity Year Book (New York: Commodity Research Bureau, 1981), pp. 303-304. An estimate of the United States Labour Department that there was a reduction of 6,000 in those employed in the jewellery, silverware and plateware industries alone between November 1979 and February 1980 is quoted in S. Fay, The Great Silver Bubble (London, etc.: Hodder and Stoughton, 1982), p. 151. The figures for the decline in the consumption of silver during the first half of the 1980s are taken from 1986 CRB Commodity Year Book (Jersey City: Commodity Research Bureau, 1986), p. 229. The efforts to economize on silver in certain industrial branches are described in Wolffs Guide to the London Metal Exchange, pp. 90-92.
61
Chapter III
TRADE IMBALANCES AND POLICIES IN THE DEVELOPED MARKET-ECONOMY COUNTRIES
A. Introduction
The 1980s have witnessed the emergence of large trade imbalances and increased tensions in the international trading system in which disparities in the mix and stance of macroeconomic policies in developed market-economy countries have played a major role. While, as noted in the previous chapter, the speculative nature of currency markets and of financial flows among international capital markets has been an important factor in the behaviour of exchange rates in the 1980s, macroeconomic policies have not always been conducive to exchange-rate alignment and stability. Sharp swings in exchange rates resulting from the interaction of macroeconomic policies with speculative market behaviour have made a substantial contribution to trade imbalances. Differences in the overall stance of macroeconomic policies in different industrial countries have also given rise to disparities in the pace of domestic demand expansion, thereby accentuating trade imbalances. These policies have also exerted a significant influence on key international prices, contributing to pressures on the external payments of developing countries. These, in turn have served to further aggravate the trade imbalances of industrial countries.
Pressures for protectionist measures against imports from developing countries have a long history in the developed market-economy countries. More recently, exchange-rate volatility, misalignments and trade imbalances have intensified, and in some cases triggered, such pressures, thus rendering international adjustment even more difficult.
Moreover, the decline in the pace of economic growth and the rise in unemployment have made it extremely difficult to undertake the structural adjustment necessary to restrain protectionism. But the brunt of protectionism has not necessarily fallen on those whose policy actions contributed most to exchange-rate misalignments and trade imbalances. In particular, protectionism has increased at a time when developing countries are being advised to pursue policies to raise their export earnings in order to overcome debt and balance-of-payments difficulties. Moreover, firms in some industrial countries have been able to initiate a process of shifting production abroad through direct investment in response to increased trade tensions and exchange-rate uncertainty. Since this possibility is not open to most developing countries, it may serve to concentrate protectionist pressures on imports from such countries. Furthermore, even if such direct investment helps to reduce trade imbalances among industrial countries, it has the implication that trade policy and exchange-rate considerations may come to dominate the geographical allocation of foreign direct investment.
This chapter discusses these issues. Section B examines the nature and the origin of trade imbalances among the industrialized countries, and discusses the recent trade adjustment experience and the risks and opportunities ahead. Section C examines the recent trend towards managed trade. It traces the influence of macroeconomic policies, exchange rates and trade imbalances on trade policies,
62
protectionism and foreign direct investment, and makes a broad assessment of policies needed to prevent concentration of protect
ionism on exports from developing countries and to roll back protectionism in general.
B. Trade imbalances among the developed market-economy countries
Introduction
From close to overall balance at the beginning of the 1980s, the external payments position of the United States deteriorated steadily thereafter and registered a deficit of over $155 billion, or 3.5 per cent of GDP, by 1987, notwithstanding a significant depreciation of the dollar since 1985.42 As early as 1982, the steady worsening of the United States current account led to a steady weakening of its net foreign investment position; by the end of 1984 the earlier surplus of United States assets abroad over foreign assets in the United States had virtually disappeared and by the end of 1985 foreign assets in the United States (official and private) exceeded United States assets abroad by close to $112 billion, a figure which rose to $264 billion by the end of 1986 (see table 11). Since the net external liabilities of the country were being augmented by amounts equivalent to its current-account deficit, the external debt of the United States must have approached $400 billion by the end of 1987. If present trends continue this debt would increase by over $100 billion each year for the near future.
The very large flows required to finance both the United States trade deficit and its potentially heavy external debt service are subjecting the world economy to strains which have been reflected in sporadic turmoil in financial and exchange markets. While the potential impact on economic activity of these disorders has perhaps not been fully realized, in a highly interdependent world economy negative impulses stemming from business uncertainties could spread internationally with increasing intensity. The current steady pace of business activity may thus conceal disruptive forces whose effects are still to be felt. The lack of significant progress in the international ad
justment process, furthermore, has given rise to increased protectionist pressures which may pave the way for generalized trade wars among the major trading nations.43 The problem of correcting the world payments imbalances has thus become all the more urgent.
The purpose of this section is to provide an overview of the nature and historical development of the United States external imbalance. By reviewing the available evidence and analyses, it aims to highlight certain features which are relevant to policy discussions concerning its correction.
A configuration of factors, of both domestic and foreign origin, was responsible for the deterioration of the external payments position of the United States. In particular, the expansionary fiscal policy adopted by that country in contrast to the highly restrictive stance generally taken in other major industrialized countries contributed to producing large differentials in aggregate demand growth which from 1982 to 1985 tended to work to the detriment of the United States trade balance. By eroding the competitive position of United States industry, the appreciation of the dollar during the first half of the 1980s contributed to widening further the United States trade gap. Moreover, these developments took place at the same time as the debt crisis of the developing countries was emerging. The concomitant financial pressures on the debtor countries led to significant import compression on their part which, because of traditional trading patterns, affected with particular severity United States exports of foodstuffs and capital goods. To the extent that the effects of these factors are mutually reinforcing, the adjustment of the imbalance must rely on a broad approach emphasizing at the same time a recovery of the competitiveness of United States exports, a reversal of the gap between rates of demand
42 By early 1988 the real effective exchange rate of the dollar had fallen by about 30 per cent below its 1985 peak.
43 For a discussion of recent developments in trade policies and protectionism see section C below.
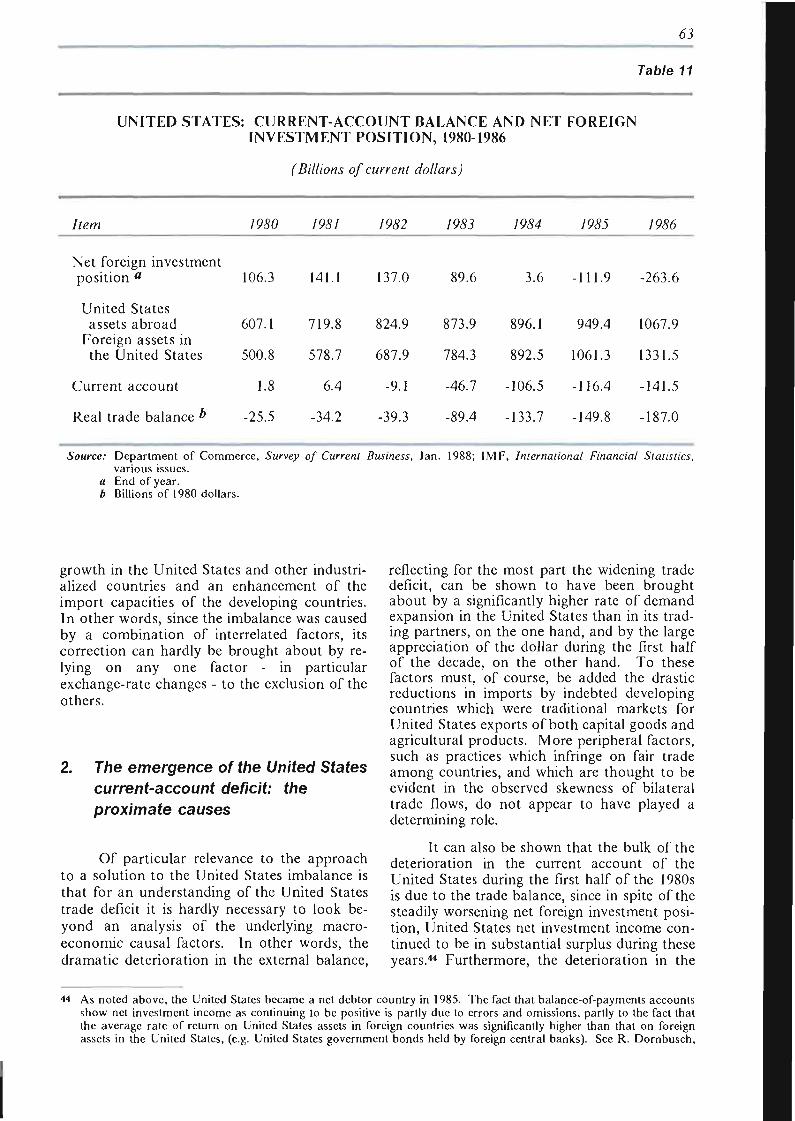
63
Table 11
UNITED STATES: CURRENT-ACCOUNT BALANCE AND NET FOREIGN INVESTMENT POSITION, 1980-1986
(Billions of current dollars)
Item
Net foreign investment position a
United States assets abroad
Foreign assets in the United States
Current account
Real trade balance *
/&S0
106.3
607.1
500.8
1.8
-25.5
/?&/
141.1
719.8
578.7
6.4
-34.2
/P62
137.0
8249
687.9
-9.1
-39.3
/%%
89.6
B73.9
7843
-46.7
-89.4
/9&f
3.6
896.1
892.5
-106.5
-133.7
/P&)
-111.9
949.4
1061.3
-116.4
-149.8
/966
-263.6
1067.9
1331.5
-141.5
-187.0
Source: Department of Commerce, Survey of Current Business, Jan. 1988; IMF, International Financial Statistics, various issues.
a End of year. 6 Billions of 1980 dollars.
growth in the United States and other industrialized countries and an enhancement of the import capacities of the developing countries. In other words, since the imbalance was caused by a combination of interrelated factors, its correction can hardly be brought about by relying on any one factor - in particular exchange-rate changes - to the exclusion of the others.
The emergence of the United States current-account deficit: the proximate causes
Of particular relevance to the approach to a solution to the United States imbalance is that for an understanding of the United States trade deficit it is hardly necessary to look beyond an analysis of the underlying macro-economic causal factors. In other words, the dramatic deterioration in the external balance,
reflecting for the most part the widening trade deficit, can be shown to have been brought about by a significantly higher rate of demand expansion in the United States than in its trading partners, on the one hand, and by the large appreciation of the dollar during the first half of the decade, on the other hand. To these factors must, of course, be added the drastic reductions in imports by indebted developing countries which were traditional markets for United States exports of both capital goods and agricultural products. More peripheral factors, such as practices which infringe on fair trade among countries, and which are thought to be evident in the observed skewness of bilateral trade flows, do not appear to have played a determining role.
It can also be shown that the bulk of the deterioration in the current account of the United States during the first half of the 1980s is due to the trade balance, since in spite of the steadily worsening net foreign investment position, United States net investment income continued to be in substantial surplus during these years.44 Furthermore, the deterioration in the
** As noted above, the United States became a net debtor country in 1985. The fact that balance-of-payments accounts show net investment income as continuing to be positive is partly due to errors and omissions, partly to the fact that the average rate of return on United States assets in foreign countries was significantly higher than that on foreign assets in the United States, (e.g. United States government bonds held by foreign central banks). See R. Dornbusch,
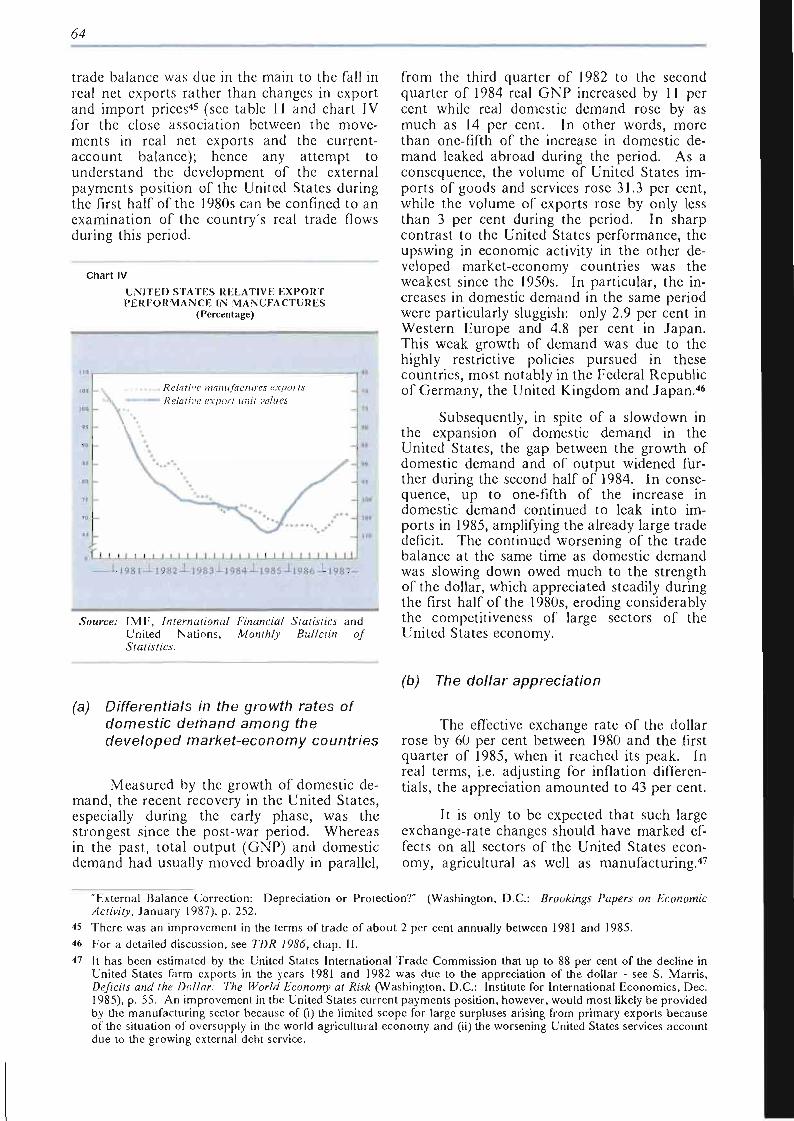
64
trade balance was due in the main to the fall in real net exports rather than changes in export and import prices45 (see table 11 and chart IV for the close association between the movements in real net exports and the current-account balance); hence any attempt to understand the development of the external payments position of the United States during the first half of the 1980s can be confined to an examination of the country's real trade flows during this period.
Chart IV
UNITED STATES RELATIVE EXPORT PERFORMANCE IN MANUFACTURES
(Percentage)
\ . Relative manufactures exports,
— Relative export unit values
XL I I I I I I I I I I I i i i i I I 1 I , IJ
•1981-1-1982-1-1983-1-1984 J-1985-1-1986 J-1987-
Source: I VIF, International Financial Statistics and United Nations, Monthly Bulletin of Statistics.
from the third quarter of 1982 to the second quarter of 1984 real GNP increased by 11 per cent while real domestic demand rose by as much as 14 per cent. In other words, more than one-fifth of the increase in domestic demand leaked abroad during the period. As a consequence, the volume of United States imports of goods and services rose 31.3 per cent, while the volume of exports rose by only less than 3 per cent during the period. In sharp contrast to the United States performance, the upswing in economic activity in the other developed market-economy countries was the weakest since the 1950s. In particular, the increases in domestic demand in the same period were particularly sluggish: only 2.9 per cent in Western Europe and 4.8 per cent in Japan. This weak growth of demand was due to the highly restrictive policies pursued in these countries, most notably in the Federal Republic of Germany, the United Kingdom and Japan.46
Subsequently, in spite of a slowdown in the expansion of domestic demand in the United States, the gap between the growth of domestic demand and of output widened further during the second half of 1984. In consequence, up to one-fifth of the increase in domestic demand continued to leak into imports in 1985, amplifying the already large trade deficit. The continued worsening of the trade balance at the same time as domestic demand was slowing down owed much to the strength of the dollar, which appreciated steadily during the first half of the 1980s, eroding considerably the competitiveness of large sectors of the United States economy.
(a) Differentials in the growth rates of domestic demand among the developed market-economy countries
Measured by the growth of domestic demand, the recent recovery in the United States, especially during the early phase, was the strongest since the post-war period. Whereas in the past, total output (GNP) and domestic demand had usually moved broadly in parallel,
(b) The dollar appreciation
The effective exchange rate of the dollar rose by 60 per cent between 1980 and the first quarter of 1985, when it reached its peak. In real terms, i.e. adjusting for inflation differentials, the appreciation amounted to 43 per cent.
It is only to be expected that such large exchange-rate changes should have marked effects on all sectors of the United States economy, agricultural as well as manufacturing.47
47
"External Balance Correction: Depreciation or Protection?" (Washington, D.C.: Brookings Papers on Economic Activity, January 1987), p . 252.
45 The re was an improvement in the terms of trade of abou t 2 per cent annually between 1981 and 1985.
46 For a detailed discussion, see TDR ¡986, chap. II.
It has been estimated by the United States International T r a d e Commission that up to 88 per cent of the decline in United States farm exports in the years 1981 and 1982 was due to the appreciation of the dollar - see S. Marris , Deficits and the Dollar. The World Economy at Risk (Washington, D C : Institute for International Economics , Dec. 1985), p. 55. An improvement in the United States current payments position, however, would most likely be provided by the manufacturing sector because of (i) the limited scope for large surpluses arising from primary exports because of the situation of oversupply in the world agricultural economy and (ii) the worsening United States services account due to the growing external debt service.
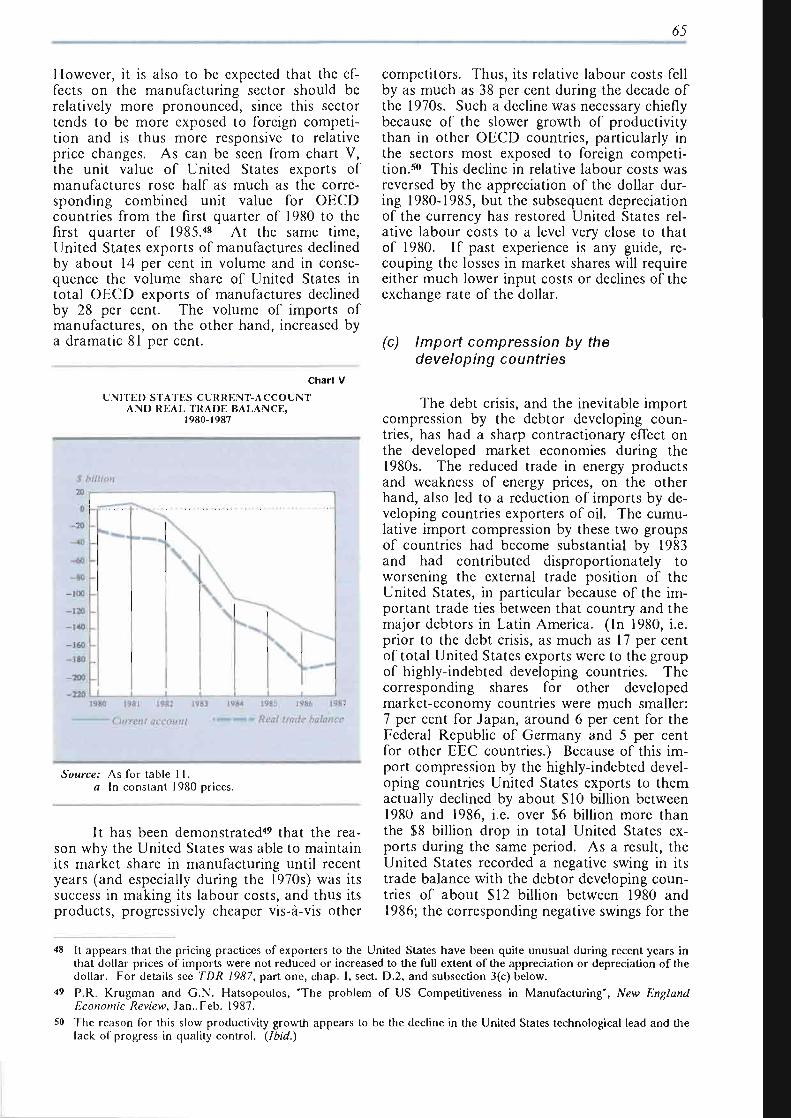
65
However, it is also to be expected that the effects on the manufacturing sector should be relatively more pronounced, since this sector tends to be more exposed to foreign competition and is thus more responsive to relative price changes. As can be seen from chart V, the unit value of United States exports of manufactures rose half as much as the corresponding combined unit value for OECD countries from the first quarter of 1980 to the first quarter of 1985.48 At the same time, United States exports of manufactures declined by about 14 per cent in volume and in consequence the volume share of United States in total OECD exports of manufactures declined by 28 per cent. The volume of imports of manufactures, on the other hand, increased by a dramatic 81 per cent.
Chart V
UNITED STATES CURRENT-ACCOUNT AND REAL TRADE BALANCE,
1980-1987
$ billion 20
0
-20
-40
-tth
-100
-120
-140
-160
-180
-200
-220
--
-
-•
1
r^*<y *
— > \ \
V > L \
\V_ \
^ *" L
V S
•
1980 1981 1982 1983
Current account
1984 198S 1986 1987
->—*• Real trade balance
Source: As for table 11. a In constant 1980 prices.
It has been demonstrated49 that the reason why the United States was able to maintain its market share in manufacturing until recent years (and especially during the 1970s) was its success in making its labour costs, and thus its products, progressively cheaper vis-à-vis other
competitors. Thus, its relative labour costs fell by as much as 38 per cent during the decade of the 1970s. Such a decline was necessary chiefly because of the slower growth of productivity than in other OECD countries, particularly in the sectors most exposed to foreign competition.50 This decline in relative labour costs was reversed by the appreciation of the dollar during 1980-1985, but the subsequent depreciation of the currency has restored United States relative labour costs to a level very close to that of 1980. If past experience is any guide, recouping the losses in market shares will require either much lower input costs or declines of the exchange rate of the dollar.
(c) Import compression by the developing countries
The debt crisis, and the inevitable import compression by the debtor developing countries, has had a sharp contractionary effect on the developed market economies during the 1980s. The reduced trade in energy products and weakness of energy prices, on the other hand, also led to a reduction of imports by developing countries exporters of oil. The cumulative import compression by these two groups of countries had become substantial by 1983 and had contributed disproportionately to worsening the external trade position of the United States, in particular because of the important trade ties between that country and the major debtors in Latin America. (In 1980, i.e. prior to the debt crisis, as much as 17 per cent of total United States exports were to the group of highly-indebted developing countries. The corresponding shares for other developed market-economy countries were much smaller: 7 per cent for Japan, around 6 per cent for the Federal Republic of Germany and 5 per cent for other EEC countries.) Because of this import compression by the highly-indebted developing countries United States exports to them actually declined by about $10 billion between 1980 and 1986, i.e. over $6 billion more than the $8 billion drop in total United States exports during the same period. As a result, the United States recorded a negative swing in its trade balance with the debtor developing countries of about $12 billion between 1980 and 1986; the corresponding negative swings for the
48
49
so
It appears that the pricing practices of exporters to the United States have been quite unusual during recent years in that dollar prices of imports were not reduced or increased to the full extent of the appreciation or depreciation of the dollar. For details see TDR 1987, part one, chap. I, sect. D.2, and subsection 3(c) below.
P.R. Krugman and G.N. Hatsopoulos, 'The problem of US Competitiveness in Manufacturing", New England Economic Review, Jan. Feb. 1987.
The reason for this slow productivity growth appears to be the decline in the United States technological lead and the lack of progress in quality control. (Ibid.)
66
other developed market-economy countries were much smaller: about $3 billion for Japan, $2.4 billion for the Federal Republic of Germany and $1.6 billion for the other EEC countries (for a quantitative analysis of the widening United States deficit, see box 2).
(d) The United States trade deficit and the pattern of world trade
Due to its large size, the emergence of the United States deficit was accompanied by marked changes in the pattern of world trade and had as its counterpart the bulging surpluses of a number of other countries, most notably Japan and the Federal Republic of Germany. Because of much-reduced oil imports, the United States trade balance recorded an improvement with respect to the developing countries exporters of oil, but a worsening with respect to all other major groups of countries during 1980-1986 (see table 12); the biggest deterioration was in trade with Japan. The deterioration of the balance with EEC countries as a whole (excluding the Federal Republic of Germany) was a little more than half as large as it was for the other developed market-economy countries (notably Canada) and the East Asian developing countries. For the Federal Republic of Germany it was rather small.
Not all of the observed deterioration in bilateral balances of the United States was reflected in improved overall trade balances of its trading partners. As in the United States, oil imports were substantially reduced in other developed market-economy countries, easing considerably pressures on the balance of payments in many instances. Some of the major trading partners of the United States nevertheless faced exposed external payments positions which could constrain growth if import compression in the United States failed to be offset by demand expansion elsewhere. A most illustrative example is that of the EEC member countries other than the Federal Republic of Germany. As can be seen from table 12, the improvement in the trade balance of those countries in 1980-1986 was due mainly to the sharp drop in their imports from the oil-exporting developing countries. Their growing surplus vis-à-vis the United States, however, was more or less offset by their worsening po
sition in trade with the Federal Republic of Germany and Japan. This pattern suggests that an improvement in the United States balance of payments that was not facilitated by (and taking place largely at the expense of) the Federal Republic of Germany and Japan would lead to payments difficulties for the other Western European countries. In such a case, "adjustments" by the United States would not "adjust" balances in the world economy, but simply redistribute them among these countries.
The Federal Republic of Germany was in a different position from other EEC countries, since its surplus was more widely distributed on a geographical basis. As can be seen from table 2, its overall surplus resulted from an improved position with most trading partners, the main exception being Japan, where there was a relatively small deterioration during 1980-1986. The improvement with respect to the United States was of the same order of magnitude as with the other EEC members and somewhat larger than that recorded in trade with other developed market-economy countries and with the oil-exporting developing countries. Reduced imports from the latter countries, together with the substantial improvement vis-à-vis the United States, accounted for the bulk of the growing surplus of Japan during 1980-1986.
Recent changes in the patterns of trade balances have shown that there need not be a strict correspondence between the emergence of bilateral imbalances, which were sometimes quite large, and the overall trade position of a country. While in a multilateral trading system there is no need for bilateral flows to balance, the imbalances of the United States with Japan and some East Asian developing countries have provoked very adverse domestic reactions and given rise to protectionist sentiment against many of those countries.51 In particular, pressures were brought to bear to have them revalue their currencies so as to reduce their competitiveness. It appears, however, that the improvement that occurred in the competitiveness of the fast-growing exporters in recent years would have taken place quite independently of the exchange rates then prevailing. This is at least the conclusion that can be drawn from a comparison in table 13 from 1980 to 1985 between changes in the real effective exchange rates of the main suppliers to the United States (excluding the major oil-exporting countries) and changes in the exports of these countries, both to the world and to the
Sl The United States Administration, for example, has removed the so-called newly industrialized countries from the list of its GSP beneficiaries.
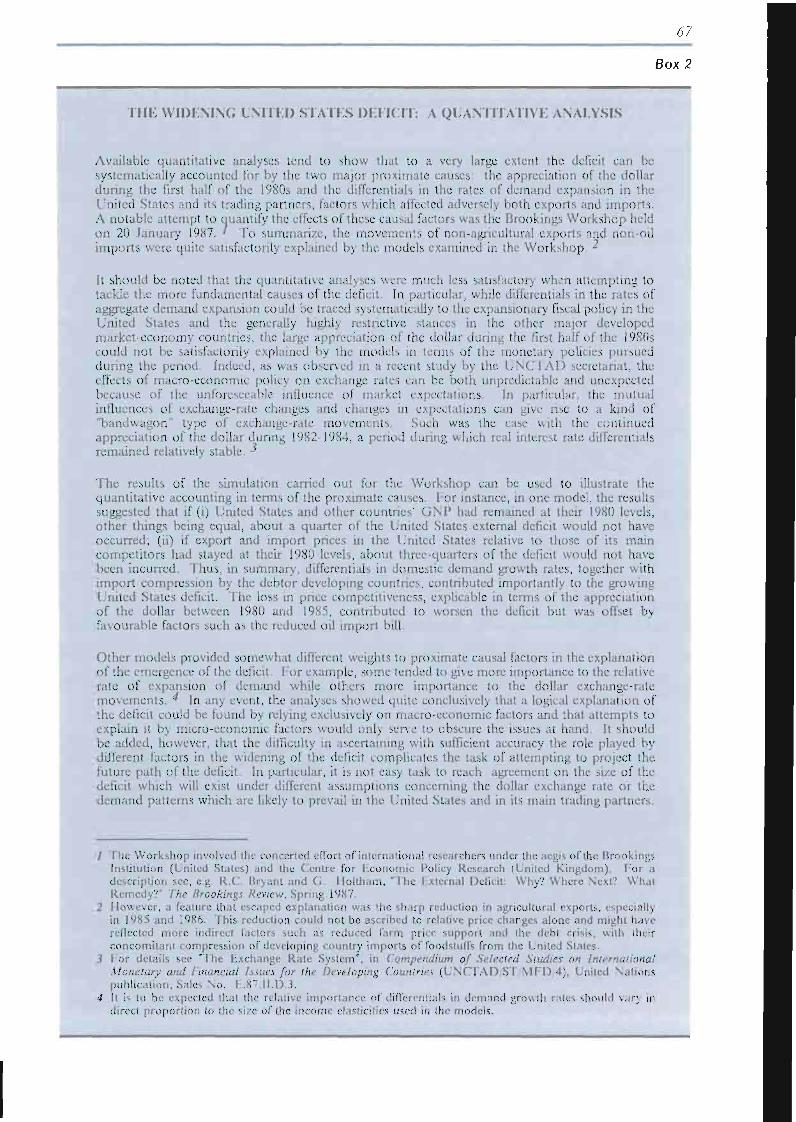
11 IK WIDENING UNITED STATES DEFICIT: A QUANTITATIVE ANALYSIS
Available quantitative analyses tend to show that to a very large extent the deficit can be systematically accounted for by the two major proximate causes: the appreciation of the dollar during the first half of the 1980s and the differentials in the rates of demand expansion in the United States and its trading partners, factors which affected adversely both exports and imports. A notable attempt to quantify the effects of these causal factors was the Brookings Workshop held on 20 January 1987. ' To summarize, the movements of non-agricultural exports and non-oil imports were quite satisfactorily explained by the models examined in the Workshop. ^
It should be noted that the quantitative analyses were much less satisfactory when attempting to tackle the more fundamental causes of the deficit. In particular, while differentials in the rates of aggregate demand expansion could be traced systematically to the expansionary fiscal policy in the United States and the generally highly restrictive stances in the other major developed market-economy countries, the large appreciation of the dollar during the first half of the 1980s could not be satisfactorily explained by the models in terms of the monetary policies pursued during the period. Indeed, as was observed in a recent study by the U N O AD secretariat, the effects of macro-economic policy on exchange rates can be both unpredictable and unexpected because of the unforeseeable influence of market expectations. In particular, the mutual influences of exchange-rate changes and changes in expectations can give rise to a kind of "bandwagon" type of exchange-rate movements. Such was the case with the continued appreciation of the dollar during 1982-1984, a period during which real interest rate differentials remained relatively stable. *
The results of the simulation carried out for the Workshop can be used to illustrate the quantitative accounting in terms of the proximate causes. For instance, in one model, the results suggested that if (i) United States and other countries' GNP had remained at their 1980 levels, other things being equal, about a quarter of the United States external deficit would not have occurred; (ii) if export and import prices in the United States relative to those of its main competitors had stayed at their 1980 levels, about three-quarters of the deficit would not have been incurred. Thus, in summary, differentials in domestic demand growth rates, together with import compression by the debtor developing countries, contributed importantly to the growing United States deficit. The loss in price competitiveness, explicable in terms of the appreciation of the dollar between 1980 and 1985, contributed to worsen the deficit but was offset by favourable factors such as the reduced oil import bill.
Other models provided somewhat different weights to proximate causal factors in the explanation of the emergence of the deficit. For example, some tended to give more importance to the relative rate of expansion of demand while others more importance to the dollar exchange-rate movements. "* In any event, the analyses showed quite conclusively that a logical explanation of the deficit could be found by relying exclusively on macro-economic factors and that attempts to explain it by micro-economic factors would only serve to obscure the issues at hand. It should be added, however, that the difficulty in ascertaining with sufficient accuracy the role played by different factors in the widening of the deficit complicates the task of attempting to project the future path of the deficit. In particular, it is not easy task to reach agreement on the size of the deficit which will exist under different assumptions concerning the dollar exchange rate or the demand patterns which are likely to prevail in the United States and in its main trading partners.
/ The Workshop involved the concerted effort of international researchers under the aegis of the Brookings Institution (United States) and the Centre for Economic Policy Research (United Kingdom). For a description see, e.g. R.C. Bryant and G. Holtham, "The External Deficit: Why? Where Next? What Remedy?" The Brookings Review. Spring 1987.
2 However, a feature that escaped explanation was the sharp reduction in agricultural exports, especially in 1985 and 1986. This reduction could not be ascribed to relative price changes alone and might have reflected more indirect factors such as reduced farm price support and the debt crisis, with their concomitant compression of developing country imports of foodstuffs from the United States.
J For details see "The Exchange Rate System", in Compendium of Selected Studies on Internationa! Monetary and Financial Issues for the Developing Countries (UNCTAD ST, MFD 4), United Nations publication, Sales No. E.87.II.D.3.
4 It is to be expected that the relative importance of differentials in demand growth rates should vary in direct proportion to the size of the income elasticities used in the models.
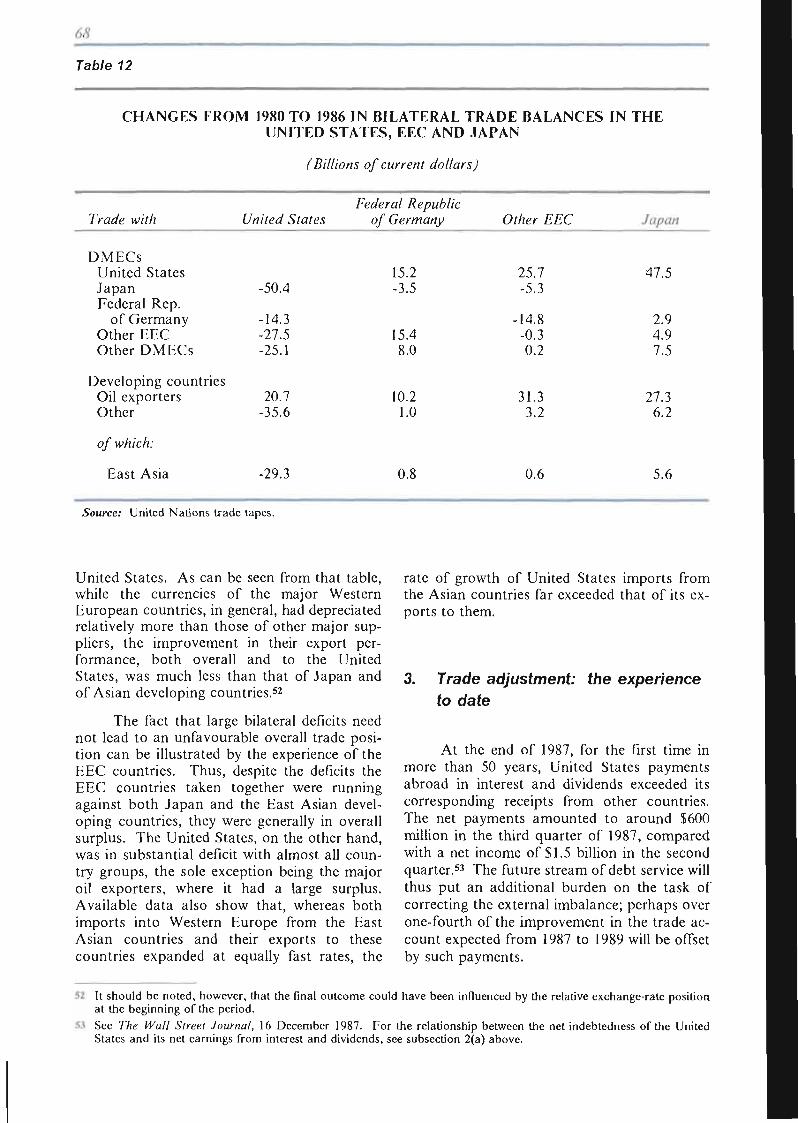
68
Table 12
CHANGES FROM 1980 TO 1986 IN BILATERAL TRADE BALANCES IN THE UNITED STATES, EEC AND JAPAN
(Billions of current dollars)
Trade with
DMECs United States Japan Federal Rep.
of Germany Other EEC Other DMECs
Developing countries Oil exporters Other
of which:
East Asia
United States
-50.4
-14.3 -27.5 -25.1
20.7 -35.6
-29.3
Federal Republic of Germany
15.2 -3.5
15.4 8.0
10.2 1.0
0.8
Other EEC
25.7 -5.3
-14.8 -0.3 0.2
31.3 3.2
0.6
Japan
47.5
2.9 4.9 7.5
27.3 6.2
5.6
Source: United Nations trade tapes.
United States. As can be seen from that table, while the currencies of the major Western European countries, in general, had depreciated relatively more than those of other major suppliers, the improvement in their export performance, both overall and to the United States, was much less than that of Japan and of Asian developing countries.52
The fact that large bilateral deficits need not lead to an unfavourable overall trade position can be illustrated by the experience of the EEC countries. Thus, despite the deficits the EEC countries taken together were running against both Japan and the East Asian developing countries, they were generally in overall surplus. The United States, on the other hand, was in substantial deficit with almost all country groups, the sole exception being the major oil exporters, where it had a large surplus. Available data also show that, whereas both imports into Western Europe from the East Asian countries and their exports to these countries expanded at equally fast rates, the
rate of growth of United States imports from the Asian countries far exceeded that of its exports to them.
Trade adjustment: to date
the experience
At the end of 1987, for the first time in more than 50 years, United States payments abroad in interest and dividends exceeded its corresponding receipts from other countries. The net payments amounted to around $600 million in the third quarter of 1987, compared with a net income of $1.5 billion in the second quarter.53 The future stream of debt service will thus put an additional burden on the task of correcting the external imbalance; perhaps over one-fourth of the improvement in the trade account expected from 1987 to 1989 will be offset by such payments.
52 It should be noted, however, that the final outcome could have been influenced by the relative exchange-rate position at the beginning of the period.
53 See The Wall Street Journal, 16 December 1987. For the relationship between the net indebtedness of the United States and its net earnings from interest and dividends, see subsection 2(a) above.
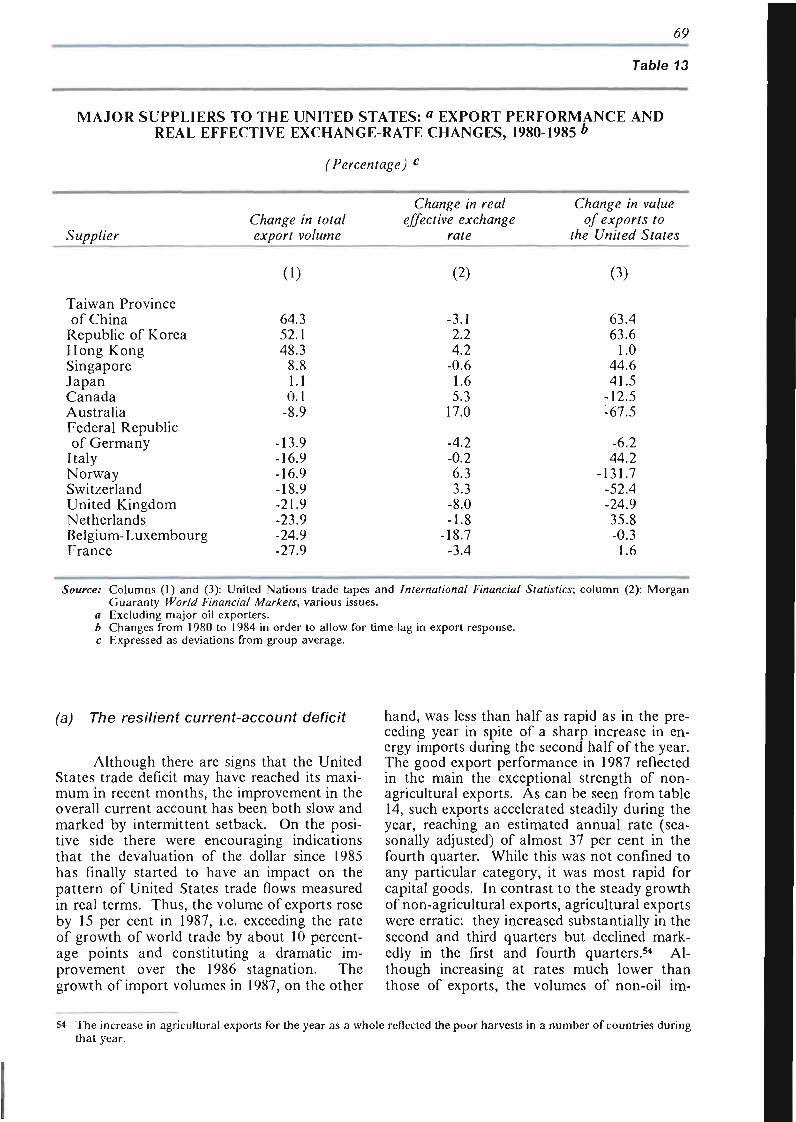
69
Table 13
MAJOR SUPPLIERS TO THE UNITED STATES: « EXPORT PERFORMANCE AND REAL EFFECTIVE EXCHANGE-RATE CHANGES, 1980-1985 b
(Percentage) c
Supplier Change in total export volume
Change in real effective exchange
rate
Change in value of exports to
the United States
Taiwan Province of China
Republic of Korea Hong Kong Singapore Japan Canada Australia Federal Republic of Germany
Italy Norway Switzerland United Kingdom Netherlands Belgium- Luxembourg France
(1)
64.3 52.1 48.3
8.8 1.1 0.1
-8.9
-13.9 -16.9 -16.9 -18.9 -21.9 -23.9 -24.9 -27.9
(2)
-3.1 2.2 4.2
-0.6 1.6 5.3
17.0
-4.2 -0.2 6.3 3.3
-8.0 -1.8
•18.7 -3.4
(3)
63.4 63.6
1.0 44.6 41.5
-12.5 -67.5
-6.2 44.2
-131.7 -52.4 -24.9 35.8 -0.3 1.6
Source: Columns (1) and (3): United Nations trade tapes and International Financial Statistics; column (2): Morgan Guaranty World Financial Markets, various issues.
a Excluding major oil exporters. b Changes from 1980 to 1984 in order to allow for time-lag in export response. c Expressed as deviations from group average.
(a) The resilient current-account deficit
Although there are signs that the United States trade deficit may have reached its maximum in recent months, the improvement in the overall current account has been both slow and marked by intermittent setback. On the positive side there were encouraging indications that the devaluation of the dollar since 1985 has finally started to have an impact on the pattern of United States trade flows measured in real terms. Thus, the volume of exports rose by 15 per cent in 1987, i.e. exceeding the rate of growth of world trade by about 10 percentage points and constituting a dramatic improvement over the 1986 stagnation. The growth of import volumes in 1987, on the other
hand, was less than half as rapid as in the preceding year in spite of a sharp increase in energy imports during the second half of the year. The good export performance in 1987 reflected in the main the exceptional strength of non-agricultural exports. As can be seen from table 14, such exports accelerated steadily during the year, reaching an estimated annual rate (seasonally adjusted) of almost 37 per cent in the fourth quarter. While this was not confined to any particular category, it was most rapid for capital goods. In contrast to the steady growth of non-agricultural exports, agricultural exports were erratic: they increased substantially in the second and third quarters but declined markedly in the first and fourth quarters.54 Although increasing at rates much lower than those of exports, the volumes of non-oil im-
54 The increase in agricultural exports for the year as a whole reflected the poor harvests in a number of countries during that year.
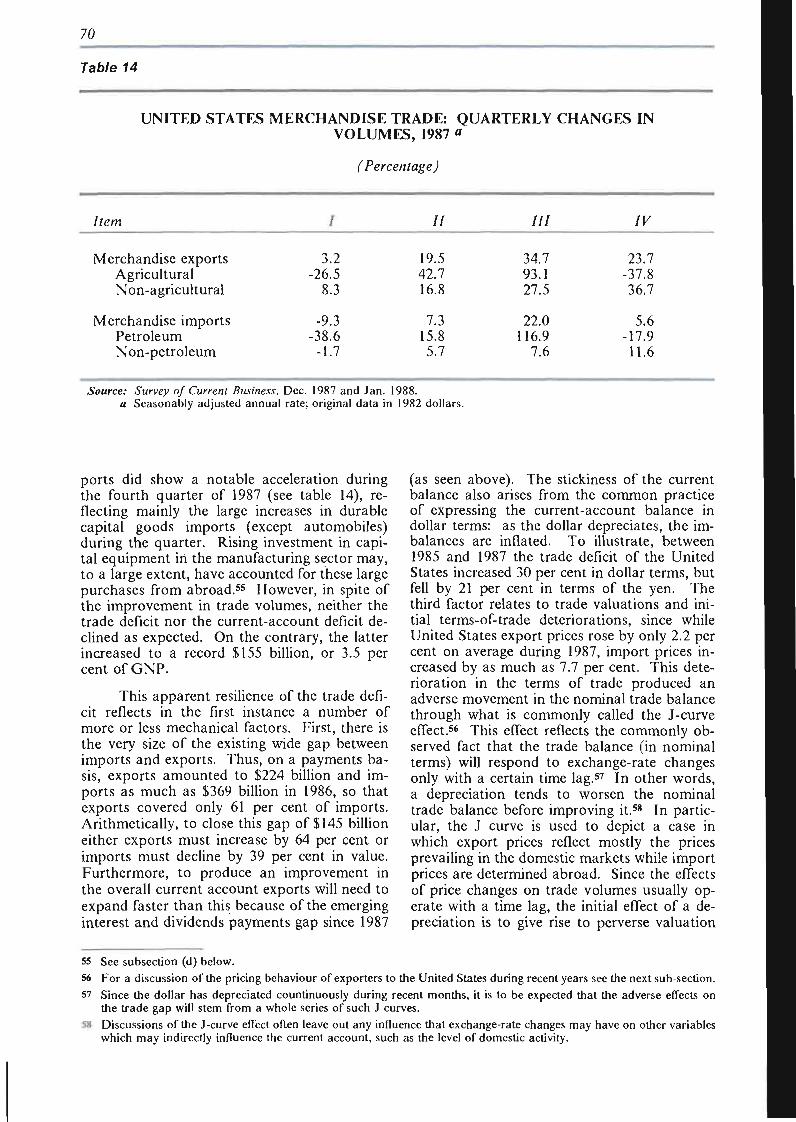
70
Table 14
UNITED STATES MERCHANDISE TRADE: QUARTERLY CHANGES IN VOLUMES, 1987 «
Item
Merchandise exports Agricultural Non-agricultural
Merchandise imports Petroleum Non-petroleum
/
3.2 -26.5
8.3
-9.3 -38.6
-1.7
(Percentage)
II
19.5 42.7 16.8
7.3 15.8 5.7
III
34.7 93.1 27.5
22.0 116.9
7.6
IV
23.7 -37.8 36.7
5.6 -17.9 11.6
Source: Survey of Current Business, Dec. 1987 and Jan. 1988. a Seasonably adjusted annual rate; original data in 1982 dollars.
ports did show a notable acceleration during the fourth quarter of 1987 (see table 14), reflecting mainly the large increases in durable capital goods imports (except automobiles) during the quarter. Rising investment in capital equipment in the manufacturing sector may, to a large extent, have accounted for these large purchases from abroad.55 However, in spite of the improvement in trade volumes, neither the trade deficit nor the current-account deficit declined as expected. On the contrary, the latter increased to a record $155 billion, or 3.5 per cent of GNP.
This apparent resilience of the trade deficit reflects in the first instance a number of more or less mechanical factors. First, there is the very size of the existing wide gap between imports and exports. Thus, on a payments basis, exports amounted to $224 billion and imports as much as $369 billion in 1986, so that exports covered only 61 per cent of imports. Arithmetically, to close this gap of $145 billion either exports must increase by 64 per cent or imports must decline by 39 per cent in value. Furthermore, to produce an improvement in the overall current account exports will need to expand faster than this because of the emerging interest and dividends payments gap since 1987
(as seen above). The stickiness of the current balance also arises from the common practice of expressing the current-account balance in dollar terms: as the dollar depreciates, the imbalances are inflated. To illustrate, between 1985 and 1987 the trade deficit of the United States increased 30 per cent in dollar terms, but fell by 21 per cent in terms of the yen. The third factor relates to trade valuations and initial terms-of-trade deteriorations, since while United States export prices rose by only 2.2 per cent on average during 1987, import prices increased by as much as 7.7 per cent. This deterioration in the terms of trade produced an adverse movement in the nominal trade balance through what is commonly called the J-curve effect.56 This effect reflects the commonly observed fact that the trade balance (in nominal terms) will respond to exchange-rate changes only with a certain time lag.57 In other words, a depreciation tends to worsen the nominal trade balance before improving it.58 In particular, the J curve is used to depict a case in which export prices reflect mostly the prices prevailing in the domestic markets while import prices are determined abroad. Since the effects of price changes on trade volumes usually operate with a time lag, the initial effect of a depreciation is to give rise to perverse valuation
55 See subsection (d) below.
56 For a discussion of the pricing behaviour of exporters to the United States during recent years see the next sub-section. 57 Since the dollar has depreciated countinuously during recent months, it is to be expected that the adverse effects on
the trade gap will stem from a whole series of such J curves. Discussions of the J-curve effect often leave out any influence that exchange-rate changes may have on other variables which may indirectly influence the current account, such as the level of domestic activity.
71
effects because import prices in terms of the domestic currency - in this case the dollar - will rise and thus will worsen the trade deficit. With time, however, trade volumes will react and the current account will improve, thus giving rise to the J curve.59
(b) Trade adjustment: aspects of aggregate demand
Since the United States constitutes the single most important import market and a major outlet for a large number of exporters, the adjustment of its trade deficit, if it were to rely exclusively on domestic demand compression, would seriously affect the net exports of such suppliers and hence their overall economic growth. In particular, because of the close trade linkages, the adjustment could be made more difficult by the consequent slowing down of demand for United States exports.
In the present context of very subdued economic activity worldwide, an improvement in the net exports of the United States would necessarily diminish the growth of output of its trading partners. Thus, in sharp contrast to the situation existing at the onset of the 1983 recovery, when the fast-growing United States trade deficit provided a stimulus to activity in other market-economy countries, the adjustment of this same deficit, if it were to be based mainly on reduced absorption by the United States, would impart a contractionary impulse to many countries. The impact would be particularly strong on those most dependent on external trade in general, and on the United States market in particular, or which experience sharp decreases in imports from the United States. In any event, in the absence of additional stimulus to activity in the major countries, the correction of the United States deficit may turn out to be quite limited, as differentials in the growth rates of domestic demand in the United States and other countries limit the influence of changes in exchange rates. It is germane to note that at the onset of the recent economic recovery, the rates of demand growth in the United States were higher than those of its trading partners by as much as 3.7 percent
age points in 1983 and 5.6 in 1984. However, it is probable that the growth of domestic absorption in most of the trading partners of the United States will exceed by less than 2 percentage points that of domestic demand expansion in that country in the coming months.60 It should also be noted that the current changes in the United States in savings and consumption behaviour will tend to reinforce the effects of the depreciating dollar. Savings rates have been recovering steadily from the record low reached during recent months and available data indicate that in early 1988 the savings rate was a full percentage point higher than the average for 1987, reflecting in part the attempt to recoup the wealth losses following the stock market crash of October 1987.
Under present circumstances faster expansion in other major countries is all the more necessary, particularly in the Western European surplus countries. This is so because an improvement in the United States payments position will undoubtedly be reflected in a worsening of the payments positions of many of the European developed market economies which were already in deficit in 1987. In the absence of more rapid expansion in the Federal Republic of Germany, the present pattern of exchange rates within the European Monetary System (EMS) will almost surely be called into question.
(c) Trade adjustment: exchange rates and prices in international trade
The decline in the effective dollar exchange rate, which started during 1985, had reversed by the end of 1987 all the rises which had taken place during the first five years of the decade and brought the rate back to approximately its level of 1980, when the United States current account was in broad balance. Had there not been official intervention, the exchange rate would have fallen even further. Indeed, official flows financed much of the current-account deficit during most of 1986 and 1987, though there was also a sustained movement of short-term funds into the United States
59
Í.0
Assuming that the so-called Marshall Lerner conditions are satisfied, i.e. that the sum of the elasticities of demand for an individual country's imports and exports exceeds unity in absolute terms. Some observers, however, have expressed doubts as to the relevance of demand growth differentials as a channel for the correction of the United States current-account imbalance. These doubts are, in general, based on partial analyses which tend to emphasize the low amounts of United States exports destined for some major surplus countries, in particular Japan. It should be noted that available quantitative simulations, which take fully into account the indirect effects of international trade linkages, have demonstrated that the deficit-reducing effects of higher demand growth in the United Stales trading partners could be substantial. Thus, on average, the simulations suggest that if demand outside the United States were to grow 1 percentage point higher than United States demand, the deficit would be reduced by SI7 billion after three years and by more than $40 billion after five years.
72
through the banking sector during the third quarter of 1987, in response to the widening of differentials between United States interest rates and those in other countries, especially Japan and the Federal Republic of Germany.
The evidence tends to show, however, that these changes in effective exchange rates have been only partially reflected in the terms of trade of the United States.61 In particular, there was an asymmetry in the behaviour of export and import prices, which is explainable by the way in which firms have adjusted profit margins to cushion the impact of exchange-rate changes,62 for example, by cuts in wages or by switching production to low-cost countries, especially by manufacturers in Japan. Studies show, in particular, that the decline of the dollar was reflected only partially in higher dollar import prices in the United States. On the other hand, it did not immediately influence the dollar prices of exports and, therefore, was reflected in a drop in the relative prices of United States goods in foreign markets.63 These findings tend to support the view that the relatively slow response of the trade deficit so far to the decline of the dollar can be accounted for by the sluggishness in the response of trade prices and not so much to the failure of the trade volumes to respond to price changes. Consequently, the full impact on the value of imports and exports has still to be felt. Nevertheless, despite this expected improvement in the competitiveness of exports, it may not prove sufficient to close the existing wide trade gap of the United States.
(d) Trade adjustment: supply aspects
There has been widespread concern about the ability of United States industry to recover its losses in market shares simply by improving its competitiveness through dollar depreciation. On the one hand, foreign suppliers that had entrenched themselves in United States markets during the years of dollar overvaluation might prove difficult to displace. On the other hand, there seems to have been some inertia on the part of United States firms to expand their productive capacity in order to recoup their
market losses, both at home and abroad.64 One reason for this inertia appears to be the instability of the dollar exchange rate over the past few years.
The reluctance to invest in new capacity by United States producers contrasts with the attitude of foreign competitors. Dollar devaluation encouraged both Western European and Japanese firms to increase substantially their direct investment in the United States. A short-term perverse effect of this wave of foreign direct investment might be to increase imports for the establishment or expansion of production facilities.
At the aggregate level, however, it seems that many manufacturing firms still had ample capacity to increase production substantially. According to data published by the Federal Reserve Board of the United States, the rate of capacity utilization in the manufacturing sector was on average only about 82.2 per cent in December 1987, though there was much variation from one industry to another. For instance, both the paper and textile industries were operating at a rates close to or higher than 95 per cent (see table 15). It appears that many companies in these industries were passing up export opportunities in order to cater to the domestic market, which was given higher priority. However, capacity utilization rates were in general relatively low among those manufacturing industries which shipped a large share of their output to foreign markets. As can also be seen from table 15, apart from food processing, the industries with low utilization rates were also those which exported a relatively large proportion of their total output, and these were mostly investment goods industries (instruments, vehicles and machinery). This was even more the case in 1981 with exports to the developing countries, i.e. prior to the debt crisis. It should be noted that investment in the highly-indebted developing countries, especially in Latin America, has declined significantly in recent years and thus had a depressing effect on United States capital goods exports.65
Given the low capacity utilization rates, these industries should have ample room for expansion to meet a resurgence of investment demand in those developing countries.
61 See TDR 1987, table 10. 62 P R . Krugman has suggested that the failure of import prices to rise in line with devaluation was due to sunk costs
and exchange-rate volatility. (Financial Times, 11 February 1988).
63 See P R . Krugman and R E . Baldwin, "The Persistence of the United States Trade Deficit", Brookings Papers on Economic Activity, January 1987, p 21 .
64 T h u s , there is the possibility that the long-term damage inflicted by the years of dollar overvaluation has prevented exporters from responding quickly to the new favourable competitive position. T h e failure of impor t prices to respond fully to exchange-rate trends is also considered by some observers to be evidence of long-term damage .
65 For more details on the recent compression of capital goods imports by the highly-indebted developing countries see chap . IV, sect. A.5 , below.
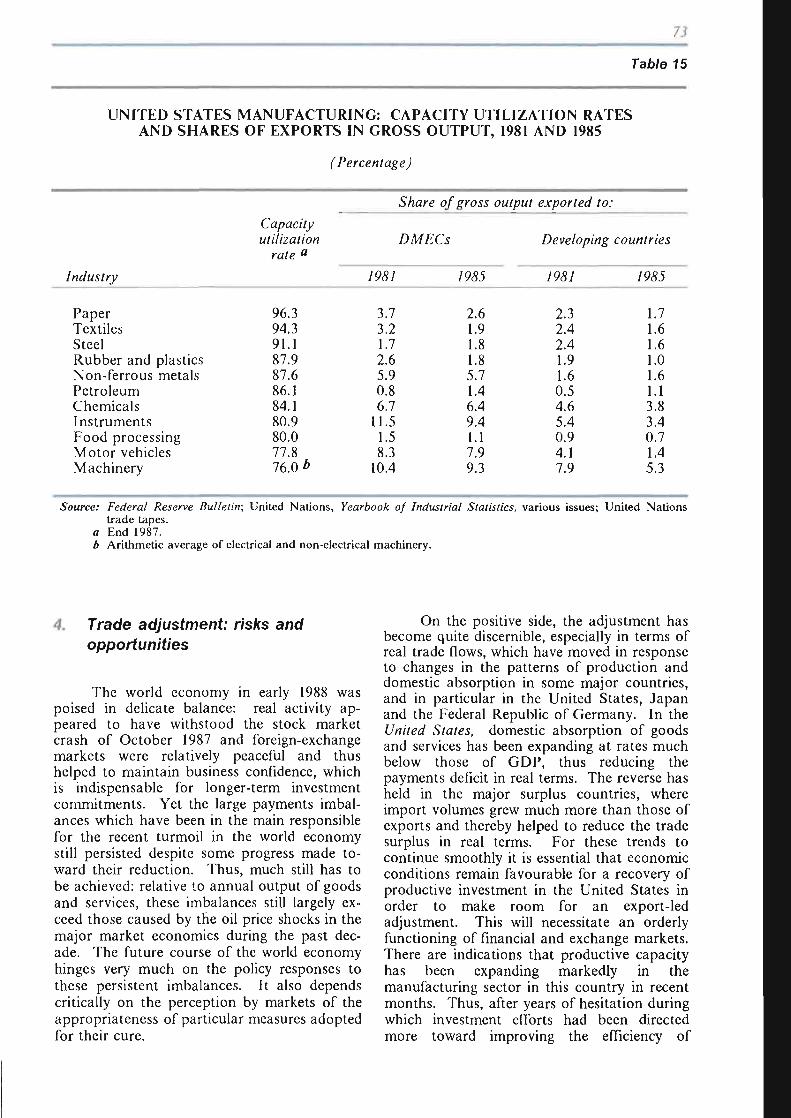
73
Table 15
UNITED STATES MANUFACTURING: CAPACITY UTILIZATION RATES AND SHARES OF EXPORTS IN GROSS OUTPUT, 1981 AND 1985
(Percentage)
Industry
Paper Textiles Steel Rubber and plastics Non-ferrous metals Petroleum Chemicals Instruments Food processing Motor vehicles Machinery
Capacity utilization
rate a
96.3 94.3 91.1 B7.9 87.6 86.1 84.1 80.9 80.0 77.8 76.0 6
Share of
DMECs
7969/
3.7 3.2 1.7 2.6 5.9 0.8 6.7
11.5 1.5 8.3
10.4
gross output
/P&5
2.6 1.9 1.8 1.8 5.7 1.4 6.4 9.4 1.1 7.9 9.3
exported to:
Developing
/&;/
2.3 2.4 2.4 1.9 1.6 0.5 4.6 5.4 0.9 4.1 7.9
countries
/&9J
1.7 1.6 1.6 1.0 1.6 1.1 3.8 3.4 0.7 1.4 5.3
Source: Federal Reserve Bulletin; United Nations, Yearbook of Industrial Statistics, various issues; United Nations trade tapes.
a End 1987. b Arithmetic average of electrical and non-electrical machinery.
Trade adjustment: risks and opportunities
The world economy in early 1988 was poised in delicate balance: real activity appeared to have withstood the stock market crash of October 1987 and foreign-exchange markets were relatively peaceful and thus helped to maintain business confidence, which is indispensable for longer-term investment commitments. Yet the large payments imbalances which have been in the main responsible for the recent turmoil in the world economy still persisted despite some progress made toward their reduction. Thus, much still has to be achieved: relative to annual output of goods and services, these imbalances still largely exceed those caused by the oil price shocks in the major market economies during the past decade. The future course of the world economy hinges very much on the policy responses to these persistent imbalances. It also depends critically on the perception by markets of the appropriateness of particular measures adopted for their cure.
On the positive side, the adjustment has become quite discernible, especially in terms of real trade flows, which have moved in response to changes in the patterns of production and domestic absorption in some major countries, and in particular in the United States, Japan and the Federal Republic of Germany. In the United States, domestic absorption of goods and services has been expanding at rates much below those of GDP, thus reducing the payments deficit in real terms. The reverse has held in the major surplus countries, where import volumes grew much more than those of exports and thereby helped to reduce the trade surplus in real terms. For these trends to continue smoothly it is essential that economic conditions remain favourable for a recovery of productive investment in the United States in order to make room for an export-led adjustment. This will necessitate an orderly functioning of financial and exchange markets. There are indications that productive capacity has been expanding markedly in the manufacturing sector in this country in recent months. Thus, after years of hesitation during which investment efforts had been directed more toward improving the efficiency of
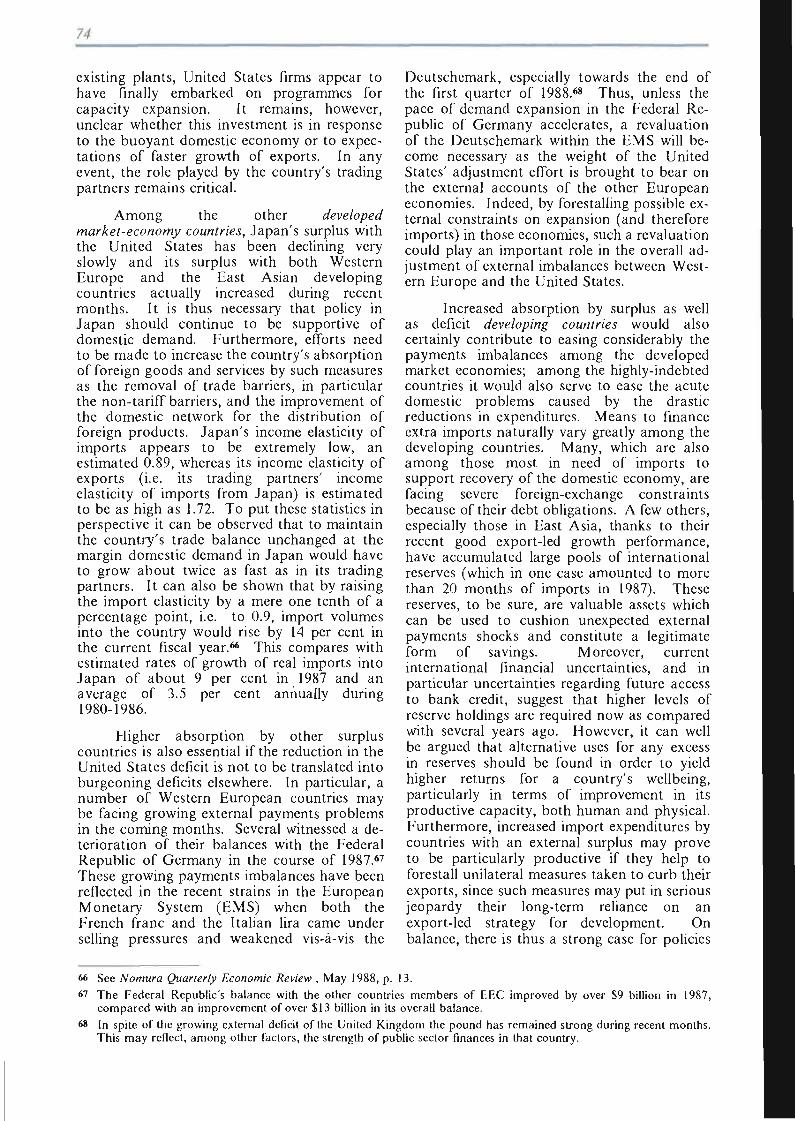
existing plants, United States firms appear to have finally embarked on programmes for capacity expansion. It remains, however, unclear whether this investment is in response to the buoyant domestic economy or to expectations of faster growth of exports. In any event, the role played by the country's trading partners remains critical.
Among the other developed market-economy countries, Japan's surplus with the United States has been declining very slowly and its surplus with both Western Europe and the East Asian developing countries actually increased during recent months. It is thus necessary that policy in Japan should continue to be supportive of domestic demand. Furthermore, efforts need to be made to increase the country's absorption of foreign goods and services by such measures as the removal of trade barriers, in particular the non-tariff barriers, and the improvement of the domestic network for the distribution of foreign products. Japan's income elasticity of imports appears to be extremely low, an estimated 0.89, whereas its income elasticity of exports (i.e. its trading partners' income elasticity of imports from Japan) is estimated to be as high as 1.72. To put these statistics in perspective it can be observed that to maintain the country's trade balance unchanged at the margin domestic demand in Japan would have to grow about twice as fast as in its trading partners. It can also be shown that by raising the import elasticity by a mere one tenth of a percentage point, i.e. to 0.9, import volumes into the country would rise by 14 per cent in the current fiscal year.66 This compares with estimated rates of growth of real imports into Japan of about 9 per cent in 1987 and an average of 3.5 per cent annually during 1980-1986.
Higher absorption by other surplus countries is also essential if the reduction in the United States deficit is not to be translated into burgeoning deficits elsewhere. In particular, a number of Western European countries may be facing growing external payments problems in the coming months. Several witnessed a deterioration of their balances with the Federal Republic of Germany in the course of 1987.67
These growing payments imbalances have been reflected in the recent strains in the European Monetary System (EMS) when both the French franc and the Italian lira came under selling pressures and weakened vis-à-vis the
Deutschemark, especially towards the end of the first quarter of 1988.^ Thus, unless the pace of demand expansion in the Federal Republic of Germany accelerates, a revaluation of the Deutschemark within the EMS will become necessary as the weight of the United States' adjustment effort is brought to bear on the external accounts of the other European economies. Indeed, by forestalling possible external constraints on expansion (and therefore imports) in those economies, such a revaluation could play an important role in the overall adjustment of external imbalances between Western Europe and the United States.
Increased absorption by surplus as well as deficit developing countries would also certainly contribute to easing considerably the payments imbalances among the developed market economies; among the highly-indebted countries it would also serve to ease the acute domestic problems caused by the drastic reductions in expenditures. Means to finance extra imports naturally vary greatly among the developing countries. Many, which are also among those most in need of imports to support recovery of the domestic economy, are facing severe foreign-exchange constraints because of their debt obligations. A few others, especially those in East Asia, thanks to their recent good export-led growth performance, have accumulated large pools of international reserves (which in one case amounted to more than 20 months of imports in 1987). These reserves, to be sure, are valuable assets which can be used to cushion unexpected external payments shocks and constitute a legitimate form of savings. Moreover, current international financial uncertainties, and in particular uncertainties regarding future access to bank credit, suggest that higher levels of reserve holdings are required now as compared with several years ago. However, it can well be argued that alternative uses for any excess in reserves should be found in order to yield higher returns for a country's wellbeing, particularly in terms of improvement in its productive capacity, both human and physical. Furthermore, increased import expenditures by countries with an external surplus may prove to be particularly productive if they help to forestall unilateral measures taken to curb their exports, since such measures may put in serious jeopardy their long-term reliance on an export-led strategy for development. On balance, there is thus a strong case for policies
66 See Nomura Quarterly Economic Review , May 1988, p. 13.
67 The Federal Republic's balance with the other countries members of EEC improved by over $9 billion in 1987, compared with an improvement of over SI 3 billion in its overall balance.
68 In spite of the growing external deficit of the United Kingdom the pound has remained strong during recent months. This may reflect, among other factors, the strength of public sector finances in that country.
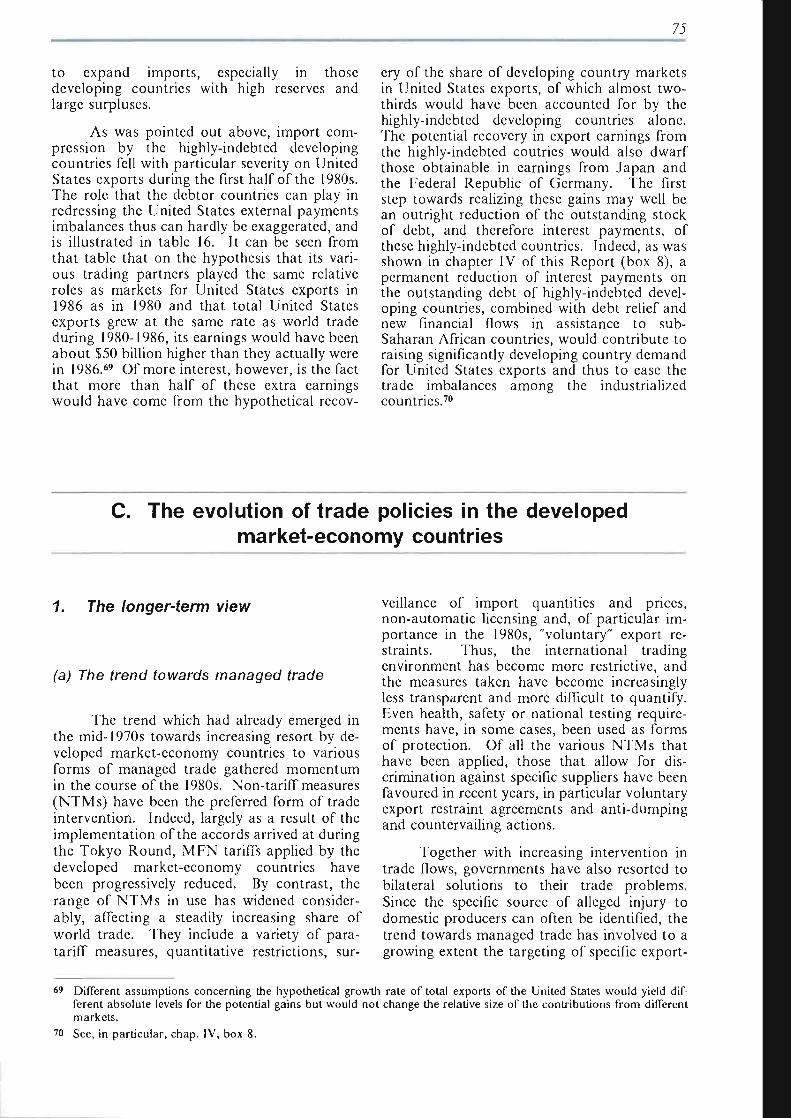
75
to expand imports, especially in those developing countries with high reserves and large surpluses.
As was pointed out above, import compression by the highly-indebted developing countries fell with particular severity on United States exports during the first half of the 1980s. The role that the debtor countries can play in redressing the United States external payments imbalances thus can hardly be exaggerated, and is illustrated in table 16. It can be seen from that table that on the hypothesis that its various trading partners played the same relative roles as markets for United States exports in 1986 as in 1980 and that total United States exports grew at the same rate as world trade during 1980-1986, its earnings would have been about $50 billion higher than they actually were in 1986.69 Of more interest, however, is the fact that more than half of these extra earnings would have come from the hypothetical recov
ery of the share of developing country markets in United States exports, of which almost two-thirds would have been accounted for by the highly-indebted developing countries alone. The potential recovery in export earnings from the highly-indebted coutries would also dwarf those obtainable in earnings from Japan and the Federal Republic of Germany. The first step towards realizing these gains may well be an outright reduction of the outstanding stock of debt, and therefore interest payments, of these highly-indebted countries. Indeed, as was shown in chapter IV of this Report (box 8), a permanent reduction of interest payments on the outstanding debt of highly-indebted developing countries, combined with debt relief and new financial flows in assistance to sub-Saharan African countries, would contribute to raising significantly developing country demand for United States exports and thus to ease the trade imbalances among the industrialized countries.70
C. The evolution of trade policies in the developed market-economy countries
1. The longer-term view
(a) The trend towards managed trade
The trend which had already emerged in the mid-1970s towards increasing resort by developed market-economy countries to various forms of managed trade gathered momentum in the course of the 1980s. Non-tariff measures (NTMs) have been the preferred form of trade intervention. Indeed, largely as a result of the implementation of the accords arrived at during the Tokyo Round, M FN tariffs applied by the developed market-economy countries have been progressively reduced. By contrast, the range of NTMs in use has widened considerably, affecting a steadily increasing share of world trade. They include a variety of para-tariff measures, quantitative restrictions, sur
veillance of import quantities and prices, non-automatic licensing and, of particular importance in the 1980s, "voluntary" export restraints. Thus, the international trading environment has become more restrictive, and the measures taken have become increasingly less transparent and more difficult to quantify. Even health, safety or national testing requirements have, in some cases, been used as forms of protection. Of all the various NTMs that have been applied, those that allow for discrimination against specific suppliers have been favoured in recent years, in particular voluntary export restraint agreements and anti-dumping and countervailing actions.
Together with increasing intervention in trade flows, governments have also resorted to bilateral solutions to their trade problems. Since the specific source of alleged injury to domestic producers can often be identified, the trend towards managed trade has involved to a growing extent the targeting of specific export -
69 Different assumptions concerning the hypothetical growth rate of total exports of the United States would yield different absolute levels for the potential gains but would not change the relative size of the contributions from different markets.
70 See, in particular, chap. IV, box 8.
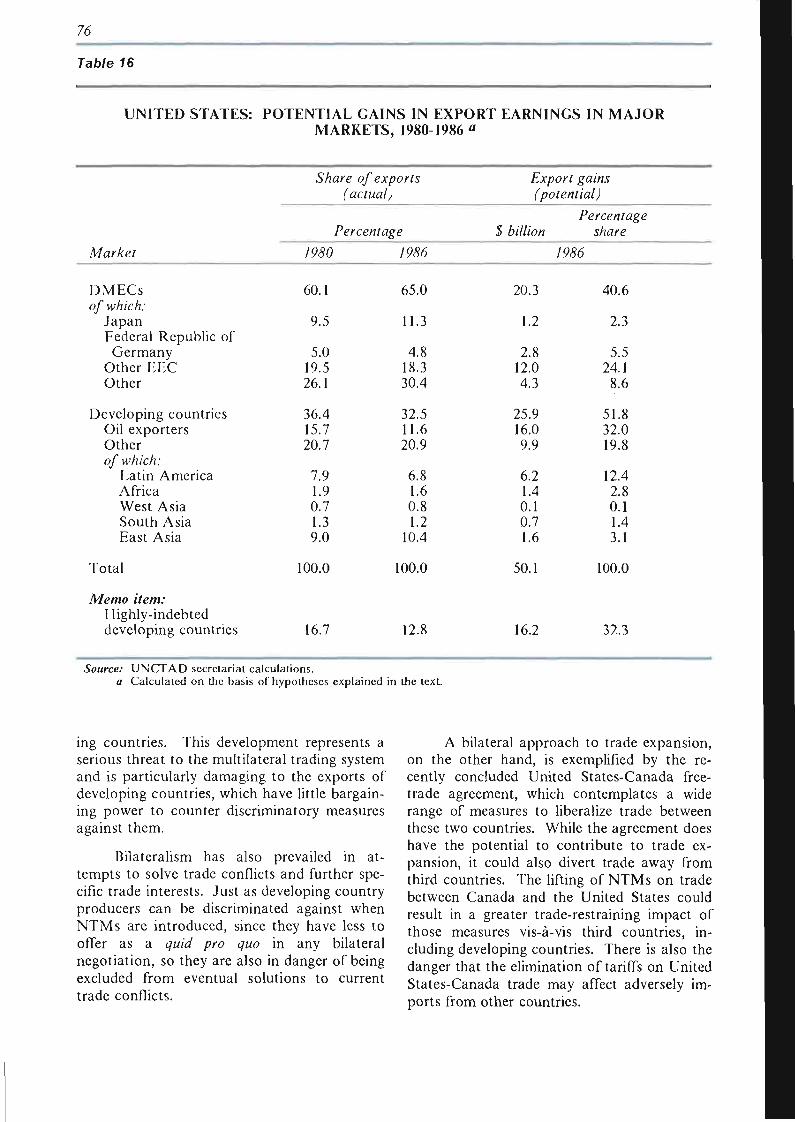
76
Table 16
UNITED STATES: POTENTIAL GAINS IN EXPORT EARNINGS IN MAJOR MARKETS, 1980-1986 «
Market
DMECs of which:
Japan Federal Republic of
Germany Other EEC Other
Developing countries Oil exporters Other of which:
Latin America Africa West Asia South Asia East Asia
Total
Memo item: Highly-indebted developing countries
Share of exports (actual)
Percentage
/960
60.1
9.5
5.0 19.5 26.1
36.4 15.7 20.7
7.9 1.9 0.7 1.3 9.0
100.0
16.7
/ % #
654
11.3
4.8 18.3 30.4
32.5 11.6 20.9
6.8 1.6 0.8 1.2
10.4
100.0
12.8
Export gains (potential)
$ billion Percentage
share
/pas
20.3
1.2
2.8 12.0 4.3
25.9 16.0 9.9
6.2 1.4 0.1 0.7 1.6
50.1
16.2
40.6
2.3
5.5 24.1
8.6
51.8 32.0 19.8
12.4 2.8 0.1 1.4 3.1
100.0
32.3
Source: UNCTAD secretariat calculations. a Calculated on the basis of hypotheses explained in the text.
ing countries. This development represents a serious threat to the multilateral trading system and is particularly damaging to the exports of developing countries, which have little bargaining power to counter discriminatory measures against them.
Bilateralism has also prevailed in attempts to solve trade conflicts and further specific trade interests. Just as developing country producers can be discriminated against when NTMs are introduced, since they have less to offer as a quid pro quo in any bilateral negotiation, so they are also in danger of being excluded from eventual solutions to current trade conflicts.
A bilateral approach to trade expansion, on the other hand, is exemplified by the recently concluded United States-Canada free-trade agreement, which contemplates a wide range of measures to liberalize trade between these two countries. While the agreement does have the potential to contribute to trade expansion, it could also divert trade away from third countries. The lifting of NTMs on trade between Canada and the United States could result in a greater trade-restraining impact of those measures vis-à-vis third countries, including developing countries. There is also the danger that the elimination of tariffs on United States-Canada trade may affect adversely imports from other countries.
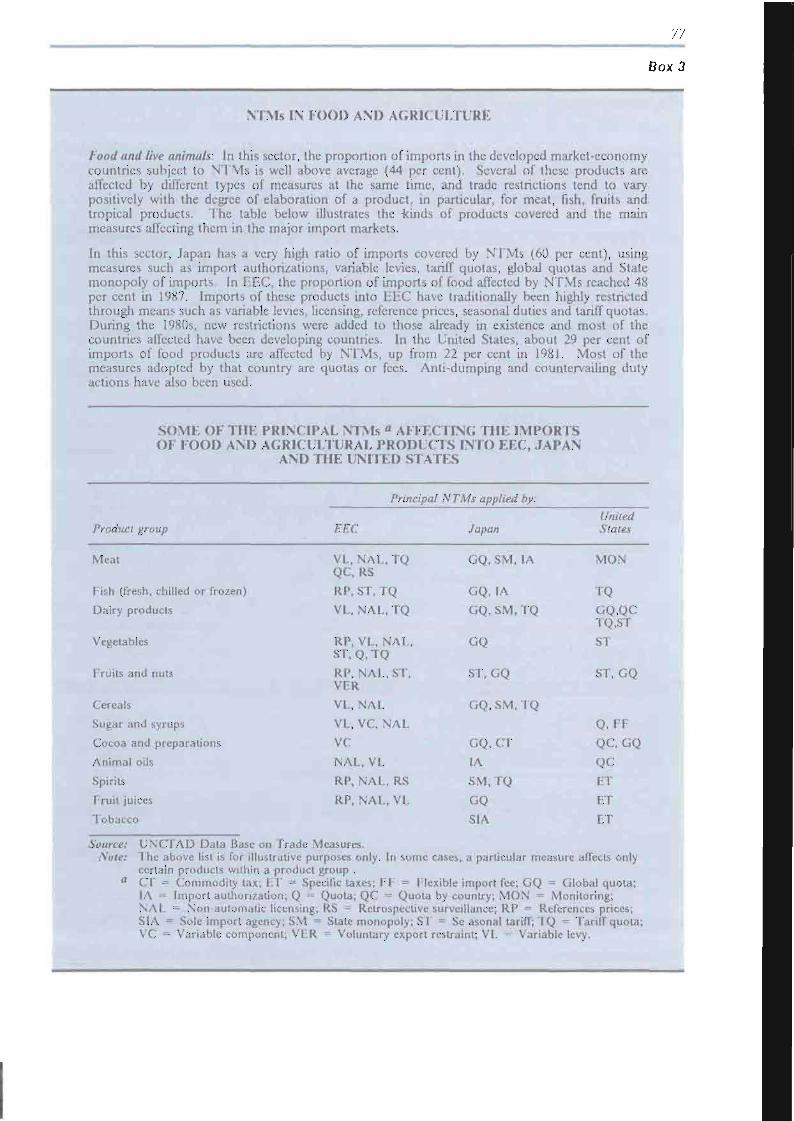
/ /
Box 3
NTMs IN FOOD AND AGRICULTURE
Food and live animals: In this sector, the proportion of imports in the developed market-economy countries subject to NTMs is well above average (44 per cent). Several of these products are affected by different types of measures at the same time, and trade restrictions tend to vary positively with the degree of elaboration of a product, in particular, for meat, fish, fruits and tropical products. The table below illustrates the kinds of products covered and the main measures affecting them in the major import markets.
In this sector, Japan has a very high ratio of imports covered by NTMs (60 per cent), using measures such as import authorizations, variable levies, tariff quotas, global quotas and State monopoly of imports. In EEC, the proportion of imports of food affected by NTMs reached 48 per cent in 1987. Imports of these products into EEC have traditionally been highly restricted through means such as variable levies, licensing, reference prices, seasonal duties and tariff quotas. During the 1980s, new restrictions were added to those already in existence and most of the countries affected have been developing countries. In the United States, about 29 per cent of imports of food products are affected by NTMs, up from 22 per cent in 1981. Most of the measures adopted by that country are quotas or fees. Anti-dumping and countervailing duty actions have also been used.
SOME OF THE PRINCIPAL NTMs a AFFECTING THE IMPORTS OF FOOD AND AGRICULTURAL PRODUCTS LNTO EEC, JAPAN
AND THE UNITED STATES
Product group
Meat
Fish (fresh, chilled
Dairy products
Vegetables
Fruits and nuts
Cereals
Sugar and syrups
or frozen)
Cocoa and preparations
Animal oils
Spirits
Fruit juices
Tobacco
Source: UNCTAD Data Base A W : The above list is for ill
on Trade ustrative i
Principal
EEC
VL, NAL.TQ QC, RS
RP, ST, TQ
VL, NAL,TQ
RP, VL, NAL, ST, Q, TQ
RP, NAL, ST, VER
VL, NAL
VL, VC, NAL
VC
NAL, VL
RP, NAL, RS
RP, NAL, VL
NTMs applied by:
Measures. purposes only. In some cases
Japan
GQ, SM,
GQ, IA
GQ, SM,
GQ
ST, GQ
GQ, SM
GQ, CT
IA
SM,TQ
GQ
S1A
a particul
IA
TQ
TQ
ar measure
United States
MON
TQ
GQ.QC TQ.ST
ST
ST, GQ
Q, FF
QC, GQ
QC
ET
ET
ET
affects only certain products within a product group . Cr = Commodity tax; ET = Specific taxes; FF = Flexible import fee; GQ = Global quota; IA = Import authorization; Q = Quota; QC = Quota by country; MON - Monitoring; NAL = Non automatic licensing; RS = Retrospective surveillance; RP = References prices; SIA = Sole import agency; SM = State monopoly; ST = Se asonal tariff; TQ = Tariff quota; VC = Variable component; VER = Voluntary export restraint; VL = Variable levy.
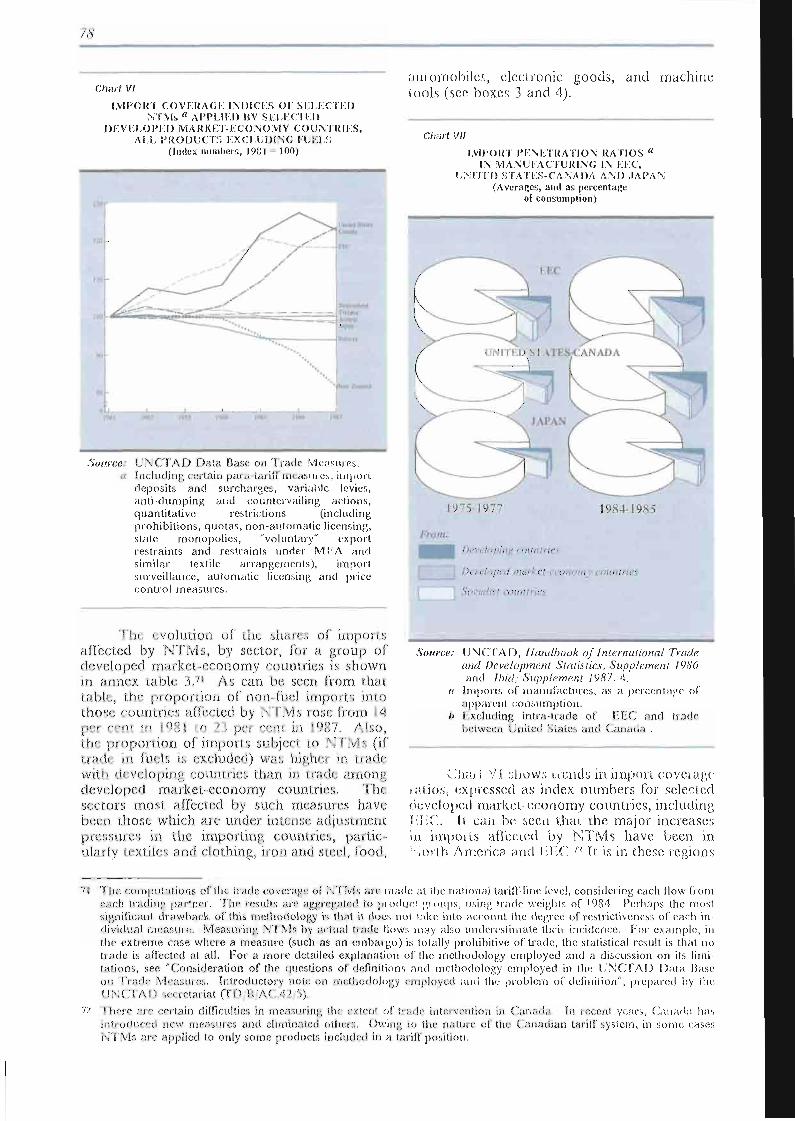
78
Chart VI
IMPORT COVERAGE INDICES Of SELECTED NTMs " APPLIED 1SY SELECTED
DEVELOPED MARKET-ECONOMY COUNTRIES, ALL PRODUCTS EXCLUDING I UCLS
(Index numbers, 1981 = 100)
« 0 /T
- * — _ _ ^ - " ^ s'
^Z-S
1
I1IU I *
Liiiuii Sum O H * •
1'
SmidtMid 1 In l«nn
Nw /rilumt
.%»KCR.- U N C T A D Data Base on Trade Measures. S including certain para tariff measures, import
deposits and surcharges, variable levies, a n t i d u m p i n g and countervailing actions, quantitative restrictions (including prohibitions, quotas , non-automatic licensing, state monopolies , "voluntary" export restraints and restraints under M FA and similar textile arrangements), import surveillance, automatic licensing and price control measures .
automobiles, electronic goods, and machine tools (see boxes 3 and 4).
Chart VII
IMPORT PENETRATION RATIOS " IN MANUFACTURING IN EEC,
UNITED STATES-CANADA AND JAPAN (Averages, and as percentage
of consumption)
1975-1977 1984-1985
•
9 Developing countries
Developed market economy countries
Socialist count) ¡es
i fie evolution oí tne siums ut imports alTccicd by NTMs, by sector, Tor a fuoup of developed market economy countries is shown in annex table 3.7J As can be seen from that table, ihr pioponiou of non fuel imports into those countries affected by NTMs tose (rom M per cení in #9%l. m / ] pe/ rem in f%'/. Also, the pro{)onioo of imports subject to NTMs (if trade in fuels is excluded) was hifdi».) m uadc with developing countries than m trade mnong developed market-economy counlries. I'he sector; mosi afiected by such ineasmes have: been those which are under intense adjustment pressures in the importing countries, partic-ularly textiles and clothing, iron %n() sn^el, Ibod,
Source: U N C T A D , Handbook of International Trade and Development Statistics, Supplement 1986 and Ibid: Supplement 1987. 4
a Imporis of manufactures, as a percentage of apparent consumption.
b Excluding intra trade of E E C and trade between United Slates and Canada .
Chart V ( shows trends in import coverage ratios, expressed as index numbers for selected developed market-economy countries, including EEC. It can be seen that the majoi increases in imports affected by NTMs have been in North America and liKC " ll is in these regions
/: T h e computa t ions of the trade coverage of N T M s are made at the national tariff-line level, considering each flow from each trading partner . The results are aggregated to product groups, using trade weights of 1984, Perhaps the most significant drawback of this methodology is tiiat it docs not fake into account the degree of íestrictiveness of each in dividual measure , Measuring N T M s by actual h a d e flows may also underestimate their incidence. Foi example, in the extreme case where a measure (such as an embargo) is totally prohibitive of trade, the statistical result is that no t rade is affected at all. For a more detailed explanation of the methodology employed and a discussion on its limitations, see "Consideration of the questions of definitions and methodology employed in the U N C T A D Data Base on T r a d e Measures . Introductory note on methodology employed and the problem of definition", prepared by the U N C T A D wrre ta i i a t f( D ft A C T ; ',).
72 The re arc certain difficulties in measuring !h- extent of trade intervention in Canada , In recent years, Canada has introduced new measures and eliminated oilier:;. Owing ¡o ¡he natuie of the Canadian tariff system, in some eases N I M í a ie applied to only some products included in a tariff position
79
that established domestic producers have come under increasing competition from Japanese and developing country producers in an increasing number of sectors.
On the other hand, Japan's import coverage ratio has remained practically unchanged. Its principal trade measures are quantitative restrictions, which affect the imports of food, chemicals, leather and textiles, but perhaps the most important obstacles to trade in Japan are technical standards and regulations on imports. During the 1980s, there has been a movement towards liberalizing imports, including the simplification of regulations, partly as a result of bilateral agreements or of action to avoid retaliation by its main trading partners. Nevertheless, as shown in chart VII, the share of imports in apparent consumption of manufactures is considerably lower in Japan than in the other major trading areas, even after the intra-trade of EEC and of the United States and Canada are excluded from the ratios in order to take account of the close integration of the respective groups, i.e. among countries at similar levels of development. In addition, Japan's import penetration ratio has increased much less than those of its main trading partners since the mid-1970s. The relatively low level and rate of increase in the share of imports in domestic consumption of manufactures are often taken as an indication that certain features of the Japanese economy discourage imports in ways which escape measurement but which still constitute forms of intangible protection. This is, however, a subject of considerable debate, and research on the topic has not yielded definite conclusions.73
(b) The role of inadequate structural adjustment
As noted above, NTMs are concentrated in specific sectors. In some cases, particularly in traditional manufactures, protectionism has been a policy response to the loss of international competitiveness to foreign producers brought about by differential rates of growth in factor productivity. Thus, some forms of non-tariff barriers had already made their appearance in sectors such as textiles and clothing as far back as the early 1960s, when exporters from Japan and a small number of developing countries began to demonstrate their ability to
penetrate markets in North America and Western Europe.
With the passage of time, the problems of structural adjustment began to spread to other sectors employing more complex technologies. Beginning in the 1970s, they were compounded by the shift that took place in the stance of macroeconomic policies in most industrialized countries from maintaining full employment to combating inflation. In the face of growing unemployment, in some cases protectionism came to be used as a tool to relieve the employment effects of the change in the objectives of macroeconomic policy.
In addition, partly as a result of the more restrictive tilt of demand management policies, there was a visible decline in the rhythm of economic growth, which became more marked in the 1980s. In such an environment, positive structural adjustment measures targeted at sectors where much of the unemployment is located have become politically difficult to put in place. And it is precisely those sectors that have come under pressure from new suppliers based mainly in Japan and in some developing countries. Thus, there is a rough sectoral coincidence between the degree of import penetration (as measured by the share of imports in apparent consumption) and the share of imports affected by NTMs.
This broad positive association between import penetration and NTMs does not hold in all industries. Industries characterized by a large component of intra-industry trade exhibit both high import penetration ratios and, at the same time, high shares of exports in total production. In such industries, where a significant proportion of trade among the industrialized countries of North America and Western Europe is concentrated, levels of protection tend to be low. On the other hand, although intra-industry trade between the developed market-economy countries and some of the more industrialized developing countries is growing, most trade between these two groups of countries is of an inter-industry nature. In manufacturing, developing countries have concentrated on the export of labour-intensive goods or of goods which utilize fairly standardized technologies. The increasing imports of these goods into the developed market-economy countries is often associated with intensified competition and adjustment pressures. For this reason, the problem of protectionism tends to centre on these sectors, and high im-
73 for a full discussion of this issue, see C. Fred Bergsten and William R. Cline, The United States - Japan Economic Problem (Washington, D C : Institute for International Economics, 1987), chap. 3; and Robert Z. Lawrence, "Imports in Japan: Closed markets or minds?", Brookings Papers on Economic Activity, No. 2, 1987.
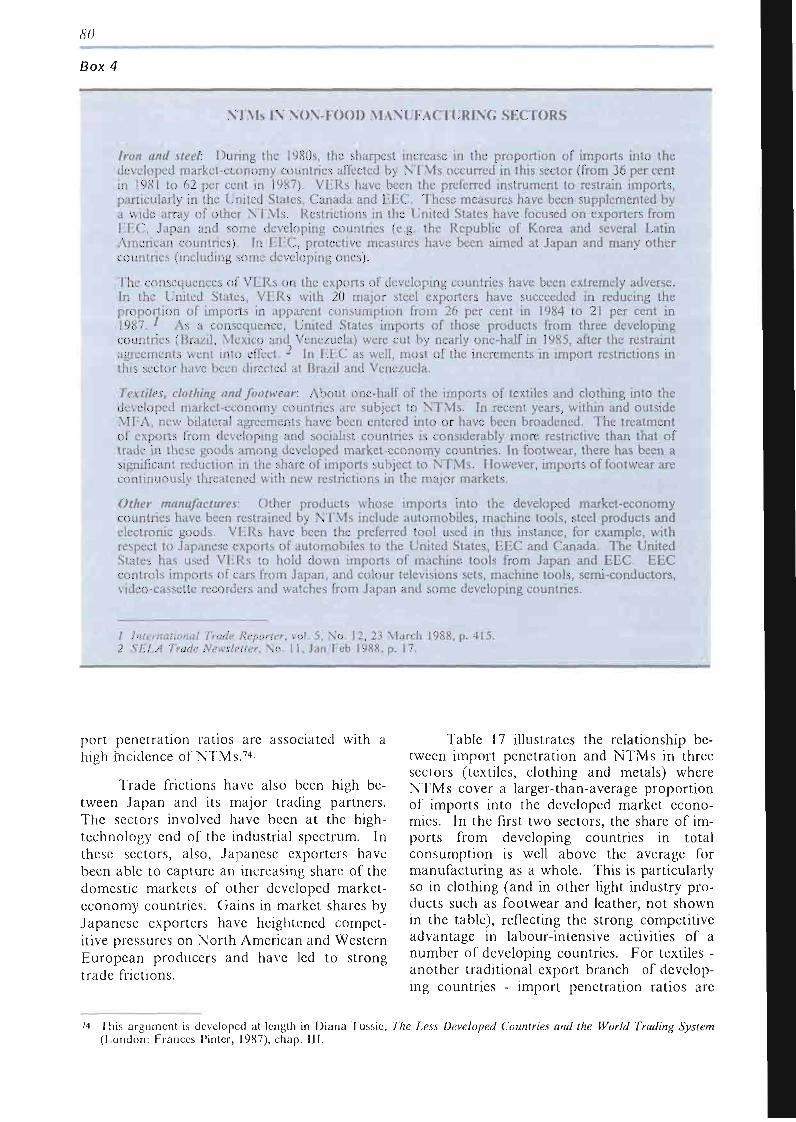
¿YO
Box 4
NTMs IN NONFOOD MANUFACTURING SECTORS
Iron and steel: During the 1980s, the sharpest increase in the proportion of imports into the developed market-economy countries affected by NTMs occurred in this sector (from 36 per cent in 1981 to 62 per cent in 1987). VERs have been the preferred instrument to restrain imports, particularly in the United States, Canada and EEC. These measures have been supplemented by a wide array of other NTMs. Restrictions in the United States have focused on exporters from EEC, Japan and some developing countries (e.g. the Republic of Korea and several Latin American countries). In EEC, protective measures have been aimed at Japan and many other countries (including some developing ones).
The consequences of VERs on the exports of developing countries have been extremely adverse. In the United States, VERs with 20 major steel exporters have succeeded in reducing the proportion of imports in apparent consumption from 26 per cent in 1984 to 21 per cent in 1987. ' As a consequence, United States imports of those products from three developing countries (Brazil, Mexico and Venezuela) were cut by nearly one-half in 1985, after the restraint agreements went into effect. ^ In EEC as well, most of the increments in import restrictions in this sector have been directed at Brazil and Venezuela.
Textiles, clothing and footwear: About one-half of the imports of textiles and clothing into the developed market-economy countries are subject to NTMs. In recent years, within and outside MEA, new bilateral agreements have been entered into or have been broadened. The treatment of exports from developing and socialist countries is considerably more restrictive than that of trade in these goods among developed market-economy countries. In footwear, there has been a significant reduction in the share of imports subject to NTMs. However, imports of footwear are continuously threatened with new restrictions in the major markets.
Other manufactures: Other products whose imports into the developed market-economy countries have been restrained by NTMs include automobiles, machine tools, steel products and electronic goods. VERs have been the preferred tool used in this instance, for example, with respect to Japanese exports of automobiles to the United States, EEC and Canada. The United States has used VERs to hold down imports of machine tools from Japan and EEC. EEC controls imports of cars from Japan, and colour televisions sets, machine tools, semi-conductors, video-cassette recorders and watches from Japan and some developing countries.
/ International Trade Reporter, vol. 5, No. 12, 23 March 1988, p. 415. 2 SELA Trade Newsletter, No. 11, Jan/Feb 1988, p. 17.
port penetration ratios are associated with a high incidence of NTMs.7 4-
Trade frictions have also been high between Japan and its major trading partners. The sectors involved have been at the high-technology end of the industrial spectrum. In these sectors, also, Japanese exporters have been able to capture an increasing share of the domestic markets of other developed market-economy countries. Gains in market shares by Japanese exporters have heightened competitive pressures on Nor th American and Western European producers and have led to strong trade frictions.
'14 This argument is developed at length in Diana Tussic (London: Frances Pinter, 1987), chap. III.
Table 17 illustrates the relationship between import penetration and N T M s in three sectors (textiles, clothing and metals) where N T M s cover a larger-than-average proportion of imports into the developed market economies. In the first two sectors, the share of imports from developing countries in total consumption is well above the average for manufacturing as a whole. This is particularly so in clothing (and in other light industry products such as footwear and leather, not shown in the table), reflecting the strong competitive advantage in labour-intensive activities of a number of developing countries. For textiles -another traditional export branch of developing countries - import penetration ratios are
The Less Developed Countries and the World Trading System
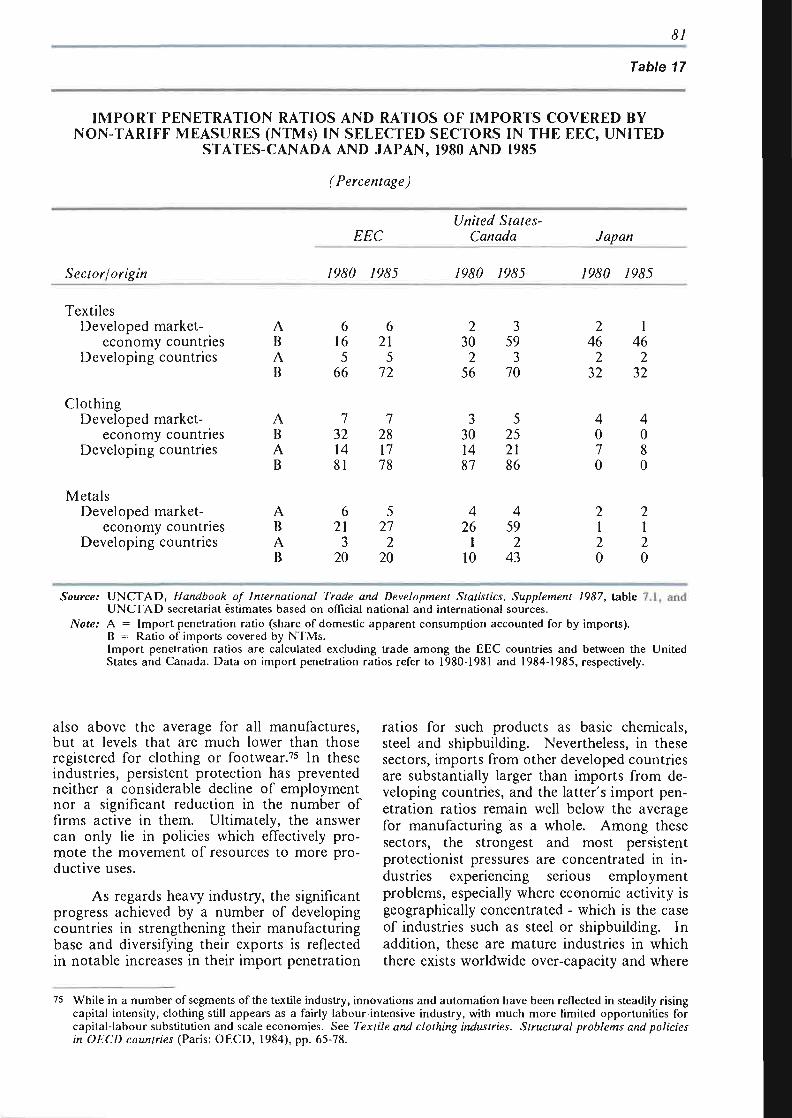
81
Table 17
IMPORT PENETRATION RATIOS AND RATIOS OF IMPORTS COVERED BY NON TARIFF MEASURES (NTMs) IN SELECTED SECTORS IN THE EEC, UNITED
STATES CANADA AND JAPAN, 1980 AND 1985
(Percentage)
Sector/origin
Textiles Developed market-
economy countries Developing countries
Clothing Developed market-
economy countries Developing countries
Metals Developed market-
economy countries Developing countries
A B A B
A B A B
A B A B
EEC
/&S0
6 16 5
66
7 32 14 81
6 21
3 20
/9&5
6 21
5 72
7 28 17 78
5 27
2 20
United States-Canada
7 WW
2 30 2
56
3 30 14 87
4 26
1 10
79&J
3 59
3 70
5 25 21 86
4 59 2
43
Japan
/960
2 46
2 32
4 0 7 0
2 1 2 0
1985
1 46
2 32
4 0 8 0
2 1 2 0
Source: UNCTAD, Handbook of International Trade and Development Statistics, Supplement 1987, table 7.1, and UNCTAD secretariat estimates based on official national and international sources.
Note: A = Import penetration ratio (share of domestic apparent consumption accounted for by imports). B = Ratio of imports covered by NTMs. Import penetration ratios are calculated excluding trade among the EEC countries and between the United States and Canada. Data on import penetration ratios refer to 1980-1981 and 1984-1985, respectively.
also above the average for all manufactures, but at levels that are much lower than those registered for clothing or footwear.75 In these industries, persistent protection has prevented neither a considerable decline of employment nor a significant reduction in the number of firms active in them. Ultimately, the answer can only lie in policies which effectively promote the movement of resources to more productive uses.
As regards heavy industry, the significant progress achieved by a number of developing countries in strengthening their manufacturing base and diversifying their exports is reflected in notable increases in their import penetration
ratios for such products as basic chemicals, steel and shipbuilding. Nevertheless, in these sectors, imports from other developed countries are substantially larger than imports from developing countries, and the latter's import penetration ratios remain well below the average for manufacturing as a whole. Among these sectors, the strongest and most persistent protectionist pressures are concentrated in industries experiencing serious employment problems, especially where economic activity is geographically concentrated - which is the case of industries such as steel or shipbuilding. In addition, these are mature industries in which there exists worldwide over-capacity and where
75 While in a number of segments of the textile industry, innovations and automation have been reflected in steadily rising capital intensity, clothing still appears as a fairly labour-intensive industry, with much more limited opportunities for capital-labour substitution and scale economies. See Textile and clothing industries. Structural problems and policies in OECD countries (Paris: OECD, 1984), pp. 65-78.

62
the scope for product diversification is much more limited than in most light industries. These characteristics explain the persistence of protectionist pressures in such industries, as well as their particular sensitiveness to even a marginal increase in import penetration.
High or growing levels of import penetration do not necessarily lead to the imposition of protectionist measures. As has already been mentioned, much of the trade among developed market-economy countries is composed of two-way flows in the same industry. In such cases, high import penetration ratios go hand in hand with a significant proportion of exports in total production in the same sectors. In addition, barriers to trade tend to be low or nonexistent, since in these sectors growth and profitability are associated with economies of scale that arise from access to larger markets than those afforded by a national economy.
As some developing countries have matured industrially, they have also tended to engage increasingly in two-way intra-industry trade with the developed market-economy countries. In recent years, the export performance of some developing countries in a number of more technology-intensive products (e.g. telecommunications equipment, domestic electrical appliances, machines and turbines, photographic and optical goods, watches and clocks) has been remarkable. The penetration of technology-intensive products from developing countries may have been facilitated by the fact that protectionist pressure has generally been less accentuated in sectors characterized by high product differentiation and specialization, high elasticity of demand and industrial structures which are dispersed geographically.76
However, a development which is probably of even more importance has been the rapidly growing two-way trade in this area between developed market-economy countries and developing countries. As the latter countries diversify and upgrade their productive and export structures, their needs for capital goods and technology also increase considerably. Many firms in the industrial countries which are dependent upon exports of such goods are sensitive to the possibility that protection at home might trigger off protection abroad. Moreover, in certain industries, firms in the developed market-economy countries have become dependent on intermediate goods and compo
nents manufactured or assembled in developing countries. Protection of such imports raises the cost of production for such firms and renders them uncompetitive internationally.
The incipient development of two-way trade between developed and developing countries, however, has not been confined to high-technology sectors. Even in some traditional, labour-intensive sectors, such as clothing, the share of exports to developing countries in the production of developed market-economy countries has been rising, albeit slowly and from low levels. This reflects largely the importance in this area of offshore assembling and sub-contracting arrangements with the developing countries.
(c) Protectionism and exchange-rate instability
The extreme variability and prolonged periods of misalignment that have characterized exchange rates since the abandonment of the Bretton Woods system of fixed parities in 1973 (and that are discussed in chapter II) have been another force behind the spread of protectionism. Since exchange-rate volatility has been on the increase in the 1980s (see table 18), it is not surprising that governments have sought increasingly to manage trade flows. Recent studies have found evidence linking the rise of protectionism to exchange-rate volatility. On the one hand, it has been shown that currency appreciation has led to rapid increases in import penetration in a large number of manufacturing sectors in the countries experiencing the appreciation.77 On the other hand, a positive association between import penetration ratios and the imposition of NTMs has also been found.78 However, the existence of a causal association running from exchange-rate volatility to protectionism depends on there being an asymmetry in the political process whereby protectionism is granted: protectionist measures taken during a period of appreciation are not necessarily dismantled once a currency begins to depreciate. If this were the case, exchange-rate volatility would lead to a trendlike increase in protectionism and to a deceleration in the rate of growth of international trade.7?
76 Protectionist measures applied by industrial countries against consumer electronics imports from developing countries have been a major exception.
77 See Eric V. Clifton, "Real exchange rates, import penetration and protectionism in industrial countries", IMF Staff Papers, September 1985.
7& William R. Cline, Exports of Manufactures in Developing Countries (Washington, D C , The Brookings Institution, 1984), chap. two.
79 A recent study (P. dc Grauwe, "Exchange rate variability and the slowdown in the growth of international trade", IMF
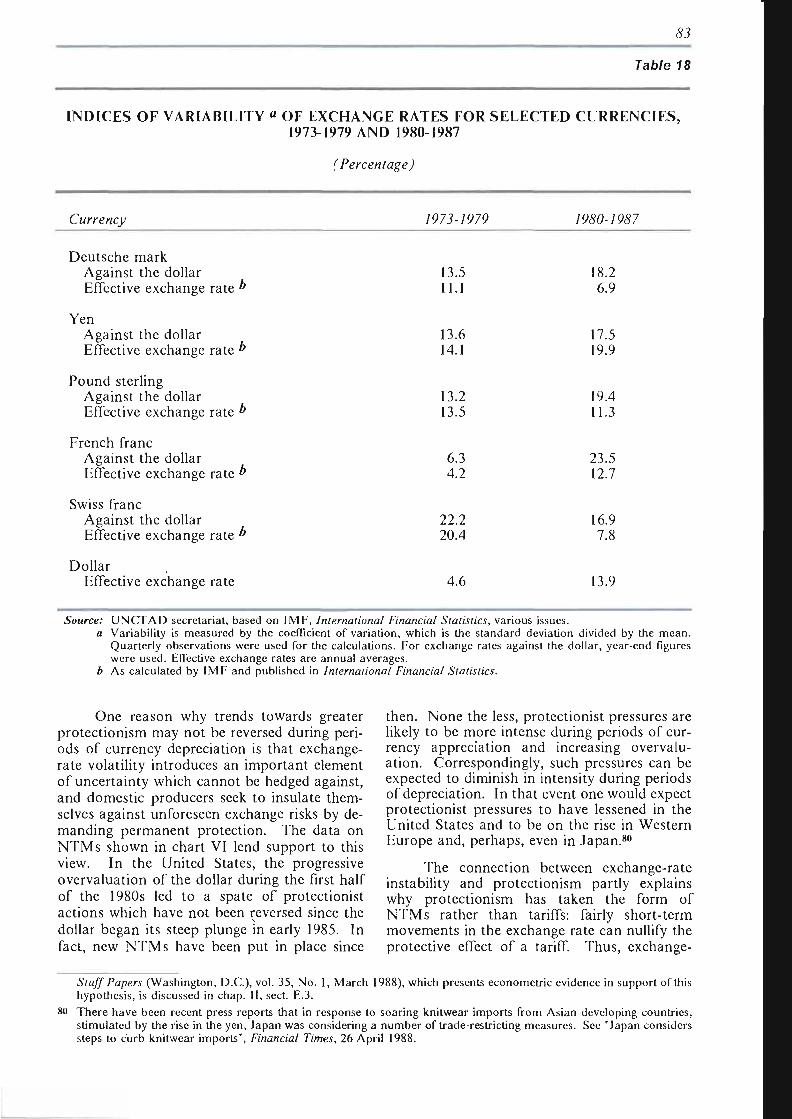
83
Table 18
INDICES OF VARIABILITY « OF EXCHANGE RATES FOR SELECTED CURRENCIES, 1973-1979 AND 1980-1987
(Percentage)
Currency /97J-/97P /%S0-y%97
Deutsche mark Against the dollar Effective exchange rate &
Yen Against the dollar Effective exchange rate ^
Pound sterling Against the dollar Effective exchange rate b
French franc Against the dollar Effective exchange rate *
Swiss franc Against the dollar Effective exchange rate &
Dollar Effective exchange rate
13.5 11.1
13.6 14.1
13.2 13.5
6.3 4.2
22.2 20.4
4.6
18.2 6.9
17.5 19.9
19.4 11.3
23.5 12.7
16.9 7.8
13.9
Source: UNCTAD secretariat, based on IMF, International Financial Statistics, various issues. a Variability is measured by the coefficient of variation, which is the standard deviation divided by the mean.
Quarterly observations were used for the calculations. For exchange rates against the dollar, year-end figures were used. Effective exchange rates are annual averages.
b As calculated by IMF and published in International Financial Statistics.
One reason why trends towards greater protectionism may not be reversed during periods of currency depreciation is that exchange-rate volatility introduces an important element of uncertainty which cannot be hedged against, and domestic producers seek to insulate themselves against unforeseen exchange risks by demanding permanent protection. The data on NTMs shown in chart VI lend support to this view. In the United States, the progressive overvaluation of the dollar during the first half of the 1980s led to a spate of protectionist actions which have not been reversed since the dollar began its steep plunge in early 1985. In fact, new NTMs have been put in place since
then. None the less, protectionist pressures are likely to be more intense during periods of currency appreciation and increasing overvaluation. Correspondingly, such pressures can be expected to diminish in intensity during periods of depreciation. In that event one would expect protectionist pressures to have lessened in the United States and to be on the rise in Western Europe and, perhaps, even in Japan.80
The connection between exchange-rate instability and protectionism partly explains why protectionism has taken the form of NTMs rather than tariffs: fairly short-term movements in the exchange rate can nullify the protective effect of a tariff. Thus, exchange-
so
Staff Papers (Washington, D.C.), vol. 35, No. 1, March 1988), which presents econometric evidence in support of this hypothesis, is discussed in chap. II, sect. E.3. There have been recent press reports that in response to soaring knitwear imports from Asian developing countries, stimulated by the rise in the yen, Japan was considering a number of trade restricting measures. See "Japan considers steps to curb knitwear imports", Financial Times, 26 April 1988.
¿94
rate instability has not only contributed to a more restrictive trading environment but has also been an important factor behind the increasing resort to measures that are targeted at flows from individual trading partners.
The causal relationship running from exchange-rate instability and misalignment to protectionism is also borne out by the data on the trade coverage of NTMs shown in annex table 3. It has already been noted that the increase in the percentage of trade affected by NTMs during the 1980s has been greater for imports from other developed market-economy countries than for imports from developing countries. Exchange-rate instability among major currencies has a greater impact on trade among developed market-economy countries than on trade between those and developing countries. Since exchange-rate instability has increased in the 1980s, it is not surprising that the intensification of protectionism has concentrated on imports from other developed market-economy countries.
There are, of course, other reasons why countries have resorted to NTMs rather than to tariffs. In the first place, as a result of past multilateral trade negotiations, tariffs have been reduced considerably, and countries cannot unilaterally raise them without incurring retaliation from other major trading partners. Secondly, NTMs have certain specific features, in that they can be selectively aimed at individual trading partners whereas tariffs have to be applied in respect of all of them.
2. Recent exchange-rate movements, foreign direct investment and trade policies
Since the first quarter of 1985, there have been dramatic changes in exchange rates which have profoundly affected the competitiveness of the major participants in world trade. By the first quarter of 1988, in real effective terms,81
the dollar had lost more than it had gained from its sharp appreciation during the first half of the 1980s, the yen had appreciated by over 50 per cent, and the Western European currencies (particularly the deutsche mark) had also appreciated significantly (see chart 8). On the other hand, since 1985, the currencies of the major developing country exporters of manu
factures have either continued to depreciate in real effective terms (in some countries, owing to the impact of the debt crisis) or have remained practically unchanged. In recent months, the currencies of the Republic of Korea and Taiwan Province of China have appreciated somewhat, in response to pressure to reduce their growing trade surpluses.
As noted above, these changes should have lessened protectionist pressures in the United States and increased them in Western Europe. To some extent, they have indeed done so. In the United States, there has been a dramatic decline in the number of antidumping or countervailing duty investigations initiated, from 116 in 1985 to 24 in 1987. At the same time, the number of anti-dumping investigations initiated in EEC has remained fairly constant since 1985, at around 40. But the number of such investigations initiated against developing country exporters has been growing steadily over the last few years.
Although the fall in the dollar should have defused protectionist pressures in the United States, there has been no rollback of measures already in place. Indeed, there appears to have been some increase in the proportion of trade affected by NTMs. The trade bill passed by Congress and vetoed by the President in mid-1988 is another indication that protectionist political forces are still strong and could easily overwhelm those groups whose interests lie in unrestricted access to imports. The trade bill has given rise to concern because of provisions which would require strong mandatory action against trading partners perceived to be engaging in "unfair trade practices". The failure of protectionist sentiment markedly to subside as the dollar has fallen supports the view that measures to protect special interests from foreign competition are more easily adopted than removed, because they create vested interests in their perpetuation.
In addition, in the current situation, the fall in the dollar has not sufficiently eased competition from foreign producers in the United States market. This is partly because Japanese and Western European exporters to the United States have been cutting prices in their own currencies in order to protect their market shares in that country.82 In addition, manufactures from the more industrialized developing countries remain quite competitive in the United States market. Thus, domestic United States producers have benefited less
81 The real effective exchange rale for a country's currency takes into account its movements against the trade-weighted currencies of all its major trading partners and differences in the rates of price movements for traded goods and services between the country in question and its trading partners.
82 For a further elaboration of this point, see section B above.
85
from the depreciation of the dollar than might have been expected at first sight.
As can be seen from table 19, there has been a substantial deceleration in the rate of growth of manufactured imports into the United States, but this has not diminished competitive pressures on United States manufacturers. Most of the deceleration has been in imports from Japan. Japanese (and also Western European) firms have been replacing exports to the United States by domestic production within that country. Recent exchange-rate changes, growing trade tensions, and the process of maturation of Japanese firms have all operated to transform these firms from large exporters to truly transnational corporations.83 Also, the main focus of foreign direct investment by Japanese corporations has been the United States. Whereas in 1970 less than one-fifth of the stock of such investment was in the United States, the proportion had risen to over one-third by 1987.
In addition, the growth of imports from developing countries has accelerated. To some extent, in some sectors there has been a shift in the geographical origin of United States imports, from Japan and Western Europe to the more industrialized developing countries. In order to remain competitive, some Japanese companies have relocated part of their production destined for the United States market to some developing country sites - particularly in South-East Asia and Mexico. And some developing country producers have succeeded in capturing part of the United States market previously held by Western European or Japanese manufacturers. Although precise figures are not available, it seems that the decline in the growth of imports from Japan and Western Europe has led to a relatively small increase in output by United States domestic producers, and it may be for this reason that the fall in the dollar has not yet resulted in any significant lessening of protectionist barriers.
Stimulated by currency appreciation, the growth of Western European imports is already accelerating.84 But the rate of increase is being held down by lacklustre economic growth. Imports from the United States have increased, but imports from the more industrialized developing countries have risen much faster. In view of the slow pace of economic growth, this is bound to lead to an intensification of
protectionist pressures -against developing country exports of manufactures. Lingering trade tensions betwen EEC and Japan can also be envisaged, because there has not been as much trade-replacing Japanese foreign direct investment in Western Europe as in the United States.
As far as Japan is concerned, the rise in the yen has triggered quick strategic responses from Japanese transnational corporations, rather than fundamental changes in trade policies. The appreciation of the yen appears to be viewed by the business community and the Government as being more or less permanent, and it is one of the factors accounting for the sharp increase in Japanese foreign investment abroad. Imports into Japan are increasing rapidly, much of the rise being on account of foreign affiliates of Japanese companies; imports from the developing countries of South-East Asia have also been expanding sharply. The growth of imports into Japan is likely to remain high, in view of the rapid expansion in domestic demand, and could make an important contribution to relaxing trade tensions. Imports from other industrialized countries will help to dampen protectionist demands against Japan in those countries. In addition, as Japan becomes a more important absorber of imports from developing countries, those countries, particularly the highly-indebted ones, will be under less pressure to export to the other developed market-economy countries.
it is difficult to predict the future course of trade policies, as it will depend on the changing alignment of political forces within each industrialized country and the interaction of these forces with the evolving domestic and international economic situation. It is possible, however, that new protectionist measures will be increasingly directed at developing country producers.
Given the large number of still unresolved trade disputes, trade tensions among the industrialized countries are unlikely to disappear. However, the recent surge of foreign direct investment in those countries, and particularly into the United States, a phenomenon alluded to above, might lessen protectionist pressures. Since the early 1980s, transnational corporations from Japan and, to a lesser extent, from Western Europe, have been engaging in trade-
83
M
For a fuller discussion of this issue, see UNCTC, Transnational Corporations in World Development - Trends and Prospects (United Nations publication, forthcoming), chaps. I and V. Since they are expressed in dollars, the figures in table 19 overstate the acceleration in the growth of imports into Japan and EEC. During 1980-1985, dollar appreciation tended to understate the growth of imports (expressed in dollars); by the same token, dollar depreciation since 1985 overstates the growth of imports (again, expressed in dollars).
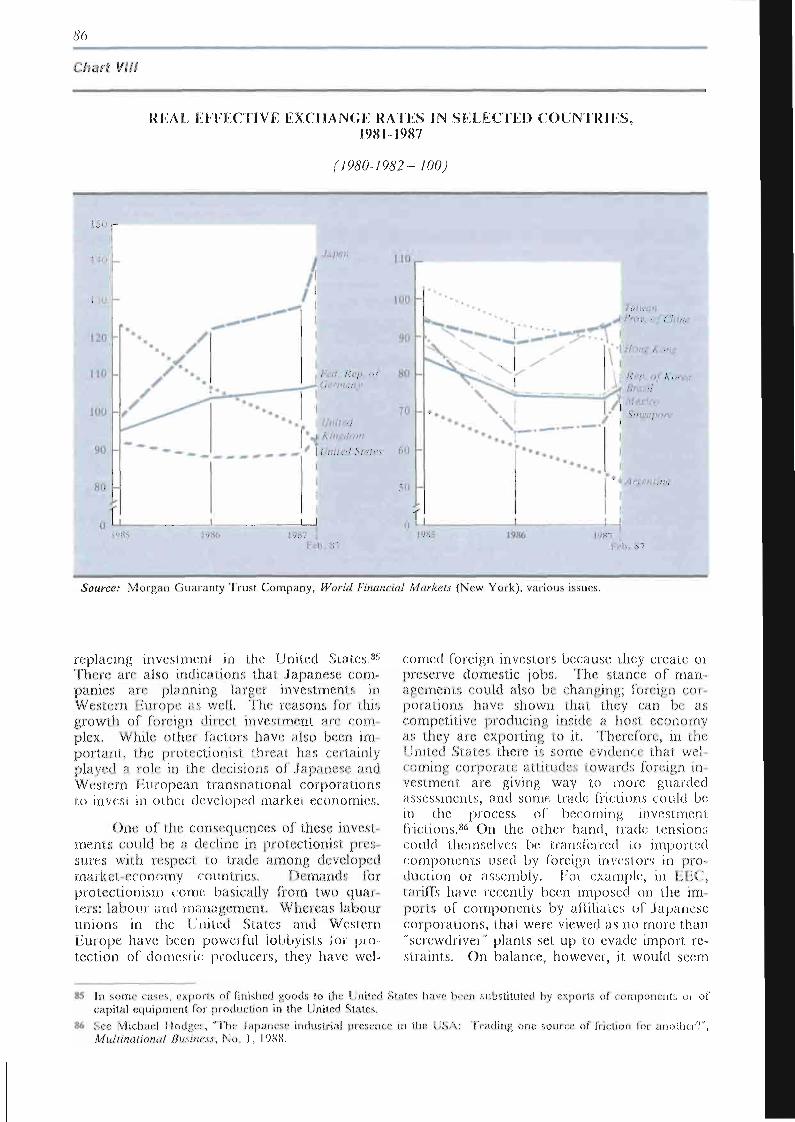
86
; / iw * y///
REAL EFFECTIVE EXCHANGE RATES IN SELECTED COUNTRIES, 1981-1987
150
140
130.
no
no
100
90
SO
¡upan
f* |p Kingdom
* " • " • — - _ „ * \ United States
J I
110 ^
too -
1'ed Rep. of HO Gerrnnni
L mtcd
Taiwan J /'ran. ni China
' • Hans Kong
•> Brazil
1985 1987 Feb. 8?
1986 Feb, S7
Source: Morgan Guaran ty Trust Company, World Financial Markets (New York) , various issues.
replacing investment in the United States.8' There arc also indications thai Japanese com panics arc planning larger investments in Western Eumpc ¿is well. the reasons fm ¡his growth of foreign direct investment are com plex. While other factors have also been im portant, ihe protectionist threat has certainly played a mlr in ihe decisions of Japanese and Western European transnational corporations to invest in o the; developed market economies.
One of the consequences of these invest-ments could be a decline in protectionist prcs-sures with respect i o trade among developed markcl economy rounbies. Demands (oi protectionism come basically from two quar-ters: labour and management. Whereas labour unions in the United States and Western Europe have been powerful lobbyists for protection of domestic producers, they have web
corned foreign investors because they create or preserve domestic jobs. The stance of managements could also be changing; foreign cot porations have shown that they can be as competitive producing inside a hosl economy as they are exporting to it. Therefore, in the United Stales there is some evidence thai welcoming corporate atlilndcs inwards fotcign in vestment are giving way l o more guarded assessments, and some trade frictions could be in the process of becoming investment frictions.86 On the othct hand, trade tensions could themselves be transferred io imported components used by foreign inveslois in pi o duction oi assembly. Lot example, in EEC, tariffs have recently been imposed on the imports of components by affiliates of Japanese corporations, that were viewed as no more than "screwdriver" plants set up io evade import restraints. On balance, however, it would seem
85 In some cases, exports of finished goods to the United States have been substituted by exports of components oi of capital equipment for production in the United States.
86 See Michael Hodges, ' 1 IK Japanese Multinational Business, No . I, 1988.
iustrial presence in ihe USA: leading one source oí friction ioi another?",
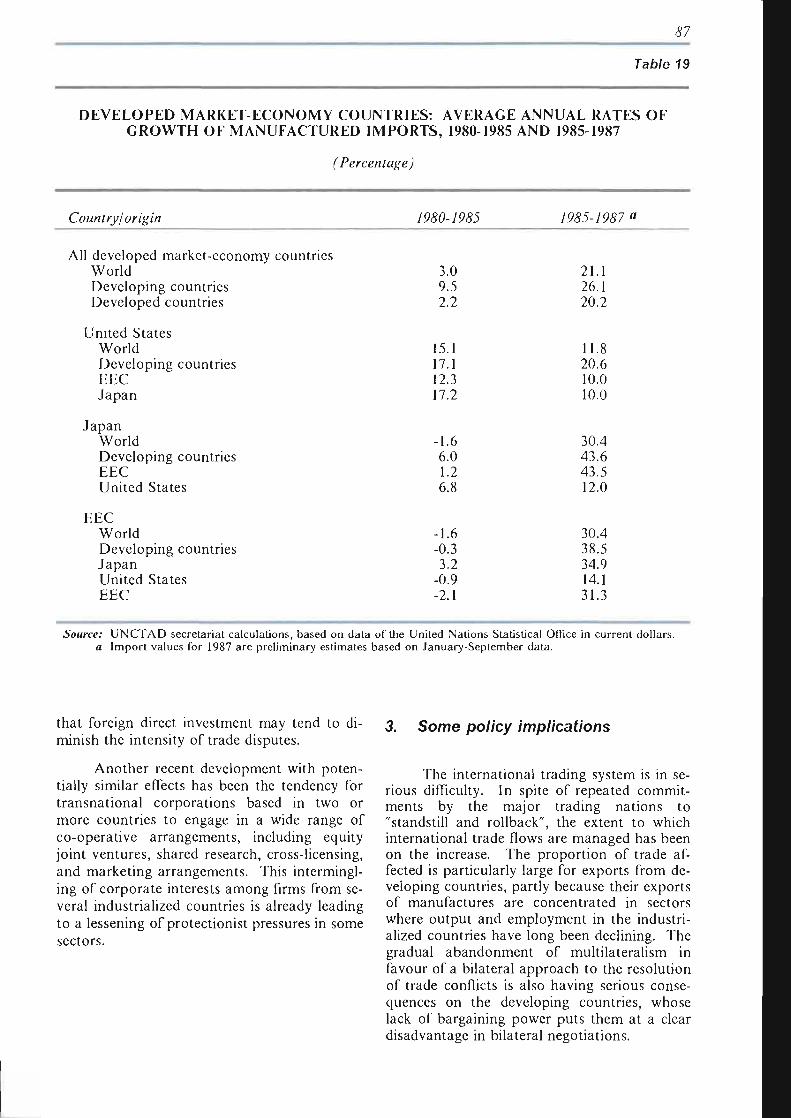
87
Table 19
DEVELOPED MARKET-ECONOMY COUNTRIES: AVERAGE ANNUAL RATES OF GROWTH OF MANUFACTURED IMPORTS, 1980-1985 AND 1985-1987
(Percentage)
Country/origin
All developed market-economy countries World Developing countries Developed countries
United States World Developing countries EEC Japan
Japan World Developing countries EEC United States
EEC World Developing countries Japan United States EEC
/&S0-/9&5
3.0 9.5 2.2
15.1 17.1 12.3 17.2
-1.6 6.0 1.2 6.8
-1.6 -0.3 3.2
-0.9 -2.1
/9&5-/&S71
21.1 26.1 20.2
11.8 20.6 10.0 10.0
30.4 43.6 43.5 12.0
30.4 38.5 34.9 14.1 31.3
Source: UNCTAD secretariat calculations, based on data of the United Nations Statistical Office in current dollars. a Import values for 1987 are preliminary estimates based on January-September data.
that foreign direct investment may tend to diminish the intensity of trade disputes.
Another recent development with potentially similar effects has been the tendency for transnational corporations based in two or more countries to engage in a wide range of co-operative arrangements, including equity joint ventures, shared research, cross-licensing, and marketing arrangements. This intermingling of corporate interests among firms from several industrialized countries is already leading to a lessening of protectionist pressures in some sectors.
3. Some policy implications
The international trading system is in serious difficulty. In spite of repeated commitments by the major trading nations to "standstill and rollback", the extent to which international trade flows are managed has been on the increase. The proportion of trade affected is particularly large for exports from developing countries, partly because their exports of manufactures are concentrated in sectors where output and employment in the industrialized countries have long been declining. The gradual abandonment of multilateralism in favour of a bilateral approach to the resolution of trade conflicts is also having serious consequences on the developing countries, whose lack of bargaining power puts them at a clear disadvantage in bilateral negotiations.
<M
The problem of growing protectionism should be seen in the broader context of its relationship to international economic instability and slow world economic growth. Protectionism is a complex phenomenon, with multifaceted roots. While other variables have also been important, exchange-rate volatility and persistent misalignments have encouraged moves towards greater protectionism. Therefore, a greater measure of international monetary stability would contribute to the dismantling of controls on trade flows. If market forces are to operate effectively in international trade, governments will have to exert greater efforts to co-operate internationally so as to produce a more stable international framework for their operation.
However, even if the desired international monetary framework is achieved, the problem of incorporating the developing countries more fully as equal partners into the emerging international trading system will remain. Developing countries are increasingly becoming competitive exporters of manufactures to major international markets, and their exports are giving rise to increasing trade conflicts with, and adjustment pressures in, the industrialized countries. Thus, in the years to come, trade tensions could come to focus increasingly on the exports of manufactures from the developing countries. With the huge resources at their disposal, corporations based in the developed market-economy countries have the flexibility to switch from exporting to a certain market to producing domestically in that market via an affiliate. Thus, they are able to "skip over" trade barriers and, in fact, many have done so. This possibility is not open to the vast majority of firms in the developing countries.
Therefore, if the problem of protectionism is not to centre increasingly on the exports of developing countries to the industrialized countries, a full implementation of the long-standing international policy commitment to "make room" for the exports of manufactures from developing countries will be needed.87 Such a commitment needs to take concrete forms: a rollback of existing non-tariff barriers and other measures to improve market access (including the lowering of tariffs on products of export interest to developing countries). The Uruguay Round of multilateral trade negotiations currently under way offers an opportunity to achieve these objectives.
The current environment of slow economic growth militates against trade liberalization by the developed market-economy countries. Faster and more sustainable eco-
87 See Conference resolutions 96 (IV), 121 (V), 159 (VI) an
nomic growth in those countries would clearly facilitate trade liberalization and the structural adjustment that is its necessary adjunct. It would also foster two-way intra-industry trade between developed and developing countries and would, thus, facilitate the development of the latter countries as producers of modern manufactures.
As the experience of the post-war period amply demonstrates, there is also a strong positive relationship between trade liberalization and economic growth. The fast growth experienced by the developed market-economy countries during the 25-year period that ended around 1973 was due in no small measure to the trade-creating effects of successive rounds of multilateral tariff reductions under the aegis of GATT. The trade negotiations currently under way in the Uruguay Round hold out the promise that a reversal of the trend towards managed trade could help invigorate world economic growth. The Punta del Este Ministerial Declaration which launched the negotiations in September 1986 laid down the broad objectives of these negotiations as bringing about further liberalization and expansion of world trade, improving the multilateral trading system based on the principles and rules of GATT, and increasing the responsiveness of the GATT system to the evolving international economic environment.
By contrast with previous rounds, which centred mainly on tariff reductions and some aspects of non-tariff measures, the benefits of which accrued mostly to the developed countries, the Uruguay Round is dealing with a wide variety of subjects. The whole range of NT M s is to be examined, with the objective of rolling them back. In fact, commitments to achieve a standstill on new measures and to roll back existing ones are enshrined in the Punta del Este declaration. Other issues on the agenda, to which developing countries have been attaching great importance for a long time, are trade in textiles and clothing, trade in tropical products, agriculture, the remaining high tariffs in some sectors and safeguards. Developments and issues in the negotiations are reviewed in annex 2.
Trade liberalization in the areas of export interest to developing countries would relax their foreign-exchange constraint to growth and, therefore, would have a beneficial impact on their rate of growth. The developed countries would also gain. Since developing countries will tend to spend most, if not all, of their additional export earnings on imports, mainly of machinery and intermediate goods, a large
also para. 105 of the Final Act of UNCTAD VII.

m
share of which originate in the developed countries, trade liberalization in favour of developing countries is likely to result in a reallocation of resources among the developed countries towards those sectors with higher levels and rates of growth of factor productiv-ity.
The benefits of trade liberalization for the entire world economy are likely to be even greater. By improving the debt-servicing ca
pacity of developing countries, trade liberalization would make a significant contribution to the resumption of financial flows to these countries, and would result in higher levels of world demand. Therefore, the working out of solutions to the problems faced by the exports of developing countries could be an important ingredient in a set of international measures to speed up world economic growth and give a new impulse to the development process."

Blank page _____________
Page blanche
Chapter IV
DEBT AND DEVELOPMENT
A. The crisis and the strategy
1. The expansion of borrowing (1974-1979)
The debt crisis of the 1980s can be traced in part back to the mid-1970s. Although neither widespread debt-servicing difficulties nor over-exposure occurred in those years, and a "debt explosion" was avoided, borrowing from commercial sources began to assume a disproportionately large role. The responsibility for this was shared by the debtors, creditors, creditor governments and international financial agencies.
The pace of debt accumulation, especially of commercial bank debt, rose sharply after the rise in oil prices in 1973, and by 1979 the share of bank loans in the debt of developing countries owed to DAC member countries had reached one third, compared to one tenth in 1971. This increase was concentrated in middle-income developing countries, though many poorer countries also borrowed from banks; official and officially-guaranteed export credits were also an important source of financing for them. At first, debt accumulation outstripped the pace of export and output growth, causing the debt-export and debt-GDP ratios to rise by 20 per cent; the real cost of debt also increased.
However, after 1976 export volumes and output growth gathered pace, with the result that these ratios and other debt indicators did not rise much further, and the real cost of debt fell. Consequently, although interest payments rose by 30 per cent per annum in nominal terms in 1976-1979 the increase was only 18 per cent in real terms (i.e. in terms of the volume of exports needed to cover interest payments) (see chart IX).
Many borrowing countries suffered an increase in their vulnerability to factors beyond their control. Higher ratios of debt and interest payments to exports meant that import capacity became even more sensitive to fluctuations in export prices - a point of particular significance to commodity-dependent countries. Moreover, the increased share of variable interest debt tied the interest bill directly to swings in international interest rates. Furthermore, debtors became dependent on the continued willingness of creditors to keep rolling over past credits falling due and to sustain a positive flow of net lending. The last two sources of vulnerability, which affected the middle-income countries in particular, largely stemmed from the characteristics of bank financing rather than the total volume of indebtedness.
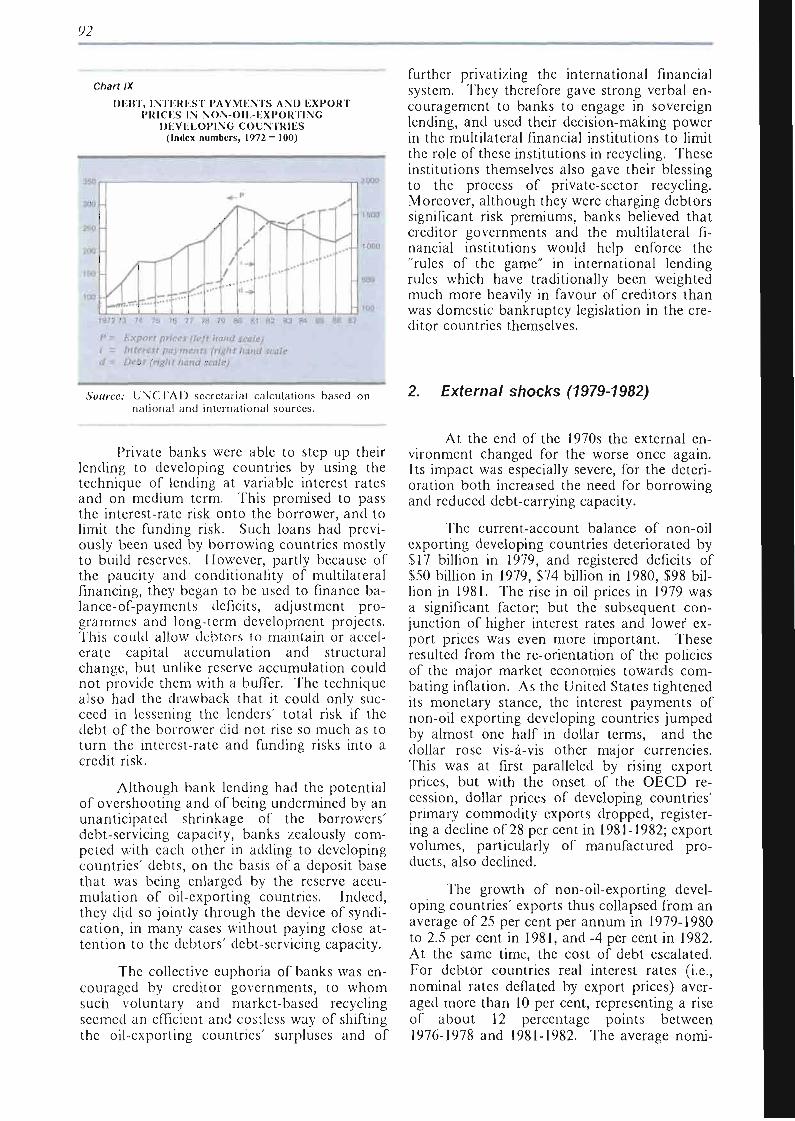
92
Chart IX
D E B T , I N T E R E S T PAYMENTS AM) E X P O R T PRICKS IN NON-OIL-EXPORTTNC
DEVELOPING COUNTRIES (Index numbers, 1972 = 100)
a ju
260
200
1 W -
100 -
*-<•
"""' — -
» • " • - : •
I
. ..-
/ /
i
/ i - »
,; , ..
i i i
-,"*' c— • •
H - •
1 1
1500
1000
SCO
100
1972 73 74 75 76 77 78 79
P = Export prices (left hand scale) i - Interest payments (right ¡land scale d= Debt (right hand scale)
1 82 83 84 85 96 S I
Source: U N C I A D secretariat calculations based on national and international sources.
Private banks were able to step up their lending to developing countries by using the technique of lending at variable interest rates and on medium term. This promised to pass the interest-rate risk onto the borrower, and to limit the funding risk. Such loans had previously been used by borrowing countries mostly to build reserves. However, partly because of the paucity and conditionality of multilateral financing, they began to be used to finance ba-lance-of-payments deficits, adjustment programmes and long-term development projects. This could allow debtors to maintain or accelerate capital accumulation and structural change, but unlike reserve accumulation could not provide them with a buffer. The technique also had the drawback that it could only succeed in lessening the lenders' total risk if the debt of the borrower did not rise so much as to turn the interest-rate and funding risks into a credit risk.
Although bank lending had the potential of overshooting and of being undermined by an unanticipated shrinkage of the borrowers' debt-servicing capacity, banks zealously competed with each other in adding to developing countries' debts, on the basis of a deposit base that was being enlarged by the reserve accumulation of oil-exporting countries. Indeed, they did so jointly through the device of syndication, in many cases without paying close attention to the debtors' debt-servicing capacity.
The collective euphoria of banks was encouraged by creditor governments, to whom such voluntary and market-based recycling seemed an efficient and costless way of shifting the oil-exporting countries' surpluses and of
further privatizing the international financial system. They therefore gave strong verbal encouragement to banks to engage in sovereign lending, and used their decision-making power in the multilateral financial institutions to limit the role of these institutions in recycling. These institutions themselves also gave their blessing to the process of private-sector recycling. Moreover, although they were charging debtors significant risk premiums, banks believed that creditor governments and the multilateral financial institutions would help enforce the "rules of the game" in international lending rules which have traditionally been weighted much more heavily in favour of creditors than was domestic bankruptcy legislation in the creditor countries themselves.
2. External shocks (1979-1982)
At the end of the 1970s the external environment changed for the worse once again. Its impact was especially severe, for the deterioration both increased the need for borrowing and reduced debt-carrying capacity.
The current-account balance of non-oil exporting developing countries deteriorated by S17 billion in 1979, and registered deficits of $50 billion in 1979, S74 billion in 1980, $98 billion in 1981. The rise in oil prices in 1979 was a significant factor; but the subsequent conjunction of higher interest rates and lower export prices was even more important. These resulted from the re-orientation of the policies of the major market economies towards combating inflation. As the United States tightened its monetary stance, the interest payments of non-oil exporting developing countries jumped by almost one half in dollar terms, and the dollar rose vis-à-vis other major currencies. This was at first paralleled by rising export prices, but with the onset of the OECD recession, dollar prices of developing countries' primary commodity exports dropped, registering a decline of 28 per cent in 1981-1982; export volumes, particularly of manufactured products, also declined.
The growth of non-oil-exporting developing countries' exports thus collapsed from an average of 25 per cent per annum in 1979-1980 to 2.5 per cent in 1981, and -4 per cent in 1982. At the same time, the cost of debt escalated, For debtor countries real interest rates (i.e., nominal rates deflated by export prices) averaged more than 10 per cent, representing a rise of about 12 percentage points between 1976-1978 and 1981-1982. The average nomi-
93
nal interest rate in Africa remained well below that in the other two developing regions, but in real terms Africa was only marginally better off than Asia. Real interest rates were on average more than 5 percentage points higher for Eatin America than the other two regions, with almost all major borrowers facing rates of over 15 per cent; but the widest swing in real interest rates was in Africa. Although the incidence of the various shocks varied widely among developing countries, the ratio of interest payments to GNP was broadly similar for countries at similar income levels. For many countries the ratio was above 10 per cent, and in some over 30 per cent.
Between 1980 and 1982 interest payments (on total medium and long-term debt) increased by 50 per cent in nominal terms and 75 per cent in real terms. The debt indicators worsened drastically: between 1979 and 1982 the interest payments/exports ratio doubled, the debt/GDP ratio increased by 10 percentage points and the debt/exports ratio by 40 percentage points. For low-income countries in aggregate the ratio of interest payments to exports rose to reach 10 per cent, above the figure for some East Asian countries but lower than for Latin America; for some Latin American countries, the ratio rose to one third in 1983. For capital-market borrowers, the driving force was the rise in interest rates, while for low-income countries it was falling export revenues; but some countries in each of the regions and income groups were hit hard on both accounts.
The commercial bank debt of middle-income developing countries continued its rapid rise: three quarters of the debt outstanding in 1982 had been accumulated in the previous four years. Lower-income countries accumulated debt more slowly, since official flows were less elastic; but several of them also added substantially to their total debt, especially in the form of export credits and bank loans. Although the additional borrowing greatly increased the aggregate stock of debt, it covered less than half the total shock. Thus, much of the debt accumulation was used to compensate for the worsened external environment rather than to add to productive capacity. Most countries substantially curtailed the level or growth of imports.
Several oil-exporting countries that had been net borrowers reduced their debt accumulation in response to the rise in oil prices in 1979. However, a few (including Mexico) used their improved credit standing to set up borrowing in the expectation (which proved false) that oil prices would keep rising. In some cases, this was not fully matched by real capital accumulation. The increase in debt also meant
that the subsequent rise in interest rates hit harder, leading to further borrowing.
Although most non-oil-exporting countries that reduced their borrowing had no other choice, several countries did so deliberately. For instance, some Asian countries with a strong manufacturing base chose to restrict the increase in their debt indicators by expanding export volumes. However, most countries did not adjust in this way, many of them because their economies were not sufficiently diversified, and as a matter of deliberate choice. With hindsight, it is obvious that many countries exercised the financing option too much and for too long, and that a number of the more industrialized capital-market borrowers could have achieved substantial export growth and lessened capital flight (which was a major factor in certain countries) by changing their policies. However, it must be borne in mind that the consensus view in 1980-1981 was that debt ratios were manageable, that interest rates would soon fall steeply from their abnormally high levels, and that OECD economies would quickly recover and pull up commodity prices and export revenues. It therefore seemed sensible to borrow to avoid "stop-go" policies.
However, real interest costs not only failed to decline but kept rising, and the OECD recession proved the most severe of the postwar period in both depth and duration. The dynamics of making compensatory borrowing at stiff interest rates eventually led to the perception that debt levels were excessive and hence to interruptions in the flow of financing; these, in turn, triggered a self-reinforcing liquidity squeeze. For some, mostly poorer, countries financing dried up relatively quickly, making retrenchment and, often, debt rescheduling unavoidable. For middle-income capital-market borrowers, the debt crisis came after August 1982, when Mexico declared a moratorium following large capital outflows, increasing resort to short-term financing, a fall-off of new lending by commercial banks and loss of reserves. Bank lending subsequently collapsed for a large number of heavily indebted countries, especially in Latin America and Eastern Europe.
The debt crisis was potentially catastrophic for many commercial banks in the developed market economies, and hence for the international monetary and financial system. The cumulative lending of banks had greatly raised their exposure to developing countries both in absolute amounts and relative to their capital base. By end-1982, the exposure rate for United States banks averaged 184 per cent compared to 127 per cent five years earlier; and that of the big money - centre banks 284 per
94
cent. These claims were heavily concentrated in a few countries: ten developing countries accounted for three quarters of the total developing country exposure of the big United States banks, and four Latin American countries for half. The banks and creditor governments therefore felt it of prime importance to ensure that the major capital-market borrowers did not default either because of ¡¡liquidity or as part of a generalized breakdown of financial relations between developing country debtors and their creditors.
3. The design of the strategy
The strategy adopted in the early 1980s to deal with the spread of debt-servicing difficulties was modelled on the treatment typically accorded to troubled debtors in the past rather than on departures from orthodox practice, such as the Indonesian settlement of 1965 (see box 5) or the retroactive terms of adjustment agreed to by the Trade and Development Board in its resolution 165(S-XI). However, there was a major innovation in the form of "concerted lending" by banks to middle-income countries.
The strategy has evolved in certain respects over time, particularly as regards its points of emphasis. For instance, following the "Baker initiative" of 1985, growth has become a more central objective; greater attention has been paid to the development-capital requirements of low-income debtor countries; and the menu of options for private creditors has been expanding, and now even includes voluntary debt-reduction. But while evolution has not been absent, the main features of the strategy have remained constant. The following paragraphs attempt to sketch these features and set out their rationale; recent changes, including the widening of menu, will be examined in subsection 5.
Although based on case-by-case negotiations between debtor countries acting individually and their various creditors acting in concert, the strategy had the same basic objective in all cases, namely to prevent rupture in creditor-debtor relations. Such rupture was viewed as harmful not only for the creditor but also for the debtor, since it would prevent it from regaining its credit standing for many years to come, as well as expose it to retaliatory action by individual creditors and their governments, such as trade restrictions and seizure of assets. Moreover, it was argued that widespread default among the major capital-market
borrowers could set off an international financial crisis and a deep depression.
The strategy sought to ensure that the debtor had enough liquidity to stay current and, more important, to realign debt-service obligations and capacities sufficiently to correct over-indebtedness and allow relations with creditors to become more normal. Ratios of interest payments and debt to exports and national income were to be reduced substantially and the debtors' underlying growth and export performance were to be strengthened. To that end, roles were assigned to each of the parties: the debtor country, commercial creditors, creditor governments and multilateral financial institutions.
Since concessional interest rates and debt cancellation were not instruments of the strategy, the task of reducing rates of indebtedness and providing a sustainable growth momentum - which was the key to success - was assigned almost entirely to the debtor country. Debtors were required to bring about a major reduction of their borrowing needs, in both the short and the long term, by changing their policies.
In the first place, macro-economic policy was to be tightened in order to improve the current account while generating additional export revenues for debt servicing. Aggregate spending was to be drastically cut through the pursuit of stringent monetary and fiscal policies designed to curtail the volume of credit, raise real interest rates, increase fiscal revenues and reduce government expenditure. At the same time, the real exchange rate was to be substantially lowered so as to switch expenditure onto non-traded goods and home production towards foreign markets. As a result, debt growth would be curtailed, capital flight reversed, and export earnings raised. Although (as already pointed out) the sources of the increased current-account deficits were external, it was assumed that reduced home demand would be largely counter-balanced by increased net exports; that the cut in spending levels would be reflected largely in higher savings rather than lower levels of investment or activity; and that the inflationary impact of currency depreciation would be counter-balanced by the restrictive monetary policy. Thus, although the external adjustment process would necessarily involve a drop in living standards, the damage to the internal economy and the rhythm of development would be minor and/or temporary.
Debtor countries were also to reform their micro-economic policies. "Growth-oriented" structural policies - which were also urged upon countries without debt problems -received particular emphasis after the launching
95
Box 5
GERMAN AND INDONESIAN DEBTS: TWO HISTORIC RESCHEDULINGS
There have been at least two examples in the post-war period of debt restructurings in which concessional treatment has been a central feature.
In the 1969-1970 agreement on $2.2 billion of Indonesian debt: '
• all medium- and long-term debt outstanding was to be repaid in equal instalments over 30 years (starting 1970);
• payments of current interest and interest arrears up to the date of agreement were postponed for 15 years (up to 1984); thereafter these payments were to be made in equal instalments over the following 15 years;
• the debtor country was given the option during the first eight years of the agreement to postpone up to 50 per cent of the rescheduled principal payments (up to an accumulated total equivalent to three annual amortization payments) to the final eight years of the 30-year period at a 4 per cent interest rate.
• The terms could be re-adjusted after 10 years in the light of the country's economic performance, including the possibility of writing-off rescheduled interest and of accelerating principal payments.
This agreement lifted the country's debt overhang and enabled it to honour its rescheduled debt obligations while using a larger share of export earnings and new financial flows. It covered only official debt, while some of the main problem cases today involve debts to commercial banks.
The Indonesian rescheduling agreement was based on a proposal by Dr. Hermann-Joseph Abs, a banker who had been a principal negotiator of the London debt treaty of 1953, whereby German debt dating from before 1945 and from the reconstruction period 1945-1953 was restructured. In this debt settlement: ^
• all debt outstanding was to be repaid with maturities of up to 20 years and a grace period of 5 years;
• interest was reduced to 75 per cent of the originally contracted rate for both current interest payments and interest arrears;
• for medium- and long-term private debt, one third of interest arrears was to be cancelled and two thirds to be capitalized.
Both reschedulings were designed to tailor the debt-service burden to the capacity of the country. A solution was thought possible only in the context of expansion, not in the context of austerity. The focus was therefore on rebuilding domestic production and export capacity to ensure a viable external debt position and resumption of credit-worthiness in the long run. * The reschedulings made an important contribution to both countries' strong growth performance in later years.
1 See T. KampfTmeyer, Die Verschuldungskrise der Entwicklungs lander, Dcutsches Institut für F.ntvvicklungspolilik, Berlin, 1987, pp. 56-67.
2 See "German External Debts", Department of State of the United States of America, Treaties and other International Acts, Series 2792; "Settlement of United States Claim for Postwar Economic Assistance to Germany", ibid., 2795; "Germany", ibid., 2274.
3 See H.J. Abs, "Das Londoner Schuldenabkommen" in: Zeitfragen der Geld-und Wirtschaftspolitik, Frankfurt, 1959, p. 16.
of the "Baker initiative" as a reaction to the collapse of growth following the pursuit of macro-economic austerity; but they were seen as a complement to, not as a substitute for, macro-economic tightening. Allocative efficiency was to be improved by giving much broader scope to market mechanisms and private-sector initiative. Emphasis was to be put on liberalization, especially of imports, deregulation, pri
vatization, and reduction of the role of the state and the share of public consumption and investment. It was expected that such a shift would reduce capital costs, improve profitability and enhance competitiveness, thereby strengthening the willingness and capacity of firms to invest, innovate and take risk generally. The gains were expected lo accrue swiftly and independently of the level of investment
%
and of economic activity; and the social and political constraints were expected to be surmountable.
A key role was assigned to IMF, namely to provide liquidity on condition that the debtor country pursued the policies outlined above. IMF conditionality had originally been instituted to protect the revolving character of Fund resources, i.e. to ensure that countries' drawings were repaid. However, IMF generally required members drawing on its resources to remain current on all their debt service, and its programmes were designed to ensure that debtors generated a sufficiently large trade balance (in some cases, sizeable surpluses) in order to be able to do so. Consequently, IMF conditionality helped commercial creditors collect on their past lending, including to cover the risk of non-payment.
By contrast, the financing role of IMF became more limited than originally intended: for many debtor countries, it served as a "catalyst" of private flows rather than a source of funds. This evolution reflected the reluctance of several countries with a major voice in decision-making to enlarge the size of the Fund, as well as the magnitude of the liquidity needs of a number of major troubled debtors; much the same was true of the World Bank although it assumed increased responsibilities following the "Baker initiative".
To play its catalytic role, IMF also made the provision of its own resources to countries heavily indebted to commercial banks contingent upon the banks' making the contribution required of them by the strategy ("bailing the banks in"). Banks were therefore called upon not only to restructure debts but also to provide new money in amounts that, while very modest by past standards, were considerably greater than they were now willing to extend. It was argued that banks had a strong collective interest in providing liquidity. Not only would they suffer great damage if debtors were forced into arrears by a liquidity squeeze, but also debtors needed financing to strengthen their debt-servicing capacities over time and thereby reduce the risk of default in the future. While debtors reduced their rates of indebtedness and payments constrictions, private creditors could reduce their rates of exposure by enlarging their capital base. Therefore, even if the level of bank exposure were raised by new lending, the vulnerability of banks would lessen over time. This, in turn, would remove the danger posed by the debt of developing countries to international financial stability.
However, individual banks viewed their own interest as lying in minimizing exposure,
even if that meant passing the problem onto other creditors. They could therefore not be expected voluntarily to behave in accordance with the debt strategy (i.e. in their own long-term interests). Consequently, in order to achieve the desired outcome, lending had, like debt reschedulings, to be organized and made "involuntary" and not left to the free play of market forces. Order was to be attained in part by the banks disciplining each other (in particular pressure by big, highly-exposed banks on small ones which could withstand default); and in part by the creditor governments and IMF pressing creditor banks as a whole to continue lending.
The outcome was "concerted lending" (also referred to as "involuntary" or "forced" lending) whereby each bank rescheduled its loans and contributed new money in proportion to its existing exposure, the aggregate amount being the minimum thought necessary to avoid arrears. Negotiations between the country, IMF and the creditors acting through an "advisory committee" thus came to be the main forum for restructuring the finances of troubled debtor countries with a high proportion of commercial bank debt. Wherever they could, banks made acceptance of IMF conditionality a prerequisite for debt rescheduling and new lending; they also often required rescheduling of official debts at the Paris Club.
The bulk of the debt of lower-income countries with debt-servicing difficulties was owed to official creditors. The main forum for rescheduling their debts was consequently the Paris Club. As in the past, an IMF agreement was generally a sine qua non. New money often formed part of the Paris Club package in the form of capitalization of interest at current market rates. Export credit agencies were expected to restore cover as arrears were cleared up and policy changes implemented.
Owing to the high market interest rates, the longer-term financing needs of the lower-income debtors were expected to be met mostly from official sources, in particular bilateral ODA and multilateral flows. However, the strategy adopted in 1982 did not include a major new effort to raise the volume of such funding (though, as already noted, this deficiency came to be acknowledged over time). Rather, it sought to reorient existing aid to troubled debtors and, more particularly, to enhance policy conditionality on development loans. Structural Adjustment Loans (SALs) and sector loans by the World Bank (to both lower-income and middle-income debtors), which required the borrower to adopt market-oriented policies, thus assumed increased importance. SALs were as a rule given only after
97
an IMF agreement was in place, resulting in two sets of conditionality. Bilateral ODA was also increasingly tied to the acceptance of Fund/Bank conditionality.
The strategy excluded rescheduling debts owed to multilateral financial agencies, since their privileged creditor status was considered important for their standing in capital markets and hence for their ability to assist their developing country members. Largely for this reason, the scope for according relief to those middle-income countries whose debt was owed largely to multilateral institutions was much narrower than for other troubled debtors.
With respect to both official and private debt, the strategy envisaged a short-leash approach, intended to keep the debtor under conditionality until its debt-servicing capacity had improved sufficiently. It was taken for granted that the short-leash approach would not be counter-productive, e.g. by concentrating the focus of government policy on cashflow management at the expense of development.
Similarly, the strategy did not seek to harmonize debt-restructuring negotiations and the activities of IMF, which were geared to bringing about swift financial adjustment, with the longer-term investment requirements of the debtor country. For many poorer countries, capital requirements were addressed in the context of such bodies as aid consortia, but separately from debt restructuring and balance-of-payments issues. Middle-income debtors lacked any forum for addressing long-term capital needs.
The absence of a major effort at enlarging development financing, the short-leash approach and the de-linking of debt and development found their rationale in the expectation that prevailed in 1982 that world economic conditions would undergo a substantial and swift improvement. Interest rates were widely and confidently expected to fall steeply from their current exceptionally high levels; and most observers felt sure that the OECD economies would recover strongly from recession, stimulating demand for developing countries' exports and hence raising both commodity prices and the volume of non-traditional exports. It was assumed that the combination of lower world interest rates and a slower growth of debt would substantially reduce interest payments; and equally, that improved world demand conditions would complement the efforts of developing countries to increase supplies of exportables, resulting in a substantial boost to earnings. Thus, the design of the strategy reflected the expectation that the debt problem
would be short-lived and normalcy regained quickly and relatively painlessly.
Although its success depended on an early and substantial fall in real interest rates and recovery in commodity prices, the strategy failed to assign responsibilities for achieving these results. Instead, it assumed (erroneously, as explained below) that they would be achieved automatically provided that the major market economies grew at about 3 per cent per annum. The strategy also required markets in industrialized countries to be accessible to developing countries, but in this respect also no concrete commitments were made and no specific responsibilities assigned.
As already noted, the strategy has undergone a number of adaptations over time. These have all been prompted by the failure to attain its objectives of reducing over-indebtedness and reviving growth, as well as by the threat posed by that failure to the strategy's ability to avert a breakdown of creditor-debtor relations. The next subsection reviews both the successes and the failures of the strategy, and the following one attempts to explain why there was failure or success.
4. The record of the strategy
Of the several objectives of the strategy, only a few have been met: a generalized breakdown of creditor-debtor relations has been avoided; the international banking system has been protected; the exposure of commercial banks to troubled debtors has been reduced, and their provisions against losses increased. In other respects the record has been one of failure. The over-indebtedness of troubled debtor countries has persisted; indeed, it has increased. Despite major policy reforms in many countries designed to foster thrift, enterprise and exports, the growth momentum of debtor countries continues to be thwarted; their inflationary pressures have remained strong; and investment has remained depressed, causing the pace of structural adjustment in trade and production to be slow. Creditor-debtor relations are more strained than at the outbreak of the debt crisis: more countries are now in arrears than in 1982; repeated reschedulings have become the rule rather than the exception; an even greater proportion of the commercial bank lending to developing countries is "involuntary". Indeed, the risk of eventual defaults has increased rather than lessened. For that reason, even the apparent successes recorded by the strategy may prove to be illusory.
%
(a) Creditor interests and creditor-debtor relations
The generalized default and banking crisis which many observers in 1982 feared (and the avoidance of which, as already noted, was the prime objective for some of the parties involved) has not occurred. Neither of the two major bank failures experienced (in the United States and in the United Kingdom in 1984) stemmed from over-exposure to developing countries, and the many failures of small banks which have taken place recently in the United States have been due to the distress of domestic agricultural and energy producers. Indeed, United States banks managed to increase their profitability each year up to 1986.
The developing country debt crisis itself gave commercial banks an opportunity to increase their earnings. For many Latin American borrowers, for instance, the lending margins in the 1982-1983 restructuring were between 2 and 2.5 per cent, compared to much less than 1 per cent before the onset of the crisis, although maturities were 2-3 years shorter. One study, carried out in 1983, estimated that restructured debt was yielding banks about 2 per cent more than before.88 As one negotiator of the Mexican rescue operation stated, "Restructuring turned out to be good business for them" (i.e. the banks).89 Subsequently, charges were reduced: for example, the margin over LIBOR was decreased. However, the improvement of lending conditions was much less marked for countries that were relatively small debtors.
Perhaps the most notable achievement of the strategy is that the exposure of banks to troubled debtors in relation to capital has fallen steeply. For instance, the ratio to capital of the claims of United States banks on 15 highly-indebted developing countries has been cut by half - from about 130 per cent at end-1982 to about 65 per cent at end-1987. The annual growth of bank claims on developing countries, which had been running at 23 per cent between 1974 and 1980, fell steeply to 8 per cent in 1982 and below 1 per cent in 1984. Since then, it has remained within the range of 4-6 per cent (see
annex table 2). Bank exposure to troubled debtors has fallen substantially even in absolute terms: the claims of United States banks on the 15 highly-indebted developing countries dropped by about S9 billion from 1982 to mid-1987, largely as a result of declines in trade credit (whose share in the total of the banks' claims on those countries has fallen from about 57 per cent in 1982 to 38 per cent five years later). The share of claims on the 15 highly-indebted countries fell from 7.4 per cent of total United States bank assets to about 5 per cent (and on developing countries as a whole from 10.3 per cent to 6.3 per cent). Thus the large United States money-centre banks - which were among the most vulnerable to default - have greatly strengthened their ability to withstand nonpayment.
In 1987 a number of United States, Canadian and British banks took decisive steps designed to cushion themselves against eventual nonpayment. In May 1987 one of the largest, Citibank, decided to make extraordinary provisions of $3 billion, thereby increasing its provisions for losses on developing country loans to 25 per cent of book value, and many other large banks soon followed suit. By the end of 1987, the level of provisions against problem country loans had reached 20-35 per cent for the 15 largest United States banks (compared to an average of 5 per cent earlier), 35-40 per cent for Canadian banks, and 25-30 per cent for British banks. Although it does not match that of most Western European banks - those of the Federal Republic of Germany, France and Switzerland have provisions amounting to 35-70 per cent of their developing country exposure - a significant degree of protection is now available to banks in North America and the United Kingdom.90
However, the international banking system has not been freed from the risk of default, since the probability of default by developing country debtors has not lessened. Indeed, the market's own evaluation of the situation is that these risks are high and rising. The secondary market prices for developing country debt show steep and rising discounts. Even the debt of countries which certain observers claim are fully solvent, such as Argentina, Brazil and
M
HO
¡VI.S. Mendelsohn, Commercial Banks and the Restructuring of Cross-Border Debt (New York: Group of 30, 1983), p. 8. The study added that "on an admittedly very rough calculation, which takes into account that many of the leading banks obtain their funds at an average cost below LIBOR, banks may be earning about an extra $1.75 billion a year on the $90 billion of cross-border debt recently renegotiated or being renegotiated" ( loc. cit.).
Quoted by S. Dell, in his "Crisis management and the international debt problem", International Journal, XL, Autumn 1985, p. 674. Previously, there were sharp differences among banks of different nationalities as regards loan loss reserves, largely due to differences in tax and accounting regulations. The tax deductibility for loan loss provisions, which is usually enjoyed by banks in continental Western Europe is generally much greater than for United States banks; however, Japanese banks have, at least in appearance, not been well provisioned.
99
Mexico, is selling for less than half its face value. The provisioning moves described above as being among the successes of the strategy can also be interpreted as indicative of the growing feeling among creditors that the probability of full debt servicing is considerably less than unity - or, in other words, that the strategy will not succeed.
Over time, consolidation periods in reschedulings have tended to lengthen. However, the return to normalcy in debtor-creditor relations that was sought has not occurred. Many developing countries have repeatedly accumulated arrears. In 1986-1987 alone, about nine Latin American countries had fallen behind in interest payments (Bolivia, Brazil, Costa Rica, Dominican Republic, Ecuador, Honduras, Nicaragua, Paraguay and Peru), whereas in 1985 there had been only three. In only a few (e.g. Brazil, Ecuador and Peru) were payments formally suspended. Among African debtors, Nigeria had accumulated substantial arrears, largely constituted by trade credits; Côte d'Ivoire, at the end of 1987, announced it was unable to service its debt; and Zaire, in 1986, and Zambia, in 1987, declared that they would not make debt-servicing payments above a specified proportion of export revenues. Many other low-income countries have also accumulated arrears, in some cases to multilateral institutions, including IMF. In some cases suspension of payments has been linked with abandonment of programmes agreed to with the Fund. In others, arrears have built up pending the conclusion of negotiations with IMF and hence the conclusion of a debt rescheduling agreement. At the beginning of 1988, there were 25 countries that did not have a Paris Club agreement in effect but which could be expected to seek an official rescheduling when an IMF-supported programme was in place. During 1988, only 6 countries have rescheduled in the Paris Club, while the other 19 countries are accumulating arrears.
Many countries have had repeatedly to go to the negotiating table to restructure their debt. In 1986, 24 countries renegotiated their debt with official creditors or with banks. In fact, no country that has renegotiated its foreign debt has been able to avoid a repetition of the exercise. The Paris Club, which had been designed as a one-off mechanism for overcom
ing temporary balancc-of-paymcnts problems, has been transformed into an established feature of financial co-operation, and repeated reschedulings have become commonplace. Over the past four years, one debt-distressed African country (Niger) has rescheduled Paris Club debts four times, five others (Madagascar, Mauritania, Senegal, Togo and Zaire) have rescheduled three times; and four others (Mozambique, Sierra Leone, Somalia and Zambia) have rescheduled twice. Similarly, relations between troubled debtor countries and commercial banks have continued to be conducted outside the usual market framework, and the bulk of lending that has been forthcoming for these countries from banks remained "involun-tary".
(b) Rates of indebtedness and the debt burden
The debt strategy has not yielded an improvement in the main debt indicators. Indeed, these indicators are on the whole worse than in 1982. If recent interest arrears by a number of debtor countries (e.g., Brazil, Côte d'Ivoire, Ecuador and Peru) are added to the stock of debt, the ratio of external debt to GDP in the highly-indebted countries91 rose to approximately 0.50 in 1987 from 0.42 in 1982 (see chart X). While over this period, the stock of external debt rose by only 4.5 per cent per annum (which was considerably less than in the 1970s), GDP in dollar terms rose by less than 1 per cent per annum. In sub-Saharan Africa,92 the ratio of external debt to GDP has increased every year since 1980, from about 0.40 to almost 0.70 in 1987. The growth rate of GDP in dollar terms was higher than for the highly-indebted countries, but the pace of debt accumulation was also much faster.
The ratio of the stock of external debt to the value of exports has also worsened (see chart X). In the highly-indebted countries at the end of 1987 this ratio (adjusted for interest arrears) was 65 percentage points higher than in 1982. In sub-Saharan Africa it has moved almost continuously upward since the beginning of the decade, more than doubling between 1980 and 1987.
91 This group is comprised of the so-called Baker 15 (Argentina, Bolivia, Brazil, Chile, Colombia, Cote d'lvoire, Ecua dor, Mexico, Morocco, Nigeria, Peru, Philippines, Uruguay, Venezuela and Yugoslavia).
92 In this sub-section the term "sub-Saharan Africa" refers to all developing countries of the region other than Nigeria.
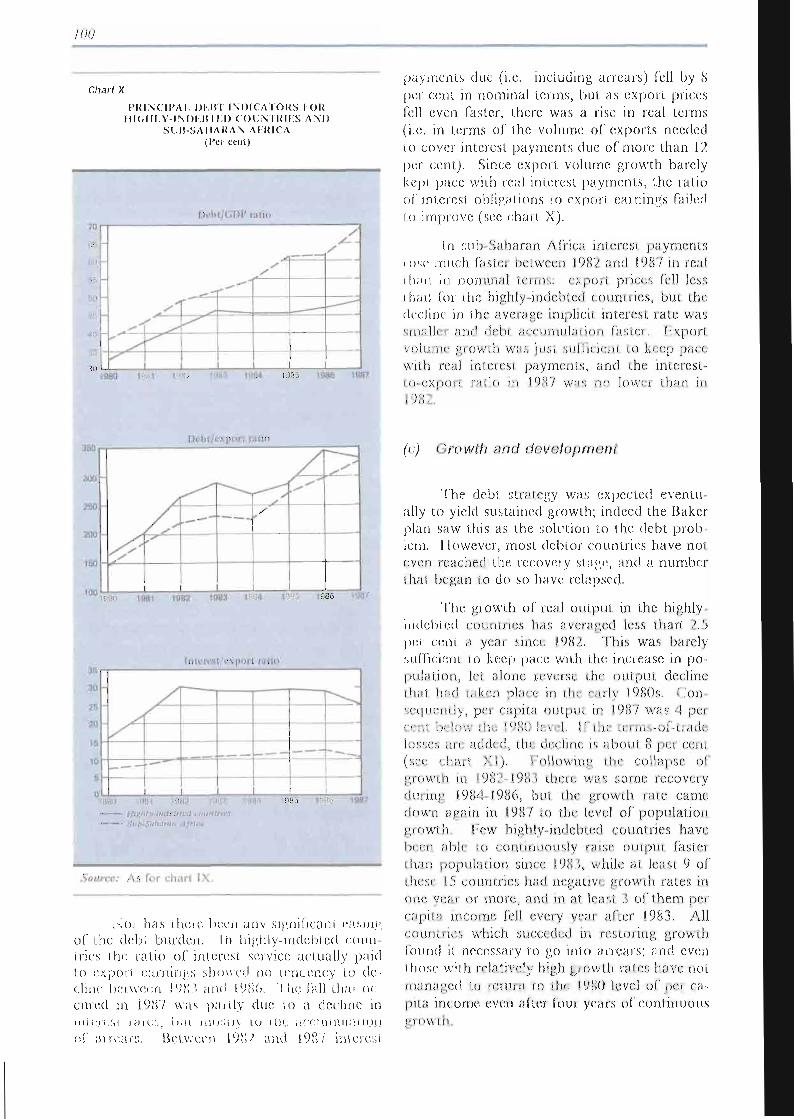
100
Chart X
PRINCIPA!, 1)1,1? I INDICATORS I OR ll l( ; iII ,Y-IM)l,HII, l) ( OUNTRIKS AM)
SUB-SAHARAN AI RICA (Per cent)
Debt/OOP ratio 70
-
^ s s-
, -s
s*-
lOaO 1981 1982 1983 1904 1985 1086 19B7
payments due (i.e. including an ears) fell by 8 pei cent in nominal terms, but as export prices fell even faster, there was a rise in real terms (i.e. in terms of (he volume of exports needed Co cover interest payments due of more than 12 per cent). Since export volume growth barely kepi pace with real interest payments, ihe ratio of interest obligations ío expon earnings failed to improve (see chart X).
In sub Sanaran Africa interest payments lose, much faslei bel ween 1982 and (987 in real lhan in nominal teams, c.xpoit prices fell less than foi the highly indebted countries, bui the decline in the average implicit inlercsi rate was srnalLe: and debí accumulation faster. Export volume growth was just sufficient io keep pace with real imcicsl payments, and the interest-to-export ratio in 198/ was no lown than in 1982."
360
3UU
250
100
160
100
Debt export ratio
#
/V , "
—-"* .
- X
X
t^ ~P
1985 198G 198/
Interest/export ratio
9 30 19 81 19 12 19 33 19 1
M 19 85 19 3b 19! M
Highly-indebted countries Sub-Sahoian Africa
6 o m r r ; As for chart IX
Not has there been any significant easing oí the debt burden. In highly-indebted countries the ratio of interest service actually paid lo export earnings showed no tendency to decline between (98.4 ami 1911o. I he fall thm nr-cured in 198/ was paitly due lo a decline in interest rates, but mostly tó the accumulation of airrars. Rdween 1982 and 198/ inleiest
(cj G/oM/i/v and c/eve/opmcf;/
The debl strategy was expected eventu-ally to yield sustained growth; indeed the Baker plan saw this as the solution to the debt problem. However, most debtor countries have not even leached the reroveiy stage, and a number thai began to do so have relapsed.
The growth of real output in the highly mdebied comunes has averaged less than' Ao pci cent a year since 1982. This was barely sufficient to keep pace with the increase in population, let alone rçverst the output decline i hat had taken piare in the early 1980s. Con scipiently, pci capita output in (987 was 4 pci cent 1/ low the 1980 k \' 1. II the Knn.,-of bade losses are added, the. decline is about 8 per cent (ve rliail XI). Following the follapsr of growth in i98) 19K.S ibcm was some recovery dm tug 1984 198C, bui ihe giowth iate came down again in 1987 to the level of population growth. Few highly-indebted countiies have been able it) continuously raise output faster than population since, 19IU, while ai least 9 of these IJi comunes had negative growth rates in one vcai m more, and in ;U lema j of ihem per capita income, fell every ycaj aftei 1983. All count nés which succcdc.d in testoring growth found it necessary to go into an ears; and even those with rrlatively high growth ml es have not managed to ictuni io Ihe (9o0 level of pe, ra pita income even aftei four years of continuous growth.
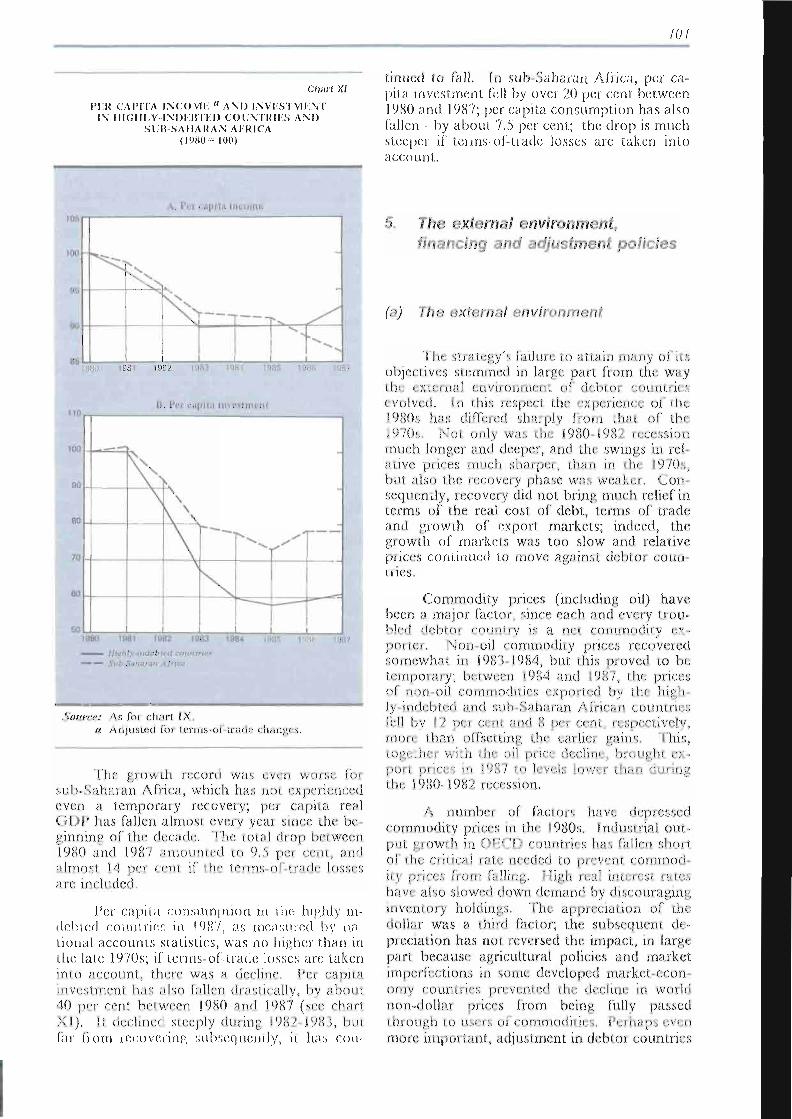
IOÎ
C/KW(X/
P I : R C A P I T A I N C O M E " A N O I N V E S T M E N T
IN H I G H L Y - I N D E B T E D C O U N T R I E S A : \ D S U B - S A H A R A N A F R I C A
(1980-100)
tinned to fall. In sub Sanaran Africa, per ca pita investment fell by over 20 per cent between 1980 and 1987; per capita consumption has also fallen - by about 'I.S per cent; the drop is much steeper if terms of tiade losses are taken into account.
A. Per capiia income
1980 1981 1982 1983 1984 198ü I98G 1987
in
no
nn
m
,T.
Ml
Rtl
1
B Per capita investment
N K \
\ V \
.
" " - . / '
1980 1931 1B82 1983 19B<t
Highly-indebted countries Sub-Saharan Africa
I9UL, I98P
Som-r.c; As foi chart IX a Adjusted loi terms of trade chsrtgK
'l.'hc. growth iecord was even worse for stib Saharan Africa, which has noi experienced even a temporary lecovery; pci capita real ÜDT has fallen almost eveiy yeai since the be ginning of the decade. Ihe total drop between 1980 and 1987 amounted to 9..') pn cent, and almost M per rent ib t he terms-of-trade losses ate included.
Cet capita consumption in the highly-in-debicd countries in 19X7, ns measured by na-tional accounts statistics, was no higher than in the late 1970s; if terms of trade losses are taken into account, there was a decline, Pei capita investment has also fallen drastically, by about 40 per cent between 1980 nnd 198/ (sec chart XI). It declined steeply timing 198/ 1983, but far from recovering subsequently, it has con
financing and adjustment policies
(aj /he exfema/ eny/ronmenf
The strategy's failure to attain many of us objectives stemmed in large part from the way the external environment of debtm commies evolved. In this rcspeci ihe experience of bit, 1980s has diffemd sharply from thai of the 1970s. Xot only was the 1980-198/ ,mission much longci and deeper, and the swings in rcl a live prices much sharper, than in ih< 1970s, but also the recove,y phase was wealmi. Lou sequently, recovery did not bring much relief in terms of the real cost of debt, terms of trade and growth of export markets; indeed, the growth of markets was too slow and relative prices continued to move against debtor conn tries.
Commodity prices (including oil) have been p major fad m, since r%mh %nd r-vny Iron bled debtor country is a ne1 commodity ex-pmioi. Non oil commtidiiy prices recovered somewhat in 1981 1984, but i his pioved to be temporaly; bciweeti i98d and 19%7, Ihe prices of ,,on oil commodities exported by the highly-indebted and sub-Saharan African countries fell by I? pc, cent and 8 per cent, respectively, more than offset ting ihe earlier gains, This, logoiliii with the oil price decline, brought export prices m 1987 io levels lower than during ihe 1980 1987 mcessiou.
A numbei of factors have depressed commodity prices in Ihe 1980s. Industrial out ¡mi ¡'lowih iu D O T ; countries lias fallen shon oí ihe critical ram needed to p,rvnn cummod it y prices from falling. High real interest rates have also slowed down demand by discouraging invent m y holdings. The appreciation of i he dollar was a third factor; the subsequent depreciation has not reversed the impact, in large part because agricultural policies and market imperfections in some developed market ccon on i y countries prevented the decline in world non-dollar pnces bom being fully passed through to ust! s of commodities. Perhaps even mom important, adjustment in debt m countries
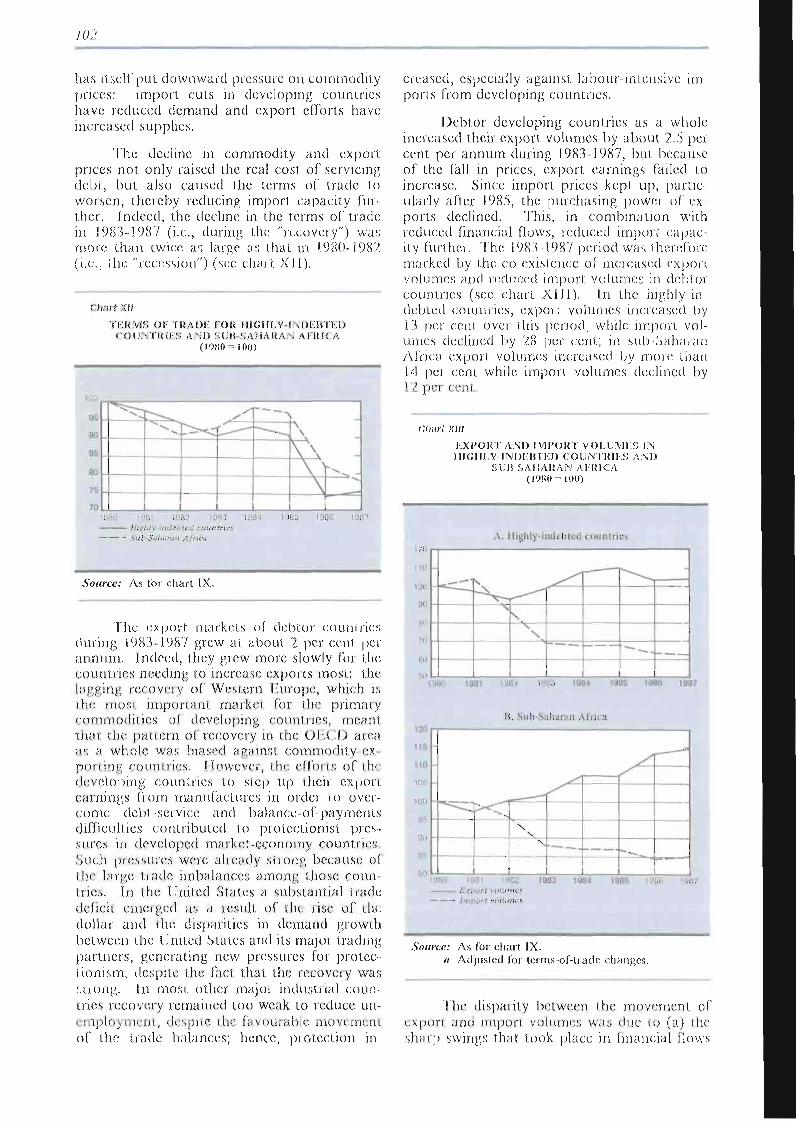
¡02
has itself put downward pressure on commodity prices: import cuts in developing countries have reduced demand and export efforts have increased supplies.
The decline in commodity and export prices not only raised the real cost of servicing debt, but also caused the terms of trade to worsen, thereby reducing import capacity further. Indeed, the decline in the terms of trade in 1981 1987 (i.e., during the "rccovciy") was mote than twice as large as that in 1980 1982 (i.e., Ihe "recession") (see chari XII).
Chart XII
TERMS OF I'ltADF, FOR HIGHLY-INDEBTED Í QUNTRlES AND SUB-SAHARAN AFRK A
(1980=100)
103
Li-
90
86
BO
75
70
^ r q
980 1£
- Sut
^ r^^c ^ ~ — - ^
81 1982 1983 1984
•Saharan Africa
\
\ \ \ 1 M . -
.—=1
1985 1986 19 17
Source: As for chart IX.
The export markets of dcbtoi count ries during 1983 198/ grew ai about 7 per cent per annum. Indeed, they grew more slowly for the countries needing io increase exports most: the lagging recovery of Western Europe, which is the most important market for ihe primary commodities of developing countries, meant that the pattern oí recovery in the ObCl) aiea as a whole was biased against commodity-exporting countries. However, the efforts of ihe developing countries to step up i hen expon earnings from manufactures in order to overcome debt-service and balance-of-payment s difficulties contributed to protectionist pressures in developed market-economy countries, Such pi essuies weie altcady strong because of the large trade imbalances among those coun tries. In the United States a substantial trade deficit emerged as a result of the rise of th( dollai and the disparities in demand growth between ihe United States and its major trading partners, generating new pressures for protectionism, despite the fact that the recovery was strong. In most othei majot industrial court tries recovery remained too weak to reduce un employment, despite the favourable movement of the tiade balances; hence, protection in
creased, especially against laboui-intensive imports from developing countries.
Debtor developing countries as a whole inci eased their export volumes by about 2.5 per cent per annum during 1983-1987, but because of the fall in prices, export earnings failed to increase. Since import prices kept up, panic ularly after 1985, the purchasing power of exports declined. This, in combination with reduced financial flows, ¡educed import capac ity further. 'Ihe 1981 1987 period was therefore marked by the co-existence of increased expon volumes and reduced import volumes in debtor countries (see chart XIII). In the highly-indebted countries, export volumes increased by 13 pet cent over I his period, while import volumes declined by 28 pci cent, in sub-Saharan Africa export volumes increased by more than 14 per cent while import volumes declined by ¡2 per cent.
Cli.iri XIII
EXPORT AM) IMPORT VOI LiiVII S IN HIGHLY-INDEBTED COUNTRIES AM)
SUB-SAHARAN AFRICA (1980=100)
A. Highly-indebted countries 120
110
100
90
go
70
GO
50
_ j . , W " " ' N
\ \
.
"
— _
1980 1981 1982 1983 1984 1985 1980 1987
115
110
100 •
1 . Sub-Si liaran / Úrica
^"~*^_
X
-\
>*
. ***~-
1980 lull, 118/ Export \oiumes Import volumes
1983 1084 1985
Source: As for chart IX. a Adjusted for terms-of trade changes.
The disparity between the movement of export and import volumes was due io (a) the sharp swings that took place in financial flows
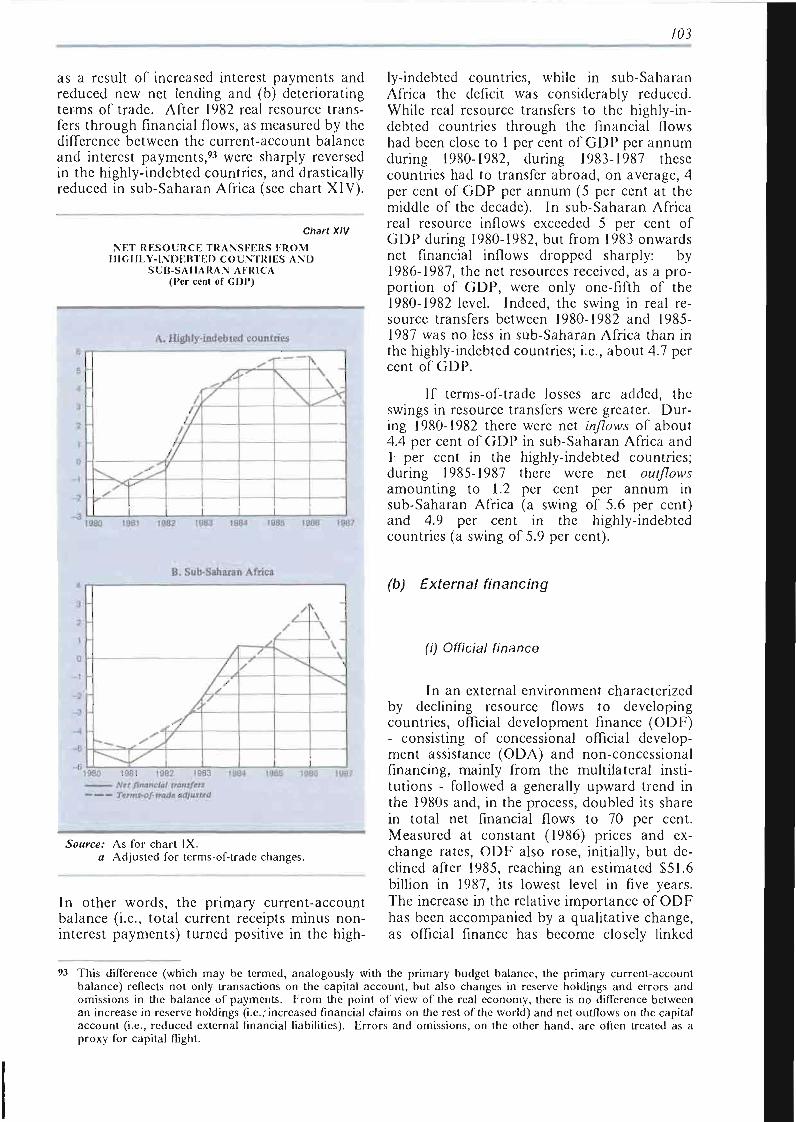
/OJ
as a result of increased interest payments and reduced new net lending and (b) deteriorating terms of trade. After 1982 real resource transfers through financial flows, as measured by the difference between the current-account balance and interest payments,93 were sharply reversed in the highly-indebted countries, and drastically reduced in sub-Saharan Africa (see chart XIV).
Chart XIV
NET RESOURCE TRANSFERS FROM HIGHLY-INDEBTED COUNTRIES AND
SUB-SAHARAN AFRICA (Per cent of GDP)
A. Highly-indebted countries
^ .*& ^
.
/, n //
ff
If
i
**s
> " - ' \
\
\ A
JH
I960 1931 1982 1983 1984 1888 1986 1987
ly-indcbted countries, while in sub-Saharan Africa the deficit was considerably reduced. While real resource transfers to the highly-indebted countries through the financial flows had been close to 1 per cent of GDP per annum during 1980-1982, during 1983-1987 these countries had to transfer abroad, on average, 4 per cent of GDP per annum (5 per cent at the middle of the decade). In sub-Saharan Africa real resource inflows exceeded 5 per cent of GDP during 1980-1982, but from 1983 onwards net financial inflows dropped sharply: by 1986-1987, the net resources received, as a proportion of GDP, were only one-fifth of the 1980-1982 level. Indeed, the swing in real resource transfers between 1980-1982 and 1985-1987 was no less in sub-Saharan Africa than in the highly-indebted countries; i.e., about 4.7 per cent of GDP.
If terms-of-trade losses are added, the swings in resource transfers were greater. During 1980-1982 there were net inflows of about 4.4 per cent of GDP in sub-Saharan Africa and 1 per cent in the highly-indebted countries; during 1985-1987 there were net outflows amounting to 1.2 per cent per annum in sub-Saharan Africa (a swing of 5.6 per cent) and 4.9 per cent in the highly-indebted countries (a swing of 5.9 per cent).
B. Sub-Saharan Africa
1980 1981 1982 1983 1984 — — Net financial transfers — — — Terms-of-trade adjusted
18116 1987
Source: As for chart IX. a Adjusted for terms-of-trade changes.
In other words, the primary current-account balance (i.e., total current receipts minus non-interest payments) turned positive in the high-
(b) External financing
(i) Official finance
In an external environment characterized by declining resource flows to developing countries, official development finance (ODF) - consisting of concessional official development assistance (ODA) and non-concessional financing, mainly from the multilateral institutions - followed a generally upward trend in the 1980s and, in the process, doubled its share in total net financial flows to 70 per cent, Measured at constant (1986) prices and exchange rates, ODF also rose, initially, but declined after 1985, reaching an estimated $51.6 billion in 1987, its lowest level in five years. The increase in the relative importance of ODF has been accompanied by a qualitative change, as official finance has become closely linked
93 This difference (which may be termed, analogously with the primary budget balance, the pr imary current-account balance) reflects not only transactions on the capital account , but also changes in reserve holdings and errors and omissions in the balance of payments. F rom the point of view of the real economy, there is no difference between an increase in reserve holdings (i.e.,-increased financial claims on the rest of the world) and net outflows on the capital account (i.e., reduced external financial liabilities). Errors and omissions, on the other hand , are often treated as a proxy for capital flight.
704
with adjustment and policy reform in debtor countries.
Bilateral ODA strengthened its position as the largest single financial flow since 1982 and amounted to some S33 billion in constant prices in 1987, or 45 per cent of total net flows to developing countries. Low-income countries have received considerable amounts of bilateral ODA. Sub-Saharan Africa, for example, has attracted a growing share of such aid in recent years, reaching over 30 per cent in 1986-1987, The OECD countries remained by far the major providers of bilateral aid, with a share of over three-fourths in 1987. Flows from this source have increased since 1982 both in nominal and, up to 1985, in constant terms. Preliminary information for 1987 indicates that bilateral ODA flows from OECD countries declined by nearly 2 per cent in real terms to $25.8 billion. Progress towards the achievement of the 0.7 per cent of GNP target for ODA, therefore, continues to falter.94
The recent performance of the multilateral lending agencies appears to be in contrast with the expectations generated by the Baker initiative. The volume of concessional lending in nominal terms has been maintained on a gradual upward trend since 1982, with a marked increase in 1986 of $1.0 billion largely due to increased aid to sub-Saharan Africa, in particular from the World Bank through IDA and the Special Facility for Africa. On the other hand, non-concessional multilateral lending declined even in nominal terms in 1985-1987 to $6.5 billion in the latter year, a fifth less than in 1984. One reason for this contraction in net lending was a major increase in amortization payments arising from the build-up of multilateral lending in the 1970s and early 1980s combined, in the case of the World Bank, with a virtual stagnation of commitments during 1982-1985 and delays in loan disbursements. The latter are in part attributable to the recent expansion in policy-based lending and to difficulties encountered both in negotiating such loans and in the implementation of the related adjustment programmes.
Heavy repayment schedules, combined with the reduced availability of resources on appropriate terms, have also diminished the role of IMF as a source of financing for many developing countries. Net purchases from the Fund have fallen drastically since 1983, and were actually negative in 1986 and 1987. For sub-Saharan Africa there was a transfer of
about SO.9 billion to the Fund in each of these years on a net basis (including charges on use of Fund credit).
Multilateral debt has indeed come to represent a major burden for certain categories of developing countries. In 1986 the multilateral institutions, including IMF, accounted for 22 per cent of the external debt of sub-Saharan Africa and for about one-third of the debt of the low-income debt-distressed countries in Africa. For three of these latter countries the proportion was more than half. Not only are such obligations ineligible for rescheduling, but also failure to remain current entails loss of access to further finance and, in the case of arrears to IMF, also to the possibility of rescheduling official debts at the Paris Club. On the other hand, honouring these substantial multilateral debt-service obligations in the present economic circumstances imposes severe constraints on both the balance of payments and the public budget of debtor countries.
Several middle-income countries not included among the Baker 15 face a similar, and in some respects a worse, predicament. For them too, unreschedulable multilateral debt represents a high proportion of the total external debt - on average 33 per cent in 1986 for 11 such countries (mainly in Latin America), with the proportion as high as 42-44 per cent in some instances. Unlike the countries concerned by the Baker initiative, however, these debtors have not had any access to "involuntary" commercial bank loans; and, because of their "middle-income" status, they are not eligible to draw from any of the recently-established concessional financing facilities and programmes. In 1986 the net transfer from the multilateral institutions to these countries amounted to just over $203 million, a 75 per cent drop from the 1982 level.
The generally rising trend of total net flows of ODF between 1982 and 1987 has been accompanied by a sharp decline in the net flow of official and officially-guaranteed export credits to developing countries, from almost $14 billion to $-0.7 billion. This trend, which has affected all categories of debtor countries, is attributable to a number of factors linked, directly or indirectly, to the twin influences of debt problems and adjustment efforts. An important factor has been the practice of export credit agencies (ECAs), modified in 1987,* of withdrawing cover once a debtor fell into arrears and requested a Paris Club rescheduling -
•>)
95
Some donors have recently announced new aid initiatives which may be expected to improve their ODA/GNP ratios. For instance, Japan has decided to double its ODA budget to S50 billion over the next five years.
As from mid-1987 most ECAs have been prepared, for countries with a good record in concluding and implementing previous bilateral rescheduling agreements with creditors and adjustment programmes, to keep such countries on
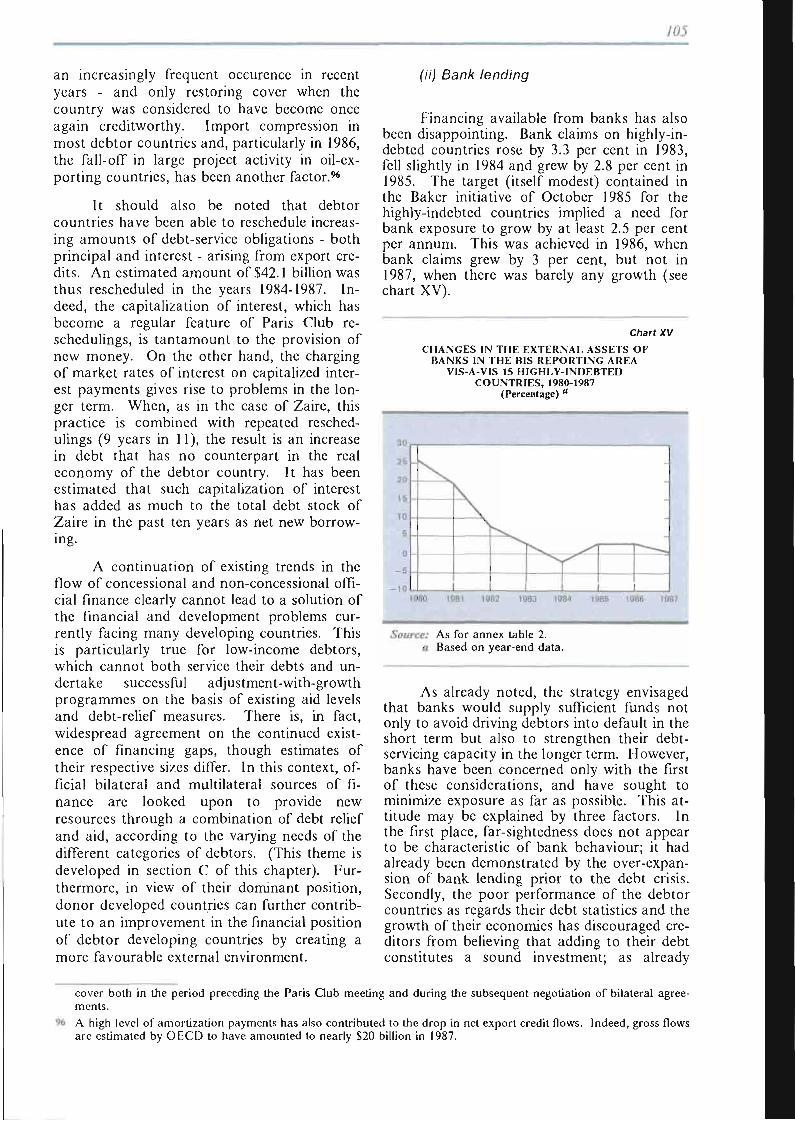
i 05
an increasingly frequent occurence in recent years - and only restoring cover when the country was considered to have become once again creditworthy. Import compression in most debtor countries and, particularly in 1986, the fall-off in large project activity in oil-exporting countries, has been another factor.96
It should also be noted that debtor countries have been able to reschedule increasing amounts of debt-service obligations - both principal and interest - arising from export credits. An estimated amount of $42.1 billion was thus rescheduled in the years 1984-1987. Indeed, the capitalization of interest, which has become a regular feature of Paris Club reschedulings, is tantamount to the provision of new money. On the other hand, the charging of market rates of interest on capitalized interest payments gives rise to problems in the longer term. When, as in the case of Zaire, this practice is combined with repeated reschedulings (9 years in 11), the result is an increase in debt that has no counterpart in the real economy of the debtor country. It has been estimated that such capitalization of interest has added as much to the total debt stock of Zaire in the past ten years as net new borrowing.
A continuation of existing trends in the flow of concessional and non-concessional official finance clearly cannot lead to a solution of the financial and development problems currently facing many developing countries. This is particularly true for low-income debtors, which cannot both service their debts and undertake successful adjustment-with-growth programmes on the basis of existing aid levels and debt-relief measures. There is, in fact, widespread agreement on the continued existence of financing gaps, though estimates of their respective sizes differ. In this context, official bilateral and multilateral sources of finance are looked upon to provide new resources through a combination of debt relief and aid, according to the varying needs of the different categories of debtors. (This theme is developed in section C of this chapter). Furthermore, in view of their dominant position, donor developed countries can further contribute to an improvement in the financial position of debtor developing countries by creating a more favourable external environment.
(ii) Bank lending
Financing available from banks has also been disappointing. Bank claims on highly-indebted countries rose by 3.3 per cent in 1983, fell slightly in 1984 and grew by 2.8 per cent in 1985. The target (itself modest) contained in the Baker initiative of October 1985 for the highly-indebted countries implied a need for bank exposure to grow by at least 2.5 per cent per annum. This was achieved in 1986, when bank claims grew by 3 per cent, but not in 1987, when there was barely any growth (see chart XV).
Chart XV
CHANGES IN THE EXTERNAL ASSETS OF BANKS IN THE BIS REPORTING AREA
VIS-A-VIS 15 HIGHLY-INDEBTED COUNTRIES, 1980-1987
(Percentage) "
313
SE
20
15
!0
E
0
- 5
- 1 0 1880 1981 1082 1983 1934 I9U5 1986 1BB7
È b _
Source: As for annex table 2. a Based on year-end da ta .
As already noted, the strategy envisaged that banks would supply sufficient funds not only to avoid driving debtors into default in the short term but also to strengthen their debt-servicing capacity in the longer term. However, banks have been concerned only with the first of these considerations, and have sought to minimize exposure as far as possible. This attitude may be explained by three factors. In the first place, far-sightedness does not appear to be characteristic of bank behaviour; it had already been demonstrated by the over-expansion of bank lending prior to the debt crisis. Secondly, the poor performance of the debtor countries as regards their debt statistics and the growth of their economies has discouraged creditors from believing that adding to their debt constitutes a sound investment; as already
cover both in the period preceding the Paris Club meeting and during the subsequent negotiation of bilateral agreements .
96 A high level of amort izat ion payments has also contributed to the drop in net export credit flows. Indeed, gross flows are estimated by O E C D to have amounted to nearly $20 billion in 1987.
/Oó
noted, the market pessimism regarding debtors' prospects is evident in the low prices quoted for their paper in secondary markets. A third, and equally important factor, has been the banks' progress in reducing their exposure and in making provisions for losses (reviewed above), which has made them less fearful that unless they extend new loans they will themselves risk insolvency. This fear was never shared by the United States regional banks or by many continental Western European banks, since their vulnerability had never been critical. But it has tended to diminish even among the big United States money-centre banks which, because of their high degree of exposure and lack of provision, had as a group been the most supportive of "concerted lending" at the initial stages of the debt strategy.
Much the same factors that have led * many banks to become increasingly reluctant to provide new money have led them towards various devices for converting their claims into other and more secure assets, including cash. Financial innovation has led to a considerable enlargement of the range of options available to creditors, which now includes such techniques as debt-equity swaps, exit bonds and other forms of securitization. Creditor governments have encouraged this trend, seeing it as a convenient means of providing funds from the private sector to debtor countries without cornrniting public monies or providing official guarantees.
However, these new devices and techniques have not yielded a major increase in the flow of resources to debtor countries. For example:
• About $6 billion of debt has been converted into equity during the period 1984-1987, but that amounts to only about 2 per cent of the total commercial bank debt of the 15 highly-indebted developing countries. The amounts may be expected to rise over time. However, there are a number of factors on both the countries' and the investors' sides restricting the scale of debt-equity conversions. The proportion of its total capital stock (or the stock in key sectors) that a country can sell to non-residents without feeling an excessive loss of control is limited; if the proportion were to rise to the tolerance limit, foreign investors would find that they had exchanged a credit risk for an expropriation
risk. An exception is Chile, which has successfully used swaps for capital repatriation. The scope for replicating this experience elsewhere depends critically on how far the owners of flight capital are prepared to expose themselves to public attention in the light of their expectations regarding the country's economic, political and social evolution. A second limiting factor arises from the impact of debt-equity swaps on the money supply. The availability of additional flows of foreign direct investment is also a determinant of the scale on which debt can be swapped into equity. Almost all countries that have adopted such schemes have done so as a means of attracting foreign direct investment, rather than as a means of reducing debt (see box 6). An Argentine offer of exit bonds has failed to find many takers. This has been because, owing to the continued debt overhang of the issuer, the "seniority" of the bonds has not been sufficient to outweigh the lower interest rate. Mexico has succeeded in converting about $3.7 billion of old debt into $2.6 billion of new securities which carry a somewhat higher coupon and whose repayments of principal are fully collateralized by zero-coupon bonds specially issued by the United States Treasury for that purpose. However, the amount actually converted amounts to less than one-fifth of the amount sought.97 The disappointing result actually achieved reflected, as with the Argentine exit bonds, the markets' doubts regarding the value of the senior status of the bonds, given the country's debt overhang, and consensus regarding the lack of collateral on interest due. Some of the loans sold by banks on the secondary market at a discount have been taken up by other investors willing to take the risk of holding them. This change of claimant brings no benefit for the debtor country. However, in the case of some low-income countries (such as Bolivia and, so it is reported, some African countries) the purchasers have been aid donors, and the result has been to relieve the debtor. Direct buy-backs by debtor countries have as yet been rare, owing to the legal limitations on advance repayment. Peru has implemented a programme of debt-to-goods swaps whereby short-term
97 In December 1987, Mexico, in co-operation with Morgan Guaranty, offered to exchange at a discount some of its outstanding public sector debts for 20-year bonds on which repayment would be secured by United States Treasury bonds. It was hoped that up to S20 billion of debt could be exchanged for the new bonds, which, given the discount then prevailing in the market, would have reduced Mexico's public sector external debt, which amounted to $53 billion, by $10 billion.
107
Box 6
THE SCOPE FOR DEBT EQUITY SWAPS
Almost all the heavily indebted countries have implemented debt-equity swap schemes and other debtor countries have also shown interest in doing so.
The effect of debt-equity swaps on the balancc-of-payments through the immediate relief on interest payments is at present insignificant, given the small amount of debt convened. Furthermore, with the exception of a few countries, such as Brazil, Costa Rica and Mexico, debtor countries do not capture the benefit of the discount on their debt on the secondary market, which most often accrues to foreign investors. However, the reduction in interest payments now is counterbalanced by remittances of profits and capital in the future. Although profits depend on the success of the enterprise, their remittance abroad can create transfer problems for the host countries later on.
Compared to the amount of debt, the number of equity investment opportunities which can be profitable to both host countries and foreign investors is small. Fear of foreign control over the domestic economy can put limits to equity swaps. Some debtor countries have required that funds be invested in new facilities and have excluded the possibility of acquisition of existing equity assets with funds obtained from debt swaps.
Another important constraining factor is the negative impact that debt swaps can have on the budgetary and monetary controls of debtor countries. 'Ihe local currency required to repurchase the foreign currency debt is provided by the monetary authority of the debtor country through money creation or the issuance of domestic public debt, unless the local original borrowers are required to redeem their debt in local currency out of their existing assets. Money creation is inflationary, while substitution for public debt can be a source of budgetary problems, as domestic interest rates are generally higher than foreign interest rates because of high domestic inflation even after making appropriate adjustment to take account of the rate of exchange from foreign currency into local currency. This increase in interest payments will worsen the government budget deficit, which might result in further cuts of government investment expenditure. On the other hand, the government is earning income from taxes imposed on these operations, which might mitigate the negative impact on its budget deficit.
Some countries have succeeded in encouraging through debt swap programmes the repatriation of flight capital by nationals who take advantage of the existence of large debt discounts. But concern has been raised with respect to "round tripping": residents use debt swaps to repatriate flight capital and cam profits from the debt discount, then buy foreign currencies in the parallel market in order to transfer capital abroad again, thereby pushing up the exchange rate on the parallel market and depleting the country's foreign exchange reserves. This would put pressure on the government to undertake a currency devaluation.
These possible adverse consequences of debt-equity swaps have led debtor countries to tightly control these operations and to impose quotas and limits on the amount of debt which can be swapped.
Debt-equity swaps arc therefore not a major instrument of debt management. Indeed, most debtor countries have implemented debt-equity swap programmes primarily as a means of promoting foreign investment, especially in priority sectors.
working capital debt owed to some commercial banks is exchanged on a "three-to-one" basis; for each dollar of debt the creditor banks must buy three dollars of exports.98 The amount of debt thus exchanged is modest, but the technique has been found useful for promoting non-traditional exports.
From one point of view, concerted lending and voluntary debt conversion can co-exist peacefully in an "evolving menu approach" and jointly provide debtor countries with an adequate flow of resources. However, converting debt at a discount can put in question the rationale of new lending: the additional dollar lent may have to be valued at considerably less in the lender's portfolio. Besides, as already noted, the trend towards debt conversion stems
98 In 1987 Peru signed debt to-goods swap agreements with two commercial banks for the withdrawal of debts amounting to $22 million. A new deal is to be signed in 1988 covering an amount of debt of $15 million.
/oa
from much the same source as the trend away from new lending. In short, the present system of involuntary lending plus voluntary debt reduction lacks coherence. As argued at greater length below, a further evolution is required, in the direction of concerted debt reduction plus voluntary lending.
(c) The impact of adjustment policies
As already noted, the strategy depended for its success on the debtor countries making heavy and swift cuts in spending without permanently depressing investment and hence growth. This, in turn, required them to replace cuts in domestic demand by additional net exports through currency depreciation, and to compensate for the reduced net inflow of financial resources by increasing savings. In practice, aggregate spending has been substantially cut, but it has not proved possible to avoid acute domestic disequilibria and stagnation. In many cases the adjustment achieved has amounted to little more than an accommodation of external constraints at the expense of stability and growth, and external debt has been serviced either at the cost of rapidly accumulating internal debt or by drastically reducing productive spending, or a combination of the two. Policy shortcomings were common. Some of them reflected a failure to follow the advice received. Others ensued from following such advice, which was sometimes framed without a full understanding of the relationships between the financial and real variables in a developing economy. However, it would have been difficult even with the best of policies and willingness to implement them to reconcile the magnitude and speed of the adjustment required with the adjustment capabilities of the debtors, especially in view of the continuously unfavourable environment.
Debtor countries have achieved large swings in the current-account balance. In the highly-indebted countries the current-account deficit was reduced from more than $50 billion in 1982 to under $10 billion in 1986-1987, a swing of about 5 per cent of GDP. The swing in sub-Saharan Africa was comparable, i.e., over 4 per cent of GDP.
With two exceptions, the real effective exchange rates of the highly-indebted countries had by 1986-1987 fallen much below the levels of 1982; on average, the depreciation was 35 per cent. At least 10 of these 15 countries have had continuous real depreciations every year. In sub-Saharan Africa, devaluations have more than offset the appreciation in real terms that took place during 1980-1983: at the beginning of 1987, the weighted average real effective exchange rate in that region was 40 per cent be
low its 1980 level. In addition, many debtor countries have undertaken a significant liberalization of their trade regime, including dismantling of quantitative restrictions and reduction of tariffs.
Real demand has, as a general rule, been substantially reduced through the pursuit of monetary and fiscal restrictiveness, often (though not always) in the context of IMF programmes. Nominal interest rates have in most countries been raised substantially, and real interest rates have on the whole been positive; in some countries they have reached exceptional heights. Non-interest expenditure by the public sector,has been reduced substantially, both as a share of government expenditure and in relation to GDP. Fiscal imbalances have also been attacked. In the highly-indebted countries the average fiscal deficit, which was of the order of 6 per cent of GDP during 1982, was cut by half by 1985; it then started to rise, largely due to increased interest payments on domestic debt, reaching 6 per cent again in 1987. In sub-Saharan Africa fiscal deficits fell from more than 7 per cent of GDP in the early 1980s to under 5 per cent in 1985; they have risen in the last two years. In debt-distressed countries, the deficit was less than 4 per cent of GDP in 1986, the lowest level in the 1980s and about a third of the peak attained in the early 1980s.
Budget deficits are still sizeable in many countries, in large part because the magnitude and abruptness of the swing in the net flow of financial resources has made it difficult for governments to keep control of fiscal policy, Similarly, inflationary pressures have been intensified, in large part because of the cost-push effects of currency devaluations and of increases in interest rates and public-sector prices.
In many highly-indebted countries total debt service on external public and publicly-guaranteed debt has exceeded a third of government revenues, with interest payments on such debt absorbing more than a quarter of the budget; in some countries even net foreign borrowing has been negative. Governments have had to generate resources amounting to 5-6 per cent of GDP to service external debt. Negative net transfers have created a domestic transfer problem. Foreign exchange has been generated by the private sector while debt has had to be serviced mainly by the public sector. An internal transfer from the former to the latter has been needed to effectuate the net external transfer.
Such a resource extraction can be done in three ways: by generating a surplus of revenues over the sum of primary spending and domestic interest payments; by increased domestic borrowing; and by monetary expansion. In prac-
709
tice governments have resorted to all three methods, including increased taxation, in order to . resolve the budgetary transfer problem. However, the imbalances have reappeared as difficulties elsewhere. In some countries, deficits resulting from the transfer burden were at times financed through monetary expansion, with adverse consequences for price stability. This avenue has, however, been closed to countries pursuing IMF adjustment programmes, which generally limit domestic borrowing to the government. There have also been substantial difficulties in reducing primary deficits through increased revenues. Tax revenues are difficult to raise when incomes are falling, and although real devaluations tend to raise trade taxes, tariff reductions have the opposite effect. When government revenues are raised by increasing the prices of public sector products, their impact on inflation is no less severe than financing deficits with monetary expansion. Moreover, the debt strategy has sought to reduce the share of the public sector, as well as its deficit.
The quest for adjustment itself has increased claims on the budget in various ways. Many governments have extended substantial incentives to promote exports, such as interest rate subsidies and tax rebates. On the other hand, sharply increased interest rates at home and abroad, in combination with currency devaluations and cuts in domestic demand, have led to serious financial strains in the corporate sector, particularly in non-tradeable goods industries, necessitating substantial financial rescue operations, subsidized private debt servicing and, eventually, nationalization of private external debt.
For these reasons, the burden of fiscal adjustment has fallen on public sector investment and social spending. This has had serious consequences for growth and the incidence of poverty. Contrary to orthodox expectations, cuts in public investment, particularly in physical infrastructure, tend to "crowd out" private sector investment since they are often complementary to, rather than competitive with, private-sector activities. Reduction of government spending on health and education slows the development of human resources and hence diminishes longer-term growth prospects.
Governments have also had to resort to domestic borrowing at high interest rates. The tightening of monetary policy, the lifting of ceilings on interest rates, and increased competition, both between the public and private sectors for domestic financial resources and between public-sector bonds and foreign-exchange assets, have all raised borrowing costs steeply. Interest payments on domestic debt have therefore climbed rapidly, necessitating further cuts to be made in the primary deficits. In most highly-indebted countries interest pay
ments on external and domestic debt have become the single most important item in the government budget, exceeding investment, health and education. Most highly-indebted countries have been generating primary budget surpluses (i.e., surpluses of government revenues over government non-interest expenditures) during the last few years. Yet their fiscal deficits have continued to rise due to the rising interest bill.
When the public sector borrows in domestic markets in order to service its external debt, domestic over-indebtedness can easily ensue if the currency keeps depreciating in real terms and the real interest rate on domestic debt remains high, even if the transfers abroad remain unchanged in dollar terms. If the rate of currency depreciation exceeds the rate of growth of nominal GDP, domestic debt incurred to make transfers abroad will rise relative to GDP. Similarly, if the interest rate on government debt is kept higher than the rate of growth of nominal GDP (i.e., if the real interest rate on government debt is higher than the real growth rate), then domestic interest payments will require, even with an unchanged primary budget, domestic debt to increase faster than GDP. Thus, real currency devaluations and high interest rates will raise the government deficit, which will then feed into a larger public debt; this, in turn, will result in still higher deficits through higher interest payments; thus, the need for primary surpluses will continuously rise. This has been the experience of many highly-indebted countries. This quest for export growth has resulted in rates of depreciation (in real terms) considerably above the rate of output growth, while their quest for price stability and a reversal of capital flight has caused real interest rates to rise substantially above the real growth rate. Thus, policies of high interest rates and currency depreciation (which have often been recommended by international financial agencies) have not only aggravated the budget transfer problem but also generated a domestic debt explosion - and one which will gather force as old debts are refinanced at higher interest rates. Rapidly rising public debt arouses inflationary expectations, which makes it difficult to stabilize interest and exchange rates. Moreover, since the scope for generating primary surpluses has limits, governments in such a trap run the risk of insolvency vis-à-vis domestic (as well as foreign) creditors.
The budget problem created by the shrinkage of financial flows is serious in sub-Saharan Africa, where, because the banking system and the private sector have limited access to external financial flows, the relationship between the budget and external financial flows is much closer. The sharp swing in net transfers since the beginning of the decade amounting to about 5 per cent of GDP has exerted
110
powerful pressures on the budget, necessitating large cuts in public spending. Because of the narrowness of domestic financial markets in these countries, as well as the limited scope for increasing tax revenues, the burden of fiscal adjustment has fallen mostly on public sector investment and on social spending, with particularly harsh effects on certain vulnerable groups.
The sharp swing in resource transfers and the raising of key domestic prices have also added to price instability. In sub-Saharan Africa inflation accelerated sharply at the beginning of the decade and has shown no tendency to decline during the last few years; the average rate of inflation in the region during 1980-1987 was 50 per cent higher than 1970-1979. In the highly-indebted countries where inflation rates have been historically high, particularly Latin America, there was a sharp rise in the early 1980s compared to the 1970s. During the last five years the average rate of inflation has been double the 1982 rate, and, again, it has shown no tendency to decline.
When an economy is faced with external shocks entailing a substantial transfer of resources abroad, be it through terms-of-trade deterioration or adverse financial flows, a major conflict arises regarding the distribution of the burden among various classes and groups, which often sets off an inflationary process. Inflationary forces stemming from distributional conflicts tend to be further exacerbated where payments imbalances impinge directly on aggregate supply capabilities. For instance, the deterioration of economic performance in OECD countries during the 1970s and the early 1980s is often explained by the rise in oil prices: these, according to OECD, "imposed enormous strains on OECD economies, necessitating a degree and pace of adaptation that severely challenged the capability of the OECD economic system."99 The rate of inflation more than tripled between 1972 and 1974; it declined only moderately in the subsequent years, and, again doubled between 1978 and 1980 following the second oil price rise. The OECD economies experienced two long and deep recessions, and inflation could only be brought down at the expense of substantially increased unemployment and reduced growth which served to reverse the earlier terms-of-trade losses by putting downward pressure on commodity prices.
Income losses due to terms-of-trade deterioration amounted to about 1.5 per cent of GDP in OECD countries in 1974 and 1 per cent in 1979-1980. These figures are, however, small compared to the real resource losses suffered by developing country debtors through the channels of trade and finance (5.6-5.9 per cent
of GDP); these losses have also been more enduring. The capacity of these countries to adjust has also been much more limited, particularly since their supply capabilities have at the same time been greatly reduced. Currency devaluations, interest rate rises, elimination of subsidies and increased prices of public sector goods have added substantially to price instability by redistributing incomes and triggering cost-push pressures. Distributional conflicts have made it extremely difficult to attain macroeconomic stability, particularly in debtor countries with an organized urban working class. In all countries governments must bear in mind the possible reactions of the populace in designing economic policies.
The massive swing in the current-account balance noted earlier has been achieved not so much through increases in export revenues as import cuts. Indeed the entire improvement in the trade balance of the highly-indebted countries during 1982-1987 was due to cuts in imports. In sub-Saharan Africa export revenues have fallen, with the consequence that import cuts exceeded the decline in trade deficits.
Cuts in non-essemial imports provided some of the savings. But typically import cuts had to go much further. This posed a dilemma. Compressing imports of intermediate inputs would have required existing capacity to be under-utilized, with consequences for the level of income and employment and, in some cases, even exports. Reducing imports of capital goods, on the other hand, would have reduced capacity expansion and hence the ability to make structural changes required for genuine adjustment. The choice has usually been made at the expense of investment, since import requirements per unit of investment are typically much greater than for other components of domestic production; this allowed countries to cut the import bill without commensurate cuts in the degree of capacity utilization. Imports of direct and indirect inputs for capital goods production were reduced alongside imports of machinery and equipment, and the composition of domestic production changed at the expense of goods which provided for domestic investment.
In the highly-indebted countries capital goods imports from the OECD area have been cut by 40 per cent in value terms since the beginning of the decade, while exports of such goods to the OECD area have more than doubled; the fact that net trade in capital goods and aggregate investment have moved closely together strongly suggests that the swing in net imports of capital goods was due to retrenchment rather than to increased production for export or import substitution. However, the components of GDP other than investment
99 OECD Economic Outlook (Paris), No. 31, July 1982, p. 7.
Ill
rose or fell much less than imports of intermediate goods, which suggests that a substantial amount of import substitution took place in intermediate goods industries.
In sub-Saharan Africa cuts in capital goods imports, while large, did not greatly exceed those made in other types of imports, including food and intermediate inputs. Indeed, in that region investment has been cut somewhat less than in the highly-indebted countries, perhaps because financial flows to the region have been more project-tied. However, since these countries have had far fewer import substitution opportunities in intermediate goods industries their import cuts directly reduced their ability to produce and to maintain the capital stock.
The failure to restore import capacity through increased export earnings despite large devaluations and suppression of domestic demand has been due to the interaction of domestic and external constraints. The slow growth of markets, depressed prices of commodities and increased protectionism have been major factors on the external side. But domestic structural factors standing in the way of a swift and sizeable export response have been no less significant. The ability of commodity-dependent countries to increase exports by switching goods to external markets has been limited because domestic absorption generally accounts for a very small proportion of total exportable production. Many countries at a higher level of industrialization have been able to increase the volume of manufactured exports, but this has been done, in large part, by a combination of increased capacity utilization and redirecting output from the home to foreign markets. New capacity creation, which is vital for sustained adjustment, has been a minor factor.
Debt service has reduced the supply of savings in two ways. First, it has impaired the capacity to raise savings out of income, since growth has been constrained by the shortage of foreign exchange. Second, interest payments have absorbed a significant portion of the available pool of savings while net new lending has added very little. Consequently, resources at the disposal of the debtor countries have been barely sufficient to meet debt servicing, to
The previous section has shown that troubled debtor countries are no less over-indebted than before the debt crisis. The task of realigning debt-service obligations and capaci-
rcplace the existing capital stock and to invest in human and physcial infrastructure in order to satisfy the needs of a growing population.
In sub-Saharan Africa domestic savings rates have been maintained despite the falls in income. However, the swing in external financial flows has caused a sharp reduction in investment; the contribution of external resources to capital accumulation has fallen from more than 5 per cent of GDP during the early 1980s to less than 1 per cent in recent years. In the highly-indebted countries the domestic savings ratio has fallen only by about 2 percentage points since the early 1980s. But the decline in the investment ratio has been drastic, from more than 23 per cent to under 16 per cent. More than a fifth of domestic savings has been absorbed by interest payments on external debt while net new lending has added less than 1 per cent of GDP to investible resources.
Since a certain proportion of GDP was needed simply to replace the existing capital stock, net investment has declined proportionately much more than gross investment for both groups of debtors. The available evidence suggests that at least 8 per cent of GDP (i.e., half of gross investment) is needed to replace the existing capital stock. Since the gross investment ratio is estimated to have been about 15 per cent of GDP since 1982, the net investment ratio must have been on average less than 7 per cent. Since, typically, housing and infrastructure generally account for about two-thirds of total gross investment (and even more in sub-Saharan Africa) while the rate of depreciation is much greater in manufacturing, net new investment available for restructuring and expansion of industrial capacity has, on average, amounted to less than 2 per cent of GDP; indeed, it has been barely positive in a number of countries. Such low rates of investment have tightly limited debtor countries' ability to increase the supply of exportables, improve efficiency and competitiveness, strengthen debt-servicing capacity and restore credit worthiness. In short, it has been principally the loss of resources through finance and trade which has prevented adjustment efforts from succeeding in raising debt-servicing capacity sufficiently to make the debt burden sustainable.
ties with one another thus remains to be accomplished. But in many respects this task is now much more formidable than six years ago. Investment ratios and living standards are far
B. The debt overhang and growth prospects
112
below their previous levels, the share of interest payments in government expenditures is higher and that of social expenditures lower, problems of income-distribution are more intense, and the financial position of private enterprises is in many cases worse.
It is generally agreed that over-indebtedness can be corrected only by lifting the rate of output growth rapidly from its presently depressed level and reducing debt ratios over the medium term. This has become a guiding priority of the debt strategy. However, whether there is for each country a combination of policy improvements and further debt accumulation capable of achieving that result cannot be taken for granted.
Growth requires investment to be stepped up, which in turn requires imports to rise. The question is how to generate the import expansion needed for sustained growth in output and exports, starting from a situation in which the scope for reducing consumption and that for adding to debt are both at best highly restricted and the outlook for the external environment unpromising. Are the constraints so tight as to create a debt overhang which presses the debtor country into persistent stagnation and over-indebtedness? If not, the present approach can work if properly applied. But if they are too tight, a once-and-for-all reduction in debt-service obligations will be needed to make it possible to embark on the process of growing out of debt, i.e., to find a solution through a combination of policy effort with new borrowing.
This section discusses the debt and development prospects for highly-indebted and for low-income countries. This is the conventional approach. It does not focus on differences among countries within each group, nor does it include those troubled debtor countries which are neither in sub-Saharan Africa nor in the Baker 15 (including a number in Asia, Northern Africa and Central America). Its results should therefore not be taken as a complete assessment of debt and development prospects. Nevertheless, the approach is useful, in that it allows the present strategy to be examined frontally. Throughout, it is assumed that export efforts will not be frustrated by weak demand or import barriers abroad. This may be an unrealistic assumption, but it is a useful way to simplify analysis of the debt overhang problem as it relates to investment and external resource needs.
The first subsection deals with the highly-indebted countries. It first assumes a sustained policy effort but no improvement in the (low of external resources; it then analyzes the scope for growing out of debt by stepping up
debt accumulation; and it finally examines the impact of a once-and-for-all debt or interest reduction. The second subsection examines the external financing requirements of sub-Saharan Africa, and is followed, in subsection 3, by a discussion of ways to achieve debt reduction.
1. Highly-indebted countries
As already noted, the expansion in export volumes since 1982 was made possible by using existing capacities more fully and by redirecting the flow of output to foreign markets. The scope for continuing in this way has narrowed considerably. Further export growth will depend critically on the extent to which additional capacities are created, and old plant and equipment restructured. Both need new investment. However, the level of investment is extremely low, largely because savings are being heavily drained by the net transfer of resources abroad to service debt. It is difficult to increase savings by further cutting consumption, since living standards have already been drastically reduced. Savings can rise if incomes grow, and do so at a faster rate than the income growth; but that would require investment to be stepped up first, and imports to rise to match that increased demand for investment goods and the need for imports of intermediates in line with income growth. Import growth must therefore lead the growth of investment, exports and incomes; it cannot follow them or even simply stay abreast.
The needed boost in import capacity cannot be expected to come from an improved external environment. The cumulative impact (especially on productive capacity) of the unfavourable environment of the past several years has been so substantial that there is no plausible improvement in external financial and trading conditions that would provide a significant offset. For example, even a marked acceleration of growth in the OECD economies would pull commodity prices only part of the way up to previous levels. It is therefore realistic to consider debt perspectives on the assumption that real commodity prices and the terms of trade will remain unchanged - an assumption which is also made in recent IMF scenarios for the medium term.
Nor can world interest rates be expected to fall significantly. The major market economies now seek to stabilize the dollar around its present level, and short-term interest rates are at low levels in Western Europe and Japan; consequently, the scope for reduction in dollar
113
interest rates is limited.100 Indeed, increased concerns with overheating and rekindling of inflationary expectations in the United States could trigger a substantial rise in interest rates. Long-term interest rates started to move upwards in the spring of 1988, and short-term interest rates are expected to rise over the next couple of years, reaching the 1985 level by the end of 1989.
(a) The baseline scenario
The baseline scenario is designed to assess growth prospects of debtor countries with improved domestic policies under present external conditions; i.e., an unchanged flow of resources and an unchanged trading and financial environment. It is based on a model in which, given the domestic savings ratio and the import requirements of investment and other components of GDP, income and investment are jointly determined by the availability of foreign exchange. Investment in export industries serves to reduce the foreign exchange constraint, allowing income and investment to be raised further. Thus, for any given level of external resource transfers, the growth path of the economy depends on the pace of export growth and, hence, on the level and efficiency of investment in export industries. The model parameters are derived from the recent performance of the group.101
Regarding the external environment it is assumed that the terms of trade and the real burden of debt (i.e., the volume of exports needed to meet interest payments per dollar of debt) will remain unchanged at their average levels of 1985-1987. Thus, export prices are assumed to move in line with import prices, and both of them in line with interest rates.
Although in practice some countries have filled their foreign exchange gap by accumulating interest arrears, in the present scenarios arrears have been added to the stock of debt, and taken into account in estimating the average implicit interest rate. This treatment does not alter net financial transfers and supply of savings available for investment, but it raises the stock of debt relative to income and exports. Notwithstanding this adjustment, net lending by banks to highly-indebted countries is assumed to be negligible, and total net lending to these countries to register the same annual av
erage as in 1985-1987, when the entire net external financing to these debtor countries as a group came from official and multilateral sources.
On the domestic side, the savings ratio is assumed to remain unchanged over the next five years, but improvements are assumed to take place in the quality of investment. It is assumed that 20 per cent of total net investment is allocated to export industries; since net investment outside housing and infrastructure barely exceeds 2 per cent of GDP, this implies that about 70 per cent of net investment outside these areas will go directly into export-generating activities. Investment in physical and human infrastructure also helps to raise exports over a longer period; the ratio of new export-generating investment assumed is high enough to allow for this effect. On the other hand, since the aggregate rate of investment is very low, a further redirection of investment to export industries may be neither feasible nor desirable, considering complementarities and indivisibilities and the needs of a growing population.
If its quality is improved, replacement, as well as net, investment can serve to raise output and export potential. This is assumed to take place. The World Bank has claimed that there exists a close association between lower incremental capital-output ratios (ICORs) and increased outward orientation. On the basis of the observation that the average ICOR for "outward-oriented" groups of countries for 1963-1973 was 2.5 while for "inward-oriented" groups it was from 3.3 to 5.2, depending on the degree of inward orientation, in the 1973-1985 period the ratios were around 4.5-5 and 6.2-8.7, respectively. In the present scenarios an average ICOR of 3.5 is assumed for the highly-indebted countries. Since they are in the "inward-oriented" group, this implies a substantial improvement not only over their own recent performance but also over the performance of strongly "outward-oriented" countries. Thus, the baseline scenario assumes a strong domestic policy effort to give whatever incentives are needed to substantially improve the allocation and quality of investment, and to translate that into export earnings.
The baseline scenario indicates that, if policy efforts are not accompanied by an increase in the level of investment, the debtor countries will achieve an annual export volume
100 If there is an upward pressure on the dollar due to an accelerated improvement in the US trade deficit, the likely response could be a rise in interest rates in Western Europe and Japan rather than a decline in the United States.
101 Import requirements are estimated on the basis of the recent behaviour of total imports, capital and intermediate goods imports, investment and GDP, and are lower than their historical values due to import substitution that has taken place in recent years. The savings ratio used is the average of 1985-1987.
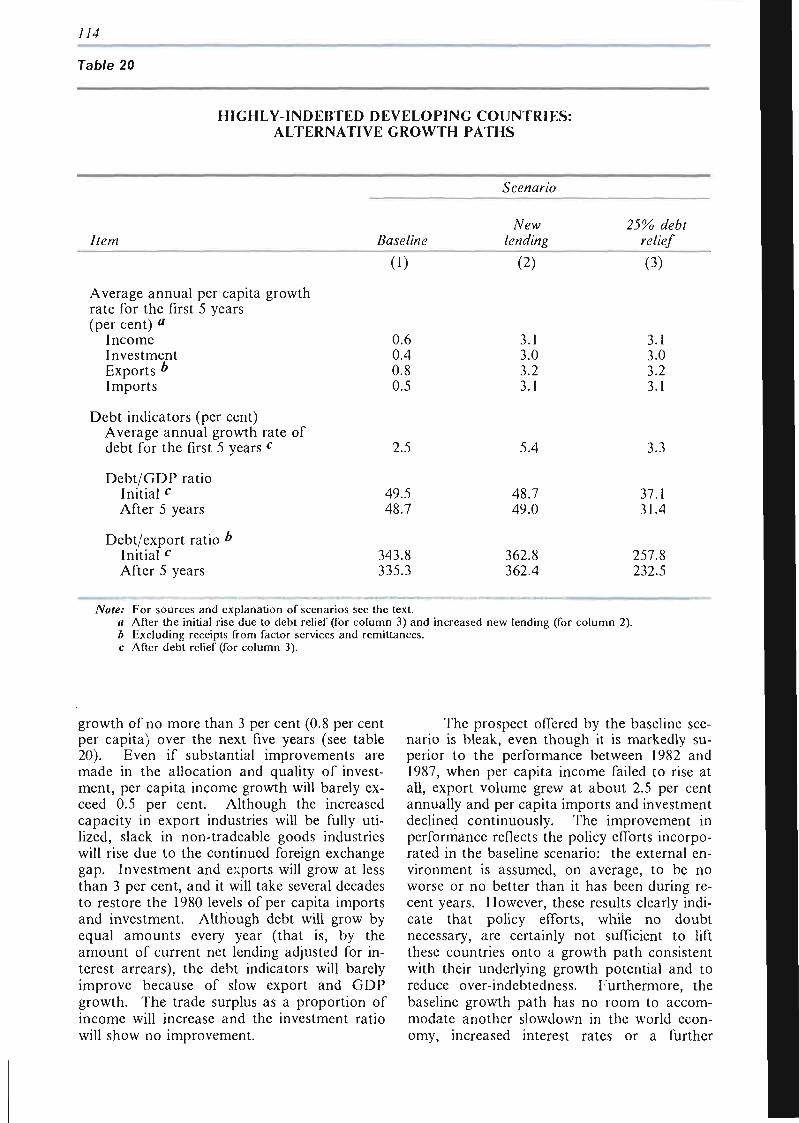
114
Table 20
HIGHLY-INDEBTED DEVELOPING COUNTRIES: ALTERNATIVE GROWTH PATHS
Scenario
Item Baseline New
lending 25% ¿e6f
relief
(1)
Average annual per capita growth rate for the first 5 years (per cent) a
Income Investment Exports b
Imports
Debt indicators (per cent) Average annual growth rate debt for the first 5 years c
Debt/GDP ratio Initial c
After 5 years
Debt/export ratio b
Initial c
After 5 years
of
0.6 0.4 0.8 0.5
2.5
49.5 48.7
3418 335.3
(2)
3.1 3.0 3.2 3.1
5.4
48.7 49.0
362.8 362.4
(3)
3.1 3.0 3.2 3.1
3.3
37.1 31.4
257.8 232.5
Note: For sources and explanation of scenarios see the text. a After the initial rise due to debt relief (for column 3) and increased new lending (for column 2). b Excluding receipts from factor services and remittances. c After debt relief (for column 3).
growth of no more than 3 per cent (0.8 per cent per capita) over the next five years (see table 20). Even if substantial improvements are made in the allocation and quality of investment, per capita income growth will barely exceed 0.5 per cent. Although the increased capacity in export industries will be fully utilized, slack in non-tradeable goods industries will rise due to the continued foreign exchange gap. Investment and exports will grow at less than 3 per cent, and it will take several decades to restore the 1980 levels of per capita imports and investment. Although debt will grow by equal amounts every year (that is, by the amount of current net lending adjusted for interest arrears), the debt indicators will barely improve because of slow export and GDP growth. The trade surplus as a proportion of income will increase and the investment ratio will show no improvement.
The prospect offered by the baseline scenario is bleak, even though it is markedly superior to the performance between 1982 and 1987, when per capita income failed to rise at all, export volume grew at about 2.5 per cent annually and per capita imports and investment declined continuously. The improvement in performance reflects the policy efforts incorporated in the baseline scenario: the external environment is assumed, on average, to be no worse or no better than it has been during recent years. However, these results clearly indicate that policy efforts, while no doubt necessary, are certainly not sufficient to lift these countries onto a growth path consistent with their underlying growth potential and to reduce over-indebtedness. Furthermore, the baseline growth path has no room to accommodate another slowdown in the world economy, increased interest rates or a further
115
deterioration of the terms of trade. If such shocks were to occur over the next few years, per capita income growth would become negative once again, and indebtedness would rise sharply relative to income and exports.
(b) A new lending scenario
Could combining policy efforts with substantially increased levels of new lending provide the answer? There can be little doubt that if the foreign exchange gap were eliminated and imports and investment raised by substantial and continuous infusions of new money, the highly-indebted countries could grow at a much faster rate, both by using installed capacities in non-tradeable production more fully and by adding to productive capacity all round. The more interesting question is how the new borrowing would alter the principal debt indicators. To arrive at an answer, the same assumptions are made regarding the parameters (other than net lending) as in the baseline, except that it is assumed (as explained below) that a much larger share of investment is allocated to export industries.
The scenario confirms that if net capital inflows are raised, on average, by about 2.4 times the baseline figure, the foreign-exchange constraint can be eliminated.102 In order to lift investment to the level necessary for the subsequent growth path the stock of debt will need to rise by 5.5 per cent above its present level. Following the rise in net investment, exports will grow at 5.4 per cent per annum. Income will initially rise by 7.2 per cent, and grow at 5.3 per cent annually over the next five years. Debt will continue to grow by more or less the same rate (i.e. 5.4 per cent), since net capital flows will rise continuously in order to keep up with interest payments. In other words, increased net lending needed to raise investment and imports will also raise interest payments, which will, in turn, feed into higher debt and, hence, still higher interest payments. The average additional lending needed is about $16 billion per annum, implying an increase of about $80 billion over the baseline figure over the five-year period.
In this scenario the principal debt indicators show no improvement. The debt/GDP ratio initially drops a little, but subsequently, since debt and income grow more or less by the same rate, the ratio barely improves. The debt/export ratio is 27 percentage points higher
than in the baseline scenario at the end of five years.
With per capita income rising strongly, there is scope for increasing the marginal rate of savings, and thereby raising investment, income and exports even further. That will bring some improvement in the debt indicators over time in spite of the high rate of growth of debt. However, the indicators will still remain at an unacceptably high level at the end of the five years. If, for instance, with the same amount of new lending, the savings rate is raised by 2.5 percentage points, the growth rates of income and exports will increase by about 1.4 percentage points per annum. This will lower the debt indicators compared to the levels given in table 20 under new lending. However, the debt/GDP and debt/export ratios at the end of five years will not be very much different from their baseline levels; i.e., about 48 per cent and 340 per cent respectively.
A strategy of accumulating substantial amounts of additional debt at market rates is fraught with dangers, since it would not succeed in correcting over-indebtedness in a reasonable time-frame. It is also for that reason most unlikely to be feasible. Private lenders would be most reluctant to increase their exposure if they saw no prospect of normalcy in sight. Even if official guarantees on new loans or interest capitalization were forthcoming, the process would remain extremely vulnerable to increases in world interest rates, falls in the terms of trade and other external shocks. A strategy of breaking out of the present trap by adding to debt may therefore be considered out of the question in most cases,
(c) A debt-relief scenario
The preceding analysis suggests that a substantial reduction of debt-servicing obligations may present the only way to both revive development and correct over-indebtedness. A once-and-for-all reduction of the outstanding stock of debt (or interest payments due) will release foreign exchange and allow imports, investment and output to be raised permanently to higher levels. Further increases will then be possible as the increased investment is translated into increased export capacity and earnings. In other words, once the levels of imports, investment and GDP are pushed up by a permanent reduction in the debt burden, the economy can settle on a growth path reflecting its ability to
102 The assumed growth path is the same as that generated by the 25 per cent debt-relief scenario discussed below.
116
generate higher export earnings (and hence import capacity) through investment, and higher savings (and hence investment) through output growth. Thus, a reduction in debt-servicing obligations will allow, even with an unchanged domestic savings ratio, a larger and even continuously increasing proportion of GDP to be invested, and the higher level of investment will generate higher import capacity through export expansion. However, for this dynamic to take effect, the initial push needs to be big enough to raise investment to the level that will allow the economy to attain its growth potential.
In this scenario the prime objective of the debt relief is not to bring down debt-service obligations immediately to the level of existing debt-servicing capacity, but to allow that capacity to rise to the new level of debt-servicing obligations within a reasonable time-frame. In other words, over-indebtedness is reduced through debt relief only to the extent that is needed to eliminate the debt overhang, and permit a growth-oriented adjustment to be initiated in which over-indebtedness is steadily brought down by increasing output and exports in the context of continued new borrowing and policy efforts. What is being discussed is not a "quick fix".
The debt-relief scenarios examine such a process on the assumption of a permanent reduction of interest payments, which could be brought about either by scaling down the outstanding stock of debt or by reducing the interest rate on the outstanding stock of debt, with new debt being subject to market interest rates. Tables 20 and 21 report the results according to the first option. Total net new lending is assumed to be the same as in the baseline scenario, and banks are assumed to provide no net lending.103
Although for analytical simplicity debt relief is treated as an across-the-board reduction by certain proportions of total interest payments, the relief is meant to apply to bank debt only. Since about 80 per cent of the total debt of these countries is to private creditors
and since such debt bears somewhat higher interest rates than official debt, an overall reduction of interest payments by 25 per cent would be equivalent approximately to a 30 per cent reduction of interest payments to private creditors.
Since the level of new lending is assumed to remain unchanged, and since it barely covers a quarter of current interest payments, even a debt relief of 40 per cent would not suffice to reverse financial outflows. Thus, the growth paths generated by the rates of debt relief given in table 20 leave net transfers negative, though at lower rates than in the baseline scenario.
Apart from interest payments, the debt-relief scenario differs in one important respect from the baseline. It requires the entire amount of savings from interest payments to be allocated to investment in export industries in order to lift the foreign exchange constraint;104 consumption increases follow only later, as domestic incomes rise. Consequently, both the initial levels and subsequent growth rates of investment and income rise. However, this does not mean that other types of investment remain depressed. Since income and domestic savings will be rising faster, total investment will increase by much more than the savings from interest payments; hence, investment in other industries and infrastructure will also be raised above their baseline levels.
The scenario results indicate that an across-the-board debt relief of about 25 per cent is, on average, the maximum required to eliminate the foreign-exchange constraint and allow the debtor countries to grow at the rate permitted by their supply capabilities.105 It will allow investment initially to be raised by about 16 per cent, imports by 10 per cent and income by 7 per cent over and above their baseline levels before exports begin to accelerate (see table 21). Imports will be higher by the same amount as the reduction in interest payments; but income and investment will be respectively about six and two times higher than the reduction in interest payments because of the
103 T h e results in the second option would differ with respect to the initial change in the debt indicators, but not with respect to real growth rates and relative improvements in the debt indicators brought about by the growth process. In the case of a write-off, gross lending is lowered by the amoun t of reduction in principal payments on the par t of debt written off. In the case of reduction in interest rates, gross lending would need to be kept unchanged since principal repayments continue as originally scheduled. However, for these two to be equivalent, market interest rates should be applied not to gross but to net lending; otherwise, old debt carrying reduced interest rates would rapidly be replaced by new debt at market interest rates.
104 The proportion of total net investment allocated to export industries is adjusted (raised) accordingly. The same ratio is used in the new-lending scenario discussed above.
105 Supply capabilities arc difficult to measure, but taking into account the rate of investment permitted by a 25 per cent debt reduction and the existing slack in non-tradeable production, an average growth rate of around 6 per cent over the next five years seems reasonable. The debt reduction allows this to take place by both eliminating the foreign exchange constraint and raising investment and the capacity growth rate. A higher rate of debt relief would raise growth further by adding to investment and by increasing the scope for intensifying savings efforts.
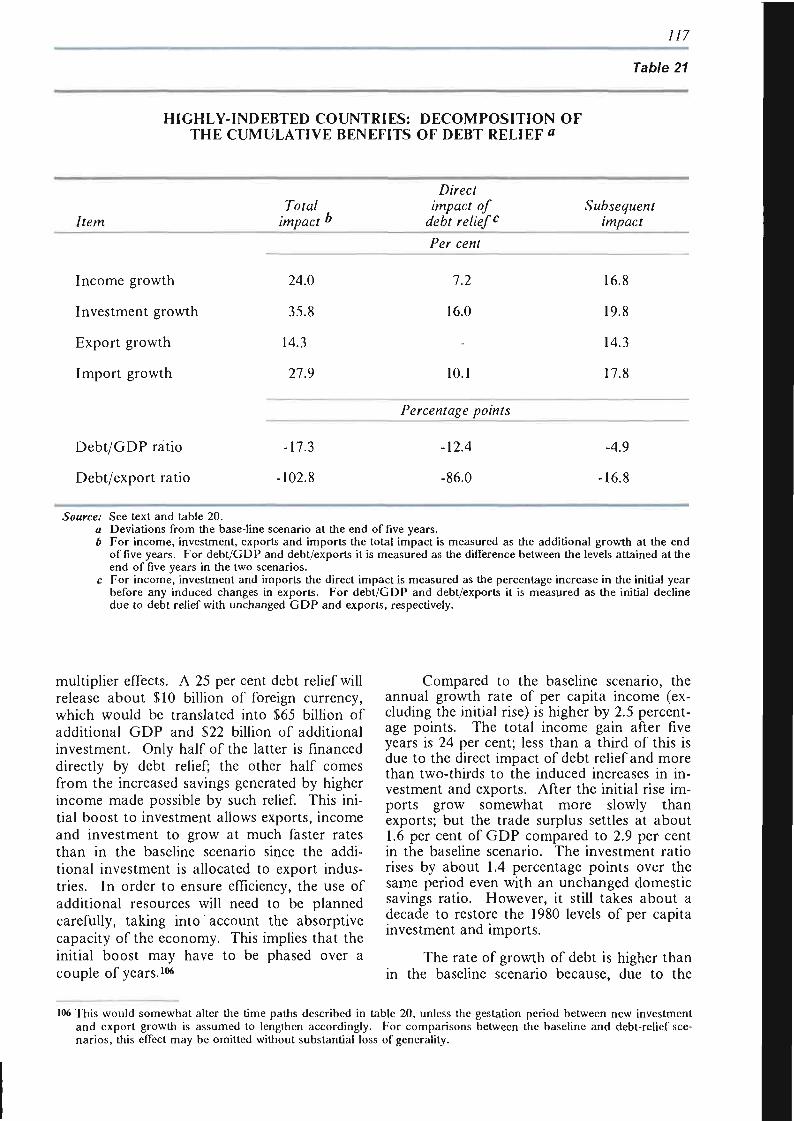
117
Table 21
HIGHLY INDEBTED COUNTRIES: DECOMPOSITION OF THE CUMULATIVE BENEFITS OF DEBT RELIEF a
Item Total
impact b
Direct impact of
debt relief0 Subsequent
impact
Income growth
Investment growth
Export growth
Import growth
Debt/GDP ratio
Debt/export ratio
24.0
35.8
14.3
27.9
-17.3
•102.8
Per cent
7.2
16.0
10.1
Percentage points
-12.4
-86.0
16.8
19.8
14.3
17.8
-4.9
•16.8
Source: a b
See text and table 20. Deviations from the base-line scenario at the end of five years. For income, investment, exports and imports the total impact is measured as the additional growth at the end of five years. For debt/GDP and debt/exports it is measured as the difference between the levels attained at the end of five years in the two scenarios. For income, investment and imports the direct impact is measured as the percentage increase in the initial year before any induced changes in exports. For debt/GDP and debt/exports it is measured as the initial decline due to debt relief with unchanged G D P and exports, respectively.
multiplier effects. A 25 per cent debt relief will release about $10 billion of foreign currency, which would be translated into $65 billion of additional GDP and $22 billion of additional investment. Only half of the latter is financed directly by debt relief; the other half comes from the increased savings generated by higher income made possible by such relief. This initial boost to investment allows exports, income and investment to grow at much faster rates than in the baseline scenario since the additional investment is allocated to export industries. In order to ensure efficiency, the use of additional resources will need to be planned carefully, taking into account the absorptive capacity of the economy. This implies that the initial boost may have to be phased over a couple of years.106
Compared to the baseline scenario, the annual growth rate of per capita income (excluding the initial rise) is higher by 2.5 percentage points. The total income gain after five years is 24 per cent; less than a third of this is due to the direct impact of debt relief and more than two-thirds to the induced increases in investment and exports. After the initial rise imports grow somewhat more slowly than exports; but the trade surplus settles at about 1.6 per cent of GDP compared to 2.9 per cent in the baseline scenario. The investment ratio rises by about 1.4 percentage points over the same period even with an unchanged domestic savings ratio. However, it still takes about a decade to restore the 1980 levels of per capita investment and imports.
The rate of growth of debt is higher than in the baseline scenario because, due to the
106 This would somewhat alter the time paths described in table 20, unless the gestation period between new investment and export growth is assumed to lengthen accordingly. For comparisons between the baseline and debt-relief scenarios, this effect may be omitted without substantial loss of generality.
118
write-off, the initial stock of debt is lower. However, the principal debt indicators keep improving considerably compared to the baseline. At the end of five years the debt/GDP ratio is lower by 17 percentage points, and the debt/export ratio by more than 100 percentage points, and although a large part of this is due to the initial reduction of the stock of debt, a firm trend has been established whereby exports and income rise much faster than debt. If such a growth path is maintained for 10 years, the debt/export ratio will fall to about 200 per cent and the debt/GDP ratio to about 25 per cent; increases in exports and income would account for about half of the improvements. If the savings rate is also raised, income, investment and exports will grow much faster, bringing further improvements in the principal debt indicators.
The scenarios of new lending and 25 per cent debt relief do not differ with respect to real growth rates because they have been consciously designed not to do so. However, they do differ considerably with respect to movements in the principal debt indicators. In the case of debt relief, the initial debt reduction is continuously reinforced, whereas in new lending over-indebtedness remains acute. As in all exercises of this kind, the assumptions underlying the scenarios are of key importance. Nevertheless, since all assumptions regarding the values of the structural parameters (import requirements, capital-output ratios, savings rates, etc.) and the external environment (interest rates and the terms of trade) are common to all scenarios, changes in them would have similar effects on the corresponding growth paths, with the consequence that their relative positions would be little affected.
The main conclusions are therefore robust. Under any reasonable assumption regarding external environment and policy actions, growth prospects are rather bleak. A substantial increase in new lending can initiate growth provided that it is sustained (which is itself doubtful), but will not correct over-indebtedness. Consequently, debt relief is the only viable means of achieving the aims of the strategy with respect to the highly-indebted countries.
These results refer to the highly-indebted countries as a group. There are substantial variations among individual countries with respect to savings and investment rates, the burden of debt, structure of industry and trade, the degree of dependence on imports and so on. Certain countries are in a better position than others, and may thus need a smaller rate of debt relief (or perhaps none at all) in order to
attain a satisfactory growth path. Others may need much more. For instance, where the industrial structure is not sufficiently advanced to permit a quick export response to increased investment, the country may need increased amounts of external resources on a continuous basis on top of debt relief. Therefore, a case-by-case examination of the specific circumstances would be needed to assess for each country the amount of relief necessary to lift the debt overhang, and the domestic policies and new resources required to grow out of the debt problem.
2. Sub-Saharan Africa
Reversing the downward trend in per capita import volumes is the very minimum requirement to check the economic decline of sub-Saharan Africa. These countries are much more dependent on imports to sustain production, investment and basic needs than highly-indebted countries. Basic food imports account, on average, for about 20 per cent of total imports, amounting to about 7 per cent of total consumption. Import requirements of investment and the other components of GDP are at least twice as high as in highly-indebted countries because of inadequate levels of industrial development, reaching 60 and 20 per cent respectively. Non-essential goods account for a very small proportion of total imports, with the consequence that the burden of import cuts necessarily falls on intermediate inputs, capital goods and food. The structure of the economies of these countries gives few opportunities for import substitution in capital and intermediate goods, so that there is almost a one-to-one correspondence between the volume of imports and economic performance.
Restoring import volumes is thus essential for maintaining and rehabilitating the existing capital stock, strengthening infrastructure, increasing the degree of capacity utilization and raising per capita consumption. In sub-Saharan Africa the per capita import volume in 1987 was one-third below the 1980 level. Raising imports by this amount would have required an additional $10 billion over and above what was available in 1987. This amounted to 36 per cent of export earnings or five times the net financial transfers (i.e., net capital inflows minus interest payments). Even if the entire interest payments had been eliminated through debt relief, the region would have needed an additional $5.5 billion to restore per capita import volumes.
119
The scope for restoring imports through export expansion is much more limited in sub-Saharan Africa than in highly-indebted countries. These countries are highly dependent on commodity exports, with a very high concentration on a few commodities. Increased export volumes do not always promise higher earnings as they often serve to depress prices. Capacity in non-traditional exports is limited for structural reasons; it has further been depressed for the reason that structural adjustment has been obstructed by sharp cuts in imports and investment. Reducing domestic absorption further, even if feasible, would not release goods for external markets but reduce domestic activity. Resources cannot be easily shifted from non-tradeable to tradeable industries because of structural rigidities and inadequate infrastructure.
IMF has projected, for developing Africa as a whole, an annual export volume growth of about 2.5 per cent over the next few years.107
Even if real commodity prices and the terms of trade remain unchanged, this will not provide sufficient foreign exchange to keep imports apace with population growth. Thus, per capita imports may continue to decline unless new external resources are provided through debt relief and increased financial flows. This would be necessary not only to halt the economic decline, but also for the success of vigorous adjustment efforts undertaken by many of these countries.
It must be recognized that, unlike the highly-indebted countries at a higher level of industrialization, even a substantial infusion of new external resources in sub-Saharan Africa cannot be expected to yield quick benefits in terms of increased export capacity. For one thing, part of any increase in external resource availabilities will be needed to reduce poverty and malnutrition. For another, resources would need to be directed to areas which do not immediately generate export capacity. Investment in physical and human infrastructure, such as roads, hospitals, schools and telecommunication, is necessary to provide an adequate basis for future industrialization, but its impact on non-traditional exports is inevitably slow. Furthermore, increased attention would need to be given to agriculture and other primary industries in order to accelerate primary import substitution, particularly in food. This will help eventually to reduce import requirements of consumption, export and investment
growth, but cannot be expected to provide substantial balance-of-paymcnts relief quickly.
Hence a once-and-for-all injection of external resources cannot initiate a dynamic, self-generating growth process in sub-Saharan Africa. External resources would need to be provided continuously and at an increasing rate for many years, taking into account the need to accelerate structural transformation and keep pace with population growth, as well as to compensate for any further adverse movements in commodity prices and the terms of trade.
The volume of external resources needed to lift the balance-of-payments constraint in sub-Saharan Africa is difficult to quantify if only because the structural relationships that would need to be taken into account have greatly changed since 1980. The World Bank has estimated for 1988-1990, for a number of low-income, debt-distressed sub-Saharan countries, the external financial resources needed to raise per capita import volumes by I per cent annually while maintaining a level of debt service of 25 per cent of export earnings, and has concluded that an additional $1.5 billion per annum are required over and above what was already in prospect. The Advisory Group on Financial Flows for Africa established by the Secretary-General of the United Nations has applied this scenario to the rest of the region and estimated a financing gap of over $5 billion per annum for sub-Saharan Africa as a whole for the next few years.108 Commitments made at the end of 1987 by the World Bank, IMF and the African Development Bank are expected to provide an additional $3 billion per annum. The remaining $2 billion has been suggested to be met by debt relief and increased bilateral flows.
A flow of this magnitude would go a long way in checking the economic decline in sub-Saharan Africa. However, it would not succeed in lifting completely the balance-of-payments constraint on growth. The assumed growth rate of imports would not permit any real improvement over the next few years; at the turn of the century even per capita import volumes would still be considerably lower than in the early 1980s. More importantly, per capita output and consumption would grow by only 1 per cent per annum, which is only a small improvement over the baseline medium-term scenario for 1989-1991 of IMF, which projects a growth rate of about 3.3 per cent per annum, barely above the rate of population increase; such a growth rate is regarded by IMF as "an
107 IVIF, World Economic Outlook, June 1988.
108 Financing Africa's Recovery. Report and Recommendations of the. Advisory Group on Financial Flows for Africa, United Nations, New York, 1988, pp. 15-16.
720
unacccptably slow rate of increase in living standards in a continent where income levels are already very low."109 Finally, it is not clear if this level of imports would allow full utilization of new capacity, let alone reduce the existing slack.
The figure of $2 billion advanced by the Advisory Group should therefore be taken as the minimum needed to check the economic decline rather than the level required to underpin a satisfactory growth process. If the target growth rate for per capita income and consumption were set at 3 per cent over the next five years (i.e., the same as in the debt-relief scenario in subsection 1 above for the highly-indebted countries), the external resource requirement would be about $5 billion per annum (starting with $3 billion and rising to over $10 billion in five years) over and above what is already in prospect. Even then, per capita import
volumes would not be restored before the middle of the next decade.
The scope for providing the resources needed for adjustment and growth through debt relief is much more limited in sub-Saharan Africa than in the highly-indebted countries. Bilateral official debt accounts for about 40 per cent of the total debt, but, due to low interest rates, for less than 20 per cent of total interest payments. Long-term debt to financial markets is about 20 per cent of the total and accounts for a third of the total interest payments. The rest (i.e., about 40 per cent of total debt) is due to multilateral institutions, including IMF, and short-term debt to private creditors and accounts for a half of the total interest payments. Thus, even if the entire interest payments on official bilateral debt and long-term commercial debt were eliminated (i.e., a total debt relief of about 50 per cent), an additional $3 billion in new flows would still be needed.
C. Towards a durable solution
Until recently efforts to deal with the debt problem have sought above all to ensure that
, debt forgiveness is the exception rather than the norm. However, as demonstrated in the previous chapter, significant amounts of debt (or interest) reduction will generally be needed - as well as appropriate domestic policies and additional official flows - to revive growth and reduce debt ratios, without which the strategy's objective of returning to normalcy will not be attained. In short, the debt strategy has arrived at a critical turning point: there is a choice to be made between reaching its objectives and sticking to present practices. If countries are to emerge from their debt problem, measures to lift the burden of debt on development must be assigned a central role.
An encouraging evolution towards debt (or interest) reduction has been evident regarding both low-income and middle-income debtors. However, the pace of evolution must be accelerated. This section examines the evolution that has occurred and various ways in which its pace might be quickened.
1. Low-income debtors
Over the past year, there has been a growing recognition by official creditors and donors that the debt-servicing problems of the poorer countries, particularly those in sub-Saharan Africa, require urgent and special attention. Following the recommendations by the 1987 Venice summit, a number of the poorest African countries were granted a significant lengthening of the repayment and grace periods in their Paris Club reschedulings. However, this move in itself did not give rise to concessionary, as market-related rates continued to be applied on rescheduled debt, with the exception of a few official creditors who began granting concessional interest rates to selected debtors in bilateral agreements. Other initiatives included forgiveness of ODA debt or debt payment owed by the least developed and some other poorer countries to OECD donors,
109 I M F , World Economic Outlook, October 1987, p . 24.
110 Within the framework of the Toronto summit meeting in June 1988, Japan and the Federal Republic of Germany announced plans to relieve the poorest developing countries of their bilateral ODA debt burden. Japan would provide about SI billion in commodity grants to assist a group of poorer debtor countries in Africa and Asia to service $5.5
121
along the lines of Trade and Development Board resolution 165 (SIX); '1 0 enhancement of IMF's structural adjustment facility; and the World Bank's cofinancing scheme with bilateral donors in support of adjustment programmes in sub-Saharan Africa. In addition, some developed country donors helped Bolivia buy back half of its commercial bank debt at heavily discounted prices prevailing in the secondary market. A similar scheme was sponsored by the Netherlands for Zambia.
The need for genuine concessionality in Paris Club reschedulings for poorer countries has been at the centre of debate among official creditors following the proposal of the United Kingdom to give interest-rate reductions to low-income debt-distressed countries undertaking adjustment efforts, and the proposal by the President of France to cancel one-third of debt service due by the same countries. The outcome of these discussions was an agreement at the Toronto summit meeting in June 1988 which entailed a "menu" of options for official creditors, including "concessional interest rates on shorter maturities, longer repayment periods at commercial rates, partial write ofls of debt-service obligations during the consolidation period, or a combination of these options".
The consensus achieved at Toronto represents an important qualitative change in official creditors' stance with regard to non-concessional debt owed by poorer debtors and has the potential for easing their debt burden. There are, however, a number of questions that need to be addressed:
• The degree of concessionality of the scheme would have to be defined within the Paris Club. It is hoped that the reduction in future debt service will be large enough to allow debtor countries eventually to avoid the capitalization of interest in future reschedulings. The sums involved are very small compared to the aid-giving capacity of donor countries. As an example, bilateral official debt of the poorest sub-Saharan countries amounts to $23 billion, a sum roughly equivalent to one day's output of the seven largest developed market economies.
• Comparability among the various options being chosen by official creditors also needs to be worked out by the Paris Club, in order to determine the burden-sharing among creditors. Under the option involving longer repayment periods, it would be difficult to achieve a degree of concessionality which is comparable to that implied by the other two options, involving reduction in interest rates or in the stock of debt. Furthermore, the stretching of maturities will not improve the ex ante (i.e. before further rescheduling) cash-flow position of debtor countries during the grace period, which had already been extended to 7-10 years; financial benefits will accrue only thereafter. Conversely, the other two options, by reducing the debt-service obligations over the entire life of the loans concerned, have the potential to improve debt indicators and expected cash flow over the next few years and thus to contribute to breaking the snowball effect of interest capitalization. But none of the three options will avoid the need for repeated reschedulings, unless the consolidation period is lengthened accordingly.111
• The list of beneficiary countries appears to be limited to the poorest debt-distressed countries undertaking internationally-approved adjustment programmes.112 Consideration should be given to the possibility of widening the eligibility criteria in order to include other countries, that are less poor but still heavily-indebted, as well as poorer countries which have so far been able to avoid Paris Club restructurings, but only at a high cost. In order to help meet the huge financial requirements of beneficiary countries and of developing countries in general, the concessional resources provided under this initiative should be truly additional to aid allocations to such countries as well as to currently planned aid programmes.
The initiative taken at the Toronto summit needs to be complemented by further action on debt relief as well as additional concessional flows to the least developed and other poorer countries. The example already set by those
billion of ODA loans granted between April 1978 and March 1988. The Federal Republic of Germany would cancel ODA debt equivalent to $1.3 billion owed by 12 sub-Saharan African countries.
111 It is understood that under the three options only maturities falling due during the consolidation period - typically of 12-15 months - rather than the entire stock of debt outstanding would benefit from the proposed measures.
112 Under current Paris Club practices, eligibility for the easier rescheduling terms first applied in mid-1987 is decided on a case-by-case basis. Broadly speaking, however, poverty is defined in terms of IDA-eligibility and debt-distressed countries are those with a scheduled debt service above 30 per cent. In accordance with these criteria, around 30 countries would in principle be eligible for the concessional measures agreed upon at the Toronto summit, provided they are undertaking the internationally-approved adjustment programmes required of all debtors requesting a Paris Club rescheduling.
722
donors that have forgiven ODA debt, or taken equivalent action, in accordance with Board resolution 165 (S-IX), should be followed by other donors. Furthermore, careful examination of export prospects and import requirements for growth is likely to lead to the conclusion that the cancellation of ODA debt is necessary for a broader group of countries than has so far benefited from such measures. Multilateral debt will account for about 20 per cent of total debt service by both low-income countries and sub-Saharan African countries in 1988-1990. Debt owed to multilateral institutions has not been rescheduled so far, mainly because of the perception that this would impair their own creditworthiness and so raise their funding costs on international capital markets. However, the time has come to find ways and means to overcome this problem. Among the possibilities that should be examined is establishing - with additional concessional resources - interest-subsidy schemes and refinancing mechanisms which would allow multilateral non-concessional loans to be converted into loans on IDA terms, along the lines of the proposal made by the Nordic countries.113
It would be desirable to supplement official debt relief for the least developed and other poorer countries with buyback programmes for their commercial bank debt, which is typically relatively small. Additional official support for these schemes should be considered. Since discounts in secondary markets for such debt are very large, relatively small sums of aid funds can provide considerable debt relief and promote the return to normal relations with commercial banks, including the re-establishment of short-term credit lines.
Measures to reduce the burden of debt to commercial banks could be linked to debt relief on official bilateral debt in a single scheme, along the lines of the recent proposal made by the African Development Bank. This plan involves the securitization of both kinds of debt, in which medium-term claims would be converted into 20-year bonds carrying a below-market interest rate.114 This proposal deserves to be further explored in the light of the action taken at the Toronto summit.
Even under very optimistic assumptions regarding debt relief, the volume of external re
sources needed for adjustment and growth in low-income debt-distressed countries is of such a magnitude as to require greatly increased concessional flows, both bilateral and multilateral, in addition to action to alleviate their debt burden. Furthermore, new aid flows need to be fast-disbursing and flexible so as to respond to changes in the external environment, which will remain a determining factor in poorer countries' efforts to recover. Creditor governments can improve the financial position of debtor countries by supporting their adjustment efforts both directly, through a substantial increase in the currently planned aid budgets, and indirectly, by keeping the multilateral institutions adequately financed. In the Toronto summit declaration, it was stressed that "an increase in concessional resource flows is necessary to help the poorest developing countries resume sustained growth, especially in cases where it is extremely difficult for them to service their debts". These good intentions need to be put quickly into practice.
2. Commercial bank debt
As noted in section A, commercial banks have been exchanging in various ways their claims on debtor countries for other assets that are less subject to credit risk. Although sales of debt to other investors willing to take such a risk bring no benefit to the debtor countries, many of the other portfolio adjustments do bring such relief. Even so, action to date has not reflected full recognition of the mutual interest of debtors and creditors in such relief:
• Most debtors have been acting on the assumption that only by preserving their reputation for meeting interest payments in full and on time will they be able to restore creditworthiness. Accordingly, concessional debt-service reduction has been viewed as harmful from a long-term standpoint. However, for most debtors the restoration of creditworthiness in the near future is problematic no matter what sacrifices they endure to preserve their reputation for fulfilling contractual obligations. The question, then, is whether persever-ence with present practice on consensual debt-service reduction would provide a
113 The Nordic countries have indicated their willingness to make funds available to grant relief with respect to World Bank debt owed by countries which are currently only IDA-eligible.
114 Under the scheme, repayment of principal would be guaranteed by a redemption fund to which debtor countries would make annual contributions. The assets in the redemption fund would be managed by a board of trustees including representatives of all creditors and the debtor. The interest rate would be set so that when added to multilateral debt service and to the payments to the redemption fund the overall debt service would be at a sustainable level in accordance with past experience.
¡23
shorter path to a return to normal credit relations. A serious case can now be made for the argument that by allowing debtors to strengthen quickly their debt-servicing capacity, consensual debt reduction would more effectively lay the basis for eventually re-establishing credit standing. Creditors, too, now have an interest in according concessional treatment, for the very same reason. As debtor countries grow, commercial banks will be able to enlarge the scale of their normal banking operations (i.e. those not involving "sovereign lending") with them; and as the debt statistics improve, so eventually will the market value of creditors' portfolios. Given the present outlook,115 such prospects are not offered by "concerted lending", which is likely in the long run to prove a more costly way of defending the value of assets.
However, in practice commercial banks tend to overlook the mutual interest in removing the debt overhang. When considering the pros and cons of converting some of their claims at a discount for other assets (such as cash, collaterized securities, bonds enjoying seniority, and equity), they weigh the loss taken from exchanging debt at a discount against the benefits of acquiring new assets carrying a lower (or no) risk of default and no obligation to provide new lending. The impact of the 'loss' on the debtor's economic performance and debt-servicing capacity is not given sufficient weight in these commercial calculations.
This neglect of the positive feedback from providing relief arises in part because only a negligible portion of it accrues to the creditor providing the relief; the bulk is captured by other creditors, regardless of whether they follow suit. Because of this "free-rider" problem (which, in the context of the present approach, has necessitated new lending to be "concerted") the prospect that relief will strengthen a debtor's economy will not serve as a motivation to individual creditors to provide relief. Besides, to have a significant impact on the debtor's performance, and hence on the markets' perceptions of its prospects (on which the secondary market prices for the remaining debt depend), the debtor country needs assurance that the relief will be sufficiently large and predictable to allow it to initiate investments in a number of sectors simultaneously and sustain them for several years. If debt or interest reduction takes place piecemeal and in an unpredictable manner, the gains to growth will be negligible. However, no single creditor (or
small number of creditors) is sufficiently important to be able to provide the needed stimulus on its own. In short, atomistic decision-making can only be expected to yield marginal results; in order to obtain the sizeable relief needed to capture the externalities and scale economies a concerted effort is essential.
The feedback is also ignored because it necessarily takes place through complex economic processes which take time to have effect, whereas the outlook of banks tends to be dominated by recent and current experience. This is partly because making accurate predictions of the future is inherently difficult; besides, the precise breaking point for debtors is more a matter of subjective judgement than scientific proof. But an even more important factor is that, because their normal business is short-term lending, commercial banks are not accustomed to calculating on the basis of long-term considerations. Their lack of far-sightedness was also an important factor in the rapid expansion of bank lending before the outbreak of the debt crisis and the paucity of "concerted lending" subsequently.
Banks' unwillingness to give relief may also reflect a fear that if the present "rules of the game" based on the sanctity of contractual commitments are unduly relaxed, and not replaced by an adequate set of alternative ground rules, they may be pushed down a "slippery slope" involving repeated and excessive concessions on their part. Moreover, if they feel assured that in collecting their debts they can count on the unstinting support of creditor governments and international financial agencies, they will be reluctant to accept that it is both necessary and wise to provide some relief in order to assure the full servicing of the remaining debt.
Because the voluntary, market-oriented approach that currently prevails does not permit the positive feedback effect of debt (or interest) reduction to influence bank behaviour, the extent to which it can yield relief is limited by the capacity of debtor countries to offer alternative assets of sufficient attraction. It is therefore not surprising that the amount of relief generated by debt conversions of various kinds thus far has been small (except where, as with Bolivia, for example, donor governments stepped in to provide the alternative assets needed, in the form of cash). For the same reason (and with the same exception), the discounts given have been captured by those debtors with relatively strong financial positions, since they are better able to supply new assets attractive to creditors. The present approach
US See section B above.
724
therefore does not have the potential for providing relief on the scale called for by the preceding analysis.
Systematic resort to debt or interest reduction would constitute a major innovation -no less than the "concerted lending" which it would replace. However, it would not mean abandoning the case-by-case approach. On the contrary, it would allow that approach to be made much more effective. Differences in the degree of solvency of countries cannot be adequately taken into account when, as has been the case so far, only consolidation periods, maturities and grace periods are subject to modification. Ability also to adjust the stock of debt (or the rate of interest) would remove this shortcoming and allow debt restructuring and financing packages to be better tailored to the circumstances of individual countries.
The potential benefits of debt relief have been overshadowed by the question whether the creditors can afford to take the losses. If United States banks were to cancel 30 per cent of their claims on the 15 heavily-indebted countries, they would collectively lose about 24 per cent of their total developing country portfolio. This is less than the 25-30 per cent level of provisions those banks have reached on average on their developing country loans. For the nine money-centre banks taken together the loss would represent about 25 per cent of their developing country portfolio. Except for three whose provisions range from 20 per cent to 24 per cent, these banks have reserves covering at least 25 per cent of their outstanding developing country loans. However, the portfolio of some individual banks is concentrated on the 15 highly-indebted countries; for them, a 30 per cent reduction in claims on those countries would not be fully covered by reserves. The precise impact would depend on how the re
duction was distributed among the countries, and on the exact country distribution of the banks' portfolios.
On the other hand, part of the losses to banks would be offset by tax reductions for realized write-downs. Applying a 34 per cent tax rate, the losses implied by a 30 per cent debt cancellation in favour of the highly-indebted countries would amount to about 15.8 per cent of their outstanding claims on developing countries (16.2 per cent for the nine money-centre banks). Even if it were assumed that the entire exposure to developing countries of a money-centre bank were accounted for by debtors in the highly-indebted group, the loss involved would represent just under 20 per cent of its total claims on developing countries. All money-centre banks presently have provisions against developing country loans of 20 per cent or more. However, tax deduction cannot take place when a bank is already experiencing losses, which would be the case if the losses from the once-and-for-all cancellation greatly exceeded annual income.116 Banks in such a situation would need to be allowed to spread losses over time.117 An additional reason for spreading losses is that if they were taken in one year, the impact on reported income could depress share prices and the banks' ability to enlarge their equity base. Provided appropriate regulatory and tax changes were made to mitigate the impact, a 30 per cent debt cancellation could be absorbed without threatening the viability of the banks.118
When evaluating the cost to banks of relief it should be borne in mind that over the years they have been charging premiums to cover the risk of lending. It is estimated that premiums paid by Latin American countries on their bank debt since 1974 have a present value
116 This is more specifically a problem for those United States banks which have additional sources of difficulty in their loan portfolios (due to developments in the domestic economy, for instance, as well as in other areas, such as energy). For one of the most vulnerable money-centre banks, if full tax benefits could be enjoyed (in which case losses would have to be spread over more than 10 years), the actual capital losses from a 30 per cent stock of debt reduction would amount to all its country loan reserves (but would not exceed it). The operation would reduce the capital ratio of that bank by about 20 per cent.
H? One recent precedent exists in the United States, for instance, where savings and loan associations have been allowed to write off losses on bad loans over a 40-year period.
118 Estimates made on the impact of a write-down on stockholders' equity and capital of the big US banks indicate that, though the stockholders' equity of these institutions has already been eroded by losses on the reserves declared in spring 1987, "each of these banks could absorb an immediate 20 per cent write-down of their developing country debt without incurring any further losses or erosion of equity. At the same time, their primary capital ratios would remain comfortably above the minimum". (Don Pease, "A Congressional plan to solve the debt crisis', The International Economy, March, April 1988, p. 101.) Calculations made on the basis of discounts closer to the secondary market prices for developing country debt also indicate that "Judging from bank earnings over the past few years, each of the big banks could absorb a further write-down of 25 per cent (to a grand total of 45 per cent) over the next five years without reducing its primary capital or stockholders' equity." {Ibid., p. 101.) Another study of 13 major US banks by a bank analyst calculated how many years of current earnings it would take to make up for a write-down of LDC debt at roughly the secondary market prices. It concluded that "most of the banks could recover their lost ground in a year or two". 1 Iowever, for two big banks, which have had other problems than their developing country portofolios, it could take more time (almost four years for one and more than 10 years for the other). (Institutional Investor, July 1987, p. 168.)
/25
of more than $40 billion, i.e. about 17 per cent of their accumulated debt.
3. Options for commercial bank debt
There are two ways of overcoming the shortcomings of the present approach and meeting the legitimate concerns of both debtors and creditors. One is to enlarge the supply of assets in exchange for which commercial banks would be prepared to give significant discounts. For large-scale portfolio adjustment to be possible, creditor governments would need to extend funds or guarantees either on their own or via an international debt facility. The other is for creditors to regard relief as a positive sum game and reduce their claims accordingly. A combination of these two approaches is also possible.
Both called for the creation of an international agency. The idea of a debt agency has come strongly to the fore in the last two years, and a number of new proposals have been made - for instance, by Senator Paul Sarbanes, Representatives Bruce Morrison and Sander Levin (a joint proposal), John Lafalce and Don Pease of the United States, a study group of WIDER, Percy Mistry (a former World Bank official), James Robinson III, Chairman of American Express Corporation, and Arjun Sengupta, an Executive Director of IMF (in his personal capacity). These proposals tend to be more elaborate and detailed, and address more fully such issues as the method of capitalization of the agency, the extent of funding and guarantees, bank participation, and the relations between the facility and debtor countries after the relief operation. Substantial conditionality of one kind or another is required in almost all these proposals (see box 7).
(a) Relief through portfolio adjustment
A number of schemes have been designed in order to put to good use the willingness of commercial banks to pay in order to replace their claims on troubled debtor countries by more secure assets. Such schemes involve the issue of long-term securities at fixed interest rates (e.g. bonds) by an intermediary agency funded by and/or backed by the guarantees of major creditor governments, against which commercial banks would exchange at a discount the developing country loans in their portofolios. The discount could take the form of a reduction in the face value of the claims and/or a reduction of the interest charge. The intermediary would replace the liabilities of debtor countries to banks by liabilities to itself, which would be smaller in toto and/or carry lower interest rates, and would have long maturities and fixed interest rates. In short, by assuming the risk of non-payment by debtors, creditor governments would be able both to improve the quality of bank assets, thereby strengthening the banking system, and to reduce the debt overhang of developing countries, thereby stimulating development and the flow of exports from developed to developing countries.
• The first proposals of this kind were advanced in 1983 separately by Felix Roha-tyn, a prominent investment banker who had been the architect and head of the New York Municipal Assistance Corporation, and by Peter Kenen, a distinguished United States academic and policy adviser.
One of the main objections to the establishment of a debt facility is that it would in one way or another involve public monies. Some plans seek to minimize the level of capitalization through bold financial engineering. But governments would carry the credit risk, whether directly or indirectly, even if they paid in relatively little in cash; the whole process is based on the guarantee/safety provided to banks in exchange for a discount. Even backing by IMF or the World Bank would imply claims on creditor governments. Thus, the mobilization of public funds or guarantees cannot be avoided in any scheme designed to shift bank claims away from troubled debtor countries. In evaluating such costs, however, it needs to be borne in mind that promoting the safety and stability of the banking system and national and world prosperity are important objectives of public policy, which presumably would justify expenditure of public monies in the modest amounts that would be needed to achieve expeditiously those objectives.
e One recent proposal, put forward by Professor P. Davidson, seeks to achieve the purpose of an international debt facility through exchanges of bank claims on developing countries for direct claims on creditor governments on a national basis (rather than claims on an intermediary set up by creditor governments collectively). The country's central bank would stand willing to accept a significant portion of banks' portfolios of international loans in exchange for its own stock. It would in turn sell their loans to its government in exchange for government bonds. The go-
726
7
SALIENT FEATURES OF RECENT DEBT FACILITY PROPOSALS
The agency envisaged in the Kenen plan would be a new institution, whereas in the Rohatyn plan it would be a subsidiary of the World Bank or IMF. In some recent proposals (Mistry, Robinson, Sengupta and Pease) the facility would, as in the Rohatyn proposal, be located in IMF or the World Bank. In others, there is no mention of such an affiliation.
Most plans envisage the provision of capital by creditor governments: in the Mistry, Sarbanes, WIDER and Robinson plans the facility would be capitalized by the major developed country creditor governments. ' Some plans (Robinson, Sarbanes and WIDER) envisage that surplus countries such as Japan would assume a substantial role in capitalizing the agency. In the Lafalce proposal, the agency would be capitalized using part of IMF's gold holdings. Similarly, in the Pease proposal, the agency's obligations to banks would be backed by IMF. Some proposals seek to limit the agency's need for capital by allowing a high gearing ratio. In the Mistry plan, for instance, a gearing ratio of 10:1 is mentioned, while that in the Robinson proposal is 3:1, compared to the 1:1 ratio of multilateral development banks and the 4:1 ratio of IFC. The Morrison-Levin plan calls for participating countries (mainly member countries of OECD) to assume a contingent liability for the repayment at maturity of obligations issued by the facility. ^ In the Sengupta proposal, the principal would be guaranteed by industrial countries, while interest payments would be secured by IMF's general resources. In the Pease plan the developing country debt held by the facility has seniority over any obligation issued by the country after the facility has acquired the country's debt; this reduces potential calls on public monies. The Robinson plan provides for the contrary in order to encourage lending.
Most plans involve conditionally. In the Kenen plan only debtor countries with IMF's "seal of approval" would be eligible; the Rohatyn proposal stresses the need to avoid undue austerity. In the Lafalce plan, prior agreement on a detailed plan for the future economic development of the country is required for the scheme to be initiated. The WIDER plan allows for debt relief on condition that appropriate policy reform packages are adopted. In the Sengupta plan the debtor country would have to adopt a Fund programme to obtain debt relief. In the Morrison plan assistance by the facility in restructuring or retiring debt is conditional upon a country's committing itself to long-term economic development policies. In the Mistry scheme, the facility buys only the debt of those countries for which appropriately structured policy reform packages have already been agreed. Some proposals go even further. The Pease plan, for instance, provides for the debt relief to be revoked if the conditions were not met; however, those conditions would differ substantially from those normally attached to IMF credit. 3 In the Robinson plan, debt forgiveness would have to be earned over time through performance, and non-payments to the facility without satisfactory demonstration of extenuating circumstances would lead to punitive action.
1 In the WIDER plan the facility would be set up with a relatively small paid-in capital, supported, however, by substantial callable capital. In the Mistry plan, while the facility would be administered by the World Bank, its capital (S30 billion, with 10 per cent paid in) would be provided by governments. In the Robinson plan, S12.5 billion would be provided as common equity capital by governments, the paid-in portion to be determined in the light of budgetary considerations and other internal factors.
2 In the Morrison-Levin proposal, the main function of the facility would not be to replace commercial banks as a creditor, as the facility would act principally as an investment bank. For instance, it would, among other things, help debtor countries to repurchase their own debt, or act as their agent in debt equity swaps. It could also package or pool debt instruments and act as an agent for the debtor country in devising new debt instruments and placing them.
3 Countries meeting balance-of-payments targets and maintaining policies to combat capital flight could be free to design their own economic policies as long as the policies were economically and environmentally sustainable and promoted broad-based development. In this way, accountability to creditor countries would be maintained without unduly sacrificing the autonomy of developing countries.
vernment would then negotiate a degree of relief with each debtor country. Another approach, which has been ad vanccd by Shafiqul Islam (Senior Fellow,
Council on Foreign Relations), would be akin to what has been taking place in the debt rescheduling negotiations process. The facility would act as an "organizer"
127
with a board to which the country would apply for relief, for instance by submitting a letter of intent specifying its assessment of the required relief and its programme for policy adjustment. If the application for relief were accepted by the facility, the debtor would directly negotiate the degree of debt discount with creditor banks, with "forced mediation" from the Board of the facility. The facility would either issue or guarantee the bonds swapped for existing debt. The facility would gradually evolve from an embryonic to a fully-fledged institution; it would initially be set up by the United States and one or two major surplus countries such as Japan, and other major creditor governments could join in due course.
(b) Relief based on a mutual interest
as part of an internationally supervised programme of stabilization and reform. In the Fischer plan, relief would be available in the context of adjustment programmes adopted by countries in co-operation with IMF and the World Bank. In each negotiation payments of interest and principal to commercial lenders would be reduced to 65 per cent of the contractual value. The recent proposal by the President of Argentina in connection with that country's debt would substantially reduce interest rates on commercial bank debt for a number of years; this would be combined with an extension of maturities and guarantees of amortization payments by the World Bank through cofinancing.120 Although this proposal has been made with respect to the debts of one country, it could also be applied to others.
The second category of proposals seeks to improve the quality of bank claims not by providing new assets in exchange for discounted debt paper but via the impact of the discounts themselves on the growth and debt-servicing capacity of the debtors. In such schemes, governments do not have to provide funds or guarantees. Their role is rather to induce banks to take losses without being rid of a potential credit risk. Proposals in this category include those put forward by United States Senator Bradley, Professors Jeffrey Sachs and Stanley Fischer, and the President of Argentina, Dr. Raul Alfonsin:
• The Bradley Plan calls for creditors to offer debt and interest rate relief in exchange for debtor reforms designed to restore balance to North-South trade, to revive hopes for widely shared economic progress, and to strengthen the international financial system."9 The mutual interest of developed and developing countries in trade is a key element of the plan (see box 8).
• The Sachs proposal would require banks to grant relief to those countries that need it most, i.e. those having experienced large declines in per capita income, in the form of interest payment forgiveness for a given period. The relief would be granted only
(c) Hybrid schemes
The Sengupta plan referred to above provides for some of a country's debt to remain on the banks' books and to be restructured by the banks themselves so as to provide relief to the debtors. A different type of hybrid proposal was put forward by Lord Lever and Christopher Huhne: it combines debt relief with guarantees on new lending. In this plan, regulated, official guarantees on fresh loans would be provided annually by the institutions of creditor governments, provided that banks wrote down each year part of their existing debt.121
Both the options set out above, as well as such hybrid schemes, deserve serious consideration. However, regardless of the choice of approach or mechanics, a number of conditions would need to be met:
All developing countries with severe debt-servicing difficulties and with significant amounts of commercial bank debt should be eligible, though none should be obliged to seek relief if, for instance, it considered that forgoing the opportunity offered more promising prospects for restoring creditworthiness and reviving development.
"9 Senator Bradley proposed a programme covering a three-year period. Each year interest rates would be reduced by 3 percentage points on debt owed to governments and banks, and the outstanding principal would be written down by 3 per cent. The relief would be accompanied by additional capital flows to support structural adjustment.
120 T h e interest rate on Argentina 's bank debt would be reduced from its prevailing 9 per cent a year to 4 per cent for three years. Such a reduction would then apply to a declining proport ion of bank debt, so that by the eighth year the marke t rate would apply again to 50 per cent of the debt. T h e proposal also suggests relief measures for Argentina 's official debt.
121 In addition, agreement would also be required for long-term rescheduling of the interest on that part of the debt that was written down.
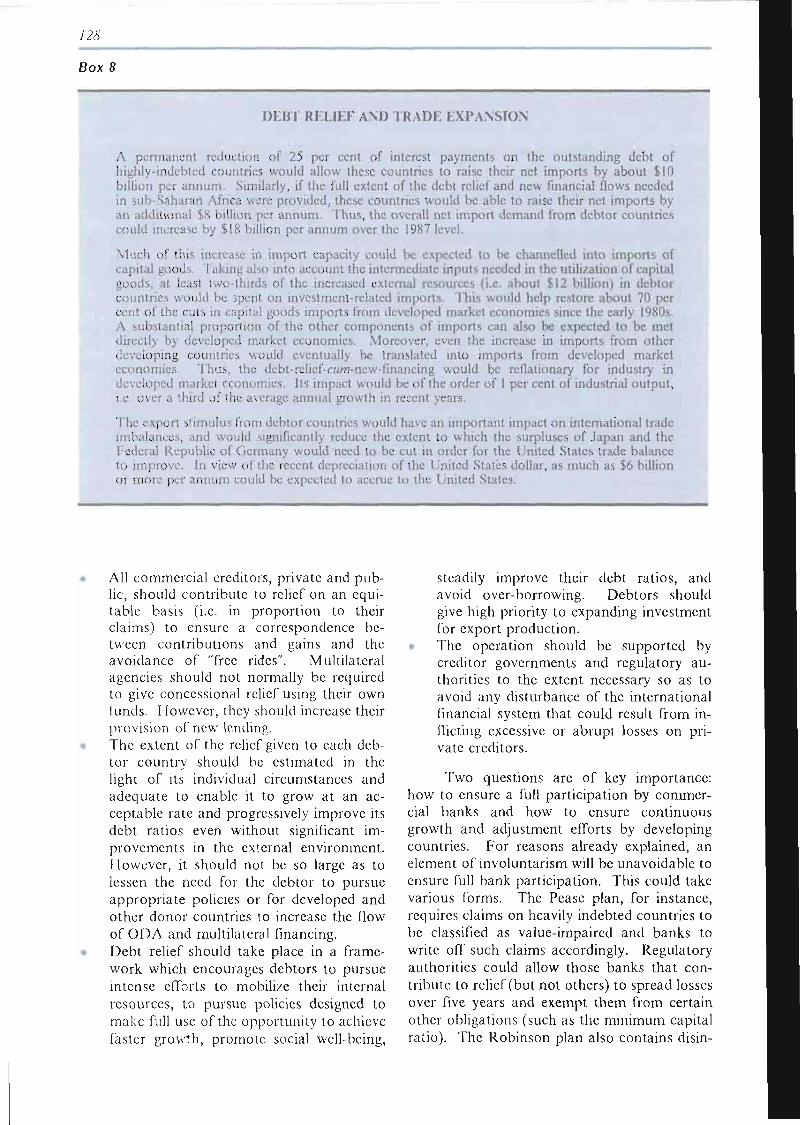
/2<S
Box 8
DEBÍ RELIEF AND TRADE EXPANSION
A permanent reduction of 25 per cent of interest payments on the outstanding debt of highly-indebted countries would allow these countries to raise their net imports by about $10 billion per annum. Similarly, if the full extent of the debt relief and new financial flows needed in sub-Saharan Africa were provided, these countries would be able to raise their net imports by an additional $8 billion per annum. Thus, the overall net import demand from debtor countries could increase by $18 billion per annum over the 1987 level.
Much of this increase in import capacity could be expected to 1% channelled into imports of capital goods. Taking also into account the intermediate inputs needed in the utilization of capital goods, at least two-thirds of the increased external resources (i.e. about $12 billion) in debtor countries would be spent on investment-related imports. This would help restore about 70 per cent of the cuts in capital goods imports from developed market economies since the early 1980s. A substantial proportion of the other components of imports can also be expected to be met directly by developed market economies. Moreover, even the increase in imports from other developing countries would eventually be translated into imports from developed market economies. Thus, the debt-relief-cuw-new-financing would be reflationary for industry in developed market economies. Its impact would be of the order of 1 per cent of industrial output, i.e. over a third of the average annual growth in recent years.
The export stimulus from debtor countries would have an important impact on international trade imbalances, and would significantly reduce the extent to which the surpluses of Japan and the Federal Republic of Germany would need to be cut in order for the United States trade balance to improve. In view of the recent depreciation of the United States dollar, as much as $6 billion or more per annum could be expected to accrue to the United States.
All commercial creditors, private and public, should contribute to relief on an equitable basis (i.e. in proportion to their claims) to ensure a correspondence between contributions and gains and the avoidance of "free rides". Multilateral agencies should not normally be required to give concessional relief using their own funds. However, they should increase their provision of new lending. The extent of the relief given to each debtor country should be estimated in the light of its individual circumstances and adequate to enable it to grow at an acceptable rate and progressively improve its debt ratios even without significant improvements in the external environment. However, it should not be so large as to lessen the need for the debtor to pursue appropriate policies or for developed and other donor countries to increase the flow of ODA and multilateral financing. Debt relief should take place in a framework which encourages debtors to pursue intense efforts to mobilize their internal resources, to pursue policies designed to make full use of the opportunity to achieve faster growth, promote social well-being,
steadily improve their debt ratios, and avoid over-borrowing. Debtors should give high priority to expanding investment for export production. The operation should be supported by creditor governments and regulatory authorities to the extent necessary so as to avoid any disturbance of the international financial system that could result from inflicting excessive or abrupt losses on private creditors.
Two questions are of key importance: how to ensure a full participation by commercial banks and how to ensure continuous growth and adjustment efforts by developing countries. For reasons already explained, an element of involuntarism will be unavoidable to ensure full bank participation. This could take various forms. The Pease plan, for instance, requires claims on heavily indebted countries to be classified as value-impaired and banks to write off such claims accordingly. Regulatory authorities could allow those banks that contribute to relief (but not others) to spread losses over five years and exempt them from certain other obligations (such as the minimum capital ratio). The Robinson plan also contains disin-
729
centives for non-participating banks.122 In the Fischer plan banks that opted out "would forgo the help of the IMF and their governments in extracting resources from the debtors, and negotiate on their own".123 A clear signal from governments and international financial agencies that they will not support commercial lenders in debt collection unless they provide reasonable amounts of relief could prove highly convincing. Governments could also make positive moves of their own, for instance by taking the lead and cancelling part of their official debts (or reducing the interest rate on them) pro rata in anticipation of complementary action by private lenders.
As for the policy performance of debtors, two points need to be added to those already made above in discussing the conditionality provisions of different schemes. In the first place, since debtor countries receiving relief would have a continuing need to borrow from multilateral institutions, such institutions would continue to be able to give advice. Secondly, mechanisms designed to link more directly debt relief and domestic investment may also have a role to play. For example, debtor countries could agree to pay to the agency organizing the relief in domestic currency the interest from which they had been relieved by their foreign creditors, which the agency would then lend to enterprises for productive investment, especially in the export sector. This could serve to ensure that the debt relief was used to advance, rather than to avoid, adjustment.
Systematic debt relief would also achieve a number of other desiderata. Since debt or interest reduction can bring about a permanent improvement in the resource position of a country, it could be targeted to make debt restructuring and financing exercises fully supportive of efforts to adjust in the context of growth and development. Moreover, the investment requirements of middle-income countries would inevitably be explicitly examined and addressed in the course of assessing each country's need for relief. Finally, once a debtor country was freed of a perpetual short-term cash shortage, its government would be able to formulate plans, policies and programmes in a more predictable perspective and private firms would be able to calculate risks more accurately and invest more securely for the long term.
Thus, a consensual removal of the debt overhang would allow the attention of international and domestic policy to shift from short-term financial management towards fostering development and structural change, and thereby provide a durable solution to the debt-cw/7i-development crisis. Equally, private creditors, by voluntarily accepting modest losses in an orderly way, would enhance their own position. Indeed - perhaps paradoxically - there appears to be no alternative to consensual, orderly and adequate relief if the present strategy of growing out of over-indebtedness and avoiding default is to be preserved."
>22 The debt retained by banks would be serviced by debtor countries after the debt held by the facility was paid. 123 S. Fischer, "Sharing the burden of the international debt crisis', American Economic Review, Vol. 77, No. 2, May 1987,
p. 169.
/JO
Chapter IV: Notes and references
Section
A.1 For a fuller treatment of the expansion of commercial bank lending to developing countries and the associated privatization of international financial flows see TDR 1984, part II, chap. IV. For a fuller treatment of debt accumulation during the 1970s see TDR 1985, part two, chap. I. For a comparison of certain "rules of the game" in international lending and domestic bankruptcy legislation in creditor countries see also TDR 1986, annex to chap. VI: 'Towards international debt reform?".
A.2 For a fuller treatment of external shocks, adjustment and debt see TDR 1985, part two, chap. I, sect. E, and chap. II, sects. A and B. See also Revitalizing Development Growth and International Trade. Assessment and Policy Options (TD/328/Rev.l), United Nations publication, Sales No. E.87.II.D.7, chap. I. The typical evolution of a self-reinforcing liquidity squeeze is described in 'Trade financing for developing countries: some aspects of current difficulties and policy responses" - study by the UNCTAD secretariat (TD/B/C.3/212).
A.3 The strategy adopted for handling the spread of developing countries' debt-servicing difficulties is also described in Revitalizing Development, Growth and International Trade ..., chap. II.
A.4 Concerning the tax deductibility associated with loan loss provisions for banks see, OECD, Prudential Supervision in Banking (Paris, 1987).
A.5 Reasons for the depression of commodity prices in the 1980s are discussed in Revitalizing Development, Growth and International Trade ..., chaps. I and III. There is a discussion of recent changes in rescheduling practices at the Paris Club in "Review of the implementation of the guidelines contained in Board resolution 222 (XXI)" (TD/BB/1167), and of the financing gaps for low-income countries in Financing Africa's Recovery - Report and Recommendations of the Advisory Group on Financial Flows to Africa (New York: United Nations, 1988), pp. 13-17. There are fuller accounts of the problems associated with debt-equity swaps in TDR 1987, annex 4, sect. B, Revitalizing Development, Growth and International Trade ..., paras. 335-339, and Group of Thirty, Finance for Developing Countries (New York, 1987). Other recent UNCTAD reports treating adjustment are: TDR 1985, part two, chap. II, sects. C and D, and Revitalizing Development, Growth and International Trade ..., chap II, sects. A.3 and C.l-2. The relation between the reduction of inflation in OECD countries and downward pressures on commodity prices is analyzed in more detail in TDR 1986, chap. Ill, sect. D.
B.1 For recent actual and expected movements of interest rates see OECD Economic Outlook (Paris), June 1988, pp. 14-17.
B.2 The estimates of import requirements of investment and other components of GDP for sub-Saharan Africa are taken from Lance Taylor, Varieties of Stabilization of Experience: Towards Sensible Macroeconomics in the Third World (Helsinki: WIDER, 1987), p. 45.
C.2 The precedent of allowing savings and loan associations in the United States to write off losses on their loans over a period of 40 years is described in Euromoney, September 1987, p. 81.
C.3 The proposals and plans described in this subsection are to be found in the following sources: those of Rohatyn and Professor Kenen in The Debt Crisis and the World Economy, Report by a Commonwealth Group of Experts (London: Commonwealth secretariat, 1984), appendix 2.2; those of United States Senator Sarbanes and Representative Lafalce in W.R. Cline, Mobilizing Bank Lending to Developing Countries, Policy Analyses in International Economics 18 (Washington, D.C.: Institute for International Economics, June 1987), appendix B; those of Representatives Morrison and Levin in a bill (H.R. 1453) presented to the first session of the 100th United States Congress; that of Representative Pease in a bill (H.R. 4130) presented to the second session of the 100th United States Congress; that of the WIDER study group in Mobilizing International Surpluses for

131
World Development. A WIDER Plan for a Japanese Initiative, WIDER Study Group Series No. 2 May 1987; that of Robinson in James D. Robinson III, "A Comprehensive Agenda for LDC Debt and World Trade Growth", The AM EX Bank Review. Special Paper, No. 13 (Ixmdon, American Express Bank Ltd., March 1988); that of Mistry in his article, "Third World Debt: Beyond the Baker Plan", The Banker (London), September 1987; that of Sengupta in his article, "A Proposal for a Debt Adjustment Facility", The World Economy, June-July 1988; that of Professor Davidson in his article, "A modest set of proposals for resolving the international debt problem", Journal of Post-Keynesian Economics, vol. X, Winter 1987-1988; that of Shafiqul Islam in "Dealing with the debt overhang: financing, forgiving and adjustment", mimeographed paper prepared for UNCTAD, 2 June 1988; that of Senator Bradley in his speech, "A Proposal for Third World Debt", Zurich, 29 June 1986; that of Professor Sachs in his article, "Managing the LDC Debt Crisis", Brookings Papers on Economic Activity (Washington, D C ) , 2:1986; that of Professor Fischer in his article, "Sharing the burden of the international debt crisis", American Economic Review, vol. 77, No. 2, May 1987; that of Lord Lever and Huhne in their book, Debt and Danger. The World Financial Crisis (London: Penguin Books), chap. IX; and that of the President of Argentina in the Financial Times, 3 June 1988.

Blank page _____________
Page blanche
Part Two
SERVICES IN THE WORLD ECONOMY

Blank page _____________
Page blanche
135
introduction
An impressive body of literature is rapidly developing with respect to services, although material concerned with the relationship between services trade and services in economic development is not extensive. As part of the work undertaken in its mandate in this area, the UNCTAD secretariat has addressed the role of services in the development process. Its findings in this context have been submitted in summary form to the Trade and Development Board and the Conference.124
The present study, drawing on previous work in UNCTAD and elsewhere, attempts to provide an analytical description of the role of the service sector in the world economy. To this end, it examines services in the developed market economies, socialist countries of Eastern Europe and developing countries, in the context of their national economies and in the external transactions of these countries. Dealing with the service sector it addresses the relationships between the domestic and external sectors, between services and other external transactions, as well as between countries, over time. The strategic aspects of services and some of the policy questions to which they give rise are also examined.
This study does not purport to provide an exhaustive treatment of the subject. Rather it endeavours to discuss aspects that have not been explored so far, and to serve as a framework of reference for future study by identifying a series of issues and relationships which might not previously have been viewed in juxtaposition. The overall findings suggest how services could be more appropriately brought within the ambit of development strategies, and identify areas where national, regional and international action might be required.
The major impediment to conducting studies of the service sector, especially trade in services, is the lack of reliable statistics, especially statistics which are internationally comparable. International efforts to construct an improved system of statistics for services are in the early stages of what will be a lengthy exercise.125 The UNCTAD secretariat has therefore been faced with the alternatives of postponing
the study of services, or attempting to draw certain observations on the basis of currently available data and thus run the risk of criticism that the weakness in the basic data could not justify the conclusions that might be drawn. The secretariat considered that the importance of shedding additional light on services in the development process warranted this risk. At the same time, care has been taken to avoid pushing conclusions farther than justified by the data.
Resort has been made to various statistical sources, among which national sources have been drawn on extensively. Some of the latter have been recently produced as part of the national studies on services that many developing countries are presently undertaking, some with the technical support of UNCTAD.126 It was felt that a better understanding of the service sector's contribution to development could be obtained from a close examination of this role in individual countries rather than by attempting to arrive at general observations drawn from such internationally comparable data as are available. Although countries were selected for study more as a result of the secretariat's access to available knowledge of their national service sector rather than on the basis of a specific set of criteria (such as geographic balance), the countries turned out to be representative of certain sets of dominant characteristics.
In approaching this study, it has been considered that the first step should be to obtain a clearer understanding of the evolution of the service sector in the developed market-economy countries. It was in these countries that one first began to hear the expressions "services revolution", "new service economy", "de-industrialization" and other terms that attempted to describe a particular phenomenon whose most striking visible characteristic was the fact, of paramount political importance, that the service sector had become the principal source of new employment opportunities. Chapter I therefore examines in considerable detail the changing role of the service sector in those countries, concentrating particularly on the employment aspects.
124 Including TD/B/1008/R.ev.l, TD/B/1100, TD/B/328/Rev.l, TD/B/1162.
125 This process has been described in TD/B/1162. See also chap. I below, boxes 9 and 10. 126 Unde r T r a d e and Development Board decision 309 (XXX).
/J6
Chapter II reviews international trade in services, pointing out that the increase in services as a proportion of gross domestic product (GDP) in the developed market-economy countries has not been reflected in a corresponding increase in overall world trade in services. In fact, the relative growth of services trade has occurred only in the basket category of "other" services, which includes a variety of activities (often categorized differently in different countries) among them the more dynamic producer services. Through a set of graphical presentations of "current-account profiles", devised by the Centre d'études prospectives et d'informations internationales, Paris, described in chapter II, the position of services with respect to other components of the current account in different countries is observed. Although the analytical value of such an approach is limited, it does suggest certain commonalities and differences of interests as between countries, and interesting aspects for further study.
The importance of trade in services extends beyond its contribution to world trade and payments. Chapter III attempts to explain the additional "strategic" role of services and examines the policy issues arising from the transnationalization of services, including those currently being addressed in the Uruguay Round negotiations of a multilateral framework of rules and principles for trade in services.
Chapter IV addresses the role of services in the economies of the socialist countries of Eastern Europe. For historical reasons, services have tended to be neglected in these countries and statistical limitations restrict
comparisons with other groups of countries. Socialist countries, however, have been successful in exporting a variety of services, and services are expected to be given a major role in current plans for economic restructuring.
The situation of the services sector in the national economy and the external sector of developing countries is discussed in chapter V. Such examinations suggest that developing countries can be grouped into a few categories, based on common characteristics of their external accounts which also reflect the composition of services in the domestic economy, and of the policy issues they face. The examination of trade, production and employment in services in developing countries as a whole and at the regional level is supplemented by a deeper analysis of the role of services in the economies of a number of developing countries and of the policy measures which their governments are taking to improve the contribution of services to their development objectives.
Chapter VI contains a summary of findings and identifies a series of policy conclusions aimed at identifying appropriate actions to be taken at the national, regional and international levels to maximize the contribution of services to the development process.127
In this exercise, UNCTAD has benefited from the studies on services carried out by Governments, academic institutions, business enterprises and international organizations, including the United Nations regional commissions, as well as from the work undertaken in developing countries at the regional and national levels, including that conducted in collaboration with UNCTAD.
127 In the preparation of part two of this Report, the secretariat benefited from the active collaboration and contributions from persons outside the United Nations system. These included: Anton Brender (Centre d'Etudes prospectives et d'informations internationales, Paris), Deepak Nayyer (J. Nehru University, New Dehli), and Dorothy Riddle (International Services Institute, Tempe, Arizona, United States), as well as Thierry Noyelle (Columbia University, New York) and Joel Bonamy (Economie et Humanisme, Lyon). Much of the material relating to the Andean Group and Mexico was derived from work undertaken by Luis Abugutas (Junta de Acuerdo de Cartegena, Lima) and Fernando de Mateo (SECOFI, Mexico) and their colleagues. Chapter IV drew heavily from a study prepared by J. Manciejewiez (Central School of Planning and Statistics, Warsaw). Support and ideas were also received from UN bodies, notably the Economic Commission for Latin American and the Caribbean (ECLAC), the United Nations Centre on Transnational Corporations and the Economic and Social Commission for Western Asia (ESCWA).
137
Chapter I
THE GROWTH OF SERVICES IN DEVELOPED MARKET-ECONOMY COUNTRIES
A. Introduction
services provoked a debate with respect to its implications for the productivity and international competitiveness of national economies, future quality and quantity of employment opportunities, and the structure of society as a whole. The ensuing debate, from which has emerged vocabulary such as "the new service economy", "deindustrialization" and the "post-industrial state", has extended to the role of services in growth and development in general.
This chapter attempts to clarify the factors contributing to the "services revolution" by examining key aspects of the postwar growth of services in the most developed OECD countries: (a) employment trends; (b) major hypotheses about the shift to services; (c) changes in labour force composition; and (d) location of production.
The past quarter century has seen a marked rise in output per capita in developed market-economy countries. Although growth has proceeded somewhat differently in each economy, an important characteristic common to all is the significant rise in the share of output and employment accounted for by the services sector. It was the rapid increase in employment in services that first drew attention to the structural changes taking place. By 1985 even the most conservative estimates showed that, for the 10 OECD countries ranking highest in terms of 1985 shares of employment in services, the average share had risen from below one half in 1960 to two-thirds in 1985; among the 10 lowest ranking OECD countries, the average share rose .from below 40 to over 55 per cent.128 The shift in employment opportunities from the goods producing industries to
128 OECD , National Accounts Statistics, ¡960-1985, Paris, 1987.
7J<S
Box 9
CONCEPTUAL PROBLEMS IN THE DEFINITION AND CLASSIFICATION OF SERVICES AND ANALYSIS OF THE INTERRELATIONSHIP BETWEEN SERVICES
AND THE ECONOMY
The difficulties that economists encounter in defining services defy common sense: in daily life, it is easy to distinguish between goods which can be purchased and whose material characteristics can be described precisely and services which are sought in order to improve health, repair a vehicle or make a payment or a financial investment. Services should, however, not be defined simply by contrasting them with material goods; characteristics such as immateriality, non-storability and simultaneity of production and consumption are only relative and can be partially or wholly changed by technological developments (remote delivery of services by modern means of communication, computerized storage of data flows, etc.).
A more abstract definition is needed to obtain a better understanding of the economic significance of the problems involved in defining and classifying services. A service can be defined as an act which is the result of a productive activity and whose effect is to change the status or position of a beneficiary. ' The service output is not distinguishable from its production process and the result or effect of the service is inseparable from its beneficiary and cannot form the subject of a new transaction. Accordingly, classifications of services are classifications of activities (since the nature of the various service activities can be described) and not classifications of products (which are difficult to define and measure).
The International Standard Industrial Classification of all Economic Activities (ISIC) contains very few details on service activities, which currently account for 50 to 75 per cent of overall economic activity. Its definition of the new activities that have developed recently is inadequate and leaves numerous ambiguities in the distinction between activities that produce goods or services. This applies, in particular, to the process of the externalization of service functions in which the change of status (of a department or an internal activity of an industrial firm, for example) has an impact on the measurement of services (employment and value added become those of a service industry) and on their expansion (externalization reveals the nature of many activities which are carried out within the industry and which are service activities).
Current trends show the development of service production chains, which are becoming increasingly complex as a result of the interlinkage of different activities, so that more than 50 per cent of producer services output is consumed by service firms themselves, the value added of a good tends to include more services (over 50 per cent in the case of the aeronautical, data processing and telephone industries) and the end-product of an activity tends to be defined in terms of a complex of services that once again highlights the interlinkages between services and the economy.
Throughout this part of the report, frequent reference is made to these "producer services", i.e. those services linked to production functions, which ensure the design and optimization of production and trade conditions, or are associated with the downstream phases of production, which determine the use of goods and services produced. In chapter I, where most information is gleaned from OECD data, these are defined as business and professional services, finance, insurance and real estate, differentiated from distributive services, personal services and social services, as well as from construction and utilities. In chapter II it is evident that many of what could be considered as producer services fall into the "other" services category when they enter into international trade. Chapter III examines producer services more from the functional view as inputs into the productive process at different stages of production (as well as linking them to the category of "knowledge-intensive" services). Chapter IV explains the different concepts used in the Socialist countries of Eastern Europe. Chapter V indicates that, for comparison of data from national accounts, the "banking, insurance and business service" category is used as a proxy for producer services.
/ T.P. Hill: 'The economic significance of the distinction between goods and services", OECD, Paris, 1987; André Marcet: "La montée des services: vers une économie de la servuction", CEDES, Economie et Humanisme, Lyon, 1987.
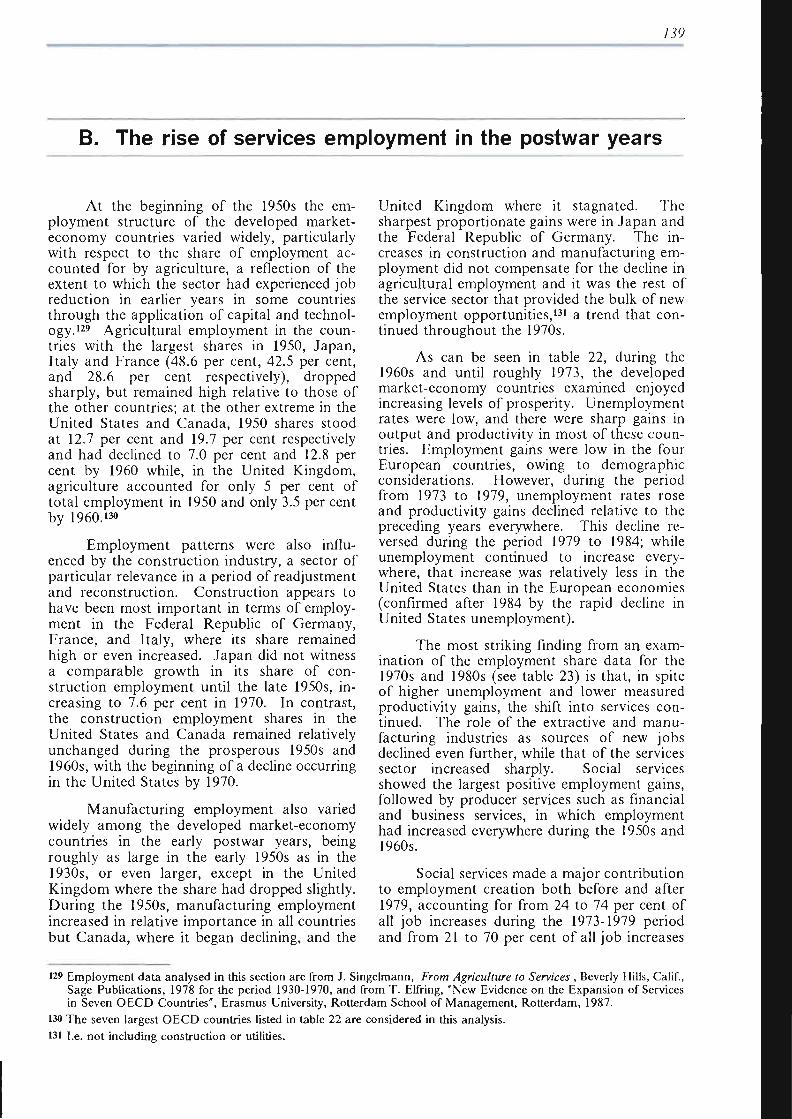
/J9
B. The rise of services employment in the postwar years
At the beginning of the 1950s the employment structure of the developed market-economy countries varied widely, particularly with respect to the share of employment accounted for by agriculture, a reflection of the extent to which the sector had experienced job reduction in earlier years in some countries through the application of capital and technology.129 Agricultural employment in the countries with the largest shares in 1950, Japan, Italy and France (48.6 per cent, 42.5 per cent, and 28.6 per cent respectively), dropped sharply, but remained high relative to those of the other countries; at the other extreme in the United States and Canada, 1950 shares stood at 12.7 per cent and 19.7 per cent respectively and had declined to 7.0 per cent and 12.8 per cent by 1960 while, in the United Kingdom, agriculture accounted for only 5 per cent of total employment in 1950 and only 3.5 per cent by I960.130
Employment patterns were also influenced by the construction industry, a sector of particular relevance in a period of readjustment and reconstruction. Construction appears to have been most important in terms of employment in the Federal Republic of Germany, France, and Italy, where its share remained high or even increased. Japan did not witness a comparable growth in its share of construction employment until the late 1950s, increasing to 7.6 per cent in 1970. In contrast, the construction employment shares in the United States and Canada remained relatively unchanged during the prosperous 1950s and 1960s, with the beginning of a decline occurring in the United States by 1970.
Manufacturing employment also varied widely among the developed market-economy countries in the early postwar years, being roughly as large in the early 1950s as in the 1930s, or even larger, except in the United Kingdom where the share had dropped slightly, During the 1950s, manufacturing employment increased in relative importance in all countries but Canada, where it began declining, and the
United Kingdom where it stagnated. The sharpest proportionate gains were in Japan and the Federal Republic of Germany. The increases in construction and manufacturing employment did not compensate for the decline in agricultural employment and it was the rest of the service sector that provided the bulk of new employment opportunities,131 a trend that continued throughout the 1970s.
As can be seen in table 22, during the 1960s and until roughly 1973, the developed market-economy countries examined enjoyed increasing levels of prosperity. Unemployment rates were low, and there were sharp gains in output and productivity in most of these countries. Employment gains were low in the four European countries, owing to demographic considerations. However, during the period from 1973 to 1979, unemployment rates rose and productivity gains declined relative to the preceding years everywhere. This decline reversed during the period 1979 to 1984; while unemployment continued to increase everywhere, that increase was relatively less in the United States than in the European economies (confirmed after 1984 by the rapid decline in United States unemployment).
The most striking finding from an examination of the employment share data for the 1970s and 1980s (see table 23) is that, in spite of higher unemployment and lower measured productivity gains, the shift into services continued. The role of the extractive and manufacturing industries as sources of new jobs declined even further, while that of the services sector increased sharply. Social services showed the largest positive employment gains, followed by producer services such as financial and business services, in which employment had increased everywhere during the 1950s and 1960s.
Social services made a major contribution to employment creation both before and after 1979, accounting for from 24 to 74 per cent of all job increases during the 1973-1979 period and from 21 to 70 per cent of all job increases
>29 Employment data analysed in this section are from J. Singelmann, From Agriculture to Services , Beverly Hills, Calif., Sage Publications, 1978 for the period 1930-1970, and from T. Elfring, "New Evidence on the Expansion of Services in Seven OECD Countries", Erasmus University, Rotterdam School of Management, Rotterdam, 1987.
130 T h e seven largest O E C D countries listed in table 22 are considered in this analysis.
131 I.e. not including construction or utilities.
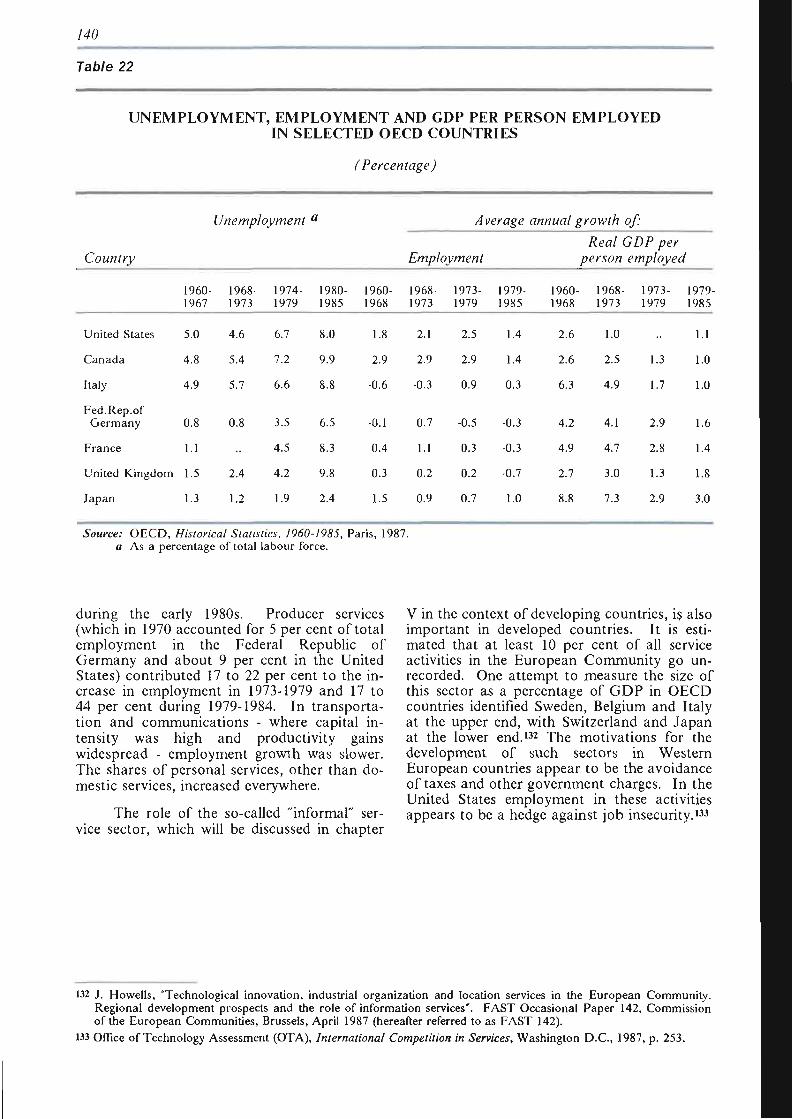
740
Table 22
UNEMPLOYMENT, EMPLOYMENT AND GDP PER PERSON EMPLOYED IN SELECTED OECD COUNTRIES
(Percentage)
Country
United States
Canada
Italy
Fed.Rep.of Germany
France
United Kingdom
Japan
1960-1967
5.0
4.8
4.9
0.8
1.1
1.5
1.3
Unemployment
1968-1973
4.6
5.4
5.7
0.8
2.4
1.2
1974-1979
6.7
7.2
6.6
3.5
4.5
4.2
1.9
a
1980-1985
8.0
9.9
8.8
6.5
8.3
9.8
2.4
1960-1968
1.8
2.9
-0.6
-0.1
0.4
0.3
1.5
A ver age
Employment
1968 1973
2.1
2.9
-0.3
0.7
1.1
0.2
0.9
1973-1979
2.5
2.9
0.9
-0.5
0.3
0.2
0.7
1979-1985
1.4
1.4
0.3
-0.3
-0.3
-0.7
1.0
annual growth of:
Real GDP per person employed
1960- 1968- 1973- 1979-1968 1973 1979 1985
2.6 1.0 .. 1.1
2.6 2.5 1.3 1.0
6.3 4.9 1.7 1.0
4.2 4.1 2.9 1.6
4.9 4.7 2.8 1.4
2.7 3.0 1.3 1.8
8.8 7.3 2.9 3.0
Source: OECD, Historical Statistics, 1960-1985, Paris, 1987. a As a percentage of total labour force.
during the early 1980s. Producer services (which in 1970 accounted for 5 per cent of total employment in the Federal Republic of Germany and about 9 per cent in the United States) contributed 17 to 22 per cent to the increase in employment in 1973-1979 and 17 to 44 per cent during 1979-1984. In transportation and communications - where capital intensity was high and productivity gains widespread - employment growth was slower. The shares of personal services, other than domestic services, increased everywhere.
The role of the so-called "informal" service sector, which will be discussed in chapter
V in the context of developing countries, is also important in developed countries. It is estimated that at least 10 per cent of all service activities in the European Community go unrecorded. One attempt to measure the size of this sector as a percentage of GDP in OECD countries identified Sweden, Belgium and Italy at the upper end, with Switzerland and Japan at the lower end.132 The motivations for the development of such sectors in Western European countries appear to be the avoidance of taxes and other government charges. In the United States employment in these activities appears to be a hedge against job insecurity.133
132 J. Howells , "Technological innovation, industrial organization and location services in the European Community . Regional development prospects and the role of information services*. F A S T Occasional Paper 142, Commission of the European Communit ies , Brussels, April 1987 (hereafter referred to as F A S T 142).
133 Office of Technology Assessment (OTA), International Competition in Services, Washington D C , 1987, p . 253.
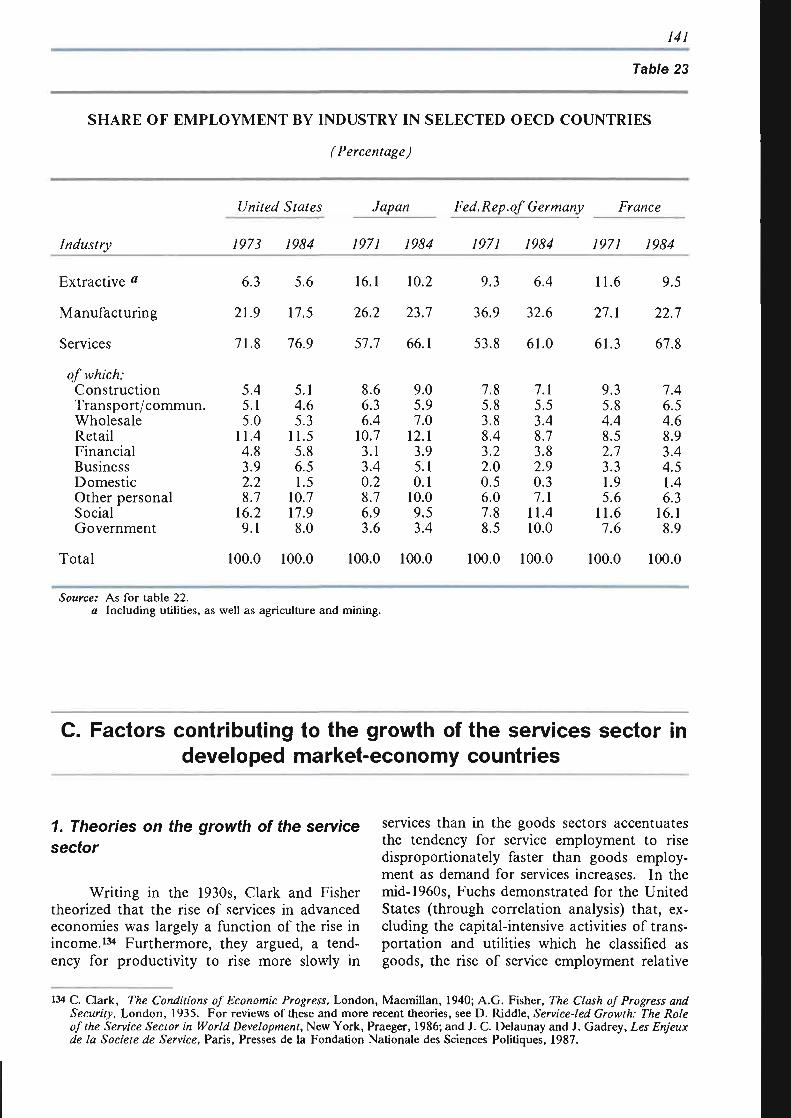
141
Table 23
SHARE OF EMPLOYMENT BY INDUSTRY IN SELECTED OECD COUNTRIES
(Percentage)
Industry
Extractive a
Manufacturing
Services
of which: Construction Transport/commun. Wholesale Retail Financial Business Domestic Other personal Social Government
Total
United States
797J
6.3
21.9
71.8
5.4 5.1 5.0
11.4 4.8 3.9 2.2 8.7
16.2 9.1
100.0
/9&4
5.6
17.5
76.9
5.1 4.6 5.3
11.5 5.8 6.5 1.5
10.7 17.9 8.0
100.0
Japan
797/ /9¿W
16.1
26.2
57.7
8.6 6.3 6.4
10.7 3.1 3.4 0.2 8.7 6.9 3.6
100.0
10.2
23.7
66.1
9.0 5.9 7.0
12.1 3.9 5.1 0.1
10.0 9.5 3.4
100.0
Fed.Rep.of Germany
797/ 7964
9.3
36.9
53.8
7.8 5.8 3.8 8.4 3.2 2.0 0.5 6.0 7.8 8.5
100.0
6.4
32.6
61.0
7.1 5.5 3.4 8.7 3.8 2.9 0.3 7.1
11.4 10.0
100.0
France
1971
11.6
27.1
61.3
9.3 5.8 4.4 8.5 2.7 3.3 1.9 5.6
11.6 7.6
100.0
/9<S4
9.5
22.7
67.8
7.4 6.5 4.6 8.9 3.4 4.5 1.4 6.3
16.1 8.9
100.0
Source: As for table 22. a Including utilities, as well as agriculture and mining.
C. Factors contributing to the growth of the services sector in developed market-economy countries
1. Theories on the growth of the service sector
Writing in the 1930s, Clark and Fisher theorized that the rise of services in advanced economies was largely a function of the rise in income.134 Furthermore, they argued, a tendency for productivity to rise more slowly in
services than in the goods sectors accentuates the tendency for service employment to rise disproportionately faster than goods employment as demand for services increases. In the mid-1960s, Fuchs demonstrated for the United States (through correlation analysis) that, excluding the capital-intensive activities of transportation and utilities which he classified as goods, the rise of service employment relative
134 C. Clark, The Conditions of Economic Progress, London, Macmillan, 1940; A.G. Fisher, The Clash of Progress and Security, London, 1935. For reviews of these and more recent theories, see D. Riddle, Service-led Growth: The Role of the Service Sector in World Development, New York, Praeger, 1986; and J. C. Delaunay and J. Gadrey, Les Enjeux de la Société de Service, Paris, Presses de la Fondation Nationale des Sciences Politiques, 1987.
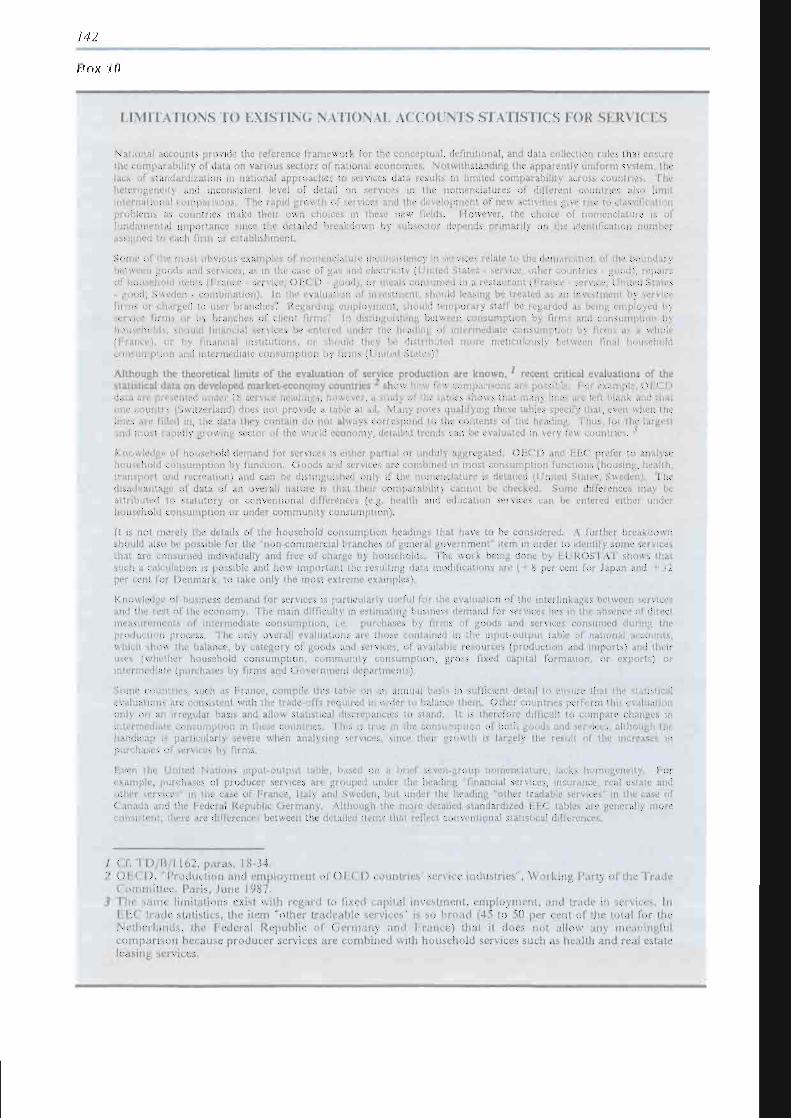
Hnx /H
LIMITATIONS TO EXISTING NATIONAL ACCOUNTS STATISTICS FOR SERVICES
•National accounts provide the reference framework for the conceptual, definitional, and data collection rules that ensure the comparability of data on various sectors of national economies. Notwithstanding the apparently uniform system, the lack ol standardization in national approaches to services data results in limited comparability across countries; I he heteiogeneit) and inconsistent level of detail on services m the nomenclatures of different countries also limit international comparisons. The rapid growth of services and the development of new activities give rise to classification pioblcms as countries make their own choices in these new fields. However, the choice of nomenclature is of fundamental importance since the detailed breakdown by subsector depends primarily on the identification number assigned to each firm or establishment
Some of [he most obvious examples of nomenclature inconsistency in services relate to the demarcation of the boundary between goods and services, as in the case of gas and eleclncit) (United States - service, other countries - good), repairs ot household items (1 ranee set vice, OECD - good), or meals consumed in a restaurant (Prance - senne, l ni ted States - good, Sweden - combination) In the evaluation of in.estaient, should leasing be treated as an investment b) service firms or charged to usei branches? Regarding employment, should temporary staff be regarded as being employed by servies firms or by branches of client films? In distinguishing between consumption b> firms and consumption by households, should financial services be entered under the heading of intermediate consumption by funis as a whole (France), 01 by financial institutions, or should the) be distributed more meticulously between final household consumption duo intermediate consumption by firms (l ni ted States)?
Although the theoretical limits of the evaluation of service production are known, 1 recent critical evaluations of the statistical data on developed market-economy countries 2 show how few comparisons aie possible 1 or example, OECD data arc presented under 18 seivice Headings, howftvtf, a study of die tables shows that many hue-. ,uc left blank and Chat one courier} (Switzerland) does not provide a tabic at all. Many notes qualifying these tables specify that, even when the lines are filled in, the data they contain do not always correspond to the contents of the heading Thus, foi the largest 2nd most rapidly gi owing sectoi of the world economy, detailed trends can be evaluated in very few countries. "
Knowledge of household demand for services is either partial or unduly aggregated. OECD and EEC prefer to analyse household consumption by function. Goods and services are combined in most consumption functions (housing, health, transpon and recreation) and can be distinguished only if the nomenclature is detailed (United States, Sweden). I he disadvantage of data of an overall nature is that then comparability cannot be checked. Some differences may be attributed to statutory or conventional differences (e.g. health and education services can be entered either undei household consumption or under community consumption).
It is not merely the details of the household consumption headings that have to be considered. A further breakdown should also be possible for the non-commeicial branches of general government" item in order to identify some services that aie consumed individually and free of charge by households. "I he work being done by EUROS EAT shows that such a calculation is possible and how important the resulting data modifications are ( + 8 per cent for Japan and i 32 per cent for Denmark, to take only the most extreme examples')
Knowledge of business demand for services is particularly useful foi the evaluation of the interlinkages between services and the rest of the economy. The main difficulty in estimating business demand for services lies in the absence of direct measurements of" intermediate consumption, le purchases by firms of goods and services consumed during the production process. The only overall evaluations are those contained in the input-output table of national accounts, which show the balance, by category of goods and services, of available resources (production and imports) and then uses (whet he i household consumption, community consumption, gross fixed capital formation, or exports) oi intermediate (purchases by firms and Government departments),
Some countries, such as France, compile this table on an annual basis in sufficient detail to ensure that the statistical evaluations are consistent with the trade-offs required in order to balance them. Other countries perform tins evaluation only on an irregular basis and allow statistical discrepancies to stand It is therefore difficult to compare changes in intermédiare consumption m these countries Tins is ti uc in .he consumption of both goods and su vices, although the handicap is particularly severe when analysing services, since their growth is largely the result of the increases in purchases (^ services by firms.
L\en the I nited Nations input-output table, based on a brief se\en gioup nomenclature, lacks homogeneity For example, purchases of producer services are grouped under the heading ' financial services, insurance, real estate and othei sei vices' in the case of France, Italy and Sweden, but under the heading "other tradable services" in the case of Canada and the Eedeial Republic Germany. Although the more detailed standardized EEC tables are generally more consistent, there are differences between the detailed items that reflect conventional statistical differences.
/ Cf. I ' D I i 1162, paras . 18-34. 2 O E C D , 'Product ion and employment of O E C D countries ' service industries", Working Parly of the Trade
Committee, Paris, June 1987. 3 The same limitations exist with regard to fixed capital investment, employment, and trade in services. In
P E C trade statistics, the item "other tradeable services" is so broad (45 to 50 per cent of the total for the Nether lands , the Federal Republic of Germany and France) that it does not allow any meaningful compar ison because producer services arc combined with household services such as health and real estate leasing services.
143
to goods could be explained principally by the higher rate of growth in labour productivity in the production of goods. Differences in income elasticity of demand were found to play only a minor role.135
The emphasis on productivity differentials was the basis for a well-known article by Baumol in which he suggested that, since higher productivity in the production of goods (principally manufacturing) tended to raise wages of workers employed in those sectors, labour costs in services would rise more than warranted by productivity increases.136 The result would be a chronic tendency for the costs and prices of services to rise relative to goods, a result which he subsequently dubbed the "cost disease" of services. In actuality, however, the more widespread unionization prevailing in the manufacturing sector as compared with service industries has raised the wages and prices in manufacturing much more rapidly than in most services.137
In the late 1970s, there was a renewed interest in the growth of services. Studies carried out at the time emphasized that multiple forces were at work and that different services responded to these forces in different ways, Income effects and productivity differences were recognized, but institutional factors such as changing product and market strategies, corporate structure and public policy were also held to be important.138 Analysis proceeded on the basis of groups of services that shared key characteristics, related largely to functions performed (e.g. distributive services) or markets served (e.g. consumer services, producer services).
Gershuny has stressed the role of self-service in limiting the growth of consumer services.139 Yet there is considerable complementarity between the demand for many consumer goods and consumer services. Not only do products require retailing efforts and maintenance and repair services, but there is a strong tendency for goods and services to be
demanded together as in travel, recreation, education and a wide variety of other activities -for example, the use of the automobile in conjunction with a variety of vacation services. Thus complementarity, along with rising incomes, continues to propel the growth of consumer services in developed economies, even though there are restraining substitution effects at work as well.
Another contribution was that of Levitt who called attention to the strong trend toward the "industrialization" of services.140 Levitt noted that new managerial approaches were making it increasingly possible to effect major economies of scale in the production of services through centralizing functions (such as finance, planning or advertising) and standardizing the delivery of services in widely dispersed outlets, frequently organized under franchised arrangements. He held that, through such practices, it was possible for tendencies toward increasing costs to be largely overcome.
More recently, Gershuny and Miles have suggested a model that places considerable emphasis on the role of the widespread application of new information technology, which they see as giving rise to a whole new class of service industries that produce "intermediate consumer services" such as computer software, television programmes, educational software for other producers and for households.141 Two major conclusions are drawn: (a) that future employment opportunities are likely to lie largely in this new intermediate consumer service sector; and (b) that the development, scale, and importance of these new services are critically dependent on the development of an elaborate telecommunications infrastructure. But Gershuny and Miles remain unclear as to whether or not the development of such services will foster rapid growth in employment or, on the contrary, slow growth (e.g. by promoting more "self-service").
Another recent contribution is that of Baumol and his colleagues.142 They maintain
135 V. R. Fuchs , Productivity Trends in the Goods and Service Sector, 1929-61, National Bureau of Economic Research, Occasional Paper 89, New York, 1964.
136 William J. Baumol , "Macroeconomics of unbalanced growth: The autonomy of urban crisis", American Economic Review, Vol. LVII , June 1967.
137 See A. Brender, A. Chevalier, J. Pisani-Ferry, "Etats-Unis, croissance, crise et changement technique dans l 'économie tertiaire", Paris , La Documentat ion française, 1980.
138 See Singelmann, op. cit.; R. Shelp, Beyond Industrialization: The Ascendency of the Global Service Economy, New York, Praeger, 1981; T. M. Stanback, Jr. et al., A White Paper on Softnomization, Softnomics Centre, Tokyo, 1985.
139 J.I. Gershuny , After Industrial Society? The Emerging Self-Service Economy, London, 1978.
140 T . Levitt, "The industrialization of services", Harvard Business Review, September 1976.
141 J.I. Gershuny and I. Miles, The New Service Economy, The Transformation of Employment in Industrial Societies (London, Frances Pinter, 1983).
142 W. J. Baumol , S A B . Blackman, and E.N. Wolff, "Unbalanced growth revisited: Asymptotic stagnancy and the new evidence", American Economic Review, Vol. 75, Sept. 1985.
/44
that, although Baumol's earlier theory holds for a number of services largely related to consumption (the "stagnant" services), there are other services (the "progressive" services) where standardization in delivery and utilization of technology does indeed make substantial productivity gains possible. Their special contribution, however, has been to call attention to a third group - the "asymptotically stagnant" services such as television, radio broadcasting and computer services - in which productivity gains are likely to be high during a stage dominated by the application of computer and telecommunications technologies; with time, however, the labour-intensive inputs (e.g. production of software, script writing, production of programmes) come to play the leading role and the "cost disease" sets in. This would suggest that there is a "life-cycle" for such services, with productivity gains at the stage of innovation and stagnation at the stage of standardization.
2. Forces at work
While many of these theories provide useful insights into the growth of services, it is important to recognize the role played by the fundamental changes affecting both what is being produced and how production occurs in reinforcing the shift to services observed in all developed economies.
The rapid rise of producer services (to be discussed below) must largely be seen as a manifestation of the transformation in how production takes place and more specifically of a shift in emphasis within the firm toward such functions as finance, advertising, research, product development, tax matters, government relations and so on. Behind this new set of managerial concerns lie the demands of the new economic environment brought on by changes in markets, the rise of the large corporation, and the increased complexity of regulations. More specifically, competition is intensifying as a result of both internationalization and deregulation. Products are becoming more differentiated to appeal to more specific market niches; product lives are shortening and product lines broadening. Greater emphasis is given to planning and product development, to flexibility in production, to advertising, to getting the product on the retailers' shelves.
143 FAST 142. l44SeeTD/B/1162, op. cit.
145 FAST 142.
As the demand for expertise expands, the opportunities for specialized service firms increase. Moreover, the benefits of economies of scale mean that user organizations are frequently better off going outside for a host of services ranging from legal assistance to plant location surveys, engineering, accounting, janitorial services or the hiring of executives, rather than providing for such functions internally. Evidence of the growing purchase of producer service inputs by manufacturers is presented in table 24, showing growth in the ratio of expenditure on producer services to the value of manufacturing in four EEC member states producers between 1975 and 1981. But the trend is in no way limited to manufacturing. There is similar evidence of growing purchases of producer services by other private and public service organizations, including government, throughout the developed market economies.
This externalization of service production has taken place at two levels. First, in-house services have increasingly been replaced by the purchase of specialized services from other firms. Second, service operations provided within the firm have tended to be sold to outside clients, a process which usually leads to the establishment of externalized subsidiaries that then sell the service both back to the parent firm and on the open market.143 The process of externalization has had the further result of making specialized producer services more available to small and medium sized enterprises, thus in turn facilitating the establishment of more specialized service firms. Service firms in sectors where there has been a general move toward externalization have shown particularly rapid rates of growth regardless of their sophistication (e.g. both cleaning and software), stimulating the dynamism of the whole service sector and of the economy in general, as will be discussed in greater detail in chapter III.144
The tendency of firms to rely on outside service suppliers may be prompted by a variety of motives: (a) external firms may be more efficient through specialization; (b) outside contracting of personnel and production can be a method for firms to meet peaks in demand while avoiding the permanent expansion of staff or investment in new capital equipment; and (c) firms may license or purchase technology to save on R & D costs or hire consultants to deal with new problems, such as meeting increased competition, and entering new product lines or new markets.145
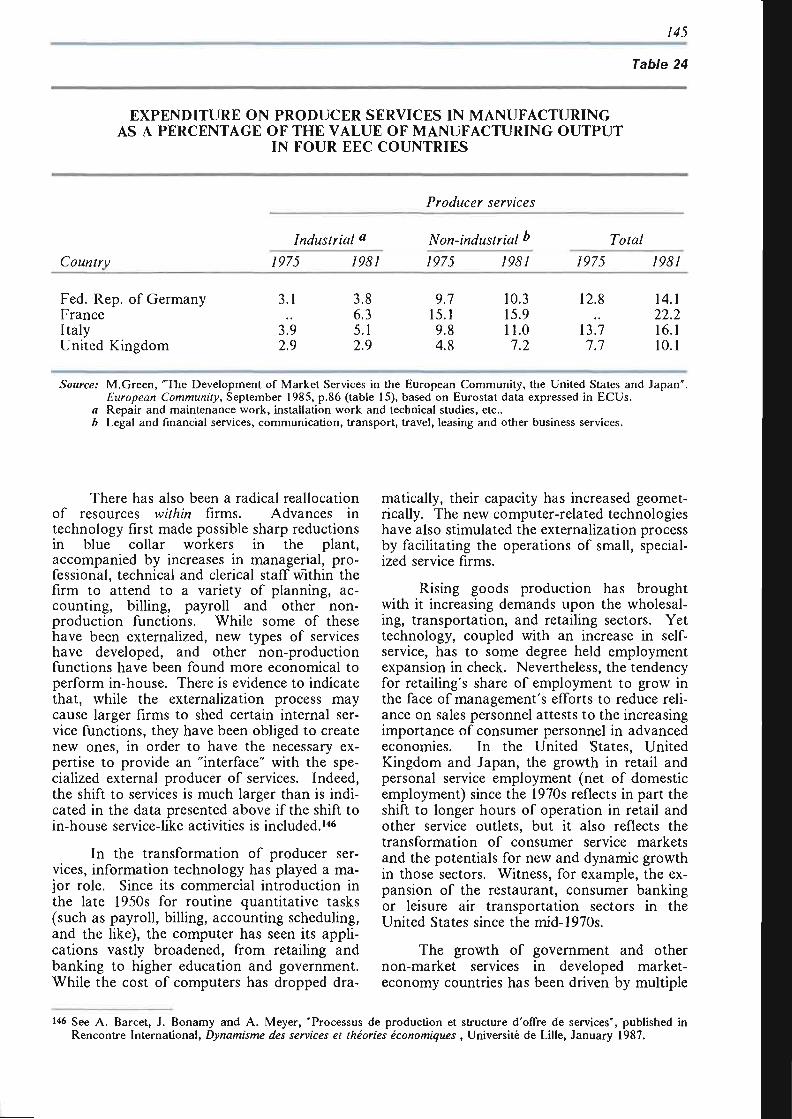
145
Table 24
EXPENDITURE ON PRODUCER SERVICES IN MANUFACTURING AS A PERCENTAGE OF THE VALUE OF MANUFACTURING OUTPUT
IN FOUR EEC COUNTRIES
Country
Fed. Rep. of Germany France Italy United Kingdom
Industrial a
/97J
3.1
3.9 2.9
796/
3.8 6.3 5.1 2.9
Producer services
Non-industrial b
1975 1981
9.7 15.1 9.8 4.8
10.3 15.9 11.0 7.2
/97j
12.8
13.7 7.7
Total
796/
14.1 22.2 16.1 10.1
Source: M.Green, "The Development of Market Services in the European Community, the United States and Japan" European Community, September 1985, p.86 (table 15), based on Eurostat data expressed in ECUs.
a Repair and maintenance work, installation work and technical studies, etc.. b Legal and financial services, communication, transport, travel, leasing and other business services.
There has also been a radical reallocation of resources within firms. Advances in technology first made possible sharp reductions in blue collar workers in the plant, accompanied by increases in managerial, professional, technical and clerical staff within the firm to attend to a variety of planning, accounting, billing, payroll and other non-production functions. While some of these have been externalized, new types of services have developed, and other non-production functions have been found more economical to perform in-house. There is evidence to indicate that, while the externalization process may cause larger firms to shed certain internal service functions, they have been obliged to create new ones, in order to have the necessary expertise to provide an "interface" with the specialized external producer of services. Indeed, the shift to services is much larger than is indicated in the data presented above if the shift to in-house service-like activities is included.146
In the transformation of producer services, information technology has played a major role. Since its commercial introduction in the late 1950s for routine quantitative tasks (such as payroll, billing, accounting scheduling, and the like), the computer has seen its applications vastly broadened, from retailing and banking to higher education and government. While the cost of computers has dropped dra
matically, their capacity has increased geometrically. The new computer-related technologies have also stimulated the externalization process by facilitating the operations of small, specialized service firms.
Rising goods production has brought with it increasing demands upon the wholesaling, transportation, and retailing sectors. Yet technology, coupled with an increase in self-service, has to some degree held employment expansion in check. Nevertheless, the tendency for retailing's share of employment to grow in the face of management's efforts to reduce reliance on sales personnel attests to the increasing importance of consumer personnel in advanced economies. In the United States, United Kingdom and Japan, the growth in retail and personal service employment (net of domestic employment) since the 1970s reflects in part the shift to longer hours of operation in retail and other service outlets, but it also reflects the transformation of consumer service markets and the potentials for new and dynamic growth in those sectors. Witness, for example, the expansion of the restaurant, consumer banking or leisure air transportation sectors in the United States since the mid-1970s.
The growth of government and other non-market services in developed market-economy countries has been driven by multiple
146 See A. Barcet, J. Bonamy and A. Meyer, "Processus de production et structure d'offre de services", published in Rencontre International, Dynamisme des services et théories économiques , Université de Lille, January 1987.
746
forces, including the increased demand by the public for a more equitable redistribution of the fruits of economic growth to provide greater security and better education and health services, and a need on the part of the business community for a more developed regulatory framework and a better trained labour force in
an ever more technological and institutionally complex society. In recent years, however, certain governments have adopted policies aimed at restraining or even reversing the expansion of social services and government regulation.
D. Labour force composition
To a large extent, the development of service activities in advanced economies has been accompanied by a number of changes in the workforce, involving (a) the increasing participation of women; (b) the shift to white collar jobs; and (c) an increase in the level of skills.
In most advanced economies, women have been a prime labour pool target of service employers as they built their workforces (see table 25). At a time when participation rates of men were stagnating, if not declining, in most countries, participation rates of women usually increased, at times rather sharply. To understand the role being played by women in services, several factors need to be understood. In many countries, employment opportunities for women have, in large part, been limited to the service sector where women have remained concentrated in the lowest paying jobs, with significant gender-based pay differentials existing even in managerial positions.147
A second major dimension of the shift to the services in advanced economies has been the shift to a more white collar oriented labour force, not simply because the service industries employ mostly white collar workers but also because of the parallel transformation of the labour force employed by the goods-producing
sector towards greater use of managers, engineers and other white collar workers.
The third concomitant development of the shift to services and to an increasingly white collar labour force is the rising demand for a better educated labour force, owing to growth in the occupations known traditionally for demanding high levels of formal education and to technological change demanding a substantial upskilling of work.148 However, this can be contrasted with a parallel growth in employment in sectors characterized by low productivity, low pay and job insecurity.
Studies in the United States, for example, show a continuing use of part-time labour in the service sector, with pay, fringe benefits, and job security consistently below those in the manufacturing sector. The United States service sector has been described as "two-tiered", containing highly-skilled professionals in high-demand and low-wage, low-skilled workers with little upward mobility.149 In Australia, Canada, Finland, France, Japan and the United Kingdom, the growth rate of part-time employment exceeded that of full-time employment, and in the United Kingdom, part-time jobs accounted for over 80 per cent of the net employment growth between 1983 and 1985.150
147 See B. Springer and D. Riddle, "Women in services: A US - EC comparison", paper presented at the annual meeting of the Western Political Science Association, 1985. Contrary to popular opinion, gender-based pay differentials in the service sector are now smaller in EEC than in the United States, with women receiving $0.74 per dollar paid a man in EEC, compared with $0.59 in the United States.
•48 See, for example, the work of the OECD Centre for Educational Research and Innovation, "Technological Change and Human Resources Development in the Service Sector" including five individual country studies.
149 O T A , International Competition in Services, op. cit.
150 O E C D , Employment Outlook, September 1986, p . 19.
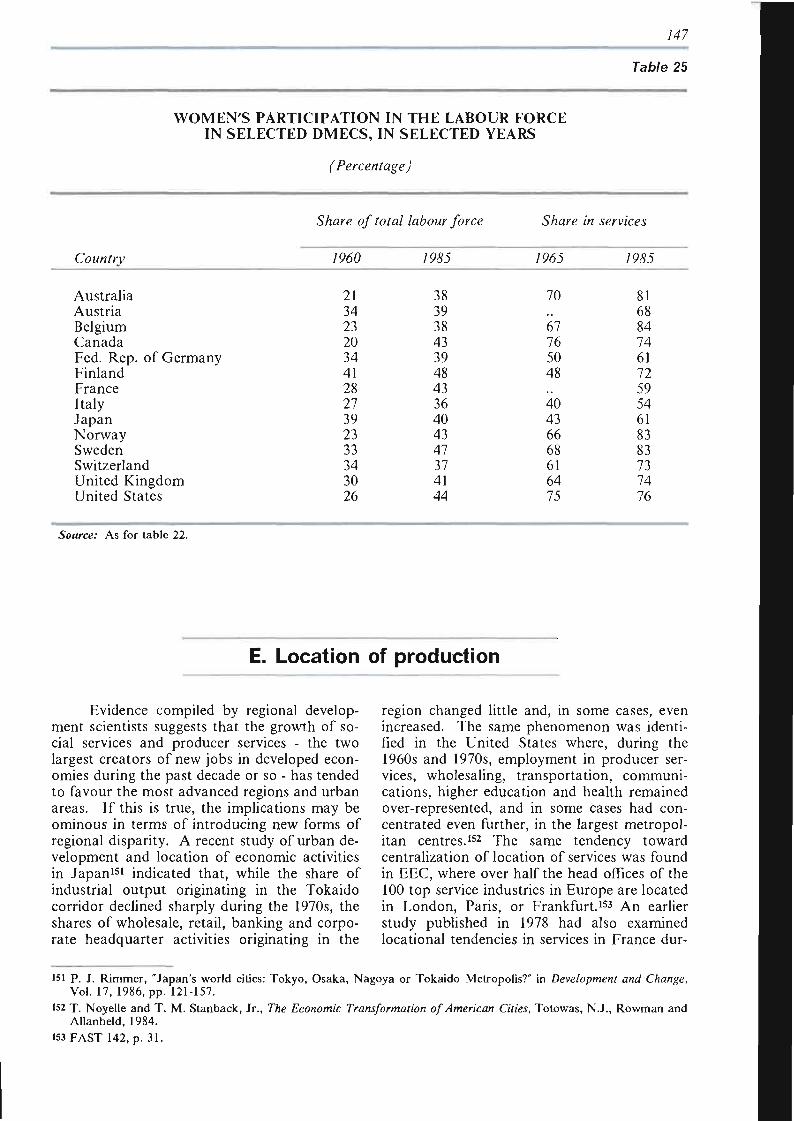
147
Table 25
WOMEN'S PARTICIPATION IN THE LABOUR FORCE IN SELECTED DMECS, IN SELECTED YEARS
(Percentage)
Country
Share of
/960
21 34 23 20 34 41 28 27 39 23 33 34 30 26
total labour force
/P&S
38 39 38 43 39 48 43 36 40 43 47 37 41 44
Share in
/96J
70
67 76 50 48
40 43 66 68 61 64 75
services
/&SJ
81 68 84 74 61 72 59 54 61 83 83 73 74 76
Australia Austria Belgium Canada Fed. Rep. of Germany Finland France Italy Japan Norway Sweden Switzerland United Kingdom United States
Source: As for table 22.
E. Location of production
Evidence compiled by regional development scientists suggests that the growth of social services and producer services - the two largest creators of new jobs in developed economies during the past decade or so - has tended to favour the most advanced regions and urban areas. If this is true, the implications may be ominous in terms of introducing new forms of regional disparity. A recent study of urban development and location of economic activities in Japan151 indicated that, while the share of industrial output originating in the Tokaido corridor declined sharply during the 1970s, the shares of wholesale, retail, banking and corporate headquarter activities originating in the
region changed little and, in some cases, even increased. The same phenomenon was identified in the United States where, during the 1960s and 1970s, employment in producer services, wholesaling, transportation, communications, higher education and health remained over-represented, and in some cases had concentrated even further, in the largest metropolitan centres.152 The same tendency toward centralization of location of services was found in EEC, where over half the head offices of the 100 top service industries in Europe are located in London, Paris, or Frankfurt.153 An earlier study published in 1978 had also examined locational tendencies in services in France dur-
151 P. J. Rimmer, "Japan's world cities: Tokyo, Osaka, Nagoya or Tokaido Metropolis?" in Development and Change, Vol. 17, 1986, pp. 121-157.
152 T . Noyelle and T . M . S tanback , Jr. , The Economic Transformation of American Cities, T o t o w a s , N.J . , R o w m a n and Allanheld, 1984.
153 FAST 142, p. 31.
/4¿9
ing the 1960s and early 1970s and had arrived at similar conclusions.154
Studies in Europe have demonstrated that this concentration of head offices has been accompanied by a concentration of ownership, taking place in parallel with the externalization process. Both services and manufacturing firms are now attempting to acquire ownership of a wide range of service operations in order to take advantage of profit opportunities, to support their own operations, to offer a package of services to the client, and to hedge against recessionary trends. Strategic planning and decision-making functions have thus become even more concentrated in a few large metropolitan areas, thus promoting the concentration of other intermediate business and producer service activities in these centres.
An unfortunate consequence of such concentration has been that more peripheral areas become associated with the delivery of less sophisticated, routine services, making them increasingly less attractive as location sites.155 The acute shortage of successful small and medium sized service enterprises in the peripheral regions of EEC can be attributed in
large part to the lack of adequate producer service support available.156 It has been observed that "although innovation and technological development in service activity would appear to provide a potential liberating role in terms of offering new opportunities in services to less favoured areas" and while "developments in telecommunications and information technology can allow for new forms of services organization that are potentially no longer constrained by distance and offer new opportunities for more remote, peripheral areas", in reality "interwoven, cumulative organizational and structural constraints appear to be restricting the spread and indigenous development of technological innovations in services outside of metropolitan areas".157
Developments in labour markets have reinforced trends toward centralization. On the one hand, the introduction of new technologies is resulting in new pressures on the quality of local labour markets and on the availability of skilled and highly skilled workers. Furthermore, the concentration of services, mentioned above, would result simply in the concentration of skilled labour, providers of knowledge-intensive services, in central locations."
154 A. Lipietz, "La Dimension Régionale du Tertiaire", in Activities et régions, Travaux et Recherches de Prospective No. 75, Paris, La Documentation française, 1978.
155 See "Business services as an industrialization variable in underdeveloped regions: Two case studies in Southern Italy", FAST Occasional Paper 108, p. 166.
156 Bakis, "The communicat ions of larger firms and their implications for the emergence of a new industrial order", contributing repor t to the Commission of the Industrial System, International Geographical Union, Chuo University, Tokyo , 1980, p . 87.
157 F A S T 142, p . 93 . For example, it has been found that corpora te communica t ion networks, which could allow increased decentralization of strategic functions, had the opposite effect in the case of the United Kingdom, serving to reinforce centralization of global control to the detriment of the local au tonomy that had been acquired. J. Howells and A .E . Green , "Location, structural change in the U.K. Services: nat ional and regional economic development prospects", FAST Occasional Paper 101, July 1986.
WP
Chapter II
TRADE IN SERVICES IN THE WORLD ECONOMY
A. Introduction
This chapter attempts to sketch a profile of trade in services in the contemporary world economy. It begins by outlining the dimensions at the global level, and continues by a discussion at a disaggregated level for the developed market economies and for selected developing countries. The object of the exercise is to compare the trends in trade in services with the trends in the other major components of the current account on the balance of payments for each of the countries. In doing so, the analysis seeks to assess the relative importance of international service transactions in the current-account balance, whether it is surplus or deficit, and how this has changed over time. Any such analysis is characterized by two serious problems. For one, balance-of-payments statistics are not available at a sufficiently disaggregated level by sector, origin and destination. For another, it is difficult not only to measure trade in services in terms of existing statistical categories, but also to capture international service transactions in terms of balance-of-payments statistics alone. All the same, the serious dearth of information on the subject warrants such an attempt despite the limitations.
The evidence presented in this chapter provides broad orders of magnitude on the absolute and the relative importance of trade in services, as compared with the other major components of the balance of payments, for each of the countries. The facts are important in themselves. But this also constitutes a step towards improving our understanding of services in the world economy. At one level, it
highlights the relationship between trade in services and the role of the services sector in the national economy. At another level, it identifies aspects that deserve further study if the role of services in the trade and development of countries is to be better understood. Apart from outlining the facts on trade in services, the discussion also sheds some light on the possible interest of individual countries and country groups, as also on the possible conflict of interests between countries, with a view to identifying areas for multilateral co-operation.
The discussion that follows is based, in large part, on balance-of-payments statistics compiled by IMF. The cross-section evidence for the major exporters and importers of services in the world economy is presented for the categories of shipping, travel, passengers, other transportation and the residual but large category of "other" services; there is a further disaggregated analysis of the "other" services category in an attempt to identify important segments of trade in services. The time series evidence on the developed market economies and the selected developing countries is based on a regrouping of IMF statistics and a set of graphical presentations based on the CHELEM158 developed by the Centre d'études prospectives et d'informations internationales (CEPII), Paris. In this approach the components of the current account on the balance of payments, for each economy, are divided into the following categories which involve a regrouping of IMF standard components of detailed presentation of balance of payments statistics (i) merchandise trade;159 (ii) travel;160
158 Comptes ha rmonisés sur les échanges et l 'économie mondia le . For a brief description of C H E L E M , see C E P I I , Economie prospective internationale, No . 1, Jan . 1980, p . 7. Details of the data b a n k are given in Michel Fouquin , "Une b a n q u e de données sur l 'économie mondiale: C H E L E M " , Economie et Statistique, N o . 104, October 1987.
159 IMF items 1,2.
160 I M F items 9,10 travel.
150
(iii) transportation;161 (iv) "other" services;162 (v) official transactions;163 (vi) income from labour;164 (vii) earnings from property including intellectual property;165 and (viii) interest payments166 or receipts plus other investment income.
The definition of what constitutes "trade" in services is currently a subject of multilateral negotiations in the Uruguay Round context. The ex post facto nature of the exercise, that is, that no economic analysis of the subject of "trade" in services had been carried out prior to the initial proposals to negotiate on such "trade", has complicated matters for academics and researchers, as any definition they may use for analytical purposes could have negotiating implications. As discussed in chapter III, the new issues in the negotiating debate related to defining the frontiers between trade and income derived from property and labour. This is not only a negotiating problem but a statistical problem for governments, where the reporting of earnings as trade or property income may reflect the particular characteristics of different national fiscal systems. The rearrangements of the IMF categories described above tend to narrow the definition of trade in services.
Any analysis of trade in services is also hindered by the lack of internationally comparable statistics at a sufficiently disaggregated level. In recognition of this situation, the present analysis in this chapter and in chapter V makes use of three different sets of statistics, First, those found in the IMF balance-of-payments figures are used to present overall regional and country situations as these are the figures that most readers would be familiar with. Second, the CHELEM system is used as a basis for the graphical presentations; however, the fundamental intention of the regrouping has been to remove, to the extent possible,
from the "other" services categories those items relating to labour income and return on property (i.e. intellectual property). Third, national sources are used to identify the main components of the "other" services category as defined by developed countries; and to identify trends in individual countries.
There would seem to be a general impression that trade in services has been increasing. This is perhaps due to the fact that the contribution of goods in world current accounts has been declining, from 73 per cent in the late 1960s to 68 per cent in 1986. However, the consequent growth in invisible transactions, which in 1986 exceeded $1 billion, has largely been due to a dramatic increase in interest payments of 8 percentage points, while the importance of the remaining invisible operations has diminished. (The growth in international financial intermediation has served to inflate the interest payment figures.) In terms of relative shares, there has been a decline in labour and property earnings (including intellectual property), as well as in trade in services such as transportation and tourism. Only trade in "other services" has shown a relative increase, and now accounts for around 5 per cent of world current transactions.
The increase in interest payments reflects primarily an exacerbation of the structural debtor position of countries, particularly developing countries (and some developed countries). The major response of indebted countries to their debt-servicing difficulties has been to enlarge merchandise trade surpluses both by increasing exports and, in the case of many developing countries, by reducing merchandise imports or at least stabilizing their growth. The contribution of services to this adjustment process has differed as between various countries and groups of countries.
B. Profiles of the developed market-economy countries
Developed market-economy countries remain preponderant in international trade in
services, accounting for 78 per cent of world receipts and 73 per cent of world payments in
161 IMF items 3,4 shipment, 5,6 passenger services, 7,8 other transportation. 162 I M F items 31,32 other goods , services and income.
163 I M F i tems 21 ,22 interofficial, n.i .e. , 23,24 o ther res ident official n.i.e., 25,26 other foreign official n.i.e., 39,40 interof-ficial t ransfers , 41,42 o ther transfers of res ident official, 43 ,44 o ther transfers of foreign official.
164 IMF items 27,28 labour income, 33,34 migrants' transfers, 35,36 workers' remittances, 37,38 other private transfers. 165 IMF items 13,14 other direct investment income, 29,30 property income, n.i.e.
166 I M F i tems 15, 16, o ther inves tment i ncome of resident official, including interofficial; 17, 18, other inves tment i ncome of foreign official, excluding interofficial; 19, 20, o ther inves tment income.
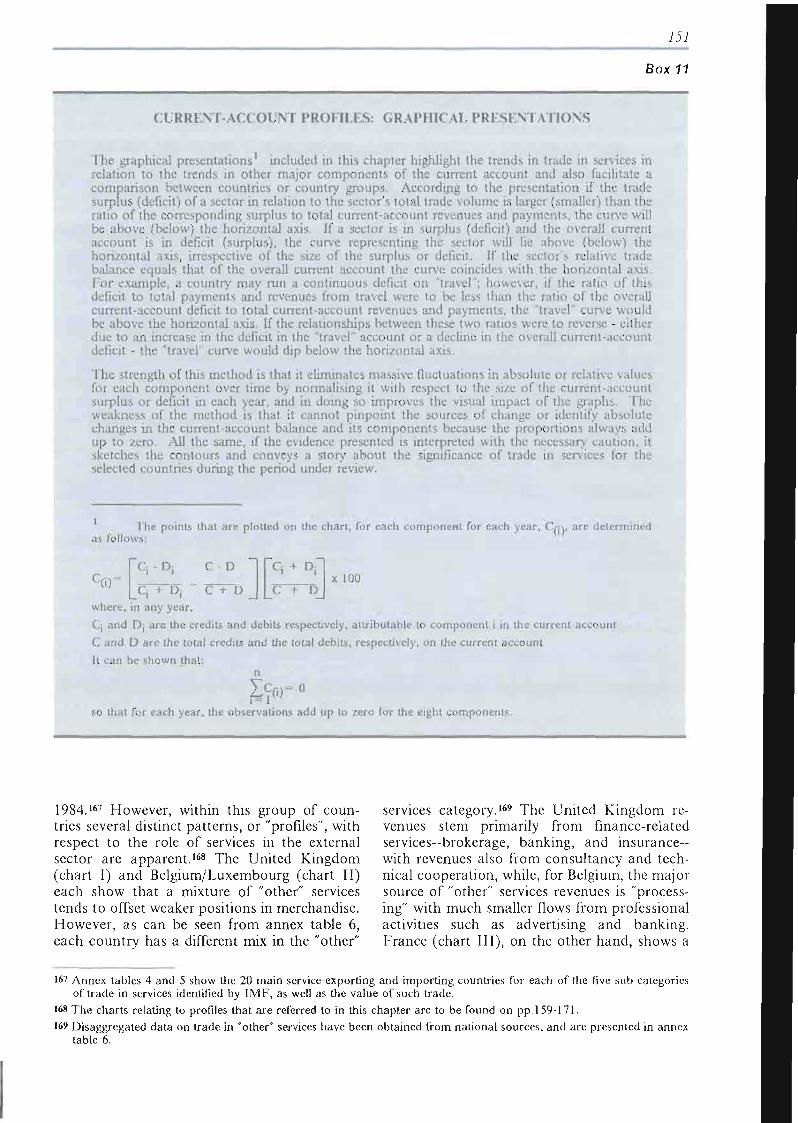
151
Box 11
CURRENT-ACCOUNT PROFILES: GRAPHICAL PRESENTATIONS
The graphical presentations1 included in this chapter highlight the trends in trade in services in relation to the trends in other major components of the current account and also facilitate a comparison between countries or country groups. According to the presentation if the trade surplus (deficit) of a sector in relation to the sector's total trade volume is larger (smaller) than the ratio of the corresponding surplus to total current-account revenues and payments, the curve will be above (below) the horizontal axis. If a sector is in surplus (deficit) and the overall current account is in deficit (surplus), the curve representing the sector will lie above (below) the horizontal axis, irrespective of the size of the surplus or deficit. If the sector's relative trade balance equals that of the overall current account the curve coincides with the horizontal axis. For example, a country may run a continuous deficit on "travel"; however, if the ratio of this deficit to total payments and revenues from travel were to be less than the ratio of the overall current-account deficit to total current-account revenues and payments, the "travel" curve would be above the horizontal axis. If the relationships between these two ratios were to reverse - either due to an increase in the deficit in the "travel" account or a decline in the overall current-account deficit - the "travel" curve would dip below the horizontal axis.
The strength of this method is that it eliminates massive fluctuations in absolute or relative values for each component over time by normalising it with respect to the size of the current-account surplus or deficit in each year, and in doing so improves the visual impact of the graphs. The weakness of the method is that it cannot pinpoint the sources of change or identify absolute changes in the current-account balance and its components because the proportions always add up to zero. All the same, if the evidence presented is interpreted with the necessary caution, it sketches the contours and conveys a story about the significance of trade in services for the selected countries during the period under review.
The points that are plotted on the chart, for each component for each year, C/¡\, are determined as follows:
C ( i ) -q - D¡ C D
q + D¡ C + D
C: + D;
C + D x 100
where, in any year, C¡ and D; are the credits and debits respectively, attributable to component i in the current account C and D are the total credits and the total debits, respectively, on the current account It can be shown that:
ft»- ° so that for each year, the observations add up to zero for the eight components.
1984.167 However, within this group of countries several distinct patterns, or "profiles", with respect to the role of services in the external sector are apparent.168 The United Kingdom (chart I) and Belgium/Luxembourg (chart II) each show that a mixture of "other" services tends to offset weaker positions in merchandise. However, as can be seen from annex table 6, each country has a different mix in the "other"
services category.169 The United Kingdom revenues stem primarily from finance-related services-brokerage, banking, and insurance-with revenues also from consultancy and technical cooperation, while, for Belgium, the major source of "other" services revenues is "processing" with much smaller flows from professional activities such as advertising and banking. France (chart III) , on the other hand, shows a
167 Annex tables 4 and 5 show the 20 main service-exporting and impor t ing countries for each of the five sub-categories of t r ade in services identified by I M F , as well as the value of such t rade.
168 T h e char ts relating to profiles that are referred to in this chapter are to be found on pp. 159-171.
169 Disaggregated data on t rade in "other" services have been obtained from nat ional sources , and are presented in annex table 6.
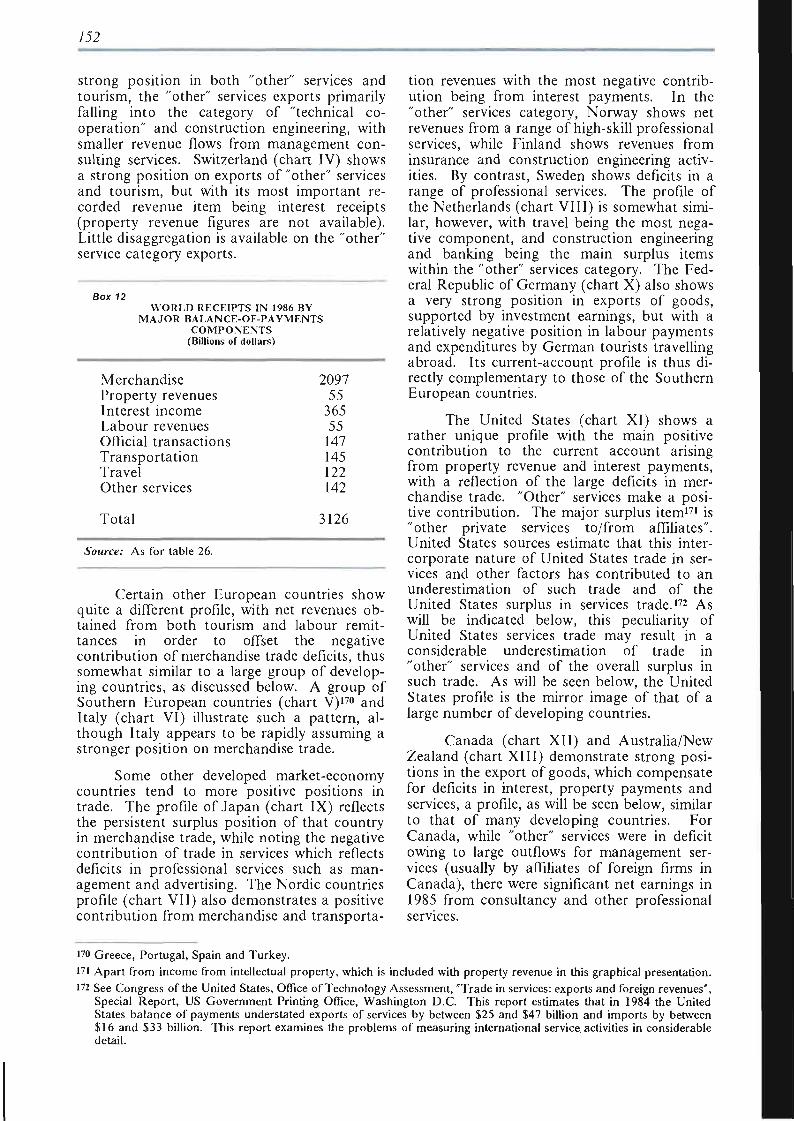
152
strong position in both "other" services and tourism, the "other" services exports primarily falling into the category of "technical cooperation" and construction engineering, with smaller revenue flows from management consulting services. Switzerland (chart IV) shows a strong position on exports of "other" services and tourism, but with its most important recorded revenue item being interest receipts (property revenue figures are not available). Little disaggregation is available on the "other" service category exports.
Sox 72 WORLD RECEIPTS IN 1986 BY
MAJOR BALANCE-OF-PAYMENTS COMPONENTS
(Billions of dollars)
Merchandise Property revenues Interest income Labour revenues Official transactions Transportation Travel Other services
Total
2097 55
365 55 147 145 122 142
3126
Source: As for table 26.
Certain other European countries show quite a different profile, with net revenues obtained from both tourism and labour remittances in order to offset the negative contribution of merchandise trade deficits, thus somewhat similar to a large group of developing countries, as discussed below. A group of Southern European countries (chart V)170 and Italy (chart VI) illustrate such a pattern, although Italy appears to be rapidly assuming a stronger position on merchandise trade.
Some other developed market-economy countries tend to more positive positions in trade. The profile of Japan (chart IX) reflects the persistent surplus position of that country in merchandise trade, while noting the negative contribution of trade in services which reflects deficits in professional services such as management and advertising. The Nordic countries profile (chart VII) also demonstrates a positive contribution from merchandise and transporta
tion revenues with the most negative contribution being from interest payments. In the "other" services category, Norway shows net revenues from a range of high-skill professional services, while Finland shows revenues from insurance and construction engineering activities. By contrast, Sweden shows deficits in a range of professional services. The profile of the Netherlands (chart VIII) is somewhat similar, however, with travel being the most negative component, and construction engineering and banking being the main surplus items within the "other" services category. The Federal Republic of Germany (chart X) also shows a very strong position in exports of goods, supported by investment earnings, but with a relatively negative position in labour payments and expenditures by German tourists travelling abroad. Its current-account profile is thus directly complementary to those of the Southern European countries.
The United States (chart XI) shows a rather unique profile with the main positive contribution to the current account arising from property revenue and interest payments, with a reflection of the large deficits in merchandise trade. "Other" services make a positive contribution. The major surplus item171 is "other private services to/from affiliates". United States sources estimate that this intercorporate nature of United States trade in services and other factors has contributed to an underestimation of such trade and of the United States surplus in services trade.172 As will be indicated below, this peculiarity of United States services trade may result in a considerable underestimation of trade in "other" services and of the overall surplus in such trade. As will be seen below, the United States profile is the mirror image of that of a large number of developing countries.
Canada (chart XII) and Australia/New Zealand (chart XIII) demonstrate strong positions in the export of goods, which compensate for deficits in interest, property payments and services, a profile, as will be seen below, similar to that of many developing countries. For Canada, while "other" services were in deficit owing to large outflows for management services (usually by affiliates of foreign firms in Canada), there were significant net earnings in 1985 from consultancy and other professional services.
170 Greece, Portugal, Spain and Turkey.
171 Apart from income from intellectual property, which is included with property revenue in this graphical presentation. 172 See Congres s of the United States , Office of Techno logy Assessment , " T r a d e in services: expor ts a n d foreign revenues" ,
Special Report, US Government Printing Office, Washington D C . This report estimates that in 1984 the United States balance of payments understated exports of services by between $25 and $47 billion and imports by between $16 and $33 billion. This report examines the problems of measuring international service, activities in considerable detail.
153
The current-account profiles of developed market-economy countries demonstrate considerable heterogeneity. Although such countries could be grouped as between those where goods, and where services, make the most positive contribution to the balance of payments, different countries show varying and changing strengths in different categories of services and this is even more striking within the "other"
services category (an exercise permitted by the data taken from national sources of OECD countries).173 These figures do not indicate the direction of trade although important advances in this respect are being made at the national levels.174 However, in many sectors the same countries are both the major importers and exporters, as most trade in services takes place among the OECD countries.
C. Profiles of selected developing countries
A first observation arising from the current-account profiles found among developing countries is that these countries would appear to fall into three basic categories.
The first category involves the largest number of developing countries, including the major exporters of minerals and commodities whose profiles demonstrate continuing strong relative positions in goods and very negative positions on interest payments. These countries also usually show a negative position in trade in services despite their obvious efforts to obtain current-account surplus to cover interest payments. Brazil (chart XIV) is typical of such a pattern. Other countries, some of which will be discussed in greater detail in chapter V, also fall into this category, notably the Andean group (charts XXI to XXV), Côte d'Ivoire (chart XXX), and Indonesia (chart XXXIV). Most of these developing countries, when faced with major debt-servicing problems, adopted policies usually involving both import restrictions and export promotion in order to maintain the trade surpluses necessary to generate the needed foreign exchange.17S
A second category of developing countries are those that show relatively strong positions in earnings from labour and travel, with negative positions in trade in goods and most of the other service categories. Sri Lanka (chart XVII) is characteristic of this category, as is India (see chart XVIII), although to a lesser extent, given its stronger position in "other" services. Most of the developing countries in this category are found among the non-petroleum exporting countries of North Africa (chart XXVIII) and West Asia (chart XXXIII), but also in the Caribbean, e.g. the
Dominican Republic (chart XXVII). The importance of revenues from tourism is often very pronounced for smaller countries within this category. In many instances, these countries have been able to profit from special factors such as geographical and cultural affinities, combined with extraordinary levels of demand for labour imports from certain petroleum-exporting countries, as well as social acceptance in host countries, and the ability of individuals to travel across national frontiers.
A third, smaller category of developing countries, that includes certain Asian countries that have demonstrated rapid growth rates over recent years, is characterized by strong positions in services that have historically offset deficits in merchandise trade. Recently there has been a convergence of the lines in the current-account profiles reflecting an improvement in their positions in the export of manufactures. The shifts would seem to represent a broadening of the competitive base. The current-account profiles of Singapore (chart XIX) and the Republic of Korea (chart XX) demonstrate these tendencies. This third group of countries has been able to take advantage of both the demand for goods (particularly in the developed market-economy countries) and the demand for services (especially in other developing countries). The apparent relationship between such flexibility and rapid growth in manufactured exports would seem to warrant further examination.
It would be imprudent to attempt to draw specific conclusions from an analysis based on such rough graphical presentations. Several observations may be gleaned, however, which
173 See annex table 6.
174 See discussion in TD/B/1162. 175 However , w h e n interest paymen t s a re no t taken into accoun t i.e. subtracted from the formula , the profile for this
g roup of countr ies cont inues to show a negative contr ibut ion from services, as is illustrated by the case of Argent ina . T h e two profiles of Argent ina presented in charts X V and X V I , the latter with interest paymen t s not included, illustrate the relative cha rac te r of the curves in the char t s , as described in box 11 .
154
serve to suggest areas for closer examination to be analysed in the following chapters.
First, there is a major difference in the position of trade in services in the external sector profiles as between developed and developing countries. As noted above, the profiles of developed countries indicate that many show relative strengths in a variety of services and that in many cases these relative strengths have changed over time, presumably reflecting changing competitive conditions and more intricate complementarities in their mutual trade. Developing countries demonstrate greater homogeneity in their external profiles, falling basically into two general categories, with the profiles indicating little change over time. Second, for the large majority of developing coun
tries, services do not yet make a positive contribution to the external sector, which is dominated by emphasis on exports of goods and negative positions in most invisible items, including trade in services. Third, a pattern that emerges in many developing countries is a combined positive position on "travel" and earnings derived from nationals working abroad. In other words, these countries are dependent on the movement of persons across national frontiers either outward, as providers of services, or inward, as purchasers of services. Fourth, it may be only coincidental, but the developing economies currently enjoying the most rapid rates of growth of their manufactured exports are precisely those which have tended to show a traditionally strong relative position in services trade.
D. Competitiveness in trade in services
Over recent years a debate has been taking place in academic circles, stimulated by proposals for multilateral negotiations on services, as to whether the same laws of comparative advantage that are presumed to govern trade in goods also apply to trade in services, Those who question this thesis point out that, unlike the case of goods, factor movements are complementary, not alternatives, to trade in services.176 Some have concluded that "services, once produced, cannot be traded"177 (see box 13).
It would seem obvious that, with respect to certain services, countries can be deemed to possess natural attributes, such as beaches, historical monuments, geographical proximity to markets, which would encourage them to specialize in certain industries, i.e. tourism. It is also clear that certain countries possess the human capital, technological advances, etc., required to produce more of the technologically advanced services.
However, the service sector is distinguished by various modes for "delivering" the services to the purchaser (to be developed in
chapter III). A weak position with respect to these modes, or barriers to their movement, may prevent a country from taking advantage of its competitive position in a particular services sector. Countries possessing the means of delivering services to markets through capital and information flows may be more successful in world trade in services than those without such means.
A particular aspect of many service sectors is that of quality and reputation which may be of even greater importance than in goods (often reflected in brand names and trade marks) and this along with technological factors in certain sectors, may compound the difficulties faced by new entrants to penetrate world markets effectively.178 Cultural factors may also be determinants of advantage in many sectors. Another danger in drawing conclusions from balance-of-payments figures with respect to "revealed" comparative advantage in services or among services is the fact that many services are exported "incorporated" in goods or as the "service content" of goods. The examination in the following section of the service sector in Japan illustrates this phenomenon.
176 See, for example , D . Riddle, "The Service Audit" (mimeo), published by International Services Institute (1SI), Tempe , Ar izona , 1986, for a discussion of multiple sources of potential comparat ive advantage in services, underscoring the point that such comparat ive advantage is created, rather than stemming from natural endowments , and as such must be actively developed and mainta ined.
177 T . P . Hill, "The economic significance of the distinction between goods and services", See paper presented to the Twentieth General Conference of the International Association for Research in Income and Wealth, Rocca di Papa, Italy, August 1987.
178 These prob lems will be discussed in chapter III.
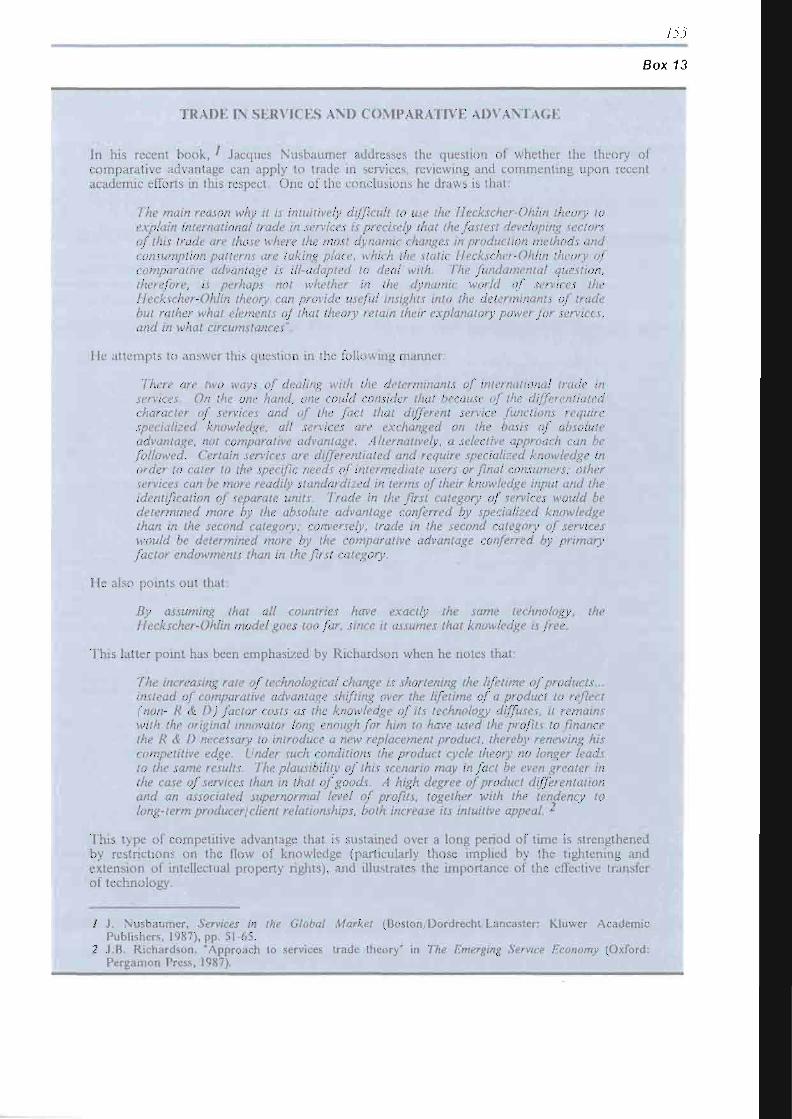
TRADE IN SERVICES AND COMPARATIVE ADVANTAGE
In his recent book, ' Jacques Nusbaumer addresses the question of whether the theory of comparative advantage can apply to trade in services, reviewing and commenting upon recent academic efforts in this respect. One of the conclusions he draws is that:
The main reason why it is intuitively difficult to use the Heckscher-Ohlin theory to explain international trade in services is precisely ¡hat the fastest developing sectors of this trade are those where the most dynamic changes in production methods and consumption pattern! are taking place, which ¡he static Heckscher-Ohlin theory of comparative advantage is ill-adapted to deal with. The fundamental question, therefore, is perhaps not whether in the dynamic world of services the Heckscher-Ohlin theory can provide useful insights into the determinants of trade but rather what elements of that theory retain their explanatory power for services, and in what circumstances".
He attempts to answer this question in the following manner:
There are two ways of dealing with the determinants of international trade in services. On the one hand, one could consider that because of the differentiated character of services and of the fact that different service functions require specialized knowledge, all senices are exchanged on the basis of absolute advantage, not comparative advantage. Alternatively, a selective approach can be followed. Certain services are differentiated and require specialized knowledge in order to cater to the specific needs of intermediate users or final consumers; other services can be more readily standardized in terms of their knowledge input and the identification of separate units. Trade in the first category of services would be determined more by the absolute advantage conferred by specialized knowledge than in the second category; conversely, trade in the second category of services would be determined more by the comparative advantage conferred by primary factor endowments than in the first category.
He also points out that:
By assuming that all countries have exactly the same technology, the Heckscher-Ohlin model goes too far, since it assumes that knowledge is free.
This latter point has been emphasized by Richardson when he notes that:
The increasing rate of technological change is shortening the lifetime of products... instead of comparative advantage shifting over the lifetime of a product to reflect (non- R&D) factor costs as the knowledge of its technology diffuses, it remains with the original innovator long enough for him to have used the profits to finance the R & D necessary to introduce a new replacement product, thereby renewing his competitive edge. Under such conditions the product cycle theory no longer leads to the same results. The plausibility of this scenario may in fact be even greater in the case of services than in that of goods. A high degree of product differentation and an associated supernormal level of profits, together with the tendency to long-term producer/client relationships, both increase its intuitive appeal. 2
This type of competitive advantage that is sustained over a long period of time is strengthened by restrictions on the flow of knowledge (particularly those implied by the tightening and extension of intellectual property rights), and illustrates the importance of the effective transfer of technology.
/ J. Nusbaumer, Services in the Global Market (Boston/Dordrecht Lancaster: Kluwer Academic Publishers, 1987), pp. 51-65.
2 J.B. Richardson, "Approach to services trade theory" in The Emerging Service Economy (Oxford: Pergamon Press, 1987).
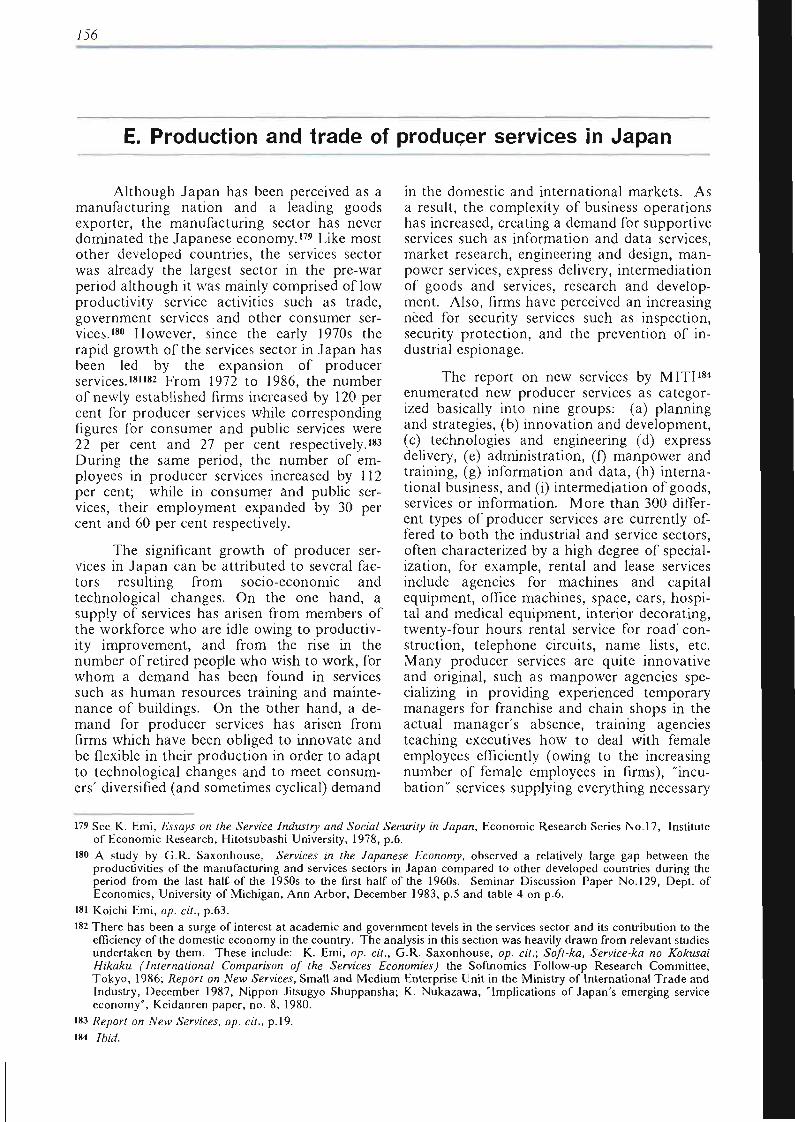
156
E. Production and trade of producer services in Japan
Although Japan has been perceived as a manufacturing nation and a leading goods exporter, the manufacturing sector has never dominated the Japanese economy.179 Like most other developed countries, the services sector was already the largest sector in the pre-war period although it was mainly comprised of low productivity service activities such as trade, government services and other consumer services.180 However, since the early 1970s the rapid growth of the services sector in Japan has been led by the expansion of producer services.181182 From 1972 to 1986, the number of newly established firms increased by 120 per cent for producer services while corresponding figures for consumer and public services were 22 per cent and 27 per cent respectively.183
During the same period, the number of employees in producer services increased by 112 per cent; while in consumer and public services, their employment expanded by 30 per cent and 60 per cent respectively.
The significant growth of producer services in Japan can be attributed to several factors resulting from socio-economic and technological changes. On the one hand, a supply of services has arisen from members of the workforce who are idle owing to productivity improvement, and from the rise in the number of retired people who wish to work, for whom a demand has been found in services such as human resources training and maintenance of buildings. On the tither hand, a demand for producer services has arisen from firms which have been obliged to innovate and be flexible in their production in order to adapt to technological changes and to meet consumers' diversified (and sometimes cyclical) demand
in the domestic and international markets. As a result, the complexity of business operations has increased, creating a demand for supportive services such as information and data services, market research, engineering and design, manpower services, express delivery, intermediation of goods and services, research and development. Also, firms have perceived an increasing need for security services such as inspection, security protection, and the prevention of industrial espionage.
The report on new services by MITI184
enumerated new producer services as categorized basically into nine groups: (a) planning and strategies, (b) innovation and development, (c) technologies and engineering (d) express delivery, (e) administration, (f) manpower and training, (g) information and data, (h) international business, and (i) intermediation of goods, services or information. More than 300 different types of producer services are currently offered to both the industrial and service sectors, often characterized by a high degree of specialization, for example, rental and lease services include agencies for machines and capital equipment, office machines, space, cars, hospital and medical equipment, interior decorating, twenty-four hours rental service for road construction, telephone circuits, name lists, etc. Many producer services are quite innovative and original, such as manpower agencies specializing in providing experienced temporary managers for franchise and chain shops in the actual manager's absence, training agencies teaching executives how to deal with female employees efficiently (owing to the increasing number of female employees in firms), "incubation" services supplying everything necessary
179 See K. Emi, Essays on the Service Industry and Social Security in Japan, Economic Research Series No.17 , Institute of Economic Research, Hitotsubashi University, 1978, p.6.
180 A study by G.R. Saxonhouse , Services in the Japanese Economy, observed a relatively large gap between the productivities of the manufacturing and services sectors in Japan compared to other developed countries during the period from the last half of the 1950s to the first half of the 1960s. Seminar Discussion Paper No.129, Dept. of Economics , University of Michigan, A n n Arbor , December 1983, p.5 and table 4 on p.6.
181 Koichi Emi, op. cit., p.63. 182 The re has been a surge of interest at academic and government levels in the services sector and its contribution to the
efficiency of the domestic economy in the country. The analysis in this section was heavily d rawn from relevant studies under taken by them. These include: K. Emi, op. cit., G.R. Saxonhouse , op. cit.; Soft-ka, Service-ka no Kokusai Hikaku (International Comparison of the Services Economies) the Softnomics Follow-up Research Committee, T o k y o , 1986; Report on New Services, Small and Medium Enterprise Unit in the Ministry of International T r a d e and Industry, December 1987, Nippon Jitsugyo Shuppansha; K. Nukazawa , "Implications of Japan ' s emerging service economy", Keidanren paper , no. 8, 1980.
183 Report on New Services, op. cit., p.19.
184 Ibid.
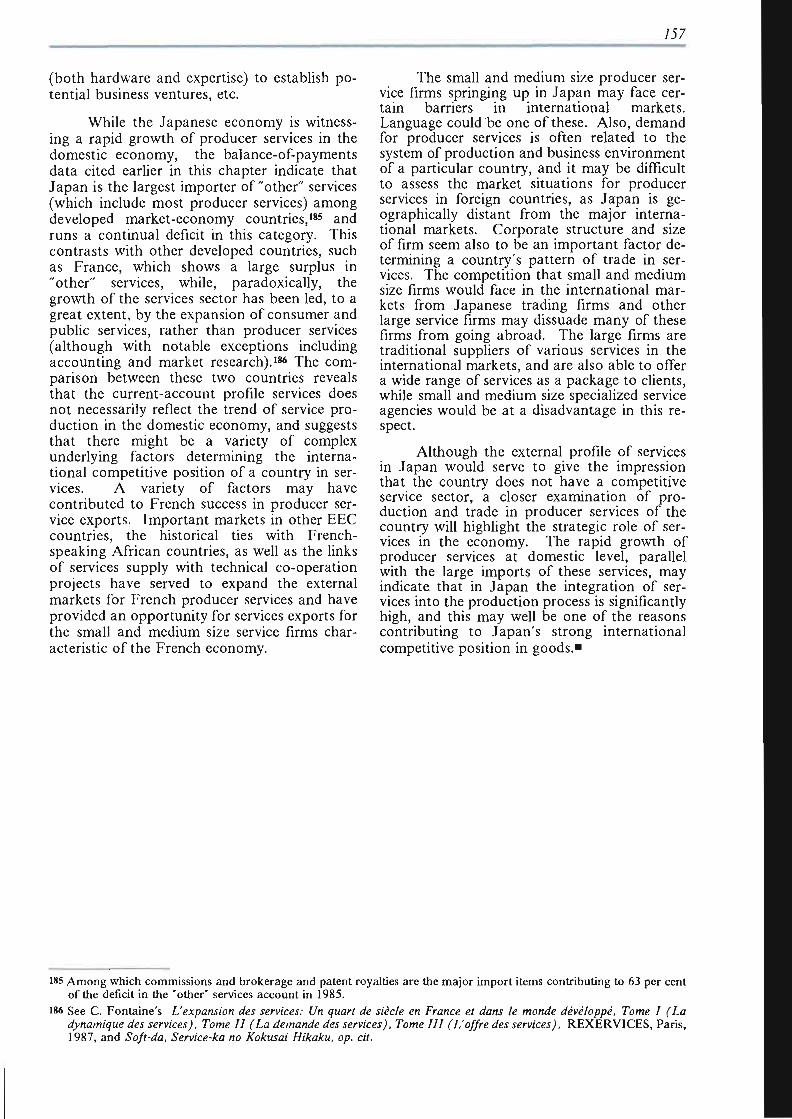
157
(both hardware and expertise) to establish potential business ventures, etc.
While the Japanese economy is witnessing a rapid growth of producer services in the domestic economy, the balance-of-payments data cited earlier in this chapter indicate that Japan is the largest importer of "other" services (which include most producer services) among developed market-economy countries,185 and runs a continual deficit in this category. This contrasts with other developed countries, such as France, which shows a large surplus in "other" services, while, paradoxically, the growth of the services sector has been led, to a great extent, by the expansion of consumer and public services, rather than producer services (although with notable exceptions including accounting and market research).186 The comparison between these two countries reveals that the current-account profile services does not necessarily reflect the trend of service production in the domestic economy, and suggests that there might be a variety of complex underlying factors determining the international competitive position of a country in services. A variety of factors may have contributed to French success in producer service exports. Important markets in other EEC countries, the historical ties with French-speaking African countries, as well as the links of services supply with technical co-operation projects have served to expand the external markets for French producer services and have provided an opportunity for services exports for the small and medium size service firms characteristic of the French economy.
The small and medium size producer service firms springing up in Japan may face certain barriers in international markets. Language could be one of these. Also, demand for producer services is often related to the system of production and business environment of a particular country, and it may be difficult to assess the market situations for producer services in foreign countries, as Japan is geographically distant from the major international markets. Corporate structure and size of firm seem also to be an important factor determining a country's pattern of trade in services. The competition that small and medium size firms would face in the international markets from Japanese trading firms and other large service firms may dissuade many of these firms from going abroad. The large firms are traditional suppliers of various services in the international markets, and are also able to offer a wide range of services as a package to clients, while small and medium size specialized service agencies would be at a disadvantage in this respect.
Although the external profile of services in Japan would serve to give the impression that the country does not have a competitive service sector, a closer examination of production and trade in producer services of the country will highlight the strategic role of services in the economy. The rapid growth of producer services at domestic level, parallel with the large imports of these services, may indicate that in Japan the integration of services into the production process is significantly high, and this may well be one of the reasons contributing to Japan's strong international competitive position in goods."
185 A m o n g which commissions and brokerage and patent royalties are the major impor t items contributing to 63 per cent of the deficit in the "other" services account in 1985.
186 See C. Fonta ine ' s L'expansion des services: Un quart de siècle en France et dans le monde développé, Tome I (La dynamique des services), Tome II (La demande des services), Tome III (L'offre des services), R E X E R V I C E S , Paris, 1987, and Soft-da, Service-ka no Kokusai Hikaku, op. cit.
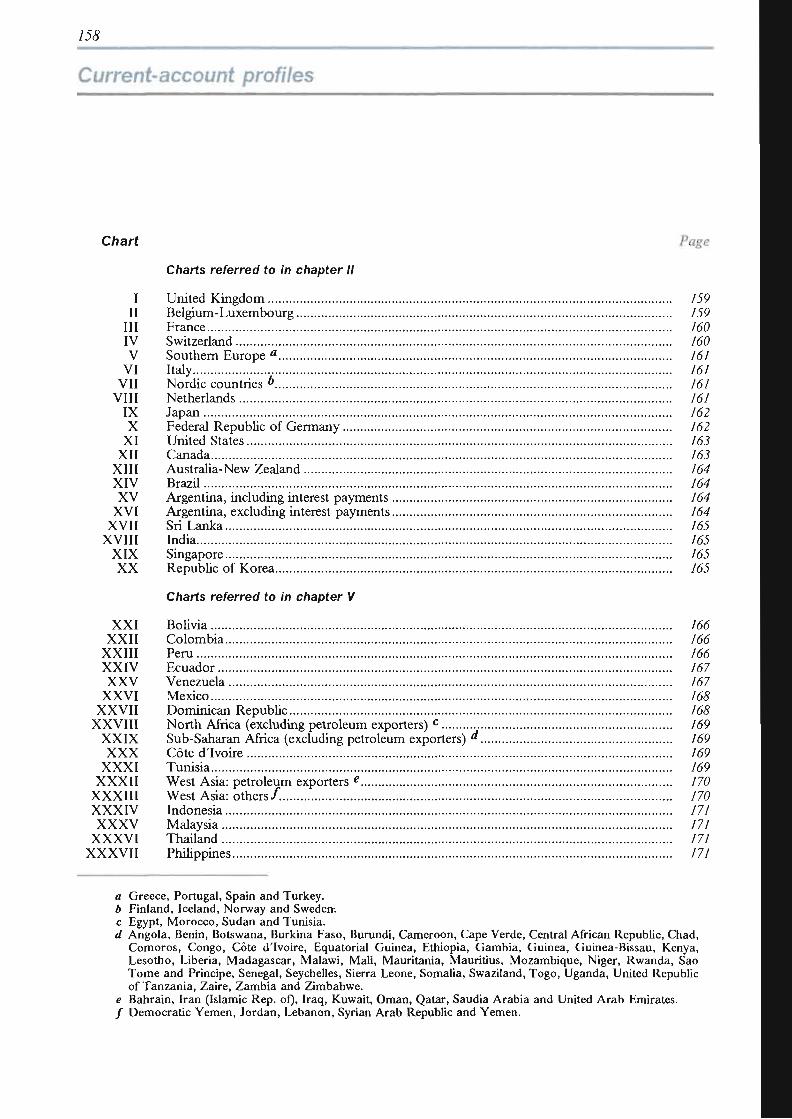
Current-account profiles
Chart Page
Charts referred to in chapter II
I United Kingdom 159 II Belgium-Luxembourg 159
III France 160 IV Switzerland 160 V Southern Europe a 161
VI Italy 161 VII Nordic countries & 161
VIII Netherlands 161 IX Japan 162 X Federal Republic of Germany 162
XI United States 163 XII Canada 163
XIII Australia-New Zealand 164 XIV Brazil 164 XV Argentina, including interest payments 164
XVI Argentina, excluding interest payments 164 XVII Sri Lanka 165
XVIII India 165 XIX Singapore 165 XX Republic of Korea 165
Charts referred to in chapter V
XXI Bolivia 166 XXII Colombia 166
XXIII Peru 166 XXIV Ecuador 167 XXV Venezuela 167
XXVI Mexico 168 XXVII Dominican Republic 168
XXVIII North Africa (excluding petroleum exporters) c 169 XXIX Sub-Saharan Africa (excluding petroleum exporters) ¿ 169 XXX Côte d'Ivoire 169
XXXI Tunisia 169 XXXII West Asia: petroleum exporters e 170
XXXIII West Asia: others/ . 770 XXXIV Indonesia 171 XXXV Malaysia 171
XXXVI Thailand 171 XXXVII Philippines 171
a Greece, Portugal, Spain and Turkey. b Finland, Iceland, Norway and Sweden. c Egypt, Morocco, Sudan and Tunisia. d Angola, Benin, Botswana, Burkina Faso, Burundi, Cameroon, Cape Verde, Central African Republic, Chad,
Comoros, Congo, Côte d'Ivoire, Equatorial Guinea, Ethiopia, Gambia, Guinea, Guinea-Bissau, Kenya, Lesotho, Liberia, Madagascar, Malawi, Mali, Mauritania, Mauritius, Mozambique, Niger, Rwanda, Sao Tome and Principe, Senegal, Seychelles, Sierra Leone, Somalia, Swaziland, Togo, Uganda, United Republic of Tanzania, Zaire, Zambia and Zimbabwe.
e Bahrain, Iran (Islamic Rep. of), Iraq, Kuwait, Oman, Qatar, Saudia Arabia and United Arab Emirates. / Democratic Yemen, Jordan, Lebanon, Syrian Arab Republic and Yemen.
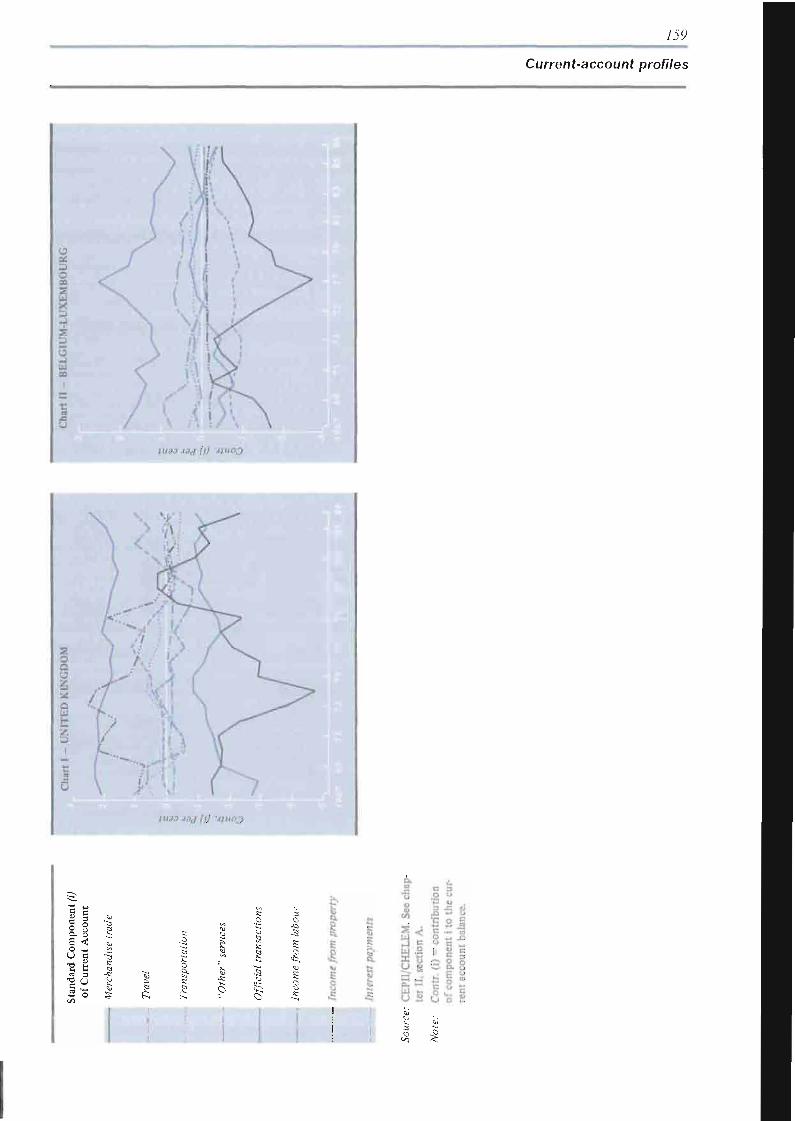
159
Current-account profiles
s
S
;waa . /a j ^ V J N O J
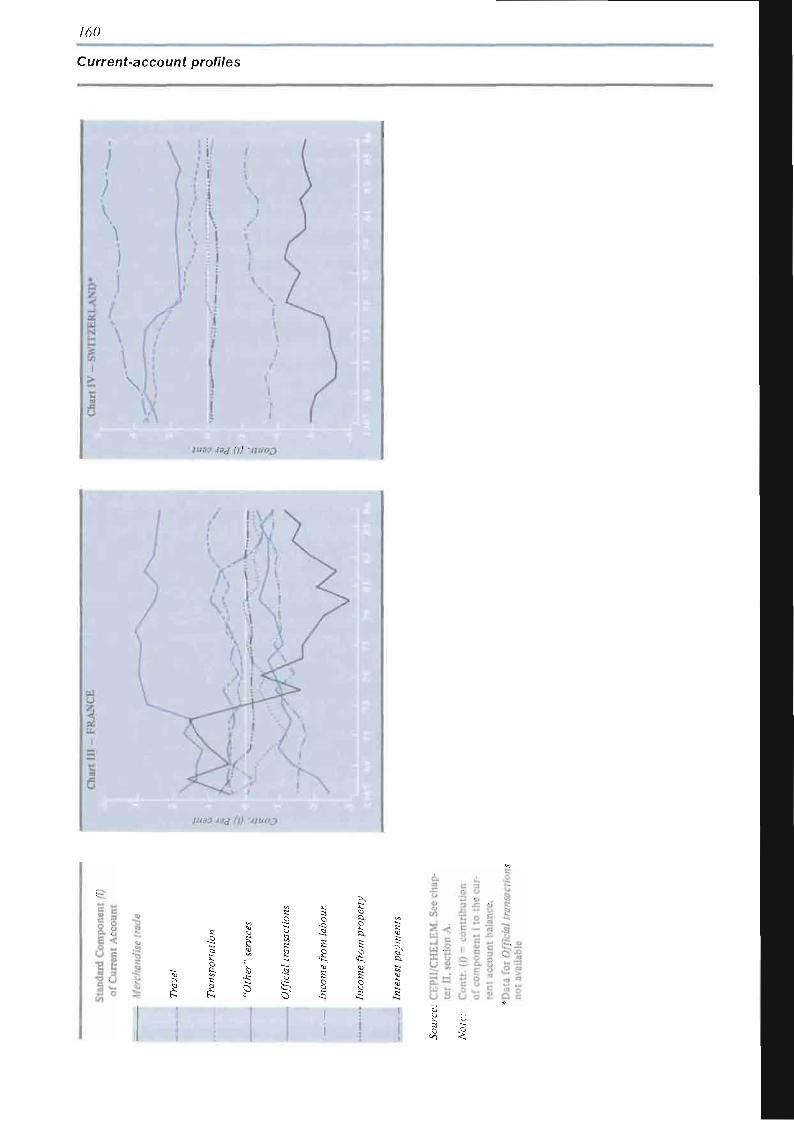
/60
Current-account profiles
\l 1
< Î
1 I
& £
b
&
£
II ¡I i*
•a
Hi i! » -Ü
#
Q 5
g
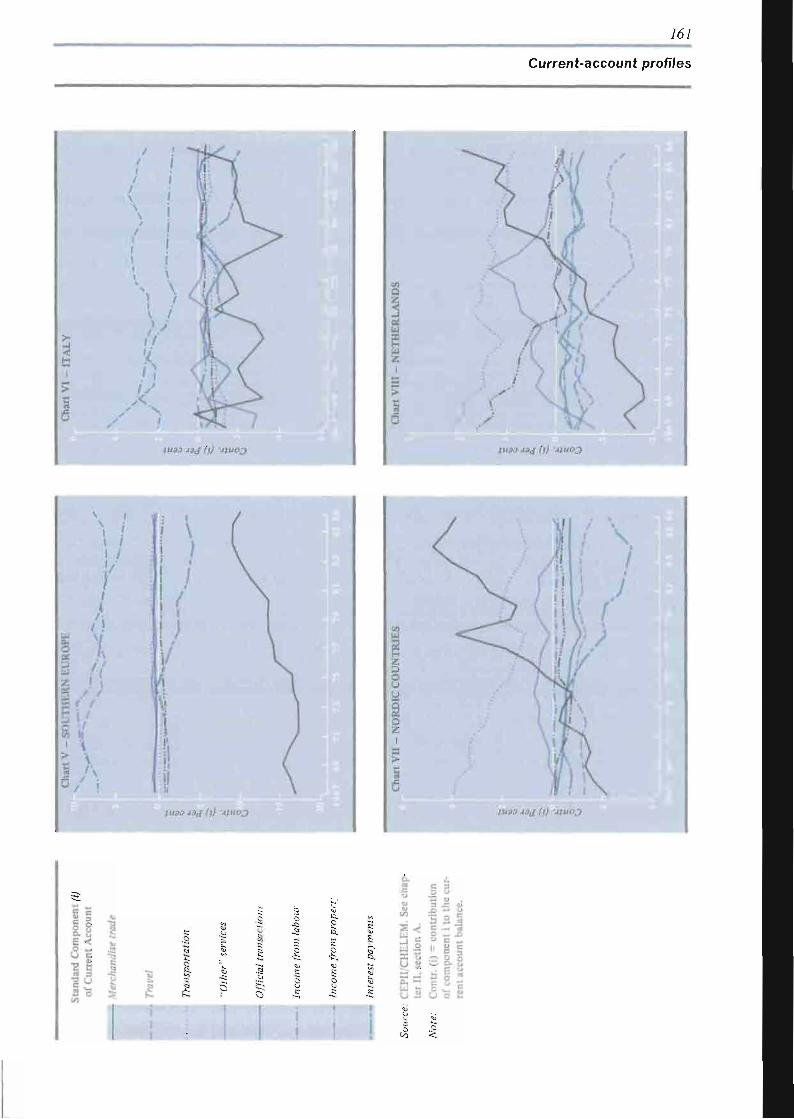
161
Current-account profiles
I >
1 IU30 J3J (l) -JtUOJ
VI Q
5 Î S
5 z 1
a 6
~ ^ - > ' / ' / / / 7 V ( 1
( A) {
\ I 7%
\ '
a '' Yi
^ í !A \ \ / i V \\v Vr/PS ;/ {
! K / /
¿ y
AJ 1 f
V', I ¡Û \ K \ 1 ' / s
xah** \ ;wao *3¿ (<) 'UUOJ
1 /
p
^
= i r: y; 1
> 5 .c U
if Í / 1 / / l| \ \ />
/ \ / ! tuao J3J (i) -Jfuoo
1 H
I O
y § g i
>
i
' \
\ A X ni \
í / i J
7) l < " ) ! / ) /
r# \ i ff 1 '/f' I I I» vi A Hf. i) \u l\
IU33J3J (}) -JJ.UOJ
I ¡ K
o. p
i ! ! !
I g S
i : III u 5
es
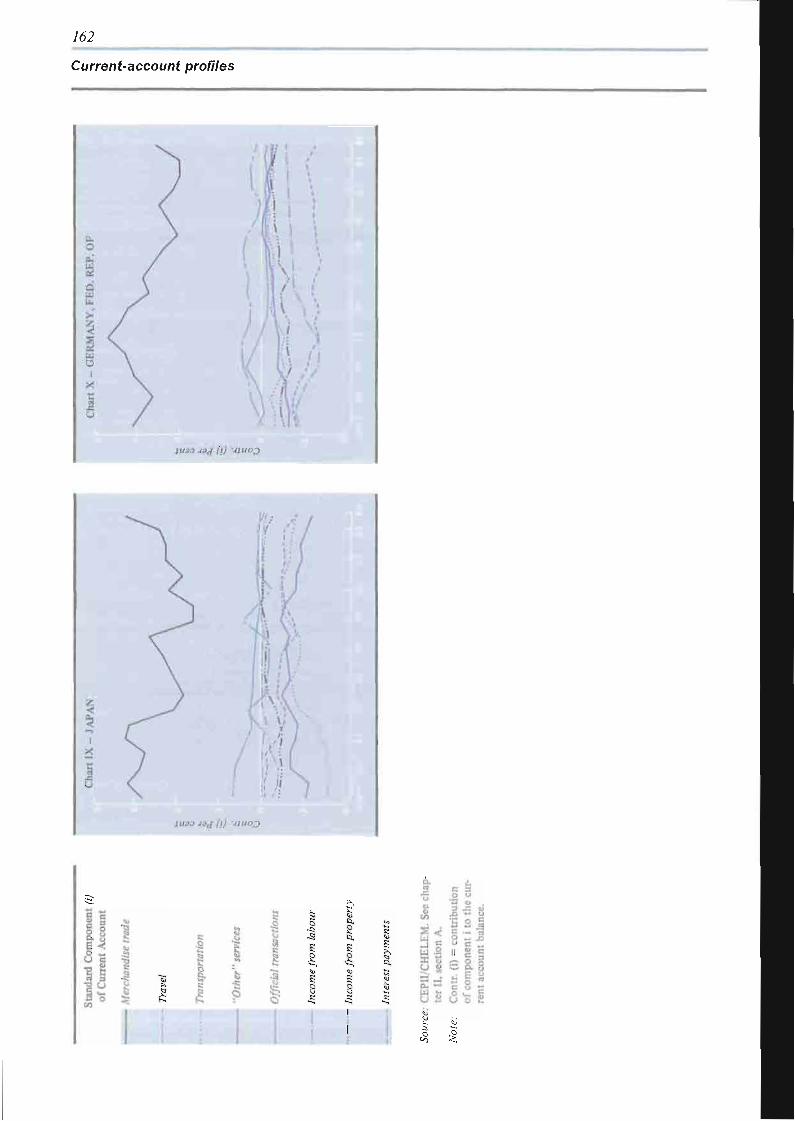
/62
Current-account profiles
ji! 3 5
* i I i
I « I ! s 3
3 I
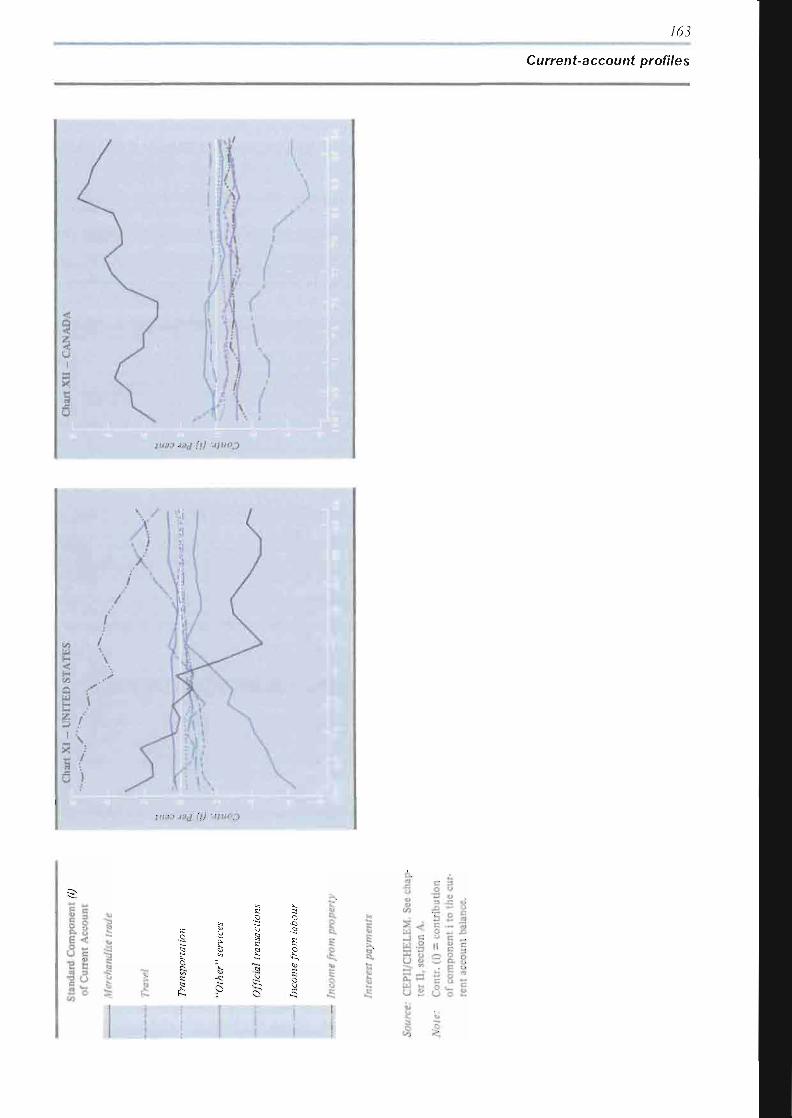
763
Current-account profiles
IU33 J3J (l) -JtUOJ
1U33J3J (l) MUOO
iji ,: o
3
1 S
£ s
K
&
t s Í E g v:
„
S
I g ta 1 N
I £
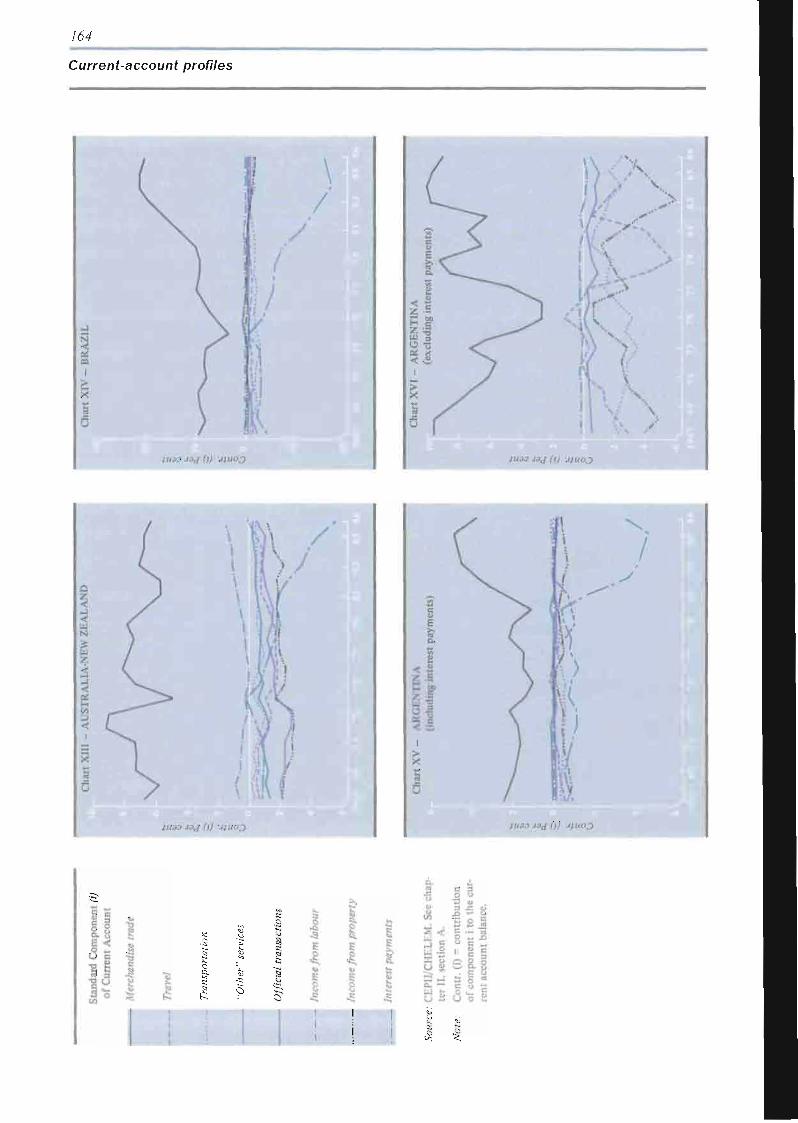
764
Current-account profiles
( 1 \
/
\ /
il
- B
RA
ZIL
C
har
t X
IV
-
JU30 J3J (l) 'HUOO
il
1 Ï.
lU33J3j(l) J1UOO
I ! I &
o
I I
g
I
il ' | ri « | 2 5^ 3%
fíg
s i
%
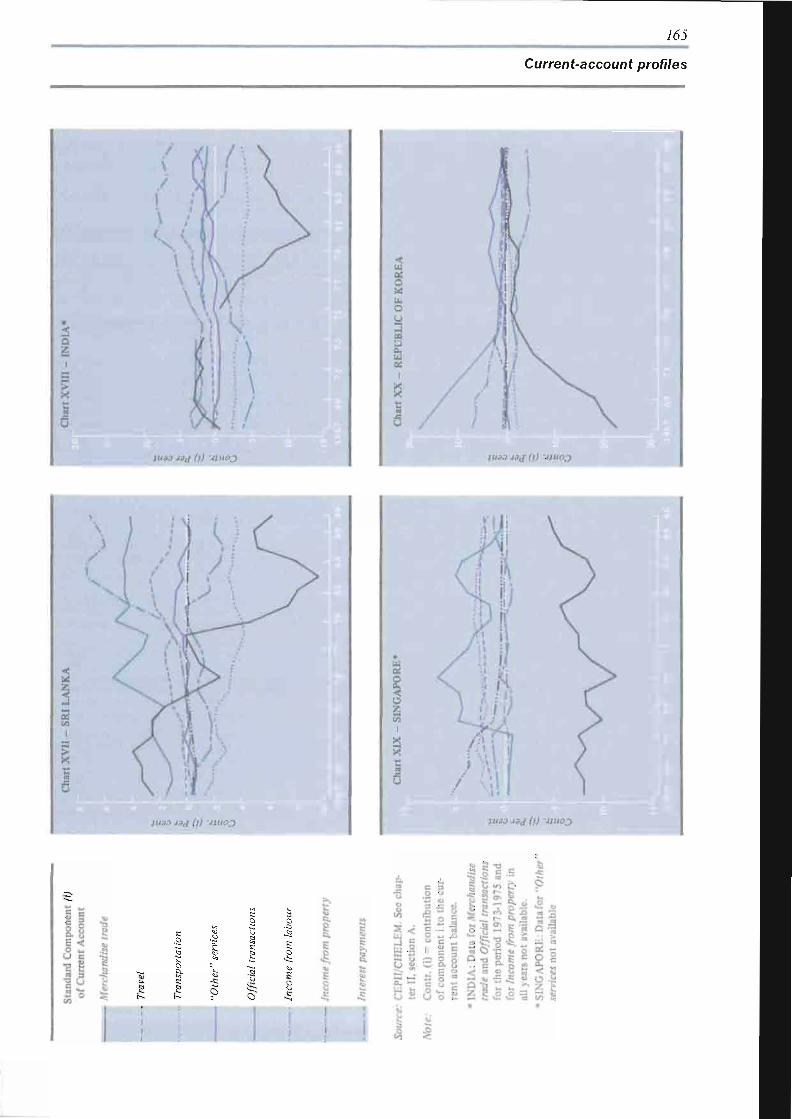
/ÓJ
Current-account profiles
< Q
I
IU33J3J (i) -JiUOQ
\
/ 1 N,
%
< / x V ? j
i i
I 1 « o
; / / K > / ! ' . • /
Li H _ y > % / / 1 \ 1 j %%>
XÎÏ A %/,> I \n '•• \ / • i ••'
ÍU33 .Orf M VÍKOJ
es
*
g ^
f i g
! ! ! ri i s sil I
I s-s
III gil III
5i II
di 3 ai S
I!
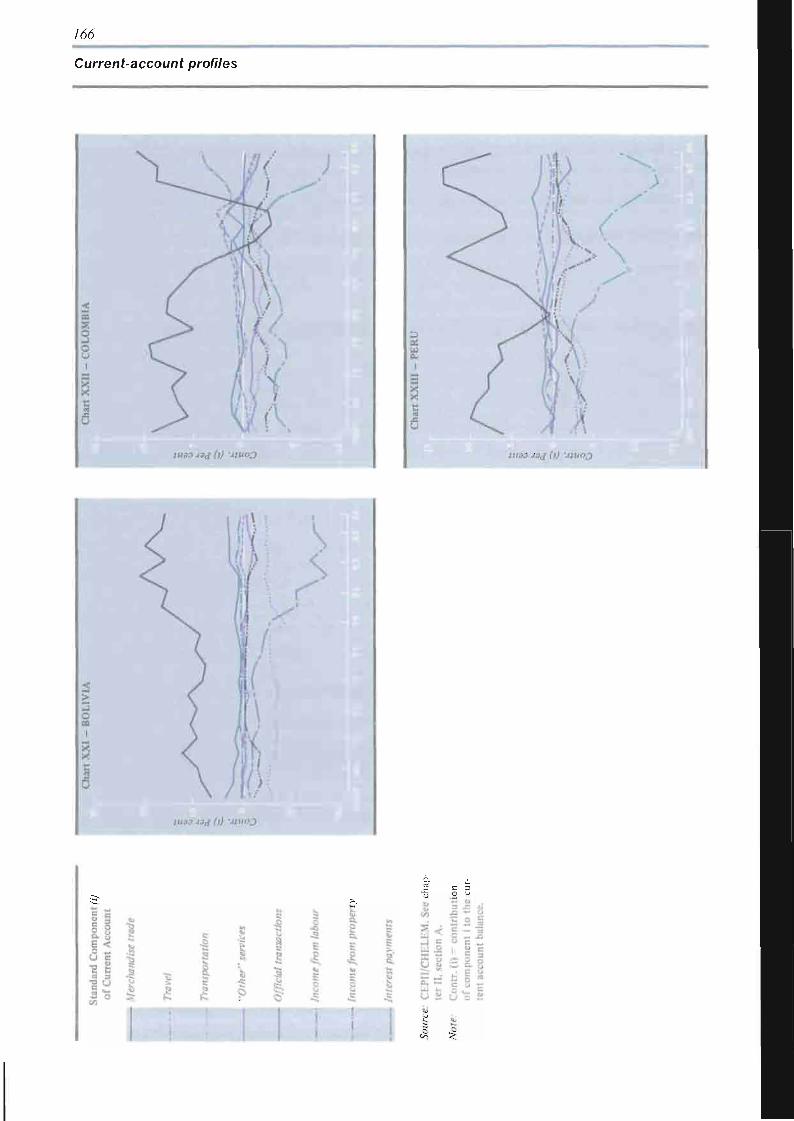
766
Current-account profiles
lU30J3d(t) A1UOO 11133 J3J (l) -JtUOJ
¡I 1 (
l I
I
I
I
i E
1 I e l
l 1 i lis S e
c — ri ¡s
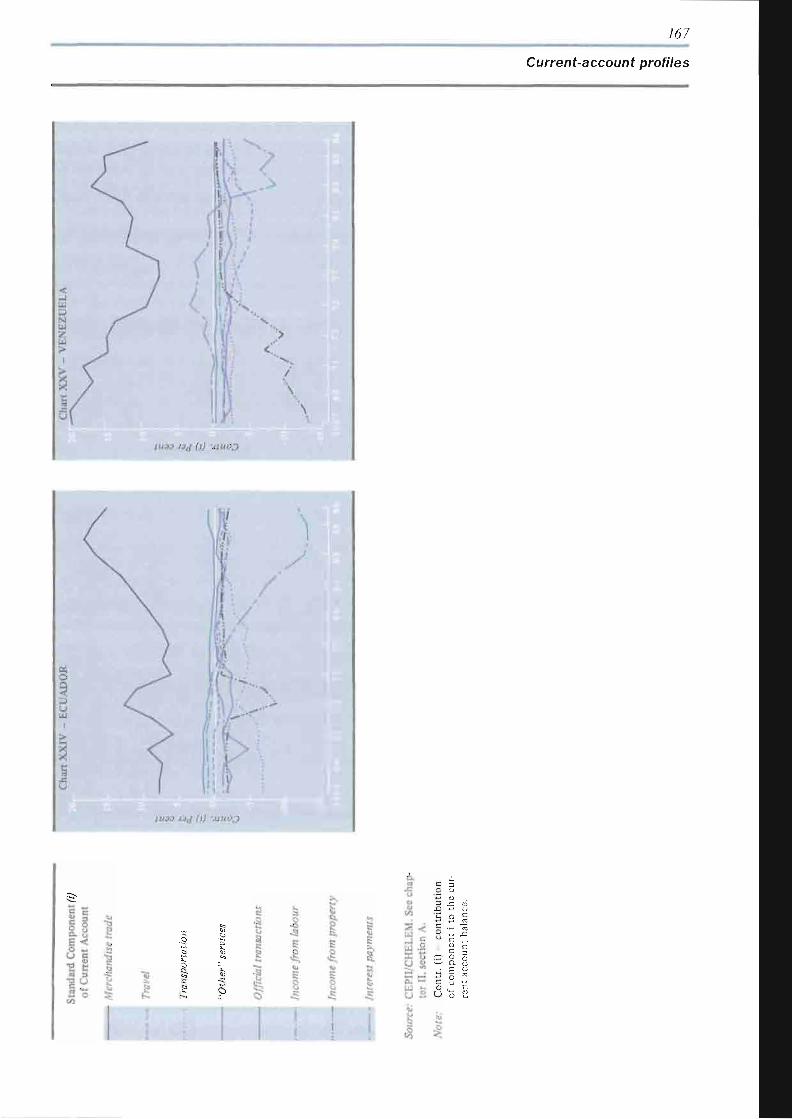
167
Current-account profiles
H
II 1 i c •S Q s
e B
fe
g a •g 5 Í 1
Offi
ciai
ir
a
Inco
me
fro
';-•
\ ...
:
i i 1
a r
tí -'-, §
II U g 5 ™> S ta 0- —
1
c u
II
£ c U
ï
.„
S c 0 u p
o
m XJ
y n
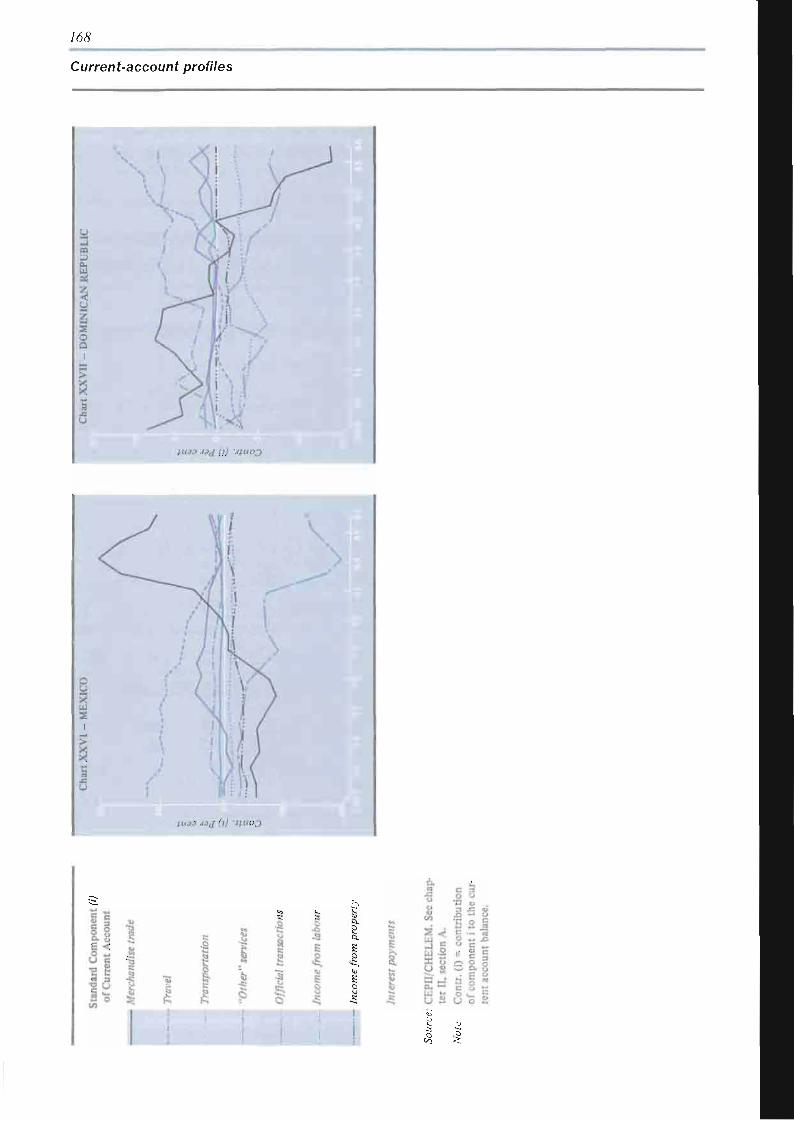
76g
Current-account profiles
!
z <
S
if. 3 S S
11 lies ¡ill 3
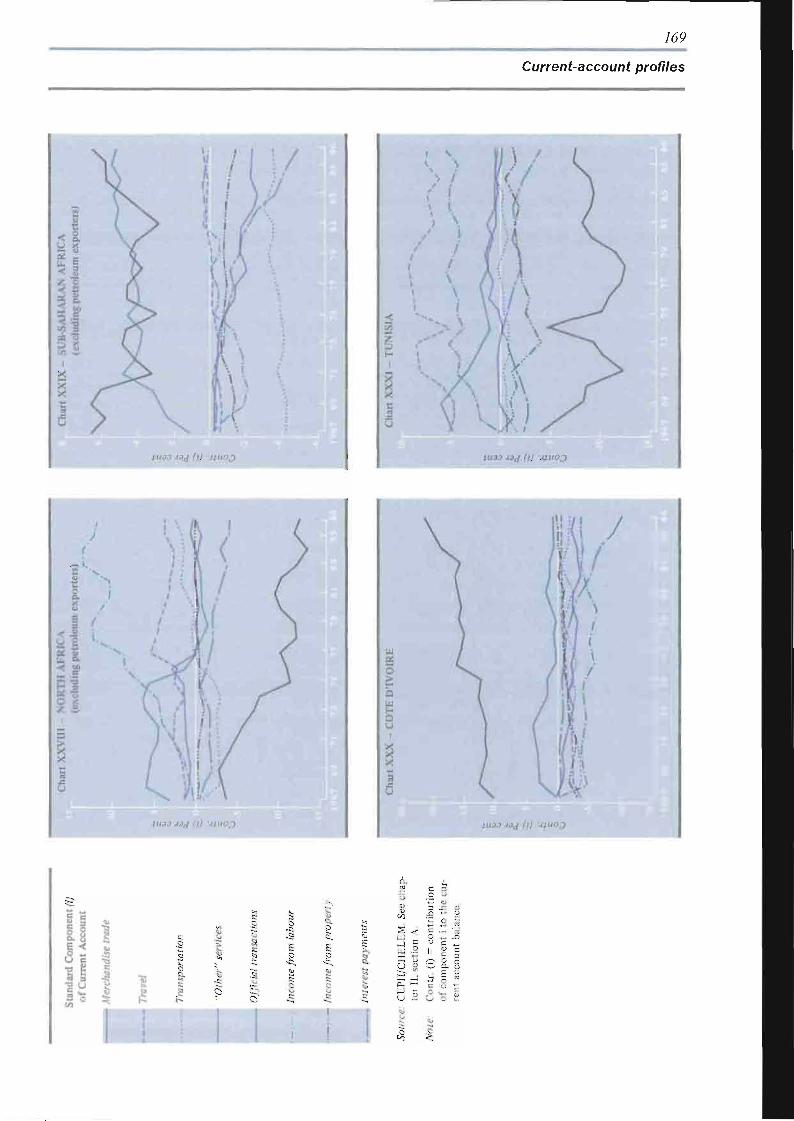
/69
Current-account profiles
1U33.13J (l) -JiUOJ ¡.1133 J3J (1) JiUOJ
|| i
n a
n. o S. K
; K
!
c <
1 I
II ¿5
g
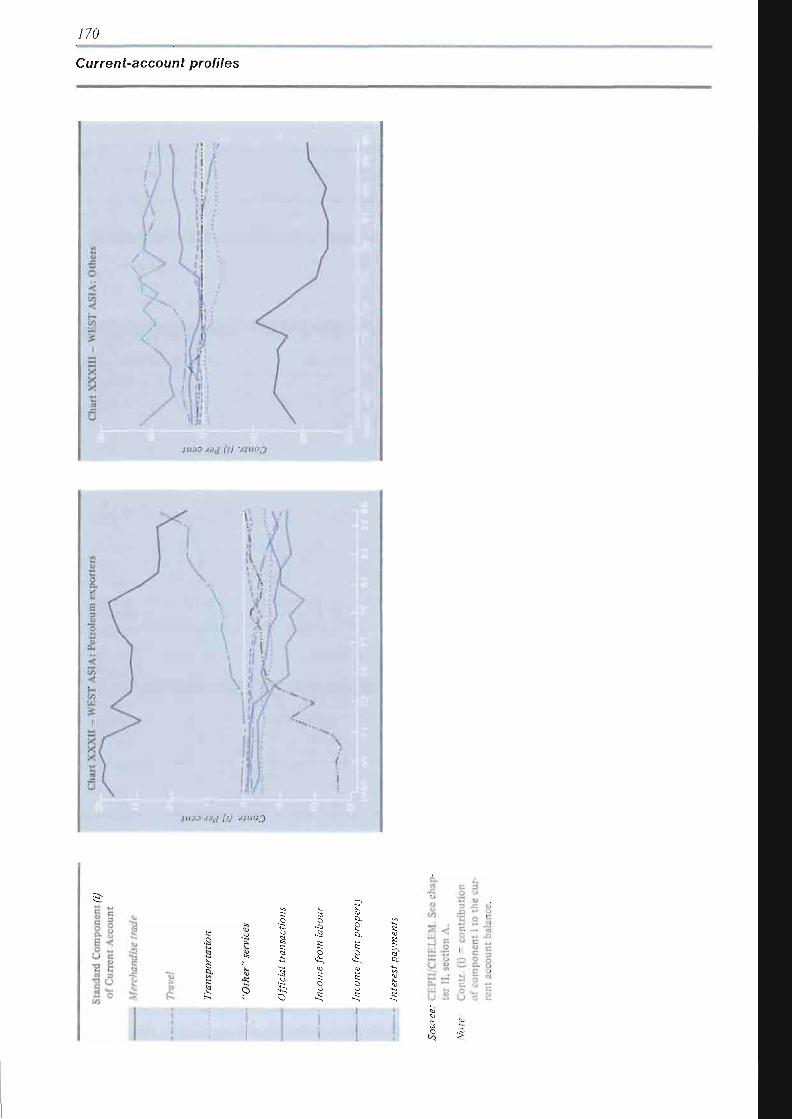
170
Current-account profiles
! . 2 ^
IV ï \
w / > * \ 1 ^ >
§( A
) \ wi )m \ .¡i (
# r/ > vi/. s-1
!
!,!
• * - . .
! )
A ! ;waa ^ a j W 'HUO0
a t -
0 c S c a 6
a <r i s O
i
•s -S £ 0 6,
E c •5
% y Q.
S t
s 0
< B « J 5 * 8
•§
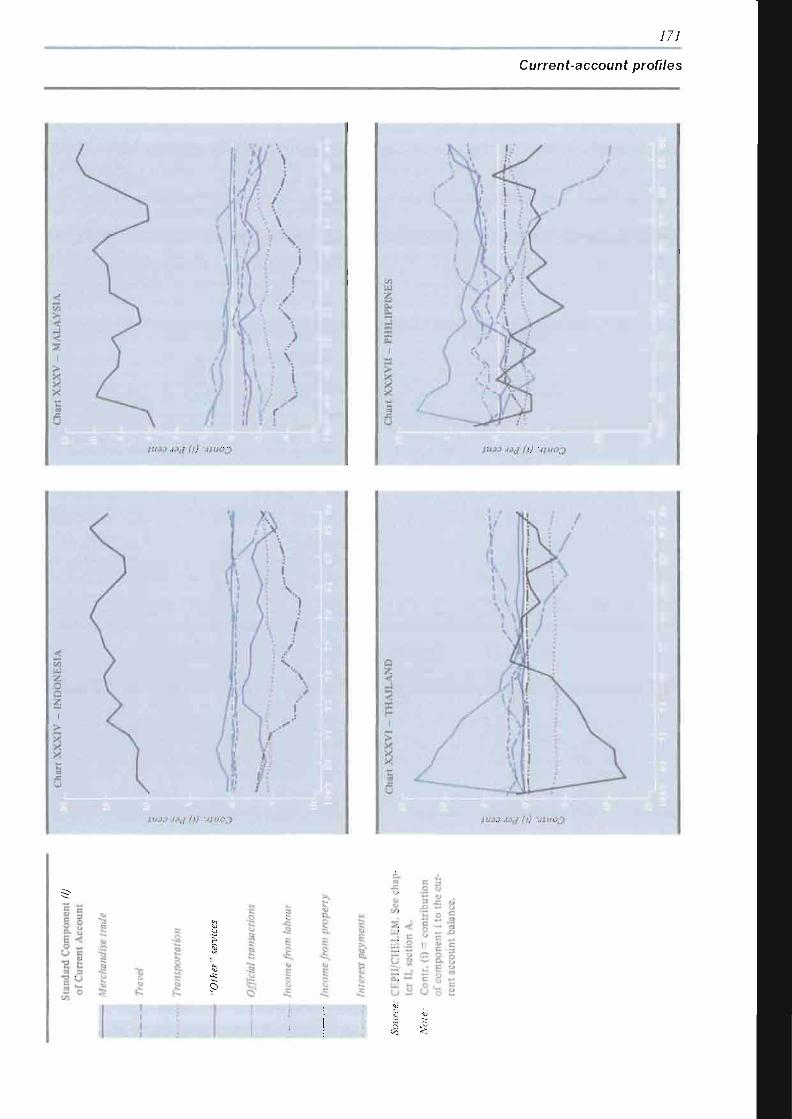
171
Current-account profiles
CO
é
-" s cu 1
>
? JS
u
S i
\
(
\
/
!, y ¿ j¿y
) ^ ft ' • )
\V i •/ 1/ ^ ! > í < <T Vi-A >
/ ' gS¿ v* i j> <)h \ T/V]
y%>--f"^ ^ < ^ T ; .
JU33 A3J (l)
r
.y r
•Jtuoj
¡§
n i
1*3 I I
o
B g • „
¡ i
a | g G «
i
I I g
S h~ K : O ^ -5 ^
mtr.
•5 I " I
ÉL. 1 -
ES n

Blank page _____________
Page blanche
17 í
Chapter III
THE STRATEGIC ROLE OF SERVICES
A. Introduction
Chapter I demonstrated the growing importance of services as employment generators in the national economies of the developed market-economy countries and examined the underlying factors. Chapter II, which attempted to identify aspects warranting further study to obtain a clearer idea of the role of services in the world economy and the development of developing countries, observed that the growth of services in national economies was not marked by corresponding growth in international trade in services in general (as defined by IMF) and, in fact, that only the basket category of "other" services showed any significant growth. It was also noted that, apart from tourism, services made little positive contribution to the balance-of-payments equilibrium of developing countries, unless services embodied in overseas labour are included. On the other hand, developed market economies tended to show a strong position in a variety of services.
What the preceding chapters have not addressed, however, are those strategic aspects of the service sector which provide it with an
importance not reflected in trade, production and employment figures.187 These strategic aspects involve the following:
(a) National sovereignty, identity and security;
(b) A basic infrastructure for the needs of the population and the functioning of the economy;
(c) The development of human capital and the upgrading of employment opportunities;
(d) The competitiveness of national firms in the world market;
(e) The location of production decision-making functions.188
and of
The first section of this chapter addresses the strategic role of services in the context of the national economy. The second section discusses the issues raised in this context by the internationalization of service production. In both cases, the impact of advances in information and communications (telematics) technology189 is taken into account.
187 T h e "strategic" role of services is a concept that is becoming more clearly defined as a result of several study p rog rammes , including those by F A S T at EEC, the Office of Technology Assessment of the United States Congress, and the Softnomics Centre in J apan . This chapter has drawn heavily u p o n the results of these study p rogrammes .
188 See discussion in chapter I.
189 T h e expression "telematics" is used in this section so as to avoid repetition of the more lengthy term "advances in information and communica t ions technologies".
174
B. The role of services in national policy
Service sector policies have always comprised an important element of overall national strategy. For example, the effective implementation of monetary and fiscal policy has called for regulation of the domestic banking system and of foreign participation in it. Similarly, key transportation and communications services have been developed under government control, for national security reasons, and for ensuring equitable distribution of services as much as for commercial considerations. Other national objectives, such as preserving national identity and culture or ensuring a minimum quality of life for the population as a whole, have created a precedent for social services (health, education) to be a public sector responsibility, and for the media to be either owned or supervised by the government.
Historically, the assumption has been made that since national governments were responsible for such services, they should themselves provide the services, usually as government monopolies. Government ownership was seen as the only way of ensuring control and perhaps of raising the necessary capital for massive investments in infrastructure. In some instances, government ownership ensured efficient service provision, high quality and equitable access, whereas in others, government monopolies tended to create inefficient systems, which were somewhat overlooked in favour of other national goals.
With increasing interdependence in the international economy, firms are now facing a wider range of competitors, domestic and foreign, public and private. Inefficiencies in any basic service will of necessity diminish the competitiveness of all firms dependent on that service and hence force them to absorb the costs of those inefficiencies. As a result, the role of the Government is changing from a provider of basic services, to that of a regulator, aimed at ensuring the availability of competitive services on an equitable basis. On the other hand, this same interdependence increases the impact of government decisions, with respect to traditional strategic services re
lated to national sovereignty and identity, such as the media, financial services and communications.
1. The role of information technology
The Government has traditionally assumed the major, if not the exclusive, responsibility in providing basic infrastructural services, including those that might be termed the "social infrastructure" for economic activities. These infrastructural services have become an increasingly important contributing factor to the overall functioning of the economy and the international competitiveness of its firms.190
This has been particularly true of communications technology given that recent advances in telematics have substantially modified the ways in which modern economies function, as well as the manner in which different actors co-operate or compete internationally. Their impact has been felt in agriculture and industry as well as in services.191 In services, the emergence and pervasiveness of information technologies has given rise to a variety of new service industries, while enhancing others. Information technology has made it possible to transport economically vast amounts of information through interacting telecommunication channels. This overcomes the traditional problem of the need for the producer and consumer of a service to be in the same geographical location for services which are essentially "information-intensive". For example, it can be the cause of dramatic tradeability of library, films, advertising and accounting services, but also affect services such as tourism and shipping where the tradeability of the information content alters the competitive situation.192 Advances in information technology have thus dramatically increased the importance of the information "mode of delivery" of services (a concept that will be discussed below). At the same time, information technology is modifying the relationship between goods and services, increasing the service content of goods.
190 O T A , International competition in services, op. cit., p .5 .
191 TDR 1987, part two.
192 See discussion later in this chapter and in annexes 3 and 5. The present analysis draws heavily from Juan Rada , "Information technology and services", mimeo, Geneva , 1986, which examines in detail the impact of information technology on t rade in services.
175
The "infrastructure" role being played by telematic services has several key elements. For a growing number of services, the telecommunications infrastructure provides a single distribution system.193 As noted above, the ability to deliver services to markets is a key factor in competitiveness in services, and a modern "services infrastructure" can be a major factor in both the growth of the domestic service sector and its international competitive position.
Information technology has also had a varying impact on the barriers to market entry. Entry barriers can be lowered where the infrastructure is used to market or distribute services, especially where access to, and the cost of, the network is shared by all the users. Access to such networks can be a determinant factor not only in trade in services but also for providing services essential to trade in goods.194
The extremely uneven distribution of the systems and infrastructure necessary to increase the productivity of services and transport services to world markets is a major impediment to increasing the contribution of services to the development process. The extreme differences in telematics infrastructures have been the subject of a number of major studies and of General Assembly195 and ITU resolutions.196
This unevenness is also reflected in qualitative terms with respect to skill levels and organizational systems. A telematically skilled labour force becomes an important competitive tool. However, the "information revolution" is in itself a result, not a cause, of the accumulation of human capital, which is being rapidly accelerated by the advances in informatics. Services have become the mechanism for organizing human capital in such a way as to adapt technological advances to commercial needs and other national objectives.197
C. The growth of knowledge-intensive services
Increasing competition in national and world markets has provoked a demand for specialized expertise. This specialized expertise has increasingly become embodied in the producer service sector which has occupied the role of converting technological advances into productive capacity and international competitiveness. Studies have shown that the main demand for producer services comes from companies wishing to improve or diversify products, meet new competitive challenges in their traditional markets or penetrate new ones.198 This continuing demand for specialized services as inputs into the production process has been met by the increasing supply and differentiation of such services permitted by the advances in information technology.199
Maintenance of this role in the economy calls for a continuous learning process and continuous adaptation to new technologies, as well as responses to customer needs. For this reason, it is not surprising that the largest proportion of "knowledge-intensive services" is found in the producer services sector. The United States Office of Technology Assessment has found such knowledge-intensive services to constitute "a critical part of the foundation and infrastructure for the production of high-value added manufactured goods" (see box 14).200
The externalization process described in greater detail in chapter I has meant that the access to services including such "knowledge-intensive services" has been facilitated, particularly for small and medium size enterprises,
193 J. R a d a , op. cit., p.2. Also Gunther Pauli, "The services infrastructure", (mimeo), Geneva, 1987.
194 A n example is customs and shipping documentat ion transmitted through electronic data interchange, see discussion of t ransborder da ta flows in this chapter.
195 Genera l Assembly resolution 36/40, World Communica t ions Year : Development of the Communicat ions Infrastructure.
196 Resolut ion N o . 24 of the Plenipotentiary Conference of the International Telecommunicat ion Union (Nairobi, 1982).
197 See discussion in annex 5.
198 Business services as an industrialization variable in under-developed regions: Two case studies in southern Italy, Censia, Rome, 1986.
199 Software is an example of such services which, in the words of the United States Congress Office of Technology Assessment, lie "between the system and the people who use it", International Competition in Services, op. cit., p . 39.
200 Ibid., p . 34.
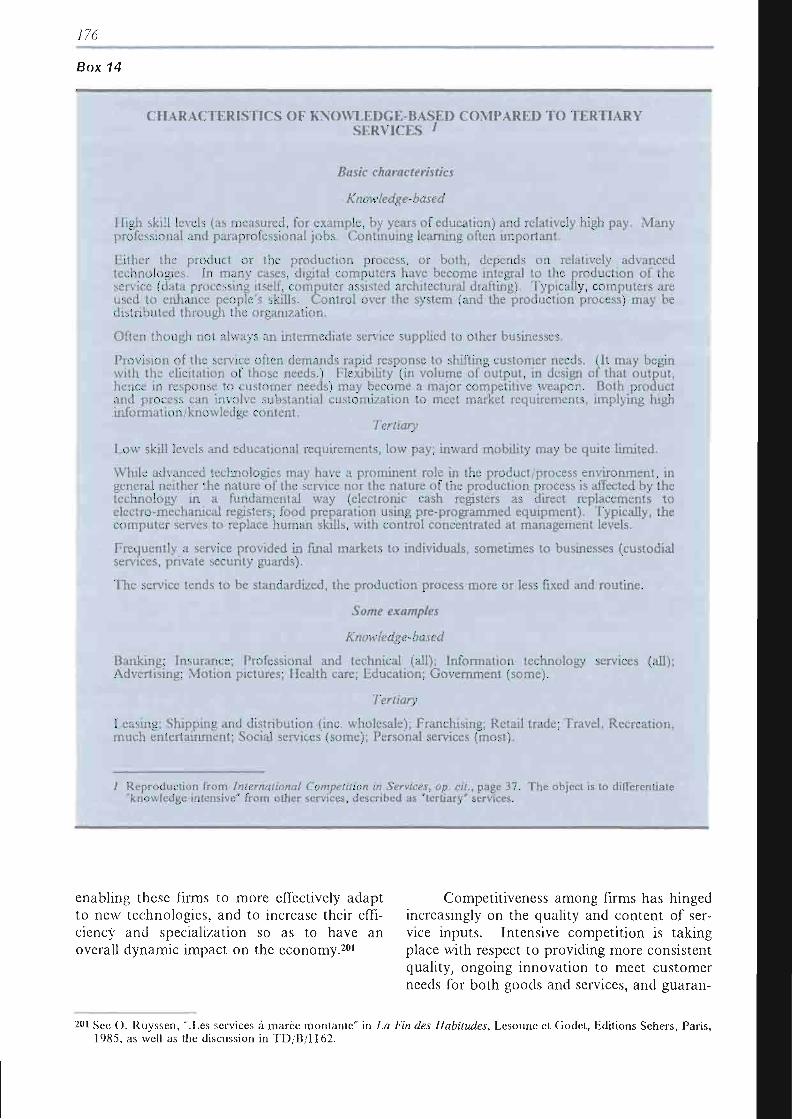
776
Box 14
CHARACTERISTICS OF KNOWLEDGE-BASED COMPARED TO TERTIARY SERVICES 1
Basic characteristics
Knowledge-based
High skill levels (as measured, for example, by years of education) and relatively high pay. Many professional and paraprofessional jobs. Continuing learning often important.
Either the product or the production process, or both, depends on relatively advanced technologies. In many cases, digital computers have become integral to the production of the service (data processing itself, computer assisted architectural drafting). Typically, computers are used to enhance people's skills. Control over the system (and the production process) may be distributed through the organization.
Often though not always an intermediate service supplied to other businesses.
Provision of the service often demands rapid response to shifting customer needs. (It may begin with the elicitation of those needs.) Flexibility (in volume of output, in design of that output, hence in response to customer needs) may become a major competitive weapon. Both product and process can involve substantial customization to meet market requirements, implying high information/knowledge content.
Tertiary
Low skill levels and educational requirements, low pay; inward mobility may be quite limited.
While advanced technologies may have a prominent role in the product/process environment, in general neither the nature of the service nor the nature of the production process is affected by the technology in a fundamental way (electronic cash registers as direct replacements to electro -mechanical registers; food preparation using pre-programmed equipment). Typically, the computer serves to replace human skills, with control concentrated at management levels.
Frequently a service provided in final markets to individuals, sometimes to businesses (custodial services, private security guards).
The service tends to be standardized, the production process more or less fixed and routine.
Some examples
Knowledge-based
Banking; Insurance; Professional and technical (all); Information technology services (all); Advertising; Motion pictures; Health care; Education; Government (some).
Tertiary
Leasing; Shipping and distribution (inc. wholesale); Franchising; Retail trade; Travel, Recreation, much entertainment; Social services (some); Personal services (most).
Reproduction from International Competition in Services, op. cit., page 37. The object is to differentiate "knowledge-intensive" from other services, described as "tertiary" services.
enabling these firms to more effectively adapt Competitiveness among firms has hinged to new technologies, and to increase their effi- increasingly on the quality and content of ser-ciency and specialization so as to have an vice inputs. Intensive competition is taking overall dynamic impact on the economy.201 place with respect to providing more consistent
quality, ongoing innovation to meet customer needs for both goods and services, and guaran-
201 See O. Ruyssen, ".Les services à marée montante" in La Fin des Habitudes, Lcsoune et Godet, Editions Sehers, Paris, 1985, as well as the discussion in TD/B/1162.
777
tees of continued service support for durable goods. Over the past few decades, changes have been occurring in the way in (and extent to) which services contribute to production, from the extraction of raw materials to the final delivery and servicing of the end product.
Producer service inputs are required at various stages in the production process, at what has been described as the "upstream", "onstream" and "downstream" stages:
Upstream: service inputs prior to the production process. Such services include feasibility studies, venture capital, product conception and design, market research.202
Onstream production: service inputs integral to the goods-production process itself such as quality control, equipment leasing, logistics of supply, maintenance and repair. Onstream parallel: service inputs necessary for the operation of any type of firm such as accounting, personnel management, personnel search, training, software, telcommunications, legal, insurance, finance, cleaning, security, catering, real estate. Downstream: service inputs, post-production, necessary to the final sale such as advertising, transportation, distribution, etc. In many industries, the most profits are now derived from the subsequent provision of services associated with the product, i.e. repairs, maintenance, client training, etc., and often such services must be provided in order for the good to be competitive.
A key to the maintenance of a competitive position in world markets has been the maintenance feedback links between "downstream", "upstream" and "onstream" services. Such feedback has helped to ensure product acceptability203 and increased sales, while reducing inventory costs through just-in-time inventory management systems and helping to ensure rapid delivery turnaround.204 Those
firms able to link the producer service inputs at the three stages of production have demonstrated their success in the world market, as they are able to maintain the continuous process of innovation and adaptation (including through the continuous adaptation to customer requirements), which the exigencies of the world market presently require.
Prior to telematic refinements, maintenance of this feedback depended upon the firm's capacity to integrate vertically in order to control supply and distribution channels. The historical strength of trading companies -such as the Japanese sogo shoshas or the more recent trading houses in the Republic of Korea - has lain in such an integrated system. Such integrated systems have been tremendously enhanced through the use of telematics to enable "real time" management of operations worldwide and the minimization of the costs associated with internal transactions such as order processing, purchasing, inventory control, and distribution. Information technology did not create the integrated system, it has simply enhanced existing ones, and made them easier to establish.
Firms can maintain electronic links to independent counterparts in the system, thus allowing smaller firms access to a telematic technology base whose advantages were formerly enjoyed only by the largest corporations. For example, smaller hospitals can maintain a computer link with their suppliers, allowing supply levels to be monitored daily, orders placed automatically, and delivery achieved just as further supplies are needed. In addition, modern services can be superimposed on traditional structures of production, increasing productivity and competitiveness, with little disruptive impact on the social structure.205
It is apparent from the foregoing analysis that in the absence of telematic and related organizational technology, firms in developing countries are unlikely to be able to effectively benefit from other cost factors which may be in
202 T h e actual raw material input in product ion has been diminishing at an accelerating rate. In J apan , for the same level of product ion, the consumption of raw materials dropped 60 per cent between 1973 and 1984. See D. Sapsford, "Real commodi ty prices: an analysis of long-run movements" (internal m e m o r a n d u m , I M F , Washington, D C , 17 May 1985) and E. Larson, M. Ross and R. Williams, "Beyond the era of materials", Scientific American, Vol. 254, No . 6, June 1986.
203 T h e Italian clothing producer Benetton, for example, has daily feedback from retail outlets to the design and production site so that consumer trends can immediately be incorporated into new products ; it has also been diversifying into leasing and financial services. See F A S T 142, p . 37.
204 See K. Pennar , "The productivity paradox ," Business Week, 6 June 1988, pp . 46-48. For example . United States firms average 9 mon ths ' inventory stock while Japanese firms, with superior feedback loops , are able to manage with less than two mon ths ' stock. Similarly, U.S. firms average 5-6 months from order to delivery, while Japanese firms average 1-2 months .
205 For example , a common network shared by smallscale clothing producers in the Pra to Valley of Italy, enabled these producers access to a variety of producer services while not affecting their corpora te organizat ion, see R a d a , "Informat ion Technology and Services", op. cit., p.12.
776
their favour, so as to achieve the same quality/cost ratios possible for firms from developed countries. These considerations strengthen the arguments in favour of devoting resources to the development of informatics and related human capital formation.
At the same time, services have become a major source of value added. Downstream services in particular are both a factor contributing to competitive strength and a source of value added. The lines between services and goods are becoming increasingly blurred, some analysts have used the term "bundling".206 Indeed, increasingly, a main factor in the competitive position of capital and consumer goods suppliers is the accompaniement of the product by comprehensive service support, such as in accompanying maintenance agreements, such goods/services packages can make it difficult for customers to switch suppliers easily, creating captive markets and barriers for new entrants.207 Exports of high-technology goods stimulate the export of knowledge-intensive services208 and vice versa. For example, the export of consultancy services can lead to the export of capital goods, and the export of aircraft to training and maintenance contracts.
Producer services located throughout this system represent an ever increasing proportion
of value added. In the same way that firms can integrate external producer services into the production process, in-house services as such can often be externalized and sold on the open market. A large percentage of the "other" service exports of developed countries would seem to involve the export of such "locked-in knowledge" in the form of services (see box 15). Some developing countries have adopted the policy of obtaining this "locked-in knowledge" from TNCs, established in their countries, so as to acquire the capacity to export services through an independent corporate structure.209
There has also been a tendency for corporations to divest themselves of these lesser value-added components in the productive process. Some corporations have been described as "hollow", in that what were previously considered to be manufacturing firms have ended up not producing any physical goods, but only providing the various high value-added services. To the extent that value added is derived more from the service component rather than from labour costs of raw material inputs, the question of where a product is produced is becoming of lesser importance than who supplies those services that constitute an increasingly important component of such value added.
D. Internationalization of services and development strategies
As noted in chapter II, international trade in services is a relatively small proportion of total world trade and, outside the broad category of "other" services, is not growing relative to other external payments. However, the subject of "trade in services" has generated a great deal of interest and given rise to much animated international debate, and the reasons for this
warrant further examination. As noted above, advances in telematic and organizational technology have facilitated the tradeability of services and provided firms, in certain countries, with clear competitive advantages in the world market. The initiatives by certain countries to improve the ability of their firms to penetrate world markets through elimination or modifi-
206 'The concept of bundling is clearly illustrated by the sale of a computer. Twenty years ago, roughly 80 per cent of the cost of producing a computer was hardware and 20 per cent software. Today, the ratio has reversed itself." G. Feketekuty and K. Hauser, "The impact of information technology on trade in services", USTR, Washington, D C , February 1985.
207 J. Rada, "Information Technology and Services", op. cit., p. 47. 208 The key role being played by "knowledge-intensive" services in the production process has been discussed in the recent
OTA report, which states that the main interest of the United States in achieving the liberalization of international trade in services would neither be its effect on employment in the country nor on the United States balance of payments (seen to be minimal), but the contribution that greater opportunities abroad could make to a strong producer services sector essential for maintaining the international competitive position of other sectors, and in the strategic interdependence of manufacturing and services, domestically and internationally. International competition in services, op. cit. p. 35.
209 See chap. V, box 22.
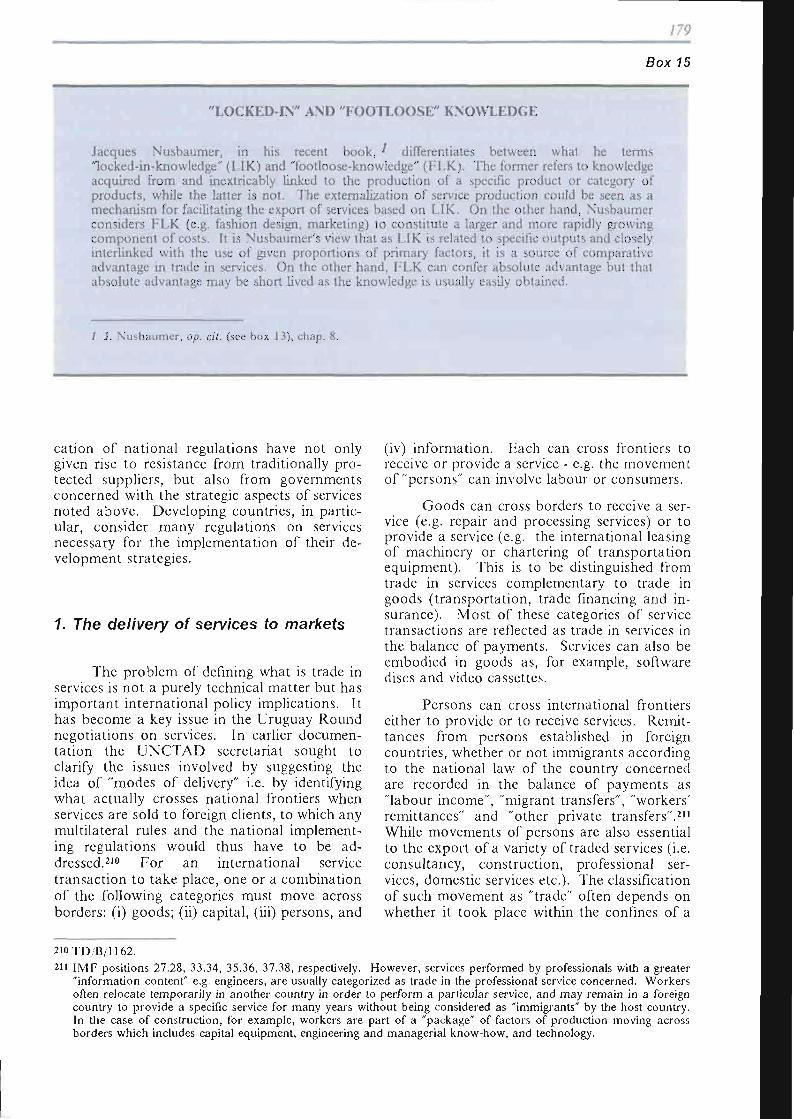
779
Box 15
"LOCKED-IN" AND "FOOTLOOSE" KNOWLEDGE
Jacques Nusbaumer, in his recent book, ' differentiates between what he terms "locked-in-knowledge" (LIK) and "footloose-knowledge" (FLK). The former refers to knowledge acquired from and inextricably linked to the production of a specific product or category of products, while the latter is not. The externalization of service production could be seen as a mechanism for facilitating the export of services based on LIK. On the other hand, Nusbaumer considers FLK (e.g. fashion design, marketing) to constitute a larger and more rapidly growing component of costs. It is Nusbaumer's view that as LIK is related to specific outputs and closely interlinked with the use of given proportions of primary factors, it is a source of comparative advantage in trade in services. On the other hand, FLK can confer absolute advantage but that absolute advantage may be short lived as the knowledge is usually easily obtained.
1 J. Nusbaumer, op. cit. (see box 13), chap. 8.
cation of national regulations have not only given rise to resistance from traditionally protected suppliers, but also from governments concerned with the strategic aspects of services noted above. Developing countries, in particular, consider many regulations on services necessary for the implementation of their development strategies.
1. The delivery of services to markets
The problem of defining what is trade in services is not a purely technical matter but has important international policy implications. It has become a key issue in the Uruguay Round negotiations on services. In earlier documentation the UNCTAD secretariat sought to clarify the issues involved by suggesting the idea of "modes of delivery" i.e. by identifying what actually crosses national frontiers when services are sold to foreign clients, to which any multilateral rules and the national implementing regulations would thus have to be addressed.210 For an international service transaction to take place, one or a combination of the following categories must move across borders: (i) goods; (ii) capital, (iii) persons, and
(iv) information. Each can cross frontiers to receive or provide a service - e.g. the movement of "persons" can involve labour or consumers.
Goods can cross borders to receive a service (e.g. repair and processing services) or to provide a service (e.g. the international leasing of machinery or chartering of transportation equipment). This is to be distinguished from trade in services complementary to trade in goods (transportation, trade financing and insurance). Most of these categories of service transactions are reflected as trade in services in the balance of payments. Services can also be embodied in goods as, for example, software discs and video cassettes.
Persons can cross international frontiers either to provide or to receive services. Remittances from persons established in foreign countries, whether or not immigrants according to the national law of the country concerned are recorded in the balance of payments as "labour income", "migrant transfers", "workers' remittances" and "other private transfers".211
While movements of persons are also essential to the export of a variety of traded services (i.e. consultancy, construction, professional services, domestic services etc.). The classification of such movement as "trade" often depends on whether it took place within the confines of a
210TD/B/1162. 211 IMF positions 27.28, 33.34, 35.36, 37.38, respectively. However, services performed by professionals with a greater
"information content" e.g. engineers, are usually categorized as trade in the professional service concerned. Workers often relocate temporarily in another country in order to perform a particular service, and may remain in a foreign country to provide a specific service for many years without being considered as "immigrants" by the host country. In the case of construction, for example, workers are part of a "package" of factors of production moving across borders which includes capital equipment, engineering and managerial know-how, and technology.
7¿?0
corporate structure.212 Movements of persons can also take the form of travelling to where services are provided, as in the case of tourists, patients seeking health care abroad, and students going abroad to study. These flows are clearly recognized as trade in services and give rise to measurable balance-of-payments credits and debits.
Many services are delivered to foreigners through foreign affiliates. Only repatriated profits earned on sales of services abroad by foreign affiliates appear in the balance of payments, and such profits are a small proportion of the value of those sales. Moreover, it is difficult to distinguish the returns on investment in services from returns on investment in other sectors. The importance of some form of presence in the market varies from sector to sector. It should be noted that the earnings of certain intermediaries or of agents can be recorded as service exports of the home country.
Information technology has permitted direct interaction between producer and consumer at a distance by the medium of transborder data flows. Transborder data flow is both a service in itself and an essential ingredient facilitating the internationalization of many other service activities. As noted above, transborder data flow can completely substitute for movements of goods, persons or capital (e.g. transmission of contracts, loan agreements, design drawings, etc.). Such trade is probably greatly underestimated as it is only when the flow of information gives rise to a payment to a legal entity residing outside a country's borders that it is recorded as international trade in services. The development of telematics has enhanced the importance of information flows in the delivery of services to foreign customers and in increasing the "information content" of services, is increasing the tradeability of a number of services not only by replacing other modes of delivery, but also by supplementing services delivered by other means.
Some national regulations can affect trade in services linked to capital, persons, goods and information. These may have a variety of objectives, including that of protecting domestic consumers or those related to the strategic considerations mentioned above, e.g. those of national security, national economic management or the preservation of national
culture, or may relate to more general goals with respect to foreign investment, immigration, tariff policy, protection of the privacy of individuals, etc. Such regulations, while considered necessary for the implementation of national policy objectives, may also impede trade in services. In this context, the concept of appropriate regulation has arisen in the Uruguay Round negotiations, where it has been suggested that the negotiations should aim at the reduction of the impediments to trade in services caused by such regulations, without impeding the implementation of their principal policy objectives. In this context, liberalization and deregulation should not be confused. In certain sectors improved access for foreign service providers has given rise to strong pressures for the tightening of regulatory controls so as to ensure that greater foreign presence in the domestic market did not undermine the effective accomplishment of the primary objective of the regulation.213
2. Issues related to the mobility of capital
In certain sectors, the movement of capital abroad to establish a "presence" in the foreign market is a common means of delivering services to foreign markets. Regulations on foreign direct investment in services, which are common in both developed and developing countries, have been considered by some observers and participants in the services debate to be "barriers to trade" as they may prevent the establishment of the "commercial presence" considered necessary to have effective access to the market of the "importing" or "host" country. To this extent foreign direct investment issues have been introduced into the Uruguay Round negotiations on trade in services where different views have been expressed with respect to the frontier between "trade in services" and "investment".
The fact that, unlike goods, capital movements can be complementary rather than an alternative to trade in services, has caused this definitional problem in differentiating between capital movement necessary to export services to foreign markets and foreign-direct investment per se. As noted above, many
212 The large "other" service exports of the Philippines may be attributed to this, see comments in chapter V.
213 See K. Heydon, "The Service Revolution - Facts and Figures", paper prepared for UNDP/UNCTAD Roundtable on the Role of the Service Sector in the Development Process", Salzburg, July 1988. The US Congress Office of Technology Assessment, considers that: "The complexity of technology and business practices ... makes it difficult for policymakers to grasp the issues, indeed, deregulation, falling back on the magic of the marketplace, has sometimes been little more than an admission of this failure". International Competition in Services, op. cit., p.22.
7¿?7
services are supplied to foreigners by foreign direct investment i.e. affiliates located abroad. Given the paucity of statistics, it is not possible to ascertain the relative importance of foreign sales by affiliates of transnational corporations in the total of international service transactions; however, it would seem to be large and increasing.214 Even when it is technically feasible to deliver the information content of services through transborder data flows, there are other features of services transactions and particular characteristics of certain sectors that discourage full reliance on that mode. For example, while a bank would issue a loan to a customer in a foreign country through an automatic teller machine, questions of creditworthiness require a thorough knowledge of local conditions which only a presence in the market can give. The same considerations appear to apply in other information-intensive services such as accounting.
Foreign direct investment in services can assist in the development of modern services for economic development, in that it may be the quickest and most cost-effective means of gaining access to the services involved. The objectives of obtaining foreign know-how and developing domestic skills can be attained by having appropriate criteria and conditions for such investment.215 The contribution that foreign directment investment may make to development objectives may be a function of the coherence of the regulatory framework in which it is made.
Foreign direct investment in services cannot necessarily be equated with the delivery of services to markets. According to the UNCTC, a large proportion of foreign direct investment in services in developing countries is either in banking (in countries known as "offshore banking centres") i.e. exporting banking services to third countries, and in trade (i.e. distribution, wholesale and retail) linked to trade in goods.216 Investment in services may not be that required to obtain the necessary presence in the market to deliver a particular service, but to act as a point for delivery of a package of services or, as noted above, of goods and services. Much of foreign direct investment in services is, in fact, acquisition of distribution networks, be it for services or goods.
3. Issues arising from transborder data flows
As noted earlier, a wide variety of information-intensive services can be provided to customers abroad through international flows of information, or transborder data flows (e.g. banking services, product design, access to information stored in data bases). By facilitating the tradeability of the information content of "other" services, they are crucial to international competitiveness and value added in all service sectors. Transborder data flows have also become a vital tool for the control and management of geographically dispersed corporate systems and thus constitute an important aspect of intra-corporate relations. This latter relationship has given rise to a linking of transborder data flow issues with more general concerns relating to the activities and strategies of transnational corporations (see box 16). The policy issues for developing countries in this area relate to (a) the import of data services via transborder data flows in relation to efforts made to develop a domestic data service capacity; (b) the contribution of more extensive transborder data flows infrastructure to the competitiveness of developing countries in the production and export of goods and services; (c) the role of transnational corporations in the development of the national data services sector (public or private) and of other knowledge-intensive services; (d) the importance of an appropriate data services infrastructure in attracting larger flows of foreign direct investment.
The advent of information technology has also enabled corporations from the developed countries to relocate some of the labour-intensive segments of their service activities to certain developing countries that offer suitable conditions and have lower wages. Labour-intensive data processing operations of United States corporations have been carried out in Caribbean countries. This kind of service export can play a role as foreign exchange earner and generator of employment in some coun-
214 For example, it has been estimated that, at least for the United States, which has the most complete information, sales of foreign affiliates are approximately five times the value of service export earnings. UNCTC, Foreign Direct Investment, the Service Sector and International Banking, London, Graham and Trotman, 1988, p. 32.
215 This is the approach followed recently by Mexico in its agreement with IBM, whereby that company was allowed to set up a subsidiary to produce micro-computers and was exempted from the requirement of taking on a domestic partner on condition that it make significant contributions to the development of domestic programming skills. See annex 5, as well as Transnational Corporations in World Development - Trends and Prospects, op. cit.
216 See UNCTC, op. cit.
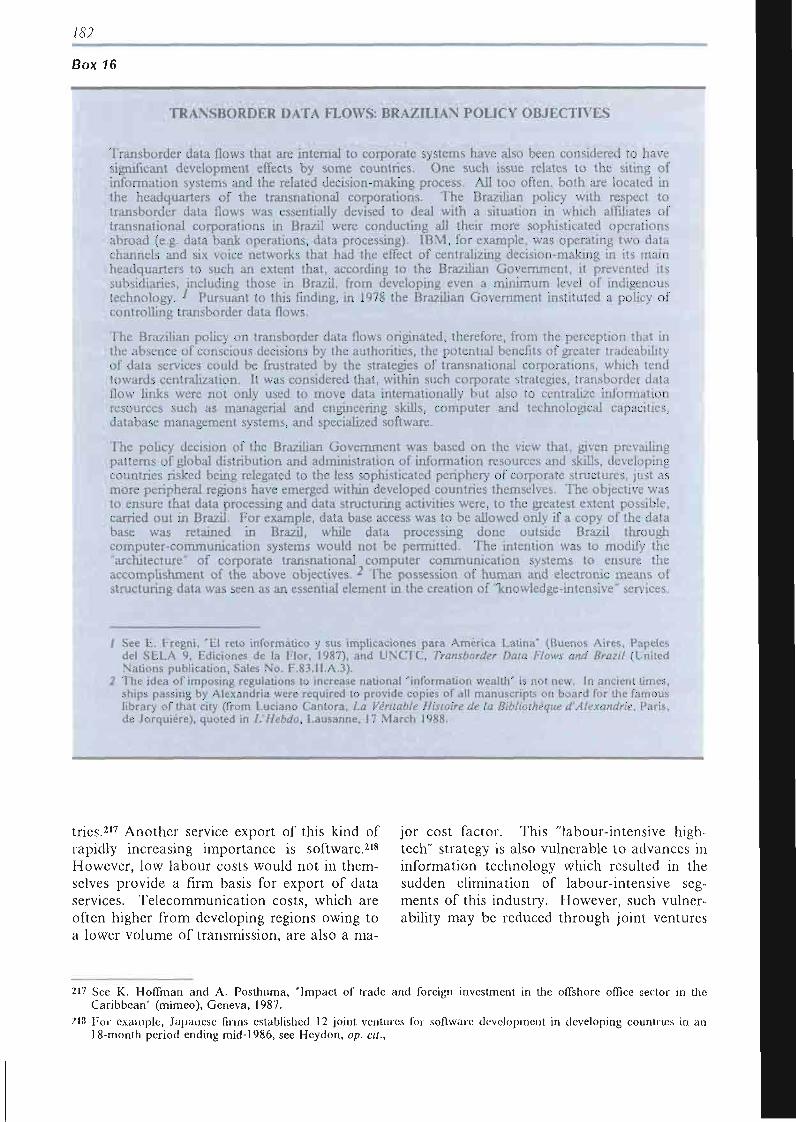
7 < s ;
Box 16
TRANSBORDER DATA FLOWS: BRAZILIAN POLICY OBJECTIVES
Transborder data flows that are internal to corporate systems have also been considered to have significant development effects by some countries. One such issue relates to the siting of information systems and the related decision-making process. All too often, both are located in the headquarters of the transnational corporations. The Brazilian policy with respect to transborder data flows was essentially devised to deal with a situation in which affiliates of transnational corporations in Brazil were conducting all their more sophisticated operations abroad (e.g. data bank operations, data processing). IBM, for example, was operating two data channels and six voice networks that had the effect of centralizing decision-making in its main headquarters to such an extent that, according to the Brazilian Government, it prevented its subsidiaries, including those in Brazil, from developing even a minimum level of indigenous technology. ^ Pursuant to this finding, in 1978 the Brazilian Government instituted a policy of controlling transborder data flows.
The Brazilian policy on transborder data flows originated, therefore, from the perception that in the absence of conscious decisions by the authorities, the potential benefits of greater tradeability of data services could be frustrated by the strategies of transnational corporations, which tend towards centralization. It was considered that, within such corporate strategies, transborder data flow links were not only used to move data internationally but also to centralize information resources such as managerial and engineering skills, computer and technological capacities, database management systems, and specialized software.
The policy decision of the Brazilian Government was based on the view that, given prevailing patterns of global distribution and administration of information resources and skills, developing countries risked being relegated to the less sophisticated periphery of corporate structures, just as more peripheral regions have emerged within developed countries themselves. The objective was to ensure that data processing and data structuring activities were, to the greatest extent possible, carried out in Brazil. For example, data base access was to be allowed only if a copy of the data base was retained in Brazil, while data processing done outside Brazil through computer-communication systems would not be permitted. The intention was to modify the "architecture" of corporate transnational computer communication systems to ensure the accomplishment of the above objectives. * The possession of human and electronic means of structuring data was seen as an essential element in the creation of "knowledge-intensive" services,
/ See E. Fregni, "El reto informático y sus implicaciones para America Latina" (Buenos Aires, Papeles del SELA 9, Ediciones de la Flor, 1987), and UNCTC, Transborder Data Flows and Brazil (United Nations publication, Sales No. E.83.II.A.3).
2 The idea of imposing regulations to increase national "information wealth" is not new. In ancient times, ships passing by Alexandria were required to provide copies of all manuscripts on board for the famous library of that city (from Luciano Cantora, La Véritable Histoire de la Bibliothèque d'Alexandrie, Paris, de Jorquière), quoted in L'Hebdo, Lausanne, 17 March 1988.
tries.217 Another service export of this kind of jor cost factor. This "labour-intensive high-rapidly increasing importance is software.218 tech" strategy is also vulnerable to advances in However, low labour costs would not in them- information technology which resulted in the selves provide a firm basis for export of data sudden elimination of labour-intensive seg-services. Telecommunication costs, which are ments of this industry. However, such vulner-often higher from developing regions owing to ability may be reduced through joint ventures a lower volume of transmission, are also a ma-
217 See K. Hoffman and A. Posthuma, "Impact of trade and foreign investment in the offshore office sector in the Caribbean" (mimeo), Geneva, 1987.
218 For example, Japanese firms established 12 joint ventures foi software development in developing countries in an 18-month period ending mid-1986, see Heydon, op. cit.,
7<S3
with firms from the developed countries involving technology transfer.219
Another implication of transborder data flows is the growing importance of international networks as a means of delivering services to markets, and as a support to competitiveness in trade in goods. Electronic Data Interchange (EDI) of customs documents not only dramatically reduces costs, but in many branches of industry will become relevant to entiy into trade by any other method. Thus, in a variety of the issues related to transborder data flows, the uneven distribution of telematic infrastructures on a geographical basis, noted earlier in this chapter, presents a serious handicap for developing countries.
4. Issues relating to the mobility of labour
Access to international markets in service sectors requiring the producer to move to the consumer is severely hampered by stringent visa regulations, and by varying professional requirements in different countries. Barriers to the temporary entry necessary to provide the service can be a particularly serious obstacle to exports of companies from developing countries, whose competitive strength is likely to be largely derived from lower costs of professional, skilled and unskilled labour.220 Firms from developing countries have demonstrated a competitive advantage over their counterparts in the developed countries in sectors where they have been able to incorporate a high national labour content in their traded services, for example, in the case of the construction sector.221 Such firms combine access to low-cost labour skills with management and design capabilities.
Developing country service exporters draw their advantage from combining relatively high skills at relatively low costs, and their exports could be facilitated by adjustments in immigration regulations, so as to permit developing country firms and professionals to enter developed countries to provide specific services. Therefore, the issue of differentiating between "trade in services" and "immigration" has also become an issue of particular impor
tance in the Uruguay Round of multilateral trade negotiations.
5. Services requiring the mobility of the consumer
Many services are provided through the movement of persons as consumers. As indicated in chapter II, many developing countries are highly reliant upon tourism for their foreign exchange earnings. The decline in transportation costs has increased the accessibility of even remote locations. The factors contributing to international competitiveness in tourism demonstrate how a combination of modes of delivery can contribute to expanding exports and achieving higher value added, particularly the direct interaction permitted by transborder data flows.
The administration of the world tourist industry has been radically altered by the development of world telecommunications services including data, telefax services, and dedicated international data networks that provide travel agents with instant access to information about schedules, prices, flight availability, hotel and car rentals. Data and document traffic are now both faster and more secure. Databases and dedicated programmes can analyse trends in traffic and bookings, or requests for new services, which can be rapidly transmitted to company head office or the national tourist board.
The effect of these changes for the tourist industry in developing countries is mixed. On the one hand, the potential increase in efficiency and international contact is vital to a tourist industiy that is distant from its clients. The networks create certainty and security for the client and hotel. Tourist resorts which are not able to get information into the network will find traffic diverted elsewhere. On the other hand, the cost of participating in these networks may be high in foreign exchange, serving as an added charge against potential earnings. The networks are likely to reinforce the market dominance of the larger hotels and tour operators, whose integrated management systems and co-ownership with airlines and network operators give them a pre-eminent position.
219 Heydon, op. cit., p . 11.
220 T h e temporary movement of persons associated with the supply of services was dealt with in the recently negotiated Canada-Uni ted States Free T r a d e Agreement, see Depar tment of External Affairs, Canada , The Canada - United States Free Trade Agreement, Ottawa, 1987.
221 See annex 6.
7¿W
Developing countries, either singly or in co-operation with other developing countries, can set up their own national and regional networks of information in order to maximize their returns from tourism. Another potential foreign exchange earner in a closely related field -which has already been entered by some countries - is the development of business conference and exhibition facilities with advanced technological services. The provision of goods attractive to tourists, especially if encouraged by duty free allowances in their countries of origin, can also increase tourist earnings.
Some professional services, particularly health and education, can also be exported by having the consumer physically move to the producing country. Competitiveness again is linked to a growing extent to the tradeability of the information content of such services. For
example, the "centre of excellence" concept, in which telematic links are maintained with advanced centres, (for example, for medical diagnosis and for educational information), would serve to upgrade the quality and reputation of newer medical and educational establishments in developing countries. Real possibilities exist for some developing countries to develop market niches.222 Competitive advantage is also provided by the availability of highly skilled personnel, adequate technological support and a wage structure that is price competitive, and often the existence of a tourist infrastructure and tourist attractions. International cooperation in related service areas, such as insurance coverage, recognition of qualifications, etc, would also contribute to assisting the expansion of developing countries' trade in such services."
222 For example, both Colombia and Singapore export medical services. Some universities in Mexico and the Caribbean have large contingents of medical students from the United States.
755
Chapter IV
SERVICES IN THE ECONOMIES OF THE SOCIALIST COUNTRIES OF EASTERN EUROPE
A. Perception of services in theory and practice
In order to understand the role assigned to the service sector in the socialist countries, it has to be placed in the context of a continuous debate on so-called productive (material) versus non-productive (non-material) activities. Traditionally, the majority of scholars in the socialist countries of Eastern Europe have distinguished between the following categories of economic activities: (a) productive - agriculture, industry and construction; (b) semi-productive - commerce, transportation and communication services provided to (a); and (c) nonproductive - public administration, education and science, health, military, professional services, arts, transportation and communications for consumers.
As most of the service sector was considered non-productive, the result was a definite under-estimation of the importance of services in economic theory as also in the economic policies of these countries. However, while assuming the non-productive nature of services, the socialist policy-makers paid great attention to the development of those services that were, by definition, closely associated with the socialist mode of production, such as social security, health, science, education, culture and sports. Thus, the policy-makers were always confronted with the dilemma of either giving preference to strictly economic considerations and thus limiting resources for non-material services, or giving preference to what they considered to be political considerations and thus
expanding at least some non-material service activities. The final outcome was the result of the interplay of these considerations.
In the statistics of the socialist countries, services are defined as activities rendered by economic agents both to other economic agents and to the population in general.223 These activities specifically include: (a) activities aimed at affecting things or objects; (b) renting and leasing of equipment and accommodation; (c) activities aimed at satisfying the material and non-material needs of the population; (d) activities concerned with the organizational and managerial needs of the national economy and the population as a whole; (e) production of goods tailored to the individual requirements of the people, as well as private construction of houses and other accommodation (see also box 17).
Thus, the statistical concept of services applied in the socialist countries of Eastern Europe differs from the standard concept used in the market-economy countries in two important respects (see box 18). First, the segments of the services sector classified as non-productive are not counted as part of the national income. Second, construction per se is excluded from the service sector. In the analysis that follows, the original country data have been rearranged in order to achieve comparability across countries.
223 See, for example, Decree No. 14 of the President of the Central Statistical Office in Poland, 17 September 1980.
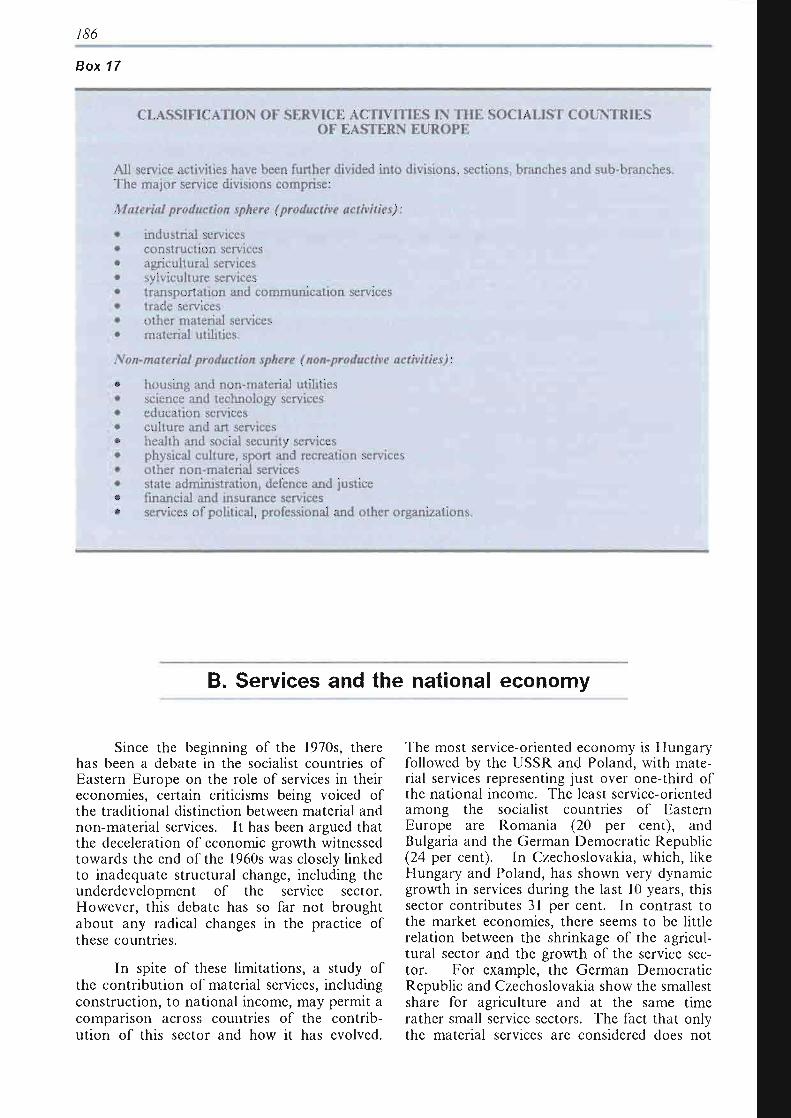
7(96
Box 17
CLASSIFICATION OF SERVICE ACTIVITIES IN THE SOCIALIST COUNTRIES OF EASTERN EUROPE
All service activities have been further divided into divisions, sections, branches and sub-branches. The major service divisions comprise:
Material production sphere (productive activities) :
• industrial services • construction services • agricultural services • sylviculture services • transportation and communication services • trade services • other material services • material utilities.
Non-material production sphere (non-productive activities) :
• housing and non-material utilities • science and technology services • education services • culture and art services • health and social security services • physical culture, sport and recreation services • other non-material services • state administration, defence and justice • financial and insurance services • services of political, professional and other organizations.
B. Services and the national economy
Since the beginning of the 1970s, there has been a debate in the socialist countries of Eastern Europe on the role of services in their economies, certain criticisms being voiced of the traditional distinction between material and non-material services. It has been argued that the deceleration of economic growth witnessed towards the end of the 1960s was closely linked to inadequate structural change, including the underdevelopment of the service sector. However, this debate has so far not brought about any radical changes in the practice of these countries.
In spite of these limitations, a study of the contribution of material services, including construction, to national income, may permit a comparison across countries of the contribution of this sector and how it has evolved.
The most service-oriented economy is Hungary followed by the USSR and Poland, with material services representing just over one-third of the national income. The least service-oriented among the socialist countries of Eastern Europe are Romania (20 per cent), and Bulgaria and the German Democratic Republic (24 per cent). In Czechoslovakia, which, like Hungary and Poland, has shown very dynamic growth in services during the last 10 years, this sector contributes 31 per cent. In contrast to the market economies, there seems to be little relation between the shrinkage of the agricultural sector and the growth of the service sector. For example, the German Democratic Republic and Czechoslovakia show the smallest share for agriculture and at the same time rather small service sectors. The fact that only the material services are considered does not
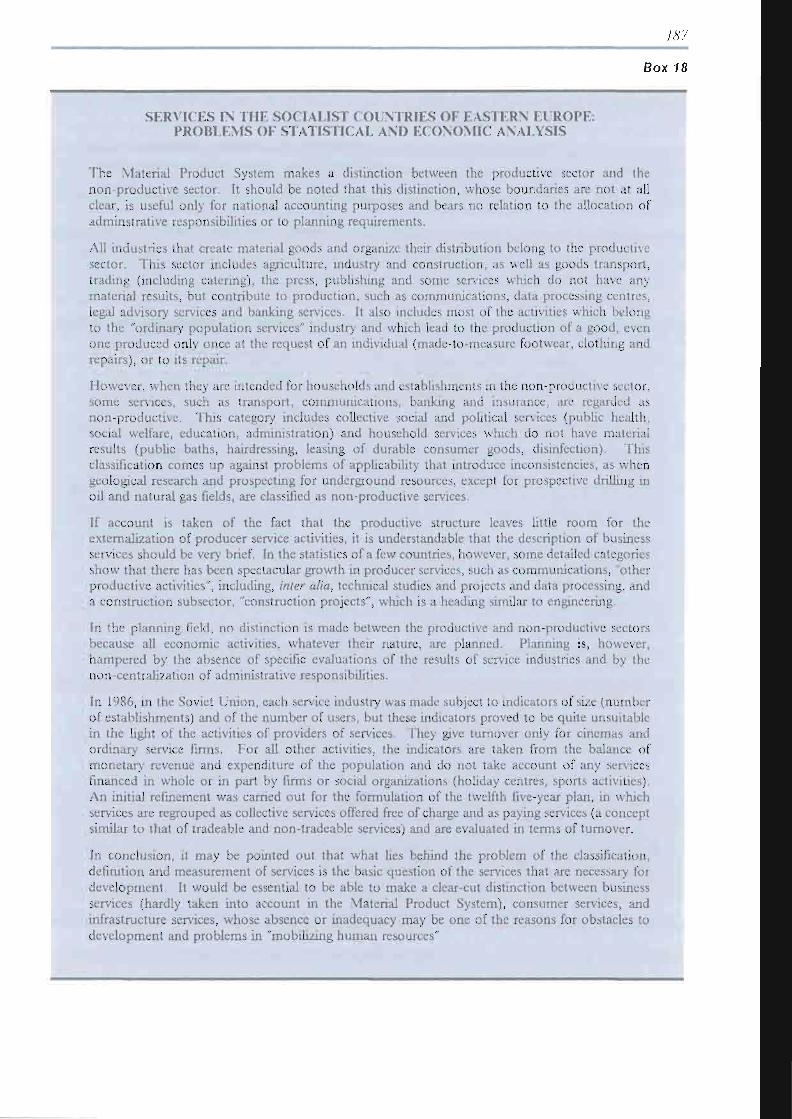
7(97
Box 18
SERVICES IN THE SOCIALIST COUNTRIES OF EASTERN EUROPE: PROBLEMS OF STATISTICAL AND ECONOMIC ANALYSIS
The Material Product System makes a distinction between the productive sector and the non-productive sector. It should be noted that this distinction, whose boundaries are not at all clear, is useful only for national accounting purposes and bears no relation to the allocation of adminstrative responsibilities or to planning requirements.
All industries that create material goods and organize their distribution belong to the productive sector. This sector includes agriculture, industry and construction, as well as goods transport, trading (including catering), the press, publishing and some services which do not have any material results, but contribute to production, such as communications, data processing centres, legal advisory services and banking services. It also includes most of the activities which belong to the "ordinary population services" industry and which lead to the production of a good, even one produced only once at the request of an individual (made-to-measure footwear, clothing and repairs), or to its repair.
However, when they are intended for households and establishments in the non-productive sector, some services, such as transport, communications, banking and insurance, are regarded as non-productive. This category includes collective social and political services (public health, social welfare, education, administration) and household services which do not have material results (public baths, hairdressing, leasing of durable consumer goods, disinfection). This classification comes up against problems of applicability that introduce inconsistencies, as when geological research and prospecting for underground resources, except for prospective drilling in oil and natural gas fields, are classified as non-productive services.
If account is taken of the fact that the productive structure leaves little room for the extemalization of producer service activities, it is understandable that the description of business services should be very brief. In the statistics of a few countries, however, some detailed categories show that there has been spectacular growth in producer services, such as communications, "other productive activities", including, inter alia, technical studies and projects and data processing, and a construction subsector, "construction projects", which is a heading similar to engineering.
In the planning field, no distinction is made between the productive and non-productive sectors because all economic activities, whatever their nature, are planned. Planning is, however, hampered by the absence of specific evaluations of the results of service industries and by the non-centralization of administrative responsibilities.
In 1986, in the Soviet Union, each service industry was made subject to indicators of size (number of establishments) and of the number of users, but these indicators proved to be quite unsuitable in the light of the activities of providers of services. They give turnover only for cinemas and ordinary service firms. For all other activities, the indicators are taken from the balance of monetary revenue and expenditure of the population and do not take account of any services financed in whole or in part by firms or social organizations (holiday centres, sports activities) An initial refinement was carried out for the formulation of the twelfth five-year plan, in which services are regrouped as collective services offered free of charge and as paying services (a concept similar to that of tradeable and non-tradeable services) and are evaluated in terms of turnover.
In conclusion, it may be pointed out that what lies behind the problem of the classification, definition and measurement of services is the basic question of the services that are necessary for development. It would be essential to be able to make a clear-cut distinction between business services (hardly taken into account in the Material Product System), consumer services, and infrastructure services, whose absence or inadequacy may be one of the reasons for obstacles to development and problems in "mobilizing human resources"
7,96
seem to explain these differences, as can be seen by the following analysis, although the difference becomes less marked (see annex table 7).
The most appropriate data for comparisons of the importance of the service sector are data on its share in employment (see annex table 8).224 The share of services in total employment ranges from 34 per cent for Romania to 51 per cent for the USSR. The three lower income countries, Romania, Bulgaria and Poland, have lower service sector employment than the richer countries, the exception being the USSR which, as a middle-income country, has the
highest service sector employment. The share of employment in the material service sector has increased in all the countries during the last 10 years. The most important sectors are construction (7-9 per cent), commerce (5-10 per cent) and transport and communications (6-9 per cent), the variations among the countries being rather small. Among the non-material services, education, culture and art are the most important sectors (fluctuating from 4 to 11 per cent). Strikingly low employment figures of only 0.5-0.9 per cent are recorded in the finance and insurance sector.225
C. Trade in services
The socialist countries of Eastern Europe represent 9 per cent of total world trade in goods, while their share in international trade in services can be estimated at about 5 per cent, indicating a lower propensity to trade in services. This figure reflects, to a large extent, the situation of the Soviet Union, which represents more than half of the Eastern European total turnover and which, as indicated by its trade balance with the Federal Republic of Germany, has an export ratio of services to goods of 6 per cent, as compared to 28 per cent for the other Eastern European countries. The import ratios are, however, more alike: 12 per cent for the USSR and 18 per cent for the other countries.226
As comparable global data on international services transactions must be derived
from the balance-of-payments statistics, only the three IMF members (Hungary, Poland and Romania) provide such data, so estimates must be made for the rest of these countries. As a whole, the socialist countries of Eastern Europe register a surplus in their net service trade with market economies ($5 billion in 1987).227 The USSR, the German Democratic Republic and Poland registered the largest surpluses, with these amounts representing an essential item of their current accounts and constituting an important factor in financing their trade deficits. The market economies are more important trade partners in services than in goods. In the case of the three countries for which data are available, the share of market economies in total trade in services ranges from 50 per cent to over 75 per cent,228 while in the case of goods the corresponding figures are between 45 and
224 As prices of non-mater ia l services are kept low and many of these are supplied free of charge, measurements of the role of services in terms of nat ional income G N P give a distorted picture, which can be avoided by using employment or investment figures.
225 T h e general level of employment is rather low as compared to developed marke t economies and the distribution a m o n g the service activities somewhat different. The fact that the figures are lower is also related to the existence of a relatively more impor tan t parallel sector in the socialist countries. In the USSR this parallel sector has been estimated at 17 to 18 million persons occasionally working at menial jobs and which, in terms of full-time employment, consists of over 2 million persons (i.e. two-thirds of the employees of State enterprises and co-operatives providing ordinary services to the populat ion and one quarter of the total turnover on the paying services). See V. Kostakov and V .M. Rutgeizer, Sovetskaya Kulrura, 8 January 1987. These differences can probably be explained by the less advanced technologies used in the socialist countries, the lack of investment that has led to the compensat ion of capital by labour , and an industrialization process that is more transport-intensive than in the case of other economies. E. Ehrlich and G.Y. Szilagyi, "International comparison of the Hungar ian infrastructure 1960-74", Acta Oeconomica, Vol. 24 (1-2), 1980, pp . 57-80.
226 T h e Federal Republic of G e r m a n y publishes data on the trade balance of goods and services vis-à-vis developed marke t economies, developing countries and the socialist countries in an annex to the monthly report by the Federal Bank.
227 Data include net services plus transfers. If investment income is included, this surplus becomes negative, reaching the a m o u n t of $2.3 billion. See ECE, Economic Bulletin for Europe, Vol. 39, No . 4, 1987.
228 Calculated from I M F , Balance of Payments Statistics,,vols. 37 and 38, and Z. Kamecki The role of services in the
MP
55 per cent. The most likely explanation is that intra-CMEA trade in services is undertaken through different kinds of compensation arrangements and thus not registered.
To obtain an idea of the structure of trade in services, data of the Federal Republic of Germany have been used. This country is an important trading partner of all the socialist countries of Eastern Europe. First of all, trade in services as compared to goods is much smaller with the socialist countries, illustrating their lower propensity to trade in services. Exports are dominated by "other" services, followed by "shipping" and "travel", which is a situation similar to that prevailing in trade with the developing countries. On the import side, "shipping" constitutes more than half of this trade in the case of the socialist countries of Eastern Europe, while the rest is comprised mainly of "other" services such as construction and assembly engineering, a situation which is once again rather similar to that of trade with the developing countries. Thus, it seems that the socialist countries' trade in services is rather traditional, i.e. shipping, travel, construction and engineering constituting the main items, whereas sectors such as insurance, personnel services and licenses and patents are under-represented.
1. Exports of services by sectors
(b) Travel
Travel or tourism is apparently the second largest service item in services trade for the socialist countries of Eastern Europe, particularly on the export side. The socialist countries of Eastern Europe received over 61 million tourists in 1985, of whom over one quarter were from developed market economies.229 Unlike shipping, this strong position of tourism, which makes up the bulk of the travel sector in the socialist countries of Eastern Europe, was achieved in spite of an inadequately developed infrastructure.
(c) Construction and engineering services
Construction and engineering services represent another important item for the socialist countries of Eastern Europe, especially in their relations with developing countries. A particularly strong position is held by the Soviet Union, which supplied 4,716 turnkey installations to other countries during the period 1950-1986, the majority of them to developing countries. These services represented less than 1 per cent of the export of goods in the mid-1980s. Among other large suppliers of this kind of services are Poland and Bulgaria. The revenues from the export of these services made up about 1 per cent of Bulgarian exports of goods at the beginning of the 1980s.230
(a) Shipping 2. Foreign direct investment in services
Shipping represents the single most important tradeable service item for the socialist countries of Eastern Europe because of their well-developed merchant fleet and relatively good port facilities. In the middle of 1986, the socialist countries of Eastern Europe owned 14.4 per cent of the world's general cargo fleet, 3.3 per cent of the tanker fleet, 5.3 per cent of bulk carriers (including combined carriers), and 3.9 per cent of the world container fleet. It mostly services the foreign trade needs of the socialist countries of Eastern Europe and Asia, though a part of its tonnage capacity is used for carrying the goods of other countries.
Economic relations among the socialist countries of Eastern Europe, as well as between them and the outside world, are characterized by the pronounced dominance of pure trade transactions. However, since the 1970s a trend towards the gradual introduction of capital flows has been observable both in socialist countries' economic relations with each other and with the outside world. Paradoxically, these have been more evident in the external relations of the socialist countries of Eastern Europe than in intra-regional relations, where only a handful of foreign direct investment projects have been set up so far.
economic relations between the East and the West, study presented at the symposium of the Centre Franco-Autrichien de Rencontre entre des Pays à Systèmes Economiques et Sociaux Différents, Budapest, 1986.
229 Economies of the CMEA countries, Moscow, 1987, and Annual Statistics, Warsaw, 1987, p. 620. 230 J. Monkiewicz and J. Maciejewicz, Technology Export from the Socialist Countries, Westview Press, London, 1986,
pp. 49-55.
7P0
(a) Outward direct investment in services
The number of enterprises with Eastern European participation established in market economies is rather moderate. Out of 640 enterprises, about 440 are located in developed countries and about 213 in the developing countries. Major investors from the socialist countries of Eastern Europe are the USSR (143 units), Hungary (150 units) and Poland (143 units).231 Though investments by socialist countries in services are mainly linked to commercial operations they also include banking, construction, engineering and prospecting services, as well as consumer services.232 Five socialist countries of Eastern Europe (Bulgaria, Hungary, Poland, Romania and the USSR) have also invested in insurance operations abroad.233 Around 70 of the socialist countries' capital ventures in the market economies are related to transport services, with the dominant role played by the Soviet Union.
(b) Inward direct investment in services
The direct capital investments in the socialist countries of Eastern Europe, in the form of joint ventures, are of a much later origin than socialist countries' investment in market economies. It is only since the beginning of the 1970s that such possibilities have been created in Romania and Hungary, followed thereafter by Poland, Bulgaria and, since 1986-1987, by Czechoslovakia and the Soviet Union.234
However, the few joint ventures located in Romania and Czechoslovakia are exclusively in manufacturing, and most of the joint venture projects under way in the USSR will also operate in manufacturing. Since the new regulations were approved only five out of 29 joint ventures have been in the service sector.235
3. Recent developments in the service sector
During recent years services have been playing an increasing role in the Eastern European countries, mainly as a result of changes in the perception of the contribution of this sector to economic development. For example, in 1983, the Department for Long-term Planning of the National Planning Office of Hungary-prepared for the first time within the planning system of a socialist country a strategy for the development of the service sector. It stated that the underdevelopment of the service sector was a barrier to further progress and that the share of services in investment needed to be increased to over 50 per cent of the total. The backwardness of the service sector has had serious economic consequences, and the calculations made have indicated that the losses caused by deficiencies in the telecommunication sector alone amounted to 10 per cent of the annual national income in Hungary.236
The growing concern about the service sector is also a result of the new economic measures and innovations in these countries, where shifts towards greater market orientation require changes in the services supporting production, as well as a new approach towards consumer services. This is clearly reflected in the "Complex Programme for the Development of the Production of Consumer Goods and Services up to the Year 2000", adopted by the Central Committee of the Communist Party and the Council of Ministers of the USSR in June 1985, in which need for further and more rapid development of the service sector is envisaged through an increase of 30-40 per cent in the supply of paid services to households during the present five-year plan. Furthermore, increases in the communal services (utilities) are projected for 1986-2000 at 140-150 per cent, with the number of beds in hotels to be increased by the same factor. By the year 2000, the private demand for new telephones should, in principle, be satisfied. Large investment is planned in the recreation sphere, with the total volume of services to be increased by 130-150
231 C.H. McMil lan , Multinationals from the Second World, Macmil lan Press, London, 1987, pp . 38-41, data as of end 1983.
232 T h e bulk of these commercial operations are probably linked to ordinary export-import activities and are therefore not to be classified as services.
233 C.H. McMil lan , op. cit., pp . 95-96.
234 See M. Lebkowski and J. Monkiewicz, "Western direct investment in centrally planned economies", Journal of World Trade Law, Vol. 20, N o . 6, November /December 1986, pp . 624-638.
235 Marie-Agnès Crosier, "Indigence du secteur tertiaire en l 'URSS", Courrier des pays de l'Est, No . 326, February 1988.
236 See Istvan Major, "Les carences du secteur des services en Hongrie", Courrier des Pays de l'Est, No. 300, November 1985, p. 51.
191
per cent by the year 2000. In addition, a decree enacted in July 1985 calls upon all enterprises and agricultural organizations to add to their normal activities the supply of certain services to their employees, as well as to households in the neighbourhood, while special resources will be assigned to them for this purpose. This programme was confirmed in the Annual Plan for 1987, where for the first time a special chapter was dedicated to consumer goods and services.237
Recent developments in the banking sector in Hungary also reflect these changes. Based until 1986 on the dominant position of the National Bank of Hungary which performed both the function of a classical bank of issue and of a commercial bank with no real competition in the field, it has completely rearranged its setting. From 1 January 1987, five banks have been given the status of general commercial banks, of which three are completely new, being former departments of the National Bank of Hungary. Altogether, at present, the country has 20 banks and other financial institutions including those co-owned by foreigners.
With regard to the external factors contributing to the new approach to services there is growing anxiety among policy-makers in the socialist countries of Eastern Europe that inadequate development of certain services may lead to a growing technology gap vis-à-vis the developed countries. This is especially true with respect to communications and telematics. In many of the socialist countries of Eastern Europe (USSR, German Democratic Republic, Poland, Hungary, Bulgaria), special plans have recently been adopted for the development of the telecommunication infrastructure and its far-reaching modernization. The demand in this respect is particularly high, due to the past policies pursued. Finally, it should be mentioned that several joint ventures have been set up in the service sector, especially in Hungary, Poland and Bulgaria, but also more recently in the USSR.
To sum up, in spite of the growing interest in the role of services in economic development displayed by the socialist countries, this sector is still rather underdeveloped, with a far smaller share than in the developed market
economies. The development of this sector has been subordinated to the production of goods, which has given rise to a rather traditional structure. The geographical distribution of their trade in services differs from that of the distribution of trade in goods, as the non-socialist countries, especially the developed market economies, are the major partners, contrary to what is observed in the case of goods. In contrast to the developing countries, the socialist countries registered a surplus in their net trade in services with the developed market economies. Services trade is dominated by the more traditional industries, trade in banking and insurance being strikingly low, mainly due to the functioning of their financial system and economic co-operation. But, as an outcome of the ongoing reforms, further development in this trade can be expected.
4. Services in Poland
During recent years the share of services in Polish foreign economic relations has considerably increased. Among three broad service categories,238 i.e. transport and communication, travel and other services, the fastest growth rate was registered in travel and other services. Transport and communication services grew less rapidly than total trade in services.
Poland is a net exporter of services, the only broad group of services in which the country shows a negative balance of trade being foreign travel. The heterogenous category of "other services" is responsible for about one-third of the positive balance of total service trade, the major surplus sector being professional and technical services.
In 1986 the largest share in Polish trade was recorded by transport and communication services followed by the group of "other services". Together these two groups of services accounted for about 90 per cent of all export earnings and 85 per cent of import expenditures on services.239
The geographical structure of Polish trade in services shows that the major partners are the developed market economies, with
237 Courrier des Pays de l'Est, 1987, op. cit.
238 Transport and communication services consist of freight, port services, services of travel bureaux, fishery services, road, air, water-borne and shipping services, forwarding services, and postal and telecommunication services. Foreign travel comprises business and training travel, tourist travel, services for foreigners visiting the country and money exchange services. Other services consist of insurance, banking, commissions, exchange of scientific and technological achievements, the costs of export contracts, fairs and exhibitions, advertising, technical services, professional services of experts and consultants, conventional fines, etc.
239 Various issues of Finance and Credit, Warsaw.
/92
about half of both exports and imports, followed by the socialist countries, with only a minor share for the developing countries. Trends differ, however; as regards exports the socialist countries increased their share while the shares of the developing, and especially the developed market economies, decreased. In the case of imports only the developing countries increased their share while the share of the developed countries was reduced and that of the socialist countries remained almost unchanged.
Maritime transport is the most important single service category in Polish trade in services. The share of maritime transport is traditionally higher in imports than in exports, so this sector shows a growing deficit in international transactions in the first half of the 1980s. These services are rendered by 10 enterprises. The regulation of this sector is relatively liberal, thus allowing for competition between Polish and foreign shipping companies.
The main trading partners of Polish shipping firms were the developed market economies, particularly EEC. The developing countries constituted about 10-15 per cent of Polish trade turnover in maritime transport. The main customers within this group of countries were Egypt, India, Brazil and Singapore. The socialist countries of Eastern Europe, ow
ing to geographical proximity and the possibility or necessity of employing other means of transportation, are relatively negligible partners of Poland in maritime transport transactions.
The category of professional services embraces a wide range of different activities. The most important are construction and engineering services, services of specialists and consultants, training services, payments for copyrights, and exchange of artists and sportsmen. Poland is a net exporter of this group of services. However it seems that the Polish export potential in professional services has not yet been fully utilized. One of the elements hampering the achievement of this aim is the existence of many barriers in both developed and developing countries.
In the first half of the 1980s, postal and telecommunication services constituted about 2 per cent of total service trade turnover. The basic item in Polish exports of these services was postal services rendered to the EEC countries, though by 1986 telecommunication services, and telephone services in particular, gained equal importance. Imports of postal and telecommunication services also came mainly from EEC, together with the Soviet Union. The most essential import items were telephone and broadcasting services"
/9J
Chapter V
SERVICES IN THE DEVELOPING COUNTRIES
A. Overview
The development of the services sector in developing countries would seem to have been in response to a different set of forces from those experienced in developed countries and described in chapter I, which may also explain the different position of services in the balance of payments in chapter II. In many developing countries the service sector reflects the peculiar effect of the deep mark left by colonial links on the geographical as well as the qualitative structure of services within the economy of many countries.240 Railways, roads and ports, wholesale and retail facilities, warehouses, banks and insurance companies as well as many utilities were developed in response to the needs arising from trade flows between the colonies and the metropolitan powers. To a great extent, the present geographical distribution of services within many developing countries is more oriented to the export of goods, primary products in particular, than to domestic requirements for those services.
Growth of employment in services in many developing countries has been stimulated by the rapid urbanization process that took place over a much shorter period than in developed countries. Generally, the growth of the manufacturing sector was not adequate to absorb the large contingents of population moving out of agriculture (or mining) and into urban areas. As a consequence, unlike the
post-war trend in Western European countries described in chapter I, an important segment of the labour force has moved directly from the primary sector (agriculture and mining) into services without contact with the manufacturing sector. However, unlike those developed countries where service sector growth also either preceded or occurred in parallel with the growth of the manufacturing sector,241 the lack of education or training and supportive infrastructures has prevented most agricultural workers in developing countries from holding service sector jobs demanding a skilled input.
Service sector development has also been affected by the heavy reliance of many developing countries on the production and export of a single primary commodity, or a few of these, normally agricultural or extractive, particularly if such production (e.g. in the mining sector) did not in itself generate much employment. In such situations, services expanded in response to the need to recycle the resources generated by the exporting sector into the rest of the economy, mainly in response to social and political considerations. This scenario departs from the situation found in developed countries and described in chapter I, where a sort of "double dynamics" in services with parallel growth in both intermediate and final consumption services appears to be taking place.242 In most developing countries, the main
240 See Riddle, Service-led Growth, op. cit.
241 See Singelmann, op. cit. His analysis shows that only the Western European countries whose manufactur ing sectors developed prior to the twentieth century followed a sequence where labour moved first out of agriculture into manufactur ing, and then out of manufacturing into services.
242 Jean Gadrey , op.cit.
794
contributions of the service sector have been to absorb excess labour while mitigating the negative consequences of the economic cycle affecting those countries, i.e. acting as an employer of "first and last" resort.
In general, the service sector in developing countries ranges between one-third and two-thirds of GDP, with higher per capita incomes have a proportionally larger service sector. The modal share for developing countries lies between 45 and 55 per cent of GDP (annex table 9). Of all the socio-economic variables potentially related to the size of the service sector, urbanization would appear to be an important indicator, as countries with a higher degree of urbanization tend to have more production and employment in the service sector. The speed of the urbanization process has also affected the composition of services. Although the size of the service sector in terms of GDP and employment may not differ significantly between developed and developing countries, differences in the composition of their service sectors are apparent with respect to five of the main categories used in the national accounts: (a) telecommunications and transport; (b} wholesale and retail trade; (c) banking, insurance and business services; (d) personal and community services; and (e) public administration and defence.243
Transport, communications and financial networks, as well as health, education and housing, have all been recognized as essential elements in articulating and facilitating the role of the various economic agents in the national economy. Available information shows that low levels of per capita income accompany low shares of "transport and communication" services in GDP; for example, in many low-income and least developed countries, these services contribute less than 4 per cent of GDP and the availability of telephone service averages less than 1 phone per 100 persons. On the other hand, in the majority of upper-income developing countries "transport and communication" accounts for over 7 per cent of GDP, with up to 45 phones per 100 persons. There seems to be an upper limit to the share of such services in GDP as few developed market-economy
countries have shares higher than 7 per cent of GDP.
"Wholesale and retail" services typically constitute the largest, though not necessarily the most dynamic, category within the service sector of all countries, but more so in the case of developing countries. The relative importance of this sector generally tends to decrease as per capita income rises. While the incorporation of new technologies recently has increased the dynamism of this sector in developed countries, in developing countries the sector is usually highly (low skill) labour intensive, with relatively low efficiency. In many countries, the size of the wholesale/retail sector is seriously under-reported because of the prominent role played by the (unrecorded) informal sector.244
Chapter I has described the evolution and importance of the producer services sector in the developed market-economy countries. Using the category of "banking, insurance and business services" as a proxy for a broader range of producer services, it is apparent that these services are under-represented in all but the most rapidly growing developing countries. In developed countries, the producer services category reaches levels close to 20 per cent of GDP; however, in low-income developing countries this category constitutes around 5 per cent of GDP, with 7.5 per cent for middle-income countries and 10.5 per cent for upper-income developing countries. The low percentage of producer services in overall GDP indicates a potential vulnerability regarding international competitiveness. It is precisely this category of producer services that has the greatest possibility of being traded internationally, just as it is the producer services that form the crucial inputs for all economic activities and create the highest value added.
In a large number of developing countries, much of the services employment and production in producer services, as well as in retail trade, is accounted for by the so-called "informal sector" (the definition of "informality" differs considerably among countries). Studies have shown that the informal sector is not necessarily synonymous with low skills and
243 The following discussion is focused on the elements of what has been considered as the "narrow definition" of services in nat ional accounts - i . e . excluding construction and utilities. The logic frequently used for the exclusion of construction from the service sector in gross domestic product , while including it in services trade statistics, is based on the debatable assumption that in the domestic economy a major portion of the value added is derived from the material content of construction ra ther than from the services input, while in the ba lance of payments it is the services componen t that is measured . T h e role of construction in the national economies of developing countries is discussed in annex 6. For the case of utilities, the rationale for exclusion from the service sector is the mixture of goods production and the actual provision of a service. See discussion in chapter I.
244 In Bolivia, for example , informal retail activity has been estimated at as much as 80 per cent of all retail activity in the country. See S. Escobar de Pabón , "Los servicios en el sector informal u rbano" , Centro de Estudio para el Desarrollo Labora l y Agrar io , La Paz , 1986 (mimeo).
195
productivity,245 although the effects of "informality" may diminish the capacity of these service producers to make a contribution to economic growth and development.
"Personal and community" services generally average less than 15 per cent of GDP. This category is at present a mixture of low value-added, labour-intensive personal services, higher value-added technical (e.g. repair) and leisure activities, and high skill social services such as health and education,246 which could be considered part of the social infrastructure.
The second largest category in the services sector of developing countries is comprised by those activities included under "public administration and defence" services. Although their relative importance also tends to decrease as per capita income rises, individual country ratios are quite disparate, reflecting differences in socio-political factors affecting the relative share of public administration and defense in individual countries. In general, more rapidly expanding public sectors have been found to be correlated with slower overall economic growth,247 as public sector expansion is often intended to compensate for lack of alternative employment opportunities.
It appears that, as the workforce shifts out of the extractive sector, the percentage share of services in employment begins to resemble more closely that of its share in GDP. The percentage employed in agriculture continues to drop, while the percentages employed in manufacturing and services both increase, but more so in the latter sector, particularly in wholesaling and retailing activities, though for
B. Trends
1. Latin America and the Caribbean
Among the important shifts in the sectoral composition of Latin America's GDP has been the declining importance of goods-producing sectors (agriculture, mining, and
245 H. De Soto, El Otro Sendero, Editorial Ausonia, Lima, 1 246 See discussion in chapter I. 247 See Riddle, "Service-led Growth", op. cit.
248 In 1986 "transportation and communications" in the regie
some countries the public sector is responsible for most of the new job creation (see annex table 10).
As noted in chapter II, the developing countries as a whole show deficits in service trade. Among these countries, however, certain show a surplus position, but usually only in the travel category (i.e. tourism). Only a few show surplus positions in categories outside this sector (see annex tables 11, 12 and 13, respectively).
The services sector can affect the balance of payments other than through actual exports. The reduction of potential export earnings by developing country producers due to the loss of value-added revenues can only be estimated, for example, by comparing f.o.b. prices with those obtained in the domestic market of the importing countries. There is also an opportunity cost aspect where goods are not exportable due to the fact that the necessary support services are not available.
Overall comparisons between individual developing countries or groups do not provide much more insight into the role of services in developing countries, given the inadequacy of the statistical data. The following sections examine the case of selected developing countries or groups from the point of view of the position, over time, of services in their external transactions, their possible relationship with the characteristics of the domestic service sector and the policy measures envisaged by governments to increase the contribution of the service sector to development objectives.
by region
manufacturing) in GDP. Services have increased their share substantially, largely owing to the expansion of infrastructural and producer services. Despite these trends, however, the relative importance of "transportation and communications" and "financial and business (producer) services" continues to be well below that of developed economies.248
986.
contributed 8.7 per cent to GDP, while in industrialized
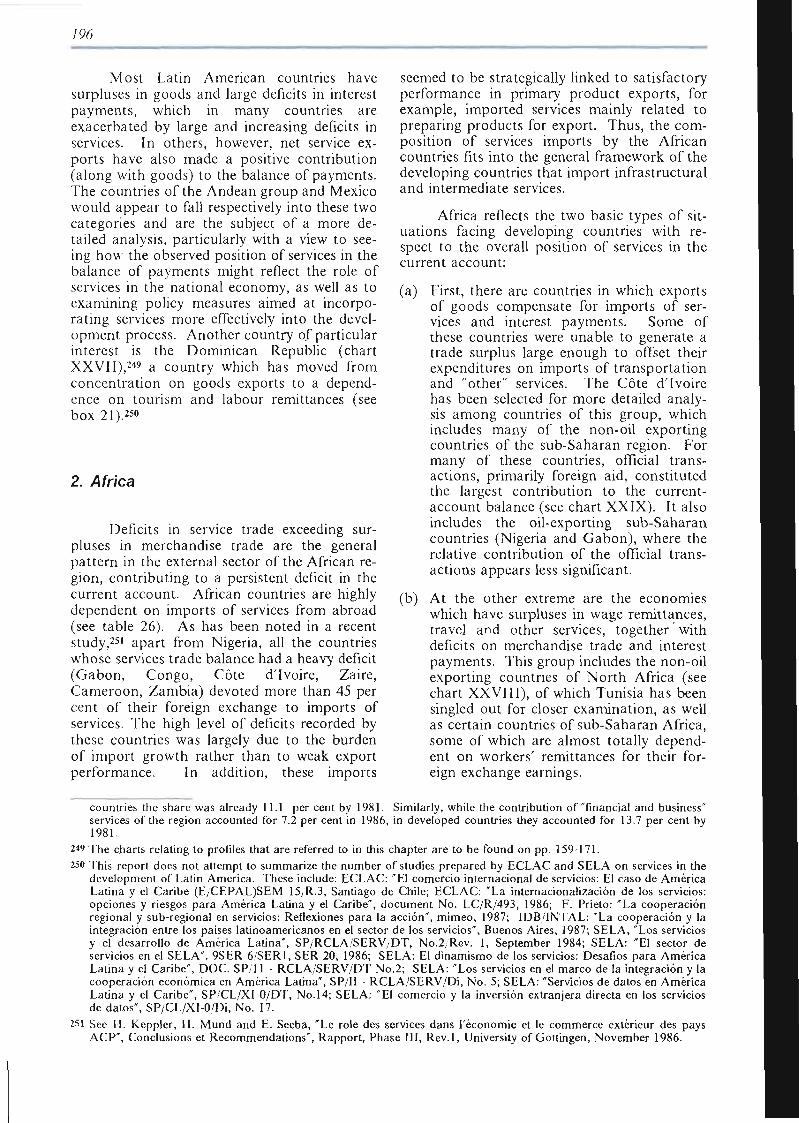
/ %
Most Latin American countries have surpluses in goods and large deficits in interest payments, which in many countries are exacerbated by large and increasing deficits in services. In others, however, net service exports have also made a positive contribution (along with goods) to the balance of payments. The countries of the Andean group and Mexico would appear to fall respectively into these two categories and are the subject of a more detailed analysis, particularly with a view to seeing how the observed position of services in the balance of payments might reflect the role of services in the national economy, as well as to examining policy measures aimed at incorporating services more effectively into the development process. Another country of particular interest is the Dominican Republic (chart XXVII),249 a country which has moved from concentration on goods exports to a dependence on tourism and labour remittances (see box 21) zw
2. Africa
Deficits in service trade exceeding surpluses in merchandise trade are the general pattern in the external sector of the African region, contributing to a persistent deficit in the current account. African countries are highly dependent on imports of services from abroad (see table 26). As has been noted in a recent study,251 apart from Nigeria, all the countries whose services trade balance had a heavy deficit (Gabon, Congo, Côte d'Ivoire, Zaire, Cameroon, Zambia) devoted more than 45 per cent of their foreign exchange to imports of services. The high level of deficits recorded by these countries was largely due to the burden of import growth rather than to weak export performance. In addition, these imports
seemed to be strategically linked to satisfactory performance in primary product exports, for example, imported services mainly related to preparing products for export. Thus, the composition of services imports by the African countries fits into the general framework of the developing countries that import infrastructural and intermediate services.
Africa reflects the two basic types of situations facing developing countries with respect to the overall position of services in the current account:
(a) First, there are countries in which exports of goods compensate for imports of services and interest payments. Some of these countries were unable to generate a trade surplus large enough to offset their expenditures on imports of transportation and "other" services. The Côte d'Ivoire has been selected for more detailed analysis among countries of this group, which includes many of the non-oil exporting countries of the sub-Saharan region. For many of these countries, official transactions, primarily foreign aid, constituted the largest contribution to the current-account balance (see chart XXIX). It also includes the oil-exporting sub-Saharan countries (Nigeria and Gabon), where the relative contribution of the official transactions appears less significant.
(b) At the other extreme are the economies which have surpluses in wage remittances, travel and other services, together with deficits on merchandise trade and interest payments. This group includes the non-oil exporting countries of North Africa (see chart XXVIII), of which Tunisia has been singled out for closer examination, as well as certain countries of sub-Saharan Africa, some of which are almost totally dependent on workers' remittances for their foreign exchange earnings.
countries the share was already 11.1 per cent by 1981. Similarly, while the contribution of "financial and business services of the region accounted for 7.2 per cent in 1986, in developed countries they accounted for 13.7 per cent by 1981.
249 The charts relating to profiles that are referred to in this chapter are to be found on pp. 159-171. 250 This report does not attempt to summarize the number of studies prepared by ECLAC and SELA on services in the
development of Latin America. These include: ECLAC: "El comercio internacional de servicios: El caso de América Latina y el Caribe (E/CEPAL)SEM 15/R.3, Santiago de Chile; ECLAC: "La internacionalización de los servicios: opciones y riesgos para América Latina y el Caribe", document No. LC/R/493, 1986; F. Prieto: "La cooperación regional y sub-regional en servicios: Reflexiones para la acción", mimeo, 1987; IDB/INTAL: "La cooperación y la integración entre los países latinoamericanos en el sector de los servicios", Buenos Aires, 1987; SELA, "Los servicios y el desarrollo de América Launa", S P R C L A S E R V D T , No.2/Rev. 1, September 1984; SELA: "El sector de servicios en el SELA". 9SER 6/SER1, SER 20, 1986; SELA: El dinamismo de los servicios: Desafios para América Latina y el Caribe", DOC. SP 11 - RCLA/SERV/DT No.2; SELA: "Los servicios en el marco de la integración y la cooperación económica en América Latina", SP/II - RCLA/SERV/Di, No. 5; SELA: "Servicios de datos en América Latina y el Caribe", SP CL/XI 0/DT, No.14; SELA: "El comercio y la inversión extranjera directa en los servicios de datos", SP/CL/XI-0/Di, No. 17.
251 See II. Keppler, H. Mund and E. Seeba, "Le role des services dans l'économie et le commerce extérieur des pays ACP", Conclusions et Recommendations", Rapport, Phase III, Rev.l, University of Gottingen, November 1986.
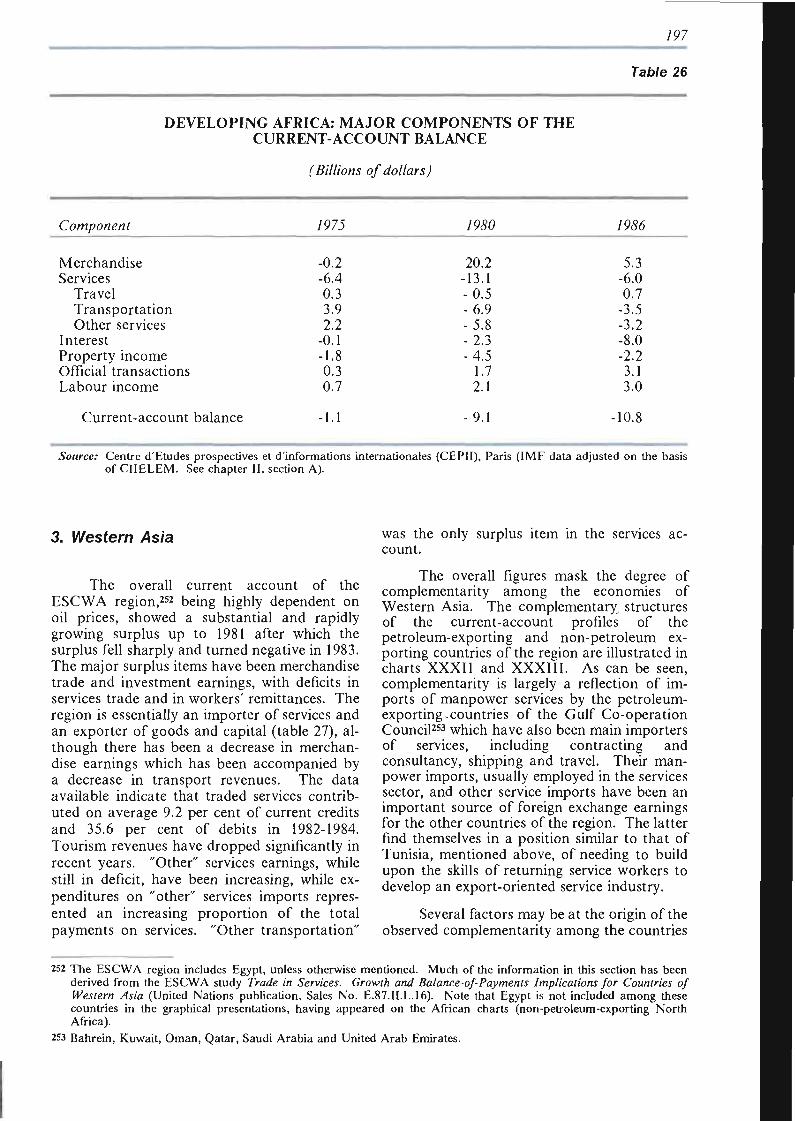
/97
DEVELOPING AFRICA: MAJOR COMPONENTS OF THE CURRENT-ACCOUNT BALANCE
(Billions of dollars)
Table 26
Component /P7J /P<90 /&S6
Merchandise Services
Travel Transportation Other services
Interest Property income Official transactions Labour income
-0.2 -6.4 0.3 3.9 2.2
-0.1 -1.8 0.3 0.7
20.2 -13.1 -0.5 -6.9 -5.8 -2.3 -4.5
1.7 2.1
5.3 -6.0 0.7
-3.5 -3.2 -8.0 -2.2 3.1 3.0
Current-account balance 1.1 9.1 •10.8
Source: Centre d'Etudes prospectives et d'informations internationales (CEPII), Paris (IMF data adjusted on the basis of CHELEM. See chapter II, section A).
3. Western Asia
The overall current account of the ESCWA region,252 being highly dependent on oil prices, showed a substantial and rapidly growing surplus up to 1981 after which the surplus fell sharply and turned negative in 1983. The major surplus items have been merchandise trade and investment earnings, with deficits in services trade and in workers' remittances. The region is essentially an importer of services and an exporter of goods and capital (table 27), although there has been a decrease in merchandise earnings which has been accompanied by a decrease in transport revenues. The data available indicate that traded services contributed on average 9.2 per cent of current credits and 35.6 per cent of debits in 1982-1984. Tourism revenues have dropped significantly in recent years. "Other" services earnings, while still in deficit, have been increasing, while expenditures on "other" services imports represented an increasing proportion of the total payments on services. "Other transportation"
was the only surplus item in the services account.
The overall figures mask the degree of complementarity among the economies of Western Asia. The complementary, structures of the current-account profiles of the petroleum-exporting and non-petroleum exporting countries of the region are illustrated in charts XXXII and XXXIII. As can be seen, complementarity is largely a reflection of imports of manpower services by the petroleum-exporting-countries of the Gulf Co-operation Council253 which have also been main importers of services, including contracting and consultancy, shipping and travel. Their manpower imports, usually employed in the services sector, and other service imports have been an important source of foreign exchange earnings for the other countries of the region. The latter find themselves in a position similar to that of Tunisia, mentioned above, of needing to build upon the skills of returning service workers to develop an export-oriented service industry.
Several factors may be at the origin of the observed complementarity among the countries
252 The ESCWA region includes Egypt, unless otherwise mentioned. Much of the information in this section has been derived from the ESCWA study Trade in Services. Growth and Balance-of-Payments Implications for Countries of Western Asia (United Nations publication, Sales No. E.87.ILL.16). Note that Egypt is not included among these countries in the graphical presentations, having appeared on the African charts (non-petroleum-exporting North Africa).
253 Bahrein, Kuwait, Oman, Qatar, Saudi Arabia and United Arab Emirates.
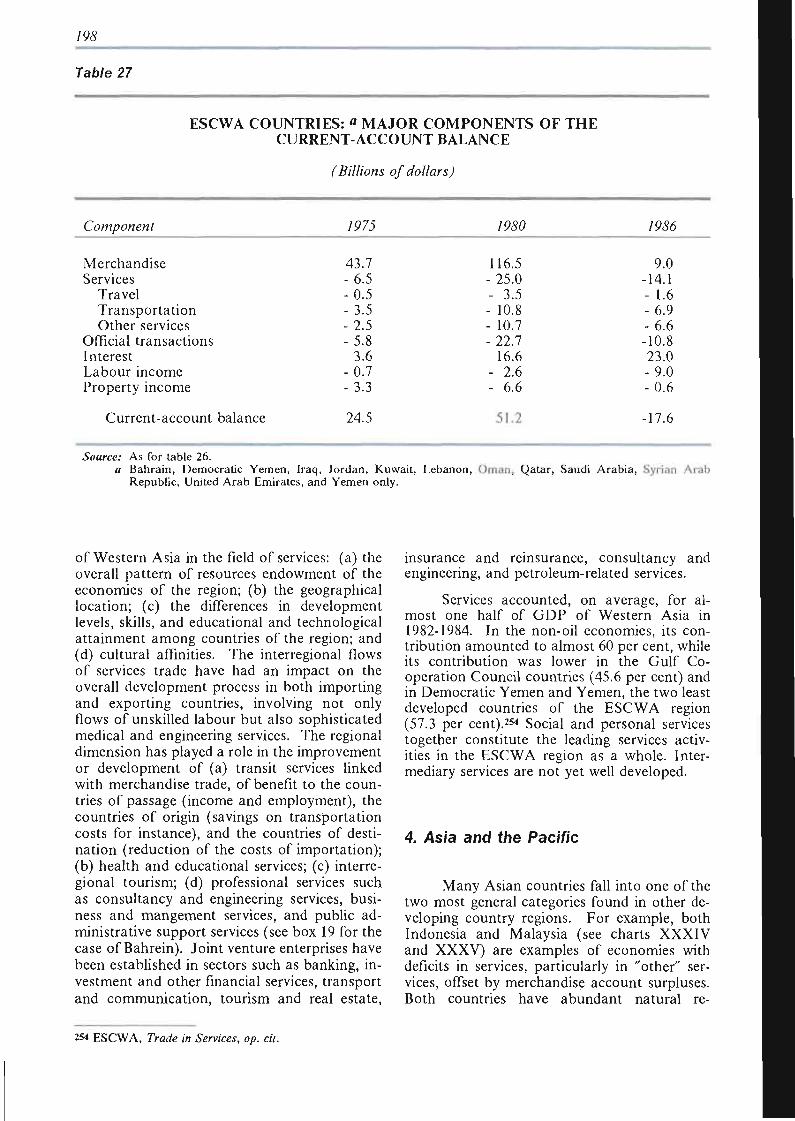
/P<S
Table 27
ESCWA COUNTRIES: a MAJOR COMPONENTS OF THE CURRENT ACCOUNT BALANCE
(Billions of dollars)
Component /P7J /P&O /P6%
Merchandise Services
Travel Transportation Other services
Official transactions Interest Labour income Property income
Current-account balance
43.7 - 6.5 -0.5 - 3.5 - 2.5 - 5.8
3.6 -0.7 - 3.3
24.5
116.5 -25.0 - 3.5 - 10.8 - 10.7 -22.7
16.6 - 2.6 - 6.6
51.2
9.0 -14.1 - 1.6 -6.9 -6.6 -10.8 23.0 - 9.0 -0.6
-17.6
Source: As for table 26. a Bahrain, Democratic Yemen, Iraq, Jordan, Kuwait, Lebanon, Oman, Qatar, Saudi Arabia, Syrian Arab
Republic, United Arab Emirates, and Yemen only.
of Western Asia in the field of services: (a) the overall pattern of resources endowment of the economies of the region; (b) the geographical location; (c) the differences in development levels, skills, and educational and technological attainment among countries of the region; and (d) cultural affinities. The interregional flows of services trade have had an impact on the overall development process in both importing and exporting countries, involving not only flows of unskilled labour but also sophisticated medical and engineering services. The regional dimension has played a role in the improvement or development of (a) transit services linked with merchandise trade, of benefit to the countries of passage (income and employment), the countries of origin (savings on transportation costs for instance), and the countries of destination (reduction of the costs of importation); (b) health and educational services; (c) interregional tourism; (d) professional services such as consultancy and engineering services, business and mangement services, and public administrative support services (see box 19 for the case of Bahrein). Joint venture enterprises have been established in sectors such as banking, investment and other financial services, transport and communication, tourism and real estate,
insurance and reinsurance, consultancy and engineering, and petroleum-related services.
Services accounted, on average, for almost one half of GDP of Western Asia in 1982-1984. In the non-oil economies, its contribution amounted to almost 60 per cent, while its contribution was lower in the Gulf Cooperation Council countries (45.6 per cent) and in Democratic Yemen and Yemen, the two least developed countries of the ESCWA region (57.3 per cent).254 Social and personal services together constitute the leading services activities in the ESCWA region as a whole. Intermediary services are not yet well developed.
4. Asia and the Pacific
Many Asian countries fall into one of the two most general categories found in other developing country regions. For example, both Indonesia and Malaysia (see charts XXXIV and XXXV) are examples of economies with deficits in services, particularly in "other" services, offset by merchandise account surpluses. Both countries have abundant natural re-
254 ESCWA, Trade in Services, op. cit.
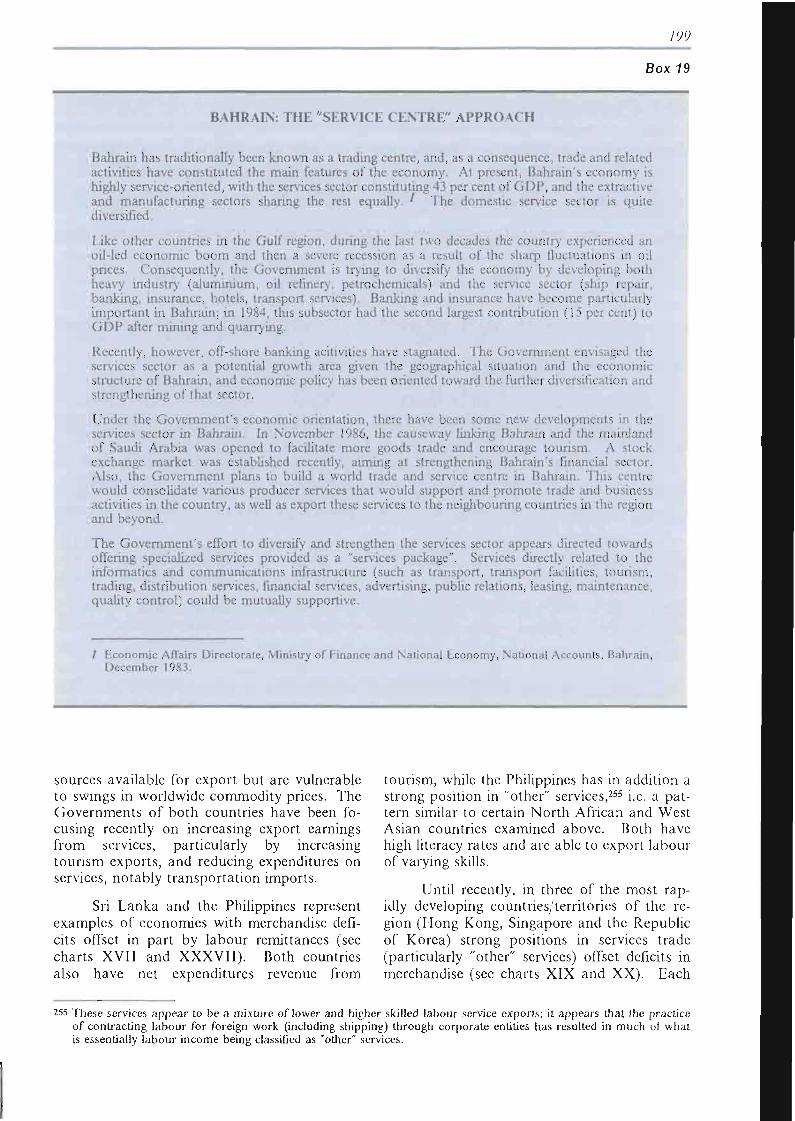
ypp
Box 19
BAHRAIN: THE "SERVICE CENTRE'' APPROACH
Bahrain has traditionally been known as a trading centre, and, as a consequence, trade and related activities have constituted the main features of the economy. At present, Bahrain's economy is highly service-oriented, with the services sector constituting 43 per cent of GDP, and the extractive and manufacturing sectors sharing the rest equally. ' The domestic service sector is quite diversified.
Like other countries in the Gulf region, during the last two decades the country experienced an oil-led economic boom and then a severe recession as a result of the sharp fluctuations in oil prices. Consequently, the Government is trying to diversify the economy by developing both heavy industry (aluminium, oil refinery, petrochemicals) and the service sector (ship repair, banking, insurance, hotels, transport services). Banking and insurance have become particularly important in Bahrain; in 1984, this subsector had the second largest contribution (15 per cent) to GDP after mining and quarrying.
Recently, however, off-shore banking activities have stagnated. The Government envisaged the services sector as a potential growth area given the geographical situation and the economic structure of Bahrain, and economic policy has been oriented toward the further diversification and strengthening of that sector.
Under the Government's economic orientation, there have been some new developments in the services sector in Bahrain. In November 1986, the causeway linking Bahrain and the mainland of Saudi Arabia was opened to facilitate more goods trade and encourage tourism. A stock exchange market was established recently, aiming at strengthening Bahrain's financial sector. Also, the Government plans to build a world trade and service centre in Bahrain. This centre would consolidate various producer services that would support and promote trade and business activities in the country, as well as export these services to the neighbouring countries in the region and beyond.
The Government's effort to diversify and strengthen the services sector appears directed towards offering specialized services provided as a "services package". Services directly related to the informatics and communications infrastructure (such as transport, transport facilities, tourism, trading, distribution services, financial services, advertising, public relations, leasing, maintenance, quality control) could be mutually supportive.
/ Economic Affairs Directorate, Ministry of Finance and National Economy, National Accounts, Bahrain, December 1983.
sources available for export but are vulnerable to swings in worldwide commodity prices. The Governments of both countries have been focusing recently on increasing export earnings from services, particularly by increasing tourism exports, and reducing expenditures on services, notably t ransportat ion imports.
Sri Lanka and the Philippines represent examples of economies with merchandise deficits offset in part by labour remittances (see charts XVII and XXXVII ) . Both countries also have net expenditures revenue from
tourism, while the Philippines has in addition a strong position in "other" services,255 i.e. a pattern similar to certain Nor th African and West Asian countries examined above. Both have high literacy rates and are able to export labour of varying skills.
Until recently, in three of the most rapidly developing countries/territories of the region (Hong Kong, Singapore and the Republic of Korea) strong positions in services trade (particularly "other" services) offset deficits in merchandise (see charts XIX and XX). Each
255 These services appear to be a mixture of lower and higher skilled labour service exports; it appears that the practice of contracting labour for foreign work (including shipping) through corporate entities has resulted in much of what is essentially labour income being classified as 'other" services.
200
of these, however, has been improving its position in merchandise trade. Both the Republic of Korea and Singapore have recently adopted policies to encourage the export of high value-added services;256 thesecountries are also large importers of services.
It would appear that these countries have developed a high degree of flexibility in their adaptation to developments in the world economy. The Republic of Korea for example, has been able to export construction services to
1. Andean group
(a) Services in the external sector
The structure of the external sector of the Andean economies (charts XXI to XXV) is characterized by increasing surpluses in merchandise trade, coupled with a continuous growth in the deficit of all services. Thus, the deficit in services has contributed to the severe debt-servicing difficulties of the region.
Total imports of services into the Andean economy during the period 1980-1984 were $7 billion per annum, equivalent to 40 per cent of merchandise imports. During the 1970s the share of imports of services to total payments in the current account averaged more than 20 per cent for all the Andean countries. The Andean countries are net importers of services (table 28), resulting in an annual average deficit of around S3.7 billion during the 1980-1985 period. Despite the overall deficit position in services trade, service exports have provided revenues on average equivalent to 12 per cent of merchandise exports. The major service export of the Andean region and of each individual country, except Venezuela, is tourism, representing around one-third of services exports and generating around $1 billion per annum. "Other" services account for around 20 per cent of the region's services exports.
oil-producing developing countries and manufactured goods to developed countries. It is possible that the human capital development in the service sector may have made an important contribution to this flexibility, which may be the key to maintaining international competitiveness in the modern trading world. Another essential component to this success would seem to have been the formulation of "service policies" by some of the governments concerned (see box 20 for the case of Singapore).
As can be seen in table 28, the largest import item on the service account is "travel". In 1985 payments amounted to $2.3 billion, of which 70 per cent of total Andean payments were incurred by Venezuelans. The second service import is "other" services - including consultancy and engineering, non-merchandise insurance, communications, professional services, processing and transformation of goods. This item has grown more rapidly than imports of goods in all the Andean economies, even during periods of declining overall demand. Imports of "other" services represent between 20 and 30 per cent of services imports.
Even during the period 1980-1985, which was characterized by recessionary trends, imports of "other" services increased by 45 per cent as compared with the previous period. To the extent that this item can be disaggregated, it would appear the most important debit item. Between 30 and 50 per cent (depending on the country) of imports of "other" services was due to reinsurance payments - totalling $300 million over 1980-1985, followed by fees and/or commissions for professional services. In the case of Peru, it has been estimated that more than 80 per cent of import procurement by the Government in such projects can be attributed to consultancy and engineering services tied to financial packages that are not registered as imports of services but as capital good imports. A recent study on the external debt of Peru showed that around 12 per cent of the total debt of $12 billion corresponded to consulting
C. Services in selected developing countries
256 See annex 6 and box 20. 257 Bolivia, Colombia, Ecuador, Peru and Venezuela
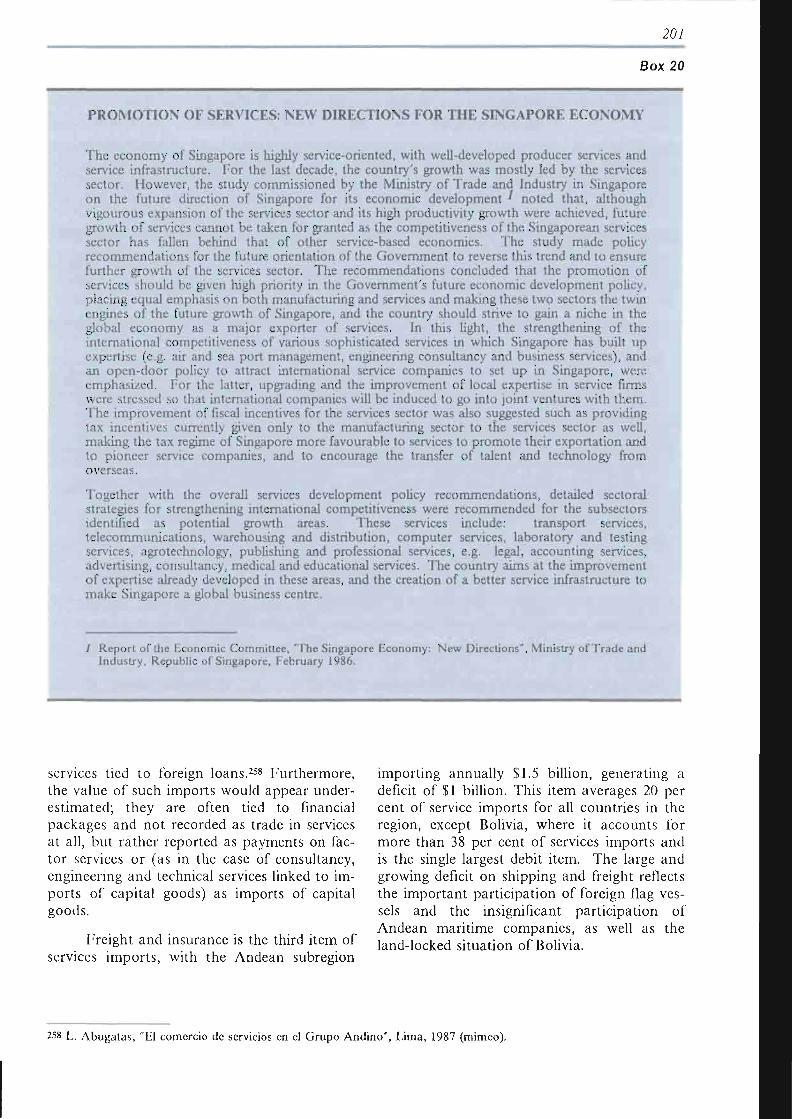
207
Box 20
PROMOTION OF SERVICES: NEW DIRECTIONS FOR THE SINGAPORE ECONOMY
The economy of Singapore is highly service-oriented, with well-developed producer services and service infrastructure. For the last decade, the country's growth was mostly led by the services sector. However, the study commissioned by the Ministry of Trade and Industry in Singapore on the future direction of Singapore for its economic development ' noted that, although vigourous expansion of the services sector and its high productivity growth were achieved, future growth of services cannot be taken for granted as the competitiveness of the Singaporean services sector has fallen behind that of other service-based economies. The study made policy recommendations for the future orientation of the Government to reverse this trend and to ensure further growth of the services sector. The recommendations concluded that the promotion of services should be given high priority in the Government's future economic development policy, placing equal emphasis on both manufacturing and services and making these two sectors the twin engines of the future growth of Singapore, and the country should strive to gain a niche in the global economy as a major exporter of services. In this light, the strengthening of the international competitiveness of various sophisticated services in which Singapore has built up expertise (e.g. air and sea port management, engineering consultancy and business services), and an open-door policy to attract international service companies to set up in Singapore, were emphasized. For the latter, upgrading and the improvement of local expertise in service firms were stressed so that international companies will be induced to go into joint ventures with them. The improvement of fiscal incentives for the services sector was also suggested such as providing tax incentives currently given only to the manufacturing sector to the services sector as well, making the tax regime of Singapore more favourable to services to promote their exportation and to pioneer service companies, and to encourage the transfer of talent and technology from overseas.
Together with the overall services development policy recommendations, detailed sectoral strategies for strengthening international competitiveness were recommended for the subsectors identified as potential growth areas. These services include: transport services, telecommunications, warehousing and distribution, computer services, laboratory and testing services, agrotechnology, publishing and professional services, e.g. legal, accounting services, advertising, consultancy, medical and educational services. The country aims at the improvement of expertise already developed in these areas, and the creation of a better service infrastructure to make Singapore a global business centre.
/ Report of the Economic Committee, "The Singapore Economy: New Directions", Ministry of Trade and Industry, Republic of Singapore, February 1986.
services tied to foreign loans.258 Furthermore, the value of such imports would appear underestimated; they are often tied to financial packages and not recorded as trade in services at all, but rather reported as payments on factor services or (as in the case of consultancy, engineering and technical services linked to imports of capital goods) as imports of capital goods.
Freight and insurance is the third item of services imports, with the Andean subregion
importing annually $1.5 billion, generating a deficit of $1 billion. This item averages 20 per cent of service imports for all countries in the region, except Bolivia, where it accounts for more than 38 per cent of services imports and is the single largest debit item. The large and growing deficit on shipping and freight reflects the important participation of foreign flag vessels and the insignificant participation of Andean maritime companies, as well as the land-locked situation of Bolivia.
258 L. Abugatas, "El comercio de servicios en el Grupo Andino", Lima, 1987 (mimeo).
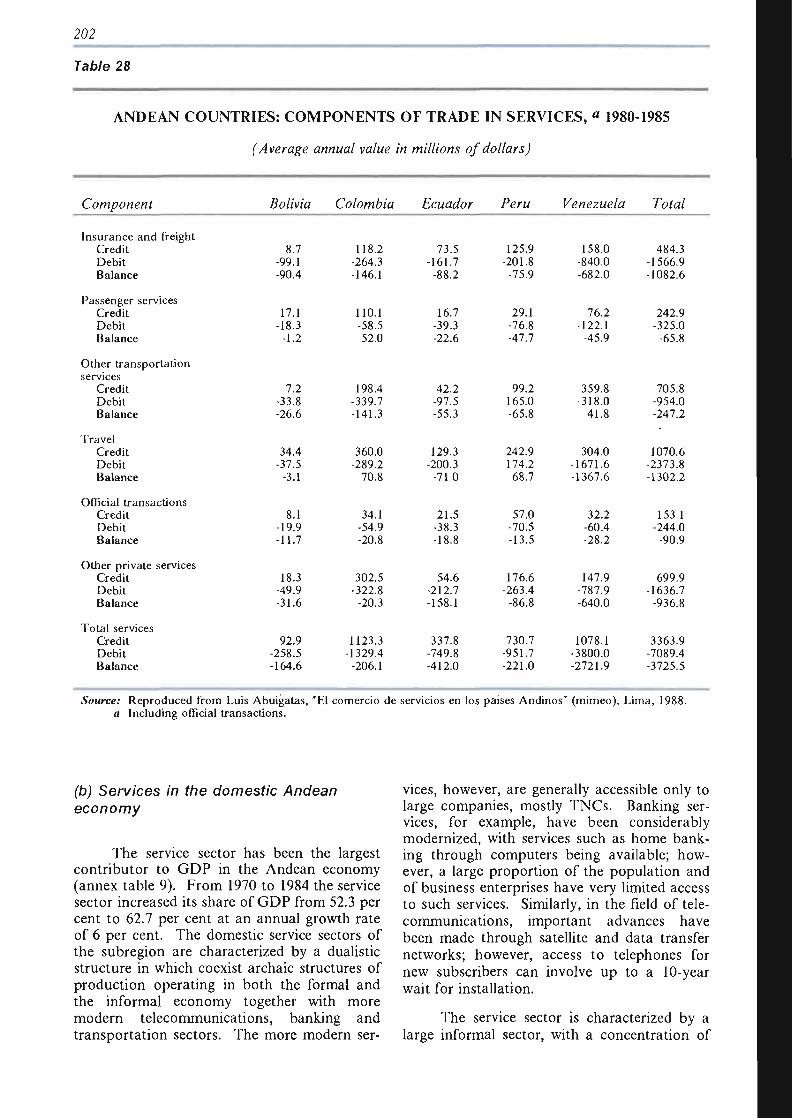
202
Table 28
ANDEAN COUNTRIES: COMPONENTS OF TRADE IN SERVICES, a 1980-1985
(Average annual value in millions of dollars)
Component
Insurance and freight Credit Debit Balance
Passenger services Credit Debit Balance
Other transportation services
Credit Debit Balance
Travel Credit Debit Balance
Official transactions Credit Debit Balance
Other private services Credit Debit Balance
Total services Credit Debit Balance
Bolivia
8.7 -99.1 -90.4
17.1 -18.3
-1.2
7.2 -33.8 -26.6
34.4 -37.5
-3.1
8.1 -19.9 -11.7
18.3 -49.9 -31.6
92.9 -258.5 -164.6
Colombia
118.2 -264.3 -146.1
110.1 -58.5 52.0
198.4 -339.7 -141.3
360.0 -289.2
70.8
34.1 -54.9 -20.8
302.5 -322.8
-20.3
1123.3 -1329.4
-206.1
Ecuador
73.5 -161.7
-88.2
16.7 -39.3 -22.6
42.2 -97.5 -55.3
129.3 -200.3
-71.0
21.5 -38.3 -18.8
54.6 -212.7 -158.1
337.8 -749.8 -412.0
Peru
125.9 -201.8
-75.9
29.1 -76.8 -47.7
99.2 165.0 -65.8
242.9 174.2 68.7
57.0 -70.5 -13.5
176.6 -263.4
-86.8
730.7 -951.7 -221.0
Venezuela
158.0 -840.0 -682.0
76.2 -122.1
-45.9
3S9.8 -318.0
41.8
304.0 -1671.6 -1367.6
32.2 -60.4 -28.2
147.9 -787.9 -640.0
1078.1 -3800.0 -2721.9
Tbfa/
484.3 -1566.9 -1082.6
242.9 -325.0
-65.8
705.8 -954.0 -247.2
1070.6 -2373.8 -1302.2
153.1 -244.0
-90.9
699.9 -1636.7
-936.8
3363.9 -7089.4 -3725.5
Source: Reproduced from Luis Abuigatas, a Including official transactions.
El comercio de servicios en los países Andinos" (mtmeo), Lima, 1988.
(b) Services in the domestic Andean economy
The service sector has been the largest contributor to GDP in the Andean economy (annex table 9). From 1970 to 1984 the service sector increased its share of GDP from 52.3 per cent to 62.7 per cent at an annual growth rate of 6 per cent. The domestic service sectors of the subregion are characterized by a dualistic structure in which coexist archaic structures of production operating in both the formal and the informal economy together with more modern telecommunications, banking and transportation sectors. The more modern ser
vices, however, are generally accessible only to large companies, mostly TNCs. Banking services, for example, have been considerably modernized, with services such as home banking through computers being available; however, a large proportion of the population and of business enterprises have very limited access to such services. Similarly, in the field of telecommunications, important advances have been made through satellite and data transfer networks; however, access to telephones for new subscribers can involve up to a 10-year wait for installation.
The service sector is characterized by a large informal sector, with a concentration of
203
employment in low productivity activities (i.e. personal services) and an insufficient supply of producer services. The dependence of the external sector of the Andean group on imported services is mostly due to the insufficient and/or inadequate Andean supply of services related to merchandise trade, of producer services, and of services of exportable quality. The situation is reflected, on the one hand, in the high concentration of employment in low productivity or low value-added activities, most of them operating in the informal economy, and, on the other hand, by the low share and limited growth rate of potential dynamic services. Public administration, commerce, and personal services accounted for more than half of total services production in every Andean country except Colombia, which, in turn, has the highest growth rate of the group. Regarding a more rapidly growing service, insurance, the countries in the subregion are underinsured according to international standards; the total premiums paid in these countries accounted for around 1 per cent of GDP, while in developed countries premium payments represent around 7 per cent of GDP.259
There continues to be a high degree of internalization of producer services in the Andean manufacturing and extractive industries. In addition, there is a high participation by government in rendering producer services such as banking, communications, transportation, and utilities in addition to the public administrative services themselves.
The importance of services as the largest employer in the economy has risen in parallel with the decline of employment in the primary sector and the only moderate labour absorption capacity of the manufacturing sector. During the period from 1960 to 1984, the growth of employment in services was 2.5 times higher than in the goods-producing sectors, and 1.5 times higher than that of the Andean economy as a whole. Almost two-thirds of employment was generated in typically low productivity activities, i.e. commerce, personal services and public administration activities, which may each be seen as "employers of last resort" (annex table 10).
(c) Foreign direct investment in services in the Andean group
Foreign direct investment (FDI) in services in Andean economies accounted in the mid-1980s for around 15 per cent of total stocks of FDI in all countries, except in Venezuela where the corresponding share was above 30 per cent. A salient feature of FDI in services in the Andean countries is its high concentration in three sectors: (a) financial activities (mainly banking), (b) trade, and (c) tourism. In all the Andean countries, except Venezuela, financial and trade activities have represented around 90 per cent of FDI in services. In Venezuela, the three sectors accounted for 72 per cent of FDI in services. In these two leading sectors, more than two-thirds of FDI is from United States sources, with higher concentration in wholesale and retail trade activities.
Intercountry comparisons of FDI in different service sectors, presented in a recent study,260 show that Colombia and Ecuador each accounts for around 25 per cent of FDI of the Andean group, followed by Venezuela and Peru with around 20 per cent. In each area of foreign investment, though, a different country is the major recipient. In banking and insurance, which accounts for almost half of FDI, Ecuador has received 40 per cent of the investment and Venezuela 26 per cent. In these two countries, financial sector investment is linked in large part to the petroleum sector and the recycling of petroleum income. In the other countries, the financial activities of foreign banks are mainly oriented to support the activities of TNCs in the goods-producing sectors other than petroleum. Accordingly, FDI in financial services would appear to be focused on rendering modern financial services to TNCs, especially risk coverage and specialized services to help them respond to the new market conditions.
Telematic-related services constitute an area of high concentration for FDI in the Andean countries. In the informatics sector, the rapid technological changes, the small size of national markets and the level of development of the Andean countries have fundamentally tilted the morphology of business activities towards massive imports of data processing equipment and related goods and services. Therefore, foreign subsidiaries serve largely as
259 See annex 4 on Insurance. 260 C. Vaitsos, "Foreign investment and related business activities in the service sector", Report presented to JUNAC,
(mimeo), Nov. 1987.
204
commercial agents to promote and secure imports.
Demand for domestic technical producer services (such as consultancy and engineering) is not very significant, mainly due to the fact that foreign-owned subsidiaries depend largely on imports of such services from their affiliates located abroad, while nationally-owned companies are often obliged to import such services linked to imports of machinery, plants and packaged turnkey projects. The great dependence and importance of FDI in consultancy is clearly reflected in the case of Ecuador. From the early 1970s until the beginning of the 1980s, almost 90 per cent of the country's aggregate demand for consultancy services originated from three sectors in which the State was actively involved, often in direct association with TNCs: energy, transport and communications, and urban development. Of the services provided, 42 per cent was engineering, 36 per cent was comprised of diverse technical studies, and 8 per cent was supervision of contracts executed.261
In general, the situation in the Andean Group countries could be described as follows. Employment in the service sector consists largely of people who have left the primary sector (mining and agriculture) and have moved to urban centres, where they have found employment most frequently in low productivity service industries, often of an "informal" nature. Public administration has often expanded to provide additional employment opportunities. While the manufacturing sector in the Andean countries has the same need for specialized, expert (i.e. "knowledge-intensive") services as is observed elsewhere, owing to the lack of a local supply (i.e. the inadequate development of human capital and supportive infrastructure), it has had to resort to foreign suppliers for many of the more highly skilled services. Recourse to such foreign supplied services is mainly by companies with some degree of foreign ownership.
The inadequate and deficient productive structure of domestically supplied services, together with low productivity, pose a dilemma for the Andean group. Without the development of a dynamic domestic producer services sector, an exacerbation of foreign dependence would seem inevitable, with negative consequences not only for the balance of payments but also for the development of improved em
ployment and investment opportunities in the subregion, a matter which would seem of crucial importance for both social and economic reasons.
The Cartagena Agreement 1969 has as a main objective, among other things, to "promote the development of the countries of the Andean subregion through economic integration". To this end, most of the integration policies and mechanisms have concentrated on developing the export potential of the agricultural, extractive, and manufacturing sectors as the cornerstone of this integration process. The Integration Agreement made only an indirect reference to services.262 However, the recent amendment of the Cartagena Agreement by the Quito Protocol provides for co-operation among member states in the field of services.
The Board of the Andean Group (JUNAC), in collaboration with national governments, has organized national studies to assess the role of services in their economies.263
In the light of the conclusions, JUNAC has proposed to undertake regional action at both the macro and the micro level. At the macro level, JUNAC is co-ordinating with actions at the national level, including the harmonization of policies and legislation, accompanied by a package of measures that includes: (a) progressive liberalization of trade in services among the Andean countries; (b) subregional preferential treatment for trade in services; (c) subregional preferential liberalization of financial flows linked to trade in services; (d) facilitation of the intraregional movements of capital and labour; (e) stimulation and facilitation of the establishment of Andean multinational enterprises specialized in services activities; (f) stimulation of subregional investment in services; (g) channeling of import procurement in favour of Andean suppliers and to take advantage of the import capacity of the Andean Group to obtain better conditions in the external acquisition of services; (h) joint actions aimed at developing R & D in the region, with special attention to new technologies; (i) actions oriented towards improving the quality of information on service-related transactions, including the harmonization of methodologies for data collection, and towards maintaining updated information on service studies carried out at national, subregional, regional and interregional levels. To make these measures effective, it has been recommended
261 C. Vaitsos, op. cit.,
262 F. Prieto, "La cooperación regional y subregional en servicios: Reflexiones pa ra la acción" (mimeo), 1987.
263 Junta del Acuerdo de Cartagena, El Sector Servicios del Grupo Andino: Cooperación regional en Servicios: Diagnostico y Lineamientos Generales para Acciones de Cooperación e Integración, Serie Financiamiento N o . 14, Doc. J/PA/7, May 1987.
205
that an Andean "Co-ordination Council for service-related activities" be set up.
At the micro level, the Andean studies highlight the need to take actions aimed at facilitating the process of integration on the sectoral level for specific service subsectors, especially those that offer a great potential for foreign currency earnings and/or savings, along with the development of specialization and complementarity at the subregional level. Among the specific subsectors that have been identified as relevant are transportation, communications, banking, insurance, tourism, and other private services (such as consultancy, reinsurance, auditing, advertising).
2. Mexico
(a) Services in the context of changing economic policies
In Mexico, services have played an important role in both the external and domestic sectors. Mexico is among the top 15 exporters of services in the world, and service revenues represent more than 20 per cent of its total export earnings from goods and services.264 The evolution of the service sector in Mexico has been influenced by key changes in economic policies. In the period 1945-1975, Mexico emphasized import substitution in progressively more sophisticated types of goods. During the mid-1970s, the Mexican external sector became dominated by earnings from petroleum exports, resulting in the adoption of a strategy based on petroleum earnings; however, as a result of drastic reductions in petroleum prices, this strategy became unworkable, compelling Mexico to adopt an export-oriented strategy primarily designed to obtain foreign exchange from non-petroleum exports. The present industrial policy focuses on upgrading the productive structure of the industrial sector in order to overcome the obsolescence of the present industrial establishment, to improve the competitiveness of industries by better integration and enhancement of producer services to enterprises, and to develop the export potential of services.265
The policies that were responsible for sheltering Mexican manufacturing industry from foreign competition also appear to have contributed to the country's failure to develop an externalized producer service sector. As has been explained in chapter I, the growth of this sector appears to be a function of the need for firms to innovate to meet competition and to enter new markets. Having acceded to GATT and embarked on an export-oriented trade policy, the Mexican Government needed to ensure the competitiveness in world markets of industries that had heretofore been protected. Policy changes have been based on the belief that the existence of a strong producer service sector is an essential component in restructuring Mexican industry to compete in national and world markets, and that the producer service sector can provide improved employment opportunities for the rapidly expanding Mexican labour force.
Efforts towards industrial restructuring have been aimed at making Mexico's productive structure more efficient and dynamic, as well as diversifying its exports. The industrial restructuring is being pursued by attempting to maximize forward and backward linkages of services with all economic activities.266 To this end, Mexico is at present engaged in an in-depth analysis of the incidence of services in the economy and, on that basis, devising policies and strategies of development to foster and upgrade specific services. A main element of this strategy involves efforts to change the composition of the domestic services sector by stimulating the externalization of services and evolving a dynamic structure of service enterprises to support the domestic firms efficiently at competitive costs and to increase the exports of services.
(b) Services in the Mexican external sector
Mexico shows the situation of many indebted developing countries where increasing merchandise trade surpluses must be generated in order to meet debt-servicing obligations. In recent years, net outflows on account of interest payments ($11.8 billion in 1984), transportation ($1.4 billion), and property income payments ($700 million) have been larger than
264 See F. de Mateo: "Mexico: Estudio nacional de servicios, informe preliminar" (mimeo), 1987; "México en las negociaciones comerciales internacionales sobre servicios" (mimeo), 1986; "El sector de servicios en México: un diagnóstico preliminar", Comercio Exterior, vol. 38, No. 1, January 1988.
265 These changes are clearly reflected in Mexico's current-account profile (chart XXVI).
266 H. Hernandez, Ministry of Trade and Industrial Promotion of Mexico, opening lecture at the First National Seminar on Services in Mexico, 24-27 August, 1987.
206
surpluses on merchandise trade ($12.8 billion in 1984).
Tourism has been a major export earner for Mexico over the years, though growth in revenues has been difficult to maintain due to a combination of political and environmental factors. The "maquiladoras,"267 or processing services, have become the second most important foreign exchange revenue earner, followed by "other" services. Among these, reinsurance is the major net revenue earner. More recently, Mexico has also been improving its competitive position in architecture and construction engineering.
Although detailed bilateral trade statistics are not yet available for services, Mexico continues to be quite dependent on the United States market, particularly for tourists. In "other" services (i.e. excluding processing), trade is primarily within the Latin American region, though Mexico has participated in some construction projects outside the region.
Recently, Mexico has been developing competitive strength in certain areas of computer-related services as a concomitant of its policy with respect to exports of computer equipment. At present, Mexico exports 50 cents for each dollar of computer equipment imported (compared with 2 cents in 1981) as a result of specific policies adopted by the Mexican Goverment with respect to information-related services during the 1970s and early 1980s, with a view to stimulating the development of domestic supply at two levels: (a) export-oriented by encouraging international subcontracting (maquiladoras); and (b) oriented to the internal market, which developed under a high level of protection. As a result of these policies, foreign computer companies entered the Mexican market to produce electronic appliances and equipment for both the internal and foreign markets; while national companies began to produce computer-related equipment under license, some have also initiated training courses in informatics. Mexico, as a result, has been able to target niches for exports to other developing countries, especially the export of software to Latin American countries.
Services account for 30-40 per cent of Mexico's total imports, with the main emphasis on "other" services and border tourism. The
"other" services imports reflect the demand for many of the new information-related producer services, i.e. those associated with specialized expertise. The process of restructuring manufacturing industry is creating a demand for more advanced services, which appears to explain the increases in the imports of "other" services.
(c) Services in the Mexican domestic economy
In the domestic economy, services accounted for more than 60 per cent of GDP and total employment in 1984, figures that do not differ very much from those of most developed countries (see annex tables 9 and 10). With respect to the composition of the sector, however, three facts are noteworthy:268 (a) the high concentration in relatively low value-added commercial activities; (b) the relatively low contribution of financial (2.2 per cent) and business (1.6 per cent) services; and (c) the high share of revenues from real estate (8.2 per cent). The question presently being studied by the Mexican Government is the nature of the interrelationship between services and other economic activities, and the extent to which the development of key services can stimulate the growth of the latter. The preliminary results of Mexico's national study have identified the following features of the services sector:
(a) The share of^ervices in GDP has remained constant during recent years; meanwhile, employment has increased at higher growth rates mainly in the public sector, and productivity in the service sector declined by almost 10 per cent between 1970-1984.
(b) In contrast to the trends towards the extemalization of producer services observed in the developed countries, between 1970-1980 there was a marked process of "internalization" of services in the manufacturing sector. Input-output analysis of this period in the Mexican economy shows that manufacturing accounted for a declining share in total services consumption. While, in developed countries, the services content of production in manufacturing has increased at a sustained rate, in
267 Owing to the importance of the transformation and processing industries (i.e. maquiladoras), the statistical recording of these transactions of Mexico is presented separately as a part of the services trade account, reflecting a service rendered to foreigners. This practice is compatible with the instructions of the IMF Handbook of Balance of Payments Statistics, which recommends the recording of transformation services on goods without any basic change in the property as an "other" services transaction (paragraph 222 of the Balance of Payments Manual).
268 Substantial disaggregation in the service sector has been developed by F. de Mateo, "Informe preliminar sobre los servicios en Mexico" (mimeo), Mexico, 1987.
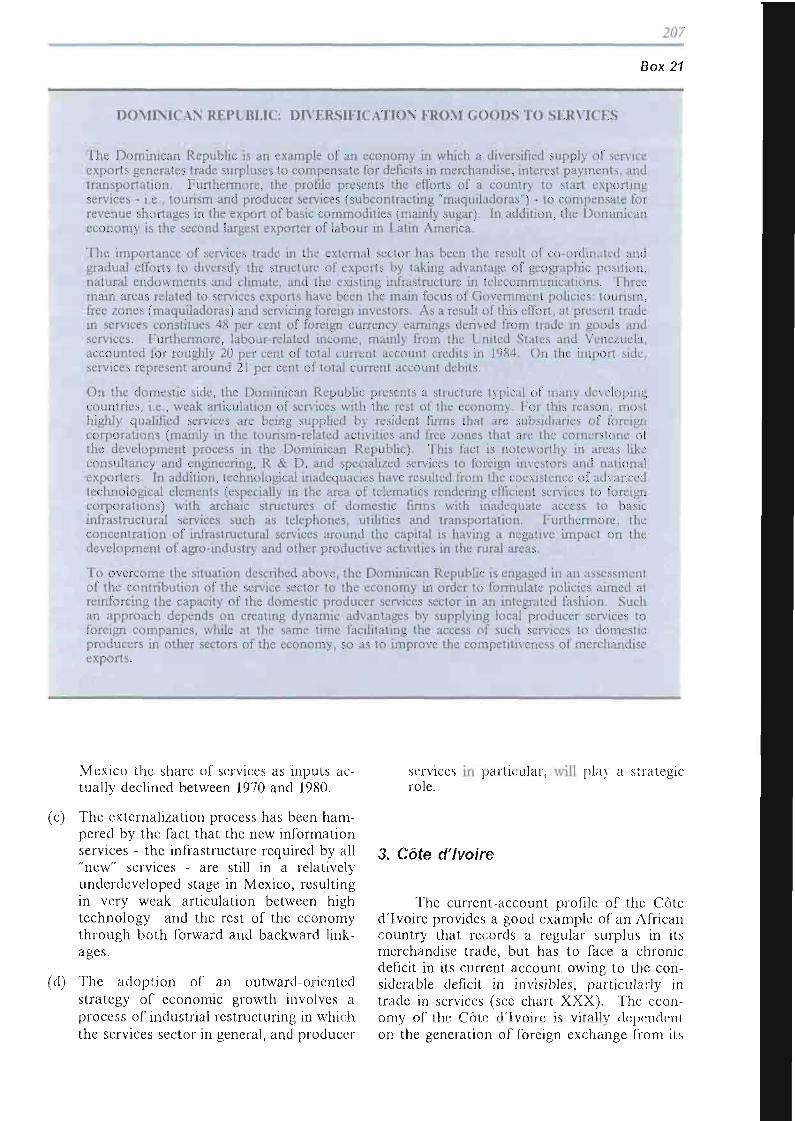
207
Box 21
DOMINICAN REPUBLIC: DIVERSIFICATION FROM GOODS TO SERVICES
The Dominican Republic is an example of an economy in which a diversified supply of service exports generates trade surpluses to compensate for deficits in merchandise, interest payments, and transportation. Furthermore, the profile presents the efforts of a country to start exporting services - i.e., tourism and producer services (subcontracting "maquiladoras") - to compensate for revenue shortages in the export of basic commodities (mainly sugar). In addition, the Dominican economy is the second largest exporter of labour in Latin America.
The importance of services trade in the external sector has been the result of co-ordinated and gradual efforts to diversify the structure of exports by taking advantage of geographic position, natural endowments and climate, and the existing infrastructure in telecommunications. Three main areas related to services exports have been the main focus of Government policies: tourism, free zones (maquiladoras) and servicing foreign investors. As a result of this effort, at present trade in services constitues 48 per cent of foreign currency earnings derived from trade in goods and services. Furthermore, labour-related income, mainly from the United States and Venezuela, accounted for roughly 20 per cent of total current account credits in 1984. On the import side, services represent around 21 per cent of total current account debits.
On the domestic side, the Dominican Republic presents a structure typical of many developing countries, i.e., weak articulation of sendees with the rest of the economy. For this reason, most highly qualified services are being supplied by resident firms that are subsidiaries of foreign corporations (mainly in the tourism-related activities and free zones that are the cornerstone of the development process in the Dominican Republic). This fact is noteworthy in areas like consultancy and engineering, R & D , and specialized services to foreign investors and national exporters. In addition, technological inadequacies have resulted from the coexistence of advanced technological elements (especially in the area of telematics rendering efficient services to foreign corporations) with archaic structures of domestic firms with inadequate access to basic infrastructural services such as telephones, utilities and transportation. Furthermore, the concentration of infrastructural services around the capital is having a negative impact on the development of agro-industry and other productive activities in the rural areas.
To overcome the situation described above, the Dominican Republic is engaged in an assessment of the contribution of the service sector to the economy in order to formulate policies aimed at reinforcing the capacity of the domestic producer services sector in an integrated fashion. Such an approach depends on creating dynamic advantages by supplying local producer services to foreign companies, while at the same time facilitating the access of such services to domestic producers in other sectors of the economy, so as to improve the competitiveness of merchandise exports.
Mexico the share of services as inputs actually declined between 1970 and 1980.
(c) The externalization process has been hampered by the fact that the new information services - the infrastructure required by all "new" services - are still in a relatively underdeveloped stage in Mexico, resulting in very weak articulation between high technology and the rest of the economy through bo th forward and backward link-ages.
(d) The adopt ion of an outward-oriented strategy of economic growth involves a process of industrial restructuring in which the services sector in general, and producer
services in particular, will play a strategic role.
3. Côte d'Ivoire
The current-account profile of the Côte d'Ivoire provides a good example of an African country that records a regular surplus in its merchandise trade, but has to face a chronic deficit in its current account owing to the considerable deficit in invisibles, particularly in trade in services (see chart XXX). The economy of the Côte d'Ivoire is vitally dependent on the generation of foreign exchange from its
206
two principal export crops, cocoa and coffee, that provide about 55 per cent of the country's export earnings. The balance-of-payments difficulties created by the sharp fall of prices on the world market for these products since 1981 and the subsequent shortfalls in earnings, coupled with rising debt-service obligations, have been exacerbated by the growing deficits in trade in services. Development of the service sector is being seen as a way to reduce these deficits, as well as contributing to the diversification of the economic structure of the country.
Exports of services accounted for only 12 per cent of total foreign exchange receipts in 1986, whereas services imports represented around 39 per cent of all import payments in the same year. All services accounts were in deficit (see table 29). "Shipment" is a main deficit item in the Côte d'lvoire's foreign trade in services, with payments for services increasing by a factor of four between 1975 and 1984 as a result of the increase in charges for freight and insurance. "Other transportation" has been the only surplus item in the Côte d'lvoire's services balance. The "other" services item also shows quite a considerable deficit, reflecting the lack of local skilled personnel in management, professional and technical services. While foreign investment has made a positive contribution to the overall development of the Côte d'Ivoire, there has been a tendency for this foreign investment to be accompanied by a heavy reliance on foreign technology and supplies as well as on expatriate expertise and know-how, without apparent "soft" technology transfer.269
The importance of services in the country's economy is reflected in their contribution to GDP (56.7 per cent in 1984). The composition of services does not deviate from the general situation in the majority of African countries. Production of services is dominated by non-tradeables. Commerce activities constitute the largest sector (16.1 per cent of GDP), followed by "public services" (10 per cent), and "transport and telecommunications" (9.4 per cent) (see annex table 9).
As regards the contribution of the service sector to employment, the available data indicate that, the in Côte d'Ivoire, about 20 per cent of the economically active population was employed in services in 1985. It is worth noting that traditional informal activities contributed more than the modern services activities to the generation of total employment (11.3 per cent against 8.9 per cent). According to available statistics, the share of services in total employ
ment rose from 17 per cent to 20 per cent over the period 1975-1985.
The major constraint on the development of intermediate services needed in the process of production is related to the weakness of the existing services infrastructure such as transport and telecommunications networks. Development has been stimulated during the last two decades by relatively high public spending on investment in infrastructure. Yet much still remains to be done. The actual infrastructure is not suitable to the development of the "new services" promoted by information technology.
At the microeconomic level, services activities have been neglected with respect to the distribution of financing by the banking system. The financial system has been less responsive to the needs of the service sector in that, contrary to the situation in the industrial and agricultural sectors, there has not been an institutional framework for service sector financing. Financial support for the industrial and agricultural sector has come from commercial banks and specialized public institutions set up specifically to provide finance to these sectors. By contrast, official financing has not been available equally to service activities. The Government of the Côte d'Ivoire is currently initiating actions to identify means of stimulating the domestic supply of certain key services.
National shipping is being promoted through the modernization of the fleet and the adoption of modern techniques of transportation essential to the competitiveness of a national shipping line. Since the two ports have considerable transit activities, it would also be important to develop good road and railway links with the landlocked countries. The creation of a national maritime insurance company is also envisaged in order to reduce the payment of premiums abroad. Financing facilities for service activities by the banking system are also a matter of concern, and the establishment of specialized institutions, comparable to those serving other sectors, is being contemplated to encourage the development of small and medium size firms in the service sector.
4. Tunisia
Tunisia represents an example of an economy with deficits in merchandise and interest accounts offset in part by travel revenues
269 UNIDO, Industrial development review series: Côte d'Ivoire, October 1986.
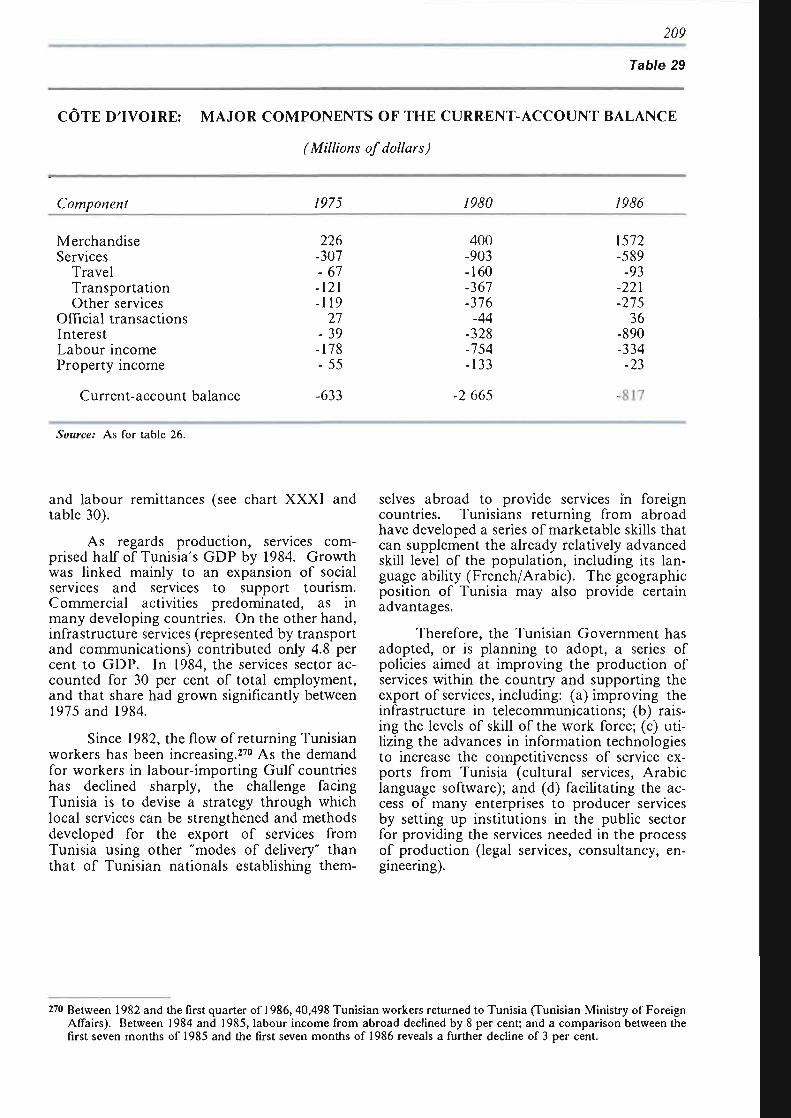
209
Table 29
CÔTE D'IVOIRE: MAJOR COMPONENTS OF THE CURRENT-ACCOUNT BALANCE
(Millions of dollars)
Component 1975 /&S0 7966
Merchandise Services
Travel Transportation Other services
Official transactions Interest Labour income Property income
Current-account balance
226 -307 - 67 -121 -119
27 - 39 -178 -55
-633
400 -903 -160 -367 -376
-44 -328 -754 -133
-2 665
1572 -589
-93 -221 -275
36 -890 -334
-23
-817
Source: As for table 26.
and labour remittances (see chart XXXI and table 30).
As regards production, services comprised half of Tunisia's GDP by 1984. Growth was linked mainly to an expansion of social services and services to support tourism. Commercial activities predominated, as in many developing countries. On the other hand, infrastructure services (represented by transport and communications) contributed only 4.8 per cent to GDP. In 1984, the services sector accounted for 30 per cent of total employment, and that share had grown significantly between 1975 and 1984.
Since 1982, the flow of returning Tunisian workers has been increasing.270 As the demand for workers in labour-importing Gulf countries has declined sharply, the challenge facing Tunisia is to devise a strategy through which local services can be strengthened and methods developed for the export of services from Tunisia using other "modes of delivery" than that of Tunisian nationals establishing them
selves abroad to provide services in foreign countries. Tunisians returning from abroad have developed a series of marketable skills that can supplement the already relatively advanced skill level of the population, including its language ability (French/Arabic). The geographic position of Tunisia may also provide certain advantages.
Therefore, the Tunisian Government has adopted, or is planning to adopt, a series of policies aimed at improving the production of services within the country and supporting the export of services, including: (a) improving the infrastructure in telecommunications; (b) raising the levels of skill of the work force; (c) utilizing the advances in information technologies to increase the competitiveness of service exports from Tunisia (cultural services, Arabic language software); and (d) facilitating the access of many enterprises to producer services by setting up institutions in the public sector for providing the services needed in the process of production (legal services, consultancy, engineering).
270 Between 1982 and the first quarter of 1986, 40,498 Tunisian workers returned to Tunisia (Tunisian Ministry of Foreign Affairs). Between 1984 and 1985, labour income from abroad declined by 8 per cent; and a comparison between the first seven months of 1985 and the first seven months of 1986 reveals a further decline of 3 per cent.
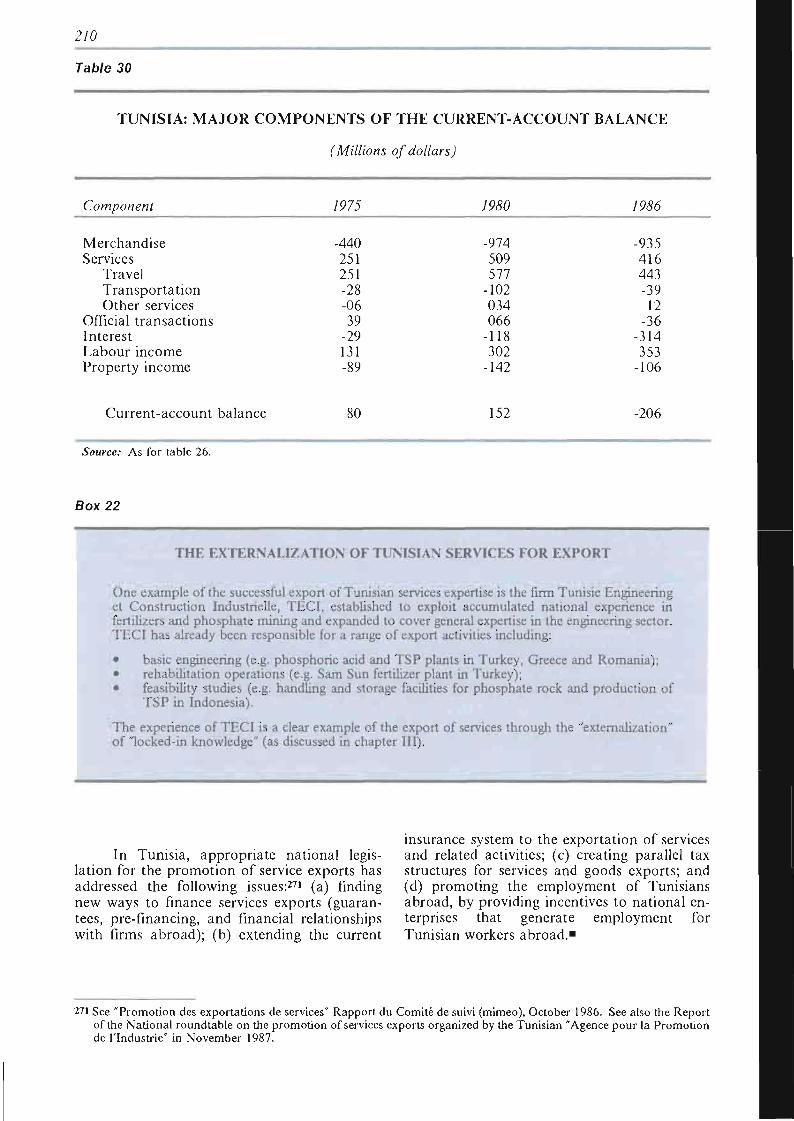
2/0
Table 30
TUNISIA: MAJOR COMPONENTS OF THE CURRENT-ACCOUNT BALANCE
(Millions of dollars)
Component 797J 7950 /9&S
Merchandise Services
Travel Transportation Other services
Official transactions Interest Labour income Property income
-440 251 251 -28 -06 39
-29 131 -89
-974 509 577
-102 034 066
-118 302
-142
-935 416 443 -39 12
-36 -314 353
-106
Current-account balance 80 152 -206
Source: As for table 26.
Box 22
THE EXTERNALIZATION OF TUNISIAN SERVICES FOR EXPORT
One example of the successful export of Tunisian services expertise is the firm Tunisie Engineering et Construction Industrielle, TECI, established to exploit accumulated national experience in fertilizers and phosphate mining and expanded to cover general expertise in the engineering sector. TECI has already been responsible for a range of export activities including:
basic engineering (e.g. phosphoric acid and TSP plants in Turkey, Greece and Romania); rehabilitation operations (e.g. Sam Sun fertilizer plant in Turkey); feasibility studies (e.g. handling and storage facilities for phosphate rock and production of TSP in Indonesia).
The experience of TECI is a clear example of the export of services through the "externalization" of "locked-in knowledge" (as discussed in chapter III).
In Tunisia, appropriate national legislation for the promotion of service exports has addressed the following issues:271 (a) finding new ways to finance services exports (guarantees, pre-financing, and financial relationships with firms abroad); (b) extending the current
insurance system to the exportation of services and related activities; (c) creating parallel tax structures for services and goods exports; and (d) promoting the employment of Tunisians abroad, by providing incentives to national enterprises that generate employment for Tunisian workers abroad."
2?l See "Promotion des exportations de services" Rapport du Comité de suivi (mimeo), October 1986. See also the Report of the National roundtable on the promotion of services exports organized by the Tunisian "Agence pour la Promotion de l'Industrie" in November 1987.
2U_
Chapter VI
SERVICE STRATEGIES FOR DEVELOPMENT
A. Recapitulation of findings
As observed in chapter I, in many developed market-economy countries services have grown in parallel with the expansion of manufacturing production, from which a producer services sector, dynamic in terms of both trade and employment, seems to have evolved. The internationalization of this process and the externalization of service production, the increased tradeability of services, and the emergence of new, primarily information-related, services, have enabled industrialized countries to develop a strong competitive position in services, as reflected in the figures and profiles in chapter II. This chapter indicates that developed market-economy countries export a variety of services and that their position to services in relation to the other components in the current account has changed over time for many of them. This apparent heterogeneity is further apparent from a more in-depth analysis of the trade in "other" services derived from national figures. The developing countries, however, roughly show three main tendencies, as described below.
The strategic importance of services in the economy has extended beyond the traditional areas related to national security, sovereignty and identity and the provision of essential infrastructure to become an essential component in the international competitive strengths of national enterprises and the retention of value added. Advances in information technologies have had an important impact in this respect. However, the potential benefits of the increased tradeability of services, arising from advances in telematic technology, s'eems to be countered by a tendency for the
concentration of information resources, knowledge-intensive services and decisionmaking in large centres, both within national frontiers, between regions and on a worldwide basis. Intensified competition at the global level has increased the demand for such services internationally, as well as for other downstream services such as marketing and advertising. Greater volatility of financial markets has resulted in increasing demand for a variety of financially-related services, which have also been the services to benefit most from advances in information and communications technol-
ogy-
In general, developing countries have deficits' in trade in services, tourism being the main exception. For the largest category of developing countries, services are a deficit item in the balance of payments, while goods (mainly primary product exports), along with official development assistance in certain cases, provide the only source of net foreign exchange earnings. Service imports in most cases have not made a contribution to balance-of-payments equilibrium and have, moreover, exacerbated the debt servicing burdens of these countries. While expanding in employment and production terms, their domestic service sectors are incapable of satisfying the demand for specialized knowledge emanating from other sectors as the "service content" of production increases. This situation has led to the need to rely on imported services or on foreign companies investing in the domestic economy. Furthermore, the weaknesses of their domestic service sectors may be hindering their ability to compete internationally and to make effective
2/2
use of imports of advanced services from developed countries.
Among the developing countries examined in detail above, the Côte d'Ivoire represents a classic case, dependent upon increasing exports of primary products with persistent and growing deficits in service trade and other invisibles and in port services providing the only exception. The countries of the Andean Group also follow this pattern: increasing imports of services place an additional strain on balances of payments already burdened by debt servicing requirements (a pattern shown by other Latin American countries). Their service sectors are growing rapidly in employment terms but inadequacies as regards human capital and supporting infrastructures reduce the contribution of services to growth and development in this region, and lead to an absence of service support to other sectors and a dependence on imported services.
A second group of countries is characterized by dependence on earnings from travel and labour services, i.e. on their nationals producing services abroad or selling services to foreigners in their own countries In other words, cross-border movements of people are essential for their economies. Developing countries falling in this category are found in all regions. As noted above, there has been a striking degree of complementarity, greatly facilitated by cultural affinities, between the petroleum exporting countries of Western Asia and the other developing countries of that region which have supplied them with services, including in the form of skilled and unskilled labour (as well as with North Africa and South Asia, which fall into the latter category). The position of such countries relying on cross-border movements of people seems to be becoming increasingly tenuous. Barriers to the movement of service producers abroad appear to be rising, due to a combination of economic and social factors. Intensive competition in the tourism sector, the difficulty in deriving value added, its sensitivity to political events, and the social costs which it may impose, place serious limitations on strategies relying heavily on tourism. As was seen in the case of Tunisia, these countries are faced with the challenge of finding ways in which their nationals can export services from the home country, and thus continue to gain foreign exchange rather than establish residence abroad. Other "modes of delivery", as discussed in chapter III, may be required.
For both sets of countries, employment considerations would seem paramount. The service sector is largely characterized by increasing employment rates and low productiv
ity jobs, constituting an employer of "first and last" resort for persons displaced from the extractive sectors. As demonstrated by the examples of the Andean group countries and Mexico, the service sector can be expected to continue to be the main source of labour absorption and the key to integrating marginalized elements of the population, including those working in the "informal sector", providing opportunities for upgrading skills. Access to services, including adequate legal and financial services, are important in this respect. In countries dependent upon earnings of nationals working abroad, the service sector will have to provide employment to those returning from service jobs abroad.
Labour costs may provide advantages to developing countries; in this respect, however, these countries may be hindered by barriers to the movement of persons across borders, particularly in developed country markets. Mexico and the Republic of Korea, for example, have found their markets for more advanced services in other developing countries. Non-regulatory barriers and certain aspects of the corporate strategies of TNCs might adversely affect their ability to enter world markets and to benefit effectively from the increased tradeability of services arising from telematic technologies.
The current-account profiles of the developing countries seem to indicate a certain rigidity which might be traced to the composition of their service sectors. In most developing countries, infrastructural and producer services are insufficiently developed. ' This weakness is especially acute in the case of countries with low per capita income, where services closely linked to the production process are still at an embryonic stage of development, while services with an important presence in the economy are precisely those with little impact on the production process. The growth of employment and production in services in developing countries is attributable largely to the supply of low productivity services arising from rapid urbanization rather than from demand on the part of either final consumers or producers.
Only a few developing countries are net exporters of services other than tourism. These countries also demonstrate a strong competitive position in manufactures. Their governments have traditionally emphasized the development of human capital and supportive infrastructures, as well as a coherent strategy in the service sector. The particular experience of Singapore in postioning itself to meet the growing producer service needs of other developing countries should be noted. The very diversity of producer services could provide a wide range of opportunities for developing
213
countries wishing to design such service export strategies.
The factors affecting the ability of developing countries to develop specific service sectors and to participate in the world market for services are discussed with respect to construction and engineering services, insurance, shipping and computer software, in the respective annexes. The findings at the country level would seem to justify the selection of these sectors, given their importance to a large number of developing countries on both the import and export side.
Producer services have shown particularly strong dynamism in the developed market economies, which appears to be closely linked with the availability of basic infrastructure, particularly of advanced telecommunications and information networks, as well as of educational and legal infrastructures. Producer services are rapidly becoming significant determinants of the international competitiveness of many countries. The development of this sector would seem to be a main component of any strategy designed to maximize the contribution of the service sector to the development process.
Many developing countries will continue to rely on traditional services such as tourism and on the movement of their nationals to provide services in foreign countries. Such countries, however, may be able to improve the development impact of the activities in question and foreign exchange earnings accruing from
As seen in chapter I, the postwar growth of the service sector in developed countries occurred in parallel with the expansion of manufacturing; and this process, stimulated on the demand side by an increasingly competitive environment and on the supply side by technological advances and other infrastructural improvements, has culminated in the recent expansion of the producer service sector in terms of value added as a stimulus to efficiency and as a source of employment. However, in a large number of developing countries, the service sector is characterized by low skills and a lack of interlinkages with the manufacturing and agroprocessing sectors. Under present
them by following improved strategies with respect to these services.
The discussion in the preceding chapters appears to suggest that, in the large majority of developing countries, the potential contribution of the services sector to development is yet to be realized and that, in contrast with developed market-economy countries, most developing countries have been unable to use services as a dynamic factor in their participation in the world economy. Their role in this respect is not only in terms of a direct contribution to improving the balance-of-payments situation through increased exports of services but also in a variety of other areas including: (a) the support of service sectors to the efficiency, productivity and international competitiveness of other sectors, (b) the creation of improved employment opportunities in both a quantitative and a qualitative sense, i.e. the creation of skills; and (c) social and other national objectives such as health, education and the incorporation of marginal segments of the population into the mainstream of the economy.
The contribution of services to efficiency and international competitiveness has been recognized in the socialist economies, where the role of services has been traditionally neglected. The USSR and other socialist countries of Eastern Europe have included policies designed to stimulate both producer and consumer services in their national plans. They are also aiming at increasing the already significant role of services as a source of foreign exchange.
conditions, the growth of the producer service sector may not occur spontaneously in developing countries, and action may be required to develop the service sector as a means of stimulating manufacturing, trade, more highly skilled employment opportunities, and technological development through policies designed for this purpose.
The creation of both more and higher quality (knowledge-intensive) job opportunities will probably remain central to the service development policies of developing countries. While expansion of the manufacturing sector can and has provided some absorption of em-
B. The need for national service policies
2/4
ployment in certain countries, its growth is interlinked with the development of the producer service sector, which represents an important source of high skill employment opportunities. The development of human capital can be pursued in the context of improved public education (in particular in the area of specialized vocational training). Studies of the supply aspects of the service sector and demand arising from the competitive needs of other sectors can help to identify priorities in this respect.
The formation of human capital and its efficient application in the service industries requires an effective infrastructure. The retarded and often distorted growth of transportation and communication infrastructure has become an increasingly negative factor in development, as technological advance in communication technologies accelerates and becomes more crucial for economic development and the delivery of services. An advanced telecommunications system would seem fundamental to the effectiveness of transportation, educational, financial, informa tic and other infrastructures.272
The uneven geographical distribution of telematic infrastructures has an adverse effect on the ability of developing countries to produce and obtain services and deliver them to markets.
The combination of human capital and appropriate informatic infrastructures has been seen as a prerequisite for upgrading the "information wealth" of a country which, through the development of a knowledge-intensive service sector, can be translated into increased productivity and competitiveness and serve to generate an environment in which advanced services could develop. Even the most technologically advanced countries have adopted policies for increasing such "information wealth", and for supporting the "knowledge-based" service sector. The support of the service sector to the manufacturing and agricultural sectors could be further facilitated by special training programmes aimed at meeting the needs of these sectors with respect to the supply of producer services. The externalization of services from manufacturing enterprises could strengthen interlinkages between the service sector and the manufacturing sector as well as providing greater accessiblity of small and medium size enterprises to producer services.
In the same way that individual firms need to develop a new set of internal service
functions to profit adequately from externalized service inputs, countries require a strong producer service sector to benefit from the possible contributions to efficiency of imports of highly advanced services. The development of indigenous producer service sectors in developing countries will enable these countries to assimilate and adapt advanced technologies from developed countries, and in the long run this should lead to increased international trade in services.
Government policies can ensure the access of producers to services by creating entities to provide essential services not available in the country and which, in accordance with national objectives, cannot or should not be provided from abroad. The provision of incentives for the establishment of service parks or service trade centres concentrating services in a geographical centre so as to maximize the possibility of their mutual support and their accessibility by other sectors has been taken up by several countries. Schemes of this nature (i.e. service/trade centres ) can provide an attraction for investment, both domestic and foreign.
Government procurement policies can and have been used to stimulate the domestic service sector, including the growth of smaller service enterprises. Regulations ensuring the standards and quality of service suppliers could also serve to upgrade the domestic sector so as to strengthen its efficiency and support to other sectors and its ability to meet foreign competition as well as to attract foreign investment in manufacturing.
Lack of access to services by individuals can impede their welfare and erode their contribution to economic growth. For example, inadequate legal and administrative services can seriously retard investment and frustrate the efforts of otherwise productive people and impede the development of small and medium size service enterprises, while efforts to upgrade the productive capacity of small agricultural producers can be frustrated if they find themselves unable to obtain financing at reasonable terms and are hence burdened by debts at extremely unfavourable rates contracted within the informal sector, or if they are unable either to derive a fair share of the value added from their production or to obtain the information required to apply technological advances effectively.
272 This has been recognized in General Assembly resolution 36/40 "World Communications Year: Development of Communications Infrastructure', and resolution 24 of the Plenipotentiary Conference of the International Telecommunication Union (Nairobi, 1982).
215
C. Service export strategies
Many developing countries recognize the need for the formulation of specific strategies to increase their foreign exchange earnings from the service sector. The development of export markets for services not only contributes to balance-of-payments equilibrium but provides a stimulus for improving employment opportunities and strengthening the domestic service sector in general. This is particularly true for countries that see little possibility of increasing their earnings from the export of goods, and especially for those countries whose possibility of constructing a development strategy around the manufacturing sector appears unpromising. However, service export strategies could also be seen as methods of strengthening domestic service firms and upgrading the knowledge base of the population rather than simply as a source of foreign exchange.
The specific characteristics of services should be taken into account in the formulation of a strategy for the penetration of foreign service markets. One is that market penetration can be achieved using different modes of delivery or combinations of these modes; as discussed in chapter III, at least one "mode", and usually a combination of the four (people, capital, goods or information), must cross national frontiers. Physical or regulatory barriers affecting such modes of delivery will have an effect on the ability to penetrate foreign markets. Given the high human capital content of services, the key to many service export strategies is to offer relatively high skills at relatively low prices. The problem is the "delivery" of such services to customers. In many cases visa regulations particularly hamper the export of services that have a high labour content (e.g. construction or professional services) in which certain developing country firms have demonstrated their competitive ability.
Foreign exchange earnings from labour-intensive services can best be achieved, as noted above, by taking advantage of the greater transportability of goods and persons wherever possible. The information "mode" is where the most impressive advances in transportability have occurred, and some developing countries
are finding niches in the market for information or data services, especially in relatively labour-intensive segments, while others are exploring ways of using transborder information flows as a means of penetrating foreign markets for services.
Another characteristic is the link between services and trade in goods. The export of certain goods can lead to the export of services and vice versa. It would appear that this services-following-goods scenario is most effective in the case of high technology goods where specialized follow-up training and maintenance are required and can often only be provided by the producer of the goods for technical and or contractual reasons. Developing countries' policies could aim at incorporating the maximum amount of domestically produced services in the goods before export and avoid the situation in which continually increasing service imports are required to export the same volume of goods. If this approach is to yield benefits, domestic production of services must be competitive.
Some developing countries have been able to develop goods-following-services strategies, linking their export of consultancy engineering services to subsequent exports of capital goods. In this area, however, the financing package is crucial. The more competitive developing country service suppliers are often placed at a disadvantage vis-à-vis developed country competitors who are able to offer a comprehensive services-goods-financing package.
Service export strengths are often found "locked-in" within the manufacturing, agro-industry and extractive sectors, and can become exportable if externalized.273 Given the growing demand for producer services, strategies based on externalizing the services content in other sectors and organizing them so as to penetrate export markets to a greater extent constitute an approach that shows much promise. Whole "packages" of services can be provided from a specific geographical locality (i.e. a "service centre") by (a) ensuring the maximum trans-
273 See J. Nusbaumer, op. cit
2/6
portability of the factors mentioned above through facilities for the movement of people (airports), goods (seaports), information (tele-ports) and capital (appropriate regulations), and (b) establishing the necessary services infrastructure (communications, education and finance), all of which can be concentrated in the locality concerned.
Competitive positions can be built on strategies that take into account the particular advantages of the country in terms of knowledge and experience that have developed for historical, geographical and cultural reasons. Often the factors contributing to such advantages may not have been recognized in the past or might even have been considered as disadvantages.274 In this context, the development of a producer service sector linked to the manufacturing or agro-industry sectors can in itself provide an export capacity in services. In countries where these other sectors are not on a scale to permit this approach, advantages can be built upon in other more traditional services (e.g. transportation, tourism), modern information and telecommunication services or on special skills and cultural and geographical factors.
The increased tradeability of services provides the means for supplying services from distant geographical locations and" thus, in theory, should permit developing countries to participate more effectively in the world market for services. Account should be taken of the fact that TNCs are important (if not the predominant) actors in international markets for modern services. Pools of highly skilled labour supported by state-of-the-art telecommunications infrastructures can attract knowledge-intensive service industries. An astute policy mix of human capital and infrastructural development and a specific regulatory framework for service TNCs could constitute central elements in a service development and trade policy.
Examples of export strategies used by developing countries include:
(a) Taking advantage of experience incurred in dynamic domestic markets to move into regional and world markets (e.g. the
Brazilian engineering industries and the construction industry of the Republic of Korea and Mexico, which have gained experience in large domestic projects);275
(b) Building on the externalization of services incorporated in goods production (e.g. the Tunisian exports of services connected with the phosphate and petroleum industries);276
(c) Exporting service capacity initially developed for domestic social reasons (e.g. Colombian exports of medical and education services);
(d) Building upon particular linguistic and cultural factors (e.g. Tunisian exports of Arabic language computer software; services based on Chinese/English bilingualism in Singapore;
(e) Developing a niche in markets for data services (e.g. Barbados offshore office services);277
(f) Extending traditional service sectors to cover new activities or to appeal to additional categories of clients (e.g. specialized convention centres in Colombia, Philippines; medical and convalescent centres in Jamaica), etc.;
(g) Meeting the producer service needs of regions or subregions (e.g. Singapore exports of agro-technical and business services);278
(h) Creating service centres (e.g. Dominican Republic service free zone for processing both goods and data);279
(i) Repairs and assembly (e.g. Singapore ship repairs);
(j) Various combinations of the above, for example tourism combined with medical, educational or particular cultural services, with participation where appropriate of other services such as insurance.
Service export strategies also require that service exports benefit from the same degree of adminstrative and financial support as exports of goods. Such support measures, provided by
274 For example, an educated workforce without ' technical" manufacturing skills, a high rate of bilingualism, distance from major centres, etc.. See D . Riddle, Service-led Growth, op. cit.
275 As described in annex 5.
276 As described in chapter III.
277 See K. Hoffman and A. Pos thuma, "Impact of t rade and foreign investment in the offshore office sector in the Caribbean: Practices, problems and potential" (mimeo), Geneva , 1986.
278 See box 19.
279 The "service free zone" in the Dominican Republic, which is 100 per cent domestically owned, offers a wide range of services to foreign companies , including maintenance , design, bookeeping, financial services, joint venture advisory services and financial feasibility studies (see promot ional documentat ion from San Isidro Free Zone , Santo Domingo).
217
certain developing country governments, include (a) access to export financing schemes; (b) favourable tax treatment; (c) provision for duty-free imports of essential equipment; (d) service trading companies, as well as consortia which export packages of capital goods and re-
As has been noted in chapter III, policies with respect to imports of services have been influenced by the perceived strategic aspects of services, particularly with respect to monetary policy (banking and insurance), transport and communications, education and media and, with the advent of telematic technologies, the strategic aspects of some services may well have increased. In tourism, "import" policies are usually dictated by balance-of-payments considerations and exchange rate policy. Policies with respect to "other" services, as distinct from general investment or immigration policy, seem to be lacking.
On the import side, service trade policies would have to take into account certain characteristics of the "other" services category and of trade in such services. Such characteristics include their strategic role in (a) influencing the geographical location of decision making, (b) attracting investment in goods and services production, (c) creating knowledge-intensive employment opportunities, and (d) contributing to productivity and innovation in other sectors. The observed propensity of TNCs to import services is also a factor to be considered.
Efforts to promote economic integration among developing countries at the regional and subregional levels could be furthered by taking into greater account the role of services in the integration process.281 Co-operation in sectors
lated services; (e) adequate risk coverage for such exports; (f) provision for greater cooperation on services in bilateral trade agreements and subregional and regional integration agreements.
Based on a more intimate understanding of the demand and supply of services in the national economy, a general policy framework with respect to access to national service markets (through whichever mode of delivery) could be drawn up. Access to the domestic market for services could be judged in relation to the service suppliers' contribution to development objectives. Such a regime might encourage: (a) transfer of technology, particularly through training programmes;280
(b) contribution to infrastructures, particularly telematics infrastructures and information; (c) an increase in competition and efficiency; (d) provision of higher skilled employment opportunities; (e) access to, and participation in, international information networks; (f) the location of information resources and decisionmaking processes in the country; (g) access to downstream services for distribution, marketing and market intelligence for the export of national goods and services; (h) willingness to use local producer services. The desired result of such policies would be the establishment of a stronger service sector which, in itself, could be a major attraction to foreign and domestic investors.
of services directly supportive of trade in goods (export financing, insurance, transportation) could be expanded to include provision for expanding trade in services per se among members of such integration schemes.
D. Service import policies
E. Regional and subregional policy considerations
280 See annex 6.
281 See F . Prieto, op. cit.
2/6
Although this area has generally been neglected, positive examples can be found, for example, in the Caribbean, Central American, and ASEAN subregions.
Regional and subregional agreements aimed at increasing mutual trade in services could build upon existing specializations and complementarities among groups of developing countries, such as has been witnessed in the Wesi Asia subregion. Subregional cooperation, directed toward establishing adequate infrastructural networks to facilitate the transportation and flow of services, especially communications and information services, aimed at the development of a more integrated services infrastructure, is being implemented among certain countries.
Regional co-operation could serve to orient domestic demand towards regionally or subregionally produced services. Services with a high cultural content should be successful in regions and subregions which share a common culture and wish to preserve or strengthen it. Regional arrangements for the mutual development of a producer service sector could focus
The increased internationalization of service activities would provide benefits to developing countries in terms of access to services incorporating advanced technologies, to the extent they have the capacity to benefit from this. However, as indicated above, a longer-term objective of developing countries should be to improve their capacity to capture a significant portion of the rapidly increasing component of service value added in the world economy, and to develop their own knowledge-based service industries capable of sustaining an indépendant, innovative, flexible, and competitive production capacity in both goods and services.
International co-operation should recognize the specific and differing roles of services in the economies of developing countries and the particular challenges they face. As has been observed above, these include the need to develop a domestic producer service sector and
both on the demand side, by facilitating the use of producer services in the region, and on stimulating supply through common efforts to develop the necessary human capital and infrastructures, with the objective of developing a regional producer service infrastructure supportive of manufacturing, agricultural processing and export services. Service exports to countries outside the region could be promoted through joint corporate mechanisms.282 By pooling their resources, developing countries might be able to buy into distribution networks for services and goods in developed countries. Joint approaches, or even common regulatory structures, could assist countries of a region to negotiate more effectively with foreign service suppliers, including transnational corporations, to seek improved terms of access in developed countries, through access to downstream services as well, and to maximize the possibilities of transfer of technology, and of attaining other development objectives mentioned above. Subregional and regional agreements could address other modes of delivery through arrangements concerning regional or subregional investment, movement of persons and information.
supportive telematic infrastructure, to develop appropriately skilled human resources, to reorient skilled manpower returning from abroad so as to continue their contribution to foreign exchange earnings, and to break into markets hitherto closed to developing country firms.
Negotiations are currently underway in the Uruguay Round aimed at establishing a multilateral framework of rules and principles for trade in services, with a view to the expansion of such trade under conditions of transparency and progressive liberalization, and as a means of promoting economic growth of all trading partners and the development of developing countries. In this context, the possibility of furthering the service export potential of developing countries could be addressed. Any liberalization measures included in such a framework could provide equal treatment to those modes of delivery in which developing country firms are in a competitive position, i.e.
F. International policy considerations
282 For example, consulting and engineering consortia have proved a successful means of gaining access to highly competitive international markets.
2/P
movements of persons across borders as well as access to the most "tradeable" mode (information). Such a framework may have to give priority consideration to assisting developing country firms to overcome obstacles in order to gain entry into world service markets. It may also have to address the impact of service imports on development, and recognize that service imports should meet certain criteria with respect to their contribution to development.
One of the purposes of an agreed multilateral framework could be to provide a set of rules and principles that would support the implementation of measures designed to increase the contribution of both imports and exports of services to the development process and serve to reduce the possibility of disputes between trading partners on service issues, in
cluding that of "managing" the potential conflicts of interests between developing countries and TNCs in such a way that the overall contribution of services to development is preserved and the positive contribution of TNCs in this process maximized.
Care should be taken that the servicing of external financial obligations and internal structural adjustment programmes are not permitted to weaken national efforts in the areas of human capital formation, as well as the development of a supportive telematic infrastructure. In effect, greatly increased government spending on education and telematics would merit support from multilateral lending institutions and technical co-operation programmes."

Blank page _____________
Page blanche

Blank page _____________
Page blanche
223
Annex 1
RECENT DEVELOPMENTS IN COMMODITY MARKETS
A. Overall performance
The evolution of prices in 1987 again demonstrated the high degree of instability and unpredictability prevailing in the markets for internationally-traded primary commodities. The decline of prices that has characterized recent years continued for some commodities, while for others, it appears to have ceased towards the end of 1987, and there were instances of significant price increases. The prices of all major categories of non-oil primary commodities rose sharply in the fourth quarter of 1987 (see chart A-1) and remained at a relatively high level during the first quarter of 1988, although some decline occurred in March. Prices of some agricultural raw materials and metals rose to levels that were unforeseen at the beginning of 1987. For 1987 as a whole, most commodities had a higher average price level than in 1986 (see chart A-II). None the less, as measured by the UNCTAD index, prices of non-oil primary commodities exported by developing countries declined slightly on average, owing to the relatively heavy weight of those commodities whose prices fell, in particular coffee. (In 1986 the opposite had occurred: most individual commodities experienced price declines while the overall average advanced somewhat). If coffee is excluded, however, the UNCTAD index shows a significant overall increase in prices in 1987.
Some of the main tendencies in the world economy which had led to the considerable slowdown in primary commodity prices in the 1980s continued to prevail in 1987. Prominent in this respect was the continued sluggish growth of the world economy, with total output rising by 3.0 per cent in 1987, which was only
slightly higher than in 1986, and world trade continuing to grow at about 4 per cent. However, some of the factors influencing commodity prices were more favourable in 1987 than in preceding years. For example, industrial output in the developed market-economy countries rose by an average of 3.3 per cent in 1987, against a mere 1.2 per cent in 1986, and the United States dollar weakened considerably, which may have contributed to firmer prices measured in dollars.
As usual, however, price behaviour responded primarily to developments in demand and supply for individual commodities or commodity groups. For tropical beverages, the market adjustment to the oversupply situation and the failure to reactivate the price support system brought about steep declines in prices in 1987. For food, the tighter supply which resulted from bad weather conditions led to price increases. For agricultural raw materials and minerals and metals, there were important influences on both the supply and the demand side. On the supply side, after several years during which excess capacity had exerted a downward pressure on prices, production cuts appear to have eliminated involuntary inventories and resulted in a better supply/demand balance. On the other hand, the strong growth in the construction sector in North America and Japan and in the automobile industry in many countries boosted the demand for rubber and metals, for which stocks had reached a low level in 1986-1987. Metals prices may also have been favourably influenced by speculative activity, which has tended to increase recently.
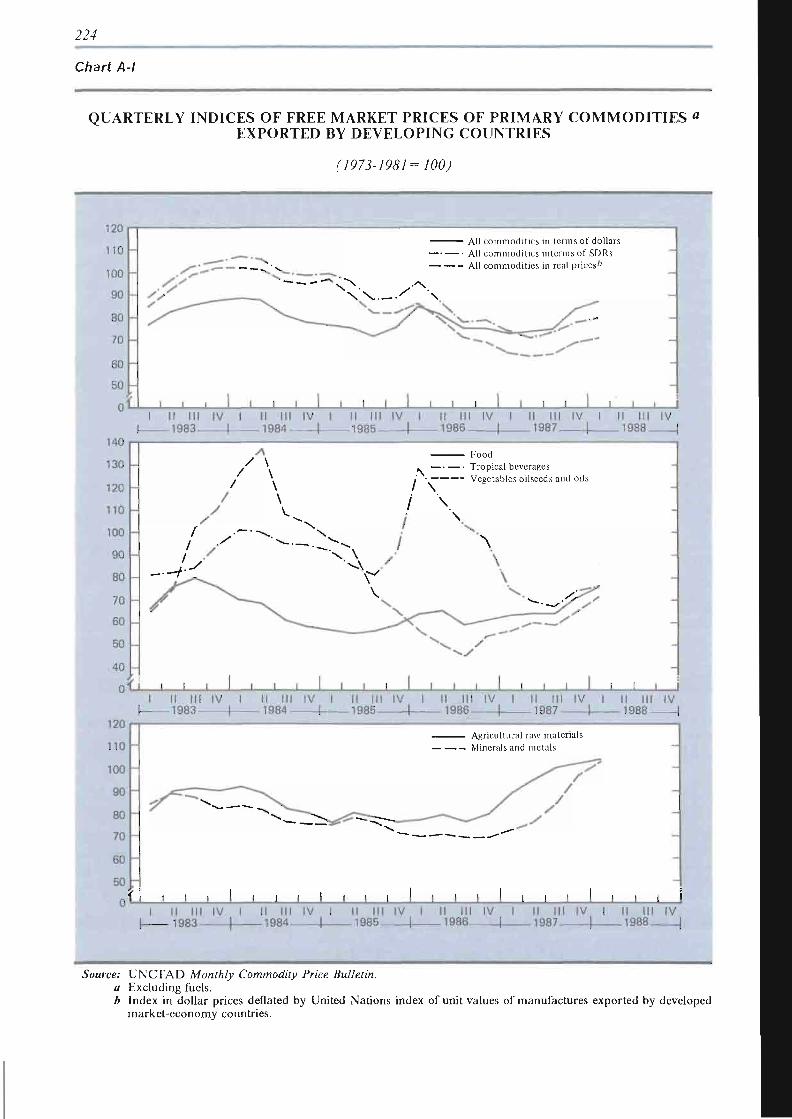
224
Chart A-l
QUARTERLY INDICES OF FREE MARKET PRICES OF PRIMARY COMMODITIES « EXPORTED BY DEVELOPING COUNTRIES
r/97J-y&s/=/oo;
120
110
100
90
80
70
60
50
n l
140
130
120
110
100
90
80
70
60
50
40
0 '
120
110
100
90
80
70
60
50
o'
- s, /
-
r i
i
_ —
/'
r i
i.
^
i i
i —
. All commodities intcims of SDRs j - * " " ^ . All commodities in real prices6
^~^ ^S_ N^_<7sX. y** ^ - ~ — ^ / > ^ = ^ ^ _ ^ - '"
i i I i i t I i i i l i t i i i i i ¡ i II III IV 1 II III IV 1 II III IV 1 II III IV 1 II III IV 1 1983 | 1984 | 1985 | 1986 | 1987 |
•* Food / ' . Tropical beverages
, \ .' • Vegetables oilseeds and oils
/_K / \ v ~-v \ / ^ - \ V_^? ^ ___ Jx ^—-— ' — \x
I I I 1 I 1 I I I I I I I 1 I 1 1 1 I 1 II III IV 1 II III IV 1 II III IV 1 II III IV 1 II III IV 1 1983 | 1981 | 1985 | 1986 | 1987 |
Agricultural raw materials Minerals and metals
^ = — ~~--^ S / ^ " " ^ ^ \ / /
< ^ z ^ ^ ^ ^ X
i i I i i i I i i i I i i i I i i i I i II III IV 1 II III IV 1 II III IV 1 II III IV 1 II III IV 1 1983 • | 1984 | 1985 | 1986 | 1987 |
s
-
i i i
II III IV 1988 I
-
I l
II III IV 1988 |
i i i II III IV 1988 |
Source: UNCTAD Monthly Commodity Price Bulletin. a Excluding fuels. b Index in dollar prices deflated by United Nations index of unit values of manufactures exported by developed
market-economy countries.
22J
All in all, the aggregate dollar price indices for agricultural raw materials and minerals and metals were respectively about 25 per cent and 16 per cent higher in 1987 than in 1986. These rises were much greater than for prices of
manufactures.1 Thus, there has been a significant improvement in the terms of trade for industrial raw materials, though not for other non-oil primary commodities.
B. Outlook
There are widespread expectations that the price increases of non-oil primary commodities will slow down in the months to come. These expectations are based on the view that the factors behind the movement of primary commodity prices in 1987 and early 1988 are rather temporary and not likely to recur. The outlook is not uniform for all commodity groups. Prices of food and vegetables, oilseeds and oils may improve until the crops for the next season are known, and prices of industrial
raw materials will probably continue on the downward path on which they have already started. However, because of the significant increase in prices which took place in the first quarter of 1988, there is likely to be an overall rise in prices in 1988 over the 1987 average. Nevertheless, the rise is not expected to exceed that of the prices of manufactures exported by developed countries, so that the terms of trade of primary commodities are likely to remain unchanged.
C. Developments in major commodity markets
Cereals 2. Sugar
Bad harvests in many regions brought about a fall in world cereal production in 1987. FA O estimates indicate a drop of about 3.8 per cent in production of paddy, about 3.7 per cent in production of wheat and about 5 per cent in production of coarse grain. For the first time in several years world stocks of rice were drawn down, and in consequence the downward trend in prices has been reversed. The price of rice reacted strongly to the expected tight supply situation and by December 1987 had risen by about 38 per cent over the December 1986 level. Prices of wheat and maize started to recover only in the fourth quarter of 1987, and their increase was less pronounced than that of rice. Although the level of aggregate stocks at the end of the 1987/88 season is likely to remain adequate for global food security, the outlook is for some further strengthening of cereal prices in the months ahead. However, developments in the second half of 1988 will largely depend on the outcome of the 1988 harvest.
The world sugar price strengthened steadily during the fourth quarter of 1987 and rose sharply in January 1988 to reach its highest level since 1983. The upsurge was boosted by the revised 1987/88 production estimates and weather-induced production shortfalls in some of the major exporting countries. Reflecting weaker than anticipated demand in some of the major importing countries and higher estimates of 1987/88 world output, the price declined somewhat in February and March 1988. According to some estimates, world sugar stocks are expected to fall to a level equivalent to 33 per cent of annual consumption by the end of the 1987/88 season, which would be much nearer the level of 25 per cent which in the past has triggered sharp price increases. The market is therefore likely to be more sensitive to any revision of the prospects for next season's output.
l The United Nations index of unit value of manufactured goods exported by developed market-economy countries rose by about 12.5 per cent in 1987 over 1986.
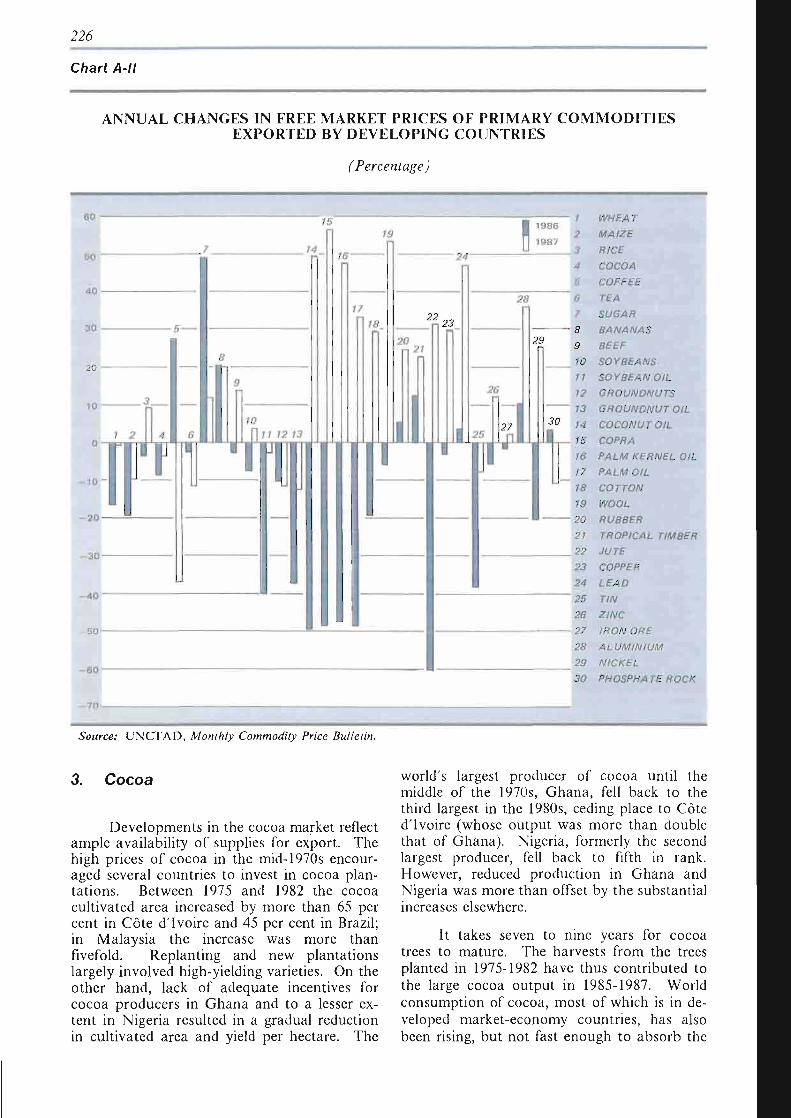
226
Chart A-il
ANNUAL CHANGES IN FREE MARKET PRICES OF PRIMARY COMMODITIES EXPORTED BY DEVELOPING COUNTRIES
(Percentage)
- 2 0
- 3 0
- 4 0
- 5 0
WHEAT
MAIZE
RICE
COCOA
COFFEE
TEA
SUGAR
BANANAS
BEEF
SOYBEANS
SOYBEAN OIL
GROUNDNUTS
GROUNDNUT OIL
COCONUT OIL
COPRA
16 PALM KERNEL OIL
17 PALM OIL
18 COTTON
19 WOOL
20 RUBBER
21 TROPICAL TIMBER
22 JUTE
23 COPPER
24 LEAD
25 TIN
26 ZINC
27 IRON ORE
28 ALUMINIUM
29 NICKEL
30 PHOSPHATE ROCK
- 7 0 -
Source: UNCTAD, Monthly Commodity Price Bulletin.
3. Cocoa
Developments in the cocoa market reflect ample availability of supplies for export. The high prices of cocoa in the mid-1970s encouraged several countries to invest in cocoa plantations. Between 1975 and 1982 the cocoa cultivated area increased by more than 65 per cent in Côte d'Ivoire and 45 per cent in Brazil; in Malaysia the increase was more than fivefold. Replanting and new plantations largely involved high-yielding varieties. On the other hand, lack of adequate incentives for cocoa producers in Ghana and to a lesser extent in Nigeria resulted in a gradual reduction in cultivated area and yield per hectare. The
world's largest producer of cocoa until the middle of the 1970s, Ghana, fell back to the third largest in the 1980s, ceding place to Côte d'Ivoire (whose output was more than double that of Ghana). Nigeria, formerly the second largest producer, fell back to fifth in rank. However, reduced production in Ghana and Nigeria was more than offset by the substantial increases elsewhere.
It takes seven to nine years for cocoa trees to mature. The harvests from the trees planted in 1975-1982 have thus contributed to the large cocoa output in 1985-1987. World consumption of cocoa, most of which is in developed market-economy countries, has also been rising, but not fast enough to absorb the
227
rise in production, with the result that, at the end of the 1986/87 season, stocks of cocoa were estimated to have reached more than 600,000 tons. The expectation of another large surplus at the end of the 1987/88 season put heavy pressure on cocoa prices, which had already been declining since 1985 and which in March 1988 reached a five-year low despite concentrated intervention by the buffer stock under the International Cocoa Agreement. Since the buffer stock reached its ceiling of 250,000 tons by the end of February 1988 and no consensus has been reached on the implementation of supplementary measures within the framework of the cocoa agreement, the prospects for cocoa prices remain gloomy.
4. Coffee
The price elasticity of demand for coffee is low, with the consequence that short-term changes in supply (actual or anticipated) have a major impact on price. Furthermore, because of the long time lag between the planting of trees and their maturity, a quick response by producers to price changes is difficult. The 1985 drought in Brazil led to an increase in 1986 of about 27.5 per cent in coffee prices over the 1985 level, but with improved output in 1987 prices fell by more than 37 per cent on average over the previous year. The steep decline in the price of coffee was reversed in October 1987 after the International Coffee Organization reached an agreement on the resumption of coffee export quotas. The agreement for a world export total of 58 million bags of coffee, in order to defend the Agreement's composite indicator price within the price range of 120 cents - 140 cents per pound, proved to be insufficient. The total quota was cut by 1.5 million bags almost immediately, and there were two further cuts of 1 million bags in January 1988. Although prices responded quickly to the reimposition of the quota, the composite indicator price reached the lower end of the range (120 cents per pound) in February 1988, only to drop again in March .
5. Vegetable oils and oilseeds
Despite an overall increase in 1987 in the supply of vegetable oils and oilseeds, due mainly to the release of large quantities of soyabeans from United States Government-owned stocks, supplies of some vegetable oils and oilseeds, in particular coconut and its de
rivatives, were smaller than in the previous year because of low rainfall in the Philippines and Indonesia. The additional supplies of soyabeans had a moderating effect on increases in the price not only of soyabeans but also of vegetable oils and oilseeds generally. Nevertheless, prices of coconut and its derivatives and of palm oil were noticeably higher in 1987 than in 1986, rising by 49 and 33 per cent, respectively.
The first quarter of 1988 was characterized by fluctuations in vegetable oil prices. In view of the good prospects for the 1988 vegetable oilseeds crops, prices declined in March 1988. However, market fears of low rainfall in the soyabean-growing area in the United States boosted the prices of soyabeans in May and June 1988. Given the tight balance between supply and demand in 1988, prices are expected to rise in the coming months.
6. Cotton
In the crop year 1987/88, a significant increase in production of cotton in the United States, together with increases in Australia, Brazil, China, Paraguay and Pakistan, was insufficient to offset the unexpectedly poor crop in India and other countries. Overall cotton production was some 400,000 tons lower than consumption, stimulating a price recovery in the first half of 1987. Prices remained firm in the third quarter. However, they fell slightly in the fourth quarter and continued to do so in 1988. Despite this decline, average annual cotton prices were about 30 per cent higher than in 1986. The decline which began in 1988 is expected to result in a lower average price for the year as a whole.
7. Rubber
Strong demand boosted the price of natural rubber to a four-year high. As measured by the INRO daily market indicator price, prices were 18.1 per cent higher in 1987 than in 1986. In January 1988, the price of rubber broke through the "must sell" level for the first time since the International Natural Rubber Agreement came into force more than seven years ago. By the end of March 1988, the buffer stock manager was believed to have sold more than 170,000 tons from the the stockpile of 370,000 tons. Apart from seasonal effects, which reduced production between March and
226
May, the strong demand from tyre manufacturing appears to underline market sentiment and to have boosted the price. From January to mid-March, buffer stock sales kept prices from rising above the "must sell" level. From then onwards, the indicator price remained slightly above that level until mid-May, when strong demand, attributable to, inter alia, speculative purchases, led to a further increase, to levels which by mid-June were far above the upper limit of the Agreement's price range. As of mid-June, the buffer stock manger was reported to be holding only 70,000 tons of stock, which gives him only limited means with which to influence prices by further sales. It should, however, be noted that the longer-term outlook for prices is uncertain and fundamental changes could occur in the supply/demand situation which would restore market conditions more typical of the past several years.
8. Minerals and metals
World minerals and metals markets recovered in 1987 after several years of depressed prices. The prices of many metals rose to record heights in December 1987 and remained at a very high level in the first quarter of 1988, taking most producers and consumers completely by surprise.
Prices of metals had been weakening considerably since 1980 for several consecutive years, mainly on account of slack demand and excess production capacities. In the light of massive overcapacity - a result of the oil-price boom years of the 1970s - closure of mines became unavoidable and the period 1982-1986 was painful for mining and processing industries. However, the production cuts appear to have changed the fundamentals, and the metals markets switched from being production-driven to demand-driven (see table Al) . The peculiar aspect of the 1987 price run-up was the failure of supplies to respond to higher prices. This can be partly traced to an erosion of the mining industry's capacity to produce. It has been reported that the industry had downgraded high-cost facilities and redesigned mines to produce at lower, more competitive costs. Thus, the rated capacities of mines and plants were often significantly in excess of their effective capacities.
(a) Copper
During 1987, the price of copper doubled, reaching a December average of 130 US cents per pound, a level not reached since 1974. World consumption of refined copper outstripped production from 1984 to 1987 (see table Al) , bringing about a significant reduction in copper inventories. This situation allowed prices to rise during 1987, when nearby supplies of copper became increasingly scarce.
Increased output is likely to turn the supply deficit in 1987 into a modest surplus in the second half of 1988, with some consequent probable weakening of the copper price. Nevertheless, the average price in 1988 is expected to be significantly higher than the 1987 average of 81 cents per pound.
(b) Aluminium
Aluminium prices rose in 1986 and at an accelerated pace in 1987 as a result of a tight supply situation in those two years when world consumption outpaced production.
The relatively strong growth in demand for aluminium, while still lower than in the period preceding the oil price increases of the 1970s, appears to have been due to resumed production growth in some major aluminium-using industries, such as transportation, as well as to continued penetration of other markets where aluminium use has become important, such as food and beverage packaging. The major cuts in capacity undertaken during the 1980s, in particular in North America and Japan, eliminated excess capacity and eventually led to production falling behind demand. Stocks, which had been falling since early 1985, were thus reduced to very low levels.
(c) Nickel
The price of nickel rose at the LME from the equivalent of 160 US cents per pound in January 1987 to 817 cents in April 1988 on account of both demand and supply factors. On the demand side, in contrast to the long-term declining trend in the intensity of nickel use, consumption of nickel grew in 1987 by about 5 per cent, the major underlying reason being rapid growth of stainless steel production, which accounts for over half of total consumption of nickel. On the supply side, closures of higher-cost units during the recessionary years resulted in the elimination of capacities equiv-
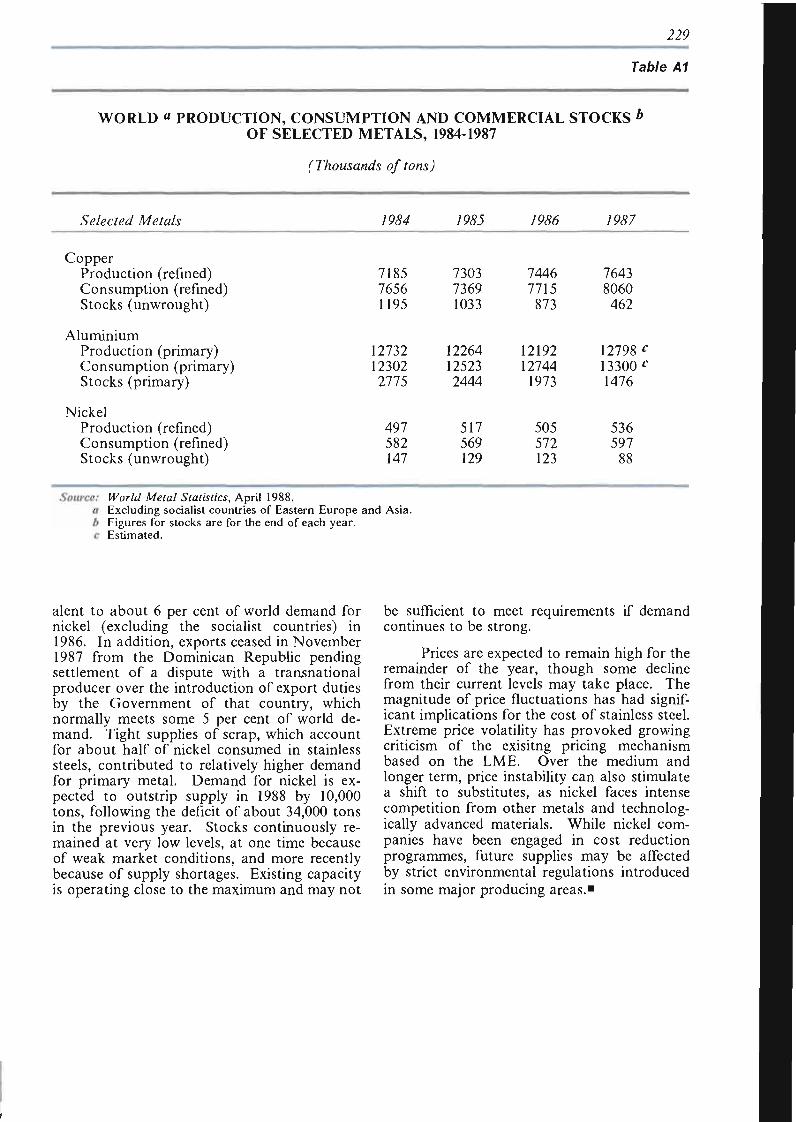
229
Table A1
WORLD « PRODUCTION, CONSUMPTION AND COMMERCIAL STOCKS b
OF SELECTED METALS, 1984-1987
(Thousands of tons)
Selected Metals /9<94 /9&S /9&6 79^7
Copper Production (refined) Consumption (refined) Stocks (unwrought)
Aluminium Production (primary) Consumption (primary) Stocks (primary)
Nickel Production (refined) Consumption (refined) Stocks (unwrought)
7185 7656 1195
12732 12302 2775
497 582 147
7303 7369 1033
12264 12523 2444
517 569 129
7446 7715
873
12192 12744 1973
505 572 123
7643
8060 462
12798 c
13300 c
1476
536 597 88
Source: World Metal Statistics, April 1988. a Excluding socialist countries of Eastern Europe and Asia. b Figures for stocks are for the end of each year. c Estimated.
aient to about 6 per cent of world demand for nickel (excluding the socialist countries) in 1986. In addition, exports ceased in November 1987 from the Dominican Republic pending settlement of a dispute with a transnational producer over the introduction of export duties by the Government of that country, which normally meets some 5 per cent of world demand. Tight supplies of scrap, which account for about half of nickel consumed in stainless steels, contributed to relatively higher demand for primary metal. Demand for nickel is expected to outstrip supply in 1988 by 10,000 tons, following the deficit of about 34,000 tons in the previous year. Stocks continuously remained at very low levels, at one time because of weak market conditions, and more recently because of supply shortages. Existing capacity is operating close to the maximum and may not
be sufficient to meet requirements if demand continues to be strong.
Prices are expected to remain high for the remainder of the year, though some decline from their current levels may take place. The magnitude of price fluctuations has had significant implications for the cost of stainless steel. Extreme price volatility has provoked growing criticism of the exisitng pricing mechanism based on the LME. Over the medium and longer term, price instability can also stimulate a shift to substitutes, as nickel faces intense competition from other metals and technologically advanced materials. While nickel companies have been engaged in cost reduction programmes, future supplies may be affected by strict environmental regulations introduced in some major producing areas."

Blank page _____________
Page blanche
2J/
Annex 2
DEVELOPMENTS AND ISSUES IN THE URUGUAY ROUND
The Uruguay Round of multilateral trade negotiations was launched against the background of general preoccupation with the continuing erosion of the international trading system, which was evident from, inter alia, the ever-increasing recourse to bilateral rather than multilateral solutions to trade problems, to discrimination and to managed trade instruments.2 These tensions in international trade relations had consequently intensified and there had been a rising number of trade disputes. Halting and reversing the increasing recourse to measures which contravened or circumvented GATT rules were viewed as a major incentive to entering into another round of multilateral trade negotiations.
The current trade negotiations differ significantly from past rounds, which dealt primarily with tariff reductions, mostly on industrial products, but also with the question of increasing disciplines with respect to specific categories of non-tariff barriers to trade, i.e. the codes negotiated during the Tokyo Round. The comprehensive agenda for the Uruguay Round includes general market access issues; liberalizing and disciplining agricultural trade; issues relating to the revision of GATT instruments and institutions; and "new" issues, whose inclusion appears to reflect the major changes occurring in the technology of production and in the structure of world output and trade, including the growing importance of services. Another characteristic feature of the negotiations is that it was considered necessary to accompany the launching of the Uruguay Round with the re-affirmation of the "standstill" and "rollback" commitments, the strict implementation of which is regarded as a crucial prerequisite for the success of the whole undertaking.
The negotiating groups on tariffs, non-tariff measures, tropical products, natural
resource-based products, and textiles and clothing aim at improving market access in both general and in specific trade sectors. In the traditional area of tariff negotiations, the focus has been on further reduction and increased binding of tariffs. Most previous rounds of the GATT trade negotiations had essentially focused on industrial tariffs and led to substantial reductions in the general level of tariff duty rates. By 1987, the tariff cuts agreed in the Tokyo Round had been implemented in most developed market-economy countries, and some of them had unilaterally undertaken further tariff reductions. As a result, post-Tokyo weighted average M FN rates (excluding trade in fuels) in EEC, Japan and the United States had fallen to 5.6 per cent, 5.5 per cent and 4.8 per cent, respectively.3 However, tariff 'peaks' still exist for certain sensitive goods, some of which have exceeded 20 per cent, concentrated mostly in food, textiles and clothing, which are items of primary export interest to developing countries.4 Other preoccupations are the low levels of tariff binding, particularly on agricultural items, and tariff escalation, which primarily affects sectors of special interest to developing countries.
Negotiations on non-tariff measures are concentrating on which barriers should be taken up so as to complement the negotiations in other groups - since quite a number of specific NTMs are being dealt with in groups such as those on agriculture, safeguards or subsidies - and on devising appropriate negotiating techniques for their reduction.
Negotiations on natural resource-based products aim to achieve the fullest liberalization of trade in these products, in particular in their processed and semi-processed forms, through a reduction or elimination of tariff and non-tariff measures, including tariff escalation. Elimination of escalation in nominal tariffs, and
See chap. II, sect. C above, and Revitalizing Development, Growth and International Trade. Assessment and Policy Options (TD/328/Rev.l), United Nations publication, Sales No. E.87.11.D.7, chap. IV.
Revitalizing Development, Growth and International Trade. Assessment and Policy Options, table IV.2. For a detailed study on the actual tariff situation, see: R. Erzan and G. Karsenty: 'Products facing high tariffs in major developed market-economy countries: an area of priority for developing countries in the Uruguay Round", UNCTAD Discussion Paper No. 22.
2J2
the related reduction of effective rates of tariff protection for a number of commodities, is one of the most important objectives of developing countries. Developed countries are concerned with the frequent resort to administrative regulatory measures by both developed and developing countries. While the Punta del Este declaration does not point to specific sectors to be tackled in this respect, certain sectors - including non-ferrous metals and minerals, forestry products, and fish and fishery products - have already been examined in the context of the preparatory work, and considerable expertise and statistical data have thus been accumulated.
Negotiations on trade in textiles and clothing aim at formulating modalities that would permit the eventual integration of this sector, which for more than a quarter of a century has been subject to a special trade regime, into the GATT on the basis of strengthened GATT rules and disciplines.5 The Uruguay Round is expected to eliminate the derogation from GATT rules and disciplines in this sector of particular interest to developing countries, thereby also contributing to the objective of further liberalization of trade.
Tropical products constitute a special case, not only because of their primary export interest to developing countries but also to the fact that they are the subject of long-standing commitments by most developed countries to provide unrestricted entry for such products. Tropical products were supposed to be dealt with as a "special and priority sector" in the two previous rounds of multilateral trade negotiations. However, many tariff and non-tariff restrictions against developing country exports to the markets of developed markets still remain in place. The Uruguay Round declaration stipulates that this subject will receive special attention.
Controversy over the issue of safeguards and frequent disregard of GATT rules in this area have been major factors undermining the credibility of the multilateral trading system. There has been a tendency for countries to avoid the disciplines of GATT article XIX6 and
to resort to unilateral actions, or bilateral "grey area" arrangements, particularly to so-called "voluntary" export restraints, thus seriously undermining the security of access to markets, particularly for smaller trading partners. The Punta del Este declaration states that an agreement on safeguards shall be based on the basic principles of the General Agreement, it shall clarify and reinforce its disciplines, and should be applicable to all contracting parties and shall provide for objective criteria for safeguard action. Among these provisions, the strict application of the principle of non-discrimination would seem to be of importance, at least to those countries with weaker economic power, including the developing countries. Success in the safeguard negotiations is crucial to reversing the erosion of the rules of the GATT system and the Punta del Este declaration recognizes that an agreement on safeguards is of particular importance to progress in the other areas of negotiation.
Issues relating to trade in agricultural products were not addressed effectively and conclusively in earlier GATT rounds, which failed to establish effective disciplines for curtailaing practices which seriously distort international trade in agricultural products. The Uruguay Round negotiations attempt to deal with all facets of the issue. Efforts to liberalize agricultural trade will have to deal effectively with the myriad barriers and distortions to trade in this sector, including a high level of unbound tariffs, a large variety of non-tariff measures, and widespread resort to export subsidies. The latter have been one of the main causes of the depressed world market conditions for many agricultural commodities, giving rise to a number of trade disputes, including disputes among the major trading countries. There have been proposals to discipline subsidies affecting trade in agriculture through improvement of existing rules and disciplines, as well as proposals for a general prohibition of export subsidies, with specific exceptions. These proposals vary from far-reaching liberalization of trade in this area to emphasis on early relief measures.
With the conclusion of the Long-Term Arrangement on Cotton Textiles (LTA) in 1962, trade in textiles and clothing was formally exempted from GATT rules. In 1974 the LTA was superseded by the Multi-Fibre Arrangement (MFA), which included some additional fibres (e.g. wool and man-made fibres). The MFA was then renewed periodically, most recently in 1986. With each renewal the coverage of the Arrangement was simultaneously expanded. The MFA is a special sectoral safeguard arrangement which permits GATT contracting parties to escape from certain GATT obligations and to negotiate bilateral restraint arrangements on a discriminatory basis that would not otherwise be permissible. The Arrangement also introduced the concept of "market disruption", which contributed to the erosion of the GATT system. For more details on the issue see: Ying-Pic Choi, Hwa Soo Chung and Nicolas Marian: The Multi-Fibre Arrangement in Theory and Practice (London and Dover: Frances Pinter, 1985).
GATT article XIX ("Emergency Action on Imports of Particular Products") provides for a contracting party's right to introduce, under certain conditions, trade-protective measures. However, it requires that all safeguard protection should be non-discriminatory in its application.
2 j j
Effective disciplines in this sector may also involve special dispensations in the form of waivers, protocols of accession, and the like. The liberalization of agricultural trade and the elimination of subsidies will have to address the possible adverse effects on net food-importing developing countries. If price rises were to result, such countries might require access to enhanced financial resources in order to be able to continue importing essential agricultural items. Of course, higher agricultural prices can have a positive effect in the long term, as they would provide a greater incentive to farmers to expand production.
In many developing countries agriculture is closely linked to the development process, and the importance of the agricultural sector transcends purely commercial considerations. Food and other agricultural products are essential imports for many such countries. Unlike imports of industrial goods, they have little or no margin for reducing essential food imports in response to heavy pressure on their external payments position. Hence, these countries must devote sufficient resources to the development of the food and agricultural sector, even if low international prices might favour imports. This particular consideration may have to be kept in mind in the formulation of regulations covering agricultural trade.
The supply of low-cost credits and other inputs, the assurance of remunerative prices to producers and the development of infrastructure, including research and extension, are some of the important policy instruments used by developing countries to stimulate agricultural production. It may be necessary to align the emerging disciplines in agriculture to such development needs.
Negotiations aiming at redressing institutional shortcomings or modifying certain provisions of the General Agreement constitute another major part of the agenda. The outcome of deliberations on issues such as Dispute Settlement, MTN Agreements and Arrangements, Subsidies and Countervailing Duties, GATT Articles, and the Functioning of the GATT System, is expected to contribute to bringing about a strengthened trading system responsive to the interests of all contracting parties, whatever their size or level of economic
development. In particular, this might entail improving the effectiveness of the Part IV commitments7 and including specific provisions for special and differential treatment in a number of other GATT articles and instruments, strengthening the dispute settlement procedure so as to ensure its impartial functioning, as well as rectifying the current asymmetry in the trade policy surveillance mechanism.8
The outcome of the negotiations on Subsidies and Countervailing Duties and on the other MTN Agreements and Arrangements could also contribute substantially to trade liberalization if they were to reduce effectively the scope for the abusive use of countervailing and anti-dumping duties as an instrument for the harassment of trade.
The negotiations on goods in the Uruguay Round also deal with two entirely new subjects, namely trade-related aspects of intellectual property and trade-related investment measures. The inclusion of these items resulted from the need, as expressed by some developed countries, to reflect major changes occurring in world production and trade. Knowledge-intensive production is increasingly becoming the key factor in international competitiveness in goods and services.
The major challenge before the negotiating group on trade-related aspects of intellectual property rights is to address the often conflicting objectives of countries already possessing the knowledge and those which wish to acquire it. The Negotiating Group is to accomplish three separate tasks: (i) to clarify GATT provisions and elaborate as appropriate new rules and disciplines; (ii) to develop a multilateral framework of principles, rules and disciplines dealing with international trade in counterfeit goods; and (iii) to consider the relationship of these negotiations with the activities of other relevant international forums, particularly WIPO. There may be a need to reach a balance between the adequate protection of intellectual property rights and the use of intellectual property regimes as possible instruments for market domination and impediments to the transfer of technology. However, whether and to what extent these aspects can be covered within the scope of the MTNs in this area is yet to be determined.
Part IV (articles XXVI XXVII) of the General Agreement provides for the "less-developed" contracting parties' right for special and differential treatment. However, it has been the view of developing countries that, for a number of reasons, those provisions do not fully respond to their expectations and needs.
One of the tasks before the Group on the Functioning of the GATT System is "to enhance the surveillance in the GATT to enable regular monitoring of trade policies and practices of contracting parties and their impact on the functioning of the multilateral trading system* (GATT, Basic Instruments and Selected Documents, Thirty-third Supplement (Geneva, June 1987), p. 47). The emergence of this agenda item is seen as a recognition of the fact that the existing practices do not provide for the comprehensive and regular surveillance of trade policies of all GATT contracting parties, particularly those having a major impact on the trading environment.
2J4
Further, any rules relating to trade in counterfeit goods will have to enable countries to deal effectively with imports of counterfeit goods, while ensuring that such measures do not disrupt legitimate trade.
The negotiations on trade-related investment measures address the trade-restrictive and distorting effects of obligations imposed on foreign investors, in particular local content and export performance requirements. The group has attempted to identify those investment-related measures which actually distort or restrict trade and the extent to which GATT articles apply. Specific GATT articles have been identified, with a view to examining their application to investment measures. Developing countries consider it necessary, however, to lay down conditions and criteria which would align such investments to overall national development objectives and to ensure that the activities of transnational corporations contribute to development. They propose that the negotiating group focus on the the extent to which investment measures actually cause damage to the interests of other trading partners. Moreover, they consider that all governmental and non-governmental investment measures, including the investment policies of transnational corporations, should be discussed.
The negotiation of a multilateral framework for trade in services is being carried out under Part II of the Ministerial Declaration, as an integral part of the Uruguay Round, but outside the scope of the GATT legal framework. The declaration aims at establishing a multilateral framework with a view to expansion of services trade and as a means of providing for the economic growth of all trading partners and the development of developing countries. The challenge facing negotiators is to arrive at a framework of rules and principles which ensures the compatibility of and mutual support among the objectives identified in the Uruguay Declaration, and that such a balance, in particular the development objective, is effectively incorporated into possible agreements on individual service sectors. In this context, rules and principles from a variety of international instruments are being explored for possible models. In the negotiations, developed countries have expressed concerns regarding the need for liberalization so that their firms are able to
compete more freely in other countries. On the other hand, developing countries clearly wish to develop those services considered necessary for their future competitiveness in trade in both goods and services and for the attainment of other economic and social objectives, as well as for national sovereignty and security.9 The importance of the service negotiations appears to be attributable not only to the volume of trade in services, but also to the strategic role played by services in international competitiveness in both goods and services, and in the development process. Furthermore, it has been noted that service exports of developing countries are usually associated with the physical movement of persons across national frontiers (for work or for tourism), while developed countries rely more on capital and information, including transborder data flows within the network of transnational corporations, to deliver their services to foreign markets. A better understanding of these relationships, to which work in UNCTAD is contributing, may be necessary to achieve results consistent with part II of the Ministerial Declaration on the Uruguay Round.
Since the Uruguay Round was launched, more than 200 proposals or position statements have so far been tabled, which reveals both the determination of participants to seek solutions to existing problems and the variety of approaches suggested to that end. In spite of the intensive negotiating activity so far, the negotiations have been slow in meeting the needs and interests of developing countries. Perhaps the most significant feature has been that the negotiations have not been able to halt the drift toward protectionism and managed trade. Indeed, the "standstill" commitments have not been strictly adhered to, while the unresolved question of the consistency of newly introduced trade measures with the General Agreement has precluded the Surveillance Body from effectively discharging its functions.10 It has also been observed that the pace of the negotiations has been uneven, with emphasis being placed on the issues of interest to developed countries, while equal progress has not been made in the areas of primary importance to developing countries. At the mid-term review to be conducted by a ministerial session of the Trade Negotiations Committee in Montreal in December 1988, Ministers will have the opportunity to address the difficulties that have emerged and to provide a timely impetus to the negotiating process."
9
10
For a more comprehensive discussion, see part two of this report, chap. III.
The Surveillance Body was established by virtue of the decisions taken by the Trade Negotiations Committee (TNC) on 28 January 1987, with a view to monitoring the implementation of the "standstill" and "rollback" commitments. For the full text of the relevant decisions, see Focus, Gatt Newsletter, No. 43.
2JJ
Annex 3
WORLD SHIPPING AND INTERNATIONAL TRADE
A. Shipping and the balance of payments
In 1985 total freight payments of IMF member countries amounted to SDR 80.2 billion11 and freight receipts to SDR 53.2 billion. This large discrepancy between receipts and disbursements shows the major difficulty of determining the global contribution of shipping to the balance of payments. About one third of world tonnage is registered under flags of convenience. Services to international trade of this tonnage are duly recorded as debits in the balance-of-payments statistics of those countries using these services. The corresponding credits, however, are not recorded,12
as the flag State regards the companies that own and operate those fleets as extraterritorial entities.
When comparing the balance-of-payment contribution of shipping in developed and developing countries, developed countries' earnings should therefore be adjusted by these shortfalls in credit entries as their nationals are the major beneficial owners of open-registry tonnage. Consequently, the freight entries of developed market-economy countries and developing countries members of the IMF compare as indicated in table A2 below. According to table A2 the deficit of developing countries in the sea transport balance amounted to SDR 20.3 billion in 1979, SDR 31.7 billion in 1982 and SDR 22.1 billion in 1985.
The current order of magnitude of freight payments of some S45 billion contributes considerably to the existing imbalance in the balance of trade and invisibles, and thus to the debt problem of developing countries. The only way to remedy this situation is to pursue a consistent policy of import substitution and of export promotion of shipping services. However, when evaluating the potential contribution of a national fleet to the balance of payments it has to be borne in mind that, although the total freight paid to the national line in the country's foreign trade represents a gross foreign exchange saving (earning), the net effect on the balance of payments will be considerably less, depending on the degree that national resources can be used in providing such services. The most important outflows in foreign exchange stemming from an engagement in shipping are financing costs for ships purchased abroad, bunker costs and costs incurred in ports.
Consequently, the net foreign exchange effect of an investment in shipping differs considerably from country to country, with available figures ranging from 10 per cent to 70 per cent of gross revenues depending on a variety of factors. Thus, even on the basis of a conservative estimate of only 30 per cent of gross foreign exchange savings representing actual net savings, developing countries could reduce their foreign exchange outflow by some $7.0
11 Taking into account also the socialist countries' share in world shipping, world-wide sea transport debits can thus be estimated to be the equivalent of approximately SDR 89.0 billion.
12 The major country providing flag of convenience facilities, Liberia (with the largest merchant fleet in the world under its flag), does not show any credit entries in its sea transport account.
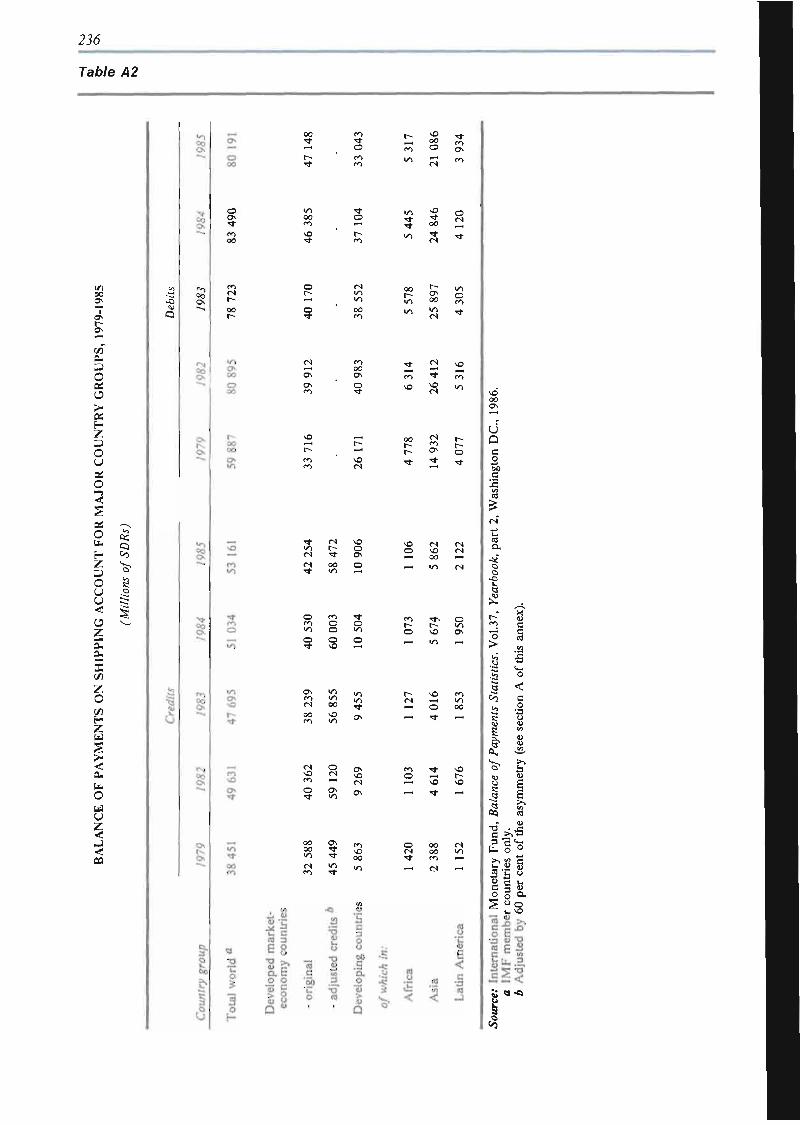
236
Table A2
"¿ 00
o NO 00
o ON
PI
i o ON
1/1 00 S V I
00 8
I s;
•s Q
I o
§
(S VI
00
00
VI VI VI
VI O
>*
V3 0 . 3 O a; u K E-Z 3 o u % o
s o Es.
É -
z 3 o u u < u z 2-X
z o
a. u. O ü U
i aa
§ V I
00
O N
ON r»)
00 ON
( S
\0
00
^ • *
P I
V I
c -t -o
Oí Q
~'¿
1
I
I
• > • •
8
5
3
•a-
vi r -
( S oo • * </i
o m M o v> o
S
o\ vi m ui (N 00
</1
(N O
§ a
oo ON 00 t K l * t
(N V I
=
VI u i
(N
M]
00
\C
o (S \o 00
(N (N
o ? o
55 ON
(S —l VI - H o oo
r<1 T f \ C o -H r~
o rs t
00 00 m
<N VI
I a
a
ï I
-H f » M
< <
i <
I
oo ON
U Q
I
a •s Q
î. r-" m
i 2 c
G O •a
f I î | .
l'fl
III in lit
a <s
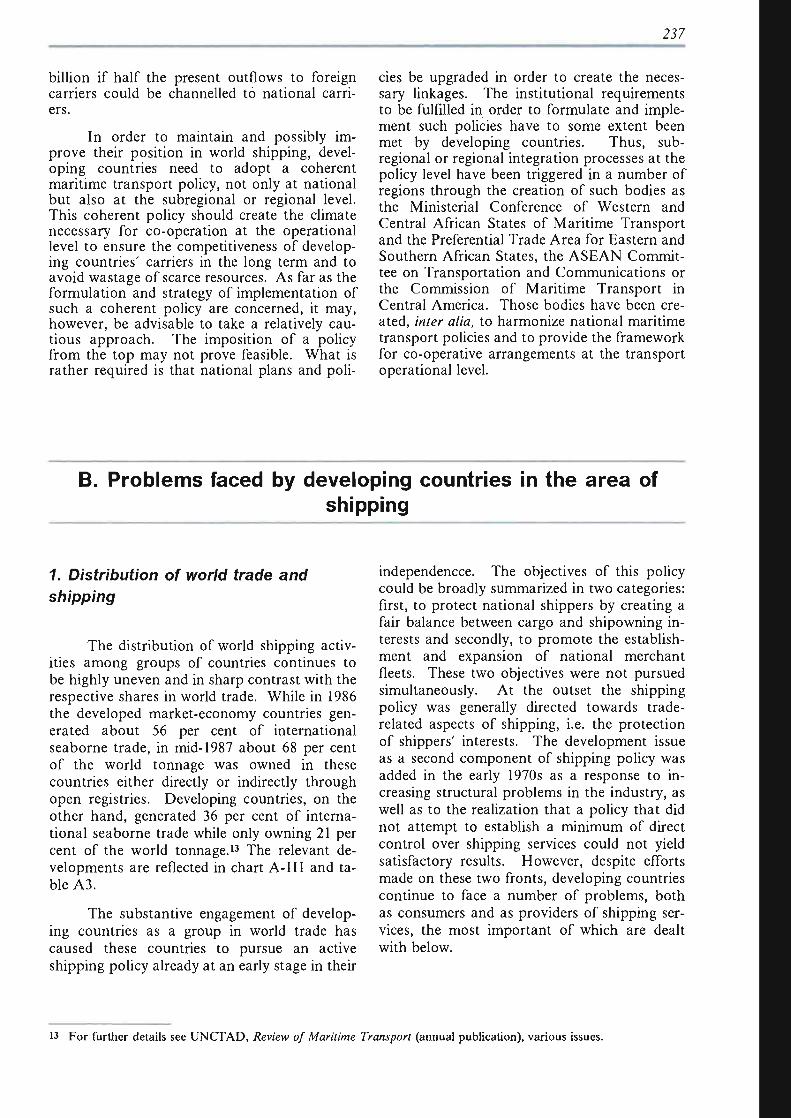
237
billion if half the present outflows to foreign carriers could be channelled tó national carriers.
In order to maintain and possibly improve their position in world shipping, developing countries need to adopt a coherent maritime transport policy, not only at national but also at the subregional or regional level. This coherent policy should create the climate necessary for co-operation at the operational level to ensure the competitiveness of developing countries' carriers in the long term and to avoid wastage of scarce resources. As far as the formulation and strategy of implementation of such a coherent policy are concerned, it may, however, be advisable to take a relatively cautious approach. The imposition of a policy from the top may not prove feasible. What is rather required is that national plans and poli-
1. Distribution of world trade and shipping
The distribution of world shipping activities among groups of countries continues to be highly uneven and in sharp contrast with the respective shares in world trade. While in 1986 the developed market-economy countries generated about 56 per cent of international seaborne trade, in mid-1987 about 68 per cent of the world tonnage was owned in these countries either directly or indirectly through open registries. Developing countries, on the other hand, generated 36 per cent of international seaborne trade while only owning 21 per cent of the world tonnage.13 The relevant developments are reflected in chart A-III and table A3.
The substantive engagement of developing countries as a group in world trade has caused these countries to pursue an active shipping policy already at an early stage in their
cies be upgraded in order to create the necessary linkages. The institutional requirements to be fulfilled in order to formulate and implement such policies have to some extent been met by developing countries. Thus, sub-regional or regional integration processes at the policy level have been triggered in a number of regions through the creation of such bodies as the Ministerial Conference of Western and Central African States of Maritime Transport and the Preferential Trade Area for Eastern and Southern African States, the ASEAN Committee on Transportation and Communications or the Commission of Maritime Transport in Central America. Those bodies have been created, inter alia, to harmonize national maritime transport policies and to provide the framework for co-operative arrangements at the transport operational level.
independencce. The objectives of this policy could be broadly summarized in two categories: first, to protect national shippers by creating a fair balance between cargo and shipowning interests and secondly, to promote the establishment and expansion of national merchant fleets. These two objectives were not pursued simultaneously. At the outset the shipping policy was generally directed towards trade-related aspects of shipping, i.e. the protection of shippers' interests. The development issue as a second component of shipping policy was added in the early 1970s as a response to increasing structural problems in the industry, as well as to the realization that a policy that did not attempt to establish a minimum of direct control over shipping services could not yield satisfactory results. However, despite efforts made on these two fronts, developing countries continue to face a number of problems, both as consumers and as providers of shipping services, the most important of which are dealt with below.
B. Problems faced by developing countries in the area of shipping
13 For further details see UNCTAD, Review of Maritime Transport (annual publication), various issues.
2 #
Chart A-lll
WORLD SEABORNE TRADE BY COUNTRY GROUPS, 1986
(Percentage distribution of world total tonnage)
GOODS LOADED
¡Developed market-economy countries
46.4 <%,
Developing countries
Socialist countries
GOODS UNLOADED
I Developed market I economy countries
Developing countries
Socialist countries
7 %
Source: U N C T A D data bank.
It goes without saying that the choice of trading terms decisively influences the ability of any country to participate in the transport of its own foreign trade. While it is not possible to establish a general pattern of terms applied in general cargo trades, it is clearly established that, in both liquid and dry bulk trades, there is a consistent tendency for developing countries to have to accept f.o.b. terms for their exports and c and f terms for their imports. This effectively shuts them out from engaging in downstream export activities which they may wish to undertake to diversify their economic activities and to reduce their reliance on the production of raw materials only. This tendency to impose disadvantageous trading terms which reflect the imbalance in power of traders in developed and developing countries, as well as the large participation of transnat ional in bulk trades, is often disputed but was largely confirmed by worldwide investigations carried out of the dry bulk trades in 1981 and of the liquid hydrocarbon trade in 1983.
A group of experts on the transport of liquid hydrocarbons14 found, on the basis of information received from importers of nearly 80 per cent of world trade flows in crude oil, that 76 per cent of the volume covered was traded on f.o.b. terms leaving transportation in the hands of the buyers who are usually located in developed countries. Furthermore, it was found that 47 per cent of the imports reported actually consisted of trade between affiliated companies. A similar bias towards f.o.b. terms was found by another UNCTAD expert group with regard to major dry bulk trades15 (iron ore, phosphate, bauxite, alumina) relevant to developing export countries, where the share of f.o.b. contracts ranged from 80 per cent for phosphates to 94 per cent for bauxite.
2. Trading practices
The trading terms agreed upon in an individual sales contract determine the right of the seller or the buyer to make the necessary shipping arrangements. Most common are "free on board" (f.o.b.) or similar terms stipulating that the buyer undertakes to arrange for shipment, and "cost and freight" (c and f) or similar terms stipulating that the seller arranges the transport.
3. Adequacy of services
For any shipping service, particularly any liner service, to be adequate for maintaining and/or developing the trade concerned requires that certain minimum requirements are satisfied mainly with respect to transit time, frequency and regularity of sailing, type of ship used and availability of services for all cargoes traded.16
14
IS
16
See the repor t of the G r o u p of Experts on International Sea Transpor t of Liquid Hydrocarbons in Bulk on its second session (TD/B/C.4 /263) , Geneva, 1984.
See the repor t of the G r o u p of Experts on Problems faced by the Developing Countries in the Carriage of Bulk Cargoes on its second session (T'D/B/C.4/234), Geneva, 1981.
For a detailed discussion on problems of adequacy of services and level and structure of freight rates see, inter alia, U N C T A D , The liner conference system (TD/B/C.4 /62/Rev. l ) and Protection of shippers' interests (TD/B/C.4/176) , United Nat ions publications, Sales Nos. respectively E.70.11.D.9 and E.70.II .D.7.
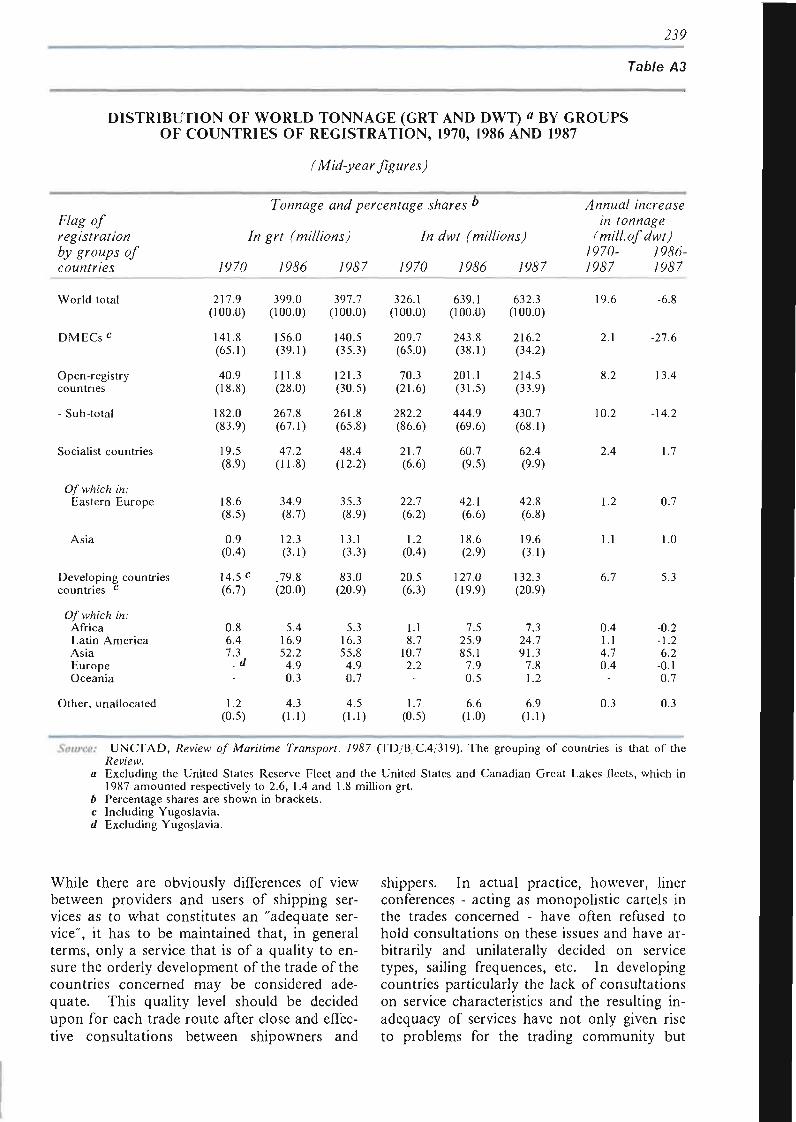
2J9
Table A3
DISTRIBUTION OF WORLD TONNAGE (CRT AND DWT) « BY GROUPS OF COUNTRIES OF REGISTRATION, 1970, 1986 AND 1987
(Mid-year figures)
registration by groups of countries
World total
D M E C s c
Open-registry countries
- Sub-total
Socialist countries
Of which in: Eastern Europe
Asia
Developing countries countries c
Of which in: Africa Latin America Asia Europe Oceania
Other, unallocated
Tonnage and percentage shares "
In grt (millions) In dwt (millions)
7970 79&6 79&7 7970 7946 7967
217.9 (100.0)
141.8 (65.1)
40.9 (18.8)
182.0 (83.9)
19.5 (B.9)
18.6 (8.S)
0.9 (0.4)
14.5 c
(67)
0.8 6.4 7.3
1.2 (0.S)
399.0 (100.0)
156.0 (39.1)
111.8 (28.0)
267.8 (67.1)
47.2 (11.8)
34.9 (87)
12.3 (3.1)
79.8 (20.0)
5.4 16.9 52.2 4.9 0.3
4.3 (1.1)
397.7 (100.0)
140.5 (35.3)
121.3 (30.5)
261.8 (65.8)
48.4 (12.2)
35.3 (B.9)
13.1 (3.3)
83.0 (20.9)
5.3 16.3 55.8
4.9 0.7
4.5 (1.1)
326.1 (100.0)
209.7 (65.0)
70.3 (21.6)
282.2 (86.6)
21.7 (6.6)
22.7 (6.2)
1.2 (0.4)
20.5 (6.3)
1.1 8.7
10.7 2.2
1.7 (0.5)
639.1 (100.0)
243.8 (38.1)
201.1 (31.5)
444.9 (69.6)
60.7 (9.5)
42.1 (6.6)
18.6 (2.9)
127.0 (19.9)
7.5 25.9 85.1
7.9 0.5
6.6 (1.0)
632.3 (100.0)
216.2 (34.2)
214.5 (33.9)
430.7 (68.1)
62.4 (99)
42.8 (6.8)
19.6 (3.1)
132.3 (20.9)
7.3 24.7 91.3
7.8 1.2
6.9 (1.1)
Annual increase in tonnage
(mill.of dwt) 7970- 7966-79<97 79#7
19.6
2.1
8.2
10.2
2.4
1.2
1.1
6.7
0.4 1.1 4.7 0.4
0.3
-6.8
-27.6
13.4
-14.2
1.7
0.7
1.0
5.3
-0.2 -1.2 6.2
-0.1 0.7
0.3
Source: UNCTAD, Review of Maritime Transport, 1987 (TD/B C.4,319). The grouping of countries is that of the Review.
a Excluding the United States Reserve Fleet and the United States and Canadian Great Lakes fleets, which in 1987 amounted respectively to 2.6, 1.4 and 1.8 million grt.
b Percentage shares are shown in brackets. c Including Yugoslavia. d Excluding Yugoslavia.
While there are obviously differences of view between providers and users of shipping services as to what constitutes an "adequate service", it has to be maintained that, in general terms, only a service that is of a quality to ensure the orderly development of the trade of the countries concerned may be considered adequate. This quality level should be decided upon for each trade route after close and effective consultations between shipowners and
shippers. In actual practice, however, liner conferences - acting as monopolistic cartels in the trades concerned - have often refused to hold consultations on these issues and have arbitrarily and unilaterally decided on service types, sailing frequences, etc. In developing countries particularly the lack of consultations on service characteristics and the resulting inadequacy of services have not only given rise to problems for the trading community but
240
have also in some cases provided a factor aggravating port congestion problems.
4. Cost of transport, including level and structure of freight rates
Apart from the considerations related to adequacy of services, the level and structure of freight rates are obviously of crucial importance to the trading community. In international trade transport costs have basically the same protective effect as customs tariffs and are a decisive factor in determining a country's export potential. As many developing countries' key export goods are moved by liner services (table A4), the ratio of liner freight rates to prices of selected commodities gives a representative sample of freight charges faced by developing countries and, consequently, indicates their importance for the latter's competitiveness in foreign markets.
The price of shipping services also has a critical effect upon the industry of developing countries, particularly on infant manufacturing industries established to process imported raw materials into manufactured or semimanufactured exports and to take advantage of relatively low labour costs. Such industries can only remain viable so long as the costs and difficulties of transport do not outweigh the savings and convenience which derive from the use of local labour.
Quite apart from the effects of shipping upon trade and industry, developing countries have grounds for concern about the level of freight rates, because they tend to bear the incidence of freight costs of both their imports and their exports. If freight levels rise they tend to have to pay more for their imports, and at the same time their producers may receive less for the goods they sell overseas.17
Problems of the level and structure of freight rates faced by developing countries have been closely linked to the existence and the mechanisms of the liner conference system. The conference system, created to eliminate price competition among its members, had adopted unilateral rate-setting procedures exploiting their monopolistic powers. At various
international meetings the developing countries had expressed their views that certain practices adopted by the shipping conferences had harmed their trade and development. Developing countries' criticism of the conference system with regard to the level and structure of freight rates related to:
(a) Arbitrary imposition of freight rates including:
(i) General increases and level of rates;
(ii) The fixing of specific freight rates;
(iii) The lack of promotional freight rates; and
(b) Loyalty agreements and imbalance of obligations.
Developing countries' mistrust of the conference system, which gave rise to complaints, was also due in no small measure to the secrecy that cloaks conference rate setting and other policies. Undoubtedly the secrecy in which the system operated resulted in considerable lack of understanding of its mechanism. However, the majority of shippers and shipowners in developing countries regarded the conference system as a necessity - or at least as a lesser evil than rate instability and irregular services.
The problem of unilateralism and secrecy of rate setting was expected to be overcome, or at least eased, by institutionalizing consultation procedures between shipowners and shippers. However, shippers in developing countries complain that the "consultations" held by the liner conferences are often of a superficial character. A particular grievance is that the conferences conduct their "real" negotiations with their trading partners in developed countries and that liner conferences are circumventing procedures for consultations on basic freight rates by the device of increasing surcharges for bunker prices or currency adjustment factors, often under formulas which shippers claim are not comprehensible,
Among others, these problems have been addressed and at least partially resolved in the United Nations Convention on a Code of Conduct for Liner Conferences. The Convention entered into force on 6 October 1983 and will be reviewed at a plenipotentiary conference scheduled to be held under UNCTAD auspices in Geneva (31 October - 18 November 1988).18
17 For a full discussion of the reasons for this situation see the report by the UNCTAD secretariat, Freight markets and the level and structure of freight rates, United Nations publication, Sales No.E.69.II.D.13.
18 See also chapter III.
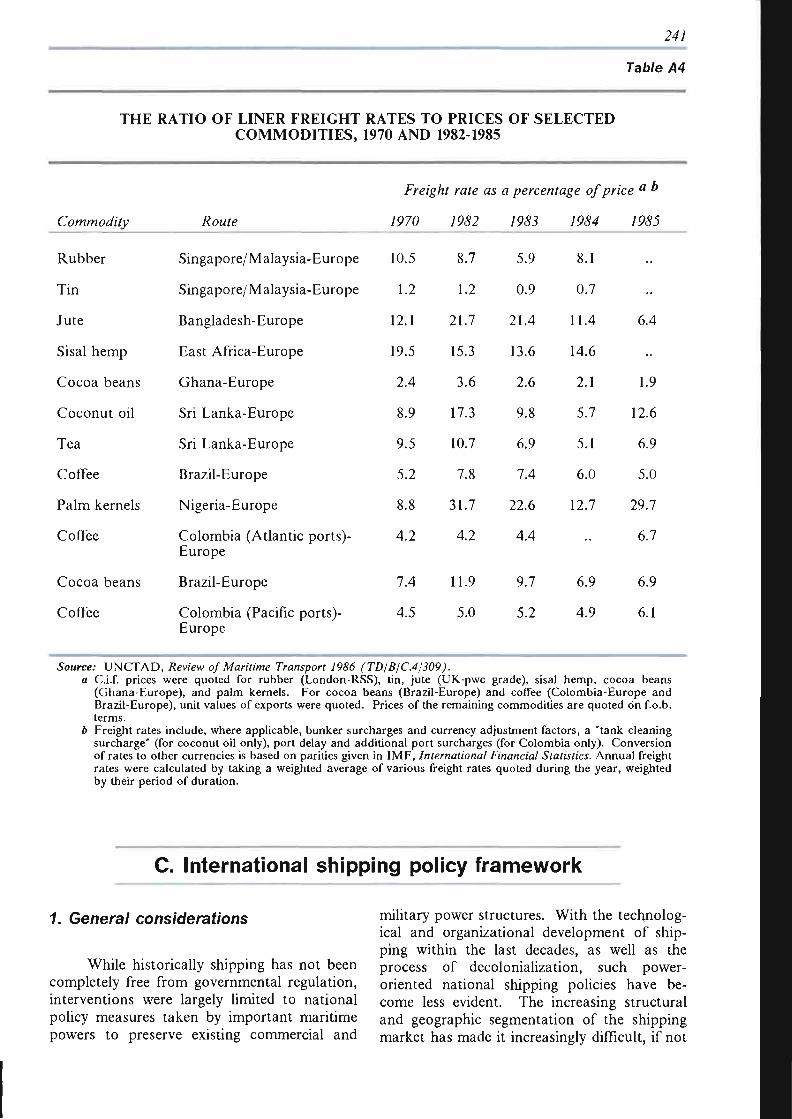
247
Table A4
THE RATIO OF LINER FREIGHT RATES TO PRICES OF SELECTED COMMODITIES, 1970 AND 1982-1985
Commodity
Rubber
Tin
Jute
Sisal hemp
Cocoa beans
Coconut oil
Tea
Coffee
Palm kernels
Coffee
Cocoa beans
Coffee
Route
Singapore/Malaysia-Europe
Singapore/Malaysia-Europe
Bangladesh-Europe
East Africa-Europe
Ghana-Europe
Sri Lanka-Europe
Sri Lanka-Europe
Brazil-Europe
Nigeria-Europe
Colombia (Atlantic ports)-Europe
Brazil-Europe
Colombia (Pacific ports)-Europe
Freight rate as a percentage of price a "
7970
10.5
1.2
12.1
19.5
2.4
8.9
9.5
5.2
8.8
4.2
7.4
4.5
7P42
8.7
1.2
21.7
15.3
3.6
17.3
10.7
7.8
31.7
4.2
11.9
5.0
/Pgj
5.9
0.9
21.4
13.6
2.6
9.8
6.9
7.4
22.6
4.4
9.7
5.2
1984
8.1
0.7
11.4
14.6
2.1
5.7
5.1
6.0
12.7
• •
6.9
4.9
796J
6.4
1.9
12.6
6.9
5.0
29.7
6.7
6.9
6.1
Source: UNCTAD, Review of Maritime Transport 1986 (TD/B/C.4,'309). a C.i.f. prices were quoted for rubber (London-RSS), tin, jute (UK-pwc grade), sisal hemp, cocoa beans
(Ghana-Europe), and palm kernels. For cocoa beans (Brazil-Europe) and coffee (Colombia-Europe and Brazil-Europe), unit values of exports were quoted. Prices of the remaining commodities are quoted on f.o.b. terms.
b Freight rates include, where applicable, bunker surcharges and currency adjustment factors, a "tank cleaning surcharge" (for coconut oil only), port delay and additional port surcharges (for Colombia only). Conversion of rates to other currencies is based on parities given in IMF, International Financial Statistics. Annual freight rates were calculated by taking a weighted average of various freight rates quoted during the year, weighted by their period of duration.
C. International shipping policy framework
7. General considerations
While historically shipping has not been completely free from governmental regulation, interventions were largely limited to national policy measures taken by important maritime powers to preserve existing commercial and
military power structures. With the technological and organizational development of shipping within the last decades, as well as the process of decolonialization, such power-oriented national shipping policies have become less evident. The increasing structural and geographic segmentation of the shipping market has made it increasingly difficult, if not
242
impossible, for individual countries to formulate all-embracing regulatory policies. At the same time, the mobility of the ships themselves and the internationalization of market segments, reflecting the increasing international division of labour, have necessarily created problems of implementation, even in cases where such policies were formulated in relation to individual market segments.
Another important change that has characterized developments in shipping policy concerns the understanding of what "shipping policy" actually embraces. Traditionally, an active shipping policy was the prerogative of important maritime States. It is again only within the last decades that shipping policy has ceased to comprise merely the promotion of national shipping and is more and more understood to contain two equally important elements - the above-mentioned promotion of national shipping and, secondly, the protection of shippers' interests in the widest sense. Thus countries that are typically users of shipping services now have shipping policy aspirations, a fact which has considerably influenced shipping policy considerations at the national as well as the international level.
This dual policy approach inevitably influences policy contents. It aims primarily at enabling the industry to play its proper role as a carrier of international seaborne trade. This role is to be understood not only as neutral but also as a positive one in promoting international trade and economic integration. Consequently, shipping policy should aim at providing a framework that will enable the industry to reach an equilibrium reflecting true cost, thus creating the prerequisite for shipping to be responsive to the needs of trade providing efficient, low-cost services. It is in the absence of such policies that trade may become subservient to transport, with the inherent danger of limiting access of local goods to foreign markets.
Shipping policy considerations are not limited to trade aspects of shipping but extend equally to developmental aspects, even though these cannot be strictly separated from trading concerns. International shipping policy should aim to allow or, in a more active way, to promote the international division of labour also in the shipping sector. In view of existing political constraints in particular, but with due regard also for economic and social constraints, such policy should ideally be designed to allow shipping activities to shift to those countries that enjoy a comparative advantage in providing such services.
The types of measures employed involve regulatory as well as promotional policies which are complementary policy approaches. There is, however, a fundamental difference in policy objectives. National promotional policies, exclusively applied, inherently accept existing market structures and are basically limited to improving the competitive situation of the national fleet vis-à-vis its foreign competitors. Comprehensive regulatory policies, on the other hand, aim at ensuring a desired level of competition by influencing market structures. In practice, a clear-cut differentiation between these policies is not always feasible. The type of policy mix preferred by any country depends mainly on two factors, namely, the political framework established by the general economic policy and the capability of individual countries actually to implement formulated policy principles.
One of the most important promotional policy measures presently adopted, which also contains elements of a protectionist policy, is the granting of direct or indirect subsidies to national shipowners, a course of action pursued primarily by developed countries. While it cannot be denied that there may be certain political considerations involving the maintenance of a minimum national fleet that would justify such policy options, widespread subsidization has considerable negative effects on the international shipping markets. Not only does such a policy eschew any attempt to remedy distortions of shipping markets but, on the contrary, it adds considerably to the maintenance or even the aggravation of presently existing structural disequilibria. It keeps the supply of shipping services at an artificially high level and prevents capital movements to other countries that have a comparative advantage in shipping. Furthermore, this type of policy has been shown to trigger off a subsidy race in which those countries, particularly developing ones, that are neither able nor willing to participate are left behind.
Other forms of promotional policies might not have the same detrimental effect, but nevertheless should be combined with a coherent regulatory policy. The reasons for this can be seen in the fact that promotional policy measures will be the more effective the less the market structures themselves place constraints on the development of a complete shipping sector or on the participation of a particular national fleet therein. Structural problems cannot be overcome by promotional policies.
While promotional policies are often applied in an undifferentiated manner to all sectors of shipping, regulatory policies are by nature more selective and have in their appli-
24J
cation largely been limited to liner shipping. Market mechanisms, particularly in liner shipping, have proved to be only partly capable of enabling the industry to play its proper role in the orderly development of world trade. While the existence of liner conferences is generally accepted as beneficial to trade and development, there is a broad consensus that the system lends itself to abuses and that there is a consequent need to create a multilateral regulatory environment conducive to the beneficial development of trade and shipping services. Whatever policy measures have been applied, major aims are to regulate two crucial aspects of the liner conference system, namely, the admission of lines and conference/ shipper relations.
The basic concept behind the regulation of liner shipping is to curb the concentration of power fostered by the prevailing market structures, either by creating the framework for a countervailing power to develop within the market or by an institutional neutralization of the power exercised by shipping cartels. An example of the first approach would be the anti-trust exemption of shippers' councils, and of the second the creation of a supervisory body controlling specific elements of conference behaviour. Consequently, the primary aim of regulatory policy cannot be to reduce or even eliminate competition but rather to ensure a minimum level of fair competition that market forces themselves cannot generate.
The specific objectives of regulatory policy also make it imperative to apply specific policy measures. In view of the structural differences of the shipping market segments they need to be designed in such a way as to be able to address particular problems. This necessary selectivity would render unworkable any attempt to introduce chapeau regulation covering shipping markets as a whole.
Both promotional and regulatory policies can no doubt be pursued at a national or international level; the question is at what level they can be employed most effectively. With regard to specific promotional policies, the answer depends largely on the exact formulation of policy objectives. With regard to regulatory policies, however, the situation is quite different. As mentioned before, regulatory policies aim to correct mechanisms of markets which, by nature, are international. Consequently, unilateral and unco-ordinated regulatory action will lead to further market distortions rather than to optimum market structures.
2. The United Nations Convention on a Code of Conduct for Liner Conferences
This need for a multilateral dialogue and internationally-agreed solutions to shipping problems has long been recognized by the international community. One of the most important achievements in this respect is the United Nations Convention on a Code of Conduct for Liner Conferences adopted in 1974 which entered into force in October 1983. Today, 71 countries are Contracting Parties to the Code This Convention provides an internationally accepted regulatory framework within which liner conference operate. Moreover, the Code of Conduct is to be an important instrument for the attainment of a more significant participation in shipping by developing countries, as expressed in the International Development Strategy for the Third United Nations Development Decade in the field of transport. In fact, the Code is one of the most crucial support measures for the realization of the major targets of the 1980s in shipping, i.e. the attainment of structural change in the shipping industry and a 20 per cent share of world tonnage for developing countries. As far as liner shipping is concerned, the Code makes a dual contribution to the attainment of these goals because it reduces investment risk and, what is even more important, it helps developing countries' shipping lines to secure cargo - a support without which any quantitative tonnage targets become meaningless.
The importance of the Code for developing countries is not to be seen in isolation but as part of a shipping political package containing other important elements which aim at the same target and which have been under consideration in UNCTAD. Among others, these related elements include ship financing, registration of ships, multimodal transport operations, model legislation, etc.
Despite these considerations, the Code is not confined in its application to developing countries but is of a universal character. In fact, the Preamble to the Convention stresses its universality and it is only in one place - i.e. article 12 (c) - that explicit reference is made to the specific needs of developing countries.
The objectives of the Code are to ensure rights of participation in trade of national lines so that they are entitled to carry a substantial share of their countries' foreign trade; to balance the interests of shippers and shipowners; and to facilitate the orderly expansion of liner trade. To this end, the Code regulates, inter alia, the relationship between member lines of
244
conferences, in particular the rights of admission of national shipping lines to conferences serving their countries' foreign trade. It also establishes rules for the participation of member lines in the trade carried by conferences, Unless otherwise agreed when determining a share of trade within a pool operated under a conference, the group of national shipping lines of each of two countries, the foreign trade between which is carried by the conference, shall have equal rights to participate in the freight and volume of traffic generated by their mutual foreign trade and carried by the conference. Third-country shipping lines, or cross-traders, if any, shall have the right to acquire a significant part, such as 20 per cent, in the freight and volume of traffic generated by that trade and carried by the conference. Thus, the so-called 40:40:20 rule is nowhere expressly mentioned in the Convention but is arrived at by mathematical deduction based on strict interpretation of the Code provisions on trade participation. However, such a rigid interpretation does injustice to the Code which, particularly in the section on participation in trade, provides for a considerable measure of flexibility in sharing arrangements, as is already evidenced by the use of the expression "such as 20 per cent" for third country liftings, as well as the proviso "... unless otherwise mutually agreed". The Code leaves similar room for flexible arrangements with regard to other provisions as well. Consequently, the argument of rigidity brought forward by Code opponents appears to be
largely based on a misunderstanding of its provisions. The Code also sets forth rules for the establishment of pools or other types of trade-sharing arrangements in conferences, as well as other internal conference activities, such as self-policing.
Moreover, the Code regulates the relationship between shippers and liner conferences by establishing equitable principles for the use of loyalty arrangements as well as the provision that conferences are required to hold consultations with shippers or their representative organizations on matters of concern to shippers, such as changes in freight rates, loyalty arrangements, imposition of surcharges, etc. It also sets forth rules regulating freight rate increases, promotional freight rates, surcharges and currency adjustment factors.
Even though the Code has been in force only for a relatively short time and even though it has to be recognized that shipping developments have rendered some of its specific provisions less relevant than they were at the time of its adoption, the Code has clearly had a significant impact on the developing countries' desires to participate equitably in shipping and to ensure the provision of services adequate to their trading needs. More than any other national or international instrument, the Code has contributed to the reconciliation of divergent shipping interest, both between North and South as well as between users and providers of shipping services."
24J
Annex 4
THE INSURANCE SECTOR
The modern form of insurance appeared towards the end of the seventeenth century, but it was mainly during this last century that insurance became an institutionalized activity. The modern history of insurance may be divided into two periods:
The first half of this century saw the institutionalization of the activity of insur
ance, together with increasing government involvement. The second half of this century witnessed its growth to maturity. In the industrialized countries, the annual increase in premiums collected is significantly higher than the depreciation of money and far greater than the increase in gross domestic product.
A. Insurance and economic activity
The service provided by insurance is not a homogeneous product. Various types of insurance exist and they are not interchangeable. Therefore, it is not strictly possible to speak of one insurance market, but, rather, of several markets. A distinction is usually made between life insurance and non-life insurance, but here again the product varies according to insurance cover and from one country to another.
The ratio of total premiums written to gross national product is the measure most commonly used to evaluate the importance of insurance to the economy. Although it does not give a complete picture of insurance output because of the considerable variation in premium rates between different countries, this measure has the advantage of being uninfluenced by currency factors.
Table A5 shows clearly that, with few exceptions, the ratio of total premiums to gross national product is much larger than 2 per cent for the industrialized countries and smaller than 2 per cent for the developing countries. The relationship between development and the im
portance of the insurance sector is further confirmed when this ratio is analysed for the least developed countries (see table A6).
The study of total premium volume for non-life insurance demonstrates a high income elasticity of demand for insurance. Even if the sample of 36 countries cannot claim to be representative, it covers a very wide range of standards of living and levels of industrialization. Graphic analysis and regression analysis make it possible to verify that demand for non-life insurance can be adjusted fairly well by a linear function of gross domestic product per head of population. The adjustments would appear to be relatively satisfactory bearing in mind the diversity of the countries considered, the disturbing influence of exchange rates and the probable imperfections in the statistical machinery of some States.
It should nevertheless be remembered that demand for insurance is a reflection not only of income, but also of prices, aversion to risk and the specific social and political features of each country.
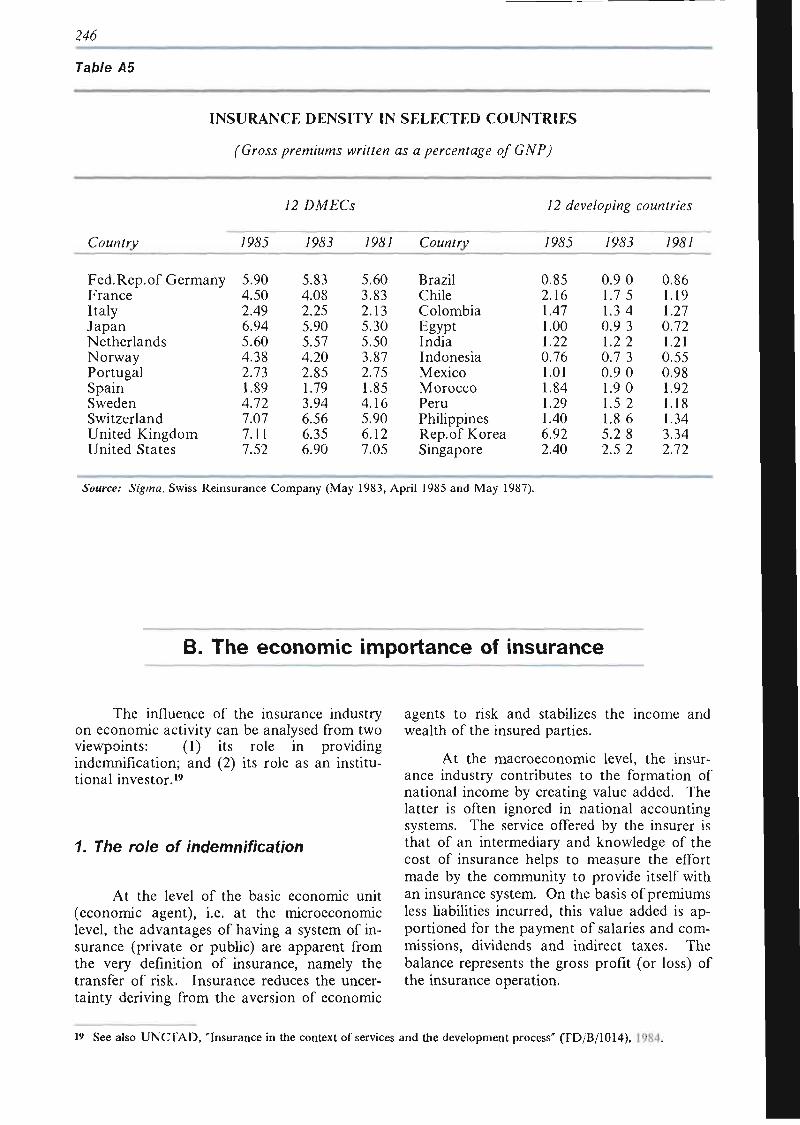
246
Table A5
INSURANCE DENSITY IN SELECTED COUNTRIES
(Gross premiums written as a percentage ofGNP)
Country
Fed. Rep. of Germany France Italy Japan Netherlands Norway Portugal Spain Sweden Switzerland United Kingdom United States
/ & #
5.90 4.50 2.49 6.94 5.60 4.38 2.73 1.89 4.72 7.07 7.11 7.52
12 DMECs
/9&3
5.83 4.08 2.25 5.90 5.57 4.20 2.85 1.79 3.94 6.56 6.35 6.90
/OS/
5.60 3.83 2.13 5.30 5.50 3.87 2.75 1.85 4.16 5.90 6.12 7.05
Country
Brazil Chile Colombia Egypt India Indonesia Mexico Morocco Peru Philippines Rep.of Korea Singapore
12 developing countries
/P&5
0.85 2.16 1.47 1.00 1.22 0.76 1.01 1.84 1.29 1.40 6.92 2.40
7&SJ
0.9 0 1.7 5 1.3 4 0.9 3 1.2 2 0.7 3 0.9 0 1.9 0 1.5 2 1.8 6 5.2 8 2.5 2
/9<9/
0.86 1.19 1.27 0.72 1.21 0.55 0.98 1.92 1.18 1.34 3.34 2.72
Source: Sigma, Swiss Reinsurance Company (May 1983, April 1985 and May 1987).
B. The economic importance of insurance
The influence of the insurance industry on economic activity can be analysed from two viewpoints: (1) its role in providing indemnification; and (2) its role as an institutional investor.19
1. The role of indemnification
At the level of the basic economic unit (economic agent), i.e. at the microeconomic level, the advantages of having a system of insurance (private or public) are apparent from the very definition of insurance, namely the transfer of risk. Insurance reduces the uncertainty deriving from the aversion of economic
agents to risk and stabilizes the income and wealth of the insured parties.
At the macroeconomic level, the insurance industry contributes to the formation of national income by creating value added. The latter is often ignored in national accounting systems. The service offered by the insurer is that of an intermediary and knowledge of the cost of insurance helps to measure the effort made by the community to provide itself with an insurance system. On the basis of premiums less liabilities incurred, this value added is apportioned for the payment of salaries and commissions, dividends and indirect taxes. The balance represents the gross profit (or loss) of the insurance operation.
19 See also UNCTAD, "Insurance in the context of services and the development process" (TD/B/1014), 1984.
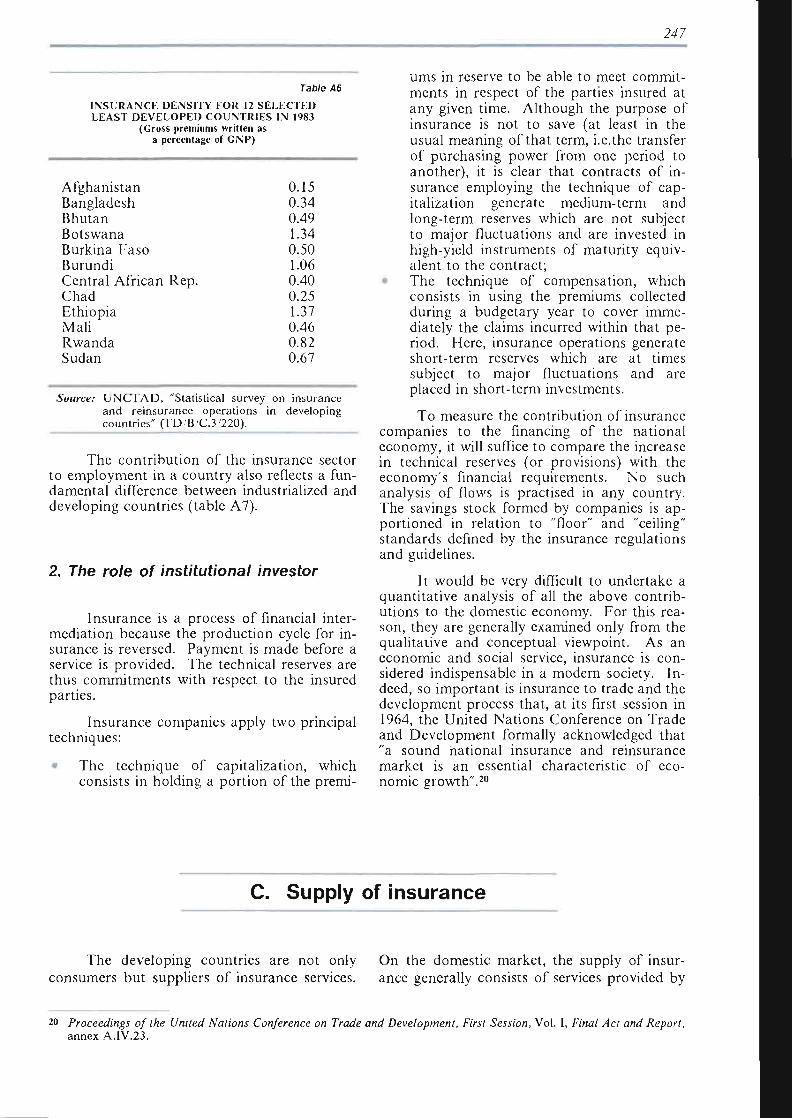
247
Table A6
INSURANCE DENSITY FOR 12 SELECTED LEAST DEVELOPED COUNTRIES IN 1983
(Gross premiums written as a percentage of GNP)
Afghanistan Bangladesh Bhutan Botswana Burkina Faso Burundi Central African Rep. Chad Ethiopia Mali Rwanda Sudan
0.15 0.34 0.49 1.34 0.50 1.06 0.40 0.25 1.37 0.46 0.82 0.67
Source: U N C T A D , "Statistical survey on insurance and re insurance operations in developing countries" (TD B'C.3 '220) .
The contribution of the insurance sector to employment in a country also reflects a fundamental difference between industrialized and developing countries (table A7).
2. The role of institutional investor
Insurance is a process of financial intermediation because the production cycle for insurance is reversed. Payment is made before a service is provided. The technical reserves are thus commitments with respect to the insured parties.
Insurance companies apply two principal techniques:
• The technique of capitalization, which consists in holding a portion of the premi-
C. Supply
The developing countries are not only consumers but suppliers of insurance services.
urns in reserve to be able to meet commitments in respect of the parties insured at any given time. Although the purpose of insurance is not to save (at least in the usual meaning of that term, i.e.the transfer of purchasing power from one period to another), it is clear that contracts of insurance employing the technique of capitalization generate medium-term and long-term reserves which are not subject to major fluctuations and are invested in high-yield instruments of maturity equivalent to the contract;
The technique of compensation, which consists in using the premiums collected during a budgetary year to cover immediately the claims incurred within that period. Here, insurance operations generate short-term reserves which are at times subject to major fluctuations and are placed in short-term investments.
To measure the contribution of insurance companies to the financing of the national economy, it will suffice to compare the increase in technical reserves (or provisions) with the economy's financial requirements. No such analysis of flows is practised in any country. The savings stock formed by companies is apportioned in relation to "floor" and "ceiling" standards defined by the insurance regulations and guidelines.
It would be very difficult to undertake a quantitative analysis of all the above contributions to the domestic economy. For this reason, they are generally examined only from the qualitative and conceptual viewpoint. As an economic and social service, insurance is considered indispensable in a modern society. Indeed, so important is insurance to trade and the development process that, at its first session in 1964, the United Nations Conference on Trade and Development formally acknowledged that "a sound national insurance and reinsurance market is an essential characteristic of economic growth".20
of insurance
On the domestic market, the supply of insurance generally consists of services provided by
20 Proceedings of the United Nations Conference on Trade and Development, First Session, Vol. I, Final Act and Report, annex A. IV.23 .
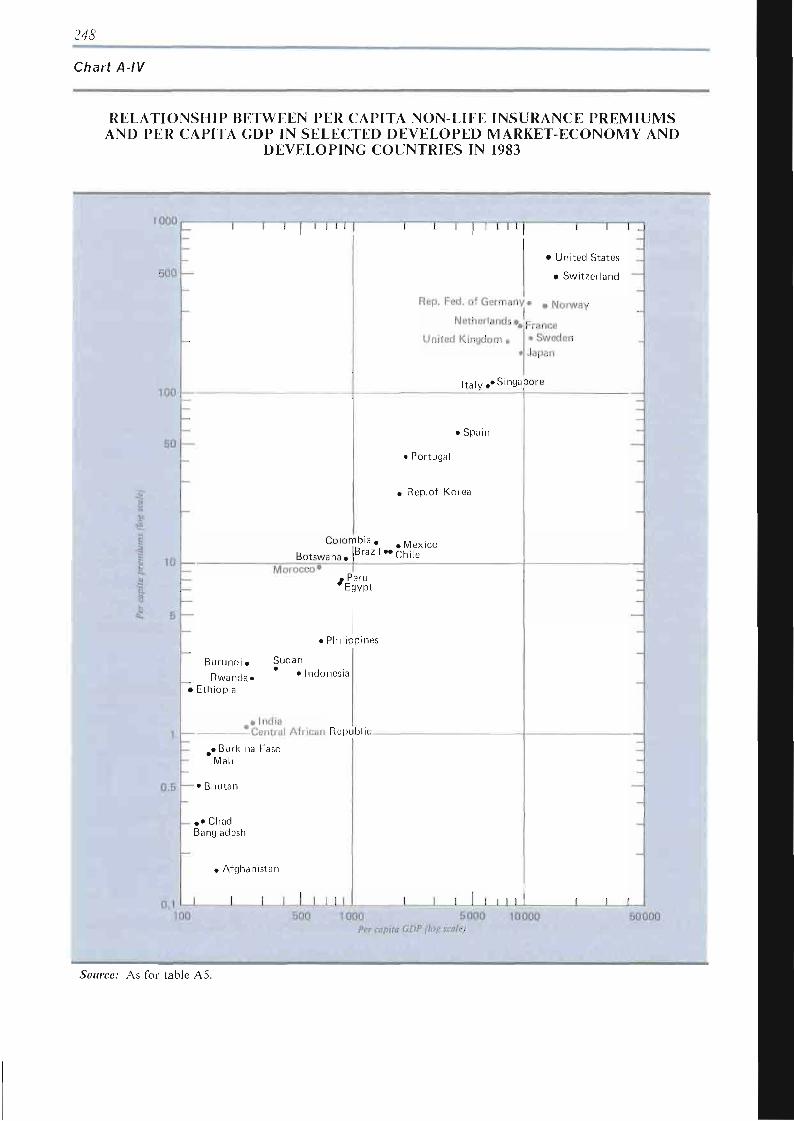
24(9
Chart A-IV
RELATIONSHIP BETWEEN PER CAPITA NON-LIFE INSURANCE PREMIUMS AND PER CAPITA GDP IN SELECTED DEVELOPED MARKET-ECONOMY AND
DEVELOPING COUNTRIES IN 1983
100Ü
500
100
50 —
I !
I 10
0 5
0.1 I—i
5 —
1 i 1 I I I I I 1 1 1 | I I I I i — r q
United States
• Switzerland
Rep. Fed. of Germany • . Norway
Netherlands». |
United K ingdom,
France • Sweden Japan
I t a l y . «Singapore
> Spain
Portuga
Rep.of Korea
Botswana
C o l o m b i a . . M e x i c o Brazil • • c h i l e
Morocco» .Peru Egypt
i Philippines
B u r u n d i . Sudan
Rwanda. «Indonesia
; Ethiopia
. I n d i s —Central Afr ican Republic
• Burkina Faso Mali
'•—• Bhutan
. , « Chad Bangladesh
Afghanistan
_J I i _u I I I I I I J L
100 500 1000 5000 Per capita GDP (log scale)
10000 50000
Source: As for table A5.
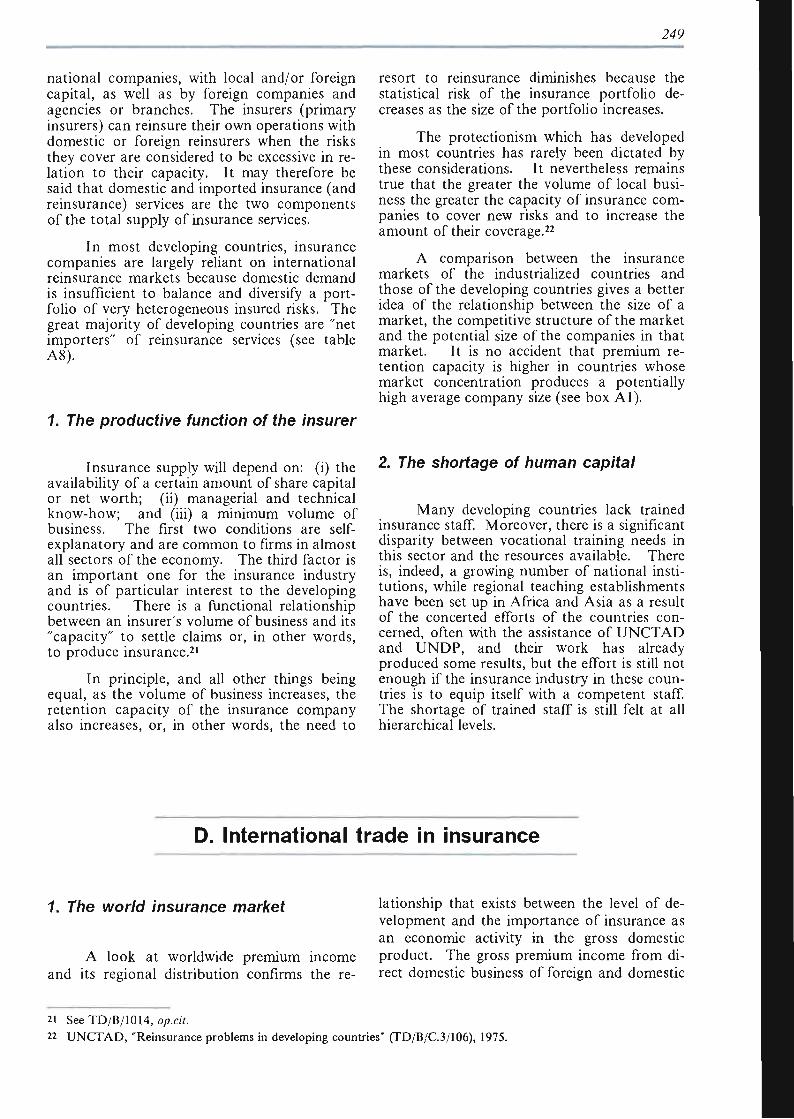
249
national companies, with local and/or foreign capital, as well as by foreign companies and agencies or branches. The insurers (primary insurers) can reinsure their own operations with domestic or foreign reinsurers when the risks they cover are considered to be excessive in relation to their capacity. It may therefore be said that domestic and imported insurance (and reinsurance) services are the two components of the total supply of insurance services.
In most developing countries, insurance companies are largely reliant on international reinsurance markets because domestic demand is insufficient to balance and diversify a portfolio of very heterogeneous insured risks. The great majority of developing countries are "net importers" of reinsurance services (see table A8).
1. The productive function of the insurer
Insurance supply will depend on: (i) the availability of a certain amount of share capital or net worth; (ii) managerial and technical know-how; and (iii) a minimum volume of business. The first two conditions are self-explanatory and are common to firms in almost all sectors of the economy. The third factor is an important one for the insurance industry and is of particular interest to the developing countries. There is a functional relationship between an insurer's volume of business and its "capacity" to settle claims or, in other words, to produce insurance.21
In principle, and all other things being equal, as the volume of business increases, the retention capacity of the insurance company also increases, or, in other words, the need to
1. The world insurance market
A look at worldwide premium income and its regional distribution confirms the re-
resort to reinsurance diminishes because the statistical risk of the insurance portfolio decreases as the size of the portfolio increases.
The protectionism which has developed in most countries has rarely been dictated by these considerations. It nevertheless remains true that the greater the volume of local business the greater the capacity of insurance companies to cover new risks and to increase the amount of their coverage.22
A comparison between the insurance markets of the industrialized countries and those of the developing countries gives a better idea of the relationship between the size of a market, the competitive structure of the market and the potential size of the companies in that market. It is no accident that premium retention capacity is higher in countries whose market concentration produces a potentially high average company size (see box Al).
2. The shortage of human capital
Many developing countries lack trained insurance staff. Moreover, there is a significant disparity between vocational training needs in this sector and the resources available. There is, indeed, a growing number of national institutions, while regional teaching establishments have been set up in Africa and Asia as a result of the concerted efforts of the countries concerned, often with the assistance of UNCTAD and UNDP, and their work has already produced some results, but the effort is still not enough if the insurance industry in these countries is to equip itself with a competent staff. The shortage of trained staff is still felt at all hierarchical levels.
lationship that exists between the level of development and the importance of insurance as an economic activity in the gross domestic product. The gross premium income from direct domestic business of foreign and domestic
D. International trade in insurance
21 See TD/B/1014, op.cit.
22 U N C T A D , "Reinsurance problems in developing countries" (TD/B/C.3/106) , 1975.
2)0
Table A7
EMPLOYMENT IN THE INSURANCE SECTOR AS A PERCENTAGE OF THE ECONOMICALLY ACTIVE POPULATION IN 1983
(Percentage)
Developed market-economy countries Developing countries
Fed. Rep. of Germany France Italy Japan Netherlands Norway Portugal Spain Sweden Switzerland United Kingdom United States
0.80 0.88 0.47 2.16 0.94 0.71 1.35 0.95 1.83 1.27 1.11 1.69
Bangladesh Botswana Brazil Chile Colombia Ecuador Egypt Ghana India Indonesia Mexico Morocco Peru Philippines Rep. of Korea Thailand Tunisia
0.05 0.06 0.23 0.13 0.28 0.09 0.12 0.11 0.04 0.06 0.13 0.09 0.12 0.16 1.33 0.20 0.14
Source: Employment: As for table A6 and OECD, Insurance Statistics, 1986; Economically active population: UNCTAD, Handbook of International Trade and Development Statistics, Supplement 1986.
insurance companies forms the basis of the data presented in table A9 for the years 1980 to 1985. The data show the growing share of Japan in the world market and, contrary to some widely expressed statements,23 the fact that the United States share of world premium volume grew over the recent period. The shift in 1985 is mainly due to rate of exchange fluctuations but the share of world premium remains higher in both life and non-life insurance than in 1980. As can readily be seen, this does not apply to the developing countries.
In the past few years, Japan showed the highest real rate of increase of all the important countries in terms of premiums, whereas Europe and the developing countries had a reduced share (with the exception of the Republic of Korea and Taiwan Province of China). It is worth noting that if the income-elasticity of demand for insurance is still greater than 1.0 in European countries it is only 1.0 in North America and Australia.24
2. International insurance transactions in developing countries
International operations connected with insurance and having an impact on the balance of payments of the developing countries are commonplace. A clear distinction must be made between primary (direct) insurance activities and reinsurance activities.
The first category of international operations results from the inability of the national market to offer adequate risk coverage. This inadequacy may be due to several causes:
(i) Since the insurance companies operating on the national market are not in a position to underwrite a particular risk, the insured is entitled to cover the whole risk abroad;
23 Richard M. Detwiler "Foreign trade barriers: Hazard of international insurance", Journal of Insurance, May/June 1983, pp.15-27.; Paul F. Butler, "Issues in International Insurance Trade", Insurance Conference, Subcommittee on Services, U.S. Department of Commerce, Washington, D C , February 1983.
%* Sigma, Swiss Reinsurance Company, Zurich, No. 7, July 1986.
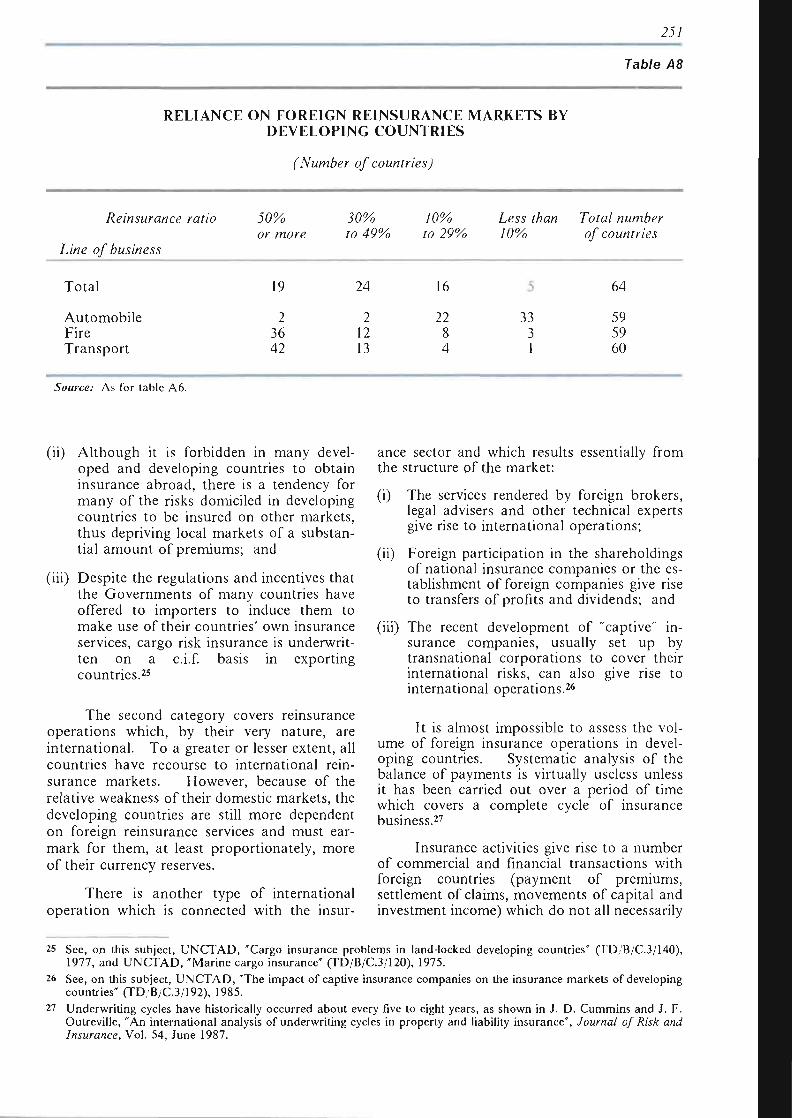
251
Table A8
RELIANCE ON FOREIGN REINSURANCE MARKETS BY DEVELOPING COUNTRIES
(Number of countries)
Reinsurance
Line of business
Total
Automobile Fire Transport
ratio J0% or more
19
2 36 42
J0% fo49%
24
2 12 13
/0% fo29%
16
22 8 4
Less than / 0%
5
33 3 1
Total number of countries
64
59 59 60
Source: As for table A 6.
(ii) Although it is forbidden in many developed and developing countries to obtain insurance abroad, there is a tendency for many of the risks domiciled in developing countries to be insured on other markets, thus depriving local markets of a substantial amount of premiums; and
(iii) Despite the regulations and incentives that the Governments of many countries have offered to importers to induce them to make use of their countries' own insurance services, cargo risk insurance is underwritten on a c.i.f. basis in exporting countries.25
The second category covers reinsurance operations which, by their very nature, are international. To a greater or lesser extent, all countries have recourse to international reinsurance markets. However, because of the relative weakness of their domestic markets, the developing countries are still more dependent on foreign reinsurance services and must earmark for them, at least proportionately, more of their currency reserves.
There is another type of international operation which is connected with the insur
ance sector and which results essentially from the structure of the market:
(i) The services rendered by foreign brokers, legal advisers and other technical experts give rise to international operations;
(ii) Foreign participation in the shareholdings of national insurance companies or the establishment of foreign companies give rise to transfers of profits and dividends; and
(iii) The recent development of "captive" insurance companies, usually set up by transnational corporations to cover their international risks, can also give rise to international operations.26
It is almost impossible to assess the volume of foreign insurance operations in developing countries. Systematic analysis of the balance of payments is virtually useless unless it has been carried out over a period of time which covers a complete cycle of insurance business.27
Insurance activities give rise to a number of commercial and financial transactions with foreign countries (payment of premiums, settlement of claims, movements of capital and investment income) which do not all necessarily
25 See, on this subject, U N C T A D , "Cargo insurance problems in land-locked developing countries" (TD/B/C.3/140) , 1977, and U N C T A D , "Mar ine cargo insurance" (TD/B/C.3/120), 1975.
26 See, on this subject, U N C T A D , "The impact of captive insurance companies on the insurance markets of developing countries" (TD/B/C.3/192) , 1985.
27 Underwri t ing cycles have historically occurred about every five to eight years, as shown in J. D . Cummins and J. F. Outreville, "An international analysis of underwriting cycles in property and liability insurance", Journal of Risk and Insurance, Vol. 54, June 1987.
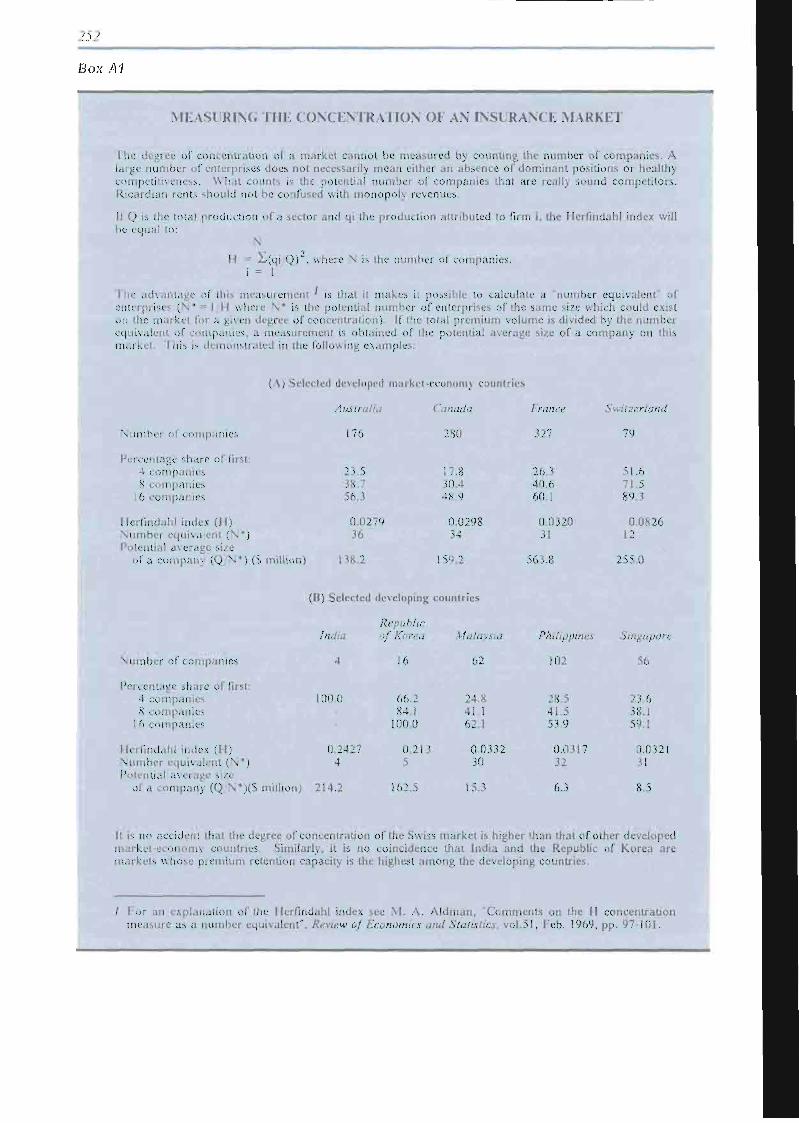
252
Box A1
M E A S U R I N G T H E C O N C E N T R A H O N O F AN I N S U R A N C E M A R K E T
I he degree of concentration of a market cannot be measured by counting the number of companies. A large number of enterprises does not necessarily mean either an absence of dominant positions or healthy competitiveness. What counts is the potential number of companies that are really sound competitors. Ricardian rents should not be confused with monopoly revenues.
If Q is the total production of a sector and qi the production attributed to firm i. the Herfindahl index will be equal to:
N
II = Z(qi Q) , where N is the number of companies. i = 1
I he advantage of this measurement ' is that it makes it possible to calculate a "number equivalent" of enterprises (N* = 1 H where \ * is the potential number of enterprises of the same size which could exist on the market for a given degree of concentration). If the total premium volume is divided by the number equivalent of companies, a measurement is obtained of the potential average size of a company on this market. I his is demonstrated in the following examples:
(A) Selected developed market-economy countries
Number of companies
Percentage share of first: 4 companies 8 companies
16 companies
Herfindahl index (H) Number equivalent (N*) Potential average size
of a company (Q N*) (S million)
ustralia
176
23.5 38.7 56 3
0.0279 36
Canada
280
17.8 30 4 48.9
0.0298 34
France
327
26.3 40.6 60.1
0.0320 31
Switzerland
79
51.6 71.5 893
0.0826 12
138.2 159 2 563.8 255.0
(B) Selected developing countries
Number of companies
Percentage share of first: 4 companies 8 companies
16 companies
Herfindahl index (II) Number equivalent (N*) Potential average size
of a company (Q N*)(S million) 214.2
-K&;
4
0.0
0.2427 4
Republic of Korea
16
66.2 84 1
1000
0.213 5
Malaysia
62
24.8 41.1 62 1
0.0332 30
Philippines
102
28.5 41.5 53.9
0.0317 32
Singapore
56
23.6 38.1 59.1
0.0321 31
162.5 15.3 6.3
It is no accident that the degree of concentration of the Swiss market is higher than that of other developed market-economy countries. Similarly, it is no coincidence that India and the Republic of Korea are markets whose premium retention capacity is the highest among the developing countries.
/ for an explanation of the Herfindahl index see M. A. Aldman, 'Comments on the H concentration measure as a number equivalent", Review of Economics and Statistics, vol.51, Feb. 1969, pp. 97-101.
253
relate to the same financial year. Only by taking into account the present net value of inflows and outflows is it possible to calculate the balance of these settlements. It can, of course, be positive or negative according to the year and the cycle of underwriting results. In the former case, insurance operations are a source of foreign currency, whereas, in the latter, they contribute to the external deficit or reduce the balance-of-payments surplus. In view of the inadequacy of available statistics on these capital flows, estimates are often more deceptive than useful.
Concern about the balance of payments has been an important factor determining the use of restrictions on trade and exchange controls by practically all soft-currency countries, and by some hard-currency countries as well. The majority of insurable risks are purely domestic in scope and international insurance transactions on these risks, whether or not they are in fact prohibited or subject to a kind of tariff protection, are unlikely to be on a large scale. The very fact that they cannot, as a rule, be based on a regular canvassing organization is likely to make them incidental.
On the other hand, marine hull and cargo insurance against risks which cannot be covered in the country are often exempted from prohibition and duties and in these lines transactions are on a comparatively large scale. This is likely to be the case for developing countries.
1. The production of insurance services
The premiums-benefits process which insurance represents implies the following functional structure: (i) sales and marketing; (ii) underwriting; (iii) reinsurance; (iv) reserves and investment; (v) claims adjustment and settlement.
The sales department of an insurance company plays a vital role as few consumers of insurance have the skill to select the combi-
3. The world reinsurance market
Recalling the extent of State intervention in the field of direct insurance (primary insurers) in almost all the countries, it would probably be hopeless to attempt to draw up a list of companies controlled by outside concerns and which are operating on a worldwide basis.
On the other hand, due to the international nature of reinsurance, reinsurers have enjoyed, and on the whole are still enjoying, relatively preferential treatment. The same political and economic forces working towards nationalization of direct insurance, and the establishment of national insurance markets, also favour international reinsurance. At the same time, reliance on foreign insurers has decreased markedly, and reliance on foreign reinsurers has consequently increased.28 Moreover, as reinsurance is practically invisible to the public, and not directly in contact with it, it does not offend nationalistic sentiments.
Today, the volume of international reinsurance transactions is certainly quite important although not known with precision. The first 100 reinsurers wrote in 1986 $38,963 million according to the most recent source available.29 This market is in the hands of a few countries. The first 32 companies wrote more than 70 per cent of total net premiums in 1986 and originate in only 8 countries (see table A10).
nation of insurance products that will best meet their needs. The statement "insurance is sold, not bought" has evident validity in life insurance. In property and liability insurance the consumer is generally more aware of his needs, but the prospects of sales by mail or via personal computer are still limited to very standard products such as automobile insurance. It seems unlikely that the sales function for more sophisticated business risks can be exported. The character of the service, including other related services such as risk management, normally requires that the labour be local.
E. Development of the production of and trade in insurance
28 UNCTAD "Insurance of large risks in developing countries" (TD/B/C.3/137).
» "The world's top 100 reinsurers", ReActions, March 1988.
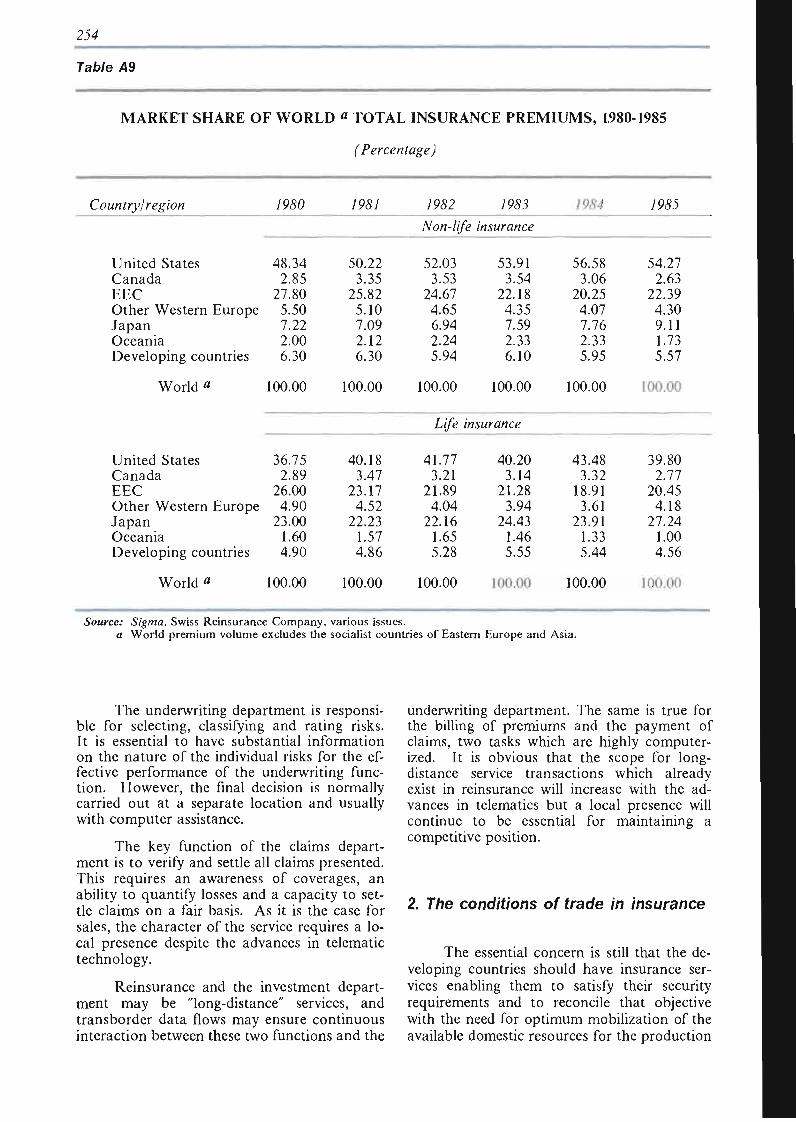
2)4
Table A9
MARKET SHARE OF WORLD « TOTAL INSURANCE PREMIUMS, 1,980-1985
(Percentage)
Country/region
United States Canada EEC Other Western Japan Oceania
Europe
Developing countries
World a
United States Canada EEC Other Western Japan Oceania
Europe
Developing countries
World a
/&S0
48.34 2.85
27.80 5.50 7.22 2.00 6.30
100.00
36.75 2.89
26.00 4.90
23.00 1.60 4.90
100.00
7&S/
50.22 3.35
25.82 5.10 7.09 2.12 6.30
100.00
40.18 3.47
23.17 4.52
22.23 1.57 4.86
100.00
/&S2
M,«-/#g
52.03 3.53
24.67 4.65 6.94 2.24 5.94
100.00
/&SJ
insurance
53.91 3.54
22.18 4.35 7.59 2.33 6.10
100.00
Life insurance
41.77 3.21
21.89 4.04
22.16 1.65 5.28
100.00
40.20 3.14
21.28 3.94
24.43 1.46 5.55
100.00
1984
56.58 3.06
20.25 4.07 7.76 2.33 5.95
100.00
43.48 3.32
18.91 3.61
23.91 1.33 5.44
100.00
/%%
54.27 2.63
22.39 4.30 9.11 1.73 5.57
100.00
39.80 2.77
20.45 4.18
27.24 1.00 4.56
100.00
Source: Sigma, Swiss Reinsurance Company, various issues. a World premium volume excludes the socialist countries of Eastern Europe and Asia.
The underwriting department is responsible for selecting, classifying and rating risks. It is essential to have substantial information on the nature of the individual risks for the effective performance of the underwriting function. However, the final decision is normally carried out at a separate location and usually with computer assistance.
The key function of the claims department is to verify and settle all claims presented. This requires an awareness of coverages, an ability to quantify losses and a capacity to settle claims on a fair basis. As it is the case for sales, the character of the service requires a local presence despite the advances in telematic technology.
Reinsurance and the investment department may be "long-distance" services, and transborder data flows may ensure continuous interaction between these two functions and the
underwriting department. The same is true for the billing of premiums and the payment of claims, two tasks which are highly computerized. It is obvious that the scope for longdistance service transactions which already exist in reinsurance will increase with the advances in telematics but a local presence will continue to be essential for maintaining a competitive position.
2. The conditions of trade in insurance
The essential concern is still that the developing countries should have insurance services enabling them to satisfy their security requirements and to reconcile that objective with the need for optimum mobilization of the available domestic resources for the production
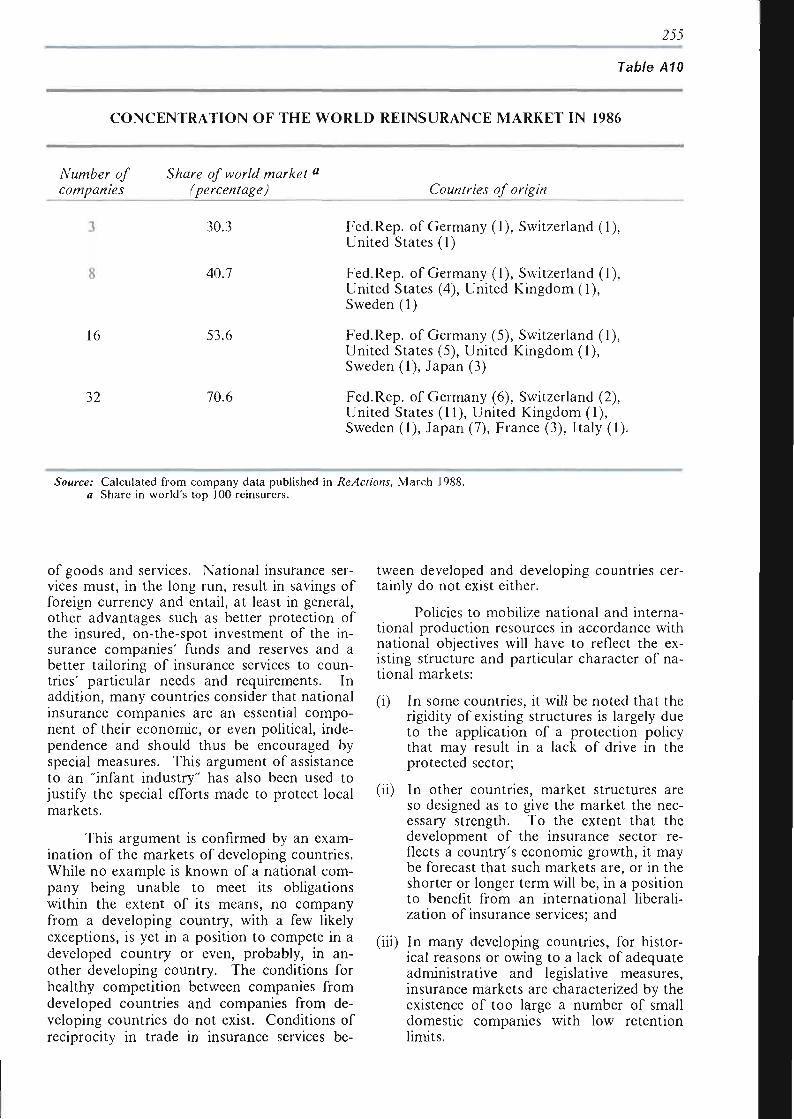
2JJ
Table A10
CONCENTRATION OF THE WORLD REINSURANCE MARKET IN 1986
Number of Share of world market a
companies (percentage) Countries of origin
16
32
30.3
40.7
53.6
70.6
Fed. Rep. of Germany (1), Switzerland (1), United States (1)
Fed.Rep. of Germany (1), Switzerland (1), United States (4), United Kingdom (1), Sweden (1)
Fed. Rep. of Germany (5), Switzerland (1), United States (5), United Kingdom (1), Sweden (1), Japan (3)
Fed.Rep. of Germany (6), Switzerland (2), United States (11), United Kingdom (1), Sweden (1), Japan (7), France (3), Italy (1).
Source: Calculated from company data published in Re Actions, March Ie
a Share in world's top 100 reinsurers.
of goods and services. National insurance services must, in the long run, result in savings of foreign currency and entail, at least in general, other advantages such as better protection of the insured, on-the-spot investment of the insurance companies' funds and reserves and a better tailoring of insurance services to countries' particular needs and requirements. In addition, many countries consider that national insurance companies are an essential component of their economic, or even political, independence and should thus be encouraged by special measures. This argument of assistance to an "infant industry" has also been used to justify the special efforts made to protect local markets.
This argument is confirmed by an examination of the markets of developing countries. While no example is known of a national company being unable to meet its obligations within the extent of its means, no company from a developing country, with a few likely exceptions, is yet in a position to compete in a developed country or even, probably, in another developing country. The conditions for healthy competition between companies from developed countries and companies from developing countries do not exist. Conditions of reciprocity in trade in insurance services be
tween developed and developing countries certainly do not exist either.
Policies to mobilize national and international production resources in accordance with national objectives will have to reflect the existing structure and particular character of national markets:
(i) In some countries, it will be noted that the rigidity of existing structures is largely due to the application of a protection policy that may result in a lack of drive in the protected sector;
(ii) In other countries, market structures are so designed as to give the market the necessary strength. To the extent that the development of the insurance sector reflects a country's economic growth, it may be forecast that such markets are, or in the shorter or longer term will be, in a position to benefit from an international liberalization of insurance services; and
(iii) In many developing countries, for historical reasons or owing to a lack of adequate administrative and legislative measures, insurance markets are characterized by the existence of too large a number of small domestic companies with low retention limits.
2Jó
The problem as regards reinsurance is a different one. Many developing countries still have considerable reservations concerning regional co-operation. Many examples of bilateral agreements between developing and industrialized countries can be quoted to show that there is a lack of confidence in the developing countries' capacity to expand their trade. It is no accident that the countries enjoying an
international reputation in reinsurance matters are also those which have hard currencies and great freedom of capital movement. The problem of reinsurance security is certainly a major factor in this reluctance of the developing countries to develop their trade and only the international negotiation of a code of conduct in this area could improve the situation. *» •
30 See: UNCTAD, "Reinsurance security" (TD/B/C.3/221), 1987,
2J7
Annex 5
TECHNOLOGY ISSUES IN INFORMATION SERVICES
A. Introduction
As referred to in chapter III, information technologies play an increasingly important role in the services economy and merit special attention. This annex intends to present some of the issues raised by the rapid technological changes in this field, review the modalities of transfer of technology and discuss a number of policy implications for developing countries.
Services activities were originally separated from agriculture and industry by emphasizing two characteristics which, taken in conjunction, were held to distinguish them from the other economic sectors: those characteristics were non-storability and the simultaneity of provision by the supplier and use by the demander. This definition is no longer adequate, because of technological developments in informatics which both permit storage and allow a user to capitalize on the service at a date or dates subsequent to purchase. The point is obvious in relation to computer software. It may be objected that software, physically embodied in a disc or tape, is a commodity and it is precisely the physical feature which renders it storable and subject to use at diverse times. Yet, software basically replaces human skills employed internally in either manufacturing or service activities by skills embodied in a logic built into a package that is usually acquired from outside the firm, and as such may be viewed as a service. Furthermore, software and hardware or equipment are normally sold in combination and it is therefore difficult for them to be valued independently.
Information technologies have created a symbiosis between development in the manufacturing and the services sectors. Manufac
turing branches of many kinds are already or could become highly sophisticated information processing operations in which product design, organization of tasks, the passing of instructions to machines, the movement of products from one stage to the next, control over quality, maintenance and the handling of inventory are all essentially dealt with through computer systems. The information technologies can not only revolutionize the work place but also alter upstream design possibilities and tributary relations with input suppliers.
Yet, it is all too easy to assume that, because of the umbrella character of these recent technological changes, they are entering rapidly into all branches and all phases of design, installation, operation, maintenance and repair of production systems, and marketing. Such a view would be misleading. Looking first at the organization of firms,the administrative branches of activity (accounting, personnel listings and general data processing) are the areas most affected. They are the ones which involve relatively mechanical use of computers, i.e., number crunching capability rather than problem solving applications, and also the areas where introduction of data processing systems can be kept fairly compartmentalized. An enterprise does not have to run many risks with this type of innovation and it is certainly quite a different proposition from the complete reorganization of production systems. It has been recognized, for example, that the introduction of flexible manufacturing systems will be quite a slow business in which even many of the largest firms will have to resolve many difficulties.
2J<S
The preceding remarks indicate that a focus on the distinction between goods and services is not too helpful; of far more interest is
Software embodies the information that allows computing machines to perform the wide range of tasks they now handle which include basic data processing, factory organization and instrument monitoring, inventory relations with supply firms, design functions, problem solving and so on. The elements of software are the source code (the method of handling the problem), the object code, which is generated by a compiler or interpreter and acts to translate the source code into machine readable language, and such software as may be built straight into the hardware and is often referred to as firmware.
Software varies according to the degree of standardization, ranging from programmes of general applicability (standardized software) through customized software, which essentially is amended package software for particular users, to custom software, directed at the specific needs of a particular user. The contractual terms governing transfer of technology (TT) are frequently closely related to the degree of packaging. The functions of software can be divided into systems software, which covers all the materials for operating a system, applications software, and database software. Much discussion tends to focus on the second of these categories only, leaving aside the significance of the first item in particular.
The classifications just described obviously have a relation to the patterns of market structure which have been in operation since the growth of the computing industry. Initially there was a strong emphasis on promoting sales of hardware and for this reason the equipment producers often simply gave away the software; moreover, these firms were the only source of information. As the system developed, and particularly with the landmark 1969 court decision in the United States to force IBM into separate sales of software and hardware,31 there was also a move away from the custom items
a focus on high skill-intensive activities where the information processing and problem solving elements are of major significance.
which had initially dominated the market towards package sales. Now the market is fairly mixed with the package items being particularly strong in sales made to the private market of individuals with home computers.
Broadly speaking, the present structure of supply, at least judging from the United States and some other OECD markets, is that hardware producers still have more than 50 per cent of the total software market (although software sales usually account for no more than 5 per cent of their sales revenue). Software houses are growing but they still represent a small share of the total market, and a large share of applications and data base software (more than 80 per cent of the total in the United States) is still carried out by in-house groups of users.32 The hardware firms have moved towards a certain amount of overseas contracting, e.g., the establishment of centres in Mexico and Venezuela, while India and Singapore, in particular, have attempted to set up as large-scale software suppliers functioning on a subcontracting basis.
These measures still remain relatively limited, however, and, although the software business is international, the degree of foreign direct investment in that sense is fairly limited, It is estimated that trade in systems software may only be some 4 per cent of trade in hardware. From a strategic angle, therefore, the hardware firms have an interest in concentrating sources of supply so they can link them to new vintages of hardware.
The situation regarding transfer of technology to developing countries is easy to summarize. Since, with some exceptions only, most of these countries are completely dependent on imports of computer hardware, this creates a corresponding dependence on imported software. Obviously, a certain degree of domestic production can take place, but in general this
B. Transfer of technology in information technologies
3Î In the more recent Data General Corporation antitrust litigation, the trial court stated that software hardware tying arrangements should not ordinarily be deemed to be illegal.
î2 Economic Commission for Europe, Software for Industrial Automation, New York, 1987.
2JP
will be confined to the less important and peripheral types of software. Although straight sales of equipment without software do occur, the tentative impression is that these are not too important. They are of some relevance for peripheral items in connection with computer usage and to this extent can also be candidates for local import substituting production.
For most uses, developing countries are compelled to obtain their software from abroad and this is generally done through licensing contracts, though other forms of legal arrangements are sometimes used. Software providers generally rely on contractual and trade secret protection in the case of custom software; the basis of the individual and usually lengthy licensing contract is that the software (especially the source code and programming documentation) will be kept confidential.33 Copyright protection, although it is relevant, is relatively less important for the protection of custom software. In the case of standardized software, the provider will mainly rely on copyright and trade-mark protection against unauthorized copying by the user, but will usually attempt to obtain additional contractual protection through a pre-printed adhesion contract.34
However, the validity of a contract formed under such conditions would probably not be recognized in most countries.
It is clear from the above that the legal basis for any licensing contract for software will depend on the legal means available for protecting the software. In this respect, the importance of copyright protection35 has been reinforced by the growth in licensing of standardized and semi-custom software. Although copyright protection for computer programmes has been granted in several countries, including some developing countries, many developing countries are still considering the appropriate means of protection, or have yet to address the question. Unauthorized copying of standardized software is widespread in some countries. Even where protection for software is granted and enforced, there are continuing uncertainties or disparities relating to whether copyright protection extends to object code, microcode, organization of programmes, or visual display ("look and feel"), as well as relating to the terms and conditions of protection, including duration and protection against unauthorized reproduction. Some countries have modified the
traditional principles of copyright so much in its application to computer programmes as to have almost created a sui generis form of protection. The standard on which protection should be based at the international level is also unclear; given the uncertainty as to the applicability of the international copyright conventions to computer programmes, a few countries are protecting programmes created by foreigners on the basis of reciprocity only.
Despite this legal vacuum, the use of licensing arrangements does appear to be an important instrument in the services sector. To date, the information available stems from two sources, viz. TT registries in certain developing countries, and some case-study material. The data from registries suggest that licensing contracts in software are a rapidly increasing proportion of total contracts (these data probably apply only to licensing of custom software; moreover, they do not take account of software elements in contracts that also embrace other items). The number of arrangements involving hardware and software packages seems to be on the increase, although here the data are less clear. Case-study information is fairly rich as far as some branches are concerned, and shows that internationalization is a fast growing aspect of these operations. It thus seems reasonable to conclude that additional TT arrangements are likely. In general, it is necessary to keep in mind the linkage emphasized earlier between changing technologies in manufacturing and services sector developments. A significant part of technology transactions stemming essentially from developments in this sector will certainly show up in new arrangements for manufacturing products, processes and system organization.
On the whole, large corporations are not seeking to extend their establishments in developing countries and are much more interested in separate sales of hardware and software. However, it is undeniable that quite a few technology transactions of a service type take place between already existing affiliates. Thus far, the empirical evidence is insufficient to judge the importance of such deals. When attention is given to the hardware/software distinction, the obvious question is whether the latter is leading to the creation of affiliates of software houses in developing countries. Cer-
33 In the United States such a provision will result in trade secret protection valid against third parties. 34 These are often termed shrink-wrap licences because of the provision printed on the outside of the package containing
the diskette that, if the user opens it, he is deemed to have accepted the licence.
35 Although most developed countries are more lax now than they were before in assessing whether computer programmes meet the stringent requirements of patentability, patent protection is not as yet available for the vast majority of programmes created. Moreover, a patent application necessarily involves disclosure of a programme, resulting in loss of secrecy, and is therefore inappropriate for custom programmes.
260
tainly, some cases exist, but it would be premature to argue that this is a strong trend. The real point, however, is that no fully satisfactory system has yet been devised and it is therefore not surprising that suppliers should try, when negotiating licensing arrangements, to put the maximum number of protective clauses into the contracts.
From the negotiating angle of developing countries, the principal points to be kept in mind are reasonably familiar from other kinds of licensing negotiations, and can be summarized as follows:
(i) The definition of items to be transferred is crucial; buyers need to obtain source codes as well as object codes, and to obtain access to the necessary support documentation including instructions for operators and so on. Upgrading of software should similarly be allowed for in this definition of subjects;
(ii) The duration and degree of exclusivity of licences has to depend again on the package/custom distinction. Perhaps the most important practical point is that where governments are the buyers they will usually want to make multiple use (i.e., in various locations) of the software provided
A veritable information-based technologies revolution is under way with wide-ranging repercussions on the ways of handling production and economic organization. No country can ignore these technological developments or suppose that this is an area where no domestic efforts are necessary. If it was true in the past that at least some kind of industrial development was a sine qua non for economic advancement, so, in the last decade of the second millenium, is this true of the information technologies. The whole of manufacturing itself, including the international division of labour in manufactures, is being affected by these changes. What happens in these branches of services is going to be a key determinant of production and trading advantages throughout manufacturing and agriculture.
Some major developing countries have already formulated and are implementing poli-
and this is often excluded by standard licensing arrangements. Consequently, these should be amended to take account of government needs. The packaging problem seems to be quite severe. This is because of the incorporation of software into equipment and machinery (generally referred to as firmware), the close relation of hardware and software systems, which often implies that the one will not operate without the other specifically designed for it, and the fact that, even within software alone, there are items which constitute the consolidation of several forms of knowledge in a single entity;
(iii) The obsolescence problem clearly exists to an important degree. Constant improvements in both hardware and software force enterprises to evaluate the productivity of their existing systems continually and hence to consider technological modifications. The accent on training within the firm has to be particularly pronounced in this field, above all because of the role of software. Arrangements with technological partners should emphasize this element of local development and thereby permit the firm to increase its own programming capabilities.
cies regarding informatics and computing in particular. Brazil has stressed three aspects of policy. First, the creation of two public sector firms, Digibras (1974) and Cobra (with the aim of producing electronic components and computers). Second, a market reservation scheme in micro- and mini-computers to ensure that domestically controlled enterprises become the suppliers for such items. While TT is permitted, the aim is to create domestic production capacity so that the strategic nature of the sector is fully reflected in the capabilities developed. Third, the establishment in 1979 of the Special Secretariat for Information (SEI), which is part of the National Security Council of the Presidency, and which not only sets overall policy but also participates with the National Institute of Intellectual Property (INPI) in the evaluation of TT arrangements in the informatics field. There is little doubt that these three pillars of policy can be seen as
C. Policy implications for developing countries
267
working together to develop a strong basis for local capabilities and to ensure that policy decisions are reached at the highest level. Within the informatics policy as a whole, the dimensions applied to software include domestic preference in government procurement, joint participation of key organs in contract evaluation, and insistence on relatively short duration of contracts and transferral of source code in all software agreements. Emphasis on computer literacy is also an aspect of Brazilian policy. Fundamental decisions relating to the future evolution of Brazil's informatics policy may be taken soon, possibly taking into account bilateral representations that have been made concerning this policy.
Mexico set out its computer industry policy in 1981, with emphasis on 51 per cent local equity holding, a strong local content in production and a longer-term export aim. Thus far progress has been slower on the production side than in Brazil, but the Mexican Government has also made use of the technology registry where software contracts must be entered. Although no specific criteria have been laid down for acceptance or refusal of contracts, the evidence available so far suggests that matters of confidentiality, guarantees, price, and availability of adequate local supplies have been the main reasons for rejecting contracts. As of the early 1980s the growing importance of software was becoming more evident in that some 10 per cent of royalties in all sectors were paid out under this heading.
India tackled both computing industry policy and electronics much earlier than the other countries in that its initiatives date back to the 1960s. However, although the local computer industry has developed reasonably well, the efforts to set up software subcontracting have not worked satisfactorily owing to relative isolation from the latest hardware developments. A software policy was set up in late 1984 with the accent being placed on tariffs as a means of controlling imports. Some changes were made to this policy in 1986. The impression as of now is that the country has still to redefine its position, particularly regarding the TT aspects.
With respect to technology transfer, these countries have also been able to negotiate quite extensive technology agreements with major suppliers. They have insisted upon the creation of R and D centres (devoted to improving hardware production capabilities and, in some cases, software development) in the country, the provision of substantial engineering training and the establishment or extension of production facilities within the country to provide a good share of the microelectronic compo
nents necessary for the computers used in the telecommunication systems. The existence of these indicates that awareness of the issues is not lacking among the big buyers.
For developing countries with less attractive domestic markets, smaller and less sophisticated industrial sectors, relatively fewer well-qualified people, and less articulated administrative and institutional structures for tackling TT questions, the prospects for obtaining satisfactory technology arrangements are of course more limited. Even there, however, the scope of the issues compels them to try and build up domestic capabilities as much as they can. There is the possibility of moving into some of the simpler kinds of microelectronic production and to develop some programming skills. Since the larger developing countries have already gone quite far in these directions, there could well be scope for cooperation among developing countries in coming to grips with some at least of the problems. These steps can be backed up by policy measures to guide imports into the channels that would encourage the further improvement of domestic skills.
Moreover, information technologies are at the core of the new approach not merely to production but also to social organization. Thus, TT policies towards them go a long way beyond those that can conventionally be applied to a specific industrial branch and go to the heart of how to establish literacy in what is a vital tool for future output.
In general terms developing countries are in a weak position in that they only have a minor say as regards hardware and software production. The inextricable linkages between the two mean that policy should try to promote both of them. Some of the more advanced developing countries have already been able to pursue this route. Others, with but a few exceptions, have to proceed in a much more piecemeal fashion.
A policy in this area will need to take the following aspects into account:
First, the pervasive influence of microelectronics in all areas of industry is now such that a policy in microelectronics is fairly close to setting up a new policy for industrialization. Choices about the nature and kind of TT in this area will have an enormous influence on what can be done elsewhere. Second, it follows that computer literacy is fast becoming just as important as general literacy, a fact which has implications for import policy. Even a country which
is seeking to use TT in, for example, telecommunication systems, to develop a large measure of self-sufficiency there has to ensure that its people are conversant with computers. To achieve such literacy in a brief space of time might be served by encouraging imports of micro-computers - in other words a policy aimed at longer-term import substitution could best be pursued through short-run encouragement of imports. Third, the design of educational systems and the sort of training arrangements which are sought from foreign firms whose equipment is purchased and/or foreign direct investment is accepted must attach great importance to the new requirements. It is a question of shifting the whole system towards an information-oriented way of producing and organizing inter-firm and inter-branch relations. This is particularly important with regard to the development of small and medium-size enterprises in developing countries. It is quite likely that even these firms will have to become much more information oriented than they have been in the past. Fourth, none of these developments can sensibly be made without a highly conscious policy stressing technological assessment and technological search (market
and other intelligence systems). In the past technology policy in developing countries (and indeed in most other countries) has been a bit like Topsy, just growing, but without more than occasional attempts to provide clear directions. The emphasis of the policy has still been, to a fair extent, on coping with financial aspects and building local capabilities. Those matters will of course remain of much weight in future policies, but there the assessment dimension must come much more into play. While such efforts are always subject to a degree of risk, the margins of error, particularly for relatively short- to medium-term activities, are often not so great. This is an area in which developing countries could pool their efforts and where (as has been done in some other activities in the past) an attempt could be made to utilize the skills of nationals of developing countries located in OECD countries. There are resources to draw on and it is essential for them to be used. Fifth, finally, the question of an appropriate legal regime covering the protection and licensing of computer software needs in-depth consideration by policy-makers, given its importance for access to software technology."
Annex 6
THE CONSTRUCTION AND ENGINEERING DESIGN (CED) SERVICES SECTOR: SOME TRADE AND DEVELOPMENT
ASPECTS
A. Some conceptual and definitional issues
The construction and engineering design (CED) services are part of the wider group of producer services. They cover a broad spectrum of technical services that differ in technological intensity, are interrelated in nature and together help to bring an investment project from conception to realization, including operation and maintenance. They are also required for the extension or renovation of existing structures and production facilities. There are different ways of classifying these services. One broad classification that is used here differentiates between two large categories: engineering design services and construction services. These two groups of services very often overlap and are supplied by individuals acting either solely or grouped in firms that are integrated, autonomous or tied into manufacturing entities. These firms can also be private or state-owned, sectoral or multisectoral, specialized in certain types of engineering design and construction services or highly diversified. They provide those personal services to clients belonging to the public and private sector in either their country of residence or in other countries.
1. Engineering design services
These services could be generally defined as the essential intellectual activities needed to optimize investment in all its forms, in its choices, in the technical process of its realization and in its management. The designs and specifications that these services produce should in principle be the least-cost and highest-productivity solutions consistent with the economic and social constraints of individual markets. These services generally fix the technology dimension of an investment project through the techno-economic specifications they produce for its civil construction part, the materials to be used and the machinery and equipment to be purchased.
More specifically, engineering design services produce different outputs such as prefea-sibility and feasibility studies, preliminary and detailed engineering design, tender documents, evaluation of bids, selection of suppliers and contractors, supervision of construction and erection work, maintenance, project management, personnel training, etc. Many of these services are multidisciplinary in nature and technology intensive. They require general and specialized engineering and other skills to produce the requisite outputs. Engineers are neeeded to select and evaluate technological alternatives, economists to undertake private and social cost-benefit analysis, financial ana-
264
lysts to examine the various aspects of project financing and scientists and ecologists to assess the environmental aspects.
2. Construction services
Construction services are those required for the physical construction of investment
projects, be they of the infrastructure, industrial or agricultural type. They bring together labour, materials and equipment in order to translate the techno-economic specifications produced by the engineering design services into concrete physical entities (e.g., industrial plants, infrastructure projects). While construction services require general and specialized engineering and managerial skills, they also make abundant use of unskilled and semiskilled labour.
B. Role of CED services in the development process
1. Characteristics of the industry
The CED services industry plays a critical role in the domestic economies of many countries, be they developed or developing. This sector accounts for about 10 per cent of GDP in industrialized countries and provides employment for a fairly sizeable segment of the labour force.36 In the United States, for example, in 1985 this sector contributed S353 billion in value added to the economy, accounting for about 9 per cent of GNP, and employed about 5 million people of different skills ranging from architects, engineers, managers and land surveyors to skilled craftsmen and unskilled labour. In 1982 nearly 10 per cent of total United States services exports came from this sector.37 In the EEC the CED services industry accounted in 1981 for about 6.8 per cent of total value added and provided about 7.9 per cent of employment. In Japan it accounts for about 10 per cent of both GDP and employment.
In developing countries the development and growth of this sector is not uniform. It accounts for about 8 per cent of GDP for Algeria and Yugoslavia compared to 3 per cent for Nepal and Uganda.38 In the Republic of Korea, this sector accounted for 6.8 per cent of GNP in 1982 and employed about 829,000 persons during that year. Despite differences among countries in the contribution of the in
dustry to national economic efforts, there is a recognition in all countries, particularly developing countries, of the important role of engineering and construction services in economic growth and development.
The rationale stems from the crucial role these technical services play in the development process, particularly through their direct contribution to the realization of investment projects and the interlinkages they produce between different parts of the economy, especially between services production and capital goods manufacture. While the engineering design services account for a relatively small percentage of the project cost, ranging from 5 per cent to 10 per cent depending on the type, size and complexity of the project, construction services, materials and equipment account for the bulk of this cost. The equipment component cost is generally higher for industrial projects than it is for infrastructure in which the civil engineering part dominates.
The fact that engineering design services absorb a small fraction of the project cost does not make them any less important than construction services for the realization of investment projects. This is particularly so because the suppliers of these services tend to influence the selection of the contractors and the sourc-ing of machinery and equipment as well as other manufactured goods and raw materials. The impact of their work extends therefore be-
36 World Bank, The Construction Industry: Issues and strategies for developing countries, Washington, D.C., 1984, pp. 3 and 11.
37 Office of Technology Assessment, International Competition in Services: Banking, Building, Software, Know-How, chapter 4: International competition in engineering and construction, Washington, D.C., July 1987, p.124.
38 World Bank, op.cit.
265
yond the project and could entail significant externalities.
In this connection it is often argued that projects designed by indigenous firms in a given country tend to use more local inputs, thereby increasing the demand within the country for capital goods, components and raw materials. This is likely to occur because the indigenous engineering design firm, when delivering engineering services, tends to produce specifications for construction technology that is used in its own country by the same company or other local contractors. Such a firm tends also to produce specifications for the machinery and equipment that it knows best, which very often means equipment manufactured by the local capital goods sector. In the trade context, this could mean that exports of design work from one country could lead to export of construction services and equipment from the same country. This linkage varies from country to country.
According to one study that examined large projects in the 1970s, about 80 per cent of investment projects designed by firms from the Federal Republic of Germany have been awarded to construction firms from this country. The corresponding percentage, however, is 63 per cent for Japan, 50 per cent for France and Italy, 43 per cent for the United States and as low as 13 per cent for the United Kingdom.39 According to a survey of United States engineering companies, 33 of 38 engineering and construction firms specified or recommended United States equipment.40 Again with regard to this derived demand link between goods and services, a study of the French industry in the late 1970s mentions that indirect sales in export markets of capital equipment are likely to be several times greater in value than fees earned for actual consulting and engineering design services.41 Building up capabilities in construction and engineering design services and promoting their utilization in the development process have become one of the main development objectives in developing countries,
Building up a national capability in CED services: the experience of some developing countries
The development of a local engineering and construction services sector in developing countries has occurred as part of the wider efforts of these countries to strengthen their endogenous technological capability in order to promote their economic and technological development. It has been given particular attention owing to the positive externalities that the development and utilization of local engineering and construction capabilities could generate for the economies of these countries, including more sales of locally-made equipment and other goods, greater employment possibilities and favourable effects on the balance of payments. Because these externalities may be significantly larger than the benefits accruing directly to the users of the CED services, many governments in developing countries seem to recognize that the development of this sector should be considered as an "infant industry case".
However, many of those externalities could materialize only if the development of a supply capacity in engineering services is matched by demand for such services, that is essentially generated by investment activities. The public sector is one important source of this demand and by far the most important in developing countries. In addition to domestic investment, the potential demand that exists in export markets for a variety of engineering and construction services provides an additional impetus to the development of this sector. In this connection, the experience of some developing countries is revealing.
In the Republic of Korea, the engineering services industry has gone through three main stages of development. The first was the period 1962-1967, which witnessed construction by foreign companies of plants for fertilizer production and petroleum refining on a turnkey basis, which had little impact on the accumulation of indigenous engineering capabilities. Attempts were then made to establish integrated engineering firms but without much success, owing to restricted domestic demand and lack of technological capabilities. Only architectural and construction design services were provided by domestic firms during this
39
40
41
Murphy K.J., Macroproject Development in the Third World, Boulder, Col., Westview, 1983, p.138. United States International Trade Commission , The relationship of exports in selected U.S. service industries to U.S. merchandise exports, USITC publication 1390, Washington, D C , 1982.
Walters, David and Stephenson, Sherry. "An overview of the export of consulting services" (mimeo), International Institute for Economics, Geneva, May 1979.
266
period, which was characterized by dependence on foreign investment and services. The second stage, starting with the early 1970s, experienced the emergence of domestic engineering services capability, which was aided by the building up of technological capability and technical experience in plant construction and the enactment of the Engineering Services Promotion Law of 1973. That Law prohibits foreign engineering firms from acting as prime contractors on domestic projects except when there is no local technical competence, and provides incentives directed at the overseas activities of Korean firms. During this period progress was also made in building up capabilities in the areas of detailed engineering, procurement and construction supervision. In the third stage, which started in the second half of the 1970s following the explosive rise in oil prices, the construction boom in West Asia helped to further the development of these capabilities. Exports of turnkey projects and construction services have taken place to this region together with an improvement in technological capabilities encompassing various types of services with the exception of basic engineering. The process that this country has gone through to establish the engineering design and construction sector involves collaboration with foreign firms, particularly at the early stage, followed by an indigenization policy accompanied by the promotion of large integrated conglomerates.
At the initial stage, India, like the Republic of Korea, also relied on foreign consultancy and engineering firms and contractors in its efforts to build up a domestic capability. During the 1950s and 1960s, the Government invested jointly with foreign firms in sectors such as steel, chemical and metalworking. From this, public sector enterprises resulted which contained project departments that developed a design capability drawing on a vast pool of highly qualified engineers and technicians and benefiting from policy measures aimed at achieving technological self-reliance. The major difference between the development process of this sector in the Republic of Korea and in India is that the former country has relied relatively more on foreign firms and has done less in terms of indigenization of its design and construction services sector.
In Brazil, public investment in transport and energy has helped to bring a domestic engineering and construction services sector into being. Public institutions specializing in oil ex
ploration and transport have developed and offer engineering design and construction services. They were established along with large private engineering and construction firms, and played an important role in the development of this sector through the "learning by doing" they acquired over time. The firms in question have been actively involved in absorbing foreign technology and upgrading the skills of engineering firms through training. They exercised entrepreneurial control while engaging in partnerships with foreign technology suppliers and drawing to the maximum extent possible on whatever contribution the local science and technology system could provide. They also benefited from policy measures to encourage technological development, such as government procurement policies that tended to favour domestic companies. The efforts that were made and the policies pursued have enabled Brazil to develop a fairly strong domestic capacity in construction services and technological services including consulting and engineering design services and other technical assistance activities.
In an effort to promote the development and utilization of its domestic engineering and construction capabilities, Indonesia makes the awarding of construction contracts conditional upon sub-contracting work to domestic companies. In other developing countries, government procurement policies tend generally to give preference to domestic firms to enable them to acquire further capabilities and allow the domestic economy in these countries to benefit from the positive externalities that could result. This procurement policy is also practised in developed countries to varying de
grees 42
From domestic to international activities
A few of the developing countries that established a domestic capability in engineering and construction have succeeded in building an export capacity in these services and penetrating international markets. The leading exporter is undoubtedly the Republic of Korea, whose total foreign exchange earnings from overseas construction by firms from the Republic of Korea amounted to about Sll billion during 1978-1985, which was over 50 per cent
42 In the United States, for publicly funded projects, the Government maintains its preference for American firms. In France, it seems that about 90 per cent of the work on the $3 billion New Euro-Disneyland project has been promised to French architects and construction firms. In the United Kingdom, Government policy requires that only firms with majority British ownership can perform engineering and design work on North Sea projects.
267
of the commodity trade deficit of the country during the same period.43 For this and other countries such as Yugoslavia, India, Brazil, Argentina, Mexico and China, the move from domestic to international activities has not been automatic but was very much influenced by the extent and nature of domestic activities carried out earlier and the evolution of foreign demand for engineering design and construction services.
These activities have through learning-by-doing added to the capability of skilled engineers and technicians that were in abundant supply in those countries. With the specific "engineering expertise" background it developed for infrastructure projects, the Republic of Korea has acquired a competitive advantage in infrastructure-related CED services. Similarly, the experience of Brazil in mining and petroleum and of India in steel and metal working explain the export capability in engineering services that developed in these sectors in those countries.
The indigenous accumulation of specific know-how through learning-by-doing and local research and development was complemented in varying degrees by imported technological inputs in the process of developing an export capacity in this sector. Despite the different approaches to technological development pursued by different developing countries, increased emphasis is placed on the central role of technology in building up such a capacity.
Whereas India pursued a strategy with the objective of achieving technological self-reliance, the Republic of Korea followed an export-oriented approach, giving particular emphasis to the improvement of production methods rather than the development of research and development capability, often in close collaboration with foreign firms at home and abroad. The result was that a large and diversified technological base was created in India, which enabled this country to take a leading position in industrial project exports, while in the case of the Republic of Korea fairly large exports of construction services and capital goods materialized but less success was achieved in foreign sales of industrial projects during the period 1975-1980.44
Brazil, and to a lesser extent Mexico and Argentina, have also emerged as exporters of engineering services. Brazil's exports of civil engineering services mainly for infrastructure projects went to other Latin American countries and a few developing countries of West Asia. It has also emerged as an exporter of consultancy services and technical assistance contracts mainly to other countries in Latin America and has succeeded in building up an export capacity in industrial engineering services as part of turnkey project exports in such sectors as capital goods, steel, sugar and alcohol.45
Whereas Mexico's exports of engineering services for infrastructure projects were almost exclusively destined to other Latin American countries, the bulk of industrial project exports went to other countries in this region, but also to other developing countries and some industrialized countries. Affiliates of foreign companies in Mexico have stimulated local demand for engineering services, which has helped national firms to obtain contracts to work on projects in which transnational corporations participated. Although those affiliates may have helped to diffuse imported technological services within the economy, they have not been very active exporters of technological services compared to national companies.46
Two other factors have contributed to the development of an export capacity in engineering and construction services - financing and government policy. Financing, however, remains one of the major obstacles for firms from developing countries in penetrating or consolidating their positions in international markets. Some efforts have been made through multilateral financing of investment projects to encourage the development of a local engineering and construction capability in these countries.47 The extent to which this has influenced the export performance of developing countries in engineering and construction services requires further investigation, which is beyond the scope of this case study.
Suffice it to mention here that the meagre financial resources available to engineering firms in most developing countries coupled with the weak financing facilities that exist there made some governments adopt different sup-
43 Kim, Sooyong, The Korean construction industry as an exporter of services, op.cit., p .11 .
44 L. E. Westphal , et al., "Exports of capital goods and related services from the Republic of Korea" , World Bank Staff Work ing Paper N o . 629, Washington, D C , World Bank, 1984.
45 Simon Teitel and Francisco C. Sercovich, "Latin America" in the special issue of World development entitled Exports of Technology by Newly-Industrializing Countries, S. Lall (éd.), Vol. 12, No . 5 6, May/June 1984, p . 645-660.
46 Ibid.
47 Fo r projects it finances, the World Bank gives bids from local contractors in developing countries a 7.5 per cent preference.
266
portive policies to promote exports of such services.48 In the Republic of Korea, for example, the Overseas Construction Promotion Act of 1975 aims at supporting and regulating overseas construction activities, and a government-supported research unit was set up to promote studies of the West Asian economies.
Among other institutional changes introduced by the Government of the Republic of Korea in this sector is the standardization of labour contracts for all construction firms operating overseas to avoid disputes between workers and managers abroad. Through the granting of preferential treatment and bank credits and interest rates as well as tax incentives, the Government instituted a system of export promotion. Other incentives include an accelerated depreciation allowance for equipment directly used in overseas construction and
income tax deductions for workers employed abroad.49
Many other developing countries have, in varying degrees, adopted policies to promote the development of an export-oriented CED services sector. Argentina, Brazil and Mexico have been doing so through their technology policies whose main object is to strengthen local technological capabilities and promote their utilization in the development process, In addition, tax incentive schemes in the form of government-supported financing of pre-investment services and provision of risk coverage helped those countries to enter the international scene.50 As discussed earlier, India has also been pursuing a policy aimed at developing an export capability in these technological services. The transition from domestic to international activities, however, does not take place in a vacuum but in the context of the competitive environment that prevails in the international market for these services.
C. International competition in CED services
The evolution of the international market for both construction and engineering design services shows that over 70 per cent of this market continues to be in the developing countries.51 Infrastructure projects are the dominant type in this market, owing essentially to public investments that were made over the past 20 years, in particular during the 1970s, to establish basic infrastructure facilities ranging from roads, highways, housing complexes, educational establishments to hospitals, airports, dams and power stations. What may explain the concentration of the international market in the developing countries is the fact that the bulk of total engineering and construction work has - not surprisingly - been in new and fairly
large projects, while about 30 to 40 per cent of similar work in developed countries tends to be devoted to repair and maintenance of existing projects.52
1. Construction services
There has been fierce competition among exporting firms in the international construction market over the last 10 years. This has often been reflected in fairly significant changes in the market shares of countries and ranking of firms from both developed and de-
48 Gove rnmen t intervention has also been used in the developed countries to provide, directly or indirectly, financial subsidies to engineering firms. This is the case of F rance , Italy and Japan , where government agencies have provided development aid but also export credits at below marke t interest rates (OTA, op.cit., p . 137.)
49 Kim, Sooyong, op.cit., p.20.
50 Teitel S. and Sercovich F. , op.cit.,
51 Most of the trade statistics used in this section come from or are based on the trade weekly, Engineering News Record (ENR), which carries out annual surveys of the top international contractors and design firms in collaboration with the University of Florida's School of Building Construction at Gainesville. ENR's annual survey of international contractors covers the top 250 international firms in the world since 1980, ranking them according to their foreign contract values. ENR's survey of international design firms covers the top 200 firms and ranks them according to the foreign fees collected for the services they supplied. From 1979 to 1982, the coverage of ENR's survey included the top 150 design firms only.
52 Hil lerbrandt , Patricia M., Economic Theory and the Construction Industry, 2nd edition, Macmil lan , London , 1985.
269
veloping countries among ENR's top 250 international contractors.
Although the United States remains by far the world's largest exporter of construction services, its competitive position has been eroding, with its share declining from 45 per cent in 1980 to about 30 per cent in 1986. In contrast, Japan's export competitiveness improved, with its market share rising from 4 per cent in 1980 to about 13 per cent in 1986. Gains of Japanese firms have been made in the North American and Asian markets.
Among European countries, Italy has consistently increased its penetration of the international market with its market share rising from 6 per cent in 1980 to as high as 11 per cent in 1985 to become the leading European exporter of construction services. French firms are particularly competitive in the African market in which they have been present for a fairly long period of time, partly owing to their linguistic and cultural affinities and educational and political ties with many African countries.
What may have contributed to heightening international competition in this sector is the increased presence of developing countries and territories in the construction export market. This is primarily the case of the Republic of Korea, but also, though to a much lesser extent, Yugoslavia, India, Brazil, Mexico and Hong Kong. The Republic of Korea emerged in the second half of the 1970s as a major exporter of construction services. It consistently ranked among the top three exporting countries, and often as second to the United States (the leading exporter) during the period 1980-1983. The export competitiveness of this country started to deteriorate in 1983 with the market share of the Republic's firms among the top 250 international contractors sliding from 11 per cent in 1983 to as low as 4 per cent in 1986. Also, the number of firms from this country appearing on ENR's list has been constantly declining from 25 in 1983 to 22 in 1984, 17 in 1985 and 14 in 1986.
Moreover, the competitive position of this country has been eroding in its principal export market, West Asia, which accounted until 1985 for 70 per cent of its foreign construction business. As regards this declining but still second largest regional market, the share of the firms from the Republic of Korea was about 7.8 per cent in 1986, well below the level of 15.6 per cent reached in 1985 and of 18.4 per cent in 1984.
A few firms from other developing countries appeared at least once among ENR's top 250 international contractors during the period 1980-1986, but their market share remained comparatively small. In 1984, for example, there were seven firms from Yugoslavia on this list, three from India, three from Brazil, and two from China, of which one appeared for the first time among the top 250 international firms with $824 million in foreign contracts. Other firms on the 1984 list of top contractors came from Argentina, Hong Kong, Kuwait, Lebanon, Mexico, Senegal, Singapore and Taiwan Province of China. In 1986, a number of firms from some of these countries continued to appear on the list but their ranking has undergone significant changes, reflecting the intense international competition in the construction sector. Some of those international contractors have also been engaging in foreign design work either as part of turnkey projects which cover both the design and construction phases or on separate design contracts. This has contributed to intensifying competition among firms in the international design market, as will be discussed in the section below.
2. Engineering design services
Although remaining the world leader in engineering design services, the United States' position has been eroding, with its share declining from 31 per cent in 1983 to 26 per cent in 1986.53 Worth noting is the loss in the United States market share in 1986 compared to 1985. With $918 million of foreign billings, the competitive position of the United States declined in all geographical regions in 1986. The declines ranged from about 1 percentage point in the Middle East to more than 15 per cent in the Latin American region. Whereas United States firms had roughly a 65 per cent share of the Latin American market in 1985, they only managed to capture 50 per cent of this market in 1986.
European firms as a group continue to have the largest market share of the foreign design market. This share increased to about 55 per cent in 1986 compared to 47 per cent in 1985 and 43 per cent in 1984. Among the European countries, the United Kingdom was in a leading position, with an average market share of 14 per cent during the period
S3 The period 1983-1986 (instead of 1980-1986) has been selected for reasons of comparability of data. Whereas ENR's Annual Surveys included since 1983 the top 200 international design firms, they included only the top 150 such firms during the period 1970-1982.
270
1983-1986. French firms improved their market share by 2 percentage points in 1986. They have more than doubled their volume of business in Asia, nearly doubled it in Latin America, tripled their North American billings and made gains of 27 per cent in Africa and 17 per cent in Europe.
The Scandinavian firms have generally been a fairly strong competitive group in the international design market. Their market share, however, declined in 1986 to 6.5 per cent from 7.3 per cent in 1985 and 8.4 per cent in 1984. In contrast, firms from Switzerland increased their share of the international design market from 2.6 per cent in 1984 to 3.7 per cent in 1985 and 4.2 per cent in 1986. The share of Japanese firms remained more or less stable at about 6 per cent. It was in 1986 that those firms made their biggest gains in the United States market. Their billings totalled $3 million, which well surpassed their best previ-
The preceding sections have shown that the international environment has witnessed some marked changes during the past 10 years. Firstly, since 1982 there has been a decline of the relative importance of the export market for CED services owing in particular to the debt crisis, the dramatic fall in commodity prices and the sluggish performance of the world economy. Accompanying this decline of the export market has been a redistribution of business among regional markets. Whereas the portion of the export market that is located in the developed countries, particularly the United States, Canada and Europe, has expanded slightly, the portion located in developing countries has continued its slide, though still remaining by far the largest part of the international market. This redistribution docs not denote necessarily a long-term shift in the location of markets, but rather a temporary phenomenon that has been influenced by wide fluctuations in investment behaviour and the evolution of the world economy. For some time to come the bulk of the international market is likely to remain in the developing countries, though its magnitude is likely to be well below that experienced during the late 1970s and the early 1980s.
ous performance in the United States ($200,000 in 1983).
The competitiveness of firms from the developing countries in the international consulting and engineering design market remains weak. In effect, the market continues to be dominated by firms from the industrialized countries. Together these firms account for more than 90 per cent of the foreign billings by the top 200 international design firms. Unlike the successful penetration of firms from the Republic of Korea into the construction export sector since the mid-1970s, design firms from this country have succeeded in obtaining only a very small market share averaging around 1 to 1.5 per cent. A few firms from other developing countries and territories have appeared among the top 200 international design firms. They come from Brazil, India, Lebanon, Pakistan, Taiwan Province of China and Yugoslavia, but their market share remains very small.
Secondly, although the United States remains the world leader in the industry, its competitiveness has been eroded, while that of Japan has improved, with the EEC countries' position remaining more or less stable. Thirdly, new players have entered the international scene since the second half of the 1970s, as reflected by the emergence of a handful of developing country exporters of infrastructure-related construction services. However, since 1984, many firms of those countries have been unable to maintain or increase their share of the international market owing in part to increases in labour costs, weakness in project financing and application in the industry of labour-saving computer technology mainly in the developed countries. Fourthly, contrary to their relative success in exporting construction services, the developing countries' competitiveness continues to be very weak in the more technology-intensive design segment of the industry. In effect, over 90 per cent of the international market for consultancy and design services continues to be controlled by firms from the developed countries."
D. Concluding remarks
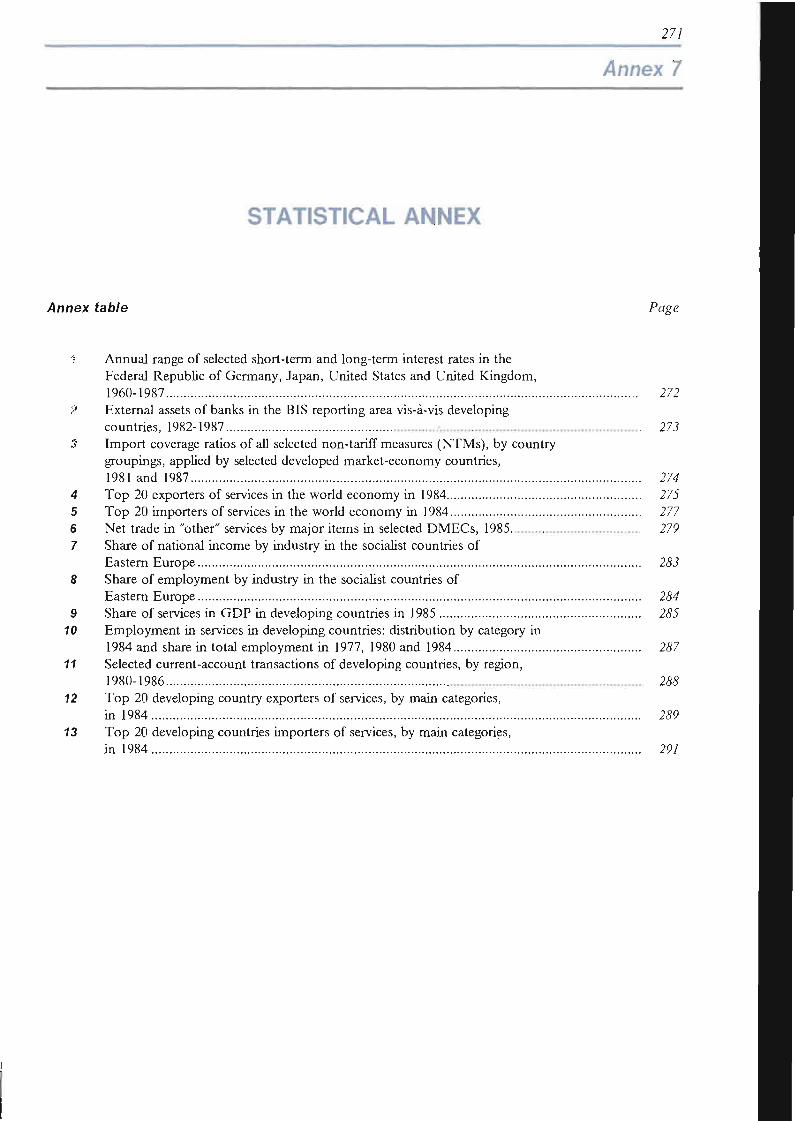
271
Annex 7
STATISTICAL ANNEX
Annex table Page
1 Annual range of selected short-term and long-term interest rates in the Federal Republic of Germany, Japan, United States and United Kingdom, 1960-1987 272
2 External assets of banks in the BIS reporting area vis-à-vis developing countries, 1982-1987 ,-. 273 Import coverage ratios of all selected non-tariff measures (NTMs), by country groupings, applied by selected developed market-economy countries, 1981 and 1987 274
4 Top 20 exporters of services in the world economy in 1984 275 5 Top 20 importers of services in the world economy in 1984 277 6 Net trade in "other" services by major items in selected DMECs, 1985 279 7 Share of national income by industry in the socialist countries of
Eastern Europe 283 8 Share of employment by industry in the socialist countries of
Eastern Europe 284 9 Share of services in GDP in developing countries in 1985 285
10 Employment in services in developing countries: distribution by category in 1984 and share in total employment in 1977, 1980 and 1984 287
11 Selected current-account transactions of developing countries, by region, 1980-1986 288
12 Top 20 developing country exporters of services, by main categories, in 1984 289
13 Top 20 developing countries importers of services, by main categories, in 1984 291
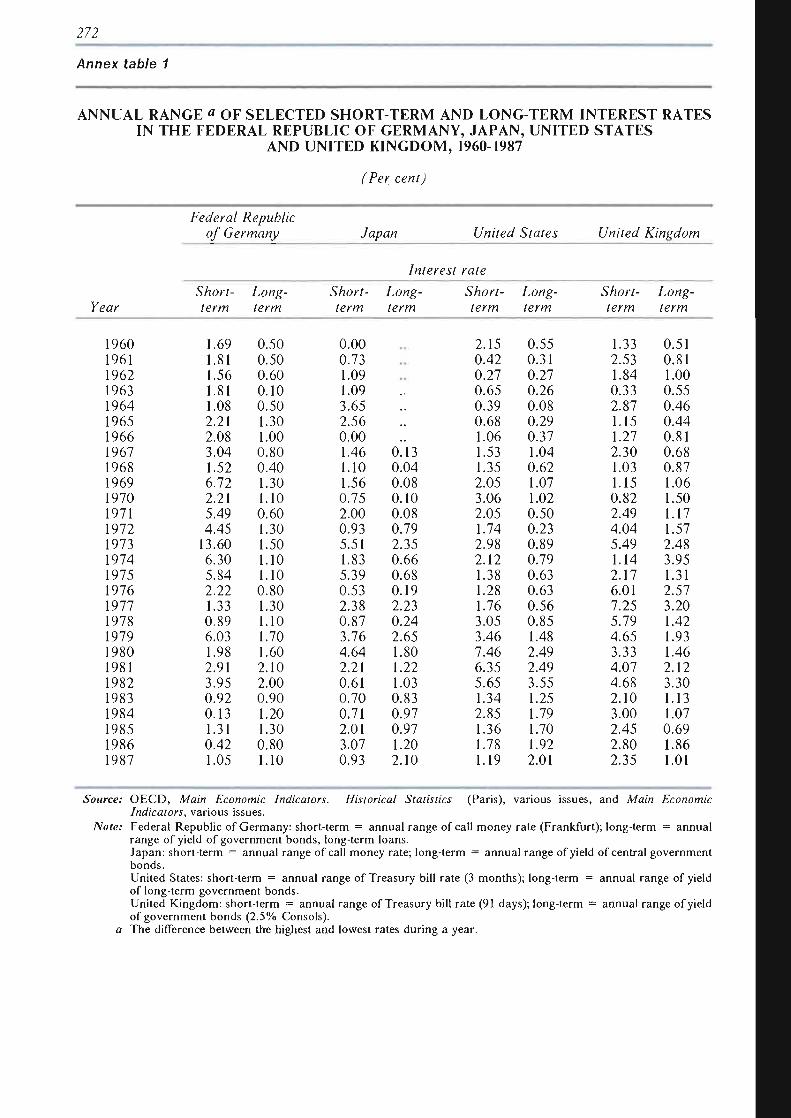
222
Annex table 1
ANNUAL RANGE « OF SELECTED SHORT-TERM AND LONG-TERM INTEREST RATES IN THE FEDERAL REPUBLIC OF GERMANY, JAPAN, UNITED STATES
AND UNITED KINGDOM, 1960-1987
(Per cent)
Federal Republic of Germany Japan United States United Kingdom
Interest rale
Short- Long- Short- Long- Short- Long- Short- Long-Year term term term term term term term term
I960 1961 1962 1963 1964 1965 1966 1967 1968 1969 1970 1971 1972 1973 1974 1975 1976 1977 1978 1979 1980 1981 1982 1983 1984 1985 1986 1987
1.69 1.81 1.56 1.81 1.08 2.21 2.08 3.04 1.52 6.72 2.21 5.49 4.45 13.60 6.30 5.84 2.22 1.33 0.89 6.03 1.98 2.91 3.95 0.92 0.13 1.31 0.42 1.05
0.50 0.50 0.60 0.10 0.50 1.30 1.00 0.80 0.40 1.30 1.10 0.60 1.30 1.50 1.10 1.10 0.80 1.30 1.10 1.70 1.60 2.10 2.00 0.90 1.20 1.30 0.80 1.10
0.00 0.73 1.09 1.09 3.65 2.56 0.00 1.46 1.10 1.56 0.75 2.00 0.93 5.51 1.83 5.39 0.53 2.38 0.87 176 4.64 2.21 0.61 0.70 0.71 2.01 3.07 0.93
0.13 0.04 0.08 0.10 0.08 0.79 2.35 0.66 0.68 0.19 2.23 0.24 2.65 1.80 1.22 1.03 0.83 0.97 0.97 1.20 2.10
2.15 0.42 0.27 0.65 0.39 0.68 1.06 1.53 1.35 2.05 3.06 2.05 1.74 2.98 2.12 1.38 1.28 1.76 3.05 3.46 7.46 6.35 5.65 1.34 2.85 1.36 1.78 1.19
0.55 0.31 0.27 0.26 0.08 0.29 0.37 1.04 0.62 1.07 1.02 0.50 0.23 0.89 0.79 0.63 0.63 0.56 0.85 1.48 2.49 2.49 3.55 1.25 1.79 1.70 1.92 2.01
1.33 2.53 1.84 0.33 2.87 1.15 1.27 2.30 1.03 1.15 0.82 2.49 4.04 5.49 114 2.17 6.01 7.25 5.79 4.65 3.33 4.07 4.68 2.10 3.00 2.45 2.80 2.35
0.51 0.81 1.00 0.55 0.46 0.44 0.81 0.68 0.87 1.06 1.50 1.17 1.57 2.48 3.95 1.31 2.57 3.20 1.42 1.93 1.46 2.12 130 1.13 1.07 0.69 1.86 1.01
Source: OECD, Main Economic Indicators. Historical Statistics (Paris), various issues, and Main Economic Indicators, various issues.
Note: Federal Republic of Germany: short-term = annual range of call money rate (Frankfurt); long-term = annual range of yield of government bonds, long-term loans. Japan: short-term = annual range of call money rate; long-term = annual range of yield of central government bonds. United States: short-term = annual range of Treasury bill rate (3 months); long-term = annual range of yield of long-term government bonds. United Kingdom: short-term = annual range of Treasury bill rate (91 days); long-term = annual range of yield of government bonds (2.5% Consols).
a The difference between the highest and lowest rates during a year.
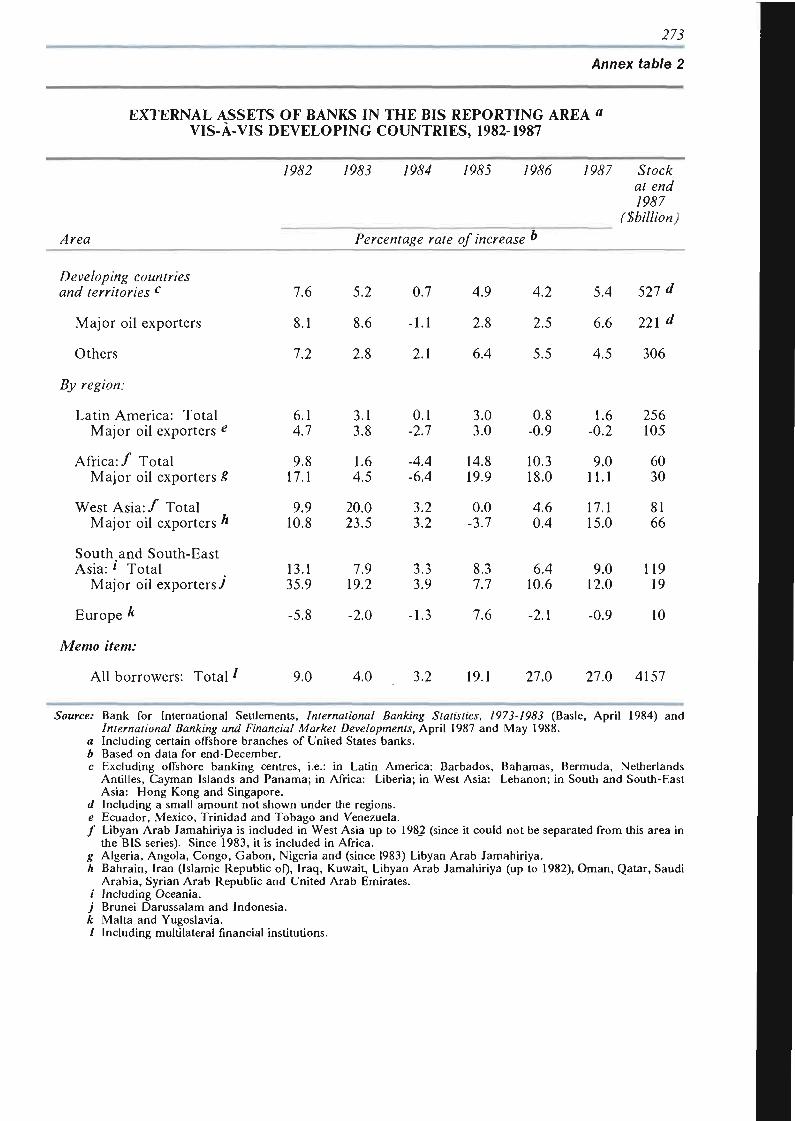
273
Annex table 2
EXTERNAL ASSETS OF BANKS IN THE BIS REPORTING AREA a
VIS-À-VIS DEVELOPING COUNTRIES, 1982-1987
Area
Developing countries and territories c
Major oil exporters
Others
By region:
Latin America: Total Major oil exporters e
Africa: / Total Major oil exporters S
West A s i a : / Total Major oil exporters &
Southland South-East Asia: * Total
Major oil exporters7
Europe &
Memo item:
All borrowers: Total '
/9&2
7.6
8.1
7.2
6.1 4.7
9.8 17.1
9.9 10.8
13.1 35.9
-5.8
9.0
/96J 7944 7963 7946
Percentage rate of increase "
5.2
8.6
2.8
3.1 3.8
1.6 4.5
20.0 23.5
7.9 19.2
-2.0
4.0
0.7
-1.1
2.1
0.1 -2.7
-4.4 -6.4
3.2 3.2
3.3 3.9
-1.3
3.2
4.9
2.8
6.4
3.0 3.0
14.8 19.9
0.0 -3.7
8.3 7.7
7.6
19.1
4.2
2.5
5.5
0.8 -0.9
10.3 18.0
4.6 0.4
6.4 10.6
-2.1
27.0
7967
5.4
6.6
4.5
1.6 -0.2
9.0 111
17.1 15.0
9.0 12.0
-0.9
27.0
Stock at end 7947
(Sbillion)
527 d
221 d
306
256 105
60 30
81 66
119 19
10
4157
Source: Bank, for International Settlements, International Banking Statistics, 1973-1983 (Basle, April 1984) and International Banking and Financial Market Developments, April 1987 and May 1988.
a Including certain offshore branches of United States banks. b Based on data for end-December. c Excluding offshore banking centres, i.e.: in Latin America: Barbados, Bahamas, Bermuda, Netherlands
Antilles, Cayman Islands and Panama; in Africa: Liberia; in West Asia: Lebanon; in South and South-East Asia: Hong Kong and Singapore.
d Including a small amount not shown under the regions. e Ecuador, Mexico, Trinidad and Tobago and Venezuela. / Libyan Arab Jamahiriya is included in West Asia up to 1982 (since it could not be separated from this area in
the BIS series). Since 1983, it is included in Africa. g Algeria, Angola, Congo, Gabon, Nigeria and (since 1983) Libyan Arab Jamahiriya. A Bahrain, Iran (Islamic Republic of), Iraq, Kuwait, Libyan Arab Jamahiriya (up to 1982), Oman, Qatar, Saudi
Arabia, Syrian Arab Republic and United Arab Emirates. i Including Oceania. j Brunei Darussalam and Indonesia. k Malta and Yugoslavia. f Including multilateral financial institutions.
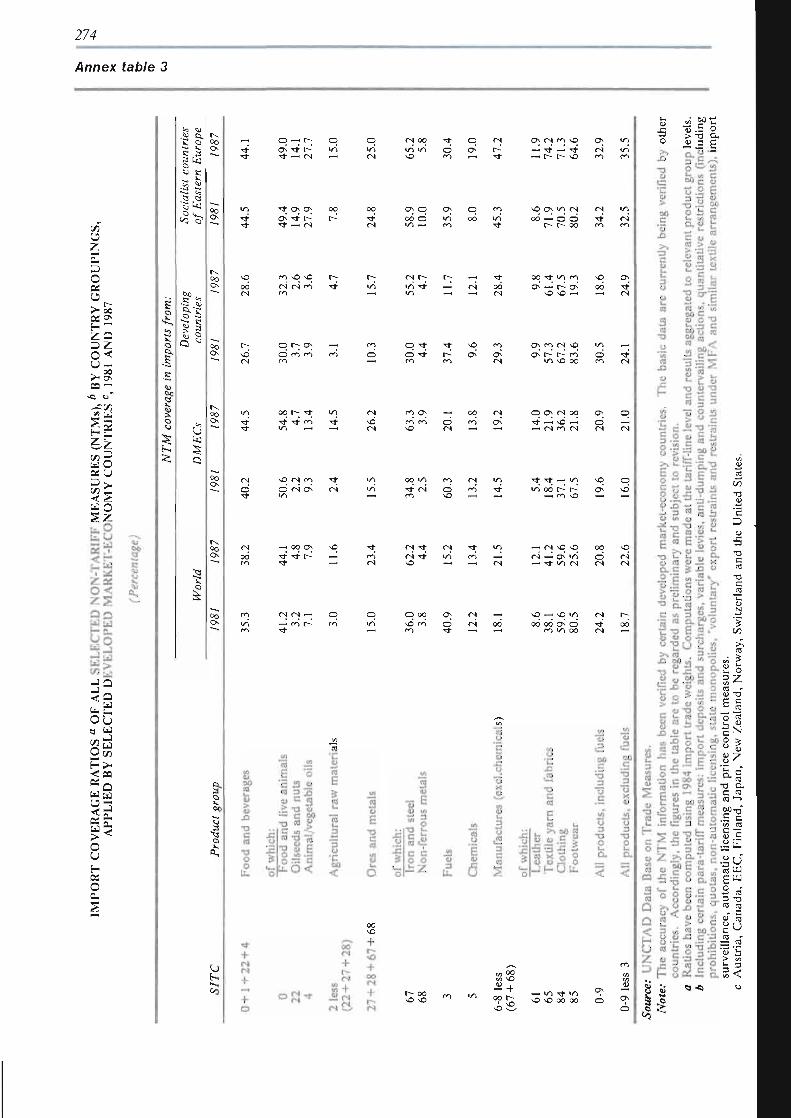
274
Annex table 3
'SI
z
O as U
« 2
z a o< u -> ^ BQ -
II II
W O
I I M O U
o 0.
1
<-: •* 1.
S1
Cl « j
% -~ <3 5 £
6f r Q.
^ C
tu
^ u
a k i
c
L-,
w k i
^
% r S-3
<3 k i
S Q
X V o ¡k
on ON
«A < f O v O i ON T f t -•3- —• <s
00
r~ 00
OO O LA _ i
CT> V)
: o\ Tf r-o LA
o (N 00 LA LA
• *
o o ON
(N r-
o\ (S m \o
- ?^S ON (N
O 00 (N
(N (N m rA
r-
(N
o r-- ov
•* 'S- rA LA _ I
r->
d
(N vu (N
LA T t
LA
(N 00 - H (N
R
00 rA
(N
l o a m i s
oo - J- LA m
ON rA CM N Û
qo¡ (Noo
—i CN) rA <N
(N
LA
d
S
rs o O Í N ON
LA <* (S
LA LA
00 LA
g r f ^ f ^ LA LA OO r - C~
— rA vO
\ 0
O o vD
N 00 t t t -
NO —i • * LA <N 5
(N <S - H
? O rA
O LA
O 00 NO (A rA
ON
i rs (S
- H
00 O i—i \ 0 LA 00 00 ON O
rA L A 00
CN
(N
i . ' I
I •a
I
1 I ï i i 111 lii !
i I¡ 11 II 1
î i
lîîl
a 3
a g
•5 a
-:-f
+ !' +
r
1 •
°3^
n -i-(S
la
00 NO
CÍ +
s I
t - i
+ r-I i
r- oo
83 £ + oo r-
¿ S
—i LA r t LA NO NO 00 00
O N
Ó
S3 5 o
É
; • •
•s i
I
S a • • ;
Ê
4?
11
II il p 43 ¥
: • -
0 G.
_ £
ïi P il
HÏI Hïf
C
¡ J . ï ,
o tn y
§ l i t 1 "S l | ï
ïlfî
il * -S
S
1 C
3
•a c
M
C
S
2 B-3
111 9 crj . e u t :
o 2 s _ ^ Î N
II
Jilî n ¡!j!
ïï^ë>
_ ü
m • - S U
1 I •Il
0 "Q
È'
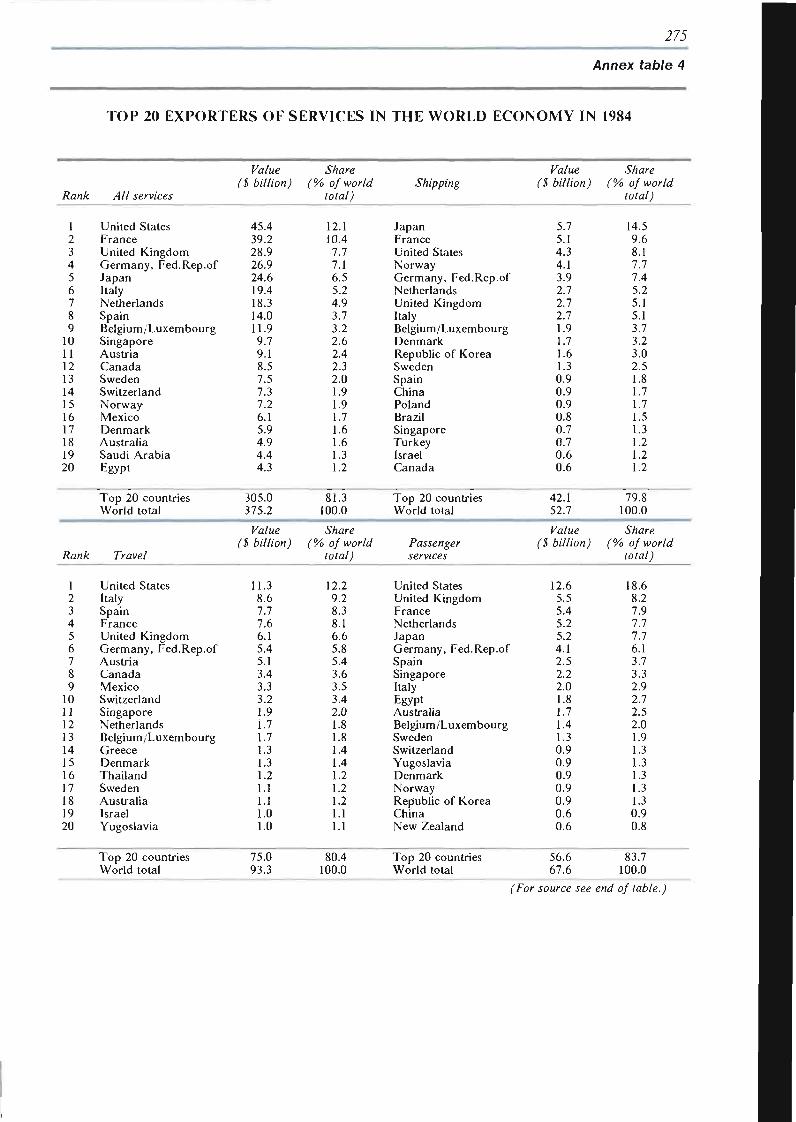
275
Annex table 4
TOP 20 EXPORTERS OF SERVICES IN THE WORLD ECONOMY IN 1984
Rank
1 2 3 4 5 6 7 8 9
10 11 12 13 14 15 16 17 18 19 20
Rank
1 2 3 4 5 6 7 8 9
10 11 12 13 14 15 16 17 18 19 20
All services
United States France United Kingdom Germany, Fed.Rep.of Japan Italy Netherlands Spain Belgium/Luxembourg Singapore Austria Canada Sweden Switzerland Norway Mexico Denmark Australia Saudi Arabia Egypt
Top 20 countries World total
Travel
United States Italy Spain France United Kingdom Germany, Fed.Rep.of Austria Canada Mexico Switzerland Singapore Netherlands Belgium/Luxembourg Greece Denmark Thailand Sweden Australia Israel Yugoslavia
Top 20 countries World total
Value (S billion)
45.4 39.2 28.9 26.9 24.6 19.4 18.3 14.0 11.9 9.7 9.1 8.5 7.5 7.3 7.2 6.1 5.9 4.9 4.4 4.3
305.0 375.2
Value ($ billion)
11.3 8.6 7.7 7.6 6.1 5.4 5.1 3.4 3.3 3.2 1.9 1.7 1.7 1.3 1.3 1.2 1.1 1.1 1.0 1.0
75.0 93.3
Share (% of world
total)
12.1 10.4 7.7 7.1 6.5 5.2 4.9 3.7 3.2 2.6 2.4 2.3 2.0 1.9 1.9 1.7 1.6 1.6 1.3 1.2
81.3 100.0
Share (% of world
total)
12.2 9.2 8.3 8.1 6.6 S.8 5.4 3.6 3.5 3.4 2.0 1.8 1.8 1.4 1.4 1.2 1.2 1.2 1.1 1.1
80.4 100.0
Shipping
Japan France United States Norway Germany, Fed.Rep.of Netherlands United Kingdom Italy Belgium/Luxembourg Denmark Republic of Korea Sweden Spain China Poland Brazil Singapore Turkey Israel Canada
Top 20 countries World total
Passenger services
United States United Kingdom France Netherlands Japan Germany, Fed.Rep.of Spain Singapore Italy Egypt Australia Belgium/Luxembourg Sweden Switzerland Yugoslavia Denmark Norway Republic of Korea China New Zealand
Top 20 countries World total
Value ($ billion)
5.7 5.1 4.3 4.1 3.9 2.7 2.7 2.7 1.9 1.7 1.6 1.3 0.9 0.9 0.9 0.8 0.7 0.7 0.6 0.6
42.1 52.7
Value ($ billion)
12.6 5.5 5.4 5.2 5.2 4.1 2.5 2.2 2.0 1.8 1.7 1.4 1.3 0.9 0.9 0.9 0.9 0.9 0.6 0.6
56.6 67.6
Share f% o/wor/d
total)
14.5 9.6 8.1 7.7 7.4 5.2 5.1 5.1 3.7 3.2 3.0 2.5 1.8 1.7 1.7 1.5 1.3 1.2 1.2 1.2
79.8 100.0
Share f% o/wor/d
total)
18.6 8.2 7.9 7.7 7.7 6.1 3.7 3.3 2.9 2.7 2.5 2.0 1.9 1.3 1.3 1.3 1.3 1.3 0.9 0.8
83.7 100.0
(For source see end of table.)
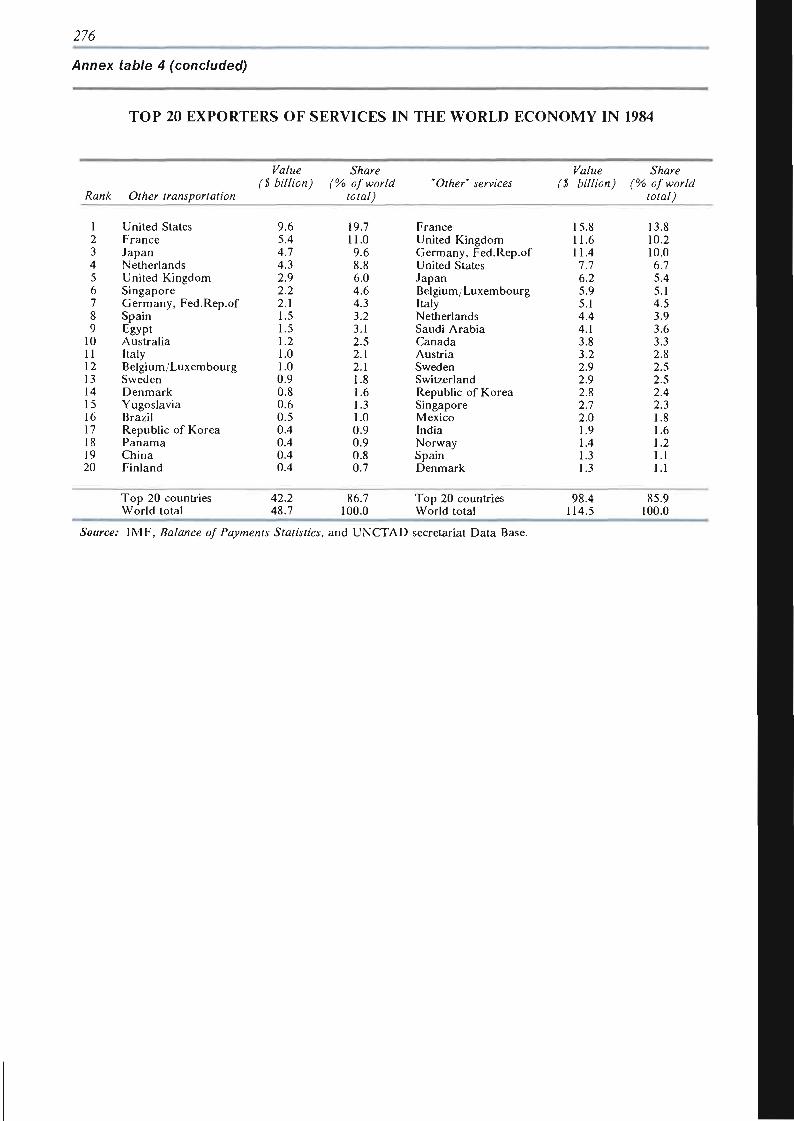
276
Annex table 4 (concluded)
TOP 20 EXPORTERS OF SERVICES IN THE WORLD ECONOMY IN 1984
Value Share Value Share ($ billion) (% of world "Other" services ($ billion) (% of world
Rank Other transportation total) total)
1 2 3 4 5 6 7 8 9
10 11 12 13 14 15 16 17 18 19 20
United States France Japan Netherlands United Kingdom Singapore Germany, Fed.Rep.of Spain Egypt Australia Italy Belgium Luxembourg Sweden Denmark Yugoslavia Brazil Republic of Korea Panama China Finland
9.6 5.4 4.7 4.3 2.9 2.2 2.1 1.5 1.5 1.2 1.0 1.0 0.9 0.8 0.6 0.5 0.4 0.4 0.4 0.4
19.7 11.0 9.6 8.8 6.0 4.6 4.3 3.2 3.1 2.5 2.1 2.1 1.8 1.6 1.3 1.0 0.9 0.9 0.8 0.7
France United Kingdom Germany, Fed United States Japan
.Rep.of
Belgium/Luxembourg Italy Netherlands Saudi Arabia Canada Austria Sweden Switzerland Republic of Korea Singapore Mexico India Norway Spain Denmark
15.8 11.6 11.4 7.7 6.2 5.9 5.1 4.4 4.1 3.8 3.2 2.9 2.9 2.8 2.7 2.0 1.9 1.4 1.3 1.3
13.8 10.2 10.0 6.7 5.4 5.1 4.5 3.9 3.6 3.3 2.8 2.5 2.5 2.4 2.3 1.8 1.6 1.2 1.1 1.1
Top 20 countries 42.2 86.7 Top 20 countries 98.4 85.9 World total 48.7 100.0 World total 114.5 100.0
Source: IMF, Balance of Payments Statistics, and UNCTAD secretariat Data Base.
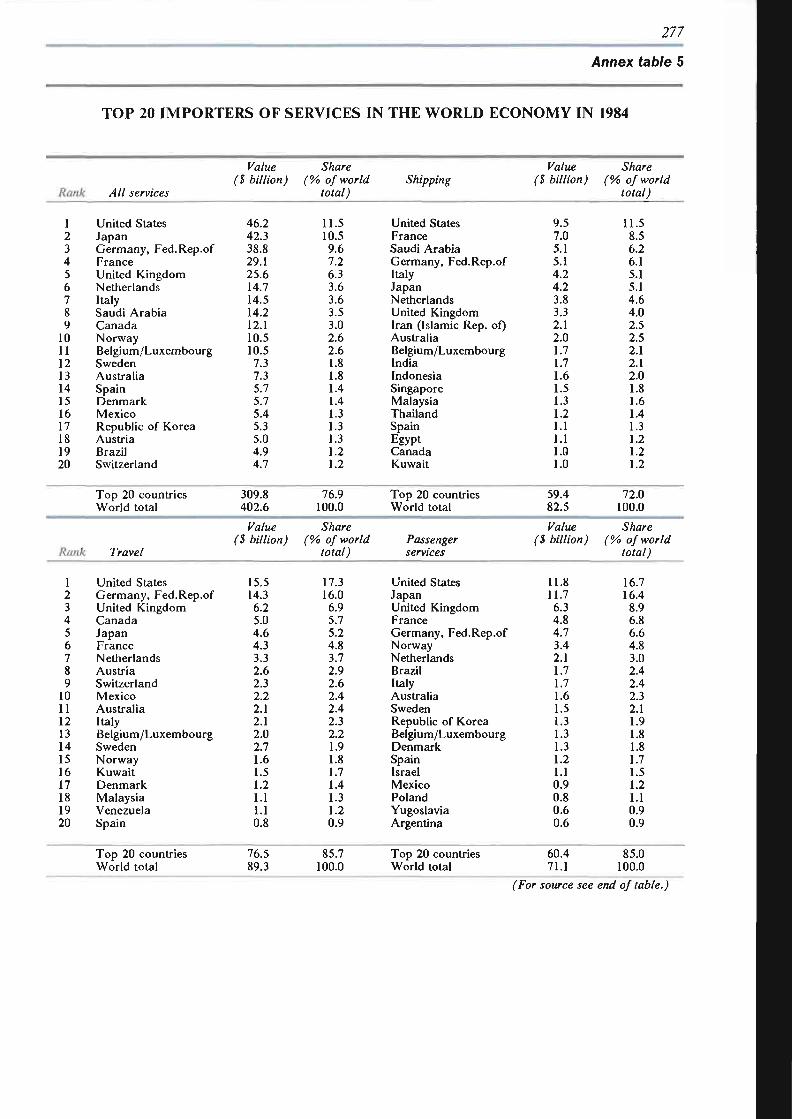
277
Annex table 5
TOP 20 IMPORTERS OF SERVICES IN THE WORLD ECONOMY IN 1984
Rank
1 2 3 4 5 6 7 8 9
10 11 12 13 14 15 16 17 18 19 20
Rank
1 2 3 4 5 6 7 8 9
10 11 12 13 14 15 16 17 18 19 20
All services
United States Japan Germany, Fed.Rep.of France United Kingdom Netherlands Italy Saudi Arabia Canada Norway Belgium/Luxembourg Sweden Australia Spain Denmark Mexico Republic of Korea Austria Brazil Switzerland
Top 20 countries World total
Travel
United States Germany, Fed.Rep.of United Kingdom Canada Japan France Netherlands Austria Switzerland Mexico Australia Italy Belgium/Luxembourg Sweden Norway Kuwait Denmark Malaysia Venezuela Spain
Top 20 countries World total
Value ($ billion)
46.2 42.3 38.8 29.1 25.6 14.7 14.5 14.2 12.1 10.5 10.5 7.3 7.3 5.7 5.7 5.4 5.3 5.0 4.9 4.7
309.8 402.6
Value ($ billion)
15.5 14.3 6.2 5.0 4.6 4.3 3.3 2.6 2.3 2.2 2.1 2.1 2.0 2.7 1.6 1.5 1.2 1.1 1.1 0.8
76.5 89.3
Share (% of world
total)
11.5 10.5 9.6 7.2 6.3 3.6 3.6 3.5 3.0 2.6 2.6 1.8 1.8 1.4 1.4 1.3 1.3 1.3 1.2 1.2
76.9 100.0
Share (% of world
total)
17.3 16.0
6.9 5.7 5.2 4.8 3.7 2.9 2.6 2.4 2.4 2.3 2.2 1.9 1.8 1.7 1.4 1.3 1.2 0.9
85.7 100.0
Shipping
United States France Saudi Arabia Germany, Fed.Rep.of Italy Japan Netherlands United Kingdom Iran (Islamic Rep. of) Australia Belgium/Luxembourg India Indonesia Singapore Malaysia Thailand Spain Egypt Canada Kuwait
Top 20 countries World total
Passenger services
United States Japan United Kingdom France Germany, Fed.Rep.of Norway Netherlands Brazil Italy Australia Sweden Republic of Korea Belgium/Luxembourg Denmark Spain Israel Mexico Poland Yugoslavia Argentina
Top 20 countries World total
Value ($ billion)
9.5 7.0 5.1 5.1 4.2 4.2 3.8 3.3 2.1 2.0 1.7 1.7 1.6 1.5 1.3 1.2 1.1 1.1 1.0 1.0
59.4 82.5
Value ($ billion)
11.8 11.7 6.3 4.8 4.7 3.4 2.1 1.7 1.7 1.6 1.5 1.3 1.3 1.3 1.2 1.1 0.9 0.8 0.6 0.6
60.4 71.1
Share (% of world
total)
11.5 8.5 6.2 6.1 5.1 5.1 4.6 4.0 2.5 2.5 2.1 2.1 2.0 1.8 1.6 1.4 1.3 1.2 1.2 1.2
72.0 100.0
Share (% of world
total)
16.7 16.4
8.9 6.8 6.6 4.8 3.0 2.4 2.4 2.3 2.1 1.9 1.8 1.8 1.7 1.5 1.2 1.1 0.9 0.9
85.0 100.0
(For source see end of table.)
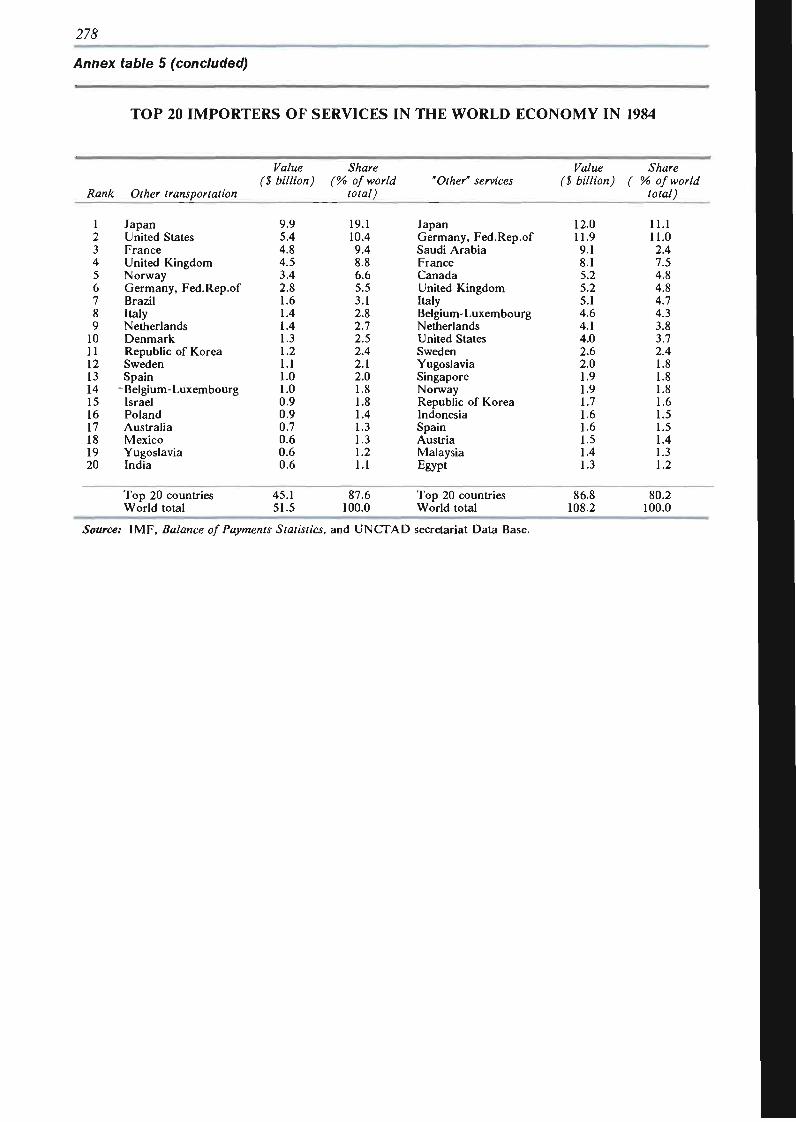
276
Annex table 5 (concluded)
TOP 20 IMPORTERS OF SERVICES IN THE WORLD ECONOMY IN 1984
Rank
1 2 3 4 5 6 7 8 9
10 11 12 13 14 15 16 17 18 19 20
Other transportation
Japan United States France United Kingdom Norway Germany, Fed.Rep.of Brazil Italy Netherlands Denmark Republic of Korea Sweden Spain
- Belgium - Luxembourg Israel Poland Australia Mexico Yugoslavia India
Top 20 countries World total
Value ($ billion)
9.9 5.4 4.8 4.5 3.4 2.8 1.6 1.4 1.4 1.3 1.2 1.1 1.0 1.0 0.9 0.9 0.7 0.6 0.6 0.6
45.1 51.5
Share (% of world
total)
19.1 10.4 9.4 8.8 6.6 5.5 3.1 2.8 2.7 2.5 2.4 2.1 2.0 1.8 1.8 1.4 1.3 1.3 1.2 1.1
87.6 100.0
"Other" services
Japan Germany, Fed.Rep.of Saudi Arabia France Canada United Kingdom Italy Belgium-Luxembourg Netherlands United States Sweden Yugoslavia Singapore Norway Republic of Korea Indonesia Spain Austria Malaysia Egypt
Top 20 countries World total
Value ($ billion)
12.0 11.9 9.1 8.1 5.2 5.2 5.1 4.6 4.1 4.0 2.6 2.0 1.9 1.9 1.7 1.6 1.6 1.5 1.4 1.3
86.8 108.2
Share ( % of world
total)
11.1 11.0 2.4 7.5 4.8 4.8 4.7 4.3 3.8 3.7 2.4 1.8 1.8 1.8 1.6 1.5 1.5 1.4 1.3 1.2
80.2 100.0
Source: IMF, Balance of Payments Statistics, and UNCTAD secretariat Data Base.
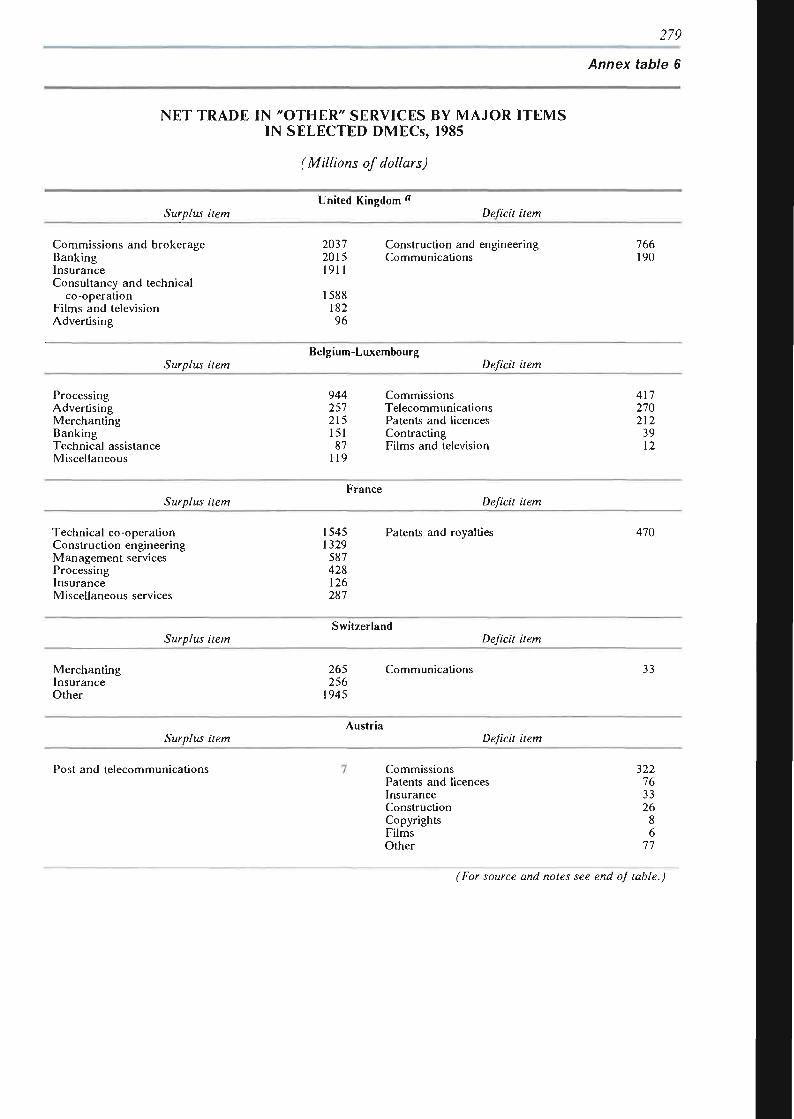
279
Annex table 6
NET TRADE IN "OTHER" SERVICES BY MAJOR ITEMS IN SELECTED DMECs, 1985
(Millions of dollars)
Surplus item United Kingdom a
Deficit item
Commissions and brokerage Banking Insurance Consultancy and technical
co-operation Films and television Advertising
2037 2015 1911
1588 182 96
Construction and engineering Communications
766 190
Surplus item Belgium-Luxembourg
Deficit item
Processing Advertising Merchanting Banking Technical assistance Miscellaneous
944 257 215 151 87
119
Commissions Telecommunications Patents and licences Contracting Films and television
417 270 212
39 12
Surplus item France
Deficit item
Technical co-operation Construction engineering Management services Processing Insurance Miscellaneous services
1545 1329 587 428 126 287
Patents and royalties 470
Surplus item Switzerland
Deficit item
Merchanting Insurance Other
265 256
1945
Communications 33
Surplus item Austria
Deficit item
Post and telecommunications Commissions Patents and licences Insurance Construction Copyrights Films Other
322 76 33 26
8 6
77
(For source and notes see end of table.)
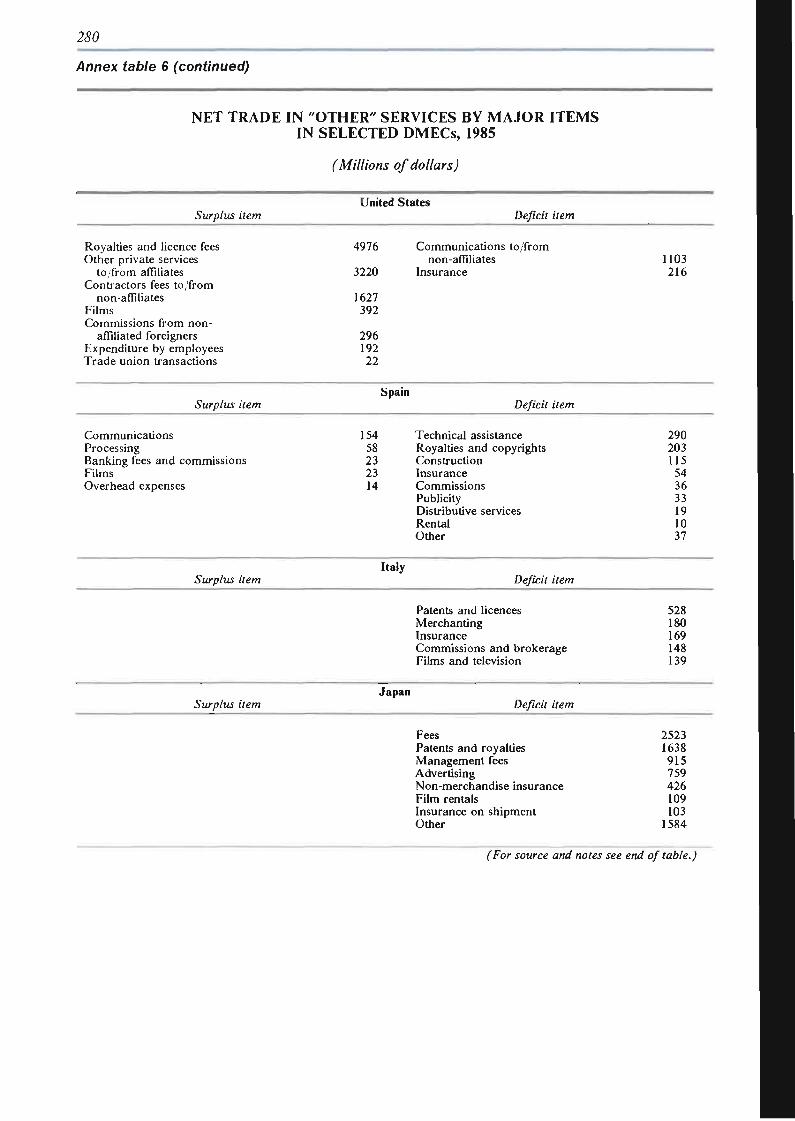
280
Annex table 6 (continued)
NET TRADE IN "OTHER" SERVICES BY MAJOR ITEMS IN SELECTED DMECs, 1985
(Millions of dollars)
Surplus item
Royalties and licence fees Other private services
to/from affiliates Contractors fees to, from
non-affiliates Films Commissions from non
affiliated foreigners Expenditure by employees Trade union transactions
Surplus item
Communications Processing Banking fees and commissions Films Overhead expenses
Surplus item
Surplus item
United States
4976
3220
1627 392
296 192 22
Spain
154 58 23 23 14
Italy
Japan
Deficit item
Communications to/from non-affiliates
Insurance
Deficit item
Technical assistance Royalties and copyrights Construction Insurance Commissions Publicity Distributive services Rental Other
Deficit item
Patents and licences Merchanting Insurance Commissions and brokerage Films and television
Deficit item
Fees Patents and royalties Management fees Advertising Non-merchandise insurance Film rentals Insurance on shipment Other
1103 216
290 203 115
54 36 33 19 10 37
528 180 169 148 139
2523 1638 915 759 426 109 103
1584
(For source and notes see end of table.)
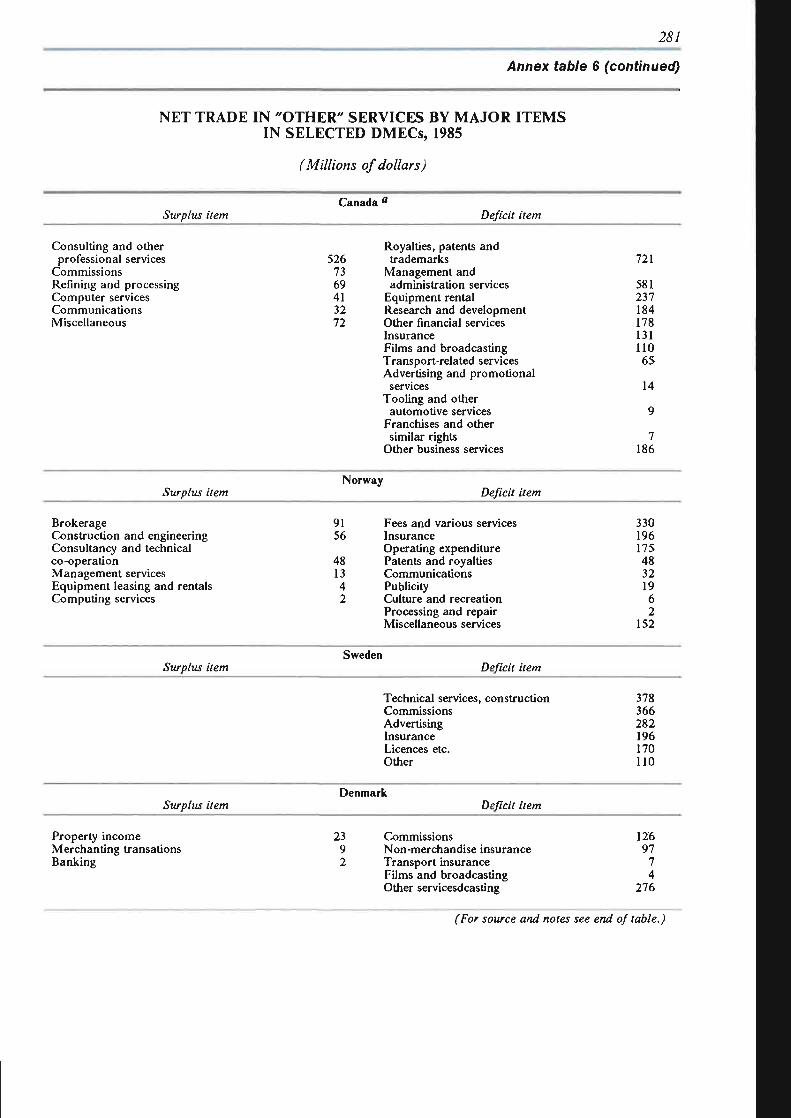
281_
Annex table 6 (continued)
NET TRADE IN "OTHER" SERVICES BY MAJOR ITEMS IN SELECTED DMECs, 1985
(Millions of dollars)
Surplus item Canada a
Deficit item
Consulting and other professional services
Commissions Refining and processing Computer services Communications Miscellaneous
Royalties, patents and 526 trademarks
73 Management and 69 administration services 41 Equipment rental 32 Research and development 72 Other financial services
Insurance Films and broadcasting Transport-related services Advertising and promotional
services Tooling and other
automotive services Franchises and other similar rights
Other business services
721
581 237 184 178 131 110 65
14
9
7 186
Surplus item Norway
Deficit item
Brokerage Construction and engineering Consultancy and technical co-operation Management services Equipment leasing and rentals Computing services
91 56
48 13 4 2
Fees and various services Insurance Operating expenditure Patents and royalties Communications Publicity Culture and recreation Processing and repair Miscellaneous services
330 196 175 48 32 19 6 2
152
Surplus item Sweden
Deficit item
Technical services, construction Commissions Advertising Insurance Licences etc. Other
378 366 282 196 170 110
Surplus item Denmark
Deficit item
Property income Merchanting transations Banking
23 Commissions 9 Non-merchandise insurance 2 Transport insurance
Films and broadcasting Other servicesdcasting
126 97
7 4
276
(For source and notes see end of table.)
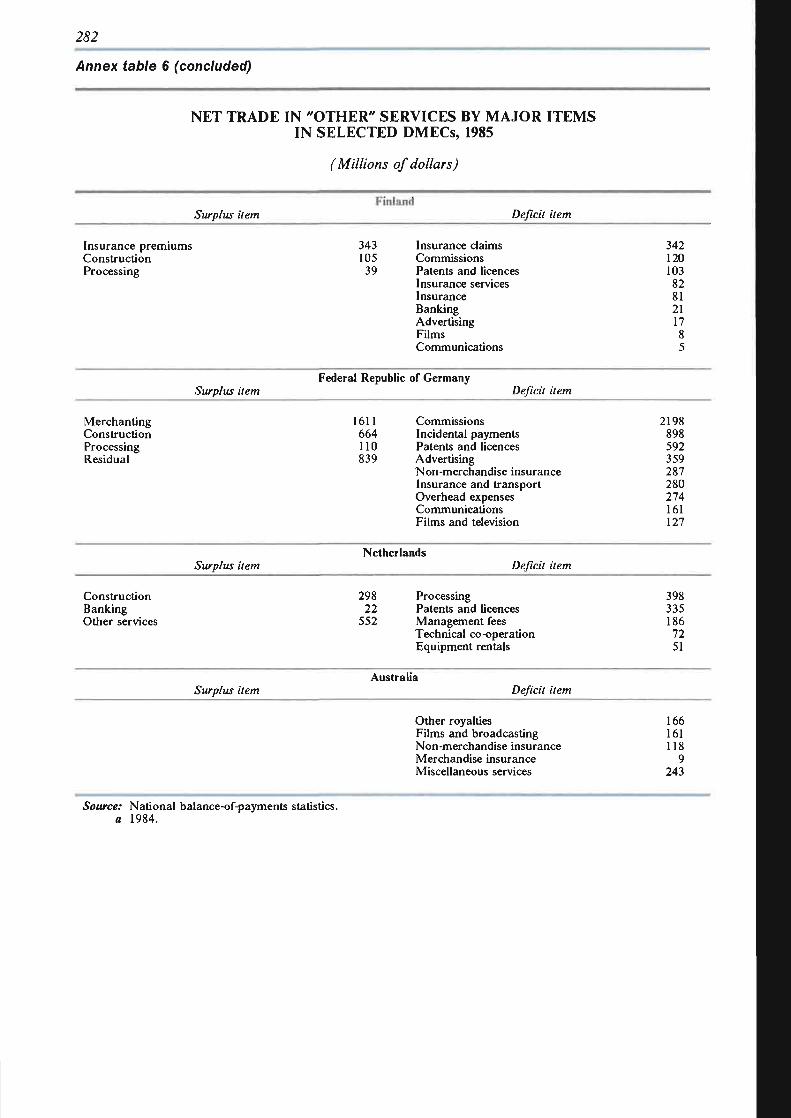
282
Annex table 6 (concluded)
NET TRADE IN "OTHER" SERVICES BY MAJOR ITEMS IN SELECTED DMECs, 1985
(Millions of dollars)
Finland Surplus item Deficit item
Insurance premiums Construction Processing
343 105
39
Insurance claims Commissions Patents and licences Insurance services Insurance Banking Advertising Films Communications
342 120 103 82 81 21 17
Surplus item Federal Republic of Germany
Deficit item
Merchanting Construction Processing Residual
J 611 Commissions 664 Incidental payments 110 Patents and licences 839 Advertising
"Non-merchandise insurance Insurance and transport Overhead expenses Communications Films and television
2198 898 592 359 287 280 274 161 127
Netherlands Surplus item Deficit item
Construction Banking Other services
298 Processing 22 Patents and licences
552 Management fees Technical co-operation Equipment rentals
398 335 186 72 51
Australia Surplus item Deficit item
Other royalties Films and broadcasting Non-merchandise insurance Merchandise insurance Miscellaneous services
166 161 118
9 243
Source: National balance-of-payments statistics. a 1984.
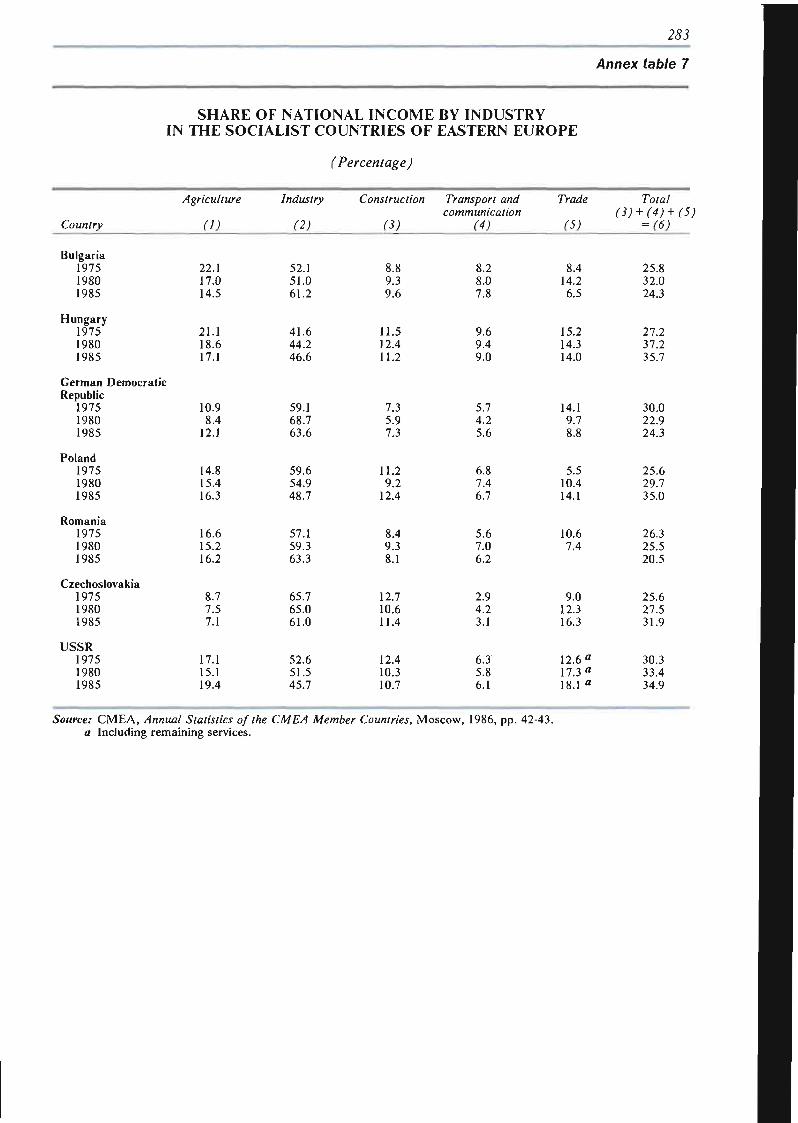
283
Annex table 7
SHARE OF NATIONAL INCOME BY INDUSTRY IN THE SOCIALIST COUNTRIES OF EASTERN EUROPE
(Percentage)
Country
Bulgaria 1975 1980 1985
Hungary 1975 1980 1985
German Democratic Republic
1975 1980 1985
Poland 1975 1980 1985
Romania 1975 1980 1985
Czechoslovakia 1975 1980 1985
USSR 1975 1980 1985
Agriculture
(I)
22.1 17.0 14.5
21.1 18.6 17.1
10.9 8.4
12.1
14.8 15.4 16.3
16.6 15.2 16.2
8.7 7.5 7.1
17.1 15.1 19.4
Industry
(2)
52.1 51.0 61.2
41.6 44.2 46.6
59.1 68.7 63.6
59.6 54.9 48.7
57.1 59.3 63.3
65.7 65.0 61.0
52.6 51.5 45.7
Construction
(3)
8.8 9.3 9.6
11.5 12.4 11.2
7.3 5.9 7.3
11.2 9.2
12.4
8.4 9.3 8.1
12.7 10.6 11.4
12.4 10.3 10.7
Transport and communication
(4)
8.2 8.0 7.8
9.6 9.4 9.0
5.7 4.2 5.6
6.8 7.4 6.7
5.6 7.0 6.2
2.9 4.2 3.1
6.3 5.8 6.1
Trade
(S)
8.4 14.2 6.5
15.2 14.3 14.0
14.1 9.7 8.8
5.5 10.4 14.1
10.6 7.4
9.0 12.3 16.3
12.6» 17.3 a
18.1 a
Total
w + w + fj; = w 25.8 32.0 24.3
27.2 37.2 35.7
30.0 22.9 24.3
25.6 29.7 35.0
26.3 25.5 20.5
25.6 27.5 31.9
30.3 33.4 34.9
Source: CMEA, Annual Statistics of the CMEA Member Countries, Moscow, 1986, pp. 42-43. a Including remaining services.
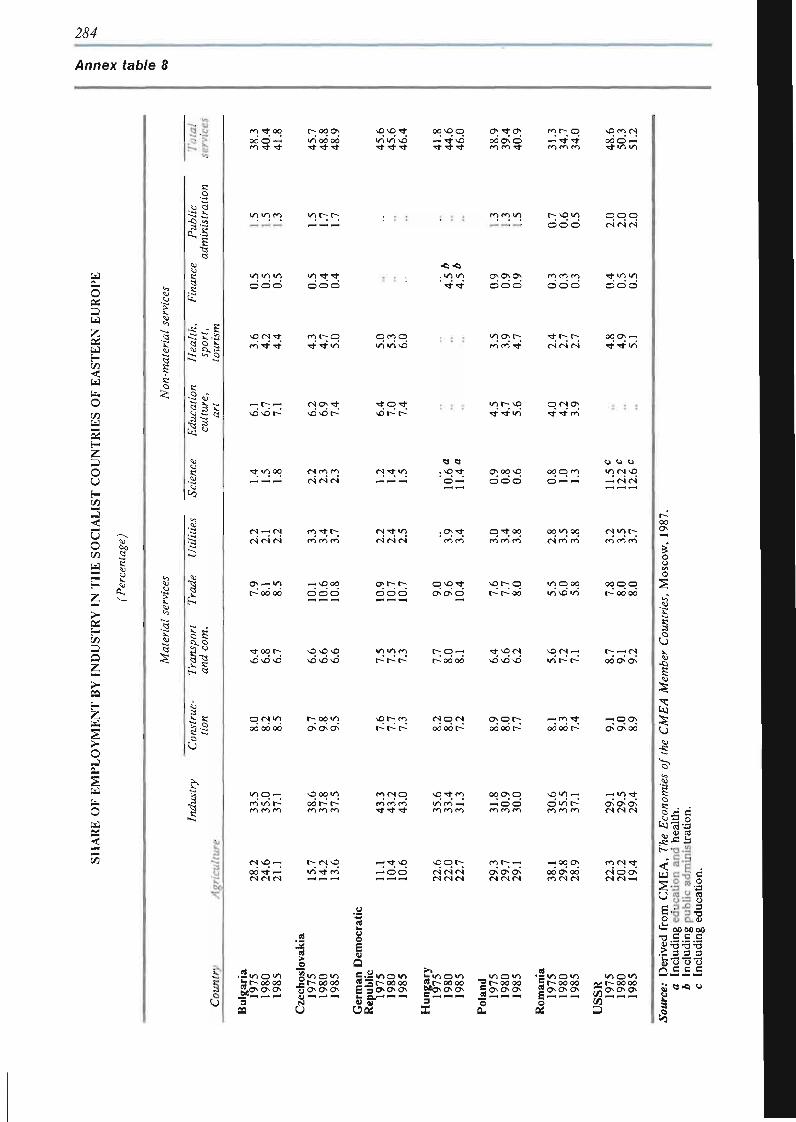
244
Annex table 8
o Oí
r-
< fa. o
z O
u w
U O W
H Z
E r-
Q Z
>•
E-
> O j a. S w u. O
< X VI
I 1
I
E2B
^ #
4)
11
*{
Si
h
1
M O -rA • * N *
LA 00 00 N C N O * * O O N O O
—; ^ N ¿ oo'oÑd rArA t t
- H ^ ^ t
ód<ó
o o o -H •st i / ILA
O O O r i <s «s
LA L A LA
O O O
NO I N - 4 -
rA * t <*
—• t~; «
LA • * ' < t
o d d
rA r - ; 0 r f r f L A
CNlON ^
I N rA rA r i (S is
•c-o .LA LA
• * • *
ON ON ON
O O O
rA rA rA
O O O
« f LA LA
O O O
O f A O LA LA NO
< * 0 ' L *
rA r A TI
LA C - ; N 0
T f r f LA
T f t— r -( S C N i r q
O I S O N
T f T t IA
T f - * I A
Q «t
.NO • *
o —
ON 00 NO
O O O
0 0 O rA
O —H i—i
u u u LA ( S NO
« I N I N
I N — <N
I N I N I N
« • * [ - .
( A l A f A
I N ^ - L A I N I N Í N
. O N T f
I A I A o t o o 00 LA 00
I N r A rA
i N L A r ^
O ; ^ L A « N O M
o d d i y r ~ r -
o o o
O N O v t
O N O N O
NO t - ~ o c - c-~oo
L A O 00 LA NO LA
0 0 O O r — o o o o
T 00 [~
N O N O N O
NO NO NO N S N O N O
L A l A r A
r— t— t—-t~- .° ' - : r ^ o o o o
t N D M
NONONO
NO I N «
L A r » r -r~ « i N 00 ON ON
O « N I A
00 OOOO
L A O —;
r-. o c L A
ooc— c—
r-'r~ r~
r A f N j q
•L *T f * t
( S O I S
oo'odi-^ ONOr- ;
oooo'r-« r A r f
oooo t-^
« O O N
LAIA « — o o r A m r A
O L A t ~ f N l I S t N
<NvO «
00 TÍ- -H I N I N I N
t - I N NO
LA T f l A « • * NO
« O O
N o o r -
I N I N I N M I N (S
rA t - ~ «
I N I N I N
« 0 0 ON
00 ON 00 ( A i S l N
r A l N T f
( N O O N I N I N «
• - L A O L A
&««« 33
1 <r~"
¡ Q E . ï m O L O «-LAOLA S 3 r- oo oo « r- oo oo E S O N O O N 0*ONONCJN L. Q _ « « « Ç « « «
. L A O l A > t - 0 0 00
£
•=</*> O LA E t - 0 0 00 " O N ON ON { ; « « «
L A O l A V f - 0 0 00
w « « « 3
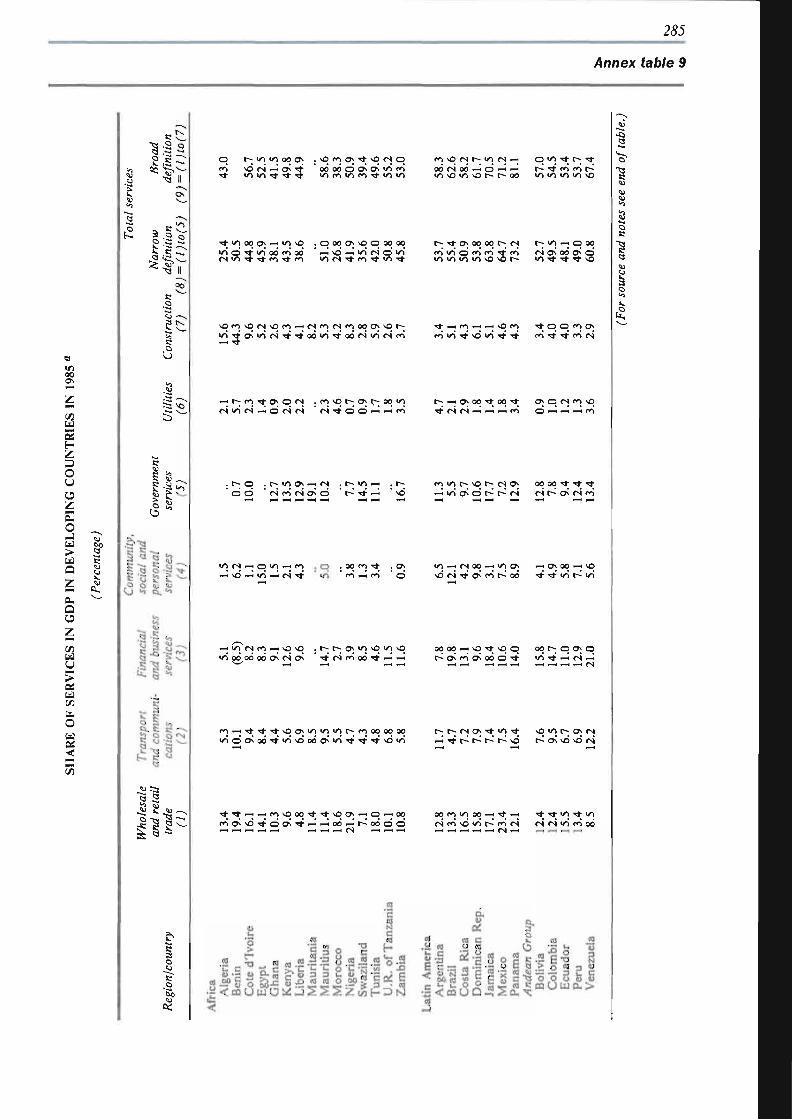
285
Annex table 9
I £
•2 «a
Hf 1
o
c
g
_
Z O U U Z E o Û > « Q
a. a
> « -O
¡ S CO
3
I
£
! <2
±
is-o a <N <J -c; v -
I s
1 S ! N N J ^
? ; -a -
Î
o rA
[— LA LA 00 ON
NO i N « ON • * LA LA Tj- T f r f
, NO rA ON T f NO I N O
' od od O ON ON LA IA LA rA LA rA Tf LA LA
-Lf LA 00 ON mH LA NO . O OO ON NO O 00 00 LA O Tf LA 00 rA 00 « NO « LA IN O <A i N L A T f - N J t r A T r r A LA IN Tf IA Tf LA Tf
N O r A N O C N l N O f A « t N c A C N l r A 0 0 O N N O r ~ L A T f O Ñ i Á i N T l - N Ñ Í M i A T t o d r N i í A r N i r A
H h ^ N t O N O t s . rA No r- ON r- oo LA IN LA IN « O IN IN (N if O O « « (A
rA NO IN f- LA IN « O LA rt- t-- rf oo (S oo rn o »-< r-Tj-rAt-At^ LA NO LA NO r- r- 00 LA LA LA LA NO
t-; •* O; 00 OO t^ IN (A LA d r < Tf rA LA LA LA LA NO NO r-
N* « rA « « NO rA rA «A rf NO LA Tf Tf
t-- « ON 00 Tf 00 Tf Tt IN IN « « « rA
t-; LA « O 00 IN ON 00 ON d LA Tf Tf Tf NO
N t q o m o v rA T Í T Í rÁ I N
ON O IN rA NO
O —i « « rA
o o r » i / i o N « i S . r— LA « i . r> I N I A I N O N O t— TJ--H NO
rA LA f . NO t"-; IN ON
« LA OÑ O l~~ f~ IN 00 00 1- Tf Tt IN C-- ON c-i rA
LA IN « O LA « rA « NO « LA « IN **•
. O LA
. 00 rA Tf IA « IA
. O »
O LA « IN 00 « LA O; « ON 00 « NQ NO IN Tf ON rÁ r- 00 Tf rf LA r^ LA
« LA IN rA « NO NO
LA 00* oo' O0 ON CN ON t . r> ON LA NO LA NO rf CNÏ rÀ OO Tf « «
oo oo H NO rf No o o o t - o o o t— ON I A ON 0 0 O T f LA T t « I N «
« « p-l pH ^H « , — * , — * « I N
r A « T f T f N ^ N O C » N l A L A l A r - ; r A 0 0 0 0 0 0
L Á O C ^ O O r Í L A v O O o ' o Ñ l A T r T t T Í N Ó l A
N t N j ' F H F H r r > N O O O N t ^ N O \ 7 N ' - H O - * O Û
f r i O N N O N t O O N N t ^ H O O ^ i ^ O O O O « « « « « « « « fN r—I « «
t— C-; IN ON Tt LA Tt « T)- r-I t- t-~ t-~ NO
NO LA r* o; IN r~ o\ No No IN
oo rA LA oo « Tt « 't 't "1 •"* ""j IN CA NO LA f~ rA IN IN IN LA rA 00 « « « « « |N « « — —« «
¡ill! â*&ôâH&$ Il£<3i3 tí
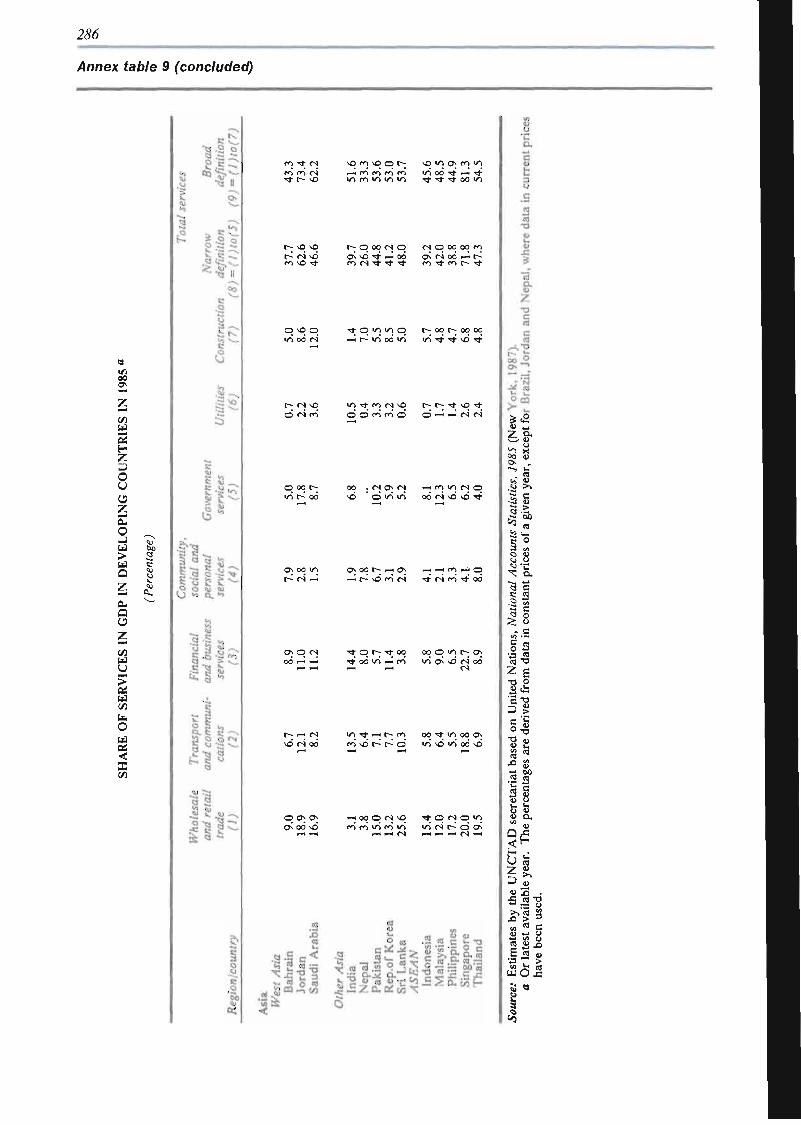
2&S
Annex table 9 (concluded)
I - ft,
1 A • • . ' . • •
lit I
f
t - ü - i
<o
Î1* I-a
o % 8J
¡It
I
m t n (S **• r~ vo
vo c> \£> o r- \ o W) o \ f ) i/i •—i m r*-> ro f"> v i oo r f p-4 Tf wi m «A «A 1 1 r f * t • * oo <n
r~ <N vD M \C Tf
q vq o v i od <N
t— ÍS vO
d <N ci
C O M I S O QN VÛ T t F-H OO M <s * * * t t
—" 1-° v> od wi
1/1 Tt m <s ^3 o o m f ! o
q 00 t-; v i r^ oo
DO . (S o \ (S o «X wi
(S q oo oo m o í (N oo° ~-< t~¿
r^ oo t^- oo oo
t-; t-; • * vO "* O ^ ^ Í S <N
od c i \ d *¿ Tt
[~° <N « o\ oo r "M o\ ^ H ^ f < i ^ o —' r- v¿ f> ri ^ <Ñ ci W od
CT; q <N »* q t-; ** 00 rf o¿ W) —¡ r<i
"•"C "! r1 vd <Ñ od r*** \¿ r~ r-* o
ooo«nt^o; ir! c" vo <s od
oo - v% oo o> irí v¿ vS od vd
o" od *o - H « 0 ( S > Û *»• o <s o >/i
^-* pM fS ^-t mH p^ C4 t—i
111 JÍ £ £ £
•a § «3
II s§ II
s
a -o
6 $
i
8 S3 "la
5 S
I! ¡ ¡s
31
1¡ •5-3
31
• S !
il O Q.
Î! ill 1!I
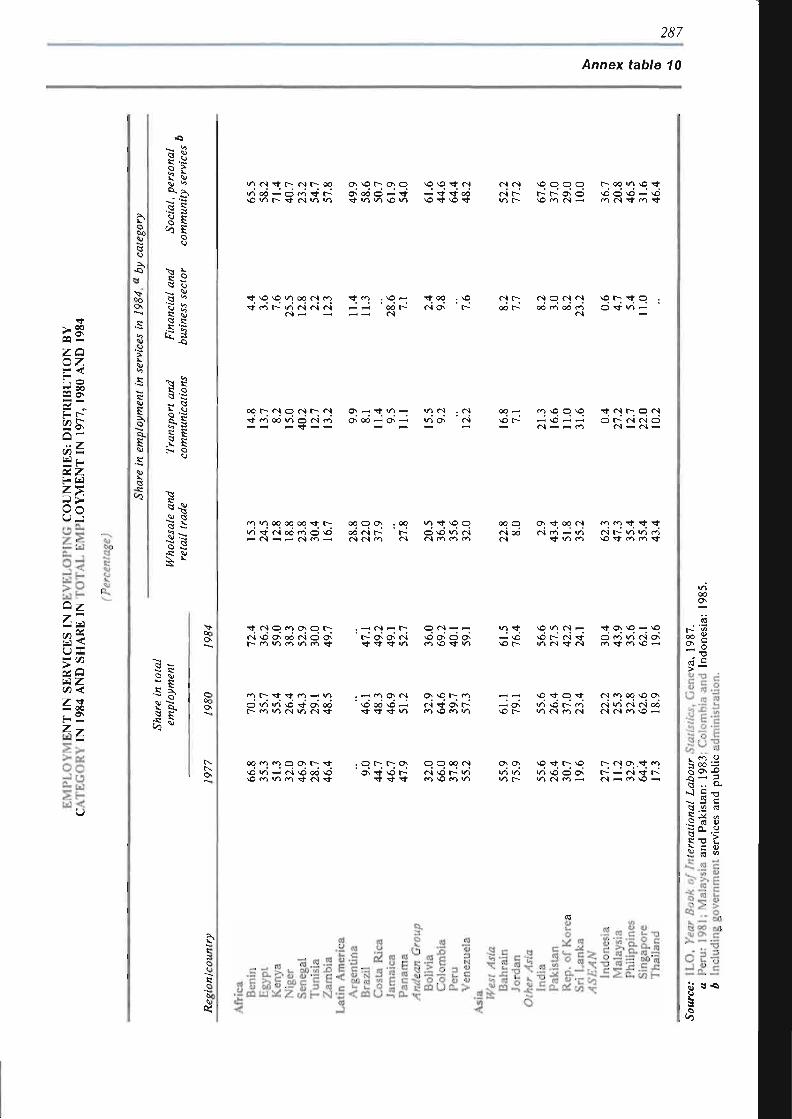
267
Annex table 10
« 2 Z Û
s ; Eí o -
«
¡i
oz
Si ¡i ?I
Ï u
i s
!
Il il
o
1
II
il 11 •s; !»
§ o u s"
I
"/UN •* i> <s r-oo o ^ ^ o r - o ^ o \ovOTf M
vo «o i> r t r* irt wn o o o o - i - í r f V) V) \G V") O rf \£> *f
(N <N
1/1 c-
*£> o o o O C I < s —<
l^- 0 0 W1 SO ^ f
*t c i r~ </•> <s <s <s oo t -; ^ ' t-1 od C-"
<s q (N <s od n i od m
(N
vq r~ •* q O Tf u i «
oo t-- <N q <s r-; <N ffl-H^^«
OS 0 0 *-* Os ^H
i/1 <N
1/1 Os . es ' < N
0 0 —1
vor-r*-j \ 0 O sO
5 ^ Z M t N h O N
o r^ <s <N o f S —i <N —i
m u i oo oo oo T f r*.
—' <N —* F—1 ( S O í ^H
00 O Os O O M I ^ f S <N <"1
. 00
r -i / l T t \ û o O sO >/1 r-i
00 o (N 00
Os • * 00 <N
T t m <s-i
m « T t * * r s r - v i v i n sO ^ f f ) f ) T*
• f <N o r-o O) O r^ íN v¿ O oô <N O 0> r- c*i VÏ f*% Vi r*-i Tt rf TT TT V)
O <S ^H —4
O ^\ o o\ ro O - t v^
^ \ ¿ M¿ r- Í S •** o t - Vï <N ^ <N
•ít ( ^ VÛ ^ VÛ O r*S vS (N Os m •* n \û «
m r^ Tf ta- m ^4 t/s O " A i / 1 \ D r f O M » t— o >/i csi « i < s T*
. ~ H f*1 Os <N v û o o v û ^ T t • * • * « 1
os so r^ m m so m vi
- H _
^-i Os
s í t O t
vi o r- m VI <N O <N
N M O O V O U N t f l N t N O O <N <S IS-> sD ~-i
\0 vS <—4 r4 \d oó \¿ vu n i/i to <t r < - ^ <r ^ <f
O O OO <N (S -o •> vS m \D m *A
Vi vS l A v D O l T ' I> t-H ÍS -*t l> <S •—i f> "O ^N
n
« .2 -2 l& l fcf i i l
2 s il iW
«
o iï œ U O .S à
il II. S i ?
<-> JC —
55 g
P
„ S »
«1
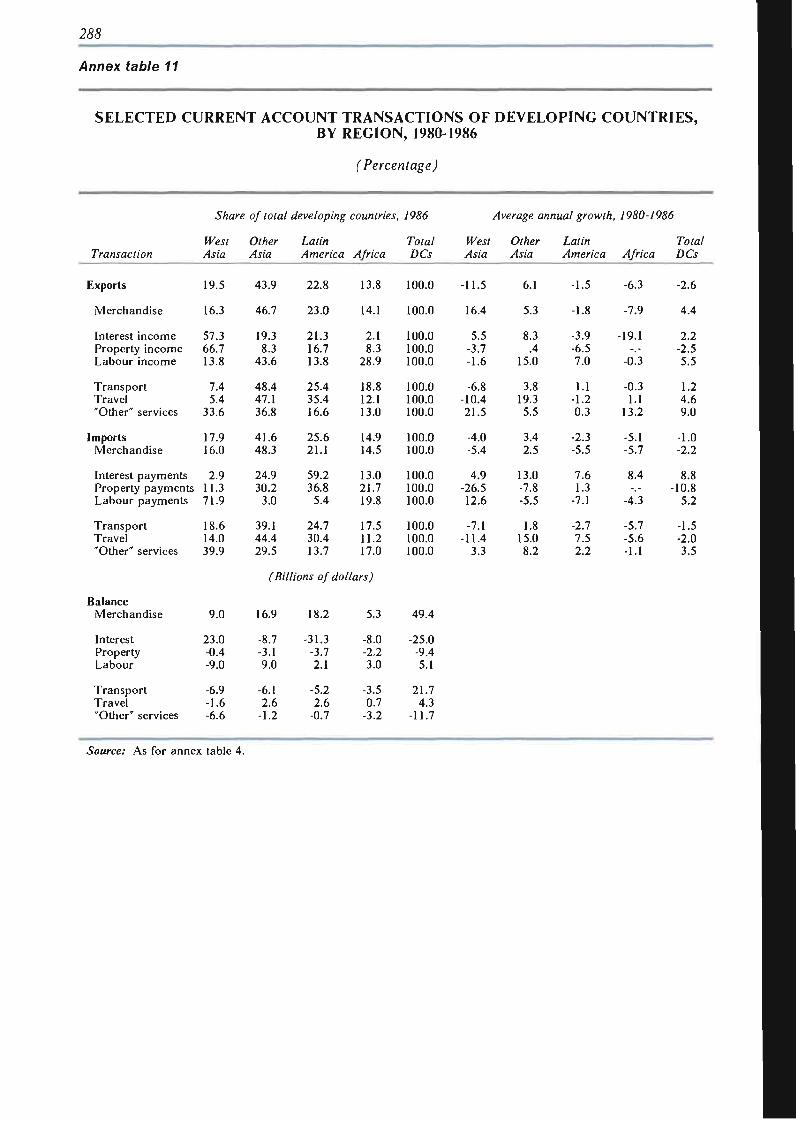
266
Annex table 11
SELECTED CURRENT ACCOUNT TRANSACTIONS OF DEVELOPING COUNTRIES, BY REGION, 1980-1986
(Percentage)
Share of total developing countries, 1986 Average annual growth, 1980-1986
West Other Latin Total West Other Latin Total Transaction Asia Asia America Africa DCs Asia Asia America Africa DCs
exports
Merchandise
Interest income Property income Labour income
Transport Travel "Other" services
mports Merchandise
Interest payments Property payments Labour payments
Transport Travel "Other" services
19.5
16.3
57.3 66.7 13.8
7.4 5.4
33.6
17.9 16.0
2.9 11.3 71.9
18.6 14.0 39.9
43.9
46.7
19.3 8.3
43.6
48.4 47.1 36.8
41.6 48.3
24.9 30.2
3.0
39.1 44.4 29.5
22.8
23.0
21.3 16.7 13.8
25.4 35.4 16.6
25.6 21.1
59.2 36.8
5.4
24.7 30.4 13.7
13.8
14.1
2.1 8.3
28.9
18.8 12.1 13.0
14.9 14.5
13.0 21.7 19.8
17.5 11.2 17.0
100.0
100.0
o o
o o
o o
100.0 100.0 100.0
100.0 100.0
100.0 100.0 100.0
100.0 100.0 100.0
-11.5
16.4
5.5 -3.7 -1.6
-6.8 -10.4 21.5
-4.0 -5.4
4.9 -26.5 12.6
-7.1 -11.4
3.3
6.1
5.3
8.3 .4
15.0
3.8 19.3 5.5
3.4 2.5
13.0 -7.8 -5.5
1.8 15.0 8.2
-1.5
-1.8
-3.9 -6.5 7.0
1.1 -1.2 0.3
-2.3 -5.5
7.6 1.3
-7.1
-2.7 7.5 2.2
-6.3
-7.9
-19.1
-0J
-0.3 1.1
13.2
-5.1 -5.7
8.4
-4.3
-5.7 -5.6 -1.1
-2.6
4.4
2.2 -2.5 5.5
1.2 4.6 9.0
-1.0 -2.2
8.8 -10.8
5.2
-1.5 -2.0 3.5
(Billions of dollars)
Balance Merchandise
Interest Property Labour
Transport Travel "Other" services
9.0
23.0 -0.4 -9.0
-6.9 -1.6 -6.6
16.9
-8.7 -3.1 9.0
-6.1 2.6
-1.2
18.2
-31.3 -3.7 2.1
-5.2 2.6
-0.7
5.3
-8.0 -2.2 3.0
-3.5 0.7
-3.2
49.4
-25.0 -9.4 5.1
21.7 4.3
11.7
Source: As for annex table 4.
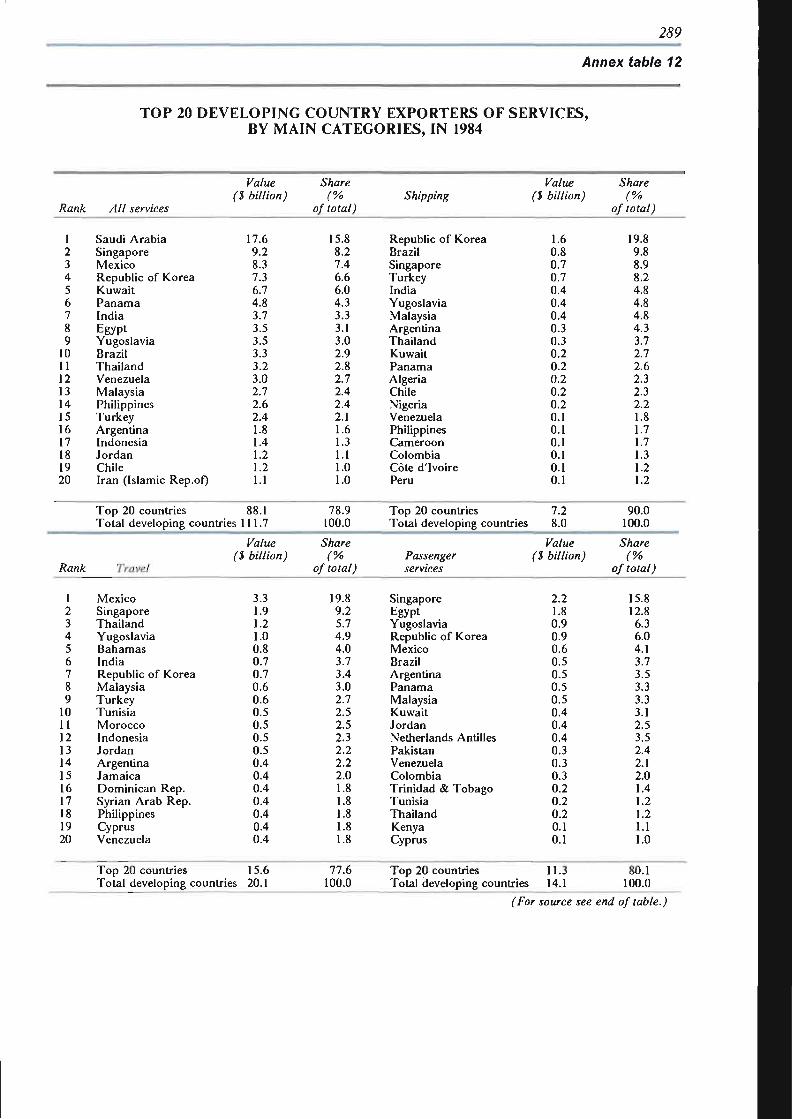
289
Annex table 12
TOP 20 DEVELOPING COUNTRY EXPORTERS OF SERVICES, BY MAIN CATEGORIES, IN 1984
Rank
1 2 3 4 5 6 7 8 9
10 11 12 13 14 15 16 17 18 19 20
Rank
1 2 3 4 5 6 7 8 9
10 11 12 13 14 15 16 17 18 19 20
All services
Saudi Arabia Singapore Mexico Republic of Korea Kuwait Panama India Egypt Yugoslavia Brazil Thailand Venezuela Malaysia Philippines Turkey Argentina Indonesia Jordan Chile Iran (Islamic Rep.of)
Top 20 countries
Value (S billion)
17.6 9.2 8.3 7.3 6.7 4.8 3.7 3.5 3.5 3.3 3.2 3.0 2.7 2.6 2.4 1.8 1.4 1.2 1.2 1.1
88.1 Total developing countries 111.7
Travel
Mexico Singapore Thailand Yugoslavia Bahamas India Republic of Korea Malaysia Turkey Tunisia Morocco Indonesia Jordan Argentina Jamaica Dominican Rep. Syrian Arab Rep. Philippines Cyprus Venezuela
Top 20 countries
Value ($ billion)
3.3 1.9 1.2 1.0 0.8 0.7 0.7 0.6 0.6 0.5 0.5 0.5 0.5 0.4 0.4 0.4 0.4 0.4 0.4 0.4
15.6 Total developing countries 20.1
Share
r% of total)
15.8 8.2 7.4 6.6 6.0 4.3 3.3 3.1 3.0 2.9 2.8 2.7 2.4 2.4 2.1 1.6 1.3 1.1 1.0 1.0
78.9 100.0
Share
r% of total)
19.8 9.2 5.7 4.9 4.0 3.7 3.4 3.0 2.7 2.5 2.5 2.3 2.2 2.2 2.0 1.8 1.8 1.8 1.8 1.8
77.6 100.0
Shipping
Republic of Korea Brazil Singapore Turkey India Yugoslavia Malaysia Argentina Thailand Kuwait Panama Algeria Chile Nigeria Venezuela Philippines Cameroon Colombia Côte d'Ivoire Peru
Top 20 countries Total developing countries
Passenger services
Singapore Egypt Yugoslavia Republic of Korea Mexico Brazil Argentina Panama Malaysia Kuwait Jordan Netherlands Antilles Pakistan Venezuela Colombia Trinidad & Tobago Tunisia Thailand Kenya Cyprus
Top 20 countries Total developing countries
Value ($ billion)
1.6 0.8 0.7 0.7 0.4 0.4 0.4 0.3 0.3 0.2 0.2 0.2 0.2 0.2 0.1 0.1 0.1 0.1 0.1 0.1
7.2 8.0
Value ($ billion)
2.2 1.8 0.9 0.9 0.6 0.5 0.5 0.5 0.5 0.4 0.4 0.4 0.3 0.3 0.3 0.2 0.2 0.2 0.1 0.1
11.3 14.1
Share
f% of total)
19.8 9.8 8.9 8.2 4.8 4.8 4.8 4.3 3.7 2.7 2.6 2.3 2.3 2.2 1.8 1.7 1.7 1.3 1.2 1.2
90.0 100.0
Share
r% of total)
15.8 12.8
6.3 6.0 4.1 3.7 3.5 3.3 3.3 3.1 2.5 3.5 2.4 2.1 2.0 1.4 1.2 1.2 1.1 1.0
80.1 100.0
(For source see end of table.)
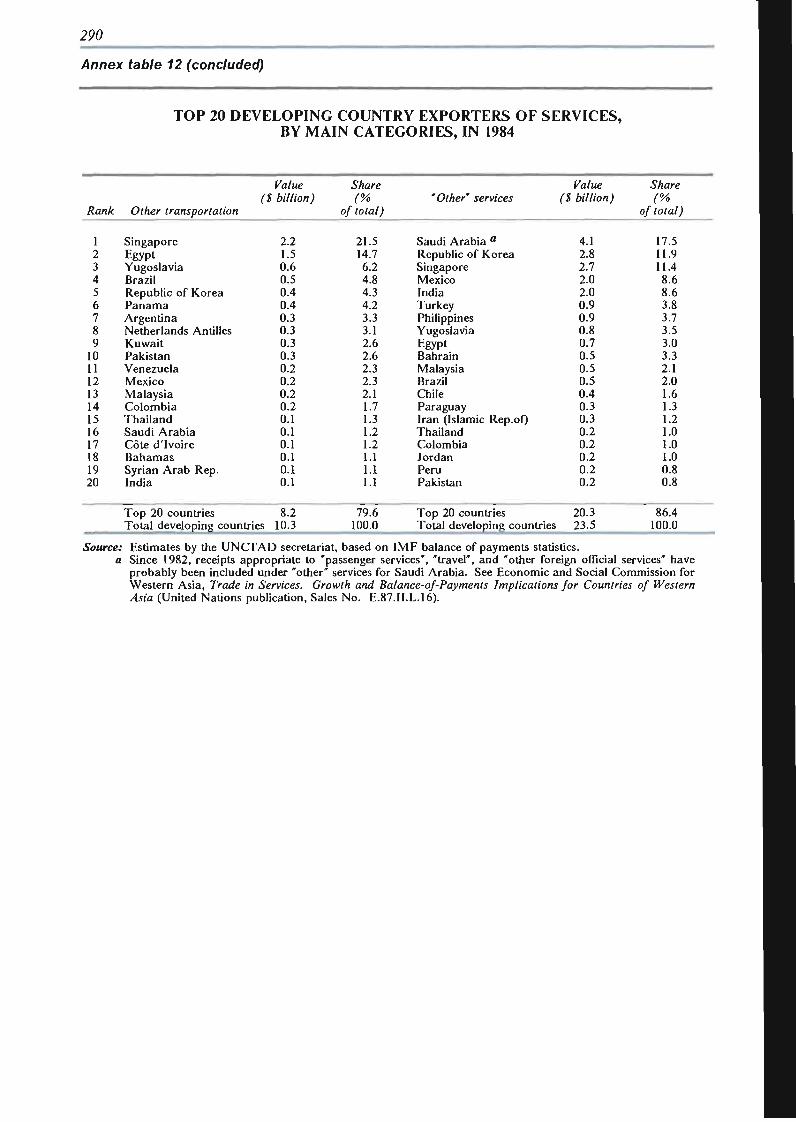
2P0
Annex table 12 (concluded)
TOP 20 DEVELOPING COUNTRY EXPORTERS OF SERVICES, BY MAIN CATEGORIES, IN 1984
Rank
1 2 3 4 5 6 7 8 9
10 11 12 13 14 15 16 17 18 19 20
Source
Other transportation
Singapore Egypt Yugoslavia Brazil Republic of Korea Panama Argentina Netherlands Antilles Kuwait Pakistan Venezuela Mexico Malaysia Colombia Thailand Saudi Arabia Côte d'Ivoire Bahamas Syrian Arab Rep. India
Top 20 countries
Value ($ billion)
2.2 1.5 0.6 0.5 0.4 0.4 0.3 0.3 0.3 0.3 0.2 0.2 0.2 0.2 0.1 0.1 0.1 0.1 0.1 0.1
8.2 Total developing countries 10.3
; Estimates by the UNCTAD secretariat, i Since 1982, receipts ai >propriate to "pa
Share f%
of total)
21.5 14.7 6.2 4.8 4.3 4.2 3.3 3.1 2.6 2.6 2.3 2.3 2.1 1.7 1.3 1.2 1.2 1.1 1.1 1.1
79.6 100.0
based on
"Other" services
Saudi Arabia a
Republic of Korea Singapore Mexico India Turkey Philippines Yugoslavia Egypt Bahrain Malaysia Brazil Chile Paraguay Iran (Islamic Rep.of) Thailand Colombia Jordan Peru Pakistan
Top 20 countries Total developing countries
Value ($ billion)
4.1 2.8 2.7 2.0 2.0 0.9 0.9 0.8 0.7 0.5 0.5 0.5 0.4 0.3 0.3 0.2 0.2 0.2 0.2 0.2
20.3 23.5
IMF balance of payments statistics. ssenger services", "travel", and "other for eign official
Share
r% of total)
17.5 11.9 11.4 8.6 8.6 3.8 3.7 3.5 3.0 3.3 2.1 2.0 1.6 1.3 1.2 1.0 1.0 1.0 0.8 0.8
86.4 100.0
services" have probably been included under "other" services for Saudi Arabia. See Economic and Social Commission for Western Asia, Trade in Services. Growth and Balance-of-Payments Implications for Countries of Western Asia (United Nations publication, Sales No. E.87.ILL.16).
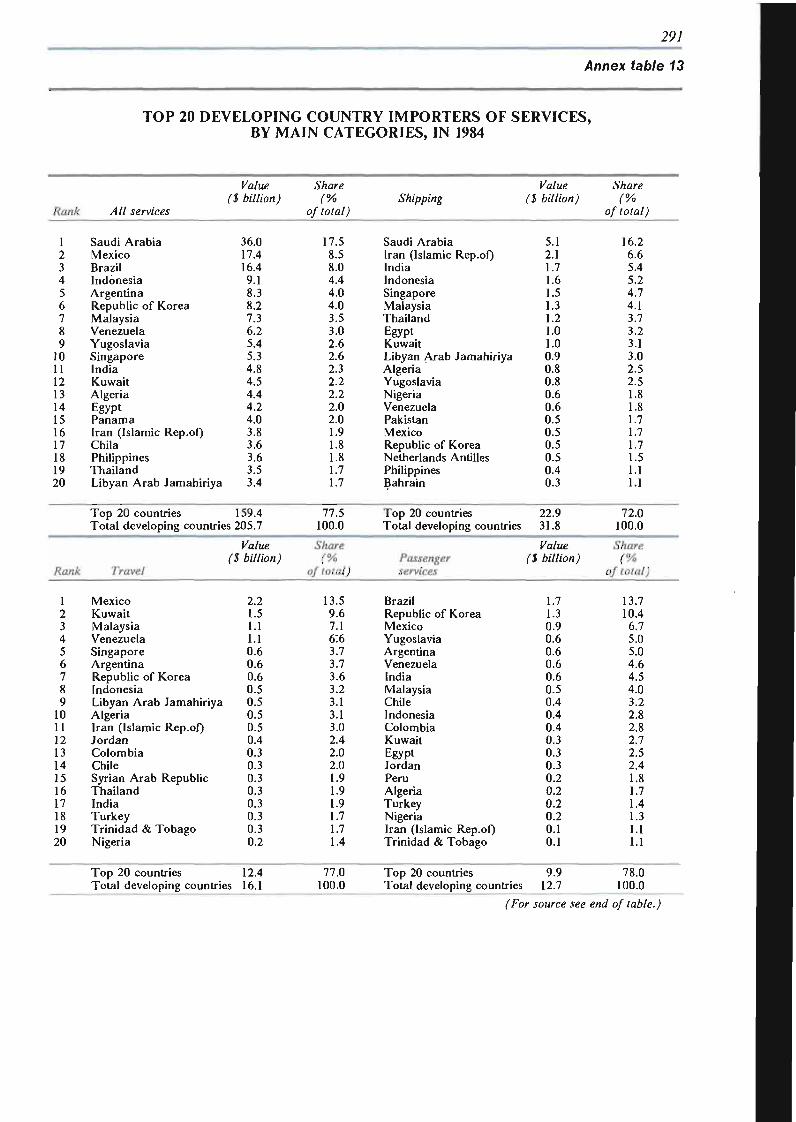
291
Annex table 13
TOP 20 DEVELOPING COUNTRY IMPORTERS OF SERVICES, BY MAIN CATEGORIES, IN 1984
Rank
1 2 3 4 5 6 7 8 9
10 11 12 13 14 15 16 17 18 19 20
Rank
1 2 3 4 5 6 7 8 9
10 11 12 13 14 15 16 17 18 19 20
All services
Saudi Arabia Mexico Brazil Indonesia Argentina Republic of Korea Malaysia Venezuela Yugoslavia Singapore India Kuwait Algeria Egypt Panama Iran (Islamic Rep.of) Chila Philippines Thailand Libyan Arab Jamahiriya
Top 20 countries
Value ($ billion)
36.0 17.4 16.4 9.1 8.3 8.2 7.3 6.2 5.4 5.3 4.8 4.5 4.4 4.2 4.0 3.8 3.6 3.6 3.5 3.4
159.4 Total developing countries 205.7
Travel
Mexico Kuwait Malaysia Venezuela Singapore Argentina Republic of Korea Indonesia Libyan Arab Jamahiriya Algeria Iran (Islamic Rep.of) Jordan Colombia Chile Syrian Arab Republic Thailand India Turkey Trinidad & Tobago Nigeria
Top 20 countries
Value ($ billion)
2.2 1.5 1.1 1.1 0.6 0.6 0.6 0.5 0.5 0.5 0.5 0.4 0.3 0.3 0.3 0.3 0.3 0.3 0.3 0.2
12.4 Total developing countries 16.1
Share f%
of total)
17.5 8.5 8.0 4.4 4.0 4.0 3.5 3.0 2.6 2.6 2.3 2.2 2.2 2.0 2.0 1.9 1.8 1.8 1.7 1.7
77.5 100.0
Share (%
of total)
13.5 9.6 7.1 6:6 3.7 3.7 3.6 3.2 3.1 3.1 3.0 2.4 2.0 2.0 1.9 1.9 1.9 1.7 1.7 1.4
77.0 100.0
Shipping
Saudi Arabia Iran (Islamic Rep.of) India Indonesia Singapore Malaysia Thailand Egypt Kuwait Libyan Arab Jamahiriya Algeria Yugoslavia Nigeria Venezuela Pakistan Mexico Republic of Korea Netherlands Antilles Philippines Bahrain
Top 20 countries Total developing countries
Passenger services
Brazil Republic of Korea Mexico Yugoslavia Argentina Venezuela India Malaysia Chile Indonesia Colombia Kuwait Egypt Jordan Peru Algeria Turkey Nigeria Iran (Islamic Rep.of) Trinidad & Tobago
Top 20 countries Total developing countries
Value ($ billion)
5.1 2.1 1.7 1.6 1.5 1.3 1.2 1.0 1.0 0.9 0.8 0.8 0.6 0.6 0.5 0.5 0.5 0.5 0.4 0.3
22.9 31.8
Value ($ billion)
1.7 1.3 0.9 0.6 0.6 0.6 0.6 0.5 0.4 0.4 0.4 0.3 0.3 0.3 0.2 0.2 0.2 0.2 0.1 0.1
9.9 12.7
Share (%
of total)
16.2 6.6 5.4 5.2 4.7 4.1 3.7 3.2 3.1 3.0 2.5 2.5 1.8 1.8 1.7 1.7 1.7 1.5 1.1 1.1
72.0 100.0
Share (%
of total)
13.7 10.4
6.7 5.0 5.0 4.6 4.5 4.0 3.2 2.8 2.8 2.7 2.5 2.4 1.8 1.7 1.4 1.3 1.1 1.1
78.0 100.0
(For source see end of table.)
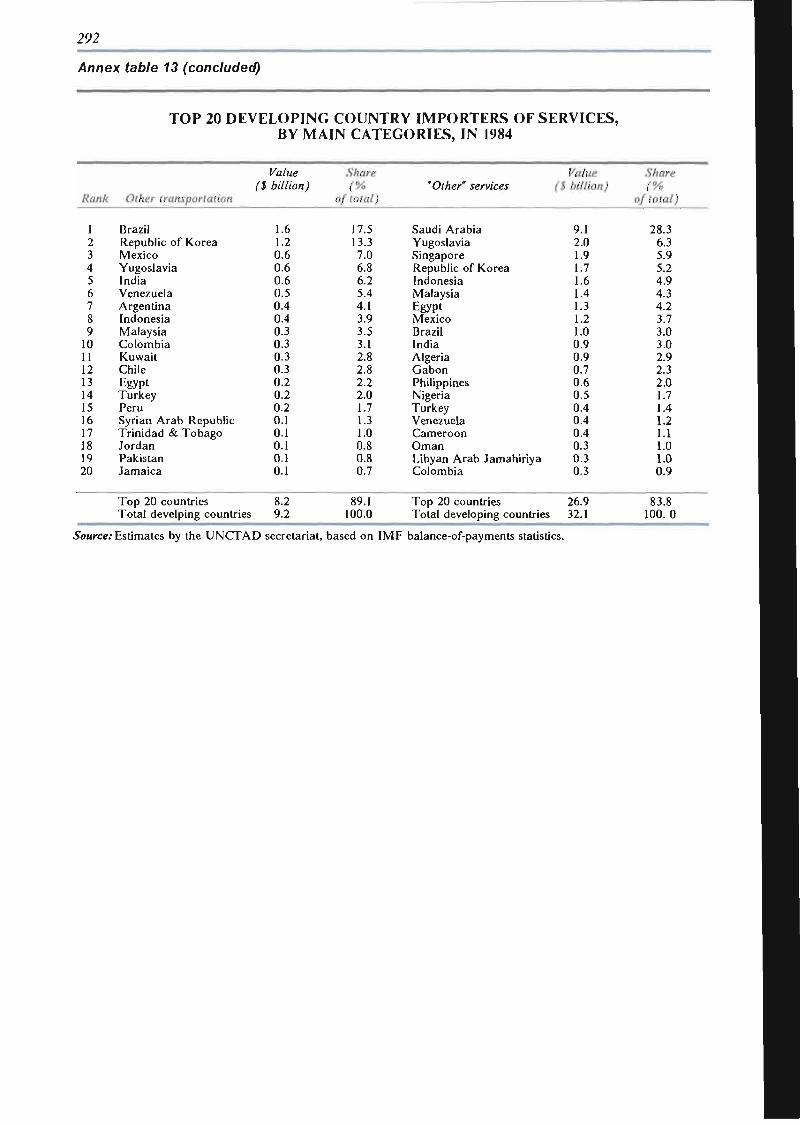
292
Annex table 13 (concluded)
TOP 20 DEVELOPING COUNTRY IMPORTERS OF SERVICES, BY MAIN CATEGORIES, IN 1984
Rank
1 2 3 4 5 6 7 8 9
10 11 12 13 14 15 16 17 18 19 20
Other transportation
Brazil Republic of Korea Mexico Yugoslavia India Venezuela Argentina Indonesia Malaysia Colombia Kuwait Chile Egypt Turkey Peru Syrian Arab Republic Trinidad & Tobago Jordan Pakistan Jamaica
Top 20 countries Total develping countries
Value ($ billion)
1.6 1.2 0.6 0.6 0.6 0.5 0.4 0.4 0.3 0.3 0.3 0.3 0.2 0.2 0.2 0.1 0.1 0.1 0.1 0.1
8.2 9.2
Share (%
Of total)
17.5 13.3 7.0 6.8 6.2 5.4 4.1 3.9 3.5 3.1 2.8 2.8 2.2 2.0 1.7 1.3 1.0 0.8 0.8 0.7
89.1 100.0
"Other" services
Saudi Arabia Yugoslavia Singapore Republic of Korea Indonesia Malaysia Egypt Mexico Brazil India Algeria Gabon Philippines Nigeria Turkey Venezuela Cameroon Oman Libyan Arab Jamahiriya Colombia
Top 20 countries Total developing countries
Value ($ billion)
9.1 2.0 1.9 1.7 1.6 1.4 1.3 1.2 1.0 0.9 0.9 0.7 0.6 0.5 0.4 0.4 0.4 0.3 0.3 0.3
26.9 32.1
Share (%
of total)
28.3 6.3 5.9 5.2 4.9 4.3 4.2 3.7 3.0 3.0 2.9 2.3 2.0 1.7 1.4 1.2 1.1 1.0 1.0 0.9
83.8 100.0
Source: Estimates by the UNCTAD secretariat, based on IMF balance-of-payments statistics.
HOW TO OBTAIN UNITED NATIONS PUBLICATIONS
United Nations publications may be obtained from bookstores and distributors throughout the world. Consult your bookstore or write to: United Nations, Sales Section, New York or Geneva.
COMMENT SE PROCUBER LES PUBLICATIONS DES NATIONS UNIES
Les publications des Nations Unies sont en vente dans les librairies et les agences dépositaires du monde entier. Informez-vous auprès de votre libraire ou adressez-vous à : Nations Unies, Section des ventes, New York ou Genève.
KAK n O J i y H H T b H3AAHHH O P r A H H 3AII.HH OBT>É/IHHEHHibIX HAU.HH
HsflaHHH OpraHH3auHH 06-i.e/iHHeHHbix Hauuft MOXCHO KynHTb B KHH>KHI>IX Mara-3HHax H areHTCTBax BO Bcex paftotiax MHpa. HaBOflHTe cnpaBKH 06 H3flaHHHx B BauieM KHHÎKHOM MarasHHe H/IH nmiiHTe no anpecy : OpraHH3auHH 06T.eflHHeHHbix HauHft, CeKiiHH no npoaame H3flaHHñ, HbK>-HopK H/IH HCeHeBa.
COMO CONSEGUIR PUBLICACIONES DE LAS NACIONES UNIDAS
Las publicaciones de las Naciones Unidas están en venta en librerías y casas distribuidoras en todas partes del mundo. Consulte a su librero o diríjase a: Naciones Unidas, Sección de Ventas, Nueva York o Ginebra.
frinted in Switzerland GE.88-52050 August 1988—8,200
UNCTAD/TDR/8
02000P United Nations publication Sales No. E.88.H.D.8
ISBN 92-1-112248-1 ISSN 0255-4607
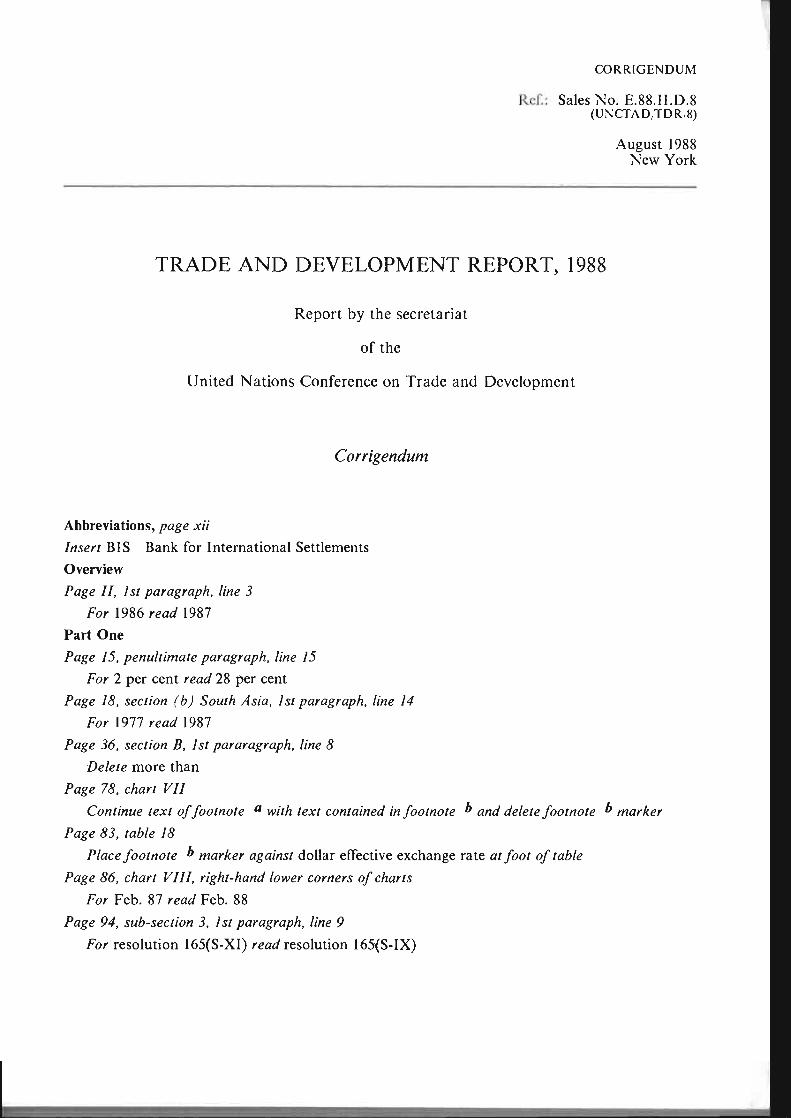
CORRIGENDUM
Réf.: Sales No. E.88.II.D.8 (U\'CTAD,TDR.8)
August 1988 New York
TRADE AND DEVELOPMENT REPORT, 1988
Report by the secretariat
of the
United Nations Conference on Trade and Development
Corrigendum
Abbreviations, page xii
Insert BIS Bank for International Settlements
Overview
Page II, 1st paragraph, line 3
For 1986 read 1987
Part One
Page 15, penultimate paragraph, line ¡5
For 2 per cent read 28 per cent
Page 18, section (b) South Asia, 1st paragraph, line 14
For 1977 read 1987
Page 36, section B, 1st pararagraph, line 8
Delete more than
Page 78, chart VII
Continue text of footnote a with text contained in footnote & and delete footnote & marker
Page 83, table 18
Place footnote & marker against dollar effective exchange rate at foot of table
Page 86, chart VIII, right-hand lower corners of charts
For Feb. 87 read Feb. 88
Page 94, sub-section 3, 1st paragraph, line 9
For resolution 165(S-XI) read resolution 165(S-IX)
f 2
Part Two
Page 150, 3rd paragraph, line 8
For SI billion read SI trillion
Page 160, chart IV, Switzerland
Replace chart IV and accompanying note by chart and note contained in page 3
of this corrigendum
Page 164, chart XIII, Australia-New Zealand
Replace chart XIII by chart contained in page 3 of this corrigendum
Page 165, chart XIX, Singapore
Replace chart XIX and accompanying note by chart and note contained in page 3
of this corrigendum
Page 233, footnote 7, first line
For Part IV (articles XXVI - XXVII) of the ...
read Part IV (articles XXXVI - XXXVII) of the ...
fagg 2J9. fa6/e /U.
Column 1
For Developing countries countries c read Developing countries d
Column 2
Delete footnote references c and "
footnote c
For Including Yugoslavia read Including Yugoslavia in 1970.
footnote d
For Excluding Yugoslavia read Excluding Yugoslavia in 1970.
Column 1, first row
For 3 read 4
Column 3, line 2
For United States (1) read United States (2)
Page 264, section B, sub-section I, 3rd paragraph, line 7
Delete production
Page 267, 6th paragraph, last line
Delete case
Page 269, 1st paragraph, line 6
Delete export
Page 269, 3rd paragraph, line 13
Delete (the leading exporter)
Idem, line 14
Delete export
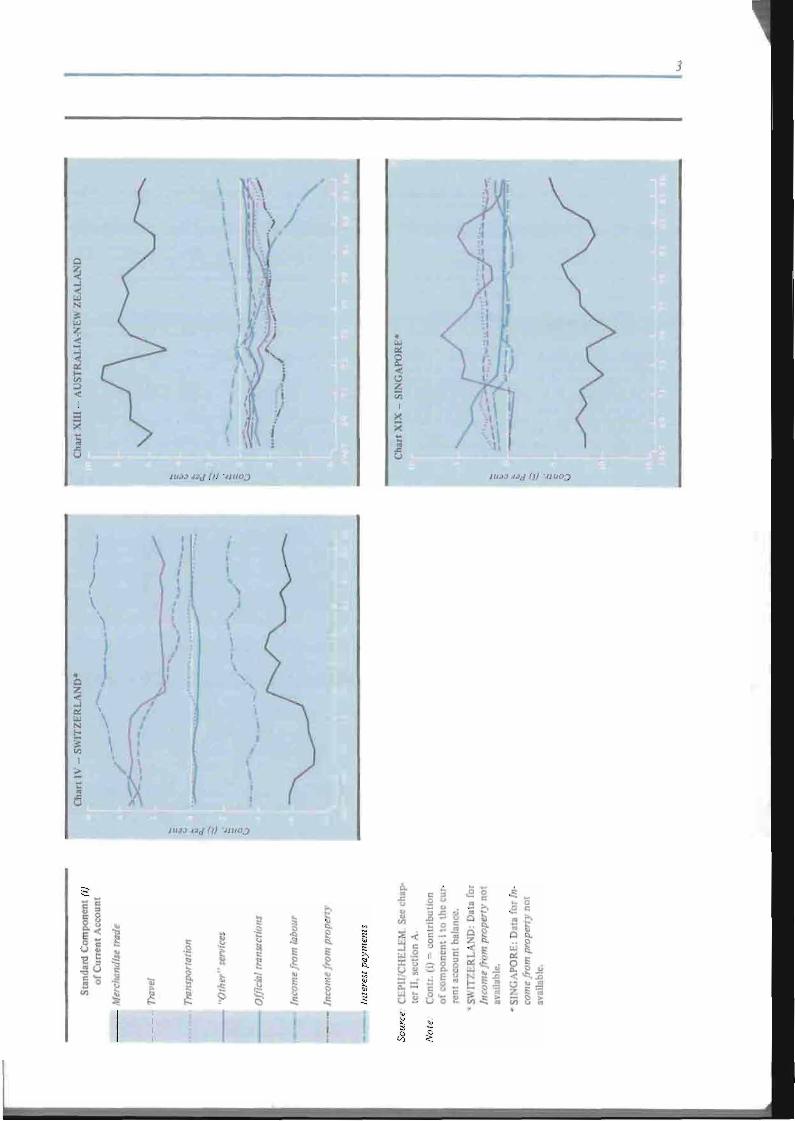
3
1 i i 1
I I
I § •2 g
B ¡5 g
¡I C . - n S3 * - °
IÍUÍ g
i
11!
si
55 S S

r
Printed in Switzerland GE.88-52050-August 1988-8,200
UNCTAD/TDR/8/Corr.l Original: English