
Download - United Nations Digital Library System
117
-·----- UNEP :• (02) I A33 ~·I ·1~11 I I I .I 11 ,:· / / ·' I I .' .- ;
-
Upload
khangminh22 -
Category
Documents
-
view
0 -
download
0
Transcript of Download - United Nations Digital Library System

-·-----UNEP
:• (02) I A33 ~·I ·1~11
I I I .I 11 ,:·
/ /
·' I I .' .-;

Climate and Human Settlements Integrating Climate into Urban Planning and Building Design in Africa
Vinka R. Adebayo, Editor Nairobi 1991
ISBN 92-807-1302-7
SEP 2 (: 19£5
@ UNJ Si~ COLLEC1~0t'-\
UNEP P.O. Box 30552, Nairobi, Kenya Fax:520302 Telex: 22068 UNEP KE Telephone: 333930

ii

Foreword
All too often climatic factors have been ignored in the planning. design and construction of cities to the detriment of human comfon. well-being and the urban environment. On a metropolitan scale. land use and design have implications for urban air quality. energy consumption and the rational use of resources. At the same time. the design features of each building influence the health, physical comfort and daily activities of its inhabitants. Until recently, little inter-disciplinary work has been done on urban climatology and the creation of urban living conditions amenable to climate.
While awareness has grown. the actual incorporation of climatic factors in urban planning and management has lagged behind. Unfortunately the information needed to tum awareness into practice has been lacking. This is especially true for tropical regions where rapid urban growth intensifies the need for better adaption to, and consideration of, the natural environment The present volume addresses this gap with a wealth of · material on the technical and policy concerns of urban climatology. It results from a symposium organized by the University of Nairobi, Kenya. in April 1986. Fony-six participants, including planners, architects. engineers and meteorologists representing seventeen countries and four international organizations, presented materials ranging from simple, practical suggestions on room ventilation to use of climate data in land use planning. The symposium provided a rare opportunity to discuss urban climatology with a strong emphasis on Africa.
Africa has always had a rich building tradition sensitive to climate. That tradition has been weakened by inappropriate plans and standards and by the extensive use of building materials and technologies developed for other eco-geographical regions. This is one of the issues considered by the symposium and reflected in this volume. Research, teaching, design, application, legal and policy questions are also examined.
We hope this book will stimulate further discussion and contribute eventually to the routine consideration of climatological factors in all aspects of urban planning. The material should be of interest to planners and policy-makers, architects and builders, alike.
We are indebted to Professor Eric Meffert (fozmerly of the Faculty of Architecture of the University of Nairobi) for taking the lead responsibility for organizing the symposium. Dr Yinka R. Adebayo acted as scientific editor of papers submitted to the conference; to him we are grateful. Finally, thanks are due to the authors whose work has advanced knowledge and awareness of urban and building climatology and whose contributions have made this book possible.
Naigzy GEBREMEDHIN Chief, Technology and Environment Branch United Nations Environment Programme
iii

Acknowledgement
Mr. N. Gebremedhin's effort and Prof. Erich Meffert's input are very much acknowledged. Mela Shah, of UNEP, must be thanked for painstakingly typing the manuscript. The artwork for the figures was produced by Mr. Ismail Mahiri. I sincerely urge any author whose view may be misrepresented, as a result of the tight editorial work, to accept my apology for such inadvenent error.
iv
Editorial Note
CLIMATE AND HUMAN SETTLEMENTS: The journey so far and the task ahead
~espite. tne fact th_at i~vestigations in urban. and b~lding climatology date back to the last century, mtemat10nal coordmauon of efforts at the Uruted Nations (UN) level did not begin until 1968 when the World Health Organization (WHO) and the World Meteorological Organization (WMO) gathered some experts in Brussels for a conference on urban and building climatology. This was in response to the increasing levels of the problems relating to climates of urban areas like atmospheric pollution the need for energy conservation and comfort consideration. After the Brussels meeting, similar UN-sponsored fora were held in Asheville, Mexico City, Geneva and, again, Mexico City in 1975, 1981, 1982 and 1984 respectively. This is not to say that there have not been serious research efforts in the areas of bioclimatology, climatic design, pollution studies and urban climatology before the 1968 meeting. But the problem was that earlier efforts have been rather &i ~. quasi-related to climate-sensitive planning and design, hence of little relevance in solution to comfort, pollution, energy and other related problems.
Beyond the problem of coping with the rapid increase in the number and sizes of urban centres, and the attending climatic problems, experts also note that the problems ofurban and building climatology are in two categories: professional and spatial. The professional perspective of the problem centres upon the fact that despite the long history of urban climatological research, many architects and planners perform out of tune with urban climatologists, thus leaving the problems of physiological comfon and annospheric pollution largely unsolved. The spatial dimension of the problem is that the majority of investigations in urban climatology have been carried out in temperate areas, while very little has been done in the tropics, where there are prospects for many mega-cities in the future.
Today, with the wave of alarm and apprehension over possible environmental consequences of global change in climate, another dimension is being introduced into the problem. This is because, with scientific ascertainment of climate change it will be necessary to re~tailor settlement planning and building design to take full care of negative consequences of such envisaged change. This dimension seriously complicates the task of scientists, planners, architects and environmentalists. Climate change will certainly render earlier prescriptions for pollution control obsolete because of the emergence of a new atmospheric circulation system. It will also be necessary to put new designs on the drawing board to take care of physiological comfon and energy conservation.
The need to promote research in the tropics, the imponance of closing the gap between urban climatologists and the users of their research outputs and the need to prepare for climate change, all in several ways, render urban climatology much more relevant these days than before. Generally, efforts are being coordinated by the International Federation for Housing and Planning (IFHP); Standing Committee on Urban and Building Qimatology and the International Council for Building Research Studies and Documentation (CIB), with support from United Nations bodies like WHO and WMO. Prior to the 1980's, UN bodies like the United Nations Environment Programme (UNEP) and the United Nations Centre for Human Settlements (UNCHS-HABITATI limited their efforts to an &l ~ monolithic approach to problemsolution, whenever the need amse, such as studies of urban air quality, indoor physiological comfort and energy conservation in buildings.
In the middle of the 1980s, the direction changed. UNEP broke away from this direction by co-sponsoring, with HABITAT and UNESCO, an international symposium on urban and building climatology, which was held in Nairobi in 1986 (14th-17th April). The significance of the 1986 symposium is that for the firs_t ~e planners. architects and climatologists came together to focus on the problem of urban and bu~ldrng climatology with so many examples from Africa. Although some of the papers presented were rev1ewe_d by the authors after the conference, it was not until December 1989 befo:e UNEP, f?C sponsor of tlus publication, called upon this editor as a participant in the 1986 forum to review and edit the papers. After
V

exte~ive ed~torial ~oi:Ic, s~;ne of the papers were selected for publication and upon putting them together the Utle of this pubbcauon, Cl.IMA TE AND HUMAN SETTLEMENTS: Integrating Climate into Urban Planning and Building Design in Africa", emerged as a reflection of the overall focus of the contributions.
The nature of the problems of the urban atmosphere are examined in the introduction. This is followed by Section II which deals with matters relating to climatological data analyses and computerisation. Since the architect and the planner cannot operate in isolation from the conditions of urban climates, some examples of the factors which influence microclimates of cities and, subsequently, climatic comfort and pollution are examined in Section III under two case studies. It is possible to learn a lot from traditional methods of planning and design because they have been modified over the years for adaption to the local climates. Section IV contains examples of climatic consideration in some African traditional architecture and planning. Some factors which exercise control over states of human physiological comfort, indoors, are analysed in Section V. At the end of the day, urban and building climatology can only become operational if its relevance at various stages of planning and design are considered by planners and architects guided and supponed by adequate legislation. The above issues are examined in section VI. The conclusions advocate the need for planners and architects to employ climatic design for the enhancement of human health as well as to minimise climatic modification.
In the tradition of most planners and architects, discussions in this publication tend to separate building climatology from urban climatology. This is partly because it is difficult to integrate urban climatology into planning and design frameworks, and also because some architects and planners are not conscious of the need for this integration. Unfortunately, there is no way urban climatology can be successfully incorporated into planning and design frameworks for the protection of natural climate if planners and architects remain so far away from the urban climatological community. This is one issue which should be listed as a top priority in any agenda aimed at discussing possible ways of reducing the impact of humankind on climate and environmental security as a whole. Herein lies an additional task ahead of concerned organizations.
Yink.a R. Adebayo Nairobi, 1991
vi
Contents
Section I -Introduction Section V - Comfort, Cooling and Ventilation
Chapter 1 , Chapter 11 Perspectives on Problems of the Urban Atmosphere 'Maximization of Passive Control for Better Indoor Within the Framework of Urban Planning. and Environment, 0lajide Solanke, 51 Building Design - Yinka R. Adebayo, 1
Section II - Data Collection and Analysis
Chapter 2 The Presentation of Climatic Data Must be Relevant to the Design Process - Lother GOtz, 6
Chapter3 The Oimate-Site Analysis - ErichE. Meffert, 11
Chapterll The Effect of Environmental Strain Upon Students' Comfort and WorkPerfonnance-Ferede Befekadu, 59
Chapter 13 Cooling and Ventilation In Kenya: Some Comments - Derrick Aatt, 63
Chapter 4 Section VI - Climatological Theory, Practice and Notes on Computerized Storage of Oimatological Building Legislation Data for the Architect - Olasimibo 0. 0gunsote, 1S
Section III - Case Studies of Urban Microclimates
Chapters IR-Temperature Measurement of Walls and Ground Surfaces of a Small Area in Hannover, With and Without Vegetation Cover - Fritz Wilmers, 18
Chapter6
Chapter 14 NotesonRelativeimportanceofQimateasaPhysical Planning Determinant in Egypt - Sayed M. Ettouney, 6S
Chapter15 Daylighting Design for Building in the Tropics -Brian Marland, 78
Chapter 16 City-Surface Component and the Microclimates of Ibadan - Yinka R. Adebayo, 23
Bridging the Gap Between Climatological Theory Section JV - Climate, Traditional Design and Plan- and Practice in Middle Africa - Paul Dequeker, 83 ning
Chapter 17 Chapter 7 Climatic Impact and Building Legislation in Zam-Effects of Oimate on Traditional House Design in bia - Francis M. Ndilila, 91 Tropical Countries - Yohannes Hailu, 28
Chapters· Some Aspects of Climate-Oriented Design and Planning of Architecture in the Ethiopian Highlands - Klaus Ferstl, 33
Chapter9 Thennal Comfort Considerations in Vernacular Architecture in Northern Nigeria - Hamman T. Sa'ad, 38
Chapter 10 Climate and Building in Ibadan: Some Observa-tions - Yinka R. Adebayo, 46
vii
Section VJ/- Conclusion
Chapter 18 Towards Environmentally Sound Urban and Building Oimatology - Yinka R. Adebayo, 101
List of Illustrations and Tables, 106

viii
CHAPTER 1: INTRODUCTION Perspectives on Problems of the Urban Atmosphere Within the Framework of Urban Planning and Building Design Yinka R. Adebayo Department of Geography, Kenyatta University, Nairobi, Kenya
A Diagnosis of the Problem
For three major reasons, the atmosphere can be regarded as a key component of the environment. First, this gaseous envelope around the earth fonns an impartant medium for the transfer of energy and moisture between the lithosphere and the biosphere. Second, its conditions, regarded as weather and climate, are of great importance to human physiological comfort and agriculture. Third, components of the atmosphere, like oxygen and carbon dioxide, are essential respiratory resources for mammals and plants respectively.
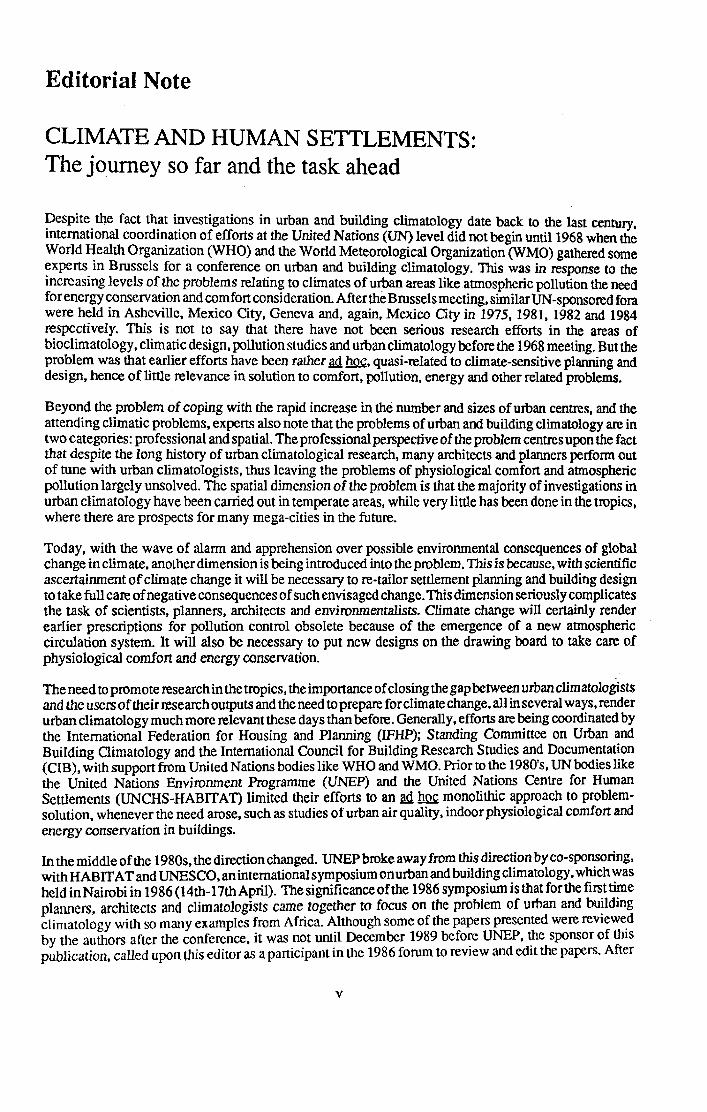
The links between various activities on earth and the atmosphere have increased over the years, due to increases in population and scientific sophistication. A major result of technological ingenuity has been massive industrialization which has also led to heavypollutionand modification of the environment. The city can be regarded as a major
centre where these changes have the greatest impact (Fig. 1.1). As a result of this, urban climates deserve close attention
Before the advent of contemporary urbanization, the central question was how to design a simple house for adequate shelter. Building technology was simple; as a result, buildings of the pre-industrial era were highly vulnerable to the impact of weather and climate. Paradoxically, as traditional methods of design were improved in order to atune the houses to various micro-environments, the big jump in socio-technological sophistication during the period of the Industrial Revolution led to a negligent attitude towards climatic considerations for settlement planning and building design.
The situation is worse in contemporary urban areas than it used to be, especially before the Industrial Revolution. Today, the problems of urban climates go beyond the
Reoionol climate
(of GQH)
llo4lflcotle., Ore•t•• ContempororJ .
reoio11al climate
Climoto of
,urol Hfflement
~ig 1.1: The modification of regional climate
I. 5to••, b•o,.., ••" lno• at•• 2. E•• or the •••••trial ••••••tlo
( Primotulty)
Urbon climate
(Me11olopoli1)
1
1.2a PRIMATE CITY
-+Wl11d ---- •Crvdtbuulldo'7alth1urtlandollll
q Vevetotlon • !3uilt up urt>Gn ereo
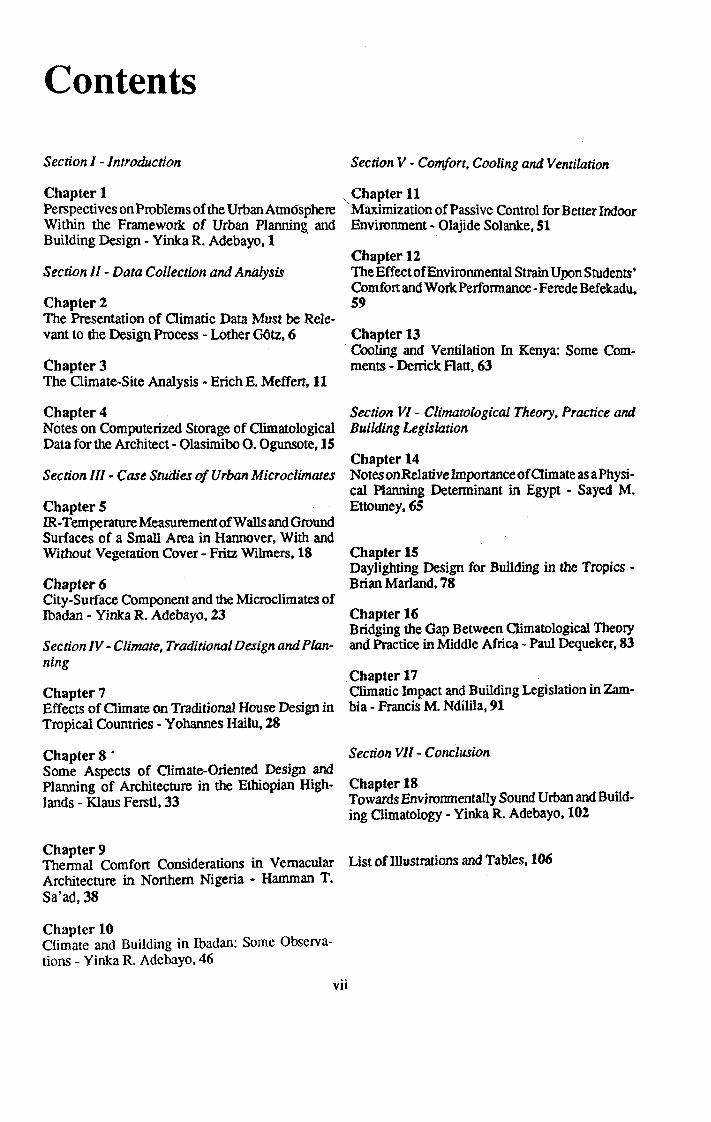
Fig 1.2a & 1.2b: Idealised representation of the urban dome
boundary of the urban environment (see Fig. 1.2a) as we can even theorize the existence of complexes of mesoclimates in a megalopolis with the area down-wind exhibiting a higher level of urban dome (Fig. 1.2b ).
It is generally accepted that there is now knowledge to allow the construction of buildings which can withstand climatic extremes. create adequate indoor climate and at the same time conserve energy. Unfortunately these ideas are not always put to ~1se in modem planning and design. For example. the modem tower-building is space-saving; accommodating many offices and homes within a relatively small surface area and thus avoiding unnecessary spatial decay through economy of land. But. this is the actual root of the climatic problem of, and created by, the modem building especially iflocated in the modem industrial city. This problem can be identified in two different forms, as follows:
1. Similar designs are adapted across climatic regions with disregard for local climatic considerations. Examples abound of the wholesale transfer of design from the temperate latitudes to the tropics.
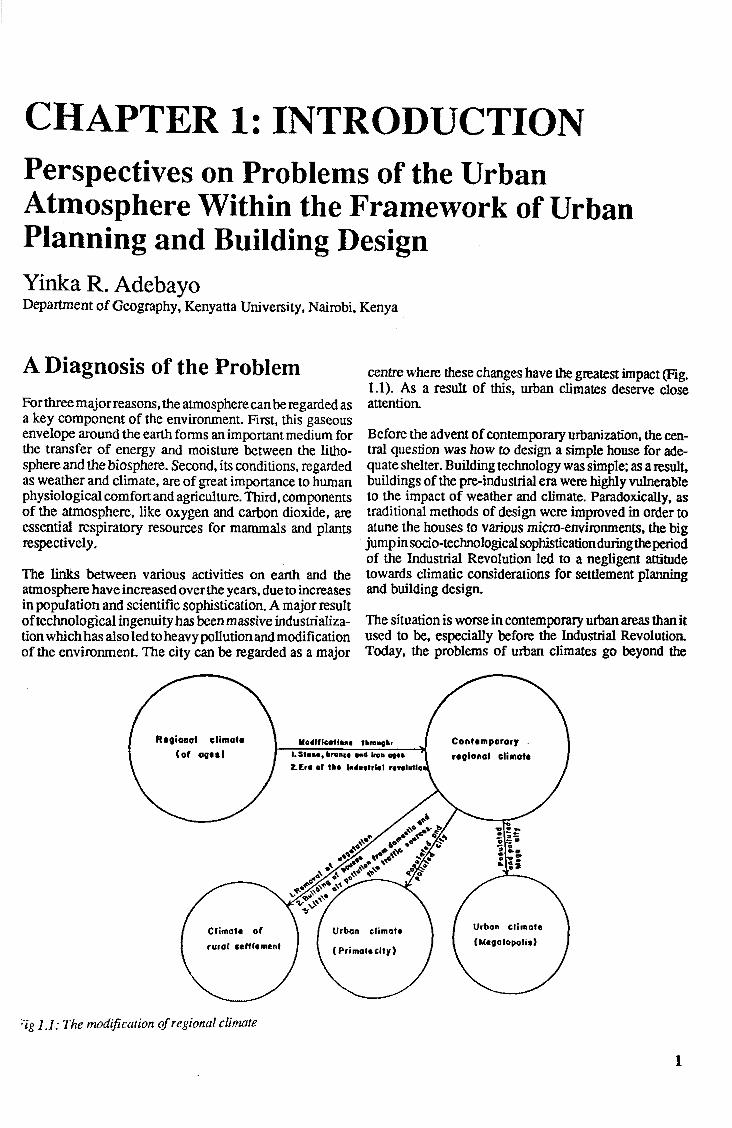
2. While trying to cope with all problems arising from urbanization, the architects of the modem building end up providing no satisfactory solution to the problem of indoor microclimates. For example, in an attempt to design for adequate security and keep away noise and air pollution, the architect may be unable to provide adequate crossventilation and sufficient indoor lighting (Fig. 1.3).
It is not as if policy makers have been passive all along. Many countries have adopted anti-pollution legislation and building design acts. Unfortunately, the problems persist in high magnitude as a result of contending socioeconomic and environmental forces. To worsen the mat•
2
ter, they attain various dimensions from time to time due to population growth and increase in technological sophistication. In response to these challenges, scientists have also made considerable eff ortto provide adequate solutions .. The nature of these solutions are reflected in this publication. But before we look into these efforts, it is only appropriate to briefly examine how the urban atmosphere looks.
The Urban Atmosphere
Fundamental distinctions between urban and rural climates can be made through an examination of the differences in the surface disposition of solar radiation. At a general level, the surface radiation and energy budgets could be described as follows.
If (Q+q) is the total amount of short wave radiation
Fig 1.3: Aspects of environmental pressures on a building. Source: modified after Ryd, 1970. (The ideal goal of an architect is to protect man and building against the effects of adverse weather and other hazards and at the same time provide adequate indoor climate and security.)

DAY NIGHT
(Q♦ q)
1/lll!IIIIII I I/II/Ill/II' Wl//17111/ili!/li/il/l/l
rr /" lRn t /L£ MJJJJJ// I/II/Ill Ill/I I '/Jfill/77/JW/Jlllll/l
Fig 1.4: Schematic representation of radiation and energy fluxes at the earth's surface by day and by night (after Munn, 1966)
transmitted through the atmosphere and (Q+q)x is the amount of reflected radiation, in which case xis the albedo or surface reflectivity, then since albedo (in ratio fonn) cannot be greater than unity, the total amount of radiation left at the surface can be represented as (Q+q) (1-x) (see
Fig. 1.4). The difference between atmospheric long wave countcrradiation (La) and terrestrial long wave radiation (Lt) is regarded as the net long wave radiation (L*). L* adds up to what is left at the surface, that is (Q+q) (1-x), to make up the net all-wave radiation (Rn). Rn and L* can either be positive (usually, during the day) or negative (usually, at night) (Fig. 1.4). Rn could be utilized as sensible heat (H), latent heat (LE) or stored in the ground (G). This description is not a complete summary of what actually happens at a spot because some energy could be used or stored within the plant'scanopy.Energycould also be lost or gained as a result of surface advection.
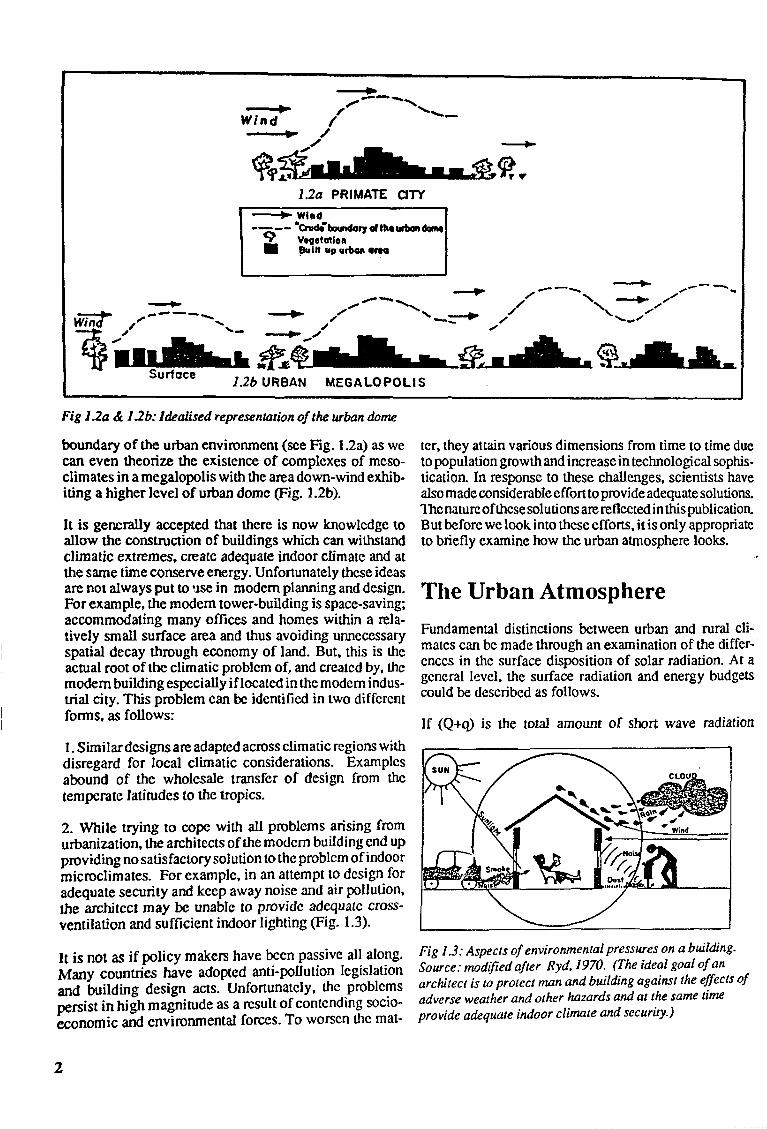
Fig. 1.5 gives a picture of the urban-rural dichotomy in climatic conditions.-In addition to energy which is gener• atcd by the tannac, building and so on, there is also a direct emission of heat into the urban atmosphere from some anrhropogenic sources like electrical equipment, automobiles and industrial combustion. Urban atmospheric circulation is also influenced by its juxtaposed buildings while pollution too affects all-wave radiation.
The urban atmosphere can be classified into two categories: (1) the urban boundary-layer; (2) the urban canopy layer (Fig. 1.6). The former is mainly governed by processes acting at a micro-scale within the city structure. Oke (1976) defined the urban canopy as consisting of the air contained between the urban roughness elements, mainly buildings. The boundary of the urban canopy is likely to be imprecise because of the nature of the urban surface. The
Much heat is used / up in transpiration
U\\\ME / ~\
'
Much heat is alsorbed \ I
I
--+ --+ --+ -+
---sunroy ~ Air current
by buildings and other ).\
structures t ~ J
7 l
- • - Boundaryofurbon dome
Buildings
QTrees
Urban Oasis caused by trees
Low level ~breeze/
,..Grass
Fig J .5: J Jypothetical view of urban-rural characteristic microclimatic condition (modified after Oke 1977)
3

- - - - Top d urban canopy layer -·-•-Top of urban boundary layer _. - · - • - • - • - · -
Top ol dominant rural bo::.'.~• -• -°f r • / • Urban boundary Urban plume
Regional airflow-/./ layer l /./· l Urban canopy layer
-/.
RURAL
Fig 1.6: Schematic representation of urban atmosphere illustrating a two-layer classification of thermal modification (after Ou, 1976)
depth of this layer may be a function of wind speed; budget and modelling approaches were introduced. These shrinking as stronger wind allows the influences from approacheshavebeenemployedby,forexample,Halstead, above to penetrate. ~ fil (1957), Terjung {1970) and Nunez and Oke {1977).
The urban boundary layer. according to Oke and East (1971), is a local or mesocale concept referring to the ponion of the planetary boundary layer whose characteristics are affected by the presence of an urban area at its lower boundary. Its top is commonly capped by a temperature inversion, giving some correspondence with the upper limit of urban pollution.
The nature of the urban atmosphere has been defined above. But the actual conditions vary with size and location of the city. A question can be asked at this stage; have scientists made sense out of their efforts, over the years, towards understanding the urban atmosphere for the benefit of environmentally and socio-economically sound settlement planning?
Towards Some Prognoses Luke Howard pioneered studies in urban climatology through his investigations which revealed that London's city temperatures were higher than those of its surroundings (see Howard, 1833). Other significant works like those of K.rernser{l 886), Schmauss {1914), Kratzer{1956), Duckworth and Sandberg {1954) and Landsberg (1956) only followed that of Howard. These studies involved wban-ruralcomparisonofclimaticconditions,hencerather with little quantitative rigour. From the late l 950s, in order to enhance deeper and better understanding of the fundamentals of urban climates, approaches to investigations attained some more quantitative dimensions, when energy
4
Urban climatology is not always an end in itself. It is expected to serve the following purposes: (1) provide insights into the changing level of pollution; (2) contribute to the understanding of human impact on climate, or, global change in climate; (3) enhance knowledge in the field of human bioclimatology within the highly sophisticated contemporary environment, and { 4) generate data in , usable fonn for the urban planner and the architect. 1
Studies in urban climatology have revealed many facts and methods which could help towards the attainment of climate-sensitive design. Misuses and non-uses of climatological ideas for building design and urban planning have been caused mainly by: (1) poor training; (2) inadequate public education; (3) economic considerations; (4) cultural impediments and; (5) rapid growth of settlements which has rendered earlier recipes simplistic thus leading to ineffectiveness of solutions as in the cases of some Russian cities. Brasilia, Canberra and Chandrigarrh (Oke, 1984). In these cities, climatological ideas incorporated into their planning have been found not to be effective for pollution elimination.
Overall conditions are even worse in tropical urban areas than in their temperate counterparts. Growth and development of tropical urbanism totally lost momentum a long time back, as a result of trans-continental transfer of ideas 1
and materials from the temperate areas. Titis problem is compounded by Jack of adequate knowledge about the dynamics of urban climates in the tropics. Apart from the WMO document of 1986 (see WMO, 1986) this volume represents a pioneering compilation of efforts in the area I
i:

of urban and building climatology with special reference to Africa.
References
1. Duckworth,F.S.andSandberg,J.S.1984: "Theeffectof cities upon horizontal and vertical temperatures''.. Bulletin Amer. Met. Soc. Vol. 25 pp. 198.
2. Halstead, et al 1957: "A preliminary report on the design of a computer for micrometeorology". Journ. of Applied Met. pp. 308-325.
3. Howard,L.1833: "TheClimateofLondon". Vol.I-III, Harvey and Darton, wndon.
4. Kratzer,P A.1956: "DasStadklima",Friedr. Viehweg und Sohn, Braunschweig.
5. Kremser, V. 1886: ''Vortag berdas Klima Von Berlin". Zeitschrift d. 59 Vers d.d. Natur undArtze, Berlin pp. 37-38.
6. Landsberg, HE. 1956: "The climate of towns". In Thomas W.L. ( ed) Man's Role in Changing the Face of the Earth. Univ. of Chicago Press.
7. Munn, R.E. 1966: "Descriptive Micrometeorology". Academic Press, New York.
8. Nunez,M and Oke, T.R. 1977: "The energy balance of an urban town". Journ. of Appl. Met. Vol. 16 No. I.
9. Oke, T.R. 1976: "The distinctions between canopy and boundary layer urban heat islands". Atmosphere Vol. 14 pp. 268-278.
10. Oke, T.R.1984: "Towards a prescription/or the greater use of climatic principles in settlement planning" .Energy and Building 7,pp. 1-10.
11. Oke,T R.andEast,C.1971: "Theurbanboundarylayer in Montreal". Boundary /ayer Meteorology Vol. I pp.411-437.
12. Ryd, H. 1970: "The importance of meteorology in building". In Building Climatology, WMO Tech Note No. 109Geneva.
13. Schmauss,A.1914: "MeteorologischeGrundstzeim Haus-und St dbau." Bayerisches lndustrie - und Gewerbeblat46,pp. 181-183.
14. Terjung, W.H. 1970: "Urban energy balance climatology: a preliminary investigation of the city-man system in ws Angeles". Geographical Review Vol. 60 No. 1.
15. WMO, 1986: "Urban Climatology and its Applications with Specia.l Regard to Tropical Areas" WMO No. 652.
5

CHAPTER2 The Presentation of Climatic Data Must be Relevant to the Design Process
LotharGotz Faculty of Architecture and Town Planning, University of Stuttgart
The Various Tasks of the Architect
In designing a building the architect must meet a large number of different requirements. First of all, the building he is to design must be technically correct. This requirement alone means that not only docs the architect have to be familiar with all the available options in the fields of material and construction technology, he must also be able to make the right choices and combinations among these options. He must be conversant with traditional and modern construction techniques. He needs to be familiar with the latest developments in construction research, a field of enormous progress, especially in the areas of building physics and mechanical equipment. He must know the capability of the craftsmen working on the building and, at the same time. have full information on the available ultramodern construction apparatus, so that he can plan his building method around these facts. The difficulty of doing a good job technically, with the abundance of technical alternatives available these days, is demonstrated by the large numbers of constructional defects. And anyway, that his building should be technically correct is only one of the things expected of an architect.
It goes without saying that the buildings should be economically feasible as regards both construction and running costs. The economical aspect of building is relevant for I.he level of rent to be charged later in housing, or for the financial soundness of a business in commercially used premises. The running cost of a building is increasingly becoming a more crucial factor. In the industrialized countries, the running costs that a tenant in the housing sector has to pay every month are rapidly approaching the level of the monthly rent. Also, the ever-increasing amounts of technical equipment being installed in office buildings, schools, hospitals and other buildings in the public sector are vital factors which arc responsible for the rise in running costs.
Another aspect the architect has to take into account in his design work is the social conditions in which the users of his buildings live. In tropical countries, especially, we frequently find grotesque examples of the failure of an
6
architect to· bear in mind the social condition of the eventual users of the building he is designing; and even the simplest aspects of the way they do things.
The architect must also, of course, comply with buildin~ regulations, which in the industrialized countries presentl) constitute a baffling and incomprehensible jungle. Hopefully, the rest of the world will be spared these excesses.
The architect is also expected to make an aesthetic contribution to our environment with his buildings. He mus1 have the gift of adapting to often problematical surroundings of placing accents. This aspect of the architect's job, in particular, runs the risk of being constricted to an everincreasing extent by the straitjacket of technological, economic and legal requirements. Nevertheless, it is still the task of the architect to make his contribution to contemporary culture through his artistic achievement.
Besides architecture, an architect really needs to study social sciences, physics, chemistry, psychology, geography, meteorology, aesthetics, and many other subjects too. In I.he end he would, I am sure, no longer be an architect!
It must be remarked that in spite of the fact that this article deals with issues relating to climatic data for the architect, it is necessary to give at least a brief description of the manifold aspects of the architect'sjob,asdoneabove. This is always necessary in order to show that climatic design, though, of course, a matter of great importance to any architect worth his salt, is still just one component of a whole spectrum of tasks. The architect must naturally think of ways of guaranteeing the greatest possible comfort inside a building under extreme conditions of climate. The users want to feel comfortable in the building, whether it is a residential or other type of building. If people cannot wait to get out of the building so that they can feel better'. in the open air, it should never have been built in the firstj place! Regrettably, there are too many buildings of this sort.
We must, the ref ore, look into the question of why so little

attention is paid to climatic factors in building. One explanation, certainly, is the ever- expanding spectrum of the architect's tasks. But there are other reasons, cf which I should like to give a few examples.
Obstacles to Climatic Design
A century ago it was still generally the case that a builder, or the architect, operated in a region where he knew the people and the climate from his own experience. Since then, the radius of action of planners and architects has expanded considerably. Architects design buildings in regions where the only knowledge they have of the people, the climate and other conditions, they got at the airport or during short visits. You do not need to be a prophet to be able to predict the quality of the results. But, such extreme cases aside, we must face the fact that even within a single country or region, archi tccts cannot be familiar with all the climatic zones from their own experience. We too often tend to oversimplify and think superficially when we associate particular countries with a particular climate. Take Iran, for example: what architect would think in this context of the considerable differences in climate between the Iranian plateau and the northern province of Gilan (Madani-Moghaddam, 1985)? Who would conceive of there being a total of eleven different climatic zones in Sri Lanka (Gunaratne, 1985) or twelve in the Federal Republic of Gennany (Esdorn, et al 1985)? In short, we must accept the fact that an architect has to design buildings for climatic zones that he does not know. with features that he must first become familiar with. One way of doing this, often underestimated, would be for the architect to take a good look at the traditional building techniques .i~ the region he is unfamiliar with. As a rule, these traditional methods are the result of hundreds of years of corrections and improvements. The traditional architecture of a region can show us how to find appropriate solutions to local climatic problems,
Countries where extremes of climate occur arc miles ahead of the industrialized countries in the field of climatic design: their traditional building methods have taken account of these extremes and adapted to the climate. They would be ill-advised to give up this advantage and import from the industrialized countries styles and techniques that take no account of their climates. On the contrary, here they have the opportunity to d~m~nst~ate 1!1eir s~periority over the industrialized countncs m chmauc design.
The importance that people attach t~ various aspects of climate differs greatly from one region ~o ano~cr. The subjective effects of sunshine are totall}'. diff ~rem mScandinavia and in Africa. For example wmd, m the. dese~, combines with sand to make life a misery, paradoxically it is experienced as pleasantly cooling on the c~ast o~ a tropical land. In the oasis, people long _for Lhc ram wh1cl~ brings new life, but in northern Europe m rhc co_Id mo!1ths of Lhe year it can be very unpleasant when allied with a
biting wind. The architect today is not usually able to appreciate all these subjective considerations: he lacks the capacity to see the essential differences in these various factors.
The biggest obstacles to the acceptance of climatic design are ideological influences and fashionable trends, as will become clear from two examples. In many parts of the world cement and its most important derivatives, concrete and cement stone are the incarnation of progress, wealth, and sometimes even independence (or apparent independence). Today, cement stone is also in the process of eclipsing some of the traditional building materials and techniques, which have been developed over hundreds of years to a high state of perfection, and producing in place of these results that are unhygienic, uneconomical, and in conflict with the laws of building physics. Neither the government responsible nor the people affected question whether cement stone is climatically appropriate for a particular region.
Climatic design will also find it very difficult to comrete against the trendy design elements of the so-called postmodern architecture. These post-modernist fads are merely based on superficial architectural cliches such as the arch, the column, the triangle, classical forms, etc. We can already see how this totally unsuitable architectural import is beginning to invade tropical countries.
If an architect advocates climatic design and criticizes the cement stone ideology or the questionable taste of postmodemism, he runs the risk of being called old-fashioned. Every architect works in a competitive situation, however, and- to be "old-fashioned .. is a considerable handicap. Thus, we see that decision-making in questions of design is by no means always based on rational conside:-1tions or conducive to the well~being of those who are gomg to use our buildings.
Nevertheless, the primary goal of an architect _mus~ I><: the physical and psychological well-being of man m buildings and towns. He must be able to fight for this ideal, too. ~t is why I have entered the field. in the cau~~ of clima~c design, because climatic design 1s a prerequis1~e fo~man s well-being in our buildings and towns. To attam ~s goal, however, we need climatic data applicable to design.
Presentation of Climatic Data for Practical Use: General Remarks
It is absolutely useless to pretend that the architect, .fa~d as we have seen with a complex spectrum of t~ks~ 1s m a position to go through the vast amount of _c1im~tic data available fO him, assess their relevance for his ~esi~, and make practical use of them. The available chm~tlc data must be presented in such a way that the architect can
7

immediately see from the data or from graphs and diagrams the climatic features significant for him and his design, and can adopt the necessary technical measures in this building to cope with these features. When we call for a presentation of climatic data in relevance to design, this is not an abstract quest for scientific perfection, but the prerequisite for the adaptation of architecture to climate, now and in the future.
The way climatic data are structured at present probably derives from a wish to describe variations in climate which we call "weather". 1bis type of description, however, a well-established tradition. is a long way from being a design-relevant data structure. For the architect it is more of a data .. cemetery", which needs to be organized if it is to have any practical value. It is not yet possible to judge whether the 'test reference year" will prove to be a useful tool for the presentation of data in relevance to design. There are, however, grounds for being skeptical, as the maximum values, so important for design and planning, are rounded down in the 'test reference year', too. Though sequences are to be found to a cenain extent, correlations between individual climatic components are so far not in evidence in the test reference year(seeEsdom, et al 1985). Toe direction that Valko (1975) is taking in his research seems to be to open up more possibilities, even if it gives the impression thus far of being too complex for the architect and planner.
Jtis to be hoped that meteorologists and climatologists will realise that in future climatic data must be presented in different ways for different needs. Weather-forecasting presumably requires one type of data structure, other types are needed for tourism, agriculture, building. regional planning and so on. Qimatic design requires not so much average values as maxima and minima, with details of their frequencies, climatic sequences and, above all, correlations between the individual components of climate.
Presentation of Data of Various Climatic Components for Climatic Design
For a start. the architect needs to have climatic data organi7.ed under different aspects, depending on the climatic component. As a general rule, all types of average climatic values are unsuited to the architect's needs. Annual air temperature averages. arrived at on the basis of decades of observations, are misleading in regions where the air temperature varies appreciably. Average values for wind speed are quite absurd: according to th~se a~e:age values the world is made up solely of areas with mrmmal movements of air. These average wind s~eds are low even in those parts of the world where sandstonns, blizzar?s a~d hunicanes constitute some of the most unpleasant chm~uc phenomena. Buildings have to be stable in the face of wmd speeds that may only occur once every fifty years.
8
As regards air temperature, on the other hand, discomfort occasioned by maxima or minima only registered every ten or twenty years can be tolerated by the human organism. In regions where there is a big difference between day I and night temperatures, the time of day is a significant factor: in cold regions some reduction in comfort can be · accepted in the indoor climate during the night, whereas in ' hot latitudes in the daytime there are definite limits to the i temperatures acceptable during working hours.
If we take precipitation, the annual amounts of rain and snow may well provide a rough indicator of the potential for agricultural exploitation within a particular region. For the architect, annual precipitation figures are not so important as the likelihood of extreme amounts of precipitation per day or hour. The building and its surroundings must be so designed that even extremely high amounts of precipitation per day or hour can be drained off and dispersed.
We see. then, that different components of climate require different methods of presentation. With wind speed, the stability of buildings must be guaranteed in the face of absolute maximum values. As regards air temperature and precipitation, maximum values together with an index of frequency are also the best guidelines for the architect.
Presentation of Climatic Sequences for Climatic Design The demonstration of periodically occuning climatic situ• ations is for the architect an important aid to decision• making. A classification according to seasons or rainJ seasons is, however, too vague. A step in the right directior is the presentation of climatic sequel)ces in the elaboratior of the test reference year for the climatic regions of the Federal Republic of Gennany (Esdom,.tUl.1985) orin the work of Valko (1975), for example. Of particular importance, however, is the swiftness of transition from one sequence to another, which has so far not been tabulated. When considering fluctuations in air temperature it is important to know whether periodic fluctuations occw within the space of hours or days. The frequency of sudden or gradual changes in air temperature, for example, can be a crucial factor in deciding whether to employ heavy-duty or lightweight construction techniques and materials. It is also important for the architect to know how often sequences occur: seldom occurring scquenc~s can be more easily discounted than frequently occumng ?nes. The duration of specific climatic sequences is also important, for it makes a difference whether for instance a spell of high air temperature in a temperate climatic zone lasts for three days or for three wec~s. The same is _true for pre-J cipitation in the shape of ram or s~ow.1:1ax1mum v~ues prevailing foronl ya few hours require a d1ff erent architectural evaluation from maxima that last for a week or two. Climatic sequences can also apply to ~e time of_day. Over a fairly long period in Sri Lanka. wmd and ram show a cyclic rhythm according to the time of day (see Gunaratne

1985). The tabulation of sequences should, therefore, not be restricted to air temperature and sunshine, but must also include other climatic components, such as precipitation and wind.
Correlation of Climatic Data for Climatic Design
Man is affected by climate as a whole, not by the separate components that go to make up climate. When high temperature, high humidity, heavy rain and wind occur together, they are experienced as climate, not each phenomenon for itself. Another example of the "holistic" effect on the human climatic sensors is the combination of high temperature and low humidity with high wind speed and air pollution in the fonn of sand. Anyone who has spent some time in a mountain region during the cold period of the year will have vivid memories of the joint effect of wind force, wind direction and precipitation in the fonn of snow.
Climate is also to be seen as a whole by the architect when he has to make decisions in his design process. Thus, when climatic data are to be organized in relevance to design, climatic components that have been treated separately for the purpose ofdescription must be correlated again. A few examples will show how important the presentation of correlated climatic data is for the architect as designer.
For the orientation of a building it is vital to know the prevalent direction of wind when there is heavy precipitation. Wind direction, wind speed and precipitation constitute a unity in respect of architectural decision-making. When the architect sees the correlation of wind direction, wind speed and precipitation, he can usually restrict expensive additional protective measures to specific parts of the building. Thus, a correlated picture of climate would promote economical building, too.
The correlation between wind speed and air temperature is also of significance: a totally different evaluation of maximum or minimum temperature is required, depending on whether there is no wind or a gale.
It is not sufficient, when describing the climatic component wind, to correlate data on wind direction and wind speed. The specific elements contained in the air, such as sand, chemical or other contaminants, not forgetting rains, hail and snow, must one way or the other be correlated with wind direction and wind speed. In climatic design, this correlated description of climate will have a direct influence on the fonn and position of the building, the arrangement of the windows, the materials and construction of the external walls, and so on. Another important correlation of climatic components is the connection between air temperature and solar radiation. In cold latitudes, good builders have always had ideas
for adapting their designs to make use of solar radiation as an additional source of energy to improve the interior climate. In this way they have managed to offset some of the heat loss from buildings. In recent years this has come to be termed the "passive solar energy". If used in the right way, this technique can promote man's indoorphysiological comfort, and can also make building more economical; depending on the climatic region and the method of construction.
It is also necessary to correlate maximum and minimum air temperatures with maximum and minimum humidity. The interaction between the two and their joint influence on man's perception of climate have long been known. Even so, strict segregation is the rule when these factors are tabulated - and yet, constructional options are directly affected by this combination of forces. When very high humidity is associ~ted with a very high airtemperature, the only means of rendering the climate at all tolerable is via the movement of air, if we discount the installation of airconditioning equipment. When humidity is very high and the air temperature relatively low, the movement of air must be kept to a minimum. For very low humidity and high air temperature, we are familiar with the tried and tested methods of humidification via straw matting next to the air-catcheror fountains in the patio. The measures to be taken in building are always oriented on climatic conditions that can only be appreciated with the aid of a correlated description of climate. The architect needs to have the basic data available in an organized form, so that he knows at once when, where and how he can promote or reduce the movement of the air inside or outside the buildings by means of constructional modifications. This means that quite different decisions may have to be taken at the design stage.
Conclusion
Of course, we can even now collate the necessary data from the various descriptions and tables. But in view of the variety of tasks facing the architect. as already mentioned, he cannot afford the time for this job. If climatic data are to be relevant to design, they must be presented in the light of maxima and minima with index of frequency, in sequences, and in correlation. Only this data basis will enable the architect to design buildings appropriate to the climate. In the computer age there cannot be any fundamental problem in coordinating the immense quantities of data.
In sum, we can say that the architect needs a designoriented presentation of climatic data to be able to attain the planner's goal, the well-being of men and women in buildings and towns.
9

References
1. Esdorn,H.,Fortalk,H. andJahn,A. 1985: "Elaboration of test ref ere net year (TRY) for climatic regions of the Federal Republic of Germany". Report of Current Developments on "Rational Use of Energy by Households and Small Consumers" Federal Republic of Germany.
2. Gunaratne, K. 1985: "Integration of traditional (Kandyan) domestic architecture in modern domestic architecture of Sri Lanka. with particular reference to climate". Unpublished Thesis, University of Stuttgart.
3. Madani-Maghaddam, I. 1985: "Rural types of settlements and buildings in Gilan, Northern Persia''. Unpublished Thesis, University of Stuttgart.
4. Valko,P. 1978: "Wind". MeteoPlan, Vol. 2Halwag, Bern-Stuttgart.
5. Valko, P. 1975: "Solar irradiation of buildings for various types of construction and fafade orientation". Meteo Plan, Vol. 1 Halwag, Bern-Stuttgart.
10

CHAPTER3
The Climate-Site Analysis
Erich E. Meffert, Stone Town Development Authority, P.O. Box 4233, Zanzibar, Tanzania
Introduction Specific Site --Data Identification
It is essential for the architect to be aware of the particular climate of the site where any building is to be located. One easy way of doing this is described here, in stages. Find the climatic data for the meteorological station near
est to the site of the proposed building.
Regional Identification Data Manipulation Identify the most reliable and up-to-date climatic map Data Manipulation (I) (showing the existing stations) for that region or country. For example, Fig. 3.1 is adequate for a study in Kenya.
Z'"
I
,:, , .•~ ,. • ,1 IIO 100 SO 0
n"
5•
0
'f 'f"•' .. ~ 1bo tAoka._
Select the relevant climatic data for the two extreme months. Usually temperature and relative humidity are considered. This does not imply that other climatic elements, such as wind, are not important. The two extreme months are hot and cold seasons. Under some otherclimatic conditions, these could be wet and dry seasons. These data are given in the form of mean (dry bulb) temperature at specific hours, but, in particular, maximum and minimum readings are considered. In most cases, however, climatological recordings are limited to 0600, 0900 and 1500 hours, Local Zone Time (LZI').
Data Manipulation {II)
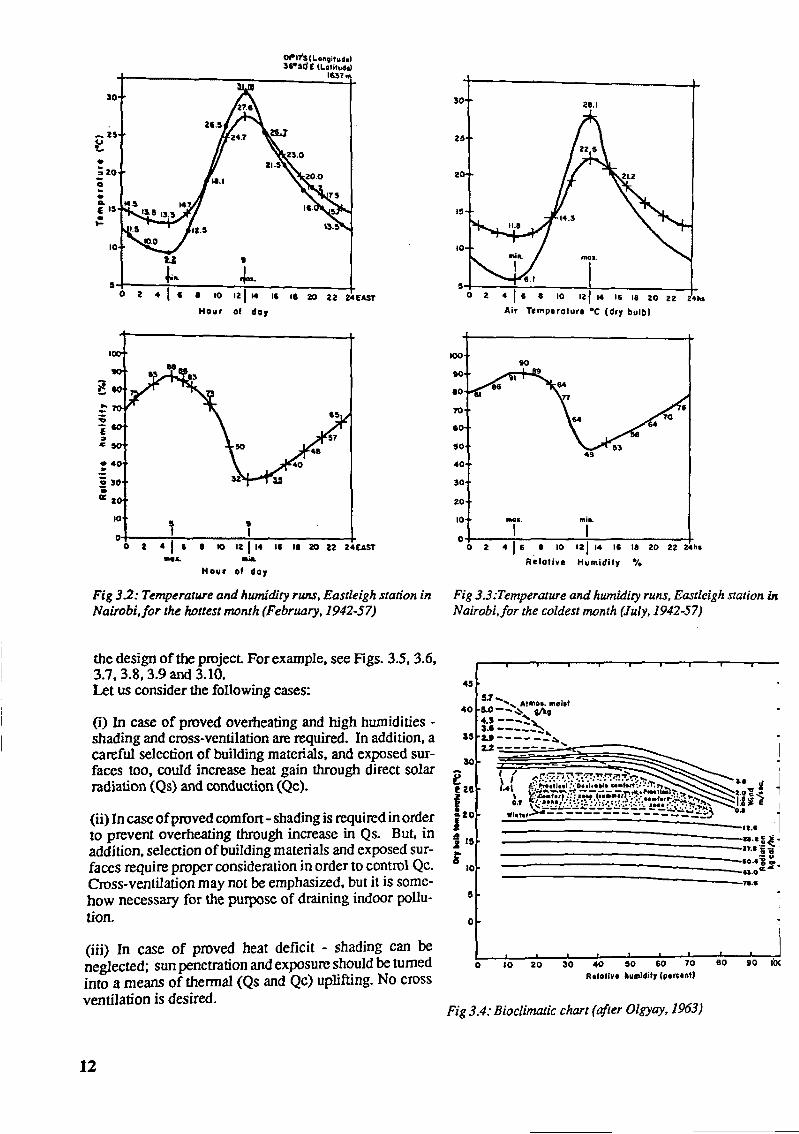
By estimating the timings of the thennal turning points, the daily temperatures and humidities can be presented in form of simple 24-hour diagrams (see, for example, Figs. 3.2 and 3.3).
Data Manipulation (Ill)
Clarify the relevant timings (thennal turning point, that is) with regard to the particular project. They can differ significantly from one project to the other; from residential to educational and commercial designs.
Data Manipulation (IV)
By plotting the most characteristic temperature and bu" midity readings (for the two extreme months) on the
Bioclimatic Chart fonnulated by Olgyay (I 963) (Fig. 3.4 ), one will get two typical climographs which under normal circumstances are sufficient to identify the ambient comfort condition for the site, and thus a worthwhile basis for Fig 3.1: Spatial location of meteorological stations in Kenya
11
10
U I
~-- ,la •. s--101-.--,.-il:-•-----;l:--------l. ,. I 10 12 14 11 11 ZO U 24E:AST
Hour of do,
10 5 I
0 I I
0 2 .. I I • IO 12114 II ,a 20 22 24EAST -&. ·-Hour of do,
Fig 3.2: Temperature and humidity runs, Eastleigh station in Nairobi.for the hottest month (February, 1942-57)
the design of the project For example, see Figs. 3.5, 3.6, 3.7, 3.8, 3.9 and 3.10. Let us consider the following cases:
(i) In case of proved overheating and high humidities -shading and cross-ventilation are required. In addition, a careful selection of building materials, and exposed surfaces too, could increase heat gain through direct solar radiation (Qs) and conduction (Qc).
(ii) In case of proved comfon - shading is required in order to prevent overheating through increase in Qs. But, in addition, selection of building materials and exposed surfaces require proper consideration in order to control Qc. Cross-ventilation may not be emphasized, but it is somehow necessary for the purpose of draining indoor pollution.
(iii) In case of proved heat deficit - shading can be neglected; sun penetration and exposure should be turned into a means of thennal (Qs and Qc) uplifting. No cross ventilation is desired.
12
28.1
ma•.
5~0-2---;-1-----!-,-------+-4 6 8 10 12 14 15 18 20 22 24ha
Air Tempe rotur■ •c (dry bulb I
100 90
40
10 •aa. ffl.ift.
o+----:------.:,-------+ 0 2
I I 4 I' • 10 12j 14 II 18 20 22 24hs
Relotive Humidity -.,.
Fig 3.3:Temperature and humidity runs, Eastleigh station in Nairobi.for the coldest month (July, 1942-57)
45
5.1-..,, AtlllOO. 1110111 40 s.o- ... ~ t/ko
4.,---~'l> 3.1-----~, 15 2.,---- --~
u------- ..
0
0 10 20 30 40 110 10 70 Relollve hun>lditi (peteut)
Fig 3.4: Bioclimatic chart (af1er O/gyay, 1963)
80 90 I()(

h , . .,. I 14·:5 7S 13 s 3·5 u :5 ~ Be 1 14-7 BS 9 !.!!:.! n II 2,4-7 50 13 ~ 32 15 2&7 ~ 17 230 ~ 19 200 48 21 IT·S f>'I' :,.
n 15-7 6:5
Fig 3.5: Temperature and humidity conditions, Nairobi, on 0lgyay's Comfort Chart (Februmy lwttest month)
h ,. I IJ·O n 3 12·0 u 5 1.1:J 91 7 IJ,7 89 9 l!!l u II 19·0 H I) ru 49 ,, w ll 17 ,,., ,a :u 19 11-3 •• •U 21 14•7 70 23 13-7 71
Fig 3.6: Temperature and humidity conditions, Nairobi, on Olgyay's Comfort Chart (July, coldest month)
h ,. % I ZS ., u 3 2 •• , u II 2S·8 32 7 211 Ill
C , 21', 80 II :S1•3 ti , ., ~•7 10 I! 31•4 n IT :I()- .. 19 28·) TO 21 2$-7 74 2) 2$,7 79
:5
s
Fig 3.7: Temperature and humidity conditions.Mombasa, on O/gyay's Comfort Chart (March, hottest month)
~- t• . ,. I 21-3 ea J 2C),T 92 5 20.5 95 7 21·3 u
c __ 9 2~3 17 II 25-3 74 IS H-0 14 IS H,7 61
" 211-0 72 19 23.:5 71
·21 2)-0 87 23 22·) 15
Fig3.8: Temperature and humidity conditions.Mombasa, on Olgyay's Comfort Chart (August, coldest month)
~- ,. ..,_ I 27•0 u Ill , 2.:5~ u
:5 2.:5·1 72 7' 25·7 69 9 2.8·S G2. II :53 4S ,s 36-9 S5 1:5 35- 38 IT 42 19 48 C 21 ll2 2l 57
Fig 3.9: Temperature and humidity conditions,Mandera, on Olgyay's Comfort Chart (February lwttest nwnth)
... , . % r 24·3 62 :, 2J·O 66 5 22•7 99 7 <l·S 67 9 2:5•7 61
II ·5 48 , 13 J3·3 S9
15 ·O 41 17 29·6 4♦
19 28·0 48 21 26·3 :53 23 25-3 sr
Fig 3.10: Temperature and humidity conditions,Mandera, on Olgyay's Comfort Chart (August, coldest month)
240/60 ·-,,..,1, I I I co•hrto•I• I I -•. ~;;--t---~;;-;-~-- -----------,---"'r---
200/50 ot c,1111 I ! I too hi
I I ;- t I I I I -;; ;
I" ' 160/40 ;; Io I I I I I • .. ,- I ... ,,
I~ I • 0 I • I ~ • • . - I 120/30 - I ,o
I . :. I 1 I '. I
~ .... t .. I• I
C I" I 80/20 '= t
I !r I • 0 I 1-
40/ 10 I• I I I
NAIROBI I ' LAMUt I I
-8.0 I -•.o ••. o I +a.o + 010 -10.0 -6.0 -z.o +2.0 +6.0 +10.0
VY,• mlmin ~ =Vof4 ror o singlutore, t>uildino with mo1qu ito -proored windows .
• ~opour pressure= 19 ml>
Fig 3.11: Human comfort scale
.0
13

Summarizing Data
BY converting the climatic data into one-figure values - for 11
instance hygrothennal factor or factor of sultriness (as done by the author) - a one year diagram of isopleths (isohygrothenns) can be drawn, which offers instant information about the climatic conditions of a statistical year (see Table 3.1 and Figs. 3.11 and 3.12).
Conclusion
The success of the above analysis. in reality, depends on the nature and accuracy of the climatic data. Periods over
-1• ••T
-~ -~·• . .. ·•·• .• .
loo~J9'0lllet1111 in IIIOnlhly ffilGftl 196~-1974/~ "4el. Slolioft.
which the archival data have been collected are also 24•'a,f--._--r--,,-.-,--,.--.----, · I be ,.,.,. to biG•""'"'i< oMrt lJDp01tanl t must IlOted that the above analysis iS not
21 Occotdin9 to0'9yay
the only approach an architect could take.
References
I. Olgyay. V. 1963: "Design with Climate", Princeton University Press, Princeton, NJ.
Nou: This article was wrilun when the author was at the University of Nairobi, Kenya.
II
12
' • 3
~~\-+---+---+caoli"11 by air ""°'•rnent required
1--1~ ..... _.,~nc..~:d~:::• rtQUittd
.......... ~~~~_.,.,...,-. ":-Apt..,,Moy......,_Nl......,.M,~~~s.,...,,0c,...,.,.~-------o.c.
Tabk 3.1: Relative Humidity and Marginal Temperature of Sultriness.(ts)
Fig 3.12: Conditions at Lamu
14
Note: ts - t = HGT (Hygrothermal Factor or Factor of Sultriness)
% ts
100 16.50
90 18.16
80 20.06
70 22.23
60 24.79
50 27.88
40 31.76
30 36.94
20 44.59
99 16.66
89 18.34
79 20.26
69 22.47
59 25.07
49 28.22
39 32.21
29 37.57
98 97 96 95 16.82 16.99 17.55 17.31
88 87 86 85 18.52 18.70 18.89 19.08
78 77 76 75 20.47 20.68 20.89 21.11
68 67 66 65 22.71 22.9S 23.20 23.45
58 57 56 55 25.36 25.65 25.95 26.25
48 47 46 45 28.58 28.95 29.32 29.70
38 37 36 35 32.69 33.15 33.64 34.14
28 27 26 25 38.22 38.89 39.59 40.33
Source: Atlas of World Epidemics vlll, Hamburg 1961
94 17.48
84 19.27
74 21.33
64 23.71
54 26.56
44 30.09
34 34.66
93 92 91 17.64 17.81 17.98
83 82 81 19.46 19.66 19.86
73 72 71 21.55 21.77 22.00
63 62 61 23.97 24.24 24.51
53 52 51 26.88 27.21 27.54
43 42 41 30.49 30.90 31.32
33 32 31 35.20 35.76 36.34

CHAPTER4
~otes on Computerized Storage of Climatological Data for the Architect )lasimibo 0. Ogunsote >epartment of Architecture, Ahrnadu Bello University, '.aria, Nigeria
:ntroduction
1.cthods of climatic design are largely neglected by archi~cts in the tropics for various reasons. Perhaps the most nportant cause of this negligence is that climatological now ledge is not sufficiently stressed during the course of 1eir (architects') education. No doubt, an awareness of ncrgy issues should be encouraged in schools of archi tec-1re. In addition, knowledge of thennodynamic principles mst be insisted upon. However, before this can be effecvely done, students should be provided with suitable )0ls and relevant infonnation (Szokolay, 1984) in order to nable them to make positive use of climatic factors in esign, after their training.
be very nature of the various analyses involved in enrgy-conscious design encourages the use of computers. be impracticability, and sometimes impossibility, of 1ckling certain problems without computers is becoming 10re and more obvious. Many architects rarely possess iathematical inclinations, as a result of which they avoid 1borious and error-prone calculations. Fortunately, the cvelopment of various microcomputcrprogrammcs would bviously help in solving this problem.
Jnfortunately the situation in the Less Developed World LOW) is bad enough to lead to the non•availability of omputers in some academic departments. This makes omputer education for architects under such a situation a cry difficult exercise. Thus the level of computer educaon in the LDW is low. To worsen the situation, the few omputers around are not functioning well!
u1 spite of the above problem, we should still encourage the design and development of small computer programmes for architecture in the LOW. Indeed, it will be a big advantage if this type of education is emphasized. Specifically, the following are the obvious advantages which may result.
(i) Universities and institutes will acquire computers.
(ii) Good programmes can be used repeatedly by students over the years with only slight, if any, alterations.
(iii) Students will be able to actively participate in the creation of ideas and ideograms for useful programmes and, in some cases, even participate in the actual programming.
(iv) The range of programmes available can be considerably increased through the exchange of programmes and ideas with other schools of architecture. In some cases, the programmes are applicable on a national basis and the results obtained could then be made available to schools without computers.
(v) Since computers would take care of the laborious calculations the students• intellect can concentrate on the development and improvement of qualitative assessment skills.
The author, in co-authorship with Boguslawa PrucnalOgunsote, sought means of utilizing the mainframe for educational purposes. The primary aim was to design simple and portable programmes that would give the students access to analytical design methods while sparing them mathematical manipulations. Programme MOTOLA and system STRESS were created as a resulL
Programme 'Motola'
MOTOLA is a computerised version of the Mahoney tables specially designed as a teaching and design aid for students; especially of architecture.
The programme is basically a version ofCLIMA TE. I twas designed in Fortran IV, which is meant to enhance its universality and portability. The programme is basically self-explanatory and it is, in addition, accompanied by a full documentation. The documentation also includes hints on how to run the programme on the CDC Cyber 72.
15

The programme uses a .. typical data set .. which comprises such basic data as the location, longitude, latitude, altitude, monthlymininnnnandmaximumairtemperatures,monthly minimum and maximum relative humidities, the monthly rainfall and the period over which these readings were taken. The data set is designed to be expandable to include wind and solar radiation data.. wet•bulb temperatures and extremes of these records, among olhers. This basic data set can thus be used by different programmes that are "location-based". The different basic data files can also be easily merged and stockpiled independently of their contents since they have a fixed size. The use of these predefined data files reduces the arduous and error-prone task of data input.
MOTOLA was designed with a bias towards producing printed results on the line-printer, although these results can also be read from the screen. The printed results can be easily trimmed and attached to A4 or quarto•size documents. These nine-page results have been formatted for legibility and clarity since, in this case, the form is as important as the content The climatic data used are presented to enable verification; and then the humidity group, the comfort limits, the thermal stress and the thermal indicators for each month are presented on separate pages. The step-by-step presentation of these results explains a logical sequence of deductions and inferences so that by the time the sketch and element design recommendations are presented they would have become obvious. This encourages creative analysis while removing the burden of calculations. The programme sums up by proposing vari• ous materials for the construction of the walls and roofs.
The climatic data recorded over a long period for about thirty Nigerian towns and cities were obtained and used to run MOTOLA. The results were compiled into a volume which is readily consulted by students. This makes comparative analysis relatively easy and a verification of the method used possible. The volume also serves as a ready source of difficult-to-come-by long-term climatic data. MOTOLA is at present available on tape, on punched cards, as a listing on paper and, of course, on the permanent magnetic disk storage at the Jya Abubakar Computer Centre.
System 'Stress'
STRESS,likeMOTOLA,isacomputerprogrammeaimed at the quantification of certain factors in the pre-design stage, though it can be useful during the elemcnt-de~ign stage, for the design of sun-shading devices. It dctenmnes and presents the thermal stress in a graphical form. The use of a graphical fonn of presentation serves a dual purpose. Firstly, it eliminates the use of numbers which arc usually in a chaotic state in such calculations. Secondly, the results, which consist of the thennal stress for over two thousand different times in a year, can be assessed at a glance, for which tentative conclusions could then be
made.
16
System STRESS makes use of the hourly temperaturi' calculation and the table of comfortlimits from the Mahone, ' tables to detennine the thennal stress from any set of af temperature and humidity records. It simply determinei the temperature at a particular time and compares it witt ' the comfort limits. This can be relatively easily do!lf manually and the value of STRESS lies in its ability to repeat the process thousands of times within seconds an: to present the results in a graphical form and in such 1
fonnat that it can be easily attached to reports. · '
Ironically, this simple procedure proved more dif:ficultt.c computerise than the Mahoney tables. The reasons for this were the hard-copy orientation of the system, the graphic.c form of presentation and the machine on which STRESS was implemented. The authors of STRESS had to resonw the Calcomp graph plotter which, despite its high-quality drawing capabilities, also has its own drawbacks. Tu small memory available also made it necessary to break the programme into smaller units, and to use intermediate ' storage. The whole process is controlled by a procedun: file and this is why STRESS is referred to as a system.
STRESS, like MOTOLA, is designed in Fortran JV and it makes use of the same typical data set The system is not ' interactive and it requires the entry of only three words to· run. At the end of each run the thermal stress is printed by the line-printer in a standard format The necessary plot-, ting commands are stored on magnetic disk, from where'. they can be transferred on to tape. The tape is then used to' make a plot on the Calcomp drum plotter. This plot is an· almost identical copy of the printout from the line-printer'. and as such the system can still be useful to consume~: without access to a drum plotter. I The aforementioned problems encountered in the design of STRESS arose mainly because of the insistence of the 1
authors on a high~quality graphical presentation such a/ can be obtained from a drum plotter. This attitude was) however, well justified underthe circumstances, since the: authors discovered that the sight of computerpapercreate• 1
a mental block, and that students have an inbuilt "mistrust' of anything that has to do with computers. Most of them however, could not recognize a plot made by a drun plotter, and in any case they had more respect for it, and a: such they readily made use of the information it provided even though they had mentally rejected the same infer mation presented on computer paper.
Conclusion
The use of MOTOLA and system STRESS so far demonstrates the usefulness of the computer as a teaching aid iE environmental design. The increasing accessibility of computers and the gradual disappearance of ~on:i puter illilcracy is bound to increase the area of apphcatton of computers in architectural design, especially in developing countries.
The development of architectural software (especially those that are basically teaching aids) should talce place in academic circles in universities and research institutes. A reliable software base can be acquired by these institutions through the exchange of programmes. Such programmes, accompanied by extensive documentation, can sometimes be modified to fit particular machines or output tastes.
The exchange of software is, however, a delicate issue. Apart from the considerable technical problems, authors tend to hoard and protect theirprogranimes from software piracy. Since this is obviously disadvantageous in academic circles, it is hereby suggested that a means of protecting the rights of authors should be sought Titis author is proposing the establishment of a SW AP library for the free exchange of Computer Oriented Design Software (CODES) to act as an official means of communication between academicians involved in the development of educational software. A donor to the library would retain his rights while gaining access to the work of others. Titis will help reduce duplication of effort while increasing and encouraging computer awareness. This may also help avoid a situation where research results remained unknown or unused for over a decade!
References
1. Prucnal-Ogunsote, B. and Ogunsote, 0.0. 1985: Program Motola: "A Computerisation of the Mahoney Tables for the determination of architectural and plan• ning design recommendations based on climatic data". Research Report of the Department of Architecture, ABU, Zaria.
2. Prucnal-Ogunsote, B. and Ogunsote, 0.0. 1985: "Architectural and planning design recommendations for Nigerian towns and cities, based on the Mahoney tables',. Research Report of the Department of Architecture. ABU, Zaria.
3. Prucnal-Ogunsote, B. and Ogunsote, 0.0. 1986: "System Stress. a computerised method/or the detenni• nation and graphical presentation of thermal stress for design purposes,,. Research Report of the Department of Architecture. ABU, Zaria.
4. Szokolay, S.V. 1984: "Energetics in Design". In Passive and Low Energy Ecotechniques. Proceedings of the Third International PLEA Conference, Mexico City, Mexico. 6-11 August. Pergamon Press.
17

CHAPTERS IR-Temperature Measurements of Walls and Ground Surf aces of a Small Area in Hannover, with and without Vegetation Cover Fritz Wilmers University of Hannover. Germany
Introduction
The gardens of the Institute of Green Planning and Garden Architecture of the University of Hannover are an example of surf ace difference in man•made infrastructure which could lead to microclimatic differences in small areas. The walls which surround the gardens are 2.30 m high. Some are made of concrete. others of bricks. Several parts of the walls are covered with vegetation. Pergolas. basins of water, lawns, shrubs and trees form garden places of · different structures and exposition; demonstrating distinct situations of human environment in towns. There are sunny and shaded, cool and wann expositions.
Measurements of surface temperature by an infrared~ scanner, type AGA 782 shortwave, made it possible to get the temperatures of different places during different times of the day.
The measurements took place on September 28th and 29th 1984 during a synoptic situation with bright sunshine • . radiation weather type. We measured air temperatures between 8 and 19°C and, surface temperatures between 5 and more than SD°C. The radiation temperature of the sky -partly to be seen in the scanned pictures- is not discussed.
Hannover is situated in the northern part of Gennany at a Latitude of 52°28' North and a Longitude of 9°42' East. The elevation above Sea Level is 52 m. Therefore, the exposition to the sun is like an example of a mid•Latitude locality in the northern part of the globe.
Measurements of Infrared temperature Measurements of surface temperatures are often very problematic as the available equipment is un~ble to d~tect the temperature without disturbing the macro-environment Because of this, the development of the remote
18
sensing measurement by infrared radiometer was a grea advantage. Lorenz (1973) gave an overview of the tech niques for meteorological purposes. Kessler (1971) tool measurements of diurnal marches of surf ace temperature: of different surfaces in a town. These measurements wen carried out by a point radiometer KT 13 made by Heimann In the same way Wilmers (1972, 1978) tookmeasurcmcnll of temperatures in the garden courts of the Institute oJ Green Planning and Garden Architecture. But those meas• urements gave only values as spots of the surface tempera· ture. Hence they were not exactly located and limited to the surface areas~ the fast detection of a couple of differem surfaces of small spaces in a few minutes was, therefore, not possible.
The industrial development of remote sensing measure· ment (Wienert 1980; Wtlmers and Wienert 1981) based on airborne equipment now gave the opportunity to scan infrared temperatures by hand•held equipment as well. It became possible to get scanned pictures of different sur• faces on the ground as well as on walls and other parts of the surroundings in a short time.
Some Examples of Measurements
Two walls with difTerent orientations
Looking at some examples of those measuremenrs we will see a southward exposed wall of concrete, on the right hand covered by an evergreen vine -Lonicera Heruyi • and with fem in front of it (Fig. 5. 1). During the day the wall was sometimes shaded by a pergola as can be seen in Fig. 5.3.
The second example is a westward exposed wall of concrete, also covered with vine and fem in front (Fig. 5.2). Different diurnal marches of temperature occur at the different expositions. Therefore, depending on weather conditions and time of the day, the bioclimatic comfort has great differences between them.

Fig. 5.1: Southward exposed wall of concrete, on the right hand covered with an evergreen vine.
I ~ 4~,7•C
k~:,~;+;J 37,7°C -47,7°C
~ 3t,7°C -37,7"C
24,goC - 31,7° C
- ~ 24,9"C
Fig. 5.J: Soiahward wall at Ji22h {1.22h pm) with bright incidtllJ sun radiation. . . . ; '. .
1 it 1a.s•c · ·
W,:{~~N¥1 1s.s•c -15,s•c
' Bl U,6~-IS,i•C .
Fig. 5.5: Southward oriented wall at 21.28h (9.28h pm)
TheFtgs.5.3-5.6showsomeinfraredscans. Thefirstones were taken in the early afternoon and the last ones in the evening.
At 5:36 h the southern wall {and at 5:44 h the western oriented wall) have the same distribution of surface teml{)ereture. The walls are relatively wann, the temperature of the vegetation is below air temperature. Plants on the ground have minimum temperatures.
At 13:22 h (1 :22 p.m.) in the early afternoon the southerly oriented wall is rather hot with bright incident of solar radiation. Those parts which are shaded by vegetation as
~·· .,, 4/t>~':~, .. --~ ~- :. ... , .... ,!'·.;~f:1'.._ ... .;""i
Fig. 5.2: Westward exposed wall of concrete like Fig 5.1 covered with vine and fern in front of it.
Fig. 5,4: We.ttward oriented wall at 13.26h (1.26h pm) still in the shadow. · : . : .
D & 16,?•C - . 1s,1•c -11,1•c
- 14,-C • 15,7°C
- tJ.&•C- 1',T"C
- 12,S"C-l3,&•C
11111 ~ 12,s•c
Fig. 5.6: Westward oriented wall at 21.41h (9.41h pm)
well as by the pergola are cooler. The surfaces of the vegetation in the sun are wam1er than the air temperature, but 10 K below the temperature of the wall (Fig. 5.3). At 13 :26 h (1 :26 p.m.) the shaded western wall remains about 20 K cooler than the southern wall, plants on the wall are cooler too, fems in the sun are wanner than the air temperature (Fig. 5.4).
At21:28 band 21:41 h(9:28 and 9:41 p.m.)in the evening the southern wall has about the same distribution of temperature as the western wall; plants are cooler, their surface temperature is about that of the air temperature (Figs. 5.5, 5.6).
19

The diurnal march of the temperature of the westward oriented wall is similar to that of the southward oriented wall but the rank of the temperature of the westerly orie~te~ wall is rather be!ow it. It depends on the angle of the incident of solar radiation, and on the whole sum of heat gained by that radiation which is also dependent on the duration of direct solar radiation. In view of this, the wes_tern wall gets the highest temperature in the evening but mall, the temperature of southern exposition is higher.
The southern front of a gardenhouse
In the next example, we will see a gardenhouse facing south, that means the exposition which earns the maximum direct solar radiation in the garden courts. That was the most extreme situation we obtained in the gardens. It is always too hot on a nonnal summer day. But this place inf ront of the house is favoured for sunny days during the cool seasons and is also a comfortable place in the evenings.
We see a southward exposed wall in front of the gardenhouse. It is sheltered by the roof. On the right a man-made pond for plants is located; the direction of view is eastwards (Fig. 5.7). At 6:13 h in the early morning the pavement in front of the southern wall of the gardenhouse, beamed by the first sunrays, has the highest temperatures. The various plants above the water and on the ground have the lowest temperatures (Fig. 5.8).
At 14:16 h (2:16 p.m.) in the afternoon the extreme of the surface temperatures are found at the sunned southern wall. The radiation is reflected from the wall onto the pavement. The shaded western wall and the reeds are cooler. The lowest temperature is found on the water surface.
•. ~ --:~: ·.: ""t~ .; ••• -- : • . ·-··--· . , ... ·- ··-·· ·:. - . ~
. '; ... -............ , -._ :. ·.··~- - .. ! __ ::_~- :~~:-:·~
Fig. 5.7: Southward exposed place in front of the gardenhouse eastwards looking
. ~.
LJ~12,1•c
~ n,o0 c - 12.1•c
~ 9,S"C - lt,OoC
nm · 7,JoC-9.rc
- 5,6"C- 7,391:
- ~S,&"C
Fig. 5.8: Place in front of the gardenhouse in the morning a. 6.13h
In the evening, at 22: 17 h (10: 17 p.m.), the whole area c the northern front of the house has remained wanner tru the air, and the base of the wall has become the wanne part of the site.
At 22:20 h (10:20 p.m.) in the evening the comer of the house has high, and the water surface low, temperatures. The lawngarden
The northern front of a gardenhouse
Situated on the other side of the gardenhouse there is a northward exposed area paved with flags of concrete. The inter-diurnal range of the surface temperatures there is the least for the sites where we have measured. Also the daytime temperature is the lowest therefore. But at night the temperatures are highest there than elsewhere.
A westwards oriented wall with a small passage to a sun! courtyard can be seen in Fig. 5.9. A pergola is situated o the left, an apple tree on the right, the surface is coverei with lawn; the court is strongly shaded.
At 2:14 h during the night the base of the wall has th highest temperature, while the lawn has the lowest on (Fig. 5.10).
At 6:37 h in the morning the dispersion of the surfaa At night the base of the wall is the position having the temperature has hardly changed (Fig. 5.11). highest temperature. At noon this position is the coldest one. At 10:36 h in the morning the maximum surface tempera·
turc is found in the apple tree and in the passage through th: At 6:07 h in the morning the base of the wall has the highest wall. temperature, the whole location is warmer than the air.
At 13:50h(l:50p.m.) in the afternoon only the upper part of the wall has the same temperature as the air- the other parts are cooler.
20
At 14:36 h (2:36 p.m.) in the afternoon the tree and th: partly sunned wooden frame of the pergola on theleftha¥f higher temperatures. The lawn has a lower temperature than the air.

Fig. 5.9: Westward oriented wall in the lawngarden with passage to sunlit court pergola on the left hand side, apple tree on the right hand.
.: 10.2•c
• ; \ "'.' )~,'., ,~~~=·· mm~~~ - -~ I; . 4 ~ • , 4
~ 1,s•c-9,o•c
- 6,3°C-7,6"C
lffiJffll ,,a•c - s,3oe
- ;S4.8°C
Fig. 5.10: Westward wall in the lawngarden at night 2.14h
~ s.s•c-11,1"c
- 8,6°C-!l,8°C
- 1,2°c-e,s•c
Fig. 5.11 :Westward wall in the lawngarden in the morning at 6.37h
LJ ~ 11.s•c
EI] l2,4°C-l3,S~c
~ 11.2oe-12J,~c
~ 10,ooe-11,2°c
- 8,70C-10,0°C
- ~e.1•c
Fig.5.JZ: Westward wall in the lawngarden in the evening at
22.41h (10.41pm)
Later in the afternoon (at4.14 p.m.) the tree, the lawn and the ~rgola are partly exposed to the sun and, therefore, remam wann but the wall becomes colder. In the evening (at 10:41 p.m.) the sunned pillars of the pergola and the sheltered walls remain warm. The lawn and the wooden frame of the pergola have the lowest temperature (Fig. 5.12).
A small court
There are some small courts which are only about 3 m wide. In the southerly oriented court, the sunshine only partly reaches the ground. The small pond filled with water, and partly covered with vegetation, influences the bioclimatic conditions of the court. It enriches the air with humidity.Toiscourtremainsrelativelycoldduringtheday but it is also relatively warm at night
At 7 :00 h in the morning the eastward oriented wall lies in the sunshine and, therefore, it is warm. Uncovered parts of the wall have a higher temperature than those parts which are covered with vegetation. Reflected by light walls, a lot of diffuse radiation reaches the other parts of the court. The living conditions of vegetation in these parts of the court and also the human comfort are ameliorated by this diffused radiation.
At 14:54 h (2:54 p.m.) in the afternoon the temperature of the sunlit wall is above the air temperature.
At 22:50 h (10:50 p.m.) in the evening the walls without vegetation have remained warmer but the vegetation cover is cooler than the air and the parts of the court which are always shaded have the lowest temperatures. The court on the whole has rather small variations of surf ace temperature, as has the air. Also, in the small space, the influences of the different areas on each other are high.
Discussions The temperatures of the surfaces fluctuate higher or less than the air tern perature. They are dependent on the energy balance, especially on the thermal conductivity below the ground and on the surface matter (Tetzlaff 1974). Direct sun radiation evokes the highest temperature. The maximum values are measured on sunlit walls, where the most significant variations of temperature from sunned to shaded parts occur. Al night the differences are rather small, but parts which are seldom or never in the sun remain cooler, except for those pans which arc protected against effective out-going radiation. In those places the nocturnal temperatures are higher than elsewhere.
The main parameters of the microclimatic differences arc the exposition to direct solar radiation, duration of radiation, thermal condition of the surface and condition of the surrounding walls (Geiger 1961).
21

Wilmers and Wittler (1981) showed the relations of foliage temperature on the starus of transpiration. Also Hoyningen-Huene (1980) measured the leaf temperature during the day in connection with the energy balance. It was found out that vegetation cover and water surfaces diminish the peaks of temperature during the day as a result of evapotranspiration effect. For this purpose walls and pergolas covered by plants are e~pecially suitable for the conditioning of the human bioclimate.
The bioclimatic effects on human beings are combined with some different bioclimatic complexes. One of the most important factors for human comfort is the thermal complex which can be explained by the energy balance. Therefore. the knowledge of climatic conditions in gardens which rule the energy balance - such as the surface temperature - enables the planner to form comfonable places by combining appropriate pans of a garden. So it is possible to lay out some sites which can be made comfonable for a stay in the morning or in the afternoon and other ones which allow the use of a garden even during the hottest hours of a summer day.
Acknowledgements
The author is very much indebted to Prof. G. Nagel, Director of the Institute of Greenplanning and Garden Architecture for his great interest and his pennission to take measurements in the garden oouns. Grateful thanks to · Dipl.- Met. K.-D. Scholz and my wife for their great help during the measurements and the latter evaluation. The· figures were prepared, carefully, by Mrs. R. Lorenz_ ..
References
J. Geiger, R. 1961: ."Das Klima dtr bodennahen L,iftschicht". 4. Ed. Vieweg. Braunschweig.
2. Hoyningen-Huene,J. V. 1980: "Mikrometeorologische untersuchungen zur evapotranspiration von bew sserten Pflanunbest ntfen". Btr. d. lnstituts /. Meteorologie u. Klimatologie d. Univ. Hannover Nr. 19.
3. Kessler, A. 1971: "Ober den tagesgang von obe,fl chentemperaturen in der Bonner lnnenstadt an einem sommerlichen Strahlungstage". Erdkunde 15, pp. 13-ZO.
4. Lorenz, D. 1969: "Temperature measurements of natural surfaces using infrared radiometers". Appl. Optics, 7,pp.1705-1718.
5. Tetzlaff,G. 1974: "DerWrmehaushaltinderzentraien sahara". Ber. d. Inst./. Meteorologie u. Klimatologie der Univ, Hannover. Nr. 13.
6. Wienen. U. 1980: "Versuch einerquantitativen oberfl
12
chentemperaturanalyse von flugzeugscanneraufnahme, imthermischen infrarot". Diplomarb. unver ff. lnst.J Meteorologie u. Klimatologie d. Univ. Hannover.
7. Wilmers, F. 1972: "Temperaturstudien in Garten/;, fen". Das Gartenamt. 21. pp. 677-681.
8. Wilmers, F. 1978: "Temperaturen in und an einemJ nstlichen Teich". Verhandl. Gesellschaft. f. Okolo git.? pp. 413-426.
9. Wilmers, F.1985: "Anspr che des menschen an sein: klima-umwelt" .Landsch. u. Stadt. 17. 30-42.
JO. Wilmers, F. u. Wienert, U. 1981: "Calibration of thi heat capacity mapping radiometer in the thermal infra, red at Lake Steinhude in June 1979". Unpubl. Ber. lflS! f, Meteor.u. Klimatologie der Univ. Hannover. pp.1-&J.
11. Wilmers,F. u. Wittler,P.1981 "Leaftemperaturein, glass house". Sbstr. Vol, 9th lnternat. Congress o; Biometeorology. Osnabrllk. pp.187-188.
CHAPTER.6
City-Surface Components and the Microclimates of Ibadan
Yinka R. Adebayo Department of Geography, Kenyatta University Nairobi, Kenya
Introduction
Investigations in urban climatology are generally carried out by C?mparing the records of climatic parameters, ~assed m th~ urban area, with those of the city's immediate countryside. Related examples include the works of Duckworth and Sandberg (1954) in San Francisco Chandler (1962) in London, Nieuwolt (1966) in Singa~re and Hage (1973) in Edmonton, Canada. With the advancement in technology and increase in scientific knowledge, as regards the fundamental causes of urban climates, high emphasis is being put (these days) on the roles of surface !ex~, as climate modifier. It is in this light that many mvesugators regard the Ianduse approach to investigations in urban climatology as adequate. For example,. Outcalt (1972) sees the landuse approach as being essential because the central question in urban climatology is how landuse interacts with weather to modify the urban climate. Morgan and Rogers (1972) also describe the role of the urban surface texture as the foundation of urban meteorology.
Surface properties play key roles in modifying the surface net radiation (Rn) through their reflective. or albedo effect (x), absorptive, storage and emissive characteristics. These properties combine to affect the amount of the terrestrial longwave radiation (Lt}, therefore, causing considerable modification. The effect of atmospheric constituents on the atmospheric counter-radiation (La} and the global radiation (Q+q) should also be noted. Pollutants increase the fonner but attenuate the latter. In summary Rn is derived as:
Rn=(Q+q)(l-x)+La -Lt .................... (1)
The effects of urban surface properties are not restricted to Rn alone. Other climatic parameters like the atmospheric vapour content, windspeed and temperature are also affected. There are multifarious causes for the variation in climatic elements over the city surface. In the words of Douglas (1981), the city could be rightly described as an ecosystem where a lot of complex interactions occur. It is
because of this that alteration in windspeed and direction could also affect Rn, temperature and conditions of vapour pressure.
Vegetation cover in the city and the condition of surface water and soil moisture can considerably affect the atmospheric vapour content or humidity. and temperature within the layer below the roof level which is referred to as the 'urban canopy' by Oke (1976).
Variations in urban climatic parameters, as primarily induced by the city-surface components, affect the States of human physiological comfort, health and energy. Pollu• tion level is ~o increased in the city. therefore. posing more danger to human health. It is in awareness of this that µtis study was conceived with the aim of examining the level of the relationship between a few· surf ace parameters and some climatic elements in Ibadan, Nigeria (lat. 7°23 'N and Long. 3°54'E).
The relationship between climatic parameters and the surface texture are analysed in four different ways, by: (1) relating the proportions of urban characteristics of different landuses with climatic parameters; (2) relating building densities of different landuses and climatic parameters; (3) analysing the relationship between the building roughness lengths and climatic parameters. and ( 4) correlating urban surface tree roughness lengths and climatic parameters.
The City-Surface Microgeography
Landuse
Landuses in Ibadan were initially identified from the work of Ayeni (1982); as the bases for analysing some air photographs, flown in 1977. On the whole, 11 landuses were originally identified, as follows: high-density residential, medium-density residential, low-density residen-
23

tial, educational, medical, rural, agricultural, industrial, commercial, acquisition and open-space. The parameters used as the bases for classifying the urban surfaces are building, water, road (tarred and untarred), pave surface, bare ground, lawn and tree. Among these parameters, water, trees and lawns are considered as being 'rural• in nature. Building, tarred and untarred roads, paved surface and bare ground are regarded as having arisen as a result of human interference, therefore, classified as 'urban' characteristics. Based on these divisions, the urban characteristics of different land-uses were calculated as shown in Table 6.1. In other words, to carry out the analysis in Table 6.1, the areas covered by trees and lawns in the landusc zones were computed as the percentage of the total areas of the landuses. This value is regarded as the "% rural" while the residual is left as "% urban".
Building densities for the land use were also estimates as in Table 6.2. Building concentration can affect the microclimate of urban areas in a considerable manner.
Table 6.1: Percentage Urban Characteristics of Different Landuses
Landuse
High-density residential Medium-density residential Low-density residential Educational Medical Rural Agricultural Industrial Commercial Acquisition Open Space Composite City
% Urban
84.7 80.0 58.6 49.9 68.0 24.1 16.1 76.5 80.5 33.0 0.8 51.7
Source: Field records ( 1983) 6.2 .2 Rougl11uss Le,igth
Zo {cm)
O 10 20 30 AO 50 60 70 80 90 100 110 120 130 140 150 160 170
High de11aly residential
Medium density
Low density
Educational
Medical
Rural
Agncu!uraJ
lndU$1rlal
Commercial
AcqulsN.::in
Open space
Con'lJOSlt9 ci1y
Fig 6 1 . Mean roughness of buildings and trees for major wind directions. . . . -~ rft Lett • r. mula(l969).lnpuJsfromFi£/dworlc(J983)
Sowct: Computcu a u au s Jor
24
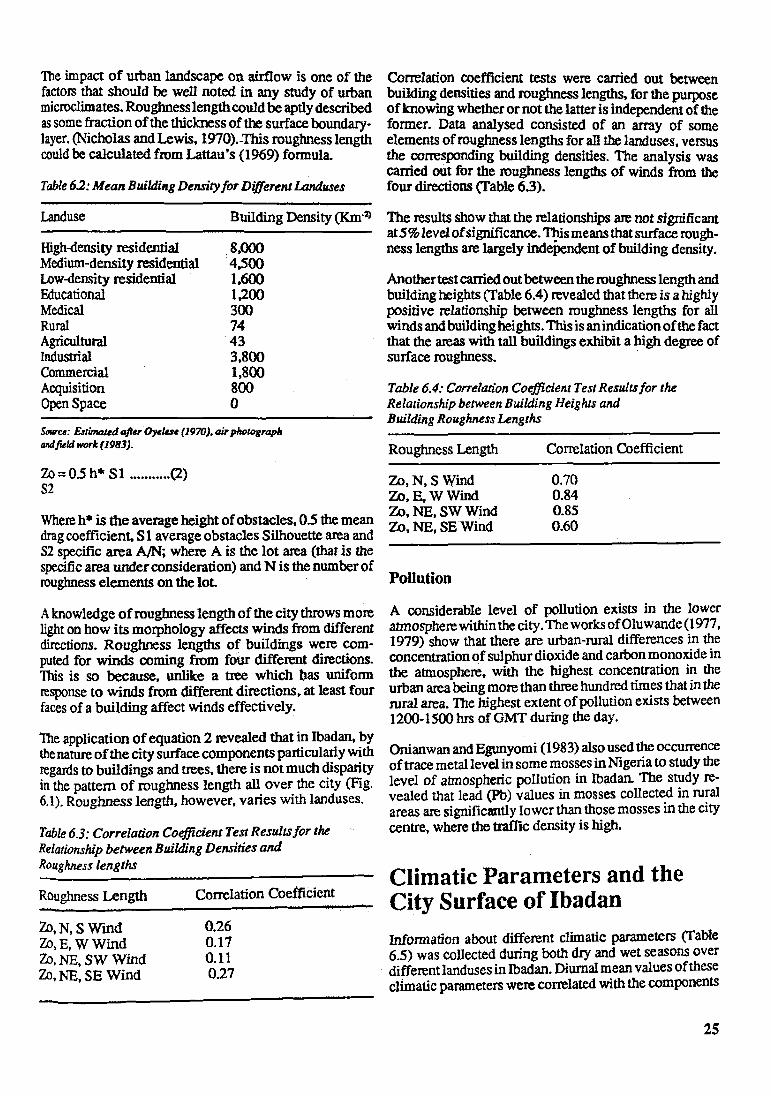
The impact of urban landscape on airflow is one of the factors that should be well noted in any study of urban microclimates. Roughness length could be aptly described as some fraction of the thickness of the surface boundarylayer. (Nicholas and Lewis, 1970).-This roughness length could be calculated from Lattau's (1969) formula.
Table 6.2: Mean Building Density for Different Land.uses
Correlation coefficient tests were carried out between building_ densities and roughness lengths, for the purpose of knowmg whether or not the latter is independent of the former. Data analysed consisted of an array of some elements of roughness lengths for all the land uses, versus the ~rresponding building densities. The analysis was earned out for the roughness lengths of winds from the four directions (Table 6.3).
Building Density (Km·2> The results show that the relationships are not significant ------------------- at5% level of significance. 'f!lismeansthatsurface rough-High--density residential . 8,000 ness lengths are largely independent of building density.
Landuse
Medium-density residential · 4,500 Low-density residential 1,600 Educational 1,200 Medical 300 Rural 74 Agricultural 43 Industrial 3,800 Commercial 1,800 Acquisition 800 Open Space 0
Smuc11: &tim4ted aft11r ~Ju• (1970), air phowgraph twljillld work (1983).
1.o = 0.5 h"' Sl ..•........ (2) S2
Where h* is the average height of obstacles, 0.5 the mean drag coefficient, S 1 average obstacles Silhouette area and S2 specific area A/N; where A is the lot area (that is the specific area under consideration) and N is the number of roughness elements on the lot
A knowledge of roughness length of the city throws more light on how its morphology affects winds from different directions. Roughness lengths of buildings were computed for winds coming from four different directions. This is so because, unlike a tree which bas uniform response to winds from different directions. at least four faces of a building affect winds effectively.
The application of equation 2 revealed that in Ibadan, by the nature of the city surface components particularly with regards to buildings and trees, there is not much disparity in the pattern of roughness length all over the city (Fig. 6.1). Roughness length, however, varies with landuses.
Table 6.3: Correlation Coefficient Test Results/or the Relationship between Building Densities and Roughness lengths
Roughness Length
7.o,N,SWmd 'ZIJ, E, W Wind 1.o, NE, SW Wind Zo, NE, SE Wind
Correlation Coefficient
0.26 0.17 0.11 021
Another test carried out between the roughness length and building heights (Table 6.4) revealed that there is a highly positive relationship between roughness lengths for all winds and building heights. Th.is is an indication of the fact that the areas with tall buildings exhibit a high degree of surface roughness. ·
Table 6.4: Co"elation Coefficient Test Results for the Relationship between Building Heighls and Building Roughness Lengths
Roughness Length
Zo, N, S Wind Zo, E, W Wind Zo. NE, SW Wind Zo, NE, SE Wind
Pollution
Correlation Coefficient
0.70 0.84 0.85 0.60
A considerable level of pollution exists in the lower atmosphere within the city. Theworksof01uwande(1977, 1979) show that there are urban-rural differences in the concentration of sulphur dioxide and carbon monoxide in the atmosphere, with the highest concentration in the urban area being more than three hundred times that in the rural area. The highest extent of pollution exists between 1200-lSOOhrs of GMT during the day.
Onianwan and Egunyomi (1983) also used the occurrence of trace metal level in some mosses in Nigeria to study the level of atmospheric pollution in Ibadan. The study revealed that lead (Pb) values in mosses collected in rural areas are significantly lower than those mosses in the city centre, where the traffic density is high.
Climatic Parameters and the City Surface of Ibadan
Information about different climatic parameters (Table 6.5) was collected during both dry and wet seasons over
· different Ianduses in Ibadan. Diurnal mean values of these climatic parameters were correlated with the components
25

of the six landuses that emerged from a re-classification of the eleven landuses. The landuses for which the analysis was done are high-density, medium-density, low-density, commercial, rural and open-space.
The result of the analysis, in Table 6.S, reveals that percentage urban landuse (% urban) and the building density generally have a higher level of correlation with climatic parameters than in the case of relationships between climatic parameters and the roughness lengths of both trees and buildings. What this resulc suggests is that relationships, either positive ornegative, exist between the urban texture and the microclimatic parameters in Ibadan. It could also be deduced that since the surface components vary according to landuse (see Tables 1 and 2) then the climatic parameters also vary according to the landuse.
The modification of urban climate cannot be wholly attributed to the role of surface physical components. Pollution has been confirmed to have an effect on ooth global radiation (Stair, 1966; Nader, 1967, and Dabben and Davis, 1974) and the net longwave radiation (Bornstein and Oke, 1979). Atmospheric pollution has been found to be more on the increase in the urban area of Ibadan than the rural area. It is then logical to conclude that the pollution veil also plays a very important role in modifying the climate of the city.
Conclusions The investigation has somehow confirmed that the variation in the urban climate of Ibadan is being jointly caused by ooth the surface components and the wban ~lluti~ veil. The variation has been found to be correlatiVe with urban landuse, since the surface components vary according to Ianduse. The change in the urb'.111 atmosp~eric components is tantamount to a reduction m the quali~ of the annosphere. It is being suggested that fo: an effective control of the variation in urban microclunate, eff on should be concentrated on proper understanding of the links between the climatic parameters on one hand, an~~ surface and atmospheric components on the other. It 1~ m the light of this that an urban renewal programme. which is expected to concentrate on the re-arrangement of the city-surface components, is beingrecofl!1!1ende~ f~r Ibadan, and indeed for most related African c1t1es. This 1s for the purpose of salvaging the atmospheres of these cities from funher deterio:ation. Architects and planners should take the roughnesr: lenL'ths of different areas in th: urb~ region into consideration before carrying out theu deSign and planning exercises. This is necessary ~caus~ ~ace roughness length plays an impo~ant ml~ m !11od1fymg the aerodynamic environment of cities; which m tum affects both the indoor and the outdoor microclimates.
Table 6.5: Correlation Coefficient Tests Between Percentages of Urban Landuses, Selected City Surface Components and Climatic Parameters
Q+qQ+qx X L* L* LE H T T RH RH Rn Rn
RA HA RA HA RA HA RA RA RA HA RA HA RA HA
% Urban -.80 -.90* -.70 -.90* -.90* -.90* .89* .88* .84 .89* -.80 -.80 .86 .86
Building Density -.70 -.80 -.90* -.70 -.70 -.70 .75 .89* .73 .75 -.70 -.70 .77 .77
Zo Building -.40 -.50 -.54 -.54 -.54 -.54 .55 .53 .14 .55 -.49 -.54 .54 54
ZoTree -.19 -.31 -.49 -.32 -.22 -.22 .20 .37 -.13 .18 -.80 -.23 .17 .17
* -Significant at 5% H - Sensible Heat Aux % Urban -Percentage of Urban Land-~s~ T - Temperature Zo Building - Roughness length of Buildmg RH - Relative Humidity
Rn - Net Radiation Zo Tree - Roughness length of Tree RA - Rainy season Q+q - Global Radiation HA - Hannanan season x-Albedo LE - Latent Hert Aux L * _ Net long wave Radiation
26

References
l.Ayeni,B. 1982: "TheMetropolitanareaoflbadan: its growth and structure". In Filanl, M.O. ( ed) Ibadan Re• gion, Department of Geography, University of Ibadan, Ibadan.
- caused env. problems". lntemadonal Journal of Environmental Studies, Vol. 11 pp 191-203.
15. Oluwande,P.A.1979: "Automobileexhaustproblem in Nigeria". Ambto, Vol., 8 No. 1.
16. Onianwa, P.C. and Egurcyomi, J. K. 1983: "Trace metal levels in some Nigerian mosses used as Indicators of Atmospheric pollution". Environmental Pollution Services B. 5,pp.71-81.
2. Bornstein, R.D. and O/ce, T.R. 1979: "Influence of pollution and urbanization on urban climates". Prepared for Adv. In Enl'. ScL and Engineering, Vol. 2.
17. Outcalt, SJ. 1972: "A reconnaisance experiment in 3. Chandler, T J. 1962: London's urban climate. Geo• mappingandmodelling". Theejfectofland-useonurban graphical Joumal, Vol. 128, pp. 270-98. thermal regions. Journal of Appl. Met, Vol. 11 No. 8.
4.Dabf,erdt, W.F. andDavis,P .A. 1974: "Detennination of energetic characteristics of urban-rural surfaces in Greater St. Louis Area'', Reprints, Symposium on Atm. Diffusion and Air Pollution, Saints Barbara, American Meteorological Soc., Boston.
5.Douglas,L 1981: "Thecityasanecosystem" ,Progress in Physical Geography, Vol. 5 No. 3 pp. 315-367.
18. Oyelese,J.O. 1970: "TheOrtho-Photomapapproach to land-use mapping" . Nigerian Geographical Journal, Vol.13 No. 1.
19. Stair, R.1966: "The measurement of solar radiation with principal emphasis on U. V. Component." International Journal of Air and Water Pollution, Vol. 10 pp. 665.
6. Duckworth, F .S. and Sandberg, T.S. 1954: "The effect Note: This article was written when the author was at of cities upon horizontal and vertical temperature". Bull. the University of florin, Nigeria. American Meteorological Soc., Vol. 25 pp.198-44.
7.Hage,N.H. 1969: "Urban-Ruralhumiditydifference". Journal of AppL Met., Vol. 14 No. 7.
8. Lettau, N.H. 1969: "Note on Aerodynamic roughness parameters estimation on the basis of roughness element description" .Journal of Appl. Met., Vol. 8 No. 5 pp. 828-832.
9.Morgan,D.L. andRogers,D.l. 1972: "Texture of a city: the foundation ofur/Jan meteorology',. Reprints of Conj. on Urban Env. and Second Conf on Biometeorol.ogy Amer. Met., Soc. pp. 29-302.
JO. Nader, J. S.1967: "Pilot study of U.V. Radiation in Los Angeles Oct. 1965". Publ. No. 999 • Ap. 38, U.D. Public Health Service, Cincinnati, 91 pp.
11. Nicholas,N.W. andLewis,J.E. 1970: "Relationships between aerodynamic roughness and land-use, land-cover in Baltimore, Marylancf'. U.S. Geological Survey Professional Paper 1098C.
12. Nieuwolt, S. 1966: "The urban microclimate of Singapore". Journal of Tropical Geography, Vol. 22.
13. Oke,T.R.1976: "Thedistinctionbetweencanopyand bouruiary-layerurban heat island''. Atmosphere, Vol.14 pp. 268-278.
14. Oluwande, P.A. 1977: "Automobile traffic and air pollution in a developing country: An example of affluence
27

CHAPTER 7
Effect of Climate on Traditional Hoos~ Design· in Tropical Countries
Yohannes Hailu Faculty of Technology, Addis Ababa University, Ethiopia
Tropical Climate and the Urban Pattern
A glance at a bioclimatic map of tropical countries will show that not all of them are alike. Most of the Arab world in Africa is typically desert with strips of cultivated and populated land adjacent to coastlines, rivers, or surround• ing scattered oases. The pattern of rainfall in Chad is very different from its neighbours - Central African Republic and 2.aire. Kenya and Ethiopia both show a broad range of ecological pattern. In short, conditions are not only differ• ent in different areas but can vary considerably within the same country.
Microclimatic conditions can also differ considerably from one town to the next (Fig. 7.1). Rainfalls are much heavier in Addis Ababa than in Cairo, and this is reflected in the architecture of Addis, which is better adapted to rain than is the architecture of Cairo.
MM,..,......-r,_,T"T'O'....,
IIM
200•+-+++++++-,H-+-H
t . ~~
~~~,.. ,!~)" $OIIOCI
I; .. ~
~
, .. . . ' • I I I
,......."T"T"l,....._,..........,D"C
Addl1 Ababa
0"C
~
Fig 7.1 :Annual temperature and rainfall change in 6 tropical
dties
28
Fig 7.2: When volume increases in relation to surface, heal exchange with the outside decreases
If we compare settlements in Ethiopia, having a strong muslim background (such as Massawa on The Red Sea coast, Harrer the regional center, a farm house in Dhera which is located on the central plateau of the Aisi regioni it becomes clear that the architecrure can differ as greatly as its landscape and climate. These differences also arise in part from the skillful use of locally available materials. A house in Harrer is built with minimum openings and flat roof with mud for protection from sun light while camel skin provides the tents for the Afar nomads.
The basic principle f-or adapting buildings to extremes of temperature is that the ratio of internal volume to external surface must be made as high as possible (Fig. 7.2~ Courtyard houses have similar climatic advantages, for they provide an open area protected from sun, wind and dust (Fig. 7.3). When they are clustered to share th~ s~e party walls, their exterior surf ace can be reduced significantly to provide further protection.

SOFA
A Qla_ ..... , ..
Fig 73: Protected areas in a house
Structure of Traditional Cities
One striking characteristic of cities is their compactness, !11e result of two overlapping patterns of organizationislands of urban blocks and neighbourhoods (Fig. 7.4). U~an islands are units with open spaces either along their penpheral streets orin their internal courtyards. Their contours result from two contradictory constraints. On the one hand protection_from climate and strangers; on the other, the need to provide access to every lot within every island.
~rban islands reflect not only the typOlogical features of a city but its historical evaluation as well. In earlier times, people thought in terms of neighbourhoods based on comm~ties differentiated along ethnic or religious lines. These neighbourhoods were defined internally in tenns of streets with a gate and their contours were not strongly defined. They were self-contained.
Fig 7.4: The clustering ef buildings limits the exposure of peripheral walls to the sun's rays.
The ~mpa~es~ of the plan of the traditional city, the physical continwty, the adaptation to topography, the importance ~f gates where market areas were located are all apparent m Harrer. Streets are narrow and winding a configuration that was climatically useful because ~ld laye~ of air could gather in them during the night and remam throughout the morning before wind would blow them away. They also provide shade, not only for passersby but for the houses across the street, so the exposure of external walls to the sun• s radiation would be limited.
Commercial, as opposed to residential areas, were shaded by temporary covers laid out over the street. When a permanent roof was built, the street became a shop on the ground level, apartments and stores on the top floor and a central passageway for pedestrians. They often had controlled entrances. The shops were usually laid out in parallel.
Traditional Courtyard House
Courtyards in tropical countries come in a variety of sizes and shapes and perfonn a variety of functions: they allow air to circulate to various parts of the house; they serve as a family gathering place; they also help cool the house. In hot climates, cold layers of air gather there during the !)ight, with the help of water, vegetation and shade, keepmg the courtyard cool during pan of the day. If the courtyard is paved and water is available, mopping the pavement can also help cool it Built-in elements such as basins or ponds are also used. They can vary in shape and do not have to be deep; they need only provide a large surface area to facilitate a high evaporation rate. Since the rate of evaporation can be increased when water is moving, basins can also be arranged to ~ep the water flowing. Planting vegetation to provide shade was a common practice and sometimes pieces of cloth were hung over-head, a system already used by the Romans who called these pieces of cloth "vela".
The size and shape of courtyards were determined in pan by local building techniques and climatic conditions; and also in part by local cultural conditions.
In a rainy climate, a covered conidor or gallery is needed to connect the adjoining rooms. The gallery can act both as a corridor and an area for resting.
Roofs in dry ell.mates perform a range of domestic functions. They can be used for drying washed materials or as a place for social gathering. If enough water is available, plants are grown there to provide shade in summer time, cut down solar radiation and make the area more pleasant at night.
Traditional Arab windows - a typical feature of Harrer -provide daylight, ventilation and some view of the outside, but in such a way as to keep the inside of a house protected.
29

They are kept small compared to European tenestration. because less light i1 needed in a hot and bright climate. The internal arrangement of European houses is determined by thenecessityofprotectionfromcold.Chairsandbedswere first introduced to provide protection from cold floors. In hot countries, in contrast, people sat on the floor because it is cooler. There is little use for heavy and elaborate furniture and, therefore, less specialization of space occurred. The same room could be used as living room. dining room or bedroom as circumstances required.
Another side effect of the difference in furnishing was that windows were placed lower down, to be at eye level for people sitting on the floor. Similarly ceilings were built much higher in tropical areas than in Europe since hot air tends to collect in the upper pan of a room.
Wind-catchers called "malgaf' in Egypt are another devise for cooling. In Egypt. they date back to Pharaonic times. Their design and construction are adapted to local wind direction. If there is a prevailing cool wind from one single direction (Fig. 7 .5), they will all be built to face that way; if the cool winds can come from any of several directions the wind towers will be constructed so as to catch it all (Fig. 7.6).
Fig 7.5: Unidirectional cool winds
30
Traditional Courtyard Housing Model
The courtyard house is not specifically limited to tropici countries. It existed in the ancient civilizations of Axum Sumer, Pharaonic Egypt, and later in western civilizatio!ll including Greece and Rome.
There were differences, however: while we might say tm all counyard houses belong to the same type, we canoo say that they all have the same model. A Roman house ir Pompeii differs from the model of an Arab house in Cain in the form of access, axiality. proportion. and in th conception of spaces adjacent to the courtyard.
Do all Arab houses belong, then, to the same desigi model? Plans and sections of houses taken from variou cities and drawn to the same scale make it immediate!; apparent that they do not. In Cairo, the main ceremoni2 room is rather far away from the courtyard. In Dher: {Ethiopia). the main room opens directly into it.
In Baghdad (Iraq), a comparable house has three levell The ground level is a summer room; on the upper floors th rooms are located away from the courtyard with transi
Fig 7.6: Multidirectional cool winds

to the courtyard and is surrounded by other rooms. outside air is brought in through a "malgaf• and cooled still further by passing it over water. This pushes the warm air out through a lantern. In Massawa (Ethiopia), where the hu• midity is very high. the main ceremonial room is open on all sides and built along the outside of the house to provide maximum ventilation through its many windows. Houses of three floors might have openings provided in the floors so that warm air will rise inside the house and escape out of the top. The variety of these climatic adaptations sug•
. . .. PAT Io gests that their design was refined gradually over many generations to provide techniques unknown .
0 5m.
Fig 7.7: Section of a room in a large house in Damascus
tional spaces in between. We can. therefore, conclude that courtyard houses vary from place to place; some models are particular to one city,·others to a group of cities.
Ventilation systems can also differ, especially in relation to the ceremonial rooms. As indicated in Fig. 7. 7, the outside air passes through the counyard where it is cooled by plants, pools and f ounlains. The cooled air then pushes the wann air out through the upper openings. In Cairo, since the main ceremonial room does not open directly on•
afternoon morning
r.d.c
A sun diagram in two-sterey buildings indicates which sets of rooms were used in winter and which in summer (Fig. 7 .8). Winter quaners are usually on the upper floor; summer quaners are on the ground floor, or even below ground during some hours of the day, and. in the evening, on the rooftop.
Although the design of houses in a city can vary in innumerable details (Fig. 7. 9), their basic model can easily be determined as a guide to the methods used. Taking three houses of the same size from the 10th century, it is found that their polygonal contours are in sharp contrast to their rectangular courtyards. Some large T•shaped rooms are
evening
~1)1{111~ ...... .., orou11d floor
Fig 7.8: Diurnal change in the use of space during summer - Baghdad
b 2
Fig 7.9: Similarities of plans in houses of different sizes
flr•t ffoor
E ~: tL. ...
~ .- -. . . . . . ... ~··· ,, .......
31

t:ound in all_three, sometimes on the north to avoid direct light, sometimes on the south with a sun breaker. Their size and location indicates that they were the main living rooms. Large houses were apt to have a gallery running 1tooF'. 1!!11.--along three or four sides, smaller ones on two sides and m very small ones had no gallery at all. The main living ooo]- ,.1• ~~-~ rooms are l0<:ated on the south side, looking toward the __ ;;;;.~ -;: . ~:: north, but the~r s11.e and ~hape become sophisticated as a -~ -:jj I · · _ house grew bigger and bigger. ._ _____ ..u..._ -L'----- ••LLERY aoov
Contemporary Development and Disruptions
Although new materials and technology are introduced in buildings in tropical countries, similar internal layouts have been maintained, with the same orientation toward the north (northern hemisphere) and toward the sea breere (Fig. 7.10).
The ~volution of vernacular architecture in most countries where architectural and cultural traditions have been disrupted has not been so successful.
Traditional houses (for example Fig. 7.11) in the old cities are being abandoned by their owners and turned into multifamily dwellings for the rural poor by dividing up the courtyards and rooms around them. New climate-control technologies are competing with traditional ones. Tall buildings adjacent to traditional low-rise courtyard houses threaten privacy and limit microclimatic qualities.
New housing types are outward looking (Fig. 7.10), so their inhabitants have to try to maintain their privacy in new ways. New urban regulations in most tropical countries forbid the building of anything other than detached houses or apartment buildings in residential areas.
In these outward looking plans for the wealthy, open-air spaces like the balcony and the verandah are located on the exterior. The functional and social role once fulfilled by the courtyard has to be taken over by an interior centrally located reception room where privacy is assured and where the air can be kept cool on summer days (Fig. 7.12).
Conclusions
Housing is a particular problem for the poor, and the suitability of most modem fonns of public housing to our social traditions is particularly questionable. Their adapta-
y , : J i , ..
Fig 7.10: New hollow block construction in Dire Dawa
32
COURTYARD
Fig 7.11: Traditional Tigre farmer's house -Ethiopia
0 l•rr•c•
.,,. .. -
Fig 7.12: First floor apartment of a/our-storey structure bi in 1950 - Damascus
tion to their natural environment as well as to prevaili climatic conditions is almost al ways unsuccessful. I tis c task to find a design for housing that will be successful tenns of our society.
While I do not believe that we should strictly imitate t past or provide more pastiches of traditional elements, l1 believe that it would be worthwhile to try to find urb architectural solutions based on those qualities of trai tional design that have evolved over the centuries. But~ must also make contemporary design our reference andn ignore new techniques. That is exactly what the old mast builder did for centuries, working in hannony with COD
munal wisdom.

CHAPTERS
Some Aspects of Climate-Oriented Design and Planning of Architecture in the Ethiopian Highlands
Klaus Ferstl Department of Architecture and Planning Addis Ababa University, Ethiopia
Introduction
The ranges of outdoor air temperature and that of relative humidity and precipitation determine six different climatic zones in Ethiopia (Figs. 8.1. 8.2 and 8.3). For practical purposes these six groups can be reduced to two groups (especially with respect to the temperatures):
;
ione I . zone 2 zone 3 zone 4 zone 5 zone 6
Worm - humid coastal strip Hot - drr lowland Ory plateau Humid plateau Upland Wet lowland
Fig8.J: Climatic zones in Ethiopia (after EshetuAbebe)
40 ,a:or • I
30 < -......... ---· ,.~ zone 2 --·- .- ..,,.,, ;::::,,- -. -,..,... .p-:.. ·- r-:::..- ---
~
, __ . '.;....- ,_ "'· ...._
.1· - ~ -·- -. zc ne 3I\ mne ~
C/~,, -- ~-......... ... c ..::-. i-•::, ,__~ ~-... ,_ .... --- ,___ .... _ i.:... ....
zo~ e 5 • -10
0 J FMAMJ JASO NO
Fig 8.2: Annual range of monthly averages of outdoor air temperature within the different climatic zones of Ethiopia. (Source: Table of Temperature, relative humidity and precipitation/or the world, Part W: Africa, Atlantic Ocean south of 35°N HMSO, London 1958)
400
mm ~ 300 +-➔-+--4--~4--lf--4~+--t-t--t--1 --D -., 200 • ~
100
J
Fig 83: Annual range of averages of precipitation. (Source: Same as/or Fig: 8.2)
i) Lowland areas (zones 1, 2 and 6) annual average of temperature about 26°C. distinct seasonal amplitude, diurnal amplitudes are low or of less effect.
33

ii) Highland areas (zones 3, 4 and 5) - annual average of temperature between 16 and
20°c, - seasonal amplitudes hardly marked, - diurnal amplitudes of greater significance (see
Fig. 8.4).
This interpretation confirms the traditional Ethiopian practice of recognizing 3 climatic zones, mainly deter-mined by the altitude (see Table 8.1).
Table 8.1: Climatic Zones in Ethiopia, on Attitudinal Basis
Local name Altitude Oimate Average annual of zone (m) temperature
Dega over2,400 temperate 16°C WoinaDega 1,800-2,400 sub-tropic 22°c Kolla below 1,800 tropic 26°C
10.000
/\ t -\. I
8.000
I .7 ....,
\ Ho izo ~ta!
/
I \. ~I ' l!-9- i ny s -~0 ns -6.000 ,-...
\ I
I 4.000
' \ r .... .•··•. / ,,,,. -~ ,_ . ·~ .... - - -
~1 I\ IW' I ., '·. '· '1 -J ' \ \ . ....... --~/ I \ .. I
2.000
\ .... •'\ ;-.... N ' ~\ l s-( .
1'. SE/' ,W /
\ '-"' V \ ..-\ I / NE. NW I
·, J
·• .. ■ ....
·- -· ~ '-J. -· -·- ·--·-0
J FMAMJJASOND
Fig 8.4: Mean daily solar radiation (diffuse and direct) on different surfaces, calculated/or an altitude of about 2.400m, a latitude o/9'W and a tarnishing factor ofT=2
34
ll\ B I ~
i',.. \
l/ r-- \ I \ , 6
\ I 4 \ I
J 2 v' 0
J FMAMJ JASON D
Fig 8.5: Daily hours of sunshine (mean values) (After Cambron and Gouin, 1965)
• .. ::, -~ •
30
°C ,.
eH {!
L
0
1/\ Max ,/
\ ~(l ~, i---· -- --~- -
~ r, MIR
""-· -- -- ·- ~p
'- .J....
-- --~
> itud i -- -
20 l( .:
:,,
--K 1~:: 0 ~
e I
~ ◄
0 J FMAMJJASOND
Fig 8.6: Annual range of mean daily outdoor temperatures or. the highland of Ethiopia, taken from various weather reports.
Since early historical times, Ethiopian human settlements have been largely concentrated on the highland plateaus and highland that are within the Dega and Woina Dega zones. Such a location of sites did not only guarantee a certain safeguard to villages and houses against attacks. greater altitude also creates more favourable conditions for both people and animals to live in. For example. the important disease-carrying insects (e.g. anopheles mos· quito, tsetse fly) are unable to live above 1,800 m and the pathogens of cholera and yellow fever above 1,500 m. That is why it seems to be admissible to limit the investigations first to the described highland zones.
In these highlands, the solar radiation (Fig. 8.5) is very high and of particular importance in April and May. when the high level on horizontal surfaces (roofs) and E/W -facades coincides with the high ambient temperature. In June and July this is lower (because of the rainy season) and between October and May the high amplitude of temperature variation causes a cooling effect, increased by the minimal outdoor temperature between November and

0 10 •. l:::::::==:!"==:::I •
Fig 8.7: Plan and section of a house of lsin-Larsa period of Babylon (about 2000-llOOc.B.C.) (after Stead, 1980)
::::=::::::.. pravoilin;
lri '"' .. ,~ J' '-'---, __ _
Fig 8.8: Traditional hoJJSe from Usbekiztan (middle Asia} with so-called "Aiwan" for ventilation purpose. (after Fertl, 1980)
January (see Fig. 8.4). This effect is illustrated by the dotted line in Fig. 8.4 indicating the recommended critical outdoor temperature for heating in several European countries. On the other hand, walls and roofs of the building are exposed to over-heating effects by high temperature and solar insulation in the day-time. This is the typical feature of arid and semi-arid climates and it usual1y results in building types which are characterized nol only by a so-called introverted layout with an internal counyard, but also by heavy and massive external constructions ~nd just a few small and shadowed openings (compare Figs. &.7 and 8.8). In such buildings not only the problem of sufficient sun-protection is solved but, by lhe great thermal masses of enclosure constructions, the high daily maxima of temperature are damped down suffic_i~ntly. An? h?w are these principles reflected in the traditional Elh10p1an houses?
Thermal Properties of Traditional Ethiopian Houses
At first sight, most of the traditional houses on the Ethio-. pian highlands seem not to follow the characterisation given above. As is shown in Fig. 8.9,onlythehousesbuilt in the nonhem part of the country and those in the nonheastem pan of the Shoa region are of heavy and massive building materials. All the others are more or less lightweight constructions. So, in the case of Gurage and Shoa Galla houses, a combination of timber and chikka - plaster is used for walls and a thatched roof. Other types, e.g. Sidarno and Chencha houses, use only split bamboo slips woven ortied together to form basket-like dwellings. The houses are made water-tight by large leaves laid between the bamboo strips. The dominance of such lightweight construction in most of the traditional Ethiopian houses may simply be explained through practical reasons. First. useful heavy and massive building materials (e.g. stone) are not always available everywhere; the collection of the necessary quantity of such stones as well as the construction of such houses is more expensive than construction with timber or bamboo. Second, most of the Ethiopian tribes were nomads and the use of lightweight constructions for dwellings still reflects the typical traditions of nomadic groups.
TIGRAI FARM HOUS[
{Hl&Clmol
CHENCHA HOUSE
SI DAMO HOUSE
~ IJIJ!JN GALLA HOUSE
C nomadic fribaal
Fig 8.9: Some of the typical traditional house forms in _ Ethiopia and their regional distribution. (after Gebremedhin. 1977)
35

These points overlook the important consideralion that in these climatic conditions the traditional houses are welldirected in hannony with the traditional Etruopian style of life. Since. as a rule, the main living and working activities of the people took place in open-air spaces, the houses were mainly used for sleeping. There was no need for any opening to admit light, and the heat gain of lhe whole building was only detennined by heattransmission through external walls and roofs. This heat gain has been calculated for the month of April for several traditional building types by a calculation method (see Petzold, 1980). The results are shown in Fig. 8.10. We see that the lowest values are reached by the Tigrai, Shoa Galla and Gurage houses because they use massive or semi-massive materials with comparatively high heat insulation co-efficients and heat storing capacity. In the case of a present day low-cost house the values are nearly twice as high because of the great amount of heat gain through the thin and uninsulated corrugated iron sheet used for the roof. However, the values are reached by Sidamo and Chencha houses. Here the immediate influence of direct solar radiation becomes clear, especially in the case of the Chencha house where the portion of walls with respect to the floor area and the extreme effect of the east-and west-facades becomes clear
400..----,---,----,.----...----.-----,
w ;.t"
Ci) Ti roi Chi f's hou e ~
, I ' I \ I
~o..._--~--+--_.-.... -+---+--+----t I I
200+---+---+-i+-~.....+-'---++-~-+----I ... ,O"
C
D
0
8 a.m.
12 4 p.m.
\ \
Fig 8.10: Heat gain through externa~ walls and roofs of some typical traditional housing constructwns.
36
by the two maxima of the graph (Fig. 8.10). That is v.ti Sidamo and Chencha houses, usually. are built on sire slighlly shaded by trees or other plants. However, if 'i-: compare the maximum external solar radiation with lb maximum heat gain shown in Fig. 8.10 we will see that fu latter is distinctly lower. One of the reasons for this is fu heat-storing capacity of the eanhened floor.
Most of the traditional Ethiopian houses (except the Tig:;: Chief's house) are one-storey buildings built immedia!ct: on the stamped earth. As Petzold (1983) has proved, ti effective thennal mass (mB) detennining the hcat-storJJi capacity of a building in such a case will be about 300-6.): kg/m1 floor area. On that account. the traditional princirt of building houses directly on the earth can be considere,: a very important element of climate-oriented design.
Concerning the use of thin and lightweight con.1-truction: in traditional houses, another aspect should be mentione.'l Because the temperatures during the night are very Im (see Fig. 8.4) and the heat gain is minimized (Fig. 8. IO)ili need for a "heating" system to avoid discomfort become' obvious. But the only available sources for such .. heating' in traditional houses are animals and people themseh'l!l (usually traditional houses are used both as accommocb tion and as a stall). And even this heat production, as car be seen in Fig. 8.11, is of considerable amount. As w: know, the necessary time to heat up a room increases ·wit increasing thermal mass. Most traditional Ethiopian hous::i show that this aspect is accepted. Some traditional housei of other arid countries consider this fact by arranging 311
upper floor made of lightweight constructions for the us:: in winterorduring night and a massive ground floor for lh: use in summer or during daytime (Halbouni, 1978).
Methods for the Adaptation of Climate-Oriented Principles to Modern Buildings
In general, the climate-related design principles and elements used in traditional houses cannot be immediately transferred to modem buildings. Both traditional and modem residential units reflect, and are based on. certain social relations and ways oflife which have to be consid· crcd in all special design principles. First of all, modern residential units in apartment buildings are raised abo•,e the ground so that the immediate contact with the thelillal mass "earth" is lost. This, however, is compensated by the thenn al mass of internal walls, floor and ceiling because of the predominance of massive building materials (brick, concrete, etc.) in the actual Ethiopian building practice.
The fact that the main space for activities has shifted from the open air Lo internal spaces has created the need for lighr and windows, Since, at the same time, the area of external walls has decreased (compared with traditional buildings) the solar insulation has become the main source of heat gain within the room. To prevent excessive over-heating

• . .. •
0
. r I 1he
.. ···--· ··-
lftol 1110111 high
- thenna mass lcw
:\. ..:.:···-··· ... . ... ··-·-·· -···-·· I
e-oo 12 100 4,00 e,oo 12,00 4,00 8 ,00 LMT
Fig8.ll: Diurnal range of the specific internal heat gain q caused by people using the house from about 8.00pm to N
6.00am (n,, =number of people per nr floor area)
re ~-\'"i. ,,
' ~',, JG s I lo , __ ......... 'o 30 . • .. E '
- ... _
~---I.J -.._ __ ..._ .... ___ -..... __ ... ____
------ .. -.. ...; __ • - 20 . • . 0
; 10 C
0 0
// IV
FG • 0.2
------i.------ -----
-Eat i---we,
20 30 m3/wl- 40 ,o Ye11tllatio11 rate V/"a
Fig 8.12: Maxima of indoor air temperarure for a modem apartment unit in Addis Ababa in April for orientations to East and West in dependence on the factor F 0 of the given glass area
of rooms. it is necessary to limit that heat gain through windows by using effective solar control devices. This is especially necessary for windows facing east and west Fig. 8.12 shows the course of the maximum indoor air temperature in east and west rooms during the month of April.
The dependence on FG, a coefficient indicating the given glass area per m2 total facade area, becomes clear, especially in considering the fact that in case of natural ventilation through windows the ventilation rate V/AB will be less than 10 m3/m2. So, forrooms having windows facing directions SE-E-NEorSW-W-NW, it is essential either to minimize the glass area of the window, or to protect them effectively by solar control devices. Since we know that facades exposed to the east and west are very difficult to shade by fixed solar control devices, movable elements (horirontal orvertical, inside or, better, outside) have to be use~. 'For the practical· selection of effective devices, tables can be used in which not only the shading coefficient of the sun-breakers is considered but also the effectiveness of the internal air temperature. Such tables may be found in Petzold ( 1980), Fertsl (1978) and Hakenschmied ( 1973) for temperate climates and can be transferred to any other climatic condition.
Conclusions
In this Chapter, we have tried to illustrate how a careful study of traditional and vernacular architecture of a certain region ~an ~ive imp~>nant hints to simple and, as a rule, econom1cchmate:onented design principles and elements. If we can combme such an empiric approach to the problem with th~ theoretical foundations of building clim~tology, _ we w11l ~ abl~ to design more or less simple chmate-onented design aids which can be easily used in modem building design practice. Thus, we can determine the necessity and effectiveness of solar control devices or the optimum size of windows. '
References
! . Abe~e.~shutu: "Climatic Design Standards/or Schools in Ethiopia".
2. Cambron, E. and Gouin, P.1965: "Diurnal Variation of some meteorological elements at Addis Ababa during 1958". lnlndoorClimate in Ethiopia. Graduation Thesis by Amannuel Tesfuzion Hsiu, College of Building Technology, 1965.
3. Ferstl, K. 1978: "Investigations concerning the thermal reactions of administration and office buildings under summer conditions". Thesis Work, University of Technology, Dresden.
4. Ferstl, K. 1980: "Traditional buildings and their impo~tance for the climate-oriented design of modern buildings - shown by the example of the architecture of Usbekistan". In Schriftenreihe der Sektion Architektur der Tu Dresden, Heft 16.
5. Gebremedhin, N. 1977: "Some traditional types of housing in Ethiopia". In Paul Oliver ( ed) Shelter in Af· rica. Barrie & Jenkins, London.
6. Hakenschmied, E. 1973: "Investigations concerning structural possibilities to stabilize the indoor climate in residential buildings under summer conditions". Thesis Work, University of Technology, Dresden.
7. Halbouni, G. 1978: "Investigations concerning the development of housing in areas with hot and dry climates with special respect to best building climatological and hygienic solutions • shown by the example of Damascus". Thesis work, University ofT echnology, Dresden.
8. P etzold,K.1980: "Thermal Load". VEB Verlag Technik Berlin.
9. Petzold, K. 1983: "Indoor Air Temperature". VEB Verlag Technik Berlin.
10. Stead, P.1980: "Lessons in traditional and vernacular architecture in arid zones". In Gideon Golony (ed) Housing in Arid Lands. Architectural Press, London.
37

CHAPTER9
Thermal Comfort Considerations in Vernacular Architecture in Northern Nigeria
Hamman T. Sa'ad Department of Architecture, Ahmadu Bello University, Zaria, Nigeria
Introduction
A few studies have been conducted on the thcnnal conditions in traditional houses in Northern Nigeria (Fig. 9.1). Peel (1958) revealed that contrary to general opinion about the "legendary coolness" of the traditional mud-roofed houses of the Hausa, the actual experience was a more .. transitory sensation associated with changing environment". This "coolness", he argues, relates more to the differential temperature between the outside and the inside than to real thennal conditions inside the room.
In another study, Peel (1961) tried to establish thennal confort zones by conducting investigations into the reactions of male and female Nursing School students in Kano. He exposed them to a variety of thennal conditions and solicited their reactions verbally. He came to the conclusion that "whilst Northern Nigerians have a slighll y higher heat tolerance than say Europeans, their actual thennal requirements for comfort are very little different from those of people living in temperate climates". This conclusion is quite in line with those arrived at by scholars in different parts of the globe. Schwerdlfeger(l 984) also worked on the thcnnal perfonnance of traditional Hausa houses in Zaria and came to the conclusion that all the three different fonns of traditional structures were climatically far from being satisfactory. With respect to thermal comfort zones his study yielded the same result as that of Peel (1961).
The majority of dwellings in Nonhern Nigeria today are what may be called "vernacular architecture" rather than "traditional architecture" since quite a number of modern clements have been incorporated into their design and construction. These include corrugated iron roofs, asbestos or cocletex ceilings, windows with glazed, wooden or metal sheet shutters, cement-screed floors, plastered and white washed walls and so on. All of these new introductions have definite effects on the thermal comfort levels achieved in the dwellings. In our current analysis, new CJtegorics of buildings that have found their way into the traditional architectural vocabulary of the I 980s will be
considered.
38
Traditional Techniques and Climatic Considerations Climate is one of the most important considerations traditional architecture the world over. Rapoport (196 contends that traditional builders lacking "the technolo . to allow them to ignore climate in their design" have build with climate. Ideally the local builder should ere, dwellings that respond successfully to climatic conditio1 But is lhis always the case? Traditional builders in Hat land exhibit knowledge of their materials in tenns resistance to rain and winds. Building orientations , sometimes related to the direction of winds and rainf, Similarly, window openings and sizes may be appropri: for the wind direction. Consequently, from some gener ised observation one can comfortably jump to the concl sion that a distinctive cultural response to the gene climate and micro-climatic conditions in Hausa land l been evolved by the traditional builders. But on a clOl look, one may arrive at a contrary conclusion.
During our field work on traditional buildings in Hau land, we were not able to detennine the level of conscioc ncss of "thcnnal comfon" among master builders a:: traditionalhouscholders(Sa'ad, 1981).Furthennore,masll builders, generally, do not seem to be cognisant of themi: characteristics of building materials. It was, therefor. difficult to ascertain whether"thennal comfort" as afacu: plays an important role in detennining the form, materul and construction of vernacular buildings in northern Ni geria. One has the feeling that the solutions arrived at~ local builders which seem to respect themtal comftt requirements arc coincidental, i.e., technical and cultlill requirements happen to operate in line with comfon It quirement rather than thermal comfort being consideW: deliberately by the builder.
This argument is buttressed by the fact that the majoriey~ solutions to thermal comfort problems in dwellings seflll' to be "non-architectural". These include changing t dwelling at different limes of the year, among otbt'I!
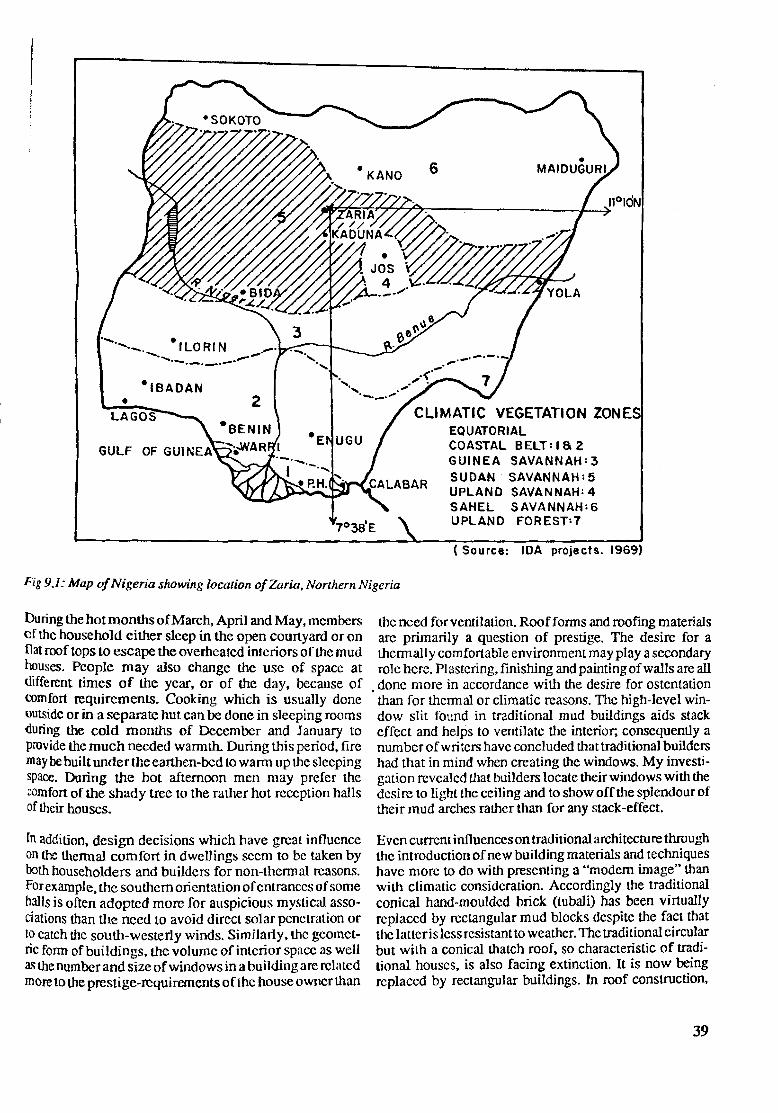
• KANO G
·-. ...___ • 1 LO RI N .-· ...................... ___ ,.,,_.,..---
•1BADAN • 2
LAGOS
GULF OF GUIN
EQUATORIAL COASTAL BELT: I a 2 GUINEA SAVANNAH: 3 SUDAN SAVANNAH:5 UPLAND SAVANNAH:4 SAHEL SAVANNAH:6 UPLAND FOREST:7
( Source: IDA projects. 1969)
Fig 9.1: Map of Nigeria showing location of ?,aria, Northern Nigeria
During the hot months of March, April and May, members of the household either sleep in the open courtyard or on i1at roof tops to escape the overheated interiors of the mud houses. People may also change the use of space at different times of the year, or of the day, because of comfort requirements. Cooking which is usually done outside or in a separate hut can be done in sleeping rooms during the cold months of December and January to provide the much needed warmth. During this period, fire may be built under the earthen-bed to warm up the sleeping space. During the hot afternoon men may prefer the comfort of the shady tree to the rather hot reception halls of their houses.
rn addition, design decisions which have great influence on the thennal comfort in dwellings seem to be taken by both householders and builders for non-thcnnal reasons. For example, the sou them orientation of entrances of some halls is often adopted more for auspicious mystical associations than the need to avoid direct solar penetration or to catch the south-westerly winds. Similarly. the geometric form of buildings, the volume of interior space as well as the number and size of windows in a building are related more to the prestige-requirements of the house owner than
the need forvemilation. Roofforms and roofing materials arc primarily a question of prestige. The desire for a thcnnally comfortable environment may play a secondary role here. Plastering, finishing and painting of walls are all
, done more in accordance with the desire for ostentation than for thermal or climatic reasons. The high-level window slit found in traditional mud buildings aids stack effect and helps to ventilate the interior; consequently a number of writers have concluded that traditional builders had that in mind when creating the windows. My investigation revealed that builders locate their windows with the desire to light the ceiling and to show off the splendourof their mud arches rather than for any stack-effect.
Even current influences on traditional architecture through the introduction of new building materials and techniques have more to do with prescming a .. modem image,. than with climatic consideration. Accordingly the traditional conical hand-moulded brick (tubali) has been virtually replaced by rectangular mud blocks despite the fact that the laUcris less resistant to weather. The traditional circular but wilh a conical thatch roof, so characteristic of traditional houses, is also facing extinction. It is now being replaced by rectangular buildings. In roof construction,
39

new fonns are being adopted thereby increasing the vari~ ety of ro?f types. Currently, there are about eight roof cons_truct1on fonns that are popular in the vernacular architecture of nonhem Nigeria; as follows:
(i) The traditional thatch roof constructed of wooden or bamboo framework covered with elephant grass or other f onn of thatching.
(ii) The dome-shaped roof made of reinforced mud arches covered with split-deleb palm trunks and a layer of mud.
(iii? The fla~ mud roof held by the help of azara joists on which mud 1s poured.
(iv) C~rrugated iron. roof with azara rafter or joists -C?mposite roof fonnat10ns are created by combining two simple roofs.
(v) Mud-domed roof as ceiling with a thatch roof over as protection against rainfall.
(vi) !'-1ud-domed roof with pitched corrugated iron roof over it
~vii) Flat mud-roof with thatch or corrugated iron roofover Il
(viii)Corrugated iron roof with coeletex, hard-board or asbestos ceiling under.
This paper focuses more on roof construction because it is ~at pan of the building which is mostly exposed to the impact of weather.
The character of Bomo settlements
In Borno settlement, our study area, most houses have mud walls (oftubali) or tirnber-fonned blocks. These are usually plastered with mud whose colour ranges from reddishbrown to dark-grey. Internally, most rooms are plastered smooth and often white-washed. floors in the older buildings are of rammed laterite while the newerd wellings have cement screed over the rammed laterite.
Bomo is a suburban settlement of Zaria but lies within what may be tenned "Greater Zaria". It is only 16 kilometers from the centre of the walled city of Zaria (Fig. 9 .2). In tenns of population, Bomo cannot be considered urban. It forms the nucleus of a community of about 10,000 inhabitants. More than half of this population is found within the now-dilapidated town walls of Bomo (Fig. 9.3). The settlement is the seat of Sarkin Bomo, the traditional fiefholder in charge of the administration of Bomo and surrounding villages. It is also the centre of a market community.
40
- lltOAO ~ YALL£Y/$TRUM ........, "AILW&Y UNC ~ CtTY WALL Q 80M0 S£TTL£MENT
I I I 4 9Ka
Fig 9.2: Location of Bomo within greater 'Zaria
Proximity to the Ahmadu Bello University has a definite influence on the character of the settlement. The University is a big employer of labour, besides providing other occupational opportunities to the inhabitants of the town. Sarkin Bomo himself is a University contractor and a number of his subjects are on the University payroll. Nevertheless, the majority of Bomo people are peasant farmers and market gardeners. In terms of character, Bomo has an urban outlook.
All compounds in Bomo are surrounded by walls of mud or grass matting (zana). Areas within compounds are often divided by a number of partition walls that shade the courtyards within their compounds. The compact arrangement of buildings, the narrow streets between compounds and the high compound walls have created a high degree of mutual shading which is beneficial during the hot afternoon (Fig. 9.4). An aerial photograph ofBomo would present a horizontal egg-crate system with a beautiful interplay of light and shade. Unfortunately this arrangement, though desirable in the afternoon, acts as a heat emitter at night to the discomfort of the inhabitants.
The open square, known as dandali, onto which the entrance hall of a compound (zaure) opens is usually planted with shady trees - mango, silk, cotton or neem trees. These afford menfolk a place to rest in the hot afternoon when the zaure becomes unbearable (Fig. 9.5). The Dandali varies in size, importance and function. The one in front of the chief's compound accommodates a mosque while the

Fig 9.3: Layout of Bomo Settlement
~ --:; ,:•·
\
\
-
·-·-t ·.-.-:\ \ · .. :·-:;\ -~~::--1From c ,
.-.,house .
.
{"' :
··tr~· :, :::.~ . , ?--·
~
oo\.--~
. :-.~•ref i{!R!f:~~2~f i%~,\ Fig 9.4: Bird's eye view of residential compound in Bom.o (after Ahmed, Personal Communications)
41

u..u.u
m11 R
o, ·.}. l~'\ f_ \ 1' J ::'..= ,,_~.i \L
.-:·f-. :~:·:~ ,!::~·
/f/ ~-~'.~
·,;~ ·.•
f.UIILY o\ · fUIILY 9 f!!!!l.!..S. A, ... &t .. h4••• Ho,_ a ..__.., kfl- Ho1boft4 C Kia1b0tl<I A 11- ,__ 111 Wife fl"-,_.,., t11 Wifo c!Roo111 l"orlowr .-, Wife
AZ • • -1!'4 • aZ • • t"" - cZ • " z."" • a,J - • ,~ •
"'' 1111 • .,., l•J e.t••- le) Chlch• •~•d ldl Gro11e1,y 0) kilclle• C111)Ad11t _,_ -• l■ I $lore
(ti T•ll•t lrl %a.,.
Fig 9.5: A typical compound at Bomo (after Mohammed J, Personal Commimications)
dandali in the centre of the town accommodates the market
The market is constructed of simple sheds that afford excellent air movement, thereby creating a thermally comfortable environment during the hot humid period of the year. During the hot-dry period the thatch roofs which are very poor insulators of heat make conditions unbearable. However, the market is cooled by a number ofleafy trees planted in the open spaces between sheds.
All compounds have a number of trees such as mango. guava, fig acacia or neem that help to regulate afternoon temperatures and provide resting places for children and women. The method of house construction and rooftypcs have already been discussed in general tenns. The specific case selected within Bomo village will be analysed below.
42
The Climate of Bomo (Zaria)
Bomo is !ocated in the Sudan Savanna (Fig. 9.1); a zone char-actensed by a composite climate. A hot-humid period last~g from May to October, and a "hot-dry" climate lasting roughly from November to April. The mean maximum temperature is reached in April (35°C) while the mean minimum temperature is recorded in Decembf (13.7°C). The mean annual rainfall is 1066 mm. Most, this rain falls within the "hot-humid" period known as wt season. The rain-less period is often referred to as dcy season. During this season the relative humidity is very low; for example, in December and January the relative ~umi~ity f~s to an average ofless than 20%. The prevailmg wmd dunng the dry season is the dust•laden north-east trade winds, blowing from the desert to the norlhern pan of Nigeria. Thennal conditions are fairly uncomfortable during the period. The details of the climatic conditions can be seen in Fig. 9.6.
The traditional society recognises four seasons in the year, as follows:
(a) The wet season from mid• May to September is known as Damina. This period is characterised by rainfall and high relative humidity. Mean monthly relative humidity rises from 54% in May to about 76% in August; falling to a mean of 67% in September. Mean monthly temperatures are relatively high, with a mean of 27°C in May falling to a minimum of 23.6°C in August rising again to 25°C in October. The south•west winds blowing from the Gulfof Guinea are responsible for the humid, rainy conditions during the Damina season.
(b) The harvest season orKaka is relatively short, lasting from the beginning of October to the end of November. Rainfall has virtually stopped except for occasional drizzles in early October. The cold harmattan winds have not begun in full force. Climatic conditions are consequently mild in this intcnnediate period. Maximum temperature is around 31°C while the minimum is between IS°C and 17°C. Relative humidity falls from a mean of 52% in October to an average of 25% in November. The wind direction changes from the south•westtonorth-east during this season.
(c) The Harmattan Season or the cold dry season (Hunturu) is characterised by winds from the desert; bringing cold, dry air. The season lasts from December to February. The average relative humidity is very low. falling from 19% in December to 13% in February. As a result of the cold, dry and dusty air, the effective temperatures can be very low at night. The minimum air temperatures for December and January are about 13.5°C and 14.0'C respectively. Rainfall is totally absent during the Hunturu season.
( d)The fourth Hausa season, B azara, can be.termed the hot season. This lasts from March to mid~ May. Though brief, this season can be quite severe with respect to thennal

conditions. In the middle of April, maximum temperature rises above 35°C. The relative humidity is quite low but as we approach the Damina season it begins to rise from 20% in March to 54% in May. Solar radiation is very intense. The wind direction changes from north-east to south-west. The B azara season is the most uncomfortable in Nonhern Sigeria ~ with respect to thennal conditions. T~ .
~limatic Consideration in Bomo Architecture
It is possible to make pertinent observations with respect to climatic consideration in Bomo vernacular architecture. The composite nature of climate inBomocreates conflicting demands on dwellings. The requirements for the hothumid Damina and the hot-dry Bazara are at loggerheads. Similarly, the requirements for the cold-dry Hunturu and
0.1 0.2 0.9 3.9 l0.0
2501---f--+---+-t--h'!!n""r ZOO.,_-+--t---t--ttH~ 150 l--1--1--+---f! ,ool---4--~=f::''"'="::i!: 50 0.1 1.0 6.3
BEFORE l953 OBSERVATIONS TAKEN AT 0.800 ANO 1300 G.M.T.
AFTER 19
~3 OBSERVATIONS TAKEN AT O.SOO AND l500 G.M.T.
',
those of Bazara are in conflict. Consequently it is difficult to achieve comfort within a given building for all the seasons without resorting to mechanical aids.
·,
Traditional compounds tend to contain structures with different thennal propenies but we have no evidence that they are used in accordance with theilllal comfort requirements. The traditional mud room with domed roofs and small window slits that would be comfortable during the cold nights of the Hunturu season and hot afternoons of the B azara season seems to be used all year round by the occupants despite the discomfort. Sheds of posts and thatch that would be comfortable for the hot-humid periods are either reserved for animals or used as cooking places. The corrugated iron roof with hard-board ceiling and fairly large window is a status symbol, consequently it is used by the household head as his abode throughout the year, including the Bazara and Hunturu seasons.
Fig9.6: Climatic Daw for Zaria (Source: IAR ABU Zaria/Schwerdifeger 1984)
43

Building type
CIRCULAR THATCHED ROOF
FLAT MUD ROOF
DOMED MUD ROOF(SORO)
CORRUGATED tRON ROOF
COMPOSITE ROOF
No
2
3
4
5
Sketch
01[)J. ~'\:"·~-:-"''\ ~- •• -:"'4 ~.
.. .
Roofing Materials
THATCH ANO POLES
MUD, AZARA
MUD,AZARA
CORRUGATED IRON SHEETS ANO AZARA
MUD, THATCH ANO AZARA
COMPOSITE ROOF 6 Ofi MUD, THATCH
ANO AZARA
CORRUGATED IRON/DOMED MUD ROOF
7 on MUD, CORRUGATED IRON SHEETS, AZARA
CORRUGATED IRON/FLAT MUD ROOF
CORRUGATED IRON ROOF WITH CEILING
8
9
Fig 9.7: Vernacular roofrypes
A typical compound in Bomo would contain most of the structures described above (Fig. 9.7). In addition, one would find water pools created by soil excavation. Ideally these should improve the relative humidity during the dry period but they dry up in Hunturu and refill in Damina, when they constitute a nuisance as breeding grounds for mosquitoes.
Our study in Bomo indicates some few areas of adaptation to climate and areas where anticlimatic solutions are preferred as a result of culture and tradition. In summary, the following highlights were noted:-
(a) North-South orientation is found to be the preferred orientation of buildings. Consequently where windows exist they face south in line with climatic requirements. But windows are rare.
44
MUD CORRUGATED IRON SHEETS AZARA
CORRUGATED IRON SHEETS AZARA AND
CELOTEX EOAR0
(b) Shading is very important to the inhabitan~ as a result of which most compounds have leafy trees planted in the courtyard. The open space (Dandali) where men meet also have such trees. Everybody is aware of the thermal comfort effect ofthese trees.
(c) It seems local builders are not aware of the relationship between part-side painting and thermal comfort in the room. Paradoxically, rooms are whitewashed internally while the external walls remain dark-grey! In some cases houses are treated with bitument for protection from the ravages of rainfall in spite of the adverse implication on comfort.
(d) Traditional builders and householders are indifferentto ventilation (it seems). Older houses have small high level window slits of about 25cm x 40cm, more for lighting than forventilation. Modem vernacular buildings have adopted

the use of windows but more often than not they are a symbol and remain permanently closed.
(e) Walls tend to be very thick in older buildings. This has its advantages during the Kaka and Hunturu seasons but bas adverse effects during the hot•hum.id period of the year.
(f) The use of ceilings is primarily for prestige rather than thermal comfort. However. both builders and households are aware that ceilings with corrugated iron roofs create a more comfortable indoor climate.
Conclusion
In this paper we have discussed thermal comfort in ver• nacularbuildings in northern Nigeria with particular refer• ence to Bomo settlement in Zaria Our analysis so far is based on conjectures and subjective impressions as sup. ported by works done by some authors. However. the opinions of builders and house occupants have been SO· licited on many vital issues. Further studies should be conducted in order to establish the relevance of vernacular architecture in modem day development of climate-sensi~ tive architecture.
References
1. Peel, C.1958: "Thermal conditions in traditional mud dwellings in northern Nigeria". Joumal of Tropical Medicine and Hygiene. No. 61 pp. 189-203.
2. Peel, C. 1961: "Thermal comfort zones in northern Nigeria". Joumal o/Tropu:al Medicine, No. 63 pp.113-121.
3. Rapoport. A. 1969: "Bouse Form an4 Cultun". Englewood-Cliff: Prentice Hall.
4. Sa' ad, H.T. 1981: "Between myth and reality: the aesthetics of traditional Hausa architecture". Ph.D Thesis, University of Michigan, USA.
5. Schwerdtfeger, F.W. 1984: "Thermal conditions in ,1raditional urban houses in northern Nigeria". Habitat International VIII. 3/4, pp. 43-76.
45

CHAPTER IO
Climate and Building in Ibadan: Some Observations Yinka R. Adebayo Department of Geography. Kenyatta University. Nairobi. Kenya
Introduction
The fact that climate is an important factor in the design and orientation of buildings cannot be over-emphasized. This is because a building is primarily designed, amongst its other functions. to protect man from the direct impact of weather elements like rainfall. solar radiation and wind. Although. in the light of the foregoing. the design of buildings varies from one climatic region to another, traditional tropical architecture could be perfected as far as indoor microclimatic condition is concerned. Although this perfection has been attempted, through trial and error. over the years the lack of adequate scientific knowledge about the vagaries of regional climates. the limited technology and the inadequacy of other necessary resources have imposed considerable limitations on climatic perf ection of most traditional architectures.
are made up of houses designed without due regard for the prevailing regional climate. This situation is worsened by our present state of social and technological sophistication.
Man has found it difficult to survive under the direct impact of climatic elements like rainfall, wind and sunshine. As a result of this, emphasis has been placed on indoor microclimatic comfort for quite a long time.
Critchfield (1979) identified the selection of site, for the construction of houses, as one of the most important factors that detennine the effect of climate on a building. Others include the design, orientation and materials used in constructing the house. This would mean that, with all these factors taken into due consideration, it is possible to minimise the adverse effect of buildings onmicroclimates.
It is peninent to pay attention to the role the building plays In West Africa (Fig. 10.1) today and, indeed, in Nigeria, in the modification of the climates of urban areas because most houses, especially those in the urban areas, are made contemporary settlements, particularly in the urban areas, of bricks and have corrugated iron roofs. This is because,
.Bamako • Ouagadougou
Abidjan
Fig JO.I: West Africa showing the directions of the trade winds in July
46
/
- - ► N.E.Wind >- S.W.Wind
0 240 480Km. l I I I I I I

as O'Connor (1978) has rightly observed. most towns in tropical Africa are of colonial origin. Because of this, the habit of building walls and roofs of traditional houses with thatch has given way to the idea of constructing houses with a modem look (Fig. 10.2).
The rapid encroachment of modem houses has affected the housingtypeswhicharenowmakingupanurbanphysiognomy that is characteristically an amalgam of traditional and modem outlays. Typical examples of urban areas with this kind of physiologic outlook are Ibadan and Kano -both in Nigeria. These cities have their traditional areas at the core and their modern outlays extending to the country.
C
Bricks or
2 d Bungalow
t
This pattern has serious microclimauc implications. Today, the growth rate of the urban population in tropical countries is alanning. According to the FAO (1984), cities like Abidjan, Dakar, Dar-es-Salaam and Lagos have been doubling in size every 5- IO years. It has also been noted that the growth of the urban population in Africa has, since early in the 1960s, been the highest in the world. It is, however, unfortunate to note that in spite of the increasing sizes of towns in tropical Africa, lack of expertise, financial resources, equipment and negligence on the side of the planners are problems that are seriously hampering rapid progress of research in urban climatology.
Thatch
b
Thatch roof
Cl D
□
□
;m. D
e Multistory
Fig 10.2: Hypothetical views of both traditional (a,b & c) and ,nQdern housing types found across West Africa
47

The situation in Ibadan
The Yoruba speaking pan of Nigeria has a long history of wbanization. 'The remaining pan of the country is generally dominated by village settlements. Although the urban population grows at an alanning rate in West Africa, the bulk of the human population dwells in the rural areas. Houses in West Africa could be coarsely classified into three broad categories. viz, .. pre-colonial''. .. colonial" and "post-colonial0
types (see ~ig. 10.2). The~e ho~es h~ve been categorized on the basts of the matenals with which they are built. and their modes of construction. There are reasonable contrasts between these categories as we shall see below.
The 'pre-colonial• houses are built with either mud or thatch walls (Fig. 10.2). These houses are common in the rural areas aero~ West Africa. While isolated houses with grass roofs are common in the coastal ~re~s. elongated, joint houses with thatch roofs are peculiar m the Hausa/ Fulani dominated northern region
These houses have numerous disadvantages with respect to the creation of comfortable indoor ltiicroclimates and inadequacy of drainage facilities. Unfonunately. the resistance of these houses to high-velocity wind is low. Because of this reason, they are easily destroyed by violent weather.
1be advent of the ·colonial administration in the last cenrury brought about a proliferation into 1!1e existi~g tropical architecrure by the tempe~te architecture; m tenns of building materials and design. There was, for instance the introduction of cement bricks and corrugated iron roofs to replace thatch walls and roofs (Fig. 10.2). 'This strait-jacket transfer of the European archite~ture led to a gradual bastardisation of the buildin~ types m ~est Africa. Consequently, two major categones of architec-ture emerged as follows: ·
I. Within the first category are the simJ?le bungalow.types. The roofs of these houses are conical m shape, typical of the type built to drain snow in Europe. The walls are sturdy with an abundant concentration of cement In some cases allowances are left for cross-ventilation
2. There are also those types ~hich could be simply ta~ged, half-baked temperate ty_pes. Half-baked ~use thelf qualities. in terms of the design and construction. ~ low. The design of such houses cannot be. grouped with the traditional types; neither can we categonse them as modem houses.
The type of houses we see on the .. streets". t~ay are roducts of the colonial era. Toes~ modern bm~dmgs are
~ost the same, in style and matenals, as th?se m ~uroP:C and America. Their special features are_ evident m thelf heights air conditioning spaces, heavily slabbed su_r-
d. ' s etc Perhaps some examples from Ibadan will roun mg, . give a clearer picture.
The components identified as the predominant textural
48
compositions are buildings, water, roads (tarred and untar• red). bare ground, pave surface, lawn and trees. They are basically the physical elements which influence the microclimates of urban areas. Ibadan was classified into eight landuses on the basis of its surface texture and the activities therein These landuses (Fig. 10.3) were later used as the basis for further analyses.
The urban characteristics of Ibadan are very well reflected in the nature and density of the houses (Fig. 10.4). The situation is such that the traditional core area is densely packed. with narrow winding roads separating the houses. The new layouts at the periphery. on the other hand, are better-arranged, with wide and well-planned roads.
Further air photograph analysis revealed that as muc~ as 40% of the total land area is dominated by 'colorual' buildings which are mostly found in some parts of the high density, medium density, commercial and the rural_ su~roundings. About 59% of the remaining are~ of the c1t! 1~ dominated by the 'post-colonial· types. The pre-colorual types are not common in the city (Table 10.1).
Table J 0.1: Estimated Area Coverage of Houses in Different Categories
Landuse
High density residential
'Pre- 'Colonial' Colonial'
0.3 25.3
Medium density -residential
4.2
Low density residential
Educational
Medical
Rural
Agricultural
Industrial
Commercial
Acquisition
Open Space
1.5
0.7 9.0
0.1
'PostColonial'
3.9
2.2
13.1
3.6
0.4
1.3
2.8
17.1
0.3
12.8
Sources: aerial photograph and fieldwork (1983)

Residential
mma~~~ity ~Medium ~density r.-;-, Low w.....:I density
N
I~ Commercial
v.tm!Open ~space
IIIIllilll Ru ra I use
.. ... ..
.. . . . . .... . . . .
.
. . /
. ~
.. . . . . . . . . . . .... . . . . . . . . . ; ..
Fig 10.3: Textured map of the city
90
80
70
2.
... " :;; = ,. m
.i1011-111u1t7 ta) R11ld111tlal
LOW•dHaltf (c) R11141ntlal
• • ! ...
IOO
90
80
70
1 .. 0111•- tlHlltr (II) Rtaldentlol
Ed1ntlona1 (cl)
Fig 10.4.: Characteristic t~ture of different landu.ses (Sources: aerial photographs and fieldwork (1983)
lhdlc'II lel
Atrlnll ■ ret It I ~
10
10
ladutrltl (U
49

100
C••••rcl•I Ill to 10
?O
10
f. lO
40
10
10
10
IOO
to IO
'° Ott• 1,u, hi 10 C.••Hlh CIIJ CL)
?O ?O
10 9 10
IO IIO
,:•o 10
10
10
0 f' ,. 1 ! .. • !•t~i: .: • • • • I >tt •• • • :::.:.,,u: • ., •
Fig 10.4.(cont.): Characteristic tuture of different landuses (Sources: Aerial photographs and fieldwork (1983)
Discussions
As mentioned earlier, one of the vital roles of buildings is to ensure the protection of man from the adverse effect of climate. This should be done, not only by erecting a shelter. but also by ensuring that as much possible comfort is provided inside. It is not possible to attain a perfect indoor climate, but it is possible to improve on whatever we have toda~. 'Yhile rational builders think about the problem of achievmg optimum physiological climate, they also ~e ~e need ~or the construction of structurally fit buildings mto consideration.
The climatic conditions in the study area call for more serious analyses as far as building climatology is concerned. For instance, Ayoade (1978) revealed that climatic sensations range from relatively hot and humid during the wet season through hot and dry during the dry season to cold anddryduringtheperiod oftheHarmattan. lnall, with the relative humidity as high as 80% and a mean daily temperature of about 26°C, it is clear that a cool breeze is required most of the year in West Africa.
At another level, Oguntoyinbo (1981) compared tempera• ture readings in traditional ('colonial') houses and the modem {'post-colonial') houses in Ibadan. While a mean diurnal temperature range of about 3.9°C was recorded in the former. the range in the latter was 5.00C. Outdoor (Airport) temperature range was 6.7°C. With respect to
so
~lativ~ ~umidity. a range of 27% was recorded in the ~olorual house. 35% in the 'post-colonial• and 49% at the
airport. !hes~ results suggest that the range of the climatic fluctuations m the 'colonial' houses (sometimes erroneously ~ferred to as traditional houses) are not as wide as tho~ m the post-~lonial houses. The building materials, which are the maJor differences between the two types of houses, are the causes of these differences.
Conclusion
The c~aotic si~ation of design in Ibadan is not peculiar to that city alone m the tropics; neither is it to West Africa. The gradual disappearance of traditional houses and the emergence of modem houses could be attributed to political factors. In the interest of the environment as well as hllffl:~ physiolo~ical comfort, it is being suggested that trad1t1onal architecture should be improved upon by blending the present knowledge of urban and building climatology with contemporary technology.
References
1. Ayoade, J.O. 1978: "Spatial and Seasonal patterns of Physiological Comfort in Nigeria". Arch. Met. Geoph. Biokl. Ser. B. 26. 319-339.
2. Critchfield, HJ. 1979: "General Climatology", Prentice-Hall of India. New Delhi.
3. FAO 1984: ''Review on agricultural development". Ceres Vol. 17 No. 5.
4. O'Connor, AM. 1978: "The Geography of Tropical Africa Development: A study of Spatial Patterns of Economic Change Since Independence". Pergamon, Oxford.
5. Oguntoyinbo, J.S. 1981: "Aspects of urban microclimates: the case of Ibadan". In sada, P.O. and Oguntoyinbo, J.S. (ed) Urbanisation Processes and Problems in Nigeria. Ibadan University Press.
Note: This article was written when the author was at the University of florin, Nigeria.

CHAPTERll Maximization of Passive Control for Better Indoor Environment Olajide Solanke Department of Architecture, Ahmadu Bello University, Zaria, Nigeria
Introduction The relationship between inner temperature and energy expenditure for survival is tenned "survival parabola": y =
Broadbent and Ward (1969) submitted that "no amount of a x2 + x (Fig. 11.1). In this Figure, the states ofhypertheranalytical work will produce a solution in formal tenns". mia and hypothermia are regarded as the two limits for This submission technically dismissed the earlier stand of human existence. Koestler (1964), who believed that creativity could be rationally induced. It is, however, pleasing to note that Physiological comfort zone Koenigsberger, et al (1973) coined the phrase "forward and backward analysis" to restate Koestler's theory. It is, Within the range of conditions necessary for survival is a perhaps, obvious today that any proposed architectural smaller range which is judged as comfortable (that is solution without the proceeding "forward analysis" and neither too warm nor too cold). In these conditions, the subsequent "backward analysis" is bound to attract some inadequacies. And these analyses are multiple. I suggest that proper organisation and orientation of spaces with respect to analysed climatic conditions can reduce the energy normally expended on the struggle for biological equilibrium. This placement of certain spaces must respect some principles.
The intention here is not to propagate any specific principle of design imposed by space organisation to the exclusion of pragmatic, analogical or canonic approaches in design procedure. It is an attempt to unearth the truth which may be manipulated to obtain perfect design. It is equally irrelevant to me if the end product found to be climatically suitable is pragmatic or canonic.
Survival limits
Sometime ago the existence limits were subjectively regarded to be sunstroke and the freezing point. No account ofman•s inner temperature was taken to fix these limits. Today. we know that the principal object of the body's complex thennorcgulatory system is the maintenance of the deep tissue at or near 37°C with a tolerable deviation of + 2°C (excluding marathon runners whose inner tempen1tures can rise up to 41 °C). And when body temperature reaches about 43°C, recovery becomes very difficult as irreversible chemical changes begin at this point. On the other hand, death can occur under the condition of cold. The body, even under general anaesthesia, cannot be cooled beyond 18-22°C.
. -C, r.>
C
>-QI ... • C Lil
r.> -0 .0 a -.,
2
12
18 2,
I -;I>-II -.0 -::
-1-; 0 0 u u :i:1 ...
21
Deep
Fig 11.1: Survival Parabola
37
132 143
I I I .I I .. ~, lo en :, .~, r~ C, ,; ~I 0 u ,~ :5) :c
I I I I
30 3-9 48
Tissue Temp. 0 c
51

Tiie discussion here is, therefore, focused on the passive · control. The magnitude of the passive control depends on some control "instruments" such as:
strain on the body's thennoregulatory mechanism is minimal. It is minimal when the air temperature does not induce man"s inner temperature to rise above or fall below the range of thermal neutrality (37° + 2°C) (Fig. 11.1). In the mentioned mechanism, the skin is the main region for -temperature sensation. The vasomotor centre and the -hypothalamus in the brain, responding to internal tempera- -ture, regulate the skin temperature which nonnally does not exceed 31 °C. The Mahoney Table on thermal comfort -limits, based on comfort humidity groups, gives the comfort -limits to range from 12°c to 34°C. Furthennore, these -limits depend on diurnal periods - day or night.
Spacing of buildings Orientation of buildings Space organization Windows Sun control devices Material selection Construction details Colour finishes
Environmental equation
Architecture has to seive man and his living comfort. Man's comfort is the measure. therefore, of the extent to which buildings have succeeded in satisfying the purpose for which they were designed. However, this depends on various factors which have been enumerated above. In recent times, environmental scientists have come to a consensus that the dry bulb temperature alone can be applied to measure comfort provided that the other three factors are within acceptable limits.
The natural environments in our buildings are rarely within acceptable comfort limits. Hence the provision of comfort for better living and perfonnanceremains a constant struggle to balance the environmental equations proposed by Szokolay (1983). In his proposal, he assumed the climatic conditions to be different from the comfort con• ditions. 11le difference between the two conditions is the control task, put as follows:
Oimatic Conditions
Control target
Comfort Conditions
= Environment Control Task
The environmental control task can be detcnnincd by applying active and/or passive controls. The passive control involves the application of a building envelop to ameliorate indoor conditions. Passive control has limitations which make it incapable of achieving total elimination of the environmental task:
Environmental = Control Task
Active Control
+ Passive Control
Now, in modern day technology, mechanical devices are used to take care of the active control, but in the developing countries human adaptation alone is usually left to absorb the excess of the environmental control task or active control which is reduced to attainable minimum when the passive control is made maximum. That is, if the environmental taSk is constant the following relationship is valid: Passive Control
52
(Max) = Active Control
(Min)
Designers have concentrated on the manipulation and regulation of solar heat input by selective shadings, the storage of heat in building mass and its distribution by air movement. Other instnllllents were considered by acci.:. dent and not as a matter of necessity. Space organization and orientation are "regarded as negligible" since their contributions to total passive control are seen as such.
The above equations imply that all instruments of passive control must be harnessed to attain its maximum magnitude. But the nature of these instruments must be investi~ gated and known to facilitate their proper application to attain maximum natural control. This attempt at an investigation assumes that all environmental factors and control instruments except temperature and space orientation have been properly handled.
Study Objectives
The study alone cannot confinn or disprove the current hypothesis on comfort criterion. It is to commence a series of other studies and investigations which may eventually put an end to the speculations that "dry bulb temperature alone can be used to assess comfort". The study is also earned out to rationalize the discourse on passive control
Site Climatic Conditions
The building investigated is within the Samaru campus of the Ahmadu Bello University, Zaria, Nigeria. It is situated at the BZ residential area of the campus. The building has its elavations orientated towards the North, East, South and WesL This house built on 0.6 ha parcel of land, is surrounded on three sides by roads. Except for the northeastern side, the site is well landscaped with trees and shrubs (Fig. 11.2). The local identity of the house is BZ 190. BZ 190 is a three-bedroom residential bungalow which was built around 1970. Apart from the three bed· rooms, it has a garage, a kitchen, sitting/dining room and two toilets (Fig. 11.3). The walls ofthis house are built of hollow blocks, windows are of glass louvres and the roof is of asbestos roofing sheets on a timber strufture.
The cam pus has a Savannah climate which has two distinct dry and wet seasons, both lasting for about 5 months. The

Fig 11.2: Site Plan
room 2
room 3
BZ 190
I
4A
SECTION A-A
Fig 113: BZ 190 and a section of it
dry season is associated with the continental air masses. This is the north-easterly wind which is dust-laden and blows from November to March. It is, however, the equatorial air masses blowing from the south-western direction and lasting from May to September that precipitate the rains of the wet season. April and October serve as transitional periods in the cyclic occurrence of the two seasons. These intermediate periods are occasioned by hotness. Thus, the whole year is characterised by four critical periods:
1. Dry-cold period: November - March 2. Hot transitional period 1: March/April 3. Wet-wann perioa: May - September 4. Hot transitional period 2: October/November
The local climate data compiled by the Institute of Agricultural Research (I.A.R.) was analysed by applying MahoneyTables 11.1 and 11.2. The annual mean temperature (AMT = 24.5°C) is found to be high. The results of the analyses closely tally with the above period classification - Tables 11.3 and 11.4. The comfort limits for the site are as in Table 11.2, under AMT greater than 20"C.
Table 11.1 Humidity Group
Group 1 Group 2 Group 3 Group 4
R.H. R.H. R.H. R.H.
Below30% 30%-50% 50%-70% Above70%
Indoor Thermal Performance Tests There was a prolonged observation of the behavioural patterns of the occupants of the investigated building, particularly during the extremely hot and cold periods. Toe children frequently escaped into a particular room. They preferred to stay in this room for most of the day during the critical periods. Hence the need to investigate the causes of the unusual thermal performance of this room.
Table 11.2: Comfort Limits*
AMT greater AMT 15 - 20"C AMT less R.H. than 20"C than 15°C Group
Night Day Night Day Night Day
1 26-34 17-25 23-32 14-23 21-30 12-21
2 2S-31 17-24 22-30 14-22 20-27 12-20
3 23-29 17-23 21·28 14-21 19-26 12-19
4 22-27 17-21 20-25 14-20 18-24 12-18
* Source: Mahoney.
53

Table 11.3-Air Temperature ('C) -1982
MONTHS J F M A
Monthly Mean Max: 29.7 31.3 34.6 35.5
Monthly Mean Min: 13.9 15.1 19.8 21.5
Monthly Mean Range: 15.8 16.2 14.8 14.0
+ + H H C C + +
Table 11.4 -Rela1ive Humidity(%) - 1982
J F M A
Monthly Mean Max - 18.7 19.3 21.5 53.0 AM Monthly Mean Min - 18.1 17.0 14.3 34.9 PM Average 18.4 18.1 17.9 44.0
Humidity Group 1 1 1 2
There are two preliminary studies - the first being a pilot study. The pilot study was carried out in 1980 during a critical period. It was aimed at establishing the occupants tolerance period. Initial attempts with an unlimited period of tests revealed that a particular time memory interference staned to influence the responses of the occupants. However. this study established 5 days as the period within which memory interference is negligible.
On establishing the test period, it became imperative to confirm the deductions from earlier observations. Thus. mental assessment tests were carried out in 1981 (see Solan.Ice, 1981) during the indicated critical periods. The room to room investigation approach involved the selection of reference space which, in this case, js the living/dining room. This is regarded as the re-adaptation space between the two critical rooms being jnvestigated. The occupants' responses to varying environmental stimuli are recorded twice daily- 7 a.m. and 4 p.m. (Tables 11.5 and 11.6)
Table 11.5 -Responses to Environmental srimulus 1981: 7:00 a.m. (local ti~)
Spaces Seasons Rev.Room Room -1 Room-3
H w C H w C H WC
Dry Season 3 5 I 7 - 6 2 Transition I 3 5 3 4 1 - 7 1
Wet Season 7 1 7 1 - 8 -Transition 2 2 6 3 5 1 7 -
54
M I J A s 0 N D
33.5 30.8 29.5 28.0 29.6 31.1 30.1 30.0
21.8 21.0 19.9 19.5 19.5 18.7 13.3 13.6
11.7 9.8 9.6 8.5 10.1 12.4 16.8 16.4
H H H H H H + + + + + + + + C C
M J J A s 0 N D
67.2 75.1 78.8 82.4 77.8 69.1 21.3 16.1
46.4 57.7q 63.9 102 63.5 50.7 20.6 13.7
56.8 66.4 71.4 76.3 70.7 59.9 21.0 14.9
3 3 4 4 4 3 1 1
Table J J .6 Responses 10 Environmental Stimulus 1984 4:00 p.m.(local time)
Seasons
Dry Season Transition 1 Wet Season Transition 2
Spaces Rev. Room Room - 1 HWCHWC
Room-3 H WC 1 6 1 3 5 3 5
5 3 7 1 3 5 -4 4 4 4 - 1 7 -3 5 4 4 - 2 6 -
H - Hot W - Warm C - Cold
The final tests involved stimuli measurements necessary for the quantitative explanation of the myth behind the "conditioned room ... The room to room thermal survey was cumbersome. Giant thermometers were placed suspended with unstretchable cotton strings at the centre of each investigated space. These thennometers dangled at a height of one metre (1 m.) above the floor level. Toe outdoor air temperature was taken at 3.5 metres away from each elevation and in the shade at the height of 1.2 metres above the ground level. Thermometer readings were ~corded for the three indoor spaces and for the outdoor au every two hours. (Tables 11.7, 11.8. 11.9 and 11.10).

Table Il.7: Outside Air and Room Temperatures (Jan 16-201982)
A.M. Noon P.M.
T'une 1200 2.00 4.00 6.00 8.00 1000 1200 2.00 4.00 6.00 8.00 1(00 1200
Outside Air 18.9 17.5 16.4 16.0 17.8 21.3 26.0 31.1 33.0 31.1 26,6 23.2 18.9
Ref.Room 21.5 20.4 19.1 18.0 16.9 17.2 19.9 22.0 26.1 30.2 30.6 28.2 21.9
Room-1 22.0 20.8 19.3 18.2 17.2 16.9 19.6 22.8 26.5 30.4 31.9 28.6 22.0
Room-3 23.2 22.1 21.4 21.0 20.6 20.1 21.4 25.2 28.7 31.9 31.0 27.3 23.2
Table 11.8: Outside Air and Room Temperatures (Mar.26-301982)
A.M Noon P.M.
Time 1200 2.00 4.00 6.00 8.00 1000 1200 2.00 4.00 6.00 8.00 1000 1200
Outside Air 25.3 24.7 23.9 22.9 22.6 26.5 32.7 34.4 37.0 33.4 29.0 26.6 25.3
Ref.Room 27.4 26.6 26.1 25.9 25.5 25.1 25.0 27.3 30.0 33.0 35.2 32.0 27.4
Room- I 27.0 26.4 25.8 25.3 25.1 24.9 26.2 28.4 31.0 33.4 35.S 31.0 27.0
Room-3 28.6 27.9 27.7 26.4 26.2 26.1 26.1 26.5 28.3 29.S 32.8 33.3 28.2
Table 11.9: Outside Air and Room Temperatures (Aug. 11-15 1982)
A.M. Noon P.M.
rune 1200 2.00 4.00 6.00 8.00 1000 1200 2.00 4.00 6.00 8.00 1000 1200
Outside Air 20.8 20.3 19.1 18.8 19.5 20.8 23.6 26.6 29.0 28.2 24.9 21.5 20.8
Ref.Room 22.3 22.0 21.7 21.1 20.0 19.5 20.I 21.5 23.0 24.8 25.6 25.1 22.3
Room- I 22.1 21.8 21.4 20.8 19.8 19.4 20.3 22.0 23.5 25.3 25.9 24.6 22.1
Room-3 23.0 22.1 22.3 21.4 27.0 20.8 19.8 20.9 22.4 23.6 25.0 25.1 23.0
Table ll.10: Outside Air and Room Temperatures (Oct.21-251982)
A.M. Noon P.M.
Tune 1200 2.00 4.00 6.00 8.00 1000 1200 2.00 4.00 6.00 8.00 1000 1200
Outside Air 22.0 21.0 19.8 18.9 18.5 22.0 26.5 30.0 31.2 28.2 25.9 24.0 22.0
Ref. Room 22.3 21.9 21.3 20.0 19.6 20.0 22.3 26.1 29.0 28.4 27.3 24.4 22.3
Room-1 22.8 22.3 21.5 20.8 20.0 19.4 21.6 25.0 28.3 29.6 27.6 25.0 22.8
Room-3 24.0 23.5 225 21.4 21.0 20.3 20.3 21.6 25.0 28.6 29.1 27.0 24.0
55

Results of Analyses
The temperature recordings from the dry bulb thennometerwere analysed along with occupants' activity chart. The comfort zones (fable 11.2), the temperature readings (fables 11.7, 11.8, 1 l.9and 11.lO}andtheactivityperiods are put together and expressed graphically in Figs. 11.4, 11.5. 11.6 and 11.7.
Critical Period - 1 (16-20 January):
With reference to Fig. 11.4, the indoor environment is generally comfortable at night But there exist cold discomfort conditions in the morning and afternoon. However, room 3 is wanner during the day and at night than room I. Confinnatory psychophysical responses showed that room 3 is preferred both at night and during the day.
LOCATION t SAMARU NIGERIA
Period~ Jon. 16-20
r----40r-'r"'11"""'T-r-r-r-r-,--r.,....r--,
36+-+-H-t--+-l-f-+-+--+-+--4
----12+-""-1~-t-....._ ........ --+-..._-+-........ 0 4 8 12 16 20 24
Ti1111
Gora91
Room I
Kitchen
Ref Room
Room 2 -Room 3 -Toilet
0 4 8 12 16 20 24
Time
to ¥ Outdoor air temperature I s Critical room no. I 3 s Critical room no.3
-Comfort Zones _;.~ -L,#
Fig J J .4: Activity chart
56
Space and
Activity
Critical Period - 2 (26-30 March):
Fig. 11.S shows that there is heat discomfort at night in both rooms 1 and 3. Although it appears that both rooms are thennally comfonable during the day. The results ~f the psychophysical tests at 4 p.m. indicate that ~om 1 1s uncomfortable while room 3 is comfortable. Agam room 3 is quantitatively and subjectively better than room 1.
Critical Period- 3 (11-15 August):
If Table 11.9 and Fig. 11.6 are carefully studied, it ~-be seen that there is an agreement between the subJecuve responses and records. That is both rooms, 1 and 3, are somehow hot at night and cold during the day. It ~hould be noted that the brief period of comfortable environment coincides with the activities in the living room.
l.OCATION~ SAMARU NIGERIA
Period, Mor. Z6-30
,----- 401-,-,r--r--.-....-y--,~~...,....-r-.
• .. :,
0 .. • Q.
E • ...
16,+-+-i-4-t--t--+-H-t--t--H
----- 12-4--"-lf.---l--+--'--f--l-f---'-+-"'--1 0 4 8 12 16 20 24
Time
Garage
Room I
Kitchen 1-----+--+-+--tf--+-t-"""1 Space and
Ref. Room ~-l--+--1-.... -flllll--t Activity
Room 2
Room 3 :.
Toilet
O 4 8 12 16 20 24
Time
to• Outdoor oir temperature I ~ Critical room no. I 3" Cri ticol room no.3
fk, .. Comfort Zonu
Fig 115: Activity chart

Critical Period - 4 (21-25 October):
The interior environment during this period is comfortable at night in room 1, while room 3 is only comfortable during early morning hours (Fig. 11.7). The thermal comfort assessment of the two rooms is also in favour of room 1 (Fig. 11.7). But the psychophysical comfort survey of these rooms is actually in favour of room 3.
The analysis of Tables 11.5 and 11.6 with absolute figure method showed lhat room 3 is warmer in the cold period of the harmattan and cooler in the hot periods of transition than room 1. Here statistically significant tests are inferior to absolute figures from psychophysical tests and, therefore, cannot be applied.
LOCATION SAMARU NIGERIA
Period• Au gust 11-15 .-----40-r-~-r--r-T----r--,-...-.--,_. __
36rrHH-+-+-+-H4-+~
32rrt-1H-+++-1--1--1-+~
~--- ,2_...._+-''-+ ....... +-.L.-r--i.--1-...1...-1 0 4 8 12 16 20 24
Time
Garage
Room I
Kitchen t---t-11111--i-.+--+-~ Spoce and t-----+--,~-+-+--1~-+---l Activity
Ret. Rqpm
Room 2
Room 3
Toilet
0 4 8 I Z 16 20 24
Time
to "' Outdoor air temperature
I :r Critico I room no. I
3 = Critical room no.3
- Comfort Zones .-,., .. - ..
Fig 11.6: Activity chart
Conclusion
The analysis of the data from the studies have shown that temperature alone cannot be used to establish comfon limits. No matter how perfectly fixed the comfort limits are, they remain mere hypothesis which can only be confinned or refuted by confinnatory tests based on the responses of the people. However, the tests have established a fact that temperature alone may be used to fix comfort limits if other environmental elements are within acceptable limits or if human perfonnance is not the target of design.
Another factor found to have influenced the perfonnance of the studied rooms is room orientation. The southern elevation enjoyed solar radiation during the cold harmattan
LOCATION• SAMARU NIGERIA
Period: October 21 - 25
~ "' -0 .. • 0..
E • I-
401r-r--r-r-.--.-""T"""~~--
36H-t-+-+-4--1--1--1--I--I-...J....I
--- IZ+-i......t.....1..--+-....1...4--1-..JL--1-...J...J...J 0 4 8 12 16 20 24
Time
Garage
Room I
Kitchen t-----~--4---1---1~...J...-L--.....J Space and
Ref. Room ._-+-+--~--•lilla-1 Activity
Room 2
Room 3
Toilet
0 4 8 12 16 20 24
Time
to: Outdoor oir temperature I : Critical room no. I
3: Critical room no.3
- Comfort Zonal ••·.-.ubil
Fig 11.7: Activity chart
57

period (critical period• 1), while the same solar radiation aggravated heat discomfortjn the rooms on the northern elevation. This means that sun-path pattern is a factor that must be taken into consideration in space organisation and orientation as this can be contributory to heat comfort or discomfort. Furthermore, spatial SHIELDS are found to be very effective in space organisation. It should be mentioned that the Shields" alone will be inadequate to maximize the passive control component of the environmental control task. QI.her mentioned factors necessary for the maximization of passive control must be separately and jointly investigated. Apart from the "uncontrolled" method employed in this research to assess the effectiveness of space organisation and orientation on thennal comfort. environmental chambers should be designed and built to investigate the effects of other factors on the magnitude of passive control in the environmental equation.
Reference J. Broadbent, C.H. and Ward, A. 1969: "Design method on an archirecrure". Arch. Ass.Paper 3, Lund Humphries, London.
2. Humphreys, M.A. 1978: "Outdoor temperatures and comfort indoors". Building Research and Practice Vol. 6 No. 2. pp. 92-105.
3. Koenigsberger, OR. etal 1973: "Manual/or Tropical Housing and Building" Parr I, Longman Harlow.
4.Koesler,A.1964: "TheActo/Creation".-Hutchinson, London.
5. Solanlce, C. 1981: "Double-glazed window in Nigeria: tropical environmental appraisal". Research Paper, Ahmadu Bello University, Zaria.
6. Szokolay, S. V. 1983: "Responsive design approaches". Habitat lntematwnal Vol. 7.
58

CHAPTER12 The Effect of Environmental Strain Upon Students'Comfort and Work Performance Ferede Befekadu Faculty of Technology. Addis Ababa University Ethiopia
The Indoor Environment
The complaints of people engaged in different kinds of sedentary activity in interior spaces regarding thennal. visual and noise environments has in many countries brought about growing concern which has necessitated a tremendous amount of research. However. due to the method of research, the kind of equipment used, facility limitations, the number of subjects, etc. the results obtained are rather varied. The principal objective of the present investigation is to study the effect of thermal, visual and noise environments upon the health, comfort and work performance of students engaged in sedentary activity in the classroom.
In order to carry out this investigation it was first of all
student subjects chosen were essentially those of a similar age group and have Ii ved at least two years in the school campus, where they have been leading similar life patterns and have become used to the general campus environment.
Experiments in the past have shown that subjective evalu~ ation varies not only among different individuals but also upon the same individual at differenttimes (Givoni, 1976). It was, therefore, necessary to use as many subjects as possible, assess each three times and take the mean values. Evaluation criteria with proper corresponding numerical scales were carefully selected for each of the three evaluated environments. The selection of these criteria was rather difficult. However, a more appropriate tenninology for expressing these criteria of evaluation than the ones given in this paper is at the moment hard to find (Hopkinson and Collins, 1970).
necessary to choose buildings whose interiors could offer Subjects were given pre-instructions regarding the purvaried environmental conditions. Two different buildings, pose of the research. Each subject was handed out a format A and B, of different orientations and surroundings were on which he had to mark three times on different occachosen. Room A is a 40 cm stone masonry lecture room sions. Subjects were unaware of the values of the simulta(ground floor) whose floor and ceiling arc made of wood neous physical measurements taken so that they would and reinforced concrete respectively, and is highly exposed base their assessment upon what they truly felt rather than to severe road traffic noise. Avaitabilityof daylight indoors on the awareness of the magnitude of the thennal, visual or is rather poor. Room B is made of concrete hollow blocks noise measurements. with a chipwood ceiling, galvanized corrugated iron roofing . , and cement tile flooring such that during the hottest parts A~o~g the facto~ which affect stud_ents assessment of
• · • h the1r mdoor environment are the kind of lecture they of 1!1-e day 1t offers se~ere mtenor tempe~~ture~ w cre~s attend, the mentality of the lecturer in question, whether dunng the earlymdmmgs very cold conditions are-ft¥Q.l-k.. . humorous or mechanical, his knowledge of the subject he able. is teaching, his method of lecture presentation, personal
ity, etc. If Lhesc factors are favourably presented to the students there is reason to believe that they may not feel the strain from the indoor environment as much as they would feel when the lecturer is otherwise. Reported cases where some students were discovered fast asleep at the time of lectures were not uncommon. Subjects' assessment of their environment in this regard is awaiting future research.
Experiments in the past have indicated that subjective assessment requires acclimatised and preferably trained subjects for experimentation. It was, therefore, necessary to make personal evaluation of the subjects to ensure dependable results. The student body included subjects who have come from lhe remotest parts of Elhiopia to undergo architectural training. Some have never encountered life in an urban area before, implying for instance that they were unaware of road traffic noise for an extended period. Assessment data obtained from such subjects could end up in unexpected or even embarrassing results. The
The Thermal Environn1ent It is known that human beings' sensation of wannth or cold is entirely subjective and depends upon various factors
59
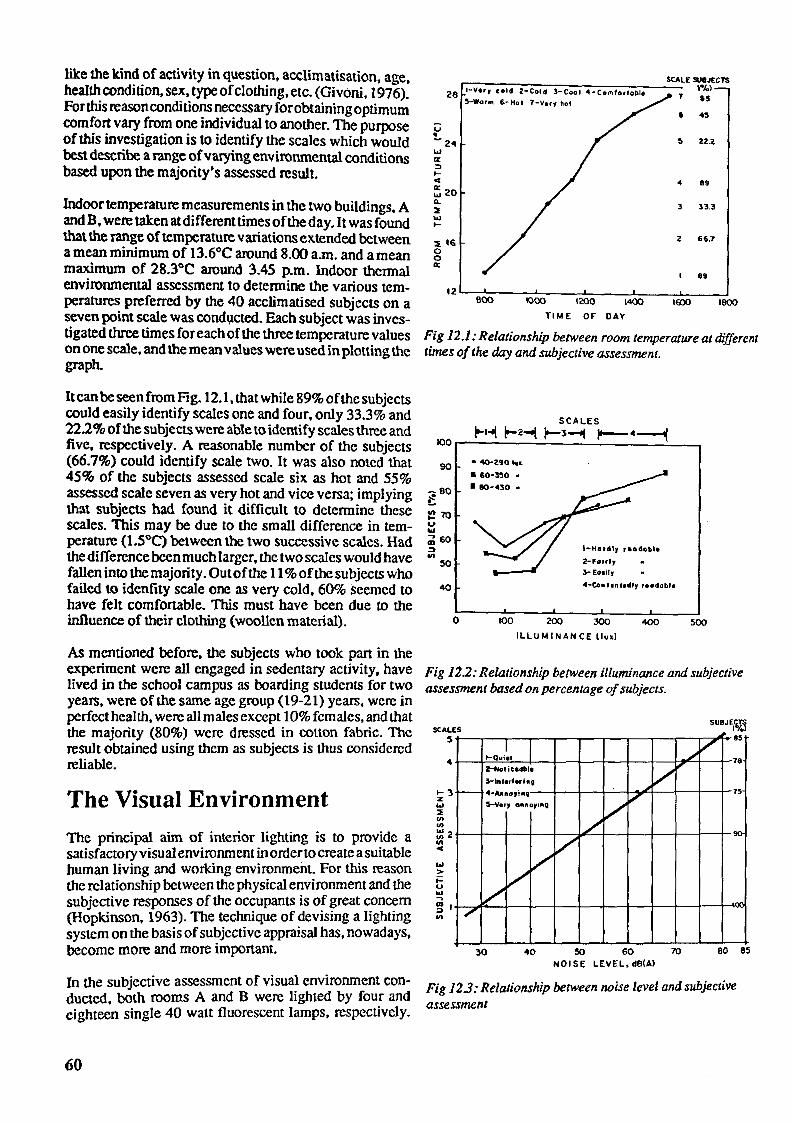
like the kind of activity in question, acclimatisation, age, health condition, sex, type of clothing, etc. (Givoni, 1976). For this reason conditions necessary for obtaining optimum comfort vary from one individual to another. The purpose of this investigation is to identify the scales which would best describe a range of varying environmental conditions based upon the majority's assessed result.
Indoor temperature measurements in the two buildings, A andB, weretakenatdifferenttimesoftheday. It was found that the range of temperature variations ex.tended between a mean minimum of 13.6°C around 8.00 a.m. and a mean maximum of 28.3°C around 3.45 p.m. Indoor thermal environmental assessment to detennine the various temperatures pref erred by the 40 acclimatised subjects on a seven point scale was cond1,1cted. Each subject was investigated three times for each of the three temperature values on one scale, and the mean values were used in plotting the graph.
It can be seen from Fig. 12.1, that while 89% of the subjects could easily identify scales one and four, only 33.3% and 22.2% of the subjects were able to identify scales three and five, respectively. A reasonable number of the subjects (66.7%) could identify scale two. It was also noted that 45% of the subjects assessed scale six as hot and 55% assessed scale seven as very hot and vice versa; implying that subjects had found it difficult to determine these scales. This may be due to the small difference in temperature (1.5°C) between the two successive scales. Had the difference been much larger, the two scales would have fallen into the majority. Out of the 11 % of the subjects who failed to identity scale one as very cold, 60% seemed to have felt comf onable. This must have been due to the influence of their clothing (woollen material).
As mentioned before. the subjects who took pan in the experiment were all engaged in sedentary activity, have lived in the school campus as boarding students for two years, were of the same age group (19-21) years, were in perfect health, were all males except I 0% females. and that the majority (80%) were dressed in cotton fabric. The result obtained using them as subjects is thus considered reliable.
The Visual Environment
Toe principal aim of interior lighting is to prov!de a satisfactory visual environment in orderto create a suitable human living and working environment. For this reason the relationship between the physical environment and the subjective responses of the occupants is of great concern (Hopkinson, 1963). The technique of devising a lighting system on the basis of subjective appraisal has, nowadays, become more and more important.
In the subjective assessment of visual environment conducted, both rooms A and B were lighted by fou: and eighteen single 40 watt fluorescent lamps, respccuvely.
60
SCALE SUBJECTS r.:-:-:----:-"."""::"""::-'."~-~--,---- \~k)
28 I-Vo,, cold 2-Cold 3-Cool 4-ComforloDle T $S 5-Wor"' 6-Ho1 1-ve,1 hot
u • -2 .. l&I a: ::, .... ◄ :!; 20 ... :I w ... ~ 16 0 0 a:
I 45
S U.2
4 89
2 66.7
I 89 ,2 ____ __.._ __ _..__ __ _._ __ ...L-, _ __.
600 IOOO 12.00 1400 1000 1800
TIME OF DAY
Fig 12.1: Relationship between room temperature at different times of the day and subjective assessment.
IOO
90
-80 .e !...
e 10 V .... ;; 60 => "' 50
40
0
SCALES
~1-4{ !-2--( )-l-f !'--4----4'
• ~2,01 .. ~
■ 60·350 •
I 90-430 •
100 200
I-Hardly 'to dobl•
2-Foirly
3-Eo•ilr
4-Coqt1nt•1Uy HOdabte
300 400
ILLIJMINANCE tlu~)
500
Fig 12.2: Relationship between illuminance and subjective assessment based on percentage of subjects.
SCALES
5
4
... '3 z ....
,--
:lo Cl) Cl)
~2 "' ◄ .... > i= u .... ~ I => "'
,
I t-Quiet
2-t4otictGIII• l-/1,1"' 3-lnterferi•o
j
◄-bnorint V :1---VerJ OftftoyinQ /
/
V V
~ V
'30 40 :SO 60 70 NOISE LEVEL,d8(Al
85
~ V
78
75
!I()-
·-
BO 85
Fig 12.3: Relationship between noise level and subjective assessment

90
_ao < iii 0 70 . _, ~ 60 ... ., 50 ... "' 0 40 z
z 30 ◄ ... :::E 20
.. l,..: .... ~ .. •./
..,,..i:- . . _,,,,: 1,.,,,-"1"
......
2 00 500 1000
MEAN ROAD TRAFFIC DENSITY (Vehicles per hour l
,_:/' .
2000
Fig JZ.4: Mean noise level as function of mean road traffic density
Wmdows were sufficiently large enough for the admission ~f daylight. ~d, because of continuous clear sky condinons, only mmor fluctuating illuminances were obseIVed. A total of thirty six different illuminance values were m~ured on the working tables of the forty subjects. Each subJect was investigated three times for each of the three illuminance values on one scale.
Rather th~ changing the illuminance values during the assessment period, each subject was asked to move to the next seat which had a different illuminance value than the previo~s ?ne in ~hich he was assessed. Using four differe~t ~tena, s~bJects were asked to identify to which cntena the different illuminance values would correspond. Su?jec~ were unaware of the magnitude of the measured illummance values throughout the investigation so that they merely depended upon the result of their feelings. They were nevertheless infonned that there were four criteria to be evaluated.
From the mean assessment data in which forty subjects took part, a graph was plotted with illuminance against percentage of subjects on a four-point rating scale. It can be seen from Fig. 12.2 that as the illuminance increases from 40 lux to 80 lux the percentage of subjects decreases, ~owing th~t 67.5% is the majority's preference to categonse 40 lux m scale one. As the illuminance increases from 100 lux to 160 lux, the percentage of subjects decreases. This shows that the 57.5% majority is in favourof lhe 100 lux to represent scale two. An increase in illuminance from 180 lux to 260 lux shows that the percentage of subjects also increases from 67.5% to 75.5%, respectively. Thus, the 260 lux may be the maximum limit for scale three. In the contentedly readable zone the percentage of subjects increases as the illuminanceincreases from 290lux to430 Iux. This shows that 87.5% is the preferred majority indicating 430 lux as ideal for scale four. It is interesting to note from the figure that at lower illuminances the range which for scale one is narrow, keeps on increasing for
hi~herilluminanceuntilatscalefouritbccomesmaximum. It 1s to be noted that in the lower illuminance regions of 40 luxto 160Iux,thepreferencesofsubjectskeepondecreasing wher~as for values above 160 lux their preferences rise ~howmg _th!t sc~es three and four required a substantial increase m illummance .
The Noise Environment
One of the gre~test nuisances facing mankind today is the problem ~f n01se: The eff~c~ of no!se on human beings engaged m any kind of activity be 1t work, recreation or eve~ sleep range from merely psychological effects such as disturbance, irritation and annoyance to the hannful ~hysiological effects that produce mental strain and fatigue, loss of appetite and indigestion, headache and in severe cases pennanent ear damage (Close, 1966; Moore, 1978; Seto, 1971). Noise becomes harmful when it is above desirable limits for a prolonged period. There is no su~h thing as the human ear getting used to objectionable noise. The psychological and physiological factors involved in noise vary greatly from person to person and henc~ Iaborato~ research intended to anticipate people's reactions to n01se has been found difficult.
The effect of noise upon students in the classroom where mental concentration for the understanding of verbal instructions is expected has been so felt that there have always been complaints both from instructors and students about the daily road traffic noise on the Jimma road facing the lecture rooms of the Faculty ofTechnology. Although the complaints have been more serious than both thennal and visual environmental effects, nothing has been done about it hitherto. The purpose of the present investigation is to investigate subjects' reactions to various sound levels on a criteria whose scales range from one through five, using forty subjects in two selected classrooms of the faculty. Each subject under investigation was exposed to five different noise levels ranging from faint to severe through approximately (32-38) dB (A), (44-51) dB (A), 57-62 dB (A), 68-72 dB (A) and (78-81) dB (A).
In order to avoid confusion and ensure accuracy of assessment, a difference of 6 dB (A) was maintained in between any successive noise levels. The subjects, who were not aware of the magnitudes of these sound levels, were asked to evaluate their effect on a criteria whose scales range from one through five. Each subject was assessed three times for each noise level presented in different order. The resultofthcassessmcntisshowninFig.12.3.Itcanbeseen from this figure that actual annoyance starts from values of more lhan 72 dB ( A), which roughly corresponds to a mean traffic density ofl 400 vehicles per hour(Fig. 4.3) the most severe ones occurring between 8-9 a.m. followed by that of 11-12 a.m. These severe noise levels, felt by 85% of subjects, occurred during the period when the number of trucks was maximum. Table 12.1 shows the number and type of vehicles passing through the street. Levels of 40dB (A) and lower were found to be in the quiet zone whereas
61

Table 121 Total n.umberof~hiclts. their corTtsponding mean noise levels and percentage of different types of vehicles passing be~en 8.00 am and 6.00pm
Trucks 25 22 24 34 37 38 52 85 84 129 118 146 126 144 180 142 279 227 269 202 15.4
Automobiles 187 213 256 247 301 360 436 534 631 619 693 696 751 798 786 869 790 1082 1242 1331 83.3
Motor Vehicles 3 S 5 9 4 12 7 61184 12 10 13 9 6 21 17 12 23 1.3
Total 215 240 285 290 342 410 495 625 726 756 815 854 887 955 975 10171090 1326 1523 1556 100
Mean noise level dB (A) 43 42 43 45 47 53 55 57 58 63 63 60 66 6 t 62 67 65 68 71 76 78
SOdB(A)andabovewereinthenoticeablerange.Fig.12.4 References shows the mean road traffic density per hour against the fluctuating noise levels which were recorded during nor- J. Close, P.D.1966: "Sound Control and Thermallnsumal working hours for a 10-hour (L 10) duration viz. 8 a.m. lotion of Buildings".Reinhold Publishing Corporation, -6p.m. The noise level 15 m from the centre of the road New York. was recorded as 78dB (A). Apan from the continuous but intennittcnt road traffic motor noise. some of the most 2. Givoni. B. 1976: "Man Climate and Architecture". serious complaints rcponed under remarks on the cvalu- Applied SciencePublishers Ltd., London. ation fonnat distributed to subjects were the repeated explosions from internal combination engines through the 3. Hopkinson, R.G. 1963: "Architectural Physics: exhaust system and the automobile homs whose maximum Lighting". H.M.S. O. ,London. noise levels were 86dB (A) and 91 dB (A) respectively. From the result of this subjective assessment it may be 4. Hopkinson, R.G. and Collins,J.B.1970: "The Ergonconcludcd that the degree of annoyance experienced by the omics of Lighting". Macdonald Co. subjects is much more serious than thatofthcrmal orvisual assessments. Thcpcrcentageofsubjcctsinnoiseasscssment 5. Moore, J.E. 1978: "Design for Good Acoustics and for all scales is much larger than that of visual or thcnnal Noise Control". The Macmillan Press Ltd., London. assessments indicating that subjects were very conscious to sounds and thus assessment was easier. 6. Seto, W.W. 1971: "Acoustics". McGraw-Hill, Inc.

Cooling and Ventilation in Kenya: Some Comments Derrick Flatt P.O. Box 14398, Nairobi, Kenya.
Introduction
Kenya is bisected by the Equator and habitable areas range from sea-level to 3000m. On the Equator, the sun rises and sets 23 degrees North or South in December and June and due East and West in March and September. The country is also bisected by a N. W./W.E. line Rift Valley. The same vegetation grows at 1800 metres East and 2000 metres West of the Rift. Because of these differences in atmospheric conditions it is difficult to point at any building as a typical Kenyan house.
After 40 years in Kenya, a longer time spent in the West than in Nairobi and other places, I have not seen a "nollllal" year yet. Our greatest enemy is the sun. So roofs and shading are our major consideration, except perhaps in Nairobi where you can build anything and the weather changes just before it becomes unbearable.
Cooling and Ventilation in Kenya 1be Arabs, who have historically occupied the coast for hundreds of years built with the intention of keeping out heat and wind. It is for this reason and because of the only slight change between day and night temperatures that light roofs (makuti) and white painted coral walls are common building components at the coast today. Both, roof and walls, arc kept damp by the salt air making the environment inside more comfonable. In addition, by using the dry N.W. Monsoon (and not the cold, wet S.W. Monsoon) one can ensure the structure to be sufficiently \'entilated.
The main inhabited areas are from 1200 metres to 2100 metres altitude. fu this range of elevation heavier roofs are necessary. Reinforced concrete can be utilized but it does ~ to be protected from temperature change, which in Kaimbi varies extensively. It should be noted that if bitumen is robe used as a safeguard, ultra-violet rays can r.ipidly destroy this substance if it is exposed.
For protection, we use closed or double roofs. A ventilated or unventilated roof space with insulation for reflective upper ceiling surface is ideal for indoors. For window shielding, aluminium louvres are effective, but look good only from outside. Asbestos grills of the right height and dep_Lh have proved effective, as have deep columns with honzontal eyebrows, but both need careful orientation.
On low buildings, wide eaves are excellent for keeping walls cool, but they present problems west of the Rift Valley where most storms are cyclonic with considerable uplift.
Most heavy basic building materials are usually, located some distance from urban centres and are, therefore, costly. This expense has discouraged the construction of thick walls. At any rate, walls built225 mm,ormore,thick tend to collect heat and act as a radiator. Cavity walls would be a more ideal building component but are not often used because they are complicated. To be effective, the operational theory of the cavity wall must be understood right through to the labor force.
Mechanical air-conditioning is expensive to install run and maintain anywhere outside Nairobi and Mombasa, and is best avoided anywhere unless you have a large computer, a refrigeration plant, or a luxury hotel where the cost of highly skilled staff can be borne. Ventilation can be achieved by moving air which is too hot or too cold by induction, suction, pressure, or other simple means, and at the worst by fans, to achieve the 4.5°C lowering of temperature which induces a feeling of cool comfort
Too little thinking is given to the design and positioning of ventilators. Usually they are placed above lintols or, even worse, incorporated in windows. They are filled with fine gauge gauze to keep out inseclS and comply with out-dated health regulations. Often they are double section concrete panels cast in an ornamental pattern which is impossible to clean and becomes progressively less effective. When not regarded as an unnecessary evil and suppressed as much as possible, they are sometimes used as architectural decoration.
63

If architects could only think of buildings as materials in a state of arrested motion and the space within them as air which, for comfort, must be continually but slowly kept in motion - drawn over a cool external entry and removed by its own heat through a scientifically placed exit-then a lot of houses and offices would be much more comfortable. For single storey buildings there is much to be said for ridge ventilators, but remember to let enough daylight into the roof space to discourage bats.
An increasing feature of urban life in Kenya is the lace cunain. It is less obtrusive than 3 M's Scotch Tint which turns windows into mirrows, but the shopkeepers' claims that it offers no obstruction to the passage of air is not correct.
A central flue separated into compartments and designed like a wood burning fireplace with a full width throat and a decompression chamber above will probably be the solution for two or more storey buildings many of us will come to, whether we can afford a fire or not.
Conclusion
high level outlet opening; an interior designer hung ceiling to floor curtains over our high and low level set of vents from which air was led away by a central outlet duct; a Bank Manager complained bitterly of the heat because he had forgotten to open the windows!
Traditionally, ventilation has al ways been an engineering matter involving mathematical fonnulae. It might save unkind remarks about miscalculations if ventilating became an art and, therefore, at the mercy of the layman, who generally fails to understand art anyhow!
One room, the smallest in most houses, is very frequently under-ventilated-the loo! This room usually has one small top-hung window. If it was brief with a low-level ventilator and a bottom-hung, open-out window, those who follow after might appreciate the improvement to the environment.
In conclusion, within the framework of architectural practice, our progress has been astonishingly fast more so if we note that there is no pennanent building, even 100 year old, in East Africa except those built by the Arabs at the coast.
Ventilation is so important. often so simple and so often Note: Derrick Flatt has practiced in Kenya as an architect overlooked. but almost impossible to make foolproof: A for more than 40 years. Town Hall engineer once fixed an intake fan into my main
64

CHAPTER14 Notes on the Relative Importance of Climate as a Physical Planning Determinant in Egypt Sayed M. Ettouney Department of Architecture, Cairo University Egypt
On Climate and Urban Form
In developing new communities, urban fonns or settlements landuse plans evolve through a complex process comprising ofintuitive and rational actions and spanning a sequence of closely related phases. The key phases of the physical planning process are as follows.
i. ii. iii. iv.
V. vi.
Definition of goals and objectives. Formulation of development programmes. Definition of planning context. Development of alternative solutions to the planning problem Le.alternative physical plans. Evaluation and evolution of alternatives. Development of a selected plan.
The physical context outlines the ranges of actions (or relative freedom) for the physical planner in manipulating and organizing urban fonn elements; i.e. functions, flow systems and visual form within the locality. The influence of the physical parameters on urban forms is normally defined at the early stages of the planning process, then it is synthesized into a set of key physical determinants which, in tum, are used as bases for the fonnulation of planning alternatives as well as criteria for their evaluation.
The main elements of the physical coritext that affect the urban fonn and development activities include:
l.
The urban form presents a challenge to the physical planner and plays a decisive role in the success or failure 11_
of any development plan (Ettouney, 1986).
location factors, spatial interrelations, existing and neighbouring landuses, linkages, flow systems and infrastructure; topography, slopes and inclinations, rudges and watershed lines, stonn water gullies etc; geotechnical aspects, soil and underground water;
iii. Urban form generation is a complicated process that results from the complex interactions of three major sets of iv. planning detenninants, namely:
Development Goals and Objectives; national, regional and local.
V.
landscape families and natural elements/features, and climatic aspects, thennal environment, wind environment, lighting, precipitatioll i.
ii.
iii.
Development Programmes, e.g. target population, labour force andjob opportunitics, cconomic base and activities, housing, community facilities requirements and thresholds etc. Physical Context Determinants; the plan setting, the site and the environment, including the existing and surrounding uses, site characteristics, environmental aspects and climate.
The relationship between climate, urban fonns and the resulting built environment is rather critical becau~ ~f the influence climate has on the features and charactensucs of the city.
The climalic effects (arguably) arc in lhe following directions:
The physical context is a major factor in shaping t?e fonn of new settlements. It is also an important detcnnmant of ii. its feamrcs and physical character. Furthermore, it provides the setting for the interactions of ~c ~rst two determinants listed above, i.e. goals and ob3ecta·cs and iii. development programmes (Y ousry and Enouncy 1980; Perkins, 1978).
The choice of location and site selection for new settlements. The shape and spatial patterns '!f setrleme~ts, i.e. its two dimensional configurauons, (e.g. linear, concentric, dispersed, concentrated etc.). . The macro-orientation of the urban mass, ma3or axes directions.
65

iv.
v.
vi.
vii.
viii.
The spatial organization of landuses within and around the settlement. Alignment of major vehicular and pedestrian routes. The configurations of urban fonn boundaries, i.e. the borders between settlements and the surroundings, e.g. desert. Details, fonns and location of urban fonn edges and delineators, e.g. shelter-belts, open spaces, green corridors and breeze channels. Major three dimensional related decisions e.g. intensity of uses, heights, densities, spacing, plot ratios etc.
deselt cities include enhancing the national economy, restoring balance to urban structure, solving urbanization problems, solving primate cities' urbanization-explosion related problems, and initiating desert development away from the over-crowded limited Nile valley ( 4% of Egypt's area).
A note on the climate of Egypt
Egypt is predominantly arid. In fact, 92% of the country's area is hyper-arid while the rest is made up of semi-arid, coastal deserts, inland and valley deserts etc. (ALNL, 1981 and Konya, 1980). Egypt is located within the maximum solar radiation belt (15°N 30°N). The country's cultivated area, the Nile valley and its delta, hardly amounts to4% of the total area (1 million sq. km) (PADCO, 1983). Three distinct climatic regions can be easily identified within the predominant aridity. These are:
The effect of climate further extends through the closely related phases ofurban development i.e. three dimensional planning; see for example Kon ya (1980). Three dimensional planning links architectural and building activities on one hand and urban planning on the other. It comprises of urban design, townscaping, landscaping, site planning and i. development control. It, also, marks the phase where the third dimension emerges and the urban scene is prepared
the Mediterranean strip, maritime region, along the northern coast and to the south (north oflatitude 30° 30' approximately).
to accommodate man-made elements; buildings and their ii. the desert region, covering most of the country, south oflatitude 29° 30' and, accessories.
Examples from Egyptian New Desert Developments
This section is a brief highlight of the features of three Egyptian new desert cities ( Figs 14.1 and 14.2) together with selected development projects within their structures. The three selected new cities belong to the 1st and 2nd generations of dcsen cities, developed and, still being developed around Egypt's two primate cities: Cairo and Alexandria. The development objectives behind the new
Table 14.1 Egypt's Climatic Regions, Highlights
Climatic Regions Features Maritime Region
1- Average annual rainfall (mm). 160-200 2- Mean monthly temperature ranges, °C. - summer 20-32 - winter 8-27 3- Mean diurnal range °C. 9-12 - summer 6 - winter 9 4- Prevailing Wind directions - Prevailing N.NW
N - Secondary 5. Mean monthly relative humidity % 50-80 - summer 73 - winter 73
iii. the transition region that links the Mediterranean zone and the arid desert region; it is comprised of the Nile valley and its delta(Fig. 14.1).
The three zones overlap and interact Their main climatic features are summarized in Table 14.1 (MD, 1960). The climate is generally stable and marked by h?t-dry and sometimes humid summers; warm or relatively cold winters. The prevailing wind directions are north and north-west. These moderate the thermal impact of the hot seasons. Strong sand storms from the south an~ the south· west prevail for a short period during the spnng season (khamaseen).
Desert Transition Region Region
5-10 50
24-43 10-34 4-32 9-21 17-22 12-17 21 14 15 13
N.NW N.W NW N 10-55 40-80 31-68 33-78 42-73 49-83
b d M ho • tabl and the data provided from 37 meteorological Thermal stress analysis of the climate of Eghypt, lase on,,: tra 'b nJ sat ~ys and night times throughout the year is as shown in stations (Salem, 1984), indicated that the t erma stress ..,,s z u .. on
Table 14.2.
66

Table 14.2: Thermal Stress Distribution from 37 Meteorological Stations. Egypt
Day Night
Thermal Stress Hot Cold Comfort Hot Cold
Total no.of months 221 93 130 29 238
Average no. of months 5.97 2.51 3.52 .79 6.43
Percentage 49.8 20.9 29.3 6.5 53.6
26 27 28 29 30 31 32 33 34 36 37
31
29
28
27
26
: 25 : . 24
• 23 : . : : .
3
EDITERRANEAN
·=•:•:•:-:•:• •• .............. 31
30
29
28
27
26
24
23
22 ~---········--··--·- .• -----·······~---······---- -·-·········---··--·-··--· ····. • 25 26 27 28
r£SI OVER 200mm.
CJ IB:3 ~ ~ IDlJilll ~ ~
190-200mm.
100-150 mm.
75-100 mm.
50-75 mm.
25-!50 mm.
I0-2!5 mm.
29 30 31 32 33
l MARITIME REGION
2. TRANSITION REGION
3 DESERT REGION
Fig 14.1: Egypt, annual rainfall and climatic regions
34 35 36 37
50 100 150 1 I I
Km
Comfort
277
4.78
39.9

New Ameriyah City (NAC) Temperature ranges: monthly mean max. monthly mean min. monthly mean (diurnal) Relative Humidity range monthly means Prevailing wind direction
18.6- 30cc 7 - 21.5°C 8.8 - 1 t.6°C
66.5 -74% NandNW
WhileFig.14.3showsthemasterplan,Fig.14.4showsthe setting for NAC- a longitudinal cross-section abstracting the features of the site, as it extends from the Mcditer- -ranean to the city's site. The NAC site is flat with a central ridge ( + 80M), markingnortbem and southern watersheds, -slopes are of the order of 3% inclinations with a few sharp gradients in the north (10%}. The climatic diagnosis - following Mahoney's Tables,
Koenigsberger et al (1973), Konya (1980) indicated that The climate is typical of coastal desert, characterized by the day/night thennal stress around the year is as follows: high relative humidity, frequent dew formation and relatively small diurnal ranges (8-11 °C).
Annual rainfall is of the order of 140-180 mm, most of which falls during the winter season. The climatic data for -NAC were extrapolated from the analysis of meteorological data of the nearest five stations surrounding the site. -Other major features of the projected climate may be summarized as follows:
December to March April and November
May and October
June to September
cold, day and night comfortable days and cold nights comfortable, day and night hot days, comfortable nights.
-------- - - - --- -------------- - --------- ------ ------.__._,,_,__. ------ ----- ------ ---- - --------------- - - - - - - -- - --- -- - - - - _.... --- ,...-- ---- -- -- - - --MEDITERRANEAN SEA - - _-_- _ _... __ - - - - - - _ -------- ~- -~- ---
SIX OCTOBER NEW CI TY S. 0. N. C .
Fig 14.2: NAC, ONC and SONC-New Cities Location, Egypt
68
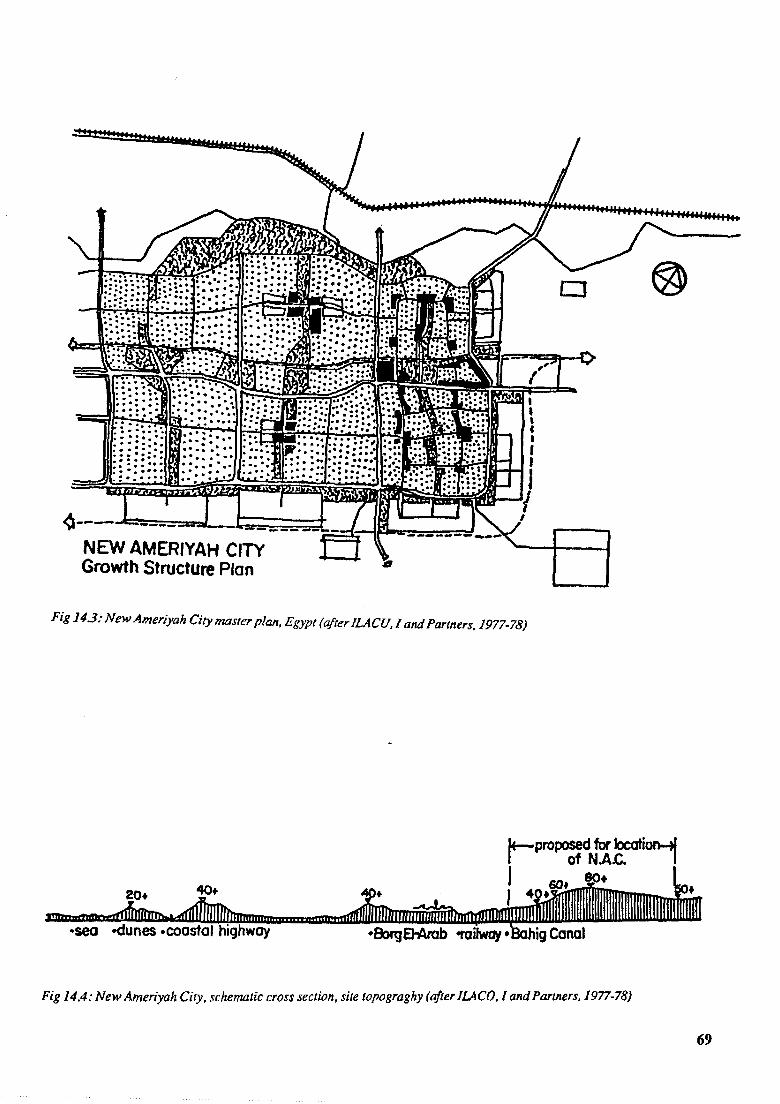
<a-.---..Jt::::-_=:_;::_;;:_::-:=::J..__ -- - -- -----
NEW AMERIYAH CITY Growth Structure Plan #II
Fig 14.3: New Ameriyah City master plan, Egypt (after ILA CU, I and Partners, 1977-78)
k-proposed for locatio~ I of NA.C. I J 80+
' •sea
Fig 14.4: New Ameriyah City, schematic cross section, site topograghy (after ILA.CO, I and Partners. 1977-78)
69
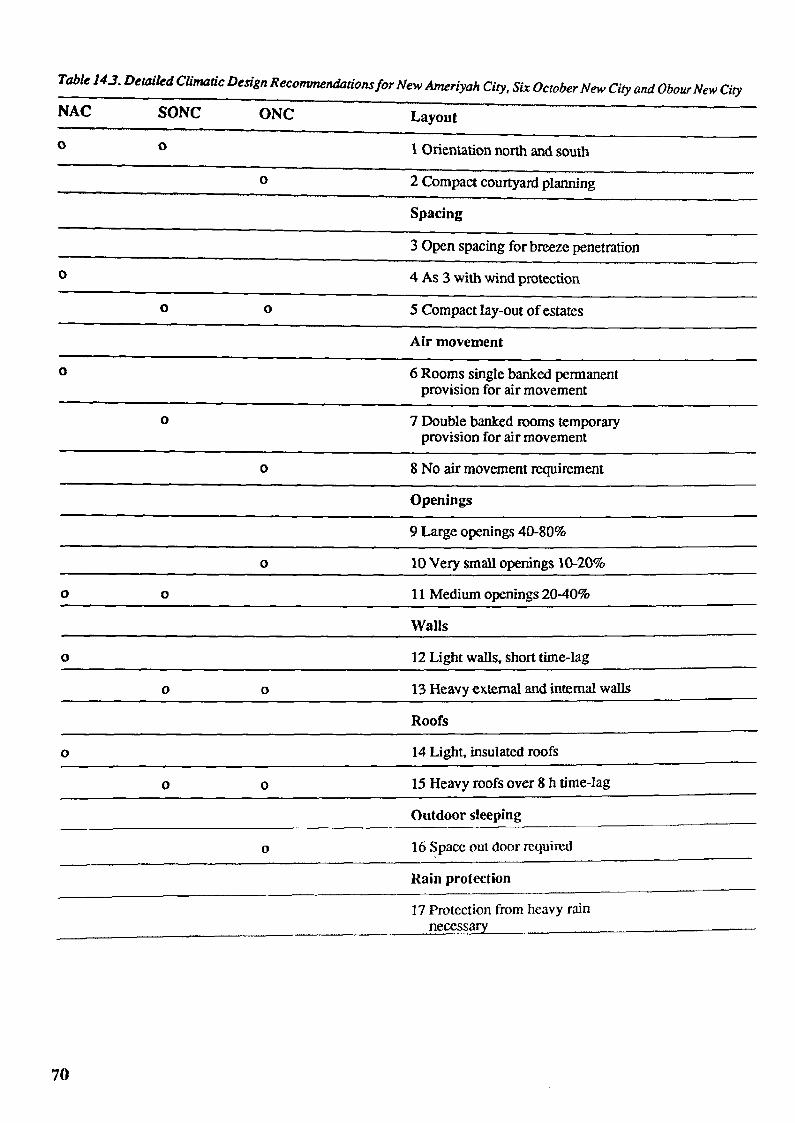
Table 14.3. Detailed Climatic Design Recommendations for New Ameriyah City, Six October New City and Obour New City
NAC SONC ONC
0 0
0
0
0 0
0
0
0
0
0 0
0
0 0
0
0 0
0
70
Layout
1 Orientation north and south
2 Compact courtyard planning
Spacing
3 Open spacing for breeze penetration
4 As 3 with wind protection
5 Compact lay-out of estates
Air movement
6 Rooms single banked pennanent provision for air movement
7 Double banked rooms temporary provision for air movement
8 No air movement requirement
Openings
9 Large openings 40-80%
10 Very small openings 10-20%
11 Medium openings 20-40%
Walls
12 Light walls, short time-lag
13 Heavy external and internal walls
Roofs
14 Light, insulated roofs
15 Heavy roofs over 8 h time-lag
Outdoor sleeping
16 Space out door required
Rain protection
17 Protection from heavy rain neccssa

Fig 145: New Ameriyah City: Neighbourhood 8-First District, Site Plan (Project Credit 1)
Fig 14.6: New Ameriyah City: Neighbourhood 9-First District, Site Plan (Project Credit 2)
The climatic design recommendations included: provision _ of open spaces for northern breeze penetration (and air _ movement), North-South orientation, i.e. long axes of blocks east - west, and protection from south-westerly sand stonns (fable 14.3).
maximum exposure to northerly winds; provisions for penetration of sea northern breeze, through north-south open space corridors bisecting the city form; efficient organization of key landuses to minimize pollution and improve micro-climatic conditions - e.g. industry is located to the south of the city and city park in the north, and exploitation of agricultural hinterland in the south.
The master plan of NAC was developed in the light of the physical detenninants, especially topographic and climatic requirements (Fig. 14 .4 ). The design is a linear form _ echoing and harmonizing with the linearity of the elongated setting along the ridge and exploiting northern slopes. The fonn is oriented north-west, its long axis runs east-west. From a climatic view point the plan has the following merits:
Figs. 14.5 and 14.6 show how two large development projects in NAC, the neighbourhoods 8 and 9, are designed to accommodate 16,000 people (Project Credits 1 and 2).
71

0 Fig 14.7: Six October New City Plan, Egypt (after General Physical Planning Organization, 1979-80)
L
Fig }4.8: Six October New City, experimental residential group layouts, 3rd and 4th districts. (Project Credit 3)
72

Six of October New City (SONC)
SONC's site is strategically located on a plateau 180- 190 m above sea level; a flat site with gentle north and southeast facing slopes, averaging 3%. The site is located in the eastern desert. This zone is influenced by the Nile delta and the Mediterranean in the north-east and north respectively. It enjoys open views to the Nile valley and the Pyramids.
The features of the local climate may be summarized as follows:
Temperature monthly mean ranges: summer 20-34°C winter 9-2D°C Diurnal ranges: summer 1 l.5°C winter 9°C Relative Humidity summer 22-71 % winter 40-42% Annual rainfall 24 mm Prevailing Wind Directions summer North and North West winter N. West, West and S. West.
l
The climatic design recommendations called for: exposure of the city mass to north and north-westerly winds during the hot season; protection from desert sand stonns (south and south-west winds) during March, April and May; careful design of shelter belts and sand barriers; protection of the city against moving sand dunes; exploitation of views axes towards the NE and SE; careful orientation of city mass and major vehicular and pedestrian routes to reduce heat gain; maximization of shadows and minimization of glare.
The Six October master plan, Fig. 14.7, closely followed the recommendations of the climatic analysis as regards orientation, exposure, landuse organization, provision of breeze corridors and edge protection against sand stonns and moving dunes. Fig. 14.7 shows the master plan of the city and its major elements, the urban mass, the tourist area, the city pruk and industrial areas.
Figs. 14.8 and 14.9 show two examples of 3 dimensional plans, to be developed during the first phase of the city's plan implementations, namely: an experimental residential cluster in the 3rd and 4th districts and the 1st tourist village, and tourist area (Project Credits 3 and 4).
I I ••• ♦... ,_
!J I ! .. ." / I I I l
I FD I r-"'hf I I L. 7
I I I I ... . ...
I I -
Ir' -- -
I I I
rr . ·-· I I
n
- : __ -,-.: .--I
I
Fig 149: Six October New City.first tourist village, the tourist area (Project Credit 4)
73

El Obour New City (ONC)
El Obournew city(Fig. 14.10) enjoys favourable physical environmental conditions. Located on a plateau intersected by a number of stonn water gullies (valleys), it slopes gently to the nonh and west, with an average inclination of 3% sand dunes flanking the site from the east and the west. The movement of these dunes is towards the east and south-east. hence they present a direct threat to landuses and development activities.
The climatic conditions for the site were extrapolated from the analysis of data from the nearest three meteorological stations flanking the site (EOMPS 1980-82). The climatic features may be summarized as follows.
- Temperature mean ranges: Summer winter
- Diurnal ranges: summer winter
- Relative Humidity ranges: summer winter
20-34.5"C 8-21"C
10.6"C 14.4°C
25-70% 34-71%
- Prevailing wind directions summer winter
- Average rainfall (annual)
Nonh, Nonh-west South-west
20mm
■-,•:;-:. ... ~~•-· .. ~ .. r-~--....-o;.,, ,1.•-;; ■;.t-,; •• -,;.:..,.;., ...... • :1 .. ~. ..· .. ·~·-~·•:.-~• -:.-.-.•:f; ·•:: ;;.»--'~-~,,,.-,,.,,,,:;.-...... - .·•~:-.-.- 4.::--·,.-:,'Q,•:·,•···~· .,;•::.~.._ .. .• . ,.·,.,.;,;._--~·q-;: • ..-.4.. ;~ - ........... ·~' .......... .... : .... •-.. _t,,. •• ·:.-.:"; ,, •. ·• NUALWIN .. ·•·-·•-t•·.·:~•.--. •. ,. •.•.•. ~ ~l•-r ~~-- .!, .. ;_,•••••• ""'••"'•~••~•._• ::;:.~ . ~- ~-:.H.:.:: ·:;~~i-:.~ .. "-~:.,~. ...... !:•.•··~-·~-·-···~·~~---- •. . ";,'~ .-, .... ~,{.:·>-;..:.• ......... .
..... ~ ..... ~.... :..: ... ~,.;-...:-~i"~"& .. ~! ;,, .. ~~ ~~~$0%'.E:!•E.~t~:!.:;-~;:." ~· 4"~~:i:.>.~•,·.- ..
::■:.!";,:.~:;~ =.~ ..
.. ·•;.,. -r, ..... .. -~-•;~:.·.·. ••.:~'i~1.:•,!~:•-=-s, I
-~•-■ -:.•-:..~."-"'":=~!!.- • II,. ,i-...;• ..... ~.:,. ::/•--~~-~-~- .. ~-·•·. ·•-~1••
::rfi:='i~-~=-~--'· ~~u:!~.:~-~ :.~::;; :;::·A;•
•••.~I-~• .. :..·.-.:·.9 :-,"1.
- , .-: .~;~;:i:~
.:;,~!t)tZ ·m·->···'· :\::.:':~.;_:;,
At the master plan phase, no climatic detailed recommendations were put forward, apart from the protection of the city mass against sand dunes located at the south-west. provisions for protection against flash floods and free movement of northern and north•westerly breezes.
Detailed analysis of the ONC site (which falls in the transition climatic sub region, carrying the overlapping influences of maritime, Nile delta and desert climates) was carried out at the 1st district planning stage. Compact planning around enclosed yards and restricted air movement were suggested (Abdel and Ettouney, 1985).
Topography, site conditions and environmental factors were considered in formulating both development alternatives and the ONC master plan. Fig. 14.11 summarizes the features of the ONC plan, which evolves along a SW •NE axis. It avoids sand dunes and respects reclaimed agricultural land. It also allows free passages for stonn water movement and breeze penetration.
Fig. 14.1 lb shows the city's master plan characterized by the division of the city mass into independent districts, separated by flow lines and green corridors; the decentralization of services and the segregation of manufacturing industries to the south of the urban mass.
Fig. 14.12 shows the winning-competition entry for the development of one of the local areas of the first district of
Fig /4.10: Obour New City, the physical setting (Project Credit 3)
14

(a)
~ SITE OF £l080UI!
e'i:J GOOIVTH ~IRECTIOII
§ ~ATIONAL HIG~AY
E3 REGl~AL ROAD
E3 RAILWAY
~ LANO RECLAMATION
8 STE!':P SUlPES
~ HILLS
E::;j SANOOUNES
Fig 14.lla and b: Obour New City. developmenl concept (Project Credit 3)
APARTMENT BLOCKS PARCELLIZATION
(b)
WAi,,t UPS- 3&4 STOR:..,U:S SINGLE FAHILT HOUSING
Fig 14.12: Obour New City.first district, two examples of housing layouts (Project Credit 5)
75

ONC (EOMPS 198S). The local area's population is of the order of 20,000 and it contains two types of housing -developments for low-income families, parcellized single family housing and apartment blocks (walk ups) (Project Credit5).
rather loose ended. the variety of possible three-dimensional developments exist within the framework. of a master plan, or similar climatic contexts; all claiming climatic design awareness and relative
On the relative importance of climate in physical development
An urban form is just an abstract statement that provides a scope for endless three dimensional decisions, site plans and town scapes; which, in tum, may result in categorically different micro climatic conditions in and around buildings within the same locality covered by the master plan. This reduces, if not altogether deletes, the macro climatic influence and related macro form decisions as regards orientation, edge conditions, landuse relations, route alignments and even location. In other words, the three dimensional phase is likely to over-shadow the two dimensional plan making stage, in spite of the overlapping of the two.
The settlement's micro-climate is effectively and predominantly shaped by masses, walls and barriers that impede and direct air, store and reflect radiation, cast shadows and allow or prevent natural lighting.
The micro-climates of the built-scapes are products of the spatial relations and fonn characteristics of masses of man-made and natural elements in the locality. To reiterate, the three dimensional phase docs fonnu1atc the microclimates of cities through decisions concerning and covering:
i.
ii. iii. iv
Settlement grain and urban tissues, solids versus voids in the city•s mass, Heights and plot ratios, physical densities, Intensity of development, activity densities, and Landscape decisions.
These detennine the basic features of the physical environment, namely: heights, volumes, surface areas,. spacing and fill. These features are, in tum, the key determinants of the following ingredients of the climates of "places".
l.
2. 3. 4.
Architectural aerodynamics, air flow patterns arowid buildings, direction, speeds and turbulence intensity. Wind shelter for buildings and outdoor spaces. Shadow patterns in and around buildings. Insulation and protection of built mas~e~ and surfaces from direct and reflected radiation.
respect to physical context requirements.
Detailed three-dimensional decisions may thus enhance or clash with earlier urban form climate related features. Therefore, emphasizing detailed and elaborate climateoriented decisions at the early stages of development i.e. urban fonn generation, evaluation and selection is likely to prove of no ( or limited) value in shaping the final resulting climate of new cities and their fabric (see also Evans, 1980).
Conclusions
Within the framework of any urban form there exists an infinite number of three-dimensional configuration possibilities. Each combines distinct physical features and characteristics including built-scapes, heights, spacing, solids versus voids ratios, space furniture and fill ... etc.
This is also manifested in existing settlements where a variety ofurban patterns, tissues and grains are juxtaposed in the same locality or town.
A variety of three dimensional configurations means a variety of microcosms and, in turn, a variety of micro climates within the same urban boundaries.
These, together with the earlier discourse and supporting examples, justify the following conclusions.
1.
2.
Climate - in spite of its comprehensive and complex nature - is one factor in a matrix of forces ~d pressures affecting the fonn of ~ettlemen:s aJ:d its elements. The efficiency of climate design 1s invariably hindered and adversely affected by the requirements and influence of other_eq~all?'. important factors including ~cono~uc_ v1ab1hty and cost effectiveness, efficient building and landuse, socio-cultural, functional and flow systems requirements.
Exaggerated precision at the early stages of climatic analysis, diagnosis and recommendations (which is synonymous with urban f~nn generation phase) is likely to prov~ me~ngless or oflimited impact on the actual m1cro-chmate of built up areas at the later stages of development.
Toe two levels of urban development exampl~s, urf?an 3. f onns and three dimensional projects, presented m secuon
Urban design, landscaping and site planning present the critical level of physical development where climatic design and control is relatively effective in panly shaping and influencing external environments and their quality in urban areas.
2, clearly show:
76
that urban fonns inteipretation of the ~li~atic context determinants are general, qual1tauve and

Project credits
2.
3.
4.
Dr. Sayed Ettouney (for) Dr. Hassan Ismail and Partners Neighbourhood 8, (Site Plan), 1st District New Ameriyah City, Egypt (1979).
Dr. Sayed Ettouney Dr. Raouf Helmy Arch. Abou Bakr Mitkees Neighbourhood 9, 1st District New Ameriyah City, Egypt. ( 1982)
Dr. Nassamat Abdel Kader Dr. Sayed Ettouney (for) the G.O.P.P. Experimental Site, Residential Block 6 October New City - General ' Physical Planning organization, Ministry of Reconstruction, Egypt, (1980).
Dr. Sayed Ettouney Dr. Nassamat Abdel Kader 2nd Tourist Village, Tourist Area,6 October New City, General Physical Planning Organization. Ministry of Reconstruction, Egypt, ( 1983 ).
5. Dr. Sayed Ettouney Dr. Nassamat Abdel Kader Local Area 7, 1st District, El Obour New City, New Communities Organization, Egypt ( 1983 ).
References
1. Abdel K. N. andEttouney, S.1985: Local Area 7,EI Obour New Town -1st District, Phase I Report, New Urban Settlements Organization, Egypt.
2. • "Arid Lands News Letter" (ALNL), No. 14, 1981: University of Arizona, Tucson, U.S.A. pp. 24, 25.
3. Egypt/German El Obour Master Plan Study Group (EOMPS - 1980 - 1982). El Obour Master Plan Study, Ministry of Reconstruction, Housing and Land Reclamation, Egypt. Reports 1 & 2.
4. Egyptian/GermanElObourMasterPlanStudyGroup (EOMPS). 1985: El Obour Master Plan Study, Competition Results- Planning a Residential Area for Low Income Families, Ministry of Reconstruction Housing & Land Reclamation, Egypt.
5. Ettouney,S. 1986: "UrbanFormGenerationforNew Communities -An Alternative Approach". International Convention on Urban Planning, Singapore.
6. Evans, M. 1980: "Housing, Climate & Comfort'. Architectural Press, London,pp. 134,156.
7. General Physical Planning Organization, 1979-80: 6 October New City-Structural Plan Studies, Ministry of Reconstruction, Housing arid Land Reclamation Egypt: Repons 1, 1, 3 and 4 - Physical planning (Arabic).
8.. ILA.CO and Partners 1977-1978: "New Ameriyah City Master Plan". Ministry of Development & New Communities, Egypt: Status Reports 1 & 2, Master Plan Technical Report.
9. Koenigsberger,O.H.etall973: "ManualofTropical Housing" Part 1, Climatic Design, Longman Group Ltd, London, pp 23 - 37, 203 - 237.
10. Konya,A.1980: "DesignPrimerforHotClimates". Architectural Press, London, pp 22, Chapter 2.
11. Meteorological Dept (MD) 1960: "Climatological Normals for U.A.R." Ministry of Military Production, Cairo, Egypt.
12. PADCO, Inc 1983: "The National Urban Policy Study", Part Two: National Level Data Advisory CommitteeforReconstruction,MinistryofDevelopment,Egypt, pp.15-19.
13. Perkins,B.1978: "PlanningthePhysicalFormofAn Arid Region New Community". Urban Planning of Arid Zones, Wiley, New York,pp. 194.
14. Salem,R.I. 1984: Yousry,M. (Sup)Ettouney,S. (Sup) "Design of Urban Spaces in Hot Regions". M.Sc. Thesis, Faculty of Eng., Cairo University, pp. 34-40 (Arabic).
15. Yousry,M andEttouney,S.1980: "UrbanDesignand Physical Planning of Amal New City" ~ G.O.P.P., D.R.T.P.C. Ministry of Reconstruction and New Communities, Egypt-2nd Report, Vol.2,pp.13-16 (Arabic)
77

CHAPTER15 Daylighting Design for Buildings in the Tropics Brian Marland School of Environmental Studies University of Zambia
Introduction extremes. In order to achieve designed daylighting it is
Daylighting is becoming increasingly associated with necessary to make a statistical analysis of the sky lumienergy conservation. Apart from reducing the need for nance in order to assess a "typical" sky which can then be artificial lighting, the relationship between energy conser- considered as the daylighting source. At any particular vation and window design lies, at least within the tropics, point in the room, therefore. the sky component of dayin the relationship between window area and the rate of lighting results from the patch of sky seen through the heat gain by the building. There are several daylighting window from that point (Figs. 15.1 and 15.2). prediction techniques available for use in climates where Various design skies have been developed, the most well the presence of an overcast sky can be assumed; although the established techniques are now under review (Lynes, 1980) since the effect of sunlight on the sky luminance (and, therefore, the effect of orientation) is ignored. Apart from guideline technique for climates with clear skies and sunlight (Plant, 1967) there is no specific technique for application in the tropics which allows the building designerto optimise window openings in respect of required levels of daylighting within the room.
Sky Luminance Distribution
The radiation transmitted through window glass into a room becomes, in terms of daylighting. the light source in the same way that an electric lamp is the source oflight for an anificially lit room. The difference between the two Fig 15.2: The SKY COMPONENT at point Pis a function of sources in tenns of characteristics and output is that the the luminance distribution of the patch of sky seen from that
lamp is predicable while the sky is variable between vast point
sky component
' re•f tected/ compo ent
Fig 15.1: The components of daylight at point P
78
internal reflected component

uniform
reference point
Fig 15.J:CIE uniform sky
a .. e,age lumlta•~•
luminance
hot h Oh L•Lz/3
known being the Unifonn Sky, which assumes constant 5,000 tux eternal illuminance from a uniformly overcast sky (Fig. 15.3) and the C.I.E. Standard Sky (CIE, 1970) which assumes a graduation of luminance between the horizon and the zenith (Fig. 15.4). These design skies are intended for areas where the sky is predominantly overcast, since the presence of sunlight is ignored and, therefore, they do not take into account the effect of orientation. This results in considerable inaccuracy (Tregenza, 1980 and Fig. 15.5); the general effect is to underestimate the daylighting level which in a northern European location may be considered a bonus addition to the lighting levels. To overcome this deficiency, the BRE Average Sky (Littlefair, 1982) distribution has been developed.
The luminance distribution of a clear sky has been studied and a standard adopted (CIE, 1973). The luminance distribution of a perfectly clear sky is symmetrical about the solar meridian with the highest luminance occurring in the circum-solarregionandthelowestvaluesoccurringonthe meridian at a point where, approximately, a 900 angle is subtended at the ground between the point of lowest luminance and the sun (Fig. 15.6). Measurements have shown that the sky luminance distribution for clear skies does not vary greatly for different locations but is dependant on the degree of pollution in the atmosphere. Skies of lowest luminance occur at high altitude at locations with little pollution (Hopkinson, et al. 1966).
Sky luminance distribution in the Tropics
Fig 15.4: CIE Standard overcast sky
The sky luminance distribution is being studied by the author in Zambia where there is a distinct wet and dry
Neither:
500
400
300
200
100
(A) Sol a r altitude and climate 1
nor (B) Orientation are token into account when usino the uniform or standard overcast sky for daylighting . design.
\ . \J.ULY
' . " . ..__"
"' ---/ ' OECEMB~,
' '\. 10 12 14
-IC ::, -.. u
.c 0 C
E :,
-16 hours
3000
2500
2000
,, 1500 ,/·
/ ---1000 ..... NORTH -
10 12 14 16
Av Eh at the back of on East Av Eh in Moy close to the window facing room • d
· · ake inJ count when using the uniform or staruiar overcast Fig 155: Neither solar altitude and climate, nor onentat1on~e t n 'OOC
sky for daylighting design. (From P Littlefair; CIE 20th session, 1983)
79

Hnlth
r•f •renc1 point
The ••r l11mino11c1 at any point i, o function of th• ,olar altitude
I east br l91at
tnl9hteu _..._ ______ -f-______ _rb~rl9hte1t
Clear 111, dhlrlbulion coneldend eeporately from eunll9hl
Fig 15.6: CIE (clear s/cy luminance distribution through the solar ~ridian )
season in common with other tropical upland regions. The sky _conditio~ ~o ~ot, therefore, slot neatly into the sky luminance d1stnbut10n so far described.
The following data has been collected:
i. Sky luminance ii. Vertical and horizontal external illuminance. iii. Internal horizontal illuminance using a model
built, for comparison purposes, to be the same dimensions as that used at the Building Research Establishment, U.K. (Littlefair, 1984). The internal surf aces are finished in matt black so that the sky component of daylighting is recorded.
The above data has been collected on a regular basis over a twelve-month period. It is intended to collect, over sample periods of time in both wet and dry seasons, the following data:
i. Internal illuminance with typical room surfaces installed in the model.
ii. Internal illuminance with two specific window shapes installed in the model.
From this data, it is hoped to produce a sky luminance model which can be related to the levels of internal
80
illuminance within the model room and to assess the effects of different window shapes and sulf ace reflectance.
Because o~ the limita?ons placed on the data collection by way of ava~able equipment and time, the data may not be represent~tive of the nature of daylighting in Zambia. This shortcommg can be mitigated by:
checking the data against existing mathematical sky models so that a general compliance with respect to sky types can be established;
establishing how typical the year was in tenns of its climatic characteristics. The Zambia Meteorological Department maintains long tenn records of tempera~ure and cloud cover (MDL, 1969), both of which fonn part of the data collection. From these the variation of the twelve months data co~ection period from an average year can be detennmed. Thus it can be established whether the twelve months in which data was collected results in an overestimate, average, or under estimate of internal daylight illumination levels;
a further check on the collected illuminance data can be made by consideration of the luminous efficacy (Littlef air, 1985) which is the quotient of luminous flux by radiant flux and can be found by obtaining the ratio of simultaneously measured illuminance, and
irradia ice on a specified plane. This is possible since the Meteorological Department records radiation data (Nwangala, 1980); the luminous efficacy can be predicted mathematically after taking into account the sky characteristics.
The range of sky conditions in Zambia is extremely wide, ranging from almost unifonnly overcast to clear. However, it can be established that the overcast skies occur predominantly in the rainy season, which occurs when the sun is in the south of the sky, clear skies occur in the 'cold season· when there is the occurrence of the longest hours of sunshine and 'intennediate skies· in the hot season.
The hot and cold season constitute the dry season with the sun, correspondingly, being in the north of the sky. The wet season occurs when the sun is in the south of the sky.
The design of buildings in the tropics with respect to thennal performance demands that windows should face north or south in order to be able to control solar penetration. If the wet and dry seasons are considered as having different sky characteristics, then there is reason for considering that for a given north/south orientation there is a maximum and a minimum level of i11umination for the room depending on the season and orientation (Fig. 15.7). This may further be resolved into consideration of an average dry and wet season day-lighting condition.
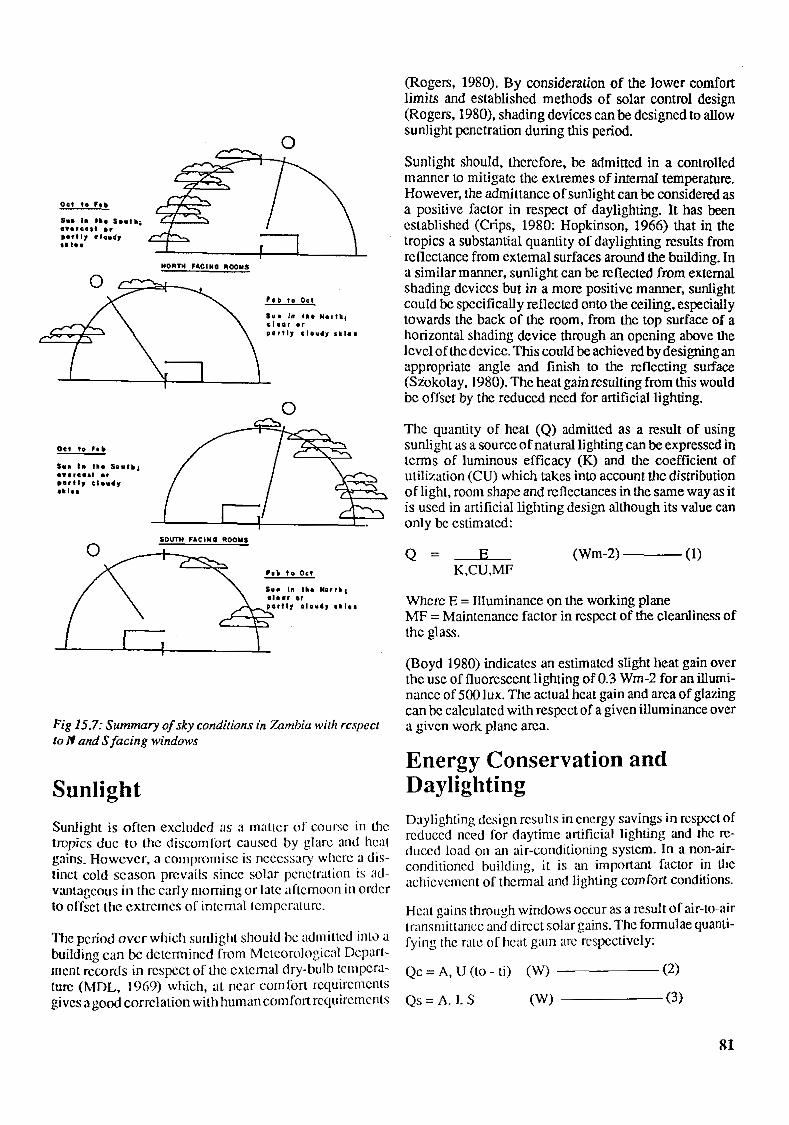
Oct t• '•1> ......... s ...... 0Yerce1t or ... ,., .,.,.4, •••••
Oct to Fol>
SM• I• tile Sovt•i •w• re eat or pa,u, clo11dy
•••••
NORTH FACING ROOMS
SOUTH FAt IN I ROOMS
Su• In O.• Nori kt cl••r or p.,,., clo-,idJ 1kl••
0
F1• to Oct
Su• ln tlle Nor tll, ch a, or put11 clo•O 1l lo ■
Fig 15 .7: Summary of sky conditions in 7.ambia with res peel to Jf and S facing windows
Sunlight
Sunlight is often excluded as a mauer or course in lhe tropics due to the discomfort caused by glare and heat gains. However, a compromise is necessary where a distinct cold season prevails since solar penetration is advantageous in the early morning or late aflernoon in order to offset the extremes of internal temperature.
The period over which sunlight should be adrn i Lted inlv a buildina can be determined from Meteorological Depart-
"' ment records in respect of the external dry-bulb tempera-ture (MDL, 1969) which, at near comfort requiremenls gives a good correlation with human comfort requirements
(Rogers, 1980). By consideration of the lower comfort limits and established methods of solar control design (Rogers, 1980), shading devices can be designed to allow sunlight penetration during this period.
Sunlight should, therefore, be admitted in a controlled manner Lo mitigate the extremes of internal temperature. However, the admittance of sunlight can be considered as a positive factor in respect of daylighting. It has been established (Crips, 1980: Hopkinson, 1966) that in the tropics a substantial quantity of daylighting results from reflectance from external surfaces around the building. In a similar manner, sunlight can be reflected from external shading devices but in a more positive manner, sunlight could be specifically reflected onto the ceiling, especially towards the back of the room, from the top surface of a horizontal shading device through an opening above the level of the device. This could be achieved by designing an appropriate angle and finish to the reflecting surface (Siokolay, 1980). The heat gain resulting from this would be off set by the reduced need for artificial lighting.
The quantity of heat (Q) admitted as a result of using sunlight as a source of natural lighting can be expressed in tcnns of luminous efficacy (K) and the coefficient of utilization (CU) which takes into account the distribution of light, room shape and rcflcctances in the same way as it is used in artificial lighting design although its value can only be estimated:
Q === E (Wm-2)---(1) K,CU,MF
Where E = Illuminancc on the working plane MF = Maintenance factor in respect of the cleanliness of the glass.
(Boyd 1980) indicates an estimated slight heat gain over the use of fluorescent lighting of 0.3 Wm-2 for an illuminancc of 500 lux. The actual heat gain and area of glazing can be calculated with respect of a given illuminance over a given work plane area.
Energy Conservation and Daylighting Daylighting design results in energy savings in respect of reduced need for daytime artificial lighting and the reduced load on an air-conditioning system. In a non-airconditioncd building, it is an important factor in the achievement of thcnnal and lighting comfort conditions.
Heat gains through windows occur as a result of air-to-a!r transmittance and direct solar gains. The formulae quanufying the rate of heat gain arc respectively:
Qc = A, U (lo - ti) (W) ----- (2)
Qs =A.I. S (W) -----(3)
81

Where Qc = Conducted Mat gain, Qs = Solar heat gain , A = Window area, U = Air•to•air transmittance, to= Ourside air temperature, Ii = Inside air temperature, I= Intensity of solar radiation., S = Solar gain factor of glass.
From these fonnulae. it can be seen that the glazing area has a direct relationship with the rate of heat gain and from this point of view should be kept to a minimum. However, the relevance of daylighting design lies in achieving the correct minimum window area since undersizing will result in unnecessary use of anificial lighting which, in tum, results in additional energy expenditure and heat gains.
Fenestration
Internal illuminance measurements described above are Uken with the window wall of the model facing nonh and south which is the most effective orientation from the point of view of solar control. Substantial areas of glazing facing east and west result in discomfon due to excessive heat gains and glare since. with conventional external shading devices, it is not possible to prevent low angle solar penetration.
For sunlight, it may be necessary to locate small areas of glazing on east and west facing walls to improve 'cold season' internal thennal conditions, panicularly in the early morning and late afternoon. Sou\h windows must be fitted with user controllable shading, which for convenience is generally fitted internally in the fonn of cunains or blinds. This type of shading (unlike an external device) gives rise to a solar gain to the room which would be undesirable in the 'hot season'. Therefore. east and west facing windows should be considered as heat sources rather than sources of daylighting.
Conclusion Window areas should be designed with respect to achiev· ing a design daylighting level and the sky conditions. In Zambia, sunlight cannot be ignored and since only north and south orientation should be considered from the point of view of controlling solar penetration, it may be necessary to produce a prediction technique which gives maxi• mum and minimum daylight levels for a given nonh/south orientation. The sky conditions in Zambia arc variable but can be broadly broken down to coincide with the wet and dry seasons which, in tum, almost coincide w!th the sun being in the south and north of the sky respect!vely. East and west facing windows should only be considered as a cold season heat source and reflected sunlight considered as a means of internal illuminancc.
82
References
I. Boyd, I.H. 1980: "Recent developments in daylighting". South African National Committee on Daylighting 27th Annual General Meeting and Congress, August.
2. CTE, 1970: "InternadonalRecommendationsforthe Calculati.on of Natural Daylight". Publication No. 16, Paris.
3. CJ E 197 3: "Standardisadon of Luminance Distri• bution of Clear Skies". Publication No. 22, Paris.
4. Crips, V.H.C. and Lynes, J A. 1980: "A model of daylight availability for daylighting design". C/BS National Lighting Conference.
5. Hopkinson, R.G. Petherbridge, P. and Longmore,]. 1966: "Daylighting". Heineman.
6. little/air, P J. 1982: "Designing for daylight availability using the BRE average sky". B.R.E. R2!82.
7. Uttlefair, P J. 1984: " Daylight a-vailability for lighting controls". 8.R.E. R3!84.
8. Little/air, P J. 1985: "The luminous efficacy of day• light: a rel'iew". B.R.E. paper PD 74185.
9. Meteorological Department Lusaka (MDL). "Sum• mary of Surface and Upper Air Data". Zambia.
JO. Meteorological Department Lusaka (MDL), 1969: "The Climate of Ndola". Zambia.
11. Mwangala, S. andMukambulo, N.K. 1980: "Global, Long-Wave and Net Radiation in Zambia". Meteoro· logical Department Technical Memorandum No. JO.
12. Plant, C.G.H. 1967: "Research in Environmental design". Tropical Daylight and Sunlight Project Final Report, UCL.
/3. Rogers,N.C. Ballinger,J.A. andDunkerbey, C. 1980: "An analysis of innovative metlwds of natural lighting". Architectural Science Review Vol. 22 No. 2, June.
14. Szokolay, S. V. 1980: "Environmental Science Handbook''. Construction Press.
15. Tregenza,P.R.1980: "Thedaylightfactorandactual i/luminance ratios". Lighting Research and Technology Vol. 12. No. 2.

CHAPTER16 Bridging the Gap Between Climatological Theory and Building Practice in Middle Africa Paul Dequeker Kinshasa, Zaire
Introduction
Since humanity began, man has developed his shelter as an in~trument for bioclimatic comfort against the rigours of climate. People learned by trial and error the influences of weather on their dwelling design. The result was a better expression of the influence of climate on design than much of the architecture we see today.
Man has forgotten to build with nature and tends to ignore the climate while he becomes pre-occupied with forms currently fashionable. The modem office or dwelling looks much the same the world over; mainly relying on mechanical systems to separate conditions inside from those of outside.
A wealthy elite can escape the consequences of poor design through mechanical air-conditioning. The others suffer from living conditions that permit neither efficient work nor rest or enjoyment.
This need not be so, because it is possible to create cities that have pleasant indoor and outdoor living spaces and are suited to the social conditions of their inhabitants. Though archi tcctural princi pies may be universal, their application in a particularenvironment and climate is the most imponant environmental factor to be considered in the design and construction of buildings. This seems very obvious but, unfortunately, it is all too often ignored or forgotten. It is not enough to look at climatic maps of reference climate or to seasonal averages tables of weather data. Daily variations have their imponance too, although small variations do not make any significant impact on indoor environment.
Climatic Data and Architecture
Climatic data, as often presented, is of litllc use to the architect, who wants to know more than daily average figures; he wants to have a clear picture of the year-round, every moment of the day, perfonnancc of climate, its influence on this building and the people who Jive in it.
Having a wealth of bioclimatical infonnation available, the problem of the practising architect lies in how to use it. Although the architect has been a climatologist much longer than he has been an expert of the other disciplines, climatic research is only a small part of his several research disciplines. He cannot spend too much time on it and needs to have a quick and clear all-year round reference. Much research has been done to make architects and builders more aware of the climate they build for.
The works of the Olgyay brothers in the United States and Professor Givoni in Israel, among others, helped to bring climatological science closer to the architect who has to translate it for the design of bioclimatically suitable buildings.
Bioclimatic comfort depends mainly on the temperature and humidity of the air, the heat radiation from the environment and the air movement around the human body. These different meteorological elements are simultaneously interacting with each other in a large num berof ways in order to produce widely varying climatic conditions.
An individual's ability to adapt himself to environmental changes around him affects not only his comfon but also his work output and efficiency. Many authors have tried to define a comfort zone using psychometric diagrams corresponding to conditions of temperature, humidity, ventilation and radiation. These psychometric graphs and charts do not always provide infonnation in a suitable fonn for an architect.
Olgyay's (1963) bioclimatic chart (Fig. 16.1) is a combined graph indicating the effects of: air temperature, humidity, radiation and air velocity on a lightly dressed man doing sedentary or light work. On this chart the comfort zone lies in the middle, from its perimeter the effects of the climatic elements are indicated in scale of their amounts needed to receive the comfort feeling on other temperatures and other relative humidities. At higher temperatures, the wind effects can bring back the feeling of comfort, the numbers on the chan indicate the needed wind velocities. At the lowerpcrimeterof the comfort zone
83
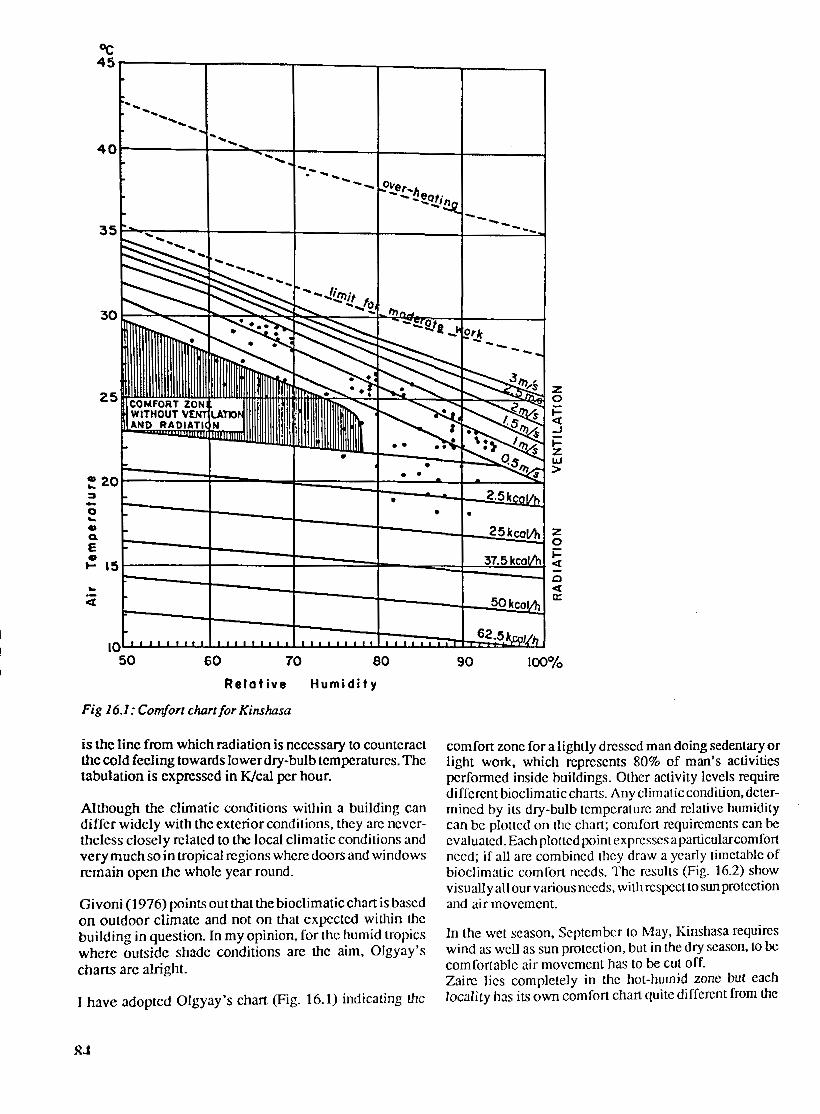
°C 45r----,----,-----r----------
...... ...... ...... ...... ..........
40,---t-~~::-+----+-----+-----l ........ ...... ....... --- 01ter ... a. ... _ ''eo,· ...... _,n
~ 20 :J -0 ... .. Q.
e .. .... 15 ~ -ct
10 50 60 70
Relative
Fig 16.1: Comfort chart/or Kinshasa
80
Humidity
is the line from which radiation is necessary to counteract the cold feeling towards lower dry-bulb temperatures. The tabulation is expressed in K/cal per hour.
Although the climatic conditions within a building can differ widely with the exterior conditions, they arc nevertheless closely related to the local climatic conditions and very much so in tropical regions where doors and windows remain open the whole year round.
Givoni (1976) points out that the bioclimatic chart is based on outdoor climate and not on that expected within the building in question. In my opinion, for the humid tropics where outside shade conditions arc the aim, Olgyay's charts arc alright.
I have adopted Olgyay's chart (Fig. 16.1) indicating the
90 100%
comfort zone for a lightly dressed man doing sedentary or light work, which represents 80% of man's activities performed inside buildings. Other activity levels require different bioclimaticcharts. Any climatic condition, determined by its dry-bulb temperature and relative humidity can be plotted on the chart; comfort requirements can be evaluated. Each plotted pointcxprcsscsaparticularcomfort need; if all arc combined they draw a yearly timetable of bioclimatic comfort needs. The results (Fig. 16.2) show visually all our various needs, with respect to sun protection and air movement.
In the wet season, September to May, Kinshasa requires wind as well as sun protection, but in the dry season, to be comfortable air movement has to be cut off. Zaire lies completely in the hot-humid zone but each locality has its own comfort chart quite different from the

u ... ::,
~12 ... u Q.
E u ,_ ' 6 nmrm11ttttttttfflfi!!¥!!~~tttt1mtirttt1ffi~;:::;l\--'lw.D-l~LAUQ.IIL.r-f---H~~~HWY:m~!!:Y I -1. 5 rn / UC.
Fig 16.2: Variation of annual comfort conditions (Kimshasha- latitude 4° 23' S; altitude 311m)
one ofits neighbour.
Mbandaka, on the equator, has no marked dry season, for the whole year round: intensive air movement and complete sun protection are necessary. Banana, situated at the Atlantic coast, has its own particular comfort chart telling its daily and monthly comfort needs. The comfort chart for Dakar in Senegal is different due to its geographical location and a much higher latitude.
'Kisangani, on the equator, has similar comfort needs as Mbandaka, being at the same latitude but situated more eastward. In Lubumbashi, situated far south and at a high altitude, air movement is no longer required; morning and evening sun penetration is even desired.
Sun Control In order to protect adequately lhe exterior walls and openings, it is mandatory to know, for the specific location, the apparent movement of the sun for each period and hour throughout the year.
outside in sunshine, until the dial shows the required date and time. The sundial or shadow chart can be used directly on the drawing board without any use of protractor or setsquare.
Our previous bioclimatic comfort chart has shown the periods when radiation is not wanted and sunrays have to be cut off by means of shading devices. It is not every moment of the year that sunrays should be cut off, some localities have periods when radiation is needed; and this can be supplied by the sun.
In LropicaJ regions, dose to the equator, as a general rule, for preventing sun penetration, east-west orientation of the building is the best, with windows and door openings only in north and south walls under the protection of a roof overhang. Louver designed on a functional basis has to be di ffcrcnt on cast-west elevations as on north-south elevations. Indiscriminate use of sun louver used to provide the same facade pattern on east-west walls as on north-south walls has adverse consequences.
Sloping site conditions sometimes demand a deviation from the recommended casr-wcst orientation. The effect of shading is that the temperature of external surfaces,
Sun path diagrams, worked out as a projection upon a plane otherwise sunJit, will be maintained at or about the temof the irnaginary spalial sphercofthemovcmcntoflhesun, pcraturc of shaded air, and consequently a much smaller need the use of a special protractor to be read. Shadow· outdoor~indoortcmpcraturediffcrenccwillbeavailableto charts based on the tip of a venical pole projecting the drive hent inwards. simpaths upon a horizontal plane arc in fact a horizontal sundial (Fig. l 6.3).
The sundial is a very simple and inexpensive tool. Attached to a model, the model can be turned and tilted,
The protection clements which cut the sunrays are themselves heated up by lhe sun. This means the heat problem of our shelter becomes reduced to I.he thcnnal bchaviourof the sun protection clements, which are the roof, the shad-

ing devices an_d the westem_end wall. Morning ncbulosiLy, very frequent m wann humid tropics, prevents the sunrays from catching the east wall.
~ the wann humid tropics, due to small temperature differences between the exterior, in shade, and the interior of a b?ilding, thermal insulation for walls remaining in shade 1s not necessary. But the thennal behaviour and heat transmission of roofs, shading devices and west walls, all heated up by the sun, need close study. In middle Africa \he choice of building materials is very limited. For the most common wall and roof sandwiches, a heat transmission graph (Figs. 16.4 and 16.5) can be made by means of the local radiation intensity figures and plotted against the mean outside shade temperature for the worst momh of the year. Different authors, who studied the behaviourof man in sun heated buildings, came to the conclusion that as complete resistance to heat transfer is inpracticable a deal of heat transfer has to be permitted. They suggest4.5°C(8°F) as the maximum acceptable increase of the indoor surface temperature above the ambient air temperature. Tinted areas on these graphs arc the acceptable limits of surface temperature increase. These graphs for roofs and walls show the very im ponance of outside surface conditions for solar radiation reflection,
Fig 16.3: Need/or Comfort
86
as there arc new or white roofing sheets and white-washed wall.
Ventilation
As we depend entirely on natural means, and in the absence of temperature and humidity comrol, the only controllable factor with which to work naturally is air movement. Superimposing the comfort need chart on a prevailing wind breeze diagram for the area enables us to evaluate the desirable breezes and to judge if nature is able to provide the relief we arc looking for.
For Kinshasa little additional air movement is necessary. On the contrary, in Mbandaka, on the equator, practically the whole year round natural air movement is not sufficient. Kananga, south on the central plateau, needs less additional air movement.
In addition to the wind intensities chan, a year round prevailing wind directions chart is necessary. It had to be noted lhat lhundcrstorms arc accompanied wil.h violent wind gusts coming often from a direction opposite to the dominant wind direction.

Natural ventilation patterns, in and around buildings, depend on wind pressures and, inside buildings, also on stack effect. In the humid tropics it is air flow which is significant for cooling, not air changes~ airflow of sufficient speed to produce desired cooling effect at the level where people sit or work.
Maximum airspeeds within a building are obtained when the outlet is larger than the inlet. The combination of air-
inertia and pressure forces makes airflow patterns unpredictable. Some general conclusions, based on model studies research, have been published and have to be taken into consideration while designing towns and buildings. Most manuals state: "the direction of the prevailing winds is the most important factor in hot humid regions when designing a building as shade can be provided by other means". I am convinced of just the reverse. Wind can easily be bent - it is not possible with sunrays. As a general principle,
--- temperature of lower celling, new cover of painted white • • ••• temperature of lower ceilinoinew cover af pointed block -- air temperature- April Kinshasa
°C 2 . 4 6' 10 12 14 16 18 20 22 2411
••• ~ tolerance . .. . . 40t---t---+-----,1---+-+---J~.a.....1~-+-~."--+--+--I----I
. . . .
•
... . ... . ..
201---+-4---l~-1--+---J.-+--l~+-f--+--t .. ..
~~ I undulatino surface 2 flat surface
I undulating surface 2 celotex 12 mm .
I undulating surface 2 kraftolu 3 flat surface
~i I undulating surface 2 krofta tu 3 celotex
~i I undulating surface 2 kraftalu 3 Louver gloss
2 0 0L--1.
2-...1
4_..J
6L--
8L--
1.L0-..1,
2-..l,4--11L..6___:1._a_2.Lo-2.._2_.24 4 f I ot surface
Fig 16.4: Roofing heat transmission
87

orientation of the building should take cognizance of lhc sun, then other measures can be taken to create pressure and depression areas to deviate the breeze so that it passes through your building. The amount of cross-ventilation in a room has to be sufficient to keep the occupants comfortable as well as to remove every kind of heat gain coming from the structure as well as from the occupants. Sometimes the natural breeze fails completely and we have to rely on temperature differences alone. Then the stack
- --- temperature innerside; outerside Vfhitewoshed • •• • • temperature ir-nerside; outerside cemented
cir temperature - April Kinshasa
effect should not be disregarded entirely, even in low structures such as one-storey houses and schools.
In hot humid areas people are used to spending a great deal of their time outdoors. This is only possible when external spaces are shaded. The erection of comfortable conditions around and between buildings is extremely important. Most welcome is the shade of a tree. Underneath a tree there is no obstruction to air movement while there is
o z "' cs a 10 11 14 16 1a 20 22 t4h ~.-6 tolerance °C
Blocks wtdth
I ..µ4.
20,----+---+--+--+--+--+----t--+--+---t-----+~
20~---+--+---J.---+---+--+--4--t--+---i---t-----1
II 120 1'01101
20L-l..---i---l--~--+--+--l---+-+--t--t--; O 2 4 6 8 10 12 l<J 16 18 20 22 24
Fig ]65: Western gable heat transmission
88

complete obstruction to solar radiation. for an overall investigation is shown by an example of a hospital ward situated at the west-end of a wardb1ock checked for the worst day and hour of the year, which means, for Kinshasa, April at 4 p.m. in the afternoon (Fig. 16.6).
In hot humid areas indoor temperature approximates outdoor shade temperature in degree as well as time. The aim is to ensure that the structure does not store up so much heat so as not to create worse thermal conditions inside than those which prevail outside. Groups of buildings influence the wind patterns and in so
doing have a distinct impact on the surrounding microcliHow quick and easy graphs and monographs can be used mate. To obtain a unifonn flow of air in cluster schemes,
----~-:;s:;.~~rio~utlet 2 inletc: e 3.&m 2.4m2 ,,,
hospital word l<I NSHASA APRIL 4 P.M.
16h . ~-----ra1!1--~-r---, ceiling temp.29+4=33°C(91.4°F)
29
1.-c__,_====::::: 1: J:::: heat gain :30m'x 3kcal/J/h • 4°C•360kcal/h(l429 BTU p.h.)
HEAT TRANSM. ROOF 16h
29 ~UIWI~ inner wall temp. 29+2• 3I°C (87.S°F) °C~·· 0°F heat gain: 1em2, 2kcol/m2/hx2°C=72kcol/h(886BTUp.h.)
HEAT WEST WALL ·
8 persons at rest produce 70kcal x8 =560 kcol/h (2223 BTUp.h.)
total heat oaln =992kcat/l1(3938BTUp.h.)
to keep indoor temp. 29+ I =30°C (86°F) we need 992kcal/h: 0.28kcol/m5/°C= 3543~/h(l25,120cu.ft p.h.)
airs eed 3543m ec
4~8~ -~ for climatic comfort we need _j-
WIND EFFECT
Fig ]6.6: Example of the use of graphs and monographs/or overall investigation
89

it is advisable to use a checker•board layout with the lightning, hurricanes, floods, earthquakes and so on, are buildings staggered rather than to lay them out in rigid some of these examples. Other nuisances are dampness, rows. condensation, mosquitoes, tennites, etc. ·
In the humid tropics housing layouts tend to be spread out so that they can take advantage of the existing air movements, but this tendency leads to low population densities and low land utilisation. With a bit of imagination, housing layouts can easily be arranged in a less rigid way without losing the benefits of good orientation and cross ventilation. By staggering urban houses 45° to the street, interesting inner courts and squares can be created.
Illumination
Decent indoor illumination is a comfort factor too and has to be examined. The methods generally accepted to calculate the daylight factor are not valid in the tropics; they, therefore, need some basic modifications. This is because a heavy overcast sky which is the most unfavourable daylight condition is considered for calculation.
Due to the importance of the external and internal reflections, combined with bilateral illumination, light inside the rooms is rather evenly distributed. In most cases daylight calculations for many points in the room are not necessary. An average daylight factor gives sufficient information about the illumination level in the room.
The average daylight factor can easily be determined by means of the standard sky luminance pepperdot diagram and a simple formulae. Windows on both sides have to be taken into consideration. The shading masks previously used for sunshade calculations permit the calculation of the reflection components of roof over-hangs and shading devices.
Our daylight factor calculation formulae based on the number of shaded and unshaded sky dots is very simple. A year round timetable shows for a daylight factor of 2% or 3% the expected average illumination level inside rooms.
Glare and others
Glare is a serious discomfort in the tropics due to the high degree of contrast between sky brightness and room brightness. Rooms designed with decent sun protection are, however. generally glare-proof, too.
Toereareotherdiscomfortelements,duetoclimate, which are known as hazards because they cause damages to buildings and materials. Driving rain, thunderstonns.
90
Conclusion
Architecture concerns first the people and their needs. second the climate and its attendant ills and third materials and the means of building.
References
1. Givoni, B. 1976: "Man, Climate and Architecture". Applied Science Publishers.
2. Olgyay, V. 1963: "Design with Climate". Princeton University Press, Princeton, NJ.

CHAPTER17 Climatic Impact and Building Legislation in Zambia Francis M. N dilila P.O. Box 50713, Lusaka, Zambia
Introduction
In order to save on the length of services such as roads, water, sewage and electricity, building standards and practices in Zambia as enforced by the National Housing Authority (NHA) and the Lusaka Urban District Council (LUDC), especially for low and medium density housing, have favoured narrow but long plot configurations. As a result of this, there is a limitation to possible shapes of floor plan and to the possible ways in which the various rooms of the house in relation to the communicational links between th~ rooms (corridor) can be arranged.
Fig 17.1: Minimum standard plot size showing limitations in arrangement of floor plan. Present regulations stipulate a distance of 3mfrom the house wall to boundary line and at least 6m in the front. The 'Jo reed" position of a corridor limits the sizes of the rooms and their arrangement
Plot sizes of about 12-16m x 30m tend to encourage a house plan which capitalizes on the length of the plot. With the given front and rear building line of 6m and 3m, a maximum length of 21m can be utilized for the house. Obligatory distances of about 3m from each side boundary leaves a total house plinth widthofabout 6- lOm. Hence the floor plan configuration of 6- I Om x 18-2lm as a guide to the floor plan configuration (Fig. 17.l).
Generally, such a plan offers some advantage if its longimdinal axis can lie on an east-west axis so that room window openings can be located on the north and south faces to allow for minimum heat load on the openings and minimize the effect of solar radiation. Deep front and rear verandahs will keep the gable window and door openings in shadow and well protected from the sun's direct rays (Fig. 17. l).
This floor plan size and shape imposes limitations to orientation in respect of wind, sun and rain; natural elements whose effects on climatic conditions of the house is crucial. Consideration of climatic consequences should be made by:
the physical planners at the time of preparing plot layout and access roads and their orientation. (Fig. 17.2 (a and b)). architects at the time of worldng out the actual floor plan in relation to the sun, wind and rain ( orientation).
As there are no enacted laws to force the architects and physical planner to address themselves seriously to the natural elements, these tend to be treated as a side factor to a "good" and «rational" town planning layout and "good architectural aesthetics." Due to the influence of climate on standards of health and comfort, building legislation should ensure that climate becomes an obligatory point of contention for the acceptability of building plans and proposals from architects and planners.
Standard practices of the Lusaka Urban District Council and those of the National Housing Authority do, in fact,
91
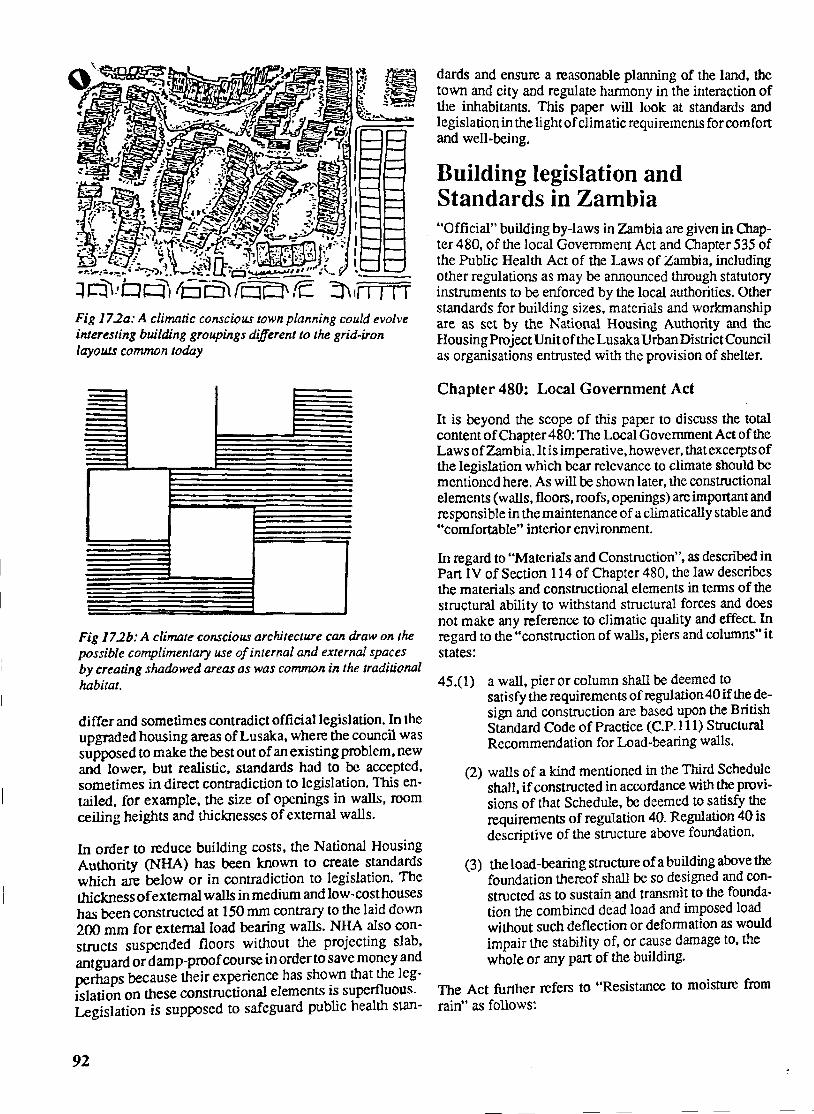
~"' ~~ ... ... - ~
·'-
' ~ ,..,_ .. • 1, l ~~ .I I :~ '"& .... . ~, . ::i .. . ;
•1'~:$ •. ~ ... - ', '), ~- -~~ fl,c::::i....__....,_!.!!:: :~--=1 P'-' b Pi f□c:i\(qpfE If I I I I Fig 17.2a: A climatic conscious town planning could evolve i1t1eresting building groupings different to the grid-iron layouts common today
Fig 17.2b: A climate conscious architecture can draw on the possible complimentary use of internal and external spaces by creating shadowed areas as was common in the traditional habitat.
differ and sometimes contradict official legislation. In the upgraded housing areas of Lusaka, where the council was supposed to make the best out of an existing problem. new and lower, but realistic, standards had to be accepted, sometimes in direct contradiction to legislation. This entailed, for example. the size of openings in walls, room ceiling heights and thicknesses of external walls.
In order to reduce building costs, the National Housing Authority (NHA) has been known to create standards which are below or in contradiction to legislation. The thickness of external walls in medium and low-cost houses has been constructed at 150 mm contrary to the laid down 200 mm for external load bearing walls. NHA also constructs suspended floors without the projecting slab, ant guard or damp-proof course in order to save money and perhaps because their experience has shown that the legislation on these constructional elements is superfluous. Legislation is supposed to safeguard public health st.an-
92
dards and ensure a reasonable planning of the land, the town and city and regulate harmony in the interaction of the inhabitants. This paper will look at standards and legislation in the light of climatic requirements for comfort and well-being.
Building legislation and Standards in Zambia "Official" building by-laws in Zambia are given in Chapter 480, of the local Government Act and Chapter 535 of the Public Health Act of the Laws of Zambia, including other regulations as may be announced through statutory instruments to be enforced by the local authorities. Other standards for building sizes, materials and workmanship are as set by the National Housing Authority and the Housing Project Unit of the Lusaka Urban District Council as organisations entrusted with the provision of shelter.
Chapter 480: Local Government Act
It is beyond the scope of this paper to discuss the total content of Chapter 480: The Local Government Act of the Laws of Zambia. It is imperative.however, that excerpts of the legislation which bear relevance to climate should be mentioned here. As will be shown later, the constructional elements (walls, floors, roofs, openings) are important and responsible in the maintenance of a climatically stable and .. comfortable" interior environment.
In regard to "Materials and Construction", as described in Pan IV of Section 114 of Chapter 480, the law describes the materials and constructional elements in tenns of the structural ability to withstand structural forces and does not make any reference to climatic quality and effect In regard to the "construction of walls, piers and columns" it states:
45.(1) a wall, pier or column shall be deemed to satisfy the re qui rernents of regulation 40 if the design and construction are based upon the British Standard Code of Practice (C.P.111) Structural Recommendation for Load-bearing walls.
(2) walls of a kind mentioned in the Third Schedule shall, if constructed in accordance with the provisions of that Schedule, be deemed to satisfy the requirements of regulation 40. Regulation 40 is descriptive of the structure above foundation.
(3) the load-bearing structure of a building above the foundation thereof shall be so designed and constructed as to sustain and transmit to the foundation the combined de.ad load and imposed load without such deflection or deformation as would impair the stability of, or cause damage to. the whole or any part of the building.
The Act further refers to "Resistance to moisture from rain" as follows:
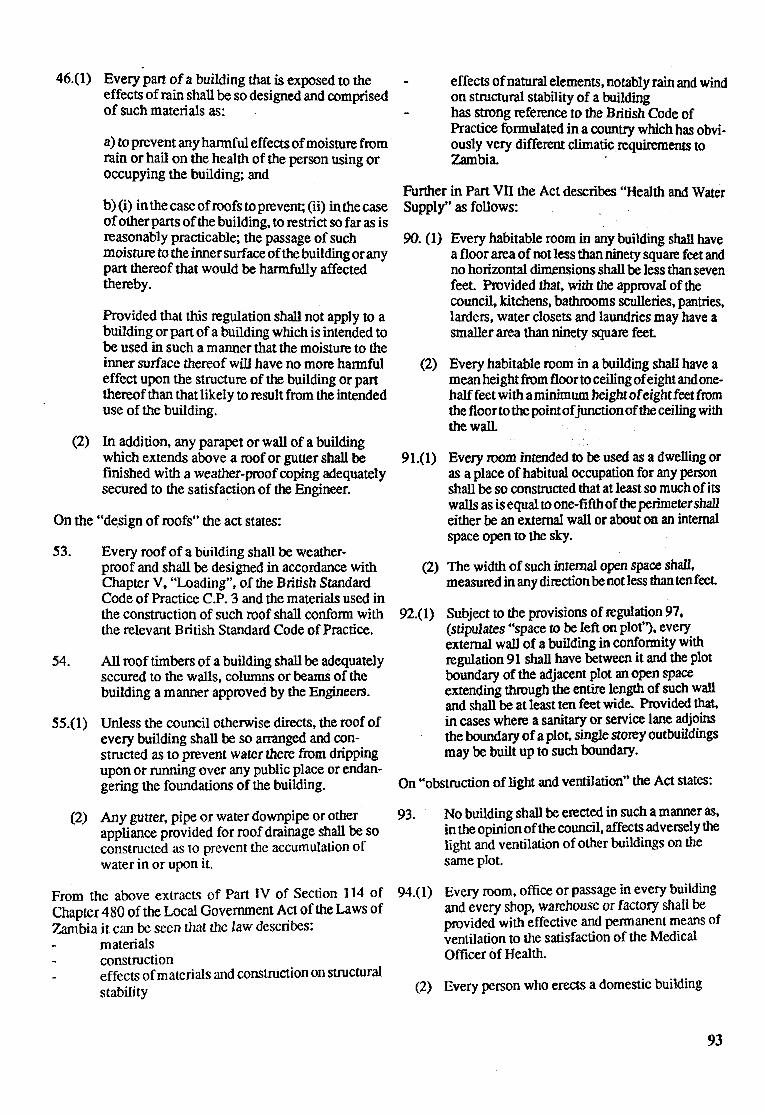
46.(1) Every pan of a building that is exposed to the effects of rain shall be so designed and comprised of such materials as:
a) to prevent any harmful effects of moisture from rain or hail on the health of the person using or occupying the building; and
b)(i) in thecaseofroofstoprevent; (ii) in the case of other parts of the building, to restrict so far as is reasonably practicable; the passage of such moisture to the inner surface of the building or any part thereof that would be harmfully affected thereby.
Provided that this regulation shall not apply to a building or part of a building which is intended to be used in such a manner that the moisture to the inner surface thereof will have no more harmful effect upon the structure of the building or part thereof than that likely to result from the intended use of the building.
(2) In addition, any parapet or wall of a building which extends above a roof or gutter shall be finished with a weather-proof coping adequately secured to the satisfaction of the Engineer.
On the "design of roofs" the act states:
53. Every roof of a building shall be weather• proof and shall be designed in accordance with Chapter V, "Loading", of the British Standard Code of Practice C.P. 3 and the materials used in the construction of such roof shall conform with the relevant British Standard Code of Practice.
54. All roof timbers of a building shall be adequately secured to the walls, columns or beams of the building a manner approved by the Engineers.
55.(1) Unless the council otherwise directs, the roof of every building shall be so arranged and constructed as to prevent water there from dripping upon or running over any public place or endangering the foundations of the building.
effects of natural elements, notably rain and wind on structural stability of a building has strong reference to the British Code of Practice formulated in a country which has obviously very different climatic requirements to Zambia. ·
Further in Part VIl the Act describes "Health and Water Supply" as follows:
90. (l) Every habitable room in any building shall have a floor area of not less than ninety square feet and no horirontal dimensions shall be less than seven feet. Provided that, with the approval of the council, kitchens, bathrooms sculleries, pantries, larders, water closets and laundries may have a smaller area than ninety square feet
(2) Every habitable room in a buil~ing shall have a mean height from floorto ceiling of eight and one• half feet with a minimum height of eight feet from the floor to the point of junction of the ceiling with the wall.
91.(1) Every room intended to be used as a dwelling or as a place of habitual occupation for any person shall be so constructed that at least so much of its walls as is equal to one-fifth of the perimeter shall either be an external wall or about on an internal space open to the sky.
(2) Toe width of such internal open space shall, measured in any direction be not less than ten feet
92.(1) Subject to the provisions of regulation 97, (stipulates "space to be left on plot"), every external wall of a building in conformity with regulation 91 shall have between it and the plot boundary of the adjacent plot an open space extending through the entire length of such wall and shall be at least ten feet wide. Provided that, in cases where a sanitary or service lane adjoins the boundary of a plot. single storey outbuildings may be built up to such boundary.
On "obstruction of light and ventilation" the Act states:
(2) Any gutter, pipe or water downpipe or other 93. appliance provided for roof drainage shall be so constructed as to prevent the accumulation of
No building shall be erected in such a manner as, in the opinion of the council, affects adversely the light and ventilation of other buildings on the same plot. water in or upon it.
From the above extracts of Part IV of Section 114 of Chapter 480 of the Local Government Act of the Laws of Zambia it can be seen that the law describes:
materials construction effects of materials and construction on structural stability
94.(1) Every room, office or passage in every building and every shop. warehouse or factory shall be provided with effective and permanent means of ventilation to the satisfaction of the Medical Officer of Health.
(2) Every person who erects a domestic building
93

shall construct in every habitable room at least one window opening directly into the open air, and every such window shall be constructed in such a way that at least one-half of such a window may be opened and further, that the opening may extend in every case from the bottom to the top of the window.
(3) Any window provided in accordance with subregulation (2) shall have the total area clear of the frames equal to at least one tenth of the superficial floor area of such room. Provided that the window area shall be increased if any such window is placed under a veranda by one and one-half per centum of floor area for each foot of width of veranda over five feet.
(6) Every habitable room and every passage in a domestic building shall be properly and efficiently cross-ventilated.
The Sections of the Act cited above describe obligatory standards for reasons of biological health and any ref ercnce to .. climatic comfort" is marginal except in the following which addresses itself to "Resistance to transmission of heat.":
95.(1) After the commencement of these Regulations, every dwelling-house shall be so constructed that adequate means shall be provided to prevent the transmission of heat through the roof or walls.
94
(2) The provisions of sub-regulation (1) shall be deemed to be satisfied in respect of any roof or ceiling of a dwelling house if:
a) the roof is constructed as a pitched roof covered with tiles or shales on batten and felt or other suitable lining, or in the case of a flat roof, with timber joists and a decking of timber not less than seven-eighths of an inch (25.4 mm) thick covered with a weather-proof covering within either case a ceiling of plaster, plaster-board or fibre building board; or
b) the ceiling in conjunction with the roof. but excepting any skylight or other opening. is so constructed or so lined as to have a thermal transmittance coefficient. when the sum of the surface is taken as 1.0 not more than 0.3.
(3) The provisions of sub-regulation (1) shall ~c satisfied in respect of any wall of the dwellmghouse if:
a) the wall is built as a solid wall i:iot less than eight inches (20.32 cm) of bncks or blocks. or in the case of a cavity wall, not less than ten inches (25.4 cm) thick of bricks or blocks of
concrete cast in situ; or
b) the wall, apart from any window or other openings, is so constructed or so lined as to have a thermal transmittance coefficient, when the sum of the surface resistance is taken as 1.0, of not more than 0.3.
Summary of Legislation requirements
From the extracts of Chapter 480 of the Local Government Act of the Laws of Zambia, a summary of factors which have or could have a climatic impact might be given as:
1. materials 2. construction 3. effects of materials and construction on structural
stability 4. effects of natural elements, notably rain and wind
on the structural stability of a building 5. floor area and height consequently minimum room
volume for habitable room 6. openings to atmosphere and sky 7. light (natural light) 8. ventilation (cross-ventilation) 9. transmission of heat 10. prescription for construction elements of roofs
and walls.
Of greater climatic impact on the building and needing more specific legislation is, among others, the factor dealing with the transmission of heat. An understanding of the principles in the transmission of heat will provide a lead to a possible solution of dealing with the problem. Ultimately, constructional elements, walls, openings and roof will have to be designed in answer to the challenges of the problem of the transmission of heat and other elements of climate (Fig. 17.3).
Standards
As pointed out in the introduction, building standards do sometimes deviate from building legislation in Zambia. The National Housing Authority acting as both designer/ planner and building contractor have been able_ to introduce new standards for their housing constructions. 150 mm external wall thickness is used in medium and lowcost housing categories and antguards and damppI"?of courses arc sometimes entirely omitted as a cost savmg measure.
The Lusaka Urban District Council has created alternate standards for those who provide their own shelter in site and service areas and in upgraded and legalized squat!er settlement areas. Salient features of new standards for site and service areas include:
Road access to be provided to all plots Plots to be 12m x 27m = 324m2

Fig 17 3: Constructional elements of a building
Maximum plinth size of a core house to be between 22.5m2 and 27.0m2
Maximum area of plinth after extension to be J0.8m2
Minimum size of living rooms 10.8m2
Minimum size of bedrooms to be 8.lm2
In comparison to the legislation these standards do not S!-3te any re~mmendations for room height and minimum s!ze ?fope~ngs for rooms, factors which are important for ai~circi,µa~10n and comfort in th_ese rooms sizes. Titis paper will examme the elements of chmate applicable to Zambia and how they effect the "climate" in a building under existing legislation and standards.
Elements of Climate
Humidity Wind Rainfall Sky conditions
Of the elements of climate given above, solar radiation and rainfall shall be discussed in more detail. This should, however, not be interpreted to mean that the other elements are oflesser importance in creating an acceptable climate. Elements of climate do not occur as separate problems and should be addressed in their complexity during the design process.
Solar radiation
In Zambia solar radiation is the single most important factor which bears a lot of influence on climate. The intensity of solar radiation reaching the earth• s surface is greatly reduced due to: In order to have a deep understanding of the design and
building implication of climate in a place, it is important that the various elements of climate and how they combine reflection from clouds
a~sorption in the atmosphere diffuse scattering
in that particular region and place are known. The data on • elements of climate should be isolated, analysed and • understood fully if they are going to be used for the advantage of comfort in buildings. Relevant elements of climate are:
High water vapour content in the atmosphere, as is characteristic of the humid tropical regions, and dust particles, which are characteristic of the dry tropics, play a major role in reducing the potential solar radiation intensity. Solar radiation
Temperature
95

h e r e
,11 •• ,, ....
Loyer close c ...... , ••
to th, surface "-4l0dln,-.lldo~
......... uc11oe
Heat transport by I ll'f'!?::a Mcillnlot ... , ...-uctlo• ~ ..... ._,....... - Colwtdloa [::-:•.~---•~.3 ung._ro41411M mim) O. .. et-.,i,yucahtat .. ft110G1er
10
12
18
10
12
16
18
tt
ANNUAL SUNSHINE (Houra) 19&a-19n
WET SEASON SUNSHINE November-Marth IHoura)
24 28
I(?() IC!C) JC!C) 4QO '90 •••
32
Fig 17.4: Heat exchange at noon/or a summer day. (The width Fig 17 .5: Hours of sunshine of the a"ows co"esponds to the transfe"ed heat amounts)
Part of the scattered radiation, however, is reflected back into space and reaches the surface of the earth as sky radiation. Cloud cover is also a source of long wave radiation especially in the tropics. The thickness and water content of the clouds detennine the amount of radiation passing through the clouds (Fig. 17.4).
Direct short wave radiation has the most profound effect on the temperature of air and building surfaces. During most pans of the year, solar radiation begins at dawn and reaches its maximum atnoon(about 12.00hoursZambian time) before falling to zero at sunset. Relevant data for Zambia for .. hours of sunshine" is a good indication of the intensity of solar radiation. In Zambia solar radiation is quite considerable even during the rainy season as the daily sunshine hours are quite considerable (Fig. 17.5). The solar radiation reaching the earth surf ace is absorbed or reflected by surfaces.
In connection with solar radiation ... sunlight" should also be mentioned. It is important to study the limes of the day and year when sunlight can penetrate outdoor and indoor spaces. angles of penetration. the likely intensity and the reflection from the ground surface are important data which give a lead on shading devices (Fig. 17.6).
96
Ty pi col fuodo
I. Sooil• fou 1 ....,._ 001111c, IU De- •oo•I t~
I. No,tll loco , Wlolar 1ol1llco U2 .,_ •-I 49"
1 Cott foe:• • Wi•ttr aol•Uc• (U ,l116a• I.CO twn,,,) ...
4. Wut fee• 1 WiaHr eol1t1c• (tt -'u•• 11,00t.o..i,d.,
i •
T1~••I locod•
Adept,, hoQI Montgoi,-.rit, ()Cdfi eld, Kirl>ra Arclu •• ,., 6 To-a PIGNte,1,
Report on l.l,t'11lo tto,al ~•1opm111t. Lu&atQ• Nowa•ber 1174
Fig 17.6: Angles of incidence of the sun

10
,.
0 , toO 100 100 400 100 ... -.. N so
Fig 17.7a: Annual rainfall distribution in Zambia
IIETU~N PEIII00fYEAIISI
2s1·;:;o•'--r-'',.,-'.....,.....,_......-:."---.-....,.._,11,--___:,10;:.----=;;o;...2:;.:11...--'11,.;.o-,;;;.;.---"-i200
J ...J
EXTREME DAILY RAINFALLS CALCULATED BY JENKINS0N'S METH00
~ 11ooJ.---lf-+--f++-Jb,+4=--:::~~~~~-+-~-+~ < a:
o...._...._.._ ......... ......_...,__..___.__....L.. _ _,___~~---.!-~-.....,•• 1510 10l0605040ll0 10 10 154 :S I O.ll
Fig 17.7b: Extreme daily rainfall of selected stations in 'Zambia
RAINFALL LIKELY TO BE REACHED OR EXCEEDED ONCE IN I ~ 20 AND !10 YEARS . . .
i E
°"I' ,v,•••1 &11•u.11. ••• ■ ,&LL •oo-. 150
~ •,-... ~ 100
r.:::::= Ir--, r-- r-- 1::,-__
!10 ----0 00
. 10 20 30 4!1 60 ,..,
DutGtion Minute•
2. 00
1:of'- A\tflRAII 4NIMUA1. "41111.&1,.1,. aOO•••
150
~ 'I' ~ ...... IOO
't-- r- ~ ,__ r-- r--....
50 -0 0 10 20 30 45 60 90 I 20
D11rati(m Minu•••
10 zo 30 45 ,o 90 10
Duration Minute•
Fig 17.8: Hourly rainfall intensity curves
Rainfall
The period of rainfall in Zambia is from October to April during which time Zambia records almost all its rainfall (Fig. 17. 7 a and 17. 7b). For purposes of design it is important to predict flooding as associated with drainage of surface such as roofs, paved areas and drainage objects such as guners and water down pipes. During the rainfall season in Zambia, rain can at times fall with extraordinary intensity and is often accompanied by thunderstorms and high winds (Fig. 17.8).
Climatic data in Zambia is available from the Meteorological Department. Such data is usually compiled and available from airfields, meteorological and research stations. The architect and planner are interested in typical conditions which are presented as monthly means or daily maxima and minima. Itis, however. advisable to scrutinize the extent of extreme values and their frequency as this will indicate how far the climate varies from the normal and will indicate special requirements and problems which may arise.
Due consideration should be taken of the fact that although meteorological instruments and stations are strategically situated their positions do not take into account places with special topographic features. These features should be investigated by the designer, separately.
Constructional Elements, Climate and Legislation
In order to establish discrepancies between the climate, building legislation and standards in 2.ambia, it will be necessary to examine the functions of constructional elements and assess how best they can respond to the elements of climate. These then will be looked at in tenns of building legislation and how best it can accommodate the requirements of climate.
The construction elements; roof, walls and openings (win-. dows and doors) are responsible for the maintenance and
regulation of the interior environment of a building (Fig. 17. 3 ). Although requirements for the construction of roofs. walls and openings varies in Zambia, important considera' tions should be given to heat insulation, heat storage, heating and cooling, porosity to water and water vapour.
Walls
A considerable proportion of the heat reaching the interior of a building is transmitted through the external walls. As exposed elements of construction they are subject to the sun's direct impact and the attendant heat loads. The sun's rays must, therefore, either be intercepted before they make their impact on the wall, or the wall must be of such material and texture as to afford reflection of the sun's rays
97

•
once these have made their impact on the surf ace. The walls must afford the neCC$sary protection against direct beat penetration.
Although Zambia climatically belongs to the Tropical Upland Climates, ambient air temperatures can be so high during the day that the interception of solar radiation before making impact will have little consequence on the beat exchange and flow process. Toe physical nature of the wall (i.e. construction) will play a vital role in regulating the interior environment.
Varying solar radiation causes surface temperatures to fluctuate in time about a mean value. These fluctuations occur with a time lag whose extent depends on the physical constructional nature of the wall, i.e. thickness and type of materials used. lbe interior surface temperature, therefore, does not reach its maximum for a considerable time after the outside surface has reached its maximum. Itis. therefore, possible that the cold stored in the wall mass at night can be released to the interior during the daytime when the ambient outside temperature is very high. This calls for a proper use of materials and appropriate wall thicknesses to ensure that cold is stored in the mass of the construction at night.
A more practical solution to the heat load on the wall is to intercept the sun before it makes any impact on the walls but that the walls can also be foreseen with protected openings to facilitate cross-ventilation. This could be done through the use of wide projecting roof eaves which will cut off the incidence of the sun to below the venical plinth of the building (Fig. 17.9).
The external walls of the building should possibly be white-washed to facilitate maximum reflection. The response oflegislation is as stated for minimum wall thickness of 200 mm.
Important aspects of climate should be considered such as:
external wall thickness in respect to orientation finish and texture of external wall
Roofs
effect of surrounding elements such as vegetation and other buildings other moderating factors perculiar to an area i.e. wind. etc.
The roof has the biggest exposure to the sun and remains unprotected most of the time. Considerations given for protection of walls from solar energy hold for roofs as well. The roof should not absorb orretain any solar radiation and consequently should be lightweight and reflective. In low and medium cost housing in Zambia the roof, although constructed to minimum technical standards, accounts for up to 33% of the total building cost. Any steps taken to improve house interior climate through roofing should be
98
. •
Front view
-.. ... . .
Side view
Plan
I'• ~ •
: . " ' ·.. . . ., -'.
Plan with sun protection device
fully open
Fig 17.9: Possible protection of window openings against direct sun rays

done bearing in mind the cost factor. An overriding factor for roofing is of course the function of arresting rain water and channelling it away from the building.
Shortcomings in legislation are highlighted by the lack of provision for:
recommended roof construction for thennal comfort surface finishes for roofs slopes of roofs for thetmal validity other than the manufacturer's minimum obligatory considerations for flat roofs. especially in public buildings.
A well known fact in Zambia is that there are a lot ofleaks with flat roofs incorporating bitumen in their construction. At times of intense sun energy at noon the solid bitumen melts. Rapid cooling in the rught causes quick contraction and, subsequently, cracks.
Openings
2.
3.
Openings in an external wall provide the greatest access 4. for solar heat. This disadvantage is, however, outweighed by the function of openings as windows to allow light and air into the room. The example of the advantages and liabilities of a window is a good demonstration of the multiple functions of building elements.
The Local Government Act, as quoted earlier, stipulates the minimum size of openings (windows) in a room to be at least "one-twelfth of the superficial floor area of such room." Other conditions as listed under "BuildingLegislation" stipulates the provision for ventilation opening but does not show any relationship to climate and room comfort apart from the health point of view of keeping a constant change of air.
Disparity
There seems, obviously, to be a disparity between elements of climate, standards and building legislation. The parts of the legislation which are inclined to imply care for the climatic impact can be interpreted in such a number of ways as to be ineffective.
Climatic Requirements and the Architect/ Planner
Architects, planners and other related fields arc aware of the climatic requirement<; placed on buildings and the environment. Various reasons can be attributed to the lack of respect which should be accorded to climatic requirements. These are:
and services seems to have freed the architect and designer from a responsibility which he traditionally undertook with his commissfon. Walter Gropius, in the new spirit of the 20th Century, claims that the designer was now released at long last from the "tyranny of the wall" which in modem architecture is usually the only boundary between the interior and exterior.
Stylistic movements in architecture have tended to export themselves internationally without regard to region and climate. Examples of such styles abound in all cities of the world.
The architect might in many cases be inadequately schooled in the science of environmental physics. In Zambia the complimentarity of the use of external space is realized through the use of the various areas around the hut when they are in shadow(Fig.17.lOand 17.llaand 17.llb). Note that huts to be used exclusively for use at night were without the wide overhanging eaves (Fig.17.12aand 17.12b).
Lack of legislation and legislation enforcement from the enforcement agencies i.e. Lusaka Urban District Council and Department of Town and Country Planning has given the an:hitect a free hand which he has in numerous instances vividly abused (Fig. 17.13). The description as shown above from the Local Government Act is vague and requires a lot of monitoring to enforce.
L The advances in the ways of servicing buildings Fig 17.10: The hut as part of the complex in ihe traditional has tended to obscure the basic responsibilities of habitat provides thermal comfort in the external shadowed
· ct· · · areas under the wide overhanging eaves the designer. The in-built cost for an-con 1uonmg
99

]
Fig 17.1 la: A series of "open" courtyards can provide possibilities for lighl and ventilation within the complex while the closed up exierior can protect against wind from the outside
Fig 17.1 lb: The closed-up central courtyard (atrium) system as is common in North, West and parts of East Africa is rigid in use and does not offer direct accessibility to the outside
Fig 17.12a:Traditional hut constructed with internal and external space in thermal comfort and complimenting the internal space
Fig 17.12b: Traditional hut constructed with internal storage space and no provision/or external complimentary usable areas
IQ~ W. W~\ rP WWQJ
Fig J 7.13: Typical gridiron layout of existing housing and other building estates shows lack of sensitivity ~o orientation a~ creation of "intimate" areas of interaction. Abstracted example from Kamwala Compound, Lusaka, 'Zambw. Note the posmve
aspect of the front and rear verandas
100

Conclusions
Building Legislation and Enforcement Agencies
The key example of limitations imposed on climatic response of a house due to plot configuration can be attributed to the government planning agencies for disregarding the impact of climate on standards for housing and the built environment. Standard solutions to planning and architecture show a lack ofimagination and consideration of the public. Agencies responsible for standard control and legislation enforcement in Zambia are ineffective due to:
shortage of professional manpower limitations in supervisory finances cumbersome procedures of enforcing legislation ambiguously defined laws and regulations political influence in local authorities tending to overrule professional decisions.
The fact that the codes quoted from the Local Government Act still make reference to the British Standard Code of Practice is testimony that no thorough work has been carried out to fonnulate appropriately applicable legislation.
The Architect/Planner and His Training
Examples in the built environment all over the world will prove that the training of the architect/planner is more conscious of the physical functional aspects of his creations rather than climate. Enforcement of climate awareness through legislation will always yield partial results as there will always be loopholes.
The training of the architect/planner should arouse his awareness and respect for climatic considerations in his design deliberations. Schools of architecture and planning should lay emphasis on regional characteristics besides giving a broad international base to the architect/planner. Victor 0lgyay (1963) in his book .. Design with Oimate", quotes Vitruvious in De Architecture as having said: .. For the style of buildings ought manifestly to be different in Egypt and Spain, in Pontus and Rome and in countries and regions of various characters. For in one part the earth is oppressed by the sun in its course; in another pan the_ earth is far removed from it; in another it is affected by 1t at a moderate distance."
Reference 1. Government of Lusaka, Local Government Act.
2. O/gyay, Victor 1963: "Design with Climate". Princeton University Press, Princeton, NJ.
101
CHAPTER 18: CONCLUSIONS Towards Environmentally Sound Urban and Building Climatology Yinka R. Adebayo Department of Geography. Kenyatta University Nairobi. Kenya
The Professionals' Analyses
Environmentally sound urban and building climatology centres upon how to design for: 1) atmospheric conservation; 2) comfonable indoor climate; 3) energy conservation and 4) pollution control. The contributions in this publication constitute a step in this direction. Unfonunately many of the issues are addressed more from the architects• professional perspectives. Thus, the analyses of some aspects of urban and building climatology, like pollution studies, urban hydrology and urban air circulation, are largely unemphasized.
Highlighted in the introduction are the general conditions of the urban climate and the states of the polluted city in relation to human health, energy, comfon and the regional climate. The problems concerning the application of climatological knowledge are also put into perspective. Following the introduction is a section-by-section analysis of the problems. Summaries of the findings are as follows.
GOtz, Meffen and Ogunsote deal with matters concerning climatological data in Section II. G6tz brings out: 1) the relevance of climatic information to the architect; 2) the overall duties of the architect and, 3) some obstacles to climatic design across various regions. In G6tz's opinion, since traditional architecture is more sensitive to the local climate, it will be necessary to use such designs in different localities as part of the guidelines for climate-sensitive design.
Meffen •s contribution is an example of how the architect could carry out a climatological analysis of any site for indoor comfort, illumination and ventilation. Using temperature and humidity data as reference parameters, the author shows how to identify the thermal turning point and comfort wnes in simplified graphic forms.
The imponance of climatological data storage and retrieval systems for architectural purpose is stressed by Ogunsote, who also advocates the need ~o~ computer education in institutions. It is the author's opm10n that the development of software programmes for processing cli-
102
matic data can boost the inclusion of climatological ideas in design and planning.
Section III contains two case studies: one by Fritz and the other by Adebayo; carried out at Hannover and Ibadan respectively. Fritz measured infrared temperature in a small courtyard, typical of a garden in an urban environment. The results reveal that the temperatures of the different ground and wall surfaces of the courtyard are very much different, both in magnitude and variability, from the air temperature because of the differences in the thennal conductivities of the materials. Exposition to direct sun radiation has been identified as another important factor controlling the infrared temperature. Infrared energy emissions from those parts of the walls covered by evergreen vines are different from infrared emissions for other surfaces. The walls under these vines are also cooler than other surfaces.
The investigation by Adebayo brings out the relationship between urban surface roughness elements and microclimatic conditions. Specifically the study reveals that a high level of relationship exists between landuse and climatic parameters. This suggests that urban physical planning for better climate, pollution control and human physiological comfon could be successfully carried out by using a landuse approach.
In Section IV Hailu, Ferstl, Sa 'ad and Adebayo examine the climatology of building design and planning in some African countries. According to Hailu, traditional architecture could vary with landscape and climates, just as microclimatic conditions could vary considerably from one town to another. The study reveals that in Harrer, Ethiopia, both the settlement and the houses were planned in such a way that comfortable.indoor and outdoor microclimates could be enhanced. Ferstl also confinns that traditional architecture in Ethiopia is sensitive to climatic conditions. In northern Nigeria, Sa'ad reveals that although vernacular Hausa architecture somehow takes indoor and outdoor comfort into consideration, the observed pattern at Zaria still suggests that some other factors such

as visual appeal could exercise great impact on the design pattern.
Unfortunately, traditional architecture is virtually absent inconternporary African cities. A typicalexampleisfound in Ibadan where according to Adebayo most of the present forms of design neither reflects the traditional architecture nor takes climatic comfort into serious consideration.
Provision of comfortable natural indoor climate only becomes an important factor in modem architecture, unfortunately, after economic consideration. Comfort is instead provided through the mechanical systems, while less attention is paid to passive cooling in the tropics and heating in the temperate areas. The problems relating to comfort and ventilation are addressed by Solanke, Bafekadu and Flatt in Section N.
Solanke examined indoor comfort in a bungalow at Zaria and concluded that indoor comfort could vary with climatic season and room orientation. The study also shows how temperature could be used to establish comfort limits, if environmental elements are within acceptable brackets and human perfonnance is not considered. One lesson which is realized from Solanke 's study is that in designing for comfort the architect should take indoor activities imo consideration.
The importance of environmental factors in comfort consideration, which Solanke reveals, is also partly confinned by B afekadu in Addis Ababa The author examines the students· indoor environment, how this could affect their state of comfort; and confirms that factors such as the kind of lectures students attend, activities, age, sex and state of health considerably affect their state of physiological comfort.
Flatt observes that the architect could find it difficult to design for adequate ventilation because of the problem of predicting changes in weather. Commenting on climatic problems, the author notes:
"0u1'-greatest enemy is the sun. So roofs and shading are ourmajorconsiderations, except perhaps in Nairobi where you can build anything and the weather changes just before it becomes unbearable".
The author is also of the opinion that many architects often handle the issue of adequate indoor ventilation with levity, and cites the toilet as an important room which is usually ignored.
In Section VI Ettouney, Marland, Dequeker and Ndilila deal with the concrete issue of application of climatological knowledge in building design and planning. Ettouney examines the importance of climate as an important factor at different stages of design and planning, citing the cases of New Ameriyah City, 6 October New City and EI Obour New City, all in Egypt, as examples of cities where
climatic consideration has played a major role in their planning. Toe author concludes that microclimates of a city are products of man-made features and the natural environment, and that the climates of any settlement cannot be separated from the 'townsc~pe' and 'landscape•.
With empirical focus on Zambia, Marland shows how adequate day-lighting could be achieved in the tropics. The study concludes that in an attempt to attain the best day-lighting through the window, designers should not fight shy of the relevance of the window for indoor energy regulation. Dequeker also brings climatology closer to the door step of the architect in hot humid central Africa by showing some ways of achieving a desirable indoor climate.
One important way of making urban and building climatology operational, for the benefit of the society, is through legislation. This is because ordinarily, the individuals would opt for beautiful houses and surroundings while health and energy considerations are relegated to the background. Legislation would also ginger the concerned practitioners into action. With an example from Zambia, Ndilila suggests that building legislation should be reviewed to incorporate more current climatological research information.
In Lusaka, according to Ndilila, there are many buildings with climatic problems. The cause of this weakness could be traced to poor expertise and inadequate legislative consideration. The Lusaka case can be extrapolated across other tropical countries.
The experts• views in this volume haye been summarized. These findings are difficult to translate totally into the professionals' "note books" unless therelevantpractitioners are philosophically convinced about the need to take hu• man comfort, energy and the environment as a whole into consideration. But at a practical level, perhaps it will be necessary to ask this question: what is the environmental relevance of climate-sensitive planning and design'?
Planning, Architecture and Professional Obligation
If it is the moral obligation of every profession to make the world a better place for all generations, then planners and architects should not be left out of the great task.
Architecture is older than settlement planning in the sense that the art, of 'what and how to build', was first perfected before the arts of 'where to build' and 'how to arrange the buildings'. Conscious settlement planning did not come inro being before the advent of urbanization. Paradoxically planning, today, comes before architecture. This is especially so because the city rests on the planning ofits layout; fuelled by efficient communication and transportation 'arteries'. Practically, it is only within an efficient city that
103
we can have economically prosperous people. Within the contemporary city, the architect has a crucial role to play. Professionally, the architect is expected to design an efficient building by utilising the limited space to house people and offices. The architect takes a decision on building orientation for purposes of comfort as well as in consonance with the layout of streets so that human and vehicular traffic flows can be enhanced. Working with a good knowledge of planning, or working hand-in-hand with the planner, the architect is, somehow, a planner as well. ·
Mostly, governments are the clients of urban planners while organizations and individuals only come in tangentially. The architect. on the other hand, is much more patronized by the individuals. But in reality, at the end of the day, both experts owe the society something. Indeed, their moral accountability goes to humanity. They should answer the following questions:
1. In a bid to design in order to aid the economy and for aesthetic reasons, how much of the earth's resources have been preserved for better sustenance of the earth's future?
2. Have the concerned professionals asked the question such as what would be the implications of their designs to human health and the environment?
Over the years, planners and architects have been making a series of effons to incorporate climatology into their functions. Unfonunately, as can be seen through the contributions in this volume. there are several areas yet to be covered. This calls for more investigations and education. But, in the meantime, for the interest of human environment how can cJimatologists, planners and architects address the situation. henceforth?
What can we do?
The challenges posed by the problems of urbanization are dynamic in nature. As a result of this, any strategies to be employed can only be developed by constantly reviewing the situations as they arise, based on previous experiences. Just like in socio-economic spheres, the physical environments are also continuously affected by the changing nature of human settlements. In attacking the problems of climate-sensitive design, both planners and architects have in the past danced to the tunes as dictated by the aunospheric environments. The problems can be dichotomised between small settlements and the big polluted city. Unfortunately. this is one concrete issue which has not been addressed by articles in this volume. Somehow, the concerned practitioners have not clearly differentiated between the climatological problems of designing for an isolated building, seen as a holistic entity, as different from those for the urban building within the complex web of the heterogenous urban environment.
Jt is very necessary to reduce the gap between the clima-
104
tologists and the architects. Agreeably, the architect bas some knowledge of climatology, but because of the diversified nature of the profession the architect rarely has a deep knowledge of urban climatology. The architect's quest for climatological knowledge should go beyond learning how to use and interpret data for building design like those explanations given by Loftness (1982). This is because it is necessary for both the architect and the planner to know the climatic implication of whatever design they put on the drawing board.
This brings to light the issue of adequate utilization of research infonnation for climate-sensitive design. Somehow, the temperate countries have made some mistakes as far as designing for better urban climate is concerned and, as Oke (1977} put it, tropical and polar areas should learn from such mistakes.
The nature of the evolution of tropical settlements also introduces some other dimensions into the applicability of climatological ideas in the tropics. This is partly because the tropical urban areas are growing at a very rapid rate with very many attending socio-economic problems such as the rapid expansion of slum and squatter settlements along with some present mega-cities in Asia, Latin America and some prospective mega-cities in Africa. The question now is. can we integrate climatology into these rapidly developing slum and squatter settlements?
It has been speculated before (see for example Adebayo, I 989) that urbanization contributes a lot to global change in climate. Whether or not the globe is wanning is not the issue here. The point is that the urban climate is not a natural climate, but an artificial one; a combination of which constitutes a large modification in the regional climate. Indeed, the city as the home for most industries, automobiles and other artifacts is undisputedly the most potent spot from where man exercises the greatest impact on climate. As Smith (1975) remarked, the atmospheric resources are being utilized as if they are inexhaustible. No doubt the urban-based man is most guilty of this offence. If this be the case, one of the ways through which this trend could be checked is by planning and designing to reduce the reckless utilization of these resources. Legislative measures and environmental education are necessary steps, to be taken in order to enforce and complement efforts being made by the relevant professionals.
Conclusion An integrated approach is the ultimate sol~tion_ to t1:e problem of urban plannin~ and bu~lding de~1gn v1s-a-v1s urban climates. In doing this, the cltmatolog1sts should be given an appropriate role in policy formulation ID'!d implementation. There is. the ne_ed for a c~nstant review of events in accordance with soc10-econom1c changes. Also, in preparing human settlements for long tenn chan~e~ in climate, it is necessary to review some aspects of building

codes side by side with a list of con.finned implications of urban artifacts and pollution on climatic elements.
References
1. Adebayo, Y.R.1989: "Application of climatology to planning and management of urban areas". Paper presented at First Annual National Research Workshop on Meteorological Application and Services, !MTR, Nairobi.
2. Loftness, V. 1982: "Climate/Energy Graphics, Climate DataApplicationsinArchitecture". WCP-30WMO, Geneva.
3. -Oke, TR. 1977: "Climate of urban areas". In Textbook of Science and Future Encyclopaedia Britannica, Chicago.
4: Smith,K.1975: "Principles of Applied Climatology". McGraw-Hill London.
105

List of Illustrations and Tables
Fig.Lt 1be modification of regional climate. 1 Fig. 5.5 Southward oriented wall at2 l .28 h(9 .28hp.m.), Fig.12 Idealised representation of the urban dome, 2 19 Fig.1.3 Aspects of environmental pressures on a build- Fig. 5.6 Westward oriented wall at 21.41 (9.41 hp.m.),
ing.2 19 Fig. 1.4 Schematic representation of the radiation and Fig. 5.7 Southward exposed place in front of the garden
energy fluxes at the eanh's surface by day and house eastward looking, 20 by night. 3 Fig. 5.8 Place in front of the gardenhouse in the mom-
Fig. 1.5 Hypothetical view of urban-rural characteristic ing at 6.13 h, 20 micrcKlim.atic condition, 3 Fig. 5.9 Westward oriented wall in thelawngarden with
Fig. 1.6 Schematic representation of urban atmosphere passage to sunlit court pergola on the left hand illustrating a twO-layer classification of thermal side, apple tree on the right hand, 21 modification, 4 Fig. 5.10 Westward wallinthelawngardenatnight2.14
Fig. 3.1 Spatial location of meteorological stations in h,21 Kenya.11 Fig. 5.11 Westward wall in the lawngarden in the mom-
Fig. 3.2 Temperan11-e and humidity runs, Eastleigh sta- ing at 6.37 h, 21 tion inN airobi for the hottest month (February, Fig. 5.12 Westward wall in thelawngardenintheevening 1942-57), 12 at 22.41 h (10.41 p.m.), 21
Fig. 3.3 Temperature and humidity runs, Eastleigh sta- Fig. 6.1 Mean roughness of buildings and trees for tion in Nairobi for the coldest month (July. major wind directions, 24 1942•57).12 Fig. 7.1 Annual temperature and rainfall change in 6
Fig. 3.4 Bioclimatic chart.12 tropical cities, 28 Fig. 3.5 Temperature and humidity conditions, Nai• Fig. 7.2 When volume increases in relation to surface,
robi, on Olgyay's comfort chart (February, heat exchange with the outside decreases, 28 hottest month), 13 Fig. 7.3 Protected area in a house, 29
Fig. 3.6 Temperature and humidity conditions, Nai• Fig. 7.4 The clustering of buildings limits the exposure robi, on Olgyay's comfort chart (July, coldest of peripheral walls to sun's rays, 29 month).13 Fig. 7.5 Unidirectional cool winds, 30
Fig. 3.7 Temperature and humidity conditions, Mom.: Fig. 7.6 Multidirectional cool winds, 30 basa. on Olgyay's comfort.chart (March, hot- Fig. 7.7 Section of a room in a large house in Damascus,
test month). 13 31 Fig. 3.8 Temperature and humidity conditions, Mom- Fig. 7.8 Diurnal changes in the use of space during
basa,onOigyay'scomfonchart(August,coldest summer • Baghdad, 31 month), 13 Fig. 7.9 Similarities of plans in houses of different sizes
Fig. 3.9 Temperature aoohumiditycorxlitions, Mandera. ,31 on Olgyay's comfort chart (March, hottest Fig. 7.10 New hollow block construction in Dire Dawa,
month), 13 32
Fig. 3.10 Temperature aoohumiditycol'KJ.itions, Mandera, Fig. 7.11 Traditional Tigre farmer's house -Ethiopia, 32
on Olgyay·s comfort chart (August. coldest Fig. 7.12 First floor apartment of a four•storey structure
month), 13 built in 1950-Damascus, 32
Fig. 3.11 Human comfort scale, 13 Fig. 8.1 Climatic zones in Ethiopia, 33
Fig. 3.12 Conditions at Lamu, 14 Fig. 8.2 Annual range of monthly averages of outdoor
Fig. 5.1 Southward exposed wall of concrete, on the air temperature within the different climatic
right hand covered with an ever-green vine, 19 zones of Ethiopia. 33
fig. 5.2 Westward exposed wall of concrete, like Fig. Fig. 8.3 Annual range of average of precipitation, 33
5.1 covered with vine and fem in front of it, 19 Fig. 8.4 Mean daily solarradiation (diffuse and direct)
Fig. 5.3 Southward wall at 13.22 h (1.22 h.p.m.) with on different surfaces, calculated for an altitude
bright incident sun radiation, 19 of about 2.400 m, a latitude of 90'N and tar-
Fig. 5.4 Westward oriented wall at 13.26 h (1.26 h.p.m.) rushing factor of T=2, 34
still in the shadow, 19 Fig. 8.5 Daily hours of sunshine (mean values). 34
106

Ftg. 8.6 Annual range of ~ean daily outdoor tempera- Fig. 14.1 Egypt, annual rainfall and climatic regions. 67 tu.res on the highlands of Ethiopia, taken from Fig.142 NAC, SONC and ONC - new cities locations, various weather reports, 34 Egypt,68
Fig. 8.7 Plan and section of a house of the Isin-Larsa Fig. 14.3 New Ameriyah city master plan. Egypt., 69 periodofBabylon(about2000-1700B.C.),35 Fig. 14.4 New Ameriyah city, schematic cross section.
Fig. 8.8 Traditional house from Usbekiztan (middle site topography, 69 Asia) with so called 'Aiwan' for ventilation Fig. 14.5 New Ameriyah city: neighbowbood 8 - first purposes, 35 district site plan, 71
Fig. 8.9 Some of the most typical traditional house Fig.14.6 New Ameriyah city: neighbowhood 9 - first fonns in Ethiopia and their regional distribu- district site plan, 71 tion,35 Fig. 14.7 Six October New City master plan, Egypt, 72
Fig. 8.10 Heat gain through external walls and roofs of Fig. 14.8 Six October New City. experimental residen-some typical traditional housing constructions, tial group layouts, 3rd and 4th districts, 72 36 Fig.14.9 Six October New City, first tourist village, the
Fig. 8.11 Diurnal range of specific internal heat gain q,, tourist area, 73 caused by people using the house from about rig. 14.10 Obour New City, the physical setting, 74 8.00 p.m. to 6.00 a.m., 37 Fig. 14.lla Obour New City, development concept, 75
Fig. 8.12 Maxima of indoor airtemperature fora modem Fig. 14.llb Obour New City, master plan, 75 apartment unit in Addis Ababa on April for Fig. 14.12 Obour New Qty, first district., two examples of orientations to East and West in dependence on housinglayouts, 75 the factor FG of the given glass area, 37 Fig. 15.1 The components of daylight at point, 78
Fig. 9.1 Map of Nigeria, showing location of Zaria, Fig. 15.2 The sky component at point Pis a fimction of Northern Nigeria, 39 the luminance distribution of the patch of sky
Fig. 9.2 Location of Bomo within greater Zaria, 40 seen from that point, 78 Fig. 9.3 Layout of Bomo settlement, 41 Fig. 15.3 CIE Uniform sky, 79 Fig. 9.4. Bird's eye view of residential compounds in Fig. 15.4 CIE standard overcast sky, 79
Bomo,41 Fig. 15.5 Neither solar altitude and climate, nor orienta-Fig. 9.5 A typical compound at Bomo, 42 tion are taken into accmmt when using the Fig. 9.6 Climatic data for Zaria, 43 unifonn orstandardovercastskyfordayligbting Fig. 9.7 Vernacular roof type, 44 design,79 Fig. 10.l West Africa, showing the directions of trade Fig. 15.6 CIE clear sky luminance distribution, 80
winds in July, 46 Fig. 15.7 Summary of sky conditions in Zambia with
Fig. 10.2 Hypothetical view of both traditional (a, band respect to N and S facing windows, 81 c) and modem housing types that are found Fig. 16.1 Comfort chart for Kinshasa. 84 across West Africa, 47 Fig. 162 Variation of annual comfort conditions (Kin-
Fig.10.3 Textured map of the city, 49 shasa- latitude4"23' South; altitude 311 m), 85
Fig.10.4 Characteristic texture of different landuses, 49 Fig. 16.3 Need for comfort, 86
Fig.11.1 Survival parabola, Si Fig. 16.4 Roofing heat tranSmission, ff7 Fig.11.2 Siteplan, 53 Fig.165 Western gable heat transmission, 88
Fig.11.3 BZ 190 and a section of it, 53 Fig. 16.6 Example of the use of graphs and monographs
Fig.11.~ Activity chart, 56 for overall investigations, 89 Fig,115 Activity Chart(March 26-30), 56 Fig. 17.1 Minimum standard plot size showing limita-
Fig.11.6 Activity Olart(August 11-15), 57 tions in arrangement of floor plan, 91
Fig.11.7 Activity Chart (October21-25), 57 Fig.17.2 a A climate conscious town planning would
Fig. 12.1 Relationship between room temperature at evolve interesting building groupings different
different times of the day and subjective as- to the gridiron layouts common today, 92
sessment, 60 Fig. 17.2 b A climate conscious architecture can draw on
Fig. 12.2 Relationship between illuminance and subjec- the possible complimentary use of internal and
tive assessment based on ixrccntageof subjects, external space by creating shadowe.cl areas as
60 was common in the traditional habitat, 92
Fig. 12.3 Relationship between noise level and subjec- Fig. 17.3 Constructional elements of a building, 95
tive assessment. 60 Fig. 17.4 Heat exchange at noon for summer day, 96
Fig.12.4 Mean noise level as function of mean road Fig. 17.5 Hours of sunshine. 96
traffic density, 61 Fig. 17.6 Angles of incidence of the sun, 96
107

Fig. 17.7 a Fig.17.7b
Fig. 17.8 Fig. 17.9
Fig. 17.10
Fig.17.lla
Fig.17.llb
Fig.17.12a
Fig.17.12b
Fig. 17.13
Armual rainfall distribution in Zambia, 97 Extreme daily rainfall of selected stations in 2.ambia, 97 Hourly rainfall intensity cuives, 97 Possibleprotectionof windowopenings against direct sun rays. 98 1be hut as part of a complex in the traditional habitat provided not only thermal comfort in the external shadowed areas under the wide overnanging eaves, 99 A series of .. open" courtyard can provide pos• sibilities for light and ventilation within the complex while theclosed•upexteriorcanprotect against wind from outside, 100 -The closed-up central courtyard (attium) sys• tern as is common in Nonh, West and parts of East Africa is rigid in use and does not offer direct accessibility to the outside, 100 Traditional hut constructed with internal and external space in thermal comfort and complimenting the internal space, 100 Traditional hut constructed with internal storage space and no provision forextemal complimentary usaBle areas, 100 Typical gridiron layout of existing housing and other building estates shows lack of sensitivity to orientation and creation of .. intimate" areas of interaction. Abstracted example from Kamuala compound Lusaka, 2.ambia, 100
LISTOFTAB~
Table 3.1 Relative humidity and marginal temperablreof sultriness. 14
Table 6.1 Percentage of urban characteristics of different land uses. 24
Table 6.2 Mean building density of different land uses, 25
Table 6.3 Correlation coefficient test results for the relationship between building densities and roughness lengths, 25
Table 6.4 Correlation coefficient test results for the re• Iatiomhipbetweenbuildingheightsandbuilding roughness lengths, 25
Table 6.5 Correlation coefficient tests between percentages of urban land uses, selected city surface components and climatic parameters, 26
Table 8.1 Qimatic zones in Ethiopia, on a latitudinal basis, 34
Table 10.1 :&timated areacoverageofhousesindifferent categories, 48
Table 11.1 Humidity group, 53 Table 11.2 Comfort limits, 53 Table 11.3 Air temperablre (0C) - 1982, 54
108
Table 11.4 Table 11.5
Table 11.6
Table 11.7
Table 11.8
Table 11.9
Tablell.10
Table 12.1
Table 14.1 Table 14.2
Table 14.3
Relative humidity (%) • 1982, 54 Responses to environmental stimulus 1981: 7:00a.m,54 Responses to environmental stimulus 1984: 4:00 p.m., 54 Outside air and room temperatures (Jan. 16-20, 1982) ..• ss Outside air and room temperatures (Mar. 26-30, 1982) .. , 55 Outside air and room temperatures (Aug. 11-15, 1982) .. , 55 Outsideairandroomtemperatures(Oct21-25, 1982) .. , ss Total number of vehicles, their corresponding mean noise levels and percentage of different types of vehicles passing between 8:00 a.m. and 6:00 p.m., 62 Egypt's climatic regions, highlights, 66 Thermal stress distribution from 37 meteorological stations, Egypt, 67 · Detailed climatic design recommendations for: New Ameriyah City, Six October New City andObour New City, 70