Download this - PLANNING MALAYSIA
419
© 2017 by MIP Advisor TPr. Hj Ihsan Zainal Mokhtar Editor-in-Chief Professor Dato’ Dr. Mansor Ibrahim International Islamic University Malaysia (IIUM) Local Editorial Board Members Professor Dr. Muhammad Abdul Mohit - International Islamic University Malaysia (IIUM) Professor Dato’ Dr. Alias Abdullah - International Islamic University Malaysia (IIUM) Professor Dr. Ho Chin Siong - Universiti Teknologi Malaysia (UTM) Professor Dr. Jamilah Mohamad - Universiti Malaya (UM) Professor Dr. Ruslan Rainis - Universiti Sains Malaysia (USM) Professor Dr. Ahmad Nazri Muhamad Ludin - Universiti Teknologi Malaysia (UTM) Professor Dr. Dasimah Omar - Universiti Teknologi Mara (UITM) Professor Dr. Suhana Shamsuddin - Universiti Teknologi Malaysia (UTM) Assoc. Prof. Dr. Jamalunlaili Abdullah - Universiti Teknologi Mara (UITM) Assoc. Prof. Dr. M. Zainora Asmawi - International Islamic University Malaysia (IIUM) Assoc. Prof. Dr. Nurwati Badarulzaman - Universiti Sains Malaysia (USM) Assoc. Prof. Dr. Mariana Mohamed Osman - International Islamic University Malaysia (IIUM) Assoc. Prof. Dr. Syahriah Bachok - International Islamic University Malaysia (IIUM) Datin Paduka Dr. Halimaton Saadiah Hashim - Universiti Kebangsaan Malaysia (UKM) Assoc. Prof. Dr. Oliver Ling Hoon Leh - Universiti Teknologi Mara (UiTM) Dr. Chua Rhan See - Jabatan Perancang Bandar dan Desa (JPBD) Khairiah Talha - Malaysia Institute of Planner (MIP) Ishak Ariffin - Malaysia Institute of Planner (MIP) Assoc. Prof. Dr. Azizan Marzuki - Universiti Sains Malaysia (USM) International Editorial Board Professor Emeritus Dr. Richard E. Klosterman - University of Akron / Whatif? Inc., USA Professor Dr. Stephen Hamnett - University of South Australia, Adelaide, Australia Professor Dr. Kiyoshi Kobayashi - University of Kyoto, Japan Assoc. Prof. Dr. Belinda Yuen - University of Singapore, Singapore Dr. Davide Geneletti - University of Trento, Italy Dr. Boy Kombaitan - Institut Teknologi Bandung, Indonesia PLANNING MALAYSIA Journal of the Malaysian Institute of Planners
-
Upload
khangminh22 -
Category
Documents
-
view
0 -
download
0
Transcript of Download this - PLANNING MALAYSIA

© 2017 by MIP
Advisor
TPr. Hj Ihsan Zainal Mokhtar
Editor-in-Chief
Professor Dato’ Dr. Mansor Ibrahim
International Islamic University Malaysia (IIUM)
Local Editorial Board Members
Professor Dr. Muhammad Abdul Mohit - International Islamic University Malaysia (IIUM)
Professor Dato’ Dr. Alias Abdullah - International Islamic University Malaysia (IIUM)
Professor Dr. Ho Chin Siong - Universiti Teknologi Malaysia (UTM)
Professor Dr. Jamilah Mohamad - Universiti Malaya (UM)
Professor Dr. Ruslan Rainis - Universiti Sains Malaysia (USM)
Professor Dr. Ahmad Nazri Muhamad Ludin - Universiti Teknologi Malaysia (UTM)
Professor Dr. Dasimah Omar - Universiti Teknologi Mara (UITM)
Professor Dr. Suhana Shamsuddin - Universiti Teknologi Malaysia (UTM)
Assoc. Prof. Dr. Jamalunlaili Abdullah - Universiti Teknologi Mara (UITM)
Assoc. Prof. Dr. M. Zainora Asmawi - International Islamic University Malaysia (IIUM)
Assoc. Prof. Dr. Nurwati Badarulzaman - Universiti Sains Malaysia (USM)
Assoc. Prof. Dr. Mariana Mohamed Osman - International Islamic University Malaysia (IIUM)
Assoc. Prof. Dr. Syahriah Bachok - International Islamic University Malaysia (IIUM)
Datin Paduka Dr. Halimaton Saadiah Hashim - Universiti Kebangsaan Malaysia (UKM)
Assoc. Prof. Dr. Oliver Ling Hoon Leh - Universiti Teknologi Mara (UiTM)
Dr. Chua Rhan See - Jabatan Perancang Bandar dan Desa (JPBD)
Khairiah Talha - Malaysia Institute of Planner (MIP)
Ishak Ariffin - Malaysia Institute of Planner (MIP)
Assoc. Prof. Dr. Azizan Marzuki - Universiti Sains Malaysia (USM)
International Editorial Board
Professor Emeritus Dr. Richard E. Klosterman - University of Akron / Whatif? Inc., USA
Professor Dr. Stephen Hamnett - University of South Australia, Adelaide, Australia
Professor Dr. Kiyoshi Kobayashi - University of Kyoto, Japan
Assoc. Prof. Dr. Belinda Yuen - University of Singapore, Singapore
Dr. Davide Geneletti - University of Trento, Italy
Dr. Boy Kombaitan - Institut Teknologi Bandung, Indonesia
PLANNING MALAYSIA Journal of the Malaysian Institute of Planners

© 2017 by MIP ii
Editorial & Business Correspondence
PLANNING MALAYSIA
Journal of the Malaysian Institute of Planners
B-01-02, Jalan SS7/13B, Aman Seri, Kelana Jaya
47301, Petaling Jaya, Selangor Darul Ehsan, MALAYSIA
Tel: +603 78770637 Fax: +603 78779636 Email: [email protected]
www.planningmalaysia.org
Copyright © MIP, 2017
All rights reserved.
No part of this publication may be reproduced, stored in a retrieval system, or transmitted in any
form or by any means, electronic, mechanical, photocopying, or otherwise without the prior
permission of the publisher.
The views expressed in this publication are those of the author(s) and do not necessarily represent
the views of MIP.
This journal is a refereed journal.
All articles were reviewed by two or three unanimous referees identified by the Institute (MIP).
Published By
Malaysian Institute of Planners
ISSN Number
1675-6215
e-ISSN
0128-0945

© 2017 by MIP iii
CONTENTS
Message from The President vii
Preface
viii
1. Sustainability Concepts in Malay and Aceh Traditional Houses
By: Noor Hanita Abdul Majid, Zuraini Denan, Zaiton Abdul Rahim, Norwina Mohd
Nawawi & Siti Norfakiah Hazman
1
2. Choosing an Appropriate Contingency Sum Estimating Methods for Highway
Construction Projects in Nigeria: A Literature Review
By: Razali Abdul Hamid & Fabi Jonathan Kehinde
13
3. A Theoretical Assessment on Sustainable Wellbeing Indicators for People
Interrelationships
By: Aisyah Abu Bakar, Mariana Mohamed Osman, Syahriah Bachok, Ismawi Zen, Alias
Abdullah & Muhammad Faris Abdullah
21
4. Field, Light and Food: Adapting the Town Square as a Leisure Gathering Space at Night
By: Khalilah Zakariya, Nor Zalina Harun & Mazlina Mansor
31
5. The Complexity of Governing Fishing Villages in the Bagan Areas of Selangor, Malaysia
By: Mohd Zin Mohamed & Norhaslina Hassan
45
6. Renewable Energy and Trade Disputes: Implications on Solar Photovoltaic Manufacturing
in Malaysia
By: Hui Nee Au Yong & Kock Lim Tan
55
7. Feeder Mode Choice Selection Behavioural Modelling: The Case of KTM Komuter, Kuala
Lumpur
By: Syahriah Bachok & Siti Hajar Madina Mohd Zin
65
8. Revitalization of China Town Area as Sustainable Urban Heritage in the City of Manado
By: VerryLahamendu, Judy O. Waani & Aristotulus E. Tungka
81
9. Community-Based Tourism in Melaka UNESCO World Heritage Area: A Success in Food
and Beverage Sector?
By: Syakir Amir, Mariana Mohamed Osman, Syahriah Bachok, Mansor Ibrahim & Ismawi
Zen
89
10. Feng Shui: The Shape of Five Elements of Low Ti Kok Mansion
By: Chong Kai Zhen & Azizi Bahauddin
109
11. Appreciation of Vertical Greenery in a City as Public Art
By: Mazlina Mansor, Khalilah Zakariya, Nor Zalina Harun & Nur Izzah Abu Bakar
117
12. Design Problem-Solving: Understanding the Significance of Iterative-Behaviour in Design
By: Danfulani Babangida Idi1 & Khairul Anwar Mohamed Khaidzir
129
13. Architectural Heritage Restoration of Rumah Datuk Setia Via Mobile Augmented Reality
Restoration
By: Aida Kesuma Azmin, Mohd Hisyamuddin Kassim, Fadzidah Abdullah & Alliyah Nur
Zafirah Sanusi
139
© 2017 by MIP iv
14. Architectural Influences of Istana Lama Seri Menanti, Negeri Sembilan
By: Nurdiyana Zainal Abidin, Raja Nafida Raja Shahminan & Fawazul Khair Ibrahim
151
15. Challenges to Implement Carrying Capacity Framework: A Case Study of Pulau Perhentian
Marine Park Institutional Framework
By: Nadia Mohd Nasir, Mansor Ibrahim, Lukman Hakim Mahamod & Rashidi Othman
163
16. A Review into the “Islamic” Tradition in the Mughal Garden: (Re) Shaping Our Stand on
Islamic Art and Design
By: Zainab Abdul Latiff & Maheran Mohd Yaman
169
17. Content Analysis of the Existence of Biomimicry Life’s Principles in Green Building Index
Malaysia
By: Noor Aziah Mohd Ariffin & Salwa Farag Gad
179
18. Revisiting Andalusian Garden: Visions for Contemporary Islamic Garden Design
By: Zainab Abdul Latiff & Maheran Mohd Yaman
191
19. Perception of Parents and Guardians on Safe Distance for Children to Travel to Public
Areas
By: Mariana Mohamed Osman, Muhammad Faris Abdullah, Najihan Khalid, Syahriah
Bachok, Nor Suzilawati Rabe, Syafiee Shuid & Zakiah Ponrahono
201
20. Daylight Characterisation of Classrooms in Heritage School Buildings
By: Maria Yohana Susan & Rani Prihatmanti
209
21. The Benefits of River Indicators to Assess the Ecological Status of IIUM Campus
By: Nor Zalina Harun, Mazlina Mansor & Safiah Abu Noh
221
22. Public Bus Level of Service Performance in Peninsular Malaysia: Correlation Analyses on
Level of Service (LOS) and Passengers’ Satisfaction Level
By: Zakiah Ponrahono, Syahriah Bachok, Mariana Mohamed Osman, Mansor Ibrahim &
Muhammad Faris Abdullah
229
23. Translation of Social Citizenship to Architecture & Built Environment: A Methodological
Review
By: Mohd Noorizhar Ismail, Abdul Razak Sapian, Peter Scriver & Mizanur Rashid
235
24. The Impact of Intangible Factors in Shaping the Identity of Ancient Cities and Architecture
of China
By: Tamara Kelly
245
25. Housing Affordability in the State of Melaka
By: Mariana Mohamed Osman, Noor Suzilawati Rabe, Muhammad Faris Abdullah, Nur
Farhanah Rosli & Farah Eleena Zainudin
255
26. The Establishment of Islamic Dwelling Principles for the Malaysian Communities
By: Wan Norisma Wan Ismail, Fadli Arabi, Elina Mohd Husini, Fatin Nur Sakinah
Zolkifly, Zuhairuse Md. Darus, Nor Haslina Abd. Jaafar & Azhani Abd Manaf
261
27. Roles of Community Towards Urban Farming Activities
By: Norul Hafizah Yusoff, Mohd Ramzi Mohd Hussain & Izawati Tukiman
271
28. The Tourist Behaviour in Different Environments: A Literature Review
By: Asra Zaliza Asbollah, Norhaslina Hassan, Safiah @ Yusmah Muhammad Yusoff &
Hanizah Idris
279

© 2017 by MIP v
29. Measuring Socio-Economic Indicators for Climatic Analysis
By: Illyani Ibrahim
289
30. Rise of Eclecticism in the 21st Century Malaysian Mosque Architecture
By: Amir H.Zekrgoo
295
31. Bibliometric Analysis on Quantifying Urban Sprawl in Assessing a Comprehensive
Meaning of Sprawl: A Review
By: Nur Aulia Rosni, Norzailawati Mohd Noor, & Alias Abdullah
305
32. Ethics & Values in Construction Industry from Islamic Perspective
By: Fatma Al-Zahraa Sami & Asiah Abdul Rahim
319
33. The Integration of Mosques and Churches to Urban Planning of Ibadan Nigeria: A
Historical Overview
By: Ibraheem Mikail Abiola
327
34. Modelling Willingness to Pay for Improved Public Transport Services: The Challenges of
Non-Response to Stated Preference Hypothetical Questions
By: Syahriah Bachok & Zakiah Ponrahono
333
35. Housing Affordability in the State of Johor
By: Mariana Mohamed Osman, Muhammad Adib Ramlee, Nasriah Samsudin, Noor
Suzilawati Rabe, Muhammad Faris Abdullah, & Najihan Khalid
347
36. A Review on Sustainable Wellbeing Indicators for Human Interrelationships with the
Environment
By: Aisyah Abu Bakar, Mariana Mohamed Osman, Syahriah Bachok, Ismawi Zen, &
Muhammad Faris Abdullah
357
37.
Young Professionals’ Housing Affordability through Housing Preferences in Kuala
Lumpur: Review on the Means-End Chain Model
By: Nor Suzylah Sohaimi, Alias Abdullah, Syafiee Shuid, & Azila Ahmad Sarkawi
369
38. Local Leadership Model Towards a Resilient City in Semarang Municipality
By: Lilin Budiati
377
39. Sidewalk Accessibility at Melaka’s Traditional Streets for People with Disabilities (PwDs)
By: Nor Haslina Ja’afar, Asiah Abdul Rahim, Nur Amirah Abd. Samad, & Che Raiskandar
Che Rahim
389
Notes to contributors and guidelines for manuscript submission
397
Ethics Statement 399
The past issues (articles)
402
“Whoever travels in search of knowledge is on Jihād until he returns”
(Transmitted by Tirmidhi & Darimi)

© 2017 by MIP vi
MIP Council Members
(2015-2017 Session)
President
TPr. Hj Ihsan Zainal Mokhtar (305/94)
Vice President
Datin TPr. Hjh Noraida Saludin (468/02)
TPr. Mohamad Nazri Jaafar (168/86)
Hon. Secretary
Datin TPr. Hjh Mazrina Dato' Abdul Khalid (559/09)
Hon. Treasury
TPr. Mohd Zamri Husin (430/01)
Council Members
TPr. Hj Abdul Hamid bin Akub (450/01)
TPr. Lee Lih Shyan (267/92)
TPr. Mahani Mohd Yasin (614/12)
TPr. Nurul Sheema Abd Rahman (633/14)
TPr. Hj Nik Mohd Ruiz Ahmad Fakhrul Razy (570/10)
TPr. Saiful Azman Abd Rashid (474/03)
TPr. Wan Andery Wan Mahmood (572/10)
Assoc Prof TPr. Dr Saniah Ahmad Zaki
TPr. Mohammad Fauzi Ahmad (418/99)
En Fathuddin Kamaruddin (656/16)
Co-opted Members
TPr. Victor Lai Wee Peng (502/05) -Chairman, MIP Sarawak & Sabah Chapter
TPr. Cheah Lye Aik (432/01) - Chairman, MIP Northern Branch
TPr. Abd Halim Ali Hassan (407/89) - Chairman, MIP Southern Branch
Advisory Council Members
Hj. Mohd. Ahyat Hj. Mohd. Nor
En. Ho Khong Ming
Dato’ Mohd. Ishak Hj. Mohd. Ariff
En. Robert Gan Chin Huat
En. Lawrence Chan Kek Tong
TPr. T. Mahesan
Dato' TPr. Dr. Mohammad b. Nong
Pn. Khairiah Talha
TPr. Hj. Mohamad Nazri Jaafar
Dato' TPr, Mohd Fadzil b. Mohd Khir
Prof. Ezrin Arbi
Datin Paduka Dr. Halimatun Saadiah Hashim
En. Ong Hong Fong
Datuk TPr. Zainuddin Haji Muhammad
TPr. Norliza Hashim
Prof. Dato' TPr. Dr Alias Abdullah
TPr. Hj Md Nazri Mohd Noordin
Hon. Auditors
TPr. Hj Lokman Omar (211/88)
Assoc Prof TPr. Hj Ahmad Suhaimi Ismail (245/91)

© 2017 by MIP vii
PREFACE
Sustainable Well-being in Architecture and Environmental Sciences
Sustainable Well-Being is broadly defined as the exploration of lasting happiness. It
highlights the importance of a sustainable lifestyle that is environmentally friendly and
socially advantageous. It requires us to pursue well-being in a much more holistic way
and within the planetary boundaries.
Towards the end of the last millennium, the word ‘sustainability’ was, and still
is, the most used phrase with regards to all aspects of our livelihood, and even more so in
the built environment field. This was when we understood that progress and
environmental conservation are symbiotic – one is supposedly benefiting the other. Well-
being, on the other hand, carries the notion of happiness, healthy and comfortable. Well-
being has long been a much researched areas, although mainly in the sociological and
psychological domains. Of late, it has increasingly becoming an important agenda in the
built environment field as well.
Acknowledging the importance of built environment in the pursuit of long
lasting happiness, this issue of the Planning Malaysia Journal carries the theme of
‘Sustainable Well-Being in Architecture and Environmental Sciences’. This issue focuses
on the design and building of living place which are harmonious and in sync with the
environment needs and conservation.
The contributions to the study of environmental sciences have come from diverse
fields including architecture, town planning, transportation, engineering, legal matters,
community development and psychology, and housing. Despite the diversity, each of the
fields cannot be viewed as separate entities since they interweave in the broad framework
of sustainable well-being. A broader yet explicit understanding of sustainable well-being
from diverse research contexts would lead to better decisions, especially in the built
environment designs and solutions.
Finally, we believe that this issue of Planning Malaysia, can become the platform
for experts and researchers to discuss on how sustainable well-being in the built
environment can be realized. It is also hoped that the articles in this issue would be useful
references for future studies related to the built environment and sustainable well-being.
Assoc. Prof. Dr. Mariana Mohammed Osman
&
Asst. Prof. Dr. Muhammad Faris Abdullah
Guest Editors

© 2017 by MIP viii
This page is intentionally left blank

1Associate Professor at International Islamic University Malaysia. Email: [email protected] 1
PLANNING MALAYSIA:
Journal of the Malaysian Institute of Planners
VOLUME 15 ISSUE 1 (2017), Page 1 - 12
SUSTAINABILITY CONCEPTS IN MALAY AND ACEH
TRADITIONAL HOUSES
Noor Hanita Abdul Majid1, Zuraini Denan2, Zaiton Abdul Rahim3, Norwina Mohd
Nawawi4, & Siti Norfakiah Hazman5
1,2,3,4,5 Kulliyyah of Architecture and Environmental Design,
INTERNATIONAL ISLAMIC UNIVERSITY MALAYSIA
Abstract
The migration of people between Acheh and Malaysia can be seen in sporadic
settlements in the northern regions. Both communities share Islam as a religion
and might have similarities in culture, ethics and the environment. Due to the
Islamic influences in both Malay and Aceh community, it is predicted that the
traditional houses in both locations are manifestations of the sustainable concept
of hablumminallah, hablumminannas and hablumminal'alam. This concept can
be analysed in terms of the Islamic implementations of hablumminallah, social
beliefs, and activities in the relationship between man and man
(hablumminannas) and climatic influences in the relationship between man and
environment (hablumminal'alam). Hence, this paper intends to investigate the
implementation of the three concepts in the Malay and Aceh houses. The research
methodologies employed are observation (through site visits), pictorial analysis
and detail evaluations on the components of the houses. Analysis conducted on
Rumah Kutai (RK), Perak and Rumoh Aceh (RA) suggest the realization of the
three mentioned sustainable concepts in the houses. In conclusion, the overall
findings confirmed the sustainability concepts adopted in the RK and RA through
adhering to Islamic guidelines, socio-cultural and climatic aspects.
Keywords: traditional house, sustainable concept, social beliefs and climate
Date Received: 30th April 2016
Date of Acceptance: 30th October 2016

Noor Hanita Abdul Majid, Zuraini Denan, Zaiton Abdul Rahim, Norwina Mohd Nawawi, & Siti Norfakiah
Concepts in Malay and Aceh Traditional Houses
© 2017 by MIP 2
INTRODUCTION
“And (remember) when your Lord said to the angels: “Verily, I am going to
place (of mankind) a khalifah (caliph) on earth” [Al Baqarah 2:30].
As a caliph, part of man responsibilities as a vicegerent on earth is to
manage the world and contribute to the sustainability of the environment. The
needs of living drive man to create a shelter to fulfil ever changing and increased
necessities. And in turn, the shelter serves the needs of man to perform their duties
to the Creator, man, and the environment. The needs, culture, and environment
always play a major role in shaping the architecture of a place or vernacular
architecture. Vernacular architecture is the most pronounced interpretation of the
needs, culture, and environment of the people. It had been widely discussed that
the traditional architecture (as a form of vernacular architecture) of each region
had been designed responsively to the local climate. (Hutchinson, 2002) asserted
that a region could often be clearly recognized by the character of its housing.
Hence, houses as a basic shelter reflect critical factors such as climate, materials,
economics and cultural background of a given environment.
The cultural values of Malays and Acehnese have always been identified
as values associated with Islam that is portrayed in the vernacular architecture of
this region; for example, Rumoh Aceh (RA) and traditional Malay house. Since
vernacular architecture is a local expression, it is also a sustainable solution for a
given environment. VerSus (2006), a European research project, affirmed the
tendency of a direct connection between sustainable and vernacular architecture
based on the research and reviews. Again, sustainability and architecture are
inseparable, and man as the vicegerent on earth has the responsibility to continue
holding to the Islamic spirituality. Spahic (2009) discussed the concepts of
sustainability in Islamic architecture, deliberating on the significance of the
concepts about man and environment. He has come to a conclusion on the
coexistence between people and environment; and reckons that sustainability is a
part of Islamic Architecture. In reaction to these propagations on the relationship
of vernacular architecture, sustainability, and Islamic architecture, this paper will
elaborate on concepts of sustainability in the relationship between man and God,
between man and man, and also between man and environment which was also
known as hablumminallah, hablumminannas, and hablumminal'alam
respectively. The discussion of this paper will discuss these concepts
implementations in traditional Malay houses in the form of Rumah Kutai (RK),
Perak and traditional Aceh house/Rumoh Aceh (RA).
RESEARCH BACKGROUND
Sustainability in Islam had been observed through having a good relationship
which can be referred to as hablumminallah (the relationship between man and
Allah (God), hablumminannas (the relationship between man and man) and

PLANNING MALAYSIA
Journal of the Malaysia Institute of Planners (2017)
© 2017 by MIP 3
hablumminal'alam (the relationship between man and environment). This
triangular concept of relations between God, men, and the environment had been
viewed as a profound element in the formation of traditional houses, in particular,
the traditional Malay and Aceh houses.
The first concept, hablumminallah can be seen based on the
implementation of Islamic teachings in all aspects of life. The concept of
hablumminallah is not only possible to be translated into physical aspect but most
importantly to be felt spiritually. The traditional house of Malay and Aceh are
expressions of iman (belief of God). The traditional houses of the Malays
symbolized the Malay culture which is rooted with the Islamic teachings and
practices. Whereas, the traditional house of Aceh is also known as a form of
architecture that reflect the faith of people in Aceh (Nas & Iwabuchi, 2008).
The terms hablumminannas means the relationship between man and
man that involves culture and social activities. The house is built not only for the
purpose of life, for shelter and to cater the basic needs, but it is also built to
strengthen the relationship between the family members and the surrounding
neighbourhood. Kamal (2015) states that the traditional Aceh house reflected the
cultural and environmental sentiment of a place and community. He added, the
society`s or individual`s belief and environmental condition have a significant
influence on the architecture of a house, as seen in the architecture of RA.
The concept of hablumminal'alam (the relationship between man and
environment) in architectural perspective can be witnessed through the site and
climatic considerations in the house design. The manifestations of the site and
climatic factors are clearly seen in the design of the RK and RA in terms of siting,
type of construction, architectural elements and features.
The relationship of Aceh and Malaysia can be traced back to the spread
of Islam and Dutch colonialisation. The traces of the migration can be seen in
sporadic settlements in the northern regions, with the largest being settlements in
Yan, Kedah, and Kampong Acheh in Pulau Pinang and Perak. These three states
in the northern part of Peninsular Malaysia are the closest to Aceh by their
geographical location. Kamaruzzaman, Ruzman and Mohd Yakub (2012) discuss
the influence of Aceh in Penang that started in the 15th century in terms of the
Malay identity. History has recorded that in the year 1567 - 1585 M, Sultan
Alauddin Mansur Syah I, the son of Sultan Mansur Syah 1 from Aceh was
brought to the throne as the second Sultan of Perak State.
The relationship between Aceh and the mentioned places in Malaysia is
part of the historical and social development. Hence, it is hypothesized that the
traditional houses of the long roof type for these regions may share the same basic
considerations in architectural design. As for RK and RA, both not just represent
the architecture features of Malay and Acehnese culture and the traditional living
of the people, but at the same time they also have been designed with particular
regard to suit to the local tropical climate. The hypothesis forwarded by Seri

Noor Hanita Abdul Majid, Zuraini Denan, Zaiton Abdul Rahim, Norwina Mohd Nawawi, & Siti Norfakiah
Concepts in Malay and Aceh Traditional Houses
© 2017 by MIP 4
Laman (2014) affirmed that the architecture of the RK has a link and resemblance
to the houses in Aceh and Makassar. Diaspora of people of the Nusantara region
has brought together with them religion, culture and ‘reconstruction’ of their
familiar environment in the new settlement. As a result, there is evidence of
amalgamation of social culture that also affects the built environment.
Since Indonesia and Malaysia are within the equatorial climate belt
region, there are a few attributes of both RK and RA that have been designed
based on respects for the surrounding nature and also responds to the climatic
context. For instance, the design for solar control, optimum ventilation and also
the control of the thermal accumulation inside the house.
RESEARCH METHODOLOGY
The research methodologies employed are observation (through site visits),
pictorial analysis and detail evaluation on the components of the houses. Site
visits to several traditional houses in Central Perak and Aceh provided the
fundamental data on the typology and layout of the houses. The site visits also
provided information on cultural experience, scale, space utilization and feeling
of space. On the other hand, pictorial analysis focuses on details and components
of both house typologies. The mentioned methodologies in combination are basis
for the detail evaluation on the house components; i.e. carvings. Data were
collected from purposive sampling for both house types. The samples of RK in
Bota, Perak (Figure 1) and RA from Banda Aceh (Figure 2) were chosen for the
case study as both represent the traditional Muslim dwelling architecture for both
regions. The character and features of both houses had been investigated and
analysed according to the implementation of Islamic design, and also the
sustainability concept of hablumminallah, hablumminannas and
hablumminal'alam that has been discussed earlier.

PLANNING MALAYSIA
Journal of the Malaysia Institute of Planners (2017)
© 2017 by MIP 5
Plan (RK) Plan (RA)
Front Elevation (RK) Front Elevation (RA)
Side Elevation (RK) Side Elevation (RA)
Figure 1 Rumah Kutai Figure 2 Rumoh Aceh
RESEARCH ANALYSIS AND FINDINGS
The research analyses the case study houses in terms of the Islamic
implementations (hablumminallah), social beliefs and activities
(hablumminannas), and climatic influences (hablumminal'alam).
The traditional houses are fundamentally a reflection of hablumminallah
or man submission to The Creator (Allah swt). As a vicegerent on earth, Man
should take responsibility to fulfil his tasks as a servant; to worship and carry out

Noor Hanita Abdul Majid, Zuraini Denan, Zaiton Abdul Rahim, Norwina Mohd Nawawi, & Siti Norfakiah
Concepts in Malay and Aceh Traditional Houses
© 2017 by MIP 6
duties towards man and environment. By performing these duties, man would
have responded to the teachings of Islam. As stated in the Quran:
And I only created Jinn and men, that they may serve Me. No sustenance
do I require of them, nor do I require that they should feed Me. For God is
He Who gives (all) sustenance, Lord of Power, steadfast (for ever) [Adh-
Dhariyat 51:56-58].
It is Allah that has created mankind as servants and provides sustenance
for a living. Therefore, man should use available means to facilitate their duties
as in building a shelter for themselves. Hence, the houses should accommodate
the needs of man to carry out the basic requirements, most importantly daily
prayers. Both RK and RA are aligned to the qiblah with the long sides elongated
on the east-west axis (Nas & Iwabuchi, 2008; Lim, 1987). The gables in RA are
oriented East-West with the main door coming from North or South. According
to Hindu belief, the entrance of the house should avoid facing towards sunset that
resembles darkness and death. Due to Islamic influences, the gables were then
oriented towards Makkah (Nas & Iwabuchi, 2008). In some instances, there are
entrances designed coming from the gable ends, but from the east so as not to
disturb the praying direction that is towards the west. The spaces in both RK and
RA also offer areas for congregational prayers beside other functions to support
health and wellbeing of the occupants as stipulated in Islam.
Hablumminannas (the relationship between man and man) is highly
reflected in the design of RK and RA. There are few characteristics of the houses
that reflect the implementation of Islamic teachings. The characteristics comprise
segregation between genders, female and male domains, and visual privacy.
The houses are inspired from the parts of man body while the
measurements used during construction was also based on human anthropometric
(Kamal, 2015; Wan Hashimah, 2005; Mohd Yusof, 2012). Table 1 shows the
association of the human form to the houses and the body parts used for the
measurements. The association to human form expressed the verticality concept.
There is a vertical domain expression of the cosmos in the RA, and a horizontal
expression of the segregation between male and female. The vertical principle as
described by Nas & Iwabuchi (2008) are related to the space underneath the house
that is the realm of animals; the raised floor level represents the human life and
the upper level with ancestors.

PLANNING MALAYSIA
Journal of the Malaysia Institute of Planners (2017)
© 2017 by MIP 7
Table 1 Measurement System in Construction of the Houses
RA RK Translation Illustrations
jaroe jari Width of 1 finger
paleut tapak tangan Back of hands
hah hasta Elbow to tip of middle
finger
jeungkal jengkal Spread of thumb and
middle finger
lhuek Length of the whole area
deupa depa Span of spread out arms
Source: Kamal (2015) & Wan Hashimah (2005)
The lowest area, or the area underneath the house, that is associated with
the realm of animals are practically used as a place of living during the daytime.
It is also used as:
i. A storage of goods such as agricultural equipment, rice pounding
block, rice, firewood.
ii. A place to rear animals. Waste are thrown here to be consumed
by the animals or burnt to evade mosquitoes.
iii. A place of play for children or place to conduct work during
daytime.
iv. A place for washing.
The vertical usage of RA is similar to most traditional Malay houses and
other countries in the Southeast Asian region that are built on stilts. Case study
visits to some areas in Perak provided evidence of the same usage of the spaces
underneath the houses. The height of this space is between 1700mm to 2500mm.
The raised floor level is the living area for man to conduct daily activities and
sleeping at nights. Lastly, the upper level that is regarded as sacred space in RA
is the place of storage for valuable possessions in RA and RK. The profane spaces
of the ground and raised level are the living areas that will be explained as
horizontal expressions for both houses.
The horizontal expressions in RA and RK are mainly divided into three

Noor Hanita Abdul Majid, Zuraini Denan, Zaiton Abdul Rahim, Norwina Mohd Nawawi, & Siti Norfakiah
Concepts in Malay and Aceh Traditional Houses
© 2017 by MIP 8
main areas that are illustrated in Table 2.
Table 2 Areas in RA and RK Parts of the House RA RK
Front area seuramoe Acheh Serambi depan
Middle area seuramoe teungoh Rumah tengah
Back area seuramoe likot Serambi belakang
The front areas are also the reception area for guests and geared towards
the male gender in both RA and RK. People sit at these place on mats that are
laid on the floor. Small feast and other activities are also held in this space. This
space is a place for the male children to sleep at night. Male guests are confined
to the front area and will not enter the middle area that is of a family and female
domain (Lilawati et. al, 2006).
Both RK and RA have rooms in the middle house; in RA there are two
rooms namely rumah inong (room for the couple of the house or married
daughter) and anjong (room for unmarried daughters). On the other hand, RK
mainly has only one room in the middle section. However, in both houses, the
room is always attributed to the couple of the house and female children (married
and unmarried). In both RK and RA, the central passage of the middle area is a
domain of family members, married couple, treatment of sick family members
and for the bathing of the dead (Kamal, 2015; Nur Azfahani, 2009). Similarly,
the main house in RA (seuramoe teungoh) is a female or family domain where in
some instances include rooms for unmarried female children.
The back area of both houses is female domain that has direct access for
female guests. The seuramoe likot in RA is a sitting room and kitchen. This area
has access to the courtyard where the well is situated. The rear access is a door
with horizontal shutters for security. RK also has access to the rear area through
serambi belakang. This access is for the female guests and also the access to the
utilities in the house compound.
The architectural elements in RK and RA that are designed to satisfy the
hablumminannas concept are door and window sizes. In both RA and RK, the
door height is lowered 1,200-1,600mm to send a message for the visitors to bow
or bend their heads when entering the house. However, once the visitor has
entered the house, the ceiling is high and gave a warm and welcome feeling.
It is common for uninvited male guests to be confined to the front steps
or invited to the front area of RK and RA. In order to preserve privacy for the
female occupants of the house, the houses were designed with small windows
that limit the view to the interior of the house. At the same time, the small
windows reduce light penetration and result to a darkened interior that supports
privacy. Privacy is also achieved due to the darkened interior when male guests
enter from the bright outdoors. The guests will take a few seconds to adjust to the

PLANNING MALAYSIA
Journal of the Malaysia Institute of Planners (2017)
© 2017 by MIP 9
dark interior and will allow the female occupants to retreat to the room or the
back area, or to cover their awrah (body parts not allowed to be seen by non-
mahram).
The relationship between man and environment (hablumminal‘alam) is
clearly interpreted in both RK and RA. Both houses respond to the hot and humid
climate that are manifested in raised form, elongated building form on the east
and west axis, open plans, high ceilings, large roof overhangs and low thermal
building materials alongside some other strategies to work with the climate. The
basic idea of the traditional houses is to use the climatic factors to advantage and
ameliorate harsh effects of the environment for the comfort of man. In agreement
with the wisdom principles in traditional architecture, the houses were designed
to optimize the given climatic conditions and the surrounding environment. The
houses optimize natural ventilation to avoid heat and humidity accumulation; for
example, RA and RK have the carved, or split gable ends on the wind path to
facilitate cross and roof ventilation (Figure 3 and 4). While RK has a simple
pitched roof ranging from 50-60 degrees that provides space for ventilation and
cooling that support the thermodynamic process to flow out the heat from the
inside to outside. Wall ventilation and raise floor help to avoid the heat
accumulation, because of external or internal heat gain through gaps in the
floorboards and walls in both RA and RK.
Figure 3: Gable Ends in
RK
Figure 4 Carved Gable Ends in RA
The carvings implemented in RK and RA is another evidence of
hablumminal’alam. Carvings on the houses depicted the entities from the
surrounding environment depicting flora and fauna motifs (Figure 5). In older
houses, there are carving motifs of fauna figures such as monkey, snake and bird
that may have existed during pre-Islamic times in contrast to the floral motifs

Noor Hanita Abdul Majid, Zuraini Denan, Zaiton Abdul Rahim, Norwina Mohd Nawawi, & Siti Norfakiah
Concepts in Malay and Aceh Traditional Houses
© 2017 by MIP 10
from plants that are allowable and in line with the teachings of Islam. Carvings
are placed on the walls, doors, ventilation panels, openings, internal partitions
and staircases (Sofyan, 2014) (Figure 6). The carvings motifs are mainly
symmetrical and repeated pattern in the form of plant shoots, flora and crisscross
patterns.
Figure 5 Carvings of Floral Motif at RK Figure 6 Carvings of Geometrical Motif
on an Internal Partition at RA
The carvings are also a reflection of the owner’s social status; the richer
the carvings, the higher the status of the owner. Floral motifs were inspired from
bunga Melati (Jasminum sambac), daun keor (M. oleifera), sulur pakis
(diplazumesculentum), rebung (Dendrocalamus asper), kupula (mimusop
elengi), pisang (Ravelana madagascariesis), bunga matahari (Helianthus
anuus), rambutan (Nephelium lappacium) and pucuk labu (Cucurbita moschata).
On the other hand, the fauna motifs were inspired from butterfly or kupu-kupu
(Danaus sp.) and grasshopper or belalang (Oxy asp.). The application of carvings
is a response to social-cultural background, climatic and geographical factor. The
higher the status of the owner, the more ornate the carvings of the house. For
example, the wall for RK are made of wood panels and carvings for higher
ranking people, and weaved bamboo panels for commoners.

PLANNING MALAYSIA
Journal of the Malaysia Institute of Planners (2017)
© 2017 by MIP 11
CONCLUSIONS
The creative and innovative craftsmanship of these traditional dwellings can be
seen through the application of the three concepts; hablumminallah,
hablumminannas, and hablumminal’alam. The spatial design, structure and
ornamentation aspects which created an identity and technology in these houses
are to be appreciated and learned. The findings from the literature reviews and
case studies suggest similarities in the realisation of the three mentioned
sustainable concepts in RK and RA. On the other hand, the results also indicated
differences in the houses due to social beliefs and activities. In conclusion, the
overall findings confirmed the sustainability concepts adopted in the traditional
Malay and Acehnese houses through adhering to Islamic guidelines, and socio-
cultural and climatic aspects.
ACKNOWLEDGEMENTS
This work was supported in part by ERGS13-010-0043. The authors would like
to thank all involved in materialising this paper.
REFERENCES Hutchinson, J. (2002). The vernacular ‘Queenslander’ part one – Prototype Houses.
Australian Model Railway Magazine, 236(20), (11), 44-50.
Kamal, A. A. (2015). Keluhuran seni arsitektur rumoh Aceh. Seminar Nasional Inovasi
Seni Kriya Bebasis Lokal Tradisi (National Seminar on Arts Innovation with
Basis on Local Tradition). Jantho, Aceh Besar.
Kamaruzzaman, B.A., Ruzman, M. N., & Mohd Yakub, M. Y. (2012). Konstruksi
identitas Melayu dalam sejarah Aceh dan Penang. 6th International Conference
Indonesia-Malaysia, July 10-12, 2012, Surabaya, Indonesia.
Lilawati, A. W., Ahmad, A. G., Kamal, K. S., & Syed Mustafa, S. A. H. (2006). Rumah
Kutai: warisan senibina Melayu negeri Perak yang semakin pupus. In
Proceedings of the 2nd Asean Post Graduate Seminar in Built Environment.
Kuala Lumpur, Malaysia.
Lim, J. Y. (1987). The Malay house: rediscovering Malaysia’s indigenous shelter system.
Institut Masyarakat.
Mohd Yusof, A. (2012). Warisan Senibina Melayu Terengganu. Kuala Terengganu:
Yayasan DiRaja Sultan Mizan.
Nas, P. J. M., & Iwabuchi, A. (2008). Aceh, Gayo and Alas: traditional house form in
special region of Aceh. Leiden: KITLV Press.
Nur Azfahani, A. (2009). Traditional Malay houses in Malaysia. Retrieved March, 2016
from http://nurazfahaniahmad.blogspot.my/2009/01/rumah-penghulu-abu-
seman.html
Seri Laman (2014). Rumah-rumah traditional di Semenanjung Malaysia. Retrieved
March, 2016 from http://serilaman.sekolah4u.com/rumah-rumah-tradisional-di-
semenanjung-malaysia/
Sofyan, S. (2014). Ornaments of flora and fauna on traditional Aceh house. Journal
Natural, 14(2), 33-35.

Noor Hanita Abdul Majid, Zuraini Denan, Zaiton Abdul Rahim, Norwina Mohd Nawawi, & Siti Norfakiah
Concepts in Malay and Aceh Traditional Houses
© 2017 by MIP 12
Spahic, O. (2009). A conceptual framework for sustainability in Islamic architecture: the
significance of the concepts of man and environment. In
Proceedings of the International Symposium on Construction in Developing Ec
onomies: Commonalities among Diversities. Penang, Malaysia.
Versus (2016). Vernacular heritage sustainable architecture. European Research Project.
Retrieved March, 2016 from http://www.esg.pt/versus/
Wan Hashimah, W. I. (2012). Houses in Malaysia: fusion of the east and the west. Skudai,
Johor: Penerbit Universiti Teknologi Malaysia.

1Associate Professor at Universiti Teknologi Malaysia. Email: [email protected] 13
PLANNING MALAYSIA:
Journal of the Malaysian Institute of Planners
VOLUME 15 ISSUE 1 (2017), Page 13 - 20
CHOOSING AN APPROPRIATE CONTINGENCY SUM ESTIMATING
METHODS FOR HIGHWAY CONSTRUCTION PROJECTS IN
NIGERIA: A LITERATURE REVIEW
Razali Abdul Hamid1, & Fabi Jonathan Kehinde2
1,2 Faculty of Built Environment
UNIVERSITI TEKNOLOGI MALAYSIA
Abstract
In order to establish a gap to be filled in a particular field, there is a need to gather
information that allows the researcher to identify and analyse the current state of
researches on the topic. Contingency sum estimation for projects plays an
important role for inclusion for risk taken by the contractor on the bid amount.
This is good in order to meet project objectives (cost, time, quality, health and
safety, and environment). The main function of contingency sum is to cater for
variations that arise during the construction phase of projects. The aim of the
study is to identifying and examine the various methods for estimating
contingency sum for projects with a view to propose an appropriate method which
will be suitable for a specific project in order to increase accuracy and reduce cost
overrun. A literature review of selected papers (journals, conference proceedings
and theses) on contingency estimation was carried out. The major findings from
this study is that most studies were carried out on building projects while few
were carried out on highway projects. From the analysis carried out, no single
method of estimating has been effective for all types of projects. These methods
of estimating contingency sums have developed over the years as a result of
shortcomings of one method after the other. It is therefore recommended that
peculiarity of each project, ease of using each of the methods and accuracy of the
estimates needed should be the basis of choosing method of estimating
contingency sum.
Keywords: Construction projects, contingency sum, estimating, highway
Date Received: 30th April 2016
Date of Acceptance: 30th October 2016

Razali Abdul Hamid, & Fabi Jonathan Kehinde Choosing an Appropriate Contingency Sum Estimating Methods for Highway Construction Projects in Nigeria: A Literature Review
© 2017 by MIP 14
INTRODUCTION
Cost performance of construction projects is a critical success criterion always
watched out for by project sponsors. El-Sayegh and Mansour (2015) state that
several studies establish that highway construction projects have higher risks than
other construction projects. This is due to the fact that highway projects are
capital intensive, take longer time to complete, spread over a wider geographic
area and are threatened by underground conditions. Reeley and Brown (2004)
posit that infrastructure and underground projects (of which highway projects)
are complex and most of the time, span through several terrains, including sandy
and rocky areas. Thomas, Kalindidi and Ganesh (2006) cited in El-Sayegh and
Mansour (2015) posits that highway projects involve very high risks due to long
project duration, low market value of security packages and complex contract
mechanisms and involvement of many participants with diverging interest and
challenges. The required huge investment and difficult as well as complicated site
conditions, according to Zayed, Amer and Pan (2008), make it imperative to have
a robust contingency sum which can take care of this imminent risks inherent in
highway projects. Cost contingency is included within a budget estimate so that
the budget represents the total financial commitment for the project sponsor
(Baccarini, 2006). Therefore, choosing an appropriate method of estimating cost
contingency and its ultimate adequacy is of great importance to success of
projects.
Definition and Attribute of Contingency
Different researchers such as PMI (2000) have at different times offer varying
definitions of contingency. AACE (2010) defines contingency as “an amount
added to an estimate to allow for items, conditions, or events for which the state,
occurrence, or effects is uncertain and that experience shows will likely result, in
aggregate, in additional costs”. Bakshi and Touran (2014) offer a definition of
cost contingency which is very relevant for this study, as a reserved budget for
coping with monetary impacts of risks and uncertainties associated with a project.
However, AACE (2010) states that contingency does not cover the following: (i)
major scope changes (ii) extraordinary events such as major strike and
catastrophes (iii) escalation and currency effect and (iv) management reserves.
Besides, many researchers applied the extension rule to the model
counting problem (Touran, 2003), and many amended it so as to apply it into the
TP of modal logic19. Still some researchers improved the extension rule, and put
forward series of algorithms such as NER, RIER, etc (Yeo, 1990; Zayed, Amer
& Pan, 2008).
Extension-rule based TP method has commended considerable
respect from many related researchers. For example, Murray (PMI, 2000;
Thomas, Kalindidi & Ganesh, 2006) has applied the extension rule into the
generation of the target language based on the knowledge compilation, and

PLANNING MALAYSIA
Journal of the Malaysia Institute of Planners (2017)
© 2017 by MIP 15
achieved good results. Besides, many researchers applied the extension rule to
the model counting problem (Touran, 2003), and many amended it so as to apply
it into the TP of modal logic (Touran & Liu, 2015). Still some researchers
improved the extension rule, and put forward series of algorithms such as NER,
RIER, etc (Yeo, 1990; Zayed, Amer & Pan, 2008).
RESEARCH METHODOLOGY
This study is a theoretical research based on review of literature on the methods
of estimating cost contingency for construction projects. Academic journals,
conference proceedings, textbooks, monograms and other valuable materials that
are relevant to the study were selected and referenced. The study carried out a
comprehensive survey of literature to highlight the findings of previous
researchers with the view to examine the characteristics of different contingency
estimation methods, in order to choose an appropriate method when the need
arises so as to provide an adequate and reliable contingency sum for construction
projects.
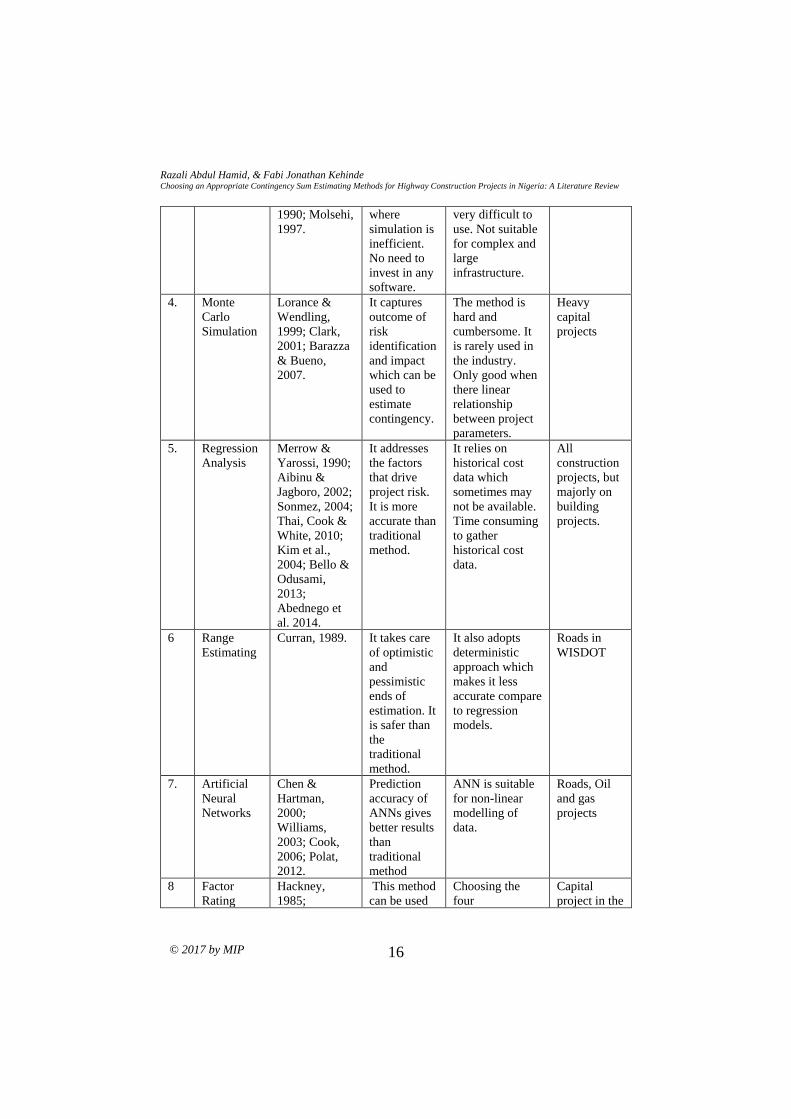
CRITICAL ANALYSIS ON VARIOUS METHODS OF ESTIMATING
COST CONTINGENCY
S/N Methods Researchers Advantages
of the
Methods
Disadvantages
of the Methods
Projects
used for
1. Traditional
method
Ahmed, 1992;
Molsehi, 1997;
Baccarini,
2004;
Mohammed,
2009; Adama
& Jimoh,
2014; Amade
et al., 2014.
It is easy to
use. It does
not require
long time or
budget.
Risk is either
ignored or dealt
with in arbitrary
way. Not suitable
for big projects.
Fail to take risk
drivers in to
consideration.
No justification
for the
percentage used.
All form of
construction
projects.
Developing
countries
still adopt it
for highway
projects,
especially
Nigeria.
2. Individual
risk –
Expected
Value
Mak, Wong &
Picken, 2000.
It can model
uncertainty
as
contingencies
with specific
probabilities
which can be
analysed for
better result.
Identifying fixed
and variable
factors of the
projects is
difficult. It still
adopts traditional
approach.
Construction
projects
generally.
3. Method of
Moment
Diekmann,
1983; Yeo,
This method
is good in
situation
Due to its
mathematical
background, it is
Rarely used
in practice.
Razali Abdul Hamid, & Fabi Jonathan Kehinde Choosing an Appropriate Contingency Sum Estimating Methods for Highway Construction Projects in Nigeria: A Literature Review
© 2017 by MIP 16
1990; Molsehi,
1997.
where
simulation is
inefficient.
No need to
invest in any
software.
very difficult to
use. Not suitable
for complex and
large
infrastructure.
4. Monte
Carlo
Simulation
Lorance &
Wendling,
1999; Clark,
2001; Barazza
& Bueno,
2007.
It captures
outcome of
risk
identification
and impact
which can be
used to
estimate
contingency.
The method is
hard and
cumbersome. It
is rarely used in
the industry.
Only good when
there linear
relationship
between project
parameters.
Heavy
capital
projects
5. Regression
Analysis
Merrow &
Yarossi, 1990;
Aibinu &
Jagboro, 2002;
Sonmez, 2004;
Thai, Cook &
White, 2010;
Kim et al.,
2004; Bello &
Odusami,
2013;
Abednego et
al. 2014.
It addresses
the factors
that drive
project risk.
It is more
accurate than
traditional
method.
It relies on
historical cost
data which
sometimes may
not be available.
Time consuming
to gather
historical cost
data.
All
construction
projects, but
majorly on
building
projects.
6 Range
Estimating
Curran, 1989. It takes care
of optimistic
and
pessimistic
ends of
estimation. It
is safer than
the
traditional
method.
It also adopts
deterministic
approach which
makes it less
accurate compare
to regression
models.
Roads in
WISDOT
7. Artificial
Neural
Networks
Chen &
Hartman,
2000;
Williams,
2003; Cook,
2006; Polat,
2012.
Prediction
accuracy of
ANNs gives
better results
than
traditional
method
ANN is suitable
for non-linear
modelling of
data.
Roads, Oil
and gas
projects
8 Factor
Rating
Hackney,
1985;
This method
can be used
Choosing the
four
Capital
project in the

PLANNING MALAYSIA
Journal of the Malaysia Institute of Planners (2017)
© 2017 by MIP 17
/Estimate
Quality
Oberlander &
Trost, 2001.
to check the
amount of
contingency
determined
by other
methods of
estimating
contingency
sum, apart
from being a
method of
estimating
contingency.
determinants of
the accuracy of
the estimate is
severely
inadequate. It
may lead to high
contingency if
the estimate is
inaccurate.
Process
industry.
9 Influence
Diagram
Diekmann &
Featherman,
1998; Park et
al., 1998;
Oppong, 2013.
It reduces
large
volumes of
data crucial
for making
decision.
Good in
sensitivity
analysis.
Like other
probability
models,
Complex
construction
projects.
10. Theory of
Constraints
Leach, 2003. It makes use
of three point
estimates and
with the use
of probability
function
makes it
more
accurate than
the
traditional
method.
This method
assumes cost
items are
independent of
each other which
is not true in real
in real life.
All form of
construction
projects
11. Fuzzy Sets Paek, Lee &
Ock, 1993;
Shayen, Fayek
& Aburizk,
2007;
Rezakhani,
2012.
It allows
analysis with
small
samples. It
reveals
relationship
between
outcome and
explanatory
variables.
It is hard to
develop a fuzzy
model. It
requires more
fine-tuning
which has made
it difficult in real
practice.
Majorly on
building
projects but
in few
occasions for
highway
projects.
12. Analytical
Hierarchy
Process
Dey,
Tabucanon &
Ogunlana,
1994; El-
Touny,
AHP is good
in solving
complex
estimating
and decision
It cannot be used
to find a true
solution to a
problem or
Complex
construction
like civil and
heavy

Razali Abdul Hamid, & Fabi Jonathan Kehinde Choosing an Appropriate Contingency Sum Estimating Methods for Highway Construction Projects in Nigeria: A Literature Review
© 2017 by MIP 18
Ibrahim &
Amer, 2014.
making
problems
which
characterizes
construction
projects.
deriving a final
answer.
engineering
projects.
13. Bayesian
Belief
Network.
Khallafah,
Taha & El-
Said, 2002.
This method
uses
probability
method
which is
more
accurate than
the
traditional
method.
It is difficult to
use by layman
Residential
buildings.
Source: Literature review.
With the extant review of literature, the major findings in the analysis of different
contingency sum estimation methods are:
1) Traditional percentage method has been widely used across all projects
despite criticisms that it is based on intuition and no rationale for arriving
at the percentage. Regression and Theory of constraints have also been
used in estimating contingency sum for construction projects
2) Monte Carlo Simulation, ANN, Influence Diagram and AHP have been
used for complex projects such as heavy engineering, roads, oil and gas.
These methods give high degree of accuracy.
3) While Bayesian Belief method has been widely used for residential
buildings, method of moment is rarely used in practice.
4) Range estimating has been used in estimating contingency sum in
WISDOT.
5) Factor rating/ Estimate quality has been used to estimate contingency
sum for capital projects in the process industry.
CONCLUSION This study reviews the concept of contingency estimation for construction
projects with a special emphasis on highway projects. While so many researchers
have focused on building projects, little attention has been paid to estimating
contingency sum for highway projects which have higher risks than other
construction projects. From the analysis carried out, no single method of
estimating has been effective for all types of projects. These methods of
estimating contingency sums have developed over the years as a result of
shortcomings of one method after the other. Also, this study will guide
practitioners in the industry on which method to use, having considered the

PLANNING MALAYSIA
Journal of the Malaysia Institute of Planners (2017)
© 2017 by MIP 19
advantages, disadvantages and type of projects different methods have been used.
It is therefore recommended that peculiarity of each project, ease of using each
of the methods and accuracy of the estimates needed should be the basis of
choosing method of estimating contingency sum
REFERENCES Adama, S. M., & Jimoh, R. A. (2014). Assessment of contingency sum in relation to the
total cost of renovation work in public school in Abuja, Nigeria.
Amade, B., Akpan, E. O. P., Ukwuoma F. P. O., & Alajemba C. C. (2014). Project cost
contingency in the Nigerian construction industry. International Journal of
Research in Management Science and Technology, 2(2), 9–21.
Association for the Advancement of Cost Engineering (AACE) (2010). International.
Cost Engineering Terminology. AACE Recommended Practice No. 10-90, TCM
Framework: General Reference, March 5.
Baccarini D. (2004). Accuracy in estimating project cost construction contingency - a
statistical analysis. In E. Robert & B. Malcolm (Eds.), Proceeding of the
Construction and Building Research Conference of RICS, 7-8 September, 2004.
Baccarini D. (2006). The maturing concept of estimating project cost contingency - a
review. 31st Australia University Build Education Assessment Conference.
(AUBEA 2006), Curtis University of Technology, Australia.
Bakhshi, P., & Touran, A. (2014). An overview of budget contingency calculation
methods in construction industry. Procedia Engineering, 85, 52–60.
Bello, W. A., & Odusami, K.T. (2013). Weak management of the predictability of
contingency allowance in construction projects in Nigeria. In S.D. Smith & D.D.
Ahiaga-Dagbui (Eds.), Proceeding of the 29th Annual ARCOM Conference (pp.
969-978), 2-4 September. Reading, UK.
Buertey, J. I. T., Abeere-Inga, F., & Kumi, T. A. (2012). Practical application of risk
management techniques in infrastructural delivery: a case study of Ghanaian
construction industry. Journal of Construction Project Management and
Innovation, 2(1), 224-244.
CIRIA (Construction Industry Research and Information Association) (1996). Control of
risk: a guide to the systematic management of risk from construction. London:
CIRIA.
Dey, P., Tabucanon, M. T., & Ogunlana S. (1994). Planning for project control through
risk analysis: a petroleum pipeline-laying project. International Journal of
Project Management. 12(1), 23–33.
El-Sayegh, S., & Mansour, M., (2015). Risk assessment and allocation in highway
construction projects in the UAE. Journal Management Engineering, 31(6).
El-Touny, A. S., Ibrahim, A. H., & Amer, M. I. (2014). Estimating contingency for
highway projects using analytical hierarchy processes. International Journal of
Computer Science, 11(6), No. 1.
Mak, S., Wong, J., & Picken, D. (1998). The effect on contingency allowances of using
risk analysis in capital cost estimating: a Hong Kong case study. Journal
Construction Management and Economics, 16, 615-619.

Razali Abdul Hamid, & Fabi Jonathan Kehinde Choosing an Appropriate Contingency Sum Estimating Methods for Highway Construction Projects in Nigeria: A Literature Review
© 2017 by MIP 20
Molsehi, O. (1997). Risk assessment and contingency estimating. In Association for the
Advancement of Cost Engineering (AACE), Inter. Transaction, D&RM/A.06.
Otali, M., & Odesola, I. A. (2014). Effectiveness evaluation of contingency sum as a risk
management tool for construction projects in Niger-Delta, Nigeria. Ethiop.
Journal of Environment Standard and Management. 7(6), 588-598.
PMI [Project Management Institute] (2000). A guide to the project management body of
knowledge. Upper Darby PA: PMI.
Thomas, A.V., Kalindidi, S. N., & Ganesh, L. S. (2006). Modelling and assessment of
critical risk in BOT road projects. Journal of Construction Management and
Economics, 24, 407-424.
Thompson, P.A., & Perry, J. G. (1992). Engineering construction risk: a guide to project
risk analysis and risk management. London: Thomas Telford.
Touran, A. (2003). Calculating contingency in construction projects. Journal of English
Management, IEE Trans, 50(2)135-14.
Touran, A., & Liu, J. (2015). A method for estimating contingency based on project
complexity. Procedia Engineering, 123, 574- 588.
Yeo, K. T. (1990). Risks, classification of estimates and contingency management.
Journal of Management in Engineering, 6(4), 458-470.
Zayed, T., Amer, M., & Pan, J., (2008). Assessing risk and uncertainty inherent in
Chinese highway projects using AHP. International Journal of Management,
26(4), 408–419.

1Ph.D candidate at International Islamic University Malaysia. Email: [email protected] 21
PLANNING MALAYSIA:
Journal of the Malaysian Institute of Planners
VOLUME 15 ISSUE 1 (2017), Page 21 - 30
A THEORETICAL ASSESSMENT ON SUSTAINABLE WELLBEING
INDICATORS FOR PEOPLE INTERRELATIONSHIPS
Aisyah Abu Bakar1, Mariana Mohamed Osman2, Syahriah Bachok3, Ismawi Zen4,
Alias Abdullah5, & Muhammad Faris Abdullah6
1,2,3,4,5,6 Kulliyyah of Architecture and Environmental Design,
INTERNATIONAL ISLAMIC UNIVERSITY MALAYSIA
Abstract
Sustainable well-being is the well-being attained without compromising others'
opportunities to pursue their happiness. The concept of well-being is not merely
personal, relational, organizational or communal issues, but rather the synergy of
all four dimensions. The four dimensions of well-being are distinguishable, but
they are inseparable entities. While focusing on subjective measure of well-being
some research fail to interrogate the influence of contextual dynamics on
respondents who report high levels of well-being despite living in deprived
community conditions. This study argues that there could not be well-being
without the combination of personal, relational, organizational and communal
wellness.
Keywords: sustainable well-being, human interrelationships with other humans.
Date Received: 30th April 2016
Date of Acceptance: 30th October 2016
Aisyah Abu Bakar, Mariana Mohamed Osman, Syahriah Bachok, Ismawi Zen, Alias Abdullah, & Muhammad Faris Abdullah
A Theoretical Assessment on Sustainable Wellbeing Indicators for People Interrelationships
© 2017 by MIP 22
INTRODUCTION
This study establishes the theoretical framework of human interrelationships with
other humans as an important component of sustainable well-being. Sustainable
well-being is the achieved well-being without compromising others' opportunity
to pursue their well-being. The study is a part of an ongoing pursuit to discover
subjective indicators of sustainable well-being that manifests in (i) human
interrelationships with other humans, and (ii) human interrelationships with the
environment. This paper focuses on human interrelationships with other humans.
Malaysia Well-Being Report 2013 (MWI, 2013) prepared by Economic
Planning Unit (EPU) reported the social progress of Malaysia under eight Social
Well-Being components. However, EPU admitted that the reports cannot cover
all aspects of wellbeing (MQLR 2004; MQLR 2011). These refer to the non-
quantifiable aspects such as the harmony of the country, work ethics, and
communal values. On June 2014, EPU inquired researchers to discover what
matter most to the citizens.
Many research focusing on subjective well-being measures failed to
interrogate the influence of contextual dynamics on respondents who report high
levels of well-being despite living in deprived conditions (Prilleltensky & Fox,
2007). There are two interesting and debatable possibilities of the mentioned
problem. The first possibility is that the poor people could be genuinely
experienced a high level of well-being despite living in underprivileged
conditions. The second possibility is that the poor people refused to be portrayed
as the object of pity (Haworth & Hart, 2007). Eckersley (2005) claims that
sources of bias are countless and social desirability is strong in many self-reports
wellbeing studies.
This study assesses recent and relevant studies on human
interrelationships with other humans largely conducted in Malaysia. The
theoretical findings help in determining the most appropriate dimensions and
indicators of human interrelationships with other humans for Malaysia. Selected
findings from recent subjective well-being studies from the year 2010 onwards
were used to capture the variables involved in human interrelationships with the
environment. The purpose of limiting the sources is to establish parameters in
determining the patterns of recent findings on subjective well-being studies,
particularly in Malaysia. The selection of the papers depends on the relevance of
the papers in examining the personal, relational, organizational and communal
well-being as well as the addressed dynamics and factors involved in human
interrelationships with the environment. The identified issues, dynamics, and
factors relate to the discovered potential indicators of human interrelationships
with other humans.

PLANNING MALAYSIA
Journal of the Malaysia Institute of Planners (2017)
© 2017 by MIP 23
SUSTAINABLE WELLBEING
Sustainable well-being entails sustainability towards achieving wellbeing
(Dodge, Huyton & Sanders, 2012; O'Riordan, 2014). The approach of sustainable
wellbeing is to place maintenance and expansion of wellbeing onto a sustainable
basis where it is being provided unsustainably in the present (Holdren, 2007;
Dodge et. al, 2012; O'Riordan, 2014). In other words, sustainable wellbeing is
achieving wellbeing without compromising others’ ability to achieve their
wellbeing. ‘Others’ is about the present society, the future generation, and the
surrounding environment. Sustainable well-being offers potential of more
comprehensive wellbeing indicators which accounts for a long term use.
Sociality is an important temperament of human existence, a theory
acknowledged as far back as Aristotle. Social connectedness is multi-faceted.
Well-being studies employing quantitative analysis have been revealing three
dimensions where people experience socially connected (Kjell, 2011; Haworth &
Hart, 2007). The experience manifests young and middle-age adults and does not
differ across ethnicities. The dimensions are intimate connectedness, relational
connectedness and collective connectedness. Intimate connectedness reflects the
fulfilment of social connection at a personal level and often associates with
marital status. Related connectedness indicates fulfilment in the needs of close
friendship and often measured by the frequency of contact with friends and family
relatives. Collective connectedness recognizes the fulfilment in the sense of
belonging to a group and often measured in the number of voluntary
memberships. Human has accessed and adapted to a diverse source of
relationship opportunities. Satisfaction of one relationship are interconnected
with satisfaction with other relationships. Humans seek fulfilments from a wide
array of relationships domains. It is within the human nature to want be close and
valued unfailingly over time.
HUMAN WELLBEING IN MALAYSIA
Many subjective well-being studies have been centred in the Western
individualistic countries. The Eastern people tend to have its place in
collectivistic society. Collectivistic values have a significant influence on things
that make Eastern people happy (Lu & Shih, 1997). The Western ideal has placed
significant emphasis on individualism and liberalism in achieving well-being.
The Western ideals greatly differ from collectivistic cultures that highly regard
harmonious relations with other members of the society (Lu & Gilmour, 2004;
Lu & Shih, 1997). The collectivistic Confucian-based societies particularly
Koreans, Chinese and Japanese held moderation as greater esteem than
extremism. That is, extreme happiness was not ideal in collectivistic culture (Lu
et al., 2001). Nevertheless, while Eastern cultures would provide significant
knowledge to well-being studies, a significant majority of the studies focused on
Chinese and Japanese. There was a lack of well-being studies on Eastern Muslims

Aisyah Abu Bakar, Mariana Mohamed Osman, Syahriah Bachok, Ismawi Zen, Alias Abdullah, & Muhammad Faris Abdullah
A Theoretical Assessment on Sustainable Wellbeing Indicators for People Interrelationships
© 2017 by MIP 24
countries such as Malaysia. Table 1, Table 2, Table 3, Table 4 and Table 5 show
findings from selected studies in Malaysia. The findings were categorized under
Overall Well-Being, Personal Well-Being, Relational Well-Being,
Organizational Well-Being and Communal Well-Being.
Table 1 Overall Well-Being
Summary of Findings Authors
The highest source of happiness for both Malaysian and Indonesian
respondents were family. The result demonstrated how Malaysian and
Indonesian societies were naturally inclined to collectivistic values that
place family and group welfare before personal contentment. Sources of
Jaafara et
al., 2012
There were significant inter-correlations between well-being domains: (i)
standard of living, (ii) health, (iii) life achievements, (iv) personal
relationships, (v) personal safety, (vi) feeling part of the community, (vii)
future security, and (viii) life as a whole.
Clark et al.,
2014
Table 2 Personal Well-Being
Summary of Findings Authors
Personality traits influence relationships between work-family conflicts
and job satisfaction.
Hashim et
al., 2012
There exists a positive and significant correlation between personal well-
being and religiosity. The well-being also shows significant positive
correlations with (i) beliefs and worship, and (ii) prayer.
Achour et
al., 2014
There was a significant relationship between stress and coping, and
religion was recognized as most apparent source of coping skills.
Sipon et al.,
2014
Holistic model for well-being of Muslim women acknowledged that
spiritual well-being as the central of the well-being model that transcends
other well-being dimensions.
Hassan,
2015
Table 3 Relational Well-Being
Summary of Findings Authors
Family well-being were predicted by (i) resiliency, (ii) safety, (iii)
savings, (iv) healthy lifestyle, (v) time with family, (vi) work-family
balance, (vii) importance of religion, (viii) number of bedrooms at
home, (ix) debt, and (x) childcare.
M. Noor et al.,
2012
Family life satisfaction was a multidimensional construct consisting (a)
family functioning, (b) family resilience, and (c) time with family.
Abu Rahim et
al., 2013
Out of 2,640 number of women interviewed, 85% of them stated that
they had never experienced violence while 15% indicated they had
experienced some types of violence. 5% of them experienced physical
violence, 7.8%, emotional violence; and 1.7%, sexual violence. 8% of
them experienced violence committed by their living partners.
Shuib et al.,
2013
Tangible and emotional support significantly associated with well-
being. Social embeddedness significantly mediates the effect of social
cohesion upon well-being through tangible support and through
Momtaz et al.,
2014

PLANNING MALAYSIA
Journal of the Malaysia Institute of Planners (2017)
© 2017 by MIP 25
emotional support. Thus suggests that social cohesion leads to increased
social embeddedness, which contribute to inducing tangible support and
emotional support, thus affect well-being.
Table 4 Organizational Well-Being
Summary of Findings Authors
(i) Job satisfaction, (ii) job involvement, and (iii) job security explained
57% variance of Quality of Work (QWL).
Noor and
Abdullah,
2011
Two directions of work-family conflicts were work interference with
family (WIF), and family interference with work (FIW). Level of WIF is
higher than level of FIW.
Panatika et
al., 2011
There was (i) a strong positive relationship between self-esteem and
satisfaction outcome, (ii) a moderate negative relationship between self-
esteem and work-family conflict and (iii) a weak negative relationship
between work-family conflict and satisfaction outcome.
Wan Rashida
et al., 2012
Gender, marital status, age groups, education levels, monthly income and
working experiences were not predictors of financial well-being.
Mokhtar et
al., 2014
Table 5 Communal Well-Being
Summary of Findings Authors
Neighbourhood location and surroundings influenced neighbourhood
satisfaction, thus affecting residents QoL.
Sedaghatnia
et al., 2013
Social capital had positive consequences on family and societal well-
being, strengthen neighbourhood and increase quality of life. The level
of social capital was influenced by how long the neighbourhood has been
established, the diversity composition of residents, locations and the
surrounding developments. Collective actions and cooperation were
negatively correlated with sense of cohesion and inclusion High density
neighbourhood result in loneliness as residents felt retracted from one
another while dealing with ‘sensory overload’.
Hamdan et
al., 2014
There was a high internal reliability in six components of social capital.. Marzuki et
al., 2014
Table 1, Table 2, Table 3, Table 4 and Table 5 summarize the findings
and highlight important variables involved from the selected articles of human
interrelationships with other human studies. The findings provide understanding
on how human-human studies are conducted and the dynamics or relationships
between the variables tested in the research. Highlighted key variables from each
article can be used to formulate the indicators of human interrelationships with
other humans.
DIMENSIONS OF HUMAN-ENVIRONMENT INTERRELATIONSHIPS
Dimensions of human interrelationships with other humans refer to the locations
where variables of human interrelationships with other humans manifested. That

Aisyah Abu Bakar, Mariana Mohamed Osman, Syahriah Bachok, Ismawi Zen, Alias Abdullah, & Muhammad Faris Abdullah
A Theoretical Assessment on Sustainable Wellbeing Indicators for People Interrelationships
© 2017 by MIP 26
is the settings or conditions to which positive interaction between human and
other humans occur. There were four dimensions of human interrelationships
with other humans recognized based on the explored findings of Malaysia well-
being studies. The first dimension is Personal Empowerment which manifests in
opportunity to exercise control, voice and choice (Hashim et al., 2012; Jaafara et
al., 2012; Achour et al., 2014; Sipon et al., 2014; Clark et al., 2014; Hassan,
2015). The second dimension is Positive Relations which manifests in positive
experience of trust, nurturance and affection (Noor et al., 2012; Jaafara et al.,
2012; Abu Rahim et al., 2013; Shuib et al., 2013; Momtaz et al., 2014; Clark et
al., 2014). The third dimension is Organizational Opportunity manifests in
traditions of inclusions, learning and horizontal structures (Noor & Abdullah,
2012; Panatika et al., 2011; Rashida et al., 2012; Jaafara et al., 2012; Mokhtar et
al., 2015; Clark et al., 2014). The fourth and final dimension is Community
Movement which manifests in maximization of social supports and benefits
throughout life cycle (Jaafara et al., 2012; Sedaghatnia et al., 2013; Hamdan et
al., 2014; Marzuki et al., 2014; Clark et al., 2014).
Potential Indicators of Human-Environment Interrelationships
Based on the literature reviews and findings from articles gathered from the
potential subjective indicators are developed (Table 6) and categorized under the
four dimensions of human interrelationships with other humans.
Table 6 Potential Indicators for Human Interrelationships with Other Humans
Dimen-
sions
Manifesta-
tion Potential Indicators Sources
Per
sonal
Em
pow
erm
ent opportunity
to exercise
control,
voice and
choice
self-determination, sense of
control, self-efficacy, physical
health, mental health, optimism,
meaning and spirituality
Hashim et al., 2012;
Jaafara et al., 2012;
Achour et al., 2014;
Sipon et al., 2014; Clark
et al., 2014; Hassan,
2015
Po
siti
ve
Rel
atio
ns
positive
experience
of trusts,
nurturance
and
affection
caring/love/affection, respect for
diversity, reciprocity, nurturance
and affection, emotional support,
collaboration, democratic
participation in decision-making
Noor et al., 2012;
Jaafara et al., 2012; Abu
Rahim et al., 2013;
Shuib et al., 2013;
Momtaz et al., 2014;
Clark et al., 2014
Org
aniz
atio
nal
Op
po
rtu
nit
y inclusions,
learning
and
horizontal
structures
respect for diversity, democratic
participation, collaborative
relationships, engagement,
good communication, clear roles
and productivity, learning
opportunities
Noor & Abdullah, 2012;
Panatika et al., 2011;
Rashida et al., 2012;
Jaafara et al., 2012;
Mokhtar et al., 2015;
Clark et al., 2014

PLANNING MALAYSIA
Journal of the Malaysia Institute of Planners (2017)
© 2017 by MIP 27
Com
munit
y M
ovem
ent
maximizati
on of social
supports
and
benefits,
and
availability
of supports
throughout
life cycle
equitable allocation if bargaining,
powers, resources and obligations
in society, gender and race
equality, universal access to high
quality educational, health and
recreational facilities, affordable
housing, employment
opportunities, access to nutritious
foods at reasonable prices, public
transportation, clean environment,
safety and peace
Jaafara et al., 2012;
Sedaghatnia et al., 2013;
Hamdan et al., 2014;
Marzuki et al., 2014;
Clark et al., 2014
Table 6 shows the potential indicators of human interrelationships with
other humans that are yet to be statistically confirmed. The potential indicators
are gathered from the literature reviews and summarized findings of selected
subjective well-being studies in Malaysia. The potential indicators are organized
under dimensions of the interdependencies between human and other humans.
The dimensions are the location where the indicators are found. The
manifestation indicates the expression or demonstration of the dimensions.
Finally, the indicators proxy the manifestations and dimensions of the
interdependencies. In other words, the indicators provide ways for the
interdependencies between human and other humans to be gauged.
CONCLUSION
This exploratory review focused on developing potential quantifiable subjective
indicators of human interrelationships with other humans at the local scale. The
indicators are valuable to measure the readiness of the locals in embracing
sustainable well-being in their lifestyle. The indicators are also useful to indicate
the extent of current lifestyles that incorporates relations between human and
other humans. Other opportunities for use include additional indicators for social
well-being components in the national well-being reports. The indicators can
serve as helpful data for policy review which before was difficult to evaluate due
to lack of unquantifiable data (MWI, 2013; MQLI, 2011; MQLI, 2004; MQLI
2002).
The limitation of this research is the lack of empirical data to prove the
dimensions of human interrelationships with other humans. The study will also
assess more relevant and reliable published academic sources especially from
social indicator researches towards finalizing the subjective indicators of human
interrelationships with other humans (Bakar et al., 2015a; 2015b; 2015c). Apart
from establishing potential indicators, reviewing selected articles enable the
researcher to distinguish the pattern of subjective well-being research particularly
in Malaysia. The next challenge of the study is to substitute the potential
indicators into questionnaire inquiries in comprehensive yet concise manner,

Aisyah Abu Bakar, Mariana Mohamed Osman, Syahriah Bachok, Ismawi Zen, Alias Abdullah, & Muhammad Faris Abdullah
A Theoretical Assessment on Sustainable Wellbeing Indicators for People Interrelationships
© 2017 by MIP 28
which are understandable to the targeted respondents. The data obtained and
analysed from the questionnaires will determine if the dimensions of human
interrelationships do in fact multivariately correlated and contribute to
sustainable well-being.
ACKNOWLEDGEMENTS
This research was supported by MyGRANTS. This paper was presented at 2015
Asia Pacific International Conference on Environment-Behaviour Studies.
REFERENCES Abu Rahim, A. R., Ishak, I., Mohd Shafie, S. A., & Shafiai, R. M. (2013). Factors
influencing family life satisfaction among parents in Malaysia: the structural
equation modeling approach (SEM). IOSR Journal of Humanities and Social
Science, 17(4), 78–85.
Achour, M., Grine, F., Mohd Nor, M. R., & MohdYusoff, M. Y. Z. (2014). Measuring
religiosity and its effects on personal well-being: a case study of Muslim female
academicians in Malaysia. Journal of Religion and Health. doi:10.1007/s10943-
014-9852-0
Bakar, A. A., Osman, M. M., Bachok, S., & Abdullah, A. (2015a, September). An
exploratory review: human interrelationships with environment. In Asia Pacific
International Conference on Environment-Behaviour Studies.
Bakar, A. A., Osman, M. M., Bachok, S., & Ibrahim, M. (2015b, September). An
exploratory review: human interrelationships with other humans. In Asia Pacific
International Conference on Environment-Behaviour Studies.
Bakar, A. A., Osman, M. M., Bachok, S., & Ibrahim, M. (2015c, November). Sustainable
well-being subjective indicators: human interdependencies with other humans
and with the environment. In 6th International Conference on Sustainable
Future for Human Security.
Clark, M., Amar-Singh, H. S., & Hashim, L. (2014). The subjective well-being of
Malaysian school children : grade level, gender and ethnicity. Psychology, 5,
1453–1462.
Dodge, R., Daly, A., Huyton, J., & Sanders, L. (2012). The challenge of defining
wellbeing. International Journal of Wellbeing, 3(2), 222-235.
Eckersley, R. (2015). Beyond inequality: Acknowledging the complexity of social
determinants of health. Social Science & Medicine, 147, 121-125.
Geller, E. S. (2015). Why we need humanistic behaviorism. ISHN, 49(10), 52.
Hamdan, H., Yusof, F., & Marzukhi, M. A. (2014). Social capital and quality of life in
urban neighborhoods high density housing. Procedia - Social and Behavioral
Sciences, 153, 169–179. doi: 10.1016/j.sbspro.2014.10.051
Hashim, N., Ishar, N. I. M., Rashid, W. E. W., & Masodi, M. S. (2012). Personality traits,
work-family conflict and job satisfaction: items validity using rasch
measurement approach. Procedia - Social and Behavioral Sciences,
65(ICIBSoS), 1013–1019. doi: 10.1016/j.sbspro.2012.11.235

PLANNING MALAYSIA
Journal of the Malaysia Institute of Planners (2017)
© 2017 by MIP 29
Hassan, S. A. (2015). Islamic transcendental wellbeing model for Malaysian Muslim
women: implication on counselling. Asian Social Science, 11(21), 331–341.
doi:10.5539/ass.v11n21p331
Haworth, J., & Hart, G. (2007). Webs of well-being: the interrelationships of personal,
relational, organizational and communal well-being. In Well-being: Individual,
community and social perspectives. Basingstoke: Palgrave Macmillan.
Holdren, J. P. (2007). Energy and sustainability. Science, 315(5813), 737-737.
Jaafara, J. L., Idris, M. A., Ismuni, J., Fei, Y., Jaafar, S., Ahmad, Z., & Sugandi, Y. S.
(2012). The sources of happiness to the Malaysians and Indonesians: data from
a smaller nation. Procedia - Social and Behavioral Sciences, 65(ICIBSoS), 549–
556. doi:10.1016/j.sbspro.2012.11.164
Kjell, O. N. (2011). Sustainable well-being: A potential synergy between sustainability
and well-being research. Review of General Psychology, 15(3), 255.
Lu, L., & Shih, J. B. (1997). Sources of happiness: a qualitative approach. Journal of
Social Psychology, 137, 181–187.
Lu, L., & Gilmour, R. (2004). Culture, self and ways to achieve SWB: a cross-cultural
analysis. Journal of Psychology in Chinese Societies, 5, 51–79.
Lu, L., R. Gilmour, S.F. Kao, T.H. Eng, C.H. Hu, J.G. Chern, S.W. Huang & Shih, J. B.
(2001). Two ways to achieve happiness: when the east meets the west.
Personality and Individual Differences, 30, 1161–1174.
Malaysia Quality of Life Report [MQLI] (2004). The Malaysian Quality of Life Index
2004. Putrajaya: Economic Planning Unit, Prime Minister's Department.
Malaysia Quality of Life Report [MQLI] (2011). The Malaysian Quality of Life Index
2011. Putrajaya: Economic Planning Unit, Prime Minister's Department.
Malaysia Wellbeing Report [MWI] (2013). The Malaysian Wellbeing Index 2013.
Putrajaya: Economic Planning Unit, Prime Minister's Department.
Malaysian Quality of Life Index [MQLI] 2002. The Malaysian Quality of Life Index 2002.
Putrajaya: Economic Planning Unit, Prime Minister's Department.
Marzuki, N. A., Ahmad, N. A., Hamid, A. S. A., & Ishak, M. S. (2014). Community
social capital in Malaysia: a pilot study. Asian Social Science, 10(12), 202–209.
doi:10.5539/ass.v10n12p202
Mokhtar, N., Husniyah, a. R., Sabri, M. F., & Abu Talib, M. (2015). Financial well-being
among public employees in Malaysia: a preliminary study. Asian Social Science,
11(18), 49–54. doi:10.5539/ass.v11n18p49
Momtaz, Y. A., Haron, S. A., Ibrahim, R., & Hamid, T. A. (2014). Social embeddedness
as a mechanism for linking social cohesion to well-being among older adults :
moderating effect of gender. Clinical Interventions in Aging, 3, 863–870.
Noor, N. M., Gandhi, A. D., Ishak, I., & Wok, S. (2012). Development of indicators for
family well-being in Malaysia. Social Indicator Research, 115, 279-38.
doi:10.1007/s11205-012-0219-1
Noor, S. M., & Abdullah, M. A. (2012). Quality work life among factory workers in
Malaysia. Procedia - Social and Behavioral Sciences, 35(December), 739–745.
Retrieved from http://dx.doi.org/10.1016/j.sbspro.2012.02.144
O'Riordan, T. (2014). Sustainability beyond austerity: possibilities for a successful
transition to a wellbeing society. Análise Social, 211, 497-520.

Aisyah Abu Bakar, Mariana Mohamed Osman, Syahriah Bachok, Ismawi Zen, Alias Abdullah, & Muhammad Faris Abdullah
A Theoretical Assessment on Sustainable Wellbeing Indicators for People Interrelationships
© 2017 by MIP 30
Panatika, S. A. B., Badri, S. K. Z., Rajab, A., Rahman, H. A., & Shah, I. M. (2011). The
impact of work family conflict on psychological well-being among school
teachers in Malaysia. Procedia - Social and Behavioral Sciences, 29, 1500–
1507. doi:10.1016/j.sbspro.2011.11.390
Prilleltensky, I., & Fox, D. R. (2007). Psychopolitical literacy for wellness and justice.
Journal of Community Psychology, 35(6), 793-805.
Rashida, W. E. W., Nordin, M. S., Omar, A., & Ismail, I. (2012). Work Family Conflict:
The Link between Self-Esteem and Satisfaction Outcomes. Procedia - Social
and Behavioral Sciences, 65(ICIBSoS), 564–569. doi:10.1016/
j.sbspro.2012.11.166
Sedaghatnia, S., Lamit, H., Ghahramanpouri, A., & Mohamad, S. (2013). An evaluation
of residents‟ quality of life through neighborhood satisfaction in Malaysia.
Environmental Management and Sustainable Development, 2, 114–125.
Shuib, R., Endut, N., Ali, S. H., Osman, I., Abdullah, S., Oon, S. W., & Shahrudin, S. S.
H. (2013). Domestic violence and women’s well-being in Malaysia: issues and
challenges conducting a national study using the WHO multi-country
questionnaire on women's health and domestic violence against women.
Procedia - Social and Behavioral Sciences, 91, 475–488. doi:10.1016/
j.sbspro.2013.08.445
Sipon, S., Nasrah, S. K., Nazli, N. N. N. N., Abdullah, S., & Othman, K. (2014). Stress
and religious coping among flood victims. Procedia - Social and Behavioral
Sciences, 140, 605–608. doi:10.1016/j.sbspro.2014.04.478.

1Assistant Professor at International Islamic University Malaysia. Email: [email protected] 31
PLANNING MALAYSIA:
Journal of the Malaysian Institute of Planners
VOLUME 15 ISSUE 1 (2017), Page 31 - 44
FIELD, LIGHT AND FOOD: ADAPTING OF THE TOWN SQUARE AS
A LEISURE GATHERING SPACE AT NIGHT
Khalilah Zakariya1, Nor Zalina Harun2, & Mazlina Mansor3
1,2,3Kulliyyah of Architecture and Environmental Design
INTERNATIONAL ISLAMIC UNIVERSITY MALAYSIA
Abstract
A square is an important built open space in cities and towns. In many urban
areas throughout the world squares act as essential form of public space, making
them a venue where socializing, meeting and event activities take place. Over
the years, more squares are emerging as public spaces in Malaysian cities and
towns as an alternative to parks. While most people often visit parks in the
morning and evening, they still need a public space where they can conduct their
leisure activities after working hours and at night. This is particularly relevant for
towns and cities located in tropical and humid countries like Malaysia. The rising
need to be outdoors in a cooler environment in the evening and at night, as a
respite from the daytime heat and work, has attracted people back to the town
squares. The sense of openness that a square offers is different from that of a park
at night. The attractiveness of a square as a night space relies on how its users
relate to the square’s physical, social and environmental attributes. Through
examining a town square in Malaysia that has transformed into an active public
space at night, this article aims to explore the attributes that enabled the square to
be adapted into a night space. The findings revealed that there is a strong
relationship between the opportunities for various activities and the provision of
relevant infrastructure that support the square to serve as a public space for people
at night. This is an important tangent in shifting how urban public space in
Malaysia might be designed and planned in the future so as to cater for the
changing needs of urban dwellers.
Keywords: urban square, town square, public space, urban design
Date Received: 30th April 2016
Date of Acceptance: 30th October 2016

Khalilah Zakariya, Nor Zalina Harun, & Mazlina Mansor
Field, Light and Food: Adapting of the Town Square as a Leisure Gathering Space at Night
© 2017 by MIP 32
INTRODUCTION
Square, also referred to as plaza, is an important urban space that has vital roles
dated back to the early civilizations until today. Generally, squares function as
places for people to gather, whether to socialize or engage in leisure activities
(Nur Azlini Abdullah, 2004; Tibbalds, 1992). They are a type of civic places that
allows people to socialize and interact with each other in the public (Childs,
2004). Squares with historical and cultural significance often become landmarks
for towns and cities (Lynch, 1960, 1981), such as the Tiananmen Square in
Beijing, China, the Djemaa El-Fnaa in Marrakech, Morocco and the Trafalgar
Square in London, United Kingdom. In Malaysia, the Dataran Merdeka is one of
the prominent historic squares that have similarly become an urban and tourism
landmark in Kuala Lumpur (Khalilah Zakariya & Nor Zalina Harun, 2013; Nor
Zalina Harun & Ismail Said, 2008).
The attractiveness of an urban square is generally contributed by its
design, location, surrounding context and facilities that can accommodate
people’s diverse activities. Its activeness is supported by the availability of other
active activities, such as the presence of eateries, food stalls and shops. While
these factors may help to sustain the life of a square weekly, the square needs to
be managed and planned for events throughout the year in order to attract larger
crowds from time to time. As written by Whyte (1980), ‘what attracts people
most, it would appear, is other people’. These supporting spaces and activities
influence the activeness of the plaza, and vice versa because essentially, urban
spaces operate as a connected system (Cooper-Marcus & Francis, 1998; Lynch,
1981).
Due to the perceived popularity of squares in major cities, more squares
have been designed in other towns and cities in Malaysia. However, not all
squares remain active and vibrant as they were initially planned. The roles of
squares need to adapt to the process of urbanization and changes in lifestyle of
their users. Cooper-Marcus and Francis (1998) suggest that squares in
contemporary society are not the same as squares in the older civilizations.
Nonetheless, the contextual and functional attributes that make a square
successful are still applicable and need to be adaptable to contemporary setting.
Consequently, some squares are left underutilized and perceived as a waste of
urban open space. This is a critical point where the functions and roles of a square
in its very own context need to be well understood. Designing and planning a
square is not merely about adopting successful design from elsewhere and hoping
that it would function in the same way. Rather, it is vital for us to learn about
what makes certain squares active and inactive, and then adapt the lessons to how
squares can be designed and managed in the future.
As such, embarking from this position, this article aims to examine
factors that contribute to the attractiveness and activeness of a town square
through a case study located in Ipoh, Perak in Malaysia. The square, Dataran

PLANNING MALAYSIA
Journal of the Malaysia Institute of Planners (2017)
© 2017 by MIP 33
Majlis Bandaraya Ipoh (Dataran MBI), acts as a pilot study for the research to
explore the physical and functional dimensions that influence the vitality of an
urban square as a night public space that builds upon the image of the city. This
study is significant in establishing the parameters for the larger body of research
on squares and public space in the Malaysian context.
URBAN SQUARE: THEN AND NOW
Historically, public spaces for people to gather have evolved since the early
Islamic and Western cities, which initially derived from religious spaces (Kostof,
1992). As an expansion of this public space, cities extended their streets and built
open spaces into square or plaza. For instance in the Islamic city, the maidan
(square) can be found to be located in the middle of residential, commercial and
mosque areas (Kostof, 1992). The functions of squares back then are different
from present days. As an example, the maidan in early Iranian cities are utilized
for horse racing sports, polo-field and market area. Early Western cities have also
found to have city squares as a public space. Evidence of this can be traced back
to the development of Greek cities, where squares functioned as an aesthetic
social space for people to interact (Carmona, Heath, Oc, & Tiesdell, 2003).
In the recent years, the European Square Conference (ESC) reported several
issues regarding the role of squares in today’s cities (International Making Cities
Livable, 2002). Some of the challenges for squares in Europe consist:
a) Uncontrolled commercial and suburban development at the city’s
periphery;
b) Mass tourism that turns the historic square into a tourist attraction;
c) The square’s increasing monofunctional character;
d) Promotion of information technology that attempts to replace social life
on the square with virtual agora.
The European Square Conference (ESC) further acknowledged that, “in
order (for the square) to function, social and economic life had to be organized
through negotiation and consensus, by establishing democratic principles in the
equitable use of place”. According to the ESC, urban squares and plazas are found
to be:
a) A representation of the city’s unique identity;
b) A potential “market place”;
c) Have potential for “mixed use and diversity”;
d) Need “appropriate balance between resident and tourist use of the
square”;
e) A place for “social learning environment”.
The concern over the issue of urban squares in Europe is not much different
from that in Asia, although research on Malaysia’s urban square and its

Khalilah Zakariya, Nor Zalina Harun, & Mazlina Mansor
Field, Light and Food: Adapting of the Town Square as a Leisure Gathering Space at Night
© 2017 by MIP 34
multifaceted roles as a night public space is still very scarce. An example of this
can be seen at the Heritage Bazaar in Dataran Pahlawan Megamall in Banda Hilir,
Malacca. Dataran Pahlawan is an urban square that has been renovated to be
raised above the ground level to provide shops and food courts underneath it.
Recent studies on Dataran Pahlawan revealed the square to be less active than
before, other than during events and celebrations held occasionally throughout
the year. This had led to the decline of income for some of the small business
operators.
METHODOLOGY
This study uses a case study approach in order to examine how an urban square
functions as a night space. This case study is part a larger research work that
examines other squares in Malaysia. Researchers in the field of built environment
often utilize a case study approach to understand and examine conditions and
phenomena of spaces (Denscombe, 2007; Francis, 2003; Zeisel, 1984). This
approach is adopted for this study to allow the researchers to explore and
understand in-depth about the urban square and its users (Yin, 2003; Zaidah
Zainal, 2007). Therefore, the pilot study acts as an exploratory case study to guide
the preparation of the framework of the larger body of research. This is
fundamental in determining the research operations that will be adopted in the
next phases.
Two main methods were employed in this study, which are (i) conducting
survey questionnaires to visitors, and (ii) conducting observation and site
mapping. Survey questionnaires have the advantage to reach a reasonable
representative group of people in a short period of time. This data is essential in
identifying the types of users, their motivations for coming and their level of
experience and satisfaction conducting their activities at the square. The
respondents to the survey were people that visited the square during the days of
the fieldwork, which covered weekdays and weekends, during the day, evening
and at night. This is done to ensure that the collected data will be able to represent
the different types of users and their activities at the square. 72 respondents
(N=72) were surveyed during the fieldwork.
Observation and site mapping are methods commonly employed in
environment-behaviour research. As a method of data collection, observation
does not rely on what people say or think they do, but rather on documenting
what they actually do by means of observing (Denscombe, 2007; Zeisel, 1984).
The observation is documented using photographs and site mapping diagrams to
support the quantitative data gained from the survey questionnaire. Mapping
allows the researcher to illustrate the connections between the users, the square
and the surrounding context. The observations were conducted systematically
using fieldwork form that has been prepared prior to the field work. The
observations were conducted in four sections during weekdays and weekend:

PLANNING MALAYSIA
Journal of the Malaysia Institute of Planners (2017)
© 2017 by MIP 35
a) Morning (between 8.00 am to 12.00 noon) – when people visit the square
on weekdays and weekends
b) Lunch break (between 12.00 noon to 2.00 pm) – when people pass by the
square during their lunch break
c) Late afternoon to evening (between 2.00 pm to 6.00 pm) – when most
people start to have their recreational activities after school, after office
hours and on weekend evenings
d) Night (6.00 pm to 12 midnight) – night activities and outdoor eating
The selection of mix methodology that combines quantitative and
qualitative data in this study helps to achieve the research aim. The cross-
examination between quantitative and qualitative data provides a pragmatic way
of justifying and explaining the research findings. According to Yin (2003), the
generalization from the findings of case study research contributes to expand our
understanding of theories through the identification of patterns or repetitive
conditions.
The findings from the data collected at the square from both methods are
then cross-examined to extract the key findings that inform how the urban square
is used as public space and as domestic tourist attraction.
FINDINGS
Dataran Majlis Bandaraya Ipoh as a Town Square
Dataran Majlis Bandaraya Ipoh (Dataran MBI) is located in Greentown, which is
part of the new town development in Ipoh (Figure 1 & 2). The square is located
in front of Majlis Bandaraya Ipoh, the local authority of Ipoh. Dataran MBI is
selected as the case study because of the presence of active temporary food stalls
that operate at night along the square, known as the MBI Terrace. This makes the
square popular with locals and visitors to Ipoh. Its nightlife represents an
emerging trend of informal activities and recreations conducted at night,
particularly on weekends and during public holidays.
Figure 1 Location Plan of Dataran MBI Figure 2 Image of the Square at Night

Khalilah Zakariya, Nor Zalina Harun, & Mazlina Mansor
Field, Light and Food: Adapting of the Town Square as a Leisure Gathering Space at Night
© 2017 by MIP 36
Dataran MBI is surrounded by a commercial area and two main roads.
The square is designed with an open green field in the centre and paved walkway
around it. The focal point of the square is the clock tower, which is located on a
raised plaza (Figure 3). In the daytime, people who work and visit the area occupy
the parking spaces around the square.
Figure 3 Panoramic View of the Square
Visitor’s Profile
Based on the survey questionnaire, it was found that the majority of the visitors
at Dataran MBI were Malay (93.1%). The majority of the visitors are young
adults, aged between 20 and 29 (69.4%), followed by those aged 30 to 39
(12.5%). Children are also present with some of the adults, as they come as a
family.
Interestingly, the majority of the visitors came from outside of Ipoh.
20.8% came from other places in Perak, while 40.3% came from other states in
Malaysia. The number of out of state visitors signifies that domestic tourists also
visit Dataran MBI. Most visitors come with other people to the square, where
43.1% came in a big group, 37.5% came with their friends or partner, and 19.4%
came with their families. This clearly demonstrates the role of the square as a
social space.
Motivations for Visit
The data presented in Table 1 provides an overview of the visitors’ motivations
and experiences at Dataran MBI. This includes their main purpose of the visit,
frequency of visit and the activities that they do at the square.
Table 1 Main Purpose of Visit to Dataran MBI
Activities` Percentage
Eating 31.9%
Recreation 29.2%
Others (meeting people, business, attending events,
others) 38.9%
The survey reveals that the main purposes of visiting Dataran MBI are
for eating (31.9%), recreation (29.2%), meeting friends and relatives, business
and attending events. All of these activities are strongly related to the role of the

PLANNING MALAYSIA
Journal of the Malaysia Institute of Planners (2017)
© 2017 by MIP 37
square as an urban open space in Ipoh. The most popular activities engaged by
visitors are eating (22%) and recreation (21%). The intensity of these activities
compared to other activities is relevant to the types of spaces provided at Dataran
MBI. The MBI Terrace food stalls offer the visitors an outdoor eating experience
at night. Visitors are also able to get a variety of food at affordable prices. On the
other hand, the open green field, the walkways and raised plaza enables visitors
to conduct recreational and leisure activities, such as strolling, jogging, and
sitting, and as a kick-about area (Figure 5-7).
Table 2 Space Utilization at Dataran MBI
Activities Images
During the day, the square is least active. The
perimeter of the square is mostly used for parking.
This part of the sidewalk is called MBI Terrace,
where food stall vendors operate at night.
From about 5 pm until midnight, food stall vendors
utilize the sidewalks on one side of the square,
called the MBI Terrace. Many visitors are seen to
visit and dine at the food stalls. All of the vendors
are Malay and most of the customers are also
Malays.
Children and families gather, sit and played on the
raised platform where the clock tower is located.
Events are held occasionally at the square, such as
the mawlid and religious lectures that are open to
the public. Public events like these attract huge
crowd to the open green field.

Khalilah Zakariya, Nor Zalina Harun, & Mazlina Mansor
Field, Light and Food: Adapting of the Town Square as a Leisure Gathering Space at Night
© 2017 by MIP 38
Most of the visitors visit the square at least once a year (23.6%) or once
a month (20.8%), while there are those that visit the square occasionally or by
chance when they happen to be in town (26.4%) (Table 3). The peak time of the
visit at Dataran MBI is at night, from 7 pm until 12 midnight (37.5%). This is
followed by late evening, from 5 pm until 7 pm (25%). This finding is closely
related to the eating activities at MBI Terrace, where food stall vendors start to
operate from about 5 pm until midnight. Interestingly, there are users that occupy
the square during the daytime (22.2%). This is contributed by the parking
facilities and adjacency of the square to the commercial area that operates actively
during the day.
Table 3 Frequency and Time of Visit to Dataran MBI
Activities Percentage
Occasional or by chance 26.4%
Once a year 23.6%
Once a month 20.8%
7 pm – 12 midnight 37.5%
5 pm – 7 pm 25%
9 am – 12 noon 22.2%
There are several activities that visitors do at the square. Eating and
drinking was found to be the main activities (M=4.07), followed by chatting
(M=3.72), passing through (M=3.67), watching other people (M=3.65) and
meeting someone (M=3.60). Again, eating and drinking activities remain to be
the most sought activities due to the presence of food stalls at MBI Terrace.
The distributions of activities in the square during the daytime were
observed to be scattered. At night, the patterns of activities are more active at
MBI Terrace, which is where the food stalls are (Figure 4). The visual activeness
of the crowds is contributed by the presence of the food stalls that add liveliness
to the square at night, when there are no events held. Interestingly, young people
are seen to park and display their cars as part of an informal social gathering at
the road between the square and Majlis Bandaraya Ipoh’s building (Figure 5).
This reveals another aspect of how existing crowds draw in more crowds to the
square.

PLANNING MALAYSIA
Journal of the Malaysia Institute of Planners (2017)
© 2017 by MIP 39
Figure 4 Distribution of Activities at Dataran MBI
Figure 5 Some Visitors Park and ‘Display’ Their Cars As They Socialize
Attributes of Dataran MBI
The square brings several different meanings to the visitors. The survey indicated
that Dataran MBI is most recognized as a place for events (M=4.11) and as a
place to socialize (M=4.10). This is closely followed by visitors perceiving the
square as a place for recreation (M=3.97) and a landmark for Ipoh (M=3.78). The
square is seen less as a place with historical significance or a place for relaxation.
A correlation test is conducted to analyse the relationship between the four
meanings of the square towards visitors (see Table 4). There are two significant
relationships found to be important from this finding. The square is a place to
socialize as it is regarded as a place for recreation (r=0.466). It is also a place for
events with a landmark to Ipoh (r=0.384). This important relationship indicates
that the role of an urban square as a public space is multi-dimensional. To
accommodate visitors’ socializing activities, the square must be facilitated with

Khalilah Zakariya, Nor Zalina Harun, & Mazlina Mansor
Field, Light and Food: Adapting of the Town Square as a Leisure Gathering Space at Night
© 2017 by MIP 40
activities for leisure and recreation. Then to draw crowds for events, it must have
some cultural significance to the city, such as a landmark that people can easily
identify with the place.
Table 4 Correlations on the Meaning of the Square to Visitors
A landmark in Ipoh A place for recreation
A place to socialize .196 .466**
A place for events .384** .363**
In terms of accessibility of the square, visitors found the square to be well
connected, visible and accessible (Table 5).
Table 5 Accessibility of the Square
Accessibility Mean
The square is well-connected 3.46
The square is visible from far 3.38
The sidewalk is well-connected 3.25
It is easy to find parking 3.18
The image is considered to be important towards the visitor’s perception
of the square (Table 6). Visitors at Dataran MBI prefer the green atmosphere of
the square, which makes the square attractive. They felt the square reflects a local
image. This is contributed by the presence of the clock tower that has been at the
square for more than 20 years.
Table 6 Image of the Square
Image Mean
Looks green 3.58
Attractive 3.28
Reflect local image 3.22
Clean 3.15
Well-designed 3.14
Safety and comfort are other important attributes that influence visitors
to come to the square (Table 7). The crowd level at Dataran MBI was found to be
tolerable during days without events. The visitors consider the square to be well
lit, vibrant with activities and safe. The square is facilitated with a spotlight that
lights the open green field, as well as street lighting and decorative lighting
around the square (Figure 6).

PLANNING MALAYSIA
Journal of the Malaysia Institute of Planners (2017)
© 2017 by MIP 41
Table 7 Safety Level of the Square
Safety Mean
Tolerable crowd 3.46
Well-lit 3.43
Vibrant with activities 3.36
Safe 3.12
Figure 6 Lighting at the Square
In terms of the provision of facilities at Dataran MBI, visitors prefer that
the square offers more retail outlets and food stalls. While they agreed that the
square has proper pedestrian walkways, they felt that the square’s seating areas,
trees and dustbins are less adequate (Table 8). The square green space has the
potential to be used for various leisure and recreational activities. However, there
are inadequate shady trees and the landscape does not seem to encourage visitors
to become attracted to occupy the green space during the day (Figure 7).
Table 8 Satisfaction Level on Facilities at the Square
Facilities Mean
Retail outlet and food stalls 3.24
Proper pedestrian walkway 3.11
Adequate trees 2.90
Adequate dustbins 2.78
Well-maintained toilets 2.56

Khalilah Zakariya, Nor Zalina Harun, & Mazlina Mansor
Field, Light and Food: Adapting of the Town Square as a Leisure Gathering Space at Night
© 2017 by MIP 42
Figure 7 Landscape Design of the Square
Visitors’ Suggestions
There are several suggestions gathered from the respondents on ways to enhance
Dataran MBI. The outdoor facilities at the square need to be improved in order to
attract more robust activities during the day and night. Similarly the landscape
design should offer more trees in some parts of the square to provide shade. In
ensuring safety at the square, they suggest for the local authority to increase the
patrolling hours. The square also has potential to become a place for educational
purposes, where the authorities can generate more ideas for events.
From the survey and suggestions, it can be construed that Dataran MBI
is functioning relatively successfully at its scale as a town square. Although
Dataran MBI is not as prominent as other squares in Malaysia, such as Dataran
Merdeka and Dataran Pahlawan, it is still able to attract daily visitors to the
square. Suggestions for improvement can be expected to boost the square’s image
and role as a vibrant public space and night space gradually in the future.
DISCUSSION AND CONCLUSION
As revealed in the findings from the questionnaire survey, observation and site
mapping, the activeness of Dataran MBI is largely contributed by five key factors:
1. The presence of MBI Terrace food stalls.
2. The events that are held occasionally in the square.
3. The square and the clock tower as landmarks.
4. The location of the square that promotes accessibility (availability of
parking, adjacency to a commercial area, surrounded by main roads).
5. The availability of infrastructures (lighting, walkways, open field for
activities, areas for vendors, etc.) that attracted people to visit the square
in the evening and at night.

PLANNING MALAYSIA
Journal of the Malaysia Institute of Planners (2017)
© 2017 by MIP 43
The presence of the food stalls allows visitors to come to the square for
‘necessity’ activities, which is eating and drinking. Eating in public areas is an
activity that strongly relates with socializing. By providing eating areas, the
visitors indirectly visit the square and consequently attach their eating activities
with the square. However, it is critical to note that simply placing food stalls or
food kiosks may not guarantee that people will come. The liveliness of the MBI
Terrace food stalls is also significantly contributed by its location next to a
commercial area and main roads. This makes the food stalls also ‘visually’
accessible. The visual activeness that comes from the activities, movements,
sounds and lighting at the food stall add liveliness the square, which otherwise
would remain less active.
Events are another key activities that are able to attract local and out of
town visitors. Since the urban square is one of the open public spaces in a city,
its spatial characteristics and openness are usually able to accommodate large
crowds compared to parks. The success of an event at an urban square is largely
contributed by the location of the square, where accessibility and supporting
facility play a major role. In addition, the planning and management of the event
by the organizer and the local authority also determine the success of the events.
Nonetheless, events are one of the ways of how urban squares can be made active
and ‘marketed’ from time to time. This also may build a stronger image of the
square over the years.
Accessibility, infrastructure and adjacencies are equally crucial in
encouraging the utilization of an urban square by the public. Parking spaces, well-
maintained public toilets, well connected walkways, robust spaces and lighting
are some of the design requirements that need to meet the varieties of users’
activities, from children, youths, families to elderlies. For Dataran MBI, the local
authority has demarcated the MBI Terrace for temporary food stall vendors.
Although the infrastructure provided might be minimal (marking of stall lots for
vendors, improving the drainage, providing water taps and widening the
sidewalk), this gesture was able to enliven the square on weekday nights. Again,
regular and continuous use of the square will eventually enhance the attachment
and relationships that people have with it. This is a vital component in building
the place attachment among the locals and visitors to the place.
Another interesting attribute that the square has is people’s association
with it as a landmark. While the MBI Terrace is relatively new, the clock tower
and the open field of Dataran MBI have existed as part of Greentown for over 20
years. This signifies a kind of ‘soft’ infrastructure where there is already a cultural
familiarity between people and the square. Since Dataran MBI has already
regarded as a landmark, it is much easier for people to recognize and accept the
square as part of a public space in Ipoh.

Khalilah Zakariya, Nor Zalina Harun, & Mazlina Mansor
Field, Light and Food: Adapting of the Town Square as a Leisure Gathering Space at Night
© 2017 by MIP 44
The adaptation of Dataran MBI into a night public space is important in
guiding the design of a good setting for civic and commercial buildings in cities.
A place like this is visually, socially and physically accessible as it is believed
that its placement, facilities of its surrounding areas also have influenced people’s
frequent visit. This can simultaneously establish a harmonious relationship
amongst the community and visitors. In conclusion, the findings from this pilot
study reveals several important key points and attributes that will further be tested
at other squares in the country that is currently facing decline in terms of its
vibrancy as a public space. Lessons from this study can also help the planning or
redevelopment of other town and city squares in Malaysia.
REFERENCES Carmona, M., Heath, T., Oc, T., & Tiesdell, S. (2003). Public places urban spaces: the
dimensions of urban design. Oxford: Architectural Press.
Childs, M. C. (2004). Squares: a public place design guide for urbanists. Albuquerque:
University of New Mexico Press.
Cooper-Marcus, C., & Francis, C. (1998). People Places: Design Guidelines for Urban
Open Space. New York: John Wiley & Sons.
Denscombe, M. (2007). The good research guide: for small-scale social research
projects. Maidenhead: McGraw-Hill.
Francis, M. (2003). Urban open spaces. Washington, D.C.: Island Press.
International Making Cities Livable. (2002). The European Square. Retrieved from
http://www.livablecities.org/articles/european-square-conference-report.
Khalilah Zakariya, & Nor Zalina Harun (2013). The people’s dataran: celebrating historic
square as a potential temporary market space. Procedia - Social and Behavioral
Sciences, 85, 592–601.
Kostof, S. (1992). The city shaped: urban patterns and meanings through history.
London: Routledge.
Lynch, K. (1960). The image of the city. Cambridge: MIT Press.
Lynch, K. (1981). The good city form. Cambridge: The MIT Press.
Nor Zalina Harun, & Ismail Said (2008). Morphology of padang: a case study of Dataran
Merdeka, Kuala Lumpur. In International Seminar in Sustainable Environment &
Architecture. Shah Alam.
Nur Azlini Abdullah (2004). Plaza in Urban Area. International Islamic University
Malaysia.
Tibbalds, F. (1992). Making People-Friendly Towns. London: Longman.
Whyte, W. H. (1980). The social life of small urban spaces. Washington D.C.: The
Conservation Foundation.
Yin, R. K. (2003). Case study research: design and methods (3rd ed.). California: Sage.
Zaidah Zainal. (2007). Case study as a research method. Jurnal Kemanusiaan, 9.
Zeisel, J. (1984). Inquiry by design: tools for environment behavior research. New York:
Cambridge University Press.

1Associate Professor at International Islamic University Malaysia. Email: [email protected] 45
PLANNING MALAYSIA:
Journal of the Malaysian Institute of Planners
VOLUME 15 ISSUE 1 (2017), Page 45 - 56
THE COMPLEXITY OF GOVERNING FISHING VILLAGES IN THE
BAGAN AREAS OF SELANGOR, MALAYSIA
Mohd Zin Mohamed1, & Norhaslina Hassan2
1Kulliyyah of Architecture and Environmental Design
INTERNATIONAL ISLAMIC UNIVERSITY MALAYSIA 2Geography Department
UNIVERSITY OF MALAYA
Abstract
This paper examines the current administrative structure that deals with informal
fishing villages in Selangor aiming to identify the governance issues of these
communities from the local-, district-, state- and federal-level perspectives. Data
collection techniques employed were field observations conducted through site
visits, in-depth interviews with the state and local planning officials, and focus
group discussions involving chairpersons of the Village Development and
Security Committees (VDSC). The analysis reveals a sizable number of entities
involved in the governance and management of these fishing communities at all
levels and accordingly, concludes by outlining a more strategic administrative
structure that could effectively govern informal fishing villages that is applicable
to Selangor and beyond.
Keywords: Village Development and Security Committees (VDSC),
administrative structure, fishing villages
Date Received: 30th April 2016
Date of Acceptance: 30th October 2016

Mohd Zin Mohamed, & Norhaslina Hassan
The Complexity of Governing Fishing Villages in The Bagan Areas of Selangor, Malaysia
© 2017 by MIP 46
INTRODUCTION
Many fishing communities in rapidly developing countries are now at a cross-
road. Against the backdrop of accelerated urbanization and expanding municipal
areas, they are caught between the need to maintain their traditional way of life
and embracing development that is increasingly conditioned by sustainable
principles leading to uncertainties regarding their future. While the
unsustainability of fishing villages has always been attributed to the general lack
of infrastructure and public amenities, unplanned settlement and poverty,
informal fishing villages are more disadvantaged due to geographical
marginalization, basic service deficits, poor governance frameworks, limited
access to land and property, precarious livelihoods and, due to their locations in
environmentally sensitive areas, high vulnerability to the adverse impacts of poor
and exposed environments, climate change and natural disasters. It has indeed
been noted that urban sensitive areas in developing countries are currently facing
challenges and impacts resulting from processes such as urban sprawl and
development, urban agglomeration, tourism development and informal
settlements (Trzyna, 2007; Rebelo et al., 2011).
The negative impacts of indiscriminate expansion of informal fishing
villages in Malaysia include illegal exploration of land, garbage and sewage
problems, socioeconomic problems, lack of road network and improperly
installed water and electricity supplies as well as inadequacy of community
amenities. Informal fishing villages are more problematic via the traditional ones
seen from the development planning perspective. Not only are these villages
plagued with environmental and socioeconomic issues, formal planning of these
settlements is hindered by the status of land being occupied. This is despite the
serious efforts by the government to raise the standard of living for fishing
communities, while at the same time improve fisheries conservation and
management (Tietze et. al. 2006).
The Department of Local Government has identified 19 new villages in
Bagan areas in Selangor covering the districts of Sabak Bernam, Kuala Selangor,
Klang, Kuala Langat and Sepang (Figure 1) which do not fall under the categories
of the new villages (Brigg’s Plan) or “kampung tersusun” (resettlement villages).
The Malay word “Bagan” refers to jetty which serves to characterize these
villages as settlements with jetties. The location of these fishing villages now is
amongst the prime area for development where the majority of the villagers are
still without land titles which contributes to their informality status. Effective
management of these villages depends to a great extent on the governance
structures that are present including their administrative roles, financial support
and more importantly, a clear goal on future development of the settlements
themselves. Given the informal fishing village’s history of marginalization and
alienation from policy processes, this paper argues for co-management strategy
that can better achieve a more sustainable governance outcomes. It examines the

PLANNING MALAYSIA
Journal of the Malaysia Institute of Planners (2017)
© 2017 by MIP 47
current administrative structure that deals with informal fishing villages in
Selangor aiming to identify the governance issues of these communities and
concludes by outlining a more strategic administrative structure that could
effectively govern informal fishing villages that is applicable to Selangor and
elsewhere.
GOOD GOVERNANCE AND CO-MANAGEMENT
Governance in the urban management context refers to all of the laws,
regulations, frameworks, systems and processes that shape the way in which the
local government operates. It is a complex system whose ultimate definition is
not only difficult to be claimed by anyone but also highly contextual where the
process and practices vary based on the environment in which they are applied.
Based on the definition by UNDP, Bello and Dola (2014) have defined local
governance as the exercise of economic, political and administrative authority to
manage affairs at local levels. Good urban governance provides the legal, political
and networking framework in which good management flourishes. A critical
element of effective governance at the local government level is the establishment
of an inter-governmental institutional framework that (1) clearly specifies the
responsibilities of each level of government; (2) provides the appropriate
authority to support the delegated responsibilities; (3) specifies and enforces a
code of conduct to underpin administration and (4) encourages private sector and
civil actors to participate in development or management. Additionally, good
governance requires a sound public-private partnership as well as effective
government and citizen interaction.
Increasingly, the potential of co-management is seen to provide a
strategic governance alternative for a more democratic and participatory
decision-making regarding the sustainability of the informal fishing villages
within the context of rapidly urbanizing region. Co-management seeks to bring
together resource users in shared stakeholder management regimes (Armitage,
Berkes & Doubleday, 2007; Olson, 2009). The premise is that co-management is
not just about managing resources but is also fundamentally about managing
relationships (Goetze, 2005). By incorporating a diversity of stakeholders, co-
management aims to provide opportunity for building trust and linkages among
interested parties. Accordingly, the inclusionary practices are purported to
increase the legitimacy of decision-making processes and, furthermore, lead to
better resource management by incorporating processes of social learning and
knowledge integration (Armitage, Berkes & Doubleda, 2007; Berkes, 2009). This
“co-benefits” by “co-managing” the development process is to be facilitated by
strengthening the local administrative machinery in dealing with the complex
socio-environmental issues associated with informal fishing villages. Effective
co-management demands the creation of an enabling environment that gives
power and authority to both government and resource users at community and

Mohd Zin Mohamed, & Norhaslina Hassan
The Complexity of Governing Fishing Villages in The Bagan Areas of Selangor, Malaysia
© 2017 by MIP 48
district levels in a broader participatory management process. By-laws at the
district authority level should be legally binding and according to which fisheries
resources are considered as natural goods for the benefit of the local communities
(Njaya, 2007; Olson, 2009).
METHODOLOGY
Data collection techniques employed in this study were field observations
conducted through site visits, in-depth interviews with the state and local
planning officials and focus group discussions involving chairpersons of the
Village Development and Security Committees (Jawatankuasa Keselamatan dan
Kemajuan Kampung - VDSC).
Figure 1 Fishing Villages in the Bagan Areas of Selangor
Quantitative data was collected using questionnaire survey and
administered on village residents through purposive and snowball sampling. The
survey instrument was distributed among the VDSC committee members who

PLANNING MALAYSIA
Journal of the Malaysia Institute of Planners (2017)
© 2017 by MIP 49
then recruit other respondents from among their acquaintances. This strategy
produced a sample of 1,500 head of households; 739 from the villages in the
district of Sabak Bernam, 423 from the district of Klang and 328 from the district
of Kuala Selangor (from the total of 1,162; 2,240 and 1,194 households in the
villages which represent 49.3%, 21.9% and 28.9% of the total sample
respectively. This corresponds to the 5% sampling error (significance level (α) -
.05) and 95% level of confidence. The instrument was designed to solicit the
general household characteristics, livelihood means and participation in village-
based organisations as communicative channels for community issues at the
villagers’ level and at the ketua kampung (village heads) level, the 19 Tok Sidang
were involved in both FGD sessions and individual semi structured interviews to
gather information regarding the flow of information bottom-up and vice versa
with higher authorities.
HOUSEHOLD CHARACTERISTICS AND MEMBERSHIP IN
VILLAGE-BASED ORGANISATIONS
The majority (87.5%) of the respondents surveyed are married and has only
primary level education (72.7%). Although most (67.9%) head of households
reported self-employment there is also a relatively large proportion (19.5%) of
the surveyed respondents who are either unemployed (due to old age) or retired
indicating to the increasing number of aging fishers in the villages. 85.8% of the
households reported having between 1-4 members being involved in the local
economy which revolves around the fishing sector. The 14.2% of the households
which did not have any members in the local economic sector shows the trend of
increasing disassociation between the fishing villages and the sea as the main
source of livelihoods among their current residents.
Almost all (98.3%) head of households studied said that they own the
houses in which they live in. Almost all (90.3%) head of households rated their
housing conditions to be fair. Despite the informality of the fishing villages, the
majority of houses were supplied with electricity and water from official utility
providers (97.5% and 97.3% respectively). However, only 41.6% of the houses
in these villages have modern toilet while the rest drained their domestic sewage
directly into the rivers. The study also found that 98.4% of the head of households
surveyed admitted to having stayed in the villages for more than 20 years; 83%
said to have lived there for more than 30 years.
A chi-square test was performed to determine whether the three most
common village-based organisations were equally subscribed to by the villagers.
The result shows that subscription to the organisations was not equally distributed
in the population, χ2 (4, N = 1500) = 212.4, p < .05. Table 1 shows that the
villager’s resident association was not the preferred organisations compared to
the fishermen’s cooperation. A large proportion of the respondents also reported
non-membership to any organisation in the villages as in the case of the villagers
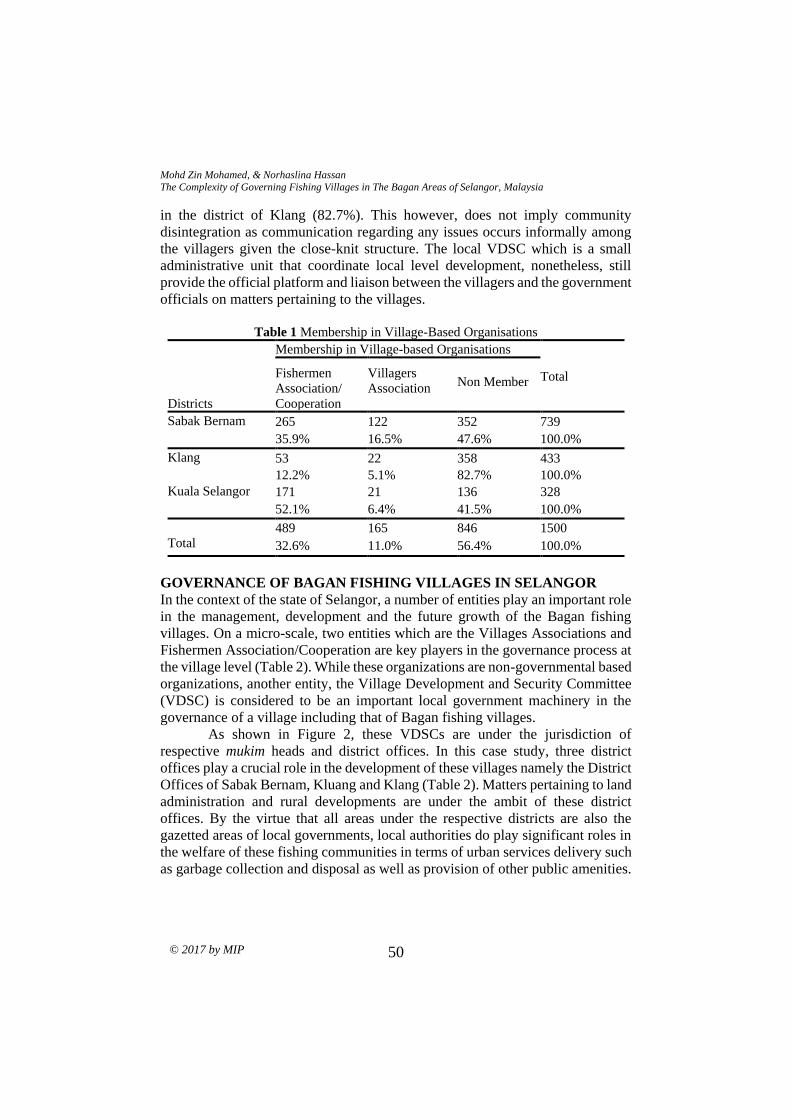
Mohd Zin Mohamed, & Norhaslina Hassan
The Complexity of Governing Fishing Villages in The Bagan Areas of Selangor, Malaysia
© 2017 by MIP 50
in the district of Klang (82.7%). This however, does not imply community
disintegration as communication regarding any issues occurs informally among
the villagers given the close-knit structure. The local VDSC which is a small
administrative unit that coordinate local level development, nonetheless, still
provide the official platform and liaison between the villagers and the government
officials on matters pertaining to the villages.
Table 1 Membership in Village-Based Organisations
Districts
Membership in Village-based Organisations
Total Fishermen
Association/
Cooperation
Villagers
Association
Non Member
Sabak Bernam 265 122 352 739
35.9% 16.5% 47.6% 100.0%
Klang 53 22 358 433
12.2% 5.1% 82.7% 100.0%
Kuala Selangor 171 21 136 328
52.1% 6.4% 41.5% 100.0%
Total 489 165 846 1500
32.6% 11.0% 56.4% 100.0%
GOVERNANCE OF BAGAN FISHING VILLAGES IN SELANGOR
In the context of the state of Selangor, a number of entities play an important role
in the management, development and the future growth of the Bagan fishing
villages. On a micro-scale, two entities which are the Villages Associations and
Fishermen Association/Cooperation are key players in the governance process at
the village level (Table 2). While these organizations are non-governmental based
organizations, another entity, the Village Development and Security Committee
(VDSC) is considered to be an important local government machinery in the
governance of a village including that of Bagan fishing villages.
As shown in Figure 2, these VDSCs are under the jurisdiction of
respective mukim heads and district offices. In this case study, three district
offices play a crucial role in the development of these villages namely the District
Offices of Sabak Bernam, Kluang and Klang (Table 2). Matters pertaining to land
administration and rural developments are under the ambit of these district
offices. By the virtue that all areas under the respective districts are also the
gazetted areas of local governments, local authorities do play significant roles in
the welfare of these fishing communities in terms of urban services delivery such
as garbage collection and disposal as well as provision of other public amenities.

PLANNING MALAYSIA
Journal of the Malaysia Institute of Planners (2017)
© 2017 by MIP 51
Figure 2 Administrative Structure of the State of Selangor
Source: Official Portal of Selangor State Government (www.selangor.gov.my)
Further up the state administrative structure, other government entities
also pay important contributions in terms of its public policy decision and
implementation of development programmes. The State Economic Planning Unit
(SEPU) for example, is responsible for the planning and future development of
these villages whilst the State Town and Country Planning Department (STCPD)
involves in the physical planning of these villages. Another state entity, the State
Land and Mines Department (SLMD) is responsible for land matters of the
fishing communities. However, in the state structure the ultimate decision with
regards to the development of these fishing villages and their future direction of
growth lies with the State Executive Committee (EXCO) or sometimes referred
to as the State Cabinet which is chaired by the Chief Minister of Selangor. Under
this EXCO system, there are a number of committees established of which a
committee called Committee of Investment, Industries, Commerce, New Villages
and Illegal Factories chaired by a state assemblyman is responsible for matters in
relation to Bagan fishing villages in Selangor.
Based on the FGD among selected villages and VDSC members in the
three districts, a number of observations/findings can be made related to the issues
of governance in these fishing villages of which two concerns are most prominent
as follows:

Mohd Zin Mohamed, & Norhaslina Hassan
The Complexity of Governing Fishing Villages in The Bagan Areas of Selangor, Malaysia
© 2017 by MIP 52
i. One of the important governance issues gravitated around the status of
the land of the village the fishers are residing which is on ‘temporary
occupation license (TOL)’ status. The majority of the residents prefer to
continue staying in these villages to earn their livelihood that they have
sustained for at least two generations. Their economic livelihood centres
on the need to improve their economic status particularly those related to
fishing activities.
ii. Given the uncertainty with the status of ownership, it remains one of the
challenges of VDSC to find a solution to this issue. It is felt that the award
of permanent titles to the land will provide them with the confidence to
make investments such as upgrading their place of residence,
participation in tourism projects and fishing sector.
Given the rapidly urbanizing scenario in Selangor, it is a matter of time
that these fishing villages will be engulfed by the wind of urban change. This
brings into question the survival and sustainability of theses villages. One of the
strategic approach in adapting these fishing communities would be through a
system of co-management that encourages local public participation, inclusionary
practices as well as strengthening local machinery to address various governance
issues for the betterment and welfare of the fishing communities (Armitage,
Berkes & Doubleday, 2007; Olson, 2009).
In the case of Bagan fishing villages, the first strategic step would be to
strengthen the VDSC by beefing up its capacity and capability through
enhancement of expertise, skill and knowledge in order to provide a good service
to its communities. In such a case, the role of the District Offices of Sabak
Bernam, Kuala Selangor and Klang together with the local authorities of Sabak
Bernam District Council, Kuala Selangor District Council and Klang Municipal
Council are to assume a leadership role in enhancing the effectiveness of the local
machinery (VDSC). On a slightly broader scale of governance, the state and local
agencies that have bearing on the development of fishing villages and
communities either in the form of policy formulation, coordination of
development programmes, project implementation, enforcement of regulations or
monitoring of projects are provided in Table 2.
Table 2 Federal and State Agencies Involved in the Management and Implementation
of Development Projects at Fishing Village Level Agencies Formulation Coordination Implementation Enforcement Monitoring
STCP √ √ √ √
SEPU √ √ √ √
DID √ √ √ √
PWD √ √ √ √
JPNS √ √ √ √

PLANNING MALAYSIA
Journal of the Malaysia Institute of Planners (2017)
© 2017 by MIP 53
DWNP √ √ √ √ √
CDD √ √
JKOA √ √ √
BOMBA √ √ √
POLICE √ √ √
JKKS √ √ √
DOE √ √ √ √
SWMA √ √ √ √
LKIM √ √ √
TSB √ √ √
LA √ √ √ √ √
LDO √ √ √ √ √
IMPLICATIONS OF THE STUDY
The study on the fishing communities in the three districts of Selangor, namely,
the District of Sabak Bernam, Klang and Kuala Selangor unravels the complexity
of local governance against the backdrop of the rapidly urbanizing state of
Selangor. The future or survival of these 19 villages or communities hinges, to
a larger extent, on how these entities adjust and adapt to the ever-changing socio-
economic and political environment in order to stay functional and relevant.
Failure to strategize will lead these villages to lose their traditional way of living
and hence its heritage importance. To survive, it entails a skilful and strategic
governance approach to navigate among the diversity of stakeholders, optimizing
the availability of human as well as financial resources and in line with the
developmental objectives and need of a developed state like Selangor (Goetze,
2005). This study underlines the need to have a strong and effective local
administrative structure in the form of the Village Development and Security
Committee established within the state administrative machinery to play the role
of promoter and facilitator of socio-economic development at the village level.
To this, it calls for VDSC to adopt a co-management strategy, not only to manage
resources but also managing relationships among the stakeholders to ensure the
orderly growth of these fishing villages into modern entities and yet retaining
their traditional characters and become important heritage of Selangor. The study
also underpins the importance of building capacity and capability of these VDSC
to meet the challenges of local governance in an urban setting.
CONCLUSION
This paper clearly shows the complexity of governance of Bagan fishing villages
in the State of Selangor as shown by the presence of many stakeholders at the
state and local levels. The analysis reveals that the administrative structure at the
district level is most effective in managing development issues of informal fishing
villages in Selangor. The VDSC together with the Office of Village
Mohd Zin Mohamed, & Norhaslina Hassan
The Complexity of Governing Fishing Villages in The Bagan Areas of Selangor, Malaysia
© 2017 by MIP 54
Communication Officer at the District Land Office, however, need to be
strengthened as they are important entities that effectively bridge the gap between
local and state level development planning. This complexity of governance
underpins the importance of adopting co-management strategy as a strategic
governance alternative to ensure the survival of these fishing villages in the
Bagan areas within the context of rapidly urbanizing State of Selangor.
ABBREVIATION VDSC Village Development & Security Committee CDD Selangor Community Development
Department
ECXO State Executive Committee JAKOA Department of Orang Asli Development
STCPD State Town & Country Planning Department BOMBA Selangor Fire & Rescue Department of
Malaysia
SLMD State Land & Mines Department POLICE Selangor Royal Malaysia Police
SEPU State Economic Planning Unit JKKS Selangor Department of Health
DID Department of Irrigation & Drainage DOE Department of Environment
PWD Public Works Department SWMA Selangor Waters Management Authority
LDO Land District Office LKIM Fisheries Development Authority of Malaysia
JPNS Selangor Education Department TSB Tourism Selangor Berhad
DWNP Department of Wildlife & National Parks LA Local Authority
REFERENCES
Armitage, D., Berkes, F., & Doubleday, N. (Eds). (2007). Adaptive co-management:
collaboration, learning and multi-level governance. Vancouver: University of
British Columbia Press.
Bello, A., & Dola, K. (2014). Sustainable development and the role of local governance :
experience from Malaysian model regions. International Journal of Humanities
and Social Science, 4(1), 268–280.
Berkes, F. (2009). Evolution of co-management: role of knowledge generation,
bridging organisations and social learning. Journal of Environmental
Management, 90, 1692–1702.
Goetze, T.C. (2005). Empowered co-management: towards power-sharing and
indigenous rights in Clayoquot Sound, BC. Anthropologica, 47(2), 247-265.
Njaya, F. (2007). Governance challenges for the implementation of fisheries co-
management : experiences from Malawi. International Journal of the Commons,
1(1), 137–153.
Olson, M. (2009). The logic of collective action: public goods and the theory of groups
(Vol. 124), Cambridge: Harvard University Press.
Rebelo, A.G., Holmes, P.M., Dorse, C. & Wood, J. (2011). Impacts of urbanization in a
biodiversity hotspot: conservation challenges in Metropolitan Cape Town, South
Africa. Journal of Botany, 77 (1), 20-35.
Tietze, U., Haughton, M., & Siar, S.V. (Eds), (2006). Socio-economic indicators in
integrated coastal zone and community-based fisheries management – case
studies from the Caribbean. FAO Fisheries Technical Paper (491). Rome: FAO.
Trzyna, T. (2007). Global urbanization and protected areas. California: California
Institute of Public Affairs.

1 Assistant Professor at Universiti Tunku Abdul Rahman. Email: [email protected] 55
PLANNING MALAYSIA:
Journal of the Malaysian Institute of Planners
VOLUME 15 ISSUE 1 (2017), Page 55 - 64
RENEWABLE ENERGY AND TRADE DISPUTES: IMPLICATIONS
ON SOLAR PHOTOVOLTAIC MANUFACTURING IN MALAYSIA
Hui Nee Au Yong1, & Kock Lim Tan2
1Faculty of Business and Finance
UNIVERSITI TUNKU ABDUL RAHMAN
Abstract
Malaysia has realised the importance of renewable energy (RE) in the energy mix
and continuously reviewing its energy policy to ensure sustainable energy supply.
The use of RE is among the options although the RE capacity is still under-
utilized. Malaysia achieves 5.5% share of RE in the energy mix by 2015, and the
RE sector is expected to double by 2020 with strong growth in the solar
photovoltaic (PV), biomass and biogas markets. Beyond 2020, it is predicted that
solar energy will surpass all other forms of RE for Malaysia and other countries,
and the solar power will be the long term source of energy supply. After an
investigation on the RE policy, the domestic solar PV manufacturing scenario is
elaborated in this paper. This includes the solar PV manufacturing, issues and
trade disputes, and the way forward. Among the key findings from this paper
include: the foreign direct investment (FDI) related to RE sector especially from
the US and lately China, have increased rapidly, and more ‘green' jobs in the solar
PV manufacturing and installation sectors have been created. With the existence
of trade disputes between the United States and the European Union with China,
Malaysia has the potential to reap benefits with the inflow of direct investments
from China. Nevertheless, the future incidence of RE trade disputes is still
uncertain.
Keywords: Feed-in-tariff, green technology, renewable energy, solar
photovoltaic, trade disputes
Date Received: 30th April 2016
Date of Acceptance: 30th October 2016

Hui Nee Au Yong, & Kock Lim Tan
Renewable Energy and Trade Disputes: Implications on Solar Photovoltaic Manufacturing in Malaysia
© 2017 by MIP 56
INTRODUCTION
As the level of carbon dioxide keeps increasing and causing global warming,
countries need to introduce the generation of electricity with an energy mix that
is sustainable. Data from United Nations indicate that Malaysia recorded 187
million tons of carbon emission or 7.2 tons per capita in 2006. During the United
Nations Climate Change Conference 2009 (COP 15) in Copenhagen, Denmark,
the Malaysian Prime Minister declared that the country has agreed by 2020 to
reduce its carbon dioxide emissions to Gross Domestic Products (GDP) intensity
by 40 percent compared to 2005 levels (BERNAMA, 2009). The Malaysian
Government promotes renewable energy by enacting the Renewable Energy Act
2011, the introduction of Feed-in-Tariff (FiT), the establishment of Sustainable
Energy Development Authority (SEDA) and the formulation of the green
technology policy (KeTTHA, 2012). Currently, about 90% of electricity in
Malaysia is mainly produced using liquid natural gas (LNG) and coal (Economic
Planning Unit, 2006). Table 1 illustrates that electricity generation in Malaysia
heavily relies on fossil fuels.
Table 1 Fuel Mix for Electricity Generation in Malaysia, 2000-2010.
YEAR GAS (%) COAL (%) OTHERS (%)
TOTAL
(GWh)
20005000-02 77 9 14 69,280
2005805 70 22 8 94,299
2010069 56 36 8 137,909
Source: EPU (2006)
This paper presents some of the key issues of the development of RE for
a green economy in Malaysia, and makes reference to the solar panel global trade
dispute that is building up and to solar industries that are under protectionist
policies.
RE SCENARIO IN MALAYSIA
RE mix for Malaysia in 2012 was made up of 58MW (41%) from biomass,
47MW (35%) from solar and 32MW (24%) from other RE sources including
biogas, solid waste and small hydro, contributing a total of 137MW of RE
electricity to the power grid (SEDA, 2012). The Renewable Energy Roadmap
provides long-term goals and a holistic approach that encourages various types
of renewable resources in the energy mix (Table 2).

PLANNING MALAYSIA
Journal of the Malaysia Institute of Planners (2017)
© 2017 by MIP 57
Table 2 Renewable Energy Quota
Source 2011/2012 (Mw) 2013 2014 Total
Biogas 30 30 20 80
Biomass 75 70 60 205
Hydro 30 30 95 155
Solar 54 52 52 158
TOTAL 189 182 227 598
Source: SEDA
According to SEDA, after the launch of Feed-in-Tariff (FiT) in 2011, 400
MW (40 percent target) were connected to the power grid by 2015 (BERNAMA,
2015a). The FiT scheme has a key objective to provide financial support to
residential, industrial and commercial consumers with 21 years payback period
and 8% per annum degression rate (The Star Online, 2013). Furthermore,
Malaysia targets to generate 2,000 megawatts (MW) of electricity from RE
sources by 2020 (Table 3). Two new mechanisms were introduced as part of the
efforts to achieve the target, which are net-metering and utility-scale solar (USS).
The National Renewable Energy Policy and Action Plan formulated by the
Ministry of Energy, Green Technology and Water aims to increase generation of
RE power capacity in Malaysia to 4,000 MW by 2030. This increase will be
supported by strong growth in the solar PV, biomass and biogas markets.
Table 3 Malaysian National RE Targets
Year Cum. RE
`Capacity
RE Power Mix (vs.
Peak DD.)
Cumulative CO²
Avoided
2010 73 MW 0.50% 0.3 M.T.
2015 985 MW 5.5% 11.1 M.T.
2020 2,080 MW 11% 42.2 M.T.
2030 4,000 MW 17% 145.1 M.T.
Source: KeTTHA, (2008)
Globally, by 2050, it is expected that RE sources will play generate a
cumulative capacity of 11.5 GW, out of which 9GW from solar PV, as illustrated
in Figure 1. Solar power will be the long-term global source of energy supply.
Solar power generation possesses advantages of low greenhouse gasses (GHG)
emission, low maintenance cost and low operation noise, and therefore it is

Hui Nee Au Yong, & Kock Lim Tan
Renewable Energy and Trade Disputes: Implications on Solar Photovoltaic Manufacturing in Malaysia
© 2017 by MIP 58
considered the best choice for future electricity generation (Hosseini & Wahid,
2014).
Figure 1 Long-Term Global Energy Supply
After the launch of the FiT scheme, the number of solar PV installations
in Malaysia has been increasing. FiT has been successful in promoting RE at the
small scale generation level. Additionally, as shown in Table 4, 10,852 jobs were
created after 13 months of the e-FiT system launched. The two highest job
contributions were from the biomass and the solar PV sectors, which were 4,389
and 4,224 jobs respectively (SEDA, 2012).
Table 4 Statistics of Green Job Creation in Malaysia.
RE Technology No. of Job Created
Biogas (Palm Oil Waste, Agro-Based, Farming) 513
Biomass (Palm Oil Waste, Agro-Based) 4,389
Small Hydro 1,726
Solar PV 4,224
Total 10,852 Source: SEDA (2012)
SOLAR PV MANUFACTURING
China is the world’s top solar PV manufacturer. Goodrich et al. (2014) found that
China’s price advantage is driven by scale and supply chain development. China

PLANNING MALAYSIA
Journal of the Malaysia Institute of Planners (2017)
© 2017 by MIP 59
is successful in attracting Incoming Foreign Direct Investments (FDIs), mainly
through the establishment of joint ventures with western partners, which at the
same time are potential channels for accelerating technology transfers into China
(DeLaTour, Glachant & Meniere, 2011).
PV imports in the US have been rising for reasons including increasing
solar module production in places like Malaysia; Malaysia is now a large PV
module supplier to the US, as Malaysia is the production base for First Solar
Malaysia and AUO SunPower, and the German producer, Q-Cells (now Hanwha
Q-Cells owned by Korean) (Platzer, 2012). Since the establishment of First Solar
Malaysia in 2008, Malaysia has become the home to top manufacturers of solar
PV around the globe. According to Sawhney and Kahn (2011), Malaysia’s share
in the US import of the core high-tech solar modules was zero in 1989 versus six
percent in 2010 (and the fifth largest source after China, Mexico, Japan and
Taiwan).
The solar PV industry is one of the growth sectors for electrical and
electronics (E&E) in Malaysia. The growth was incentivised by the award off
pioneer status, favourable investment tax allowance and the Green Technology
Financing Scheme (MIDA, 2015; Green Tech Malaysia, n.d.). Platzer (2012)
suggests that low labor cost environment of countries such as China and Malaysia
has also contributed in making them solar PV production hubs. Malaysian
Government also provides additional bonus FiT rate based on bonus criteria of
locally manufactured PV modules. As a result, solar PV manufacturing has
grown especially in Penang, Kedah, and Sarawak (Table 5).
Table 5 Major Solar PV Industrial Players in Malaysia
No. State Location Company
1 Johor Iskandar Malaysia Xinyi Solar
Port of Tanjung Pelepas Flextronics (for Sun Edison)
2 Kedah Kulim Hi-Tech Park First Solar, Panasonic Energy
3 Melaka Rembia AU Optronics – SunPower
4 Penang Prai Jinko Solar
Bayan Lepas JA Solar
Penang Science Park TS Solar
5 Perak Kanthan Industrial Area,
Ipoh
Solar Twin Creeks / TCTI
6 Sarawak Sama Jaya, Kuching Comtec Solar, Sun Edison
Bintulu Tokuyama
7 Selangor Sepang, Selangor Science
Park 2
Hanwha Q-Cells
Source: NewsBase (2015).

Hui Nee Au Yong, & Kock Lim Tan
Renewable Energy and Trade Disputes: Implications on Solar Photovoltaic Manufacturing in Malaysia
© 2017 by MIP 60
The main Malaysian PV manufacturing are First Solar and Panasonic
Energy in Kulim Hi-Tech Park, JA Solar, Jinko Solar and TS Solar in Penang
Science Park, Solar Twin Creeks in Ipoh, Hanwha Q-Cells in Selangor Science
Park 2, AUO-SunPower in Rembia, Xinyi Solar in Iskandar Malaysia,
Flextronics produces solar PV panels for Sun Edison in Port of Tanjung Pelepas,
Comtec Solar and Sun Edison in Kuching, and Tokuyama in Bintulu. In 2015,
Malaysia has turned into a major destination for Chinese solar companies seeking
to circumvent the high taxes imposed by US and Europe since 2012 (The Edge
Market, 2015).
Malaysia offers an advantageous location evidenced by the
announcement of global solar PV manufacturers, JA Solar, to build a 400MW
solar cell plant at RM300 million (Osborne, 2015) and Jinko Solar’s inauguration
of its 500MW solar cell and 450MW solar module fab in Penang (Jinko Solar,
2015). These facilities seemed to be established as a solution to the US’s anti-
dumping duties that are imposed on certain China-made PV products (Energy
Trend, 2015).
The Malaysian industrial eco-system, especially intellectual property (IP)
protection and well-established semiconductor and supporting industries, has
help to attract world major solar PV producers to set up their overseas production
facilities in Malaysia. JASolar, for instance, was pleased to be able to support
Malaysia's objectives of growing the renewable energy industry (BERNAMA,
2015b). It invested in Penang because of the strategic location, good
infrastructure, highly skilled workforce and the support from state and federal
authorities (Mok, 2015). Furthermore, locating in Malaysia is part of its long-
term strategy of moving some of its manufacturing sites to outside China in order
to reduce geographical risk, and to be able to adjust to politics and policies around
the world (The Edge Market, 2015). As for JinkoSolar, Malaysia was chosen due
to its offering of a pool of highly educated workers, advanced industry
infrastructure, a receptive business investment climate and cost-competitive
environment, and also to avoid single production base risks (Jinko Solar, 2015).
ISSUES ON RENEWABLE ENERGY AND TRADE DISPUTES
It was reported that the challenges faced by the Malaysian solar industry include
limited local market size, human capital development, the need for more
investments from public and private entities as well as the increasing global
market competition (BERNAMA, 2014). In addition, the solar PV panels
manufacturing involves high energy consumption and the use of chemicals which
are harmful to the environment (Ismail, 2015). Environmental Impact
Assessment Report 2013 on First Solar’s maintenance activity of the
semiconductor deposition equipment in Kulim facility has recorded cadmium
(Cd) in excess of the 5 μg/m3 limit.

PLANNING MALAYSIA
Journal of the Malaysia Institute of Planners (2017)
© 2017 by MIP 61
Globally, the emergence of more solar panel production countries has
resulted in an increasingly globalized supply chain and higher frequency of RE
trade disputes (Lewis, 2014). In 2012, the U.S. implemented anti-dumping duties
which was applicable to Chinese solar cells used for panel manufacturing.
However, many Chinese solar manufacturers produce panels from cells produced
out of China especially Taiwan, while components of ingots and wafers are
manufactured in China. The U.S. ruled in January 2015 that solar PV imports
from China and Taiwan harmed American manufacturers, and imposed the anti-
dumping duties on China PV modules, and Taiwan-made solar cells as well. In
December 2015, the European Commission announced preliminary measures of
anti-circumvention duties and anti-subsidy duties on Chinese solar PV panels and
cells shipped from Taiwan and Malaysia to the European Union from 30 May
2016 onwards.
THE WAY FORWARD
Ahmad and Tahar (2014) suggest that availability of renewable resource and
feed-in tariff rate are the most important sub-criteria from economical aspect
while from technical aspect are the efficiency and maturity of technology. There
are vast investment opportunities in the green technology industry. As of June
2011, the total investment in Malaysia solar energy industry has hit RM15.8
billion and generated some 14,300 jobs (Kaur, 2011). Among these investments
were by Comtec Solar, JA Solar, Jinko Solar and Xinyi Solar, all from China.
This is timely and in line with the aim of Malaysia to become number two in the
global solar PV manufacturing by 2020, second only to China. With its existing
supporting industries and the complementary development, this solar project will
contribute to the overall ecosystem for the PV industry and further enhance
Malaysia competitiveness as the next major player in the PV industry.
Nevertheless, new investments, such as Jinko Solar must produce solar cells in
the facility in Malaysia without sourcing its primary input from China/Taiwan at
subsidized prices. Malaysia does not want to be used as a transhipment point for
China and Taiwan solar cells and panels to enter major markets such as the United
States and the European Union.

Hui Nee Au Yong, & Kock Lim Tan
Renewable Energy and Trade Disputes: Implications on Solar Photovoltaic Manufacturing in Malaysia
© 2017 by MIP 62
Figure 2 Aiming to Become No. 2 in Solar Manufacturing by 2020
Source: The Green Mechanics
CONCLUSION It is unfortunate that the future RE trade disputes is unknown. As countries
develop RE support programs, questions remain on industrial policies that
possibly constitute a conflict with trade rules. When RE is subsidized, there are
inherent conflicts with international trade rules. As a result, the utilization of RE
technologies as an important part of climate change solution, and increasing trade
tensions, will add to both the economic and political costs of deployment. Thus
far, Malaysia has successfully maintained as international and reputed solar
manufacturers. The country has benefited from the US-China trade disputes
which have caused China and Taiwan solar producers transferring their
manufacturing outside China (and to Malaysia) to avoid the anti-dumping
measures imposed by the US. Additionally, the inking of the Trans-Pacific
Partnership Agreement (TPPA) and negotiation of Regional Comprehensive
Economic Partnership (RCEP), Malaysia could be a beneficiary of the complex
interaction of global trade rules, economic competitiveness and environmental
policies in the production of solar PV, where tariffs have the most immediate
effect. Malaysia, with its proactive government policies, control, price regulation
and right manufacturing ecosystem, is all set to become the second-largest solar
manufacturer in the world.

PLANNING MALAYSIA
Journal of the Malaysia Institute of Planners (2017)
© 2017 by MIP 63
REFERENCES Ahmad, S. & Tahar, R. M. (2014). Selection of renewable energy sources for sustainable
development of electricity generation system using analytic hierarchy process: a
case of Malaysia. Renewable Energy, 63, 458-466.
BERNAMA (2009, December 17). Malaysia announces conditional 40 percent cut in
emissions. BERNAMA. Retrieved from http://www.bernama.com/bernama/
v8/newsindex.php?id=463031
BERNAMA (2014, November 7). The Malaysian solar PV roadmap 2030 to spur solar
industry development and capacity building. BERNAMA. Retrieved from
http://www.bernama.com/bernama/ v8/newsindex.php?id=1083038
BERNAMA (2015a, October 6). Malaysia set to record over 2,000 megawatts of RE by
2020. BERNAMA. Retrieved from http://www.bernama.com/bernama/
v8/newsindex.php?id=1177284
BERNAMA (2015b, October 22). JA Solar to increase exports to US, emerging markets.
BERNAMA. Retrieved from http://www.bernama.com/bernama/
v8/bu/newsbusiness.php?id=1182003
DeLaTour, A., Glachant, M., & Meniere, Y. (2011). Innovation and international
technology transfer: The case of the Chinese photovoltaic industry. Energy
Policy, 39(2), 761-770.
Economic Planning Unit (2006). Ninth Malaysia Plan 2006–2010. Putrajaya, Malaysia:
EPU.
Economic Planning Unit (2015). Eleventh Malaysia Plan 2011–2015. Putrajaya,
Malaysia: EPU.
Energy Trend (2015, October 20). JA Solar’s Malaysian PV cell plant to become
operational. Energy Trend. Retrieved from http://pv.energytrend.com/news/
JASolar_s_Malaysian_PV_Cell_Plant_to_Become_Operational.html
Goodrich, A. C., Powell, D. M., James, T. L., Woodhouse, M., & Buonassisi, T. (2013).
Assessing the drivers of regional trends in solar photovoltaic manufacturing.
Energy and Environmental Science, 6(10), 2811-2821.
Green Tech Malaysia (n.d). Green Technology Financing Scheme (GTFS). Retrieved
from https://www.gtfs.my/
Hosseini, S. E., & Wahid, M. A. (2014). The role of renewable and sustainable energy in
the energy mix of Malaysia: a review. International Journal of Energy Research,
38(14), 1769-1992.
Ismail, A. M., Ramirez-Iniguez, R., Asif, M., Munir, A. B., & Muhammad-Sukki, F.
(2015). Progress of solar PV in ASEAN countries: a review. Renewable and
Sustainable Energy Reviews, 48, 399–412.
Jinko Solar (2015, May 26). JinkoSolar inaugurates its first overseas solar cell and solar
module fab in Penang, Malaysia. Retrieved from http://jinkosolar.com/
us/press_post/jinkosolar-inaugurates-its-first-overseas-solar-cell-and-solar-
module-fab-in-penang-malaysia/
Kaur, S. (2011, October 4). Senai Hi-Tech Parks sets to attract more solar players. New
Straits Times. Retrieved from https://www.pressreader.com/malaysia/new-
straits-times/20160627/282741996119378
KeTTHA [Ministry of Energy, Green Technology & Water] (2012). National green
technology policy and its implementation challenges.

Hui Nee Au Yong, & Kock Lim Tan
Renewable Energy and Trade Disputes: Implications on Solar Photovoltaic Manufacturing in Malaysia
© 2017 by MIP 64
KeTTHA (2008). National reewable energy policy and action plan.
Lewis, J. I. (2014). The rise of renewable energy protectionism: emerging trade conflicts
and implications for low carbon development. Global Environmental Politics,
14(4), 10-35.
MIDA (2015). Incentives in green technology industry. Retrieved from
http://www.mida.gov.my
Mok, O. (2015, October 21). Leading Chinese solar cell maker launches RM300m facility
in Penang. Malay Mail Online. Retrieved from
http://www.themalaymailonline.com /money/article/leading-chinese-solar-cell-
maker-launches-rm300m-facility-in-penang
NewsBase (2015, October 3), China's new solar silk road. NewsBase. Retrieved from
http://newsbase.com/commentary/china%E2%80%99s-new-solar-silk-road
Osborne, M. (2015, May 18). JA Solar building 400MW solar cell plant in Malaysia. PV-
Tech. Retrieved from https://www.pv-tech.org/news/ja_solar_building_400mw
_solar_cell_plant_in_malaysia_forms_jv_in_india
Platzer, M. D. (2012). U.S. solar photovoltaic manufacturing: industry trends, global
competition, federal support. CRS Report for Congress. Sawhney, A., & Kahn, M. E. (2011). Understanding cross-national trends in high-tech
renewable power equipment exports to the United States. NBER Working Paper
17217.
SEDA (2012). Annual report 2012.
The Edge Market (2015) JA Solar to begin exporting solar cells from Malaysia next
month. 21 Oct. 2015
The Star Online (2013, June 17). Bank offering loans to buy solar panels. The Star Online.
Retrieved from http://www.thestar.com.my/ news/nation/2013/06/17/bank-
offering-loans-to-buy-solar-panels/

1Associate Professor at International Islamic University Malaysia. Email: [email protected] 65
PLANNING MALAYSIA:
Journal of the Malaysian Institute of Planners
VOLUME 15 ISSUE 1 (2017), Page 65 - 80
FEEDER MODE CHOICE SELECTION BEHAVIOURAL
MODELLING: THE CASE OF KTM KOMUTER, KUALA LUMPUR
Syahriah Bachok1, & Siti Hajar Madina Mohd Zin2
1,2Kulliyyah of Architecture and Environmental Design
INTERNATIONAL ISLAMIC UNIVERSITY MALAYSIA
Abstract
Transit oriented development propagates the use of feeder services such as buses,
taxis and paratransit to support the main rail trunks (Taylor, 1982; Limtanakool
et.al, 2006; Alshalalfah & Shalaby, 2007). This paper attempts at explaining the
preferences of passengers of a Malaysian rail service towards feeder buses,
factors influencing their choices and recommendations to encourage the KTM
Komuter passengers to switch mode to feeder services instead of driving their
private vehicles to and from stations. Using on-board intercept survey method,
some results of 200 samples were analysed for the research. Findings showed that
76% of the passengers did not prefer to use the feeder. As such, the chi-square
analysis did not find any socio-demographic factors such as gender, income, level
of study, employment types, to be significant in explaining this mode switching
behaviour. Some trip characteristics such as vehicle ownership, frequency and
length of using the KTM Komuter service also did not significantly influence the
passengers' preference in using the feeder bus service. Other factors were then
examined, including stations’ characteristics, users’ access and egress
behaviours, travel time and distance. Therefore, in order to encourage the KTM
Komuter users in using the feeder bus service, several recommendations such as
providing an efficient, reliable frequency and catchment areas of feeder bus
services were made.
Keywords: Feeder bus, KTM Komuter, public transportation, multimodal
transportation system, integrated public transportation.
Date Received: 30th April 2016
Date of Acceptance: 30th October 2016

Syahriah Bachok, & Siti Hajar Madina Mohd Zin
Feeder Mode Choice Selection Behavioural Modelling: The Case of KTM Komuter, Kuala Lumpur
© 2017 by MIP 66
INTRODUCTION
This paper revolves around the assessment of preference for bus feeder services.
Feeder service is important for any public transport system to work effectively
because integration between several different modes of transportation can
contribute to a more efficient and highly patronage public transport services. For
instance, feeder bus services can pick passengers up in certain areas to transfer
points where passengers make an onward journey through other public transport
services such as other public buses, trains, trams, rapid transit or even paratransit
such as taxis or walking. Feeder buses usually acts as a connector within a locality
or regional area. Therefore, its importance as a networking link in promoting the
integration of public transportation is crucial. In addition, it promotes a better
development that encourages sustainable development such as the transit-
oriented development.
Prior to National Key Results Area initiatives (NKRAs) development
programme in the year 2013, Malaysian urban rail networks have limited support
facilities including park and ride systems as well as feeder services (PEMANDU,
2011). KTM Komuter is a provider of services in the Klang Valley and its
surrounding city region hinterlands. The hinterlands spread as far as Seremban
district in Negeri Sembilan, a state located southern of Kuala Lumpur; as well as
Tanjung Malim in southern Perak district, a state northern of Kuala Lumpur. By
2013, the heavy rail system started to receive a huge investment injection from
the government so as to increase the patronage in view of achieiving a more
favourable modal split of 40:60. However, until 2013, only seventeen of KTM
Komuter’s 53 stations were offering the feeder bus services.
Hence, the feeder bus was still not commonly used as a mode of transport
to KTM Komuter stations, neither as access nor egress vehicle. Amongst the
problems faced by the KTM Komuter passengers regarding the use of feeder bus
service were the unreliability of the service especially in terms of frequency and
routes, the lack of provision of feeder bus service at KTM Komuter stations and
the lack of partnership between the KTM Komuter authority with feeder bus
service providers. Therefore, finding and developing a simplistic model to
provide behavioural variations in feeder bus selection as an access and egress
mode is the aim of this research paper. The two objectives are then formulated to
be: i) to assess the parameters that significantly explain the mode choice selection
among rail users and ii) to recommend areas in which feeder services can be
improved from the rail passengers’ perspectives.

PLANNING MALAYSIA
Journal of the Malaysia Institute of Planners (2017)
© 2017 by MIP 67
LITERATURE REVIEW
The Significance and Function of Feeder Bus in the Bus Service Industry
The function of feeder bus in the bus industry is more focused on door to door
connection for instance using a feeder bus from the origin such as residential area
to the transit point such as the rail-transit network (Chien & Schonfeld, 1998). In
addition, Ceder and Yim (2003) stated that, “Advanced and attractive
feeder/shuttle transit system that operates reliably and relatively rapidly, part of
the passenger door-to door chain with smooth and synchronized transfers."
Which means, a feeder bus services provide the users the ability to move from
door to door which can be interpreted as from the door of one mode of transport
to another mode of transport easily without the need to walk for because the
transports are efficiently connected.
Moreover, the use of private vehicles such as motorcycles and cars which
causes problems such as congestion or environmental pollution can be reduced,
and at the same time does not require the people to exert extra energy to walk far
as there is feeder bus service they can use to bring them to their nearest transit
points (Kuah & Perl, 1988). However, the feeder bus system too has its own
disadvantages such as in terms of feeder bus planning, if there is insufficient
analysis on the feeder bus users or a particular planning for feeder bus system is
not being carried out, the success of an efficient and reliable feeder bus system
cannot be implemented.
The KTM Komuter Feeder Bus Service
The KTM Komuter is a rail service provider under the subsidiary of the Keretapi
Tanah Melayu Berhad (KTMB), the oldest rail service provider in Malaysia.
KTM Komuter was the first electric train introduced in Malaysia which started
its services in 1995 (KTM Komuter, 2010).
Only some KTM Komuter stations have bus services offered as part of
the supporting facilities namely;
▪ Bandar Tasik Selatan
▪ Batu Caves
▪ Batu Kentomen
▪ Kg Batu
▪ Klang
▪ KL Sentral
▪ Kuala Lumpur
▪ Labu
▪ Nilai
▪ Padang Jawa
▪ UKM
▪ Sungai Gadut
▪ Taman Wahyu
▪ Shah Alam
▪ Subang Jaya
▪ Seremban
▪ Serdang Source: Keretapi Tanah
Melayu Berhad (2013)

Syahriah Bachok, & Siti Hajar Madina Mohd Zin
Feeder Mode Choice Selection Behavioural Modelling: The Case of KTM Komuter, Kuala Lumpur
© 2017 by MIP 68
FACTORS INFLUENCING THE USE OF FEEDER BUS
Literature review has identified various factors influencing the use of feeder
buses. The bulk of literature has focused on users’ socio-demographic
characteristics as determinants of mode choice behaviours. Conclusive research
on public transport facilities provision and trip characteristics (access or egress
behavior) that might influence passengers’ choices has been however, lacking.
Table 1 outlines the contemporary literature that have been conclusively
modelled the behavioural choices of feeder bus services as an alternative access
and egress mode to and from the stations.
Table 1 A Summary of Literature Review of Factors Influencing the Use of Feeder Bus
Variables Authors Contents
Gender Zahabi, Miranda-Morena,
Patterson & Barla (2012); Xie
(2012); Besser & Denneberg
(2005)
Agreed that gender as a part of
socio-economic characteristics
has its share in influencing the
preferences of people to use
the bus
Origin and
destination
Public-Private Infrastructure
Advisory Facility [PPIF], The
World Bank (2013)
Have stated several reasons
why the origin and destination
of people that use the transit
affect the use of feeder bus.
Distance Martin & Shaheen (2011);
Elhabiby, Fikry, Mahdi, Kandi
(2013); Lomax & Schrank
(2010); Bachok et. al. (2012)
Have agreed that the travel
time from people's origins and
destinations do have an
influence on people's
preferences in choosing public
bus as mode of transport.
Vehicle
ownership
Bar-Yosef, Martens &
Benenson (2013)
The captive riders - students,
low income people, disabled
people - are neither capable of
using their own private
vehicles or could not afford to
own their own vehicles
depends on buses to travel to
the point of not caring if the
waiting time for the buses is
long.
Education Bouf (2007); Glaeser, Kahn,
Rappaport (2008); Soltani &
Ivaki (2011)
Level of education does
influence preference of using
bus service.

PLANNING MALAYSIA
Journal of the Malaysia Institute of Planners (2017)
© 2017 by MIP 69
Occupation Taylor et al. (2009); Chow et
al, (2002); Gomez-Ibanez
(1996); McLeod et al (1991);
Kain (1964); Black (1995)
Giuliano (2005).
Per capita income and
employment levels are the
leading economic
characteristics related to
ridership
Trip
characteristics
and
origin/destination
waiting facilities
Taylor (1982); Limtanakool et.
al. (2006); Alshalalfah &
Shalaby (2007)
Travel time, access distance to
transit station, trip
characteristics and purposes
influenced the mode choices.
STUDY METHODOLOGY
Data Collection
The primary data used for this research are based on the on-board intercept
surveys, observation and interviews while the secondary data are obtained from
the websites of the KTM Komuter authority itself. For the on-board survey, a
sample of 400 respondents had been approached from the total population of
approximately 95,000 people which was the average number of people using the
KTM Komuter service daily (KTM Komuter, 2010). However, after data input
and cleaning, only 200 samples were deemed useful for analysis purpose.
Statistical Analysis
Both descriptive and inferential analyses have been carried out. Inferential
analysis has been limited to cross-tabulation and chi-square test, prior to the
attempt at developing a simplified model using linear regression analysis.
Dependent variable (FEEDER PREFERENCE) has been tested against various
(independent) socio-demographic factors, trip characteristics and rail stations’
support facilities.
ANALYSIS AND FINDINGS
Descriptive Analysis (n = 200)
The survey of n = 200 samples consisted of 52.5% female (105) and 47.5% male
(95). Most respondents have access to a vehicle, either a car or a motorcycle
(Figure 1).

Syahriah Bachok, & Siti Hajar Madina Mohd Zin
Feeder Mode Choice Selection Behavioural Modelling: The Case of KTM Komuter, Kuala Lumpur
© 2017 by MIP 70
Figure 1 Respondents' Vehicle Ownership
Monthly income has been categorised to reflect the domestic definitions
of income levels. Low income reflected those earning less than RM2,000,
medium being between RM2,000 and RM4,000. Finally, high income
represented those earning more than RM4,000. The lower income dominated the
respondent income group at 82% (Figure 2).
Figure 2 Respondents' Income Distribution
The majority (39.5%) of the respondents were College Diploma holders
(Figure 3).
23
11.5
31.534
0
5
10
15
20
25
30
35
40
Does not own any
of both
Owns at least one
motor
Owns at least one
car
Owns both motor
and car
%
82
14.5
3.5
0
10
20
30
40
50
60
70
80
90
Low Income Medium Income High Income
%

PLANNING MALAYSIA
Journal of the Malaysia Institute of Planners (2017)
© 2017 by MIP 71
Figure 3 Respondents' Level of Education
Meanwhile, student community formed highest percentage (26%),
providing a popular employment type. The routes that KTM Komuter ply through
have been the educational and institutional catchment areas.
Trip characteristics of respondents are presented in the following figures.
The highest percentage (49%) of the regularity of using the KTM Komuter
service was less than 10 times a month (Figure 4). Meanwhile, most of the
respondents (63%) had only used the KTM Komuter service between one to five
years (Figure 5).
Figure 4 Annual Rail Trip Frequency
27.5
39.5
28.5
4.5
0
5
10
15
20
25
30
35
40
45
School CollegeDip Degree Postgrad
%
49.50
38.00
12.50
0
10
20
30
40
50
60
Less than 10 times a
month
10 to 20 times a month More than 20 times
%

Syahriah Bachok, & Siti Hajar Madina Mohd Zin
Feeder Mode Choice Selection Behavioural Modelling: The Case of KTM Komuter, Kuala Lumpur
© 2017 by MIP 72
Figure 5 Length of Rail Usage
Origin station with the highest number of people coming from was KL
Sentral at 12%. Similarly, people heading to KL Sentral as destination was also
the highest (11.5%). Meanwhile, Klang (6.5%) was the second most popular
destination.
The highest proportion (27%) of respondents has at least 10 minutes of
rail travel time. Frequency of people travelling a shorter travel time was much
higher than people travelling longer time. Stated preference revealed that feeder
buses were not preferred as an access and egress mode (76% of respondents,
Table 3).
Table 3 Feeder Service Preference by Respondents (N = 200)
Frequency Percent
No 152 76.5
Yes 48 23.5
Total 200 100.0
STATISTICAL ANALYSIS
Socio-demographic characteristics have been tested using chi-square test. These
factors were gender, monthly household income, level of education and type of
employment. Rail services usage variables such as frequency/regularity and
familiarity were also tested. Neither the preference was determined by the
frequency of usage in year nor was it influenced by the usage duration based on
the year of the first ride. None of these factors were found significant in
influencing feeder services selection.
15
65
15.5
4.5
0
10
20
30
40
50
60
70
Less than 1 year 1 to 5 years 6 to 10 years More than 10 years
%

PLANNING MALAYSIA
Journal of the Malaysia Institute of Planners (2017)
© 2017 by MIP 73
Table 4 Chi-Square Test and Results for Selected Socio-Demographic and Trip
Characteristics Parameter Pearson Chi-
square Value
df Asymptotic
Significance
(2-sided)
Significant at
* 95%,
**99% levels
# insignificant
Gender .196 1 .658 #
Monthly income 4.797 2 .091 #
Level of education 2.842 3 .417 #
Type of employment .861 2 .650 #
Vehicle ownership .509 3 .917 #
Usage frequency 2.452 2 .293 #
Usage familiarity 5.496 3 .139 #
One possible explanation could be the small sample size (n = 200), to be
dispersed across multiple categories (column) of independent variables. Feeder
preference was quite low (24%), due to various reasons which could only be
explained by a more qualitative research, which is not within the ambit of this
paper.
An alternative to such analysis, is to combine or collapse the independent
variable categories into smaller number, hence reducing the degree of freedom.
The Tables below, provide the cross tabulation of feeder services by the
other variables to be analysed using chi-square test. Factors or parameters tested
included categories of access and egress modes to and from station, distance
(number) of station between origin and destination, availability of parking and
feeder services at either origin or destination stations respectively, and whether
respondents have driven and parked at the stations of origin or destination,
respectively as well as collapsed travel time categories.
Table 5 Feeder Service Preference by Categories of Access Mode to Station
Feeder preference
Categories of access mode to stations Total
Private mode Public mode
No 74 78 152
Yes 4 44 48
Total 78 122 200

Syahriah Bachok, & Siti Hajar Madina Mohd Zin
Feeder Mode Choice Selection Behavioural Modelling: The Case of KTM Komuter, Kuala Lumpur
© 2017 by MIP 74
Table 6 Feeder Service Preference by Categories of Egress Mode from the Station
Feeder preference
Categories of access mode to stations Total
Private mode Public mode
No 72 80 152
Yes 9 39 48
Total 81 119 200
Table 7 Feeder Service Preference by Categories of Station Numbers between Origin
and Destination Stations
Feeder preference
Station Distance Total
Below 10 stations 10 stations and above
No 84 68 152
Yes 17 31 48
Total 101 99 200
Table 8 Feeder Service Preference by Origin Stations with Feeder Service
Feeder preference
Feeder Available
Total No Yes
No 106 46 152
Yes 32 16 48
Total 138 62 200
Table 9 Feeder Service Preference by Destination Stations with Feeder Service
Feeder preference
Feeder Available
Total No Yes
No 109 43 152
Yes 33 15 48
Total 142 58 200
Table 10 Feeder Service Preference by Origin Stations with Parking Facilities
Feeder preference
Parking Available
Total No Yes
No 20 132 152
Yes 5 43 48
Total 25 175 200

PLANNING MALAYSIA
Journal of the Malaysia Institute of Planners (2017)
© 2017 by MIP 75
Table 11 Feeder Service Preference by Destination Stations with Parking Facilities
Feeder preference
Parking Available
Total No Yes
No 17 135 152
Yes 5 43 48
Total 22 178 200
Table 12 Feeder Service Preference by Having Driven to Origin or from Destination
Stations
Feeder preference
Drove to or from stations
Total No Yes
No 117 35 152
Yes 41 7 48
Total 158 42 200
Table 13 Feeder Service Preference by Having Parked at Origin or Destination Stations
Feeder preference
Parked at either stations
Total No Yes
No 108 44 152
Yes 43 5 48
Total 151 49 200
Table 14 Feeder Service Preference by Travel Time Ranges
Feeder preference
Travel time categories
Total
Below One
Hour One Hour or More
No 142 10 152
Yes 42 6 48
Total 184 16 200
Tests have shown (Table 15) that feeder services preference was
dependent on various factors including the type of mode used for access and
egress to the stations of origin and destination respectively (significant at 99%
C.L.).
Moreover, feeder preference was influenced by distance or number of
stations between the origin and destination stations and whether respondents have
parked their access or egress mode at either the origin or destination stations
(significant at 95% C.L.).

Syahriah Bachok, & Siti Hajar Madina Mohd Zin
Feeder Mode Choice Selection Behavioural Modelling: The Case of KTM Komuter, Kuala Lumpur
© 2017 by MIP 76
However, feeder preference has also been influenced by availability of
parking facilities and feeder services at either origin and destination stations or
driven to and from stations of origin and destination, respectively. Similarly,
feeder preference was not determined by travel time, or the duration of travelling
exclusively by rail.
Table 15 Chi-Square Tests Analysis and Results for Selected Parameters
Parameter Pearson Chi-
square Value
df Asymptotic
Significance
(2-sided)
Symmetric
measures
(Phi, Cramer’s
V, contingency
efficient)
Approximate
Significance
Significant at
* 95%,
**99% levels
# insignificant
Type of access
modes
24.967 1 .000 .353, .353, .333 .000 **
Type of egress
modes
12.399 1 .000 .249, .249, .242 .000 **
Distance
between Origin
and Destination
Stations
5.748 1 .017 .170, .170, .167 .017 *
Available
parking at origin
(O) station
.251 1 .617 .035, .035, .035 .617 #
Available feeder
bus at origin (O)
station
.161 1 .688 .028, .028, .028 .688 #
Available
parking at
destination (D)
station
.022 1 .882 .010, .010, .010 .882 #
Available feeder
bus at
destination (D)
station
.155 1 .694 .028, .028, .028 .694 #
Drove to or from
OD stations
1.567 1 .211 -.089, .089, .088 .211 #
Parked at either
OD stations
6.772 1 .009 -.184, .184, .181 .009 **
Travel time
ranges
1.738 1 .187 .093, .093, .093 .187 #
Non-significant testing was validated with a regression analysis, to
develop a simple model of feeder preferences.

PLANNING MALAYSIA
Journal of the Malaysia Institute of Planners (2017)
© 2017 by MIP 77
Table 16 Regression Model for Feeder Preference by Distance (Number of Stations)
Between Origin and Destination
Model R R Square Adjusted R
Square Std. Error of the Estimate
1 .041a .002 -.003 .429
a. Predictors: (Constant), DISTANCEOD
Table 17 Regression Coefficientsa
Model
Unstandardized
Coefficients
Standardized
Coefficients t Sig.
B Std. Error Beta
1 (Constant) 1.208 .064 18.956 .000
DISTANC
EOD .003 .006 .041 .579 .563
a. Dependent Variable: FEE
Selection for regression analysis was based on the significant results for
chi-square analysis. However, parameters of ratio data such as travel distance (p-
value 0.563) and trip frequency (p-value 0.980) made by rail were not found to
be significantly contributing to the development of models for feeder preferences.
Table 18 Regression Model for Feeder Preference by Trip Frequency
Model R R
Square
Adjusted R
Square Std. Error of the Estimate
1 .002a .000 -.005 .429
a. Predictors: (Constant), REG2
Table 19 Regression Coefficientsa
Model
Unstandardized
Coefficients
Standardized
Coefficients t Sig.
B Std. Error Beta
1 (Constant) 1.241 .048 26.036 .000
REG2 -
7.574E-
5
.003 -.002 -.025 .980

Syahriah Bachok, & Siti Hajar Madina Mohd Zin
Feeder Mode Choice Selection Behavioural Modelling: The Case of KTM Komuter, Kuala Lumpur
© 2017 by MIP 78
FINDINGS
The empirical analysis indicates that not many passengers (23%) were using the
feeder bus services. This was probably because most of the respondents were not
regular commuters as most of them were only using the KTM Komuter services
not more than 10 times annually. Moreover, more than half of the respondents
were using the KTM Komuter service either for the first time and/or less than five
years.
The statistical analysis has shown that out of seventeen independent
variables tested, only four parameters were found by chi-square test to be
significantly influencing mode choice behaviours, namely feeder bus as an access
or egress mode for trunk rail service. Nevertheless, the chi-square results
corresponded with some of the conclusion made by selected studies researched
(Martin & Shaheen, 2011; Taylor, 1982; Limtanakool et. al, 2006; Alshalalfah &
Shalaby, 2007). These results therefore can be interpreted in both ways: i) that
feeder was not an attractive mode and ii) that returning to bus system was seen as
inferior to the current rail system that passengers were enjoying. It can be said
that lower demands for feeder bus service was due to the lower number of stations
providing this service (seventeen out of 53 stations only). Hence, other variables
needed to be examined so as to model the passengers’ modal choices.
Regression analysis failed to confirm the strength of the two ratio
parameters (number of stations between origin and destination, and travel
frequency) in developing a model for mode choice behaviour in this research
paper. As such, extended research should be focused on attaining more accurate
and precise ratio data for tests including travel time (minutes) and travel distance
(kilometre). Access and egress modes to stations, at this juncture were the two
variables, worth investigating as the ultimate determinant for mode choice
behavioural model for feeder services supporting trunk rail routes.
RECOMMENDATIONS
Based on the findings that there was a low demand, recommendations are focused
on improving the availability and quality of feeder bus services. Thus, these
recommendations have been forwarded to the KTM Komuter management team
so as to increase passengers’ patronage of feeder buses to their rail stations. They
are:
i. KTM Komuter should provide feeder bus services at all KTM Komuter
stations instead of providing the service at only the selected stations.
ii. KTM Komuter should establish partnership with feeder bus service
providers such as RapidKL (now Prasarana) or Metrobus with the
supervision of the Land Public Transport Commission (SPAD) and to
provide suitable routes at places with large catchment areas such as
residential and institution areas.

PLANNING MALAYSIA
Journal of the Malaysia Institute of Planners (2017)
© 2017 by MIP 79
iii. KTM Komuter should also provide suitable supporting facilities for the
feeder bus service such as comfortable and convenient waiting facilities,
proper bus stops, route maps, integrated scheduling and ticketing
between rail and feeder services.
iv. The Land Public Transport Commission (SPAD) should start providing
special lanes for buses only so that the bus services are the prioritised
traffic, since buses are usually stigmatised to be congested and
unattractive relative to other road vehicles.
CONCLUSION
In brief, this empirical study has proven that buses received less proportionate
demand as feeder vehicles. The lower demand could be attributable to buses being
inferior to rail and that only seventeen out of 53 rail stations of KTM Komuter
have been providing the feeder service. It was confirmed that access and egress
modes to stations determined the mode choice. Additionally, the number of
stations in between origin and destination as well as whether users’ had parked at
either origin or destination stations were significant in explaining this behaviour.
Therefore, KTM Komuter and related agencies may adopt the recommendations
made in this paper to encourage more people to use the feeder bus service. The
paper’s suggestion for feeder services improvements can also benefit other
researchers, academicians, transport planners, public transport service providers
of city region with characteristics similar to those of Klang Valley, Malaysia. REFERENCES Alshalalfah, B.W., & Shalaby, A.S. (2007). Case study: relationship of walk access
distance to transit with service, travel, and personal characteristics. Journal of
Urban Planning and Development, 133(2), 114-.
Bachok, S., Osman, M. M., Khalid, U. A., & Zainaldin, M. F. (2012). The application of
regression analysis on users’ tolerance to prolonged waiting time: the case of
KTM Komuter services of Malaysia. 13th International Conference on Design
and Operation in Railway Engineering 2012 (COMPRAIL 2012), New Forest,
UK.
Bar-Yosef, A., Martens, K., & Benenson, I. (2013). A model of the vicious cycle of a bus
line. Transportation Research Part B: Methodological, 54, 37-50.
Bouf, D., & Hensher, D. (2007). The dark side of making transit irresistible: the example
of France. France: Transport Policy, 14(6).
Ceder, A., & Yim, Y. (2003). Integrated smart feeder/shuttle bus service. California
PATH working paper UCB-ITS-PWP-2003-4.
Chien, S., & Schonfeld, P. (1998). Joint optimization of a rail transit line and its feeder
bus system. Journal of Advanced Transportation, 32(3), 253-284.
Elhabiby, M. M., Fikry, A. O., Mahdy, H. A., & Kandil, K. A. (2013). Influence of
unscheduled random public bus stops on transit travel time. Journal of Traffic
and Logistics Engineering, 1(1), 20-21.
Syahriah Bachok, & Siti Hajar Madina Mohd Zin
Feeder Mode Choice Selection Behavioural Modelling: The Case of KTM Komuter, Kuala Lumpur
© 2017 by MIP 80
Glaeser, E. L., Kahn, M. E., & Rappaport, J. (2008). Why do the poor live in cities? The
role of public transportation. Journal of Urban Economics, 63(1) , 10.
KTM Komuter (2010). KTM Komuter Station Facilities. Retrieved July 17, 2013, from
KTM Komuter Website: http://www.ktmkomuter.com.my/station_maps/
station.php#here
Kuah, G. K., & Perl, J. (1988). Optimization of feeder bus routes and bus-stop spacing.
Journal of Transportation Engineering, 114(3), 341-354.
Limtanakool, N., Dijst, M., Schwanen, T. et. al., (2006). The influence of socioeconomic
characteristics, land use and travel time considerations on mode choice for
medium- and longer-distance trips. Journal of Transport Geography, 14(5), 327-
341.
Lomax, T., & Schrank, D. (2010). Developing a total travel time performance measure a
concept paper for mobility measurement in urban transportation. Texas: Texas
Transportation Institute (TTI).
Martin, E., & Shaheen, S. (2011). The impact of carsharing on public transit and non-
motorized travel: an exploration of North American carsharing survey data.
Energies (4), 2096-2108.
Performance Management & Delivery Unit [PEMANDU]. (2011, March 18). St Regis
Development Entry-Point Project to Boost Tourism Space. Retrieved July 19,
2013, from Economic Transformation Programme (ETP):
http://etp.pemandu.gov.my/News-@-St_Regis_Development_Entry-
Point_Project_to_Boost_Tourism_Space.aspx
Soltani, A., & Ivaki, Y. I. (2011). Inequity in the Provision of Public Bus Service for
Socially Disadvantaged Groups. Journal of Sustainable Development, 4(5), 231-
233.

1 Lecturer at University of Sam Ratulangi Manado. Email: [email protected] 81
PLANNING MALAYSIA:
Journal of the Malaysian Institute of Planners
VOLUME 15 ISSUE 1 (2017), Page 81 - 88
REVITALIZATION OF CHINATOWN AREA AS SUSTAINABLE
URBAN HERITAGE IN THE CITY OF MANADO
Verry Lahamendu1, Judy O. Waani2, & Aristotulus E. Tungka3
1,2,3Faculty of Engineering
UNIVERSITY OF SAM RATULANGI MANADO
Abstract
China Village or Town is an urban region with Chinese as majority of the
community. The China Town is located at the old part of the city of Manado and
is well known as one of the oldest trade centres in Manado. As one of the urban
heritage in the city of Manado, the Chinatown has unique landmarks with temples
that are religious buildings for the Chinese community. With time, the quality of
the environment has degraded and the image of the Chinatown has become vague.
This paper investigates the existing condition of the town through site
observation. It then proposes several suggestions with regard to the revitalisation
of the Chinatown without discarding its existing function as a one of the trade
centres in Manado. It is hoped that the revitalisation of the town would improve
the quality of its urban environment that at the end would positively impact the
quality of life of its dwellers, and construct the image of the city as a whole.
Keywords: Revitalization, Chinatown, urban heritage, sustainable
Date Received: 30th April 2016
Date of Acceptance: 30th October 2016

VerryLahamendu, Judy O. Waani, & Aristotulus E. Tungka
Revitalization of China Town Area as Sustainable Urban Heritage in The City of Manado
© 2017 by MIP 82
INTRODUCTION
The development of a city cannot be separated from the presence of the old town
area. Old town within a city may be a positive asset to the city and acts as a
reference point Nur, 2010). One form of heritage which is also a tourism asset of
Manado City is the Chinatown (Pecinan, Kampung Cina or Chinese Village). The
Chinatown is located in the old city centre of Manado. It was one of the oldest
trading centres in the city, and today has become one of the tourist destinations
in Manado City. It is known by the name of Kampung Cina, because almost all
building owners here are of Chinese ethnicity. Bustling with activity and very
crowded every day, Kampung Cina still keeps a number of relatively old
buildings, and some of them are very old. The buildings are generally a legacy of
the Dutch colonial era and were used as shops (Silomba, 2013).
Figure 1 The City of Manado and the Old Town Area
Source: Site observation.
Manado City with traces of its history has the potential to be developed
as an urban heritage tourism. It has many attractions, both natural and artificial,
which are important assets of the city. This area is the centre of activity from the
very beginning that initiated the formation of the city. The appeal of the area
continues as the centre of trade and services has led it to become a melting pot of
business and trade people from various background and social status. However,
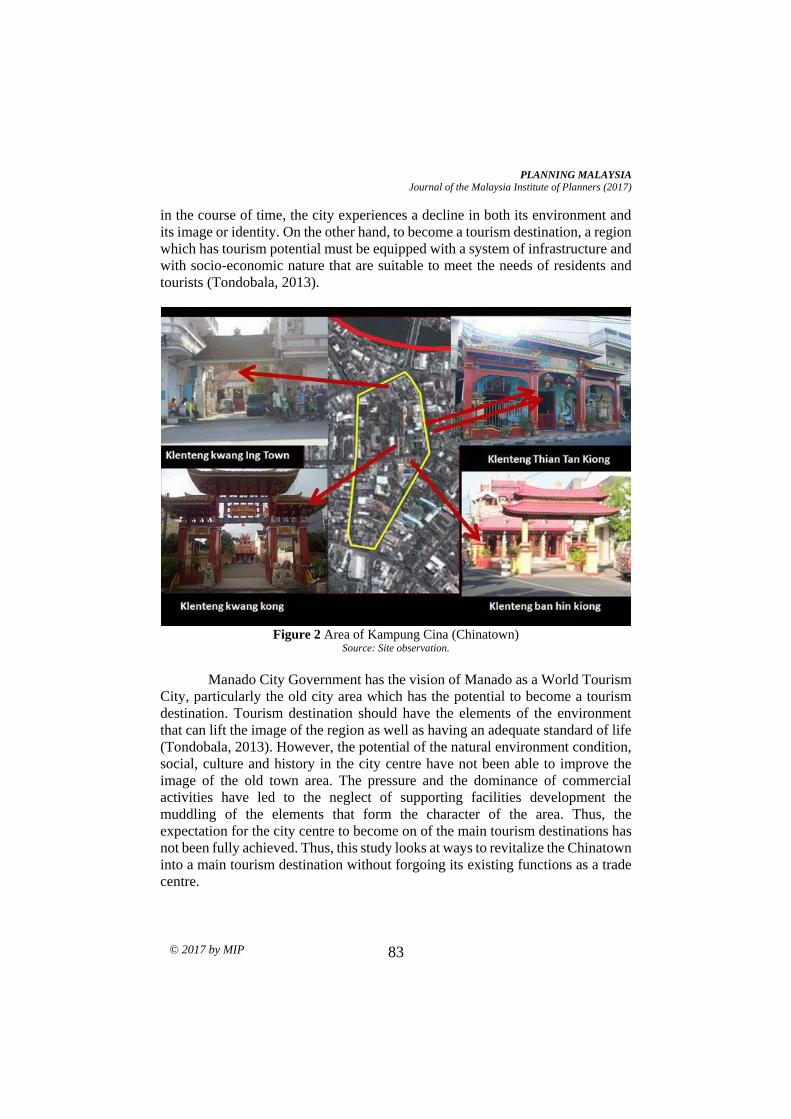
PLANNING MALAYSIA
Journal of the Malaysia Institute of Planners (2017)
© 2017 by MIP 83
in the course of time, the city experiences a decline in both its environment and
its image or identity. On the other hand, to become a tourism destination, a region
which has tourism potential must be equipped with a system of infrastructure and
with socio-economic nature that are suitable to meet the needs of residents and
tourists (Tondobala, 2013).
Figure 2 Area of Kampung Cina (Chinatown)
Source: Site observation.
Manado City Government has the vision of Manado as a World Tourism
City, particularly the old city area which has the potential to become a tourism
destination. Tourism destination should have the elements of the environment
that can lift the image of the region as well as having an adequate standard of life
(Tondobala, 2013). However, the potential of the natural environment condition,
social, culture and history in the city centre have not been able to improve the
image of the old town area. The pressure and the dominance of commercial
activities have led to the neglect of supporting facilities development the
muddling of the elements that form the character of the area. Thus, the
expectation for the city centre to become on of the main tourism destinations has
not been fully achieved. Thus, this study looks at ways to revitalize the Chinatown
into a main tourism destination without forgoing its existing functions as a trade
centre.

VerryLahamendu, Judy O. Waani, & Aristotulus E. Tungka
Revitalization of China Town Area as Sustainable Urban Heritage in The City of Manado
© 2017 by MIP 84
LITERATURE REVIEW The heritage or cultural heritage in the broad sense implies a legacy or historical
inheritance of cultural heritage objects. The word itself is often associated with a
legacy of something (value) that is derived or inherited (generation to generation)
and are transferred from one generation to the next. Given its role as a carrier of
past historical value, then the heritage is seen as an important part of the cultural
tradition of a society. One way of managing urban heritage in a professional and
sustainable is by undertaking revitalization.
Revitalization is an effort to restore the dynamics and to revive the
assisted environment, which is affected by various factors, such as social,
cultural, economic and political policies. Jefrizon and Rimadewi (2012) provide
an understanding of the revitalization as an attempt to revitalize an area or a part
of town that was once vital and alive, but then suffered a setback or degradation.
According to the Ministry of Public Works, revitalization is an attempt to revive
a dead region by redeveloping the area to rediscover their potential. Revitalization
is also expected to provide improved quality of the urban environment, which in
turn, improve the quality of life of its inhabitants (Jefrizon & Rimadewi, 2012).
RESEARCH METHODOLOGY
This study began with the identification of the context of the problem and goal
setting. Based on the objectives, methods were selected for data collection and
data analysis. Primary data were obtained through site observation while
secondary data were gathered from secondary sources including research articles,
maps, statistics and planning standards. Data were analysed in order to establish
the history of the area and to make comparisons.
DISCUSSION
The city, as a complex assisted environment, is always changing, and the changes
are believed to be somewhat normal and natural. The changes could be positive
towards the improvement of the quality of an environment, or it could be
otherwise. If a city is changing towards the decline, then it may not be feasible to
accommodate new activities or functions.
The existence of historical buildings, sites or monuments is the potential
for the development of cultural heritage tourism as an alternative to urban tourism
development (Hayati, 2014). The development of cultural heritage tourism in
urban area is ideal to be implemented because a city will not lose its local identity,
as well as providing an understanding and a sense of pride in the town's history
and culture of the local community.
Revitalization is an attempt to revive an area to its former glory but under
the present atmosphere, requirements or needs. The revitalization of an area is
based on the principles that empower or improve the vitality of the region that
was declining or degraded over time. In relation to the Chinatown (Kampung

PLANNING MALAYSIA
Journal of the Malaysia Institute of Planners (2017)
© 2017 by MIP 85
Cina) in Manado City Centre, elements that have the potential to be revitalized
are both the non-physical and the physical elements of the area. Dependencies
between elements are very important. Physical elements would be valuable if it
can provide added value to the economic and socio-cultural activities of the area.
In other words, if the physical elements are well contained by non-physical
element, they can provide attraction for visitors. A physical element will
deteriorate if it is not used by the presence of non-physical elements. Non-
physical element will be lost if its meaning is not understood by the public
(Tondobala, 2013).
Revitalization of Physical Building and Environment
Based on the comparison between the building and the street (streetscape), the
streets in Chinatown were lined with shops of varied conditions. The present
layout of the shops does not provide adequate space for greenscapes and parking
space for vehicles. Lack of parking space has resulted in the streets being
congested most of the time. In terms of the buildings, in overall the buildings are
still in good condition structurally, but they look ‘old’ and only minimum
maintenance was conducted by the owners. The position of the buildings which
are on lower platform level as compared to the streets’ has resulted in the
buildings being often submerged in water during the rainy season. Some of the
gutters are damaged and sidewalks are often used by street vendors to peddle their
merchandise. These make the area look disorganized and shabby.
Figure 3 Physical Condition of Building and Environment at Kampung Cina
Source: Site observation.

VerryLahamendu, Judy O. Waani, & Aristotulus E. Tungka
Revitalization of China Town Area as Sustainable Urban Heritage in The City of Manado
© 2017 by MIP 86
Some of the buildings in Chinatown, including the temples, portray
Chinese architectural style. However, the buildings are in need of repairs and the
area is in need of upgrades. Improvement and upgrades are required in terms of
the building condition, green spaces, road connection system, signs and
billboards, and open space. Besides the Chinese-style building, the area also has
several buildings with colonial architecture. This is not inseparable from the
Dutch colonial rule that at the time makes the Old Town Centre as the centre of
residency government administration (Wulur, Kumurur & Kaunang, 2013).
Buildings of colonial-style architecture in the Chinatown area help shaped values
of locality in architectural form for the city of Manado. However, these buildings
are slowly began to disappear. Thus, revitalization of the area need to include a
clear benefit and contribution for the establishment of the community; not only
for the present but also for the future.
Economic Revitalization
The Chinatown was the embryo of the economy of Manado City in colonial times.
The ethnic Chinese were involved in mediating trade negotiations between the
Dutch government and the natives. Although no longer an economic hotspot
presently, the Chinatown has the potential as a tourism destination for the region
because it has a distinctive tradition of good food and celebrations. The
revitalization process of the area should begin with the rejuvenation of urban
artefacts, which in turn would support the process of rehabilitation of economic
activity. Chinatown short term physical improvements are expected to
accommodate formal and informal economic activities, so as to provide added
value to the city area. In the context of the revitalization is necessary to develop
a mix of functions that can encourage economic activities in the region.
Social Revitalization
In the old days, there was a harmonious relationship in the Chinatown between
the society and the surrounding environment, and life was calm and peaceful.
However, in the present day, life in the Chinatown is hectic because everybody
is busy involving themselves in the economic activities. The increase in
population of the area has made the area crowded. Focussing too much on the
economic activities has also made the people to ignore and forget local cultural
values and wisdoms. Thus, revitalisation of the Chinatown must also give
emphasis on the social aspect of the area. Culture and society can become
invaluable tourism assets for the area.

PLANNING MALAYSIA
Journal of the Malaysia Institute of Planners (2017)
© 2017 by MIP 87
CONCLUSION
Despite the fact the Chinatown has the assets to become a tourist destination for
the region, these has not being fully exploited. The historical buildings are
decaying, and the environment is congested and without adequate infrastructure
and greens. Thus, this paper proposes the area to be revitalized, not only in terms
of the physical aspect, but also the economic and social aspects. The revitalization
programme can be implemented as a cooperation between the Government and
the private sector to create job, encourage home industry, increase levy and
increase revenue from the region investors. Communities must also be involved
in the programme. For instance, religious organizations (since there are several
temples in the area) can play a role as a mediator or liaison between the
communities and the Government so that community participation can accelerate
the revitalization of the Kampung Cina in Manado. The revitalization of the area
into a cultural heritage in urban tourism is ideal because it will not lose its local
identity, as well as providing an understanding and a sense of pride in the town's
history and culture of the local community.
ACKNOWLEDGEMENTS
Our thanks to all those who have helped in this research especially Sam Ratulangi
University Rector, Dean of the Faculty of Engineering, Head of the Architecture
Department, Kaprodi PWK, fellow lecturers and students of Architecture / PWK.
Not to forget the support of the whole family and wife for their prayers and
assistance.

VerryLahamendu, Judy O. Waani, & Aristotulus E. Tungka
Revitalization of China Town Area as Sustainable Urban Heritage in The City of Manado
© 2017 by MIP 88
REFERENCES Hayati, R. (2014). Pemanfaatan bangunan bersejarah sebagai wisata warisan budaya di
Kota Makassar. JUMPA, 1(1), 1-42. Jefrizon, & Rimadewi, S. (2012). Arahan revitalisasi kawasan cagar budaya kota lama
siak. Jurnal Teknik Pomits, 1(1), 1-4.
Nur, K. W. (2010). Revitalisasi kawasan pecinan sebagai pusaka kota (urban heritage)
Makassar (Master’s thesis). Institut Teknologi Sepuluh Nopember, Surabaya,
Indonesia.
Silomba, D. (2013). Mengungkap perubahan arsitektur dan fungsi kawasan kota lama
Manado sejak abad 16 hingga tahun 2012. Jurnal Matrasain, 10, 50-63.
Tondobala, L. (2013). Kelayakan pusat Kota Manado sebagai destinasi pariwisata. Jurnal
Media Matrasain, 9(3), 82-103.
Wulur, A., Kumurur, V. A., & Kaunang, I. R. B. (2015). Gaya bangunan arsitektur
kolonial pada bangunan umum bersejarah di Kota Manado. Jurnal Sabua, 7(1),
371-382.

1Assistant Professor at International Islamic University Malaysia. Email: [email protected] 89
PLANNING MALAYSIA:
Journal of the Malaysian Institute of Planners
VOLUME 15 ISSUE 1 (2017), Page 89 - 108
COMMUNITY-BASED TOURISM IN MELAKA UNESCO WORLD
HERITAGE AREA: A SUCCESS IN FOOD AND BEVERAGE SECTOR?
Syakir Amir1, Mariana Mohamed Osman2, Syahriah Bachok3, Mansor Ibrahim4,
& Ismawi Zen5
1,2,3,4,5Kulliyyah of Architecture and Environmental Design
INTERNATIONAL ISLAMIC UNIVERSITY MALAYSIA
Abstract
Community-based Tourism (CBT) is a tool for local economic development due
to its capability and strength to provide economic sources to the resident
destination. Given its focus on benefiting the local community, CBT has attracted
a significant degree of academic attention. However, to date, there has been little
discussion and evidence based on comprehensive studies on local economic
benefits with regards to tourism activities in Malaysia as compared to other
regions. This study examined tourists’ expenditure on food and beverage, and its
contribution to the local economic in Melaka UNESCO World Heritage area. A
total of 1,000 diary record survey were collected. Chi-square Automatic
Interaction Detection (CHAID) was used to model interaction of domestic and
international tourists. The results revealed 22.1% of the tourists spent between
RM16.00-RM147.50 per trip for breakfast, lunch and dinner. However, only 9%
(breakfast), 34% (lunch) and 43% (dinner) were channelled to local economy.
Keywords: Tourists expenditure, food and beverage, Melaka UNESCO World
Heritage area
Date Received: 30th April 2016
Date of Acceptance: 30th October 2016

Syakir Amir, Mariana Mohamed Osman, Syahriah Bachok, Mansor Ibrahim, & Ismawi Zen Community-Based Tourism in Melaka UNESCO World Heritage Area: A Success in Food and Beverage Sector?
© 2017 by MIP 90
INTRODUCTION
Malaysia has been practising the community-based tourism (CBT) approach in
tourism development since the year 2000 until the present. The community-
beneficial policies and strategies were introduced in the Eighth Malaysia Plan for
the period of 2001-2005. The aspiration for community benefits was continued
in the Ninth Malaysia Plan (2006-2010) and Tenth Malaysia Plan (2011-2015).
The government has allocated around RM19 million to help generate income
among the local community members involved in the tourism industry (Ministry
of Tourism and Culture Malaysia, 2015). Community-based tourism programs
that were considered successful in generating an influx of tourists were homestay
programs in Kampung Bukit Bangkong, Kampung Hulu Chucoh and Kampung
Hulu Teris in Banghuris, Selangor (Fauziah Che Leh & Mohd Rezuan Hamzah,
2012). Many researchers have conducted studies on local participation in tourism
activities such as Zaaijer and Sara (1993), Brandon (1996), Wells, (1996), Aas,
Ladkin and Fletcher (2005), Jones (2005), Lepp (2007), and Lee (2012).
However, to date, limited study has been done to assess and validate the economic
benefits received by the local economy from the various tourism activities in an
area and therefore, this research is timely. Melaka UNESCO World Heritage area
was chosen as the study area as it has recorded the highest number of domestic
and international tourist visits in addition to being inscribed by United Nations
Educational, Scientific, and Cultural Organization (UNESCO) as a ‘World
Heritage Site’.
Tourism is an expenditure-driven economic activity (Mihalic, 2002), that
often a significant source of income in many countries (Mok & Iverson, 2000; Li,
Song & Witt, 2005; Song & Li, 2008). Tourists purchasing pattern is likely to
vary in several tourism activities namely in accommodation, entertainment,
shopping, food and beverage as well as transportation (Wang, Rompf, Severt &
Peerapatdit, 2006). Moreover, tourist expenditure in those tourism activities is
considered as one of the potential tools to improve the economy of local
communities (Beeton, 2006; Trejos & Chiang, 2009; Sutawa, 2012). Therefore,
tourism is believed to be able to generate income and enhance the economic
opportunities of the local community. However, more recently, literatures have
emerged that offer different findings, where benefits from tourism activities are
low to local economy (Crompton, Lee & Shuster, 2001; Tyrrell & Johnston, 2001;
Kasimati, 2003; Daniels, Norman & Henry, 2004). Therefore, community-based
tourism should be encouraged to improve the economic benefits received by the
local community in expanding their economic opportunities in the tourism
industry.
The aim of this paper is to examine the local economic benefits from the
food and beverage sector in Melaka UNESCO World Heritage area.

PLANNING MALAYSIA
Journal of the Malaysia Institute of Planners (2017)
© 2017 by MIP 91
LITERATURE REVIEW
Community-based Tourism
Community-based tourism (CBT) is a type of sustainable tourism where ‘people’
or ‘community’ is the focus of tourism development in a particular host
destination. Pearce and Moscardo (1999) believe that CBT can produce
successful practice and implementation process in developing and less developed
countries. This is supported by McCool, Moisey and Nickerson (2001), Davis
and Morais (2004), Roe, Ashley, Page and Meyer, (2004) where their studies
have observed the CBT in countries like Gambia, Uganda, Cambodia and Laos.
McMillan and Chavis (1986) define the term ‘community’ into three categories
(i) Ecological approach: the community living together and adapting to the
setting, a process that produces distinctive community characteristics. (ii) Social
approach: the roles and institutions that govern society, social relations and the
primacy of group membership. (iii) Interactive approach: social interactions of
individuals, people, organization occupying a restricted geographic area. As a
result, these categories portray multiple descriptions and classifications of the
term.
Kling and Posner (1990) have added the ‘community’ in ecological
approach, as a group of people that share a similar geographical area, for instance,
the community in a residential area or a village. Madrigal (1995) argues that a
community living in the same geographical area can be categorized into smaller
communities, such as the youth community, elderly community and housewife
community that share common characteristics within the area.
Hollinshead (2004) divides the community into three groups, which are
based on solidarity, geographic area and socio-geographic structure. Other
scholars define ‘community’ as a group of people living and staying in the same
locality, as well a group of people that share similar ideas, purposes and basic
values (Davis, 1991: Mayer et al., 2000; Williams & Lawson, 2001).
The clarification of ‘community’ is crucial for the study in order to justify
the direction of community-based tourism. The definitions discussed mainly refer
to spatial and interaction factors. This shows that communities are varied in
nature. A community consists of various characteristics and attributes in the
radius of large land uses and town centres along with types of tourism activity
areas that consists of different community organizations, structures, relations and
roles.
Local Economic
According to authors such as Bellamy, Meppem, Gorddard and Dawson (2003),
Koo (2005), Shaffer, Deller and Marcouiller (2006), and Gunder (2009), there is
no clear and hierarchal sequence of local economic theories in describing details
of local economic development and benefits due to the complexity, flexibility and

Syakir Amir, Mariana Mohamed Osman, Syahriah Bachok, Mansor Ibrahim, & Ismawi Zen Community-Based Tourism in Melaka UNESCO World Heritage Area: A Success in Food and Beverage Sector?
© 2017 by MIP 92
multiple perspectives influenced by mixed concepts (Rowe, 2009; 2012),
practices (Valler & Wood, 2010) and rhetoric (Scott, 2006). In addition, Gunder
(2004) clarifies that the built environment field, especially in town and regional
spatial planning, often face inconsistent and conflicting theoretical bases when
dealing with local economic development. Most of the CBT describe high
economic impacts and benefits of tourism activities which must be channelled to
the host destination residents (Amat Ramsa Yaman & Abdullah Mohd, 2004;
Jones, 2005).
Local economic development in CBT perspective is defined as a process
in which the local residents design, develop and implement the tourism
development strategies by using local resources, with the aim to improve the
quality of life and economic opportunity of the local community (Potter et al.,
1999; Pike, Rodriguez & Tomaney, 2006). Within the framework of local
economic benefits and impacts, the benefits can be divided into direct effects and
indirect effects. Direct effects towards the local economy are the effects, benefits,
and consequences from the tourism activities themselves (Bowitz & Ibenholt,
2009). These effects are generated through two main channels, which are earnings
and revenues to the local community especially local-based businesses (Nel,
2001) as well as employment opportunities (Ashley, 2000; Wearver & Lawton,
2007). According to UNWTO (2005), there are six ways in which the CBT may
generate earnings and revenue for a particular local community: (1) the foreign
exchange earnings, (2) direct and indirect employment and income, (3) ownership
and management of tourism establishment (e.g. hotel, restaurants, café and
private taxi), (4) direct sales of tourism goods and services to tourists, (5)
investment in tourism infrastructure, and (6) development of cultural values.
CBT can boost the living standard of households with casual earnings
and its propensity to generate equitable distribution of revenue (Ashley, 2000;
Wearver & Lawton (2007). Although the earnings are observed to be natural in
most of the studies, it can be improved by diversifying the sources of earnings in
the tourism sector. Recently, the numbers of small and medium enterprises
(SMEs) in the tourism industry have increased due to the active involvement of
the local communities in tourist destinations (Weaver & Lawton, 2007). CBT
provides direct employment to travel agents, hotel receptionists and food
hawkers. Whereas, CBT indirect employment refers to employment in related
sectors that do not serve the tourists directly but generates income from the
expenditure in tourism linkages; for instance, the employees working in the
construction industry building hotels (Ashley, 2000; Beeton, 2006; Tosun, 2006).
Sebele (2010) describes that CBT can provide various sources of employment for
the local communities as alternative means of survival (Nel, 2001).
Various sectors are connected to the tourism industry, such as
accommodation, food and beverage, transportation, management, and health. The
increase of goods and services demand from the tourists generates more

PLANNING MALAYSIA
Journal of the Malaysia Institute of Planners (2017)
© 2017 by MIP 93
employment in handicraft making, agriculture, manufacturing and other related
sectors. This is supported by Holloway (2000), who validated that tourism is a
labour intensive industry generating many direct and indirect employment
opportunities compared to other sectors.
From the previous broad discussions, CBT can be acknowledged as the
community’s long term tool for sustainability that preserves local resources and
cultures, maintains the participation and support from community, and provides
benefits to the local economy in terms of income, profits, jobs, and quality of life.
However, one major drawback of the CBT concept is that detail study on
economic impact and benefit of the community is still lacking as compared to
studies on community participation in tourism development.
Food and Beverage
Cohen and Avieli (2004) believe that the food and beverage sector had been
neglected in hospitality and tourism studies. This is due to the conventional view
which stated that eating while traveling is a secondary tourists experience and
routine (Godfrey & Clarke, 2000; Quan & Wang, 2004). However this finding is
contradicted with published researches on food in relation to the tourism sector
such as food experience in tourism (Kivela & Crotts, 2006; Chang, Kivela &
Mak, 2011), local food consumption and spending (Torres, 2002; Kim et al.,
2009), food service (Sheldon & Fox, 1988; Nield, Kozak & KeGrys, 2000), food
as a form of special interest tourism (Hall et al., 2003; Long, 2004), as well as
food preferences and choices among tourists (Torres, 2002; Chang, Kivela &
Mak, 2010).
On top of the aforementioned research, the tourist preference in food
consumption has been discussed along with numerous factors, namely personality
traits (Cohen & Avieli, 2004; Quan & Wang, 2004; Kim, Eves & Scarles, 2009;
Chang et al., 2011), exposure and past experience (Richards, 2002; Cohen &
Avieli, 2004; Ryu & Jang, 2006) as well as physiology and motivation (Long,
2004; Kivela & Crotts, 2006; Kim et al., 2009). In fact, studies have also
confirmed that a number of socio-demographic factors have significantly
influenced tourist expenditure, which among others are nationality and cultural
influence. Tourists from Japan (Sheldon & Fox, 1988), France, Italy (Pizam &
Sussman, 1995), South Korea, Taiwan and Thailand (March, 1997) have strong
preferences for their own cuisine, while American and Canadian tourists prefer
local food in the host destination (Torres, 2002). Cohen and Avieli (2004)
confirm that Asian inbound tourists prefer their own national cuisine as compared
to westerners who are less particular. In terms of age, it has been observed that
younger tourists enjoy different tastes and range of foods compared to older
tourists (Khan, 1981; Tse & Crotts, 2005; Kim et al., 2009); whereas for gender,
it has been observed that women are more interested in local cuisine compared to
men (Kim et al., 2009). On the other hand, based on education level, it is found

Syakir Amir, Mariana Mohamed Osman, Syahriah Bachok, Mansor Ibrahim, & Ismawi Zen Community-Based Tourism in Melaka UNESCO World Heritage Area: A Success in Food and Beverage Sector?
© 2017 by MIP 94
that tourists with higher education levels are more interested in experiencing
foreign cultures by consuming the local cuisine (Khan, 1981; Kim et al., 2009).
METHODOLOGY
The diary record survey was implemented to record the expenses of domestic and
international tourists that visited the study area with cluster sampling approach.
This study employed the cluster sampling approach in the scope of probabilistic
sampling method to collect the data. It has evenly distributed a total of 1,500 diary
record survey booklets in selected hotels based on star-rating in Melaka. The
hotels were divided into 3 main clusters. The first cluster consisted of 5 and 4 star
hotels, the second cluster consisted of 3, 2 and 1 star hotels, and third cluster
consisted of budget hotels (3, 2 and 1 orchard). Thus, each of the cluster was
distributed with 500 diary records survey booklets, 250 booklets of which were
distributed to domestic tourists while 250 booklets were distributed to inbound
tourists. The survey was administered in two months (March and April) that
included six weekdays and six weekends. The determination of survey period was
based on the results of the two pilot studies; these two months recorded the
highest tourists’ peak in Melaka, for domestic and also inbound tourists. This was
because the period being the peak of Malaysia’s holiday season due to school-
break and spring holiday. Since the survey was a self-administered questionnaire,
these booklets were distributed to the respondents during their hotel check-in at
2.00pm. After completing the booklets, they returned them to the receptionist
during check out at 12.00pm. They reported their expenditure depending on the
number of days spent in Melaka. For this study, Chi-square Automatic Interaction
Detection (CHAID) analysis method was used to identify the linkages of tourist
expenditure in several tourism sectors especially food and beverage. This method
was established to involve continuous and categorical data that consists of ordinal
and nominal types of variables. Hence, it is flexible in operate a mixture of data
types. CHAID method have been successfully applied in many tourism and travel
researches (Van Middlekoop, Borgers & Timmermams, 2003; Assaker & Hallak,
2012).
RESULTS AND FINDINGS
Profile of Respondents
1,500 sample were distributed for survey, but only 1,000 survey were collected.
The survey collected 525 domestic respondents and 475 international
respondents. From the initial cohort of domestic respondents, 39.0% were male
and 13.5% were female, while from the total international respondents, 29.3%
were male and 18.2% were female. Thus, the male respondents contributed
towards 68.3% of the total responses and the female 31.7%. Moreover, 21-30
years age group was recorded as the highest percentage (26.6%) of domestic

PLANNING MALAYSIA
Journal of the Malaysia Institute of Planners (2017)
© 2017 by MIP 95
respondents participating in the survey, followed by 31-40 years age group
(18.3%), 11-20 years age group (3.4%), 41-50 years age group (2.9%), 51-60
years age group (10%) and 61-70 years age group (3%). Similarly, the 21-30
years age group was also recorded as the highest percentage (17.4%) for
international respondents, followed by 31-40 years age group (17.2%), 41-50
years age group (6.4%), 51-60 years age group (5.4%) and 61-70 years age group
(6%). Respondents with single status was recorded as the highest percentage
among domestic respondents, which was 28.8%, followed by married (23.3%),
divorced/separated (0.3%) and widowed (0.1%); while married status was
recorded as the highest percentage among international respondents, which was
23%, followed by single (22.6%), divorced/separated (1.4%), and widowed
(0.5%).
Almost half (47.4%) of those surveyed worked in the private sector with
19.4% were domestic respondents and 28% were international respondents. This
followed by 22.4% that were government servants; 14% of which were among
domestic respondents, and 8.4% were international respondents; 13.6% were self-
employed which comprised 9% domestic respondents and 4.6% international
respondents; 12.3% were students comprising 9.5% domestic respondents and
2.8% international tourists; 3.9% were pensioners, which comprised 0.6%
domestic tourists and 3.3% international respondents. 0.4% unemployed were
recorded among international respondents. For education level, bachelor’s degree
was recorded as the highest percentage among domestic respondents (24%),
followed by diploma (12.7%), master’s degree (5.6%), SPM/O-level (5.4%),
certificate (4.1%), PhD (0.4%) and STPM/Matriculation/A-Level (0.3%).
Similarly, bachelor’s degree was recorded as the highest percentage among
international respondents at 31.4%, followed by master’s degree (7.1%), diploma
(3.9%), certificate (2.1%), PhD (1.7%), SPM/O-level (0.8) and
STPM/Matriculation/A-Level (0.4%).
Of the initial cohort of 1,000 respondents, 83.5% visited Melaka for
holiday purposes, where 45.5% of those were domestic respondents and 38%
were international respondents. This was followed by business purposes (6.5%),
visiting family (2.7%), education trip (2.5%), shopping (1.9%),
conference/seminar (1.6%) and health treatment purposes (1.3%). Moreover,
36.9% of the international respondents visited Melaka for the first time compared
to domestic respondents of only 8.1%, while 44.4% of the domestic respondents
had visited Melaka several times compared to only 10.6% international
respondents. Next, in response to the number of visiting adults and children, 46%
of the respondents were traveling single, while 85.2% travelled to Melaka without
children.
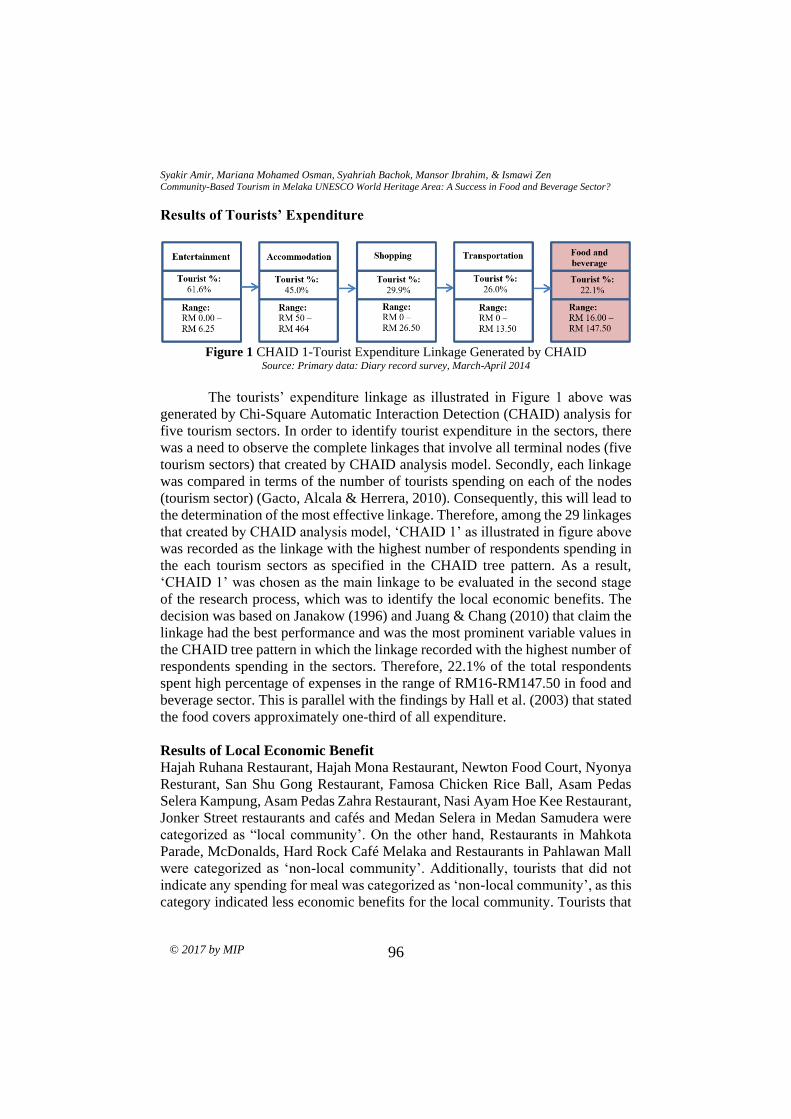
Syakir Amir, Mariana Mohamed Osman, Syahriah Bachok, Mansor Ibrahim, & Ismawi Zen Community-Based Tourism in Melaka UNESCO World Heritage Area: A Success in Food and Beverage Sector?
© 2017 by MIP 96
Results of Tourists’ Expenditure
Figure 1 CHAID 1-Tourist Expenditure Linkage Generated by CHAID
Source: Primary data: Diary record survey, March-April 2014
The tourists’ expenditure linkage as illustrated in Figure 1 above was
generated by Chi-Square Automatic Interaction Detection (CHAID) analysis for
five tourism sectors. In order to identify tourist expenditure in the sectors, there
was a need to observe the complete linkages that involve all terminal nodes (five
tourism sectors) that created by CHAID analysis model. Secondly, each linkage
was compared in terms of the number of tourists spending on each of the nodes
(tourism sector) (Gacto, Alcala & Herrera, 2010). Consequently, this will lead to
the determination of the most effective linkage. Therefore, among the 29 linkages
that created by CHAID analysis model, ‘CHAID 1’ as illustrated in figure above
was recorded as the linkage with the highest number of respondents spending in
the each tourism sectors as specified in the CHAID tree pattern. As a result,
‘CHAID 1’ was chosen as the main linkage to be evaluated in the second stage
of the research process, which was to identify the local economic benefits. The
decision was based on Janakow (1996) and Juang & Chang (2010) that claim the
linkage had the best performance and was the most prominent variable values in
the CHAID tree pattern in which the linkage recorded with the highest number of
respondents spending in the sectors. Therefore, 22.1% of the total respondents
spent high percentage of expenses in the range of RM16-RM147.50 in food and
beverage sector. This is parallel with the findings by Hall et al. (2003) that stated
the food covers approximately one-third of all expenditure.
Results of Local Economic Benefit
Hajah Ruhana Restaurant, Hajah Mona Restaurant, Newton Food Court, Nyonya
Resturant, San Shu Gong Restaurant, Famosa Chicken Rice Ball, Asam Pedas
Selera Kampung, Asam Pedas Zahra Restaurant, Nasi Ayam Hoe Kee Restaurant,
Jonker Street restaurants and cafés and Medan Selera in Medan Samudera were
categorized as “local community’. On the other hand, Restaurants in Mahkota
Parade, McDonalds, Hard Rock Café Melaka and Restaurants in Pahlawan Mall
were categorized as ‘non-local community’. Additionally, tourists that did not
indicate any spending for meal was categorized as ‘non-local community’, as this
category indicated less economic benefits for the local community. Tourists that

PLANNING MALAYSIA
Journal of the Malaysia Institute of Planners (2017)
© 2017 by MIP 97
had meal outside the study area boundary, or had meal in relative’s house or
attended wedding were categorized as ‘other’. This is because they were spending
outside the boundary of the study area.
The validation and estimation of local involvement and ownership in the
food and beverage sector was verified by the officer from Business Premises
Management and Customer Service Department, Melaka Historic City Council.
Breakfast
Table 1 below illustrates the cross-tabulation result between 221 respondents and
the food and beverage venues in which they have dined and spent between RM
16.00-RM 147.50 for breakfast. McDonald Café was recorded as the most
popular dining venue among the respondents (14.5%). It was followed by 12
respondents (5.4%) spending at Restaurants in Mahkota Parade such as Nando’s,
The Chicken Rice Shop, Secret Recipe, Starbucks, Station Kopitiam, OldTown
White Coffee, Kentucky Fried Chicken (KFC) and McDonalds. Only one
respondent (0.5%) each spending at Hajjah Ruhana Restaurant and Asam Pedas
Zahra Restaurant at Plaza Mahkota. 155 respondents (70.1%) provided ‘no
answer’ for their breakfast record and thus was assumed that they did not have
anything for breakfast.
Table 1 Summary of Cross-tabulation Result for Food and Beverage (Breakfast)
Food and Beverage Venues Percentage (%) Frequency (Person)
Hotel 0.9 2
Jonker Street Cafes 5.0 11
McDonald Café 14.5 32
Mahkota Parade (Restaurants) 5.4 12
Hajjah Ruhana Restaurant 0.5 1
Asam Pedas Zahra Restaurant 0.5 1
Restaurant Melaka Raya (Mamak) 1.8 4
Kedai Kopi Chung Wah Jonker Street 1.4 3
‘No answer’ 70.1 155
Total 100 221
Source: Primary data: Diary record survey

Syakir Amir, Mariana Mohamed Osman, Syahriah Bachok, Mansor Ibrahim, & Ismawi Zen Community-Based Tourism in Melaka UNESCO World Heritage Area: A Success in Food and Beverage Sector?
© 2017 by MIP 98
Figure 2 Distribution of Local Economic Benefits (Food and Beverage: Breakfast)
Source: Primary data: Diary record survey, March-April 2015
Figure 2 above reveals the distribution of local economic benefits from
the tourists’ expenditure for breakfast in the food and beverage sector. Based on
Figure 2 above, only 9.1% of the local community gained benefits from the food
and beverage sector during breakfast in the study area, hence revealed the weak
linkage between the food and beverage sector and the local community in the
area. Moreover, the proportion for ‘non-local community’ was 90.9% during
breakfast, which serves as an indication of the leakages occurring along the
tourism value chain in the area.
Lunch
Table 2 and Figure 3 illustrate the cross-tabulation result between 221
respondents and the food and beverage venues in which they have spent between
RM 16.00-RM 147.50 for lunch. Restaurants in Pahlawan Mall were recorded as
the most popular dining place among tourists for lunch, as indicated by 43
respondents (19.5%). It was followed by 36 respondents (16.3%) spending at
restaurants in Mahkota Parade. Asam Pedas Zahra Restaurant in Plaza Mahkota
remains the least popular with only one respondent (0.5%) had lunch there. One
respondent (0.5%) attending a wedding. 14 respondents (6.3%) provided ‘no
answer’ for their lunch expenditure and it was most probably that they skipped
lunch.
9.2%
90.9%
0%
10%
20%
30%
40%
50%
60%
70%
80%
90%
100%
Local community Non-local community

PLANNING MALAYSIA
Journal of the Malaysia Institute of Planners (2017)
© 2017 by MIP 99
Table 2 Summary of Cross-Tabulation Result for Food and Beverage (Lunch)
Percentage (%) Frequency
(person)
Hajjah Ruhana Restaurant (PM) 2.3 5
Asam Pedas Zahra Restaurant (PM) 0.5 1
San Shu Gong Restaurant (JS) 2.7 6
Nasi Ayam HoeKee (JS) 1.4 3
Famosa Chicken Rice Ball (JS) 5.0 11
Medan Selera Medan Samudera 2.7 6
Asam Pedas Selera Kampung 0.9 2
McDonald Cafe 7.7 17
Mahkota Parade (Restaurants) 16.3 36
Pahlawan Mall (Restaurants) 19.5 43
Jonker Street Restaurants and Cafes 8.1 18
Hard Rock Café Melaka 9.5 21
Wedding 0.5 1
Relatives house 1.4 3
Bukit Katil 0.9 2
Bukit Cina 1.4 3
Ayer Keroh 8.1 18
Jusco Aeon Peringgit 5.0 11
No answer 6.3 14
Total 100 221
Source: Primary data: Diary record survey
Figure 3 Distribution of Local Economic Benefits (Food and Beverage: Lunch)
Source: Primary data: Diary record survey, March-April 2015
43.2%
53.0%
6.3%
0.0%
10.0%
20.0%
30.0%
40.0%
50.0%
60.0%
Local community Non-local
community
Others

Syakir Amir, Mariana Mohamed Osman, Syahriah Bachok, Mansor Ibrahim, & Ismawi Zen Community-Based Tourism in Melaka UNESCO World Heritage Area: A Success in Food and Beverage Sector?
© 2017 by MIP 100
Figure 3 presents the distribution of local economic benefits from the
tourists’ expenditure for lunch in the food and beverage sector. As can be seen,
only 42% of the local community gained benefits from the food and beverage
sector in the study area, hence revealed the weak linkage between the food and
beverage sector and the local community in the area. Moreover, the proportion of
economic gain for ‘non-local community’ was 58%, which indicates where the
leakages occur along the tourism value chain in the area.
Dinner
Table 3 and Figure 4 illustrate the cross-tabulation result between 221
respondents and food and beverage venues in which they have spent between
RM16.00-RM147.50 for dinner. Hard Rock Café was recorded as the most
popular dining place among respondents, as indicated by 36 respondents (16.3%).
It was followed by 32 respondents (14.5%) spending at Hajah Mona Restaurant
in Kota Laksamana and 30 respondents (13.6%) spending at Banda Hilir
McDonald Restaurant. The lowest response were two respondents (0.9%)
spending at Nyonya Restaurant and one respondent (0.5%) spending at the hotel.
19 respondents (8.6%) provided ‘no answers’ for their dining venue.
Table 3 Summary of Cross-tabulation Result for Food and Beverage (Dinner)
Food and Beverage Venues Percentage (%) Frequency (Person)
Hard Rock Café Melaka 18.6 41
McDonald Café 16.3 36
Hajah Mona Asam Pedas 8.1 18
Jonker Street Restaurants and Cafes 11.3 25
Newton Food Court 6.8 15
Ikan Bakar Umbai 10.0 22
Mahkota Parade (Restaurants) 10.4 23
Pahlawan Mall (Restaurants) 13.6 30
Nyonya Restaurant Plaza Mahkota 0.9 2
Hotel 0.5 1
No answer 3.6 8
Total 100 221
Source: Primary data, Diary record survey

PLANNING MALAYSIA
Journal of the Malaysia Institute of Planners (2017)
© 2017 by MIP 101
Figure 4 Distribution of Local Economic Benefits (Food and Beverage: Dinner) Source: Primary data: Diary record survey, March-April 2015
Figure 4 above reveals the distribution of local economic benefits from
the tourists’ expenditure for dinner in the food and beverage sector. Based on
Figure 4, only 37.1% of the local community gained benefits from the food and
beverage sector in the study area, hence revealed the weak linkage between the
food and beverage sector and the local community in the area. The proportion of
‘non-local community’ benefits was 59.4%, indicating where the leakages occur
along the tourism value chain in the area.
DISCUSSION
According to the Value Chain Model developed, the food and beverage sector
recorded high spending among domestic and inbound tourists, but provided low
economic benefits to the local community in the Melaka UNESCO World
Heritage area. As illustrated in CHAID linkage, 45% of the tourists spent in the
range of RM16.00-RM147.50; and only 9.1% from the tourists’ expenditure was
channelled to the local community during breakfast, 43.2% during lunch and
37.1% during dinner.
The high expenditure but low benefits to the local economy in terms of
food and beverage in the study area could be attributed to a few factors. Firstly,
the variety of unique local food in the study area attracts tourists due to the six
major races with different religions found in the study area namely Malay,
Chinese, Indian, Baba Nyonya (Chinese Peranakan), Chitty (Indian Peranakan),
and Portuguese Serani, with their uniqueness and diversity of food. The authentic
37.1%
59.4%
3.6%
0.0%
10.0%
20.0%
30.0%
40.0%
50.0%
60.0%
70.0%
Local community Non-local
community
Others

Syakir Amir, Mariana Mohamed Osman, Syahriah Bachok, Mansor Ibrahim, & Ismawi Zen Community-Based Tourism in Melaka UNESCO World Heritage Area: A Success in Food and Beverage Sector?
© 2017 by MIP 102
food in Melaka is associated with its historical roots, colonial influence, religion
and local folk culture. By experiencing the local cuisines, the tourists are
experiencing new cultures (Baker & Crosbie, 1993). People nowadays have
increased their experience to a variety of ethnic food and products during travel
(Torres, 2002; Boxkir & Sezer, 2011). Hence, this may encourage a greater
demand for local cuisine. Food in the study area can be sampled everywhere and
walking distance away (Nurbaidura Salim, Abdul Ghapar Othman, Badaruddin
Mohamed & Hairul Nizam Ismail, 2012), from luxury restaurants to local street
stalls. Malay cuisines can be found in most places in the study area, which among
others are Restoran Hajjah Mona Asam Pedas in Kota Laksamana and Asam
Pedas Selera Kampung Restaurant in Plaza Mahkota, while Chinese cuisine is
featured at the famous Hoe Kee Chicken Rice in Jonker Street. In addition, Baba
Nyonya cuisine can be found at Bibik Neo Restaurant in Plaza Mahkota. In fact,
most of the hotels in the study area actively advertise local traditional cuisine
especially during the festive season. This gives them extra promotion to increase
their occupancy.
Secondly, the experience of trying local food has encouraged the tourists
to ignore the prices in order to enjoy the experience. In tourism, food consumption
and expenditure are not referred to repetitive daily eating habits and routines.
They are considered a request for various foods to engage in experiences. Quan
& Wang (2004) categorize two types of seeking behaviors in food consumption
during holidays. First is routine rotation of various foods across time. This type
of routine is known as “routine variety-seeking’ behavior. Second is “novelty-
seeking,” or the act of eating foods that the tourists have never tried before. This
refers to the tourists’ behavior of requesting for food experiences that are beyond
the borders of their routine. Sims (2009) categorises food experience as firstly,
the ingredients of foods are unique and enjoyable; and secondly, the way the food
is made, delivered and consumed is unique. This is described by the Hoe Kee
Chicken Rice Restaurant, which is a famous Chinese restaurant among locals and
tourists especially from Singapore and China. The restaurants situated in one of
the small colonial shop lots located on Jalan Hang Jebat (Jonker Street). The
crowd is apparent during the weekends. The signature dish, which is chicken rice
that shaped like ping pong balls rather than served as a bowl of rice. This has
created a new experience for tourists visiting Melaka, tasting the special chicken
rice in a small local Chinese restaurant atmosphere. Food consumption during
holidays might become part of the peak touristic experience (Quan & Wang,
2004). Thus, these two factors have led to the increase in food consumption
among tourists in Melaka, hence increasing the expenditure in the food and
beverage sector.

PLANNING MALAYSIA
Journal of the Malaysia Institute of Planners (2017)
© 2017 by MIP 103
In the context of the local economic benefits, the locally owned food
outlets and restaurants have less demand from the tourists as compared to
multinational operators. The spread of multinational operators in the food
industry has given intense competition to the local food outlets. The food offered,
including hamburgers, pizza, fried chicken, pastries, coffee, and ice-cream,
attracts the young generation and children. Among the leading multinational
operators and international companies are McDonalds, Hard Rock Café, KFC,
Burger King, Baskin-Robbins, Domino’s Pizza, Seoul Garden and Dunkin
Donuts (Khan, 1981). These outlets can be found in the study area. On the other
hand, locally owned food outlets encourage participation of the local community
to produce, distribute and promote local products.
The local food operators do not have the ability and knowledge to
promote their food as a tourism product. Many local restaurants and cafés in the
study area are mostly small and medium-scaled. Most of the cafés on Jonker
Street are family operated and only open at night or during weekends.
Furthermore, they only provide a few tables and a small counter in front of the
shop lot, with their homes at the back part of the shop. Hence, the desire to carry
out promotion and awareness does not exist due to financial barriers, style of
business and knowledge. In comparison, multinational companies and fast food
enterprises such as McDonald and Hard Rock Café feature a distinct type of menu
and target population. Therefore, Stout and Rust (1993), and Hyun, Kim and Lee
(2011) believe that such big enterprises are controlling the specific segment of
consumer market because of their promotion. Besides the strong promotion, they
have strong world-recognized branding. The restaurant brand and labels affected
the tourists’ purchasing intentions (Albright & Flora, 1990; McCall & Lynn,
2008; Eibel et al., 2009). Therefore, the restaurants that have strong and well-
known label would dominate the local food options.
CONCLUSION
This paper has identified the local economic benefits from the tourists’ expenses
in food beverage sector. This study suggests strong partnerships or clustering
among the tourism stakeholders, especially the suppliers in Melaka UNESCO
World Heritage area. A cluster can be formed between similar tourism service
suppliers and also between the suppliers that offer different kinds of tourism
services to ensure that all the tourism products, services as well as facilities
offered can be accessed by all kinds of tourists that visit the study area. For
instance, the budget hotels in Jonker Street are encouraged to carry out a joint
venture with the local restaurants nearby to provide breakfast to their overnight
clients and deal with local traditional Malay massage parlours for discounts on
their services. This is regularly applied in most tourism destinations such as Bali,
Indonesia and Bangkok, Thailand. This partnership idea extremely promotes and
supports local businesses, resulting in a stronger community because the money

Syakir Amir, Mariana Mohamed Osman, Syahriah Bachok, Mansor Ibrahim, & Ismawi Zen Community-Based Tourism in Melaka UNESCO World Heritage Area: A Success in Food and Beverage Sector?
© 2017 by MIP 104
stays within the local area, hence promote the community-based tourism in
Melaka. Moreover, the unique relationship among the local businesses may
provide the community of the study area with a distinctive character and values
that are currently lacking in the area. A suggestion of future research needs to be
carried out to explore the factors affecting the poor and high participation and
economic benefits in relation to Melaka UNESCO World Heritage site or other
tourism destinations. The factors may include internal and external factors. It is
important to note that not all tourism destinations operate and are impacted in the
same way and to the same economic extent towards the local community. Some
destinations may contribute more effectively towards the local economies.
REFERENCES
Aas, C., Ladkin, A., & Fletcher, J. (2005). Stakeholder collaboration and heritage
management. Annals of Tourism Research, 32(1), 28-48.
Albright, C. L., & Flora, J. A. (1990). Restaurant menu labeling: Impact of nutrition
information on entree sales and patron attitudes. Health Education, 17(2), 157-167.
Amat Ramsa Yaman, & Abdullah Mohd. (2004). Community-based ecotourism: A new
proposition for sustainable development and environmental conservation in
Malaysia. Journal of Applied Sciences, 4(4), 583-589.
Ashley, C. (2000). The impacts of tourism on rural livelihoods: Experience in Namibia.
ODI Working Paper 128, London: Overseas Development Institute.
Assaker, G., & Hallak, R. (2012). European travelers' return likehood and satisfaction
with Mediterranean sun-and-sand destinations: a chi-square automatic
identification detector based segmentation approach. Journal of Vacation
Marketing, 18(2), 105-120.
Baker, G. A., & Crosbie, P. J. (1993). Measuring food safety preference: Identifying
consumer segments. Journal of Agricultural and Resource Economics, 18(2), 28-
35.
Beeton, S. (2006). Community Development through Tourism. Melbourne: Landlinks.
Bellamy, J., Meppem, T., Gorddard, R., & Dawson, S. (2003). The changing face of
regional governance for economic development: implications for local
government. Sustaining Regions, 2(3), 7-17.
Bowitz, E., & Ibenholt, K. (2009). Economic impacts of cultural heritage research and
perspectives. Journal of Cultural Heritage, 10, 1-8.
Boxkir, A. S., & Sezer, E, A. (2011). Predicting food demand in food courts by decision
tree approaches. Procedia Computer Science, 3, 759-763.
Brandon, K. (1996). Ecotourism and conservation: A review of key issues. Washington:
World Bank.
Chang, R. C. Y., Kivela, J., & Mak, A. H. N. (2011). Attributes that influence the
evaluation of travel dining experience: when east meets west. Tourism
Management, 32 (2), 307–316.
Cohen, E., & Avieli, N. (2004). Food in tourism: Attraction and impediment. Annals of
Tourism Research, 31 (4), 755–778.

PLANNING MALAYSIA
Journal of the Malaysia Institute of Planners (2017)
© 2017 by MIP 105
Crompton, J. L., Lee, S., & Shuster, T. J. (2001). A guide for undertaking economic
impact studies: The springfest example. Journal of Travel Research, 40, 79-87.
Daniels, M. J., Norman, W. C., & Henry, M. S. (2004). Estimating income effects of a
sport tourism event. Annals of Tourism Research, 31 (1), 180-99.
Davis, J. S., & Morais, D. B. (2004). Factions and enclaves: Small towns and socially
unsustainable tourism development. Journal of Travel Research, 43(1), 3-10.
Eibel, B., Kersh, R., Brescoll, V., & Dixon, B. (2009). Calorie labeling and food choices:
A first look at the effects on low-income people in New York City. Health Affairs.
28(6), 1110-1121.
Fauziah Che Leh & Mohd Rezuan Hamzah. (2012). Homestay tourism and pro-poor
tourism strategy in Banghuris Selangor, Malaysia. Elixir International Journal, 45,
7602-7610.
Gacto, M. J., Alcalá, R., & Herrera, F. (2010). Integration of an index to preserve the
semantic interpretability in the multiobjective evolutionary rule selection and
tuning of linguistic fuzzy systems. IEEE Transactions on Fuzzy Systems, 18(3),
515-531.
Godfrey, K., & Clarke, J. (2000). The Tourism Development Handbook. Cassell, London.
Gunder, M. (2009). Imperatives of enjoyment: economic development under
globalization. In J. E. Rowe (Ed.), Theories of local economic development:
Linking theory to practice (pp. 285-300), Surrey, UK: Ashgate Publishing Limited.
Hollinshead, K. (2004). Symbolism in tourism: lessons from “Bali 2002”: Lessons from
Australia’s dead heart. Tourism Analysis, 8, 267-295.
Holloway, J. (2000). Tour. In J. Jafari (Ed.), The Encyclopedia of tourism (pp.582-583),
London: Routledge.
Hyun, S. S., Kim, W., & Lee, M. J. (2011). The impact of advertising on patrons’
emotional responses, perceived value and behavioral intentions in the chain
restaurant industry: The moderating role of advertising-induced arousal.
International Journal of Hospitality Management, 30, 689-700.
Jones, S. (2005). Community-based ecotourism: The significance of social capital. Annals
of Tourism Research, 32 (2), 303–24.
Kasimati, E. (2003). Economic aspects and the summer Olympics: A review of related
research. International Journal of Tourism Research, 5, 433-444.
Khan, M. A. (1981). Evaluation of food selection patterns and preferences. CRC Critical
Reviews in Food Science and Nutrition, 15, 129-153.
Kim, Y. G., Eves, A., & Scarles, C. (2009). Building a model of local food consumption
on trips and holidays: A grounded theory approach. International Journal of
Hospitality Management, 28, 423-431.
Kivela, J., & Crotts, J.C. (2006). Tourism and gastronomy: Gastronomy’s influence on
how tourists experience a destination. Journal of Hospitality and Tourism
Research, 30 (3), 354–377.
Kling, J. M., & Posner, P. S. (1990). Class and community in an era of urban
transformation. In J. M. Kling & P. S. Posner (Eds.). Dilemmas of activism: Class,
community, and the politics of local mobilization (pp. 23-45). Philadelphia:
Temple University Press.
Koo, J. (2005). Technology spillovers, agglomeration, and regional economic
development. Journal of Planning Literature, 20(2), 99-115.

Syakir Amir, Mariana Mohamed Osman, Syahriah Bachok, Mansor Ibrahim, & Ismawi Zen Community-Based Tourism in Melaka UNESCO World Heritage Area: A Success in Food and Beverage Sector?
© 2017 by MIP 106
Lee, T. H. (2012). Influence analysis of community resident support for sustainable
tourism development. Tourism Management, 34, 37-46.
Lepp, A. (2007). Residents’ attitudes towards tourism in Bigodi village, Uganda. Tourism
Management, 28(3), 876-885.
Li, G., Song, H., & Witt, S. F. (2005). Recent developments in econometric modeling and
forecasting. Journal of Travel Research, 44(1), 82-99.
Long, L. M. (2004). Culinary Tourism. Kentucky: The University Press of Kentucky.
Madrigal, R. (1995). Residents’ perceptions and the role of government. Annals of
Tourism Research, 22(1), 86-102.
Mayer, L. C., Burnett, J. H., Ogden, S., & Tuman, J. P. (2000). Comparative politics:
Nations and theories in a changing world. New Jersey: Prentice.
McCall, M., & Lynn, A. (2008). The effects of restaurant menu item descriptions on
perceptions of quality, price ad purchase intention. Journal of Foodservice
Business Research, 11(4), 439-445.
McCool, S. F., Moisey, R. N., & Nickerson, N. P. (2001). What should tourism sustain?
The disconnect with industry perceptions of useful indicators. Journal of Travel
Research, 40(4), 124-131.
McMillan, D. W., & Chavis, D. M. (1986). Sense of community: A definition and theory.
Journal of Community Psychology. 14, 6-23.
Mihalic, T. (2002). Tourism and economic development issues. In R. Sharpley & D. J.
Telfer (Eds.), Tourism and development: Concepts and issues (pp. 81-111).
Clevedon, UK: Channel View Publications.
Mok, C., & Iverson, T. J. (2000). Expenditure based segmentation: Taiwanese tourists to
Guam. Tourism Management, 21(3), 299–305.
Nel, E. (2001). Local economic development: A review and assessment of its current
status in South Africa. Urban Studies, 38(7), 1003-1024.
Nield, K., Kozak, M., & LeGrys, G., (2000). The role of food service in tourist
satisfaction. International Journal of Hospitality Management, 19, 375-384.
Nurbaidura Salim, Abdul Ghapar Othman, Badaruddin Mohamed, & Hairul Nizam
Ismail. (2012). Heritage awareness among tour operators in heritage sites: A case
study of rickshaw pullers in Melaka. Paper presented at 3rd International
Conference on Business and Economic Research, March 12-13, Bandung,
Indonesia.
Pearce, P. L., & Moscardo, G. (1999). Tourism community analysis: Asking the right
questions. In D. G. Pearce & R. W. Butler (Eds.). Contemporary issues in tourism
development (pp. 31-51). London and New York: Routledge.
Pike, A., Rodriguez, P. A., & Tomaney, J. (2006). Local and Regional Development. New
York: Routledge.
Potter, J., Walsh, J., De Varine, H., & Barreiro, F. (1999). Best practices in local
development. Local Employment and Economic Development Programme,
OECD-TDS, Paris.
Quan, S., & Wang, N. (2004). Towards a structural model of the tourist experience: An
illustration from food experience in tourism. Tourism Management, 25 (3), 297–
305.

PLANNING MALAYSIA
Journal of the Malaysia Institute of Planners (2017)
© 2017 by MIP 107
Roe, D., Ashley, C., Page, S., & Meyer, D. (2004). Tourism and the poor: Analysing and
interpreting tourism statistics from a poverty perspectives (Working paper No. 16).
London: UK Department for International Development. .
Rowe, J. E. (2009). Moving the theory of local economic development beyond metaphors.
Australasian Journal of Regional Studies, 15(1), 101-114.
Rowe, J. E. (2012). The case for employing Deleuzian philosophical concepts for
understanding local economic development. Applied Geography, 32, 73-79.
Scott, A. J. (2006). Creative cities: Conceptual issues and policy questions. Journal of
Urban Affairs, 28(1), 1-17.
Sebele, L. S. (2010). Community based tourism ventures, benefits and challenges: Khama
Rhino Sanctuary Trust, Central District, Botswana. Tourism Management, 31,
136-146.
Shaffer, R., Deller, S., & Marcouiller, D. (2006). Rethinking community economic
development. Economic Development Quarterly, 20(1), 59-74.
Sheldon, P., & Fox, M. (1988). The role of foodservice in vacation choice and experience:
A cross-cultural analysis. Journal of Travel Research, 27 (3), 9–15.
Song, H., & Li, G. (2008). Tourism demand modelling and forecasting: A review of
recent research. Tourism Management, 29(2), 203-220.
Stout, P. A., & Rust, R. T. (1993). Emotional feelings and evaluative dimensions of
advertising: Are they related? Journal of Advertising, 22(1), 61-72.
Sutawa, G. K. (2012). Issues on Bali tourism development and community empowerment
to support sustainable tourism development. Procedia Economics and Finance, 4,
413-422.
Torres, R. (2002). Toward a better understanding of tourism and agriculture linkages in
the Yucatan: Tourist food consumption and preferences. Tourism Geographies, 4
(3), 282–306.
Tosun, C. (2000). Limits to community participation in the tourism development process
in developing countries. Tourism Management, 21, 613-633.
Trejos, B., & Chiang, L. H. N. (2009). Local economic linkages to community-based
tourism in rural Costa Rica. Singapore Journal of Tropical Geography, 30, 373-
387.
Tyrrell, T. J., & Johnston, R. J. (2001). A framework for assessing direct economic
impacts of tourist events: Distinguishing origins, destinations, and causes of
expenditures. Journal of Travel Research, 40, 94-100.
Valler, D., & Wood, A. (2010). Conceptualizing local and regional economic
development in the USA. Regional Studies, 44(2), 138-151.
Van Middlekoop, M., Borgers, A., & Timmermans, H. (2003). Inducing heuristic
principles of tourist choice of travel mode: A rule based approach. Journal of
Travel Research, 42(1), 75-83.
Wang, Y., Rompf, P., Severt, D., & Peerapatdit, N. (2006). Examining and identifying
the determinants of travel expenditure patterns. International Journal of Tourism
Research, 8(5), 333-346.
Weaver, D. B., & Lawton, L. J. (2007). Twenty years on the state of contemporary
ecotourism research. Tourism Management, 28, 1168-1179.
Wells, M. P. (1996). The social role of protected areas in the new South Africa.
Environment Conservation, 23(4), 322–331.

Syakir Amir, Mariana Mohamed Osman, Syahriah Bachok, Mansor Ibrahim, & Ismawi Zen Community-Based Tourism in Melaka UNESCO World Heritage Area: A Success in Food and Beverage Sector?
© 2017 by MIP 108
Williams, J., & Lawson, R. (2001). Community issues and resident opinions of tourism.
Annals of Tourism Research, 28(2), 269-290.
Zaaijer, M., & Sara, L. M. (1993). Local economic development as an instrument for
urban poverty alleviation: A case from Lima, Peru. Third World Planning Review,
15, 127–142.

1Student at School of Housing, Building and Planning, Universiti Sains Malaysia. 109
PLANNING MALAYSIA:
Journal of the Malaysian Institute of Planners
VOLUME 15 ISSUE 1 (2017), Page 109 - 116
FENG SHUI: THE SHAPE OF FIVE ELEMENTS OF LOW TI KOK
MANSION
Chong Kai Zhen1, & Azizi Bahauddin2
1,2School of Housing, Building, and Planning,
UNIVERSITI SAINS MALAYSIA
Abstract
Feng shui is one of the most outstanding subjects and popular life principles in
the world and is also one of the oldest traditional Chinese philosophies. Feng shui
is seen as wisdom that has been accumulating for more than three thousand years
of history and experience in architectural theory. The application of feng shui is
not only a unique knowledge but is also a complex way to comprehend natural
phenomena. The aim of feng shui in architecture is to enhance the quality of life
for humans, building, and nature. It is related to the built environment theory.
Feng shui had indeed been incorporated into the construction of Chinese
mansions in Peninsula Malaysia despite having only a few people who are aware
of them. Since feng shui is a complex subject, this paper focuses on one of the
feng shui principles: the Five Elements. The Five Elements and their respective
shapes are Water, wavy-shaped; Wood, angular-shaped; Fire, triangle; Earth,
square; and Metal, circle. These elements are discussed in their association with
the case study of Low Ti Kok Mansion. The Low Ti Kok Mansion, which is
located in Kajang, Selangor, has no recorded documentation on feng shui as
opposed to the Cheong Fatt Tze Mansion in Penang, which is known for being
influenced by feng shui. In this paper, the researcher attempts to investigate and
document the case study based on feng shui influences. The objectives of this
paper are twofold and they are (1) to understand the feng shui and (2) to examine
the Five Elements concept on the Low Ti Kok Mansion. The research approach
in this paper is qualitative in nature. Document reviewing and observation have
been employed and interpreted in this paper to analyse the case study, which is
based on the Five Elements concept. It is found that the Five Elements shapes are
clearly shown on the floor plan of Low Ti Kok Mansion.
Keywords: Five Elements, feng shui, Low Ti Kok Mansion
Date Received: 30th April 2016
Date of Acceptance: 30th October 2016

Chong Kai Zhen, & Azizi Bahauddin
Feng Shui: The Shape of Five Elements of Low Ti Kok Mansion
© 2017 by MIP 110
INTRODUCTION
Feng shui is an ancient practice that has accumulated more than three thousand
years of history, knowledge and experience. It has also been incorporated into
architectural theory, especially with regards to position and design. Feng shui is
a part of an ancient Chinese philosophy of nature and is considered a cultural
heritage in China (Erdogan & Erdogan, 2014). Since feng shui is considered a
traditional Chinese philosophy and not a religion and belief, feng shui practice is
popular among people. It has flourished worldwide when the literature about it in
English was introduced (Erdogan & Erdogan, 2014; Lip, 2010).
The practice of feng shui has also continued uninterrupted in fate and
business among Chinese communities in Hong Kong, Taiwan, Malaysia, and
Singapore (Lip, 1979). This basic purpose of feng shui is to enhance the quality
of harmonious life between humans, buildings, and nature (Erdogan & Erdogan,
2014).
The feng shui philosophy is a wide and complex subject in architecture
theory. Unity of Heaven, Earth, and Human, qi, yin and yang principle, and the
Five Elements are principles used in feng shui. These principles incorporate
divination, medicine, and astrology. Feng shui also incorporates certain fields of
science, especially climatology, geology, topography, ecology and landscaping.
The architectural theory of feng shui can be divided into two main schools of
thought: the Form School and Compass School (Yap, 2007). The Form School
emphasises the consideration of earth surface where the qi, the energy, is affected
while the Compass School focuses on the cosmic pattern, magnetic field, and
sensitive direction based on the Chinese compass. The Form School has been
widely accepted by international researchers in the analysis of built environment
(Yap, 2007).
During the late nineteenth century, the Chinese migrants brought their
culture including feng shui and architecture into Malaysia. Chinese builders
incorporated feng shui into Chinese houses, especially shophouses and mansions.
The Cheong Fatt Tze Mansion is an excellent example of a mansion in which
feng shui has been strictly incorporated. The architectural aspect of feng shui had
been used and it flourished in Chinese houses until the late 1930s.
Since feng shui is a complex subject, this paper focuses on one of its
aspects, which is the Five Elements. This paper investigates the incorporation of
the Five Elements into the construction of the Low Ti Kok Mansion in Kajang,
which has no recorded documentation to date.
LITERATURE REVIEW
Feng Shui
The term of feng shui is extremely difficult to translate (Yap, 2007). Feng shui is
a tool in designing and orientating the site to balance between human and nature.

PLANNING MALAYSIA
Journal of the Malaysia Institute of Planners (2017)
© 2017 by MIP 111
It is a need to understand the relationship between the conditions of surrounding
and humans. Feng shui might be called environmentology and is not related to
Chinese geomancy. In definition, feng shui is the art of placing a building on a
site so that it is in harmony with other man-made structures and in balance with
nature (Erdogan & Erdogan, 2014). Yap (2007) states that feng shui is a skill of
studying the flow of invisible energy in the environment, planetary influences,
and contours of the land, and river and mountain formations in relation to a
property.
Feng shui is so deeply rooted in Chinese architecture that since historic
times, it had been incorporated into architecture, environmental science,
conceptual design, cultural heritage and interior decoration (Erdogan & Erdogan,
2014). The art of feng shui has been accepted into architectural design principles
in order to create sustainable buildings and environments (Mak & So, 2015). It
reflects nature and buildings. This concept of feng shui has been widely used in
modern buildings in Hong Kong especially the Bank of China and Shanghai
Bank. The concept of feng shui in buildings is to obtain the balance between
nature and human behavioural impacts.
Five Elements
The Five Elements comprises the five basic groups of substances in the world.
There are the elements of Wood, Fire, Earth, Metal, and Water. This theory of
Five Elements represents the initiation, progress, development, fatigue, and
cessation processes of events (Mak & So, 2015). The Five Elements can be
determined by the element of a people to obtain the suitable element after
organising the interior space. Every space has its element of the Five Elements
such as bathroom represents Water.
The Five Elements present their characteristics in seasons, times,
directions, conditions, colours, forms, and numbers. The Five Elements have its
cycle between two elements. For example, Water is related to the colour black
while Fire is related to red. These elements are destroyed where Water will
extinguish Fire according to a specific order. The cycles of the Five Elements are
the productive cycle, controlling cycle, and weakening cycle (Lip, 2010). The
productive cycle creates positive energy and produces the element. In other
words, Fire produces Earth; Earth produces Metal; Metal produces Water; Water
produces Wood; and finally Wood produces Fire. The controlling cycle creates
negative energy and destroys the opposite element: Fire destroys Metal; Metal
destroys Wood; Wood destroys Earth, Earth destroys Water; and Water destroys
Fire. The weakening cycle creates the natural cycle between elements. The
productive and controlling cycles are commonly used in the Five Elements. These
cycles assist in creating the movement of energy in nature according to the laws
of nature and heaven (Erdogan & Erdogan, 2014). Figure 1 shows the three cycles
of the Five Elements

Chong Kai Zhen, & Azizi Bahauddin
Feng Shui: The Shape of Five Elements of Low Ti Kok Mansion
© 2017 by MIP 112
Figure 1 The Cycles of the Five Elements
Source: Lip, 2010.
The shape of the Five Elements can be seen on the gable end wall of the
Chinese shophouse. The pointed shape represents Fire, the square or flat shape,
Earth, the round shape, metal, the wavy-shaped, Water, and angular-shaped is
Wood. Figure 2 shows the shape of the Five Elements on the gable end wall.
Figure 2 The Five Elements on the Gable End Wall.
Source: Drawn by author from Tan.
METHODOLOGY
To investigate the Five Elements on the case study, the qualitative research
approach is employed through observation. The primary sources such as visual
data and the secondary sources are gathered. All information are then presented
and interpreted in the findings of this paper.
CASE STUDY
The Low Ti Kok Mansion is located in the north of Kajang Town in Hulu Langat
District. Historically, this mansion was built in 1932 and was owned by Towkay
Low Ti Kok (1877-1943). This mansion was sold to the Hulu Langat Hokkien
Association (HLHA) in 1985 and is known as HLHA building today. Today, it
still stands as an old Chinese mansion that escaped the bombing during World
War II in Kajang. Figure 3 shows the floor plan surveyed by researcher during
fieldwork.

PLANNING MALAYSIA
Journal of the Malaysia Institute of Planners (2017)
© 2017 by MIP 113
Figure 3 Floor Plan of Low Ti Kok Mansion Source: Adapted and surveyed by author
The Low Ti Kok Mansion is facing directly south. In Figure 3, it can be seen that
there are different shapes such as semi-circle, angular-shape, and square, on the
outline of the floor plan of the Low Ti Kok Mansion. The semi-circle and square
can be seen on the right side of the mansion while angular-shaped can be seen at
the front and the left side of the mansion. These shapes will be discussed in the
findings of this paper to reveal the shape related to the Five Elements.
FINDINGS
This section discusses the findings of the Low Ti Kok Mansion based on the Five
Elements. According to the Four Emblems, there is a Black Tortoise at the back;
Green Dragon on the left; Red Bird in the front; and White Tiger on the right of
the site. These Four Emblems are related to the Five Elements and the symbolism
of the shapes. They are Black Tortoise represents Water and is wavy-shaped; The

Chong Kai Zhen, & Azizi Bahauddin
Feng Shui: The Shape of Five Elements of Low Ti Kok Mansion
© 2017 by MIP 114
Green Dragon is Wood and rectangular or angular-shaped; the Red Bird is Fire
and triangular; and White Tiger is Metal and circular.
Besides that, according to the Nine Chambers of the Magic Square, the
Five Elements are also related to direction. North is Water; Northeast and
Southwest is Earth; East and Southeast is Wood; South is Fire; and Southwest
and West is Metal. These elements are also represented by the shape.
Figure 4 Four Emblems
Source: Modified by author
From the findings, it is found that the semi-circle at the right side of the
Low Ti Kok Mansion has a similar concept to the Metal in the Five Elements of
the Nine Chambers. The angular shape on the left side represents Wood while the
square at the southwest is related to Earth. Besides that, the front of the mansion
is angular-shaped which represents the Wood Element and it faces South, the Fire
Element. According to the productive cycle of the Five Elements, this is
preferable as Wood produces Fire.

PLANNING MALAYSIA
Journal of the Malaysia Institute of Planners (2017)
© 2017 by MIP 115
Figure 5 Findings on the Floor Plan
Source: Modified by author
CONCLUSION
This study is not only crucial but is also enlightening for the understanding of the
design of feng shui in architectural theory. Shapes are used by humans to design
buildings. The shaping of the buildings has an impact on the building and
surrounding nature. The main idea of this study is the application of the shapes
of the Five Elements to reflect the design principles, especially of harmony and
of balance. This can be used as a guide for designers in the feng shui concept. It
assists in enhancing the concept of sustainability in nature and future architectural
space.

Chong Kai Zhen, & Azizi Bahauddin
Feng Shui: The Shape of Five Elements of Low Ti Kok Mansion
© 2017 by MIP 116
ACKNOWLEDGEMENT
The author thanks the support of USM Fellowship.
REFERENCES Erdogan, E., & Erdogan, H. A. (2014). Feng shui paradigm as philosophy of sustainable
design. International Journal of Social, Behavioral, Educational, Economic,
Business and Industrial Engineering, 8(10), 3328-3333.
Lip, E. (2010). All you need to know about feng shui. Singapore: Marshall Cavendish
International (Asia) Private Limited
Lip, E. (1979). Chinese geomancy. Singapore: Times Books International
Yap, J. (2007). Xuan Kong flying stars feng shui: an introduction to flying stars feng shui.
Kuala Lumpur: JY Books Sdn. Bhd.
Mak, M. Y., & So, A. T. (2015). Scientific feng shui for the built environment: theories
and applications. Hong Kong: City University of Hong Kong Press.

1Assistant Professor at International Islamic University Malaysia. Email: [email protected] 117
PLANNING MALAYSIA:
Journal of the Malaysian Institute of Planners
VOLUME 15 ISSUE 1 (2017), Page 117 - 128
APPRECIATION OF VERTICAL GREENERY IN A CITY AS PUBLIC
ART
Mazlina Mansor1, Khalilah Zakariya2, Nor Zalina Harun3, & Nur Izzah Abu
Bakar4
1,2,3,4 Kulliyyah of Architecture and Environmental Design
INTERNATIONAL ISLAMIC UNIVERSITY MALAYSIA
Abstract
Vertical greenery (VG) is greenery where plants can be grown on, up, or against
internal or external walls of buildings or as freestanding structures. Whereas,
public art (PA) is a structure or form that contains an artistic expression. It is
placed in public spaces. VG has gained tremendous popularity in recent years,
and this offers an opportunity to integrate it as a part of public art in cities. A
place with a combination of art and aesthetics with environmental principles
would become a new urban art that will help extend VG’s survivability and
human security in the future. Most research in VG focuses on an environmental
and technical aspect that consider its benefits, technical issues, feasibility,
acoustic impact, sustainability, system and maintenance. On the other hand,
creative methods to approach VG are seldom researched upon especially in
Malaysia. Hence, this study explores this possibility from the public’s
perspectives. The objectives were to identify public’s familiarity and values of
VG as PA, and VG attributes to be as a PA. An online survey was used to obtain
public’s perspectives on the integration of VG as PA. The target respondents were
the public, whereby the link to the survey was sent out to 400 potential
respondents. The survey obtained 117 responses, and they were gathered
automatically in an Excel spreadsheet. The data were converted into the themes
to generate results. Findings yield positive outcomes in terms of the public’s
familiarity of the terminologies (i.e. VG and PA), people’s awareness of VG in
an urban environment, and the possibilities and potentials of VG to become a PA
in Malaysian cities. It means that VG has extended beyond the environmental
benefits to also become an art form for people in a city.
Keywords: Vertical greenery, public art, integration, sustainability
Date Received: 30th April 2016
Date of Acceptance: 30th October 2016

Mazlina Mansor, Khalilah Zakariya, Nor Zalina Harun, & Nur Izzah Abu Bakar
Appreciation of Vertical Greenery in A City as Public Art
© 2017 by MIP 118
INTRODUCTION
This research focuses on the potential of vertical greenery (VG) to be appreciated
as public art (PA) in a city. VG is greenery where plants can be grown on, up, or
against internal or external walls of buildings or acts as freestanding structures.
PA is a structure or form that contains an artistic expression. It is placed in a
freely accessible public space for people to view. In the 80’s, there was a growing
interest in environmental issues. The scenario has triggered a vision of bringing
nature into cities, environmentally and aesthetically. VG is suitable in urban
places, as there is insufficient urban green spaces. VG is increasingly being
implemented in the city’s public spaces and buildings to improve the urban life
quality and ecosystems, as well as to upgrade urban realm. VG can modify
temperature, improves air quality and increases biodiversity. Contact with
greenery in city is also said to improve people’s physiology and mental health.
Hence, VG has gained tremendous popularity in recent years to be erected in
public spaces. This popularity offers a great opportunity for it to be appreciated
as a part of public art in city spaces. It is implied that a place with a combination
of art, aesthetics and environmental principles would become a new urban art that
helps to extend the survivability of VG. The interest will not be just a passing
trend for one time only (Séguin, 2012).
Furthermore, most researches on VG were centred on the environmental
and technical aspects, such as on the benefits, technical issues, feasibility,
acoustic, sustainability, system and maintenance of VG (Peck et al., 1999; Watts,
2009). However, the creative methods to approach VG were seldom researched
upon especially in Malaysia. Hence, this paper explores the views and acceptance
of city residents on the creative methods to appreciate VG in public spaces.
Recent increase in the popularity of VG has created the possibility to incorporate
VG as ‘green public art’ into city spaces. The aim is to identify the possible ways
VG can be appreciated as public art (PA).
LITERATURE REVIEW
There is a growing trend of using the VG system to green urban public spaces.
There is also a definite need to improve the selection and appearance of PA in
Malaysia (Shunmugam, 2006; Mohd Fabian et al., 2012). PA in Malaysia is
claimed only typically to decorate and fill empty spaces of a public area. It lacks
art quality, unable to command people’s attention or evoke deeper feelings to the
public. Hence, VG is seen as a new way to creatively attract the public to
appreciate PA.
The utilization of VG for its beauty and functions can be traced back to
as early as the 500 BC. For instance, the Hanging Gardens of Babylon applied
terrace structure over arch stone beams, and were waterproofed with thick layers
of reeds and tar. More recently, the garden city movement jump-started the
concern and care for the environment in urban spaces in the 1920’s. During the

PLANNING MALAYSIA
Journal of the Malaysia Institute of Planners (2017)
© 2017 by MIP 119
garden city movement, Stanley Hart White, a professor in Landscape
Architecture field had patented a vertical greenery system for environmental
benefits, known as Vegetation-Bearing Architectonic Structure and System
(Hindle, 2012). However, due to the public’s concern about the strength of the
structure, the concept was not popular at the time.
To understand VG’s association with PA, a history of PA also needs to
be considered. The term ‘public art’ was first coined in 1959 when the first
Percent-for-Public Art ordinance in the United States was adopted by the city of
Philadelphia, Pennsylvania (Cartiere & Willis, 2008). However, PA was only
used for its aesthetic value during the time. In 1967, PA started to be used for
environmental, aesthetic and social values. Concurrently, from the 1960’s to
1980’s, PA started to be adopted in Malaysia. Nonetheless, most of the artworks
at this time were influenced by the post-formalist approach. However, in the late
70’s, as Islamic consciousness increased, more artists began to align themselves
with abstract-expressionist style, as well as Islamic centred art (Sarena, 2011).
PA during this time was designed for its social, environmental and aesthetic
benefits. The awareness of Land Art has also started to emerge parallel to this
event as artists becoming more concern about environmental issues (Irons, 2012).
This led to more interest in environmental issues, resulting in the vision of
bringing nature into cities was conceived in the 80’s. At the same time in
Malaysia the artworks were began to be influenced by environmental awareness,
social democracy and human rights (Sarena, 2011) and they began to use recycled
materials in their artworks and diverse art techniques.
Figure 1 Three Types of Public Art (PA)
In 1988, Patrick Blanc’s re-introduced the concept of modern VG to the
world that was already initiated by Professor White in 1938. One of the most
prominent examples of VG in Blanc’s works was a palette of foliage that creates
a subtle mixture of effects, forms and shades over the surface of walls. It has put

Mazlina Mansor, Khalilah Zakariya, Nor Zalina Harun, & Nur Izzah Abu Bakar
Appreciation of Vertical Greenery in A City as Public Art
© 2017 by MIP 120
the VG system into the limelight whereby it was appreciated for its environmental
and aesthetical utilisation.
Over the years, both VG and PA have gone through many stages of
development. What can be determined from this is that the integration of both
produces many benefits to city spaces. Their application and usage could be
explored in many other creative ways. The sustainability of urban landscape can
be generated when the site, art and people are integrated. Buildings around the
world have embraced VG for its environmental, aesthetic and economic values.
The application of green concepts for urban design cityscapes is made obligatory
in some parts of the world. These have popularised the installation of vegetation
on external street walls. For instance, a piece of garden wall art can enhance the
experiential quality of the adjacent space by providing an aesthetically pleasing,
calming and the environment that is closer to nature (Chin, 2010). VG as PA is
an urban greening project, which creates an environment for people to be
comfortable shopping, working or living, and their community’s character is
expressed (Watts, 2009). Hence, successful urban greening projects will be
worthwhile and rewarding in the long term for the community. Currently, VG has
often showcased beautiful patterns and becoming a new urban art in a city
(Séguin, 2012).
Figure 2 (a) vertical garden (VGr); (b) bio façade wall (BW); (c) green wall (GW); (d)
green façade (GF); (e) vertical greenery system (VGS); (f) green scaffolding (SG); (g)
green space wall (GSW); (h) living wall (LW)
Several types of VG have the potential to become PA in urban public
space (Figure 2). Vertical garden (VGr) is all forms of plant surface of the wall.
It allows the growing of plants, up, or on the façade of buildings (Baskaran, 2003;
Green Public Art, 2010). Bio facade wall (BW) is vegetation that is guided to
climb through the structure like wires or cables. Green wall (GW) is all forms of
vegetation surface, while green facade (GF) is climbing plants or cascading

PLANNING MALAYSIA
Journal of the Malaysia Institute of Planners (2017)
© 2017 by MIP 121
groundcovers trained to cover designed supporting structures (Badrulzaman,
2011). Vertical greenery system (VGS) is a way in which plants can be grown
on, up, or against a façade of a building or feature walls (Wong et al., 2010).
Green scaffolding (GS) applies mainly to eco-retrofitting, essentially wraps a
lightweight structure around the exterior of existing buildings. Green space wall
(GSW) is an eco-sphere that doubles as an exterior wall or mixed interior/exterior
spaces in new development (Birkeland, 2008). Living wall (LW) consists of pre-
vegetated panels, vertical modules or planted blankets that are fixed vertically to
a structural wall or structure (Chin, 2010).
METHODOLOGY
An online survey was used to identify public’s familiarity and responses on the
integration of VG as PA. Electronic survey is becoming increasingly common
because it provides strong advantages such as speedy distribution and response
cycles, the ability to conduct large-scale distribution of a questionnaire to
prospective respondents, and cost less compared to postal mail survey (Yun &
Trumbo, 2000; Lazar & Preece, 1999). The questionnaire consisted of three
sections. The first section recorded the respondent’s background. The second
section dealt with familiarity with the terms VG and PA. The third section
explored public’s views on the integration between VG and PA. The survey
questions consisted of mainly closed-ended question, supported by pictorial
questions and open-ended questions.
A link to the survey was sent online to potential respondents, where the
respondents were automatically directed to the Google Form survey. The survey
was pre-tested and fine-tuned before being distributed to the respondents. The
target respondents were the Malaysian public, and the link to the survey was sent
out to almost 400 potential respondents. The survey was opened for two months
to allow potential respondents ample time to answer. All in all, the survey
managed to gather 117 responses.
Several steps were used to analyse the online responses. The responses
were automatically recorded in Excel spreadsheet and later sorted into respective
themes to generate frequency distributions. The analysis process began with
familiarizing the data. This phase involved reading and re-reading the responses
to become familiar with its content. Important dimensions from the responses
were selected using categorical analysis. Descriptive analyses were used to
analyse the closed-ended questions using percentage from frequency distributions
derived from the Excel spreadsheet. For the open-ended questions, category
headings were used to theme the results about the objectives of the study. In this
case, categorising the responses that the respondents replied and suggested based
on the parameters.

Mazlina Mansor, Khalilah Zakariya, Nor Zalina Harun, & Nur Izzah Abu Bakar
Appreciation of Vertical Greenery in A City as Public Art
© 2017 by MIP 122
FINDINGS
Respondents’ Profile
The minimum age of the respondents was limited to 18 years or older to ensure
that the respondents were adults. 64% of the respondents are within the age of
18-30 years old. 24% are within the age of 31-40 years old, 8% within 41-50
years old, and 4% within 51-60 years old. More than half of the respondents were
female (62%). Almost half of the respondents are professionals (43%). 21% of
them are academicians, 19% students and the rest (17%) consisted of various
groups of professions. Regarding the place of residence, 50% of the respondents
reside in Selangor, 21% in Kuala Lumpur and the others (28%) live in other states
in Malaysia. 57% of the respondents have degree qualification and 32% have
postgraduate qualification. 8% of the respondents are diploma holder and 3%
only have secondary school education.
Familiarity with Vertical Greenery and Public Art
Concerning familiarity, less than half of the respondents (48%) are familiar with
the term vertical greenery (VG). It is because VG is a new term among
Malaysians, and it is associated with terms that are closer to it such as vertical
wall and green wall. The public might have encountered it before, but unsure of
the terms used to describe it.
Eight types of VG, as in described in Figure 2, were shown to the
respondents using images in pictorial questions. As shown in Table 1, most of the
respondents are familiar with the VGS (71%), followed by GF (69%), LW (67%)
and BW (56%). Less than half of the respondents are familiar with the GW (48%),
VGr (45%), GS (39%) and the GSW (34%). 56% of the respondents have seen
the VGS in the public spaces. The results suggest that even though the
respondents are not very familiar with the term VG, they do recognised the types
of VG images that were shown in the survey. Some have also seen it personally.
Overall, the results suggest that even though VG is a new term of landscape
approach in Malaysia, the public is quite familiar with it.
Table 1 Familiarity with Types of VG
Variables VGr BW GW GF VGS GS GSW LW
Familiarity on types of VG (%) 45 56 48 69 71 39 34 67
The types of VG that respondents
have seen in a public area (%) 26 40 22 49 56 26 21 48
Location of
VG being
displayed
Selangor 3 13 11 16 8 10 3 12
Kuala Lumpur 9 3 6 9 18 7 12 24
Others 7 4 3 4 4 4 6 15 Note. Highlighted figures are the highest frequency (%)

PLANNING MALAYSIA
Journal of the Malaysia Institute of Planners (2017)
© 2017 by MIP 123
In terms of familiarity with the PA term, majority (78%) of the
respondents is familiar with the term. Three types of PA, namely the integrated
art (integrated walls-IW, integrated fence-IF), environmental art (EA) and stand-
alone art (SAA) were shown to the respondents to identify their familiarity and
preference of PA in the urban public space. The finding is necessary to understand
the public’s knowledge about PA. Results on the familiarity of different types of
PA are shown in Table 2.
Table 2 Familiarity with Types of PA and the Preferred PA
Variables IA
EA SAA IW IF
Familiarity with types of PA (%) 93 79 73 92
Preferred PA (%) 20 46 34 Note. Highlighted figures are the highest frequency (%)
The respondents are most familiar with IW (93%) followed by stand-
alone art SAA (92%), IF (79%) and EA (73%). The result shows that the
Malaysian public is more familiar with the term PA as compared to the term VG.
Regarding preference in types of PA, the result shows that the respondents
preferred EA out of all types of PA (46%). It is followed by SAA (34%) and IA
(20%). The result suggests that even though the respondents are more familiar
with IW (integrated wall), they prefer EA (environmental art) and would like to
see more EA being implemented in the urban spaces. Also, these findings reveal
that the public is aware of the importance of having more environmental-friendly
PA in urban public spaces.
Integration of Vertical Greenery as Public Art
To assess respondents’ familiarity and views whether VG can be appreciated as
PA, they were asked to identify four types of VG that can act also as a PA. These
are VG as IW, VG as IF, VG as EA and VG as SAA. To assist the respondents,
pictorial questions with the image of the abovementioned VG were provided in
the survey. Results are shown in Table 3.
The results show that the public in Malaysia is not yet very familiar with
the integration between VG and PA. About half of the respondents (43%) pointed
out that they are familiar with VG as EA. Nonetheless, 85% of the respondents
stated that they have seen VG as SAA in urban public spaces in Malaysia. The
results show that the public is familiar with the VG as PA in Malaysia even
though they seldom encounter the artwork personally in urban public space, but
have seen the artwork being displayed in Malaysia in the media. It shows that
although VG was still not widely implemented as PA as compared to other
countries, the implementation has already started in Malaysia. Thus, it would not
be a hindrance for it to be widely implemented in Malaysia.

Mazlina Mansor, Khalilah Zakariya, Nor Zalina Harun, & Nur Izzah Abu Bakar
Appreciation of Vertical Greenery in A City as Public Art
© 2017 by MIP 124
Table 3 Familiarity of VG as PA
Variables Detail VG as
IW
VG as
IF
VG as
EA
VG as
SAA
Familiarity with VG as PA
(%)
Yes 42 23 43 23
No 57 76 54 72
Familiarity of VG as PA
being displayed in urban
public space in Malaysia
(%)
Yes 80 84 74 85
No 16 15 23 10
Location of VG as PA (%) Selangor 3 3 10 1
Kuala
Lumpur 6 12 - 1
Other
states 1 4 4 4
Note. Highlighted figures are the highest frequency (%)
On the idea to integrate VG as PA, 92% of the respondents agreed with
the idea to integrate VG as PA. It shows that the public is very interested in the
idea to implement VG as PA. An analysis of the survey data found seven
dimensions or reasons for their agreement for the appreciation of VG as PA
(Table 4).
Table 4 Integration of VG as PA
Reasons to integrate VG as PA Frequency (no)
1. Aesthetic: aesthetic value, attractive 9
2. Environment 36
Mitigate greenhouse effect; pollution 8
Nature; balance development; scenery 12
Environmentally friendly 11
Native plant species 2
Health benefits 1
Minimum land usage 2
3. Awareness 11
Promote message to public 2
Greener Malaysia; appreciate green art 9
4. Economic 7
Attract tourism; economic benefit 5
Enhance space value 2
5. Design 9
Possible trend 3
Unique; creative; Providing varieties 6
6. Development of VG - improve 1

PLANNING MALAYSIA
Journal of the Malaysia Institute of Planners (2017)
© 2017 by MIP 125
7. Development of PA 6
Promote green art; awareness on PA 3
Quality PA; artistic; diversity of PA 3
Support social needs 1
The most cited reason by respondents is that VG is good to be appreciated
as PA for the care of the environment (36 times). The respondents suggest that it
can mitigate the greenhouse effect, bring nature in cities, environmentally
friendly, improve the scenery, produce environmental benefits, utilise many plant
species in Malaysia, mitigate pollution problems, balance between development
and nature, health benefits, and minimum land usage. Among the respondents’
insights on this is “...The development always concerns on the buildings and the
facilities. Everything is made up of concrete and metal. It is a good idea to
implement the greenery in the area for the aesthetic value of the area, landmarks,
and most importantly the environment, such as cooling down the area, cleans the
air, etc..’. The response shows that the idea to integrate VG as PA is well accepted
by the public and the idea would have a bright future to be realised.
The Attributes of Vertical Greenery as Public Art
Questions on the attributes of VG as PA preferred for city spaces in Malaysia
were also included in the survey. Table 5 shows the respondents’ answers, where
59% - 78% of the respondents preferred all types of VG to be moderate in size.
In terms of colour, 56% - 67% preferred it to be a combination of warm and cool
colour. 56% - 67% agreed for the VG to be located outdoor rather than indoor.
For the design attribute, 84% - 92% favoured the VG to be a combination of
natural and formal design. Finally, 45% - 56% prefer the material to be a
combination of natural, recycled and new materials. These responses would help
designers to have ideas on the attributes that should be taken into consideration
when designing VG as PA.
Table 5 Preferred Attributes of the Implementation of VG as PA
Attributes Dimension Vertical Greenery as Public Art (%)
Remarks VG as IW VG as IF VG as EA VG as SAA
1. Size
Small 0 9 1 10
Moderate 62 78 59 61 Size: Moderate
Range: 50%-80%
Large 38 14 37 26
2. Colour
Warm 4 5 11 10
Cool 29 32 28 24
Combination 67 61 56 61 Colour: Combination
Range: 50%-70%
3. Location
Indoor 5 7 3 9
Outdoor 92 91 91 84 Location: Outdoor
Range: 80%-92%

Mazlina Mansor, Khalilah Zakariya, Nor Zalina Harun, & Nur Izzah Abu Bakar
Appreciation of Vertical Greenery in A City as Public Art
© 2017 by MIP 126
Note. Highlighted figures are the highest percentage (%)
Most importantly, the open-ended question on the preference of attributes
also produced many valuable suggestions. 27 responses were obtained from the
respondents, which can be categorised into 14 dimensions as shown in Table 6.
The highest frequency of the attribute is in the choice of plants. The public
suggests the consideration of Malaysian native plants, the plants’ habitat,
aromatic plants and medicinal plants. The result implies that the public can accept
the idea to integrate VG as PA and is very keen on it.
Table 6 Additional Attributes Derived from Respondents’ Responses
Attributes Frequency
(nos.)
1. Maintenance - proper and easy maintenance; low 5
2. Function – shade; health benefits; good for LA Profession 3
3. Education - appreciate nature 1
4. Islamic Values 1
5. Location 1
6. Public acceptance 1
7. Types of plants – species; native plants; habitat; aromatic; medicinal 6
8. Supporting elements – recreational element 1
9. Irrigation system 1
10. Locality - cultural heritage elements; building facade’s character 1
11. Awareness - message 1
12. Safety – no vandalism; safe 2
13. Design - retaining wall along the highways; green standing
structures
2
14. Cost - management 1
Recommendation for Vertical Greenery to Be Integrated As Public Art
In terms of recommendations, 46 respondents provided ideas which were
classified into seven categories (Table 7). Education and promotion (15 times)
are the utmost importance to improve the integration. It is vital to educate the
public to care for effort in the maintenance of the VG and to educate public to
realize the idea. Awareness, strong promotion through mass media, promotion
through expo and exhibits, ‘bring back nature campaign’, no vandalism
4. Design
Natural 27 27 29 22
Formal 5 10 8 10
Combination 66 57 57 62 Design: Combination
Range: 50%-70%
5. Materials
Natural 23 24 25 23
Recycle 18 17 15 15
New 3 5 9 8
Combination 56 45 45 50
Material:
Combination
Range: 40%-60%
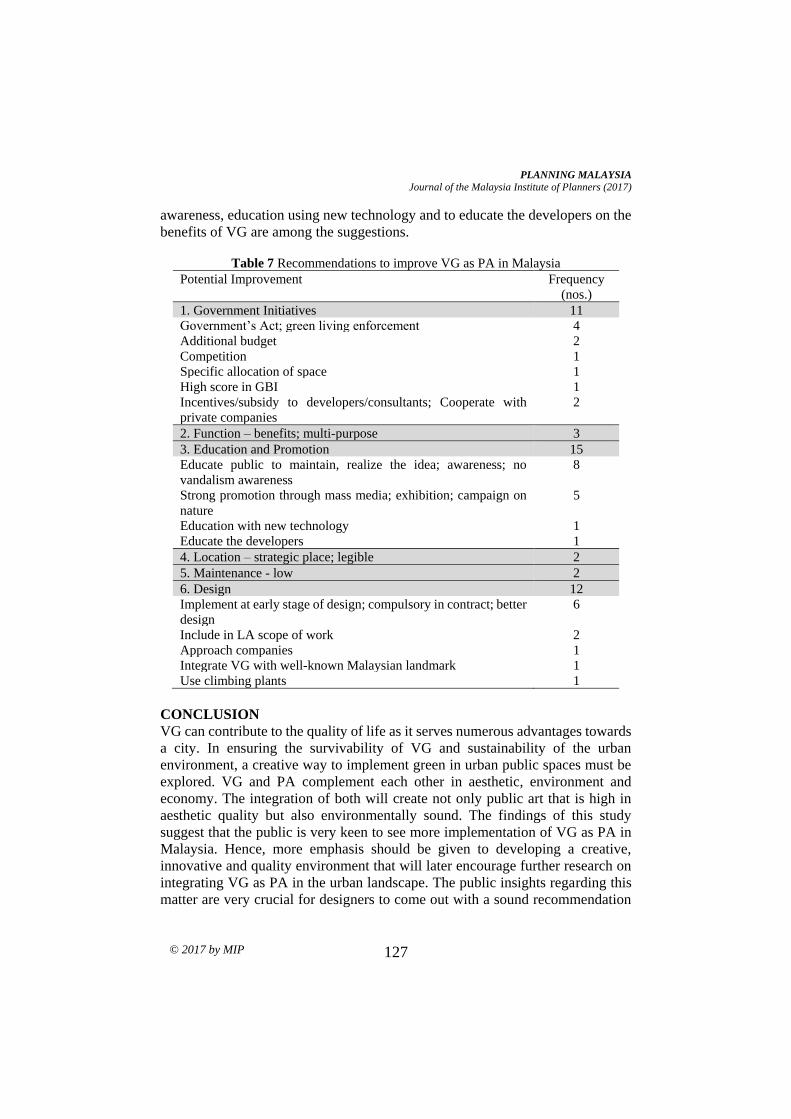
PLANNING MALAYSIA
Journal of the Malaysia Institute of Planners (2017)
© 2017 by MIP 127
awareness, education using new technology and to educate the developers on the
benefits of VG are among the suggestions.
Table 7 Recommendations to improve VG as PA in Malaysia
Potential Improvement Frequency
(nos.)
1. Government Initiatives 11
Government’s Act; green living enforcement 4
Additional budget 2
Competition 1
Specific allocation of space 1
High score in GBI 1
Incentives/subsidy to developers/consultants; Cooperate with
private companies
2
2. Function – benefits; multi-purpose 3
3. Education and Promotion 15
Educate public to maintain, realize the idea; awareness; no
vandalism awareness
8
Strong promotion through mass media; exhibition; campaign on
nature
5
Education with new technology 1
Educate the developers 1
4. Location – strategic place; legible 2
5. Maintenance - low 2
6. Design 12
Implement at early stage of design; compulsory in contract; better
design
6
Include in LA scope of work 2
Approach companies 1
Integrate VG with well-known Malaysian landmark 1
Use climbing plants 1
CONCLUSION
VG can contribute to the quality of life as it serves numerous advantages towards
a city. In ensuring the survivability of VG and sustainability of the urban
environment, a creative way to implement green in urban public spaces must be
explored. VG and PA complement each other in aesthetic, environment and
economy. The integration of both will create not only public art that is high in
aesthetic quality but also environmentally sound. The findings of this study
suggest that the public is very keen to see more implementation of VG as PA in
Malaysia. Hence, more emphasis should be given to developing a creative,
innovative and quality environment that will later encourage further research on
integrating VG as PA in the urban landscape. The public insights regarding this
matter are very crucial for designers to come out with a sound recommendation

Mazlina Mansor, Khalilah Zakariya, Nor Zalina Harun, & Nur Izzah Abu Bakar
Appreciation of Vertical Greenery in A City as Public Art
© 2017 by MIP 128
of VG as PA. This exploratory study provides the stimulus for designers to
rethink approaches to the functions, content and strategies for VG as PA.
REFERENCES Badrulzaman J., Ismail S., & Mohd Hisyam, R. (2011). Evaluating the impact of vertical
greenery system on cooling effect on high rise buildings and surroundings: A
review. SENVAR, Johor: Skudai. www.epublication.
fab.utm.my/180/1/SENVAR1201
Baskaran, B. (2003). Evaluating rooftop and vertical gardens as an adaptation strategy
for urban areas. Ottawa from http://lib.fo.am/_media/
Birkeland, J. (2008). Space frame walls: facilitating positive development. In G. Foliente,
T. Luetzkendorf, P.Newton, & P. Paevere (Eds.) The World Sustainable Building
Conference (pp. 21-25). Victoria, Melbourne, Australia.
Cartiere C., & Willis, S. (2008). The practice of public art (Eds.), New York: Taylor &
Francis.
Chin, M. Y. (2010, September). Wrapped in life-giving green. The Star Online. Retrieved
from http://thestar.com.my/lifestyle/
Green Public Art (2010). Urban landscaping: green walls. Retrieved from
http://greenpublicart.com/
Hindle, R. L. (2012). A vertical garden: origins of the Vegetation-Bearing Architectonic
Structure and System (1938). An International Quarterly, 32(2), 99-110. doi:
10.1080/14601176.2011.653535
Irons, K. (2012). The purpose and value of public art. eHOW. Retrieved from
http://www.ehow.com/
Lazar, J., & Preece, J. (1999). Designing and implementing web-based surveys. Journal
of Computer Information Systems, 39(4), 63-67.
Mohd Fabian, H., Osman, M. T., & Mohd Nasir, B. (2012). Towards integrating public
art in Malaysian urban landscape. Pertanika, Journal of Social Sciences &
Humanities, 20(2), 251–263.
Peck, S. W., & Callaghan, C. (1999). Greenbacks from green roofs: forging a new
industry in Canada. Status report, Canada Mortgage and Housing Corporation,
March 1999.
Sarena, A. (2011). Thematic approaches in Malaysian art since the 1990s. Jati, 16, 97-
113.
Séguin, M. L. (2012). Green walls. Architecture Posts. Retrieved from http://
http://inhabitat.com/tag/green-wall/
Shunmugam, V. (2010, September). By the artists, for the people. The Star. Retrieved
from http://thestar.com.my/lifestyle/
Watts, P. (2009). Ecoartspaceblog. Report from Seattle Public Art Conference; 2009.
Retrieved from http://ecoartspace.blogspot.com/
Wong, N. H., Tan, A. Y. K., Chen, Y., Sekar, K., Tan P. Y., Chan, D., & Chiang, K.
(2010). Thermal evaluation of vertical greenery systems for building walls.
Building and Environment, 45(3), 663-672. doi: 10.1016/ j.buildenv.2009.08.005
Yun, G. W., & Trumbo, C. W. (2000). Comparative response to a survey executed by
post, e-mail, & web form. Journal of Computer-Mediated Communication, 6(1).
doi: 10.1111/j.1083-6101.2000.tb00112.x

1Ph.D. Candidate at Universiti Teknologi Malaysia. Email: [email protected] 129
PLANNING MALAYSIA:
Journal of the Malaysian Institute of Planners
VOLUME 15 ISSUE 1 (2017), 129 - 138
DESIGN PROBLEM-SOLVING: UNDERSTANDING THE
SIGNIFICANCE OF ITERATIVE-BEHAVIOUR IN DESIGN
Danfulani Babangida Idi1, & Khairul Anwar Mohamed Khaidzir2
1,2 Faculty of the Built Environment,
UNIVERSITI TEKNOLOGI MALAYSIA
Abstract
Different concepts and definitions associate iterative-behaviour with repetition.
This study consider iterative-behaviour simply means as the act that involve
repetition of activities to improve the evolving design. The research further
investigate the significance of designer iterative behaviour in design using
sketching as the media for design interaction. The retrospective protocol analysis
of the video data have identified and measure designer iterative behaviour in
design, through a sketching and scoring sessions by five (5) final year
undergraduate students and five (5) design tutors, all from the Department of
Architecture, University of Technology Malaysia. The design and score were
qualitatively and quantitatively compared using close group discussion and the
Pearson correlation coefficient analysis. The result shows that in design problem-
solving, designer iterative-behaviours were not statistically significant in
determining the quality of design.
Keywords: Iterative-behaviour, modification, revisit, fixation, representation
Date Received: 30th April 2016
Date of Acceptance: 30th October 2016

Danfulani Babangida Idi, & Khairul Anwar Mohamed Khaidzir
Design Problem-Solving: Understanding the Significance of Iterative-Behaviour in Design
© 2017 by MIP 130
INTRODUCTION
Iterative-behaviour simply means involving repetition of activities to improve an
evolving design (Eppinger, Nukala & Whitney, 1997). Different concepts and
definitions associate iterative-behaviour with repetition. Among research
specifically conducted to measure iterated-behaviour uses straight observation,
interviews, questionnaires, and protocol analysis with records of verbal and
actions of real design activity (Stauffer & Ullman, 1991; Ericsson & Simon,
1980) To date, there has been little research specifically addressing issues of
designer iterative-behaviour in design (Jin & Chusilp, 2006). Literature indicated
repetitive actions such as physical actions, sign language, and eye movement, and
sketching activities such as regroup, interpret, reorganize, generate, revise, refine
and consolidate are all form of iterative-behaviour developing a design idea
(Robbins, 1994; Gero, Tversky & Purcell, 2001; Suwa & Tversky, 1997; Schön,
1983; Goldschmidt & Smolkov, 2006; Safoutin, 2003). However, studies on the
relationship of iterative-behaviour and sketch quality was slightly under
researched. To this end, this study had successfully observed, identified and
analysed some of the above classification of iterative-behaviour in design
problem-solving that uses sketching as the design tool (Furlinger & Moore, 2008;
Aguero et al., 2010).
THEORETICAL FRAMEWORK
In recent times information and communication have become key features in any
technological advance. The use of sketch as a medium for communication that
has begun in early civilization and has continued up to the present digital era for
design ideation. This study adopted a method use to study designer behaviour by
Adams and Atman (1999) using fresh and senior students in their engineering
design coursework. The focus of their work was to identify designers' behaviours,
such as the monitor, search, verify, plan, redefine and capture, and further related
to design competency. The research method used was verbal protocol.
Alternatively, this study used sketching and pin-up design assessment as design
media and scoring tool. Coding categories were equally used to describe and
measure the specified required behaviour. Although the result of their study
suggest designer behaviour is a significant component of design activity, whereas
this study suggests otherwise. Their result indicates measures of designer
activities correlate positively with design success, and senior students tend to
have more efficient behaviour than freshman students (Adams & Atman, 1999). The architects are trained professionals charged with the responsibilities
of solving design problems and managing the building processes. The behaviour
of these professionals could provide insight into their problem-solving processes;
therefore lacking in this knowledge constitutes a significant research gap in the
study of Architectural design process. Iterative-behaviour is the act of repetitive
behaviour, usually with the aim of achieving the desired goal, yet the occurrence

PLANNING MALAYSIA
Journal of the Malaysia Institute of Planners (2017)
© 2017 by MIP 131
of iterative-behaviour in architectural design is under-researched. In addition,
since sketch is a common visual thinking tool for design, the study of designer
behaviour with regards to it potentially forms an important issue of research in
the architectural design process. Findings and results of this kind of study can
assist stakeholders in design domains to improve on existing manual and
traditional methods of design problem solving. The main objectives of the study
are to identify and investigate the role of designer iterative-behaviour in sketching
using final year undergraduate architecture students and design tutors.
ITERATIVE-BEHAVIOUR
According to Wynn, Claudia and John (2007), iterative-behaviour has five (5)
attributes namely repetition, revisit, rework, modification and fixation. Repetition
means the repetition of a process such as do it again, reworks, copy, delineation
and revisit activities until you are satisfied with the outcome of your design. Copy
activity means the act of duplication or reproduction direct or indirect transfer of
drawings from the same sheet or between two sheets. Another aspect of repetition
considered is delineation as the process of outlining or defining an object for
further clarification by tracing, shading or colouring. According to Wynn,
Claudia and John (2007), modification is the refinement of primary
characteristics of secondary characteristics by enhancing and integrating of
shapes, lines or texture together with maintaining the originality of the design.
Also, by combining and amalgamating different parameters of various shapes to
converge as well-defined design (Wynn, Claudia & John, 2007).
Visual or Haptic visitation using eye movement or haptic hand contact
during sketching are other forms of iterative-behaviour found in this study. Visual
visitation refers to designers' act of visit and revisits with eye movements between
drawing sheets at a distinctive time interval during the sketching session, while
Haptic visitation means designers transformation moves between drawing sheets
using physical hand movement during sketching. Also Haptic and Visual
visitation are also found to transfer or communicate information ideas or to draw
during design. Further research can prove the need to develop a computerized
designer haptic sketching tool for effective sketching activity. Figure 1 illustrates
visual and haptic visitations in the sketching session. According to Bilda, Gero,
& Purcell (2006), designers’ undergo some premature difficult caused by
cognitive and behavioural activities such as brainstorming and handling tools
during sketching. A moment where innovation is blocked (Figure 2). The
fixedness occurs as a result of identifying and finding solutions to the problem
using knowledge, skills, experience, measure, construct, observe, tasks and
information or handling sketch working tools such as pencil, pen, and drawing
sheet. Designers’ communicate their ideas using methods such as visual
information transfer either manually or computerized. According to Fish and
Scrivener (1990) designers communicate abstract and concrete ideas using

Danfulani Babangida Idi, & Khairul Anwar Mohamed Khaidzir
Design Problem-Solving: Understanding the Significance of Iterative-Behaviour in Design
© 2017 by MIP 132
imagery and sketches (Abstract), schematic drawings and 3D modelling
(Concrete). This study used the same concept to categorized designers
embodiment design as Concretization while Abstraction represents the method of
preliminary designs presentation. This study used the 5 classifications of
iterative-behaviour illustrated by Wynn, Claudia and John (2007) and in Table 1
as the variables that will represent iterative-behaviour in the research.
Figure 1 Designer Visual and Haptic
Visitations during Sketching Activity
Figure 2 Designer Cognitive Fixation
in Design
METHODOLOGY
Among methods of studying design activities are protocol studies, observation,
interviews, content analysis, close group discussion and linkography. Eastman
conducted the first protocol study in 1968 in which experienced architectural
designers were asked to redesign the interior of a residential bathroom (Akin &
Lin, 1995).
Protocol studies is classified into content oriented and process oriented
studies (Gero, Tversky & Purcell, 2001) where the content-oriented approach is
centred on the study of the drawings produced, such as sketch, CAD drawings,
and models while, the process-oriented approach is the study of the process of
production such as behaviours, verbal use, and gestures. Most recently an
empirical protocol analysis was used to compare two design working
environments, which were manual pencil and paper and the monitor, keyboard,
mouse working environments, using FBS, Chi-square Test, and Paired-T test
(Tang, Lee & Gero, 2010).
This study select protocol study as research methodology because of the
ability to study procedures based on behaviour, verbalization, and gestures found
in architecture, industrial design, mechanical engineering, electronic engineering,
and software design conducted in an observed experiment involving a drawing or
sketching process (Cross & Anita, 1996).

PLANNING MALAYSIA
Journal of the Malaysia Institute of Planners (2017)
© 2017 by MIP 133
The aim of this research is to identify and investigate the significance of
designer iterative-behaviour in design problem-solving. The research method and
design include stages of experimental design, subject recruitment, conducting
experiments, transcribing protocols, coding schemes, quantitative and qualitative
comparisons using close group discussions with a supervisor and members of the
research group, literature review and non-probabilistic experiment that
established findings and possible options for future research.
EXPERIMENTAL DESIGN
The experimental design consists of planning, positioning, and distribution of
experimental components such as designers, instruments with appropriate
distribution of methods, processes, time, position of the instrument, space
allocation and other facilities required for the study. The design consists of the
designers positioning, design task and arrangement of supporting instruments.
The designers are five highest grade score final year students of architecture
selected based on their sketching ability, design grade and willingness to
participate in the exercise. The selected subjects worked independently for a
period between 45 to 60 minutes.
The design problem requires the design of an internet café for the
international student of UTM. The café should have a range of shopping and
commercial shops, along with some public, cultural and social space within the
same site. It will also have some courts. There shall be adequate parking facilities
and landscaping to provide the student with a sense of identity. Pedestrian paths
and sidewalks shall ensure safety for the student from vehicular movement. The
proposed design shall aim to evolve a more humane internet café through
sustainable strategy, appropriate construction and technology, innovative
planning, creative architecture, and sustainable environmental design. These shall
be the main criteria for the evaluation of the project.
Experimental procedure akin to this research experiment was conducted
using two high-level video cameras in the corners of the room20. One of the
cameras points to the designer behaviour while the other to the sketching activity
(Dorst & Cross, 2001). This study also used three video cameras, one digital
photo camera, film editing computer system, stopwatch, bell, voice recorder,
loudspeakers, drawing sheets and instruments, table and chair.
These instruments are technically arranged in an Audio/Visual Lab
as illustrated in Figure 3.

Danfulani Babangida Idi, & Khairul Anwar Mohamed Khaidzir
Design Problem-Solving: Understanding the Significance of Iterative-Behaviour in Design
© 2017 by MIP 134
Figure 3 Experimental Set-up
DESIGN ASSESSMENT
In a similar context, a research study conducted an experiment that uses design
tutors assessments as a method of obtaining the overall ‘quality of a design using
five independent, skilled design teachers from the TU Delft Faculty of Industrial
Design Engineering, all of whom are also practicing designers to assess the
designs (Dorst & Cross, 2001). Below is the procedures of the design quality
measurement set-up: First, the assignment was read, and some of the relevant information were
shown to the judges. The judges could ask questions for further clarification.
Slides of all the concepts were shown in random order for 15 seconds,
accompanied by a one-sentence summary to explain the way each of them works.
The scoring categories together with the design concepts are presented to
the judges for scoring. The scoring categories are creativity, aesthetics, technical
aspects and ergonomics, and business aspects. In the last run-through, the judges
were asked to give total judgments of the concepts. Thus, the ‘total’ judgments is
not a mean of the other scores, but a separate, ‘overall impression’ score (Dorst
& Cross, 2001).
In this research, the assessment was done by experienced architectural
design academicians from the architecture department at the Faculty of the Built
Environment, Universiti Teknologi Malaysia. The drawings produced by the
students was collected immediately after every experimental session and
immediately presented to the assessors for scoring.
The scoring process was the same as the normal “pin-up” studio design
assessment. Four different criteria were used to judge a design where each
criterion have a maximum of 25% marks which in sum gives a total of 100%
marks. The first criterion is designer ideation (Aesthetics order) which is the role
of achieving a sense of unity or synthesis through the characteristics of shapes,

PLANNING MALAYSIA
Journal of the Malaysia Institute of Planners (2017)
© 2017 by MIP 135
patterns, or detailed that constitute the design (Laseau, 2001). The second
criterion is designer skills (Proficiency in communication) which represent the
designer ability to communicate explicitly design ideas (Laseau, 2001). The third
criterion is the progression (transformation) in design, which is the
transformation of concept and detailed design (Laseau, 2001). The final criterion
is the clarity of the information contained in the drawing (Laseau, 2001).
RESEARCH DATA
The process of data collection is classified into phases of different protocols
starting with an introductory warm-up exercise before proceeding with both
sessions (design and scores). The first category of data is the drawing while the
second category is the information derived from video record based on the five
variables that represent iterative-behaviour, i.e. repetition, modification, revisit,
representation, and fixation. Then the third and final category which is the result
of the design quality measurements carried out by the design tutors (Data on
Design Quality Measurements).
Table 1 Proposed Coding Categories for the Study of Iterative Behaviour
ACTIVITIES CODE ACTION DESCRIPTION
Repetition C1
D1
Copy
Delineation
The act of duplicating and defining objects in sketching
Modification E1
N1
Enhancement
Integration
Adding of lines, colour, texture, magnitude as well as connecting shapes in sketching
Revisit V1
H1
Visual
Haptic
Designer eye and hand contacts during sketching activity
Fixation C2
B1
Cognitive
Behavioural
Designer fixedness during caused by Brainstorming or physical
actions
Representation C3 A1
Concretization Abstraction
Detailed and conceptual design
The authors further divided the five variables into ten sub-variables of
copy, delineation, enhancement, integration, visual, haptic, cognition,
behavioural, concretization and abstraction. These ten sub-variables are the
designer behaviour that represents iterative-behaviour in the design session. The
second category is the score that is produced by the four judges. The scoring
variables include ideation, clarity, skills, and progression which collectively give
the actual measurement of the sketch. Each variable is assigned with 25% weight,
and the sum of the four variables makes the actual measure of the design. The
approach used in extract the data from the data involves the use of various tables
and codes for data categorization and collection.

Danfulani Babangida Idi, & Khairul Anwar Mohamed Khaidzir
Design Problem-Solving: Understanding the Significance of Iterative-Behaviour in Design
© 2017 by MIP 136
ANALYSIS AND RESULT
Processing and summing designers’ iterative-behaviour and judges score has
established the figures that has been used for qualitative and quantitative data
analysis. The two different analysing factors are judges’ score and iterative-
behaviour. Table 2 illustrate the sum of individual designer iterative-behaviour
and score.
Table 2 Data on Designers Iterative-Behaviour and Score Designers Iterative-behaviour Score
D1 166 74
D2 204 79
D3 122 79
D4 161 62
D5 242 69
Based on the result of the observed designer iterative-behaviour as
presented in Table 3, Figure 4 indicated that the relationship between the sum of
iterative-behaviour and score (column 2 and 3 in table 2) was negative and weak.
Moreover, the influence of the measured iterative-behaviour seems to be very low
or even close to zero when compared with the score implying that iterative-
behaviour has a negative and weak relationship with the score.
Figure 4 Correlation score between Iterative-Behaviour and Design quality (Score)
Table 3 Research Data for Iterative-Behaviour
Subjects ITERATIVE-BEHAVIOR
Sum D1 E1 N1 V1 H1 C2 B1 C3 A1
D1 44 6 6 21 21 0 0 38 9 166
D2 59 4 4 33 33 0 0 48 2 204
D3 18 3 3 30 30 0 0 10 9 122
D4 43 5 5 36 34 0 0 16 1 161 D5 48 5 5 53 49 0 0 32 4 242

PLANNING MALAYSIA
Journal of the Malaysia Institute of Planners (2017)
© 2017 by MIP 137
However, the findings have shown some positive relationship between
skills and score together with ideation and progression. There are nearly no
correlations between Iterative-Behaviour and score but some findings between
other scoring criteria have a strong and positive relationship with iterative-
behaviours. The result further expressed that getting higher scores in architectural
design sketch is not related to designer iterative-behaviours as presented in Table
4. Table 4 The Correlation between Iterative-Behaviour and Scores
Iterative-Behaviour and Score Correlation coefficient
-0.196
CONCLUSION
This study examines the role of iterative-behaviour in architectural design
sketching where the empirical comparison is used to compare iterative-behaviour
and sketching through protocol analysis and Pearson correlation coefficient
analysis. The results show that the relationship between iterative-behaviour and
score was negative and weak. Moreover, the influence of iterative-behaviour
seems to be very low or even close to zero when compared with the score
implying that iterative-behaviour has a negative and weak relationship with the
score of architectural design sketch. However, the findings have shown some
positive relationship between skills and score together with ideation and
progression. The results of Pearson correlation (Table 3 and Figure 4) show that
there was no significant relationship between iterative-behaviour and a total score
of architectural sketching processes. In other words, too much of iterative-
behaviour does not have either positive or negative impact on the outcome of the
overall score of an architectural sketch. Maybe the reason for the negative and
weak correlation result could be due to the conventional sketching method used
in this research. Maybe a computerized sketching tool could proof a strong and
positive relationship between iterative-behaviour and score.
ACKNOWLEDGEMENT
This study is funded by Universiti Teknologi Malaysia, Skudai through the
Teaching Development Grant (Dana Pembangunan Pengajaran, DPP 2015)
entitled 'Peer Instruction in Virtual Collaborative Environment of Studio-Based
Learning' (R.J130000.7721.4J165).

Danfulani Babangida Idi, & Khairul Anwar Mohamed Khaidzir
Design Problem-Solving: Understanding the Significance of Iterative-Behaviour in Design
© 2017 by MIP 138
REFERENCES Adams, R., & Atman, C. (1999). Cognitive processes in iterative design behavior. 29th
ASEE/IEEE Frontiers in Education Conference, San Juan, Puerto Rico.
Aguero, C., Canas, J., Martın, F., & Perdices, E. (2010). Behavior-based iterative
component architecture for soccer applications with the Nao humanoid. In 5th
Workshop on Humanoids Soccer Robots. Nashville, TN, USA.
Akin, O., & Lin, C. (1995). Design protocol data and novel design decisions. Design
Studies, 16(2), 211-236.
Bilda, Z., Gero, J., & Purcell, T. (2006). To sketch or not to sketch? That is the question.
Design Studies, 27(5), 587-613.
Cross, N., & Anita, C. (1996). Winning by design: the methods of Gordon Murray, racing
car designer. Design Studies, 17(1), 91-107.
Dorst, K., & Cross, N. (2001). Creativity in the design process: co-evolution of problem–
solution. Design Studies, 22(5), 425– 437.
Eppinger, S., Nukala, M., & Whitney, D. (1997). Generalized models of design iteration
using signal flow graphs. Research in Engineering Design, 9(11), 112-123.
Ericsson, K., & Simon, H. (1980). Protocol analysis: verbal reports as data. Cambridge:
MIT Press.
Fish, J., & Scrivener, S. (1990). Amplifying the mind's eye: sketching and visual
cognition. Leonardo, 23(1), 117-126.
Furlinger, K., & Moore, S. (2008). Detection and analysis of iterative behavior in parallel
applications. 8th ICCS, Krakow, Poland.
Gero, J., Tversky, B., & Purcell, T. (Eds.) (2001). Visual and spatial reasoning in design
II. Sydney: Key Centre of Design. Computing and Cognition, University of
Sydney.
Goldschmidt, G., & Smolkov, M. (2006). Variance in the impact of visual stimuli on
design problem-solving performance. Design Studies, 27(5), 549-569.
Jin, Y., & Chusilp, P. (2006). Study of mental iteration in different design situations.
Design Studies, 27(1), 25-55.
Laseau, P. (2001). Graphic thinking for architects and designers. Toronto: John Wiley.
Robbins, E. (1994). Why architects draw. Cambridge, MIT Press.
Schön, D. (1983). The reflective practitioner: how professionals think in action. London:
Basic Books.
Safoutin, M. (2003). A methodology for empirical measurement of iteration in
engineering design processes (thesis). University of Washington.
Stauffer, L., & Ullman, D. (1991). Fundamental processes of mechanical designers based
on empirical research. Journal of Engineering Design, 2(2) 113-125.
Suwa, M., & Tversky, B. (1997). What do architects and students perceive in their design
sketches? A protocol analysis. Design Studies, 18(4), 385-403.
Tang, H., Lee, Y., & Gero, J. (2010). Comparing collaborative co-located and distributed
design processes in digital and traditional sketching environments: A protocol
study using the function-behaviour-structure coding scheme. Design Studies,
32(1), 1-29.
Wynn, D., Claudia, E., & John, C. (2007). Modeling iteration in engineering design.
International Conference on Engineering Design, ICED’07, Paris, France.

1Assistant Professor at International Islamic University Malaysia. Email: [email protected] 139
PLANNING MALAYSIA:
Journal of the Malaysian Institute of Planners
VOLUME 15 ISSUE 1 (2017), Page 139 - 150
ARCHITECTURAL HERITAGE RESTORATION OF RUMAH DATUK
SETIA VIA MOBILE AUGMENTED REALITY RESTORATION
Aida Kesuma Azmin1, Mohd Hisyamuddin Kassim2, Fadzidah Abdullah3, &
Alliyah Nur Zafirah Sanusi14
1,2,3,4 Kulliyyah of Architecture and Environmental Design,
INTERNATIONAL ISLAMIC UNIVERSITY MALAYSIA
Abstract
This paper focuses on Mobile Augmented Reality (MAR) for architectural
heritage restoration as an alternative technique to visually restore the ruined rear
house of Rumah Datuk Setia, Kuala Kangsar, Perak. The research consists of the
development of Virtual Heritage (VH) based on the architectural heritage
information of the ruined rear house, such as spatial organization, construction,
ornamentation, materials; as well as “Augmented Reality” (AR) for architectural
heritage restoration via mobile devices, such as smartphone and tablet. The
objective is to develop Mobile Augmented Reality Restoration (MARR) of
Rumah Datuk Setia, as a showcase of architectural conservation technique, for
future restoration. The study reveals the process by integrating layers of
architectural heritage information – VH, MAR and other enabling technologies
as primary mediums for architectural heritage restoration. The research
manifestation introduces a new technique of architectural heritage building
restoration through MARR. It highlights necessary elements needed to be
considered, and challenges, in developing the MARR, which can be applied for
future architectural restorations.
Keywords: Virtual heritage, mobile augmented reality, architectural heritage
restoration
Date Received: 30th April 2016
Date of Acceptance: 30th October 2016

Aida Kesuma Azmin, Mohd Hisyamuddin Kassim, Fadzidah Abdullah, & Alliyah Nur Zafirah Sanusi
Architectural Heritage Restoration of Rumah Datuk Setia Via Mobile Augmented Reality Restoration
© 2017 by MIP 140
INTRODUCTION Architectural heritage restoration normally comes in physical forms, which
requires commitments in terms of time, cost, and energy. Physical restoration of
a building of authentic values entails careful handling so as not to damage the
original building elements. Thus, to restore architectural heritage virtually is
perceived as significant to “preserve, protect and interpret” cultural and building
heritage (Noh, Sunar & Pan, 2009). This research proposes an alternative
restoration technique to visualize architectural heritage information at the
historical site by employing MARR application and integrating it with other
potential enabling technologies.
In doing so, the research intends to develop MARR of the ruined rear
house of Rumah Datuk Setia (Datuk Setia House), as a showcase of MARR at
the heritage site. “MARR” is a term to describe the utilization of mobile devices,
such as smartphone and tablet, to visualize architectural heritage information,
which has been virtually restored in the database. Development of MARR
involves a thorough study of the original run-down building representation, as
many similarities as possible.
Since physical architectural heritage restoration is scarcely affordable,
this alternative restoration technique would be established even though the
original architectural heritage on the site is in ruin. It offers an extraordinaire
experience showcasing the legacy of the priceless Malay – Colonial architectural
heritage in its glory days.
RUMAH DATUK SETIA
Rumah Datuk Setia is distinctive among other colonial bungalows due to its
hybrid architecture. Colonial influences’ immersion into the local building
tradition with prominent Islamic principles became the primary ideology
underlying its design approach. The development in Perak and the British
intervention in the local scene have brought new materials and architectural style
to the design of local dwellings. The 86-years-old mansion sits within a sixteen
acres land, in Kampung Enggor, Karai, Kuala Kangsar, Perak.
Historical Architectural Components
Built approximately in the 1930s, the house was believed to be purposely
designed by a British architect for the village chief, Penghulu Endut. Rumah
Datuk Setia is divided into two main buildings: front and rear.
The front facade accentuates the house’s characters - carefully adapted in
response to his personality. As one approaches towards the mansion, one would
notice this symmetrically designed building embraces a hybrid of Colonial and
Traditional Malay architecture, embellished with decorative motifs, which
portrays the owner’s stature. The bungalow’s grandeur scale is inspired by neo-
classical public buildings and palace designs in Malaysia during the period.

PLANNING MALAYSIA
Journal of the Malaysia Institute of Planners (2017)
© 2017 by MIP 141
The most prominent feature is the entrance porch (porte cochére), with
Greek-style Corinthian capital using Setawar leaf motifs and cornice detailing on
the entablature, on top of paired masonry columns. Its colonial architecture is
indicated by the plastered brick masonry external walls and columns, originally
in peach colour; and symmetrically protruding polygonal verandas (anjung) on
both sides with the same column design. Floral motifs of Lotus flower and
Setawar leaf symmetrically and repetitively enhance the arches.
Decorative floral ornaments at the fascia board and above the window
lintels enhance the elegance of the building’s appearance. Another interesting
architectural feature is the trefoil arches discernible throughout the ground floor
above the windows, which are uniformly glazed with small panes, and regularly
spaced with arched mouldings at the top. The space planning demonstrates
colonial characters through the formal and symmetrical layout. The front house
layout is designed mainly for administration, whilst the upper floor and rear house
are the family's dwelling areas.
In contrast, the rear building is instilled with traditional Malay
architecture with square and cylindrical masonry columns at the ground level and
common timber post-and-beam frameworks on the upper floor, with bigger and
higher scale to adapt with the proportion of the colonial domain. Rafter boards
(papan sisek), wooden lattice walls, lattice above openings and Malay floral
motifs were carved onto the fascia boards. The open-plan space planning on the
upper level depicts the traditional space division of a typical Malay house, with
the selang (hallway) as a transitional space between the front and rear house; and
the kitchen at the back. This space also includes a set of staircases at the back
entrance, and another ladder on the east side, which leads straight into the kitchen.
RUMAH DATUK SETIA RESTORATION
The focus of the MARR is at the rear house, which is in a dilapidated state. Due
to the lack of maintenance by the owner(s), major defects are apparent on floors,
walls, roof structure, as well as finishes. The timber lattice walls at the ground
floor are missing, leaving only traces of low-height brick masonry walls of about
580mm. Square brick masonry and round Doric style columns on the ground
support the timber beams and floor joists on the upper floor. Also, there is evident
of classical ornament below the timber beams acting as light holder below the
upper floor joists. There was turquoise painted horizontal timber strip walls and
panelled ceilings at the top floor interior. The walls, including openings, have
been destroyed by termites. The roof systems are severely damaged, and cracks
are visible on the leftover roof tiles.
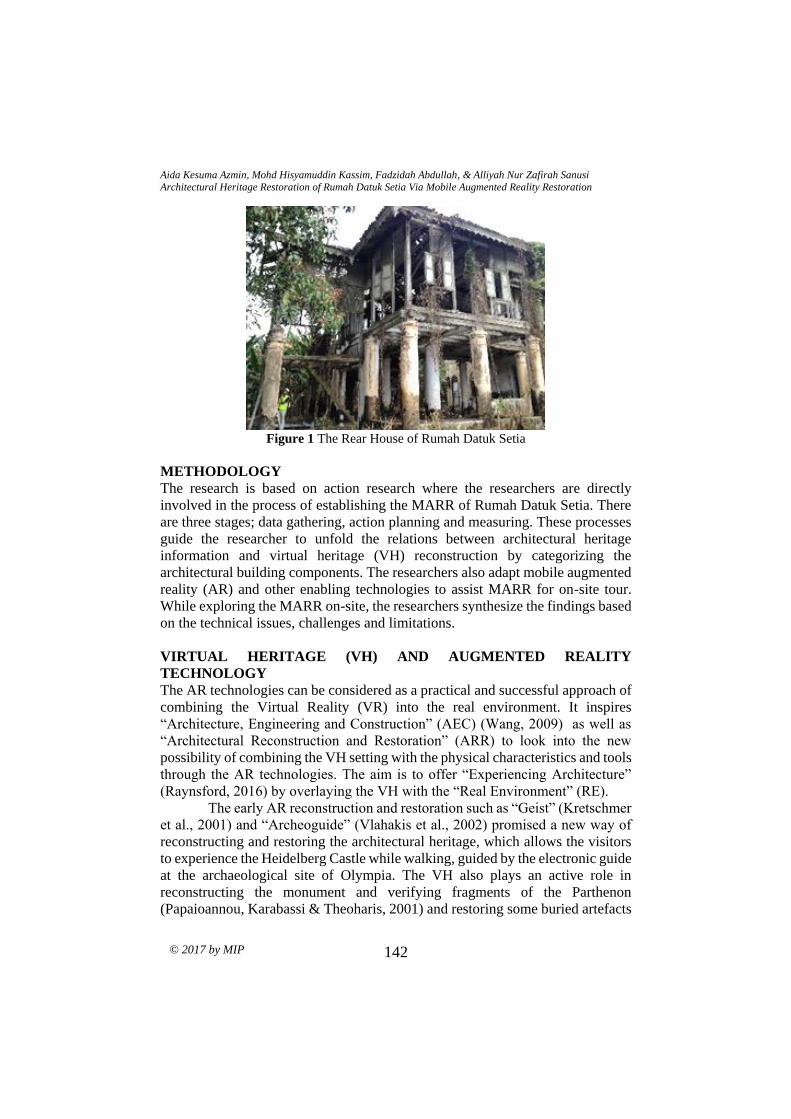
Aida Kesuma Azmin, Mohd Hisyamuddin Kassim, Fadzidah Abdullah, & Alliyah Nur Zafirah Sanusi
Architectural Heritage Restoration of Rumah Datuk Setia Via Mobile Augmented Reality Restoration
© 2017 by MIP 142
Figure 1 The Rear House of Rumah Datuk Setia
METHODOLOGY
The research is based on action research where the researchers are directly
involved in the process of establishing the MARR of Rumah Datuk Setia. There
are three stages; data gathering, action planning and measuring. These processes
guide the researcher to unfold the relations between architectural heritage
information and virtual heritage (VH) reconstruction by categorizing the
architectural building components. The researchers also adapt mobile augmented
reality (AR) and other enabling technologies to assist MARR for on-site tour.
While exploring the MARR on-site, the researchers synthesize the findings based
on the technical issues, challenges and limitations.
VIRTUAL HERITAGE (VH) AND AUGMENTED REALITY
TECHNOLOGY
The AR technologies can be considered as a practical and successful approach of
combining the Virtual Reality (VR) into the real environment. It inspires
“Architecture, Engineering and Construction” (AEC) (Wang, 2009) as well as
“Architectural Reconstruction and Restoration” (ARR) to look into the new
possibility of combining the VH setting with the physical characteristics and tools
through the AR technologies. The aim is to offer “Experiencing Architecture”
(Raynsford, 2016) by overlaying the VH with the “Real Environment” (RE).
The early AR reconstruction and restoration such as “Geist” (Kretschmer
et al., 2001) and “Archeoguide” (Vlahakis et al., 2002) promised a new way of
reconstructing and restoring the architectural heritage, which allows the visitors
to experience the Heidelberg Castle while walking, guided by the electronic guide
at the archaeological site of Olympia. The VH also plays an active role in
reconstructing the monument and verifying fragments of the Parthenon
(Papaioannou, Karabassi & Theoharis, 2001) and restoring some buried artefacts

PLANNING MALAYSIA
Journal of the Malaysia Institute of Planners (2017)
© 2017 by MIP 143
at the Museum of Terra Cotta Warriors and Horse (Zheng & Zhang, 1999).
Regarding touring on the historical site, iTacitus established the MAR guide for
a historical sight, which applied historical media as augmentation layers (Zoellner
et al., 2007). The aim is to use 2D feature-tracking method for exterior
exploration.
Thus, the research fully utilizes the role of VH with architectural heritage
information contents and overlays them with the historic site. This alternative
technique promises a new way of architectural heritage documentation, history
and culture resources; while giving the opportunity to simultaneously visualizing
and reconstructing the lost architectural heritage, and also experiencing the
architectural heritage without risk of damage as well as enhancing the virtual
tourism (El-Hakim et al., 2004).
AR and Other Enabling Technologies
The development of AR technologies is mostly related to other enabling
technologies. The research attempts to unfold these techniques, which could
assist MARR regarding localization, User Interface (UI) design, online
environment and mobile device technologies.
In term of localization, the usage of GPS, RFID, UWB, SF, SLAM
(Hammad, Wang & Mudur, 2009; Razavi & Haas, 2011a; 2011b; Shahi et al.,
2012; Castle, Klein & Murray, 2008) and Barcoding in AR application have
improved the tracking, especially on site location. The AR application is also
integrated with Natural User Interface (NUI), which fully utilizes the human
movement and gesture as a medium of interaction such as kinaesthetic control,
SixthSense, iHelmet, ARCADE and KinÊtre (White, Lister & Feiner, 2007;
Tonn, Petzold & Donath, 2008; Mistry & Maes, 2009; Yeh, Tsai & Kang, 2012;
Stein, 2012; Chen, Izadi & Fitzgibbon, 2012). In accessing the information, AR
application integrates with Cloud Computing environment such as CloudBIM
and SOA4BIM that can be accessed at anytime and anywhere (Redmond et al.,
2012; Møller & Schwartzbach, 2006). Regarding devices, there are many AR
research application, which use smart phones, tablets, HMD or Glasses
(Papagiannakis & Magnenat-Thalmann, 2007; Jang, 2009; Goldman, 2012).
These mobile devices are smaller, affordable and powerful, and offer high-
resolution display, which can be utilised at the on-site tour.
Thus, these enabling technologies provide an insight to the research
proposal for the architectural restoration method using computer generated visual
algorithms and its deployment to the AR application for the mobile device such
as smartphone and tablet. This AR application is supported by cloud computing
and geo-location where all VH information is stored in database and GPS to track
the information about location and position of the real object and overlaid onto
the VH.

Aida Kesuma Azmin, Mohd Hisyamuddin Kassim, Fadzidah Abdullah, & Alliyah Nur Zafirah Sanusi
Architectural Heritage Restoration of Rumah Datuk Setia Via Mobile Augmented Reality Restoration
© 2017 by MIP 144
MARR AND ITS REQUIREMENTS
MARR is a term used to describe the application of mobile devices, such as
smartphone and tablet, to visualize Augmented Reality (AR) model, which has
been virtually restored. VH is established concerning the original run-down
building, representing as much similarity as possible. Since physical architectural
heritage restoration could be highly expensive and resource consuming, this
alternative technique may serve building archaeologists, as well as tourists in
restoring or experiencing the precious architectural heritage. In developing the
MARR, the research highlights components such as architectural heritage
information, AR application, MAR, Cloud Computing (CC) and Internet
connection as the design ingredients for a design decision.
AR Application
In developing the VH, the research uses SketchUp Pro 2013 as a tool to
reconstruct and restore the ruined rear house of Rumah Datuk Setia. The software
is integrated with AR-media Plugin, which allows VH to be visualized out of
Virtual Environment (VE) by connecting the webcam and printed markers or
GPS. The VH can be visualized through a personal computer or mobile devices
such as smartphone or tablet.
MAR Devices and NUI
The MARR file is a stand-alone and compatible for all common mobile platforms
such as IOS and Android. The AR-media Player can be downloaded from App
Store or Play Store by using mobile devices such as smartphone and tablet and
stored into AR-media Player library. The user can interact using NUI to navigate
or touring on the historical site at Karai, Kuala Kangsar since AR-media Player
supports geo-location to visualize the VH without printed marker.
Architectural Heritage Information
The MARR emphasizes on the accuracy and photorealism 3D Virtual Heritage.
In measuring and restoring the rear house of Rumah Datuk Setia, the research
applied contact method (Remondino & El-Hakim, 2006) involving measuring,
tracing, scrubbing and moulding. For the photorealistic AR, the MARR models
use existing UV mapping for adding details of the VH.
Online Database
The online database is the supporting unit of MAR Restoration model, which is
accessible by the user and system administrator. The MARR files can be
downloaded from the online database. The files can be categorized into the spatial
organization, building components, construction, ornamentation and decoration.
All MARR files are assigned with metadata descriptions. The idea is to facilitate
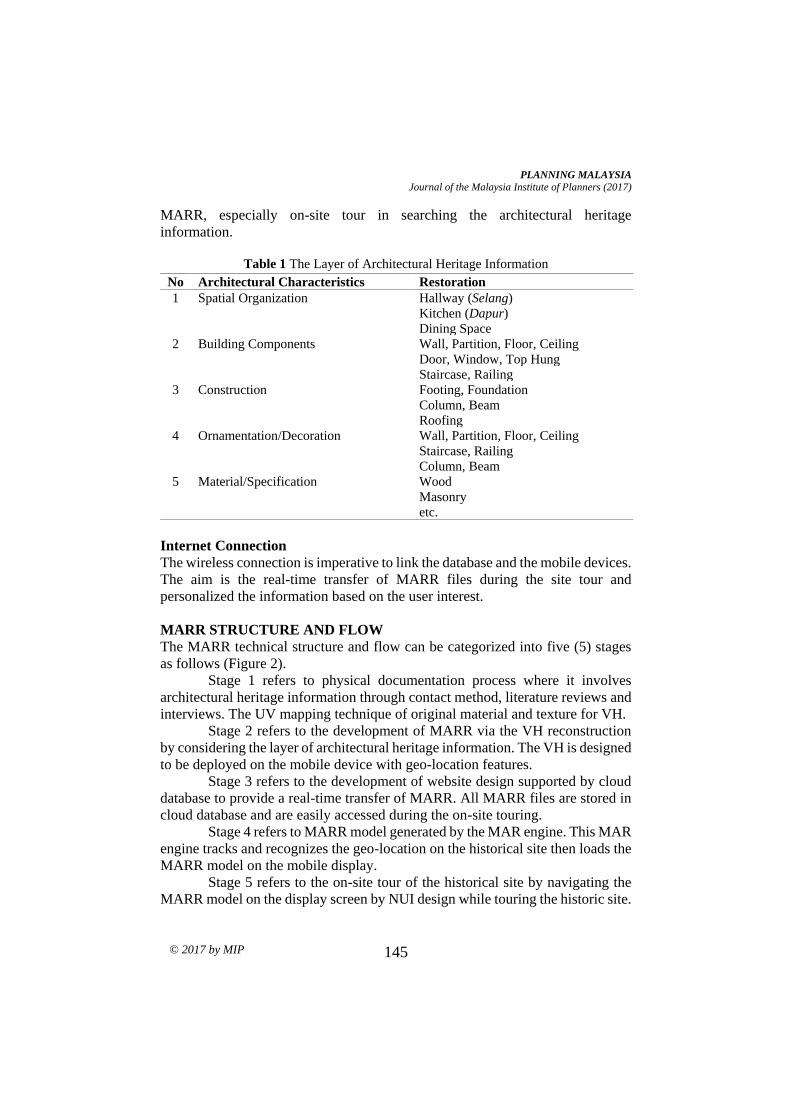
PLANNING MALAYSIA
Journal of the Malaysia Institute of Planners (2017)
© 2017 by MIP 145
MARR, especially on-site tour in searching the architectural heritage
information.
Table 1 The Layer of Architectural Heritage Information
No Architectural Characteristics Restoration
1 Spatial Organization Hallway (Selang)
Kitchen (Dapur)
Dining Space
2 Building Components Wall, Partition, Floor, Ceiling
Door, Window, Top Hung
Staircase, Railing
3 Construction Footing, Foundation
Column, Beam
Roofing
4 Ornamentation/Decoration Wall, Partition, Floor, Ceiling
Staircase, Railing
Column, Beam
5 Material/Specification Wood
Masonry
etc.
Internet Connection
The wireless connection is imperative to link the database and the mobile devices.
The aim is the real-time transfer of MARR files during the site tour and
personalized the information based on the user interest.
MARR STRUCTURE AND FLOW
The MARR technical structure and flow can be categorized into five (5) stages
as follows (Figure 2).
Stage 1 refers to physical documentation process where it involves
architectural heritage information through contact method, literature reviews and
interviews. The UV mapping technique of original material and texture for VH.
Stage 2 refers to the development of MARR via the VH reconstruction
by considering the layer of architectural heritage information. The VH is designed
to be deployed on the mobile device with geo-location features.
Stage 3 refers to the development of website design supported by cloud
database to provide a real-time transfer of MARR. All MARR files are stored in
cloud database and are easily accessed during the on-site touring.
Stage 4 refers to MARR model generated by the MAR engine. This MAR
engine tracks and recognizes the geo-location on the historical site then loads the
MARR model on the mobile display.
Stage 5 refers to the on-site tour of the historical site by navigating the
MARR model on the display screen by NUI design while touring the historic site.

Aida Kesuma Azmin, Mohd Hisyamuddin Kassim, Fadzidah Abdullah, & Alliyah Nur Zafirah Sanusi
Architectural Heritage Restoration of Rumah Datuk Setia Via Mobile Augmented Reality Restoration
© 2017 by MIP 146
Figure 2 MARR Technical Structure and Flow
DISCUSSION AND SUGGESTIONS
In developing the MARR model, accuracy of geo-location is the most important
factor to determine the alignment between VH and RE. However, mobile tracking
technologies using GPS have difficulty to identify the geo-location on the large
environment, and consequently effecting the precise position and orientation of

PLANNING MALAYSIA
Journal of the Malaysia Institute of Planners (2017)
© 2017 by MIP 147
the MARR model as well as Rumah Datuk Setia. As an alternative, the research
suggests using AR-media SDK application to track the 3D object in the RE
(Battini & Landi, 2015). The aim is to improve mobile tracking by establishing
the connection between the architectural heritage images and VH geometric
features.
Regarding visualization, MARR suffers from poor visualization quality
and is too detail to operate with the complex layer of architectural heritage
information. Consequently, it affects the navigation performance of MARR such
as lagging during the on-site touring. The research suggests that VH
reconstruction should adopt Building Information Modelling (BIM) as a tool to
manage the complex architectural heritage information (Fai et al., 2011). The aim
is to categorize and minimize the complexity of object entities without losing any
architectural heritage information.
CONCLUSION
The research presents architectural heritage restoration by employing MAR with
other enabling technologies to assist the architectural archaeologists and tourists.
MAR provides the alternative technique for architectural heritage restoration of
the ruined rear house of Rumah Datuk Setia. The research also highlights the
technical structure and the flow that need to be considered in producing the
MARR as well as the challenges and limitations of the technology faced
throughout the research. The MARR offers new hope for architectural heritage
restoration since physical restoration can be highly expensive. It promises an
enriched experience and features the legacy of the Malay – Colonial Architecture
even though the original architectural heritage on the site is in ruined.
ACKNOWLEDGEMENTS
The researchers are grateful to all the Heritage Studies’ colleagues and students
for their cooperation and assistance in documenting architectural heritage
information of Rumah Datuk Setia.

Aida Kesuma Azmin, Mohd Hisyamuddin Kassim, Fadzidah Abdullah, & Alliyah Nur Zafirah Sanusi
Architectural Heritage Restoration of Rumah Datuk Setia Via Mobile Augmented Reality Restoration
© 2017 by MIP 148
REFERENCES
Battini, C., & Landi, G. (2015). 3D tracking based augmented reality for cultural
heritage data management. The International Archives of
Photogrammetry, Remote Sensing and Spatial Information Sciences,
40(5), 375-379.
Castle, R., Klein, G., & Murray, D. W. (2008). Video-rate localization in multiple
maps for wearable augmented reality. 12th IEEE International
Symposium on Wearable Computers, September 28 – October 1, 2008,
Pittsburgh, USA.
Chen, J., Izadi, S., & Fitzgibbon, A. (2012). KinÊtre: animating the world with
the human body. In Proceedings of the 25th annual ACM symposium on
User interface software and technology. Cambridge, Massachusetts.
El-Hakim, S. F., Angelo Beraldin, J., Picard, M., & Godin, G. (2004). Detailed
3D reconstruction of large-scale heritage sites with integrated
techniques. Computer Graphics and Applications, IEEE, 24(3), 21-29.
Fai, S., Graham, K., Duckworth, T., Wood, N., & Attar, R. (2011). Building
information modelling and heritage documentation. In Proceedings of
the 23rd International Symposium, International Scientific Committee
for Documentation of Cultural Heritage (CIPA). Prague, Czech
Republic.
Goldman, D. (2012). Google unveils “project glass” virtual-reality glasses.
Money (CNN).
Hammad, A., Wang, H., & Mudur, S. P. (2009). Distributed augmented reality
for visualizing collaborative construction tasks. Journal of Computing in
Civil Engineering, 23(6), 418-427.
Jang, W. (2009). Utilization of ubiquitous computing for construction AR
technology. Automation in Construction, 18(8), 1063-1069.
Kretschmer, U., Coors, V., Spierling, U., Grasbon, D., Schneider, K., Rojas, I.,
& Malaka, R. (2001). Meeting the spirit of history. In Proceedings of the
2001 Conference on Virtual Reality, Archaeology, and Cultural
Heritage. Glyfada, Greece.
Mistry, P., & Maes, P. (2009). SixthSense: a wearable gestural interface.
SIGGRAPH ASIA 2009. Yokohama, Japan.
Møller, A., & Schwartzbach, M. I. (2006). An introduction to XML and Web
technologies. Pearson Education.
Noh, Z., Sunar, M. S., & Pan, Z. (2009). A review on augmented reality for virtual
heritage system. In M. Chang, R. Kuo, Kinshuk, G.D. Chen & M. Hirose
(Eds.), Learning by playing. Game-based education system design and
development (pp. 50-61). Alberta: Springer Berlin Heidelberg.
Papagiannakis, G., & Magnenat-Thalmann, N. (2007). Mobile augmented
heritage: Enabling human life in ancient Pompeii. International Journal
of Architectural Computing, 5(2), 396-415.

PLANNING MALAYSIA
Journal of the Malaysia Institute of Planners (2017)
© 2017 by MIP 149
Papaioannou, G., Karabassi, E., & Theoharis, T. (2001). Virtual archaeologist:
Assembling the past. Computer Graphics and Applications, IEEE, 21(2),
53-59.
Raynsford, A. (2016). From spatial feeling to functionalist design: contrasting
representations of the Baroque in Steen Eiler Rasmussen’s experiencing
architecture. In A. Leach, J. Macarthur, M. Delbeke (Eds.), The Baroque
in architectural culture, 1880-1980 (pp. 173-184). New York:
Routledge.
Razavi, S. N., & Haas, C. T. (2011a). Using reference RFID tags for calibrating
the estimated locations of construction materials. Automation in
Construction, 20(6), 677-685.
Razavi, S. N., & Haas, C. T. (2011b). Reliability-based hybrid data fusion method
for adaptive location estimation in construction. Journal of Computing in
Civil Engineering, 26(1), 1-10.
Redmond, A., Hore, A., Alshawi, M., & West, R. (2012). Exploring how
information exchanges can be enhanced through cloud BIM. Automation
in Construction, 24, 175–183.
Remondino, F., & El-Hakim, S. (2006). Image-based 3D modeling: a review. The
Photogrammetric Record, 21(115), 269-291.
Shahi, A., Aryan, A., West, J. S., Haas, C. T., & Haas, R. C. (2012). Deterioration
of UWB positioning during construction. Automation in Construction,
24, 72-80.
Stein, M. (2012). ARCADE: a system for augmenting gesture-based computer
graphic presentations. SIGGRAPH 2012 Computer Animation Festival.
Los Angeles, USA.
Tonn, C., Petzold, F., & Donath, D. (2008). Put on your glasses and press right
mouse button AR-based user interaction using laser pointer tracking. In
Proceeding of the 26th conference on education in computer aided
architectural design in Europe. Antwerp, Belgium.
Vlahakis, V., Ioannidis, N., Karigiannis, J., Tsotros, M., Gounaris, M., Stricker,
D., Gleue, T., Daehne, P., & Almeida, L. (2002). Archeoguide: an
augmented reality guide for archaeological sites. IEEE Computer
Graphics and Applications, 5, 52-60.
Wang, X. (2009). Augmented reality in architecture and design: potentials and
challenges for application. International Journal of Architectural
Computing, 7(2), 309-326.
White, S., Lister, L., & Feiner, S. (2007). Visual hints for tangible gestures in
augmented reality. In Proceedings of the 2007 6th IEEE and ACM
International Symposium on Mixed and Augmented Reality. Washington,
USA.

Aida Kesuma Azmin, Mohd Hisyamuddin Kassim, Fadzidah Abdullah, & Alliyah Nur Zafirah Sanusi
Architectural Heritage Restoration of Rumah Datuk Setia Via Mobile Augmented Reality Restoration
© 2017 by MIP 150
Yeh, K., Tsai, M., & Kang, S. (2012). On-site building information retrieval by
using projection-based augmented reality. Journal of Computing in Civil
Engineering, 26(3), 342-355.
Zheng, J. Y., & Zhang, Z. L.(1999). Virtual recovery of excavated relics.
Computer Graphics and Applications, IEEE, 19(3), 6-11.
Zoellner, M., Stricker, D., Bleser, G., & Pastarmov, Y. (2007). iTACITUS –
novel interaction and tracking paradigms for mobile AR. In D. Arnold
(Ed.), The European research network of excellence in open cultural
heritage (EPOCH) (pp. 110-117). Budapest: Archaeolingua.

1Student at Universiti Teknologi Malaysia. Email: [email protected] 151
PLANNING MALAYSIA:
Journal of the Malaysian Institute of Planners
VOLUME 15 ISSUE 1 (2017), Page 151 - 162
ARCHITECTURAL INFLUENCES OF ISTANA LAMA SERI
MENANTI, NEGERI SEMBILAN
Nurdiyana Zainal Abidin1, Raja Nafida Raja Shahminan2, & Fawazul Khair
Ibrahim3
1Faculty of Built Environment,
UNIVERSITI TEKNOLOGI MALAYSIA 2, 3Center for the Study of Built Environment in the Malay World (KALAM),
UNIVERSITI TEKNOLOGI MALAYSIA
Abstract
Traditional Malay Royal Palaces in Malaysia are monumental buildings
representing the rich architecture, heritage, traditions and expertise of the Malays.
The architecture of these palaces differs from one another to demonstrate the
identities of the vernacular architecture as timber palaces were representations of
Traditional Malay Houses on an exaggerated scale. One example of this is Istana
Lama Seri Menanti in Kuala Pilah which is a four-storey timber palace built in
the 20th century by Malay carving experts. Another factor to consider is the rich
cultural acceptance of the Minangkabau as they have been around in Negeri
Sembilan since the 15th Century. Hence, this paper aims to determine the
architectural identity of Istana Lama Seri Menanti through the influences on the
palace architecture and the factors affecting these influences. The research
methods undertaken include case studies, interviews with experts, and document
and historical analysis of subjects about palaces. The findings conclude that the
key element of ‘atap bergonjong’ cannot be found in Istana Lama Seri Menanti
which has the more common modest curve of the roof ridges found in houses of
Negeri Sembilan. Furthermore, Chinese influences on the woodcarvings of the
palace can be seen on the columns and beams of the exterior of the palace. In
conclusion, there are many influences on the architectural identity of Istana Lama
Seri Menanti such as Chinese influences and British’s political influences on the
design of the palace.
Keywords: Architecture, heritage, traditional Malay royal palaces
Date Received: 30th April 2016
Date of Acceptance: 30th October 2016

Nurdiyana Zainal Abidin, Raja Nafida Raja Shahminan, & Fawazul Khair Ibrahim
Architectural Influences of Istana Lama Seri Menanti, Negeri Sembilan
© 2017 by MIP 152
INTRODUCTION
Palaces belonging to royalties were built as representations of the power, wealth
and influence the royal families had over their subjects and ruling states (Abdul
Rahman, 1999). Considerable thoughts and ideas were put into the design of a
palace. Hence, palaces are architectural identities of the royal families and the
culture of the area it is located in (Fuh et al., 1993). Therefore, it can be said that
palaces represent the symbol of the Malay rulers because palaces act as buildings
of residence, administration and venue of royal functions (Fuh et al., 1993).
Traditional Malay royal palaces can be considered as a replica of a traditional
Malay house on a larger and grander scale (Gibbs, 1987). Due to the nature of the
Malay culture as a very nature-associated society, the architecture of the Royals
was also a reflection of the ideologies and beliefs of the traditional Malays (Megat
Latif & Abdullah, 2008). Hence, the architectural elements of traditional Malay
royal palaces which included design allowance for environmental factors, privacy
and safety of residents and also gender segregations of male and female members
of the families (Haja Bava Mohidin, Ismail & Megat Abdullah, 2012).
Gender segregation is important in Adat Perpatih as it relates back to the
Islamic teachings it is rooted in. Therefore, it is an important design element in
traditional Malay houses in Negeri Sembilan as many of the houses include
gender segregated spaces to allow for female family members to have their areas
within the house. This design can be found in the abundant number of houses in
Negeri Sembilan which includes attic designs and have houses which are more
than one storey high (Haja Bava Mohidin, Mohd Razif & Kadikon, 2012). Figure
1 below illustrates a key design element of Traditional Malay Houses in Negeri
Sembilan which includes an attic.
Figure 1 A Traditional Malay House in Rembau, Negeri Sembilan with an Attic Space

PLANNING MALAYSIA
Journal of the Malaysia Institute of Planners (2017)
© 2017 by MIP 153
It is important to understand the vernacular architecture of Traditional
Malay Houses in Negeri Sembilan because the architecture relates back to the
palace architecture of Istana Lama Seri Menanti which will be discussed in this
paper. The same design element can also be found in the palace which
communicates the local building practices and culture of Adat Perpatih practised
by the locals. As much as Adat Perpatih influences the daily activities and
customs of Negeri Sembilan residents, it is important to identify the influences
on the architecture of Istana Lama Seri Menanti and determine the architecture of
the vertically designed timber palace.
RESEARCH METHODOLOGIES
The research methodologies undertaken in this research are case studies and
precedent studies of timber palaces in Malaysia and interviews of experts on the
knowledge of architectural heritage. Seven case studies were used as subjects for
this research about the architecture of Istana Lama Seri Menanti. Table 1
illustrates the case studies used in this research to identify the similarities and
differences of timber palaces around the years that Istana Lama Seri Menanti was
built.
Table 1 Traditional Malay Royal Palaces in Late 1800s-early 1900s.
NO PALACE YEAR LOCATION
1 Istana Balai Besar
1842 Kelantan
2 Istana Ampang Tinggi
1864 Negeri
Sembilan

Nurdiyana Zainal Abidin, Raja Nafida Raja Shahminan, & Fawazul Khair Ibrahim
Architectural Influences of Istana Lama Seri Menanti, Negeri Sembilan
© 2017 by MIP 154
3 Istana Sultan Ismail
1870 Perak
4 Istana Tengku Nik
1881 Terengganu
5 Istana Jahar
1887 Kelantan
6 Istana Lama Seri Menanti
1908 Negeri
Sembilan
7 Istana Sri Terentang
1908 Pahang

PLANNING MALAYSIA
Journal of the Malaysia Institute of Planners (2017)
© 2017 by MIP 155
8 Istana Kenangan
1926 Perak
The case studies were selected based on the construction materials used
which were timber and the year they were built in which was during the late
1800s-early 1900s. These factors will adequately determine the factors behind the
construction of Istana Lama Seri Menanti and the architecture seen in the palace.
However, not all of the palaces can still be found today as the palaces have either
been demolished or have deteriorated.
TRADITIONAL MALAY ROYAL PALACES
Timber was commonly used by the traditional Malays for the construction of
buildings such as houses, mosques and even palaces (Massart, Meuter & Van
Begin, 2008). The availability of timber was a major factor in determining timber
as the choice of construction materials. The durability and robustness of timber
also made it the prime material for construction. Hence, the expertise of the locals
in using timber increased with the construction of bigger buildings such as
mosques and palaces. These experts known locally as Tukang were not only
carpenters but were also woodcarvers. Tukang of palaces were appointed by the
Sultan or Raja, and in the case of Negeri Sembilan the Yang Dipertuan Besar and
were known as Tukang Raja (Md. Nazuan, 2005). The Tukang also acts as a
Pawang or Shaman as beliefs in the mistics were still prevalent during the olden
days and as a Pawang, it is important that the future site of the palace is selected
carefully and any negative energy were cast out (Md. Nazuan, 2005).
Palaces in the olden Malay towns were surrounded by villages as the
commoners lived surrounding the royal families and influential leaders (Daud,
Arbi & Faisal, 2012). Some palaces were located on top of hills for the advantage
of the view and safety factors whereas the villages surrounded the lower hillside
(Daud, Arbi & Faisal, 2012). Only palaces were allowed to be gated or fenced in
as they were considered important buildings of the society (Massart, Meuter &
Van Begin, 2008). The most common layout of a traditional Malay town must
include a palace, an open field for the community and a market (Noor & Khoo,
2003; Harun & Said, 2009). This layout allowed the state generates income for
itself and becomes a self-sustaining city, and the power of the royals will be
stable.

Nurdiyana Zainal Abidin, Raja Nafida Raja Shahminan, & Fawazul Khair Ibrahim
Architectural Influences of Istana Lama Seri Menanti, Negeri Sembilan
© 2017 by MIP 156
Architecturally, traditional Malay royal palaces can be divided into two
typologies which are single-type building and multiple-type building (Md.
Nazuan, 2005). These typologies mean that palaces can be built as a free-standing
building on its own and gated within an area or as a part of a complex of multiple
different buildings within an enclosed area. Figure 2 below illustrates an image
of Istana Ampang Tinggi as a single-type palace building in Negeri Sembilan.
The Palace is a residential building as is a stand-alone building.
Figure 2 Single-type Palace Building of Istana Ampang Tinggi in Negeri Sembilan
A multiple-type building is a complex of buildings which include the
main Rumah Ibu, separate halls and bedrooms for the royalties (Md. Nazuan,
2005). For example, Figure 3 below is an example of a multiple-type palace
which was once part of a complex of palace buildings in Terengganu. Istana Satu
was the Rumah Ibu and acts as the main building within the complex.
Figure 3 Istana Satu was part of a Multiple-Type Palace Complex in Terengganu
Another important element found in the design of traditional Malay royal
palaces were the spatial layout of the palace. The most common layout would be

PLANNING MALAYSIA
Journal of the Malaysia Institute of Planners (2017)
© 2017 by MIP 157
the sporadic design layout where the palace building spread out over a large area
of Palace reserves. However, there is the less common spatial design of building
vertically with palaces that are more than one storey high (Abdul Aziz, Remaz
Ossen & Idid, 2010). These types of spatial layout vary from one state to another,
but none has been built more than two storeys high using timber except for Istana
Lama Seri Menanti.
ISTANA LAMA SERI MENANTI
In Negeri Sembilan, the earliest known traditional Malay royal palace was Istana
Barong-Barong which was located in Ampang Tinggi (Raja Shahminan, 2010).
Istana Pulih was then built during the reign of Yamtuan Antah (1875-1888) but
was burnt down by British troops during the Bukit Putus War in 1875 (Sheppard,
1969). Istana Baroh was later built to replace the burnt-down palace and was used
as a residential palace for the royal family (Raja Shahminan, 2010; Saw & Raja
Barizan, 1991). In 1902, Tuanku Muhammad who was the 7th Yang Dipertuan
Besar Negeri Sembilan instructed the building of a new palace in Seri Menanti as
the new residential palace (Muhammad, 2011).
The construction of Istana Lama Seri Menanti was completed through
the expert skills of Tukang Kahar and Tukang Taib who were local carvers in
Seri Menanti. Tukang Kahar was appointed the Tukang Raja as he was
commissioned to design and construct a timber palace for Tuanku Muhammad.
The palace was completed in 1908 with the help of Tham Yoong, who was a
Chinese contractor, and the drawings were prepared by Mr Woodford, who was
a British Draftsman from the Public Works Department (Muhammad, 2011). As
timber palaces were not found to be more than two storeys high in other states in
Malaysia, there might be a sharing of skills and technology for Tukang Kahar and
Tukang Taib to be able to construct such a vertically planned timber palace. Even
so, it is very common to find traditional Malay houses especially that of the
aristocrats and wealthy leaders to have houses that were two and even three
storeys high. Thus, it is plausible that the technology and skills were available in
Negeri Sembilan with the Tukang but were further developed with the Chinese
influences. The British draftsman was only providing technical drawings
expertise, but the British influences could be found in the space allocations within
the palace as specifically dedicated spaces were provided such as the
dining/reception area and separate bedrooms for family members. Figure 4 below
illustrates the image of an abandoned Istana Lama Seri Menanti before being
turned into a museum.

Nurdiyana Zainal Abidin, Raja Nafida Raja Shahminan, & Fawazul Khair Ibrahim
Architectural Influences of Istana Lama Seri Menanti, Negeri Sembilan
© 2017 by MIP 158
Figure 4 Istana Lama Seri Menanti before Being Turned into a Royal Museum
The timber used for the construction of the palace were locally known as
Penak or Cengal, and were taken from nearby forests in Negeri Sembilan. A study
by Saw & Raja Barizan (1991) plots the Cengal forest distribution in Peninsular
Malaysia including Cengal forests in Negeri Sembilan. Figure 5 below illustrates
the Cengal forests found in Peninsular Malaysia while specifically highlighting
those in Negeri Sembilan.
Figure 5 The Distribution of Neobalanocarpus heimii (Cengal) in Peninsular Malaysia

PLANNING MALAYSIA
Journal of the Malaysia Institute of Planners (2017)
© 2017 by MIP 159
The spatial layout of Istana Lama Seri Menanti is vertically planned
throughout the four storeys where the spaces are segregated according to
functions. The ground floor of the palace is dedicated to the palace staff and is a
public domain (Abdul Aziz, Remaz Ossen & Idid, 2010). The first floor of the
palace is a semi-public area where royal functions such as Majlis Menghadap are
held at the serambi where a special raised platform is built for the Yamtuan. The
first floor is also a place for meeting delegates and making public summonses.
The floor also includes four bedrooms and a dining/reception area for the royal
families. The second floor of the palace is dedicated to only the royal families as
three bedrooms are located on this floor. The third and fourth floor are private
spaces for the Yamtuan and hold his room and a storage area on the highest floor
for family heirlooms. Figure 6 below illustrates the vertical planning of Istana
Lama Seri Menanti.
Figure 6 The Vertical Plan of Istana Lama Seri Menanti
The function of Istana Lama Seri Menanti remained as a residential
palace during 1908 until 1931 when a new palace was built nearby. The Istana
Besar Seri Menanti was a masonry construction of double storey high and became
the new palace the royal families resided in. After the Yamtuan had moved into
the new palace, Istana Lama Seri Menanti became a place of residence for other
royalties of visiting families of the Royals. In 1959-1964 however, the palace was
used by the local state as a religious school for the local children. It was during
this time that the ground floor and first floor of the palace became a place for
religious classes and helped spread the knowledge of Islam. Later in the years,
the palace was restored and converted into a Royal Museum in 1992. Figure 7
below illustrates the palace photo taken in 2015 during which further restorations
were being undertaken.

Nurdiyana Zainal Abidin, Raja Nafida Raja Shahminan, & Fawazul Khair Ibrahim
Architectural Influences of Istana Lama Seri Menanti, Negeri Sembilan
© 2017 by MIP 160
Figure 7 Istana Lama Seri Menanti in Negeri Sembilan
FINDINGS
Findings of the research demonstrated that Istana Lama Seri Menanti was built
with the skills and expertise of the local Tukang as vernacular architecture in
Negeri Sembilan were commonly found to be more than one storey high. Hence,
the construction of a vertical timber palace was plausible with their expertise and
skills in Negeri Sembilan and not found elsewhere in Malaysia. Furthermore,
Chinese contractors were hired to help with the construction. Thus some Chinese
influences could be found in the design of the palace particularly some of the
woodcarvings found on the beams of the palace. Figure 8 below illustrates the
images of a mythical creature carved on the beams of the palace’s entrance.
Figure 8 Woodcarvings of Mythical Creatures on the Beams of the Palace
The design of the palace which was symmetrical on plan and the
elevations could prove the existence of a British influence on the spaces of the
palace because, traditionally, Malay vernacular architecture was not symmetrical
and did not provide specific spaces for specific activities. Malay vernacular
architecture usually provides multi-functional spaces in their buildings which

PLANNING MALAYSIA
Journal of the Malaysia Institute of Planners (2017)
© 2017 by MIP 161
could be used in different functions and for different purposes according to the
needs of the users. Hence, the segregation of spaces and dedicated rooms to
specific activities is very Western-like and could prove the existence of British
influences on the palace.
Figure 9 The First-Floor Plan Shows Symmetry and Balance
CONCLUSION
In conclusion, Istana Lama Seri Menanti which was constructed using only
timber without the reinforcements of nails is a unique 20th century traditional
Malay royal palace. While other timber palaces were built earlier in the 1800s,
Istana Lama Seri Menanti was built as a permanent palace of residence for the
royalties during which masonry palaces were already being built extensively
around Malaysia.
The palace which was designed to be symmetrical throughout is another
unique factor which separates it from other timber palaces in Malaysia. The
verticality of the palace’s image provides a grandeur architecture which can be
seen from afar and differentiates itself from any other traditional Malay royal
palaces. More information is needed in determining the influences on the
architecture of Istana Lama Seri Menanti. This research is still ongoing, and
further findings will be developed into more discussions in the future.
ACKNOWLEDGEMENTS
This work was supported by MyBrain15 under the MyPhd scholarship given by
the Ministry of Higher Education Malaysia (MoHE).
REFERENCES Abdul Aziz, Z. A., Remaz Ossen, D., & Idid, S. Z. A. (2010). The Islamic Malay
traditional towns: learning through the attributes - special emphasis on Johor
Bahru, Malaysia. First International Conference on Urban & Architecture
Heritage in Islamic Countries: It’s Role in Cultural & Economic Development.
Riyadh, Saudi Arabia.
Abdul Rahman, A. R. (1999). The traditional Malay architectural world view (with
emphasis on the role of the tukang. Jurnal Alam Bina, 2(1), 1-12.

Nurdiyana Zainal Abidin, Raja Nafida Raja Shahminan, & Fawazul Khair Ibrahim
Architectural Influences of Istana Lama Seri Menanti, Negeri Sembilan
© 2017 by MIP 162
Daud, N. I. M. K., Arbi, A., & Faisal, M. (2012). Pengaplikasian ukiran kayu melayu
dalam seni bina di Malaysia. Journal of Design and Built Environment, 11, 1-
14.
Fuh, K. C. et. al. (1993). Istana Seri Menanti. Measured Drawings. Skudai: Universiti
Teknologi Malaysia.
Gibbs, P. (1987). Building a Malay house. Singapore: Oxford University Press.
Haja Bava Mohidin, H., Ismail, A. S., & Megat Abdullah, A. (2012). A Study of styles
classification and influences on administration buildings in Malaysia (15th-21st
Century). Seminar of International Convention: Bridging Between Old & New
2012. Johor Bahru, Malaysia.
Haja Bava Mohidin, H., Mohd Razif, F., & Kadikon, S. (2012). Pengaruh Islam dalam
politik dan senibina pentadbiran pada Zaman Kesultanan Melayu Melaka.
Jurnal Teknologi, 58, 85-88.
Harun, N. Z., & Said, I. (2009). The changing roles of public spaces in Malaysia. National
Landscape Seminar 2009 (UMRAN09) - Healing the World, Gombak, Selangor.
Massart T., Meuter C., & Van Begin L. (2008). On the complexity of partial order trace
model checking. Information Processing Letter, 106(3), 120-126.
Md. Nazuan, N. M. (2005). Istana Baroh, Negeri Sembilan. Measured drawings. Skudai:
Universiti Teknologi Malaysia.
Megat Latif, H., & Abdullah, C. A. (2008). Islam dalam perlembagaan Malaysia:
kewajarannya berdasarkan faktor Kesultanan Melayu. Journal of Ethics, Legal
and Governance (REKAYASA), 4, 1-12.
Muhammad, S. A. (2011). The relationship between the socio-culture of royalty and the
architecture of Istana Sepahchendera. Warisan Nusantara dan Bicara Kraf
Warisan 2011. Sabah: Universiti Malaysia Sabah.
Noor, F. A., & Khoo, E. (2003). Spirit of wood: the art of Malay woodcarving. Singapore:
Tuttle Publishing.
Raja Shahminan. R. N. (2010). Seri Yang Menanti. Retrieved Dec. 15, 2015 from
http://nagariperpatih.blogspot.my/2010/02/seri-yang-menanti.html.
Saw, L. G. & Raja Barizan, R. S. (1991). Directory of plant genetic resources in Malaysia.
Research Pamphlet 109/1991, 1-161.
Sheppard, M., (1969). Malay Palaces of the past: part one. Malaya in History, 8(1), 21-
25.

1PhD Candidate at International Islamic University Malaysia. Email: [email protected] 163
PLANNING MALAYSIA:
Journal of the Malaysian Institute of Planners
VOLUME 15 ISSUE 1 (2017), Page 163 - 168
CHALLENGES TO IMPLEMENT CARRYING CAPACITY
FRAMEWORK: A CASE STUDY OF PULAU PERHENTIAN MARINE
PARK INSTITUTIONAL FRAMEWORK
Nadia Mohd Nasir1, Mansor Ibrahim2, Lukman Hakim Mahamod3, & Rashidi
Othman4
1International Institute for Halal Research and Training (INHART),
2,3,4Kulliyyah of Architecture & Environmental Design
INTERNATIONAL ISLAMIC UNIVERSITY MALAYSIA
Abstract
The environmental quality at Pulau Perhentian Marine Park is degrading day by
day. Many studies have been done in order to support sustaining the tourist sites
such as having limits in development and tourist arrival, or better known as
carrying capacity. Despite the existence of many agencies whose job scope is
related to Pulau Perhentian, poor implementation of the guideline is resulting in
degrading environmental quality of the park. This paper looks at the roles and
functions of each government agencies related to Pulau Perhentian. The outcome
of this paper is the analysis of the current roles and responsibilities of the agencies
and where are the gaps that can be filled in order to promote sustainable tourism
in Pulau Perhentian.
Keywords: Institutional framework, government agencies, tourism key players,
sustainable tourism
Date Received: 30th April 2016
Date of Acceptance: 30th October 2016

Nadia Mohd Nasir, Mansor Ibrahim, Lukman Hakim Mahamod, & Rashidi Othman
Challenges to Implement Carrying Capacity Framework: A Case Study of Pulau Perhentian Marine Park Institutional
Framework
© 2017 by MIP 164
INTRODUCTION
Pulau Perhentian is one of the coral reef islands on the east coast of Peninsular
Malaysia. Statistics on tourist arrivals show an increasing arrival trend from
123,159 in 2005 to 244,762 in 2015 (Department of Marine Park, 2016). The
increase in tourist arrivals has led to the various infrastructures been developed
on the island. As suggested by Nurul (2013) and Rees (1992), development in
areas like marine park should be controlled to avoid negative impacts on the
environmental quality of the area. However, Pulau Perhentian is under
overlapping administration of various agencies, which has created coordination
issues.
This paper reviews the existing institutional framework related to the
planning, management, implementation and operations of Pulau Perhentian. An
examination of the roles and functions of each agency and association involved
has been carried out to identify common ground, overlapping jurisdictions and
potential conflicts. The federal, state and local agencies involved in the
administration of Pulau Perhentian are as shown in Table 1 below.
Table 1 List of Government Agencies Involved in Managing and Developing Pulau
Perhentian.
Federal Ministry of Tourism and Culture, Terengganu Office (MOTAC)
Tourism Malaysia Terengganu
Terengganu Marine Park Department
Terengganu Marine Department
State Terengganu State Economic Planning Unit
(UPEN)
Terengganu Town and Country Planning
Department (JPBD)
District Besut District Council
Besut District and Land Office
METHODOLOGY This paper adopted a survey approach to obtain primary data from the
stakeholders. In developing tourist sites, a formal institution will normally consist
of internal and external parties (Singh, et. al., 2009). Internal parties are usually
those who involve directly on-site, such as the local communities, resort and
chalet owners, scuba diving operators, and boat service operators. Meanwhile,
the external parties are the government agencies who are tasked with monitoring
and regulating the sites.
The analysis undertaken in this study was for the external party audit,
which sought the views of concerned parties on the island's current and potential
tourism image and branding. The audit was done for both Perhentian Kecil and
Perhentian Besar islands via interviews with various stakeholders, such as the
Ministry of Tourism and Culture Malaysia (MOTAC), Tourism Malaysia, and

PLANNING MALAYSIA
Journal of the Malaysia Institute of Planners (2017)
© 2017 by MIP 165
Department of Marine Park Malaysia (DMPM). It is also to study the structure
and function of each government agencies and what are the contributions to the
ecosystem of the island.
ROLES AND RESPONSIBILITIES OF EACH STAKEHOLDER
Ministry of Tourism and Culture, Terengganu Office (MOTAC)
This agency is set up by the Ministry of Tourism and Culture to act on its behalf
at the state level and to provide the linkage between Federal & State Government
on tourism-related matters. Basically, MOTAC gives advice on tourism policy
and implementation. Besides that, it monitors the planning and development of
tourism products and infrastructure, as well as tourism services and training.
MOTAC handles licensing applications for travel agents, homestays, tour
guides, excursion buses, hire/drive cars, tourism training institutes and tourism
accredited shops. They are to liaise with Tourism Malaysia in promoting tourism
in Terengganu.
Tourism Malaysia Terengganu/ Terengganu State Economic Planning Unit
(UPEN)
Tourism Malaysia Terengganu is responsible for the overall planning and
development of tourism in Terengganu, in addition to acting as the link between
the State & Federal Government. The agency is also responsible for assessing
state resources, identifying development projects and their feasibility and/or
implementation, and providing general advice on planning and economic matters,
including advice on alternative proposals for consideration.
Terengganu Marine Park Department
Terengganu Marine Park Department have the authority on the protection of
aquatic flora and fauna, and on the protection, preservation and management of
the natural breeding grounds and habitat for aquatic life with particular regard to
species that are rare or endangered.
The department is also in charge of promoting the natural regeneration
of aquatic life whenever such life has been depleted. Therefore, one of their job
scopes is to promote scientific study and research that will preserve and enhance
the pristine state and productivity of such areas. Recreational and other activities
are to be regulated too to avoid more damage to the environment of the area.
Additionally, boatmen training courses for island villagers are also held
by the department in order to train them in handling tourists. The department also
organises awareness programmes relating to marine parks for the island local
community and tourists such as beach/coral clean up and ‘coral camp’. It is also
in charge of collecting conservation charges which are imposed on all tourists
visiting the marine parks.
Nadia Mohd Nasir, Mansor Ibrahim, Lukman Hakim Mahamod, & Rashidi Othman
Challenges to Implement Carrying Capacity Framework: A Case Study of Pulau Perhentian Marine Park Institutional
Framework
© 2017 by MIP 166
Terengganu Marine Department
This agency is responsible for ensuring the safety of users navigating in the waters
of Terengganu. Unlike the Marine Park Department, it specializes in the
registration of ships and licensing of boats, enforcing and regulating shipping
laws, and conducting ship inspections and surveys.
The Marine Department is also in charge of Kuala Besut jetty in terms of
providing the facilities, managing passengers and controlling ferries/boats
coming in and going out at the jetty. However, the officers interviewed mentioned
that currently, the department is facing shortage of workforce to carry out
monitoring and enforcement programmes, therefore leading to lack of monitoring
of tourist behaviour and activities on site.
Terengganu Town and Country Planning Department (JPBD)
JPBD is responsible as an advisor to the State Government on matters relating to
land use and development and maintenance in Pulau Perhentian. The department
is also accountable for the planning of projects and development of land, besides
providing planning advice to the public. The department also oversees the
preparation and implementation of statutory development plans for the area such
as Special Area Plan, District Local Plan and State Structure Plan.
Besut District Council
Besut District Council is responsible to plan and control development in the Besut
District. Among its other roles are to provide environmental cleanliness services,
plan, implement, maintain and encourage landscape beautification and social
facilities structure programme in Besut District. It also responsible in the
preparation, implementation and monitoring of the Special Area Plan and District
Local Plan of the area.
Besut District and Land Office
This agency is responsible to plan, coordinate and implement physical
development projects and community development in the Besut District. It also
processes land subdivision applications, change of land category and other land
matters in Besut District. Nevertheless, the capacity and budget allocation is the
main problem here because more manpower is needed in managing Pulau
Perhentian.
FINDINGS
This study has found that there are some overlapping jurisdictions between the
agencies. If the agencies can clarify further their job scopes and make effective
collaboration and coordination model among themselves, this could help to
alleviate problems associated with insufficient workforce to monitor and

PLANNING MALAYSIA
Journal of the Malaysia Institute of Planners (2017)
© 2017 by MIP 167
administer Pulau Perhentian. Coccossis and Mexa (2004) suggest that with
effective coordination, they can also improve the existing management plans,
master plan and also the policy implementation.
Table 2 Classification of Roles and Responsibilities of Perhentian Island External
Stakeholder
No
Agencies
Roles and functions
Current issues
Po
licy
mak
er
Pla
nnin
g
Man
agem
ent
Imple
men
tati
on
&
enfo
rcem
ent
Mon
itori
ng
Mar
ket
ing
& p
rom
oti
on
Tra
inin
g
Advis
ory
Res
earc
h &
dev
elopm
ent
Saf
ety
Federal Level
1 MOTAC / / / /
2 Tourism
Malaysia
Terengganu
/ / Insufficient manpower.
At tourism information
centre Kuala Besut only 1
employee on duty.
3 Terengganu
Marine
Park
Department
/ / / / / / Insufficient manpower
and onsite enforcement in
regulating tourist and
community activities in
marine park areas.
4 Terengganu
Marine
Department
/ / / / / Insufficient manpower to
carry out monitoring and
enforcement.
State Level
5 Terengganu
State
UPEN
/ / / / / / /
6 Terengganu
JPBD
/ / / /
District Level
7 Besut
District
Council
/ / / / / Insufficient manpower in
terms of management
(planning, implementing,
maintaining, and
controlling development)
in Pulau Perhentian.
Insufficient budget
allocation for additional
staff.
8 Besut
District and
Land
Office
/ / / Insufficient manpower.

Nadia Mohd Nasir, Mansor Ibrahim, Lukman Hakim Mahamod, & Rashidi Othman
Challenges to Implement Carrying Capacity Framework: A Case Study of Pulau Perhentian Marine Park Institutional
Framework
© 2017 by MIP 168
CONCLUSIONS
This study is significantly valuable for the tourism key players to identify and
recognize their main roles, and then improve their service delivery, for instance,
to include the local participation in the management of coastal marine resources.
Studies by Cinner (2005), Kaza (1988), Kenchington (1988) and White (1986)
support the findings that both state and federal agencies should be more effective
in delivering their roles, aside from giving priority to the community
involvement, as it is the main factor in the success of marine protection area.
This study is done due to the concern of the environmental issues that are
occurring nowadays at Pulau Perhentian Marine Park. Even though many studies
have provided solutions such as low impact visitation and eco-friendly tourism
activities, but without effective implementation and management, the
environmental degradation of the park will continue.
ACKNOWLEDGEMENTS
The authors are grateful for the financial support provided by Ministry of Higher
Education (MOHE) and International Islamic University Malaysia (IIUM) for the
Research Grant NRGS13-002-0002.
REFERENCES Coccossis, H., & Mexa, A. (2004). The challenge of tourism carrying capacity
assessment: theory and practice. Burlington, USA: Ashgate Publishing Company.
Cinner, J. (2005). Socioeconomic factors influencing customary marine tenure in the
Indo-Pacific. Ecology and society, 10(1), 1-14.
Department of Marine Park (2016). Tourist arrivals and receipts to Malaysia -facts &
figures. Retrieved August 16, 2016 from http://www.dmpm.nre.gov.my/
data_pelawat.html? uweb=jtl.
Kaza, S. (1988). Community involvement in marine protected areas. Oceans, 31(1), 75-
81.
Kenchington, R. A. (1988). Managing reefs and inter-reef environments and resources
for sustained exploitive extractive and recreational uses. In Proceedings of the 6th
International Coral Reef Symposium (pp. 81-87), Australia.
Nurul I. G.., Noh K. M., & Tai S. Y. (2013). Assessing environmental damage to marine
protected area: a case of Perhentian Marine Park in Malaysia. Journal of
Agriculture Science, 5(8), 132-141.
Rees, W. (1992). Ecological footprints and appropriated carrying capacity: what urban
economics leaves out. Environment and Urbanization, 4, 121–130.
Singh R. K., Murty, H. R., Gupta, S. K., & Dikshit, A. K. (2009). An overview of
sustainability assessment methodologies. Ecological Indicators, 9, 189-212.
White, A. T. (1986). Marine reserves: how effective as management strategies for
Philippines, Indonesian and Malaysian coral reef environments? Ocean
Management, 10, 137-159. http://dx.doi.org/10.1016/0302-184X (86)90019-3.

1 Researcher at Universiti Putra Malaysia. Email: [email protected] 169
PLANNING MALAYSIA:
Journal of the Malaysian Institute of Planners
VOLUME 15 ISSUE 1 (2017), Page 169 - 178
A REVIEW INTO THE “ISLAMIC” TRADITION IN THE MUGHAL
GARDEN: (RE)SHAPING OUR STAND ON ISLAMIC ART AND
DESIGN
Zainab Abdul Latiff1, & Maheran Mohd Yaman2
1Faculty of Design and Architecture,
UNIVERSITI PUTRA MALAYSIA 2Kulliyyah of Architecture and Environmental Design,
INTERNATIONAL ISLAMIC UNIVERSITY MALAYSIA
Abstract
In the field of garden history, Mughal gardens represent a prominent chapter of
what is often called the Islamic garden tradition. Most previous studies have
discussed on its theories and principles. However, it is essential to establish the
physical characteristics of the Mughal garden as representing Islamic garden
tradition. The method of content analysis has been applied in this study. The study
found that Mughal garden design is much influenced by the Persian’s Chāhār
Bāgh, Hindu mythology and Quranic paradise imagery. To conclude, Mughal
garden design needs to be assimilated into the current culture of local people
within the established principles of environment in Islam.
Keywords: Mughal garden, contemporary garden, Islamic garden, culture,
Islamic principles
Date Received: 30th April 2016
Date of Acceptance: 30th October 2016

Zainab Abdul Latiff, & Maheran Mohd Yaman
A review into the “Islamic” tradition in the Mughal garden: (Re) shaping our stand on Islamic art and design
© 2017 by MIP 170
INTRODUCTION
The origin of Mughal gardens can be traced to central Asia, while the climax was
reached in India over a long period of time (Koch, 1997a). Mughal gardens were
influenced by gardens of other regions and times such as regional influences from
central Asia, Kashmir, western Punjab, Persia and Delhi sultanate (Wescoat,
1996). Mughal gardens had always had a powerful impact on architectural
history and design as one of the pre-eminent expression of Islamic art, culture,
and values. It represents the extraordinary synthesis of human concerns. It
integrates the finest features of natural and built environments with the finest
traditions of local and regional landscape design. They draw together human
aspirations for worldly spiritual order by merging the Paradise imageries with
real garden design on earth (Wescoat, 1996).
OBJECTIVE OF THE STUDY
The main objective of the study is to dispute the assignment of the Mughal garden
as representing the Islamic garden.
METHODOLOGY OF THE STUDY
The methodology followed in this study is mainly content analysis and library
search that emphasized on the theories and principles of the Mughal garden.
THEORIES AND PRINCIPLES OF THE MUGHAL GARDEN
Mughal gardens are primarily situated along the plains of India and Kashmir. The
climate of the area is tropical and winds are warm and dry (Lehrman, 1980). The most important aspect of Mughal gardens is that the built environment
remained very closely wedded with the natural ingredients such as plants, lights
of the sunshine and the moon, the songs of the birds and movements of the air
saturate with the garden environment (Koch, 1997b). Man-made structures were
organized in such a way that one felt to be in an idealized natural environment.
The built environment captured the harmony which existed within nature.
Similarly, man-made elements such as aiwans, streams, fountains, walkways and
lamps coexisted simultaneously with natural elements. The individual elements
formed a whole, and the whole was always subordinate to nature. Therefore,
gardens were actually used as places of enlightenment, meditation and revelation
(Ashtiani & Sadat, 2015; Asher, 2003). The Mughals were Persianised Turks originated from Central Asia and
brings Persian culture to India (Dickie, 1985). Babur (1526-1530), the first
Mughal Emperor (Lehrman, 1980; Koch, 1997b) was directly descended from
Genghis Khan and Tamerlane (Koch, 2008). The sensational conquests of his
great ancestor over a century before had brought together Central Asia, North

PLANNING MALAYSIA
Journal of the Malaysia Institute of Planners (2017)
© 2017 by MIP 171
India, Persia, Mesopotamia, Syria, and Asia Minor in a single empire with its
capital at Samarkand, and subsequently Herat (Dickie, 1985). This is evidenced
in the remarkable similarity of garden layout and planning over a vast
geographical territory and time period, despite wide variations in local culture
and technological contexts (Blair & Bloom, 2003). The Mongols had no real
culture or well-defined religion of their own and they readily adopted those of the
country they conquered. To embellish his capital of Samarkand, Babur imported
garden designers from Central Asia, as one of his initiatives to develop a garden
(Jaffar, 1936). India was first ruled by Babur (1526-1530) followed by Humayun (1530-
1556), Akbar (1556-1605), Jahangir (1605-1627) and ended by Shah Jahan
(1627-1657). Of these five emperors, Babur, and his great-grandson, Jahangir
was the most passionate nature lovers and the most renowned garden builders
(Moynihan, 1980). Gardens were the new centres of royal power (Petruccioli,
1997) during their time. Therefore, the tradition of formal gardens in the Indian
subcontinent started with the arrival of the Mughals.
The Mughals were justifiably known as some of the history’s greatest
patrons of gardens. Before the establishment of Mughal rule, the sites for
recreation and pleasure activities were mostly informal and situated in the suburbs
of residential settlements or near water sources. Planned landscape features
existed in and around shrines, temples and water bodies. The objectives of such
formal and informal spaces were to bring the human mind and soul closer to
nature. The Mughals gave a new image of the landscape to areas occupied by
them. Gardens were built within towns, in suburbs, and along major highways
(Mubin, Gilani & Hasan, 2013). One of the significant features of Mughal gardens is that they are mostly
used during the evenings rather than day time. This is exhibited in the extensive
use of lamps and moonlight in the gardens. The sensory qualities of landscape
elements in the Mughal gardens made up its ambience (Petruccioli, 1998;
Wescoat, 2011). The earliest Mughal garden was of Babur’s, located in Agra; was laid out
in an urban context in a deliberate opposition to the citadel-palaces or forts, built
by pre-Mughal rulers (Asher, 2003; Md Jani et al., 2015; Wescoat, 2011). The Ram Bagh of Agra came into the picture when Babur visited Timurid and
Uzbek gardens in Samarkand, Kabul and Herat before coming to Hindustan. He
was amused by Samarkand’s fascinating gardens that stimulated him in
developing his own garden (Titley, 1979). Babur was interested in the garden as
an object of beauty and a means of delight, rather than as a man-made reflection
of the Quranic image of paradise. The open layout and greater architectural
character have eventually been so typical of the Indian garden (Ansari, 2011;
Ashtiani & Sadat, 2015; Asif et al., 2015; Esmaili, 2014).

Zainab Abdul Latiff, & Maheran Mohd Yaman
A review into the “Islamic” tradition in the Mughal garden: (Re) shaping our stand on Islamic art and design
© 2017 by MIP 172
Most of Babur’s gardens were in the hilly country, with abundant streams
which then Babur ordered to be diverted into straight watercourses and
rectangular basins. It was this concept of orderliness and symmetry which he
carried with him to India (Dale, 2004; Gilliat-ray & Bryant, 2010; Mirza,
2015). However, Babur’s craftsmen from Persia and Central Asia brought the
Islamic garden tradition of order, geometry, symmetry, straight channels and
rectilinear pools but also absorbed local custom. On the other hand, Hindu
craftsmen introduced an organic quality (Dickie, 1985; Rehman, 2013;
Rehman & Akhtar, 2012). The basic plan and other elements of the Mughal
garden are influenced from the earlier gardens in Turkestan and Persia, especially
the Chāhār Bāgh or fourfold garden layout (Gilliat-ray & Bryant, 2010;
Brooks, 1988; Stronach, 1994). Mughal gardens took a great advantage of the natural feature in the
landscape by erecting gardens of three types; first, gardens within the palace
courts; second, gardens that surrounded tombs and third are the gardens of large
charbaghs or paradise gardens (Moynihan, 1980). Tomb gardens recalled an
earlier Persian garden design with no terraces, only a slight slope and shallow
changes in the level for the gravity-fed water system. Its layout was a square with
multiple divisions of plots in the four quarters. While, the layout of paradise
garden is a parallelogram with four-square gardens on each terrace (Dickie,
1985; Wescoat, 2011; Moynihan, 1980; Mughal, 2011). Water dominated all Mughal gardens. The heart of their charbaghs was
the central watercourse. The early gardens depended on upon wells, later in
canals, as a more dependable water supply followed by widening of the
watercourses studded with fountains. These charming water gardens in a
waterless landscape provided the user with a scene of sensational and poetic
(Moynihan, 1980; Rehman, 2013). Relating to the concept of Quranic paradise imagery in Mughal garden,
Mr. Sajjad Kausar in his publication on Shalamar garden made this comparison
by stating that, “The Islamic garden tradition…can be traced in all Mughal
gardens…that often represent those of the Quranic gardens of paradise”
(Moynihan, 1980). “Mughals gardens were full of symbolism delineate the culture of the
local people. For example, the terraces in the gardens represented those
of the Quranic garden of paradise. Superstitious, but religious at the
same time, some of the emperors sought guidance from the stars and
occasionally built their charbaghs to conform to the number of planets
and signs of the zodiac. The number nine and eight have a special
meaning to the Mughals which always be crystallized onto gardens
spatial element designs.”
Moynihan (1980)

PLANNING MALAYSIA
Journal of the Malaysia Institute of Planners (2017)
© 2017 by MIP 173
In contrast, Brookes (1988) opposes to that by stating that, “Islamic art
(in India) was the very antithesis of Hindu art; for Hindu adornment was
individualistic, irregular and symbiotic, while Islamic decoration was
mathematical, continuous and abstract” (Moynihan, 1980). The early Mughal
gardens had more vitality and a stronger character than the later, more voluptuous
gardens (Moynihan, 1980; Ross, 1931). It is evident in the reflection of wealth
and security in Mughal buildings. Also, the structures of gardens became more
palatial, light silken awnings and other features emulating an increase in
extravagance. These mutual influences of garden and palace culminated in Shah
Jahan’s palace in the Red Fort of Shahjahanabad in Delhi, which was not a palace
at all but a terrace of luminous marble pavilions linked by gardens and
watercourses (Stuart, 1913). The Mughal garden was developed for two purposes; to serve as a
mausoleum and those developed for pleasure. The Mughal mausoleum set in its
garden was not derived from Iranian precedents; it is more likely to have evolved
from Mongol tradition or even from Hindu mythology. A garden would be
developed during the owner's lifetime when the building at its centre was possibly
used for receptions and banquets, and then converted into a mausoleum upon his
death. The second purpose is to suit the Islamic style of gardening to create
pleasure gardens in a summer resort with fertile plains, green hills and springs
outpouring, where it is described by Jones Lehrman “as a natural paradise on
earth” (Baarah, 2010). The courtyards were also largely for pleasure when they were designed
as small enclosed gardens with water, grass and shade. Courtyards in the mosque
were still well designed and executed, paved and contained an ablution basin in
the centre (Lehrman, 1980). A Mughal garden is always rectangular in shape,
accessible (Dickie, 1985), terraced and had pavilions and avenues lined with
trees and fountain and bore Iranian names. The focus of the design of the pleasure
garden was a pavilion that was inspired from the Chahār-Bāgh layout in Chihil
Sutun. Therefore, the Chahar Bagh layout was used only to refer to Timurid
gardens or to those of Babur’s (Jaffar, 1936; Rehman, 1997). Meanwhile, gardens in the plains were more related to the traditional
formal paradise layout and were primarily the setting for magnificent buildings.
The development of the pleasure garden, on the other hand, largely reflected the
regard felt by the Mughal Emperors for Kashmir, where many such gardens were
established. The rulers of the Mughal Empire built grand palaces and gardens
which were usually adaptations of the Mughal style after the empire weakened
resulting in the decline of its architecture. These palace gardens were built
without the application of strong axial symmetry and the use of water in them
diminished or in other words, Chahār-Bāghs were no more plays the role of the

Zainab Abdul Latiff, & Maheran Mohd Yaman
A review into the “Islamic” tradition in the Mughal garden: (Re) shaping our stand on Islamic art and design
© 2017 by MIP 174
garden’s prototype. The great Mughal period ended after the death of Shah Jahan
(Moynihan, 1980; Stuart, 1913). The Islamic characteristics in the Mughal garden are, in fact the influence
of Timurid gardens. This tradition was brought to the south to produce the Persian
garden and to east to produce the Mughal garden, which are mostly located in
palaces (Moynihan, 1980; Stronach, 1994; Stuart, 1913; Wescoat, 2011). As a consequence, the introduction of lush gardens of Central Asia into the dusty
plains of India produced a mixture of garden (Dickie, 1985; Hamed, 1994).
Babur ruled Afghanistan for 22 years (Titley, 1979). His first garden there was
inspired by a Timurid model. It was built more as a residential environment that
consists a sitting place, enjoyment hall, horse stables, camping place, a splendid
gateway and an abundance of cherry trees, orange trees, sugar cane and
pomegranates in a Chāhār Bāgh layout (Rehman, 1997; Rehman & Akhtar,
2012). Meanwhile, Babur’s first garden in India, the Ram Bagh was designed
by himself in an orderly and symmetrical way (MacDougall & Ettinghausen,
1976) with a square pool often placed at the junction of two waterways (Rehman
& Akhtar, 2012) as well as a pleasure house in the centre. There was a stone
platform for sitting, shaded by a canopy. The platform is placed in front of the
first pavilion, and close to a pool. Steep terracing became characteristic of his
design, and he apparently never built a garden without water (Moynihan, 1980). The attractive border area contained plantings. The other pavilion is slightly
larger and is most likely of a type which backs onto the garden wall and has a
small rectangular room in the rear. Monumental gates were essential components
(Rehman, 1997). Columns and flowers were carved. There were also two pavilions along
the waters’ edge and a few courtyards. There were trees and flowers, two
fountains and square stone tanks with coloured tiles and fountains (Moynihan,
1980; Titley, 1979). There were constant movement and sparkle of water (the
hilly landscape encouraged the introduction of waterfalls), cascades, stone-lined
water channels, water chutes, mausoleum or kiosk, cisterns, and wells. There was
also a geometrical pattern of raised walks and platforms. The walks are some ten
feet above ground level and about eight feet wide, with narrow irrigation channels
down the centre to water the trees planted at intervals along the walks. At the
corner of the pavements are stone platforms surrounded by narrow watercourses
which can be found in almost all Mughal gardens.
Mughal gardens are always in a series of ascending terraces, and this
concept was followed in many later gardens. The first level was open to the
public, the second was the emperor’s private garden, and the third was the zenana
garden for the harem. A Mughal garden could have eight terraces, which followed
the Islamic concept of paradise in eight divisions. Among the examples of

PLANNING MALAYSIA
Journal of the Malaysia Institute of Planners (2017)
© 2017 by MIP 175
Mughal gardens are Bagh i-Wafa (garden of fidelity), Nimla, Kashmir Shalimar
Bagh, Nishat Bagh, Lotus Garden, Sheikhpura (today Pakistan) which is similar
to pairidaeza of the Sassanian kings of Persia26 and others. Alternatively, a garden
could have seven divisions which then reflected the seven planets. There was
little consistency; Nishat Bagh in Kashmir was given twelve divisions one for
each sign of zodiac (Ruggles, 2008). The manipulation of water through channels was sometimes laid at right-
angles to the main water course and conformed to the traditional fourfold
division. These channels were paralleled by straight paths (MacDougall &
Ettinghausen, 1976; Mirza, 2015), grassed area, edged with narrow flower
beds shaded by straight rows of imposing trees. The garden was enclosed by
massive walls, which gave a sense of privacy and peace. The walls were a shield
against the hot winds of summer and the brown land. There were lofty gateways
centred on the wall, contained huge wooden doors, studded with heavy iron
bosses, nails and spikes. Regular avenues led from the gateway or flanking
pavilion to a central structure in front of which were rectangular water tanks.
Water flowed through carved inclined planes or chutes (chadar) from one terrace
level to the next. The channels of the early Mughal gardens were narrow and
shallow, with broad areas of paving on each side. The secondary channels led
from the main ones. As Mughal garden design evolved, the channels became
wider. The base of the channels was sometimes inlaid with zig-zag stripes of dark
marble to symbolize the movement of the waves as the water flowed through
(Ansari, 2011; Ashtiani & Sadat, 2015; Asher, 2003). The Mughal gardens were also planted with imported trees such as
poplar, oriental plane or chenar, dark cypress, willow and the massive chenar.
Roses and narcissus were also planted. Locally grown fruit trees are also planted
such as apples, oranges, figs, mangoes, coconuts, bananas, mulberries, lime,
quince, apricot, cherry, plum, peach, guava, pear, pomegranate, and tamarind.
Flowers that were cultivated were roses, violets, sunflowers, jasmine, marigolds,
poppies, carnations, hollyhocks, wallflowers, delphiniums, hibiscus, hyacinths,
jasmine, lilies, narcissus, lotus, lilacs and tulips, which were all watered by hand
during the extensive dry season. Iris has been the substitute of myrtle; frequently
present in Mughal iconography. For irrigation purposes, artificial lakes, canals
and wells with raised water by an arrangement of wheels and levers was used for
many years before Mughal (Lehrman, 1980). Mughal garden is usually in a square or rectangular shape with rows of
trees and flowerbeds, centrally placed canals, waterfalls and running fountains
(Mughal, 2011). The gardens had Chāhār Bāgh layout (Wescoat, 2011) which
was originally inspired from Iran, and brick-lined walkways and causeways. A
high wall, adorned with serrated battlements and pierced by a lofty entrance
gateway, encircles the garden. In larger gardens there are always four main
gateways or buildings. The water runs into a trim stone or brick-edged canal down

Zainab Abdul Latiff, & Maheran Mohd Yaman
A review into the “Islamic” tradition in the Mughal garden: (Re) shaping our stand on Islamic art and design
© 2017 by MIP 176
the whole length of the enclosure, falling in cascades, or rushing over carved
water-chutes (cedars) then ended up in a larger or smaller tank, usually studded
with numerous small fountains (Ali, 2003). The principal pavilion was often placed in the centre of the largest of
these sheets of water. There are also side-canals, leading out from the principal
into the wall, raised platforms (Rehman & Akhtar, 2012) and gateways. From
these stone-bordered canals and tanks, the water required for irrigating the soil is
conducted by pipes. Avenues of plane and cypress trees were planted in the
square plots intersected by watercourses which were filled with fruit trees and
parterres of flowers. There were shady walks, pergolas of vines and flowers;
turfed open squares shaded by large trees planted at the corners, or having one
central chenar or mango tree surrounded by a raised platform of masonry or grass,
terraces, fountains, and narrow watercourses, with their tiny, carved water-chutes,
and the old well from which the garden was supplied with water from the Jumna
(Dale, 2004).
Water chutes are used in a series of high terraces (Dale, 2004; Wescoat,
2011). But in small gardens, or in the plains, even the slightest slope was made
into little waterfalls. A small pavilion built on the terrace at the far side of the
garden. There are two large sunk plots on the garden’s site. This enclosure, square
plots, narrow watercourses, raised paths, sunken flower beds, continuous
parterres, lowered square garden, flower beds that contain rose bushes, fruit trees,
and tall-growing flowers and herbs. The large fountain basins and tanks were
designed in the same fashion, their corners and sides being ornamented with
scrolls of sculptured stone or marble, wide terraces with lines of little fountains
and broad pathways (Mirza, 2015; Nath, 1982; Petruccioli, 1998). The early Mughal gardens in India followed closely on their Persian
origin. It is essentially a terraced garden. Water was manipulated beautifully in
canals, jets of water, waterfalls, cascades, ponds and lakes (Nath, 1982). “The
central artificial pool was highly appreciated as a place of relaxation and as a
setting for court ceremonials” (Ross, 1931). Here the paved walkways are raised
some ten feet above the level of the beds. The height above the flowerbeds varied
according to what was intended to be planted in the garden: thus, some gardens
were quite shallow while others were very deep. Thus, the Indo-Islamic garden
operated simultaneously on two levels: visually, on the upper level, as a living
carpet; and, sensually, on a lower plane, as a place of shade and intimacy and cool
repose. It could only operate visually as a floral carpet or actually as a refuge from
the scorching heat provided the planting was dense (Rehman, 1997).
CONCLUSION
Mughal garden is one of the great gardens in the Muslim world, which was largely
constructed to serve the emperors or sultans. The garden was generally built in a

PLANNING MALAYSIA
Journal of the Malaysia Institute of Planners (2017)
© 2017 by MIP 177
palatial environment, influenced by the ancient culture and traditions of the
Persians as well as local cultures of Hinduism. Though the Quranic concept can
be traced in all parts of the garden, the garden does not stand on glorifying the
Quranic imageries alone, but mixed with local culture, which is obviously beyond
Islamic doctrine. It is essential to note that, nothing on earth is equivalent to the
paradise promised to the believers by the Almighty Allah (SWT), what more to
equalize a man-made (restructured) environment to a paradise, which appearance
is undoubtedly incomprehensible by a normal person’s mind. Indeed, as indicated
in the article; Mughal garden apparently has gone through a series of
transformation from a nature-appreciation landscape, during the reign of the first
emperor, Babur, to a voluptuous garden in the reign of the last emperor of
Mughal, Shah Jahan. Secondly, the implication of culture in the garden is
discernible throughout its construction and design. The construction and
arrangement of the built structures, vegetation, water elements, location,
materials used, pre-determined layout and other physical features in the garden
should be assimilated into contemporary garden design according to local
context, preferences, religious affiliation as well as the underlying environmental
principles in Islam, such as unity (tawhid); creation (fitra); balance (mizan); and
responsibility (khalifa) (Khalid, 2010; Abdul Latiff & Mohd Yunus, 2016).
REFERENCES Abdul Latiff, Z., & Mohd Yunus, M. Y. (2016). The Islamic Garden design principles: thoughts for
the 21st century. Research Journal of Fisheries and Hydrobiology, 11(3), 175-178.
Ali, D. (2003). Gardens in early Indian court life. Studies in History, 19(2), 221–252.
Ansari, N. (2011). The Islamic garden (seminar paper). CEPT University, Gujarat, India.
Ashtiani, M. & Sadat, F. (2015). Principles for designing a modern Islamic garden. How can new
design contain the memory of the past? (Master’s thesis). University of Illinois at Urbana-
Champaign.
Asher, C. B. (2003). The new Cambridge history of India architecture of Mughal India. In G.
Johnson, C. A. Bayly & J. F. Richards (Eds.). United Kingdom: The Press Syndicate of the
University of Cambridge.
Asif, N., Utaberta, N., Othman, M. A., & Mohd Yunos, M. Y. (2015). Redefining Islamic garden:
comparative analysis of approaches, ideas and design framework.”Jurnal Teknologi 75(9), 77–81.
Baarah, S. A.(2010). Gardens in Islamic architecture: an analytical study (Thesis). An-Najah
National University, Nablus, Palestine.
Blair, S. S., & Bloom, J. M. (2003). The Mirage of Islamic Art: Reflections on the Study of an
Unwieldy Field. The Art Bulletin, 85(1), 152–184.
Brooks, J. (1988). Gardens of Paradise: the history and design of the great Islamic gardens. New
York: New Amsterdam Books.
Dale, S. F. (2004). The garden of the eight paradises. Leiden: Koninklijke Brill.
Dickie, J. [Yaqub Zaki] (1985). The Mughal garden: gateway to paradise. Muqarnas, 3, 128–137.
Esmaili, M. (2014). The impact of Persian architecture on the Indian architecture. Journal of Life
Science and Biomedicine, 4(4), 286–289.
Gilliat-ray, S., & Bryant, M. (2010). Islamic gardens in the UK: dynamics of conservation, culture
and communities. Retrieved from es.cardiff.ac.uk/islamukcentre/research/islamic-gardens/
Hamed, S. (1994). Paradise on earth: historical gardens of the arid Middle East. Desert Architecture
III: Building a Sustainable Future Paradise, 36, 1–8.

Zainab Abdul Latiff, & Maheran Mohd Yaman
A review into the “Islamic” tradition in the Mughal garden: (Re) shaping our stand on Islamic art and design
© 2017 by MIP 178
Husain, A. A. (2000). Scent in the Islamic garden: a study of Deccani Urdu literary sources.
Karachi: Oxford University Press.
Jaffar, S.M. (1936). The Mughal Empire from Babur to Aurangzeb. Peshawar: S. Muhammad Sadiq
Khan Kissa Khani.
Khalid, F. (2010). Islam and the environment: Ethics and practice. The 15th General Conference
the Environment in Islam. Amman, Jordan.
Koch, E. (2008). Mughal Imperial Architecture (1526-1858 A.D). Retrieved from
https://isites.harvard.edu/fs/docs/icb.topic771131.files//Past_Syllabi/HAA183.pdf.
Koch, E. (1997a). Mughal Palace Gardens from Babur to Shah Jahan (1526-1648). Muqarnas, 14,
143-165.
Koch, E. (1997b). The Mughal waterfront garden. In A. Petruccioli (Ed.) Gardens in the time of the
great Muslim empires: theory and design, pp. 140-160. Leiden; New York: E.J. Brill.
Lehrman, J. B. (1980). Earthly paradise: garden and courtyard in Islam. University of California
Press.
MacDougall, E. B., & Ettinghausen, R. (1976). The Islamic Garden. Dumbarton Oaks Colloquium
on the History of Landscape Architecture, 4.
Md Jani, H. H., Harun, N. Z. Mansor, M., & Zen, I. (2015). Exploring the Islamic Garden concept
as inspirational landscape design. Procedia - Social and Behavioral Sciences, 170, 359–368.
Mirza, M. (2015). Paradise on Earth. University of Manitoba Winnipeg, Manitoba, Canada.
Moynihan, E. B. (1980). Paradise as a garden: in Persia and Mughal India. London: Scholar Press.
Mubin, S., Gilani, I. A., & Hasan, W. (2013). Mughal gardens in the city of Lahore – a case study
of Shalimar Garden material & methods. Pakistan Journal of Science, 65(4), 511–522.
Mughal, M. R. (2011). Impact of urbanization on ancient gardenscape of Lahore and the World
Monument of Shalimar Garden (Pakistan). 15th ICOMOS General Assembly and International
Symposium: ‘Monuments and sites in their setting - conserving cultural heritage in changing
townscapes and landscapes’, Xi'an, China.
Nath, R. (1982). History of Mughal architecture (Volume 1). Abhinav.
Petruccioli, A. (Ed.) (1997). Gardens in the time of the great Muslim empires: theory and design.
Leiden; New York: E.J. Brill.
Petruccioli, A. (1998). Rethinking the Islamic Garden. Yale F & ES Bulletin, 10, 349-364.
Rehman, A. (2013). Changing concepts of garden design in Lahore from Mughal to contemporary
times.” Garden History, 37(2), 205–217.
Rehman, A. (1997). Garden types in Mughal Lahore according to early seventeenth century written
and visual sources. In A. Petruccioli (Ed.) Gardens in the time of the great Muslim empires:
theory and design. Leiden; New York: E.J. Brill.
Rehman, A, & Akhtar, M., (2012). The Mughal Gardens along the Grand Trunk Road in Pakistan
and Afghanistan. Dumbarton Oaks. Retrieved from http://www.doaks.org/resources/middle-
east-garden-traditions/
Ross, D. E. (1931). The Persians. London: Oxford at the Claridon Press,
Ruggles, F. D. (2008). Islamic Gardens and Landscapes. Philadelphia: University of Pennsylvania
Press.
Stronach, D. (1994). Parterres and stone watercourses at Pasargadae: notes on the Achaemenid
contribution to garden design. The Journal of Garden History, 14, 37–41.
Stuart, C. M. V. (1913). The Gardens of the Great Mughals. Soho Square: Adam and Charles Black.
Titley, N. M. (1979). Plants, and gardens in Persian, Mughal and Turkish Art. British Library
Booklet.
Wescoat, J. L. (2011). The Changing Cultural Space of Mughal Gardens. In R. M. Brown & D. S.
Hutton (Eds.), A Companion to Asian Art and Architecture. Oxford, UK: Wiley-Blackwell.
Wescoat, J. L. (1996). The Mughal garden: interpretation, conservation and implications.
Ferozsons.

1Assistant Professor at International Islamic University Malaysia. Email: [email protected] 179
PLANNING MALAYSIA:
Journal of the Malaysian Institute of Planners
VOLUME 15 ISSUE 1 (2017), Page 179 - 190
CONTENT ANALYSIS OF THE EXISTENCE OF BIOMIMICRY
LIFE’S PRINCIPLES IN GREEN BUILDING INDEX MALAYSIA
Noor Aziah Mohd Ariffin1, & Salwa Farag Gad2
1,2Kulliyyah of Architecture and Environmental Design
INTERNATIONAL ISLAMIC UNIVERSITY MALAYSIA
Abstract
Concerns about climate change and global warming have led many countries to
initiate energy rating systems in the planning and development of the built
environment. Although useful and novel, this paper contends that these ratings
are only remedying and alleviating whatever negative impacts that development
creates. Energy ratings are seemingly lacking in attempts to integrate and enhance
the physical development of the natural environment. Instead, biomimicry is a
discipline that explores nature and tries to understand its bio-integration for the
establishment of sustainable products, processes and systems. This paper
postulates that with the integration of Biomimicry – Life’s Principles (BLP) into
the Green Building Index (GBI) Malaysia, a higher level of environmental
sustainability could be achieved. This paper attempted to explore the presence
and the extent of the presence of BLP in the existing GBI utilizing the content
analysis method. This article concludes that although the presence of BLP in the
GBI is high, the extent of the presence is low. The paper also recommends the
areas of concern that could be improved within the GBI for a more effective rating
system.
Keywords: Green Building Index (GBI); Biomimicry - Life’s Principles (BLP);
content analysis; presence; extent of presence
Date Received: 30th April 2016
Date of Acceptance: 30th October 2016

Noor Aziah Mohd Ariffin, & Salwa Farag Gad
Content Analysis of The Existence of Biomimicry Life’s Principles in Green Building Index Malaysia
© 2017 by MIP 180
INTRODUCTION The primary aim of this paper is to explore the existence of BLP within the GBI Malaysia. Thus, the study was conceptualised based on three objectives: The first is to explore the meaning and concept of biomimicry in the development of the built environment. Secondly, is to analyse the presence of biomimicry principles in the current energy rating tools and finally, is to analyse the extent of that presence or usage of BLP in the GBI system.
What is Biomimicry?
The term biomimicry comes from the Greek words bios, meaning life, and mimesis, which mean to imitate (Baumeister, 2012). This concept emerged in 1982 and was made famous by Janine Benyus in her book ‘Biomimicry: Innovation Inspired by Nature’ in 1997. Benyus (1997) defines biomimicry as the “new science that studies nature's models and then imitates or takes inspiration from these designs and processes to solve human problems”. Biomimicry is a scientific approach that examines nature's lessons and methods, which are applied to the processes and designs to solve human problems. It seeks sustainable solutions by imitating nature’s patterns and strategies (Zanowick, 2011). According to Gamage & Hyde (2012), biomimicry could be called ‘strong ecological design’ because it advocates using the same materials and processes applied by nature closely. Reap (2009) used three verbs to define biomimicry: ‘study, imitate and solve’. Reap (2009) studies the living systems with the intent of imitating it to solve technical problems. Additionally, a final evaluation was required to ensure that the product or design commensurate with the natural principles.
Biomimicry has achieved some innovative and efficient technologies in materials and product, and has resulted in numerous innovations in fields such as transportation, material science and medicine. It is also gaining recognition in the design professions such as architecture (Gamage & Hyde, 2012). Designers and architects are becoming more interested and aware of how much nature can offer to improve the way the systems function. El Ahmar et. al., (2013) among others, contended that biomimicry is a growing area of research in the field of architecture and engineering. However, it is still unrealized, largely in architecture as demonstrated by the small number of built case studies (El-Zeiny, 2012; Klein, 2009; McGovern, 2009). The paper suggests that biomimicry should be considered as an approach to increase the sustainability of a building project. The mimicking of general ecosystem principles should be integrated into the design at the earliest stage and utilised as an evaluative tool all over the design process (Zari, 2015).
Biomimicry Design Lens
The ‘Biomimicry Design Lens’ (Figure 1) is a guide that helps in understanding how biomimicry can be applied to any discipline or design scale. The Lens includes the Biomimicry – Life’s Principles (BLP), and Biomimicry Thinking

PLANNING MALAYSIA
Journal of the Malaysia Institute of Planners (2017)
© 2017 by MIP 181
(Biomimicry 3.8, 2013). The Biomimicry – Life’s Principles (BLP) represents ‘Nature’s strategy for sustainability’ and they provide a lens to observe design strategies (Zanowick, 2011). According to Biomimicry 3.8 (2013), these principles also signify the central patterns found among the species living on Earth. The Design Lens or framework demonstrated six (6) main principles and twenty (20) sub-principles. The principles are all equally weighted, and they are (in no particular order): Adapt to Changing Conditions; Be Locally Attuned & Responsive; Use Life-Friendly Chemistry; Be Resource Efficient; Integrate Development with Growth and Evolve to Survive. The BLP design lens was used as a guide in assessing the primary aim in this paper (Figure 1).
Figure 1 The Biomimicry Design Lens Source: http://biomimicry.net/
Noor Aziah Mohd Ariffin, & Salwa Farag Gad
Content Analysis of The Existence of Biomimicry Life’s Principles in Green Building Index Malaysia
© 2017 by MIP 182
Green Building and Green Building Rating Systems
The main motivation behind the green building movement is the sustainable development paradigm (Kibert, 2012). Green building is an outcome of applying sustainable construction approaches to provide a responsible built environment. The term ‘green building’ refers to the actual structures’ quality and characteristics that are provided using sustainable construction principles and methodologies (Kibert, 2012). At present, Green building movement grows rapidly and it is supported by many government and non-government organisations. This movement becomes popular among professionals and authorities to create a balance between the building and its surrounding environment. The goals are to lower the buildings’ adverse impacts on the environment during the life cycle of the building, which can be achieved through better design, siting, construction, operation, maintenance and demolition. A building is defined as green when it has undergone an evaluation process. The evaluations are to verify that a building follows the strict requirements of the green building rating systems to provide detailed assessments (Kibert, 2012). As a result, these systems can be called assessment building systems, or building rating tools or systems such as the Leadership in Energy and Environmental Design (LEED) (US, 1998) and Green Building Index (GBI) (Malaysia, 2009).
GBI Malaysia is made up of six Parts: Energy Efficiency, Indoor Air Quality, Sustainable Site Planning and Management, Materials and Resources, Water Efficiency and Innovation. Under each of these Parts, there are several criteria according to which the building will be evaluated. In the beginning, two GBI rating tools were developed: the Non-Residential and the Residential rating tools. After that, several more tools were developed. Recently, there are around 11 GBI rating tools. Each of these rating tools has its own point allocation, where each tool places its emphasis on GBI criteria that are different from other tools. One of these tools is the Non-Residential New Construction (NRNC), which is the focus of this research.
Green Building and Nature
As stated before, the natural systems have many solutions for the current problems that people are facing nowadays. Most of green building’s definition states that ecology and ecological principles are important for the designing of green buildings. However, some critics claim that ecological or natural-based principles do not exist in a coherent manner in the green buildings (Gamage & Hyde, 2012). Some other critics suggest that most green building designs operate as a collection of eco-technologies such as photovoltaic panels and eco materials (Yeang, 2006). This illustrates a lack of knowledge in understanding the significance of holistic integration (Gamage & Hyde, 2012). According to Kibert (2012), the progress of high-performance green building requires the ability of the design team to understand and apply ecology and its principles. In other words, buildings should have ‘a synergistic relationship’ with the natural

PLANNING MALAYSIA
Journal of the Malaysia Institute of Planners (2017)
© 2017 by MIP 183
environment surrounding it (Kibert, 2012). Kibert (2012) claims that green building with higher economic and aesthetic value can be produced when there is a use of design approach that is based on the understanding of natural systems and ecosystems’ behaviour. In short, green buildings need to go beyond the points and certifications, and they are required to integrate and blend with nature and this cannot be achieved with a simple checklist as used by most rating tools.
METHODOLOGY
This paper is the beginning of a deeper study and is more exploratory in nature. In order to achieve the stated aim and the subsequent questions, the principle methodology used in this study is utilizing the content analysis method. Analyses were done on the GBI documents to investigate on the presence and on the extent of the application of the biomimicry principles in the existing ratings. The content analysis used not only the exact words but also the meaning or concepts of the BLP that are deemed relevant in the GBI. The findings of the analysis would from a basis for the recommendation of improving the present GBI document wherever relevant.
Content Analysis
Content analysis is a method of analysing documents, and it helps in testing theoretical issues to improve the understanding of the data (Elo & Kynga, 2007). There are different levels of content. There is the primary content that is represented by themes and main ideas of the text, and there is a latent content that is represented by the context information. The purpose of content analysis method is to provide new insights, knowledge, a representation of facts and a practical guide to action and also to get a shortened or broad explanation of the phenomenon (Elo & Kynga, 2007). The processes of content analysis involves coding of raw data, such as visual images, textual material, and illustrations, in accordance with a classification scheme. The coding is a process for organizing content in a way that helps in easily identifying, indexing, or retrieval of the content that is relevant to the research questions. The components of the content could be words, phrases, topics, theories, concepts or other features.
Content analysis method is used with either qualitative or quantitative data by either deductive or inductive processes and consists of three phases of work: preparation, organizing and reporting. The preparation phase includes deciding on sampling, selecting the unit of analysis and making sense of data. After that, a decision will be made whether to use deductive or inductive approach. If the deductive approach is chosen, a categorization or conceptual matrix will be developed (Elo & Kynga, 2007). The data are coded for correspondence with the identified categories or concepts. For each deductive category, clear definitions, examples, and coding rules must be provided and arranged in a coding agenda. There are several computer programs that are widely used for content analysis, and one of them is ATLAS.ti. This program works as an assistant in working through the material, writing marginal notes, defining

Noor Aziah Mohd Ariffin, & Salwa Farag Gad
Content Analysis of The Existence of Biomimicry Life’s Principles in Green Building Index Malaysia
© 2017 by MIP 184
category and codes, underlining, writing comments and others. Also, it is a very helpful tool for handling the text.
The deductive approach was used because the BLP was developed by the Biomimicry Institute (Biomimicry 3.8, 2013). It is divided into six main categories and twenty sub-categories. BLP were coded as the codes/categories and the GBI document was coded for correspondence with the identified codes/categories. The codes definition of BLP document (Biomimicry 3.8, 2013) is shown in Table 1.
Table 1 The Code Definition for BLP
Document Main Principles Code Sub-
principles
BLP -
Biomimicry
Life’s Principles
Evolve to Survive C1 3
Be Resource (Material & Energy)
Efficient
C2 4
Adapt to Changing Conditions C3 3
Integrate Development with Growth C4 3
Be Locally Attuned and Responsive C5 4
Use Life- Friendly Chemistry C6 3
Total 20
The codes definition of GBI document (Non-Residential New
Construction (NRNC), 2015) is shown in Table 2.
Table 2: The Code Definition for GBI
Document Parts Code Criteria
GBI, Green
Building Index
Energy Efficiency EE 9
Indoor Environmental Quality EQ 15
Sustainable Site Planning &
Management
SM 13
Materials & Resources MR 7
Water Efficiency WE 5
Innovation INV 2
Total 51
Stages for Conducting Content Analysis Stage 1 is the Preparation stage where both documents were analysed and the coding was specified and assigned. The researcher decided to code for sets of words, phrases or themes, which were relevant or related to the specified codes/concepts (pre-defined set of categories). Stage 2 is the Organization stage where the software Atlas.ti was actively used in the coding process. Atlas.ti was helpful in working through the text, underlying, writing comments and applying codes to a highlighted or selected text. These actions were to look for the existence of assigned words and concepts according to the codes specified in the

PLANNING MALAYSIA
Journal of the Malaysia Institute of Planners (2017)
© 2017 by MIP 185
GBI document. The codes were then organised into categories, using the Biomimicry Lens as a guide. The outcome of this is shown in Stage 3, the Reporting stage. This stage is the most crucial stage where the results found from Stage 2 were presented in tables and charts for clarity of reporting. In this stage, the BLP Lens was used to illustrate the presence of these principles in the GBI terms.
ANALYSIS & RESULTS
Most of the analyses were done in Stage 2: the coding process. Coding of the text
was conducted by reading through the documents and manually writing down the
occurrences of concepts identified, using Atlas.ti. The GBI rating tool was
considered as the document or data analysed according to the existence of the
codes (as concepts and not as exact words). The text was coded using ATLAS.
Ti (attaching the code to a text that used the principle) and the results were
arranged in a matrix and finally reported in the forms of bar chart and as a
summary, the radar chart. The results were reported in terms of the presence and
the extent of this presence. Table 3 shows an example of the coding process
undertaken.
Table 3 Example of the Coding Process of the Occurrences of the Concepts in the
GBI similar to BLP
BLP: C 1-1: Replicate Strategies that Work
GBI Criteria Quotation
EE1: Minimum EE
Performance
“Promote the use of MS 1525.”
EQ6: Thermal Comfort: Design
& Controllability of
Systems
“Design to ASHRAE 55 standards in conjunction
with the relevant localised parameters as listed in
MS 1525:2007.”
EQ10: Electric Lighting
Levels
“The ambient lighting level should be designed in
accordance with the illuminance level
recommended in MS1525:2007.”
SM13: Building User Manual “To document Green building design features and
strategies for user information and guide to sustain
performance during occupation.”
The coding process was where the texts within the GBI were coded for the
presence of the Biomimicry life’s principles (BLP) as obtained from Atlas.ti. In
addition, the extent of existence was also provided in the form of the percentages
of the presence of each main principle in GBI. It is important to note that the
coding was for the presence of the concept/principles and not how it was applied.
The aim was to find out whether these concept or principles were embodied or
employed in the GBI criteria or not.

Noor Aziah Mohd Ariffin, & Salwa Farag Gad
Content Analysis of The Existence of Biomimicry Life’s Principles in Green Building Index Malaysia
© 2017 by MIP 186
The next step was to categorise or arrange the quotations from the GBI text (coded text as shown above) into a matrix to look for the presence of the BLP in the GBI. An example of the categorization matrix of the presence of BLP in the Energy Efficiency Part from the GBI is shown in Table 4.
Table 4: Example of the Categorization Matrix in the Energy Efficiency Part
GR
EE
N B
UIL
DIN
G I
ND
EX
(GB
I)
BIOMIMICRY LIFE’S PRINCIPLES (BLP)
Res
ult
s
C1
:
Ev
olv
e to
Su
rviv
e
C2
:
Be
Res
ou
rce
Eff
icie
nt
C3
:
Adap
t to
Ch
angin
g
Con
dit
ions
C4
:
Inte
gra
te D
evel
op
men
t
wit
h G
row
th
C5
:
Be
Lo
call
y A
ttun
ed
and
Res
po
nsi
ve
C6
:
Use
Lif
e-F
rien
dly
Ch
emis
try
C1
-1
C1
-2
C1
-3
C2
-1
C2
-2
C2
-3
C2
-4
C3
-1
C3
-2
C3
-3
C4
-1
C4
-2
C4
-3
C5
-1
C5
-2
C5
-3
C5
-4
C6
-1
C6
-2
C6
-3
To
tal
%
EN
ER
GY
EF
FIC
IEN
CY
EE
1
4 20
EE
2
1 5
EE
3
2 10
EE
4
1 5
EE
5
3 15
EE
6
0 0
EE
7
0 0
EE
8
1 5
EE
9
0 0
The categorization matrix was conducted for all 6 Parts of the GBI
document (refer to Table 2). These were further analysed to present the
investigation of the BLP codes in the GBI documents.
The presence of the BLP was reported at two levels: in GBI as a whole
and then in each part of the GBI. On the other hand, the extent of the presence
has two dimensions: the extent of the fulfilment of BLP itself and their extent of

PLANNING MALAYSIA
Journal of the Malaysia Institute of Planners (2017)
© 2017 by MIP 187
the presence in GBI. This study takes the stand that all principles must be
fulfilled to create conditions conducive to live as seen in the Biomimicry Life’s
Principles framework or lens. The summary of the findings is reported next.
The Presence of BLP in GBI
When looking at the GBI as a whole, the level of presence of the BLP is a likely 65%. This result means that much of the contents of the GBI include the themes and concepts as coded and categorised from the BLP. The total number of presences equate to the number of sub-principles found in the whole GBI document. Further analyses showed that 13 BLP sub-principles out of a total of 20 were present but in the different Parts of the GBI. The radar chart in Figure 2 illustrates the summary of the results of the three levels of analyses on the presence of the BLP in the GBI.
Figure 2 Summary of the Presence of Biomimicry Life Principles in GBI
The most outer ring presents the 6 Parts of the GBI (see Table 2). The second ring shows the criteria of each Parts and the third ring shows the levels of

Noor Aziah Mohd Ariffin, & Salwa Farag Gad
Content Analysis of The Existence of Biomimicry Life’s Principles in Green Building Index Malaysia
© 2017 by MIP 188
occurrence/presence of BLP in each criteria of the GBI. Going inwards, the fourth ring shows the levels of fulfilment or the extent of the presence of the BLP in the GBI. The innermost or smallest ring shows the total and percentage of the presence of BLP in the GBI.
All Parts of the GBI were represented, but not all criteria have the presence of the BLP. For example, in the Innovation (IN) Part, which consisted of only two criteria (IN1 & IN2), BLP is only found in one criterion. However, the level of the fulfilment of BLP is the highest (25%) amongst all criteria. Another example is the Indoor Air Quality (IAQ) Part, where nine criteria out of fifteen do not have any BLP presence in them. When going deeper into the inner ring, the result illustrates the magnitude of the presence of BLP in each GBI Part on the whole. Energy Efficiency (EE) Part obtained the highest presence of BLP with 35%. On the other hand, Materials and Resources (M&R) Part has seven criteria but the lowest number of BLP with only 20% presence.
The Extent of the Presence of BLP in Parts of GBI
The definition of the extent of presence here means the level of frequency of the presences of the BLP in the GBI. The frequency was obtained through a categorization matrix where the presence of the BLP sub-principles was ticked against the criteria in the GBI when found. These occurrences may appear several times in some criteria/sub-principle matrix. While in another matrix, it may not appear at all. The results are shown in Figure 3.
Figure 3 The Extent of Presence of BLP in GBI
The results show the percentage of the extent of the presence of each main principle of BLP in the GBI. Although many of the BLP existed in GBI as a whole (65%), the extent (or level of frequency) of the presence is low. The highest numbers of the frequency of presence (8%) in GBI are evident in two principles. They are “Be Locally Attuned and Responsive” and “Be Resource
3%
8%
4%
2%
8%
2%
0% 20% 40% 60% 80% 100%
C1: Evolve to Survive
C2: Be Resource Efficient
C3: Adapt to Changing Conditions
C4: Integrate Development with Growth
C5: Be Locally Attuned and Responsive
C6: Use Life-Friendly Chemistry
Extent of Presence in GBI
BL
P

PLANNING MALAYSIA
Journal of the Malaysia Institute of Planners (2017)
© 2017 by MIP 189
Efficient (Materials and Energy)”. The lowest extent of presence is by the “Use Life–Friendly Chemistry” and “Integrate Development with Growth” principle, where the extent is only 2% in the GBI criteria.
This result would infer that more efforts are required to increase and enhance these principles in the GBI. On average, the total of the extent of the presence of BLP was calculated as 4.7% in the whole GBI. This finding indicated poor bio-integration of ecological principles into the existing green building-rating tool.
CONCLUSION Green building design and biomimicry are two different evolving approaches to sustainability in the built environment. Green building design aims to achieve the sustainable development goals and principles. On the other hand, biomimicry seeks to study nature’s models to solve all problems that humans face nowadays. In other words, biomimicry is based on the natural model while the green building relies on the man-made model. As demonstrated, nature is considered as a perfect paradigm of sustainability and, therefore, using the biomimicry life’s principles in green building design could be very beneficial. The synergy between biomimicry and green building design can help in improving and further develop the green building rating tools that are widely used by building’s professionals to help them define and produce a sustainable building.
This research uses the Biomimicry Life’s Principles (BLP) framework or lens to analyse the GBI Malaysia rating tool. The whole GBI document was examined against the existence of Biomimicry principles in it. This study helped in highlighting the natural principles that exist in GBI and also indicating those that do not exist. Once the missing attributes were found, efforts can be made to enhance the content of the GBI document to achieve a higher level of sustainability. The study explicated the extent of the presence of BLP in GBI, which, in general, is low. The findings inferred a need for more integration of the BLP in the next generation of the GBI rating tool. Future study would be to find out how the missing principles may be included in the existing GBI and how the other existing principles may be enhanced. An improved framework can be developed in which all the criteria are designed based on the natural principles where all criteria are working together to help professionals in producing the building that “create conditions conducive to life”.
ACKNOWLEDGEMENTS
The authors would like to acknowledge the International Islamic University
Malaysia, in particular the Faculty of Architecture & Environmental Design,
where this research took place.

Noor Aziah Mohd Ariffin, & Salwa Farag Gad
Content Analysis of The Existence of Biomimicry Life’s Principles in Green Building Index Malaysia
© 2017 by MIP 190
REFERENCES Baumeister, D. (2012). Biomimicry resource handbook, life’s principles, and biomimicry
spirals. Missoula MT, USA: Biomimicry Group Inc.
Benyus, J. (1997). Biomimicry: innovation inspired by nature. New York, USA: William
Morrow & Company, Inc.
Biomimicry 3.8. (2013). Biomimicry Design Lens: A visual guide. USA.
El Ahmar, S., Fioravanti, A., & Hanafi, M. (2013). A methodology for computational
architectural design based on biological principles. In eCAADe 2013:
Computation and Performance - Proceedings of the 31st International Conference
on Education and research in Computer Aided Architectural Design in Europe.
Delft: Faculty of Architecture, University of Delft.
El-Zeiny, R. M. A. (2012). Biomimicry as a problem solving methodology in interior
architecture. Procedia - Social and Behavioral Sciences, 50, 502-512.
Elo, S., & Kynga, H. (2007). The qualitative content analysis process. Journal of
Advanced Nursing, 62, 107–115.
Gamage, A., & Hyde, R. (2012). A model based on Biomimicry to enhance ecologically
sustainable design. Architectural Science Review, 55(3), 224-235.
Kibert, C. J. (2012). Sustainable Construction: Green Building Design and Delivery (3rd
ed.). Canada: John Wiley & Sons.
Klein, L. (2009). A phenomenological interpretation of Biomimicry and its potential
value for sustainable design. (Doctoral dissertation) Kansas State University.
McGovern, J. (2009). Biomimicry: how learning from nature can restore sustainability
in architecture. (Master’s dissertation) University of Cincinnati.
Non-Residential New Construction (NRNC) (2011). Retrieved on June 25, 2014 from:
http://www.greenbuildingindex.org/Resources/GBI%20Tools/
Reap, J. J. (2009). Holistic biomimicry: A biologically inspired approach to
environmentally benign engineering. (Doctoral dissertation) Georgia Institute of
Technology, Ann Arbor.
Yeang, K., (2006). Ecodesign: a manual for ecological design. London: Wiley-Academy.
Zanowick, M. B. (2011). Biomimicry: Nature’s Time-Tested Framework for
Sustainability. Retrieved from peakstoprairies.org/library/.../2012.../
Biomimicry_overview_01_12.doc
Zari, M. (2015). Mimicking ecosystems for bio-inspired intelligent urban built
environments. Intelligent Buildings International, 8(2), 57-77.
Zari, M. & Storey, J.B. (2007). An ecosystem based biomimetic theory for a regenerative
built environment. In Proceedings of SB07: Sustainable Construction, Materials
and Practices: Challenge of the Industry for the New Millennium. Lisbon,
Portugal.

1 Researcher at Universiti Putra Malaysia. Email: [email protected] 191
PLANNING MALAYSIA:
Journal of the Malaysian Institute of Planners
VOLUME 15 ISSUE 1 (2017), Page 191 - 200
REVISITING ANDALUSIAN GARDEN: VISIONS FOR
CONTEMPORARY ISLAMIC GARDEN DESIGN
Zainab Abdul Latiff1, & Maheran Mohd Yaman2
1 Faculty of Design and Architecture,
UNIVERSITI PUTRA MALAYSIA 2 Kulliyyah of Architecture and Environmental Design,
INTERNATIONAL ISLAMIC UNIVERSITY MALAYSIA
Abstract
Andalusian garden is one of the historical gardens in the Muslim world. It appears
that the garden designers at the time managed to emulate the spiritual and sacred
essence of the paradisiacal environment on earth. The method of content analysis
and library search was applied in this study. The findings of this study reveal that
the Andalusian garden has been built in accordance with Islamic principles of
environment and has crystallized the Quranic paradise description in reality. To
conclude, the physical attributes of the Andalusian garden made an essential
reference for a contemporary Islamic garden design.
Keywords: Andalusian garden, Islamic garden, contemporary garden,
environmental principles
Date Received: 30th April 2016
Date of Acceptance: 30th October 2016

Zainab Abdul Latiff, & Maheran Mohd Yaman
Revisiting Andalusian Garden: Visions for Contemporary Islamic Garden Design
© 2017 by MIP 192
INTRODUCTION
Historically, Muslim has ruled Spain from early 8th century until 1492 (Abdu-
Noor, 2005). Al-Andalus, the Muslim political sovereignty in Spain was
governed by the Umayyad caliphs in Damascus until 750 when the Abbasid
dynasty came to power in the East. Abd al-Rahman ibn Mu'awiyah ibn Hisyam
ibn Abd al-Malik ibn Marwan or Abd ar-Rahman I (756-788 A.H. 139-172), the
last surviving member of the Umayyad dynasty, escaped from Damascus and fled
to Spain. He established an independent Umayyad state (Dodds, 1992) in
Cordoba, thus became the founder of Umayyad dynasty there. He built the first
garden called Al-Rusafa (Ruggles, 2008; Almagro & Ruggles, 2007; Dodds,
1992) in the city of Al-Rusafa, Cordoba based on what he saw at Damascus, Syria
(Abdine, 1986; Lehrman, 1980) that had influences from the Umayyad dynasty
during the caliph Hisham’s reign from 724-743 (Ruggles, 2008), and if the dating
is correct, this garden was the earliest Islamic garden exemplar (Almagro &
Ruggles, 2007; Grabar, 1980). This was also the moment when a number of small
Muslim dynasties bloom.
Al Rusafa garden is a large garden enclosed by mud-brick walls. In the
centre, an elevated square pavilion of stone with four sides’ access is located
(Almagro & Ruggles, 2007). Elevating a building on an intersection allows
elevated views and vistas of the surrounding garden as well as an expression of
sovereign power. This garden did not follow the four-part layout that became
ubiquitous in most of the Islamic gardens Dodds, 1992; Ruggles, 2008). Its
orchards were watered by a pipe which ended in a pool, over which there was a
lion covered in pure gold. The water entered through its hindquarters and poured
out through its mouth (Al-Makkari, 1840).
Another type of Andalusian garden is the open courts and gardens
(Abdine, 1986), which are found throughout the south of Spain including
Cordoba, Seville and Málaga. Madinat al-Zahra is one of the examples of an open
court garden built by the first Spanish Umayyad caliph, Abd al-Rahman III (North
African reverts to Islam) located in the royal city of Madinat al Zahra' (Doak,
2009). This luxurious palace garden of Madinat al-Zahra is built in the
agricultural zone (Ruggles, 2008) on three stepped terraces on the sloping skirt
of a mountain (Ruggles, 1992) in the royal city, using materials that reflected the
king’s wealth such as marble, bronze, silver, and gold (Foret, 2009). The garden
consists of several palaces and planted with palms, olives, oranges, jasmine,
yellow roses and pomegranate (Abdine, 1986; Almagro & Ramón-Laca, 2007;
Lehrman, 1980). “Madinat al-Zahra’ resembles that of Abbasid cities like
Samarra which tended in their maze-like form. The planning shows the impact of
Abbasids, decorated from an indigenous Spanish Islamic tradition” (Dodds,
1992).
Accordingly, it became the model of subsequent palace estates built in
Cordoba. It had influences from Iran and Mesopotamia gardens. The renowned

PLANNING MALAYSIA
Journal of the Malaysia Institute of Planners (2017)
© 2017 by MIP 193
term Mesopotamia was first used by the Greek to refer to the area between the
Tigris and Euphrates rivers (Phillips, 2010). Madìnat al Zahrā’ had enclosed
courtyard complete with essential elements in an Andalusian Islamic garden such
as pavilions, sculptures, arcades and terraces lined with trees and flowers, watered
from rivers and hillside streams (Abdine, 1986; Lehrman, 1980).
OBJECTIVE & METHODOLOGY OF THE STUDY
The main objective of the study is to determine the physical characters of the
Andalusian garden to be emulated into contemporary Islamic garden design. The
methodology adopted is mainly content analysis and library search that
emphasised on the theories and principles of the Andalusian garden, as well as
reference to the Quran, Hadiths and related literature written by Islamic scholars.
THE PARADISIACAL CONCEPT IN THE ANDALUSIAN GARDEN
Andalusian garden has a paradisiacal concept in the sense that it is filled with
scented flowers, singing birds and water-wheels with entertaining sound (Al-
Makkari, 1840). There are three types of Andalusian garden (Harvey, 1974); first,
walled courtyard or patio, domestic and inward looking (Court of the Myrtles
(1334-1354). Second, the large gardens (Jennat al-Arif) or the Generalife or ‘The
paradise of the Architect’ (Fromherz, 2010). The third, the ordinary garden
(Harvey, 1974). It is also called Royal Garden, referring to its construction of
high ranking courts and splendid royal palaces, the Morphological Garden,
referring to the aroma, color and aesthetic hedonistic ends and multiple uses of
plants; used for medicine, decoration, food, agriculture, dyes, perfumes, and
cosmetics (Ruggles, 2008). Essential elements in the garden are water, plants,
trees, sculptures and pavilions while figural sculpture is very rare in Islam
(Harvey, 1974).
Andalusian garden also exhibits the sense of intimacy and privacy;
remote from the outside world; delicacy and subtle use of water as the major
conceptual focus of a paradisiacal garden world; astounding variety of low,
musical sounds created by many tiny splashing jets and the last is the intensity
created by contrasts between large and very tight spaces, and the contrast between
deep shade and bright light (Nevins, 1988). Lastly, the garden is always around
pools or water features (Almagro & Ramón-Laca, 2007).
The Alhambra is a majestic complex of administration with several
courtyard gardens in different sizes. It is the Islamic palatial and residential
architecture (Rabbat, 1985) where a great emphasis is given to the inward
orientation (Attia, 2006) around the court which appears as the typical Islamic
inclination (Omer, 2009). The Alhambra is no more than a palace in the same
sense as Versailles and Buckingham Palace. The palace was more like a synthesis
of early Islamic palaces and a fortified town which comes from both Roman and
2ndcentury central Asian traditions. The palace is saturated with divine codes.

Zainab Abdul Latiff, & Maheran Mohd Yaman
Revisiting Andalusian Garden: Visions for Contemporary Islamic Garden Design
© 2017 by MIP 194
There is no division between the sacred and secular life of the code, even the
earthly power of the sultan is subordinate to that of god. “God alone is the Victor”,
the motto of the Nasrid is present on the walls of the Alhambra (Dickie, 1992).
The Court of the Lions has always been praised for the balanced
composition or architecture, vegetation and water (Rabbat, 1985). The longer
east-west axis in the court is defined by projecting pavilions sheltering fountains
whose overflow draining through channels to the centre, forms two of the rivers
of paradise. A central pond in the middle of the Court of the Lions and the Court
of Myrtles symbolizes soul purification, reflection, contemplation, continuity,
nucleus, animation, delicacy, infinity and symmetries. Bowls in the courts let
water flows continuously in carved channels made of stone before spilling into
rectangular pond (Attia, 2006). Meanwhile, in the large garden of the Generalife,
the water channels are diagonal that run across the steep hillside to fall into patio
gardens (Attia, 2006). There are also three layers of water stairway that provide
dramatic views over the landscape, juxtaposed with the visual play of water and
stone. The dynamism of water management in the Court of the Lions is accounted
as purifying the soul, contemplating God’s creation of the universe (Lehrman,
1980) and to give life to the inanimate. The dynamism of water management is
put into the physical form of water fountains, channels, an underground cistern
to catch rainwater, small jets, underground reservoirs, small canals and tanks.
The availability of water in abundance was also intelligently used as a
cooling agent within an enclosed space such as in the Patio de la Acequia.
Stagnant water feature in the patio is essential as reflecting agent; reflecting the
sky, surrounding architecture and plants. She mentioned that, in order to ensure
the movement of water in the small-area garden in the Court of the Lions, pumps
and hydraulics are used showing the flexibility and the sense of regionalism or
space. Rainwater is captured by gables on the roof to each tree with minimal
evaporation and water loss (Carroll, 2003). The Court of the Lions is a water
clock-fountain, regarded as a rejuvenating agent that adheres strictly to the
management of water, use water only when people actually use the space. The
lion statues were designed in such a way that it will shoot water both ways when
the shadow casts on them to remind the Muslim of zuhur prayer time, and the
water that circulates is clean enough for ablution.
The principal of spirituality was well displayed by the repetitive
inscriptions of geometric and calligraphic decorations on the walls of the Court
of the Lions as an Islamic iconography (Foret, 2009; Mirza, 2014; Rabbat, 1985).
It is important to note that, Kufic is used for calligraphies from the Qur’an, which
tend to be high up on the walls nearer to the heaven, while the poetry is further
from heaven nearer the ground. These repetitions of inscriptions on the walls of
the Alhambra symbolize the instability of the political environment of the Nasrids
due to an endless war with other Muslim dynasties and non-Muslim dynasties,
the Castilla and Aragon (Ahmad, 2004). Built primarily by Muhammad V, the

PLANNING MALAYSIA
Journal of the Malaysia Institute of Planners (2017)
© 2017 by MIP 195
Court of the Lions reflected cultural syncretism (Ahmad, 2004). Today, the routes
are no more the same, windows have been converted into doors, beds into
passageways and the two palaces of Alhambra and Generalife are now connected
(Dickie, 1992). The whole palace complex was the setting of the mysterious real
and imaginary worlds of splendour, intrigue and romance.
For most scholars, the Court of the Lions was seen as having the
paradisiacal image of four gardens (Ali, 2000). Such interpretation also can be
found in Persian gardens however; the court was not conceived in the image of
Paradise (Rabbat, 1985). It was an earthly garden for earthly pleasure imitating
the tradition of the Roman of villa rustica. The purpose of the court was not to
glorify materials or feats of engineering, or even to impress the subjects of the
King but to provide its inhabitants with an intimate, entertaining living space
(Grabar, 1990). It displays profoundly the traditional architecture not technology
(Ahmad, 2004) which was already found during Achaemenid.
There is no evidence in the first four centuries of Islam that gardens were
consciously designed with four quadrants and four water channels in order to
imitate the paradise. Most gardens belonged to palaces where the environment
was decidedly impious, characterized by the political display and other immoral
acts that are forbidden to be practiced by Muslims (Ruggles, 2008). Even the 12
lion statues in the centre of the Court of the Lion was built by the Jews. This is
supported by the facts that the Jews who used to live within Muslims for hundred
years, had used to the culture of Moorish Spain and considered it something they
shared with Spanish Muslims. It is a symbol of so-called harmony coexistence of
Christians, Muslims and Jews; three faiths lived together in peace and harmony.
Courtyards are private and secured gardens constructed to optimize a small space
located on a small scale of area normally in a building fully occupied by rich
spatial elements derived from the description of paradise from the Qur’an. Strict
geometric patterns (Lehrman, 1980; Ruggles, 2000) also promote a sense of
belonging (Lehrman, 1980).
This principle of balance and harmony are aligned between vegetation
and architecture in the sense that they did not conflict with each other (Lehrman,
1980). For example, in the Court of Myrtles, aromatic bushes are planted in
parallel to the walkways (Attia, 2006) and sometimes in geometrical and maze
layout (Lehrman, 1980), orange trees are planted in four corners of four axial
canals. Consequently, the truth becomes the hidden baraqah for the old building
which survives till today from the 14th century, when without the Muslim, the
building also acted as a reminder of the Oneness as angels still conduct dzikr from
the walls decorations. Theoretically this is known as 'spirit of a place' alive for
centuries. It was not realized by the Christian's Spaniard of Ferdinand and Isabelle
due to their culture of siesta which destroyed them till today. It is interesting to
find that these inscriptions show exactly the intention of its builders (Hoag, 1977).

Zainab Abdul Latiff, & Maheran Mohd Yaman
Revisiting Andalusian Garden: Visions for Contemporary Islamic Garden Design
© 2017 by MIP 196
The Alhambra was developed by the Moors in 1238-1492 (Lehrman,
1980). It has the influences from Europe, the Almohads, the Fatimids and the
Eastern Islamic world (Ahmad, 2004). The layout of the magnificent Alhambra
conceitedly organised around an inner courtyard. It presents to the outside world
high windowless walls interrupted only by a single low entrance that emphasised
its perspective and ensemble the successful integration of water and built
environment (Attia, 2006). It promotes passive ventilation system; capture the
wind and reduce heat where the designer can manipulate the site and create a
variety for water, vegetation and pavement composition (Attia, 2006). For
example, in the Court of Myrtles, built by Muhammad V, there is a rectangular
courtyard with a rectangular pool in the middle (Attia, 2006) with a dodecagonal
basin is located at the bottom of the twelve stone lions (Attia, 2006; Hoag, 1977).
The settings and arrangement of the animate and inanimate in this small
area garden of Court of Myrtles (Harvey, 1974) are done in a balanced
composition that occupies the small space of the garden to the maximum. In order
to optimize the space usage, the layouts and settings of the area are always done
in such a way to reach as many geometric patterns as possible by employing
quadripartite lines (Attia, 2006), squares, perpendiculars, dodecagonal, axial,
parallel, axes; longitudinal, transversal and symmetries.
The lavish decorations by the mean of geometric designs and muqarnas
vaulting in the garden represent the infinite and the divine (Foret, 2009). The
decorations of the chambers enhanced the idea of abundance (Abdine, 1986;
Foret, 2009). These abstract patterns were seen as agents of the spiritual world.
The decorations are lively and set in a space allocated for contemplation as one
of the ultimate forms of pleasure that were attained through God and seen through
the abstract patterns of the geometric decoration and muqarnas vaulting (Grabar,
1990). The muqarnas are a representation of the rotating dome of heaven, which
in turn represents the mastery of time. The inscriptions on the walls directly
suggest the illusion of heaven.
King Muhammad V has magnificently designed the Alhambra with the
profuse usage of water, rectangular pools with water reflecting the sky and the
abundance of water in the garden itself. The value of proportion, spiritual
refreshment, paradisiacal, luxury, spaciousness, luminosity and relaxation that
mirror the ideal human condition that deeply concerned with inner soul
development is established. The court consists of four principle-surrounding
chambers of the Hall of the Muqarnas, the Hall of Justice, the Hall of Abencerajes
and the Hall of the Two Sisters (Hoag, 1977).
Besides, the court and all the spaces in it are built in such a way for people
to sit on or near to the floor (Hoag, 1977). “This explains why...all the other
fountain basins...are flush with the marble floors...reflections on the water are
also best observed while seated beside them...hence the verses around the central
fountain basin” (Hoag, 1977). Plantings of flowers, bushes and small trees were

PLANNING MALAYSIA
Journal of the Malaysia Institute of Planners (2017)
© 2017 by MIP 197
also once being nearer to the eye level of persons seated in the porticoes but the
view to the court are not concealed. However, there are no trees planted in the
court (Attia, 2006).
Domestic courtyards (Lehrman, 1980; Omer, 2009) in the Andalusian
garden emulate as much the characteristics of paradise as mentioned in the Qur’an
in terms of its layout, settings and arrangements of its spatial elements. The stone
paving, white stuccoed walls, bright and dark colored tiles (Lehrman, 1980),
potted plants for the minimal use of water (Lehrman, 1980), white marbles and
trees of cypress, orange and palm that were planted in rows to show infinite
rhythmic at each side of a small pool with trickling fountain is a reminder of the
paradise of Muslim. There is also a channel that flows into a basin with a pavilion
in the centre of the courtyard (Lehrman, 1980). In order to remind one of the
paradise, a small bower is placed at the junction of paths that were formed from
the cypress trees. The enhancement of privacy and shade is successfully reached
in this generous garden courtyard. The courtyard garden is a cool and shady as
the trees and plants were so dense that they do not allow the sunrays to reach the
ground thus providing a gentle wind all day (Attia, 2006).
The Generalife is a city within a city, was built in the time of the King of
Granada, Muhammad II (1273–1302), and later enlarged by Kings Muhammad
III (1302–1309) and Isma‘il I (1313–1325). Besides featuring Granada’s Muslim
legacy, it was also a city of scholars32 such as al-Mazini, ibn Tufayl, ibn Rushd,
ibn Zuhr, ibn Khaldun, ibn Batuta and ibn al-Khatib to name a few. Its setting on
the elevated spot with good fertile red soil displays its majestic political and
religious complex. The Generalife is a series of gardens and pavilions; known as
the summer retreat of the Sultan or the court of irrigation (Attia, 2006).
The quadripartite design is mentioned more than one time in the Qur’an
hence become a common design for Islamic gardens from Spain to Mughal India
(Carroll, 2003; Lehrman, 1980). In order to resemble paradise, evergreen, shady,
colourful and lavish plants and vegetation are planted such as artichokes, myrtle
and cyprus. These plants provide structure and lushness year-round such as in the
Court of the Alcazar, Seville (Carroll, 2003). The combination of natural and built
environment elements of the garden is shown when climbing vines (Foret, 2009)
are sometimes let to cover the wall as a finishing element to make it look like
high evergreen hedges to maintain coolness such as in the modern design of urban
plazas (Nevins, 1988). Aromatic plants are also planted to form Arabic
calligraphy in the garden, besides being used for culinary purposes (Lehrman,
1980).
Ground covers are normally planted under the tall trees (Ruggles, 2000).
These ground covers, sunken beds or living carpet design make use of both lush
and dry landscape (Ruggles, 2000). It is designed and arranged in such a way that
the plants are planted with the same level with the adjacent water feature thus
water that was captured from the adjacent water feature can be used minimally

Zainab Abdul Latiff, & Maheran Mohd Yaman
Revisiting Andalusian Garden: Visions for Contemporary Islamic Garden Design
© 2017 by MIP 198
(Hoag, 1977). Therefore, an Islamic garden should be harmless for people or
visitors to sit on the ground while enjoying the variety, beauty and aromatic smell
(Ali, 2000) of the garden as picking fruits that hang low within the reach of hands
(Ali, 2000). Fruit trees are arranged in lines of garden walks and parapets
(Lehrman, 1980). Plantation lent additional colour and fragrance that use any
water runoff to irrigate the garden (Lehrman, 1980).
Among the accessories in the Andalusian garden are solid benches that
stand on their own and sometimes are attached to a wall. There are also pots of
terracotta, flower beds (Lehrman, 1980), vases of coloured glaze, unglazed tiles
that were formed and paved and capped walls. The walkways are faced with tiles,
bricks, earth-coloured and smooth pebbles laid in a geometric pattern. There are
also fountains and paths and edged steps (Lehrman, 1980). Courtyards in the
Andalusian garden has a minimal use of plants and water in the most purposeful
ways. The focus is given more on living spaces while leaving the native landscape
dry. Andalusian garden offers shade and flexibility within a built environment.
The lushness is created without a great deal of water thus highlighting the
uniqueness of the space and makes the urban fabric feel grounded in place.
Gardens on the hilly area are terraced with an orchard to mitigate erosion and
surface runoff. It also produces the maximum effect by using minimum
expenditure of water (Harvey, 1974). The Generalife is exhibited as planted with
trees and shrubs and brightly colourful flowers with penetrating perfumes.
Cypress trees are used as its principle tree that lived for 600 years (Harvey, 1974).
The Alhambra is known for its sustainable water management planning
in the city. The Andalusian garden is full of water. Water is the binding thread
that ties everything together. Fountains in the centres of the Hall of the
Abencerajes and of the Two Sisters drain again into the centre, symbolizing the
other two rivers of the paradise. The uses of water in the palaces fountains and
watercourses are dynamic in terms of its design, which are rightly to the long-
evolving tradition of ornamental and palatial water usage in the Mediterranean
and Persia, both in the pre-Islamic and Islamic periods (Grabar, 1980).
Having a royal city in a large urban complex can also be seen in the other
parts of the world such as Rome, Byzantine, Constantinople, Samarra and
monastery garden. Six features of the Domus Aureus from the mediaeval ages
had influenced much on the Islamic palaces. They are grand size, different kinds
of water (pools, fountains, hot, cold), the luxury of surfaces and artificially
composed nature (as in gardens or agriculture). There are three types of
decorations namely vegetal, geometric and epigraphic. The Alhambra of today is
a modification. This delicate and fragile palace was made essentially for temporal
power and worldly pleasure. Its decoration is flawless but not new. It represents
the mixture of previous cultures that the Nasrids had to balance politically and
culturally. The decline of the dynasty in 1453 had also marked the end of the
Muslim empire in Spain and Catholicism was spread to every corner of the world.

PLANNING MALAYSIA
Journal of the Malaysia Institute of Planners (2017)
© 2017 by MIP 199
CONCLUSION
Andalusian garden is a metaphor of garden which is a reward for those who
practice good deeds as a garden on planet earth; it is far from the real paradise
gist as described in the Qur’an. The real garden attributes are varying according
to the Muslim culture all over the world and is determined by weather and local
practices. "Among the examples of Islamic architecture under the sway of light,
the Alhambra at Granada sets the first rank. The Court of Lions in particular sets
the example of stone transformed into a vibration of light; the lambrequins of the
arcades, the friezes in muqarnas the delicacy of the columns which seem to defy
gravity, the scintillation of the roofs in green tile-work and even the water jets of
the fountain, all contribute to this impression. By analogy, one can say of Muslim
architecture that it transforms stone into light which, in its turn, is transformed
into crystals” (Nasr, 1987). Andalusian garden shows an attempt of spiritual and
sacred essence of paradisiacal environment emulation by its designers at the time.
However, to truly adhere to Islamic principles is not enough by integrating the
paradise description on garden’s design alone, however, it must instil the senses
of tawhid, mizan, fitrah and khalifah (Abdul Latiff & Mohd Yunus, 2016). Into it as
everyone are answerable to His Creator for how he has used the countless blessing
rewarded upon him. Not to mention that, Islam forbids any unlawful act or
elements in any circumstances including in designing a garden that disgrace Islam
and create misinterpretations about the religion. REFERENCES Abdul Latiff, Z., & Mohd Yunus, M. Y. (2016). The Islamic Garden design principles:
thoughts for the 21st century. Research Journal of Fisheries and Hydrobiology,
11(3), 175-178.
Abdine, A. E. (1986). The Islamic garden in Andalucía, Spain. Environmental Design:
Journal of the Islamic Environmental Design Research Centre, 1, 76-77.
Abdu-Noor, M. I. (2005). Sunset in the Gardens of al-Andalus. Nebula, 2(1), 1–11.
Ahmad, I. (2004). The Bride Unveiled: Influences on and Interpretations of the
Alhambra.
Ali, A. Y. (2000). The Holy Qur'an: original Arabic text with English translation &
commentary. Saba Islamic Media.
Attia, S. (2006). The role of landscape design in improving the microclimate in traditional
courtyard buildings in hot arid climates. In Proceedings of 23rd International
Conference on Passive and Low Energy Architecture - PLEA 2006 (Vol. V(1)) (pp.
61–67). Geneva, Switzerland.
Almagro, A., & Ramón-Laca, L. (2007). Introduction to the catalogue of Andalusian
Gardens. Retrieved on June 15th, 2015 from http://www.doaks.org/resources/
middle-east-garden-traditions/andalusian-gardens/introduction-to-andalusian-
gardens.

Zainab Abdul Latiff, & Maheran Mohd Yaman
Revisiting Andalusian Garden: Visions for Contemporary Islamic Garden Design
© 2017 by MIP 200
Almagro, A., & Ruggles, F. D. (2007). Early Islamic Gardens in Syria, Jordan and Iraq.
Retrieved on January 2nd, 2016 from http://www.doaks.org/resources/middle-east-
garden-traditions/early-islamic-gardens-of-greater-syria/introduction.
Al-Makkari, A. I. M. (1840). The History of the Mohammedan Dynasties in Spain (Vol.
1). London: Harvard College Library.
Carroll, M. (2003). Earthly paradises: ancient gardens in history and archaeology. Los
Angeles: Getty Publications.
Dickie, J. (1992). The palaces of the Alhambra. In J. D. Dodds (Ed.) Al-Andalus: the art
of Islamic Spain, p.135-151. New York: The Metropolitan Museum of Art.
Doak, R. (2009). Empire of the Islamic World. New York: Chelsea House Publisher.
Dodds, J. D. (1992). Al-Andalus: the art of Islamic Spain. New York: Metropolitan
Museum of Art.
Foret, A. S. (2009). Reflections on Pleasure: The Fourteenth-Century Alhambra
(Master’s thesis). Southern Methodist University.
Fromherz, A. J. (2010). Ibn Khaldun: Life and Times. Edinburgh: Edinburgh University
Press.
Grabar, O. (1990). From Dome of Heaven to Pleasure Dome. Journal of the Society of
Architectural Historians, 49(1), 15-21.
Grabar, O. (1980). Symbols and signs in Islamic architecture. In G. K. Jonathan (Ed.),
Architecture as symbol and self-identity. Philadelphia: Aga Khan Award for
Architecture.
Grabar, O. (1976). The Alhambra. Cambridge: Harvard University Press.
Harvey, J. H. (1974). Spanish gardens in their historical background. Garden History,
3(1), 7-14.
Hoag, J. D. (1977). Islamic architecture. H. N. Abrams.
Lehrman, J. B. (1980). Earthly paradise: garden and courtyard in Islam. University of
California Press.
Mirza, M. (2014). Paradise on Earth: Designing a Socially Sustainable Landscape in
Northwest Pakistan (Master’s thesis). University of Manitoba Winnipeg, Canada.
Nasr, S. H. (1987) Islamic Art and Spirituality. Albany: SUNY Press.
Nevins, D. (1988). Learning from the Hispano-Arab garden. ANTIQUES, 133(3), 692-
703.
Omer, S. (2009). The history and character of the Islamic built environment. Kuala
Lumpur: Arah Pendidikan Sdn Bhd.
Phillips, D. A. (2010). Syria. New York: Chelsea House Publisher.
Rabbat, N. (1985). The Palace of the Lions, Alhambra and the Role of Water in its
Conception. Environmental Design: Journal of the Islamic Environmental Design
Research Centre, 2, 64-73.
Ruggles, F. D. (1992). Gardens of the Alhambra and the concept of the garden in Islamic
Spain.
Ruggles, F. D. (2000). Gardens, landscape and vision in the palaces of Islamic Spain.
University Park, Pennsylvania: Pennsylvania State University Press.
Ruggles, F. D. (2008). Islamic gardens and landscapes. University Park, Pennsylvania:
Pennsylvania State University Press.
Zaimeche, S. (2004). Granada-The Last Refuge of Muslims in Spain. Foundation for
Science, Technology and Civilization.

1Associatiate Professor at International Islamic University Malaysia. Email: [email protected] 201
PLANNING MALAYSIA:
Journal of the Malaysian Institute of Planners
VOLUME 15 ISSUE 1 (2017), Page 201 - 208
PERCEPTION OF PARENTS AND GUARDIANS ON SAFE DISTANCE
FOR CHILDREN TO TRAVEL TO PUBLIC AREAS
Mariana Mohamed Osman1, Muhammad Faris Abdullah2, Najihan
Khalid3, Syahriah Bachok4, Nor Suzilawati Rabe5, Syafiee Shuid6, &
Zakiah Ponrahono7
1,2,3,4,5,6Kuliyyah of Architecture and Environmental Design
INTERNATIONAL ISLAMIC UNIVERSITY MALAYSIA 7 Faculty of Environmental Studies
UNIVERSITI PUTRA MALAYSIA
Abstract
Children safety is of utmost important. Children are susceptible to safety risk
while traveling to public areas such as schools, parks and bus stops. Perception
of parents and guardians on the safety of their children determines their decision
whether or not to allow their children to travel to public areas and how. This study
looks at the perception of parents and guardians on the safe distance for children
to travel to public areas. 4,500 respondents were surveyed. It was found that
parents and guardians perception of safe distance is heavily influenced by
distance and children’s age factors.
Keywords: Safe distance, children, public areas
Date Received: 30th April 2016
Date of Acceptance: 30th October 2016

Mariana, Muhammad Faris, Najihan, Syahriah, Nor Suzilawati, Syafiee, & Zakiah
Perception of Parents and Guardians on Safe Distance for Children to Travel to Public Areas
© 2017 by MIP 202
INTRODUCTION Increasing incidence of crime against children has posed a challenge to parents
and families in ensuring the safety of their children (Al-Dawamy & Sulaiman,
2010). Parents tend to focus on the welfare and safety of their children and most
parents tend to ensure that their children are within their view when at public
places. Knowledge of the suitable safe distance is crucial to ensure safety of
children, especially when the children are to travel to public areas. Thus, the aim
of this research is to study parents and guardians perception on the safe distance
for children to travel to public areas such as schools, shopping mall, community
facilities, bus stations, parks and others.
Background of the Study
Knowledge on safe distance is crucial to community in order to prevent unwanted
incidents involving children from happening due to the negligence of parents in
public areas. Public areas are areas that include residential area, schools, parks,
shopping malls and other public places. According to Mammen, Buliung & Lay
(2012) and Oluyomi et al. (2014), distance is one of the factors that influences
the element of safety among children. Their studies found that the closer the
distance between school and home, the higher the perception of safety among
parents. Other factors such as the security system in school, the type of
development surrounding the school and the school condition also influence the
perceived safety of children among parents (Mammen, Buliung & Lay, 2012;
Oluyomi et al., 2014). McDonald (2008) suggests that a typical walking rate for
school-aged children is about 2.7 miles per hour (or 1.35 miles per 30 minute-
period). Therefore, most children will probably not walk farther than 1.35 to/from
school.
Crime against children is a widely discussed issue among the public. This
is not unwarranted since researchers have found that crime against children are
increasing yearly (Al-Dawamy & Sulaiman, 2010). This, to an extent has affected
parents in determining where their children can go and how to go there. In the
United States, according to Evers et al. (2014), walking rates to school among
children remain low because parents are concerned for their children safety.
Safety in this case is not limited to only crime, but also road safety (Fatimah &
Osman, 1997).
In Malaysia, Child Act 2001 (Act 611) was enacted with the aim to
preserve and protect the social and physical rights of children. Act 611 highlights
the responsibility of parents or guardians to protect the well-being of children.
Parents or guardians are considered guilty and subjected to criminal offence if
these responsibilities are ignored (Act 611; Mohd Yussof & Tahir, 2005).

PLANNING MALAYSIA
Journal of the Malaysia Institute of Planners (2017)
© 2017 by MIP 203
METHODOLOGY
This study adopted questionnaire survey method for primary data collection. The
questionnaire survey form was made up of two sections to obtain information
regarding respondents’ profile and their perception of safe distance. Using the
from, enumerators surveyed 4,500 respondents in the Klang Valley region. The
areas selected fall within the administrative boundary of Kuala Lumpur City Hall
(1,000 respondents), Shah Alam City Council (1,000 respondents) Petaling Jaya
City Council (500 respondents), Subang Jaya Municipal Council (500
respondents), Ampang Jaya Municipal Council (500 respondents), Klang
Municipal Council (500 respondents) and Selayang Municipal Council (500
respondents). The targeted respondents were those aged at least 18 years old and
have at least a child or a relative who are still schooling either at preschool,
primary school or secondary school level. Data obtained through the survey was
keyed in into SPSS software and analysed using both descriptive and inferential
analyses.
ANALYSIS AND FINDINGS
Respondents’ Profile
Table 1 below shows the profile of the respondents. The majority of the
respondents (63%) were those aged between 18 to 39 years old. In terms of race,
74% of the respondents were Malay. The majority of the respondents attained
diploma level in education and over 85% were in employment. The average
household size was 4.
Table 1 Respondents’ Profile
Respondents’
profile
Category Frequency Percentage
(%)
Age Youth
Adult
Retired
: 18 – 39 years old
: 40 – 60 years old
: 60 years old
2,839
1,628
33
63.1
36.2
0.7
Sex Male
Female
2,044
2,456
45.4
54.6
Race Malay
Chinese
Indian
Others
3,344
699
430
27
74.3
15.5
9.6
0.6
Education
Level
Primary
Middle
Higher
: Primary School
: Secondary School
: Certificate
: Diploma
: Degree
: Master
: PhD
88
899
458
995
1,750
272
38
2.0
20.0
10.2
22.1
38.9
6.0
0.8

Mariana, Muhammad Faris, Najihan, Syahriah, Nor Suzilawati, Syafiee, & Zakiah
Perception of Parents and Guardians on Safe Distance for Children to Travel to Public Areas
© 2017 by MIP 204
Marital
status
Single
Married
Divorced
265
4,119
116
5.9
91.5
2.6
Occupation Employed
Unemployed
: Executive,
Professional
: Admin,
Management
: Business
: Full-time Student
: Housewives
: Retired
1,553
1,777
465
181
477
47
34.5
39.5
10.3
4.0
10.6
1.0
Household
income
RM 1,000 – RM 1,999
RM 2,000 – RM 2,999
RM 3,000 – RM 3,999
RM 4,000 – RM 4,999
RM 5,000 – RM 5,999
RM 6,000 – RM 6,999
> RM 7,000
264
609
1,042
844
670
374
697
5.9
13.5
23.2
18.8
14.9
8.3
15.5
Household
size
< 3
4 – 6
7 – 9
> 10
1,340
2,767
352
41
29.8
61.5
7.8
0.9 Source: Questionnaire Survey, 2015
Table 2 below shows the number of children or relatives of respondents
by gender. The highest number of respondents (61%) has at least one male child
or relative who are attending school. Meanwhile, 51% of the respondents have at
least one female child or relative who are still schooling.
Table 2 Number of Children/Relatives Still Schooling by Gender
Gender Female child/relative (nos)
Total % 0 1 2 3 4 5 6
Mal
e ch
ild
/
rela
tiv
e (n
os)
0 0 896 165 69 10 4 10 1,154 25.6
1 1,343 1,229 126 26 13 4 1 2,742 60.9
2 186 126 97 18 7 1 1 436 9.7
3 52 28 28 8 3 1 0 120 2.7
4 19 6 5 2 2 0 0 34 0.8
5 9 0 0 0 0 0 0 9 0.2
6 0 2 2 1 0 0 0 5 0.1
Total 1,609 2,287 423 124 35 10 12 4,500 100.0
% 35.8 50.8 9.4 2.8 0.8 0.2 0.3 100.0

PLANNING MALAYSIA
Journal of the Malaysia Institute of Planners (2017)
© 2017 by MIP 205
Children Mode of Transportation to Public Area
Table 3 shows the children mode of transportation in going to public area. Over
80% of respondents stated that their children or relatives travel to public area in
motorised transport. Of this, 67% travel using private transportation and 14%
travel using public transportation. Only 11% walk, and 9% cycle, to public area.
Table 3 Children Mode of Transportation to Public Area
Vehicle type Transportation mode Frequency %
Motorised Private 3,002 66.7
Public 621 13.8
Sub-total 3,623 80.5
Non-motorised Walking 476 10.6
Cycling 401 8.9
Sub-total 877 19.5
Total 4,500 100.0
Respondent Perception of Safe Distance
Respondents were asked on the distance they perceived as safe for their children
to travel to public area. 49% of the respondents felt that it was safe for children
to walk within 100 metres to public area (Table 4). Meanwhile, 31% perceived
400 metres as the safe distance for children to walk to public area and 20% felt
that it was still safe for children to walk 1 kilometre to public area. This indicates
that the farther the children have to travel to public area, the less safe it was
perceived by the respondents.
Table 4 Perceived safe distance
Source: Questionnaire Survey, 2015
A cross-tabulation between results from Table 4 and Table 5 shows that
despite perceiving that 100 metres is a safe distance for children to travel to public
areas, many of the respondents still transport their children to those areas in
private vehicle (Table 5). In fact, for each category of safe distance (i.e. 100m,
400m and 1 km), private vehicle was the highest mode of transportation chose by
the respondents. This reflects that respondents perceived traveling by private
vehicles as safer than other modes of transportation.
Statement Frequency Percentage
(%)
Safe distance is to walk within 100 meters to the
public area 2,193 48.7
Safe distance is to walk within 400 meters to the
public area 1,397 31.0
Safe distance is to walk within about 1 km to the
public area 910 20.2
Total 4,500 100.0

Mariana, Muhammad Faris, Najihan, Syahriah, Nor Suzilawati, Syafiee, & Zakiah
Perception of Parents and Guardians on Safe Distance for Children to Travel to Public Areas
© 2017 by MIP 206
Table 5 Respondent Perception on Safe Distance for Children and Mode of
Transportation Mode of
transportation
Perception of respondents on safe distance Total
100m walking to
public area
400m walking to
public area
1 km walking to
public area
Walking 203 156 117 476
(4.5%) (3.5%) (2.6%) (10.6%)
Riding bicycle 140 154 107 401
(3.1%) (3.4%) (2.4%) (8.9%)
Private vehicle 1,604 864 534 3,002
(35.6%) (19.2%) (11.9%) (66.7%)
Public
transport
246 223 152 621
(5.5%) (5.0%) (3.4%) (13.8%)
Total 2,193 1,397 910 4,500
(48.7%) (31%) (20.2%) (100.0%)
Source: Questionnaire Survey, 2015
Chi-square analysis (Table 6) shows that there is a significant
relationship between the respondents' perceptions of the safe distance for children
to travel to public area with the mode of transportation they travelled in.
Respondents tend to perceived that using private vehicle would be safer as
compared to using public transport, cycling or walking.
Table 6 Chi-Square Analysis on Respondent Perception on Safety Distance with Mode
of Transportation Value df Asymp. Sig. (2-sided)
Pearson Chi-Square 87.774a 6 .000
Likelihood Ratio 88.350 6 .000
Linear-by-Linear Association 5.590 1 .018
N of Valid Cases 4500
a. 0 cells (.0%) have expected count less than 5. The minimum expected count is 81.09.
Determinants of Safe Distance
A review of the literatures has identified six factors that commonly influence
parents and guardians in determining the safe distance their children are allowed
to travel to. These factors are age of the child, gender of the child, distance to the
destination (whether near or far), the company of the child (whether the child
travels alone or with company), time (whether day or night) and familiarity of the
destination. In this study, respondents were asked to rank these factors in order to
determine which factors influenced them most in deciding how far is safe for their
children to travel to public areas.

PLANNING MALAYSIA
Journal of the Malaysia Institute of Planners (2017)
© 2017 by MIP 207
Table 7 Respondents’ perception on factors determining the safe distance
Source: Questionnaire Survey, 2015
Based on the results shown in Table 7, the most important factors
perceived by the respondents in determining the safe distance for children to
travel to public areas was age of the child. Over 30% of the respondents ranked
age as the most important factor (i.e. Rank 1). Meanwhile, familiarity with the
destination was perceived as the least important factor with only 6% of the
respondents ranked this factor as the most important. Mean score analysis also
portrays the same result. Age of the child was the highest priority factor, with a
mean score of 2.67. Familiarity with destination was the lowest priority factor
with a mean score of 4.71.
Public perception on the importance of safe distance
Respondents were also asked to rank the importance of safe distance for children
to travel to public areas. Based on ranking, ensuring safety of children in public
places was the most important reason to the respondents. It received Rank 1 from
over 40% of the respondents (Table 8). Similarly, based on mean score analysis,
ensuring safety of children in public places was also the highest priority, with a
mean score of 2.06. This is followed by, in order of importance, reducing crime
rate, ensuring access to public places, reducing road accidents and contributing
towards safe city.
Factors Rank 1 Rank 2 Rank 3 Rank 4 Rank 5 Rank 6 Mean
score
Priority
order
Age 1,391
(30.9%)
1,252
(27.8%)
608
(13.5%)
418
(9.3%)
383
(8.5%)
448
(10%) 2.67 1
Sex
(Male/
Female)
1,039
(23.1%)
1,062
(23.6%)
754
(16.8%)
545
(12.1%)
577
(12.8%)
523
(11.6%) 3.03 2
Distance
(Near/Far)
585
(13%)
703
(15.6%)
1,037
(23%)
1,020
(22.7%)
810
(18%)
345
(7.7%) 3.40 3
Chile
condition
(Alone/
With
Company)
865
(19.2%)
687
(15.3%)
802
(17.8%)
740
(16.4%)
626
(13.9%)
780
(17.3%) 3.43 4
Time
(Night/Day)
366
(8.1%)
542
(12%)
882
(9.6%)
1,139
(25.3%)
1,146
(25.5%)
425
(9.4%) 3.76 5
Destination
(Familiar/Unf
amiliar)
249
(5.5%)
259
(5.8%)
418
(9.3%)
647
(14.4%)
958
(21.3%)
1,969
(43.8%) 4.71 6
Total 4,500
(100)
4,500
(100)
4,500
(100)
4,500
(100)
4,500
(100)
4,500
(100)

Mariana, Muhammad Faris, Najihan, Syahriah, Nor Suzilawati, Syafiee, & Zakiah
Perception of Parents and Guardians on Safe Distance for Children to Travel to Public Areas
© 2017 by MIP 208
Table 8 Public Perception on the Importance of Safe Distance
Source: Questionnaire Survey, 2015
CONCLUSION
This study was successful in identifying the perception of parents and guardians
on safe distance for their children to travel to public areas. It was found that
majority of the respondents perceived that it was safest for children to walk 100
metres to public areas. However, this is heavily influenced by the age of the
children. Respondents also perceived that safe distance is important in order to
ensure safety of children in public areas.
REFERENCES Akta Kanak-Kanak (2001)
Al-Dawamy, A. R., & Sulaiman, S. N. H. (2001) Persepsi pelajar tentang kejadian jenayah
terhadap kanak-kanak. Universiti Teknologi Malaysia.
Evers, C., Boles, S., Johnson-Sheltona, D., Schlossberg, M., & Richey, D. (2014). Parent
safety perceptions of child walking routes. Journal of Transport & Health, 1, 108–
115.
Fatimah, M., & Osman, A. (1997). The risk of road traffic accidents among primary school
children in Kuala Terengganu. Medical Journal Malaysia, 52(4), 402-408.
Mammen, G., Faulkner, G., Buliung, R., & Lay, J. (2012). Understanding the drive to escort:
a cross-sectional analysis examining parental attitudes towards children’s school travel
and independent mobility. BMC Public Health, 12, 862. DOI: 10.1186/1471-2458-12-
862.
Mohd Yussof, J. Z., & Tahir, Z. (2005). Akta Kanak-Kanak 2001: penguatkuasaan semula
tugas dan tanggungjawab ibu bapa atau penjaga? Journal of Malaysian and
Comparative Law, 32(1).
McDonald N. C. (2008). Children’s mode choice for the school trip: the role of distance and
school location in walking to school. Transportation, 35(1), 23–35.
Oluyomi, A. O., Lee, C., Nehme, N., Dowdy, D., Ory, M. G., & Hoelscher, D. M. (2014).
Parental safety and concerns and active school commute: correlates across multiple
domains in the home-to-school journey. International Journal of Behavioral Nutrition
and Physical Activity, 11(1), 32. DOI: 10.1186/1479-5868-11-32.
Statements Rank 1 Rank 2 Rank 3 Rank 4 Rank 5 Average
score
Priority
order
Ensuring the safety of
children in public places. 1,956
(43.5%)
1,254
(27.9%)
657
(14.6%)
316
(7%)
317
(7%) 2.06 1
Reducing crime rate. 1,143
(25.4%)
1,295
(28.8%)
1,188
(26.4%)
538
(12%)
336
(7.5%) 2.47 2
Ensuring accessibility to
public facilities. 905
(20.1%)
963
(21.4%)
896
(19.9%)
895
(19.9%)
841
(18.7%) 2.96 3
Reducing road accidents. 222
(4.9%)
568
(12.6%)
1,132
(25.2%)
1,637
(36.4%)
941
(20.9%) 3.56 4
Assisting in creating a safe
city. 274
(6.1%)
420
(9.3%)
627
(13.9%)
1,114
(24.8%)
2,065
(45.9%) 3.95 5
Total 4,500
(100%)
4,500
(100%)
4,500
(100%)
4,500
(100%)
4,500
(100%)

1Lecturer at Ciputra University. 209
PLANNING MALAYSIA:
Journal of the Malaysian Institute of Planners
VOLUME 15 ISSUE 1 (2017), Page 209 - 220
DAYLIGHT CHARACTERISATION OF CLASSROOMS IN
HERITAGE SCHOOL BUILDINGS
Maria Yohana Susan1, & Rani Prihatmanti2
1,2 Interior Architecture Department,
CIPUTRA UNIVERSITY, INDONESIA
Abstract
This paper studies the daylight characteristics in selected high schools that are
located in heritage-listed buildings. Heritage buildings were selected in this
research due the problematic condition regarding the indoor illumination level
after being adaptively reused. Based on the previous research, lighting in
educational institution is a critical factor because poor lighting not only is
detrimental to the occupants’ visual comfort but also might lead to visual fatigue.
To achieve the objectives of this paper, daylight level measurements and
observation were conducted. The results show that the daylight that penetrates
into the classrooms were below the standard due to many obstructions founded
in both schools. Artificial lightings were used as a supplementary during the
whole school hours since the daylight was not uniformly distributed. Thus it can
be concluded that the inappropriate adaptive reusing heritage building indoor is
significantly affecting the indoor light level and might lead to visual discomfort
issues for students. The research findings as well as the suggestions have been
delivered to the school management to overcome the issues founded.
Keywords: Daylight performance, visual comfort, heritage building, adaptive
reuse, high schools
Date Received: 30th April 2016
Date of Acceptance: 30th October 2016

Maria Yohana Susan, & Rani Prihatmanti
Daylight Characterisation of Classrooms in Heritage School Buildings
© 2017 by MIP 210
INTRODUCTION The issue regarding the effect of the indoor light level to the visual comfort has been highlighted since the last few years. This is also related with the green building trend where building occupants need to be comforted when they are indoor, be it is in an office, school, store or even at their own residence. Nowadays, green building rating tools have included the assessment on the Indoor Environmental Quality (IEQ) in order to obtain a healthy occupants and one of the assessments is to focus in on the visual comfort.
Based on the previous research, the indoor light level has a detrimental
effect on the building occupants, including students. Indoor lighting is widely
known to give a significant role in satisfying visual comfort as it is highly
affecting students' satisfaction and their academic performance. Moreover,
several studies have been conducted to highlight the lighting performance in
learning environment (Yang, Becerik-Gerber & Mino, 2013; Samani & Samani,
2012; Axarli & Tsikaloudaki, 2007; Benya, 2001).
To achieve good indoor lighting quality, it needs an appropriate planning. The lighting must accommodate the occupants’ activity. However, there were some buildings were not meant to be built as its main purpose. Adaptively reused buildings are prone to cause discomfort to the occupants (Prihatmanti & Bahauddin, 2011) and this is commonly found in heritage buildings which being reused into a different purpose or can no longer functioned with its original purpose. Therefore this research aims to study the lighting performance in high schools that is located in heritage-listed buildings.
LITERATURE REVIEW
Heritage building is an evidence of history. By conserving those buildings, it
helps to understand the past and to contribute for the future generations. It can
give the sense of continuity and belonging to the place where people live. One
method for conserving heritage building is by adaptive reusing it. As stated in the
Burra Charter (Australia ICOMOS, 1999), adaptive reuse is rehabilitating or
renovating heritage buildings or structures for any uses other than the present
uses. It involves no change to the culturally significant fabric, changes that are
significantly reversible, or changes with minimal impact. Meanwhile, according
to Bullen, adaptive reuse is known as one of the effective strategies to improve
the sustainability of the existing building by lowering material, transport and
energy consumption, as well as helps to reduce the pollution level (Bullen, 2007).
The changes of building function has made the building’s IEQ level
degrade, including the indoor lighting performance. It could be in the form of
obstructing the windows, doors or any other openings in order to create more
indoor spaces by applying full height partition. In order to maintain the IEQ level,
there is a need to study the performance of the indoor light level based on the
daylight that penetrates in the designated buildings.

PLANNING MALAYSIA
Journal of the Malaysia Institute of Planners (2017)
© 2017 by MIP 211
The lighting performance is generally measured by the illuminance level (E), daylight factor (DF), and also the uniformity ratio. E or illuminance is a measure of the illumination of a surface (Szokolay, 2004). The illuminance level may vary for each room with different function. Illuminance level was produced by an overcast sky, and it strongly depends on the solar altitude angle behind the clouds. The overcast sky illuminance may vary in wide range limits. As the outdoor lighting conditions are highly variable, design can only be based on the worst conditions. However, the ratio between illuminance on a certain point indoors to the outdoors remains constant (Szokolay, 2004).
Where,
Ei = indoor illuminance
Eo = outdoor illuminance (vary from 20klx-130klx)
DF = Daylight Factor
The indoor illuminance for DF is measured in two measurement points.
They are Main Measurement Moint (MMP) and Side Measurement Point (SMP)
(Badan Standardidasi Nasional, n.d). MMP is observed in the middle of side
walls, with the distance of 1/3 from effective daylight aperture; while SMP is
taken in the distance of 0.5m from the side wall, in line with the MMP. Both of
measurement points must be taken on the workplane height (0.75m).
Uniformity ratio is used to study daylight distribution. Higher uniformity
ratio means better daylight distribution. It is measured as the ratio of minimum
workplane illuminance to average workplane illuminance. The maximum number
for uniformity ratio is one (Yang, Becerik-Gerber & Mino, 2013). Good
daylighting for tropical climate is indicated by several parameters. As for
classroom, the illumance level standard in tropical climate is approximately 200
lx (Rea, 2000). The standard for DF value on MMP point is 0.35d (d=room depth)
and on the SMP point is 0.2d (Badan Standardidasi Nasional, n.d). In order to supply maximum daylight into any room, uninterrupted visual
line between the room inside and sky dome should be provided. In the past,
buildings were designed to be adaptive with the local climate. The features of
adaptive strategies in those buildings were purposely constructed to create users’
thermal comfort. However, inappropriate design of the features could interrupt
the visual line and reduce the daylight penetration into the room (Heerwagen,
2004).

Maria Yohana Susan, & Rani Prihatmanti
Daylight Characterisation of Classrooms in Heritage School Buildings
© 2017 by MIP 212
METHODOLOGY
Selection of the Research Objects In Surabaya, there are number of heritage buildings that have been adaptively reused as schools that is located in heritage buildings. The research objects were selected based on the heritage significances. There were 2 schools selected in this study; all of them are the prominent private schools in Surabaya. Those are Santa Maria Senior High School and St. Louis Senior High School. These schools are listed as the national heritage building by the Surabaya City government regulation No. 5/2005. Since most of the heritage schools are expanding due to the increased numbers of students enrolled every year, this research was conducted in the classroom that is located only in the heritage building. However, due to the permission given by the schools, the survey was conducted during the last subject that is between 1 to 2 p.m. The typical classrooms from both schools can be seen in Figure 3 and 4.
Research Objects Description
A. Santa Maria Senior High School
This school is located in Raya Darmo Street Surabaya. This building is divided
into the main and annexe building. The main building is considered heritage
building since it was built in the 1920s. In this study, the studied class is located
on the second floor, in the heritage wing, which is facing to the south. The east
and west side of this building are facing open space, the north side is facing the
Rever Academy building, and the south is where the annexe building located. The
site illustration is shown in Figure 1.
Figure 1 The Santa Maria School
Building of the studied classroom
Studied classroom
Rever
Academy
St. Maria
Annexe
Building

PLANNING MALAYSIA
Journal of the Malaysia Institute of Planners (2017)
© 2017 by MIP 213
The studied classroom is equipped with wooden desks and chairs. The
floor is covered by grey-coloured terrazzo. The classroom is surrounded by brick
walls, painted in matte white, with light green ceramics on the bottom-half of the
wall. The ceiling height is approximately 3.5m and painted in white. Based on
the observation, there are no high reflectance materials in this classroom. The
openings (1.8x1.0m in size) are located on 1.8m above the ground, on the north
and south wall. The high ceiling and openings are the common characteristics of
climate adaptation for buildings in the tropical climate. The obstructions for the
openings come from the surrounding buildings, that is the annexe building (2-
storey high) and the Rever academy (single storey).
B. St. Louis Senior High School
This building is located at Polisi Istimewa street Surabaya. The building itself has
a U-shape form. Similar with Santa Maria, this school also consist of heritage
building and annexe building as the additional one. The building has open spaces
on the north side and a courtyard on the south. The studied class is located on the
second floor, in front part of this building, facing the north, i.e. the main road and
parking spaces.
Figure 2 The St. Louis School
The furniture inside the classroom are made from wood, stained in dark
colour. Dark grey terrazzo is used as the flooring material. Brick is used for wall
material, and painted with green colour as its finishing. The 5 m ceiling is finished
with white paint. Similar with the other building, most of the building fabrics and
other materials are less reflectance. High openings are placed in north, east, and
south wall. A door as an opening at the south wall is used for circulation access
from the corridor to the classroom. The daylight comes mostly from the openings
at the north and east side. The external obstruction comes from the vegetation on
Building of the studied classroom
Studied classroom

Maria Yohana Susan, & Rani Prihatmanti
Daylight Characterisation of Classrooms in Heritage School Buildings
© 2017 by MIP 214
the open spaces, while internal obstruction comes from the internal shading as the
window treatment.
METHODOLOGY
The objectives of this research is to assess the characteristics of daylight in
heritage school buildings. Therefore the studied buildings need to be visually
observed on the physical conditions (classroom and its surroundings) and the
illuminance level needs to be measured quantitatively. The observations were
taken on September 2015, when the sun is on the equinox position and in overcast
sky. Surabaya is situated along the Equator (7º15’55’’ S and 112º44’33’’E), thus
the amount of daylight is abundant throughout the year.
First, each classroom was divided into grids with 1.00m to 1.20m distances.
The illuminance level for every grid’s points were measured in workplane height
(0.75m) by using hand held light meter in daylight condition. The illuminance
level measured was also for MMP and SMP. The daylight factor assessment was
done by measuring indoor illuminance level and outdoor illuminance level at the
same time, at the grid point that has been made.
Figure 3 Illuminance Data of a Typical Classroom in Santa Maria
17 36 33 34 37 23 23
19 21 34 38 45 48 26
18 22 25 31 41 43 26
17 26 28 31 37 37 24
17 29 29 30 37 39 24
16 27 26 28 34 39 24
10 14 18 20 23 25 23
MMP 1
25MMP 2
36
SMP 1B
18
SMP 1A
33
SMP 2A
28
SMP 2B
16
7200
1000
1000
15
40
23
60
16
00
400
7200
1000
1800
1700
1800
1600

PLANNING MALAYSIA
Journal of the Malaysia Institute of Planners (2017)
© 2017 by MIP 215
Figure 4 Illuminance Data of a
Typical Classroom in St. Louis
Figure 5 Daylight Factor of a Typical
Classroom in Santa Maria
Figure 6 Daylight Factor of a Typical Classroom in St. Louis
6800
85
01
60
02
95
01
40
02
95
01
60
08
50
850160019001600850
10
80
01
40
0
36 53 59 52 42
54 69 35 73 50
60 73 72 71 26
60 74 81 73 36
66 73 84 78 40
64 77 103 105 53
68 83 97 99 58
74 91 93 91 48
81 96 87 70 57
69 79 81 80 56
34 28 56 43 43
MMP1
88
SMP1a
81
SMP1b
50
MMP2
93
SMP2a 60
SMP2b
80
MMP 1
0.02MMP 2
0.03
SMP 1B
0.02
SMP 1A
0.03
SMP 2A
0.02
SMP 2B
0.01
7200
10
00
10
00
15
40
23
60
16
00
40
0
7200
10
00
18
00
17
00
18
00
16
00
6800
85
01
60
02
95
01
40
02
95
01
60
08
50
850160019001600850
10
80
01
40
0
MMP1
0.07
SMP1a
0.06
SMP1b
0.04
MMP2 0.07
SMP2a 0.05
SMP2b 0.06

Maria Yohana Susan, & Rani Prihatmanti
Daylight Characterisation of Classrooms in Heritage School Buildings
© 2017 by MIP 216
Figure 3 and 4 show the illuminance data for each classroom while the
DF value for each measurement point can be seen in Figure 5 and 6. Thus,
observation on the building and lighting parameters were conducted to answer
the objectives of this research. To analyse the data that have been gathered
previously, descriptive analysis was carried out as well as comparing with the
references related.
DISCUSSION AND CONCLUSION
Illuminance Level
Analysis of illuminance level is started with the isocontour graphics as seen in
Figure 7 and 8. Higher illuminance level are shown with orange-red colour, while
the blue colour shows the lower one. Both isocontour graphs show that higher
illuminance levels are placed around the centre of the room. This result shows
that lighting treatments on heritage building (high window, high ceiling, light
painted) are successfully to bring the light deeper into the room. However, the
numbers of illuminance level are still below the standard. Good illuminance level
was analysed based on the IESNA requirements for classroom. The highest
internal illuminance from both classrooms is only 105 lx, that is below the
standard (200 lx)9.
Figure 7 Isocontour of a Typical
Classroom in Santa Maria
Figure 8 Isocontour of a Typical
Classroom in St. Louis

PLANNING MALAYSIA
Journal of the Malaysia Institute of Planners (2017)
© 2017 by MIP 217
Daylight Factor (DF)
Beside illuminance level, DF was also considered in this research to indicate
design effectiveness in bringing daylight into the indoor area. As mentioned
previously, DF is the ratio between outdoor illuminance to indoor illuminance in
the overcast sky. As seen in Figure 5 and 6, the DF value from both classes is
between 0.01-0.07. This results are then compared to the DF value standard, and
tabulated in Table 1.
Table 1 Daylight Factor Level
Name DF actual d (m) MMP= 0.35d SMP 0.2d
Santa Maria Senior High School
MMP 1 0.02
7.2
2.52
SMP 1A 0.03 1.44
SMP 1B 0.02
MMP 2 0.03 2.52
SMP 2A 0.02 1.44
SMP 2B 0.01
St. Louis Senior High School
MMP 1 0.03
10.8
3.78
SMP 1A 0.04 2.16
SMP 1B 0.02
MMP 2 0.05
6.8
2.38
SMP 2A 0.04 1.36
SMP 2B 0.03
Table 1 shows that all classrooms taken for this research have DF value
below the standard level. As mentioned previously, uninterrupted visual line
between room inside and sky dome should be provided in order to supply
maximum daylight into any room. Some heritage features that need to be
considered as the obstructions are the corridor, shading device, and surrounding
building.
Both classrooms measured in this research are along the corridor. It is
widely known that corridor could reduce the daylight penetration into the room.
However, the DF value in St. Louis classroom is slightly higher since the
classroom has higher ceiling level (6 meters) compare to the Santa Maria (4
meters). Higher ceiling gives chance for higher window level, which lead to
higher chance for daylight penetration without any obstruction.
Since this research is conducted in tropical climate, shading device is one
of climatic responsive strategies that needs to be considered. Appropriate design
of shading device will contribute to better daylight condition. The overhangs
could create higher illuminance level and distribution uniformity. However deep
corridor make reflected sunlight cannot reach the room inside. Horizontal louvers
with reflective metal materials could give more advantages. As shown in Figure

Maria Yohana Susan, & Rani Prihatmanti
Daylight Characterisation of Classrooms in Heritage School Buildings
© 2017 by MIP 218
9, horizontal louvers can reflect much more sunlight and contribute in giving
higher daylight factor.
Figure 9 The Horizontal Louvers
Uninterrupted visual line can be provided if there is no obstruction from
site contour, vegetation and surrounding building. Classroom observed in St.
Louis has no surrounding buildings. However, the visual line of classroom
observed in Santa Maria is obstructed by surrounding buildings.
Uniformity Ratio
Uniformity ratio is used to study the daylight distribution. Higher uniformity ratio
means better daylight distribution, and the maximum value is one. Uniformity
ratio for both classrooms are shown in Table 2.
Table 2 Uniformity Ratio
Name Minimum
WPI
Average WPI Uniformity
Ratio
Santa Maria 10 28 0.36
St. Louis 26 77.84 0.33
Theoretically, high ceiling, high window and appropriate placement of
window are good strategies for creating better daylight distribution. But in this
research, those strategies failed to create good daylight distribution. This can be
seen from low uniformity ratio value. This is mainly due to the appropriate
strategies that are not followed by sufficient daylight source. In the St. Louis the
daylight source at one side of the rooms is obstructed by the corridor, while in
Santa Maria it is obstructed by the corridor and surrounding buildings.

PLANNING MALAYSIA
Journal of the Malaysia Institute of Planners (2017)
© 2017 by MIP 219
CONCLUSION
The result from the measurements shows that the indoor light levels in both
classrooms were below the standard. The daylight was insufficient to provide
good illuminance and the lights were not uniformly distributed. Thus it can be
concluded that the inappropriate adaptive reusing heritage building indoor is
significantly affecting the indoor light level and might lead to visual discomfort
issues for the students.
Treatments for improvement are limited to the heritage building
conservation rules. Therefore indoor treatments are the most preferred. Treatment
in ceiling, wall and floor are suggested. Material with appropriate reflectance
number will increase the illuminance level and DF value, while curved ceiling is
suggested to obtain higher uniformity ratio.
The research findings as well as the suggestions have been delivered to
the school management to overcome the issues discovered. However, there is a
need in conducting research regarding the visual satisfaction in adaptively reused
buildings, particularly in the school or office.
ACKNOWLEDGEMENTS
The authors would like to thank to the Indonesian State Ministry of the Research
and Technology as the funding body under the grant scheme No.
050/SP2H/P/K7/KM/2016.
REFERENCES Benya, J. R. (2001). Lighting for schools. National Clearinghouse for Educational
Facilities. Retrieved from http://www.ncef.org/pubs/lighting.pdf
Badan Standardidasi Nasional (n.d). SNI 03-2396-2001.
Bullen, P. A. (2007). Adaptive reuse and sustainability of commercial buildings.
Facilities, 25 (1/2), 20-31
Heerwagen, D. (2004). Passive and active environmental controls, informing the
schematic design for buildings. Singapore: McGrawHill.
Axarli, K., & Tsikaloudaki, K. (2007). Enhancing visual comfort in classrooms through
daylight utilization. In Proceedings of Clima 2007 WellBeing Indoors. Helsinki,
Finland.
Prihatmanti, R., & Bahauddin, A. (2011). The indoor environmental quality of UNESCO
listed heritage buildings, George Town, Penang. In Proceedings of 5th
International Conference on Built Environment in Developing Countries.
Penang, Malaysia.
Samani, S. A., & Samani, S. A. (2012). The impact of indoor lighting on students’
learning performance in learning environments: a knowledge internalization
perspective. International Journal of Business and Social Science, 3(24), 127-
136.
Rea, M. S. (Ed.) (2000). The IESNA lighting handbook. Illuminating Engineering Society
of North America.
Szokolay, S. V. (2004). Introduction to architectural science: the basis of sustainable

Maria Yohana Susan, & Rani Prihatmanti
Daylight Characterisation of Classrooms in Heritage School Buildings
© 2017 by MIP 220
design. Oxford: Elsevier.
Australia ICOMOS (1999). The Burra Charter. Victoria: Australia ICOMOS
Incorporated.
Yang, Z., Becerik-Gerber, B., & Mino, L. (2013). A study on student perceptions of
higher education classrooms: impact of classroom attributes on student
satisfaction and performance. Building and Environment, 70, 171–188.

1Assistant Professor at International Islamic University Malaysia. Email: [email protected] 221
PLANNING MALAYSIA:
Journal of the Malaysian Institute of Planners
VOLUME 15 ISSUE 1 (2017), Page 221 - 228
THE BENEFITS OF RIVER INDICATORS TO ASSESS THE
ECOLOGICAL STATUS OF IIUM CAMPUS
Nor Zalina Harun¹, Mazlina Mansor², & Safiah Abu Noh³
1,2,3Kuliyyah of Architecture and Environmental Design
INTERNATIONAL ISLAMIC UNIVERSITY MALAYSIA
Abstract
The concept of sustainable campus has emerged from the social, economic and
environmental impacts due to anthropogenic activities around the world. One of
the initiatives of sustainable campus is the application of ecological indicators.
The indicators provide information about the current condition and early warning
on the possible risks of environmental impacts to the campus environment.
However, lack of understanding on the values of natural ecosystem in campus
and the lack of proper planning has led to the depletion of natural ecosystem. The
study seeks to examine river degradation in IIUM campus and to explore the
benefits of river indicators towards achieving IIUM as an ecologically sustainable
campus. Data were gathered using a qualitative approach involving three methods
of data collection namely: (i) document analysis, (ii) semi-structured interview
and (iii) site inventory. The finding reveals that the application of river channel
morphology indicators is an important basis for physical planning in making a
campus ecologically sustainable. Further analysis suggests that the suitable
indicators to assess the condition of IIUM River are the river channel morphology
indicators such as width, depth, channel pattern and slope ratio. The process of
selecting the indicators are carried out based on six criteria of good indicators
discussed in this study. The study concluded that the application of river channel
morphology indicators is a critical process in physical planning of a sustainable
campus as it contributes in preventing the loss of natural ecosystem and it offers
a credible basis for creating a conducive place for campus residents.
Keywords: IIUM campus, sustainable, ecological indicator, river
Date Received: 30th April 2016
Date of Acceptance: 30th October 2016

Nor Zalina Harun, Mazlina Mansor, & Safiah Abu Noh
The Benefits of River Indicators to Assess the Ecological Status of IIUM Campus
© 2017 by MIP 222
INTRODUCTION The concept of sustainable development is an approach of making economic,
social and environmental resources available for current and future generations.
This concept has been implemented throughout the world as a response to many
environmental degradation. Nowadays, the world faces numerous challenges that
threaten to undermine the welfare of people all over the world. Issues like urban
sprawl, congestion, waste and global warming has alarmed many urban planners
and encouraged them to apply evolving notions of sustainability in city planning.
As a result, many actions and policies have been developed to cater the issues of
social, environmental and economic sustainability, especially in the urban
contact.
The concept of sustainable urban development can be applied at any scale
of development from a global scale to as small as institutional scale such as a
campus of higher learning institution. Accordingly, a campus today is recognised
as a vital platform where all new information and efforts to improve quality of
life without compromising the needs for future demands can be disseminated
(United Nations Environment Program, 2014). Significantly, an ideal campus is
supposed to be an entity that can be an inspiration for many organizations in
implementing efforts towards achieving sustainable development.
In Malaysia, three campuses have implemented the use of ecological
indicator for their sustainable campus development. They are Universiti
Kebangsaan Malaysia, Universiti Malaysia Sabah and Universiti Sains Malaysia.
Among the three universities, four aspects that are often highlighted in their
sustainability efforts are energy, water, transportation, and waste management
(Zen et al., 2013; Saadatian et al., 2010).
This study contends that a tool for assessing the current condition of the
natural ecosystems could help to predict any changes of the ecosystem state, as it
is significant to maintain the natural ecosystem in order to create a conducive
environment that supports learning, teaching, innovation and research. However,
lack of awareness and consideration in maintaining the health of the river
ecosystem in IIUM has led to degradation of the ecosystem, which contributes to
many environmental impacts such as flash flood. In this case, the need of a tool
to assess the river condition is vital to provide information, in order to avoid
severe environmental impact on campus. Initial study revealed that the main
trigger of the degradation of the river is because of the physical changes of the
river. Therefore, this research was set out to identify the condition and factors of
river changes and the framework of selecting ecological indicators for sustainable
campus by concentrating on the river channel morphology.
Ecologically Sustainable Campus and Its Environment
Managing campuses by taking into account the environmental aspect is a must
today. Ecologically sustainable campus is basically motivated by the idea that the

PLANNING MALAYSIA
Journal of the Malaysia Institute of Planners (2017)
© 2017 by MIP 223
campus is expected to be a comfortable, clean, sound, beautiful and healthy place
for knowledge seekers. By managing campus physical aspect, it will provide a
healthy environment that is vital for the wellbeing of the campus residents. As a
result, a good environment in campus will foster academic performance, and
social and personal development by providing a place for students to get the
opportunity to form an identity and sense of community of the institution.
The Concept of Sustainable Development
Sustainability or sustainable development has widely emerged in many areas of
human civilization. It has started many years ago and continuously disseminated
especially during 1987 when Brundtland Report was presented during the World
Commission on Environment and Development Conference (WCED, 1987). The
concept of sustainable development is actually emerged from the awareness about
the importance of preservation and maintenance of natural resources. Since then,
numerous initiatives have been taken at local, national and global levels in an
effort to tackle diverse aspects of the environmental disputes (Mebratu, 1998).
According to WCED (1987), sustainability can be defined as an approach that
serves the needs of the present without neglecting the ability of future generations
to fulfil their own needs. Brundtland’s definition of sustainability has inspired
many policymakers, environmentalists and researchers to further improve the
inclusive definition of sustainability, resulting in a wide variety of meanings and
interpretations.
Sustainable Campus
The sustainability concept evidently is applicable to any scale of development
including institution like university. University is seen to be a key player in the
global transition towards sustainable development. With its population and
activities held in campus, it is recognized that its decisions and actions have a
very significant impact on the environmental, economic and social aspects at
present and in the future. University is seen to be accountable to perform as role
model for the bigger community. It is because university is an ideal platform to
disseminate the idea of sustainability (Howitt, & Rickards, 2013). The future
leaders that study in the campus are valuable assets and are hoped to spread the
sustainability concept after they graduated especially in their working
environment. Therefore, it is recommended that this is accomplished through the
education of future generations about sustainability practices into their own
university operation.
Campos (2008) who views the work of Le Corbusier in 1936, highlights
that the campus is a place which students enjoy the pleasant stage of life in the
ambience of a paradise. Here, the term campus is envisioned as a physical
boundary used by students for a certain period of study that have a comfortable
and conducive learning environment. The visualization of a sustainable campus

Nor Zalina Harun, Mazlina Mansor, & Safiah Abu Noh
The Benefits of River Indicators to Assess the Ecological Status of IIUM Campus
© 2017 by MIP 224
must be envisioned by the character of a paradise which highlights the exquisite
of its ecological aspect. Therefore, campus should serve as a place with vibrant
environment for learning because knowledge seeking should be the most
enjoyable juncture in human life that depicts a character of a paradise.
Therefore, an ideal ecologically sustainable campus is a campus that
resides picturesque landscape blended with a great diversity of ecosystems. Lush
green ecosystems that showcase the flora and fauna available within the campus
are properly preserved for general awareness and research that offer excellent
opportunities for the study of complex ecosystems. This idea only can be
achieved by the awareness of the university management in maintaining the
health of the available ecosystem.
Campus Sustainability Assessment
The campus operation must be based on a systematic planning and operation.
This will enable university management to take a more structured approach to
managing resources and environmental impacts in campus. A good framework of
sustainable campus is developed by Cole (2003) namely the campus
sustainability assessment framework (CSAF). Cole (2003) proposes an egg of
sustainability (Figure 1) that integrates of two systems which are the people and
the ecosystem. In her framework, the sustainability of ecosystem covers aspect
of land, water, air, materials and energy. Whereby, the sustainability of people
system incorporates aspects of knowledge, community, health and wellbeing,
governance, economy and wealth. Cole’s framework has been adapted by many
campuses around the world as it provides comprehensive framework that can be
used in implementing sustainability in campus.
Figure 2 Egg of sustainability
Source: Cole, 2003
ECOSYSTEM
AIR
WATER
LAND
MATERIALS
ENERGY
KNOWLEDGE COMMUNITY
HEALTH & WELLBEING GOVERNANCE
ECONOMY & WEALTH
PEOPLE

PLANNING MALAYSIA
Journal of the Malaysia Institute of Planners (2017)
© 2017 by MIP 225
RESEARCH METHODOLOGY
The research employed qualitative approach using ecological site inventory,
semi-structured interview and document analysis as methods of data collection.
Meanwhile, the case study is chosen as the strategy of inquiry. In constructing
the method, understanding on the issue of studied area, and types of information
need to be collected are considered as significant. The site inventory checklist
and interview questions are formulated parallel with the research questions, aim,
and research objectives. The site inventory is done to understand real
phenomenon of the studied area. Whereby, semi structured interview is done for
two group of respondents to investigate the factors of phenomenon and
verification process of framework that shows the process of selecting suitable
indicators for IIUM river. Next, the data is analysed to identify major factor,
critical component to be monitored and the impacts on river ecosystem. Based
on the data from interview and site inventory, the process of indicator selection
is proposed through thematic analysis from previous framework studied form
literature review. The data are themed according to the steps of the selection of
indicators. Finally the framework is verified by experts to check the
appropriateness of the process and suitability of indicators.
FINDINGS AND DISCUSSIONS
The findings reveal that there are remarkable changes to the physical
characteristic of river in IIUM. These have proved that there is alarming issue on
the sedimentation that changes the physical character of the river, thus, influence
biological and chemical properties of the river. The evidence presented in Table
1 thus far supports the idea that sedimentation resulted from anthropogenic
activities has led to many consequences to the overall integrity of the river
ecosystem.
Table 1 Factors of River Depletion and Its Impacts on the River Attributes
Factor Driver Attributes Impact
Sedimentation Sand mining
Construction
Erosion
Clogged-
culvert
Physical Channel width reduction
Channel depth reduction
Channel pattern changes
Increase slope rate that increase erosion
rate
Reduce water retention capacity during
heavy rain
Reduce water clarity
Land degradation
Loss of reservoir capacity
Changes on the soil physical character
New vegetation increase sedimentation
rate

Nor Zalina Harun, Mazlina Mansor, & Safiah Abu Noh
The Benefits of River Indicators to Assess the Ecological Status of IIUM Campus
© 2017 by MIP 226
In view of factors and impacts of sedimentation, this has confirmed the
significance of the study of river channel morphology in detecting changes on the
ecosystem. The study reveals that physical character of the river has the strongest
influence on the biological and chemical component of the river and the quality
of the river are determined by the measurement of the physical character of the
river. The physical form and the shape distribution to forecaster variables are
somewhat simple to determine. The changes to the river channel morphology can
be caused by two activities. The first factor is from anthropogenic activity
modification in and surrounding the river. The second factor is from natural factor
over short and long term period.
The process of selecting the suitable river indicators explained in this
paper has identified river channel morphology indicator as the most suitable
indicator to detect changes on the river morphology as it is the most badly
affected component in IIUM.
The ability to assess the condition of the river ecosystem, evaluate
sensitivity to modification, and recognize potential changes to the ecosystem
resulting from different anthropogenic activities such as development adjacent to
the water body is important to notify risk of river degradation for resolution
making. A more systematic and sustainable approach to reduce the negative
impacts of anthropogenic activities is required in making the campuses more
sustainable and liveable. Although many environmental protection methods can
be seen at some universities, the natural ecosystem like river is usually left
unattended. One way that university management can apply in monitoring the
condition of river is through the implementation of river indicators that will
characterize the current situation and help determine where to focus efforts in
order to make the campus ecologically sustainable.
Figure 2 explains the process of physical planning in campus
organization. The monitoring process of any project or development should be
implemented using ecological approach to maintain an ecologically sound
environment of a campus. Accordingly, ecological approach is vital while
planning for campus physical development. By promoting this approach, it will
thrive for increasing environmental awareness and help to build consensus around
the concept of sustainability and the need for incorporating ecological knowledge
into planning. By applying river indicators for campuses that own river
ecosystem, it will reduce the potential risk on the river such as river depletion,
sedimentation, flood, wildlife extinction and loss of ecosystem that will further
disrupt the wellbeing of the residents.
Other perceived benefits of river indicators as one process in the
landscape planning process is that they convey useful information about the
condition of current ecosystem so that planners can use those beneficial
information in planning and maintaining campus physical ground. The
integration of ecology and planning is therefore seen as multi-disciplinary

PLANNING MALAYSIA
Journal of the Malaysia Institute of Planners (2017)
© 2017 by MIP 227
landscape planning, in particular, to assist in helping biodiversity and
development planning move away from their predominantly site-based emphasis.
Figure 2 Campus Planning Process
CONCLUSION
The implementation of river indicator framework is emphasized because campus
sustainable planning is essential and urgent in order to plan for suitable and
enduring ecosystem for campus residents. Therefore, planners and landscape
architects need to work harder in promoting effectively the integration of several
disciplines, and incorporate ecological theory appropriately so that the campus
residents can live harmoniously with nature. The research also revealed
sedimentation resulted from sand mining activity, construction, erosion and
clogged culvert is known as the salient factor that causes physical destruction of
river ecosystem in IIUM. Therefore, maintenance and inspection are essential to
(a) policies, strategies and general proposals for the development and use of county
land
(b) a summary of the situational analysis
(c) proposals for proper physical development, resource utilization and linkages
(d) diagrams, illustrations and description of current and anticipated developments in
the county
(e) an implementation budget
(f) an implementation strategy; (g) a reporting, monitoring and evaluation strategy
(h) any other matters as may be prescribed

Nor Zalina Harun, Mazlina Mansor, & Safiah Abu Noh
The Benefits of River Indicators to Assess the Ecological Status of IIUM Campus
© 2017 by MIP 228
the successful performance of sedimentation control measures. Lack of
maintenance on the river ecosystem is the most common cause of failure.
Practices should be inspected on a regular basis and after each storm event. If
maintenance is required, it should be performed in a timely manner to ensure
proper function. Failure of a structure can release large amounts of sediment,
severely impacting the river physical characteristic that later will impact the
integrity of the biological and chemical attributes.
In conclusion, landscape ecology is clearly recognised as a basis for
positive planning, rather than simply controlling land use on a reactive basis.
Presently, in many countries in the world, there is a growing interest in integrated
approach in making a campus ecologically sustainable. By applying this
framework, it offers a credible basis for creating a campus a conducive place for
campus residents harmonising with nature, making it sustainable for all living
beings.
REFERENCES Campos, P. (2008). Sustainable education campus in Spain - nature and architecture for
training. PEB Exchange, 10, 7. DOI: 10.1787/16097548
Cole, L. (2003). Assessing sustainability on Canadian university campuses: development
of a campus sustainability assessment framework. Royal Roads University.
Howitt, R. & Rickards, S. (2013). Complete campus engagement via embedding
ecological footprinting curriculum. In Proceedings of the 13th International
Australasian Campuses towards Sustainability (ACTS) Conference, Sydney,
Australia.
Mebratu, D. (1998). Sustainability and sustainable development. Environmental Impact
Assessment Review, 18(6), 493-520.
Saadatian, O., Salleh, E., Mohd Tahir, O., & Dola, K. (2009). Observation of
sustainability practices in Malaysian research universities: highlighting particular
strength. Pertanika Journal of Social Sciences & Humanities, 17(2), 225-244.
United Nations Environment Programme. (2014). Greening universities toolkit.
Retrieved from http://www.unep.org/training/docs/Greening_University_
Toolkit.pdf
World Commission on Environment and Development [WCED] (1987). Our common
future. Oxford: Oxford University Press.
Zen, I. S., Bandi, M., Zakaria, R., & Saleh, A. L. (2013). UTM sustainable campus:
institutionalize sustainability, the living lab approach and sustainable energy
management program. International Workshop on UI Greenmatric 2013, Depok
City, Indonesia.

1Lecturer at Universiti Putra Malaysia Email: [email protected] 229
PLANNING MALAYSIA:
Journal of the Malaysian Institute of Planners
VOLUME 15 ISSUE 1 (2017), Page 229 - 234
PUBLIC BUS LEVEL OF SERVICE PERFORMANCE IN PENINSULAR
MALAYSIA: CORRELATION ANALYSES ON LEVEL OF SERVICE
(LOS) AND PASSENGERS’ SATISFACTION LEVEL
Zakiah Ponrahono¹, Syahriah Bachok², Mariana Mohamed Osman³, Mansor
Ibrahim4, & Muhammad Faris Abdullah5
¹ Faculty of Environmental Studies
UNIVERSITI PUTRA MALAYSIA 2,3,4,5Kulliyyah of Architecture and Environmental Design
INTERNATIONAL ISLAMIC UNIVERSITY MALAYSIA
Abstract
This study explore the stage bus performance of 48 routes within selected urban
and regional settlements in Peninsula Malaysia, using a quantitative traffic
engineering measure known as Level of Service standards or LOS and validated
through the evaluation of passengers’ satisfaction level. The findings on the level
of service (LOS) highlight the poor performance of the urban and rural bus
service with the tolerable threshold below D. There are clear disparities on LOS
and passenger satisfaction level between the urban and rural bus operation
systems in terms of frequency, operation hour, bus speed, and passengers’ load
threshold
Keywords: Level of Service (LOS), stage bus, passengers’ satisfaction
Date Received: 30th April 2016
Date of Acceptance: 30th October 2016

Zakiah Ponrahono, Syahriah Bachok, Mariana Mohamed Osman, Mansor Ibrahim, & Muhammad Faris Abdullah
Public Bus Level of Service Performances in P. Malaysia: Correlation Analyses on LOS and Passengers’ Satisfaction Level
© 2017 by MIP 230
INTRODUCTION Assessing bus service performance is important to improve the quality, reliability,
efficiency and effectiveness of the system. Service quality is not only can be
measured from the aspect of operation and management but also through the
perception and expectation of the passengers. The level of service (LOS)
assessment is a tool to measure the quality of service based on specific attributes.
The passengers’ satisfaction assessment can help to improve the level of service,
the quality and performance (Zakaria et al., 2010).
The objective of this paper is to assess bus performance of 48 routes
within selected urban and regional settlements in Peninsula Malaysia, using LOS
and validated the findings through the evaluation of passengers’ satisfaction
level.
LITERATURE REVIEW
Passengers’ satisfaction survey is a tool to measure the performance and quality
of bus service that sequentially useful as a benchmark or indicator to enhance the
efficiency and effectiveness of bus service delivery and operations (Dell’Olio,
Ibeas & Cecin, 2011; Rojo et al., 2015). It is also defined as a judgment from the
passengers that relates to the pleasurable level of consumption (Ismail et al.,
2012; Lai & Chen, 2011).
Research on service quality and passengers’ satisfaction identified
attributes that usually be measured such as waiting time, reliability, service
information, comfort, travel time, convenience, safety, security, affordability and
frequency of service (Ismail et al., 2012; Nakanishi, 1997). According to
Parasuraman, Zeithaml and Berry (1985), service quality lies around the aspect
of intangibility, heterogeneity and inseparability, and can be defined as the degree
and direction of discrepancy between consumers’ perceptions and expectations
(Parasuraman, Zeithaml & Berry, 1988). It is the key component in measuring
the bus services from the view point of passenger (Transportation Research
Board, 2013). Even though there exist no specific standard to measure bus service
quality, the attributes in LOS and passengers’ satisfaction study are considered as
sufficient for service quality assessment (Ismail et al., 2012; Nakanishi, 1997).
METHODOLOGY
This study employed the qualitative measures of LOS for bus quality assessment
and validated the analyses through on-board face to face passengers’
questionnaire on comfort and convenience of passengers riding the buses. In this
study, performance measures for selected attributes qualitative determination of
the level of service (LOS) were referred to the standards for Level of Service
(LOS) from A to F grade developed by Transportation Research Board (2003)
and applied in previous researches.
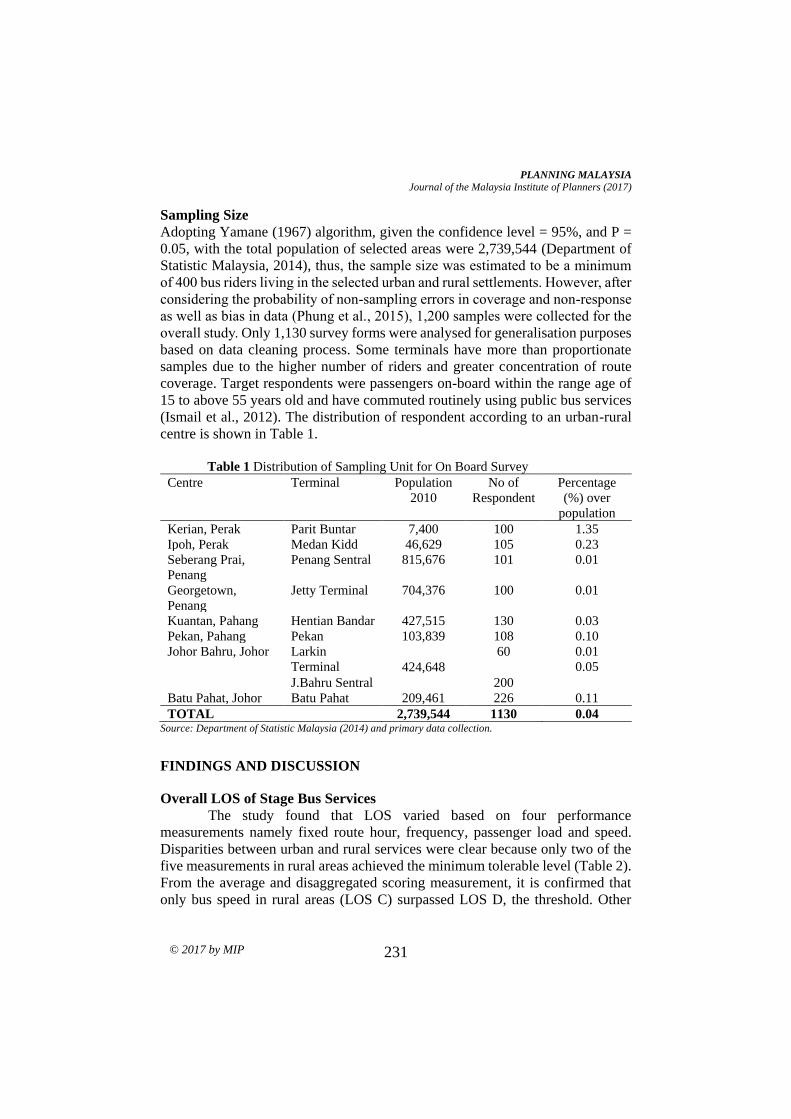
PLANNING MALAYSIA
Journal of the Malaysia Institute of Planners (2017)
© 2017 by MIP 231
Sampling Size
Adopting Yamane (1967) algorithm, given the confidence level = 95%, and P =
0.05, with the total population of selected areas were 2,739,544 (Department of
Statistic Malaysia, 2014), thus, the sample size was estimated to be a minimum
of 400 bus riders living in the selected urban and rural settlements. However, after
considering the probability of non-sampling errors in coverage and non-response
as well as bias in data (Phung et al., 2015), 1,200 samples were collected for the
overall study. Only 1,130 survey forms were analysed for generalisation purposes
based on data cleaning process. Some terminals have more than proportionate
samples due to the higher number of riders and greater concentration of route
coverage. Target respondents were passengers on-board within the range age of
15 to above 55 years old and have commuted routinely using public bus services
(Ismail et al., 2012). The distribution of respondent according to an urban-rural
centre is shown in Table 1.
Table 1 Distribution of Sampling Unit for On Board Survey
Centre Terminal Population
2010
No of
Respondent
Percentage
(%) over
population
Kerian, Perak Parit Buntar 7,400 100 1.35
Ipoh, Perak Medan Kidd 46,629 105 0.23
Seberang Prai,
Penang
Penang Sentral 815,676 101 0.01
Georgetown,
Penang
Jetty Terminal 704,376 100 0.01
Kuantan, Pahang Hentian Bandar 427,515 130 0.03
Pekan, Pahang Pekan 103,839 108 0.10
Johor Bahru, Johor Larkin
Terminal 424,648
60 0.01
0.05
J.Bahru Sentral 200
Batu Pahat, Johor Batu Pahat 209,461 226 0.11
TOTAL 2,739,544 1130 0.04 Source: Department of Statistic Malaysia (2014) and primary data collection.
FINDINGS AND DISCUSSION
Overall LOS of Stage Bus Services
The study found that LOS varied based on four performance
measurements namely fixed route hour, frequency, passenger load and speed.
Disparities between urban and rural services were clear because only two of the
five measurements in rural areas achieved the minimum tolerable level (Table 2).
From the average and disaggregated scoring measurement, it is confirmed that
only bus speed in rural areas (LOS C) surpassed LOS D, the threshold. Other

Zakiah Ponrahono, Syahriah Bachok, Mariana Mohamed Osman, Mansor Ibrahim, & Muhammad Faris Abdullah
Public Bus Level of Service Performances in P. Malaysia: Correlation Analyses on LOS and Passengers’ Satisfaction Level
© 2017 by MIP 232
achievements were LOS D, E, E, and F respectively. Passenger loads during the
weekend were in the worst condition (LOS F). The crush load situation (Level F,
more than 1.5 capacity factors) has created uncomfortable and inconvenient
riding experience for the passengers. A very mild gap was also observed in terms
of bus service hour, trip frequency, service hours, passengers load and bus speed
suggesting that different geographical location does influence the services
provided.
Table 2 Summary of Overall Scores for LOS of Selected Urban-Rural Bus Services in
Peninsular Malaysia
Measure Urban Rural
Fixed-route hour
service C
Early evening service
provided D Daytime service provided
Frequency E Service available during
the hour E
Service available during
the hour
Passengers Load
(Weekdays) E
Maximum schedule load
for urban transit E
Maximum schedule load
for urban transit
Passengers Load
(Weekend) E
Maximum schedule load
for urban transit F Crush load
Bus Speed C
Small increase in traffic
causing substantial
increase in approach
delay and hence, decrease
in arterial speed
C
Small increase in traffic
causing substantial
increase in approach
delay and hence,
decrease in arterial speed
Correlating the LOS Bus Services and Passengers’ Satisfaction Level
The level of satisfaction survey was carried out to verify the level of service
(LOS) identified and to assist in the improvement of the bus services. From the
1,130 respondents surveyed, three in five (60.4%) were dissatisfied with the
current public bus service (Table 3). About one in five (18.2%) were satisfied,
and the remaining 21.4% were undecided or feel indifferent regarding the
performance of the bus service. The mean value for overall passengers’
satisfaction level was 1.58, indicating the greater number of the dissatisfied
respondents.
Table 3 Passengers’ Satisfaction Level Distribution
Satisfaction Level Frequency % Mean
Dissatisfied 682 60.4
1.58
Between Satisfied and
Dissatisfied 242 21.4
Satisfied 206 18.2
Total 1130 100

PLANNING MALAYSIA
Journal of the Malaysia Institute of Planners (2017)
© 2017 by MIP 233
Based on the findings observed in the Table 3, the LOS variables were
then tested using Spearman Rho correlations. A Spearman’s correlation was
employed to determine the relationship between passengers’ satisfaction level
and the LOS of bus service. The hypotheses developed were:
H0: There is no relationship between passengers’ satisfaction level and the bus
service quality.
H1: There is a significant relationship between passengers’ satisfaction level and
the bus service quality.
Based on the results in Table 4, since the significant values of LOS
measurements such as bus speed and bus condition were lower than the critical
value of 0.05 and the r value is less than 0.20, the null hypothesis can therefore
be rejected. The results above shows that the significant value of LOS of bus
speed was r < 0.20, suggesting a very weak, negative correlation; where
satisfaction level was increased even the LOS of bus speed was poor. Meanwhile
the significant value of LOS of bus condition was r < 0.20 indicating a very weak,
positive correlation. When the bus condition was better, the level of satisfaction
increased. Based on the observed significant value, it can be concluded that the
variables of LOS confirm the association between the values of LOS with
passengers’ satisfaction level. Thus, H1 can be accepted.
Table 4 Spearman Rho Correlations: Passengers’ Satisfaction Level and Bus Service
Quality
Bus Service
Quality
Correlation
Coefficient
Sig. (2-
tailed) N
Relationship (Rule of Thumb by
Guilford, (1956)
LOS Service Hour .048 .349 1,130 Fail to reject Null Hypothesis
LOS Frequency -.032 .289 1,130 Fail to reject Null Hypothesis
LOS Bus Speed -.065* .030 1,130 Very weak negative correlation
LOS Passenger
Load (Weekday) -.052 .079 1,130
Fail to reject Null Hypothesis
Bus Condition .172** .000 1,130 Very weak positive correlation **. Correlation is significant at the 0.01 level (2-tailed).
*. Correlation is significant at the 0.05 level (2-tailed).
CONCLUSION
It can be concluded that the stage bus LOS was associated with passengers’
satisfaction level. Hence, the objective of the research is achieved. Even more
notable, there are correlation relationships in aspects of bus speed and bus
condition. In summary, these findings indicate that, the level of service in stage
bus services somewhat has influenced the passengers’ satisfaction level. In
essence, the attributes in assessing the level of service of public bus system–such
as travel time, waiting time, the level of occupancy, regularity of service, or

Zakiah Ponrahono, Syahriah Bachok, Mariana Mohamed Osman, Mansor Ibrahim, & Muhammad Faris Abdullah
Public Bus Level of Service Performances in P. Malaysia: Correlation Analyses on LOS and Passengers’ Satisfaction Level
© 2017 by MIP 234
reliability, comfort, cleanliness, and crew behaviour–were indeed affected by the
passengers’ satisfactory level. In short, the sustainability of public buses in
Malaysia can be achieved first by implementing a comprehensive systems
assessment through LOS identification and passengers’ satisfaction survey.
REFERENCES
Dell’Olio, L., Ibeas, A., & Cecin, P. (2011). The quality of service desired by public transport
users. Transport Policy, 18(1), 217–227. http://doi.org/10.1016/j.tranpol.2010.08.005
Department of Statistic Malaysia. (2014). Intercensal mid-year population estimates.
Retrieved from http://www.statistics.gov.my/portal/download_Population/files/
Anggaran_Penduduk_Pertengahan_Tahun_Antara_Banci2001_2009.pdf
Ismail, R., Hafezi, M. H., Nor, R. M., & Ambak, K. (2012). Passengers preference and
satisfaction of public transport in Malaysia. Australian Journal of Basic and Applied
Sciences, 6(8), 410-416.
Lai, W.-T., & Chen, C.-F. (2011). Behavioral intentions of public transit passengers - the roles
of service quality, perceived value, satisfaction and involvement. Transport Policy, 18(2),
318-325. http://doi.org/10.1016/ j.tranpol.2010.09.003
Nakanishi, Y. J. (1997). Bus performance indicators on-time performance and service
regularity. Transportation Research Record, 1571(August), 3-13.
Parasuraman, A., Zeithaml, V. a, & Berry, L. L. (1985). A conceptual model of service quality
and its implications for future research. Journal of Marketing, 49(1979), 41-50.
http://doi.org/10.2307/1251430
Parasuraman, A., Zeithaml, V. a, & Berry, L. L. (1988). SERVQUAL: a multiple-item scale
for measuring consumer perceptions of service quality. Journal of Retailing, 54(2), 161-
166. http://doi.org/10.1016/S0148-2963(99)00084-3
Phung, T. D., Hardeweg, B., Praneetvatakul, S., & Waibel, H. (2015). Non-sampling error and
data quality: what can we learn from surveys to collect data for vulnerability
measurements? World Development, 71, 25-35.
http://doi.org/10.1016/j.worlddev.2013.11.008
Rojo, M., dell’Olio, L., Gonzalo-Orden, H., & Ibeas, Á. (2015). Inclusion of quality criteria
in public bus service contracts in metropolitan areas. Transport Policy, 42, 52-63.
http://doi.org/10.1016/j.tranpol.2015.05.002
Transportation Research Board (2003). Part 3 quality of service contents. In Transit Capacity
and Quality of Service Manual 2nd Edition (pp. 3-i to 3-94).
Transportation Research Board (2013). Part 2 bus transit capacity. In Transit Capacity and
Quality of Service Manual Third Edition (pp. 2-1 to 2-96). Retrieved from
http://www.trb.org/main/blurbs/169437.aspx
Yamane, T. (1967). An Introductory Analysis (Second). New York: Harper and Row.
Zakaria, Z., Hussin, Z. H., Batau, M. F. A., & Zakaria, Z. (2010). Service quality of Malaysian
public transports: a case study in Malaysia. Cross-Cultural Communication, 6(2), 84–92.

1Lecturer at Universiti Sains Islam Malaysia. Email: [email protected] 235
PLANNING MALAYSIA:
Journal of the Malaysian Institute of Planners
VOLUME 15 ISSUE 1 (2017), Page 235 - 244
TRANSLATION OF SOCIAL CITIZENSHIP TO ARCHITECTURE &
BUILT ENVIRONMENT: A METHODOLOGICAL REVIEW
Mohd Noorizhar Ismail1, Abdul Razak Sapian2, Peter Scriver3, & Mizanur Rashid4
1 Faculty of Engineering and Built Environment
UNIVERSITI SAINS ISLAM MALAYSIA 2 Kulliyyah of Architecture and Environmental Design
INTERNATIONAL ISLAMIC UNIVERSITY MALAYSIA 3,4School of Architecture and Built Environment
UNIVERSITY OF ADELAIDE
Abstract
Social Citizenship is a concept that is used to represent acceptance and identity
by the local community. This is a manifestation expressed in the form of space,
monument or buildings. Buildings such as mosques and other religious buildings
are a form of manifestation to such expression left for other generations to see
and study. This manifestation of citizenship through religious buildings can be an
expression of struggle, establishment, sense of belonging and local acceptance
towards achieving social citizenship. The understanding of this concept implicitly
shows that these elements are the driving forces behind the architecture that is
erected in order to find approval from the local population. This paper reviews
the employed research designs, methods and procedures in the process of
understanding the translation of social citizenship to architecture expressed by
mosques. The methods adopted were aimed toward obtaining archival/historical
evidence that can elicit proof of the concept. The methods also involved the
process of inquiry that would be the basis for discussion and to draw a conclusion
to the relationship between social citizenship and architecture. This paper also
highlights the strengths and limitations of the methodological techniques besides
spelling out the variables needed to prove the relationship.
Keywords: Archival/historical inquiry, typo-morphology, social citizenship,
sense of belonging, space, architecture
Date Received: 30th April 2016
Date of Acceptance: 30th October 2016

Mohd Noorizhar Ismail, Abdul Razak Sapian, Peter Scriver, & Mizanur Rashid
Translation of Social Citizenship to Architecture & Built Environment: A Methodological Review
© 2017 by MIP 236
INTRODUCTION
Social Citizenship is a concept that is represented by displaced people in a foreign
country. Displaced people are the minorities of foreign origin that may have come
to a place to work and later establish a small community. Social Citizenship is a
concept that is used to represent acceptance and identity by the local community.
This is a manifestation expressed in the form of space, monument or buildings.
This manifestation is crucial to achieving social citizenship because it is a
permanent monument is an expression of self-identity, hardship and struggle in
order to achieve the acceptance of the local community. According to Proshanky,
Fabian and Kaminoff (1983), and Lefebvre (1974), place identity is based on a
persons’ sense of memories, ideas, feelings, attitudes, values, preferences,
meanings and conception of behavior and experiences that is gained every day.
Creating a form of architecture is, in fact an expression of the emotions
(Proshanky, Fabian & Kaminoff, 1983). This relationship of space and people
can be referred as a form of investment and as a self-proclamation of
independence in a foreign place. This collective effort in acquiring a space, land
or building is a form of establishment, representation and to establish a sense of
belonging (Tuan, 1977).
This paper aims to highlight the translation of social citizenship to
architecture. This is because civil citizenship is a recognition that is given on
paper (Turner, 1993) that is fulfilling emotionally but does not fulfil their way of
life and sense of belonging towards their home country. Social citizenship is a
medium of expression that is expressed at urban level translating the sense of
belonging and individual expressions to the acceptance of the locals (Turner,
1993; Roche, 1987). This research is based on historical implication to the built
environment through the understanding about of culture, ethnicity and historical
values (Roche, 1987). It will contribute to the understanding of different cultures
in different settings and how they integrate and accepted in the country (Pakulski,
2007; Roche, 1987). Accordingly, the focus of the paper is to describe the
research designs, methods and procedures employed to understand the translation
of social citizenship to architecture and the built environment. It also highlights
the strengths and weaknesses of the methodological tools besides spelling out the
variables needed to prove the relationship. This paper will explore the idea of
social citizenship in the context of Australia in detail, and Perth Mosque and
Adelaide Mosque as the case studies.
BACKGROUND: THE CONTEXT
The implication of a mosque to the built environment is wide-ranging. From an
urban planning point of view, a mosque is regarded as a built urban form that
serves the community similar to the role of a community/civic centre. In relation
to community sustainability, a mosque is the right place that can promote social
cohesion. The concept of social cohesion is central to social sustainability as it

PLANNING MALAYSIA
Journal of the Malaysia Institute of Planners (2017)
© 2017 by MIP 237
focuses on to foster civic participation, strengthen community network, promote
community tolerance and to support shared sense of social tolerance.
In this context of research, Social Citizenship refers to immigrants from
all over the world trying to establish a place in where they reside today (Feldman,
1990). The struggles of the immigrants in establishing a place that represents their
culture and society while gaining approval from the locals are well represented
in the concept of Social citizenship (Bugg, 2013). The phenomena of Social
Citizenship can be viewed in cities with many immigrants such as in Birmingham,
New York and Sydney. Immigrants of different backgrounds whether from
Indian, Afghan or Arabic descendants have strived in placing their culture and
identity in the community and strived in assimilating into the local community
while maintaining their uniqueness (Arijit Sen, 2013; Harris, 2013). The
translation of Social Citizenship to Architecture is a symbol of their uniqueness
represented in solid form for all to see, experience and appreciate (Arijit Sen,
2013).
The translation of citizenship to architecture and the built environment is
based on certain elements that are defined by the relationship of human sense of
establishment and the sense of belonging (Arijit Sen, 2013). These elements are
the driving force behind the architecture that is erected in order to find approval
from the local population and acceptance of their existence in the land. Drawing
from the idea presented by Phillips (2014), Feldman (1990) and Gale (2004), the
authors formulated a concept of social citizenship that impacted the architecture
and the built environment (refer Figure 2):
Figure 1 Translation of Social and Cultural Implication to Architecture
The concept of Social Citizenship in Figure 1 and Figure 2 relates to the human
need of establishment in terms of social and in the form of architecture. This
establishment is the symbol and representation of the struggles that the migrants
have done n a country. According to Figure 1, the human factor that is usually
resulted to migration to a foreign country.

Mohd Noorizhar Ismail, Abdul Razak Sapian, Peter Scriver, & Mizanur Rashid
Translation of Social Citizenship to Architecture & Built Environment: A Methodological Review
© 2017 by MIP 238
Figure 2 Concept of Social Citizenship
Source: Modified from Phillips (2014), Feldman (1990) & Gale (2004).
In Figure 2, the concept of Social Citizenship is represented by five
elements. These elements are what make social citizenship translated to an
architectural form in terms of a building, monument or open space (Tuan, 1977).
Each of the elements plays a role in expressing the feeling and the struggle of the
immigrants as the sense of belonging to their homeland is strong in them (Arijit
Sen, 2013). The first generation of immigrants has a stronger sense of belonging
and by establishing a building or structure that represents their existence. This is
a strategy that translates into a building that would later be appreciated by the
next generations and locals as something unique and exotic representing a sub-
minority group of locals (Arijit Sen, 2013).
METHODOLOGY
The methodology adopted incorporates the process of gathering the data,
processing the data/information and interpreting the data or archival information
obtained. In this study, the method of processing and understanding the data in
the most crucial step because of its historical value and story that it has behind it.
The methods adopted are aimed toward obtaining archival/ historical evidence
that can elicit proof of the concept. It also involved the process of inquiry that
would be the basis for discussion and to draw a conclusion to the relationship
between social citizenship and architecture.
Historical Inquiry (Historiography)
Historical inquiry comprises of historical method of doing research and it is also
known as historiography (Berg, 2001). In doing historical research, evidence-

PLANNING MALAYSIA
Journal of the Malaysia Institute of Planners (2017)
© 2017 by MIP 239
based and primary sources are the basis of analysis (Peters, 2013). Evidence-
based research would require evidence from books, archived information, old
newspapers and documents. These information gathered from the government or
reliable source relating to the topic of the research. In this case of Social
Citizenship, information relating to buildings and mosques is very vital (Berg,
2001). The buildings that are constructed, submitted and approved drawings from
government agencies and reports relating to the construction of the buildings is
an important element required for analysis (Berg, 2001).
Data used for historical research are divided into two sources. Data
sources for histiography is different than any other qualitative methods as the
histiography approach is through existing and verified data that is currently
available. Histiography data can be divided into primary sources and secondary
sources (Berg, 2001).
Primary sources include written statements of eyewitnesses,
documentation of original articles and narration of experiences by a person
directly related to an event (Berg, 2001). These include documents, photographs,
recordings, diaries, memoirs, journals, life histories, drawings and other related
relics, (Berg, 2001; Salkind, 2000).
Secondary source is based from oral interview from a person who is not
present or directly available the event (Berg, 2001). This is a testimony of people
in the form of written objects or documents created by others that relate to a
specific research question or area of research interest (Berg, 2001).
Historical inquiry methodology is based on criticism from fixed set of
questions (Garraghan, 1946). The set of questions is generated based on the topic
that is being researched on. In the case of Social Citizenship, questions regarding
the background of Social Citizenship and the source of social citizenship comes
into place. According to Garraghan (1946), questions are being formulated based
on the guidelines below:
i. When was the source, written or unwritten, produced (date)?
ii. Where was it produced (localization)?
iii. By whom was it produced (authorship)?
iv. From what pre-existing material was it produced (analysis)?
v. In what original form was it produced (integrity)?
vi. What is the evidential value of its contents (credibility)?
These questions are used in relation to the main topic where any other
information that is found shall be added to suit the context.

Mohd Noorizhar Ismail, Abdul Razak Sapian, Peter Scriver, & Mizanur Rashid
Translation of Social Citizenship to Architecture & Built Environment: A Methodological Review
© 2017 by MIP 240
Interpretive Approach
Interpretive Approach is another method used in determining the quality of
information and exact analysis of the topic. The interpretive method is used in
determining account of journeys, case work, case history and anthropological
field study (Howell & Prevenier, 2001; Johansson, 2003). The interpretive
approach is a good point of determining fragmented history from multiple sources
that require detailed analysis and interpretation in order to extract the particular
information need in the research (Peters, 2013).
In the case of Social Citizenship, the approach of historical Inquiry and
interpretive approach is used in order to structure and arrange the information that
came from numerous sources (Howell & Prevenier, 2001). This information may
come from newspaper articles, a fraction of an article mentioning related articles
or just an advertisement describing the required information (Berg, 2001).
Typo-Morphology
Typo-Morphology is an approach that focuses on the changes in the physical form
of a city over time and how different cities compare to each other (Anne Vernez,
1997). Typology refers to categorized form types in architecture and urban
design. Architectural typologies refer to the form characteristics of buildings, the
study of categorized form types in architecture and urban design. As opposed to
building type, which refers to functionality, architectural typologies refer to the
form characteristics of buildings (Anne Vernez, 1997).
Meanwhile, morphology refers to a study of larger urban structures,
pattern and issues. Morphology is also a study of the form of human settlements
and the development of their formation and transformation according to time and
era. Generally, the aim of the technique is to capture and examine the spatial
structure and character of a space, village or city through studying the patterns of
its components, parts and the process of its development and growth according to
time (Anne Vernez, 1997).
Figure 3 Typo-Morphology Approach
Source: Anne Vernez, M., 1997

PLANNING MALAYSIA
Journal of the Malaysia Institute of Planners (2017)
© 2017 by MIP 241
To further clarify on the connections of Social Citizenship, typo-
morphology approach is used by analysing patterns and structure of the urban
landscape against buildings established by the immigrants. The analysis is done
in urban settings where immigrants are established. These urban settings
represent a variety of settings and different background of urban sceneries and
history (Gulgonen, 1998). The similarities between cities and towns are the
placement of the immigrants in relation to major elements of the city. Points of
analysis that will take into account for all urban elements in this analysis will be:
i. Train station
ii. Major transportation
routes into city
iii. Town hall
iv. Hotels
v. Government buildings
vi. Commercial areas
vii. Mosque location
viii. Industrial area
Based on these elements, the positioning of the building is measured
against the location of important places in the town or city. This measurement
will be based on the distance between the building and the important
infrastructure of the city. This is to analyse the importance of the area and also
the significance of the mosque based on the location (Anne Vernez, M., 1997;
Gulgonen, 1998).
This method analyses the differences between all urban areas where the
cameleers have establish themselves and how do these characteristics affect the
architectural outlook of the cameleers’ mosque. These elements will also affect
the mosque architectural outlook relating to social and affordance of the Muslim
community and what they represent in the area.
DISCUSSION
The methods adopted in this research would yield historical information relating
to the activities of the immigrants, their contributions towards the local society
and the level of acceptance that they receive (Pakulski, 2007). Usually, these
immigrants are displaced and lurking at the edge of the city far away from local
population. This is because of different backgrounds and way of life making them
alienated by the society (Bugg, 2013). The scream for acceptance is always
represented in the form of a building that is unique to their culture and
background but exotic to the locals (Bugg, 2013). This difference in the form of
architecture is easily perceived by the locals as it is regarded as a unique trait in
the urban settings that invokes curiosity to the locals. This architecture is later
easily received and the immigrants are recognized as part of the society (Arijit
Sen, 2013).

Mohd Noorizhar Ismail, Abdul Razak Sapian, Peter Scriver, & Mizanur Rashid
Translation of Social Citizenship to Architecture & Built Environment: A Methodological Review
© 2017 by MIP 242
In reference to Figure 4, the mapping of the major elements against Perth
Mosque location shows the significance of the mosque (Bartsch et al., 2015).
Based on the historical research, Perth Mosque is located in the main area of
Williams Street a major retail street of Perth (Bartsch et al., 2015), Western
Australia in the early 1900’s. The location of the mosque there shows that the
Afghan immigrants strived to establish a building in a major area so that they can
be seen and accepted easily.
Figure 4 Sample of Morpho-Typology Mapping
Source: Author
The mapping of the location against the major amenities and elements of
the city shows that the land that was purchased to build the building is in a
significant area where major activities are done. The information historically is
further supported by the mapping using typo-morphology method. Certain other
cities may not reflect the same situation as in Perth such as the Adelaide mosque
where the mosque is built in the fringe area of the city where it is well known to
be an immigrant spot (Bartsch, 2015). However, in the long run, the Adelaide
mosque today is located in the main area of Adelaide City. The Afghans had
established a significant piece of landmark in Adelaide that is well accepted and
celebrated by the locals. This is a way of approvement and acceptance of the
locals towards the Afghans.
The methodology used in this research is a way of selecting and verifying
information based on historical events, archived information and mapping the

PLANNING MALAYSIA
Journal of the Malaysia Institute of Planners (2017)
© 2017 by MIP 243
information on a plan of the city to view the changes and relationship of the
building towards the urban and local society.
By applying this method more information is easily obtained and the
relationship between historical information and architecture of the building is
seamlessly translated from the mapping from typo-morphology and historical
data.
CONCLUSION
The translation of citizenship to architecture and the built environment is based
on elements that are defined by the relationship of human sense of establishment
and the sense of belonging. The understanding of this concept implicitly shows
that these elements are the driving forces behind the architecture that is erected
in order to find approval from the local population and acceptance of their
existence in the land. The research also signifies the importance of architecture
as a classifying device (Thomas & Deborah, 2002) through social citizenship.
The strength of the method in this research is in discovering and understanding
the history of places especially relating to migrants and migration and the
application of religious architecture as a point of establishment. However, it also
poses some limitations which mainly involves the data itself; to obtain credible
data and information, verification of the sources and the way one understand and
interprets the true meaning of the information. Conclusively, this method can be
further explored.
ACKNOWLEDGEMENTS
The authors would like to acknowledge the International Islamic University
Malaysia and the University of Adelaide for funding this research through the
ARC Linkage Project (LP130100859).
REFERENCES Anne Vernez, M. (1997). Urban morphology as an emerging interdisciplinary field.
International Seminar on Urban Form, 1, 3-10.
Arijit Sen. (2013). Staged disappointment: interpreting the architectural facade of the
Vedanta temple, San Francisco. Winterthur Portfolio 47(4), 207-244.
Bartsch, K. (2015). Building identity in the colonial city: the case of the Adelaide
Mosque. Contemporary Islam, 9(3), 247-270.
Bartsch, K., Rashid, M., Scriver, P., Ismail, I., & Jones, P. (2015). Golden threads:
understanding the transnational significance of the Perth Mosque (1905).
Australia ICOMOS Conference, Adelaide, Australia.
Berg, B. L. (2001). Qualitative research methods for the social sciences. 4 ed, ed. S.L.
Kelbaugh.: United States of America.
Bugg, B. L. (2013). Citizenship and belonging in the rural fringe: a case study of a Hindu
temple in Sydney, Australia. Antipode, 45(5), 1148-1166.

Mohd Noorizhar Ismail, Abdul Razak Sapian, Peter Scriver, & Mizanur Rashid
Translation of Social Citizenship to Architecture & Built Environment: A Methodological Review
© 2017 by MIP 244
Feldman, R. M. (1990). Settlement-identity psychological bonds with home places in a
mobile society. Environment and Behaviour, 22 (2), 183-229.
Gale, R. (2004). The multicultural city and the politics of religious architecture: urban
planning, mosques and mean-making in Birmingham, UK. Built Environment,
30(1), 18-32.
Garraghan, J.G. (1946). A guide to historical method. New York: Fordham University
Press.
Gulgonen, A. (1988). A typo-morphological approach to design thinking. In M. B.
Sevcenko (Ed.) Theories and principles of design in the architecture of Islamic
societies. Cambridge: Massachusetts.
Harris .J (2013). Identity and adaptation: mosque architecture in south-east Queensland.
In A. Brown & A. Leach (Eds.), Proceedings of the Society of Architectural
Historians, Australia and New Zealand 30. Gold Cost, Queensland, Australia:
Griffith.
Howell, M., & Prevenier, W. (2001). From reliable sources: an introduction to historical
methods. Ithaca: Cornell University Press.
Johansson, R. (2003). Case study methodology. International Conference
“Methodologies in Housing Research”. Stockholm, Sweden.
Lefebvre, H. (1974). The production of space. UK: Blackwell Publishing.
Pakulski, J. (2007). Cultural citizenship. Citizenship Studies, 1(1), 73-86.
Peters, C. J. (2013). What lies beneath: interpretive methodology, constitutional authority,
and the case of originalism. Brigham Young University Law Review, 2013(5),
1251-1339.
Phillips, D. (2014). Claiming spaces: British Muslim negotiations of urban citizenship in
an era of new migration. Transactions of the Institute of British Geographers,
40(1), 62-74.
Proshansky, H. M., Fabian, A. K., & Kaminoff, R. (1983). Place-identity: physical world
socialization of the self. Journal of Environmental Psychology, 3, 57-83.
Roche, M. (1987). Citizenship, social theory and social change. Theory and Society,
16(3), 363-399.
Salkind, N. J. (1996). Exploring research. Upper Saddle River, N.J: Prentice Hall.
Schmitt, M. H., Brink, P. J., & Wood, M. J. (Eds.) (1989). Advanced Design in Nursing
Research. Newbury Park, CA: Sage Publications.
Thomas A. M., & Deborah, C. (2002). The words between the spaces: buildings and
language. USA and Canada: Routledge.
Tuan, Y. F. (1977). Space and place. Minnesota, USA: University of Minnesota Press.
Turner, B. S. (1993). Citizenship & social theory. London: Sage Publication Ltd.

1University Teacher at Abu Dhabi University. Email: [email protected] 245
PLANNING MALAYSIA:
Journal of the Malaysian Institute of Planners
VOLUME 15 ISSUE 1 (2017), Page 245 - 254
THE IMPACT OF INTANGIBLE FACTORS IN SHAPING THE
IDENTITY OF ANCIENT CITIES AND ARCHITECTURE OF CHINA
Tamara Kelly1
1Department of Architecture and Design
ABU DHABI UNIVERSITY, UNITED ARAB EMIRATES
Abstract
China is an immense nation and highest population on earth with incredible
civilization, it kept up its character over millenniums in spite of its different ethnic
gatherings and distinctive geographical conditions. The Ancient Chinese
architecture and urban planning are fundamental units of the world architecture
and well known of their particular character. In addition, they were an
extraordinary wellspring of motivation for some neighbouring nations. Several
factors were behind the momentous Chinese architecture and urban planning, and
among those was the emperor guidance who unified the government and
encouraged regularity in many aspect in Chinese architecture including city
planning. The aim of this paper is to examine the impact of nonphysical factors
such as Chinese culture and beliefs in shaping the distinct identity of ancient
Chinese cities. This is done by studying; feng shui notion, Yin and Yan forces,
the theory of five elements and other Metaphysics philosophies of China.
Furthermore, this paper scrutinises a number of Chinese ancient capital cities and
temples of heaven in Beijing as case studies to measure to what extent the
intangible factors contributed in shaping the identity and layout of Chinese cities
and architecture.
Keywords: Traditional houses, vernacular architecture, magic square, five arts
of Chinese, sustainable houses, feng shui art.
Date Received: 30th April 2016
Date of Acceptance: 30th October 2016

Tamara Kelly
The Impact of Intangible Factors in Shaping the Identity of Ancient Cities and Architecture of China
© 2017 by MIP 246
INTRODUCTION In order to understand the Chinese architecture, the culture of China must firstly be understood. Chinese believe in many metaphysics theories and one of these is the feng shui, which is one of the Five Arts of Chinese. It meant according to English dictionary wind-water. However the notion to Chinese is to harmonise the building and occupants with the surrounding environment or events within the universe. Traditionally, feng shui was widely used to orient buildings in certain direction to bring luck, for instance a providential building location should be determined by reference to local great features such as water body, a powerful stars, or a compass. Harley & Woodward (2010) suggest that the better meaning of feng shui is the British one, which is positioning or placement than the word geomancy.
Therefore the application of this phrase led into siting the structures as
buildings, villages, capital cities even a space within a building in favourable
locations to benefit from the qi energy generated from nearby water body,
mountains or other features of terrain. Qi energy has a great influence on denizen
mood and health of living occupant or even dead. “The Chinese art of siting has
been applied in and mankind is its guardian a very wide range of spatial
dimensions, from smallest of space- say bedroom or even the location of chair to
largest, cosmic direction ” (Harley & Woodward, 2010, p.216).
Feng shui philosophy also articulates that qi energy exists in living
creatures and inanimate objects or natural elements such as trees or hill.
Moreover, qi is created by two contradictory forces, Yin the female and Yan the
male, and these two powers should be kept in balance neither the male dominating
the female nor the opposite or else disaster and chaos will occur. These two forces
come together to generate everything in our universe and represented by numbers,
colours, seasons, direction, temperature, natural feature or other terms of
endearment. For instance Yin (female) is even number, weak, earth or valley and
refer to north direction and its colour is black or dark representing a poor, old and
distraction status. The female force is winter, moon and water whereas the Yan
(male) is white, heaven, odd numbers, light, sun, fire and the opposite of all
female attributes. The male represents the south direction, rich, young, strong and
summer season.
Yin and Yan interact together to create the five elements known as Wood,
Metal, Water and fire, and consequently everything including living creatures and
lifeless elements in our universe are made of these five components. In Chinese
legends the tow forces male and female were born since the beginning of the
cosmos establishment and their harmonized interaction took place at the centre
of earth and has led to creation of the first human being and various deities. Hence
centrality is a fundamental principle in Chinese architecture and it is evident
through many case studies in this paper. For instance vital buildings such as
emperor palaces or government buildings were commonly located at the core of

PLANNING MALAYSIA
Journal of the Malaysia Institute of Planners (2017)
© 2017 by MIP 247
the city. According to this philosophy, humankind was in the centre of the
universe and the link between earth and heaven. Furthermore, his duty is crucial
to protect earth and maintain harmony among Yin and Yan and this notion led to
establish the well field diagram. “The garden was the good Earth, and mankind
is its guard for this he had to establish harmony in himself between yan and yin”
(De Sheng, 1991, p.35).
APPLICATION OF FENG-SHUI THEORY IN CITY PLANNING
As mentioned earlier, feng shui principle articulates that building or city should
have great link with surrounding milieu to benefit from qi energy forthcoming
from mountain or watercourses. Hence, most of ancient Chinese city were located
at the mountain foot and nearby water body or forest. “Indigenous chicness
religious traditions were based on a belief in life after death, ancestors
worshiping and reverence for natural features such as trees, rocks and hills, as
well as cosmic element such as sky, sun and moon” (Frenzo, Moffett &
Wodehouse, 2013, p.82). This approach underscores the link between
architecture and the five element theory. For instance the forest provides the wood
and fire whereas the mountain is source of earthy material needed for construction
and act as barrier. Moreover, it assists in generating rain. Finally, the water body
is for drinking, farming and fire control since wood is the main construction
materials. “Mountains and rivers played an important role in the popular creeds
of Chinese form the most remote antiquity they have been objects of worship.
Mountains, forests, rivers, valleys, high hills have the power to produce rain, to
make rain and wind: of all these things it is said that they are then a sacred
powers” (De Sheng, 1991, p.31)
In fact, the influence of Yin and Yan theory is palpable in building
orientation. Dwellings faces south to permit better air circulation, and maximize
heat and light acquisition. Moreover, south represents Yan the male who is a
symbol of richness youth and luck, and this resulted in grid layout of city to allow
south positioning of premises. “The philosophy foundation of development of
square –shaped cities in ancient china was determined by ancient philosophy
such as the philosophy of YING –YANG along with the principle of the five
elements of water, fire, earth, wood and metal. The theme of duality, which
featured in these philosophy led to an emphasis on forming a central axis in the
basic layout of cities in and also promoted symmetry” (Yanxin, 2010, p. 9).
In China the emperor duty expand beyond governing the nation. He is
also in charge of choosing the best locations of his capital and other major cities
to ensure good feng shui of new established cities. Therefore he sends his trusted
officers to collect data concerning water availability and topographical aspects of
the site, water quality should also be investigates as it effect farming and mankind
health. “Feng shui is a philosophy with origins in the traditions of ancient
Chinese Culture, which held great respect for man’s natural environment and

Tamara Kelly
The Impact of Intangible Factors in Shaping the Identity of Ancient Cities and Architecture of China
© 2017 by MIP 248
which had a significant impact on the choice of locations for the ancient cities
and their layout” (Yanxin, 2010, p. 9).
The synthesis of qi energy with feng shui philosophy inspired the Chinese
planners to invent the well field diagram or system which combined numbers,
shapes and geomancy, the diagram acknowledge the setting of the emperor at the
centre between heaven and earth by locating the palaces and governments
buildings at the core of the diagram. The well field square comprises 9 squares
numbered from 1 to 9. The centre square is numbered by 5 representing the male
power and featured the link with five elements which forms everything in the
universe. Square 5 named the inner city accommodating royal palaces and other
crucial buildings through which emperor governs the nation. Moreover, inner city
is surrounded by wall and out of bound to the public. It is only for empower
members, upper class citizens and government officers. Other odd numbers 1, 3
and 7 accommodate multipurpose hall, temple of harvest and ancestor’s temples
and even numbers exist in the corner as female power to balance the male force
accommodating residential villages or wards (Figure 1).
Figure 1 Well Field Square Figure 2 Zhou Dynasty Well field
System
Another feature of the well field system is the nine main avenues running
from North- South and West –East directions and they end in main gates on each
opposite side. The entire city is protected by a second wall and the diagram layout
was common during the Zhou Dynasty when the emperor power was dominating
the religious authority. The first application of the diagram was adopted firstly in
Chengzhou 1036 BC (Figure 2). “This plan, like its counterparts in several other
Eurasian civilization, was designed to illustrate and establish the centrality of the
ruler, the son of Heaven who sat at the pivot of the four quarters and meditate
between heaven and earth. Hence emperor through Chinese history often
concerned themselves with the geometric layout and numerological symbolism of
Inner
city

PLANNING MALAYSIA
Journal of the Malaysia Institute of Planners (2017)
© 2017 by MIP 249
the capital and its cultic sites and structure.” (Harley & Woodward, 2010, p.
212). The layout of many other ancient cities in China such as Chang’an, Luoyang
and Beijing were evidently inspired by the well field system. Usually, the
emperor before establishing the well diagram on selected setting, would
requested a report regarding the site to ensure it has a good feng shui and link
with the five elements such mountain or natural terrain.
CASE STUDY - CHANG’AN CITY
Chang'an is primordial capital city for several dynasties in Chinese history was
set up around 618AD (at present, the city referred to Xinjiang in Shaanxi). It was
a great urban planning model and inspiration for many areas, and influenced the
design of bordering nation Japan, in particular Kyoto and Nara cities. The
Chang'an city was initiated in light of the well field diagram created during Zhou
era and imparted basic components from Chengzhou city with the exception of
internal city, the city roads were laid in matrix framework, and both inner and
outer cities were fenced by walls. Entry to city is through odd gates. The royal
premises or governments buildings occupying central square 5 were shifted
northwards in Chang'an prototype to satisfy different traditions or notions (Figure
3).
Figure 3 Chang'an Prototype
Many assumptions or reasoning behind such modification. Among those
theories of the transference was to highlight the royal residence, as many
orthogonal streets lead and end with limits of internal city. Further suggestion is
to recognize the royal zone from external city or to diminish cuts in existing urban

Tamara Kelly
The Impact of Intangible Factors in Shaping the Identity of Ancient Cities and Architecture of China
© 2017 by MIP 250
fabric. In fact, the rationale behind this adjustment was Qinling Mountain located
north of the city acted as natural barrier and protected the inner city from possible
conquest from north. Whereas the urban fabric beneath inner city is a further
obstruction if invasion occur from southern direction. The city has good feng shui
and connection with the five elements through the mountain and water source as
Wei River with its streams flow through Chang'an city providing water supply
for citizens.
LUOYANG CITY
Luoyang the timeworn city was situated on eastern China and in the west of
Henan Province where Huanghe River (Yellow River) divided the city into two
districts. The city is regarded as an antiquated capital of nine noteworthy lines in
China. It was implicit the Zhou tradition as the eastern capital in
acknowledgement of the effective foundation of Zhou. Initially the city was set
up as capital thence advanced to be an incredible business hub. But the broadened
part of the city was finished by Emperor Guangwu amid Han period. It is apparent
that the city is comparable to previous case study (Chang'an) outline and its layout
educed from the well field system. Yet the internal city is situated in the north of
the scheme between two natural barricades, the mountain Mangshan in the north
east embraces inner city and is a great barrier. Meanwhile, Luo River is
southwards, segregating internal city form outer district (Figure 4).
Figure 4 Luoyang the Timeworn City

PLANNING MALAYSIA
Journal of the Malaysia Institute of Planners (2017)
© 2017 by MIP 251
The city is a squared grid layout once the river omitted and roads are
orthogonal, similar to well field diagram. But the city irregular shape ensued by
geological factor and the urban fabric east of the royal district is a third obstacle
layer against invasion from east. The city has good feng shui through its location
at the foot of the mountain and watercourse within its fabric. Furthermore, it
acknowledges the male forces through the usage of odd digit 3 as the two banks
of the city linked by 3 bridges and each side of external wall accommodates 3
main gates.
BEIJING CITY
Beijing, similar to Chang'an city, was an ancient capital of five lineages including
the last three supreme dynasties (Zhou, Ming, and Qing). Likewise, it was the
auxiliary principle of two northern administrations (Liao and Jin.). Beijing layout
is considerably similar to the well field system in particular the location of inner
city at core square number five with slight shift southwards to protect the city
from conventional conquests attempts from Mongols state north of China. The
design of the city and its components emulated the customary of urban arranging
in old China. It highlighted the idea of central axis and a focal area of inward city
to symbolize the stature of the supreme ruler who deemed as the focal point of
the universe (Figure 5). “The imperial palace, known as inner or forbidden city,
was built at the heart of Beijing bisecting the city symmetrically along a North –
South axis” (Yanxin, 2010, p. 17). Several treatments in the city reflect great
recognition to feng shui philosophy and Yin -Yan forces through emphasizing
southern orientation and main access to inner city likewise its premises is via
south Axis. China was subject to frequent invasions from north when Mongolians
cause severe destruction to many capitals. Hence, north is a symbol of
annihilation, enemy, evil, poorness and bad luck. Central axis in Forbidden City
(known as inner city) is stressed by locating crucial building along it and main
route to agriculture as well as heaven temples is across same axis. Moreover,
Meridian the main gate to inner city is on central path. Royal Buildings in
Forbidden City were laid in group of three or five stressing the male force. Even
the main gate Meridian accommodating three entry path and leads to five bridges
over the stream (Figure 6). “The compound is divided into two complexes along
the north–south axis; the southern outer court has three principles halls and the
northern inner courtyard has another three main buildings” (Yanxin, 2010, p.
3). Another feature of the Zhou diagram is to place sanctuaries on both sides of
majestic palace. Hence the Ancestral temple was built to the left side of royal
residence with Altar of earth on the right. Beijing city was changed over various
densities, for instance the supreme city was moved southwards to enhance the
entrance to the royal residence and another divider was developed outside the
southern mass of the city during Ming dynasty. However, the wall was not
finished on different sides because of absence of assets (Figure 6). “The southern

Tamara Kelly
The Impact of Intangible Factors in Shaping the Identity of Ancient Cities and Architecture of China
© 2017 by MIP 252
wall of imperial city within Beijing city was relocated further southwards by
approximately half mile, to facilitate the extension of the road (for imperia
carriage) leading to the main gates of the innermost imperial palace” (Yanxin,
2010, p. 7). The last modification of Beijing city occurred when the leader of the
Ding line held the fundamental design of Beijing city and revamped the Palaces
which were decimated by seismic tremor or blazed and requested to move
neighbourhoods from the internal city into the external city while the inward city
retained cabins and camps for the horde of the Imperial militaries.
Figure 5 Beijing City Focal Point of the Universe
Like early antiquated urban areas specified, Beijing layout recognizes
feng shui as the city shielded by various mountains and placed toward the end of
Miaofeng Mountains and a few streams with aquatic canals spout through the city
to supply drinking water to city populace.

PLANNING MALAYSIA
Journal of the Malaysia Institute of Planners (2017)
© 2017 by MIP 253
Figure 6 Main Gate Meridian
The legends and philosophies of Chinese cast its shadow on urban
planning and even on buildings layout. For instance, temple of Heaven in Beijing
emphasizing the Yan and Yin forces in particular the usage of number 3. The
temple accommodates three components; the Hall of Prayer for Good Harvests,
the Imperial Vault of Heaven and the Circular Mound Altar. Central Axis is
dominant and entry into the temple and vital buildings were located along it. Main
gateway to the halls accommodate three doors and access to temple is through
southern direction. The Prayer hall crowned by thee roofing layer and stands on
three rings of stones similar to Circular Mound Altar, stressing the male force
(Figure 7).
Figure 7 Circular Mound Altar

Tamara Kelly
The Impact of Intangible Factors in Shaping the Identity of Ancient Cities and Architecture of China
© 2017 by MIP 254
CONCLUSION
The influence of Chinese mores and metaphysics theories is extremely evident in
modelling the ancient cities of China and in particular feng shui philosophy and
the two opposite forces Yin and Yan. Feng shui notion imposes great association
with surrounding environment or even beyond our planet. It recognizes the stars
and the entire cosmos. Feng shui principle and the theory of five elements were
identified in the three case studies by establishing the cities at the foot of
mountains and nearby water bodies to provide water for drinking and farming.
Whereas, the mountains acted as natural barriers against possible invasions.
Another critical rationality in Chinese custom is pertinent to emperor
stature and his position at the centre between earth and heaven. Emperor power
overshadowed religious sovereignty during Zhou Dynasty. He was recognized as
son of god and his duty was central to guard the earth and harmonizing the two
main forces Yin and Yan. Hence ruler leverage was symbolized by focal area of
magnificent castles or inward city inside the city arrangement, such as Beijing
city. This vision inspired Chinese to develop the well field diagram during Zhou
Dynasty and set it as guideline for many urban models where the administration
premises and head royal residences involve the focal point of the outline or the
city. The diagram addressed emperor perception and acknowledgement of order
as great tool to rule the nation and organize society. Principal door to the city or
royal residences normally situated along central access and dwellings commonly
faces south direction. In effect, the guideline elements of pivotally and cardinal
introduction are fundamental since Chinese trust that north spoke to the severities
of winter, the danger of savage triumphs and malice impact while south speaks
to paradise or positive Yang qi subsequently. Essential structures opened towards
southern heading and primary portability ways are south.
REFERENCES
De Sheng, A. L. (1991). Magic squares: the ancient Chinese city.
Yanxin, C. (2010). Chinese architecture. Cambridge: Cambridge University Press.
Barme. G. R. (2012). The Forbidden City. Harvard University Press.
Harley, J. B., & Woodward, D. (2010). The history of cartography. Chicago: University
of Chicago Press.
Frenzo, M., Moffett, M., & Wodehouse, L. (2013). A world history of architecture.
London: Laurence King Publisher.

1Associate Professor at International Islamic University Malaysia. Email: [email protected] 255
PLANNING MALAYSIA:
Journal of the Malaysian Institute of Planners
VOLUME 15 ISSUE 1 (2017), Page 255 - 260
HOUSING AFFORDABILITY IN THE STATE OF MELAKA
Mariana Mohamed Osman1, Noor Suzilawati Rabe2, Muhammad Faris Abdullah3,
Nur Farhanah Rosli4, & Farah Eleena Zainudin5
1,2,3,4 Kulliyyah of Architecture and Environmental Design,
INTERNATIONAL ISLAMIC UNIVERSITY MALAYSIA
Abstract
Housing is a basic need to man. It provides shelter and comfort from the
elements and improve quality of life of the residents. Hence, housing should
be affordable to all. This paper assesses the housing affordability for the
districts in Melaka. This was achieved by calculating the median multiple of
the price income ratio and comparing the score to the housing affordability
index. Secondary data were obtained from reports published by the
governmental agencies. The results show that housing is mostly moderately
unaffordable in the districts of Melaka. Additionally, housing affordability
has improved from 2012 to 2014 in majority of the districts.
Keywords: Housing affordability, affordable housing price, district, Melaka.
Date Received: 30th April 2016
Date of Acceptance: 30th October 2016

Mariana Mohamed Osman, Noor Suzilawati Rabe, Muhammad Faris Abdullah, Nur Farhanah, & Farah Eleena
Housing Affordability in The State of Melaka
© 2017 by MIP 256
INTRODUCTION
Owning a home for shelter and comfort is considered by many as a life goal and
a measure of personal success (Hashim, 2010). However, the price of houses is
increasing, so much so that housing has become unaffordable to many. In
Malaysia, the same situation occurs where house price is surging upwards,
unproportionately to income. Land scarcity and economic growth have often been
cited as the factors that drive house price up to the point that it becomes
unaffordable to the majority of Malaysian public (Hashim, 2010). As Malaysia
aspires to be a developed nation with high-income economy by 2020, the housing
industry needs to be adaptive and responsive to demand for special groups,
especially the medium and low income earners. ISIS (2013) proposes that the
Government must take appropriate measures to ensure access to quality and
affordable housing is enjoyed by all. ISIS (2013) also notes that as public
purchasing power has reduced, housing affordability gap has widened even
further. However, Chang (2013) argues that the determining factors on the ability
to purchase a property is not dependable solely on income but also by the high
house price and the mortgage interest rate. Making houses affordable, especially
to the lower income group is critical for poverty reduction, institution building,
good governance at the local and national levels, and conflict prevention. (Shuid,
2016).
The objective of this paper is to provide an overview of the affordable
housing scenario in Melaka and to determine the housing affordability index for
each districts in Melaka. It is hoped that the findings from this paper would
contribute in making housing more affordable to the Malaysian public.
SITE PROFILE
Melaka is a state in Malaysia and located in the southern region of the Peninsular
Malaysia. The state borders the famous Straits of Malacca on the west, Negeri
Sembilan to the north and Johor to the south. Melaka is also well known by the
inclusion of its city centre in the UNESCO World Heritage Site. Melaka is one
of the smaller states in Malaysia, measuring a little over 165,000 hectares. The
state is made up of three districts, which are Melaka Tengah, Jasin and Alor
Gajah. Alor Gajah is the largest district in the state, but Melaka Tengah, although
the smallest district, has the highest number of population. The historic Melaka
City Centre is located in the Melaka Tengah district.
AFFORDABLE HOUSING IN MELAKA
Affordability is defined as ‘the ability of households to meet housing costs, while
maintaining the ability to cover other basic living costs’ (AHURI, 2004).
Meanwhile, Shaqra’a, Badarulzaman and Roosli (2015) define affordability as
appropriate and reasonable house price based on its quality and location. In terms
of housing affordability, Khazanah Research Institute (2015) ranks Melaka as the

PLANNING MALAYSIA
Journal of the Malaysia Institute of Planners (2017)
© 2017 by MIP 257
state with the most affordable housing in Malaysia. In fact, according to KRI
(2015), Melaka is the only state in Malaysia that achieved a median multiple of
3.0 in 2014, indicating that housing in Melaka is affordable to its population.
Melaka is also one of the few states in Malaysia that has established its
own Housing Board. The Melaka Housing Board is a state government agency
that oversees housing development projects in Melaka. The Board was
established in 2002 through the passing of the Melaka Housing Board Enactment
2002. Prior to the establishment of the Board, housing development projects in
the state were monitored by the State level housing department and the local
authorities of the area.
METHODOLOGY
Affordable housing is related to the ability of a household to pay for their house
(EsruqLabin, 2014). The concept of housing affordability can be measured from
three perspectives, namely Repayment Affordability, Purchase Affordability and
Price Income Ratio (PIR). For the calculation of housing affordability index
(HAI) for each district in Melaka, the PIR was used. To derive the HAIs, the
median multiple formula, which makes use of the annual income and median of
all house prices, was employed (Figure 1). Data on population income and house
price for year 2012 and 2014 were sourced from the Department of Statistics
Malaysia and the National Property Information Centre of the Valuation and
Property Services Department Malaysia.
Figure 1 Median Multiple Formula Source: Khazanah Research Institute, 2015
The resulting median multiple scores were then compared to the housing
affordability index categories as shown in Table 2 below.
Table 2 Housing Affordability Rating Categories
Rating Median multiple
Severely unaffordable 5.1 and above
Seriously unaffordable 4.1-5.0
Moderately unaffordable 3.1-4.0
Affordable 3.0 and below Source: Demographia, 2016.
FINDINGS
Table 3 shows the housing affordability index by districts in Melaka for year 2012
and 2014. On average, housing affordability in Melaka has improved from year
Median Multiple = Median All House Price
Annual Medium Income

Mariana Mohamed Osman, Noor Suzilawati Rabe, Muhammad Faris Abdullah, Nur Farhanah, & Farah Eleena
Housing Affordability in The State of Melaka
© 2017 by MIP 258
2012 to 2014. The district of alor Gajah recorded HAI of seriously unaffordable
in 2012, has improved to moderately unaffordable in 2014. For the district of
Melaka Tengah, although the HAI for both years remained at moderately
unaffordable, the median multiple has reduced to 3.1 in 2014 from 3.6 in 2012.
However, for the district of Jasin, the HAI has worsened from moderately
unaffordable in 2012 to seriously unaffordable in 2014. At state level, the study
KRI (2015) shows that the HAI has improved from moderately unaffordable in
2012 to affordable in 2014.
Table 3 also shows that there was a substantial increase in the annual
median income for both Alor Gajah and Jasin. This helped to lower the median
multiple score for the districts, resulting in improved HAIs. Similar situation also
occurred at state level where the percentage increase in annual median income
was larger than the percentage increase in median house price, resulting in
improved HAI. In Jasin, the percentage increase of income is lower than that of
house price, which led to worsening HAI.
Table 3 Housing Affordability Index in Melaka by Districts in 2012 and 2014
District
2012 2014
Annual
Med
ian
Inco
me
(RM
)
Med
ian -
All
House
Pri
ces
(RM
)
Med
ian M
ult
iple
Aff
ord
abil
ity
HA
I
Annual
Med
ian
Inco
me
(RM
)
Med
ian -
All
House
Pri
ces
(RM
)
Med
ian M
ult
iple
Aff
ord
abil
ity
HA
I
Alor
Gajah# 38,370 185,500 4.8 Seriously
Unaffordable 56,628 190,000 3.4
Moderately
Unaffordable
Jasin# 36,523 140,000 3.8 Moderately
Unaffordable
53,520 221,000 4.1 Seriously
Unaffordable
Melaka
Tengah# 44,977 160,000 3.6 62,940 195,913 3.1 Moderately
Unaffordable
Overall
Melaka* 47,076 160,000 3.4
Moderately
Unaffordable 60,348 180,000 3 Affordable
Source: *Khazanah Research Institute (2015); # Authors own calculation.
RECOMMENDATION
Despite the affordable HAI for the state of Melaka, housing is still found to be
unaffordable at district level (Table 3). Hence, Table 4 shows the suggested
median house price for the districts in order to meet the affordable HAI rating
(i.e. median multiple score of 3.0). The suggested median house price is derived
by multiplying the 2014 annual median income of each district by 3.0.

PLANNING MALAYSIA
Journal of the Malaysia Institute of Planners (2017)
© 2017 by MIP 259
Table 4 Housing Affordability Index of Ration by Median All House Prices
Source: Authors own calculation
Earlier findings show that Jasin experienced worsening HAI from 2012
to 2014. To achieve affordable HAI rating, the median house price for the district
of Jasin is proposed to be capped at a maximum price of RM160,560. Meanwhile,
for the districts of Alor Gajah and Melaka Tengah, the proposed price are
RM169,884 and RM188,820, respectively.
Figure 2 compares the 2014 median house price and the proposed median
house price for each district in Melaka. Again, it can be seen that difference
between the 2014 median house price and the proposed median house price is
largest in the district of Jasin. This corroborates the findings that Jasin has the
worst HAI as compared to the other districts in Melaka (Table 3). Melaka Tengah
has the smallest difference between the two prices. This is reflected in the 3.1
median multiple score for the district, which is only slightly above the affordable
rating of 3.0.
Figure 2 Comparison between 2014 Median House Price and Proposed Affordable
Median House Price for Districts in Melaka
District Annual Median
Income 2014 (RM)
Median All house
Price 2014 (RM)
Proposed Affordable
Median House Price
(RM)
Jasin 53,520 221,000 RM 160,560
Alor Gajah 56,628 190,000 RM 169,884
Melaka Tengah 62,940 195,913 RM188,820
Overall Melaka 60,348 180,000 RM181,044
Median House Price in 2014
Proposed affordable maximum median house price

Mariana Mohamed Osman, Noor Suzilawati Rabe, Muhammad Faris Abdullah, Nur Farhanah, & Farah Eleena
Housing Affordability in The State of Melaka
© 2017 by MIP 260
CONCLUSION
This paper has shown that despite the affordable HAI of the state, at district level
housing was still unaffordable in Melaka. Nevertheless, the level of
unaffordability was not severe. Only one district recorded a seriously
unaffordable HAI, while the other two were at moderately unaffordable.
However, measures must be undertaken by the state and local governments in
Melaka to ensure that the population of each of the district can truly enjoy access
to affordable and quality housing.
REFERENCES AHURI [Australian Housing and Research Institute] (2004). Measuring housing
affordability. AHURI Research and Policy Bulletin, 45.
Chang, H. t.-I. (2010). A study of rural economy in Yunnan. Yunnan, China.
Demographia (2016). 12th Annual Demographia International Housing Survey.
Esruq-Labin, A. M. J., Che Ani, A. I., Mohd Tawil, N., Nawi, M. N. M., & Othuman
Mydin, M. A. (2014). Criteria for affordable housing performance measurement:
a review. In Proceedings of the Emerging Technology for Sustainable
Development Congress, August 5, Bangi, Malaysia.
Hashim, Z. A. (2010) House price and affordability in housing in Malaysia. Akademika,
78, 37-46.
Khazanah Research Institute [KRI] (2015). Making housing affordable. Kuala Lumpur:
Khazanah Research Institute.
Shaqra’a, E., Badarulzaman, N., & Roosli, R. (2015). Residents’ perception of the
affordability of private housing schemes: lessons from Aden, Yemen. Procedia
– Social and Behavioural Sciences, 202, 389-399.
Shuid, S. (2016). The housing provision system in Malaysia. Habitat International, 54
(3), 210-223.

1Lecturer at Universiti Sains Islam Malaysia. Email: [email protected] 261
PLANNING MALAYSIA:
Journal of the Malaysian Institute of Planners
VOLUME 15 ISSUE 1 (2017), Page 261 – 270
THE ESTABLISHMENT OF ISLAMIC DWELLING PRINCIPLES FOR
THE MALAYSIAN COMMUNITIES
Wan Norisma Wan Ismail1, Fadli Arabi2, Elina Mohd Husini3, Fatin Nur Sakinah
Zolkifly4, Zuhairuse Md. Darus5, Nor Haslina Abd. Jaafar6, & Azhani Abd Manaf7
1,2,3,4,5Department of Architecture
UNIVERSITI SAINS ISLAM MALAYSIA 6Department of Architecture
UNIVERSITI KEBANGSAAN MALAYSIA 7 Kulliyyah of Architecture & Environmental Design
INTERNATIONAL ISLAMIC UNIVERSITY MALAYSIA
Abstract
Strong family ties built on the teachings of the Quran and Sunnah produce
excellent foundation in forming a household which are constantly under the
protection and blessing of Allah and in turn contribute to the overall health of a
community. A dwelling filled with the remembrance of Allah will no doubt find
an aura of peace and tranquillity. This is called a home, a place for a family to
worship Allah, to relax body and mind, enjoy legitimate worldly delights, teach,
learn and propagate the message of Islam. Therefore, provision and design of a
dwelling should be considered important to make it a blessed home. This includes
the provision of spaces for religious activities, daily basic chores of households,
social production, reproduction hygiene needs, privacy and security. Cultural,
religious and sustainable aspects of inhabitants should be considered in the
planning and design process of a dwelling in the Malaysian context. The Syariah
sources have provided basis for its design to conform to Islamic criteria, thereby
facilitating various ibadah activities for the inhabitants and users. A review of
theory and philosophy of dwelling from Islamic perspective is analysed to justify
the comprehensive living approach as promoted by Islam. This paper aims to
review literature pertaining to housing principles in Islam and to present basic
principles for developing housing criteria based on Islamic teachings.
Keywords: Islamic, dwelling, principles, model, design, communities
Date Received: 30th April 2016
Date of Acceptance: 30th October 2016

Wan Norisma Wan Ismail, Fadli Arabi, Elina, Fatin Nur Sakinah, Zuhairuse, Nor Haslina, & Azhani The Establishment of Islamic Dwelling Principles for The Malaysian Communities
© 2017 by MIP 262
INTRODUCTION Dwelling may mean the same as house, home, residence, abide, lodging,
accommodation, or housing, among other meanings. The social unit that lives in
a dwelling is known as household. Most commonly, a household is a family unit
of some kind, though households can be other social group, such as single
persons, or groups of unrelated individuals. Many people leave their houses
during the day for work and recreation and return home for other activities. The
meaning of dwellings has been studied from many different perspectives, such as
psychology, phenomenology, sociology and environment-behaviour studies. A
good dwelling design must be set out according to the conditions of that locality
and meet the technical, hygienic, quality requirements and social-cultural aspects.
Coolen (2006) notes that a dwelling is an individual's primary anchor in the
environment. It may serve many functions, such as shelter, privacy, security,
control and status. From an ecological point of view the meaning of dwellings
lies in these functional relationships between human beings and their dwellings.
DWELLING FROM ISLAMIC POINT OF VIEW
Islam shaped ideas and styles about dwellings and other architectural forms as
well. A dwelling was once considered a typology within Islamic architecture, as
it facilitated the religious life as it was a space for daily prayer at home. It was
designed based on religious prescriptive regarding family, privacy, spirituality
and hospitality (Ibrahim, 2012). Yusuf al-Qardhawi, the Islamic researcher and
chairman of the International Union of Muslim Scholars, defines a dwelling as
the place where an individual protects himself from the climatic elements and in
which he finds freedom from the restrictions and pressure of society. It is a place
of rest for the body, and relaxation for the mind and soul. The Quran highlights
that a dwelling is a shelter or a private sanctuary to its residents. Allah says, “And
Allah has made for you from your homes a place of rest…” (al-Nahl 16:80).
Creating an atmosphere of faith in the home and taking the home as a
place of worship is very important as Allah says, “And We inspired to Moses and
his brother, "Settle your people in Egypt in houses and make your houses [facing
the] qiblah and establish prayer and give good tidings to the believers” (Yunus
10:87).
A dwelling from an Islamic view celebrates good and righteous people
and seekers of knowledge to visit the home. As Allah says, “My Lord, forgive me
and my parents and whoever enters my house a believer and the believing men
and believing women…” (Nuh 71:28).
SUMMARY OF LITERATURE REVIEW
In order to identify publications that provide insights of Islamic dwelling,
database searches were undertaken. Thirty selected publications published from
2000 to 2015 were selected for this research. However, only 15 most related

PLANNING MALAYSIA
Journal of the Malaysia Institute of Planners (2017)
© 2017 by MIP 263
publications were chosen for the purpose of this paper. These publications are
looking at as many criteria as possible and their respective principles to the design
of Islamic dwellings. A summary of all 15 publications are provided in Table 1
below.
RESEARCH FINDINGS
Principles of Islamic Dwelling
Based on the publications analysed and the key findings in Table 1, the following
are the main domains which should feature in nearly all Islamic dwellings.
Location - Land
The most important feature for an Islamic dwelling is its land, good air, much
water, and flat and smooth land. Ali (as) stated, ‘Housing is not desirable, but
with three things: good air, plenty of water and fertile ground’ (Amar, Ismail &
Salleh, 2012). Imam Ali (as) also emphasizes on suitable home and states, ‘The
blessing of a house is its good location, large yard and its neighbours’. Besides
that, a dwelling is best located near to a mosque to enable men to join the
congregational prayers.
Climate and Topography
All climatic aspects within the tropical regions such as climate, topography, wind
direction, sun movement and humidity must be taken into account for effective
self-heating, cooling, ventilation and illuminating mechanism. The adaptation of
climate-responsive design in coping with heat and humidity reflected in dwelling
design of a vernacular Malay house such as open floor plan arrangement, raised
floor on stilt, full length window, large overhang, interconnected open space, and
shading trees and shrubs helps modify microclimate around the house by cooling
down air temperature and directing cool breeze towards the dwelling
(Limthongsakul et al., 2012). Generally, an Islamic house will be favourably
responsive to its ecosystem, energy efficient, nature friendly and sustainable
where it will not depend solely on artificial sources and means of energy (Omer,
2010).
Orientation - Qiblah Direction
Qiblah means the direction one should face when observing the prayer.
Therefore, the orientation of every Islamic dwelling should consider qiblah
direction. The Sunnah of the Prophet (peace be upon him) is to respect and revere
the prayer direction. This is indicated in several hadiths, such as “When one of
you stands in his prayer, he is in close conversation with his Lord or his Lord is
between him and his qiblah. Therefore no one should spit in the direction of his
qiblah” [Sahih Bukhari, Kitab al-Salah].

Wan Norisma Wan Ismail, Fadli Arabi, Elina, Fatin Nur Sakinah, Zuhairuse, Nor Haslina, & Azhani The Establishment of Islamic Dwelling Principles for The Malaysian Communities
© 2017 by MIP 264
Table 1 Summary of Literature on Islamic Housing Principles
No Author(s) Year Publication Purpose Key findings
1 Fakriah and
Ahmad 2009
Journal
article
To assess the
adaptable house
design attributes in
Malaysia related to
Islamic principles.
Space organization (sleeping area,
eating area, recreation and leisure area,
kitchen, toilets, storage and circulation
areas) and architectural design style
are the main determining factors of an
Islamic house design.
2
Majid
Yazdani
et al.
2013 Journal
article
To analyse the
characteristics of
suitable home from
Islamic views and
modern architecture
Important housing characteristics in
Islam view are suitable land, location,
neighbour, building design and its
architecture and extension of the
home.
3 Hashim
et al. 2008
Journal
article
To identify urban
malays user-behavior
and perspective on
privacy and spatial
organization of
housing
Re-introduction of the serambi
concept in modern housing as a
transition zone for informal
entertaining and social interaction
space for the immediate
neighbourhood to fulfill privacy needs.
4 Ahmad and
Zaiton 2008
Journal
article
To study the influence
of privacy regulation
on urban malay
families living in
terrace housing.
Defined territory and the need to
respect the neighbors' privacy are
found to indirectly affect community
intimacy among Muslim families
living in terrace housings.
5 Ahmad et
al. 2005
Journal
article
To analyse visual
privacy and family
intimacy among
Malay inhabitants
living in low-cost
terrace housing.
Visual privacy due to location of
openings, separation of sleeping places
of male and female family members
and separation area during social
interactions should be considered in
the planning and design process.
6 Hannah
Ibrahim 2012
Doctoral
Dissertation
To identify a
contemporary house
that is a manifestation
of the practices of the
Islamic religion.
Courtyard type dwelling, openings on
external walls, bent entry, separation
of male and female area, clear division
of public, private and semiprivate
areas, multifunction musallah design
for individual and collective.
7 S. Omer 2010 Book
To analyse the subject
of housing in Islam, as
both in concept and
reality.
Front door design, windows design
and other apertures, privacy protection
among family members / between
visitors and the occupants, maid’s
room, bedrooms, toilets, kitchen,
house orientation consider qiblah
direction, musolla and studying area.
8 S. Omer 2011 Article
To identify Islamic
principles through
conceptualizing
Islamic housing
Inner courtyard, partly or fully
screened windows, raising windows
above the eye level, bent entrances,
parapets, or protective walls, along the
edges of balconies and open roofs,
double circulation houses.
9 Fakriah and
Ahmad 2009
Journal
article
To assess the
adaptable house
design attributes in
Malaysia that relate to
Islamic principles.
Space organization (sleeping area,
eating area, recreation and leisure area,
kitchen, toilets, storage and circulation
areas) and architectural design style
are the main determining factors of an
Islamic house design.

PLANNING MALAYSIA
Journal of the Malaysia Institute of Planners (2017)
© 2017 by MIP 265
Space Configuration (Zoning)
The spatial planning and layout in the dwelling design should divide spaces that
are public, semi-public, semi-private and private spaces. These spaces are
determined based on gender segregation, limitation of awrah, privacy and
isolation from the interest of the public that constitutes with visual and
accessibility restriction. The public spaces receive and entertain non-mahram
guests such as neighbours, relatives and friends (Mortada, 2003). The private area
is specially created for family members and females without being interfere by
non-mahram guests (Mortada, 2003; Abdul Rahim, 2008). Spaces that are
indefinite and unclear whether they are public or private allow less control on
social interaction and create conflicts (Ramezani & Hamidi, 2010).
Privacy - Visual Privacy
Privacy of the dwelling is significantly stated in many places in the Quran. Allah
says, “O you, who have believed, do not enter houses other than your own houses
10 Nahid and
Sakineh 2001
Journal
article
To investigate muslim
women privacy
requirements with
ventilation needs in
Malaysian terrace
houses
Privacy spaces in a house can be
divided into public area, semi-private
and private. Terrace houses could not
provide complete privacy and some
traditional adaptation can be applied
by rearrange the unit floor.
11
Ghaffarian
Hoseini
et al.
2014 Journal
article
To analyse the
environmental and
social-culture values
of Malays vernacular
house.
Nature and tropical climate are main
basis of design. Privacy and optimal
use of space are significant social
values while natural ventilation is
most significant environmental value.
12
Muhammad
Suhaimi bin
Musa
2011 Journal
article
To discuss topics on
the needs of design
elements for the
establishment of
Muslim behaviour in
traditional and modern
Muslim dwelling.
Space configuration that consider
place of worship, size of space,
internal layout, privacy, cleanliness,
pictures and study of traditional Malay
house in space zoning.
13 Noorul
Huda 2013
Journal
article
To identify residential
visual privacy on
traditional and modern
architecture house
designs and urban
designs
Majority of women regard visual
privacy at home from outsider as
extremely important. Urban designers
are to incorporate core values of the
culture to meet the needs of residents.
14 Zeenat
Begam 2011
Journal
article
To find guiding
principle from Al-
Quran and Sunnah
regarding the planning
amd design of a
house.
Privacy is principles that separate
owners private life and public
intercourse which consider visual
privacy and acoustical privacy, safety,
interior decoration aspects,
cleanliness, avoid wastage.
15 Amar et al. 2012 Journal
Article
To produce basic
Islamic guidelines for
the developers to build
and design the internal
part of houses for
Muslims.
A basic guideline of building a
Muslim house accordingly to the
Islamic teachings, considered of house
location and site layout, main
entrance, living and dining area,
fencing and bedrooms.

Wan Norisma Wan Ismail, Fadli Arabi, Elina, Fatin Nur Sakinah, Zuhairuse, Nor Haslina, & Azhani The Establishment of Islamic Dwelling Principles for The Malaysian Communities
© 2017 by MIP 266
until you ascertain welcome and greet their inhabitants. That is best for you;
perhaps you will be reminded” (An-Nur 24:27).
Visual privacy inside the house should be maintained by the design
treatment by both public and private domains as well as spaces declared as sacred
such as bedrooms, in the private domain. Guest room location should be close to
the entrance and separated from the family domain to maintain the privacy of
women in the rest of the house. Creating a space for hosting guests is encouraged
in the Muslim dwelling. Although Islam greatly encourages invitation of guests,
it disallows mixing between unrelated male guests and the family females.
Therefore, direct visual access between the guest domain and family is prohibited.
Design measures should be provided to eliminate such access and to maintain the
privacy of the family domain. The Quran stated very clearly that one’s privacy is
one’s own right and no one should intervene in it without one’s permission.
Muslim scholars emphasize three elements of design that can control the visual
privacy of a dwelling for instance the entrance door, windows, openings and
screen height (Omer, 2010; Mortada, 2003; Abdul Rahim, 2008).
Privacy - Acoustical Privacy
Acoustical privacy is of no less importance than the visual. Mortada (2003) and
Abdul Rahim (2008) mention that privacy of acoustic means controlling the
transmission of sound from inside to the outside of the dwelling that can be heard
by opening doors and windows. Therefore, precautions should be taken to prevent
sound transmission from the house to the outside and from the family domain to
the guest inside the house. Through creative space organization and suitable
building materials, it ensures the acoustic privacy between the internal zones and
the outside zone.
Privacy - Sense of Smell
Olfactory privacy also plays an important role in the control of smells privacy or
odours produced in kitchens to prevent them from spreading to spaces where
guests are entertained. Muslim narrated, “If you cook something with gravy,
increase the gravy and send some of it to your neighbours.” In another hadith,
Islam encourages another caring attitudes amongst Muslims as follows, “One is
not a perfect Muslims who eats until he is full and leaves his neighbours (also
kith and kin, one has more responsibility for them) hungry.” [al-Tabarani]
Internal Layout - Main Entrance
A front door should be designed in such a way that it does not give immediate
access to domestic dwelling, but lead to an intermediate space, or a lobby which
act as a mediator between inside and outside of the dwelling. In short, it is a buffer
between public and personal space (Amlashi, Mousavi & Falakian, 2013). The
buffer can be in the form of a wall or just a screen, outside or right in front of the

PLANNING MALAYSIA
Journal of the Malaysia Institute of Planners (2017)
© 2017 by MIP 267
doorway. Ibrahim (2012) notes that the entrance is designed to obstruct any view
of the interior: a bent entrance faces a blank wall with reception adjacent. This
provides privacy and further protects the house from noise.
Internal Layout - Living & Dining
The living area is the most public of the private. It is a place for family and close
friends (Omer, 2010). The family area should have an open space allowing for
numerous activities at once. It is a space for more intimate family friends to
socialize. Thus a living area should be located near a front door. Dining area is a
semi-public area. In Islam, it is advisable to have separate doorways for the living,
dining and kitchen due to the restriction access of male to the female guests.
Having a double circulation system inside the house is recommended.
Internal Layout - Bedroom
Bedrooms should be designed such that the bed position can be placed
perpendicular to the qiblah direction. The bed should be positioned so that
someone sleeping on their right side will be facing the qiblah, as recommended
by the Prophet (pbuh). One can also sleep with his head facing the qiblah and his
feet facing the opposite direction. If one has a study area, one could also orient
the desk such that one is facing the qiblah when studying. The Prophet said: “Lie
on your right side” (Al-Bukhari & Muslim). Barra bin ‘Azib reported,
“Messengger of Allah said: If you want to sleep in bed, purify for prayer. Then
lie down with you lying on your right side” (AlBukhari).
Internal Layout - Prayer Room
A main sign of a home that is filled with Allah’s remembrance is for it to become
lively at tahajjud, fajar and other prayers. Therefore, if one is having a dedicated
prayer room, all seating arrangements and prayer rugs should be oriented toward
the qiblah. This will ensure that people are facing the qiblah not only while they
are praying, but also while they are sitting for dhikr, dua or Qur’an recitation.
Internal Layout - Kitchen
Kitchens are best located in the deepest and most secured from the public zone of
the dwelling since women spend much of their time there. A buffer is needed
between the kitchen and other public sections linked between them to ensure that
regardless who was in the house, women will not be interrupted of their domestic
duties and they are freely to move around.
Internal Layout - Toilet, Bathrooms & Ablution Area
Water closet in a toilet should not face the qiblah direction, nor to turn their backs
to it. It should be perpendicular to the qiblah direction. This way, one is neither
facing the qiblah nor turning one’s back on it while relieving oneself. Muslim

Wan Norisma Wan Ismail, Fadli Arabi, Elina, Fatin Nur Sakinah, Zuhairuse, Nor Haslina, & Azhani The Establishment of Islamic Dwelling Principles for The Malaysian Communities
© 2017 by MIP 268
narrated “If you go to defecate, do not face to qiblah nor turn your back towards
it. Instead you should turn to your left side or your right”. “When any of you goes
to relieve himself, he should not face the qiblah nor turn his back on it. He should
face the east or west.” [Sahih Bukhari, Kitab al-Wudu]. Water hose or hand bidet
should be fixed on the right side of the water closet so that one can turn on the
tap using the right hands and doing the cleaning by using the left hands. In Islam,
it is sunnah to wash one’s private parts with water as purification (Amar, Ismail
& Salleh, 2012) The recycled water (Mustakmal) is fine for cleaning but not
permissible for ablution. Ablution need pure water (Mutlak) (Amar, Ismail &
Salleh, 2012). Hence, it is good to have a separate compartments for bath, water
closet and ablution. Ablution area should be positioned such that one is directly
facing the qiblah when doing wudhu. Internal Decorations
Traditional Islamic teachings recommend that a Muslim home dweller should
beautify the internal space of his/her home by using non idolatry decorations or
artefacts, such as flowers and decorated fabrics instead of expensive gold or any
animal or human like statues (Mortada, 2003). They are encouraged to decorate
their homes with flowers or greenery, pictures and photographs of natural
environment because it praises Allah with His beautiful creation.
Openings
Windows are function to gain natural light, fresh air, view the environment and
their neighbourhood. At the same time, it should be designed to comply with the
requirements of privacy protection. Placement of the window cannot be in a
position parallel to the window of the neighbouring house or neighbouring house
entrance. At certain location, windows must be built above the eye level for the
upper and lower floor of the dwelling, to maintain the internal privacy (Mortada,
2003; Abdul Rahim, 2008). These openings can be strategically and artistically
screened using opaque or semi-transparent glass, parapets, vent blocks, louvres,
decorative ornamentations, masyarabiyah, slabs and many more so that the awrah
and privacy of the family members are not infringed upon.
Safety
Having the highest safety and security standards is one of the main criteria of an
Islamic dwelling. Yusof (2011) notes that a building with backdoor is necessary
because it can be a second exit of the buildings that it is important during
emergency. According to her, architects need to comply with Allah’s injunctions
to achieve the strength of buildings.
Social Interaction - Neighbourhood
Neighbours are the important subject in buying land or house. Imam Ali (as)
states, “Before way ask about about friend of way about friend of way, and before

PLANNING MALAYSIA
Journal of the Malaysia Institute of Planners (2017)
© 2017 by MIP 269
buying a house a house ask about neighbours”. Prophet (pbuh) says, “Four
things are signs of bliss and happiness of man: good spouse, big house, good
neighbour and good vehicle”. An open space within or outside the dwelling act
as a place for socialization and occasions to enhance the spirit of brotherhood.
Referring to Hashim and Rahim (2008), sharing of external spaces encourages
interaction among the communities and strengthens the community bond.
Internal Recreational
Dwelling design with an internal opening such as courtyard, terraces or backyards
with appropriate recreational facilities or through creative design inventions helps
to improve the occupants’ physical, mental and spiritual wellbeing. According to
Omer (2010), pursuing a good and ingenious recreation at home is indispensable
for maintaining one’s emotional and psychological wellbeing. This will also
enhance the relationship between all family members and as a result eliminate
many social illnesses.
Nature Responsive
It is believed that viewing and being in nature improves our health, both mentally
and physically. Weather, nature and temperature clearly influence human
behaviour. Thus, an ideal Islamic dwelling will incorporate as much nature as
possible and connect open spaces into its fold. Natural ventilation is the most
significant environmental value extracted from the analysis of Malay houses
(GhaffarianHoseini, Berardi & Dahlan, 2014). This consideration helps
dwellings to be energy efficient, sustainable and eco-friendly.
Disabled Friendly
An Islamic dwelling should also consider the needs of the disabled and elderly
people. The concept of an ideal dwelling has changed over last century as a
response to the changing of demographic, health condition and family patterns.
Among the considerations for a disabled friendly dwellings are to avoid split
levels within the house, clear doorway opening for wheelchair clearance,
spacious bedroom for wheelchair turning and window sill between 450 to 600
mm above floor level to allow view outwards from seated position.
CONCLUSION
Many research findings indicate that despite significant differences between
traditional and modern dwelling design and settings, the majority of its occupants
regard visual privacy at home from outsiders as extremely important. Occupants
who live in the modern neighbourhood often modify the original design of their
homes in order to increase the level of privacy and other aspects. This study
concludes that urban designers need to understand and incorporate core values of
the culture in which they are working, in order to meet the needs of a city's

Wan Norisma Wan Ismail, Fadli Arabi, Elina, Fatin Nur Sakinah, Zuhairuse, Nor Haslina, & Azhani The Establishment of Islamic Dwelling Principles for The Malaysian Communities
© 2017 by MIP 270
residents. The most appropriate dwelling design fits the use; it is not the use fits
design. As Islam requires homes are to be built in accordance with these
principles and therefore designers should treat these principles as guidelines of
their dwelling design. It is clear here that the design of a Muslim dwelling should
be the product of the Islamic beliefs and values of the inhabitants. In conclusion,
an Islamic dwelling is Islam manifested.
ACKNOWLEDGEMENTS
This work was supported in part by USIM under Grant Nos. PPP/USG-
0115/FST/30/11915.
REFERENCES Abdul Rahim, A. (2008). Housing from the Islamic Perspective. Kuala Lumpur. IIUM
Press.
Amar, N. Z. M., Ismail, Z., & Salleh, H. (2012, April). (2012). Guidelines for internal
arrangement of Islamic house. Business Engineering and Industrial Applications
Colloquium (BEIAC), 2012 IEEE, IEEE, p. 189-194.
Amlashi, A. P., Mousavi, S. Y., & Falakian, A. (2013). The characteristics of suitable
home from Islam point of view in comparison with modern architecture.
International Research Journal of Applied and Basic Sciences, 4(5), 1312-1318.
Coolen, H. (2006). The meaning of dwellings: An ecological perspective. Housing,
Theory and Society, 23(4), 185-201.
Ghaffarian Hoseini, A., Berardi, U., & Dahlan, N. D. (2014). What can we learn from
Malay vernacular houses? Sustainable Cities and Society, 13, 157-170
Hashim, A. H., & Rahim, Z. A. (2008). The influence of privacy regulation on urban
Malay families living in terrace housing. Archnet-IJAR, 2(2), 94-102.
Ibrahim, H. (2012). The Contemporary Islamic House (Doctoral dissertation). University
of Arkansas.
Limthongsakul, S., Vudipong Davivongs, M. L., Santisan, A., Yamyolngam, P., &
Chaisawataree, T. (2012). Sustainable design and Muslim vernacular houses:
understanding local wisdom, cultural relationships, and architectural evolution.
Kasetsart Journal Soc. Sci, 26, 27-35.
Mortada, H. (2003). Traditional Islamic principles of built environment. London:
RoutledgeCurzon.
Omer, S. (2006). Towards an understanding of the concept of the Islamic house. Housing
and Building National Research Center Journal, 2(2).
Omer, S. (2010). Islam & housing. A.S. Noordeen.
Ramezani, S., & Hamidi, S. (2010). Privacy and social interaction in traditional towns to
contemporary urban design in Iran. American Journal of Engineering and Applied
Sciences, 3(3), 501-508.
Yusof, Z. B. (2011). Islamic guiding principle (shari’ah law) for architectural
interpretation of housing. In M. Rashid (Ed.), Islam and built environment (First
edition) (pp. 19-33). Kuala Lumpur: IIUM Press.

1Master Candidate at International Islamic University Malaysia.Email: [email protected] 271
PLANNING MALAYSIA:
Journal of the Malaysian Institute of Planners
VOLUME 15 ISSUE 1 (2017), Page 271 - 278
ROLES OF COMMUNITY TOWARDS URBAN FARMING
ACTIVITIES
Norul Hafizah binti Yusoff1, Mohd Ramzi Mohd Hussain2, & Izawati Tukiman3
1,2,3Kulliyyah of Architecture and Environmental Design
INTERNATIONAL ISLAMIC UNIVERSITY MALAYSIA
Abstract
The aim of this paper is to review and analyse the importance of the framework
for urban farming activities to be implemented within cities environment. This
paper also describes the role of the community to achieve the environmental,
economic and social sustainability for the enhancement of the urban environment
and healthy lifestyles through community participation in food supplies,
nutrition, and spaces utilization. The paper evaluates the benefits and potential of
urban farming activities within limited urban spaces and how it improves the
quality of life. It also reviews on how urban farming is beneficial to the society
due to food shortage crisis which is inadequate for the whole population. It is
necessary to apply and practice in our daily lives for the consumption of food
security, human safety, and health. Therefore, the role of community is very
crucial in the implementation of urban farming activities within urbanized areas
as the demand for green development increases. Based on this theoretical
framework, it is hoped that the paper will be a useful addition to the body of
knowledge in promoting a stronger community interdependence to create the
sustainable urban environment.
Keywords: Urban farming, role of community, importance, sustainable.
Date Received: 30th April 2016
Date of Acceptance: 30th October 2016

Norul Hafizah Yusoff, Mohd Ramzi Mohd Hussain, & Izawati Tukiman Roles of Community Towards Urban Farming Activities
© 2017 by MIP 272
INTRODUCTION
Aggressive development challenges the human mind to trigger innovative ideas
to create sustainable development in fast growing cities. Certainly, urban farming
is widely practiced by the society in rapid urbanization areas, cities and town
spaces (Bellows, Brown & Smit, 2003). Suryandari (2012) reported that urban
farming activities had been introduced to reduce and overcome the
environmental, economic and social problems other than to fulfil people needs
and demands.
With regards to the implementation of urban farming, theory on The
Garden City Movement initiated by Sir Ebenezer Howard during the year of 1898
has proved that urban farming concept is not a new idea. In retrospect, The
Garden City Movement method emphasized on the combination of town and
country to offer an alternative to working class in crowded and unhealthy cities
(ACT Planning and Land Authority, 2003). It was intended to create cities with
economically independent and countryside’s preservation. Indeed, the connection
between foods and the city had already evolved since ancient times.
Although urban farming is not new worldwide, it is yet to become
popular in Malaysia due to lack of awareness and participation from community
(Islam & Siwar, 2012; Kaur & Hitam, 2010). Thus, the objectives of this paper
are to identify the role of community in the urban farming activities towards
sustainable urban environment, and to explore the benefits and potential of urban
farming activities and how it improves the quality of life.
URBAN FARMING
Thoreau (2010) defines urban farming as food or livestock growth or processes
that are undertaken within the urban area or around the urban centres with the
purpose to generate income. Likewise, Watson (2015) also discovered that urban
farming is about raising foods including plants and animals in the city ground
either at allotment land or non-occupied space. In the context of Malaysia, urban
farming is often recognized as “pertanian bandar” or “kebun bandar”. Izham
Alias, whom the founder of Kebun Bandar: Jom Tanam Sendiri stated that urban
farming is an activity that helps to encourage communities to plant crops while
saving expenses on foods, which at the same time significantly related to the
ecology, health, sustainability and food security (Md Sani, 2016; Mat & Abdul
Majid, 2015). Urban farming activity is also beneficial to the society especially
urban communities and helps to lessen the problem of food shortage and limited
spaces for agriculture (Giedych, 2015; Smith, 2005).
Types of Urban Farming
The application of urban farming varies from every corner of urban settings and
its ecosystem. Considering the necessity of urban farming, several studies
reported that urban farming has already been implemented on grounds, and on
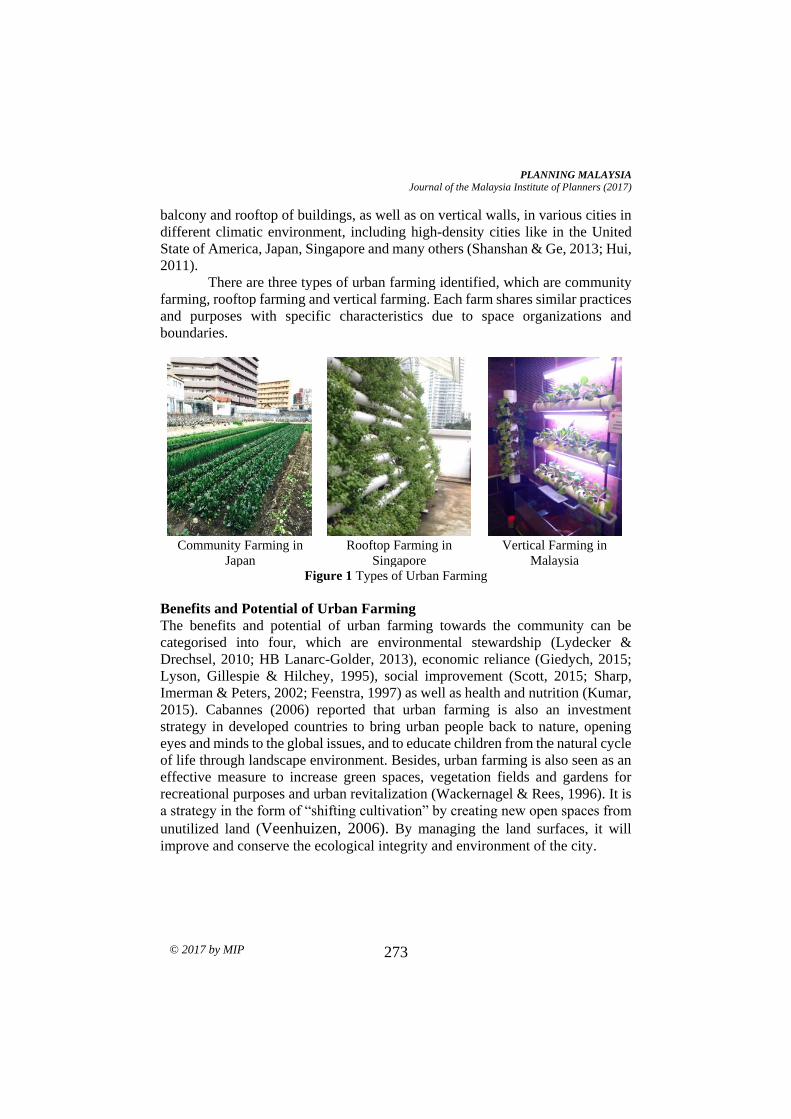
PLANNING MALAYSIA
Journal of the Malaysia Institute of Planners (2017)
© 2017 by MIP 273
balcony and rooftop of buildings, as well as on vertical walls, in various cities in
different climatic environment, including high-density cities like in the United
State of America, Japan, Singapore and many others (Shanshan & Ge, 2013; Hui,
2011).
There are three types of urban farming identified, which are community
farming, rooftop farming and vertical farming. Each farm shares similar practices
and purposes with specific characteristics due to space organizations and
boundaries.
Community Farming in
Japan
Rooftop Farming in
Singapore
Vertical Farming in
Malaysia
Figure 1 Types of Urban Farming
Benefits and Potential of Urban Farming
The benefits and potential of urban farming towards the community can be
categorised into four, which are environmental stewardship (Lydecker &
Drechsel, 2010; HB Lanarc-Golder, 2013), economic reliance (Giedych, 2015;
Lyson, Gillespie & Hilchey, 1995), social improvement (Scott, 2015; Sharp,
Imerman & Peters, 2002; Feenstra, 1997) as well as health and nutrition (Kumar,
2015). Cabannes (2006) reported that urban farming is also an investment
strategy in developed countries to bring urban people back to nature, opening
eyes and minds to the global issues, and to educate children from the natural cycle
of life through landscape environment. Besides, urban farming is also seen as an
effective measure to increase green spaces, vegetation fields and gardens for
recreational purposes and urban revitalization (Wackernagel & Rees, 1996). It is
a strategy in the form of “shifting cultivation” by creating new open spaces from
unutilized land (Veenhuizen, 2006). By managing the land surfaces, it will
improve and conserve the ecological integrity and environment of the city.

Norul Hafizah Yusoff, Mohd Ramzi Mohd Hussain, & Izawati Tukiman Roles of Community Towards Urban Farming Activities
© 2017 by MIP 274
Table 1 Four Benefits and Potential of Urban Farming
Environmental Stewardship
▪ Urban revitalization
▪ Ecosystem enhancement
▪ Climate changes
▪ Waste reduction
▪ Sound insulation
▪ Noise absorption
▪ Minimize transport footprints
▪ Enrich visual quality
Economic Reliance
▪ Free-cash nutrient
▪ Lowering expenditure
▪ Income generator
▪ Green innovation
▪ Employment creation
▪ Introduce local food production
▪ Positive economic description
Social Improvement
▪ Community empowerment
▪ Youth development and training
▪ Green education opportunities
▪ Cultural integration and
preservation
▪ Positive community interaction
and social well-being
Health and Nutrition
▪ Food access and security
▪ Organic fruits and vegetables
▪ Nutrient retention
▪ Therapeutic treatment
▪ Amenity recreational and garden
spaces
▪ Physical activities and exercises
▪ Aesthetic values
THE ROLES OF COMMUNITY IN URBAN FARMING ACTIVITIES
Community perception and participation in urban farming is highly related to the
level of awareness of the benefits of the activity. To be successful, it is important
that community involvement is kept continuous in the implementation of urban
farming.
Community Perception
Russell (2008) discovered perception as the way of people grouping particular
matters into things or perspectives which derived from sensations or images. It is
the way people classify things through the ability of sensory and reaction of their
personal judgment. People can acknowledge something through physical senses
by seeing, hearing, tasting and feeling during certain situations. They get to
understand, interpret and become aware on something from their point of views
and giving the opinions based on the limited knowledge a person has.
Community Participation
World Health Organization (2002) define community participation as to actively
involved or taken part in the community development issues and strategies
through the physical actions taken by the neighbourhood members in the
particular community area. Likewise, Burns et al. (2004) note that community
participation is associated with the individuals’ or groups’ opportunities of
sharing some involvement and engagements in the decision-making process.
They get to express themselves by showing their concerns through the significant
physical powers, efforts and influences which they had clearly understood and

PLANNING MALAYSIA
Journal of the Malaysia Institute of Planners (2017)
© 2017 by MIP 275
realize about the importance of something that may help in changing and
enhancing their quality of lifestyles.
A positive correlation was found by Banning (2015), indicating that the
practices of urban farming activity are linked with the commitment and the
awareness of urban communities towards preserving and protecting the natural
resources for future growth through establishing environmentally-friendly
educational community programs held in the neighbourhood green spaces.
Access to food supplies and knowledge of health among the communities will
also provide positive outcomes to the number of participations of the urban
community in urban farming (Trutko, 2014).
Sustainable Urban Environment
Considerable evidences support the notion that the public play important roles in
in creating sustainable urban environment through the practice of urban farming.
Although many researchers have mentioned about the benefits of urban farming
activities in the urban context, very few studies regarding urban farming have
been conducted in Malaysia (Islam & Siwar, 2012; Kaur & Hitam., 2010). This
is because urban farming in Malaysia is currently lacking public support,
especially in terms of public participation.
Table 2 presents the relationship between community participation with
the urban farming activities towards sustainable urban environment. According
to recent researches as in Table 2, urban farming activities can provide
opportunities in fostering community building and support environmental
education.
Table 2 Relationship between Community Participation in Urban Farming Activities
and Sustainability
Sources Urban Farming
Activities Community Participation
Sustainable Urban
Development
Evan, Valsecchi
& Polastri
(2012)
Matter of awareness
about progressive
detachment in the
reality of food
production knowledge.
Hesitation due to the
different attitude and
perceptions (farming is
rural and traditional
senses).
It is necessary to maintain
a growing and living
spaces in the changing
environment.
Peemoeller
(2011)
For future, people need
to understand the
relevance of food in
their lives.
Engage and educate the
public about healthy and
sustainable food systems.
Community leadership is
essential, recognize the
strength of diversity.
Funders’
Network (2011)
Physical, technical,
educational and
programmatic support
is important to urban
agriculture success and
longevity
Absences of community
engagement and
opportunities (lack of
supportive public policies
and community visioning).
-
Norul Hafizah Yusoff, Mohd Ramzi Mohd Hussain, & Izawati Tukiman Roles of Community Towards Urban Farming Activities
© 2017 by MIP 276
Kaur & Hitam
(2010) -
Lack of community
participation in sustainable
program.
Local Agenda 21 - fewer
authorities efforts “words
are, action not”.
Rujiroj
Anambutr
(2010) -
Community need for
motivation and application
experiences for better
understanding and
awareness to gain good
results.
Policy → apply→
enforcement
- time, efforts and
cooperation are needed.
Victor Rubin
(2008) -
Increase environmental
justice campaign from
development projects &
healthier activities
Contribution of greening-
need diverse methods and
supports, connection for
green movement.
CONCLUSION
Scholars agreed that there is a widespread realization of efforts and determination
aimed at the restoration and preservation of natural ecosystem. This has, to an
extent, promote the rapid emergence of urban farming especially in relation to
meeting demand for local food and resilient community (HB Lanarc-Golder,
2013). However, the success of urban farming is dependent on many factors, most
importantly the perception and participation of the local community. Active
community participation indicates the power and control of the community in the
decision-making as according to their demands for environmental justice and
community interdependence for better well-being (Kumar, 2015; Burns et al.,
2004; Rubin, 2008). Several scholars indicated that community involvement in
the urban farming activities can help strengthen the ties between communities
(Sharp, Imerman & Peters, 2002; Nemore, 2015). Farming itself can build a
strong and vibrant brotherhood, create a sense of partnerships, and enhance
community cohesion as well as diverse cultures among the growers and farmers.
Urban farming has existed in many cities throughout the world. It
provides a valuable complimentary farming activity to the urban residents. It is
time for urban farming to also enjoy popularity in Malaysia. Further researches
are required to look at other criteria of urban farming like sustainability strategy
and investment returns so that the public as well as the authorities in Malaysia
can be convinced to implement urban farming in their cities.

PLANNING MALAYSIA
Journal of the Malaysia Institute of Planners (2017)
© 2017 by MIP 277
REFERENCES ACT Planning and Land Authority (2008). Garden City values and principles - design
considerations for residential development in inner North and South Canberra.
Anambutr, R. (2010). Moving toward eco-friendly city: Perspective on Thailand. In L. L.
Fook, C. Gang (Eds.), Towards a liveable and sustainable urban environment:
eco-cities in East Asia, p. 107-128. Singapore: World Scientific.
Banning, J. (2011). Food (and farms) for thought: campus farming and environmental
sustainability. Retrieved October 21, 2015 from
http://blogs.worldwatch.org/nourishingtheplanet/food-and-farms-for-thought-
campus-farming-and-environmental-sustainability.
Bellows, A. C., Brown, K., & Smit, J. (2003). Health Benefits of Urban Agriculture.
Community Food Security Coalition, 19, 702–703.
Burns, D., Heywood, F., Taylor, M., Wilde, P., & Wilson, M. (2004). Making community
participation meaningful: a handbook for development and assessment. Bristol:
The Policy Press.
Cabannes, Y. (2006). Financing and investment for urban agriculture. In R. V.
Veenhuizen (Ed.), Cities farming for the future, p.87-124. Silang, Philippines:
International Institute of Rural Reconstruction.
Evans, S., Valsecchi, F., & Pollastri, S. (2012). Design for distributed and networked
urban farming in Shanghai. Cumulus 2012. Helsinki, Finland.
Feenstra, G. W. (1997). Local food systems and sustainable communities. American
Journal of Alternative Agriculture, 12(1), 28-36.
Funders’ Network (2011). Investing in healthy, sustainable places through urban
agriculture (Translation paper 5).
Giedych, R. (2013). Urban agriculture: structure, functions, future challenges. Global
Landscapes Forum. Warsaw, Poland.
HB Lanarc-Golder (2013). The urban farming guidebook: planning for the business of
growing food in BC’s towns and cities. Vancouver.
Hui, S. C. M. (2011). Green roof urban farming for buildings in high-density urban cities.
The 2011 Hainan China World Green Roof Conference. Hainan, China.
Islam, R., & Siwar, C. (2012). The analysis of urban agriculture development in Malaysia.
Advances in Environmental Biology, 6(3), 1068–1078.
Kaur, H., & Hitam, M. (2010). Sustainable living: an overview from the Malaysian
perspective. In L. L. Fook, C. Gang (Eds.), Towards a liveable and sustainable
urban environment: eco-cities in East Asia, p. 159-178. Singapore: World
Scientific.
Kumar, R. (2012). Five reasons why urban farming is the most important movement of
our time. Retrieved December 22, 2015 from:
http://magazine.good.is/articles/five-reasons-why-urban-farming-is-the-most-
important-movement-of-our-time.
Lydecker, M., & Drechsel, P. (2010). Urban agriculture and sanitation services in Accra,
Ghana: the overlooked contribution. International Journal of Agricultural
Sustainability, 8(1), 94-103.
Lyson, T., Gillespie, G., & Hilchey, D. (1995). Farmers' markets and the local
community: bridging the formal and informal economy. American Journal of
Alternative Agriculture, 10(3), 108-113.

Norul Hafizah Yusoff, Mohd Ramzi Mohd Hussain, & Izawati Tukiman Roles of Community Towards Urban Farming Activities
© 2017 by MIP 278
Mat, R., & Abdul Majid, A. (2015). Kepentingan pertanian bandar dan cabaran yang
dihadapi oleh petani bandar di Malaysia. International Journal of Environment,
Society & Space, 3(1), 44–56.
Md Sani, M. S. (2016). Bantu warga bandar bertani. HM Online. Retrieved March 16,
2016 from http://www.hmetro.com.my/node/24925?m=1
Nemore, C. (1998). Rooted in community: community gardens in New York City. City
Farmer. Retrieved November 12, 2015 from
http://www.cityfarmer.org/NYcomgardens.html.
Peemoeller, L. (2011). Sustainable food system. In S. Coyle (Ed.) Sustainable and
resilient communities: A comprehensive action plan for towns, cities, and regions,
p. 269-283. Hoboken, New Jersey: John Wiley & Sons.
Rubin, V. (2008). The roots of the urban greening movement. In E. Birch, S. Wachter
(Eds.), Growing Greener Cities, p. 187-. Philadelphia: University of Pennsylvania
Press.
Russell, B. (2008). Lecture VII: definition of perception, the analysis of mind. LLC:
NuVision Publications.
Scott, E. (2012). Why gardening beats reading for stress relief. Retrieved October 17,
2015 from http://stress.about.com/od/generaltechniques/a/gardening.htm.
Shanshan, D., & Ge, C. (2013). Multiple functions of urban farming. Retrieved October
17, 2015 from http://www.pcd.org.hk/en/newsletter/multiple-functions-urban-
farming.
Sharp, J., Imerman, E., & Peters, G. (2002). Community Supported Agriculture (CSA):
building community among farmers and non-farmers. Journal of Extension, 2002.
Retrieved October 14, 2015 from http://www.joe.org/joe/2002june/a3.html.
Smith, D. L. (2005). Urban and peri-urban agriculture as a public policy issue. Workshop
on Policy Prospects for Urban and Peri-Urban Agriculture in Kenya. Nairobi,
Kenya.
Suryandari, R. Y. (2012). Urban farming and its impact on local communities and urban
environment: A case study of West Jakarta and Tangerang, Indonesia. Malaysian
Journal Society and Space, 8(3), 12–22.
Thoreau, C. (2010). Defining urban farming. Vancouver Urban Micro. Retrieved
November 19, 2015 from http://cmthoreau.wordpress.com/2010/10/15/defining-
urban-farming/.
Trutko, A. (2014). Perceived outcomes of a community-based urban agriculture and
nutrition education program: a case study of Common Good City Farm’s Green
Tomorrows program in Washington, D.C. IGARSS 2014. Quebec, Canada.
Veenhuizen, R. V. (Ed.) (2006). Cities farming for the future. Silang, Philippines:
International Institute of Rural Reconstruction.
Wackernagel, M., & Rees, W. (1996). Our ecological footprint: reducing human impact
on the earth. Gabriola Island, BC: New Society Publishers.
Watson, M. (2014). What is an urban farm? About Food. Retrieved November 14, 2016
from http://localfoods.about.com/od/localfoodsglossary/g/What-Is-An-Urban-
Farm.htm/
World Health Organization (2002). Community participation in local health and
sustainable development: approaches and techniques. Copenhagen: WHO
Regional Office for Europe.

1Fellow at University of Malaya. Email: [email protected] 279
PLANNING MALAYSIA:
Journal of the Malaysian Institute of Planners
VOLUME 15 ISSUE 1 (2017), Page 279 – 288
THE TOURIST BEHAVIOUR IN DIFFERENT ENVIRONMENTS: A
LITERATURE REVIEW
Asra Zaliza Asbollah1, Norhaslina Hassan2,
Safiah @ Yusmah Muhammad Yusoff3, & Hanizah Idris4
1,2,3,4Faculty of Arts and Social Sciences
UNIVERSITY OF MALAYA
Abstract
In ensuring the tourism destinations are successful and sustained, good quality
environments are needed. Furthermore, without an attractive environment, there
would be no tourism activities. Nevertheless, people generate and encompass
many different types and patterns of changes in the environment and in turn, the
environment can facilitate and even reduce stress to people. In this context, it is
necessary to understand the perspective of tourists and knowing what they look
for in a particular destination to obtain a better understanding of spatial tourism
behaviour and areas of sustainable tourist destinations. The primary focus of this
paper is to understand the perceptions, expectations, experiences and motivations
that tourists have when they choose to visit specific tourist destinations. Based on
the literature, identifying and examining the elements of tourist attractions, tourist
preferences, the values which characterize the tourism demand and their
relationship to the environment would highlight challenges as well as
implications for tourism development especially in Malaysia.
Keywords: Tourist behaviour, environment, perceptions, expectations,
experiences, motivations
Date Received: 30th April 2016
Date of Acceptance: 30th October 2016

Asra Zaliza Asbollah, Norhaslina Hassan, Safiah @ Yusmah Muhammad Yusoff, & Hanizah Idris
The Tourist Behaviour in Different Environments: A Literature Review
© 2017 by MIP 280
INTRODUCTION Despite a wide range of publications assessing the behaviour of tourists to various environmental settings, little is actually known about the complexity of demand responses towards different environments in the Malaysian context. The purpose of this paper is to review and discuss existing studies and provide a framework for a better understanding of tourist behaviour. The literature indicates that tourism has a significant effect on social life globally that can no longer be understood as merely what happens at the location of the destination, nor why tourists choose to do something different from their normal life and work. Tourism is a central part of understanding the social organization of destination and is no longer simply a specialist consumer product or mode of tourist consumption (Inglis, 2000; Framke, 2002). In other words, tourism is not only about supply and demand but also relates to the behaviour of tourists.
The reasons for undertaking a literature review is because it provides as complete a list as possible especially all the published and unpublished studies relating to particular subject areas and towards the end, this study summarizes and draws conclusions about the relevant topic. This study undergone a few stages of the literature review. It began with an extensive review to establish the context and rationale for this study so as to confirm the choice of research focus or question. Then, the topic is refined by narrowing down the relevant and detailed literature. The topic is then divided into key themes to make it easier to look for information. This study also uses different journal articles and books to identify key authors and significant theories that relate to the themes and make them as a starting point. Finally, this study relates the findings from the literature and identifies the implications for this study.
TOURIST BEHAVIOUR In order to identify behaviour in relation to tourism, it is crucial for researchers to understand what motivates tourist, their perceptions, expectations and also their experiences. This begins with a particular focus on the perception of the tourist. Tourism is no longer simply regarded as a universal and homogenous phenomenon, it is essentially a contemporary phenomenon and thus needs to be analysed in view of the larger context of modernity (Wang, Yamada & Brothers, 2011). It can be stated as the linkages between travel and knowledge recognized in contemporary travel practices which people in modern world tend to explore other parts that are different from their normal place. In other words, people use traveling as a mean to perform their own modernity.
The tourism, in which the modern world lust for visuality and geographical movement, accelerated tremendously with the inventions of cameras; caused a profound multiplication of images and sights; a constitutive part of modernity’s traveling cultures. In addition, little research has been conducted looking at movements of tourists. As Lau and McKercher (2006) reported, factors such human (motivation and travel party) and physical (destination geomorphology) affect tourists' choices of itineraries and give

PLANNING MALAYSIA
Journal of the Malaysia Institute of Planners (2017)
© 2017 by MIP 281
reasons to support the shaping of the movement patterns. Thus, it can be said that contemporary tourism is fundamentally constructed culturally, socially and materially through images and performances of destinations.
The term perception refers to a view of the total environment that is cognitively sensed and experienced and becomes the basis for decision-making (Morin, Gates & Zimmerman, 2009). Furthermore, people construct views through space, and organize the acquired knowledge, information and experience through the senses (Lau & McKercher, 2006). Thus, the tourist perception is generally referred to the outcomes that visitors have constructed for a physical and social environment they have visited. This perception differs between each individual, as there are various perception within individuals depending on their past and present experiences through values, needs, memories, moods, social circumstances, and expectations (Saarinen, 1976). This means that perception is different for each individual tourist at any time regarding anything or towards different environment setting. This is indeed because of the perception is strongly linked to psychology, and people construct their views based on cognitive processes that capture and organize knowledge, experiences and information through the senses (Lau & McKercher, 2006). Thus, a destination’s pull factors, such as their promotional activities, weather, beaches, scenery, facilities and attractions are also important influences in setting expectations, and subsequently, in meeting the needs of tourists.
Tourists’ perception of a destination is also likely to be influenced not only by their own experience but also by their expectations of that destination. These expectations are built on the representations permeating their own culture and absorbed from the media, the advice from friends and relatives, and guidebooks and travel brochures (Jenkins, 2000). However, tourists’ expectations of a destination do not necessarily match as what the guidebook or travelogue describes. In short, different expectations held by different tourists in different kinds of environments resulted in different types of behaviours. Expectation derives from a number of sources that include the qualities and perceptions which will be influenced by tourists’ cultural backgrounds (Fountain, Espiner & Xie, 2011). Once tourists activated their needs and requirements of travel, motivation is the key factor in the formation of expectations. The expectation, conversely, determines the perception of a performance of the products and services at a destination, and the perception of the experience. Tourist behaviour may have distinctive phases of expectation, partly because tourists have the ability to transform their expectation through their experience. Presumably, the understanding of what to expect at a destination also colours the behaviour that different tourists use to interpret their travel experience.
In parallel, the tourist experience comprises everything that tourists have seen, done or felt during their trips (Inglis, 2000). Khalilah (2006) argues that tourist experience is a significant process and outcome of tourism. It will determine whether a visit is successful or not for the tourists, and consequently, how they rate their overall experience will influence their future travel decisions.

Asra Zaliza Asbollah, Norhaslina Hassan, Safiah @ Yusmah Muhammad Yusoff, & Hanizah Idris
The Tourist Behaviour in Different Environments: A Literature Review
© 2017 by MIP 282
McIntosh (2003) reported that gazing and authenticity are among the dimensions of the tourist experience. Chui, Rahim, Hassan, Musa, Yusof and Hashim (2010)
defined tourist experience “as a temporal account of the tourist gaze as to describe the process through which a tourist reminisces the place or experience he or she encounters”. In other words, the gaze is a recollection of the temporal experience which, there is an aura to the fullest extent of the experience. However, tourist’s experiences vary according to the varieties of people and their geographical distribution. At the same time, tourist experience is influenced by different factors such as traveling experience, destination attributes and attractions (Li, 2000). Apparently, destinations can offer and provide more than just one type of tourism experience. In relation to that, to provide a high-quality experience, one must understand what factors can motivate and influence people to travel.
Figure 1 Formation of Travel Motivation
Source: Humphreys & Holloway (2009)
Another view states that motivation is one way of determining tourist
behaviour (Dann, 1981). He continued in his assessment of tourist motivation mentioned that there is consent, that an understanding of motivation express why an individual or group have behaved or are about to perform an action. Sharing this view, Moutinho (1987) similarly asserts that motivation refers to a state of need, a condition that exerts a push on the individual towards certain types of actions that are likely to bring satisfaction. In other words, motivation is closely related to a tourist’s needs, personality and way of life. On top of that, motivations activate and direct the behaviour of the tourist. According to Deci and Ryan (2000), there are two types of motivation, intrinsic and extrinsic motivations. Intrinsic motivation refers to motivation that is driven by a curiosity and exists within the individual while extrinsic motivation comes from outside sources such as motivation to gets a reward or reinforcement. Wang, Yamada and Brothers (2011) add that when people have a need to travel, they must also have equivalent

PLANNING MALAYSIA
Journal of the Malaysia Institute of Planners (2017)
© 2017 by MIP 283
individual factors and external environmental conditions, such as physical fitness, financial status, weather, and transport, etc. as shown in Figure 2 below.
Figure 2 The Formation of Travel Motivation and Travel Actions
Source: Education Bureau (2009)
Thus, motivation is essential to be successful in any activities and is still
needed in order to boost behaviour. In short, motivation can be defined as the inside or outside stimulant that drives humans to satisfy their needs. Motives and motivations, thus explain why people (tourists) behave or are about to perform an action. In parallel, it can be stated that features or the environment, which attract tourists to a site, can be considered as motivations (and when acted upon, become activities).
Tourist decisions about destination and motivation are related to images that are created based on personal experience and knowledge, recommendations and opinions of others and information provided by the media. Images developed and travelled to many places, and became a train of ideas to another object, places, cultures and people. In short, the image of the destination is actually referred to the perception of tourists towards attractions that available in the destination. In fact, the perception of the image of tourist destination is a major factor that plays a role or motivation to bring tourists to visit a destination. Accordingly, tourism motivations may help to predict tourist behaviour (Patterson, 2006), whereby tourist behaviour is the interplay of forces – avoidance of routine or stressful environments and seeking recreation places for certain psychological rewards. Motivation obviously impacts on satisfaction formation. As stated by Murphy (2004), closing the distance between what stakeholders want and expect with what they experience, increases their satisfaction. In this sense, motivations and preferences play a role in the formation of satisfaction and enhances the experience in destinations.
In short, the behaviour of tourists actually represent tourist’s needs, personality and way of life. Therefore, knowing about tourist behaviour is particularly important in developing the tourism industry today. In Malaysia, it is the government’s intention to maintain and control the tourism development. Bhuiyan, Siwar and Mohamad Ismail (2013) conclude that Malaysian government has played a significant role in instituting a legal and institutional

Asra Zaliza Asbollah, Norhaslina Hassan, Safiah @ Yusmah Muhammad Yusoff, & Hanizah Idris
The Tourist Behaviour in Different Environments: A Literature Review
© 2017 by MIP 284
framework for ensuring sustainable tourism. It can be seen from the number of foreign tourist’s arrival and tourist expenditure that is increasing year by year. The study also reveals that the Government has given special emphasis on the tourism sector during each Malaysia Plan period by adopting and formulating various laws and regulations to ensure sustainable tourism development as well as implement necessary policies.
However, despite these actions, Bhuiyan, Siwar and Mohamad Ismail (2013) also emphasise that many other issues need to be addressed, including identifying the benefits that community will get, attracting foreign investment and identifying region based tourism development which is necessary to enhance tourism sector in Malaysia. Other than that, initiatives for sufficient human resource and entrepreneurship development, and emphasis on education and research activities can be developed as to enhance Malaysia’s tourism sector.
DISCUSSION The discussion above clearly indicates that the tourist experience is affected by the availability of attractions, destination features and amenities. The performance of a place bounds to how the tourists remember that particular place (Baerenholdt et.al, 2004). Tourists perceive destinations in varying ways, hence, each is looking for different signs to lead them to different experiences (Backhaus, 2003). Some look for the extraordinary, where signs will suggest the potential for experiences that differ from normal expectations; but most signs also serve to contribute to the selection of a destination. These interactions and involvement between the tourists and their destinations can significantly influence the level of experiences experienced by the tourist. As Urry (2003) emphasizes that tourists are attracted to features which are unique and not in their everyday experience because it provides them with intense pleasure and anticipation. Thus tourists are often perceived as being more motivated by destinations’ attributes such as sun, sea and local culture than their internal disequilibrium, which they wish to consume.
The tourist’s experience actually allows the tourists to feel unique and relevant to what/where they are visiting. The good and memorable experience is the most important quality of place experience for tourists. Nonetheless, the degree of tourist satisfaction gained from their experiences relates to the expectations of the tourist, the basis of those expectations, the ability of the tourists to adapt to the actual experience and the nature of their experience (Urry, 2003). Thus, this study suggests that tourist experience is the result of the tourist’s ability to tolerate the behaviour of others, context, and pattern of activities, motivation, expectation, and perception. As Cohen (1972) contended, this experience could be positioned on a scale, with a desire for pleasure at one end of the scale and a desire for meaningful experiences at the other. He added this type of tourist holds different views predicated on a relationship between the centre of their own societies and the centre of other societies.

PLANNING MALAYSIA
Journal of the Malaysia Institute of Planners (2017)
© 2017 by MIP 285
In short, a destination which is the space of tourism is a place of experience and as such, tourist behaviour influences tourist experience, which in turn is heavily influenced by external factors such as the attractions, place features and amenities. To sum up, it can be summarized that there are two independent uncontrollable variables considered during tourism decision making (Figure 3).
Figure 3 Tourist Behaviour Model Arguably, tourists are looking for an extraordinary experience that is
totally different from their normal lives, and regardless of what happens during their travel experience, will shape tourist destination selection and repetition. Thus, attitudes, mood and expectations also affect the evaluation of tourist’s own experience rather than just the quality of the product which offered by the destination. As mentioned, people desire to visit other places to experience the cultural, social and environmental differences that exist, although this desire varies between individuals. To state the obvious, an individual’s perceptions and responses to a place will vary according to differences in gender, ethnicity, religion, culture, wealth as well as education. As a developing industry, tourism in Malaysia has many components comprising the overall travel experience. Other than accommodation and facilities, it includes such things as food and beverage, transportation, entertainment, and special events. Thus, it is clear that the Malaysian destinations require proper development. At the same time, it requires the cooperation between the public and the private sectors, and to understand perceptions, expectations, experiences and motivation that tourist have. The key point to understanding tourism and tourist behaviour is to understand what motivates tourists to travel or their preferences towards destination environments. This including the physical influencing elements such as transport network, accommodation and attractions which characterize the destination itself. Thus, the environment can be recognized as one of the major forces modifying and defining tourism development and also the behaviour of the tourist. However, the main concern is how to incorporate all elements in order to make the resultant environment and view more useful and beautiful for the tourists to experience.

Asra Zaliza Asbollah, Norhaslina Hassan, Safiah @ Yusmah Muhammad Yusoff, & Hanizah Idris
The Tourist Behaviour in Different Environments: A Literature Review
© 2017 by MIP 286
The good environment is essential for tourist satisfaction and repeat visitation. Thus, the measurement of tourist expectations and perceptions of the environment in the context of tourism development plays a vital role in the future success of a destination.
CONCLUSIONS
From the discussion above, it is clearly shown that there is the variation of tourist
behaviour, especially their perceptions, expectations, experiences and
motivation, depending on the characteristics of the environment. Thus, it can be
concluded that the influence of environments on tourism demand patterns can be
shaped by the response of tourists' perceptions, motivations, expectations and
experiences. Tourists have the largest adaptive capacity of elements within the
tourism system because of their flexibility to substitute the place, timing and type
of holiday, even at very short notice. Consequently, understanding tourist
behaviour and reactions to the impacts of destination environment is essential to
anticipate the potential different environment in tourism demand, as well as the
decline or increase of specific tourism markets.
ACKNOWLEDGEMENT
The dissemination of the findings of this paper was supported by the University
of Malaya Research Grant RP017A – 13SBS.

PLANNING MALAYSIA
Journal of the Malaysia Institute of Planners (2017)
© 2017 by MIP 287
REFERENCES Backhaus, N. (2003). Non-place jungle: the construction of authenticity in national parks
of Malaysia. Indonesia and the Malay World, 31(89), 151-160.
Baerenholdt, J., Haldrup, M., Larsen, J., & Urry, J. (2004). Performing tourist places.
Ashgate: Aldershot.
Bhuiyan, M. A. H., Siwar, C. & Mohamad Ismail, S. (2013). Tourism development in
Malaysia from the perspective of development plans. Asian Social Science, 9(9),
11-18.
Chui, C. T. B., Rahim, F. A., Hassan, F. H., Musa, R., Yusof, J. M., & Hashim, R. H.
(2010). Segmenting nature-based tourists and perception of servicescape at Taman
Negara (National Park Malaysia). 2010 International Conference on Business,
Economics and Tourism Management. Singapore.
Cohen, E. (1972). Towards a sociology of international tourism. Social Research, 39,
164-182.
Dann, G. M. S. (1981). Tourist motivation: an appraisal. Annals of Tourism Research,
8(2), 187-219.
Deci, E. L., & Ryan, R. M. (2000). The 'what' and 'why' of goal pursuits: Human needs
and the self-determination of behavior. Psychological Inquiry, 11, 227-268.
Education Bureau. (2009). Manual on Module I: introduction to tourism. Hong Kong:
Social and Humanities Education Section.
Fountain, J., Espiner, S., & Xie, X. A. (2011). Cultural framing of nature: Chinese
tourists’ motivations for, expectations of, and satisfaction with, their New Zealand
tourist experience. Tourism Review International, 14(2-3), 71-83.
Framke, W. (2002). The destination as a concept: a discussion of the business-related
perspective versus the socio-cultural approach in tourism theory. Scandinavian
Journal of Hospitality and Tourism, 2(2), 92-108.
Humphreys, C., & Holloway, J. C. (2009). The Business of Tourism (9th Edition).
London: Pearson.
Inglis, F. (2000). The delicious history of the holiday. London: Routledge.
Jenkins, J. (2000). The dynamics of regional tourism organisations in New South Wales,
Australia: history, structures, and operations. Current Issues in Tourism, 3(3), 175-
203.
Khalilah, Z. (2006). Refining Tourist’s Place Experience through Placemaking: A Case
Study on Middle East Tourists in Kuala Lumpur City Centre (Master’s thesis).
Universiti Teknologi Malaysia, Skudai, Malaysia.
Lau, G., & McKercher, B. (2006). Understanding tourist movement patterns in a
destination: a GIS approach. Tourism and Hospitality Research, 7(1), 39-49.
Li, Y. (2000). Geographical consciousness and tourism experience. Annals of Tourism
Research, 27, 863-883.
McIntosh, A. J. (2003). Tourists’ Appreciation of Maori Culture in New Zealand. Tourism
Management, 25, 1-15.
Morin, J., Gates, C., & Zimmerman, T. (2009). Scared landscapes in Anatolia and
neighboring regions. London: Archaeopress.
Moutinho, L. (1987). Consumer behavior in tourism. European Journal of Marketing,
21(10), 1-44.

Asra Zaliza Asbollah, Norhaslina Hassan, Safiah @ Yusmah Muhammad Yusoff, & Hanizah Idris
The Tourist Behaviour in Different Environments: A Literature Review
© 2017 by MIP 288
Murphy, P. E., & Murphy, A. E. (2004). Strategic management for tourism communities:
bridging the gaps. Clevedon: Channel View Publications.
Patterson, M. (2006). Consumption and everyday life. Abingdon: Routledge.
Saarinen, T. F. (1976). Environmental planning: perception and behaviour. Boston:
Houghton Mifflin Company.
Urry, J. (2002). The tourist gaze (2nd ed.). London: Sage Publications.
Wang, S., Yamada, N., & Brothers, L. A. (2011). Case study: discussion of factors and
challenges for urban cultural tourism development. International Journal of
Tourism Research, 13, 553-569.

1Assistant Professor at International Islamic University Malaysia. Email: [email protected] 289
PLANNING MALAYSIA:
Journal of the Malaysian Institute of Planners
VOLUME 15 ISSUE 1 (2017), Page 289 - 294
MEASURING SOCIO-ECONOMIC INDICATORS FOR CLIMATIC
ANALYSIS
Illyani Ibrahim1
1Kulliyyah of Architecture & Environmental Design
INTERNATIONAL ISLAMIC UNIVERSITY MALAYSIA
Abstract
Socio-economic indicators are important indexes to measure the effect of human
activities towards climate. This paper aims to study on the two main socio-
economic indicators for the urban area, namely population and GDP, to determine
the relationship between these variables and climate condition. The State of
Selangor, Malaysia was chosen as the study area as this state is among the highest
GDP contributors to the country. Secondary data was used for this study by
utilising datasets from Statistical Department and Department of Meteorology.
The model derived shows that climate condition is moderately dependence of
population and GDP. Further analysis can focus on more important socio-
economic variables which may contributed to the climate condition in the urban
area.
Keywords: Socio-economic indicators, GDP, urban area
Date Received: 30th April 2016
Date of Acceptance: 30th October 2016

Illyani Ibrahim Measuring Socio-Economic Indicators for Climatic Analysis
© 2017 by MIP 290
INTRODUCTION The expansion of impervious surface by transforming green and natural areas is
a part of human activities, and gives impact towards local and global
environment. Globally, more people live in urban areas than in rural areas.
Starting in 2007, the global urban population exceeded the global rural population
and this pattern continues until now (United Nations, 2014). A study by United
Nation Statistics Division (2012) shows that the urban population in Malaysia is
73.5% of the total population. Thus, the need to understand the relationship of
human activities with the environment is crucial to ensure a good standard of
quality of life of the urban population.
At local scale, urban heat island (UHI) is an example of the climatic
problem as the temperature in the urban area rises higher than that of the area
outside the city. The size of city and the number of residents are shown to have
an inverse connection with regional wind speed and the logarithm of the
population (Oke, 1973). Oke (1973), and Torok, Morris, Skinner and Plummer
(2001) studied the relationship of UHI and population and found a relationship
through logarithmic relationships. In addition, Oke (1973) concluded that even a
city with a small population could be affected by UHI. However, another analysis
had a correlated surface temperature and population density and found a quite
linear pattern by removing the influence of the rural area (Streutker, 2003).
Several other studies have correlated UHI or surface temperature to the economic
and social indicators (Foroni et al., 2007; Murphy, 2009), which illustrated that
the concern about how far temperature can impact people’s way of life and vice
versa.
In a study carried out by Zhang, Wang, Shen and Da (2009), the socio-
economic indicators used were population, electricity power consumption and
gross domestic product. The found a high correlation between UHI intensity and
these variables. In addition, Cheval and Dumitrescu (2009) calculated UHI using
remote sensing imagery by comparing average temperatures of 5 km and 10 km
buffers, which is due to the heterogeneity of the land cover causing larger
differences between adjacent surfaces. These studies support the argument that
UHI is a local environmental problem which is related to land cover changes.
Human activities are also modifying the chemical composition of the
atmosphere through the urban build-up of greenhouse gasses which significantly
increases the urban heat (Bhiwapurkar, 2007). The alteration of landscapes to
urban impervious surfaces has also altered the energy balance of outgoing and
incoming solar radiation. As a result, this contributes to the higher urban air
temperature as compared to the surrounding areas, adding to the UHI effect.
The above discussion on previous studies highlighted the impacts of
human activities to climate. Hence, this study will seek to understand the
relationship between socio-economic indicators and temperature using datasets
of 40 years.

PLANNING MALAYSIA
Journal of the Malaysia Institute of Planners (2017)
© 2017 by MIP 291
METHOD
This study utilised secondary socio-economic and mean-monthly temperature
data. Data on GDP were obtained from the World Bank datasets to represent
economic indicator. These data were recorded in US dollar. GDP is one of the
primary indicators of economic activity. Meanwhile, population data were
sourced from the Department of Statistics Malaysia to represent social indicator.
Temperature data were obtained from the Malaysian Meteorological Department.
These were mean temperature recorded at the Petaling Jaya, Selangor weather
station. Linear regression method was used to analyse these data. It was discussed
in the literature that appropriate analysis should use datasets covering more than
30 years. For this current dataset, the mean annual temperature was used from
1971 until 2010 (39 years).
In the meantime, a supervised classification of four satellite imageries
was also generated to identify the urban areas within the study area. The land
cover map was produced by using the Supervised Classification by the iteration
of the clustering algorithm. Series of classes are produced to determine the
signature of each class so each of the pixel was compared to these signatures and
labelled to the most similar values digitally. Figure 1 show the work flow of the
research.
Figure 1 Framework of the work flow
RESULTS AND DISCUSSION
The analysis demonstrated the influence of socio-economic indicators towards
urban growth and the increase of the air temperature in the study area. For
instance, Figure 2 shows that a moderate significant linear relationship is evident
between GDP and the mean annual temperature, which means that a moderate
dependence of urbanization growth (R2 =0.6) has impacted the increase of mean
annual temperature. The rest of regression (0.4) are due to other factors. This

Illyani Ibrahim Measuring Socio-Economic Indicators for Climatic Analysis
© 2017 by MIP 292
study suggested that the economic growth of Kuala Lumpur and mean annual
temperature have consistently increased over the years.
Figure 2 Mean annual temperature and Malaysian GDP (billion)
Figure 3 shows the scatterplot of Malaysian GDP and urban development
areas (in km2) where the time studied is according to available images. According
to the graph, a strong linear regression exists between GDP and urban
development areas. This relationship indicates that the good positive linear
relationship exist between these two variables. The underlying factor of this
finding is that the Malaysian GDP is always related to the economic development,
which in turn is closely related to the physical activities such as industrial and
commercial development. These development often involve conversion of large
greenfields into urban areas which has accelerated the impact of UHI intensity.
Figure 3 Malaysian GDP and urban development areas
y = 0.0087x + 26.825
R² = 0.626.0
26.5
27.0
27.5
28.0
28.5
0 20 40 60 80 100 120 140 160
Mea
n A
nn
ua
l T
emp
era
ture
(ºC
)
Malaysian GDP (billion)
Mean annual temperature (urban) vs Malaysian GDP
(billion)
y = 0.0044x - 6.3285
R² = 0.9416
0
50
100
150
200
250
0 10000 20000 30000 40000 50000
GD
P (
US
'b
illi
on
)
Urban Development Areas
Malaysian GDP vs Urban Development Areas

PLANNING MALAYSIA
Journal of the Malaysia Institute of Planners (2017)
© 2017 by MIP 293
The scatterplot in Figure 4 shows the mean annual temperature versus
population (‘000). The analysis shows that it has a moderately linear regression
between mean annual temperature and population data at R2 = .557. A positive
correlation was also identified, which indicated that the mean annual temperature
was increasing as the population number increased over the time period.
Figure 4 Mean annual temperature and population data
The analyses conducted show that there is a relationship between mean
annual temperature and socio-economic indicators, where the temperature has
increased in sync with the increased in GDP and population growth. The growth
of urban areas is also closely interrelated to UHI intensity of the study area. These
indicate that economic development do accelerate the temperature increase in the
urban area. This result shows consistency with the findings by Zhang et al. (2009)
that UHI has increased linearly with population, and a significant logarithmic
relationship is evident between UHI intensity and GDP. Oke (1973) also found
that population has a logarithmic relationship to UHI. However, Pindyck (2010)
argues that the economic impact of warming should be modelled as a relationship
between temperature change and the growth rate of GDP, and suggests that future
research should not simply depend on temperature alone, but also the entire path
of temperature.
CONCLUSION
This paper have shown that there is a significant increasing trend in mean annual
temperature and the relationship of mean annual temperature is higher with GDP
compared to its relationship to population. The increase of GDP and population
y = 0.0276x + 26.734
R² = 0.557
26.2
26.4
26.6
26.8
27.0
27.2
27.4
27.6
27.8
28.0
28.2
0 10 20 30 40 50
Mea
n A
nn
ua
l T
emp
era
ture
(º
Cel
siu
s)
Population data ('00000)
Mean Annual Temperature versus Population data in Selangor

Illyani Ibrahim Measuring Socio-Economic Indicators for Climatic Analysis
© 2017 by MIP 294
have brought about spatial growth in urban development as well as increased in
motorised vehicles, and also the conversion of greenfields into built-up areas.
This has changed the landscape of the study area and has contributed rising local
temperature. Future analysis should focus on the density of housing, number of
vehicle, household income and telephone lines which and seek their relationship
to the climate condition, especially of the urban areas.
ACKNOWLEDGEMENTS
This study is funded by the Research Initiative Grant Scheme (RIGS) RIGS15-
025-0025 from International Islamic University Malaysia (IIUM).
REFERENCES Bhiwapurkar, P. (2007). Urban heat island phenomenon, urban morphology and building
energy: the case of Chicago, USA (Doctoral dissertation). Illinois Institute of
Technology, USA.
Cheval, S., & Dumitrescu, A. (2009). The July urban heat island of Bucharest as derived
from MODIS images. Theoretical and Applied Climatology, 96, 145–153.
Foroni, M., Salvioli, G., Rielli, R., Goldoni, C. A., Orlandi, G., Zauli Sajani, S., Guerzoni,
A., Maccaferri, C., Daya, G., & Mussi, C. (2007). A retrospective study on heat-
related mortality in an elderly population during the 2003 heat wave in Modena,
Italy: the Argento Project. J Gerontol A Biol Sci Med Sci, 62(6), 647–651.
Murphy, R. (2009). Heat stress vulnerability as predicted by spatial analysis of remotely
sensed imagery and socioeconomic data for Philadelphia (Master’s thesis).
University of Delaware, USA.
Oke, T. R. (1973). City size and the urban heat island. Atmospheric Environment, 7(8),
769–779. http://doi.org/10.1016/0004-6981(73)90140-6
Pindyck, R. S. (2010). Modeling the impact of warming in climate change economics.
NBER Working Paper No. 15692. http://doi.org/10.2139/ssrn.1539020
Streutker, D. R. (2003). A study of the urban heat island of Houston, Texas (Doctoral
dissertation). Rice University, Houston, Texas, USA.
Torok, S. J., Morris, C. J., Skinner, C., & Plummer, N. (2001). Urban heat island features
of southeast Australian towns. Australian Meteorological Magazine, 50, 1–13.
United Nations. (2014). World Urbanization Prospects.
Zhang, K., Wang, R., Shen, C., & Da, L. (2009). Temporal and spatial characteristics of
the urban heat island during rapid urbanization in Shanghai, China.
Environmental Monitoring and Assessment, 169(1), 101–112.

1Professor at International Islamic University Malaysia. Email: [email protected] 295
PLANNING MALAYSIA:
Journal of the Malaysian Institute of Planners
VOLUME 15 ISSUE 1 (2017), Page 295 - 304
RISE OF ECLECTICISM IN THE 21ST CENTURY MALAYSIAN
MOSQUE ARCHITECTURE
Amir Hossein Zekrgoo1
1Kulliyyah of Architecture & Environmental Design
INTERNATIONAL ISLAMIC UNIVERSITY MALAYSIA
Abstract
A stylistic survey of Malaysian mosque architecture shows four distinct trends:
1) Traditional style, which covers most of the mosques that were built before the
country’s independence in 1957; 2) Colonial style that was influenced by Indian
Mughal architecture, was followed partly after independence, and continued for
a while after that; 3) Modern trend began with the National Mosque completed in
1965, and scattered mosques that were built after the National Mosque until the
end of the 20th century; and 4) Mosques that were erected in the 21st century,
which can be generally explained by the term ‘eclectic’ design. Eclecticism
gained rapid momentum in the field of Malaysian mosque architecture since the
dawn of the current century. Significant eclectic mosques that have transformed
the scene and skylines of major Malaysian cities have often been heavily financed
by the government – an indication of conscious choice of direction. This paper
aims at providing a categorisation of the process of evolution of contemporary
mosque architecture in Malaysia, not based on independent stylistic tendencies,
but under three major historical/thematic phases: 1) Independence and Departure
from Tradition; 2) Middle Eastern Inspirations; and 3) Rise of eclecticism, with
an emphasis on the last phase, i.e. rise of eclecticism in the 21st century. Masjid
Wilayah, completed in August 2000, was chosen as a case study because it is the
first major eclectic mosque born in the 21st century, incorporating some six
established styles, and also the most comprehensive example.
Keywords: Eclecticism, 21st century, style, architecture, mosque, Malaysia
Date Received: 30th April 2016
Date of Acceptance: 30th October 2016

Amir Hossein Zekrgoo
Rise of Eclecticism in the 21st Century Malaysian Mosque Architecture
© 2017 by MIP 296
INTRODUCTION
The evolution of Malaysian mosque architecture, from its traditional timber
prototypes that related and connected it to the large family of Southeast Asian
vernacular architecture, to the unique and independent styles that emerged after
independence, all the way to the colourful eclectic developments in the 21st
century, exhibits a rapid transformation of political thought, aesthetic values and
socio-economic identity. Adjustment to this change has not been easy, as it
brought about challenges at various levels – personal, cultural and national. But
it paved the way for problem-solving and creativity at a higher level. The ongoing
change expanded the views in the realm of architecture and environmental design,
and led to opportunities for new developments. At the same time, it disturbed the
tempo of life and introduced a lifestyle that is more exciting and less peaceful.
The evolution of architecture in any society is a byproduct of the evolution of
mindset, social norms and aesthetic values of the said society. On the other hand,
the appearance of new buildings changes a city-scape and, in a timespan, imposes
a new mindset, norms and values on the citizens. Eclecticism, which involves
borrowing forms and styles rooted in another culture, and using them in a single
monument/complex is an embodiment of this challenge.
PHASE 1: INDEPENDENCE AND DEPARTURE FROM TRADITION
Modernism, which was initially formed and developed in mid-19th century
Europe and America as a movement in art and literature, was soon spread to other
aspects of life and to non-Western societies, not only as an artistic form of
expression, but as a world view that favoured new over tradition. Modernism is
characterized by a deliberate rejection of tradition. Malaysian mosque
architecture before its independence in 1957 can be explained as having certain
style(s) of traditional timber architecture built from heavy hardwood species
called cengal (Balanocarpus heimii), constructed in post and beam system with
no metal fasteners to join the timber members (Ismail Said, 2001). Kampung Laut
Mosque, located in Kota Baru, Kelantan is the oldest existing example of
traditional Malay Mosque architecture. It is in many respects similar to Malay
house architecture (Figure 1).
Traditional Malaysian mosque architecture is part of a family of vernacular
tradition in Southeast Asia that includes Indonesian archipelago, Malay
Peninsula, Thailand and the Philippines. “What has so far been emphasized in
recorded history are the pyramid or meru type of timber roof which are either
placed on stilts or which cover masonry colonnaded wall with tiled floor”
(Mohamad Tajuddin Mohamad Rasdi, 2012).” Meru is a sacred mythical
mountain in Indian religious traditions (Hinduism, Buddhism and Jainism) and
considered as the central axis of the universe, both physical and metaphysical. As
most of the population of Southeast Asian countries were followers of Hinduism
and Buddhism before converting to Islam, the term survived mainly due to its

PLANNING MALAYSIA
Journal of the Malaysia Institute of Planners (2017)
© 2017 by MIP 297
cosmological connotations that associate it with the concept of the place of
worship – on the confluence of heaven and earth.
Figure 1 A Scaled Model of Kampung Laut Mosque
After Independence, the first outstanding monument that stressed on the
country’s independence as a nation on the one hand, and on its Islamic inclination
on the other, was the National Mosque or Masjid Negara. Unlike the typical
traditional Malay mosques, which were closely associated in their general
characters with Malay house architecture and conversed in the same visual
language of its surroundings, the National Mosque communicated a different
message using a different tone.
This monument, built from concrete, made a statement that projected
country’s new mindset and preferred future direction – not to continue with the
old traditions, but a deliberate departure from them. Although the National
Mosque’s semi-open umbrella-shaped roof may have some formal resemblance
to Malay traditional mosques, it projects a different spirit; it loudly resonates a
political slogan of nationalism adorned with religious embellishments in
monumental scale. A similar building with a white roof, known as ‘Hero’s
Mausoleum’ (Makam Pahlawan), was erected within the National Mosque’s
compound. It further echoed the political/national spirit. Makam Pahlawan,
completed in 1965, is the burial ground of a number of Malaysian leaders (Figure
2).

Amir Hossein Zekrgoo
Rise of Eclecticism in the 21st Century Malaysian Mosque Architecture
© 2017 by MIP 298
Figure 2 National Mosque or Masjid Negara, completed in 1965 is the larger structure
with patterned roof on the right while the smaller building with similar roof structure on
the left is the Hero’s Mausoleum (Makam Pahlawan).
PHASE 2: MIDDLE EASTERN INSPIRATIONS
The concept of umbrella-shaped roof for mosques stayed fashionable for a short
while, but by 1980’s the idea “…declined rapidly in popularity amongst the
architects, as onion-shaped dome regained its earlier prominence” (Abdul Halim
Nasir, 2004). The prominence of onion-shaped domes in Malaysia’s history in
the past few centuries, however, was not necessarily connected to Islam or any
religion for that matter, as it was also used extensively in the secular colonial
buildings by western non-Muslim rulers. No wonder then that the earliest
recorded mosque in Malaysia with onion-shaped dome, Ubudiah Mosque in
Perak (built in 1913-1917), was designed by a British architect Arthur Benison
Hubback (1871-1948). An overview of the architectural elements reveals a strong
inspiration from the Mughal architecture of India.
The trend of mosque architecture in post-independence Malaysia,
however, unveils a drastic change of inclination. Some scholars have put an effort
to provide a timeline for the dominance of architectural styles that emerged after
1957 until the end of the 20th century and vaguely called it modern (A. Ghafar
Ahmad, 1999). While buildings are called colonial simply for having onion-
shaped domes, it seems an over simplified or even misleading to include well-
established architectural styles such as those from Mughal India, Safavid Iran and
Ottoman Turkey that mark the majority of mosques erected during the period with
the term ‘Modern.’
Malaysia, after her independence, gradually exercised an open-door
policy that had significant impact on the country’s economy and culture, and as
a result, a wide range of styles – originating from the Subcontinent to the Middle
East, and even North Africa and Spain – appeared on the plain of mosque
architecture. Among them, mosques inspired by Turkey and Iran designs gained

PLANNING MALAYSIA
Journal of the Malaysia Institute of Planners (2017)
© 2017 by MIP 299
more popularity, especially with the major state funded mosques. An outstanding
example is the Blue Mosque or Shah Alam Mosque, the largest mosque in
Malaysia that was completed in 1988. This mosque which is also known by the
name of its founder as Sultan Salahuddin Abdul Aziz Mosque, has been reported
by the Malaysian Ministry of Tourism in 2011 to be Malaysia’s largest mosque
and the second largest in Southeast Asia. First glance at the pictures of the mosque
one could easily imagine that its location is somewhere in Iran or Turkey. The
form of the dome as well as the glazed blue tiles that entirely cover it, and
coloured windows seem Persian. While the overall plan with the four tall minarets
shows Ottoman influence (Figure 3). From the outer appearance of the Blue
Mosque, no Malay element is noticeable; although the inner skin of the dome is
covered with wooden panels that reflect Malay traditional architecture.
Figure 3 Blue Mosque Shah Alam, Selangor, Malaysia
PHASE 3: RISE OF ECLECTICISM
As stated earlier, the trend of adopting foreign styles of mosque architecture on
Malaysian soil picked up during the last two decades of the 20th century. During
this period architects experimented with various forms, styles, colours and
material, and as a result, a large number of small and medium size mosques of a
very wide spectrum of styles and designs were erected. The fast process of
mosque construction changed the landscape of Malaysia significantly. Most of
the newly built mosques were clearly influenced by certain well-established
styles or even a certain well-known mosque; a Qubbat al-Sakhra Mosque in
Jerusalem, for instance, has often been imitated. Though most scholars have stuck

Amir Hossein Zekrgoo
Rise of Eclecticism in the 21st Century Malaysian Mosque Architecture
© 2017 by MIP 300
to the general categorization of ‘traditional, colonial and modern,’ Mohamad
Tajuddin Mohamad Rosdi (2012) steps a little further and uses terms that are
more specific. He divides Malaysian mosque architecture historically into three
periods: “the Early Vernacular, the Colonial Adaptation and Modern – Post
Modern.
From the dawn of the 21st century, however, combining various
architectural styles in a single mosque became more of a conscious trend. Funding
bodies, which in most cases were government institutions, encouraged
incorporating foreign styles into mosque design. This was in line with promoting
tourism under the open door policy. Architects were given free hand to come up
with creative ideas, and financial support was there to implement them. A
systematic amalgamation of styles began to sprout, which in the process gave
birth to a rather new trend in Malaysian mosque architecture that may be
designated as “Eclectic Style” (Amir H. Zekrgoo, 2014).
Eclectic architecture is a product of amalgamation of elements from
various structural, spatial and decorative forms that carry features representing
specific and distinct cultures in a single structure (Turner, 1996). Although in an
overall assessment formal similarities were observed between Post Modernism
and Eclecticism, while studying it in Malaysian mosque architecture context one
realizes a fundamental difference. Post Modernism in architecture was a reaction
to Modern Functionalism in western architecture, which was perceived a failure.
This was partly because Modern architecture had undermined ornamentation at
the cost of function, and Post Modernism was there to revive the aesthetic aspect
of mosques.
Malaysian Eclecticism, on the other hand, had a total different
background. Modernism, in the technical/stylistic sense, never actually found
manifestation in Malaysian mosques; moreover, mosques were never deprived of
their ornamentation. In other words, architects of the 21st century Malaysia
experimented with formal and structural elements of existing styles in the Muslim
world in search of new compositions while their efforts were not in any way a
reaction or objection to the existing conditions.
From among a number of major eclectic mosques that the author has
surveyed, Masjid Wilayah, the grand regional mosque of Kuala Lumpur, seems
a distinct example.
Completed in August 2000 Masjid Wilayah is the first major eclectic
mosque born in the 21st century. While discussing the subject of eclecticism in
Islamic architecture, the author had a tradition of taking his students to this
mosque every semester for over a decade. In its construction, refined features
borrowed from renowned traditional styles are blended with sophisticated
modern technology. Studying the structure as well as its decorative components
one can trace the presence of features from the Sultan Ahmed Mosque of Istanbul
(Turkey), Shah Mosque in the Naqsh-e Jahan Square of Isfahan (Iran), the Taj
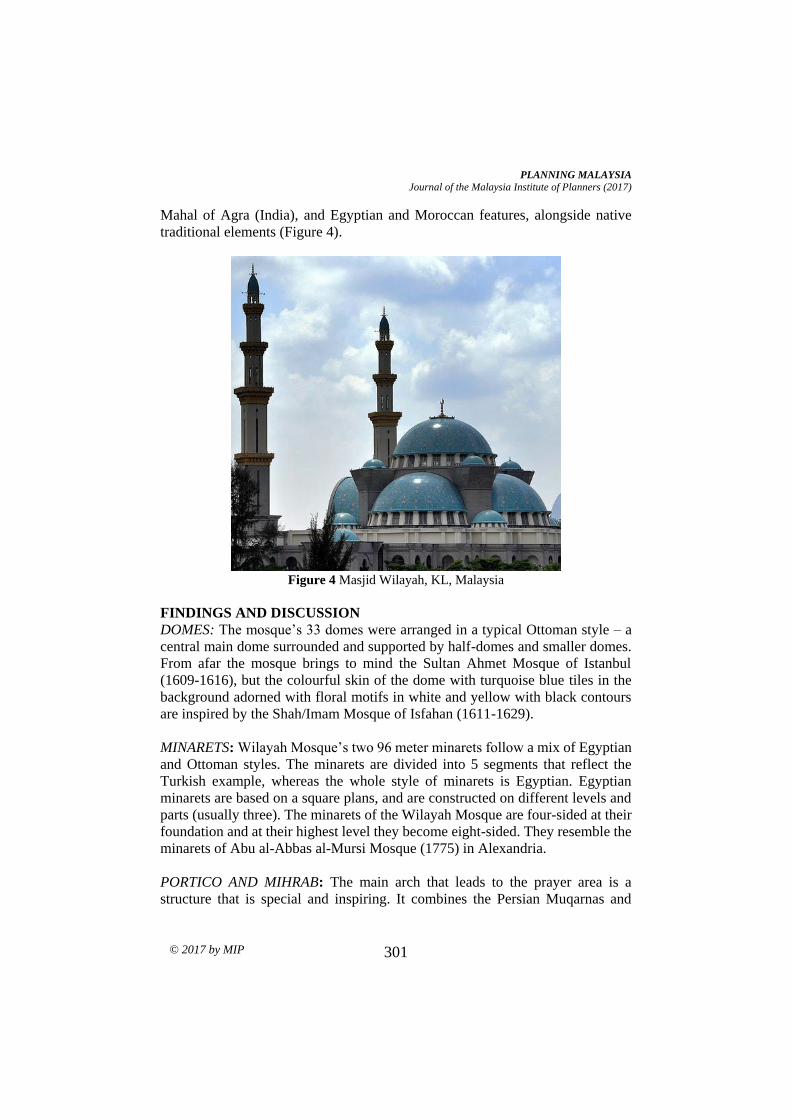
PLANNING MALAYSIA
Journal of the Malaysia Institute of Planners (2017)
© 2017 by MIP 301
Mahal of Agra (India), and Egyptian and Moroccan features, alongside native
traditional elements (Figure 4).
Figure 4 Masjid Wilayah, KL, Malaysia
FINDINGS AND DISCUSSION
DOMES: The mosque’s 33 domes were arranged in a typical Ottoman style – a
central main dome surrounded and supported by half-domes and smaller domes.
From afar the mosque brings to mind the Sultan Ahmet Mosque of Istanbul
(1609-1616), but the colourful skin of the dome with turquoise blue tiles in the
background adorned with floral motifs in white and yellow with black contours
are inspired by the Shah/Imam Mosque of Isfahan (1611-1629).
MINARETS: Wilayah Mosque’s two 96 meter minarets follow a mix of Egyptian
and Ottoman styles. The minarets are divided into 5 segments that reflect the
Turkish example, whereas the whole style of minarets is Egyptian. Egyptian
minarets are based on a square plans, and are constructed on different levels and
parts (usually three). The minarets of the Wilayah Mosque are four-sided at their
foundation and at their highest level they become eight-sided. They resemble the
minarets of Abu al-Abbas al-Mursi Mosque (1775) in Alexandria.
PORTICO AND MIHRAB: The main arch that leads to the prayer area is a
structure that is special and inspiring. It combines the Persian Muqarnas and
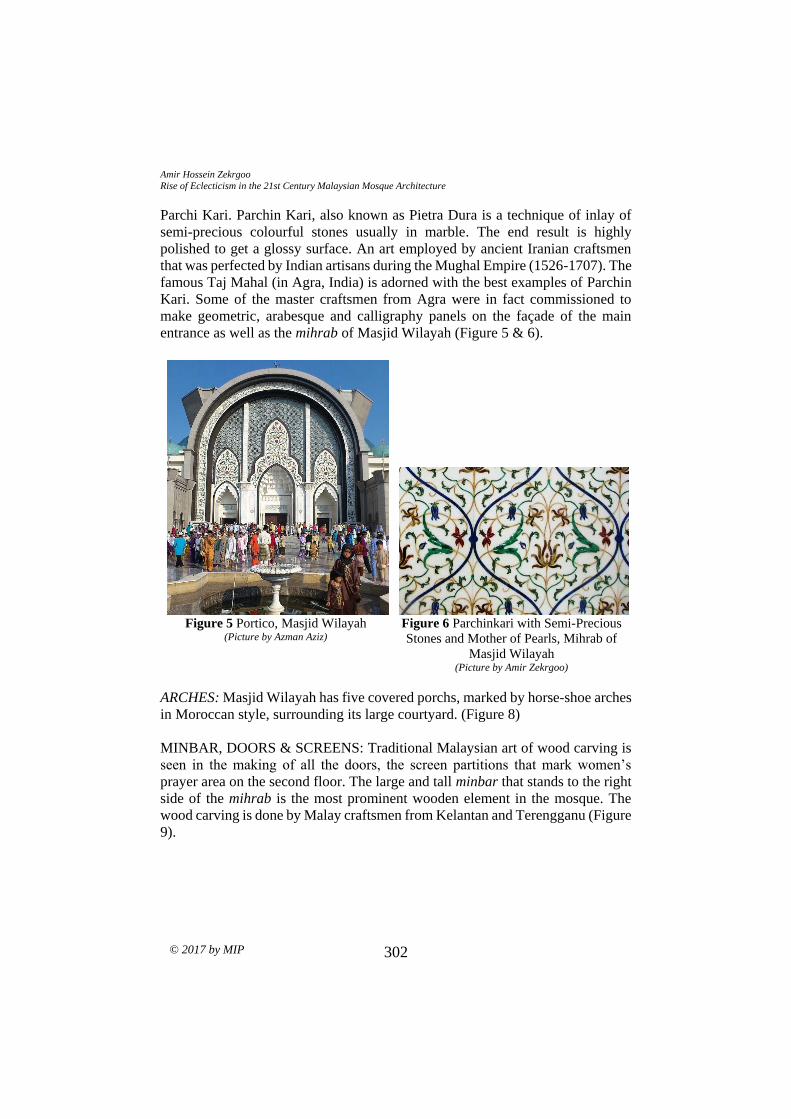
Amir Hossein Zekrgoo
Rise of Eclecticism in the 21st Century Malaysian Mosque Architecture
© 2017 by MIP 302
Parchi Kari. Parchin Kari, also known as Pietra Dura is a technique of inlay of
semi-precious colourful stones usually in marble. The end result is highly
polished to get a glossy surface. An art employed by ancient Iranian craftsmen
that was perfected by Indian artisans during the Mughal Empire (1526-1707). The
famous Taj Mahal (in Agra, India) is adorned with the best examples of Parchin
Kari. Some of the master craftsmen from Agra were in fact commissioned to
make geometric, arabesque and calligraphy panels on the façade of the main
entrance as well as the mihrab of Masjid Wilayah (Figure 5 & 6).
Figure 5 Portico, Masjid Wilayah
(Picture by Azman Aziz)
Figure 6 Parchinkari with Semi-Precious
Stones and Mother of Pearls, Mihrab of
Masjid Wilayah (Picture by Amir Zekrgoo)
ARCHES: Masjid Wilayah has five covered porchs, marked by horse-shoe arches
in Moroccan style, surrounding its large courtyard. (Figure 8)
MINBAR, DOORS & SCREENS: Traditional Malaysian art of wood carving is
seen in the making of all the doors, the screen partitions that mark women’s
prayer area on the second floor. The large and tall minbar that stands to the right
side of the mihrab is the most prominent wooden element in the mosque. The
wood carving is done by Malay craftsmen from Kelantan and Terengganu (Figure
9).

PLANNING MALAYSIA
Journal of the Malaysia Institute of Planners (2017)
© 2017 by MIP 303
Figure 7 Moroccan Arches Surrounding
Masjid Wilayah’s Courtyard. (Picture by Amir Zekrgoo)
Figure 8 Traditional Malay
Woodcarving with Floral Motifs Inspired
by Local Plants, Door to the Main Prayer
Hall, Masjid Wilayah (Picture by Amir Zekrgoo)
CONCLUSION
Malaysian mosque architecture underwent drastic transformation since its
independence in 1957. Before independence the mosques shared general
characteristics of South-east Asian vernacular timber architecture. Masjid Negara
marks the first departure from tradition towards modernism. After the erection of
this historic landmark, until the end of the 20th century, Malaysian urban
landscapes were witness to the sprout of countless mosques that were inspired
mostly by the Middle Eastern mosques. The result was colourful structures with
no clear stylistic direction. The 21st century however displays a conscious
direction towards treating eclecticism as a style, a deliberate bringing of multiple
styles under a single roof, which Masjid Wilayah in Kuala Lumpur seems to be a
comprehensive and impressive example. Eclectic mosque architecture of
Malaysia needs wider and deeper investigation, as the change of form and
structure of the mosques dictates different social behaviour of the Muslims in
their collective acts of worship. Acceptance or resistance towards such changes
can be regarded as an indications of the degree of willingness to depart from
indigenous cultural and aesthetic values.

Amir Hossein Zekrgoo
Rise of Eclecticism in the 21st Century Malaysian Mosque Architecture
© 2017 by MIP 304
REFERENCES A. Ghafar Ahmad (1999). The architectural styles of mosques in Malaysia: from
vernacular to modern structures. In Proceedings Symposium on Mosque
Architecture: The Historic and Urban Developments Of Mosque Architecture
(Volume 2) (pp. 147-163). King Saud University, Riyadh, Saudi Arabia.
https://cap.ksu.edu.sa/en/Symposiume_on_Mosque_Architecture
Abdul Halim Nasir (2004) (translated by Omar Salahuddin Abdullah). Mosque
architecture in the Malay World. Bangi: Penerbit Universiti Kebangsaan
Malaysia.
Amir H. Zekrgoo (2014). Emergence of eclecticism as style: new approaches to mosque
architecture in Malaysia. Firooze Islam, Journal of Research on Islamic
Architecture and Urbanism, 1(1), 25-32.
Ismail Said (2001). Art of woodcarving in timber mosques of Peninsular Malaysia and
Southern Thailand. Jurnal Teknologi, 34, 45-56.
Mohamad Tajuddin Mohamad Rasdi, (2012). Traditional Islamic architecture of
Malaysia. Kuala Lumpur: Dewan Bahasa dan Pustaka.
Turner, J. (1996). The Grove dictionary of art. New York: Oxford University Press.

1Ph.D. Candidate at International Islamic University Malaysia. Email: [email protected] 305
PLANNING MALAYSIA:
Journal of the Malaysian Institute of Planners
VOLUME 15 VOLUME 1 (2017), 305 - 318
BIBLIOMETRIC ANALYSIS ON QUANTIFYING URBAN SPRAWL IN
ASSESSING A COMPREHENSIVE MEANING OF SPRAWL: A
REVIEW
Nur Aulia Rosni1, Norzailawati Mohd Noor2, & Alias Abdullah3
1,2,3 Kulliyyah of Architecture & Environmental Design
INTERNATIONAL ISLAMIC UNIVERSITY MALAYSIA
Abstract
After more than half century has passed, urban sprawl remains as one of the most
important and unresolved matters in the urban development process. This paper
adopts “Bibliometrics Analysis” technique, which is a statistical analysis of
scientific publications to review the studies on urban sprawl from the year 1996
till 2015 in order to identify the fundamental issues and problem of urban sprawl.
This method allows the researcher to review the literature of topic of interest
critically, not only based on national and international networks but includes the
multi-disciplinary fields of science and technology relating to urban planning.
The publications on urban sprawl were retrieved from the two largest scientific
databases namely Scopus and ScienceDirect. The sampling of publications was
based on the “Most Cited Articles” indicator. The findings on urban sprawl issues
and problems are presented in four categories, which are the lack of consensus in
defining urban sprawl, unavailability of method to quantify urban sprawl, access
to data and tools, and varying urban sprawl patterns based on area. The findings
of this study provide the gap for future research on urban sprawl.
Keywords: Urban sprawl, sprawl issues and problem, urban sprawl planning,
bibliometric analysis.
Date Received: 30th April 2016
Date of Acceptance: 30th October 2016

Nur Aulia Rosni, Norzailawati Mohd Noor, & Alias Abdullah
Bibliometric Analysis on Quantifying Urban Sprawl in Assessing a Comprehensive Meaning of Sprawl: A Review
© 2017 by MIP 306
INTRODUCTION
The paper uses “Bibliometrics Analysis” technique to analyse research
publications on urban sprawl topic ranging from 1996 till 2015 in order to extract
the relevant issues and problems of urban sprawl. Since the term became apparent
in the 1950s, “Urban Sprawl” has been globally studied by researchers from
various backgrounds and interests. Unfortunately, even after a few decades have
passed, the definitive way to define urban sprawl is still absent. Urban sprawl is
a fundamental issue in modern urban development since its rapid, but
uncontrolled expansion is alarming for many professionals in the built
environment (Altieri et al., 2014; Arribas-Bel, Nijkamp & Scholten, 2011). Some
researchers agree that urban sprawl is something undesirable and have more
negative impact rather than positive consequences (Ewing, 2008; Ewing et al.,
2016; Ewing, Pendall & Chen, 2002; Knaap et al., 2005). Urban sprawl is a broad
term involving different characteristics and types, and caused by various factors,
thus different approaches are needed to address them (Majid & Yahya, 2010,
2011). Advocating for certain development concept or planning policies may not
necessarily be successful without initially knowing the key issues and problem of
sprawl faced by a city (Chorianopoulos et al., 2010; Habibi & Asadi, 2011).
THEORETICAL REVIEW ON URBAN SPRAWL
According to Wu (2006), a city is a highly complex socio-economic and spatial
entities with a distinct hierarchical order. It is a hub of almost all human activities
(Rajeshwari, 2006). Apart from physical forms, cities are shaped by various
development forces such as economic, political, cultural and social, which later
imposing themselves in physical forms and closely relate to urban sprawl
(Apostolos, 2007; Ardeshiri & Ardeshiri, 2011).
In Western countries, urban development is characterized by two
important processes which are the inner-city decline and urban sprawl. These two
processes are in fact interrelated as urban sprawl accelerates the inner-city
decline. Bhatta, Saraswati and Bandyopadhyay (2010b) consider “Urban
Growth” and “Urbanisation” are both the processes of “Urban Development.”
Meanwhile, urban growth and urbanisation as defined by EEA (2006) are “the
increase in the number of people living in towns and cities” and “the proportion
of a country that is urban”. The process has a high impact on the environment
such as depletion of natural resources, landscape deterioration, pollution and
climate changes (Olujimi, 2009; Ramachandra, Bharath & Sowmyashree, 2014;
Weng, 2001).
Based on the growing awareness of the public on the uncontrolled urban
development issues, it is vital to improve understanding of this phenomena and
their underlying causes (Rajeshwari, 2006; Verbeek, Boussauw & Pisman, 2014).
However, some scholars also argue that urban sprawl is inherent to city growth
and that it will always continue to be a side effect of urban development process

PLANNING MALAYSIA:
Journal of the Malaysia Institute of Planners (2017)
© 2017 by MIP 307
(Steil, Salingaros & Mehaffy, 2007; Almeida, 2005; Bhatta, Saraswati &
Bandyopadhyay, 2010b; Altieri et al., 2014). Thus, what is required is not halting
urban sprawl but to lessen its negative impacts in order to promote sustainable
development (Steil, Salingros & Mehaffy, 2001).
Sprawl has become a characteristic of urban development worldwide.
Urban sprawl has became one of the most important issues in the urban area
around the world since the twenty-first century whose importance is still growing
today (Altieri et al., 2014; Arribas-Bel, Nijkamp & Scholten, 2011). Its rapid and
uncontrolled expansion are alarming for many professionals including planners,
urban specialists, statisticians, engineers and decision makers Arribas-Bel,
Nijkamp & Scholten, 2011; Bruegmann, 2015; Ewing, Pendall & Chen, 2002).
On the contrary, sustainable development concept espouses development that
meets the requirements of the present without conceding the capability of
upcoming generations to meet theirs. (Ardeshiri & Ardeshiri, 2011; Tanguay et
al., 2010). The sustainable development concept has become increasingly
significant for creating a better future for the world, economically, socially and
environmentally (Arbury, 2005). As a result, this concept depends on the future
role of urban planning in handling urban sprawl issues (Catalán, Saurí & Serra,
2008; Yeh, 2000).
METHODOLOGY
Bibliometric analysis was used to obtain reliable information on urban sprawl
issues and problems. Bibliometric analysis offers a powerful set of methods and
measures for studying the structure and process of scholarly communication.
Besides, this method is expected to play an increasingly important role in research
assessment and management (Campbell et al., 2010; Bellis, 2009; Borgman &
Furner, 2002). Also, bibliometric indicators which quantify the production and
use of bibliographic material, have been used extensively in the assessment of
research performance (Russell & Rousseau, 2010; Campbell et al., 2010; Bellis,
2009; Reuters, 2008). The scientific databases used to collect journals and articles
include Scopus, ScienceDirect, and Web of Science ranging from the year 1996
to 2015 (20 years) as the principle search parameter. Specific keywords were
retrieved from the title and abstract of each journal and article using Boolean
Searching technique for urban sprawl publications of different subject areas. The
enormous numbers of publications for this topic were then limited by “Most Cited
Paper” for each year making the final document analysed pertinent to the interest
of this paper only 100 records from all databases. Based on the selected
publications, a detail and comprehensive analysis on the content of the literature
review was conducted using content analysis technique to extract the issues and
problems of sprawl.
The results from Bibliometric analysis not only provides valuable
information on the scientific trend and pattern of urban sprawl studies but assist

Nur Aulia Rosni, Norzailawati Mohd Noor, & Alias Abdullah
Bibliometric Analysis on Quantifying Urban Sprawl in Assessing a Comprehensive Meaning of Sprawl: A Review
© 2017 by MIP 308
the researcher in indicating the most important and relevant issues and problems
associated with urban sprawl for the last 20 years. The findings were discussed
into four categories of challenges namely (i) urban sprawl, (ii) geospatial indices,
(iii) GIS and remote sensing, lastly on (iv) the different urban context. The
identified issues and problems stand as the gap in determining urban land use
sprawl through geospatial indices measurement method using GIS and remote
sensing.
ANALYSIS AND FINDINGS
The term “Urban Sprawl” is a concept that is vague in its definition. Despite being
vigorously researched into, urban sprawl remains to be without a universally
accepted and well-established definition (Altieri et al., 2014; Arribas-Bel,
Nijkamp & Sholten, 2011; Barnes et al., 2001; Bhatta, 2010; Bhatta, Saraswati &
Bandyopadhyay, 2010a, 2010b; Bruegmann, 2015). Bibliometric analysis on
urban sprawl publications (Table 1) shows that publications on urban sprawl topic
have been increasing since 1996. This indicates a growing awareness among
academicians and professionals on urban sprawl. However, publications that
emphasise on defining urban sprawl are still lacking. For over 20 years, only 20%
of the publications focus on defining urban sprawl. The lowest publication on
urban sprawl studies is from medicine subject area (4.1%), business, management
and acccounting (4.8%), and economics, econometrics and finance (5.6%),
proving that there is some form of disregard of urban sprawl importance in some
subject areas.
Lack of awareness on sprawl issues from some areas cause the efforts to
contain sprawl sometimes resulted in increasing another (Coisnon, Oueslati &
Salani, 2014, 2012; Galster et al., 2001; Gottlieb, 1999; Ngoran & Xue, 2015;
Wu et al., 2006). Besides, the analysis of the pattern of urban sprawl publications
also indirectly explain why there are so many unintegrated methods and tools to
measure sprawl. In terms of the urban context, the United States is the leading
country in the urban sprawl research with 1,127 documents published in 20 years
period. The publication gap between the Unites States and China (391) is 736
publications. The huge difference proves that urban sprawl issues first
acknowledged and conducted in the United States. Most of literature and debates
on urban sprawl also have been based on the US experience (Chorianopoulos et
al., 2010; Habibi & Asadi, 2011; Nechyba & Walsh, 2004; Travisi, Camagni, &
Nijkamp, 2009). China is taking the lead in the context of Asian Countries,
followed by India (91 publications) and Japan (49 publications). Countries with
a low number of research publications are either developing or third world
countries that faced problem such as over-populated, slum area, congestion and
apparently sprawling.

PLANNING MALAYSIA:
Journal of the Malaysia Institute of Planners (2017)
© 2017 by MIP 309
Table 1 Publications on Urban Sprawl
Sources: Scopus, ScienceDirect, WoS
DISCUSSION OF ISSUES AND PROBLEMS
Urban Sprawl
Unavailability of agreeable definition for the term
Urban sprawl is a term that has a long history in the academic and development
practice. Nonetheless, it is still widely discussed as a major problem today
(Coisnon, Oueslati & Salani 2014). Surprisingly, a standard and precise definition
of urban sprawl is still not existed (Altieri et al., 2014; Bruegmann, 2015; Terzi
& Kaya, 2008; Theobald, 2003; Wilson et al., 2003). Bhatta, Saraswati and
Bandyopadhyay (2010a) claim urban sprawl as a concept suffers from difficulties
in the definition. Hammer and Witten (2011) question if there is a single widely
accepted definition of sprawl on which the majority of stakeholders can agree.
Hasse and Kornbluh (2004) add that there is a need to better define the term to
focus specifically on the undesirable and problematic development that many
stakeholders are arguing.
Urban Sprawl Urban Sprawl Definition
Year Scopus
Science
Direct
Web of
Science Scopus
Science
Direct
Web of
Science
1. 2015 314 821 132 8 379 9
2. 2014 331 663 136 8 278 7
3. 2013 310 661 111 8 290 8
4. 2012 296 562 98 9 250 1
5. 2011 265 404 90 5 160 6
6. 2010 238 316 87 3 151 2
7. 2009 202 373 90 4 148 2
8. 2008 217 339 63 5 150 1
9. 2007 170 261 55 4 105 1
10. 2006 143 259 41 4 110 1
11. 2005 147 186 36 12 76 3
12. 2004 118 212 35 4 77 2
13. 2003 108 158 17 7 68 5
14. 2002 81 135 17 3 56 1
15. 2001 86 173 26 3 64 3
16. 2000 57 107 12 1 37 1
17. 1999 37 63 7 0 24 0
18. 1998 37 72 7 1 27 1
19. 1997 25 106 4 0 47 0
20. 1996 25 92 5 0 39 0
TOTAL 3,207 5,963 1,069 89 2,536 56
10,239 2,679

Nur Aulia Rosni, Norzailawati Mohd Noor, & Alias Abdullah
Bibliometric Analysis on Quantifying Urban Sprawl in Assessing a Comprehensive Meaning of Sprawl: A Review
© 2017 by MIP 310
According to Ewing (2008), Ewing, Pendall and Chen (2002, and Galster
et al. (2001), most people especially professionals may recognise sprawl when
they see it, but this may not be helpful in practice especially in the rule or decision
making. Currently, sprawl has been loosely defined as dispersed and inefficient
urban growth that is always associated with characteristic such as low-density,
decentralization and fragmentation (Farber & Li, 2013; Hasse & Lathrop, 2003).
Without a universal definition, quantification and modelling of urban sprawl are
difficult (Bhatta, Saraswati & Bandyopadhyay, 2010b; Wilson et al., 2003).
Moreover, Bruegmann (2015) also states that there has been a significant debate
in academia on how to measure sprawl and to understand its dynamics, thus a
universal definition of urban sprawl is required.
Ambiguous ways in determining the urban sprawl concept
Urban sprawl is a critical issue in today’s world. While being a manifestation of
development, it is known for its negative environmental and social impacts
(Crawford, 2007; Feng et al., 2015). Over the years, urban sprawl concept has
been defined in many ways by many different groups with each definition
seemingly only serving each particular group’s interest (Haase & Nuissl, 2007;
Hammer & Witten, 2011; Ngoran & Xue, 2015). As a matter of fact, not all urban
growth is considered as sprawl and one person's sprawl can be another person's
solution to sprawl (Almeida, 2005; Gottlieb, 1999). Numerous studies have
revealed the nature of urban sprawl and the reasons for its occurrence in different
contexts (Coisnon, Oueslati & Salani, 2014). Much of the confusion about
sprawl, especially on causes, consequences and conditions, stems from the
conflation of ideology, experience, and effects (Galster et al., 2001).
Universality: Sprawl from a broader context
As pointed out earlier, the term ‘‘urban sprawl’’ is loose and ambiguous. It can
be seen that urban sprawl is not only important issue for urban specialists,
planners, and statisticians, but this issue expanded to the mainstream. The rapid
and uncontrolled urban expansion in the world is alarming, both in developed and
developing countries (Altieri et al., 2014; Banzhaf & Lavery, 2010; Bruegmann,
2015; Wassmer, 2007). However, this variety of views and understandings on the
matter may also enrich the analysis if performed universally (Arribas-Bel,
Nijkmap & Scholten, 2011; Barnes et al., 2001). Urban development process
without sufficient understanding of its wider context leads to inadequate
interpretations of sprawl and its impact (Altieri et al., 2014; Bhatta, Saraswati &
Bandyopadhyay, 2010b; Chorianopoulos et al., 2010). Ewing (1997) prove that
there are different standpoint of viewing and defining urban sprawl from town
planners and economists perspectives. Anas and Pines (2008) and Vyn, (2012)
explore the idea of studying the relationship between different aspect of sprawls

PLANNING MALAYSIA:
Journal of the Malaysia Institute of Planners (2017)
© 2017 by MIP 311
that proved unintegrated development policies might reduce sprawl in one aspect
but increase in another.
Other issues and problem associated with urban sprawl
Urban sprawl is a serious challenge for urban management and planning in many
countries (Gennaio, Hersperger & Burgi, 2009). Assessment of the environmental
and socio-economic impact of sprawl fails to find the solution and is still a subject
of debate (Haase & Nuissl, 2007). Furthermore, many urban management
strategies for sustainable development such as compact city, smart growth and
green city concept contradict one another and failed to curb sprawl
comprehensively (Arbury, 2005; Ardeshiri & Ardeshiri, 2011). Besides, urban
sprawl has contributed to the deterioration of the quality of life. A study by Ewing
et al. (2014) shows that adults living in sprawling counties have a higher body
mass index (BMI) and are more likely to be obese than are their counterparts
living in compact cities.
Sprawl is widely discussed but poorly understood. It may mean different
things to different people. However, most observers seem to agree that sprawl
can be characterized by a fragmented pattern of land development (Wu, 2006).
However, Gottlieb (1999) claims that many economists do not see sprawl as a
problem nor acknowledge its existence because the fragmented pattern of city
growth is a result of fair-market being in operation. Many economists also argue
that sprawl occurs due to market failures and lack of useful integrated economic
model (Anas & Rhee, 2006; Brueckner & Helsley, 2011; Nechyba & Walsh,
2004). In contrast, urban planners and policy makers favour land use controls that
directly limit the expansion of cities and encourage high-density development in
central cities, which are widely presumed to reduce sprawl (Ewing, 1997).
Geospatial Indices Distinguishing urban development from urban sprawl
As urban development occurs, its growth is often confused with urban sprawl.
Ewing (2008) suggests that there are three dimensions associated with urban
development namely land use, density and time. The same dimensions also apply
to sprawl. However, to what extend the growth is dispersed or compact remain as
a problem (Almeida, 2005; Burchfield et al., 2006; Tsai, 2005). Additionally,
understanding on urban sprawl, especially in Asian countries, still heavily relies
on qualitative discussion instead of quantitative analysis (Feng, 2008). Some
scholars propose that urban sprawl needs to be quantitatively measured in order
to determine whether it is on the rise or decline, and whether it is a recent
occurrence or has been evident for a long time (Gerundo & Grimaldi, 2011;
Bruegmann, 2015).

Nur Aulia Rosni, Norzailawati Mohd Noor, & Alias Abdullah
Bibliometric Analysis on Quantifying Urban Sprawl in Assessing a Comprehensive Meaning of Sprawl: A Review
© 2017 by MIP 312
Limitation in capturing the characteristics of urban sprawl in measurement
As mentioned earlier, many definitions use characteristics such as low density or
dispersed development to identify urban sprawl. However, these features are not
adequately defined or explained, nor these can comprehensively determine urban
sprawl (Ardeshiri & Ardeshiri, 2011; Couch & Karecha, 2006). As different
factors caused various types of sprawl, different approaches are required to
address them. Any measures taken without first knowing what kinds of sprawl
the city is facing may not necessarily work (Majid & Yahya, 2010; Verbeek et
al., 2014). Numerous researches were dedicated to the measurement or urban
form, but they have limitations in capturing the overall characteristics of urban
sprawl. (Almeida, 2005; Jaeger, Bertiller, Schwick, Cavens & Kienast, 2010;
Jaeger, Bertiller, Schwick & Kienast, 2010; Li & Yeh, 2004; Steil, Salingaros &
Mehaffy, 2007; Yeh & Li, 1999a, 1999b). Bhatta, Saraswati and
Bandyopadhyay (2010a) assert that effective way to identify sprawl can never
be achieved without first defining its solid characterisations. However, this is not
an easy task since previous researches on characterising sprawl have either failed
to draw a conclusion or cannot be universally implemented.
Managing urban sprawl from different geographical background
According to Ewing et al. (2016), there is rather limited researches that explore
the global characteristics of urban development and urban sprawl as well as their
implications for equity and sustainable development. Gennaio, Herperger and
Burgi (2009) relate this problem to the difficulties in comparing the international
urban development due to diverse databases. They found that different countries
have different databases and in many cases, the data is different between cities,
counties and states of the same country.
GIS and Remote Sensing Application Availability of routinely update database
Frequent monitoring of urban sprawl is needed to limit the impact of this
phenomenon towards the environment. Thus regularly updated data is required
for that purpose Altieri et al., 2014; Durieux, Lagabrielle & Nelson, 2008). As
highlighted beforehand, there are not many quantitative contributions in urban
sprawl research as compared to the qualitative discussion. One probable reason
for this scenario is the limited availability of good and reliable data (Arribas-Bel,
Nijkamp & Scholten, 2011). Information on urban development especially in
developing cities is often unavailable, due to their rapid development and
capacity constraints of planning authorities to keep track. The ability to assess,
measure and monitor sprawl depend on the availability of relevant, accurate and
reliable data (Altieri et al., 2014; Belal & Moghanm, 2011; Bhatta, Saraswati &
Bandyopadhyay, 2010b; Feng, 2008; Herold, Couclelis & Clarke, 2005; Osman,
Nawawi & Abdullah, 2008).

PLANNING MALAYSIA:
Journal of the Malaysia Institute of Planners (2017)
© 2017 by MIP 313
Lack of synchronizing tools/methods to control urban sprawl
Allen and Lu (2003) state that modelling and predicting urban growth has begun
in the 1950s, but slowed down during 1970s to 1980s. Recent availability and
improvement of spatial data combined with the advancement of geographic
information system and computer technologies, the activities have again
increased since the 1990s till now. However, there are still very few methods used
to assist in the identification and monitoring of urban sprawl in development
areas. Therefore, there is a clear need for such method to be used with geospatial
databases from GIS and remote sensing data (Altieri et al., 2014). Anas and Pines
(2008) argue that if local urban planners and decision makers were to use
uncoordinated land use policies that are generated based on less accurate data and
inadequate evaluation methods, the overall urban sprawl rate may increase and
cause shuffling of population among neighbouring cities. Last but not least, the
recent demand for the data with high resolution and accuracy as well as the latest
technology of geospatial tools. The high cost of data acquisition and tools used
to process the data has affected the stages in conducting research and the quality
of outcomes (Gamba, 2009).
Urban Context Excessive concentration on urban sprawl experience from specific urban
context
Many researchers have come to conclude that modern debates on the urban form
and urban sprawl have become influenced strongly by the result of an excessive
concentration on American experiences, hence, leading to neglecting of
experience from urban context of other countries. Urban sprawl occurrence varies
in different context due to various economic, geographic, environmental, social
and political situations (EEA, 2006; Castracane et al., 2003; Catalán, Sauri &
Serra, 2008; Chorianopoulos et al., 2010; Couch & Karecha, 2006; Habibi &
Asadi, 2011; Nechyba & Walsh, 2004). Most of the developing countries
particularly in Asia suffer the absent of clear quantitive approaches to indicate
sprawl and way to evaluate the extent of its growth (Feng, 2008). Moreover, there
is a growing awareness from researchers in Europe, Asia and Africa on the issue
where majority of the literature on sprawl focuses on American urban areas
(Travisi, Camagni & Nijkamp, 2009). Based on the bibliometric analysis
conducted for this research, it can be seen that as of 2015, the United States of
America has the highest number of published literature on sprawl. For Asian
countries, China and India are taking the leads while Malaysia is still in infancy
stage. Osman, Nawawi and Abdullah (2008) proclaim that in Malaysia, there is
relatively low visibility of urban issues and there seemed to be many lingering
problems which were the outcome of the urban development process for the past
thirty years. The development process influenced by globalisation and economic

Nur Aulia Rosni, Norzailawati Mohd Noor, & Alias Abdullah
Bibliometric Analysis on Quantifying Urban Sprawl in Assessing a Comprehensive Meaning of Sprawl: A Review
© 2017 by MIP 314
competitiveness factors that seen many main cities as economic growth engines,
so the control of its previous expansion almost not exists. The intensification of
urban sprawl within the three top Malaysia’s metropolitan areas has led to greater
growth in urban areas outside the city centre boundaries (Abdullah, 2012).
CONCLUSIONS
The paper provides an insight of the current trend and status of urban sprawl
studies based on published literature through most used scientific databases. By
doing so, the researcher was able to find most relevant and reliable sources of
research information on urban sprawl to extract the issues and problem.
Examining the issues and problems of this topic helps the researcher to find the
most significant research gap, and the best solution can be explored. The author
explores the Bibliometric analysis technique, which is the best known of
sophisticated approaches, in evaluating the qualitative literature into quantitative
assessment (Borgman & Furner, 2002). This paper contributes to determining the
research gaps for author’s research on ‘Developing Land Use Geospatial Indices
(LUGI) in Measuring Urban Sprawl using GIS and Remote Sensing Techniques:
Case Study of Kuala Lumpur.”
ACKNOWLEDGEMENT
The authors greatly acknowledge the support from IIUM. The authors also thank
all the reviewers for their comments and suggestion for the improvement of this
paper.
REFERENCES Abdullah, J. (2012). City competitiveness and urban sprawl : their implications to socio-
economic and cultural life in Malaysian cities. Procedia - Social and Behavioral Sciences,
50, 20–29.
Allen, J., & Lu, K. (2003). Modeling and prediction of future urban growth in the Charleston
Region of South Carolina : a GIS-based integrated approach. Conservation Ecology, 8(2),
20. Retrieved from http://www.consecol.org
Almeida, B. (2005). A GIS Assessment of Urban Sprawl in Richmond, Virginia (Master’s
thesis). Virginia Polytechnic Institute and State University, Blacksburg, Virginia, USA.
Altieri, L., Cocchi, D., Pezzi, G., Scott, E. M., & Ventrucci, M. (2014). Urban sprawl
scatterplots for urban morphological zones data. Ecological Indicators, 36, 315–323.
Anas, A., & Pines, D. (2008). Anti-sprawl policies in a system of congested cities. Regional
Science and Urban Economics, 38(5), 408–423.
Anas, A., & Rhee, H. J. (2006). Curbing excess sprawl with congestion tolls and urban
boundaries. Regional Science and Urban Economics, 36(4), 510–541.
Apostolos, L. (2007). Fractal analysis of the urbanization at the outskirts of the city : models,
measurement and explanation. Cybergeo, Article 391. Retrieved from
https://cybergeo.revues.org/8902.
Arbury, J. (2005). From urban sprawl to compact city – an analysis of urban growth
management in Auckland (Master’s thesis). University of Auckland, Auckland, Australia.

PLANNING MALAYSIA:
Journal of the Malaysia Institute of Planners (2017)
© 2017 by MIP 315
Ardeshiri, M., & Ardeshiri, A. (2011). Sprawl or Compact City: The Role of Planners in
Urbanization Processes in Developing Countries. Conference on Built and Natural
Environment Research Papers. The British University, Egypt.
Arribas-Bel, D., Nijkamp, P., & Scholten, H. (2011). Multidimensional urban sprawl in
Europe: A self-organizing map approach. Computers, Environment and Urban Systems,
35(4), 263–275.
Banzhaf, H. S., & Lavery, N. (2010). Can the land tax help curb urban sprawl? Evidence from
growth patterns in Pennsylvania. Journal of Urban Economics, 67(2), 169–179.
Barnes, K. B., Morgan, J. M., Roberge, M. C., & Lowe, S. (2001). Sprawl Development: Its
Patterns, Consequences, and Measurement (Technical report). Towson University,
Baltimore, Maryland.
Belal, A. A., & Moghanm, F. S. (2011). Detecting urban growth using remote sensing and
GIS techniques in Al Gharbiya Governorate, Egypt. The Egyptian Journal of Remote
Sensing and Space Science, 14(2), 73–79.
Bellis, N. De. (2009). Bibliometrics and citation analysis: from the science citation index to
cybermetrics. Maryland, United States of America: The Scarecrow Press Inc.
Bhatta, B. (2010). Analysis of urban growth and sprawl from remote sensing data. New York:
Springer-Verlag Berlin Heidelberg.
Bhatta, B., Saraswati, S., & Bandyopadhyay, D. (2010a). Quantifying the degree-of-freedom,
degree-of-sprawl, and degree-of-goodness of urban growth from remote sensing data.
Applied Geography, 30(1), 96–111.
Bhatta, B., Saraswati, S., & Bandyopadhyay, D. (2010b). Urban sprawl measurement from
remote sensing data. Applied Geography, 30(4), 731–740.
Borgman, C. L., & Furner, J. (2002). Scholarly communication and bibliometrics. Annual
Review of Information Science and Technology, 36, 2–72.
Brueckner, J. K., & Helsley, R. W. (2011). Sprawl and blight. Journal of Urban Economics,
69(2), 205–213.
Bruegmann, R. (2015). Urban sprawl. International encyclopaedia of the social & behavioral
sciences (Second Edi, Vol. 24). Elsevier.
Burchfield, M., Overman, H. G., Puga, D., & Turner, M. a. (2006). Causes of sprawl: a portrait
from space. The Quarterly Journal of Economics, 121(2), 587–633.
Campbell, D., Picard-Aitken, M., Cote, G., Caruso, J., Valentim, R., Edmonds, S.,
Archambault, E. (2010). Bibliometrics as a performance measurement tool for research
evaluation: the case of research funded by the National Cancer Institute of Canada.
American Journal of Evaluation, 31(1), 66–83.
Castracane, P., Iavarone, F., Mica, S., Sottile, E., Vignola, C., Arino, O., Pratesi, I. (2003).
Monitoring urban sprawl and its trends with EO data. UrbEx, a prototype national service
from a WWF-ESA joint effort. 2nd GRSS/ISPRS Joint Workshop on “Data Fusion and
Remote Sensing over Urban Areas. (pp. 245–248).
Catalán, B., Saurí, D., & Serra, P. (2008). Urban sprawl in the Mediterranean? Patterns of
growth and change in the Barcelona Metropolitan Region 1993-2000. Landscape and
Urban Planning, 85(3–4), 174–184.
Chorianopoulos, I., Pagonis, T., Koukoulas, S., & Drymoniti, S. (2010). Planning,
competitiveness and sprawl in the Mediterranean city: the case of Athens. Cities, 27(4),
249–259.
Coisnon, T., Oueslati, W., & Salani, J. (2014). Urban sprawl occurrence under spatially
varying agricultural amenities. Regional Science and Urban Economics, 44(1), 38–49.
Couch, C., & Karecha, J. (2006). Controlling urban sprawl: Some experiences from Liverpool.
Cities, 23(5), 353–363.

Nur Aulia Rosni, Norzailawati Mohd Noor, & Alias Abdullah
Bibliometric Analysis on Quantifying Urban Sprawl in Assessing a Comprehensive Meaning of Sprawl: A Review
© 2017 by MIP 316
Crawford, T. W. (2007). Where does the coast sprawl the most? Trajectories of residential
development and sprawl in coastal North Carolina, 1971-2000. Landscape and Urban
Planning, 83(4), 294–307.
Durieux, L., Lagabrielle, E., & Nelson, A. (2008). A method for monitoring building
construction in urban sprawl areas using object-based analysis of Spot 5 images and
existing GIS data. ISPRS Journal of Photogrammetry and Remote Sensing, 63(4), 399–
408.
E. E. A. (2006). Urban sprawl in Europe: The ignored challenge. Copenhagen.
Ewing, R. (1997). Is Los Angeles-style sprawl desirable? Journal of the American Planning
Association, 63(1), 107.
Ewing, R. (2008). Characteristic, causes, and effects of sprawl: a literature review. In J. M.
Marzluff, W. Endlicher, G. Bradley, U. Simon, E. Shulenberger, M. Alberti, … C.
ZumBrunnen (Eds.), Urban Ecology An International Perspective on the Interaction
Between Humans and Nature (1st ed.), p. 829. New York: Springer.
Ewing, R., Hamidi, S., Grace, J. B., & Dennis, Y. W. (2016). Does urban sprawl hold down
upward mobility? Landscape and Urban Planning, 148, 80–88.
Ewing, R., Meakins, G., Hamidi, S., & Nelson, A. C. (2014). Relationship between urban
sprawl and physical activity, obesity, and morbidity - update and refinement. Health and
Place, 26, 118–126.
Ewing, R., Pendall, R., & Chen, D. (2002). Measuring sprawl and its impact. Smart growth
America. Retrieved from http://www.smartgrowthamerica.org/
sprawlindex/sprawlindex.html
Farber, S., & Li, X. (2013). Urban sprawl and social interaction potential: an empirical analysis
of large metropolitan regions in the United States. Journal of Transport Geography, 31,
267–277.
Feng, L. (2008). Applying remote sensing and GIS on monitoring and measuring urban
sprawl. A case study of China. International Journal of Applied Earth Observation and
Geoinformation, 10(1), 47–56.
Feng, L., Du, P., Zhu, L., Luo, J., & Adaku, E. (2015). Investigating sprawl along China’s
urban fringe from a spatio-temporal perspective. Applied Spatial Analysis and Policy,
(September).
Galster, G., Hanson, R., Ratcliffe, M. R., Wolman, H., Coleman, S., & Freihage, J. (2001).
Wrestling sprawl to the ground: defining and measuring an elusive concept. Housing
Policy Debate, 12(4), 681–717.
Gamba, P. (2009). Current trends in urban remote sensing. In Proceedings of the 30th Asian
Conference on Remote Sensing, 6.
Gennaio, M. P., Hersperger, A. M., & Burgi, M. (2009). Containing urban sprawl - evaluating
effectiveness of urban growth boundaries set by the Swiss Land Use Plan. Land Use
Policy, 26(2), 224–232.
Gerundo, R., & Grimaldi, M. (2011). The measure of land consumption caused by urban
planning. Procedia Engineering, 21, 1152–1160.
Gottlieb, P. D. (1999). Do economists have anything to contribute to the debate on urban
sprawl? (And would anybody listen to them if they did?). Forum for Social Economics,
28(2), 51–64.
Haase, D., & Nuissl, H. (2007). Does urban sprawl drive changes in the water balance and
policy? Landscape and Urban Planning, 80(1–2), 1–13.
Hasse, J. E., & Lathrop, R. G. (2003). Land resource impact indicators of urban sprawl.
Applied Geography, 23(2–3), 159–175.
PLANNING MALAYSIA:
Journal of the Malaysia Institute of Planners (2017)
© 2017 by MIP 317
Hasse, J., & Kornbluh, A. (2004). Measuring accessibility as a spatial indicator sprawl. Middle
States Geographer, 37, 108–115.
Habibi, S., & Asadi, N. (2011). Causes, results and methods of controlling urban sprawl.
Procedia Engineering, 21, 133–141.
Hammer, M. J., & Witten, J. D. (2011). Conservation and development? Effectively packaging
land protection tools to preserve farmland and manage growth. Tufts University.
Retrieved from http://search.proquest.com/docview
/879424533?accountid=13042\nhttp://oxfordsfx.hosted.exlibrisgroup.com/oxford?url_v
er=Z39.88-
2004&rft_val_fmt=info:ofi/fmt:kev:mtx:dissertation&genre=dissertations+&+theses&si
d=ProQ:ProQuest+Dissertations+&+Theses+Global&a
Herold, M., Couclelis, H., & Clarke, K. C. (2005). The role of spatial metrics in the analysis
and modeling of urban land use change. Computers, Environment and Urban Systems,
29(4), 369–399.
Jaeger, J. A., Bertiller, R., Schwick, C., Cavens, D., & Kienast, F. (2010). Urban permeation
of landscapes and sprawl per capita: new measures of urban sprawl. Ecological
Indicators, 10(2), 427–441.
Jaeger, J. A. G., Bertiller, R., Schwick, C., & Kienast, F. (2010). Suitability criteria for
measures of urban sprawl. Ecological Indicators, 10(2), 397–406.
Knaap, G., Song, Y., Ewing, R., & Clifton, K. (2005). Seeing the Elephant : Multi-disciplinary
Measures of Urban Sprawl. Retrieved from
http://smartgrowth.umd.edu/multidisciplinarymeasuresurbansprawl.html.
Li, X., & Yeh, A. G.-O. (2004). Analyzing spatial restructuring of land use patterns in a fast
growing region using remote sensing and GIS. Landscape and Urban Planning, 69(4),
335–354.
Majid, M. R., & Yahya, H. (2010). Sprawling of a Malaysian city: what type and what
solutions? The First International Conference on Sustainable Urbanization (ICSU 2010),
Kowloon, Hong Kong.
Majid, M. R., & Yahya, H. (2011). Urban Sprawl In Malaysia : Is Compact Development The
Answer ? Johor Bahru, Malaysia.
Nechyba, T. J., & Walsh, R. P. (2004). Urban sprawl. Journal of Economic Perspectives,
18(4), 177–200.
Ngoran, S. D., & Xue, X. (2015). Addressing urban sprawl in Douala, Cameroon: Lessons
from Xiamen integrated coastal management. Journal of Urban Management, 4, 53–72.
Olujimi, J. (2009). Evolving a planning strategy for managing urban sprawl in Nigeria.
Journal of Human Ecology, 25(3), 201–208.
Osman, S., Nawawi, A. H., & Abdullah, J. (2008). Urban sprawl and its financial cost : - a
conceptual framework. Asian Social Science, 4, 39–50.
Rajeshwari. (2006). Management of the urban environment using remote sensing and
geographical information systems. Journal of Human Ecology, 20(4), 269–277.
Ramachandra, T. V., Bharath, a. H., & Sowmyashree, M. V. (2014). Monitoring urbanization
and its implications in a mega city from space: Spatiotemporal patterns and its indicators.
Journal of Environmental Management, 148, 67-81.
Reuters, T. (2008). Whitepaper using Bibliometrics: a guide to evaluating research
performance with citation data. Thomson Reuters.
Russell, J. M., & Rousseau, R. (2010). Bibliometrics and institutional evaluation.
Encyclopaedia of Life Support Systems (EOLSS), Part 19.3 Science and Technology
Policy. UNESCO/EOLSS Publishers.

Nur Aulia Rosni, Norzailawati Mohd Noor, & Alias Abdullah
Bibliometric Analysis on Quantifying Urban Sprawl in Assessing a Comprehensive Meaning of Sprawl: A Review
© 2017 by MIP 318
Steil, L., Salingaros, N. A., & Mehaffy, M. W. (2007). Growing sustainable suburbs : an
incremental strategy for reconstructing sprawl. In T. Haas (Ed.), New Urbanism and
beyond: contemporary and future trends in urban design, pp. 1–25. Rizzoli.
Tanguay, G. a., Rajaonson, J., Lefebvre, J. F., & Lanoie, P. (2010). Measuring the
sustainability of cities: An analysis of the use of local indicators. Ecological Indicators,
10(2), 407–418.
Terzi, F., & Kaya, H. S. (2008). Analyzing urban sprawl patterns through fractal geometry:
the case of Istanbul Metropolitan Area (CASA Working Paper No. 144). London: Centre
for Advanced Spatial Analysis (UCL).
Theobald, D. M. (2003). Defining and mapping rural sprawl: examples from the Northwest
US*. Fort Collins, CO: Growth Management Leadership Alliance white paper.
Travisi, C. M., Camagni, R., & Nijkamp, P. (2009). Impacts of urban sprawl and commuting:
a modelling study for Italy. Journal of Transport Geography, 18(3), 382–392.
Tsai, Y.-H. (2005). Quantifying urban form: compactness versus “sprawl.” Urban Studies,
42(1), 141–161.
Verbeek, T., Boussauw, K., & Pisman, A. (2014). Presence and trends of linear sprawl:
Explaining ribbon development in the north of Belgium. Landscape and Urban Planning,
128, 48–59.
Vyn, R. J. (2012). Examining for evidence of the leapfrog effect in the context of strict
agricultural zoning. Land Economics, 88, 457–477.
Wassmer, R. W. (2007). Causes of urban sprawl in the United States: auto reliance as
compared to natural evolution, flight from blight, and local revenue reliance. Journal of
Policy Analysis and Management, 27(3), 536-555.
Weng, Q. (2001). A remote sensing – GIS evaluation of urban expansion and its impact on
surface temperature in the Zhujiang Delta, China. International Journal Remote Sensing,
22(10), 1999–2014.
Wilson, E. H., Hurd, J. D., Civco, D. L., Prisloe, M. P., & Arnold, C. (2003). Development of
a geospatial model to quantify, describe and map urban growth. Remote Sensing of
Environment, 86(3), 275–285.
Wu, J. (2006). Environmental amenities, urban sprawl, and community characteristics.
Journal of Environmental Economics and Management, 52(2), 527–547.
Wu, Q., Li, H., Wang, R., Paulussen, J., He, Y., Wang, M., Wang, Z. (2006). Monitoring and
predicting land use change in Beijing using remote sensing and GIS. Landscape and
Urban Planning, 78(4), 322–333.
Yeh, A. G. O. (2000). Urban form and density in sustainable development. Retrieved from
http://www.urbandensity.org/urban-form-and-density-sustainable-development.
Yeh, A. G. O., & Li, X. (1999a). Measurement of urban sprawl in a rapid growing region using
entropy. In Proceedings of the International Symposium on Digital Earth (pp. 1–5). Hong
Kong: Science Press.
Yeh, A. G. O., & Li, X. (1999b). An entropy method to analyze urban sprawl in a rapid
growing region using TM images. In Proceedings of the 20th Asian Conference on
Remote Sensing (pp. 542-547).

1Ph.D. Candidate at International Islamic University Malaysia. Email: [email protected] 319
PLANNING MALAYSIA:
Journal of the Malaysian Institute of Planners
VOLUME 15 VOLUME 1 (2017), 319 - 326
ETHICS & VALUES IN CONSTRUCTION INDUSTRY FROM
ISLAMIC PERSPECTIVE
Fatma Al-Zahraa Sami1, & Asiah Abdul Rahim2
1,2 Kulliyyah of Architecture & Environmental Design
INTERNATIONAL ISLAMIC UNIVERSITY MALAYSIA
Abstract
The purpose of this paper is to explore the principles of Islamic ethics to be
applied in construction projects by establishing Islamic ethical practices to
improve project performance. In an Islamic system, ethics and construction
business are inextricably linked. This paper aims primarily to identify the ethics
in general and from the Islamic perspective, and to identify the principles of
Islamic ethics in construction projects. The methodology of was content analysis
of peer-reviewed empirical studies published in academic journals. In addition,
specialist texts to review the principles of Islamic ethics in construction projects
in order to give an overview of main ethics theories. This paper will discuss the
impact of Islamic ethics on performance jobs and project outcomes. Finally, this
study also shows how construction companies could adapt the Islamic ethics and
create Islamic ethical work climate in their projects and in society as well. In
conclusion, implementation of the recommended solutions can minimize
unethical acts in the construction projects.
Keywords: Islamic ethics, ethics and values, construction industry and Islamic
perspective, Al-Quran, Al-Sunnah
Date Received: 30th April 2016
Date of Acceptance: 30th October 2016

Fatma Al-Zahraa Sami, & Asiah Abdul Rahim
Ethics & Values in Construction Industry from Islamic Perspective
© 2017 by MIP 320
INTRODUCTION
Different researchers give different definitions of ethics. A partial reason of the
collapse of a number of construction projects in the past was probably the failure
to follow ethical values as propagated by Islam. Failure of construction projects
has led the Western societies to develop their own sets of work ethics for
professional involved in construction projects. However, these sets of ethics were
developed based on human intellectual capacities without looking into what the
divine religions might have to say about them, although some of these man-made
ethics are in conformity with what Islam or any other divine religion might have
regarding them.
In recent years, attempts have been made to develop Islamic work ethics
for professionals. One of such attempt is the book written by Abdi Omar Shuriye
and Ahmad Faris Ismail. This research paper intends to deduce the principles of
ethics and values for construction projects from Islamic sources, i.e. the texts of
the Qur’an and Hadith of the Prophet (PBUH), so that this set of ethics would
represent the Islamic values and perspective. This paper also explores the impact
of embracing Islamic work ethics towards job performance and project outcomes.
Finally, this paper puts forward several suggestions to reduce ethical issues in
construction projects in the future.
LITERATURE REVIEW
Ethic & Islamic Ethic
Ogbonna and Ebimobowei (2011) state that ethic and values is reflected in the
rule that a man uses to govern his/her actions and the personal standard by which
a person distinguishes the correct from the wrong. Islamic work ethics are the
yearnings of the relations between the individuals themselves and their conduct
at work in light of Islamic principles and fundamentals. Islamic work ethics stress
on two things; (i) to accomplish every task with the best of an individual’s
capacity and (ii) to perform the task to please Almighty Allah alongside satisfying
essential socio-economic needs. However, Islamic ethic incorporates the outer
and inner parts of individual’s life (Ibn Manzur, 1990; Miqdad Yaljin, 1973).
Beekun and Badawi (2005) analyse Islamic ethic from a standard
perspective. Their essential finding asserted that Islamic ethic could not be
isolated from a Muslim’s day-to-day life. The Islamic ethical system is fair,
balanced, just and benevolent, and looks to respect the rights of both primary and
secondary stakeholder’s without taking into consideration abuse, nepotism and
other human ills. Beekun and Badawi (2005) additionally emphasise that
humankind must not overlook his/her part as God's steward or vicegerent on
earth.
In Islamic context, ethical framework is revealed from the teachings of
the Quran and the Sunnah. Islamic ethic manages all aspects of human life. It

PLANNING MALAYSIA:
Journal of the Malaysia Institute of Planners (2017)
© 2017 by MIP 321
manages relationships between man and Allah, man and his fellow man and other
elements and creatures of the universe, and man and his inmost self (Hanafi &
Sallam, 1997). Besides, the objectives of Islam itself are not fundamentally
materialistic. They depend on Islamic ideas of human prosperity and great life
that underline fraternity and financial equity, and require an adjusted fulfilment
of both material and needs of all people.
Additionally, Islamic ethic is also known as akhlak. Akhlak is the Islamic
values, which have been specified in the Quran and executed by Prophet
Muhammad (PBUH). Primarily, there are two (2) types of akhlak, bad or good.
Islam underlines the imperative of honing good akhlak in all parts of human life
and realizes it as one of the purpose of sending His messengers (Shaharuddin,
2005). Prophet Muhammad (PBUH) said: “I have been sent only for the purpose
of perfecting the qualities of good akhlak” (Imam Malik). Beekun and Badawi
(2005) state that the term most closely related to firmly identify with ethic in the
Quran is khuluq. Allah says in the Quran, “And thou (standest) on an exalted
standard of character.” (68:4).
The Quran additionally utilizes an entire cluster of terms to portray the idea
of goodness, for example, khayr (goodness), birr (uprightness), qist (equity), ‘adl
(equilibrium and justice), haqq (truth and right), ma’ruf (known and approved)
and taqwa (piety). Devout activities are depicted as salihat and irreverent
activities are portrayed as sayyiat.
The Principles of Islamic Ethics in Construction Projects
Adl and Qist (Justice and Equal)
Muhammad et al. (2008) suggest that Justice as Equity or ‘Adl intends to treat
individuals similarly is a pre-imperative of decency and equity. It is an
equiponderant implementation of obligations and rights. Allah says in the Quran
with regard to justice,
“Allah commands justice, the doing of good and liberality to kith and kin.
He forbids all shameful deeds and injustice and rebellion; he instructs you,
that ye may receive administration.” (16:90)
In construction projects, the standard of justice applies both figuratively
and literally. As far as relationship between project manager and his subordinates,
the standards of justice infers that managers should exercise fair and equal
treatment to all professionals (workers) paying little respect to gender, physical
appearance, race, religion and political belief. Surely, experience, skills and
attitude will decide the standings of the professionals (workers). Furthermore,
Islam completely dismisses the act of bias and cronyism that lead to unfairness in
procuring workers and in their promotion. Indeed, professionals ought to be
picked or promoted based on their level of experience, academic qualification,

Fatma Al-Zahraa Sami, & Asiah Abdul Rahim
Ethics & Values in Construction Industry from Islamic Perspective
© 2017 by MIP 322
job competency and, in addition, their good qualities (Shaharuddin, 2005). It is
intriguing that another significance of ‘Adl is equity and equilibrium. As can be
seen from the above citation of the Quran, a balanced transaction between
stakeholders and construction companies is likewise evenhanded and just.
Generally, Islam dislikes man’s affinity for rapaciousness and his love for
possessions (Beekun, 2005).
Amanah (Trust)
Trust is a key to constructive interpersonal connections in different settings since
it is fundamental to how we communicate with others (McKnight & Chervany,
1996). Ahmad (1995) points out that the acknowledgement of God's will by
carrying on ethically is a piece of man's trusteeship and an obligation that he has
taken upon himself to fulfil. More significantly, the wealth and other resources
that mankind has access to are not his, but rather have been credited to him by
God as instruments to fulfill the obligations of the trusteeship. Without a doubt,
trust is accentuated in the Qur’an and Hadith. Allah says in the Quran,
“If ye are on a journey, and cannot find a scribe, a pledge with possession
(may serve the purpose). And if one of you deposits a thing on trust with
another, let the trustee (faithfully) discharge his trust, and let him fear his
Lord. Conceal not evidence; for whoever conceals it, his heart is tainted
with sin. And Allah knoweth all that ye do.” (2: 283)
The Prophet (PBUH) specified the sigificance of trust as,
“Any ruler who has been entrusted with the affairs of a group of Muslims
and who dies as a dishonest ruler, to him paradise is forbidden by Allah.”.
Islam considers human life and assets as a trust rested on men by Allah.
Subsequently, every project manager is in charge of the professionals (workers)
and other resources with whom he is depended upon. Trust is particularly
imperative for Muslim stakeholders in construction industry as result of the need
to make profit and the enticements to upgrade the characteristics of their project
or service during construction period. The project manager ought to treat all
project resources as a heavenly trust. In this manner, the partner or administrator
ought to make the most productive and socially alluring utilization of the project
resources. The project activities ought to not harm the society or the natural
environment. In reality, Islam underlines man’s role towards the natural
environment by making him in charge of his surroundings as Allah’s vicegerent.
Ihsaan (Benevolence)
Ihsan means capability, fineness or charitableness in managing other.
Muhammad et al. (2008) describe ihsaan as “a demonstration which benefits
persons other than those from whom the demonstration continues with no

PLANNING MALAYSIA:
Journal of the Malaysia Institute of Planners (2017)
© 2017 by MIP 323
commitment”. The concept of benevolence is additionally frequently repeated in
the Quran and the Hadith. Allah says,
Spend your wealth for the cause of God, and be not cast by your own hands
to ruin; and do good. Lo! God loves those who behave with ihsan.” (2:195)
The Prophet (PBUH) is reported to have said that,
“The inmates of Paradise are three types: one who wields authority and is
just and fair; one who is truthful and has been endowed with power to do
good deeds; and the person who is merciful and kind-hearted towards his
relatives and to every pious Muslim, and who does not stretch out his hand
in spite of having a large family to support.” (Sahih Muslim).
Absence of justice in project construction causes damages and aggravates
peace and harmony, however the absence of benevolence does not harm anybody.
It suggests a more liberal treatment than what equity requires (Hasanuzzaman,
2003). Aside from justice, the relationship between project managers and
professionals (workers) ought to be on the basis of benevolence.
Ikhlas (Sincerity)
Sincerity is most usually comprehended to be truthful in word and act.
Additionally, sincerity can be characterized as the quality or state of being
genuine; honesty of mind or intention; and devoid of hypocrisy, false pretence or
disguise (Muhammad et al., 2008). Islam has accentuated ikhlas as we see in
Quran and Hadith. Allah says,
“So woe to the worshippers, who are neglectful of their Prayers, Those
who (want but) to be seen (of men), But refuse (to supply) (even)
neighbourly needs.” (107: 4- 7)
The Prophet (PBUH) said, in respect to sincerity,
“Actions are but intention and every man shall have but which he intended.
Thus he whose migration was for Allah and His messenger, and he whose
migration was to achieve some worldly benefit or take some woman in
marriage, his migration was for that for which he migrated.”
Hence, the execution of obligations requires that all professionals in
construction projects work with sincerity. Establishing sincerity in the
construction projects can enhance the professionals' effectiveness in job
implementation resulting in higher productivity. Furthermore, such ethical code
additionally debilitates control or misuse of others for individual reasons
(Ahmad, 1995). Thus, a sincere professional is not anticipated to swindle
resources, create mischief and exploit others deliberately.

Fatma Al-Zahraa Sami, & Asiah Abdul Rahim
Ethics & Values in Construction Industry from Islamic Perspective
© 2017 by MIP 324
IMPACT OF ISLAMIC ETHICS ON JOB PERFORMACE AND
PROJECT OUTCOMES
Earlier studies show that there is a positive relationship between Islamic ethics
and job performance because Islamic ethics forms a constitutive part of a Muslim
employee’s belief system (Haroon, Zaman & Rehman, 2012; Hayati & Caniago,
(2012); Marri et al., 2012; Batool, Gul & Shahzad, 2013; Yousef, 2001). As a
result, professionals who view their work environment in harmony with Islamic
teachings and the ethical values are more satisfied in performing their duties.
Consequently, this increases their intrinsic motivation to work. According to Daft
and Marcic (2013, p. 400) “a positive attitude toward one’s job” is called job
satisfaction.
Also, Manan, Kamaluddin ad Puteh Salin (2013) explain that Islamic
notion of considering work as a worship can make professionals become further
motivated to work hard with higher rate of efficiency and effectiveness, which in
turn benefits the organization both in the long and short run. Moreover, studies
also reported that Islamic ethics has a positive significant correlation with project
outcomes (Abbasi, Rehman & Bibi, 2011: Yesil, Sekkeli & Dogan, 2012).
CONCLUSION
In conclusion, this paper gives a review of the concept of ethic from Islamic
perspective, in relation to construction projects. This paper provided the empirical
proof of the positive relationship of Islamic ethics with job performance and
project outcomes, but literature review revealed a number of issues. One of the
major issues is that the review of the literature did not provide any theoretical
arguments and reasoning as to how such a relationship exists. Therefore, this
paper suggests that future studies into Islamic work ethics, especially in
construction work ethics, to work on building strong logical arguments and
theoretical studies by supporting their hypothesis and results. Moreover, future
researchers are also recommended to build Islamic framework to in order to
structure the values and principles of ethics in construction projects.

PLANNING MALAYSIA:
Journal of the Malaysia Institute of Planners (2017)
© 2017 by MIP 325
REFERENCES Abbasi, A. S., Rehman, K. U., & Bibi, A. (2011). Islamic work ethics: How it affects
business performance. Actual Problems of Economics, 126(12), 312.
Abdul Rahman, H., Saimon, M. A., & Ali, A. S. (2009). Professional ethics in the
construction industry of an Islamic country: clients’ perspective. Construction
in the Muslim World Conference, October 21-23, 2009, Kuala Lumpur,
Malaysia.
Ahmad, M. (1995). Business ethics in Islam. Islamabad: The International Institute of
Islamic Thought, Islamabad.
Badawi, J. (2005). Toward a spirituality for the contemporary organization. In Bridging
the Gap between Spirituality and Business (pp. 66-79). Santa Clara, CA: Santa
Clara University.
Batool S. M. K., Gul A., & Shahzad, K. (2013). Combined effects of ethical leadership
and Islamic work ethics (IWE) on organizational commitment and job
satisfaction. Journal of Islamic Business and Management, 3(1), 35-49.
Beekun, R. I., & Badawi, J. A. (2005). Balancing ethical responsibility among multiple
organizational stakeholders: The Islamic perspective. Journal of Business
Ethics, 60, 131–145.
Daft, R. L., & Marcic, D. (2013). Understanding management (9th ed.). Stamford, USA:
Cengage Learning.
Hanafi, A.A. & Sallam, H. (1997). Business ethics: An Islamic perspective. In F. R. Faridi
(Ed.), Islamic principles of business organisation and management. Kuala
Lumpur: S. Abdul Majeed & Co.
Hasanuzzaman, S. M. (2003) Islam and business ethics. London: Institute of Islamic
Banking and Insurance.
Haroon, M., Zaman, H. F., & Rehman, W. (2012). The relationship between Islamic work
ethics and job satisfaction in healthcare sector of Pakistan. International Journal
of Contemporary Business Studies, 3(5), 6-12.
Hayati, K., & Caniago, I. (2012). Islamic work ethic: The role of intrinsic motivation, job
satisfaction, organizational commitment and job performance. Procedia-Social
and Behavioral Sciences, 65, 272-277.
Ibn Manzur (1990). Lisan al-`Arab (Vol.10). Beirut: Dar Sadir.
Manan, S. K., Kamaluddin, N., & Puteh Salin, A. S. A. (2013). Islamic work ethics and
organizational commitment: evidence from employees of banking institutions in
Malaysia. Journal of Social Sciences and Humanities, 21(4), 1471-1489.
Marri, M. Y. K., Sadozai, A. M., Zaman, H. M. F., & Ramay, M. I. (2012). The impact
of Islamic work ethics on job satisfaction and organizational commitment: a
study of agriculture sector of Pakistan. International Journal of Business and
Behavioral Sciences, 2(12), 32-45.
McKnight, D. H., & Chervany, N. L. (1996). The meaning of trust. Retrieved from
http://misrc.umn.edu/ wpaper/WorkongPapers/9604.pdf
Miqdad Yaljin (1973). Al-Ittijah al-Akhlaqi fi al-Islam. Mesir: Maktabah al-Khanji.
Mohammed, A. (2005). The relationship between Islamic rules and accountants’ ethics.
Unpublished manuscript. Yemen: Hadhramout.

Fatma Al-Zahraa Sami, & Asiah Abdul Rahim
Ethics & Values in Construction Industry from Islamic Perspective
© 2017 by MIP 326
Muhammad, M. Z., Ilias, A., Ghazali, M. F., Abdullah, R. C., & Amin, H. (2008). An
analysis of Islamic ethics in small and medium enterprises (SMEs). Unitar E-
Journal, 4(1), 46-58.
Ogbonna, G., & Ebimobowei, A. (2011). Ethical compliance by the accountant on the
quality of financial reporting and performance of quoted companies in Nigeria.
Asian Journal of Business Management, 3(3), 152-160.
Shaharuddin, A. (2005). Islamic business ethics: A managerial perspective. In
Proceedings of the Malaysian Finance Association 7th Annual Conference.
Kuala Terengganu: UiTM.
Yesil, S., Sekkeli, Z. H., & Dogan, O. (2012). An investigation into the implications of
Islamic work ethic (IWE) in the workplace. Journal of Economics and
Behavioral Studies, 4(11), 612-624.
Yousef, D. A. (2001). Islamic work ethic - A moderator between organizational
commitment and job satisfaction in a cross-cultural context. Personnel Review,
30(2), 152-169.

1Ph.D. Candidate at International Islamic University Malaysia. Email: [email protected] 327
PLANNING MALAYSIA:
Journal of the Malaysian Institute of Planners
VOLUME 15 VOLUME 1 (2017), 327 - 332
THE INTEGRATION OF MOSQUES AND CHURCHES TO URBAN
PLANNING OF IBADAN NIGERIA: A HISTORICAL OVERVIEW
Ibraheem Mikail Abiola1
1Kulliyyah of Islamic Revealed Knowledge and Human Sciences
INTERNATIONAL ISLAMIC UNIVERSITY MALAYSIA
Abstract
In the face of the uncontrolled expansion of Nigerian towns and cities since
independence, urban planners and other stakeholders have accepted that
development policies for urban and rural areas have failed or have not worked as
expected. Cities in Nigeria, especially, Ibadan have been observed to have
changed in size, spatial organization or morphology, quality and distribution of
public services and infrastructure, and in its employment base. Despite many
efforts aimed at resolving the urban problems through the enactment of plethora
of planning laws and regulations, the administration and implementation of these
laws and regulation have been problematic, especially due to the rapid increase
of religious sites (places of worship) such as churches and mosques in Ibadan.
The objective of this paper is to propose a solution to the problems created by
religious sites in the planning of Ibadan. The study employs a qualitative research
design using survey method, with field observation as the research instrument
used for data collection.
Keywords: Nigeria, Ibadan, urban, rural, mosques, churches.
Date Received: 30th April 2016
Date of Acceptance: 30th October 2016

Ibraheem Mikail Abiola
The Integration of Mosques and Churches to Urban Planning of Ibadan Nigeria: A Historical Overview
© 2017 by MIP 328
INTRODUCTION
Ibadan is located and situated in the southwestern part of Nigeria, in the
southeastern part of Oyo state, about 120km east of the border with the Republic
of Benin. The city total area is 1,190 sq miles (3,080km2). The city is naturally
drained by four rivers which have many tributaries i.e. streams flowing into larger
lake: Ona River on the north and west, the Ogbere River towards the east, Ogunpa
flowing through the city and Kudeti River in the central part of Ibadan metropolis.
In 1931, less than 7% of Nigerians lived in planned urban centres. Over
a period of exactly 30 years (1952-1982), the population in significant Nigerian
towns has increased. For example, in the city of Ibadan, it rose from 625,000 in
1963 to 2.8 million in 1982 (Adekilekun, 2001). The people were scattered all
over Ibadan in areas that are not properly planned, and in building that are not
structurally sound. More easily observable is the lack of Islamic principle in rapid
urban growth in Ibadan. This paper examines the historical analysis of urban
planning in Ibadan, Nigeria, from 1960 to 2010, with special emphasis on its
presumed Islamic connection. It explores factors that have contributed in shaping
the planning of urban settlements, in addition to the influence of local topography
and morphological features of pre-existing cities such as Ibadan.
RESEARCH METHODOLOGY
This study looks into an extant historical phenomenon of an urban planning. It
adopts a qualitative research design using survey method. Data were obtained
through site observation and also from secondary sources. Content analysis
method was employed to analyse the data.
INTEGRATION OF MOSQUES AND CHURCHES INTO URBAN
PLANNING IN IBADAN
Integration of Mosques
Obviously, in view of the pledge of Islam to provide a house in paradise for
whoever builds a mosque, Ibadan Muslims have individually and collectively put
up structures of different sizes, designs and magnitude for praying purposes. Doi
(1984), Adekilekun (2001) and Agbetola (1999) have given an account in their
work of the origin, development and administration of the mosques in the
southwestern part of Nigeria. Agbetola (1999), in his account writes that the early
Muslims merely chose a clean spot to spread their animal skins, mostly ram, and
mats to establish their prayers. Later, a marked off area with a fence made from
sand emerged; “this is the Musallah, the Yoruba Ibadan called it Masalasi”
(Agbetola, 1999).
“The Masalasi gave way to small permanent structure known as the real
Masjid (English: Mosque) because it had structures and a few facilities. The
development of the simple form of thatched roof hut resting on four or six

PLANNING MALAYSIA:
Journal of the Malaysia Institute of Planners (2017)
© 2017 by MIP 329
forked sticks similarly gave way to one supported by mud walls. This was a
real building, but with a design of open windows and door ways of no
security... This structure also with time developed into modest architectural
design with facilities such as modest minarets. They carried simple designs
of Muslim traditional slate (Arabic Lawh) on the roof or minaret as the sign
for a Muslim place of worship.”
Doi (1984) however, writes about the decorations given to mosques by the
Ibadan Muslims:
“The decoration in the mosque buildings is simple, but most eye-catching,
restrained according to the principles of Islamic art and architecture, and
avoids the use of icons or even the slightest resemblance to any living animal
or insect...”
He continues:
“The mosques are planned with such great dexterity that at a given time,
one can see only one or two decorations because of the contrast of light and
shadow in the total scheme of the construction”, (Doi, 1984).
Nevertheless, Doi (1084) also observes that some mosques were
decorated with icons contrary to Islamic principles by having decorative
elephants on the top of the mosques. He also claims that the icons had been
removed thereafter. Agbetola (1999) also gives some pictorial views of some
mosques in Ibadan and environs. However, this study contains of pictures which
cut across central, community (ratibi), institutional, organizational and
government house mosques in Agodi Ibadan (Doi, 1984).
However, based on observation made on site, some of the present
mosques, such as the Aare Abdul Azeez Arisekola Central Mosque, Iwo-road
Ibadan and Adeojo Mosque along Lagos-Ibadan express way are more impressive
than those described by Agbetola (1999) and Doi (1984). Some of these mosques
are even up to three-storey high. Some mosques, such as the Shamsu-suud
mosque, Omowumi-Olorunsogo, Ibadan have tall minarets built using stones or
concrete. Others have minarets carrying domes against the flat head of the
mosques, with the demands of modern time such as parking space, social hall,
and committee room (Akintola, 2004). Many mosques, particularly the early
ones, do not have space for such facilities. Some of these mosques were built
within compounds obviously for family use, while others were constructed close
to the road and lined up in the streets of Ibadan, leaving barely trek able distance
to one another. For example, the Ayegoro mosque could hardly be distinguished
from residential buildings. In fact, the distinguishing factor between a part of a
building used as a mosque and that used as residence is the loudspeaker which,
as in other mosques, is located on top of the mosques or beside or within the

Ibraheem Mikail Abiola
The Integration of Mosques and Churches to Urban Planning of Ibadan Nigeria: A Historical Overview
© 2017 by MIP 330
walls. There have been issues generated between the Muslim community and
non-Muslims who feel that the loudspeakers are being abused by some mosques
within Ibadan and other cities in Nigeria. Also, some mosques are built close to
the main roads and left the road users with narrow roadway, which escalate
obstructions and blockage of road during the large turnout of worshippers on
Fridays and when there are some other occasions within the mosque premises
(Liadi, 2001).
Church Integration
In the 1970s, when orderliness reigned in Ibadan, churches were built with
maximum conformity to planning regulations, societal overall aesthetic appeal,
beauty and comfort of users and neighbours (Joseph, 1997). Aside from the
expansive worshipping area, ample parking spaces were provided to discourage
street parking and minimize the likely inconvenience to other road users. Within
the church precinct, it was conventional and traditional to find houses for the
leadership and church workers, and small scale or small size commercial building
to generate income to support the church activities. In some churches,
complementary buildings, such as schools and clinics, which provide services to
the immediate and remote communities could be found (Shope, 1954).
Between 1975 to 1979, the Ibadan population rose and church
development had kept pace with this growth without any adverse effort on the
urban planning system, urban infrastructure and societal psyche. Among the then
prominent churches were Catholic, Anglican, Methodist, Jehovah witness,
Seventh Day Adventise, Apostolic and Redeem among others. The downfall of
the Nigerian economy in the 1980s and subsequent political crisis of 1993 were
the impetus for a substantial number of manufacturing industries within Ibadan
to terminate their productions (Iyanda, 2004). In the wake of this development,
many manufacturing sites and warehouses were left vacant.
The inability of the Urban Planning Ministry to be pro-active on the best
alternative uses of those abandoned premises provided a veritable platform for
churches. As a result, the stretch of Oluyole estate roads to Challenge Elewura,
Iwo Road to Basorun were littered with flags and banners of different churches.
The conversion of the industrial premises and private houses into churches in
Ibadan had created a severe traffic burden for the city since the emerging scenario
was not envisaged during the presentation of Ibadan master plan. With the end of
the manufacturing sector and growth of population within Ibadan metropolis,
poverty incidence increased, and the cry for divine intervention became louder.
Churches in Ibadan continue to expand on the old denominations as well as the
erection of new ones. For example, The Redeemed Christian Church has over 100
branches within Ibadan (Kabir, 2006).
The demand for industrial premises and warehouses to be converted into
churches became enormous. Consequently, the price of those premises rose to

PLANNING MALAYSIA:
Journal of the Malaysia Institute of Planners (2017)
© 2017 by MIP 331
astronomical rate and was no longer affordable, hence recourse to residential area.
Although the foray is more pronounced in residential areas, it is not limited to
this stretch of land or zone. Business premises such as quick service restaurants,
cinemas, like Baba Sala cinema at Agbowo, and merchandising shops, were not
spared. Currently, the presence of churches in residential areas within Ibadan has
significantly depleted the housing stock available to the populace, in a city
grappling with an estimated hundreds of thousands of housing deficits (Kabir,
2006). The situation is alarming and generating sudden fear as churches are now
influencing building owners to eject their tenants to take over their apartments.
The occupation range from one bedroom or three bedroom apartments in multiple
apartment buildings either on long lease, contract or outright purchase from the
building owners. No neighbourhood in cosmopolitan Ibadan is devoid of this
phenomenon, except in the emerging higher class residential estates where there
is control of church development (Kabir, 2006). As of today, the population of
Ibadan has climbed to about 3 million and churches have continued to grow
geometrically.
SUGGESTED SOLUTIONS
To overcome this problem, this study proposes that the Oyo State Ministry of
Physical Planning and Urban Development with the Ministry of Lands, Housing
and Survey in Ibadan should undertake a primary and the traditional role with the
Christian Association of Nigeria (CAN) and the Nigeria Supreme Council for
Islamic Affairs (NSCIA). The Ministries should engage CAN and NSCIA with a
view to identify the number of churches and mosques in each residential district.
At the same time, adequate resettlement and re-planning strategies must be put in
place for the residents of the acquired properties, reference should be made to
existing regional or local plans, and Environmental Impact Analysis of such
church and mosque agglomeration must first be submitted and discussed with the
stakeholders in each district.
Also, there is a need for the CAN and NSCIA to sensitize their members
on the negative implications of church and mosque incursion to residential areas
and to encourage them to set up a Development Control and Standardization
Department within their respective organizations. All measures to improve urban
planning in Ibadan will be meaningful; thus it is crucial to reverse the rattle of
church depletion of housing stock through strict adherence to planning
regulations and effective engagement of relevant stakeholders. It will be of
utmost importance to draw attention of the Ministry of Physical Planning and
Urban Development to the emergence of mega churches at the Basorun Olowo-
Nla axis, also Lagos-Ibadan Expressway. If the trend and progression of church
development continue, as it is in this corridor, Lagos-Ibadan Expressway may not
be able in the next ten years to rival this pristine location in terms of traffic
imbroglio and other social and economic crises.

Ibraheem Mikail Abiola
The Integration of Mosques and Churches to Urban Planning of Ibadan Nigeria: A Historical Overview
© 2017 by MIP 332
CONCLUSION
Town planning has become an integral and necessary portion of governance in
the modern time. In the case of Ibadan, the state government which oversees the
planning and development of the city has undertaken significant efforts in
ensuring the city is well planned. Nevertheless, the proliferation of religious
houses in the city has undermined the planning efforts of the government.
However, efforts to plan and develop Ibadan in orderly manner must continue.
This paper has made several proposals on how this can be achieved.
ACKNOWLEDGEMENT
This work is supported Alhaji Sheik Mikail Abdul Aziz, Imam of Islamic Society
of Papua New Guinea, near Australia.
REFERENCES Adekilekun, A. L. (2001). Muslim and Islamic Law in Southern Nigeria (1988-1999).
Ede: Mojoyinola Publishers.
Doi, A. R. (1984). Islam in Nigeria. Zaria: Gaskiya Corporation Limited.
Agbetola, A. S. (1999). Architectural design of the mosque in Islam: Ondo State as a case
study. Oye Ogun Journal of Arts, viii, 44-54.
Shope, J. H. (1954). The need for church planning. Journal of the American Institute of
Planners, 20(3), 122-124.
Akintola, I. L. (2004). An evaluation of the impact of the proliferation of churches and
mosques in the Nigeria society. Insight: Journal of Religious Study, 1(2&3), 76-
91.
Liadi, M. (2001). Mosques structure across Ibadan, Ibadan: Legacy Print Press.
Kabir, O. (2006). Impact of religious sites on city planning in Nigeria. Longman Press,
16-30.
Iyanda, P. (2004). Churches in the City Plan. Landsmark Publication, 25.
Joseph, W. (1997, May 21). Planning for church location, report and review. Vanguard
News.

1Associate Professor at International Islamic University Malaysia. Email: [email protected] 333
PLANNING MALAYSIA:
Journal of the Malaysian Institute of Planners
VOLUME 15 VOLUME 1 (2017), 333 - 346
MODELLING WILLINGNESS TO PAY FOR IMPROVED PUBLIC
TRANSPORT SERVICES: THE CHALLENGES OF NON-RESPONSE
TO STATED PREFERENCE HYPOTHETICAL QUESTIONS
Syahriah Bachok1, & Zakiah Ponrahono2
1Kulliyyah of Architecture & Environmental Design
INTERNATIONAL ISLAMIC UNIVERSITY MALAYSIA 2 Faculty of Environmental Studies
UNIVERSITI PUTRA MALAYSIA
Abstract
The paper focuses on the modelling attempt of willingness to pay for an improved
bus service in selected cities and towns of Malaysia. Using responses from on-
board intercept surveys, 1,130 samples of bus passengers have been analysed so
as to arrive at a simplified model of how passengers trade off their money with
possible upgrading of bus services elements. The willingness to pay among these
bus riders was very low, despite the high expectation of improvements aspired by
them. For service providers, fares are a function of travel time, travel distance
and other operating costs. For passengers, the utility function is explained by
costs, time, distance and various latent parameters. This paper highlights the
significant results of chi-square analysis at various confidence levels. However,
modelling the exact utility function of preferences for staggered increased in fares
could not be carried out successfully at 95 percent confidence level, due to the
relatively small number of respondents stating their and/or undecided response to
willingness to pay for the additional fare rate. The issue of non-response to
hypothetical survey questions is also raised, explaining the difficulties in
modelling this choice behaviour.
Keywords: Public transport, bus, willingness to pay, frequency, increased fare.
Date Received: 30th April 2016
Date of Acceptance: 30th October 2016

Syahriah Bachok, & Zakiah Ponrahono Modelling Willingness to Pay for Improves Public Transport Services: The Challenges of Non-Response to Stated Preference
Hypothetical Questions
© 2017 by MIP 334
INTRODUCTION
Improvement of public transport services is essential in ensuring the maintenance
of operation and sustenance of patronage. Among the less unattractive public
transport provision is the bus service. Buses are more susceptible to congestion
and incidents due to shared road spaces with other road users and vehicles, having
no exclusive right of ways. For users, higher aspiration could be expected
compared to rail and taxi services due to the lower comfort and convenience
levels offered to bus passengers.
This paper elaborates on the passengers’ expectation of improved bus
services in various aspects. The case study presented in this paper is eight towns
and cities in four Malaysian states of Johor, Pahang, Perak and Penang. The aim
of the research is to model the willingness to pay for an increased fare rate among
passengers for specific bus improvement areas. The objectives of the research
are: i) to identify the socio-demographics of bus passengers in Malaysia, ii) to
determine the proportion of passengers willing to pay additional fare in return of
improved bus services and iii) to develop simplified model explaining such
willingness.
BUS FARES AND WILLINGNESS TO PAY
Contemporary literature has been focusing on improvement of buses in various
aspects of the services. The focus of this paper, is however, limited to the
determination and structuring of the fare system. Basic fare system which
concentrated on time and distance costs has been discussed by Turvey and
Mohring (1975), and Pedesson (2003). The utility function for fare structure, has
been globally set to be consisting of travel time which include both in-vehicle
time and waiting time, travel distance and seating capacity.
Other factors or parameters found to be significant in determining the
fare amount and structure are fleet supply or vehicular interior configuration, as
well as fuel type and utilisation rate. Among these studies, O’Garra et al., (2007),
Ricci, Bellaby and Flynn (2008), and Saxe, Folkesson and Alvfors (2007) have
discussed the effects of fleet and vehicular aspects such as chassis, fuel, route
capacity and seating or standing capacities on fare structure change.
Time variability, confidence in schedules and consistency in operation
time, headways and frequency have been found to be significant in determining
fare structure as propagated by Phanikumar and Maitra (2007), Hensher and
Stanley (2003), Li, Hensher and Rose (2010), and Dodgson and Katsoulacos
(1988).
Waiting and other support facilities and amenities are also essential in
fare rate determination (Hess, Brown & Shoup, 2004). Politis et al. (2010) argued
that information provision and dissemination system are also important in
influencing fare structure. Latent variables such as comfort and convenient are

PLANNING MALAYSIA:
Journal of the Malaysia Institute of Planners (2017)
© 2017 by MIP 335
also deemed important in explaining the changes in fare structure and system
(Espino, Roman & De Ortuzar, 2006).
Most researches have been contemporary yet were not conducted in
South East Asian context, let alone, in the Malaysian scenarios. Hence, it is timely
and essential that such similar study be undertaken in the Malaysian context so
as to assist operators, regulators and authorities relevant to the public transport
sectors to understand better the local or domestic bus fare and market structure.
METHODOLOGY
The research has deployed on-board intercept survey upon some 1,130 samples
from four different states in Malaysia, namely Johor, Pahang, Perak and Penang.
By 2014, National Key Results Areas of the Malaysian public transportation have
been almost completely undertaken, with various initiatives and bus improvement
schemes being implemented.
During the survey, passengers on board bus vehicles were approached
with questionnaire survey set to be completed and returned within the respective
duration of the bus trips. Questions were relating to socio-demographics, trip
characteristics, perception of current or existing bus services, anticipation and
aspiration of the future services and the hypothetical amount in fare increased
given such anticipated improvement be implemented within stipulated time
period.
Descriptive and inferential analyses have been conducted using SPSS
version 23 software. The next section elaborates both analyses.
FINDINGS AND DISCUSSION
Socio Demographics
From the 1,130 samples, females were disproportionately represented, forming
some 64 percent of bus passengers. With this gender bias distribution, it might be
possible to expect some latent variables, including safety, security, comfort and
convenience to be essential in explaining their responses, perception and choice
behaviours. Figure 1 below shows the unequal distribution of age range, with
higher representation (more than 30 percent) of young (20 to 30 years old) in the
sample. So, it can be expected that aspiration of a modernised or state-of-the-art
bus technologies are on the high. It can also be assumed that the samples
represented users with a lower level of education, lower income earned and higher
proportion of income being allocated and spent on transportation. Hence,
willingness to pay for additional fare towards bus improvements can be expected
to be relatively lower.

Syahriah Bachok, & Zakiah Ponrahono Modelling Willingness to Pay for Improves Public Transport Services: The Challenges of Non-Response to Stated Preference
Hypothetical Questions
© 2017 by MIP 336
Figure 1 Respondents’ Age Range
Trip Characteristics
Rides for leisure (43 percent) and commuting (38 percent) purposes on the bus
were in the majority. The answers relating to fare would be expected to be very
elastic because of the leisurely nature of the trips made.
Table 1 Respondents’ Trip Purpose
Frequency Percent
Business 47 4.2
Educational 167 14.8
Leisure 490 43.4
Workplace 426 37.7
Total 1,130 100.0
About 40 percent of respondents were using the buses less than 5 days
per month. In other words, they were infrequent bus riders. About 18 percent were
regular passengers, using the buses almost on daily basis (more than 20 days in a
month). Hence, the answers relating to fare would be expected to be very elastic
due to the non-frequent usage of the bus services.

PLANNING MALAYSIA:
Journal of the Malaysia Institute of Planners (2017)
© 2017 by MIP 337
Table 2 Respondents’ Current Monthly Trip Frequency
Frequency Percent
less than 5 days per month 452 40.0
6-10 days per month 69 6.1
11-15 days per month 113 10.0
16-20 days per month 296 26.2
21-25 days per month 86 7.6
more than 26 days per month 114 10.1
Total 1,130 100.0
Bus Conditions and Improvements Aspired
In general, passengers surveyed were dissatisfied (60 percent) with the current
bus services, reflecting the possibility of lower willingness to pay for increased
rate of fare. These passengers had already had negative perception of the quality
of services provided and would not be in favour of any price increase. This is
further supported by the list of improvements aspired by the respondents. Most
remarks (31 percent) were made on punctuality, frequency, departure and arrival
time. Next, they would prefer clean and comfortable vehicles (17 percent) and
new or modern vehicles (10 percent). It can be said that, expectation was high of
the current quantity and quality of vehicle fleet. Waiting facilities were also of
great concern (7 percent). Affordability (6 percent) however, received less than
proportionate attention by the respondents. Information provision and safety or
security issues were also ranked lower by respondents (4 percent, respectively).
Some 19 percent users did not respond to this question. It is quite common that
survey of this nature to receive non-preference feedback as discussed by various
authors (Sanchez & Morchio, 1992; Duffy & Smith, 2005). Refer Table 3 and
Table 4 below.
Table 3 Respondents’ Satisfactory Level with the Existing Bus Services
Frequency Percent
Dissatisfied 682 60.4
Between Satisfied and Dissatisfied 242 21.4
Satisfied 206 18.2
Total 1,130 100.0
Table 4 Respondents’ Aspiration of Aspect of Bus Services to be Improved
Frequency Percent
On-time service and more frequent 353 31.2
Reliable and accurate information 54 4.8
Comfort and clean vehicles 195 17.3
Safe and Secure service 47 4.2
Affordable service 70 6.2
New vehicle and modern system 115 10.2
New waiting facilities and infrastructure 80 7.1

Syahriah Bachok, & Zakiah Ponrahono Modelling Willingness to Pay for Improves Public Transport Services: The Challenges of Non-Response to Stated Preference
Hypothetical Questions
© 2017 by MIP 338
No comment or positive comment for current service 216 19.1
Total 1,130 100.0
Respondents were also asked about other preferences. The stated
preference for frequency of use can be seen almost equally distributed (between
16 percent and 25 percent). Lower responses (12 percent) were gained for “never”
to ride the bus again. The majority (41 percent) would prefer buses to operate
between 6am and 10pm, which was a fairly appropriate service duration for a
typical bus service. However, a high majority (62 percent) would like to see a
more frequent service in the future, with buses arriving or departing every 15
minutes. This reflected the invariability of bus frequency that the respondents
were experiencing, disclosing the issue of punctuality and headways. The speed
at which most respondents (37 percent) preferred was that bus operating at 70 km
per hour. Refer Table 5, Table 6, Table 7 and Table 8 below.
Table 5 Respondents’ Stated Preference of Trip Frequency if Bus Services are
Improved
Frequency Percent
everyday 260 23.0
5 days per week 276 24.4
3 day per week 182 16.1
1 day per week 278 24.6
never 134 11.9
Total 1,130 100.0
Table 6 Respondents’ Stated Preference of Bus Service Duration
Frequency Percent
9.00am to 6.00pm 243 21.5
6.00am to 9.00pm 134 11.9
6.00am to 10.00pm 458 40.5
8.00am to 11.00pm 210 18.6
7.00am to 9.00pm 85 7.5
Total 1,130 100.0
Table 7 Respondents’ Stated Preference of Bus Frequency
Frequency Percent
every 60 minutes 43 3.8
every 45 minutes 40 3.5
every 30 minutes 190 16.8
every 20 minutes 152 13.5
every 15 minutes 705 62.4
Total 1,130 100.0

PLANNING MALAYSIA:
Journal of the Malaysia Institute of Planners (2017)
© 2017 by MIP 339
Table 8 Respondents’ Stated Preference of Bus Average Speed
Frequency Percent
90 km/h 132 11.7
80km/h 220 19.5
70km/h 423 37.4
60km/h 228 20.2
45km/h 127 11.2
Total 1,130 100.0
When posed with issues of priority improvements, respondents ranked
high aspects related to safety and waiting facilities (29 percent). However,
combined together (43 percent), issues relating to travel time, frequency and
punctuality were deemed important too (Table 9).
Table 9 Respondents’ Stated Preference of Prioritised Area Public Transport
Improvement
Frequency Percent
on time 235 20.8
frequent 255 22.6
safe and facilitate with proper bus stop 331 29.3
clean and comfort 210 18.6
trained and competent driver 99 8.8
Total 1,130 100.0
A hypothetical scenario relating to fare increased in return for better and
improved services was received with mixed responses. Table 10 below indicates
passengers surveyed perceived that safety, comfort and cleanliness (30 percent)
were the stronger aspects to be prioritised if fare was to be increased. This was
followed by provision of wifi and television on board (25 percent), quality drivers
(17 percent), fully seated vehicles and electronic fare system (14 percent
respectively).
Table 10 Respondents’ Stated Preference of Bus Services Aspects, if They Have to Pay
Increased Fare Rate
Frequency Percent
trained and competent driver 188 16.6
safe, comfort and clean bus 337 29.8
provide wifi and tv 283 25.0
no standing passengers 162 14.3
electronic ticketing system 160 14.2
Total 1,130 100.0

Syahriah Bachok, & Zakiah Ponrahono Modelling Willingness to Pay for Improves Public Transport Services: The Challenges of Non-Response to Stated Preference
Hypothetical Questions
© 2017 by MIP 340
Figure 2 The Distribution of Ranges of Current Fare Paid Respondents
Current fare ranges paid by respondents was from RM0.00 to RM10.00
(Figure 2). Half of respondents (50 percent) paid between RM2.01 and RM3.00.
Some 20 percent paid RM1 and less. This was followed by those who paid
between RM3.01 and RM4.00 (17 percent). About 10 percent paid between
RM4.01 and RM5.00. The remainder (3 percent) paid between RM5.01 and
RM10.00.
When hypothetical questions relating to willingness to pay, only 64
respondents or less than 6 percent stated positive reactions (Table 11). Issues of
lower responses for willingness to pay questions and their parameters have been
discussed by many authors including Lui and Jansen (2017), Martinez-Espiniera
and Lyssenko (2012), Manisera and Zuccolotto (2014), Gibbs Jr. and Bryant
(2008) and Lietz (2008). These authors discussed the effects of social desirability,
political correctness, cognitive effects and efforts, optimal relevance and attitude
as hindrances to extraction of exact responses for hypothetical questions. This
was especially true of questions relating to monetary, finance and fiscal elements
relating to respondents’ personal income and expenditure. Due to this negative
reception of willingness to pay questions, it has been a challenge for the authors
of this paper to develop and determine the most suitable model to reflect this
choice behaviour.

PLANNING MALAYSIA:
Journal of the Malaysia Institute of Planners (2017)
© 2017 by MIP 341
Table 11 Respondents’ Stated Preference of Future Increased in Fare
Frequency Percent
Valid maintain current fare 1,066 94.3
increase 10-20cent 40 3.5
increase 30-40cent 16 1.4
increase 50-60cent 8 .7
Total 1,130 100.0
Willingness to Pay for Additional Fare
This section elaborates the stated preference for increased fare rate. It discusses
the attempts at modelling this preferential behaviour.
Table 12 Fare Increased Preferred by Respondents Willing to Pay for Increased Fare
Frequency Percent
Valid increase 10-20cent 40 62.5
increase 30-40cent 16 25.0
increase 50-60cent 8 12.5
Total 64 100.0
Table 12 above, indicates that only 64 users surveyed preferred fare
increase at various levels to be paid for improvement of bus services. The
majority (63 percent) were willing to spend some RM0.20 for this purpose. A
quarter (25 percent) were willing to pay additional RM0.40 to see bus
improvements in the near future. For the 6 percent respondents who were willing
to pay additional fare in return for improved bus services, the followings are the
aspects of bus improvements they would like to see in the near future (Table 13).
Table 13 Bus frequency Preferred by Respondents Willing to Pay for Increased Fare
Frequency Percent
Valid every 60 minutes 2 3.1
every 30 minutes 9 14.1
every 20 minutes 7 10.9
every 15 minutes 46 71.9
Total 64 100.0
For the fare increased, the majority (72 percent) would prefer to have bus
service at every 15 minutes or 4 buses in an hour (Table 13). Other non-time
related improvements were comfort (33 percent) and safety (23 percent). Refer
Table 14 below.

Syahriah Bachok, & Zakiah Ponrahono Modelling Willingness to Pay for Improves Public Transport Services: The Challenges of Non-Response to Stated Preference
Hypothetical Questions
© 2017 by MIP 342
Table 14 Bus Improvement Priority Areas by Respondents Willing to Pay for Increased
Fare
Frequency Percent
Valid increase the safety 15 23.4
fix trip/schedule 6 9.4
on time trip 8 12.5
more frequent trip 8 12.5
waiting time less than 10-15 min 5 7.8
comfort (wifi, air-cond, etc.) 21 32.8
to remain the current fare 1 1.6
Total 64 100.0
Modelling
Inferential analysis for this study has been chi-square tests and a linear regression
modelling for the willingness to pay additional fare. The following tables provide
the analysis results.
Table 15 Chi-Square Cross Tabulation of Fare Choices (DV) * Reason to Increase Fare
(IV)
Reason to increase fare
Total Comfort safety and latent
parameters
Travel time
parameters
increase 10-20cent
increase 30-40cent
increase 50-60cent
21 19 40
9 7 16
7 1 8
Total 37 27 64
Chi-Square Tests
Value df
Asymptotic Significance
(2-sided)
Pearson Chi-Square 3.370a 2 .185
Likelihood Ratio 3.844 2 .146
Linear-by-Linear Association 2.554 1 .110
N of Valid Cases 64

PLANNING MALAYSIA:
Journal of the Malaysia Institute of Planners (2017)
© 2017 by MIP 343
Symmetric Measures
Value
Approximate
Significance
Nominal by Nominal Phi .229 .185
Cramer's V .229 .185
Contingency Coefficient .224 .185
N of Valid Cases 64
From the three tables above, results have shown that willingness to pay
for additional fare were not significantly different for those users who preferred
improvements in latent variables (comfort and safety) compared to those
preferring travel-time related variables. At 95% confidence level, p-value was
0.185 (higher than critical 0.05) and Phi and Cramer’s V values were small
(0.229), indicating a failure to reject the null hypothesis.
Another attempt at explaining the willingness to pay additional charge
was upon the headways of bus in an hour. The three tables below, show that bus
headways or frequency in an hour had been significant in explaining the
difference in fare increased preferred by users surveyed. The results of p-value at
0.045 and slightly higher Phi and Cramer’s V value of 0.312, indicated a
significant relationship between fare rate increase and bus frequency. In other
words, passengers who were positive about additional fare would consider paying
more for increased bus frequency or reduced headways.
Table 16 Chi-Square Cross Tabulation of Fare Choices (DV) * Preferred Bus
Frequency (IV)
Preferred frequency
Total 1 4
Fare choices increase 10-20cent 4 36 40
increase 30-40cent 6 10 16
increase 50-60cent 1 7 8
Total 11 53 64
Chi-Square Tests
Value df
Asymptotic Significance
(2-sided)
Pearson Chi-Square 6.213a 2 .045
Likelihood Ratio 5.527 2 .063
Linear-by-Linear Association 1.351 1 .245
N of Valid Cases 64

Syahriah Bachok, & Zakiah Ponrahono Modelling Willingness to Pay for Improves Public Transport Services: The Challenges of Non-Response to Stated Preference
Hypothetical Questions
© 2017 by MIP 344
Symmetric Measures
Value
Approximate
Significance
Nominal by Nominal Phi .312 .045
Cramer's V .312 .045
Contingency Coefficient .297 .045
N of Valid Cases 64
Next, a simple linear regression was carried out to model the willingness
to pay for increased fare, in the attempt at predicting the value for money of these
respondents. The following four tables can be summarised to represent a
significant model at 90 percent confidence level, with fare rate increased being
positively determined by the increased in bus frequency or reduced headways
(albeit lower R2 = 0.049 and p-value of 0.080). The derived utility function would
be as follows: Fare increased = RM0.18 + 0.347 (hourly bus frequency)
Table 17 Regression Analysis for Variables Entered/Removed
Model Variables Entered Variables Removed Method
1 Preferred frequencyb . Enter
a. Dependent Variable: Fare choices
b. All requested variables entered.
Table 18 Model Summary
Model R R Square Adjusted R Square Std. Error of the Estimate
1 .221a .049 .033 14.014
a. Predictors: (Constant), preferred frequency
Table 19 ANOVAa
Model
Sum of
Squares df Mean Square F Sig.
1 Regression 623.827 1 623.827 3.176 .080b
Residual 12176.173 62 196.390
Total 12800.000 63
a. Dependent Variable: Fare choices
b. Predictors: (Constant), preferred frequency
Table 20 Coefficientsa
Model
Unstandardized
Coefficients
Standardized
Coefficients t Sig.
B Std. Error Beta
(Constant)
Preferred frequency
18.394 4.100 4.486 .000
.347 .194 .221 1.782 .080
a. Dependent Variable: Fare choices

PLANNING MALAYSIA:
Journal of the Malaysia Institute of Planners (2017)
© 2017 by MIP 345
RECOMMENDATIONS AND CONCLUSION
This paper has discussed the perception of 1,130 bus passengers on the current
bus services in four Malaysian states. From the analysis, the users surveyed had
generally negative views on the existing service provision. They were highly
aspired to see more improvements on buses services, especially in the following
aspects: travel time, waiting time, punctuality and bus frequency. Also receiving
attentions were issues of safety, comfort and vehicles quality. Hence, these are
priority areas that bus operators, vehicle suppliers, transport regulators and
monitoring authorities and respective agencies related to public transport must be
focusing on, when initiating pilot improvement schemes or investing in the future
public transport systems.
When hypothetically faced with increase fare rates, preferences were
clearly skewed towards increased frequency or reduced headways compared to
other latent variables. The paper has attempted at modelling and predicting the
necessary improvements in bus services, especially with regards to frequency,
when the inevitable price or fare increase is to be executed by public transport
operators or regulators.
All three objectives of the papers, including determining the proportion of
passengers willing to pay additional fare amount in return of improved bus
services, and developing a model explaining such willingness have been
achieved. It is therefore concluded that, public transport passengers were willing
to pay for additional fare, provided that service frequency was to be increased.
This paper confirms findings of previous research by Hensher and Rose (2010),
and Phanikumar and Maitra (2007). The findings were also in congruent with
previous on issues faced by hypothetical questionnaire types of data collection
methodology, whereby high proportion of respondents were not willing to help
in determining prices or monetary values even if they possessed the expertise and
experiences to answer these questions types as propagated by Sanchez & Morchio (1992), Lietz and Petra (2008) and Duffy and Smith (2005).
REFERENCES Dodgson, J. S. & Katsoulacos, Y. (1988). Quality competition in bus services: some
welfare implications of bus deregulation. Journal of Transport Economics and
Policy, 22(3), 263-281.
Duffy, B., & Smith, K. (2005). Comparative data from online and face-to-face surveys.
International Journal of Market Research, 47(6), 615-639.
Espino, R., Roman, C., & De Ortuzar, J. D. (2006). Analysing demand for suburban trips:
a mixed rp/sp model with latent variables and interaction effects. Transportation,
33(3), 241-261.
Gibbs Jr., R. W., & Bryant, G. A. (2008). Striving for optimal relevance when answering
questions. Cognition, 106, 345-369.
Hensher, D. A., & Stanley, J. (2003). Performance-based quality contacts in bus service
provision. Transportation Research Part A: Policy and Practice, 37(6), 519-538.

Syahriah Bachok, & Zakiah Ponrahono Modelling Willingness to Pay for Improves Public Transport Services: The Challenges of Non-Response to Stated Preference
Hypothetical Questions
© 2017 by MIP 346
Hess, D. B., Brown, J., & Shoup, D. (2004). Waiting for the bus. Public Transportation,
7(4), 67-84.
Li, Z., Hensher, D. A., & Rose, J.M. (2010). Willingness to pay for travel time reliability
in passenger transport: A review and some new empirical evidence.
Transportation Research Part E: Logistics and Transportation Review, 46(3),
384-403.
Lietz, P. (2008). Questionnaire design in attitude and opinion research: current state of
an art (655 Working Paper), Jacobs University, Bremen.
Liu, Z., & Jansen, B. J. (2017). Identifying and Predicting the Desire to Help in Social
Question and Answering. Information Processing and Management, 53, 490-504.
Manisera, M., & Zuccolotto (2014). Modelling “Don’t Know” Responses in Rating
Scales. Pattern Recognition Letters, 45, 226-234.
Martinez-Espineira, R., & Lyssenko, N. (2012). An alternative approaches to dealing with
respondent uncertainty in contingent valuation: a comparative analysis. Journal of
Environmental Management, 93, 130-139.
O’Garra, T., Mourato, S., Garrity, L. et al. (2007) Is the public willing to pay for hydrogen
buses: a comparative study of preference in four cities. Energy Policy, 35(7), 3630-
3642.
Phanikumar, C. V., & Maitra, B. (2007). Willingness to pay and preference heterogeneity
for rural bus attributes. Journal of Transportation Engineering, 133(1), 62-69.
Pedesson, P. A. (2003). On the optimal fare policies in urban transportation.
Transportation Research Part B: Methodological, 37(5), 423-435.
Politis, I., Papaioannou, P., Basbas, S., & Dimitriadis, N. (2010). Evaluation of a bus
passenger information system from the users’ point of view in the city of
Thessaloniki, Greece. Research in Transportation Economics, 29(1), 249-255.
Ricci, M., Bellaby, P., & Flynn, R. (2008). What do we know about public perceptions
and acceptance of hydrogen bus? A critical review and new case study evidence.
International Journal Hydrogen Energy, 33(21), 5868-5880.
Sanchez, M. E., & Morchio, G. (1992). Probing “don’t know” answers effects on survey
estimates and variables relationships. Public Opinion Quarterly, 56, 454-474.
Saxe, M., Folkesson, A., & Alvfors, P. (2007). A follow up and conclusive report on the
attitude towards hydrogen fuel cells buses in the cute project – from passengers in
Stockholm to bus operators in Europe. International Journal of Hydrogen Energy,
32(7), 4295-4305.
Turvey, R., & Mohring, H. (1975). Optimal bus fares. Journal of Transport Economics
and Policy, 9(3), 280-286.

1Associate Professor at International Islamic University Malaysia. Email: [email protected] 347
PLANNING MALAYSIA:
Journal of the Malaysian Institute of Planners
VOLUME 15 VOLUME 1 (2017), 347 - 356
HOUSING AFFORDABILITY IN THE STATE OF JOHOR
Mariana Mohamed Osman1, Muhammad Adib Ramlee 2, Nasriah Samsudin3,
Noor Suzilawati Rabe4, Muhammad Faris Abdullah5, & Najihan Khalid6
1,2,3,4,5,6 Kulliyyah of Architecture & Environmental Design
INTERNATIONAL ISLAMIC UNIVERSITY MALAYSIA
Abstract
The Malaysian property market has been facing significant changes in terms of
housing price since a decade ago and these changes are different between states.
The changes in housing prices are being supported by the economic theories of
demand and supply as well as the regional economic and demographic factors
such as income level, housing supply stock, speculative buying and population
changes. This paper provides an overview of the affordable housing policy and
elaborates on the housing affordability index for the districts in the State of Johor.
Using datasets for year 2012 and 2014 in order to determine the median multiple
of price-income ratio, this paper found that housing in all the districts were
generally unaffordable. Some districts recorded HAI of severely unaffordable,
while others in the seriously and moderately unaffordable index categories.
Keywords: Property market, housing affordability index, affordable housing,
Johor, Malaysia
Date Received: 30th April 2016
Date of Acceptance: 30th October 2016

Mariana Mohamed Osman, Muhammad Adib Ramlee, Nasriah, Noor Suzilawati, Muhammad Faris,, & Najihan.
Housing Affordability Index in the state of Johor
© 2017 by MIP 348
INTRODUCTION
Home ownership or the ability to own residential property has been a goal for
many people in Malaysia. Owning a residential property provides sense of
security which leads to happiness, productive and fulfilment of one’s live.
Moreover, home ownership will improve stability and the quality of life of the
people. However, rapid economic growth of the nation has somewhat led to a
surge in housing prices, making houses in Malaysia unaffordable to many of her
citizens. Research by Hashim (2010), for instance, shows that price movement is
influenced by the economic fundamentals, affecting purchasing power and
borrowing capacity. Despite the various housing policies and strategies outlined
and implemented to regulate and monitor the housing supply in Malaysia (Shuid,
2010), house prices in Malaysia keep increasing, especially in city areas. As a
result, of late, housing prices and housing affordability have been a great concern
to the Government of Malaysia.
The objective of this paper is to identify the affordable housing policies
for the State of Johor and to analyse the housing affordability index at the district
level in the state. It is hoped that the findings from this paper would contribute in
making housing more affordable.
LITERATURE REVIEW
The idea of affordable housing recognizes the needs of households whose
incomes are not sufficient to allow them to access appropriate housing in the
market without assistance (Milligan et al., 2004). Thus, the term 'affordable
housing' describes housing that assists lower income households in obtaining and
paying for appropriate housing without experiencing undue financial hardship
(Milligan et al., 2004).
The growth of economy and scarcity of land have caused major issues
that resulted in many housing provision-related issues. As can be seen today the
issues on housing affordability have been the main concerns to many agencies,
political leaders, experts, public as well as governments in many countries.
Although this issue is not new in Malaysia, but concrete solution has yet to be
found. The problem is heightened in part because housing affordability carries
different meaning to different parties. Therefore, a specific mechanism or a
precise measure of housing affordability need to be considered to ensure aspired
home owners can own their own houses as well as the basic need of shelter is not
jeopardised.
Furthermore, housing also poses a significant impact on the
competitiveness of local economy (Quigley & Raphael, 2004). Review of
literature indicated that if the house price is not competitive and beyond the
affordability of the locals, companies in the area will find it difficult to keep and
recruit personnel as fewer families could afford to own a house and reside in the
area. Unaffordable housing will also contribute to financial problems, due to

PLANNING MALAYSIA:
Journal of the Malaysia Institute of Planners (2017)
© 2017 by MIP 349
lower disposable income to finance the house mortgage (Hashim, 2010). Besides,
due to tight housing market, people are unable to afford a house within or near to
city centre as the prices offered are usually beyond affordability level of the
people. As a consequence, households will have to reside farther from the city
centre, where houses are relatively more affordable, and commute a longer
distance to work in the city centre. This would result in higher transportation cost,
longer journey time and exhaustion, which would reduce productivity at work
place. Additionally, rising of house prices with stagnant income level will result
in property overhang, where houses are left unsold.
As a rule of thumb, usually a house is considered affordable if it costs
less than 30 percent of gross household income. However, this is not often the
case in Malaysia. Even for houses marketed as “Rumah Mampu Milik
(Affordable Houses)” by many developers in Malaysia, the price of these houses
was set without referring to any established affordability fact or indexes as its
basis (Hashim, 2010).
Thus, this paper aims to analyse the housing affordability index for the
districts in the state of Johor so that it will become a basis or reference point in
determining the price of housing which is sustainable to the population.
According to a recent study by Khazanah Research Institute (KRI) Malaysia
(2015), Johor has been ranked as the 9th state in Malaysia in terms of housing
affordability. The housing affordability index for Johor was 4.2 in 2014, which is
considered as seriously unaffordable (KRI, 2015). The index was calculated
based on the median all-house price over the median annual household income.
This study will focus on the housing affordability index by districts level in the
state of Johor for year 2012 and 2014.
SITE PROFILE
Johor is a state in Malaysia, located on the southern part of Peninsular Malaysia
and is one of the most developed states in Malaysia. The state capital city of Johor
is Johor Bahru and it is adjacent to the Republic of Singapore. The total acreage
of Johor is 1,898.676 hectares and it is the second-most populous state with the
population of 3,230,440 people in 2010. The state is the 3rd largest conurbation
in Malaysia and consist of 10 districts namely Kota TInggi, Ledang, Mersing,
Segamat, Batu Pahat, Muar, Pontian, Kulai Jaya, Johor Bharu and Kluang. The
districts are governed by 14 local authorities.
JOHOR HOUSING POLICY
The policy of Dasar Perumahan Rakyat Johor (DPRJ) or Housing Policy for
Johorean were introduced in January 2014. The policies deal with several criteria
related to the low cost and middle low cost types of housing. The policy proposed
several types of housing components namely Perumahan Komuniti Johor A (PKJ
A) or Johor Community Housing Type A, PKJ B, Rumah Mampu Milik Johor

Mariana Mohamed Osman, Muhammad Adib Ramlee, Nasriah, Noor Suzilawati, Muhammad Faris,, & Najihan.
Housing Affordability Index in the state of Johor
© 2017 by MIP 350
(RMMJ) or Johor Affordable Homes and medium cost shop lot. The policy is
applicable state-wide although there are some dissimilarity in housing
requirements for Iskandar Malaysia as compared to the rest of the state.
DPRJ Requirements for Areas within Iskandar Malaysia
The percentage composition for low and medium cost housing within the
Iskandar Malaysia is as shown in Table 1 below. Any new housing development
within Iskandar Malaysia is required to provide several types of low and medium
cost houses based on the categories stipulated in the DPRJ. Affordable housing
should constitute a minimum of 40% of a housing development project. Out of
this, 5% should be the PKJ A, which are low cost units (high-rise
flats/apartments) to be priced at RM42,000 and targeted for buyers with
household income of less than RM3,000 per month. 10% should be for PKJ B, to
be priced at RM80,000 and targeted for those with income of less than RM4,500
per month. The RMMJ should constitute 20% and to be priced at RM150,000 and
targeted for buyers with income of less than RM6,000 per month.
The requirement to provide these low and medium cost housing is to
assist lower income earners to purchase houses at affordable prices. However,
when compared with the household income survey for the year 2014, the average
income of the people in the District of Johor Bahru, where Iskandar Malaysia is
located in , is RM7,473 with a median of RM6,121 (Department of Statistic,
2015). This clearly show that 50% of the people in Iskandar Malaysia are within
the medium income categories and eligible to buy these affordable houses.
Table 1 The Composition of Affordable Housing Based on DPRJ for Areas Within
Iskandar Malaysia
House type %
Floor
Area
(Sq. ft.)
Plot Size Type
Maximum
Selling
Price
(RM)
Target
Household
Income/month
PKJ A 5% 720 sqft Nil Strata 42,000 RM3,000
PKJ B 10% 850 Sqft Nil Strata
80,000 RM4,500 16’ x 55’ Landed
RMMJ 20% 1,000
18’ x 60’ Landed
*150,000
RM6,000 20’ x 70
Town
House
NA Strata
Medium
Cost Shop 5% 1,200 NA Landed 200,000 RM7,000
Total 40% From Total Development Units Source: Pekeliling Am Kerajaan Johor on Dasar Perumahan Rakyat Johor, 2014

PLANNING MALAYSIA:
Journal of the Malaysia Institute of Planners (2017)
© 2017 by MIP 351
DPRJ Requirements for the Areas Outside of Iskandar Malaysia
For areas outside Iskandar Malaysia, different affordable housing type
composition and prices is applicable, as shown in Table 2 below. The main
differences are in the percentage of PKJs and RMMJ, and the selling price of
RMMJ and medium cost shop.
Table 2 The Composition of Affordable Housing Based on DPRJ for Areas Outside
Iskandar Malaysia
House
Type %
Floor
Area
(Sq. ft.)
Plot Size Type
Maximum
Selling
Price
(RM)
Target
Household
Income/
Month
PKJ A 10% 720 16’ x 60’ Landed/
Strata 42,000 RM3,000
PKJ B 15% 850 18’ x 60’ Landed/
Strata 80,000 RM4,500
RMMJ 10% 1,000 20’ x 70’ Landed/
Strata
*140,000
*150,000 RM6,000
Medium
Cost Shop 5% 1,200 NA Landed
*150,000
*170,000 RM7,000
Total 40% From Total Development Units
* for city council area. Source: Pekeliling Am Kerajaan Johor on Dasar Perumahan Rakyat Johor, 2014
HOUSING AFFORDABILITY INDEX
Affordable housing is related to the ability of a household to pay for their house
(EsruqLabin, 2014). The concept of housing affordability can be measured from
three perspectives, namely Repayment Affordability, Purchase Affordability and
Price Income Ratio (PIR). For the calculation of housing affordability index
(HAI) for each districts in Johor, the PIR was used. To derive the HAIs, the
median multiple formula, which makes use of the annual income and median of
all house prices, was employed (Figure 1). Data on population income and house
price for year 2012 and 2014 were sourced from the Department of Statistics
Malaysia and the National Property Information Centre of the Valuation and
Property Services Department Malaysia.
Figure 1 Median Multiple Formula Source: Khazanah Research Institute, 2015
The resulting median multiple scores were then compared to the housing
affordability index categories as shown in Table 3 below.
Median Multiple = Median All House Price
Annual Medium Income

Mariana Mohamed Osman, Muhammad Adib Ramlee, Nasriah, Noor Suzilawati, Muhammad Faris,, & Najihan.
Housing Affordability Index in the state of Johor
© 2017 by MIP 352
Table 3 Housing Affordability Rating Categories
Category Median Multiple
Severely Unaffordable 5.1 and Over
Seriously Unaffordable 4.1- 5.0
Moderately Unaffordable 3.1- 4.0
Affordable 3.0 and Under Source: Demographia, 2016.
FINDINGS
Table 4 below shows the median multiple and the associated HAIs calculated for
each district in Johor for year 2012 and 2014. Generally, there has been an
improvement in terms of housing affordability in many of the districts from 2012
to 2014. Out of the ten districts in Johor, eight have experience improved housing
affordability in 2014 as compared to 2012. For instance, the District of Kota
Tinggi recorded a median multiple of 4.7 in 2014, as compared to 6.9 in 2012.
This could be due to increase in median income among the population higher than
the increase of median house price in the district. Other districts that experienced
improved housing affordability were Ledang, Batu Pahat, Muar, Pontian, Kulai
Jaya, Johor Bahru and Kluang. Despite the improvement in affordability, the
median multiple for these districts were still above 3.0, indicating housing
unaffordability. For example, for the District of Ledang, the median multiple for
2014 was 5.3, indicating that housing in the district was severely unaffordable
despite slight improvement in the affordability index from 2012.
Two districts experienced worsening median multiple, which were
Mersing and Segamat. The median multiple for Mersing was 5.7 in 2012 but
worsen in 2014 to 6.1. For Segamat, it worsen slightly from 5.2 in 2012 to 5.3 in
2014. For these districts, the HAI indicated that housing in the districts were
severely unaffordable both in 2012 and in 2014.

PLANNING MALAYSIA:
Journal of the Malaysia Institute of Planners (2017)
© 2017 by MIP 353
Table 4 HAI for 2012 and 2014 by Districts in Johor
District
2012 2014 M
edia
n
Inco
me
(RM
)
An
nu
al
Med
ian
Inco
me
(RM
)
Med
ian
- A
ll
Ho
use
Pri
ces
(RM
)
Med
ian
Mu
ltip
le
Aff
ord
ab
ilit
y
HAI
Med
ian
Inco
me
(RM
)
An
nu
al
Med
ian
Inco
me
(RM
) M
edia
n -
All
Ho
use
Pri
ces
(RM
)
Med
ian
Mu
ltip
le
Aff
ord
ab
ilit
y
HAI
Kota
Tinggi 2,338 28,061 195,000 6.9
Sev
erel
y U
naf
ford
able
4,814 57,768 272,500 4.7
Ser
iousl
y
Unaf
ford
able
Ledang 2,161 25,937 152,500 5.9 4,398 52,776 278,800 5.3
Sev
erel
y
Unaf
ford
able
Mersing 2,437 29,241 167,500 5.7 3,253 39,036 237,500 6.1
Segamat 3,437 41,250 215,000 5.2 4,249 50,988 270,000 5.3
Batu
Pahat 3,251 39,012 202,500 5.2 5,142 61,704 255,000 4.1
Ser
iousl
y
Unaf
ford
able
Muar 2,569 30,822 140,000 4.5
Ser
iousl
y U
naf
ford
able
4,787 57,438 178,750 3.1 M
oder
atel
y
Unaf
ford
able
Pontian 3,158 37,899 171,000 4.5 4,658 55,896 180,000 3.2
Kulai
Jaya 3,242 38,900 166,250 4.3 5,066 60,792 247,500 4.1
Ser
iousl
y
Unaf
ford
able
Johor
Bahru 4,540 54,485 221,000 4.1 6,121 73,452 288,800 3.9
Moder
atel
y
Unaf
ford
able
Kluang 3,112 37,346 149,000 4.0
Mo
der
atel
y
Un
affo
rdab
le
3,833 45,996 170,000 3.7
Source: Researcher calculation,2016

Mariana Mohamed Osman, Muhammad Adib Ramlee, Nasriah, Noor Suzilawati, Muhammad Faris,, & Najihan.
Housing Affordability Index in the state of Johor
© 2017 by MIP 354
Affordable house price for each district was then derived based on the
annual median income of population of each district multiplied affordability
index of 3.0. The results are as shown in Table 5. These are the maximum median
house price if houses in the districts were to be made affordable to the population
of the districts.
Table 5 Affordable House Prices by District in Johor based on Data for 2014
District Annual Median
Income (RM)
Median All House
Price (RM)
Affordable
Maximum Median
House Price Based
on Housing
Affordability Index
Ratio of 3.0
Mersing 39,036 237,500 117,108
Segamat 50,988 270,000 152,964
Ledang 52,776 278,800 158,328
Kota Tinggi 57,768 272,500 173,304
Batu Pahat 61,704 255,000 185,112
Kulai jaya 60,792 247,500 182,376
Johor bahru 73,452 288,800 220,356
kluang 45,996 170,000 137,988
Pontian 55,896 180,000 167,688
Muar 57,438 178,750 172,314 Source: Researcher calculation,2016
Figure 2 Affordable House Price in Johor by Districts in 2012 and 2014
Source: Researcher calculation, 2016
PLANNING MALAYSIA:
Journal of the Malaysia Institute of Planners (2017)
© 2017 by MIP 355
Figure 2 compares the actual median house price in 2014 and the derived
affordable maximum median house price based on population median income. In
all of the districts, the actual median house price is higher than the derived
affordable median house price, indicating that housing in the districts are
unaffordable given the income of the population. The difference between actual
median house price and the derived affordable median house price are largest in
the districts of Mersing, Segamat and Ledang. This corroborates the HAIs in
Table 5 where the three districts were identified with severely unaffordable
housing. Smaller difference between actual median house price and the derived
affordable median house price occurs in the districts of Kluang, Pontian and
Muar, all of which were identified with moderately unaffordable HAI in Table 5.
CONCLUSION
In conclusion, this paper has shown that despite the presence of affordable
housing policy for the State of Johor, house prices in the state is largely higher
than what the population can afford, making housing unaffordable to the
population. The housing affordability index for some of the districts was worst at
severely unaffordable while others were in the seriously and moderately
unaffordable categories. None of the districts was found to have median house
price that commensurate the population income. Although some districts
experienced improvement in terms of housing affordability in 2014, the HAI of
these district was still in the unaffordable rating categories.
REFERENCES Cagamas Holdings Berhad (2010). Housing the nation: policies, issues and prospects.
Kuala Lumpur: Cagamas Holdings Berhad.
Chander, R. (1977). Housing needs versus effective demand in Malaysia. Kuala Lumpur:
Department of Statistics Malaysia. Demographia (2016). 12th annual Demographia international housing survey.
Department of Housing, Johor State Government (2014). Pekeliling Am Kerajaan Johor.
Retrieved 17/01/2017 from http://erumah.johor.gov.my/ePerumahan/
home/index.htm.
Department of Statistics Malaysia (2007). Population and housing census, Malaysia
2007. Putrajaya: Department of Statistics, Malaysia.
Esruq-Labin, A. M. J., Che Ani, A. I., Mohd Tawil, N., Nawi, M. N. M., & Othuman
Mydin, M. A. (2014). Criteria for affordable housing performance measurement:
a review. In Proceedings of the Emerging Technology for Sustainable
Development Congress, August 5, Bangi, Malaysia.
Hadi, A. N. (2015). Housing policy and housing program in Malaysia. Retrieved from
http://www.academia.edu/12498641/Housing_Policy_and_Housing_Program_
In_Malaysia.
Hashim, Z.A. (2010) House price and affordability in housing in Malaysia. Akademika,
78, 37-46.

Mariana Mohamed Osman, Muhammad Adib Ramlee, Nasriah, Noor Suzilawati, Muhammad Faris,, & Najihan.
Housing Affordability Index in the state of Johor
© 2017 by MIP 356
Khazanah Research Institute [KRI] (2015). Making housing affordable. Kuala Lumpur:
Khazanah Research Institute.
Khazanah Research Institute [KRI] (2016). The state of household. Kuala Lumpur:
Khazanah Research Institute.
Milligan, V., Gurran, N., Lawson, J., Phibbs, P., & Phillips, R. (2009). Innovation in
affordable housing in Australia: bringing policy and practice for not-for-profit
housing organisations together, AHURI Final Report No. 134. Melbourne:
Australian Housing and Urban Research Institute Limited.
National Property Information Centre (2012). Data on housing property for demand and
supply 2012. Retrieved from http://napic.jpph.gov.my/portal/publication.
National Property Information Centre (2014). Data on housing property for demand and
supply 2014. Retrieved from http://napic.jpph.gov.my/portal/publication.
Qigley, J., & Raphael, S. (2004). Is housing affordable? Journal of Economic
Perspectives, 18(1), 191-214.
Shuid, S. (2010) Policies and strategies for housing supply in Malaysia. Kuala Lumpur:
Ministry of Urban Wellbeing Housing and Local Government, Malaysia.
Sliogeris, E., Crabtree, L., Phibs, P., & Johnston, K. (2008). Housing affordability
literature review and affordable housing program audit. Penrith, N.S.W:
University of Western Sydney. Retrieved from
http://www.uws.edu.au/__data/assets/pdf_file/0004/164623/landcom_report_2
008-07-21.pdf
Wendell, C., & Pavletich, H. (1988). 8th annual Demographia international housing
affordability survey. Retrieved from http://www.demographia.com/dhi.pdf
Zainun, N. Y., & Eftekhari, M. (2010). Forecasting low-cost housing demand in Johor
Bahru, Malaysia using artificial neural networks2 (ANN). Journal of
Mathematics Research, 2(1), 14-15.

1Ph.D. Candidate at International Islamic University Malaysia. Email: [email protected] 357
PLANNING MALAYSIA:
Journal of the Malaysian Institute of Planners
VOLUME 15 VOLUME 1 (2017), 357 - 368
A REVIEW ON SUSTAINABLE WELLBEING INDICATORS FOR
HUMAN INTERRELATIONSHIPS WITH THE ENVIRONMENT
Aisyah Abu Bakar1, Mariana Mohamed Osman2, Syahriah Bachok3, Ismawi Zen4,
& Muhammad Faris Abdullah5
1,2,3,4,5 Kulliyyah of Architecture and Environmental Design,
INTERNATIONAL ISLAMIC UNIVERSITY MALAYSIA
Abstract
The environment should appear not only as a commodity to humans but as an
inspiring source that appeals to humans’ ethical ability. In Malaysia, studies
concerning factors influencing pro-environmental behaviours are vast. However,
studies on interrelationships between humans and the contextual surroundings are
scarce. Towards achieving sustainable well-being, it is undoubtedly important for
humans to have conforming emotions, behaviours, cognitions and motivations
towards the environment. This study intends to identify the determinants of
human values and ethical behaviour concerning the environment towards
developing a theoretical framework of interrelationship between human and
environment.
Keywords: sustainable well-being, human interrelationships with the
environment
Date Received: 30th April 2016
Date of Acceptance: 30th October 2016
Aisyah Abu Bakar, Mariana Mohamed Osman, Syahriah, Ismawi Zen, Alias Abdullah, & Muhammad Faris An Assessment of Sustainable Wellbeing Indicators for Human Interrelationships with the Environment
© 2017 by MIP 358
INTRODUCTION
This study is a part of an ongoing research to discover variables of sustainable
well-being for Malaysia at the local scale. Sustainable well-being in simplest
understanding means to pursue well-being without compromising others’ abilities
to pursue their well-being (Kjell, 2011; Kajikawa, 2008; O’Brien, 2008). The
term ‘others’ refer to all living and resourceful beings. This study recognizes
‘others’ as humans and environment. Variables of sustainable well-being
manifests in human interrelationship with other humans and human
interrelationship with the environment (Kjell, 2011). The term ‘interrelationship’
refer to mutual reliance between two groups, which in this case (i) between
human and other humans, and (ii) between human and the environment. The
variables are practical for national and international use in measuring the
readiness and the extent of efforts of everyday practices towards sustainable well-
being at the local scale. This paper focuses on theoretical exploration of the
interrelationship between human and environment.
The natural resources have fulfilled many of humans’ basic needs, such
as water, food, materials and shelters. In return, human activities have been
exploiting and polluting the environment (Kajikawa et al., 2007; Yarime, Takeda
& Kajikawa, 2010). The principal reason for this alarming issue is that humans
have conceptualized the natural environment as the resources of utility and
commodity (Kjell, 2011). Environment ought to inspire human’s ethical ability.
In pursuit of sustainable well-being, it is vital for humans to have conforming
emotions, attitudes, cognitions and motivations that relate to their contextual
environment (Kjell, 2011; Krajhanzl, 2010; Horayangkura, 2013). The ethical
ability refers to positive human engagements with natural surroundings reflected
in norms, lifestyles and outdoor skills (Krajhanzl, 2010). This paper demonstrates
the theoretical framework of human interrelationship with environment towards
developing the intended variables at the local scale. The variables serve as
quantifiable indicators of mutual reliance between human and environment.
This paper discussed examples of findings from recent environmental
studies from the year 2010 onwards to capture the variables involved in human
interrelationship with the environment. This paper was presented at 2015 Asia
Pacific International Conference on Environment-Behavior Studies. In
association with the conference’s follow up journals, the environmental studies
were gathered from published articles of ajE-Bs and jABs. The purpose of
limiting the sources is to establish parameters in determining the patterns of
recent findings on human-related environmental studies, particularly in Malaysia.
The selection of the papers depends on the relevance of the papers in examining
the human-environment concerned issues as well as the addressed dynamics and
factors involved in human interrelationship with the environment.

PLANNING MALAYSIA:
Journal of the Malaysia Institute of Planners (2017)
© 2017 by MIP 359
SUSTAINABILITY AND HUMAN WELLBEING
Environmental sustainability acknowledges to the balance between the rate of
depletion of natural resources and replenishment of natural resources (Schultz,
2002). Common scientific research fields that concern on environmental
sustainability are forestry, fisheries and agriculture (Kajikawa et al., 2007;
Yarime, Takeda & Kajikawa, 2010). A number of authors found that there is a
lack of study on the relations of well-being with mentioned research fields
(Yarime, Takeda & Kajikawa, 2010; Kjell, 2011). Sustainability research
objectives include the pursuit of happiness of both present and the future
generation (Kajikawa, 2008). There is a large number of authors that recognize
well-being within sustainability (Kjell, 2011; O’Brien, 2008). However, the
nature of the “well-being” has not been clearly explained (Horayangkura, 2013).
Therefore, profound understanding of well-being from the view of sustainability
research is in need.
The significance of sustainable well-being lies in the interdependencies
between a variety of interaction processes and systems (Lele & Noorgard, 1996).
As asserted by O’Hara (1998), every so often human interaction systems are in
tension and not mutually compatible. Interdependencies can be a result of well-
being that is sustained at another’s expense. The studies of social context
illustrated how one person’s well-being may source from ill-being of others,
which in reverse is also true (Lele & Noorgard, 1996; O’Hara, 1998; Lazarus,
2003; Kjell, 2011). Thus, interdependencies between human and the contexts
which he acts in are a significant measure of sustainable well-being (Lazarus,
2003; Horayangkura, 2013). The theories of sustainable well-being suggested
that sustainable well-being is achievable through supportive and congruent
interaction system (Kjell, 2011; Krajhanzl, 2010; Lazarus, 2003). In other words,
for well-being to be sustained, the entities in the interaction system must also
achieve compatible and cohesive wellness. The entities, for the most part, are
people and environment.
Sustainable well-being between human and environment is achievable
when humans and environment are supportive of each other and relied on one
another for mutual wellness. As achieving human well-being growingly followed
by environment ill-being, the interrelationship between human and environment
rise in pressure. Among recognized causes of this pressure are sheer
neglectfulness, lack of knowledge and experiences and hesitant to change
attitudes and lifestyles (Krajhanzl, 2010). However, there are more to the barriers
of environmental ethics. Other factors which lack in academic discussions are
individual personality, intentional and unintentional interaction with natural
environment, and external conditions such as economic constraints and cultural
roots (Krajhanzl, 2010; Lim, 2011; Delima & Zaman, 2012).
Therefore, more theoretical understanding and observable indicators are
necessary to comprehensively discern the interrelationship between human and

Aisyah Abu Bakar, Mariana Mohamed Osman, Syahriah, Ismawi Zen, Alias Abdullah, & Muhammad Faris An Assessment of Sustainable Wellbeing Indicators for Human Interrelationships with the Environment
© 2017 by MIP 360
environment. The following subsections discuss on common findings of human-
related environmental studies as well as dimensions and factors influencing
human interrelationship with the environment. The outcome is used to develop
quantifiable subjective indicators of human interrelationship with the
environment suitable for Malaysia.
RELATED ENVIRONMENTAL STUDIES IN MALAYSIA
Human-related environmental studies refer to broad interdisciplinary academic
fields that investigate the interaction between human and environment in the
attempt to provide a solution to complex issues. The study fields cover topics
relating to the natural environment, built environment, behavioural studies
relating to the environment and the relationships between them (Knight, 2015;
Delgado, Aceituno & Loaiza, 2015). Horayangkura (2013) stresses the need for
profound theories and observable measures on human interrelationship with the
environment for architectural designs. The field of environmental psychology can
assist to elucidate understanding of interrelationships between human and
environment for more people-centric built environment. According to Krajhanzl
(2010), the dynamics of human interaction with the environment is a very wide
web. The model cannot be static, but it changes from time to time as determinants
of the interrelations between human and environment evolve. Table 1, Table 2,
Table 3 and Table 4 summarized findings from human-related environmental
papers in ajE-Bs and jABs.
Table 1 Environmental Behaviour
Summary of Findings Authors
Inception of ecopsychology elements in environmental education
increases attitudes towards environment.
Kamidin et al.,
2010
Gender and parents’ education levels have no effect on conservation
behaviour. Urban and rural strata and faculties have a linear effect
on conservation behaviour.
Asmuni et al.,
2010
Students preferred the convenient modes of transportation: personal
cars over the public transports due to needs and constraints.
Singhirunnusorn
et al.2011
Recycling attitudes cannot guarantee recycling behaviour.
Consumers with high collectivistic values have high recycling
behaviours than consumers with high materialistic and
individualistic values.
Abdul Latif and
Omar, 2012
Knowledge, attitude and recycling behaviour have significant and
positive correlations.
Singhirunnusor et
al., 2012 Sense of community and place develops willingness to take
responsibility for more than their immediate surroundings.
Laurens, 2012
Situational factor has significant and direct effect on both recycling
behaviour and intention to recycle. Intention to recycle is a partial
mediator in linking situational factors to recycling behaviour.
Abdul Latif et al.,
2012

PLANNING MALAYSIA:
Journal of the Malaysia Institute of Planners (2017)
© 2017 by MIP 361
Communication barely occur between designers and building users.
Due to continual cultural factors and adaptations, inclusion of
environment-behaviour in architectural practices seemed
impossible.
Horayangkura,
2013
Table 2 Outdoor Environment
Summary of Findings Authors
The community believed that it was necessary to maintain stability
of social life to provide peace and stability to the forest.
Zahari et al.,
2010
Users feel safe in surrounding with vegetation that was well
maintained, not dense, provided a clear view, clean and spacious.
Gender and age had no significant relationship on personal safety in
public park.
Maruthaveeran,
2010
Influential factors affecting house value were (i) variety of park
elements, (ii) conceptual or design of the park, (iii) distance to the
park, (iv) views towards the park, and (v) active areas in the park
facing the house, respectively.
Othman &
Nawawi, 2010
The lower the satisfaction levels of the patients due to bed
positioning in relation to window and inaccessibility to outdoor
garden, the longer their recovery process.
Ghazali & Yusoff
Abbas, 2011
There exist positive and strong correlation between diversity of green
infrastructure and (i) physical well-being, (ii) cognitive well-being,
and (iii) social well-being.
Mansor et al.,
2012
The pre-test indicated there was a relationship between people’s
accessibility to green open space and their corresponding social
health and behaviour. Most of respondents showed very few cases
on physical symptoms, stress, and anxiety disorder.
Singhirunnusorn
& Sahachai-
saeree, 2012
Stimulation of natural elements is statistically effective on (IV) and
(i) flexibility of functions, (ii) play-participation, and (iii) curiosity
(DV).
Faizi et al., 2013
Urban-rural strata, age and gender had significant effect on outdoor
walking speed. Walking distance and walking time were dependent
on physical ability, stamina health, and availability of pedestrian
space, visual appropriateness, and obstacles.
Azmi et al., 2013
Park users were equally distributed among gender and age groups
which implied safety and implausibility of unwarranted juvenile.
Human behaviours response to the physical setting of the park.
Ngesan et al.,
2013

Aisyah Abu Bakar, Mariana Mohamed Osman, Syahriah, Ismawi Zen, Alias Abdullah, & Muhammad Faris An Assessment of Sustainable Wellbeing Indicators for Human Interrelationships with the Environment
© 2017 by MIP 362
Table 3 Environmental Policy
Summary of Findings Authors
Failing to enforce regulations due to limited resources had increase
pressure on SWM industry and intensify barriers to residents’
participation in recycling and waste separation. Awareness and
behavioural change were crucial to improve the situation.
Lim, 2010
EEC of Malaysian managers was statistically explained by (i)
regulation aspects, (ii) financial aspects and (iii) stakeholder
information Costs of environmental efforts help to lower cost of
operations, reduce environmental impact and improve corporate
image. Stakeholder involvement impart pressure and promote
awareness.
Delima &
Zaman, 2012
Table 4 Environmental Stress and Pollution
Summary of Findings Authors
Environmental stressed are statistically related to housing size,
surrounding living area and exposure to natural disaster. Housing size
Sahari et
al., 2012
Improper construction process and procedures during alterations of houses
often resulted to issues to the house and surrounding areas. This include
natural environment, health and quality of life.
Isnin et al.,
2012
There exists simultaneous relationship between per capita income and per
capita pollutant emission.
Borhan et
al., 2013
People living in tropical climate such as Malaysia adapted to higher
temperature, more humid and less breezy conditions.
Nasir et al.,
2013
The tables summarize the findings and highlight important variables
involved from the selected articles of human-environmental studies. The pattern
of the summary suggested that a majority of the studies tend to examine socio-
psychological aspects of human-environment relations. The findings provide
understanding on how human-environmental studies are conducted and the
dynamics or relationships between the variables tested in the research.
Highlighted key variables from each article can be used to formulate the
indicators of human interrelationship with the environment.
DIMENSIONS OF HUMAN-ENVIRONMENT INTERRELATIONSHIPS
Dimensions of human interrelationship with environment refer to the locations
where variables of human interrelationship with environment manifested. That is
the settings or conditions to which interaction between human and environment
occur. Human interaction with the environment can be influenced by internal
factors and external factors (Krajhanzl, 2010). Internal factors refer to the
physical and the mental aspects of the individuals while the external factors refer
to the environmental surrounding of the individuals. Internal factors vary from
personality and lifestyle, commitment and ability while interacting with nature
and responsible behaviour towards the environment. External factors vary from

PLANNING MALAYSIA:
Journal of the Malaysia Institute of Planners (2017)
© 2017 by MIP 363
legalities, cultural and social values, public amenities and economical aspects.
There are four dimensions of human interrelationship with the environment. The
first dimension is Individual Personality which manifests in lifestyle, life values
and personal qualities (Schwartz, 1992; Nickerson, 2003; Krajhanzl, 2010;
Kamidin et al., 2011; Krajhanzl, 2010). The second dimension is Interaction with
Nature which manifests in the need to interact, norms, commitment, abilities and
skills relating to natural environment (Kaplan & Talbot, 1983; Gifford, 1997;
Kaiser, 1999; Bell et al., 2005; Bechtel & Churchman, 2002; Krajhanzl, 2010).
The third dimension is Environmental Behaviour which manifests in sensitivity,
concerns and behaviour towards environment (Schmuck & Schultz, 2002;
Bechtel & Churchman, 2002; Clayton & Myers, 2003; Krajhanzl, 2010). The
fourth and final dimension is External Control which manifests in economic
development, legalities, physical context, cultural roots and social values
(Bechtel & Churchman, 2002; Saunders, 2003; Krajhanzl, 2010).
Potential Indicators of Human-Environment Interrelationships
Based on the literature reviews and findings from articles in ajE-Bs and jABs
(Refer to Table 1, Table 2, Table 3 and Table 4), the potential subjective
indicators are developed (Refer to Table 5) and categorized under the four
dimensions of human interrelationship with environment.
Table 6 Potential Indicators for Human Interrelationships with the Environment
Dimen
-sions
Manifesta
-tion Potential Indicators Sources
Indivi-
dual
Perso-
nality
Lifestyles,
life values
and
personal
qualities
Levels of consumerism,
materialism, collectivism and
individualism, extent of voluntary
modesty, conformity and
indolence, sense of control.
Kamidin et al., 2011;
Kamarul Zahari et al. et
al., 2010;
Interac
-tion
with
Nature
The need
to interact
with
nature,
norms,
commit-
ment,
abilities
and skills
relating to
natural
environ-
ment
Personal health in association with
surrounding, time spent in open air,
presence of natural objects at home,
extent of exposure to nature during
work hours, able to cope outdoors
physically, emotionally and
intellectually (relating to skill and
knowledge), used to various types
of weather and common outdoor
temperature, able to see and hear
what others miss, notice scientific
details, in harmony with nature,
able to recall experiences with
nature.
Kamidin et al., 2011;
Kamarul Zahari et al. et
al., 2010;
Maruthaveeran, 2010;
Shukur et al., 2010;
Mansor et al., 2012;
Singhirunnusorn and
Sahachaisaeree, 2012;
Faizi, et al., 2013;
Azmi, et al., 2013;
Ghazali & Mohamed
Yusoff Abbas, 2011;
Ngesan et al., 2013;
Nasir et al., 2013

Aisyah Abu Bakar, Mariana Mohamed Osman, Syahriah, Ismawi Zen, Alias Abdullah, & Muhammad Faris An Assessment of Sustainable Wellbeing Indicators for Human Interrelationships with the Environment
© 2017 by MIP 364
Envi-
ron-
mental
Beha-
viour
Environ-
mental
sensiti-
vity
concerns,
and
behaviour
Motivated to understand and
preserve nature and environment,
acquire whole range of pro-
environmental habits, concern on
environmental damage, willing to
reduce needs for the preservation of
environment, involved in public
activities or political programs.
Asmuni et al., 2011;
Singhirunnusorn et al.,
2011; Abdul Latif et al.,
2012; Singhirunnusor et
al., 2012; Laurens,
2012; Singhirunnusorn
et al., 2012;
Horayangkura, 2013
Exter-
nal
Condi-
tion
Economic
developm
ent,
legalities,
physical
context,
cultural
roots and
social
values
Affordability, availability,
common collective needs,
environmental pollution and stress,
waste handling, animal abuse,
traditions, moral rules, religious
and value system, influence of
organizations and employers,
availability of conducive
environment, current
environmental condition, traffic
infrastructure, civic amenities,
waste management regulations, and
enforced laws.
Kamarul Zahari et al. et
al., 2010; Lim, 2011;
Delima & Zaman, 2012;
Sahari et al., 2012;
Isnin, et al., 2012;
Borhan et al., 2013;
Nasir et al., 2013
Table 5 shows the potential indicators of human interrelationship with
the environment which are yet to be statistically confirmed. The potential
indicators are gathered from the literature reviews and summarized findings of
selected articles. The potential indicators are organized under dimensions of the
interdependencies between human and the environment. The dimensions are the
location where the indicators are found. The manifestation indicates the
expression or demonstration of the dimensions. Finally, the indicators proxy the
manifestations and dimensions of the interdependencies. In other words, the
indicators provide ways for the interdependencies between human and
environment to be gauged.
CONCLUSION
This exploratory review focuses on developing potential quantifiable subjective
indicators of human interrelationship with the environment at the local scale. The
literature review is important to establish understanding of operational terms and
variables in the theory of human interrelationship with the environment. The
review also distinguishes the determinants and the dimensions of the
interdependencies. Previous studies which attempted to determine relationship
between human and environment have assisted this research to recognize
important factors and potential indicators for the interdependencies. The
indicators are valuable to measure the readiness of the locals in embracing
sustainable well-being in their lifestyle. The indicators are also useful to indicate

PLANNING MALAYSIA:
Journal of the Malaysia Institute of Planners (2017)
© 2017 by MIP 365
the extent of current lifestyles that incorporates relations between human and
environment. Other opportunities of use include additional indicators for the
environmental component in the current national well-being reports. The
indicators serve as helpful data for policy review, which before was difficult to
evaluate due to lack of unquantifiable data (MWR, 2013).
This study is a part of an ongoing research to develop sustainable well-
being model for Malaysia. The limitation of this paper is the lack of empirical
data to statistically prove the presence of dimensions of human interrelationship
with the environment. The study will also need to assess more relevant and
reliable publish academic sources especially from social indicator research
towards finalizing the subjective indicators of human interrelationship with the
environment. Apart from establishing potential indicators, reviewing ajE-Bs and
jABs articles enable the researcher to distinguish the pattern of human-related
environmental research particularly in Malaysia. The next challenge of the study
is to substitute the potential indicators into questionnaire inquiries in
comprehensive yet concise manner, which are understandable to the targeted
respondents. During the analysis stage, the dimensions of the interdependencies
between human and the environment will be the latent variables and the finalized
indicators will be the observed variables. The data obtained and analysed from
the questionnaires will determine if the dimensions of human interrelationship
with the environment do in fact multivariately correlated and contribute to
sustainable well-being.
ACKNOWLEDGEMENTS
This research was supported by MyGRANTS. This paper was presented at 2015
Asia Pacific International Conference on Environment-Behaviour Studies.
REFERENCES Abdul Latif, S., & Omar, M. S. (2012). Determinants of recycling behavior in Tioman
Island. Journal of Asian Behavioral Studies, 2, 39–50.
Asmuni, S., Mohd. Khalili, J., & Mohd. Zain, Z. (2012). Sustainable consumption
practices of university students in Selangor, Malaysia. Journal of Asian
Behavioral Studies, 2, 73–82.
Azmi, D. I., Abdul Karim, H., & Mohd Amin, M. Z. (2013). Walking behavior of urban
and rural streets. Journal of Asian Behavioral Studies, 11, 97–110.
Bechtel, R. B., & Churchman, A. (2002). The new handbook of environmental
psychology. New York: John Wiley.
Bell, P. A. (2001). Environmental psychology. 5th edition. Fort Worth, TX: Harcourt
College Publishers.
Borhan, H., Ahmed E. M., & Hitam, M. (2013). CO2, quality of life and economic growth
in East Asian 8. Journal of Asian Behavioral Studies, 3(8), 13–24.
Clayton, S., & Myers, G. (2009). Conservation psychology: Understanding and
promoting human care for nature. Chichester, UK: Wiley-Blackwell.

Aisyah Abu Bakar, Mariana Mohamed Osman, Syahriah, Ismawi Zen, Alias Abdullah, & Muhammad Faris An Assessment of Sustainable Wellbeing Indicators for Human Interrelationships with the Environment
© 2017 by MIP 366
Delgado, M., Aceituno, F. J., & Loaiza N. (2015). Multidisciplinary studies on the
human–environment interaction during the initial peopling of the Americas.
Quarterly International, 363, 1-3.
Delima, M., & Zaman, K. (2012). Environmental ethical commitment (EEC): factors that
affect Malaysian business corporations. Journal of Asian Behavioral Studies, 2,
11–22.
Faizi, M., Azaria A. K., & Maleki, S. N. (2013). Design guidelines of residential
environments to stimulate children’s creativity. Journal of Asian Behavioural
Studies, 3, 25–36.
Ghazali R., & Abbas, M. Y. (2011). Paediatric wards: healing environment assessment.
Asian Journal of Environment-Behavior Studies, 2, 63–75. doi:
10.1016/j.sbspro.2012.12.217
Gifford, R. (1997). Environmental psychology: Principles and practice (2nd Edition).
Boston: Allyn & Bacon.
Horayangkura, V. (2012). Incorporating environment-behavior knowledge into the
design process: an elusive challenge for architects in the 21st century. Procedia
- Social and Behavioral Sciences, 50, 30–41. doi: 10.1016/j.sbspro.2012.08.013
Isnin, Z., Ramli, R., Hashim A. E., & Ali, I. M. (2012). Are house alterations sustainable?
Journal of ASIAN Behavioral Studies, 2, 1–14.
Kaiser, F. G. (1999). Ecological behavior, environmental attitude, and feelings of
responsibility for the environment. European Psychologist, 2(4), 59-74.
Kajikawa, Y. (2008). Research core and framework of sustainability science.
Sustainability Science, 3(2), 215-239.
Kajikawa, Y., Ohno, J., Takeda, Y., Matsushima, K., & Komiyama, H. (2007). Creating
an academic landscape of sustainability science: an analysis of the citation
network. Sustainability Science, 2(2), 221-231.
Kamarul Zahari, N. F., Omar M., & Daim, S. (2011). Lawad, Ye’ Yo’ and Tum Yap: The
manifestation of forest in the lives of the Bateks in Taman Negara National Park.
Journal of Asian Behavioral Studies, 1, 29–40. doi:
10.1016/j.sbspro.2012.04.181
Kamidin, T., Muda, A., Roslan, S., Konting, M. M., Md Jahi, M., & Rashid, N. A. (2011).
Ecopsychology elements in environmental education as to strengthen attitudes
towards the environment. Journal of ASIAN Behavioral Studies, 1, 17–28.
Kaplan, S., & Talbot, J. (1983). Psychological benefits of a wilderness experience. In I.
Altman et al. (Eds.), Behavior and the natural environment. New York: Plenum
Press.
Kjell, O. N. (2011). Sustainable well-being: A potential synergy between sustainability
and well-being research. Review of General Psychology, 15(3), 255-266.
Knight, C. G. (2015). Human–environment interactions: case studies. International
Encyclopaedia of the Social & Behavioral Sciences (2nd Edition). Pp. 405-409.
Krajhanzl, J. (2010). Environmental and pro-environmental behavior. Social and Health,
21, 251-274.
Laurens, J. M. (2012). Intervention program to change the pro-environmental behavior of
the riverside community. Journal of ASIAN Behavioral Studies, 2, 45–56.
Lazarus, R. S. (2003). Does the positive psychology movement have legs? Psychological
Inquiry, 14(2), 93-109.

PLANNING MALAYSIA:
Journal of the Malaysia Institute of Planners (2017)
© 2017 by MIP 367
Lele, S., & Norgaard, R. B. (1996). Sustainability and the scientist’s burden.
Conservation Biology, 10(2), 354-365.
Lim, M. (2011). Measuring waste in Malaysia: A neglected approach. Journal of Asian
Behavioral Studies, 1, 41–54. doi: 10.1016/j.sbspro.2012.04.182
Malaysia Wellbeing Report (2013). The Malaysian Wellbeing Index 2013. Putrajaya:
Economic Planning Unit, Prime Minister's Department.
Mansor, M., Said, S., & Mohamad, S. (2012). Experiential Contacts with Green
Infrastructure’s Diversity and Well-being of Urban Community. Asian Journal
of Environment-Behaviour Studies, 49, 33–48. doi:
10.1016/j.sbspro.2012.07.024
Maruthaveeran, S. (2012). The perception of social safety in a green environment: a
preliminary study at the Kepong Metropolitan Park. Journal of Asian Behavioral
Studies, 1, 45–56.
Nasir, R. A., Ahmad S. S., & Zain-Ahmed, A. (2013). Adaptive outdoor thermal comfort
at an urban park in Malaysia. Journal of Asian Behavioral Studies, 3, 1–16.
Ngesan, M. R., Abdul Karim, H., & Zubir, S. S. (2013). Relationship between night-time
leisure behaviour and urban park setting in Shah Alam. Asian Journal of
Environment-Behavior Studies, 4. doi: 10.1016/j.sbspro.2012.12.239
Nickerson, R S. (2003). Psychology and environmental change. New Jersey, London:
Lawrence Erlbaum Associates, Publishers.
O’Brien, C. (2008). Sustainable happiness: how happiness studies can contribute to a
more sustainable future. Canadian Psychology-Psychologie Canadienne, 49(4),
289-295.
O’Hara, S. (2001). The economics of nature and the nature of economics. In C. Cleveland,
D. Stern & R. Costanza, (Eds.), The challenges of valuation: Econolical
economics between matter and meaning (pp. 89-107). Cheltenham, U.K.:
Edward Elgar.
O’Hara, S. U. (1998). Internalizing economics: Sustainability between matter and
meaning. International Journal of Social Economics, 25(2-4), 175-195.
Sahari, S. H.., Yusup Mohd Yaman, Awang, S., and Awang, R. (2012). Part-time adult
students in Sarawak and environmental stress factors. Journal of Asian
Behavioral Studies, 2, 47–57.
Saunders, C. D. (2003). The emerging field of conservation psychology. Human Ecology
Review, 2(10), 137–149.
Schmuck, P., & Schultz, W. (2002). Psychology of sustainable development. Boston:
Kluwer Academic Publishers.
Schwartz, S. H. (1992). Universals in the content and structure of values: Theoretical
advances and empirical tests in 20 countries. Advances in Experimental Social
Psychology. San Diego: Academic Press.
Shukur, F., Othman N., & Nawawi, A. H. (2010). The values of parks to the house
residents. Asian Journal of Environment-Behavior Studies, 1, 85–94. doi:
10.1016/j.sbspro.2012.07.033
Singhirunnusorn, K., & Sahachaisaeree, N. (2012). Effects of green open space on social
health and behavior of urban residents: a case study of communities in Bangkok.
Procedia - Social and Behavioral Sciences, 36, 449–455. doi:
10.1016/j.sbspro.2012.03.049

Aisyah Abu Bakar, Mariana Mohamed Osman, Syahriah, Ismawi Zen, Alias Abdullah, & Muhammad Faris An Assessment of Sustainable Wellbeing Indicators for Human Interrelationships with the Environment
© 2017 by MIP 368
Singhirunnusorn, W., Donlakorn, K., & Kaewhanin, W. (2012). Household recycling
behaviors and attitudes toward Waste Bank Project: Mahasarakham
Municipality. Asian Journal of Environment-Behaviour Studies, 36, 35–48. doi:
10.1016/j.sbspro.2012.03.075
Singhirunnusorn, W., Luesopa, P., Pansee, J., & Sahachaisaeree, N. (2011). Students’
behavior towards energy conservation and modes of transportation: a case study
in Mahasarakham University. Asian Journal of Environment-Behavior Studies,
2, 62–70. doi: 10.1016/j.sbspro.2012.02.147
Yarime, M., Takeda, Y., & Kajikawa, Y. (2010). Towards institutional analysis of
sustainability science: a quantitative examination of the patterns of research
collaboration. Sustainability Science, 5(1), 115-125.

1Postgraduate Student at International Islamic University Malaysia. Email: [email protected] 369
PLANNING MALAYSIA:
Journal of the Malaysian Institute of Planners
VOLUME 15 VOLUME 1 (2017), 369 - 376
YOUNG PROFESSIONALS’ HOUSING AFFORDABILITY THROUGH
HOUSING PREFERENCES IN KUALA LUMPUR AND A
REVIEW ON THE MEANS-END CHAIN MODEL
Nor Suzylah Sohaimi1, Alias Abdullah2, Syafiee Shuid3, & Azila Ahmad Sarkawi4
1,2,3,4 Kulliyyah of Architecture & Environmental Design
INTERNATIONAL ISLAMIC UNIVERSITY MALAYSIA
Abstract
In a broad-spectrum, housing affordability issue is interrelated to young
professional's well-being. However, this paper deliberated on young
professional's housing preference in affordability context by taking into account
some attributes of housing preference criteria. Data was obtained through
questionnaire survey among 50 respondents aged between 25 and 35 years old
and working in various professional fields in Kuala Lumpur. Descriptive analyses
were then undertaken on the data from the survey. The study found that security
criterion is the highest priority in housing preferences among the respondents.
Having Wi-Fi is the second most important criterion. Additionally, this paper also
provides a conceptual review on the Means-End Chain model.
Keywords: Housing preferences, affordability, young professional, Means-End
Chain model
Date Received: 30th April 2016
Date of Acceptance: 30th October 2016

Nor Suzylah Sohaimi, Alias Abdullah, Syafiee Shuid,, & Azila Ahmad Sarkawi Young Professionals’ Housing Affordability through Housing Preferences in Kuala Lumpur: Review on the Means-End Chain
Model
© 2017 by MIP 370
INTRODUCTION
A house is beyond a shelter. It also plays important role in the design of
psychological significance and economic well-being and individual wealth
(Bourne, 1981). Due to this reason, a house has evolved from a mere shelter to a
preference. Housing affordability among the young generation has become
precarious circumstances. Youth Access (2007) views that young people struggle
over housing affordability issues, as they are more likely to experience rented
housing and homeless issues as compared to other groups. In dealing with
housing preferences, young professionals also experience housing affordability
limitation.
RESEARCH OBJECTIVE
Firstly, the study aims to identify young professionals’ housing preferences
through descriptive analysis. Secondly, the study aims to provide a conceptual
review on the Means – End Chain (MEC) model.
LITERATURE REVIEW
Young Professional
In Malaysia, young professionals are referred to as graduates who have a Diploma
or Bachelor Degree qualification. To elaborate the young professional cohort, age
is another criterion that should be emphasised, although from international point
of view, there is no consensus on the definition of youth based on age. The United
Nations suggest that youth cohort refers to people aged 15 to 24 years while other
studies have defined youth age is not later than 35 years old (Ministry of Youth
Affairs and Sports India, 2014). On the contrary, from Malaysia’s perspective,
youth are those aged between 15 and 40 years. Because of the large range of the
age, some scholars suggested the youth category is further divided into early
youth comprises those 15-20 years old, middle youth 21-24 years old and late
youth 25-35 years old (Hamzah et.al., 2007).
Overview of MEC Model in Housing Preferences
A review of housing affordability literature is considered voluminous. However,
young professionals’ affordability was not measured in these studies, but they
were asked directly about affordable housing prices. When they make a decision
to buy a house, they need to consider the housing preferences since it could be
reflected on affordability.
Initially, MEC model has been applied to consider user’s motives and
found widespread application in marketing and consumer behaviour studies to
identify consumer’s value based on the choices made (Gutman, 1982). It has also
been accepted broadly in various fields for its versatility (Zachariah & Mohd
Jusan, 2011). Even though MEC model adaptation in housing study is considered

PLANNING MALAYSIA:
Journal of the Malaysia Institute of Planners (2017)
© 2017 by MIP 371
still at the infancy stage, it has been found to be a worthy method to identify
housing preferences.
The MEC model was introduced by Gutman (1982), and its function is
to understand value of product or service. The key point of MEC model is that
consumer’s option for achieving the desired consequences and minimalising the
undesirable consequences. In a similar vein, some scholars posit that MEC is
associated with attributes of good to achieving objectives and values (Coolen,
Boelhouwer & Kees, 2002). The “means” in the model are product or service in
which consumers employ such as buying, consuming and reading. Meanwhile,
“end” is valued states of being such as satisfaction, happiness, etc.
The MEC model structure associates attribute (A), consequences (C) and
values (V) as shown in Figure 1. The theory is accepted in the study of housing
preferences as it depicts how a house buyer makes a decision based on housing
attributes and the consequences of the usage of prospect housing and finally the
buyer’s value.
Figure 1 MEC Model Structure
Briefly, attributes in the chain explain the product or services’ features,
which some argue that attributes are signified as perceptible characteristics of a
product (Veludo-de-Oliveira, Ikeda & Campomar, 2006). Meanwhile,
consequences are referred as effects of product use or, in other words, consumer’s
positive or negative responses towards product consumption (Lin, 2002). Values
are viewed as life’s drives, which motivate people to function in their actions
(Gengler, Mulvey & Oglethorpe, 1999). Adaption of the MEC model in
measuring housing preferences has been extended from the original approaches
by using quantitative method namely the laddering interview instead of
depending merely on depth interview.
METHODOLOGY
The review of the MEC model was based on information from published previous
studies, which was obtained through literature review. The housing preference of
young professional, on the other hand, involve the use of questionnaire survey to
obtain primary data from respondents. For the survey, young professionals aged
between 25-35 years old (late youth) in various professional fields such as
academic, architecture, engineering, banking and legal practice in Kuala Lumpur
were given a self-administered questionnaire. The respondents were required to
rate the housing attributes that they desire. The housing preferences attributes
considered in this study comprises locational attributes which are access to the
public transport and proximity to the places of occupation, shop and community
services, parklands, and friends or family. Availability of facilities were also
Attributes Consequences Values

Nor Suzylah Sohaimi, Alias Abdullah, Syafiee Shuid,, & Azila Ahmad Sarkawi Young Professionals’ Housing Affordability through Housing Preferences in Kuala Lumpur: Review on the Means-End Chain
Model
© 2017 by MIP 372
considered including having a garden, shopping mall, Wi-Fi, self-service laundry,
religious facilities, restaurant and sports facilities. Neighbourhood attributes such
as a sense of community, security, privacy and quietness were also considered. A
5-point Likert scale, ranging from “Not Important” to “Critically Important” was
used. Additionally, the affordable housing price or rent was also asked to identify
their affordability.
The convenience sampling technique was applied in the survey. Initially,
one hundred survey forms were handed out but only 70 were returned. Out of this
70, 20 were incomplete, leaving only 50 questionnaires for analysis.
RESULT AND ANALYSIS
Respondents Background
Table 1 illustrates the respondents’ characteristics in this survey. In terms of
living quarters, the analysis found that a majority of the respondents (52%) lives
in an apartment, followed by terraced house (30%) and other type of houses
(10%). Over half of them (62%) are renting and about 24% live in their parents’
house. Only 10% of the respondents own a house. In addition, about 68% of
respondents have three-bedroom home, regardless of renting or owned.
Table 1 Characteristic of Respondents Frequency Percentage
Gender
Male
Female
17
33
34
66
Age
25-30
31-35
19
31
38
62
Marital status
Single
Married
Divorced
25
24
1
50
48
2
Education level
Bachelor Degree
Master Degree
Doctor of Philosophy
Other
24
22
1
3
48
44
2
6
Professional Level
Undergraduate degree
Postgraduate degree
Professional qualification
23
25
2
46
50
4
Housing Affordability
In terms of affordable housing price, 41% of the respondents agreed that they can
afford a house priced between RM150,001 to RM200,000. Meanwhile, 27% of
them felt that they can afford a house priced between RM200,001 to RM250,000,

PLANNING MALAYSIA:
Journal of the Malaysia Institute of Planners (2017)
© 2017 by MIP 373
8% can afford a house priced between RM250,001 to RM300,000. 10% of them
agreed that they can afford a house priced between RM300,001 to RM350,000.
For a house priced more than RM350,000, less than 10% of the respondents felt
that they can afford it. On the other hand, 4% of the respondents felt that they can
only afford a house priced RM150,000 and below.
In terms of affordable rent, 35% of the respondents are willing to pay
RM501 to RM700 rental monthly. The percentage became lesser as the rental rate
becomes higher.
Housing Preferences Almost all of the respondents (98%) desired to buy a house. Only 2% preferred
to rent. Additionally, 82% of the respondents intended to buy a house to live and
only 18% intended to buy a house for investment. Based on current affordability,
most of the respondents responded that they live in an apartment, regardless of
owned or rented. However, they desire to stay in a terraced or semi-detached
house in the future.
The respondents were also asked about their preferences for house size.
44% of them wished to have spacious house (more than 1,100 sq. ft.), 28%
preferred to stay in a house of 701 – 900 sq. ft. and 901 – 1100 sq. ft. respectively.
Houses with less than 700 sq. ft. was not preferred by any of the respondents
(Figure 2).
Figure 2 Housing Size Preferences
Additionally, the respondents were required to indicate the importance of
housing criteria as illustrated in Figure 3. Number 1 to 16 in Figure 3 represent
the house criteria. Whereas, number 0 to 4 is the axis to measure the degree of
importance of the housing criteria, where four (4) is the highest degree of
importance and zero (0) is the least degree of importance. In this analysis, the
preference on the housing criteria is explained based on respondents’ salary
category.

Nor Suzylah Sohaimi, Alias Abdullah, Syafiee Shuid,, & Azila Ahmad Sarkawi Young Professionals’ Housing Affordability through Housing Preferences in Kuala Lumpur: Review on the Means-End Chain
Model
© 2017 by MIP 374
Figure 3 Importance of Housing Criteria
In overall, security criterion is the most important criterion among the
respondents from all salary categories. However, respondents from three salary
categories (RM5,001-RM7,000, RM7,001-RM9,000, and RM9,001 and above)
have highest preference on security criteria at level 4 degree of importance while
the respondents from other salary categories rate security at level 3.5 degree of
importance.
Besides security, respondents also preferred houses with proximity to the
shop and community service. Respondents with salary of RM7,000 and below
have strong preference on this matter at about level 3 degree of importance, but
those with salary of more than RM7,000 rated this criterion at level 4 degree of
importance.
Availability of Wi-Fi was also important among the respondents.
Respondents from all salary categories, except the RM5,001-RM7,000 category,
indicated that Wi-Fi is important to them at level 3 to 4 degree of importance.
The importance of Wi-Fi was almost identical to the proximity to the workplace
criterion, where most of the respondents also rated it as important criteria at level
3 to 4 degree of importance. Only respondents with salary of RM9,000 and above
did not rated this criterion as important in choosing a house.

PLANNING MALAYSIA:
Journal of the Malaysia Institute of Planners (2017)
© 2017 by MIP 375
Respondents in the highest salary category, which is RM9,000 and
above, have high preference in many criteria such as proximity to shop and
community service, parkland, religious facilities, sense of community, security,
quietness, Wi-Fi, trendy cafés, shopping malls and sports facilities. They rated all
these criteria at level 4 degree of importance.
Other criteria such as such as parkland and open space, religious
facilities, quietness, a sense of community, privacy and proximity to public
transport cannot be ignored as these are also needed by young professionals. All
of these criteria averaged level 3 of the degree of importance. On the other hand,
respondents rated facilities such as shopping mall, sports facilities, trendy cafés
and garden or yard were only proved as moderately important house criteria.
Other criteria such as proximity to friend or family, and self-service laundry were
even less important, averaging about level 2 degree of importance.
CONCLUSION
In conclusion, this paper has explored the young professional’s housing
preferences. Young professionals have been chosen as the respondents since their
contribution in human capital is considered significant and potentially affect the
nation’s economy growth. On that note, affordable housing is vital to improve the
wellbeing of young professionals. Home is no longer perceived as only a shelter,
but also importantly, with the right criteria it provides comfort and good quality
of life.
Figure 4 Proposed Extension of MEC Model on Housing Preferences Study

Nor Suzylah Sohaimi, Alias Abdullah, Syafiee Shuid,, & Azila Ahmad Sarkawi Young Professionals’ Housing Affordability through Housing Preferences in Kuala Lumpur: Review on the Means-End Chain
Model
© 2017 by MIP 376
This paper also provided a brief review on the MEC model. It is
suggested that the model be employed in further housing preferences research.
Even though the MEC model was established quite a while ago, it is still
considered to be at infancy level in housing research (Zachariah & Mohd Jusan,
2011). Coolen’s (2002) study on housing preference was probably the first
attempt to adapt the MEC model to housing preference studies. The MEC model
is also recommended to be expanded by applying the laddering technique, since
the technique is useful for studying the complexities of consumer’s cognitive
structures. By expanding the model technique, it can be combined with survey
question by asking the housing attributes, before proceeding with the laddering
interview (Figure 4). Previous scholars also highlighted that the MEC approach
is able to divulge the unseen choice behaviours (Zachariah & Mohd Jusan, 2011).
Therefore, the MEC model is well suited as a method for determining both
objective and subjective features of housing environments and consumers’ choice
behaviours respectively.
ACKNOWLEDGEMENTS
The author appreciatively acknowledges the support from International Islamic
University Malaysia (IIUM) and Ministry of Higher Education Malaysia, for the
funding granted under the MyRa Incentive Grants Scheme (MRIGS).
REFERENCES Bourne, L. S. (1981). The geography of housing. London: Edward Arnold Ltd.
Coolen, H., Boelhouwer, P., & Kees, V. D. (2002). Values and goals as determinants of
intended tenure choice. Journal of Housing and Built Environment, 17, 215-236.
Gengler, C. E., Mulvey, M. S., & Oglethorpe, J. E. (1999). A means-end analysis of mother’s
infant feeding choices. Journal of Public Policy and Marketing, 18(2), 172-18.
Gutman, J. (1982). A means-end chain model based on consumer categorization processes.
Journal of Marketing, 46, 60-72.
Hamzah, A., Krauss, S. E., Noah, S. M., Suandi, T., Juhari, R., Manap, J., & Kassan, H. (2007).
Muslim religiosity and personality assessment: prototype for nation building. Selangor:
Institute for Social Sciences Studies (IPSAS)-University Putra Malaysia.
Lin, C. (2002). Attribute-consequence-value linkages: A new technique for understanding
customer’s product knowledge. Journal of Targeting Measurement and Analysis for
Marketing, 10, 339-352.
Ministry of Youth Affairs and Sports India (2014). National Youth Policy India.
Veludo-de-Oliveira, T. M., Ikeda, A. A., & Campomar. M. C. (2006). Discussing laddering
application by the means-end chain theory. The Qualitative Report, 11(4), 626-642.
Youth Access (2007). Understanding young people’s needs for advice, information and
education on housing and related issues: an overview. Department for Communities and
Local Government, UK.
Zachariah, Z. B., & Mohd Jusan, M. (2011). Means-end chain model framework for
measuring housing environment choice behavior. Journal of Civil Engineering and
Architecture, 5(6), 535-546.

1Senior Instructor, Education and Training Agency of Central Java. Email: [email protected] 377
PLANNING MALAYSIA:
Journal of the Malaysian Institute of Planners
VOLUME 15 VOLUME 1 (2017), 377 - 388
LOCAL LEADERSHIP MODEL TOWARDS A RESILIENT CITY IN
SEMARANG MUNICIPALITY
Lilin Budiati1
1EDUCATION AND TRAINING AGENCY OF CENTRAL JAVA
Abstract
This study assessed local leadership necessary for developing city resilience in
the phase of more escalating, complicated and critical disaster phenomenon. The
study departed from an assumption of the need for an effective and creative model
of local leadership in order to transform risks into resilience, so that the city
possesses a local capacity to develop Semarang as the resilient city. Leadership
competency can be taught and trained by a leadership education and training
under the Center for Education and Training of the Provincial Government of
Central Java. Learning premise and practice of the leadership education and
training in this study was formulated as follows: (1) Why was the leadership of
Semarang Mayor unable to improve effectiveness of state internal bureaucracy
towards city resilience?; (2) How was the model of local leadership necessary to
develop Semarang city resilience?; and (3) What learning model of leadership
education and training was effective to educate and to train the effective and
creative bureaucratic leaders? Using a case study based qualitative approach, this
study resulted in as the followings: (1) the mayoral leadership concerning hazard
and city resilience issues was proven effective, but was unable to improve the
effectiveness of the state internal bureaucracy due to structural conflict; (2) local
leadership model related to disaster and city resilience issues that can be applied
to Semarang Municipality is a congruent model with public-private partnership
approach; and (3) the effective learning model that can be applied to the
leadership education and training is a constructivist learning model with an
intuitive approach.
Keywords: Local leadership, city resilience, constructivistic, leadership training
and education
Date Received: 30th April 2016
Date of Acceptance: 30th October 2016

Lilin Budiati
Local Leadership Model Towards a Resilient City in Semarang Municipality
© 2017 by MIP 378
INTRODUCTION
Semarang Municipality is a city familiar with disasters due to its geographical
condition. The city is unique and specific, composed of coastal area at the “lower
city zone” and highland at the “upper city zone”. The coastal area is prone to such
disasters as elevation of sea level, tidal flood, abrasion, and erosion, to mention
some. Whereas, the highland has been identical with landslide, land movement,
hurricane, drought, and flood due to high rainfall.
Previous studies (2009-2011) have proven that prior to 2010, effort from
the municipal government of Semarang to overcome the disastrous conditions
were technical, short-termed, and not integrated within medium- and long-term
city planning. A study by Bisrie, Salim and Suroso (2011) revealed that Semarang
became the coastal city in Indonesia with the most vulnerable of disaster. The
Resilient City 2015 workshop identified shocks and pressures faced by
Semarang. The determination of priority was done according to the 100RC tools
by considering risk levels and probabilities. The workshop identified six major
shocks currently faced by Semarang (Table 1):
Table 1 Disaster-Related Conditions in Semarang Municipality and Their Impacts
No. Shock Major sub-mover Main dimension
1. Heavy flood Ecosystem and asset management Leadership and strategy
2. Fire Ecosystem and asset management Environment and
infrastructure
3. Landslide Ecosystem and asset management Leadership and strategy
4. Dengue hemorrhagic
fever (DBD)
capacity and facility of public
health service
Health and social welfare
5. Drought Ecosystem and asset management Environment and
infrastructure
6. Stability of raw
material supplies
Provision, storage, and
distribution
Economy and social
Strategies and actions promulgated within the City Resilience Strategy had
been performed under the co-ordination of the Working Group for the Resilience
of Climate Change of Semarang Municipality, an ad hoc and multi-stakeholder
team formalized by the Mayoral Decree of Semarang Municipality. The success
of managing risk, adapting and mitigating disasters in a sustainable manner is
affected by leadership, in particular the municipal leader (the mayor) and his or
her municipal bureaucratic staff. Etzioni and Gross (1985) explain that a leader
can be divided into two categories: formal and informal. Informal leaders are
individuals with ability to control the others/followers by attribute, characteristic,
and leadership capital derived from his or her personal strength. On the other
hand, informal leaders are those having power due to his or her position, which,
in turn, becomes the leadership requirement to influence the others, differing his
or her from the “non leaders”.

PLANNING MALAYSIA:
Journal of the Malaysia Institute of Planners (2017)
© 2017 by MIP 379
Leadership is an art/way and/or ability to influence the others, to direct
attitudes of subordinates or groups, to have particular abilities or proficiencies as
required for obtaining organizational or group objectives (Kartono, 2003).
Leaderships refers to three important aspects namely (1) leading process, (2) all
leading activities or behaviours, and (3) ability to influence the others to perform
particular duties determined by the leader for the group or organization objectives
(Williams & Cudjoe-Braithwaite, 2012).
In case of the current study, local leader is defined as a formal leader’s
leadership due to his or her strategic role and function in determining city (urban)
development. By positional authority, formal leader is capable of mobilizing
participation and collaboration of informal leaders and civil society to mutually
develop local capacity for developing the city resilience.
The focal point of the local leadership comprises three leadership aspects
namely (1) political leadership by the municipal leader (the mayor) and his or her
bureaucratic leadership and staff, (2) professional and/or managerial leadership
by professionals and/or higher education institutions, and (3) community
leadership by community/civil society, non-government organization,
autonomous institution and private sector leaders. Figure 1 illustrates the
perspective of local leadership.
Figure 1 Local Leadership Perspective
Local leadership has an important role to develop local capacity to build a
city resilience in order to decrease and to manage risk, to adapt, to give response,
and to mitigate impact as well as to restore from damage and/or loss due to
disasters. Towards this end, the local leadership is urged to integrate efforts of
decreasing and managing the risk and adaptation of the disasters by planning the
spatial development at short-, medium-, and long-terms.

Lilin Budiati
Local Leadership Model Towards a Resilient City in Semarang Municipality
© 2017 by MIP 380
The purpose of developing the city resilience can only by achieved when
the city is considered as a system where good urban governance is found.
The substantive meaning of the good urban development from the
perspectives of disaster and city resilience are as follows: (a) the municipal
government of Semarang becomes a conceptor, initiator, and implementor of
policies on the local capacity building towards the development of a “resilient
city” based on local identity, directing towards the actualizing “local identity”, a
situation that identifies localities of the city (geography, history, characteristics,
and culture). These aspects become the foundation of the local capacity building;
(b) local capacity building is achieved by productivity and growth in political,
economic, social, and cultural aspects; (c) development efforts must allow
participation of stakeholders and/or civil society at the stages of decision-making,
planning, implementation, and evaluation; (d) development results, in forms of
productivity and growth, must not be achieved by ignoring principles of equality
and harmony in economic, social, and environmental aspects; and (e) urban
system development must agree with the principles of good urban governance.
RESEARCH METHODOLOGY
This study applied a qualitative research method with a case study approach. The
author assessed data with a comparative analysis, in a reflective manner, and
followed it up with comparing interpretation translated into codes and categories.
Research Design
Figure 2 Research Design
Source: Remenyi et. al. (1998); CIPG elaboration by Budiati (2015)

PLANNING MALAYSIA:
Journal of the Malaysia Institute of Planners (2017)
© 2017 by MIP 381
Conceptual Framework
A conceptual framework is a result of the author’s thought about problems
currently assessed and discovered to get the problem solution. It is a dialectical
accumulation of vary activities, i.e. observation, seminar, workshop, and focus
group discussion (FGD) concerning shocks and pressures faced by the city of
Semarang due to hydro-meteorological and climate change disasters. The
empirical reality observed was ecological damage footprints and vulnerability of
the city towards the disastrous conditions, which had demanded the need for
developing a sustainable, resilient city. Figure 3 illustrate the research conceptual
framework.
Figure 3 Conceptual Framework
RESULTS AND DISCUSSION
According to the Working Group for the Capacity of the Semarang Municipal RC
Team (Municipal Government of Semarang, 2016), at sectoral level from the
perspectives of disaster and city resilience, the effectiveness of the Semarang
Mayor concerning the disaster (chronic shocks and pressures) had been in line
with the reality, as the followings:
a) Evaluation and control of risk and adaptation to climate change impact
b) Financial and program aids from central government, international donors,
and partner countries
c) Adaption and mitigation of acute shocks and chronic pressures (construction
of folder, retention pond, critical area conservation, river stream
restoration/west riverbank)
d) Development of strategy and roadmap for city resilience
e) Initiative of Semarang RC program
Lilin Budiati
Local Leadership Model Towards a Resilient City in Semarang Municipality
© 2017 by MIP 382
f) Establishment of Semarang Municipal RC Team
At the larger scope, the FGD results proved that the leadership of the
Semarang Mayor had not been effective to build the local capacity necessary for
developing the city resilience, as proven by the following empirical facts:
a) Citizens of Semarang and the Performing Work Unit (SKPD) had not known
and understood city resilience and/or Semarang RC programs
b) The implementation of the retention pond construction in Muktiharjo for
overcoming flood and social aid project for poverty alleviation had not been
accountable and been prone to corruption;
c) Programs/projects dealing with disaster control by the Municipal Disaster
Prevention Agency (BPBD) and other concerned SKPDs were not integrated
in a single package;
d) Lacking data and information of disasters. The available data were only
understood by their makers.
e) “Alert Village” Program (Program Desa Siaga) promoted by the BPBD to
build the preparedness and response of the community to the disasters was
perceived as a subsidiary or grant project. Therefore, the BPBD was required
to allocate funds by the community.
In case of BPBD of Semarang Municipality, the performance
ineffectiveness is not merely caused by the poor influence and ability of the
mayor to motivate BPBD to perform its principal duty and function effectively,
but also due to internal gap because BPBD itself also lacks of instrumental
efficiency by its structural construction. The BPBD structure is built upon Perka
BNPB 3/2008 on the establishment of BPBD and Permendagri 46/2008 on Guide
for Organization and Work of BPBD.
The FGD held on March 31, 2016 found that the ineffectiveness of the
mayoral leadership for building the local capacity for developing a resilient city
was due to the following factors:
a) The government tended to focus on policy or program during and post
disaster. the policy only had a single purpose with a limited scope in
particular disaster, such as flood. The implementation of the policy on flood
in Semarang were as follows: early warning system, river sedimentation
removal, road raising, and retention pond construction.
b) From the perspective of a city as a system and disaster context, the policy and
program implemented by the municipal government of Semarang had not
been effective because of lacking the good local/urban governance with the
following principles: inclusion, productivity, locality, and sustainability. The
program/project dealing with the flood was initiated by the government using
the local budget (APBD) and/or the national budget (APBN) and had a single
purpose to overcome problems related only to the flood.

PLANNING MALAYSIA:
Journal of the Malaysia Institute of Planners (2017)
© 2017 by MIP 383
c) Social transformation where the citizens mobilize vertically and take part into
the city planning did not occur. The mayoral policy flow was to-down and
the aspiration and opinion flow of the citizens was bottom-up. Both flows
were not integrated into a compromising point by mutual consent to make a
decision of the city planning.
d) Gap between the effective mayor performance and ineffective local stage
bureaucratic performance can be explained by the theory of situational
leadership. According to Hersey and Blanchard (1998), the maturity of the
subordinates (bureaucratic leadership under the mayor) is at the lowest level
(unable and unwilling) to follow up and implement the Semarang RC
program.
e) The position of the mayor as a political leader at the top of the hierarchy of
the state bureaucratic structure at the local level, which manages the structural
officials from the echelons IV to II, were generally career positions. This
situation might lead to structural gap from authority distribution of the
functions in the bureaucratic structure.
f) The establishment of the Semarang Municipal RC Team was ad hoc in
characteristic. In other words, it was outside the bureaucratic structure. Thus,
the Semarang RC program was unknown and lacking objective realities as
the mutual agenda and goal.
Table 2 Ineffectiveness of Policy of Semarang Mayor
No. Cause of
ineffectiveness
Current condition of Semarang Municipality
1 Practical politics
in planning
Some policies of the Semarang Municipality were incremental,
incomprehensive, lacking preventive efforts. The government
tended to focus on policies or programs during or post disaster. The
comprehensive policy may result in good result or effect because of
rational thinking process supported by complete data or information.
It is expected to guarantee the sustainability of the policy.
2 Limited data and
information
From the aspect of policy transparency, the government was not
active in socializing the policies on the city resilience. the citizens
should have managed to access the information from either
conventional media or social media. For example, the policy on
license and surveillance of ABT in Semarang was relatively unclear.
3 Ego sector Confusing programs caused multi-interpretative programs with
similar substances.
4 Programs/
activities were
not aspiring,
participative, and
inclusive.
A program or policy must be inclusive by involving and providing
opportunities to all stakeholders to give their opinions, complaints,
and to determine the role and contribution towards end result.
Implementation in Semarang Municipality still needed an
improvement of the citizens’ active participation.
Private sector was expected to enlarge its role by co-ordinating with
the government and the community/civil society with an integrated
effort towards a much better policy implementation.

Lilin Budiati
Local Leadership Model Towards a Resilient City in Semarang Municipality
© 2017 by MIP 384
5 Poor monitoring
and evaluation
The importance of monitoring and evaluation of the implementation
of a policy or program as the main indicator for finding out to which
extent the program has been achieved, along with its obstacles and
the solutions. The poor monitoring and evaluation became an
obstacle for the Municipal Government of Semarang to implement
its policies, such as that of dealing with Underground Water (ABT)
license. The license had been strict by a prohibition at the red zone,
but the monitoring and evaluation in practice must be actually
performed to prevent violations.
6 Capacity of ad
hoc institution
Institutional networks were not integrated in the planning process, as
evidenced by authority and program overlapping, causing the
lacking focus of the program. A grand design should have been made
available and mutually agreed by concerned parties, i.e. the
government (Bappeda, BPBD, and concerned institutions), private,
and community.
The Semarang Municipal RC Team had managed to develop an
organizational structure, which composes of three local leadership, i.e. political
leadership (the mayor), professional leadership (academics/higher education),
and community leadership (civil society), as well as private sector, as illustrated
by Figure 4.
Figure 4 Organizational Structure of Semarang RC
The above organizational structure represents a policy networks at the
program level with a public-private partnership. The problem will be how to make
the program performance effective towards an optimal outcome. The main
function of the local leadership, in particular the mayor, becomes a key factor to
the successful program. However, the empirical reality proved the otherwise.

PLANNING MALAYSIA:
Journal of the Malaysia Institute of Planners (2017)
© 2017 by MIP 385
Handayani (2015) found that the support of the municipal government of
Semarang to the implementation of the 100 RC program was not significant and
“business as usual”, without any innovation.
The involvement of the stakeholders through development plan meeting
(Musrenbang) was ineffective and exposed by challenges. The developmental
pattern tended to elitist, technical, partial and project oriented with short-term
paradigm. In such condition, the local leader as the “agent of change” is
necessary.
The 100 RC contains formal (the government) and informal (non-
government and civil society) organizational components. Therefore, a leadership
model that integrates both component area needed. The formal organization of
Semarang Municipal Government was structural (the functions were composed
systematically in a hierarchical structure). Whereas informal organizations were
functional (non-hierarchical structure). The difference in the organizational
characteristics had created gap prone to counter-productive conflicts. The
delineation of both components can be done by adopting a congruent model
introduced by Nadler and Tushman (1997) modified by the program need.
Figure 5 Local Leadership Model
At the input stage, there were components of local leadership, i.e. political
leadership the mayor), professional leadership (professional organizations and
higher education), and community leadership (civil society and NGOs). At the
transformation stage, the strategy was transformed by the SKPD’s principal duty
and function as planned. At the output stage, work/program plans were
established by a full support from the communities. The program/work plan
implementation was monitored and evaluated in concert as feedback to the local
leadership.
New pattern of Leadership Education and Training is a learning model
based on experience by the State Administrative Agency (LAN) to replace the

Lilin Budiati
Local Leadership Model Towards a Resilient City in Semarang Municipality
© 2017 by MIP 386
old pattern. The New Leadership Education and Training demonstrates a novelty
that fulfilled the requirement as an innovation. The innovation was actualized as
planned and systematically towards greater outcome, greater benefit, greater
impact, cost effective, lesser risk, lesser resources, and greater performance. The
novelty in the New Leadership Education and Training compared to the Old
Leadership Education and Training is illustrated in Table 3 below:
Table 3 Novelty of New Leadership Education and Training Model
Dimension Old Leadership
Education and Training
New Leadership
Education and Training
Policy Output-oriented participant
competency
Outcome-, integrity-, innovation-
and collaboration-oriented networks
Paradigm Administration Public service
Approach model State centred (by State
Administrative Agency,
LAN). Domestic approach
model
A combination between state
centred, pluralistic, and
transnational (intermestic) approach
models
Provision Off-campus education and
training unavailable
Off-campus education and training
available
Learning Behaviouristic, cognitivistic,
competence-based learning
Constructivistic – experience based
learning
Change project Unavailable Available
Coach & Mentor Unavailable Available
Passing output 100% Less than 100%
Networks concept Unavailable Available
Intensity of
collaboration between
institutions
Low High
Constructivistic learning model applied to the New Leadership Education
and Training had been adequate. However, the implementation had not been
effective as expected. The problem lied in the leadership substance as taught and
trained by the education and training program. Towards the 21st century, the
leadership model contains new leadership values to answer the current threats and
questions.
CONCLUSION AND RECOMMENDATION
Based on the findings, it can be concluded that:
a) The leadership of the Semarang Mayor related to disaster and city resilience
had been effective but yet unable to improve the effectiveness of the state
internal bureaucracy due to structural conflict.
b) The local leadership model that could be proposed for developing a resilient
city towards the Semarang RC was a partnership-based congruent model, in
which public and private sectors co-operate to implement a city resilience
forum.

PLANNING MALAYSIA:
Journal of the Malaysia Institute of Planners (2017)
© 2017 by MIP 387
c) The ideal learning model applied to the Leadership Education and Training
was constructivist with an intuitive approach.
Recommendations to be proposed according to the findings of this study
were as follows:
a) As a regulator, the municipal government of Semarang must re-evaluate its
policies and programs for aiming targets in line with the actual needs. The
municipal government must also perform periodical monitoring and
evaluation over the policies and programs transparently for their
sustainability.
b) As a facilitator, the municipal government of Semarang has to make effort to
improve community awareness of the importance of the city resilience by
socializing and updating issues, programs, achievements by means of official
website, printed and electronic mass media, and social media networks.
c) There is a need for integration and co-ordination between formal organization
(the government) and informal organizations, either internally (inside the
administrative border of Semarang Municipality) or externally (areas nearby
the city), in order to manifest local leadership for the successfully
implemented city resilience program and policy.
d) Citizens of Semarang are expected to participate in activities dealing with
decision-making, in particular those related to the city resilience, either in the
planning, implementation, monitoring, or evaluation processes.
e) There is a need for mobilization and recognition of actual roles played by
private sector by a co-ordination in planning and utilizing the CSR programs
in integrated, transparent, and sustainable manners.
ACKNOWLEDGEMENT
The author is indebted to all individuals with their own contribution towards the
completion of this paper: Hendrar Prihadi, Herru Setiadhi, Bambang Haryono,
Bobi Setiawan, Sigit Sumarhaen Yanto, Nugroho in Saputra, Wiwandari
Handayani, Happy Santosa, Johan Silas, Prihadi, Jawoto, Pur, Joko, Lutfi and
Mega. Special thanks go to Toton, Myrna, Arga, Mita, Nizar and Yaniz.
REFERENCES Bisrie M. B.F., Salim A. W., & Suroso D. S. A. (2011). Entry points. 2nd International
Conference on “Cities at Risk”, Taiwan, 11 – 13 April 2011.
Budiati, L. (2015). Diklat kepemimpinan pola baru dalam prespektif inovasi dan
pembelajaran konstruktivistik. Jurnal Pembangunan Wilayah & Kota, 11(2),
211-221.
Etzioni A., & Gross E. (1985). Organizations in society. Englewood Cliff: Prentice-Hall.
Handayani W. (2015). Strategi Ketahanan Kota Semarang: Menuju Keselamatan Pangan,
Air, dan Energi Melalui Adaptasi Perubahan Iklim. 100 Resilient Cities.

Lilin Budiati
Local Leadership Model Towards a Resilient City in Semarang Municipality
© 2017 by MIP 388
Retrieved on October 17, 2016 from https://drive.google.com/file/d/
0BxfH4L8MDpwhX1pGeE42bGF5c00/view.
Hersey P., & Blanchard K. H. (1998). Management and organizational behavior.
Englewood Cliff: Prentice-Hall.
Kartono K. (2003). Pemimpin dan kepemimpinan. Jakarta: PT Raja Grafindo.
Municipal Government of Semarang (2016). Laporan Kelompok Kerja (Pokja) Kapasitas
Tim RC Semarang.
Nadler D. A., & Tushman M. L. (1997). Competing by design: the power of organization
architecture. New York: Oxford University Press.
Peraturan Kepala BNPB (2008). Pembentukan Badan Penanggulangan Bencana Daerah
(BPBD) No. 3.
Peraturan Menteri Dalam Negeri (2008). Pedoman organisasi dan tata kerja Badan
Penanggulangan Bencana Daerah (BPBD) No. 46.
Remenyi D., Williams B., Money A., & Swartz E. (1998). Doing research in business
and management. London: Sage Production.
Williams G., & Cudjoe-Braithwaite J. (2012). Electronic goal management. a case study
in the water and sewerage authority. Retrieved on October 18, 2016 from
http://unpan1.un.org/intradoc/groups/public/documents/undpadm/unpan049780
.pdf.

© 2017 by MIP 389
PLANNING MALAYSIA:
Journal of the Malaysian Institute of Planners
VOLUME 15 VOLUME 1 (2017), 389 - 396
SIDEWALK ACCESSIBILITY AT MELAKA’S TRADITIONAL
STREETS FOR PEOPLE WITH DISABILITIES (PwDs)
Nor Haslina Ja’afar1, Asiah Abdul Rahim2, Nur Amirah Abd. Samad3, & Che
Raiskandar Che Rahim4
1Faculty of Engineering and Built Environment
UNIVERSITI KEBANGSAAN MALAYSIA 2,3,4Kuliyyah of Architecture and Environmental Design
INTERNATIONAL ISLAMIC UNIVERSITY MALAYSIA
Abstract
The accessibility of street as a social arena that fulfils the need for people with
disabilities (PwDs) is an important consideration in the urban design of an area.
With the rising number of PwDs in Malaysia, this aspect of street design is even
more critical. This paper evaluates the accessibility level of sidewalk along Jalan
Hang Jebat, Melaka to PwDs. On-site access audit simulation was carried out.
Actual PwDs were engaged for the simulation. It was found that the sidewalk in
inaccessible to PwDs due to presence of barriers and the design of the sidewalk
itself. This paper suggest that the minimum requirement of MS1184:2014 must
be implemented in the sidewalk design and the concept of ‘shared space’ can be
adopted in the study area.
Keywords: Traditional street, accessibility, public space, access audit, people
with disabilities (PwDs).
Date Received: 30th April 2016
Date of Acceptance: 30th October 2016

Nor Haslina Ja’afar, Asiah Abdul Rahim, Nur Amirah Abd. Samad, & Che Raiskandar Che Rahim
Sidewalk Accessibility at Melaka’s Traditional Streets for People with Disabilities (PwDs)
© 2017 by MIP 390
INTRODUCTION
In urban design, street is an indispensable element in shaping a city. Lynch (1960)
identifies street as ‘path’, which is one of the main elements of urban design. The
importance of street can be seen from its appearance and its function as ‘public
open space' where it becomes a major node as an arena for various social activities
such as relaxing, walking and chatting. Important streets generate their own
individual character, which are mainly evident in old and traditional cities and
towns (Abdul Rahim et al., 2014; Sulaiman, Shamsuddin & Anwar, 2007; Bashiti
& Abdul Rahim, 2015).
Streets should also cater for the people with disabilities (PwDs). This is
to promote similar level of accessibility to PwDs as to the general public. The
consideration of PwDs’ needs in street design is even more critical now,
especially when the statistics from the Jabatan Kebajikan Masyarakat (Social
Welfare Department) show an increasing trend in the number of PwDs in
Malaysia (Bashiti & Abdul Rahim, 2015). Similarly, Ja’far (2015) and Mohd
Hussain et al. (2016) also state that the number of application for PwDs
cards/passes in Malaysia is also increasing.
Abdul Rahim et al. (2014) propose that a sustainable design for
accessibility should be considered in all of our physical development in order to
make our cities world class. Accessibility in the built environment is increasingly
relevant to Malaysia, not only to prepare for the ageing population and PwDs, but
also for the whole population at large. In order to understand the best way to
include the widest range of users it is necessary to recognise the range of abilities
that must be served and hence to be able to prioritise their different needs
(Harisson & Dalton, 2013). Universal Design, having moved on from ‘barrier-
free’ design, embraces more diverse needs than just providing for people with
disability and recognises that in everyone’s life course various forms of disability
will be experienced, with differing degrees of seriousness. Perhaps one of the
greatest advantages of adopting universal design principles is that they are
inclusive of everyone, and not just providing for ‘special needs’ users or thinking
merely of a ‘barrier-free’ environment.
In a more local context, Mohd Hussain et al. (2016) agree that the needs
of PwDs have received attention from all parties since their number keeps
increasing year by year. It is thus vital to provide proper planning and design
guidelines to ensure that this group of people have the opportunity to access the
environment (Ja’afar, 2015). Moreover, improved accessibility enhances the
value of the built environment, thus creates a place or street that facilitates the
people to have a better quality of life (Kose, 2014).
It is important that street environment, especially of the traditional
streets, is accessible to all group of people including PwDs. Traditional streets
are places of legacy. By having access to the streets, their legacy would be
enjoyed and experienced by the people including PwDs and also tourists. Thus,

PLANNING MALAYSIA:
Journal of the Malaysia Institute of Planners (2017)
© 2017 by MIP 391
this paper analyses the level of accessibility for PwDs to sidewalk of a traditional
street design by referring to the minimum design requirements provided in
Malaysian Standards MS1184:2014.
METHODOLOGY
Jalan Hang Jebat, which is located in the Historical City of Melaka, was selected
as the study area. The Historical City of Melaka is one of the heritage site listed
under the UNESCO World Heritage Sites. The Jalan Hang Jebat is a popular
street in the City, which is frequented by locals and tourists alike. The street is
lined with old shophouses on both sides. Sidewalks separate the street from the
shophouses.
Data was obtained through access audit simulation, in which actual PwDs
were employed to conduct the simulation on-site. Access audit is an examination
of an existing building, including its facilities and services, against pre-determine
criteria to assess its usability. The main objective of access audit is to study the
accessibility level of a place (in this study, Jalan Hang Jebat) in order to aid the
planning, design and improvements so that the objective of inclusive and
universal use may be achieved (Mohd Hussain et al., 2016; Jabatan Kebajikan
Masyarakat, 2014).
The simulation was carried out with actual disabled persons from three
categories; elderly (including frail person), visually impaired and mobility
impaired persons. These three categories were selected because they are the most
significant category of the PwDs (Harrison & Dalton, 2013; Shamsuddin &
Sulaiman, 2008). The objective was to test how well the outdoor street
environment performs in terms of access and ease of use by these groups of users.
Six PwDs were engaged for the simulation, with two PwDs per category. They
are well trained in conducting access audit and simulations identify the types of
barriers and dangers to PwDs in an area that may be unforeseen by urban
designers, architects and city planners.
Checklist form was pre-prepared and used during the audit simulation.
Elements of accessibility that were observed included curb cuts, tactile walking
surface indicator (TWSI), pedestrian crossing and general obstructions. All
identified problem areas were photographed as evidence and used in data
analysis. Consequently, semi-structured in-depth interviews were conducted with
the participants of the audit (the six PwDs) to gain information on their
perceptions towards the accessibility level of the study area. Data from the
simulations were compared to the Malaysian Standards MS1184:2014 in order to
identify the level of accessibility. Colour codes were used to denote access level
of the study area: (i) red (inaccessible), (ii) yellow (moderately accessible) and
(iii) green (accessible). These approaches have been used by other researchers in
conducting access audit simulation such as Zen, Abdul Rahim & Abu Bakar
(2012), and Ja’afar, Sulaiman and Shamsuddin (2012).

Nor Haslina Ja’afar, Asiah Abdul Rahim, Nur Amirah Abd. Samad, & Che Raiskandar Che Rahim
Sidewalk Accessibility at Melaka’s Traditional Streets for People with Disabilities (PwDs)
© 2017 by MIP 392
RESULTS
One of the main outputs of the access audit was a layout plan of the study area
indicating the accessible routes along the Jalan Hang Jebat. For the study area,
five main pit stops were identified along the street (Figure 1). The destination to
each point was analysed, measured and marked. The results of the access audit
are as in Table 1 below.
Figure 1 Journey of PwDs Base on 5 Main Stations
Table 1 Sidewalk Accessibility at Jalan Hang Jebat to PwDs
Component
& Spaces
Disability
Wheelchair user Visual impaired Crutches / walking
with stick / elderly
Sidewalk
Legend:
Level of Accessibility Colour Code
Accessible
Moderately accessible
Inaccessible
Based on the access audit simulation, several obstructions were
identified. It was found that the location of street lamps and vehicle that were
parked on the sidewalk have obstructed the movement of PwDs (Figure 2)
especially the wheelchair users and the visually impaired persons. According to
the PwDs, "The location of lamp post in the centre of sidewalk obstructs the
movement of people, especially the PwDs. There are also vehicles parked on the
sidewalk and this irresponsible behaviour has created difficulties for people to
walk along the sidewalk, especially PwDs. I think people who illegally parked
their vehicles should be penalised."
Moreover, poorly designed and poorly maintained sidewalk also posed
difficulties to the visually impaired persons and the wheelchair users (Figure 3).
Poor design includes irregular width of the sidewalk, especially the portion where

PLANNING MALAYSIA:
Journal of the Malaysia Institute of Planners (2017)
© 2017 by MIP 393
the sidewalk is too narrow. Width of sidewalk is also affected by peddlers and
shop owners using the sidewalk to display their merchandise. Poor maintenance
include broken surface of the sidewalk and missing tiles from the sidewalk
surface.
Figure 2.1 Obstructive Elements Along The
Sidewalk: Lamp Post Figure 2.2 Loading Activities Obstructing
the Accessibility of Sidewalk Especially for
Wheelchair Users and Visual Impaired
Persons.
Figure 3.1 The Width of Sidewalk is
Narrow at Some Locations
Figure 3.2 Poor Maintenance of Pavement
Surface Create Barriers for PwDs
RECOMMENDATIONS
The information emerged from the access audit simulation indicates that the
overall level of accessibility for PwDs at Jalan Hang Jebat is poor (inaccessible)
especially for wheelchair users and visual impaired persons (Table 1). Thus, this
paper recommends that the universal design approach based on the minimum
requirements of the MS1184:2014 is implemented in the study area.
According to MS1184:2014, the clear minimum width of sidewalk
should be 1500mm (Department of Standards Malaysia, 2014) (Figure 4).
Therefore, this paper suggests that the street lamps should be relocated away from

Nor Haslina Ja’afar, Asiah Abdul Rahim, Nur Amirah Abd. Samad, & Che Raiskandar Che Rahim
Sidewalk Accessibility at Melaka’s Traditional Streets for People with Disabilities (PwDs)
© 2017 by MIP 394
the sidewalk. At the same time, strict enforcement of traffic rules must be
implemented to penalise and discourage people from parking their vehicles on
the sidewalk.
The narrow width of sidewalk also obstructing the movement of the
PwDs. One of the reason of narrow sidewalk in the study area is because of
limited area. Thus, it is recommended that in cases where sidewalk width cannot
be provided at the minimum of 1500mm, then sidewalk should not be provided
at all. Instead, the concept of ‘shared space’ can be implemented where
movement priority is accorded to pedestrians (Figure 4). Previous research shows
that motor vehicles will slow down in shared space area because drivers will have
to be aware of the pedestrian movement (MPMBB, 2010). In some cases, the
‘shared space’ can be transformed from street into pedestrianized area with
limited vehicle access.
Other measures to improve sidewalk accessibility in the study area to
PwDs must also be implemented. These include regular maintenance of the
sidewalk and the restriction to shop owners and peddlers to use the sidewalk to
display their merchandise.
Figure 4.1 Minimum 1.5m width of sidewalk without any obstacle

PLANNING MALAYSIA:
Journal of the Malaysia Institute of Planners (2017)
© 2017 by MIP 395
Figure 4.2 An Example of Shared Space Approach
CONCLUSIONS
This paper has shown that despite the provision of sidewalk in the study area, it
is not accessible to PwDs because of the existence of barriers and obstructions on
the sidewalk, as well as the design of the sidewalk itself. This paper recommends,
among others, the implementation of ‘shared space’ concept in the study area in
order to ensure accessibility to PwDs. At the same time, the access audit which
was conducted with actual PwDs proved to be reliable and useful.
ACKNOWLEDGEMENTS
The authors thank Universiti Kebangsaan Malaysia (UKM) for the support of this
research via research grant "GUP 2015-028". Appreciation is also accorded to
KAED Universal Design Unit (KUDU) team for their assistance in data
collection.
REFERENCES Abdul Rahim, A., Zen, I., Abd. Samad, N. A., & Che Rahim, C. R. (2014). Universal
design and accessibility: towards sustainable built environment in Malaysia. In
H. Caltenco, P. Hedvall, A. Larsson, K. Rassmus-Grohn & B. Rydeman (Eds.),
Universal Design 2014: Three Days of Creativity and Diversity, Proceedings of
the International Conference of Universal Design – Assistive Technology
Research Series (Volume 35) (pp. 299-306). Amsterdam: IOS Press.
Bashiti A., & Abdul Rahim, A. (2015). A study on the accessibility in shopping malls for
people with disabilities (PwDs) in Malaysia. International Journal of Natural
Science Research, 3(1), 9-20.
Department of Standards Malaysia. (2014). Universal design and accessibility in the built
environment - code of practice (2nd revision). Malaysia Standard 1184:2014.
Ja’afar N. H., Sulaiman A. B., & Shamsuddin, S. (2012). The contribution of landscape
features on traditional streets in Malaysia. In M. Y. Abbas, A. F. Ibrahim & N.

Nor Haslina Ja’afar, Asiah Abdul Rahim, Nur Amirah Abd. Samad, & Che Raiskandar Che Rahim
Sidewalk Accessibility at Melaka’s Traditional Streets for People with Disabilities (PwDs)
© 2017 by MIP 396
F. Nik Azhari (Eds.), ASEAN Conference on Environment-Behaviour Studies
2012 (pp. 1-14). Bangkok, Thailand: Universiti Teknologi MARA.
Ja’afar N. H. (2015). Karakter fizikal jalan tradisional; kajian kes di Melaka Bandaraya
Bersejarah (Doctorate thesis). Universiti Teknologi Malaysia, Skudai, Johor.
Jabatan Kebajikan Masyarakat (2014). Statistik Jabatan Kebajikan Masyarakat 2014.
Harrison, J., & Dalton, C. (2013). The familiar and the strange: the limits of universal
design in the European context. In Proceedings of the 3rd International
Conference on Universal Design in the Built Environment 2013. Kuala Lumpur:
KUDU.
Kose, S. (2014). Tourism for all: how can universal/inclusive design accommodate senior
travelers? Symposium on Trends in Universal Design 2014, December 1, 2014,
Kuala Lumpur, Malaysia.
Lynch, K. (1960). Image of the City. London: The MIT Press.
Mohd Hussain, M. R, Tukiman, I., Zaidin, N., & Mohd Shahli F. (2016). Campus
landscape environment fot student with disabilities (SwDs) in IIUM. Journal of
Universal Design in the Built Environment, 2(1), 37-51.
MPMBB. (2010). Rancangan Khas. Majlis Perbandaran Melaka Bandaraya Bersejarah.
Shamsuddin, S., & Sulaiman, A. B. (2008). Lessons from traditional towns and cities for
sustainable future places. In: A. B. Sulaiman & M. M. Mai (Eds.), Urban design
issues in the developing world; the case of Malaysia and Nigeria (pp. 1-174).
Kuala Lumpur: Penerbit Universiti Teknologi Malaysia.
Sulaiman, A. B., Shamsuddin, S., & Anwar, M. (2008). Gentrification process and place
attachment in historical settlements: a case study. In Proceeding Regional
Architecture and Identity in the Age of Globalization (Vol. 3) (pp. 1287-1298).
Zen, I., Abdul Rahim, A., & Abu Bakar, A. (2012). Access audit in religious buildings
and public spaces in old Damascus city, Syria. Kuala Lumpu: IIUM Press.

PLANNING MALAYSIA
Journal of the Malaysia Institute of Planners (2020)
193 © 2020 by MIP
NOTES TO CONTRIBUTORS AND GUIDELINES FOR MANUSCRIPT
SUBMISSION
INTRODUCTION
The Journal of the Malaysian Institute of Planners or PLANNING MALAYSIA is a
multidisciplinary journal related to theory, experiments, research, development,
applications of ICT, and practice of planning and development in Malaysia and
elsewhere.
The objective of the journal is to promote the activity of town planning through dialogue
and exchange of views concerning professional town planning practice. PLANNING
MALAYSIA will welcome any news, feature articles, or peer reviewed (including book
reviews, software review, etc.) articles for publication. All articles should be original
work by the authors. Articles, views and features will not be taken to be the official
view of the Malaysian Institute of Planners (MIP) unless it carries the name of MIP
as the author. This is to encourage open discussion on diverse issues and opinion for the
advancement of town planning practice. Articles and contributions will be accepted from
MIP members and non-members worldwide.
In year 2010, PLANNING MALAYSIA Journal has been indexed in SCOPUS. Previous
issues of PLANNING MALAYSIA Journal can be viewed on the MIP website.
SUBMISSION OF MANUSCRIPTS
Manuscript should be emailed to [email protected]. Manuscript should ideally be
in the range of 8-10 pages long. Each manuscript should have a title page and an abstract
of about 150 words. The title page should contain the title, full name(s), designation(s),
organizational affiliation(s), a contact address, and an email address. All manuscripts are
received on the understanding that they are not under concurrent consideration at another
journal. Exclusive copyright of accepted manuscripts shall be assigned to the Publisher
(i.e. the MIP), and in consideration for this, one copy of the current Journal will be
provided for each article. Additional reprints of article can be ordered, at cost, by the
author(s). PDF format of the article (if available) can be obtained from the Publisher.
LAYOUT
Manuscript should be typed in single spacing (including footnotes, endnotes and
references) on one side of the paper only (preferably A4) with the following margins:
right and left - 4.25 cm, top - 5.5 cm and bottom - 5.2 cm (including header – 4.5 cm and
footer – 4.3 cm) in 11 point Times New Roman font. Footnotes should be numbered
consecutively and placed at the end of the manuscript. Footnotes should be kept to a
minimum. Tables and diagrams should be provided in the text. References should follow
the APA (6th Edition) referencing format. All foreign words must be typed and
transliterated. The Editorial Board reserves the right to change the transliteration of all
historical names, titles and non-English terminology to bring them into conformity with
its own style.

Guidelines
© 2020 by MIP 194
USE OF FORMULA, FIGURES AND TABLES
Formula (mathematical formula) should be used only when necessary and the
CONCLUSION derived must be explained and made intelligible to a non-mathematical
reader. Wherever possible, authors are encouraged to place the mathematical parts of the
article in an appendix. In cases of empirical articles, authors are expected to make readily
available a complete set of data and any specialized computer programs to interested
readers.
All illustrations, figures and/or tables in the manuscript must be captioned, in clear black
and white (grayscale) and ready for reproduction.
REFEREEING PROCEDURE
Manuscripts will be acknowledged upon receipt. Only selected (preferred) manuscripts
will be reviewed by two (or three) referees in addition to the editors. Editorial decision
will normally be made within two to six months, but circumstances beyond control
occasionally dictate a longer cycle. If authors are invited to prepare a revision for further
consideration, the major issues to be resolved will be outlined and will be forwarded to
them as quickly as possible.
ACCEPTED ARTICLES
Authors of accepted articles will be requested to provide a digital copy of the manuscript,
preferably in Microsoft Word to the MIP (the Publisher) via email at
[email protected]. MIP will not be responsible for the loss or damage of the digital
copy.
COPYRIGHT
Copyright & Creative Commons Licence
eISSN: 0128-0945 © Year. The Authors. Published for Malaysia insititute of planner.
This is an open-access article under the CC BY-NC-ND license.
The authors hold the copyright without restrictions and also retain publishing rights
without restrictions.
Contact:
Editor-in-Chief
PLANNING MALAYSIA
Journal of the Malaysian Institute of Planners
B-01-02, Jalan SS7/13B, Aman Seri, Kelana Jaya,
47301, Petaling Jaya, Selangor Darul Ehsan, MALAYSIA
Tel: +603 78770637 Fax: +603 78779636
Email: [email protected]
Homepage: www.planningmalaysia.org
***

PLANNING MALAYSIA
Journal of the Malaysia Institute of Planners (2020)
195 © 2020 by MIP
ETHIC STATEMENT
The Journal of the Malaysia Institute of Planners or PLANNING MALAYSIA is a peer-
reviewed journal. This statement spells out ethical behaviour of all parties involved in the
act of publishing an article for this journal, i.e. the author, the peer-reviewer, the chief
editor and editors, and the publisher. This statement is based on COPE’s Best Practice
Guidelines for Journal Editors. URL: http://publicationethics.org/files/u2
/Best_Practice.pdf
DUTIES OF AUTHORS
Reporting Standards
Authors of original research should present an accurate account of the work done as well
as an objective discussion of its significance. Data of the research should be represented
accurately in the article. An article should contain sufficient detail and references to
permit others to replicate the work. Fraudulent or knowingly inaccurate statements
constitute unethical behaviour and are unacceptable.
Data Access and Retention
Authors may be asked to provide the raw data in connection with an article submitted for
editorial review, and should be prepared to provide public access to such, if practicable,
and should in any event be prepared to retain such data for a reasonable time after
publication.
Originality and Plagiarism
Authors should ensure that they have written entirely original works, and if the authors
have used the work and/or words of others this must be appropriately cited or quoted.
Such quotations and citations must be listed in the Reference at the end of the article.
Multiple Publication
An author should not in general publish manuscripts describing essentially the same
research in more than one journal or primary publication. Submitting the same manuscript
to more than one journal concurrently constitutes unethical publishing behaviour and is
unacceptable.
Acknowledgment of Sources
Proper acknowledgment of the work of others must always be given. Authors should cite
publications that have been influential in determining the nature of the reported work.
Authorship of the Paper
Authorship should be limited to those who have made a significant contribution to the
conception, design, execution, or interpretation of the study, and should be listed as co-
authors. Others who have participated in certain substantive aspects of the research
project, they should be acknowledged or listed as contributors.
Ethic Statement
© 2020 by MIP 196
Corresponding Author
Corresponding author is the author responsible for communicating with the journal for
publication. The corresponding author should ensure that all appropriate co-authors and
no inappropriate co-authors are included on the paper. All co-authors have seen and
approved the final version of the paper and have agreed to its submission for publication.
Acknowledgment of Funding Sources
Sources of funding for the research reported in the article should be duly acknowledged
at the end of the article.
Disclosure and Conflicts of Interest
All authors should disclose in their manuscript any financial or other substantive conflict
of interest that might be construed to influence the results or interpretation of their
manuscript.
Fundamental Errors in Published Works
When an author discovers a significant error or inaccuracy in his/her own published work,
it is the author’s obligation to promptly notify the journal editor or publisher and
cooperate with the editor to retract or correct the paper.
DUTIES OF REVIEWERS
Contribution of Peer Review
Peer review assists the chief editor and the editorial board in making editorial decisions
while editorial communications with the author may also assist the author in improving
the paper.
Unqualified to Review or Promptness
Any reviewer who feels unqualified to review the assigned manuscript or unable to
provide a prompt review should notify the editor and excuse himself/herself from the
review process.
Confidentiality
Manuscripts received for review must be treated as confidential documents. They must
not be shown to, or discussed with, others except as authorized by the chief editor.
Privileged information or ideas obtained through peer review must be kept confidential
and not used for personal advantage.
Standards of Objectivity
Reviews should be conducted objectively. There shall be no personal criticism of the
author. Reviewers should express their views clearly with supporting arguments.
Acknowledgment of Sources
Reviewers should identify relevant published work that has not been cited by the authors.
Any statement that had been previously reported elsewhere should be accompanied by
the relevant citation. A reviewer should also call to the chief editor's attention any

PLANNING MALAYSIA
Journal of the Malaysia Institute of Planners (2020)
197 © 2020 by MIP
substantial similarity or overlap between the manuscript under consideration and any
other published paper of which they have personal knowledge.
Conflict of Interest
Reviewers should decline to review manuscripts in which they have conflicts of interest
resulting from competitive, collaborative, or other relationships or connections with any
of the authors.
DUTIES OF EDITORS
Decision on the Publication of Articles
The chief editor of the PLANNING MALAYSIA is responsible for deciding which of the
articles submitted to the journal should be published. The chief editor may be guided by
the policies of the journal's editorial board subjected to such legal requirements regarding
libel, copyright infringement and plagiarism. The chief editor may confer with other
editors or reviewers in making this decision.
Fair play
Manuscripts shall be evaluated solely on their intellectual merit.
Confidentiality
The chief editor/editors and any editorial staff must not disclose any information about a
submitted manuscript to anyone other than the corresponding author, reviewers, potential
reviewers, other editorial advisers, and the publisher.
Disclosure and Conflicts of Interest
Unpublished materials disclosed in a submitted manuscript must not be used by anyone
who has a view of the manuscript while handling it in his or her own research without the
express written consent of the author

The Past Issues
© 2017 by MIP 402
PLANNING MALAYSIA JOURNAL:
THE PAST ISSUES
Volume 1, 2003: (http://www.mip.org.my/doc/journal1.pdf)
1. Incorporating Sustainable Development Objectives into Development Plans through
Strategic Environmental Assessment
Muhammad Faris Abdullah & Ishak Ariffin
2. Environmental Concern in Local Planning Practice
Foziah Johar
3. Ecotourism Planning: Who is Really Responsible?
Badarudin Mohammed & Abdul Aziz Hussin
4. Towards A Sustainable Built Environment: Environmentally Conscious Planning, Design
and Construction
Norhayati Mahyuddin
5. Rural Sustainability: An Examination Of The Practice Of Sustainable Development
Principles In A Rural Community In Malaysia
Ibrahim Ngah
6. Managing Urban Development Process By Using Spatial Information System: A Case
Study of I-Space
Alias Abdullah, Muhammad Faris Abdullah & Fauzan Nordin
7. USM Pushing the Frontier of Town Planning
Lee Lik Meng
8. The Suburbanisation of the Kuala Lumpur Metropolitan Region
Jamalunlaili Abdullah
Volume 2, 2004: (http://www.mip.org.my/doc/vol.2-2004.pdf)
1. Creating The Essence Of Cities: The Putrajaya’s Experience
Jebasingam Issace John
2. A Study to Evaluate Child-Friendly Neighbourhoods through a Set of Child-Friendly
Indicators
Alias Abdullah & Nik Munerahanim Nik Muhammad
3. The Evaluation of Beaches in Northern Malaysia
Badarudin Mohammed, Rahmat Azam Mustafa, Adrin Abdullah, A. Ghafar Ahmad &
Shida Irwana Omar
4. Urban Land Use Change & the Langat Basin Ecosystem Health
Shaharudin Idrus & Abdul Samad Hadi
5. Application of Land Use Approaches in Controlling Industrial Wastewater Discharge into
River
Muhammad Faris Abdullah
Volume 3, 2005: (http://www.mip.org.my/doc/vol.3-2005.pdf)
1. Planning Education, Accreditation & Inter-Professional Links
Mohd Thalha Alithamby
2. Electronic Local Authority Management System
Tan Thean Siew
3. A Study on the Demand of Spatial Planning & Decision Support System in Malaysia
Muhammad Faris Abdullah, Alias Abdullah, Mansor Ibrahim & Dazilah Abdul Samad
4. The Technology of Asset Management & Maintenance Culture in Ensuring Sustainable
Development
Khairiah Talha & KC Leong
5. Tessellation Planning & Honeycomb Housing

PLANNING MALAYSIA:
Journal of the Malaysia Institute of Planners (2017)
© 2017 by MIP 403
Mazlin Ghazali, Michael J. Durack & Mohd Peter Davis
6. The Application of the Concept of Defensible Space for Secured Housing Environment
Saari Omar & Megat Arif Shah Megat Omar
Volume 4, 2006: (http://www.mip.org.my/doc/vol.4-2006.pdf)
1. How We Failed To Plan for Habitability
Lee Lik Meng, Aldrin Abdullah, Tan Sook Fern, Nurwati Badrulzaman & Ahmad Sanusi
Hassan
2. Cairo’s Al-Azhar Park: Millennium Development Goals Etched in Green
Khaled el-Khishin
3. Knowledge Cities: Examining the Discourse Smart Villages, Internet Cities Or Creativity
Engines
Ali A. Alrouf
4. A Preliminary Investigation of A Model On The Decision To Implement Teleworking In
The Japanese Business Organisations
Abdul Azeez Kadar Hamsa & Masao Miura
5. An Integration of Multicriteria Analysis with GIS in the Malaysian National Physical Plan
Nor Sallehi Kassim & Rafikul Islam
Volume 5, 2007: (http://www.mip.org.my/doc/vol.5-2007.pdf)
1. Effectiveness of Public Participation Programme: A Feedback from Participants (Sabak
Bernam District Local Plan and Kuala Lumpur Structure Plan)
Dasimah Omar & Oliver Ling Hoon Leh
2. Multicriteria Analysis of Flood Causes in Kuala Lumpur
Nur Fazzillah Muhamed Noordin, Alias Abdullah & Muhammad Nur Azraei Shahbudin
3. Urban Housing Development: Town Planning Issues
Ibrahim Mohd @ Ahmad, Ezrin Arbi & Ahmad Ramly
4. Sustainable City Planning: Emphasis on the Management of Environmentally Sensitive
Areas
Halimaton Saadiah Hashim, Joy Jacqueline Pereira & Ibrahim Komoo
5. The Environment Component in Sustainability Assessment at the Local Level Plan
Abdul Hadi Harman Shah, Shaharudin Idrus & Abdul Samad Hadi
6. Developing a Communicative Planning Approach to Resolve Land Use Conflicts in
Jelutong Area of Georgetown, Penang, Malaysia
Mohammad Abdul Mohit & Raja Mohd. Firdous B. R.M. Harun
7. Komuniti Mapan: Penilaian Tahap Kemapanan Komuniti Orang Asli Temiar Di Negeri
Perak
Khairul Hisyam B. Kamarudin & Ibrahim B. Ngah
8. Book Review: “The Boulevard Book”
Shu Charng Yen
Volume 6, 2008: (http://www.mip.org.my/doc/vol.6-2008.pdf)
1. Safe City Programme: Are we on the right path to reduce crime?
Kamalruddin bin Shamsudin
2. The Contribution of Fiqh al-Jinayat (Islamic Criminal Law) To the Planning of a Safe
City
Azila Ahmad Sarkawi, Ahmad Basri Ibrahim & Alias Abdullah
3. Urban Crime and Safe Neighbourhood: Community Perspectives
Khairiah Talha
4. Towards A Safe Place for Children in Today’s Residential Neighbourhoods
Halimaton Saadiah Hashim, Joy Jacqueline Pereira & Ibrahim Komoo
5. Role of Land Use Planning in Improving Public Health: Way Forward For Malaysia

The Past Issues
© 2017 by MIP 404
Ainul Jaria Maidin
6. Energy Consumption and Carbon Dioxide Emission Considerations in The Urban
Planning Process in Malaysia
Wee Kean Fong, Hiroshi Matsumoto, Chin Siong Ho & Yu Fat Lun
Volume 7, 2009: (http://www.mip.org.my/doc/journal7.pdf)
1. Urbanization, Environmental Planning and Management: A Challenge for Jamaica.
Leiska J. Powell
2. Structural Changes of the Malaysian Economy and Its Spatial Incidence on Regional
Economic Growth
Mohammad Abdul Mohit
3. Urban Sustainability and Growth Management in South-East Asian City-Regions: The
case of Kuala Lumpur and Hong Kong
Suharto Teriman, Tan Yigitcanlar, Severine Mayere
4. Urban Sprawl in Malaysia: Evidences from Three Largest Metropolitan Areas
Jamalunlaili, Mohd. Zulhafidz Yahaya, Mohd Zuwairi Mod Yunus & Mohd Shakir Md Ali
Safudin
5. An Integrated Approach for the Prediction of Water Quality Index Based on Land Use
Attributes Using Data Generation Method and Back Propagation Network Algorithm
Faris Gorashi & Alias Abdullah
6. Groundwater Extraction Modeling for Kuala Lumpur Water Resource Planning
Pieter E. Stek
7. Power of the Local Authority in Regulating Land Planning and Development Control:
Whither Control
Ainul Jaria Maidin & Bashiran Begum Mobarak Ali
8. Australia Planning Report Card – Telling It Like It Is!
Liz de Chasterl
Volume 8, 2010: (http://www.mip.org.my/doc/vol.8-2010.pdf)
1. Vehicle Ownership and Quality of Life in Urban Residential Neighbourhoods, Northern
Peninsular Malaysia
Abdul Ghapar Othman & Hassim Mat
2. Analysis of Commute Characteristics and Residential Location Choice of IIUM Gombak
Campus Employees of Malaysia
Mohammad Abdul Mohit & Mootaz Munjid Mustafa
3. The Relationship between Urban Population Density and Transportation Fuel
Consumption in Malaysian Cities
Neoh Siew Yin & Ho Chin Siong
4. The Socio-technical Factors in the Use of GIS at the Planning Departments of the Kuala
Lumpur City Hall
Mohd Ramzi Mohd Hussain
5. Book Review: Handbook of Research on E-Planning: ICTs for Urban Development and
Monitoring, Carlos Nunes Silva (Eds.) IGI Global Publishing Company, Hershey,
Pennsylvania, USA (2010). 454 pages. ISBN-13:9781615209293.
Alias Abdullah & Carlos Nunis Silva
Volume 9, 2011: (http://www.mip.org.my/doc/vol9.pdf)
1. City Development Strategies (CDS) Contribution toward Sustainable Urban Development
in Developing Countries
S. Mostafa Rasoolimanesh, Nurwati Badarulzaman & Mastura Jaafar
2. Urban Residents’ Attitude toward Wildlife in Their Neighbourhoods: The Case Study of
Klang Valley, Malaysia

PLANNING MALAYSIA:
Journal of the Malaysia Institute of Planners (2017)
© 2017 by MIP 405
Nik Hanita Nik Mohamad
3. Evaluating Stakeholders’ Preferences: Reconciling Heritage And Sustainability In Kuala
Lumpur Traditional Area
Noor Amila Wan Abdullah Zawawi & Alias Abdullah
4. Solid Waste Generation Characteristics: The Malaysia Local Authorities’ Outlook
Muhammad Abu Eusuf, Mansor Ibrahim, Shamzani Affendy Mohd. Din & Rafikul Islam
5. Urban Air Environmental Health Indicators: A Preliminary Set for City of Kuala
Lumpur
Oliver Ling Hoon Leh, Shaharuddin Ahmad Kadaruddin Aiyub & Yaakob Mohd. Jani
6. Classification of Satellite Fused Data for Land Use Mapping in Development Plan
Norzailawati Mohd Noor, Alias Abdullah & Mazlan Hashim
Special Issue I, 2011:
(http://www.mip.org.my/doc/MIP%20Jurnal%20Special%20Issue%20on%20Langkawi.
pdf)
1. Conservation with Development: Showcasing Langkawi Geopark - An Introduction
Halimaton Saadiah Hashim & Rahimah Abdul Aziz
2. Geopark for Heritage Conservation: A Need for Integrated Planning and Management
Rahimah Abdul Aziz, Halimaton Saadiah Hashim, & Ibrahim Komoo
3. Implementing Langkawi Geopark through Land Use Planning
Noor Yazan Zainol, Hapiz Abd Manap, Ibrahim Yacob, Mahani Muhammad, Mariam
Tajuddin & Ikhwan Mohd Said
4. The Importance of Geological Heritage Resources in Land Use Planning: Experience
from Langkawi Geopark
Che Aziz Ali & Tanot Unjah
5. Land Use Planning Statutes for Langkawi Geopark Conservation and Development
Sarah Aziz, Halimaton Saadiah Hashim, Rahimah Abdul Aziz, Chan K. L. Geraldine &
Tanot Unjah
6. Potential Biosites of Significant Importance in Langkawi Geopark: Terrestrial Vertebrate
Fauna
Norhayati, A., Chan, K.O., Daicus, B., Samat, A.,Grismer, L.L, & Mohd Izzuddin, A.
7. Planning for Heritage Tourism: The Case of Langkawi Geopark
Ong Puay Liu & Sharina Abd Halim
8. Place Making, Place Names, and Local Myths and Legends Rahimah Abdul Aziz & Ong Puay Liu
9. Introducing Networks in Planning: An Example from Langkawi
Chan K. L. Geraldine, Halimaton Saadiah Hashim & Sarah Aziz
10. Participation towards Heritage Conservation: Case of a Fishing Community in Langkawi
Geopark
Sharina Abdul Halim, Ong Puay Liu, Nurhafizah Yussof & Lim Choun Sian
Volume 10, 2012: (http://www.mip.org.my/doc/vol.10-2012.pdf)
1. Determinant Factors of Neighbourhood Quality
Norainah Abdul Rahman, Dasimah Omar & Abdul Ghani Salleh
2. The Relationship between Variations of Grid Layout and Burglary
Saniah Ahmad Zaki & Jamalunlaili Abdullah
3. Analysis of Factors Influencing the Stated Preference of Academic Employees towards
Telecommuting in IIUM Campus, Gombak
Farah Diyanah Ismail, Abdul Azeez Kadar Hamsa & Mansor Ibrahim
4. Study on the Potential of Urban Forest Park for Sustainable City
Noralizawati Mohamed, Noriah Othman & Mohd Hisham Ariffin

The Past Issues
© 2017 by MIP 406
5. A Study on the Effectiveness of Provision of New Static Information Signage: A Case
Study of International Islamic University Malaysia, Gombak Campus
Syazwani Sahrir, Syahriah Bachok & Mariana Mohd. Osman
6. Study the Construction and Demolition Wastes in Klang Valley, Malaysia
Muhammad Abu Eusuf, Mansor Ibrahim & Rafikul Islam
7. The Future of Coastal Management Programme in Malaysia: Making the Coast Visible to
Planners
M. Zainora Asmawi
Special Issue II, 2013: (http://www.mip.org.my/doc/se2013.pdf)
1. Impacts of Urban Land Use on Crime Patterns through GIS Application
Ahmad Nazri Muhamad Ludin, Norsiah Abd. Aziz, Nooraini Hj Yusoff & Wan Juliyana
Wan Abd Razak
2. Estimation of Residential Impervious Surface using GIS Technique
M. Rafee Majid, Jamal Aimi Jamaludin & Wan Yusryzal Wan Ibrahim
3. Green Space Audits on its Accessibility in Pasir Gudang
Wan Yusryzal Wan Ibrahim, Ahmad Long & Ariva Sugandi Permana
4. Firm Dynamic Analysis for Urban Land Use and Economic Growth Modelling
Noordini Che’ Man, Soheil Sabri, Nafisa Hosni & Harry Timmermans
5. Assessment of Neighbourhood Affordability based on Housing and Transportation Costs
in Kuala Lumpur, Malaysia
Soheil Sabri, Ahmad Nazri M. Ludin & Foziah Johar
6. Potential Urban Development Parameters that Reduce Energy Consumption in
Residential Area
Ariva Sugandi Permana, Norsiah Abd. Aziz & Abd. Razak Jaffar
7. Incorporating Pedestrian Index into Googlemaps
Nabila Abdul Ghani, Muhammad Zaly Shah Muhammad Hussein & Safizahanin
Mokhtar
8. Seismic Microzonation for Banda Aceh City Planning
Foziah Johar, M. Rafee Majid, Abdul Razak Jaffar & Adi Safyan Yahya
9. The Reliability Test of Visual Landscape Features Measurement in Highlands Tourism
Planning
Nafisa Hosni, Nooraini Yusoff & Hairul Nizam Ismail
Volume 11, 2013: (http://www.mip.org.my/doc/Journal%202014.pdf)
1. Malaysian Development Plan System: Issues and Problems, One Decade after its Reform
(2001-2011)
Faizah Ahmad, Ibrahim Mohd., Syra Lawrance Maidin, Rosilawati Zainol & Norzailawati
Mohd Noor
2. Perceptions on Quality of Life in Malaysia: The Urban-Rural Divide
Norhaslina Hassan, Noor Ismawati Mohd Jaafar, Raja Noriza Raja Ariffin, Asnarulkhadi
Abu Samah & Mohd Nazari Jaafar
3. Awareness by Kuala Lumpur City Hall Staffs for Successful Implementation of Crime
Prevention through Environmental Design (CPTED)
Shuhana Shamsuddin & Natasha Azim Hussin
4. Sustainable Forest Management in Lower Kinabatangan, Sabah: Issues and Current
Practices
Normah Abdul Latip, Nurwati Badarulzaman, Azizan Marzuki & Mohd Umzarulazijo
Umar
5. User’s Preference and Perception on the Pedestrian Crossing in Malaysia: The Case of
Ampang Road, Kuala Lumpur

PLANNING MALAYSIA:
Journal of the Malaysia Institute of Planners (2017)
© 2017 by MIP 407
Oliver Ling Hoon Leh, Zamila Zamri, Mohd Zamreen Mohd Amin & Marlyana Azyyati
Marzukhi
6. Commuters’ Perceptions on Rail based Public Transport Services: A Case Study of KTM
Komuter in Kuala Lumpur City, Malaysia
Syahriah Bachok, Mariana Mohamed Osman, Ummi Aqilah Khalid & Mansor Ibrahim
7. Land Cover Change Detection Analysis on Urban Green Area Loss Using GIS and Remote
Sensing Techniques
Norzailawati Mohd Noor, Alias Abdullah & Mohd Nasrul Hanis Manzahari
8. Analysis of Factors Influencing Use of Motorcars in International Islamic University
Malaysia
Nelza Lynna Abdul Rahim & Abdul Azeez Kadar Hamsa
Volume 12, 2014: http://www.mip.org.my/doc/Journal12.pdf
1. Evaluating the Impact of Density on Access to Local Facilities in Urban Neighbourhoods
Wan Nurul Mardiah Wan Mohd Rani
2. Town Planners’ Perceptions of Sports Facilities and Urban Development: A Case Study
of 13 States’ Main Sports Facilities in Malaysia
Maassoumeh Barghchi & Dasimah Bt Omar
3. Disaster Risk Reduction In Malaysian Urban Planning
Intan Afida Mohamad Amin & Halimaton Saadiah Hashim
4. Conceptualise Tourism Support System through Web-Based GIS for Collaborative
Tourism Planning
Tarmiji Masron, Azizan Marzuki, Badaruddin Mohamed & Norizawati Mohd Ayob
5. Integrating Climate Change Mitigation and Adaptation into Spatial Planning: Developing
Criteria for Spatial Plan Evaluation in the Selangor River Basin
Chee Ping Ngang, Joy Jacqueline Pereira & Halimaton Saadiah Hashim
6. Analysis on Community Involvement in Cultural Activities: Transmission of Ethnic
Language
Aisyah Abu Bakar, Mariana Mohamed Osman, Syahriah Bachok & Mansor Ibrahim
Special Issue III, 2014: (http://www.mip.org.my/doc/JournalSE3.pdf)
1. Geospatial Technology Approaches in Urban Morphology for Resilient Urban
Governance
Norzailawati binti Mohd Noor, Marina Mohd Nor, Alias Abdullah & Rustam Khairi
Zahari
2. Sustainable Governance in relation to the Financial Aspect in Managing Coastal Areas:
Malaysian Experience
M.Zainora Asmawi, Lukman Hakim Mahamod, Mohd Zin Mohamed & Tuminah Paiman
3. E-payment at the Local Government Level: A Study of Majlis Bandaraya Shah Alam
and Majlis Daerah Kampar
Rustam Khairi Zahari, Raja Noriza Raja Ariffin, Nurhawani Zamin & Norzailawati binti
Mohd Noor
4. Residential Satisfaction –Concept, Theories & Empirical Studies
Mohammad Abdul Mohit & Adel Mahfoud Mubarak Al-Khanbashi
5. Historical Influences to Present Legal Setting of Planning Law in Malaysia
Azila Ahmad Sarkawi & Muhammad Faris Abdullah
6. Understanding of Tourists’ Preferences Pattern: A Study in Melaka,Malaysia
Syakir Amir, Mariana Mohamed Osman, Syahriah Bachok & Mansor Ibrahim
7. The Review for the Use of Urban Climatic Map in the Land Use Plan for Urban
Planning
Illyani Ibrahim, Azizan Abu Samah & Rosmadi Fauzi
The Past Issues
© 2017 by MIP 408
8. Evaluating the Effects of Road Geometrical Design Towards Spot Speed Distribution on
Arterial Road
Noor Hafiza Mohd Maksid & Abdul Azeez Kadar Hamsa
Volume 13, 2015: (http://www.mip.org.my/doc/PMJ2015.pdf)
1. Creative Cities Research in Penang, Malaysia: A Review of Conceptual and
Methodological Framework
Khoo Suet Leng, Nurwati Badarulzaman, Narimah Samat, Morshidi Sirat & Sharifah
Rohayah Sheikh Dawood
2. The Role of Fabric Banners for Community Engagement in Digital Era
Rosilawati Zainol, Goh Hong Ching, Ibrahim Mohd, Nikmatul Adha Nordin, Siti
Maisara Baharom & Tengku Adeline Adura Tengku Hamzah
3. Thermal Comfort and Energy Solutions for a Better Residential Environment in
Malaysia
Noor Aziah Mohd Ariffin
4. The Relationship of Human Happiness and Neighbourhood Planning: Case Study
Puchong Indah Housing Estate, Selangor, Malaysia
Oliver Ling Hoon Leh, Farah Ayuni Marhalim, Siti Nur Afiqah Mohamed Musthafa,
Yusfida Ayu Abdullah & Marlyana Azyyati Marzukhi
5. Assessing the Urban and Rural Stage Bus Services Disparities in Peninsula Malaysia
Zakiah Ponrahono, Syahriah Bachok, Mariana Mohamed Osman, Mansor Ibrahim,
Muhammad Faris Abdullah & Alias Abdullah
6. The Roles of Urban Heritage in Determining the Image of the Royal Town of Sri
Menanti, Negeri Sembilan
Nor Zalina Harun, Dg. Norhidayah Fairuz & Nor Adilla Nordin
7. Carbon Sequestration through Urban Green Reserve and Open Space
Alamah Misni, Sakurah Jamaluddin & Siti Mazwin Kamaruddin
8. Sustainable Governance in Relation to the Financial Aspect in Managing Coastal Areas:
Malaysian Experience
M.Zainora Asmawi, Lukman Hakim Mahamod, Mohd Zin Mohamed, & Tuminah
Paiman
Special Issue IV, 2016: http://www.mip.org.my/doc/apsa2016.pdf
1. Mapping Poverty Hot Spots in Peninsular Malaysia Using Spatial Autocorrelation
Analysis
M. Rafee Majid, Abdul Razak Jaffar, Noordini Che Man, Mehdrad Vaziri & Mohamed
Sulemana
2. Managing Urbanisation and Urban Sprawl in Malaysia by Using Remote Sensing and GIS
Applications
Nur Aulia Rosni, Norzailawati Mohd Noor & Alias Abdullah
3. From Trade Routes to Streets Cultures – An Overview of the Significance and
Characteristics of Southeast Asian Traditional Streets
Mongkol Khan & Syed Zainol Abidin Idid
4. Leadership Styles: Incentive or Disincentive Approach in Addressing Street Vendor
Problems in Jakarta and Bandung, Indonesia
Ariva Sugandi Permana, Norsiah Abd Aziz & Ho Chin Siong
5. Preservation of Urban Cultural Landscape: Case Study of Roji in Kagurazaka, Tokyo
Benika Morokuma
6. Community Perception of Management Goals in Matoushan National Nature Reserve
Chengzhao Wu, Tianren Yang, Pei Pei & Haisu Chen
7. Tripographic Assessment of VFR Travel in Context of Malaysian Domestic Travelers

PLANNING MALAYSIA:
Journal of the Malaysia Institute of Planners (2017)
© 2017 by MIP 409
Sharifah Eisyahtun Syed Darar & Hairul Nizam Ismail
8. Evaluating Significant Factors that Influence Public Transport Usage in Kerman, Iran
Azin Bahreini, Hamed Mirzaei, Mehdi Moeinaddini, Zohreh Asadi-Shekari, Muhammad
Zaly Shah & Zahid Sultan
9. Influences of Housing Settings and Designs in Fulfilling the Malay Residents’ Social
Cultures
Noor Aimran Samsudin & Syed Zainol Abidin Idid
10. The Impact of Iskandar Malaysia Development on Urban Amenities
Muhammad Rafeq Razak, Foziah Johar & Rabiatul Adawiyah Abd Khalil
11. Factor Analysis of Motorcycle Crashes in Malaysia
Zahid Sultan, Noor Irdiana Ngadiman, Fara Dela A.Kadir, Nuur Fathin Roslan & Mehdi
Moeinaddini
12. An Overview of Critical Success Factors of Public-Private Partnership in the Delivery of
Urban Infrastructure and Services
Zayyanu Muhammad, Kim Kwang Sik, Foziah Johar & Soheil Sabri
13. The Provision of Vertical Social Pockets for Better Social Interaction in High-Rise Living
Siew Bee, Aw & Poh Im, Lim
14. The Rukun Warga-Based 3Rs and Waste Bank as Sustainable Solid Waste Management
Strategy
Sherly Towolioe, Ariva Sugandi Permana & Norsiah A. Aziz, Chin Siong Ho & Dario G.
Pampanga
15. Liveability Planning for Cities: Within the Islamic Framework of Maqasid Al-Shari’ah
Norimah Md Dali, Alias Abdullah & Azila Ahmad Sarkawi
16. Islamisation of Town Planning Education: A Review on the Courses Offered by the
Department of Urban and Regional Planning, International Islamic University Malaysia
Azila Ahmad Sarkawi, Alias Abdullah & NorimahMd Dali
17. Spatiotemporal Land Use and Land Cover Change in Major River Basins in
Comprehensive Development Area
Wan Yusryzal Wan Ibrahim & Ahmad Nazri Muhamad Ludin
18. Human Behaviour in Open Space around Spring Water in a Central Area of Mito-City in
Japan
Takayuki Kumazawa
19. Identify Significant Indicators for a Happy City
Hamed Mirzaei, Azin Bahreini, Mehdi Moeinaddini, Zohreh Asadi-Shekari, Muhammad
Zaly Shah & Zahid Sultan
20. A Discrete Choice Model for Firm Location Decision
Noordini Che’ Man & Harry Timmerman
21. Co-Benefit Modelling and Optimization of Air Pollution Control in Iskandar Malaysia: A
Methodology using BenMAP
Nadhirah Nordin, M. Rafee Majid, Ho Chin Siong & Gakuji Kurata
22. Exploring the Implementation and Success of Green Urban Mobility in Asian Cities
Zahid Sultan, Nuhu H. Tini & Mehdi Moeinaddini
23. Analysis of Shrines Properties using Remote Sensing Approach: Case Study of Lembah
Bujang
Shairatul Akma Roslan, Norzailawati Mohd Noor, Alias Abdullah & Zuraini Md Ali
24. The Evolvement of Brand Identity of Langkawi Island, Malaysia
Mohd Fadil Mohd Yusof & Hairul Nizam Ismail
25. A Theoretical Overview of Road Hump Effects on Traffic Speed in Residential
Environments
Khairun Sarah Radhiah Bachok, Abdul Azeez Kadar Hamsa, Mohd Zin Mohamed &
Mansor Ibrahim

The Past Issues
© 2017 by MIP 410
26. Implications of Sprawled and Compact Development on Mobility Patterns: A Case-Study
of Bhopal, India
Neha Saxena & Chidambara
27. Research for a Comprehensive and Active Planning Method in an Industrial-Residential
Mixed Area- Focused on Ota Creative Town Vision in Ota Ward, Tokyo
Taku Nohara, Yu Okamura & Susumu Kawahara
28. Measuring the Dimensions and Attributes of Liveability of Low-Income Housing
Communities in Nigeria
Sule Abass Iyanda & Mohammad Abdul Mohit
29. An Investigation on the Relationship between Land Use Composition and PM10 Pollution
in Iskandar Malaysia
Muhammad Azahar Zikri Zahari, M. Rafee Majid, Ho Chin Siong, Gakuji Kurata &
Nadhirah Nordin
30. Monitoring the Performance of State Structure Plan in Delivering Output using Dynamic
Model
Muhammad Faris Abdullah, Alias Abdullah, Rustam Khairi Zahari & Samsuddin Jaafar
Special Issue V, 2016:
1. Sustainable Urban Development Through Urban Consolidation Policy in Shiraz, Iran
Mozhgan Samzadeh, Zunaibi Abdullah, Saari Omar & Aniza Abdul Aziz
2. An Initiatives-Based Framework for Assessing Smart City
Yasmin Mohd Adnan, Hasniyati Hamzah, Melasutra Md Dali, Md Nasir Daud & Anuar
Alias
3. Environmental Psychology: The Urban Built Environment Impact On Human Mental
Health
Chen Wang, Suzaini M. Zaid & Nurhanisah Nazarali
4. Demographic Transition and Sustainable Communities in Malaysia
Hanan Elsawahli, Faizah Ahmad & Azlan Shah Ali
5. Elderly and Community Health Care Facilities: A Spatial Analysis
Rosilawati Zainol & Christopher J. Pettit
6. Sustainable Housing Affordability in Sabah
Rosli Said, Rohayu Ab. Majid, Anuar Alias, Yasmin Mohd Adnan & Muhammad Najib
Razali
7. The Challenge of Labour Shortage for Sustainable Construction
Faizul Azli Mohd-Rahim, Nurul Safwah Mohd-Yusoff, Wang Chen, Nurshuhada Zainon
& Rafikullah Deraman
8. Incorporating Walking in Travel to Work: The Meaning of Commuting for Kuala Lumpur
Community
Mastura Adam & Ahmed Abubakar
9. Campus Walkability in Malaysian Public Universities: A Case-Study of Universiti
Malaya
Liow Ken Keat, Naziaty Mohd Yaacob & Nor Rasidah Hashim
10. Prevention of Aedes Breeding Habitats for Urban High-Rise Building in Malaysia
Nurshuhada Zainon, Faizul Azli Mohd Rahim, Dalila Roslan & Azlan Helmy Abd-Samat
11. Energy Efficiency Policy for Existing Typical Campus Buildings in The University of
Malaya
Muhammad Azzam Ismail, Karam M. Al-Obaidi, Raha Sulaiman
12. Preferences of Student Residents Towards Sustainability with The Concept of Bioclimatic
Design
Adi Ainurzaman Jamaludin, Hazreena Hussein, Nila Keumala & Ati Rosemary Mohd
Ariffin

PLANNING MALAYSIA:
Journal of the Malaysia Institute of Planners (2017)
© 2017 by MIP 411
13. Synthesising an Effective Incentives System in Safeguarding the Heritage Village of
Melaka and George Town
Indera Syahrul Mat Radzuan & Yahaya Ahmad
Volume 14, 2016:
1. Main Criteria in the Development of Smart Cities Determined using Analytical Method
Zurinah Tahir & Jalaluddin Abdul Malek
2. Understanding Land Idling as a Strategic Behaviour: A Brief Note Using the Real Options
Approach
Haniza Khalid
3. Sustainable Well-Being: An Empirical Exploration on Human Needs and Human
Interdependency
Aisyah Abu Bakar, Mariana Mohamed Osman, Syahriah Bachok, Mansor Ibrahim &
Muhammad Faris Abdullah
4. Information Quality for Flood Risk Reduction in Site Planning: Town Planners’ Perception
Intan Afida, Shaharudin Idrus & Halimaton Saadiah Hashim
5. A Study on the Effects of Road Humps in Reducing Speed Along Local Roads in
Residential Areas: Case Study of Taman Setiawangsa
Siti Syazwani Ahmad Sofi & Abdul Azeez Kadar Hamsa
6. What Brings Youth to Recreational Park?
Rosilawati Zainol & Cheong Peng Au-Yong
7. Neighbourhood Satisfaction and Qoul in Middle-Income Housing in Kuala Lumpur City,
Malaysia
Mohammad Abdul Mohit & Mohamed Sajid Ali
8. Identifying Factors Influencing Urban Spatial Growth for the George Town Conurbation
Mohd Amirul Mahamud, Narimah Samat & Norzailawati Mohd Nor
9. The Critiques to Positivism Direction of Inquiry in Comprehending the Complexity of
Governance in Managing Cities Competitiveness
Faizul Abdullah & Fatimah Yusof