Download (11MB) - Keele Research Repository
273
This work is protected by copyright and other intellectual property rights and duplication or sale of all or part is not permitted, except that material may be duplicated by you for research, private study, criticism/review or educational purposes. Electronic or print copies are for your own personal, non- commercial use and shall not be passed to any other individual. No quotation may be published without proper acknowledgement. For any other use, or to quote extensively from the work, permission must be obtained from the copyright holder/s.
-
Upload
khangminh22 -
Category
Documents
-
view
1 -
download
0
Transcript of Download (11MB) - Keele Research Repository

This work is protected by copyright and other intellectual property rights and duplication or sale of all or part is not permitted, except that material may be duplicated by you for research, private study, criticism/review or educational
purposes. Electronic or print copies are for your own personal, non-commercial use and shall not be passed to any other individual. No quotation may be published without proper acknowledgement. For any other use, or to
quote extensively from the work, permission must be obtained from the copyright holder/s.

VARIABLE AND CONSTANT ERRORS OF PERCEIVED
ANGLE SIZE
S. R. HAKIEL
Thesis sibmitted in fulfillment of the requirement for the
Degree of Ph. D at the University of Keele
July 1978

ii
Abstract
Experiments were carried out to characterise the perception of angles in terms of the acuity and constant error of comparisons of acute angle sizes. Both measures, determined by the forced choice method of constant stimululi, were found to increase linearly with stimulus angle size. Constant errors varied systematically with stimulus orientation, following the cblique-effect (Apelle, 1971), while acuities did not. The differential expansion of acute angles was found to decrease with increased stimulus duration, st3bilising after about 0.5 second.
Despite the previous success of the hypothesis that perceptual expansion of acute angles is an orientation contrast effect due to lateral inhibitory interactions between channels selectively responsive to different orientationsp the present observations proved- inconsistent
with predictions derived from this hypothesis concerning both acuities and constant errors, and temporal variation of these measures. Results
of adaptation and masking experiments also failed to show meridional
anisotropier.. -of the eselectivities- ýof orientation chanTiels'4--VMcIYCI; idre
considered necessary assumptions for the explanation of meridicnal
variation of perceived angular extent by the lateral inhibition hypothesis.
The discrepancy between the present results and previous cbservatims which were consistent with the orientation contrast hypothesis was-
attributed to the fact that in the majority of previous studies perceived orientation was measured, not perceived angular. exteal: The. prvsýent data, therefore, do not contradict the orientatim contrast model,, but suggest that this contrast is not a sufficient explanation of the misperception of angular extent. As an alternatives, it was proposed that variaticn of perceived angular extent results from
meridional anaisotropies in the scaling of an orientation metric derived
from the integration of outp uts from orientation selective channels-

iii
Acknowlegments
I should like to thank Dr. D. P. Andrews for his valuable advice, given
over the course of these investigations, and for his assistance in the
development of both the hardware and the software by means of which
the majority of the experiments were carried out. I am equally grateful to Professor and Mrs. MacKay for the loan of
apparatus, and assistance in its operation, which enabled me to carry
out the remainder of the experiments.
All members of the Department of Communication -and Teuroscience at the
University of Keele must be thanked also for the provision of an,
environment of continual criticism and support in both tecnical and
theoretical concerns, which contributed to the undertaking of the
research presented in this thesis.
The author was supported financially by a research studentship awarded by the Science Research Council.

iv
Contents
Declaration
Abstract
Acknowledgrents
i ii
iii
The Perception of Angle Size cmd Orientation 1
1.1 Angle Perception and the Illusions of Direction 1
1.2 The Perception of Orientation 19
1.3 Orientation Perception and Lateral Inhibition 26
1.4 An Appraisal of the Lateral Interaction 41
Hypothesis for Orientation Contrast.
1.5 Preface to the Experiments 45
2. Tuning Characteristics of Orientation-selective 46
Channels
2.1 Experiment 1: McCollough Effect in horizontal 46
and oblique channels.
2.2 Experiment 2: Masking functions of vertical 54
and oblique channels
2.3 Conclusions 57
3. The Automated method of Constant Stimuli.
3-. 1 Psychophysical Methods
3.2 Experimental apparatus I: Hardware
3.3 Experimental apparatus 11: Software
4. Acuity and Constant Error in the Perception of
Angles: I
4.1 Effects of spatial parameters on perceived
angle size
4.1.1 Experiment 3: Perception of orthogonality
4.1.2 Experiment 4: Matching of right angles
4.2 Comparison of Angle Sizes: Acuity and Constant
Error as functions of angle size, orientation
and line length
4.2.1 Experiment 5: Comparison of angle sizes - horizontal reference angle.
4.2.2 Experiment 6: Comparison of angle sizes - oblique reference angle.
58
58
61
67
71
71
72
77 80
80
95

V
4.3 Cmclusims 97
5. Acuity and Constant Error in the Percept -ion of 99
Angles: II
5.1 Experiment 7: Comparison of angle sizes - 101
acuity and constant error as a function of
angle size.
5.2 Experiment 8: Comparison of angle sizes - 105
acuity and constant error as a function of
stimulus orientation.
5.3 Discussion ill
6. The Time Course of the Perceived Expansion of 112
Acute Angles.
6.1 Experiment 9 114
6.2 Experiment 10 118
6.3 Experiment 11 124
6.4 Difference Threshold in Experiments 9,10 127
an d 11
6.5 Cmclusims
7. A Metric for Perceived Angular Extent?
7.1 Experiment 12: Additivity of perceived
angular extent.
7.2 Experiment 13: Magnificaticn factor as a function of angle size.
7.3 Difference threshold for perceived angular
extent as a function of angle size.
7.4 Discussion
135
137
137
162
164
167
8. The Perceptim of Angular Extent 171
8.1 Factors influencing variable and constant 171
errors in the perception of angles 8.1.1 Effects on acuity for perceived
angular extent 8.1.2 Effects on constant error of perceived
angular extent 8.2 Mechanisrs underlying the perception of
angular extent.
171
174
178

vi
References 193
Appendix I: Tables of Variable Errors (standard 205
deviations) and Constant Errors (biases)
cbtained in Experiments 3- 13
Appendix II: Computer Subroutines 257
II-1 IDISPI - stimulus display subroutine 257
11-2 'TEST' - stimulus optimisatica routine 260
Appendix III: Tables of Criterion Frequencies used by 264
by the 'TEST' subroutine.

1
Chapter 1. The Perception of Angle Size and Orientation
1.1 Angle Perception and the Illusions of Direction
The processes by which angles are perceived by the human visual system and the
means by which they are Xupresented have been of interest to sensory psychologists
since the second half of the nineteenth century, initially because Of the role
which they were believed to play in the induction of the misperceptions which
are found in many of the so-called geometric visual illusions. A number- of
studies since then have been concerned with- simple angle figures. in the hope
of understanding and explaining hc*z more complex angle-based-figures, such_ as
the Poggendorff and Ullner illusions, give rise to distortions in perceived-
visual space. As early as 1866 Helmholtz (1962 pt_IIIO p 196) was, able to
state that "... as a general thing acute angles, composed of smaller. angles
distinctly marked, seem to be relatively - too_large compared to obtuse or. right_
angles not thus divided. " 7be picture referred to (fig. 1.1) may be interpreted
in terms of the filled-space category of illusions - although the connection
- -; -�
4.
Fig 1.1 (a) Perceptual expansion of acute angles demonstrated by the apparently greater size of the top left and bottom right rigH : ingles in comparf n
X. with the top right and bottom left right angles.
(b) The angle enlargement effect does not require the physical presence of angle vertices. (Both figures after Helmholtz, 1856).
of this phenomenan with the simple expansion of acute angles is not yet evident.
He continues, with reference to an earlier illustration (Fig. 1.2): "... the
apparent magnification of an acute angle is such that its two sides-are expanded
This view was reaffirmed by Wundt (1902, p 137) who observed that "... acute
angles are overestimated, obtuse angles -are underestimated', and that the
directicn of the lines forming the angle varies accordingly, "

2
Fig 1.2 Basic example of perceived expansion of ocute angles (Helmholtz, 1856).
One of the earliest comprehensive studies of simple angles was performed by Jastrow (1892). His results indicate that angles of 150 were slightly over- estimated, but those between 30 0 and 75 0 were underestimated. The underestimates fell to zero again at 90 0 then, between 900 and 1200 became overestimates once more. The error fell to zero at 135 0, angles between 150 0 and 1650 being again underestimated. This study indicates that over large ranges acute angles are underestimated and cbtuse angles overestimated, thus directly contradicting the reports of Helmholtz and Wuridt. Jastrow's method,, however, is open to
severe logical criticism. His subjects viewed a card on which an angle was displayed, which they were then asked to reproduce in a drawing. By this
procedure, however much the subjects over- or underestimated the angles
perceptually, they should have, made accurate reproductims (subject to some
random error) because to draw an antle, which, looked like the original, they'
would have to draw one the same size. The perceptual error would thus be
included in their drawings. If, as a result of overestimation of angle size, his subjects drew bigger angles, then the reproduced angles, would also look'
bigger. Evidently, therefore, the constant errors in Jastrow's study must be attributable to some source other tham that which leads to the observations
reported by Helmholtz and by Wundt.
Beery (1968) replicated Jastrow's findings, that acute angles. are underestimated
and obtuse angles overestimated, but made. the same mistake as Jastrowo if not
even more obviously. His subjects merely reproduced an angle which remained
continuously visible. Fisher (1969) pointed out Jastrow's error and repeated
the study using a method of absolute judgments. From his findings. he was able to support the view that acute angles are overestimated while obtuse angles are underestimated, with the zero error points occurring at, between 900 and 110 0
0 andalso at about 180 " As has been pointed out by Bums, and Pritchard (1972)
and by Robinson (1972), Fisher's method is just as logically unsound as was that
of Jastrow and of Beery. Subjects leam the labels which they attach to angle

3
sizes as a result of experience with angles of a known size. Thus an angle of 45 0 will be labelled as ý45 01 however much the internal representation may be
distorted. As Robinson writes: "FisheA results are just as mysterious as Jastrowls, and it is just as much a mystery that they follow the majority
opinion as that Jastrow's do not. " (Robinson, 1972, p 82). To confound the issue still further, ]Fisher replicated Jastr-ow's method in a later experiment
and obtained results similar to those of Jastrow and of -Beery.
In a further attempt at a comprehensive study of the. effect of a number. of
paraneters believed to influence the pert6eived size of angles, - Le **'angle
size, bisector orientation and presence or absence of, visual cues, Maclean and Stacey (1971) showed that the differences between the results of Fisher and those
of Jastrow and of Beery can be relably obtained, -the critical variable. being
response mode. Verbal identificatlon of angle size, 'as irk Fishor? s study, leads to an underestimation while graphic reconstruction -leads to an underý
estimation of acute angles. However, while this study does confirm, the,
reliability of the results found in earlier experiments, as a study of the
perception of angle size it is no more valid -than thoseý already mentioned, for
the same reasons. The differences between. the stimulus-angle size and the
response angle size connot be considered'as measuring misperceptions of
angle sizeq because to do so would require the assumption thatthe. stimulus
is seen veridically while the response suffers the perceptual distprtiQA
under investigation.
By using a rather more indirect technique to detemine the perceived angle size
the difficulties related above (which are to be found in all direct matching
techniques) may be overccme. This approach has been-applied by Ogasawara
(1956,, cit. Oyama, 1960) using the figure shown as Fig. 1.3, subjects-beifig
asked to adjust the upper line until it appeared -to be, co-Unear with-'one am, -
of the angle. His reasoning was that any perceived' change, in angle size implies
/ /
Fig 1.3 Stimulus configuration used by Ogasawara (1956, cit. Oyamo, 1960).

a correspcnding change in the perceived orientations of the ams of the angle. In order to detect this change in orientation,, the line which is not part of the angle, and which is presumably not influenced for this reason, is set.
at the same apparent orientatim as the adjacent am of the angle. The
difference between the orientations of the. two lines is then -taken- as, a measure
of the extent to which perceived angle size differes from the real angle Size. Ogasawara found a maximum for angles of 25 0- 30 0 which fell. to zero at 900,
the directim of the error being such as to indicate that acute angles. are - overestimated. He also showed that when the lower oblique line was crossed by several parallel lines the illusion increased with-the number. of intersecting
lines,, although the shape of the function remained the same. --
Using the similar Ebbinghaus figure (_Fig, 1.41., an earlier-study by-Morinaga (1932, cit. Oyama, 1960) showed that the angular separation between'the two arms
/
Fig 1.4 Ebb; nghaus figure used by Morinaga (1932, cit. Oyoma, 1960).
of the angle was not the sole deteminant of the perceived angle size, which is also dependent on the orientatim of the angle. Morinaga found the erTor
of alignment of the dash with the oblique line to be greatest when both lines
lay in the same quadrant, neither being either vertically or horizontally
oriente d.
Bouma and Andriessen (1970) used a test figure similar -to that of Ogasawaraq
differing in that a dot was set by -the subjects -to be colinear withý the arm, of
the angle, rather tham another line segment. This procedure has -the advantage
that the dot can undergo no perceptual distortion of direction which may have
occurred in the experiments of Morinaga and of Ogasawara. Varying both angle
size and orientation, Bouma and Andriessen found the perceived enlargement of
angle size to occur maximally with 45 0 between test and induction line,. falling
to zero at 90o -a value rather larger than that -found by Ogasawara. 'Their

5
results for the orientation of the induction line for a constant angle size differed also from those of Morinaga, in that the greatest effect was found
with vertical or horizontal inducing lines, with vertical lines exerting a
slightly stronger influence than horizontal lines and oblique inducing lines
exerting the smallest effect. Further experiments showed that when the test line was replaced by two dots representing the end-points (separation 28 min.
arc) the results were similar although the magnitude of the perceived- expansion
of the angle was somewhat reduced.
Blakemoreq Carpenter and Georgeson's (1970) investigation of the effect-of
angle size and orientation on. perceived angle size used. error in, setting
a comparison line parallel to one am of an angle in the presence of the- other
am at different angular separations, compared to -that made in the. absence of the third line, as the estimate of the - perceptual expansion of acute angles,
and reduction of oblique angles. They found the maximum error to occur with angle sizes of around 10 0 falling to zero at 90 0 with the maximum underestimation of obtuse angles occurring at 165 0- 170 0, The latter angle size may be
0-0 interpreted as a virtual acute angle of about 10 , 15 . complementary to the
obtuse angle,, showing perceptual expansim. Studies of the effect of the
orientation of the test figure (Carpenter & Blakemore, - 19-73) gave results
agreeing with those of Bouma and Andriessen (1970), the m4ximum-effect
occurring with lines close to the vertical or horizontal.
In another study (Maheux, Townsend & Gresock, 1960) a segment of the Z811ner
illusicn containing two angles, as shown in Fig. 1.5, was used. The subjects
F
Fig 1.5 Stimulus configuration used by Maheux, Townsend & Gresock (1960).
were asked to set the orientaticn of the test line so that it had the same
orientaticn as that of the two pointers. The difference between this
orientation of the line segment and that obtained in the ccntrol when the

6
parallels were not present was taken as the measure of perceptual expansion. This was found to at a maximum for 10 0 angles, diminishing rectilinearly with increasing angle size. The effect of orientation of the stimulus figure was not studied.
Of those experiments which can be considered as logically'sound, there is, there- fore,, an overall agreement conceming the occurrance of the perceptual
overestimaticn of acute angles and underestimation of obtuse angles, although there is some dispute as to which angle sizes result in the greatest error,
00 experimental results ranging from 10 to 45 . With reference to the effect
of stimulus orientation, only Morinaga's results are, at variance with the others,
which show the greatest effect with vertically or horizontally oriented angles
and the smallest with obliquely oriented angles. -Lennie (1971) has also investigated the effect of the orientation of an. angle on its perceived size. He asked subjects to adjust one arm of an angle, of variable bisector orientation
until the angle was judged to be of the same size as a second angle whose bisector was horizontal. The two angles had a common vertex. He foAnd
minimum differences when the test angle was vertical or horizontal, but when it was oblique the settings made showed the test angle to be perceived as
appreciably smaller than. the horizontal angle, a difference of about 8 0- 90 being found for 400 angles. His findings give further support, therefore, to
the conclusion that the overestimation of acute angles is greatest when they
are bisected by the horizontal and vertical and least when the bisector of
the angle lies on a main diagonal.
As Wundt (1898) pointed out, there is a large set within the class of geometric
optical illusions in which anglesq particularly acute angles, seemed to be the
active elements. He suggested that certain figures containing angles may be
constructed Such that the perceptual enlargement of the component angles introduces distortions into the figure which compound to generate in illusion
caused by the misperception the the direction or orientation of the lines of
which the figure is composed. The role of the over- and underestimation Of
acute and cbtuse angles in the induction of the distortions seen in these illusions,, however, has not been universally accepted, principally because of
the disagreements already mentioned conceming the behaviour of angles with
sizes between 45 0 and 900. Them are also some figures-whichý showý angular
or directional distortions but which do not contain angles as such. These
have been taken by several writers to demonstrate that recoursa to the, mechanisms involved in the misperception of angle size is not sufficient to explain these illusions.

7
Perhaps the best known of the illusions of directicn is the Z811ner, illusion
shown in Fig. 1.6. In the first detailed work to be published on this
figure Z811ner (1860) reported that the maximum illusion was obtained when the
Icnger lines were oriented at 45 0 (or 1350)9 the illusicn falling to a minimum
as the figure is rotated until these lines are vertical or horizontal. This '
observation has been confirmed by Judd and Courten (1905) and by Morinaga (, 1933)-
as well as by a number of more recent studies.
)
x \, \ //
ýr/ \ 0/.,
\/\
Fig 1.6 Z811ner illusion.
The effect of varying the angle of intersecticin of the main (test) lines
with the background (inducing) lines of the figure, as determined by a number
of studies is not so consistent between investigations. A summary of the
results obtained is given in Table 1.1. The main differences. in the findings
shown are between those who report a continuous. diminishing of the illusion
and those who report that the sign of the iilusion changes. at about a 45 0
intersection angleg retuming to zero at an angle of 90 No, reasm has been
suggested for this somewhat glaring discrepancy which divides the studies into
two groups. It is worth noting that apart from -Day C1965) the other-workers
who report this finding, Hoffman and Bielchowsky (1909) and Gibson and Radner
(1937), used similar displays, although not the most reduced version of the
Zbllner figure - Furthermore, the effect claimed by Day (19 65), using, a full
Zdllner figure with intersecticn angles of 62.50 is barely- perceptible, if at
all, and is certainly less than half the magnitude obtained-with the 22.5
intercept, which is the strength reported.
The second disagreement is in the intersect angle required to give the maximum illusion - found by Maheux, Townsend and Gresock and by'Gibson and Radner to

8
SOURCE ILLUSION CHARACTERISTIC FIGURE USED
Morinaga (1933) Max. at 200-30 0 falling sharply Z811ner figure
at 20 0, slowly at 300, to
zero at 900.
Day (1965) Max at 15 0, zero at 40 0%
reversal between 45 0 and 900
Wallace & Crampin Max. at 15 0 -20
0, shape of (1969) curve as Morinaga, reversals
0 at 2
White (1971,1975) Max. at 20 0. curve as
cbtained by Morinaga.
Oyama (1975) Max. at 150-300 (according
to values of other variables) Minimal by 45 0, reversals at
0 10
Gibson & Radner Max. at 10 0. zero at 45 0
(1937) reversals at 45 0.
Hoffman & Biel- Max.. at 20 0, decreasing to
chowsky (1909) zero at 45 0, reversal at
0- 0 45 90 ,
Maheux, Townsend Max. at 10 0, decreasing to 0 & Gresock (1960) minimum at 60
Zbllner figure
Z811ner figure
Z811ner f igure
Z811ner figure
Single T-line with
Background of cne
orientation (half
Z811ner)
Single line with
oblique intercepts
Two parallels with
one oblique.
TABLE 1- Summary of results obtained when size of Mllner illusion is meaýured as a function of angle between background and test lines.

9
be 10 0, in comparison with the value of 15 0- 20 0 found by the others. 7bere
are two major differences between the experimental stimuli which may contribute to this lack of agreement. One is the number of obliques, or the background
density. The implicaticn of this variable was demcinstrated by Heymans (1897).
and has since been quantified by Wallace and Crampin (1969), White (1971) and Oyama (1975). All these studies show that illusion magnitude increases as a function of background density. Wallace and Crampin report further that after
correcting their data for line thickness as well as background density, the intersect angle required for maximum i3-lusicn is 10 0, thus bringing their
findings in line with those of Maheux et al. and of Gibson and Radner.
Presumably the application of similar corrections to the other results
would bring these too into agreement.
The other difference is in where -the measurement was made. In -the. work- of
Wallace and Crampin it was made on the horizontally oriented. parallels, whereas
in that of Maheux at al. it was made on-the oblique intersect, the orientation
of which varied but did not approach the horizontal or the vertical. As will
be discussed later, this question of orientation is a fundamental one and
could well explain the results shown to be anomalous, particularly, with 0
reference to the change of sign effect at angles, greater- than 45
A number of other features have been - abstracted from -the Ullner. illusion in
order to identify those which make an active contribution to the effect. - Wallace (1966) refers to Heyman's (1897) finding that the illusion is stronger,
with increases in the number of obliques . and asks which features - of these
repetitive cbliques are important. In particular, is it their overall
dizection in relation to the test lines which is important, or is it their
straightness - would a series of zig-zag lines be just as effective? * The
figures used are shown in Fig. 1.7; for each pattern the illusion was viewed
at five distances - 80,1309 200,300 and 450 cm. The wavy line was found to
reduce the illusion at short distances, but with increasing viewing
distance there was a marked increase in the magnitude of the illusion; - at
300cm pattern B gives an illusicn as large as that given with the control.
Wallace ccncludes that at short distances overall direction alone of the - intersects is not sufficient to generate the illusion, the background lines
must also be straight. As the viewing distance increases, however, the-
waviness becomes less important and overall direction becomes the important
feature; "of the two wave patterns, B produces more disiprtion than C, which means
that it possesses more linearity. This despite the fact that the. slope of

10
the waves in B is greater i e. deviates more from the overall direction than
the slope in C. The important difference then is not this, but the fact that
Ia
C
Fig 1.7 Stimuli used by Wollace (1966).
Scm
5mm
B is twice the frequency of C. Now me can consider these patterns as
'dotted' lines, the dots being the wave peaks. In order for the perceptual
system to detemine the overall direction. of the line a certain minimumý
number of dots must be sampled. Since, however, there are twice as many per
unit length in B than in Ca small fixed sample of B gives more overall
dir, ection informatim. than the same size sample of C. It would seem-that it
is the directim. of the lines as determined by these samples. which dist9rts
the direction of the main test lines. " (Wallace, 1969)_
These findings suggest that it may not be the intersection of the test, lines
with the background field of lines as. such. but the interaction of the - 1directionalityl of the test lines with that of the background fiel4o as
abstracted by the perceptual systems which gives rise to the illusion effect
of the Z811ner figure - In other words, the effect is not -one of contour
interaction,, but one of orientation interaction. If this-is, so, then-it need
not be a necessary condition for the illusicn that the lines intersects as is
indicated by one of Heyman's (1897) figures. This possibility,, together
with the prediction that "there will be a critical distance (measured ai3

11
visual angle) separating the background lines from the test lines at which the distorting interaction no longer occurs" was investigated by Wallace (1969).
The results of the first experiment are shown in Fig. 1.8(a)-from which it is
immediately apparent that the presence of the gap does not abolish the illusion,
that is,, that the intersection is not a necessary condition for the- illusion.
)
2 S sap
10-
fi
Fig 1.8 (o) Z811ner illusion magnitude as a function of the size of the gap between transversal and background.
(b) Z811ner illusion magnitude as a function of length of background lines. (Both figures from Wallace, 1969)
In a second experiment a converse configuration was used to measure the effect
of lengths of background lines an the size of the illusicn. If there is a
critical distance for interacticn between orientationsl, then with increasing
length of background lines the illusion should increase, but should. reach
an asymptote at some point beyond which further increases . of line, length have
no effect. The lengths of the background lines were such that the perpendicular distances from their ends to the test lines were equivalent to the different
gap sizes in the first experiment. In addition a l5mm-line was added. The
results from this experiment am shown in Fig. 1.80). The curve, reaches
an symptote at 10mmo suggesting that for the intersect angle ýf 15 0 used,
parts of the background more than l0mm, perpendicular aatance frqm, the test
lines do not ccntribute, to their distortion.
7be results of these two experiments appear to be in good . 2greelment. Both
indicate a limiting distance of 10mm beyond which- the backgmund lines have
little effect ca the test lines. In the apparatus used, this distance
correspcnds to a visual angle of l. deg. arc. Oyama (1975). has also investigated the effect of gap size with more steps than Wallace (1969) as well

12
as at a number of different intersect angles between 10 0 and 400. Not only was the finding that the illusion persisted in the absence of physical intersection of the lines repeated, but it was also found that there was a significant interaction between gap size and angle of intersection. As the
gap between the background and the test line was increased, the angle at which the maximum illusion was found was seen to decrease. In a subsequent
experiment Oyama determined the relation between line length and illusion
magnitude (cf. Wallace, 1969), again at a number of different interts'ection
angles. These results compare well with those, bbtained'by Wallace, the magnitude functicns reaching an asymptote at lengths of between 45 and 60 min. arc. Here too angle size was found to interact with the primary independent
variable. In this instance the peak magnitude was found 'at smaller angles as the line length increased. The relaticn between these two sets of inter-
actions is, however, neither obvious nor made explicit although both main effects are quite consistent in their estimates of the limiting distance for interactions between the two orientations present in the stimulus.
White (1972) provides further evidence for the notion -that the interacting
variables in the Z811ner illusim and -therefore, perhaps,, in all distortims
of perceived orientation which may described as perceptual expansion of acute
angles, are orientaticns of lines rather than the lines - themselves - as explicit
contours. He proposed that a straiglit line can be ccnsidered as a row of dots with zero separation. "The critericn for when a line is not a line is
DOT SEPARATION (mm)
Fig 1.9 Results obtained for increasing dot separations in the backgrounds of the Z811ner illusion figures shown (White, 1972).
given by a certain dot separation depending on the nature of the surrounding implicit ccntours. In the Present instance (Fig. 1,9) the surrounding ccntours were virturally unrecognisable when the dot separation was 15mm, - (1.4 deg-arc), i. e. when it was equal to the perpendicular distance between the adjacent ccntours. Dotting a line thus results in a decreased overall

13
intensity of the corresponding explicit contour. " As his results show, this
reduction of the "'intensity' of the contour results in a corresponding decrease in the illusion magnitude which fell to zero at a separation of 10-15MM; at which the dot-defined lines were no longer recognisable as lines.
Degradation of a continuous line into fragments which act as sub-optimal
stimuli for the perceptual mechanisms which extract orientation information
from the pattern under inspection thus results in a decrease in the contrast between these orientations. It might be 6xpected, therefore, that-if the 'intensity' or efficacy of the lines were differentially altered. in a different
way, a similhr result would be obtained'. To test this hypothesis Wallace, (, 1975)-
measured the effect of different background line luminance contrasts on the
magnitude of the Z811ner illusion. The results were, fully in accordance with,
the expectaticn, illusion magnitude showing a linear, relation to log luminance
contrast.
This study compares favOureblY with a variation of Blakemores-Carpenter and
GeorgescnIs (1970) experiment reported'by Parker (. 1974).. P. ýrker used
essentially the same stimulus as, did Blakemore 6t-al. j'but differentially
varied the luminances of the lines forming the, angles. for a constant
luminance of line A (the inducing line - see', Fig. 1.10), decrea, ýing the
luminance of line B gave an increase in the illusion magnitude. -'When. the
Fig I- 10 Stimulus configuration used by Parker ( 1974).
luminance of line B was held constant and that of line A reduced the illusicn
magnitude decreased. Cmccmitant reduction of the luminances of lines A and B
gave no significant change in illusica magnitude. The close similarity of
the consequences of these corresponding -manipulaticns performed on the two'
stimulus patterns, cne the simple angle and the other the more cipmplex-Mllner figure, offers further evidence in support of Helmhotz's origianI proposal that
the key factor in the illusicns of directicn is the. perceptual expansivin of
acute angles.

14
The Z811ner figure may be considered as one of a set of illusicns which comprise
a small number of lines superimposed on a background field of regularly spaced lines of a different orientatim. It was. perhaps the use of the term -background field which led Orbisoa (1934) to explore the consequences-of superimposing figures such as lines squares, circles, etc. onto fields of concentric circles or
radii of circles and to account for the induced distorticns from -a Gestaltist
viewpoint. He proposed that 'fields of force I -were set- up by the background
lines, presumably in the visual cortex. Any line crossing this 'force field'
would interact with it aid be distorted to a predictable - degree -
in a predictable direction. If, for example, the crossing lines were radial to a background of
concentric circles, or arcs on a field of radii (with a commm centre for both
arcs and radii)*, then the 'forces' would be prefectly balanced and there would-be
no distortion. If the crossing lines did so at any angle other than 90 01
then they would be distorted in the direction of the lines. where the forces
were balanced. Thus, in Fig. 1.11a, the lines of the square are distorted in
t
(a)
Fig I -I I Orbison figures.
(b)
v -- -
the direction of the radial lines and in Fig. 1.11b the two parallel lines are distorted in the direction of the concentric circles.
As it is now evident that the neural mechanisms subserving the perception of
orientation do not operate in terms of 'fields of force' Orbison's theory has little explanatory value. As description, the chal"acteristic behaviours of
the intersecting lines deduced from his figures are in general agreement with
those studies of the Z511ner illusion described above, as exemplified by the
findings of Wallace and Crampin C1969) . White C1971) and Oyama C1975). Those
studies which reported a cross-over (zero illusicn) at angles, of 45o are therefore in disagreement with orbisonts findings, as well as with the findings
of the other Zbllner studies. Berliner and Berliner (1948) cited Hoffmann and Bielchowsky's (1908) study as a refutation of Orbison's proposals ands using

15
this data of Hoffmann and Bielchowsky, advanced a hypothesis of their own to
account for this type of distorticn. Struck by the resemblance of this data
to a sinusoid, they gave a mathematical expressicn to fit it, - which, they
claimed, emables the prediction of the amount of distortion which will be
produced by an Orbison-type figure:
For d= amount of distortion
a= angle of tilt of the background lines, Cangle of intersection)
c= constant coefficient
e= error coefficient
d=c. sin4a te
Insofar as this expression. predicts the findings of Hoffmann and Bielchowskyj,
including the reversal of -the illusion at angles'l. between', 45 0 and 900, -then
the
bending of the test line would vary in directim according to whether it- interr
sected the background lines at angles greater or less than 45P. This prediction
was experimentally corroborated by Kristof (1960) using me half of the
Hering figure. The prediction of zero illusicn at 450,, followed by a reversal
of illusicn at angles between 450 and 900 is, of course, also supported by the
results of Day (1965) and Gibscn and Radner (1937) on the Z811ner type illusicn.
The Berliners go on to point out that when a single line crosses a field of
parallel lines at an angle, the cbservation is not a bending of the lines but
a rotation, as can be seen in the stimulus configuration. of the Ullnerfigure.
In the Hering and the Wundt figures and in the Orbison figures the angle, of
intersection cbanges systematically and so the line, appears curved - an
'integration' (term used by Berliner and Berliner, 1948) of the changes -of
orientation at each intersectim or 'locus of distortion' (Crassini,, & Over,, 1974)
or, as it were, as a smoothed polygon.
But, however useful the Berliner- and Berliner expression, or its post. hoc
modifications may be for predicting the distortions to be expected from -Yariqus
figures of this general class,, it is descriptive and not explanatory. Nothing
whatsoever is said about the mechanisms of the perceptual system whereby
inputs give non-veridical outputs.
The outstanding unresolved feature in this discussion so far is the disagreement
between those studies which report a biphasic illusion function and those in
which the illusion magnitude function is monotonic. Although no systematic
study of this discrepancy has been published to date, a possible hint of its

16
resolution may be found in the results of Virsu. and Taskinen (1975) who
studied the effect cn perceived contrast and orientation of the test line
brought about by the introduction of a second line at angular separations between 20 and 900. Error in perceived orientation wasplotted as a fmction
of angular separation. of the two lines and was shown for each subject. While
none of the functions could be properly termed biphasic, two of the three 00 subjects show negative illusions at angles greater thaa 70 and 80 , That of
the third subject has no negative component at large angles and the pooled data
shows a typical monophasic functim. It must be admitted, however, that these
small inter-subJect differences do not approach the almost symmetrically biphasic function published by Day (1965), for example.
Another well-known geometric illusion - the Poggendorff illusion (fig. 1.12a)- - has often been cited as a further example of a figure which appears perceptually distorted as a ccnsequence of the apparent expansion of acute angles. Z1311ner
/ / (a) (b)
I Fig 1.12 (a) Basic Poggendorff figure.
(b) Version of the Z811ner figure from which Poggendorff claimed his figure was derived.
(1860) mentioned this figure, and also referred to a disagreement between
Poggendorff and himself as to whether the two illusicn were identical. Z811ner
denied this# attributing Poggendorff's claim to a particular instance of the
Zbllner figure (Fig. 1.12b) in which each intersection could be considered
as a Poggendorff figure. He claimed that when the Z811ner figure was drawn
with thin lines the putative Poggendorff component was no longer present.
Hering (1861)9 however, first interpreted the Poggendorff illusion as being
a result of the perceptual enlargment of acute angles. and so identified it -with
the Z811ner illusion which Helmholtz (1866) had already interpreted in the same
way*

17
In a recent critical study by Day and Dickinson (1975) both the apparent change in orientation and the apparent lateral translation of the -transversal of the Poggendorff figure were measured by using stimuli of the type shown in
rig. 1.13b, derived from Tolanski Is version of the Poggendorff figure, - at a
number of intersect angles. While the changes in the perceived orientation
99%
ýe
Jý
a b
. 1Y
Fig 1.13 (a) Tolonski's (1960) variant of the Poggendorff figure showing illusory loss of colinearity in the absence of any illusory change in perceived orientation.
(b) Stimulus figures used by Day & Dickinson (1975).
of the transversals were small and unsystematic,, the translation effect was
unequivocal. It may be concluded, therefore, that the Poggendorff illusion is
not one of orientation and is unrelated to the Ullner illusim and its,
variants. Despite its obvious interest, therefore, It is beyond the scope of
this discusidon.
It has been shown that perceptual distortion of orientations whether. in Simple
or in relatively complex figures, varies -in degree - according . -to -the 1prientatim
of the figure based on a given angle-of intersection between, the background
(or inducing) component and the foreground (or test) component. The notion
that these perturbations of visual space are due tosome-sort of interaction
between the directionality or orientation of the lines'in-the figures-rather'
than to the physical presence of angles, has also been. introduced- (Wallace. - 19 66
White, 1972). The phenomena des cribed. above have,, been - termed, therefore, '-
orientation contrast effects (Gibson, 1937 - by analogy to colour and brightness
contrast), the magnitude of the apparent contrast being a function of both the

la
relative orientations (angular separations) and the absolute orientations of the
pattern elements. Furthermore, these pattern elements need not necessarily be
lines, but any I line-like I luminance contrast configuration to whicIr, the concept
of orientation may be meaningfully applied.
Unlike the earlier studies, more recent examinations of these orientation
contrast effects have often been carried out with explicit reference to
various hypothetical mechanisms, the elaboration of which has been made
possible through interaction of advances in the understanding of the neuro-
physiological uechanisrs which mediated the processing of visual infomation
as it passes through the various levels of the visual system. Before these
notions are discussed in greater detail, however, a further secticn will be
devoted to the review of phenomena: which have been reported in the investigation
of the perception of orientation of contours. This will deal with the
perception of single lines and their orientation, including the so-called 'oblique effect'. Also covered will be those aspects of the adaptation
aftereffect phenomena relevant to this study.

19
1.2 The Perception of Orientation
It hýis been observed repeatedly that even in the absence of clinical astigmatism
visual acuity is highest for vertical and horizontal lines, and lowest for lines
of intervediate orientatims. This effect was termed 'retinal astigmatismt
by Shlaer (1937) in view of his proposal that the effect was of retinal origin.
As will be seen, Shlaer's arguments for the retinal origin of the effect were
rather tenuous and there are other explanations of his findings. For this
reason an alternative term for this phenomenon, meridional anisotropy, will be
adopted.
The effect was first reported by Emsley (1925) who noticed it incidentally while
studying clinical astigmatism. He wrote, "This marked preference for lines in
a certain direction, after the optical defect of the eye has been fully
corrected, ccnstitutes a kind of residual astigmatism.. .. the reason for it is
to be sought in the lens substance, or the humours, or at the retina or even
further back along the optic nerve. " Since that time, hypotheses have been
proposed locating the mechanisms respcnsible for meridicnal anisotropy at all
of these locations.
Since this time a large number of studies have been directed toward the
characterisaticn of meridicnal anisotropy in both humans and animals, as well
as toward an explanation of the effect. Many of the earlier studies have been 2
reviewed by a number of authors (Lichtenstein, 1957; Taylor, 1963; Appelle, 1976)
so cnly a summary of the findings will be presented here.
In the last-30; years experimental investigation into the orientation response
of the visual system has shown the meridional anisotropic effects to be manifest
in all aspects of vision (Tivney & Muir (1976) have shown the effect to be
present in Chinese subjects, as well as Caucasians, but with about half the
magnitude). Acuity, as determined by measurements of the detection threshold
for fine lines, has been shown to be higher for horizontal and vertical lines
than for oblique lines (Higgins & Stultz, 1948,195oi. "Ogilvie & Taylors, 1959).
These cbservaticns have been repeated when the target to be detected was a bar
grating (Hamblin & Winser, 1927; Campbell, Kulikowski & Levinscn, 1966).
When the test measures the ability of the subject to assess the orientatipn-of
a clearly visible line the results are essentially similar. Jastrow (1892)
and Kaufmann, Reese, Volkman and Rogers (1947), aameng-athers, have shown the
unsigned average deviations of subjects I setting of a stimulus line to the

20
0 vertical or horizontal to be about 1, When the line was to be set to the
oblique (450) errors of up to 60 were reported. In a study using the ccnventicnal
absolute judgment method, Rath, Alluisi.. and Learner found a higher amount
of stimulus-response equivocation for oblique lines, compared to vertical or horizontal lines. In other words, the representation of the orientation of
oblique lines is less precise than is that of verticals and horizontals.
When the experimental task was to set a point to appear colinear with a single test line, Bouma and Andriessen (1968) found accuracy of performance to be
poorest for cbliquely oriented lines. They also found a systematic tendency for oblique lines of intermediate orientation to appear closer to the horizontal
or vertical than they actually were. When the test measure of accuracy of
perceived orientation is parallelism rather than co-linearity the oblique effect is still evident. Takala (1951) showed the test and comparison lines
successively, but his finding that the accuracy of the parallelism setting is
greatest for vertical and horizontal lines and least for 450 cbliques was fully consistent with the cbservaticns of Sulzer and Zener (1953), Rochlin (1955)
and Andrews (1965,1967a, b) who all showed test and comparison lines
simultaneously. Andrews also pre-figured Bouma, and Andriessen Is (1968)
cbservations concerning the constant errors in perceived orientation by using
a comparison stimulus whose orientation error was extremely small compared with
that of the test line. When the stimulus duration was briefs however, the ý directicn of the constant error was found to be reversed, so that lines appeared
to be closer to the 45 0 oblique than they actually were.
In his study of the Troxler effect9 Goldstein (1967,1968) found that in the
Troxler effect and under conditions of binocular rivalry, cbliquely oriented
test lines showed higher disappearance frequencies than vertical or horizontal
test lines. Ellis (1975) observed line fragmentation under steady fixation,
rather than whole disappearances, and corrcborated Goldstein's cbservaticn
showing that fragmentation frequencies were highest for oblique orientations.
He also showed that when the subject was rotated to an orientaticn 450 frx)m
the vertical, the effect showed a phase shift of 450. This cbservation is in
agreement with those of rindley and Parker (1972) and of Lennie (1974) who
used measurements of photopic visual sensitivity and of acuity to show
meridional aniz§otropy to be locked onto retinal rather than gravitational
orientation.
In a similar study in which stabilised images rather than fixated images were
used,, MacKinnon, Forde and Piggins (1969) found the same results for the effect

21
of stimulus orientation of fragmentation frequency as did Ellis (1975).
Despite the apparently reasonable arguments that afterimages are equivalent to
optically stabilised images, neither Evans (1967) nor Wade (1972) have found
any effect of line orientation on either the duration of line visibility or on
the duration of unitary disappearance. The suggestion that optically stabilised images do differ-in some respects from flash-produoed retinal afterimages is
substantiated further by Schmidt,, Cosgrove and Brown (1972) who repeated the
measure of fragmentation frequency using an optically stabilised image
(Clowes & Ditchburn . 1959) and showed a ccnsistent oblique effect.
Finally, by measuring acuity with gratings produced on the retin*a itself through
interference of two laser beams intersecting on the retina, it has-been shown
that the oblique effect persists despite this by-passing of the optics of the
eye (Campbell & Green, 1965; Mitchell, Freeman & Westheimer, 1967; Watanabe,
Nori,, Nagota & Hiwatashi, 1968).
Following on from the proposal of Har-Kay (1957,19619 1967) that the visual
system contains a population of neural subsystems differentially sensitive to
contour directions Andrews (1965,1967a) developed a model for the perception
of orientation and the meridional anisotropy of the visual systems He proposed
the existence of a set of orientation selective 'filter' units in the visual
system. The characteristics of these filters sufficient to describe the
observed perceptual performance were defined as follows:
(1) Each filter responds to a range of presentation orientations; the
response characteristic is bell-shaped and has extensive tails.
(2) Filters vary in selectivity. Those 'tuned' to orientations near the
horizontal and vertical are most selective. (3) Most filters receive inputs from both eyes. (4) Integration of filter responses is achieved by mutual inhibitiont
which takes a matter of seconds to reach a steady level.
(5) The inhibition between filters is subject to adaptation.
These filters were uniformly distributed with reference to oridntation. Bouma
and Andriessen (1968) proposed an alternative model which was similar to that
of Andrews except that their filter characteristics were identical at all
orientationsq but the filters were differentially distributed with reference to
orientation. Andrews (1967a) had, in fact,, already mentioned a model of this
form, but had rejected it on the grounds that it did not predict the changes
of perceived stimulus orientation with increased stimulus duration that he had
observed (Andrews, 1967a).

22
A large number of neurophysiological studies of the response characteristics of
single units in the visual cortex, initiated by Hubel and Wiesel's discovery
that many cells in this region are selectively tuned with reference to the
orUntation of the stimulus have provided a neural basis for the filter-type
hypothesis. At the same tire psychophysical studies under a number of experimental
methods have confirmed the existence of channels selectively tuned to orientation
and attempted to define the characteristics of these channels, and the way in which they interact.
Sekuler (1965) and Parlee (1969) using backward masking, Houlihan and Sekuler
(1968) using forward masking and Campbell and Kulikowski (1966) using
simultaneous maskingha%ve all shown that the extent to which the detectability
of the the target is affected by the presence of the masking stimulus is
determined largely by the relative orientations of the two stimuli. At angular
separations of greater than 450 the magnitude of the masking effect is
equivalent to that of a homogeneous field of equivalent luminance. As the
angular separation of the two stimuli is decreased the amount of masking increases to a maximum at zero separation.
In all these studies it was found that at angular separations of about 15 0
the masking effect was reduced by about one half. Phase differences between
target and masking gratings did not alter the results (Campbell & Kulikowskij
1966; Sekuler, 1965), nor did the use of different targets. An illuminated
stripe (Houlihan & Sekuler, 1968), a grating (Campbell & Kulikowski, 1966) and
a dark bar (Sekuler, 1965) all gave essentially the same result. Even Parlee's
(1969) use of a bar as both masking and target stimuli did not lead to
essentially different observations. Campbell cmd Kulikowski also compared
the masking characteristics of channels tuned to vertical and oblique
orientations. As well as repeating the observation that the sensitivity of the
oblique channels is lower than that of vertically tuned channels, they
cbserved the half-width of the masking function for vertical stimuli to be
25% narrower than that for obliquely oriented stimuli.
Stimuli presented outside of the 'perceptual mcment' can also affect the response
to a stimulus, as is known from adaptation phenomena. In this situation, as
demonstrated by Barlcw and Hill (1963), prolonged stimulation will reduce the
responsivity of sane feature -analysing mechanisms. A rationale can be given,
similar to that on which the masking experiments were based, that the amount by which the perception of a test stimulus is affected by prior viewing of
another adaptation stimulus will provide some estimate of the extent to which
23
the two stimuli are processed by the same mechanisms- In fact, a whole range
of phenomena result from prolonged inspection of an adapting stimulus, most Of
which have been used in the study of orientation perception.
According to Blakemore and Sutton (1969) those aftereffects which might be
expected to follow stimulus specific adaptation fall into four classes: (1) The strength of the sensation should decline throughout adaptation. (2) After adaptation it should be more difficult to detect a stimulus
handled by that channel. (3) Because of imbalance in opponent channels, a sensation of opposite
value should arise spontaneously after adaptation. (4) The appearance of stimuli of different value, but within the same
modality should be distorted after adaptation. In the orientation domain effects in classes (1) and (2) have been demonstrated
by Blakemore, Muncey and Ridley (1971,1973). They found further that the
time courses of the induction period and recovery period of perceived contrast
were very similar to those of threshold elevation (class 2 aftereffect) found
by Blakemore and Campbell (1969) in a similar study. Blakemore ot al. (1973)
proposed, therefore, that threshold elevation is a special instance of the
general effect of reduction of apparent contrast. In their measurement of the
effect of relative orientation between the test and adapting gratings they
found apparent contrast reduction to decrease exponentially, becoming minimal 0
with separations of 45 . The balf-width of the function was found, however, to
be about 80 which is substantially less than that of 15 0 reported in the masking
studies.
A larger number of studies have been concerned with threshold elevation following
adaptation (Gilinsky, 1967; filinsky, Boyko & Baras, 1967; Gilinsky, 1968) have
used a number of criteria for detectability in their experiments, which all
showed threshold elevation when the adapting and test stimuli were of similar
orientation. May% Gilinsky and Jochnowitz (1968) and Gilinsky and Mayo (1971)
found no effects with angular separations greater than about 2009, but the half-
width of the adaptation function was comparable to that determined by Blakemore,
Muncey and Ridley (1973). Using adaptation periods i; anging from 50msec to
1000msec, Gilinsky and Cohen (1972) found that the half-width of the adaptation
function decreased with increasing adaptation, from about 26 0 at the shortest
duration to about 120 after 1 minute. This study gives further support to
Andrews' proposal that the selectivity of orientation filters varies with
stimulus duration as lateral inhibitory interactions stabilise. Finally,

24
Maffei and Campbell (1970) have shown the adaptation effect to be reflected in
reductions of the cortical evoked potential while no corresponding changes in
the electroretinogram were observed.
Class (3) adaptation aftereffects have been reported by MacKay (1957) and threshold reductions for orientations orthogonal to the adapting orientation
were observed by Gilinsky (1967).
The class (4) after-effect in which the appearance of stimuli of a different value but within the same submodality as the adapting stimulus is distorted following
adaptation is exemplified in the orUntation domain by the tilt aftereffect, described first by Gibson (1933). Since then many studies of this aftereffect have been reported. The change in the perceived orientaticn of the test
stimulus is in such a direction as to enhance the perceived separation of the
adapting and test stimuli (Gibson, 1933; Gibson & Radner, 1937; Gilinsky &
Mayo, 1971) and the angular separaticn giving the strongest effect is 70 - 80 (Gilinsky & Cchen, 1972; Campbell & Maffei, 1971).
Stimulus variables have been found to have a significant effect on the size of
the tilt aftereffect. The magnitude of the change in perc6ived orientation is
greater in peripheral vision than in central vision (Muir & Over, 1970;
Over, 1971; Over, Broerse & Crassini, 1972). This is consistent with the
finding of Hubel and Wiesel (1962) that the receptive fields in the periphery
are larger than those in the Area Centralis, especially in view of the
demonstration by Watkins and Berkely (1974) that the orientation specificity of
units in the cat visual cortex is correlated with the size of the receptive
fields of the units inversely. Parker (1972) has shown that if the contrast
of the adapting grating is lower than that of the test grating the magnitude
of the effect is increased; when the relative contrast of the gratings is
reversedg then the magnitude of the effect is decreased. The dependence of the
tilt aftereffect on the spatial frequencies of the adapting and test gratings
is undecided. While Campbell and Maffei (1971),, Collins (1970), Maffei and
Campbell (1971) and Parker (1972,1973) have all found the effect to be
independent of the spatial frequencies of the two gratings, Blakemore and
Campbell. (1969) and Ware and Mitchell (1974) have fount the tilt aftereffect
to be spatial frequency specific.
Although there are a number of quantitative inconsistencies between the studies
described, qualitatively all the expectations outlined by Blakemore and Sutton
(1969) concerming the consequences of adapting out one of an array of

25
orientationally selective mechanisms are fulfilled. So far as can be seen, then,
the human visual system behaves in a manner which can be described in terms of
an arTay of 'filter' mechanisms which are selectively tuned for different
orientaticns. Furthermore, these filters hsow-, a decline in response with
protracted stimulati6n., ' - adaptation - so that after such stimulation a state
of reduced sensitivity is attained. Although it is postulated that each filter
has a preferred ori6ntation - that which on input gives the maximum response from
the filter - it will also respond to a range of different orientations, the
response decreasing monotonically with increased difference between the input
orientation and the preferred orientation. There is evidence that the respmse decreases exponentially as the angular separation between the stimulus
orientation and the preferred orientation of a given filter is increased until
a separation is reached at which the filter no longer responds.
These inferred properties of orientation Processing mechanisms in the human
visual system are ccnsistent with the discoveries of neurones in the visual
cortex of the cat and monkey, as discovered in physiological studies. On this
evidence it may be assumed that in the human visual cortex, as the the cat and
the monkey cortex, the orientation of a contour is represented not in terms of
the spatial characteristics of a pattern of excitation on the cortical surface,
but in terms of the distribution of responses of the set of orientation selective
filters. The perceived orientation of the stimulus corresponds to the location
of some characteristic of the response distribution in the 'orientation space'
defined by the set of filters.

26
1.3 Orientation Contrast and Lateral Inhibition
On the basis of the characteristics of the tilt aftereffect, summarised in the
preceding section, Coltheart (1971o) proposed an explanation of the tilt
aftereffect based upon the earlier proposal of Sutherland (1961) and similar
to that described by Day (1962,1965). When a straight-line contour is being
inspected, a range of orientation-sensitive units will be stimulated. Those
units whose preferred orientation coincides with the orientation of the stimulus
will respond most strongly. Other units will respond less strongly, their response
rate depending inversely on the degree of departure of the stimulus orientation
from the unit's preferred orientation. It is supposed that the perceived
orientation yielded by this pattern of response is given by averaging the
preferred orientations of all the units which respond, having weighted each
of these preferred orientations by the extent to which the unit U; responding
above its spontaneous discharge level.
It is assumed for the purpose of exposition that for humans the range of
orientations to which a single unit will respond is ± 200 about its preferred
orientatim (as suggested by Campbell & Kulikowski, 1966 and Mayo et al. 1968).
Suppose a subject inspects an I-figure -a line tiltdd-7at +100 (the plus sign
indicating a clockwise departure from the vertical). In this case$ units with
preferred orientatims between -100 and +300 will respond to the +100 figure.
With protracted viewing, these units will adapt. If a vertical line, the
T-figure, is now inspected, units frcm -20 0 to -10
0 will respond with normal
vigour, since they were not stimulated during the inspection of the I-figure
and hence will not have adapted. However, units with preferred orientations
from -10 0 to +200 will be in a state of reduced sensitivity because they were
stimulated throughout the inspection period. They will respond less strcngly
therefore to the vertical stimulus than they ought. As a ccnsequence, the
weighted average response to the vertical line will be biased in the negative
direction, instead of being 00, as would normally be the case. The vertical
line will be perceivQd, therefore, as having a counterclockwise tilt - that is,
there will be a negative aftereffect.
The direct relationship between aftereffect magnitude and duration of inspection
of the I-figures and the inverse relationship between aftereffect magnitude
and time since I-figure offset are obviously deducible from this analysis. So
is the 'distance paradox': in general the magnitude of the tilt aftereffect is
inversely related to the angular separation between the two figures, except
when they have almost identical orientations. Here the aftereffect is very

27
small, and an increase in the angular separation of the two figures can produce
a larger aftereffect. This is to be expected because when the I-figure and
the T-figure almost coincide, the distribution of adapted units is almost
symmetrical about the T-figure. Only when the two figures differ appreciably in orientation will a sizeable asymmetry begin to emerge.
Despite the apparently good fit of this model to the data derived from adaptation
studies, there appeared to be a major shortcoming of the theory in that
whereas the threshold elevation and apparent contrast reduction effects had
been shown to be specific to spatial frequency (Blakemore & Campbell, 1969;
Blakemore & Nachmias, 1971; Blakemore, Muncey & Ridley, 1973), the tilt
aftereffect was reported by Collins (1970), Campbell and Maffei (1971) and Parker (1972,1973) to be only slightly sensitive to spatial frequency differences
between the adapting and the test stimuli. This led to the suggestion (Campbell
& Maffei, 1971) that two different neural sub-populations were responsible for
the differing spatial frequency characteristics of the adaptation effects. This unsatisfactory position is further complicated by Georgeson's (1973)
demonstraticn that the simultaneous tilt illusion - which apart from the temporal
factor is equivalent to the tilt aftereffect - shows similar spatial frequency
selectivity to that shown by the spatial frequency shift effect (Blakemore,
Nachmias & Sutton, 1970), as well as to that of the orientation-specific
effects of adaptation on thresholds and apparent contrast.
In the study of Campbell and Maffei (1971), however, the adapting gratings had
rectilinear luminance profiles and therefore adaptation was not limited to any
single spatial frequency. Parker (1972) did use sinusoidal gratings, but
these were of equal physical contrasts. In this case it is possible that the
results were confounded by the fact that stimuli of equal physical contrast might
not be equally effective at different spatial frequencies, especially as the
relative contrast of adapting and test gratings is an important variable in
determining the magnitude of the tilt aftereffect (Parker, 1972), and the
visual system is differentially sensitive to different spatial frequencies
(Campbell & Green, 1965).
Taking these two factors into consideraticn, Ware and Mitchell (1974) re-examined
the spatial tuning of the tilt aftereffect, departing fran Parker's (1972)
method mainly in that in order to make stimuli at different spatial frequencies
more comparable, the contrast of the gratings was always kept at a fixed
increment (0.75 log units) above the subject's contrast threshold for adaptation.

28
The outcome of this refined procedure was that differences of spatial frequency
between adapting and test stimuli resulted in a reduction of the magnitude of the tilt aftereffect, the slope of the reduction curve being quite comparable to those obtained for the other classes of aftereffect, as well as to that
shown by the simultaneous orientation contrast effect. Thus, cn the basis of this new evidence, there is no need to postulate a different neural mechanism for the tilt aftereffect.
There is, therefore, little argument against the retention of a hypothesis
based cn the notion of feature analysers in that it allows the rotation of lines
and edges as a whole, thus avoiding some of the difficulties raised for the
older theories by Sutherland (1961). Such a hypthesis goes further than any
earlier attempt toward providing a theoretical model whereby psychophysical
phencmena such as the oblique effect and the tilt aftereffect, as well as the
effect of adaptation on thresholds for lines of similar and different
orientations, may be understood. At the same time this model has been extended to include the perception of simple line figures containing more than one
orientation simultaneously.
In their simultaneous masking study Campbell and Kulikowski (1966) showed that
the threshold for detection of a grating was elevated in the presence of another
suprathreshold grating whose orientation was similar to that of the test
grating. Parlee (1969), using single lines as masking and test stimuli, showed
that the masking effect is not attributable solely to the fact that the two
stimuli overlap, but that an inhibitory effect of orientation detectors cn
detectors for similar orientations must also be taken into account. These data
are in accordance with the postulate of Andrews (1965) that there is mutual
inhibition between orientation detectors such that "when a short-line stimulus
causes filters to respcnd, all but a few are inhibited completely when the
inhibition has had time to reach a certain level and these respond in a
pr, oporticn which determines the angle seen. " (Andrews, 1965, p1219). Andrews
also postulated, in accordance with the findings of Hartline, and ,"
Ratliff (1957)
that the inhibitory output of a detector is proportional to its 'level of
excitation. These postulates account for the high acuities supported by
orientation detectors despite their relatively wide tunings.
Blakemore, Carpenter and Georgeson (1970) proposed a model for the perception
of simple angle figures in which the neural representation of an angle figure
is the summation of the neural representations of each of the lines presented
singly More specifically, it was proposed that the orientation selective

29
mechanisms in the human visual system are each excited by a relatively narrow band of orientations and inhibited by a broader band, both the inhibitory and
excitatory functions being centred on the optimal orientation of the detector.
On presentation of a single line, those detectors with optimal orientations
around that of the single line will be excited, while those further away will be
inhibited. The overall activity in the orientation domain will then correspond to the response curve of a single detector, which in turn is the sum of the
excitatory and inhibitory weighting functions of the detector (Fig. 1.14).
DISTRIBUTION2 n
I I
I I
SUMMED DISTRIBUTION
STIMULI *1 21 300 200 100 1100 20* 30* 111"iIi. III
120 ORIENTATION
160 Fig 1.14 Diagram illustrating the perceived expansion Of acute angles according to Carpenter & Blokemore's proposed mechanism based on lateral inhibition between orientot; on-selective channels in the orientation domain (From Carpenter A Blokemore, 1973).

30
The distribution of activity produced on the perception of an angle figure,
assuming linear surmnation of excitation and inhibition, will be the sum of the
two distributions produced by each of the component single lines. If the
orientation of a line is assessed by the identification of the most active neurones, that is by identifying the position in the orientation domain of the peak(s)
of the distribution, then this model predicts that when the angle size is
sufficiently small for the distributions to overlap in part, then the two
peaks of the distribution will be shifted apart from one another, and so the angle
will appear larger than it actually is (see Fig. 1.14) This fits the known
behaviour of perceived angles. It must be stressed, however, that the
X-ordinate in this case represents orientation not spatial location, and that
changes in the positions of the excitation-inhibition curves represent changes in orientation, not changes in location. This explanation of the expansion
of acute angles in terms of lateral inhibition in the orientation domain
should not be confused with theories in which inhibition in the position dcmain is said to cause apparent 'repulsion' of neighbouring contours (vm
Bekesy, 1967; Ganz, 1966b).
To measure the size of the effect, subjects adjusted the orientation of a
compariscn line until it appeared parallel to cne arm of an angle which was
fixed, the orientation of the other am being systematically varied (Fig. 1.15).
The distance between lines B and C had been determined such that there was a
minimal influence of line A on settings of C. This procedure is based on the
assumption, therefore, that the distorting effect of cne line on another is
localised, as any ncn-localised effect would influence line C just as much as
line B, so that no effect would be cbservable. Biases in settings for parallelism
were also previously measured, and the final results adjusted accordingly.
Errors in the setting of C were determined for values of angle size ranging
from 00 to 180 0 for each of a number of orientations of line B between 00 and
90 0. ror all values of B's orientation the maximum distortim was found for
C
Horizontal -
Fig 1.15 Stinvilus configuration used by Carpenter & Blakemore (1973).

31
angles of 15 0, but the error decreases more sharply when line B is horizontal
or vertical than it does when line B is closer to the main cblique. For all
orientations of B the error was zero for angles of 90 0, and became negative for
larger angles - as would be expected from the earlier findings that obtuse
angles appear smaller than they are.
As Carpenter and Blakemore (1973) point out, these results could be explained in
two ways. Either the spread of influence from A (in the orientation domain) is
greater when A is horizcntal or vertical than when it is cblique; or the spread
of sensitivity of B to the influence of A is greater when B is oblique than
when it is vertical or horizontal. A further experiment was undertaken to
distinguish between these two possibilities. If B is set between 00 and 450,
and the shape of the angle expansion curve determined first'with A at a greater
angle (near the oblique) and then with A at a smaller angle (near the horizontal)
then the second hypothesis predicts that the expansim should fall off equally
in both directions, while the first suggests that the decline of angular
distortion should be steeper on the side where A is nearer the oblique. The
results were that the distortion falls off more rapidly when A is near the
cblique, suggesting the first hypothesis to be correct, i. e. the changes in
dist, Drticn are due to changes in the properties of A's 'output field' rather
than in B's 'input field'.
From these data Carpenter and Blakemore (1973) conclude that if angle expansion
is due to lateral inhibition in the orientation danain, then units optimally
sensitive to oblique lines draw their inhibitory input from a broader range
of orientations than do units tuned to the horizontal or vertical. This ii
shown by the slower fall-off of effect when B is oblique than when it is vertical
or horizontal. Conversely, the inhibitory outputs of vertically and
horizontally tuned units - the 'skirts' shown in Fig. 1.14 - are broader for
horizontal and vertical orientations than for obliques.
In a final series of experiments by these authors, a fourth line, line D, was
added to the display, having the same origin as lines A and B. A and B were
set to such orientations as to give a large perceptual distortion, and the
effect of varying the orientation of D was measured. Assuming no interactions
between the influences of A and D on B and a simple linear system, it would be
expected that the final angular distortion of B would be the sum of the effects
due to A and D. The results showed that rather than increasing the
displacement of B, the effect of line D was a reduction of distortion; the
degree of decrease being greater the closer D approached A. In other words, line

32
D causes disinhibition - by inhibiting the inhibitory effect of A, indicating
the inhibitory interaction put forward as the mechanism of angle expansion
must be of the recurrent type.
The theoretical conclusions drawn from these findings are summarised thus: "If inhibition and excitation are really both linear, as Fig. 1.14 demands,
then our data set rather stringent limits on the shape of the actual distributions of activity. First of all, since we find shifts of
orientation of up to sane 30, it must follow that the convex-topped, excitatory portion of the distribution could not be narrower than twice
0 this, i. e. 6. Similarly, since angular changes are induced by line A forming an angle of only 50 with line B, at only 50 from the centre of the distribution the inhibitory "skirt" (with downward slope) must have
already started. Unfortunately, it is extremely difficult to make
observations with angles of less than 50 because the thickness of the lines
tends to make them amalgamate near the apex. But it is difficult to believe that we should not have found some expansion with an angle of
say 30, if the apparatus had permitted it. As it is, the swift descent
between 30 and So, which imparts a rather unphysiological appearance to the
functions of rig. 1.14, is necessary to meet these two conditions. Thus
the assumption that excitation and inhibition add linearly is almost
certainly wrong. On the other hand, if the recurrent inhibition acted
presynaptically or in some other way to reduce the gain of the inputs,
it would be possible to cbtain- angle expansion with angles smaller than
the maximum angular change observable. We therefore conclude tentatively
that the inhibition between human orientation detector-s could be
presynaptic rather than postsynaptic. 11 (Carpenter & Blakemorles 19739
pp 300-301)
With some quantitative differences, these observations are similar to those
of Bouma. and Andriessen (1970) who also found maximal distortion of the
perceived slant of a test line when the inducing line was either horizontal
or vertical. Their results differ mainly in that whereas the angular separation
giving maximal effect was 15 0 in the study of Carpenter and Blakemore (1973),
Bouma and Andriessen did not obtain maximum effect until the angle between the
two lines was as great as 450. This difference was remarked upon with
reference to the maximum effectiveness of smaller angles from 100 - 200 in
the Z511ner illusion, for example, but they had "no evidence pertinant to the
explanation of this apparent discrepancy" (Bouma & Andriessen, 19701, p 337).

33
A possible source of this difference in results may lie, however, in the
different procedures used in the studies. Bouma and Andriessen used essentially
the same technique as they had employed in their earlier study of the perception
of the orientation of line segments (Bouma & Andriessen, 1968). This entailed the adjustment by the subject of a dot along an axis perpendicular to the test
line until it lay on the imaginary extension of this line. The dot is assumed to be uaaffected by any factors which distort the perceived orientation of the test line, and any misalignment is therefore taken as a measure of the difference between the perceived orientation and the physical orientation.
That the results obtained in both the single line studies and the angle studies
are consistently different from corresponding studies in which the perceived
orientation was estimated by means of setting a reference line to the same
orientation as the test line (Andrews, 1965; Blakemore et al., 1970) suggests
that the two tasks - orientation matching and line extrapolation - are mediated
by different perceptual processes which differ in their operating characteristics
with reference to orientation information. This identification of the method
of measurement as the source of the discrepant estimates of induced
orientation bias, rather than the differences between the stimulus patterns
used, is supported by Wallace and Crampin's (1969) report that the maximum
effect in the Z811ner illusion is found when the angle between the parallel 0 transverses and the background is around 15 . In this study, for which the
stimulus is necessarily quite different from those used by both Blakemore's
group and Bouma and Andriessen, the change in perceived orientation of the
transverse was measured as the change in orientation required to give the
two transversals the appearance of parallelism -a precedure which is close
to that used by Blakemore et al., and which gives comparable results.
A recent study by Emerscn, Wenderothq Curthoys and Edmonds (1975) compared the
perceived orientations of a line in a stimulus configuration used by Lennie
(1971). Both the parallelism and the colinearity methods were used and it
was found that there were cmsistent differences between the two methods.
This support gives further support to the suggesticn that the differences
between the angle expansicn results of Bouma and Andriessen and those of
other workers are due to the differences in methods used.
Bouma and Andriessen (1970) also made measurements of the size of effect when
two dots (separaticn 28 min. arc) were substituted for the test line. Little
quantitative difference was found between the magnitudes of orientaticnal displacements of full lines and dots, indicating that at this separation the

34
two dots representing the end points of the lines may act as a sufficient
stimulus for the appropriate orientaticn analyser. This finding supports
their earlier observation that line end-points are equivalent to line
segments under scne cmditiais (Bouma & Andriessen, 1968).
To explain their results 1buma and Andriessen (1970) did not invoke the concept
of lateral inhibition, but proposed instead that the presence of the linduction'
line causes a reduction in the sensitivity of detectors tuned to that orientation
and at the same time enhances the sensitivity of detectors tuned to the
orthogonal orientation. "Because of these changes in the sensitivity envelope
of the set of tuned orientation detectors, the test line now brings about different excitations in the sensors, to the effect that an extra bias is
formed towards the perpendicular of the induction line" (Bouma & Andriessen,
1970, p, 343). This, however, is suggested by Carpenter and Blakemore (1973) as being the result of lateral inhibition. In arriving at this formulation,
their basic model proposed for the perception of orientation in the earlier
paper (Bouma & Andriessen, 1968) is modified so that the detectors are now
equally distribute'd rcilong -the ýoriehtaii-on -dimension, with --ldi-fferent -sensitivities
maximum for vertical and horizontal orientations and minimum for 45 0 cbliques. Enhancement of sensitivity for orthogonal contours following adaptation has also been reported by Gilinsky (1967) and Gilinsky, Boyko and Baras (1967).
That the perceptual expansion of acute angles could be explained solely in terms
of differential adaptatim of orientation detectors was claimed by Coltheart
(1971b) in his criticism of the lateral inhibition explanation given by
Blakemore, Carpenter and Georgesm (1970). As Blakemore, Carpenter and
Georgeson (1971) point out. in their reply to Coltheart, the two alternative
explanations predict opposite effects in the case where a third line is added
to the angle figure,, between the two arms of the angle. Adaptation theory
predicts an increased distortion of perceived orientation of the test line (A)
whereas the lateral inhibition theory predicts the reduction of effect - disinhibition - which was observed experimentally.
Further reasons for deciding upm the lateral inhibition explanation of angle
expansion given by Blakemore et al. (1970) were firstly, that the effect
remains when the subject makes his settings in 3-4 secondsq with long rest
periods between each adjustment, implying a very short build-up time for the
supposed adaptation. Secondly, because the observer generally glanced back and
forth between lines B and C, recovery from 'adaptation' must have been very fast
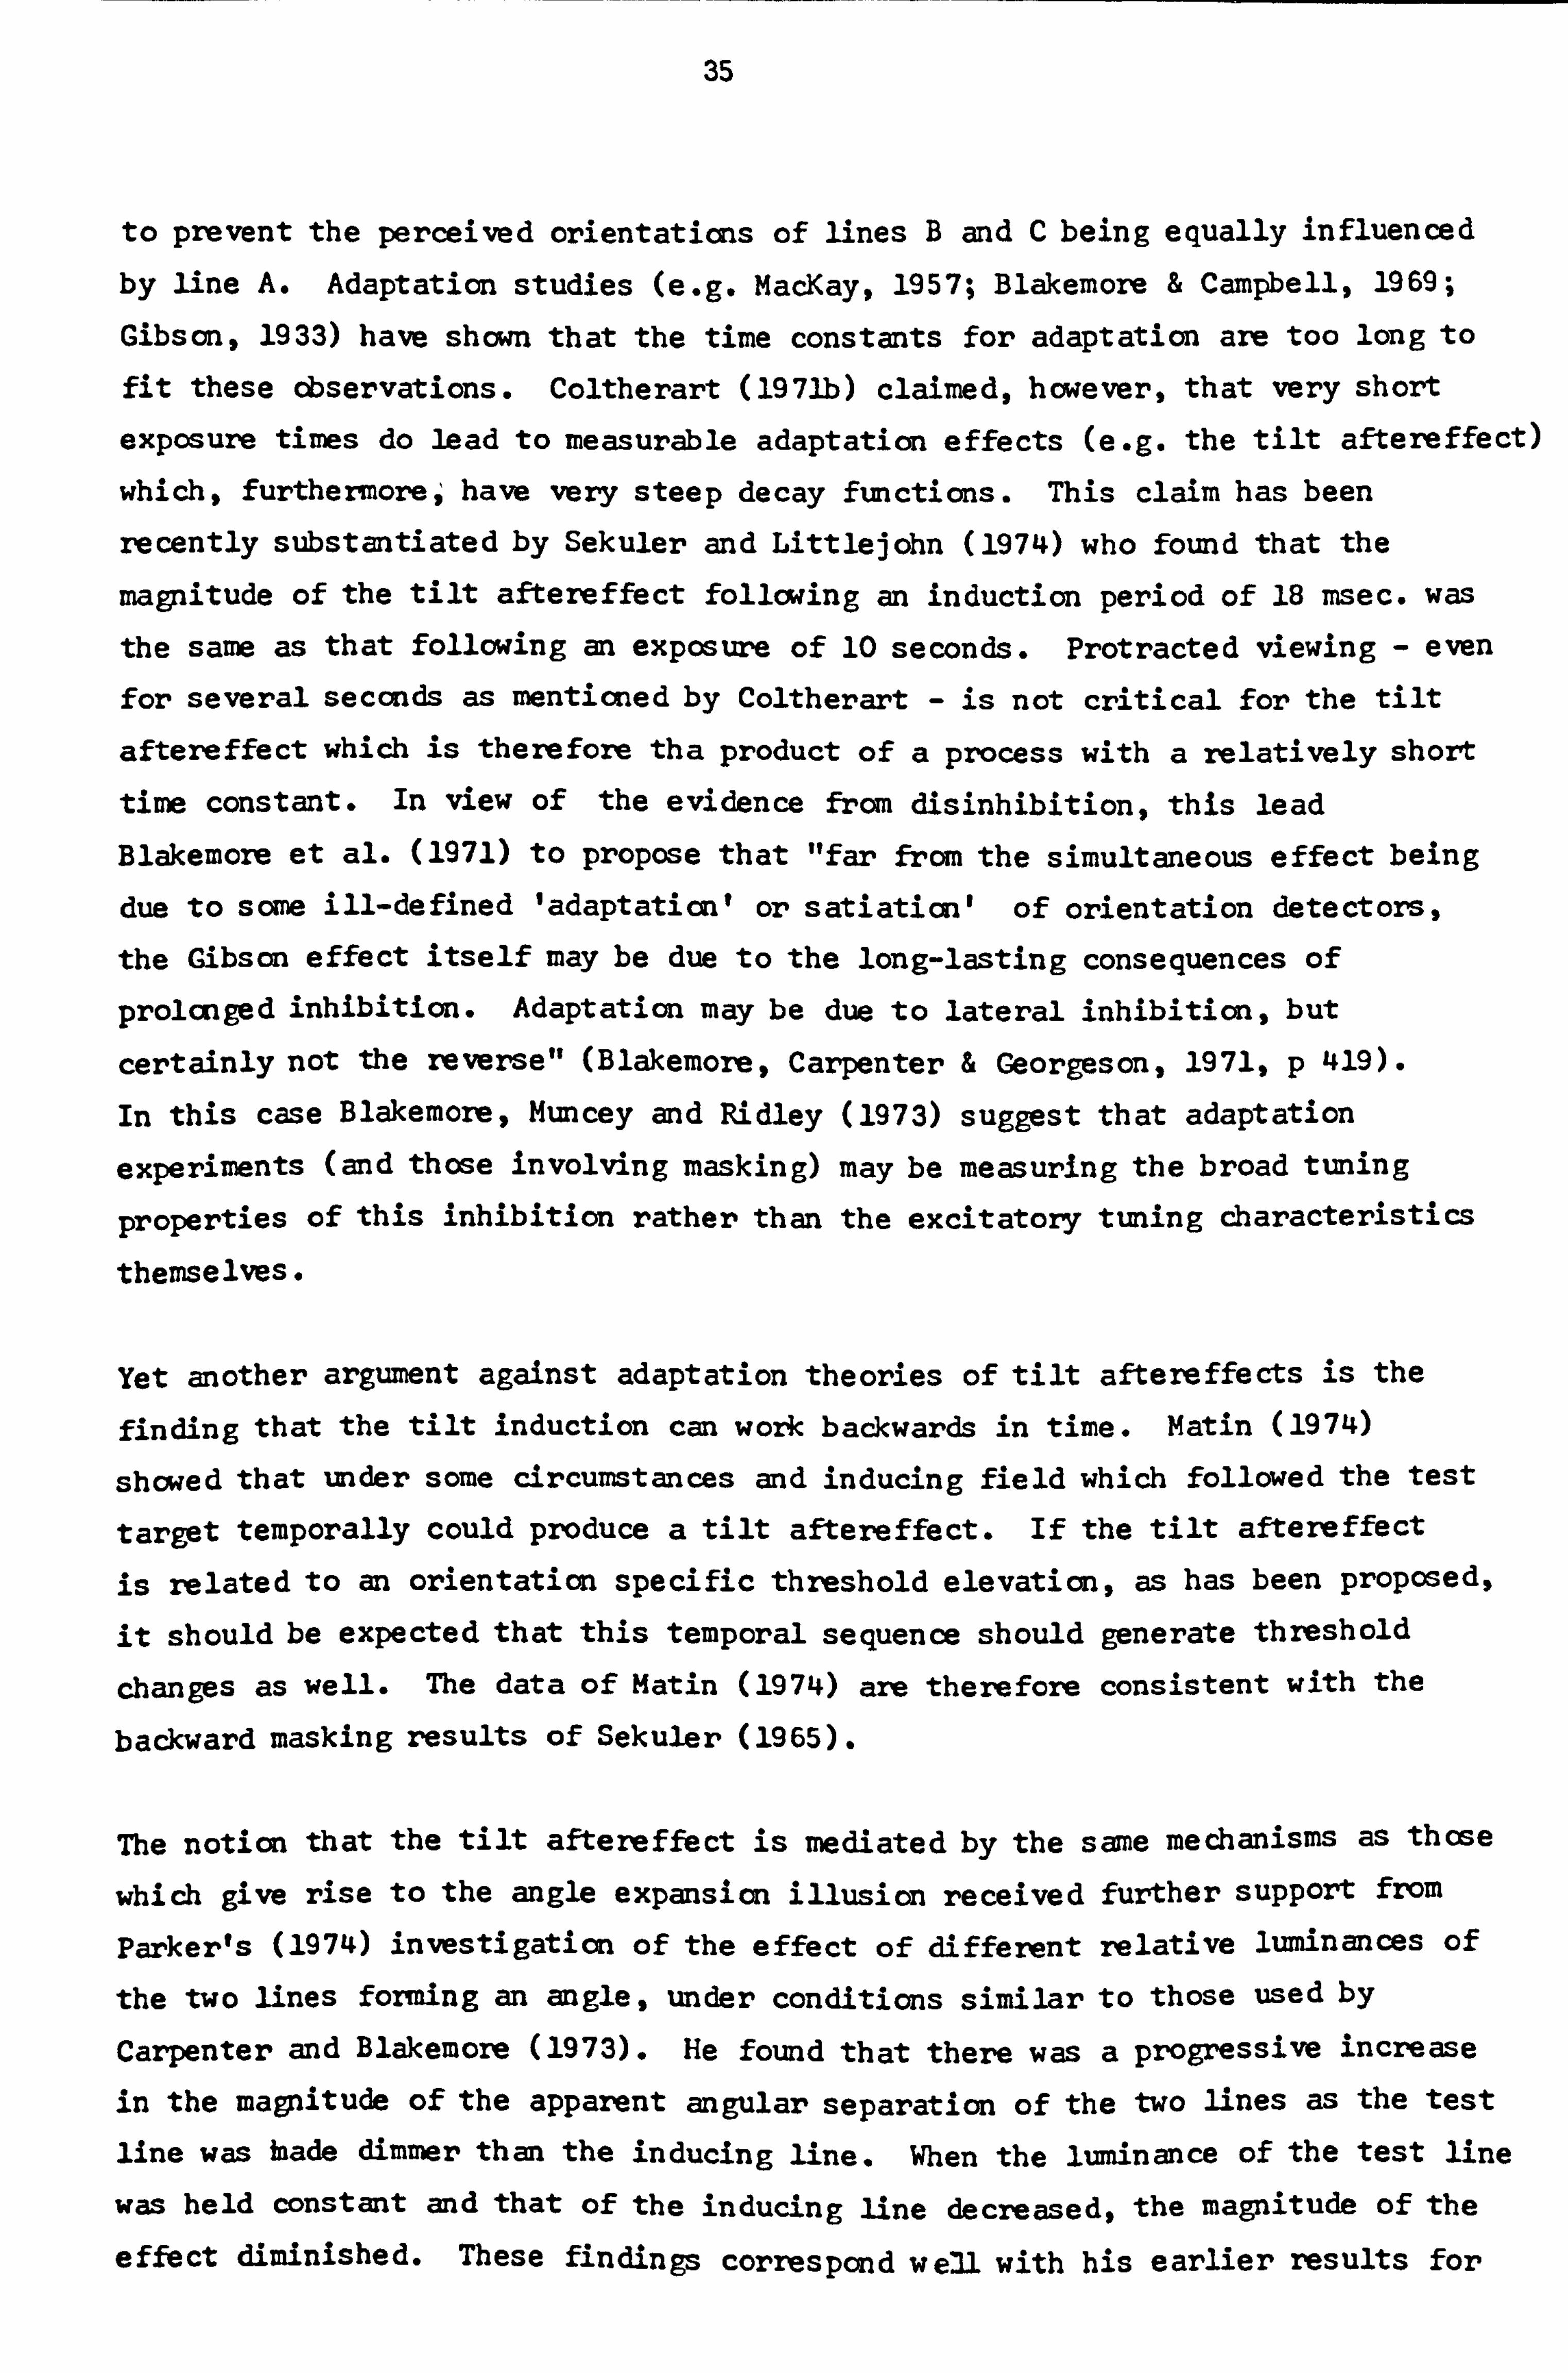
35
to prevent the perceived orientaticns of lines B and C being equally influenced
by line A. Adaptation studies (e. g. MacKay, 1957; Blakemore & Campbell, 1969;
Gibson, 1933) have shown that the time constants for adaptation are too long to
fit these cbservations. Coltherart (1971b) claimed, however, that very short
exposure times do lead to measurable adaptation effects (e. g. the tilt aftereffect)
which, furthermoreý have very steep decay functions. This claim has been
recently substantiated by Sekuler and Littlejohn (1974) who found that the
magnitude of the tilt aftereffect following an induction period of 18 msec. was the same as that following an exposure of 10 seconds. Protracted viewing - even for several seccnds as mentioned by Coltherart - is not critical for the tilt
aftereffect which is therefore tha product of a process with a relatively short time constant. In view of the evidence from disinhibition, this lead
Blakemore et al. (1971) to propose that "far from the simultaneous effect being
due to some ill-defined 'adaptation' or satiaticn' of orientation detectors,
the Gibson effect itself may be due to the long-lasting consequences of
prolcnged inhibition. Adaptation may be due to lateral inhibiticn, but
certainly not the reverse" (Blakemore, Carpenter & Georgeson, 1971, p 419).
In this case Blakemore, Muncey and Ridley (1973) suggest that adaptation
experiments (and those involving masking) may be measuring the broad tuning
properties of this inhibition rather than the excitatory tuning characteristics
themselves.
Yet another argument against adaptation theories of tilt aftereffects is the
finding that the tilt induction can work backwards in time. Matin (1974)
showed that under some circumstances and inducing field which followed the test
target temporally could produce a tilt aftereffect. If the tilt aftereffect is related to an orientation specific threshold elevation, as has been proposed,
it should be expected that this temporal sequence should generate threshold
changes as well. The data of Matin (1974) are therefore consistent with the
backward masking results of Sekuler (1965).
The notion that the tilt aftereffect is mediated by the same mechanisms as those
which give rise to the angle expansion illusion received further support from
Parker's (1974) investigation of the effect of different relative luminances of
the two lines forming an angle, under conditions similar to those used by
Carpenter and Blakemore (1973). He found that there was a progressive increase
in the magnitude of the apparent angular separation of the two lines as the test
line was Inade dimmer than the inducing line. When the luminance of the test line
was held constant and that of the inducing line decreased, the magnitude of the
effect diminished. These findings correspond well with his earlier results for

36
the effect of different relative luminances on the tilt after-effect (Parker, 1972).
When taken together with the similarity between the tilt aftereffect and the
simultaneous orientation contrast effect (Georgeson, 1973; Blakemore., 1973)
and with Ware and Mitchell's (1974) study of the spatial tuning of the tilt
aftereffect, these findings present strong evidence for the hypothesis that all
these effects are closely related.
A further observation supporting this hypothesis has been presented by Over,,
Broerse and Crassini (1972). They showed that the difference between the
simultaneous effects measured in central and peripheral vision corresponded well
to those found for the tilt aftereffects measured under these two conditions.
These psychophysical studies may be taken, therefore, as providing supportive
evidence for the hypothesis that the phenomenon of perceptual expansion of
acute angles is a result of a lateral inhibitory process which operates between
orientation detectors in the human visual system. Blakemore et al. (1970) and
Carpenter and Blakemore (1973) have proposed that the response characteristic
of an orientation detector may be considered as a summation of two functions,
one excitatory and one inhibitory. Both functions, which may be approximated
by the Gaussian function, have their absolute maxima at the same point in the
orientation domain, but that of the excitatory function is greater than that of the
inhibitory function. On the other hand, the range of the inhibitory function
is greater than that of the excitatory function.
Benevento, Creutzfeldt and Kuhnt (1972) have made intra-cellular recordings from
the cat visual cortex which suggest that the "retinotopic input to cortical
cells is excitatory and that inhibitory intracortical connections between
neighbouring cells or columns may account for some of 'their trigger features".
The intracellular records showed that the response of these cells to slits moving
across their receptive fields consisted of both excitatory post-synaptic
potentials and inhibitory post-synaptic potentials. When the slits were optimally
oriented and moving in the preferred direction excitation prevailed and the
firing threshold was reached, whereas when the optimally oriented stimulus was
moved in the non-preferred direction excitation was not sufficient to reach
threshold. Changes of the orientation of the stimulus also resulted in striking
changes in the proportion of inhibition to excitation - showing the inhibitory
inputs to the cell to be orientationally selective - as are the suprathreshold
spike responses of simple and complex cells. This inhibition was produced by
changes in orientation as small as 100 and was present over a much wider range
than excitation. Benevento et al. suggest further that the excitation which reaches

37
a cortical cell or column is derived from the retino-geniculate projection to
the cortex, giving a coarsely tuned excitatory input - the specificity of the
cell being shaped by inhibitory inputs from neighbouring columns.
Also recording from the cat visual cortex (areas 17 and 18), Blakemore and Tcbin
(1972) fir, st used moving bars to determine the preferred direction and
orientaticn tuning of single units. When a tuning curve had been determined the
cell was then stimulated with a bar at its preferred orientation, but with all
of the stimulus screen aroýnd the receptive field filled with a high contrast
grating which moved back and- forth-at random. -Responses - ftom-#e., unit were
recorded for each of a series of orientaticns of the surround grating. The
effect of the grating was to inhibit the respcnse over a range of orientaticns
which was centred on the same orientaticn as the peak of the tuning curve.
This inhibitory tuning curve showed a wider width than that given initially,
which may be ccnsidered as the summation of the excitatory and inhibitory units.
The results from these two physiological studies are in very good agreement with
the predictions made from the psychophysical studies described above, and with
one another. Blakemore and Tobin (1972) re-state the proposal of Benevento et al. (1972) that the direct input to each cortical cell might make it into a crude
orientation filter, while inhibition from cells in the same and neighbouring
columns could sharpen up the tuning curve.
The discovery that gamma-amino-butyric acid (GABA) acts as an intracortical
inhibitory neurctransmitter Uverscn, Mitchell i Srinivasan, 1971) which is
reversibly blocked in the presence of bicuculline (Curtis, Duggan, Fe ' lix &
Johnston, 1970) has given a further possibility of testing the hypothesis that
the direct excitatory input from the LGN to visual cortical cells is broadly
tuned, the stimulus specificity of these cells being effected by even more
broadly tuned intracortical inhibitory connections with neighbouring cells. If
the specificity of a visuo-cortical cell along any stimulus dimension is the
result of intracortical inhibition mediated by GABA, then the blocking of GABA
with bicuculline should result in an increase in the breadth of orientation
tuning as w1l as, for example, a reduction of the specificity of the cell with
reference to directionality of movement etc.
Pettigrew and Daniels (1973) have reported that intravenous administration of
bicuculline increased the breadth of orientation tuning, the responsiveness
and the spontaneous activity of complex cells. The respcnse characteristics of
complex cells were modified also in that 'on I and 'off I areas could be

38
discriminated with flashing spots - behaviour usually taken to be characteristic
of simple cells. Hypercamplex cells were found to lose their inhibitory end
zones and become responsive to lines which had previously been too long to be effective stimuli. All these changes are as would be expected. Simple cells, however, were found to become less responsive, and sometimes more narrowly tuned. These reported results, therefore, are partially in support of and partially in
ccnflict with the hypothesis.
Rose and Blakmore (1974) carried out studies of the dffect of bicuculline on the tuning characteristics of visual cortex cells using both intraveneous and topical application. Following intravenous application no consistent changes in the responses of two simple and three complex cells were recorded. This
finding, together with the inconsistency of the results of Pettigrew and Daniels
(1973), was attributed to the fact that intraveheously administered bicuculline
has unknown potential influences on extracortical neural systems - such as the
retina (Strchschill & Penwein, 1969), LGN (Phyllis, 1971) and reticular system (Tebecis, H8sli & Hass, 1971) - all of which are likely to change the activity
of cells in the visual cortex in unpredictable 'ways which may not necessarily be
attributable to the blocking of intracortical inhibitory inputs.
In order to limit the spread of effect of bicuculline and so reduce these
uncertainties, Rose and Blakemore (1974) studied the effect of topically applied
bicuculline on three simple cells and five complex. Under these conditions the
orientation tuning of all three simple cells was broadened, and the other
predictions described above were fully realised in two of the cells. Two of
the cells also showed three- and five-fold increases in the receptive field area.
The five complex cells showed more varied responses. Two showed increases in
breadth of tuningp one of these also fulfilled all the other predictions of the
hypothesis under examination. A third complex cell showed no consistent response
to the application of bicuculline. The fourth was unusual in that clear inhibitory side flanks in its orientation tuning curve were observed prior to
the application of bicuculline. The drug abolished these dide flanks as well
as increasing the breadth of tuning and the peak response. The fifth complex cell
had a very similar receptive field and tuning curve to the fourth. Immediately
following application of bicuculline both the peak response and the breadth of
tuning decreased, but after 45 minutes both parameters increased to above the
lev6l before the drug was given. However, after more than two hours under the
drug the inhibitory side flanks persisted, with strong inhibition even for a.
stimulus perpendicular to the preferred orientation. Rose and Blakemore have
interpreted this as indicating the presence of sane non-orientation specific

39
inhibition, possibly not GABA-mediated, which may operate in addition to the
orientation-specific inhibition in some or all cells.
Although the theoretical expectations are not unequivocally fulfilled in this
study, the results obtained lend some support to the notion that the response
specificity of at least some cells in the visual cortex is increased by an intracortical inhibitory mechanism mediated by the neurotransmitter GABA.
Although topical application of drugs to the brain may lead to a more localised
zme of influence of the drug, a relatively large volume of the brain will still be affected, a volume far greater than that containing, for example, one column.
The difficulty in attributing the cause of the changes, or lack of changes, in the
receptive field organisation and response characteristics of a cell to either blockage of specific, stimulus - dete mined inhibitory inputs, or to more wide-
spread or generalised changes in non-specific inhibitory processes following the
administraticn of bicuculline can be greatly reduced by a third method of drug application - that of iontophoresis - employed by Sillito (1975a, b).
Using this technique, very small quantities of a substance can be applied to the
immediate vicinity of the cell under study, with a high degree of precision, via
micropipettes running alongside the recording electrode.
Under these conditions Sillito (1975b) found the behaviour of cells under the
influence of bicuculline to be more consistent than that observed in the other
two studies. All cells, whether simple or complex showed a reduction in
orientation specificity,, a reduction or elimination of directional specificity
and an increase in the overall size of the receptive field from which a response
could be elicited. Two types of change of orientation specificity were seen
according to the type of the cell. In simple cells the loss of orientaticn
specificity was restricted such that cells which prior to the iontophoretic
application of bicuculline respcnded to only one of the range of stimulus
orientations (spaced at 250 intervals), were effectively stimulated by several
orientaticns under the influence of bicuculline. Only a relatively small number
of simple cells showed a response to all orientations after treatment. These
observaticns are consistent, therefore, with the hypothesis that simple cells
receive a broadly tuned excitatory input, the response tuning curve being made
sharper by intracortical inhibitory inputs in the orientation domain.
For complex cells the Picture was rather different. In the majority of cases
orientatim selectivity was almost completely lost following application of
bicuculline, many cells responding as strongly to stimulus orientations at 900

40
to the previously preferred orientation, with approximately the same response
magnitude to these orientations as to the preferred orientation. In this case the
observations suggest that the input to complex cells is not orientation
specific, all the specificity normally observed being attributable to intra-
cortical inhibition. These and other differences in the responses of simple and
complex cells to bicuculline administration contribute further evidence against the simple hierarchical convergence model of Hubel and Wiesel.
While the physiological evidence cited is strongly in favour of the existence of lateral inhibitory processes which operate between neighbouring orientaticn analysers in the visual cortex, it is not yet sufficient to enable the relation between the neural mechanisms and the perceptual correlates to be made explicit. The results of the bicuculline experinents only demonstrate-*that intracortical
inhibition is largely, but not wholly responsible for the specificity of the
r, espcnse of single units, as was proposed on the basis of psychophysical evidence from, for example, Parlee (1969). However, while data have been presented detailing the tuning curves of units with and without inhibitory inputs (Rose &
Blakemores 1974a; Sillito, 1975b) and also showing the inhibitory tuning curve
compared with the response curve of units in the presence of inhibition
(Benevento, Creutzfeldt & Kuhnt, 1972; Blakemore & Tobin, 1972), hardly any data
are yet available which either directly compare or enable the comparison the
the pure inhibitory function and the pure excitatory function with that of the
cell under normal experimental conditions, although sane idea of their relations
may be derived from Rose and Blakemore (1974a, rig. 1. p 377). Furthermore,
neither Blakemore and Tobin (1972) nor Benevento et al. (1972) specify whether
their units were simple or complex. This information is of particular importance
in the light of the recent demonstrations (Watson & Berkely, 1974; Rose &
Blakemore, 1974b; James, 1976) that simple and complex cells have significantly
different orientation selectivities, notwithstanding the further possibility
that these two classes of cells may be involved in quite different information
processing systems (Ikeda & Wright, 1972,1974; Maffei & Fiorentini, 1973).

41
1.4 An Appraisal of the Lateral Interactim Hypothesis for Orientation
Contrast
In the experimental determination of the existence and characteristics of
multiple-channel feature analysing mechanisms in the visual system of humans,
whether operating in the domain of orientation, spatial frequency, retinal disparity or any other dimension of visual perception, a great deal of
reliance has been placed on the data provided by adaptation experiments for the
reasons given by Blakemore and Sutton (1969). So long as the nature of the
adaptation process - that is the underlying neural mechanisms whose activity is responsible for the various perceptual consequences of the prolcnged viewing
of any spatio-temporal luminance distribution - remain unspecified, then the
usefulness of this paradigm is limited. As the history of adaptation studies
shows, until Ganz (1966a, b), the reduction in sensitivity following adaptation
was attributed to some kind of 'fatigue' or 'satiation' of neurones conseqWnt to prolonged excitation. Ganz proposed an alternative explanation: the
reduction in activity of a unit (or channel) following adaptation is not due to
a passive reduction in the excitability of the unit, but rather is an active
elevation of threshold due to the longer time constant of the inhibitory
response of the system which outlasts the excitatory response. In this way,
he argued, the similarity between simultaneous contrast effects (illusions) and
successive contrast effects (aftereffects) could be explained. Although the
neural model to which this principle was applied was inappropriate, Blakemore,
Muncey and Ridley (1973) have suggested that the principle itself may still
hold, the aftereffects of adaptation being due to prolonged inhibition rather
than to over-excitation (Blakemore, Carpenter & Georgeson, 1971). In this case
adaptation experiments (and those involving masking) may be measuring the
properties of inhibitory processes rather than the excitatory characteristics
themselves.
The joint hypothesis that adaptation effects are a consequence of inhibitory
processes whose activity outlasts the duration of the stimulus and that the
sensitivity functions of these inhibitory processes are wider than those of
the excitatory processes predicts that it should be possible to adapt a channel
using a stimulus to which that channel does not give an excitatory response.
While investigating the red-blue specificity of channels selectively tuned
to the spatial frequency of vertical gratings (Blakemore & Campbell, 1969),
Sharpe (1974) found that adapting to a pattern of one colour (e. g. red) can
significantly elevate the contrast threshold for a pattern of the same or similar
spatial frequency of the other colour (blue), even when the luminance of the

42
adapting stimulus is too low to excite the colour channel responsible for the
detection of the test grating. As it had been shown in the same study that the
spatial frequency-specific channels are also colour specific insofar as the
superimposition of a imifom background of one colour upon a sinusoidal grating
of another colour has no effect on the subject's contrast threshold for that
grating, cross-colour adaptation cannot, therefore, be a result of prolonged
excitation. It is much more likely, as Sharpe concludes, that it is the result
of proicnged inhibition of those spatial detectors responding to the test pattern by other spatial detectors stimulated by the adapting pattern. Sharpe and Mandl
(1977) report further that this cross-colour adaptation is orientation-specific: the threshold elevation for gratings of a different colour from that of the
adapting grating was only found for gratings whose orientation was the same or
similar to that of the adapting grating.
In an analogous way Dealey and Tolhurst (1974) demonstrated that spatial frequency channels could be adapted by gratings sub-threshold to the adapted channel
and concluded similarly that the adaptation aftereffects were the result of
proicnged inhibition. Within the spatial frequency domain Tolhurst (1972) has
found evidence which suggested that lateral inhibitory interactions occurred
between detectors selectively tuned to spatial frequency. These inhibitory.
interactions would explain the simultaneous spatial frequency (or texture density)
contrast effects (MacKay, 1973; Klein, Stromeyer & Ganz, 1974) which parallel
those found in the orientation danain, while the spatial frequency selective
adaptation aftereffects (Blakemore & Campbell, 1969; Blakemore & Sutton, 1970;
Blakemore 9 Nachmias & Sutton, 1970; Blakemore , Ridley & Muncey, 1971), which are
similarly analogues of those found in the orientation domain, would be explained
by the prolonged inhibition hypothesis.
Although directly comparable studies have not been carried out in the orientation
domain, the findings of Sharpe and Mandl (1977) suggest that orientation-
specific adaptation is a consequence of the same process. As well as the fact
that allsimultaneous and successive contrast effects found in the orientation
domain are also spatial frequency specific and may be considered, therefore,
as the same phenomena as spatial frequency specific adaptationg certain
experimental discrepancies in the measurement of channel bandwidths have been
noted in both domains. Spatial frequency channel widths as determined by
adaptation techniques (Blakemore & Campbell, 1969; Tolhurst, 1972j 1973) have
shown relatively little variation between studies but have been consistently
broader than those determined by sub-threshold summation techniques (Sachs,
Nachmias & Robson, 1971; Kulikowski & King-Smith, 1973). Similarly,

43
particularly after Movshon and Blakemore's (1973) revision of Campbell and Kulikowskils (1966) data, most estimates of the half-widths of threshold
elevation curves following adaptation of orientation selective channels give a 0
value of about 7, The bandwidth as estimated by Kulikowski, Abadi and King-Smith
(1973)employing the sub-threshold summation technique is considerably less -
about 3 0, Since the sub-threshold summation method measures the extent to which
the sensitivity to a line is enhanced in the presence of gratings or lines of
various orientations at sub-threshold contrasts, the half-width measured in this
way may be interpreted as the excitatory half-width of the channel - subthreshold
stimuli causing no threshold elevation (Tolhurst, 1972; Dealy & Tolhurst, 1974).
The present evidence suggests, therefore, that sub-threshold summation methods
measure the bandwidth of the inhibitory effect exerted on neighbouring channels by the stimulated channel.
Now, the model proposed by Carpenter and Blakemore (1973) is based on an
assumption that the excitatory response functions of orientation detectors have
eq, 4ivalent characteristics for all orientations while the inhibitory functions
are wider for vertically and horizontally tuned detectors than for intermediate
orientations. Despite the number of studies of the tuning of orientation
detectors by adaptation, masking or subthreshold summation techniques, only one
study of each of these types has included comparisons of tuning characteristics of
the pertinent effect at different orientations. Campbell and Kulikowski (1966)
found that the masking function was wider for oblique orientations than for
vertical adapting stimuli, by about 30, but they did not examine any intermediate
orientations. In a mom comprehensive study Hirsch, Schneider and Vitiello (1974)
showed that although the expected oblique effect for detection threshold was
found - the threshold for oblique gratings being higher than that for verticals
and horizontals - no differences were found between the kidaptation tuning curves 00000 determined after adapting to gratings at 0,22 , 45 , 67
'. and 90 . It has
already been argued that masking and adaptation phenomena are supported by the
same mechanisms and, as outlined above, there is evidence to show that these
phenomena reflect the tuning characteristics of inhibitory processese However,
even if the former argument cannot be sustained, 'even the latter neither of
these findings support the model described by Blakemore et al. (1970) and
Carl)enter and Blakemore (1973).
Differences in characteristics of the channels tuned to vertical and horizontal
orientatims and those tuned to oblique orientatims cannot be attributed to
differences in excitatory response characteristics either. Using the subthreshold
summaticn technique Abadi (1974) has shown that the relations between relative
sensitivity and angular difference between test and background gratings at test

44
orientations of 90 0 and 45 0 cannot be distinguished. In both cases the half-
0 widths obtained were about 3.7 . Further results obtained by Abadi show that
astigmats exhibit no differences between the tuning curves for the subthreshold
summation effect at their affected and unaffected orientations. Freeman and Thibos (1973) have shown that subjects who have reduced resolution for patterns
of particular orientations due to astigmatism variation also show a decreased
visual evoked potential elicited by a target at the deprived orientation. Thus,
although the astigmat shows a reduced V. E. R. at the deprived orientatim analagous to the reduced V. E. R. found by Maffei and Campbell (1970) for cblique orientations
as compared with vertical orientations in normal subjects, in neither instance is
there a correspcnding alteration of orientation selectivity for the affected
channels whether it is the excitatory or inhibitory characteristic which has been
measured.
Since the demonstration that cats do not show meridional anisotropies when tested
behaviourally (Bisti & Maffei, 1974), cat neurophysiolo'gical data cannot be
considered to be of direct relevance in determining the source and nature of human meridional anisotropies. Although no work has been published concerning
the measurement of contrast sensitivity etc. as a functim of orientation in
monkeys by behavioural methods, Mansfield (1974) has shown that populations of
neurcnes responding to vertical or horizontal orientations are larger than those
responding to intermediate orientations when counted in the striate cortex. That
these differences in population size diminish in a markddly similar way to that
in which human meridional anisotropies decrease in both animals as a function of
retinal eccentricity suggests that the oblique effect should be considered in
these terms. In view of the evidence contradicting the assumption made by
Blakemore et al. (1970) that the tuning of inhibitory inputs to orientation
selective channels varies with preferTed orientation, it appears, therefore, that
any explanation for the oblique effect, with reference to both lines and angles,
must rest on the assumption that the population differences found by Mansfield
in the monkey must also exist in the human visual system.

45
1.5 Preface to the Experiments
At the commencerent of this study it was intended to use detailed observations
of the constant errors in the percption of angle size and of the response
error distributions - the variable error - to elaborate a detailed
quantitative model of the interactions between orientation analysers. It
was expected that these measures, particularly the error distributions,
would give useful information concerning the response profiles of
orientation analysers which, as Carpenter and Blakemore (1973) have pointed
out, appear markedly non-physiological under their hypothesis'.
As work progressed, the data collected became increasingly difficult to
account for in terms of the lateral inhibitory interaction explanation of
the perceptual expansion of acute angles. The emphasis of this study
consequently was changed, with the primary objective now being to gather
more detailed observations concerning the perception of angle size, with
specific attention being given to the dynamics of the interaction
between line stimuli of differing orientations.
While the majority of the experiments described were directly concerned
with angle patterns, therefore, two brief experiments were carried out
to look further at the orientation specific adaptatim and masking effects.
These were prompted particularly by the results obtained by Abadi (1974),
Bisti and Maffei (1974), Hirsch, Schneider and Vitiello (1974) and
Mansfield (1974), the implications of which were discussed in section 1.4.
Because these two experiments relate to the assumptions underlying the
lateral inhibition hypothesis, rather than to its predictions and performance,
they have been presented first, although they were not performed until the
end of the study. The masking experiment, particularly$ was performed
under severe limitations of time and should be taken as suggestive rather
than definitive -

46
Char)ter 2: Tunin7 Characteristics of'Orientation Selective Channels
Experiment 1. McCollouph Effect in Horizontal and Oblique Channels
The tuning characteristics of the-. inhibitory and excitatory functions of the orientation selective analysers in the human visual system feature
prominently in current theories of orientation processing. The way in
which tunings of the inhibitory functions vary with the preferred orientation
of the analyser is a critical parameter in the most widely held
explanations of the apparent expansion of acute angles and the variation
of the magnitude of this apparent expansion with the orientation of the
angle. Evidence suggesting that the inhibitory tuning characteristic
of orientation specific channels is invarient with reference to the
preferred orientation of the channel has already been presented (chapter
1.4). Before considering the detailed studies of angle perception, there-
fore, it was considered necessary to obtain-more data concerning the
relative tuning of orientation analyser- inhibitory functions using a
paradigm not yet reported in the literature - the orientation contingent
colour aftereffect. The information so derived will enable a reduction
of the number of altermative models to be taken into consideration when
the implications of the angle studies are discussed.
Method
Stimulus Materials
0 The two orientations compared were 00 (horizontal) and 135 , Adapting
stimuli were projected from prepared 35mm slides shown through a remotely
controlled projector with an internal timing mechanism which automatically
changed slides at a preset interval. The slides were made up in, the
following way:
Red - (590nm - 670nm) 1 layer of 'Cinemoid' gelatin filter No. 4.
Green - (480nm - 560nm) 1 layer of 'Cinemoid' gelatin filter No. 24
on either side of a square-wave grating which subtended a frequency of
2 cycles/degree at the viewing distance of 1.4m. These combinations gave
approximately equal luminances on projection.
b) Adapting Procedure
All subjects were exposed to two adapting orientatims, both the horizontal
and the oblique. These sessions were separated by two days from one
another.

47
The subject sat with head maintained in an upright postiion by a bite
bar, -in front of a projection screen at a viewing distance of 1.4m. The
adaptation patterns, projected from slides, were viewed with both eyes. The internal timer of the projector was set to change slides at 5 second intervals and immediately after each change the subject pressed a button which reversed the direction of motion of the slide-carrier so that
the same two slides were seen in a repeatedly alternating sequence. To
protect against lapses of memory on the part of the subject, the sequence
of slides in the carrier was: opaque, red, green grating, red, opaque. Subjects were intstructed to let their eyes roam around the target to
minimise the build up of conventional afterimages, and to keep their eyes
closed at the end of the 20 minute adaptation period to 'store' the
effect until testing (MacKay & MacKay, 1975a).
c) Test Procedure
The two test patterns used in the measurement of the orientation contingent
colour aftereffect (OCCA) magnitude are shown in Fig. 2.1 (a, b). Each
had a rear-lit window - the C-section in pattern 1 and the central disc
in pattern 2- surrounded by a front -illuminated field. The two orientations in pattern 2 are orthogonal.
The magnitude of the OCCA was measured by having the subject adjust the
colour of the light passing through the rear-illuminated window until it
matched that of the surround. The apparatus by means of which this
measurement was carried out was a slightly modified version of that
described by MacKay and MacKay (1975b), as shown in Fig. 2.2. Rear
ZZIN
TEST PATTERN I (CI)
TEST PATTERN 2
(b)
Fig. 2.1 The two test patterns used in the measurement of the strength of the OCCA.. for details see text.

48
(a)
M
D C I
O: D
4 --Ip
(b) red
Fig. 2.2 Apparatus for measuring pattern contingent chromatic aftereffects. (a) Whole apparatus, (b) detail of adjustable colour filter as viewed from T. C- movable red and green filters; M- mask with slits, over projector lens;
F- diffusing screen (white card); P- pen motor; D- diffusing tissue; C- chin rest; T- test pattern; R- low-voltage 'pea-bulb; E- mirror; G- dove prism; H- viewing
aperture.
illumination was provided by a 100w projector with a diffusing screen M
in the slide holder and a red/green filter (C), moved--by a pen-motor Qp) 9
situated in front of a translucent aperture over the lens. The arrangement
was such that the displacement of the red-green boundary (i. e. the excess
of red over green, or vice versa) was linearly related to the pen motor
current. A second aperture in the mask M allowed a fixed amount of white
light to dilute the saturation of the beam (Fig. 2.2(b)). The reflector
screen M ensured that there was MaKimum mixing of the light colours.
Front illumination of the test pattern was provided by two low-voltage
bulbs whose yellowish light (about 1.45 log ft lamberts) approximately

49
matched the whitest mix seen through the rear-illuminated window.
The test pattern was viewed through a dove prism which was rotated, by the
experimenter, in 50 steps from adapting orientation minus 90 0 up to
adapting orientaticn plus 900. A measure of the OCCA was made at each
orientation.
In the test apparatus the subject isat with chin supported and the untested
eye overed with an eye-patch. While viewing the test window he adjusted its colour (by rotating a smooth control knob which controlled the pen-motor
current) until its perceived hue matched that of the surround. When
satisfied, the subject recorded the current in the pen motor by pressing
a switch connected to an X-Y recorder. The position of the pen on the
x-axis was determined by the orientation of the dove prism while the
postim m the Y-axis recorded the pen motor current. A micro-switch
in the chin rest, feeding a DC bias into the Y-input enabled a
separate plot for each eye. Prior to each adapting session each subject
was tested in this manner in order to establish a control baseline.
Two observations were recorded for each eye at each orientation, me on
the upward sweep and another on return.
The arithmetic mean of the post-adaptation measures minus the preiradaptation
measure was taken for each orientation. For comparison these resulting
magnitudes were then normalised against the maximum peak-to-peak value
for that trial.
Res ults
Tuning curves for the OCCAs are shown in Figs 7.3 and 7.4. The dashed
horizontal line crossing each curve represents the mean pre-adaptation level
with vertical bars at each end showing ± me standard deviation. Points
above the base line represent colour settings redder than those made for
the same orientatims in the pre-adaptation control run, greener settings
are represented by points below the baseline.
Ccmpariscn of the two tuning curves obtained for each subject-test pattern
revealed no significant difference between the effects of the two adapting
orientations (paired comparison t-test). These results agree with those
of Ifirsch, Schneider and Vitiello (1974), therefore, and disagree with
those obtained by Camýbell and Kulikowski (1966).
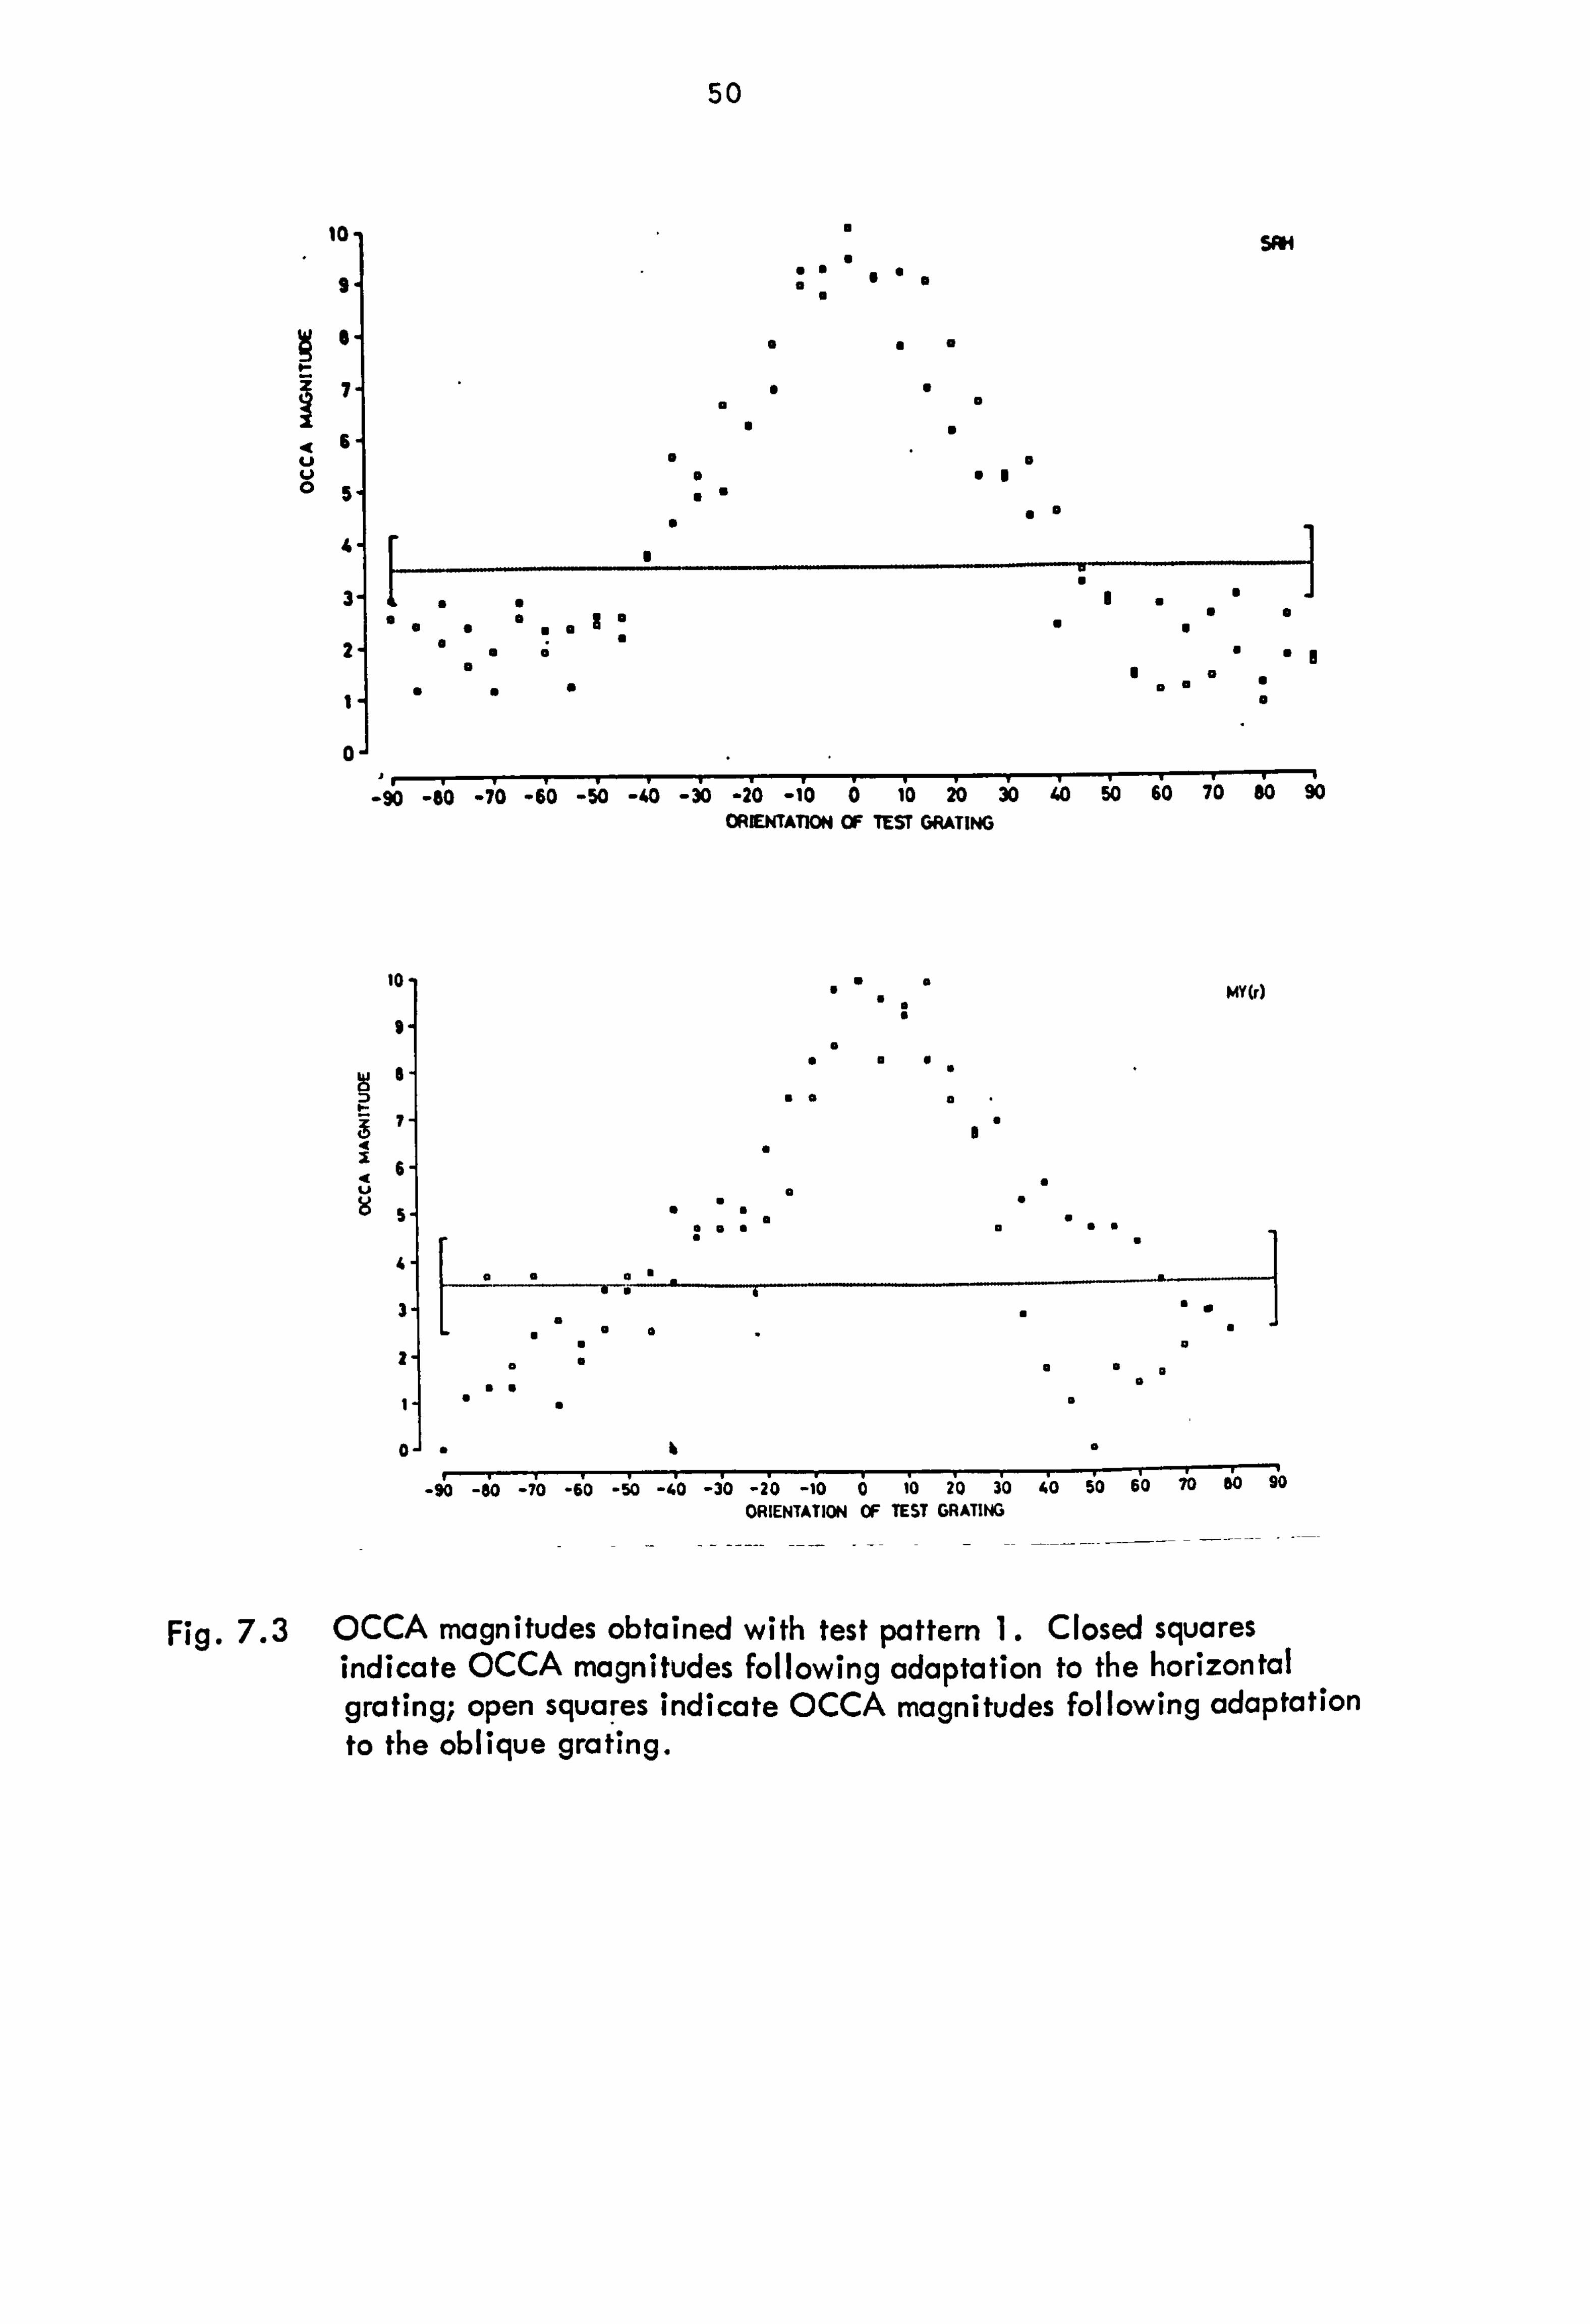
50
10 S.
46 U U
1. ý
3
2
I
0
U
S S. S
S Iaa
aaa SU
CC
S
S
S
a
S
S U
U
0 9 'I
10
SAM
S S
SI. SS SSS SS
S 0S5
0 Ia S
S
I -jo
40 -io 40 4) 40 -io -io -io ;o io 36 ;D 5ý io io 8ý io OREXTATION OF TEST GRATING
10-1
D I-
4
4 U
9ý
Iý
7ý
5ý 41
3
I
I SS
I
SS
":. ""S
OJ . li
40 40 70 -60 -50 -40 -30 40 40 6 ;o jo jo ýo 50 60 70 bo 90
ORIENTATION OF TEST GRATING
Fig. 7.3 OCCA magnitudes obtained with test pattern I. Closed squares indicate OCCA magnitudes following adaptation to the horizontal grating; open squaFes indicate OCCA magnitudes following adaptation to the oblique grating.
MY(r)
SS
.a

51
10-1 a S
2ý
85
S
S'S
0
aý
I
4ý
31
V
a
Iý S
oJ
S
S
&0.
..
a
0 S.
D
S
S a :: a.
S
-w
. a a
S
"u
aa a
a
I
-9; 40 40 40 40 40 4 40
-; 0 a- ;o- 70 io zo io io io io io
ORWNTATION OF TEST ORAM
10
9 S
S
S
S. S
IS 6 7
6 I
5ý
4ý
3-1
21
Iý 0
S
0
S
eS
S
S S
"S"
S.
0
: 4a a
a "aa a"
CRJ
0a.
0 0 a
WO)
0
6
-- --- --Tý 40 40 -io
40 -io
40 -3k) -jo -io 0 10 2'0
T 40 50 60 70 io io
ORIENTATION OF TEST CRATING
Fig. 7.4 OCCA mgnitudes obtained vi i th test pattern 2. Closed squares indicate OCCA magnitudes following adaptation to the horizontal grating; open squares indicate OCCA magnitudes following adaptation to the oblique grating.

52
Subject Estimated 1-width Test Pattem
SRH 18.25 01
MY(r) 24.560 1
MY([) 23.750 2
CRJ 28.560 2
Table 2.1 Estimated half-widths of the OCCA
In Table 2.1 estimated half-widths of the adaptation effects are given for
each subject. These are derived from the segments of the tuning curves
above the pre-adaptation baseline, to which a straight line was' fitted by
the method of least squares, and from which the angular separation
required to give a halving of the OCCA magnitude was determined. The
figures given in the table are the means for the two halves of the
tuning curve. Although there are large differences between subjects, intra-
subject variation appears to be low, as is illustrated by the two values
given for subject MY, which represent results for the two different test
patterms used.
Although only one of the colour stimuli (green) was associated with a
pattern of stripes, in both test-pattern conditions the results show that
some colour has become associated with directions outside the range of the
negative aftereffect. The curves show that while this is the case for
both test patterns, the magnitude of greenness recorded was relatively
smaller for the test figure containing only me orientation of stripes
than it was for that containing the two orthogonal orientations. It can
also be seen that when the test pattern contained only one direction, the
green aftereffect appears as a noisy but relatively uniform level. In
the presence of the orthogonal orientations, however, the magnitude of the
green aftereffect bears a definite relation to the test pattern orientation.
Discussial
The results obtained in this experiment demonstrate that there is no
difference between the tuning characteristics of horizontal and oblique
orientation selective channels, as measured by the orientation specific
colour aftereffect. Because most other studies of the orientation.
specificity of adaptation have used sinusoidal gratings (e. g. Blakemore &
Nachmias, 1971; Blakemore, Muncýy & Ridley, 1973), direct comparisons

53
between previous results and the results presented here is not really
practicable. This is especially so in the face of the finding that until
an 'equivalent contrast' transformation is applied to the raw data the half-width of the adaptation tuning curve may vary between 100 and 500
according to the spatial frequency of the adapting grating (Blakemore &
Nachmias, 1971). Hirsch, Schneider and Vitiello (1974), however, did
use square-wave gratings (5.2c/deg. ) as adapting and test stimuli, and
report tuning curves for two subjects. The -half-widths of these two
curves are approximately 250 and 350 - values which are of approximately the same magnitude as those obtained in the present study, despite the differences in the spa#al frequencies of tbe. gratings used.
That the two different studies, using similar stimuli, should obtain,
comparable results, despite the difference in the experimental paradigms juikests. that the characteristic of the visual system being measured is
the same in both experiments. rollowing the argument that this character- istic is indeed the inhibitory output function of the orientation, selective
channels, then Creutzfeldt's (1974) proposal that the orientation specificity
of the McCollough effect is a consequence of a "temporary alteration of
inhibitory camections between colour sensitive cells and orientation
sensitive cells in cortical columns" is consitent with the experimental
findings.
The results of both the current study and that of Hirsch et. al. exclude
differences between the ranges'of inhibitory output of channels tuned-
to the vertical/horizontal and those tuned to cbliques as a possible
explanation for observed meridicnal variations in the magaitude of
simultaneous orientatim contrast phenomena. The discrepancy between
the adaptation studies and the masking study of Campbell and Kulikowski
(1966) which doesshoi4 a difference between verticallhorizontal and
joblique channels, though not in the direction expected under the Carl)enter
and Blakemore (1973) hypothesis, remains unresolved. In view of this a brief
attempted replication of the simultaneous masking experiment was carried
out as the second experiment in this series.

54
Experiment 2. Simultaneous Masking Functicns of Vertical and Oblique
Channels
Method
Masking and test gratiny, were generated on the screens of two Hewlett-Packard
HP - 1300 display oscilloscopes postioned so as to be superimposed when
viewed through a beam-splitting cube. Only a central, circular area of
each screen was visible (subtending 8.25 deg. a-c to the observer), the
remainder being masked off with black card. Under the dim roan illumination
used during the experiment the surround luminance of this circular field 2
was 0.77 cd. /M . (All direct luminance measures were made with an SEI
photometer)
Both gratings were derived from the same original X-Y-Z signals, giving identical square gratings of 2 cycles per degree, in phase. The field
luminance, in the absence of both masking and test grating moduL3tion of 2
the raster was 14.97 cd/m . The contrast of the masking grating, with an
unmodulated test field was 0.57 (C' = lmax. - Imin / lmax t Imin). The
orientation of the test grating was fixed at goo relative to the, screen
so the oblique masking grating had to be obtained by physical rotation of
the whole oscilloscope. The signal which generated the test grating was
passed through a sine-cosine potentiometer, which enabled continuous
variation of the orientation of the test grating, whose contrast was also
under the control of the observer.
Contrast thresholds for the test grating were obtained with the mask field
unmodulated, at orientations -'5 0,
-10 0,
-15 0,
-20 0,
-25 0,
-35 0,
-45 0 and
-90 0
relative to each of the masking orientations (90 0 and 450). The
observer used the method of adjustment, four distinct contrast settings
being obtained for each of these orientations. The threshold modulation
depth of the test grating was directly read from an oscilloscope monitoring
the Z-input to the test 'scope. These measures were then repeated in the
presence of the masking gratings, eight separate threshold settings were
made at each test-grating orientation, one on, each of four sweeps away from
, ýthe`masking orientation and one on each of the return sweeps.
The observer$ SRH, had normal uncorrected visim, viewing was binocular
and no artificial pupils were used.

55
Results
The contrast thresholds and the relative thxeshold elevation -due to the
presence of the masking gratings at the two orientations are given in
Table 2.2 and the masking functions are shown in rig. 2.5. The two
masking functions were compared using the paired observation t-test, and were not found to be significantly different (t = 0.9, d. f. = 7).
c 3.01
>
0 0
2.5
2.0ý
a 0
9
U
1.5ý 0
0
LOH 0a U
. 0
-5 -10 -20 -30 -40 -50 -90 relative orientation of test grating
Fig. 2.5 Relative threshold elevations for the two masking orientations; 0- 9do mask, m- 450 mask.
Discussicn
7be results obtained from this brief masking study are in good agreement
with those obtained for orientation-specific grating adaptation (Hirsch,
Schneider & Vitiello, 1974) and the orientation contingent colour
aftereffect (Experiment 1), which give no evidence for differences in
the tuning characteristics of the orientation specificity of the effects
at vertical/horizmtal and oblique orientations. Although the half-

56
V') le w CD är, 2; c> 0 t 0 0 1 0 1 0 1 0 44- LU
-0 c 0- 0
0 c C, 4
0 a)
_c w
CLO
le -0
-dk- -
.. ýe «a In 0 0 -c ýe U)
10 1>�
%0 m
01
- le S
C, 4
b C: )
Il> 2 -e
in -
0 c; 0 0 0 c; c; 2 c;
0
0 U) OL
_C
0 vi CN
b C)
b CD
ý ýo
0 0
2 'LI LO - Li
C, 4
, ý c0 JE c; cý CD c; c; c; c; c;
0- 0 0 -. Z - 10
m (>
z8 LO 10
0 C) g C)
0. «s '0 2 cn (-) -e Co le
N C) le (11)
in c: c) O c) 0 c; c; c; c; c; c;
0 u ,= «9 . -0 0 > -. M 0
V) _C 0 LA) 119 %0 Ln LO
E C: ) CD 0 C: ) 0 r- c; c; c; c; c; c;
0
Ct� 0, cý, clq C, 4 m le 0,
-o C> Ol
0)
0)
0
42
0 x
N
Cý 0,
-a a I-

57
widths of the functions derived in these studies vary according to the
experimental method used, suggesting that there are some differences in
the precise details of the underlying mechanisms responsible for these
phenomena in terms of their responses to the slight variations in the
stimulation techniques, there are good reasons to believe that the
adaptation aftereffects and the masking effects do reflect the inhibitory
characteristics of the orientation selective channels in the visual
system (Parlee, 1969; Dealey & Tolhurst, 1974). The nature of the
mechanisms underlying the McCollough effect are still not fully
elaborated (Ellis, 1977), but if the observed orientation specificity of
this effect does prove to be derived from the adaptation of the orientation
selective channels which are responsible for the simpler orientation
selective effects, then. the observations relating to this phenomenonialso
show a lack of difference between vertical/horizontal and oblique channels.
Conclusion
Further examination of the relative tuning characteristics of orientation-
specific channels tuned to vertical or horizontal orientations and to
oblique orientations was provoked by reports that adaptation and sub-
threshold summation effects revealed no differences between the tuning
characteristics of channels selective for these orientations. These
findings are in agreement with neurophysiological studies which have
shown similarly that the tuning characteristics of single units in the
visual cortex of the cat (Rose & Ulakemore, 1974b) and of the primate
(Mansfield, 1974) do not differ according to the preferred orientation
of the unit. The brief studies reported here provide further corroboration
of these findings and, consequently, contribtite to the doubt cast on any
hypotheses concerned with the perceptual expansion of acute angles which
are based on differential inhibition or excitation as a function of
orientation -

58
Chapter 3: Automated Method of Constant Stimuli
All further studies to be described were based on one principal experimental
procedure and were carried out using the same techniques for stimulus
generation and response recording. These procedures and techniques will be
described in detail in this chapter although some particulars may be given,
where appropriate, in the description of specific studies in later chapters.
a) Psychophysical Methods
The dependent variables in all the following studies were the means and
standard deviations of response error distributions. The procedure adopted for the
determination of the values of these quantities under the range of stimulus
conditions employed was the method of constant stimuli where the subject has to make
a forced choice according to his perception of the relative magnitudes3,
along the attribute under consideration, of two simultaneously presented
stimuli, or between a single stimulus and scme internal representation of
a quality such as verticality or orthogonality.
Traditionally this procedure is rather lengthy and tedious for the subject
insofar as many trial runs may be required in order to determine an
approximation to the mean of the response error distribution (equivalent to
the PSE) which may differ considerably from the PPE. Even when the PSE is
determined, given no prior information concerning the standard deviation of
the response error distribution, many stimulus presentations are required to
accurately estimate the slope of the psychometric function - which is
equivalent to the standard deviation of the error distribution. In the
face of these difficulties much of the research concerned with the perception
of orientation and angle size has been carried out using alternative
procedures such as the staircase method and its derivatives or the method
of adjustment.
While these procedures do give reasonable estimates of the constant errors or
biases (as determined by taking the difference between the PPE and the PSE),
they are not especially suitable as indicators of the standard deviations.
As the standard deviation of the response error distribution represents the
minimum difference between the stimulus components required for the perception
o fthis difference to a response-correct criterion, i. e. the difference
thresholdv which was one of the variables under investigation in this series
of studies, neither of these two methods was considered appropriate. Fortunatelyq

59
however, Andrews (Andrews, 1967a; Andrews, Butcher & Buckley, 1973; Andrews,
Webb & Miller, 1974) has derived an experimental procedure based on the method
of constant stimuli. This version overcomes the practical drawbacks mentioned
by selecting for presentation to the subject only those stimulus difference
levels within a range about 2.5 tires the standard error of the response
distribution. This stimulus range, symmetrically disposed about the mean of the
response error distribution is that which defines the psychophysical function most accurately. Although this technique would be extremely laborious
were the experiment to be run under human control, it is easily implemented when
the system is under computer control.
One run of an experimental session comprised approximately 120 stimulus
presentations preceded by a set of pre-run trials. Twenty-one levels of
difference between stimulus components were available to the controlling
computer program, ten on each side of the PPE, as well as the zero difference
level itself. 7be pre-run used a staircase method to obtain an estimate of
the PSE and the width of the range of stimuli to be used in the main run.
This part of the run was terminated after three reversals of direction of
stimulus level change. The mean of the four (out of 21) stimulus levels
at which reversals occurred was taken as the initial working PSE, while the
difference between the last pair of highestý, -and lowest stimulus levels obtained
the two levels at which the two last reversals occurred - gave the intial
estimate of the width of the range of stimuli required for the main run.
According to the values of these two Parameters four stimulus levels were
selected for presentation. The particular stimulus to be presented on each
trial was selected by a random number generator. The selection was constrained,
however, to ensure that the same stimulus was never shown more than. twice in
successi6n, and did not have the same sign (with reference to the mid-point of
the stimulus distribution) more than five times in succession. This saves the
subject from the disturbing feeling that he ought to be responding 'the other
way'; which may lead to a shift in criterion (an over-readiness to respond
in the opposite way to recent responses).
After the first thirty trials in the main run the response error distribution
was systemmatically compared with a series of optimal response distributions q
each derived from possible stimulus distributions (Andrews, personal communication).
According to the goodness of fit between the observed and expected distributions
the stimulus distribution was either unchanged, or changed to that from which
the expected distribution which best fitted the cbserved distribution was derived.

60
In this way the response error distribution was optimised for the subsequent
computation of the psychometric function. The criteria by which the goodness of fit was judged were input to the program at the beginning of each run. The
valued of these criteria were not varied throughout the series of studies carried out using this system. Subsequently this 'TEST' procedure was called by the
main 'RUN' program at the end of each group of fifteen trials and the response error distribution represented by the thirty most recent responses used to monitor and change the stimulus set, if necessary, in the same way. Thus responses to 120 stimulus presentations (falling into eight groups of fifteen) were obtained and recorded.
The number of stimulus presentations was not set to 120 in order to allow for the
various unpredictable events which tend to occur during experimental sessions. If the subject was not able to fixate correctly for a given presentation, due to
coughing or sneezing for example, he was requested not to record a response. Alternatively, should the subject Irealise' that he has pressed the wrong
response button, he was able to cancel that response. In these cases the tally
of respcnses was not incremented, the criterion for temination of a run being
not 120 presentations but 120 responses.
At the end of each run the response distributions were printed out by teletype
in blocks of 15 so that within run variations of the PSE and stimulus range
(and thus of the standard deviation of the response distribution) could be
detected. An accumulated response distribution was also printed. The computer
then carried out a Probit analysis (Finney, 1952) on the results. This analysis
gives the median of the response error distribution and a rate of change of the
error probability, as a function of the increasing magnitude of the signed
difference between the sizes of, for example, the two angles in the stimulus, in
the region of the median. If the error distribution is normal, these define
repectively the mean and the standard deviation of the distribution. The analysis
program 'PROBIT' computed a chi-square for the goodness of fit between the response
error distribution and the normal distribution derived from the computed median
and slope. On the rare occasions that the chi-square value was so large that
the response error distribution could not be considered as a good approximation
to a normal distribution the results for that run were discarded and the run
repeated as the precision of the resulting estimates of the distribution parameters
would be too low. On no occasion did any experimental stimulus condition give
response error distributions which were consistently not normally distributed.
.4
Probit analyses were made for each half-run, as well as for the whole run, but

61
differences between half-runs usually proved small. Where there were large differ-
ences between half-runs, inspection of the blocked printout of responses almost
invariably indicated that the stimulus set designated by the pre-run were inappropriate and that the bulk of the first half of the run had been taken up
by adjustments of the stimulus set toward one which was appropriate. If this
occurred the run was repeated, by-passing the pre-run and starting the run proper
with the stimulus sdt on which the discarded run had stabilised. When this was
dcne the repeat run was usually satisfactor-j. On the few occasions when it was
not satisfactory it was found that
enserrble selected by the initial
again repeated and the first run
sequence of e-vents occurred only
; )ut for the whole series.
the print-out showed a reversicn to the stimulus
pre-run. Under these circumstances the run was
considered as an inexplicable aberration. - This
several times out of the hundreds of runs carried
b) Experimental Apparatus: I Hardware
The basic block diagram of the experimental system hardware is shown in Fig. 3.1.
COMPUTER
(Analog 1/0)
4
C. R. T.
y- Z) 1-0 SUBJECT
FIG. 3.1 Block diagram showing the basic plan of the computerised experimental system.
on the basis of the stimulus specification input at the beginning of the run the
necessary voltages required to define the stimulus pattern for display on the CRT
(LAN Electronics Display Unit 419DD), operating in the X-Y mode, were computed by
the program 'COMP'. All stimulus patterns comprised no more than 4 lines and a
fixation point. Assuming that all four lines and the fixation point were required
for a particular stimulus pattern, the voltages required to define the pattern
were: a) X and Y voltage levels to define the origins of the lines and
the location of the fixation point; b) X and Y voltage levels to define the end points of the lines.
A minimum of four analogue outputs were required, therefore, for the minimum
specification of the pattern components. Line origin loci and the fixatim point
coordinates were computed with reference to a screen of dimensions 1052 by 1052
units (in practice 1000 by 1000) corresponding to the resolution of the 10-bit
summators of the analogue outputs.
DISPLAY DRIVING
CIRCUITS
(integrators and Adders)

62
The screen centre corresponded, therefore, to (500,500) which in turn coi-responded
to (0,0) volts.
In order to make maximum use of the 10-bit resolution provided by the analogue
outputs, all voltage levels for line end-point descriptions were computed independently of the physical length of the line to be drawn. Where possible this
variable was set by off-line adjustment of the signal amplitude. Exceptions to
this rule were made when a comparison line longer than the stimulus lines was
required for one of the studies to be described. The positions of the end-points
were calculated as Xe": 5. c,,,, 0, Ye=5. sinO ; where 0 is the orientation of the
line required, referred to the horizontal (00), the range of the analogue outputs being +5 volts.
Stimulus timing was also under direct computer control. The basic unit of stimulus
duraticn timing was set at 1 msec. during which one stimulus component (line
or point) was drawn on the CRT. A secondary unit of 5 msec. was the time taken
for the most complex stimulus pattern - four lines plus fixation point - to be
drawn on the CRT once. The repetiticn rate for the whole stimulus was, therefore,
200 Hz, well above flicker fusion frequency. One further output, in addition to
the stimulus defining voltages, was a timing synchronisation pulse generated by
the computer at 1KHz. This pulse was derived from me of the analogue output
registers. Although the analogue voltage outputs were 10-bit the output registers
were 12-bit, corresponding to the 12-bit word-length of the PDP-8, each bit being
independently accesible. This pulse, taken from bit 0 of one of the output
registers, which did not contribute to the voltage summator of the analogue
voltage output, was used to regulate the timing of the operations carried out by
the custom-built integrating circuits between the computer and the CRT amplifiers.
A more detailed block diagram of the system is 'shown in Fig. 3.2.
In this "interface", which was distal to the computer and proximal to the CRT
stimulus display, the X and Y voltage levels defining the line end points were
integrated to give a ramp-like waveforn. After integration these X and Y signals
were summed with the voltages defining the line origins and transmitted to the
X and Y amplifiers of the CRT. The circuit diagram for the X channel of the
interface is shcwn in Fig. 3.3. With the exception of the operational amplifier
providing the switching voltages to the f. e. t. s in the integrator, which served
both X and Y channels, the Y channel was identical and, therefore, is not shown.

ANALOG OUTFJTS
F-X-l Isý X-DEFLECTION
i
Fy--I
Fy--I
COMPUTER
I
FROM SUBJECT
INTERFACE
Y-DEFLECTION
Z-MOCULATION r
RT
I
TO SLMJECT
FIG. 37.2 Block diagram illustrating the functional compOnehts bf'the stimulus generating apparatus.
1
vs oul (G)
FIG. 3.3 Circuit diagram for the X-channel of the stimulus generating interface. VRI and VR2 enable independent attenuation of the ramp and offset components of the signal respectively. (Capital letters at inputs and outputs refer to the waveforms, shown in FIG. . 6. )
.k

I
64
The timing circuitry comprised three stages of signal processing. In the first
the brief timing pulse generated by the computer triggered a monostable
whose pulse width was set to approximately 950 microseconds. This pulse was
passed to the integrator f. e. t. s via the inverting operational amplifier on
the X-channel board, putting them into conductirg states and thus initiating
the integration of the voltages representing the X and Y components of the
line end-point. This monostable pulse was also used to trigger a second
monostable whose pulse width was variable and from which the Z-modulation
signal was derived. This variable pulse-width was, therefore, one of the
means by which the line lengths of the pattern were varied. (This method was
choseh when other circumstances permitted, as it affected the line length
directly, while use of the potentiometers on the integrator outputs required
recalibration to ensure that the maxima were the same for each channel. These
potentiometers were usually used for such fine adjustment. Variation of the
gains of the X and Y amplifiers of the oscilloscope had the same drawback,
as well as the further drawback of affecting the line origin voltage magnitudes,
and so were not used. )
A variable time constant RC network was added to the input end of the second
monostable which enabled the blanking out of undesirable oscillations in the
X and Y ramp waveforms, generated at the onset of integration. This blanking
out of the initial few microseconds of the ramps required compensation in the
computation of the line origin coordinates. The delay also gave the possibility
of introducing the absence of angle vertex as a potential experimental factor$
the size of the gap being continuously variable. The circuit as described so
far is shown in rig. 3.4.
IB)
ýtable SN74121
IK
V, oul ý(C) 2K
FIG. 3.4, Circuit diagram for the first two staqes. ý(see text) of the Z-modulation channel. VRI enables variation of the delay between the trigger signal and the onset of the output of monostable 2. (Capital letters at inputs and outputs refer to the waveforms shown in Fig. 3.7).

65
(a)
voltB
ob)
Lu-monce
I
0.1 ý I
C
0.9
6
wax-ý
- --- -------- I-
time krnsec, distance from line origin, ; n..
FIG. 3.5 Graph (a) shows the input to the Z-channel of the display oscilloscope, graph (b) illustrates the type of response actually obtained.
111Z. 11-11 to
The third stage of the Z-channel was required because of the slow respnse of the Z-channel of the oscilloscope. Although the CRT phosphor was a fast TV
phosphor, the relation between Z-input and phosphor output, for a rectangular input is shown in rig. 3.5. Presumably the slow response was in the amplifier.
The change in luminance along the line on the CRT was immediately obvious and
was therefore compensated for by adding to the rectangular Z-modulation
signal its positive differential. The accuracy of this derivative was not
quantitatively of importance and so a simple transisor differentiator was used.
In order to be able to compensate for the changes in the shape of the
waveform (b) in Fig. 3.5 with changes in the line-length introduced by
altering either the X and Y signal amplitudes or the X and Y amplifier gains
a variable time constant was incorporated into the differentiator. The
circuit diagram for the compensating stage is shown in Fig 3.6.
FIG. P. 6
V, (Cl IOK V oul VR2 (H)
im
Circuit diagram used to compensate for the defficiency illustrated in Fig. 3.5. By varying VRI the input to the Z-channel of the display oscilloscope was manipulated until a line of uniform luminance was obtained. VR2 enabled variation of the maximum output voltage. (Capital Itters at input and output refer to the waveforms shown in Fig. 3.7).
.L4.1.
I
I

66
I msec msec I
msec msec
A "n .0 B
C -ju U
D
- -- -
I-I --
_Li 0 LrLr LI L FIG. 3.7 Signal waveforms at various stages of the computer/display interface:
A. Bit zero of analog output register - input to monostable I. B. Output of monostable I. C. Output of monostable 2. D. Origin coordinate voltage (X
0 ).
E. Line endpoint voltage (X e, ).
r. %. -
F. Integrator output . G. Summed integrator output + origin coordinate voltage. H. Z-modulation input.

67
Responses were recorded by means of micro-switch push buttons which set
general purpose flags in the computer, which were examined by the program at appropriate times. rour flags were available, enabling the running of two
subjects simultaneously. At certain stages in the run the push buttons could also be used to select different pathways through the program.
C) Experimental Apparatus: II Software
The basic structure of the program set is shown in rig. 3.8:
r-IN-MUT
EME PRERUN
DISP
OUTPUT PROBIT RESULTS (PSE & SD
I0B1T I
.. 4; 't
OUTPUT ' IYES"SE DISTRIBUTIONS
FIG. 3.8 Block diagram showing the flow-path s between the programs and subýroutines
... M- -
used for running the experiments, driving the display and analysing responsP.. ý'., L,
The functions of these programs and subroutines were as follows:
(a) START: To initialise those variables which inform 'INPUT' that it is
being called for the first time and that it is not being called
from 1PROBIT1.
'tb) INPUT: When called from 1PROBIT1 this program first performs the outpdt of
the probit analysis. This was necessary because the amount ofFdorclr-
taken up by 'PROBIT' for the performance of the data analysis
not leave sufficient roan for the inclusion of output instructions.
When called from 'START' this segment is skipped. Primarily the
function of 'INPUT' was to record run-and subject-identifir-ation
codes, the parameters defining the stimulus pattern, its timing,
and the definition of the set of stimuli, e. g. the distance between

68
each of the 23 stimulus levels. The initial mid-point and range.;.
width for the constant stimulus method are also entered, and the
response recording arrays are cleared. (c) COMP: This program computes the screen origin co-ordinates for all the
stimulus components and the voltage levels required to draw each of
the twenty-three stimulus patterns. (d) PRERUN: Before obtaining an initial estimate of the mid-point and range-
width of the four stimulus levels required for the main run, this
program first generates a sequential display of the 23 stimulus levels
commencing with those for which an 'A' response is appropriate and
proceeding through to those for which a IBI response is appropriate.
This display familiarises the subject with the stimuli and the way in
which he should respond. The display duration parameters are
also set up in this program. (e) DISP; This subroutine, called by both IPRERUNI and 'RUN' actually draws
the stimulus on the CRT face. The numbers representing all the
required voltage levels for the stimulus are transferred to
unsubscripted variables before commencement of the display so that
they may be accessed in the minimum time. Variables determining
whether or not any particular stimulus component is to brighted up
or not are also set up at this stage. As described in the previous
section, the bright-up of any stimulus component is initiated by
a pulse delivered when bit zero of one of the output registers is
loaded. If the component in question is not to be shown, e. g. if
the stimulus patterm being used comprises only three lines, then
a zero is loaded into this bit and thus no pulse is generated. A
flow chart for this subroutine is shown in Fig. 3.9. Each of the
segments responsible for drawing one stimulus component also
contains a timing loop with a counter set to an empirically
determined value which gives an interval of 1 msec. between
brightup initiating pulses. One pass through these segments
draws the stimulus once completely, taking 5 msec. and this is
repeated until the display has been shown for the required amount of
time.
(g) RUN: As the whole sequence of programs was written to run up to two
subjects in tandem some apparent peculiarities in the logic of
this program may be resolved when this is taken into account.
Basically, on entry to the program a stimulus is presented to the
first subjects followed by a 2-3 second delay to give time for
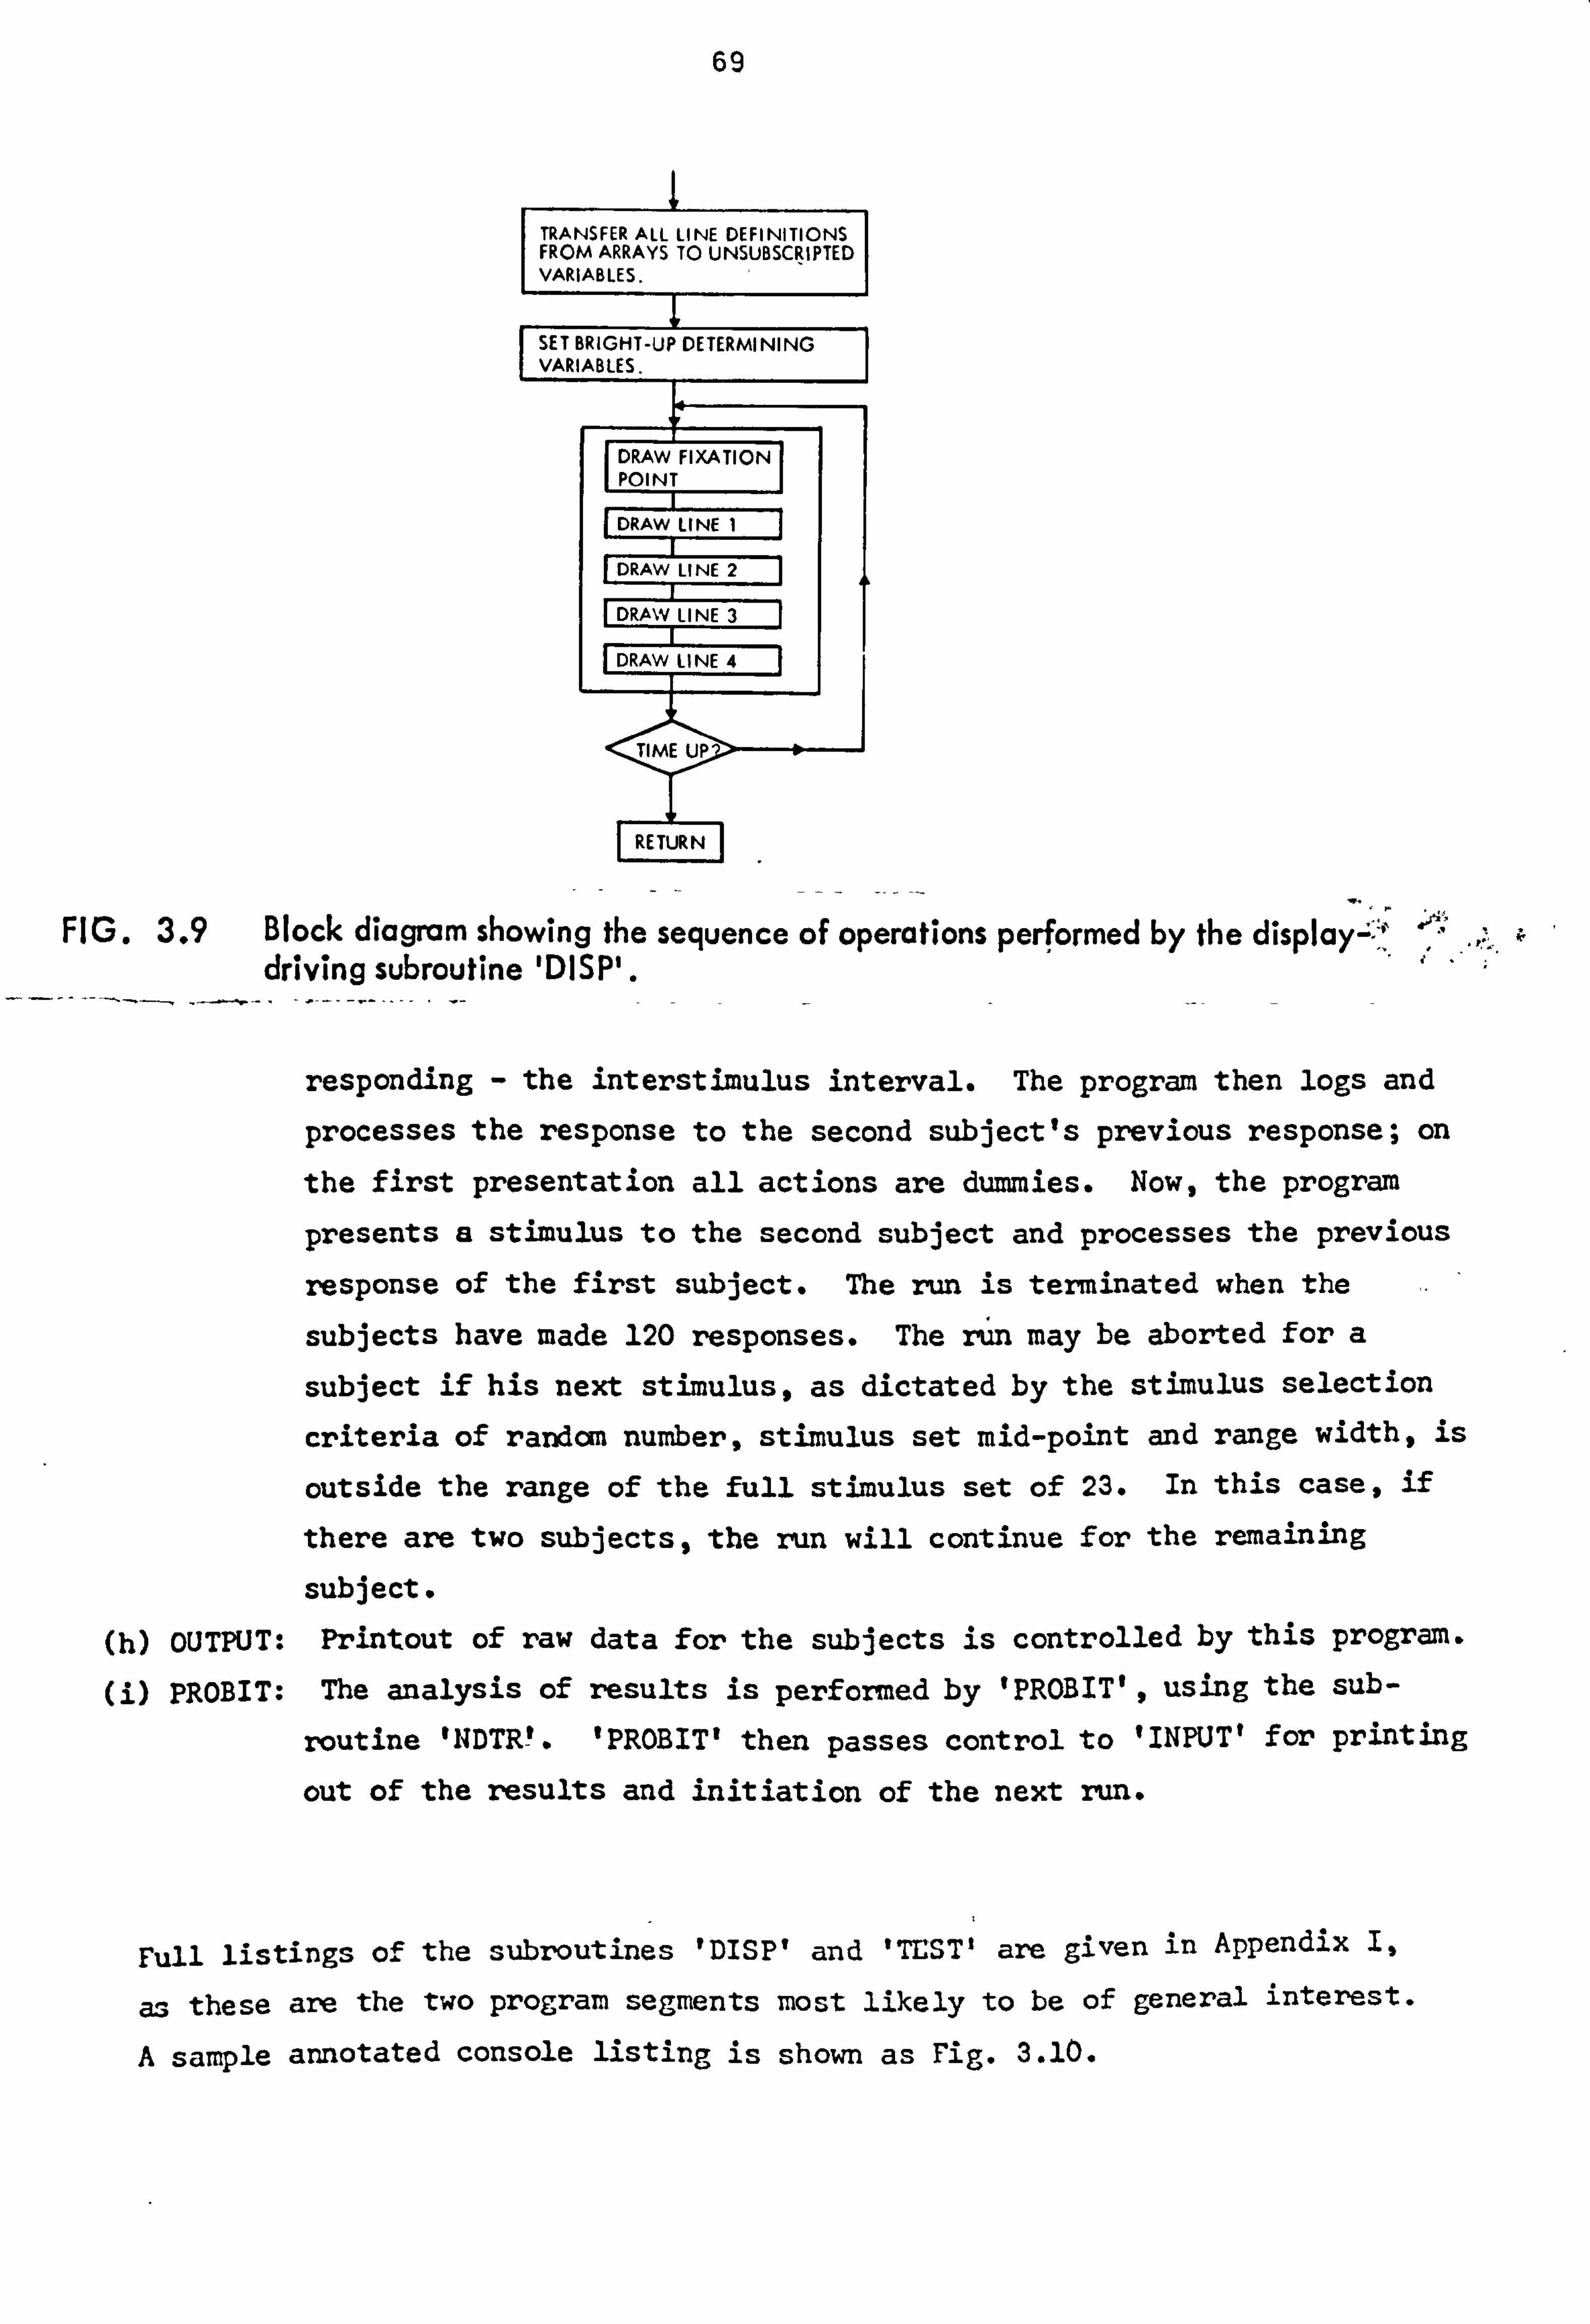
69
TRANSFER ALL LINE DEFINITIONS FROM ARRAYS TO UNSUBSCRIPTED VARIABLES.
SET BRIGHT-UP DETERMINING VARIABLES,
DRAW FIXATION POINT
I
--I DRAW LINE I
DRAW LINE 2 1
DRAW LINE 3
DRAW LINE 4 I
FIG. 3.9 Block diagram showing the sequence of operations performed by the display-;. "', 10 .---I---.. I r% I& no
arivingSUDrourine -uiar-.
responding - the interstimulus interval. The program then logs and
processes the response to the second subject's previous response; on
the first presentation all actions are dummies. Now, the program
presents a stimulus to the second subject and processes the previous
response of the first subject. The run is terminated when the
subjects have made 120 responses. The run may be aborted for a
subject if his next stimulus, as dictated by the stimulus selection
criteria of random number, stimulus set mid-point and range width, is
outside the range of the full stimulus set of 23. In this case, if
there are two subjects, the run will continue for the remaining
subject. (h) OUTPUT: Printout of raw data for the subjects is controlled by this program.
(i) PROBIT: The analysis of results is performed by 1PROBIT1 , using the sub-
routine INDTR'. 1PROBIT' then passes control to 'INPUT' for printing
out of the results and initiation of the next run.
Full listings of the subroutines IDISPI and 'TEST' are given in Appendix 1,
as these are the two program segments most likely to be of general interest.
A sample annotated console listing is shown as Fig. 3.10.

70
NSUB= I MY DATE: 23 MAY I
VDIST= 150 SCALE: 20 LINE LNTH= 0.8 ChITERIA: 20/20 FIX-PT: 0 INTER-STIM T=2 DISP TIME=2.00
EXP- VARIABLE: 0 INCREMENT: 1.0 AXI'S: 000 ANGLE SI/-E= 045 ORIENTATION= 000 ANG. SEP= 135 SEFAkATION., Ll: 000 L2: 000
K2(1)= 11/1 F/NO. = 46 hUN: 31 -I/M
MY 9303303101 10 505617404404,213314303426 11 224314404213224 12 112123,1 56 13 235145224224145134055022 14 033033033044
WN: MY 23 MAY
x (DEG-) CMIN-ARC) AaNT -2o -2-00 -0-6400 7007
1* -1000 -0-3200 31 50 36 09 0-00 0-0000 13 60 19 1* 1-00 0-3200 380 11 2o 2-00 0-6400 9 25 0 34 3o 3-00 0-9599 0 13 0 13
PSE S( PSE) IST HALF 1-21 -0-312 2ND HALF 0.26 -0*277
ýHOLE RUN 0.70 -0*207
LINE LENGTH= - 18-334
SD S(SD) CHI-SO -1-495 0-314 3.06/4 -1-418 0.314 2.04/4 -1-509 0-225 3.25/4
Fig. 3.10 Consol listing of input to program, response distributions and
results of probit analysis

71
Chapter 4 Acuity and Constant Error in Angle Perception I
Prior to conductInE experiments aimed at the elucidation of neural mechanisms
underlying the perception of angle size a set of studies of the effects of
systematic variation of several spatial parameters of angle stimuli was
carried out. Apart from gaining information concerning the effects of the
selected parameters on perceived angle size, these studies also served to demonstrate that the apparatus used was sufficiently sensitive to register the known effects of manipulation of the stimulus characteristics. Replication
of two standard studies was also used to determine that the subject(s) were 'normal' with reference to the oblique effect and to the illusory expansion
of acute angles.
4.1 Effect of spatial parameters on perceived angle size.
Onley and Volkmann (1958) showed that the oblique effect extended to the
perception of right angularity or orthogonality. When subjects were required
to set a line perpendicular to the remainder of the stimulus (in an 'XI, ILI
or IT' configuration) performance was best for all figures when the arms of the
angle were vertical or horizontal and worst when they were oblique. This example
of the oblique effect was manifest in both constant error and variance of
constant error measures of performance. Similar findings have since been
reported by Weene and Held (1966) and Fisher (1969). As Andrews (1967a) showed
that difference thresholds for orientation were smallest for vertical and
horizontal orientations, an initial study of the perception of right angles,
using the apparatus described in the preceding chapter, was censidered as
appropriate for testing both the oblique effect and the sensitivity of the
apparatus.
A further factor, investigated by Andrews (1967a), which might influence the
perception of orientation or angle size, is retinal location. It has been
shown by a number of studies Derkely, Kitterle & Watkins, 1976; Mansfield, 1974;
Muir & Over, 1970; Over, Broerse & Crassini, 1972; Watkins & Berkely, 1974) that
acuity for orientation, constant errors, spread of adaptation effects and the
magnitude of the meridional anisotropy vary with increasing retinal eccentrici: ty.
These studies treated eccentricity with reference to the whole visual field
and so are not precige enough to enable estimation of any effects which may be
found within a radius of about 2 deg. arc of the fixation point. As anatomical
studies show (Polyak, 1941) the diameter of the elements of the retinal mosaic
show a substantial increase in size within this radius. , If this increase

72
in the size of the elements of the retina does affect acuity, then obviously
such an effect must be taken into consideration when ideal acuities or biases
are derived from models. In order to determine whether or not eccentricities
of such a relatively small magnitude have any systematic effect on acuity for
orientation or angle size or on biases in perceived angle size, retinal location was introduced as one of the independent variables in this study, the
other being orientation of the bisector of the angle.
Experiment 3: Perception of Orthogonality
Methods
The experiment was carried out using the computerised method of constant stimuli described in chapter 3 above. The basic stimulus used was, a single right angle
and a fixation point. The set of 21 posýdble stimulus levels comprised angles 0
greater and less than 90 . As well as varying the orientation of the bisector
of the angle at 22.5 0 intervals between runs, the location of the angle in the
visual fieldq with reference to the fixation point, was systematically varied.
The configurations used are shown in Fig. 4.2 (inset). Two runs were carried out
for each orientation and positicn. Each experimental run consisted of 120
responses to 2 second stimulus presentaticns, the response being to indicate 0
whether the stimulus angle appeared to be greater or less than 90 . Stimuli
were separated by a2 second response period/interstimulus interval with a
further seccnd for acquisition of the fixation point. With the exception of
location 6 (fig. 4.2), the fixation point was also shown during the stimulus
interval in order to maintain good fixation.
7he subject had normal uncorrected vision. Usually an experimental session lasted
between 1 and 2 hours; even after the longer sessions the subject experienced
no sense of 'visual strain'.
Results
The effects of variation of angle orientation and retinal location of the angle
on the threshold for departure fran orthogonality are shown in Fig. 4.1.
Analysis of variance showed retinal location to have no significant effect on
threshold for orthogcnality (Table 4.1) whereas the effect of angle orientation
was found to be significant (P4 0.01, Table 4.1). The geometric mean thresholds
at each orientation, pooled across location are shown also in Fig. 4.1. The
graph shows the expected obliqueeffect with minimum thresholds for vertical and

73
horizontal component lines and maximum thresholds for obliquely oriented lines.
SRH
3.0-1
2.0
q 0 3i
O. j
LJ> -I
"I.. ..
I I
0
I
A
0 22 45 67 90 112 135 157 180 202 225 247 270 292 315 33
STIMUWS ORENTATION
FýG 4.1 Thresholds kr orthogonal ity, shoývn as a function of stimulus orientotfon, 'and
retinal location. With reference'to Fig. 4.2 the locations are: P-2, o-3, o-4, o-5, &-6; mean-* .
Source of Variance
Sum of Squares
df Variance estImate
F-ratio
Orientation 8.88 15 0.59 5.36 p -C 0.01
0.49 5 0.10 0.88 n. s.
Residual 8.29 75 0.11
Total 117.66 95 1 1 1-I
Table 4.1 Analysis of variance summary table for thresholds: Experiment 3
-. -L 11, '0
Weene and Held (1966), in their study of perceived orthogonality as a functioný..,
of stimulus orientation, obtained results-, which suggested that different
quadrants show variations in the strength of the effect of orientation. In order
to test for this effect on acuity, a further analysis of variance was carried'
�. \ r
I

74,
out for which the results obtained in the present study at equivalent
orientations in each quadrant were pooled across retinal location. It
was found that while the effect of orientation xemained significant (Table 4.2, p, < 0.01). there was no difference between the four quadrants.
Source of Variance
d. f. Sum of Squares
Variance Estimate
'F-ratio
Orientation 3 1.19 0.40 15.42 p<0.01
Quadrant 3 0.04 0.01 0.54 n. s.
Residual 9 0.23 0.03
Total 15 1.46ý
Table 4.2', Analysis of variance summary table for comparison of difference ' thresholds obtained at equivalent orientations in the four quadrants (Experiment 3).
The minimum observed thresholds are somewhat larger than those reported by
onley and Volkmann (1958) who used line lengths of 2 deg. 44 min. arc as '
compared with the 18 min. arc line lengths used here, but Andrews (1967b),
has shown that acuity for orientation increases with line length.
The observed biases or constant errors are shown for each retinal location
in rig. 4.2. Both orientation and retinal location were found to influence
the contstant error in perceived orthogonality (p < 0.05 for both factors,
Table 4.3) in contrast to the finding for threshold. As was expected from
previous studies cited above,, constant errors were minimum for angle orient-
ations where the lines comprising the angle were vertical or horizontal, and
maximum where the lines were oblique.
Source of Variance
Sum of Squares
df Vari-anc e es timate
F-ratio
Orientation 274.48 15 18.30 2.48 p<0.05
Location 129.81 5 25.96 3.51 p .40.05
Residual 554.29 75 7.39
Total 958.58 95
Table 4.3 Analysis of variance summary table for constant errors: Experiment 3.

75
L -5 L E16 L,
2 3LI
1. i
18-3min fix. point
FIG 4.2 Biases in perceived orthogonality as a function of orientation of the angle bisector and the location of the angle with reference to the fixation point The inset (lower right) shows the locations used, with reference to the fixation point. The numbers at the centres of the graphs correspond to those labelling the ang
' les in the inset. The radial coordinates represent the amount of
bias in degrees, the bisector orientation is shown around the circumference. .
In most locations the constant errors were positive, indicating that right
angles at oblique orientations are perceived as being less than 90 0 but there
are sufficient counter-examples (Fig. 4.2 graphs 1,3, and 5 especially) to show
that this cannot be generalised to a principle. V-.

76.
Discussicn
The finding that there were no consistenEeffects of orientatim on the constant
errors of perceived orthogonality casts some doubt on the generalisability of Weene and Held's (1966) report of differences between quadrants. They found the
constant errors to be greatest for the upper left and upper right quadrants. Although such asymmetries were found in the present study, the orientations
at which the greatest constant errors were recorded showed a tendency to change from one retinal location to another. Further, the observed differences in
patterns of constant error at different retinal locations cannot be attributed,
as was suggested, to the increase in size of the retinal elements with increasing
eccentricity. Whatever effect this may have had, the effect would have
displayed some radial symmetry in the pattern of the graphs as a whole presented in Fig. 4.2. It is suggested, therefore, that the differences between the
perceived angle sizes at the different -locations in the foveal visual field
exposed in this study reflect local variations in the scaling of the metrics defined by the analyser groups receiving their inputs from the different retinal
locations. This being the case, it may be expected that the re , lationship
between constant error and orientation at a 'given locaticn would show a tendency
to filuctuate over relatively long periods of time, of the order of weeks or
mcnths. It may be concluded that within the fovea the retina may be considered
as homogeneous with reference to acuity and subject to random variations with
reference to scaling. The scaling variations are likely to be manifest in
the foveal projection areas of the visual cortex, of course, and not in the
retina itself.
The occurrance of minimal constant errors at angle orientations giving vertical
and horizontal lines (oblique bisector orientations) is consistent with the
model presented by Andrews (1967a). According to this model obliquely oriented
lines should also show minimal constant error as the arrays of orientation
analysers show symmetry about the main obliques, as they do about the horizontal
and vertical. This prediction was not supported by the experimental observations
which showed constant errors to be maximal for angles with oblique lines. This
finding suggests that the perceived characteristics of lines as parts of
angles may differ from those of lines seen in isolation from lines of other
orientations.
The difference thresholds bbserved in this study showed no deviation from the
expected meridicnal anisotropy effect, whereas neither the retinal location nor
the quadrant in which the angle bisector lay had any significant effects. It .
is

77
appgrent, therefore, that constant errors and difference thesholds are sensitive differentially to aspects of the stimulus. On the basis of the results obtained
I in this study alone it is not possible to detail which aspects of the stimulus determine the bias and which the difference threshold in terms of any hypothetical mechanism for angle perception. This matter, however, will receive further attention in subsequent chapters of this thesis.
7be results obtained during this study show that the experimental apparatus
was capable of registering the effects of orientation on perc6ived angle size
and difference thresholds and that the subject SRH showed the expected oblique
effect.
Experiment 4: Matching of RightAngles
, On the basis of the results obtained in the first part of this chapter, it is
possible to make some predictions concerning the performance for the task of
matching two right angles of the same orientation, one on either side of the
fixation point. For difference threshold, it would be expected that the effect
of orientation be the same as that for parallelism or orthogonality, maximum thresholds occurring at oblique line orientations and minimum thresholds
at vertical and horizontal orientations. The predicted constant errors are
shown in Table 4.4. These were obtained by taking the difference between the
ccnstant errors obtained at locations 1 and 3 in Experiment 3, these locations
corresponding to the locations of the two angles to be compared in the present
experiment.
Methods
The experimental procedure was identical to that employed for the previous
experiment with the exception of the stimulus used. Instead of presenting one
angle at a time, two angles were presented simultaneously at locations correspond- ing to locations 1 and 3 in experiment 3. The task of the subject was to
determine which of the two angles presented appeared the smaller, and to respond
accordingly. Two runs were carried out at each orientation. The subject used
was the same person.
Results
Difference thresholds for the comparison of right angles are shown in Fig. 4.3

78 I
t
Bisector Orientation
Bias at Location 13
Difference (1 - 3)
Expected Bias
Observed Bias
0 1.59 -3.6 5.19 -5.19 -1.40 22 2.37 -3.91 6.28 -6.28 -1.48 45 1.31 -2.07 3.38 -3.38 -0.17 67 6.19 3.63 2.56 -2.56 -0.66 90 5.35 11.95 -6.60 6.60 o. 62
112 2.69 9.87 -7.18 7.18 -0.67 135 0.03 0.40 -0.37 0.37 -0.32 167 -5.32 1.36 -6.68 6.68 1.41 180 -4.99 0.28 -5.27 5.27 -0.43 202 -5.21 -0.19 -5.02 5.02 0.41 225 -3.47 0.41 -3.88 3.88 -0.80 247 -3.33 5.91 -9.24 9.24 -0.47 270 -0.90 5.69 -6.59 6.59 0.87 292 -4.25 4.72 -9.97 9.97 0.19 315 1.23 -1.64 2.67 -2.67 0.09 337 1.65 0.33 1.32 -1.32 -0.70
Table 4A Biases from Experiments 3 at locations I&3 are shown incolumns 2 and 3. The differences in column 4 are signed such that if the angle at position I is greater than that at position 3 the difference is positive; if the converse is true then tFe difference is negatively signed. In Experiment 4, if angle I appears greater than angle 2 at PPE, then the bias will be negative, and vice versa; the expected biases will have the opposite sign to the calculated differences. The observed biases are shown in the final column.
SRH
3.0-1
-41 ? 2-0ý Z,
1.0
0
0 22 45 67 90 112 135 157 180 202 225 247 270 292 315 337
STIMLLUS ORIENTATION
FIG 4.3 Effect of stimulus orientation on threshold for perceived equality of Hght
angles.

79
as a function of bisector orientation of the angles. As in the previous study,
the expected oblique effect is evident. The observed biases are shown in
Table 4.4 and in graphic form in Fig. 4. It is evident that there is little
agreement between the predicted values for the biases and the observed values.
2
71 B
w tn CL
-2
SRH
/\\/\/\. /1N
6 22 45 67 90 112 135 157 160 202 225 247 270 292 315 337
. FIG 4.4 Effect of stimulus orientation on constant error in comparison of right an. gles.
The observed biases are considerably smaller than were expected, and there is no
consistent agreement even between the signs of the expected and of the observed
values.
DiscussiOn-
These results are substantially in agreement with those obtained in the preceding
study, so far as the difference thresholds are concerned. Rotation of the
stimulus angles gives a regular fluctuation of difference threshold, with minima
and maxima occurring when the component lines are vertical and horizontal and
oblique respectively. The lack of such systematic variations in observed
biases, with the exception of minima (near zero) biases occurring when the
canponent lines coincide with the vertical and horizontal, raises a question
concerning the predictability of performance on a relatively complex comparison
task on the basis of performances on simpler tasks which may be considered as
elements of the more canplex task. A similar lack of predictability was found
in Experiment 3 where it was found that constant errors in judgements of
or, thogonality did not fully agree with expectations based on the observed biases
fr-om judgements of parallelism. This question will be considered further in
following chapters.
I

80
4.2 Coupariscn of Angle Sizes: acuity and ccnstant error as functions of
angle size, orientation and line length.
Experirent 5: Comparison of angle sizes - horizontal reference angle -
The perceptual expansion of acute angles has been shown to be influenced by the
orientaticn of the angle (Blakemore, Carpenter & Georgeson, 1970; Carpenter
& Blakemore, 1973; Lennie, 1971) and by the size of the angle (Carpenter &
Blakemore, 1973). The effect will beexamined, with reference to explanatory hypotheses in a later chapter; the studies to be described here represent
an exploratory study of the effect of orientation, angle size and line length
on the perr-eived expansion of acute angles. These studies were undertaken for three reasons: (1) to ensure that the effect could be replicated with the apparatus and methods used, (2) to collect data describing the behaviour
of the effect under a wider range of conditions than is available in the
literature, (3) to relate the acuity for angle size to other acuities by
comparing the effects of line lengths on the performances obtained for
different stimuli.
-1
Method
Measures of difference threshold and constant error were obtained using the
automated method of constant stimuli. The basic stimulus used is shown in
Fig. 4.5(a) and the range of the 21 possible stimuli available in any run is
indicated in Fig. 4.5(b), together with the sign conventions used in reference
to the stimulus and results. This is essentially the same stimulus pattern as
was used by Lennie (1971) although in his study the method of adjustment was
used. A negative bias indicates that at the PSE angle II (ROS) was set larger
than angle I (POQ) and, therefore, that angle II appeared smaller than angle I
at the PPE. A positive bias indicates that the reverse was the case.
In all cases the bisector of angle I was oriented at 00 (horizmtal), so that
the absolute orientation of angle II is equivalent to the relative orientaticn
of the bisectors of the two angles. The full range of possible cmfiguraticns
used, cbtained by the systematic variaticn of angle size and orientation, is
shown in Fig. 4.6.

81
bisector of (a) angle two
bisector of angle one
(b)
§TIMULUS STIMULUS STIMULUS NUMBER I NUMBER I1 (0) NUMBER 21
FIG 4.5 (a) Basic stifinulus configuration used in Experiment 4. (b) The three patterns represent the range of possible patterns available'to
the subject in a given run.
only one observer was subjected to the full set of stinulus confli gurat ions,
other observers were used only to confirm the replicability of the results obtained in the later, critical experiments. The subject SRH had normal uncorrected
vision and was experienced in this type of spatial acuity experiment. Stimuli
were viewed under normal illuminaticn (1 x 40 watt fluorescent tube) in a small
roan with no other sources of illumination.
For all runs comprising this study, the stimulus duration was 2 seconds preceded
by a one second presentation of the fixation point. As the fixation point
coincided with the co=cn vertex of the angles it was suppressed during the
presentation of the stimulus. Each presentation was followed by a two second
interstimulus interval. Viewing distances were 50cm or 150cm according to the
angular subtense required.
Results
(a) Constant errors
Lennie's finding that horizontally and vertically oriented acute angles appear
larger than cbliquly oriented angles is substantiated by the results shown in

82
ANGLE SIZE
RELATIVE ORIENTATION (ANGULAR SEPARATION)
ogd* 1120 13? 1570 18do 20f 22e 2470 271f
le v..: c %-, A., -
300 V.
C::: ý ', ý A.
C, - ýý, -7. < 1<4. <
450 \/< \J< --ý< ><T7<1< '1<
60P >< 7< -7< -, el< A<
9d,
FIG 4.6 The full range of stimuli used in Experiment 4 (with the exception of the W angles), obtained by crossing orientation of test angle (angle 11) with ýngle
size for each line length. The line lengths in the diagram are 2/3rds the length of the actual stimulus line lengths generated on the CRT for a line subtending 0.3_deg. arc.
rig. 4.7. The characteristic 'W' pattern is not exhibited for the smallest
angles (15 0 ), but the effect is strong for the other angle sizes, though there
appears to be an interaction effect with line length. Analysis of variance (Table 4*5) shows that the three factors: orientation, angle size and line
length all exert a significant infuence (p < 0.01) on the perceived relative angle
sizes. All two-factor interactions are also significant (p< 0.01), but the
three factor interaction is not. Bias as a function of line length is shown in
Fig. 4.8. Bearing in mind that there is an interaction effect between line length
and orientations a tendency for bias to increase with increasing line length is
apparent, levelling off between 0.6 deg. arc and 1.0 deg. arc, as illustrated

83
FIG 4.7 Effect of relative orientation'bn the perceived relative sizes of acute angles: The angle sizes were: * -'If, - &- 360, m-4?, v- 600. The line lengths were (a) 0.3 deg. arc, (b) 0.6 deg. arc, (c) 1 .0 deg. arc, M 3.0 deg. arc. (Angular separation = Velative orientation).
r 0 1 7 N) .4V
III
(aU) SVI
a rr-
[n z 0 P
ul v
. Z.,
r a SII
(uy0) SY9 10
-I- 1.
0 ,NI"
C.
IR
9
R f4
p.
to C4
Po V
N
R

84
I
011%
%uI
0
do-%
% ro, ;0
FIG 4.8 Effect of line length and relative orientation on the perceived relative sizes of acute angles. The test angle orientations were: *- 900, *- 1350,
A- 1860, m- 2250, v- 2760. Broken lines indicate obliquely oriented test angles and continuous lines Indicate vertical and horizontal test angles. The angle sizes were: (a) 150, (b) 300, (c) 45 0, (d) 60 0
,'M
svis
%II It
7!
'7
/
ro m
FW 0
ro
'Mo
IIIII
.4 ID III
-1 10
0
0 fn
m le
12
10
ýo 0 cý Z
14
10
0
.4-; II - l4 -I
(016uv. ) syle
SVIG
0
-v "I sei so
IIS
0
U
-o 3
,0
z -j
0
0
T
0
e-
-T 10 o

85
I
FIG 4.9 Effect of angle size on the perceived relative sizes of acute angles. The orientations were: *- 9004, *- 1350, A, - 1860, a- 2250, v- 27do. Broken lines indicate obliquely oriented test angles and continuous lines indicate vertical and horizontal test angles. Line lengths were: (a) 0.3 deg. arc, (b) 0.6 deg. arc, (c) I. 0 deg. arc, (d) 3.0 deg. arc.
%91
I
L
%-o
0 .1
�� -� _�
�/ � /
� "1
II / /� -I
// -I
SS I
I/ I I/
I I! /
II / /�
#1 I,, / Ill /
I I! ' I II '
(al6uv syls -
I lb
2
T
-ýa %%.. 0
0 ID
FS
0
o(
0 r4
LO
(016uy ) SY19 7 T7 7
0
0 to
2
in
Lo .(
0
e
0
-
(Iuy. ) S'I
.4N IIII
9 S. I,
,f0 11 , 'I .0« M
ý, o
9 f4 o-N I"
(40w) syle
ip

86
most clearly in Fig. 4.8(c). ' Other graphs in this series show, however, that this
tendency is by no means unequivocal.
The effect on bias of the third variable, angle size is shown in Fig. 4.9.
The distinction between vertical/horizontal angles and oblique angles is brought
out clearly, with the exception of the 2250 orientation test angles in graphs
(a) and (d). Despite the range of angle sizes used, there is little marked
effect of increasing angle size when the angles to be compared are horizontal
or vertical, with one exception to be seen in Fig. 4.9(d). When the test angle
is oblique, however, the effect of increasing angle size is to increase the bias 0
even up to the maximum angle size of 60
Source of Variance
d. f. Sum of Squares
Variance Estimate
F-ratio
Line length 3 15.732 5.244 23.69 p e, 0.01
Angle size 2 63.691 31.845 143.88 p40.01
Oriento tion 4 146.217 36.554 165.16 p 0.01
LxA 6 9.048 1.508 6.81 p 0.01
Lx0 12 13.099 1.092 4.93 p 0.01
Ax0 8 73.219 9.152 41.35 p<0.01
LxAxO 24 8.313 0.346 1.56 n. s.
Residual 60 13.280 0.221
Total 119 342.599
Table 4.5 Analysis of variance summary table for comparison of constant
___ __ __ errors_ obtained in
- Experiment 5.
__
(b) Difference Thresholds
The effects of the three independent variables line length, angle size and
relative orientation are shown in Figs 4.10 to 4.13. Analysis of variance
showed all three to have a significant effect 'of the difference threshold (p-C 0.01, Table 4.6), and interaction effects between length and angle size

87
Source of Variance
d. f. Sum of Squares
Variance Estimte
F-ratio
Line length 3 0.457 0.152 4.89 p<0.01
Angle size 2 12.497 6.248 201.61 p 0.01
Orientation 4 1.106 0.277 1
8.90 p 0.01
LxA 6 0.529 0.088 2.84 p<0.05
Lx0 12 0.602 0.050 1.61 n. s.
AxO 8 0.885 0.111 3.55 p<0.01
LxAxO 24 1.244 0.052 1.66 n. s.
Residual 60 1.869 0.031
Total 119 19.189
Table 4.6 Analysis of variance summary table for comparison of difference thresholds obtained in Experiment 5
and between relative orientation and angle size were also significant. The
remaining two-factor interaction and the three-factor interaction did not
show a significant effect.
In Fig. 4.10 each graph shows differing angle'-sizes at a given line lengths
-while in Fig. 4.11 the graphs show different line lengths at the same angle
sizes. In Fig. 4.12 the effect of line length is shown and in Fig. 4.13 the
main variable is angle size.
The most clear cut effect is that of angle size. For most relative orientations
and all line lengths the threshold for angle size increases with the size of
the angles to be compared. Although the effect is not independent of orientation,
it can be seen that overall)orientation does not exert a systematic effect, as
is indecated by Figs. 4.10 and 4.11. Similarly, differences in line length do
not substantially alter the slopes of the graphs. Neither line length nor
relative orientation, when considered as the main independent variables, appear
to have a simple relationship with the acuity for angle size.

88
FIG 4.10 Effect of relative orientation on acuity for angle size. The angle sizes 0
were: e- 15 `" -A "' ! 7.30P, m7 450, Y- 660. The line lengths wer6:. (a) 0.3 deg; 6ýc', ". "(6) 0.6 de'6'. 'arc, (c) 1 .0 deg. arc, (d) 3.0 deg. arc. (Angular separation = relative orientation).
0115uy-) GIONS3841
d (0115UY-) CIONS3UH1
0
C4
In
p-
5
U, r)
hv
09
..
F
,. 0
0
FE
.0ý W
[1-21 ,e-
v
ýr
v
40d
4f /i\
IIII17,,,,,, IIII 0 C4
(0150Y. ) OIOHS38HI
/
LF
R C4
ýn
al
In
C4 II
i
U? 0 U? 0
(016UV ) 010HS3hP4i
9

89
2.5 -1
2.0- ID CD c
0
0
LU w = I-
1.5.
1.0 ý
1.0 ý
0.5
V..
-16 -
co ----------- a----
t--- 90 - I11 112 135 157 1ý0 262
ANGULAR SEPARATION
---v- 225 11 247 270
FIG 4.11 Effect of relative orientation on acuity for angle size. The line lengths were: 0-0.3 deg. arc, &-0.6 deg. arc, m-I. 0 deg . arc, v-3.0 deg. arc.
The angle sizes were: (a), 450 (open symbols) and 60 (closed symbols), (b) 30 , (C) 150. (Angular separation = relative orientation).

90
FIG 4.12
IIIIIII in 0 f4 94
0--%
0 6qle orientations Effect of line length on acuity for angle size. The test aý
ývere; , e-7 90 135o, 1800, m -: 2250, v- 270 . Broken lines indicat& obliquely oriented test angles and continuous lines indicate vertical and horizontal test angles. Angle sizes were: (a)150, (b) 300, (c) 450, (d) 6do .
(004. ) TIONS3UHL
2
[0
5r - X)
I
a
w z -J
m CD
0
0 I.,
U
"0
to
0
(OIBLIV. ) CIIOHS38HI
0 r
I
w
W! 94
C? 44
IyIIIýIII1 -1
C5
ei 44 W?
19? (405UY. )
U I I-
w z :3 L
ro
0
i
I

91 ..
FIG4.13 Effect of size of angles on acuity for angle size. The relative orientations were: 900;, 1359, A, -m- 225 0, v- 2700. Broken lines indicate', obl , iquely oriented test ang , les . and continuous lines indicate"vo'e"rifc, al
.1,, I and horizontal test angles. Line lengths were: (a) 0.3 deg. arc, (b) 0. '6 deg. arc, (c) 1.0 deg. arc, (d) 3.0 deg. arc.
C.
(a]15UV ) OIOHS3HHI
0 �C
0
0 -Std
p1
Id
F
2
Ul 0 Ln
c4
C-. wl
C3 w
LO rn
0 Is w
C-
ýIIIIIII.
IIII T-T
a U? (D C4
(01". ) CIIOHS38HI
0 0
LO In
a ýl w N
An q
fn
0 N
S?
U? 0
La Ei',
CD I$ w
N Ln
0
2 Lo
,ýT
(al6uV CIIOHS38HI

92
Discussion
(a) Constant Error
The results obtained for variations of bias with relative orientation are in
agreement with Lennie's observations (1971) that the perceived difference
between angles is greatest when the test angle (angle II) is oriented obliquely
and the ccmpariscn angle (angle I) is oriented horizontally. The IWI-shaped
graph is preserved for all the angle sizes used, with the exception of the
smallest (150). This finding is also in agreement with other studies (chapter 1)
which have also shown that the perceived expansion of acute angles is greatest
when the angles are vertically or horizontally oriented.
The effect of line length on the perceived relative sizes of angles or on the
magnitude of the perceived expansion of acute angles has not been reported in
the literature,, and the findings of the present study do not lend themselves to
any simple unequivocal interpretaticn. The graphs shown in Fig. 4.8, when
'averaged' by eye suggest that the relation between bias and line length has the
form of an inverse U with the maximum (negative) bias occurring at line lengths
of about 1 deg. arc. Fig. 4.8 (d) is not of great value here, as observations 0
at intermediate line lengths were not made at an angle size of 60 , 7hese
observations do not compare well with Andrews' (1967b) observations for the effect
of line length on constant errors for parallelism which showed the ccnstant error
to decrease with increasing line length. In his study minimum biases were
usually attained with line lengths of approximately 23 min. arc.
The relation between bias and angle size presents some difficulty for those
theories which explain the perceptual expansion of acute angles simply in terms
of orientation contrast mediated by lateral inhibitory interactions between
oridntation analysers. As the angle size increases, the separation of the active
analysers in the orientation domain becomes greater and, therefore, according to
lateral inhibition models the strength of the inhibitory interactions will
become weaker. As it is the differences between perceived angle sizes which are
being measured in this experiment some increase in the bias would be expected up
to a maximum angle size, beyond which there should be a decrease. This prediction
is based on the already questionaMe assumpticn that the width of the inhib itory
output range of the vertical and horizontally tuned orientation analysers is
greater than that of obliquely tuned analysers. Following this assumption, as the
angle size increases the separation of the lines in the oblique angle will become

93
greater than the range, of mutual interaction sooner than will the separation of
the lines in the horizontally oriented canparison angle. Eventually the
separation of the lines in the horizontal angle will also exceed the maximum
range for interaction, and in so doing the perceived difference between the sizes
of the angles should diminish to zero. This tendency should be accelerated,
perhaps even to the extent that the sign of the bias shows reversal, as the
ccmponent lines in the canparison angle approach the cbliques with increasing
angle size and so the strength of the mutual inhibitory interaction for a given
separation diminishes. At the same time the ccmponent lines of the test angle,
at an oblique orientation, will be approaching the vertical and horizontal and
so the magnitude of interaction for a 'given separation will accordingly increases
thus reinforcing the tendency for a decrease of the perceived difference between
the sizes of the two angles.
It has already been shown by adaptation studies (Hirsch, Schneider & Vitiello,
1974; this thesis, chapter 2) that the assumption of different inhibitory tuning
curves for oblique and horizontal or vertical orientation analysers is
untenable. - Also the estimated widths of these tuning curves is probably barely
sufficient to maintain perceptual expansion by inhibitory interaction for angles
as great as 60 0. These estimated total widths of inhibitory tuning curves have
been given values of between 450 and 600 in various studies, the most quoted
value being about 500 (Hirsch et al., 1974; Lovegrove, 1976; Movshon & Blakemore,
1973; Sharpe & Mandl, 1977; this thesis;, chapter 2). The half width of these
tuning curves is consi erably less, being of the order of 60-12 0 or about 250 consilered
according to the study/, so the strength of the inhibitory effect at the maximum
range is relatively small. Even without the assumption of different tuning
characteristics, therefore, the mutual inhibition explanation of the perceptual
expansion of acute angles would predict a decrease in the perceived difference in
angle size, with oblique test angles, as the angle size tends toward the maximum
of the range for mutual interaction.
Although the results presented in Fig. 4.9 are not unequivocal on this point,
those biases observed at the largest'angle sizes are so large as to be beyond
doubt. Conversely, for small angles which would be expected to show theýgreatest
apparent expansion, and therefore the greatest differences for different
orientations, no systermati6 variation was observed. The biases for the 15 0
angle are in fact comparable to biases obtained for canparisons of angles of
equivalent orientations, independent of orientation (see chapter 5). These
findings indicate, therefore, that the processes underlying the perceptual
expansion of acute angles cannot be explained simply in terms of lateral interactions
between orientation detectors, despite the close agreement of Blakemore,
I

94
Carpenter & Georgeson's (1971) and Carpenter and Blakemore's (1973) findings
with this model.
(b) Thresholds
The many studies reviewed in chapter 1 demonstrate that acuity for orientation is
greatest when the stimulus orientation is vertical or horizontal, and least
when the stimulus orientation is cblique. On the basis of these data alone it
would be expected that threshold for angles size, if simply determined by the
orientation difference thresholds for single lines, wou ' ld be greatest when the
lines comprising the angle stimulus are close to the vertical or horizontal and
least when the lines are closer to the main cbliques. In this study orientation
and angle size as independent variables are confounded, but least so for the 0 smallest angles size of 15 . The orientation effect on acuity for tl,, ase small
angles would be expected to be most cbvious, giving the typical sinusoid-like
variation of acuity with increasing angular separation of the bisectors of the
two angles, as the t7est angle departs from the vertical toward the oblique, to
the horizontal and so on. ýFor the smaller angles (15 0 and 300) this expectation is evidently quite erroneous, as the results illustrated in Fig. 4.10 and 4.11
show.
The same reasoning applies to the relation between acuity for angle size and the
size of the angle. As the size of the angle changes, then at different bisector
orientations the lines comprising the test angle should be perceived better or
worse as the angle size changes. For example, at a test angle orientation of
135 0, as the size of the angle increases the component lines move further and
further away from the bisector of the angle and becane nearer and nearer to the
horizontal. The converse is true for vertically or horizontally oriented' test
angles. However, as Fig. 4.12(a) shows, there is aconsistent increase in threshold
with increasing angle size, for all orientations. At the same time as the lines
in the test angle are, for example moving fran, e. g. 135 0 to the vertical and
horizontal, the lines of the comparison angle are, by the same amount, approaching
the obliques. Consideration of this factor only leadd to the expectation that,
for a given anglular separation of test and ccmpariscn angles, the acuity should
remain approximately constant. This prediction too, however, does not reflect
the experimental observations which are repeated for all orientations and line
lengths employed, that acuity decreases with increasing angle size. Although
the relation between acuity for angle size and the size and orientation of the
angles will be considered further in the following chapter, the observations

95
derived from this experiment strongly suggest that the acuity for angle size is
not determined simply by the combined acuities for the lines comprising the angles.
The effect of the third factor, line length, on the difference threshold for
angle size appears to be no more predictable from other measures of acuity than
were the effects of orientation and angle size predictable from earlier studies. Andrews (1967b) and Andrews, Butcher and Buckley (1973) have both repeated
earlier findings and shown new observations that increasing line length results in a reduction of threshold for a nunber qf spatial acuity tasks. The results from this study can only be compared to the earlier observations for the longer
lines, as 18 min. arc was the shortest line length used. Also, the number of
subjects is hardly appropriate to detailed generalisation -for quantitative rules.
However, as the results illustrated in Fig. 4.13 show, there is little obvious
systematic relation between threshold and line length, although line length was
shown to have a significant effect on the difference threshold (Table 4.6).
Experiment 6: Compariscn of angle sizes - Oblique reference angle.
7be final experiment to be described in this chapter was a variation of the
experiment just discussed, for which the stimulus set employed was rotated 0 through 450 so that the bisector orientation of the comparison angle was 45
0 and that of the test angles was varied in 220 steps from 1350 to 315 , This
variant was introduced as a check on the consistency of the method, the subject
and the effect to be measured, with reference to the results obtained in the
preceding experiment. As Experiment 5 showed that the perceived size of a
horizontal angle was greater than that of obliquely oriented angles, it was
expected that the IWI-shaped graphs obtained with a horizontal comparison
angle would be inverted to become an IMI-shape with an oblique comparison angle.
As the test angle should appear greater (at PPE) than the comparison angle
at relative orientations of 135 0 and 225 0, the maximum biases should have a
positive sign.
Method
Apart from the changed orientation of the stimulus all other conditions under
experimenter control were identical to those in the previous experiment. The
line length was 18 min. arc, and the angle size was 300.
I i,
f
r

96
Results
The outcome of this study was, with the exception of one aberrant point on the
graph, fully consistent with expectations. The results are shown in Fig. 4.14,
together with the graph for the results of the previous study for the same
angle size and line length. Despite the obviously outre point at a relative
2-i
Iý
T01
--I ý tn 4 Ri -2
-3
-10-ý
-5-J io 11'2 65 1ý7 lio 262 2i5
ANGULAR SEPARATION
--T-
247 270
FIG 4.14 Effect of relative orientation on the perceived relative sizes of acute angles. The bisector orientations of the comparison angles were: A-00
,&- 450.
orientation of 2700', the coincidence of the minima for the two conditions is
reassuring, although it is not clear why there should be an identical non-zero
constant error, with such a high consistency where the test and canparison
angle orientations are equivalent.
conclusions
Two experiments described in this chapter have shown that the apparent size of
a= acute angle varies with the orientation of the bisector of the angle such that,
with reference to a horizontal comparison angle, the size of the test angle is
minimum whenthe bisector lies on one of the major obliques. Conversely, when
the comparison angle lies on a main oblique, the test angle isý maximally larger,
than the comparison angle when its bisector is horizontal or vertical. It is
confirmed, therefore, that an acute angle appears larger when it is horizontal
or vertical than it does when it is oblique. Given that acute-angles are

97 .
perceptuAlly expanded, then this expansion is least for obliquely oriented angles.
The influence of line length on the amount of perceptual expansion of acute
angles is to increase the difference between obliquely and horizontally oriented
angles. The magnitude of the difference between the comparison angle and oblique
test angles is also increased by increases of the size of the two angles. 15 0
angles did not shovi any consistent differences between horizontal and oblique
orientations. The perceived difference of size of the horizontal and oblique
angles appears at about 300 and subsequently increases with increases of angle
size.
The acuity or difference threshold for angle size was also found to be influenced
by all three experimental variables of which, however, only angle size showed
an obvious relation to acuity, difference threshold increasing with increasing
angle size. The rate of increase was largely unaffected by the line length or
by the relative orientations of the test and comparison angles. No obvious
relationship between acuity for angle size and either relative orientation or line
length of the two angleý to be compared was discernible.
The study described above has the shortcoming that full comparisons between
the perception of orientation and the perception of angles are complicated by
the fa , ft-that the stimulus variables of ort: -ý. ntation and angle size were confounded.
rurther studies will be described in the foliowing chapter which attempt to
disentangle these two variables.
General Conclusions
Where the experiments described in this chapter attempted to repeat earlier
findings concerning the perception of angles the results were favourable.
Some results obtained by extending this study beyond those previously reported
showed that despite the successful repetitions, the perception of angles has
neither been fully described nor explained. Those hypotheses which have been
proposed do not generalise to observations covering a relatively wide range
of stimulus values, particularly of angle size. Sane of these observations -
especially those concerning the biases obtained in experiments 3 and 4, and
the effects of angle size and orientation on both bias and threshold in experiment
5- suggest that the perception of angles cannot be fully understood on the basis
of a knowledge of orientation perception alone. Angularity appears to be a
property recognised as such by the visual system, rather than as differences

98
between orientations. The studies to be described in the following
chapters will examine the perception of angles and angle size more closely in an attempt to reach a better understanding of the rechanism whereby the visual system processes information concerning angular extent.
I

99
Chapter 5- Acuity and Constcmt Error in Angle Perception: II
Introduction
The results obtained from Experiments 3 and 4 described in the previous chapter
showed that acuities for comparisons of angle size followed the pattern expected
from the behaviour of single lines, when the angles were ri#lt angles. The
difference threshold was lowest when the lines comprising the angles lay on
the vertical or horizontal and highest when the lines were oblique. In the
first part of that experiment (Expt. 3), it was found that a similar-pattern
was shown for judgments of orthogonality. The. difference thceshold for
departures from a right angle was smallest when the. angle-was oriented such
that the component lines were vertical and horizontal, and greatest when the
lines were oblique. The constant errors obtained in these two studies, however$
were not so easily explained, appearing to vary arbitrarily, and not conforming
to expectations generated by any current hypotheses concerned. with- the
perception of orientation.
When the angles were acute, as in Experiment 5, _bwever, theexpectations
derived from single line or single. -orientatiori studles-were not fulfilled. In
this study the angle sizes and orientations of the angles interacted in-such a
way that, e3cept when in the horizontal orientationthe orientatiom of the
lines was not equivalent. Although the, results for difference thresholds
show little pattern at all, any expected pattern of fluctuations of threshold
would be quite complex. For this-reason a further study of the-effect of
orientation and angle size on acuity was carried out in which the angles to
be compared were identical in both size and orientation, varying only in
retinal location which, as was shown in Experiment 4, has no. effect. on acuity
within the eccentricity used.
Method
As befores the experiment was carried out using the computerized -method of
constant stimuli. The basic stimulus shown to the subject was made up of two
angles and a fixation point. as illustrated in Fig. 5.1 (a). The stimulus -set for a given run was composed of 21 pairs of angles varying from angle. -I greater
than angle II to angle I smaller than angle II. As usuals stimulus number 11
represented the PPE with angle I equal to angle II.
The effects of three variables were investigated in the two, experiments comprising

100
angle 1
lp 0
1.0 -< - «< ci I< 0 ý:
C2 (a) ::: ýo * 4< C3
(
ci
I �/ 0
- %%s C2
I
� %
%
(c)
C3
PO' 1, 0
(d)
FIG. 5.1 Stimuli used in experiments 7A8: (a) basic stimulus pattern, the dotted lines represent the bisector of the angles; (b) the three cofiguration variants C I, C2 and C3; (c) the effect of varying the orientation of the angle bisector on the three variants, the dotted lines represent the angle bisectors; M the stimulus as used with angle size as the independent variable for a giý8n angle orientation. The 3 orientations used were 450,900& 0 (The relation bwween the angles and the fixation points is not representative of the stimulus patterns used in which an adjustment was made so that the distance from the fixation point was set with reference to the 'centre of gravity' of the angle, which was maintained at a constant distance from the fixation point for any orientation or angle size. )
this study: angle size, angle orientation and stimulus configuration - as
shown in Fig. 5.1 (b - d). The inclusion of the three configurations Cl, C2 and
C3 controlled for the possibility that the different proximities of the vertex
or end-points of the angles to the fixation pointso within the-eccentricity used,
might lead to ambiguous results for the effect of orientation, when the orient,
ations of the angles were identical, as in Cl. In the first experiment the
main independent variable was angle size-and ih- the second. the-effect of
orientational changes on thresholds for a constant angle-size was determined.
For all stimuli the line length was 18.33 min. arc (referred -to as 0.3 deg. arc)
and the distance between the centres of gravity of the angles. was l. S deg. arc.

101
5.1 Experiihent COMDarison of angle sizes: Acuity and Constant E3ýfor as
a Function of Angle Size.
In three sets of runs the size of the angles comprising the stimulus was varied between 15 0 and 900 at three orientations 4- horizontal (0 0 ), oblique (450) and
vertical (90 0) in configuration C1 (rig. 5.1b). The angle sizes were 15 0,30 0
45 0,60 0 and 900, increasing as-) shown in Fig. 5.1 (d). The subject, SRH, had
normal uncorrecteEvision.
Four runs were made for each angle size at 00 and 900 angle orientations and 0
six at 45
Results
The thresholds obtained at each angle size for the three orientations are shown
in Fig. 5.2. For all orientations of the angles, the difference threshold was
found to increase with increasing angle size. While this increase is mAintained
-ao-l
2.5-
2.0-
1.5 x 0 w ir i-r
1.01
0.5
0
10 20 30 40 50 60 70 80 90 ANGLE SIZE
FIG. 5.2 Effect of angle size on the difference threshold for angle size. The solid symbols and lines show the results of the. present
,:, ýv -, t, 0C?
experiment (7): 90w 90 en, 'ymbols
A 46o. The oý '-ý s represent the thresholdi
, '. observed in exp6timent 5 f6r, "thii closest
corresponding orientations: o -ý 18001 a- 90P, A- b3o.
for the vertically and horizontally oriented angles, for the obliquely oriented
angle the threshold starts dropping again after an angle size of 600, and the
threshold for the oblique 600 angle is rather lower than that for the vertical
or horizontal angles of the same size.

102
In absolute terms the thresholds at 90 0, vertical and horizontal orientations, compare reasonably with the results obtained in Experiment 4 where the stimulus was identical to that for the 90 0 angles size in this experiment. Comparison
of the results obtained in this experiment with those obtained in Experiment 5, for the same line length and the closest equivalent orientations (900,1350
and 1800, see Fig. 4.13a) reveals that the thresholds obtained for an angle
size of 15 0 are very similar in both-experiments for all orientations. The,
similarity between the observations from the two experiments at 30 0 is quite
good, but at 45 0 the experiments show some divergence. While the thresholds
for the vertical and horizontal angles (in comparison with. the--horizontal
reference angle) continue to increase, with the horizontal and. vertical angle.
thresholds of the present experiment, the threshold for the oblique 60 0 angle is considerably lower than that for any orienation in this, -experiment, including the oblique angle whose threshold is already lower than that of the
remainder. This observation is opposite to that which-may have-beenexpected
on the basis of the threshold relation to orientation from single lines. In
Experiment 5 the separations of the lines comprising the two angles from the
nearest horizontal or vertical are 300 for the lines in angleý, I,, (the. comparison
angle) and 150 for the lines in angle II (the test angle). In the present
experiments because the bisector orientation of both angles. is 4ý 0 -the, 0 distance of all the component lines from the-vertical and horizontal i's 15
it might have been expected, therefore, that the performance in-the present
experiment would have been better than that in the previous one. In fact the
reverse was found to be the case.
The biases corresponding to these threshold observations, are. shown-jrL Fig. 5.3',
together with their equivalents from experiments 4 and 5. 'With-the-exception
of the one aberrant point from experiment 5 (30 0 angle at 180 0 relAtiye
orientation) the biases for the vertical and horizontal angles, in the. earlier
experiments fall within the same range of values as those found in thepresent
experiment. The biases for the obliquelyoriented, test angle from,. experimdnt__
5 increases *ith increasing anglesize, reflecting the different apparent sizes
of horizontally and obliquely oriented angles.
The biases obtained in this study and -in the. earlier experiment 5 for the non-
oblique test angles show that even when angle. sizes are-equal and orientations
e(pal or equivalent, relatively large, constant-errors, occur in an apparently
arbitrary fashion. These constant errors appear to have a range of approximately
+ 20 and so obviously must be taken into account should any quantitative modelling
of the apparent size difference effect be undertaken. ' Similarly

103
arbitrary constant errors betwen equal stimuli in different retinal locations
hve already been reported in this investigation (experiments 3 and 4) and in
Andrews' study of perceived orientation (Andrews, 1967a, p 979ff. ).
2
I
iv FIG. 5.3
0
tn
-0
-5ý
-_
i I
-6 J "0 io ýo 4 50 60 70 io io
ANGLE SIZE
Effect of angle size on constant error. The solid symbols and lines show the results of the present experiment (7): 0-00 0-90 0,
A- 45o. The open symbols for angle sizes I? to represent,,,. - the biases observed jjn experiment 5 for the closest corresponding orientations: 0- 18do, * c3 - 909, &- 135o. The vo! ues represented by the open symbols at an angle size of 9do are taken from Experiment 4, in which the stimuli were identical to those used in this experiment.
The characteristics of this arbitrary constant error are similar to those found
by Andrews in his study - it varies with time (experiments 4 and 6 were separated
by several, months) and it appears to be of randan magnitude with reference to
retinal location. The occurrance of this component of constant. error was
attributed by Andrews to Irandcm scaling errors, which simply reflect randcm
biases in recent visual inputs' which give rise to local differences in
adaptaticn or level of inhibition.
Discussion
The aim of this experiment was to test the predictability of acuity for angle
size fran the known meridional anisotropy of acuity for' single lines. The
prediction tested was as follows: For vertical and horizontal angles, increasing
angle size would give a monotonic increase in difference threshold up to a 0
maximum at 90 . For oblique angles, because at small angle sizes the component
lines are closest to the oblique (+ 7.50 for 150 angles) the threshold would
7'

104
be expected to be highest for the smallest angles and steadily decrease until
the component lines lay on the vertical and horizontal for go 0 angles, which
would give the lowest thresholds. As the results of the experiment have shown
this prediction was largely , but not totally, erroneous.
For small angles, with vertical and horizontal bisectors, the expectation was
fulfilled. The major discrepancy is that the threshold for cingle sizes
between 150 and 450 do not show any substantial orientation effect. This
observation had been suggested by the findings in Experiment 5, but the present
findings obtained in the absence- of difficulties raised by the stimulus
configuration used in experiment 5 support this observation. The evidence
indicates, therefore, that difference thresholds for angles of less than 45 01
do not show meridional anisotropy.
At angle sizes greater than 450 the expected separation of threshold magnitudes
between horizontal-vertical and oblique angles did appear. While for the vertical-
horizontal angles the threshold continued to increase as the angles became
largers and their component lines approached the main cbliques, the threshold
for the oblique angles began to decrease as the component lines approached the
vertical and horizontal, thus repeating the finding of experiments 3 and 4 that
acuity measures for right angles do show the expected oblique effect. Small
angles, then, appear to behave differently. from angles of about 600 or greater.
At the larger angle sizes the component lines are subject to the meridional
anisotropy of the visual system, indicating that there is a substantial
qualitative difference at sane stage of visual processing between the represent-
aticn of angles greater than 60 0 and angles less than 600 in size. This
difference could be attributable either to the existence of some form of
interaction between the neural representations of the lines forming small
acute angles or to the existence of a mechanism which somehow processes angle
size as a quantity independently of the processing of orientation.
There are several hypotheses concerned with the perception of orientation which
postulate interactions between orientatim analysers, described in chapter 1,
section 5, which will be reviewed and examined experimentally in the following
chapter. However, as was shown in chapters 2 and 4. observations have already
been made which question these hypotheses as they stand.
The results obtained in this experiment, for constant errors in the comparison
of angle size)have already been discussed above. When these findings are
considered together with those obtained in experiment 5, the observation that

105
constant error increases with angle size, made in that experiment, can be
qualified. In the present experiment rather large constant errors were found
which although differing with angle size, did not show any consistent tendency
to increase systematically with increasing angle size. These findings parallel
the earlier observation (see Fig. 4.9) that such systematic increases in bias
were only associated with comparisons of angles of different relative orientations. It is confirmed, therefore, that there are two possible sources of constant error
in the angle-matching task, one which is arbitrary and which arises from
randan differences in scaling fran one retinal location to another (this is not
to imply that the source of the error is necessarily in the retina) and another
which is a measure of perceived differences between the sizes of angles at
different orientations. Only this second component increases with increased
angle size. This is one of the observations feferred to above which calls into
question the inhibitory interaction explanation for the perceived differences
in angle size since it is typical of an interaction of this sort that the
strength of the interaction, and consequently of the magnitude of the perceptual
manifestation, should diminish with increasing separation of the interacting
units of the treceptor surface' (Mach, 1868b; Cornsweet, 1970; Hartline &
Ratliff, 1958).
5.2 Experiment 8 Ccmparison of Angle Size: Acuity and Constant Error as a
Function of Stimulus Orientation and ConfiEýration.
Because of the controversial nature of the finding that small angles do not
show the expected meridional 6nisotropy of the visual system, which has been
established for almost every visual function where stimulus orientation is
a variable (Appelle, 1971; chapter 1, section 2) a further experiment was
carried out to investigate the influence of orientation on acuity for angle size
in more detail.
Methods
The influence of two variables was measured in this experiment, as. final tests
of the preceding observations-- these were stimulus orientation and stimulus
configuration. Using the basic stimulus shown in-Fig. 5.1(a) the three
configurations shown in Fig. 5.1(b) were tested at the orientations shown in
rig. 5.1(c). The orientations were: 00,22 0,45 0,67 0 and 900. The angle size
was 150 and the line length 18-3 min. arc and separation of the angles, 90min arc. Subject SRH had normal uncorrected visioni subjects DTM and KB had vision correct-

106
ed to normal with spectacles.
Results
The effects of orientation on difference threshold are shown in Fig. 5.4. An
initial 3-way analysis of variance showed subjects and orientations to be
significant sources of variance (p4 0.01) while configurations were not a
significant factor (Table 5.1). Subsequent analyses of the data from each
f.
Source of Variation
d. f. Sums of Squares
Mean Squares
F-ratios
Subjects 2 0.14.8.1 0.074 7.21 pz 0.01'
Configuration 2 0.010 '0 005 . Orientations 3 0.719 0.240 23.55 P-4 0.01
Subi. x Conf. 4 0.036 0.009
Subi. x Orient. 6 0.202 0.034 3.27 p< 0.01
Conf. x Orient. 6 0.037 0.006
S. xC. X0. 12 0.104 0.009
Residual 36 0.371 0.010
Total 71 1 628
Table 5.1 Analysis of variance summary table for difference thresholds obtained in experiment B.
subject (Tables 5.2 - 5.4) show configuration is not significant for any
subject, as would be expected frcm the first analysis, and that orientaticn is
a significant factor only for subjects DTM and SRH. The observations for each
bf these two subjects were pooled across configurations and submitted to
Tukey's test for post hoe comparison of means. The results of the Tukey test
showed that for both subjects, only the difference threshold at 00 orientation
was significantly different from thresholds obtained at all other orientaticns (p < 0.05). No threshold observation other than at 00 was significantly
different from a threshold at any orientation other than the horizontal.
f

107
TV
90 ic
80
cc? rlý (A Ul 000Q
('aJ6Uvj CIIOHS3kJHI
(015UV ) OIOHS3t3Hl
0 CY)
r, ý to
z 0
z Li 9
Ln
te) Z 17
CN
0
C3
Ln
ýo
xm Ir 0- 90 V) Qx
'D %ft-0
c .Q
4
I
7/
// II
a? OR r"ý %p 0000 (alBuv) alOHS3dHi
C4 (n
M,
IE 0
I
Ln It 00
-IIII ýä cr? cq rý uý ul %. -. 0 00000
(a16uyý) CI1OHS3UH1
F t, to
in hx
C4
0
0
z 0 9-
rt'4
0
FIG. 5.4 Effect of stimulus orientation on difference threshold for angle size. Graphs (a) - (c) show individual results for each subject for each -, -, of the three stimulus configurat . ions; the open symbols represent, the meo'n thresholds (rms) at each 6"'r"ientatioq. Graph (d) shows the mean, threshblds for each subject.

108
-4
Source of Variation
d. f. Sums of Squares
Mea n Squares
F-ratio
Configuration 2 0.017 0.008 8.53 n. s.
Orientation 3 0.604 1 50.12 P< 0.01
Conf. x Orient. 6 0.075'--'ý '-, O' P]2 3.11 n. s. . , ý Residual 12 0.048 004
Total 23 0.745
'4.
'o ; 'ý f. ,
Table 5.2 Analysis of variance summary table for difference thresholds obtained in Experiment 8 for subject SRH.
Source of Varb tion
d. f. Sums, of Squares
Mean Squares
F-ratio
Configuration 2 0.003 0.001 0.15 n s,
Orientation 3 0.2P6 0.079 9.15 'bi p< o.
Conf. x Orient. 12 0.103 0.009 0.91 n. s.
Total 23 0.389..,. - - -
I
Table 5.3 Analysis of varia'n'ce summary table of differepc' ', 'Iýresholcls obtained in Experiment 8 for kubject DTM-
Source of Variation
d. f. Sums of Squares
Mean Squares
F-ratio
Configuration 2 0.027 0.013 0.73 n. s.
Orientati on 3 0.080 'O'ý 027 1.47 ns.
Conf. x Orient. 6 0.019 0.003 0.18
Residual 12 0.220 0.018 , IV , v. 1. ,,
Total L3 0.346
Table 5.4 Analysis of variance summary table for difference thresholds obtained in Experiment 8 for subject KB.

109
The observed constant errors for the comparisons of angle sizes in this
experiment are shown in Fig. 5.5. Analysis of variance (Table 5.5) showed a
significant effect between subjects (P < 0.05) and between orientations (p< 0.01)
but not between configurations. Further comparison.. bf the mean constant errors
at each angle orientation, for each subject pooled over configurations revealed
no systematic trends in the variation of constant error with angle orientation.
Source of Var; 3tion
d. f. Sums of Squares
Mean Squares
F-ratio
Subjects 2 4.743' 2.371 3.59 p <, q*'05
Configuration 2 0; '975 0.487 0.79 n. s.
Orientation 4 17.046 4.262 6.453 p<0.01
S. x C. 4 1.291 0.323 0.52 n. s.
S. X0. 8 3.258 0.407 0.65 n. s.
C. x 0. 8 10.781 1.348 2.14 p <0.05
S. xC. X0. 16 12.140 0.759 1.31 n. s.
Residual 45 26.022-ý 0.578
Total 89 76.254
Table 5.5 Analysis of variance summary table for constant errors obtained in Experiment 8.
significant differences were found only for subjects SRH and KB, DTMts results
showed no significant effect of orientation on constant error. For KB only the
bias at 67 0 was significantly different from any other bias (p4 0.05) while
for sRH 5 out of the 10 possible pairwise comparisons hhowed a significant
difference: 00- 45 0900- 670,0 0- 90 0,220 - 67 0,45 0- 67 0, at p40.05.
The lack of any systematic relationship between stimulus orientation and bias,
and the lack of consistency between subjects for those differences which were
found repeats the findings of experiments 3,4 and 6 reinforcing the interpret-
ation of such observations that the constant errors obtained for comparisons
of angles differing only in riýtinai location reflect aitkitrary variations in
angle scaling across the presumably cortical mapping of the retina.

110
, eq Irl C
le 0 C. ) .4
Am
a
0
C14
C
I-
M
- Ig
0 C"
r- ýo
Ln
C14 (14
L-
(a16uy0) s'v'tg
2: 1
0a4
C
4- U 0
D 0,
A-
(015uv. ) SVIS - C-4
:)2a
0 4a
x d3d
0 rm
P (0
LO
%f
C14
L-
(015uv. ) svis
U)
U)
M
_0 :: 3 2
0
04a
90 u I 1
0 T
-
0
to
L.. &t) P. 4
C14
6-0
W,
ý 91- (D
Ln It
-N (14
L- 0
II (alBuvd) tvis
FIG. 5.5 Effect of stimulus orientation on constant error in comparison of an'gles of equal sizes and equivalent orientations. Graphs (a)-(c)
-show individual results for each subject for each of the 3 stimulus I. configurations. Graph (d) shows the mean constant error for the
three subjects.

ill
Discussion
The major finding of this experiment is the confirmation of the observation made in experiment 5 that difference threshold or acuity for angle size is not
systematically dependent on the orientation of the stimulus angles. In the
present experiment the size of the angles was held constant, and the bisectors
of the two angles to be compared were at the same orientation. It is not the
case, therefore, that differences in acuity have been submerged beneath the
confounding of absolute orientation, relative oridntation and angle size as
was possible with the stimulus set used in experiment 5. These results are also
consistent with those obtained in the previous experiment which showed that for
angle sizes up to 450 - 60 0 there was no'difference between difference thresholds
for vertical$ horizontal and oblique angles. The consistency of these findings
is marred only by the observation that the threshold at 00 was significantly different from the remainder for subjects SRH and DTM. Significant differences
between orientations were found in experiment 5 but, as in this experiment,
these differences were not those which would have been predicted from the
oblique effect as described.
on the basis of the results obtained from experiments 5,7 and 8 it is concluded
that small ankles (45 0- 60 0 or less) are not subject to the oblique effect
found for comparable discrimination tasks where the stimulus contains single
orientations only. These findings substantiate the doubts raised in the
discussion of experiment 5 concerning the role of so-called orientation
analysers, in the perception of ant; es.

112
CHAPTER 6: The Time Course of the Perceived Expansion of Acute Angles.
Results obtained fran the orientation Contingent Colour Aftereffect and
the masking studies demonstrate that the differences between the perceived
sizes of an acute angle at different orientations cannot be due to
differences in the inhibitory tuning characteristics of orientation selective
channels. Evidence presented by Abadi (1974) has shown further that this
effect cannot be attributable to differences in the excitatory tuning
curves of these channels, which again were found to be equivalent for vertical
and horizontal and oblique orientations.
Andrews (1965,1967a) has shown that there are constant errors in the
perceived orientations of single lines, such that for flash presentations
of stimuli the perceived orientation was biased toward the oblique, while for
lines presented for longer durations (greater than 500 msec. ) the direction
of the bias was reversed. rurther characteristics of the empirical response
error distributions showed tha bias to be minimal for vertical, horizontal
and oblique lines, with maxima occurring between the horizontal or vertical
and the obliques. This finding was explained in terms of asymmetries of the
response distributions, such that the longer tails are always in. the direction
toward-the oblique. * Only response distributions to vertical, horizontal and
oblique orientations were proposed to be symmetrical.
The observed biases in percieved orientation were thus explained in terms
of differences in the response characteristics of the orientation selective
channels. According to this model, although the sign and magnitude of the
constant error in the perceived orientations may vary as a function of the
amount of lateral inhibition, and therefore of stimulus duration, neither the
existence of the constant error nor the differences in the selectivity between
the detectors tuned to different orientations is claimed to be a consequence
of the mutual inhibition between the detectors.
According to Blakemore's model, and other possible models based on the
inhibitory interaction model derived from the brightness contrast paradigm;
displacement of perceived orientation leading to the perceived expansion of
acute angles is consequent on the presence of two adjacent orientations in the
stimulus and a subsequent displacement of the peaks of activity in the
orientation domain, -
As illustrated by Blakemore's representation (see rig. 9.1)
this displacement, due to summation of inhibition in the region where the
inhibitory profiles of the two detectors overlap enhances the apparent
I
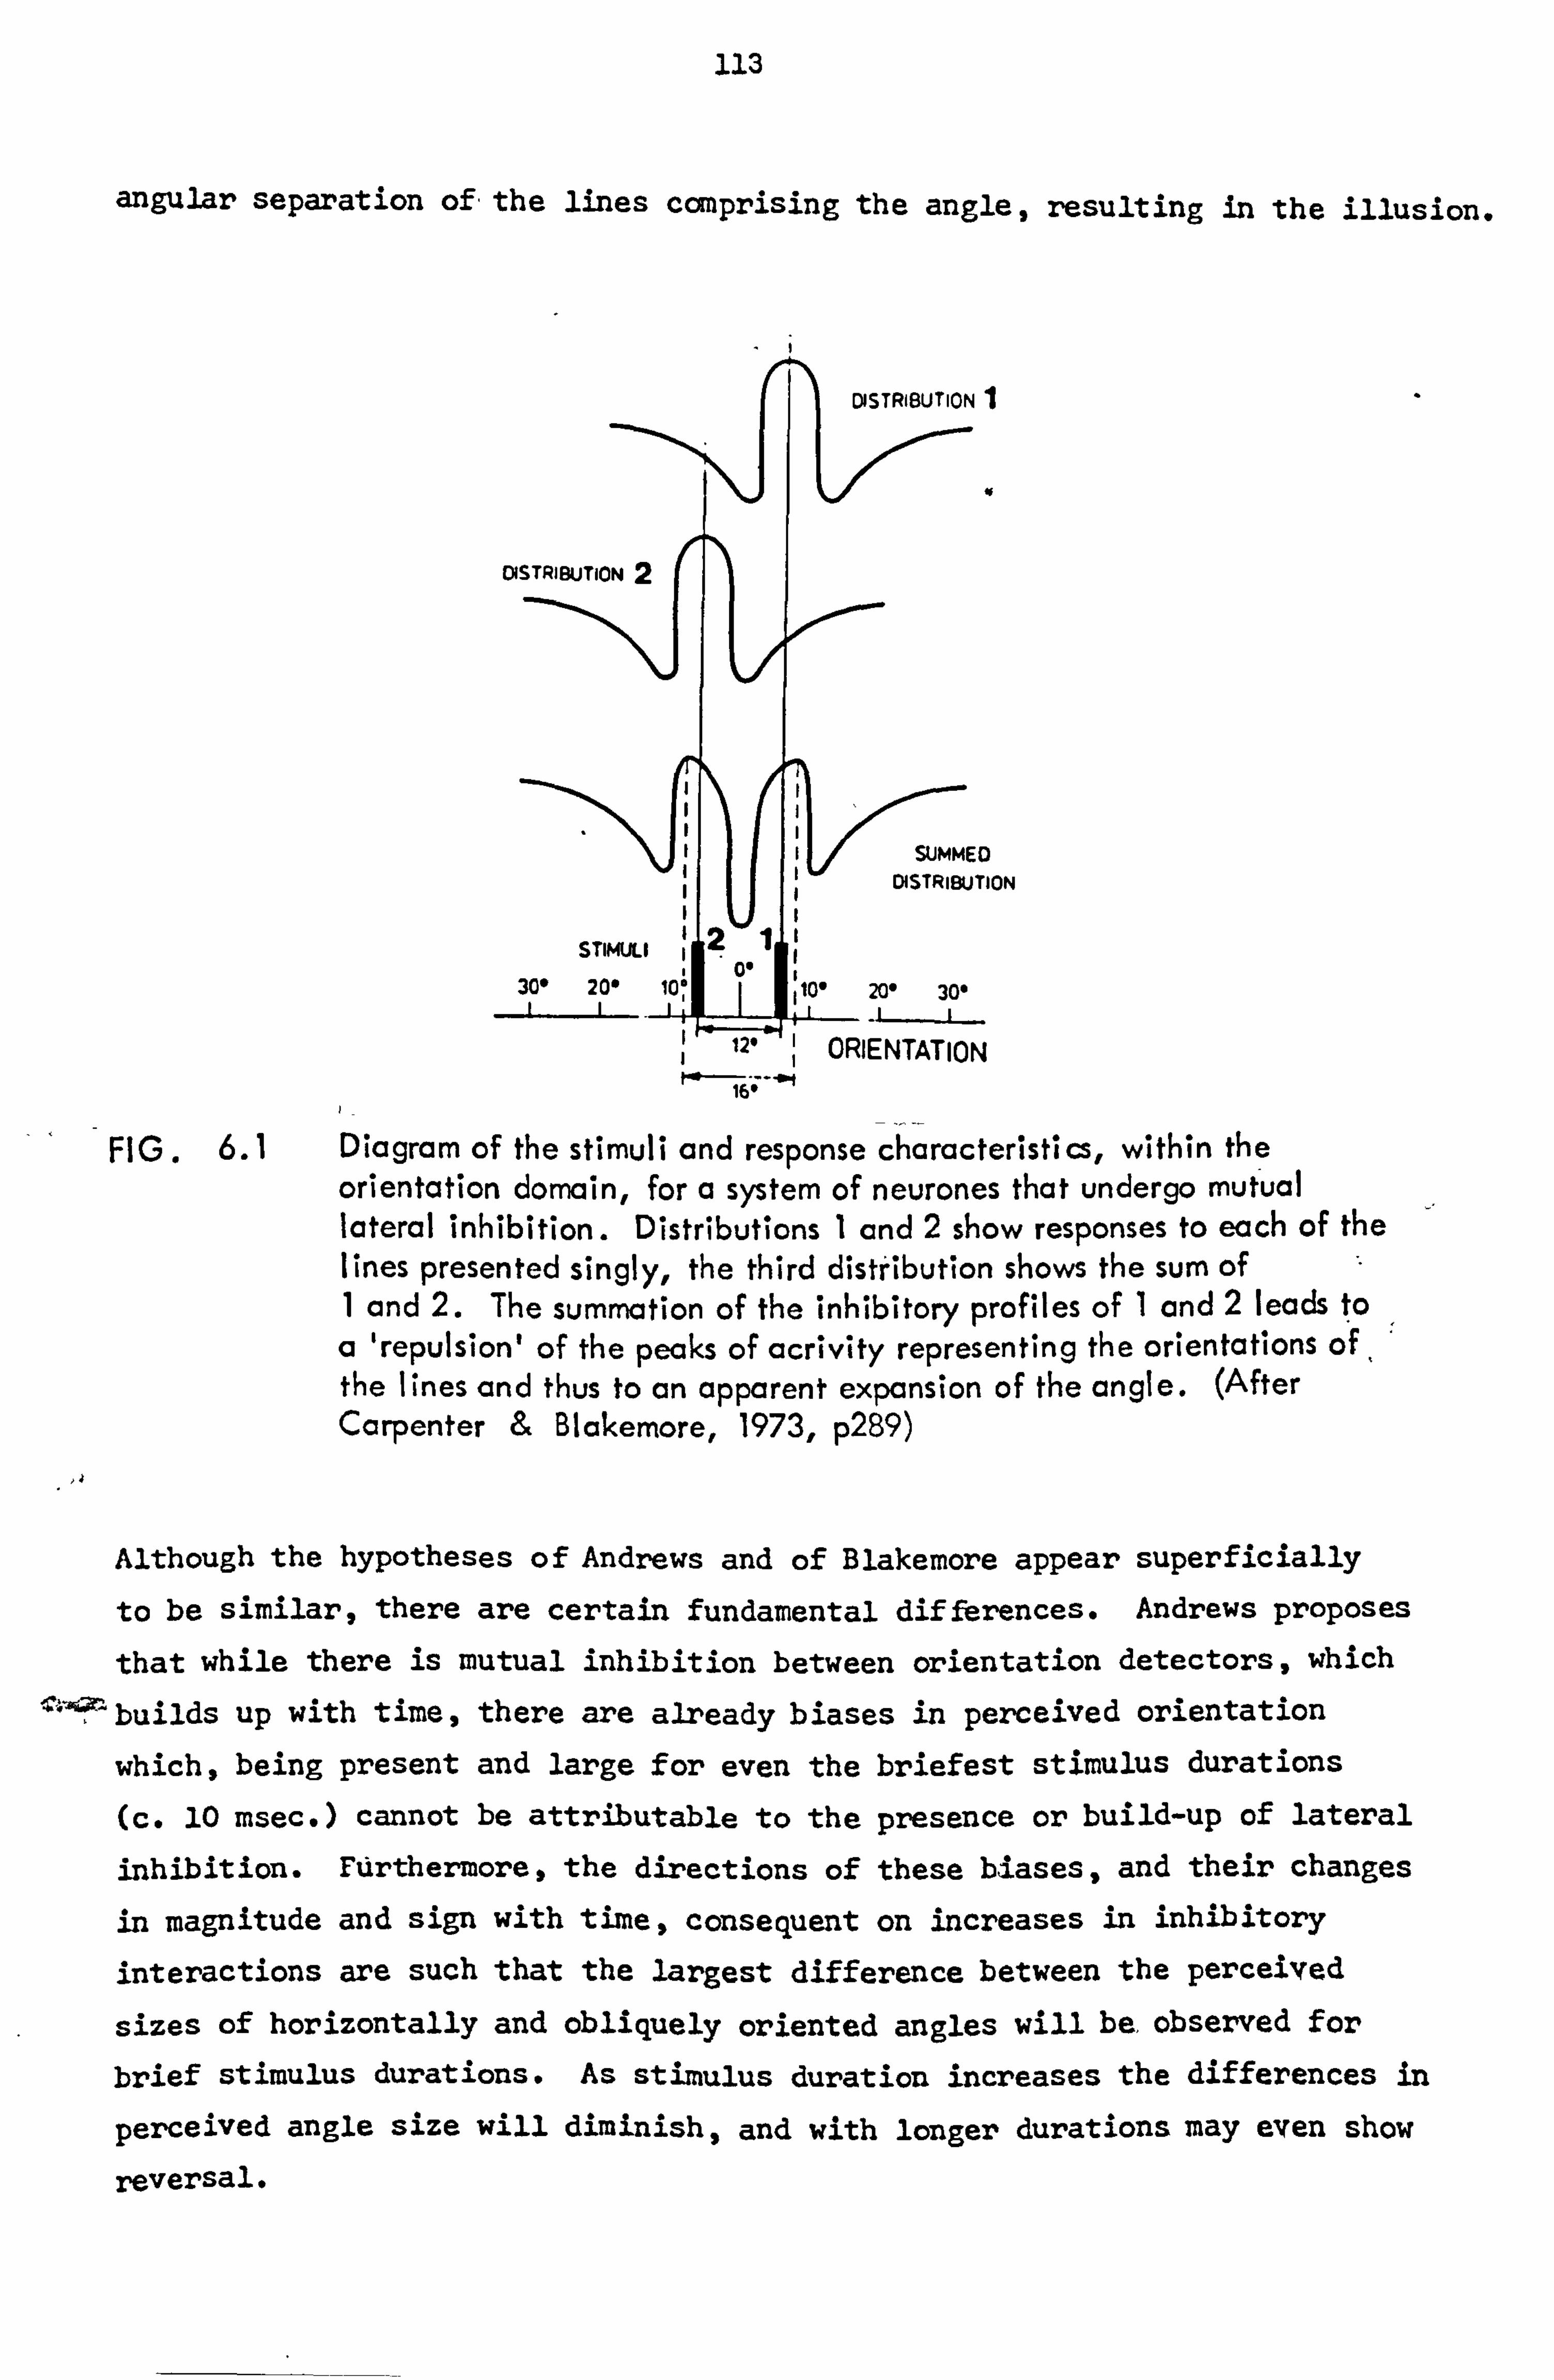
113
angular separation of - the lines canprising the angle, resulting in the illusion.
SUMMED DISTRIBUTION
120 ORIENTATION
FIG. 6.1 Diagram of the stimuli and response characteristics, within the orientation domain, for a system of neurones that undergo mutual lateral inhibition. Distributions I and 2 show responses to each of the lines presented singly, the third distribution shows the sum of I and 2. The summation of the inhibitory profiles of I and 2 leads to a 'repulsion' of the peaks of acrivity representing the orientations of, the I ines and thus to an apparent expansion of the angle. (After Carpenter & Blakemore, 1973, p289)
Although the hypotheses of Andrews and of Blakemore appear superficially
to be similar, there are certain fundamental differences. Andrews proposes
that while there is mutual inhibition between orientation detectors, which 14"ýý-builds up with time, there are already biases in perceived orientation
which, being present and large for even the briefest stimulus durations
(c. 10 msec. ) cannot be attributable to the presence or build-up of lateral
inhibition. Ftirthermore, the directions of these biases, and their changes
in magnitude and sign with time, consequent on increases in inhibitory
interactions are such that the largest difference between the perceived
sizes of horizontally and obliquely oriented angles will be, observed for
brief stimulus durations. As stimulus duration increases the differences in
perceived angle size will diminish, and with longer durations may even show
reversal.

114
Carpenter and Blakemore (1973), on the other hand, suggest on. -, the:, -basis of some rather cursory experiments that "the process producing this phenomenon has a characteristic growth time-constant of less than a second or two" (op. cit. p 298). Insofar as the expansion of perceived angle size is in
their view fully contingent on lateral inhibition, it would be expected, therefore, that the size of the illusion be an increasing function of time for
stimulus durations up to at least 0.5 seconds.
This being the case, a testable distinction can be drawn between the two
models described. That of Carpenter and Blakemore predicts that the
magnitude of the effect will increase with time, while Andrews' model suggests that the effect will be present even at the shortest durations and will diminish or even reverse with longer stimulus durations. An experimental test between these two predictions was therefore carried out.
Experiment 9
Methods
The experiment was carried out using the ccmputerised method of constant
stimuli described in chapter 3 above. The basic stimulus pattern used is
shown in Fig. 6.2 (a) and the set of 21 possible patterns is indicated by
the examples in Fig 6.2 (b). An obtained negative bias indicates that at the
(a) bisector of angle two
bisector of angle one
(b)
STIMULUS STIMULUS STIMULUS NUMBER I NUMBER I1 (0) NUMBER 21
G., 2. (a) The basic stimulus configuration used in Experimert I. (b) ange of sti'mulus configurations available during any one run. The signs in pai6ntheses indicate th6, ppsition of the stimulus in the stimulus range.
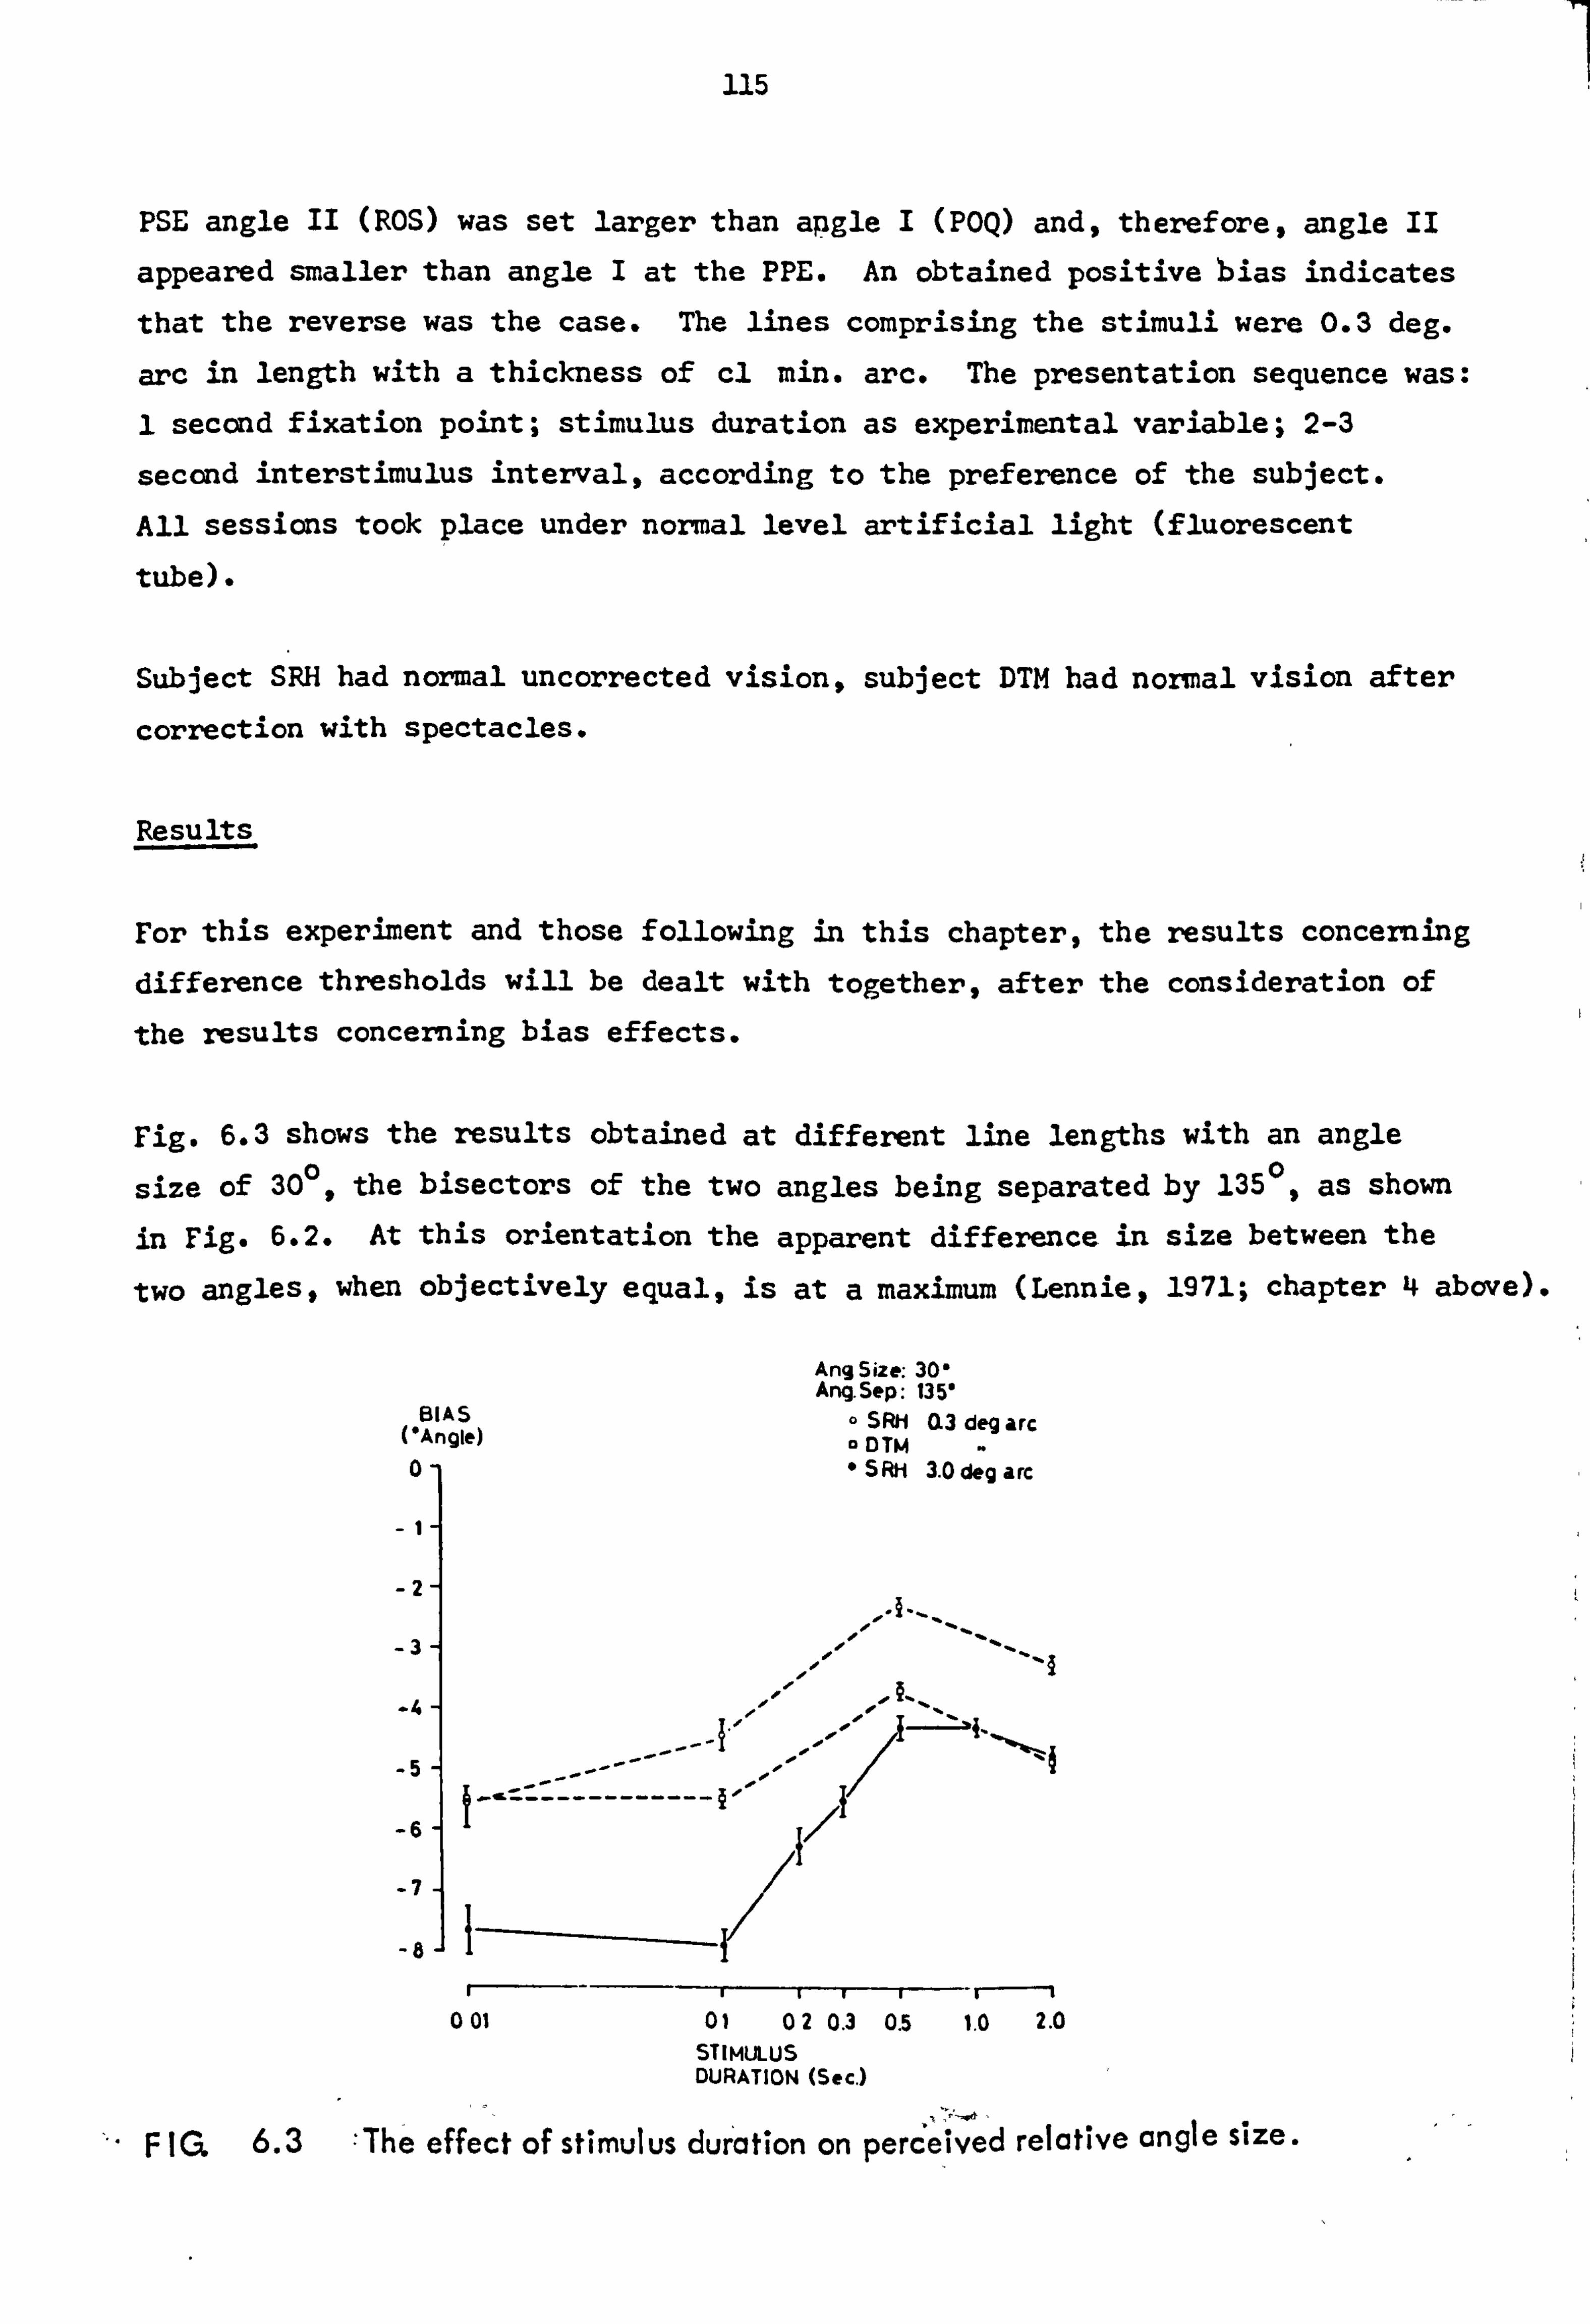
115
PSE angle II (ROS) was set larger than apgle I (POQ) and, therefore, angle II
appeared smaller than angle I at the PPE. An obtained positive bias indicates
that the reverse was the case. The lines comprising the stimuli were 0.3 deg.
arc in length with a thickness of cl min. arc. The presentation sequence was: 1 second fixation point; stimulus duration as experimental variable; 2-3
second interstimulus interval, according to the preference of the subject. All sessions took place under normal level artificial light (fluorescent
tube).
Subject SRH had normal uncorrected vision, subject DTM had normal vision after
correction with spectacles.
Results
For this experiment and those following in this chapter, the results concerning difference thresholds will be dealt with together, after the consideration of
the results concerning bias effects.
Fig. 6.3 shows the results obtained at different line lengths with an angle
size of 30 0, the bisectors of the two angles being separated by 135 0. as shown in Fig. 6.2. At this orientation the apparent difference in size between the
two angles# when objectively equal, is at a maximum (Lennie3,1971; chapter 4 above).
BIAS (*Angle)
0-1
-2-1
-3
-4 -ý
-5
-6
-7
-8
Ang Size: 30, Ang. Sep: 135*
* SRH a3 deg arc * DTM * SRH 3.0 deg arc
-I -ý
�_ s__. I-
I
1 I -.
--I I-L
------------
I
001 ol 02 0.3 0.5 1.0 STIMULUS DURATION (Sec. )
2.0
FIG 6.3 Jhe effect of stimulus duration on perceived relative angle size.

116
In all cases there was an overall decrease in the magnitude of the illusion
with increasing stimulus duration. 7be graphs also illustrate the inter-
subject variation in the absolute magnitudes of the effect. Despite these differences between subjects, however, the time-course of the effect remained
similar for the two subjects at both line lengths.
The observed changes in the perceived difference in the sizes of the two
angles shows the effect to diminish with time, as is predicted by Andrews'
model. Had the altermative hypothesis been true, that as a result of the
build-up of inhibitory influences with increasing time the error in perceived
angle size should grow, the perceived difference between the sizes of the two
angles would be expected to increase - horizontally oriented angles being
subject to a greater degree of perceptual enlargement than obliquely oridnted
angles. The agreement with Andrews' hypothesis is, however, marred by the
inflexion in the curves occurring at a duration of 0.5 seconds, where the
trend is reversed and assumes a direction consonent with the hypothesis
proposed by Carpenter and Blakemore (1973) in that the apparent difference
in angle sizes tends to increase with further increases in stimulus duration
up to the longest duration used, 2 seconds.
Further investigations showed,, however, that this inflexion is not a distinctive
characteristic of the process underlying the errors in perceived angle size.
Fig. 6.4 shows the time course of the apparent difference in angle size effect
as the relative orientation of the angles is varied. As can be seen, although there are marked differences in the amount by which the relation between
stimulus duration and bias is non-monotonic at the different relative orientations
this degree does not appear to be systemmatically linked with any of the
parameters manipulated. 7be presence of this inflexion cannot be taken,
therefores to indicate an 'Andrews-stage' followed by a 'Blakemore-stagel
in the dynamic attributes of the effect.
Despite these favourable results, a problem remains in that the data shown in
Fig. 6.5, derived fran studies already described, are in close agreement with
results obtained by Lennie (1971). These results, he claimed, are inconsistent
with Andrews' model in that the errors in the perceived orientations of the
component lines, as derived from these measurements is always in the direction
toward the obliques. Andrews' model predicts that for longer stimulus durations biases in perceived orientation should tend toward the nearest horizontal or vertical. Lennies' proposed explanation of his findings is
based, however, on the premise 'differential inhibitiont between orientatioTs

117
BIAS (*Angle)
0-1
-Iý
-2 -
-3 -l
-4
-5
-6
H
-81
I
0.01
Ang. Sim: 30* Subj: SRH Lines: 3.0 deg arc
I 90'Ang Sep all2l *1351
An% Size: 30* Subj: DTM Lines: 0.3 deg arc
* 90' Ang Sep * 112*
3
LLJI
0 i
0.1 0.2 0.3 0.5 1.0 2.0 STIMULUS DURATION (Sec. )
-1 -1
-2 -1
-4
-5
-6
i
f
i r-
001 0.1 0.5 STIMULUS DURATION (Soc)
- 135'
FIG. 6.4 Effect of stimulus duration on perceived relative angle size for three angular separations between the bisectors of the test and the comparison angles.
I
0 iI. %%
.0T
. 44 8
im
r 9.0 T
135 lio 2ý5 2ýO ANGULAR SEPARATION
SUbj: SRH Angle size: * 150
& 301, 0 450 9 600
Lines: 0.3 degarc
FIG. 6.5 Variation of perceived relative angle size as a function of relative orientation (angular separation) of the comparison and test angles. The angle size was 30 and the line length 0.3 deg arc at a stimulus duration of 2 seconds.
ob -2 -
-4
-5-1
-6
i
20
I,, - f'T
I

118
such that "this inhibition is greater between detectors tuned to vertical and
horizcntal than it is between those tuned to other orientations. " The results
already presented, obtained from Adaptation and masking experiments (chapter 2)
have already shown there to be no observable differences in the inhibitory
characteristics of orientation analysers (also Hirsch et al., 1974; Abadi, 1974).
However, although Lennie's hypothesis for the explanation of his results cannot
be accepted, his observations that the error in the perception of angle size
implies an error in the perception of orientation in a direction opposite
to that predicted by Andrews' hypothetical orientation analysers hre
substantiated. While the dynamics of the effect are, therefore,, in agreement
with AndrewS'model, its behaviour with variations of perceptual error according
to stimulus orientation is not.
Experiment ICF
In order to try and resolve this contradiction a further series of runs was
conducted in which the changes of the perceptual bias to a stimulus containing
only one orientation were measured as a function of stimulus duration. 7be aim
of this part of the study was to determine whether the perceived size of an
angle could be predicted from some simple canbination of perceived orientations.
The orientations studied were those corresponding to the orientations of the
lines making up the angles used in the previous experiment, where the 0 orientation of the bisector of the test angle was 135
Methods
The perceived orientations of the four lines comprising the stimulus figure in
the previous experiment were estimated by measuring the constant error for
parallelism (Andrews, 1965) at each of the four orientations. The computerised
method of constant stimuli was employed. For these studies the stimulus
comprised two lines, one either side of the fixation point at equal distancest
as. shown in rig. 6.6.
on the basis of Andrews' (1967b) finding that bias is least and acuity greatest
with long lines - compared to 10 min arc - the comparison line was set at a
length of 4 deg. arc, and was visible to the subject throughout each run. The
test line was of the same length as the ams of the angles in the previous
study - 0.3 deg. arc. Although it cannot be assumed that the perceived

119
orientation of the comparison line was unbiased, what bias there was could be
considered to be very'small compared to that of the perceived bias in the
orientation of the test line. Presentation durations for the test lines were 0.01 sec., 0.5 sec. and 2 seconds. The two subjects used were SRH and DTM,
as in Experiment 9
I
1(-) I,::
-_
r-11 0-3 deg. arc
6.6 Range of stitmulus configurations for the parallelism study. The signs I- LL- -f LL- !-A. L-
m puit; mittnuz, inuicuft: Trie pu5mun uT me brimuiuz, in mt: bmilulua lullut,
and are op 6site to the sign of the bics, If the PSE is represented by, ',, ý
a stim-u'luý,. with a positive sign it--,, J! s! 'In-'f6rred that at PPE the test line
was s6en 6t an orientation less thainý. t6t of the comparison line, by
Results
the some magnitude as the bias.
As can be seen in Fig. 6.7 no greatly non-monotonic change in the perceived orient-
ation of single lines was observed for any of the orientations which comprised
the stimulus configuration of the angle experiment. The changes of perceived
orientation of the line segments with time have been re-plotted in Fig. 6.8
so that the biases and the directions of change of bias at each orientation of
the stimulus may be more clearly seen. The information presented in this
figure is summarised in Table 6.1.
Taking the signs of the biases and the directions in which these biases change
with increasing stimulus duration them are no inconsistencies between the
two subjects. However, little unequivocal support is offered to either of the
two hypotheses under examination. At 150 0 and 150 the lines appeared closer
to the horizontal than did the comparison line, while at 120 0 and 345 0 the biases were toward the obliques. For the shorter durations only half of these
results are in agreement with the findings of Andrews (1967a) - the observations
at 1200 and 3450. None of the results support the differential inhibition
11(0) 21(f) r

, 12Q
Subi- SRH
kç
1201 64 '1, 150* 015*
BIAS 345'
VAngle) Subj: DTM
9 1201. 0 150* BIAS
------------------------ ('Angle)
ý, ý - -a . -- 31 3
2-1
I
-I -ý
-2 -
-3
-4 1
I
001 0.5 2.0 0.01 STIMULUS DURAT ION (Sec)
0.5 STIMULUS DURATION (Sec)
FIG. 6.7 Effect of stimulus"d"' uration on perceived relative oHe6tation of the test Me with ref6rence toý the comparison I ine. using the"stimulus shown in Fig. 6.6.
$
2.0
hypothesis since it is assumed that at these short durations the inhibition
which is responsible for the biases does not contribute much to the response
characteristics of the detectors. For all but the 150 line which showed
little or no change of bias with increasing stimulus duration, the changes
of bias show more agreement with Andrews' observations in that the magnitudes
of the biases decreased. With the exception of the 1500 line, this entails
a change in perceived orientation away from the oblique and toward the nearest
horizontal or vertical. The perceived orientation of the 1500 line, however,
which for the shorter durations was biased toward the horizontal rather than
toward the oblique, moved closer to the oblique - at both durations showing
behaviour inconsistent with that predicted by Andrews' hypothesis. In the
light of such apparently conflicting results, it does not seem reasonable to
conclude in favour of either hypothesis on the basis of these two studies.
By finding the angular separations of the two pairs of lines at each stimulus duration, a prediction of the perceived relative sizes of the two angles can be made. In this way it is possible to test the unlikely assumption that the
perceived angle sizes are determined solely by the, perceived orientations of the canpcnent lines as seen in isolation. The expected biases derived following
this procedure are shown in Fig. 6.9. It is immediately obvious that there is

121
I
I
U I4
------------------------------
0. 6
------------------------------
in 1;
;w
x
i-
L. ý (1)
. 99 -0 U:
'
-
10 F3
- I- 4-
*. ýo ...
. "I
.
,7
.4
9
. of
ci 00S) Nownina sninvius
ý «t w .0'. 2 0
-9
CD
E (L). 1% %
2
OA
0-, A
uj ý 91 V -0 I. s
ý
.1 ý6
x -4- %0
, a) -0 s-
D
E
. 1-
a) 0
1D
4 . 4- 'J
C) W Cl
ý in 12
ý '42,
ý re
1-- .0
Co
0

1ý
122
0 Subject: SRH
Stimulus duration Effect of increased Direction of change of Orientation 10 msec. 2 sec. stimulus duration. bias with increased dur.
345 0 343.33 345.33 Change from bias to Bias to Obl. Bias to H Obl. to bias to H. Oblique to Horizontal
0150 11.31 11.31 No change Bias to H. Bias to H
1260 122.63 121.70 Reduced bias to Bias to Obl. Bias to 0. Obliqu Oblique to Vertical
15do 152.35 150.99 Reduced bias to Bias to H Bias to H Horizontal Horizontal to Oblique.
*Subiect: DT M
3450 342.93 343.45 Reduced bias to Bias to Obl. Bias to 0. Oblique. Oblique to Horizontal
0150 13.58 13.05 Increased bias to Bias to H. Bias to H. Horizontal Oblique to Horizontal
120 0 123.00 120.70 Reduced bias to Bias to Obl. Bias to 0. Oblique Oblique to Vertical
15do 153.61 150.92 Reduced bias to Bias to H. Bias to H. Horizontal. Horizontal to Oblique
Table 6.1 The influence of stimulus duration on the perceived orientation of the test test line in the parallelism study, presented graphically in Figs 6.7 and 6.8 are summarised here together with the directions of changes of perceived orientations observed between the longest and shortest stimulus durations.
little similarity between these graphs and those which were obtained
experimentally. The main difference is in the sign of the bias, which indicates
that horizontally oriented angles should appear smaller than the obliquely
oriented angles. This prediction is in direct opposition to the findings of
these and other studies (Lennie, 1971; Carpenter & Blakemore, 1973) that an
angle oriented horizontally appears larger"'than an obliquly oriented angle.
'Furthermores half the perceived angle sizes predicted from the single line data
are smaller than the actual angles (see Table 6.2) -a prediction wholly
inccnsistent with the finding that acute angles are perceptually expanded.

123
Subject Orientation of Angle (300)
Perceived Angle Size 10 msec. 2 sec.
SRH do 27.98 25.98
135ý 29.72 29.29
DTM op 30.65 27.60
1350 30.61 30.22
Table 6.2 The entrants for perceived angle size are calculated from the perceived orientations of single lines, at the two stimulus durations shown in Table 6.1. These figures result in the predicted time course of the perceived differences in angle size shown in Fig 6.9.
I
4-1
Z
2
I -ý
0-
.. A
0. STIMULUS DURATION (Sec)
SRH DTM
v
0.5., -g 2.0
FIG. 6.9 Predicted time course f6rth'e" eived relative sizes of angles iwiý, ý- i--: ý perc configuration used i, n Experirn! ýý. t I. The predictions are derived froiý'- the parallelism study as summbrised in Table 6.2.

S66ject: -SRH *
Orientation 10 msec. 2 sec. Effeýcfof i

124
It may be concluded, therefore, that neither the perceived size of an angle nor the perceived relative sizes of two angles of different orientations can be predicted from a knowledge of the perceived orientation of the component
single lines in the absence of further information concerning the perceptual
mechanisms involved with the simultaneous perception of lines of differing
orientations. The results obtained also cast some doubt on the generality
of the two hypotheses which have been considered as possible explanations of the process underlying the perception of angles.
Experiment 11-
Both these hypotheses postulate that the changes in the perceived orientation
of lines taken either singly or in angle patterns is a consequence of inhibitory interactions operating between orientation selective feature
analysers. A further experiment in this series was carried out in order to
determine whether the influence of lateral inhibition on perceived angle size
could be isolateds and if so, what form this influence would take.
Following the suggestion (Blakemore, Muncey & Ridley, 1973) that the 'tuning
curves of feature detectors as measured in masking and adaptation experiments
may describe the inhibitory characteristics of these detectors which decay
slowly with time, rether than their excitatory characteristics's experiments
by Sharpe (1974) in the colour dcnain and by Dealy and Tolhurst (1974) in the
spatial frequency domain have provided evidence in support of this hypothesis.
The experiments of Kulikowski, Abadi and King-Smith (1974) which showed that
the tuning curves for orientation analysers, as revealed by the method of
subthreshold summaticnq which presumably depends on excitatory summations
are considerably narrower than those derived by other methodsq give further
indirect support-
This being the case, adaptation to a grating should establish a high level of inhibitory activity in the orientation domain, roughly comparable to that which
follows prolonged viewing of a line stimulus. Thus, if the perceived
orientation of a contour is a function of the amount of inhibitory input to
the pertinant orientation detectors, it would be expected that a period of
adaptation to a grating would 'prime' the system with referenýe . -to the
perceived orientation of a subsequently presented line of the same actual
orientation as the grating. That' is to say, the build-up of inhibition during
adaptation should result in the perceived orientation of a briefly presented

125
line approximating that of a line presented for a more extended duration.
Methods
The experimental procedure followed in this experiment was precisely the same as that followed in the preceding experiment with the exception that prior to the
commencement of a run the subject had 5 minutes to freely gaze at a photograph
of a bar grating at the same orientation as the comparison line in the stimulus
and with approximately the same line width. Between each 10 msec. stimulus
presentation the subject viewed the grating for a further 3 seconds during
the interstimulus interval. The orientations used the Experiment 10 were used
again in this experiment. The subjects taking part were SRH and DTM.
Results
The results of this experiment are shown together with those of the pý-evious experiment in Fig. 6.10. In view of the rather uncontrolled nature of the
experiment, due to the inabilitY to guarantee a constant level of adaptation throughout the duration of each run, a quantitative comparison the the two sets
0"1 2.0
vo I
$1$
It It It It It 1t It II II It It I -.
II II II II II
____________ tT
10a OTM
7 IS4 153 152 10 ISO Of 123 122 121 120 go 45 Is 14 13 12 11 0 344 345 3" 343 342 315
PEKEIVIED ORIENTATION (0)
FIG. 6.10 Effect of prior adaptation on the bias for parallelism, superimposed on the results of the previous study. The arrow's in4icate the bias for a 10-Wseq-ýtlr qjuq, duroti6n;! and are shown at liý'Iop and bottom to
- .. -M ýte foci I it6iiý. 66ýý6ýIS'Onlof ih" cis e post-adaptation 61" with both the I ong and short stirn*ut'us presentations in theabsenceof adaptation.
__-

126
of results is not justified. Qualitatively, the expectation that the effect
of a longer stimulus duration on the perceived orientation can be simulated for short duration presentations by prior adaptation is fairly well upheld. Of the points of discrepancy, both subjects showed the expected change for the
15 0 line, which had not been found at all in Experiment 10 , leaving only the
contrary result for DTM at 3450 unexplained. Here the shift was in the direction
opposite to that which was expected.
Discussion
The results of Experiments 9 and 10 show that as the time for which the stimulus is presented to the visual system is increased the constant error in the
percepticn of the orientation of the line or lines comprising the stimulus becanes smaller. In several instances a reversal of the sign of the bias was found for single lines, the constant error for the two second presentation
thus being in the opposite direction to that found for the shortest durations.
The demonstration that similar changes in perceived orientation can be induced
by adaptaticn to a grating of the same orientation as the test line indicates
that the mechanism responsible for the reduction in constant error involves
lateral inhibitory processes, operating in the orientation domain, as was
originally proposed by Andrews (1965). The finding that neither the perceived
size of the angle, nor the apparent relative sizes of angles of different
orientations can be simply predicted by combining the apparent orientations
of single lines offers further evidence for the existence of interactions between
the channels responsible for the detection of lines, and the analysis of their
orientations, where more than one line is presented simultaneously. This is
especially evident in the prediction, based on the perceived orientations of
single lines, that acute angles should appear smaller than they actually are
(see Table 6.2). Insofar as the constant error in the comparison of angle sizes
does not show a change of sign, or a levelling off around zero, this interaction
appears to show at least one characteristic of the system proposed by
Blakemore et al. (1970) even though the time course of the constant error
magnitude is in a direction opposite to that which would have been expected
of such a system.
An attempt to modify either of the two models to accommodate these observations,
however, would be ill-advised, as the observed biases of perceived orientation
found in E*periment 10 show when referred to the horizontal and vertical rather
than to the stimulus orientation. Both hypotheses give clear predictions for
the direction in which the biases should lie, but the data are not consistent

127
with either. Some orientations were found to be biased to the obliques at longer durations, as predicted by the Blakemore et al. (1970) inhibition model; other orientations appeared biased toward the vertical and horizontal, as found by Andrews (1967a).
A further difficulty for the models of both Andrews and Blakemore et al. has been pointed out by Lennie (1971). When 40 0 angles are used in the 1350
ccnfiguration (see Fig. 6.2) there should be no apparent difference in their
magnitudes since"all four arms are at the same orientation with respect to the vertical and horizontal, and the interactive effects should therefore
cancel. It has been shown, both by Lennie and in this study (chapter 4) that it is at this relative orientation that the effect is greatest.
Difference Thresholds - Experiments 9,10 & 11
Although these experiments were primarily concerned with the effects of
stimulus duration on perceived angle sizes and line orientations, i. e. the biases,
the difference threshold measures obtained as a matter of course during the
experiments are not without interest. According to the model developed by
Andrews (1965,1967a) the function of lateral inhibitory interactions between
orientation analysers is to integrate the responses of these analysers over time,
the perceived orientation corresponding to maxima in the resulting pattern of,
inhibition.
"For very brief stimuli, mutual inhibition does not stabilise. Response
frequencies following stimulation are small and subject to large sampling
variation. The maximum in the pattern of inhibition may occur at an
inappropriate orientation .... For longer exposures, miltual inhibition stabilises.
Infrequent'responses are reduced or shut off, and the variation of the point
at which the maximum occurt becomes smaller; .... The distribution of apparent
slope will be narrower and more symm4ýtrical than with flashed presentations. "
(Andrews, 1967a, p 994)
The thresholds obtained for the discrimination of angle size as a function of
stimulus duration are shown in Fig. 6.11 (a)- (c). In all cases there is a
decrease in threshold with time of presentation. These findings are, therefore,
ccnsistent with the notion that sane integrating process does operate to
reduce the weight of small, inappropriate responses to the response distribution
representing the percdived orientation. Further, the graphs show a marked
tendency to flatten beycnd the 0.5- second point, in agreement with Andrews'

U CL
Co r
Ir
ChE C:
U
. ý41e, *. 'ý; ý,
ý. ' Li
in c2 (n
, no
_e_4 -.
FI-I C!
(alBuy, ) (310HS38Hi
I.
III Ii
I! Ii
I! I:
"1
-I 7/il
t4
(al6uy. ) (IJOHS3blHl
". _.:. " �I
// -. --. /
b &; A,.
\I
Ai O4
II II
F-- 6
(albuv. ) (IIOHS28HI
0
a
0
0
-R U, 0
ci
C'. ,9ý, -
-" e
o VIZ. :)2 iP D<
6, 6
9 C4
Ui CD
u ffý lllý
a (I) C4
V) z D0
IR En o
0
CL u 10
41 1-.
I,
a* ý,
rI r-----r fn
(al6uV. ) 3Sd
CL
: L, opi 6v) ri C4 LO
ýj It, c : 3.5 -4 LA -i
cr :"o
m es Z, m
mg, -00
o 41 40,
-W
I -v- II --T--- 11
C4 In
---I
cn -u Ulb
I';,
1ý
. cp-
10 el Co
CID
C? c4
UI 0
Z 0
c5 Z) 0
tA
I
oc) c_c O-
o Cr1'i
On..
olv u
In
au �-
2 iyc. tn -C "Ai
Ui _0 4ý
; .ý F) 0
q
a --
ll: ý -. (L)
r2 1 -0 -0
9 fm
Ln 0 lllý
0Z
crt
Ln 0
128,
- >I_ o -c 0
-C W Lo 7-- L.
...
EEL:

129
suggestion that the. time constant for the integrating inhibitory process is
about half a second (Andrews, 1967a). Although changes in threshold do occur
between 0.5 second and 2 second presentations these changes are small in
comparison with the changes which were found for increases in stimulus duration
from 10 msec. to 0.5 sec.
When the time courses for the changes in* threshold and for the changes in
bias are taken together, however, some difficulty arises. If, as Andrews
proposed, both changes in threshold and changes in bias are consequences of
the same process, the growth of mutual inhibitory interactions between
orientation analysers, it would be expected that their time courses would
have similar characteristics. Comparison of the data presented in Figs. 6.11
(a) - (c) and (d) -M show that this is not the case; none of the reversals
of the bias are reflected in the thresholds obtained for the longer stimulus
durations.
These data suggest, therefore, that the positions of the inhibitory maxima in
the pattern of activity of orientation analysers are not necessarily invariant for given stimulus conditions- In other words, although there is a
consistent reduction in the width of the response distribution with increasing
time for integration, the process may not 'home' consistently to one perceived
orientation on an absolute scale. Rather, the final perceived orientation may
be determined not only by the characteristics of the stimulus, but also by the
state of the analysers. This state could be determined, perhaps, by adaptive
effects with much longer time constants than those of the stimulus-induced
inhibitory interactions. Long-term shifts of perceived orientation have already
been found, independent of the short term effects of stimulus presentation
(Andrews, 1967a).
It is possible, then, that the short-term narrowing of the response distribution
of an analyser is generated and maintained by the activity following the
presentation of a stimulus, while the perceived orientation or angle size is a
resultant of the superimposition of this activity onto an 'uneven', changing,
representation space. The metric characteristics of this space would be due to
the sensitivity characteristics of the neural analysers at the time of stimulation.
These characteristics would be themselves determined by the long term 'perceptual
diet' to which these analysers had been exposed.
This interpretation of the data assumes that Andrews' postulates concerning the
mechanism of orientation analysers applies equally to the perception of angular

130
extent. If this were the case, analysis of anguLar extent would entail the
neural representation of angular extent as the distance between the peaks of
activity representing the orientations of the lines comprising the angle.
Changes in perceived angle size would entail, therefore, changes in the separation
of the distributions of activity representing the lines. The shortcomings of
any simple 'orientation-contrast' model which is based on lateral inhibitory
interactions have already been described. This means, therefore, that although
the reduction with time of the variance of the response distributions of the
oridntation analysers may be attributable to a-lateral inhibition process, the
change in perceived angle size, and necessarily of perceived orientation of
the components of angles, cannot be attributed to this process alone.
If lateral inhibitory interactions between channels cannot be responsible for
the changes of perceived angular extent with time, then these effects may be
caused by differences in the 'receptor surface' in the orientation domain.
The finding that the sensitivity to lines, gratings etc. varies with stimulus
orientation so that sensitivity is highest for vertical and horizontal
orientations and lowest for oblique orientations has already been extensively
covered in chapter 1. Neurophysiological studies (Mansfield, 1974) have shown
that the thresholds of individual neurones in the primate striate cortex do
not vary with orientation. The same study did show, however, that in the
foveal projection area of the monkey cortex cells tuned to vertical and
horizontal orientations were markedly more numerous than cells tuned to other
orientations.
It is suggested that the properties of orientation analysers are the
characteristics of populations of cells each of which has, on average, the same
threshold (the actual threshold of any given cell at a given time may be found
to vary ). All units in a particular analyser need not have the same
preferred orientation. Instead, analyser membership depends on the population to
which the individual neurone is most closely connected. In neural terms this
population could be represented by the columns first reported in the visual cortex
of the cat by Hubel and Wiesel (1959). Subsequent studies have shown that there
is a distribution of preferred orientations of the neurones comprising one
columnar unit.
The composition of these analyser-populations is constrained by the finding that
analysers tuned to different orientations (horizontal, vertical and oblique) do
not differ in their bandwidths. As the overall sensitivity of an analyser
is being considered to be dependent on the number of sensitive units, the slope
11

131
of the analyser response distributions must be sharper. This is in agreement
with the findings of Rochlin (1955), Andrews (1967a), ý6nd Bouma and Andriessen (1968) who showed that estimates of perceived orientation were
more precise for vertical and horizontal stimuli than for oblique stimuli. Thus, Andrews illustration (Andrews, 1967a, Fig. 12; reproduced here as Fig.
6.12) of the 'response frequency to flash stimulation of hypothetical direction-
sensitive neural units' would describe the response frequency distributions
FIG. 6.12 Response frequency to flash stimulation of hypothetical direction sen. ";. ifive"e"" neural units as represented 6ý Andrews' (190a).
of the orientation analysers; described here as columns, but not the response
characteristics of the units of which the analysers; are composed. Insofar as the
sensitivity characteristics of the analyser reflect the characteristics of the
population of neurones belonging to the analyser, these curves would also be
expected to reflect the frequencies of occurance of cells tuned to an orientation
as the preferred orientation of the an&lyser (the mean preferred orientation
of the cells within the column) varies.
In order that this model does not assume the characteristics of that of
Blakemore et al. (1971) a further proposal must be made: inhibitory interactions
should be predominantly within analysers, serving to reduce the widths of
their response distributions, and so not to give a contrast effect due to
between-analyser inhibitory interactions.
As neurophysiological studies have shown (Sillito, 1975b; Creutzfeldtl, Kuhnt &
Benevento, 1974; Creutzfeldt, Innocenti & Brooks, 1974), however, excitatory
input to orientation selective cells in the cat visual cortex is rather broadly
tuned, the high selectivity being a function of inhibitory inputs. The cortical
distance over which such inhibition is effective has been estimated as about
800 micrometers (Hess, Negishi & Creutzfeldt, 1975) while all orientations

132
are represented within an area of a hypercolumn- 300 - 500 micrometers in
diameter. As the neural unit of function corresponding to the orientation
selective channel is the column, the existence of intercolunnar inhibitory
connections implies that inhibitory interaction occurs both within analysers
and between analysers. The assumption required for the interpretation above is, therefore, untenable.
Those characteristics of orientation analysers which would be necessar-I for the
explanation of perr-eived angle sizes in terms of combinations of perceived
orientations cannot, therefore, be substantiated.
Further evidence opposing the notion that angles are perceived in tems of
combined outputs of orientation analysers is provided by the comparison of
difference thresholds for angle size with those obtained for oridntation.
These data are presented in Table 65.3. Here the difference thresholds for angle
Subject- Stimulus Stimulus durations orientation 10 msec 500 msec 2 sec
SRH 015' 1.348 1.817 0.793 0.629 0.701 0.491
34? 1.623 2 634 977 0 0 955 511 0 . . . .
120a 397 1 952 1 1 041 IA4 ýZ1 Q 0 504 I1 . . . 114 z ", -'
,i
1 j ,, h! 'ý. " -j *
l5do -C+ 1 .733 999 2 1 165 1" *" § , -", 1v 07055 ' 0 9l2 . . . , , , .
Angle 4.6526 0.972 0,945 0.99: 11 0.982
e Ol 0.917 0.841 0.742 0.551 0.497 0.244
34? 1.125 1.266 0.817 0.666 0.691 0.478
i 0, 294 1.496 2.238 0.626 0.392 0.508 0.258
150a 1.729 2.989 0.671 0.450 0.705 0.497
Angle 1.341 1.798'Y' O. b97-' -'0.805 0.988 0.976
S .1 -2 2 s s s
, j, 4, TkkBLý-'6.3 Difference thresholds (st6ficjaý'& deviations and variances) for orientations
wir; 1; 1 ell- and for equivalent angles', inade up of the four orientations. -(I'pr. explanation see text).

133
size and perceived orientation are shown for the two subjects at three stimulus durati ons -
The difference threshold, as the standard deviation of the normal distribution
most closely resembling the response error distribution, is a measure of the
variability of perceived orientation or angle size. If it were the case that
the perception of angle size is mediated wholly by combinations of outputs from
orientation analysersq then it would be expected that the variability of
perceived angle size would equal the total variance of all the estimated
orientations comprising the angles under comparison. As the figures in Table
6.3 show, this is not the case. In fact, the variability of perceived angle size is closer to that for one line (and occasionally two) than to four lines.
This surprisingly low variance of perceived angle size estimation indicates
that the orientation estimates in angle perception are more accurate than are those
in the perception of the orientation of single lines in the parallelism task.
As this leads to an implausibly high orientation acuity for each component line
a more likely interpretation of these observations is that acuity for angle size
is not directly derived from the orientation acuity for single lines. This
interpretation is consistant with that of the cbserved constant errors.
The conclusion derived from consideration of the biases obtained in these
experiments comparing the perception of angle size with the percepticn of
orientations that the processes by which angle size is perceived bear no simple
relation to those processes by which orientation aicne is perceived, is supported
further by these findings concerning the difference thresholds for the two
tasks, and reinforces the findings presented in chapters 4 and 5.
Finally, in the third experiment of this set, during which subjects adapted to a
grating prior to estimating the orientation of the test line, the relaticn between
perceived orientation, difference threshold and adaptation was examined. If
the perceptual consequences of adaptation, the aftereffects, were the result of
a reduction in sensitivity due to slowly decaying inhibition of analysers sensitive
to the adapting stimulus then, if the increase of acuity with increased stimulus
duration is also a consequence of inhibitory activity, pre-adapation to an
orientation would be expected to reduce the difference threshold for short
duration stimuli at the same orientation in the following way. During the
adapting period, as the subject viewed a grating at a given orientation, the
analyser corresponding to that orientation would be the most excited and

134
consequently liable to the great. est inhibitory influence. The test stimulus
will be presented, therefore, to an analyser which is already, presumably, in
a state corresponding to that following prolonged viewing of the stimulus. As
the test stimulus was well supra-threshold, the expected result of this
procedure would be that the 'outlying' responses found for short duration
presentations of the stimulus under non-adapted conditions would be inhibit6d
thus giving a difference threshold corresponding to longer duration stimuli.
As the results given in Table 6.4 show, this expectation was not fulfilled.
Subject Stimulus Duration
Stimulus Orientation
1200 1500 0150 3450
SRH 10 msec 1.397 1.732 1.348 1.632
500 msec 1.041 1.165 0.793 0.977
2 sec 0.710 0.955 0.701 0.715
10 msec 1.082 1.950 1.538 1.455 (adapted)
DTM 10 msec 1.496 1.729 0.917 1.125
500 msec 0.626 0.671 0.742 0.817
2 sec 0.508 0.705 0.497 0.691
10 msec 1.125 1.187 0.836 0.642 (adapted)
TABLE 6.4 Difference thresholds for parallelism (single orientation) obtained for
various stimulus durations and after adaptation to a grating of the some orientation.
In all but one case (Subject DTM at 3450) the thresholds obtained following
prior adaptation to the grating were found to be closer to the values obtained
for the short duration presentations (without prior adaptation) than to the
long (2 sec. ) stimulus presentations.
In retrospect, however, this experiment was somewhat misconceived. Tolhurst
(1975a, b) has shown that there is strong evidence supporting the existence of
two parallel visual information processing systems in humans, comparable to the
X- (sustained) and Y- (transient) systems demonstrated in the cat retinal

135
gAng. lion tce]jsý, _. by Enroth-Cugell and Robson (1966) and in the cat visual
cortex by Ikeda and Wright (1974,1975). It may be supposed that in this
adaptation experiment the short duration stimulus was processed largely by
the transient system whereas the adaptation primarily influenced the sustained
system as the grating was stationary. From this point of view it would not be expected that the difference threshold for short duration presentations would be influenced by prior adaptation, there being no evidence to date for
inhibition of the transient system by the sustained system, although inhibition
operating frcm transient to sustained has been proposed on the basis of
neurophysiological evddebce (Singer & Bedworth, 1973) and psychophysical
evidence (Breitneyer & Ganz, 1976). If this interpretation of the data is
correct then it is likely that the improvement of acuity resulting from
increases of stimulus duration is to sane extent reliant on the increased
involvement of the sustained system in the processing of the stimulus
orientations, and not simply to the build-up of inhibition. Improvements of
acuity from medium duration to long duration stimuli, e. g. fran 50 100 msec
upward, will still be a consequence of integration of responses through inhibit-
ion, as this improvement at these durations cannot be attributed to the
increasing involvement of the sustained system.
The finding that there was some effect of adaptation to the grating suggests
that for both short and long duration presentations perceived orientation may
be referred to a common underlying metric which is influenced by prior inputs to orientation analysers. These inputs may arise from either the sustained
or the transient systems.
Conclusions
Despite the attractive simplicity of the model proposed by Cappenter and
Blakemore (1973) as an explanation for the perceived expansion of acute angles,,
results of the three experiments described in this chapter show it to be
untenable in its current form. The notion that orientaion analysers exert
mutual inhibitory interactions was not refuted as such, but it was shown that if
anything this process operates to reduce the effect, or at least the differences
between the strengths of the effect at different orientations insofar as the
magnitude of this difference was found to decrease with increasing stimulus
&: ta: t: iCn, This finding was consistent with the model elaborated by Andrewsý
(1967a, b).

136
7be results obtained fran the second experiment described in this chapter
were not, however, fully consistent with those obtained under similar conditions by Andrews. rurthermore , canparison of the biases and thresholds obtained in
this experiment with those obtained in the first experiment indicate that the
relation between perceived orientation and perceived angle size is not a simple
one. Modification of Andrews' hypothesis in such a way as to embrace the
current findings generated a prediction which was not consistent with available
neurophysiological evidence, and which, therefore, was abandoned.
Although the third experiment to be described was considered to have been
inappropriate to the question for which it was designed, the results obtained
were consistent with the currently held hypothesis that there are two parallel information processing systems within the visual pathway, the 'sustained' system
and the 'transient' system. The results also corroborated the hypothesis that
although the transient system exerts an inhibitory effect on the sustained
system, this inhibitory interaction is not reciprocated. This experiment did
not, however, shed any new light on the relation between perception of orientation
and the perception of angle size.

137
Chapter 7: A Metric for Perceived Angular Extent?
All the experiments described so far have been designed with reference to
the hypothesis that the visual system decomposes the visual scene, at least
partially, into edges and contours. In terms of these elementsq as abstracted by the cortical striate feature-analysers, the visual input is transmitted
to post-striate regions of the brain. Because, however, the cortical'analysers
are non-independent and interact mutually through lateral inhibitory
connections, contrast effects were supposed to lead to enhancement of
separations between orientations represented by feature analyzers sufficiently
close together to mutually distort their response distributions.
Although the observations made in a number of varied studies, described in
chapter 1, have been in agreement with hypotheses framed in these terms, the
results of the experiments described in preceding chapters have not been
consistent with this hypothesis. Any further description of the mechanism
underlying the perception of angle size must, therefore, not only encompass
the data obtained in the present study, but also those obtained in the
previous studiesq including the neurophysiological evidence for the existence
of orientation selective channels with mutual inhibitory interactions, which
is quite independent of the psychophysical evidence from which these systems
may be deduced. The data obtained in the preceding studies, however, while
clearly inconsistent with the type of hypothesis outlined above do not appear
to fall into any self-consistent patterns from which an alternative explanation
may be derived.
For these reasons it was decided to carry out a further series of experiments
which made no reference to hypotheses concerning the neural processes under-
lying the perception of angles, but which were intended to cbaracterise the
perceptual attributes of angles in such a way as to determine whether or not
a metric space for angle size as a perceptual quantity is reflected in the
activity of the visual system.
7.1 Experiment 12: Additivity of Perceived An7ular Extent.
The first experiment was intended to determine whether or not additivity was
a property of such a metric, if it exists - for example, is the perceived size
of a 300 angle equal to the sum of the perceived sizes of the two adjacent 15 0 angles included in the 300 angle? If this were the case, then a magnif-

138
ication factor, the ratio of percieved angle size to actual angle size would be constant for all angle sizes, fluctuating 6nly with any meridicnal aniso- tropy of the metric for angular extent, to the degree that such anisotropy is present.
In fact perceived angle size cannot be relat6d to actual angle size for, in
order to make such a comparison the perceived angle must somehow be compared to the real angle. In order for such a comparison to be made the observer
must view both and measure the difference between the two, an operation which is manifestly impossible. It is, however, unnecessary to use actual angle
size in the comparison. The perceived size of any angle will do, so long as it remains a reference angle and is not included into the metric. The
assumption was made, therefore, that a horizontal angle (00 bisector orientation)
would be taken as a reference and, for no other purpose than numerical conven- ience, the perceived size of this angle was said -to be equal to its physical
size. Because, as is demýnstrated in experiments 5 and 6, angles of this
orientation show the largest perceptual enlargement, it would be expected that
the magnification factor M would be less than unity for all other test
orientations and minimum when the test angle is oriented about the main obliques.
Methods
15 0 Stimulus Angle
30 0 Size
45 0 60*
*97
Angle 112 105 112 Orientation 127 120
(Ist quadrant) 142 135
157 157 172 165
------------- --- 187 ------------------------------------- 180
Ang] e 202 195 202
Orientation 217
(2nd quadrant) 232 225
247 247 240
262 255
Table 7.1 Bisector orientations of test angles in Experiment 1_2_

139
The method and stimulus configurations used in this experiment were identical
to those used in Experiment S. In order to investigate the additivity of
angular extent the bisector orientations of the test angles were as listed
in Table 7.1.
The stimulus duration was set at 2.00 seconds with a two or three second inter-
stimulus interval, according to the preference of the subject. The stimulus
line length was 18 minutes of arc.
Subjects SRH and SG had uncorrected normal vision, subject DTM had corrected
normal vision. Trials in the first quadrant were run on all three subjects
and SRH did runs covering both the first and the second quadrant.
Results
In order to calculate the magnification factor (M) the units of the metric
were normalised to a circle of 3600 by first re-scaling the raw perceived
angle sizes (a) so that a quadrant or semicircle of perceived angular extents
summed to 900 (or 1800), for each stimulus angl .e
size (A). For each angle
size, therefore, a normalising constant M was derived K=90/1: a - and
normalised perceived angular extents W) calculated: a' K. a . The
magnification factor was then calculated as the ratio W/360MA/360), which
reduces to M= a'/A.
As the untransformed values for perceived angular extent were found to be
significantly different for the three subjects (p40.01 at all angle sizes,
see Table 7.89 7.9,7.10), magnification factors were derived separately for
each subject. The results are shown in Fig. 7.1 and in Tables 7.2 to 7.4.
The vertical bars in the graphs represent the estimated standard error of
the magnification factor (M), and were derived from the expression:
sm S(a) A
where s(a) is the rms of the standard errors of the constant errors of
perceived angle size.
on the basis of the normalised perceived angular extents W) for a stimulus
angle size (A) of 150 expected magnification factors for larger angles were
calculated (EH). Each of pairs of a' subsumed by 300 stimulus angles were
added (see Table 7.1) and divided by 30 to give the estimated magnification

140
factors, which are shown in columns 5 and upward in Tables 7.4 to 7.9. EM
values for 450 stimulus angle sizes were similarly derived by summing the
appropriate triplets of a' (Table 7.1). ror subject SRH EM values were also
calculated for stimulus angles of 600, both from adjacent tetrads of a' derived from 15 0 stimulus angle sizes and from adjacent pairs of a' derived
from 300 stimuli. Tables 7.4 to 7.9 show, therefore, for each subject the
untransformed perceived angle size (a) - the PSE, the normalised perceived
angle size W), the magnification factor M and the expected magnification factors (EM) for the larger stimulus angle sizes based on the perceived angle
sizes with 150 and 300 stimulus angles, at each test angle orientation.
For each subject and at each stimulus angle size the observed magnifiqation (M) was compared with the estimated magnification (EM) using the t-test
statistic for matched pairs (2-tail). No significant differences between
M and EM were found for any of the tests carried out. These results show
clearly that the perceived angular extent of, for example, a 30 0 stimulus
angle can be predicted simply by adding together the perceived angle sizes
of the two adjacent 150 angles subsumed by the 300 angle. This property
of additivity has been found to extend over the whole range of angle sizes
tested in this study.
It is demonstrated therefore, that at some level of the visual system a metric
for angular extent is encoded. This metric surface is not topographically
identical to the physical dimension of angle size, under an orientation- independent transformation, as thi metric for perceived angular extent
shows a regular meridional anisotropy. As a consequence of this anisotropy
it is not possible to reverse the direction of prediction of perceived
angular extents from greater to smaller angles by simple divisiont all ý a3lo/2. 15 However, given a' and one a the other a', may be found. 30 151 1
The apparent similarity of the curves for M as a function of angle orientation
across subjects was tested using analysis of variance, the summary tables for
which are presented as Tables 7.11 to 7.13 for the three angle sizes. No
significant differences were found between subjects although the differences
between orientations were preserved (p<0.01).
These observations corroborate those reported in chapter 4, experiment 5, in
showing the W-shaped curve of perceived angular extent as a function of test
angle orientation. In both this study and the forementioned previous study-
the pSCs do not show the difference between vertical and horizontal orientations

141
of the test angle which are shown when magnification factor is considered as
a function of orientation. The present observations indicate then, that
the vertical and horizontal oriientations are not precisely equivalent
with reference to perceived angular extents at these orientations, although both orientations are different from obliques. Similar findings were
reported in chapter 5.
One observation which is not consistent with earlier findings is the meridional
anisotropy shown with the 15 0 test angles for all subjects. In the previous
studies (Expt. 5), in which only SRH took part, the characteristic W-shaped
curve for constant error was not found with stimulus angles of this size. Again this is only manifest for the variation of M with rotation of the
test angle, and is not clearly evident in the untransformed data.

: ýE
12: ý I-
0
uj
Ln I -
a) 4-.
C) CY) : 2:
C4) CII)
04 N 0 Dý
C*4 T)
0
0
CV) C14 C)
%0 %0 %0 mK NO (> CY% 0-
c; c; c;
0
Co ;ý C) 41) vi N Cl vý ,0 CO CO ýo -N CO LO OD c4 N
o' o' o' (> o, cy, c> o' c) 0 c; cý c; c; cý c; c; (ý 12 -2
u
xx LLJ 0 -6-
7z 0 ri (L)
, -.,. 0
1. -4-
-2- -0 LE
0 *Z
(D C, 4 CN C) (> CY, r, , to 0 -0 C) e r's, 10 CO C, 4 (n ý c4 Ec 90 cý cz; L)
N 11)
C,
C) C
a CV) Co c4 N C, 4 (> - %0 NN0
%0 (> CO (> tt') (> OD ýt (N
c4 cý cý cý c4 vý cý cý -4 vi
C C) I..
0
LO
N 0- ! 14 tý C*q
It N C%4 CO C)
CN :. CM
M r44 c4
C%4 %0 CN C14
-%C) CD ci
L,. J
VI j2- tA
0
04 K
0

143
0 CD
N
0)
cv) 0 ýo 5 ij 00
CD
lýI - c2 Z; A 2ý Ln ;; 0 Lu 0--0
" 00000 III
0
c> 0 N %0 (> CY-
CC) co oc) C> Q ýN C> Lf)
: ýaE S) o% b, 5 o- . _: C; 6 1: C;
ri ;X Lin o- - e- - vi o'
CCIý4 Icci
LO C)
-0 ce Co Lo C> ýo N cn
0 c; ýý cý
4-
a) 0
N 00 a co 00 C4 0- 0% Q
C; C; 1:
Lil) to to V) to LO No Cs C, 4 le, r- C, 4 C, 4
04 CV) qo
11 4)
0)
tt
LlI
01. LO 04 C%4 a C) C; C;
II
r4 00
CD CD
00
LO Q. CO C14 CII) , Rt LO LO ýo 0
ýE 0 0- 01ý CN LU -: C; 6 -:
C; C;
0 CV! NO "Cr
0 CV) 00
(4 cý le 't
ýt (1) N (>
,,, ;ZZ; CCR) 0- 13 4 C; C4 1ý Nt Nt 't
. 1- C C)
0 CN1 11 tn' CC)
ý C-4 C14
cq LO
cY) 0 F-
C 4-
0 U
CN hý:
C)

-144
0 C)
C) Cl) C) %0 : -5: LU
I
ý C: ) C> C) 0
c; c;
CO) N co 0 cc) co CN
6. C), : 2: 6 C; LU
o C*4 C14 0 C; C;
I
CY) 00 C4 01- 0- : C;
cy) LO C14
8 co 3
a
a
0'
0
sý0, N 0-
Ln ý: 00 ;x LO
cq CN te") %0 CC)
r-
0
o C, 4 co e r- v- C, 4
8 0
E
0
0
10
C14 Ilz
0

145
402 ýE
qo
(on
-2 0)
Lin (V) c"i
C) CY)
: ýE LU
0 CN 04 C*4 0 01-
C;
%0 0% %0 LO CV) a) ýo 0- 01- 0% C; C; 8
N; r Ce) 10 0- N o% N 0-
a .44
Lc;
00 Ol
Cý a) N
Le) %0 CD m cm CC) 1 11 r2 00 (> C, 4 C, 4
C? - cv) --t C14 C14 Cn 4,
C14 N C*4 C14 04 "t
In.
%-0 CO
CN
m
0 Cl)
LLJ 0 I"
0
C) CIO
: 2: LU
C) irý cN C%A C, 4 0 Cb 0
ý:
:30 LO
: 2: 25 (b 0 C)
CY) - 14t 00 Os 00 C%4 0%
Fo CY) C14 LO
Co
(>, c3
*Z7 CY) CN CN 00 -Vi
-I-
C,
o LO LO to CD M 10 - r- -
I. -,
Co
0 4-
x ui
LL- c -: ) E
ul
c mu
0 Cl C'�i
(A.. i c)-
CV) rlý
w -Q

146
0
Ln ct 2: oa LLJ C; 6 I I
, In ce CN Zit : jý 0-
cv)
LO N 04 ý co Q
Cý C; It 0%
C14
C14 It
CV) "Cr
0; 00
olun
0 C14
.N 0
0)
tý
c) 8 0
Co
-u a) C
4- C 0 0
0 II
0 I-

0)
Lil
LU
C) CY)
LLJ
oo- 0O
C41) CV) ON
0%
C;
ce) Lin C%4 N :2 Co Co ul a. ! ý5
c)% 0 CY- (> (>
c; .2c; c; c;
OD CO C-4 C-4
a
. 1-
o
ce)
Ci tO C) 0%
10 LO %0 10 (D P-ý N (n (> %0
cý c4 c4
N 0-
NN CN N ý; t
00
0 II
C')
, c; : --; CO in
0 C14
0 0 C, 2
N z71
C) CY) Cl) 0 : ýE o LLII C;
C> CII)
: 5- LU
I
Cf) -Mt Cl) N 01ý 0 0% CN
SSS ý00
CO (n - ri %0
c>
io-'ý X I-
-0 . 6-
LL. C 0
LU
0
LL-
c 0
0)
I, - - .t C'4 C'4 00 00 00 c; c; rl
LO -qt 04 04
CY) 04 CY) 0%
c 0
M cf) CN
tin Lin LA *i:: C) m0
C4 04-
'l. ý- LU oci Ln
0- Ln
N "0 0 r- 0
II 0
I-

148
N
v) C, 0) C
to , tt cv) ýE Lu i C)
to 'ýo 'It ., t C) 0-
ýE 0 01ý LU 1: C;
C) or* CN 00 C) 0
. _: C;
a ()% ;t cl CO - <: > LO IRt "Cr -41
CC) r-
C4 qt
C14
0 I-
LO N
C4 co
Nt 8
-0
1: 0

1 149
1-44 -0
I. '
44
F-0.4
1. ý
004 1ý
*44 4
6-ý
0-0-4
PAW
1. ý jw
llý
D"4
0-04
4 "4
0-0-4
1. -4N-4
»4 0.
ffl CD-4
0 odbe
b. 04
14. N co 8
77, --' q 'Q 'P' 8 110 cl 1E, . ck _ p- --- a C5 6d6
t 21 C4
10 c4
ý59 C4
ý! i N c .2 6-0 00 a t-- en - At
1- ýý-- .013:
0 C4 C4
kR z w -0 C4
0 z ui
Ir. CL > Le
C) výO
-i ý- -0
00
(D 5 41 z
LU
0 in
-= % tn 0 _C cm. -0 .> ta
tn 0
0
OEØ
-'- w ib --c-
.2< "ý =
0 Cj a: 0 . - c ce -ý, 0
.2 LA 1 4) -C- -b- 9 0 L4-
>0
tr- . =O *r- A LO U
r-
0 CV)
0 C4
0 Fý
hl:
(W) NOIJLtf3l: IINDVW

150
In view of the positive outcome of this experiment a further series of
runs was carried out to examine the orientation related characteristics of
the magnification factor under conditions of brief stimulus'presentation.
Method
With the exception of the stimulus duration which was set at 0.01 seconds,
runs in this series were in all respects as similar as possible to the previous
series. Only stimuli in the first quadrant were employed,, however, for all
subjects.
Results
The raw data were treated in the same way as were those for the previous runs
with the 2 second stimulus duration. The values for a. a', and M, together
with K, s(, ) and EM are shown in Tables 7.5 to 7.7. Values of M as d
function of orientation are shown in rig. 7.2. At each angle size and for
each subject the observed and expected values of the magnification factor
were compared using the matched pair t-test. Once again no significant differences were found.
For the analysis of the effects of orientation and subject on the size of M.
data from the previous experiment were included so as to evaluate the influence
of the two stimulus durations. Summary tables are given in Tables 7.11 to
7.13. The differences attributable to changes in test stimulus orientation
were found to be significant (p. 4 0.01) but neither differences between subjects
nor differences between the stimulus durations contributed to the observed differences between individual observations. A corresponding analysis of
variance of the untransformed PSE data showed the effects of all three factors -
stimulus duration, orientation and subjects - to be significant (p, < 0.01, see
Tables 7.8 to 7.10).
In all respects, therefore, the characteristics of the relation between
magnification factor and the orientation of the test angle with reference to
the horizontal comparison angle are comparable across subjects and are invarient with respect to stimulus duration - for those durations used. These
two factors both have significant effects on the constant errors of perceived angular extent showing, therefore, that although the absolute values of relative magnitudes of test and comparison stimuli vary between subjects and
1

151
with changes of stimulus duration, the relative proportions of the quadrant or semicircle taken up by the component angles remain constant.
1.16-
1.14- 1.12-
1.10-
1.08-
1.06-
1.04- 102-7
1.00-
0.98- 0L96-
a94-
SRH
f If v
a
I 0 I
1 .. 11
v
go 100 110 120 130 140 150 160 170 180
TEST ANGLE ORIENTATION
FIG. Z2 Magnification factor (M) shown as a function of test angle orientation at a stimulus duration of 0.01 seconds, for subject SRH. Angle sizes,
00 are represented as: I e, v- 360, m- 45 ,A- 60 .
The bars represent s Ope, n symbols show the respective estimated M as M derived by adding the perceived angular extents of the smaller com' onent angles. Colours,, show the corresponding data for subjects DTM an SG.

152
11 111111111111
11 C4
-" ýR 13 C4
ý!? -0 ;Z -0 -() li
a, "
ýo -w- c in- '. " clý i . 2-0,. o 0
- %W -E a)
C4 -I
": !"
C) 0 i- E -, v @ -C ý S4
%- . 0- w
0
ýoX- -0 - U, S) ý- 0 ! -- !Zr. 7 _-L. F- C-4 F---
. ý! r. "In
W
-j 2
-e -0 0 in E: a
ý- 6. :c LLI
Ln V-, ocý
Lg 0
- LL! ýA (Y) ýA- : r- ýC- :1u
Z; iý0 0 ýp -D F-I ýf
4N "= ß_ - Z- 2 -'
a -a
1 -0 3.
LL.
ýo ýr e4
e
OD 0 14 (4 0 CO 0
(iAl) NOUVOIJINDWY

153
lý
:2
0 p4
C) a) C
til
ui
C) CV)
iE uj
tr) to CY)
0%
C;
(1) a; co C> 0-
Q0
to CII) N C) cc)"4-
(0..
r- ý000-
C-) LO 0 c) 04 V- LO C)% U') 0 16 16 C4 Cý 4 tc; C; r- ýýýýý 0-
0
4-. C C)
I-
0
10 c4 10 N le M --Ct ýý-
C%4 CN Igt
10 N
C, 4 K
CC) 0
C;
C\l tz
m
Lon- C)
CD 0, M CO CV) OD ý Oý,
C! cý l> Wý C) c;
0 ix 1 101 : 2-: ýý 00 0
. -:
- r-4 M %0 NQ
(N Lo c; cn CN (n CN
ýo
. 1- C
I-
0
M 00 - cq CN 00
LO Lei Ln (D (12 %0 r- r- r-
C'14 0 C;
0- x x0
LU
c
.0
ýý 0
t- ý
oP
-0 LE
0D E
0) 0
,0U
15 2
LLJ
V)
LO
I- Ø II

tO ll; r ýE
0
Co Co
0 C) 1
Lt) tn 9 ýE uj C;
CW2 N
ýE %0 M CD Ch
1-e 00 CN
!ý le 0%
CV) "t r- r- 04
C4 tý Rt (Y)
0,
0 04
o
ID 0)
0
a
NO
M
*Z c 0 U
LO
154
0

155
.. o. : 2: LLJ
0
LL-
c 0
II w N
C) C
LO
LU
C) C#)
LU
clq Co *0 (V)
0
to LO Co %0 LO
dd
0 CY) CV) 04
C; C; iI
(=) to - to C'e) 00 %0 U')
:: 5-- C! C! Cý Lu -00
- %0 10 Ul) -t C14 0% 0- :ý 00 ýo S C', C'4 CO 0 CC) Cý Oý llý 0 CD ý 10 C;
N (b -e $; Co 0 ci 11 - c4 C) ,3 to m cý .6c; ýý-ý-- C),
"N Cý 10 m LO cf) - "It C) 0 04 CN
C4 C4 C4 -: C; C4 C4 N
C C)
o C14 r-
N 0- ttý
C%4 C%4 N
C%4
t94 C114
11 v
o -44- 0 "t Q
Cý 143 M C4
NO N
(N
0 Ilý -* r-4 c44
0
tn to CD (Y)
V;
m c
to %0 r- r-
0 0
Co
. 1-
0 u 'I-
.2 CD
0 2
u -0 0" LL
.2E V
c 0
od %4-
LLJ
tn
40 >Z
I- C)

156
ID 0)
Lt) 0 C) %0 ul C) C: )
0
U. ) (N -e ýo
:ý LLJ
00 m
CN CC)
8 8z 1:
C) 0 cý Co tr; 4 le 0-
0- oý C> ý
e4 cý i ýe Co
a) 04
0
C4 C14
11 v
10 N
(1)

C6
0)
LO %0
C) CV)
:: E ui
I-
ci (D %0
157
-4-
.. 0- : ý5- uj
0
%0 %0 00 - 1,0 0 (b ch 0% 0
C; C; C; -*
C) CD (N 0- l> -ý Ilý ýý cý , .40 ýe cn -4 LA o- Co
04 '4t -m o- a) 0!
. Ci iz
zr tc; Cý C-) Lo Ln CC)
4- C C,
I-
0 N 01-
04 tý C-t, 4 1; ý 9!
-0-- 11 --ý C> C> --; E-
LY
C) -
g) Co
C: ) CO) cv. ) (Y)
-; 9 LU r-
10 tin ý C> C: ) 0ý
1p
c 0
*Z
13
xx uj
.2 -u
oý
CV)
1ý
:: -: c L- .0
Os Or- - CD
Int %0 clýI (N CY) r2 CV2 0, (N CC) G- C) m CNI CN (>
N 00 "N %0 NN
co CV) 04 C14
I-
co 00
o.
0
C) 92 ci
0 to U') LO 11 N *r CD (v) 10
bz 0
0)
- _: _Z LL- U
E .u" 94- Ut
C 0
:: E Vb C) 0
04- 0
LU
U) 0 CL v)
N
bl* C)
0
i

V; 0
Ln
LO
ui
a) It 04 cq C) 0 00
Co
0 :21
ý:
co 0 CC) C)'. 04
1ý C4 C; l4t Nr 0%
0 it C14 01% V; C; C-;
IT co
. Z: "
0
0 0 0 II
tn
-u C,
C 4-
C 0 U
1-1-1
. ý58ý
I

159
Source of Variation
d. f. Sums of Squares
Mean Squares
F-ratio
Duration 1 8.178 8.178 21.594 p<0.01 Subject 2 29.829 14.915 39.380 p<0.01
Ang. Orient 1 67.302 67.302 177.700 p<0.01
DxS 2 14.857 7.428 19.614 p<0.01 DxO I 0.4E-5 0.000 0.000 n. s.
Sx0 2 4.832 2.416 6.379 p<0.05
DxSx0 2 5.634 2.817 7.437 p<0.01 Residual 12 4.545 0.379
Total 23 135.18 5.877
Table 7.10 Analysis of variance summary table for PSEs obtained with 45o angle stimuli (Expt. 12).
--Source of Variation
d. f. Sums of Squares
Mean S q'uares
F-ratio
Duration I 0.2E-4 0.000 0.011 n. s. Subject 2 0.4E-3 0.000 0.099 n. s.
Ang. Orient 5 0.118 0.024 13.098 p<0.01
DxS 2 0.4E-3 0.000 0.096 n. s.
DxO 5 0.016 0.003 1.815 n. s.
Sx0 10 0.023 0.002 1.279 n. s.
DxSx0 10 0.018 0.002
Total 35 0.176 0.005
Table 7.11 Analysis of variance summary table for magnification factors (M)
obtained with 15a stimulus angles (Expt. 12). I

160''
Source of Variation
d. f. Sums of Squares
Mean Squares
F-ratio
Duration 1 8.378 8.378 47.78 p<0.01 Subject 2 10.295 5.148 29.36 p<0.01 Ang. Orient 5 38.251 7.650 43.631 p(0.01 JD X'S 2 17.903 8.952 51.06 p <- 0.01
Dx0 5 2.984 0.597 3.407 p<0.05 Sx0 10 7.923 0.793 4.518 p 0,0.01
DxSx0 10 4.770 0.470 2.720 p<0.01 Residual. 36 6.312 0.175
Total 71 96.818 1.364
Table 7.8 Analysis of variance summary table for PSEs obtained with le angle stimuli (Expt. 12).
i
Source of Variation
d. f. Sums of Squares
Mean Squares
F-ratio
Duration 1 25.857 25.857 123.089 p <. 0.01
Subject 2 29.371 14.687 69.913 p<0.01
Ang. Orient 2 102.58 51.254 243.986 p<0.01
DxS 2 57.611 28.805 137.123 p<0.01
Dx0 2 11.836 5.918 28.170 p<0.01
Sx0 4 7.024 1.756 8.359 p<0.01
DxSx0 4 4.846 1.212 5.768 p<0.01
Residual 18 3.781 0.210
Total , 1 35 242.84 6.938
Table 7.9 Analysis of variance summary table for PSEs obtained with 300 angle stimuli (Expt. 12).
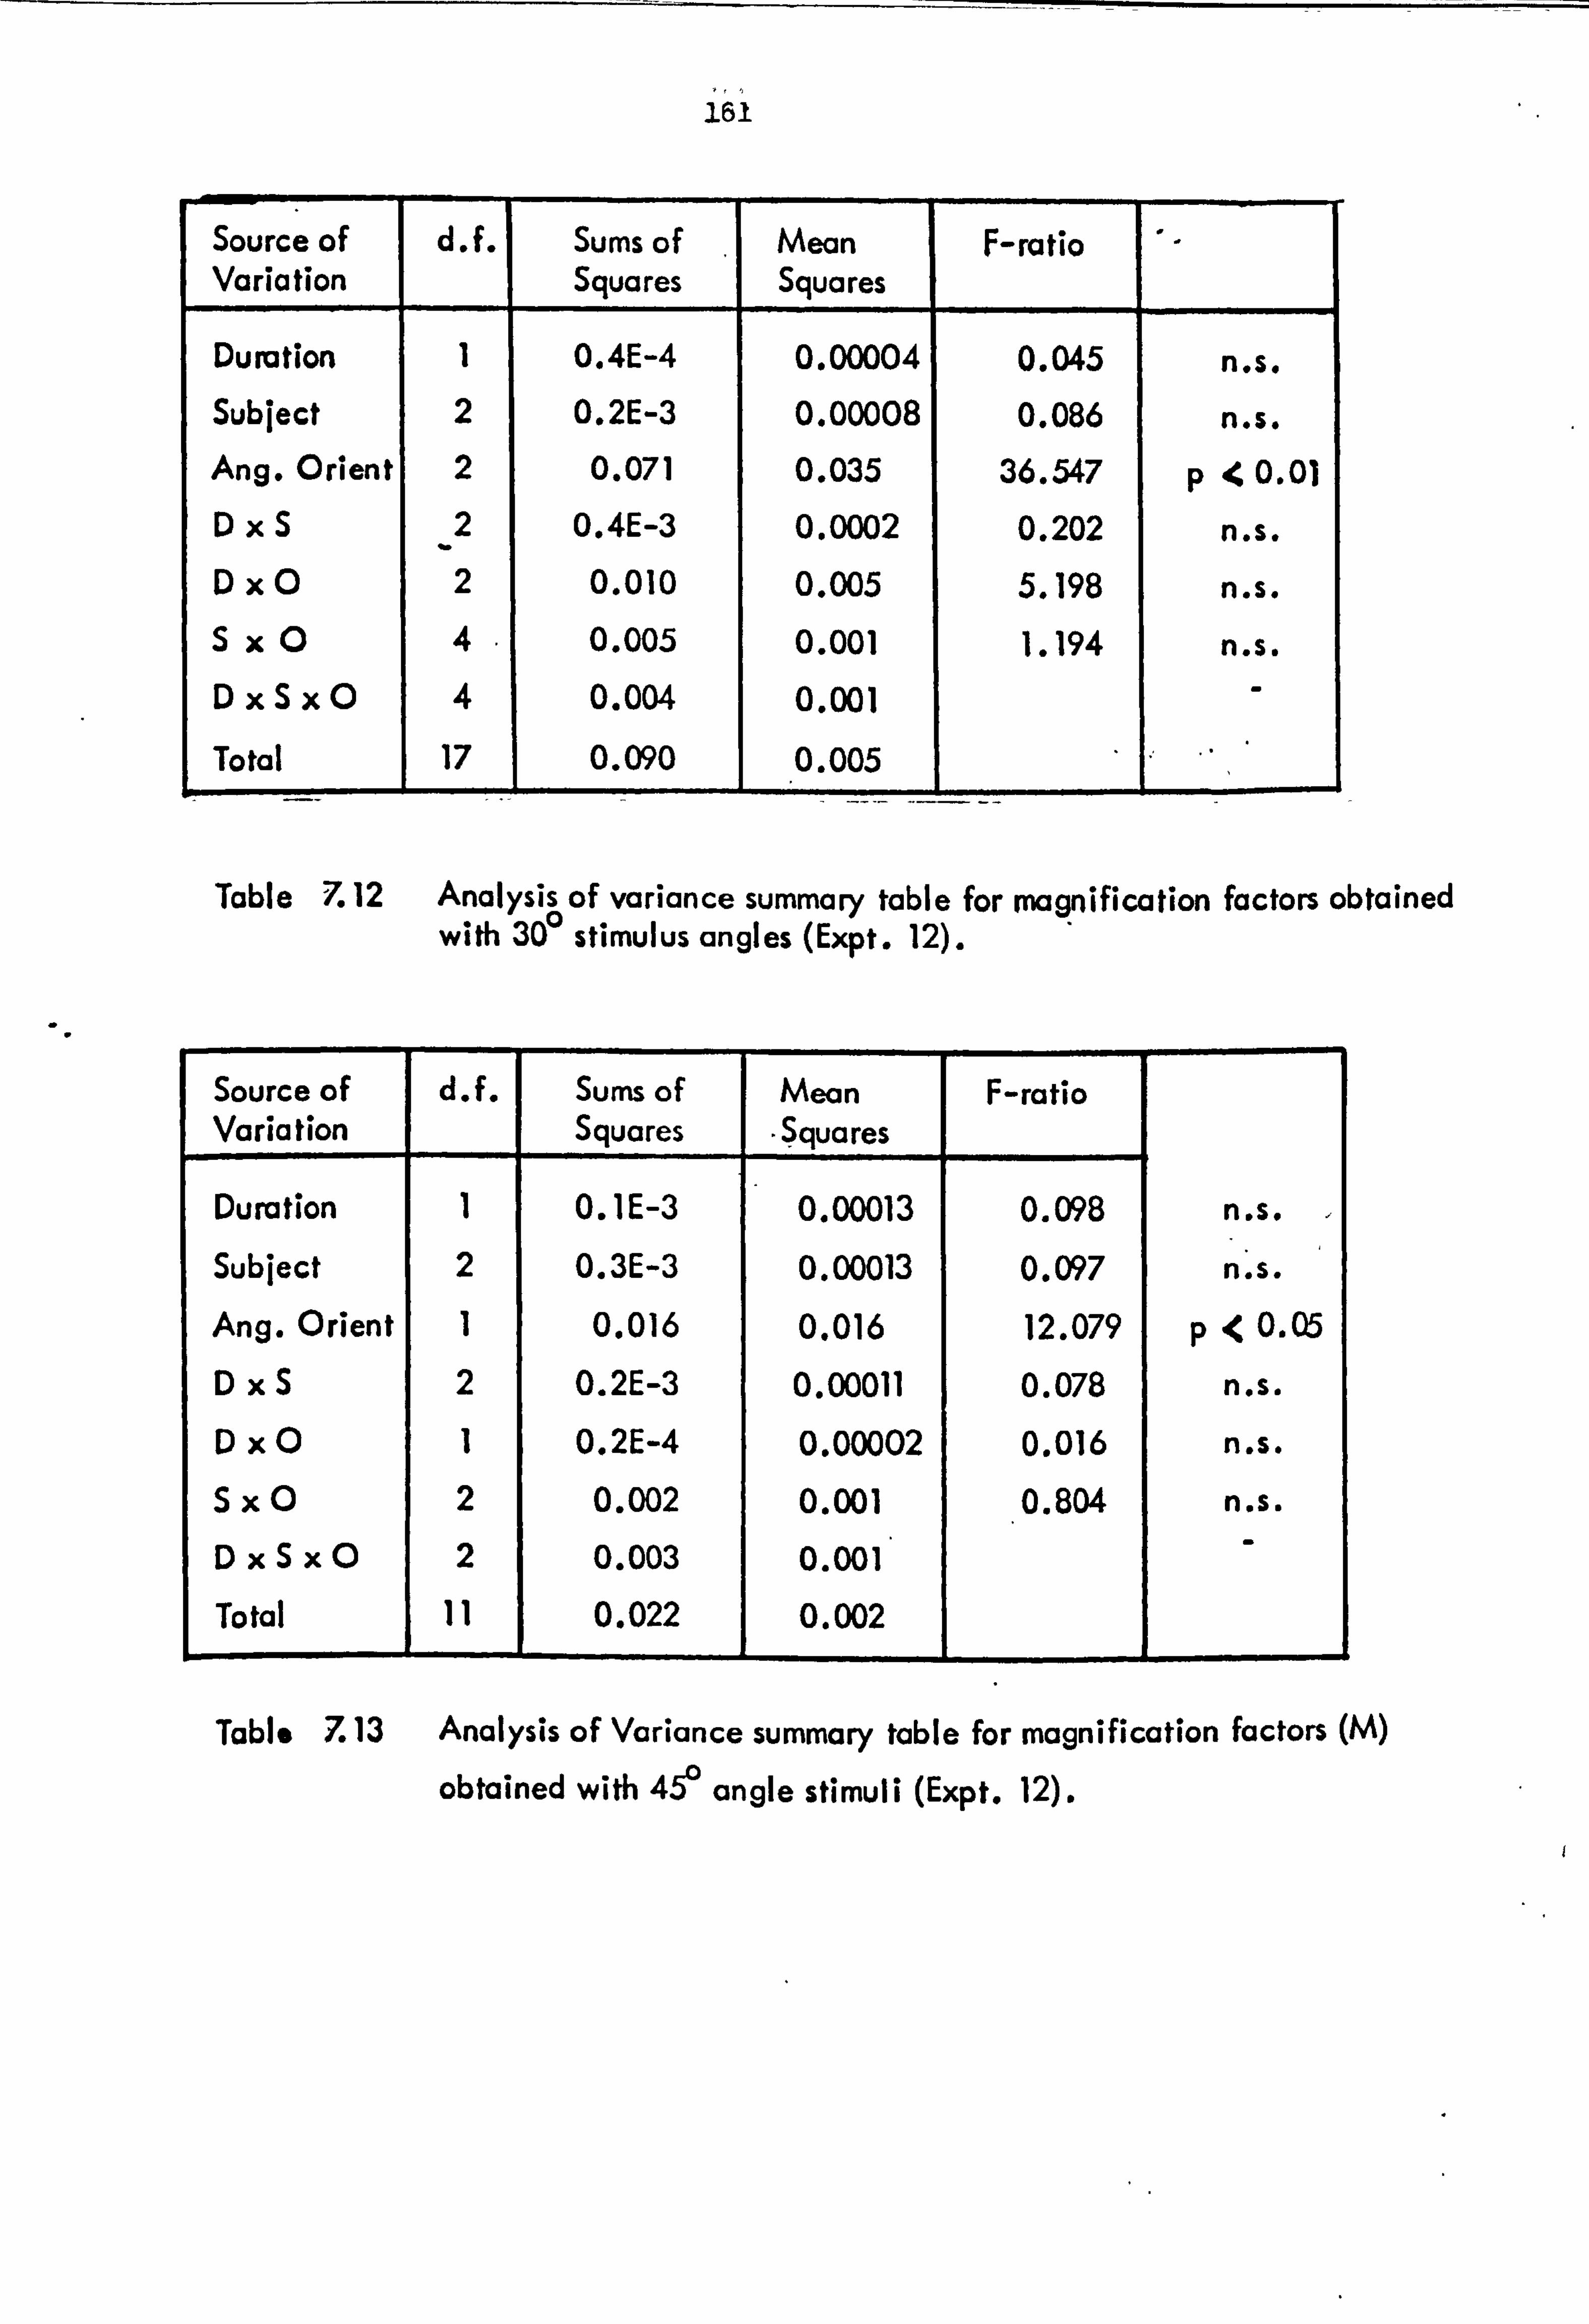
161
Source of Variation
d. f. Sums of Squares
Mean Squares
F-ratio
Duration I 0.4E-4 0.00004 0.045 n. s. Subject 2 0.2E-3 0.00008 0.086 n. s. Ang. Orient 2 0.071 0.035 36.547 p40.01 DxS
_2 0.4E-3 0.0002 0.202 n. s.
Dx0 2 0.010 0.005 5.198 n. s. Sx0 4 0.005 0.001 1.194 n. s. DxSx0 4 0.004 0.001
Total 17 0.090 0.005
Table Z 12 Analysis of variance summary table for magnification factors obtained with 30F stimulus angles (Expt. 12).
Source of Variation
d. f. Sums of Squares
Mean Squares
F-ratio
Duration 1 0.1 E-3 0.00013 0.098 n. s. Subject 2 0.3E-3 0.00013 0.097 n. s. Ang. Orient 1 0.016 0.016 12.079 p<0.05 DxS 2 0.2E-3 0.00011 0.078 n. s. Dx0 1 0.2E-4 0.00002 0.016 n. s. Sx0 2 0.002 0.001 0.804 n. s. DxSx0 2 0.003 0.001'
Total 11 0.022 0.002
Table Z 13 Analysis of Variance summary table for magnification factors (M)
obtained with 460 angle stimuli (Expt. 12).
I

162
7.2 ExperiTnent 13: Magnification Factor (M) as a Function of -Angle Siz
The observations described above are consistent with the notion that angular
extents are coded as such by the visual system, and that adjacent perceived
angular extents of small angles (15 0- 300) may be added to give the perceived
angular extents of the larger angle subsuming the smaller ones. The hypothesis
presented in the introduction to this chapter included, however, the proposal
that the magnification factor at a given orientation should be constant. The
test angle orientations required in the previous experiment (Expt. 12) to
test the notion of additivity were such that very few angle sizes utilised
test angles at the same orientations, and so the proposed consancy of the
magnification factor at a specific orientation could not be well tested. This
shortcoming was remedied by carrying out one further experiment in which data
were collected to determine whether M is, in fact,, constant for all ýLngle
sizes at a given orientation.
Method
The experiment was corried out using the method of constant stimuli under the
same conditions as described for the previous experiment. The test angle
was set at a bisector orientation of 135 0 and two runs were made by each of the
subjects at angle sizes from 15 0 to 450 in 50 steps at each stimulus duration - o. 01 seconds and 2.00 seconds. The order of presentation of angle sizes was
randomised.
Results
The PSEs for each subject were converted to perceived angular extents W)
subject by subject using K, averaged across angle sizes for each subject for
each duration. These data are presented in Table 7.14. The results are shown
graphically in rig. 7.4. As the previous experiment has shown a lack of - significant effect on M by subject differences and stimulus duration differences
all the observations were pooled for the calculation of regression and correlation
coefficients.
The regression coefficient b aI. A was found to be 0.958 with the correlation
between a' and A being 0.981. The value of the slope of the line is equivalent
to M and is not greatly divergent from the values obtained for M at 135 0 in
the previous experiment (mean M9 averaged across subjects and durations was
I

163
Subi. Dur. &
le 200
Stimulus
250
Angle Size
300 3e 40 0 45P SRH 0.01 15.59 18.90 23.08 26.43 33.33 37.41 41.25
2.00 16.19 18.60 23.38 28.36 34.35 36.77 41.90
SG 0.01 16.00 19.93 25.41 29.14 35.87 36.52 41.77
2.00 16.63 20.10 25.69 29.54 38.37 41.46 46.25
DTM 0.01 14.42 20.03 26.39 24.06 36.90 42.02 46.79
2.00 15.57 18.78 24.84 29.54 36.02 37.79 45.53
Table -7.14 Values for a' obtained during Expt. 13.
.: - 45-
uj 40- F- x w
35- 8 a z <30-
Lw 25
20-
15-1
10-i
0 4 S
a
IIIII11 15 20 25 30 35 40 45
ANGLE SIZE (A)
A. G. Z4 Perceived angular extent as a function of angle size with a horizontal, comparison angle and a test angle at 13e. Closed symbols represent". "
observations for 2.00 second stimulus durations and open. symbols those for 0.01 second stimulus durations. The subjects were: o- SRH.; n- DTM, A- SG.
I

164
0.915 at 1350). The linearity of the relation between stimulus angle size and
perceived angular extent is consistent with the hypothesis that at a given
test angle orientation the magnification factor is a constant.
7.3 Difference Threshold for Perceived Angular Extent as a Function of Stimulus Angle Size
It was suggested in the results of Experiment 5 and has-been confirmed in the
results of Experipents 12 and 13 above that the constant error in perceived
angular extent is a constant proportion of the size of the stimulus angle,
which varies with the orientation of this angle. This suggests in turn that
at some stage of visual processing the magnitude of the perceived angular extent is registered as the linear combination of some perceptual units of angular
extent, the size of which varies according to the location of this 'unit' in
the orientation domain. Alternatively, the magnitude of the perceived angle
could be represented in terms of an 'intensity' code whereby the spike frequency represents the magnitude of the angle.
If it is supposed that there is a certain precision associated with each 'unit,
or 'interval' of perceived angular extent then, accordingly, as the intervals
are integrated there would be some proportionate loss in the precision of the
estimate of the final perceived angular extent. Observations made in preceding
experiments have shown that the difference threshold for angle size does
indeed increase with increasing stimulus angle size (Expts 5,7 and 9) although in these experiments observations were made only with three or four angle sizes.
To investigate the relation between these two variables more closely the
threshold measures obtained in Experiment l3were examined. These data are
shown in rig. 7.5.
An analysis of variance showed all three factors - subject, stimulus duration
and angle size to be significant influences on difference threshold, together
with all interaction terms (p 4 0.01, Table 7.15). Comparison -of the graphs
in Fig. 7.5 suggested, however, that these differences may be the consequence
of including the observations from DTM at the 10 msec. stimulus duration in the
analysis as these are obiously different from the corresponding observations
for the other two subjects. Further analysis, eliminating these observations,
showed the three factors to retain their level of significance (Table 7.16).
it may be concluded therefore that the between subject differences are valid
and not simply attributable to 'deviant' observations from DTM.

165
0
0 N
C)
0) &- #A
c 20 c: 0 . --0
K1111111,,, 111111 c4 0 Co 10 le c4 0 00 10 4 e4 0 CO ýo ýq c4 0 ri N C-4 c4 N ci ci ci cs CIIOHS3UHI
. 0- LA ! i- 0
.Z 1- -0 .- 0%
LI. - -B 3'
oo
o U,
ri N c4 cq (. 4 eq (. ) CnOHS3tiHI
(4 z 10 CIO c; c;
1%
6
0
0 ,,, 111 f-- iii r- iii111
c4 0 Co 0e c4 0 Co 0 -4 c4 0 cq 9 le "0 r4 ri r4 N cý cý N -x "" .ZZ: 00ö (-) CIOHS3WHI
a; Q P, 9 do -
a
in ;R
LU) re
p0 cn
ý c4
J-! 2
-IIIIIIIII A0 Cý 'Q IT 94 _: -j Z -3 odc; 6
4-1 CO �U
.0
99 c3 0 -A
w N U) LU -i 0
ui N U) LLI
0 WI) I-M
0 co)
ý In _C4
ý0 _C4
:2
-J 0
. 6- Z; -i-- - 0 -5ý-E
-0
- CL -,
- w 78
.. 0 17-- SA w.
w -n
rn E0
ý.. o -
-E 3-
-C c
o L.
0
LO
U-

166 1
Source of Variation
d. f* Sums of Squares
Mean Squares
F-ratio
Subject 2 3.439 1.719 85.055 p -C 0.01
Duration 1 27.801 27.801 1375.22 p<0.01
Ang. Size 6 10.950 1.825 90.277 p<0.01
SxD 2 1.537 0.769 38.018 p -C 0.01
S xAS 12 1.729 0.144 7.129 p<0.01
D xAS 6 2.831 0.472 23.342 p<0.01
SxD xAS 12 1.120 0.093 4.617 p<0.01
Residual 42 0.849 0.020
Total 83 50.258 0.606
Table ý7.15 Analysis of variance summary table for difference thresholds obtained in Expt. 13.
Source of Variation
d. f. Sums of Squares
Mean Squares
F-ratio
Subject 1 1.008 1.008 41.754 p<0.01
Duration 1 24.955 24.955 1033.76 p <ý0.01
Ang. Size 6 10.673 1.779 73.684 p<0.01
SxD 1 0.107 0.107 4.440 p<0.05
S xAS 6 0.473 0.079 3.266 p e. 0.05
D xAS 6 3.076 0.513 21.239 p<0.01
SxD xAS 6 0.182 0.030 1.254 n. s.
Residual 28 0.676 0.024
Total 1 55 J 41.150 0.748
Table 7.16 Analysis of variance summary table for thresholds obtained in Expt. 13, oAtting the observations from DTM.

167
Regression analysis showed high correlations between angle size and difference
thresholds and, with the exception of subject DTM, a difference in regression
coefficients between the two stimulus durations, the slope for the shorted duration stimulus being greater than that for the longer durations. The
results of this study demonstrate, therefore, that the difference threshold
for perceived angular extent is a linear function of the stimulus angle size,
and that the slope of this function may be substantially smaller for long
stimulus durations than for brief stimulus durations.
The difference between the graphs for SG and SRH and that for DTM indicates
that the differences between slopes are not a necessary consequence of differing
stimulus durationsg suggesting that the visual system has a choice of strategies
which may be adopted for discrimination between angular extents, one of which is more effecient than the other, but perhaps more difficult to employ under
conditions of brief stimulus presentation.
7.4 Discussion
The rationale behind the experiments described in this chapter was to try to
identify a regular pattern in the responses of the visual system to angle
stimuli, outside of the frame of reference provided by the lateral inhibition
model for interaction between orientation analysers. A working hypothesis
that there may be a perceptual metric for angular extent was adopted, and
the stimuli used were selected in order that this hypothesis could be
tested and, if supported by the observations, elaborated.
The data obtained from the first experiment (Expt. 12) provided intial support
for the hypothesis that a regular perceptual scale of angular extent can be
derived, which is related to physical angle size by a 'magnification factor',
M, which was found to vary as a function of test stimulus orientation (Fig. 7.3).
This finding was supported by the data obtained in the second experiment (Expt. 13) in which the relation between stimulus angle size and perceived
angular extent was examined in more detail at a fixed orientation. Perceived
angular extent was shown to be linearly related to stimulus angle size with a 0
proportionality constant Mý0.958 at a test angle orlintation of 135
The value of the magnification factor is only relativeg however, depending on
an assumed perceived angular extent for the comparison angle. As the absolute
value for this measure cannot be determined, the perceived angular extent of the comparison angle was arbitrarily set equal to the physical angle size. Any

168
change in this assumed magnitude would shift the curve depicted in rig. 7.3
about the horizontal axis, but would not change the shape of the curve. As
the apparent expansion of acute angles is known to be greatest at the horizontal
and vertical the values of M derived in this study are overestimates - the
assumed reference perceived angular extent being rather smaller than its
probable value.
The fluctuations in perceived angular extent thus characterised simply
redescribe the well-known fact that obliquely oriented acute angles are seen
as being smaller than vertically or horizontally oriented angles of the same
size. The stimulus orientations used, however, enabled the determination of
a further attribute of the metric for perceived angular extent$ namely that of
additivity. Thusq within the range of angle sizes tested, it was shown that
the perceived angular extent of a large angle could be predicted as the sum
of the perceived angular extents of the smaller angles contained within the
larger angle.
As the untransformed values for perceived angular extent were shown to be
significantly different at the two stimulus durations, and for the three
subjects, the magnitudes of the units of the notional perceived angular
extent metric are evidently both duration dependent and subject specific.
After the transformation of the perceived angular extents the effects of both
stimulus duration and subject differences were lost, indicating that given
perceived angular extents maintain constant relative magnitudes according to
their meridional locations, and consequently represent constant proportions
of the perceptual scaleg whatever the stimulus duration.
The scaling factor which relates the physical circle of 360 0 to the perceptual
scale of perceived angular extent varies not only between subjectss therefore,
but also with stimulus duration. The values of the normalising constants
shown in Table 7.17 indicate that, on the whole, the absolute values of the
notional perceptual units of perceived angular extent increase with increased
stimulus duration, although subject SG does not follow this trend.
It would appears on the basis of these observations, that at some, level-in the
visual'system, angles are represented in terms of the angular extent embraced by the lines delineating the angle and that the size of the angle is represented by the summing of the outputs of orientationally adjacent neural systems. This simplistic conceptualisation is not intended to stand as an explanation

169
Subject Angle K0 01 K2 00 S ize . . SRH 150 1.182 1.058
30 0 1.106 1.032
450 1.136 1.031 DTM 15 0 1.229 1.119
30 0 1.238 1.030 45 0 1.022 1.018
SG 15 0 1.050 1.120 300 1.021 1.062
L 4f 1.075 1.088
Table I Z17 Va I ues of the norma I ising constant K derived in Experiment 12 (see text).
of the process of angle perception, but only to act as a point of departure
for subsequent discussion. In terms of a model of this type, angular extent
can be supposed to be represented as an amount of neural activity which bears
a positive$ monotonic and apparently linear relation to the size of the stimulus
angle - at least over some part of the range of activity. The amount of
activity is determined by the number of subordinate units activated.
This notion receives support from the results of experiment 15 which show the
difference threshold for angle size to be a linear function of the magnitude
of the test angles. In other words, over the range of angle sizes tested$ the
difference threshold follows Weber's Law - &I/I =K- in which I is the
intensity or magnitude of the stimulus and AI is the difference threshold.
Although most stimulus variables to khich Weber's Law has been applied can be
considered as intensity variables, e. g. light intensity, pains sound intensity,
pressures etc. * some stimulus variables which have been related to perceptual
continua by Stevents Power Laws considered to give a better fit to
psychophysical scaling data (Stevens, 1970). are more comparable to perceived
angular extent, e. g. visual length and visual area. These are both abstracted
perceptual magnitudes whose quantity representation is dependent on prior processing of the input, in contrast to other intensity variables for which it
can be shown that the strength of neural response is proportional to the

170
intensity of the stimulus at the receptor surface - e. g. in rods or cones of the retina.
The fact that a visual-perceptual variable can be described in terms of an intensity continuum by no means implies that the variable must be coded in the
pre-striate or striate levels of the visual system in terms of simple increasing
spike frequency of some population of neurones as are,, for example, brightness
and loudness. In view of what is known of the receptive field characteristics
at these levels of the visual system, such an encoding mechanismcannot be
postulated, there being no reported physiological findings that describe
angle-shaped receptive fields.
White and Riggs (1974) have claimed evidence supporting the existence of 'angle
detectors' in the human visual system derived from a contingent colour
aftereffect study. This study, however, is liable to the criticism made by
MacKay and MacKay (1974) of similar claims for the existence of curvature
analysers. They suggested that in these studies the so-called angle or
curvature contingent colour aftereffect can be easily explained in terms of the
simple orientation contingent colour aftereffect in that there is a simple
association of colour and tilt in the left and right halves of the retina during adaptation. When the adapting pattern is swept across the retina so that
all parts of the retina are exposed to all parts of the adapting patterns the
colour aftereffect is not found.
To date, therefore, there is neither neurophysiological nor psychophysical
evidence to support the hypothesis that the perception of angles is mediated by channels in the visual system that are selectively tuned for angle sizet
comparable to the channels postulated for orientation and spatial frequency.
This being the case, any orientation information utilised in the perception
of angle size must be derived in some way from the output of those orientation
selective channels that are known to exist in the human visual system.

171
Chapter 8: The Pemeption of Angular Extent
In this chapter an attempt will be made to integrate the cbservatians
made in the preceding experiments, and to examine the implications of
these observations for current models of the processing of orientation
information in the visual cortex. In the first sectim, the cbservations
will be surmarised from the point of view of performance; the
theoretical implications will be dealt with in -the second part. Most of
the arguments, concepts and hypotheses pertinant to this discussim have
been described in detail either in chapter I or in associatim with the
experiments to which they were appropriate. In the discussim to
follow, therefore, concepts which have been elaborated in previous
chapte rs will be referred to only as is appropriate to the requirements
of the discussion.
8.1 Factors Influencing Variable and Constant Errors of the Perception
Of Angles.
The results obtained in the preceding experiments have shown both. the
acuities and the constant errors for comparisons of angular extents to
be influenced by a number of stimulus variables. The variables investigated,
together with summaries of their effects of perceptual performance with
angle stimuli, are described in this section. The effects of these
variables on acuities for angle size will be considered first.
8.1.1 Effects on Acuity for Perceived Angular Extent.
(a) Fetinal Location
Ultimately, the accuracy with which aspects of visual stimuli may be
specified in the visual system is limited by the size of the elements of
the retinal mosaic. According to the anatomical studies of Polyack (1941)
the size of retianl cones increases from about 20 sec. arc at the centre
of the fovea to about 40 sec. arc at an eccentricity of 2 deg. arc. If
the accuracy with which angular extents may be specified and compared is,
in 'fact, limited only by the functional grain of the retina within
the foveal and parafoveal regicns, it would be expected that performance decrements would be observed according to the eccentricity of the stimuli. Furthermore, the involvement of any local features of the stimulus in the
evaluation of perceived angular extent might also be revealed by observed

172
differences of performance when stimuli are disposed on the retina such
that different parts of the angles - the vertices and bases, for example -
were more or less distant from the centre of fixation.
According to the results obtained in experiment 3, concerning acuities
for orthogonality (Fig. 4.1) and from experiment 8, concerned with
acuities for comparisons of angular extents, the location of the stimulus
on the retina and its configuration within-an eccentricity of, + 2 deg. arc
has no significant effect m the accuracy with which estimates of angular
extents can be made by the observer. It may be concluded that the
limitations cn accuracy are imposed at some level of the visual system
subsequent to the retinal receptor surface.
(b) Line Length
The effect of line length ca acuity for angle size was investigated
briefly in experiment S. Although the influence of this stimulus variable
on performance was found to be significant, the relationship between the
line length and acuity was by no means unequivocal. Most of the
'noisiness" of these observations occurred with line lengths of less
than 0.6 deg. arc, beyond which increases of length 'tend to result in, a
slight gain in acuity. For shorter lines the acuity-tends to-Inczease
from line lengths of 0.16 deg. arc up to lengths of 0.6 deg. arc. Even
over this range, however, the changes of acuity were not great, the
largest improvement in acuity (excluding the most extreme data points)
w as cn ly 10
In Andrews' (1967b) study of the influence of line length on acuity for
orientaticn the greatest improvements of perfornance occurred as the
length of the test line was increased up to about 0.15 deg. arc after
which there was a smaller but continuous improvement of acuity with
further increases of line length. The difference between the acuity
functions of orientation with line length, and angular extent -with- line
lengh_t, if valid, contributes to the'evidence in support of the
hypothesis developed in this thesis, that the mechanism by which information
contributing to the percepticn of angular extent is processed is not identifiable with the operation of -orientaticn-s'ejective- channels 'and
their interactims alone.
(
I

173
(c) Stimulus Duration
The influence of increasing stimulus duration on acuity for angle size,
as cbserved in experiment 9, was at least qualitatively consistent with the
results obtained by Andres (1967a) for orientation acuity. A continuous
improvement of the accuracy of the comparisms of angle sizes was
cbserved as stimulus duration was increase from lOmsec. to about 5OOmsec
(Fig. 6.11). Little observable improvement of performance was observed
with longer stimulus durations than 1 second. These findings suggest
that, whatever the mechanism underlying the perception of angular
extent, some temporal integration of neural responses occurs, resulting
in a narrowing of the respcnse error distribution. A possible relation
between the variance of the response error distribution for perceived
orientation and the perception of angular extent is developed in the
next section of this chapter (8.2).
(d) Stimulus Orientation
Both the absolute orientation of angle bisectors and the relative
orientations of the two angles comprising the stimulus were tested'for
effects on acuity for angular extent. In experiment 8 acuities-were
obtained over a range of oridntatims, with the configuration. of the
angles such that the absolute orientations of the bisectors of the angles
was either identicals or symmetrical about the vertical axis. /ýs
described in 8.1.1(a), differences of stimulus configuration had no effect
on acuity. Significantly different effects of orientation on acuity were
cbserved for the three cbservers, one of whom UB, Fig 5.4) showed no
effect at all of orientation on acuity. The remaining cbservers showed
significantly different acuities only between the horizontal angles and
angles of all other orientations, performance being worst with the
horizontal angles.
When the influence of relative orientation - the angular separation between
the bisectors of the two stimulus angles - was investigated in experiment
5 it was found, once again, that at least some different orientations of
test angle gave performances statistically different from those given at
other orientations. As with the results of experiment 8, however, the
relation between test angle orientation and acuity bore UUIO-TesOmblance
to the meridicnal anisotropy of the acuity for orientation. The worst
performances occurred at test angle orientations of 900 and 2700 (with a

174
horizontal reference angle (Figs 4.10 and 4.11), and even this observation
was not consistent for all line lengths and angle sizes.
(e) Stimulus Angle Size
The relation between acuity for angle size and the stimulus angle size
was the one relationship including acuity which was both consistent and
systematic in all experiments which supplied relevent data (experiments 5,
7 and 13). The presentation of the results from experiment 5 in figure
4.13 clearly shows acuity to decrease with increasing stimulus angle size -
and at the same time demonstrates the absence of a systematic orientation
effect. Although the shapes of the graphs drawn for each line length differ
(the line length by angle size interaction was found to be significant)*
the overall trend for acuity to decrease as a mcnotonic function of
angle size is evident. 7his finding was repeated in the results of
experiment 7 where the orientations of the bisectors of the two stimulus
angles were identical or equivalent.
In experiment 13 acuities for angle size were obtained. at s! naller intervals
of stimulus angle size than in the previous experiments, using a
stimulus configuration identical to that used in experiment 5. For all
observers and for both lOmsec. and 2 second stimulus durations the - difference threshold was found to increase monotonically '; 1ith stimulus
angle sizes from 15 0 to 600. Linear regressions were fitted to each
set of data (rig. 7.5), which accounted for between 0.61 and 0.96 ý of
the variance of the cbservatims. Differences between subjects were
found to be significant,, as were differences between acuities obtained
at the two stimulus durations.. The slope of the regression line was
relatively shallow for the longer stimulus durations (b = 0.018 approx. ).
For the shorter stimulus durations the curves were vertically displaced,
showing an overall decrement of performance, and for two of the subjects
the slope increased by af ctor of about 3. The third subject showed
only a slight increase in slope, from O. Ola to 0.026.
8.1.2 Effects m Constant Errors of Perceived Angular Extent
The constant errors of perceived angular extent measured in the preceding
experiments refer only to the differences between the perceived angular
extents of the two stimulus angles. The constant error gives the magnitude
of the difference, and its sign indicates which of the angles appeared

175
larger than the other when both were of equal size. The data obtained do not, therefore, show what was the perceived size of the angle, compared to an absolute physical magnitude. The assumption was made cn the basis
of previous studies that acute angles appear perceptually expanded; the
cmstant error, therefore, reflects differences in the misperceptim of angular extents.
(a) Retinal Locaticn
Some measurable constant error was observed in all the experimental conditicns investigated in this study. Results cbtained in experiment 8 showed that when the angles to be compared differed only in their location and arrangement on the retina the constant error was within the
range + 10. There were no significant differences between the constant errors cbserved at any of the three configurations of angles included in
this experiment, but the variation between subjects was found to be
significant.
In experiments 5 and 7 larger constant errors were cbserved,, in the range
+ 20, which again were not associated with any differences between the
two stimulus angles other than in their dispositions on the retina. These
results demonstrate, therefore, that while variation of the position of
an angle on the retina can lead to quite substantial variation of
perceived angular extent, such variations are noa-systematic, within an,
eccentricity of 2 deg. arc. It is suggested that this component of the
observed constant error is representative of local variation of the
scaling of a perceptual metric for angular extent. Similar random,
variation of constant error has been reported by Andrews (1967a) for the
perceived orientation of line segments.
(b) Line Length
The influence of varying stimulus line length on constant error was
similar to its influence cn acuity in that little consistent systematic effect could be discerned in the me experiment where line length was manipulated as an independent variable (experiment 5). A greater emphasis was given to other independent variables - stimulus duraticn,
orientation and angle size - through the course of this study, and investigaticn of the effects of line length was not pursued in greater detail.
The results that were obtained showed line length to contribute significantly

176
to the cbserved variance of constant error, both as a main effect, and in interaction with stimulus angle size and stimulus orientation. The
graphs presented in figure 8.4 show the relatim between line length and ccnstant error to be nan-manotanic, and for some angle sizes to be either U-shaped or inverse U-shaped according to the angle size and the orientation
of the test angle. The clearest results were cbtained with an angle size
of 45 0; here the constant error was found to increase as the length of the
line was increased from 0.16 deg. arc to a maximum at lengths of 1.0 deg.
arc. Further increases of line length. lead to a slight decrease in the
magnitude of the constant error. In view of the paucity of -the deta
cbtained, hcwever, no interpretation of these cbservations was made. '
(c) Stimulus Duration
The relation between. constant error and stimulus duration was investigated
in experiment 9, the results of which showed'. the,. perceived- difference
between the sizes of the two angles comprising the stimulus to show an
overall decrease as the time for which the stimulus was visible was
increased. Examination of the data presented in figures. 6.3 and 6.4 reveals
relatively little change in constant erTor to occur as the stimulus
duration was increased from lOmsec to 100msec. The majority of the
cbserved decrease occurred at stimulus durations between 100msec- and
50omsec; as the. stimulus duration was increased to 2 seconds further,
smaller and less consistent changes in the magnitude of the constant error
were observed.
Significant change of constant error magnitude was seen with a vertical
test angle and horizcntal reference angle, where orient ati cn-de pendent
constant error is minimal. This finding suggest that while the observed
cmstant error, in principle, may be partitioned into an orientation- dependent compcnent and an orient ati cn-in dependent compment, both-
components are subject to reductim of magnitude as the stimulus is
visible for lmger periods of time. The time course of the change of
constant error of perceived angular extent is comparable to that Cbserved by Andrews (1967a) for changes of perceived orientation.
(d) Stimulus Orientation
The relation between the magnitude of perceived differences between
the sizes of angles at different orientation has been investigated
extensively, using a number of different cibnfiguraticns Cchapter 1.1).
The results cbtained in the present sudy were consitent with those I

177
obtained in previous experiments insofar as the maximum difference of
perceived angular extent was cbserved when an oblique angle was compared
with a vertical or horizcntal reference angle, cblique angles being
perceived as smaller than vertical or horizontal angles. With the
exception of the small angles used in experiment 5 (15 0 ), this relation
was observed consitently in the results from experiments 5,, 6,9 and 12.
In experiment 12 it was shown that, after normalisation, the relation between the perceived sizes of the test and reference angles of the stimulus could be expressed as at = M. A ; where a' is the normalised
perceived angular extent$ A is the stimulus angle size and M is a
magnification (scaling) factor whose value varies as a function of the
orientaticn of the test angle relative to, the horizontal reference angle. In this experiment it was also found that while stimulus duration had
the expected effect on the untransformed constant errors, no effect of
stimulus duration on the value of the scaling factor W was found for
a given stimulus orientation.
(e) Stimulus Angle Size
Stimulus angle size as a determinant of the magnitude of the constant -
erTor of perceived angular extent was investigated in experiments 53,7,12
and 13. In the first of these data were obtained which suggested that the
ccnstant error increases with the size of the stimulus angles, where the
test angle was oblique and the reference angle horizontal. When the test
angle was horizontal or vertical the magnitude of the constant error was
unaffected by the stimulus angle size. The absence of any effect .
of angle size on constant error under similar conditims was confirmed
in experiment 7 where no substantial change of constant error was
cbserved for any stimulus orientation when the orientations of the two
stimulus angles were identical, or equivalent with reference to the
vertical or horizcntal axis. There are, therefore,, -as suggested- earlier$
two companents to the constant erTor; cne independent of stimulus angle
size and orientaticn, the other dependent on the value of these stimulus
variables.
In experiment 12 it was found that the constant errors of perceived
angular extent were additive: The ccnstant error for a large stimulus angle
was found to be equal to the sum of the constant errors of perceived
angular extent for the smaller adjacent angles subsumed by the larger
angle, after nornalisation. In other words, the value of the scaling

178
factor (M) is constant for a given test angle orientation. This observation was conf irmed in experiment 13, the results of which showed 0.96 of the variance of the observed constant errors to be accounted for by a linear regression of normalised perceived angular extent onto stimulus angle size. In this experiment no significant variation between
observers was found for the normalised constant errors. At the test angle orientation used in this experiment (135 0 ), the relation between the
normalised perceived angular extent and stimulus angle size was found to be expressable as a' = 0.958. A. This value of M was in fairly good agreement with that obtained for this orientation in 'experiment 12.
8.2 Mechanisms Underlying the Perception of Angular Extent
Current hypotheses concerned with the perception of forms defined by
contours of a number of orientations all make the fundamental assumption that the perception of angles - the areas enclosed by irttersections of
contours - is essentially an extension of the process by which the
orientations of these contours are perceived. when presented- singly. The
various models developed for -the explanation of orientatim perception
have been reviewed in chapter 1- Thus, whatever the supposed characteristics
of orientation analysers and of interactions between them, it is apparent that many workers have assumed that angles are represented in the
visual system not as angular extents, but as co-occurrences of the
representations of lines of differing orientations. The differences
between the perceived sizes of angles-and the actual sizes-of the angle
stimulus, together with the effects of illusions of orientation or direction, have been attributed to the occurrance of lateral inhibitory interactions between the orientation analysers which respond selectively to the orientations of the lines comprising the stimulus.
The cbservations which provided the evidence that lateral inhibitory
interactions do occur between orientation analysers have also been
reviewdd in detail in chapter 1. These observations were derived
primarily from adaptation and masking studies, especially, for example,
those of Dealy and Tolhurst (1974) and Sharpe and Mandl (1977) which have demonstrated that the adapt-aticn after-effect can be induced by
stimuli that are sub-threshold to the analysers which subsequently show
I

179
threshold elevaticn effects. The respcnse of the adapted channels to
stimuli to which these channels are not excitatively sensitive, necessarily,
must be generated by inputs from channels which are sensitive to the
adapting stimuli. The source of these inputs has been identified as the
lateral inhibitory connections between the orientation-selective analYSers,
which have been observed in neurophysiological studies of single unit
activity in the visual cortex (e. g. Benevento, Creutzfeldt & Kuhnt, 1972;
Blakemore & Tcbin, 1972; Fries, Albus & Creutzfeldt, 1977).
Initial arguments against the direct, causal implication of orientation
contrast due to lateral inhibitory interactions between orientation
analysers in the misperception of angular extent (presented in chapter 1.4)
rely primarily on the observation by Hirsch, Schneider and Vitiello (1974)
that there are no differences between the adaptation tuning curvess and hence inhibitory tuning characteristics, measured after prolonged viewing
of stimuli of a number of different orientations. The differences between
the inhibitory tuning characteristics at different orientations which Hirsch et al. failed to find were originally pmtulated so that observed
meridional variation of the perceptual expansion of aculte angles could
be accounted for by the hypothesis that mispercepticn of angular extent
was a manifestation of orientation contrast. Further evidence for the
absence of any meridional variation in the orientation specificity of
adaptation and masking effects has been presented in the results of
experiments 1 and 2 of the present study. Meridional variation of
perceived angular extent cannot be explained as a consequence of differential
inhibition between orientation analysers,, therefore, when evidence for
the required meridional variation of the inhibitory characteristics
of orientation analysers cannot be found.
An alternative explanation for the observed meridicnal variation of
percieved angular extent could have been based on the premise of differential
selectivity of the excitatory responses of orientation analysers, but
for Abadi's (1974) demonstration that this characteristic toO is
meridionally isotropic. A further alternative hypothesisv based on
Mansfield's (1974) report that there are more neurones in the primate
visual cortex tuned to vertical and horizontal orientations than to
oblique orientations was attempted in chapter 6. Consequences of the
assumptions made in this model, however, proved to be inconsistent with

180
other known characteristics of inhibitory interactions between orientation-
selective neurones in the visual cortex, thus rendering the hypothesis
untenable. Furthermore, subsequent neurophysiological. studies of the
primate visual cortex have failed to repeat Mansfield's observations, finding the numbers of neurones tuned to different orientations to be
statistically equivalent (Schiller, Finlay & Volman,, 1976; Poggio, Doty
& Talbot, 1977).
Even in the absence of these problems, Carpenter and Blakemore (1973) have
raised further difficulties with their &scription of the shapes of the
tuning characteristics which would be required in order to give the
observed magnitudes of the perceptual phenomena associated with acute angles.
The available data concerning the tuning characteristics of cortical
orientation-selective neurones do not exhibit the extremely narrow response
profiles depicted by Carpenter and Blakemore, and thus detract further
from the likelihood that the misperception of angular extents can be
explained either directly or soldj in terms of orientation contrast induced
by inhibitory interactions between orientation-selectivq cortical analysers.
While orientation contrast may contribute to these effects, it is insufficient
to explain them.
Further evidence that the apparent enlargement of angular extents is a
consequence of some perceptual process other than contrast enhancement
between the perceived orientations of the line components of an angles
caused by lateral inhibition, is provided by the results of the experiments
described in the preceding chapters of this thesis. The observations which
constitute this evidence were made in studies of the time course of the
development of meridional differences of perceived angular extent, and
of the relaticn between constant errors of comparisons of angular extents
and the sizes of the stimulus angles. Detailed elaborations of the
implications of these observations for current hypotheses have been
presented in chapters 6 and 5 respectively. For the benefit of further
discussion these findings will be summarised.
Firstly, inhibitory activity has been shown to develoPe more slowly than
excitatory activity by Ratliff, Hartline and Miller (-1963) in Limulus while
corroborative observations for human orientation analysers have been
presented by Andrews (1965). As demonstrated by the time-course of
adaptaticn aftereffects, this inhibition also outlasts excitatory activity. Any perceptual phenomenon dependent on inhibitory interaction dhould be
I

181
expected, therefore, to show an increase in magnitude from stimulus onset until a stable equilibrium between excitatory and in)iibitory activities is attained. As the data obtained in experiment 9 demonstrate, the
perceived differences between the sizes of horizontally oriented and cbliquely oriented acute angles diminishes with increasing stimulus duraticn up to 0.5 - 1.0 seconds. This period is comparable to the time
constant for the stabilisation of inhibitory interactions described by
Andrews. If the change of perceived angular extent with increasing stimulus duration is a consequence of temporal, integration of responses, mediated by lateral inhibition, then the inhibitory interactions appear to effect
a reducticn of meridimal differences of perc6lved angular extent, rather than the induction of this effect.
The evidence presented by the observed relation. between constant errors
of perceived angular extent and the stimulus angle size is rather more indirect. Briefly, as the separation, between the mutually inhibiting
orientation channels increases, the strength- of their mutual influence
diminishes, as has been demonstrated by conventional studies -of orientation-
specific masking and adaptation, as well as by physiological observations
of lateral inhibitory activity. Thus, as the stimulus angle sizes and
hence the separation of the constituent orientations, is increased, the
magnitude of any perceptual expansion of angular extent should diminish
as the strength of the inhibitory interactions between the constituent
orientations diminishes. When separation is large enough, there should
be no perceptual expansion of angular extent, and consequently no difference
between perceived angular extents other than the residual constant error
found for comparisons of identically o4ented angles in experiments 7 and 8.
The only interactions which miEýt occur at the larger stimulus angle
sizes would be those between the adjacent arms of the two different angles. This interact-ion, however, would act in such a direction as to reduce
perceived differences of angular extent or, conceivably, to a reversal
of the sign of the difference.
The results obtained in experiment 5 do not fit this expectaticn at all,
increasing the size of the stimulus angles resulted in a mone. onic
increase of the constant error$ representing the perceived difference
between the angular extents of the two stimulus angles, with stimulus angle
sizes of up to 600. Meridional differences of constant errors were -
conserved across the range of stimulus angle sizes with the exception only
of the smallest angle sizes uded (150).

182
These observations, which were repeated in greater detail in experiments 12 and 13, were particularly puzzling as they disagree not only with the
predictions of the lateral inhibition hypothesis for the perceptual expansion of acute angles, but also with previously published results obtained with other simple angle-based stimulus configurations and Z811ner-type stimuli,
as well as with those obtained from masking and adaptation experiments. Out of all the available data concerning the perception of orientation
and angular extent, those obtained in the pTesent study appear unique in
their lack of consistency with both currently held hypotheses and other
empirical data.
There is, however, one substantial difference between the experiments
described in the preceding chapters and the majority of other studies
concerned with the perception of angles. This difference lies in the
actual perceptual comparison made by the observers, from which estima; es
of the misperception of angular extent are derived. An analysis of this
difference, one of methodology, may lead to an under-standing of, if not
an explanation ofs the apparent conflict between the observations described
herein, and those described elsewhere.
In the majority of previous studies the perceptual task performed by the
observer has been referred to the orientation of one of the lines comprising the stimulus pattern - Usually, the cbserver has either adjusted the
orientation of a line until it appeared parallel to a comparison line or, in other experiments, the position of a dot (or line segment) has been
adjusted until the dot (or line) appeared to be co-linear with the test
line. It is assumed by both these techniques that the adjustable reference line or dot is beyond the range of influence of any parts of the stimulus
which may influence the apparent orientation of the test line. Both these
methods give an estimate of the perceived orientation of the test line.
The difference between estimates made with the test line alone and estimates
made in the presence of a second line forming an angle, or in the presence
of an inducing field is a measure of the change in perceived orientation
of the test linev caused by the presence of adjacent orientations and
explained by means of lateral inhibitory interactions which lead to
perceived orientation contrast enhancemefLt. These procedures are directly
comparable to those used to measure conventional tilt aftereffects and the equivalent simultaneous orientation contrast phenomena observed-when
adjacent gratings of appropriate angular separations are used as stimulL.

183
The perceptiial contrast thus cbserved is, of course, in the same direction
as that implied by the perceptual expansion of acute angles. The proposal that lateral inhibitory interacticns are the cause of the perceptual expansion of acute angles entails, however, the assumption that perceived angular extent is equivalent to the difference of the perceived orientations of the lines comprising the angle. Consequently, the perceptual expansion of acute angles is assumed to be equivalent to the change of the perceived orientation of a line induced by the presence of anal-her line or pettern of lines with a similar orientation.
The stimulus configuration used in the majority of the experiments of the
present study, derived from Lennie's (1971) technique,, requires a different
task of the cbserver. The experimental procedure using this stimulus does not derive an estimate of perceived angular extent from measures of
perceived orientation but, instead, the observer is required to compare
angular extents directly, and to make judgments on the basis of these,
comparisons. Furthermore, except in the conditions either where the
angular separations of the bisectors of the angle is 1800, or where me
of the lines of each angle is separated from the other by 1800, line
orientatims cannot be used by the observer as cues for the equality of
the anglesý.
The cmflicting observations obtained under these two techniques indicate
that the two tasks, as analysed above-, cannot be considered as equivalent
and that the perceptual demands the. they impose upon the observer must,
therefore,, be different. This being the case, the results obtained in
the present study constitute evidence against the above argument relating
the perceptual expansion of acute angles to orientation contrast through
the falsification. of the definition of perceived angular extent as the
difference of the perceived orientations of the lines comprising the angle
pattern. on the basis of this finding, a new hypothesis will be considered
which, expressed in its simplest form, proposes that mechanisms other than
those described by mutually inhibiting orientation analysers are involved
in the perception of angular extent, some characteristics of which will
be described later in this chapter.
Emerson, Wenderoth, Curthoys and Edmunds (1975) have already shown that radically different results are obtained when angle-matching and end-point matching techniques are used in conjunction with the Lennie stimulus configuration. They also demonstrated that the difference between the two sets of results obtained was attributable to the nature of the task, rather than to the different loci of attention which may be employed in the performance of the two tasks.

184
The working hypothesis thus proposed, that orientation processing and the
processing of angular extent utilise different perceptual mechanisms, is
supported by further observations made in the present series of experiments. These observations are concerned with the threshold for detection of differences of angle size. If the perceived size of each angle was derived
from the difference between the perceived orientations of the two lines
describing each angle then, in order to compare the sizes of two angles
the orientations of each of the four lines comprising the two lines would
have to be assessed. The accuracy with which the two angle sizes could
be compared, therefore, would be expected to reflect the accuracies with
which the orientations of the four component lines can be established.
Consequently, the meridional variation. of acuity for angle size would be
expected to appear in the difference thresholds for angle size comparisons.
Neither of these expectations was fulfilled.
Previous measures of acuity for orientation of straight line segments,
of lengths comparable to those used in the majority of the experiments
under discussion have been: Andrews (1967b), 0.2 0-0.5 0; Bouma and 00 Andriessen (1968), 0.5 - 1.0 ; Westheimer, Shimamura and McKee (19761
0 0.3 , Even the best of these acuities is within the range of difference 0 thresholds for angular extent, found with an angle size of 15 , This
would imply, under the orientation difference hypothesis for angle
perception, that the accuracy with which perceived angular extents can
be derived from the perceived orientations of four stimulus lines - is the
same as that with which the orientation of a single line can be compared
to that of, for example, a long, continuously visible line. The variance
of -the perceived orientations of the component lines in the two-angle
stimulus would be no more than half that of the perceived orientations
of single lines.
Although some sharpening of the response tuning curves of individual
orientation anlysers would be expected as a consequence of lateral
inhibitory interactions at small stimulus angle sizes, the consequent improvement of the accuracy of the estimation of the oridntatims of the
component lines due to this process would be expected to decrease with increasing angle size. After a certain angle size the separations of the orientations would be greater than the range of lateral interactions
and no further decrement of performance accuracy would be expected. On
the basis of masking studies, the range of inhibitory interactions is

185
estimated to be about 45 0; at larger angular separations the interactims
are minimal. Also, the strength of interaction decreases in an exponential- 0 like manner, the half-width of which is about 12 , From this data,
therefore, the loss of improvement of acuity due to increasing angular
separation of the stimulus line compcoents would be expected to be a
negatively accelerated mcnotmic function, flattening out at stimulus 0 angle sizes of about 45
The observed function did not have this form, but showed the difference
threshold to increase linearly with increasing stimulus angle size up to 0 the largest angle sizes used - 60 . Thus, although inhibitory interaction
between orientation analysers could lead to an enhancement of the average
acuity for orientation of the lines comprising the angles, it could not
accouat for the cbserved relation between acuity and stimulus angle size.
It is also unlikely that the increase in average accuracy of o: ýient 'aticn
estimation due to the influence of lateral inhibitory interactions on the
response characteristics of the active analysers would be sufficient to
accomt for the observed acuities for the comparison of small acute angles.
In a similar way it can be argued that if perceived angular extent was derived from the combined outputs of orientation analysers, without the
involvement of any other perceptual mechanism, it would be expected that
the poorest acuity for angle size would not be much-worse than the combined
acuities for the orientations of the line components, under, similar
conditions. That the error increases linearly as a function of increasing
stimulus angle size indicates that the performance decrement is not the
result of information loss at the tire when the responses of individual
analysers are combined. Were this the case, any error introduced by
combinaticn of outputs should be independent of the separation of the
analysers in the orientation domain. As has been shown by the data
cbtained, this too il not the case.
The second finding relating to the difference threshold for perceived angle
size, which also supports the hypothesis that angular extent is a perceptual
quantity other than orientation difference, is the absence of meridional
anisotropy of angle acuity. Although the data cbtained in experiments 5,
7 and 8 show that stimulus orientation does influence the accuracy with
which angular extents can be compared, there is no evidence at all for
a systematic relatim between the oridntation of the angles and the

186
difference threshold. This cbservation, particularly, in view of the
apparent ubiquity of the systematic influence of stimulus orientaticn on sensitivity and selectivity when perceived orientaticn has been
investigated. The absence of meridional variaticn of the acuity for
angle size cannot be attributed to the characteristic of a process which integrates orientation information with an inefficiency large enough to
mask meridional variatim of the accuracy of orientation information, for
this would lead to lower acuities than those which were cbserved.
Acuities of the observed magnitudes could be achieved, perhaps, if the
information upon which the angle comparisons were based was the relative separation bf the arms of the angles. The task carried out by the
cbserver would be then reduced to the comparison of two linear distances.
This hypothesis can be rejected, however, by consideration of the cmstant
errors which would arise, were this the adopted procedure. The constant
error in comparisons of linear distance is itself influenced by the
relative orientations of the distances to be compared - the well known
vertical-horizontal illusion (Robinson, 1972 p96f). Applying this effect
-to the comparison of angle sizes by means of the comparison of arm
separations, the constant error would be maximum when one angle was
vertical and the other horizmtal, the horizontal angle appearing greater
than the vertical angle. As the angular separation of the bisectors of
the angles was increased, with the reference angle remaining horizontal,
the constant error would decrease continuously until a minimum was
reached when both angles were horizontal. As shown by Lennie's (1971) data
and by those obtained in experiments 5,6 and 12 of this study this pattern
of fluctuation of bias does not appear in the observed constant errors
of comparisons of angle sizes. The possibility that arm separation
constitutes the basis for comparisons of angular extent is thus rejected,
as is any other explanation which relies on a comparison of simple, linear
separations of components of the two stimulus angles.
Neither the observed characteristics of the ccnstant errors in the comparison
of angular extents nor the accuracy with which these comparisons are
performed, therefore, are adequately explained by the hypothesis that
angular extents are perceived as differences between compment orientations
of the angles, and misperceived as a consequence of apparent contrast
enhancement between those orientations. The consistency of this hypothesis
with results cbtained in previous studies can be accounted for by the
cbservaticn that, while these studies have been concerned, ostensibly,

187
with the perception of angular extent, the techniques used have actually measured perceived orientations. The observations made in these studies
can be explained, therefore, by a hypothesis framed in terms of
orientation analysers which was initially proposed to explain interactions
between perceived orientations cbserve&-under. dIfferent experimental
paradigms. The proposal of the hypothesis that direct comparisons of
angle sizes are made in terms of perceived angular extents, and not with
explicit reference to the perceived characteristics of the orientations
of the lines which define the angles, gives a satisfactory account of the
contradiction between many of the observations made in previous studies
and those described in the preceding chapters.
The aim to the last two experiments to be described, experiments 12 and
13, was the systematic investigation of the characteristics of perceived
angular extent, considered as an integral perceptual quantity.. These
investigations postulated the existence of a perceptual metric for angular
extent as an initial working assumption, and were designed to explore
some of the properties of this metric. The information thus gained, it
was intended, would give some indication of the way in which angular
extent is encoded by the visual system.
Assuming perceived angular extent to be an integral quantity, by which
is meant cne which cannot be analytically reduced to some other perceptual
dimensicns - such as orientation in the present instance - the first
questicn of interest concerns the relation, between the stimulus angle
size and the corresponding perceived angular extent. If such a relation
between angle size and perceived angular extent can be determined, and
is found to be a continuous function, then the cbjective scale of angle
size and the correspcnding subjective scale of angular extent are
topologically equivalent.
As was expected, the relation obtaining between stimulus angle size and
perceived angle size was found to be continuous and 'meridiQnally anisotropic,
reflecting the established characteristics of perceived angular extent.
It was also found that the same scaling factor (M) was applicable to all
sizes of angle included in the experiments, at a given orientation,
suggesting that magnitudes of perceived angular extent are combined by
some process of linear summation. This observation was verified by
comparison of the perceived angular extents of the larger angle stimuli

188
with predictions derived by summing the perceived angular extents of
smaller adjacent angles subsumed by the larger angle. The differences
between the observed and expected magnitudes of perceived angualr extent
were found to be noa-signifi cant.
The constancy of M at a particualr orientation (9) was further corroborated
by the results of experiment 13 which showed that about 0.96 of the
variance of perceived angular extent can be accounted for by the linear
regression of perceived angular extent onto stimulus angle size. The data
from these two experiments show, therefore, that the perceived angular
extent of a stimulus angle is deter-mined by a scaling factor whose
magnitude varies according to the orientation of the bisector of the angle.
The meridional anisotropy of M, as depicted in figure 7.3, can be
approximated by a function of the form M= f(cos40) although a further
factor varying as a function. of sin29 should be included in order to -
account for the difference between the magnitudes of M at horizontal and
vertical orientations.
The perceptual metric for angular extent can be considered, therefore,
as a regular elastic deformation of the objective metric for angle size,
such that the unit interval of the subjective metric is related to that
of the objective metric by a transfer function of the form: '
4' (A) = A. [(k. cos4g + a) + (l. sin29 + b)]
Equations of this form have already been proposed by Berliner and
Berliner (1948) to describe the distortions induced by Orbison figures
and by Lichtenstein (1953) to describe the visibility characteristic of
fine lines, both as functions of stimulus orientaticn. Consequentlyt
the perceived angular extent of any stimulus angle, compared to that 6f
a reference angle of a specified orientation, can be considered as the
linear sum of the unit intervals subsumed by the projection of the angle
figure onto this metric. Such a process would account for the data
pertaining to the constant errors of perceived angular extent obtained
in experiments 12 and 13.
Given the properties of the metric for perceived angular extentO as
determined by the scaling factor M and its meridional variationj, a
further postulate is required to account for the cbserved difference
thresholds for the comparison of angular extents. The difference
threshold, at a given orientation of the test angle relative to the

189
reference angle,, was found to increase linearly with stimulus angle size and, consequently, with perceived angular extent. It is proposed, then, that there are errors associated with the magnitude of each unit interval
which summate linearly as the intervals are combined. This would be
expected since, of course, these errors would be included in the magnitudes
of the unit intervals which contribute to any perceived angular extent. This proposal extends the scope of the hypothesis so that it can now
account for both the constant errors of comparisons of perceived angular
extents and the accuracies with which the comparisons are made. In
order the. the observed absence of meridional variation of acuity be
conserved, these errors cannot be associated with the actual magnitudes
of the unit intervals.
According to the transfer function. described above, the unit interval of
perceived angiilar"extent is greater at vertical and horizontal 19ci in
the orientation domain than at oblique loci. Considered in this way, the
postulated perceptual metric for angular extent does exhibit me charact-
eristic of the orientation domain which has been explained in terms of
the orientation-selective channel hypothesis. Using the method of
absolute judgmentss Rath, Alluisi and Learner (1961) found there to be
greater respmse equivocatim. at oblique orientations than around the
horizontal or vertical. This means that if the metric were to be
divided into equal intervals according to the objective scale, more
orientations would be found in the intervals in oblique regions than in
those around the horizontal and vertical. It follows from this that
the separatims between orientations about the cbliques tend to be smaller
than those around the horizontal and vertical. This is implied, of
course, by the lower acuities for orientation, cbserved at oblique
orientations revealed by difference threshold methods.
The perceptual metric for angular extent can be seen, therefore, to reflect
that attribute of the perceptual orientation. domain manifest ia the
meridional variation of acuity for orientation, rather than that attribute
which is manifest in constant errors of perceived orientatiM. Consequently, the meridional characteristics of perceived angular extent could be derived from the variances of the response distributions Of
orientation. analysers rather than fxxxn the central tendencies of these distributions. In this way the unparsimcnious requirement for a separate mechanism for the perceptim of angular extent is Obviated.

190
Andrews (1964) has proposed that the metric of the two-dimensional Visual
space is determined by the statistics of visual input in such a way the,
the average contour separation over a period of integration is seen as
uniform. The characteristics of percieved orientation determined in later
experiments by Andrews (1967a) are consistent with the application of this principle to an orientation metric - the response distributions of
orientation analysers being such that, averaged over time, the distribution
of activity of orientation analysers will be uniform across all
analysers. The characteristic of the orientation anlysers by which. this
uniformity is achieved is manifest in the meridional variation of the
empirical response distributions of the analysers which, in turn, is
responsible for the meridional anisotropy of the orientation metric, as
manifest in the observed magnitudes of difference thresholds for
orientation. It is proposed, then, that the meridional variation of
perceived angular extent is attributable to the same source as is the
meridional variation of acuity for orientation.
Despite the apparent inccmpatibility between the orientation analyser
model for the perceptian of orientation and orientation differences and
the cbserved characteristics of perceived angular extent, it now appears
that these cbservations can be accomodated by the hypothesis, provided
that the distinctim between perceived orientation and perceived angular
extent is maintained. As has been shown, these two perceptual variables
can be distinguished operationally by means of different experimental
procedures, according to whether measurement is made of the variable
and constant erTors of perceived orientation, or of variable and
constant errors of perceived angular extent.
According to the scheme so far developed, therefore, the perception of
both orientation and angular extent is mediated by the same set of cortical
neural mechanism,, after all, but by different attributes Of the response
characteristics of these mechanisms. When, as defined by the experimental task, the emphasis is Cn contour orientation the data obtained reflect the central tendencies of the distributica of activity amongst orientation
selective analysers. When the emphasis is on angular extent,, the data
obtained in the experiment reflect the second moment of the empirical
response distributions - the variance.,

191
The phenomencn of perceived orientation contrast, and its changes with time, have been accounted for by reference to the effect of lateral
inhibitory interacticns between orientation analysers on the localtion of the central tendency of the respcnse distributions of the analysers in
the orUntation domain. The failure of the attempt to relate the temporal
changes of perceived angular extent to the changes of perceived orientation,
even when the observers were the same for the two sets of measurements made
in experiments 9 and 10, is now ccmprehensible. In order to account for
the effect of increased stimulus duratim on constant errors of comparisons
of angular extent, the influence of the operation of lateral inhibitory
interacticns on the variability of the responses of orientation analysers
and, consequently, cn the perceptual metric for orientation and angular
extent, must be examined.
As lateral inhibiticn between orientation-selective analysers builds up,
the variability of the pcssible response of each analyser to a stimulus
is reduced by the suppression of extreme responses. The effect of lateral
inhibition on perceived orientaticn. results from the influence of the
change of higher moments of the response distributim cn the central
tendency of the distribution. When two orientaticns are presented
simultaneously the result of this process is the 'repulsion' of the
peaks representative of the two perceived orientations, and the occurrence
of the phenomenal orientatim contrast enhancement.
The reduction of the variability of the response distributions, considered
in terms of the perceptual metric for angular extent, will result in a
reduction of the magnitude of the unit interval of the met: Kc in the
region of excitation. Consequently, the distance between the two
orientations, specified with reference to the sum of the unit intervals
of the metric, not by the difference between the two perceived orientations,
will decrease and, thus, the magnitude of the perceived angular extent
will decrease. The results of experiment 9 are in agreement with this
hypothesis, therefore, so long as meridional anisotropy of the metric is
conserved over increased stimulus duration, as was shown to be the case
in experiment 12.
The conservaticn of meridional anisotropy and the invariance of the
scaling factor (M) over increasing stimulus durattions with the consequent

192
reducticin of unit interval magnitude brought about by lateral inhibition,
while maintaining the constancy of relative perceived angular extents, implies variation in the system which is, so far, unaccounted for. This
variaticin occurs in the raw, un-normalised constant error data which were found to vary across both stimulus durations and observers, and which is
summarised by the factor used to normalise the summed relative perceived
angular extents contained within a quadrant or semi-circle of 90 0 or IS 00
in the treatment of the raw data obtained in experiments 12 and 13. This
factor adds further complexity to the relation between the objective and
subjective metrics for angular extent which is not covered by the transfer
functicin relating unit intervals of the objective and subjective metrics. Further investigation would be required for the determination of the
nature and identity of this additional factor.
The re-analysis of the perception of angular extent described in this
section, based on, the data obtained in experiments 12 and 13 led to the
elaboration of a new hypothesis which accounts for the majority of the
observations made in those experiments. Subsequent examination of the
relaticn between the operation of orient ati on-se le ctive analysers, as
described by Andrews, and the observed characteristics of perceived
angular extent as interpreted by this new hypothesis has shown that the
distinction between the mechanisms for the perception of orientation and
for the perception of angular extent is not so great as had been concluded
on the basis of the inccnsistency between the observations made in this
study and those expected under the prior orientation-analyser hypothesis.
Both the present cbservations and those which led to the development of the orientation analyser model can be explained in terms of this model if
the variable errors of perceived orientation are considered as contibuting
to the function of orient ation-se le ctive analysers in the visual process,
as well as the constant errors.
Under this reformulatica of the description of the operation of cortical,
crientation-selective, mutually inhibiting channels the static and dynamkc
attributes of the perception of both orientation and angular extent are
explained and the apparent contradictions discovered initially are
res olve d.

193
]REFERENCES
ABADI, R. V. (1974) The effect of early anomalous visual inputs on
orientation selectivity. Perception 3 141-150
ANDREWS, D. P. (1964) Error-correcting perceptual mechanisms. Quart. J. exp. Psychol. 16- 104-115
ANDREWS, D. P. (1965) Perception of contours in the central fovea.
Natum 205 1218-1220
ANDREWS,, D. P. (1967a) Perception of contour orientation in the central fovea Ft. I: Short lines. Vision Res. 7 975-997
ANDREWS, D. P. (1967b) Perception of contour orientation in the central fovea Pt. II: Spatial integration. Vision Res. 7 999--1013
ANDREWS$ D. P., BUTCHER, A. K. & BUCKLEY, B. R. (1973) Acuities for
spatial arrangement in line figures; Human and ideal observers
compared. Vision Res. 13 599-620
ANDREWS, D. P., WEBB, J. M. & MILLER, D. T. (1974) Acuity for length
comparison in continuous and broken lines. Vision Res. . 14
757-766
APPELLE, S. (1972) Perception and discrimination as a function of
stimulus orientation. Psychol. Bull. 78 266-278
BARLOW, H. B. & HILL, R. M. (1963) Evidence for a physiological explanation
of the waterfall phenomenon and figural aftereffects.
Nature 200 1345-1347
BEERY, K. E. (1968) Estimation of angles. Percept. Mot. Skills 26 11-14
BEKESY, G. vcn (1967) Senso Inhibition (Princeton : thiversity Press)
BENEVENTO, L. A., CREUTZFELDT, O. D. & KUHNT, U. (1972) Significance of intracortical inhibition in the visual cortex. Nature 238 NB 124-126
BERKELY, M. A. 9 KITTERLE9 F. & WATKINS9 D. A. (1975) Grating visibility
as a function of orientation and retinal eccentricity. Vision Res. 15 239-244
BERLINER, A. & BERLINER, S. (1948) The distortion of straight and curved lines in geometrical fields. Amer. J. PsyChOl- 6_1 153-166

I
194
BISTI, S. & MAFFEI,, L. (1974) Behavioural contrast sensitivity of the
cat in various meridians. J. Physiol. (Lcnd. ) 241 201-210
BLAKEMORE, C. (1973) The Baffled Brain. In: R. L. GREGORY & E. H. COMBRICH
(Eds) Illusim in Nature and in Art (Lcndcn ; Duckworth)
BLAKEHORE, C. & CAMPBELL, r. w. (1969) On the existence of neurones in
the human visual system selectively sensitive to the orientation
and size of retinal images. J. Physiol. (Lond. ) 203 237-260
BLAKEMORE, C. 1, CARPENTER3, R. H. S. & GEORGESON, M. A. (1970) Lateral
inhibition between orientation detectors in the human visual
system. Nature 228,37-39
BLAKEMOREq C., CARPENTER, R. H. S. & GEORGESON, M. A. (1970) Lateral
thinking about lateral inhibition. Nature 234 418-419
BLAKEMORE, C., MUNCEY, J. P. J. & RIDLEY, R. M. (1971) Perceptual fading
of a stabilised cortical image. Nature 233 204-205
BLAKEMORE, C., MUNCEY, J. P. J. & RIDLEY, R. M. (1973) Stimulus specificity
in the human visual system. Vision Res. 13 1915-1931
BLAKEMORE, C. & NACHMIAS, J. (1971) The orientaticn specificity of two
visual aftereffects. J. Physiol. (Lond. ) 213 157-174
BLAKEMORE, C. 1, NACHMIAS, J. & SUTTON, P. (1970) The perceived spatial
frequency shift: evidence for frequency selective neurones
in the human brain. J. Physiol. (Lond. ) 210 727-750
BLAKEMORE, C. & SUTTON, P. (1969) Size adaptaticn: anew aftereffect.
Science 166 245-247
BLAKEMORE, C. & TOBIN, E. A. (1972) Lateral inhibiticn between orientation
detectors in the cat's visual cortex. Exp. Brain Res. 15 439-440
BOUMA, H. & ANDRIESSEN, J. J. (1968) Perceived orientation of isolated
line segments. Vision Res. 8 493-507
BOUMA, H. & ANDRIESSEN, J. J. (1970) Induced changes in the perceived
orientation of line segments. Vision Res. 10 333-349
BREITMEYER, B. G. & GANZ, L. (1976) Implications of sustained and transient
channels for theories of visual masking, saccadic suppression
and information processing. Psychol. Fev. 8_3 1-36
BURNS, B. D. & PRITCHARD, R. (1971) Geometrical illusions aad the response
of neurones in the cat's visual cortex to angle pattems. J. Physiol. (Lond. ) 213 599-616

195
CAMPBELL9 F. W. & MEN, D. G. (1965) Optical and retinal factors affecting
visual resolution. J. Physiol. (Lond. ) 181 576-593
CAMPBELL, F. W. & KULIKOWSKIl J. J. (1966) Orientaticnal selectivity
of the hi I system. J. Physiol. (Lond. ) 187 437-445
CAMPBELL, F. W., KULIKOWSKI, J. J. & LEVINSON9 J. (1966) The effect of
orientation on the visual resolution of gratings. J. Physiol. (Lond. ) 187 427-436
CAMPBELL, F. W. & MAFFEI, L. (1971) The tilt aftereffect: a fresh look.
Visicn Res. 11 833-840
CARPENTER, R. H. S. & BLAKEMORE, C. (1973) Interactims between orientations
in human vision. Exp. Brain Res. IS 287-303
CLOWES, M. B. & DITCHBURN, R. W. (1959) An improved apparatus for producing
a stabilised retinal image. Optical Acta 6 128-133
COLLINS, J. K. (1970) The aftereffects following single line and grid
inspection figures. Percept. Mot. Skills 35 50
COLTHEART, M. (1971a) Visual feature analysers and aftereffects Of tilt
and curvature. Psychol. Rev. 78 114-121
COLTHEART, M. (1971b) Is there lateral inhibition in the visual cortex?
Nature 231 NB 256
CORNSWEET, T. N. (1970) Visual perception (New York ; Academic Press)
CRASSINI, B. & OVER, R. (1974) Loci of distortion in the Wundt and
Hering figures. Vision Res. 14 1491-1492
CREUTZFELDT, O. D. (, 1974) Some neurophysiological considerations concerning
"memory". In: H. P. ZIPPEL (Ed. ) Memorv and Transfer of
Infomation (New York : Plenum)
CREUTZFELDT, O. D., INNOCENTI9 G. M. & BROOKS, D. (1974) Vertical
organisation. in the visual cortex (area 17) in the cat.
Exp. Brain Res. 21 315-336
cREUTZFELDT, O. D., KUHNT, U. & BENEVENTO, L. A. (1974) An intracellular
analysis of visual cortical neurones to moving stimuli:
responses in a cooperative neuronal network. Exp. Brain-Res. 21 251-274

196
CURTIS, D. R., DUGGAN*, A. W., FELIX, D. & JOHNSTON, G. A. R. (1970) GABA,
bicuculline md central inhibitim. Nature 216 1222-1224
DAY, R. H. (1962) Excitatory and inhibitory processes as the basis of
contour shift and negative aftereffect. Psychologia 5 185-193
DAY, R. H. (1965) Inappropriate constancy explanation of spatial distortions*
Nature 207 891-893
DAY, R. H. (1969) Human Perception (Sydney : Wiley)
DAY, R. H. & DICKINSON, R. G. (1976) The components of the Poggendorff
Illusim. Brit. J. Psychol. 67 537-552
DEALY, R. S. & TOLHURST, D. J. (1974) Is spatial adatpation an aftereffect
of prolonged inhibition? J. Physiol. (Lond. ) 241 261-270
ELLIS, S. R. (1975) Fragmentatiaa of fixated line stimuli as a function
of gravitational orientation. Perception & Psychophysics, 17 601-606
EMERSON, P. , WENEROTH, P., CURTHOYS, 1. & EDMORDS, 1. (1975) Measuring
perceived orientation. Vision Res. 15 1031-1033
EMSLEY, H. H. (1925) Irregular astigmatism of the eye. Trans. opt. Soc. 27 28-41
ENROTH-CUGELL, C. & ROBSON, J. G. (1966) The contrast sensitivity of
retinal ganglial cells in the cat. J. Physiol. (Lond. )
187 517-552
EVANS, C. R. (1967) Further studies of pattern perception and a stabilised
retinal image. The use of prolonged afterimages to acheive
perfect stabilization. Brit. J. Psychol. 58 315-327
FINDLAY, J. M. & PARKER, D. M. (1972) An investigation of visual orientation
constancy using orientation-specific properties of acuity
and adaptation. Perception 1 305-313
FINNEY, D. S. (1952) Probit Analysis (Cambridge : C. U. P. )
FISHER, G. H. (1969) An experimental study of angular subtension. Quart. J. exp. Psychol. 21 356-366
FREEMAN, R. D. & THIBOS, L. N. (1973) Electrophysiological evidence that
abnormal early visual experience can modify the human brain. Science 180 876-878

197
FRIES, W., ALBUS, K. & CREUTZFELDT, O. D. (1977) Effects of interacting
visual patterns on single cell responses in cat's striate
cortex. Vision Res. 17 1001-1008
GANZ, L. (1966a) Is the figural aftereffect an aftereffect? A review
of its intensity, onset, decay and transfer characteristic. Psychol. Bull. 66 151-165
GANZ, L. (1966b) Mechanism of figural aftereffects. Psychol. Rev. 73 128-150
GEORGESON, M. A. (1973) Spatial frequency selectivity of a visual tilt
illusion. Nature 245 43-45
GIBSON9 J. J. (1933) Adaptation, aftereffect and contrast in the perception
of curved lines. J. exp. Psychol. 16 1-31
GIBS()N, J-J. (1937) Adaptation, aftereffect and contrast in the perception
of tilted lines (2): Simultaneous contrast, and the areal
restrictim of the aftereffect. J. exp. Psychol. 20 553-569
GIBSON9 J. J. & RADNERO M. (1937) Adaptaticn, aftereffect and contrast in the perception of tilted lines (1): Quantitative Studies.
J. exp. Psychol. 20 453-467
GILINSKY9 A. S. (1967) Masking of contour-detectors in the human visual
system. Psychonomic Science 8 395-396
GILINSKYO A. S. (1968) Orientation specific effects of patterns of
adapting light on vis-ual acuity. J. opt. Soc. Am. 58 13-18
GILINSKY, A. S., BOYKO, E. P. & BARAS, H. L. (1967) Pesolution of lines
with specific orientations after patterned light adaptation. J. opt. Soc. Am. 57 581
GILINSKY, A. S. & COHEN,, H. H. (1972) Reacticn time to change in visual
orientation. Perception & Psychophysics 11 129-134
GILINSKY, A. S. & MAYO, T. H. (1971) Inhibitory effects of orientational
adaptation. J. opt. Soc. Am. 61 1710-1714
GOLDSTEIN, A. (1967) Retinal rivalry and Troxler's effect. Psychonomic Science 7 427-428
GOLDSTEIN, A. (1968) Retinal rivalry and Troxler's effect: a correlaticn. Percpetion & Psychophysics 4 261-263
GREGORY9 R. I. (1977) Vision with iso-luminant colour contrast I: A
projection, technique and observaticns. Percpetion 6 113-119
198
HAMBLIN, J. R. & WINGER, T. H. (1927) On the resolution of gratings by
the astigmatic eye. Trans. Opt. Soc. 29 28
HARTLINE, H. K. & RATLIFF9 F. (1957) Inhibitory interaction of receptor
units in the eye of Limulus J. gen. Physiol. 40 357-376
HELMHOLTZ, H. (1962) Helmholtz's Txeatise of Phy2iological Optics
J. P. C. SOUTHALL (Ed. ) (New York ; Dover)
HERING, E. (1861) Beitrage zur Psychologie (Leipzig : Engelman)
HESS, R., NEGESHI, K. & CREUTZFELDT, O. D. (1975) The horizontal spread
of intra-cortical inhibiticn in the visual cortex.
Exp. Brain Res. 22 415-420
HEYMANS, G. (1897) Quantitative Untersuchungen Uber die Z811nersche
und die Loebsche Viuschungen. Z. Psychol. 14 101-139
HIGGINS, G. C. & STULZ, K. (1948Y Visual acuity as measured with various
orientatims of a parallel line test cbject. J. opt. Soc. Am. 38 756-758
HIGGINS, G. C. & STULZ, K. (1950) Variation of visual acuity with various
test object orientations and viewing conditions. J. opt. Soc. Am. 40 135-137
HIRSCH, J., SCHNEIDER, B. & VITIELLO, M. (1974) The effects of adaptation
to square wave gratings as a function of grating Orientation-
Percpetion & Psychophysics 15 475-478
HOFMANNJ F. B. & BIELSCHOWSKY, A. (1909) Ueber die Einstellung der
scheinbaren Horizontalen und Vertikalen bei Betrachtung eines
von schrligen Konturen erfüllten Gesichtsfeldes.
Arch. f. d. ges. Physiol. 126 453-475
HOULIHAN? K. & SEKULER, R. W. (1968) Contour interactions in visual
masking. J. exp. Psychol. 77 281-285
HUBEL, D. H. & WIESEL, T. N. (1959) Receptive fields of simple neurones
in the cat's striate cortex. J. Physiol. (Lond. ) 148 574-591
IKEDA, H. & WRIGHT, M. J. (1972) Receptive field organisation of "sustained"
and "transient" retinal ganglion cells whibh subserve different functional roles. J. Physiol. (Lond. ) 227 769-800

199
IKEDA, H. & WRIGHT, M. J. (1974) Evidence for "sustained" and "transient"
neurones in the cat's visual cortex. Vision Res. 14 133-136
IKEDA, H. & WRIGHT, M. J. (1975) Retinotopic distributicn, visual latency
and orientatim tuning of "sustained! ' and "transient"
cortical neurcnes in area 17 of the cat. Exp. Brain Res. 22
385-398
IVERSON, L. L., MITCHELL, J. F. & SRINIVASAN,, V. (1971) The release of
amincbutyric acid during inhibition in the cat visual cortex.
J. Physiol. (Lond. ) 212 519-534
JAMES, C. R. (1975) Passive Evoked Potentials and SinjZle Unit Responses
in the Visual Cortex of the Cat. (Unpublished Ph. D Thesis
University of Keele)
JUDD, C. H. & COURTEN, H. C. (1905) The Zbllner Illusion. PsYchol. Monogr.
7 (No. 29) 112-141
KAUn4MN, E. L., REESE, T. W., VOLKMANN,, J. & ROGERS, S. (1947) The
accuracy, variability and speed of adjusting an indicator
to a required bearing. Mount Holyoak College Report 166-I-MHC 4.
KLEIN, S., STROMEYER III, C. F. & GANZ, L. (1974) The simultaneous- spatial
frequency shift: a dissociation between the detection and
percepticn of gratings. Vision Res. 14 1421-1432
KRISTOF, W. (1960) Ein Umschlag der Heringschen THuschung bei Abwaiidlung
der Vorlage. Z. exp. angew. Psychol. 7 68-75
KULIKOWSKI9 J. J., ABADI, R. & KING-SMITH, F. E. (1973) Orientati'onal
selectivity of grating and line detectors in human vision.
Vision Res. 13 1480-1486
KULIKOWSKI, J. J. & KING-SMITH, P. E. (19731 Spatial arrangement of line,
edge and grating detectors revealed by subthreshold summatim. Vision Res. 13 1455-1479
LF, NNiE, P. (1971) Distorticns of perceived orientaticn. Nature 233
NB 155-156
LENNIE, P. (1974) Head orientaticn and meridicnal variations in acuity.
Vision Res. 14 107-111
LICHTENSTEIN9 M. (1957) Note on a function of stimulus orientation common to several aspects of vision. J. opt. Soc. Am. 47 256-257
LOVEGROVE, W. (1976) Inhibiticn and successive contour interaction in
human vision. Visicn p , es. 16 1519-1521

200
MACH, E. (1868) Uber die Abh3ngigkeit der Netzautstellen vcn einander.
Translaticn in: F. RATLIFF (1965) Mach Bands (San Francisco
Holden Day)
MACKAY, D. M. (1957) Moving visual images produced by regular stationary
patterns. Nature 180 849-850
MACKAY, D. M. (1961) Interactive processes in visual percepticn.
In: W. A. ROSENBLITH (Ed. ) Sensory Communication (Cambridge,
Mass. : M. I. T. Press)
MACKAY, D. M. (1967) Ways of looking at perception. In: W. WATREN-DUNN (Ed. )
Models for the Perception of Speech and Visual Form
(Cambridge, Mass. : M. I. T. Press)
MACKAY,, D. M. (1973) Lateral interaction between neural channels sensitive
to texture density? Nature 245 159-161
MACKAY, D. M. & MACKAY, V. (1974) Do curvature-contingent chromatic aftereffects require "detectors for curvature"? Visicn Res. 14 1285-1287
MACKAY, D. M. & MACKAY, V. (1975a) What causes decay of pattem contingent
chromatic aftereffects? Vision Res. 15 462-464
MACKAY, D. M. & MACKAY, V. (1975b) Dichoptic inductim of m ccollought -type
effects. Quart. J. exp. Psychol. 27 225-233
MacKINNON, G. E., FORDE, J. & PIGGINS, D. J. (1969) Stabilised. images'ý
steadily fixated figures and prolonged afterimages. Canad. J. Psychol. 23 184-195
MACLEAN, I. C. & STACELY, G. B. (1971) Judgment of angle size.
Perception & Psychophysics 9 499-504
MAFFEI, L. & CAMPBELL, F. W. (1970) Neurophysiological localisation of the
vertical and horizontal co-ordinates in man. Science 167
386-387
MAFFEI, L. & FIORENTINI, A. (1973) The visual cortex as a spatial
frequency analyser. Vision Res. 13 1255-1267
MAHEUX, M., TOWNSHEND, J. C. & GRESOcK, C. J. (1960) Geometric factors in
illusions of direction. Amer. J. Psychol. 73 535-543
MANSFIELD, R. J. W. (1974) Neural basis of orientaticn perception in primates.
Science 186 1133-1134

201
MATIN, E. (1974) Light adaptation and the dynamics of induced tilt. Vision Res. 14 255-265
MAYO, T. H., GILINSKY, A. S. & JOCHNOWITZ, A. (1968) -Visual masking and tilt aftereffects as a function of tilt and angular
separation between test and adaptation line patterns. Proc. 76th Ann. Con. of the A. P. A. 3 97-98
MITCHELL, D. E., FREEMAN, R. D. & WESTHEIMER, G. (1967) Effect of
orientation m the modulation sensitivity for interference
fringes on the retina. J. opt. Soc. Am. 57 246-249
MOVSHON, J. A. & BLAKEMORE, C. C1973) Orientation specificity and spatial
selectivity in human vision. Perception 2 53-60
MUIR, D. & OVER, R. (1970) Tilt aftereffects in central and peripheral
vision. J. exp. Psychol. 85 165-170
OGILVIE, J. C. & TAYLOR, M. M. (1958) Effect of orientation cn the visibility
of fine wires. J. opt. Soc. Am. 48 628-629
ONLEY, J. W. & VOLKMAUN, J. (1958) The visual perception. of perpendicularity.
Am. J. Psychol. 71 504-516
ORBISON, W. D. (1939) Shape as, a function of the vector field.
Amer. J. Psychol. 52 31-45
OVER, R. (1971) Comparison of normalisation theory and neural enhancement
explanation. of negative aftereffects. psychol. Bull. 75
225-243
OVER9 R., BROERSE, J. & CRASSINI, B. (1972) Orientation illusion and
masking in central and peripheral vision. J. exp. Psychol. 96
25-31
OYAMA, T. (1960) Japanese studies of the so-called geometrical optical
illusions. Psychologia 3 7-20
OYAMA, T. (1975) Determinants of the Zbllner Illusion.
Psychological Research 37 261-280
PARKER, D. M. (1972) Ccntrast and size variables in the tilt aftereffect. Quart. J. exp. Psychol. 24 1-7
PARKER, D. M., (1973) The effects of adaptation to gratings cn the
perceived orientation of single lines. Quart. J. exp. Psychol.
25 289-299

202
PARKER, D. M. (1974) Evidence for the inhibition hypothesis in the
expanded angle illusion. Nature 250 265-266
PARLEE, M. B. (1969) Backward masking of a single line by a single line.
Visicn Res. 9 199-205
PETTIGREW, J. D. & DANIELS, J. D. (1973) Gamma-amino butyric, acid antagonism:
Different effects cn simple, complex and hypercomplex
neurones. Science 182 81-83
PHYLLIS, J. W. & YORK, D. H. (1967) Cholinergic inhibition in the cerebral
cortex. Brain Res. 5 517-520
POGGIO, G. F., DOTY, R. W. & TALBOT, W. H. (1977) Foveal striate cortex of
behaving mmkey: single-neurone response to square-wave
gratings during fixation of gaze. J. Neurophysiol. 40 1369-1391
POLYACK, S. L. (1941) The Retina (Chicago : University of Chicago Press)
RATH, G. J., ALLUISI, E. A. & LEARNER, D. B. (1961) An equal discriminability
scale of lineal inclination. In*. E. A. ALLUISI (Ed. )
USAF ASD Technical Report. 61 - 741.
RATLIFF, F., HARTLINE, H. K. & MILLER, W. H. (1963) Spatial and temporal
aspects of retinal inhibitory interaction. 7. opt. Soc. Am. 53 110
ROBINSON, J. O. (1972) The Psychology of Visual Illusion (London : Hutchinson)
ROCHLIN9 A. M. (1955) The effect of tilt on the visual perception of
parallelness. Amer. J. Psychol. 68 223-236
ROSE, D. & BLAKEMORE, C. (1974a) Effects of bicuculline on functions Of
inhibition in visual cortex. Nature 249 375-377
RoSEv D. & BLAKEMORE, C. (1974b) An-analysis of orientation selectivity
in the cat's visual cortex. Exp. Brain Res. 20 1-17
SACHS, M. B., NACHMIASs J. & ROBSON$ J. G. (1971) Spatial frequency
channels in human vision. J. opt. Soc. Am. 61 1176-1186
SCHILLER, P. H. 9 FINLAY, B. L. & VOLMAN, S. F'. (1976) Quantitative studies
of single cell properties in monkey striate cortex II:
Orientation selectivity and ocular dominance.
J. Neurophysiol. 39 1320-1333
SCHMIDT, M. J., COSGROVE, M. P. & BROWN, D. R. (1972) Stabilized image:
functional relationships among populations of orientation-
specific mechanisms in the human visual system.
Perception & Psychophysics 11 389-392

203
SEKULER, R. W. (1965) Spatial and temporal determinants of visual backward masking. J. exp. Psychol. 70 401-406
SEKULER, R. W. & LITTLEJOHN, J. (1974) Tilt aftereffect following very brief expcsures. Vision Res. 1_4 151-152
SHARPE, C. R. (1974) The colour specificity of spatial adaptation: red- blue interactions. Vision Res. 14 41-51
SHARPE, C. R. & MANDL, G. (1977) Colour inputs to orientation detector's
in the human visual system. Vision Res. 17 77-82
SHLAER, S. (1937) The relation between visual acuity and illumination.
J. gen. Physiol. 21 165-188
SILLITO, A. M. (1975a) The effectiveness of bicuculline as an antagonist
of GABA and visually evoked inhibition in the cat's visual
cortex. J. Physiol. (Lond. ) 250 287-304
SILLITO, A. M. (1975b) The contribution of inhibitory mechanisms to
the receptive field properties of neurones in the striate
cortex of the cat. J. Physiol. (Lcnd. ) 250 305-329
SINGER, W. & BEDWORTH, N. (1973) Inhibitory interaction between X- and
Y-units in the cat lateral geniculate nucleus.
Brain Res. 49 291-307
STRASCHILL, M. & PENWEIN, J. (1969) The inhibition of retinal ganglion
cells by catecholamines and '6-amino butyric acid. PflUgers Archiv. ges. Physiol. 312 45-54
SULZER, R. L. & ZENER, K. (1953) A quantitative analysis of relations
between stimulus determinants and sensitivity of the visual
perception of parallelness. Amer. Psychologist 8 444
SUTHERLAND, N. S. (1961) Figural aftereffects and apparent size. Quart. J. exp. Psychol. 1_3 222-228
TAKALA, M. (1951) On constant errors in the judgment of degree of inclination. Acta Psychol. fenn. 1 129-142 -
TAYLOR9 M. M. (1963) Visual discrimination and orientaticn. J. opt. Soc. Am. 53 763-765
TEBECIS, A. K., HOSLI, L. & HAAS, H. L. (1971) Bicuculline and the depressicn
of medullary reticular neurcnes by GABA and glycine. Experientia 27 548

204
TIMNEY, B. N. & MUIR, D. W. (1976) Orientation anisotropy: incidence and
magnitude in Caucasian and Chinese subjects. Science 193 699-701
TOLHURST, D. J. (1972) Adaptation to square wave gratings: inhibition
between spatial frequency channels in the human visual
system. J. Physiol. (Lond. ) 226 231-248
TOLHURST, D. J. (1973) Separate channels for the analysis of the shape
and'the movement of a moving visual stimulus.
J. Physiol. Mond. ) 231 385-402
TOLHURST, D. J. (1975a) Reaction times in the, detection of gratings by
human observers: a probabilistic mechanism. Vision Res. 15
1143-1149
TOLHURST, D. J. (1975b) Sustained and transient channels in human visicn.
Visiai Res. 15 1151-1155
VIRSU, V. & TASKINEN, H. (1975) Central inhibitory interactions in
human visicn. Exp. Brain Res. 23 65-74
WADE, N. J. (1972) Orientation effects on line afterimages. Perception &
Pdychophysics 12 409-416
WALLACE, G. K. (1966) The effect of background on the Milner Illusion-
Acta Psychologica 25 373-380
WALLACE, G. K. (1969) The critical distance of interaction in the Z511ner
Illusion. Perception & Psychophysics 5 261-264
WALLACE, G. K. (1975) The effect of contrast cn the Z811ner Illusicn.
Visicn Res. 15 963-966
WALLACE, G. K. & CRAMPIN, D. J. (1969) The effect of background density
cn the ZB11ner Illusion. Visicn Res. 9 167-177
WARE, C. & MITCHELL, D. E. (1974) The spatial selectivity of the tilt
aftereffect. Vision Res. 14 735-737
WATANABE, A., MORI, T., NAGATA, S. & HIWATASHI* K. (1968) SpatLal sine
wave responses of the human visual system. Vision Res- 8
1245-1263
WATKINS, D. W. & BERKELY, M. A. (1974) The orientation selectivity of single
neurones in cat striate cortex. Exp. Brain Res. 19 433-446

205
WEENE, P. & HELD, R. (1966) Changes in perceived size of angle as a function of orientation in the frontal plane. J. exp. Psychol. 71 55-59
WEISSTEIN, N. (1970) Neural symbolic activity: a psychological measure. Science 168 1489-1490
WEISSTEINq N., MONTALVO, F. & OZOG, G. (1972) Differential adaptation to
gratings blocked by hexagms: A test of the neural symbolic
activity hypothesis. Psychonomic Science 27 89-92
WENDEROTH, P. & BEH, H. (1977) Component analysis of orientation illusions. Perception 6 57-75
WESTHEIMER, G., SHIMAMURA, K. & McKEE,, S. P'. (1976) Interference with
line orientatim sensitivity. J. opt. Soc. Am. 66 332-338
WHITE, K. G. (1971) Z811ner Illusion as perceptual enlargement of acute
angles. Psychoncmic Science 24 73-75
WHITE, K. G. (1972) Implicit contours in the Z811ner Illusion.
Amer. J. Psychol. 85 421-424
WHITE, K. G. (1975) Orientation effects on contour interaction in the
Z811ner Illusion. Perception & Psychophysics 17 387-392
WHITE, K. D. & RIGGS, L. A. (1974) Angle contingent colour aftereffects.
Vision Res. 14 1147-1154
WUNDT, W. (1902)Beiträge zur Theorie der Sinneswahrnehmung.
(Leipzig : Engelman)
WUNDT, W. (1898) Die geometrisch-optischen Täuschungen.
Abhand. mathphys. der sachs. Ges. Wiss. 24 53-178
ZOLLNIER, F. (1860) Über einer neue Art von Pseudoskipie und ihre
Beziehungen zu den vcn Pleteau und Oppel beschrieben
Bewegungsphäncmenon. Ann. Phys. Chem. 186 500-523

2 05 Lj,,,
Appendix I: Tables of Constant Errors (biases) and Variable Errors
(standard deviations) obtained in experiments 3- 13.
rollowing each table of biases and standard deviations is
a second table for the same experiment showing the standard
errors of the biases and standard deviations of the response
distributions.
The first value given in each cell of the tables is the bias, or the standard error of the biasý this is followed
by the standard deviation, or the standard error of the
standard deviation. In the majority of the tables, two sets of
values are given for each cell, with a third set of values, the mean and the root mean square of the bias and the standard deviation respectively.

206
LO
lqt
Experiment 3: Biases and Standard Deviations.
ýz :4 10 in
0 to LO It to 0-
cc ;A %0
oý (Y, ,0 lqt c"0, ,: 0c;
ý0
: 31
Co & (> %0 %0 N c"i to CO %0 1. t (Z) 00 Co , ýo 0- C. 4 C, 4 m ri ýo - (> 10 C, 1 CO C)
cý -4 lý -4 c; -4 c; cý 0 -4 c4 c4 Lr; CC) co 10 C> CC) 0 10 Nt C> NN Cl)
r- C%4 0
't 10 Co 00 lit CO le - Co
(V) C*4 C, 4 N ýo 0N0 cli m
rz tr; cý c4 cý cle) co
to
I- "-
CV) NS Cl) 4t qt s 00 Lo o" C), -t CNA c? ) Nt (Y) 10 ON m to %0 CC) CV)
Cý C4 C4 Cý C4 tr; tý a u 0N %0 04 LO C) C*') CY) to C%4 ý; t C%4 CC) CO)
-1 0- C) C%4 Ol 0N 0- 02 L11)
CV! Ci Cý - Oll I- K 0- N It co - CII) 00 Wýý0':
-: .: C; C; :1 c) n ON
cv) Lo N- o 'o co C), ;, - % C14 m 41. %0 0- %0 ON a) 114, CY) CN 'Itt N Cl) V) C4 Cý Cý 0: C; C; C; L6 C;
c4
0' '0
--
0 CC) 10 Co
ch %0 clq 0 '- -.
LO LO *ýo
to Co
ce) CC) (Y) N CN
--
04 LO (14 CN b %0 C, 1) le (> Co LO
OD C). c> n Ilý ddc; 0
le ýo %0 0. ýt ci CD N CD Uli CY- NN CC)
Ln 04 N 0- Go
C4 C; .: 1: 6
0 0. LO 04 - LO ý
,0 Ilý CY) t
-4 Le;
C> LO
1:
LO
C4
%0 04 LO 04 , qt C*4 LO 0- C; Cý
6 C4 11
03 C) It Nt CY) K '0 ;A CC) to a) Cl) CN CN Cl LO K
10 C4 CV) - 0 1.: _: C; .: 1: .: C;
00 C*3 CII) C) 00 LO 8- Nt LO C)
N r,., to
CV) N a) C; C; 1ý 1: C; C;
%0 19t 0- -At :4 Oý N 04 C> 0 04 LO N co co CC) 10 a) Q 10 ýo (4 0 le C, 2
C> tn
n ce) m CV) C> to -- 1" -- I
CY- CC) (N !, 2 ,6 ! ýO, (D N CD 00 LO 000
LCA CN C> CN NO CD Lo C, 4 co -N cs (Y- 0 CI) CD C: ) NN OD CV2 m ce CY) le
cý -: .2c; c4 o,. Ln cv) 04 mo Ln c., ) Ln Cl Cl Cl C! cv! CV) 0. - 04 C-4 %0
r- C%4 %0 LO C%4 0 LO qt LO CII) C%I)
04 LO N C%4 It %0
C) 01. C14 tn CV)
C) CC)
I- -
C, 4 tr) N clq 0 (N gN clq C*4 c"i pý
Ln C05
N cle) CV)

207
Experiment 3: Standard errors of Biases and Standard Deviations.
SO
to
It
N le m0 clq 10 0m OD %0 00 C%q S40 -e - -e & C'4 -e CN
LO C, 4 C, 4 C, 4 (N r- CN g; CS
ýA 6z (0
cdcddd CY)
LO OD
C> LO to M Co CO C: ) LO m -0 Ln ýt LO 00 C%A 10 N (N %0 Nm (> C) Kn CO 0 C> le cli (>
cý C",! - Cli cýI Ci C! cý Ci (D 00,00C: ) c; 000000c; c; c;
CII) CY)
C;
% 2ý 'A CN F-
000
0- ý2 C;
to C) CY) CN C*4
to
ýo m LO C: ) %0 (D 10 (V) @I) te, CN m C, 4 C, 4
0% to %0 N 00 C14 LO 110 11 'Itt 00 CD 0 00
Cý - Ci -- C; C; a C; 0 C; CS
le C, 2 (N C) 10 cm Co r1. C) lit LO LO OD %0 CN m clq CN CN
c; c; c; c; c LO 02% ci Co g . 6- t%i cn tli a"-; " -; " -;
0000000
-J
.A (V) 2). 10 0 Ln Lf)
D Z: C", CO _N
C-x)
ddccdcd I,,
NN clq Co CY- (> MN
c. '1
r-
ddoo
LO CV) %0
ýo C>ý Co %0 LO Co 9; 2N cv)
Ci cý CN
C> C: ) C) C) c; c;
F. 14 16N CN
C; C;
D
dddcdd
I-
0
CY) C) 04
I-
C,,
0
cl CY)
2MNeý -t CN1 Co CO
c; c;
8ý C;
0% CN Nt LO C%4
dddd LO ýs Ict & C14
00 (D
1-4* %0
000
. 'o 0 CY) co
. X4 C)
lcoýl
;
co C) %0 (Y) -41t C4 N co co N C%4 U") lqt CN N CC) - 04 N LO CC) C-4
C) CO) 04 6
%0 "Wt % CY) CN CN
C; C;
0ý CV) C%4 CY) N 01. a) CY) CY) CN C; cs C; C=;
N 04
CD 0 C>
co
CY) 00 OD 04 NN
Cl Cf) 04 C; C; C;
C, 4 C, 2
ddo
Ln c#) %0 C*4 C14
00
wý 10
6
0
0- 04
CN co C) a) N CY) C-4 os CN 000
CC) co OD 0ý
s CY)
N C, 4 Im- C14 C;
LO CV) a) Ln P- 0N %0 U') 0. :2 Cl N LO 04 CY) Cý Cý
- C"! Cý - cl Cý C) C> C) 0 C) C) C) Q0C; c,
04 - LO N- 0 Cq l4t O
CN LO c) C'4 Lr) 0 F4 04 C14
CD C%I) 0.0 0
C-4 C14
(D
0 CN 04 04 C

208
Experiment 4
Orientation PSE SD s(PSE) s(SD) 0 -1.40 2.115 0.290 0.362
22 -1.48 1.705 0.254 0.266
45 -0.17 1.178 0.202 0.225
67 -0.66 1.841 0.266 0.278
90 0.62 3.226 0.442 0.706
112 -0.67 2.832 0.371 0.523
135 -0.32 1.233 0.180 0.196
157 1.41 1.703 0.236 0.279
180 -0.43 2.170 0.304 0.407
202 0.41 2.124 0.287 0.354
225 -0.80 1.530 0.220 0.248
247 0.47 1.412 0.202 0.227
270 -0.87 1.935 0.254 0.350
292 0.19 1.451 0.215 0.228
315 0.09 0.903 0.141 0.141
337 -0.70 1.398 0.195 0.225

209
Experiment 6: Standard Errors of bias and standard deviation
0 LO c4 (4
c 0 *Z
0 C14 0 C%4
c'. 1 I-
Co (n
SZ
-t %0 (D C-4 ý C-4 F- -I
C; C; CO lqt r) (V)
C: ) 10 00 clq
------
; 0, c; c; ;x tr)
m U- U- ---
0
. 4-
000
Co
0)
I-
N U; 0 .2 CC) c% -Ln .!
D
0
LO CW) r4 Co le CN M cýJ
0o
CY) fý ;z 11 CC)
0 Cq 0- CN
0Q0
M Co %0 tel LO LO
C; C; C; --ýz C; C; 4- L4
Ln Ln 0. (L) :: ý k-
rz
odd 00
C"4 Co tt') CM (> (Z
C; C; C; C; C; Co (N
0 LO CW)
; CC)
G) N
C) C) C
;
ocD C)
0
0 N It CN
a) N
z71
CN OD ýo
C; C; Lin le Uli le C*4 cn I- U
C; C=;
0 C) ce)
10 J -0

210
Experiment 6: Biases and Standard Deviations
OLO
CN 04
0 04 0 CN
le ýo CO N 10 N
d C) N 04 Ol
C;
CC) CV) C> C> C) oco
. Cý 0 C) 0 C=; C; En
CV) c4 (N C, 4 %0 %0 %0 C, 4 le (> Ln
cý (ý »: 1: c 0 Lel 10 le LO
r_
-0 .= a 0 0) C
F-
4- �6,
I-
Ln 8 LO C%4
"41 00 CN LO
0Q
M Co 1.0 00 -
C, 4
I- --
0 C14 0%
C;
0
0N CN , ýo m
C) CV) C%4 C) - 0% N co
0 C; C; C;
C14
(N M C-4 Co C, 4 CD
C) 06 CN
qn CII)
ýo r) clq CN
N CN
co
I- I-
III 0'-
r2 10 LO CD C: )
Co N 00
cý d c; I-
o '-
--- III
(D N
Z;; C6 0 C') CI) c
---
--
m 0- Nt CV)
C; C; a
0 Cl
U 0
C
E '0
co I-
U I.. C
C) 1)
0
(Y)
-c " . 1- 0) C
C
-j
j -0 c 0 u ! L)
C) 0
c4
0 . 4-
2
E

211
Experiment 5: Standard Errors of bias and standard deviation
0
04
Lo t 401 rz 00 m ýýi LO 00 Co 0- N %0 (N %0 C'ý CN C-4 CV) M
d cz; 00dc; c; dd
10 00 C: ) Q I- -
CO
10 zoo 1144 c4 Cý Cý
a CD C; CD a
M 00 N C) nt 0 C%A "0 w- P-
C11 cý cý 0 C; c; c; c; 0 C)
eN C%4 cl C, 4 C, 4 (n M CN M CY) C, 4 le (N m ýe un 4- -- r"i
c; c; Co M Le) "0 c) R C, 4 4
LO le C*4 C, 4 C�4 CN C, 4 C*4
c; 0 c:, c; c; c; c; r C4
C'4 (N 110 00 Nt CN CN co
V) C%4 &
l4t ce) , lq* C4 N 't 4) --- C14 C%4 04 04 C14 I--
C; C; C; C; C; C; C; C; 16 cs c; C;
C-4 CD C, 4
0 U-
0
LO OD LO Co C, 4 00 CI) CN
0Q (D 0 C) 0
CO
00Q
14t 14t C%4 CV)
C, ; -) c) C; C; C; C;
CN
0, ý C-A %0 1.0 Co clq C, 4 ý C%4
00 0
4)
Rn c6 oLn Cl)
0 C: )
1ý
U I. - U
2 E
09 j 1'. -0 Z, - c 0
C: )
CD
0 11
CE :5

212
Experiment 5: Standard Errors of bias and standard deviation
Co
c42 ý (n (> %0 %0 ý C) ýo %0 %0
ý C: ) 10 lit Lin ý %0 04 LO m le c44 ý C, 4 CN CN
c; c; c; c; c; d c; c; c; c; c; c; (N cf) %0 04 %0 'A tj
0. tý K c) Z8 C14 %0 0% LO LO
r- P- - C%4 C%4 C14 C; C; C; C; C; C; C; C; C; C; C; 6
co In C14 cq ýo C)
C14 C14 C; C) C; C; c; c; C; C; C;
N CY) 0 LO 04 10 C) CC) C> CY) %0 It 04 CN CN
C; C; C; C; cs C; C; C; . 6-
(Y) C-4 CO CN N CV2 N Co ri 00 CO (V) C: ) 0 (N CY) m C) 0, CD .rg; ý CO CN CN cq
00c;
cc; c; c:. c; c; c; c; c; ,0 4) cn C, 2 Co M ýo C) -, 0 %0 C, 4 - C, 4 r) CY) CY) LO N NO <
CN clq (N C%4 CN c; c; c; c; c; c; c; c;
I-- -
CV) N C4, ) ;; N" cq C-4 C%4 "qt 1-t Nt C14 C%4 C%4 0
C; C; C; C; C; C; C; r_
(Y) N C> CC) *E clq (N CN 7- C-4 r-4 C'4 10
c; c> c> c> c> c; c; c; CO C> (N (V3 0- C, 4 8 2D u Fý - C: ) le m 't (1) CO LO N ß_ r-ý ----C, 4 C, 4 C, 4 CN M CN 0
c; d c; c; c; cý c; c; cz; c; cz; c; a (P
C: ) (>
r, to 0 C'4 C'4 N to (D r, 4 :2C: ) C> lqt C, 4 't (1) %0 C) CO C, 4 C, 4 C, 4 C*4 m CN
rg c; c; c; c; cý c; c; c; - c; 11 X c3)
vi 0,0 otn 0a
%0 0
CC

213
Experiment 5: Biases and Standard Deviations
0 C) N C%4
04
0 00
ýo %0 CY) clq CD CC) CV) CY) %0
0 tn N LO tc) C*4 0 CO
C;
9- tn
Cl) to 0. NO
Oll 10 %0 0 C; C;
:4 Cý
ý2 cl;
--t R; co co 00 n cl CV) C%4
00 , %0 C, 4 CC) OD N
I- -
-
%0 -t Lin %0 -e CN CN CN 04 CY) CY)
II
9',
C%4 0- C) (-) -e 2 10 -0 LO 0,0 LO %
C) OD C: ) CD 10 r-z
00 cli C'! ci ZO LO
c; c; zi 2 P-t3 C14 04
0 04 C) C*4
4)
0)
ý uj tli w tli tu) CI) C) LO Co %(x: LO r2 le cn N0ý C) %0 qt ýC.
cý c43
Cb (D
ýý z3 :: 9 tol- 10 lqt Co Q
c; c; c; cz; c; 0)
. 21 CY) 0- r- C, 4 «3M CO 7x
cý N CD Co le CN e-. )
c4 cý cý cý; 11
_c OC> 010 0 CW2 C)
lqt %0
04 CvI) C4
U
clý
0
v
u
E e
cý u
c4
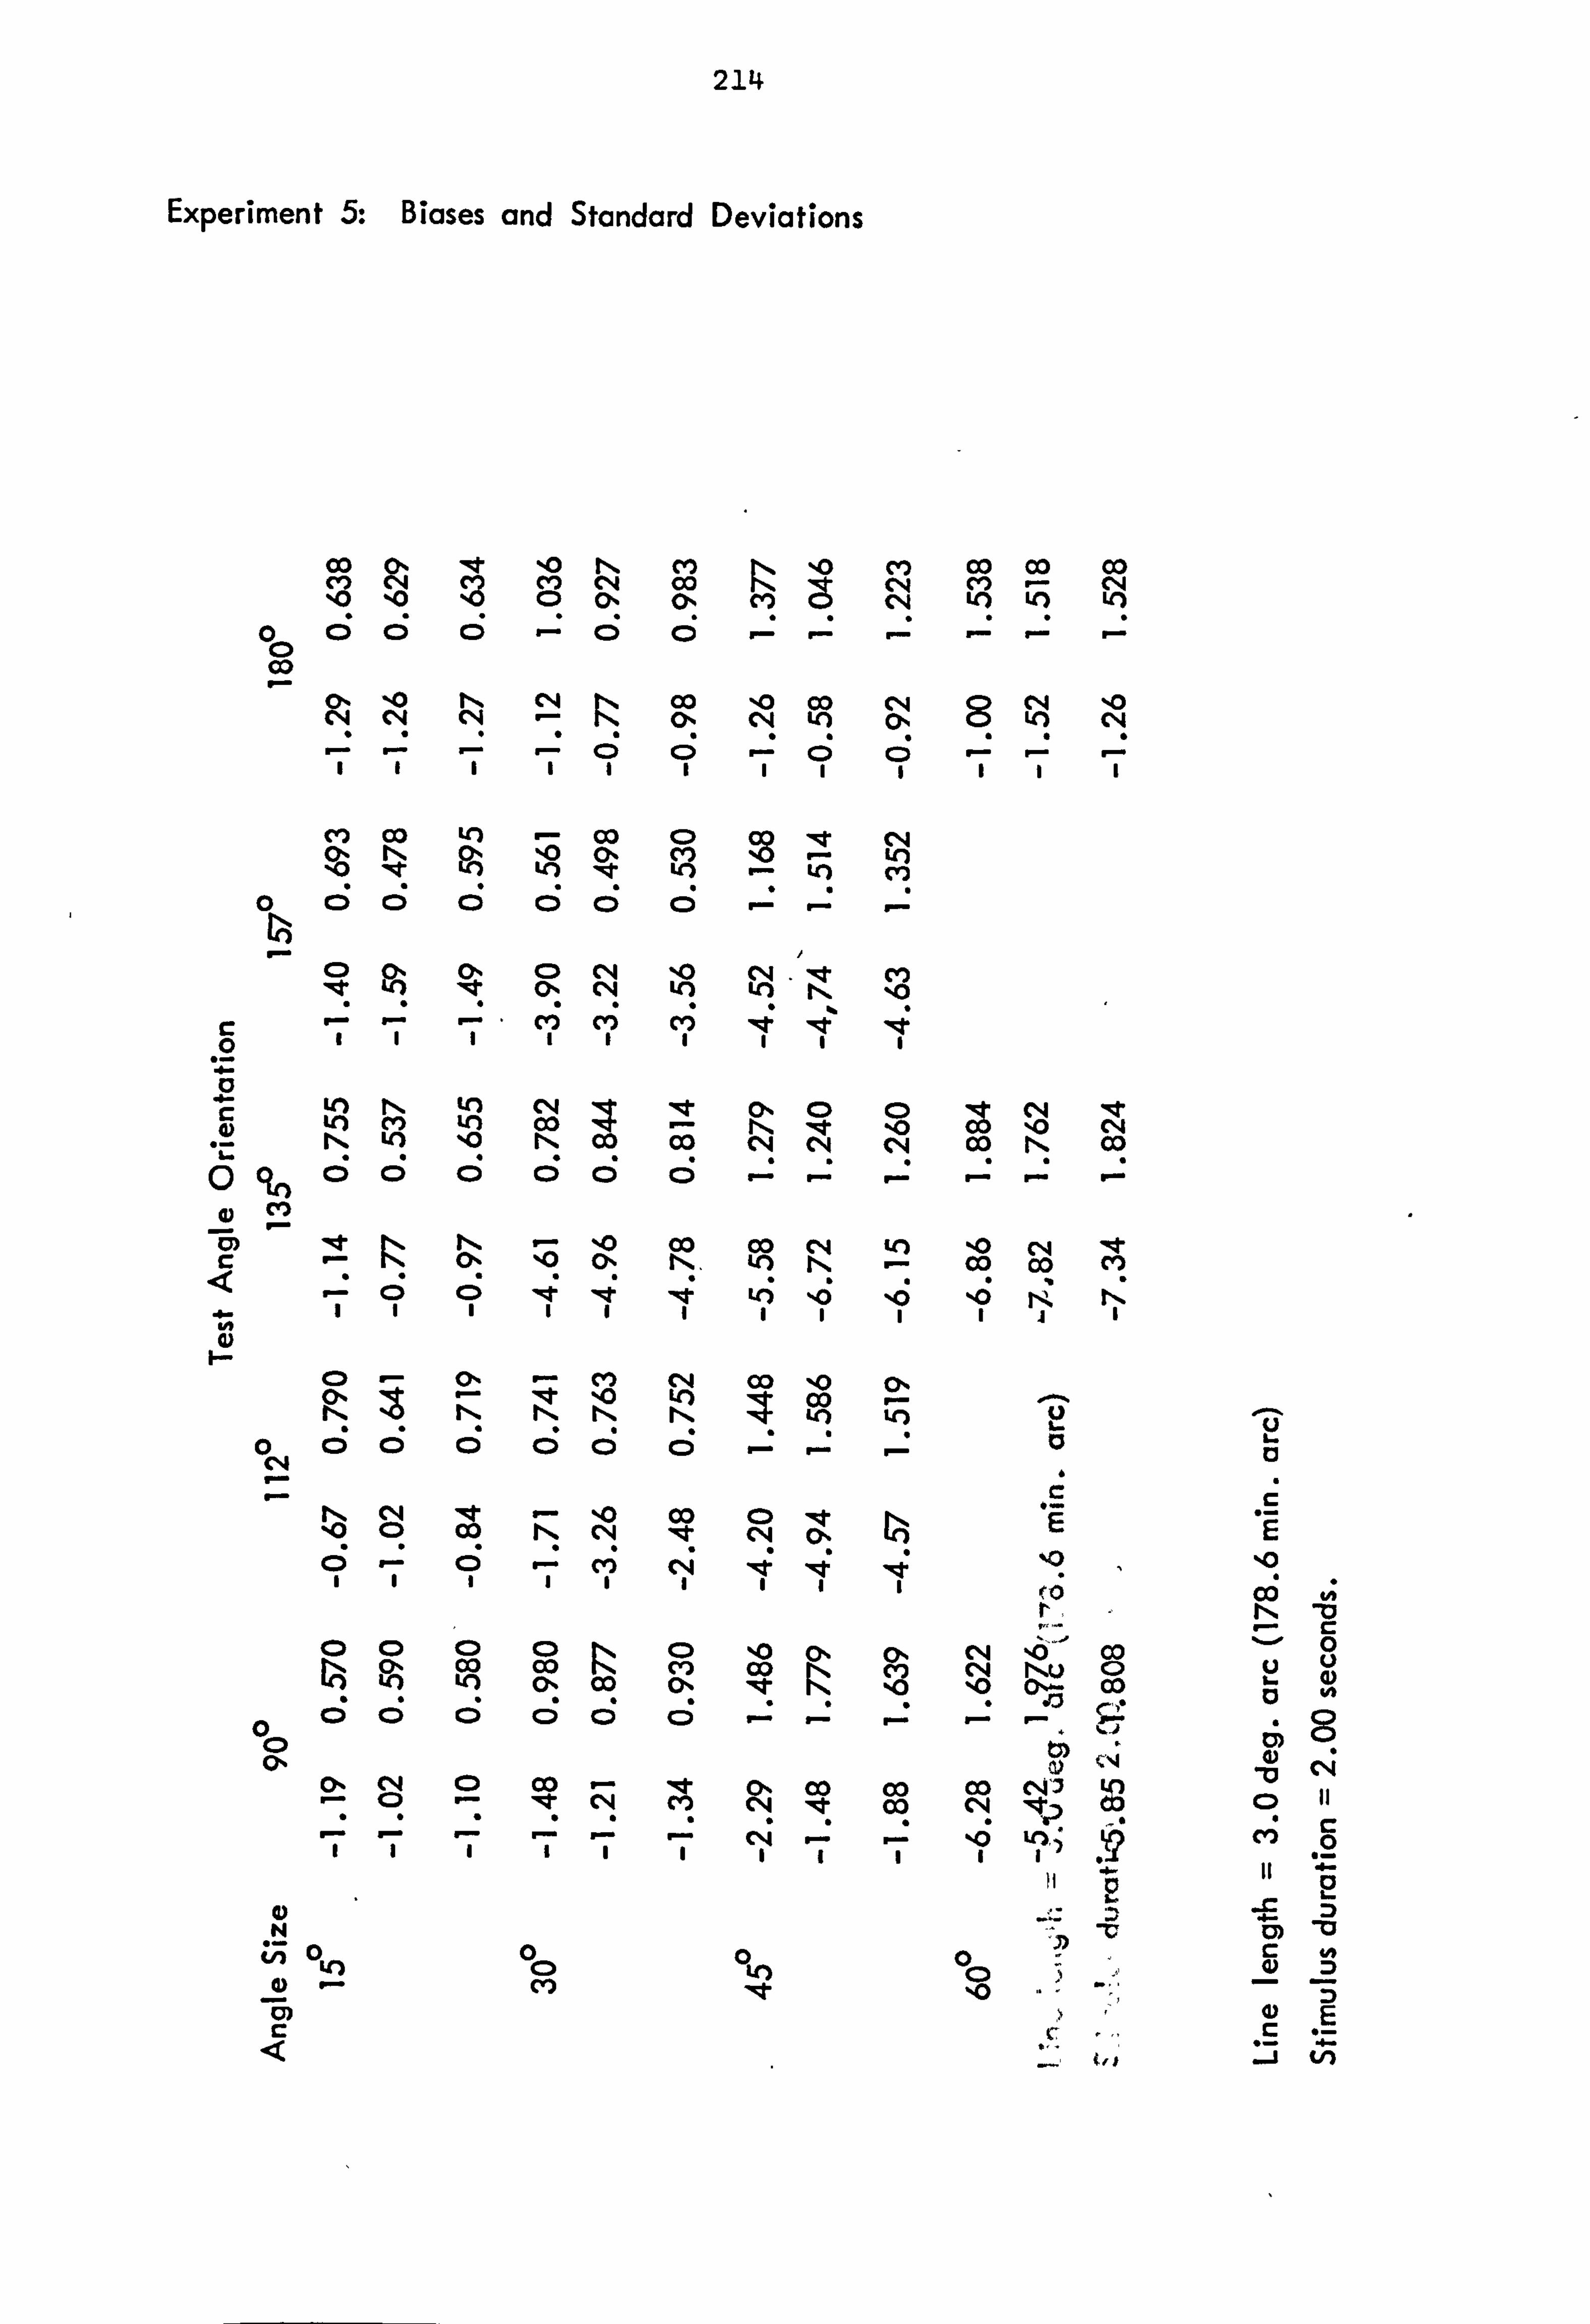
214
Experiment 5: Biases and Standard Deviations
Co I-
0
Co ()% (1) CN NO 140
ON C%4 NO C14
2 C;
CC) 0 (> oý
': lý 10 CW2 CD 00 ci 25 <CNN lLvol _LO
F- F
co 04
N CNA k 00 %0 CC) CN 8 C-4 %0 CN C, 4 LO Ch LO CN I- -00-00-
IIIIIIIII
CY) 00 LO - 03 C)
LO U" I
10 -. t Eý 24 )
C; C; C; C; CS cs to
p. - -
C'14 Zn co
I- -
C, 4 NO CN le CV) CN Lin (0 N 10
I-
II
0L0 4) 2
0
SSSSS
CIP) CY) CY)
LO N tn 04 :4 --t C), a0 ;& C4 .t Ln C4f) Ln co ; X; N llq* %0 10 C14 N LO %0 N 00 04 N CN a) N a)
C; C; C; C; C; C; -: 1: 1.: 1: -: -:
U- F-.. O
oo II
ý
Nt
Co CO 0 rý, i N, LO CD 00
1-- (=> - (> - cn (N co K :ý ;Z Zt 1>10% Irl. :4 ER U-) 2u
0 c; c; c; c; c; c;
I-
(D c: D CD %0 (> cm NO -, CO CO CO C, 3 CO (V3 C, 4 0u LO ()% Co (> lqt %0 %0 00 1-
C> C: ) C) c; c; C> CO ý le C> Co Co Co
C) -e cý4 m CN e CD C-4
!ý C*4 'It - %0 00 a 't CD co C%4 It CN 0ý
c) C4 10 1
C, D N
OLO 0c) 0) c C, .-c
_Z - %-0 IM %0

215
Experiment 5: Standard Errors of bias and standard deviation
0 04
CN ý (n 80 LO 0 Co gl CO N C) lý cý Ci c
c; c; c; c; c; 0 c> ,d CO !N CN4 C, 4
c; c; c; c; c; ý r2
(gý Co Co C, 2 C»4 CO LO
ki) CD (> CO 0- C. 2 - CN clq C, 4 CN
0 lo CN c44
c 0
OC> ý CD
v I-
C) C
4-
I-
C) lit Co %0 C: ) CO C) :3N n le m ce) M c4 C, 4 C, 4 clq C, 4 C%4
o0 cx I- ('. 4 ('jC. ) (V)
0 00 d
0 C> 00 C> C> C) 00
&N 10 %0 C114 It 04 00 0 C) - 00 OD 00 04 Or%
04 C%4 0000 C) 00
lqt to CC) c4 to C, 4 (D clq ý r- CN (N clq
IRt ý41 19t C*4 C> C14 C14 CN
0000 C)
Co ýt cm CO LO CD Igt C: ) C) Co 0- N CO C, 4 - Cý4 -
qn ooo CY)
0
im
co C%4 0 a) 00 CN (N ;ý0,
00 0
a CD (D
-3t, Z8 C;, C;
co co IV N C) LO - CV) C*4 C4 C14 C14
C> (D C) C)
(4 le Co C) C)
c; c; c; 0
0
I-
00
qo
00 C)
- I- -
00
10 ýt 10 Co C, 4 -
0
0% CN C14 C;
c4 lit 00 OD %0 cli (> C> - -e C, 4 CN C, 4 (N CN
c; c; c; c; d c;
0c C) qo
U
a
-a

216
Experiment 5: Biases and Standard Deviations
o it N0
C%4
C%A %0 s; (Z LO Cý4 ý
C; C; Cý Ol
1: I
LO cm C" ;x tý u- CD 10 CN C, 4 C, 4 c4
cli CD 00
Ný
CN
C) 04 Cý Ci
04 C14 CN III
ýt CO CD C, 4 00 CD c> CN 1-0 cn LO C: ) 00 00 oý -0 00 M
c; c; c; 1: _: -i _: 1: ".: Ul 04 04
N %0 C) 0 Lr) C14 '"T co 04 Cv) CY) N 114, Ln CC) ý 0ý cl; C4 C4 444 r-ý 18 18 I; - I- IIIii. I- fi
0
.P Co 0 %0 N CN c OD CD :: 9 S '10
0 00 CD
41) r- C) C
a P-
(D
Co CV) C44
I
0 I-
Co CO OD C*4 OD ýo C, 4 0
---
to C) IRt CN 04 %0 01. C> CN C) Ln
C4 C4 C4 C4 C; IIIIII
Co Q N
Cto c; CW2 I-
% Q.
LO LCI %0
c; c;
ce) co
Ol
CD %0 00 CN4 c4 CV) (> %0 ý C, 4 ý (> (D %0 -m
. -: c; 1: 1: 12 ý2 u- c4 Co C) CC) 0
C, 4 Co .. t :Z
N.. 0 r) N.
"0 dd a
0 0'
CD Co
cs .2_: -:
co
(> (D %0 0 (n ý ci
cý q ýI - CC) - 0o
v; 0,0 Cýz -2 "- C, 2
0 LO Nt
U I- 0
E LO
u a

217
0 C) P-ý C%4
CL, CN C, 4
Experiment 5: Standard Errors of bias and standard deviation
%0 % CN C#) C*4 00
04 a) 0 %0 (1-4 IT C14 CN CN C*4 0 C; C; C; 6 C; (S
CN 0- ci (%4 e3 CM 00 %0 CD ýo CN le
C, 4 (N C, 4
C; c; c; c; dd
%0 It 'o ý8 C> Cl C) cw) C*4 ý 0- 't lqt Nt -: 41"! 7 C"! C"! c! o C; C; ooooo
NO CV) 10 LO C14 C4 CC) C-4 CN CN SO It lqt V- r- - 04 CN C%4
r: c; c; c; c; c; c; c; -2 N0 CN -e -e ýt (> cý CC) 0 CO (n CN C%4
C) C*4 c4 clq
c; c; c; c; c; c; c; cs 00 co I-
c, ) C
I-
nt ;x %0 C*4 OD e- Co N Ln
cý cý 0 c; 00 c)
LO 10
N CV) q1t CC) 10 %0 10 C) N C) 0% 0
Cý4 ý 04
c; c; c; c; c; c; c; ý c> eN iN E>n CD N C)
cý cýI clý c; c> c; c> C: ) CD CN
.2 C-4 C*4 C, 4 %0 %0 CO CD %0 CY) zt LO LO c4 %0 CY- 0- ýt m
cý ci c> c> c) c; c; c; c5 c> 00
,0 EA -e cm ci (N -0 3m u-) ýt c4 C*4 CN
c; c; c; c; c; c;
0 cto -2
r- (V) le 0)
<
t4 -0
e

218
Experiment 5: Biases and S*andard Deviations
(Z) N CN
lqtn C4 04
04 04 04 Cl) "Wt Ln LO
r-
LO mý ci LO %0 LO ýo %0 CY) C-4 ci
toll
c; c; c; ý2 -: -: ý2 -: :
:s -0
C%4 C'14 04 C14 04
qn CV) r-
0 C) Cr-
CD
ý co C) ccl tn Lfl) , Wt CY) 14, N co co NNN CV) C14 6 C; C; .: ': -:
r2 0-m (4 10 CC) CC) 0 0- (Y) m
C-4 0 C%4
01% 00
, qt lqt Oll co
ýo 0% %0 Co r-4 c9 C-4 Int N CW2 0 cn
c4 C, 4 0- Co N V) c4 :4$; CN CO N0 (N ý
c; c; c; .: -: -:
qqt CC) ýo CV) N C) to LO
- I- -
-0 le Lin zý; %0 Co CD 0 Co 0- (V) LO N
0
I-
lq; t
ý8 C'4 %0 -. 4. LO CV) M- 04
C) CC) Ce) LO C-1 cn C14 a :s
C23
Cý C-; u-) Ln tr; IIIII
0% co
c, cc: ) 04 0-- 't 00 CO C'
C04 Cl)
N ,0
5h ce Co Nk lqt 10 Co LO N
C) CD C) C) CD
N
C) C) C
0
m
u
E Ln
M
ýo

219
Experiment 5: Standard Errors of bias and standard deviation
0
Clq
c a
RIO C14 04
OD
C) C
In
N le LO
cv) Ln 4" 04 'Rt M p..
C; C;
-- I- ---
0 %o (n CN (14 C: ) CO (> N Co 40 N
M nt Mm c; c; c; c; c; c;
C) LO ce CM C*4 cm 40 ýe cm 00 le le nt %0 %0 %0 ý Co LO
(Y) ce) C%I) m CY) ce)
0 C) C) 0 C) 000000
C> to (n (> ý ýo CO le 10 10 10 C, 3 Q Co S2N LO e C'4 m- OD LO
CN CN clq CY) C*14 C%4
0000000000 C) 0
CV)
C; C;
00 2 10 OD %0 (12 Igt CN CN
c; c; 10 le 0 LO 00 ýo C
.. ý! C, 4 LO
r-1 CN
c; c; c; c; c; ()% %0 M
C, 4 C, 4
c; c; % r, m LO
C; C;
OD NO
0 -e ýi 2 00 :ý cn (D C, 4 0 u- M r1q N ýWt r- CN
ý: ý--- clý4 C, 4 CN cq C, 4 u
c) c; c; c; c; c; c; 16. 90 0
C14 "Ict C14
C;
00 C) CD "it 0% N C4 C14 04
000
, ýo C*4 i4>1 LO %0 In) C, 4 CN C, 4 C, 4
Q0
(N le %0 le 0 CD 00 00 LO C%4 c9 C%4 CN CN
c; cz; d c; c;
- en r.., t,. i l .n 1fl üi Z ;0-, ý, x% 14 ý ;;; ý ei -0N le %0 "E - ý2 --c,! cý c,! C'4 C-4 C-4 ci c; c; c; c; c; c> 0 (D c> c; c; c; 0 u
CO N Co ýo %0 No C, 4 %0 (L) %0 le LO LO LO to 10 CD 49 r-i C, 4 clq r. 4 CN c14 CY) ri cyl 0 (D
c; c; c; cý c; cý cz; c; c; c; c; IC! CD CN 0- -0
CD pýi 00 5,2 2 r2 ', 't cli CO m C*4 (N C%i c4 CN C, 4 (V) clq r2
c; c 0 0
0Qc; c; c; c; c;
Ln 0 Kn cý> in 9z (L)
_D

220
Experiment5: -. Biases and Standard Deviations
0
04
CV) C> 0, LO CV) LO co co 9 C; 00
co %0
1ý :4 Rn C; C%4 C4
C%4
II
Co r-
04 ýo %0 Cq 04 co CY) C) Cl) 10 ri.
ý Nt cv)
Cý C4 Cý C4 Cý
CD - CD
;x lit %0 Co Co
Nr CY) CO
1: _: _: I-
tr) Co CO OD Int 't :3eC, 4 CD C%l ýe NO LO N- 't Co
CV) CY) CY) C%4
C%4 C14 CV) %0 C14 - 'o N CD 0-
C; C; C; -: C;
0a CN 00 I-
r9 C: ) clq CV) Co ýo C) 00 le N NO ýo
I- I-
CC) 0% 0- Cl Cl) CN ýo CC) 04 - CN LC) N 10 C) 00 Ce) N" co 0
C; (S C; C4 C4 C4
to %0 CN CC) %0 00 tn N 10
%Ln c; c; r2 r-
0 0'
00 N CV) LO co 0 CN CC) OD co CO Ln co C) CN Nt
ýo N CC) CN 0 CN co C) C) -41 CN ra N co 00 CIO %0 LO C) co Ci Oý C> C) C) C; C; C; CS C; IIIIIIIII
a) 0 C) C) 04 CC) %0 U. I CD m r--ý "0 C) ý; C'14 :4
I- ---- U- U
C) "It %0 oco LO CV) CY) CY)
N ci ;5 L%rol CCV»
a 7x 9
0 C) C) CY) ce) IIIII
CV) %0 to
(4 0 CN (> ý LO CN 8 zt ce) iz C) LO
Co ýo LO
(V) (N NO (N cn M %0 c\I u- 0 CC) tin ý cl C) C) C> C) cl
0 06 0&0
0)
Co Co le m clq %0 CV) N0
CN
-t C) - C) CY) C) Nr C4
C; C; C; I
0 CD
E Ci CC) Z, u 0 c; 0 -0
li
.E
0 u
C4
0 D
_0
E
V)

221
I
Experiment Standard Deviations
0 0,
°L()
LO a %0 0 LO ().. Cl) W44; r 1ý0 - N cc) cc) " LO
0 C4 C; Cý
C)
%0
-0 -0 Co CN Ce) ci CO
týO LO C), Co
cý c4 cý 12 a0C, 4 N
0 c4 - 00 C-4 Cv)
cn :4 (> CVI oý ý C) C> ý- IIIII
C, N
v) C) C) C
U, D
E 4-
ýo co %0 4 CV) Mý %0 LO 04 C") CC) 0 %0 r- ýý e4
co C*4 04 cr) o in oo C4 C;
0N 04 0.0 LO C1.4 N C) 04
- CN C")
0 C) CV)
qc)
I In
E I-
(V) Co CO 00 8 (n C, 4 c4 C>
c; c; c; c; c; 111-
cc) CV) C-4 C14 k
0ý co CC)
C; C; C; OL()
00 0 I, I
00
(V) m Lin le ýo CY) (0 c, i CN C-2 o' LO Co tý L. 2 - ýt to N %0
ýýý r- ýý r-
CC) %0 it N 04 Q l4t %0 N lqt
C; C; C; 6
Cý
-41 00 a) Cl) - 00 04 N "Cr
CN CN C%4
,' :2 fol, 04 C-4 04
ýe CC) e (V) %0 Fý C'4 M cl) 0 Ln LO K LO C, 4 N CD
9ý to -M
-- V) - 04 04 CN 04 CN CN
CV) OD m '"t
ci SO 0 Cl. ) to - Ln ci) C; C4
CD M
C, 4 02 CO 'oý
I- I- I-- U-. I
0 C, 4 9; C) (N OD ý; %0 N C, 4 C, 4 A- c42 to CV2 (>
0000-- C) -0 .11
e LO 10 C> le le (> - No nt 00 -e JA -- Co N C-2 8 c4 C)% (V) C) ý ON 0 ý (D -ýýý I- 0'- I-
m ýo m ;xK OD C) CC) V) CN 10 N %0 N
0 C> C) 0 C) 0 C) 00a
(V) cn LO oý CO 0, :Z LO 0 LA Co C> CO
10 LO ýo NN
00 00 00 0
m U') C: ) to %0 c'-l C: ) - N NO Oý. h. - CC) (n c> r-
C) C: ) (C) -
0 Lf) 00
, qt Ol

222
Experiment 7: Standard Errors of bias and standard deviation
80, N C) CY) Nt Ol LO 0 0% ca 'At CC) C%4 CY) 0% %0
ý; r CY) Nt 04 - CN 04 04 C-4
C el
4-
Ln
0 0
00 C) 0 C) 0000
cn (DI-0 %0 (N LO Lil) 0 CN C, 2 Int lqt
6
- LO N LO CO N LO 0 CN CY) %0 "It 0 CV) CY) c, 4 Ln ;A co 65 C, N C) cl) .t Cl) Cý -N 'Iýr CV) CY) C") C4W) 04 - 04 CN 04 04 CN4 CY) CY) CY) C; C; C; C; (S C; C; C; C; C=; C; C; C; C; cs
CO Z& LO -ý CO F le - CC) NO N CD m C: ) LO > CO C) CY) 00 C, 4 c42 %0 m C, 4 %0 C, 4 ce) CV) CY) lý ... 0. oa00c; c; (S c; c; c; c; c; %0 co g; OD (%4 LO 0- g; %0 N CC) K
le r) CC) CY) CY) N nt C) CN4 CN pmC, 4 (N le CN CY) CN
ooo 0 O(DO(Doo
CO N Os - CD a (> -"-N Co ()% CV) (V) C) 0 -: cý (1 ci C'4 C-4 - CN c4 C-4 ci C-4 m c3)
c c> C: ) (D o c; c; d c; d c; c; cs c;
0 0 Cl)
Ln %0 to 2 le �o tý Co cýq !ý Co 0 w CO mN 't cn 0a 7ý
Fý (N C'4 -- (N c4 C, 4 C, 4 C, 4 C*4
0 c; c; c; c; c; c; c; c; c; c; d,
04 %0 M LO CD NN- Lo ý N 0,00 N- oN c-) a Ln ýýý C14 04 ýý CN 04 0000 0 00000
OC)oo 0 CDOOOO
CO C: ) ce) 00 - CN C)% - LO (V3 (> N tel 0- %0 ý cýA - CN -ýC, 4 C%4 P-
CY)
C;
C) CD C)
C)ý CV) CV) CY)
00 0
C14 -N LO 0 04 CY) CY) CV)
00 0
C14 C) CN , 078 0
7 ": ý. 00
N C) 9; ýt P, I- "
;dc; d
100 10 LO Ull 0 c> cch LO C*2 :l SE S c:: ) ýýZ: P-: ýs 77 . 0 c; c; c; d dc; d oo 0 Ný to %0 10 Cl) 10 't a C*4 , qt Nt
C; C; C; C; C; C; C; C; C; C; cs c
v) 0

223
Experiment 8: Standard Errors of bias and standard deviation
to
ci2 v
CN m CO Co a)
4- SC>
CD
cz; c; c; C, 4
CD s CD
00 0
CV) Ol 04
QQ0
C) C) CD
z: ce ul
(D Co
ýý N --
C> C)
0
Ol
C;
0 C)
cr 0
Iz p

224
Experiment 8: Standard Errors of bias and standard deviation
0
col 3
oto
14,
D E0
*Z (4 (A CN
- CN (N -0 a) %0 r*4 (D CD CD - 00 C) ý- ýý ý -0 8;
ýý ý
c; c; c; c; c; c; ddc;
C; C;
cv) t") "qt C%4 - C414 00 CV) -
%0 Co 9 CD CO
CD
c> c> cý cz;
r2 1-0 C: ) C%4 C%4
0
'tt ý 00 C*4 - CN 0 LO C) - C) C) CN C. )
CN CD - CD (N -
00 0 CC) 0
LO Co
OC) 0 C)o 0 00 0
CN CO CD clq C, 4 CV2 CY)
c; c;
--- 04 C%4 C) I- --
I-
I- p. - I-
Q0 C)
00 C) 00000
00 0
tin (N (> - CD -N co cn CY)
-0 r-4 CN 00 ko MN 0 cn M (n
c; c; c; c; c; c; c; c;
00 ---
cý o_- cs
CV)
to Co N CN le cn ---
C; C; c12 V
C-4 CV)
4-
U a)
u

225
Experiment 8. - Standard Errors of bias and standard deviation
0 LO
0 C14 C*4
0 C)
le 0N 0- e CY, OD Co 1: > s2 c> c; c; c; c; c; c; c; c5 c;
C14
00 0 CD
-0 CN Q C) ---
000
0- m %0 CO No Co %0 00 N OD 00 CO CO %0 CO OD CD C: ) C> C: ) CD Q
C) CD C) C;
-0S (> g Qc CC) %0 ,
c; c; c; c; c;
0ý N %0 C, 4 Co %0 CO C: ) CD C: ) C: ) CO
C) C) C>
CO ý CO %0 OD C. 4 %0 (n (D C> 10 OD CC) (> e; 52 c2;
0 00 CD CD
c; c; c; cs c; c; c; c; d
NN-0 CN -e OD e (N ---2; 20
c; c; c; c; c; cz; cz; No M ý7 ý
c; 0 c; c; c;
C) CY) Co - to
c; c;
C%4 CY)
I-
. 1- C., C,
U

226
Experiment 8: Standard Errors of bias and standard deviation
%0 nt 0-% C) (> CO c>
O, % "0
In
qo 'IT
vi c4
c 0
aQ C> 0
c4 CN (N C, 4 (12 (V) C: ) C) C> C> CD
c; c; c; c;
0Q
(y) 8 04 QQ ---
0 C) a
2; - Ln C14 CN ý3 z; CII) cv) %0 a) C) C) 00 C; C; C; C; C; C; C; C; 6 LO %0 *10 %- 0 cX) cv) %0
os s (O)o '2D s
00 c; C; c; C; C; (s c;
-0 8 Co CY) CN ei - %0 (>
c; c; c; c; c; 0 c; c; N 10 c4 (D N CN le LO 0
C; c; c; c; c; c; c;
%0 C) LO CV)
C; C; C;
._-
Cl 0
Ln N
00
C, 4 %0 , :$
00
clq le r) cn C, 4 ei
C; C; C; c; c; C;
CN CY)
= U,
4- U a) D
V)

227
Experiment 8: Biases and Standard Deviations
04
C; C; C;
Co til (4 C-A N0
I-
0% CY) CC) C14 4 co LO
u :: E c; C; c; 4) cr 0 :FN
24 10 Ln
OA
0
. 6- 2 -e 0% clq Z cn cli Ce) . LM %0 10 ýc
C) 00
vý (V) CY) c -0
CI-> C), le c c; c; c;
o0
r- -E
2)
U

228
Experiment 8: Biases and Standard Deviations
0
qn NT
0 V) CN
0 C)
%0 0 cn qý CD
SO %0
c; c; c; Ln (N
- �_
ýi; le, 2 ,qý vý
2,0 0 ) CN %0 SO N %0
0 CD CD C: ) (D C>
ONO 00 ,0C, 2 (>, - C4 -
(-) (b ! ý; C) M KO Lr) (>ý ý (n ( :$ In> .i (n ;x %0 LO 10 le N ýo
0 C) c> c; c; c; c; c; C%4 0 %0 (> Co Co
C; C; C;
(V) 0 CN ýo C*4 (b Co Co CY) (> CD OD ý (: ý - C> C>
cs Oý 10 cý CD
01 0 LA
�0 oo o' <lý -N 2 ;Xý %0 r" ýt %0
d c; c; c; c; c; c:; dd N co 'Ito m %0 -t C)%
CV) 't Q C) Oa CV) 00 0 00 CD
1111
co LO co Cý 0
CY- iR 0- (n k (> ý; 2 Qý -N Co C) C) C) 0 C) 0
C) C)
0 LO cl) ;Z ce, Lý ý-, g -Z le CY3 ým
co
I- C*4 CY)
4- U C,
-D In
u

229
Experiment 8: Biases and Standard Deviations
le 00 00 m (> LO �o pe, -qt ,e ZN LO %0
c; c; c; c; c; c; is c; c; 0 ! ý; jý 0 r2 ýx c> N0g (D c. Ci Ci clý c9 C! cý li C, 4 0 C) 0 CD C) CD
90
0 C4 CN
co co ý3 "Rot 4 It C; C; C;
m tý it r) -e
C; C; C; :sNý q- in C; C;
ý ý! e ýN- D ýQ ýt m cn cc) - %. 0 ý_o ul Z) rýI Wý CD
0 C) C) II
--t Ln ZR NN LO 04 NW cv) (>, to (1) IRt CV) "t C")
(S C; C; C; C; C;
LO CC) le ýt
00 0
0. ý C) %0 %0 C) to Co CC) C, 2 %0 Cy) CV) KC) -" N
ccc Toc? c-c,
%'4 1 -ý tli V4 ; iý 2 ()% :x
Le) Co iz NN %0
C; C; C; C; o %000 co Cý
II
c 0 2 D r- 0)
tr- c 0
2e p Co Co 0
N Z: It) Co m Co c) Co CY) Lr)
c; c; c; c; 11
(N (V)
OD 01 INf
. 1- U
U)
U

230
Experiment 8: Biases and Standard Deviations
Cv) 0'ý C-4 8 CV) ký, ce) Na in o Zo ýo 11 104 Z; !ý 53 "r; t
C; C; 6 C; C; C;
Ilý Iv- CN
(n "e N0 (> CV) ;Z' CC) 1 (> OD %0 LO LO (n C: )
b- 17; c> K Co C; C; 0- to 1ý 10 -t 8- to -0 c C) [ý, "') C4 CC) 04 C; C; C; C; C; C; C;
:r W tn
ul) 1q,
0 C%4 CN
0 C) CD C) 0a c) c; (s cn to ()% CO ;x %0 ce k (D N 10 -0 (n ýt NO
0 C) o c;
Co C) le (N C: ) (V) 8 tr1. ) @ 1) e3 ! ý; tell 1200 ;xN "req
ý %0 S %0 N C, 4 ci co c)- o' cý c; c;
00 C) C) 0 C) c; co & 19t C) co %0 to :s to C14 LO -- cj 00 C; C; C; C; C; C; C; C; IIIII
CC) CY) co ý; Ln (N CS4 0ý co 00 ol "COO
00 C; C; C; C; C; C;
I-
m
. 1. - C)
-Q
u

231
Experiment 9: Biases and Standard Deviations
Stimulus Relative Orientation
Duration goo 112 0 1350
0.01 -3.20 M344 -3.86 1.784 -7.64 2.880 -4.04 2.496 -4.08 1.652 -7.62 2.640
-3.62 2.421 -3.97 1.719 -7.63 2.763
0.10 -3.26 2.046 -4.50 1.624 -7.96 1.596 -3.26 1.628 -5.36 0.968 -7.80 1.352
-3.26 1.849 -4.93 1.337 -7.88 1.479
0.20 -6.50 1.650 -5.98 2.146
-6.24 1.914
0.30 -5.40 1.452 -5.58 1.764
-5.49 1.616
0.50 -1.96 1.222 -2.25 1.012 -4.18 1.072 -1.92 0.926 -2.42 1.378 -4.36 0.860
-1.94 1.084 -2.34 1.209 -4.27 0.972
1.00 -4.78 1.067 -3.80 1.088
-4.29 1.078
2.00 -1.48 0.980 -1.71 0.741 -4.61 0.782 -1.21 0.877 -3.26 0.763 -4.96 0.844
-1.34 0.930 -2.48 0.752 -4.96 0.844
Subject: SRH
Angle size: 309
Line length: 3.0 deg. arc

232
Experiment 9: Standard Errors of bias and standard deviation
Stimulus Relative Orientation
Duration goo 112 0 13f
0.01 0.334 0.364 0.280 0.264 0.394 0.460 0.362 0.386 0.260 0.266 0.395 0.388
0.348 0.375 0.270 0.265 0.395 0.426
0.10 0.324 0.328 0.264 0.242 0.250 0.266 0.268 0.262 0.198 0.184 0.234 0.214
0.297 0.297 0.233 0.215 0.242 0.241
0.20
0.30
0.258 0.272 0.324 0.298
0.293 0.285
0.256 0.250 0.274 0.284
0.265 0.268
0.50 0.132 0.200 0.224 0.172 0.224 0.188 0.204 0.172 0.252 0.206 0.196 0.170
0.172 0.187 0.238 0.190 0.210 0.179
1.00 0.161 0.178 0.163 0.169
0.162 0.174
2.00 0.157 0.150 0.127 0.113 0.128 0.129 0.142 0.131 0.129 0.121 0.133 0.137
0.150 0.140 0.128 0.117 0.131 0.133
Subject: SRH
Angle size: 300
Line length: 3.0 deg. arc

233
Experiment 9: Biases and Standard Deviations
Stimulus Relative Orientation
Duration goo 112 0
0.01 0.48 1.507 -3.78 1.687 0.69 1.366 -1.99 1.539
0.59 1.438 -2.29 1.615
0.10 1.41 1.098 -1.79 0.864 1.14 0.821 -0.74 1.059
1.28 0.969 5" r
0.50 1.74 0.824 -1.35 0.703 2.72 0.607 0.79 0.604
2.23 0.724 -0.28 0.655
2.00 0.63 0.750 -1.28 0.692 %82 0.616 0.71 0.513
1.23 0.686 -0.28 0.609
Subject: DTM
Angle size: 300
Line length: 0.3 deg. arc
13f
-5.89 1.330 -5.05 1.351
-5.47 1.341
-6.50 0.853 -4.41 0.993
-5.45 0.925
-3.48 0.931 -3.80 0.851
-3.64 0.897
-5.11 0.961 -4.65 1.015
-4.88 0.988

234
Experiment 9: Standard Errors of bias and standard deviation
Stimulus Duration 90 0
0.01 0.230 0.234 0.201 0.209
0.216 0.222
0.10 0.161 0.162 0.132 0.123
0.147 0.144
0.5 0.136 0.130 0.110 0.100
0.124 0.116
2.00 0.125 0.115 0.113 0.095
0.119 0.105
Relative Orientation
112 0
0.233 0.273 0.232,0.236
0.233 0255
1359
0.188 0.207 0.192 0.214
0.190 0.211
0.133 0.143 0.157 0.170
0.145 0.157
0.115 0.117 0.121 0.095
0.118 0.107
0.115 0.122 0.111 0.092
0.113 0.108
Subject- DTM
Angle size: 30a
Line length: 0.3 deg. arc
0.142 0.138 0.154 0.177 0.148 0.159
0.145 0.157 0.134 0.141
0.140 0.149
0.151 0.155 0.152 0.164
0.152 0.160

235
Experiment 9: Biases and Standard Deviations (with standard errors)
Stimulus Duration PSE SD
0.01 -4.95 2.349 -6.12 1.952
-5.54 2.157
0.10 -4.74 2.080 -4.01 1.329
-4.38 1.745
0.50 -2.27 0.827 -2.25 1.098
-2.26 0.972
2.00 -3.00 1.003 -3.52 0.980
-3.26 0.991
Subject: SRH
Angle size: 3do
Line length: 0.3 deg. arc Relative orientation: 135o
s(PSE) s(S D)
0.309 0.415 0.300 0.330
0.305 0.375
0.324 0.312 0.183 0.199 0.263 0.262
0.132 0.123 0.169 0.158
0.152 0.142
0.151 0.157 0.166 0.157
0.159 0.157

236
Experiments 10 & 11: Biases and Standard Deviations
14t to C) 10 Ul 01) 0%
C> LO
c (y) CO 04 It.
14T C)
=00, C; C; -0 -C EI 0
Z in %0 c4 kil Co
0 CD CN
0
o
c
0 CD C; C; C*4 U-
N 0- CV) 01. co 01. C) 00
111
CW2 LO CN N CC) to 00 C) to CC) CN m 00 m %0 Ln le LO CC) %0 N C) C, 4 -0 CC) C),
ý: : ý: ": ý2 :2c; (: ý 02 M LO to C, 4 cy) tý ý '4 M O(M - lqt r14 (N C, 4 clq c4 C%j 0- (D 111111111
N %0 N (n (> -e-C: ) C%A %0 0, le CCN>
c4 CN C, 4 c4 C, 4 r4 ýN P- 11t111111
tft C D-0 2ZC: )
E 12 c: ý
tn LZ
llt -Ct CV2 ý CO clq Co m Co 10 0 Cq no

237
Experiments 10 & 11: Standard Errors of bias and standard deviation
%0 LO %0 CD C: ) C> mm m
3:
0 C) C; C; C;
z3 k 11101 C, 4 04 CN
; C; C; C) LO I'll 00 C) LO
0 C; C; 0 C14 r-
IC)
0 c1
v, C
(>, CV) -
%0 to
00
C, 4 [ý 0 LO CN (Z) 0 CN CO (> Co N CV)
ci
. C**1. -. -. -ý -: -. Q C) 0Q00000 C%4 Co c20 C> CD Lin %0 LO 10 le m le LC) N %0 LO m le clq C, 4 c4 ýý r-
c; c; d c; d c; c; cz; c;
%0 Int C) CD "it %0 Ol CY) CN cn C) C*4 %0 Cý C14 C'A 04 0-1
tf)
m r-, ýo c4 CN cli C: ) (> LO le C: ) CN N CY) LO CY) CN C, 4 cli cm ----
(ý c; c; c; c; c; c; dd
C14
. 1- 0
V)

238
Experiments 10 & 11: Biases and Standard Deviations
0 0 LO V-
04 04 04 Cw) 0 CV)
I-
N.. a3 I-
C14 cn
C%4 V) CN III
LO CN 9. -ý 00 0ý 9-
04 r-
N
C4
0, C)
N %0 N
% .: ý: .2c; c; c; c; c; c;
C-4 C: ) - Co CD -ýt C-) c4 cq LO N %0 ()% CV) -0 Co (>
0- C, 4 10 ý ýc (> %0 CY) lit
WD C :)0
9
CV) W C) 14t tn 0 C4 V; Cý III
G C;
c4 ce , Co
C: ) 00000
r> [A Kn ": . Ilý '-0 0
III
0 LO
C;
Co clq C: ) CN N
Or- 0 III
8 C4 Ln

239
Experiments 10 & 11: Biases and Standard Deviations
9n CII)
0 10 Lil
U- U- U-
0-- 04 co 1.0- C14
C; - C;
3:: qn
Co 29 CI) lqt ul ---
to
C4 C4 C4
No- (n C, 2 CC) k CV) C: ) LO CN le clq CO r2 CC) - CN 0- 10 Ný a-
zs NN
0
CY)
qn
mC D. 0
3ý
EE -Z- 2 th 12
ýý ý 0- (DO 0
Nt r- ! ý; 0% "t ý 0- r-
0 0ý CD CO) - Clq 0- co C) C%40 ýo
C; C; C; C; C;
C, 4 %0 Co CO C%4 m C. 4 Zt ý
(Z) a c; c; c; c; -e LO (> Os ýt %0
CV) C*I) CY) CII) CY) CY) CV7 CV) cf)
-4t C14 0- %0 CC) N %0 10 co 10
C%j
Ln

240
Experiments 10 & 11: Standard Errors of bias and standard deviation
oLn "t CII)
00 ci ; xcc) c4
04 - C14 00
to - cn ý Cý, C) 04 04
0 CD 0
0% C) 0 "t Nt Cl) CN 04 CN
CIO a00
V-
0 Lo It CII)
OLO
le Co %0 c4 C%4 CNA C, 4 c4 clq
00
%0 CD (N Co CY) 00
ce) CN
c; c; c; cz; c; c; d c; c;
CN c> lqt 10 10 C) ýo (n 00 LO CN CN Co c4 CN (N C%4 C, 4
OC) 0 00 0 00 0
N- LO %0 ý (> c> m so Co C*4 C: ) CN
CN CN 00 C) 00 0 00 0
CV) CN "It 0- C14 LO C*4 Itt CO (: ) CV) CN CY) CV) C%4
04 CN r- ý-ý 0a0 Cl C) C) 0 C> 0
vb C CD
-Z- 2 th 0
. 1- U 0
-D

241
Experiments 10 &M Biases and Standard Deviations
CV) on C; 6 C;
Ro 0 C) 0
%0 in 0 c4 CY) CY)
9n Nt CY)
OLO
gý 2 0, c0 r; c4
0.0 %0 Co CO M CO N Co
U- U- -
C) - Lel C) C> N Lil tel r1q CN CN (> C) CN V) CO
LO C" 93 . -: : .: c; c; d c; d %oco C) ;7 LO
It Nt ul C%4 - Cý4 C%A
01 NN Co clq CN %0 MN c4 ý :2 8ý 00 CCO 2 iz :4 ;xZt: ":. 0 C) C) 00000a
---
- ce CN to LO LO %0 to LO L(I CV) ýt (> (> cyý 01 (> 0-
00
D=
------
Q0 0
0
.9 U V
(I,

242
Experiments 10 & 11: Standard Errors of bias and standard deviation
c 0
»z
OU.,
lqt CY)
c4 a p»: . 00
e 2
c; C> C) c14 C*4
p- 7 P-: 00 0
C%4 C14 N C*4 C14
0 C; C; C; C%4 N C)
"It
00 0
ýo (V) k C) 8 Ln C) -- IRt 10 CII) 0 C-4 - 7 c! -. -. 7 -. -. -: -: 00 0 00 0 00 0 Ln , "t CY)
90
ub C :)
E2 vi iz
CO CY) C, 4 75 N ýo U- UUI
00 0 00 0 00 C)
tn :3% 14t Co cli N CD (> CY) C: ) C, 4 CC) OD C)
c; c; c; c; c; c; c; c; ýo CN :4 tin m .---
C; C; C;
0
C;
CN le re C-4 CY) m C, 2 ý CN r- u- ý
0 C) 0 C) 0
8 C4
I-
.9

244
Experiment 12: Standard Errors of bias and standard deviation
0 C*4 %0 04
0
ci
0 04 CV) 04
D r- C4
V)
C, 4
0
to CN 0 0% ý0
C; 6
CII) co 9
7. 00
0
'0 0 U-
0
oý ce Co 00 C: ) Q
c; c; c; M LO (>
Co 00 so C: )
c; cý c;
C%i CD - ssg;
C; C=; C; -M N
VC2 ss 00 0
Go %0 C4
0 C)I a
C) Q
C; C; C;
90 Ln c4
CY) ýN CII) Itt CV)
C; C; C; 0 %0 r2 t lqt le
U- U- U-
C; C; C;
'At %0 00 00 -t Cf) ý C%4 CO ss
9.. Cl C) Q OLO C; o c;
04 Cl) %0 tr) C%4 CY) C: ) -4tt C14 CW)
C> C: ) (D CD
CN 6*ý CD b Cl C) 0 010
0- LO 2 CO C) Qý
c; (ý c;
CV)
C; C; NO (Y) ý rý4
---
C> Cl CD
NO LO (n %0 CY) 0
CN CN 0 C) 0
0- CC) ()% LO 0- N
0 0 14, C4
CO 0-
C; C; C;
0
C14
r- LO Ch %0
cý c; 0
cv) ei
0 r, cý 92 N
C, 4 (N
c; c; c;
0 0 C14
cy) Cý cl 00 0 CN C) - a CY) 04 C%4 04 04
%0 CY) 04 lot
C4
N 10 N (n 0- - Vq - c4
CD (D C)
N et ýý ci oe
c; c; c; In r- 10 (b
A 2: tý c; c; c;
Z:
.0
4)
0 OCD OLO 00 %0

243
Experiment 12: Biases and Standard Deviations
0 C%4 %0 04
4A
E . 6-
cn
0
0 CN m 04
0N.
C1
0 N C) 04
Co 9-
N C14 &II; !! ý
C; C;
N
;x
14t 0% %0 Cý Cli Ci C) C)
a
Cý a C) C)
;; U') C") C-4 LO
a C) 0 111
CN4 tr) :4 %0
le
C; C; ýx lit
c; 0 C.. 4
_- II
CC) Cl) CC) CN llqt lqt C; C;
8 ;z&; C4
C, 4 lit CWI 110
19 4 Icr
c; cz; c; %0 CN C) C) I- P-
(> Cs
Co cb CO 0 LO ul) 04
00 0
N Co OD 9 -ý r-ý C-4 ý-
10 %0 cn Ln C) CD 00
gL0 C; C; C;
C. 4 CN
VIII. tý tý cl; cl; C4 IIII -1- -1,
o. CY)
C; C;
ON CY)
C;
9:: s "N't,
I- U-
c; c; c; Co Ol -41 CC) Ol
III1 -1 -1
0 cýO Ný c3) (n c
0 CY)
0 N 10, C14
0 04 0 CN
Cl U- U-
c , O)N LO CY%
0 (D CC)
CV) 00 Co LO
ci cý cý
tn Cl - :: jý
LO til) le LO
ý: ý: 1:
Ln C, ) CN V) 01. CC) C) 0
02
ý %0 :4 1: _: _:
0 C> C14
LO 00 Ln CO c4 ci
Cq - CN
0 Co (Y. (N N le
cý cý cý 111
-D C 0 U V 14
0 0 (N
C - CO LO o
C! C! 9 1: 4-
ce vý
ýt vi

245
Experiment 12: Standard Errors of bias and standard deviation
ýeR L(I zg %0 -- %0 (n CO to LO le LO clq CN CN tý tý tý
c; c; c; c; c; c; c; V- CN (n Co Co - C) %0 CD fý
CD LO N le 9 [ý %0 CC) Ln le le cq CV) (Y) m
- LO CV) %0 CY) 14t
00 0
C) ýo CZ) m %0 r- C) ,0 te, - r-N
ýe le 't c4 C, 4 C, 4 CY) m
00 0 00 0 C)C) 0
c
c .0 .7 0
E Ln
C)%
g0M800 ýt, ;; cl) LO Cl) ý
Cf) C14 CN 04 Cv) CY) CY)
0 C) CD ac a ao 0
-Rt Ln CO 04 C) (D CY) l4t "it
q* C4 CN C%4 0 CN
o2 00 0 00 0 00 0
ON Nýc01-1 Lr), * C-4 LO sz ý; N CD le, Co
C, 4 CN C, 4 CN
LO 10 r) c4 (D [ý N Co lit C, 4 CN
cý-c; c; c; c;
0 C) C) 0 C> CD C) (D C)
qn
0
4ý-
Co CN , le , ()% tý (D r) - cý cý N
c; 000 C%l N V) - CZ) ý- P- LO ci :4 CV) ;; C%4 CO Co Co CY) LO (1 C-4 CN C'4 c4 C'4 C'4 00 c; c; c; c; ic; cz;
Ln u:; Co %0 ce (D c4 ýo CN -e r2 -e -e ý c4 ý- CV2 C, 2 c4 c4 CN CN c4 clq
00 0 00 0 00 0
co (D 00 0
(> Ln CN - tfl c4 ce) (n %0 ce) CV) r)
', ' t, - c214 0 C)
O
Ol LO ltý C*4
C, _4 Zý
C4
C; C; C;
0
0
o-
m
C 0 U 4) 44
C C
C 0
I
U,
C 0 U U,
0
C 0
Ln

246
Experiment 12: Standard Errors of bias and standard deviation
0 04
Co C%4 C: ) C, 4 Int Ce) CO oý (> le CN CY) 21 cý cý , Cli 17 0Q00 C> 0
:: g ý CO 00 %0 CO LO LO le (4
Cli cý cý ý-
(D C> C) C) Q C) C) C) C)
te) o Lo C14 - 04 ý r- %0 LO ý 'Rt 04 M C) 0.01ý CII) CV) P- CN ý
C; C; C; C; C; 66 Cý
%0,0 - CV) CV) CV) 0% 0 CD c4 Ln lqt (> clq CN CN u-
c; c; cý c; c; c; c; c; cý
V co C*4 04 co LO NNN ý 10 N LO %0 CV) - C14 Ci Ci -: 17 -. 11"! Cll! Cý
0 00 C) 00 CD C*4 V
0 e2 C, 4 C, 4 CY) CY) Ch %0 to m le %0 LO (N C, 4 c4
c; c; cý c; c; c; c; c; c;
CO oý 0- (4 CO (> ý CV) r2 (n le Lin NM- C, 4 clq CN c4 CN
c; c; c; c; c; c; c; c; N CV) LO LO %0 %0 rg ,b clq C%4 C, 4 CV) LO ýe 00 0-
Ln C4 C4 CN r- ý V-
C; C; C; C; C; C; C; C; C;
Co %0 CN cý CN 0 00 0 (> Un ýqt LO CO Nw (> Co C, 4 c4 clq 7 -: ý: -: ý -: (D (D CD CD 0 CD C) CD 0
C) 0 C) Q CD a0
90 ý c> , qt - C, 4 C%4 C, 4 C, 4 0 (Z)
N r) LO ýo -ý0 ý r) c4.4 C%4 clq c4 R
ýý s CN c"i CN C'4 - CN
- '8 Ln Z 7. C) Q
CN 'Itt
C; C; C;
c1114 C, 4 LO tel N %0 0
c) c; c> c; c> d
4-
w 1-- tn
0 LO
0)
S
Ln
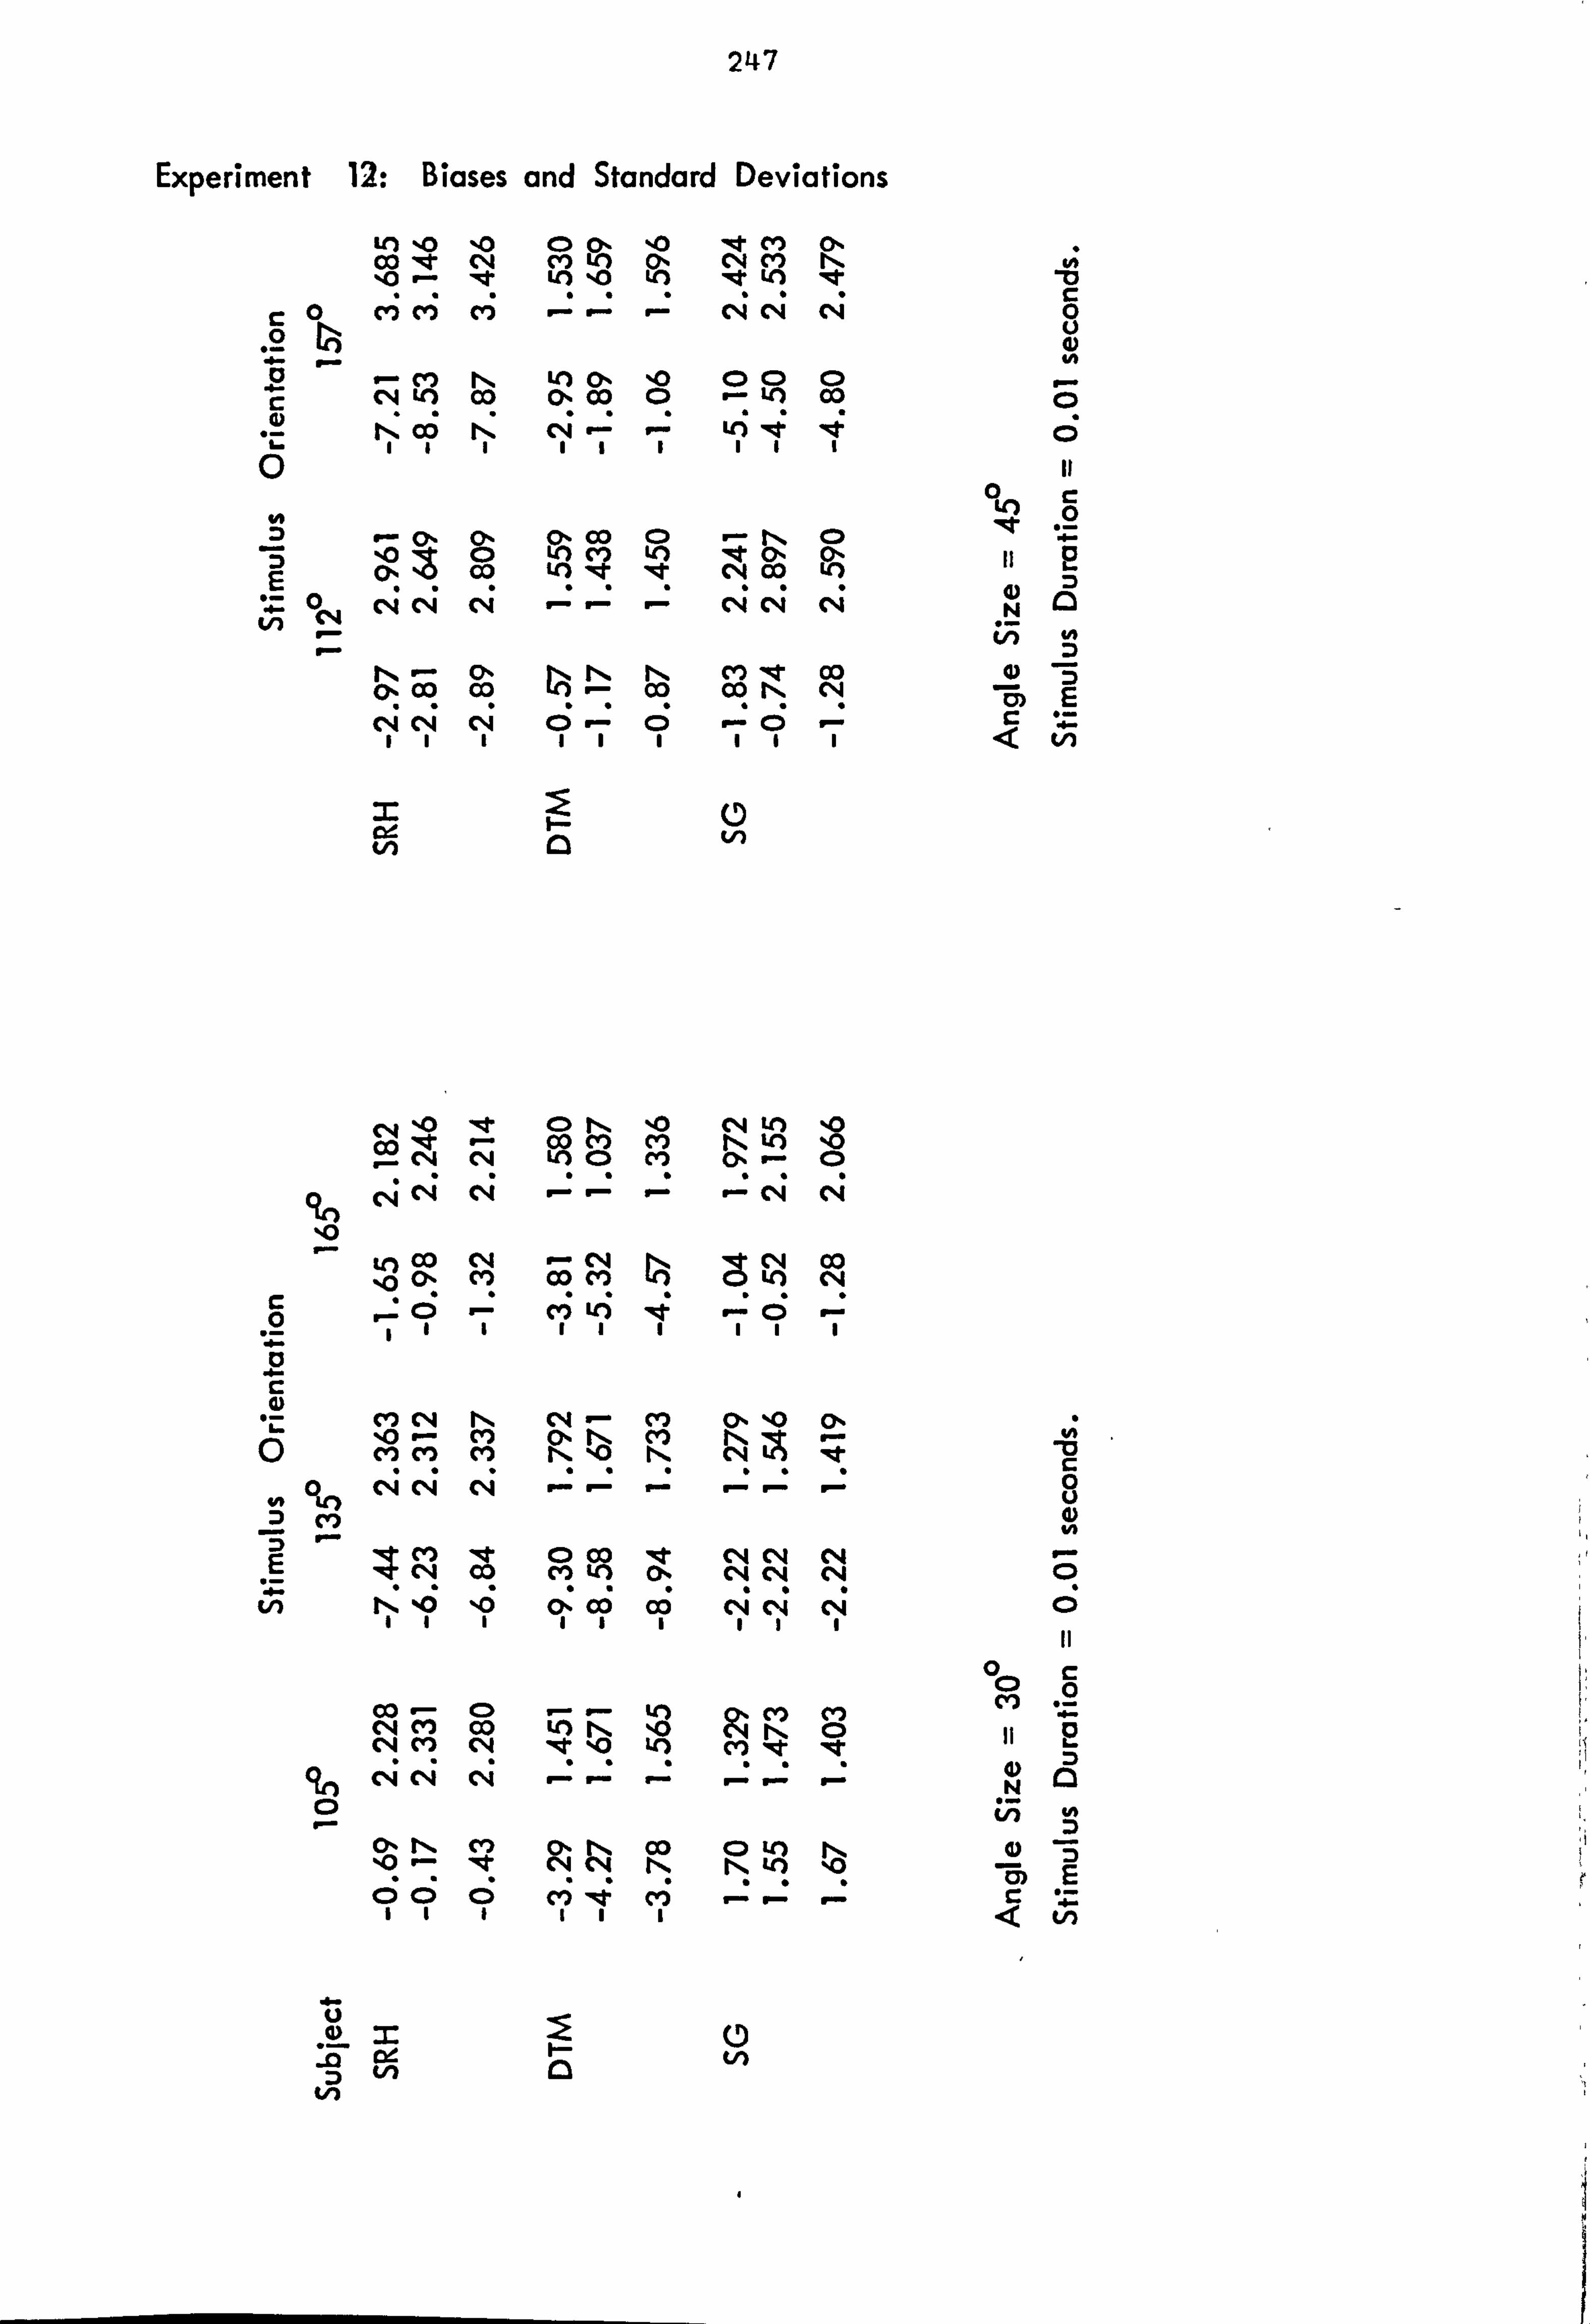
247
Experiment 12: Biases and Standard Deviations
LO %0 %0 (D %0 le Co lqt CN CY)
,0- "Kt* LO 10 EA Vtl, ILO
E . 4- Ln
E �I)
0
;; CV) N LO 0- %0 00 0 LO CO 0- co 0- LO CC)
ýt (D tý %0 C%4 to e CC) CI) N to %0
C, 4 LO C) ce) 0, - CD
N co N C%4 Ln it IIIIII
0ý
0% CC) 0 Cý C4 C4 04
%0
CW2 CW2 m (N c4 c44
EA Co C: ) r)
in le ---
Ný C)'ý Jý N r, CII) CC) ()% co CC) CC) co 04
CN Co
Cý Cý Cý
c4 (N C*4 0-0ý0 r- 11a111111
=0
c4 1-0 CO le ý C'4
cý cý (4 u- ý r- - C, 4 c4
CO c4 c4 c44 00 0- Cl m LO (N
c4 Lii .4
CV) clq N c4 - (n 0- (n 0- rls
(12 CV) ci N No
c4 c4 cý CV) Nt Ci llý
N %0 %0 III
0 Co (n LO (> Co 00
141
CO - (D clq ci Co clq m CN le %0
(> %0 (>
U- U- U-
CN CN N c4 c4 (N
... C%4 C%4
2& CV) (Y) LO m
oN; r
(? n cq C, 4 c4 ,,
tn
_- I- -
C> lý CO CD LO N CN NN to ý, 0 CV) Cl)
4..
Ln I- (D
Ln
0 U')
0 0 CY)
z;, - 0 Co
1; -0
1; -0

248
Experiment 12: Biases and Standard Deviations Cl - (N C) C> 10 CO %0 C> cli LO CD %0%0 1.0 CO CO CD Co 00 C> C-4 -
0 04 N
C14
I- -- 00 0---
0 CN %0 LO C%i Co CW, ) N %0 %0 (b Ný CN
0 C, 4 - 191
C%l CY2 &0 N (n CD N C) le CY) %0 C) Co 0- 00
0 C14 N; r
--- a) 04 0
Cý Cý Cý III
0- 0 1
- CN CN CY) CY) 00 CY) C%4 04
---
%0 LO N- C> OD C4 a N- 0'. 8 10 C14 C), N co NN 0ý C) Cl) Ci
U-
0 409 N
n C%4
E . 4-
---
co [ý CC) - 10 l4t 8: m %0 LO LC) "t 14t 0. - N CC)
Cý Cý Cý Cý Cý
a Ln co Oo ca ýi 04 :4 (Y) 't LO co 40
I- PI
III
C; C; 6
10 le CY-
Cq - (v) %0 C%j CY- N CN 01 ý C%4
Nt
ý V- 0ý
LO CO (Y) CI*4 CO)
clq to lqt ýo lit 0-0 C, 2 C, 4 OD C%, ) e r*% C*4
vi (1 CY) ce) (N CN CN 0- 0 111111,111
0 C%4
0N
CN OD CY2 to N :3, OD -e 0
LO C)
ý- - 0- ý
0% - C) ý- LO M LO 114t C> 04 'Ict 00
Cý
m oý c4 %0
---
Co CN C: ) 04 -e (N N 00 OD
0
CO C%4 LO %0 C) CV) U- '-
III
4. - U
1/) U)
(>
C-4
I-
co 't 00 C14 C'4 04
---
LO 2 lqt
00 0
ý OC) to in K ;; CV) C*4
F- --
co C14 co 0 10 0% %0 co
1111
0 tA
0' N
a) c, ) C
c 0
Cl C;
0
E . 4-
Ln

249
Experiment -12: Standard Errors of bias and standard deviation
14t C) CV) N Cl) '4 CN 00 0 10
'-Ilt %CO
Cý -. C%! 7 -. -:
_qn oo o C) 0 c) 00 c)
c %0 N LO (N Ol %0 co
C C; C;
0
CO lqt - t Co to, cn
c; c; c; c; c; c; c; c; c;
:4 "A ! ýý I- P
C; C; C; q4
Uli le CC) :jýý C) ý qt CO LO LO M- clq
0 c: i CD c; CD 0 c; c>
90 u-
0 LO CO)
=0 I-
to ýo - Co C, 2 CN %0 c> CD Lil le to (D to CY) z: s c> c; c; c; c; c; c; c; d c; Cl) *ýo to 04 W CV) %0 0
Ict Itt - %0 C") (N 04
C; C; CS C; C; C; C; C;
C; C;
OLO
N
04
C;
ý CC) 2s s
00 C)
0% N 01% 0% C', C2 C4 CC) C> C) ooC; C; C; C; C;
qo C> r-
ýo %0 -Nm CD clq le (n CY) CY) c*II CY) ý" C%A C. el a. 11
U- U-
- el 00 ri 10 le
c; c;
- C) %0 00 2; 00 (D C)
C; C; C;
C) 0 C) I.
C; C; C; C; C; Ln
(4 - C, 4 %0 (> OD clq Lr) CY) le - CY) " -2
c c; cý c; c; c; c; c; c; c; <
cl V)
-0
0
C) Q
0
cl
E

250
Experiment 12: Standard Errors of bias and standard deviation
%0 Q (V) r" %0 C) C2 0 (> CO (D CD CD
0 04 N
0
0 c4 le U-
(4
I-
E V)
0 C14
0-
OC) 0 00 0 00 0
- OD 0 lle cn (n ý -e (n
C) C) C) C) aa0 (D C)
c4 LO 0- -- '0 r. % (> 0, CO Co 00 CD 2; Q CD
SC) C) ý; 2; COI),
C; C; C; 6 C; C; 6 C; C; rý% %0 C, 4 CD le
c: > C> c; c; c; C; C; C;
%0 Co CN (N LO NM Co ýo LO Co
CN CD C: ) 0 C)
00 0 00 0 OC) 0
N- (> to (> N lle (N m Co Co CD 222; C> CD CD
c; c; c; c; d c;
kG Ln co Ln NN 10 C) C) 0r Dlý 100 8 ts (0=0)
C; C; C; C; 6 C; C; C; C;
CO 'Irt N 01ý CY) CC) 0.0ý co 99 E; C)o S; 2; 88
0 C) 0 C) a C) aaC;
ci (12 CN to %0 N Lii C: ) 0
00000
C) (D Cý C) aa C> C) C)
N C14 12 9
C; C; C;
ý RCI CO - (> 0M Lin lqt
Co CN - CN ,8 Q0 CD C: ) cs b CO" 00000 40 C) 0
Cý
C; C;
4-
.! U,
(I,
LO CC)
a) C) 0 00
I-
C: ) E; le co OC> CY) 0
V)
In -o 0 U a, In
0 0
CS4
0
(4
E . 1-

251
Experiment 12: Biases and Standard Deviations
CN -N CN C) CN 0. - 10 CC) 10 CN 11 N LO %0 ýo NN cl) - CN 0- 0- 01ý N 0- CC)
0 VI D
E V)
0 vi
_: 1: 1: 00 0 00 0
CD LO %0 C) 00 (> , l' le (V) CV) lq» 0 r-4 (> CD Co -N ýt
m Ln o, 04 04 04
Q C%4 u) N C-) 0% CV)
0 C%4 U- I-
ýo
"I
co IRt ZR cco C4 C) N CV) LO %0 %0
: 22 (D I-- Ln
CD iz N C), t, o' 8 :s C%4 0- CY) 8 "Rt 0- CC) co %0 co N 10 10
c; C; C; ': C; cs C; C;
_ I- " r- I- IIIIII
CN LO CV) LO 0. - N I- Ir-
III
ri C, 4 Co le ci cn CY2 tn 0 (> oý 2 C) CY) - co NN ýo %0
90 cl
C) C) C) C) 0 C) 0 C) C)
tn N C14 CY)
C4 C4 11
9
C4 1
0 OD IRT -0a %0 "I
C; C; C=; NN 04 C) LO C%4 Cw) CN CY) co co 00
Cý C4 C4 111
to Co cli - C, 4 N le 00 C> C, 4 't Co
CD Lo - u; (D ý-N LO CO N C) (> le LO CN C> - 0% CD OD %0 Co N le LO LO
Cin 0 C) 0 C: ) 0 0 r-
% . 11,00 ! ý§ I 00 0
III 00 C) oý -
IRT Ul) Ul C*-4 C) a. Ln K CC) 04
En Ln
OLO
N vi 0 0)
0 CD
N v)
8
0 u 0 #A
0 C)
C4
0
. 4-
2 3 M
E -I. - C/I
V)

252
Experiment 12: Biases and Standard Deviations
c4 N
4- tn
0
C) C) %0 co LO 1-t
C; C;
III
c4 LO N 00 C, 4 (%4 C. 4 0 Co :40 CN CN 2t ýe U. ) ci -e
c; c; d0dc: S d
G OD %0 (N 00 (D CY) 0N lqt le le
1.: 6 1:
lqt Co r- CO
IIIIII
08 CC) N co 0 0% LO 'T In L; -Rit
IS? lcl; ctl
C; C; C; C; C; C; C; C; N Oll CC)
--- III
ca 10 N CN C%4 01ý CY) ý CC) %0 C%4 LO 00 CV) 0% ce) m (1) CY)
0 C; C; C; C; C; (s c; 04
'At CV)
C4
10 0. co ýN Vý 7N C14 00
8
C%4 C4
CV) 0N C%l :Z to 1.0 b
le CD C*4 04
C, 3 CN C%4 CD CC) - C) C) C: ) (Z %0 (> 0 LO :4 00 %0
lqt (1) r) C, 2 CI) CV) ýe le 0 C) 000 C) 00 C) 0 C%4
LO - a) OD - C) C)% ý tr) cr) N; t CY) CN LO Nt C") - C%4
Cý Cý Cý 4Ni C4 C4
t0 LO CO ý CO N ý; le
90 C: )
1N
10 CY) CV2 LA lqt LC) 0 c; c; c; c; c; c; c; d c; C*4 >
LO co 40 C)
I- --
%0 CY) CV) LO M 't
odd III
N Co Co N2 NO NO ýe ýýi (> N !ý 0- LO !ý %0 (N
Ci Ci Ci . Ci . <i le 0 CD 000C: ) C: ) c) 0 cý N
%0 C) CV) LO
C; C=;
4-
-12 vi 0
c 0
cl;
if c
)E C
8 COI) C4 90
0 'I)

253
Experiment 13: Standard Errors of bias-and standard deviation
Subject
Angle Size SRH DTM SG
le 0.203 0.219 0.147 0.143 0.150 0.146 0.202 0.217 0.185 0.203 0.164 0.161
0.203 0.218 0.166 0.176 0.157 0.154
2e 0.200 0.240 0.191 0.217 0.176 0.161 0.243 0.284 0.164 0.167 0.235 0.247
0.222 0.263 0.178 -0.194 0.206 0.208
2e 0.249 0.306 0.156 0.165 0.189 0.197 0.249 0.271 0.232 0.208 0.227 0.253
0.249 0.289 0.194 0.188 0.208 0.227
360 0.332 0.344 0.280 0.273 0.235 0.202 0.317 0.405 0.281 0.282 0.253 0.234
0.435 0.376 0.281 0.278 0.244 0.220
3? 0.428 0.414 0.263 0.275 0.356 0.309 0.364 0.394 0.267 0.243 0.371 0.399
0.396 0.404 0.265 0.259 0.364 0.357
400 0.468 0.477 0.324 0.325 0.363 0.389 0.419 0.449 0.287 0.285 0.387 0.496
0.444 0.463 0.306 0.306 0.374 0.446 & 0.451 0.504 0.227 0.212 -0.474 0.458
0.451 0.450 0.283 0.265 0.507 0.517
0.451 0.478 0.280 0.240 0.491 0.488
Stimulus duration = 0.01 seconds.

254
Experiment 13: Biases and Sfandard Deviations
Subject
Angle Size SRH DTM - SG
le -1.19 1.475 -2.86 0.844 0.20 0.949 -1.49 1.413 -2.34 1.038 0.48 1.073
-1.34 1.444 -2.60 0.946 0.34 1.013
2e -3.77 1.448 -2.83 1.290 -0.24 1.089 -3.10 1.716 -2.73 1.086 -1.76 1.646
-3.44 1.588 -2.78 1.192 -1.00 1.396
2? -4.70 1.857 -2.14 1.058 0.09 1.317 -4.86 1.739 -2.47 1.335 -1.65 1.635
-4.78 1.799 -2.31 1.204 -0.78 1.485
309 -6.23 2.312 -9.30 1.792 -2.22 1.279 -7.44 2.362 -8.58 1.671 -2.22 1.546
-6.84 2.337 -8.94 1.733 -2.22 1.419
3f -6.02 2.704 -3.76 1.609 -0.51 2.099 -5.58 2.507 -2.79 1.567 -1.11 2.576
-5.80 2.607 -3.27 1.588 -0.81 2.350
40 6 -7.21 3.137 -3.43 2.112 -6.10 2.443 -7.23 2.973 -4.32 1.913 -4.29 2.767
-7.22 3.056 -3.87 2.015 -5.19 2.610
4? -8.24 3.088 -4.80 1.332 -5.72 2.995 -9.48 2.990 -4.84 1.656 -4.63 3.325
-8.86 3.039 -4.82 1.503 -5.18 3.164
Stimulus duration = 0.01 seconds

255
Experiment 13: Standard Errors of bias and standard deviation
Subject
Angle Size SRH DTM SG
le 0.110 0.100 0.097 0.088 0 D88 0.081 0.111 0.109 0.086 0.072 0.103 0.106
0.111 0.105 - 0.092 0.080 0.096 0.094
200 0.121 0.105 0.096 0.093 0.124 0.094 0.116 0.125 0. (P5 0.080 0.105 0.091
0.119 0.115 0.096 0.087 0.162 0.093
2e 0.116 0.112 0.114 0.109 0.114 0.118 0.113 0.100 0.122 0.130 0.096 0.086
0.114 0.106 0.206 0.120 0.105 0.103
3do 0.127 0.130 0.121 0.101 0.087 0.081 0.131 0.111 0.117 0.098 0.109 0.090
0.129 0.121 0.119 0.099 0.098 0.085
35P 0.153 0.163 0.124 0.112 0.120 0.117 0.170 0.163 0.116 0.108 0.153 0.144
0.161 0.163 0.120 0.110 0.127 0.131
4do 0.149 0.145 0.115 0.118 0.130 0.125 0.138 0.143 0.120 0.113 0.131 0.117
0.144 0.144 0.118 0.115 0.131 0.121
4f 0.191 0.190 0.169 0.180 0.164 0.179 0.160 0.188 0.170 0.168 0.177 0.200
0.176 0.189 0.170 0.174 0.171 0.190
Stimulus duration = 2.00 seconds.

256
Experiment 13: Biases and Standard Deviations
Subject
Angle Size SRH DTM SG
le 0.62 0.598 -0.84 0.449 0.32 0.448 0.27 0.605 -0.67 0.376 0.20 0.503
0.44 0.601 -0.75 0.414 0.26 0.476
2do -2.13 0.707 -2.09 0.468 -1.66 0.483 -2.40 0.675 -2.32 0.389 -1.48 0.480
-2.26 0.691 -2.21 0.430 -1.56 0.482
2? -3.00 0.678 -1.18 0.609 -1.74 0.657 -2.40 0.629 -1.76 0.743 -1.11 0.448
-2.70 0.654 -1.47 0.679 -1.43 0.562
3do -2.83 0.793 -2.15 0.634 -3.22 0.413 -3.06 0.730 -1.88 0.633 -2.47 0.436
-2.95 0.762 -2.02 0.633 -2.90 0.425
3? -2.23 0.992 -0.98 0.745 0.41 0.674 -2.24 1.147 -0.78 0.665 -0.01 0.956
-2.24 1.072 -0.88 0.706 0.20 0.827
460 -4.6.1 0.951 -3.89 0.688 -2.12 0.789 -5.25 0.884 -4.51 0.704 -1.77 0.650
-4.93 0.918 -4.20 0.696 -1.95 0.723 &
-4.98 1.316 -2.13 1.134 -2.19 1.105 -5.15 1.099 -1.61 1.043 -2.94 1.231
-5.06 1.212 -1.87 1.089 -2.57 1.167
Stimulus duration = 2.00 seconds

257
Appendix II: Computer Subroutines - used for on-line control of stimulus
presentation and monitoring of respcnse distributicns.,
Ihe programs written to run the computer-cmtrolled system have been described in chapter 2. Of these, two subroutines are of potential interest, those used to present the stimuli and to monitor and optimise the respcnse distributicns of the observers - IDISPI and 'TEST' . run listings of these two subroutines are provided in this appendix.
II-1 DISP
X and Y screen coordinates for the line end-points and line origins of
each of the 4 lines of the 21 constant stimuli were stored in arrays in
the main program and transmitted to unsubscripted variables in the
subroutine for speed of access. IPXl - IPX4 -X coordinates for endpoints IPYI - IPY4 -Y coordinates for endpoints KOU - KOX4 -X coordinates for origins KOYl - KOY4 -Y coordinates for origins KFX, M - X, Y coordinates for fixation point.
After setting the various timing counters, the program enters a loop of five sectims, me for the drawing of each of the four lines,, and me for
the fixation point. One pass through this loop takes 5msec., the number
of iteratims required was, therefore, t/5 where T is the stimulus duration
in milliseccnds.
Instructims 6351 and 6352 loaded the X and Y line end-point DAC registers; instructions 6125 and 6315 loaded the X and Y origin DAC registers. Variables Gl - C4, and GF were set to I or 0 in bit 0 of the Y origin
register to activate the integrators if that line was to be shown.
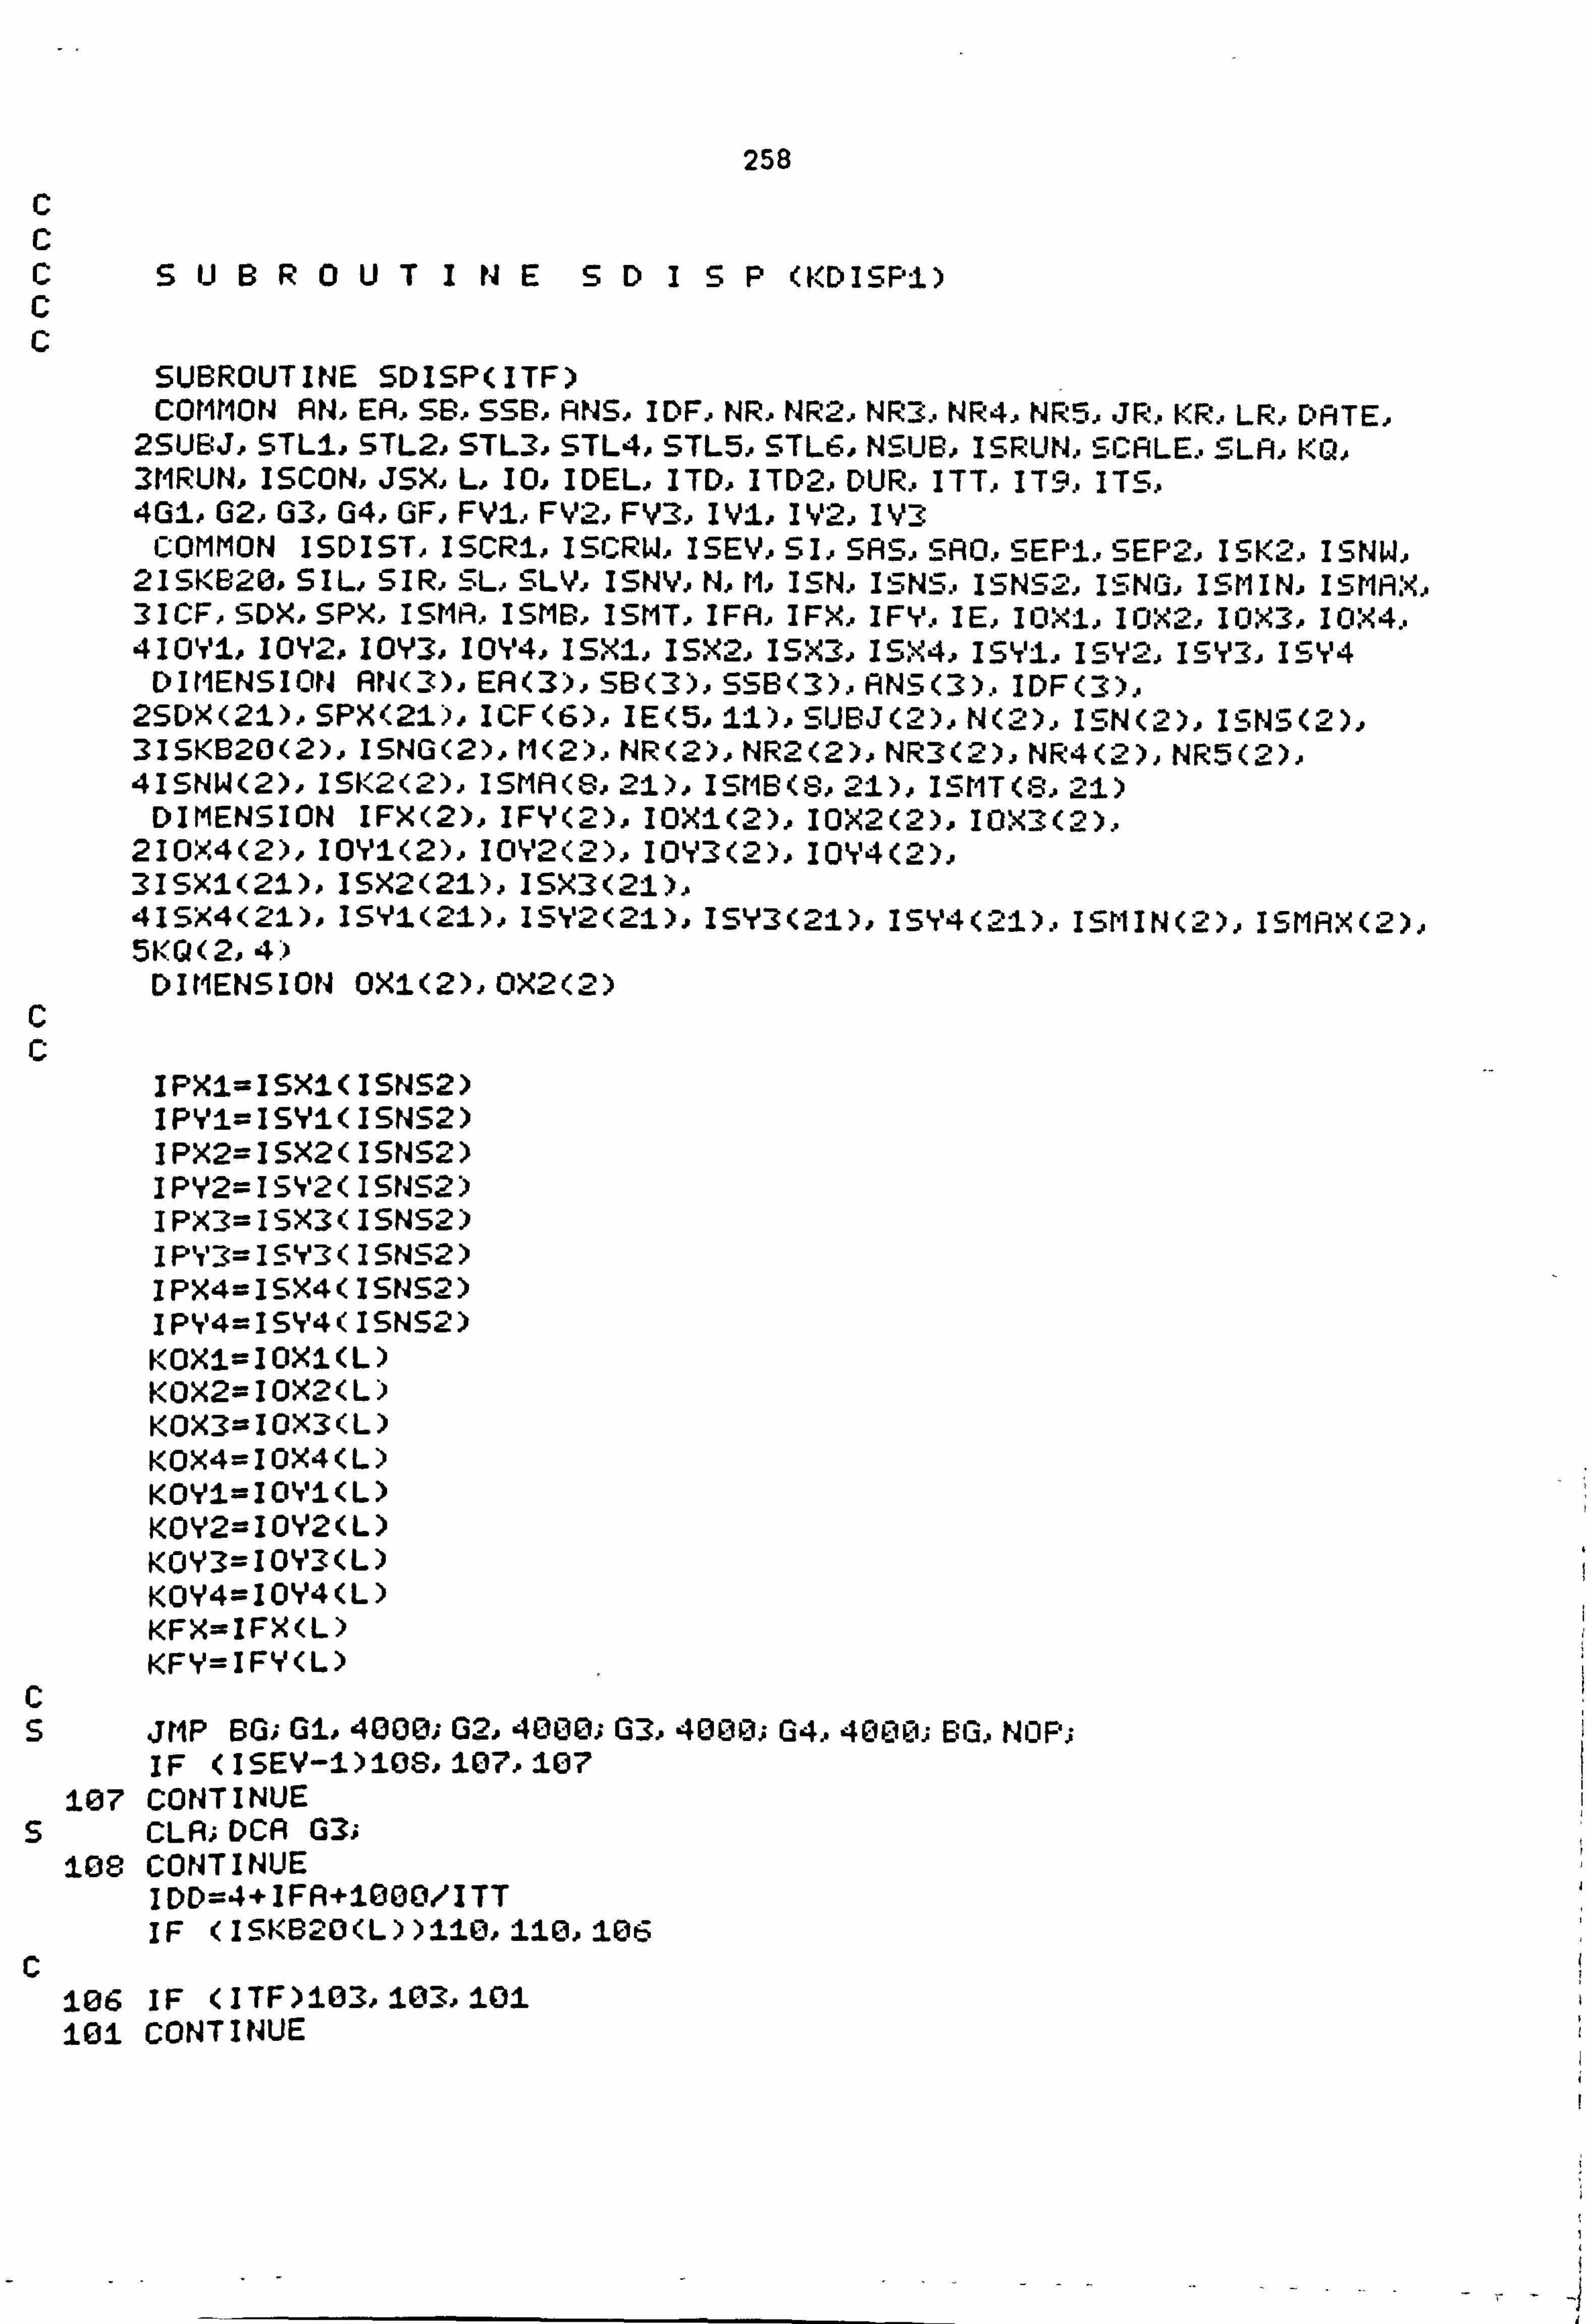
258 c c c SUBROUTINE SDI SP<KDISPi) c c
SUBROUTINE SDISP(ITF) COMMON AN, ER, SB. - SSB, RNS, IDF, NR, NR2, NR3. - NR4, NR5.. JR, KR, LR, DATE,
2SUBJ, STLI, STL2, STL3, STL4, STL5, STL6, NS. UB, ISRUN. -SCALE, SLA, KQ, 3MRUN, ISCON, JSX, L, IO, IDEL, ITD, ITD2, DUR, ITT, IT9, ITS, 4GI, 02, G3, G4, GF, FY: I, FY2, FY3, IVI, IY2, IV3
COMMON ISDISTISCRi, ISCRW, ISEVSISAS.. SAO, SEPi, SEP2, ISK2.. ISNW. - 21 SK820, SIL, SIR, SL, SLV, I SNV. - N, M, I SN, I SNS. - I SNS2, ISNG, ISM I N, I SMAX. - 31 CF, SDX, SPX, I SMA, - I SMB, I SMT, I FA. - I FX, I FY. - I E, I OXI, I OX2' I OX31 I OX4. - 410Yi. - IOY2, IOY3, IOY4, ISX: lj ISX2, ISX3, ISX4, ISYl, ISY21 ISY31 ISY4 DIMENSION AN(3), ER(3), SB<3), SSB<3), ANS<3).. IDF(3)..
25DX(2i), SPX(2: 1), ICF<6), IE<5, IJ. ), SUBJ(2), N(2)., ISN(2), ISNS(2), 3ISK820(2), ISNG(2), rl<2), NR<2), NR2<2), NR3<2), NR4<2), NR5(2), 41SNW<2), ISK2<2), ISMA(8,21>, ISMB<8,2i), ISMT(S.. 2i)
DIMENSION IFX(2), IFY(2), IOXI(2), IOX2(2), IOX3(2), 210X4(2). -IOYI<2). -IOY2<2), IOY3(2), IOY4(2). - 31SXi(2i), ISX2(2: 1), ISX3<2: 1), 41SX4<2i), -ISYI(21). -ISY2<21),, ISY3(21), ISY4(2J. )., ISMIN(2), ISMA. X(2), 5KQ(2,4*)
DIMENSION OXI<2), OX2(2) C
IPXI=ISXi(ISNS2) IPYI=ISYi(ISNS2) IPX2=ISX2(ISt4S2) IPY2=15Y2(ISNS2) IPX3=ISX3<ISNS2) IPY3=ISY3<ISNS2) IPX4=ISX4<ISNS2) IPY4=ISY4(ISNS2) KOXi=IOXi(L) KOX2=IOX2<L) KOX3-IOX3(L) KOX4=IOX4(L) KOYi=IOYi<L) KOY2=IOY2(L) KOY3=IOY3(L) KOY4=IOY4(L) KFX=IFX(L) KFY=IFY<L)
C
C s JMP BG; Gi, 4000; G2,4000; G3,4000; G4,4000; 8G, NOP;
IF (ISEV-i): L0S, l07. -107 107 CONTINUE
s CLA; DCA G3; 108 CONTINUE
IDD=4+IFA+1000, 'ITT IF <I5KB20(L))li0, ll0,106
C 106 IF <ITF)103,10-3, i0l 10i CONTINUE

259
ITFi=ITF*1000/5 IT8=0875 DO 102 I=I, ITF: t
s CLA; TAD \IT9; CIA; DCA TF s TAD (764; 6351; CLA; TAD (764; 6352; CLA/SET DRCXi. -Yi TO 0 s TAD \KFX; 6125; CLA; TAD \KFY; TAD <4000.. 6-315. - CLA/SET FIX PT. s CPRGE 4 s SKP; TF, O; FT, ISZ TF; JMP FT/TIMING LOOP FOR FIX PT. s CLA; TAD \IT8; CIA; DCA TF, s CPRGE 2 s FS, ISZ TF; JflP FS; CLA;
102 CONTINUE 103 CONTINUE
S S S S S C S S S S S C S S S S S C
S S S S C S S S S S S S C
DO 104 J=I, ITT CLA; TAD \IT9; CIR; DCR TTI TAD \IPXi; 6351; CLR; TRD 'sIPYI; 6352; CLA TAD 'sKOXi; 6: 125; CLA; TRD \KOYI; TAD r3l; 6315; CLA CPAGE 4 SKP; TTI, 0; STI, I SZ TTI; JMP STt,, T IMI N(33 FOR LINE I
CLR; TFID '%IT9; CIR; DCR TT2 TRD 'ý%IPX2; 6351; CLFI; TRD l,. IPY2; 6352; CLR TI9D %. KOX2; 6125; CLR; TRD «�. K0Y2; TFID G2; 6315, CLFI CPRGE 4 SKP; TT2,0; ST2, I 'ESZ TT2; JMP ST2. YT IMI NG LI NE 2
CLR; TRD \IT9; CIR; DCR TT3 TRD NIPX3; 6351; CLR; TRD NIPY3; 6352; CLFI TRD '%KOX3; 6125; CLR; TRD \KOY3, TriD G3; 6315; CLR CPRGE 4 SKP; TT3,0; ST3, I 9SZ TT3; JMP ST3, -T 1MI NG LI NE 3
CLR; TAD \IT9; CIA; DCA TT4 TAD \IPX4; 6351; CLA; TAD \IPY4; 6352; CLA TAD \KOX4; 6125; CLRTRD \KOY4; TAD G4; 6-315; CLA CPRGE 4 SKP; TT4,0; ST4, ISZ TT4; JMP ST4/TIMING LINE 4
CLR; TRD \IFR; SNR; Jr1P NF CLP; TRD 's. IT9; CIR; DCFI TF: 1 TRD <764; 635: 1; CLR; TRD (764; 6352; CLR TFID '%F', FX; 6125; CLR; TFID ", F, "FY; TRD (401120; 6315; CLR CPPGE 4 SI(P; TF: 1,0; FTI, I SZ TF: i; JMP FT: 1 NF. - CLFI
104 CONTINUE GOTO 120
: 110 D0 iii I =1, IDD DO Iii J=i, ITT
s CLA; TAD \IT9; CIR; DCA TTD 5 CPAGE 4 s SKP; TTD, 0000; DTISZ TTD; JMP DT
i1i CONTINUE 120 CONTINUE
FZTUIUI
120

260
11-2 'TEST'
The variables input to this subroutine were: ISK2 - the mid-point of the current range of 4 stimuli ISIIW - the stimulus range-width descriptor - i. e. hcw far
from ISK2 the largest and greatest stimuli were. ISMA
ISMB
IVNG
the frequencies of A and B respmses
the identity of the current group of 8 responses most
recently acquired.
ISM - empirically determined criteria which determine the
ISCRW resistance to change of the stimulus set mid-point and range width. A value of 20 was used for each of these in all rims.
IC - array containing the criterion values of response frequencies against which empirical response frequencies
are compared (see Appendix III for values)
I

261
c c c SUBROUTINE TEST <KTEST) c c
SUBROUTINE TEST(NNG) COMMON AN, EA, SB, SSB, ANS, IDF, NR, NR2, NR3, NR4. - NR5, JR, KR, LR, DATE.,
25UBJ, STLi, STL2, STL3, STL4, STL5, STL6, NSUB. -ISRUN, SCALE.. SLR.. KQ, 3MRUN, ISCON, JSX, L, 10, IDEL, ITD, ITD2, DUR, ITT, IT9, ITS, 4GI, G2, G3.. G4, GF, FVi, FV2, FV3, IVI, IY2, IY3
COMMON ISDIST, ISCRI, ISCRW, ISEY. - SI, SAS, SAO. - SEPl, SEP2, ISK2, ISNW, 21SKS20, SIL, SIR, SL, SLV, ISNV, N, M, ISN, ISNS, ISNS2, ISNG3, ISMIN, ISMAX. - 31 CF, SDX, SPX, I SMA, I SMB, I SMT, I FA. - I FX, I FY, I E. - I OX1, I OX2, I OX3, I OX4. - 41 OY1, I OY2, I OY3, I OY4, I SX1, I SX2.. I SX3, I SX4, I SYl. - I SY2, I SY3, I SY4
DIMENSION RN<3), EA<3), SB<3), SSB<3), ANS(3).. IDF(3). - 2SDX<21), SPX<21), ICF<6), IE<5,11), SUBJ<2).. N(2), ISN(2>.. ISNS(2), 31Si'%'B20(2), ISt4G(2), M(2), NR(2), NR2<2), NR3(2), NR4<2).. NR5(2), 41SNW<2), ISK2<. -C-'*), ISMA(8,21).. ISMB(8,2i), ISMT<8,21)
DIMENSION IFX(2), IFY<2), IOXi(2), IOX2(2), IOX3<2), 210X4(2), IOYi<2), IOY2<2), IOY3<2), IOY4(2), 3ISX: 1<2i), ISX2(2i), ISX3<21), 41SX4(2: 1), ISYI(2i), IS'v'2<21), ISY3(21), ISY4<21).. ISMIN<2), ISMFi'X(2>. - 5KQ(2,4)
DIMENSION OXI(2)AOX2<2) DIMENSION K<8), JA(8), JB<8), JT(8)
C c c MODIFIED CONST METHOD <MODE 4/5) c TEST FOR POSN & WIDTH OF RANGE c
le IZ=ISNW(L) IZI=I/(IZ+I) K5=ISK2(L)+3*IZi N0=(IZ+i)/2 Ni=N0*0- I REM( I Z/2)) KtIIN=K5-Ni-2*lZi KMAX=K5+NI+IZI K(i)=KMIN 11(2)=K5-NO-lZi K(3)=K5+NO K<4)=KMAX
s JMP FD; DIV, O; CLA; TAD ". UTAD <-I; SZR CLR; JMP F2; TAD '-. IV; s JmP DD; F2, TAD \IV; CLL RTR; RTR; DD, AND U7; DCA \J; JMP I DIV; S FD, UOP;
IF (NNG-1)956,956,12 12 DO 651 MM=i, 4
lil%=K(MM) I V=lSMA(NNG, IK)
S JMS DIV JR<MM)-i IV=ISMB<NNG, IK)
S JMS DIV 651 JB(mm)=j
c c

262
970 IH=4 tiwi=IZ+IZI IIW2=IZ+2-IZ/4 IF( NNG-i) 956,956,950
950 DO 306 JK=1,4 N2=KQ(L, JK) IY=ISMAQ4NG-i, N2)
s JMS DIY JI=J I Y= I SMS ( NNG-1, N2)
s MIS DIY J2=J DO 305 JL-i, 4 lFQ42-K(JL))305,307,305
307 JR(JL)=JR(JL)+Jl JS<JL)=JB(JL)+J2 GO TO 306
305 CONT I NUE IH=IH+i JP(IH)=Ji JB(IH)=J2 K(I H) -? J2 lF(U2-KMltl)120. -130,130 120 KMIN=? J2
i3o IFýN2-KMAX)306,306, i40 140 KIMAX=N2 306 CONTINUE
c c IE(5, tJ) REFERS TO NW=O c
JZ=O DO 100 IL-i, IH JT<IL)=JP<IL)+JB<IL) IF<JA(lL)*JB(IL))100,100, j0j
101 iz=JZ+l 100 CONTINUE
s TAD \JZ; TRD (-2; SPA CLP; JMP \104; TAD \JZ; TRD <-4; SPA CLA imp \103ijmp \106
104 IZ=IZ-i+IZI NW2= I Z+i GO TO 103
106 IZ-IZ+i-IZ. -4 tjwi- I Z+i
103 Imico lw=IZ+i+IZ. -14+3*(I/(IZ+I)) IF<K5+IW-21)40,40,41
4 '5-21-IW 40 IF(K5-IW)42,42,43 42 K5-ILJ+i 43 IF<K5-KMlN-10)44,44. -45 45 K5=KMIN+iO 44 IF(KMAX-K5-10)46,46,47 47 K5=KMAX-i0 46 Do 573 19-1, IH
ND- K( 19) -K5

263
JMS NDS IEX=JT(I9)*(50*(NDS+I)-NDS*IE(IZ+Ijii-ND*NDS))
572 Irll=IMl+IABS<JR(I9)*l00-IEX) I rl= 1 r4l JMP \576; NDS, O; TAD \ND; FiND (4000; CLL; RTL; CIA; SMFi TAD <I; DCFi \NDS; JtIP I NDS
576 KK=ll *MAX-KMIN-10 KKl=KlMIN KK2=KMAX IF( W-l. ') 563,563,564
564 f-l 'KI=KMIN+KK KK2=KMAX-KK
563 IF<KK2+IW-2i)4S, 48,49 9V 4 'K2=2i-IW
48 IF(KKI-IW)50,50,51 50 KKI=IW+i 51 DO 520 Ii=KKIKK2
Imi=o DO 503 14=iIH ND=K(14)-Ii
s MIS NDS IEX=JT(I4)*<50*(NDS+I)-NDS: *IE<IZ+: 1,11-t4D*NDS))
503 Itll=IMl+IABS(JAQ4)*l00-IEX) IF(IM-IMI-ISCRI)520,520,521
521 IM=IMI 1'5= Ii
520 CONTINUE 522 DO 500 I3=NWi. -NW2
IW=13+I3/5+3*(I/I3) IF(IRBS(K5-11)+114-: 10)700,700,500
700 Itql=o DO 506 16=1, IH ND=K< I 6)-f%'5 JMS NDS IEX=JT<I6)*450*(NDS+I)-NDS*IE<I3, il-ND*NDS))
506 IMl=IMl+IABS(JA(I6>*l00-IEX) IF< 111- 1 Mi- I SCRW) 500,500,569
569 Irq=IMI Iz=I3-l
500 CONTINUE C
959 ISNW(L)=IZ 956 ISK2(L)=K5-3*<I/<I+IZ))
13 DO 800 M5=1,4 800 KQ(L, M5)=i"'(r45)
RETURN END

264
Appendix III: Criterion frequencies for subroutine 'TEST'
The values listed below were stored in the array IE(I, J), where I= NWtl and J=ISNS. NW describes the current width of the range of
stimuli (ISNW) and ISNS the identity of the stimulus out of the set of
21 possible stimuli.
IE(1,1)=100 IE(2,1)=100
IE(1,2)=100 IE(2,2)=100
IE(1,3)=100 IE(2,3)=100
IE(1,4)=100 IE(2,4)=100
IE(1,5)=100 IE(2,5)=100
IE(1,6)=100 IE(2,6)=100
IE(1,7)=100 IE(2,7)= 99
IE(1,8)=100 IE(2, B)= 96
IE(199)= 96 IE(219)= 89
IE(1,10)=82 IE(2,10)=73
IE(1,11)=50 IE(2,11)=50
IE(3,1)=100
IE(3s2)=100
IE(3s3)=100
IE(3$4)=100
IE(3,5)=100
IE(3,6)= 99
IE(3,7)= 96
IE(3*8)= 91
IE(3,9)= 82
IE(3,10)=67
IE(3111)=50
IE(4pl)=100 IE(5,1)= 99
IE(4,2)=100 IE(5,2)= 98
IE(4,3)= 99 IE(5,3)= 96
IE(4p4)= 98 IE(5,4)= 94
IE(4ý5)= 96 IE(5,5)= 91
IE(4,6)= 93 IE(5,6)= 87
IE(4$7)= 89 IE(53,7)= 82
IE(4$8)= 82 IE(508)= 75
IE(4,9)= 73 IE(5,9)= 67
IE(4$10)=62 IE(5110)=59
IE(4,11)=50 IE(53,11)=50