Monoketonic Curcuminoid-Lidocaine Co-Deliver Using ... - MDPI
For Review O
nly
Does your data deliver for decision making?
Journal: Interlending & Document Supply
Manuscript ID: ILDS-10-2013-0030
Manuscript Type: Original Article
Keywords: Academic libraries, Statistics, Surveys, User studies, Customer Service,
Interlibrary loan
http://mc.manuscriptcentral.com/ilds
Interlending & Document Supply
For Review O
nly
Does your data deliver for decision-making?
new directions for resource sharing assessment
Collette Mak
University of Notre Dame
Margaret Ellingson
Emory University
Charla Lancaster
Virginia Polytechnic Institute and State University
Abstract Purpose – To describe how data was used to design and evaluate new services at the University of Notre Dame and
how data was used to evaluate changes in user behavior at Emory University.
Design/methodology/approach – Each author describes sources, methods, and applications of data, gathered
through a variety of sources used to plan new services and evaluate user satisfaction.
Findings – There is no one perfect approach to data-informed decision making; every approach has advantages,
costs, and disadvantages. What is important is that resource sharing practitioners become comfortable with a variety
of assessment tools.
Originality/value – The user experience is increasingly recognized as a critical part of any service or library product
but most resource sharing practitioners have little to no background in assessment and statistics. This article
provides an introduction to methods, sources, and applications of data specifically applied to interlibrary loan.
Keywords Academic libraries, Statistics, Surveys, User Studies, Customer Service, Interlibrary Loan
Librarians count things. We count the number of volumes, we count the number of people who come through the
door, we count circulation, items shelved, use of electronic resources, research consultations, the number of
interlibrary loan requests received, and on and on. These numbers, without context or purpose, are useless. At the
American Library Association (ALA) Annual Conference, June 2013, the RUSA STARS section held a program
entitled “Does your data deliver for decision making? new directions for resource sharing assessment” where panel
members discussed different assessment methods for data-informed decision making as well as the tools and data
sources appropriate to the problem being addressed. [1] The session was extremely well attended with an informal
door count of 211. [2] Unfortunately, the limited time allotted to each speaker only allowed a very general and high-
level overview of the various approaches with no opportunity to compare their respective merits and/or limitations.
In this paper the panelists expand on their ALA presentations to provide a more thorough discussion of assessment
tools and techniques that can be applied to library services with specific focus on interlibrary loan (ILL) and
document delivery.
Historic Data (Use Data)
Using historic data to plan for new or changing services provides both a baseline for comparison as well as data that
can inform the design. As Nate Silver [3] said in a recent interview about statistics, “It's not about clairvoyance. This
is not mysticism. It's about using science to know… the order between what we know and what we don't know.”
(Greene, 2013) Historic data has the advantage of recording actual use, what really happened, not what nostalgia or
cynicism wants us to believe. The number of people in the building is the number of people in the building; the
number of books checked out is the number of books checked out. What historic data can’t provide is nuanced
information unless it was collected at that time. Gate counts can tell you how many people entered or left the library
but they cannot tell you where those people went once they passed through the doors, nor what they did once inside
the building. That said, because historic data provides a true picture of actual transactions, it can be invaluable in
planning for projects such as implementing a new service or making a significant change in an existing service.
Page 1 of 12
http://mc.manuscriptcentral.com/ilds
Interlending & Document Supply
123456789101112131415161718192021222324252627282930313233343536373839404142434445464748495051525354555657585960
For Review O
nly
Basing decisions on historic data makes a number of assumptions. First, that user behavior after the change will be
fairly consistent with user behavior before the change. While that assumption would be pure lunacy if the change
involved a dramatically new technology, it is safe to assume that most undergraduates will continue to procrastinate
on course work, have tight deadlines, and will place a higher value on instantly available resources (electronic) over
physical content that takes time and effort to retrieve. It’s also safe to assume that, if graduate students are the
highest users of the print collection, that they will continue to be heavy users of print and that faculty accustomed to
handing bibliographies to assistants for fulfillment will not suddenly begin to place their own requests, no matter
how user-friendly the online form becomes. In other words, services and technologies can change quickly; human
nature changes slowly.
Another assumption is that the data points of today are an exact, or near exact, match to the historic data points. If
the systems or methods of data collection have changed over time then the usefulness of the historic data is
compromised. That doesn’t mean it’s no longer useful but it does mean that comparisons are less exact. Fortunately
for the design of academic library services the data doesn’t need to go back decades, three to five years is sufficient.
That period of time is long enough to follow an entire undergraduate class and establish patterns for graduate
students and faculty. In addition, in many libraries the technology and the electronic content change so rapidly that
comparisons to time periods more than five years ago are more interesting than instructive.
This section shows how historic data was used to design new services and adjust existing services. At the
University of Notre Dame, the goals of the Resource Access and Delivery Team (RAD) were designed to be long-
term, with strategies and specific projects changing as needed. Those goals were:
• Improve the user experience
• Provide a consistent high level of service across all hours of operation
• Engage in continual process improvement
• Make appropriate use of technology
RAD covered what is often called access services—circulation, stacks, reserves, ILL, and document delivery.
Before these units were combined to form RAD, the Hesburgh Library had multiple service desks with different
hours of service. Interlibrary loan materials were picked up in the ILL office during standard business hours but at
the reference desk after ILL hours and on weekends. Reserves were available at the reserves desk and recalled books
were available at the circulation desk. Service-specific desks meant that a library user who needed to use course
reserves, pick up a recalled item and an ILL book had to go to three different service desks on a library floor that
covers literally two acres.
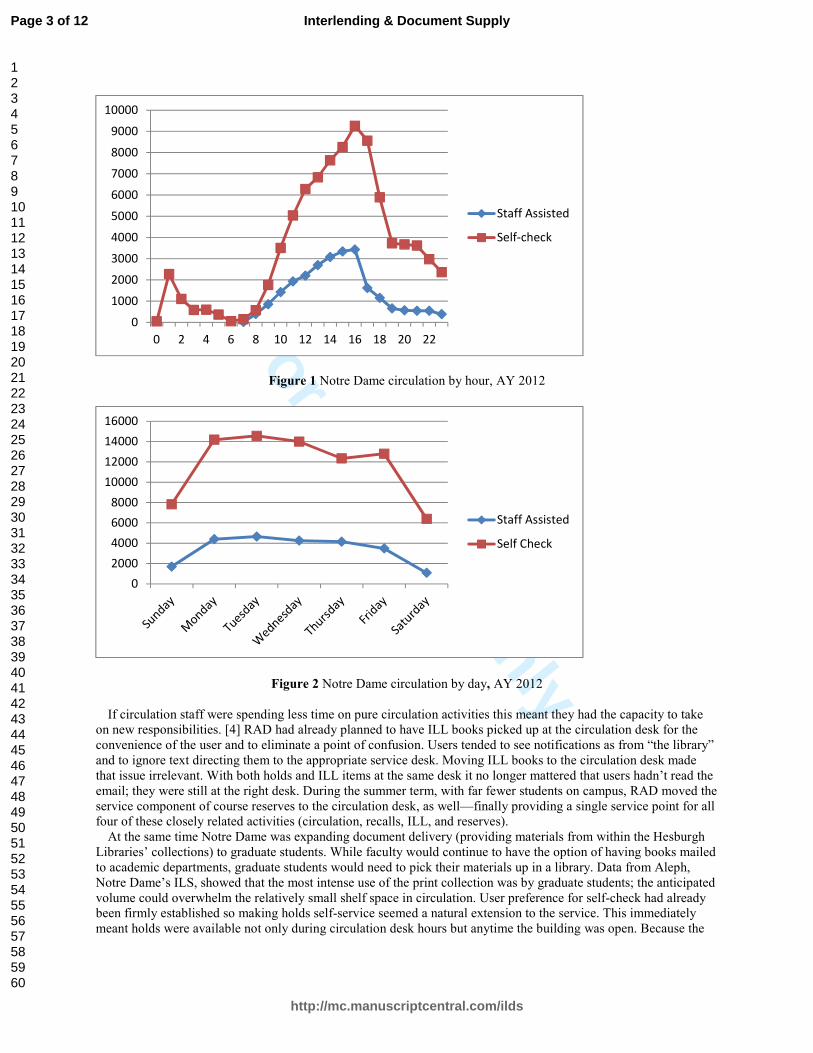
RAD had been studying use patterns to understand the relationship between gate counts, which record use of the
building, and transactions (e.g. database searches, circulation, interlibrary loan requests). The primary purpose was
to inform decisions about staffing levels. The second was to confirm or refute the commonly held belief that the
library was used as a study hall in the evenings and that professional staff wasn’t needed then. In fact, the pattern of
circulation, database searches, and ILL requests mirrored the gate count. The surprising fact was that circulation
through self-service kiosks was much higher than staff-assisted circulation. What was even more significant was that
self-check was more heavily used across all hours and days of operation; this was not a function of activity outside
of desk hours. Circulation data pulled from Notre Dame’s ILS showed that 76% of all materials that could be
circulated via self-service were circulated through the self-check machines. That is, items in the open stacks were
circulated overwhelmingly through self-service. Even during hours when the circulation desk was staffed, 74% of
circulated items were self-checked. Users clearly showed a marked preference for self-service and were comfortable
with the technology.
Page 2 of 12
http://mc.manuscriptcentral.com/ilds
Interlending & Document Supply
123456789101112131415161718192021222324252627282930313233343536373839404142434445464748495051525354555657585960
For Review O
nly
Figure 1 Notre Dame circulation by hour, AY 2012
Figure 2 Notre Dame circulation by day, AY 2012
If circulation staff were spending less time on pure circulation activities this meant they had the capacity to take
on new responsibilities. [4] RAD had already planned to have ILL books picked up at the circulation desk for the
convenience of the user and to eliminate a point of confusion. Users tended to see notifications as from “the library”
and to ignore text directing them to the appropriate service desk. Moving ILL books to the circulation desk made
that issue irrelevant. With both holds and ILL items at the same desk it no longer mattered that users hadn’t read the
email; they were still at the right desk. During the summer term, with far fewer students on campus, RAD moved the
service component of course reserves to the circulation desk, as well—finally providing a single service point for all
four of these closely related activities (circulation, recalls, ILL, and reserves).
At the same time Notre Dame was expanding document delivery (providing materials from within the Hesburgh
Libraries’ collections) to graduate students. While faculty would continue to have the option of having books mailed
to academic departments, graduate students would need to pick their materials up in a library. Data from Aleph,
Notre Dame’s ILS, showed that the most intense use of the print collection was by graduate students; the anticipated
volume could overwhelm the relatively small shelf space in circulation. User preference for self-check had already
been firmly established so making holds self-service seemed a natural extension to the service. This immediately
meant holds were available not only during circulation desk hours but anytime the building was open. Because the
0
1000
2000
3000
4000
5000
6000
7000
8000
9000
10000
0 2 4 6 8 10 12 14 16 18 20 22
Staff Assisted
Self-check
0
2000
4000
6000
8000
10000
12000
14000
16000
Staff Assisted
Self Check
Page 3 of 12
http://mc.manuscriptcentral.com/ilds
Interlending & Document Supply
123456789101112131415161718192021222324252627282930313233343536373839404142434445464748495051525354555657585960
For Review O
nly
Hesburgh library is situated next to a large parking lot this would benefit faculty, graduate students, and staff,
allowing them to pick up materials on the way to work in the morning or on the way to their cars in the evening.
While making holds available on open shelves is common practice in public libraries it is unusual for an academic
library. Because a book would be on hold for the specific person who requested it, only that person would be able to
check it out. However, with books on open shelves, other students might remove books that were involved in ‘recall
wars.’[5] While that might seem improbable, the concern was real. The library also needed to address the issue of
user privacy without adding time and expense to the process. These concerns were addressed by shelving the books
‘spine in’ so that the title was not visible. [6]
There was no doubt that the new document delivery program would be popular among graduate students. What
was unknown was the level of service required to meet their needs. Because the initial implementation involved
users submitting requests in ILLiad, Notre Dame’s ILL system, and staff completing them in the Aleph ILS, the
work required knowledge of two completely different systems. In addition, ILL staff and students did not work
evenings or weekends. Would weekday service hours frustrate rather than serve users?
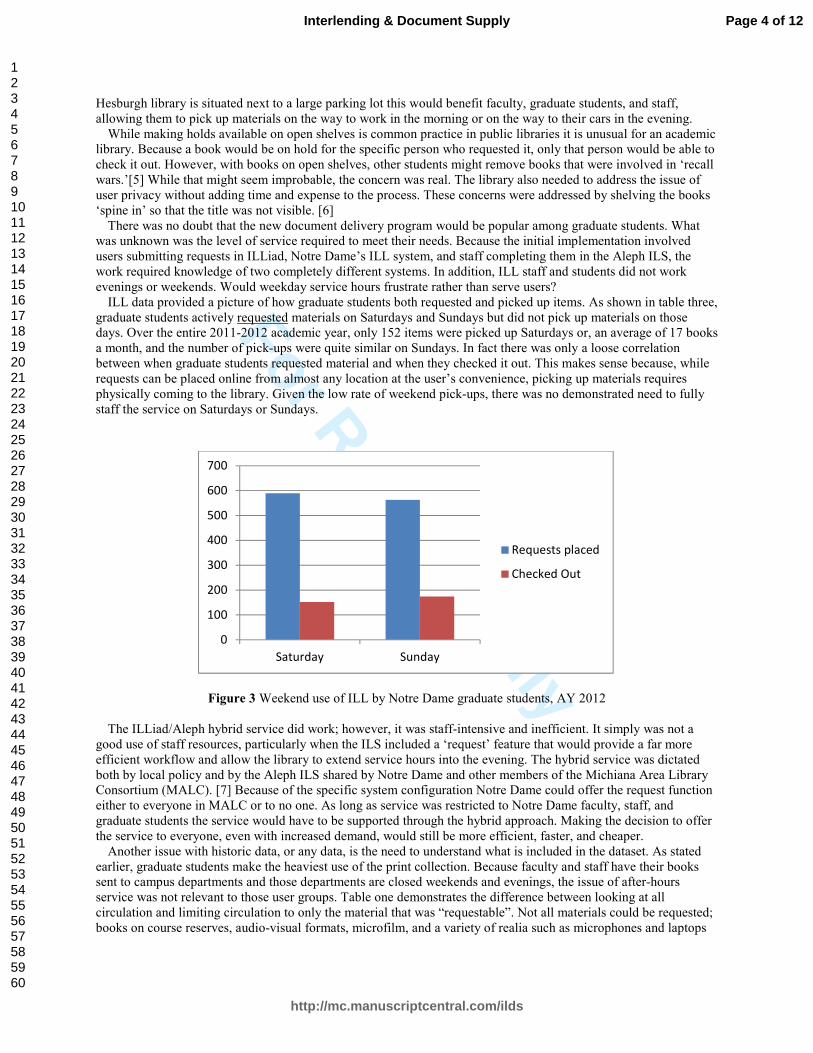
ILL data provided a picture of how graduate students both requested and picked up items. As shown in table three,
graduate students actively requested materials on Saturdays and Sundays but did not pick up materials on those
days. Over the entire 2011-2012 academic year, only 152 items were picked up Saturdays or, an average of 17 books
a month, and the number of pick-ups were quite similar on Sundays. In fact there was only a loose correlation
between when graduate students requested material and when they checked it out. This makes sense because, while
requests can be placed online from almost any location at the user’s convenience, picking up materials requires
physically coming to the library. Given the low rate of weekend pick-ups, there was no demonstrated need to fully
staff the service on Saturdays or Sundays.
Figure 3 Weekend use of ILL by Notre Dame graduate students, AY 2012
The ILLiad/Aleph hybrid service did work; however, it was staff-intensive and inefficient. It simply was not a
good use of staff resources, particularly when the ILS included a ‘request’ feature that would provide a far more
efficient workflow and allow the library to extend service hours into the evening. The hybrid service was dictated
both by local policy and by the Aleph ILS shared by Notre Dame and other members of the Michiana Area Library
Consortium (MALC). [7] Because of the specific system configuration Notre Dame could offer the request function
either to everyone in MALC or to no one. As long as service was restricted to Notre Dame faculty, staff, and
graduate students the service would have to be supported through the hybrid approach. Making the decision to offer
the service to everyone, even with increased demand, would still be more efficient, faster, and cheaper.
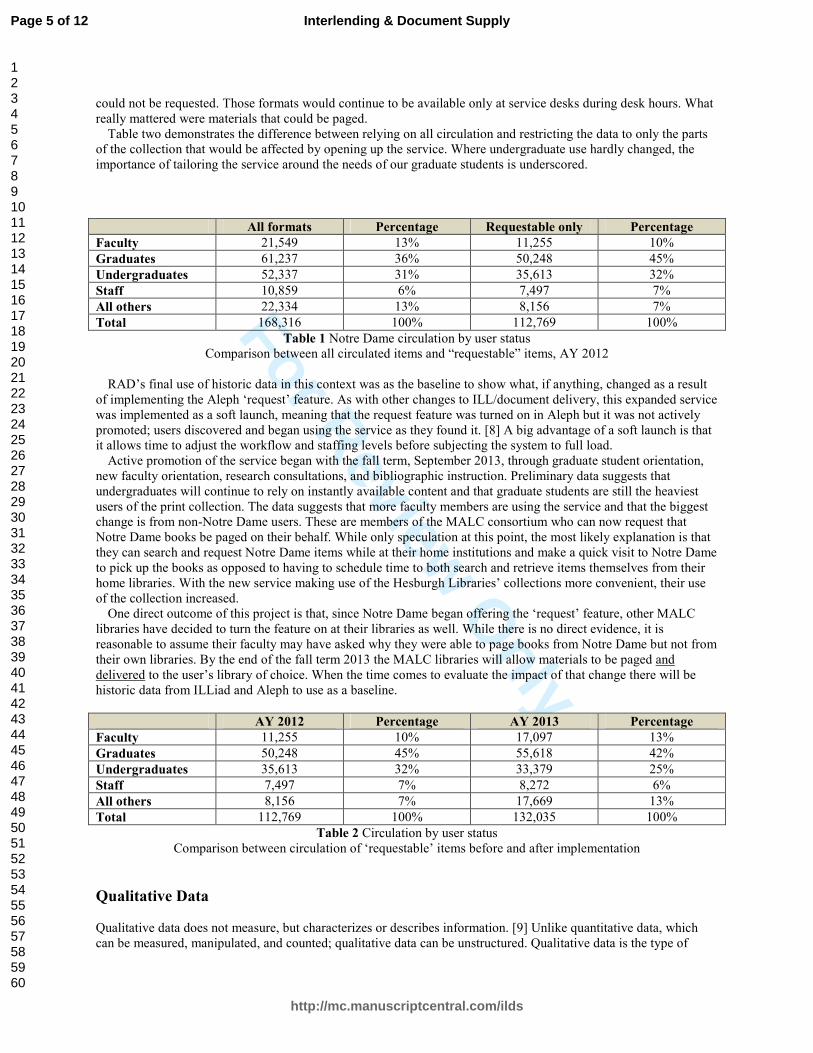
Another issue with historic data, or any data, is the need to understand what is included in the dataset. As stated
earlier, graduate students make the heaviest use of the print collection. Because faculty and staff have their books
sent to campus departments and those departments are closed weekends and evenings, the issue of after-hours
service was not relevant to those user groups. Table one demonstrates the difference between looking at all
circulation and limiting circulation to only the material that was “requestable”. Not all materials could be requested;
books on course reserves, audio-visual formats, microfilm, and a variety of realia such as microphones and laptops
0
100
200
300
400
500
600
700
Saturday Sunday
Requests placed
Checked Out
Page 4 of 12
http://mc.manuscriptcentral.com/ilds
Interlending & Document Supply
123456789101112131415161718192021222324252627282930313233343536373839404142434445464748495051525354555657585960
For Review O
nly
could not be requested. Those formats would continue to be available only at service desks during desk hours. What
really mattered were materials that could be paged.
Table two demonstrates the difference between relying on all circulation and restricting the data to only the parts
of the collection that would be affected by opening up the service. Where undergraduate use hardly changed, the
importance of tailoring the service around the needs of our graduate students is underscored.
All formats Percentage Requestable only Percentage
Faculty 21,549 13% 11,255 10%
Graduates 61,237 36% 50,248 45%
Undergraduates 52,337 31% 35,613 32%
Staff 10,859 6% 7,497 7%
All others 22,334 13% 8,156 7%
Total 168,316 100% 112,769 100%
Table 1 Notre Dame circulation by user status
Comparison between all circulated items and “requestable” items, AY 2012
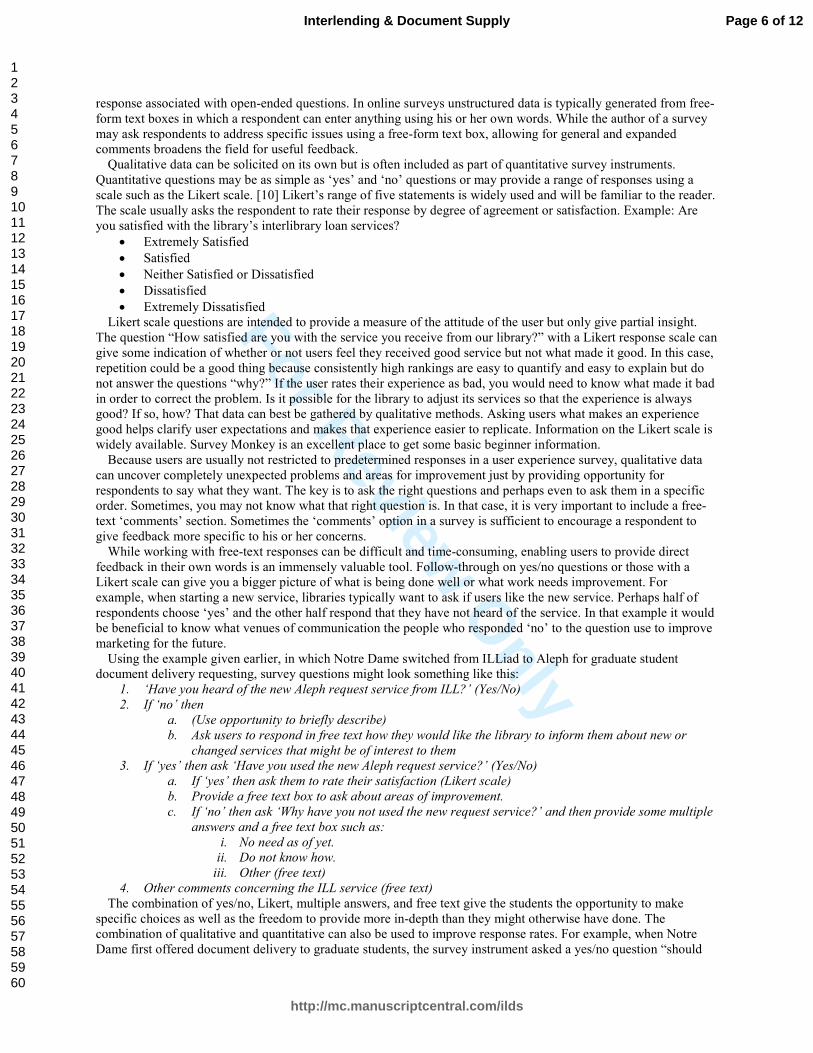
RAD’s final use of historic data in this context was as the baseline to show what, if anything, changed as a result
of implementing the Aleph ‘request’ feature. As with other changes to ILL/document delivery, this expanded service
was implemented as a soft launch, meaning that the request feature was turned on in Aleph but it was not actively
promoted; users discovered and began using the service as they found it. [8] A big advantage of a soft launch is that
it allows time to adjust the workflow and staffing levels before subjecting the system to full load.
Active promotion of the service began with the fall term, September 2013, through graduate student orientation,
new faculty orientation, research consultations, and bibliographic instruction. Preliminary data suggests that
undergraduates will continue to rely on instantly available content and that graduate students are still the heaviest
users of the print collection. The data suggests that more faculty members are using the service and that the biggest
change is from non-Notre Dame users. These are members of the MALC consortium who can now request that
Notre Dame books be paged on their behalf. While only speculation at this point, the most likely explanation is that
they can search and request Notre Dame items while at their home institutions and make a quick visit to Notre Dame
to pick up the books as opposed to having to schedule time to both search and retrieve items themselves from their
home libraries. With the new service making use of the Hesburgh Libraries’ collections more convenient, their use
of the collection increased.
One direct outcome of this project is that, since Notre Dame began offering the ‘request’ feature, other MALC
libraries have decided to turn the feature on at their libraries as well. While there is no direct evidence, it is
reasonable to assume their faculty may have asked why they were able to page books from Notre Dame but not from
their own libraries. By the end of the fall term 2013 the MALC libraries will allow materials to be paged and
delivered to the user’s library of choice. When the time comes to evaluate the impact of that change there will be
historic data from ILLiad and Aleph to use as a baseline.
AY 2012 Percentage AY 2013 Percentage
Faculty 11,255 10% 17,097 13%
Graduates 50,248 45% 55,618 42%
Undergraduates 35,613 32% 33,379 25%
Staff 7,497 7% 8,272 6%
All others 8,156 7% 17,669 13%
Total 112,769 100% 132,035 100%
Table 2 Circulation by user status
Comparison between circulation of ‘requestable’ items before and after implementation
Qualitative Data
Qualitative data does not measure, but characterizes or describes information. [9] Unlike quantitative data, which
can be measured, manipulated, and counted; qualitative data can be unstructured. Qualitative data is the type of
Page 5 of 12
http://mc.manuscriptcentral.com/ilds
Interlending & Document Supply
123456789101112131415161718192021222324252627282930313233343536373839404142434445464748495051525354555657585960
For Review O
nly
response associated with open-ended questions. In online surveys unstructured data is typically generated from free-
form text boxes in which a respondent can enter anything using his or her own words. While the author of a survey
may ask respondents to address specific issues using a free-form text box, allowing for general and expanded
comments broadens the field for useful feedback.
Qualitative data can be solicited on its own but is often included as part of quantitative survey instruments.
Quantitative questions may be as simple as ‘yes’ and ‘no’ questions or may provide a range of responses using a
scale such as the Likert scale. [10] Likert’s range of five statements is widely used and will be familiar to the reader.
The scale usually asks the respondent to rate their response by degree of agreement or satisfaction. Example: Are
you satisfied with the library’s interlibrary loan services?
• Extremely Satisfied
• Satisfied
• Neither Satisfied or Dissatisfied
• Dissatisfied
• Extremely Dissatisfied
Likert scale questions are intended to provide a measure of the attitude of the user but only give partial insight.
The question “How satisfied are you with the service you receive from our library?” with a Likert response scale can
give some indication of whether or not users feel they received good service but not what made it good. In this case,
repetition could be a good thing because consistently high rankings are easy to quantify and easy to explain but do
not answer the questions “why?” If the user rates their experience as bad, you would need to know what made it bad
in order to correct the problem. Is it possible for the library to adjust its services so that the experience is always
good? If so, how? That data can best be gathered by qualitative methods. Asking users what makes an experience
good helps clarify user expectations and makes that experience easier to replicate. Information on the Likert scale is
widely available. Survey Monkey is an excellent place to get some basic beginner information.
Because users are usually not restricted to predetermined responses in a user experience survey, qualitative data
can uncover completely unexpected problems and areas for improvement just by providing opportunity for
respondents to say what they want. The key is to ask the right questions and perhaps even to ask them in a specific
order. Sometimes, you may not know what that right question is. In that case, it is very important to include a free-
text ‘comments’ section. Sometimes the ‘comments’ option in a survey is sufficient to encourage a respondent to
give feedback more specific to his or her concerns.
While working with free-text responses can be difficult and time-consuming, enabling users to provide direct
feedback in their own words is an immensely valuable tool. Follow-through on yes/no questions or those with a
Likert scale can give you a bigger picture of what is being done well or what work needs improvement. For
example, when starting a new service, libraries typically want to ask if users like the new service. Perhaps half of
respondents choose ‘yes’ and the other half respond that they have not heard of the service. In that example it would
be beneficial to know what venues of communication the people who responded ‘no’ to the question use to improve
marketing for the future.
Using the example given earlier, in which Notre Dame switched from ILLiad to Aleph for graduate student
document delivery requesting, survey questions might look something like this:
1. ‘Have you heard of the new Aleph request service from ILL?’ (Yes/No)
2. If ‘no’ then
a. (Use opportunity to briefly describe)
b. Ask users to respond in free text how they would like the library to inform them about new or
changed services that might be of interest to them
3. If ‘yes’ then ask ‘Have you used the new Aleph request service?’ (Yes/No)
a. If ‘yes’ then ask them to rate their satisfaction (Likert scale)
b. Provide a free text box to ask about areas of improvement.
c. If ‘no’ then ask ‘Why have you not used the new request service?’ and then provide some multiple
answers and a free text box such as:
i. No need as of yet.
ii. Do not know how.
iii. Other (free text)
4. Other comments concerning the ILL service (free text)
The combination of yes/no, Likert, multiple answers, and free text give the students the opportunity to make
specific choices as well as the freedom to provide more in-depth than they might otherwise have done. The
combination of qualitative and quantitative can also be used to improve response rates. For example, when Notre
Dame first offered document delivery to graduate students, the survey instrument asked a yes/no question “should
Page 6 of 12
http://mc.manuscriptcentral.com/ilds
Interlending & Document Supply
123456789101112131415161718192021222324252627282930313233343536373839404142434445464748495051525354555657585960
For Review O
nly
the library continue to offer this service?” as well as a free text question “how can the service be improved?” Notre
Dame knew the graduate students wanted the service continued. The question about continuing the service was
included solely to encourage users to respond to the survey and to provide more detailed suggestions on how to
improve service.
Analyzing Qualitative Data: The Basics
Analyzing qualitative data does take longer than entering information into a spreadsheet and working a little bit of
numbers magic. Each text field needs to be read thoroughly and multiple times. These free-text responses are
referred to as “verbatims”. While verbatims can be used to emphasize a specific area in the analysis they aren’t
statistically useful in their raw form. Coding this data to help streamline the responses into specific categories helps
to better organize the data into intelligible and organized groupings. While time consuming, without that additional
step of coding and organizing it is difficult to impossible to present the findings and associated recommendations in
any meaningful fashion.
Because the range of responses and terms in free-text fields varies widely and in unpredictable ways, it is usually
necessary to do a preliminary analysis to identify the common themes and appropriate terms for coding. This step is
best done by one person to avoid duplication or omission of terms. The list of codes and categories should then be
shared so that everyone is coding the data the same way. Defining these codes is also helpful so that everyone has an
understanding of how and why these terms are used and in what way. In addition, each comment can be coded into
multiple categories, as needed. For example the comment: “I really like the ILL service but I get confused on the
web pages sometimes and how to complete a request with the library catalog” covers a lot of areas and would need
multiple codes or categories. One category could simply be ‘web pages’ and define this category by indicating that
any time the library web pages are mentioned this category is used. More granular distinctions can be made by using
additional codes or subgroups. The choice as to whether to create sub-groupings is dependent on several
considerations:
1. Purpose of the subcodes: Although it can be tempting to code at the most specific level possible it will add
time and complexity to the project. If the project will not use that level of detail it isn’t necessary to code to
that level.
2. Time and staff resources: Adding additional codes and subgroups will slow down the coding process and
increases the probability of errors because it requires that the coder make more, and more detailed,
judgment calls.
3. Number of respondents: A large number of responses will take longer to code and a small number of
responses makes it unnecessary. If you have a low response rate, there may be no need for going into such
fine detail. Interesting or particularly illustrative verbatims can be quoted in the report or presentation.
For those who still like numbers, in the long run, the results actually turn into quantitative data that can be used in
statements such as “Ten out of fifty respondents mentioned difficulty in navigating the web page” as well as using
this information in charts and graphs. In this example the data could be further analyzed by taking a closer look at
the verbatims to see if those ten respondents are saying the same thing about the web page. The Learning Store
provides a short but well laid out document that walks you step-by-step through the process of analyzing qualitative
data. [11]
Using Google to Share the Data with Colleagues
Google Docs, which fully switches to Google Drive in November 2013, is a wonderful (and free) tool to use when
working with a team on survey analysis for qualitative data. Not only can a group create its survey form in Google
Drive, the spreadsheet with responses can be read, shared and edited simultaneously. Up to 50 people can edit at one
time and the document itself can be shared with up to 200 people. Edits from the different contributors are in
different colors so it’s easy to tell where you are in the document when sharing with others. Google spreadsheets can
be downloaded into formats such as .xls, .pdf, .txt and .csv, to name a few, so there are many options for
manipulating data with software other than Google docs. [12]
Some potential issues with using Google are that if a survey participant does not hit the ‘submit’ button when
completing the survey, the answers are not recorded. Also, there is a limit of 20MB of data in total for Google
spreadsheets. If the survey is expected to gather a large number of responses or if it is a large survey with multiple
parts, it is best to find a different product that is more conducive to that type of survey analysis. For a more in-depth
analysis of large quantities of qualitative data, Wikipedia has a list of free and proprietary software that may better
Page 7 of 12
http://mc.manuscriptcentral.com/ilds
Interlending & Document Supply
123456789101112131415161718192021222324252627282930313233343536373839404142434445464748495051525354555657585960
For Review O
nly
assist the bigger projects. These resources may provide more flexibility and offer other tools within the software
such as content searching and linking tools for data analysis.
For interlibrary loan, choosing your survey sample and marketing the survey are not as challenging as you might
think. The challenge actually comes with getting users to read what you send them! Your ILL system probably
requires an email address as part of requesting or registering to use the service. To focus on just those users who are
actively using the service you could send emails to users who have used your services in the last year. This would
eliminate users who have graduated, retired, or changed jobs. However, if you feel that you are missing an
opportunity to include past users who, for whatever reason, have discontinued service, it might be a prime
opportunity to find out why, as well as remind them that your services are still available to them. Another technique
for advertising the survey or telling users about new services is to include flyers with the materials that you are
providing them. Other easy survey marketing options include advertising on your library web page and/or in campus
or community newsletters. Of course, probably the best method to ensure that users are aware of the survey is to tell
them verbally when you interact with them.
Sending out surveys and analyzing qualitative data is not easy. It can be time-consuming and tedious. Figuring out
the best way to communicate with users and get feedback is important in working toward continuous improvement.
Sometimes, though, if you want to know something, all you have to do is ask and those invested in your service will
certainly tell you!
A Combinatorial Approach
In some cases it takes a combinatorial approach to answer the question at hand. [13] For example, routine statistical
reporting can indicate an increase or decrease in the use of interlibrary loan. Especially if data is available from an
integrated library system (ILS) and/or ILL management system, additional use data may be able to identify where
the change is happening. Is the change happening across the board or is it in particular segments of your user base,
for example, in certain academic departments or disciplines (humanities vs. health sciences) and/or in particular user
statuses (faculty vs. students)? One caveat is that, while use data can narrow the focus of the next steps in analysis, it
cannot tell you why a service is seeing more or less use, nor can it tell you what, if anything, you might need or want
to do about it.
Emory’s experience shows how a variety of approaches and data sources can be useful for assessment. When
reviewing the Association of Research Libraries (ARL) Statistics for recent years [14], library leadership concluded
that the university’s ILL borrowing numbers and ranking were not where they “should be”. Follow-up discussion
revealed the perception that an institution of Emory’s caliber, with active and engaged research faculty and graduate
students, should have higher interlibrary borrowing numbers relative to other ARL libraries.
In response to leadership’s perception that Emory’s ILL borrowing was “out of line” with its peers, the main
library began a process called a “deep dive”, a concept popularized by Jack Welch. (Welch, 2001) [15] In this case
the deep dive involved going beyond the common metrics and basic survey instruments to uncover why ILL
borrowing levels were lower than leadership expected and, in fact, decreasing.
Emory first looked at standard ILL metrics such as fill rates and turnaround times. These performance measures
offered little insight into why ILL use would be “below normal” and decreasing. In fact, fill rates at most of Emory’s
libraries were high and stable and turnaround time was steadily improving at the same time that ILL use was
decreasing. In addition, ARL’s LibQual and Emory Libraries’ own survey data showed high levels of both
awareness and satisfaction among faculty and graduate students, historically the heaviest users of ILL services.
Still with no cogent explanation for the “outlying” ILL borrowing numbers, a closer look at ILLiad use data
revealed that the largest drop in use was at the Woodruff Main Library (WML). Further segmentation of WML ILL
users by school revealed that use was decreasing among researchers in the arts and sciences while use by researchers
in the health sciences was, if anything, trending slightly higher than in the past. With the scope of the deep dive
narrowed to WML’s traditional arts and sciences user base (which consistently reported high levels of awareness
and satisfaction with ILL), the focus shifted to identifying external factors and data sources that might help explain
lower than expected use of ILL:
• Stable materials budget? Based on ARL data, Emory’s materials budget had been relatively stable
compared to its peer institutions. While stable collection budgets and acquisitions could reduce the need for
ILL requesting, leadership was doubtful that WML’s physical collections were meeting Emory researchers
needs significantly better than other ARL libraries.
• Availability of online resources? Was the licensed content available to WML users meeting such a high
proportion of user needs that they didn’t feel the need to request more? Leadership thought this was
unlikely and data that might support further investigation was deemed too unreliable to pursue.
Page 8 of 12
http://mc.manuscriptcentral.com/ilds
Interlending & Document Supply
123456789101112131415161718192021222324252627282930313233343536373839404142434445464748495051525354555657585960
For Review O
nly
• Decreased number of faculty? The 2008 financial crisis resulted in reductions in force and/or increased
teaching time on the part of permanent faculty, especially in the college and graduate school. Could these
changes be having a significant impact on ILL use by faculty? Existing institutional data was identified that
promised to elucidate how much and where faculty numbers had changed. However, it turned out that the
readily available data did not distinguish between full- and part-time faculty, making meaningful
comparisons from year to year impossible. The library may pursue more reliable faculty data in the future
(expressed in FTEs, or full-time-equivalents).
• Fewer graduate students? Since graduate students tend to be the heaviest users of ILL, a post-2008 decrease
in the number graduate students, especially in key departments, could help explain a drop in ILL use. There
was anecdotal evidence of smaller cohorts of incoming graduate students, especially in the humanities.
However, the readily available institutional data for graduate students suffered from the same reliability
issues as the faculty data. Thus, the lack of FTE-based data for both faculty and students made any
suppositions about decreases in their numbers speculative at best.
• Decreased research? A reduction in grants or degrees awarded might also provide insight into decreased
ILL levels but research in the humanities and social sciences is not as heavily grant-driven as other
disciplines and data on the number of degrees granted in recent years was not conclusive.
The Voice of the Customer
Having mined available library, institutional and ARL data only to find it either inconclusive or unreliable, Emory
decided to use a Voice of the Customer (VoC) approach to understanding ILL customer requirements. [16] This
approach had been used successfully elsewhere in the library so there was VoC expertise within the organization to
draw upon. Based on previous VoC experience, they first attempted to gather ILL-related VoC data via focus
groups. However, they were unable to schedule sufficient numbers of faculty and or/graduate students for focus
groups in the desired timeframe. This experience demonstrates one of the drawbacks of focus groups, particularly in
an academic environment: during the term faculty and graduate students are busy with classes and/or administrative
duties and during breaks many are busy with research, often away from campus. It is possible to assemble focus
groups in an academic environment. However, it often requires tangible incentives, such as food, gift cards or a
chance to win something like an iPod. Libraries wishing to conduct focus groups will want to check institutional
policies and/or local regulations to ensure that remuneration is allowed and to plan ahead so that the funds for
incentives are built into the budget. Tax implications for the recipient should also be considered, since in some areas
a gift card is considered to be a cash payment and therefore taxable.
Subsequently, a change in senior library leadership at Emory resulted in a change in focus for the ILL deep dive.
The focus shifted from attempting to “explain” Emory’s ARL ILL borrowing numbers to exploring variations in
user expectations and needs by discipline and to using individual VoC interviews instead of focus groups. Interviews
have the advantage of not needing to coordinate the schedules of multiple people but lack the synergy of a focus
group. The good news is that data from well-conducted focus groups and interviews is considered equally reliable.
As with many research strategies, the advantages and disadvantages must be balanced with the time frame and
resources available. Since Emory had already identified faculty and graduate students in the arts and sciences as the
immediate focus for further assessment, interviewees were drawn from this pool. Health Sciences researchers were
not included in the initial round of interviews in large part because their ILL use is stable or increasing and also
because their needs and expectations are already known to be substantially different from those of traditional WML
users. These researchers will be the focus of future VoC research.
The VoC approach involves asking questions designed to encourage customers to think and talk in their own
terms about what they’re doing and what they need from your organization to do it better. In this case, the focus is
on faculty & graduate students doing academic research and how the library can help them be more successful in
this endeavor. In line with VoC principles, Emory developed the following general questions and follow-ups:
1. What do you do when you discover that items you need for your research are not available at Emory?
2. Have you found that this strategy is effective?
-- Were you able to obtain items in the format you needed?
--Were you able to get items in time?
3. What kinds of items have been the most challenging to get for your research?
-- Are there materials you were not able to get at all?
4. What do you wish for, in terms of being able to find and access materials needed for your research?
Page 9 of 12
http://mc.manuscriptcentral.com/ilds
Interlending & Document Supply
123456789101112131415161718192021222324252627282930313233343536373839404142434445464748495051525354555657585960
For Review O
nly
Note how the opening and follow-up questions incorporate descriptive language about what researchers do when
they run into obstacles in their research (like not being able to find needed items at Emory) and whether they are
satisfied with the option(s) they try to overcome the obstacles. Rather than using library jargon and limiting the
focus to a specific service (like ILL), open-ended questions and follow-ups encourage customers to discuss, in their
own terms, their thoughts, requirements and expectations for both library- and non-library-based solutions to their
research problems. As with open-ended survey questions, discussed earlier, the customer’s exact words (verbatims)
are critical to the process and, depending on the amount of data, require the same sort of coding and analysis to
reveal common themes. Thus far, Emory has only conducted a few ILL-focused VoC interviews so the amount of
data has not required extensive coding or analysis to identify themes.
As expected based on existing survey data, VoC interviewees did report using WML ILL services when they
needed items not held at Emory and being generally satisfied with the service they were receiving. The following
verbatims were typical for Q.2:
• ILL is faster than recalls. Electronic delivery is super-fast & wonderful – request one day and have it the
next. – Post Doc, Anthropology & Public Heath
• They are pretty fast. It really depends on the book…. They can find stuff that’s incredible and they can get
it relatively fast, sometimes it takes awhile. I’m completely impressed by them. – Professor, Chinese
History
Verbatims for Q.3, regarding items difficult or impossible to get included:
• Unpublished dissertations and theses [and] materials in vernacular languages since often they are
romanized incorrectly…. Also materials in European or Australian libraries that do not lend overseas. –
Grad Student, South Asian History
• Original sources, obviously, like archival sources, handwritten, 16th, 17th, 18th century, all sorts of
different countries – it’s just tough to get these things. – Professor, Chinese History
Not surprisingly, verbatims for Q.4, regarding interviewees’ wishes for finding and accessing materials, were
wide-ranging and highlighted a variety of areas for improvement, including, but by no means limited to, interlibrary
loan:
• Longer ILL loan periods, a more intuitive [library] website & better linking from DiscoverE [Emory’s
search & discovery interface] to ILLiad. – Post Doc, Anthropology & Public Health
• Sometimes images in journal articles aren’t good quality or are missing because they’re in the back of the
volume. It would be helpful to fix that problem so articles are right the first time. – Grad Student, Art
History
• Most of the ebooks . . . anything that has any kind of DRM, are just awful . . . . -- Professor, History
• The latest update to DiscoverE is annoying. I’m not sure about call number searching and status
information is often unclear or not up-to-date. – Grad Student, Art History
• I don’t like the keyword searching in DiscoverE…. You get large result sets even when searching for known
items. – Post Doc, Anthropology & Public Health
Emory’s WML ILL staff is already taking steps to address customer expectations for longer loan periods, better
linking between ILLiad and other library systems, and high-quality and complete images in scanned documents.
They have also forwarded verbatims regarding other library systems and services to appropriate colleagues for
follow-up. In addition, they will continue and expand their use of VoC interviews to various user subgroups,
including health sciences. The VoC process definitely enriches the perspective that ILL and other library staff can
gain from traditional library assessment approaches. With a VoC-enhanced understanding of their customer’s needs
and expectations, staff can more effectively plan, implement and improve the library systems and services our
customers require to succeed in their endeavors.
Conclusion
Interlibrary loan practitioners must become conversant in data collection and analysis in order to run effective,
efficient offices. “Does your data deliver” is an introduction to data-informed decision-making and should be
considered a starting point. Making good decisions and designing useful services rely on the quality, consistency,
and currency of the data but also on planning. Before beginning data collection it's important to ask good questions,
identify real problems and then determine what approach(es) is/are likely to help the most, always remembering that
data collection and analysis have costs. Even “free” sources require staff time; the effort should be in proportion to
the expected benefit and within the resources of the project. Do not limit yourself to only data that is already
available or easily collected from within the library. The larger institution will have data, such as the number of
graduate students by department, which could be critical to your analysis.
Page 10 of 12
http://mc.manuscriptcentral.com/ilds
Interlending & Document Supply
123456789101112131415161718192021222324252627282930313233343536373839404142434445464748495051525354555657585960
For Review O
nly
There are two dangers that were not discussed in this overview. The first is a reminder that this article is about
data-informed decisions, not data-driven. Services and policies should never be determined only by the numbers;
they must be shaped by a customer-focused philosophy of service. The second danger of data is that it is too easy to
impose your own expectations on it. Do not begin data analysis with an answer or a solution already in mind.
Assumptions and predetermined solutions result in wasted time and effort and, worst of all, fail to solve the real
problem at hand. Be prepared to listen and act on the story the data is telling you, even when it is not what you
expected to hear. In other words, listen to your customers.
Notes
1. Program details for “Does your Data Deliver” are available online at http://ala13.ala.org/node/10235.
2. The number of attendees at “Does your Data Deliver?” was announced at the STARS Executive Committee
meeting on Monday, July 1, 2013 at the ALA annual conference.
3. Nate Silver is a statistician whose blog, www.fivethirtyeight.com, has had an extremely high degree of
accuracy in predicting elections by applying techniques he developed for sports to politics.
4. In addition to increased productivity, taking on additional duties allowed RAD to successfully petition to
have the positions upgraded.
5. “Recall wars” result when two or more people engage in ongoing recalls for a single resource.
6. Late in summer 2013, after the ALA program, Notre Dame implemented remote circulation among all
members of the shared local system. Because books from other libraries cannot be checked out through a
kiosk, books ‘on hold’ are once again staff-served.
7. MALC, the Michiana Academic Library Consortium, consists of the Hesburgh Libraries at University of
Notre Dame and the libraries of Holy Cross College, Saint Mary’s College, and Bethel College. Michiana
is a combination of Michigan and Indiana, two states that share a long border.
8. Current users of ILL and document delivery were notified via email ahead of the change. Also, 950 faculty
members, graduate students, and staff members who had used either ILL or document delivery during the
current academic year were emailed two weeks prior to the change.
9. A definition of qualitative data can be found online in the Business Dictionary,
www.businessdictionary.com/definition/qualitative-data.html.
10. For more information on the Likert scale, see Survey Monkey’s “The Likert Scale Explained,”
www.surveymonkey.com/mp/likert-scale/. This site provides practical information on how to construct and
apply the scale in addition to a basic definition.
11. The Learning Store’s guide “Analyzing Qualitative Data” provides an introduction to the topic as well as a
step-by-step guide, http://learningstore.uwex.edu/assets/pdfs/g3658-12.pdf.
12. For more information on Google export conversions and charts, see “Overview of Google Sheets” at:
https://support.google.com/drive/answer/140784?ref_topic=20322&rd=1.
13. Brief definitions of “combinatorial” can be found online in The Free Dictionary,
www.thefreedictionary.com/. Apropos to the context of Emory’s deep dive, this kind of approach has also
been referred to as “an advanced way of finding a needle in a haystack”,
www.udel.edu/chem/C465/senior/fall00/DrugDiscovery/WhatisCombinatorialChemistry.htm.
14. ARL statistics can be found at http://publications.arl.org/ARL_Statistics.
15. The exact quote is “One of my favorite perks was picking out an issue and doing what I called a “deep
dive.” It’s spotting a challenge where you think you can make a difference—one that looks like it would be
fun—then throwing the weight of your position behind it.”
16. A brief description of the VoC process is available at
www.mit.edu/~hauser/Papers/Gaskin_Griffin_Hauser_et_al%20VOC%20Encyclopedia%202011.pdf. For a
complete and practical “how to” book on the VoC process, see Voices into choices: acting on the voice of
the customer by Gary Burchill and Christina Hepner Brodie for the Center for Quality Management,
Madison, WI, Joiner Associates, 1997.
Page 11 of 12
http://mc.manuscriptcentral.com/ilds
Interlending & Document Supply
123456789101112131415161718192021222324252627282930313233343536373839404142434445464748495051525354555657585960
For Review O
nly
References
Greene, D. (2013), “Nate Silver On His Move To ESPN, ABC”, NPR radio broadcast, 26 July, available at:
www.npr.org/templates/story/story.php?storyId=205695280 (accessed 5 August 2013).
Welch, J. and Byrne, J.A. (2001), Jack: straight from the gut, Warner Books, New York.
Page 12 of 12
http://mc.manuscriptcentral.com/ilds
Interlending & Document Supply
123456789101112131415161718192021222324252627282930313233343536373839404142434445464748495051525354555657585960
Copyright © 2022 FDOKUMEN