Does the continental United States have the weather to support large-scale wind and solar...
18
Does the con*nental United States have the weather to support largescale wind and solar deployment? 1 C. T. M. Clack, A. E. MacDonald, A. Alexander, A. Dunbar, Y. Xie, J. Wilczak AMS Annual Meeting, January 8
-
Upload
independent -
Category
Documents
-
view
4 -
download
0
Transcript of Does the continental United States have the weather to support large-scale wind and solar...
Does the con*nental United States have the weather to support large-‐scale wind and solar
deployment?
1
C. T. M. Clack, A. E. MacDonald, A. Alexander, A. Dunbar, Y. Xie, J. Wilczak
AMS Annual Meeting, January 8
Study Descrip*on
2
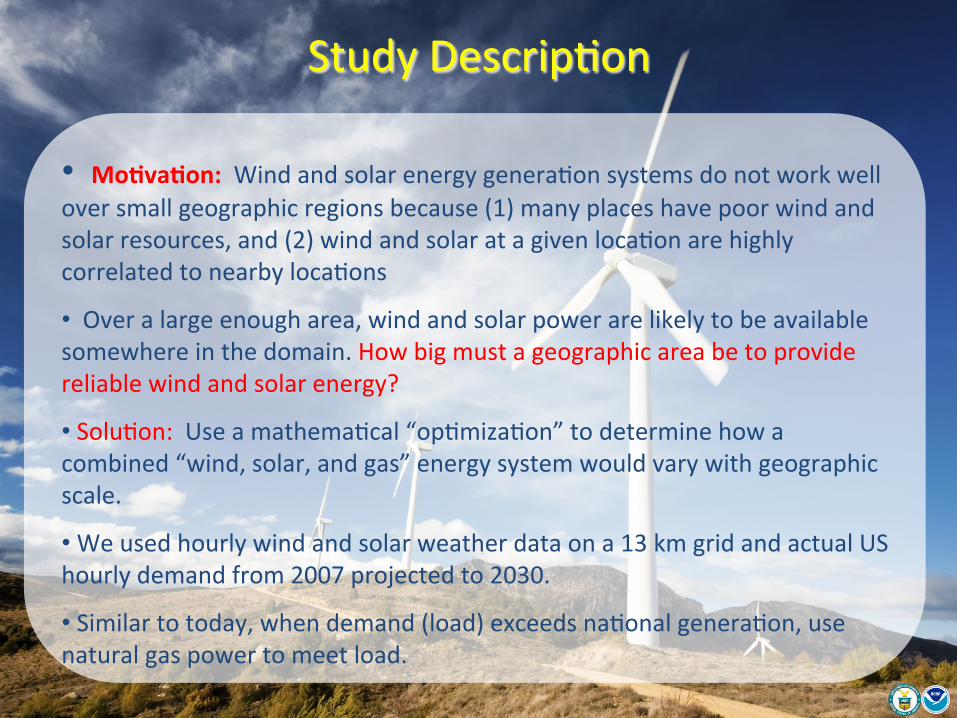
• Mo<va<on: Wind and solar energy genera*on systems do not work well over small geographic regions because (1) many places have poor wind and solar resources, and (2) wind and solar at a given loca*on are highly correlated to nearby loca*ons
• Over a large enough area, wind and solar power are likely to be available somewhere in the domain. How big must a geographic area be to provide reliable wind and solar energy?
• Solu*on: Use a mathema*cal “op*miza*on” to determine how a combined “wind, solar, and gas” energy system would vary with geographic scale.
• We used hourly wind and solar weather data on a 13 km grid and actual US hourly demand from 2007 projected to 2030.
• Similar to today, when demand (load) exceeds na*onal genera*on, use natural gas power to meet load.
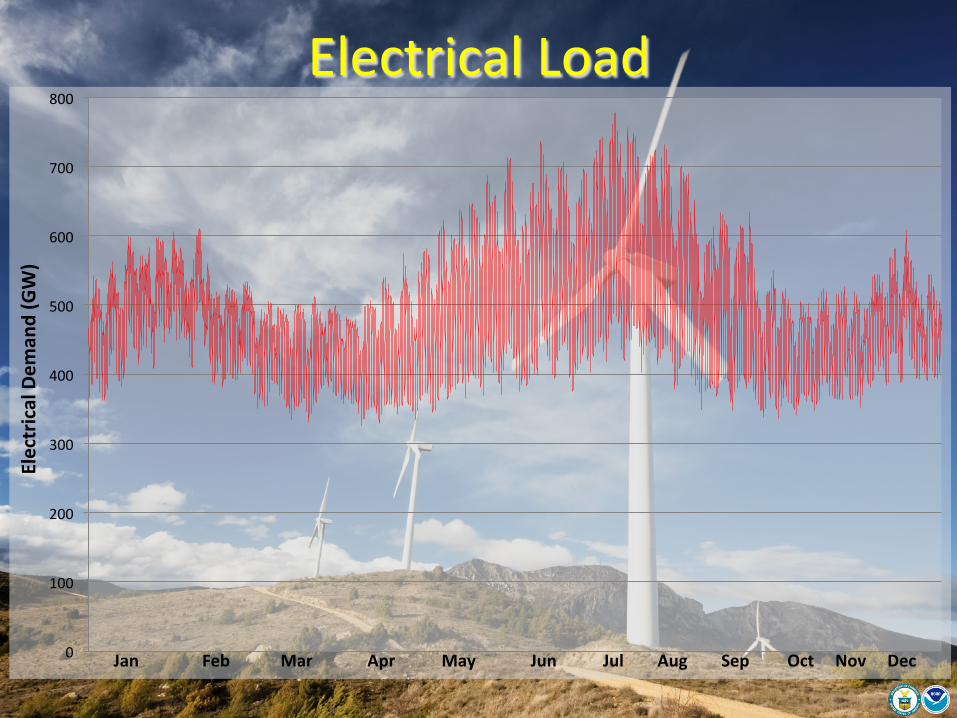
Electrical Load
3
0
100
200
300
400
500
600
700
800
Electrical Dem
and (GW)
Jan Feb Mar Apr May Jun Jul Aug Sep Oct Nov Dec

Average wind Capacity factor 2006-2008 Average solar Capacity factor 2006-2008
Classifica*on Maps
5
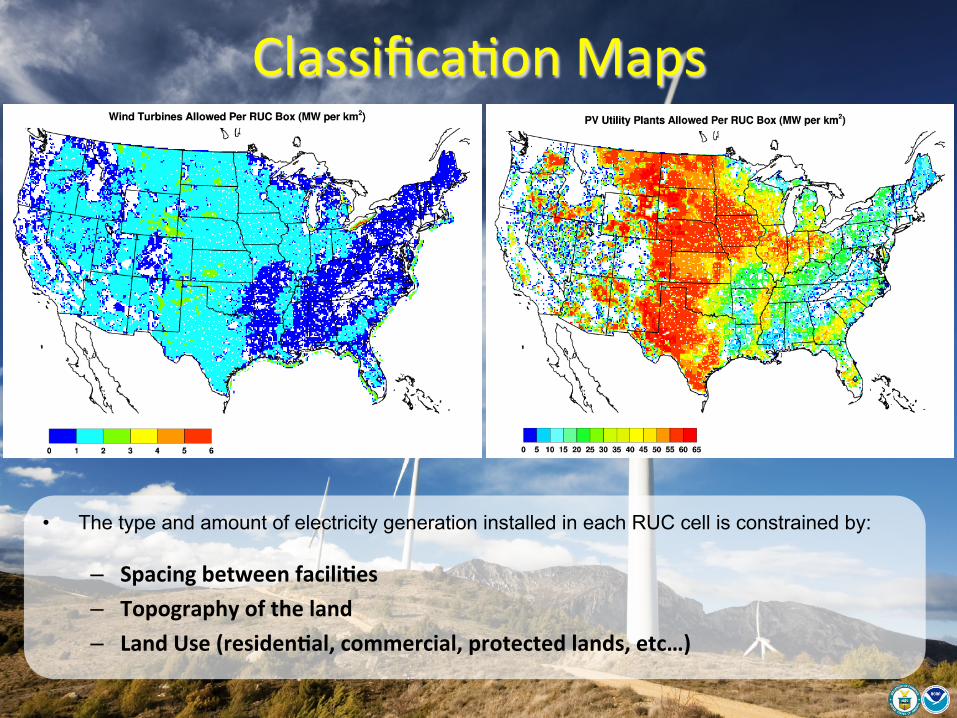
• The type and amount of electricity generation installed in each RUC cell is constrained by:
– Spacing between facili<es – Topography of the land – Land Use (residen<al, commercial, protected lands, etc…)
Price Parameter Space
6
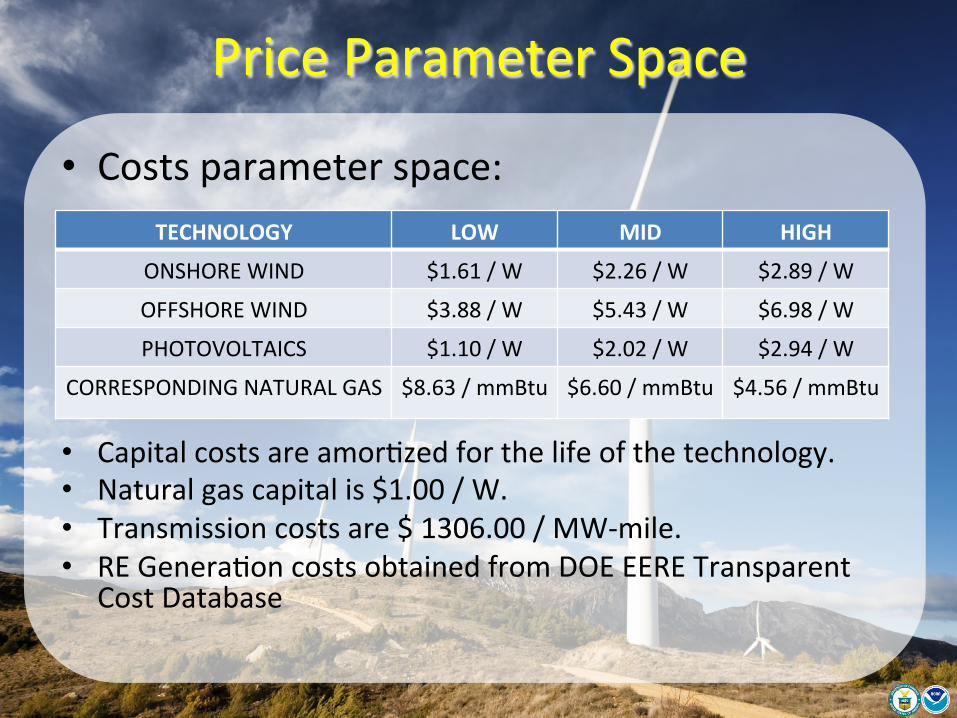
• Costs parameter space:
• Capital costs are amor*zed for the life of the technology. • Natural gas capital is $1.00 / W. • Transmission costs are $ 1306.00 / MW-‐mile. • RE Genera*on costs obtained from DOE EERE Transparent
Cost Database
TECHNOLOGY LOW MID HIGH
ONSHORE WIND $1.61 / W $2.26 / W $2.89 / W
OFFSHORE WIND $3.88 / W $5.43 / W $6.98 / W
PHOTOVOLTAICS $1.10 / W $2.02 / W $2.94 / W
CORRESPONDING NATURAL GAS $8.63 / mmBtu $6.60 / mmBtu $4.56 / mmBtu
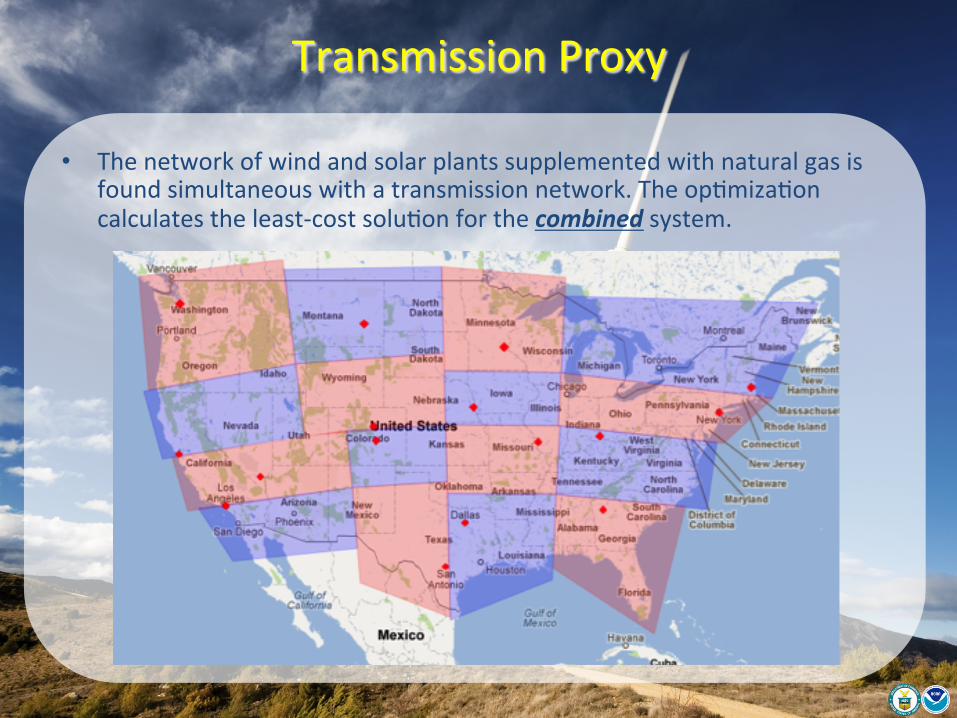
Transmission Proxy
7
• The network of wind and solar plants supplemented with natural gas is found simultaneous with a transmission network. The op*miza*on calculates the least-‐cost solu*on for the combined system.
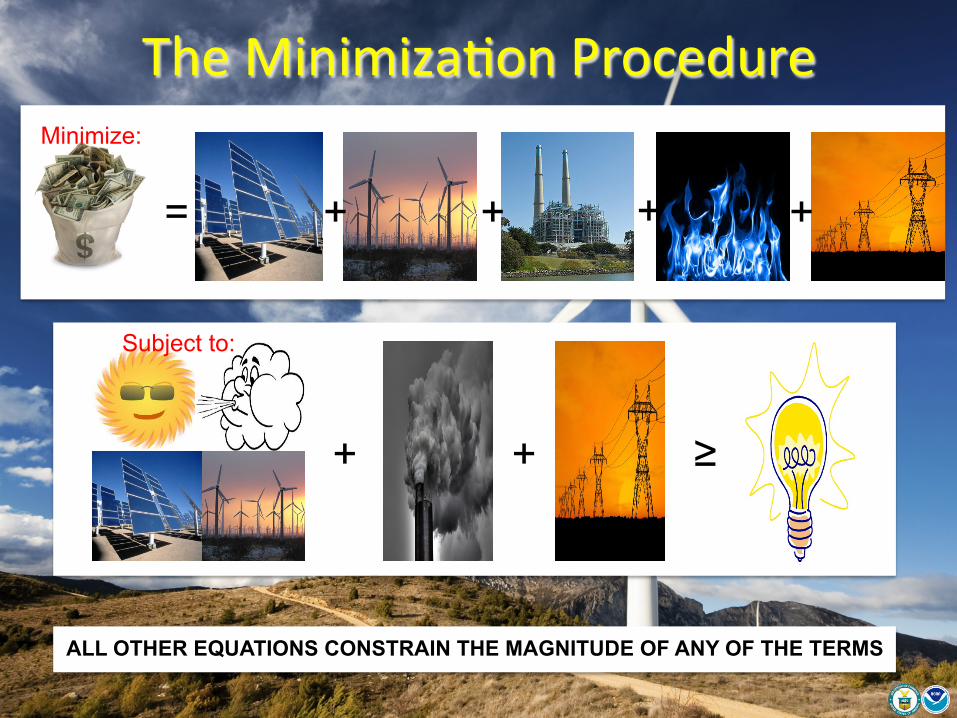
The Minimiza*on Procedure
8
= + + + +
+ + ≥
ALL OTHER EQUATIONS CONSTRAIN THE MAGNITUDE OF ANY OF THE TERMS
Minimize:
Subject to:
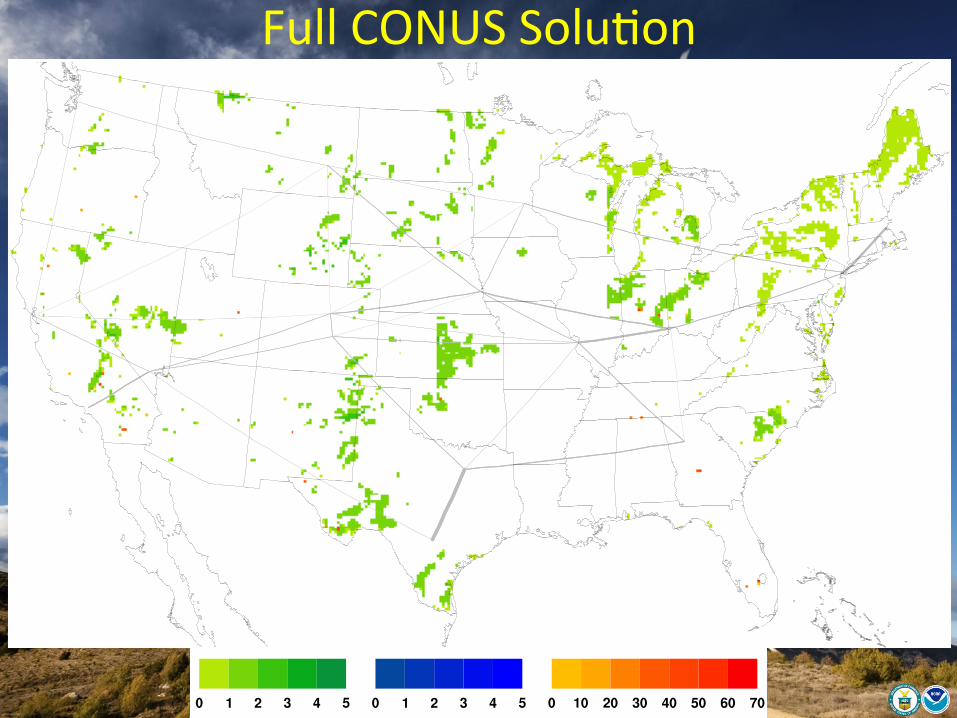
Full CONUS Solu*on
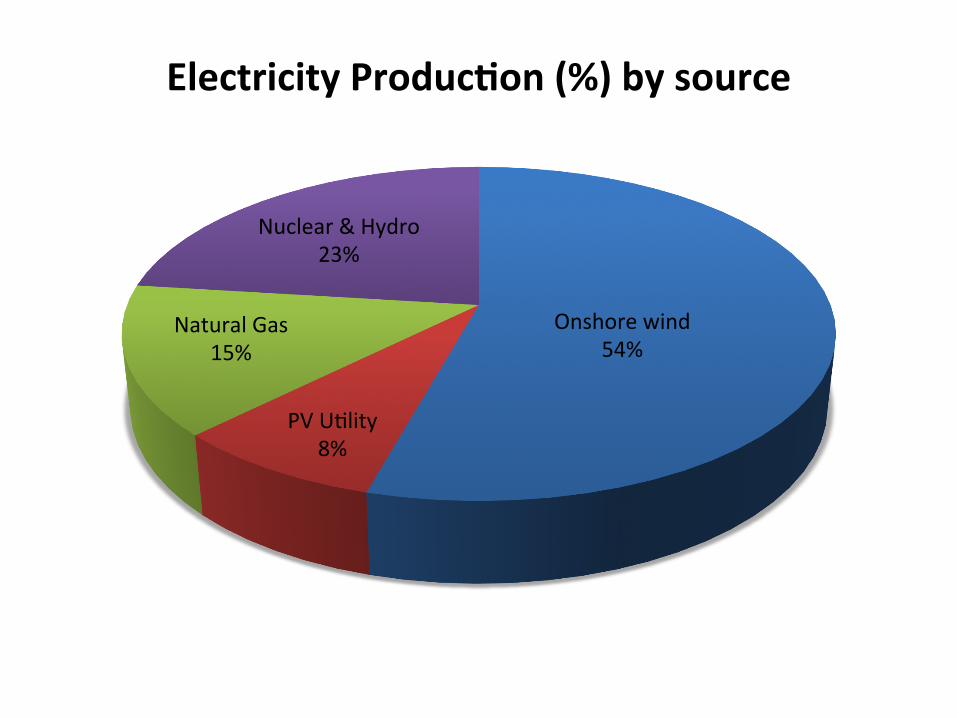
Onshore wind 54%
PV U*lity 8%
Natural Gas 15%
Nuclear & Hydro 23%
Electricity Produc<on (%) by source
Generation vs Load
0 50 100 150 200Time (Hrs)
0
200
400
600
800
Gen
erat
ion
/ Lo
ad (G
W)
Generation vs Load
0 50 100 150 200Time (Hrs)
0
200
400
600
800
Gen
erat
ion
/ Lo
ad (G
W)
Generation vs Load
0 50 100 150 200Time (Hrs)
0
200
400
600
800
Gen
erat
ion
/ Lo
ad (G
W)
Generation vs Load
0 50 100 150 200Time (Hrs)
0
200
400
600
800
Gen
erat
ion
/ Lo
ad (G
W)
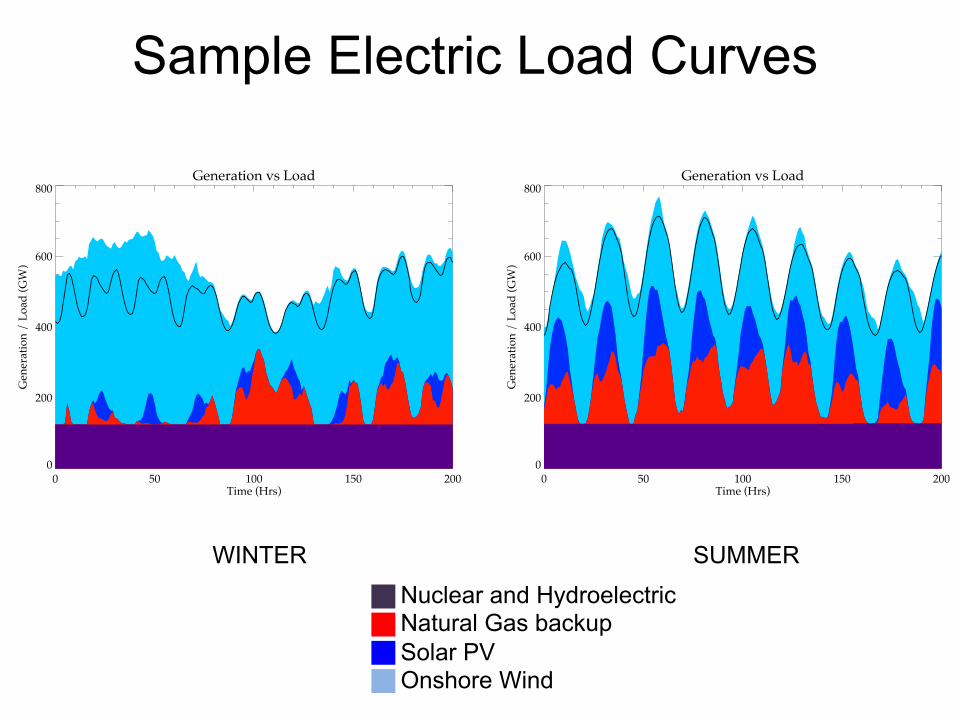
Figure 18: Electrical load and generation curves for 2007 low RE and high NG cost scenario.The top row is for the full 48 state solution and the bottom is for the 128 divisions. The leftcolumn is about a week in January and the right is about a week in July. Dark purple is thenuclear and hydro base load, dark blue is the PV, light blue is the wind and red is the naturalgas. The black line is the electrical demand.
scenario (right column). The different price scenarios are displayed to show the effect of priceon the supply and demand histogram. It can be seen that in general the curve has shifted to theleft of the solid black line (which denotes supply equals demand) showing more dependencyon natural gas over wind and solar. The same dependency is shown for smaller geographicscales, the top row is the full 48 state solution and it can be seen that there is a high numberof hours of the year where the demand is met, or exceeded, by the generation from wind andsolar. When the 128 divisions solution (bottom) row is observed it is clear that the curve hasmoved left and the histogram has tightened suggesting heavier reliance on natural gas base loadproduction. Indeed, it can be calculated from the histogram in Fig. (19) that in the low RE andhigh NG cost scenario for 2007 for over half the year the contiguous USA would be producingzero CO2 emissions from electricity production, while for the 128 divisions (a proxy for howdevelopment is proceeding today) only a small fraction of the time would that be true. Againsimilar traits exist for all the scenarios, but the exact figures change. Another interesting featureof the histograms shown in Fig. (19), is that the integral of the right-hand-side of the blackline is amount of energy curtailed, and the integral of the left-hand-side of the black line is theamount of energy supplied by the natural gas generation.
36
Sample Electric Load Curves
WINTER SUMMER
Nuclear and Hydroelectric Natural Gas backup Solar PV Onshore Wind
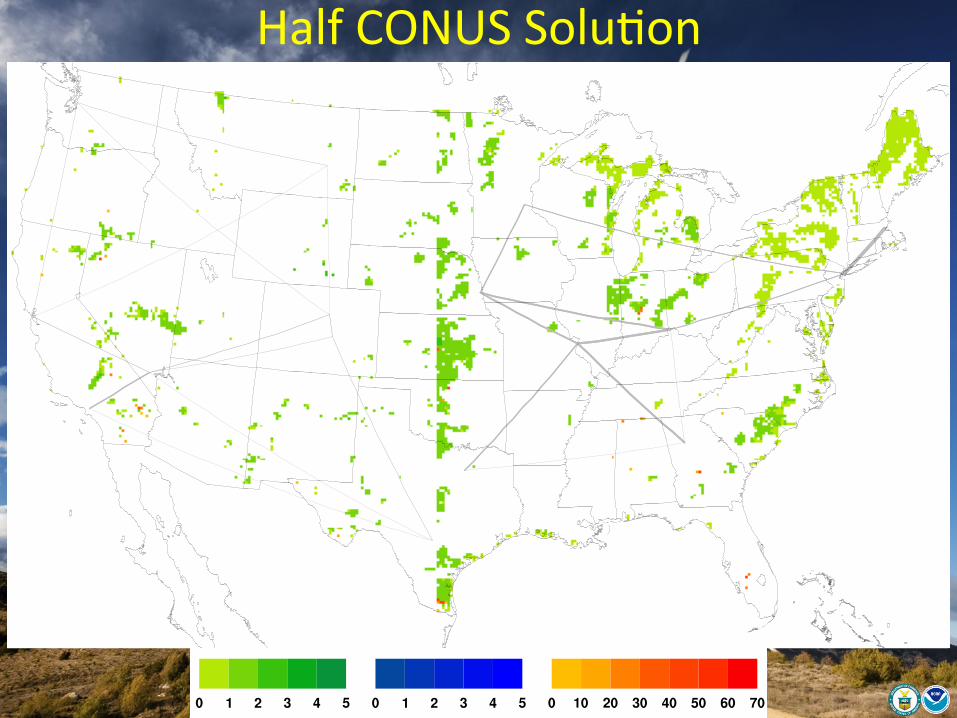
Half CONUS Solu*on
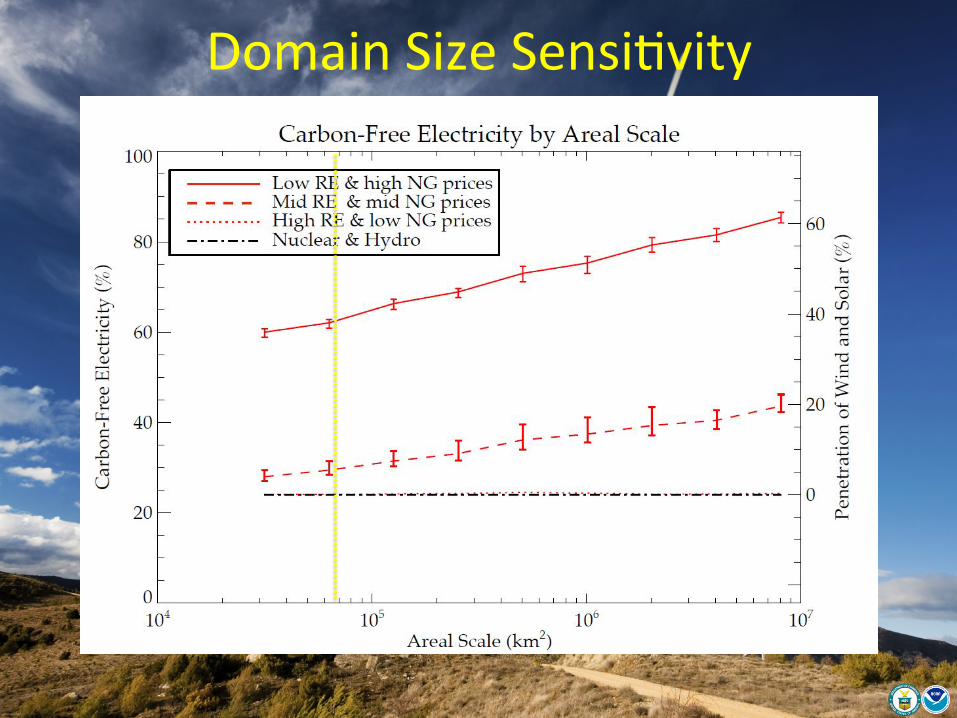
Domain Size Sensi*vity
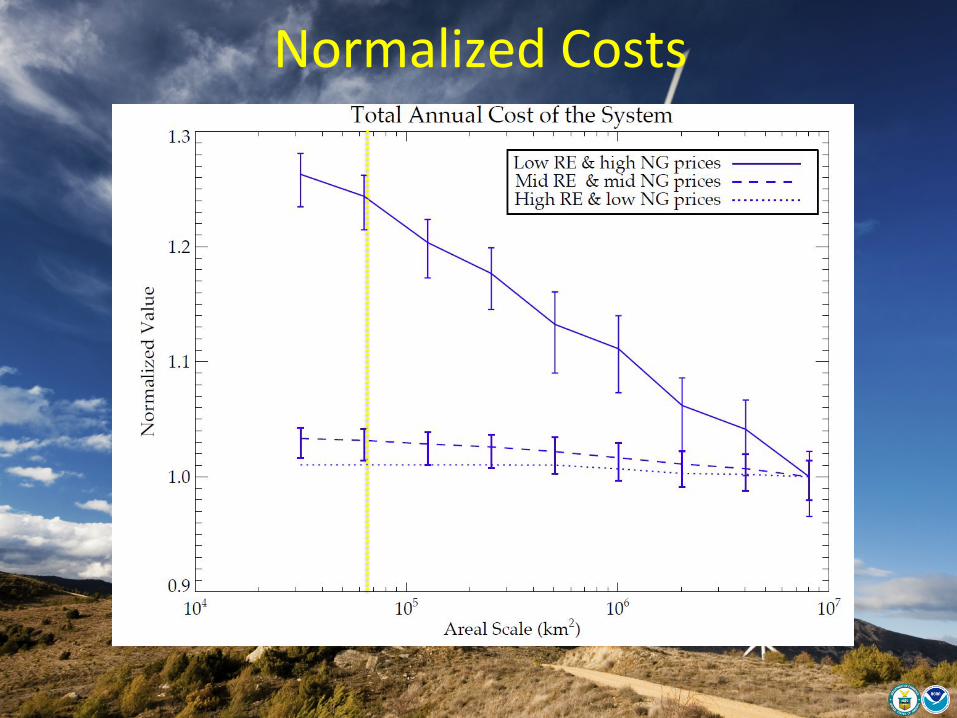
Normalized Costs
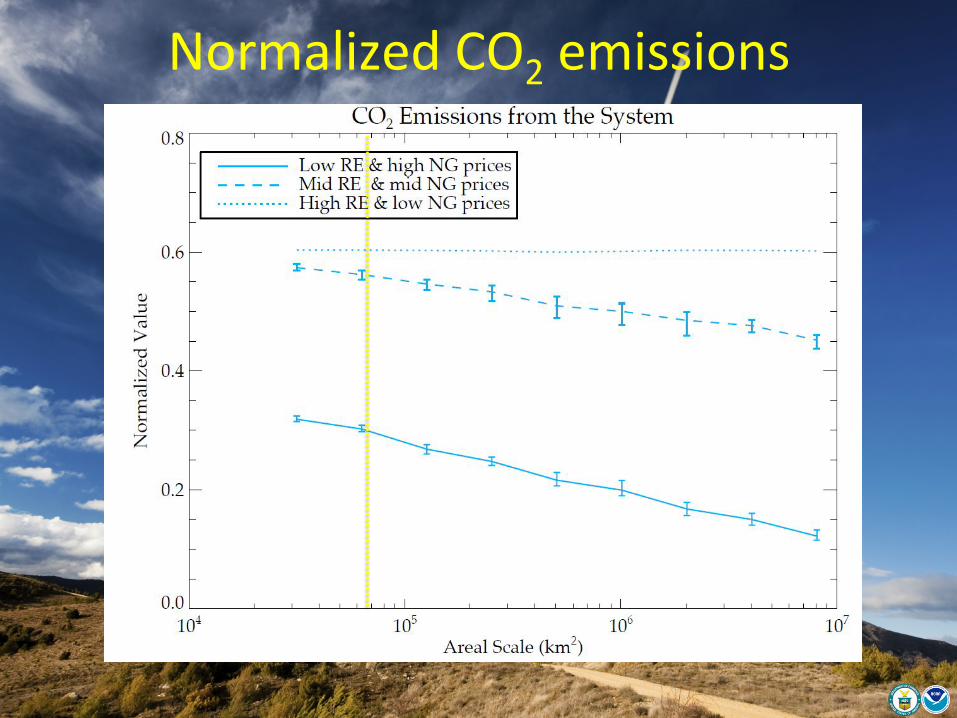
Normalized CO2 emissions
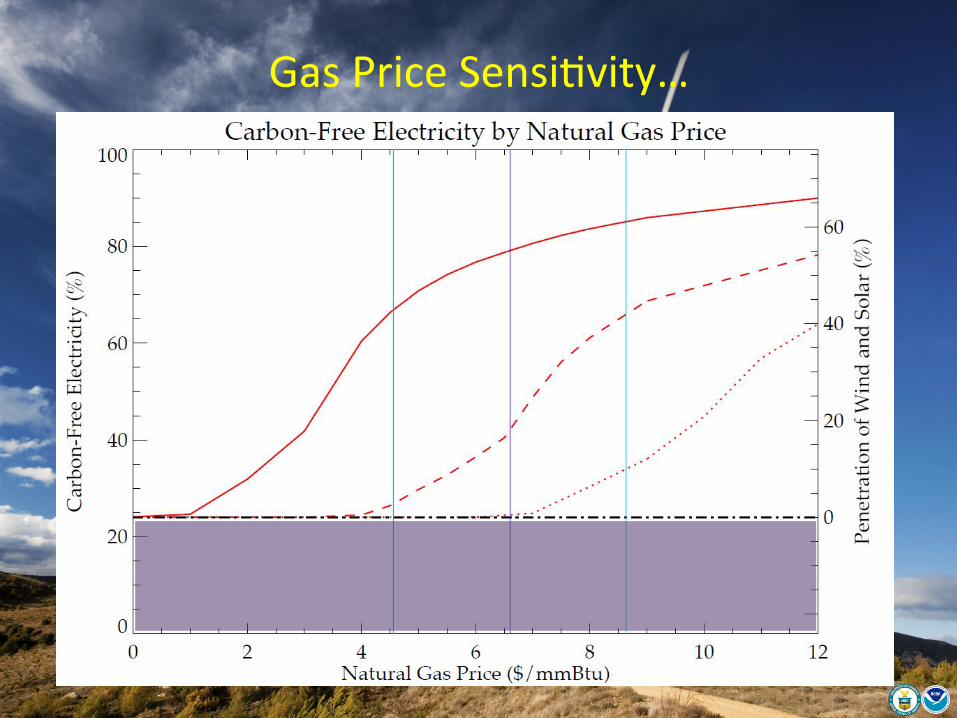
Gas Price Sensi*vity…
16
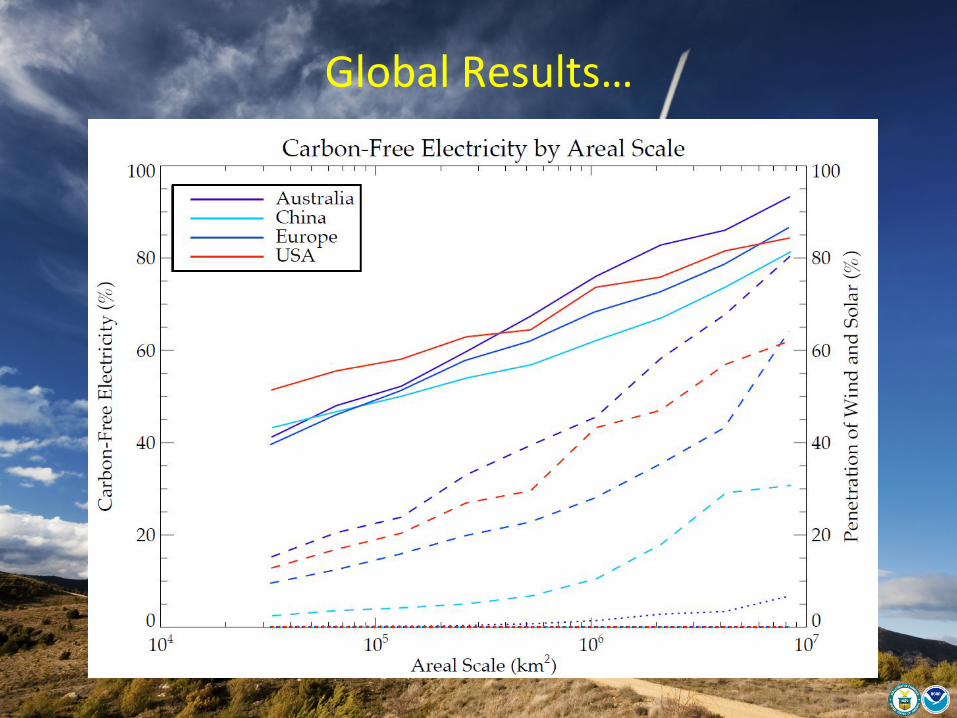
Global Results…
17
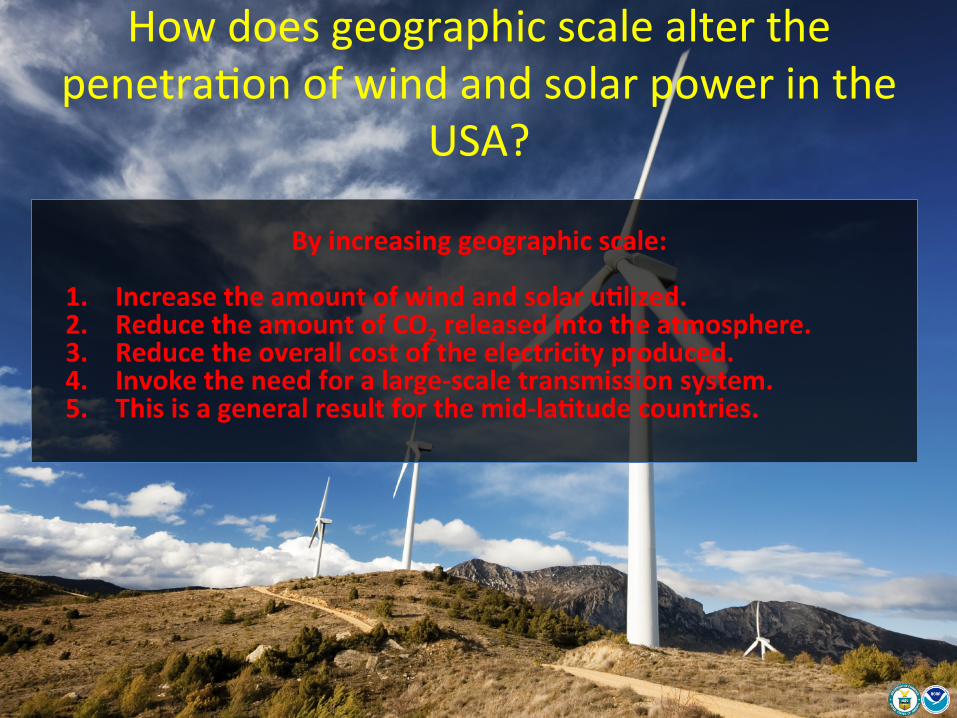
How does geographic scale alter the penetra*on of wind and solar power in the
USA?
18
By increasing geographic scale:
1. Increase the amount of wind and solar u<lized. 2. Reduce the amount of CO2 released into the atmosphere. 3. Reduce the overall cost of the electricity produced. 4. Invoke the need for a large-‐scale transmission system. 5. This is a general result for the mid-‐la<tude countries.