Lake trout in northern Lake Huron spawn on submerged drumlins

This article was downloaded by: [Universidad De Concepcion], [rodrigo Abarca-Del-Rio]On: 05 April 2012, At: 14:51Publisher: Taylor & FrancisInforma Ltd Registered in England and Wales Registered Number: 1072954 Registeredoffice: Mortimer House, 37-41 Mortimer Street, London W1T 3JH, UK
Remote Sensing LettersPublication details, including instructions for authors andsubscription information:http://www.tandfonline.com/loi/trsl20
Does Lake Titicaca still control theLake Poopó system water levels? Aninvestigation using satellite altimetryand MODIS data (2000–2009)Rodrigo Abarca-Del-Rio a , Jean-Francois CrÉtaux b , Muriel Berge-Nguyen b & Philippe Maisongrande ba Departamento de Geofisica (DGEO), Universidad de Concepción(UDEC), 160-C, Concepción, Chileb le Centre national d'études spatiales (CNES), Laboratoired'Etudes en Géophysique et Océanographie Spatiales (LEGOS),31400, Toulouse, France
Available online: 22 Mar 2012
To cite this article: Rodrigo Abarca-Del-Rio, Jean-Francois CrÉtaux, Muriel Berge-Nguyen & PhilippeMaisongrande (2012): Does Lake Titicaca still control the Lake Poopó system water levels? Aninvestigation using satellite altimetry and MODIS data (2000–2009), Remote Sensing Letters, 3:8,707-714
To link to this article: http://dx.doi.org/10.1080/01431161.2012.667884
PLEASE SCROLL DOWN FOR ARTICLE
Full terms and conditions of use: http://www.tandfonline.com/page/terms-and-conditions
This article may be used for research, teaching, and private study purposes. Anysubstantial or systematic reproduction, redistribution, reselling, loan, sub-licensing,systematic supply, or distribution in any form to anyone is expressly forbidden.
The publisher does not give any warranty express or implied or make any representationthat the contents will be complete or accurate or up to date. The accuracy of anyinstructions, formulae, and drug doses should be independently verified with primarysources. The publisher shall not be liable for any loss, actions, claims, proceedings,

demand, or costs or damages whatsoever or howsoever caused arising directly orindirectly in connection with or arising out of the use of this material.
Dow
nloa
ded
by [
Uni
vers
idad
De
Con
cepc
ion]
, [ro
drig
o A
barc
a-D
el-R
io]
at 1
4:51
05
Apr
il 20
12

Remote Sensing LettersVol. 3, No. 8, 20 December 2012, 707–714
Does Lake Titicaca still control the Lake Poopó system water levels? Aninvestigation using satellite altimetry and MODIS data (2000–2009)
RODRIGO ABARCA-DEL-RIO*†, JEAN-FRANCOIS CRÉTAUX‡, MURIELBERGE-NGUYEN‡ and PHILIPPE MAISONGRANDE‡
†Departamento de Geofisica (DGEO), Universidad de Concepción (UDEC), 160-CConcepción, Chile
‡le Centre national d’études spatiales (CNES), Laboratoire d’Etudes en Géophysique etOcéanographie Spatiales (LEGOS), 31400 Toulouse, France
(Received 27 July 2011; in final form 14 February 2012)
Complementary analysis of satellite mission data (altimetry, Moderate ResolutionImaging Spectroradiometers (MODIS)) and climate fields over 2000–2009 was con-ducted to investigate the variability of the water cover surfaces and the geographicalsource of water inflowing into the Lake Poopó system. The results suggest thatover the time span of 2000–2009 a great part of the variability of the Poopó systemoriginates from geographic sources other than Lake Titicaca. Possible alternativecauses include climate change inducing increased temperatures and greater evapo-ration rates along the Altiplano; increased glacier and snow melting over the AndesCordillera; and a potential increased anthropogenic water use (such as irrigation,minery, etc.) throughout the path of the Desaguadero River (which connects lakesTiticaca and Poopó). This change in the hydrology of this region could lead to acollapse of water supplies and endanger the already fragile Poopó system as well asthe regional socioeconomic system, which closely depends upon it.
1. Introduction
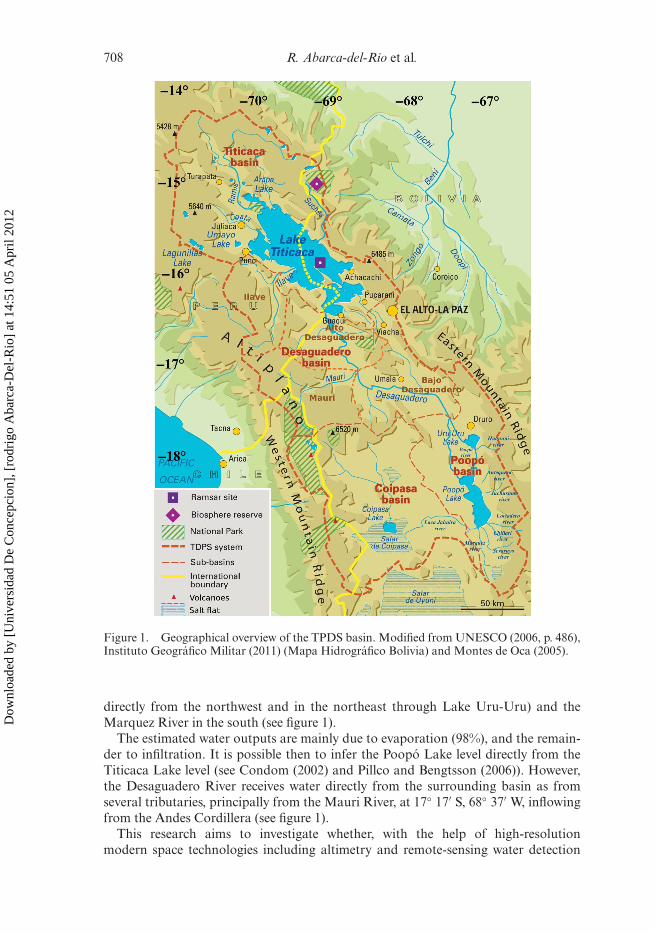
The Poopó Lake system is part of the Titicaca–Poopó–Desaguadero–Salar de Coipasa(TPDS) system (14◦ 03′–19◦ 53′ S, 71◦ 00′–66◦ 00′ W; see figure 1) located withinthe Altiplano (Montes de Oca 2005). Within the TPDS basin, there is a pronouncednorth–south (900–200 mm year−1) gradient in the yearly precipitation with the wetseason taking place from November to March and the dry season from mid-April toOctober (Garreaud et al. 2003).
The Poopó Lake system (17◦ 10′–19◦ 53′ S and 67◦ 50′–66◦ 24′ W, at 3686 m abovesea level (a.s.l.)) comprises two interconnected lakes, the Uru-Uru and the Poopó.Lake Poopó is remarkably shallow, with depths of only 0.5–2.5 m (see Pillco andBengtsson (2006)). It has a permanent central zone of around 1.4 m depth, encompass-ing about 1500 km2. The shallow zone is seasonally dependent on hydrologic rechargeduring the wet season, resulting in extents that vary from 1000 to 2000 km2.
Main water inputs are fluvial (80%). The remaining 20% comes directly into the lakefrom precipitation. The main source of fluvial inputs is the 436-km long DesaguaderoRiver which connects Lake Poopó with Lake Titicaca in the north (in two locations:
*Corresponding author. Email: [email protected]
Remote Sensing LettersISSN 2150-704X print/ISSN 2150-7058 online © 2012 Taylor & Francis
http://www.tandfonline.comhttp://dx.doi.org/10.1080/01431161.2012.667884
Dow
nloa
ded
by [
Uni
vers
idad
De
Con
cepc
ion]
, [ro
drig
o A
barc
a-D
el-R
io]
at 1
4:51
05
Apr
il 20
12
708 R. Abarca-del-Rio et al.
Figure 1. Geographical overview of the TPDS basin. Modified from UNESCO (2006, p. 486),Instituto Geográfico Militar (2011) (Mapa Hidrográfico Bolivia) and Montes de Oca (2005).
directly from the northwest and in the northeast through Lake Uru-Uru) and theMarquez River in the south (see figure 1).
The estimated water outputs are mainly due to evaporation (98%), and the remain-der to infiltration. It is possible then to infer the Poopó Lake level directly from theTiticaca Lake level (see Condom (2002) and Pillco and Bengtsson (2006)). However,the Desaguadero River receives water directly from the surrounding basin as fromseveral tributaries, principally from the Mauri River, at 17◦ 17′ S, 68◦ 37′ W, inflowingfrom the Andes Cordillera (see figure 1).
This research aims to investigate whether, with the help of high-resolutionmodern space technologies including altimetry and remote-sensing water detection
Dow
nloa
ded
by [
Uni
vers
idad
De
Con
cepc
ion]
, [ro
drig
o A
barc
a-D
el-R
io]
at 1
4:51
05
Apr
il 20
12
Lakes Titicaca and Poopó water levels from space techniques 709
technologies, it is possible to monitor the geographic source of the actual water inputsinto the Lake Poopó system.
2. Data and methodology
2.1 Data
The water height variations of Lake Titicaca were calculated from the radar altimetrydata of different satellites: Topex/Poseidon (T/P) from August 2005 to August 2008(interleaved orbit); Geosat Follow On (GFO) from February 2000 to August 2008; andEnvisat from October 2002 to October 2009. It has been demonstrated that the radaraltimeters have the capability to measure water level every 10–35 days (dependingon the orbital repeatability) over continental water bodies, including lakes (Crétauxand Birkett 2006). For large lakes such as Titicaca, the accuracy can be within a fewcentimetres, due to the possibility of averaging a large number of measurements fromdifferent missions. A monthly time series of water height variations of Lake Titicacais presented here. The surface of reference is the geoid GGM02C. More details onaltimetry data processing are given in Crétaux et al. (2010).
Unfortunately, the radar altimeter satellite tracks cover only the western side of theshallow parts of Lake Poopó, which is only intermittently covered by water. It is, there-fore, not possible to estimate Lake Poopó levels from space altimetry. Since previouswork has correlated the dimensions of Lake Poopó with its depth in a relatively lin-ear fashion (Pillco and Bengtsson 2006, 2007), we calculated the water-covered areafrom an analysis of Terra Moderate Resolution Imaging Spectroradiometer (MODIS)images. To monitor the temporal variations of water surface area, we classified 8-dayMODIS mosaics by estimating a maximum threshold value for open water. Fromairborne campaign and field measurements in floodplains of central Australia, athreshold value of surface reflectance in band 5 was validated (see Crétaux et al.(2011)).
Daily (1◦ × 1◦) precipitation fields were obtained from the Global PrecipitationClimatology Project (GPCP) (Huffman et al. 2007). Finally, all the data (time seriesand precipitation fields) were averaged linearly to monthly resolution.
2.2 Methodology
We first compare time series of monthly Lake Titicaca level with the monthly surfacearea covered by waters over Lake Poopó (figure 2(a)). This graph shows common fea-tures, as well as differences between the time series from lakes Poopó and Titicaca. It ispossible to infer the geographic origin of the water which gives rise to Lake Poopó vari-ations by comparing the Poopó surface area time series with the information derivedfrom the precipitation-gridded field. Thus, we construct associated local lake levels (orsoil moisture storage) from the daily 1◦ × 1◦ GPCP precipitation field over each 1◦ ×1◦ grid of the TPDS basin (14◦ 30′–20◦ 30′ S and 70◦ 30′–66◦ 30′ W). These are calledprecipitation-derived local lake level (hereinafter PRdLL). The associated local lakelevel grids are computed by the local accumulated daily precipitation (i.e. a consecu-tive daily sum from 2000 to 2009), which is then detrended. This assumes that withinthe TPDS, locally (over each 1◦ × 1◦ grid) the variance of precipitation is greater thanthat of evaporation. Analysis of water budget climatology (Willmott et al. 1985) overthe TPDS confirms this. Thus, as an example, over the Titicaca basin, precipitationand evaporation monthly variance is around 80 and 10 mm, respectively, and around
Dow
nloa
ded
by [
Uni
vers
idad
De
Con
cepc
ion]
, [ro
drig
o A
barc
a-D
el-R
io]
at 1
4:51
05
Apr
il 20
12

710 R. Abarca-del-Rio et al.
20003809
400
200
0
−200
−400
1.0
0.5
0.0
−0.5
−1.0
3810
3811
3812
2001
(a)
(b)
(c)
La
ke leve
l (m
)P
Rd
LL
(m
m)
La
ke leve
l (m
)
La
ke s
urf
ace
are
a (
km
2)
La
ke s
urf
ace
are
a (
km
2)
2002 2003 2004
Titicaca Lake level
Titicaca Lake level trend
Titicaca basinMaury basinPoopó basin
Annual Titicaca Lake level
Modulation annual Titicaca Lake level
Annual Poopó Lake surface area
Modulation annual Poopó Lake surface area
Poopó Lake surface areaPoopó Lake surface area trend
2005 2006 2007 2008 2009 2010
2000 2001 2002 2003 2004 2005 2006 2007 2008 2009 2010
2000 2001 2002 2003 2004 2005 2006
Year
2007 2008 2009 2010
3000
2500
2000
1500
1000
500
1000
500
0
−500
−1000
0
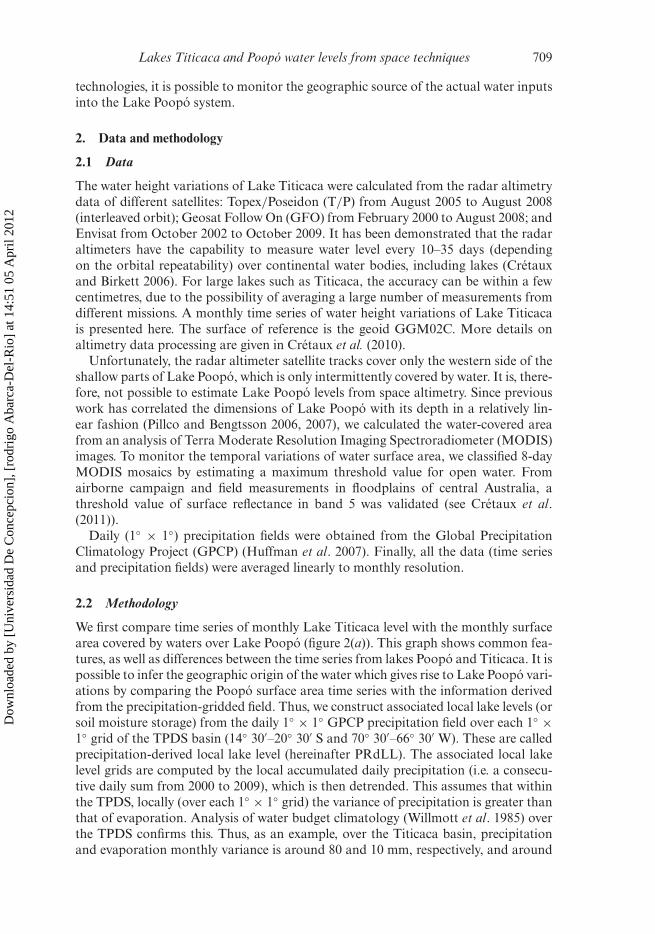
Figure 2. Comparison of time series. (a) Monthly Poopó surface area (km2) in blue andmonthly Lake Titicaca level (m) in red. Estimated trend for different epochs plotted in cyanand brown lines, respectively. (b) Monthly precipitation-derived local lake level (PRdLL) timeseries (mm) over the Titicaca basin (15◦ 30′ S, 69◦ 30′ W, see area labelled as ‘A’ in figure 3(a))in red, the Maury basin (17◦ 30′ S, 69◦ 30′ W, see area labelled as ‘B’ in figure 3(a)) in cyanand the Poopó basin (19◦ 30′ S, 66◦ 30′ W, see area labelled as ‘C’ in figure 3(a)) in blue. (c)Annual signal of monthly Poopó surface area (blue) (km2) and monthly Lake Titicaca levels(m) in red. Amplitude modulation of the annual signal is displayed as solid cyan and orangelines, respectively.
50 and 20 mm, respectively, over the Poopó basin. Estimates of evaporation from LakePoopó itself, if compared with the variance of the inflowing water, also present littlevariance (Pillco and Bengtsson 2006). This is also the case for Lake Titicaca (Delclauxet al. 2007).
A gridded field of PRdLL time series over 2000–2009 was constructed. Here, wemainly focused on the localization of variations of the PRdLL time series (comparedwith Lake Poopó’s surface area) rather than on a perfect water budget. To visually con-firm the main similarities between different locations within the TPDS and the time
Dow
nloa
ded
by [
Uni
vers
idad
De
Con
cepc
ion]
, [ro
drig
o A
barc
a-D
el-R
io]
at 1
4:51
05
Apr
il 20
12
Lakes Titicaca and Poopó water levels from space techniques 711
−70°−20°
−19°
−18°
−17°
−16°
−15°
−69° −68° −67° −66° −70° −69° −68° −67° −66°Longitude
(a) (b)1.0
0.8
0.6
0.4
0.2
0.0
1.0
0.8
0.6
0.4
0.2
0.0
Longitude
La
titu
de
−20°
−19°
−18°
−17°
−16°
−15°
La
titu
de
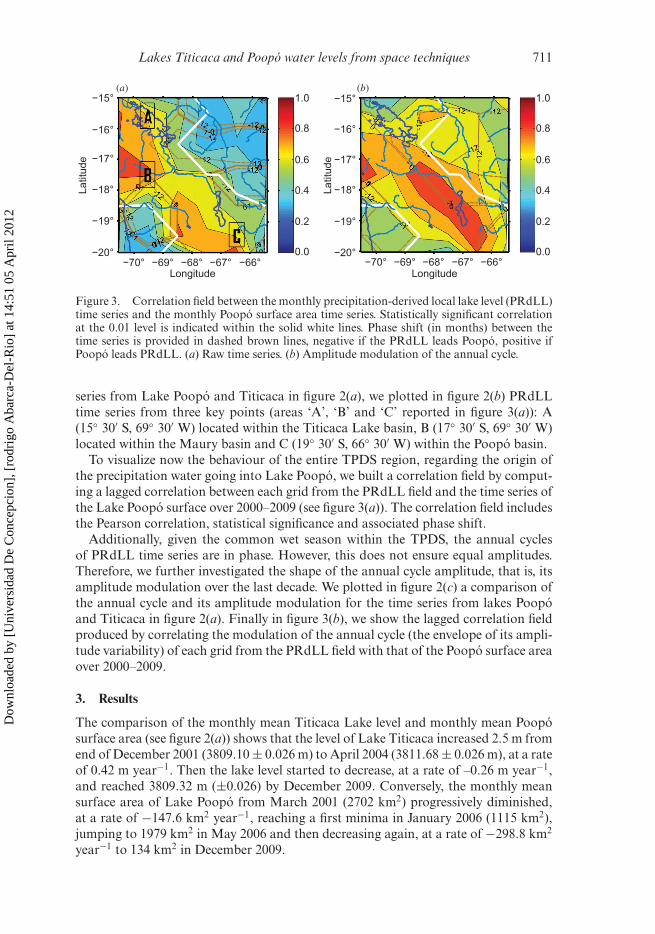
Figure 3. Correlation field between the monthly precipitation-derived local lake level (PRdLL)time series and the monthly Poopó surface area time series. Statistically significant correlationat the 0.01 level is indicated within the solid white lines. Phase shift (in months) between thetime series is provided in dashed brown lines, negative if the PRdLL leads Poopó, positive ifPoopó leads PRdLL. (a) Raw time series. (b) Amplitude modulation of the annual cycle.
series from Lake Poopó and Titicaca in figure 2(a), we plotted in figure 2(b) PRdLLtime series from three key points (areas ‘A’, ‘B’ and ‘C’ reported in figure 3(a)): A(15◦ 30′ S, 69◦ 30′ W) located within the Titicaca Lake basin, B (17◦ 30′ S, 69◦ 30′ W)located within the Maury basin and C (19◦ 30′ S, 66◦ 30′ W) within the Poopó basin.
To visualize now the behaviour of the entire TPDS region, regarding the origin ofthe precipitation water going into Lake Poopó, we built a correlation field by comput-ing a lagged correlation between each grid from the PRdLL field and the time series ofthe Lake Poopó surface over 2000–2009 (see figure 3(a)). The correlation field includesthe Pearson correlation, statistical significance and associated phase shift.
Additionally, given the common wet season within the TPDS, the annual cyclesof PRdLL time series are in phase. However, this does not ensure equal amplitudes.Therefore, we further investigated the shape of the annual cycle amplitude, that is, itsamplitude modulation over the last decade. We plotted in figure 2(c) a comparison ofthe annual cycle and its amplitude modulation for the time series from lakes Poopóand Titicaca in figure 2(a). Finally in figure 3(b), we show the lagged correlation fieldproduced by correlating the modulation of the annual cycle (the envelope of its ampli-tude variability) of each grid from the PRdLL field with that of the Poopó surface areaover 2000–2009.
3. Results
The comparison of the monthly mean Titicaca Lake level and monthly mean Poopósurface area (see figure 2(a)) shows that the level of Lake Titicaca increased 2.5 m fromend of December 2001 (3809.10 ± 0.026 m) to April 2004 (3811.68 ± 0.026 m), at a rateof 0.42 m year−1. Then the lake level started to decrease, at a rate of –0.26 m year−1,and reached 3809.32 m (±0.026) by December 2009. Conversely, the monthly meansurface area of Lake Poopó from March 2001 (2702 km2) progressively diminished,at a rate of −147.6 km2 year−1, reaching a first minima in January 2006 (1115 km2),jumping to 1979 km2 in May 2006 and then decreasing again, at a rate of −298.8 km2
year−1 to 134 km2 in December 2009.
Dow
nloa
ded
by [
Uni
vers
idad
De
Con
cepc
ion]
, [ro
drig
o A
barc
a-D
el-R
io]
at 1
4:51
05
Apr
il 20
12
712 R. Abarca-del-Rio et al.
The correlation coefficient between the monthly time series in figure 2(a) is 0.66 (at0-month lag). If we retain only the seasonal time scales (by filtering out low frequenciesgreater than 1/1.5 year−1), the correlation jumps to 0.80 (at 0-month lag). Conversely,if only lower frequencies (greater than 1/1.5 year−1) are retained, the correlationdecreases to 0.62 (Poopó leads by 1 month). Thus, there is an evident dichotomybetween lower frequency variations in Poopó and Titicaca.
The analysis of the PRdLL field and Poopó surface area correlation field (figure3(a)) shows that higher correlations (and most at 0-month lag) are found over thewestern side, within the Maury basin. It is also found over the centre of the TPDSbasin, within the Bajo Desaguadero basin, following the Desaguadero River afterits connection with the Maury and to the south east over the Poopó basin itself.Interestingly, high correlations are also found within the Coipasa basin, whose watersindeed are not part of the waters flowing into Lake Poopó.
To visualize and confirm the correlation field found in figure 2(b), three time seriesof the PRdLL are represented. The first (red) over the Lake Titicaca basin (area ‘A’ infigure 3(a)), in which a consistent relationship with the Lake Titicaca level time series(see figure 2(a), also red) is visually evident, as confirmed by the correlation (0.91 at0-month lag). The second (solid cyan) over the Maury basin (area ‘B’ in figure 3(a))and third (solid blue) over the Poopó basin (area ‘C’ in figure 3(a)) also show a reliableassociation with the Lake Poopó surface area time series (see figure 2(a), also blue).It is confirmed by their respective correlations (0.81 and 0.71, both at 0-month lag)with the Lake Poopó time series. Conversely their respective (B and C) correlationswith Lake Titicaca time series (in figure 2(a)) are 0.61 (Titicaca led by 12 months) and0.59 (at 0-month lag).
The analysis of figure 2(c) shows that although both time series’ annual cycles arein phase (correlation is 0.86 at 0-month lag), their annual amplitude modulation isquite different (correlation 0.56, Titicaca led by 6 months). Analysis of the correlationfield (figure 3(b)) demonstrates that the reason concerns the geographic source of thisvariability. Again, the main source of the variability of the modulation arises herewithin the Maury basin and also within the Desaguadero and Poopó basins and notnecessarily solely within the Titicaca basin.
4. Discussion and conclusion
The analysis performed here suggests that, over the period 2000–2009, the variabi-lity of Lake Poopó is influenced by a number of sources, besides Lake Titicaca.Comparative analysis of water surface area of the levels of Lake Poopó and LakeTiticaca shows a lack of agreement at seasonal (amplitude modulation of the annualcycle) and low-frequency time scales. Principally, the analysis of the precipitation fieldssuggests that, over this epoch, the main sources of Lake Poopó are located south of 16◦30′ S, within the Maury River basin, within the Bajo Desaguadero basin throughoutthe path of the Desaguadero River to Lake Poopó and within the Poopó basin.
Given the reported high dependence of Lake Poopó on Lake Titicaca, a number ofinterpretations can be proposed.
Over tropical Andes, near-surface air temperature has significantly increased overthe last ∼70 years, with a strong impact on glacier retreat throughout the Cordillera(Vuille et al. 2008). This suggests increased run-off from the Andes. Furthermore,maximal temperature and evaporation throughout the Altiplano have increased overthe previous decades (Garcia and Yucra 2007). In addition, associated with the very
Dow
nloa
ded
by [
Uni
vers
idad
De
Con
cepc
ion]
, [ro
drig
o A
barc
a-D
el-R
io]
at 1
4:51
05
Apr
il 20
12

Lakes Titicaca and Poopó water levels from space techniques 713
slight gradient of the Desaguadero River, a progressive increased anthropogenic usageof river discharge due to agriculture south of the Titicaca, along the Alto Desaguaderobasin before connecting with the Maury, could also be one of the causes (PNUMA2011). The question is, apparently, whether the river flowing out from Lake Titicaca,along with the modest rainfall rates along the whole Desaguadero basin, is enough tocompensate for not only the almost constant high pan evaporation rates, but notablythe agricultural use.
The Titicaca Lake outlet lies at 3807 m a.s.l., so actual levels (3811–3809 m) arejust a few metres above the outlet, thus resulting in only minimal water flux pres-sure. During the early Holocene, a decrease in precipitation caused Lake Titicaca tofall below its outlet and water supply to the central Altiplano, via the Desaguadero,was cut off (see Cross et al. (2001) and Condom et al. (2004)). Thus, if, as projected,the next century brings drier conditions than those of today, a joint palaeoclimaticand modelling research (Bush et al. 2010) showed that a tipping point may occur inthe mid-twenty-first century, when the relatively benign agricultural conditions of thenorthern Altiplano will be replaced by more arid climates. A decrease (10–30%) inAltiplano precipitation by the end of this century under moderate-to-strong green-house gas emission scenarios has been predicted (Minvielle and Garreaud 2011),while under the same scenarios temperatures will rise faster at higher altitudes andglaciers may soon disappear (Vuille et al. 2008) with potentially grave consequencesfor water supplies. The consequences for the Poopó Lake basin and the surroundingregion (Oruro region) during drought epoch may be dramatic, associated with highsocioeconomic and environmental impacts.
AcknowledgementsThe authors thank three anonymous referees and the editor for their valuable com-ments to improve the quality of this article. Matt Miller (DGEO) kindly assistedthe authors in improving the English of this article. This work was initiated withinthe framework of ECOSud program, project ‘C04U02: Continental hydrology bycombining altimetry, gravimetry, satellite imagery and in situ data. Application tothe Andean Region’. R. Abarca-del-Rio is indebted to Observatoire Midi Pyrenees(Toulouse, France) for the ‘Poste Rouge’ Chair of excellence which allowed this work.This work has been supported by the Centre National d’Etudes Spatiales (CNES,France) in the framework of the TOSCA program. The altimetry data are down-loaded from the Centre de Topographie des Océans et de l’Hydrosphère (CTOH)of Legos. The MODIS data were downloaded from the Earth Observing SystemData and Information System (EOSDIS) (wist.echo.nasa.gov/api/). The GSHHScoastlines and river network were downloaded from the website: www.soest.hawaii.edu/pwessel/gshhs.
ReferencesBUSH, M.B., HANSELMAN, J.A. and GOSLING, W.D., 2010, Nonlinear climate change
and Andean feedbacks: an imminent turning point? Global Change Biology, 16,pp. 3223–3232.
CONDOM, T., 2002, Dynamiques d’extension lacustre et glaciaire associées aux modifications duclimat dans les Andes Centrales. PhD thesis, Université Paris VI, Paris, 289 p.
CONDOM, T., COUDRAIN, A., DEZETTER, A., BRUNSTEIN, D. and DELCLAUX, F., 2004,Transient modelling of lacustrine regressions. Two case studies from the AndeanAltiplano. Hydrological Processes, 18, pp. 2395–2408.
Dow
nloa
ded
by [
Uni
vers
idad
De
Con
cepc
ion]
, [ro
drig
o A
barc
a-D
el-R
io]
at 1
4:51
05
Apr
il 20
12
714 R. Abarca-del-Rio et al.
CRÉTAUX, J.-F., BERGÉ-NGUYEN, M., LEBLANC, M., ABARCA-DEL-RIO, R., DELCLAUX,F., MOGNARD, N., LION, C., PANDEY, R.-K., TWEED, S., CALMANT, S. andMAISONGRANDE, P., 2011, Flood mapping inferred from remote sensing data.International Water Technology Journal, 1, pp. 48–62.
CRÉTAUX, J.-F. and BIRKETT, C., 2006, Lake studies from satellite altimetry. Comptes RendusGeosciences, 338, pp. 1098–1112.
CRÉTAUX, J.-F., CALMANT, S., ABARCA-DEL-RIO, R., KOURAEV, A., BERGÉ-NGUYEN, M. andMAISONGRANDE, P., 2010, Lakes studies from satellite altimetry. In Handbook onCoastal Altimetry, S. Vignudelli, A.G. Kostianoy, P. Cipollini and J. Benveniste (Eds.)(Berlin: Springer-Verlag).
CROSS, S.L., BAKER, P.A., SELTZER, G.O., FRITZ, S.C. and DUNBAR, R.B., 2001, Latequaternary climate and hydrology of tropical South America inferred from an iso-topic and chemical model of Lake Titicaca, Bolivia and Peru. Quaternary Research, 56,pp. 1–9.
DELCLAUX, F., COUDRAIN, A. and CONDOM, T., 2007, Evaporation estimation on LakeTiticaca: a synthesis review and modeling. Hydrological Processes, 21, pp. 1664–1677.
GARCIA, M. and YUCRA, E., 2007, Análisis climático y evaluación de tendencias de cambioclimático en el Altiplano y zonas de estudio. Proyecto SANREM CRSP: Practicasy Estrategias a los Cambio Climáticos y del Mercado en Agroecosistemas Vulnerables,Facultad de Agronomía-UMSA (Eds.), La Paz, Bolivia, 60 p.
GARREAUD, R., VUILLE, M. and CLEMENT, A., 2003, The climate of the Altiplano:observed current conditions and mechanisms of past changes. Palaeogeography,Palaeoclimatology, Palaeoecology, 194, pp. 5–22.
HUFFMAN, G.J., ADLER, R.F., BOLVIN, D.T., GU, G., NELKIN, E.J., BOWMAN, K.P., STOCKER,E.F. and WOLFF, D.B., 2007, The TRMM multi-satellite precipitation analysis: quasi-global, multi-year, combined-sensor precipitation estimates at fine scale. Journal ofHydrometeorology, 8, pp. 38–55.
INSTITUTO GEOGRÁFICO MILITAR, 2011, Mapa Hidrográfico Bolivia. Available online at: www.mirabolivia.com/mapahidro.htm (accessed 12 December 2011).
MINVIELLE, M. and GARREAUD, R.D., 2011, Projecting rainfall changes over the SouthAmerican Altiplano. Journal of Climate, 24, pp. 4577–4583.
MONTES DE OCA, I., 2005, Enciclopedia Geográfica De Bolivia, 871 p. (La Paz: Atenea).PILLCO, R. and BENGTSSON, L., 2006, Long-term and extreme water level variation of the
shallow Poopó Lake, Bolivia. Hydrological Sciences Journal, 51, pp. 98–138.PILLCO, R. and BENGTSSON, L., 2007, Three methods for determining the area–depth relation-
ship of Lake Poopó, a large shallow lake in Bolivia. Lakes & Reservoirs: Research &Management, 12, pp. 275–284.
PNUMA, 2011, GEO Titicaca: Perspectivas del Medio Ambiente en el Sistema HídricoTiticaca-Desaguadero-Poopó-Salar de Coipasa (TDPS), Programa de Naciones Unidaspara el Medio Ambiente (Ed.), 187 p. (Panamá: Novo Art). Available online at:http://www.pnuma.org/deat1/pdf/Geo%20Titicaca(Web).pdf
UNESCO, 2006, Water: A Shared Responsibility. The United Nations World Water DevelopmentReport 2, 601 p. (Paris: UNESCO).
VUILLE, M., FRANCOU, B., WAGNON, P., JUEN, I., KASER, G., MARK, B. and BRADLEY, R.,2008, Climate change and tropical Andean glaciers: past, present and future. Earth-Science Reviews, 89, pp. 79–96.
WILLMOTT, C.J., ROWE, C.M. and MINTZ, Y., 1985, Climatology of the terrestrial seasonalwater cycle. Journal of Climatology, 5, pp. 589–606.
Dow
nloa
ded
by [
Uni
vers
idad
De
Con
cepc
ion]
, [ro
drig
o A
barc
a-D
el-R
io]
at 1
4:51
05
Apr
il 20
12
Copyright © 2022 FDOKUMEN