
Lake—Wide Seasonal Changes in Limnological Conditions in Lake Michigan in 1976
15
J. Great Lakes Res. 8(3):413-427 Internat. Assoc. Great Lakes Res., 1982 LAKE-WIDE SEASONAL CHANGES IN LIMNOLOGICAL CONDITIONS IN LAKE MICHIGAN IN 1976 Carl R. Bartone l Visiting Research Associate Environmental Engineering and Science Program Manhattan College Riverdale, New York 10471 and Claire L. Schelske Great Lakes Research Division University of Michigan Ann Arbor, Michigan 48109 ABSTRACT. Data collected on lake-wide cruises in 1976 were used to study seasonal and vertical variations in water temperature, transparency, chlorophyll a, and nutrients in Lake Michigan. Data were analyzed according to subsets corresponding to the northern and southern open lake. Comparisons (t-tests) of data from the open lake indicated that the average water temperature was cooler and average water transparency was greater in the northern lake than in the southern, but with the exception of totalphosphorus, average nutrient concentrations did not differ between the northern and southern parts. It was found that physical-chemical characteristics of nearshore and Straits of Mackinac stations differed significantlyfrom open lake stations. Seasonalphytoplankton dynamics in the open lake were related to seasonal and vertical changes in silica and nitrate nitrogen. The spring phytoplankton bloom occurred before the lake was strongly stratified thermally. After thermal stratification was well developed, epilimnetic concentrations of chlorophyll a decreased, probably due to some combination of nutrient limitation and zooplankton grazing, and maximum chlorophyll a concentrations were found below the thermocline. Epilimnetic silica concentrations decreased after thermal stratification and diatoms were replaced in the phytoplankton assemblage by green and blue- green algae in late summer. Total phosphorus averaged only 8 p.g/L on a lake-wide basis and thus only small but significant reductions in absolute concentration can be expected from phosphorus control programs. However, over a period of several years, these small reductions in concentration may be difficult to verify from total phosphorus measurements which have relatively large sampling errors and variances. ADDITIONAL INDEX WORDS: Eutrophication, nutrients, chlorophyll a, light extinction. INTRODUCTION Lake-wide sampling that was conducted on Lake Michigan in 1976 as part of a research program on eutrophication processes produced a unique set of information on temporal and spatial variability in limnological conditions. The data set is unique in that the entire basin was sampled intensively from April to October and in that more variables were sampled than on any previous investigation of Lake 'Currently with the Pan American Center for Sanitary Engineering and Environmental Sciences (CEPIS), Casilla Postal 4337, Lima 100, Peru. 413 Michigan. The purpose of this paper is to present a synthesis of some of the results obtained as a basis for understanding relationships between nutrient and phytoplankton dynamics. DATA BASE During 1976 lake-wide sampling of Lake Michigan was carried out jointly by the Great Lakes Surveil- lance Branch (GLSB), U.S. Environmental Protec- tion Agency, and the Great Lakes Research Divi- sion (GLRD), University of Michigan. GLSB made six complete and two partial cruises covering 51
-
Upload
independent -
Category
Documents
-
view
0 -
download
0
Transcript of Lake—Wide Seasonal Changes in Limnological Conditions in Lake Michigan in 1976

J. Great Lakes Res. 8(3):413-427Internat. Assoc. Great Lakes Res., 1982
LAKE-WIDE SEASONAL CHANGES IN LIMNOLOGICALCONDITIONS IN LAKE MICHIGAN IN 1976
Carl R. Bartone l
Visiting Research AssociateEnvironmental Engineering and Science Program
Manhattan CollegeRiverdale, New York 10471
and
Claire L. SchelskeGreat Lakes Research Division
University of MichiganAnn Arbor, Michigan 48109
ABSTRACT. Data collected on lake-wide cruises in 1976 were used to study seasonal and verticalvariations in water temperature, transparency, chlorophyll a, and nutrients in Lake Michigan. Datawere analyzed according to subsets corresponding to the northern and southern open lake.Comparisons (t-tests) of data from the open lake indicated that the average water temperature wascooler and average water transparency was greater in the northern lake than in the southern, but withthe exception oftotalphosphorus, average nutrient concentrations did not differ between the northernand southern parts. It was found that physical-chemical characteristics of nearshore and Straits ofMackinac stations differed significantly from open lake stations. Seasonalphytoplankton dynamics inthe open lake were related to seasonal and vertical changes in silica and nitrate nitrogen. The springphytoplankton bloom occurred before the lake was strongly stratified thermally. After thermalstratification was well developed, epilimnetic concentrations ofchlorophyll a decreased, probably dueto some combination of nutrient limitation and zooplankton grazing, and maximum chlorophyll aconcentrations were found below the thermocline. Epilimnetic silica concentrations decreased afterthermal stratification and diatoms were replaced in the phytoplankton assemblage by green and bluegreen algae in late summer. Total phosphorus averaged only 8 p.g/L on a lake-wide basis and thusonly small but significant reductions in absolute concentration can be expected from phosphoruscontrol programs. However, over a period of several years, these small reductions in concentrationmay be difficult to verify from total phosphorus measurements which have relatively large samplingerrors and variances.ADDITIONAL INDEX WORDS: Eutrophication, nutrients, chlorophyll a, light extinction.
INTRODUCTION
Lake-wide sampling that was conducted on LakeMichigan in 1976 as part of a research program oneutrophication processes produced a unique set ofinformation on temporal and spatial variability inlimnological conditions. The data set is unique inthat the entire basin was sampled intensively fromApril to October and in that more variables weresampled than on any previous investigation of Lake
'Currently with the Pan American Center for Sanitary Engineeringand Environmental Sciences (CEPIS), Casilla Postal 4337, Lima 100,Peru.
413
Michigan. The purpose of this paper is to present asynthesis of some of the results obtained as a basisfor understanding relationships between nutrientand phytoplankton dynamics.
DATA BASE
During 1976 lake-wide sampling of Lake Michiganwas carried out jointly by the Great Lakes Surveillance Branch (GLSB), U.S. Environmental Protection Agency, and the Great Lakes Research Division (GLRD), University of Michigan. GLSB madesix complete and two partial cruises covering 51

414 BARTONEandSCHELSKE
stations in the southern half while GLRD made fivecruises covering some 32 stations in the northernhalf and 25 stations west of the Straits of Mackinac.Station locations and cruise dates are shown inFigure 1.
Some of the results of water quality parametersanalyzed are shown in Tables 1 and 2. Generally,sampIes in the southern basin were from depths of2, 5, 10, 20, and 50 meters with an additionalsample at greater than 50 meters. Depths ofsampling in the northern basin were 5, 10, 20, 30,40, and 50 meters, with several additional samplestaken at varying depths greater than 50 meters.Results presented in this paper were retrieved fromSTORET (data management system, U.S. Environmental Protection Agency).
Only selected water quality variables collectedduring the intensive study of Lake Michigan arepresented in this report. Results of the completeinvestigations have been presented in several datareports (Rockwell et al. 1980, Schelske et al. 1981,Stoermer 1981). Methods used were standardprocedures. Chlorophyll a was analyzed fluorometrically on samples extracted in 90% bufferedacetone and measurements were corrected forphaeophytin. Technicon AutoAnalyzers were usedfor chemical measurements which included threeforms of phosphorus (total phosphorus, totaldissolved phosphorus, and ortho phosphate), ammonia nitrogen, nitrate nitrogen, and soluble reactive silica. Total and total dissolved phosphoruswere measured after digestion with acid persulfate.Ammonia nitrogen and nitrate nitrogen were determined on unfiltered samples from the southernbasin (Table 1) and on HA-Millipore filteredsamples from the northern basin (Table 2). Comparison of results indicated that this proceduraldifference did not affect the results significantly.Data for nitrate are the results of measurementsthat were not corrected for nitrite. However, in theoxygenated open waters of Lake Michigan, nitriteconcentrations are an insignificant fraction of therelatively large nitrate concentrations. More than2,000 measurements were made in the two basinsfor these water quality parameters that are presented in this paper. Other chemical data are alsogiven in Tables 1 and 2 for purposes of descriptionand general information. Units for chemical measurements are given in Tables 1 and 2 and in figurelegends.
In addition to water quality parameters, data onphytoplankton and zooplankton abundance werecollected for the northern half of the lake. Phyto-
LAKE MICHIGAN 1976 SAMPLING SITES
CRUISE DATES
Northern Lake
22-28 April02-07 June12-18 July12-18 Aug.08-14 Oct.
Southern Lake
01-03 May25 May-02 June15-21 June07-18 July03-10 Aug.24 Aug.-02 Sept.14-19 Sept.07-08 Oct.
FIG. 1. Lake Michigan 1976 Surveillance programsampling locations and cruise dates. Northern lakecruises (north of lat. 440N) were made by the UMGLRD, while southern lake cruises were the responsibility of the EPA -GLSB.
plankton counts from 5 meters (Stoermer 1981)were aggregated by cruise over the open lake toobtain cruise averages for each major taxon. Cruisetotals for each major taxon were then converted toconcentrations in dry weight carbon using conversion coefficients (pg-C/ cell) and methods inStoermer and Ladewski (1978). For zooplanktonbiomass, conversion factors for the principal crustacean species were obtained from Canale andDePalma (1975), Bierman et al. (1980), and D. C.McNaught, University of Minnesota (personalcommunication). Dry weight carbon (mg/ L) wasthen calculated from these factors and from speciescounts ~upplied by J. Gannon, State University ofNew York-Oswego, and T. Ladewski, University ofMichigan (personal communication).
SEASONAL CHANGES IN LAKE MICHIGAN 415
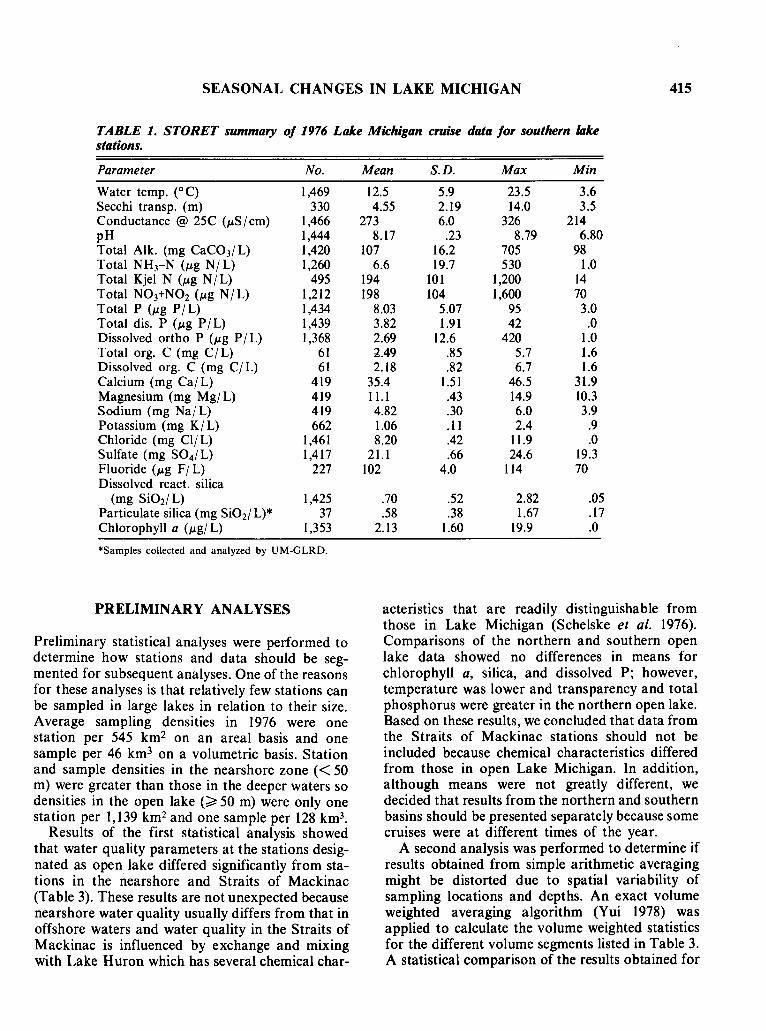
TABLE 1. STORET summary of 1976 Lake Michigan cruise data for southern lakestations.
Parameter No. Mean S.D. Max Min
Water temp. (0C) 1,469 12.5 5.9 23.5 3.6Secchi transp. (m) 330 4.55 2.19 14.0 3.5Conductance @ 25C (J.LS I cm) 1,466 273 6.0 326 214pH 1,444 8.17 .23 8.79 6.80Total Alk. (mg CaC031L) 1,420 107 16.2 705 98Total NH3-N (J.Lg NIL) 1,260 6.6 19.7 530 1.0Total Kjel N (J.Lg NIL) 495 194 101 1,200 14Total N03+NOz (J.Lg NIL) 1,212 198 104 1,600 70Total P (J.Lg PI L) 1,434 8.03 5.07 95 3.0Total dis. P (J.Lg PI L) 1,439 3.82 1.91 42 .0Dissolved ortho P (J.Lg PI L) 1,368 2.69 12.6 420 1.0Total org. C (mg CfL) 61 2.49 .85 5.7 1.6Dissolved org. C (mg Cf L) 61 2.18 .82 6.7 1.6Calcium (mg CalL) 419 35.4 1.51 46.5 31.9Magnesium (mg MgI L) 419 ILl .43 14.9 10.3Sodium (mg Nal L) 419 4.82 .30 6.0 3.9Potassium (mg KI L) 662 1.06 .Il 2.4 .9Chloride (mg Cli L) 1,461 8.20 .42 11.9 .0Sulfate (mg S04/L) 1,417 2Ll .66 24.6 19.3Fluoride (J.Lg FI L) 227 102 4.0 114 70Dissolved react. silica
(mg SiOz/L) 1,425 .70 .52 2.82 .05Particulate silica (mg SiOzl L)* 37 .58 .38 1.67 .17Chlorophyll a (J.Lgl L) 1,353 2.13 1.60 19.9 .0
*Samples collected and analyzed by UM-GLRD.
PRELIMINARY ANALYSES
Preliminary statistical analyses were performed todetermine how stations and data should be segmented for subsequent analyses. One of the reasonsfor these analyses is that relatively few stations canbe sampled in large lakes in relation to their size.Average sampling densities in 1976 were onestation per 545 km2 on an areal basis and onesample per 46 km3 on a volumetric basis. Stationand sample densities in the nearshore zone « 50m) were greater than those in the deeper waters sodensities in the open lake (~50 m) were only onestation per 1,139 kmz and one sample per 128 km3•
Results of the first statistical analysis showedthat water quality parameters at the stations designated as open lake differed significantly from stations in the nearshore and Straits of Mackinac(Table 3). These results are not unexpected becausenearshore water quality usually differs from that inoffshore waters and water quality in the Straits ofMackinac is influenced by exchange and mixingwith Lake Huron which has several chemical char-
actenstlcs that are readily distinguishable fromthose in Lake Michigan (Schelske et al. 1976).Comparisons of the northern and southern openlake data showed no differences in means forchlorophyll a, silica, and dissolved P; however,temperature was lower and transparency and totalphosphorus were greater in the northern open lake.Based on these results, we concluded that data fromthe Straits of Mackinac stations should not beincluded because chemical characteristics differedfrom those in open Lake Michigan. In addition,although means were not greatly different, wedecided that results from the northern and southernbasins should be presented separately because somecruises were at different times of the year.
A second analysis was performed to determine ifresults obtained from simple arithmetic averagingmight be distorted due to spatial variability ofsampling locations and depths. An exact volumeweighted averaging algorithm (Yui 1978) wasapplied to calculate the volume weighted statisticsfor the different volume segments listed in Table 3.A statistical comparison of the results obtained for

416 BARTONE and SCHELSKE
TABLE 2. STORET summary oj 1976 Lake Michigan cruise data jor northern lakestations including Straits oj Mackinac stations.
Parameter No. Mean S.D. Max Min
Water temp. (0C) 1,329 8.7 5.1 20.2 2.0Secchi transp. (m) 1,262 7.63 3.0 21.0 1.0Conductance @ 25C (J..tS Icm) 1,331 269 17 311 201pH 1,171 8.39 .16 8.98 7.56Total Alk. (mg CaC03/L) 277 107 6.08 137 79Dissolved NHrN (J..tg NIL) 1,151 7.2 4.8 36 2.0Dissolved N03+N0 2 (J..tg NIL) 1,311 198 52 320 70Total P (J..tg PI L) 1,253 7.52 3.41 28 2.0Total dissolved P (J..tg P/L) 1,182 3.64 2.29 28 2.0Dissolved ortho P (J..tg PI L) 430 1.82 1.34 11 1.0Calcium (mg Cal L)* 31 35.1 1.2 37.7 32.9Magnesium (mg MgI L)* 31 11.2 .29 11.7 10.7Sodium (mg Nal L)* 31 4.78 .13 5.1 4.5Potassium (mg KI L)* 30 1.07 .04 1.1 1.0Chloride (mg CI/L) 1,341 7.66 .57 11.3 5.2Sulfate (mg S04/L)* 31 21.6 .34 22.1 21.0Fluoride (J..tg F/L)* 31 102 .86 104 100Dissolved react. silica
(mg Si02/L) 1,320 .66 .47 2.7 .10Particulate silica (mg Si021L) 1,272 .52 .30 2.86 .09Chlorophyll a (J..tgl L) 1,317 1.77 1.56 22.2 .02
*Samples collected and analyzed by EPA-GLSB.
each segment by the two methods (simple arithmetic and volume weighted) showed no significantdifference in the averages obtained by the differenttechniques. This also held true when comparisonswere made for specific cruise dates or for specificlayers within each volume segment. From thisanalysis we concluded that the spatial distributionof the stations were adequate to ensure that the.data collected were representative of the watermasses defined, and that the simple arithmeticaveraging techniques could be used for the analysesmade below.
Results of the final analysis showed that thewater column could be divided into three depthlayers: ~ 20 m, 21-55 m, and> 55 m. Analysesperformed on data subsets for the northern andsouthern open lake and for different depth stratawithin each subset are discussed in the followingsections.
TEMPERATURE
Sampling in the northern basin was initiated inApril before average water temperatures reached4° C, the temperature of maximum density (Fig.
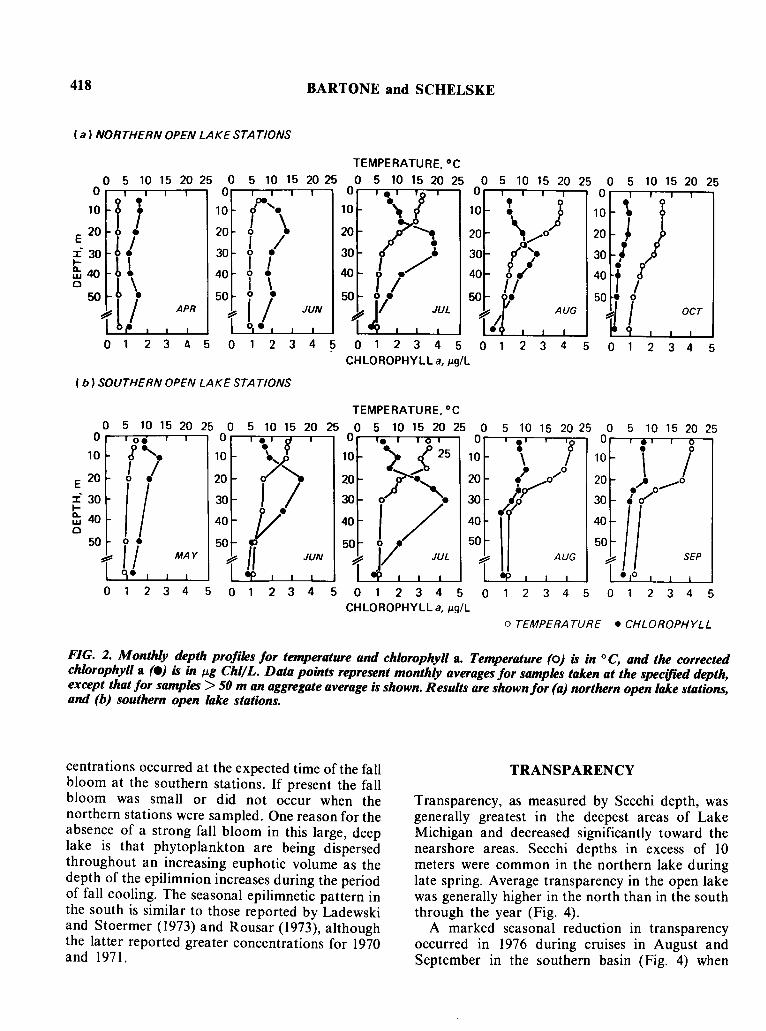
2a), and in the southern basin in May when surfacetemperatures were only slightly greater than 4° C(Fig. 2b). It is known that the lake is verticallymixed during winter and early spring (Mortimer1975, Schelske et al. 1980). Results of Church(1945) and Rousar (1973) show that thermal stratification over most of the lake would not beexpected until May, and possibly later in thenorthern basin.
Thermal stratification began in late May, proceeding from inshore to offshore. By June I most ofthe southern region (Fig. 2b) was weakly stratified,and by June 20 stratification was well-establishedover the entire southern water mass with thethermocline at about 10 meters. In the north (Fig.2a) the development of the thermocline laggedbehind several weeks and by June 7 most deepwaterstations still exhibited circulation throughout theentire water column.
Throughout July and August the depth of theepilimnion remained between 15 and 20 meters,while the epilimnetic waters continued to warmfrom 14° C to 21 ° C in the south and from 12° C to19°C in the north (Figs. 2a, 2b). Hypolimneticwaters were in the temperature range of 4.5-5.0°C.

SEASONAL CHANGES IN LAKE MICHIGAN 417
Water QualityParameter
TABLE 3. Comparison of epilimnetic station groups using one-sided t-test with a = .05. (t,,=.05, dJ.=oo = 1.645).
a. b. c. d. e. f.
Temperature(0C)
Xt
Result
Secchi Depth x(m) t
Result
Chlorophyll xa t
(~g/L) Result
Reactive xSilica t
(mg/L) Result
Total P x(mg/L) t
Result
Dissolved P x(mg/L) t
Result
Chlorides x(mg/L) t
Result
11.6 11.9-0.14
=7.0 7.8
-3.58<
2.2 1.85.65>
0.5 0.5-0.27
=.0076 .0072
2.94>
.0034 .0034-0.37
=7.9 8.0
-5.46<
11.9 12.5-1.63
=7.8 5.6
9.69>
1.8 2.8-8.56<
0.5 0.6-1.85
<.0072 .0083
-5.05<
.0034 .0036-1.27
=8.0 8.2
-7.60<
14.5 13.91.47=
5.3 3.65.32>
1.8 2.8-6.86<
0.5 0.6-3.91
<.0069 .0082
-5.79<
.0034 .0036-3.09
<8.2 8.4
-5.61<
9.3 9.9-U5
=8.3 6.4
8.17>
1.8 2.7-5.06<
0.5 0.50.11=
.0077 .0084-2.25
<.0035 .0035
0.30=
7.9 8.0-2.14<
9.3 14.5-5.11
<8.3 5.3
8.40>
1.8 1.80.30=
0.5 0.5-0.20
=.0077 .0069
4.11>
.0035 .00341.38=
7.9 8.2-17.44
<
9.3 10.3-2.25<
8.3 7.44.10>
1.8 2.1-2.55<
0.5 0.42.53>
.0077 .00701.98>
.0035 .00294.11>
7.9 7.06.56
>
The metalimnion and clinolimnion, following theterminology of Hutchinson* (1957), extended toabout 25-30 meters and 50-55 meters respectivelyduring this period. By late September the epilimnion deepened and the thermocline descendedas the result of surface cooling and entrainment ofcolder hypolimnetic waters. During the third weekof September the southern thermocline was locatedat a depth of 25 meters, and by October 14 it wasdown to 30 meters over most of the lake. Theaverage thermocline depth during the summerstratification period was 20 meters.
CHLOROPHYLL a
The seasonal cycle of chlorophyll a corrected forphaeophytin was related to the thermal cycle.
*The metalimnion comprises the layers on either side of the thermocline, loosely embracing the whole region of rapid fall in temperaturewith depth. The clinolimnion is the boundary region between thelower metalimnion and upper hypolimnion characterized by a relatively constant coefficient of eddy diffusivity but decreasing stability.
During the homothermous periods in April andMay the vertical distribution of chlorophyll a in thenorthern and southern basins was fairly uniform(Figs. 2a and 2b) with concentrations averaging< 1.5 JJ.g/ L. After the lake stratified, the zone ofmaximum chlorophyll concentration was found inthe thermocline or below. This subsurface chlorophyll maximum, with concentrations as large as4 JJ.g/ L, was present at the southern stations inJune and by July was well developed at bothsouthern and northern stations. After the Julycruises, the maximum decreased and by Augustonly a small peak remained at the northernstations.
In the epilimnion, the seasonal change in averagechlorophyll concentrations was relatively small.Average concentrations during the spring bloomwhich occurred in May and June at the southernstations and in June and July at the northernstations (Figs. 3a, 3b) were only slightly greaterthan 2 j.Lg/ L. No great increase in chlorophyll con-
418 BARTONE and SCHELSKE
(a) NORTHERN OPEN LAKE STA TlONS
012345012345 5012345
o 5 10 15 20 25 0 5 10 15 20 25o'--r--~-r---r-----. 0 r--,--~....,....--,.--,'. )~I \ 010 10 b
20 \/0 20 ~)30 ? ..... 301
40 g~' 40 1/50 ~I 50 • 0
JUL ~ /, AUG ~ I OCT
"I. < I
01234501234CHLOROPHYLLa, IJg/L
TEMPERATURE,OC
o 5 10 15 20 25or---r-::~-r::--r----.
:It40 f l/50 0/
fitJUN
5 10 15 20 25
30
pe......
1 \I /o •I Io •I \
50~ r i•
40
20 25 0or--~-r-....,....----r---'
10
20
APR
o 5 10 15o ..----r---r-~__r---,
10 X tI I
E 20 y.t:i 30 b
~ 40 t l0
50t \
~l/
( b) SOUTHERN OPEN LAKE STA nONS
o 5 10 15 20 25 0 5 10 15 20 25o 0 • 0 r--"T'"'"':;;.-r--:::r----r--,
E: go,- :: ~~ 30 li;1 30 ylI~ 40 40o
50""" riMA y 50?, /I JUN
•0123450
TEMPERATURE,OC
o 5 10 15 20 25or--T:.~-'-o"""---'
10 Z {25
~~ r'.: 1/~ 1/ JUL
2345012345012345012345CHLOROPHYLLa, IJg/L
o TEMPERATURE • CHLOROPHYLL
FIG. 2. Monthly depth profiles for temperature and chlorophyll a. Temperature (0) is in °C, and the correctedchlorophyll a (e) is in Jl.g Chl/L. Data points represent monthly averages for samples taken at the specified depth,except that for samples> 50 m an aggregate average is shown. Results are shownfor (a) northern open lake stations,and (b) southern open lake stations.
centrations occurred at the expected time of the fallbloom at the southern stations. If present the fallbloom was small or did not occur when thenorthern stations were sampled. One reason for theabsence of a strong fall bloom in this large, deeplake is that phytoplankton are being dispersedthroughout an increasing euphotic volume as thedepth of the epilimnion increases during the periodof fall cooling. The seasonal epilimnetic pattern inthe south is similar to those reported by Ladewskiand Stoermer (1973) and Rousar (1973), althoughthe latter reported greater concentrations for 1970and 1971.
TRANSPARENCY
Transparency, as measured by Secchi depth, wasgenerally greatest in the deepest areas of LakeMichigan and decreased significantly toward thenearshore areas. Secchi depths in excess of 10meters were common in the northern lake duringlate spring. Average transparency in the open lakewas generally higher in the north than in the souththrough the year (Fig. 4).
A marked seasonal reduction in transparencyoccurred in 1976 during cruises in August andSeptember in the southern basin (Fig. 4) when

SEASONAL CHANGES IN LAKE MICHIGAN 419
A. Northern Lake B. Southern lake
• <20 m • <20 m
o21·56m 021·55 m
~3 .>56 m~
"'>55 m",3,.
~,.
'" .'
~~
~
~..J
~ 2>-:I: 2..
?". "...
0 00:: 0::
0 0..J ..J
15' 15 1 \--~........~ ,..0
A I M I j I j I A S I 0 AIMljlJIA1Slo
FIG. 3. Seasonal variations in chlorophyll a. Datapoints represent cruise means for corrected chlorophylla (JJg ChilL) in layers from 0-20 m (.), 21-55 m (0),and> 55 m(Ji.). Results are shownfor (a) northern openlake stations, and (b) southern open lake stations.
MEAN ± 1 STD. DEV.• NORTHERN LAKEo SOUTHERN LAKE
FIG. 4. Seasonal variation in Secchi depth (m) in LakeMichigan, 1976. Cruise means ± 1 standard deviationare shown for northern (.) and southern (0) open lakestations.
epilimnetic chlorophyll 0 values were also low (Fig.3b). Ladewski and Stoermer (1973) also found thatminimum summer and autumn Secchi disc transparency corresponded with the seasonal minimumin chlorophyll 0 and showed that these reducedSecchi depths resulted from light upwelled by"milky" waters rather than to decreased lightpenetration. Ayers et of. (1967) also observed that
Secchi depths of less than five meters were associated with "milky" waters that occurred fromAugust to October. Milky waters have been attributed to suspensions of precipitated calcium carbonate (Schelske and Callender 1970). (The latterhypothesis was corroborated by Strong and Eadie[1978] based on comparisons of Landsat observations of "whitings" in Lake Michigan and otherGreat Lakes with in situ data.)
To determine causes for reduced transparency,two subsets of data were analyzed by linear regression and correlation techniques. In both cases theextinction coefficient, calculated as Ke = 1.9/Secchi depth after Beeton (1958), was regressedagainst chlorophyll 0 concentration. For the subsetcomprised of data from seven cruises conductedfrom April 22 to July 18, a significant linearrelationship was found with an intercept value ofKe = .15/ meter. The second subset correspondedto four cruises made from August 3 to September19. For those months there was no significant correlation between the extinction coefficient andchlorophyll 0 concentrations; that is, the regressionline slope was zero and the intercept equaled themean value of Ke = .44/ meter. Thus it was concluded that reduced transparency during Augustand September (Fig. 4) resulted form milky water.These results show that light attenuation can beestimated only from submarine photometer orquantum meter measurements during the periodsof "milky water."
OTHER BIOMASS MEASUREMENTS
At the northern stations, seasonal changes in totalphytoplankton and diatom biomass for 5-m samples (Fig. 5a) closely paralleled those for epilimnetic chlorophyll 0 concentrations (Fig. 3a). Oneexception was that total phytoplankton and diatombiomass were at a minimum in August. In addition,there was a definite shift in phytoplankton composition from diatoms to non-diatoms during thesummer. Diatoms comprised 67% of the totalspring biomass, but this decreased to 17% inAugust when green and blue-green algae predominated (Fig. 5b) and silica concentrations werereduced.
A secondary peak in phytoplankton biomassoccurred in October at the northern stations (Fig.5a). This peak was not apparent from the chlorophyll data at the northern or southern stations (Fig.3a). Comparison of data from the northern stationsshowed that the chlorophyll to carbon ratio for

420 BARTONE and SCHELSKE
Lake Michigan, Open Lake, 1976
FIG. 6. Seasonal variations in 'Zooplankton biomass fornorthern open lake stations. Datapoints represent cruisemeans above 30 m for 'Zooplankton dry weight carbon inmg CIL.
....J-OlE
z 0.050 /ecoa: 0.04«u
/z 0.030I-~ 0.02z«....J 0.01c..
.~00N 0.00
A 0
mum concentration of 1.3-1.4 mg/ L reported byRousar (1973) to 1.0 mg/L or less. At the northernstations concentrations decreased from 1.0 mg/ L inlate April to 0.9 mg/ L in early June, while the lakewas vertically mixed (Fig. 7a). At the southernstations, concentrations were reduced to 1.0 mg/ Lin May when the first open lake samples wereobtained (Fig. 7b). After thermal stratification,epilimnetic concentrations were reduced to minimum levels of 0.1-0.2 mg/L during July andAugust at southern and northern stations. Epilimnetic concentrations increased in the early fall asthe result of epilimnetic entrainment of deeperwaters with greater silica concentrations. Silicaconcentrations would be expected to increase untilDecember or January to the winter maximumconcentration of 1.4 mg/ L found by Rousar (1973).
The water column average of dissolved reactivesilica was relatively constant at ca. 1.0 mg/ Lthroughout the year. However, the depth distribution of silica changed greatly seasonally at thesouthern and northern stations. At depths::;;;; 20 m,silica decreased and at depths> 55 m it increasedthroughout the sampling period (Fig. 8). At thenorthern stations, silica decreased at the intermediate depths as well as in the shallower waters,
SILICA
Recent observations of summer epilimnetic silicadepletion in Lake Michigan are of great interestbecause of the relationship of silica depletion tochanges in phytoplankton species composition.Schelske and Stoermer (1971) hypothesized thatincreased inputs of phosphorus prior to 1969 hadstimulated the growth of diatoms, reducing euphotic zone silica concentrations to levels which limitdiatom growth during summer stratification. Theseconditions induced a major species shift in phytoplankton assemblages allowing blue-green andgreen algae to gain a competitive advantage inassemblages (Stoermer 1972, Schelske et ai. 1976,Conway et ai. 1977) that were previously dominated by diatoms. This shift in species compositionwas found during the thermally stratified period in1976 (Fig. 5b).
Changes in dissolved reactive silica concentrations were closely related to the seasonal thermaland phytoplankton cycles. Silica uptake by diatomsduring the spring reduced concentrations of silicain the entire water column from the winter maxi-
phytoplankton ranged from 20 to 50 p,g Chl/ mg Cduring the study.
The peak in zooplankton biomass for thenorthern lake stations occurred in August (Fig. 6),one month after the peak in phytoplankton biomass (Fig. 5a). These data indicate that thezooplankton community had a period of rapidgrowth in June and July and a subsequent declineby early autumn.
FIG. 5. Seasonal variations in phytoplankton biomassand composition for northern open lake stations. FigureA. shows cruise means for 5 m samples of the phytoplankton dry weight carbon in p,g CIL, both for totalbiomass (0) and for diatom biomass only (6) and B.shows mean percent composition by major algal typeson a dry weight carbon basis for each cruise.
A. Northern Lake z B. Southern Lakee;::
;)ine0.
!r ::!e
~. 100U
TOTAL BIOMASS ~ 100::!
0&w
~ 80u~ 80
z 0.
i:? 60 ~ 60
'":'i 40 ~ 40..J S0.
i:? 20 ~ 20>- ~r 0 " 00. :t
A'M1J1J'A'SIO 0.

SEASONAL CHANGES IN LAKE MICHIGAN 421
(a) NORTHERN OPEN LAKE STA nONS
SOLUBLE REACTIVE SILICA, mg/L
OCT
:1'e,.,t
\.
o0,.--_-.-_--r2--,
10
20
30
40
50
2
AUG
oo •
10
20
30
40
50
2
JUL
2 o 2 0 1O.---------r---r--, O.-------.----r--,
% 10 % 10 :
\ 20 \ 20\t 30 T 30 'e• 40. 40 ~1 I ,\ APR 50::? \ JUN 50? .\
L--__• ---' •
50
oo.-------.---.-----,10
E 20
i= 30a.w 40o
(b) SOUTHERN OPEN LAKE STATIONS
2
SOLUBLE REACTIVE SILICA, mg/L
o 20 2 012 0 20o .------.:-------r--, 0 .--------.,...,----.---, 0 0 ..----:;:.,----,...,----.---, 0 r---:;:.:------r---r--,
10 T 10' 10 ; 10 \ 10 \
;:~ .\ : \ :\ :~ .., :'~ 40 40 \ 40 \ 40 --....\ 40 .\
50 • 50 • 50 • 50 50;:::; \ MA Y.::;:: \ JUN ~ AUG ::::: SEP
FIG. 7. Monthly depth profiles for soluble reactive silica (mg Si02/ L) in Lake Michigan, 1976. Data points representmonthly averages for samples taken at the specified depth, except that for samples> 50 m an aggregate average isshown. Results are shown for (a) northern open lake stations and (b) southern open lake stations.
FIG. 8. Seasonal variations in dissolved silica. Datapoints represent cruise means for dissolved silica (mgSiO2/L) in layers from 0-20 m (e), 21-55 m (0), and>55 m(Jt.). Results are shown for (a) northern open lakestations and (6) southern open lake stations.
but at the southern stations this trend was not asobvious.
After stratification, a positive vertical gradient ofdissolved reactive silica from the clinolimnion tothe bottom was established; however, it is important to note that the relationships were quitedifferent in the southern and northern basins. Thegradient was greater in the southern basin than inthe northern basin, and in addition maximumconcentrations were greater in the southern basinthan in the northern. These data indicate that thetype of gradient may be related to the depth of thewater column and that steeper gradients in thesouther basin were related to shallower depths.These relationships suggest that the dissolution ofdiatoms occurs mainly at the deepest depths in thewater column.
-<20 m021-55 m
·>S5m
B. Southern Lake
or-A-r-IM
TI-J'I-J"'A--r-IS '1-0
-4
A. Northern Lake

422 BARTONEandSCHELSKE
(a) NORTHERN OPEN LAKE STATIONS
AMMONIA NITROGEN, mg/L
0 0.01 0.02 0 0.01 0.02 0 0.01 0.02 0 0.01 0.02 0 0.01 0.020 0 0 0 0
,0 • 0, , 4t P • ° • °10 0\ • 10 10 10 \ I ' ,
I /0' ~Q" 10 \1.,0, ~o",E 20 0 • 20 ° i 20 .., 20 • 0 20
I \ \ \\ '. '% ~..)i= 30 • 30 0 • 30
1~30 '. 30 ~.........Q. \ I / I \~
~ 40 40 40~ cI .i 0
T40 40 •I \ ~ I \
50
\ APR 50 0 • JUN 50 0. JUL 50 ('AUG 50 ° ·OCT:::::: \ :::::: I \ ~ I \ r r I \I• 0 • • • •0 0.2 0.3 0 0.2 0.3 0 0.2 0.3 0 0.2 0.3 0 0.2 0.3
NITRATE NITROGEN, mg/L
( b) SOUTHERN OPEN LAKE STA TlONS
0.30.2
AMMONIA NITROGEN, mg/L
0.01 0.02 0 0.01 0.02 0 0.01 0.02 0 0.01 0.02o c. 0 • 0 0 r..:-:o;;-----,---r--.
~% .0 .0
10 \'\ 10 \ \ 10 '{
20 ~ 0\ 20 0",:::::--", 20 ('\.-......
:~J tu, :ti~J=tl ~
o 0.2 0.3 0 0.2 0.3 0
NITRATE NITROGEN, mg/L
o AMMONIA NITROGEN • NITRATE NITROGEN
FIG. 9. Monthly depth profiles for ammonia nitrogen and nitrate nitrogen. Datapoints represent monthly averages, inmg N / L for NH3 (0) and N03 +N02 (e), for samples taken at the specified depth, except that for samples> 50 m anaggregate average is shown. Results are shown for (a) northern open lake stations and (b) southern open lake stations.
o 0.01 0.02 0o 2 : 0 0
Y 1 ? ,
~~~\ \ ~\\50:::::: \ \ MA Y 50:::::: 1\ JUN
LO---L-__...L-..J L-O.L..-.o 0.2 0.3 0 0.2 0.3
NITROGEN
The ammonia data are relatively noisy, but they doindicate the existence of a subsurface peak inAugust (Fig. 9) that coincides with the peak inzooplankton biomass (Fig. 6). The subsurface peakprobably resulted from excretion by zooplanktonand possibly by predators that would be expectedto be associated with the deep chlorophyll a layer(Fig. 2). Average epilimnetic concentrations ofNHrN ranged from 4-8 IJ-gjL through the year,while in the hypolimnion the range was 3-9 IJ-gj L.In the layer from 21-55 m, however, summerconcentrations were 6-20 IJ-gj L.
Seasonal patterns in the vertical distribution ofnitrate (Fig. 9) were similar to those for soluble
reactive silica (Fig. 7). The major difference is thatepilimnetic concentrations of nitrate were notdepleted to the extent that they become limiting forphytoplankton growth, although they were reducedgreatly by phytoplankton uptake in the euphoticlayer (0-20 m) during the stratified period. Epilimnetic concentrations decreased from 220-232IJ-gj L when the lake was thermally mixed to110-125 IJ-gj L in August. Metalimnetic concentrations were maintained at 220-250 IJ-gj L during theyear, and hypolimnetic concentrations increasedslightly with depth.
PHOSPHORUS
Phosphorus is the major plant nutrient limitingphytoplankton growth in Lake Michigan (Sche1ske

SEASONAL CHANGES IN LAKE MICHIGAN 423
et al. 1974, Schelske et al. 1978). Because phosphorus is limiting, concentrations of soluble reactive phosphorus are maintained at low levels in theeuphotic layer by phytoplankton uptake and therefore have little value in determining relationshipsbetween this limiting nutrient and phytoplanktongrowth (Schelske and Callender 1970). As would beexpected, soluble reactive phosphate in the euphotic layer was present at barely detectable levels.In the southern region a limit of detection of 2/J-g/ L was used and the majority of the data werereported simply as <2 /J-g/ L. For the northern lake,a lower detection limit of 1 /J-g/ L was employed,and many observations of 1 /J-g/ L were reported. Inthe north, average summer concentrations of soluble reactive phosphate ranged from 1.0-1.5 /J-g/ Lin the 0-55-m layer, and in the deep hypolimnionaverage values were 3.5 /J-g/ L in July and August.
Larger hypolimnetic values probably resulted fromremineralization. Even though it was not possibleto calculate true means for southern stationsbecause of the higher detection limit used, deephypolimnetic concentrations were consistentlygreater than 3 /J-g/ L during the same July-Augustperiod.
Although the seasonal dynamics of total phosphorus are not as apparent as those for silica andnitrate nitrogen, there are some similarities. Thevertical distribution of total phosphorus was fairlyuniform during the homothermous periods, andrelatively high concentrations were found inAugust at the depths associated with the subsurfacechlorophyll maximum (Fig. 10). After thermalstratification was established, total phosphorusconcentrations appeared to increase in the hypolimnion, indicating a net flux of phosphorus from
,( a) NORTHERN OPEN LAKE STATIONS
PHOSPHORUS, 1l9/L0 5 10 0 5 10 0 5 10 0 5 10 0 5 10
0 ., 0 0 0 0
1 • ) I.: p • 0
\10 • 10 • 10 /010 I (0 10
J, ,.
~o,
e 20 20 • I 20 • 20 ~ 20
~. 30 \ I I ; '0 ~ I ~• I30 • 30
",-' 30 • 30
t ~ \,
tQ. • r .~ 40 • 40 40 0 40 • I 40
I / J I \ I50 0 50 0 50 • 50 • 50
"'.":P\ \ APR ::fS< \ \ JUN~ \ '\L ::fS< '\UG \ ttP:fIlII' • • • •
(b) SOUTHERN OPEN LAKE STA TlONS
10PHOSPHORUS,Il9/L
o 5 10o.----r-r--~-,......,\ ~, "0"
t ~
\{\ ",UL
• 0
105oor----=-----r-=----n; ~
10 r 6 10
: \ \ :40 ! I 40
50~ \ O'\UN 50....
• 0
o 5o~----:~,.,,---n
, 0..9
10 T 0
~: . /\Ii:~4O
50~ \ \ MAY
o TOTAL PHOSPHORUS • DISSOLVED PHOSPHORUS
FIG. 10. Monthly depth profiles jor total phosphorus and total dissolvedphosphorus. Data points represent monthlyaverages, in p.g P / L jor totalP (0) and dissolvedP (e), for samples taken at the specifieddepth, except thatfor samples>50 m an aggregate average is shown. Results are shownjor (a) northern open lake stations and (b) southern open lakestations.

424 BARTONE and SCHELSKE
the euphotic zone. Interpretation of total phosphorus data is complicated in that relatively largevariances were associated with segmented averagesfor this variable in comparison to those for solublenutrients.
Although increasing amounts of phosphorushave been discharged to the lake, much of itobviously has been lost to the sediment sink. Theloading rate of 7.05 X 10⁶ Kg/ yr calculated for 1976(Eisenreich et al. 1977), which excludes shorelineerosion, is equivalent to an annual input of 1.5 f.LgP/ L which would double the lake concentrations in5 or 6 years if phosphorus were not sedimented.Open lake water column concentrations may not beaffected greatly by nearshore phosphorus inputs asthe nearshore zones act as a buffer where phosphorus is sequestered biologically and subsequentlysedimented or only slowly mixed with the open lakewater mass. Phosphorus deposited in the sedimentsapparently does not return to the water column, atleast not at appreciable rates, as bottom conditionsare aerobic in the open lake at all depths throughout the year.
Data for total phosphorus are the best measureof quantity of this important nutrient that can berelated to phytoplankton standing crops in thelake. Total phosphorus in 1976 samples fromsouthern and northern stations averaged 8 f.Lg/ L ofwhich 3-4 f.Lg/ L was total dissolved phosphorus(Tables I and 2). Rousar (1973) also reported anaverage of 8 f.Lg P/ L for total phosphorus for openlake stations. Rousar and Beeton (1973) summarized Lake Michigan data on total phosphorus forthe open lake. They concluded that the availablehistorical data are not adequate to indicate adefinite trend in phosphorus concentrations. However, given the paucity of data and recognizing themeasurement and sampling problems which existed, this must be accepted as a qualitativeobservation.
Open water phosphorus concentrations averagedonly 8 f.Lg/ L in 1976 so levels in the absolute sensecould have increased little historically. Becausepresent levels are small and the residence time andvolume of the lake is large, one would expect relatively small changes in total phosphorus concentrations in 5 to 10 years regardless of planned orprojected changes in inputs or loadings. As a consequence it may be difficult to evaluate the efficacy ofphosphorus control programs on the basis of shortterm changes in total phosphorus concentrationswhich have relatively large sampling errors andvariances (Tables 1 and 2).
PHYTOPLANKTON DYNAMICS ANDTROPHIC STATUS
Phytoplankton dynamics were closely related to theseasonal thermal and silica cycles in LakeMichigan. During the homothermal period whichlasted until June in the northern lake and until Mayin the southern lake, the vertical distributions ofchlorophyll a (Fig. 2), silica (Fig. 7), and nitrogen(Fig. 9) were uniform throughout the watercolumn. During this circulation period, chlorophylla concentrations averaged ca. 1 f.Lg/ L. The springbloom apparently occurred soon after the lake wasweakly stratified when chlorophyll a concentrations exceeded 2 f.Lg/ L (Fig. 3). It is interesting tonote that maximum chlorophyll concentrations occurred at depth before the lake was stronglystratified. Maxima were at 20 m in June at thenorthern stations and IO m in May at the southernstations (Fig. 2). This may represent the earlydevelopment of the subsurface chlorophyll maximum that was present in July in both basins.
After the lake was stratified, maximum chlorophyll a concentrations were found at depth, specifically in the metalimnion and clinolimnion (Fig. 2).Average concentrations were significantly greaterin the subsurface layer below 20 m than in thesurface waters. Epilimnetic decreases in silica andnitrate nitrogen occurred after thermal stratification as the result of uptake by phytoplankton.Diatom uptake of silica was great enough to reducesilica to limiting levels for diatom growth over theopen lake by July (Fig. 7) and to cause a shift in thephytoplankton assemblage which previously hadbeen dominated by diatoms to an assemblage thatwas dominated by green and blue-green algae inAugust (Fig. 5). This shift in species composition isconsistent with the silica depletion hypothesis ofSchelske and Stoermer (1971).
The seasonal cycle of epilimnetic chlorophyll awas mainly unimodal with no autumnal pulse beingevident from the data that were collected (Fig. 3).An autumnal pulse smaller than the spring pulsewas found by Rousar (1973) at open lake stationsso the sampling frequency during 1976 may nothave been adequate to record this part of the cycle.Stoermer (1978) indicated that an annual cycle witha small autumnal pulse relative to the spring pulsewould be expected in Lake Michigan at its presentstate of nutrient enrichment. Epilimnetic silicaconcentrations in the autumn increased (Fig. 8) asthe epilimnion deepened and entrained silica-richwaters and, with the increase in silica concentra-

SEASONAL CHANGES IN LAKE MICHIGAN 425
tions, the proportion of diatoms in the phytoplankton also increased (Fig. 5).
One of the most interesting features of thephytoplankton dynamics was the presence of thesubsurface chlorophyll a maximum (Fig. 2). Reasons for the existence of this layer, reported previously by Brooks and Torke (1977) and Mortonson (1977), are not clear and apparently arecomplex, encompassing physical, chemical, andbiological factors. A number of relationships canbe postulated concerning formation and maintenance of subsurface layers, but most of these arerelated to formation by sinking phytoplankton orto maintenance by in situ growth. The decrease inchlorophyll concentrations in the epilimnion mustbe important, either to provide phytoplankton thatsink to the depth of the subsurface maximum or toincrease light penetration at depth so in situ growthcan occur. Data on vertical distribution of phytoplankton indicate that sinking of phytoplanktoncannot be invoked as the major mechanism(S toermer 1981 and personal communication).Little is known about the effects of zooplanktonbut they must play an important role. Zooplanktongrazing could be responsible for the decrease inepilimnetic chlorophyll observed after stratification(Fig. 2). Excretion by zooplankton also could be animportant source of nutrients for in situ phytoplankton growth at depth. Data for ammonia showincreased concentrations at depth during thermalstratification (Fig. 9) which probably resulted fromexcretion. Presumably phosphorus which limitsphytoplankton growth was also released at thesame time, but this release would not be measurable chemically because uptake by phytoplankton would be rapid. In addition, upward verticaltransport of phosphorus undoubtedly results fromphysical processes and the presumed gradient ofphosphorus concentrations in the open lake, but todate this effect has not been quantified. Eithernutrient release by zooplankton or vertical diffusion of nutrients or both could be important inpromoting in situ phytoplankton growth.
Data presented in this paper make a valuablecontribution to the data base on limnological conditions in the Laurentian Great Lakes. Data forLake Michigan were not included in the previoussummary and comparisons of nutrients and waterquality (Dobson et al. 1974), probably because fewreliable data were available. Some of this information is now available in several publications(Schelske and Roth 1973, Torrey 1976, andSchelske et al. 1980). In addition, an excellent
synthesis of phytoplankton dynamics and speciescomposition changes has been prepared (Tarapchak and Stoermer 1976).
The trophic status of open waters in LakeMichigan would appear to be either in the upperrange of oligotrophic or mesotrophic. In 1976 theaverage value for particulate phosphorus was 4-5,."g P / L, which is the upper range for oligotrophicwaters (Dobson et al. 1974). Based on data forpdmary production, chlorophyll a, and phosphorus loading, Vollenweider et al. (1974) classifiedthe three upper Great Lakes as oligotrophic butshowed that Lake Michigan was more eutrophicthan either Lake Huron or Lake Superior. LakeMichigan was classified as mesotrophic byTarapchak and Stoermer (1976) because oligotrophic diatom populations have been replaced bymesotrophic populations and because, as pointedout above, silica depletion has caused pronouncedchanges in phytoplankton assemblages after summer stratification, with phytoplankton assemblageschanging from those dominated by diatoms tothose dominated by green and blue-green algae(Stoermer 1972, Schelske et al. 1976; Conway et al.1977). The shift in species composition is caused bysilica depletion that has been attributed to excessivephosphorus loading (Schelske and Stoermer 1971).
Certain nearshore waters of Lake Michigan onthe other hand have been generally recognized asbeing highly enriched compared to offshore waters(Tarapchak and Stoermer 1976, Schelske et al.1980) and nearshore waters were categorized as"secondary eutrophic" by Vollenweider et al.(1974). Our data for 1976 are consistent with theassessment that particulate phosphorus concentrations place open lake waters of Lake Michigan inthe upper oligotrophic range and that nearshorewaters are more highly enriched, presumably theresult of nearshore phosphorus loading (Schelske etal. 1980).
ACKNOWLEDGMENTS
We appreciate the valuable assistance in analyzingthe 1976 surveillance data provided by WilliamRichardson, Linda Fuchs, and Alexander Yui ofthe EPA Large Lakes Research Station, by RobertThomann of Manhattan College, and by TheodoreLadewski, Eugene Stoermer, and Russell Moll ofthe Great Lakes Research Division.
This work was completed during a sabbaticalleave for the principal author from the WorldHealth Organization, for which grateful acknowledgment is made. During the leave, support facili-

426 BARTONE and SCHELSKE
ties were provided by the USEPA Large LakesResearch Station, Grosse Ile, Michigan. This research, in addition, was supported by the U.S.Environmental Protection Agency under a researchgrant to Manhattan College and a research grant tothe University of Michigan (R-804503). Contribution No. 339 of the Great Lakes Research DivisionUniversity of Michigan. '
REFERENCES
Ayers, J. c., Stoermer, E. F., and McWilliams, P.1967. Recently noticed changes in the biologychemistry of Lake Michigan. In Studies on theenvironment and eutrophication ofLake Michigan, J.C. Ayers and D. C. Chandler (eds.), pp. 95-Il 1. Univ.Michigan, Great Lakes Res. Div. Spec. Rep. 30.
Beeton, A M. 1958. Relationship between Secchi discreadings and light penetration in Lake Huron. Am.Fish. Soc. Trans. 87: 73-79.
Bierman, V. J., Jr., Stoermer, E. F., Gannon, J. E., andSmith, V. E. 1980. The development and calibrationof a spatially simplified multi-class phytoplanktonmodel for Saginaw Bay, Lake Huron. Great LakesEnvironmental Planning Study (GLEPS), Contribution No. 33. Great Lakes Basin Commission, AnnArbor, Michigan.
Brooks, A S., and Torke, B. G. 1977. Vertical andseasonal distribution of chlorophyll a in LakeMichigan. J. Fish. Res. Board Can. 34: 2280-2287.
Canale, R. P., and DePalma, L. M. 1975. A food webmodel for Lake Michigan. Part 2-Model formulation andpreliminary verification. Univ. Michigan SeaGrant Program, Ann Arbor, Michigan. MICHU-SG75-201.
Church, P. E. 1945. The annual temperature cycle ofLake Michigan. II. Spring warming and summer stationary periods, 1942. Univ. Chicago, Inst. Meteoro!.Misc. Rep. 18.
Conway, H. L., Parker, J. I., Yaguchi, E. M., andMellinger, D. L. 1977. Biological utilization andregeneration of silicon in Lake Michigan. J. Fish.Res. Board Can. 34: 537-544.
Dobson, H. F. H., Gilbertson, M., and Sly, P. G. 1974.A summary and comparison of nutrients and relatedwater quality in Lakes Erie, Ontario, Huron andSuperior. J. Fish. Res. Board Can. 31: 731-738.
Eisenreich, S. J., Emmling, P. J., and Beeton, A. M.1977. Atmospheric loading of phosphorus and otherchemicals to Lake Michigan. J. Great Lakes Res. 3:291-304.
Hutchinson, G. E. 1957. A Treatise on Limnology.Vol. 1: Geography, Physics and Chemistry. NewYork: Wiley.
Ladewski, T. B., and Stoermer, E. F. 1973. Watertransparency in southern Lake Michigan in 1971 and
1972. In Proc. 16th Con! Great Lakes Res., pp.791-807. Internat. Assoc. Great Lakes Res.
Mortimer, C. H. 1975. Physical characteristics of LakeMichigan and its response to applied forces. InEnvironmental status of the Lake Michigan region,Vol. 2, pp. 1-102. Argonne Nat. Lab. Argonne,Illinois ANLj ES-40.
Mortonson, J. A 1977. The vertical distribution ofchlorophyll a and nutrients at a deep station in LakeMichigan. M.Sc. Thesis, Univ. Wisconsin, Milwaukee.
Rockwell, D. C., DeVault, D. S., Palmer, M. F.,Marion, C. V., and Bowden, R. J. 1980. LakeMichigan intensive survey 1976-1977. U.S. Environmental Protection Agency, Rep. No. EPA-905j4-80003-A, Great Lakes National Program Office,Chicago, Illinois.
Rousar, D. C. 1973. Seasonal and spatial changes inprimary production and nutrients in Lake Michigan.Water, Air, and Soil Poll. 2: 497-514.
____, and Beeton, A. M. 1973. Distribution ofphosphorus, silica, chlorophyll a, and conductivity inLake Michigan and Green Bay. Trans. Wis. A cad.Sci. Arts Lett. 61: 117-140.
Schelske, C. L., and Callender, E. 1970. Survey ofphytoplankton productivity and nutrients in LakeMichigan and Lake Superior. In Proc. 13th Conf.Great Lakes Res., pp. 93-105. Internat. Assoc. GreatLakes Res.
____, and Roth, J. C. 1973. Limnological surveyof Lakes Michigan, Superior, Huron, and Erie. Univ.Michigan, Great Lakes Res. Div. Pub!. No. 17.
____, and Stoermer, E. F. 1971. Eutrophication,silica depletion and predicted changes in algal qualityin Lake Michigan. Science 173: 423-424.
____ , Rothman, E. D., Stoermer, E. F., andSantiago, M. A 1974. Responses of phosphoruslimited Lake Michigan phytoplankton to factorial enrichments with nitrogen and phosphorus. Limnol.Oceanogr. 19: 409-419.
____, Stoermer, E. F., Gannon, J. E., andSimmons, M. S. 1976. Biological, chemical andphysical relationships in the Straits of Mackinac, U.S.Environmental Protection Agency, Eco!. Res. Series,EPA Rep. No. EPA-600j3-76-095, Duluth, Minnesota.
____, Moll, R. A, and Berry, T. D. 1981.Limnological characteristics of Northern LakeMichigan, 1976. Submitted. U.S. Environmental Protection Agency, Duluth, Minnesota.
____, Feldt, L. E., and Simmons, M. S. 1980.Phytoplankton and physical-chemical conditions inselected rivers and the coastal zone ofLake Michigan,1972. Univ. Michigan, Great Lakes Res. Div. Pub!.No. 19.
____, Rothman, E. D., and Simmons, M. S.1978. Comparison of bioassay procedures for growth-

SEASONAL CHANGES IN LAKE MICHIGAN 427
limiting nutrients in the Laurentian Great Lakes.Mitt. Internat. Verein. Limnol. 21: 65-80.
Stoermer, E. F. 1972. Statement, pp. 217-254. In ConLPollution of Lake Michigan and its tributary basin,Illinois, Indiana, Michigan and Wisconsin-4th session, Sept. 19-21, 1972, Chicago, IL. U.S. Environmental Protection Agency, Chicago, Vol. 1.PB-255-145.
____. 1978. Phytoplankton assemblages as indicators of water quality in the Laurentian Great Lakes.Trans. Amer. Microsc. Soc. 19: 2-16.
____. 1981. Phytoplankton population studies ofNorthern Lake Michigan, 1976. Submitted. U.S.Environmental Protection Agency, Duluth, Minnesota.
____" and Ladewski, T. B. 1978. Phytoplanktonassociations in Lake Ontario during IFYGL. Univ.Michigan, Great Lakes Res. Div. Spec. Rep. 62.
Strong, A. E., and Eadie, B. J. 1978. Satellite observations of calcium carbonate precipitations in the GreatLakes. Limnol. Oceanogr. 23: 877-887.
Tarapchak, S. J., and Stoermer, E. F. 1976. Phytoplankton of Lake Michigan. In Environmental statusof the Lake Michigan region, Vol. 4, pp. 1-211.ANLI ES-40. Argonne Nat. Lab., Argonne, Illinois.
Torrey, M. S. 1976. Chemistry of Lake Michigan. InEnvironmental status of the Lake Michigan region,Vol. 3, pp. 1-481. ANL/ES-40. Argonne Nat. Lab.,Argonne, Illinois.
Vollenweider, R. A., Munawar, M., and Stadelmann, P.1974. A comparative review of phytoplankton andprimary production in the Laurentian Great Lakes. J.Fish. Res. Board Can. 31: 739-762.
Yui, A. K. 1978. The VWA data base at the Large LakesResearch Station. EPA Large Lakes Research Station, Grosse He. System manual.


![Elektor[nonlinear.ir] 1976-03.pdf](https://static.fdokumen.com/doc/165x107/63255337cedd78c2b50c8927/elektornonlinearir-1976-03pdf.jpg)