Does Industrial Concentration Raise Productivity in Food ...
21
Does Industrial Concentration Raise Productivity in Food Industries? Munisamy Gopinath * Daniel Pick + Yonghai Li * Abstract : This manuscript investigates the productivity-industrial concentration relationship in U.S. food industries. We identify a critical level of industrial concentration beyond which its relationship with productivity growth becomes negative. The welfare effects of an increase in concentration – productivity growth and deadweight loss- are computed. Welfare loss from increasing concentration is substantially offset by gains from productivity growth. Presented at 2002 Annual Meeting of the Western Agricultural Economics Association July 28-31, 2002 Long Beach, California ____________________ * Gopinath is an Associate Professor in the Department of Agricultural and Resource Economics, Oregon State University. Li is a graduate student at Oregon State University. + Pick is the Chief of Specialty Crops Branch, MTED at USDA’s Economic Research Service. Partial financial support was provided by USDA’s Economic Research Service. brought to you by CORE View metadata, citation and similar papers at core.ac.uk provided by Research Papers in Economics
-
Upload
khangminh22 -
Category
Documents
-
view
2 -
download
0
Transcript of Does Industrial Concentration Raise Productivity in Food ...
Does Industrial Concentration Raise Productivity in Food Industries?
Munisamy Gopinath*
Daniel Pick+
Yonghai Li*
Abstract: This manuscript investigates the productivity- industrial concentration relationship in U.S. food industries. We identify a critical level of industrial concentration beyond which its relationship with productivity growth becomes negative. The welfare effects of an increase in concentration – productivity growth and deadweight loss- are computed. Welfare loss from increasing concentration is substantially offset by gains from productivity growth.
Presented at 2002 Annual Meeting of the Western Agricultural Economics Association July 28-31, 2002
Long Beach, California ____________________ *Gopinath is an Associate Professor in the Department of Agricultural and Resource Economics, Oregon State University. Li is a graduate student at Oregon State University. +Pick is the Chief of Specialty Crops Branch, MTED at USDA’s Economic Research Service. Partial financial support was provided by USDA’s Economic Research Service.
brought to you by COREView metadata, citation and similar papers at core.ac.uk
provided by Research Papers in Economics
1
Does Industrial Concentration Raise Productivity in Food Industries?
I. Introduction
The purpose of this article is to investigate the effects of industrial concentration on
innovation in the U.S. food processing industries. Increasing concentration, a
characteristic of these industries in recent years, has often been cast in negative terms.1
The exclusive focus on the welfare losses from imperfect competition has led to several
investigations into the procurement and sales practices of food processors by the U.S.
Departments of Agriculture and Justice. However, a number of studies have explored the
theoretical possibility that the static welfare losses of increasing concentration can be
offset by dynamic welfare gains such as a higher rate of innovation, the subject matter of
this study (Peltzman, 1977; Grossman and Helpman, 1991; Scherer, 1999).2 Specifically,
we investigate (i) whether growth in concentration increases the rate of innovation in the
U.S. food processing industry, and if so, (ii) can the welfare gains from a higher rate of
innovation offset the deadweight loss from an increase in concentration.
The traditional reason for the effect of concentration on innovation is
Schumpeter’s “creative destruction,” which suggests that a competitive market is
perfectly suited for static resource allocation, but the large firm in a concentrated market
is the source of long-run expansion of output. That is, extra profits from marking up
prices over marginal costs provide resource for innovation. However, as Cohen and Levin
(1989) note, market concentration is one source of innovation, while others such as the
demand structure, technological opportunity and appropriability conditions are equally
important. For instance, the existence of opportunities/production possibilities to
2
translate research resources into new production techniques and the cost of
imitation/copying by prospective competitors should be accounted for while investigating
the effect of concentration on innovation.
Our study of the effect of industrial concentration on innovation differs from
previous studies in several ways. First, the rate of innovation is represented by the rate of
growth in total factor productivity (TFP). Growth in TFP embodies technological
innovations, both product and process types (Scherer, 1999, p.30), while the analysis of it
continues to remain useful and important in the development of new endogenous growth
theories (Barro and Sala-I-Martin, 1995, p.352). Moreover, TFP growth is likely a better
measure of the rate of innovation than patent counts or citations, which do not match the
new product data in the case of the food industries (Hall, Jaffe and Trajtenberg, 2001;
New Product News, 1998). Second, our focus is at the [food] industry level rather than at
the firm level. Here, we search for a possible critical level of concentration, i.e., the
inverted-U hypothesis (originally due to Scherer), beyond which its relationship with
productivity can turn negative. Gisser (1982) also investigated the relationship between
productivity and concentration at the industry level, but postulated a monotonic
relationship between them. Furthermore, we estimate of the tradeoff between
productivity growth and concentration in the presence of conditioning variables, and
recognizing their simultaneity, unlike Gisser (1982) and other studies (Sexton, 2000).3
Data from the National Bureau of Economic Research (NBER) and the U.S.
Department of Commerce (USDC) for the period 1964-92 are used for simultaneous
estimation of TFP growth and concentration. 4 Consistent with prior research, we find
that the conditioned productivity- industrial concentration relationship has an inverted-U
3
shape. The critical level of concentration (ratio), where the relationship between growth
rates of TFP and concentration turns negative, appears to be 62.3, a 24% increase from
the current levels. Including welfare loss estimates and a mapping of the net gain from
an increase in concentration suggests that current deadweight loss of $7.8 billion can be
reduced to $2.8 billion with an increase in concentration by 18% from its current level.
II. Economic and Empirical Model of the Productivity-Concentration Relationship
Our investigation of the productivity-concentration relationship is based on some recent
theoretical models of innovation-driven growth at the industry level (e.g., Peretto, 1996,
and Smulders and van de Klundert, 1995). Since the basic models of this theory have
been widely discussed, we provide in this section only rudimentary details and focus
instead on the results. The reader is referred to Kamien and Schwartz (1982), Baldwin
and Scott (1987), Cohen and Levin (1989), Scherer and Perlman (1992), and Sutton
(1998) for a review of theory on market structure and technology, and empirical issues.
In the case of Peretto (1996), the economy’s manufacturing sector is characterized
as a differentiated oligopoly. Consumers maximize lifetime utility, where preferences are
symmetric over the range of available differentiated goods. Firms’ instantaneous demand
schedules are of the Dixit and Stiglitz (1977) type. The manufacturing technology
requires fixed costs and allows for knowledge cumulation and cost reduction. The
maximization of the value of the firm involves allocating labor to physical and
knowledge production and choosing the product price. All firms face the same production
(and knowledge) technologies and demand schedules. A condition of symmetric industry
equilibrium with free entry and exit is that the average rate of growth in cost reduction in
4
an industry varies inversely with the number of firms, and directly with knowledge
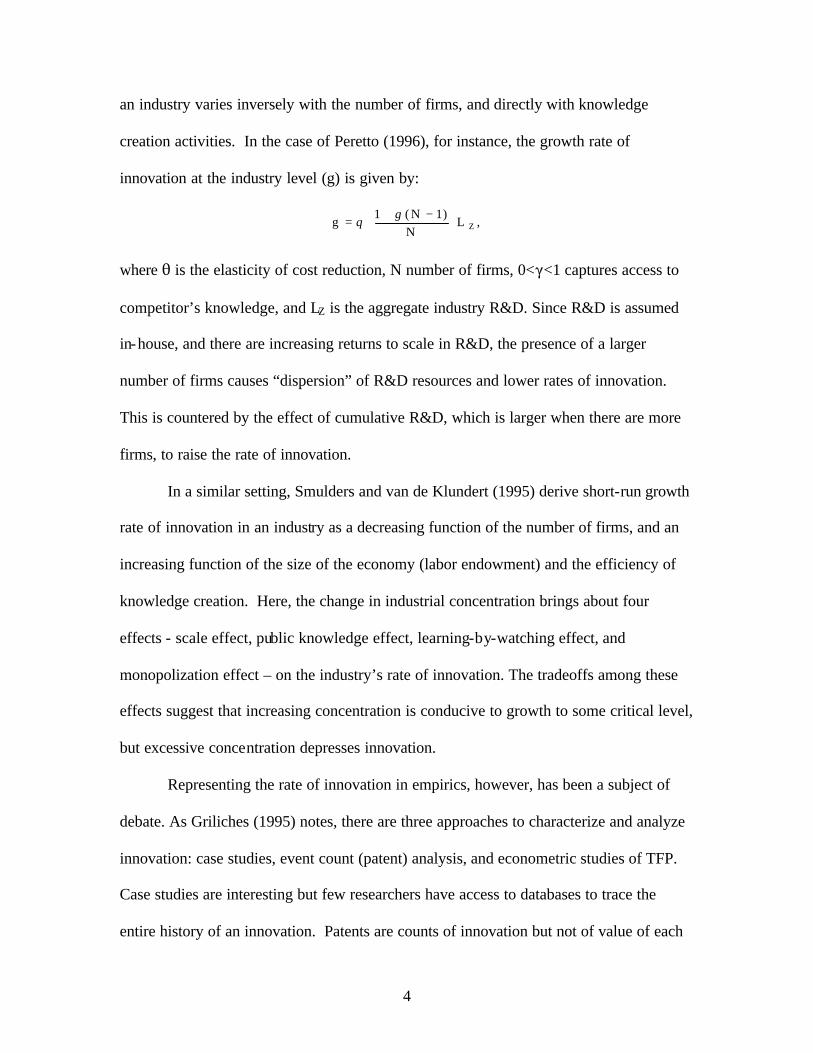
creation activities. In the case of Peretto (1996), for instance, the growth rate of
innovation at the industry level (g) is given by:
,LN
)1N(1g Z
−+
=γ
θ
where 2 is the elasticity of cost reduction, N number of firms, 0<(<1 captures access to
competitor’s knowledge, and LZ is the aggregate industry R&D. Since R&D is assumed
in-house, and there are increasing returns to scale in R&D, the presence of a larger
number of firms causes “dispersion” of R&D resources and lower rates of innovation.
This is countered by the effect of cumulative R&D, which is larger when there are more
firms, to raise the rate of innovation.
In a similar setting, Smulders and van de Klundert (1995) derive short-run growth
rate of innovation in an industry as a decreasing function of the number of firms, and an
increasing function of the size of the economy (labor endowment) and the efficiency of
knowledge creation. Here, the change in industrial concentration brings about four
effects - scale effect, public knowledge effect, learning-by-watching effect, and
monopolization effect – on the industry’s rate of innovation. The tradeoffs among these
effects suggest that increasing concentration is conducive to growth to some critical level,
but excessive concentration depresses innovation.
Representing the rate of innovation in empirics, however, has been a subject of
debate. As Griliches (1995) notes, there are three approaches to characterize and analyze
innovation: case studies, event count (patent) analysis, and econometric studies of TFP.
Case studies are interesting but few researchers have access to databases to trace the
entire history of an innovation. Patents are counts of innovation but not of value of each
5
innovation, and most process innovations are not patented (Hall, Jaffe and Trajtenberg,
2001). In the case of the food industry, the number of patents do not match the number
of new products released every year, strongly suggesting the prevalence of process
innovations (New Product News, 1998). That is, the underlying (unpatented) process
innovations in the food industry has allowed for proliferation of new products/varieties.
Moreover, patent citations data suffer from significant truncation and measurement
problems. TFP growth accounts for growth in output that is not attributable to tangible
inputs, and hence includes technical progress, improvements in technical efficiency, and
learning-by-doing (Backus, Kehoe and Kehoe, 1992). It may also include scale
economies and disequilibrium effects (Morrison-Paul, 2001), which can be controlled for
using instrumental regression procedures. Moreover, analysis of TFP growth has served
an important role in guiding policy (Scherer, 1999) and developing new growth theories
(Barro and Sala-I-Martin, 1995). Given these trade-offs and the context (food industry),
we choose TFP growth to represent the rate of innovation.
Empirical studies have used production or cost function as a starting point to
derive TFP growth as function of industrial concentration and other factors.5 Consistent
with the theory and some recent empirical work (Nickell, 1996; Gort and Sung 1999), our
initial specification of the productivity- industrial concentration relationship takes the
following form:
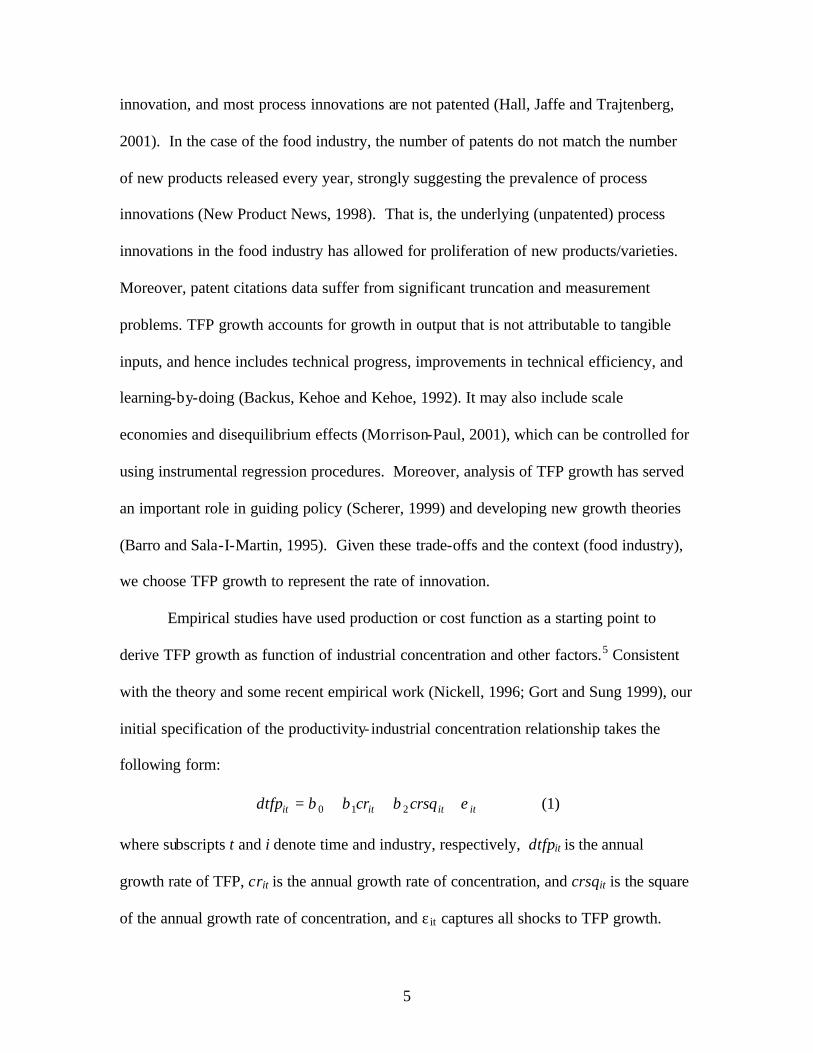
itititit crsqcrdtfp εβββ +++= 210 (1)
where subscripts t and i denote time and industry, respectively, dtfpit is the annual
growth rate of TFP, crit is the annual growth rate of concentration, and crsqit is the square
of the annual growth rate of concentration, and ε it captures all shocks to TFP growth.
6
The productivity- industrial concentration relationship as specified above is
subject to endogeneity and specification problems. First, there is the case for reverse
causality, i.e., innovation affects price-cost margins (Demsetz, 1973). Some authors have
disagreed. For instance, Baldwin and Scott (1987), rephrasing Schumpeter, argue that
large-scale innovation may not be attractive unless some sort of insurance is available to
the potential entrepreneur. That is, an insurance against the failure of an innovation is the
ability to engage in a price strategy, and thus monopolistic power in existing products
markets may be a precondition for innovation (also see Gisser, 1986). However, our
empirical investigation covers a fairly long time period and the possibility of TFP growth
affecting concentration cannot be ignored.
Secondly all of the growth in productivity is not accounted for by concentration.
As Cohen and Levin (1989) note, demand structure, technological opportunity and
appropriability are additional factors impacting the rate of innovation in an industry.
Since we focus exclusively on the food industries (four-digit Standard Industrial
Classification, SIC, codes), demand differences are likely to be less important than
factors such as research and development. Unfortunately, direct measures of R&D
expenditures/stocks are not available at the level of our analysis, four-digit Standard
Industrial Classification (SIC) codes. The R&D data available at the two-digit SIC (20)
level together with growth in real factor prices faced by these industries are used to proxy
technological opportunity and appropriability conditions.6 The aggregate R&D
represents the pool of knowledge available to these industries. When R&D is in-house,
(creation of new products and/or processes is internal to a firm/industry) real growth in
factor prices such as labor cost can capture its activity including learning-by-doing. Real
7
increases in prices of intermediates and new capital goods are likely to reflect out-
sourcing of technology (Levin, Cohen and Mowry, 1985; Grossman and Helpman, 1991).
Hence, we augment the initial specification of the productivity- industrial concentration
relationship to include a specification for growth in concentration:
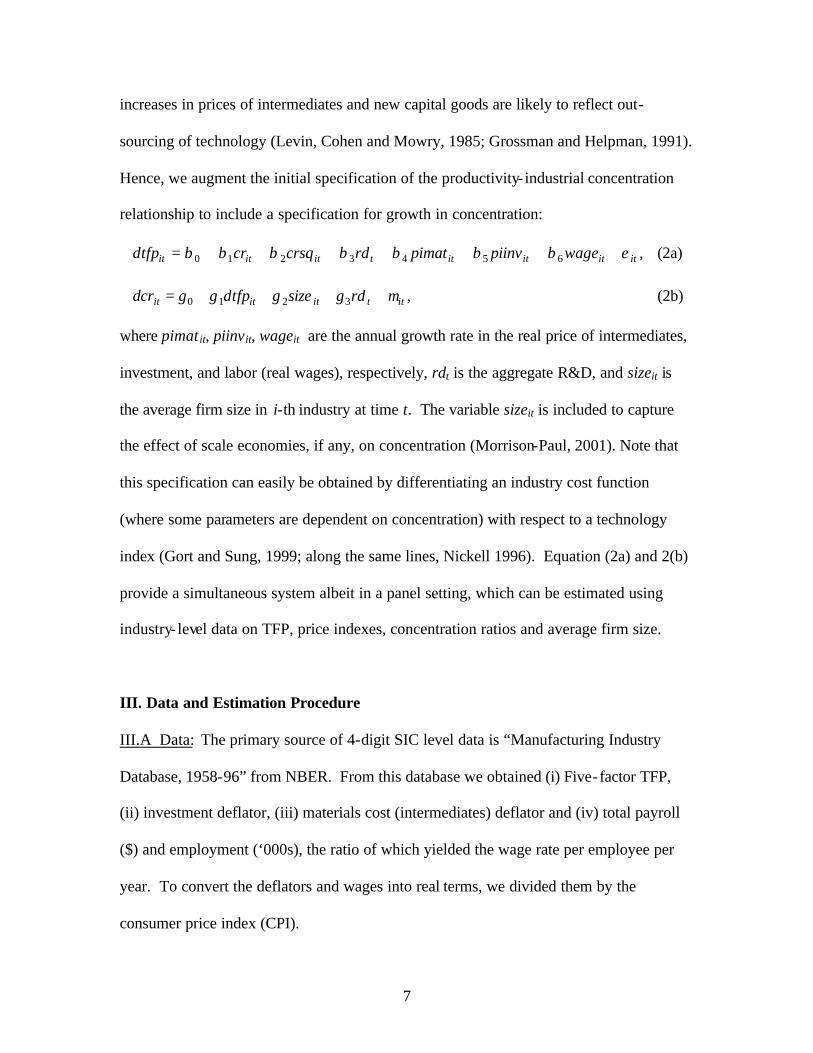
,6543210 itititittititit wagepiinvpimatrdcrsqcrdtfp εβββββββ +++++++= (2a)
,3210 ittititit rdsizedtfpdcr µγγγγ ++++= (2b)
where pimat it, piinvit, wageit are the annual growth rate in the real price of intermediates,
investment, and labor (real wages), respectively, rdt is the aggregate R&D, and sizeit is
the average firm size in i-th industry at time t. The variable sizeit is included to capture
the effect of scale economies, if any, on concentration (Morrison-Paul, 2001). Note that
this specification can easily be obtained by differentiating an industry cost function
(where some parameters are dependent on concentration) with respect to a technology
index (Gort and Sung, 1999; along the same lines, Nickell 1996). Equation (2a) and 2(b)
provide a simultaneous system albeit in a panel setting, which can be estimated using
industry- level data on TFP, price indexes, concentration ratios and average firm size.
III. Data and Estimation Procedure
III.A Data: The primary source of 4-digit SIC level data is “Manufacturing Industry
Database, 1958-96” from NBER. From this database we obtained (i) Five-factor TFP,
(ii) investment deflator, (iii) materials cost (intermediates) deflator and (iv) total payroll
($) and employment (‘000s), the ratio of which yielded the wage rate per employee per
year. To convert the deflators and wages into real terms, we divided them by the
consumer price index (CPI).
8
Data on industrial concentration take the form of four-firm concentration ratio,
i.e., share of value of shipments accounted by the 4 largest companies in each food
processing industry. Average firm size is represented as the ratio of real value of industry
shipments to its number of companies (Bureau of the Census, USDC). Due to the
availability of data for concentration ratio and number of firms at five-year intervals, we
use grouped data (see Greene, 1997 for an exposition). We have 6 groups as follows:
group1: 1964-1967 (group size: 4-year); group2: 1968-1972 (group size: 5-year); group3:
1973-1977 (group size: 5-year); group4: 1978-1982 (group size: 5-year); group5: 1983-
1987 (group size: 5-year); group6: 1988-1992 (group size: 5-year). Thus, we compile
one 4-year average and five 5-year average data.
The variables dtfp, pimat, piinv, wage and rd are generated by taking the
difference between initial (I) and final (F) levels and solving fo r x in (I+x)4 or 5 = F. The
growth rate (x) is then premultiplied by the square root of the respective group size (4 or
5). Similarly, given concentration ratios and average firm size at 4- or 5-year intervals,
the process above is repeated to derive their growth rates, which are then premultiplied
by the respective group size. Note that Gisser (1982) uses grouped data for concentration
variables, but does not account for the ensuing heteroskedasticity.
Our database has 6 (grouped) observations on each of the 36 out of the 48 food
processing industries. The other 12 food processing industries are excluded since
concentration ratios are not available for all census periods in our sample. Persistent
negative growth rates of TFP, observed for a few industries, are likely whenever output
growth is lower relative to growth of input, which can occur in highly protected
industries such as the dairy processing and cane-sugar processing.
9
III.B Estimation Procedure: As noted earlier, equations (2a) and (2b) form a system of
simultaneous equations in a panel setting. Advances have been made in deriving
appropriate estimators and their properties in this context (Baltagi, Chapter 7, 1995). In
line with prior applications of these procedures (e.g., Nguyen and Bernier, 1988; Kinal
and Lahiri, 1993), we employ two-stage least squares (2SLS), which allows for fixed
industry and time effects.7 In the first stage growth rates of TFP and concentration are
regressed on all exogenous variables, and industry and time dummies. Fitted values are
obtained for both regressands using a one-way fixed effects specification based on a F-
test. The respective specifications, as in equations (2a) and (2b), are estimated using the
fitted values of TFP and concentration growth rates. Both one-way and two-way fixed
effects models are estimated. The quadratic specification for TFP growth is compared
with a linear specification as well. The objective and the log- likelihood values (F-test
and Likelihood ratio test) are used to choose among the various specifications. The
lowest (highest) objective (likelihood) value is obtained for a one-way specification with
time dummies, the results of which are reported in table 1. The R2 for the TFP and
concentration equation are 39% and 22%, respectively, but note that the number of cross
sections (36) exceeds that of the time series (6).
IV. Results
In this section, we first deal with the results of the relationship between productivity and
concentration and vice versa. It is followed by the analysis of total welfare and the
distributional impacts of a rise in concentration.
10
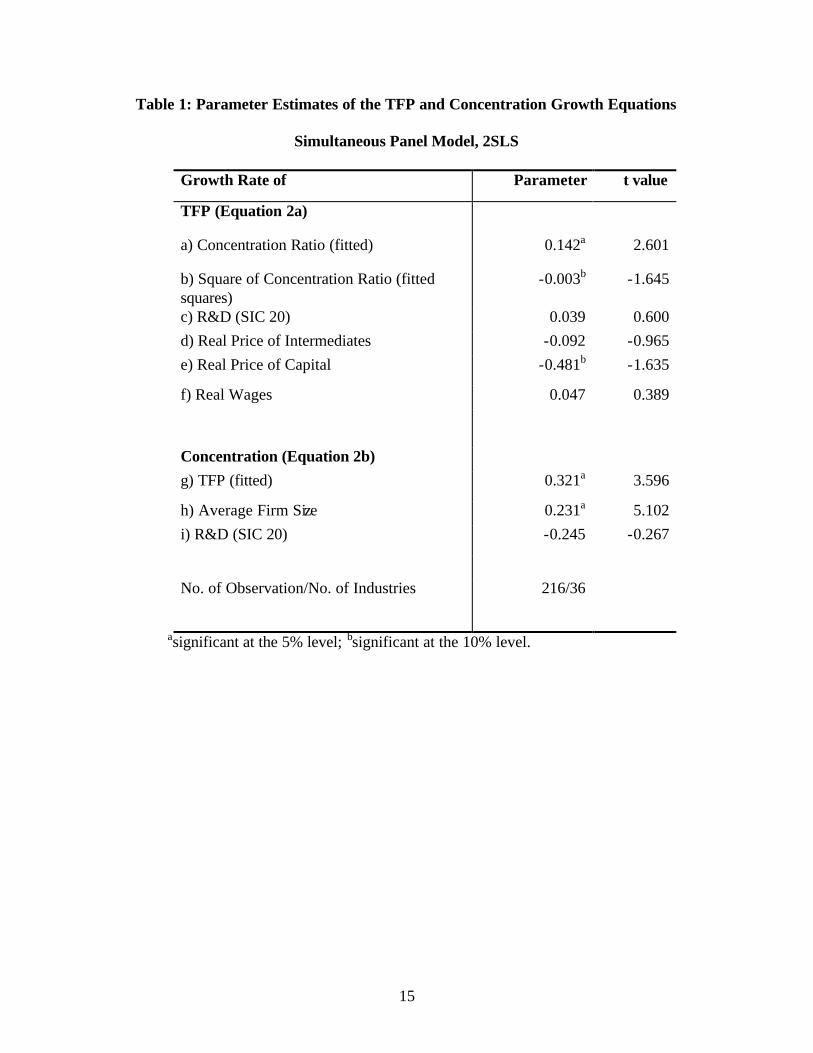
IV.1 Productivity and Concentration: The results from the estimation of equations (2a)
and (2b) are reported in table 1. Consistent with conventional wisdom, regression of TFP
growth on concentration and its square (fitted values), in the presence of conditioning
variables, provide support for the inverted-U hypothesis. The coefficient on
concentration and its square, 0.142 and –0.003, are significant at the 5% and 10% level,
respectively. The magnitude of the estimates are similar to those obtained by Levin,
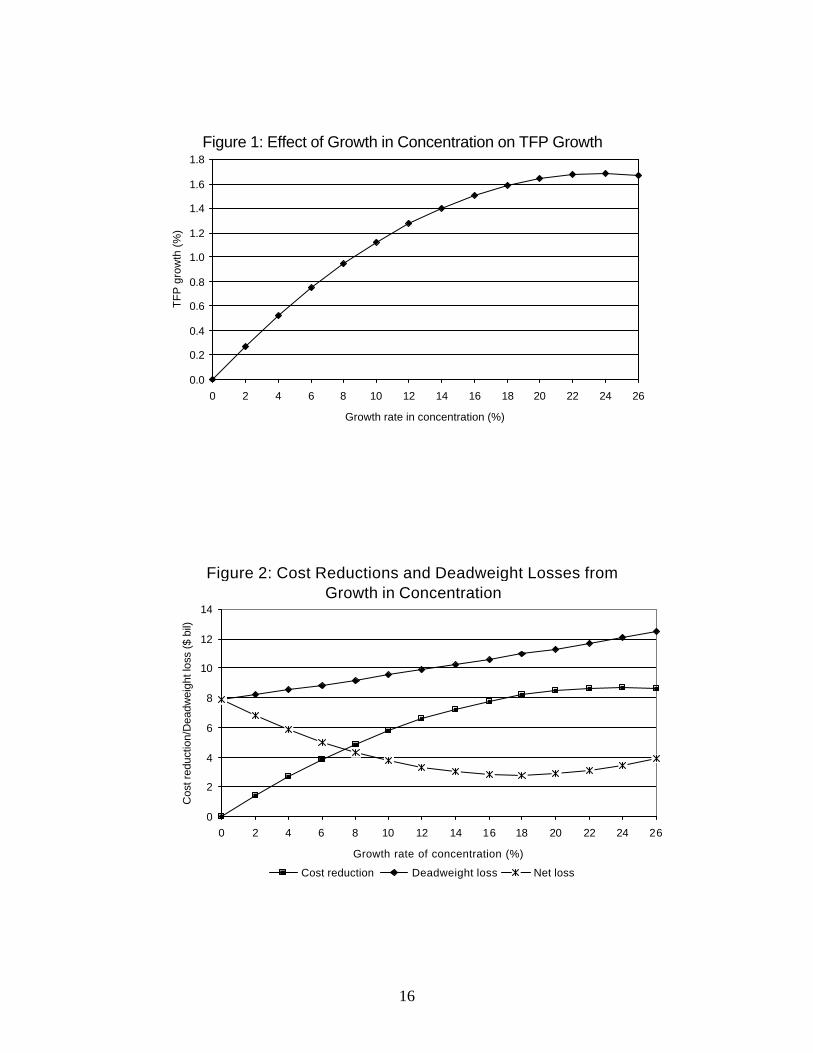
Cohen and Mowery (1985). Figure 1 illustrates the effect of growth in concentration on
TFP growth. A 1% growth in concentration brings about an initial 0.139% change in
TFP growth, but the contribution declines with further increases in concentration. The
peak suggests that a 24% growth in concentration, from existing levels, brings about the
maximum benefits in the form of TFP growth at 1.687%. Concentration ratios ranged
from a low of 22% (SIC 2026) to a high of 90% (SIC 2082) in 1992, and a simple
unweighted average level of concentration in the food industry (SIC 20) is 50.2%. Hence,
the results suggest that additional growth in TFP of about 1.687% can be achieved if
concentration were to rise to 62.3% (=1.24*50.2). Note that the increase in concentration
ratio by 24% need not occur in just one time period. A weighted average of concentration
ratios as in Gisser (1982) does not change the qualitative interpretation of these results.
Evidence on technological opportunity or appropriability conditions is not strong.
Although the aggregate R&D variable has the expected positive sign, it is not significant.
The growth in the real price of capital has a negative and significant (10% level) effect on
TFP growth, while the effect of real wages and real price of intermediates are
insignificant. We suspect data limitations as the source of difficulty in modeling
11
technological opportunity and appropriability conditions (Levin, Cohen and Mowry,
1985). Note that the R&D variable does not have cross-sectional variation.
The results of concentration growth equation (2b) are also reported in table 1.
The effect of TFP growth (fitted values) is positive and significant suggesting that
innovations increase concentration. Moreover, the effect of average firm size on
concentration is significantly positive. That is, the larger the average size of firms in an
industry the greater is the concentration, which is likely due to scale economies
(Morrison-Paul, 2001). Similar to that of the TFP growth equation, R&D exerts an
insignificant effect on growth in concentration.
IV.2 Total Welfare Analysis: Using the results from the TFP growth regression, we
provide some insights into the tradeoff between productivity growth and industrial
concentration. First, we assume a constant returns to scale (CRS) technology in food
processing for computational convenience. In the cost function, the productivity
paramter will be raised to the power of –1, if technology is of the CRS-type. Hence, a 1%
increase in TFP lowers cost by 1%. Evidence suggests that a majority of the food
processing industries exhibit increasing returns to scale, in which case the benefits from
TFP growth are underestimated (Morrison-Paul, 2001; Bhuyan and Lopez, 1997). Given
that the current level of gross output in the food processing industries is $514 billion
(constant 1996 dollars, Bureau of Economic Analysis, USDC), a 1% reduction in cost
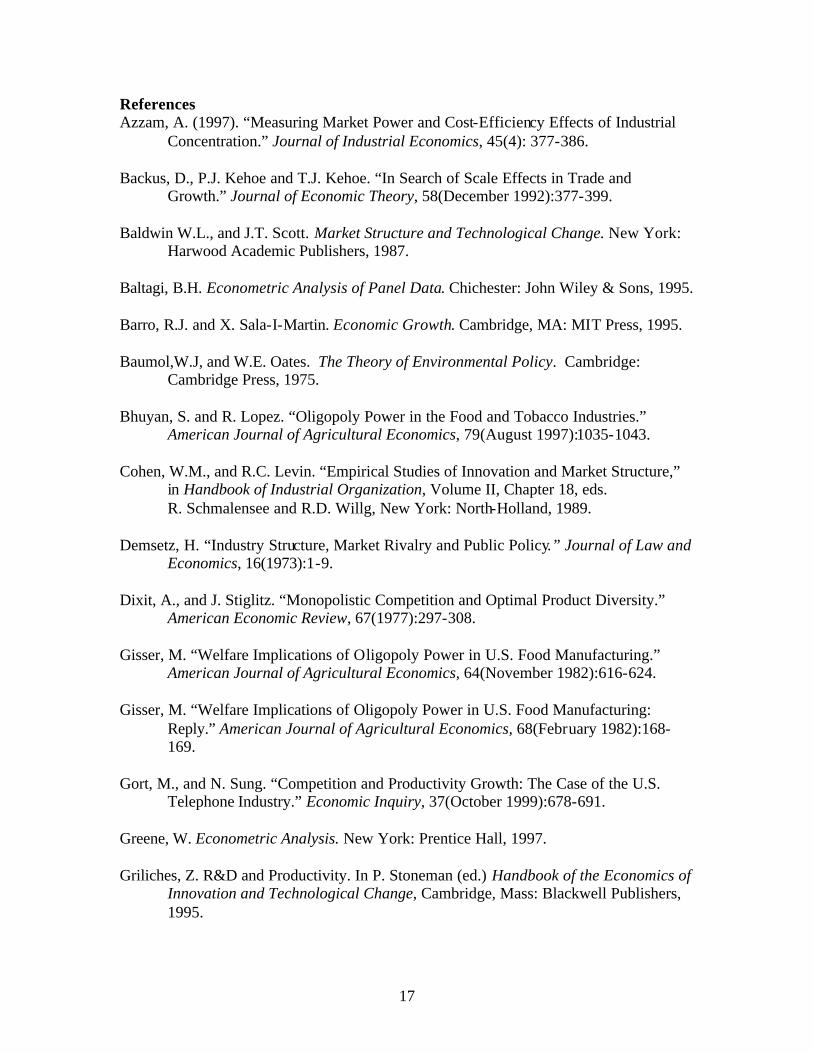
leads to a welfare gain bounded by $5.14 billion, given the CRS assumption. In figure 2,
we plot these welfare gains from TFP growth converted into cost reductions (billion $)
for various rates of growth in concentration. Similar to the relation between
concentration and TFP growth, we observe an inverted-U relationship between
12
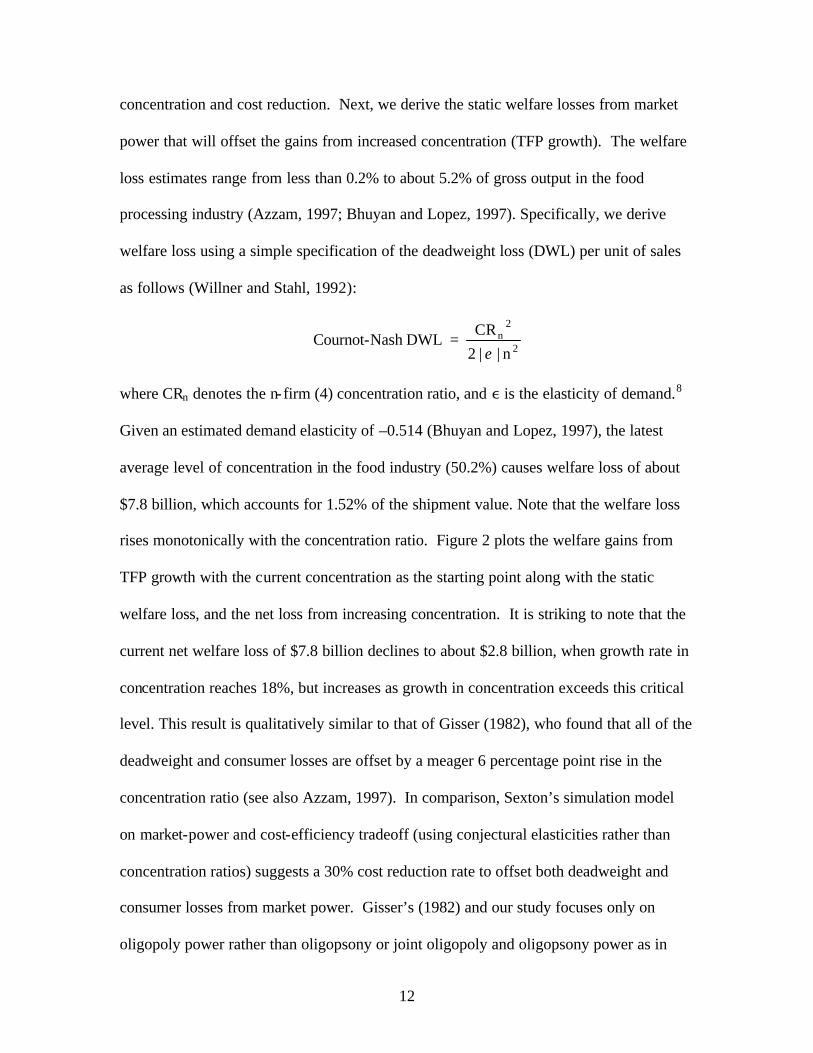
concentration and cost reduction. Next, we derive the static welfare losses from market
power that will offset the gains from increased concentration (TFP growth). The welfare
loss estimates range from less than 0.2% to about 5.2% of gross output in the food
processing industry (Azzam, 1997; Bhuyan and Lopez, 1997). Specifically, we derive
welfare loss using a simple specification of the deadweight loss (DWL) per unit of sales
as follows (Willner and Stahl, 1992):
Cournot-Nash DWL = 2
2n
n||2CR
ε
where CRn denotes the n-firm (4) concentration ratio, and , is the elasticity of demand.8
Given an estimated demand elasticity of –0.514 (Bhuyan and Lopez, 1997), the latest
average level of concentration in the food industry (50.2%) causes welfare loss of about
$7.8 billion, which accounts for 1.52% of the shipment value. Note that the welfare loss
rises monotonically with the concentration ratio. Figure 2 plots the welfare gains from
TFP growth with the current concentration as the starting point along with the static
welfare loss, and the net loss from increasing concentration. It is striking to note that the
current net welfare loss of $7.8 billion declines to about $2.8 billion, when growth rate in
concentration reaches 18%, but increases as growth in concentration exceeds this critical
level. This result is qualitatively similar to that of Gisser (1982), who found that all of the
deadweight and consumer losses are offset by a meager 6 percentage point rise in the
concentration ratio (see also Azzam, 1997). In comparison, Sexton’s simulation model
on market-power and cost-efficiency tradeoff (using conjectural elasticities rather than
concentration ratios) suggests a 30% cost reduction rate to offset both deadweight and
consumer losses from market power. Gisser’s (1982) and our study focuses only on
oligopoly power rather than oligopsony or joint oligopoly and oligopsony power as in
13
Sexton. Note that even if losses from oligopsony are added to our welfare loss measure,
the net loss may increase, but the possibility that it declines until a critical level of
concentration continues to hold.
IV.3 Distributional Impacts: Thus far, we demonstrated that total welfare may improve
when increases in concentration are accompanied by productivity growth. However,
losses to consumers, not to the society, often are a guiding principle for antitrust policy.
We can offer some insights into the distributional impact of the concentration-
productivity relationship, albeit in a second-best world.
Note that the level of oligopoly output would lie somewhere between the
competitive and monopoly output, given an inelastic demand structure. All else constant,
the output level should shrink and the price should rise when concentration increases
(static case). However, the marginal cost curve is not the same as before since there is a
link between concentration and productivity. Hence, the shift (lowering) of the marginal
cost curve results in new competitive and monopoly output levels, which are greater
relative to the static case. As a result, oligopoly output can increase accompanied by a
fall in the price when concentration increases up to a critical point. We showed in the
previous section that the total welfare rises with concentration given current conditions.
Given the possibility of increased output and lower prices as a result of an increase in
concentration, consumer surplus can rise in a second-best world. That is, consumers are
better-off than before although they are still farther from the “true” competitive
equilibrium. With regard to producers’ welfare, revenue and price vary inversely given
the inelastic nature of the demand. However, they wouldn’t have embarked on
product/process innovations unless they are profitable.
14
V. Summary and Conclusions
In this study, we focused on the Schumpeterian hypothesis of “creative destruction,”
where industrial concentration can increase welfare by impacting innovation. We
consider the productivity- industrial concentration relationship in the presence of other
conditioning variables such as external and internal sources of knowledge, and industry-
specific effects. In addition, we allow for a simultaneous determination of industrial
concentration. Grouped data from public domain are used to provide empirical insights
into this relationship. Our focus is a bit limited because R&D variables are available at
aggregate levels and not at the level of our analysis.
We find that growth in concentration is an important determinant of TFP growth
and vice versa. Consistent with prior studies, an inverted-U relationship is found between
TFP growth and concentration. The critical growth rate of concentration is found to be
18%, where most of the static deadweight losses are offset by increases in TFP growth.
Thus, total welfare improves and consumers are better-off given the second best scenario
depicted here.
Future studies may continue to focus on evaluating the net welfare loss/gain from
increasing concentration by adding static losses from concentration to the welfare gains
from innovation and other sources (e.g., lower environmental externalities, reduced price
variability). Thus, antitrust/regulation policies must take into consideration the dynamic
welfare gains of industrial concentration.
15
Table 1: Parameter Estimates of the TFP and Concentration Growth Equations
Simultaneous Panel Model, 2SLS
Growth Rate of Parameter t value
TFP (Equation 2a)
a) Concentration Ratio (fitted) 0.142a 2.601
b) Square of Concentration Ratio (fitted squares)
-0.003b -1.645
c) R&D (SIC 20) 0.039 0.600 d) Real Price of Intermediates -0.092 -0.965 e) Real Price of Capital -0.481b -1.635
f) Real Wages 0.047 0.389
Concentration (Equation 2b) g) TFP (fitted) 0.321a 3.596
h) Average Firm Size 0.231a 5.102 i) R&D (SIC 20) -0.245 -0.267
No. of Observation/No. of Industries 216/36
asignificant at the 5% level; bsignificant at the 10% level.
16
Figure 1: Effect of Growth in Concentration on TFP Growth
0.0
0.2
0.4
0.6
0.8
1.0
1.2
1.4
1.6
1.8
0 2 4 6 8 10 12 14 16 18 20 22 24 26
Growth rate in concentration (%)
TF
P g
row
th (
%)
Figure 2: Cost Reductions and Deadweight Losses from Growth in Concentration
0
2
4
6
8
10
12
14
0 2 4 6 8 10 12 14 16 18 20 22 24 26
Growth rate of concentration (%)
Cos
t red
uctio
n/D
eadw
eigh
t los
s ($
bil)
Cost reduction Deadweight loss Net loss
17
References Azzam, A. (1997). “Measuring Market Power and Cost-Efficiency Effects of Industrial
Concentration.” Journal of Industrial Economics, 45(4): 377-386.
Backus, D., P.J. Kehoe and T.J. Kehoe. “In Search of Scale Effects in Trade and Growth.” Journal of Economic Theory, 58(December 1992):377-399.
Baldwin W.L., and J.T. Scott. Market Structure and Technological Change. New York: Harwood Academic Publishers, 1987.
Baltagi, B.H. Econometric Analysis of Panel Data. Chichester: John Wiley & Sons, 1995. Barro, R.J. and X. Sala-I-Martin. Economic Growth. Cambridge, MA: MIT Press, 1995. Baumol,W.J, and W.E. Oates. The Theory of Environmental Policy. Cambridge:
Cambridge Press, 1975. Bhuyan, S. and R. Lopez. “Oligopoly Power in the Food and Tobacco Industries.”
American Journal of Agricultural Economics, 79(August 1997):1035-1043. Cohen, W.M., and R.C. Levin. “Empirical Studies of Innovation and Market Structure,”
in Handbook of Industrial Organization, Volume II, Chapter 18, eds. R. Schmalensee and R.D. Willg, New York: North-Holland, 1989.
Demsetz, H. “Industry Structure, Market Rivalry and Public Policy.” Journal of Law and
Economics, 16(1973):1-9. Dixit, A., and J. Stiglitz. “Monopolistic Competition and Optimal Product Diversity.”
American Economic Review, 67(1977):297-308. Gisser, M. “Welfare Implications of Oligopoly Power in U.S. Food Manufacturing.”
American Journal of Agricultural Economics, 64(November 1982):616-624. Gisser, M. “Welfare Implications of Oligopoly Power in U.S. Food Manufacturing:
Reply.” American Journal of Agricultural Economics, 68(February 1982):168-169.
Gort, M., and N. Sung. “Competition and Productivity Growth: The Case of the U.S.
Telephone Industry.” Economic Inquiry, 37(October 1999):678-691. Greene, W. Econometric Analysis. New York: Prentice Hall, 1997. Griliches, Z. R&D and Productivity. In P. Stoneman (ed.) Handbook of the Economics of
Innovation and Technological Change, Cambridge, Mass: Blackwell Publishers, 1995.
18
Grossman G., and E. Helpman. Innovation and Growth in the Global Economy. Cambridge MA: MIT press, 1991.
Hall, B.W., A.B. Jaffe, M. Trajtenberg. The NBER Patent Citation Data File: Lessons,
Insights and Methodological Tools. NBER Working Paper No.W8498, October 2001.
Kamien, M. and A. Schwartz. Market Structure and Innovation. Cambridge: Cambridge
University Press, 1982. Kinal, T, and K. Lahiri. “On the Estimation of Simultaneous-Equations Error-
Components Models with an Application to a Model of Developing Country Foreign Trade.” Journal of Applied Econometrics, 8(Jan-Mar 1993):81-92.
Levin, R.C., W.M. Cohen, and D.C. Mowery. “R&D Appropriability, Opportunity, and
Market Structure: New Evidence on Some Schumpeterian Hypotheses.” American Economic Review, 75(May 1985):20-24.
Morrison-Paul, C.J. “Cost Economies and Market Power: The Case of the U.S. Meat
Packing Industry.” Review of Economics and Statistics, 83(August 2001): 531-540.
New Product News. “New Product Intros Fall Flat in 1997.” New Product News,
Chicago, IL, (January 1998): 24-25. Nguyen, T. and G. Bernier. “Beta and q in a Simultaneous Framework with Pooled
Data.” Review of Economics and Statistics, 70(August 1988):520-524. Nickell, S.J. “Competition and Corporate Performance.” Journal of Political Economy,
104(1996):724-746. Peltzman, S. “The Gains and Losses from Industrial Concentration.” Journal of Law and
Economics, 20(1977):229-63. Peretto, P.F. “Sunk costs, Market Structure and Growth.” International Economic
Review, 37(November 1996):895-923. Scherer, F.M. New Prespectives on Economic Growth and Technological Innovation.
Washington DC: Brookings Institution Press, 1999. Scherer, F.M. and M. Perlman (eds.). Entrepreneurship, Technological Innovation and
Economic Growth: Studies in the Schumpeterian Tradition. Ann Arbor: University of Michigan Press, 1992.
Sexton, R. J. “Industrialization and Consolidation in the U.S. Food Sector:
Implications for Competition and Welfare.” American Journal of Agricultural
19
Economics, 82(December 2000):1087-1104. Sheldon, I.M., and D.R. Henderson. Industrial Organization and International Trade:
Methodological Foundations for International Food and Agricultural Research, Columbus: The Ohio State University Press, 1991
Smulders, S., and T. van de Klundert. “Imperfect Competition, Concentration and
Growth with Firm-Specific R&D.” European Economic Review, 39(1995):139-160.
Stigler, G.J. “The Economics of Information.” Journal of Political Economy, 69
(June 1961): 213-225. Sutton, J. Technology and Market Structure: Theory and History. Cambridge: MIT press,
1998. Willner, J., and L. Stahl. “Where are the Welfare Losses of Imperfect Competition
Large?” European Journal of Political Economy, 8(1992):477-491.

20
1See Sheldon and Henderson (1991) for a survey of the new empirical industrial organization literature. 2Other sources of dynamic welfare gains include the protection of environment and natural resources (Baumol and Oates, 1975), and reduced price variability (Stigler, 1961). 3 Azzam (1997) explores the market power and cost efficiency effects of concentration on output price. 4Data on four-firm concentration ratio for 1997 are not available at this time for inclusion into our analysis. In addition, the BEA uses a new system called North American Industrial Classification system for 1997 census, which does not necessarily have a one-to-one correspondence with the standard industrial classification system. 5For a survey of empirical studies at the firm level, see Cohen and Levin (1989). 6In line with prior empirical work, we let industry-specific dummies/error component to capture other missing effects. 7The implicit assumption in 2SLS is that the disturbances in our two equations are not contemporaneously correlated. Otherwise, three-stage least squares (3SLS) should be preferred. As Nguyen and Bernier (1988) note, the price that is paid for the use of 3SLS is that if the complete system is misspecified, all the estimates of the structural parameters will be affected, rather than, in the case of 2SLS, only the estimates of the structural parameters of one equation. Moreover, 2SLS continues to provide consistent estimators and as noted by Kinal and Lahiri (1993), the efficiency gains from 3SLS are modest. 8Willner and Stahl (1992) derive welfare losses under three different scenarios, Cournot-Nash, Stackelberg, and Collusive behavior and two types of demand specification. For the Stackelberg, and Collusive behavior, the computation of welfare losses is similar except that the denominators change to [(2n-1)2 2|,|] and 2|,|, respectively.