Engaging with diverse audiences to raise awareness about ...

DOES INVESTMENT IN SCHOOLING RAISE NATIONAL INCOME? EVIDENCE
FROM CROSS-COUNTRY STUDIES.
Theodore R. Breton.
No. 11-01
2011

Electronic copy available at: http://ssrn.com/abstract=1862924
Does Investment in Schooling Raise National Income?
Evidence from Cross-Country Studies
Theodore R. Breton
June 5, 2011
Abstract
The economics literature identifies three effects of schooling on national income; the direct
effect on the earnings of the workers who receive the schooling and the external effects on
workers’ earnings and on physical capital due to schooling’s spillover effect on the productivity
of these other factors of production. This paper reviews the estimates of the income elasticity of
these three effects in the literature and finds that the evidence supports an elasticity of 0.34. The
associated marginal rates of return on national investment in schooling in 2000 are found to
average about 12 percent in countries with high levels of schooling and about 25 percent in
countries with low levels of schooling.
JEL Codes: E23, F43, I21, O11, O15, O47
Key Words: Human Capital, Schooling, Education, Physical Capital, National Income,
Economic Growth

Electronic copy available at: http://ssrn.com/abstract=1862924
2
How much does investment in schooling raise national income? Over the last 20 years
the effect of schooling on national income has been one of the most controversial issues in the
fields of economic growth and economic development. Innumerable cross-country empirical
studies have been carried out to ascertain the magnitude of the effect, and until recently these
studies had failed to reach any consensus. While some studies indicated that additional
schooling has a large, positive effect on national income, other studies found no effect, or a
negative effect.
Why have the studies in the literature found such different effects? A consensus seems to
be emerging that the studies that found small or negative effects suffered from a series of data
and statistical estimation problems. In the more recent studies that have used better data and
addressed the identified methodological problems, the estimated effect of schooling on national
income is quite large, particularly in cross-sectional studies and in lower-income countries.
This article explains the processes by which additional schooling appears to raise national
income, including the external effects on the productivity of physical capital and unschooled
labor. The article then summarizes the historic estimates of the effect of schooling on national
income in the literature, summarizes the current explanations for the lack of consistency in these
estimates, and explains why the latest estimates seem to have more validity. Finally, the article
presents the marginal product of human capital from schooling for 61 countries in 2000 using
data from one of the most recent studies and discusses the implications of these estimates for
public policy on investment in schooling.
I. Methodological Considerations
The starting point for any economic analysis is the observation of economic activity and
the creation of a conceptual model that may explain that activity. Economists have observed the

3
growth of national economies and hypothesized that output is determined by a series of factors,
including the number of workers (L), the skill or human capital of these workers (H), the
physical capital (land, structures, or equipment) employed (K), and other national characteristics
that affect the productivity (A) of these factors. The most widely-used mathematical model of
national output using these factors in the literature is a Cobb-Douglas production function:
1) Y= (K)α (H)
β (AL)
1-α-β
Due to this model’s multiplicative structure, it exhibits what has been termed “capital-
skill complementarity,” which means that increases in either physical capital or human capital
raise the marginal product of the other capital factor. Implicitly the increase in one capital factor
has a direct effect on national output and an indirect effect that occurs through its effect on the
other factors. For example, suppose a private firm has a personal computer, which is a form of
physical capital (K), and two employees (L) of which one has some capability (H) to utilize this
computer. If the one employee is trained to make better use of this computer, his human capital
increases, which makes him more productive and also makes the computer more productive. In
addition, this employee may be able to use the computer to make the other employee (L) more
productive. In this way, the increase in one employee’s human capital raises the marginal
productivity of all three factors of production in the economy.
Although human capital can be created through informal training, in a modern economy
it is created primarily through the formal schooling process. In the remainder of this article, H
refers only to the portion of human capital created through formal schooling.
Figure 1 shows the dynamic process by which increased schooling affects national
income in the model of national output in Equation (1). The effects of increased schooling are
shown with a series of arrows, which indicates the direction of causality. The direct effect (1) is

4
shown with a solid line, while three external or indirect effects (2, 3, and 4) are shown with
dotted lines.
Figure 1: Model of National Production
Labor
Schooling
Physical
Capital
Market
Economy
National
Output /
National
Income
Other
Characteristics
1
3
(α)
4
(1-α-β)
Human
Capital
2
(β)
An increase in schooling raises national income through three channels. First, it raises
the nation’s human capital, which makes the workers receiving the schooling more productive.
Second, the workers who have received the schooling interact with and manage other workers,
making them more productive. Third, the greater skill of the schooled workers makes physical
capital more productive. These three effects combine to increase national output/national

5
income. The higher national income then leads through private and political decisions to a fourth
effect, which is an increase in a nation’s investment in schooling.
The key aspect of the model is that schooling increases national productivity in part
through external1 effects. In other words, as Lucas [1990] postulated, there is an external
“spillover” effect of schooling which causes national income to increase by more than the
increase in the earnings of the worker who received the additional schooling.
The direct, positive effect of schooling on a worker’s subsequent earnings is well-
documented in studies performed throughout the world [Psacharopoulos and Patrinos, 2004].
This is the effect labeled “1” in the figure. If there were no other effects, a nation’s investment
in schooling would be expected to raise national income by the aggregate increase in the
earnings of all of its schooled workers.
The second effect, labeled “2” in the figure, is the external effect that schooling has on
the productivity of workers who did not receive the schooling, which further increases regional
and national income. Empirical studies of the external effect of schooling on the incomes of
other workers in cities and regions within countries provide evidence for this external spillover
effect. Acemoglu and Angrist [2001] found external effects of schooling on the personal income
of other workers in states within the U.S. Moretti [2004] found external effects of schooling on
the personal income of other workers in U.S. cities. Liu [2007] found external effects of
schooling on the personal income of other workers in cities in China. Basu, Narayan, and
Ravallion [2002] found external effects of literacy on the personal income of illiterate family
members in Bangladesh. Breton [2010a and 2010b] presents evidence that there are external
effects of human capital from schooling on income across countries at the national level.
1 Economists define an “external” effect as one that does not result in any cost or benefit to its source in the
marketplace.

6
The external effects quantified in these various studies could occur through numerous
pathways:
Workers who are more educated may train other workers on the job, who then
become more productive in a manner not related to their own formal schooling
Countries with a more educated work force may adopt new technology more rapidly.
Educated parents may provide additional education to their children in the home
setting, who then become more productive later as workers.
More educated citizens may adopt more hygienic or other public health practices that
reduce the level of morbidity and mortality of all workers and make them more
productive on the job.
More educated citizens may demand more enlightened public policies from their
political leaders, resulting in better infrastructure, less corruption, better institutions,
and other practices that raise national productivity.
More educated citizens may experience less unemployment, commit fewer crimes,
and impose fewer costs on society.
The third effect, labeled “3” in the figure, is the external effect that human capital has on
physical capital productivity, which further increases national income. This is the result of
capital-skill complementarity, which has been documented in many countries. FitzRoy and
Funke [1995] find evidence of this effect between white collar workers and physical capital in
West German manufacturing. Grier [2005] presents evidence that increased human capital raises
investment in physical capital in sub-Saharan Africa. Lopez-Bazo and Moreno [2008] find a
strong effect of human capital on physical capital productivity in Spain. Yasar and Morrison
Paul [2008] find evidence that human capital raises physical capital productivity in Turkish

7
manufacturing. Chi [2008] presents evidence that greater human capital raises investment in
physical capital in China.
The fourth effect shown in the figure is the reverse effect from the level of income to the
level of schooling. Empirical studies in the literature indicate that individuals and nations have a
positive income elasticity of demand for schooling, i.e., when they obtain more income, they
spend more on schooling. Numerous studies have found this effect in many countries, including
Rubinfeld and Shapiro [1989] in the U.S., Maitra [2003] in Bangladesh, Song, Appleton, and
Knight [2006] in China, and Glewwe and Jacoby [2004] in Vietnam. The existence of this
reverse effect from national income to schooling, occurring simultaneously with the effects from
schooling to national income, greatly complicates the problem of accurately estimating the
magnitude of the effects of schooling on national income.
Most economists now agree that schooling and national income are related conceptually
in the four ways shown in Figure 1. What remains at issue is the magnitude of the various
effects and the importance of other characteristics of an economy that may affect the productivity
(a) of the three main factors of production.
Researchers have included an array of different variables to represent these country-
specific characteristics, and there is no consensus about their relative importance for national
productivity. These characteristics include institutional quality, the structure of the economy
(e.g., openness to FDI, international trade, or global capital flows), climate, geography, political
stability, and public health. A nation’s productivity also is affected by world technological
progress over time and by increases in human capital resulting from informal schooling (e.g.,
private tutoring, and on-the-job training). These influences are not explicitly represented in the

8
model in equation (1), so they implicitly remain as cross-country differences that affect national
productivity (A).
In a Cobb-Douglas structure the exponent on a factor of production measures the
marginal effect on income of increasing that factor of production, while holding the other factors
constant. In calculus this is known as the partial effect. The exponent β on human capital (H)
measures the effect of increased schooling on national income. Importantly, this effect includes
both the direct effect of schooling on the earnings of the worker who received the schooling and
the external effects of schooling on national output operating through the unschooled worker and
physical capital channels (labeled 1, 2 and 3 in Figure 1).
The model in equation (1) is homogeneous of degree 1 because the three exponents on
the three factors of production add up to one. This structure is conceptually appealing for a
model of national output because it guarantees constant returns to scale, i.e., if all the factors of
production are increased by a common multiple, output increases by the same multiple. This
relationship ensures that the size of a country does not determine its income per worker. With
this property small countries and large countries with the same proportions of factors of
production have the same income per worker, a relationship that seems to accord with reality.
This structure has several very convenient mathematical properties:
First, in a market economy the share of national income that accrues to each
factor of production is equal to the exponent on that factor.2 So the share of
national income accruing to physical capital (K) is α. Bernanke and Gurkaynak
[2001] estimate that this share is consistently about 0.35 across countries. The
2 This result occurs because in a competitive market the wage or return on capital is equal to the marginal product of
the factor of production, which is determined by the exponent on each factor of production.
9
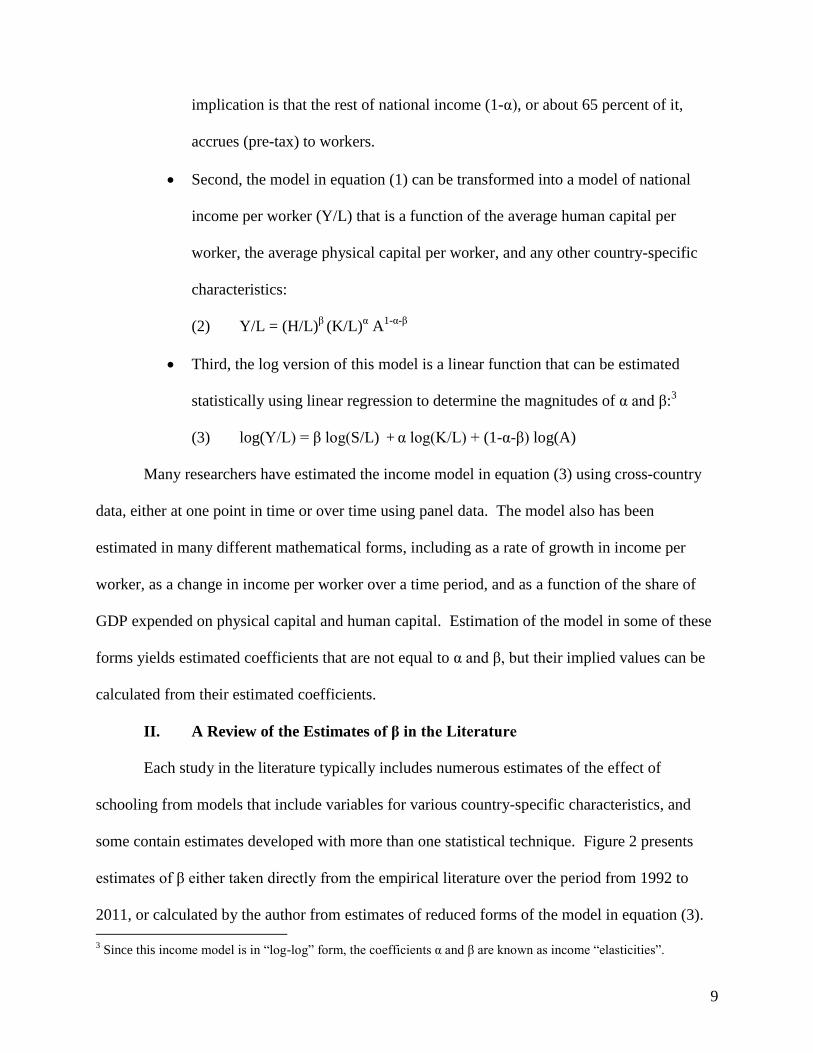
implication is that the rest of national income (1-α), or about 65 percent of it,
accrues (pre-tax) to workers.
Second, the model in equation (1) can be transformed into a model of national
income per worker (Y/L) that is a function of the average human capital per
worker, the average physical capital per worker, and any other country-specific
characteristics:
(2) Y/L = (H/L)β
(K/L)α A
1-α-β
Third, the log version of this model is a linear function that can be estimated
statistically using linear regression to determine the magnitudes of α and β:3
(3) log(Y/L) = β log(S/L) + α log(K/L) + (1-α-β) log(A)
Many researchers have estimated the income model in equation (3) using cross-country
data, either at one point in time or over time using panel data. The model also has been
estimated in many different mathematical forms, including as a rate of growth in income per
worker, as a change in income per worker over a time period, and as a function of the share of
GDP expended on physical capital and human capital. Estimation of the model in some of these
forms yields estimated coefficients that are not equal to α and β, but their implied values can be
calculated from their estimated coefficients.
II. A Review of the Estimates of β in the Literature
Each study in the literature typically includes numerous estimates of the effect of
schooling from models that include variables for various country-specific characteristics, and
some contain estimates developed with more than one statistical technique. Figure 2 presents
estimates of β either taken directly from the empirical literature over the period from 1992 to
2011, or calculated by the author from estimates of reduced forms of the model in equation (3).
3 Since this income model is in “log-log” form, the coefficients α and β are known as income “elasticities”.

10
The particular estimates shown are those from the model(s) that are most similar to the model in
equation (3) and in most cases are the one or two principal estimates highlighted in the study.
The Appendix provides the coefficients estimated in the literature and the calculated, implied
values of α and β.
A review of the results in Figure 2 shows that from 1994 until 2001, most cross-country
statistical studies rejected the hypothesis that schooling has a large, positive effect on national
income. After 2001, however, researchers obtained larger, positive estimates of β in the 0.21 to
0.34 range. But as Levine and Renelt [1992] observed, “Given that over 50 variables have been
found to be significantly correlated with [economic] growth in at least one regression, readers
may be uncertain as to the confidence they should place in the findings of any one study.” 4
Figure 2: Estimates of β in the Literature
0.28
-0.06
-0.20
-0.26
-0.09
0.14
0.05 0.05
0.260.22 0.21
0.280.34 0.33
-0.40
-0.20
0.00
0.20
0.40
4 Levine and Renelt [1992], p. 942.

11
Given the large discrepancies in the effects of schooling found across studies, it is
reasonable to ask whether the more recent estimates of β are more reliable than the earlier
estimates. As discussed below, it now appears that that the negative and small positive estimates
of β obtained during 1994-2001 were biased due to measurement error in the schooling data and
other estimation problems. Since these problems have been addressed in the more recent studies,
the more recent results are likely to be more reliable.
Estimation of the income model in equation (3) only became possible once researchers
had assembled a set of cross-country data for income per worker, physical capital per worker,
human capital per worker, and other characteristics affecting national productivity. Summers
and Heston [1991] facilitated this process when they published the Penn World Table (Mark 5),
which included a complete cross-country set of annual data on national income and investment in
physical capital, adjusted for purchasing power parity across countries. The initial Mark 5 data
set provided data from 1950 through 1985, and the most recent data set (version 7.0) provides
data through 2009 [Heston, Summers, and Aten, 2011]. Most studies estimating the effect of
schooling on national income have used these data sets.
Unfortunately, the Penn World Table does not include data on schooling, so researchers
have had to obtain these data elsewhere. Mankiw, Romer, and Weil [1992] used UNESCO data
on cross-country levels of secondary school enrollment as a proxy for the national rate of
investment in schooling, but their results were criticized because their human capital variable did
not include primary and university schooling [Dinopoulos and Thompson, 1999]. All but one of
the subsequent studies published between 1994 and 2001 used cross-country data on the average
years of schooling attainment to represent the national stock of human capital. The studies
published from 1995 to 2001 used various versions of Barro and Lee’s [1993, 2001] data on

12
average schooling attainment in the population over age 15 or over age 25. Pritchett [2001]
created his own estimate of the human capital stock using the discounted value of workers’ earnings.
In the 1994-1996 studies, researchers used the log of average schooling attainment to
represent log(H/L), and they obtained negative estimates of β. Subsequently, researchers
realized that the normal Mincerian methodology in micro studies of workers’ earnings is to relate
log(Y/L) to years of schooling rather than to the log of this value. When they used average
schooling attainment to represent log(H/L) rather than H/L, they began to get positive estimates
of the effect of schooling on national income.5 With this change in the form of the human capital
variable, the estimated coefficient on average schooling attainment ceased to be an estimate of β,
but the implied values of β in these studies are very small.
Krueger and Lindahl [2001] made a major contribution to this literature when they
determined that the small estimates of β were due to attenuation bias resulting from measurement
error in the schooling data. Since Pritchett [2001], Temple [2001], and others used a “fixed
effects” statistical technique and panel data with five-year periods to estimate most of their
models, their estimates implicitly measured only the effect of changes in schooling within
countries over five-year periods.6 Krueger and Lindahl [2001] showed that over such a short
period the measurement error in the schooling data overwhelms the small changes in the data,
biasing the statistical estimates of the effect of schooling toward 0. As an example of this
problem, Pritchett [2001] obtained an implied value of β = 0.14 when he examined the effect of
schooling on national income across countries in one year, but he obtained an implied value of β
5 A graph of cumulative investment in schooling and average schooling attainment shown in the appendix indicates
that log (H/L) is best represented by average schooling attainment, not log(average schooling attainment).
6 Researchers sometimes add a dummy variable for each country to their income model to control for any
unidentified, country-specific, non-varying productivity effect. This is called a “fixed effects” statistical technique.
The drawback of this approach is that it eliminates consideration of the cross-country variation in income and
schooling from the regression results, and this cross-country variation is much larger and less affected by data
measurement error than the variation within a country over a short period of time.

13
= -0.09 when he examined the effect of differences in schooling within countries over five
years.7 These estimates are both shown in Figure 2.
Krueger and Lindahl [2001] obtained a small implied value of β = 0.05 when they
examined the effect of the change in schooling attainment on (log) national income within
countries over 20 years, but they also obtained a value of α (the share of physical capital) that
was much higher than the value estimated from micro studies. When they forced the estimate of
α to 0.35, the share of national income actually accruing to physical capital, they obtained the
much higher implied value of β = 0.26. They concluded that the high correlation between the
human capital (schooling) data and the physical capital data, and perhaps the problem of reverse
causality, must be biasing the effect of schooling downward in the unconstrained model.
Breton [2004], Cohen and Soto [2007], Breton [2010a], Breton [10b], and Breton [2011]
subsequently estimated the effect of schooling on national income using four new schooling data
sets. Cohen and Soto [2007] and Breton [2011] used a new data set on average schooling
attainment that has less measurement error than the Barro and Lee [2001] data. Breton [2004]
and Breton [2010a and 2010b] used new data sets for the cumulative investment in schooling to
represent the stock of human capital. These researchers also used other forms of the model in
equation (3) to reduce the correlation between human capital and physical capital in the
regressions. Breton estimated the effect of human capital across countries in various years, while
Cohen and Soto estimated the effect within countries over the 1960-90 period. With these
changes in the earlier methodologies, and in some cases with the use of instruments for human
capital, the researchers obtained much larger implied values of β in the 0.21 to 0.33 range.
Within this group of estimates, arguably the more accurate estimates are those in which
the estimate of α is closer to independent estimates of its value, which as mentioned earlier,
7 Pritchett created his own estimate of the schooling capital stock using the discounted value of workers’ earnings.

14
indicate that α ≈ 0.35. Since a nation’s levels of physical capital and human capital are highly
correlated, if the estimate of the effect of one form of capital in equation (3) is biased upward,
the estimate of the effect of the other form is likely to be biased downward [Mankiw, 1995]. As
a result, the least biased estimates of β are likely to be those from regressions that obtain an
estimate of α ≈ 0.35. Figure 3 shows the estimates of α that accompanied the estimates of β
shown in Figure 2. The earlier studies with low or negative estimates of β all had estimates of α
that were considerably larger than 0.35. These are the studies shown to have had methodological
problems. In contrast, in the three recent studies with regressions that yielded an implied value
of α ≈ 0.35, the implied values of β are between 0.28 and 0.34.
Figure 3: Estimates of α and β in the Literature
-0.35
0
0.35
0.7
β
α
A major concern with all of these estimates of β is whether they successfully control for
the reverse effect of national income on schooling. As is well known, ordinary least squares

15
(OLS) regression estimates show the correlation between the dependent and explanatory
variables, but they do not show causality. Bils and Klenow [2000] argue that some of the
estimates of β in the literature are biased upward due to simultaneity bias resulting from the
reverse effect of national income on schooling.
Some researchers have tried to control for this reverse effect by using lagged values of
average schooling attainment as instruments for the current levels of schooling attainment.8 But
Dougherty and Jimenez [1991] and Psacharopoulos and Layard [1979] have shown that the
nation’s earlier levels of schooling affect national income directly, so lagged attainment is not a
valid instrument for human capital from schooling.
The 2007 and 2010 studies use different instruments. Cohen and Soto [2007] use a
combination of lagged attainment and changes in lagged attainment as instruments to address
this problem. Breton [2010a and 2010b] uses the Protestant share of the population 20 years
earlier as an instrument for cumulative investment in schooling. This variable is highly
correlated with levels of public schooling across and within countries. Concerns that this
variable might not be a valid instrument because it could affect national income directly have
been addressed in a recent study by Becker and Woessmann [2009]. The use of these
instruments for human capital in the latest studies provide some assurance that the estimated
coefficients are measuring the effect of human capital on national output rather than the reverse
effect of national income on investment in schooling. Breton’s [2010b] estimates of α and β are
a revision of the Breton [2010a] estimates, based on a conceptually-superior methodology for the
creation of the human capital and national income data. The human capital data are constructed
8 Ordinary least squares (OLS) regression examines the correlation between schooling and national income to create
the estimates of β. This method yields biased estimates of β if there is reverse causality from income to schooling.
This bias can be controlled if the estimate of β is developed using the correlation between schooling and a third
variable, known as an instrument, that does not affect income directly.

16
using the perpetual inventory method documented in OECD [2001]. These data include the
implicit cost of financial capital during the period between the investment in education and the
entry of the student into the work force. The national income data include an estimate of
students’ foregone earnings while they are in school, an element of national income that is not
included in the national accounts [Kendrick, 1976]. With these improvements in the cross-
country data, arguably the implied value of β = 0.34 documented in Breton [2010c] is the best
estimate of the effect of human capital on national income to date.
III. Policy Implications
The empirical results in the latest cross-country studies indicate that if a nation wishes to
increase national income per worker (or the rate of economic growth), one means to do so is to
increase its investment in schooling. But one of the implications of the Cobb-Douglas
production function is that the return on investment in any factor of production is subject to
diminishing returns. The implication is that as nations raise their stock of schooling capital,
national income increases at a decreasing rate. At some point the falling return on incremental
investment in schooling makes further investment unattractive. So are nations overinvesting in
schooling? This question can be answered using the empirical results from the cross-country
studies.
A Cobb-Douglas production function has a very simple formula to estimate the marginal
product of human capital from schooling (MPH). The MPH is the marginal change in national
income from a marginal change in the nation’s stock of human capital, holding the other factors
of production constant:
(5) MPH = δY/δH = β(Y/H) = (βY/L)/(H/L)

17
When calculated using national data, the MPH indicates the marginal return to the nation from
incremental investment in schooling, and it includes both the direct and the external effects.
Calculation of this rate for any country requires estimates of β, national income, and the national
stock of human capital from schooling.
Breton’s [2010c] data on these variables can be used to develop estimates of this
marginal product for β = 0.34. These estimates are shown in Figure 4 for 61 countries in the year
2000. They have the declining pattern expected with increases in human capital due to the
phenomenon of diminishing returns, but some countries with very little schooling capital also
have very low marginal rates.
Figure 4: Marginal Product of Human Capital from Schooling in 2000
Marg
inal P
roduct
(perc
ent)
Net Human Capital Stock per Adul t (2000 US$)0 20000 40000 60000 80000 100000 120000
0
10
20
30
40
50
Argentin
Australi
Austria
Bolivia Brazil
Canada
Chile
Colombia
Congo, R
Costa Ri
Cote d`I
Denmark
Dominica
Ecuador
Egypt
El Salva
Ethiopia
Finland France
GhanaGreece
Guatemal
Hong Kon
India
IranIreland
Italy
Jamaica
Japan
Jordan
Korea, RMalawi
Malaysia
Mali
Mexico
Morocco
NetherlaNew Zeal
Niger
Norway
Pakistan
Panama
Paraguay
Peru
Philippi
Portugal
Senegal
Singapor
Spain
Sri Lank
Sweden
Switzerl
Syria
Thailand
Togo
Tunisia
Turkey
UK
Uruguay
USA
Zambia

18
The Republic of Congo, Jordan, and Jamaica are notable in the figure for their
unexpectedly low marginal products of human capital. There are a variety of potential
explanations for these low rates. The marginal product in a country could be low if national
income is unusually low for reasons not related to schooling (e.g., due to a war or epidemic or
unreported income from the underground economy), or if UNESCO’s data on the country’s
public expenditures on schooling (as a share of national income) is too high, due to misreporting
or to the illicit diversion of the funds intended for schooling to other uses. Another possible
explanation is that the schooling process in these particular countries is less productive per dollar
expended than average for countries with similar levels of cumulative investment in schooling.
As there may be data issues with the marginal product for any one country, particularly in
poor countries, the important implication from these estimates is the pattern of the rates as a
function of the national level of human capital. The pattern indicates that the marginal product
of schooling is about 12 percent in countries with a high average level of schooling and about 25
percent in countries with a low average level of schooling. These estimates can be compared to
Caselli and Freyer’s [2007] estimates of the marginal product of reproducible physical capital,
which in 1996 they found to average seven percent in poor countries and eight percent in rich
countries. The implication of the rates shown in the figure is that the marginal product of human
capital from schooling is about 50 percent higher than the marginal product of physical capital in
rich countries and is (on average) about three times the marginal product of physical capital in
poor countries.
It is important to realize that the rates in Figure 4 are marginal rates, which are different
than average rates. The average rate of return measures the relationship between the historic
investment in schooling and the share of national income currently accruing to workers, while

19
the marginal product indicates the effect of incremental investment on national income. Because
there are diminishing returns to investment in any one factor of production, the average national
rates of return are considerably higher than the marginal products shown in Figure 4. It is also
important to note that these marginal products do not provide any information about the marginal
product of different types of schooling within a country, for example, preschool vs. university
education. The rates shown in Figure 4 merely indicate the incremental national marginal
product for the net human capital stock created from the historic mix of schooling in each
country.
The clear policy implication of the evidence in the latest cross-country studies is that
greater public investment in schooling is a cost-effective way to raise a poor country’s level of
income. Since the return on the investment occurs over the lifetime of the schooled worker, the
income response is delayed. But the eventual effect of incremental schooling on national income
in countries with a relatively low level of schooling is very substantial. These findings support
an economic development policy that gives schooling a high priority for incremental public
funding in poor countries.
The policy implications are a bit different for countries that already have high average
levels of schooling. The marginal product of schooling in these countries is only slightly higher
than the marginal product of physical capital. As the marginal product is the weighted average
of the marginal products of all types of schooling, by implication the marginal product of some
types of schooling is likely to be lower than the marginal cost of financial capital.
If the public objective is solely maximization of national income, public investment in
schooling should be reallocated to those types of schooling with a higher marginal product. The
analytic problem is that the marginal product that can be calculated for particular types of

20
schooling within the country is the direct return to the schooled worker, which does not include
the external return accruing to the nation. Given this dilemma, the best approach available to
governments to optimize public investment in schooling may be to redirect public funds to those
types of schooling whose direct marginal product is greatest and assume that these investments
also have the highest national marginal product when the external effects are included.

21
REFERENCES
Acemoglu, Daron, and Angrist, Joshua, 2001, “How Large Are Human Capital Externalities?
Evidence from Compulsory Schooling Laws,” NBER Macroeconomics Annual 2000, MIT Press,
Cambridge, MA, 9-59
Barro, Robert. J., and Lee, Jong Wha, 1993, “International Comparisons of Educational
Attainment,“ Journal of Monetary Economics, 32(3), 363-394
Barro, Robert. J., and Lee, Jong Wha, 2001, “International Comparisons of Educational
Attainment: Updates and Implications,” Oxford Economic Papers, 3: 541-63
Basu, Kaushik, Narayan, Ambar, and Ravallion, Martin, 2002, “Is Literacy Shared Within
Households? Theory and Evidence for Bangladesh,” Labour Economics, 8, 649-665
Becker, Sascha O., and Wössmann, Ludger, 2009, “Was Weber Wrong? A Human capital
Theory of Protestant Economic History,” Quarterly Journal of Economics, 124(2), 531-596
Benhabib, Jess, and Spiegel, Mark M., 1994, “The Role of Human Capital in Economic
Development: Evidence from Aggregate Cross-Country Data,” Journal of Monetary Economics,
34, 143-173
Bernanke, Ben S., and Gurkaynak, Refet S., 2001, “Taking Mankiw, Romer, and Weil
Seriously,” NBER Macroeconomics Annual, v16, 11-57
Bils, Mark, and Klenow, Peter J., “Does Schooling Cause Growth?” American Economic
Review, v 90, n5, 1160-1183
Breton, Theodore R., 2004, “Can Institutions or Education Explain World Poverty? An
Augmented Solow Model Provides Some Insights,” Journal of Socio-Economics 33, 45-69
Breton, Theodore R., 2010a, “Schooling and National Income: How Large are the
Externalities?,” Education Economics, v18, n1, 67-92 (published online in June 2008)

22
Breton, Theodore R., 2010b, “Schooling and National Income: How Large are the Externalities?
Corrected Estimates,” Education Economics, v18, n4, 455-456 (For details see Breton, 2010c)
Breton, Theodore R., 2010c, “Schooling and National Income: How Large are the Externalities?
Revised Estimates,” SSRN: http://ssrn.com/abstract=1669611 (August 31, 2010)
Breton, Theodore R., 2011, “The Quality vs. the Quantity of Schooling: What Drives Economic
Growth?,” Economics of Education Review, v30, 765-773
Caselli, Francesco, Esquivel, Gerardo, and Lefort, Fernando, 1996, “Reopening the Convergence
Debate: A New Look at Cross-Country Growth Empirics,” Journal of Economic Growth, 1, 363-
389
Caselli, Francesco, and Feyrer, James, 2007, “The Marginal Product of Capital,” Quarterly
Journal of Economics, v122, n2, 535-568
Chi, Wei, 2008, “The role of human capital in China's economic development: Review and new
evidence, China Economic Review, v19, i3, 421-436
Cohen, Daniel, and Soto, Marcelo, 2007, “Growth and Human Capital: Good Data, Good
Results,” Journal of Economic Growth, v12, n1, 51-76
Dinopoulos and Thompson, 1999, “Reassessing the Empirical Validity of the Human Capital-
Augmented Neoclassical Growth Model,” Journal of Evolutionary Economics 9, 135-154
Dougherty, Cristopher R. S., and Jimenez, Emmanuel, 1991, “The Specification of Earnings
Functions: Tests and Implications,” Economics of Education Review, v10, n2, 85-98
FitzRoy, Felix, and Funke, Michael, 1995. "Capital-Skill Complementarity in West German
Manufacturing," Empirical Economics, Springer, v20(4), 651-665
Glewwe, Paul and Jacoby, Hanan G., 2004, “Economic Growth and the Demand for Education:
Is There a Wealth Effect?,” Journal of Development Economics, v74, n1, 33-51

23
Grier, Robin, 2005, “The Interaction of Human and Physical Capital Accumulation: Evidence
from SubSaharan Africa,” Kyklos, v58, i2, 195-211
Heston, Alan, Summers, Robert, and Aten, Bettina, 2011, Penn World Table version 7.0, Center
for International Comparisons of Production, Income and Prices at the University of
Pennsylvania, http://pwt.econ.upenn.edu/php_site/pwt_index.php
Islam, Nazrul, 1995, “Growth Empirics: A Panel Data Approach,” Quarterly Journal of
Economics, v110, I4, 1127-1170
Kendrick, John W., 1976, The Formation and Stocks of Total Capital, National Bureau of
Economic Research, New York
Krueger, Alan B., and Lindahl, Mikael, 2001, “Education for Growth: Why and For Whom?,”
Journal of Economic Literature, v39, 1101-1136
Levine, Ross, and Renelt, David, 1992, “A Sensitivity Analysis of Cross-Country Growth
Regressions,” The American Economic Review, v82, i4, 942-963
Liu, Zhiqiang, 2007, “The External Returns to Education: Evidence from Chinese Cities,”
Journal of Urban Economics, v61, n3, 542-564
Lopez-Bazo, Enrique, and Moreno, Rosina, 2008, “Does Human Capital Stimulate Investment in
Physical Capital?: Evidence from a Cost System Framework,” Economic Modeling, v25, i6,
1295-1305
Lucas, Robert E., Jr., 1990, “Why Doesn’t Capital Flow from Rich to Poor Countries?”
American Economic Review, v80, n2, 92-96.
Maitra, Pushkar, 2003, “Schooling and Educational Attainment: Evidence from Bangladesh,”
Education Economics, v11, n2, 129-153

24
Mankiw, N., Gregory, 1995, “The Growth of Nations,” Brookings Papers on Economic Activity,
v1995, n1, 275-310
Mankiw, N. Gregory, Romer, David, and Weil, David N., 1992, “A Contribution to the Empirics
of Economic Growth,” Quarterly Journal of Economics, v107, Issue 2, 407-437
Moretti, Enrico, 2004, “Estimating the social return to higher education: evidence from
longitudinal and repeated cross-sectional data,” Journal of Econometrics, 121, 175-212
OECD, 2001, Measuring Capital: OECD Manual: Measurement of Capital Stocks, Consumption
of Fixed Capital, and Capital Services, OECD Publication Services, www.SourceOECD.org
Pritchett, Lant, 2001, “Where Has All the Education Gone?,” World Bank Economic Review, v15,
n3, 367-391
Psacharopoulos, George & Layard, Richard, 1979. "Human Capital and Earnings: British
Evidence and a Critique," Review of Economic Studies, v46(3), 485-503
Psacharopoulos, George and Patrinos, Harry, 2004, “Returns to Investment in Education: A
Further Update,” Education Economics, v12, n2, 111-134
Rubinfeld, Daniel L., and Shapiro, Perry, 1989, “Micro-estimation of the Demand for Schooling:
Evidence from Michigan and Massachussetts,” Regional Science and Urban Economics, 19,
381-398
Song, Lina, Appleton, Simon, and Knight, John, 2006, “Why Do Girls in Rural China Have
Lower School Enrollment?,” World Development, v34, n9, 1639-1653
Summers, Robert, and Heston, Alan, 1991, “The Penn World Table (Mark 5): An Expanded Set
of International Comparisons 1950-1988,” Quarterly Journal of Economics, v106, I2, 327-368
Temple, Jonathan R. W., 2001, “Generalizations that Aren’t? Evidence on Education and
Growth, European Economic Review, 45, 905-918

25
Yasar, Mahmut, and Morrison Paul, Catherine J., “Capital-skill complementarity, productivity
and wages: Evidence from plant-level data for a developing country” Labour Economics, v15, i1,
1-17

26
Appendix
The effect of schooling on national income has been estimated using many different
formulations of the Cobb-Douglas income model. Mankiw, Romer, and Weil [1992] and several
other researchers estimated a steady-state version of this model. Cohen and Soto [2007] and
Breton [2008] estimated reduced form versions of this model. In the alternative versions of these
models, the estimated coefficients on the physical capital and schooling capital variables are not
α and β, but the implied values of α and β can be calculated from these coefficients. The form of
the schooling and physical capital variable in the models, their estimated coefficients, and the
implied values of α and β are shown in Table A-1.
Table A-1
Values and Implied Values of α and β in Cross-Country Studies
Journal Article Physical Capital Schooling Capital
Variable Coef α Variable Coef β
Mankiw, Romer, and Weil
[1992]
ln(Ik/(n+g+d)) 0.69 0.31 ln(Is/(n+g+d)) 0.66 0.28
Benhabib and Spiegel [1994] ln(K/L) 0.55 ln(S/L) -0.06
Islam [1995] ln(Ik/(n+g+d)) 1.08 0.52 ln(S/L) -0.42 -0.20
Caselli, Esquivel, and LeFort
[1996]
ln(Ik/(n+g+d)) 0.64 0.49 ln(Is/(n+g+d)) -0.34 -0.26
Pritchett [2001] ln(K/L) 0.46 ln(S/L) -0.09
ln(K/L) 0.61 ln(S/L) 0.14
Temple [2001] ln(K/L) 0.43 Attainment 0.015 0.05
Krueger and Lindahl [2001] ln(K/L) 0.65 Attainment 0.015 0.05
ln(K/L) 0.35 Attainment 0.083 0.26
Breton [2004] ln(Ik/(n+g+d)) 0.69 0.32 ln(Is/(n+g+d)) 0.49 0.22
Cohen and Soto [2007] ln(K/Y) 0.68 0.40 Attainment 0.126 0.21
Breton [2010a] ln(K/Y) 0.89 0.34 ln(S/Y) 0.75 0.28
Breton [2010c] Ln(K/L) 0.35 Ln(S/L) 0.34
Breton [2011] Ln(K/Y) 0.62 0.38 Attainment 0.19 0.33
Notes: Ik and Is are the rates of investment in physical capital (K) and schooling (S), n is the
labor (L) growth rate, g is the rate of technological progress, d is the rate of depreciation, Y is
national income, and L is either the number of workers or adults. Attainment is average years of
schooling in the adult population.

27
Recently Breton [2008] developed data on the cumulative investment in schooling for the
population of working age in 61 countries. With these data it is possible to investigate directly
the relationship between cumulative investment in schooling and Barro and Lee’s [2001] data on
average schooling attainment. This relationship, shown in Figure A-1 for 1990, clearly shows
that cumulative investment in schooling has an exponential rather than a linear relationship to
average schooling attainment. The model log (S/L) = γ schooling attainment was estimated
using Breton’s estimates of cumulative investment as a proxy for S/L to calculate the implied
value of β from estimates of γ in the literature. Over the 1990-2000 period γ = 0.30 with the
Barro and Lee [2001] data, and γ = 0.36 with the Cohen and Soto [2007] data.
Figure A-1
Cumulative Investment in Schooling vs. Average Schooling Attainment in 1990
Cum
ula
tive Inve
stm
ent in
Schoolin
g p
er
Ad
ult
(1996
$)
Average Schooling Attainment (years)0 1 2 3 4 5 6 7 8 9 10 11 12 13
0
10000
20000
30000
40000
50000
60000
70000
80000
90000
Argentin
Australi
Austria
Bolivia
Brazil
Canada
Chile
Colombia
Costa Ri
Cote dIv
Denmark
Dominica
Ecuador
Egypt
El Salva
Ethiopia
Finland
France
Ghana
Greece
Guatemal
India
Iran
Ireland
Italy
Jamaica
Japan
Jordan Korea
Malawi
Malaysia
Mali
Mexico
Morocco
Netherla
New Zeal
Niger
Norway
Panama
Paraguay
Peru
Philippi
Portugal
Senegal
Singapor
Spain
Sweden
Switzerl
SyriaThailand
Tunisia
Turkey
UK
Uruguay
USA
Zambia
Copyright © 2022 FDOKUMEN