Does child spacing affect children's outcomes? Evidence from ...
71
econstor Make Your Publications Visible. A Service of zbw Leibniz-Informationszentrum Wirtschaft Leibniz Information Centre for Economics Pettersson-Lidbom, Per; Skogman Thoursie, Peter Working Paper Does child spacing affect children's outcomes? Evidence from a Swedish reform Working Paper, No. 2009:7 Provided in Cooperation with: IFAU - Institute for Evaluation of Labour Market and Education Policy, Uppsala Suggested Citation: Pettersson-Lidbom, Per; Skogman Thoursie, Peter (2009) : Does child spacing affect children's outcomes? Evidence from a Swedish reform, Working Paper, No. 2009:7, Institute for Labour Market Policy Evaluation (IFAU), Uppsala This Version is available at: http://hdl.handle.net/10419/45740 Standard-Nutzungsbedingungen: Die Dokumente auf EconStor dürfen zu eigenen wissenschaftlichen Zwecken und zum Privatgebrauch gespeichert und kopiert werden. Sie dürfen die Dokumente nicht für öffentliche oder kommerzielle Zwecke vervielfältigen, öffentlich ausstellen, öffentlich zugänglich machen, vertreiben oder anderweitig nutzen. Sofern die Verfasser die Dokumente unter Open-Content-Lizenzen (insbesondere CC-Lizenzen) zur Verfügung gestellt haben sollten, gelten abweichend von diesen Nutzungsbedingungen die in der dort genannten Lizenz gewährten Nutzungsrechte. Terms of use: Documents in EconStor may be saved and copied for your personal and scholarly purposes. You are not to copy documents for public or commercial purposes, to exhibit the documents publicly, to make them publicly available on the internet, or to distribute or otherwise use the documents in public. If the documents have been made available under an Open Content Licence (especially Creative Commons Licences), you may exercise further usage rights as specified in the indicated licence. www.econstor.eu
-
Upload
khangminh22 -
Category
Documents
-
view
1 -
download
0
Transcript of Does child spacing affect children's outcomes? Evidence from ...

econstorMake Your Publications Visible.
A Service of
zbwLeibniz-InformationszentrumWirtschaftLeibniz Information Centrefor Economics
Pettersson-Lidbom, Per; Skogman Thoursie, Peter
Working Paper
Does child spacing affect children's outcomes?Evidence from a Swedish reform
Working Paper, No. 2009:7
Provided in Cooperation with:IFAU - Institute for Evaluation of Labour Market and Education Policy, Uppsala
Suggested Citation: Pettersson-Lidbom, Per; Skogman Thoursie, Peter (2009) : Does childspacing affect children's outcomes? Evidence from a Swedish reform, Working Paper, No.2009:7, Institute for Labour Market Policy Evaluation (IFAU), Uppsala
This Version is available at:http://hdl.handle.net/10419/45740
Standard-Nutzungsbedingungen:
Die Dokumente auf EconStor dürfen zu eigenen wissenschaftlichenZwecken und zum Privatgebrauch gespeichert und kopiert werden.
Sie dürfen die Dokumente nicht für öffentliche oder kommerzielleZwecke vervielfältigen, öffentlich ausstellen, öffentlich zugänglichmachen, vertreiben oder anderweitig nutzen.
Sofern die Verfasser die Dokumente unter Open-Content-Lizenzen(insbesondere CC-Lizenzen) zur Verfügung gestellt haben sollten,gelten abweichend von diesen Nutzungsbedingungen die in der dortgenannten Lizenz gewährten Nutzungsrechte.
Terms of use:
Documents in EconStor may be saved and copied for yourpersonal and scholarly purposes.
You are not to copy documents for public or commercialpurposes, to exhibit the documents publicly, to make thempublicly available on the internet, or to distribute or otherwiseuse the documents in public.
If the documents have been made available under an OpenContent Licence (especially Creative Commons Licences), youmay exercise further usage rights as specified in the indicatedlicence.
www.econstor.eu
Does child spacing affect children’s outcomes?
Evidence from a Swedish reform
Per Pettersson-Lidbom Peter Skogman Thoursie
WORKING PAPER 2009:7
The Institute for Labour Market Policy Evaluation (IFAU) is a research institute under the Swedish Ministry of Employment, situated in Uppsala. IFAU’s objective is to promote, support and carry out scientific evaluations. The assignment includes: the effects of labour market policies, studies of the functioning of the labour market, the labour market effects of educational policies and the labour market effects of social insurance policies. IFAU shall also disseminate its results so that they become acces-sible to different interested parties in Sweden and abroad. IFAU also provides funding for research projects within its areas of interest. The deadline for applications is October 1 each year. Since the researchers at IFAU are mainly economists, researchers from other disciplines are encouraged to apply for funding. IFAU is run by a Director-General. The institute has a scientific council, consisting of a chairman, the Director-General and five other members. Among other things, the scientific council proposes a decision for the allocation of research grants. A reference group including representatives for employer organizations and trade unions, as well as the ministries and authorities concerned is also connected to the institute. Postal address: P.O. Box 513, 751 20 Uppsala Visiting address: Kyrkogårdsgatan 6, Uppsala Phone: +46 18 471 70 70 Fax: +46 18 471 70 71 [email protected] www.ifau.se Papers published in the Working Paper Series should, according to the IFAU policy, have been discussed at seminars held at IFAU and at least one other academic forum, and have been read by one external and one internal referee. They need not, however, have undergone the standard scrutiny for publication in a scientific journal. The purpose of the Working Paper Series is to provide a factual basis for public policy and the public policy discussion. ISSN 1651-1166
IFAU – Does child spacing affect children’s outcomes? Evidence from a Swedish reform 1
Does child spacing affect children’s outcomes? Evidence from a Swedish reform*
Per Pettersson-Lidbom
by
ª and Peter Skogman Thoursie©
Keywords: Child spacing, parental leave, child school performance JEL-codes: J13, J18
31 March 2009
Abstract In this paper, we provide evidence of whether child spacing affects the future success of children. As an exogenous source of variation in child spacing, we make use of the introduction of an administrative rule in the parental leave benefit system in Sweden. This rule made it possible for a woman to retain her previous high level of parental leave benefits, i.e., 90 percent wage replacement, without entering the labor market between births provided that the interval between the births did not exceed 24 months. The rule had a much larger effect on the birth spacing behavior for native-born mothers compared to foreign-born mothers due to their differential attachment to the labor market. We find that the rule caused a reduction in spacing among native-born mothers as compared to the foreign-born mothers. For individuals born by native-born mothers, the reform also caused a decrease in educational attainment. Thus, this suggests that the effect of spacing children closer has a negative impact on children’s future outcomes. We provide additional evidence that this is likely due to the strong effects of early environment on the capacity for human skill development as discussed by Knutsen et al. (2006).
* We thank Mårten Palme for providing us with the data. We also are grateful for comments from Josh Angrist, Anders Björklund, Peter Fredriksson, Per Johansson, Erik Plug, David Strömberg, Olof Åslund and seminar participants at IIES, IFN, Institute for Futures Studies, Uppsala University, University of Amsterdam, European Society of Population Economics Conference (Chicago 2007), and IFN Stockholm Conference 2008. ª Department of Economics, Stockholm University, S-106 91 Stockholm, Sweden; e-mail: [email protected] © The Institute for Labour Market Policy Evaluation (IFAU), S-751 20 Uppsala, Sweden; e-mail: [email protected]

2 IFAU – Does child spacing affect children’s outcomes? Evidence from a Swedish reform
Table of contents 1 Introduction ......................................................................................................... 3
2 The incentives for child spacing ........................................................................ 10
3 The effect of the speed-premium on child outcomes ........................................ 32
4 The impact of child spacing on university-preparatory education .................... 40
5 Additional evidence ........................................................................................... 49
6 Discussion and conclusion ................................................................................ 59
References ....................................................................................................................... 62
IFAU – Does child spacing affect children’s outcomes? Evidence from a Swedish reform 3
1 Introduction This paper empirically investigates whether child spacing, as measured by the birth
interval to the nearest younger sibling, has an effect on the older sibling’s performance
later in life such as educational attainment or school performance.1 Although, there is a
large literature dealing with other family characteristics, such as family size and birth
order,2 there is hardly any work that analyzes the effect of child spacing on the long
term outcomes of children.3, 4 The lack of studies about the effects of birth spacing on
child outcomes is surprising given that birth rates are declining and that the average
family size is below two children per family in many countries.5
The challenge of estimating the effect of child spacing on child outcomes is, of
course, to find an exogenous source of variation in birth spacing since child spacing is
likely to be endogenous, i.e., the time intervals between births is partly determined by
unobserved parental characteristics.
For example, the aver-
age total fertility rate is 1.8 in the OECD countries (Human Development Reports
2005), and in many countries, such as Sweden and the US, there has emerged a “two-
child norm” (e.g., David and Sanderson 1987). As a result, families may differ more in
the spacing of their children than they do in the number of children and therefore the
timing of births is becoming a much more salient issue.
6
1 Specifically, we analyze the outcomes of first-born and second-born subjects, and we organize the data into families with at least 2 births for first-born and families with at least 3 births for second-born, which is important because it helps defining meaningful child-spacing effects. 2 See Blake (1989) for book length treatment of the relationship between family size and school performance. The effect of family size on child outcomes has recently become a hot topic. Examples of very recent studies are Angrist et al. (2006), Black et al. (2005), Cáceres-Delpiano (2006), Rosenzweig and Zhang (2006), and Qian (2006). For Swedish evidence, see Grönqvist and Åslund (2007). 3 To the best of our knowledge, there are only two studies in sociology (Powell and Steelman 1990, 1993) and two studies in economics (Stafford 1987, Holmlund 1984) that correlate measures of child spacing and school per-formance. However, these studies raise obvious concerns about causality since they do not use any exogenous source of variation in birth spacing. Moreover, they cannot define a meaningful child-spacing effect since their measures of child spacing are flawed. For example, Powell and Steelman use the number of siblings within a particular age range, which means that the “experiment” is not well defined, i.e., treatment occurs before the subjects exist. Furthermore, this measure confounds family size with child spacing. 4 There is a large literature that investigates whether child spacing affects child mortality. In contrast to this study, this literature does not estimate the impact of the effect of the younger child on the outcome of the older child but the effect on the newly born child instead. See Conde-Agudelo et al. (2006) for a recent meta-study and Setty-Venugopal and Upadhyay (2002) for a survey of studies in developing countries. For a study in economics, see Duflo (1998). 5 One possible reason for the lack of studies of child spacing on children’s future outcomes is that information on child spacing is absent in most available data sets.
In this paper, we will use as an administrative rule
6 There is a large literature in demography and in economics investigating factors related to the timing of births. For work in economics: see for example, Heckman et al. (1985), Heckman and Walker (1990), Newman (1983), and

4 IFAU – Does child spacing affect children’s outcomes? Evidence from a Swedish reform
in Sweden which came into place in 1980 as an exogenous source of variation in child
spacing. This rule made it possible for women to retain their previous high level of
parental leave benefits (i.e., 90 percent wage replacement) without entering the labor
market between births provided that the interval between the births did not exceed 24
months.7 This administrative rule thus gave a woman a short-term economic incentive
to space her children within 24 months in order to avoid the reduction in benefits, i.e., a
“speed premium” on further childbearing.8
We argue that this rule should a priori have a differential impact on child spacing
behavior of women from different countries of origin due to their sharp differences in
taste for work (e.g., Fernández and Fogli 2009).
9
Having documented that the child spacing rule had differential impacts on the birth-
spacing behavior among native-born and foreign-born women, we turn to the analysis of
the long-term outcomes of their children. We mainly look at first and second-born
For example, in 1980 women born in
one of the Nordic countries (Sweden, Denmark, Finland, and Iceland) had the highest
labor force participation rates among all OECD countries (OECD Labor Market Statis-
tics), suggesting that Nordic-born women should be much more affected by the spacing
rule than women from another country of origin. Indeed, we find that native-born moth-
ers (women born in a Nordic country) sharply reduced their birth spacing as compared
to foreign-born mothers (women born-outside a Nordic country) after the introduction
of the child spacing rule in 1980. Most importantly, these two groups of women (native-
born and foreign-born women) had strikingly similar trends in their birth spacing for
more than 10 years prior to 1980, which lends credibility to the assumption that foreign-
born mothers constitute a valid comparison group for native-born mothers.
Newman and McCulloch (1984). For studies based on Swedish data, see Heckman et al. (1985), Heckman and Walker (1990), and Walker (1986, 1995). 7 In addition to the change in the administrative spacing rule there were other changes in the parental leave benefits that took place in 1980. The number of parental days increased by 3 months (1 month with 90 percent replacement rate and 2 months with a low flat rate compensation). Moreover, paid leave for taking care of a sick child increased by 1.5 months. These extensions of the parental leave benefits could potentially affect child performance in the long run. However, recent research by e.g., Liu and Nordström Skans (2008), Dustmann and Schönberg (2008) and Wurtz (2007) find no such effects. On the other hand, Carneiro et al. (2009) find large positive effects of increased parental leave on child outcomes. This suggests that, if anything, our negative child-spacing effect is underestimated. 8 This reform has previously been analyzed by demographers. For example, Hoem (1993) analyzed how the period total fertility rate is affected by the speed premium. See also Andersson (1999, 2002), and Andersson et al. (2006). The analysis in this paper, both regarding the empirical design and the outcomes of interest, differs significantly from their work. 9 A mother’s country of birth is also an immutable characteristic, i.e. it cannot be affected by the treatment itself or by individuals’ reaction to the treatment, thereby avoiding the problems of having an endogenous grouping variable as discussed by Heckman (1996) and Blundell et al. (1998).

IFAU – Does child spacing affect children’s outcomes? Evidence from a Swedish reform 5
individuals but we briefly also look at third-born, fourth-born and fifth-born individuals.
For first-born children, child spacing is measured by the birth interval between the first-
born and second-born child, and we include all families with at least 2 children (2+
sample). For second-born children, child spacing is measured by the birth interval be-
tween the second-born and third-born child, and we include all families with at least 3
children (3+ sample). Looking at first-born and second-born subjects, together with the
organization of the data into a 2+ and a 3+ sample, is important because it helps defin-
ing meaningful child-spacing effects. We show that the shares that have attained a
university-preparatory education among individuals with a native-born mother and
foreign-born mother closely mirror the pattern of birth spacing. Specifically, both the
levels and the trends in the educational attainment for birth cohorts younger than 1980
is very similar in the two groups, while for older birth cohorts (1980-1987) educational
attainment among individuals born by native-born mothers started to decrease relative
to individuals with foreign-born mothers in 1980, the year of the introduction of the
child spacing rule. Most importantly, similar patterns are found separately for first-born,
second-born, third-born, fourth-born and fifth-born individuals.
Taken together, the striking similarity between the changes that took place in 1980
for both child-spacing and the long-term child outcome suggests that there is a causal
relationship between child spacing and child future outcomes. As a result, we argue that
the administrative child spacing rule can be used as an instrument for child spacing.
According to our instrumental variable estimates, we find that the decrease in child
spacing had a non-trivial effect on a child’s future outcome: a one month reduction of a
mother’s birth interval due to the administrative spacing rule, implied a 1-2 percentage
point decrease in the likelihood of attaining a preparatory-university education. A way
to gauge the magnitude of the estimated child-spacing effect is to compare it with the
gap in university-preparatory education between girls and boys, which is about 15
percentage points. In other words, the gender difference corresponds to a 7.5-15 months
reduction in average child spacing. This in turn should be compared to the fact that the
average child spacing was about 46 months before and 38 months after the introduction
of the administrative rule in 1980. Thus, the administrative child spacing rule led to 8
months, or 17 percent, reduction in child spacing.
6 IFAU – Does child spacing affect children’s outcomes? Evidence from a Swedish reform
To further investigate the likely mechanisms behind the child-spacing effect and/or any
possible confounding factors, we perform a number of tests. First, we conduct tests
regarding the comparability of the treatment and comparison groups. Specifically, we
show that native-born and foreign-born mothers have similar trends in maternal age at
first birth and in the maternal education levels before 1980, which again suggests that
foreign-born mothers are an adequate comparison group for native-born mothers.10
Third, we analyze whether important differences in a child’s upbringing affect the
estimated child-spacing effect since this may provide information about the potential
mechanism behind the child-spacing effect, as further discussed below. Previous work
has suggested that out-of-home care (e.g., Baker et al. 2008) and maternal employment
(Ruhm 2004, 2008 and Bernal 2008) are important factors in a child’s upbringing that
affect child outcomes. We therefore test for whether the child-spacing effect differs
We
also show that the estimated child-spacing effect is broadly robust to alterations in the
comparison group. For example, we find similar effects when we use, one at a time,
women born in Asia, South America, or Europe as the comparison group. In sharp
contrast, when we only use mothers from North America as the comparison group there
is no child-spacing effect. These findings are reasonable since the countries in Asia,
South America, or Europe around 1980 typically had much lower women labor force
participation rates than any of the Nordic countries, while United States or Canada only
had somewhat lower rates. Thus, one should not expect to find a clear child-spacing
effect when mothers from North America constitute the comparison group.
Second, we perform a number of tests to exclude the possibility that the administra-
tive child-spacing rule affected other family outcomes that have been suggested in the
literature to affect children’s long term outcomes. To begin with, we find no evidence
that the child-spacing rule had an effect on completed family size, since native-born
mothers and foreign-born mothers have similar trends in family size both before and
after 1980. Second, we find no evidence that the child spacing rule affected divorce
rates, which otherwise could have led to a negative relationship between child spacing
and child outcomes (e.g., Gruber 2004, and Dahl and Moretti 2008).
10 The treatment and comparison groups also have similar trends in paternal age at first birth and paternal education before the introduction of the child spacing rule (due to space constraints, these are not reported in the paper, but are available on request).

IFAU – Does child spacing affect children’s outcomes? Evidence from a Swedish reform 7
across the amount of exposure to out-of-home child care by dividing the sample into
cohorts with high and low exposure to out-of home child care. We find little evidence
that the child-spacing effect is affected by differences in the exposure to out-of-home
child care.11 We also split the data depending on maternal education since high educa-
tion will typically be strongly associated with high employment. Again, we find little
evidence that the child-spacing effect differs depending on the level of maternal educa-
tion. Another potential source for creating differences in long-term outcomes of children
are differences in the quality or length of primary education (Grundskola), grades one
through nine, as discussed by Card and Krueger (1996). However, since Swedish pri-
mary education is compulsory, free of charge and regulated in a national curriculum, we
think that primary education cannot be responsible for the child-spacing effect.12
We argue that the insensitivity of the estimated child-spacing effect to important
differences in a child’s upbringing suggests that the causing factor must have happened
in the first years of the child’s life. That is because the only crucial factor that seems to
have changed for a first-born child or second-born is the presence of a younger sibling
that is born much closer, i.e., within two-year interval. There is by now a growing con-
sensus that early childhood experiences may have a uniquely powerful influence on the
development of cognitive and social skills. Knudsen et al. (2006), for example, force-
fully argue that “a cross-disciplinary examination of research in economics, develop-
mental psychology, and neurobiology reveals a striking convergence on a set of
common principles that account for the potent effects of early environment on the
capacity for human skill development.” Thus, it may therefore be particularly detriment-
tal for a child’s future development to have another sibling at a very young age since
Non-
etheless, we split the data depending on the average amount of real school expenditure
per student during grades one through nine. Again, the estimated child spacing effect
differs little between individuals in areas with high or low school spending. The child-
spacing effect is also broadly similar across other possible differences in a child’s up-
bringing such as family sizes, the gender of the child, and whether the child is first-born
or second-born.
11 For an overview of the Swedish child care system, see Gustafsson and Stafford (1996). 12 For a discussion of the Swedish education system, see Björklund et al. (2005).

8 IFAU – Does child spacing affect children’s outcomes? Evidence from a Swedish reform
when children are very closely spaced then childcare obligations dominate, i.e., a
mother must give most of her attention, commitment or energy to the newborn infant.
We argue that this is a likely explanation of our finding for the following reasons.
First, the identifying variation in child-spacing effect comes from those women who
were encouraged to have the next child within a two-year period in order to take advan-
tage of the administrative spacing rule. Second, most Swedish women stay home with
their newborn baby and any older siblings for at as least one year, since paid maternal
leave was 360 days in 1980.13 The long-term maternity leave period combined with the
fact that about 90 percent of women breastfeed their newborn the first 3 months and 70
percent up to 6 months,14 makes it obvious that there will be binding constraints for the
time a mother can spend with her older child.15
An additional and complementary reason why short birth-spacing may have a nega-
tive effect is that pregnancy in itself may affect the quality of parenting since parenting
might be poor due to tiredness during and after pregnancy. Having a next child within
24 months may exacerbate the fatigue during and after pregnancy. For example, having
two pregnancies close together may cause iron-deficiency or even led to anaemia. Ana-
emia in a pregnant woman can cause excessive fatigue and stress and make her more
susceptible to illness.
16
To conclude, if close-spacing has an effect on a mothers behavior both before child
birth (e.g., fatigue during pregnancy causes worse parenting) and after a child birth
(e.g., the time-consuming process of taking care of a newly born leads to less maternal
time for the older sibling), then the older sibling can be affected (indirectly or directly)
by the subsequent birth of the younger sibling for much more than a year. If this event
causes toxic stress in early childhood, where toxic stress refers to strong, frequent or
prolonged activation of the body’s stress management system, then this can have
“disruptive effects on the nervous system and stress hormone regulatory system that can
13 The entitled number of paid maternal leave days could be extended for a longer period than 360 days if the benefits are used at half or quarter of full time. During this time, mothers that were on maternal leave were not allowed to have their other children in public day care. 14 Most babies normally breastfeed every 1 1/2 to 2 1/2 hours during the first couple of months 15 During this time, mothers that were on maternal leave were not allowed to have their other children in the heavily subsidized (90 percent) public day care system. In 1987, for example, only about 7-8 percent of all children aged 0-6 was in private day care while 47 percent was in public day care. 16 Importantly, however, even when a woman is iron-deficient, medical research shows that the required amount of iron continues to be provided to the placenta and fetus. Otherwise this could potentially explain the negative effect on the second-born child from close birth spacing but clearly not the effect on the first-born child.
IFAU – Does child spacing affect children’s outcomes? Evidence from a Swedish reform 9
damage developing brain architecture and chemistry and lead to life long problems in
learning” (Center on the Developing Child at Harvard University 2007).17
Our paper contributes to a number of literatures. First, our child-spacing results
speak to the current debate of the validity of using twins as an instrument to test the
quality-quantity trade-off. For example, Qian (2006) argues that “the occurrence of
twins potentially has a direct effect (e.g. birth spacing) on child outcomes in addition to
its effect on family size” while Rosenzweig and Zhang (2006) argues that “no evidence
is adduced that spacing has significant effects, net of family size, on child quality”.
18
Second, our results add to the literature investigating the relationship between fertil-
ity and economic incentives. Recent work has shown that cash transfers may have an
effect of fertility, e.g., Lalive and Zweimüller (2009) and Milligan (2005). However, as
discussed by Milligan “the observed response may be transitory rather than permanent;
women may have changed the timing of children rather than the eventual size of their
families.” Similarly, Lalive and Zweimüller (2009) acknowledge that “while we do not
observe the completed fertility cycle of mothers, we conclude that it is quite likely that
the policy change did not only affect the timing but also the number of births.” In our
study we use cohorts of women who completed their fertile years at the time when the
Swedish administrative child-spacing rule came into place in 1980. In sharp contrast to
Lalive and Zweimüller (2009) and Milligan (2005), our results suggest that the parental
leave provisions only affects the timing of births but not on completed fertility (family
size).
Our evidence suggests that child-spacing has an effect.
19
Our results about economic incentives and fertility, is therefore relevant to the
current debate in several countries of how to promote fertility through economic
Our result is therefore consistent with the implications from life-cycle models of
fertility as discussed by Hotz et al. (1997). They argue that transitory changes in the
price of children or parental incomes “may be to shift the timing of births over the life-
cycle rather than have much, if any, effect on the number of births accumulated.”
17 For more information about the toxic stress on child development see National Scientific Council on the Developing Child (2005) and the references cited therein. 18 Grönqvist and Åslund (2007) find no effect of family size on child outcomes using the twin-birth design on data from Sweden. 19 That lifetime fertility size is not affected by the reform is perhaps not surprising given that the cohort fertility in Sweden has been strikingly stable. For more than half a century, cohort fertility has varied within a narrow band of 1.9 to 2.1 children per woman as discussed by Walker (1995) and Björklund (2006).
10 IFAU – Does child spacing affect children’s outcomes? Evidence from a Swedish reform
incentives. For example, Germany has recently introduced a speed premium (36
months) on future childbearing similar to the Swedish one as a way to boost fertility.20
2 The incentives for child spacing
According to our results, the German child-spacing rule is not likely to affect completed
fertility but rather to have a negative impact on a child future outcome.
The rest of the paper is structured as follows. In section 2, we discuss the administra-
tive child-spacing rule and provide evidence that it had a differential impact on native
and foreign-born mothers. Section 3 presents evidence on the impact of the administra-
tive child-spacing rule on child outcomes. Section 4 presents the results of the effect of
child-spacing on child outcomes from using two-stage least squares and Wald estima-
tors where the administrative rule is an instrumental variable for child spacing. In
Section 5 we provide additional evidence on the child-spacing effect, while Section 6
concludes.
In this section, we discuss the parental leave benefit system and the administrative rule
that provides the incentive for close child spacing in Sweden.21
20 See Spiess and Wrohlich (2006) for a discussion of the parental leave benefit reform in Germany. 21 Family policy in Sweden is characterized by flexible parental-leave regulations, generous parental leave allowances, right to part-time work, and high supply of publicly-financed day care for children. See Björklund (2006) for an overview of family policies in Sweden.
We also present evi-
dence that the administrative rule had differential impacts on child spacing of native-
born and foreign-born women.
The Swedish parental benefit system was introduced in 1974 and it was the first
program of its kind among western welfare democracies. Before 1974, women were
entitled to maternity allowances at the event of childbirth but now, either parent could
receive payment to stay at home and care for the newborn child, although mothers con-
tinued to use the bulk of paid leave opportunities. The benefit level was 90 percent of
foregone earnings with eligibility based on the parent’s individual earnings 9 consecu-
tive months or 12 out of 24 months preceding the birth-related withdrawal. Those who
did not fulfil this requirement instead received a low flat rate. In 1980, the total benefit
period was 12 months; 9 months with a 90 percent replacement rate plus three
additional months at a low flat rate.

IFAU – Does child spacing affect children’s outcomes? Evidence from a Swedish reform 11
The rules that determine parental leave benefits in Sweden also have an element that
creates a kind of “speed premium” on further childbearing. Since benefits are earnings-
related, a period of no work or only part-time work after a birth would usually reduce
the benefit level after a subsequent birth. However, in 1980 it became possible for
women to retain her previous high level of benefits without entering the labor market
between births provided that the interval between the births did not exceed 24 months.22
Here it is important to point out that it was the authorities, rather than politicians,
who determined these rules concerning the practical implementation of the parental
leave system.
Thus, this gave a woman a short-term economic incentive to space her children within
24 months in order to avoid the reduction in benefits, i.e., a speed premium on further
childbearing.
23
Figure 1
Therefore, one cannot claim that politicians deliberately created incen-
tives for the close spacing of children. Thus, there are no obvious political economy
issues which otherwise may be a potential problem when using a policy change as an
exogenous source of variation (Besley and Case 2000).
shows the child spacing behavior in Sweden during 1968 to 1992. This
figure shows that until 1980, the average spacing between two consecutive siblings was
between 45-47 months, while it sharply decreased to about 37 months in 1990. Thus,
the average child spacing was reduced with more than 20 percent over this period. This
lends some support to that it was the administrative rule that came into place in 1980
that caused the reduction in child spacing. However, this evidence is only suggestive
since it is based on a pre and post comparisons. A more compelling identification stra-
tegy is to use a differences-in-differences method which critically depends on a suitable
variable being available to classify observations into the control and treatment groups.
We will argue that a mother’s country of birth is a useful way of classifying individuals
into treatment and control groups since: (i) they should on a priori grounds be
22 From 1974 to 1979, a mother could also abstain from earnings and yet retain the right to a previous benefit level for subsequent births. In 1974 the interval between births could not exceed 12 months, while in 1978 and 1979 the interval was 15 months. Thus it may be possible that this rule could have affected the spacing decisions of a small fraction of mothers even before 1980. 23 The Swedish Government controls the authorities by each year drafting a set of appropriation instructions (regler-ingsbrev), which specifies the goals for each authority for the coming year and how much money is at their disposal. The Government has no right to instruct authorities in how to implement a certain law or how to decide in a particular matter. This is known as ministerial rule and is prohibited in Sweden. As a result, public administration and state agencies in particular, have a high degree of independence and decentralisation.

12 IFAU – Does child spacing affect children’s outcomes? Evidence from a Swedish reform
differently affected by the administrative child-spacing rule, and (ii) the country of birth
is exogenous with respect to the administrative reform.
20
2530
3540
4550
55M
onth
s
1970 1975 1980 1985 1990Birth year
Figure 1 Average child spacing 1968–92 by birth year of children Note: Child spacing is based on the time difference in birth between the child and the subsequent sibling. All birth orders are included.
To begin with, as noted previously native-born mothers should have relatively stronger
incentives for closer spacing than foreign-born mothers since they are more strongly
attached to the labor market than foreign-born mothers. In other words, both native-born
and foreign-born mothers are affected by the child spacing rule but to very different
degrees. Thus, both groups are therefore treated but we continue to label the native-born
mothers as the treatment group and the foreign-born mothers as the comparison or
control group.
Table 1 shows the labor force participation rates for native-born and foreign-born
women for the years 1979 and 1985. The upper panel shows the figures for women in
childbearing ages (i.e., women aged 16-44) and the figures for women with children
less than seven years old. Table 1 reveals that labor participation rates are significantly

IFAU – Does child spacing affect children’s outcomes? Evidence from a Swedish reform 13
higher for native-born than foreign-born mothers for both categories of women. This is
also the case both before as well as after the change in the administrative rule in 1980.
For example, native-born women had a labor participation rate of 75 percent compared
to only 61 percent for foreign-born women for those aged 16-44 in 1979.
Table 1. Labor force participation rates (n percent)
1979 1985
Native-born
Women aged 16-44
75 79
Foreign-born 61 63
Native-born
Women with children under 7
79 80
Foreign born 58 59
The markedly lower participation rates for foreign-born women are also consistent with
information provided by country specific labor market surveys (OECD Labor Market
Statistics).24 Figure 2 displays the labor force participation rates for a number of OECD
countries for the year 1980. Sweden has the highest rate followed by the other
Scandinavian countries. Thus, all other OECD countries have lower labor force partici-
pation rates than the Nordic countries. According the labor market survey, the average
labor force participation rates for the treatment group vary between 62-76 percent. For
the remaining OECD countries the corresponding rates vary between 33-60 percent.
24 The participation rate is defined as female labor force of all ages divided by female population 15-64 years old.

14 IFAU – Does child spacing affect children’s outcomes? Evidence from a Swedish reform
.
Female labor force participation rates in 1980
0
10
20
30
40
50
60
70
80S
wed
enD
enm
ark
Finl
and
Nor
way
Uni
ted
Sta
tes
Uni
ted
Kin
gdom
Can
ada
Japa
nFr
ance
P
ortu
gal
Sw
itzer
land
Ger
man
y A
ustra
lia
Aus
tria
Bel
gium
N
ew Z
eala
nd
Italy
Ire
land
N
ethe
rland
s M
exic
o G
reec
e S
pain
Figure 2 Female labor force participation rates in 1980
Classifying women into treatment and control groups based on their country of birth can
therefore also be thought of as capturing different cultural norms for women’s decision
to work as discussed by Fernández and Fogli (2009). Consequently, if we instead would
have categorized mothers treatment status based on the female labor force participation
in their country of origin, we would still have classified mothers born in the Nordic
countries as “more treated” and mother born outside the Nordic countries as “less
treated”. For reasons discussed below, we therefore define the treatment group as
women born in the Nordic countries (Sweden, Finland, Norway, Denmark and Iceland)
while the comparison group consist of those women born outside the Nordic countries.
Mothers’ country of birth is also a useful way of classifying individuals into treat-
ment and control groups since country of birth is an immutable characteristic and can
not be affected by the treatment itself or by individuals’ reaction to the treatment. If we
classify the treatment and control group based on a measure of the actual labor market
IFAU – Does child spacing affect children’s outcomes? Evidence from a Swedish reform 15
status we would run into problems of having an endogenous grouping variable since the
administrative reform is likely to affect a mother’s labor force participation. This type of
problem has been previously discussed in the labor supply literature where income has
been used to classify individuals into treatment and control groups (e.g., Heckman 1996
and Blundell et al. 1998).25
Due to confidentiality reasons, Statistics Sweden does not provide information about
an individual’s country of birth. Instead, information about origin is provided at a
country group level, consisting of 10 country regions.
As a result of defining treatment status on the basis of a
mother’s country of birth, and not the actual labor force participation status, the reduced
form relationship between a mothers outcome and the administrative spacing rule is
therefore like an “intention to treat” effect. Nonetheless, under the assumption that the
administrative child-spacing rule had no effect on child outcomes other than decreasing
child spacing, the effect of child spacing on future child outcomes can still be estimated
using an instrumental variables method.
Table 2 displays information
about the region of birth for the native-born mothers (the treatment group) and foreign-
born mothers (the control group), respectively. The information in Table 2 is based on
the first-born sample (2+ sample). As discussed above, Native-born mothers are defined
to be born in Sweden or in some of the other four Nordic Countries (i.e., Denmark,
Finland, Norway and Iceland) since women in the Nordic countries have very high
labor market attachments. Table 2 shows that 95 percent of the native-born mothers are
born in Sweden. Foreign-born mothers are classified into eight different groups by
Statistics Sweden, namely EU 15 (i.e., the non-Nordic member countries in the
European Union before the enlargement in 2004), Europe (i.e., European countries not
including EU15), Africa, North America, South America, Asia, Oceania, and Soviet
Union. Table 2 reveals that of the total of 25,325 of foreign-born mothers in our sample,
56 percent of foreign-born mothers are born in a European country (i.e., EU 15 or
Europe), 27 percent are born in an Asian country, while the others are born in some of
the other remaining groups. In the following, it is important to keep in mind that we
need to have enough observations before and after 1980 in both the control and
treatment groups since we use a differences-in-differences design. Before 1980, there
25 Heckman (1996) criticizes Eissa (1995) who use of women’s income as a grouping variable. Since women may switch groups as a result of the tax reform, this leads to biased estimates of the behavioral effect of the reform.
16 IFAU – Does child spacing affect children’s outcomes? Evidence from a Swedish reform
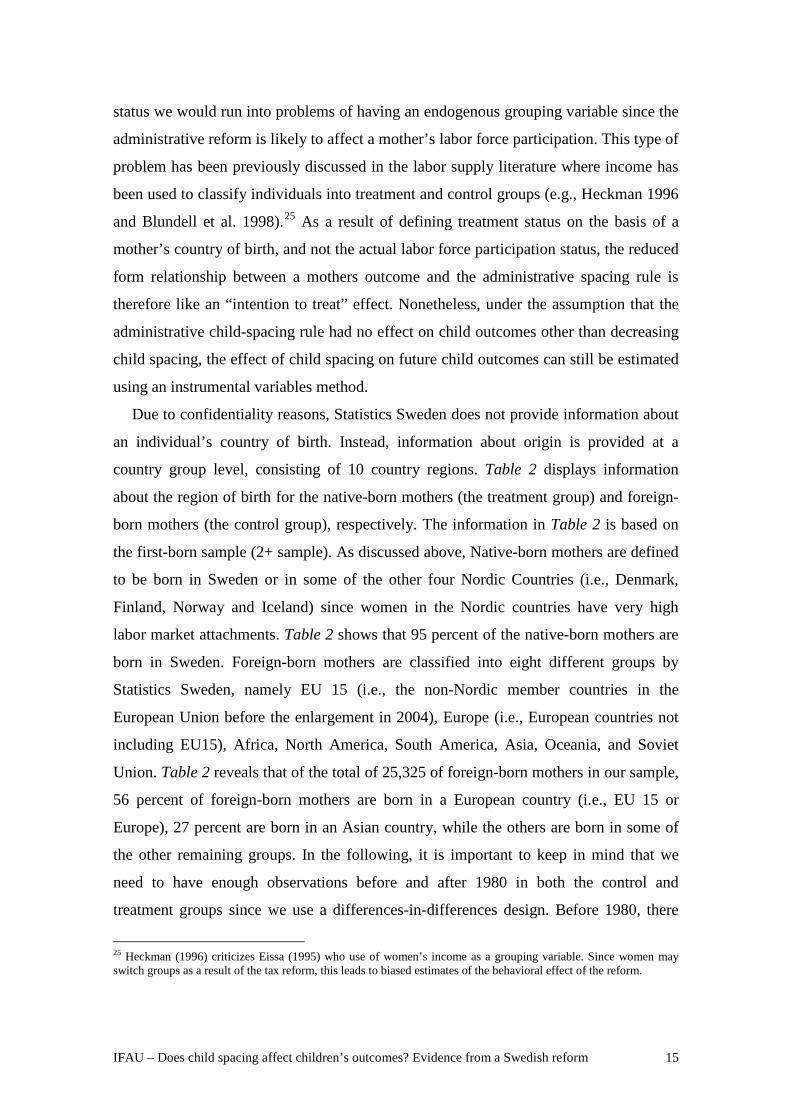
are 339,007 and 15,601 observations in the treatment and control group respectively,
while after there are 198,286 and 9,724 in the treatment and control groups respectively.
The issue of sample size in the control group is going to be important when we analyze
sub-samples of the data and when we look at second-born children, the 3+ sample. For
example, there are only 709 observations, whereof 395 are for the period after 1980,
when mothers from North America are used as the comparison group.
Table 2. Mothers’ region of birth by first born child
Frequency Percentage
Native-born mothers Sweden 511,156 95.1 Other nordic countries
26,137 4.9
Total sum 537,293
Foreign-born mothers EU 15 4,673 18.4 Europe 9,500 37.5 Africa 1,029 4.1 North America 709 2.8 South America 2,277 9.0 Asia 6,839 27.0 Oceania 78 0.3 Soviet Union 220 0.9 Total sum 25,325
Notes. - These groups are taken from the classification used by Statistics Sweden. Nordic includes: Denmark, Norway, Finland, and Iceland, EU 15 is equal to the 15 member states of the European Union but excluding Denmark Finland and Sweden. Europe does not include EU15 and the Nordic Countries. The remaining groups are self explanatory.
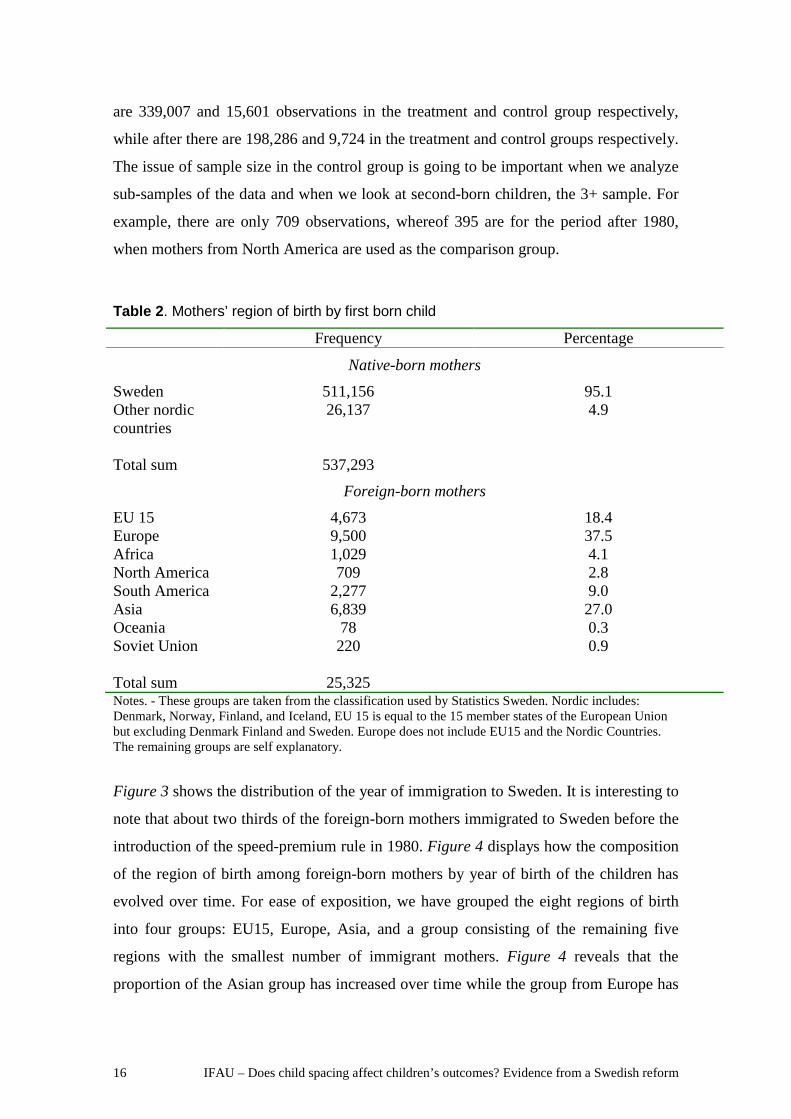
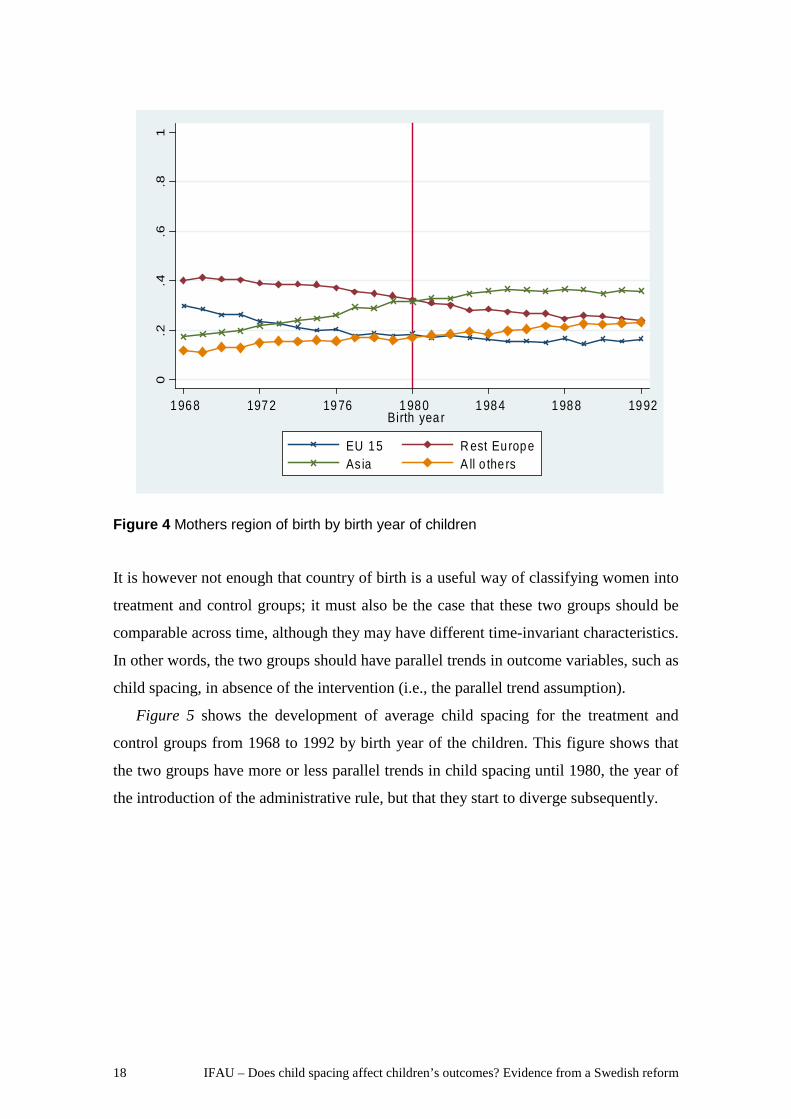
Figure 3 shows the distribution of the year of immigration to Sweden. It is interesting to
note that about two thirds of the foreign-born mothers immigrated to Sweden before the
introduction of the speed-premium rule in 1980. Figure 4 displays how the composition
of the region of birth among foreign-born mothers by year of birth of the children has
evolved over time. For ease of exposition, we have grouped the eight regions of birth
into four groups: EU15, Europe, Asia, and a group consisting of the remaining five
regions with the smallest number of immigrant mothers. Figure 4 reveals that the
proportion of the Asian group has increased over time while the group from Europe has
IFAU – Does child spacing affect children’s outcomes? Evidence from a Swedish reform 17
decreased. The proportion of mothers born in EU 15 and in the remaining group of
countries has remained more or less constant. Importantly, there are no sharp changes in
the composition of region of birth around the year of the introduction of the child
spacing rule in 1980, which otherwise could have led to problems with our identifica-
tion strategy.
0.1
.2.3
-64 65-69 70-74 75-79 80-84 85+
Figure 3 Distribution of immigration year of foreign-born mothers
18 IFAU – Does child spacing affect children’s outcomes? Evidence from a Swedish reform
0.2
.4.6
.81
1 968 1972 1976 1980 1984 1988 1992Birth yea r
EU 15 R est Eu ropeAs ia A ll o the rs
Figure 4 Mothers region of birth by birth year of children
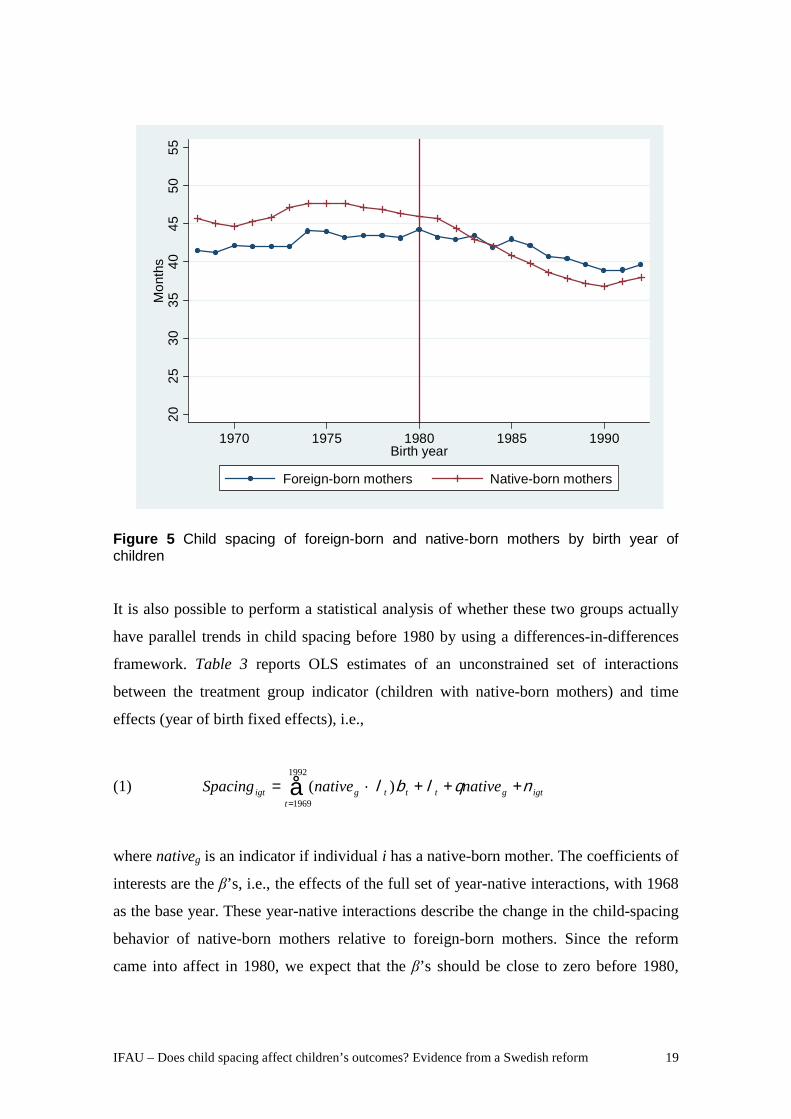
It is however not enough that country of birth is a useful way of classifying women into
treatment and control groups; it must also be the case that these two groups should be
comparable across time, although they may have different time-invariant characteristics.
In other words, the two groups should have parallel trends in outcome variables, such as
child spacing, in absence of the intervention (i.e., the parallel trend assumption).
Figure 5 shows the development of average child spacing for the treatment and
control groups from 1968 to 1992 by birth year of the children. This figure shows that
the two groups have more or less parallel trends in child spacing until 1980, the year of
the introduction of the administrative rule, but that they start to diverge subsequently.
IFAU – Does child spacing affect children’s outcomes? Evidence from a Swedish reform 19
2025
3035
4045
5055
Mon
ths
1970 1975 1980 1985 1990Birth year
Foreign-born mothers Native-born mothers
Figure 5 Child spacing of foreign-born and native-born mothers by birth year of children
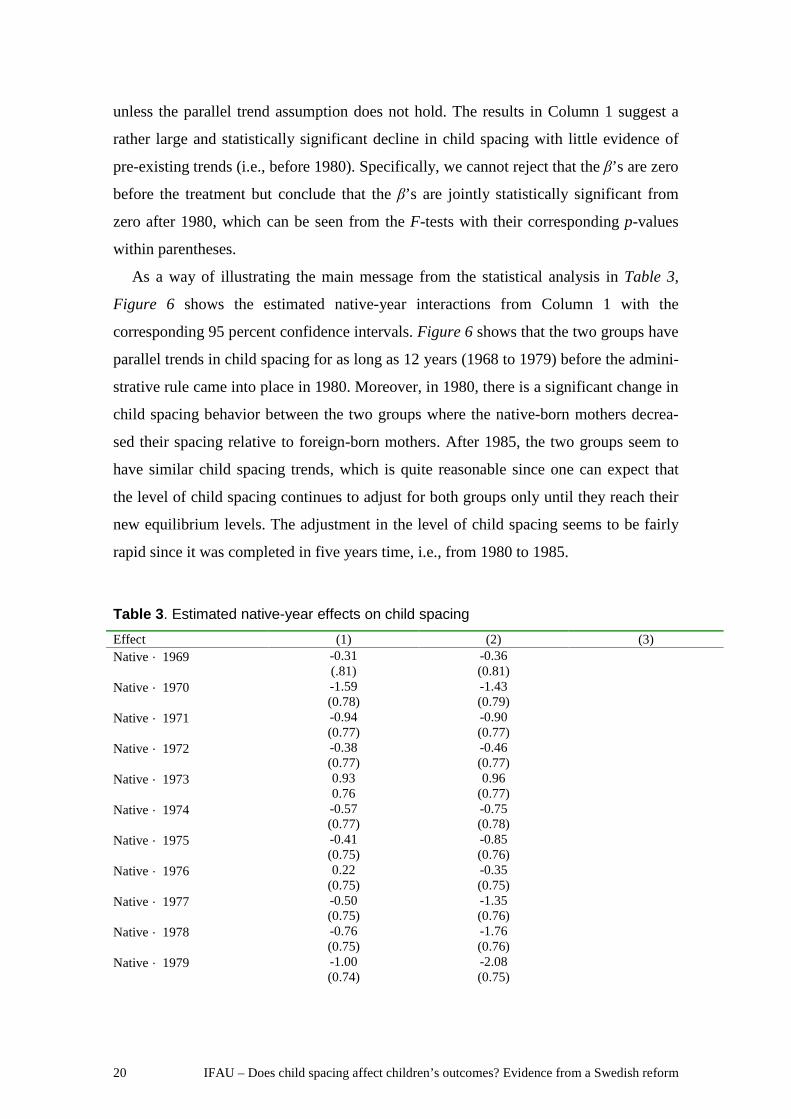
It is also possible to perform a statistical analysis of whether these two groups actually
have parallel trends in child spacing before 1980 by using a differences-in-differences
framework. Table 3 reports OLS estimates of an unconstrained set of interactions
between the treatment group indicator (children with native-born mothers) and time
effects (year of birth fixed effects), i.e.,
(1) å=
+++´=1992
1969)(
tigtgtttgigt nativenativeSpacing nqlbl
where nativeg is an indicator if individual i has a native-born mother. The coefficients of
interests are the β’s, i.e., the effects of the full set of year-native interactions, with 1968
as the base year. These year-native interactions describe the change in the child-spacing
behavior of native-born mothers relative to foreign-born mothers. Since the reform
came into affect in 1980, we expect that the β’s should be close to zero before 1980,
20 IFAU – Does child spacing affect children’s outcomes? Evidence from a Swedish reform
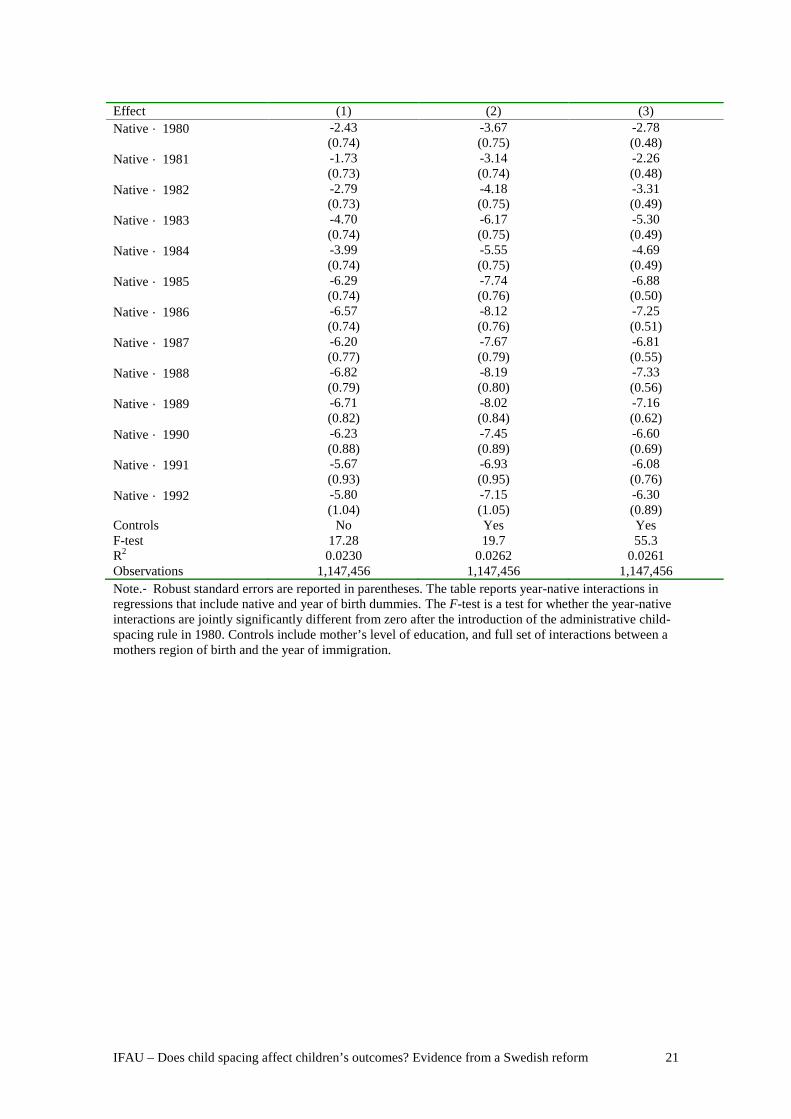
unless the parallel trend assumption does not hold. The results in Column 1 suggest a
rather large and statistically significant decline in child spacing with little evidence of
pre-existing trends (i.e., before 1980). Specifically, we cannot reject that the β’s are zero
before the treatment but conclude that the β’s are jointly statistically significant from
zero after 1980, which can be seen from the F-tests with their corresponding p-values
within parentheses.
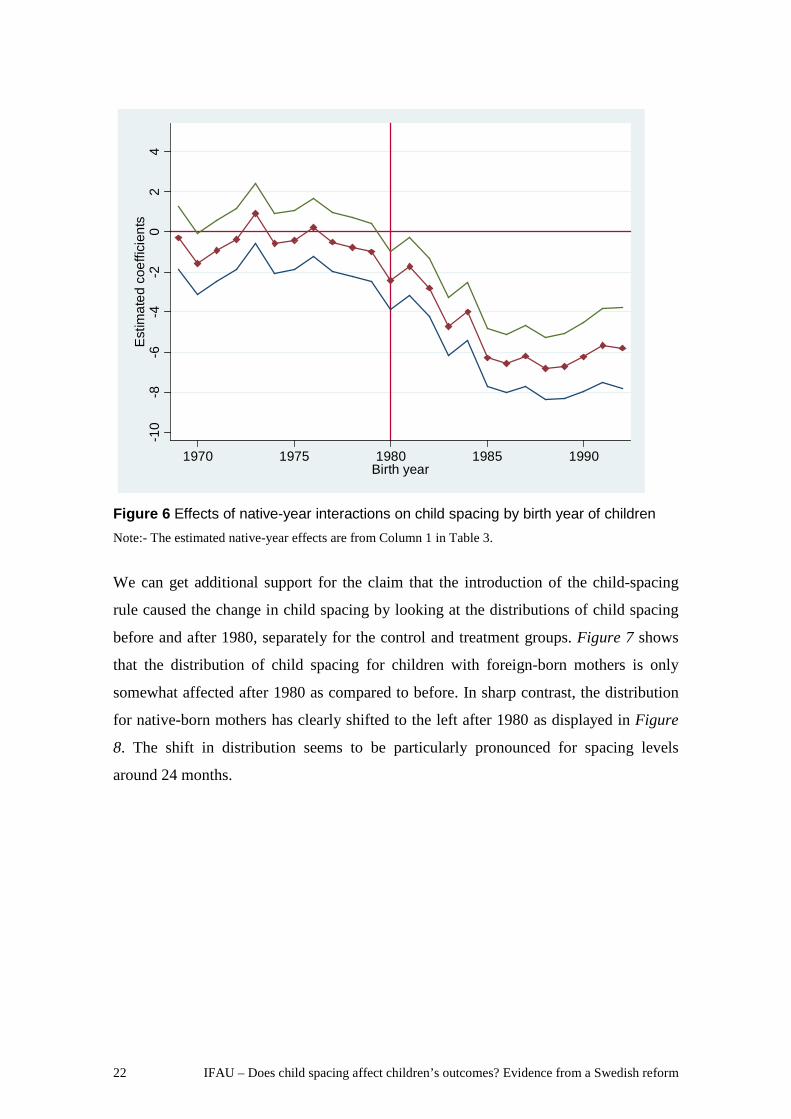
As a way of illustrating the main message from the statistical analysis in Table 3,
Figure 6 shows the estimated native-year interactions from Column 1 with the
corresponding 95 percent confidence intervals. Figure 6 shows that the two groups have
parallel trends in child spacing for as long as 12 years (1968 to 1979) before the admini-
strative rule came into place in 1980. Moreover, in 1980, there is a significant change in
child spacing behavior between the two groups where the native-born mothers decrea-
sed their spacing relative to foreign-born mothers. After 1985, the two groups seem to
have similar child spacing trends, which is quite reasonable since one can expect that
the level of child spacing continues to adjust for both groups only until they reach their
new equilibrium levels. The adjustment in the level of child spacing seems to be fairly
rapid since it was completed in five years time, i.e., from 1980 to 1985.
Table 3. Estimated native-year effects on child spacing
Effect (1) (2) (3) Native ´ 1969 -0.31
(.81) -0.36 (0.81)
Native ´ 1970 -1.59 (0.78)
-1.43 (0.79)
Native ´ 1971 -0.94 (0.77)
-0.90 (0.77)
Native ´ 1972 -0.38 (0.77)
-0.46 (0.77)
Native ´ 1973 0.93 0.76
0.96 (0.77)
Native ´ 1974 -0.57 (0.77)
-0.75 (0.78)
Native ´ 1975 -0.41 (0.75)
-0.85 (0.76)
Native ´ 1976 0.22 (0.75)
-0.35 (0.75)
Native ´ 1977 -0.50 (0.75)
-1.35 (0.76)
Native ´ 1978 -0.76 (0.75)
-1.76 (0.76)
Native ´ 1979 -1.00 (0.74)
-2.08 (0.75)
IFAU – Does child spacing affect children’s outcomes? Evidence from a Swedish reform 21
Effect (1) (2) (3) Native ´ 1980 -2.43
(0.74) -3.67 (0.75)
-2.78 (0.48)
Native ´ 1981 -1.73 (0.73)
-3.14 (0.74)
-2.26 (0.48)
Native ´ 1982 -2.79 (0.73)
-4.18 (0.75)
-3.31 (0.49)
Native ´ 1983 -4.70 (0.74)
-6.17 (0.75)
-5.30 (0.49)
Native ´ 1984 -3.99 (0.74)
-5.55 (0.75)
-4.69 (0.49)
Native ´ 1985 -6.29 (0.74)
-7.74 (0.76)
-6.88 (0.50)
Native ´ 1986 -6.57 (0.74)
-8.12 (0.76)
-7.25 (0.51)
Native ´ 1987 -6.20 (0.77)
-7.67 (0.79)
-6.81 (0.55)
Native ´ 1988 -6.82 (0.79)
-8.19 (0.80)
-7.33 (0.56)
Native ´ 1989 -6.71 (0.82)
-8.02 (0.84)
-7.16 (0.62)
Native ´ 1990 -6.23 (0.88)
-7.45 (0.89)
-6.60 (0.69)
Native ´ 1991 -5.67 (0.93)
-6.93 (0.95)
-6.08 (0.76)
Native ´ 1992 -5.80 (1.04)
-7.15 (1.05)
-6.30 (0.89)
Controls No Yes Yes F-test 17.28 19.7 55.3 R2 0.0230 0.0262 0.0261 Observations 1,147,456 1,147,456 1,147,456 Note.- Robust standard errors are reported in parentheses. The table reports year-native interactions in regressions that include native and year of birth dummies. The F-test is a test for whether the year-native interactions are jointly significantly different from zero after the introduction of the administrative child-spacing rule in 1980. Controls include mother’s level of education, and full set of interactions between a mothers region of birth and the year of immigration.
22 IFAU – Does child spacing affect children’s outcomes? Evidence from a Swedish reform
-10
-8-6
-4-2
02
4E
stim
ated
coe
ffici
ents
1970 1975 1980 1985 1990Birth year
Figure 6 Effects of native-year interactions on child spacing by birth year of children Note:- The estimated native-year effects are from Column 1 in Table 3.
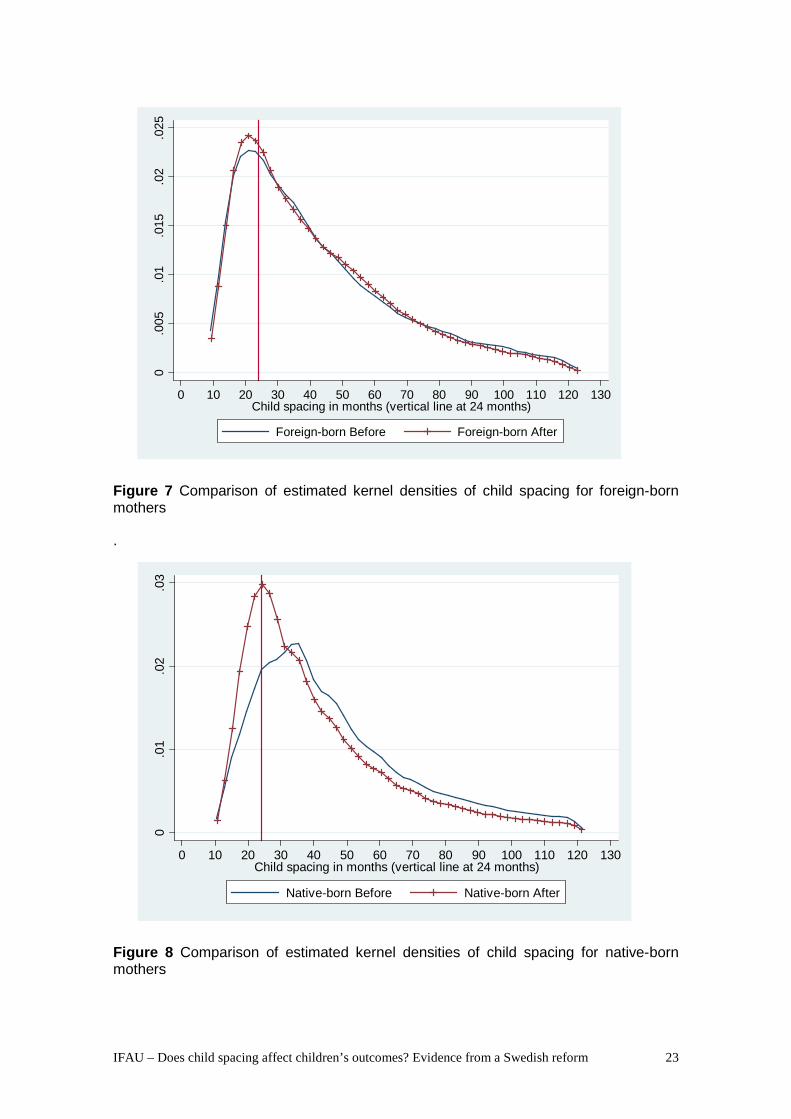
We can get additional support for the claim that the introduction of the child-spacing
rule caused the change in child spacing by looking at the distributions of child spacing
before and after 1980, separately for the control and treatment groups. Figure 7 shows
that the distribution of child spacing for children with foreign-born mothers is only
somewhat affected after 1980 as compared to before. In sharp contrast, the distribution
for native-born mothers has clearly shifted to the left after 1980 as displayed in Figure
8. The shift in distribution seems to be particularly pronounced for spacing levels
around 24 months.
IFAU – Does child spacing affect children’s outcomes? Evidence from a Swedish reform 23
0.0
05.0
1.0
15.0
2.0
25
0 10 20 30 40 50 60 70 80 90 100 110 120 130Child spacing in months (vertical line at 24 months)
Foreign-born Before Foreign-born After
Figure 7 Comparison of estimated kernel densities of child spacing for foreign-born mothers
.
0.0
1.0
2.0
3
0 10 20 30 40 50 60 70 80 90 100 110 120 130Child spacing in months (vertical line at 24 months)
Native-born Before Native-born After
Figure 8 Comparison of estimated kernel densities of child spacing for native-born mothers
24 IFAU – Does child spacing affect children’s outcomes? Evidence from a Swedish reform
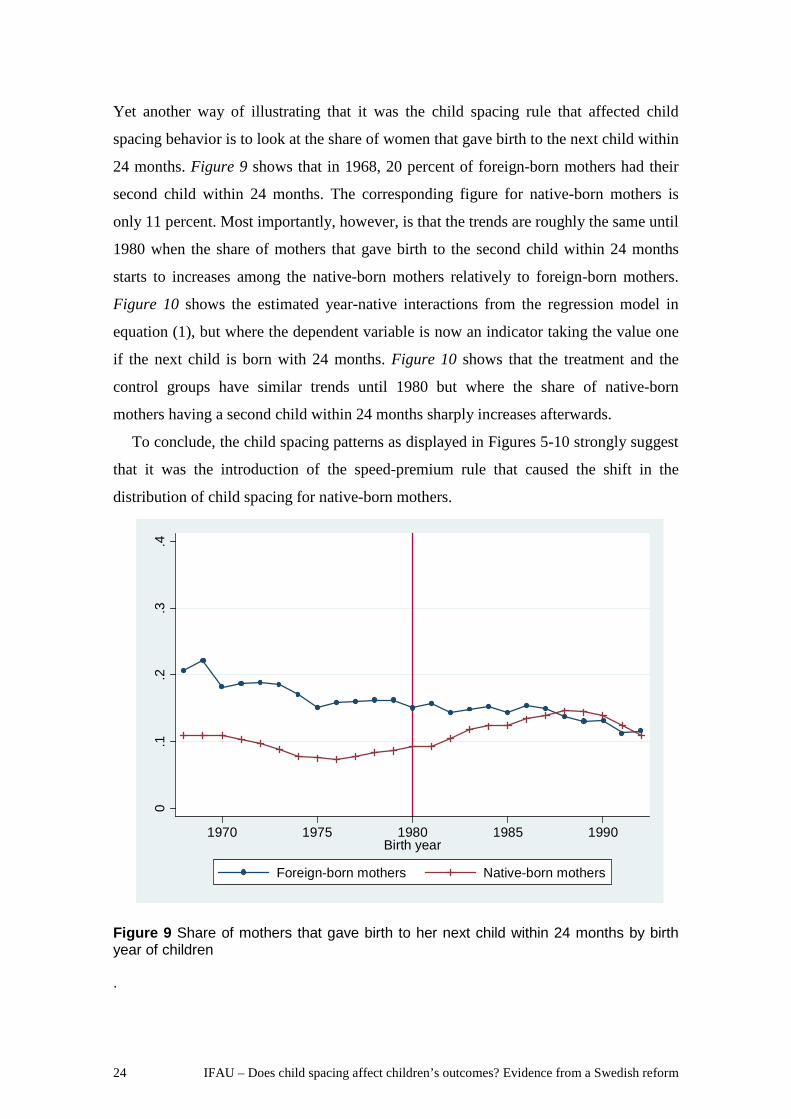
Yet another way of illustrating that it was the child spacing rule that affected child
spacing behavior is to look at the share of women that gave birth to the next child within
24 months. Figure 9 shows that in 1968, 20 percent of foreign-born mothers had their
second child within 24 months. The corresponding figure for native-born mothers is
only 11 percent. Most importantly, however, is that the trends are roughly the same until
1980 when the share of mothers that gave birth to the second child within 24 months
starts to increases among the native-born mothers relatively to foreign-born mothers.
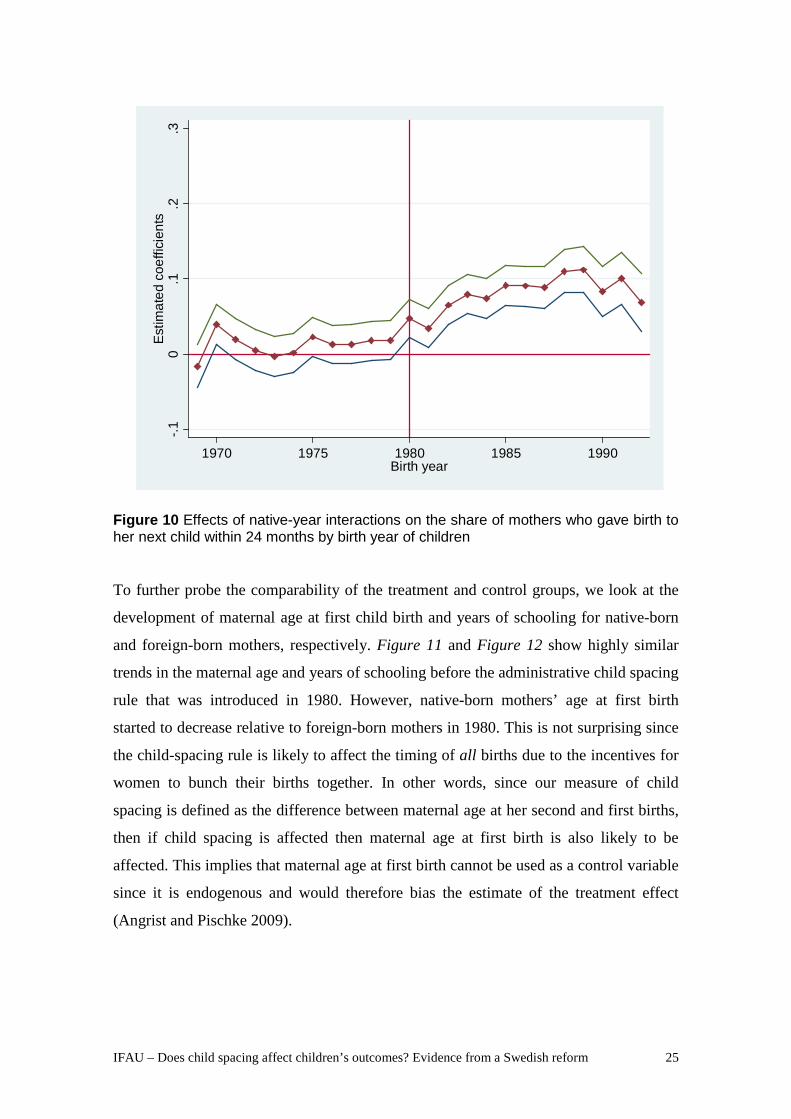
Figure 10 shows the estimated year-native interactions from the regression model in
equation (1), but where the dependent variable is now an indicator taking the value one
if the next child is born with 24 months. Figure 10 shows that the treatment and the
control groups have similar trends until 1980 but where the share of native-born
mothers having a second child within 24 months sharply increases afterwards.
To conclude, the child spacing patterns as displayed in Figures 5-10 strongly suggest
that it was the introduction of the speed-premium rule that caused the shift in the
distribution of child spacing for native-born mothers.
0.1
.2.3
.4
1970 1975 1980 1985 1990Birth year
Foreign-born mothers Native-born mothers
Figure 9 Share of mothers that gave birth to her next child within 24 months by birth year of children
.
IFAU – Does child spacing affect children’s outcomes? Evidence from a Swedish reform 25
-.10
.1.2
.3E
stim
ated
coe
ffici
ents
1970 1975 1980 1985 1990Birth year
Figure 10 Effects of native-year interactions on the share of mothers who gave birth to her next child within 24 months by birth year of children
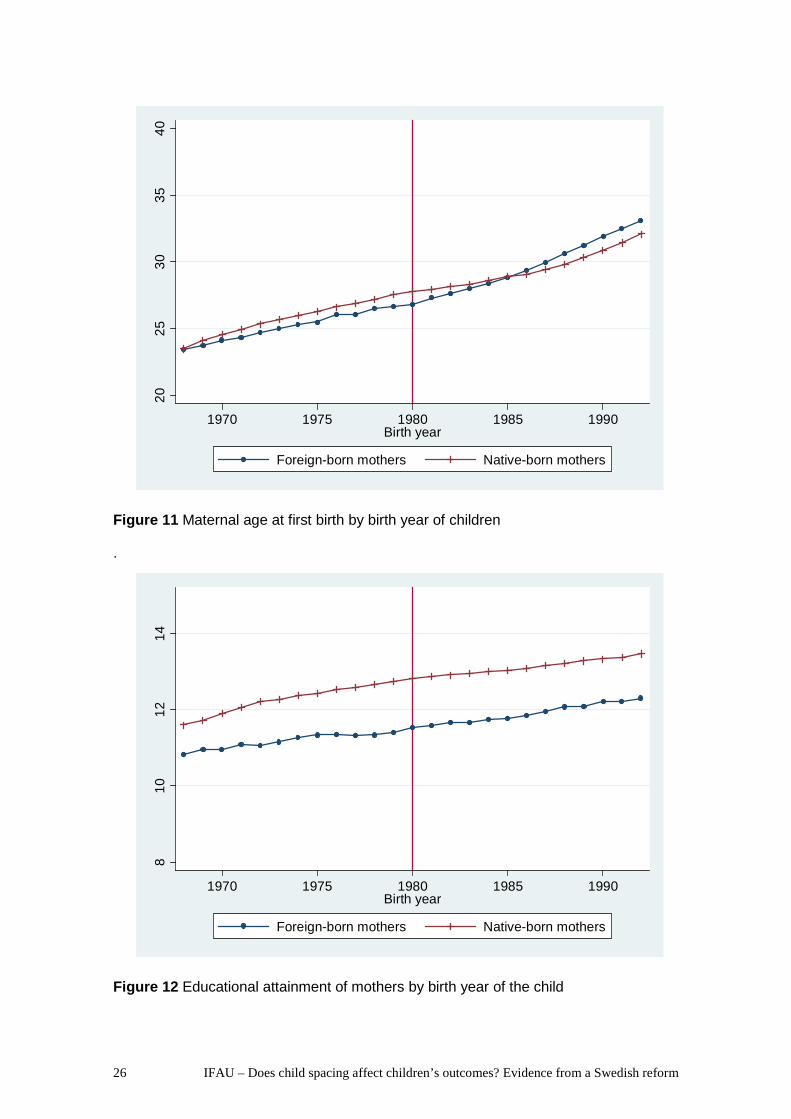
To further probe the comparability of the treatment and control groups, we look at the
development of maternal age at first child birth and years of schooling for native-born
and foreign-born mothers, respectively. Figure 11 and Figure 12 show highly similar
trends in the maternal age and years of schooling before the administrative child spacing
rule that was introduced in 1980. However, native-born mothers’ age at first birth
started to decrease relative to foreign-born mothers in 1980. This is not surprising since
the child-spacing rule is likely to affect the timing of all births due to the incentives for
women to bunch their births together. In other words, since our measure of child
spacing is defined as the difference between maternal age at her second and first births,
then if child spacing is affected then maternal age at first birth is also likely to be
affected. This implies that maternal age at first birth cannot be used as a control variable
since it is endogenous and would therefore bias the estimate of the treatment effect
(Angrist and Pischke 2009).
26 IFAU – Does child spacing affect children’s outcomes? Evidence from a Swedish reform
2025
3035
40
1970 1975 1980 1985 1990Birth year
Foreign-born mothers Native-born mothers
Figure 11 Maternal age at first birth by birth year of children
.
810
1214
1970 1975 1980 1985 1990Birth year
Foreign-born mothers Native-born mothers
Figure 12 Educational attainment of mothers by birth year of the child

IFAU – Does child spacing affect children’s outcomes? Evidence from a Swedish reform 27
The evidence provided above suggests that native-born and foreign-born mothers have
remarkably similar trends in several characteristics before 1980, such as child spacing,
years of schooling, and maternal age. Nevertheless, one might still worry about com-
positional changes in the control group since the foreign-born mothers have emigrated
from very different groups of countries. One way of addressing this is to add a number
of controls that is not affected by the child-spacing rule. We therefore control for a
mother’s educational attainment and a full set of interactions between the region of birth
and the year of immigration in specification (1).
Most of the estimated child spacing effects are hardly affected as can be seen by
comparing Column 2 with Column 1 in Table 3. However, the estimates for 1978 and
1979 are now significantly different from zero but still rather small which suggests that
there was a small change in child spacing before 1980. As discussed by Hoem (1993),
during the years 1978 and 1979, women could still retain her previous high level of
benefits without entering the labor market between births provided that the interval
between the births did not exceed 15 months. Achieving such a tight spacing of children
is biologically difficult and not desired by many parents. Thus, we still use 1980 as the
date of treatment although a small fraction of women may have taken advantage of the
tighter birth interval before 1980.
That most of the estimates of child spacing effects hardly change when pre-treatment
controls are included in equation (1), suggests that compositional bias is not an
important issue in our context. Column 3 shows the results when we impose the
restriction that all β’s are zero before 1980. The F-statistics is 55.3, which, anticipating
the instrumental variable approach, suggests that the set of instrumental have enough
explanatory power as to avoid problems of weak instruments.
Another way of addressing the comparability of the treatment and control groups is
to restrict the sample of foreign-born mothers to, say, only those who emigrated from a
country within EU15, since these women may be more comparable to native-born
women on a priori grounds. As shown further below, the estimate of the child spacing
effect is robust to alterations of the regions of birth included in the control group.
28 IFAU – Does child spacing affect children’s outcomes? Evidence from a Swedish reform
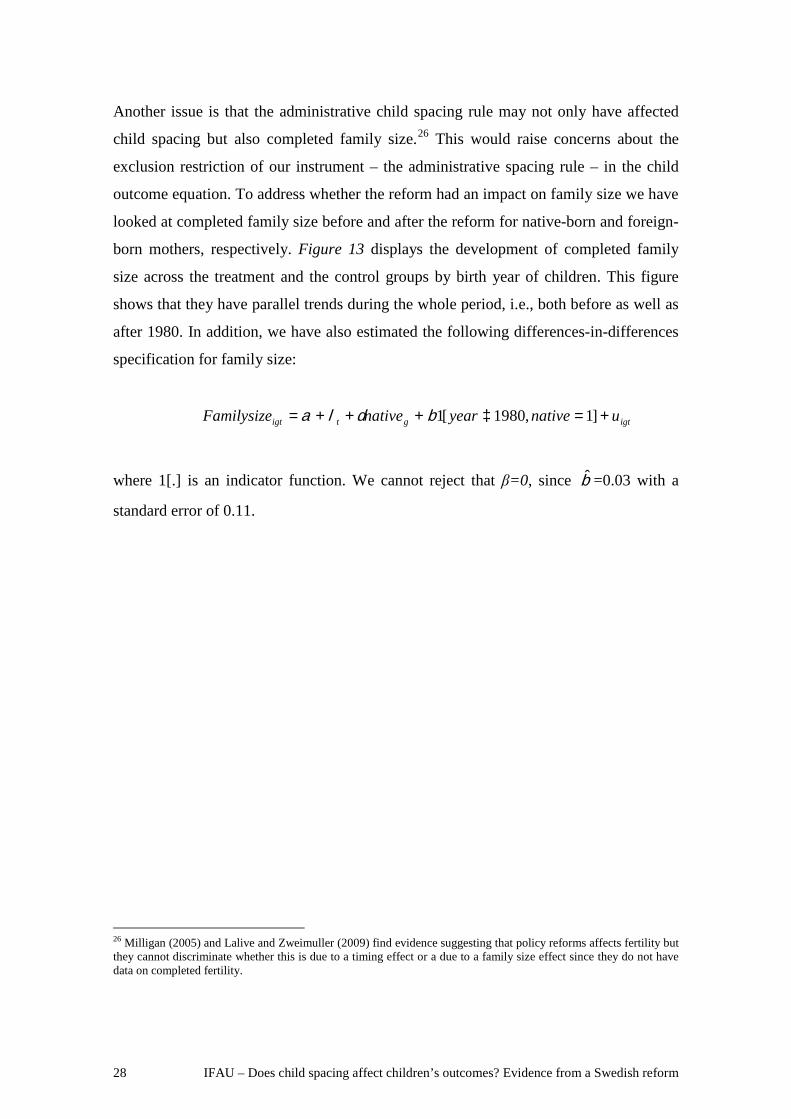
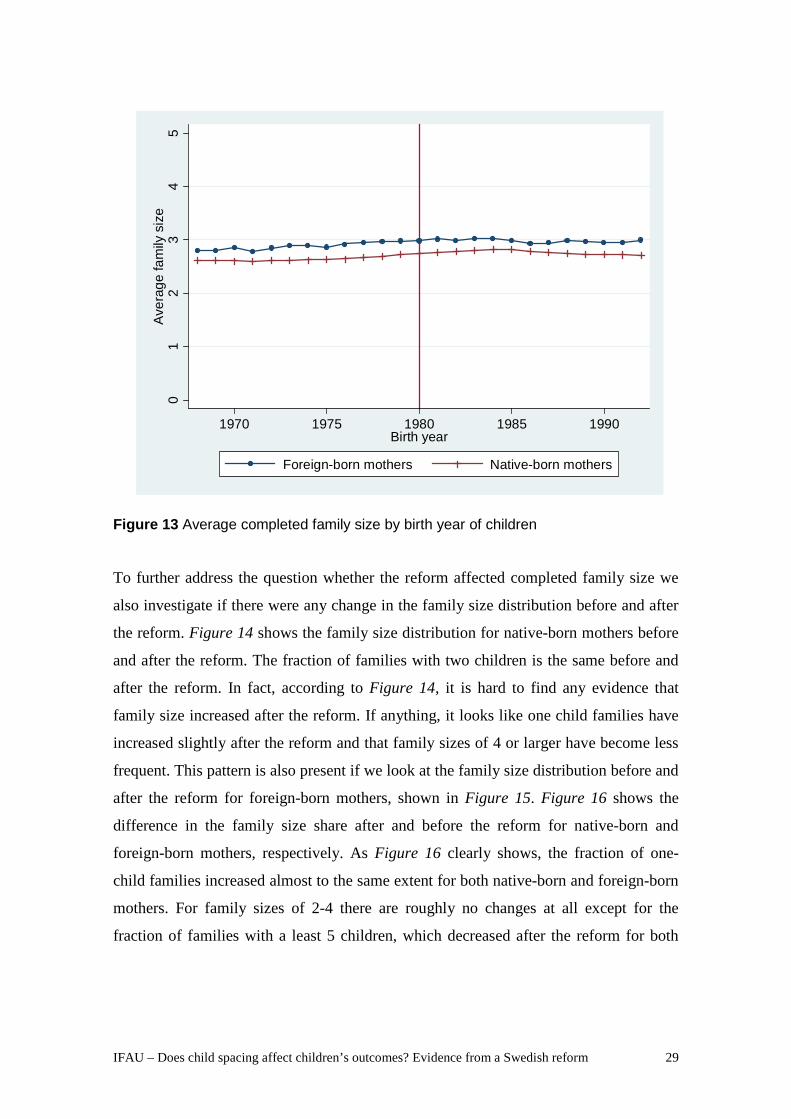
Another issue is that the administrative child spacing rule may not only have affected
child spacing but also completed family size.26
Figure 13
This would raise concerns about the
exclusion restriction of our instrument – the administrative spacing rule – in the child
outcome equation. To address whether the reform had an impact on family size we have
looked at completed family size before and after the reform for native-born and foreign-
born mothers, respectively. displays the development of completed family
size across the treatment and the control groups by birth year of children. This figure
shows that they have parallel trends during the whole period, i.e., both before as well as
after 1980. In addition, we have also estimated the following differences-in-differences
specification for family size:
igtgtigt unativeyearnativeFamilysize +=³+++= ]1,1980[1bdla
where 1[.] is an indicator function. We cannot reject that β=0, since b̂ =0.03 with a
standard error of 0.11.
26 Milligan (2005) and Lalive and Zweimuller (2009) find evidence suggesting that policy reforms affects fertility but they cannot discriminate whether this is due to a timing effect or a due to a family size effect since they do not have data on completed fertility.
IFAU – Does child spacing affect children’s outcomes? Evidence from a Swedish reform 29
01
23
45
Ave
rage
fam
ily s
ize
1970 1975 1980 1985 1990Birth year
Foreign-born mothers Native-born mothers
Figure 13 Average completed family size by birth year of children
To further address the question whether the reform affected completed family size we
also investigate if there were any change in the family size distribution before and after
the reform. Figure 14 shows the family size distribution for native-born mothers before
and after the reform. The fraction of families with two children is the same before and
after the reform. In fact, according to Figure 14, it is hard to find any evidence that
family size increased after the reform. If anything, it looks like one child families have
increased slightly after the reform and that family sizes of 4 or larger have become less
frequent. This pattern is also present if we look at the family size distribution before and
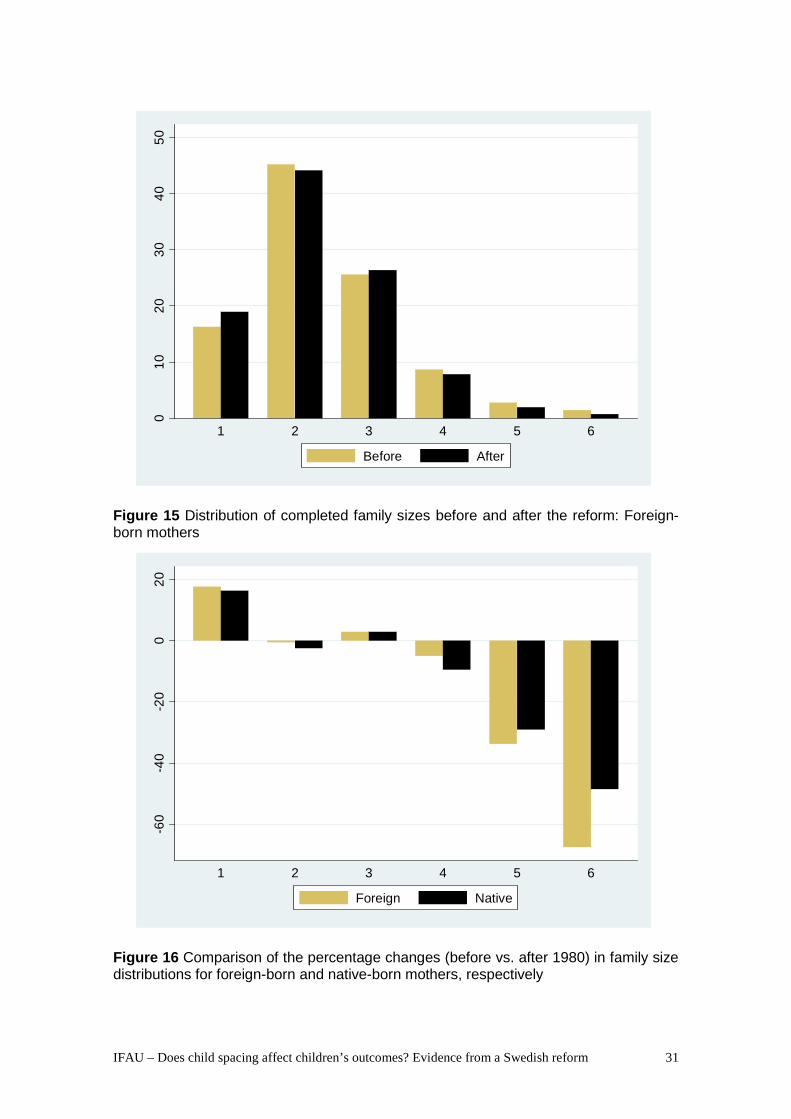
after the reform for foreign-born mothers, shown in Figure 15. Figure 16 shows the
difference in the family size share after and before the reform for native-born and
foreign-born mothers, respectively. As Figure 16 clearly shows, the fraction of one-
child families increased almost to the same extent for both native-born and foreign-born
mothers. For family sizes of 2-4 there are roughly no changes at all except for the
fraction of families with a least 5 children, which decreased after the reform for both
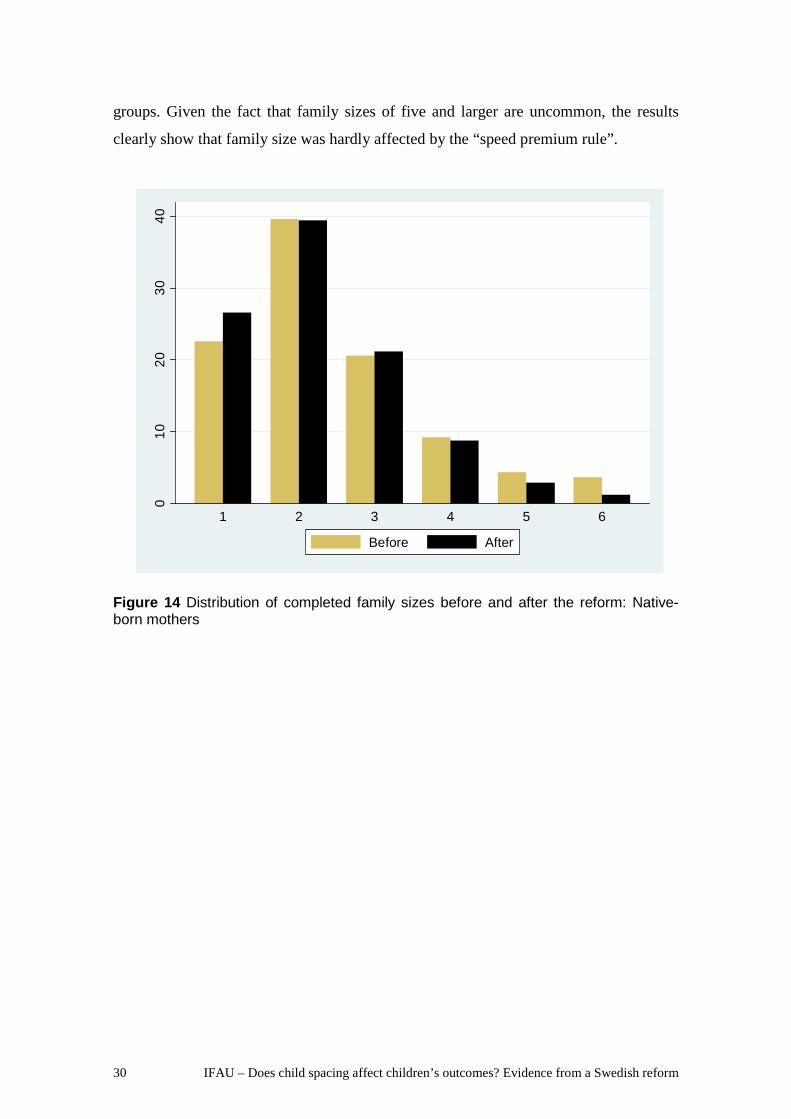
30 IFAU – Does child spacing affect children’s outcomes? Evidence from a Swedish reform
groups. Given the fact that family sizes of five and larger are uncommon, the results
clearly show that family size was hardly affected by the “speed premium rule”.
0
1020
3040
1 2 3 4 5 6
Before After
Figure 14 Distribution of completed family sizes before and after the reform: Native-born mothers
IFAU – Does child spacing affect children’s outcomes? Evidence from a Swedish reform 31
010
2030
4050
1 2 3 4 5 6
Before After
Figure 15 Distribution of completed family sizes before and after the reform: Foreign-born mothers
-60
-40
-20
020
1 2 3 4 5 6
Foreign Native
Figure 16 Comparison of the percentage changes (before vs. after 1980) in family size distributions for foreign-born and native-born mothers, respectively
32 IFAU – Does child spacing affect children’s outcomes? Evidence from a Swedish reform
3 The effect of the speed-premium on child outcomes In this section we provide evidence of the effect of the administrative rule – the speed
premium – on child outcomes. We use the Multi Generation Population Register match-
ed with the longitudinal data base LOUISE. The data were provided by Statistics
Sweden. LOUISE is a register based data set on the total Swedish population which
includes information on, among other things, income and education. The Multi Genera-
tion Registers include identifiers so that we can match parents to their biological
children and siblings to each other. Consequently, and quite importantly, the informa-
tion on child spacing, birth order and number of children is not conditional on having
found the siblings in the other parts of the data set, which otherwise is the case in most
other available micro data sets, since it is directly recorded for each mother.
When matching children to parents we use the mother identifier since almost all
children have grown up with a mother. We restrict the analysis to all first-born and
second-born individuals born between 1968 and 1988 due to limitations of the child
outcome data. As noted previously, the spacing for first-born children is measured by
the birth interval between the first and second-born child, while for second-born child-
ren child spacing is measured by the birth interval between the second and third-born.27
In other words, we work with two main analysis samples. One consists of first-born
subjects in families with two or more births (2+ sample). The second sample consists of
second-born subjects in families with three or more births (3+ sample). Data therefore
consists of repeated cross-section of mothers’ first-born or second-born child since each
mother is only observed in one year. Since we study the outcomes of children born
before the second or third birth we avoid any selection problems due to differential
preferences of family size.28
For the 2+ sample, the treatment group will therefore consist of all first-born subjects
with native-born mothers with a family size of two or more, while the comparison group
will be all first-born individuals with foreign-born mothers, also with at least two
We also restrict our sample to mothers who are born before
1965 in order to look at completed family size.
27 We also exclude observations where child spacing is less than 1 year (around 0.10 percent of the population) and more than 10 years (almost 5 percent of the sample). For children born in 1960-1995 there are around 16 percent where we have no information on mother country of birth (of those children with missing information on mothers' country of birth, 91 percent are born before 1972. 28 This is analogous to the sample criteria used by Angrist et al. (2006) and Black et al. (2005).

IFAU – Does child spacing affect children’s outcomes? Evidence from a Swedish reform 33
children. Similarly, for the 3+ sample, the treatment group consists of all second-born
subjects with native-born mothers with a family size of three or more, while the control
group will be all second-born individuals with foreign-born mothers in families with at
least 3 births.
The main child outcome measure used in this paper is university-preparatory educa-
tional attainment which individuals typically obtain at the age of 19 in Sweden. The
information on educational attainment is only available for individuals born up to 1987
since educational attainment is measured in 2006. Many individuals are therefore still in
the educational system. For example, the 1987 birth cohort is 19 years old in 2006. To
avoid any censoring problems, we therefore use university-preparatory education as our
educational attainment outcome.
The Swedish schooling system can briefly be described in the following way. Pri-
mary and middle schooling (Grundskola), grades one through nine, is compulsory.
Although there has been a growth of state financed private schools recently, public
schools, free of tuition, are still most common. Only a handful of tuition charging
schools exists. The final grades from the ninth year in compulsory school are used for
admission to secondary school education (Gymnasieskolan). Around 90 percent of the
pupils continue on to secondary school which basically consists of two tracks, voca-
tional and academic (university-preparatory). The grades from secondary school are
used for admission to higher education (colleges and universities). Generally, those
individuals who complete a university-preparatory education will do that directly after
graduation from compulsory school, and university-preparatory education is typically
three years.
We measure university-preparatory education as whether an individual has attained a
three year secondary school education that qualifies for further academic studies at a
university. All the main tracks included in a university-preparatory education i.e.,
science, social sciences, and business administration, are included in this definition.
Individuals who already have attained a higher education that requires a three year of
university-preparatory education are of course also defined as having attained a
university-preparatory education. Having a university-preparatory education is very
highly correlated with having a university degree (i.e., number of years of schooling).
Using the university-preparatory education measure for the mothers, where most of

34 IFAU – Does child spacing affect children’s outcomes? Evidence from a Swedish reform
them are likely to have completed their education, we find that those who have a
university-preparatory education have 2 more years of schooling in 2003.
Starting the analysis with first-born children, i.e., using the 2+ sample, Figure 17
shows the development in the share with a university-preparatory education during the
period 1968-1987, separately for first-born children with native-born and foreign-born
mothers, respectively. It shows that the treatment and the control groups have strikingly
similar levels and trends until the introduction of the child spacing rule in 1980 when
the levels starts to diverge. In other words, the evolution in the educational attainment is
the basically the same for 12 years (i.e., 1968 to 1979) for the treatment and control
groups.
.2.3
.4.5
.6.7
.8
1968 1970 1972 1974 1976 1978 1980 1982 1984 1986Birth cohort
Foreign Native
Figure 17 Share of first-born children who have attained a university preparatory education. Families with at least 2 children
Again, we make a statistical test of whether the two groups have parallel trends by using
an identical differences-in-differences specification as equation (1) but where a dummy
for having a university-preparatory education is the dependent variable instead of child
spacing, i.e.,
IFAU – Does child spacing affect children’s outcomes? Evidence from a Swedish reform 35
(2) å=
+++´=T
tigtgtttgigt nativenativeEducation
1)( nqlbl
Table 4 shows the results from this regression. Looking at Column 1 in Table 4, results
strongly suggest a statistically significant decline in the share of university-preparatory
education after 1980 for the treatment group with little evidence of an existing pre-
reform trend (i.e., before 1980). Specifically, we cannot reject that the β’s are zero
before the treatment but conclude that the β’s are jointly statistically significant from
zero after 1980, which can be seen from the F-tests with corresponding p-values within
parentheses. Moreover, when we add a number of controls for a mother’s educational
attainment and a full set of interactions between the region of birth and the year of
immigration, as a way of addressing compositional changes within the control group as
discussed previously, the effects are hardly affected as can be seen in Column 2. This
suggests again that compositional bias is not an important issue in our context. Column
3 shows the results when we impose the restriction that all β’s are zero before 1980. In
order to illustrate the main point from the regression model in equation (2), Figure 18
shows the estimated native-year interactions from Column 1 in Table 4 with the
corresponding 95 percent confidence intervals. Figure 18 shows that we cannot
statistically reject that the two groups have similar trends in the share of individuals
who have attained a university-preparatory education before 1980, while the two groups
have differential trends thereafter since there is a decrease in educational attainment for
the treatment group relative to the control group.
This striking similarity of the pattern of educational attainment in Figure 18 with the
pattern in child spacing in Figure 6, strongly suggests that there is a causal relationship
between child spacing and child long-term outcomes.
Turning to the outcome of the second-born in families with at least 3 births, i.e., the
3+ sample, Figure 19 shows the development of university-preparatory education.
Again, we see that the control and treatment groups have roughly similar levels and
trends until 1980. Table 5 shows the results from the statistical test, while Figure 20
displays the estimated native-year interactions from Column 1 in Table 5 with the
corresponding 95 percent confidence intervals. Figure 20 shows that we cannot
statistically reject that the two groups have similar trends in the share with a university-

36 IFAU – Does child spacing affect children’s outcomes? Evidence from a Swedish reform
preparatory education before 1980, while we conclude that the two groups have
differential trends thereafter since there is a decrease in educational attainment for the
treatment group relatively to the control group after 1980.
Table 4. Estimated native-year effects on university preparatory education for first-born children (families with at least 2 children) Effect (1) (2) (3) Native ´ 1969 0.00
(0.02) -0.00 (0.02)
-
Native ´ 1970 -0.01 (0.02)
-0.03 (0.02)
-
Native ´ 1971 -0.01 (0.02)
-0.02 (0.02)
-
Native ´ 1972 0.01 (0.02)
-0.00 (0.02)
-
Native ´ 1973 -0.01 (0.02)
-0.03 (0.02)
-
Native ´ 1974 -0.03 (0.02)
-0.04 (0.02)
-
Native ´ 1975 -0.01 (0.02)
-0.03 (0.02)
-
Native ´ 1976 -0.00 (0.02)
-0.02 (0.02)
-
Native ´ 1977 -0.01 (0.02)
-0.04 (0.02)
-
Native ´ 1978 -0.02 (0.02)
-0.04 (0.02)
-
Native ´ 1979 -0.02 (0.02)
-0.05 (0.02)
-
Native ´ 1980 -0.04 (0.02)
-0.06 (0.02)
-0.03 (0.01)
Native ´ 1981 -0.05 (0.02)
-0.08 (0.02)
-0.05 (0.01)
Native ´ 1982 -0.09 (0.02)
-0.11 (0.02)
-0.09 (0.01)
Native ´ 1983 -0.10 (0.02)
-0.12 (0.02)
-0.09 (0.02)
Native ´ 1984 -0.12 (0.02)
-0.13 (0.02)
-0.11 (0.02)
Native ´ 1985 -0.11 (0.02)
-0.13 (0.02)
-0.10 (0.02)
Native ´ 1986 -0.09 (0.02)
-0.09 (0.02)
-0.07 (0.02)
Native ´ 1987 -0.11 (0.02)
-0.12 (0.02)
-0.09 (0.02)
Controls No Yes Yes F-test P-value
F=6.62 (0.0000)
F=7.81 (0.0000)
F=17.19 (0.0000)
R2 0.0070 0.0582 0.0582 Observations 562,618 562,618 562,618 Note.- Robust standard errors are reported in parentheses. The table reports year-native interactions in regressions that include native and year of birth dummies. The F-test is a test for whether the year-native interactions are jointly significantly different from zero after the introduction of the administrative child-spacing rule in 1980. Controls include mother’s level of education, and full set of interactions between a mothers region of birth and the year of immigration.
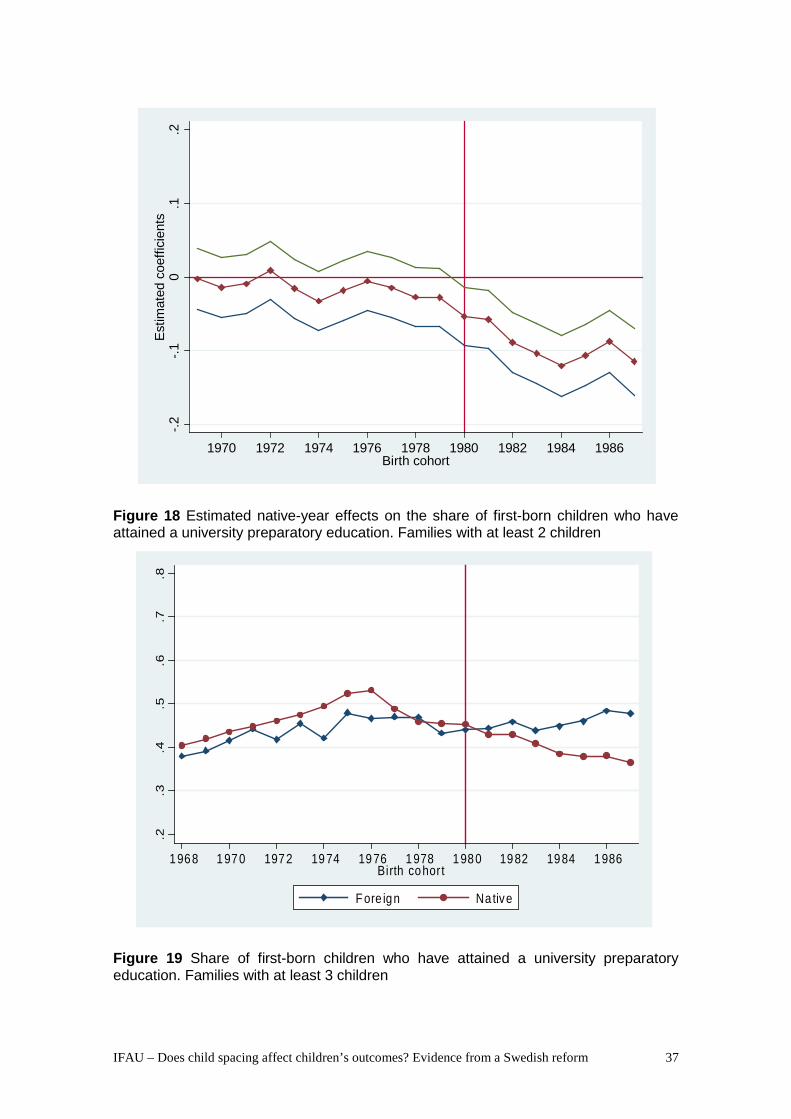
IFAU – Does child spacing affect children’s outcomes? Evidence from a Swedish reform 37
-.2-.1
0.1
.2E
stim
ated
coe
ffici
ents
1970 1972 1974 1976 1978 1980 1982 1984 1986Birth cohort
Figure 18 Estimated native-year effects on the share of first-born children who have attained a university preparatory education. Families with at least 2 children
.2.3
.4.5
.6.7
.8
1 968 1970 1972 1974 1976 1978 1980 1982 1984 1986Birth cohort
Fore ign Na tive
Figure 19 Share of first-born children who have attained a university preparatory education. Families with at least 3 children
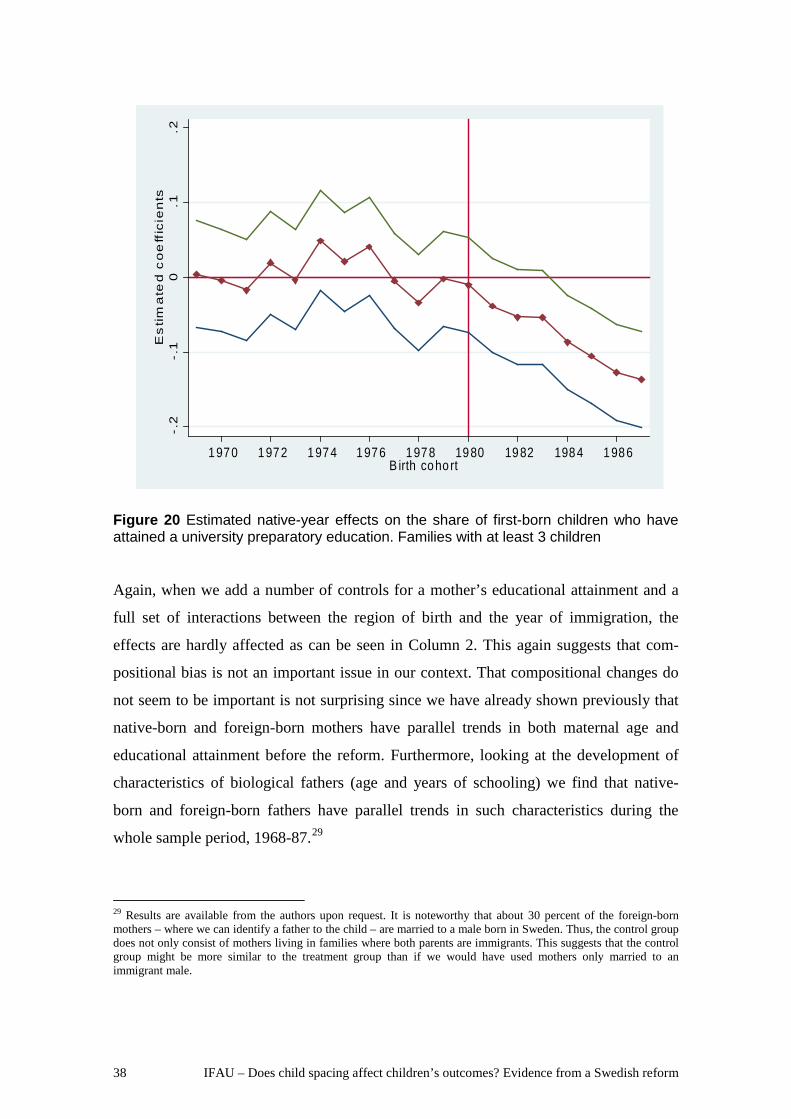
38 IFAU – Does child spacing affect children’s outcomes? Evidence from a Swedish reform
-.2
-.1
0.1
.2E
sti
ma
ted
co
eff
icie
nts
1 970 1972 1974 1976 1978 1980 1982 1984 1986B irth coho rt
Figure 20 Estimated native-year effects on the share of first-born children who have attained a university preparatory education. Families with at least 3 children
Again, when we add a number of controls for a mother’s educational attainment and a
full set of interactions between the region of birth and the year of immigration, the
effects are hardly affected as can be seen in Column 2. This again suggests that com-
positional bias is not an important issue in our context. That compositional changes do
not seem to be important is not surprising since we have already shown previously that
native-born and foreign-born mothers have parallel trends in both maternal age and
educational attainment before the reform. Furthermore, looking at the development of
characteristics of biological fathers (age and years of schooling) we find that native-
born and foreign-born fathers have parallel trends in such characteristics during the
whole sample period, 1968-87.29
29 Results are available from the authors upon request. It is noteworthy that about 30 percent of the foreign-born mothers – where we can identify a father to the child – are married to a male born in Sweden. Thus, the control group does not only consist of mothers living in families where both parents are immigrants. This suggests that the control group might be more similar to the treatment group than if we would have used mothers only married to an immigrant male.
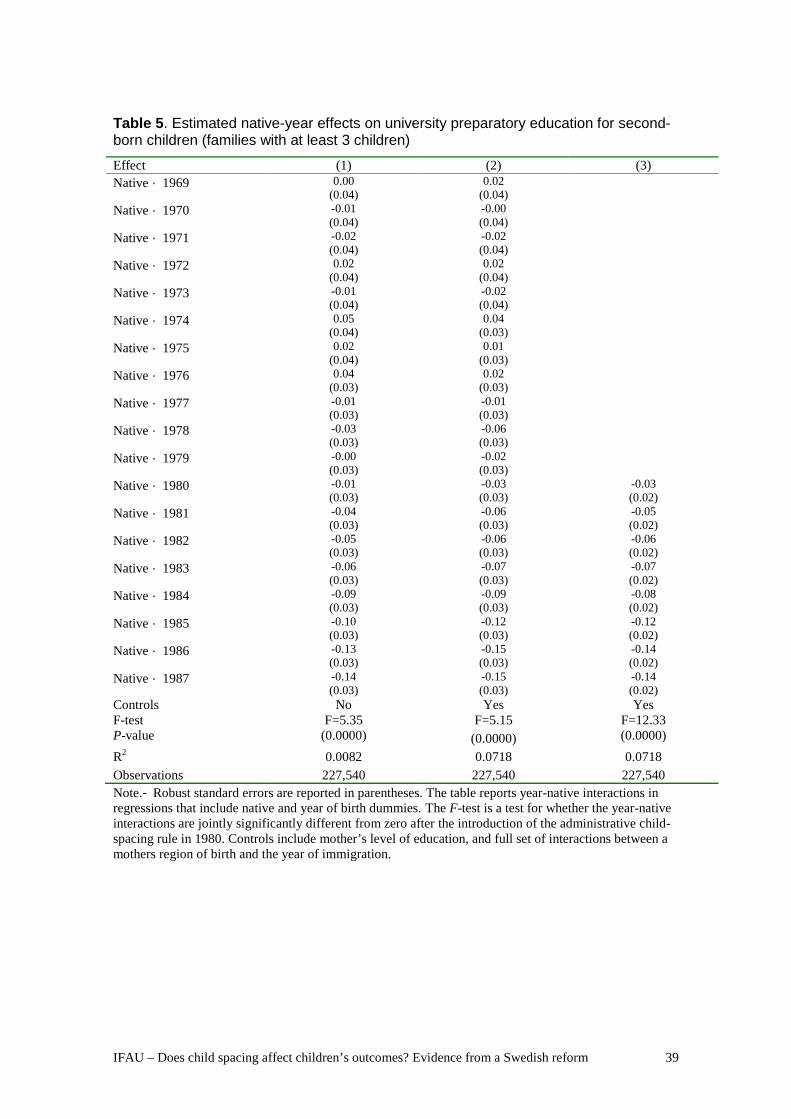
IFAU – Does child spacing affect children’s outcomes? Evidence from a Swedish reform 39
Table 5. Estimated native-year effects on university preparatory education for second-born children (families with at least 3 children)
Effect (1) (2) (3) Native ´ 1969 0.00
(0.04) 0.02
(0.04)
Native ´ 1970 -0.01 (0.04)
-0.00 (0.04)
Native ´ 1971 -0.02 (0.04)
-0.02 (0.04)
Native ´ 1972 0.02 (0.04)
0.02 (0.04)
Native ´ 1973 -0.01 (0.04)
-0.02 (0.04)
Native ´ 1974 0.05 (0.04)
0.04 (0.03)
Native ´ 1975 0.02 (0.04)
0.01 (0.03)
Native ´ 1976 0.04 (0.03)
0.02 (0.03)
Native ´ 1977 -0.01 (0.03)
-0.01 (0.03)
Native ´ 1978 -0.03 (0.03)
-0.06 (0.03)
Native ´ 1979 -0.00 (0.03)
-0.02 (0.03)
Native ´ 1980 -0.01 (0.03)
-0.03 (0.03)
-0.03 (0.02)
Native ´ 1981 -0.04 (0.03)
-0.06 (0.03)
-0.05 (0.02)
Native ´ 1982 -0.05 (0.03)
-0.06 (0.03)
-0.06 (0.02)
Native ´ 1983 -0.06 (0.03)
-0.07 (0.03)
-0.07 (0.02)
Native ´ 1984 -0.09 (0.03)
-0.09 (0.03)
-0.08 (0.02)
Native ´ 1985 -0.10 (0.03)
-0.12 (0.03)
-0.12 (0.02)
Native ´ 1986 -0.13 (0.03)
-0.15 (0.03)
-0.14 (0.02)
Native ´ 1987 -0.14 (0.03)
-0.15 (0.03)
-0.14 (0.02)
Controls No Yes Yes F-test P-value
F=5.35 (0.0000)
F=5.15 (0.0000)
F=12.33 (0.0000)
R2 0.0082 0.0718 0.0718 Observations 227,540 227,540 227,540 Note.- Robust standard errors are reported in parentheses. The table reports year-native interactions in regressions that include native and year of birth dummies. The F-test is a test for whether the year-native interactions are jointly significantly different from zero after the introduction of the administrative child-spacing rule in 1980. Controls include mother’s level of education, and full set of interactions between a mothers region of birth and the year of immigration.

40 IFAU – Does child spacing affect children’s outcomes? Evidence from a Swedish reform
4 The impact of child spacing on university-preparatory education
In this section we present results of the effect of child spacing on child outcomes. Under
the assumption that the administrative child-spacing rule – the speed premium – had no
effect on child outcomes other than decreasing child spacing, we can use this
administrative rule to construct instrumental variable estimates of the impact of child
spacing on child outcomes. For example, using a single indicator for before and after
the introduction of the speed premium rule we can construct a simple Wald/IV estimate,
i.e.,
)SpacingSpacing()SpacingSpacing(
)YY()YY(=β beforeforeign,afterforeign,beforenative,afternative,
beforeforeign,afterforeign,beforenative,afternative,IV
---
---ˆ
Since we have many post-treatment years we can also estimate the effect of child
spacing on child outcomes using a Two-Stage Least Square (2SLS) method. In the
2SLS approach, we would use all post treatment native-year interactions as instrumental
variables instead of only one instrument as in the Wald method. However, the 2SLS
method may lead to the problem of weak instruments if some of the individual
instruments are weak as discussed by Andrews and Stock (2006). The Wald approach
has the advantage of avoiding the problem of many weak instruments since it only uses
a single and strong instrument. We will therefore present results from both the Wald and
the 2SLS approaches.
We will cluster the standard errors at mothers’ birth region-year level to account for
potentially correlated effects among mothers from the same birth region. Since data is
repeated cross-section of mothers’ first-born child or second-born child and each mother
is only observed in one year, this implies that serial correlation in individual outcomes
is unlikely to be a problem. Since there are 10 birth regions and 20 years there are 200
birth-region-years, this will provide a sufficient number of clusters for the clustering
estimator to have good properties as discussed by Angrist and Pischke (2009).
Before showing the results from the Wald/IV and the 2SLS approaches, we present
results from OLS regressions, as a benchmark for assessing biases or potential
heterogeneity in the estimated child-spacing effect. Table 6 displays the results for

IFAU – Does child spacing affect children’s outcomes? Evidence from a Swedish reform 41
university-preparatory education for first-born children (i.e., using the 2+ sample) and
second-born children (3+ sample), respectively. Without any controls, the OLS estimate
is -0.00094 for first-born children (Column 1). This means that for first-born children
one month shorter birth interval will lead to an almost 0.1 percent higher probability of
having a university-preparatory education. When we add controls for the maternal level
of education and a full set of interactions between a mothers region of birth and the year
of immigration, as a way of addressing compositional changes within the control group,
the effects become slightly lower in absolute terms as can be seen in Column 2. The
estimated effects for second-born children are smaller but still significantly different
from zero (see Columns 2 and 4).
Turning to the instrumental variable approach, Table 7 displays the results from the
Wald and the 2SLS methods for first-born children. The 2SLS estimate is 0.020 while
the Wald/IV estimate is 0.022 in the specification without any additional control
variables. Thus, one month shorter birth interval will decrease the probability of obtain-
ing a university-preparatory education by around 2 percentage points. These estimates
are also statistically different from zero and of the opposite sign from the OLS estimates
in Table 6. This suggests that the OLS estimate is strongly biased or that there are
strong non-linearities in the treatment effect. On one hand, one reason for the bias in the
OLS estimates is that high ability parents choose to bunch their children closely
together as a way to avoid too many breaks in their job marker careers. On the other
hand, the treatment effect may be highly non-linear as the result of this paper indicates.
We have therefore allowed for non-linear effects in the OLS specifications and results
(not reported) suggest that spacing closer than 24 months affects children more
negatively than longer spacing.
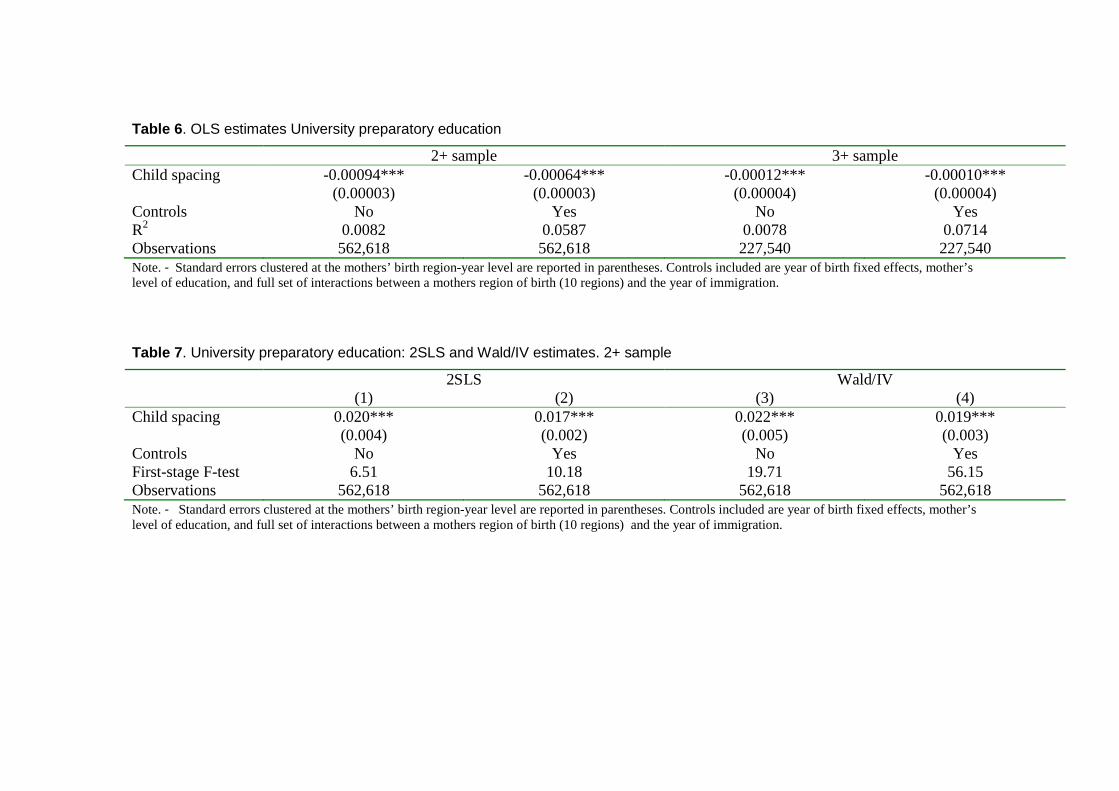
Table 6. OLS estimates University preparatory education
2+ sample 3+ sample Child spacing
-0.00094*** (0.00003)
-0.00064*** (0.00003)
-0.00012*** (0.00004)
-0.00010*** (0.00004)
Controls No Yes No Yes R2 0.0082 0.0587 0.0078 0.0714 Observations 562,618 562,618 227,540 227,540 Note. - Standard errors clustered at the mothers’ birth region-year level are reported in parentheses. Controls included are year of birth fixed effects, mother’s level of education, and full set of interactions between a mothers region of birth (10 regions) and the year of immigration.
Table 7. University preparatory education: 2SLS and Wald/IV estimates. 2+ sample
2SLS Wald/IV (1) (2) (3) (4) Child spacing
0.020*** (0.004)
0.017*** (0.002)
0.022*** (0.005)
0.019*** (0.003)
Controls No Yes No Yes First-stage F-test 6.51 10.18 19.71 56.15 Observations 562,618 562,618 562,618 562,618 Note. - Standard errors clustered at the mothers’ birth region-year level are reported in parentheses. Controls included are year of birth fixed effects, mother’s level of education, and full set of interactions between a mothers region of birth (10 regions) and the year of immigration.
IFAU – Does child spacing affect children’s outcomes? Evidence from a Swedish reform 43
When we add controls for the mother’s level of education and full set of interactions
between a mother’s region of birth and the year of immigration the effects become
slightly lower as can be seen in Columns 2 and 4. Looking at the First-stage F-statistics
from the 2SLS and Wald/IV estimators, they suggest that the Wald/IV estimator may be
preferred from a weak instrument point of view since the F-statistics is twice as large as
the F-statistics from the 2SLS estimator. Nevertheless, there seems to be small differ-
ences regarding the point estimate of the two estimators and their associated standard
errors.
Turning to second-born children, Table 8 displays the results from the Wald and the
2SLS methods. The 2SLS estimate is 0.018 which is the same as the Wald/IV estimate
in the specification without any additional control variables; both estimates are statisti-
cally different from zero. Thus, one month shorter birth interval will decrease the pro-
bability of obtaining a university-preparatory education by around 1.8 percentage
points. The effects of child spacing on university-preparatory education are slightly
reduced when adding the controls (see Columns 2 and 4). Based on the First-stage F-
statistics, the Wald/IV estimator may again be preferred to the 2SLS estimator from a
weak instrument point of view. To avoid any problems of many weak instruments we
will in the subsequent analyses only report the Wald/IV estimates.
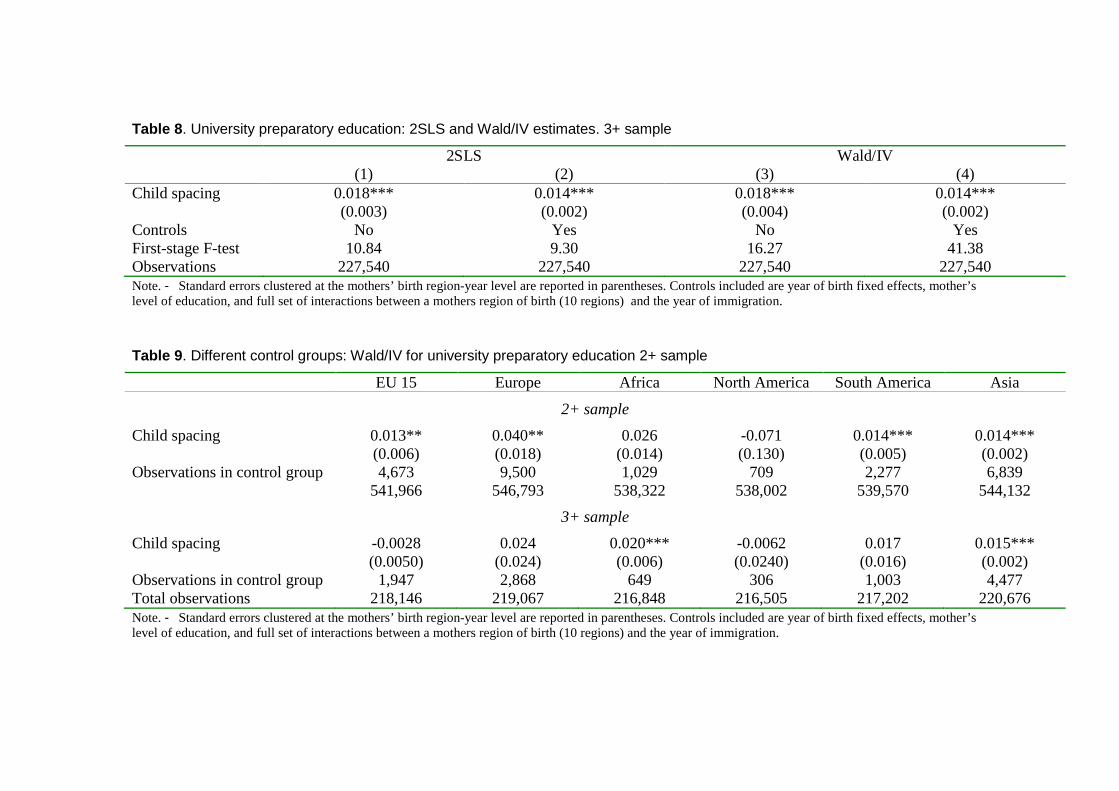
Table 8. University preparatory education: 2SLS and Wald/IV estimates. 3+ sample
2SLS Wald/IV (1) (2) (3) (4) Child spacing
0.018*** (0.003)
0.014*** (0.002)
0.018*** (0.004)
0.014*** (0.002)
Controls No Yes No Yes First-stage F-test 10.84 9.30 16.27 41.38 Observations 227,540 227,540 227,540 227,540 Note. - Standard errors clustered at the mothers’ birth region-year level are reported in parentheses. Controls included are year of birth fixed effects, mother’s level of education, and full set of interactions between a mothers region of birth (10 regions) and the year of immigration.
Table 9. Different control groups: Wald/IV for university preparatory education 2+ sample
EU 15 Europe Africa North America South America Asia
2+ sample
Child spacing
0.013** (0.006)
0.040** (0.018)
0.026 (0.014)
-0.071 (0.130)
0.014*** (0.005)
0.014*** (0.002)
Observations in control group 4,673 9,500 1,029 709 2,277 6,839 541,966 546,793 538,322 538,002 539,570 544,132
3+ sample
Child spacing
-0.0028 (0.0050)
0.024 (0.024)
0.020*** (0.006)
-0.0062 (0.0240)
0.017 (0.016)
0.015*** (0.002)
Observations in control group 1,947 2,868 649 306 1,003 4,477 Total observations 218,146 219,067 216,848 216,505 217,202 220,676 Note. - Standard errors clustered at the mothers’ birth region-year level are reported in parentheses. Controls included are year of birth fixed effects, mother’s level of education, and full set of interactions between a mothers region of birth (10 regions) and the year of immigration.

IFAU – Does child spacing affect children’s outcomes? Evidence from a Swedish reform 45
We now turn to additional analyses and examine whether the child spacing effects is
sensitive to the definition of the control group, i.e., subjects with foreign-born mothers.
This group is heterogeneous with respect to region of birth. Nonetheless, data from ILO
(2001) shows that almost all countries in these regions had smaller or much smaller
female labor force participation rates among ages 25-54 than the treatment group in
1980. Results from Wald estimations of the effect of child spacing on university-
preparatory education for first-born children, using mothers from different birth regions
as control groups, separately, are shown in the upper panel of Table 9. The lower panel
of Table 9 displays the corresponding results for second-born children. As can be seen
in Table 9, the Wald estimates are similar to the previously estimated child-spacing
effects as presented in Table 7 and 8, except when mothers born in North America are
used as the control group (see Column 4). This is consistent with the hypothesis that
mothers’ with a high labor force attachment do not constitute a relevant control group
since mothers from North America have a high labour force participation rate. Thus,
they are affected by the speed premium rule and can therefore be considered treated in
the same way as mothers from the Nordic countries. It should be pointed out, however,
that mothers from North America are relatively few, 709 observations in total. Note also
that the number of observations is also relatively small when mother from Africa and
South America are used as comparison groups. Thus, it is not surprising that the stand-
ard errors are somewhat smaller compared to the estimations reported in Table 7 and 8
where the full samples are used.
Taken together, we conclude that estimated child spacing effect is broadly robust to
alterations in the comparison group. For example, we find similar effects when we only
use women born in Asia, South America, or Europe. In sharp contrast, when we use
North America there is no child spacing effect.
In Table 10 and 11, we test whether the child-spacing effect differ across families of
different sizes, for first-born and second-born children, respectively. To avoid any
sample selection problems due to differential preferences of family size, we restrict the
sample to families with at least n births and study the outcomes of children born before
the n birth. Specifically, we look at samples with 3 or more births and 4 or more births.
For comparison, Column 1 restates the Wald/IV estimates with control variables from

46 IFAU – Does child spacing affect children’s outcomes? Evidence from a Swedish reform
Table 7. We finally also examine whether there are gender differences in the effect of
the child spacing on child outcomes. The first two columns of Table 12 show the Wald
estimates for girls and boys, separately, using first-born children. Columns 3 and 4
show the corresponding estimates using second-born children.
The general conclusion from estimations of heterogeneous effects with respect to
family size and gender is that we find that the negative child-spacing effect on educa-
tional attainment is broadly similar across family sizes and the gender of the child.
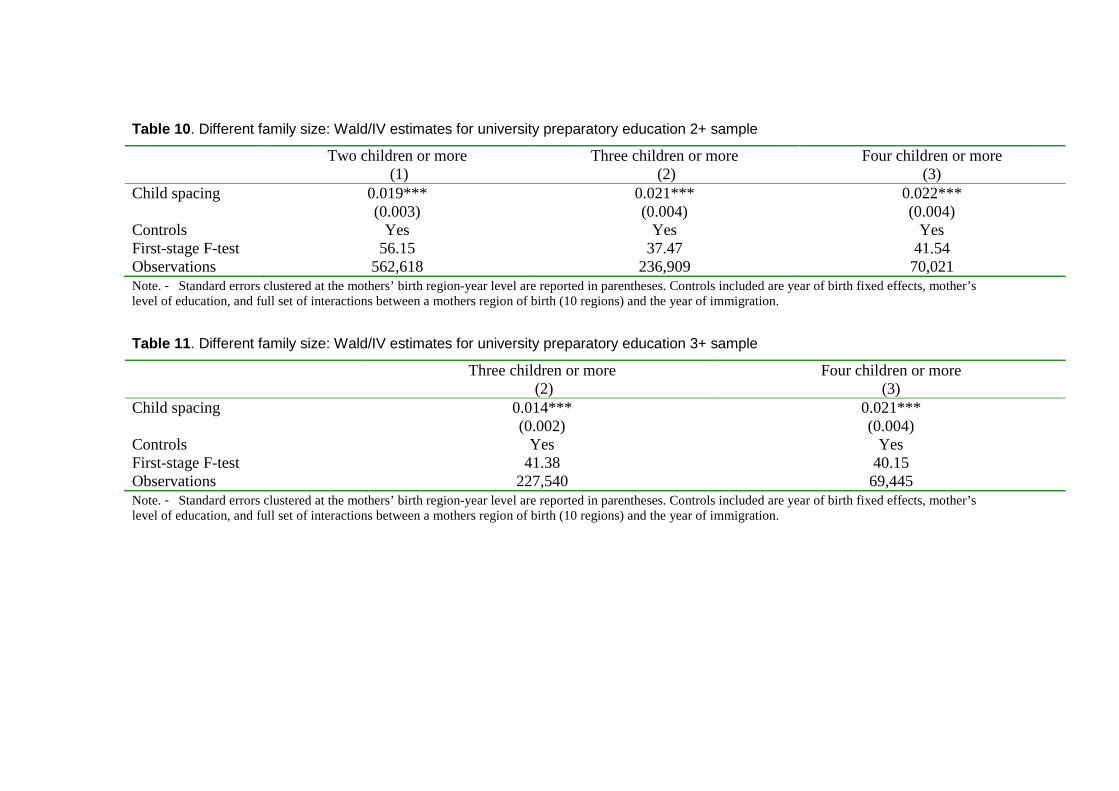
Table 10. Different family size: Wald/IV estimates for university preparatory education 2+ sample
Two children or more (1)
Three children or more (2)
Four children or more (3)
Child spacing
0.019*** (0.003)
0.021*** (0.004)
0.022*** (0.004)
Controls Yes Yes Yes First-stage F-test 56.15 37.47 41.54 Observations 562,618 236,909 70,021 Note. - Standard errors clustered at the mothers’ birth region-year level are reported in parentheses. Controls included are year of birth fixed effects, mother’s level of education, and full set of interactions between a mothers region of birth (10 regions) and the year of immigration. Table 11. Different family size: Wald/IV estimates for university preparatory education 3+ sample
Three children or more (2)
Four children or more (3)
Child spacing
0.014*** (0.002)
0.021*** (0.004)
Controls Yes Yes First-stage F-test 41.38 40.15 Observations 227,540 69,445 Note. - Standard errors clustered at the mothers’ birth region-year level are reported in parentheses. Controls included are year of birth fixed effects, mother’s level of education, and full set of interactions between a mothers region of birth (10 regions) and the year of immigration.
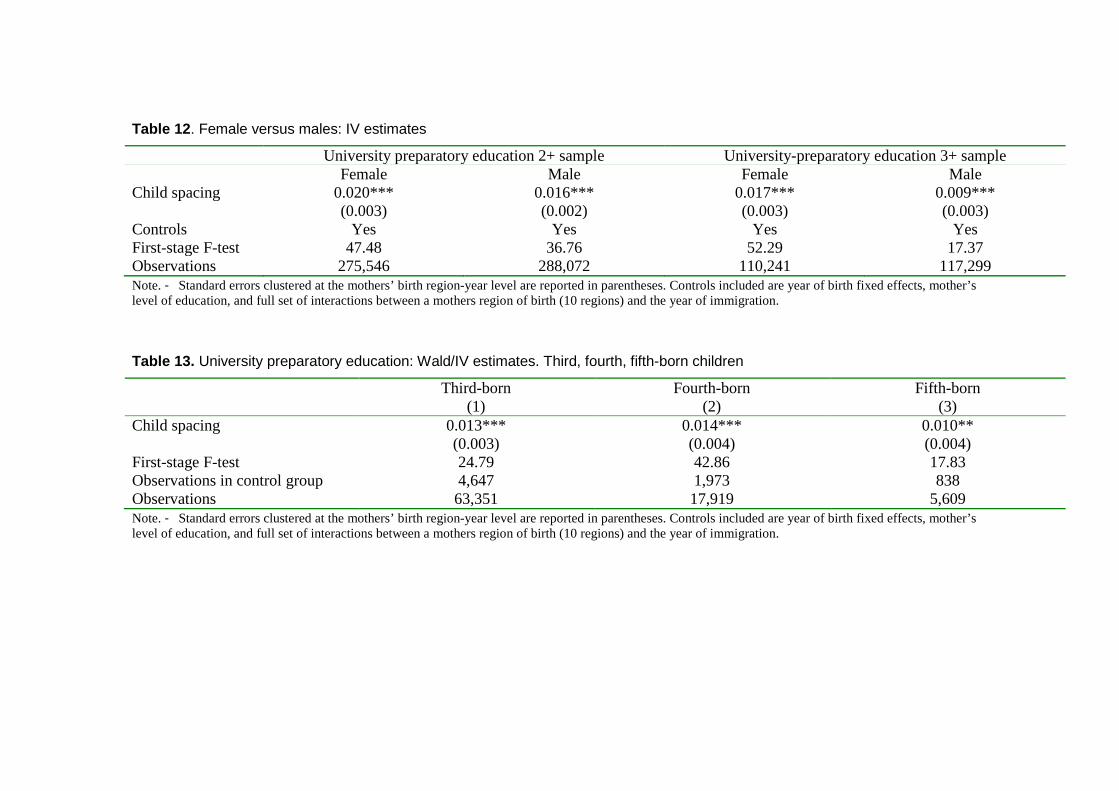
Table 12. Female versus males: IV estimates
University preparatory education 2+ sample University-preparatory education 3+ sample Female Male Female Male Child spacing
0.020*** (0.003)
0.016*** (0.002)
0.017*** (0.003)
0.009*** (0.003)
Controls Yes Yes Yes Yes First-stage F-test 47.48 36.76 52.29 17.37 Observations 275,546 288,072 110,241 117,299 Note. - Standard errors clustered at the mothers’ birth region-year level are reported in parentheses. Controls included are year of birth fixed effects, mother’s level of education, and full set of interactions between a mothers region of birth (10 regions) and the year of immigration. Table 13. University preparatory education: Wald/IV estimates. Third, fourth, fifth-born children
Third-born Fourth-born Fifth-born (1) (2) (3) Child spacing
0.013*** (0.003)
0.014*** (0.004)
0.010** (0.004)
First-stage F-test 24.79 42.86 17.83 Observations in control group 4,647 1,973 838 Observations 63,351 17,919 5,609 Note. - Standard errors clustered at the mothers’ birth region-year level are reported in parentheses. Controls included are year of birth fixed effects, mother’s level of education, and full set of interactions between a mothers region of birth (10 regions) and the year of immigration.
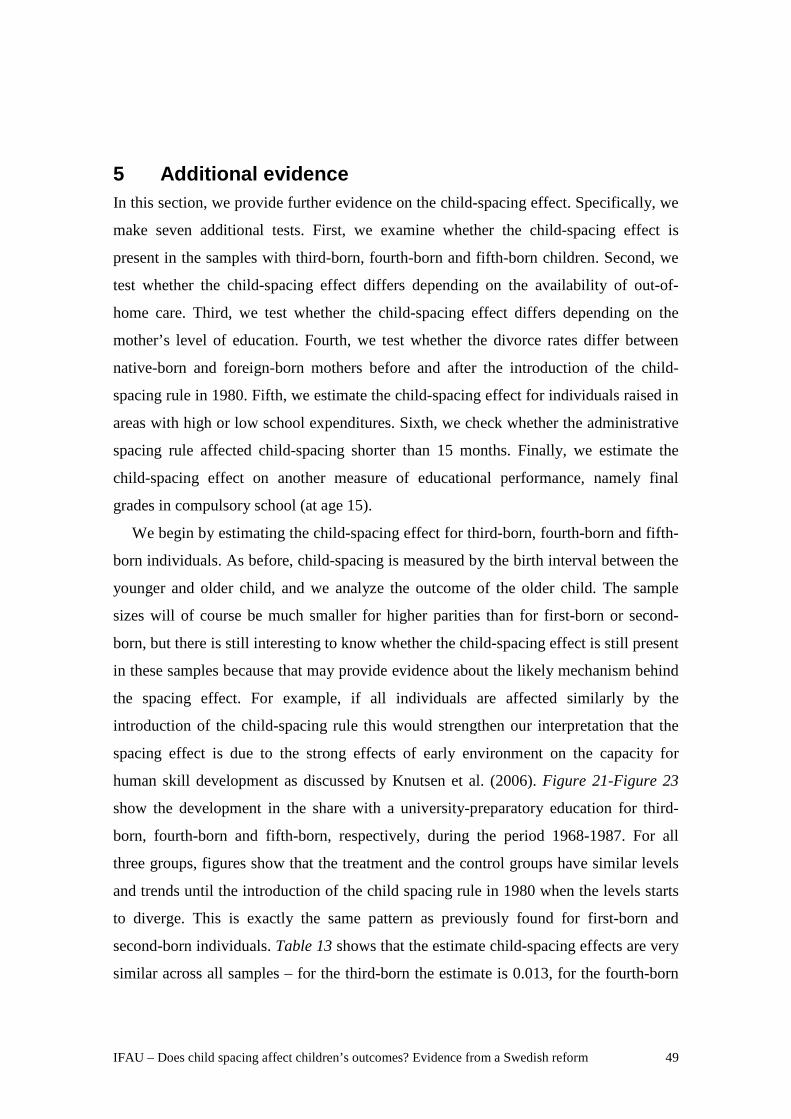
IFAU – Does child spacing affect children’s outcomes? Evidence from a Swedish reform 49
5 Additional evidence In this section, we provide further evidence on the child-spacing effect. Specifically, we
make seven additional tests. First, we examine whether the child-spacing effect is
present in the samples with third-born, fourth-born and fifth-born children. Second, we
test whether the child-spacing effect differs depending on the availability of out-of-
home care. Third, we test whether the child-spacing effect differs depending on the
mother’s level of education. Fourth, we test whether the divorce rates differ between
native-born and foreign-born mothers before and after the introduction of the child-
spacing rule in 1980. Fifth, we estimate the child-spacing effect for individuals raised in
areas with high or low school expenditures. Sixth, we check whether the administrative
spacing rule affected child-spacing shorter than 15 months. Finally, we estimate the
child-spacing effect on another measure of educational performance, namely final
grades in compulsory school (at age 15).
We begin by estimating the child-spacing effect for third-born, fourth-born and fifth-
born individuals. As before, child-spacing is measured by the birth interval between the
younger and older child, and we analyze the outcome of the older child. The sample
sizes will of course be much smaller for higher parities than for first-born or second-
born, but there is still interesting to know whether the child-spacing effect is still present
in these samples because that may provide evidence about the likely mechanism behind
the spacing effect. For example, if all individuals are affected similarly by the
introduction of the child-spacing rule this would strengthen our interpretation that the
spacing effect is due to the strong effects of early environment on the capacity for
human skill development as discussed by Knutsen et al. (2006). Figure 21-Figure 23
show the development in the share with a university-preparatory education for third-
born, fourth-born and fifth-born, respectively, during the period 1968-1987. For all
three groups, figures show that the treatment and the control groups have similar levels
and trends until the introduction of the child spacing rule in 1980 when the levels starts
to diverge. This is exactly the same pattern as previously found for first-born and
second-born individuals. Table 13 shows that the estimate child-spacing effects are very
similar across all samples – for the third-born the estimate is 0.013, for the fourth-born
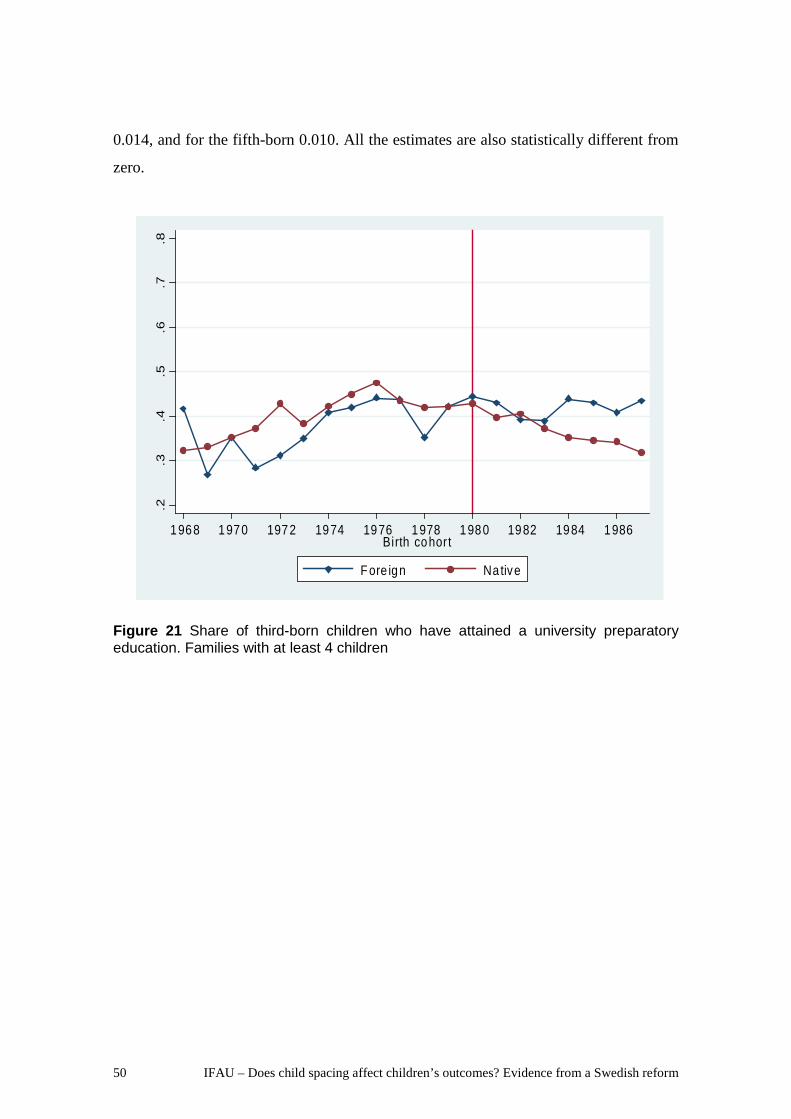
50 IFAU – Does child spacing affect children’s outcomes? Evidence from a Swedish reform
0.014, and for the fifth-born 0.010. All the estimates are also statistically different from
zero.
.2.3
.4.5
.6.7
.8
1 968 1970 1972 1974 1976 1978 1980 1982 1984 1986Birth cohort
Fore ign Na tive
Figure 21 Share of third-born children who have attained a university preparatory education. Families with at least 4 children
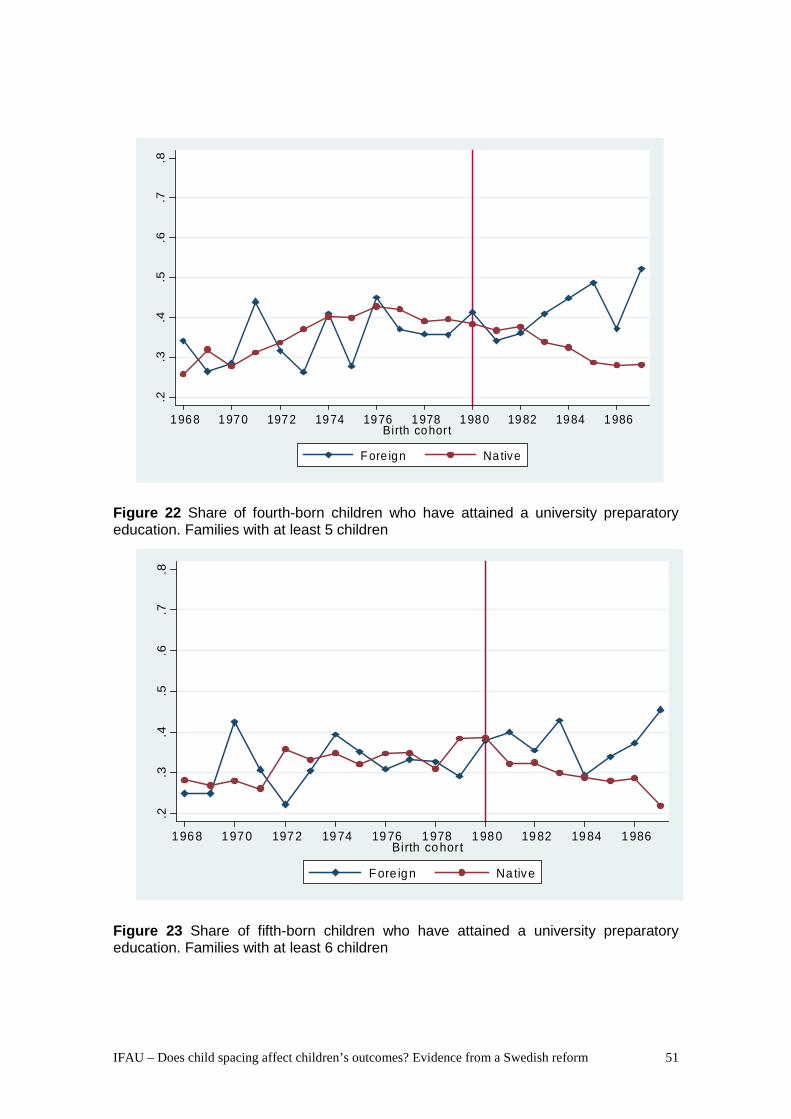
IFAU – Does child spacing affect children’s outcomes? Evidence from a Swedish reform 51
.2.3
.4.5
.6.7
.8
1 968 1970 1972 1974 1976 1978 1980 1982 1984 1986Birth cohort
Fore ign Na tive
Figure 22 Share of fourth-born children who have attained a university preparatory education. Families with at least 5 children
.2.3
.4.5
.6.7
.8
1 968 1970 1972 1974 1976 1978 1980 1982 1984 1986Birth cohort
Fore ign Na tive
Figure 23 Share of fifth-born children who have attained a university preparatory education. Families with at least 6 children

52 IFAU – Does child spacing affect children’s outcomes? Evidence from a Swedish reform
Turning to the second test, out-of-home care may be a factor that may affect a child’s
outcome. For example, Baker et al. (2008) find evidence that the introduction of
universally accessible child care in Canada has negative effects on a variety of child
outcomes. Thus, our child-spacing effect may therefore be confounded by differences in
out-of-home care for children. Alternatively, a child-spacing effect that occurs at a
young age may be reinforced (or mitigated) by a child’s exposure to out-of home care.30
To investigate this issue, we divide the sample into two groups: one group where the
availability of out-of-home care is high and another group where it is low. In Sweden,
the bulk of out-of-home child care is heavily subsidized (90 percent) and publicly pro-
vided.31 The public day care is provided at the municipality level which offers two
modes of official child care arrangements: centre and family care.32 Swedish child care
is regarded as being of high quality. We have data on the number of slots in centre care
and family day care by municipality and birth cohorts during the period 1974-87. Thus,
we can construct a measure of the average exposure to out-of-home care for children
aged 0-6 that varies across cohorts and municipalities. For example, the 1974 birth
cohort in the municipality Härjedalen had the lowest exposure to out-of-home care,
namely 3.7 percent while the 1984 birth cohort in Sundbyberg had the highest exposure,
namely 72.2 percent. In order to have roughly similar sample sizes in the groups with
high and low availability of out-of-home day care, the group with high availability is
defined as having at least 41 percent of exposure.33
Table 14
The average exposure in the two
groups is 50 and 28 percent, respectively. presents the results. We find similar
child-spacing estimates with the exception for second-born children in low availability
out-of-home care environments. That the availability of out-of-home care has little
consequence for the estimated child-spacing effect suggests that the child-spacing effect
occurred before the child was exposed to out-of-home day care. Moreover, since out-of-
home day care is strongly correlated with maternal employment, this also suggests that
maternal employment has little impact on the child-spacing effect.
30 For information about Swedish child care, see Gustafsson and Stafford (1994). 31 Only about 7 percent of children aged 0-6 has private day care. 32 As of 2009, there are 290 municipalities. 33 The reason is that 41 percent of exposure divides the sample in two halves of equal size.
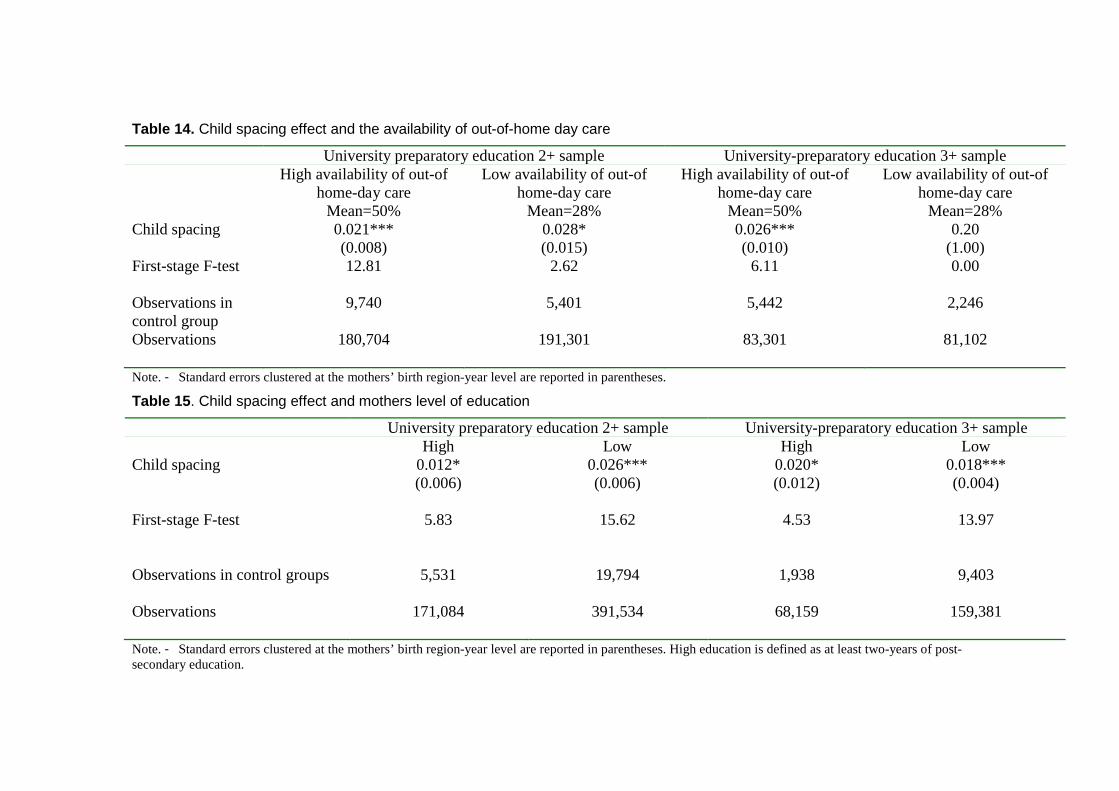
Table 14. Child spacing effect and the availability of out-of-home day care
University preparatory education 2+ sample University-preparatory education 3+ sample High availability of out-of
home-day care Mean=50%
Low availability of out-of home-day care
Mean=28%
High availability of out-of home-day care
Mean=50%
Low availability of out-of home-day care
Mean=28% Child spacing
0.021*** (0.008)
0.028* (0.015)
0.026*** (0.010)
0.20 (1.00)
First-stage F-test 12.81
2.62
6.11
0.00
Observations in control group
9,740
5,401
5,442 2,246
Observations 180,704
191,301
83,301
81,102
Note. - Standard errors clustered at the mothers’ birth region-year level are reported in parentheses.
Table 15. Child spacing effect and mothers level of education
University preparatory education 2+ sample University-preparatory education 3+ sample High Low High Low Child spacing
0.012* (0.006)
0.026*** (0.006)
0.020* (0.012)
0.018*** (0.004)
First-stage F-test 5.83
15.62
4.53
13.97
Observations in control groups
5,531
19,794
1,938
9,403
Observations 171,084
391,534
68,159
159,381
Note. - Standard errors clustered at the mothers’ birth region-year level are reported in parentheses. High education is defined as at least two-years of post-secondary education.

54 IFAU – Does child spacing affect children’s outcomes? Evidence from a Swedish reform
Turning to whether the child-spacing effect is affected by the mother’s level of
education. The idea here is that mothers’ education is strongly correlated to maternal
employment since highly educated women are more likely to work. If there are small
differences in estimated effects of child spacing between mothers with high and low
education this would also support the hypothesis that the child-spacing effect is derived
from the child’s early environment. Table 15 displays results separately for highly and
low educated mothers where high education is defined as having at least two years of
post-secondary education. Again, the child spacing-effect is broadly similar across edu-
cation levels of the mother. For first-born children the estimated effect of child spacing
for highly educated mothers is 0.012, and for low educated mothers the estimated effect
is 0.026. As regards, the second-born children the corresponding estates are 0.020 and
0.018.
We also test for whether divorce may be a confounding factor behind the child spa-
cing effect since some studies have found evidence that divorce may affect child out-
comes (e.g., Gruber 2004 and Dahl and Moretti 2008). Figure 24 shows that native-born
mothers and foreign-born mothers have strikingly similar trends in the divorce rates, as
measured in 1990, before and after the introduction of the child spacing rule in 1980.
This suggests that divorce is not confounding our estimates.

IFAU – Does child spacing affect children’s outcomes? Evidence from a Swedish reform 55
0.1
.2.3
1970 1975 1980 1985 1990Birth yea r
Fore ign Na tive
Figure 24 Mothers divorce rates by birth year of the child
As another check, we test whether differences in school resources might explain the
child-spacing effect. We have yearly data on schools expenditures from all municipal-
ities. We can therefore construct an average real spending per student by cohort and by
municipality. For example, for the 1974 birth cohort in the municipality of Stockholm,
we take average of per pupil spending in Stockholm during the years 81 to 89 (com-
pulsory schooling years grade 1 to grade 9 for 1974 birth cohort). Using this measure of
school resources, we split the data into two samples depending on median of school
spending. Table 16 displays the results. For first-born children the estimated child-
spacing effects are very similar for areas with high school spending and low school
spending, 0.019 and 0.018, respectively. The estimated child-spacing effects for second-
born are also similar but also less precisely estimated than for first-born children.
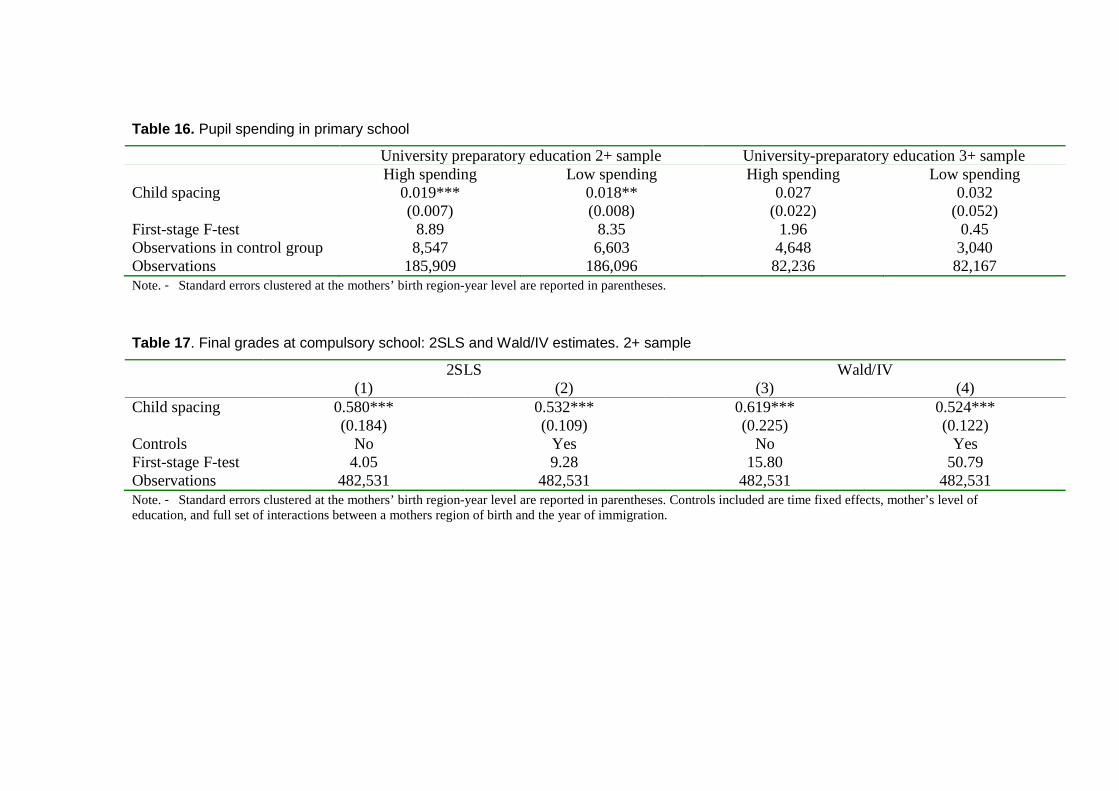
Table 16. Pupil spending in primary school
University preparatory education 2+ sample University-preparatory education 3+ sample High spending Low spending High spending Low spending Child spacing
0.019*** (0.007)
0.018** (0.008)
0.027 (0.022)
0.032 (0.052)
First-stage F-test 8.89 8.35 1.96 0.45 Observations in control group 8,547 6,603 4,648 3,040 Observations 185,909 186,096 82,236 82,167 Note. - Standard errors clustered at the mothers’ birth region-year level are reported in parentheses.
Table 17. Final grades at compulsory school: 2SLS and Wald/IV estimates. 2+ sample
2SLS Wald/IV (1) (2) (3) (4) Child spacing
0.580*** (0.184)
0.532*** (0.109)
0.619*** (0.225)
0.524*** (0.122)
Controls No Yes No Yes First-stage F-test 4.05 9.28 15.80 50.79 Observations 482,531 482,531 482,531 482,531 Note. - Standard errors clustered at the mothers’ birth region-year level are reported in parentheses. Controls included are time fixed effects, mother’s level of education, and full set of interactions between a mothers region of birth and the year of immigration.
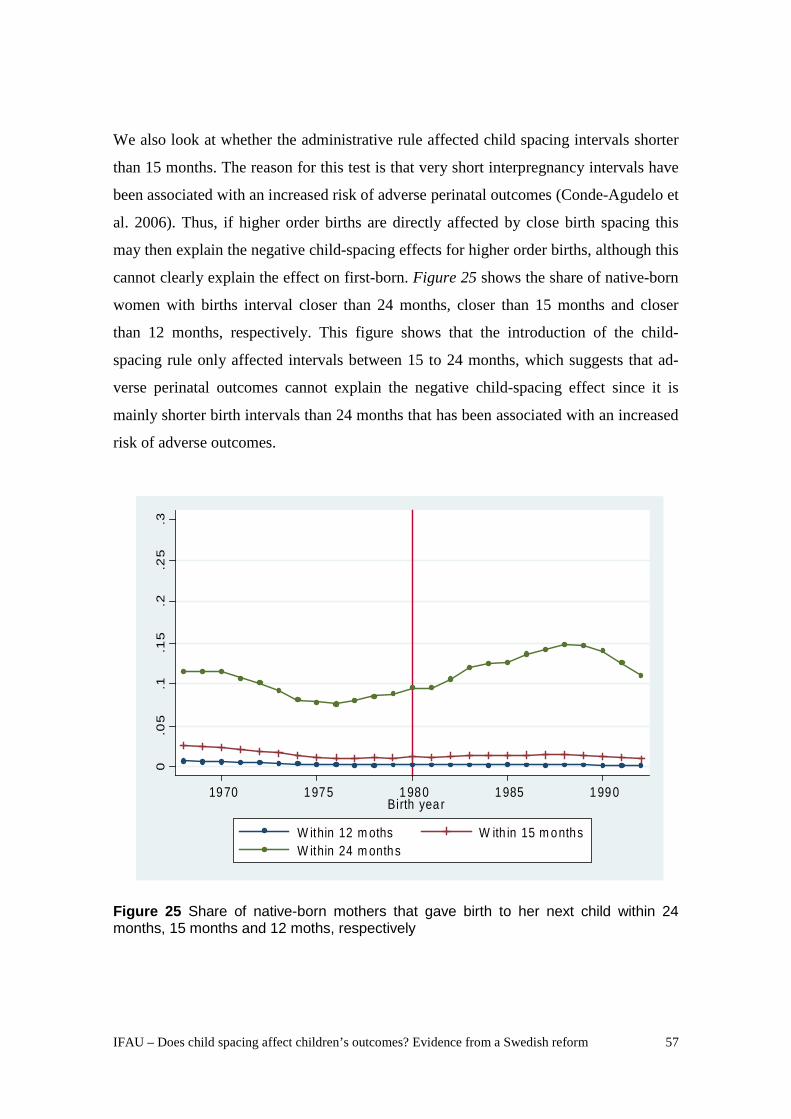
IFAU – Does child spacing affect children’s outcomes? Evidence from a Swedish reform 57
We also look at whether the administrative rule affected child spacing intervals shorter
than 15 months. The reason for this test is that very short interpregnancy intervals have
been associated with an increased risk of adverse perinatal outcomes (Conde-Agudelo et
al. 2006). Thus, if higher order births are directly affected by close birth spacing this
may then explain the negative child-spacing effects for higher order births, although this
cannot clearly explain the effect on first-born. Figure 25 shows the share of native-born
women with births interval closer than 24 months, closer than 15 months and closer
than 12 months, respectively. This figure shows that the introduction of the child-
spacing rule only affected intervals between 15 to 24 months, which suggests that ad-
verse perinatal outcomes cannot explain the negative child-spacing effect since it is
mainly shorter birth intervals than 24 months that has been associated with an increased
risk of adverse outcomes.
0.0
5.1
.15
.2.2
5.3
1970 1975 1980 1985 1990Birth yea r
W ithin 12 m oths W ith in 15 m onthsW ithin 24 m onths
Figure 25 Share of native-born mothers that gave birth to her next child within 24 months, 15 months and 12 moths, respectively
58 IFAU – Does child spacing affect children’s outcomes? Evidence from a Swedish reform
Finally, we estimate the child-spacing effect on another measure of educational per-
formance, namely final grades in compulsory school. These individuals are 15 or 16
years old when they graduate since Sweden has 9 years of compulsory schooling and
individuals’ typically start at age 7. This outcome is expressed in terms of percentile
scores. Table 17 shows the results for the 2+ sample. The estimated child-spacing effect
is about 0.6 percentile scores. A way to gauge the magnitude of the estimated child-
spacing effect is to compare it with the gap in percentile scores between girls and boys,
which is about 12 percentile scores. In other words, the gender difference corresponds
to a 20 months reduction in average child spacing, which should be compared with the
7.5-15 months reduction in average child spacing when university preparatory education
was used as the outcome of interest. Thus, although that the estimated child-spacing
effect for final grades in compulsory schooling is somewhat smaller than for university
preparatory education, it is still reassuring that the have the same signs.34
34 Following a suggestion of Peter Fredriksson, we have also used the grade measure as a control variable in our previous IV approach where we use university preparatory education as the outcome of interest. In this case, the estimated child-spacing effect goes from 2.1 to 1.6. The reason for controlling for final grades, despite the obvious endogeneity problem, is that there has been a change in the grading system during the sample period, and this change could therefore be responsible for the finding of a negative child-spacing effect. However, since the estimated effect is only marginally affected this cannot be an explanation for the estimated child-spacing effect.
IFAU – Does child spacing affect children’s outcomes? Evidence from a Swedish reform 59
6 Discussion and conclusion In this paper we have estimated a negative association between very close child spacing
(less than 2 years) and long-term outcomes of children as measured by educational
attainment. We argue that this is a causal relationship since we use a credible source of
exogenous variation in spacing, i.e., an administrative child-spacing rule which made it
possible for a woman to retain her previous high level of parental leave benefits, i.e., 90
percent wage replacement, without entering the labor market between births provided
that the interval between the births did not exceed 24 months. We argue that this rule
should a priori have a differential impact on child spacing behavior of women from
different countries of origin due to sharp difference in taste for work. Specifically, in
1980 women born in one of the Nordic countries (Sweden, Denmark, Finland, and
Iceland) had the highest labor force participation rates among all other countries, sug-
gesting that Nordic-born women should be much more affected by the spacing rule than
women from another country of origin. Indeed, we find that native-born mothers
(women born in a Nordic country) sharply reduces their birth spacing as compared and
foreign-born mothers (women born-outside a Nordic country) after the introduction of
the child spacing rule in 1980 (see Figure 5). Most importantly, native-born and fore-
ign-born mothers have strikingly similar trends in child spacing from 1968 to 1980,
which strongly suggests that foreign-born women is a valid comparison group for
native-born mothers. Equally importantly, we also show that the levels and trends in the
educational attainment for children with a native-born mother are highly similar to the
educational attainment for children with foreign-born mothers for birth cohorts born
between 1968 and 1980. For later birth cohorts, however, there is a decrease in the
educational attainment for children with native-born mothers, both for first-born and
second-born individuals (see Figure 17 for first-born, and Figure 18 for second-born,
Figure 21 for third-born, Figure 22 for fourth-born and Figure 23 for fifth-born). Thus,
there is a strong association between the differential change in birth spacing in 1980 and
the change in the educational attainment for children.
To further probe whether this association reflects a causal relationship between child-
spacing and the long term child outcome, we perform a number of different tests. First,

60 IFAU – Does child spacing affect children’s outcomes? Evidence from a Swedish reform
native-born and foreign-born women have similar trends in maternal age at first birth
and maternal education before the introduction of the child spacing rule in 1980, which
again suggests that foreign-born mothers is valid comparison group for native-born
mothers.
Second, the estimated child spacing effect is broadly robust to alteration in the
comparison group. For example, we find similar effects when we only use women born
in Asia, South America, or Europe. In sharp contrast, when we use North America there
is no child spacing effect. These findings are reasonable since the countries in Asia,
South America, or Europe around 1980 typically had much lower female labor force
participation rates than any of the Nordic countries, while United States or Canada only
had just somewhat lower rates. Thus, one should not expect to find a child-spacing
effect when the North America sample is used as a comparison group for the Nordic-
born women.
Third, the child spacing rule does not affect completed family size, which suggest
that is the change in timing of births rather than a change in completed fertility that is
responsible for the association child-spacing and the long term child outcome. Fourth,
the child spacing rule does not affect the mothers’ divorce rates, which otherwise could
have been a mediating factor. Fifth, we find similar negative-child spacing effects for
both boys and girls. Sixth, the child-spacing effect is also similar for women with high
or low maternal education, which suggests that maternal employment is not likely to be
a mediating factor since education levels are typically highly correlated with maternal
employment. Seventh, the child-spacing effect is also broadly similar for children with
high exposure and low exposure to out-of-home child care, which suggests that neither
out-of home child care, nor maternal employment (out-of-home care is almost by de-
finetion associated with maternal employment) could be mediating factors. Eight, the
child-spacing effect is also similar in areas where school resources are high or low.
Taken together, the above results suggest that one plausible explanation for the
consistent finding of a negative child-spacing effect is that a child’s development may
be particularly vulnerable to changes in their environment at an early age, i.e., the sub-
sequent birth of a younger sibling within a two-year interval. There is by now a growing
consensus that early childhood experiences may have a uniquely powerful influence on

IFAU – Does child spacing affect children’s outcomes? Evidence from a Swedish reform 61
the development of cognitive and social skills (Knudsen et al., 2006). Thus, it may
therefore be particularly detrimental for a child’s future development to have another
sibling at a very young age since when children are very closely spaced, childcare obli-
gations dominate, i.e., a mother must give most of her attention, commitment or energy
to the newborn infant. If this event causes toxic stress in early childhood, where toxic
stress refers to strong, frequent or prolonged activation of the body’s stress management
system, then this can have “disruptive effects on the nervous system and stress hormone
regulatory system that can damage developing brain architecture and chemistry and lead
to life long problems in learning” (Center on the Developing Child at Harvard Univer-
sity 2007).35
35 For more information about the toxic stress on child development see National Scientific Council on the Developing Child (2005) and the references cited therein.
62 IFAU – Does child spacing affect children’s outcomes? Evidence from a Swedish reform
References Andersson, G., (1999), “Childbearing trends in Sweden 1961-1997,” European Journal
of Population 15: 1-24.
Andersson, G., (2002), “Fertility developments in Norway and Sweden since the early
1960s,” Demographic Research 6 (4): 67-86.
Andersson, G., J., Hoem and A-Z. Duvander (2006), “Social differentials in speed-
premium effects in childbearing in Sweden,” Demographic Research: Volume 14,
Article 4.
Andrews, D. W. K., and J. H. Stock (2006), “Testing With Many Weak Instruments,”
Journal of Econometrics, Vol. 138, 24-46.
Angrist, J., and J. S. Pischke (2009), Mostly Harmless Econometrics: An Empiricist’s
Companion. Princeton, Princeton University Press.
Angrist, J., V. Lavy, and A. Schlosser (2006), “Multiple Experiments for the Causal
Link between the Quantity and quality of Children,” Working paper 26, MIT.
Baker, M., Gruber, J., and K. Milligan (2008), “Universal Child Care, Maternal Labor
Supply, and Family Well-Being,” Journal of Political Economy, 116, 709-745.
Bernal, R. (2008) “The Effect of Maternal Employment and Child Care on Children’s
Cognitive Development”, International Economic Review, Vol. 49, No. 4, 1173-
1209.
Bertrand, M., Duflo, E., and S. Mullainathan (2004), “How Much Should We Trust
Difference-in-Differences Estimates?,” Quarterly Journal of Economics, 119, 249-
275.
Besley, T., and A. Case (2000), “Unnatural Experiments? Estimating the Incidence of
Endogenous Policies,” Economic Journal, 110, 672-694.
Björklund A., M. Clark, P-A. Edin, P. Fredriksson and A. Krueger (2005), “The Market
comes to Education – An Evaluation of Sweden’s Surprising School Reforms,”
Russell Sage Foundation.
IFAU – Does child spacing affect children’s outcomes? Evidence from a Swedish reform 63
Björklund, A. (2006), “Does family policy affect fertility? Lessons from Sweden,”
Journal of Population Economics, 2006(1): 3-24.
Black, S., Devereux, P., and K., Salvanes (2005), “The More the Merrier? The Effect of
Family Composition on Children’s Education,” Quarterly Journal of Economics,
120, 669-700.
Blake, J. (1989), Family Size and Achievement. Berkeley: University of California
Press.
Blundell R., Duncan, A., C. Meghir (1998), “Estimating Labor Supply Responses
Using Tax Reforms,” Econometrica, 66, 827-861.
Cáceres-Delpiano, J. (2006), “The Impacts of Family Size on Investment in Child
Quality,” Journal of Human Resources 41(4): 738–754.
Card D., and A. Krueger (1996), “School Resources and Student Outcomes: An
Overview of the Literature and New Evidence from North and South Carolina,” The
Journal of Economic Perspectives, Vol. 10, No. 4, 31-50.
Carneiro, P., Löken, K., and K. G. Salvanes (2009), “A Flying Start? Maternity Leave
and Long-Term Outcomes for Mother and Child,” Manuscript, Norwegian School of
Economics.
Center on the Developing Child at Harvard University (2007). A Science-Based
Framework for Early Childhood Policy: Using Evidence to Improve Outcomes in
Learning, Behavior, and Health for Vulnerable Children.
http://www.developingchild.harvard.edu.
Conde-Agudelo, A., Rosas-Bermúdez, A., and A. Kafury-Goeta (2006), “Birth Spacing
and Risk of Adverse Perinatal Outcomes: A Meta-analysis,” The Journal of the
American Medical Association, 1809-1823.
Dahl, G., and E. Moretti (2008), “The Demand for Sons,” The Review of Economics
Studies, 75, 1085-1120.
David, P, and W., Sanderson (1987), “The Emergence of a Two-Child Norm among
American Birth-Controllers,” Population and Development Review, 13, 1-41.
64 IFAU – Does child spacing affect children’s outcomes? Evidence from a Swedish reform
Duflo, E., (1998), “Evaluating the Effect of Birth-spacing on Child Mortality,” mimeo,
Department of Economics. MIT.
Dustmann, C., and U. Schönberg (2008), “The Effect of Expansions in Maternity Leave
Coverage of Children’s Long-Term Outcomes,” The Institute for the Study of Labor
(IZA), Discussion Paper No. 3605.
Eissa, N. (1995), “Taxation and Labor Supply of Married Women: the Tax Reform Act
of 1986 as a natural experiment,” NBER Working paper No.5023, Cambridge, MA.
Fernández, R. and A. Fogli (2009), “Culture: An Empirical Investigation of Beliefs,
Work and Fertility.” forthcoming, American Economic Journal: Macroeconomics,
1:1, 146–177.
Grönqvist, H and O. Åslund (2007), “Family Size and Child Outcomes: Is There Really
No Trade-Off,” mimeo, The Institute for Labour Market Policy Evaluation.
Gruber, J. (2004), Is Making Divorce Easier Bad for Children? The Long Run
Implications of Unilateral Divorce”, Journal of Labor Economics, 22 (4), 799-833.
Gustafsson, S., and Stafford, F. (1994), “Three Regimes of Child Care: The United
States, the Netherlands, and Sweden.” In Social protection versus economic
flexibility: Is there a trade-off? R. Blank, ed. Chicago and London: University of
Chicago Press, pp. 333-61.
Heckman J., Hotz, J., and J. Walker (1985), “New Evidence on the Timing and Spacing
of Births,” American Economic Review. 75: 179-184.
Heckman, J., and J. Walker (1990), “The Relationship between Wages and the Timing
and Spacing of Births: Evidence from Swedish Longitudinal Data,” Econometrica,
58: 1411-1441.
Heckman, J. J. (1996), “Comment on ‘Labor supply and the economic recovery Tax Act
of 1981’ by Eissa, N.,” in Empirical foundations of household taxation, edited by
Feldstein, M. and Poterba, J., 32-38, University of Chicago Press.
Hoem, J. (1993), “Public policy as the fuel of fertility: effects of a policy reform on the
pace of childbearing in Sweden in the 1980s,” Acta Sociologica 36 (1), 19-31.
IFAU – Does child spacing affect children’s outcomes? Evidence from a Swedish reform 65
Holmlund, B (1984), “Fertility and the Opportunities of Children: Evidence on
Quantity-quality Interactions in Sweden,” Stockholm Research Reports in
Demography 24. University of Stockholm.
Hotz, J., Klerman J., and R. “Willis (1997), “The Economics of Fertility in Developed
Countries,” in The handbook of population economics, ed. Mark R. Rosenzweig and
O. Stark (Amsterdam: Elsevier Science).
Human Development Reports (2005), United Nations, New York.
International Labour Office (2001), Key Indicators of the Labour Market 2001-2002.
Geneva.
Knudsen, E. I., Heckman, J. J., Cameron, J. L., and Shonkoff, J- P. (2006), “Economic,
neurobiological, and behavioral perspectives on building America’s future
workforce”, Proceedings of the National Academy of Sciences of the United States of
America, vol. 103 (27), 10155-10162.
Lalive, R., and J. Zweimüller (2009), “How Does Parental Leave Affect Fertility and
Return-to-Work? Evidence from Two Natural Experiments,” forthcoming, Quarterly
Journal of Economics.
Liu, Q., and O. Nordström Skans (2008), “Paid Parental Leave, Mothers’ Education,
and Children’s Scholastic Performance,” Mimeo, The Institute for Labour Market
Policy Evaluation (IFAU), Uppsala.
Milligan, K. (2005), “Subsidizing the Stork: New Evidence on Tax Incentives and
Fertility,” Review of Economics and Statistics, 87, 539-555.
National Scientific Council on the Developing Child (2005), “Excessive Stress Disrupts
the Architecture of the Developing Brain,” Working Paper No. 3.
Newman J. (1983), “Economic Analyses of the Spacing of Births,” American Economic
Review, 73, 2, 33-37.
Newman, J., and C. McCulloch (1984), “A Hazard Rate Approach to the Timing of
Births,” Econometrica, Vol 52, 939-962.
66 IFAU – Does child spacing affect children’s outcomes? Evidence from a Swedish reform
Powell, B, and L. Steelman (1990), “Beyond Sibship Size: Sibling Density, Sex
Composition, and Educational Outcomes,” Social Forces, 69, 181-206.
Powell, B, and L. Steelman (1993), “The Educational Benefits of Being Spaced Out:
Sibship Density and Educational Progress,” American Sociological Review, 58, 367-
381.
Qian, N., (2006), “Quantity-Quality: The Positive Effect of Family Size on School
Enrollment in China,” mimeo, Brown University.
Rozenzweig, M. and J., Zhang (2006), “Do Population Control Policies Induce More
Human Capital Investments? Twins Birthweigt, and China’s One Child Policy,”
forthcoming in Review of Economic Studies.
Ruhm, C. (2004), “Parental Employment and Child Cognitive Development”, Journal
of Human Resources, Vol. 39, No. 1, 155-192.
Ruhm, C. (2008), “Maternal Employment and Adolescent Development”, Labour
Economics, Volume 15, Issue 5, 958-983.
Setty-Venugopal, V., and U. Upadhyay (2002), “Birth Spacing: Three to Five Saves
Lives. Population Reports,” Series L, No. 13. Baltimore, Johns Hopkins Bloomberg
School of Public Health, Population Information Program.
Spiess. K., and K. Wrohlich (2006), “The Parental Leave Benefit Reform in Germany:
Costs and Labour Market Outcomes of Moving towards the Scandinavian Model,” The
Institute for the Study of Labor (IZA), Discussion Paper No. 2372.
Stafford, F (1987), “Women's Work, Sibling Competition, and Children’s School
Performance,” American Economic Review, 77(5), 972-80.
Walker, J. (1986), “An Empirical Investigation of the Timing and Spacing of Births in
Sweden: The Effect of Changing Economic Conditions.” Phd dissertation.
Walker, J. (1995), “The Effect of Public Policies on Recent Fertility Behavior in
Sweden,” Journal of Population Economics 8 (1995): 223-252.

IFAU – Does child spacing affect children’s outcomes? Evidence from a Swedish reform 67
Wurtz, A. (2007), “The Long-Term Effect on Children of Increasing the Length of
Parents Birth-Related Leave,”, Aarhus School of Business, Department of
Economics, Working Paper 07-11.

Publication series published by the Institute for Labour Market Policy Evaluation (IFAU) – latest issues
Rapporter/Reports
2009:1 Hartman Laura, Per Johansson, Staffan Khan and Erica Lindahl, ”Uppföljning och utvärdering av Sjukvårdsmiljarden”
2009:2 Chirico Gabriella and Martin Nilsson ”Samverkan för att minska sjukskrivningar – en studie av åtgärder inom Sjukvårdsmiljarden”
2009:3 Rantakeisu Ulla ”Klass, kön och platsanvisning. Om ungdomars och arbetsförmed- lares möte på arbetsförmedlingen”
2009:4 Dahlberg Matz, Karin Edmark, Jörgen Hansen and Eva Mörk ”Fattigdom i folk- hemmet – från socialbidrag till självförsörjning”
2009:5 Pettersson-Lidbom Per and Peter Skogman Thoursie ”Kan täta födelseintervaller mellan syskon försämra deras chanser till utbildning?
Working papers
2009:1 Crépon Bruno, Marc Ferracci, Grégory Jolivet and Gerard J. van den Berg “Active labor market policy effects in a dynamic setting”
2009:2 Hesselius Patrik, Per Johansson and Peter Nilsson “Sick of your colleagues’ absence?”
2009:3 Engström Per, Patrik Hesselius and Bertil Holmlund “Vacancy referrals, job search and the duration of unemployment: a randomized experiment”
2009:4 Horny Guillaume, Rute Mendes and Gerard J. van den Berg ”Job durations with worker and firm specific effects: MCMC estimation with longitudinal employer-employee data”
2009:5 Bergemann Annette and Regina T. Riphahn “Female labor supply and parental leave benefits – the causal effect of paying higher transfers for a shorter period of time”
2009:6 Pekkarinen Tuomas, Roope Uusitalo and Sari Kerr “School tracking and development of cognitive skills”
2009:7 Pettersson-Lidbom Per and Peter Skogman Thoursie “Does child spacing affect chil-drens’s outcomes? Evidence from a Swedish reform”
Dissertation series 2008:1 Andersson Christian “Teachers and student outcomes: evidence using Swedish data”
2009:1 Lindahl Erica “Empirical studies of public policies within the primary school and the sickness insurance”