Surfactant-Induced Modification of Dopants Reactivity in Sol−Gel Matrixes
Upload
khangminh22Category
view
1download
0
Dodecylbenzenesulfonic Acid: A Surfactant and
Dopant for the Synthesis of Processable Polyaniline
and its Copolymers
von der Fakultät für Naturwissenschaften der Technischen Universität Chemnitz
genehmigte Dissertation zur Erlangung des akademischen Grades
doctor rerum naturalium
(Dr. rer. nat.)
vorgelegt von
M.Sc. Subrahmanya Shreepathi
geboren am 21.02.1977 in Ananthapur, Indien
eingereicht am 26 Juli 2006
Gutachter: Prof. Dr. Rudlof Holze
Prof. Dr. Werner A. Goedel
PD. Dr. Andreas Bund
Tag der Verteidigung: 07 Dezember 2006
Bibliographische Beschreibung und Referat
Bibliographische Beschreibung und Referat Subrahmanya Shreepathi Dodecylbenzenesulfonic Acid: A Surfactant and Dopant for the Synthesis of Proc-essable Polyaniline and its Copolymers Das Ziel der vorliegenden Arbeit ist die bessere Verarbeitung von Polyanilin (PANI), da dies bisher ein großer Nachteil unter leitfähigen Polymeren war. Dazu wird ein sperriges Tensid und Dotand, Dodecylbenzensulfonsäure (DBSA) verwendet. Zur Synthese der PANI kommen zwei verschiedene Methoden zur Anwendung, die in dieser Dissertation in zwei Kapiteln beschrieben werden.
Im ersten Teil wurden in einem kleinen Reaktionsvolumen (250 mL) PANI-DBSA-Suspensionen synthetisiert, wobei mit einem binären Gemisch aus 2-Propanol und Wasser als Lösungsmittel gearbeitet wird um die Löslichkeit zu unterstützen. Die micellenunterstützte Synthese produziert grüne Dispersionen, welche nach länger als einem Jahr noch keine sichtbare Ausscheidung zeigen. Eine detaillierte spectroelektrochemische Untersuchung der PANI-DBSA-Nanokolloide wurde durchgeführt und gibt eine bessere Erklärung der Charge-Transfer-Prozesse zwischen PANI-Kolloiden und Elektrodenoberfläche. In einem alkalischen Medium ist das UV-Vis-Spektrum von der Beweglichkeit der Anionen und von einem elektrokinetischen Phänomen abhängig. Um den „metal-to-insulator”-Übergang zwischen PANI-Kolloiden, welcher durch pH-Wert-Änderung des Mediums geschehen kann, zu zeigen, wurden UV-Vis- und pre-resonanz-Raman-Spektroskopie verwendet.
Im zweiten Teil der Dissertation wird zur Polymerisation von Anilin sowie seinen Copolymeren mit o-Toluidin eine neue Technik der Polymerisation beschrieben, welche durch inverse Emulsion erfolgt. Diese benutzt Benzoylperoxid, ein ungewöhnlicheres organisches Oxidationsmittel. Die erhaltenen PANI sind in gebräuchlichen organischen Lösungsmitteln, wie in Chloroform, vollständig löslich. Mit einer klar-transparenten, grünen Lösung von PANI können metallische Oberflächen oder Glas leicht tropfenbeschichtet werden. Zyklische Voltammetrie und spektroelektrochemische Verfahren kamen zum Einsatz, um die Elektroaktivität, das UV-Vis-Verhalten und die „metal-to-insulator”-Übergänge der chemisch synthetisierten PANI als Funktion des verwendeten Elektrodenpotentials zu untersuchen. Die elektrische Leitfähigkeit der Materialien ist relativ hoch (R = 10 Ω). SEM-Untersuchungen zeigen, dass die Menge des zugesetzten DBSA die Morphologie des Polymers stark beeinflusst. Aus in situ UV-Vis-spektroskopischen Messungen lässt sich eine gute elektrochromische Reversibilität des Polymers erkennen. DBSA kann Poly(o-toluidin) (POT) effektiv dotieren, auch wenn von der Methylgruppe eine sterische Hinderung ausgeht. Die spektroskopischen Untersuchungen, wie UV-Vis, FT-IR, Raman-Spektroskopie und zyklische Voltammetrie, zeigen deutlich, dass wirkliche Copolymere gebildet werden und die Möglichkeit von Kompositen nicht in Betracht kommt. Das entstandene Poly(anilin-co-o-toluidin) (PAT) ist in schwach polaren Lösungsmitteln wie Chloroform löslich. Wie erwartet, sind die elektrischen Leitfähigkeiten der Copolymere viel kleiner als die Leitfähigkeit von PANI-DBSA. Stichworte: Kolloidale Dispersionen, Spektroelektrochemie, Inverse Emulsion, Benzoylperoxid, PANI-DBSA, pre-resonanz Raman-Spektroskopie.
2
Abstract
Abstract
Subrahmanya Shreepathi
Dodecylbenzenesulfonic Acid: A Surfactant and Dopant for the Synthesis of Proc-
essable Polyaniline and its Copolymers
An attempt has been made to improve the poor processability of polyaniline
(PANI), a major drawback in the area of conducting polymers, by using dodecylbenzene-
sulfonic acid (DBSA), a bulky molecule containing a polar head and a long non-polar
chain which functions both as a surfactant and dopant. Two different methods for the syn-
thesis of PANI have been described in this dissertation and are discussed in two parts.
In the first part, chemical synthesis of PANI-DBSA suspensions in smaller reaction
volumes (250 mL) has been described using a binary mixture of 2-propanol+water as the
solvent to aid the solubility of DBSA. The micelle aided synthesis yields green dispersions
which do not undergo macroscopic precipitation for more than a year. Due to excellent
electrochromism of PANI, its colloidal dispersions can be directly applied in optoelec-
tronic industry which is an added advantage of synthesizing stable PANI dispersions.
Hence, a detailed study on spectroelectrochemistry of PANI-DBSA nanocolloids has been
carried out which provides a better understanding of charge transfer processes between
PANI colloids and electrode surfaces. UV-Vis and pre-resonance Raman spectroscopies
have been used to monitor the metal-to-insulator transition of the PANI colloids induced
by pH change of the medium. The shape of the colloidal particles has been investigated us-
ing transmission electron microscopy (TEM). The influence of feed ratios of DBSA to ani-
line on the morphology of PANI colloids has also been discussed.
In the second part of the dissertation, a new inverse emulsion polymerization tech-
nique using benzoyl peroxide, a less commonly used organic oxidant, has been described
for the polymerization of aniline and its copolymers with o-toluidine. DBSA has been se-
lected as dopant because it also functions as surfactant. The new inverse emulsion protocol
developed yields PANI which is completely soluble in weakly polar solvents such as chlo-
roform and a 2:1 mixture of toluene+2-propanol. A clear transparent green solution of
PANI can be easily drop-, dip- or spun-coated on metallic or glass substrates. Cyclic volt-
ammetry and spectroelectrochemical investigations were carried out to study the electroac-
tivity, UV-Vis response and the metal-to-insulator transition of the chemically synthesized
3
Abstract
PANI as a function of applied electrode potential. In situ UV-Vis spectroscopy measure-
ments reveal good electrochromic reversibility for the polymer similar to the response of
PANI synthesized electrochemically. In situ UV-Vis spectroscopy was also used to inves-
tigate the ease of permeability of different anions into PANI-DBSA film immersed in
aqueous solution containing the anion. In situ electrical conductivity measurements, which
are mainly employed for electrochemically synthesized polymers, have been used to moni-
tor the change in conductivity of the chemically synthesized PANI. Electrical conductivity
of the material is relatively high as the minimum resistance value is nearly 10 Ω. Pre-
resonance Raman investigations have been carried out to monitor the metal-to-insulator
transition of PANI induced by applied potential changes. Scanning electron microscopy
has been used to investigate the influence of the feed concentration of DBSA on the mor-
phology of the polymer. A correlation between bulk morphology and post processed nano-
scale morphology has been achieved by transmission electron microscopy.
The same inverse emulsion procedure has been extended for the synthesis of
poly(o-toluidine) (POT) and poly(aniline-co-o-toluidine)s (PATs). The efficiency of ben-
zoyl peroxide to polymerize o-toluidine in the presence of DBSA has been studied. Elec-
trochemical activity and the structural information of the polymers have been carried out
using cyclic voltammetry and spectroscopic methods such as UV-Vis, Raman and FTIR.
These techniques are also used to confirm the formation of real copolymers. A comparison
between the solubility of PANI and POT shows unusual results where solubility of POT is
less than that of PANI. Influence of morphology on physical properties of POT and co-
polymers has been investigated. Spectroelectrochemical behaviors of the chemically syn-
thesized copolymers have been studied to understand the structural/conformational differ-
ences between the chemically and electrochemically synthesized copolymers. Electrical
conductivities of the copolymers, as expected, are much lower than that of PANI-DBSA.
In situ Raman spectroscopy has been used to monitor the metal-to-insulator transition in-
duced by the change in applied potential. All the above mentioned techniques have been
used to correlate the physical properties of the copolymers with PANI and POT.
Keywords: Colloidal dispersions; Spectroelectrochemistry; Inverse emulsion; Benzoyl per-
oxide; PANI-DBSA; Pre-resonance Raman spectroscopy.
4
Zeitraum, Ort der Durchführung
Die vorliegende Arbeit wurde in der Zeit von Januar 2003 bis Januar 2006 unter Leitung
von Prof. Dr. Rudolf Holze am Lehrstuhl für Physikalische Chemie/Elektrochemie der
Technischen Universität Chemnitz durchgeführt.
5

Acknowledgements
Acknowledgements
To express all that I want to say, of people who have made it possible for me to
come up to this stage is a rather onerous task which I shall have to try and make the best of.
I would first of all like to express my most sincere appreciation and gratitude to my super-
visor Prof. Dr. Rudolf Holze for his timely support, advices and cooperation. I owe spe-
cial thanks to Prof. Dr. M. Hietschold, Dr. S. Schulze and Mrs. G. Baumann, Institute of
Physics, TU Chemnitz, Germany for their help in recording TEM and SEM images.
I am highly obliged and indebted to Prof. D. N. Sathyanarayana, Indian Institute of
Science, Bangalore for introducing me to the field of conducting polymers. I would also
like to acknowledge Prof. P. G. Ramappa, Prof. Siddaramaiah and Dr. H.D. Revanasid-
dappa, University of Mysore, India for their continuous cooperation.
I wish to express my sincere feelings to my lab mates for their help at various
stages of my work and for keeping a congenial atmosphere during my stay in the depart-
ment. I would like to thank Mr. Hung for performing anti-corrosion tests of my polymer
samples and for his friendship. Special thanks are due to Mrs. Susanne Vogel, Ms. Susanne
Mecklenburg and Ms. Evelyn Richter for the timely support both inside and outside the
campus and constant encouragement.
Above all, I wish to acknowledge from the depth of my heart the untiring sacrifices
made by my parents to achieve the highest degree in the field of education. I fall short of
words in expressing my abounding feelings for my sister, Nagaratna, for her love and af-
fection, understanding and patience. I warmly acknowledge the love and blessings show-
ered by my relatives and friends.
My special thanks go to my wife Sudeshna and children for their love, cooperation,
support and encouragement.
It gives me fabulous delectation to convey my thanks to all the members of
ACCUMOL. Thanks are also due to Chemnitz Cricket Club (CCC) for weekend enter-
tainments.
Last but not the least, I gratefully acknowledge DFG for research fellowship.
6

To my beloved parents

Table of Contents
Table of Contents
Bibliographische Beschreibung und Referat ................................................................. 2
Abstract ......................................................................................................................... 3
Acknowledgements ....................................................................................................... 6
List of Abbreviations and Symbols ............................................................................. 11
PART I
CHAPTER 1
1 Introduction
1.1 Conducting Polymers ......................................................................................... 14
1.2 Polyaniline ......................................................................................................... 15
1.2.1 Structure of Polyaniline ......................................................................... 15
1.2.2 Doping in Polyaniline: Acid Doping ..................................................... 16
1.2.3 Synthesis of Polyaniline ......................................................................... 17
1.2.3.1 Chemical Synthesis ................................................................ 17
1.2.3.2 Electrochemical Synthesis ..................................................... 18
1.2.4 Polymerization Mechanisms .................................................................. 19
1.2.5 Mechanism of Conductivity ................................................................... 20
1.2.6 Characterization of Polyaniline ............................................................. 22
1.2.6.1 Elemental Analysis ................................................................. 22
1.2.6.2 UV-Visible Spectroscopy ....................................................... 22
1.2.6.3 Fourier Transform Infrared (FTIR) Spectroscopy ................. 22
1.2.6.4 Raman Spectroscopy .............................................................. 23
1.2.6.5 Cyclic Voltammetry ............................................................... 23
1.2.6.6 In Situ Conductivity Measurements ....................................... 24
1.2.6.7 Scanning Electron Microscopy .............................................. 24
1.2.6.8 Transmission Electron Microscopy ........................................ 24
1.2.7 Solubility of Polyaniline ........................................................................ 25
1.2.8 Poly(substituted anilines) ....................................................................... 26
1.2.9 Functionalized Protonic Acid as Dopant ............................................... 26
1.2.10 Blends of Polyaniline ............................................................................. 26
8
Table of Contents
1.2.11 Copolymers ............................................................................................ 27
1.2.12 Polyaniline Dispersions ......................................................................... 27
1.2.12.1 Polymer Stabilized Polyaniline Dispersions .......................... 27
1.2.12.2 Role of Surfactants ................................................................. 28
1.2.12.3 Role of Bulky Organic acids .................................................. 28
1.3 Aim and Scope of the Work .............................................................................. 29
CHAPTER 2
2 Experimental
2.1 Chemicals ........................................................................................................... 31
2.2 Synthesis of PANI-DBSA Colloidal Dispersions .............................................. 31
2.3 Characterization ................................................................................................. 33
CHAPTER 3
3 Results and Discussion
3.1 Polymerization Process ...................................................................................... 35
3.2 Elemental Analysis ............................................................................................ 37
3.3 Polymerization Yield ......................................................................................... 37
3.4 UV-Visible Spectroscopy .................................................................................. 38
3.4.1 Effect of pH on UV-Vis Spectra ............................................................ 39
3.4.2 Spectroelectrochemical Studies at Acidic pH ........................................ 42
3.4.3 Spectroelectrochemical Studies at Basic pH ......................................... 45
3.5 Pre-resonance Raman Spectroscopy .................................................................. 49
3.6 Transmission Electron Microscopy ................................................................... 52
CHAPTER 4
4 Conclusions and Remarks
4.1 Conclusions ........................................................................................................ 54
4.2 Remarks ............................................................................................................. 55
PART II
CHAPTER 5
5 Introduction
5.1 Functionalized Protonic Acids: Counter Ion-induced Processability ................ 57
5.2 Various Synthetic Routes ................................................................................... 58
5.3 Emulsion Polymerization ................................................................................... 59
5.3.1 Miniemulsion Polymerization ................................................................ 60
9

Table of Contents
5.3.2 Microemulsion Polymerization .............................................................. 60
5.3.3 Inverse Emulsion Polymerization .......................................................... 61
5.4 Oxidants Employed in the Polymerization of Aniline ....................................... 62
5.4.1 Benzoyl Peroxide ................................................................................... 62
5.5 Copolymers of Aniline ....................................................................................... 62
5.5.1 Copolymers of Aniline with Toluidine .................................................. 64
5.6 Solubility of Parent Polyaniline ......................................................................... 65
5.7 Aim and Scope of the Work .............................................................................. 65
CHAPTER 6
6 Experimental
6.1 Chemicals ........................................................................................................... 67
6.2 Synthesis ............................................................................................................ 67
6.2.1 Synthesis of PANI-DBSA ..................................................................... 67
6.2.2 Synthesis of Poly(aniline-co-o-toluidine) .............................................. 68
6.3 Characterization ................................................................................................. 69
CHAPTER 7
7 Results and Discussion
7.1 Solubility ............................................................................................................ 72
7.2 Elemental Analysis ............................................................................................ 74
7.3 Polymerization Yield ......................................................................................... 76
7.4 In Situ Electrical Conductivity ........................................................................... 77
7.5 UV-Visible Spectroscopy .................................................................................. 81
7.6 In Situ UV-Visible Spectroscopy ....................................................................... 87
7.7 Cyclic Voltammetry ........................................................................................... 94
7.8 Infrared Spectroscopy ...................................................................................... 103
7.9 Raman Spectroscopy ........................................................................................ 106
7.10 Scanning Electron Microscopy ........................................................................ 114
7.11 Transmission Electron Microscopy of PANI-DBSA ....................................... 118
CHAPTER 8
8 Summary
8.1 PANI-DBSA .................................................................................................... 121
8.2 Poly(aniline-co-o-toluidine)s ........................................................................... 122
REFERENCES ................................................................................................................. 124
10
List of Abbreviations and Symbols
List of Abbreviations and Symbols
B Benzoid
CSA Camphorsulfonic acid
CV Cyclic voltammogram
DBSA Dodecylbenzenesulfonic acid
DMF Dimethylformamide
DMSO Dimethylsulfoxide
DNNSA Dinonylnaphthalenesulfonic acid
EB Emeraldine base
ED Electron diffraction
EM Emeraldine
ES Emeraldine salt
FTIR Fourier-transform infrared
GCE Glassy carbon electrode
IR Infrared
ITO Indium doped tin oxide
LE Leucoemeraldine
NMP N-Methylpyrrolidone
NP 40 Nonylphenolethoxylate
PANI Polyaniline
PANI-DBSA Polyaniline-dodecylbenzenesulfonate
PANI-EB Polyaniline in emeraldine base form
PANI-ES Polyaniline in emeraldine salt form
PAT Poly(aniline-co-o-toluidine)
PAT-37 PAT with 3:7 molar feed ratio of aniline-to-o-toluidine
PAT-55 PAT with equimolar feed ratio of aniline-to-o-toluidine
PAT-73 PAT with 7:3 molar feed ratio of aniline-to-o-toluidine
PN Pernigraniline
POT Poly(o-toluidine)
POT-6 POT with DBSA-to-o-toluidine feed ratio of 7:1
11

List of Abbreviations and Symbols
PTSA p-Toluenesulfonic acid
PVC Poly(vinyl chloride)
Q Quinoid
SCE Saturated calomel electrode
SDS Sodiumdodecyl sulfate
SEM Scanning electron microscopy
SQR Semiquinone radical
TBAP Tetrabutylammonium persulfate
TEM Transmission electron microscopy
TIP-5 Soluble PANI-DBSA with DBSA-to-aniline feed ratio of 5:1
TIP-6 Soluble PANI-DBSA with DBSA-to-aniline feed ratio of 7:1
TIP-7 Soluble PANI-DBSA with DBSA-to-aniline feed ratio of 10:1
UV-Vis Ultraviolet-visible
w Weak band
A Absorbance
Cani Concentration of aniline
Ctotal Total concentration
EAg/AgCl Electrode potential (vs Ag/AgCl in acetonitrile)
Eox, 1 First oxidation peak potential
Eox, 2 Second oxidation peak potential
ESCE Electrode potential (vs SCE)
Ipa Anodic peak current
Ipc Cathodic peak current
λ Wavelength
λ0 Laser excitation wavelength
λmax Wavelength at band maximum
12

PART I

Part I; 1. Introduction
Chapter 1
Introduction
The evolution of conducting polymers began in 1975 with the discovery of a linear
conjugated organic polymer, polyacetylene, by Shirakawa. However, the material showed
metallic properties (improvement in conductivity by 9−13 orders of magnitude) only after
its oxidation by iodine, which was reported two years after its discovery [1]. This gave rise
to a surge of activity directed towards the exploration, synthesis and characterization of
this class of material, also known as ‘Synthetic Metals’ [2]. These new materials combine
typical properties of organic polymers such as low density, environmental stability, resis-
tance to corrosion and low cost of synthesis with the conductivity of metals. The desirable
properties of these materials can be achieved among other possibilities through engineering
at the molecular level by modifying the parent monomers.
1.1 Conducting Polymers
A conducting polymer is a highly delocalized π-electron system with alternative
single and double bonds in the polymer backbone. The π-conjugation of the polymer chain
generates high energy occupied and low energy unoccupied molecular orbitals leading to a
system that can be readily oxidized or reduced [3]. Their electronic conductivity is called
intrinsic as it is caused by the presence of particular molecular structure elements which
enable electric charges to move around without any added conducting materials (e.g. met-
als, graphite). In most of the cases, these polymers are insulators in their neutral state and
they become conducting only after introduction of electron acceptors/donors by a process
known as ‘doping’. One should keep in mind that the term doping used in the field of con-
ducting polymers is somewhat different from the term used in the field of conventional in-
organic semiconductors. This discrepancy arises from the amount of dopant which, in
some cases, may constitute up to 50 per cent of the final weight of the conducting polymer.
Dopants interact with polymers by oxidizing or reducing them and do not participate in the
charge transport mechanism directly. An unpaired spin is generated near the valence band
or a vacancy in the conduction band is filled when an electron is removed (p-doping) or
14
Part I; 1. Introduction
added (n-doping) to the polymer. Out of several possible ways of doping a polymer,
chemical and electrochemical doping techniques are the most widely used ones [4].
Polyacetylene, the first ever discovered conducting polymer, despite its high con-
ductivity, is environmentally unstable. It has led to the discovery of other conducting
polymers such as polypyrrole, polythiophene, polyphenylene, polyphenylenevinylene,
polyaniline etc. The electrical behavior of these polymers and their derivatives is similar to
that of polyacetylene. Moreover, they show higher stability and better processability [5−7].
Of all these conducting polymers, polyaniline (PANI) is now establishing itself as a novel
material due its potential technological applications and low cost of synthesis [8].
1.2 Polyaniline
PANI has been investigated extensively for over 100 years and has attracted special
interest as a conducting material for several important reasons; the monomer is inexpen-
sive, the polymerization reaction is straightforward and proceeds with high yield and PANI
has excellent stability [9]. A first fairly detailed description of this product which was ear-
lier known as ‘aniline black’ was provided by Green and Woodhead [10]. The later discov-
eries on polyaniline dealt with its electrical conductivity and other properties like electro-
chemical redox activity, reversible doping/dedoping, electrochromism etc. [11]. Further at-
tention has been focused on PANI due to two prime reasons: (i) It can be synthesized eas-
ily both by electrochemical and chemical oxidation processes and (ii) it shows a particular
sensitivity to the proton activity of its environment [12].
1.2.1 Structure of Polyaniline
Green and Woodhead [10, 13] were the first to depict PANI as a chain of aniline
molecules coupled head-to-tail at the para position of the aromatic ring. They have pro-
posed a linear octameric structure for PANI. Polyaniline, a typical phenylene based poly-
mer, has a chemically flexible –NH– group* in the polymer chain flanked by phenyl rings
on either sides. The diversity in physicochemical properties of PANI is traced to the –NH–
group. The difference in the composition of amine and imine segments of PANI generates
several oxidation states of this material ranging from completely reduced leucoemeraldine * The −NH− group is chemically flexible because it is sensitive to the pH of the medium and the counter ions used in the synthesis. Depending on the nature of the protonating medium, the physicochemical and the elec-tronic properties of the PANI vary.
15

Part I; 1. Introduction
to completely oxidized pernigraniline states as shown in Scheme 1.1. The different forms
of PANI can be readily converted to one another by simple redox methods (Scheme 1.2;
Page 17). Out of several possible oxidation states, the 50 % oxidized emeraldine salt state
shows electrical conductivity [4].
NH
NH
NH
NH n
NNNNn
NNNH
NH n
NH
+ NH
+ NH
NH n
H+
− H++
Leucoemeraldine (pale yellow)
Emeraldine base (blue)
Pernigraniline (violet)
Emeraldine salt (green)
Scheme 1.1. Various possible oxidation states of polyaniline.
1.2.2 Doping in Polyaniline: Acid Doping
Doping in most of the known conducting polymers is achieved by partial oxidation
or partial reduction of the π-system of the polymer which leads to either increase or de-
crease in the number of electrons associated with it [4]. The uniqueness of PANI arises
from the sensitivity of its emeraldine oxidation state (EM) towards the pH which yields
emeraldine base (EB) and emeraldine salt (ES) forms of PANI. An interesting feature of
PANI arises from the fact that the non-conducting EB form of PANI can be doped to a
highly conducting regime (ES) without changing the total number of electrons associated
with it [9]. Such a doping is achieved by a simple protonation of the –NH group of EB by
mineral or organic protonic acids and is known as ‘acid doping’ (Scheme 1.2). The acid
16

Part I; 1. Introduction
doping process increases the conductivity of PANI by more than eight orders of magnitude
[14]. Positive charges accumulated on the polymer backbone during protonation of PANI
are neutralized by the negatively charged counter ions of the dopant. The protonation is
also accompanied by the drastic change in the electronic structure, crystallinity, solubility,
etc. [4]. The degree of protonation and the resulting conductivity can be readily controlled
by changing the pH of the dopant acid solution. Inorganic mineral acids such as HCl,
H2SO4, etc. are the most frequently used dopants but the metallic PANI produced, in most
of the cases, is completely insoluble. More details about the solubility of PANI are dis-
cussed in Section 1.2.7.
cheme 1.2. Interconversion of different oxidation states of polyaniline via redox procedure.
1.2.3 Synthesis of Polyaniline
methods for the synthesis of PANI. The first one is the di-
1.2.3.1 Chemical Synthesis
PANI–ES can be easily obtained as dark green powder by polymerization of aniline
in aqueous media using oxidizing agents such as ammonium persulfate, potassium iodate,
NH
+NH
+ NN
NH
+ NH
NNH
NH
NH
PN+
+e+H+
+e
+2H+
+H+
+e
+H+
+e
Pernigraniline salt (blue) Pernigraniline base (violet)
Emeraldine salt (green) Emeraldine base (blue)
Leucoemeraldine (pale yellow)
PN
ES EB
LE
S
There are two principal
rect oxidation of aniline by chemical oxidants and the second way is through electrooxida-
tion on an inert electrode.
17

Part I; 1. Introduction
hydrogen peroxide, potassium dichromate etc. [15]. The main advantage of chemical syn-
esis i
p-wise with continuous stirring for
al means. The possible polymerization routes and availability of list of oxidants
The anodic oxidation of aniline is generally carried out on an inert electrode mate-
rial which is usually platinum. However, other electrode materials such as iron, copper,
[15]. Polymerization of aniline is carried out in a three
lectro
th s its ease and capability to produce large volumes of PANI in good yield. The reac-
tion is mainly carried out in acid medium at pH between 0 and 2. The concentration of the
monomer employed varies between 0.01 and 1 M. Generally, a stoichiometric equivalent
of oxidant is used to avoid degradation of the polymer [15]. Oxidative chemical polymeri-
zation is generally carried out at low temperatures (–15 to 5 °C) in order to obtain PANI
with high molecular weight. One of the disadvantages of this method stems from the ex-
perimental observation that an excess of the oxidant and higher ionic strength of the me-
dium leads to materials that are essentially intractable.
In a typical synthesis, aniline (0.1 M) is dissolved in 1 M solution of protonic acid
such as HCl, H2SO4, HClO4, etc. and is cooled to 0–5 °C. A precooled solution of the oxi-
dant (0.1 M) with or without protonic acid is added dro
20–30 minutes. After about 10–15 minutes, the solution gradually develops a green tint.
The dark green/blue-green precipitate (ES) formed after 6 h is filtered, washed with excess
of dilute acid and then with organic solvents and dried in vacuum for 48 h. Polyemeraldine
base (EB) can be obtained by stirring the ES powder in 0.05 M solution of NH4OH for 10–
12 h. The dark blue powder of EB is further washed with 0.05 M NH4OH and dried under
vacuum.
Several other methods such as emulsion polymerization, dispersion polymerization,
interfacial polymerization, and so forth are also available for the polymerization of aniline
by chemic
have been thoroughly reviewed in the literature [4, 15, 16].
1.2.3.2 Electrochemical Synthesis
zinc, lead, etc. have also been used
e de single compartment or H–cell containing aqueous acidic solution of aniline. The
two mainly employed electrochemical routes are galvanostatic and potentiostatic modes. In
the latter case, potential can be fixed (ESCE = 0.7–1.2 V) or cycled (in the range of ESCE = –
0.2 to 0.7–1.2 V). A more homogeneous product is obtained when PANI is synthesized via
potential cycling [15]. The anodic oxidation is normally carried out in an inert atmosphere
at ambient temperature. For many conceivable applications, deposition of the polymer as a
18
Part I; 1. Introduction
thin film or thick coating is desirable which can be easily achieved using electrochemical
polymerization.
1.2.4 Polymerization Mechanisms
The wide variety of methods employed for preparation of PANI leads to products
whose nature and properties differ greatly. The mechanism and kinetics of PANI formation
tification of the intermediates and the steps in-
mechanism is the forma-
tion of
Mohilner and coworkers [18] were the first to predict that in H2SO4 medium (pH
apid electrochemi-
al-chemical-electrochemical reactions, mainly resulting in para-coupled chains. However,
para-co
has been extensively studied for the iden
volved. This knowledge is essential to correlate the relationships between possible reaction
pathways and properties of the polymeric products [12]. Information concerning the
mechanism of PANI formation has invariably been gathered with the aid of electrochemi-
cal methods. Various polymerization mechanisms and electrochemical aspects of the for-
mation of PANI have been proposed by different authors depending on the protocol used in
the synthesis of PANI and have been reviewed in detail [12, 15].
The polymerization reaction is a self-catalyzing reaction and obeys the law: i/nFA =
KC, where KC is the autocatalytic rate constant and has a value of ~0.47 s−1 for a 140 nm
thick PANI film [17]. The most accepted first step in the reaction
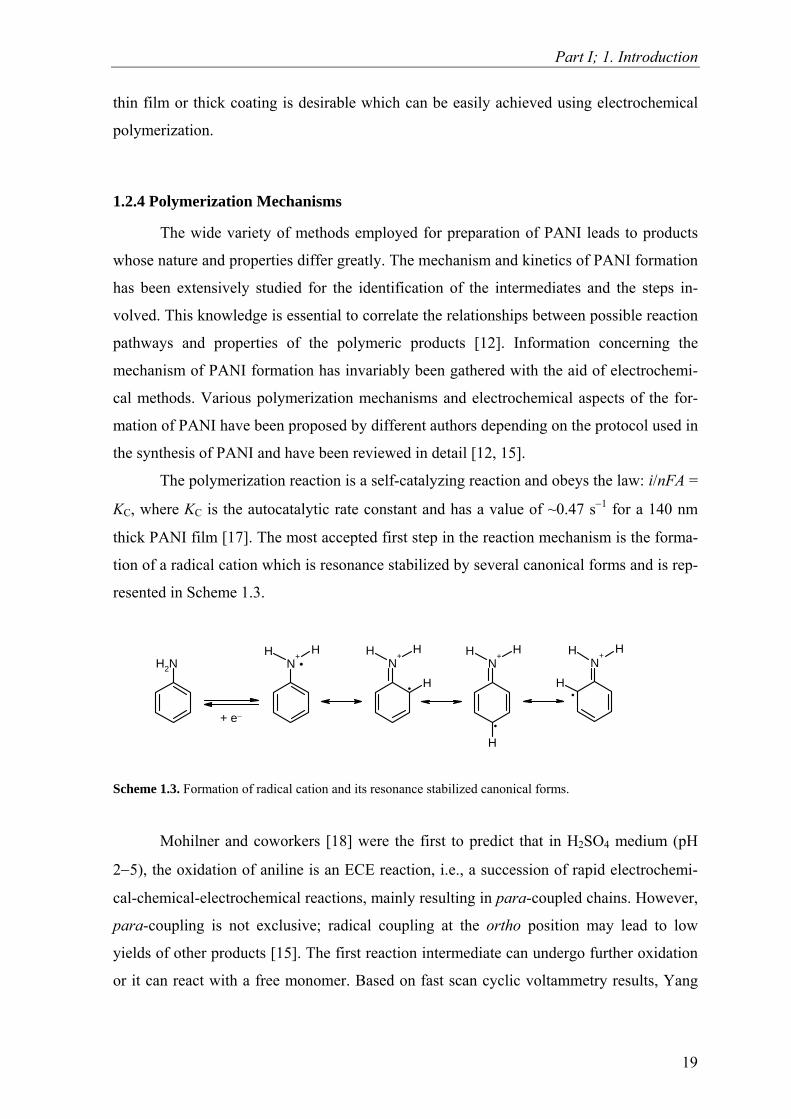
a radical cation which is resonance stabilized by several canonical forms and is rep-
resented in Scheme 1.3.
Scheme 1.3. Formation of radical cation and its resonance stabilized canonical forms.
2−5), the oxidation of aniline is an ECE reaction, i.e., a succession of r
c
upling is not exclusive; radical coupling at the ortho position may lead to low
yields of other products [15]. The first reaction intermediate can undergo further oxidation
or it can react with a free monomer. Based on fast scan cyclic voltammetry results, Yang
NH2 N+
HHN
+HH
HN
+HH
H
N+
HH
H
+ e−
.
..
19

Part I; 1. Introduction
and Bard [19] deduced a dimer (p-aminodiphenylamine) as a first intermediate product
(Scheme 1.4).
N+ H
H
H
N+ H
H
H
N+H
H
H
N+
H
H
H
N+
H
H
H
N
H
H
NH
H+
−2
2 .+
Scheme 1.4.
are rapid and Mo-
ilner et al. [18] proposed that the process occurs by formation of a tetramer, and then oc-
tamer,
The electrical conductivity of doped conducting polymers can be varied up to me-
n ten orders of magnitude. Charge transport in these
olyme
Formation of p-aminodiphenylamine from the monomeric radical cation.
The next steps in the polymerization of p-aminodiphenylamine
h
which polymerizes even further resulting in a polymer whose structure is that of
emeraldine. The polymerization mechanism is characterized as ‘autocatalytic’ because
electrooxidation of the oligomers occurs at less positive potentials than that of aniline
monomer. Such an autocatalytic effect is observed only in aqueous solutions of consider-
able acidity [12].
1.2.5 Mechanism of Conductivity
tallic state in the range of more tha
p rs has been extensively investigated but still remains poorly understood [4]. The
conjugation arising from chemical unsaturation of the carbon atom in conducting polymers
is the main cause for charge transport. The presence of localized electronic states of ener-
gies less than the band gap arising due to the changes in the local bond order have lead to
the possibility of new types of charge conduction phenomenon in these conjugated poly-
mers [4]. All conducting polymers have intrinsic topological defects which are introduced
during polymerization and their ground states are non-degenerate. Removal of a charge
from the valance band generates a radical cation whose energy lies in the band gap. In solid
20

Part I; 1. Introduction
state physics, such a radical cation which is partially delocalized over some polymer seg-
ments is called a ‘small polaron’. It stabilizes itself by polarizing the medium around it and
hence its name. Formation of polaron is associated with the distortion of lattice and the
presence of two localized electronic states in the gap. According to the model proposed by
Brazovski-Kirova [20], formation of a polaron leads to the possibility of three new optical
transitions (Figure 1.1).
VB
CB
VB
CB
VB
CBpo
laro
n en
ergy
le
vels
on e
nerg
y el
s
undope lymer doped polymer
B = conduct
heavily d polymer
ng E
nerg
y
bipo
lar le
v
Incr
easi
d po oped
VB = valence band; C ion band
Figure 1.1. Illustration of energy levels and allowed transitions of polarons and bipolarons.
When a second electron is removed from the system, it may come from either a dif-
rent segment of the polymer chain creating another polaron, or from the first polaron to
e in conductivity [21]. Several
fe
generate a dication which, in solid state physics, is referred to as a bipolaron (Figure 1.1).
A bipolaron is also associated with structural deformation and the two charges are not in-
dependent but act as a pair. Application of an external electric field makes both polaron
and bipolaron mobile via the rearrangement of conjugation.
In the case of PANI, the charged species are formed during protonation of the
polymer, which are subsequently responsible for the increas
other mechanisms are also proposed for the conductivity of PANI. Salaneck and coworkers
[22, 23], based on temperature dependent conductivity studies, have proposed a one-
dimensional variable range hopping or three-dimensional fluctuation-induced tunneling
models.
21
Part I; 1. Introduction
1.2.6 Characterization of Polyaniline
Polyaniline synthesized either chemically or electrochemically is characterized by
The basic characterization tool used in synthetic chemistry is elemental analysis
position of the sample material. Generally, elemental analysis
gives percentage weight (wt %) of carbon, hydrogen, nitrogen and sulfur present in the
ple which can be use
As mentioned in the previous sections, different oxidation states of PANI have dif-
s spectroscopy a useful technique for characterization of
PANI. The sensitivity of PANI to pH of a medium is also reflected by the color change and
Structure of PANI has been elucidated using this vibrational spectroscopic tool
[15]. Formation of the intermediate product of polymerization has also been characterized
using this technique. FTIR spectroscopy of PANI reveals that PANI is formed by 1,4-
several physicochemical techniques as discussed below.
1.2.6.1 Elemental Analysis
which gives elemental com
sam d to calculate the stoichiometry of the sample. When sulfuric acid
or organic sulfonic acids are used as dopants, elemental analysis can be used to estimate
the extent of doping in the PANI chain.
1.2.6.2 UV-Visible Spectroscopy
ferent color which makes UV-Vi
can be easily traced using this spectroscopy. Electronic absorption spectra of electrochemi-
cally deposited film of PANI or PANI dissolved in a suitable solvent gives qualitative in-
formation about the level of doping, extent of conjugation and the presence of radical
cations in the polymer. The conductor-to-insulator transition arising from the change in pH
of the medium can be clearly monitored. Further, in situ UV-Vis spectroscopy as a func-
tion of applied potential helps to understand the interconversion of different oxidation
states of PANI and allows correlating the electrical conductivity with the observed change
in the absorbance values. In some cases, electronic absorption spectroscopy can also be
used to trace the kinetics of aniline polymerization [12]. Interaction of the solvent with
PANI in which it is dissolved can also be studied by this method.
1.2.6.3 Fourier Transform Infrared (FTIR) Spectroscopy
22

Part I; 1. Introduction
coupling of aniline monomers and eliminates the possibility of formation of ortho coupled
echnique to infrared spectros-
vides definite structural characterization of PANI because of the characteristic
dependence of the Raman spectral pattern on the disposition of the ring constituents of
antage of Raman spectroscopy arises from the resonance en-
ltammetry is a powerful electrochemical tool to gain information about
ical behaviors and interconversion of oxidation states of PANI. It has not
only been used to characterize PANI but also to synthesize PANI. Kinetics of aniline po-
lymerization can be deduced with this technique. The peaks in the cyclic voltammogram
(CV), which are ascribed to the electrochemical responses of PANI, give clear knowledge
product to a considerable extent [15]. One can gain information about the presence of the
bands corresponding to both imine and amine type of rings in emeraldine state of PANI.
Formation of copolymers, presence of a functional group on the polymer backbone or
change in the protonation-deprotonation equilibrium of emeraldine can be deduced from
the presence of corresponding bands in the FTIR spectrum.
1.2.6.4 Raman Spectroscopy
Raman spectroscopy is used as a complementary t
copy. It pro
aromatic compounds. The adv
hancement of the Raman signals. Presence of several optical transitions in the UV-Vis
spectrum of PANI leads to the use of different laser excitation wavelengths to enhance the
intensity of the scattered signals. When the laser excitation wavelength matches with one
of the band maxima in the UV-Vis spectra, the intensity of the scattered light is strongly
increased. This is called ‘resonance enhancement’ [24]. The enhancement of the intensity
of Raman signals is also possible when the laser excitation wavelength lies in the longer or
shorter wavelength wing of an electronic absorption band and is called as ‘pre-resonance
enhancement’ [25, 26]. Raman spectroscopy when coupled to electrochemistry (Raman
spectra as a function of applied potential) allows monitoring of the metal-to-insulator tran-
sition arising due the change in the oxidation state of PANI. Thus, an in situ coupling is
useful in the structural study of complex multichromophore materials like PANI. Informa-
tion on each chromophore can be obtained separately by proper choice of exciting wave-
length.
1.2.6.5 Cyclic Voltammetry
Cyclic vo
the electrochem
23

Part I; 1. Introduction
of the charge injected during interconversion of any two oxidation states of PANI. Effect
samples; the
easured voltage drop across the sample in a two- or four-probe arrangement corresponds
to resistance of the sample. A new, much easier to handle, in situ electrochemical conduc-
as been developed in our laboratory [27]. This
PANI has been investigated using SEM. The
ide range of magnification makes it suitable for investigation of microstructures and
sometimes nanostructures of PANI. With the help of SEM images, one can correlate the
hanical properties, etc. of PANI with its surface
nanotechnology as active components of nano-
molecular electronic devices. Hence, investigation of nanostructures of PANI is es-
sential and can be done with transmission electron microscopy. The additional information
of different anions in the supporting electrolyte or polymerization medium on the conduc-
tivity or morphology of PANI can also be studied using cyclic voltammetry.
1.2.6.6 In Situ Conductivity Measurements
Most conductivity measurements reported in the literature were made ex situ with
samples prepared and doped chemically [4]. Usually, the conductivity measurements of
PANI are performed on pressed pellets using constant currents applied to the
m
tivity technique using a two-band electrode h
technique has been frequently used for electrochemically synthesized conducting poly-
mers. The advantage of this in situ measurement is that the change in resistance values on
changing the oxidation state of PANI can easily be monitored. In this dissertation, in situ
measurements are performed on chemically synthesized PANI to monitor the change in re-
sistance upon electrochemical doping.
1.2.6.7 Scanning Electron Microscopy
It is well established that morphology of the polyaniline film synthesized electro-
chemically or bulk PANI powder synthesized chemically strongly influences the properties
of PANI [15]. In most cases, morphology of
w
electrical conductivity, crystallinity, mec
morphology.
1.2.6.8 Transmission Electron Microscopy
The high resolution of the transmission electron microscope makes it a useful char-
acterization technique for determination of nanostructures of PANI. Conducting polymers
have significant contribution in the area of
scale
24
Part I; 1. Introduction
gained from this technique is the crystal structure of PANI deduced from electron diffrac-
cially in the determination of molecular weight which helps
olecular configuration and structure in the conducting and insulator states.
In commercial applications, solutions of PANI enhance its applicability in manufacturing
mers are insoluble in their
form of PANI exhibits partial solubility in
-meth
tion pattern of nanoparticles.
1.2.7 Solubility of Polyaniline
Solubility of PANI has gained special importance, both scientifically and commer-
cially. Scientifically, it provides a medium more conducive to the production of well re-
producible analytical data, espe
in elucidating m
technological devices [2]. Most electrically conducting poly
doped, conducting state [28]. The chemically synthesized green-black ES form of PANI is
also insoluble in common organic solvents thereby exhibiting poor processability [29].
Heeger [9], in his Nobel review article, reported that discovery of PANI was a break-
through in overcoming the processability problems of conducting polymers. However, he
quoted that high molecular weight PANI could not be processed into useful objects and
devices. PANI cannot be melt processed like conventional thermoplastic polymers because
it is unstable at melt process temperatures [30].
In 1999, Wessling [31] showed that solubility of PANI is governed by its basic
thermodynamic properties like unmoldability, unfavorable entropy of dissolution and the
extremely high lattice energy (ca. 1,100 KJ mol−1). In another work, the poor solubility of
PANI as reported by Gregory [32], is due to non-availability of suitable solvents which can
simultaneously dissolve both the hydrophilic dopant part and the hydrophobic organic part
of the polymer. However, the non-metallic EB
N yl-2-pyrrolidone (NMP) [33], dimethylsulfoxide (DMSO) [34−36] and dimethyl-
formamide (DMF) [18]. In the last two decades, much attention has been paid to improve
the solubility of PANI and thereby its processability. Several methodologies have been de-
veloped to improve the processability of PANI. These include the use of substituted ani-
lines as monomers, use of suitable anionic dopants which favor dissolution, synthesis of
blends and composites of PANI with conventional thermoplastics, copolymers of aniline
with its derivatives, dispersions of PANI and so forth which are briefly discussed below.
25

Part I; 1. Introduction
1.2.8 Poly(Substituted Anilines)
Solubility of PANI can be improved by polymerizing a derivative of aniline, par-
ticularly by choosing the substituent which has solubilizing effect. The substituents used to
odify the solubility of polyaniline range from alkyl [37], alkoxy [38] groups to phos-
e substituted polyanilines, especially those
with acid substituent groups were found to be more soluble, some of them being water
eously, render the resulting PANI complex solu-
le in common organic solvents. The functionalized counter ion acts like a ‘surfactant’ in
y charged protonated PANI
chain, and the ‘tail’ is chosen to be compatible with nonpolar or weakly polar organic liq-
brication of
everal types of conductive blends of PANI [45, 46]. The main idea behind the synthesis of
thereby making it melt proc-
essable. A phase separation between the two components of the blends leads to drastic loss
m
m
phonic [39] and sulfonic acid [40] groups. Thes
soluble and also showing higher thermal stability. Polymerization of substituted anilines,
like their parent monomer, can also be carried out either chemically [41] or electrochemi-
cally [42]. The major drawback of these ring substituted PANIs is the fact that solubility is
achieved at the cost of conductivity [43].
1.2.9 Functionalized Protonic Acid as Dopant
Cao, Smith, and Heeger [44] in 1992 used functionalized protonic acids to convert
PANI into the metallic form and, simultan
b
that the charged head group is ionically bound to the oppositel
uids [9]. This approach is also known as ‘counter-ion-induced processability’. More details
regarding this approach will be provided in the second part of the dissertation.
1.2.10 Blends of Polyaniline
A physical mixture of two or more polymers with different chemical compositions
is known as ‘blend’. Progress in the processability of PANI resulted in the fa
s
blends is to introduce flexibility and toughness to PANI
in the echanical strength of the material [47]. However, by keeping the PANI composi-
tion (wt %) less than 16 %, materials with good flexibility can be obtained [46]. Several
conductive blends of PANI salt with thermoplastic polymers such as polystyrene [48],
poly(vinyl chloride) [49], polyamides [50], poly(vinyl alcohol) [51], and so forth have been
extensively studied.
26

Part I; 1. Introduction
1.2.11 Copolymers
Copolymerization is generally carried out to combine the diverse physicochemical
properties of different polymers to a single polymeric system. As described in the preced-
g sections, mere homopolymerization of substituted anilines drastically reduces the con-
er. Copolymerization of aniline with ring or N-substituted anilines
leads to polymers which have conductivity like PANI and solubility of substituted anilines
−54]. More details about copoly
r the preparation of polymer particles in both aqueous and non-aqueous media [55,
6]. The benefits of dispersion polymerization (also known as suspension polymerization)
perature (and hence, reaction) control and the
formation of a directly usable product. One of the widely used and technologically impor-
tant ways of tackling the problem
various polymeric steric stabilizers such as
ethyl cellulose [60], carboxymethyl cellulose [57], poly(vinyl alcohol) [61], poly(vinyl
done) [61], etc. Armes
and coworkers [64] have synthesized colloidal PANI by chemical grafting of PANI onto
in
ductivity of the polym
[52 mers will be described in the second part of the disser-
tation.
1.2.12 Polyaniline Dispersions
Dispersion polymerization is a well known technique in conventional polymer syn-
thesis fo
5
over bulk polymerization include ease of tem
of poor solubility of PANI is synthesis of its colloidal
dispersions [57]. Dispersions of PANI, which can be applied in place of true solutions, are
also used in the synthesis of blends of PANI with commodity polymers [58]. Dispersions
of PANI have been studied extensively during the past decade because they can be used di-
rectly in commercial applications such as electromagnetic shielding materials, sensors,
electrooptics, and light-emitting diodes [59].
1.2.12.1 Polymer Stabilized Polyaniline Dispersions
Generally, PANI in colloidal form or as suspension is synthesized by chemical po-
lymerization of aniline in the presence of
m
methyl ether) [62], poly(ethylene oxide) [63], poly(N-vinylpyrroli
several tailor made copolymer surfactants. In such polymer-stabilized PANI dispersions,
the monomer (aniline) is soluble in the reaction medium whereas the resulting polymer
(PANI) is insoluble and its macroscopic coagulation is prevented by steric stabilizers [65].
The possible synthetic routes and the properties of PANI colloids have recently been re-
27
Part I; 1. Introduction
viewed by Stejskal [66]. The size and morphology of the colloidal particles strongly de-
pend on the steric stabilizer, oxidizing agent and reaction conditions [67]. However, the
use of polymeric stabilizers drastically lowers the electrical conductivity of PANI.
1.2.12.2 Role of Surfactants
The chemical polymerization of aniline in well-organized systems such as micelles
not only accelerates polymerization but also yields PANI with relatively high molecular
eight [68]. Such acceleration was also observed during the electropolymerization of ani-
line in the presence of sodiumdodecyl sulfate (SDS) because of a higher local concentra-
edium [69]. Surfactants like SDS were also used in the syn-
thesis o
f PANI in common organic solvents. Thereafter, the synthesis of PANI using organic ac-
ids as dopants has gained special attention [72, 73]. DBSA, being a bulky molecule, can act
re, several researchers have attempted the synthesis
of PAN
w
tion of aniline in the reaction m
f colloidal PANI dispersions [68, 70, 71]. Kuramoto et al. [68] have synthesized
HCl doped PANI dispersions in SDS micelle medium and the conducting polyemeraldine
in the dispersions was stable up to pH = 8. Recently, Hassan et al. [67] reported that both
micelle size and monomer concentration influence the size of the polymer particles when
polymerization is carried out using SDS as a surfactant. In a micelle-aided polymer synthe-
sis, the reaction takes place mainly at the micelle-water interface and the micelles are in
dynamic equilibrium with surfactant monomers in the solution. The intermediate products
of polymerization have increased hydrophobicity due to poor solubility in water; therefore,
they are readily incorporated into micelles. In the end, polymer particles are stabilized by
adsorbed and incorporated SDS molecules through electrostatic repulsive interactions [71].
1.2.12.3 Role of Bulky Organic Acids
Cao et al. [44] reported for the first time that functional protonic acids such as cam-
phorsulfonic acid (CSA) and dodecylbenzenesulfonic acid (DBSA) increase the solubility
o
both as a surfactant and dopant; therefo
I-DBSA suspensions in the last few years [69, 74−76]. CSA was also used in the
electrochemical synthesis of PANI colloids by pumping the electrolyte solution into an an-
odic chamber which was separated from cathodic chamber by an ion-exchange membrane
[77]. Kuramoto and Tomita [69] have synthesized stable PANI-DBSA suspensions in wa-
ter using ammonium persulfate as oxidant but the exact reaction volumes are not defined.
28

Part I; 1. Introduction
Haba et al. [75] have observed that in the initial stages of polymerization of aniline-DBSA
complex, agglomerates containing spherical PANI particles are formed whereas in the later
stages the voids between these particles are filled, forming a smooth surface of PANI ag-
glomerates. Non-aqueous microgel-coated PANI-DBSA colloids show core-shell mor-
phology composed of a cross-linked acrylic core and PANI-DBSA shell [76]. The effects
of aniline-to-oxidant mole ratio, DBSA concentration, temperature, period of polymeriza-
tion on the kinetics, yield and conductivity of the PANI-DBSA colloids have been exten-
sively investigated [74, 75].
1.3 Aim and Scope of the Work
As mentioned in the preceding sections, doping of PANI with DBSA not only im-
proves the solubility but also yields PANI with high conductivity and good yield. The main
dvantage of using DBSA in the synthesis of colloidal PANI is that it does not require any
additional surfactant or steric stabilizer. Generally, PANI-DBSA suspensions are obtained
n of anilinium-DBSA complex. Solid DBSA has
very lo
e of feed ratios of DBSA to aniline on the morphology, particularly the shape
and siz
a
by polymerization of aqueous dispersio
w solubility in water and, therefore, the white turbid dispersion of anilinium-DBSA
complex is prepared by mixing aniline and DBSA in large volume of water (~1 l) for more
than 3 hours [75]. Hence, additional attention is necessary to prevent air oxidation of ani-
line during such a long period of mixing. Small scale synthesis of dispersions of PANI-
DBSA is hindered by larger reaction volumes associated with the formation of anilinium-
DBSA complex. Recently, Han et al. [72] have shown that formation of turbidity can be
avoided using a mixture of 2,2,4-trimethylpentane, isooctane and water. Hence, use of a
secondary solvent, which has lower dielectric constant than water as well as high miscibil-
ity in water will open a new way towards the small scale synthesis of DBSA doped colloi-
dal PANI.
The basic aim of this work is to develop a new small scale synthetic route for the
polymerization of aniline in presence of DBSA which yields a highly stable colloidal PANI
dispersion. A significant decrease in the reaction volumes of formation of complex has
been achieved by using a binary mixture of 2-propanol+water. It is also interesting to study
the influenc
e of PANI particles, of the dispersions. The shape of the colloidal particles was
studied with TEM. PANI is well known for its electrochromism as evidenced by plenty of
reports on electrochromic behaviors of electrochemically synthesized or post-processed
29
Part I; 1. Introduction
PANI films [78, 79]. However, voltammetric responses of PANI colloids have not been re-
ported. In this dissertation, a detailed study of spectroelectrochemistry of PANI-DBSA
nanocolloids has been carried out which provides a better understanding of charge transfer
processes between PANI and electrode surfaces. UV-Vis and pre-resonance Raman spec-
troscopies are used to monitor the metal-to-insulator transition of the PANI colloids
30

Part I; 2. Experimental
Chapter 2
Experimental
2.1 Chemicals
Aniline (VEB Laborchemie Apolda, analytical grade) was distilled under reduced
pressure and stored under nitrogen. DBSA (70 wt % in 2-propanol, 70% solution, Aldrich)
and ammonium persulfate (Aldrich) were used as received. Deionized water (Seralpur pro
90 C) was used in the synthesis and for all other purposes. All other chemicals were ana-
lytical grade and were used as received. Indium doped tin oxide (ITO)-coated glass sheets
(R = 20 Ω cm–2) used in spectroelectrochemical studies were supplied by Merck.
2.2 Synthesis of PANI-DBSA Colloidal Dispersions
The reaction sequence involved in the formation of anilinium-DBSA complex and
its polymerization is described in Scheme 2.1 (see next page). In a typical experiment, 11.7
mL of DBSA (70 wt % in 2-propanol) (0.1 M) and 13.3 mL of 2-propanol were added to
200 mL of deionized water taken in a 500 mL conical flask. 0.23 mL of aniline (0.01 M)
was added to the above mixture followed by 25 mL of 0.01 M ammonium persulfate. The
reaction mixture was kept under mechanical stirring for 24 h. Nearly 45–50 minutes after
the addition of the oxidant, the colorless homogeneous solution slowly turns to blue and
then to dark green. In the end PANI-DBSA suspensions were obtained as a stable dark
green solution and a part of the dispersion was stored without further purification for inves-
tigations. The above suspension (170 mL) was poured into a 500 mL beaker containing
250 mL of methanol and the mixture was kept undisturbed for 10 h. The precipitated poly-
aniline was filtered, washed several times with water and dried in an oven at 45 °C for 24
hours.
Polyaniline-DBSA dispersions with different mole ratios of DBSA to aniline (2:1,
3.3:1, 5:1, 10:1 and 20:1) in the feed were synthesized in a similar fashion. Codes assigned
to the different dispersions are given in Table 2.1.
31

Part I; 2. Experimental
NH2 CH2(CH2)10CH3SO3H
CH3(CH2)10CH2(C6H4)SO3 NH3
+
+
+
+
++
+
+
+
+
++
+
(NH4)2S2O8
+
25 OC
24 h
Aniline DBSA
Anilinium-DBSA complex
Micelle
Stable green colloidal PANI-DBSA
+
Water+
2-propanol
Scheme 2.1. Reaction scheme for the polymerization of aniline by formation of micelles.
Table 2.1. Feed concentrations of the reactants, DBSA-to-aniline feed ratios and codes assigned to different
PANI-DBSA dispersions.
Sl No. Aniline (M) DBSA (M) (NH4)2S2O8 (M) [DBSA]/[Aniline] Sample code
1 0.05 0.1 0.05 2 PANI–1
2 0.03 0.1 0.03 3.3 PANI–2
3 0.02 0.1 0.02 5 PANI–3
4 0.01 0.1 0.01 10 PANI–4
5 0.005 0.1 0.005 20 PANI–5a
6 0.005 0.05 0.005 10 PANI–5d
7 0.005 0.025 0.005 5 PANI–5e
32
Part I; 2. Experimental
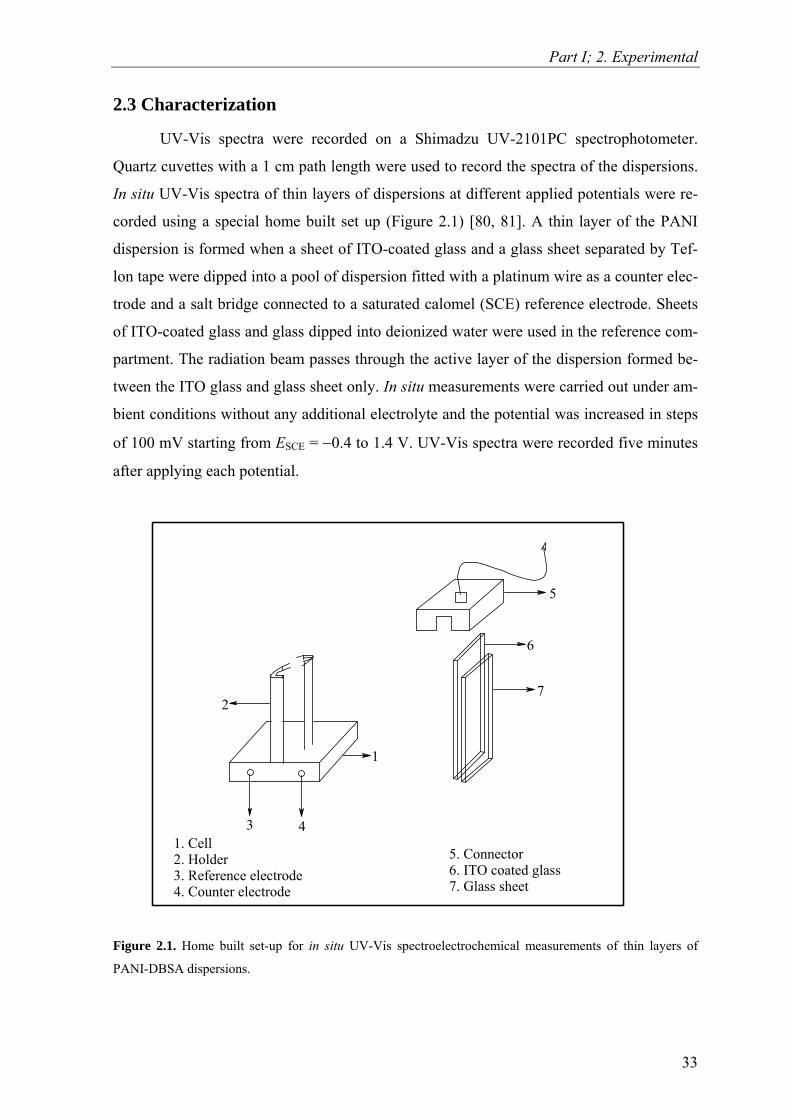
2.3 Characterization
UV-Vis spectra were recorded on a Shimadzu UV-2101PC spectrophotometer.
Quartz cuvettes with a 1 cm path length were used to record the spectra of the dispersions.
In situ UV-Vis spectra of thin layers of dispersions at different applied potentials were re-
corded using a special home built set up (Figure 2.1) [80, 81]. A thin layer of the PANI
dispersion is formed when a sheet of ITO-coated glass and a glass sheet separated by Tef-
lon tape were dipped into a pool of dispersion fitted with a platinum wire as a counter elec-
trode and a salt bridge connected to a saturated calomel (SCE) reference electrode. Sheets
of ITO-coated glass and glass dipped into deionized water were used in the reference com-
partment. The radiation beam passes through the active layer of the dispersion formed be-
tween the ITO glass and glass sheet only. In situ measurements were carried out under am-
bient conditions without any additional electrolyte and the potential was increased in steps
of 100 mV starting from ESCE = −0.4 to 1.4 V. UV-Vis spectra were recorded five minutes
after applying each potential.
1
2
3 4
5
6
7
1. Cell2. Holder3. Reference electrode4. Counter electrode
5. Connector6. ITO coated glass7. Glass sheet
Figure 2.1. Home built set-up for in situ UV-Vis spectroelectrochemical measurements of thin layers of
PANI-DBSA dispersions.
33

Part I; 2. Experimental
Raman spectra of the liquid samples were measured on an ISA 64000 spectrometer
equipped with a liquid-nitrogen-cooled CCD camera detector at a resolution of 2 cm−1.
Samples of different pH values, taken in a glass capillary, were illuminated with 476.5 nm
laser light from a Coherent Innova 70 argon ion laser.
TEM images were recorded on a Philips CM 20 FEG transmission electron micro-
scope. The samples were prepared by depositing a drop of well-diluted PANI suspension
onto a carbon (1 0 0)-coated copper grid and dried in an oven at 55 °C for two hours. Ele-
mental analysis was performed using an elemental analyzer (Vario EL; Elementar Ana-
lysen Systeme GmbH, Hanau). PANI-DBSA powders obtained by precipitating PANI dis-
persions were used in elemental analysis.
34

Part I; 3. Results and Discussion
Chapter 3
Results and Discussion
A mixture of 2-propanol+water and DBSA dissolved in 2-propanol has been used
for the synthesis of PANI-DBSA colloidal dispersions to minimize the period of mixing of
DBSA with aniline and the total reaction volume. Generally, alcohols are better media for
PANI dispersions because they facilitate the adsorption of PANI particles on the steric sta-
bilizer [82]. The synthesis of PANI-DBSA colloids was carried out at different feed ratios
of DBSA/aniline; however, stable dispersions (stable for more than a year) were formed
only when the mole ratio is greater than 3.33. Below this mole ratio, reaction mixtures be-
came a thick paste that nevertheless can be diluted to form a stable dispersion. All disper-
sions were synthesized above the critical micelle concentration for DBSA, which in water
is ~8.4 × 10⁻³ M [83]. The dispersions were characterized by different techniques without
purification in order to study the behavior of PANI particles in the presence of ionic
byproducts. PANI-DBSA particles in the above synthesized dispersions do not sediment
even after centrifugation at 15 000 rpm for 1 h.
3.1. Polymerization Process
Electronic absorption spectroscopy was used to observe the changes during polym-
erization of aniline. UV-Vis spectra of the reaction mixture were recorded soon after the
addition of the oxidant up to 5 h of polymerization. The later stage of polymerization was
also traced by UV-Vis spectroscopy but the spectra are recorded at larger time intervals
(100 min). There was no color change in the reaction mixture during the initial few min-
utes (induction period) as confirmed by the absence of any band in the UV-Vis spectra. Po-
lymerization of aniline progresses very quickly after the induction period and the clear
transparent reaction mixture turns blue and finally dark green [68]. The induction period
duration depends on the concentration of aniline in the feed; it is shorter at higher feed
concentrations of aniline. For example, when the concentration of aniline in the feed is
0.03 M, the reaction is initiated after 25 min, whereas, an induction period of 60 min is ob-
served at a concentration of 0.005 M aniline.
35

Part I; 3. Results and Discussion
The UV-Vis spectrum of chemically synthesized PANI-salt dissolved in solvents
such as DMSO generally exhibits three bands at 730–800 nm, 430 nm (both originating
from polaron transitions) and 350 nm (π∗ ← π transition) [84]. These three transitions are
also present in PANI dispersions, however, their positions are shifted depending upon the
synthetic route, dopants and solvents employed. Figure 3.1 shows the growth of the band at
670–750 nm of PANI–5a during polymerization. After the induction period, a band at 680–
690 nm appears before the bands at 350 and 430 nm and its position is blue shifted by 10–
15 nm for the first few minutes indicating generation of PANI in completely oxidized per-
nigraniline state that later on is transformed into the emeraldine state [75]. The absorbance
value at the band maximum of the band at 670–750 nm increases by 2–3 orders of magni-
tude, reaching a constant value in just 2 to 3 minutes after the induction period [85] (Figure
3.1).
igure 3.1. UV-Vis spectra of reaction mixture recorded during polymerization of anilinium-DBSA complex
A few minutes after the induction period (7–12 min), with increase in the polymeri-
zation
300 400 500 600 700 800 9000.0
0.5
1.0
1.5
2.0
2.5
67 mins
69 mins
65 mins
71 mins
60 mins
Abs
orba
nce
/ −
Wavelength / nm F
(PANI–5a).
time, the band at 700 nm shifts into the red indicating an increase in conjugation
length of the polymer backbone (Figure 3.2). The area of all of the bands increases during
the polymerization. The band in the region of 670–700 nm attains a constant position (750–
770 nm) approximately 3 h after the addition of ammonium persulfate irrespective of the
concentration of aniline in the feed (Figure 3.2). This indicates that the polymerization re-
action is completed 3 h after the addition of oxidant. Similar results were observed by
36

Part I; 3. Results and Discussion
0 100 200 300 400 500740
745
750
755
760
0.30
0.32
0.34
0.36
0.38λ m
ax /
nm
Polymerization time / min
λmax
Abs
orba
nce
/ -
Absorbance at λmax
Svelko et al. [83] during the polymerization of aniline in the presence of various surfac-
tants.
igure 3.2. Changes in the position and absorbance of the band at 670–770 nm with respect to polymeriza-
on time.
.2 Elemental Analysis
Elemental analysis was carried out for PANI-DBSA powder obtained after precipi-
spersion. N/S ratios obtained from elemental analysis were
used to
zation Yield
Part of the PANI-DBSA dispersions which were precipitated and washed to get
d used to estimate the polymerization yield. Assuming 100
% dopi
F
ti
3
tation and washing of the di
calculate the extent of doping (%) of the polymer. Elemental composition and dop-
ing percentage for all solid PANI-DBSA samples are given in Table 3.1 (Page 38). It is
clear from the table that doping of the polymer backbone increases with increasing feed ra-
tios of DBSA/aniline. Higher doping at higher DBSA/aniline mole ratio is due to the strong
complexation of DBSA with the PANI backbone in the presence of excess counter ions in
the micelles. Previous results show 40–50 % doping for PANI-DBSA salt [73, 83].
3.3 Polymeri
PANI powder were weighed an
ng of the nitrogen atoms in the polymer backbone (1:1, M/M of aniline and DBSA),
the percentage yield was calculated using the equation:
37

Part I; 3. Results and Discussion
100 We aniline ofWeight
DBSA-PANI ofWeight yield Percentage ×+
=Mx
DBSA ofight Mx
Using the present method, PANI-DBSA salts can be synthesized in good yield (up
92 %) which strongly depends on the mole ratio of DBSA/aniline in the feed (Table
3.1). Po
tion (mol %), percentage doping values and percentage yields of PANI-DBSA
ispersions synthesized at various concentration of aniline and DBSA.
ge doping Yield (%)
to
lymerization yield increases when the mole ratio of DBSA/aniline in the feed is in-
creased. Higher yields at higher concentration of DBSA are due to a decrease in the pH of
the reaction medium.
Table 3.1. Elemental composi
d
Sample code C (%) N (%) S (%) Percenta
PANI–1 5.675 0.329 0.195 66.7 38.0
PANI–2 5.702 0.336 0.196 58.5 43.1
PANI–3 5.812 0.301 0.181 59.9 56.7
PANI–4 5.971 0.25 0.163 65.5 68.6
PANI–5a 6.152 0.171 0.163 95.3 92.3
PANI–5d 5.962 0.271 0.168 62.1 56.5
PANI–5e 5.732 0.346 0.188 54.3 33.6
.4 UV-Vis Spectroscopy Electronic absorption spectra of all the dispersions show three bands in the region
nd 350–355 nm indicating that the polymer is in its emer-
aldine
3
of 760–800 nm, 410–430 nm a
salt form [67]. Of these three bands, the band at 760–800 nm is sensitive to changes
in the environment such as pH, feed concentration of the monomer/dopant, etc. [76]. Fig-
ure 3.3 (Page 39) shows the plot of the absorbance of the band at 760−800 nm vs the feed
concentration of aniline (Cani). It is evident from the figure that the absorbance exhibits lin-
ear dependency when Cani ≤ 0.02 M. Thus, below this concentration PANI-DBSA disper-
sions obey the Beer-Lambert law. This indicates that in the Beer-Lambert concentration
limit the real polymerization yield of the dispersions (the fraction of monomer transformed
into polymer) is constant. Hence, in this concentration range UV-Vis spectroscopy can be
used as an analytical tool to detect the concentration of aniline used in the synthesis of the
dispersion. At fixed aniline concentration, the ratio of absorbance of the low energy band
38
Part I; 3. Results and Discussion
to the high energy band (A770/A350) is almost the same (1.7–1.9) irrespective of the amount
of DBSA in the feed indicating almost the same level of protonation. The higher A770/A350
ratios indicate better protonation of the polymer backbone in these suspensions. Elemental
analysis of precipitated pure PANI-DBSA revealed that extent of doping is increased with
increasing amounts of DBSA in the feed (Table 3.1, see previous page). The rather unusual
behavior observed for the dispersions may be due to the interference of the ionic byprod-
ucts of the oxidant, presence of free acid and dilution. The band at 770 nm shows a hyp-
sochromic shift when the concentration of DBSA in the feed is increased from 0.025 (λmax
= 786 nm) to 0.1 M (λmax = 766 nm). This is rather unexpected because an increase in the
concentration of DBSA decreases the pH of the medium thereby decreasing the band gap
due to higher protonation. Such a blue shift was also observed by Yin and Ruckenstein
[86] for PANIs codoped with HCl and DBSA. They suggested that an increase in the
amount of HCl in the polymer increases the compact coil conformation of the polymer,
leading to a hypsochromic shift. Such a trend was also observed for PANI-DBSA dis-
solved in chloroform where scanning electron microscopy images clearly show the change
in conformation with increasing concentration of DBSA in the feed as discussed in the
second part of the dissertation.
Figure 3.3. Plot of the absorbance of t
he band at 760–800 nm vs the concentration of aniline in the feed.
The pH of the dispersion has a pronounced effect on the protonation-deprotonation
equilibrium of conducting ES and non-conducting EB forms of polyaniline. The pH of the
0.00 0.01 0.02 0.03 0.04 0.05 0.060.0
0.7
1.4
2.1
2.8
3.5
Abs
orba
nce
/ −
Cani / M
3.4.1 Effect of pH on UV-Vis Spectra
39

Part I; 3. Results and Discussion
PANI-DBSA dispersion is controlled either by the addition of 0.1 M HCl or 0.01 M
NaOH,
Figure 3.4. El easing pH values of (a)
1.8, (b) 3.5, (c)
keeping the total volume of the sample constant. Polyemeraldine base exhibits only
two bands at 550–600 and 315–330 nm corresponding to π∗ ← n and π ∗ ← π transitions,
respectively [83]. Figure 3.4 shows UV-Vis absorption spectra of PANI–5a recorded at
progressively increasing pH. The absorbance at 770 nm linearly decreases when the pH of
the dispersion is increased from 1 to 8 and above this pH, a new band that is characteristic
of the EB form of PANI in the region of 570–600 nm is observed. The decrease in absorb-
ance is attributed to the decrease in protonation of the polymer backbone which in turn de-
creases the number of polarons. The position of this band shows a red shift when pH of the
dispersion is increased from 1 to 8. It is assumed that the addition of NaOH to the PANI
suspension leads to the aggregation of colloidal particles thereby increasing the conjuga-
tion length and decreasing the band gap. The above assumption is confirmed by the gradual
macroscopic precipitation of PANI colloids under strongly basic conditions (pH > 10).
Kuramoto and Genies [68] have observed a similar trend for PANI–HCl colloids synthe-
sized in SDS aided micelle system but no explanation has been given for the observed
changes. Interestingly, Svelko et al. [83] observed blue shift in the position of the band at
770 nm with increasing pH of PANI colloids synthesized in the presence of nonylphe-
nolethoxylate (NP 40). Again, there is no explanation for the observed shifts.
0.4
0.3
ectronic absorption spectra of PANI–5a recorded at progressively incr
5.6, (d) 8.0, (e) 9.2, (f) 10.0 and (g) 10.6.
300 400 500 600 700 800 9000.0
0.1
0.2
(c)
(a)
(b)
(d)
(e)
(f)
(g)
Abso
rban
ce /
−
Wavelength / nm
40

Part I; 3. Results and Discussion
When the pH of the suspension is greater than 8, the band at 770 nm shows a blue
ents formed by protonation are gradually
transfo
Figure 3.5. Ch pH for PANI–5d.
shift and there is a sharp increase in the absorbance of the new band at 560–600 nm. This
reveals that in this pH range, the benzoid segm
rmed into quinoid segments [83]. At pH > 10, UV-Vis spectra characteristic of EB
have been observed. Both polaron bands (770 and 420 nm) exist up to pH = 9–10 which
reveals that conductivity of the PANI particles is not completely lost even at pH 10. Figure
3.5 shows the absorbance change of the PANI–5d dispersion at 770 and 570 nm at various
pH values. The observed spectral changes illustrated in two plots are attributed to the trans-
formation of protonated benzoid structures to unprotonated quinoid structures. The two
plots intersect at pH ~10 which confirms the presence of the ES state of PANI. The ES-to-
EB transition is observed in the range of pH = 9–10 for all of the PANI dispersions irre-
spective of the mole ratio of DBSA/aniline in the feed. Previous results have shown stabil-
ity of the ES state of PANI up to pH = 4 for conventional HCl doped PANI and pH = 7–8
for PANI-DBSA suspensions as well as for PANI particles synthesized in the presence of
NP 40 [68, 69, 83]. The higher stability of the ES state of PANI particles observed in the
present study may be due to the strong complexation of DBSA with the polymer backbone
in the 2-propanol+water mixture.
0.8
anges in the absorbance of the bands at 770 and 570 nm as a function of
0 2 4 6 8 10 12
0.2
0.4
0.6
Abs
orba
nce
/ −
pH
770 nm 570 nm
41

Part I; 3. Results and Discussion
The position and the absorbance of the band at 350 nm are unaffected when the pH
< 8. Fu
3.4.2 Spectroelectrochemical Studies at Acidic pH
ical stability of both chemically and
electro
.6 (Page 43) shows in situ UV-Vis spectra of PANI–5e at different poten-
tials su
rther increases in the pH increase the absorbance of this band exhibiting a blue shift
because of the ES-to-EB transformation in this pH range. The band at 420 nm, assigned to
the polaron transition, disappears for pH > 9. The existence of the low energy polaron band
(770 nm) at pH > 9 depends on the mole ratio of DBSA/aniline in the feed. This band dis-
appears at pH = 9.5 when the mole ratio of DBSA/aniline is 3.33 whereas it persists as a
hump even at pH = 11 when the mole ratio is increased to 20.
The electrochromic properties and electrochem
chemically synthesized PANI have been extensively studied using in situ UV-Vis
spectroscopy [73, 87]. In the present work, this idea has been extended to a thin layer of
the PANI-DBSA dispersion as mentioned in Chapter 2 (Section 2.3). The aim is to under-
stand how the colloidal particles of PANI respond to a change in the applied potential.
Thin layers of PANI-DBSA dispersions show changes in the band positions and the ab-
sorbance when the applied potential is gradually increased in steps from ESCE = −0.4 V to
ESCE = 1.4 V.
Figure 3
ccessively shifting into the anodic direction. Again, the band that is most sensitive
to the change in the applied potential is the low energy polaron band (770 nm). The posi-
tion of this band shows a small bathochromic shift and its absorbance decreases when the
applied potential is increased from ESCE = −0.4 to 0.2 V. In this potential range PANI exists
in the leucoemeraldine state and the increase in the absorbance observed at ESCE = 0.2 V
can be attributed to the transformation from the leucoemeraldine to the emeraldine salt
state of PANI. Further increase in the applied potential shifts this band toward lower wave-
lengths with progressive increases in the absorbance. These results are similar to those ob-
served for soluble PANI-DBSA salts which are discussed in the second part of the disserta-
tion [73]. Irrespective of the concentration of aniline or DBSA in the feed, the band at 770
nm is shifted to 680 nm when the applied potential ESCE > 1.1 V. Generally, such a steep
blue shift is attributed to an emeraldine-to-pernigraniline transformation in the PANI back-
bone [88]. However, this transformation cannot be confirmed in the present study because
the other polaron band at 420 nm is present at all applied potentials. The absorbance at 680
42
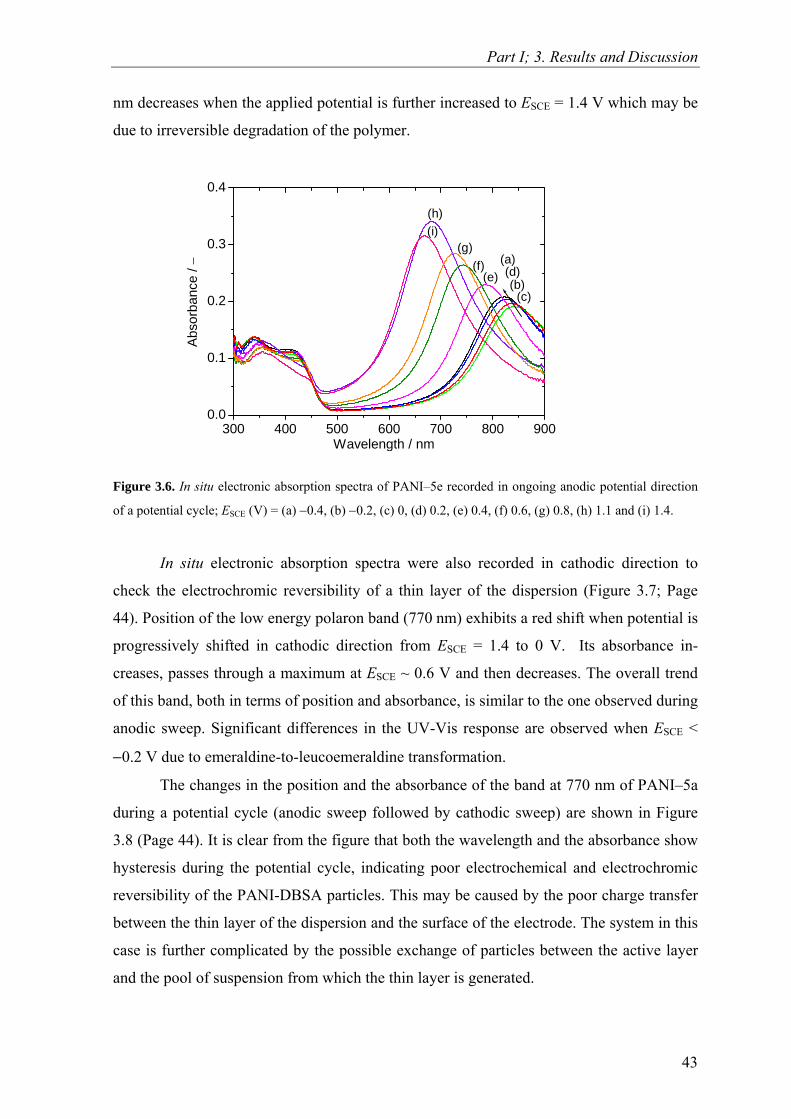
Part I; 3. Results and Discussion
nm decreases when the applied potential is further increased to ESCE = 1.4 V which may be
due to irreversible degradation of the polymer.
igure 3.6. In situ electronic absorption spectra of PANI–5e recorded in ongoing anodic potential direction
In situ electronic absorption spectra were also recorded in cathodic direction to
check
band at 770 nm of PANI–5a
during
300 400 500 600 700 800 9000.0
0.1
0.2
0.3
0.4
(i)(h)
(g)
(d)
(c)(e)
(f)(b)
(a)
Abso
rban
ce /
−
Wavelength / nm F
of a potential cycle; ESCE (V) = (a) −0.4, (b) −0.2, (c) 0, (d) 0.2, (e) 0.4, (f) 0.6, (g) 0.8, (h) 1.1 and (i) 1.4.
the electrochromic reversibility of a thin layer of the dispersion (Figure 3.7; Page
44). Position of the low energy polaron band (770 nm) exhibits a red shift when potential is
progressively shifted in cathodic direction from ESCE = 1.4 to 0 V. Its absorbance in-
creases, passes through a maximum at ESCE ~ 0.6 V and then decreases. The overall trend
of this band, both in terms of position and absorbance, is similar to the one observed during
anodic sweep. Significant differences in the UV-Vis response are observed when ESCE <
−0.2 V due to emeraldine-to-leucoemeraldine transformation.
The changes in the position and the absorbance of the
a potential cycle (anodic sweep followed by cathodic sweep) are shown in Figure
3.8 (Page 44). It is clear from the figure that both the wavelength and the absorbance show
hysteresis during the potential cycle, indicating poor electrochemical and electrochromic
reversibility of the PANI-DBSA particles. This may be caused by the poor charge transfer
between the thin layer of the dispersion and the surface of the electrode. The system in this
case is further complicated by the possible exchange of particles between the active layer
and the pool of suspension from which the thin layer is generated.
43

Part I; 3. Results and Discussion
300 400 500 600 700 800 900
0.0
0.1
0.2
0.3
0.4
(i)(h)
(g)
(f)
(e)
(d)(c)
(b)
(a)A
bsor
banc
e / −
Wavelength / nm
igure 3.7. In situ electronic absorption spectra of PANI–5e recorded in ongoing cathodic potential direction
f a potential cycle; ESCE (V) = (a) 1.4, (b) 0.8, (c) 0.6, (d) 0.4, (e) 0.2, (f) 0, (g) −0.2, (h) −0.4 and (i) −0.7.
Figure 3. –5a in an applied po-
ntial cycle (positive and then negative ongoing direction).
is spectral response of PANI suspension
aving lower Ctotal is similar to the chemically synthesized PANI films [73]. For example, a
-800 -400 0 400 800 1200 1600650
700
750
800
850
F
o
0.05
0.10
0.15
0.20
0.25
0.30
0.35
λanodic
λcathodic
λ max
/ nm
ESCE
/ mV
Aanodic A
cathodic
Abs
orba
nce
/ −
8. Change in the position and the absorbance of the band at 770 nm of PANI
te
The spectroelectrochemical response of PANI particles depends on the total ionic
concentration (Ctotal) of the suspension. The UV-V
h
44

Part I; 3. Results and Discussion
visible
absorbance of this band increases,
passes
The UV-Vis spectral response of PANI-DBSA dispersions to applied potential at
basic pH shows interesting features. As mentioned earlier, UV-Vis spectra of PANI in ba-
30 nm. The completely oxidized per-
nigrani
PANI–5d at pH = 11 recorded at different potentials suc-
cessive
transformation from emeraldine to leucoemeraldine was observed in the UV-Vis
spectra of PANI–5e (Ctotal = 0.11 M) recorded at different applied potentials successively
shifting in the negative direction (Figure 3.7; Page 44).
Another polaron band at 400–420 nm progressively shifts to higher wavelength and
its absorbance gradually decreases when the applied potential is increased from ESCE =
−0.4 V to ESCE = 1.4 V. In the cathodic sweep, the
through a maximum at ESCE = 0 to −0.2 V and then decreases. This observation
suggests that maximum concentration of radical cations is present in the potential range of
ESCE = 0 to −0.2 V [73]. The position of the band at 350 nm shifts to 315 nm and its ab-
sorbance increases when ESCE < −0.3 V, where PANI is in the leucoemeraldine state. How-
ever, neither its position nor absorbance is greatly affected above this potential.
3.4.3 Spectroelectrochemical Studies at Basic pH
sic medium exhibit two bands at 550–600 and 315–3
line state also has bands in this region [73]. During an anodic potential sweep from
ESCE = −0.4 to 1.4 V, only these two bands are observed. The band at 580 nm shows a red
shift when the applied potential is increased from ESCE = −0.4 to 0 V. Further increases in
the potential shift this band gradually and then steeply to lower wavelength which is attrib-
uted to the conversion of EB to PN. The absorbance of this band slightly decreases with an
increase in the applied potential, passes through a minimum at around ESCE = 0.8 to 0.9 V
and then slightly increases. PANI is in its conducting emeraldine form in the potential
range of ESCE = 0 to 0.8 V. The conducting property of the PANI is related to the absorb-
ance changes in the UV-Vis spectra. The decrease in the absorbance reflects the decreases
in the conductivity of the PANI.
New bands in the region of 400–430 nm and 770–860 nm (polaron bands) appear
and their absorbance increases during the reverse cathodic sweep. Figure 3.9 (Page 46)
shows in situ UV-Vis spectra of
ly shifted in the cathodic direction. The appearance and the position of the band at
770 nm depend on the amount of DBSA in the feed. The band at 520 nm characteristic of
pernigraniline is progressively shifted to 770 nm when the concentration of DBSA in the
feed is 0.1 M while two distinct bands corresponding to EB and ES states of PANI are ob-
45

Part I; 3. Results and Discussion
served when the concentration of DBSA is reduced to ≤0.05 M (Figure 3.9). The com-
plexation between DBSA and PANI is stronger at higher concentrations of DBSA; there-
fore, the band at 520 nm (PN) is shifted to 770 nm (ES). At lower concentrations of DBSA,
the reduction of pernigraniline to emeraldine yields PANI in both the EB and ES states.
The spectral changes are similar to those observed when changing the pH value of the me-
dium. In the latter case, extent of protonation in the emeraldine state is varied, whereas in
the former case, the transformation is from pernigraniline to the emeraldine salt.
0.12
Figure 3.9. In situ ogressively shifting the
applied potentia ) 1.0, (c) 0.6, (d) 0.4, (e)
.2, (f) 0, (g) −0.2 and (h) −0.6.
c
ral/basic solutions; therefore, the polaron bands in the UV-Vis
pectra are absent. The presence of polarons in the present study may be attributed to pro-
tonatio
300 400 500 600 700 800 9000.00
0.02
0.04
0.06
0.08
0.10
(h)
(g)(f)
(e)
(d)(c)
(b)(a)
Abso
rban
ce /
-
Wavelength / nm
electronic absorption spectra of PANI–5d at pH 11 recorded by pr
l in the negative direction of a potential cycle; ESCE (V) = (a) 1.4, (b
0
Generally, a PANI film (chemically or electro hemically synthesized) is electro-
chemically inactive in neut
s
n in the presence of bulky counter ions in the medium. The protonation of PANI is
not a simple process of inserting and expelling protons. Such changes were not observed
for thicker layers of dispersions. When the thin layer of PANI-DBSA colloids was kept at a
constant applied potential of ESCE = 1 V for 30–40 minutes, similar transformations were
observed during an ongoing anodic scan. Hence, it is assumed that the spectral changes are
controlled by the mobility of anions and an electrokinetic effect. Positively charged PANI
particles are repelled from the electrode in an anodic potential sweep (electrophoretic phe-
46
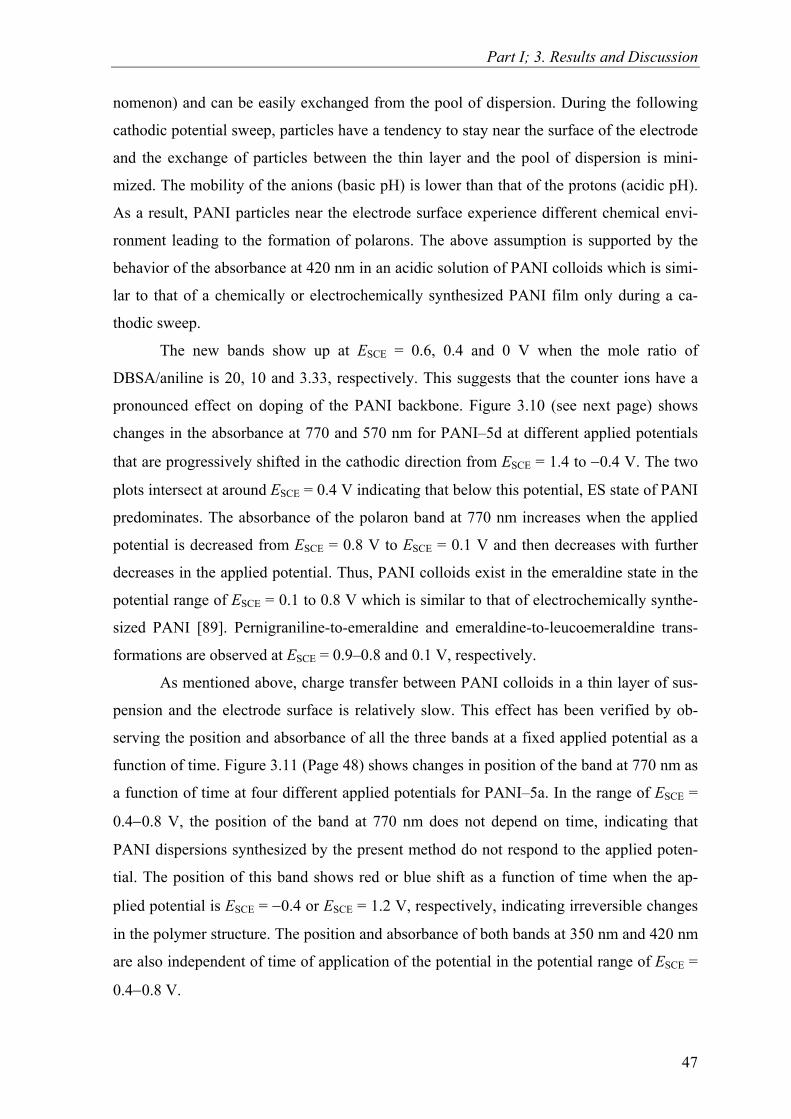
Part I; 3. Results and Discussion
nomenon) and can be easily exchanged from the pool of dispersion. During the following
cathodic potential sweep, particles have a tendency to stay near the surface of the electrode
and the exchange of particles between the thin layer and the pool of dispersion is mini-
mized. The mobility of the anions (basic pH) is lower than that of the protons (acidic pH).
As a result, PANI particles near the electrode surface experience different chemical envi-
ronment leading to the formation of polarons. The above assumption is supported by the
behavior of the absorbance at 420 nm in an acidic solution of PANI colloids which is simi-
lar to that of a chemically or electrochemically synthesized PANI film only during a ca-
thodic sweep.
The new bands show up at ESCE = 0.6, 0.4 and 0 V when the mole ratio of
DBSA/aniline is 20, 10 and 3.33, respectively. This suggests that the counter ions have a
pronounced effect on doping of the PANI backbone. Figure 3.10 (see next page) shows
change
d applied potential as a
functio
s in the absorbance at 770 and 570 nm for PANI–5d at different applied potentials
that are progressively shifted in the cathodic direction from ESCE = 1.4 to −0.4 V. The two
plots intersect at around ESCE = 0.4 V indicating that below this potential, ES state of PANI
predominates. The absorbance of the polaron band at 770 nm increases when the applied
potential is decreased from ESCE = 0.8 V to ESCE = 0.1 V and then decreases with further
decreases in the applied potential. Thus, PANI colloids exist in the emeraldine state in the
potential range of ESCE = 0.1 to 0.8 V which is similar to that of electrochemically synthe-
sized PANI [89]. Pernigraniline-to-emeraldine and emeraldine-to-leucoemeraldine trans-
formations are observed at ESCE = 0.9–0.8 and 0.1 V, respectively.
As mentioned above, charge transfer between PANI colloids in a thin layer of sus-
pension and the electrode surface is relatively slow. This effect has been verified by ob-
serving the position and absorbance of all the three bands at a fixe
n of time. Figure 3.11 (Page 48) shows changes in position of the band at 770 nm as
a function of time at four different applied potentials for PANI–5a. In the range of ESCE =
0.4−0.8 V, the position of the band at 770 nm does not depend on time, indicating that
PANI dispersions synthesized by the present method do not respond to the applied poten-
tial. The position of this band shows red or blue shift as a function of time when the ap-
plied potential is ESCE = −0.4 or ESCE = 1.2 V, respectively, indicating irreversible changes
in the polymer structure. The position and absorbance of both bands at 350 nm and 420 nm
are also independent of time of application of the potential in the potential range of ESCE =
0.4−0.8 V.
47
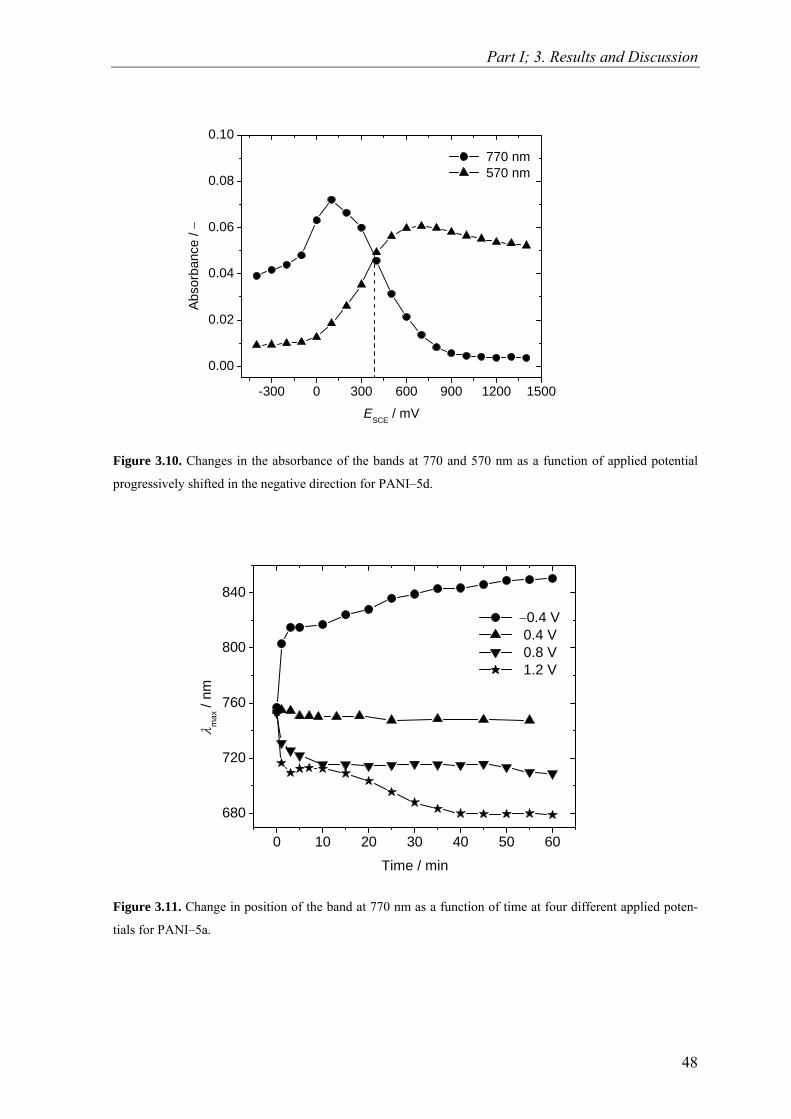
Part I; 3. Results and Discussion
0.10
Figure 3.10. ction of applied potential
progressive
Figure 3.11. C rent applied poten-
tials for PANI–
0 10 20 30 40 50 60
680
720
760
800
840
Changes in the absorbance of the bands at 770 and 570 nm as a fun
ly shifted in the negative direction for PANI–5d.
λ max
/ nm
Time / min
−0.4 V 0.4 V 0.8 V 1.2 V
-300 0 300 600 900 1200 1500
0.00
0.02
0.04
0.06
0.08Ab
sorb
ance
/ −
ESCE / mV
770 nm 570 nm
hange in position of the band at 770 nm as a function of time at four diffe
5a.
48

Part I; 3. Results and Discussion
3.5 Pre-resonance Raman Spectroscopy
films was observed because the laser ex-
citation wavelength used (λ = 476.5 nm) matches the longer wavelength wing of the ab-
sorption band of PANI
ignments for PANI-DBSA dispersions, λ0 = 476.5 nm.
Pre-resonance enhancement for the PANI
0
centered at 420–430 nm [25, 26]. However, pre-resonance en-
hancement is not effective in the alkaline pH region because of the absence of the band at
420 nm in this pH region. The frequencies of the major Raman bands and their assign-
ments are summarized in Table 3.2. In situ UV-Vis spectra at different pH values reveal
that during a progressive stepwise increase in the pH of the medium the absorbance of the
band at 420 nm shows a small increase, passes through a maximum and then decreases as
shown in the Figure 3.12 (Page 50).
Table 3.2. Major Raman bands and their ass
Frequency (cm−1) State* Assignment [90, 91]
1627−1637 B C−C ring stretching
1590−1597 Q C−C ring stretching
1540−1546 Q C−C ring stretching
1506−1516 Q C=N stretching
1490−1496 Q C=N stretching
1230−1235 Q In-plane ring deformation
nding
n
g
ion
on
1200−1205 B C−H in-plane be
1171−1177 Q C−H in-plane bending
890−895 B In-plane ring deformatio
845−855 B Amine ring deformation
825−830 Q In-plane ring deformation
800−815 Q C−H out-of-plane bendin
712−724 B Out-of-plane ring deformat
685−698 Q Out-of-plane ring deformati
640−645 B In-plane ring deformation
511−526 Out-of-plane C−N−C torsion
412−420 Q Out-of-plane C−H wag
*: B = benzoid ring and Q = q inoid ring
ows two strong peaks at 1635 and 1202 cm−1 as-
3.2). Intensity of almost all the peaks increases when pH is
raised to 8 but beyond this value, scattered light intensity decreases. This trend of pH de-
u
At pH = 1, the Raman spectrum sh
signed to benzoid rings (Table
49
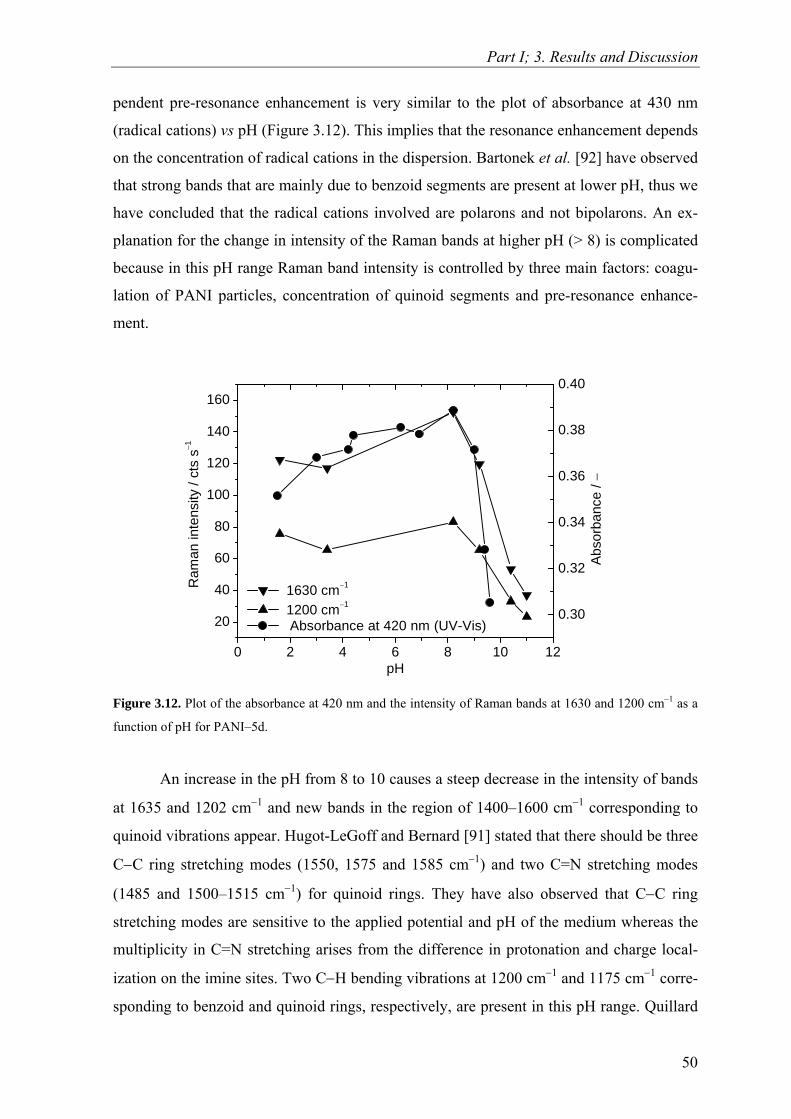
Part I; 3. Results and Discussion
penden
Figure 3. nd 1200 cm−1 as a
function of p
nd new bands in the region of 1400–1600 cm−1 corresponding to
uinoid vibrations appear. Hugot-LeGoff and Bernard [91] stated that there should be three
C−C ri
0.30
0.32
0.34
0.36
0.38
t pre-resonance enhancement is very similar to the plot of absorbance at 430 nm
(radical cations) vs pH (Figure 3.12). This implies that the resonance enhancement depends
on the concentration of radical cations in the dispersion. Bartonek et al. [92] have observed
that strong bands that are mainly due to benzoid segments are present at lower pH, thus we
have concluded that the radical cations involved are polarons and not bipolarons. An ex-
planation for the change in intensity of the Raman bands at higher pH (> 8) is complicated
because in this pH range Raman band intensity is controlled by three main factors: coagu-
lation of PANI particles, concentration of quinoid segments and pre-resonance enhance-
ment.
0.40
0 2 4 6 8 10 12
20
40
60
80
100
120
140
160
Abs
orba
nce
/ −
Absorbance at 420 nm (UV-Vis)
Ram
an in
tens
ity /
cts
s−1
pH
1630 cm−1
1200 cm−1
12. Plot of the absorbance at 420 nm and the intensity of Raman bands at 1630 a
H for PANI–5d.
An increase in the pH from 8 to 10 causes a steep decrease in the intensity of bands
at 1635 and 1202 cm−1 a
q
ng stretching modes (1550, 1575 and 1585 cm−1) and two C=N stretching modes
(1485 and 1500–1515 cm−1) for quinoid rings. They have also observed that C−C ring
stretching modes are sensitive to the applied potential and pH of the medium whereas the
multiplicity in C=N stretching arises from the difference in protonation and charge local-
ization on the imine sites. Two C−H bending vibrations at 1200 cm−1 and 1175 cm−1 corre-
sponding to benzoid and quinoid rings, respectively, are present in this pH range. Quillard
50

Part I; 3. Results and Discussion
et al. [93] have attributed two such C−H bending vibrations to a radical species having two
types of benzene rings. Bands mainly due to quinoid vibrations are present when the pH is
increased further (pH > 10) and their intensities are almost independent of the pH of the
medium which is consistent with previous results (Figure 3.13) [92]. The C−C ring stretch-
ing vibration shows a red shift from 1637 cm−1 to 1630 cm−1 with an increase in the pH of
the medium from 1 to 11. The intensity of the quinoid C=N stretching vibration at 1460
cm−1 increases at pH > 9, where the conducting ES is transformed into the non-conducting
EB. The band due to amine deformation at 840 cm−1 is absent above this pH which con-
firms the metal-to-insulator transition of PANI.
60
70
Figure 3.13. pH (a) 8.2, (b) 9.2,
(c) 9.7, (d) 10.4 a
−1 −1
f pH 9–10 can be clearly seen in Figure 3.13; the intensity of these
ands increases at the cost of the bands due to benzoid rings (1635 cm−1 and 1200 cm−1).
As me
800 1000 1200 1400 16000
10
20
30
40
50
(e)(d)(c)(b)(a)
Ram
an in
tens
ity /
cts
s−1
Raman shift / cm−1
Pre-resonance Raman spectra of PANI–5d (stacked for better visibility) at
nd (e) 11.
The generation of new bands (1170 cm and 1590 cm ) corresponding to the qui-
noid ring in the region o
b
ntioned earlier, this observation is attributed to the metal-to-insulator transition.
Such a transition observed with Raman spectroscopy was also found in UV-Vis spectra of
PANI-DBSA particles synthesized by the present method at much higher pH values (~10)
compared to the reported ones (pH 4–6) [83, 92]. A benzoid-to-quinoid transformation is
also observed in the region 900–800 cm−1. The intensity of the benzoid in-plane bending
51

Part I; 3. Results and Discussion
vibration observed at 895 cm−1 decreases whereas that assigned to the quinoid ring ob-
served at 825–830 cm−1 increases when the pH is increased from 8 to 11. The intensity of
the out-of-plane C−H wagging mode at 800–815 cm–1, which is present as a broad band
near neutral pH, increases and appears as a sharp band when the pH is increased to 11. A
band in the range of 1040–1057 cm−1 and a band at 1140 cm−1 are caused by the dopant,
DBSA and are assigned to C−S stretching and S=O out-of-plane bending modes, respec-
tively [94].
3.6 Transmission Electron Microscopy
PANI particles reported so far showed rice grain, needle or spherical morphology
depending on the choice of oxidant, steric stabilizers and reaction conditions [71]. Figure
ispersions at different molar ratios of
DBSA/
Figure 3.14. TEM images of PANI-DBSA dispersions with DBSA/aniline feed ratios of (a) 3.3 and (b) 5.
3.14 shows TEM images of PANI-DBSA d
aniline in the feed. Obviously, PANI particles are irregularly shaped. The particles
are actually spherically shaped but their high tendency to aggregate hinders the recording
of a TEM image with perfectly spherical particles. Such aggregation takes place during
sample preparation for TEM where dispersions are evaporated on a carbon-coated copper
grid. The size of particles strongly depends on the dilution of the PANI-DBSA dispersion
which supports the argument of aggregation. Vincent and Waterson [95] believe that such
aggregation during sample preparation is due to inefficient steric stabilization. However,
steric stabilization in an aqueous medium of PANI-DBSA particles is very good because
they are stable for more than a year and centrifugation does not yield a solid residue. Ir-
regularly shaped particles are observed for PANI dispersions at all DBSA/aniline mole ra-
tios, indicating the absence of any control over the shape of the particles.
52

Part I; 3. Results and Discussion
Stejskal et al. [96] have reported core-shell model for PANI particles where the par-
o-
worker
ron diffraction pattern exhibit
both br
Fi .
ticles consist of a PANI core and a shell of water soluble polymer. Recently, Han and c
s [72] have observed needle like particles with an average diameter of 10 nm and
lengths of 20–30 nm for PANI-DBSA synthesized via reverse micelle polymerization in
2,2,4-trimethylpentane+isooctane+water. PANI-DBSA particles synthesized by the present
method do not exhibit such core-shell or needle like pattern.
Electron diffraction (ED) patterns have been recorded for selected regions of cluster
of aggregated particles and are shown in Figure 3.15. Elect
ight spots or arcs characteristic of the crystalline part and amorphous halos (Figure
3.15a) indicating that bulk PANI is semicrystalline. Crystallinity of PANI-DBSA particles
is improved when the concentration of DBSA in the feed is increased (Figure 3.15b). Or-
ganically soluble PANI-DBSA, discussed in the second part of the dissertation, exhibit dif-
fraction pattern corresponding to orthorhombic crystal structure, however, in the present
case, such a well defined diffraction pattern has not been observed.
gure 3.15. ED patterns of PANI-DBSA dispersions with DBSA/aniline feed ratios of (a) 3.33 and (b) 5
53

Part I; 4. Conclusions and Remarks
Chapter 4
Conclusions and Remarks
4.1 Conclusions
Stable suspensions of PANI-DBSA have been synthesized via micelle aided po-
lymerization using 2-propanol+water as a solvent. DBSA dissolved in 2-propanol (70 %
solution) has been used both as surfactant and dopant. The binary mixture of solvent facili-
tates dissolution of DBSA, thus the polymerization reaction has been successfully carried
out in small reaction volumes. The green PANI-DBSA dispersions obtained does not un-
dergo macroscopic precipitation for more than a year even in the presence of ionic byprod-
ucts of the oxidant.
Visible color changes during polymerization have been observed only after the in-
duction period whose duration depends on the feed concentration of aniline. Higher con-
centration of aniline in the feed leads to shorter induction period. UV-Vis studies reveal
that polymerization is completed in three hours irrespective of the feed ratio of
DBSA/aniline in the feed. Polymerization yield depends on the amount of DBSA in the
feed where increased feed concentration of DBSA increases the polymerization yield.
Valuable information on the charge transfer behavior of the PANI-DBSA colloids
has been obtained from the pilot attempt made on the UV-Vis spectroscopy of thin layers
of dispersions as a function of applied potential. Spectroelectrochemical behavior of a thin
layer of dispersion depends on the pH value of the medium. In the acidic pH region, leu-
coemeraldine-to-emeraldine transformation has been observed, whereas, the second trans-
formation corresponding to emeraldine to pernigraniline could not be assigned due to the
presence of polaron band (~420 nm) at all applied potential. The hysteresis formed in the
plot of position and absorbance of band at 770 nm as a function of applied potential indi-
cates poor electrochromic and electrochemical stability of these dispersions arising from
slower charge transfer processes. Polymer particles in the form of a thin liquid layer are
stable in the applied potential region of ESCE = 0.4 to 0.8 V.
Interesting changes in the UV-Vis responses have been observed in the basic pH
region when the applied potential was swept in positive and then negative direction. In a
positive going sweep, bands only due to EB form of PANI have been observed whereas
bands corresponding to both ES and EB were observed during cathodic potential sweep.
54

Part I; 4. Conclusions and Remarks
Different UV-Vis spectral characteristics at basic pH observed during anodic and cathodic
sweep indicates that mobility of anions and an electrokinetic effect play dominant role at
higher pH.
Both electronic absorption spectroscopy and pre-resonance Raman spectroscopy
have been used to monitor the metal-to-insulator transition of the PANI particles taking
place by increasing the pH from acidic to basic pH values. The ES (metal)-to-EB (insula-
tor) transition of the PANI-DBSA dispersions synthesized by the present method occurs in
the range of pH = 9–10 which is much higher than previously reported ones.
PANI-DBSA particles in presence of ionic byproducts behave similar to pure PANI
stabilized by various polymeric stabilizers. TEM investigation reveals that it is practically
difficult to achieve control over the shape of the particles. High tendency of aggregation of
PANI particles during sample preparation yields irregularly shaped particles. Aggregated
clusters of PANI-DBSA particles are semicrystalline in nature and the crystallinity in-
creases with increasing feed concentrations of DBSA.
4.2. Remarks
As mentioned in the preceding paragraphs, highly stable PANI-DBSA colloids have
been synthesized in lower reaction volumes and their spectroelectrochemical investigations
have been successfully carried out which really gives a broad insight towards the nature of
the charge transport in PANI colloids. However, these suspensions suffer from chemical
impurity because of the presence of byproducts of oxidant and excess of dopant. The poor
electrochromic reversibility and electrochemical stability of the dispersions severely hin-
ders their use in commercial applications. These drawbacks motivated us to work on the
synthesis of DBSA doped PANI which is soluble in common organic solvents. The next
part of this dissertation deals with the synthesis and characterization of soluble DBSA
doped PANI and its copolymers.
55

PART II

Part II; 5. Introduction
Chapter 5
Introduction
As mentioned in chapter 1, polyaniline, a unique member of the family of conduct-
ing polymers, has been studied extensively in recent years due to its interesting acid-base
chemistry, high environmental stability and low cost of synthesis. However, the wide vari-
ety of technological applications of PANI is limited by its poor solubility which has al-
ready been briefed in section 1.2.7. In this chapter more attention is paid to different proto-
cols and oxidizing agents employed by various authors for chemical synthesis of PANI.
The role of organic functional acids in tackling the problem of poor processability of
PANI, different synthetic protocols for polymerization of aniline and various oxidants em-
ployed are discussed below under separate subtitles. A general overview on copolymers of
aniline and, in particular, copolymers of aniline and o-toluidine is also provided.
5.1 Functionalized Protonic Acid: Counter Ion-induced Processability
As mentioned in section 1.2.9, Cao and coworkers [44] were the first to notice a
large improvement in the solubility of metallic PANI when PANI-EB was doped with
functionalized protonic acid. They have designated the functionalized protonic acid as
where anionic species R)(MH −−+ R)(M −− containing R group is compatible with
weakly polar or non-polar organic solvents. They have used DBSA, CSA, dinonylnaphtha-
lenesulfonic acid (DNNSA), etc. and have found that PANI-DBSA complex is soluble in
xylene, chloroform, toluene, etc. The process of protonating PANI in this way is also
called ‘counter ion-induced processability’ as the solubility of the final PANI complex
originates from the counter anionic species used. Such a post-processing method involves
two steps: (1) neutralization of PANI-ES to form PANI-EB and (2) re-protonating PANI-
EB with a functionalized protonic acid.
Several investigations have been carried out after this report of Cao and coworkers
[44]. Tzou and Gregory [97] used this approach and reported that PANI-ES containing
carboxyl and amino substituents were soluble in NMP and DMSO. A similar approach was
also used by Rannou and coworkers [98] to prepare PANI-ES doped with sulfonic acid and
phosphoric acid diesters. m-Cresol which is used as a solvent, acts like a secondary dopant
57

Part II; 5. Introduction
leading to high conductivity of PANI over a wide temperature range. In most of the cases,
such post processed PANI-DBSA complex has been used in the synthesis of its blends with
insulating polymers such as polyamide, epoxy resin, etc. [99, 100]. Recently, Krzysztof
and Nan-Loh [101] have used phosphoric acid diesters as dopants and the resulting PANI
was employed in the synthesis of blends of poly(vinyl chloride) (PVC) with PANI. Dufour
et al. [102] have protonated PANI-EB dissolved in 2,2'-dichloroacetic acid with several
sulfosuccinic acid diesters to prepare free-standing films of PANI. The resulting PANI-
sulfosuccinates exhibited metallic-type conductivity and improved mechanical properties.
Shacklette et al. [103] have developed a surface-core doping process in which PANI was
doped with one acid at the core of a particle (e.g., p-toluenesulfonic acid, PTSA) and a
second dopant predominantly at the surface (e.g., DBSA). The surface dopant was chosen
to achieve increased compatibility between the PANI particles and a polymer matrix. An-
gelopoulos et al. [104] reported the synthesis of water soluble electrically conducting
PANI doped with polystyrenesulfonic acid. The polymeric acid dopants used as template
for oxidative polymerization of aniline results in a water soluble PANI.
Despite their improved solubility, counter-ion processed PANI-DBSA has maxi-
mum solubility of 0.5 % (wt/wt) in xylene [105]. As mentioned above, the post processing
approach is carried out in two steps and the resulting material could not be obtained in its
pristine state due to the presence of free and excess protonic acid. In some other cases,
PANI-EB to functionalized protonic acid ratio of 0.5 was used which led to less efficient
doping of PANI backbone [102]. As a result, several researchers have attempted to develop
new synthetic protocols, which in some cases, have shown improved solubility of the pro-
duced PANI and are discussed below.
5.2 Various Synthetic Routes
The most widely employed chemical oxidation of aniline in aqueous acidic media
using ammonium persulfate oxidant has already been described in section 1.2.3.1. Several
other methods of polymerization of aniline have come to forefront because of the sensitiv-
ity of PANI to pH and availability of a wide variety of oxidants and dopants. In addition,
the growing interest in the field of nanotechnology has also motivated several research
groups to develop new polymerization routes to produce PANI nanostructures. Some of the
recent synthetic approaches are described below.
58

Part II; 5. Introduction
Madathil et al. [106] developed a new route in which polymerization of aniline was
carried out at 23 °C by addition of ammonium persulfate in aqueous medium containing
aniline, sodium salt of dodecylbenzenesulfonate and HCl. The reaction mixture turns to a
highly viscous gel and a solid gel was obtained at the end of the reaction which was easily
cast into thin films. However, the byproducts of the oxidant and excess dopant are always
associated with the final PANI-DBSA salt. Li and Zhang [107] have also employed a gela-
tion technique which produces dendritic PANI nanofibers. Formation of the gel containing
surfactant, monomer, dopant and oxidant was achieved by mixing all the components in
acetic acid+water and quickly cooling to –7 °C.
The environmental concerns and the importance of biocompatibility resulted in a
number of reports on a natural way of synthesis of PANI. Horse-radish peroxidase enzyme
has been used for the oxidative coupling of aniline/substituted anilines in aqueous or non-
aqueous medium containing buffers [108, 109]. Recently, Ma and coworkers [110] have
extended this enzymatic approach to synthesize PANI nano-wires on Si surfaces fabricated
with DNA.
Kan and coworkers [111] have prepared PANI nano-threads using a simple proto-
col. They employed a binary mixture of water and ethanol instead of an aqueous acidic
media, and the polymerization of aniline was carried out at –20 °C. A much different pro-
cedure has been adapted by Wang et al. [112] for the synthesis of PANI hollow micro-
spheres. They carried out the polymerization of aniline in an aqueous alkaline medium
(NaOH, pH > 12) by dispersing the aniline monomer in NaOH. Ammonium persulfate was
used as oxidant and the reaction was carried out at –5 °C.
Dispersion polymerization is another important non-conventional pathway for the
synthesis of PANI which is discussed in the first part of the dissertation. Recently, Lee and
coworkers [65] have reported a new self-stabilized dispersion polymerization of aniline. A
mixture of water and chloroform was used as solvent and self-stabilization was achieved
by the oligomers formed during polymerization.
In recent years emulsion, miniemulsion, microemulsion and inverse emulsion po-
lymerization of aniline have come to the forefront and are detailed in the following section.
5.3 Emulsion Polymerization
Emulsion polymerization is a compartmentalized polymerization reaction taking
place in a large number of loci dispersed in a continuous external phase. Emulsion polym-
59
Part II; 5. Introduction
erization methods have several distinct advantages over the conventional in situ polymeri-
zation. The physical state of the emulsion system makes it easier to control the process.
Thermal and viscosity problems are much less significant than in the bulk polymerization.
The product of emulsion polymerization can, in many instances, be used directly without
further separations. High molecular weight and high reaction rates can be attained simulta-
neously by these methods. Several authors have reported this process for the synthesis of
PANI [113−116]. In these disclosures, aniline, a protonic acid, a surfactant and an oxidant
are combined with a mixture of water and a non-polar or a weakly polar liquid, for exam-
ple, xylene, chloroform or toluene, all of which are sparingly soluble or insoluble in water.
Aqueous solution of ammonium persulfate is added to the above emulsion system to initi-
ate the polymerization. In most of the cases, the product was isolated by breaking the
emulsion (adding acetone, for example) and collecting the precipitated PANI salt by filter-
ing and washing. In some cases, emulsion flocculates during the course of reaction to form
a two-phase system and the PANI remains in organic phase which can be easily separated.
The emulsion polymerization described above, sometimes, is also known as ‘conventional
emulsion polymerization’ or ‘macroemulsion polymerization’. Several other types of emul-
sion polymerization have also been reported and are briefed below.
5.3.1. Miniemulsion Polymerization
Miniemulsions contain both droplets of dispersed phase and micelles formed by
surfactant and the droplet size is lower than that of macroemulsions. However, the micelle
size in both macro- and miniemulsions is the same [117].
Marie et al. [29] have synthesized PANI latex particles using a direct miniemulsion
polymerization technique. The particles are preformed as droplets (size of 50–500 nm) by
applying high shear or stress to a system containing the phase to be dispersed, the continu-
ous phase, a surfactant and osmotic agent (essentially a hydrophobe in this case). The sur-
factant stabilizes the droplets against collisions and the mass exchange between the drop-
lets is suppressed by the osmotic agent.
5.3.2 Microemulsion Polymerization
Microemulsion is completely devoid of droplets and only micelles are present. It is
obtained using larger amounts of surfactant and continuous phase compared to the conven-
tional emulsion. As in miniemulsion, size of micelle is the same in macro- and microemul-
60
Part II; 5. Introduction
sions [117]. A microemulsion is an organized microheterogeneous system which provides
a large interfacial area and is generally less viscous.
Gan and coworkers [118] have employed this technique for the synthesis of PANI-
HCl. A solution of aniline in 3 M HCl was dispersed in petroleum ether to form a microe-
mulsion and a second microemulsion with an aqueous ammonium persulfate solution was
added to initiate the polymerization.
5.3.3. Inverse Emulsion Polymerization
Inverse emulsion (also known as reverse emulsion), is a water-in-oil type of emul-
sion which consists of an aqueous dispersed phase and organic non-polar or weakly polar
continuous phase. Inverse emulsion polymerization consists of an aqueous solution of the
monomer which is emulsified in a non-polar organic solvent and the polymerization is ini-
tiated with an oil soluble initiator [117]. However, the term inverse emulsion polymeriza-
tion was used even though a water soluble initiator, ammonium persulfate, was employed
as reported by Ruckenstein and Sun [119] for the synthesis of blends of PANI. The reac-
tion carried out in heterogeneous inverted emulsion has several distinct advantages as in
the emulsion polymerization. Only a few attempts of inverse emulsion polymerization of
aniline were made.
Marie et al. [29] reported the synthesis of PANI latex particles using an inverse
miniemulsion polymerization technique. In this process, anilinium chloride was dispersed
in ISOPAR† or cyclohexane using block copolymer poly[(butylene-co-ethylene)-b-
(ethylene oxide)] as stabilizer and a solution of potassium persulfate in H2O2 as oxidizing
agent. Recently, Han et al. [72] have also used the reverse emulsion method to synthesize
PANI-DBSA nano-particles. In this case, ammonium persulfate dissolved in water consti-
tutes dispersed phase whereas DBSA and aniline dissolved in isooctane constitute the con-
tinuous phase. This part of the dissertation also employs an inverse emulsion polymeriza-
tion procedure for the synthesis of PANI and its copolymers with o-toluidine and is de-
tailed in the next chapters.
As mentioned in section 5.2, the facile chemistry of PANI allows its synthesis using
various oxidizing agents. The different oxidizing agents reported in the literature are men-
tioned below.
† ISOPAR is the brand name for eight grades of high-purity isoparaffinic solvents with narrow boiling ranges.
61

Part II; 5. Introduction
5.4. Oxidants Employed in the Polymerization of Aniline
Potassium dichromate, ammonium persulfate, potassium bromate, hydrogen perox-
ide, ceric nitrate, ceric sulfate and chromyl chloride are some of the commonly used oxi-
dants [15]. Rao et al. [4], in their review article, have tabulated various oxidants used in the
synthesis of PANI. Tetrabutylammonium persulfate (TBAP) [120] and hydrogen peroxide
[121, 122] have also been utilized for the polymerization of aniline. Pron et al. [123] have
compared four different oxidants (NH4)2S2O8, K2Cr2O7, H2O2 and KIO3 in the polymeriza-
tion of aniline and concluded that KIO3 was the most efficient oxidant, in the sense, that it
produced good quality product over a wide range of reaction conditions, whereas, H2O2
was not a good oxidizing agent for the synthesis of PANI. Among various oxidizing
agents, the most widely used oxidant is ammonium persulfate. However, it being a strong
oxidizing agent and aniline polymerization being exothermic, controlling the reaction tem-
perature is rather difficult and consequently polymers with a wide distribution of molecular
weights result. The removal of inorganic byproducts (ammonium sulfate) from the polymer
formed is also difficult [124]. Rao and coworkers [124, 125], for the first time have em-
ployed a novel organic oxidant, benzoyl peroxide, to overcome the above mentioned draw-
backs.
5.4.1 Benzoyl Peroxide
Besides being used as an initiator in many polymerization reactions, benzoyl perox-
ide is also an efficient oxidant for polymerization of aniline. The main advantages of this
oxidant are (a) solubility in most of the organic solvents which furnishes selection of a
wide range of solvent systems, (b) the organic peroxide (compared to the conventional
ammonium persulfate) reduces the possibility of overoxidation of PANI during exothermic
reaction of aniline polymerization and (c) byproducts of the oxidant can easily be removed
using solvents such as acetone or methanol which is normally used to break the emulsion.
Recently, Ram and Palaniappan [125] have synthesized PANI salts doped with several
mineral acids using benzoyl peroxide as an oxidant via an inverse emulsion polymerization
method. Benzoyl peroxide has also been employed as an oxidant in the present dissertation.
5.5 Copolymers of Aniline
A brief introduction to copolymers has already been given in Section 1.2.11. In this
section, the advantages of carrying out copolymerization and some of the recent examples
62

Part II; 5. Introduction
of copolymers of aniline are discussed. More emphasis is given to the copolymers of ani-
line with toluidines as this dissertation describes synthesis and electrochemical investiga-
tions of poly(aniline-co-o-toluidine).
Copolymerization involves polymerizing a mixture of two monomers. The product,
referred to as copolymer, contains both monomers in the polymer chain in the alternating,
statistical, block or graft arrangement depending on the detailed chemistry of the specific
monomers and reaction conditions [117]. This technique helps in varying the chemical
structure of a polymer to obtain a product with a particular combination of desirable prop-
erties. In polymer chemistry, this technique has widely been used to alter the polymer
properties such as crystallinity, flexibility, etc. In the field of conducting polymers, co-
polymerization emerged as an efficient technique to combine the high metallic conductiv-
ity of PANI (poor solubility) and solubility of substituted anilines (very low conductivity)
to obtain a processable conducting polymer. Further, copolymerization leads to an increase
in the number of conducting polymers from the same set of monomers. The above men-
tioned advantages of copolymerization technique lead to an upsurge in the synthesis and
characterization of various copolymers of aniline. A pioneering work on copolymers of
aniline has been reported as early as 1990 [126]. Some of the recent contributions to ani-
line copolymers are reported below.
Rao and Sathyanarayana [127] have employed an inverse emulsion polymerization
route to synthesize copolymers of aniline with o- and m- aminobenzoic acid with relatively
better electrical conductivity and improved solubility. They have also employed the same
approach for the synthesis of poly(aniline-co-m-aminobenzenesulfonic acid) exhibiting
higher crystallinity and improved solubility in DMSO and DMF [128]. An inverse emul-
sion was formed by adding an aqueous solution of surfactant and dopant (HCl in these
cases) to chloroform containing oxidant (benzoyl peroxide). Copolymers of aniline and
2,5-dimethoxyaniline which exhibit remarkably improved solubility in solvents such as
chloroform, dichloromethane, etc. were also reported [129]. Chemical oxidative copoly-
merization of aniline and halogen substituted anilines yields copolymers with improved
solubility but with very low electrical conductivity [130, 131]. Recently, synthesis of
poly(aniline-co-aminoacetophenone) possessing enhanced solubility and good electrical
conductivity have been reported using both emulsion and inverse emulsion polymerization
pathways [54].
Like polyaniline (described in section 1.2.3), its copolymers can also be synthesized
either chemically or electrochemically. All of the above mentioned copolymers have been
63
Part II; 5. Introduction
synthesized through chemical oxidation of their respective monomers. Electrochemical co-
polymerization has gained increasing attention in last two decades due to the following
reasons: (a) precise tuning of oxidation potential (fixed potential or by cycling in a poten-
tial limit) can be easily achieved and (b) wide variety of monomers can be copolymerized,
for example, copolymerization of aniline and thiophene [132]. A considerable work has
been reported from our laboratory on the electrochemical copolymerization of aniline/alkyl
anilines with o-aminophenol/phenylenediamines [133−135].
5.5.1 Copolymers of Aniline with Toluidine
Synthesis of poly(aniline-co-toluidine) was initiated in 1990 by Wei and coworkers
[126]. The main aim was to combine the conductivity of PANI and solubility of poly(o/m-
toluidines). They have employed both chemical and electrochemical approaches to synthe-
size copolymers whose conductivity can be controlled in a broad range (0.1-10 S cm−1).
Following the pioneering work of Wei and coworkers, several reports have been published
on the synthesis of poly(aniline-co-toluidine) using different synthetic routes[42,
136−139]. Su et al. [140] have reported a chemical oxidative copolymerization of aniline
and o-toluidine with CSA as a chiral inductor in organic media. A helix inversion of co-
polymer backbone in contrast to PANI has been induced by the incorporation of o-
toluidine units. Recently, copolymer microtubes composed of aniline and o-toluidine have
been prepared through a template (microporous anodic aluminum oxide) guided polymeri-
zation. The copolymer microtubes show improved solubility (up to 3.83 g/L) in DMF and
very high conductivity (~17.4 S cm−1) [141]. All these reports have shown a wide range of
control over the conductivity of copolymers but failed to achieve the desired solubility in
non-polar or weakly polar organic solvents.
Most of the above works have employed aqueous mineral acids as dopants and po-
lymerization was carried out chemically using ammonium persulfate or electrochemically.
All of them described solubility of the products with respect to EB form of the polymer
backbone. The idea of retaining the conductivity of PANI by synthesizing the copolymers
of aniline and toluidines has been successfully achieved in all these work. However, in
most of the cases, the copolymers are partly soluble in DMSO, DMF, NMP, etc. and spar-
ingly soluble in weakly polar solvents such as chloroform.
64

Part II; 5. Introduction
5.6 Solubility of Parent Polyaniline
Considerable progress has been made in the last few years in the processability of
PANI by enhancing its solubility. Several research groups reported enhanced solubility of
the parent PANI emeraldine salt when they use bulky acidic groups as dopant or when they
apply a different synthetic route [86, 115, 142−146]. Laska and Widlarz [144] have re-
ported synthesis of water-soluble polyaniline with various phosphonic and sulfonic acids as
dopants. PANIs in this case are directly produced as dispersions in water and they are sta-
ble only for few days. Kinlen et al. [115] have reported a synthetic protocol for PANI
doped with DNNSA. An emulsion polymerization pathway is employed to prepare PANI-
DNNSA in the organic phase, which can be purified and extracted as a suspension in or-
ganic solvent. However, authors report that reprecipitated PANI has very low solubility. Ito
and Murata [142] have prepared sulfonated polyaniline that can be dissolved up to 88 g/L
in water. They adapted a difficult procedure to sulfonate the emeraldine base and solubility
of the resulting material depends on the S/N ratio. However, the conductivity of PANI is
low in the range of 0.02 to 1 × 10⁻⁵ S cm−1. Recently, Athawale and coworkers [146] have
synthesized polyaniline co-doped with acrylic acid but PANI synthesized is soluble only in
NMP and m-cresol. Six years ago, Ruckenstein and coworkers [86] reported synthesis of
PANI co-doped with HCl and DBSA and the resulting material was soluble in chloroform.
Conductivity of PANI prepared is as high as 7.9 S cm−1 but the solubility is not clearly de-
fined. Sathyanarayana and coworkers [84, 124] have used benzoyl peroxide as oxidizing
agent for polymerization of aniline with many organic and mineral acids as dopants in
good yield and conductivity. The weakly polar organic solvent used by them was either
chloroform or a mixture of toluene and isooctane. However, the resulting polymers have
low solubility and the authors have not studied PANI doped with DBSA.
5.7 Aim and Scope of the Work
The main goal of the work presented in this dissertation is to synthesize a com-
pletely soluble polyaniline. The aim has been achieved by employing a new inverse emul-
sion polymerization pathway for the synthesis of PANI doped with DBSA using benzoyl
peroxide as oxidizing agent. Benzoyl peroxide has been used because of its superiority
over the conventional ammonium persulfate (discussed in Section 5.4.1). DBSA has been
selected as dopant because of its recognition in improving the solubility of PANI and also
its use as a surfactant. An organic component, mixture of toluene+2-propanol, constitutes
65

Part II; 5. Introduction
the continuous phase of the inverse emulsion. The resulting polymer is completely soluble
in chloroform and in 2:1 mixture (vol/vol) of toluene+2-propanol. Spectroelectrochemical
investigations of chemically synthesized PANI have successfully been carried out which
give a better comparisons with their electrochemically synthesized counterparts.
DBSA, which has been extensively used to dope PANI in order to improve the
solubility of PANI-ES has so far, not been used to dope polytoluidines. One of the possible
reasons would be the steric factor arising from the methyl substituent of the polymer back-
bone. In this dissertation, the above described inverse emulsion polymerization technique
is also employed to synthesize copolymers of aniline and o-toluidine. DBSA has been re-
tained as dopant and surfactant in order to evaluate its efficiency to dope polymer back-
bone where methyl group exerts steric hindrance to the bulky dopant. The resulting
poly(aniline-co-o-toluidine) (PAT) is soluble in weakly polar solvents such as chloroform.
Spectroelectrochemical behavior of the chemically synthesized copolymers has been stud-
ied which is very much essential to understand the structural/conformational differences
between the chemically and electrochemically synthesized copolymers.
66

Part II; 6. Experimental
Chapter 6
Experimental
6.1 Chemicals
The details of aniline, DBSA, deionized water and ITO-coated glass sheets have al-
ready been given in Section 2.1 (Part I, Chapter 2). o-Toluidine (Merck) was distilled un-
der reduced pressure and stored under nitrogen. Tetrabutylammoniumtetrafluoroborate
(Bu4NBF4, Aldrich) and fluoroboric acid (as diethylether complex, Fluka) were used as re-
ceived. All other chemicals were of analytical grade and used as procured.
6.2 Synthesis
6.2.1 Synthesis of PANI-DBSA
The reaction sequence involved in the formation of a reverse micelle and polymeri-
zation of aniline is described in Scheme 6.1 (Page 68). In a typical experiment, 0.303 g of
benzoyl peroxide (0.025 M) was added to a 100 mL round-bottomed flask containing 35
mL of toluene. The mixture was kept under mechanical stirring. 10 mL of 2-propanol,
1.165 mL of DBSA (0.05 M) and 0.05 mL of aniline (0.01 M) were added to the above
mixture. 5 mL of water were added to this clear solution to form an inverted emulsion.
Here aniline-DBSA salt and 2-propanol in water form the dispersed phase whereas benzoyl
peroxide and 2-propanol in toluene form the continuous phase. The reaction mixture
gradually turns green in 2.5 hours and the stirring was continued for 28 hours at room tem-
perature. At the end of the reaction, organic phase containing the polymer was separated
and 50 mL of acetone were added to it. PANI phase, which is relatively denser, was then
separated from the acetone phase. The separation process was repeated four times and the
solvent associated with PANI was evaporated at room temperature for 24 hours in a pet-
ridish. A small amount of acetone was added to a thick coherent film of PANI which then
breaks into flakes. The larger flakes were separated by hand picking whereas the smaller
particles were separated by filtration and dried in an oven at 50 °C for 4 hours.
Polyanilines with different mole ratios of DBSA to aniline have been prepared in
the same way by keeping constant the oxidant-to-monomer ratio and by varying the con-
67

Part II; 6. Experimental
centration of DBSA. Concentrations of aniline, DBSA and benzoyl peroxide in the feed
and the codes assigned to different PANI-DBSA salts are given in Table 6.1.
SO3H
O OO O
NH2 P P
P
P PPP PP PP
NH2
NH2
NH2
NH2
NH2
NH
+NH
+NH
NH x
A−A−
1−x
+toluene+2-propanoland water
PANI Flakes
solventevaporation
1) 28 h2) washing with acetone
reverse micelle(P = polar head)
PANI-DBSA suspension
benzoyl peroxide
DBSA
Scheme 6.1. Reaction scheme for the formation of reverse micelle and polymerization of aniline.
Table 6.1. Feed concentrations of the reactants, feed ratio of DBSA to aniline and the codes assigned to dif-
ferent PANI-DBSA salts.
Sl No. Aniline (M) DBSA (M) (C6H5CO)2O (M) [DBSA]/[Aniline] Sample code
1 0.01 0.05 0.025 5 TIP-5
2 0.01 0.07 0.025 7 TIP-6
3 0.01 0.10 0.025 10 TIP-7
6.2.2 Synthesis of Poly(aniline-co-o-toluidine) (PAT)
Copolymers of different compositions were synthesized using the above mentioned
procedure, by varying the molar ratios of monomers in the feed and keeping constant the
68

Part II; 6. Experimental
total concentration of the monomer (Table 6.2). Molar feed ratio of the dopant to monomer
is also fixed to 7. As a representative of the system, synthesis of a copolymer of 1:1 molar
ratio of aniline to o-toluidine is described below.
Benzoyl peroxide (0.605 g; 0.025 M) was added to a 250 mL round-bottomed flask
containing 70 mL of toluene and kept under mechanical stirring. 2-propanol (20 mL) and
DBSA (3.26 mL; 0.07 M) were added to the above mixture followed by the addition of
aniline (0.046 mL; 0.005 M) and o-toluidine (0.054 mL; 0.005 M). 10 mL of water were
added to this clear solution to form an inverted emulsion. The reaction mixture gradually
turns green in ~2 hours and stirring was continued for 28 hours at room temperature. In the
end, the organic phase containing the copolymer was separated, washed, solvent evapo-
rated as mentioned in section 6.2.1. The resulting copolymer was dried in an oven at 50 °C
for 4 hours.
Homopolymers of aniline and o-toluidine were synthesized in a similar fashion
maintaining a constant concentration (0.01 M) of the monomer. Name of the hom- and co-
polymers have been abbreviated and tabulated in Table 6.2.
Table 6.2. Molar concentration of the monomers in the feed and the codes assigned to the homo and copoly-
mers.
Sl No. Aniline (M) o-Toluidine (M) Sample code
1 0.01 0 TIP-6
2 0.07 0.03 PAT-73
3 0.05 0.05 PAT-55
4 0.03 0.07 PAT-37
5 0 0.01 POT-6
6.3 Characterization
Elemental analysis was performed using an elemental analyzer (Vario EL; Elemen-
tar Analysen Systeme GmbH, Hanau).
UV-Vis spectra were recorded using a Shimadzu 2100 PC spectrophotometer. A
quartz cell of 1 cm path length and polymer/copolymer dissolved in different solvents were
used. For the in situ UV-Vis measurements, PANI/copolymer/POT dissolved in CHCl3
were drop-coated on clean ITO-coated glass sheets that were subsequently used as working
electrodes. A quartz cell of 1 cm path length fitted with a platinum wire as counter elec-
69

Part II; 6. Experimental
trode and saturated calomel electrode (SCE) connected via salt bridge as reference elec-
trode served as a three-electrode cell. In situ measurements were carried out under ambient
conditions.
Cyclic voltammograms were recorded under nitrogen atmosphere in a three-
electrode H-cell using a custom built potentiostat connected to a computer with an AD/DA
converter. CVs were recorded in three different 1 N aqueous acids (sulfuric, perchloric and
hydrochloric acids) and in a non-aqueous electrolyte solution. For aqueous systems, poly-
mer/copolymer dissolved in chloroform and drop-coated onto a glassy carbon electrode
(GCE) was used as working electrode. A Pt sheet and a saturated calomel electrode were
used as counter and reference electrodes, respectively. For non-aqueous systems, poly-
mer/copolymer dissolved in CHCl3 and drop-coated onto a Pt sheet was used as working
electrode. Pt sheet electrode and Ag/AgCl in acetonitrile were used as counter and refer-
ence electrodes, respectively. CVs were recorded in acetonitrile containing 0.1 M
Bu4NBF4 and 0.075 M HBF4 as supporting electrolyte.
For in situ conductivity measurements, a two-band gold electrode [27, 147], a gold
sheet electrode and Ag/AgCl in acetonitrile were used as working, counter and reference
electrodes, respectively. Polymer/copolymer dissolved in chloroform was drop-coated on
gold two-band electrode and dried at room temperature for 30 minutes prior to the meas-
urements. A d.c. voltage of 10 mV was applied to the two-band electrode (Gap between the
two strips is ~0.05 mm). The current flowing across the band was measured using an I/V
converter with an amplification factor (Fac) ranging from 102 to 106. The film resistance
Rx (ohm) is related to the measured voltage Ux and amplification factor Fac according to
the equation:
Rx = (0.01 x Fac)/Ux
Electrode potential was increased stepwise by 100 mV and after approximately 5
min the electrochemical cell was cut off the potentiostat. Conductivity measurements were
carried out in acetonitrile containing 0.1 M Bu4NBF4 and 0.075 M HBF4 as supporting
electrolyte.
Fourier transform infrared (FTIR) spectra were recorded with a Perkin-Elmer FTIR
1000 spectrometer using standard KBr pressed pellet technique. The spectra obtained were
baseline corrected for better visibility.
70

Part II; 6. Experimental
In situ Raman spectra were measured on an ISA 64000 spectrometer equipped with
a liquid nitrogen cooled CCD camera detector at a resolution of 2 cm−1. Samples were il-
luminated with 476.5 nm (in the case of PANI) and 514.5 nm (in the case of PAT) laser
light from an Argon ion laser Coherent Innova 70. A special three compartment cell con-
taining 1 N H2SO4 was used in the measurements. Polymer/copolymer dissolved in CHCl3
was drop-coated on a platinum disc electrode polished with γ-Al2O3 (0.3 µm) subsequently
used as working electrode. A platinum sheet electrode and a saturated calomel electrode
were used as counter and reference electrodes, respectively. The electrochemical cell was
purged with nitrogen for 6 minutes prior to the measurements. The Raman spectra thus ob-
tained were smoothed and baseline corrected for better visibility.
Scanning electron microscope (SEM) pictures of the solid polymer flakes were re-
corded using a Philips SEM 515 electron microscope. No gold or platinum coating was ap-
plied prior to recording the images. Transmission electron microscope (TEM) images were
recorded on a Philips CM 20 FEG transmission electron microscope. The samples were
prepared by depositing a drop of well diluted PANI in chloroform on a carbon (1 0 0)
coated copper grid (3 mm diameter and 10 µm thick; Plano GmbH, Germany) and dried in
an oven at 50 °C for two hours.
71

Part II; 7. Results and Discussion
Chapter 7
Results and Discussion
7.1. Solubility
All the PANI-DBSAs and poly(aniline-co-o-toluidine)s synthesized in the present
way are of high purity since excess of benzoyl peroxide, DBSA, oligomers and byproducts
of oxidation were readily removed by acetone, which was used to wash the organic phase.
(a) Solubility of PANI-DBSA
Solubility of conducting polymers is always a matter of discussion and many re-
ports have been published in the literature discussing the solubility of PANI [86, 142, 144,
146]. Normally, when a pinch of PANI doped with mineral or organic acid is added to
highly polar solvents such as dimethyl sulfoxide (DMSO) or N-methylpyrrolidone (NMP),
part of the polymer material (presumably oligomeric or of low molecular weight) is dis-
solved but a residual mass is always present in the mixture. Such a mixture is filtered and
the solubility of PANI (g/L) is calculated by weighing the residual mass. In this article
when we quote ‘completely soluble’ we mean, that the PANI is dissolved in the solvent
without leaving any solid residue. PANI-DBSA produced in the present way is completely
soluble in chloroform and a 2:1 mixture of toluene+2-propanol. In both the solvents, it
gives a clear green solution (Figure 7.1a; Page 73), which can be spin- or drop-coated on
metallic and glass substrates. Such films show strong adherence to the substrate. Figure
7.1b shows a photograph of a dip-coated PANI film on a glass substrate. The transparency
of the material is confirmed by the clear visibility of the text (PANI-DBSA), which is
nearly eight to ten centimeters behind the film. Slight solubility is also observed for PANI-
DBSA in NMP and in dichloromethane.
(b) Solubility of Poly(aniline-co-o-toluidine)
It is well known that copolymerization of aniline and toluidine improves the solu-
bility of PANI, especially PANI-EB form, in solvents such as NMP, DMSO and THF [126,
136]. A partial solubility of PATs in their ES form in DMSO, DMF, NMP, THF, CHCl3
72
Part II; 7. Results and Discussion
etc. has also been reported [139, 148]. In most cases, the partial solubility of ES form of
the copolymer arises from the undoped segments of the polymer backbone and can be eas-
ily confirmed from the UV-Vis spectra where strong band characteristic of EB form is ob-
served [139].
igure 7.1. (a) Solution of PANI in a 2:1 mixture of toluene+2-propanol and (b) its dip-coated film on glass
Poly(aniline-co-o-toluidine)s, synthesized using the present protocol, are soluble in
F
substrate.
weakly polar solvents such as chloroform and a 2:1 mixture of toluene+2-propanol. They
also show partial solubility in NMP and dichloromethane. Strong green coloration of the
solution indicates that solubility is mainly due to ES form of the polymer backbone. How-
ever, solubility of the copolymers is lower than that of PANIs. A clear green solution of the
copolymer can be easily spun- or drop-coated on a glass or metal substrate to get a coher-
ent thin/thick film. It is well established that solubility of copolymer increases with in-
crease in the feed concentration of o-toluidine [136]. Interestingly, an opposite trend has
been observed in the present study. Solubility order for PANI, POT and copolymers is TIP-
6 ~ PAT-73 > PAT-55 > PAT-37 > POT-6. In order to find out the solubility, constant
known amount of each copolymer was added to 5 mL of chloroform, stirred for two min-
utes and filtered. The difference in the solubility is evident from the photographs of their
solution as shown in Figure 7.2. Lower solubility of POT and copolymers containing
higher fraction of o-toluidine may be due to their morphology and will be discussed in Sec-
tion 7.10.
73

Part II; 7. Results and Discussion
Figure 7.2. Photographs of solutions of copolymers in chloroform (a) TIP-6, (b) PAT-73, (c) PAT-55, (d)
PAT-37 and (e) POT-6.
7.2 Elemental Analysis
The elemental composition (weight %) obtained from the elemental analysis was
converted into molar compositions and sulfur was taken as reference (S = 1) to calculate
the N/S ratio of a sample. N/S ratio obtained in this way was also used to find out the ex-
pected elemental composition and the extent of doping (%) of polymer samples.
(a) PANI-DBSA
The elemental compositions obtained from elemental analysis are in good agree-
ment with the expected elemental composition (Table 7.1). Increase in the DBSA/aniline
mole ratio from 5:1 to 7:1 does not affect the doping (40 % in both the cases) but by
changing the mole ratio to 10:1, the doping is increased by 10 % (50 % doping). Doping in
the range of 40 to 50 % always yields very good conductivity for PANI.
Table 7.1. Percentage yield, conductivity, experimental and calculated elemental composition of PANIs with
different mole ratios of DBSA/aniline.
C, H, N, S (expected) PANI Yield
(%)
Conductance
(1/R Ω−1)
C, H, N, S
(experimental) Aniline unit DBSA unit
Percentage
doping
TIP-5 39 0.102 C34H43N2.5S (C6H6N)2.5 C18H29S 40
TIP-6 45 0.096 C33H40N2.5S (C6H6N)2.5 C18H29S 40
TIP-7 61 0.129 C33H42N2S (C6H6N)2 C18H29S 50
74

Part II; 7. Results and Discussion
(b) Poly(aniline-co-o-toluidine)
Elemental composition of the homo- and copolymers obtained by the C, H, N and S
analysis are in good agreement with the expected values. Expected values were calculated
taking into account the molar ratios of the monomers and N/S ratio obtained from the ele-
mental analysis. Both expected and experimental elemental compositions are tabulated in
Table 7.2. A close agreement between the experimental and calculated values qualitatively
suggests that the ratio of the comonomer units in the polymer depends on the molar feed
ratio of the monomers.
Table 7.2. Percentage yield, conductance, extent of doping (%) and experimental and expected elemental
compositions of PANI, POT and PATs.
C, H, N, S (expected) Sample Yield
(%)
Conductance*
(1/R Ω−1)
Elemental
composition Polymer unit DBSA unit
Percentage
doping
TIP-6 45 2.05 × 10⁻² C16H14N2.5S C15H15N2.5 C18H29S 40
PAT-73 44 1.54 × 10⁻³ C18H17N2.6S C16.5H16.5N2.6 C18H29S 39
PAT-55 57 2.33 × 10⁻⁴ C18H17N2.4S C15.6H15.6N2.4 C18H29S 42
PAT-37 46 1.10 × 10⁻⁴ C21H21N2.7S C18.1H18.1N2.7 C18H29S 37
POT-6 43 6.72 × 10⁻³ C17H19N2.6S C18.2H18.2N2.6 C18H29S 38
* Minimum conductance value obtained during the ongoing cathodic potential sweep in the first cycle.
Extent of doping in homopolymers as well as in copolymers is constant and is in
the range of 37-42 %. A low doping has been expected for POT and copolymers having
higher fraction of o-toluidine due to the steric hindrance caused by methyl group which
disfavors the presence of bulky counter ions in the vicinity of −NH group of polymer
backbone. Interestingly, results of elemental analysis rules out the above expectation and
hence, it is assumed that doping in case of POT and copolymers is controlled by a confor-
mational rearrangement of the polymer (e.g. from planar to twisted conformation). Su et al.
[140] have reported that helical conformation of PANI was inverted when o-toluidine units
were introduced into the polymer main chain. The copolymers in this case were synthe-
sized by chemical oxidation of mixture of monomers using conventional ammonium per-
sulfate as oxidant and chiral CSA as dopant. These results support the above assumption
and, therefore, DBSA is considered as an efficient dopant for POT.
75
Part II; 7. Results and Discussion
7.3 Polymerization Yield
For the calculation of yield we assume 100 % doping of the nitrogen atoms in the
polymer backbone (1:1, M/M of monomer and DBSA) and the percentage yield was calcu-
lated using the equation:
100 DBSA of Weight monomer ofWeight
copolymeror homo ofWeight yield Percentage ×+
=MM xx
-
(a) Yield of PANI-DBSA
PANIs synthesized by the present method are obtained in an average yield (40−60
%; Table 7.1; Page 74). The reaction was carried out for a period of 28 hours because the
yield obtained is optimal after this reaction period. During the separation and purification
of PANI using acetone (Section 6.2.1; Page 67), a small amount of PANI remains associ-
ated with the acetone and, therefore, the reported yields of PANI are average values. Yield
increases as the molar ratio of DBSA/aniline in the feed increases. For example, when the
ratio of DBSA/aniline is changed from 5:1 to 10:1, yield increases from 39 to 61 %. This
steep increase in the yield may be due to decreased pH and higher stability of the emulsion
at higher DBSA concentration.
(b) Yield of Poly(aniline-co-o-toluidine)
Percentage yield of the homopolymers of aniline and o-toluidine and their copoly-
mers lies in the range of 45-60 % (Table 7.2, Page 75). An optimal yield was obtained
when the reaction was carried out for 28 h at the oxidant-to-monomer ratio of 2.5. All the
homo- and copolymers were produced with the same yield except PAT-55 whose yield
was ~10 % higher than the others. Su and coworkers [140] have reported highest yield for
the copolymer containing equimolar feed ratios of aniline and o-toluidine, however, above
or below this ratio, the percentage yield of the copolymer decreased. Huang and coworkers
[136] reported that yield of copolymers of aniline and o-toluidine (10–13 %) is much lower
than that of POT (34 %). The decrease in yield was attributed to the negative effect of oli-
goanilines and aniline radicals in the reaction mixture. 9–14 % yield was also observed by
Wei et al. [126] for copolymers of aniline and o-toluidine. Relatively better yields obtained
in the present case may be due to the effective protonation/complexation of DBSA with
polymer main chain.
76

Part II; 7. Results and Discussion
7.4 In Situ Electrical Conductivity
(a) Conductivity of PANI-DBSA
In situ resistance values of all PANIs synthesized by the present method are in the
order of 10 Ω (1/R = 0.1; Table 7.1; Page 74), which is much higher than the ones reported
in the literature [115, 142, 145, 149]. PANI-DBSA synthesized via gelation method has
shown conductivity of the same order of magnitude but excess of dopant always associated
with the polymer reduces the chemical purity of the polymer [106]. Conductance of PANI
is proportional to the thickness of PANI film bridging the two bands, however, beyond cer-
tain thickness, conductivity is not much affected any more. Higher conductivities in the
present case may be due to the bulky dopant DBSA and the preparative method chosen.
Figure 7.3 (Page 78) shows a plot of log R vs EAg/AgCl for TIP-7 in an anodic and ca-
thodic sweep in the second potential cycle. As the applied potential increases, log R re-
mains unchanged until the offset potential for the first oxidation wave in the CV is reached
(Figure 7.4, Page 78). Further increase in the potential causes a sharp decrease in log R (in-
dicating a sharp increase in conductivity) until the offset of the second oxidation wave in
the CV is reached. Resistance increases when the applied potential is further increased.
During the cathodic sweep resistance values follow CV and the minimum value of resis-
tance is almost the same as in the case of the anodic sweep. This indicates that stability of
the PANI bridging the two bands is very good. A similar trend is observed for polyaniline
synthesized electrochemically in non-aqueous solvents [132]. However, the minimum re-
sistance during the cathodic sweep is higher than during the anodic sweep. It is also ob-
served that conductivity of the PANI film improved after the first potential cycle. This may
be due to the conformational changes in the chemically oxidized PANI bridging the two
bands induced by the applied potential cycle. The higher potential limit in the conductivity
measurements (EAg/AgCl = 1.8 V) slowly damages the film thereby reducing the conductiv-
ity after second potential cycle. Increase in the mole ratio of DBSA/aniline in the feed does
not influence the conductivity of the film. CVs recorded after the conductivity measure-
ments reveal that the conductivity is directly proportional to the anodic peak current. With
an increasing amount of PANI bridging the two bands, the anodic peak response in CV is
higher and thus measured conductivity is higher.
Our attempt to measure the resistance values of PANI in aqueous acids failed; the
log R values were in the range of 5 and 6 for all applied potentials. Such different behavior
of conductivity in aqueous and non-aqueous electrolyte solutions is due to the presence of
77

Part II; 7. Results and Discussion
the long chain bulky dopant. This influence was later confirmed by cyclic voltammetry
studies. Polar groups of this dopant are engaged in protonation of the nitrogen atoms
whereas the non-polar aliphatic chain is extended to the environment leading to a repulsive
interaction with aqueous electrolyte solution.
igure 7.3. Plot of log R vs EAg/AgCl of TIP-7 during an ongoing anodic followed by a cathodic potential
igure 7.4. CV of TIP-7 modified gold double band electrode in acetonitrile containing 0.1 M Bu4NBF4 and
b) Conductivity of Poly(aniline-co-o-toluidine)
I (TIP-6), POT (POT-6) and copolymers
2
0 .0 0 .4 0 .8 1 .2 1 .6 2 .0
1
2
3
4
5
log
(R/Ω
) / −
E A g /A g C l / V
A n o d ic sw e e p C a th o d ic sw e e p
F
sweep in the second cycle.
0.0 0.3 0.6 0.9 1.2 1.5 1.8
-1
0
1
I / m
A
EAg/AgCl / V
F
0.075 M HBF4.
(
Plots of log R vs applied potential for PAN
(PAT-37 and PAT-73) are shown in Figure 7.5 (Page 80). In situ conductivity of POT
78

Part II; 7. Results and Discussion
(minimum resistance observed during a potential sweep) is almost an order of magnitude
lower than that of PANI. Such a decrease in conductivity for POT is due to the steric effect
caused by methyl group of the polymer chain [126]. It can also be attributed to the de-
crease in conjugation length of the polymer backbone and to the variation in molecular
conformation of polymer main chain [139]. The minimum resistance of the copolymers is
in the range of 103−104 ohm (1/R = 10−3−10−4 Ω−1). When the concentration of o-toluidine
in the feed increases, conductivity of the copolymer decreases (reflected from the respec-
tive increase in the resistance) indicating that more and more o-toluidine is incorporated in
the copolymer. These observations are similar to the previously reported ones [126, 141].
Conductivity of POT after the first potential cycle, unlike PANI, did not show any im-
provement but rather decreased. This is due to the faster degradation of POT at the higher
potential limit of the conductivity measurements. Conductance values obtained during the
cathodic sweep of the first potential cycle are given in Table 7.2 (Page 75). A decrease in
conductivity during cycling is also observed for copolymers containing higher concentra-
tion of o-toluidine in the feed.
The plot of log R as a function of applied potential (Figure 7.5; Page 80) can be cor-
related to the cyclic voltammogram (CV) recorded after the conductivity measurements
(Figure 7.6; Page 80). During an ongoing positive potential sweep, a sharp increase in the
conductivity is observed after a certain potential (EAg/AgCl = 0.4−0.6 V). The first oxidation
wave in the CV is observed in the same potential region. A decrease in conductivity ob-
served in the higher potential region (EAg/AgCl = 0.8–1.2 V) corresponds to the second oxi-
dation wave of the CV. The variation of conductivity arising from the change in the ap-
plied potential in a reverse cathodic sweep also corresponds to the cathodic wave of the
CV. Resistance values of PANI stay close to the minimum resistance in a potential range
of EAg/AgCl = 0.7–1.2 V; i.e., the potential window for PANI is ~500 mV (during a positive
going sweep). A potential window of similar magnitude was also observed for electro-
chemically synthesized PANI [150]. The potential window for POT is ~400 mV whereas
in case of copolymers, it lies in the range of ~400−500 mV (Figure 7.5). Electrochemically
synthesized POT shows very small potential window and the plot of resistance vs electrode
potential is almost parabolic in shape [42]. The larger potential window observed for POT
may be due to the different conformational arrangement of the polymer chain arising from
the different synthetic approach and bulky dopant chosen.
79

Part II; 7. Results and Discussion
Figure 7.5. Plots of log R vs applied potential of (a) TIP-6, (b) POT-6, (c) PAT-73 and (d) PAT-37 during a
ongoing anodic (⎯ ⎯) followed by a cathodic (⎯ ⎯) potential sweep in a second cycle.
Figure 7.6. Cyclic voltammograms of (a) TIP-6, (b) POT-6, (c) PAT-73 and (d) PAT-37 modified gold dou-
ble band electrode after the conductivity measurements recorded in acetonitrile containing 0.1 M Bu4NBF4
and 0.075 M HBF4. Scan rate = 50 mV s−1.
0.0 0.4 0.8 1.2 1.6
2
3
4
0.0 0.4 0.8 1.2 1.6 2.0
3
4
5
6
7
0.0 0.4 0.8 1.2 1.6 2.02
3
4
5
0.0 0.4 0.8 1.2 1.6 2.0
3
4
5
(a)
log
(R/Ω
) / −
EAg/AgCl / V
(b)
log
(R/Ω
) / −
EAg/AgCl / V
(c)
log
(R/Ω
) / −
EAg/AgCl / V
(d)
log
(R/Ω
) / −
EAg/AgCl / V
0.0 0.4 0.8 1.2 1.6
-1
0
1
2
0.0 0.2 0.4 0.6 0.8 1.0 1.2 1.4-0.8
-0.4
0.0
0.4
0.8
0.2 0.4 0.6 0.8 1.0 1.2 1.4 1.6
-0.4
0.0
0.4
0.2 0.4 0.6 0.8 1.0 1.2 1.4-0.4
-0.2
0.0
0.2
0.4
I / m
A
EAg/AgCl / V
I / m
A
EAg/AgCl / V
EAg/AgCl / V
I / m
A
(d)(c)
(b)(a)
I / m
A
EAg/AgCl / V
80

Part II; 7. Results and Discussion
As in the case of PANIs, conductivity of the copolymer samples also depends on
-
s processed from
poly(an -
(a)
ne with different
molar r
transition
hile the bands at 420 nm and 800 nm originate from the charged cationic species known
s polarons [86]. In addition, a hump at around 735 nm is observed for TIP-5 and TIP-6 in
shift when the mole ratio of DBSA in the feed is increased from 5:1 to 10:1 (Figure 7.7a;
er
ic shift.
ma
is much
m
xture of
of the
and the
). The band
ith decreasing concentration of PANI. However, such changes were not ob-
the quality of the film bridging the two gold strips and, thus, corresponds to the peak cur
rent of the first oxidation wave (in CV). However, above certain film thickness, conductiv-
ity of the copolymer is not much affected anymore. Similar to PANI, film
iline-co-o-toluidine)s also show very poor electrical conductivity in acidified aque
ous electrolytes.
7.5 UV-Vis Spectroscopy
UV-Vis Spectra of PANI-DBSA
Figure 7.7 (a and b; Page 82) shows absorption spectra of polyanili
atios of DBSA to aniline in chloroform and in a 2:1 mixture of toluene+2-propanol.
Polyaniline dissolved in chloroform or in a toluene+2-propanol mixture (2:1) shows three
bands characteristic of emeraldine salt. A band at 350 nm arises from π∗ ← π
w
a
chloroform with unknown cause. PANI dissolved in chloroform shows a hypsochromic
Page 82). Such a blue shift was observed by Yin and Ruckenstein [86] for PANIs codoped
with HCl and DBSA. They suggested that an increase in the amount of HCl in the polym
increases the compact coil conformation of the polymer leading to a hypsochrom
Increase in the dopant ions favors the compact coil conformation and thus the absorption
ximum is shifted to lower wavelengths. Such hypsochromic shift is not observed for
PANI dissolved in a 2:1 mixture of toluene+2-propanol (Figure 7.7b; Page 82). However,
interestingly the ratio of intensity of the band at 800 nm to the band at 350 nm
higher for TIP-7 indicating a higher concentration of polaronic species generated fro
higher doping (Table 7.1, Page 74).
Figure 7.8a (Page 83) shows UV-Vis spectra of TIP-5 dissolved in a 2:1 mi
toluene+2-propanol at different concentrations of PANI. At lower concentrations
polymer in the solution, a new band characteristic of PANI-EB appears at ~650 nm
low energy polaron band (760−820 nm) shows a bathochromic shift (> 50 nm
at 345 nm indicative of the extent of conjugation in the polymer backbone undergoes a
blue shift w
served for PANI dissolved in chloroform except for a small red shift of the low energy po-
81

Part II; 7. Results and Discussion
laron band (~7 nm) (Figure 7.8b; Page 83). These observations reveal the interaction of a
2:1 mixture of toluene+2-propanol with the polymer. The possible interaction between
PANI a
hen chloroform is used as a solvent, this ratio does not de-
ount of PANI dissolved, whereas, in case of a 2:1 mixture of toluene+2-
he amount of PANI in the solution is increased. For exam-
ncreases from 0.6 to 1.4 in 2:1 mixture of toluene+2-
propan
mixture of toluene+2-propanol. Higher values of the ratio of absorbances for chloroform
nd solvent in this case is hydrogen bonding between −N atoms of PANI and −OH
group of the solvent. Athawale and coworkers [146] observed such interactions for acrylic
acid doped polyaniline dissolved in m-cresol and in NMP where hydrogen bonding depro-
tonates the polymer chain. The ratio of absorbances of the bands at 330−350 and 760−820
nm (A800/A350) reveals the extent of protonation of the polymer backbone and the influence
of the solvent on protonation. W
pend on the am
propanol, the ratio increases as t
ple, the absorbance ratio of TIP-5 i
ol but shows a constant value of 1.6 in chloroform. A constant ratio suggests that
PANI dissolved in chloroform retains protonation, thereby retaining its electrical properties
in solution. However, varying ratios of absorbance for PANI dissolved in 2:1 mixture of
toluene+2-propanol proves its non-suitability for diluted solutions. Absorbance ratios of
1.1−1.2 were reported for polyaniline films on glass substrates and for PANI dispersions
by Stejskal and Sapurina [151] without any further explanation.
Figure 7.7. Electronic absorption spectra of PANI with different feed ratios of DBSA/aniline recorded in (a)
CHCl3 and (b) 2:1 toluene+2-propanol.
300 400 500 600 700 800 9000.0
0.1
0.2
0.3
0.4(a)
Abso
rban
ce / −
Wavelength / nm
TIP-5 TIP-6 TIP-7
300 400 500 600 700 800 9000.0
0.2
0.4
0.6
0.8(b)
Abso
rban
ce / −
Wavelength / nm
TIP-5 TIP-6 TIP-7
Figure 7.9 (Page 83) shows the plot of ratio of absorbances (A800/A350) as a function
of feed ratio of DBSA to aniline. The absorbance ratio exhibits a linear increase with the
feed ratio of DBSA to aniline when chloroform is used as solvent whereas a sharp increase
is noticed when the feed ratio of DBSA to aniline is changed from 7 to 10 in case of 2:1
82

Part II; 7. Results and Discussion
indicate the absence of solvent-solute interaction.
300 400 500 600 700 800 9000.0
0.2
0.4
0.6
0.8
1.0
1.2(a)
Increasingamount of PANI
345
340
339
334
766
802
819
650 827
Abso
rban
ce / −
Wavelength / nm
0.0
0.2
0.4
0.6
0.8
300 400 500 600 700 800 900
(b)
811
803
804
348
347
350Increasingamount of PANI
Abso
rban
ce / −
and
(b
Figure 7.8. Solution state UV-Vis spectra of TIP-5 dissolved in (a) 2:1 mixture of toluene + 2-propanol
) chloroform.
Wavelength / nm
1.7
1.8
1.9
5 6 7 8 9 10
1.00
1.6
1.05
1.10
1.15
A ~800
/A~3
50
A ~800
/A~3
50
[DBSA]/[aniline]
Figure 7.9. Plot of ratio of absorbances at ~800 to ~350 nm vs DBSA-to-aniline feed ratio. Solution state
spectra of PANI were recorded in chloroform (⎯ ⎯) and in 2:1 mixture of toluene+2-propanol (⎯ ⎯).
83
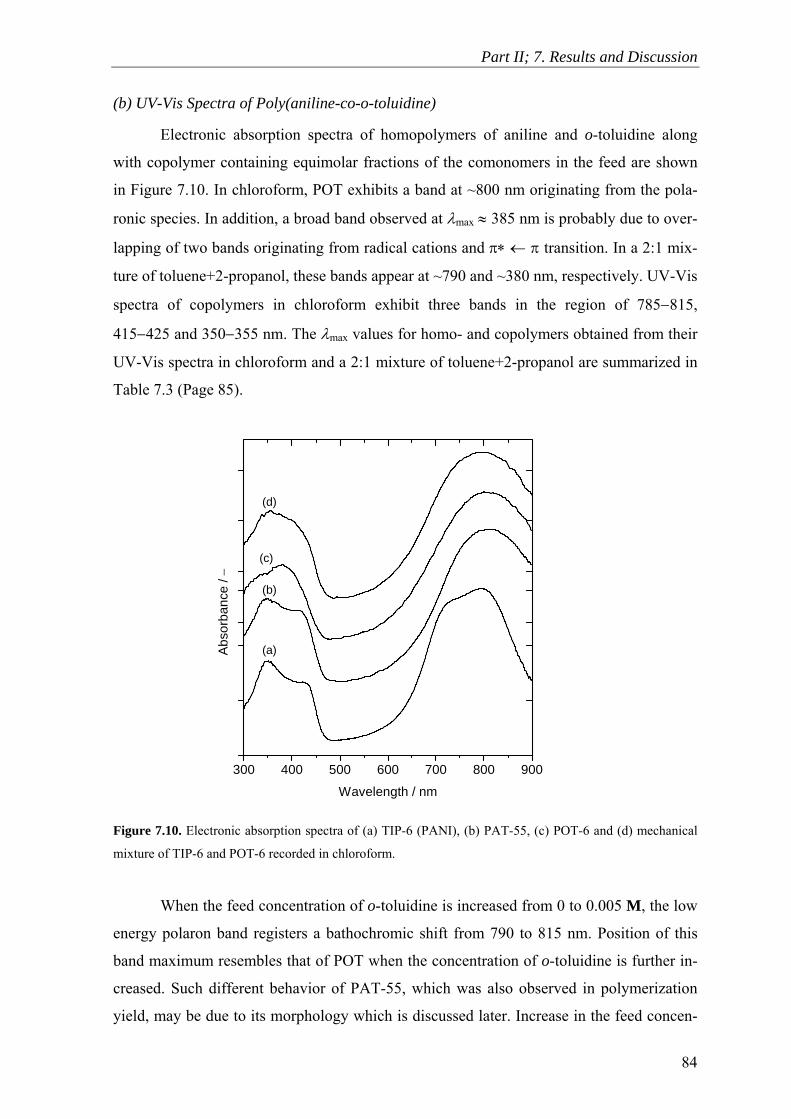
Part II; 7. Results and Discussion
(b) UV-Vis Spectra of Poly(aniline-co-o-toluidine)
Electronic absorption spectra of homopolymers of aniline and o-toluidine along
with copolymer containing equimolar fractions of the comonomers in the feed are shown
in Figure 7.10. In chloroform, POT exhibits a band at ~800 nm
ition, a broad band observed at λmax ≈ 385 nm
ng from radical cations and π∗ ← π
ture of toluene+2-propanol, these bands appear at ~790 and ~380 nm
ers in chloroform exhibit three bands in the region of 785
−355 nm. The λmax values for homo- and copolym
m and a 2:1 mixture of toluene+2-propanol are summ
age 85).
originating from the pola-
ronic species. In add is probably due to over-
lapping of two bands originati transition. In a 2:1 mix-
, respectively. UV-Vis
spectra of copolym −815,
415−425 and 350 ers obtained from their
UV-Vis spectra in chlorofor arized in
Table 7.3 (P
Figure 7.10. Electronic absorption spectra of (a) TIP-6 (PANI), (b) PAT-55, (c) POT-6 and (d) mechanical
mixture of TIP-6 an
0 to 0.005 M, the low
790 to 815 nm. Position of this
band maximum -toluidine is further in-
creased. Such different behavi observed in polymerization
yield, ma ussed later. Increase in the feed concen-
300 400 500 600 700 800 900
Wavelength / nm
(d)
(c)
(b)
(a) Abs
orba
nce
/ −
d POT-6 recorded in chloroform.
When the feed concentration of o-toluidine is increased from
energy polaron band registers a bathochromic shift from
resembles that of POT when the concentration of o
or of PAT-55, which was also
y be due to its morphology which is disc
84

Part II; 7. Results and Discussion
tration of o-toluidine does not influence the position of the ~420 and ~350 nm bands of the
copolymers. A similar trend was observed for the spectra recorded in a 2:1 mixture of tolu-
ene+2-propanol. A UV-Vis spectrum of a mechanical mixture of PANI and POT was re-
corded in chloroform in order find out whether the copolymerization produced real co-
polymers or composites because reactivity of the comonomers is different. A band at 350
nm and an ill defined hump (due to the overlapping of the bands at 380 and 420 nm) is ob-
served in the UV-Vis spectrum (Figure 7.10; Page 84) of the mixture which is essentially
different in comparison with the copolymers (PATs) indicating that the materials produced
are real copolymers.
Table 7.3. λmax of the UV-Vis absorption bands of homo- and copolymers of aniline and o-toluidine recorded
in chloroform and a 2:1 mixture of toluene+2-propanol.
λ (nm) Sample max
code Chloroform 2:1 mixture of toluene+2-propanol
TIP-6 793 737* 425 350 799 409 337
PAT-73 797 755* 425 351 821 412 345
PAT-55 813 − 415 351 825 407 342
PAT-37 806 − 415 351 815 406 339
POT-6 802 − − 384 790 − 349
* observed as a hump with unknown cause
As discussed in the preceding sections, position of the low energy polaron band
(~800 nm) depends strongly on the nature of the solvent and its interaction with the poly-
mer main chain. In a 2:1 mixture of toluene+2-propanol, with gradual increase in amount
but such a blue shift could
not be seen fo ibuted to the rear-
rangement of com ation. The compact
coil conforma tration of dissolved PANI due to the pres-
ence of more −NH and −OH
groups. Presence of the m er backbone, due to their steric hin-
drance, inhi er and −OH groups of 2-
rrangement. A similar
m-cresol [140].
Poly(aniline ixture of toluene+2-
of PANI dissolved, this band is blue shifted by more than 50 nm
r POT. The shift in PANI (at lower concentration) is attr
pact coil conformation to an extended coil conform
tion is preferred at higher concen
counter ions which compete over the interactions between
ethyl groups on the polym
bits the interaction between −NH groups of polym
propanol and, therefore, POT does not exhibit the conformational rea
observation was reported for (+)-CSA doped PANI and POT dissolved in
-co-o-toluidine)s when dissolved in a 2:1 m
85

Part II; 7. Results and Discussion
propanol also exhibit hypsochromic shift by 30–60 nm and the magnitude of shift depends
n the fraction of o-toluidine in the feed. Electronic absorption spectra of PAT-55 dis-
ic shift > 50 nm) observed for PAT-55 has
Figure ctron sorption spectra of PAT-55 ed in loroform and (b) 2:1 ure of tolu-
ene+2-pr
0 0 5 600 0 9
0.6
0.8
1.2
o
solved in 2:1 mixture of toluene+2-propanol and chloroform are shown in Figure 7.11. In-
terestingly, the spectral changes (hypsochrom
more similarity to that of pure PANI and can be attributed to the close resemblance in the
morphology of PANI (TIP-6) and PAT-55 which are discussed in section 7.10. An oppo-
site behavior was observed for copolymers of aniline and o-toluidine doped with (+)-CSA
where the spectral features of copolymers resemble POT [140].
300 400 500 600 700 800 9000.0
0.2
0.4
0.6
0.8
1.0
7.11. Ele ic ab record (a) ch mixt
opanol.
As in the case of PANI, copolymers dissolved in chloroform possess higher absorb-
ance ratios (A~800/A~350) indicating that when dissolved in chloroform, copolymers retain
the protonation. In a 2:1 mixture of toluene+2-propanol, the ratio of absorbances depends
on the amount of polymer dissolved indicating interaction between the –NH group of
30 40 00 700 80 000.0
0.2
0.4
1.0
821
868328
812
828341.5
812
350812
351
812
356
344
346
(b)
Increasingamount of PAT-5
410
410
5
410410
Abs
orba
nce
/
eleng m
(a)
415
415
415
Increasingamount of PAT-55
Abs
orba
nce
/ −
Wavelength / nm
−
Wav th / n
86
Part II; 7. Results and Discussion
polymer and –OH group of the solvent. However, the absorbance ratios of POT depend
neither on the nature of the solvent nor on the amount of the polymer dissolved, which, as
mentioned earlier, confirms the absence of conformational rearrangements in this polymer.
The ratio of absorbance is ~1.8 and ~1.6 for PANI and POT dissolved in chloroform,
whereas, this ratio for copolymers lies in the range of 1.6–1.8. The absorbance ratio of co-
polymers containing higher feed concentration of aniline is close to that of aniline while
for those containing higher concentration of o-toluidine in the feed are close to that of
POT. The higher absorbance ratios for POT and copolymers indicate that DBSA, even
though
SCE
of a compact coil structure
ions. At ESCE > 0.6 V, a drastic blue shift is observed
ominis
et al. of redoped PANI in two different sol-
act and extended coil
conformatio orption maxima at
higher energies.
aximum value at
ESCE = 0.2 V, the first oxidation wave
peak in the CV has m gure 7.19a; Page 95). In situ
spectral inv 0.2 V (identified with
their 420 nm eraldine state.
Sim ically on an
indium er, no explanation has been given for such
shifts [87] of conjugation in the
polym 0.2 to 0.8 V, this band
a bulky dopant, can effectively dope the polymer backbone overcoming the steric
hindrance exerted by methyl groups.
7.6 In Situ UV-Vis Spectroscopy
(a) In Situ UV-Vis Spectra of PANI-DBSA in Acidic Electrolyte
Figure 7.12 (Page 88) shows in situ UV-Vis spectra recorded in 1 N H2SO4 at dif-
ferent potentials successively shifted into anodic direction for TIP-7. An absorption band at
800 nm shows a blue shift with increase in the applied potential from E = −0.2 to 0.8 V.
The gradual blue shift of this band is attributed to the formation −2
4SOdue to the incorporation of
which corresponds to the conversion from emeraldine state to pernigraniline state. D
[152] observed that the absorption maximum
vents is different. They have attributed this difference to the comp
n of the PANI where the compact coil form shows abs
Absorbance at 420 nm originates from radical cations showing a m
= 0.2 V indicating maximum concentration. At ESCE
aximum peak current (Section 7.7; Fi
estigations reveal that polarons exists even at ESCE = −
band) where PANI exists in a completely reduced leucoem
ilar trends have been observed for PANI-H2SO4 synthesized electrochem
tin oxide coated glass electrode, howev
. Position of the band at 350 nm is influenced by the extent
er backbone. Increasing the applied potential from ESCE = −
shifts towards lower energy along with decrease in absorbance.
87

Part II; 7. Results and Discussion
Figure 7.12. In situ electronic absorption spectra of PANI (TIP-7) recorded in ongoing anodic potential di-
rection in 1 N H2SO4. ESCE (V) = (a) −0.2, (b) 0, (c) 0.2, (d) 0.4, (e) 0.6 and (f) 0.8.
In situ electronic absorption sp
300 400 500 600 700 800 900
0.4
0.6
0.8
ectra were also recorded in the cathodic direction to
heck the electrochromic reversibility of the polymer film. Figure 7.13 shows plots of λmax
al. It is clear from the figure that PANI films have
inear dependency with ap-
plied p
1.0
(f)(e)
(d)(c)
(b)(a)
Abso
rban
ce / −
Wavelength / nm
c
and absorbance at λmax vs applied potenti
very good electrochromic reversibility. λmax at 800 nm shows l
otential. This linear dependency improves as the molar ratio of DBSA/aniline in the
feed is increased. It is also observed that increase in the concentration of DBSA in the feed
improves the reversibility of the absorbance at λmax. In the potential range of ESCE = 0.1 to
0.9 V, PANI exist in emeraldine and pernigraniline oxidation states. There exists an isos-
bestic point at 460 nm in this potential range indicating a one-step transition from the em-
eraldine to the pernigraniline state (Figure 7.12) [153]. Recently, MacDiarmid and co-
workers [154] carried out a detailed study with UV-Vis spectroscopy during interconver-
sion of different oxidation states of the PANI, where they have observed two isosbestic
points, which are attributed to the interconversion of all three oxidation states.
88

Part II; 7. Results and Discussion
800
850
900
Figure 7.13. Plo s of λt ax (a) ).
(b) In S
750
m and absorbance at λmax (b) vs applied potential for PANI (TIP-7
-200 0 200 400 600 800 1000700
(a)
λ max
/ nm
ESCE / mV
Anodic direction Cathodic direction
-200 0 200 400 600 800 10000.10
0.11
0.12
0.13
(b)
Abs
orba
nce
at λ
~800
/ −
ESCE / mV
Anodic direction Cathodic direction
itu UV-Vis Spectra of PANI-DBSA in Acid Free Electrolytes
It is well known that PANI synthesized either chemically or electrochemically in
presence of mineral acids does not exhibit redox activity at pH > 4 [155]. However, the
UV-Vis response of the chemically synthesized PANI doped with bulky organic dopant as
a function of applied potential in acid free electrolytes has not been reported. Figure 7.14
shows the in situ UV-Vis spectra of a drop-coated film of TIP-5 as a function of applied
potential successively shifted into anodic direction as recorded in 0.1 M KCl.
89

Part II; 7. Results and Discussion
0.8
1.0
Figure 7.14. In situ UV-Vis spectra of drop-coated film of TIP-5 recorded in 0.1 M KCl as a function of ap-
plied potential successively shifting to anodic direction. ESCE (V): (1) −0.2, (2) 0, (3) 0.2, (4) 0.4, (5) 0.5, (6)
0.6 and (7) 0.8.
The low energy band at ~800 nm shows a blue shift when the applied potential is
increased from ESCE = −0.2 to 0.8 V. The absorbance increases up to ESCE = 0.4 V and then
decreases. The rapid blue shift of this band at ESCE > 0.4 V is attributed to the emeraldine-
to-pernigraniline transformation. Such changes were also observed for PANI films in 0.5
M H2SO4 but the oxidative transformation is observed at ESCE > 0.6 V (see preceding para-
graphs). The band at ~400 nm exhibit maximum absorbance for ESCE = 0.1 to 0.2 V indi-
cating maximum protonation in this potential range [156]. A decrease in the absorbance
and a red shift is observed for the band at ~350 nm when the potential is increased from
ESCE = −0.2 to 0.5 V indicating decreased conjugation caused by the protonation, an oppo-
site trend is observed for ESCE > 0.5 V. In situ UV-Vis spectra of PANI-DBSA films as a
function of applied potential were also recorded during a cathodic sweep to complete a po-
tential cycle. The spectrum shows only two bands at 330 nm and at 520−600 nm at all ap-
plied potentials. During an electrochemical oxidation, counter ions enter the PANI film
whereas they are expelled from the film during reduction [157]. The insertion of Cl− ions
into the film during an anodic sweep is a slow process due to the repelling nature of long
hydrophobic chain of DBSA and thus, UV-Vis responses of PANI film recorded in KCl
are similar to those in H2SO4.
In situ UV-Vis spectra measured in another acid free electrolyte solution (Na2SO4
300 400 500 600 700 800 9000.0
0.2
0.4
0.67 6
54
3
2
1−A
bsor
banc
e /
Wavelength / nm
90

Part II; 7. Results and Discussion
in this case) containing relatively larger counter ions ( ) reveal that anion exchange
rate between
larger anions ( ) are present in the solution, the bands corresponding to polaron transi-
tions reappear during the negative going potential sweep (Figure 7.15). It is clear from the
figure that at ESCE < 0.4 V, bands corresponding to protonated PANI-ES (~800 nm) are
broad and overlapping with the band corresponding to PANI-EB (~600 nm). Unlike in
acidic electrolytes, electrochromic as well as electrochemical reversibility in terms of posi-
tion and absorbance of the low energy band could be observed neither in KCl nor in
Na2SO4 solution. The emeraldine-to-pernigraniline transformation during the anodic sweep
in 0.3 M Na2SO4 is positively shifted to ESCE > 0.5 V when compared to that in 0.1 M KCl.
A PANI-DBSA film cycled in neutral electrolyte was washed with water, re-immersed in
0.5 M H2SO4 and cycled again to check for possible degradation/structural changes in neu-
tral electrolytes. The UV-Vis response of the PANI film re-immersed in acid is similar to
the one recorded for the fresh PANI film indicating the absence of structural modifications.
0.
0.6
0.7
0.8
0.9
−24SO
PANI-DBSA and the electrolyte is influenced by the size of the anions. When −2
4SO
5
300 400 500 600 700 8000.4
7
654
321
Abs
orba
nce
/ −
900
Figure 7.15. In situ UV-Vis spectra of drop-coated film of TIP-6 recorded in 0.3 M Na2SO4 as a function of
applied potential successively shifting to cathodic direction. ESCE (V): (1) 0.8, (2) 0.4, (3) 0.3, (4) 0.2, (5) 0,
(6) −0.1 and (7) −0.2.
Wavelength / nm
91

Part II; 7. Results and Discussion
(c) In Situ UV-Vis Spectra of Poly(aniline-co-o-toluidine) in Acidic Electrolyte
is similar to that of
rsion of the oxidation
states are taking place h spectra of POT coated ITO-
glass sheets in 0.5 eraldine-to-pernigraniline
transforma ergy polaron band (~800
nm), is observed at ESCE ≥ 0.6 V, ab-
ges, possibly due to degrada-
tion of the p ping band at ~385 nm
observed in the solu
otential sweep. The high energy polaron band originating from the radical cations exhibit
aximum absorbance at ESCE = 0.2 V for PANI, whereas its absorbance increases up to
d later. Similar to PANI, UV-Vis responses
f POT film follows its CV profile. At ESCE < 0.2 V, UV-Vis responses, characteristic of
leucoem
(V): (a) −0.2, (b) 0.1, (c) 0.2, (d) 0.3, (e) 0.4, (f) 0.5, (g) 0.6 and (h)
0.7.
UV-Vis spectral responses of POT to the applied potential
PANI except for the fact that applied potential at which interconve
as been shifted. Electronic absorption
M H2SO4 are shown in Figure 7.16. The em
tion, as reflected from the steep blue shift of the low en
ESCE ≥ 0.5 V for POT (ESCE ≥ 0.7 V for PANI). At
sorbance of this band decreases indicating irreversible chan
olymer at this potential. Interestingly, the broad overlap
tion state spectrum of POT, splits into two bands during an ongoing
p
m
ESCE = ~0.4 V in case of POT. This is in accordance with the first oxidation peak potential
observed in the CV of POT which is discusse
o
eraldine, have been observed (Figure 7.16). However, the band corresponding to
radical cations is present even at ESCE = −0.2 V, as in the case of PANI, indicating the
presence of charged species in the reduced state. Similar results were reported by Yang et
al. [138] for the electrochemically synthesized HCl doped POT on ITO-glass electrodes.
Figure 7.16. In situ UV-Vis spectra of POT-6 coated ITO-glass sheets recorded in 0.5 M H2SO4 at succes-
sively shifting positive potentials. ESCE
300 400 500 600 700 800 900
0.4
0.6
0.8 (h)(g) (f)
(e)(d)
(c)
(b)(a)
Abs
oran
ce / −
Wavelength / nm
b
92

Part II; 7. Results and Discussion
In situ spectroelectrochemical measurements were also carried out in cathodic di-
rection soon after the anodic sweep to check the electrochromic reversibility and electro-
chemical stability of the material. Figure 17.17a shows a plot of wavelength at band maxi-
mum vs applied potential. Overlapping lines in the figure indicates that POT synthesized
by the present m omic reversibility. However, a hysteresis
is formed in Figure 7.17b, where absorbance at λ
ethod possesses good electrochr
ve
In the applied potential range, UV-Vis spectral responses of copolymer films are
similar to that of POT. However, ESCE at which emeraldine-to-pernigraniline transforma-
tion is taking place depends on the fraction of o-toluidine in the copolymer. This transfor-
mation takes place at lower positive potential (ESCE = 0.4–0.5 V) for the copolymers gener-
higher concentration of o-toluidine in the feed (≥ 0.005 M), whereas, it occurs at
e o-toluidine content of the copolymer. All these observations clearly
dicate that the spectral responses of copolymers containing a higher mole fraction of ani-
ne in the feed are similar to that of PANI whereas copolymers containing higher mole
action of o-toluidine behaves like POT. Like PANI and POT, copolymers also exhibit
-200 0 200 400 600 800650
700
750
800
max is plotted vs applied potential in a po-
tential cycle, indicating that POT, in the potential range applied (ESCE = −0.2 to 0.8 V), is
electrochemically unstable. It is also clear from Figure 7.17b that absorbance values are
higher during the cathodic sweep than the anodic sweep which may be due to the dissolved
degraded species produced at higher positi potential.
850
900
(a)
λ max
/ nm
ESCE / mV
Anodic sweep Cathodic sweep
-200 0 200 400 600 8000.5
0.6
0.7
0.8
0.9
(b)
Abso
rban
ce a
t
ESCE / mV
λ ~800
/ −
Anodic sweep Cathodic sweep
Figure 7.17. Plots of (a) λmax and absorbance at (b) λmax vs applied potential for POT-6.
ated from
ESCE ≥ 0.6 V for the copolymers with the lower feed concentration of o-toluidine (≤ 0.005
M). Likewise, ESCE at which highest concentration of the radical cations is observed (A~420)
also depends on th
in
li
fr
93

Part II; 7. Results and Discussion
good electrochromic reversibility (overlapping lines in Figure 7.18a). However, electro-
0.8
n-
tial for the copolymers containing different mole fractions of the comonomers in the feed.
7.7 Cyclic Voltammetry
(a) Cyclic Voltammetry of PANI-DBSA in Acidified Electrolytes
Representative CVs of TIP-5 in three different aqueous mineral acids are shown in
Figure 7.19a. There are two pairs of redox peaks almost similar to the ones observed with
PANI prepared electrochemically in aqueous acids. A first oxidation wave around ESCE =
0.2 V is assigned to the leucoemeraldine-to-emeraldine transition and the second oxidation
wave at around ESCE = 0.8 V is due to transition from emeraldine to pernigraniline state.
During the first 20 cycles, the second oxidation wave shifts to more negative poten-
tials and a dramatic decrease in the peak current is observed. A new oxidation wave starts
appear at ESCE = 0.5 V and its current density gradually increases. In case of HCl, the
uch faster than with the other two acids. This is attributed to a kinetic
chemical stability of the copolymer films in the applied potential range (ESCE = –0.2 to
V) is not very good as indicated by the hysteresis in the plot of absorbance at ~800 nm vs
ESCE (Figure 7.18b).
Figure 7.18. Plots of (a) λmax and (b) absorbance of low energy polaron band as a function of applied pote
-200 0 200 400 600 800650
700
750
800
850
900720760800840880920700
750
800
850
900
PAT-73
ESCE / mV
PAT-55
λ max
/ nm
positive going negative going
(a)PAT-37
-200 0 200 400 600 8000.15
0.20
0.25
0.300.32
0.36
0.40
0.44
0.48
0.20
0.25
0.30
PAT-73
ESCE / mV
PAT-55
positive going negative going
Abs
orba
nce
/ −
(b)
PAT-37
to
new band grows m
94

Part II; 7. Results and Discussion
effect i.e., slow exchange of anions in the acid and the bulky dopant anions present in the
polymer film. Thus the two oxidation waves in the region of ESCE = 0.5 to 0.8 V may
origina
cathodic process leading to higher
and sharper peak currents in the anodic process.
(a an
4 4 4
-0.2 0.0 0.2 0.4 0.6 0.8 1.0
-0.4
-0.2
0.0
0.2
0.4
0.6
te from two different counter ions in the system. Dominis et al. [152] observed that
PANI redoped with DBSA does not show distinct redox waves. They quote that the surfac-
tant-like nature of the dopant hinders the charge transfer due to poor wettability of the
polymer by the aqueous electrolyte. A hump observed in the region of 0.3 to 0.5 V arises
from products of overoxidation [89]. The cathodic part of the CV exhibits complicated fea-
tures; the waves are broad and overlapping [158]. It is also observed that anodic peak cur-
rents are relatively higher than the cathodic ones. Jiang and Dong [35] have observed the
same behavior for soluble polyaniline synthesized by the treatment of emeraldine base with
boiling 2 M NaOH. They conclude that the rate of proton elimination in the anodic process
is greater than that of the proton addition reaction in the
(a) HCl H2SO4 HClO4
I / m
A
ESCE / V
Figure 7.19. CVs of ) TIP-5 coated GCE electrodes in three different acids at a scan rate of 50 mV s−1 d
(b) PANIs with different mole ratios of DBSA/aniline coated on a platinum sheet electrode at a scan rate of
50 mV s−1 recorded in acetonitrile containing 0.1 M Bu NBF and 0.075 M HBF .
0.2 0.4 0.6 0.8 1.0 1.2 1.4 1.6
(b) TIP-5 TIP-6 TIP-7
I / m
A
EAg/AgCl / V
95

Part II; 7. Results and Discussion
Cyclic voltammograms of PANI in acetonitrile containing 0.1 M Bu NBF + 0.075
M HBF with different molar ratios of DBSA/aniline in the feed are shown in Figure
7.19b. CVs show two pairs of well-defined redox waves similar to the ones synthesized
electrochemically in aqueous acids [158]. Electroactivity of PANI in non-aqueous solvents
ues of current/square root of scan rate at the peak maxima confirming the diffusion con-
trolled process. The straight lines in Figure 7.20 also indicate that electrochemical behavior
of ANI synthesized
4 4
4
is very good when compared to aqueous electrolytes even though they have low pH. As
mentioned earlier, this difference arises from the poor wettability of the PANI film in
aqueous media. CVs are reproducible for several cycles indicating absence of any free
monomers or oligomers in the PANI. When cycled up to EAg/AgCl = 2.0 V overoxidation
takes place, which is reflected by gradual decrease in the peak current. Increase in the
amount of DBSA in the feed shifts the position of the first oxidation wave to more positive
potentials (Figure 7.19b; Page 95). As mentioned earlier, an increasing amount of dopant
in the polymer leads to the formation of compact coil structures, thereby, shifting the posi-
tion of the oxidation wave to more positive potentials. Figure 7.20 shows plots of anodic
and cathodic peak currents vs square root of the scan rate. The plots yield straight lines in-
dicating that the electrochemical processes are diffusion controlled [35]. Normally, in ideal
diffusion controlled systems, the intercept of the plot is zero, but in the case of conducting
polymers contributions such as double layer charging disturb the concept of zero intercept.
Plots of current/square root of the scan rate vs EAg/AgCl (not shown here) yield identical val-
P ectrochemically synthe-
zed PANI.
(a) a e
by the present method is similar to that of el
si
Figure 7.20. Plots of nodic (Ipa) and (b) cathodic (Ipc) peak currents vs square root of the scan rat
[(ν)1/2].
2 4 6 8 10 12 14 160
4
8
12
16(a)
Pe
t / m
ak c
urre
nA
ν1/2 / (mV)1/2
Ipa−I Ipa−II
-3
-6
-9
2 4 6 8 10 12 14 160
-12 (b) Ipc−I I −IIpc
Pea
k cu
rrent
/ m
A
ν1/2 / (mV)1/2
96

Part II; 7. Results and Discussion
(b) Cyc
leads to the improved stability of the radical cations.
The oxidation potential of POT, particularly Eox, 2, is strongly influenced by the
counter ions present in the electrolyte. In HCl and H2SO4, Eox, 2 appears at ESCE = 0.81 V
whereas it appears at ESCE = 0.63 V in HClO4. During the first 20 cycles, Eox, 2 of POT in
HClO4 shifts to more negative potentials and a gradual increase in the peak current is ob-
served (Figure 7.21b; Page 98). In HCl and H2SO4 the cathodic shift is of very low magni-
tude and the peak current shows gradual decrease. With further increase in the number of
cycles, more reproducible CVs are obtained. These observations suggest that in HClO4, the
radical cations formed above Eox, 1 are not stable which may be due to the conformational
rearrangement taking place in this electrolyte. Interestingly, unlike PANI, no new oxida-
tion wave appears during cycling indicating faster exchange of the anions in the acid and
the bulky dopant anions present in the polymer film.
lic Voltammetry of Poly(aniline-co-o-toluidine) in Acidified Electrolytes
Cyclic voltammograms of POT-6 drop-coated on a glassy carbon electrode and re-
corded in three different (1 N) aqueous mineral acids are shown in Figure 7.21a (Page 98).
CVs in all three mineral acids show two redox processes corresponding to leucoemer-
aldine-to-emeraldine and emeraldine-to-pernigraniline transformations. It is clear from
Figure 7.21a that the first oxidation wave of POT (Eox, 1), when compared to PANI, has
shifted to more positive potential, whereas, the second oxidation wave (Eox, 2) has shifted to
lower positive potentials. However, the magnitude of cathodic shift in the Eox, 2 is much
smaller compared to that of anodic shift in the Eox, 1. The anodic shift of Eox, 1 is due to lar-
ger steric hindrance associated with the double bond of the radical cation which prevents
free rotation along C−N−C chain of the polymer. The instability of the radical cations in
POT due to the steric factor shifts the Eox, 2 in cathodic direction. Similar trends were ob-
served by Probst and Holze [42] for electrochemically synthesized POT in HClO4. Hence,
the electrochemical behavior of chemically synthesized POT using the present protocol is
similar to that of electrochemically synthesized one. However, the lower magnitude of the
cathodic shift observed for the second oxidation wave may be due to the sterically favor-
able molecular conformation of the polymer synthesized using present protocol which
97

Part II; 7. Results and Discussion
corded in (a) three differ-
ent mine
feed. The value of Eox, 1 of the copolymers was found to fall in between the values of PANI
and POT. When the feed concentration of o-toluidine is increased, Eox,i1 of the copolymer
gradually shifts towards the Eox, 1 of POT. Copolymers containing higher mole fraction of
aniline in the feed exhibit two oxidation waves in the region of ESCE = 0.6 to 0.8 V (Figure
7.22; Page 99) indicating their resemblance to PANI. Similarly copolymers with higher
-0.4 -0.2 0.0 0.2 0.4 0.6 0.8 1.0 1.2-0.2
-0.1
0.0
0.1
0.20.63
0.81
0.81(a)
I / m
A
ESCE / V
HCl H2SO4 HClO4
-0.2 0.0 0.2 0.4 0.6 0.8 1.0-0.2
-0.1
0.0
0.1
0.2 (b)
I / m
A
1st cycle 5th cycle 10th cycle 15th cycle 20th cycle 25th cycle
ESCE
/ V
Figure 7.21. Cyclic voltammograms of POT drop-coated glassy carbon electrode re
ral acids (1 N; 30th cycle) and (b) 1 N HClO4 at progressively increasing cycle number. Scan rate =
50 mV s−1.
Cyclic voltammograms recorded in 1 N HClO4 of homo- and copolymers with dif-
ferent mole fractions of the comonomers in the feed are shown in Figure 7.22 (Page 99)
and their oxidation potentials are given in Table 7.4 (Page 100). Electrochemical responses
of the copolymers are strongly influenced by the mole fraction of the comonomers in the
98

Part II; 7. Results and Discussion
mole fraction of o-toluidine in the feed resemble POT. The potential window of POT (Eox, 2
− Eox, 1; high conductivity range) is ~330 mV smaller than that of PANI (Table 7.4; Page
100). Copolymerization not only improves the conductivity of POT but also improves the
potential window. As mentioned in the previous paragraph for POT, CVs of the copoly-
mers recorded in 1 N HCl and H2SO4 do not show broad variation in the position of Eox, 2
thereby not showing any conformational rearrangement which destabilizes the radical
cations (Figure 7.23; Page 100). As in the case of PANI, electrochemical responses of POT
and poly(aniline-co-o-toluidine)s are not very good due to poor wetting property of the
bulky counter ions. Presence of single redox pair in the copolymers for each redox process
suggests formation of real copolymers and not composites which otherwise would have re-
sulted in separate redox pairs for PANI and POT [126, 140]. This indicates that expected
copolymers are produced from the present protocol using benzoyl peroxide as the oxidant
and DBSA as the dopant.
Figure 7.22. Cyclic voltammograms of homo- and copolymers recorded in 1 N HClO4. Solutions of the
polymers were drop-coated on glassy carbon working electrode; scan rate = 50 mV s−1; 30th cycle.
-0.2 0.0 0.2 0.4 0.6 0.8 1.0
0.0
0.10.2
-0.1
-0.15
0.00
0.15-0.4
0.0
0.4
-0.3
0.0
0.3
-0.2
0.0
0.2
0.40.63
0.45
0.36
PAT-37
POT-6
0.69
0.25 0.61 0.79
0.33 0.77
0.3 0.59
ESCE / V
TIP-6
PAT-73
I / m
A PAT-55
99

Part II; 7. Results and Discussion
Table 7.4. Oxidation potentials of homo- and copolymers obtained from their respective CVs recorded in
HClO4; scan rate 50 mV s−1 (vs SCE reference).
Sample code Eox, 1 (V) Eox, 2 (V) ∆E (mV)
TIP-6 0.25 0.61 0.79 540
PAT-73 0.33 0.63 0.77 440
PAT-55 0.30 0.59 0.69 390
PAT-37 0.36 − 0.69 300
POT-6 0.45 − 0.66 210
-0.2 0.0 0.2 0.4 0.6 0.8 1.0
-0.2
0.0
0.2
0.4-0.10.00.10.2
-0.35
0.00
0.35
-0.25
0.00
0.25
-0.2
0.0
0.2
0.210.59
0.76
0.340.71
0.790.40
0.79
0.40
0.81
0.39POT-6
ESCE / V
TIP-6
PAT-73
I / m
A PAT-55
PAT-37
Figure 7.23. Cyclic voltammograms of homo- and copolymers recorded in 1 N HCl. Solutions of the poly-
mers were drop-coated on glassy carbon working electrode; scan rate = 50 mV s−1; 30th cycle.
Generally, the first oxidation peak in the CV of electrochemically synthesized
PANI, POT or copolymers is sharp and its peak current is much higher than the second
oxidation peak [42, 126, 148]. However, homopolymers as well as copolymers synthesized
by the present protocol exhibit an opposite behavior, i.e., peak current of the second oxida-
tion peak is much higher than the first one. In case of PANI-DBSA, such a trend is ob-
100
Part II; 7. Results and Discussion
served only in the first 10 cycles. During an electrochemical reduction, counter ions are
expelled from the polymer film whereas their insertion takes place during oxidation. Emer-
aldine state is the inherent oxidation state of chemically synthesized polymer and is further
stabilized by a stable chain conformation. Due to the strong complexation of polar head
group of DBSA with amine/imine moiety of the polymer backbone, the emeraldine-to-
leucoemeraldine transformation is much slower during potential cycling. In situ UV-Vis
spectroscopy also reveals the presence of radical cations at the applied potential where
PANI or POT is in the completely reduced state. These facts lead to higher peak current
observed for the second oxidation potential. Su and coworkers [140] have observed a simi-
lar trend for POT and copolymers of aniline and toluidine synthesized using 2,3-dichloro-
5,6-dicyanobenzoquinone as oxidant and (+)-CSA as dopant but gave no explanation for
the observed trend. Wei et al. [126] have reported that CVs of chemically prepared
poly(aniline-co-o-toluidine)s (dissolved in NMP and drop-coated on an electrode surface)
are identical to those of electrochemically synthesized ones, however, no detailed discus-
sion on the CVs has been given.
o-toluidine in non-
nd co-
polymers exhibit ex itrile containing 0.1 M
Bu4NBF4+0.075 o pairs of redox waves which
are assigned to er backbone. The
lectrochemical response of POT in acidified non-aqueous electrolyte is similar to those
ynthesized electrochemically [42, 126]. Peak current of the first oxidation wave is much
e efficiently in non-aqueous electrolytes. Irrespective of the thickness of the
olymer film, peak currents in the CV of PANI are much higher than that of POT and co-
olyme
Cyclic voltammograms of homo- and copolymers of aniline and
aqueous solution are shown in Figure 7.24 (Page 102). As in case of PANI, POT a
cellent electrochemical responses in aceton
M HBF4. POT and copolymers exhibit tw
the interconversion of three oxidation states of the polym
e
s
higher than the second wave indicating that interconversion of all the three oxidation states
takes plac
p
p rs which is an indirect proof of higher conductivity of the PANI. As in the case of
aqueous acidic electrolytes, copolymers exhibit single pair of peaks for each transforma-
tion indicating formation of expected real copolymers. It is further supported by the CV of
a mechanical mixture of PANI and POT (Figure 7.24; Page 102), recorded under similar
conditions, which exhibit two oxidation waves in the higher positive potential region (Ta-
ble 7.5; Page 103).
The potential window where polymer backbone stays in conducting emeraldine
state follows a similar trend as observed in the case of aqueous electrolytes. This potential
window gradually narrows with increase in the mole fraction of o-toluidine in the feed.
101

Part II; 7. Results and Discussion
This indicates that the amount of o-toluidine units incorporated in the polymer backbone
strongly depends on its feed concentration. The values of first and second oxidation poten-
tials (Eox, 1 and Eox, 2) along with the potential window (where polymer exists in emeraldine
state) are given in Table 7.5 (Page 103). The change in the value of Eox, 1 and Eox, 2 of co-
polymers follows a trend similar to the one observed in aqueous electrolytes. Because of
the lower positive potential of Eox, 2 of POT and copolymers, overoxidation takes place
when cycled up to EAg/AgCl = 1.5 V leading to degradation of the polymer film which is re-
flected by the decrease in the peak current of their CVs during progressive cycling. The
magnitude of decrease is much faster in the copolymers containing higher fraction of o-
toluidine units. As in the case of PANI, plots of square root of scan rate vs peak current of
POT and poly(aniline-co-o-toluidine)s yield straight lines indicating that the electrochemi-
cal processes are diffusion controlled.
ure 7.24. Cyclic voltammograms of homo- and copolymers recorded in acetonitrile containing 0.1 M
M HBF . Solutions of the polymers were drop-coated on a plati foil working electrode;
0.0 0.2 0.4 0.6 0.8 1.0 1.2 1.4
-3
0
3
6-0.5
0.0
0.5
-0.50.0
0.5
1.0-0.3
0.0
0.3-0.2
0.0
0.2
EAg/AgCl / V
TIP-6
PAT-73
I / m
A PAT-37
POT-6
Mechanical mixture(TIP-6+POT-6)
Fig
Bu4NBF4+0.075 4 num
scan rate = 50 mV s−1; 5th cycle.
102

Part II; 7. Results and Discussion
Table 7.5. Oxidation potentials of homo- and copolymers obtained from their respective CVs recorded in
cetonitrile containing 0.1 M Bu4NBF4 and 0.075 M HBF4; scan rate 50 mV s−1 (vs Ag/AgCl reference).
Eox, 2 (V) ∆E (mV)
a
Sample code Eox, 1 (V)
TIP-6 0.45 − 1.06 610
PAT-73 0.54 1.15
7 0.54 − 0.96 420
0.52 − 0.85 330
cal mixt
d POT-60.44 0.91 0.96 −
− 610
PAT-3
POT-6
Mechani ure of
TIP-6 an
7.8 Infrared Spectroscopy
There are a handful of previously published reports discussing the infrared spec-
troscopy of both chemically and electrochemically synthesized PANI [84, 124] and POT
ganic acids. Figure
sized using the pre-
sign-
me exceptions, the spec-
of POT
[126].
atic ring C−C stretching
for copolymers appear in
-toluidine in the copolymer
increa o-
nding vibration of
PANI at 1296 cm T due to the steric hindrance arising
the methyl group. In the case of copolymers, intensity of this band diminishes with
ase in the mole fraction of o-toluidine in the feed (Figure 7.25; Page 105). A new
-toluidine in the feed. However, the band at 1216 cm−1 corresponding to C−N stretching
of benz
[126, 139, 159] doped with various mineral as well as functionalized or
7.25 (Page 105) shows FTIR spectra of homo- and copolymers synthe
sent protocol. The vibrational frequencies of the major infrared bands and their as
nts are summarized in Table 7.6 (Page 104). In general, with some
tral characteristics of the copolymers show greater similarity to the IR spectrum
The band at 1461 cm−1 of PANI attributed to the arom
mode is blue shifted to 1484 cm−1 for POT, whereas, this mode
the range of 1478–1486 cm−1. When the feed composition of o
ses, this band exhibits a blue shift indicating incorporation of more and more
toluidine moieties into the polymer backbone. The out-of-plane −NH be−1 is absent in the IR spectrum of PO
from
incre
band at 1240 cm−1 of weak-to-medium intensity corresponding to benzoid C−N stretching
appears only in the copolymers and its intensity decreases with increase in mole fraction of
o
oid-quinoid-benzoid triad sequence exhibits an opposite trend indicating that num-
bers of quinoid segments in POT are higher than those in PANI (Figure 7.25). The band at
103

Part II; 7. Results and Discussion
1240 cm−1 is not observed in the IR spectrum of a mechanical mixture of PANI and POT.
Appearance of the new bands clearly indicates the formation of copolymers which was
previously confirmed by cyclic voltammetry and UV-Vis spectroscopy.
Table 7.6. Major IR bands and their assignments for homo- and copolymers of aniline and o-toluidine.
Wavenumbers (cm−1)
TIP-6 POT-6 Copolymers Band assignments* [124, 159−161]
3439 − − Asymmetric +− 2NH stretching
− 3026 − −CH stretching (−CH3 group)
− 2954 2952 (w) Assymmetric −CH stretching (DBSA)
2924 2922 2922 Aromatic −CH stretching
2854 2852 2852 Symmetric −CH2− stretching (DBSA)
1552 1558 1555−1560 Aromatic C−C stretching (B)
1461 1486 1475−1490 Aromatic C−C stretching (Q)
1387 1382 1382 Out-of-plane −CH bending of −CH3 group
1296 − 1295−1305 Out-of-plane −NH bending
− − 1240−1245 Asymmetric C−N stretching (B) or C=C stretching
− 1212 1216 −
− 1165 1132
C N stretching in QBQ, QBB, BBQ
−1152 −CH rocking (o-toluidine unit)
1111
3
1110 1110−1122 −CH in-plane bending (1,4-disubstituted ring)
1022 1032 1032 S=O stretching (DBSA)
− 1008 1006 −CH3 bending
877 882 880 Ring breathing mode of ES (Q) / Out-of-plane −CH−
bending of 1,2,4-trisubstituted ring
− 828 824 Out-of-plane −CH− bending of 1,2,4-trisubstituted ring
787 − 804-810 −CH out-of-plane bending (1,4-disubstituted ring)
− 686 686 S=O stretching (DBSA)
* B = Benzoid segment, Q = Quinoid segment; (w) = weak band
A strong band at 1152 cm−1 which is attributed to the –CH3 rocking mode of POT
decreases in intensity and exhibits red shift with increase in the mole fraction of aniline in
the feed (Figure 7.25; Page 105). For example, at the feed ratio of 3:7 (aniline-to-o-
toluidine) it appears at 1152 cm−1, whereas, at 7:3 ratio, it shifts to 1138 cm−1 (weak broad
band). The –CH out-of-plane bending mode characteristic of 1,2,4-trisubstituted aromatic
ring of POT appears as two strong bands at 882 and 828 cm−1, whereas, in case of PANI
104

Part II; 7. Results and Discussion
(1,4-di
Figure 7.25. FTIR spectra of PANI, POT and copolymers having different aniline-to-o-toluidine feed ratios.
1600 1400 1200 1000 800 600
substituted benzene ring), it appears as a strong band at 787 cm−1 [160]. In the case
of copolymers, bending modes characteristic of both tri- and disubstituted rings are pre-
sent, however, the intensity of the bands due to trisubstituted ring increases and disubsti-
tuted ring decreases as the mole fraction of o-toluidine in the feed is increased and vice
versa. Similar results have been reported by Huang and coworkers [136] for copolymers
prepared via homogeneous solution polymerization using ammonium persulfate as oxidant
and HCl as dopant. The band at 787 cm−1 corresponding to the p-disubstituted benzene ring
in the PANI exhibits gradual blue shift as the molar fraction of o-toluidine in the feed is in-
creased. When the mole ratio of aniline to o-toluidine in the feed is 7:3, this band appears
at 804 cm−1, whereas, changing the feed ratio to 3:7 shifts this band to 810 cm−1.
1552
1461 13
87
1296
1167
1138
1111
1022
877
787 719
667 62
0
1556
1478
1298 12
4012
16
1030
1006
942
880
824
800
706
668
1384
764
% T
rans
mitt
nace
/ −
Wavenumbers / cm−1
TIP-6 PAT-73 PAT-55 PAT-37 POT-6
105

Part II; 7. Results and Discussion
The band at 1022 cm−1 corresponding to S=O stretching mode of the SO3 group of
DBSA splits into two bands in the case of POT and copolymers. Such a splitting is even
observed in the copolymer with 7:3 molar composition of aniline to o-toluidine.
7.9 Raman Spectroscopy
In this dissertation, Raman spectroscopy is used to gain structural information as
well as data pertaining to the metal-to-insulator transition in conducting polyaniline and its
copolymers taking place during electrochemically induced redox transformations. In case
of PANI-DBSA, pre-resonance enhancement of Raman signals [25, 26] is effective be-
cause the laser excitation wavelength used (λ0 = 476.5 nm) matches the longer wavelength
wing of the absorption band centered at 420−430 nm of PANI. In case of copolymers,
above mentioned laser excitation wavelength did not show effective pre-resonance en-
hancement. Also, the spectra recorded at this laser excitation were not well resolved.
Therefore, ecorded using a green laser excita-
tion wavelength ( lls in the shorter wavelength wing
applied potential)
originating from er backbone which exists at
ESCE is effective only beyond this potential.
ence, the term ‘pre-resonance enhancement’ is not included in the subtitle discussing the
aman spectroscopy of copolymers.
aman Spectroscopy of PANI-DBSA
at
30 nm increases, passes through a maximum and then decreases as shown in the inset of
Figure 7.26 (Page 107). Frequencies of the major Raman bands and their assignments are
summarized in Table 7.7 (Page 107). At ESC = −0.2 V, the Raman spectrum shows two
strong pea 28 and 1194 c odes. Intensity of almost all
the peaks es when the ap ESCE = 0.2 V, beyond this
value scattered light intensity d ases wit ther p
This trend of potential dependent pre-resonance enhancement is very similar to the plot of
bsorbance at 430 nm vs applied potential (inset of Figure 7.26).
in situ Raman spectra of copolymers were r
λ0 = 514.5 nm). This laser excitation fa
of the absorption band centered at 570−650 nm (position depends on
the pernigraniline oxidation state of polym
> 0.5 V and pre-resonance enhancement
H
R
(a) In Situ Pre-resonance R
As said above, pre-resonance enhancement is effective for the PANI films. In situ
UV-Vis spectra reveal that during an anodic potential sweep, absorbance of the band
4
E
ks at 16 m−1 assigned to benzoid ring m
increas plied potential is raised up to
ecre h fur ositive going electrode potential.
a
106
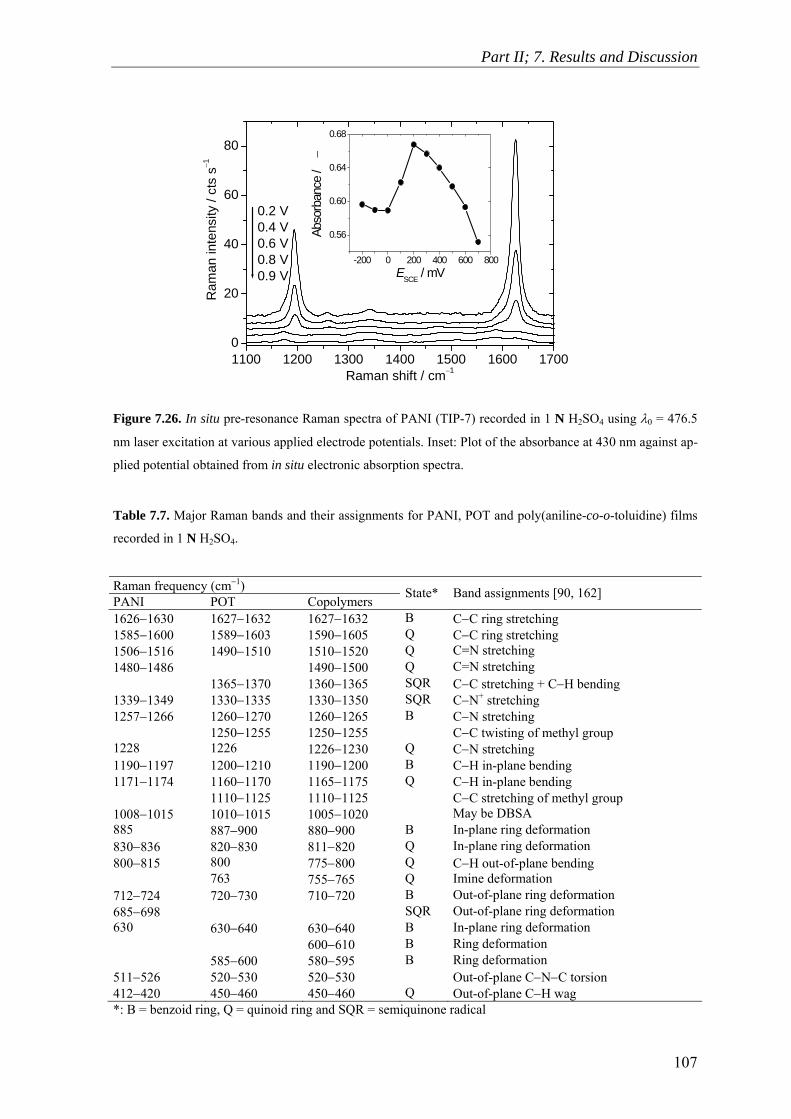
Part II; 7. Results and Discussion
Figure 7.26. In situ pre-resonance Raman spectra of PANI (TIP-7) recorded in 1 N H2SO4 using λ0 = 476.5
nm laser excitation at various applied electrode potentials. Inset: Plot of the absorbance at 430 nm against ap-
plied potential obtained from in situ electronic absorption spectra.
Table 7.7. Major Raman bands and their assignments for PANI, POT and poly(aniline-co-o-toluidine) films
recorded in 1 N H2SO4.
Raman frequency (cm−1) PANI POT Copolymers
State* Band assignments [90, 162]
1626−1630 1627−1632 1627−1632 B C−C ring stretching 1585−1600 1589−1603 1590−1605 Q C−C ring stretching 1506−1516 1490−1510 1510−1520 Q C=N stretching 1480−1486 1490−1500 Q C=N stretching 1365−1370 1360−1365 SQR C−C stretching + C−H bending 1339−1349 1330−1335 1330−1350 SQR C−N+ stretching
− 1 − − B − 1250−1255 1250−1255 C−C twisting of methyl group 1228 1226 1226−1230 Q C−N stretching 1190−1197 1200−1210 1190−1200 B C−H in-plane bending 1171−1174 1160−1170 1165−1175 Q C−H in-plane bending 1110−1125 1110−1125 C−C stretching of meth
1257 1266 260 1270 1260 1265 C N stretching
yl group 008−1015 1010−1015 1005−1020 May be DBSA
00−815 800 775−800 Q C−H out-of-plane bending 755−765 Q Imine deformation 712 730 710−720 ation 685 SQR Out-of-plane ring deformation 630 6 −640 630−640 In-plane rin ation 00−610 ing de 5 0 580−595 511− 5 5 − 412 20 4 0
1885 887−900 880−900 B In-plane ring deformation 830−836 820−830 811−820 Q In-plane ring deformation 8
763 −724 720− B Out-of-plane ring deform−698
30 B g deformB R formation 6
85−60 B Ring deformation −526
−420−53050−46
20−530450−460
Out-of-plane C N C torsionQ Out-of-plane C−H wag
*: B = benzoid ring, Q = quinoid ring and SQR = semiquinone radical
01100 1200 1300 1400 1500 1600 1700
20
40
60
80
-200 0 200 400 600 800
0.56
0.60
0.64
0.68
Abso
rban
ce /
−
ESCE / mV
Ram
an in
tens
ity /
cts
s−10.2 V0.4 V0.6 V0.8 V0.9 V
Raman shift / cm−1
107

Part II; 7. Results and Discussion
Particula ntensity 28 and ches almost by two orders
of itud r positi tentials uring an anodic
sweep, a new band appears i o 0.1 V and disappears at
ES [90] assigned this band to an out-of-plane ring defor ation of the
qu ring. A the band e in the emeraldine state of
PANI, it may be ue to the se r t 980
and 1005 cm−1 of weak-to-m intens of the sulfate an-
ion; the band at 980 cm−1 is al wo bands due to the
do DBSA a r at 104 al ch are as-
signed to C−S stretching and S=O out-of-plane odes, respectively [94].
A band at 1345 cm−1 is assigned to one
radical state (Table 7.7; Page 107); this b 2 V indicating that
som radical cations are still nt in leu in
situ copy. At higher positive po
nd the −1 de-
reases as the potential is increased in positive direction. New bands start to appear in the
rly, i of 16 1194 cm−1 bands blea
magn e at highe ve po [163] (Figure 7.26; Page 107). D
n the range f 680−690 cm−1 at E = SCE
CE = 0.6 V. Liu et al. m
inoid s xists only the potential region of
d miquinone adical and not the quinoid ring. Two bands a
edium ity are caused by internal modes
present at l applied potentials [163]. T
pant, ppea 0−1057 (at l applied potentials) and 1120 cm−1 whi
bending m
the C−N stretching vibration of the semiquin
and exists even at ESCE = −0.
e prese coemeraldine state which is also confirmed by
UV-Vis spectros tentials, a new band at 1327 cm−1 appears
a intensity of this band increases, whereas, intensity of the band at 1345 cm
c
region of 1480−1520 cm−1 at ESCE ≥ 0.6 V. At ESCE > 0.6 V, PANI exists mainly in perni-
graniline state where the polymer backbone has more quinoid segments. Figure 7.27 (Page
109) shows in situ pre-resonance Raman spectra of PANI at different applied potentials.
The new bands in the region of 1480−1520 cm−1 and at 1590 cm−1 are caused by modes of
quinoid structure. The band at 1590 cm−1 shows a red shift when the applied potential is
increased from ESCE = 0.6 to 0.8 V. Hugot-Le Goff and Bernard [91] stated that there
should be three C−C ring stretching modes (1550, 1575 and 1585 cm−1) and two C=N
stretching modes (1485 and 1500−1515 cm−1) for quinoid rings. They have also observed
that C−C ring stretching modes are sensitive to the applied potential and pH of the medium
and the multiplicity in C=N stretching arises from the difference in protonation and charge
localization on the imine sites. The low frequency shift observed in the present study may
be due to weakening of the C=N bond strength at higher potential where the next step is
overoxidation. The new bands assigned to quinoid ring at higher potential clearly indicate
the transformation from conducting emeraldine state to non-conducting pernigraniline state
and thus in situ Raman spectroscopy has been used successfully to monitor the conductor-
to-insulator transition.
108
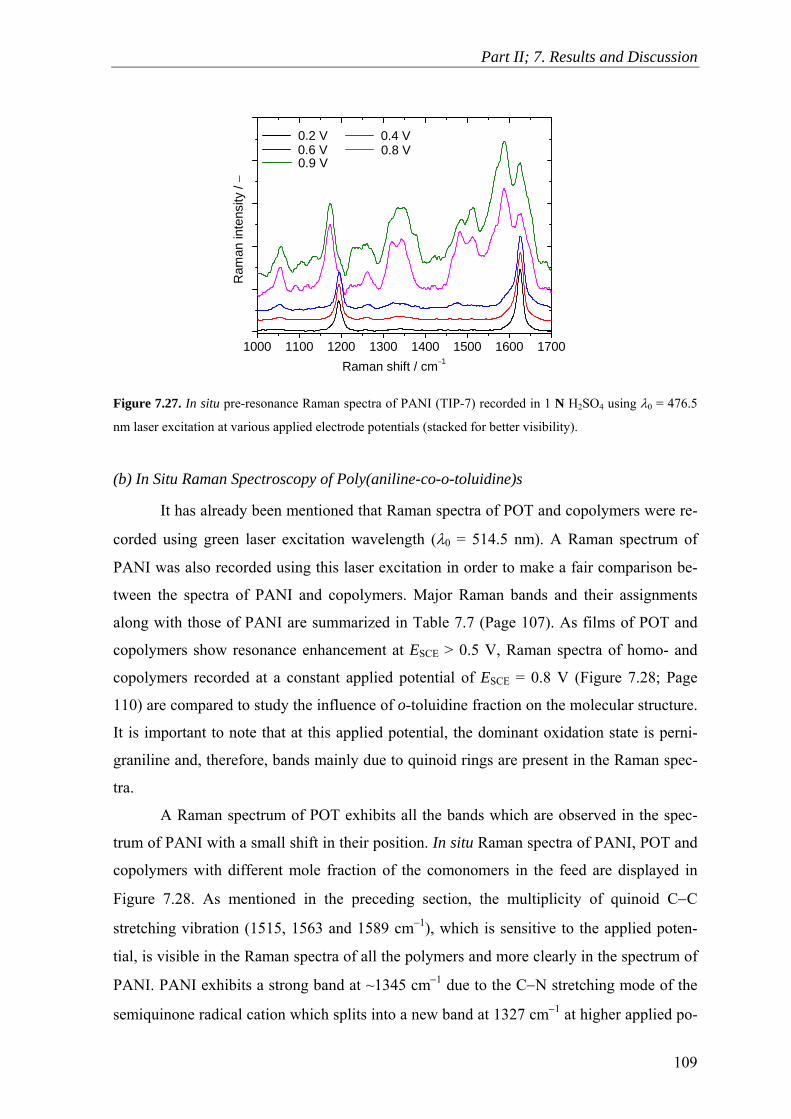
Part II; 7. Results and Discussion
1000 1100 1200 1300 1400 1500 1600 1700
0.9 V 0.8 V 0.6 V 0.4 V 0.2 V
Ram
an in
tens
ity / −
Raman shift / cm−1
Figure 7.27. In situ pre-resonance Raman spectra of PANI (TIP-7) recorded in 1 N H2SO4 using λ0 = 476.5
nm laser excitation at various applied electrode potentials (stacked for better visibility).
(b) In Situ Raman Spectroscopy of Poly(aniline-co-o-toluidine)s
It has already been mentioned that Raman spectra of POT and copolymers were re-
corded using green laser excitation wavelength (λ0 = 514.5 nm). A Raman spectrum of
PANI was also recorded using this laser excitation in order to make a fair comparison be-
tween the spectra of PANI and copolymers. Major Raman bands and their assignments
along with those of PANI are summarized in Table 7.7 (Page 107). As films of POT and
opolymers show resonance enhancement at ESCE > 0.5 V, Raman spectra of homo- and
10) are compared to study the influence of o-toluidine fraction on the molecular structure.
is important to note that at this applied potential, the dominant oxidation state is perni-
the spec-
um of PANI with a small shift in their position. In situ Raman spectra of PANI, POT and
fraction of the comonomers in the feed are displayed in
c
copolymers recorded at a constant applied potential of ESCE = 0.8 V (Figure 7.28; Page
1
It
graniline and, therefore, bands mainly due to quinoid rings are present in the Raman spec-
tra.
A Raman spectrum of POT exhibits all the bands which are observed in
tr
copolymers with different mole
Figure 7.28. As mentioned in the preceding section, the multiplicity of quinoid C−C
stretching vibration (1515, 1563 and 1589 cm−1), which is sensitive to the applied poten-
tial, is visible in the Raman spectra of all the polymers and more clearly in the spectrum of
PANI. PANI exhibits a strong band at ~1345 cm−1 due to the C−N stretching mode of the
semiquinone radical cation which splits into a new band at 1327 cm−1 at higher applied po-
109

Part II; 7. Results and Discussion
tentials [162]. Interestingly, this band further splits into three well-resolved bands in the
case of POT (Figure 7.28) and the third band appears at ~1365 cm−1. The multiplicity of
the band due to semiquinone radicals in the Raman spectra of all the copolymers is similar
to that of POT.
Figure 7.28. In situ Raman spectra of films of PANI (TIP-6), POT and copolymers with 7:3, 5:5 and 3:7 mo-
lar ratios of aniline to o-toluidine in the feed recorded in 1 N H2SO4. (a) and (b) stands for two different re-
gions of Raman shift. ESCE = 0.8 V; λ0 = 514.5 nm; laser power = 100 mW at the sample. Spectra are stacked
for better visibility.
The influence of the comonomer feed ratios on the structure of polymer can be ob-
served in the region of 1226–1260 cm−1. The strong band at 1228 cm−1 in the Raman spec-
trum of PANI originates from the C−N stretching of quinoid ring and shows gradual de-
crease in the intensity with increase in the mole fraction of o-toluidine in the feed. The
1000 1100 1200 1300 1400 1500 1600 1700
1052
1128
1174
1228
1254
1327
1347 14
9115
15
1563
1589
1627
1687
1433
Ram
(a) TIP-6 PAT-73 PAT-55 PAT-37 POT-6
an in
tens
ity / −
Raman shift / cm−1
300 400 500 600 700 800 900 1000
244 30
1
351
432
522
590
7
723
758
787 81
3
885
936 96
197
965
Ram
an in
tens
ity / −
Raman shift / cm−1
TIP-6 PAT-73 PAT-55 PAT-37
(b)
POT-6
110

Part II; 7. Results and Discussion
band at 1254 cm−1 due to C−C twisting of methyl group increases in intensity with an in-
crease in the feed concentration of o-toluidine. Another characteristic band of POT appears
at 1128 cm−1 which is assigned to the C−C twist of the methyl side group [43]. Intensity of
this band increases with increase in the feed ratio of o-toluidine which confirms that more
and more o-toluidine units have entered into the polymer chain. A band at 813 cm−1 in the
spectrum of PANI assigned to out-of-plane C−H bending mode of quinoid ring, show
gradual decrease in its intensity in the spectra of copolymers. There are three bands in the
region of 730–830 cm−1 in the spectra of PANI, whereas, two new bands appear in the
same region in the case of POT and copolymers. These bands mainly arise from the qui-
noid segments of the polymer backbone and they are well resolved in the case of POT and
opolymers. Such better resolution in POT and copolymers may be due to the applied po-
ntial (ESCE = 0.8 V) where they predominantly exist in pernigraniline oxidation state.
ngoing stepwise positive potential sweep are almost similar to the one recorded using
the quinoid stretching vibrations appear as strong bands. Both in POT
nd copolymers, spectral behaviors of the bands at 1628, 1590, 1195 and 1173 cm−1 are
NI (Fig Page ppearance or
of th kes wer tenti se in the o-toluidine
cop
he c , in e b 1 stretching
exhi crea SCE > 0.2 V. As reported by Hugot-Le Goff and
ernard [91], is se the pplied tion of any
men olym inc se in s band. In copoly-
ban t re her tent luenced by the
ion o onom feed. For e e case of PAT-55, it ap-
1519 c SCE > 0 is red ifted ther increase in
ed po l (Figure e 112 nten 4 cm−1 due the
roup i with in the plied ted to 1122
. As discussed in the UV-Vis spectroscopy and plication of po-
ntial to a che ynthes ilm uces al change which is re-
e for th hift of the band at 1114 cm−1 d in the case
c
te
In situ Raman spectra of PANI-DBSA (TIP-6) as a function of applied potential is
also recorded using green excitation wavelength. The spectral changes observed during an
o
476.5 nm blue excitation wavelength. However, with the 514.5 nm green excitation wave-
length, bands due to
a
similar to those of PA ure 7.28; 110) except for the fact that a
bleaching e bands ta place at lo po al with an increa
fraction in olymer.
In t ase of POT tensity of th and at 510 cm−1 attributed to C−N
vibration, bit sharp in se when E
B this band nsitive to a potential and transforma
smaller seg ts of the p er leads to rea the intensity of thi
mers, this d appears a latively hig po ials and is strongly inf
mole fract f the com ers in the xample, in th
pears at m at E−1 .5 V and sh to 1509 cm with fur−1
the appli tentia 7.29; Pag ). I sity of the band at 111
methyl g ncreases increase ap potential and is blue shif
cm−1 cyclic voltammetry, ap
te mically s ized POT f ind a conformation
sponsibl e blue s . Similar trend is observe
111

Part II; 7. Results and Discussion
of copolymers. The bands in the region of 1140–1350 cm−1 are well resolved at ESCE > 0.4
V and
p
a new band appears at 1020 cm−1. Further increase in the applied potential shifts this
band to 1012 cm−1.
8
16
24
32
Figure 7.29. In situ Raman spectra of PAT-55 drop-coated film in 1 N H2SO4 recorded at various applied po-
tentials progressively shifted in positive direction. λ0 = 514.5 nm; laser power = 100 mW at the sample.
The main idea of carrying out the in situ Raman spectroscopy is to monitor the oxi-
dative transformation induced by electrochemical changes. From the above discussions it is
clear that the bands at 1630 and 1590 cm−1 originate from the benzoid and quinoid seg-
ments in the polymer backbone, respectively. It is well known that higher numbers of ben-
zoid segments are resent in protonated emeraldine state and concentrations of quinoid
segments are higher in pernigraniline state. Gradual stepwise increase in the applied poten-
tial decreases the intensity of benzoid band, whereas quinoid band intensity increases. A
steep change in their intensity ratios indicates emeraldine-to-pernigraniline transformation.
Hence, a plot of ratio of band intensity of 1630 to 1590 cm−1 vs applied potential will help
us to monitor the emeraldine-to-pernigraniline transformation. Such plots for PANI (TIP-
6), POT and copolymer containing 7:3, 5:5 and 3:7 mole ratios of aniline to o-toluidine are
shown in Figure 7.30 (Page 113). The plots indicate that the offset of oxidative transforma-
tion appears at progressively decreasing positive potentials as the fraction of o-toluidine in
the feed is increased.
250 500 750 1000 1250 1500 17500
0 V 0.4 V 0.5 V 0.6 V 0.8 V
Ram
n In
tens
it /
cts
s−1a
y
Raman shift / cm−1
112
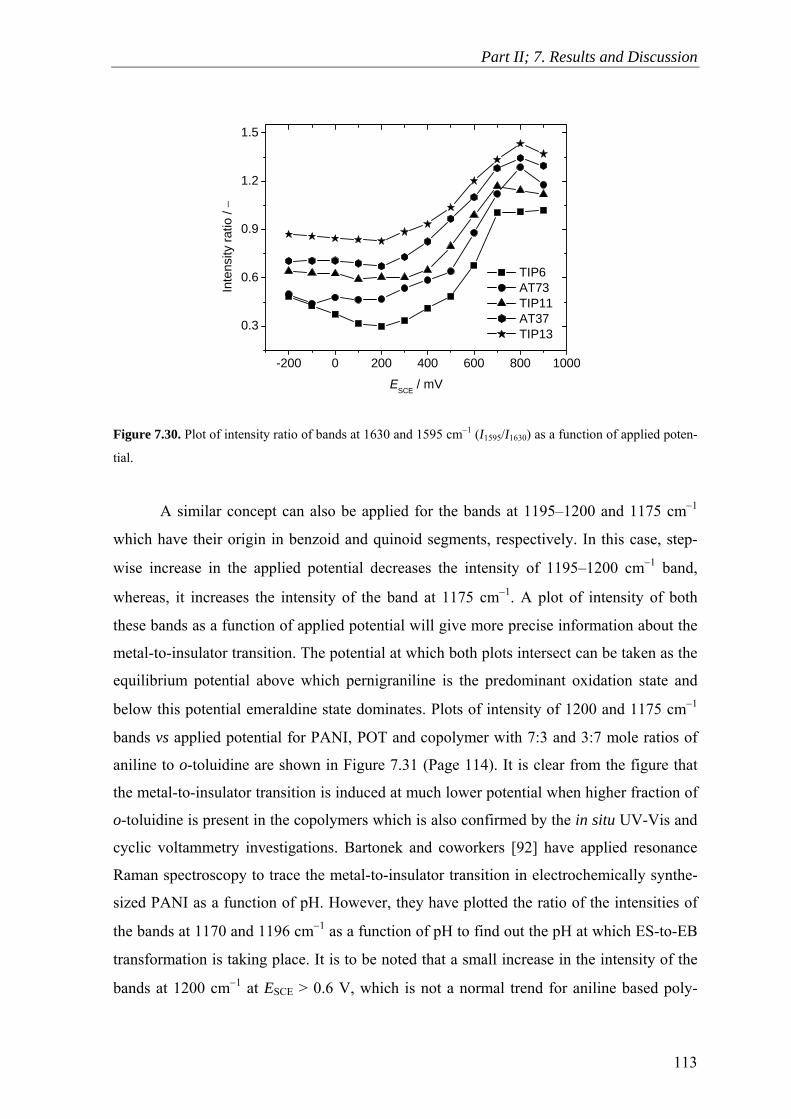
Part II; 7. Results and Discussion
113
Figure 7.30. Plot o ction of applied poten-
tial.
A sim −1
ely. In this case, step-
m−1 band,
whereas, it increases the inte . A plot of intensity of both
these bands as a function of a ation about the
me
equilibrium inant oxidation state and
below this potential em −1
bands vs ole ratios of
aniline to o 114). It is clear from the figure that
the metal-to
o-toluidine is present in the copolymers which is also confirmed by the in situ UV-Vis and
cyclic voltammetry investigations. Bartonek and coworkers [92] have applied resonance
Raman spectroscopy to trace the metal-to-insulator transition in electrochemically synthe-
sized PANI as a function of pH. However, they have plotted the ratio of the intensities of
the bands at 1170 and 1196 cm−1 as a function of pH to find out the pH at which ES-to-EB
transformation is taking place. It is to be noted that a small increase in the intensity of the
bands at 1200 cm−1 at ESCE > 0.6 V, which is not a normal trend for aniline based poly-
-200 0 200 400 600 800 1000
0.3
0.6
0.9
1.2
1.5
Inte
nsity
ratio
/ −
ESCE / mV
TIP6 AT73 TIP11 AT37 TIP13
f intensity ratio of bands at 1630 and 1595 cm−1 (I1595/I1630) as a fun
ilar concept can also be applied for the bands at 1195–1200 and 1175 cm
which have their origin in benzoid and quinoid segments, respectiv
wise increase in the applied potential decreases the intensity of 1195–1200 c
nsity of the band at 1175 cm−1
pplied potential will give more precise inform
tal-to-insulator transition. The potential at which both plots intersect can be taken as the
potential above which pernigraniline is the predom
eraldine state dominates. Plots of intensity of 1200 and 1175 cm
applied potential for PANI, POT and copolymer with 7:3 and 3:7 m
-toluidine are shown in Figure 7.31 (Page
-insulator transition is induced at much lower potential when higher fraction of
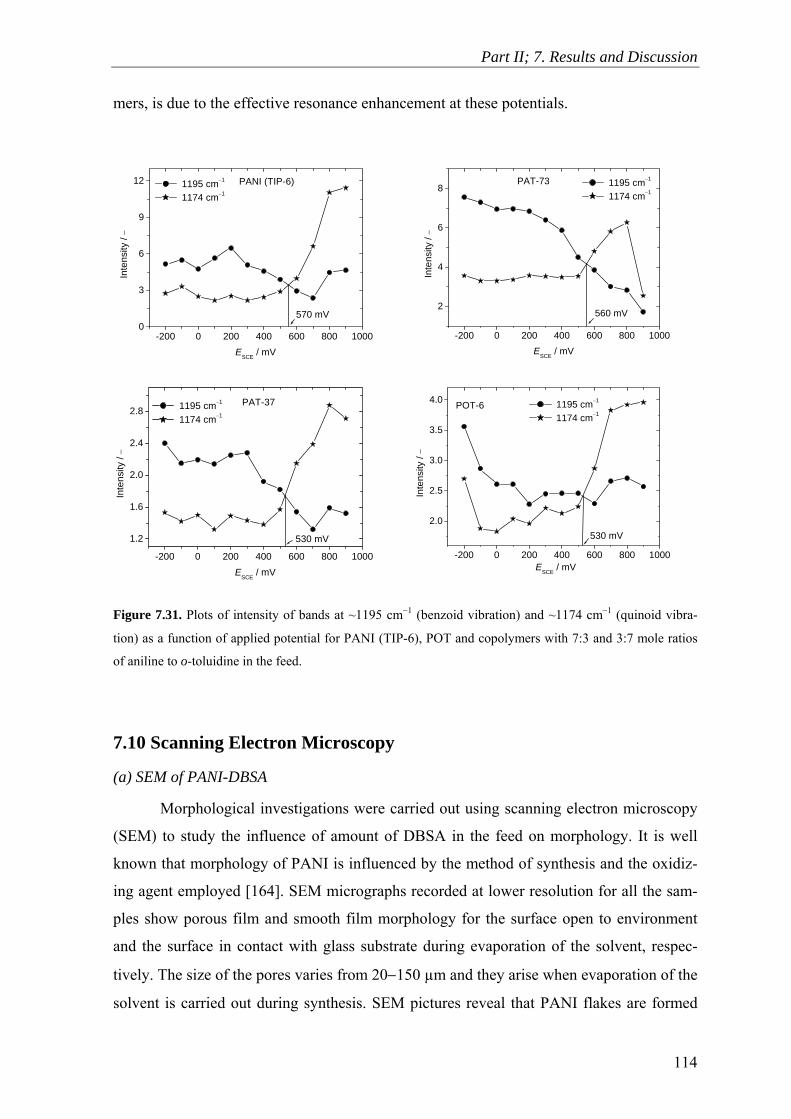
Part II; 7. Results and Discussion
mers, is due to the effective resonance enhancement at these potentials.
Morphological investigations were carried out using scanning electron microscopy
-200 0 200 400 600 800 10000
3
6
9
12 PANI (TIP-6)
570 mV
Inte
nsity
/ −
ESCE / mV
1195 cm−1
1174 cm−1
-200 0 200 400 600 800 1000
2
4
6
8
560 mV
PAT-73
Inte
nsity
/ −
ESCE / mV
1195 cm−1
1174 cm−1
Figure 7.31. Plots of intensity of bands at ~1195 cm−1 (benzoid vibration) and ~1174 cm−1 (quinoid vibra-
tion) as a function of applied potential for PANI (TIP-6), POT and copolymers with 7:3 and 3:7 mole ratios
of aniline to o-toluidine in the feed.
7.10 Scanning Electron Microscopy
(a) SEM of PANI-DBSA
(SEM) to study the influence of amount of DBSA in the feed on morphology. It is well
known that morphology of PANI is influenced by the method of synthesis and the oxidiz-
ing agent employed [164]. SEM micrographs recorded at lower resolution for all the sam-
ples show porous film and smooth film morphology for the surface open to environment
and the surface in contact with glass substrate during evaporation of the solvent, respec-
tively. The size of the pores varies from 20−150 µm and they arise when evaporation of the
solvent is carried out during synthesis. SEM pictures reveal that PANI flakes are formed
-200 0 200 400 600 800 1000
1.2
2.0
2.8
1.6
2.4
530 mV
PAT-37
Inte
nsity
/ −
ESCE / mV
1195 cm−1
1174 cm−1
3.0
3.5
-200 0 200 400 600 800 1000
2.0
2.5
4.0
530 mV
POT-6
tens
ity /
1195 cm−1
1174 cm−1 −
In
ESCE / mV
114

Part II; 7. Results and Discussion
during layer-by-layer stacking of the polymer. High-resolution SEM micrographs reveal
that morphology of PANI is strongly influenced by the mole ratio of DBSA/aniline in the
feed. Figure 7.32 shows SEM images of PANI-DBSA flakes at different molar ratios of
DBSA/aniline in the feed. TIP-5 (DBSA/aniline is 5:1) exhibit fibrillar morphology (Fig-
ure 7.32a) where the fibers are approximately 8 µm in length and 1 µm in width. When the
ratio of DBSA to aniline is increased to 7:1 (TIP-6) and 10:1 (TIP-7), morphology changes
to porous network type (Figure 7.32b) and compact film type (Figure 7.32c), respectively.
Cross sectional view shows porous network type of morphology (Figure 7.32d). SEM im-
ages of PANI-DBSA synthesized via gelation also exhibit a stacked layer-by-layer mor-
phology and the surface of the gel exhibit fibrillar morphology [106]. The change in the
morphology due to change in the mole ratio of DBSA to aniline may be caused by a
change in conformation of the polymer. At higher DBSA to aniline mole ratios, PANI pre-
fers compact film morphology.
igure 7.32. SEM micrographs of PANI-DBSA at (a) 5:1, (b) 7:1 and (c) 10:1 feed ratios of DBSA to PANI.
sectional view of image ‘b’.
F
(d) Cross
115

Part II; 7. Results and Discussion
(b) SEM of Poly(aniline-co-o-toluidine)s
As mentioned in the preceding section, morphology of aniline based polymers is
strongly influenced by the nature of dopant and oxidant used and the synthetic approach
employed. SEM image of PANI (TIP-6) shows highly ordered network type morphology
(Figure 7.32b and d; Page 115). Reaction conditions employed for the synthesis of POT
and copolymers were similar to that of TIP-6.
SEM images of POT recorded at two different resolutions are shown in Figure 7.33.
Flakes of POT exhibit relatively smoother surface without any pores. Even the larger pores
arising from the solvent evaporation are also absent. As in the case of PANI, flakes of POT
are formed through layer-by-layer stacking. It is clear from Figure 7.33c that POT flakes
are formed through a random 3D growth of the polymer. The lower solubility of POT-
DBSA, which is quite opposite to the one observed in literature, may be due to the absence
of any free volumes in it. Cross-sectional view (Figure 7.33b) of a polymer flake also re-
veals simi r compact morphology for POT. la
Figure 7.33. SEM micrographs of POT flakes recorded at (a) lower magnification (200 µm), (b) magnified
portion of the cross-section marked as ‘m’ and (c) surface of the flake at higher magnification (2 µm).
Morphology of the poly(aniline-co-o-toluidine)s is not greatly affected by the molar
ratio of comonomers in the feed with an exception. The bulk morphology of copolymer
116
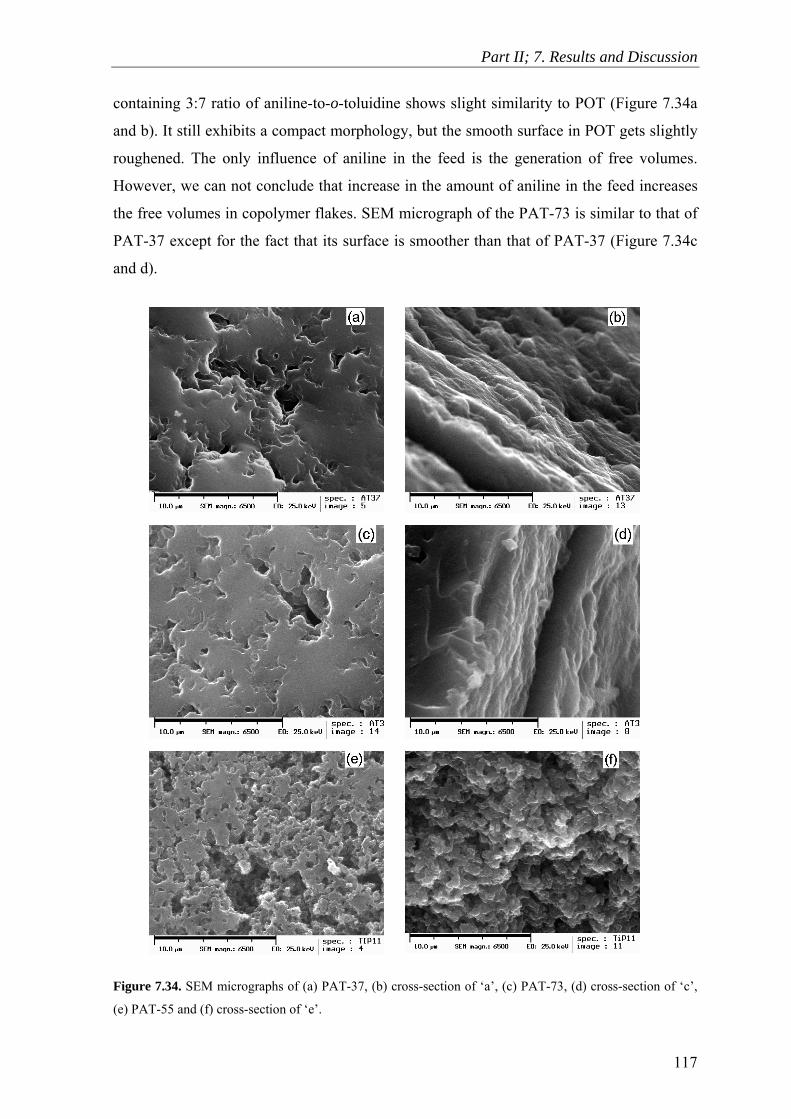
Part II; 7. Results and Discussion
containing 3:7 ratio of aniline-to-o-toluidine shows slight similarity to POT (Figure 7.34a
and b). It still exhibits a compact morphology, but the smooth surface in POT gets slightly
roughened. The only influence of aniline in the feed is the generation of free volumes.
However, we can not conclude that increase in the amount of aniline in the feed increases
the free volumes in copolymer flakes. SEM micrograph of the PAT-73 is similar to that of
PAT-37 except for the fact that its surface is smoother than that of PAT-37 (Figure 7.34c
and d).
Figure 7.34. SEM micrographs of (a) PAT-37, (b) cross-section of ‘a’, (c) PAT-73, (d) cross-section of ‘c’,
(e) PAT-55 and (f) cross-section of ‘e’.
117
Part II; 7. Results and Discussion
A surprising change in the morphology is observed for the copolymer containing
equimolar fractions of aniline and o-toluidine (PAT-55). Its morphology is somewhat simi-
lar to the morphology of PANI. Large numbers of free volumes are generated and more
regular growth of the polymer is seen (Figure 7.34e; Page 117). However, the cross-
sectional view of SEM micrograph of PAT-55 (Figure 7.34f) does not show any porous
network pattern as in PANI. Such a dramatic change in the morphology arises either due to
the formation of composite material where PANI and POT are present as homopolymers or
the conformational rearrangement of polymer chain due to self assembling. Formation of
composites in the present case is simply ruled out because all the spectroscopic and cyclic
voltammetry investigations confirm the formation of real copolymer. Therefore, the con-
cept of conformational rearrangement can be adopted to explain the special properties of
this copolymer.
7.11 Transmission Electron Microscopy of PANI-DBSA
Figure 7.35 (Page 119) shows TEM images of PANI-DBSA at different feed ratios
of DBSA to aniline. It is clear from the figures that the PANI particles are basically spheri-
cal in shape and their size is strongly influenced by the feed ratio of DBSA to aniline.
When the ratio is 5, particles are organized in a way normally exhibited by monolayers and
the average particle size lies in the range of 1−7 nm. Increasing the feed ratio to 7 and then
to 10, increases the average particle size to 8.5−15 nm and then to 20−30 nm, respectively.
The feed ratio of DBSA to aniline also influences the aggregation tendency of the PANI
particles. In TIP-6 and TIP-7 where the feed ratio is 7 and 10, respectively, the agglomera-
tion tendency is higher leading to the formation of a group of spherical particles overlap-
ping each other. Yang and coworkers [165] have reported that TEM images of PANI-
DBSA directly cast from the emulsion show entangled fibers of 1 µm width and a length of
1 mm. Nanocomposites of PANI-CSA and acrylic acid show rice grain-shaped particles
with 70 nm width and 120 nm length, whereas, electrochemically synthesized PANI-CSA
exhibits agglomerated irregular shaped particles [166, 167]. The tendency of aggregation
monitored in TEM images could be correlated to the bulk morphology (SEM) of the poly-
mers. The well organized particles observed in the Figure 7.35a for TIP-5 leads to more
ordered fibrillar morphology (Figure 7.32a; Page 115). Increasing tendency of aggregation
as reflected from the TEM images of TIP-6 and TIP-7 (Figure 7.35b and c) leads to the
118

Part II; 7. Results and Discussion
formation of porous (Figure 7.32b; Page 115) and compact (Figure 7.32c; Page 115) poly-
mer flakes, respectively.
Figure 7.35. Transmission electron microscope images of (a) TIP-5, (b) TIP-6 and (c) TIP-7.
Electron diffraction (ED) patterns were recorded for several agglomerated areas ob-
served in TEM images. At DBSA-to-aniline feed ratio of 5, ill defined ED patterns were
observed indicating the presence of both crystalline (not shown in the figure) and amor-
phous (Figure 7.36a; Page 120) regimes in the polymer. Well defined ED patterns having
bright arcs of different lengths could be seen at DBSA-to-aniline feed ratio of 10 (Figure
7.36b; Page 120). Similar ED patterns were also observed for PANI-DBSA synthesized via
an emulsion pathway and for an electrochemically synthesized PANI-CSA [138, 166].
Such a pattern is attributed to an orthorhombic crystal structure.
119

Part II; 7. Results and Discussion
Fi
gure 7.36. Electron diffraction patterns for selected agglomerated particles of (a) TIP-5 and (b) TIP-7.
120
Part II; 8. Summary
Chapter 8
Summary
8.1 PANI-DBSA
A new inverse emulsion procedure is successfully employed to synthesize PANI-
DBSA, which is completely soluble in common organic solvents such as chloroform and a
2:1 mixture of toluene+2-propanol. Remarkable improvement in the solubility of parent
PANI is observed due to the surfactant dopant (DBSA) and the synthetic approach. PANI
redissolved in these solvents can be spun-, drop- or dip-coated on metallic or glass sub-
strates with very good adhesion. PANI suspension obtained during synthesis can also be
used directly for practical applications. In situ conductivity measurements, which are, till
ate carried out only for the electrochemically deposited conducting polymers have been,
for the first time, employed for the chemically synthesized PANI and the results are in
agreement with the electrochemically synthesized ones. PANI-DBSA synthesized using
present approach possesses fairly high electrical conductivity as noticed from the minimum
resistance values (10 Ω) in the in situ conductivity measurements.
Solution state UV-Vis spectra of PANI-DBSA in chloroform do not show any shift
in the position of the low energy polaron band (~800 nm) and the ratio of intensities of
bands at 800 and 360 nm does not depend on the amount of PANI dissolved in it. These
observations reveal that chloroform is the most suitable solvent to process the pristine
PANI-DBSA. Electronic absorption spectroscopy also confirms the presence of strong in-
teraction, probably due to hydrogen bonding, between 2:1 mixture of toluene+2-propanol
and PANI-DBSA. UV-Vis responses of a drop-coated film of PANI-DBSA for the change
in applied potential are similar to that of electrochemically deposited ones. In situ UV-Vis
spectroscopy measurements reveal good electrochromic reversibility and electrochemical
stability for the polymer.
In acidified aqueous electrolytes, PANI-DBSA does not show good electrochemical
sponses because of the surfactant nature of DBSA, whereas, cyclic voltammogram re-
electrochemically synthesized PANI in aqueous electro-
tes. At more positive potentials where emeraldine-to-pernigraniline transformation oc-
d
re
corded in non-aqueous electrolyte shows two pairs of well defined redox waves which are
very similar to the response of
ly
121

Part II; 8. Summary
curs, CVs of PANI in aqueous acids show two oxidation waves due to the presence of two
ogy of PANI-DBSA from fiber-to-network-
-com
The inverse emulsion polymerization method described for the synthesis of PANI-
DBSA was also employed to synthesize poly(o-toluidine) and copolymers of aniline and o-
toluidine. POT as well as copolymers were obtained in fairly good yields indicating that
the bulky DBSA can efficiently dope POT chain even though it contains a methyl substitu-
ent which does not favor the presence of bulky counter ion in the vicinity of –N atoms of
the polymer backbone. The effective doping of POT by DBSA is also confirmed from the
elemental analysis data which indirectly provide the extent of doping in the polymer. The
expected and calculated elemental compositions are in good agreement. However, DBSA,
a well known dopant for PANI, which improves the solubility of PANI fails to improve the
solubility of POT. Solubility of POT-DBSA is lower than that of PANI-DBSA which is
due to the difference in their bulk morphologies. Flakes of PANI-DBSA possess porous
network-type morphology and, therefore, the solvent can easily penetrate through the mate-
rial making it soluble. Flakes of POT show highly compact morphology (no free volumes)
with random three-dimensional growth of the polymer and hence the solubility is dramati-
ers of aniline and o-toluidine exhibit better solubility than POT,
owever, it is lower than that of PANI. UV-Vis, FTIR, Raman spectroscopies and cyclic
at of
ANI, in the applied potential range, conductivity of POT as well as
types of counter ions in the polymer film. Their peak position and shape are influenced by
the slow anion exchange rate as also confirmed by the in situ UV-Vis spectroscopy.
In situ pre-resonance Raman spectroscopy is used to monitor metal-to-insulator
transition in PANI. Raman spectra also give valuable structural information of PANI-
DBSA. A regular change in the bulk morphol
to pact film could be achieved just by changing the concentration of DBSA in the feed.
An increase in the feed ratio of DBSA to aniline increases the tendency of aggregation of
spherical particles of PANI as indicated in transmission electron microscopy. TEM images
also reveal that morphology of PANI at molecular level is different from that of the bulk
morphology. However, the bulk morphology (SEM) could be correlated to the TEM im-
ages.
8.2 Poly(aniline-co-o-toluidine)s
cally reduced. Copolym
h
voltammetry studies confirm the formation of real copolymer.
Electrical conductivity of the copolymers, as expected, is much lower than th
PANI-DBSA. Unlike P
122

Part II; 8. Summary
copolymers does not improve after the first potential cycle because of their degradation at
much lower positive potentials. PANI-DBSA has wide, while POT has narrow potential
window of electrical conductivity and the potential window of copolymers is strongly in-
fluenced by the fraction of comonomers in the feed. Higher fraction of aniline yields co-
polymers with wider potential window (similar to PANI) and vice versa.
Solution state UV-Vis spectra of POT in a 2:1 mixture of toluene+2-propanol re-
veal that the compact coil-type conformation of POT does not undergo any rearrangement.
In situ UV-Vis responses of POT as well as copolymers resemble PANI except for the fact
that emeraldine-to-pernigraniline transformation occurs at lower positive potential than that
of PANI. In the applied potential range, POT as well as copolymers exhibit good electro-
chromic reversibility but lacks better electrochemical stabilities.
Electrochemical behavior of POT in aqueous acids does not exhibit a kinetic influ-
ence of anion-exchange during cycling. Electrochemical response of copolymers contain-
ing higher concentration of aniline is more similar to that of PANI, whereas, the copoly-
mers containing higher fraction of o-toluidine behave like POT. As in the case of PANI,
electrochemical responses in non-aqueous electrolyte are much better than those in aque-
ous electrolytes. FTIR spectroscopy reveals that amount of monomer present in the co-
polymer depends on the comonomer feed ratios. In situ Raman spectroscopy has been used
to monitor the metal-to-insulator transition induced by the change in applied potential.
Morphology of POT is completely different from that of PANI whereas morphology of co-
polymers shows greater similarity to POT.
The copolymer containing equimolar fractions of comonomers in the feed exhibits
behavior quite different from the others. It was obtained in higher yield and the position of
the band at ~800 nm show larger bathochromic shift in chloroform. Moreover, its mor-
phology shows greater similarity to PANI with large numbers of free volumes present in it.
123
References
References
1. H. Shirakawa, E. J. Louis, A. G. MacDiarmid, C. K. Chiang and A. J. Heeger, Chem.
Commun., 1977, 578.
2. A. A. Syed and M. K. Dinesan, Talanta, 38, 1991, 815.
3. A. F. Diaz, J. F. Rubinson and Jr. H. B. Mark, Adv. Polym. Sci., 84, 1988, 113.
4. P. S. Rao, D. N. Sathyanarayana and T. Jeevananda, In Advanced Functional Mole-
cules and Polymers, H. S. Nalwa (ed.), Gordon and Breach, Tokyo, Vol.3, 2001, p.
79.
5. T. A. Skotheim, R. L. Elsenbaumer and J. R. Reynolds (eds.), Handbook of Conduct-
ing Polymers, 2nd ed., Marcel Dekker, New York, 1998.
6. H. S. Nalwa (ed.), Handbook of Conductive Organic Molecules and Polymers, Wiley,
Chichester, Vols. 1−4, 1997.
7. H. S. Nalwa (ed.), Advanced Functional Molecules and Polymers, Gordon and
Breach, Tokyo, Vols. 1−4, 2001.
8. J. Y. Shimano and A. G. MacDiarmid, Synth. Met., 123, 2001, 251.
9. A. J. Heeger, Angew. Chem. Int. Ed., 40, 2001, 2591.
10. A. G. Green and A. E. Woodhead, J. Chem. Soc., 97, 1910, 2388.
11. A. F. Diaz and J. A. Logan, J. Electroanal. Chem., 111, 1980, 111.
12. R. Holze In Advanced Functional Molecules and Polymers, H. S. Nalwa (ed.),
Gordon and Breach, Tokyo, Vol. 2, 2001, p. 171.
13. A. G. Green and A. E. Woodhead, J. Chem. Soc., 101, 1912, 1117.
14. J. C Chiang, A. G. MacDiarmid, Synth. Met., 13, 1986, 193.
15. E. M. Genies, A. Boyle, M. Lapkowski and C. Tsintavis, Synth. Met., 36, 1990, 139.
6. Y. S. Negi and P. V. Adhyapak, J. Macromol. Sci. - Polym. Rev., C42, 2002, 35.
Synth. Met. 1989
ms and W. J. Argersinger, J. Am. Chem. Soc., 84, 1962,
36
1
17. Y. B. Shim and S. M. Park, , 29, , E169.
18. D. M. Mohilner, R. N. Ada
18.
19. H. Yang and A. J. Bard, J. Electroanal. Chem., 339, 1992, 423.
20. S. A. Brazovskii and N. N. Kirova, Sov. Phys. JETP Lett., 33, 1981, 4.
21. G. E. Wnek, Synth. Met., 15, 1986, 213.
22. B. Lundberg, W. R. Salaneck and I. Lundström, Synth. Met., 21, 1987, 143.
124
References
23. W. R. Salaneck, I. Lundström, T. Hjertberg, C. B. Duke, A. Paton, E. M. Conwell, W.
S. Huang, N. L. D. Somasri, A. F. Richter and A. G. MacDiarmid, Synth. Met., 18,
1987, 311.
24. D. N. Sathyanarayana, In Vibrational Spectroscopy: Theory and Applications, 2nd ed.,
New Age International, New Delhi, 2004.
25. D. J. Gardiner, In Practical Raman Spectroscopy, P. R. Graves (ed.), Springer-
Verlag: Berlin Heidelberg, 1989, p 9.
Heidelberg, 1986, p
10
D. N. Sathyanarayana, In Handbook of Organic
Conductive Molecules and Polymers, H. S. Nalwa (ed.), Wiley, Chichester, Vol. 2,
1997, p. 573.
42. M. Probst and R. Holze, Macromol. Chem. Phys., 198, 1997, 1499.
43. A. L. Schemid, L. M. Lira and S. I. Cordoba de Torresi, Electrochim. Acta, 47, 2002,
2005.
44. Y. Cao, P. Smith and A. J. Heeger, Synth. Met., 48, 1992, 91.
26. D. L. Andrews, In Lasers in Chemistry, Springer-Verlag, Berlin
6.
27. R. Holze and J. Lippe, Synth. Met., 38, 1990, 99.
28. K. Aoki, J. Chen, Q. Ke, S. P. Armes and D. P. Randall, Langmuir, 19, 2003, 5511.
29. E. Marie, R. Rothe, M. Antonietti and K. Landfester, Macromolecules, 36, 2003,
3967.
30. M. T. Nguyen, P. Kasai, J. L. Miller and A. F. Diaz, Macromolecules, 27, 1994, 3625.
31. B. Wessling, Synth. Met., 102, 1999, 1396.
32. R. V. Gregory, In Handbook of Conducting Polymers, 2nd ed., T. A. Skotheim, R. L.
Elsenbaumer, J. R. Reynolds (eds.), Marcel Dekker, New York, 1998, p.437.
33. M. Angelopoulos, A. Ray, A. G. MacDiarmid and A. J. Epstein, Synth. Met., 21,
1987, 21.
34. M. Inoue, R. E. Navarro and M. B. Inoue, Synth. Met., 30, 1989, 199.
35. R. Jiang and S. Dong, Synth. Met., 24, 1988, 255.
36. S. Li, Y. Cao and Z. Xue, Synth. Met., 20, 1987, 141.
37. S. K. Dhawan and D. C. Trivedi, Synth. Met., 60, 1993, 63.
38. L. G. Xu, S. C. Ng and H. S. O. Chan, Synth. Met., 123, 2003, 403.
39. H. S. O. Chan, P. K. H. Ho, S. C. Ng, B. T. G. Tan and K. L. Tan, J. Am.Chem. Soc.,
117, 1995, 8517.
40. X. L. Wei, M. Fahlman and A. J. Epstein, Macromolecules, 33, 2000, 8117.
41. J. Anand, S. Palaniappan and
125

References
45. C. Huber, M. Sadogi, T. Huber and D. Chacko, Adv. Mater., 7, 1995, 316.
46. J. Anand, S. Palaniappan and D. N. Sathyanarayana, Prog. Polym. Sci., 23, 1998, 993.
47. S. Yang and E. Ruckenstein, Synth. Met., 60, 1993, 249.
48. V. Jousseaume, M. Morsli, A. Bonnet and S. Lefrant, J. Appl. Polym. Sci., 67, 1998,
1209.
49. P. Banerjee and B. M. Mandal, Macromolecules, 28, 1995, 3940.
50. S. S. Im and S. W. Byun, J. Appl. Polym. Sci., 51, 1994, 1221.
51. P. S. Rao, S. Subrahmanya and D. N. Sathyanarayana, J. Appl. Polym. Sci., 98, 2005,
583.
52. Y. Wie, R. Hariharan and S. A. Patel, Macromolecules, 23, 1990, 758.
53. C. C. Han, S. P. Hang, K. F. Yang, M. Y. Bai, C. H. Lu and C. S. Huang, Macro-
molecules, 34, 2001, 587.
54. P. Savitha, P. S. Rao and D. N. Sathyanarayana, Polym. Int., 54, 2005, 1243.
55. J. Stejskal, M. Spirkova and P. Kratochvil, Acta Polymer., 45, 1994, 385.
56. K. E. J. Barret (Ed.), Dispersion Polymerization in Organic Media, Wiley, London,
1975.
57. P. Banerjee, Eur. Polym. J., 34, 1998, 841.
58. P. R. Somani, Mater. Chem. Phys., 77, 2003, 81.
9. G. Gustafsson, Y. Cao, G. M. Treac, F. Klavetter, N. Colaneri and A. J. Heeger, Na-
0. D. Chattopadhyay and B. M. Mandal, Langmuir, 12, 1996, 1585.
1. J.
8. N. Kuramoto and E. M. Genies, Synth. Met., 68, 1995, 191.
9. N. Kuramoto and A. Tomita, Polymer, 38, 1997, 3055.
70. L. Yu, J. I. Lee, K. W. Shin, C. E. Park and R. Holze, J. Appl. Polym. Sci., 88, 2003,
1550.
71. B. J. Kim, S. G. Oh, M. G. Han and S. S. Im, Synth. Met., 122, 2001, 297.
5
ture, 357, 1992, 477.
6
6 Stejskal and P. Kratochvil, Langmuir, 12, 1996, 3389.
62. P. Banerjee, S. N. Bhattacharyya and B. M. Mandal, Langmuir, 11, 1995, 2414.
63. E. C. Cooper and B. Vincent, J. Phys. D: Appl. Phys., 22, 1989, 1580.
64. S. P. Armes, M. Aldissi, S. Agnew and S. Gottesfeld, Langmuir, 6, 1990, 1745.
65. S. H. Lee, D. H. Lee, K. Lee and C. W. Lee, Adv. Funct. Mater., 15, 2005, 1495.
66. J. Stejskal, J. Polym. Mater., 18, 2001, 225.
67. P. A. Hassan, S. N. Sawant, N. C. Bagkar and J. V. Yakhmi, Langmuir, 20, 2004,
4874.
6
6
126

References
72. D. Han, Y. Chu, L. Yang, Y. Liu and Z. Lv, Colloids and Surfaces A: Physicochem.
Eng. Aspects, 259, 2005, 179.
73. S. Shreepathi and R. Holze, Chem. Mater., 17, 2005, 4078.
74. M. G. Han, S. K. Cho, S. G. Oh and S. S. Im, Synth. Met., 126, 2002, 53.
75. Y. Haba, E. Segal, M. Narkis, G. I. Titelman and A. Siegmann, Synth. Met., 106,
1999, 59.
76. Y. B. Kim, J. K. Choi, J. A. Yu and J. W. Hong, Synth. Met., 131, 2002, 79.
77. J. N. Barisci, P. C. Innis, L. A. P. Kane-Maguire, I. D. Norris and G. G. Wallace,
Synth. Met., 84, 1997, 181.
78. A. Malinauskas and R. Holze, Electrochim. Acta, 43, 1998, 2563.
. A. Malinauskas and R. Holze, J. Appl. Polym. Sci., 73, 1999, 287.
1. R. Holze, J. Solid State Electrochem., 8, 2004, 982.
82. D. Chattopadhyay, S. Banerjee, D. Chakravorty and B. M. Mandal, Langmuir, 14,
1998, 1544.
83. N. K. Svelko, S. Reynaud and J. Francois, Synth. Met., 150, 2005, 107.
84. P. S. Rao, S. Subrahmanya and D. N. Sathyanarayana, Synth. Met., 128, 2002, 311.
85. P. Ghosh, A. Chakrabarti and S. K. Siddhanta, Eur. Polym. J., 35, 1999, 803.
86. W. Yin and E. Ruckenstein, Synth. Met., 108, 2000, 39.
87. C. Li and S. Mu, Synth. Met., 144, 2004, 143.
88. M. Morita, J. Appl. Polym. Sci., 52, 1994, 711.
89. A. Abd-Elwahed and R. Holze, Synth. Met., 131, 2002, 61.
90. C. Liu, J. Zhang, G. Shi and F. Chen, J. Appl. Polym. Sci., 92, 2004, 171.
91. A. Hugot-LeGoff and M. C. Bernard, Synth. Met., 60, 1993, 115.
92. M. Bartonek, N. S. Sariciftci and H. Kuzmany, Synth. Met., 36, 1990, 83.
93. S. Quillard, M. I. Boyer, M. Cochet, J. P. Buisson, G. Louarn and S. Lefrant, Synth.
Met., 101, 1999, 768.
94. C. Y. Xu, P. X. Zhang and L. Yan, J. Raman Spectrosc., 32, 2001, 862.
95. B. Vincent and J. Waterson, J. Chem. Soc. Chem. Commun., 1990, 683.
96. J. Stejskal, P. Kratochvíl and N. Radhakrishnan, Synth. Met., 61, 1993, 225.
97. K. Tzou and R. V. Gregory, Synth. Met., 53, 1993, 365.
98. P. Rannou, B. Dufour, J. P. Travers and A. Pron, Synth. Met., 119, 2001, 441.
99. X. Lu, J. Xu and L. Wong, Synth. Met., 156, 2006, 117.
100. P. Tsotra and K. Friedrich, J. Mater. Sci., 40, 2005, 4415.
79
80. A. Abd-Elwahed and R. Holze, Curr. Top. Electrochem., 9, 2003, 93.
8
127

References
101. P. Krzysztof and Y. Nan-Loh, A dle Atlantic regional meeting of the
Am. Chem. Soc. Princeton, June
102. B. Dufour, P. Rannou, D. Dju k, M. Zagorska, A. deGeyer, J. P.
Travers and A. Pron, Chem. Mater., 15, 2003, 1587.
03. L. W. Shacklette, G. G. Miller, R. L. Elesenbaumer, C. Han, B. M. Webling and B.
Patent, 5,281,363,1994.
4. M
34, 2005, 42.
13. J.
. Sun, Synth. Met., 74, 1995, 107.
20. I.
123. A. Pron, F. Genoud, C. Menardo and M. Nechtschein, Synth. Met., 24, 1988, 193.
bstracts, 36th mid
2003, 366.
rado, H. Janecze
1
Wessling, U. S.
10 . Angelopoulos, N. Patel, J. M. Shaw, N. C. Labianca and S. A. Rishton, J. Vac.
Sci. Technol. B, 11, 1993, 2794.
105. Y. Cao, P. Smith and A. J. Heeger, U. S. Patent, 5,232,631, 1993.
106. R. Madathil, R. Parkesh, S. Ponrathnam and M. C. J. Large, Macromolecules, 37,
2004, 2002.
107. G. Li and Z. Zhang, Macromolecules, 37, 2004, 2683.
108. K. S. Alva, J. Kumar, K. A. Marx and S. K. Tripathy, Macromolecules, 30, 1997,
4024.
109. J. A. Akkara, K. J. Senecal and D. L. Kaplan, J. Polym. Sci., 29, 1991, 1561.
110. Y. Ma, J. Zhang, G. Zhang and H. He, J. Am. Chem. Soc., 126, 2004, 7097.
111. J. Kan, S. Zhang and G. Jing, J. Appl. Polym. Sci., 99, 2006, 1848.
112. X. Wang, N. Liu, X. Yan, W. Zhang and Y. Wei, Chem. Lett.,
1 E. Osterholm, Y. Cao, F. Klavetter and P. Smith, Synth. Met., 55, 1993, 1034.
114. J. E. Osterholm, Y. Cao, F. Klavetter and P. Smith, Polymer, 35, 1994, 2902.
115. P. J. Kinlen, J. Liu, Y. Ding, C. R. Graham and E. E. Remsen, Macromolecules, 31,
1998, 1735.
116. J. Li, K. Fang, H. Qiu, S. Li and W. Mao, Synth. Met., 142, 2004, 107.
117. G. Odian, In Principles of Polymerization, 4th ed. John Wiley-interscience, New
York, 2004.
118. L. M. Gan, C. H. Chew, H. S. O. Chan and L. Ma, Polym. Bull. (Berlin), 31, 1993,
347.
119. E. Ruckenstein and Y
1 Kogan, L. Fokeeva, I. Shunina, Y. Estrin, L. Kasumova, M. Kaplunova, G. Davi-
dova and E. Knerelman, Synth. Met., 100, 1999, 303.
121. Z. Sun, Y. Geng, L. Ji, X. Wang, X. Jing and F. Wang, J. Appl. Polym. Sci., 72, 1999,
1077.
122. A. Yasuda and T. Shimidzu, Polym. J., 25, 1993, 329.
128

References
124. P. S. Rao, D. N. Sathyanarayana and S. Palaniappan, Macromolecules, 35, 2002,
4988.
125. M. S. Ram and S. Palaniappan, J. Mater. Sci., 39, 2004, 3069.
1 . Wei, R. Hariharan and S. A. Patel, Macromolecules, 23, 1990, 758.
127. P. S. Rao and D. N. Sathyanarayana, Polymer, 43, 2002, 5051.
128. P. S. Rao and D. N. Sathyanarayana, J. Polym. Sci. Part A: Polym. Chem., 40, 2002,
4065.
129. B. C. Roy, M. D. Gupta, L. Bhowmik and J. K. Ray, Bull. Mater. Sci., 24, 2001, 389.
130. A. L. Sharma, V. Saxena, S. Annapoorni and B. D. Malhotra, J. Appl. Polym. Sci., 81,
2001, 1460.
131. F. R. Diaz, C. O. Sanchez, M. A. del Valle, J. L. Torres and L. H. Tagle, Synth. Met.,
11
26. Y
8, 2001, 25.
32. S. Vogel and R. Holze, Electrochim. Acta, 50, 2005, 1587.
tate Electrochem., 11, 2006, 38.
34. A
r, Mater. Chem. Phys., 73,
148. D. Kumar, Synth. Met., 114, 2000, 369.
1
133. A. A. Shah and R. Holze, J. Solid S
1 . A. Shah and R. Holze, Synth. Met., 156, 2006, 566.
135. S. Bilal and R. Holze, J. Electroanal. Chem., 592, 2006, 1.
136. M. R. Huang, X. G. Li, Y. L. Yang, X. S. Wang and D. Yan, J. Appl. Polym. Sci., 81,
2001, 1838.
137. D. D. Borole, U. R. Kapadi, P. P. Mahulikar and D. G. Hundiwale, Mater. Lett., 58,
2004, 3816.
138. C. H. Yang, T. C. Yang and Y. K. Chih, J. Electrochem. Soc., 152, 2005, E273.
139. P. Savitha and D. N. Sathyanarayana, Polym. Int., 53, 2004, 106.
140. S. J. Su, M. Takeishi and N. Kuramoto, Macromolecules, 35, 2002, 5752.
141. L. Y. Xin, X. G. Zhang, G. Q. Zhang and C. M. Shen, J. Appl. Polym. Sci., 96, 2005,
1539.
142. S. Ito, K. Murata, S. Teshima, R. Aizawa, Y. Asako, K. Takahashi and B. M. Hoff-
man, Synth. Met., 96, 1998, 161.
143. S. A. Chen and G. W. Hwang, J. Am. Chem. Soc., 117, 1995, 10055.
144. J. Laska and J. Widlarz, Synth. Met., 135-136, 2003, 261.
145. S. Palaniappan and V. Nivasu, New J. Chem., 26, 2002, 1490.
146. A. A. Athawale, M. V. Kulkarni and V. V. Chabukswa
2002, 106.
147. J. Lippe and R. Holze, Synth. Met., 41−43, 1991, 2927.
129

References
149. N. Ahmad, J. Naseer, N. Gadgil and F. Goodson, J. Indian Chem. Soc., 2004, 81, 606.
150. H. V. Hoang and R. Holze, Chem. Mater., 18, 2006, 1976.
151. J. Stejskal and I. Sapurina, Pure Appl. Chem., 77, 2005, 815.
152. A. J. Dominis, G. M. Spinks, L. A. P. Kane-Maguire and G. G. Wallace, Synth. Met.,
129, 2002, 165.
15 . Lindfors, C. Kvarnström and A. Ivaska, J. Electroanal. Chem., 518, 2002, 131.
154. J. E. de Albuquerque, L. H. C. Mattoso, R. M. Faria, J. G. Masters and A. G.
MacDiarmid, Synth. Met., 146, 2004, 1.
155. R. Mazeikiene, G. Niaura and A. Malinauskas, Synth. Met., 139, 2003, 89.
156. M. C. Bernard, S. Joiret, A. Hugot-Le Goff and P. D. Long, J. Electrochem. Soc.,
148, 2001, B299.
3. T
57. D
h. Met., 21, 1987, 157.
64. P
31, 1998, 6521.
167. P. A. McCarthy, J. Huang, S. C. Yang and H. L. Wang, Langmuir, 18, 2002, 259.
1 . A. Buttry and M. D. Ward, Chem. Rev., 92, 1992, 1355.
158. M. Lapkowski, K. Berrada, S. Quillard, G. Louran, S. Lefrant and A. Pron, Macromo-
lecules, 28, 1995, 1233.
159. M. V. Kulkarni, A. K. Viswanath and U. P. Mulik, Mater. Chem. Phys., 89, 2005, 1.
160. A. Falcou, A. Duchene, P. Hourquebie, D. Marsacq and A. Balland-Longeau, Synth.
Met., 149, 2005, 115.
161. X. Lu, H. Y. Ng, J. Xu and C. He, Synth. Met., 128, 2002, 167.
162. M. Baibarac, M. Cochet, M. Lapkowski, L. Mihut, S. Lefrant and I. Baltog, Synth.
Met. 96, 1998, 63.
163. N. S. Sariciftci and H. Kuzmany, Synt
1 . S. Rao, S. Subrahmanya and D. N. Sathyanarayana, Synth. Met., 139, 2003, 397.
165. C. Y. Yang, P. Smith, A. J. Heeger, Y. Cao and J. E. Osterholm, Polymer, 35, 1994,
1142.
166. P. C. Innis, I. D. Norris, L. A. P. Kane-Maguire and G. G. Wallace, Macromolecules,
130

Selbständigkeitserklärung
Selbständigkeitserklärung
Hierm s statt, die vorliegende Arbeit selbständig und ohne unerlaubte
fs
Chem
it erkläre ich an Eide
Hil mittel durchgeführt zu haben.
nitz, den 26.07.2006 (Subrahmanya S)
131

Curriculum Vitae
Curriculum Vitae
Personal Information
Date
Nationality: Indian
India
1997 Mysore University, India
nce, Bangalore, India
olyaniline blends
emistry,
Publications: f aniline and o-
o
the copolymers” S. Shreepathi and R. Holze, Macromol. Chem. Phys. (accepted).
Name: Subrahmanya Shreepathi
of Birth: February 21, 1977
Place of Birth: Ananthapur, India
Address: Kumara Krupa
Gurubhavana Road
SORAB-577 429
Education: 1994-1997: L.B. College, Kuvempu University, India
B.Sc (Physics, Chemistry and Mathematics)
-1999:
M.Sc (Inorganic Chemistry)
2000-2002: Project Assistant
Department of IPC, Indian Institute of Scie
Project Title: Synthesis and characterization of conducting p
with thermoplastic polymers
2003-Till date: Ph.D. Student, Institute of Physical Chemistry/Electroch
TU Chemnitz, Germany
1 “Benzoyl peroxide initiated inverse emulsion copolymerization o
t luidine: effect of dodecylbenzenesulfonic acid on the physicochemical properties of
132

Curriculum Vitae
2 “Corrosion protection performance and spectroscopic investigations of soluble con-
chem. Soc. in Press (2007).
3 “Spectroelectrochemistry and preresonance Raman spectroscopy of polyaniline-
hi and R. Holze,
4 “Spectroelectrochemical investigations of soluble polyaniline synthesized via new in-
2005) 4078.
5 “ blends of polyaniline and poly(vinyl alcohol) synthesized
yana, J.
6 “Polyaniline–polycarbonate blends synthesized by two emulsion pathways” P. S. Rao,
143 (2004) 323.
li inyl acetate) blends” P. S. Rao, S. Subrahmanya and D.N.
yani-
i et. 128 (2002)
ine
synthesized by a new inverse emulsion procedure” in IUPAC World Polymer Congress
ical investigations of soluble
on Electrochemistry at Greifswald, Germany from March 13-16, 2005
ducting polyaniline-dodecylbenzenesulfonate synthesized via inverse emulsion proce-
dure” S. Shreepathi, H. V. Hoang and R. Holze, J. Electro
dodecylbenzenesulfonic acid colloidal dispersions” S. Shreepat
Langmuir, 22 (2006) 5196.
verse emulsion pathway” S. Shreepathi and R. Holze, Chem. Mater. 17 (
Water-soluble conductive
by two emulsion pathways” P. S. Rao, S. Subrahmanya and D.N. Sathyanara
Appl. Polym. Sci. 98 (2005) 583.
S. Subrahmanya and D.N. Sathyanarayana, Synth. Met.
7 “Synthesis by inverse emulsion pathway and characterization of conductive polyani-
ne–poly(ethylene-co-v
Sathyanarayana, Synth. Met. 139 (2003) 397.
8 “Inverse emulsion polymerization: a new route for the synthesis of conducting pol
l ne” P. S. Rao, S. Subrahmanya and D.N. Sathyanarayana, Synth. M
311.
International Conferences: 1. Poster presentation of article entitled “Spectroelectrochemistry of soluble polyanil
MACRO 2004 at Paris, France from July 4-9, 2004.
2. Poster presentation of article entitled “Spectroelectrochem
polyaniline synthesized via new inverse emulsion procedure” in 4th Baltic conference
133
Copyright © 2022 FDOKUMEN