DOCUMENT RESUME CE 075 358 Brock, Thomas - ERIC
295
DOCUMENT RESUME ED 414 443 CE 075 358 AUTHOR Brock, Thomas; Doolittle, Fred; Fellerath, Veronica; Greenberg, David H.; Hollister, Robinson G., Jr.; Wiseman, Michael TITLE Creating New Hope: Implementation of a Program To Reduce Poverty and Reform Welfare. INSTITUTION Manpower Demonstration Research Corp., New York, NY. SPONS AGENCY Ford Foundation, New York, NY.; John D. and Catherine T. MacArthur Foundation, Chicago, IL.; Wisconsin State Dept. of Workforce Development, Madison.; Helen Bader Foundation, Milwaukee, WI. PUB DATE 1997-10-00 NOTE 328p. PUB TYPE Reports Evaluative (142) EDRS PRICE MF01/PC14 Plus Postage. DESCRIPTORS Adult Education; Case Studies; Comparative Analysis; *Demonstration Programs; Employment Patterns; Employment Programs; Pilot Projects; *Poverty Programs; Program Costs; Program Effectiveness; Program Evaluation; Program Implementation; Salary Wage Differentials; Tables (Data); Vocational Education; *Welfare Recipients IDENTIFIERS *Community Service; Welfare Reform; *Welfare to Work Programs; Wisconsin (Milwaukee) ABSTRACT The New Hope Project in Milwaukee, Wisconsin, was developed to reduce poverty and reform welfare by providing adults who are willing to work least 30 hours per week with the following: help obtaining a job, including time-limited, minimum wage community service jobs (CSJ) if full-time employment was not otherwise available; a monthly earnings supplement that raised most participants' income above the poverty level; subsidized health insurance; and subsidized child care. New Hope's context, implementation, impacts on key outcomes, and costs were assessed through an independent evaluation based on a treatment-control group design. During the year following random assignment to the New Hope program, approximately three-fourths of applicants accepted into the program worked full time and claimed a program benefit. Of the 24% of New Hope participants who took a CSJ job, approximately 60% eventually entered full-time employment. (Fifty-eight additional tables/figures are included. Appended are the following: data sources; a list of donors for the pilot and full programs; design of the New Hope benefits package; methodology of the New Hope neighborhood survey; selected characteristics of the New Hope full sample at random assignment; selected results of the MacArthur Child and Family Study; and 22 additional tables/figures. The bibliography lists 43 references.) (MN) ******************************************************************************** Reproductions supplied by EDRS are the best that can be made from the original document. ********************************************************************************
-
Upload
khangminh22 -
Category
Documents
-
view
0 -
download
0
Transcript of DOCUMENT RESUME CE 075 358 Brock, Thomas - ERIC

DOCUMENT RESUME
ED 414 443 CE 075 358
AUTHOR Brock, Thomas; Doolittle, Fred; Fellerath, Veronica;Greenberg, David H.; Hollister, Robinson G., Jr.; Wiseman,Michael
TITLE Creating New Hope: Implementation of a Program To ReducePoverty and Reform Welfare.
INSTITUTION Manpower Demonstration Research Corp., New York, NY.
SPONS AGENCY Ford Foundation, New York, NY.; John D. and Catherine T.MacArthur Foundation, Chicago, IL.; Wisconsin State Dept. ofWorkforce Development, Madison.; Helen Bader Foundation,Milwaukee, WI.
PUB DATE 1997-10-00NOTE 328p.
PUB TYPE Reports Evaluative (142)
EDRS PRICE MF01/PC14 Plus Postage.
DESCRIPTORS Adult Education; Case Studies; Comparative Analysis;*Demonstration Programs; Employment Patterns; EmploymentPrograms; Pilot Projects; *Poverty Programs; Program Costs;Program Effectiveness; Program Evaluation; ProgramImplementation; Salary Wage Differentials; Tables (Data);Vocational Education; *Welfare Recipients
IDENTIFIERS *Community Service; Welfare Reform; *Welfare to WorkPrograms; Wisconsin (Milwaukee)
ABSTRACTThe New Hope Project in Milwaukee, Wisconsin, was developed
to reduce poverty and reform welfare by providing adults who are willing to
work least 30 hours per week with the following: help obtaining a job,including time-limited, minimum wage community service jobs (CSJ) iffull-time employment was not otherwise available; a monthly earningssupplement that raised most participants' income above the poverty level;subsidized health insurance; and subsidized child care. New Hope's context,implementation, impacts on key outcomes, and costs were assessed through anindependent evaluation based on a treatment-control group design. During theyear following random assignment to the New Hope program, approximatelythree-fourths of applicants accepted into the program worked full time andclaimed a program benefit. Of the 24% of New Hope participants who took a CSJjob, approximately 60% eventually entered full-time employment. (Fifty-eightadditional tables/figures are included. Appended are the following: datasources; a list of donors for the pilot and full programs; design of the New
Hope benefits package; methodology of the New Hope neighborhood survey;selected characteristics of the New Hope full sample at random assignment;selected results of the MacArthur Child and Family Study; and 22 additional
tables/figures. The bibliography lists 43 references.) (MN)
********************************************************************************Reproductions supplied by EDRS are the best that can be made
from the original document.********************************************************************************

CREATING NEW HOPE
Ia a
U S DEPARTMENT OF EDUCATIONlice of Educational Research and Improvement
E UCATIONAL RESOURCES INFORMATIONCENTER (ERIC)
This document has been reproduced asreceived from the person or organizationoriginating itMinor changes have been made toimprove reproduction quality
Points of view or opinions stated in thisdocument do not necessar ly representofficial OERI position or policy
D
S
I
BEST COPY AVAILABLE 2
PERMISSION TO REPRODUCE ANDDISSEMINATE THIS MATERIAL
HAS BEEN GRANTED BY
V4T E ED 9TIONAL RESOURCESINFORM ION CENTER (ERIC)
L v1

BOARD OF DIRECTORSRICHARD P. NATHAN, ChairmanProvost, Rockefeller CollegeState University of New YorkDirector, Rockefeller Institute
of Government
PAUL H. O'NEILL, TreasurerChairman and CEOAlcoa
ELI GINZBERG, Chairman EmeritusDirectorThe Eisenhower Center for the
Conservation of Human ResourcesColumbia University
MARY JO BANEProfessor of Public PolicyJohn F. Kennedy School of GovernmentHarvard University
REBECCA M. BLANKProfessor of EconomicsNorthwestern University
ANTONIA HERNANDEZPresident and General CounselMexican American Legal Defense and
Educational Fund
ANNA KONDRATASSenior AssociateUrban Institute
RICHARD J. MURNANEProfessor of EducationGraduate School of EducationHarvard University
RUDOLPH G. PENNERManaging DirectorBarents Group
ROBERT REISCHAUERSenior FellowBrookings Institution
ROBERT SOLOWInstitute ProfessorMassachusetts Institute of Technology
GILBERT STEINERSenior FellowBrookings Institution
MITCHELL SVIRIDOFFProfessor Emeritus and Senior FellowCommunity Development Research CenterNew School for Social Research
WILLIAM JULIUS WILSONMalcolm Wiener Professor of Social PolicyJohn F. Kennedy School of GovernmentHarvard University
JUDITH M. GUERONPresidentManpower Demonstration Research Corporation
MDRC
CREATING NEW HOPE
Implementation of a Program toReduce Poverty and Reform Welfare
Thomas BrockFred Doolittle
Veronica FellerathMichael Wiseman
withDavid H. Greenberg
Robinson G. Hollister, Jr.
October 1997
MDRC
Manpower Demonstration Research Corporation
4

MDRC is evaluating the New Hope program under a contract with the New HopeProject, Inc., supported by the Helen Bader Foundation, the Ford Foundation, theJohn D. and Catherine T. MacArthur Foundation, and the State of Wisconsin'sDepartment of Workforce Development.
Dissemination of MDRC's work is also supported by MDRC's Public Policy OutreachFunders: the Ford Foundation, the Ambrose Monell Foundation, the Alcoa Foundation,and the James Irvine Foundation.
The findings and conclusions presented in this paper do not necessarily represent theofficial positions or policies of the funders of the New Hope Demonstration.
Copyright © 1997 by the Manpower Demonstration Research Corporation

Contents
PrefaceAcknowledgmentsExecutive Summary
1 The New Hope Project and Evaluation
ixxi
ES-1
1
I. Program Description 1
H. The Policy Context of New Hope 3
III. Research Design and Hypotheses 8
IV. The Organization of This Report 12
2 Project Origins and Organization 15
I. Project History 15
II. Organizational Structure and Budget 20III. Organizational Challenges of Implementation 28
IV. Conclusion 33
3 Labor Market and Institutional Context 34
I. Milwaukee's Metropolitan Labor Market 35
II. Institutional Context 47
4 Residents of the New Hope Neighborhoods 53
I. The New Hope Neighborhood Survey 54
II. The New Hope Neighborhood Households 65
III. The Neighborhood Survey Respondents 65
IV. The Demand for New Hope 75
V. New Hope Awareness 82
VI. Conclusions 84
5 Recruitment and Sample Buildup 87
I. Overview of the Recruitment Process and Buildup of the Sample 88
II. Recruitment Methods 91
III. Problems in Communicating the New Hope Offer 97IV. Reasons That People Applied to New Hope 99
V. Conclusion 101
6 Characteristics of New Hope Applicants 104
I. Profile of the Full Sample 105
II. Subgroups 110
III. Comparing the Research Sample With Eligibles in the New Hope Neighborhoods 124
7 The Roles of the Project Representatives 128I. Interactions Between Project Representatives and Participants 128
II. Participant Views About Their Project Representatives 136
III. Conclusion 138

8 The Delivery of Benefits and Services 140I. Community Service Jobs 140
II. Financial Benefits 145III. The Distinctiveness of New Hope's Benefits and Services 155IV. How New Hope Makes People Better Off: Three Case Studies 157V. Conclusion 161
9 Participants' Use of Benefits and Services 166I. The Overall Use of Benefits 167
II. Benefit Use for Subgroups in the Study 181
Appendix A Data Sources 193Appendix B Local, State, and National Donors for the Pilot and Full Programs
(as of December 1996) 197Appendix C Designing the New Hope Benefits Package 199Appendix D Methodology of the New Hope Neighborhood Survey 215Appendix E Selected Characteristics of the New Hope Full Sample at
Random Assignment, by Research Status 223Appendix F MacArthur Child and Family Study (CFS): Selected Characteristics,
Opinions, and Employment History of the New Hope Sample WithPreadolescent Children at Random Assignment 229
Appendix G Tables: Monthly Earnings Supplements for 1996 235
References 256Selected MDRC Publications 259
7-iv-

Tables and Figures
Tables
1.1 Comparison of New Hope Project and Wisconsin Works 6
2.1 New Hope Project Budget: Fiscal Years 1992-1999 27
3.1 Changes in Milwaukee's Occupational Structure: 1970-1990 37
3.2 Credential Requirements for Job Openings in the Milwaukee SMSA:October 1995 39
3.3 Percentage of Full-Time Job Openings That Are Difficult to Fill, by Locationin the Milwaukee SMSA 41
3.4 Comparison of Job Openings and Unemployed Workers, by Location in theMilwaukee SMSA 43
3.5 One-Way Commuting Times by Bus and Auto from the New Hope TargetAreas to Seven Suburban Communities in the Milwaukee SMSA, in Minutes 45
4.1 Response Rates for Neighborhood Survey 61
4.2 Population of Target Areas: 1990 and 1996 64
4.3 Household Composition of Target Areas 66
4.4 Receipt of Public Assistance in Target Areas 67
4.5 Respondent Characteristics in Target Areas 68
4.6 Marital Status in Target Areas 70
4.7 Number of Children for Adults Under Age 65 Who Reported Living With atLeast One Child Under Age 19 71
4.8 Employment Status in Target Areas 73
4.9 Job Characteristics of Employed Residents 74
4.10 Reasons for Nonemployment for Respondents Without Jobs 76
4.11 New Hope Eligibility and Demand 78
4.12 Estimated Number of Potential New Hope Participants, by Eligibility Criteria 80
4.13 Characteristics of Persons Likely to Be New Hope Eligible, by EligibilityCriteria 81
4.14 Evaluation of New Hope Benefits and Services for Adults Meeting Level 3Eligibility Criteria 83

4.15 Reported Knowledge of New Hope Household Survey Respondents
6.1 Selected Characteristics, Opinions, and Employment History of the NewHope Full Sample at Random Assignment
6.2 Selected Characteristics of the New Hope Full Sample at RandomAssignment, by Employment Status, Both Part Time and Full Time
6.3 Selected Characteristics of the New Hope Sample at Random Assignment, byPresence or Absence of Children in Household
6.4 Selected Characteristics of the New Hope Sample at Random Assignment forSingle Men
6.5 Comparison of Eligibles in the New Hope Neighborhood Survey With theNew Hope Sample
9.1 Benefits Used by an Early Cohort of Program Group Members Within 12Months After Random Assignment
85
106
112
117
121
125
169
9.2 Selected Characteristics of an Early Cohort of Program Group Members atRandom Assignment, by Post-Start-Up (Follow-Up Months 4-12) BenefitUse Category 175
9.3 Reasons for Program Inactive Status 178
9.4 Participation Outcomes for an Early Cohort of Program Group MembersWithin Follow-Up Months 1-12, by Employment Status at RandomAssignment 183
9.5 Participation Outcomes for an Early Cohort of Program Group Members inHouseholds That Received Any New Hope Benefit in Follow-Up Months 1-12, by Employment Status at Random Assignment
9.6 Participation Outcomes for an Early Cohort of Program Group Members inFollow-Up Months 1-12, by Presence or Absence of Children at RandomAssignment
9.7 Participation Outcomes for an Early Cohort of Program Group Members inFollow-Up Months 1-12 for Single Men at Random Assignment
185
187
190
A.1 Data Sources and Samples 195
B.1 Local, State, and National Donors for the Pilot and Full Programs (as ofDecember 1996) 198
C.1 New Hope Earnings Supplement 206
D.1 Adults in Respondent's Living Unit 217
D.2 Distribution of Respondents With Partners, by Gender and Age 219
D.3 Respondent and Partner Employment Status 221
-vi-

E.1 Selected Characteristics of the New Hope Full Sample at RandomAssignment, by Research Status 224
F.1 MacArthur Child and Family Study (CFS): Selected Characteristics,Opinions, and Employment History of the New Hope Sample WithPreadolescent Children at Random Assignment 230
G.1 Monthly Earnings Supplement for One Earner With No Children: 1996 236
G.2 Monthly Earnings Supplement for One Earner Under Age 25 With NoChildren: 1996 238
G.3 Monthly Earnings Supplement for One Earner With One Child: 1996 239
G.4 Monthly Earnings Supplement for One Earner With Two Children: 1996 241
G.5 Monthly Earnings Supplement for One Earner With Three Children: 1996 243
G.6 Monthly Earnings Supplement for One Earner With Four Children: 1996 245
G.7 Monthly Earnings Supplements for Two Earners With No Children: 1996 247
G.8 Monthly Earnings Supplements for Two Earners Under Age 25: 1996 249
G.9 Monthly Earnings Supplements for Two Earners With One Child: 1996 250
G.10 Monthly Earnings Supplements for Two Earners With Two Children: 1996 251
G.11 Monthly Earnings Supplements for Two Earners With Three Children: 1996 252
G.12 Monthly Earnings Supplements for Two Earners With Four Children: 1996 254
Figures
1.1 Overview of the Random Assignment Process for the New Hope Project 11
1.2 Factors Affecting the Implementation and Impacts of the New Hope Program 13
2.1 Organizational Chart: August 1994-January 1997 22
3.1 Suburban Communities and Transportation Corridors from New Hope 46
3.2 Location of Milwaukee County Human Service Providers 50
4.1 New Hope in Context: The Geography of Poverty in Milwaukee, 1989 55
4.2 New Hope in Context: Target Areas 57
4.3 New Hope in Context: Census Tracts and Neighborhoods 58

4.4 New Hope in Context: 1989 Poverty Rate by Census Tract in New HopeTarget Areas 60
4.5 Participant Recruitment and Neighborhood Survey: 1994-1996 62
5.1 Monthly Random Assignments: July 1994-December 1995 90
5.2 Types of Organizations Contacted During Community Outreach: July 1994-July 1995 93
5.3 Revised Recruitment Brochure 95
8.1 Community Service Job Assignments: January-December 1996 142
8.2 Monthly Benefits Statement 152
8.3 Single Minimum Wage Earner With No Children (Case 1) 159
8.4 Single Minimum Wage Earner With Two Children (Case 2) 160
8.5 Increased Work Hours for a Single Minimum Wage Earner With TwoChildren (Case 2) 162
8.6 Increased Earnings for a Single Earner With Two Children (Case 2) 163
8.7 Two Earners With Two Children (Case 3) 164
9.1 Cumulative Percentage of an Early Cohort of Program Group MembersUsing Any New Hope Benefit in Follow-Up Months 1-12 171
9.2 Percentage of an Early Cohort of Program Group Members Using Any NewHope Benefit in Follow-Up Months 1-12 172
9.3 Participation of an Early Cohort of Program Group Members After the Start-Up Phase: Benefit Use in Follow-Up Months 4-12 174
9.4 Early Cohort of Program Group Members Working in a Community ServiceJob (CSJ) in Follow-Up Months 1-12 180
9.5 Cumulative Percentage_of an Early Cohort of Program Group MembersUsing Any New Hope Benefit in Follow-Up Months 1-12, by Employment 184Status at Random Assignment
C.1 Federal Earned Income Tax Credit (EIC) for a Family With One Child 202
C.2 Total Real Marginal Tax Rates (MTRs) for Two Family Sizes 209
-viii- 11

Preface
At this time of national debate about the best way to promote and reward work amonglow-income people, Milwaukee's New Hope Demonstration provides an unusual learningopportunity. With its goals of increasing employment, reducing poverty, and reducing receipt ofwelfare, New Hope is an ambitious undertaking. It seeks to achieve these goals through a simpleoffer: Participants who work full time (defined as an average of 30 hours per week) are assuredof earnings above poverty, access to subsidized child care and health insurance (if needed), and apaid community service job if they are unable to find unsubsidized employment. This mix ofwork-conditioned incentives and services makes New Hope unique among the tests of reformsunder way today. The Board and staff of New Hope are unusual, too, in having committedthemselves from the very beginning to a rigorous research agenda, believing that for their projectto influence national policy, it would have to be studied seriously.
The program is operated by a community-based organization, the New Hope Project,outside the traditional public assistance system. During the demonstration, the program isoperating in two low-income areas of Milwaukee. Eligibility is based solely on income and awillingness to work full time, without any requirement that there be a single parent or even anychildren present in the household, as has been common in many welfare programs. At entry intothe program, approximately 70 percent of New Hope participants lived in households withchildren, and 63 percent were receiving some type of public assistance.
This report, the first major product of the evaluation, presents findings on New Hope'scontext, design, and implementation. A future report will present findings on the program'simpacts on key outcomes and costs. Funding for the evaluation has been provided by the HelenBader Foundation, the Ford Foundation, the John D. and Catherine T. MacArthur Foundation,and the State of Wisconsin's Department of Workforce Development.
Several messages emerge from the findings of this report. First, through an analysis of thecontext in which New Hope operates, the report presents a picture of the conditions, in twocentral-city, low-income areas within a very strong metropolitan economy. This illustrates boththe benefits of the strong overall employment picture and the limits on residents' abilities toparticipate in the economic growth.
Second, the New Hope Project successfully put in place the benefits and services calledfor in the program design, in the process learning many lessons about how to administer monthlyearnings supplements, subsidies for health insurance and child care, and paid community servicejobs. The program thus provides an opportunity to learn how to link more closely work andsupplemental financial support than is possible under existing earned income tax credits, whichlargely operate on an annual basis. Among the insights emerging from the New Hope experienceis the central role program staff can play in helping participants understand the various financialincentives, make informed choices, and pursue employment.
In New Hope, unlike many other programs, participants must work to receive programbenefits, so this report's findings on use of the benefits are also of special importance. New Hopewas not designed with any fixed sequence of program participation. Instead, it provides acollection of benefits that participants can access as they wish. Approximately three-quarters of

those accepted into the New Hope program worked full time at some point in the following 12months and received a program benefit, but not surprisingly patterns of benefit use werecomplex and varied.
Final results on the effectiveness of New Hope in meeting its goals must await laterreports on program impacts. Nevertheless, this report illustrates how the New Hope Projectsucceeded in putting in place services that have the potential to provide low-incomeworkers witha bridge from below-poverty incomes to greater economic security.
Judith M. GueronPresident

Acknowledgments
This report reflects the contributions of many people, but especially the staff ofand participants in the New Hope Project.
Sharon F. Schulz, Executive Director during the first three years of the evaluation,
gave full support to this study, provided valuable insights into the functioning of the proj-ect in its early stages, and helped develop a vision for the overall research agenda. JulieKerksick, the current Executive Director, provided first-hand information on the project'shistory, explained program procedures, and provided a detailed review of the report. DonSykes, Executive Director during the project's pilot phase, also played an important role
at the beginning of the evaluation.
Although we cannot mention each staff member by name, we sincerely thank allof them for sharing their experiences in implementing New Hope and for providing data
on program operations. Tom Back, with assistance from Suzanne Wu and other staff, ini-tiated and maintained the complex financial supplements system that is at the heart of theNew Hope offer and provided data for this report. Rachel Perez was particularly helpfulin facilitating interviews with project representatives and by contributing her own in-sights. We are grateful to the many participants in the New Hope program who, individu-
ally or in focus groups, spoke of their frustrations, successful experiences, and dreams ofachieving economic stability.
Members of the New Hope Board, which includes local leaders and New HopeProject participants, facilitated the authors' understanding of Milwaukee's economic andsocial environment, as well as that of the two target areas in which the program operated,and the Board's Evaluation Committee reviewed a draft of the report. A NationalAdvisory Board of researchers and policy analysts gave valuable suggestions for thisevaluation; in particular, Rebecca M. Blank, Lawrence M. Mead, Joan Moore, DemetraNightingale, and Deborah Weinstein commented on drafts of the report.
For the chapter on the neighborhood survey, Carol Wiseman designed the seriesof neighborhood maps, which provide pictorial context for the survey, and did program-ming for the report. Carolyn Eldred contributed significantly to the early stages of theNeighborhood Survey design. Swarnjit Arora, of the University of WisconsinMilwaukee, and his staff conducted the survey in the two neighborhoods. John Pawasaratof the University of Wisconsin Milwaukee provided information for the section on thelocal labor market. Ingrid Rothe of the State of Wisconsin's Department of WorkforceDevelopment provided technical information on administrative records.
MDRC's Executive Staff particularly Judith Gueron, Robert Granger, andGordon Berlin provided ongoing support for the research and made helpful sugges-tions regarding the report. Greg Hoerz coordinated the neighborhood survey work. IreneRobling assisted in the design phase of the evaluation and made technical recommenda-tions during the evaluation. Lynn Miyazaki and Roza Bruter developed and processed
14

the data files. Julian Brash and Kimberly Kovath did the programming for the report,with assistance from Kara Balemian. Ana Ventura efficiently coordinated the report'sproduction and fact-checking. Cristina DiMeo assisted by researching specific topics forthe report. Brad Petrie wrote sections of Chapter 3, and Andrew Feldman drafted the caseexamples in Chapter 8. The authors drew on Dudley Benoit's focus group study for ex-amples of participants' experiences with the New Hope program. Sylvia Newman editedthe report. Patt Pontevolpe and Stephanie Cowell did the word processing.
The Authors

Executive Summary
Much of the current effort to find new strategies for .helping the poor is focused onfinding ways to link income support more closely to work or work-related activities. The New
Hope Project in Milwaukee, Wisconsin, offers an innovative approach to reducing poverty;reforming welfare, and addressing the economic insecurity of low-income workers. It seeks to
increase employment and reduce poverty by creating better financial incentives to work and by
changing labor market opportunities; it offers assistance that enables poor people to supportthemselves and their families through full-time employment. New Hope serves as a modelprogram for planners involved in the design of welfare reform and antipoverty programsnationwide. It addresses many issues on the nation's social policy agenda, including the design
and operation of the Earned Income Credit (EIC) for low-income workers, community service
jobs for people who need employment, and access to health insurance and child care for working
families.
Participation in the program is voluntary, and eligibility is based on income and awillingness to work at least 30 hours per week. Adults (defined as age 18 or over) are eligibleregardless of whether or not they have children or are current or past recipients of publicassistance. Persons meeting these criteria are eligible to receive these benefits or services:
help in obtaining a job, including access to a time-limited, minimum-wagecommunity service job (CSJ) if full-time employment is not otherwiseavailable;
a monthly earnings supplement that when combined with federal and stateEICs brings most low-wage workers' incomes above the poverty level;
subsidized health insurance, which gradually phases out as earnings rise; and
subsidized child care, which also gradually phases out as earnings rise.
New Hope staff are actively involved with participants explaining the rules for accessing the
various program components, providing information on health and child care services, reaching
out to those not active in the program, and serving as coaches to support individuals'employment efforts.
New Hope operates outside the existing public assistance system, though it is designed to
be replicable as government policy should the demonstration findings be favorable. It is funded
by a consortium of local, state, and national organizations interested in work-based antipovertypolicy, as well as by the State of Wisconsin and the federal government. It was designed and is
operated by a community-based nonprofit organization, the New Hope Project, and thus providesinsights into the role nongovernmental agencies can play in income support.
One goal of the project is to provide credible information to policymakers on theimplementation, effectiveness, and costs of the New Hope approach. In 1994, program designers
initiated a demonstration of the program in two inner-city areas in Milwaukee. New Hope
ES -1
16

operated in two racially and ethnically diverse areas of the city (defined by two zip codes) thatare economically depressed, but nevertheless contain working residents and households that donot fit the stereotypes of "dysfunctional" families. Geographic targeting of New Hope wasintended to concentrate resources in two areas with high levels of poverty, thus allowing a moredetailed analysis of program context than would be possible in a program that served a widegeographic area.
New Hope contracted with the Manpower Demonstration Research Corporation (MDRC)to conduct an independent evaluation of the program's context, implementation, impacts on keyoutcomes, and costs. Among the central questions in the evaluation are: How much will NewHope services actually be used, and do those with access to New Hope achieve better outcomesthan those with access to the pre-existing service supply? In order to provide a reliable test of thedifference the program made, applicants were randomly assigned in a lottery-like process toeither a program group (with access to New Hope services) or a control group (with no access toNew Hope services, but able to seek other services). The differences in the two groups' outcomesover time (for example, their differences in employment rates or average earnings) are theobserved impacts of the program.
This report examines the creation of the New Hope Project, the implementation of thedemonstration, the labor market and neighborhood context of the experiment, and the use ofprogram services by participants. It offers insights on program design, administrative andoperational issues, and benefit use rates in New Hope. A future report will analyze programimpacts and costs.
The early findings on implementation and program use, reported here, reveal that theNew Hope package of benefits and services has considerable appeal for participants seeking towork and support themselves and their families. Even though this program may differ fromreforms contemplated elsewhere, it has much to teach about the nature and appropriate responsesto issues arising as programs change to supplement the payoff from work.
I. Findings in Brief
A. Demonstration Context
New Hope was implemented in a strong labor market and a time of rapidchange in the welfare system. In late 1995 at the point that recruitment forNew Hope ended, the unemployment rate in the Milwaukee metropolitan areawas low. However, much of the growth in jobs, especially those open toworkers without a high school diploma was occurring in suburban locationsdifficult for residents of the New Hope neighborhoods to reach by publictransit. Thus, while these strong labor market conditions increased the overallprobability that those in New Hope could find an unsubsidized job and accessprogram benefits, CSJs would still remain important for some participants. Inaddition, the public welfare system in Milwaukee and the State of Wisconsinwas undergoing major reform. Within Aid to Families with Dependent
ES-2
17

Children (AFDC), program participation and work requirements increasedover time and the caseload dropped substantially. At the same time, cashassistance under the county's General Assistance program ended. Thesecontextual factors do not invalidate the basic comparisons involved in thestudy of program impacts because they affect both those served within NewHope and those in the control group, but probably a more disadvantaged groupapplied for the program and fewer participants needed CSJs than wouldotherwise have been the case.
Within this changing context, New Hope offered a distinct package ofbenefits and services with broader eligibility rules than normal in incomesupport programs. For most single individuals and families without children,New Hope's benefits were not available under any other program. Even forfamilies with children the group typically served in public assistanceprograms the package of benefits was unique. For these families, some ofNew Hope's benefits are available through other sources; subsidized healthinsurance and child care are available through public assistance programs andMedicaid, and earnings supplements are available through the federal andstate EIC. However, paid CSJs are typically not offered. Furthermore, onepremise of New Hope's design is that the combination of benefits is more thanthe sum of its parts because together they address the main barriers to theachievement of an income above poverty through work. Also, the assistanceand "coaching" of New Hope project representatives can help participants takegreater advantage of the services than they otherwise might.
B. Program Implementation
Recruitment for the New Hope Demonstration occurred over a 16-monthperiod beginning in July 1994 and produced a diverse sample for thisresearch that in many ways reflected the characteristics of the eligiblepopulation in the neighborhood. Program applicants resembled in mostways the larger pool of neighborhood residents eligible for the program andinterested in its services. Applicants included those traditionally served inpublic assistance programs (for example, unemployed parents with dependentchildren) and also low-income working parents and adults without dependentchildren. Recruitment proved a difficult challenge for New Hope staff. Keyproblems were finding ways to bring the program to the attention of potentialapplicants and explaining the geographic eligibility rules and programparticipation requirements.' However, when people who met the program'seligibility rules attended an orientation explaining the program, most found itan attractive option and applied to participate in the demonstration.
The community-based organization operating New Hope successfully putin place the intended program services. Program services were fullyimplemented and available to program group members. A vital role is playedin the New Hope program by the "project representatives," staff who explain
ES-3
18

program services, compute benefits, and monitor participation for theircaseloads of approximately 75 participants each. Despite such efforts,participants had some difficulties understanding how the various parts of theNew Hope offer worked.
The random assignment impact research design was successfullyimplemented, providing a means to understand the net impact of NewHope on key outcomes. The goals of achieving a diverse and sizable samplewere met; the background characteristics of the program and control groupsare similar, allowing a comparison of the program and control groups' levelsof employment, earnings, public assistance receipt, family and child outcomes(where applicable), and other key measures. These findings, based on follow-up using administrative records and a survey, will be the subject of a laterNew Hope evaluation report.
C. Program Use
At some point in the year following random assignment, approximatelythree-quarters of the applicants accepted into the New Hope programgroup worked full time and claimed a program benefit. Use of New Hopebenefits is affected by the availability of and changes in other "safety net"programs, as described earlier in this summary. During the follow-up periodfor this report, earnings supplements were most frequently used (by 72 percentof the program group), followed by health insurance (38 percent), and childcare (23 percent). Twenty-four percent took a CSJ for at least a day as a wayto meet the New Hope requirement of employment. About 60 percent of theseCSJ workers made a transition to a full-time, unsubsidized job at a later pointin the follow-up period, which qualified them for New Hope benefits.
People used the program in many different ways, with differences in usereflecting their different initial circumstances, their ability to find andretain a full-time job, and their desire to maintain contact with theprogram. After an initial start-up period (defined as the first three monthsafter random assignment), 32 percent of the program group used benefitssteadily or nearly so, 39 percent intermittently, and 29 percent not at all. Sincemost participants do not use services continuously, it appears that New Hopeserves principally as a resource for those beginning employment and as asupport and safety net for those who obtain a job. Later data collection willprovide details about reasons for nonuse of program benefits.
II. The New Hope Program Design
A. The Program Model
Four principles underlie the New Hope program: (1) that people who are willing and ableto work full time should be assured the opportunity to do so; (2) that people who work full time
ES-4

should not be poor; (3) that people who work more hours should take home more pay; and (4) forthose eligible for public assistance, that full-time work should make people better off financiallythan they would be on welfare. These principles are realized by providing four benefits andservices to participants who are willing to work an average of at least 30 hours per week: help inobtaining a job (including access to a CSJ if full-time employment is not otherwise available), anearnings supplement to bring low-wage workers' income above the poverty level, subsidizedhealth insurance, and subsidized child care. The major benefits and services offered by NewHope are summarized in Table ES.1.
The program is designed so that there will always be a financial incentive to increasework hours and earn higher wages. Because the New Hope earnings supplement and subsidiesfor health insurance and child care decline as earnings rise, a participant does not see a $1increase in total income for each $1 increase in earnings. New Hope designers developed anearnings supplement that phased out at a slow enough rate so that participants always saw totalincome rise as they worked more or earned higher wages. In New Hope, people see at least a$.30 rise in total income for each $1 increase in earnings, compared with no increase in totalincome for some existing public assistance programs that reduce their grant $1 for each $1earned.
New Hope is intended to be flexible. People in the program group may enter and exitvoluntarily and use whichever benefits they need. They may also access public assistance aloneor in combination with New Hope if they wish and are eligible. However, receipt of New Hopebenefits generally makes people ineligible for welfare benefits because their total incomesbecome too high. Some people may use New Hope on an ongoing basis to boost their incomesand help them stay employed; others may use it as insurance for the times they need help. At alltimes staff try to provide full explanations to participants of program operation, benefits, and
alternatives. In short, New Hope is a new antipoverty resource for individuals willing and able to
work.
B. The New Hope Demonstration
During the demonstration, the New Hope Project is serving a diverse program group of678 low-income people drawn from two areas of inner-city Milwaukee. The eligibilityrequirements are that applicants must live in the targeted service areas, be age 18 or over, bewilling and able to work at least 30 hours per week, and have a household income at or below150 percent of the federally defined poverty level. Single- and two-parent families and adultswithout children who meet income and geographic eligibility requirements are eligible toparticipate, and no past or current receipt of public assistance is required. Because of budgetaryconstraints, the New Hope offer is open to members of the program group for a period of threeyears from the date they became part of the demonstration. Such a time limit is not integral to thedesign of the program, and the New Hope demonstration was not intended to provide a test of theeffects of time limits on public assistance.
The New Hope program is being evaluated to determine its effects on economic measuressuch as employment, income, public assistance use, access to and use of health insurance, andpurchase of paid child care. In addition, the evaluation seeks to assess the consequences for
ES-5
4

Table ES.1
The New Hope Project
New Hope Benefits and Services
Job Access
Earnings Supplement
Health Insurance
Child Care Assistance
Participants who are unemployed or who want to changejobs receive job search assistance. If after an initial 8-weekjob search they are still unable to find full-time work, NewHope offers them CSJs paying the minimum wage innonprofit organizations. If an employed person loses a jobor drops below full-time hours, a CSJ is available after ashorter period of job search. A CSJ can last up to 6 monthsand a participant is eligible for a total of 12 months ofcommunity service employment over the 3 years ofeligibility.
On a monthly basis, New Hope supplements the earningsof program participants who work 30 hours or more perweek so that, when earnings and the supplement arecombined with state and federal EICs, annual householdincome rises near or above the poverty line. As earningsincrease, the earnings supplement declines.
New Hope offers subsidized access to health insurance toparticipants who work 30 hours or more per week but arenot covered by employer plans or Medicaid. The monthlyfee charged to participants rises with family income andhousehold size.
New Hope offers financial assistance to cover child care forparticipants who work 30 hours or more per week and whohave children under age 13. The monthly fee charged toparticipants rises with family income and household size.
ES-621

participants' sense of well-being as reflected in various other measures of material well-being,family stability, and progress in achieving personal goals. The evaluation will also focus onunderstanding outcomes for families with children.
III. Program Context
A. Labor Market Conditions
New Hope was implemented during a period of strong economic growth and falling ratesof unemployment in the Milwaukee metropolitan area. However, as in other older metropolitanareas, a "spatial mismatch" was evident: The greatest employment growth was occurring in thesuburban fringe, not in the central city and not in the vicinity of the New Hope target areas.While many jobs are still available in the central city, the selection and wages offered are notgenerally as good as elsewhere in the labor market.
B. Public Assistance Reforms
Profound changes have also been occurring in the state and national welfare systems.General Assistance (a program of cash assistance largely for single adults and families noteligible for federally funded welfare) was recently eliminated in the State of Wisconsin, and thestate's AFDC program (now called Temporary Assistance for Needy Families) became morerestrictive. In early 1996, the state began requiring applicants for AFDC to conduct a job searchprior to the approval of their AFDC grant and linked payment of AFDC benefits to compliancewith program participation requirements (with reductions in the benefit for hours of requiredactivities or work missed). Both of these changes are elements of a major state welfare reform
initiative Wisconsin Works which was implemented statewide in September 1997. SinceNew Hope operates entirely outside the public assistance system, any New Hope program groupmembers who are also receiving public assistance are required to comply with relevant programrequirements. Receipt of New Hope benefits normally raises a person's income above theeligibility cutoff for cash assistance, but participants may still be receiving Food Stamps andMedicaid.
By altering the prospects for persons relying on the traditional safety net provided byAFDC, these state changes have affected, and will continue to affect, program group members'perceptions of the usefulness of the New Hope package (probably making it more appealingrelative to welfare) and the alternatives available to members of the control group (making themmore linked to work effort, like New Hope). These changes did not affect low-income programgroup members who were not receiving public assistance and were not contemplating accessingthe affected programs.
Despite these changes, New Hope's package of benefits and services remains unique inMilwaukee and control group members cannot access any comparable program. No otherprovider offers paid CSJs and earnings supplements. Other New Hope benefits and servicesjob search assistance, health insurance, and child care assistance may be available in someform through the welfare department (or in the future Wisconsin Works service providers) or
ES-7
2

other agencies. New Hope offers an alternative to services through the public assistance systemand serves people who are ineligible for welfare.
C. Conditions in the New Hope Target Neighborhoods
The two areas targeted by New Hope have high unemployment and high poverty, andcontain many families receiving welfare. They include many census tracts that have beenidentified in recent social science literature as exhibiting "ghetto poverty." Initially, programrecruitment focused on smaller geographic areas that were based on census tracts. To facilitaterecruitment by providing more easily identifiable target areas, they were expanded to includeaddresses in two entire zip codes: 53208 on the Northside of the city and 53204 on the Southside.The location of the target areas is illustrated in Figure ES.1. The majority of the population in theNorthside area is African-American, while in the Southside area Hispanics predominate. In bothareas there are more women than men, but the imbalance is somewhat greater on the Northside.Educational attainment is somewhat higher on the Northside; 66 percent have a high schooldiploma or a General Educational Development certificate (a GED), versus 57 percent on theSouthside. Mobility is also substantial in both areas: One-third of Northsiders and one-quarter ofSouthsiders had lived at their current address less than a year when they applied to New Hope.
At approximately the end of New Hope recruitment, the circumstances of residents in theNew Hope target areas were assessed with the New Hope Neighborhood Survey (NHNS), ageneral household survey of a random sample of more than 700 respondents from the two NewHope zip codes. Although substantial parts of both the Northside and Southside recruitment areaswere economically depressed, the survey reveals that these neighborhoods contain many workingresidents and two-parent families. Nevertheless, one adult in four was jobless; among African-Americans the jobless rate was 47 percent. Almost 50 percent of the jobless residents reportedthat they were available for full-time work. About 70 percent of the jobs reported by employedresidents of the targeted neighborhoods produced earnings in the range that made them eligiblefor the means-tested EIC. One-fourth of full-time workers and two-thirds of the part-timeworkers did not have health insurance. Few full- or part-time workers received assistance withchild care.
The NHNS suggests that New Hope's diagnoses of the problems confronting low-incomeworkers and unemployed individuals in the target neighborhoods is relevant for a substantialportion of area residents. Many people appear to need jobs, child care, and health insurance.Using the NHNS, an estimate was constructed of the number of persons who fell within NewHope's income eligibility rules and reported that New Hope would interest them "a great deal" ifit were made available to them. Using this approach, one adult in four in the New Hope targetarea was judged a likely participant. Of these 12,400 people, 78 percent were jobless at the timeof the survey and 59 percent live in households with children present.
The NHNS also identified some labor market difficulties facing residents that are notdirectly addressed by the New Hope program. Almost two-thirds of the 12,400 people referred toabove lack a high school education. Eighteen percent of adults who reported being jobless butavailable for full-time work cited lack of transportation as a reason for not having a job. New
ES-8

Figure ES.1
The New Hope Project
The New Hope Target Areas
SOURCES: New Hope Project and 1990 and 1992 census TIGER files.
ES-9 24 BEST COPY AVAILABLE

Hope does not include skills training or transportation facilities; but project representatives areexpected to refer participants to other agencies and programs to obtain these services if needed.
IV. Program Recruitment and Sample Characteristics
A. Recruitment Challenges
Recruitment of the sample was more challenging than staff had anticipated, partlybecause of the special circumstances of a research demonstration, which would not be present inan ongoing program. Achieving the sample goals required multiple recruitment tactics, asustained campaign over many months, and expansion of the original target neighborhoods.Among the difficulties encountered were the constraint imposed by geographic targeting to tworelatively small areas that could not be described easily; the resulting inefficiency of using manyoutreach tools such as newspapers, television, and radio that served the entire metropolitan area;residents' unfamiliarity with New Hope; people "tuning out" new messages because ofinformation overload; and the possible negative effects on word-of-mouth recruiting andwillingness to enroll created by the research requirements, including the random assignmentprocess.
Once contact was made, some people had trouble understanding or believing the NewHope offer; the arbitrary feel of the geographic restrictions, the unfamiliarity of the package ofNew Hope benefits, the complexity of the earnings supplements and copayment requirements,and the "too good to be true" nature of the offer all had to be overcome. Nevertheless, most ofthose who attended New Hope orientations and were eligible for the New Hope offer found itappealing and followed through with an application for the program.
In sum, the experience provides another illustration of the difficulty that new programsface in establishing themselves as "known quantities" within low-income communities. A tellingmeasure of this difficulty comes from the NHNS: Even in the immediate aftermath of therecruitment campaign, 86 percent of eligible residents reported that they knew nothing aboutNew Hope.
B. The New Hope Research Sample
The New Hope research sample (678 program and 679 control group members) wasrecruited over a 16-month period starting in July 1994. The recruitment effort led to a diversesample, as the program operators desired. Table ES.2 summarizes the characteristics ofapplicants in the research sample.
Applicants included people who at random assignment were employed and unemployed;on welfare and not on welfare; living alone, with children, and/or with a spouse or partner; andfrom different racial or ethnic groups. Nearly everyone in the sample had work experience.However, all had low earnings (97 percent had earned less than $15,000 in the prior 12 months);and 71 percent had used some type of welfare or Medicaid in the previous 12 months. Forty-three percent of the sample lacked a high school diploma or GED.
ES-1045

Table ES.2
The New Hope Project
Selected Characteristics of the New Hope Full Sampleat Application to the Program
Characteristic Percent
GenderFemaleMale
t.
71.628.4
Race/ethnicityAfrican-American, non-Hispanic 51.4Hispanic 26.5White, non-Hispanic 13.0Asian/Pacific Islander 5.8Native American/Alaskan Native 3.4
Shares household with'Spouse 11.9Girlfriend/boyfriend 7.2Children (own or partner's) 70.3Others 24.0
Lives alone 11.8
Employment statusCurrently employed 37.5Ever employed 95.0Ever employed full time 85.9
Approximate earnings in past 12 monthsNone 31.2$1-4,999 . 41.0$5,000-14,999 24.5$15,000 or above 3.3
Public assistance receiptCurrently receiving AFDC, Food Stamps, General Assistance, or MedicaidEver received AFDC, FS, GA, or Medicaid in past 12 months
Received a high school diploma or GED
62.970.6
57.3
Has access to a car 41.5
NOTES: Distributions may not add to 100.0 percent because of rounding.'Because some sample members may be in more than one category, totals may not equal all categories
summed.

Persons who applied to New Hope often indicated (in focus groups and conversationswith project reps) that they were ready to make a positive change in their lives. In addition,applicants were often recruited from other service organizations in the community, implying thatthere may be a high level of participation in employment and social service programs other thanNew Hope by both program and control group members. This reenforces the importance ofdocumenting participation in the program, comparing it with participation in other programs, andconducting an impact analysis of key program outcomes.
The research sample appears representative of the eligible residents in the targetneighborhoods. Comparison of the characteristics of NHNS respondents interested in and eligiblefor New Hope services with actual program applicants in the research sample reveals few majordifferences, and most of these are attributable to specific strategic recruitment choices (forexample, maintaining rough equality between the Northside and Southside samples oremphasizing inclusion of single individuals).
V. Program Operating Experience
All of the New Hope components the earnings supplements, health insurance, childcare assistance, and CSJs were implemented and readily available to those assigned to theNew Hope program group. There is no typical New Hope participant; in fact, the program isdesigned with an expectation that people will use the program in different ways. However,describing how the program works in general and for several hypothetical participants is usefulin conveying how participants interacted with and used the program.
A. Experiencing New Hope
With few exceptions, participants access New Hope benefits and services by talking withthe project representatives (project reps), who see their role as encouraging maximum use ofthese benefits and services to raise participants' household income and improve their futureeconomic prospects. Many participants seek only one or two of the New Hope benefits; theearnings supplement, for example, is used by virtually everyone active in the program. Others donot fully understand the various components of the program or how they can use them. Projectreps try to make participants aware of their options and inquire regularly about changes inemployment or family circumstances that might cause participants to need different benefits orservices than they had in the past. Reps also serve as informal counselors and as "coaches" whenpeople are searching for employment, providing leads on jobs and help in developingemployment plans and résumés. In these roles, many of the project reps are able to draw onpersonal experience, having an "I have been there" credibility. For many participants, the helpand encouragement offered by project reps is reported to be as helpful as the financial benefitsoffered by the program.
People working 30 hours or more per week are eligible for the earnings supplement andhealth insurance and child care. Those not working full time conduct an individual job search,with some assistance from project reps, to find qualifying employment. If they do not find full-time work after a search of eight weeks, they can interview for a CSJ that pays the minimumwage and that allows them to access other New Hope benefits. If they have been working and
ES-12 27

lose a job, a three-week job search is required prior to the offer of a CSJ. Staff have developedmore than enough CSJ slots in various nearby nonprofit agencies for participants to choose from,but participants have to interview for the jobs, be selected by employers, and meet the attendanceand other standards expected of regular employees. About 40 percent of CSJs are office supportor data entry, 30 percent are construction and property maintenance, and the remainder are spreadover a wide range of occupations.
Once participants are working and eligible to take advantage of New Hope's financialincentives, the project reps' role includes benefit processing. To qualify for financial benefits,New Hope participants have to provide proof of full-time employment by the fifth of eachmonth. Reps review the pay stubs submitted to determine hours and earnings, and useworksheets and automated payment schedules to calculate the amount of benefits (earningssupplements and subsidies for health insurance and child care) that participants are to receive.Benefit processing is done on a monthly basis with payment made by the twentieth of the monthfollowing employment so that the amount of work and earnings will be quickly reflected inparticipants' benefits.
The child care and health insurance assistance provided by New Hope is largely afinancial transaction. Participants must find a qualifying child care provider they like; New Hopedoes not run its own child care center, nor do staff refer participants to specific providers.Payments can be provided to any state licensed or county certified provider, and the participant isrequired to pay a portion of the cost of child care through a copayment, adjusted based on familysize and income. New Hope reimburses providers up to the same maximum level as the countyprovides for welfare recipients enrolled in work programs.
Of the benefits offered by New Hope, health insurance is mentioned as the mostimportant by many participants and staff. While some participants are covered by employerhealth insurance or Medicaid, for those without coverage, the New Hope benefit is often the onlyaffordable option. Participants working the required hours and not covered in another way canenroll in a health maintenance organization (HMO) that provides comprehensive services. Mostchoose the HMO that is used by the Milwaukee County Medicaid program. The participantcopayments are set to reflect income and household size and are intended to fall within the rangeof the premiums that workers in many employer-sponsored plans pay.
Staff learned that it took continued effort to educate participants about the benefits andservices available and to help participants understand how to use New Hope when their needsand circumstances changed. Despite these efforts, many participants had difficulty understandinghow the benefits and services worked. Participants had the most difficulty understanding howearnings supplements were calculated, especially because of fluctuations in supplement checks.Differences in earnings from month to month often occurred because of differences in thenumber of pay days in a month or changes in hours worked. Former welfare recipients often wereuncertain how New Hope supplements worked because they were used to relatively stablemonthly welfare grants. Participants also had some difficulty understanding how health insuranceand child care assistance would be affected if they lost a job or had a cutback in hours of work.
ES-13 04.0 0
0

B. illustrative Cases of New Hope Participants
Rather than creating a set sequence of services, New Hope designers created a collectionof services and benefits that they believed would serve the needs of people in a variety ofcircumstances. The following three examples, two defined based on use of New Hope and onefor a group often excluded from income support programs, illustrate the varying ways in whichpeople use the program.
Steadily employed full-time workers: About one-third of participants enteredNew Hope already working full time. Nearly three-quarters of these participantsare women, about one-fifth were living with a spouse or boyfriend/girlfriend, andabout three-fourths had children who lived with them. About one-fourth werereceiving AFDC at entry into New Hope, and about one-fourth had earnings of$10,000 or more in the prior year.
For these participants, New Hope serves as a means to increase the returnsfrom work and raise household income and for many a way to access healthinsurance and child care. If the participant in a household with one worker andtwo children works 30 hours per week at a minimum wage job, she would earn$618 per month, and receive a New Hope earnings supplement of $131, plus stateand federal EICs of $281. In addition, she could access subsidized child care (bymaking a copayment of $65 per month) and health insurance (by making acopayment of $14 per month).
As long as a participant is working full time, her main contact with theprogram will come when she submits her pay stubs each month and receives herfinancial benefits soon thereafter. Project reps may have to explain differences inbenefits from month to month if her earnings fluctuate and may play an informalcounseling/adviser role, depending on the issues the participant faces and how shechooses to use the New Hope program.
Unemployed persons without recent work experience: About one-fourth of thesample entered the program unemployed and with no earnings in the prior year. Interms of gender, age, race, parental status, and household composition theseparticipants were quite similar to those who entered the program with a full-timejob. However, only 83 percent had ever been employed and 66 percent had everheld a full-time job. Further, rates of receipt of public assistance were higher andeducation levels lower than for those working full time.
The community service job option is intended to provide participants who areunable to find an unsubsidized job with employment that qualifies them for NewHope benefits. Slightly more than one-third of those without recent earnings tookadvantage of this option. If a required initial eight-week job search does notproduce employment, project reps refer participants to designated New Hope staffwho help them find a CSJ. The New Hope CSJ placement coordinators havelistings of potential employers, and participants pick jobs they are interested inand interview for the position. CSJs give participants a chance to establish a work
ES-14
29

history and gain references, assess the pros and cons of various occupations, andbuild up some skills needed in the workplace. Once hired in a CSJ, they submitpay stubs to qualify for benefits like any other working participant, and thebenefits they receive are calculated in the same way. New Hope staff seek tomaintain contact with CSJ employers to determine how participants are doing onthe job and whether employers are providing adequate supervision and feedbackon employee performance.
Staff emphasize that CSJs are temporary placements, and participants areencouraged to continue their job search for an unsubsidized job and leave a CSJfor regular employment prior to the six-month limit. As the end of a placementnears, staff remind participants that they need to be conducting a serious jobsearch to find employment that will allow them to continue their New Hopeeligibility.
"Single" men: About one-sixth of the sample is made up of men who are livingwith neither spouse nor other partner and without dependent children. Members ofthis group have traditionally been excluded from many public assistanceprograms, but are eligible for New Hope if they meet income and willingness-to-work tests.
Single men in the sample tend to have a somewhat stronger work history thanthe rest of the sample, but fewer resources on which to rely when unemployed.Only 30 percent were receiving any kind of public assistance at applicationcompared with 63 percent of the full sample. This lack of a safety net may helpexplain the special appeal of New Hope to unemployed single men; theunemployment rate for single men in the sample is higher than for the sample as awhole.
A higher-than-average percentage of single men need to find employment toestablish eligibility for New Hope benefits. Despite their need for full-timeemployment, these men are no more likely than other participants to use CSJs.The men are often seeking as a long-term job a type of employment (either anoccupation or industry) not included among the nonprofit CSJ employers. Theytend to conduct individual job search or use CSJs as a steppingstone to otherwork. They usually need health insurance, but rarely access subsidies for childcare. When working 30 hours a week at the minimum wage, single men earn $618per month and receive a New Hope earnings supplement of $141 per month.Further, they can access subsidized health insurance for a copayment of $6 permonth.
C. The Use of New Hope Benefits
In program evaluations the use of program services is often of interest, but it is central tothe New Hope story. In many other programs designed to help people find work (for example,training programs and job clubs), participation in the program is still one step removed from theoutcome of central interest: employment. In New Hope, work is an eligibility rule for the
ES-15
'30

program. For people to receive the New Hope benefits, they have to work full time. Hence,information on receipt of program benefits also conveys early information about the level of full-time work for those in the program group.
Table ES.3 provides summary data on benefit use for the portion of the New Hopeprogram group for which 12 months of post-random assignment follow-up is available. Seventy-four percent of New Hope participants received at least one New Hope benefit at some pointduring the 12-month follow-up. Earnings supplements were used the most (by 72 percent of theprogram group), followed by health insurance (38 percent), CSJs (24 percent), and child careassistance (23 percent).
In interpreting these use rates, it is important to remember that New Hope is designed sothat participants can access only those benefits that they want or need. Participants who arecovered by employer health insurance, for example, do not need New Hope's health insurance.Participants who had been receiving AFDC are encouraged to use transitional Medicaid andchild care assistance before using New Hope's benefits. About 30 percent of the sample lived ina household without children and therefore had no need for child care. It is also important toremember the labor market context in interpreting the CSJ use; the strong local economy meantthat most participants found jobs in the private economy.
Once people moved beyond what might be considered a start-up period (the first threemonths after random assignment when unemployed applicants could find a job and qualify forbenefits), approximately two-fifths of the program group used some type of New Hope benefit ina given month of follow-up. In this post-start-up period, about one-third of the entire programgroup used at least one New Hope benefit continuously or nearly continuously, about one-thirdused a benefit intermittently, and about one-third did not use any benefit.
Among subgroups:
Those who were working at entry into the study, and especially those workingfull time, were more likely to access New Hope benefits, and used thesebenefits for more months on average.
Of applicants with children (about 65 percent of whom were receiving AFDCat application to New Hope), those with access to a car and those with a highschool credential were more likely than those without these characteristics touse benefits.
CSJs were intended to be the job of last resort for participants and tended to enroll lower-skilled and less-experienced individuals. Twenty-five percent of the participants who used CSJsmoved directly into full-time, unsubsidized employment. The remaining 75 percent quit or leftfor personal reasons, were terminated by employers, or reached the CSJ time limit (six months ina placement and a total of 12 months overall) without finding unsubsidized work. But about halfof those who left a CSJ without other employment found full-time unsubsidized work thatqualified them for New Hope benefits at some later point in the 12 months of follow-up. Thus,about 62 percent of those working in a CSJ did make a transition to unsubsidized, full-time workduring the 12-month follow-up.
ES-16
31

Table ES.3
The New Hope Project
Use of New Hope Benefits in the First YearFollowing Application to the Program
Outcome Percent
Ever used a New Hope benefitAny type 73.6Earnings supplement 72.1Health insurance 38.0Child care assistance 23.3
Ever worked in a community service job 24.0
ES-17

A full explanation of why some in the program group did not use New Hope benefits andservices will have to await completion of follow-up surveys with program group members.Among the known reasons, the two most common were that participants moved out of state ordropped out of the labor market to pursue schooling or become homemakers. In most instances,the reasons for nonparticipation are not clear. It could be that these individuals do not understandNew Hope's eligibility rules, decide to use the program only as "insurance" when theyexperience a job loss or other problem, have had negative experiences with the program, or haveincome exceeding program eligibility guidelines.
Whether these results are good or bad news for New Hope is hard to tell at this point.Complete information is not yet available on the employment behavior of the program group, noris any information on the employment and service use of the control group outside New Hope(especially on child care and health assistance) ready to analyze. The follow-up survey currentlyin the field will yield information on why program group members did not use New Hope inmonths of nonuse.
The results presented in this report suggest the importance of recognizing that people donot use a program like New Hope in a simple way: Few of the program group members joinedthe program and immediately started participating, used the benefits continuously, and moved offthe program permanently to "self-sufficiency." (Longer follow-up beyond the current 12 monthswill reveal the percentage leaving the program because their income has increased aboveprogram limits.) Instead, the use of benefits is likely to be much more complex and "nonlinear."Just as people go on and off welfare, get and 'lose jobs, and move into and out of poverty, theiruse of New Hope benefits will change to reflect these dynamic elements in their lives that affecttheir use of the New Hope benefits. Policymakers need to anticipate this pattern of use in work-based programs like New Hope, which fill the gap between earnings from available privatemarket jobs and the poverty level and provide employee benefits not otherwise obtainable.Program designers and operators need to plan for multiple entries, exits, and spells of activity.
Assessment of the net effect of the New Hope offer on the likelihood of employment,movement to self-support, and movement out of poverty of program group households awaitsaccumulation of more data and comparison of outcomes between program and control groups.This comparison will be the subject of a later New Hope report.
33ES-18

Chapter 1
The New Hope Project and Evaluation
The United States is in search of new strategies for helping the poor. Welfare programs areinadequate and unpopular; and as a result of the new federal welfare block grant to states,Temporary Assistance for Needy Families (TANF), they are undergoing significant change. Whileimportant, education and job training programs alone cannot, eliminate poverty. An improvingeconomy helps many workers, but people at the low end of the wage scale remain vulnerable. Theiranxieties whether about making ends meet, working too few hours or being laid off from a job,obtaining health care coverage, or finding safe and affordable day care for their children while theyare at work are not being addressed fully by either the government or the private sector.Policymakers want to help needy people, but do not want programs that lead to ballooningexpenditures, dependency on government aid, or behavioral responses (for example, havingchildren out of wedlock or choosing not to work) that they believe to be destructive to individualsand communities.
The New Hope Project in Milwaukee, Wisconsin, offers an innovative and comprehensiveapproach to reduce poverty, reform welfare, and address the economic insecurity of low-incomeworkers. Its solution is to offer assistance, conditioned on full time work, that enables poor peopleto support themselves and their families through employment. The program consists of fourcomponents: help in obtaining a job, an earnings supplement to bring low-wage workers' incomeabove poverty level, subsidized health insurance, and subsidized child care. Four principles underliethe program: that people who are willing and able to work full time should have the opportunity todo so; that people who work full time should not be poor; that people who work more hours shouldtake home more pay; and that full-time work should make people better off financially than theywould be on welfare.
The New Hope Project is designed to provide information to policymakers on the imple-mentation, effectiveness, and costs of the New Hope approach. Is this a workable program model?Does it succeed in boosting employment, reducing poverty, lowering welfare use, and increasingthe economic security of its program participants? Is it affordable? To answer these and otherpolicy questions, an evaluation is being conducted by the Manpower Demonstration ResearchCorporation (MDRC), under contract with the New Hope Project. This report, the secondpublication to come out of the study,' examines New Hope's implementation, programmaticcontext, and participation patterns. A future report will analyze program impacts and costs.
I. Program Description
The New Hope Project enrolled 1,362 low-income adults drawn from two inner-city areasin Milwaukee. Half of these enrollees were randomly assigned to a program group that couldreceive New Hope benefits and services; the other half were assigned to a control group that couldnot. New Hope had only four eligibility requirements: that applicants live in the targeted service
'The first publication is The New Hope Offer: Participants in the New Hope Demonstration Discuss Work, Family,and Self-Sufficiency (Benoit, 1996).
3 4

areas, be age 18 or over, be willing and able to work at least 30 hours per week, and have ahousehold income at or below 150 percent of the federally defined poverty level. The programenrolled individuals who were employed or unemployed, on welfare or not on welfare, married orunmarried, and living with or without children. Participation in the program was voluntary. Themajor benefits and services New Hope offered are as follows:
Job access: Participants who are unemployed or who want to change jobs re-ceive individualized job search assistance. If, after an eight-week job search,participants cannot find work in the regular job market, New Hope offers themcommunity service jobs in nonprofit organizations. These jobs are also offeredto participants who are between jobs or who are employed but not working the30-hour minimum. The community service jobs pay minimum wage and may beeither full time or part time.
Earnings supplements: New Hope offers monthly earnings supplements toprogram participants who work at least 30 hours per week but whose earningsleave their households below poverty level. Participants in community servicejobs also qualify for earnings supplements if they work a 30-hour minimum.Combined with the federal and Wisconsin Earned Income Credit, New Hope'searnings supplements raise most participants' annual household incomes abovethe poverty line.'
Health insurance: New Hope offers a health insurance plan to program partici-pants who work at least 30 hours per week but are not covered by employerhealth insurance or Medicaid. Participants are asked to contribute toward thehealth insurance premium on a sliding scale that takes into account their incomeand household size; New Hope subsidizes the remainder.
Child care assistance: New Hope offers financial assistance to cover child careexpenses for participants who have children under age 13 and who work at least30 hours per week. Participants are asked to pay a portion of the cost based ontheir income and household size; New Hope covers the remainder. Child caremust be provided in licensed homes or child care centers in order to qualify forNew Hope subsidies.
Participants in New Hope may use any number or combination of program benefits andservices, depending on their needs. The earnings supplements, health insurance, and child careassistance are calibrated so that participants always have an incentive to work more hours and earnhigher wages. Over time, New Hope aspires to help participants stabilize their employment andincrease their incomes to a level where they no longer need program assistance. New Hope's offerof earnings supplements, health insurance, and child care assistance extends for three years after the
'The earnings supplements are calibrated so that there is a financial incentive for increasing hours of work.Participants' incomes may be below poverty level if they work just 30 hours, but will rise above poverty level as theirhours increase. The exception is for large households: earnings supplements are adjusted upward for household size upto a maximum of two adults and four children. New Hope's other financial benefits health insurance and child care
are extended to all eligible household members, regardless of household size. For more detail on how the financialbenefits are calibrated, see Appendix C.
-2-
35

date participants agree to participate; community service jobs are limited to a total of 12 monthsover a three-year period. The time limits, which are due to funding constraints, are not consideredintegral to the program design.
II. The Policy Context of New Hope
Many social welfare programs have narrowly defined targeting or eligibility criteria. Theyserve only welfare recipients, for example, or focus on people who fit into a certain demographicgroup or family type. The New Hope project takes the position that people's economic and personalcircumstances are often in flux. They move on and off of welfare and in and out of poverty as theylose a job (or find one), experience a marital breakup (or get married), or become ill (or recoverfrom illness). New Hope provides a flexible support structure that is intended to help people stayemployed even as their personal situations change.
Research on the income patterns of welfare recipients and other poor people confirms thatthe economic and personal circumstances of low-income people are dynamic. Most welfare andpoverty spells are short, lasting a few years or less.' For example, data on Aid to Families withDependent Children (AFDC) the nation's primary welfare program before TANF indicatethat welfare spells almost always begin when a wife and mother becomes separated, widowed, ordivorced, or when an unmarried woman gives birth to or becomes responsible for a child.4Conversely, most people leave welfare because they find work or, less often, because they marry orreconcile with a partner.' Yet, it is also true that about half of the families who receive Food Stampsor welfare will return to these programs at a future date. Moreover, a substantial minority of low-income people will stay in poverty or on welfare for long periods of time.'
One reason why people end up on welfare and why some welfare recipients stay on therolls for many years is that work does not make them appreciably better off than welfare. This isparticularly true for families trying to get by on entry-level or near-entry-level jobs. To illustrate,the poverty threshold for a family of three in 1993 was $1,027 per month. The median monthlyincome of a family with a full-time, full-year worker earning up to one and a quarter times theminimum wage was just $819. The median monthly income for the same size family on AFDC,including cash assistance and such noncash benefits as Food Stamps and housing assistance, waseven less: $605.7 But while the AFDC family was ostensibly poorer than the working family, it alsodid not have to incur employment-related expenses.
If the working family had to pay for child care, for instance, it could easily be worse offthan the AFDC family. A census bureau survey found that working poor families with child care
'Gottschalk, McLanahan, and Sandefur, 1994.4Aid to Families with Dependent Children was ended by Congress in 1996. Temporary Assistance for Needy
Families (TANF) replaced AFDC beginning in the 1997 federal fiscal year.'Bane and Ellwood, 1994.6Gottschalk, McLanahan, and Sandefur, 1994; Bane and Ellwood, 1994.'Some low-income working families may also receive noncash benefits. When noncash benefits are added to
earnings, the median monthly income of low-income working families rises to $926. Of the working poor familiesin the census bureau survey, 22 percent received Food Stamps and 12 percent received housing assistance. U.S.General Accounting Office, 1995.
-3-
36

expenses spent an average of $260 a month on cl -= care in 1991.8 Another nationally representa-tive survey of families with children aged 12 and under found that in 1990 families with annualincomes under $15,000 who paid for any form of child care devoted as much as 23 percent of theirincome to this expense. Although subsidized child care is available to many low-income families, itis not universal. In 1990, 45 percent of families with incomes under $15,000 received assistance forchild care expenses or had children enrolled in subsidized centers.'
Health insurance or, more specifically, the lack of it is another factor that can makethe low-income working family worse off than the family on welfare. AFDC recipients automati-cally qualified for Medicaid, the federal health insurance program for the poor. (This is expected tocontinue under TANF, although states may decide to terminate Medicaid coverage to TANFrecipients who do not meet work requirements.)10 Low-income workers, in contrast, often do notqualify for Medicaid and do not always receive health insurance from their employers. Part-time ortemporary workers are the least likely to receive health care coverage." Persons without healthinsurance are less likely to have a regular source of health care and more likely to delay or forgomedical care for themselves and their families. As a result, they may experience increased medicalcosts in the future, restrictions in the number of hours they can work or the type of work they canperform, or job loss.12
Federal and state policymakers have pursued many different types of strategies over theyears to increase employment and earnings among welfare recipients and to improve the economicprospects of low-income, low-skilled individuals. Education, job training, and job search assistanceprograms have been developed to help people prepare for and obtain work. Welfare programs havebeen structured to promote work and penalize people who do not participate in work activities. Thetax code has been revised to make work more financially rewarding." The New Hope Project hassome elements in common with these different policies, though it intentionally does not differenti-ate between welfare and nonwelfare recipients. It tries to link people to regular employmentthrough job search assistance and subsidized community service jobs and sets up a benefit structurethat increases the financial incentive for any low-income person on welfare or not to work.
Conceptually, New Hope's financial benefits have much in common with the federalEarned Income Credit (EIC), a tax credit targeted to low-income workers. The EIC was designed tooffset the burden of the Social Security payroll tax, supplement low-wage earnings, and promotework as a viable alternative to welfare. Up to a specified income level (which varies by familysize), the amount of the credit increases as earnings increase; beyond a certain income level (whichagain varies by family size), the credit is phased out. So long as people have earnings, they mayqualify for the EIC even if they owe no taxes. It may be paid out to them as a tax refund in onelump sum or distributed partly as a lump sum and partly in installments added to workers'paychecks throughout the year.
By itself, the EIC is usually not sufficient to lift the incomes of the working poor above the
8U.S. General Accounting Office, 1995.9Willer et al., 1991.'Greenberg and Savner, 1996."Blank, 1990; Wolfe, 1994."Wolfe, 1994."Blank, 1994.
-4-
37

poverty line, but it makes significant progress in this direction." (Seven states, including Wiscon-sin, have state EIC programs that work in tandem with the federal EIC and add to its value)" NewHope's earnings supplements were designed with the federal and the Wisconsin EIC programs asthe foundation. In most instances, New Hope's earnings supplements fill the gap that remainsbetween earnings and the poverty threshold, after the federal and state EIC payments are credited.The other benefits and services that New Hope provides make the EIC and the earnings supplementeven more valuable, because they help to ensure that work is available to people who want it andthat workers have health insurance and affordable child care.
Although New Hope can be characterized as an expanded version of the EIC, it also servesas a model for welfare reform under TANF, the federal welfare block grant. States have consider-able latitude under TANF in how they design and operate their cash assistance programs. At thesame time, TANF's strict work participation requirements and 60-month time limit on cashassistance make it necessary for states to help recipients find employment quickly. One way forstates to meet TANF's objectives may be to use TANF funds to create paid community service jobs(CSJs) or to supplement the wages of people who work in the regular labor market but who do notearn sufficient income to support their families. States may also use their TANF block grants tosubsidize child care. Medicaid, as noted above, is not significantly affected by TANF, thus ensuringthat most TANF recipients will have health insurance coverage." New Hope offers a framework forintegrating these components into a work-based support system for TANF recipients.
Wisconsin's TANF program, known as Wisconsin Works (or W-2), provides an example ofa state welfare reform program that contains many New Hope elements, though it was not modeledafter New Hope." Table 1.1 compares key features of the two programs, based on the 1995Wisconsin legislation that authorized W-2." Like New Hope, W-2 is a work-based system of aidthat creates employment opportunities for people unable to find work in the regular labor market.Both programs limit the number of years that participants may receive benefits: three years for NewHope and five years for W-2. (As noted earlier, New Hope's time limits are due to fundingconstraints and are not considered part of the program design.) Also, like New Hope, W-2 offerssubsidized child care. Wisconsin families with incomes below 165 percent of poverty level mayaccess child care even if they do not rely on W-2's subsidized jobs. Medicaid (known as MedicalAssistance in Wisconsin) is run separately from W-2, but W-2 participants and nonparticipants mayapply if they meet income guidelines.
There are important differences between W-2 and New Hope, despite their common focuson work. A key difference is that W-2 benefits will not be adjusted to bring the incomes ofparticipating families above the poverty line if parents work full time. W-2's subsidized jobs willpay a fixed grant for the work that participants perform; as in the regular labor market, participants'household size will not be factored into their rate of pay. New Hope pays CSJ participants aminimum wage and uses an earnings supplement (not available in W-2) to adjust for larger
"Center on Budget and Policy Priorities, 1996."The remaining six states are Iowa, Maryland, Minnesota, New York, Rhode Island, and Vermont."Greenberg and Savner, 1996."For an in-depth analysis of W-2, see University of Wisconsin - Madison, Institute for Research on Poverty, 1996."Some elements of the W-2 program are likely to change from the 1995 legislation as the program is implemented.
Statewide implementation is scheduled for September 1997.
-5-0 0

Tab
le 1
.1
The
New
Hop
e Pr
ojec
t
Com
pari
son
of N
ew H
ope
Proj
ect a
nd W
isco
nsin
Wor
ks
Goa
l and
Pro
visi
onN
ew H
ope
Proj
ect
Wis
cons
in W
orks
(W
-2)
Impl
emen
tatio
n da
te
Elig
ibili
ty
Job
sear
ch a
ssis
tanc
e
Typ
e of
job
plac
emen
t
Tri
al jo
b(s
ubsi
dize
d em
ploy
men
t)
Com
mun
ityse
rvic
e jo
b(C
SJ)
Tra
nsiti
onal
plac
emen
t
Ear
ning
s su
pple
men
t
Aug
ust 1
994
(ful
l dem
onst
ratio
n)
Hou
seho
ld in
com
e at
or
belo
w 1
50 p
erce
nt o
f th
e fe
dera
lpo
vert
y lin
e, a
nd:
- re
side
nt o
f ta
rget
are
a in
Milw
auke
e-
will
ing
and
able
to w
ork
at le
ast 3
0 ho
urs
per
wee
kag
e 18
and
ove
r
Indi
vidu
aliz
ed a
ssis
tanc
e in
fin
ding
uns
ubsi
dize
dem
ploy
men
t
Not
a c
ompo
nent
of
New
Hop
e
Jobs
in n
onpr
ofit
agen
cies
for
par
ticip
ants
who
hav
e no
tfo
und
a jo
b af
ter
8 w
eeks
of
job
sear
ch; l
imite
d to
6m
onth
s; u
p to
two
6-m
onth
term
s al
low
ed (
tota
l of
12m
onth
s); j
obs
pay
min
imum
wag
e; p
artic
ipan
ts e
xpec
ted
to c
ondu
ct a
3-w
eek
job
sear
ch b
efor
e qu
alif
ying
for
ase
cond
CSJ
pla
cem
ent;
CSJ
s m
ay b
e us
ed to
sup
plem
ent
regu
lar
empl
oym
ent t
o ob
tain
eno
ugh
wor
k ho
urs
toqu
alif
y fo
r ot
her
New
Hop
e be
nefi
ts
Not
a c
ompo
nent
of
New
Hop
e
Proj
ect p
rovi
des
part
icip
ants
with
an
earn
ings
sup
plem
ent
chec
k to
ens
ure
that
thei
r ho
useh
old
inco
me
is a
bove
the
fede
ral p
over
ty li
ne (
for
fam
ilies
with
up
to 4
dep
ende
nts)
;pa
rtic
ipan
ts m
ust w
ork
at le
ast 3
0 ho
urs
per
wee
k to
qua
lify
Sept
embe
r 19
97 (
expe
cted
)
Hou
seho
ld in
com
e at
or
belo
w 1
15 p
erce
nt o
f th
e fe
dera
lpo
vert
y lin
e, a
nd:
- re
side
nt o
f St
ate
of W
isco
nsin
for
at l
east
60
days
- ca
nnot
hav
e re
fuse
d a
job
in th
e pr
eced
ing
180
days
cust
odia
l par
ents
with
chi
ldre
n ag
e 18
or
unde
r'-
asse
t lim
itatio
n (u
p to
$2,
500
excl
udin
g ve
hicl
es w
orth
up
to $
10,0
00 a
nd o
ne h
ome
in w
hich
the
hous
ehol
d re
side
s)
Gro
up o
r in
divi
dual
ized
ass
ista
nce
in f
indi
ng u
nsub
sidi
zed
empl
oym
ent
Jobs
for
per
sons
una
ble
to o
btai
n un
subs
idiz
edem
ploy
men
t; ex
pect
ed to
res
ult i
n a
perm
anen
t pos
ition
;to
tal o
f 24
mon
ths;
jobs
pay
at l
east
min
imum
wag
e;pa
rtic
ipan
ts r
equi
red
to w
ork
up to
40
hour
s pe
r w
eek;
$300
sub
sidy
to e
mpl
oyer
; eac
h pl
acem
ent l
imite
d to
3-6
mon
ths.
Jobs
in n
onpr
ofit
and
for-
prof
it ag
enci
es to
ass
ist p
erso
nsin
mov
ing
to u
nsub
sidi
zed
empl
oym
ent o
r a
tria
l job
;lim
ited
to 2
4 m
onth
s; jo
bs p
ay 7
5 pe
rcen
t of
the
min
imum
wag
e; in
divi
dual
s ar
e re
quir
ed to
wor
k up
to 3
0 ho
urs
per
wee
k an
d to
par
ticip
ate
in e
duca
tion
and
trai
ning
for
up
toa
addi
tiona
l 10
hour
s pe
r w
eek;
CSJ
pla
cem
ents
may
be
upto
6 m
onth
s ea
ch w
ith s
ome
exce
ptio
ns; p
aym
ent i
s$5
55 p
er m
onth
.
Ava
ilabl
e fo
r pe
rson
s in
capa
cita
ted
or u
nabl
e to
per
form
aC
SJ; l
imite
d to
24
mon
ths;
pla
cem
ents
pay
70
perc
ent o
fth
e m
inim
um w
age;
indi
vidu
als
are
requ
ired
to w
ork
up to
28 h
ours
per
wee
k an
d to
par
ticip
ate
in e
duca
tion
and
trai
ning
for
an
addi
tiona
l 12
hour
s pe
r w
eek
Not
a c
ompo
nent
of
W-2
(con
tinue
d)

Tab
le 1
.1 (
cont
inue
d)
Goa
l and
Pro
visi
onN
ew H
ope
Proj
ect
Wis
cons
in W
orks
(W
-2)
Hea
lth in
sura
nce
Chi
ld c
are
Part
icip
ant m
ust w
ork
at le
ast 3
0 ho
urs
per
wee
k; p
roje
ct p
ays
for
a po
rtio
n of
the
cost
on
a sl
idin
g sc
ale
basi
s fo
r co
vera
gein
a h
ealth
mai
nten
ance
org
aniz
atio
n (H
MO
); p
artic
ipan
tsar
e re
spon
sibl
e fo
r a
port
ion
of th
e pa
ymen
t bas
ed o
n in
com
e
Part
icip
ant m
ust w
ork
at le
ast 3
0 ho
urs
per
wee
k; p
roje
ct p
ays
for
a po
rtio
n of
the
cost
on
a sl
idin
g sc
ale
basi
s fo
r ca
re a
t ach
ild c
are
cent
er o
r in
divi
dual
pro
vide
r; p
artic
ipan
ts a
rere
spon
sibl
e fo
r a
port
ion
of th
e pa
ymen
t bas
ed o
n in
com
e an
dho
useh
old
size
Stat
e an
d fe
dera
lA
ll w
orki
ng p
artic
ipan
ts a
re e
ligib
le, i
nclu
ding
CSJ
par
ticip
ants
earn
ed in
com
e cr
edit
Fam
ily s
ize
adju
stm
ent
Edu
catio
n an
d tr
aini
ng
Loa
n as
sist
ance
Ear
ning
s su
pple
men
t is
adju
sted
acc
ordi
ng to
fam
ily s
ize,
up
to2
earn
ers
and
4 ch
ildre
n
No
educ
atio
n an
d tr
aini
ng p
rovi
ded;
par
ticip
ants
in C
SJs
who
wor
k at
leas
t 30
hour
s pe
r w
eek
may
be
paid
min
imum
wag
e fo
rup
to 1
0 ad
ditio
nal h
ours
per
wee
k in
edu
catio
n or
trai
ning
;ch
ild c
are
assi
stan
ce is
pro
vide
d
Loa
n pr
ogra
m (
up to
$10
0) f
or p
eopl
e w
ho a
re lo
okin
g fo
r w
ork
to h
elp
with
exp
ense
s re
late
d to
obt
aini
ng o
r ke
epin
g a
job;
gene
rally
rep
aid
thro
ugh
a de
duct
ion
from
the
earn
ings
supp
lem
ent
Tim
e lim
itT
hree
-yea
r of
fer
thro
ugh
the
dem
onst
ratio
nb
Med
ical
ass
ista
nce
elig
ibili
ty is
sep
arat
e fr
om W
-2el
igib
ility
; par
ticip
ants
and
non
part
icip
ants
may
app
lyfo
r m
edic
al a
ssis
tanc
e
Subs
idie
s av
aila
ble
to p
erso
ns w
ith a
gro
ss in
com
e at
or
belo
w 1
65 p
erce
nt o
f th
e fe
dera
l pov
erty
leve
l; in
divi
dual
pays
for
a p
ortio
n of
the
paym
ent b
ased
on
inco
me
and
hous
ehol
d si
ze; c
ost v
arie
s by
type
of
care
Indi
vidu
als
wor
king
in u
nsub
sidi
zed
empl
oym
ent a
nd tr
ial
jobs
are
elig
ible
; ind
ivid
uals
wor
king
in C
SJs
and
tran
sitio
nal p
lace
men
ts a
re n
ot e
ligib
le
Wag
es a
re n
ot a
djus
ted
acco
rdin
g to
fam
ily s
ize
Focu
s is
on
shor
t-te
rm, e
mpl
oym
ent-
focu
sed
educ
atio
nan
d tr
aini
ng; f
unds
for
chi
ld c
are
will
be
prov
ided
in o
rder
to p
artic
ipat
e in
edu
catio
n or
trai
ning
if in
divi
dual
has
dem
onst
rate
d a
cons
iste
nt c
omm
itmen
t to
wor
k
Indi
vidu
als
may
be
offe
red
job
acce
ss lo
ans
to h
elp
obta
inor
kee
p a
job;
mus
t be
repa
id in
cas
h an
d/or
by
doin
gvo
lunt
eer
wor
k in
the
com
mun
ity a
t min
imum
wag
e;re
paym
ent p
erio
d be
gins
upo
n re
ceip
t; up
to a
max
imum
of $
1,60
0
Five
yea
rs o
ver
a pe
rson
's li
fetim
e
SOU
RC
ES:
Wis
cons
in S
tate
Leg
isla
ture
, 199
5; W
isco
nsin
Dep
artm
ent o
f W
orkf
orce
Dev
elop
men
t, M
ay 1
2,19
97; N
ew H
ope
Proj
ect.
NO
TE
S: T
his
com
pari
son
is b
ased
on
the
1995
legi
slat
ion
that
aut
hori
zed
Wis
cons
in W
orks
(W
-2).
Som
e fe
atur
es o
f W
-2 d
escr
ibed
in th
is ta
ble
are
likel
y to
chan
ge d
urin
g pr
ogra
m p
lann
ing
and
impl
emen
tatio
n.
'Non
cust
odia
l par
ents
with
cou
rt o
rder
s fo
r ch
ild s
uppo
rt a
nd p
regn
ant w
omen
are
elig
ible
for
cou
nsel
ing
serv
ices
.b T
he 3
-yea
r tim
e lim
it on
the
New
Hop
e of
fer
is d
ue to
fun
ding
con
stra
ints
. Tim
e lim
its w
ere
not o
rigi
nally
inte
nded
as
part
of
the
mod
el.
4241

households and raise most participants' incomes above poverty level. Further, New Hope's CSJparticipants qualify for the federal and Wisconsin EICs, whereas W-2's participants do not. Finally,W-2's three tiers of job placements trial jobs, CSJ, and transitional placements createscategorical distinctions among participants that New Hope avoids. Despite these differences, W-2illustrates the options that states have under TANF to operate cash assistance programs that areradically different from AFDC and possibly more like New Hope.
III. Research Design and Hypotheses
The founders and staff of the New Hope Project, in their requests for proposals for anevaluation, wrote that they were "committed to giving the concepts of this Project as full and fair atest as possible, and committed to learning what works, what doesn't, and why."' In order to meetthis high standard, the evaluation was built around an experimental design. Program applicants whomet New Hope's eligibility criteria were randomly assigned to one of two groups: a program groupthat could participate in New Hope or a control group that could not. By comparing the outcomesof the two groups, it will be possible to distinguish the effects specific to New Hope from those thatmight have occurred for other reasons because the random assignment process ensures that thecharacteristics, backgrounds, and motivation levels of program and control group members do notdiffer systematically at the beginning of the study. After random assignment, the only systematicdifference between the program and control groups is that one group had access to New Hope.Therefore, any differences between the two groups in employment, income, or other outcomes canbe attributed to the New Hope intervention.
A. Hypothesized Outcomes
New Hope's founders expected that its combination of benefits and services job access,earnings supplements, health insurance subsidies, and child care subsidies would lead to morepeople choosing work over welfare and would improve the economic standing of programparticipants. The experimental research design will make it possible to test these hypotheses.Specifically, the evaluation will determine whether or not New Hope's program group, relative tothe control group, experiences the following outcomes:
increased rates of employment
increased income and reduced poverty
reduced use of welfare and other forms of public assistance
increased health insurance coverage
increased use of paid child care
improved sense of well-being, as reflected in measures of material comfort,home environment, family stability, and progress toward achieving personalgoals
'New Hope Project, 1992, p. 3.
-8-
43

If program group members experience these effects, then the people closest to programgroup members their children, spouses, and partners may be expected to undergo improve-ments or changes in their lives as well. Increased income precipitated by New Hope may translateinto more material resources for the family. The health insurance provision of New Hope mayincrease the likelihood that children receive immunizations and treatment for minor illnesses. Thechild care subsidy may enhance the cognitive stimulation and socialization experiences to whichchildren are exposed. Increased employment by parents may lead to restructuring of family choresand responsibilities, which in turn could affect how children spend their time and how they getalong with their parents. Children who see their parents going to work regularly and bringing homepaychecks may develop higher aspirations for their own futures.
With funding from the MacArthur Network on Successful Pathways Through MiddleChildhood a group created by the John D. and Catherine T. MacArthur Foundation to studyprocesses that contribute to positive developmental and behavioral outcomes for preadolescentchildren the New Hope evaluation will test a set of hypotheses about New Hope's effects onfamilies and children. By comparing program group families and children with control groupfamilies and children, the evaluation will be able to determine if New Hope leads to the following:
improvements in housing and material resources (including toys and educationalresources) for families
changes in family management practices and parenting routines
improvements in children's health and nutrition
improvements in child care type and quality
changes in parent-child relationships
changes in children's activities, time use, and social behavior, both in and out ofthe home
improvements in children's school performance
increased psychological well-being among parents, including a greater sense ofself-esteem and efficacy, and reduced depression
higher expectations among parents for their children's futures
higher aspirations among children for their own futures
increased sense of competence and well-being among children
What is especially attractive about studying child and family outcomes within the context ofthe New Hope evaluation is that the experimental design will make it possible to establish cause-effect relationships with greater certainty than past studies have done. At present, considerableresearch documents the risks posed by poverty to children's development and family functioning."In general, studies show that family income is related to children's intellectual and social develop-
20See, for example, Huston, 1991.
-9-4 4

ment and to family stresses even when other correlated factors (for example, parent education,marital status, ethnic group) are taken into account. The weakness in this body of information isthat it is essentially correlational; naturally occurring changes in income and welfare participationare examined. Therefore, it is always possible that something else about the people whose incomesincreased or decreased might account for the "effects" observed. The experimental design in theNew Hope Project offers an opportunity to learn whether improvements in income, combined withthe other features of the New Hope intervention, have a causal impact on children's developmentand family functioning.
B. Random Assignment Process
Random assignment of the New Hope sample began in August 1994 and ended inDecember 1995. Initially, New Hope planned on randomly assigning 1,200 applicants, buteventually recruited and randomly assigned 1,362 people to the program and control groups.' Allsample members will be included in the core analysis on New Hope's economic effects (the firstsetof hypotheses listed above). About 60 percent of the sample (812 sample members) will beincluded in the study of program effects on families and children (the second set of hypothesespresented above). The latter subgroup was identified on the basis of having at least one childbetween ages 1 and 10 at baseline. MDRC will track the experiences ofprogram and control groupmembers over a period of up to five years to determine what difference New Hope made in theirlives.
Figure 1.1 depicts the random assignment process. Staff at the New Hope Project performeda variety of outreach activities to identify potential program applicants and invited them to attend aprogram orientation. At the orientation, staff explained the New Hope offer, eligibility criteria,research objectives, and random assignment process. Persons interested in participating met withNew Hope staff afterward to determine whether they met the four eligibility criteria (residence inthe target neighborhood, age 18 and over, able and willing to work at least 30 hours per week, andincome at or below 150 percent of poverty level). If applicants qualified, New Hope staff askedthem to complete a baseline questionnaire on their demographic and household characteristics,employment and welfare history, and opinions about work and welfare.
Once the baseline forms were completed, New Hope staff called MDRC to determineapplicants' research group status. (Applicants' identification information, such as their name andsocial security number, was read over the telephone and entered into a computer for randomassignment; applicants had an equal chance of being assigned to the program or the control group.)They were immediately informed about their research group statuses. Program group memberswere asked to sign a participation agreement and could begin participating in New Hope rightaway. Control group members were told that they could not be served by New Hope, but weregiven a list of other organizations they could go to for employment-related help.
C. Evaluationramomk
The New Hope experiment is embedded in a larger evaluation framework that takes intoaccount the various factors that may affect program implementation and impacts. This framework
'Five sample members were subsequently dropped from the analysis owing to missing baseline forms. Theresearch sample comprises 1,357 individuals.
-10-
4 5

Figure 1.1
The New Hope Project
Overview of the Random Assignment Processfor the New Hope Project
Applicant attendsorientation
Applicant interestedin New Hope offer
No
Yes
Project screensapplicant to determine
eligibility
Yes
MDRC conductsrandom assignment
Program group
Participant signsNew Hope Project
agreement
Eligible for NewHope benefits and
services and remainseligible for otherservices in the
community
Control group
Not eligible for NewHope benefits and
services and remainseligible for other
services in thecommunity
46

is depicted in Figure 1.2. The context in which New Hope operates including the characteristicsof households living in the target neighborhoods; local labor market conditions; and existingwelfare, employment, and social services programs outside New Hope is presumed to affect thecomposition of the New Hope sample and the subsequent experiences of program and controlgroup members after random assignment. For example, the race and ethnicity, employmentbackgrounds, income levels, and other characteristics of people living in New Hope's target areaswill partly determine who ends up in the New Hope sample. The local economy including thenumber and types of jobs available will affect the employment patterns of both the program andcontrol groups and, for the program group, may influence how people make use of New Hope'sbenefits and services.
The context in which New Hope operates is also presumed to influence the programintervention itself. New Hope's recruitment strategies, for instance, ought to be shaped by thecharacteristics of households that the program is targeting: neighborhood residents' needs,languages they speak, and so forth. The services that New Hope provides ought to be influenced bythe availability of other social service and employment-related programs in the community and thecooperativeness or competitiveness of these organizations with New Hope.
The characteristics of the New Hope sample encompass demographic variables (forexample, gender, age, educational attainment, race or ethnicity), household status (for instance,married or single, living with or without children), employment and welfare history, and attitudinaland motivational factors. Such characteristics may help explain post-random assignment experi-ences of program and control group members. To illustrate, people's ability to find work and theamount of money they earn may be explained in part by their gender, employment experience, andeducational attainment. How hard sample members try to look for work or how much programgroup members take advantage of New Hope may be explained by their motivation levels at thetime they entered the study.
At its core, the New Hope intervention consists of job search assistance, community servicejobs, earnings supplements, health insurance subsidies, and child care subsidies, which must beavailable and be delivered to program participants who qualify and request services in order forNew Hope to receive a "fair test." However, the intervention is defined by more than these benefitsand services. It is also characterized by the recruitment strategies that the program uses, the natureand frequency of interactions between participants and staff, and the general organizationalenvironment. How does the program "market" itself to applicants? Do program staff try tomaximize or limit participants' use of benefits and services? Is the program caring or uncaring,rigid or flexible, monocultural or multicultural? The answers to questions like these may indicatethe quality of program group members' experiences in New Hope and the effectiveness of theintervention.
IV. The Organization of This Report
This report focuses on the implementation factors shown in Figure 1.2. It describes thecontext of New Hope, the sample characteristics, the program intervention, and the early in-program experiences (that is, participation in New Hope) of the program group. To do so, the reportdraws on a variety of qualitative and quantitative data, including field interviews and observationsconducted in Milwaukee and the New Hope office; a neighborhood survey; focus group interviews
-12-
47

Figure 1.2
The New Hope Project
Factors Affecting the Implementation and Impacts of the New Hope Program
Context of the New Hope Program
Characteristics of householdsin the target neighborhoods
Labor market conditions
Characteristics of existing welfare,employment, and social service programs
The New Hope Sample
Demographic and household characteristics
Employment and welfare history
Attitudes and motivations
Experiences ofprogram group members
Experiences ofcontrol group members
The New Hope Intervention
Recruitment strategies
Job search assistanceCommunity service jobsEarnings supplementHealth insuranceChild care assistance
Staff - participant interactions
Organizational environment
Impacts
Differences in outcomesbetween program and
control groups

with New Hope participants; baseline questionnaires completed by sample members; New Hope'smanagement information system (containing data on service use and benefit payments); programdocuments; and assorted published materials. These data sources are described in greater detail inAppendix A. A future report will analyze data from a survey of New Hope sample members andthe administrative records of the State of Wisconsin's welfare and unemployment insurancesystems to understand the post-random assignment experiences of program and control groupmembers and to estimate program impacts.
This report is organized as follows. Chapter 2 describes New Hope's history and organiza-tional milieu. Chapter 3 describes Milwaukee's employment opportunities and the obstacles toemployment for inner-city residents. It also covers the major changes in Wisconsin's welfaresystem during the first two years of New Hope's operations and the availability of employment andsocial services in Milwaukee to program and control group members outside New Hope. Chapter 4describes the characteristics of households that live in New Hope target neighborhoods and theireligibility and demand for New Hope. Chapter 5 tells how New Hope identified and enrolled theresearch sample and draws lessons from this experience. Chapter 6 presents data on sampledemographics and attitudes at baseline. Chapter 7 describes how program staff work withparticipants to access New Hope benefits and services and obtain work. Chapter 8 explains themajor components of the New Hope program the community service jobs, earnings supple-ments, health insurance, and child care assistance and how these benefits and services fittogether to make program participants better off financially. Finally, Chapter 9 presents data on thenumber of program group members who used New Hope's benefits and services and thepatterns of benefit and service use over a follow-up period of up to one year.
49.
-14-

Chapter 2
Project Origins and Organization
This chapter describes the historical and organizational context of New Hope. As thechapter reveals, New Hope did not come about easily, but required the sustained commitment of
a wide group of actors who believed in New Hope's approach to reducing poverty and ending
welfare dependency. Section I describes how the demonstration was launched: who had the ideasthat became New Hope and what it took for the program to get off the ground. Section IIexplains the organizational structure and budget that New Hope's founders and staff created tomount the demonstration: how they set up the program and what resources were required to keepthe project afloat. Section III describes some of the major implementation challenges that NewHope faced as an organization: how New Hope adapted to a changing political and fiscalenvironment, how program managers and staff responded to the technological demands posed by
the New Hope model, and how they built an organizational culture that would lead to thefulfillment of New Hope's mission.
I. Project History
The New Hope Project traces its origins to the Congress for a Working America(CFWA), a nonprofit organization founded in 1979 to develop and promote public policies thatsupport full employment at living wages. The organization was headquartered in Milwaukee, buthad chapters and affiliates in other U.S. cities. (In 1994, CFWA consolidated its operations inMilwaukee and changed its name to Work for Wisconsin.) CFWA provided job placement andother employment-related services to people in need; these services, in turn, enabled CFWA toengage unemployed and low-income people in the political process and to mount grass-rootscampaigns in support of job creation and better job compensation, benefits, and protections forlow-wage workers. This street-level experience made it possible for CFWA to identify and speakto the problems that poor people faced in the labor market: the decrease in wage levels at the low
end of the labor market, the increased proportion of part-time jobs, the decrease in jobs offeringhealth insurance, the lack of affordable child care, and the displacement of jobs from the central
city to outlying suburbs.
During the 1980s, while CFWA was engaged in direct services and advocacy work inMilwaukee and other cities, David R. Riemer a lawyer and founding board member of CFWA
(and later New Hope) researched and wrote The Prisoners of Welfare (1998), which examinedthe structural problems of both the welfare system and the labor market that cause people to bepoor. Riemer proposed that the existing welfare system be eliminated and replaced with analternative structure that provides different kinds of support to people based on their employmentcircumstances. For the poor who cannot work, including the elderly and the disabled, Riemerargued that the government should provide cash payments to bring them above the poverty line.For the poor who are unemployed or employed part time, Riemer proposed that communityservice jobs (CSJs) be created to allow them to work full time. For the poor who are alreadyworking full time including those in CSJs Riemer argued for earnings supplements to raise

household income above the poverty line. The earnings supplements would be based on a slidingscale that would provide an incentive for people to work and earn more and, if they were in aCSJ, to seek work in the private sector. Finally, Riemer proposed that access to health insuranceand child care be provided to all low-income persons based on their ability to pay.
In 1988, CFWA appointed a steering committee made up of CFWA staff, communityactivists, and low-income residents to consider whether a program like the one Riemer envi-sioned could be implemented in Milwaukee. CFWA was motivated in part by a desire to developa programmatic alternative to the Family Support Act, the recently enacted federal welfarereform bill. CFWA staff believed that the Family Support Act was misguided in its attempt toend welfare dependency by attempting to correct the skills deficits of welfare recipients ratherthan the structural problems of the labor market, and the welfare system. With seed money fromthe Milwaukee Foundation, the steering committee held biweekly meetings over an eight-monthperiod to develop a plan. In July 1989, the steering committee issued a draft proposal for ademonstration program based on Riemer's ideas that would be targeted to 1,000 Milwaukeehouseholds. Believing that the model offered the potential to end poverty through employment,the committee chose to name the demonstration the New Hope Project.
The steering committee's proposal contained the same basic elements that constitute theNew Hope Project today: job access, earnings supplements, health insurance, and child careassistance. The proposal did not suggest eliminating welfare, as Riemer had advocated in hisbook, but instead suggested that New Hope operate as an alternative to welfare. The committeeestimated that the program would cost several million dollars annually to run. To protect NewHope from becoming enmeshed in a welfare bureaucracy, it proposed that the program beoperated outside government and that project funding be raised entirely through private sources.
CFWA circulated the New Hope proposal to organizations throughout Milwaukee. It wonthe endorsement of numerous prominent individuals and groups, including the InterfaithConference of Greater Milwaukee, Milwaukee Mayor John Norquist, and then MilwaukeeCounty Director of Health and Social Services Howard Fuller. CFWA also submitted theproposal to the Greater Milwaukee Committee, an influential voluntary civic organization oflocal chief executive officers of major corporations. Partly in response to the strong support theproposal received from other community leaders, the Greater Milwaukee Committee appointed aspecial task force to review the feasibility of the plan.'
After an intensive review, the Greater Milwaukee Committee New Hope Project TaskForce issued a report (1990) and offered a number of recommendations. One was that New Hopeseek the active involvement of government agencies at the local, state, and federal levels. The
'The names and organizational affiliations of members of the Greater Milwaukee Committee New Hope ProjectTask Force included Kenneth R. Willis (Time Insurance Company), Fred Cullen (Banc One Wisconsin Corporation),Howard Fuller (Milwaukee County Health and Human Services), Pat Goodrich (Wisconsin Department of Health andSocial Services), Jack Murtaugh (Interfaith Conference), Roger D. Peirce (Super Steel Products Corporation), ReverendEd Ruen (Next Door Foundation), Brenton H. Rupple (Robert W. Baird and Company), James B. Wigdale (M & IMarshall and Ilsley Bank), John Galanis (Galanis and Friedland), and Robert H. Milbourne (Greater MilwaukeeCommittee).

task force agreed that New Hope should be run as a private entity, but did not believe that theproject could raise the necessary funds nor have a significant influence on public policyunless government was an active partner in program design and financing. A second recommen-dation was that New Hope reduce the number of participants to 600, mainly to limit programcosts. The task force advised that the program recruit participants in equal numbers from apredominantly African-American area on the city's Northside and a predominantly Hispanic area
on the city's Southside. A third major suggestion was that a strong evaluation component beadded to determine New Hope's effectiveness. The New Hope steering committee accepted these
and other task force recommendations, leading to a formal endorsement of the project by theGreater Milwaukee Committee in September 1990.
Over the course of the following year, the Greater Milwaukee Committee and the CFWANew Hope steering committee collaborated to bring the New Hope Project to fruition. Much oftheir effort focused on building a broad-based coalition from which New Hope could generatepolitical and financial support. Numerous state and local officials were invited to participate inproject planning. Churches and organized labor, represented by the Interfaith Conference ofGreater Milwaukee and the Milwaukee County AFL-CIO, also played active roles.
In 1991, the New Hope Project formed an independent board of directors to raise money
and carry out the tasks of specifying the program rules and procedures. Consistent with theproject's history of reaching out to various constituencies, the board was structured to include
seats for program participants, business leaders, government officials, and representatives fromnonprofit and community organizations. An effort was also made to achieve diversity inethnicity/race, gender, and ideology on the board. The board president, Thomas F. Schrader,
described the process this way:
Given the nature of the project it was a new project that required new thinkingwe sought board members and attracted board members who wanted to be in-
volved in the development of a demonstration project. The people invited to theboard had some experience with the issues. . . . Politically, we got everyone fromstaunch conservative to very liberal. They could talk to one another and reachconsensus on how issues could be approached. The goal was not to win a philo-sophical debate but to create a working design that could be tested.
The interest in testing the effectiveness of the New Hope model led the Greater Milwau-kee Committee and the New Hope board to seek guidance from social policy researchers at theUniversity of Wisconsin-Madison. The university group convened a panel of nationallyrecognized experts in July 1991 to review the New Hope approach and make recommendations
on how the program should be evaluated.' The panel found the New Hope Project to be "aninteresting and important antipoverty intervention" and recommended that it go forward. In areview statement, the panel wrote:
'The names and organizational affiliations of panel members included Gary Burtless (Brookings Institution),
Phoebe Cottingham (Rockefeller Foundation), Robert Haveman (University of WisconsinMadison), Robinson Gill
Hollister, Jr. (Swarthmore College), Lawrence M. Mead (New York University), William Prosser (U.S. Department of
Health and Human Services), and Michael Wiseman (LaFollette Institute, University of WisconsinMadison).
-17-

None of the Panel members was aware of any project or experiment in the countrythat stood so firmly on the principle that income support should come onlythrough work, and which had developed a mechanism that made work the linch-pin of the program. Such an approach has a basis in economic theory, and thetesting of it was judged to be a logical next step in both social science researchand social policy development.'
Following this endorsement, the panel made three recommendations: (1) that the NewHope board develop and specify the eligibility rules and operating procedures of the program;(2) that a small pilot phase be initiated perhaps with a group of 50 households to try out theprogram and work out any "bugs"; (3) that the program undergo an experimental evaluation,involving random assignment of eligible households into program and control groups, to measureprogram impacts. On this last point, the panel suggested that 1,200 households be invited tovolunteer for the program from census tracts selected for their high concentration of poverty.Volunteers could be screened for income eligibility and then be randomly assigned to programand control groups of equal size by an independent evaluator.
The New Hope board quickly secured sufficient private and governmental support tomount a small pilot program for 50 participants, as the review panel had recommended. DonaldSykes, formerly executive director of the Milwaukee Community Relations-Social DevelopmentCommission and a human resource management consultant, was recruited to be New Hope'sexecutive director. In addition to Sykes, the pilot program was staffed by an associate director (tohelp the executive director oversee program operations and plan for the full-scale demonstra-tion); a financial and data control manager (to monitor the budget and develop a system of fiscalcontrols); a systems administrator (to develop a management information system and providecomputer support); an accountant (to process benefit checks); two project representatives (toexplain program rules, provide job search assistance, handle community service job placement,and authorize benefits to participants); and a secretary-receptionist. Participants were recruitedthrough social service organizations throughout Milwaukee and publicity in the local media.Potential applicants were invited to orientations hosted at local churches; New Hope staff thenselected the participants from those wishing to volunteer. Selections for the pilot group weremade primarily on a first-come basis, though New Hope staff also made an effort to enrollparticipants from all of its referral sources and to achieve heterogeneity in household size, race orethnicity, and receipt or nonreceipt of welfare.
The pilot program began enrolling participants in March 1992 and continued for a littlemore than three years (overlapping with the start of the full-scale demonstration in August 1994).The pilot confirmed for New Hope board members and staff that the program model wasoperationally feasible and, more important, that it could help unemployed and low-incomeworking people get out of poverty through employment. Nonetheless, as the review panel hadpredicted, staff realized that some features of the program model required fine-tuning. Amongthe major lessons were these:
'Letter to Thomas F. Schrader (New Hope board president) and Robert H. Milbourne (Greater MilwaukeeCommittee) from the New Hope Project Consultants Review Panel, August 10, 1991.

To make clear to participants the benefits and services offered by NewHope and how to access them. Because some features of New Hope(such as the earnings supplements) operate so differently from a welfareprogram and require effort to understand, staff had to explain programbenefits and services carefully and re-educate participants on a regular ba-sis about the New Hope offer. In the words of associate director JulieKerksick: "We learned that we had to be simple and clear, to use wordsthat convey positive help without promising things we couldn't deliver,and to use visual aids."
To revise the program's definition of "full-time work." Because NewHope requires participants to work full time to qualify for earnings sup-plements, health insurance, and child care benefits, the definition of "fulltime" is critical. During the pilot, full time was defined as 35 hours ormore per week. Staff discovered that many employers in Milwaukee didnot offer their workers 35 hours or more on a consistent basis. Hence, forthe full demonstration, the number of hours participants needed to work inorder to qualify for New Hope benefits was reduced to an average of 30hours per week in a month.
To re-examine the interaction between the New Hope earnings sup-plements, "copays" for health insurance and child care, and federaland state income tax rules. The interplay between the various New Hopebenefits and between New Hope benefits and the federal and state in-come tax system is complex. New Hope's objective was to design asystem that would bring participants'income above the poverty line if theyworked full time, yet also maintain an incentive for them to work and earnmore. During the pilot, staff discovered that some participants faced asteep marginal tax rate that had the unintended effect of penalizing themfor additional earnings. The program appointed a panel to study the issueand to revise the benefit formulas so that they would be consistent withNew Hope's goals. The benefits package and the objectives used in its re-finement are described in detail in Appendix C.
To make allowances for participants in CSJs who wanted to enroll ineducation or job training. New Hope was not created to provide educa-tion and training services. However, staff realized during the pilot thatsome participants particularly those who needed CSJs also wantedor needed classroom instruction in basic education or vocational skills.The CSJ offer was modified so that CSJ participants who worked at least30 hours per week could also receive the minimum wage for each hourthey attended education or training classes in a week (up to 10 hours perweek).

These modifications were incorporated into the program before the full-scale demonstrationbegan. Subsequent chapters and appendices provide more detail on New Hope's design andoperations.
The planning and fundraising for the full-scale demonstration was a lengthy andsometimes difficult process. In 1994, the cost of the entire project encompassing the 50-person pilot, the 600-participant demonstration, and the evaluation was estimated at $18million over eight years. (As discussed in the next section, the project's eight-year costs were re-estimated and reduced to $15 million in 1996.) A multi-million-dollar fundraising goal wasambitious for any organization, let alone a nascent program like New Hope. Over a period ofseveral years, New Hope secured funding commitments from a large group of foundation, privatecorporation, government agency, and individual supporters for program operating and evaluationcosts.4 As of this writing, the majority of funds have been secured, although additional .moneyneeds to be raised in order for the program to serve each participant for the three years envi-sioned.
Following a competitive bidding process, New Hope signed a contract with MDRC inApril 1993 to design and conduct the evaluation of the full-scale demonstration. In January 1994,New Hope's board voted to proceed with the full-scale demonstration. Although all the programfunds had not been raised, a grant from the U.S. Department of Health and Human Servicesconferred legitimacy on the project and improved the prospects for grants from other sources.There was also strong feeling among New Hope board members and staff that further delaysmight jeopardize the project. As Kerksick explained, "we feared that if we didn't go forward,bureaucratic inertia could kill it."
The full-scale demonstration of the New Hope Project began in August 1994, about sixyears after the group from the Congress for a Working America first conceived the idea. Therealization of New Hope as a full-fledged demonstration project required extraordinary commit-ment and perseverance of project board members, staff, and supporters. But if the long develop-ment process sometimes tested the dedication of the people closest to New Hope, it also led tonotable improvements in the project design. It enabled the New Hope concept to be refined andgave the project an opportunity to broaden its base of support. The New Hope Project chose as itsmotto "building bridges to employment," but the history of the program suggests that it achievedanother type of bridge-building as well. New Hope created consensus among many differentpeople and organizations, with disparate views and interests, for a singular, powerful idea: thatpeople who work full time should earn a living wage and do better than they would on welfare.
II. Organizational Structure and Budget
The New Hope Project's long developmental process and pilot experience 'placed it in astrong position to begin the full-scale demonstration. The project had gained the support of aninfluential group of funders, policymakers, researchers, and community leaders; assembled a
"See Appendix B for a list of current funders.
-20- 55

core group of program staff; and developed procedures for delivering program benefits andservices. Nonetheless, the organization faced significant new demands and challenges as itprepared for its next phase. The full demonstration required New Hope staff to recruit and servemany more people than it had in the pilot period, support an intensive research effort, andrespond to an increasing number of requests from outsiders for information on the New Hopemodel and policy lessons. This section describes the organizational structure and budget thatNew Hope devised to meet these demands. It begins with an explanation of the roles of NewHope's staff and boards, followed by the projected and actual costs of the pilot and full-scaledemonstrations.
A. The Roles of Project Staff
New Hope's staff expanded from eight during the pilot phase to 18 at the start of the full-scale demonstration. By mid-1996 soon after the program completed enrollment theequivalent of 25 full-time staff were employed. New Hope's organizational structure during thedemonstration phase is depicted in Figure 2.1. Staff positions may be grouped into fourfunctional areas: managerial, direct service, accounting and information services, and adminis-trative support. These roles, and the staff who filled them, are briefly described below.
Managerial. New Hope is managed by three people: an executive director, an associatedirector, and a financial and data control manager. Sharon F. Schulz, formerly the divisionadministrator for youth services in Milwaukee County, was hired in December 1993 to beexecutive director.' The executive director has overall responsibility for directing the organiza-tion and making sure that New Hope fulfills the objectives laid out by its founders and board ofdirectors. The majority of the director's time is devoted to administration: overseeing thedevelopment and implementation of procedures to deliver New Hope's benefits and services;overseeing the hiring, training, and performance reviews of program staff; monitoring the projectbudget and coordinating fundraising activities; and resolving major policy questions affectingprogram operations. Another significant portion of the director's time is spent advancing NewHope's public policy goals, which includes building relationships with federal, state, and localgovernments to provide information about New Hope and, where appropriate, to secure politicalor financial support for the project, as well as working with the evaluators to help specifyresearch questions and coordinate research activities.
The associate director, Julie Kerksick, came from a community organizing backgroundand, as previously noted, was one of New Hope's founders. Kerksick's primary responsibility isthe direct supervision of program staff. In addition, as a registered lobbyist in Wisconsin,Kerksick plays a major policy advocacy and fundraising role within the state. She also takes thelead on New Hope's foundation and corporate fundraising.'
'Donald Sykes, New Hope's first executive director, left New Hope in 1993 to direct the Office of CommunityServices for the U.S. Department of Health and Human Services.
6Sharon F. Schulz left New Hope in February 1997 to assume the position of vice president of WisconsinWorks for the Milwaukee Private Industry Council. Julie Kerksick was appointed executive director of New Hopein March 1997.
-21- 5 6

Figure 2.1
The New Hope Project
Organizational Chart: August 1994-January 1997
ExecutiveDirector
ExecutiveSecretary
Secretary-Receptionist
Secretary -Receptionist
Southside (5/96)
Special ProjectCoordinator
(2/95)
AssociateDirector
ProjectRepresentativeTeam Leader
7 ProjectRepresentatives
2 ProjectRepresentatives
(3/96)
SOURCE: The New Hope Project.
AdministrativeCoordinator
(5/96)
CSJ PlacementCoordinator
CSJ PlacementCoordinator
(3/96)
J
CSJ andProgram Support
(4/96)
Human Resourceand Program
Support (1/96)
Financial andData Control
Manager
SystemsAdministrator
Accountant
AccountingClerk (10/95)
AccountingClerk, Part-Time
(12/96)
NOTES: Dotted lines indicate new positions added since August 1994. Dates in parentheses refer to the datea new position was added. CSJ = community service job.
-22- 5

The financial and data control manager, Tom Back, is responsible for the overall financialmanagement of the program, including developing and monitoring fiscal procedures, conductingaudits, producing financial reports, and monitoring contracts with organizations and consultantshired by New Hope. Back also supervises the accounting staff and oversees New Hope'smanagement information system. Prior to New Hope, Back had comparable experience inoperations management for a nonprofit organization.'
Direct Service. About half of New Hope's employees are directly involved in deliveringbenefits and services to participants. At full capacity with an enrollment of 681 programgroup members' New Hope employed nine project representatives (or "reps," in New Hopeparlance), a project representative team leader, and two community service jobs coordinators.
In many ways, the project representative role is the most central to New Hope'soperations. The reps handle the calculation and processing of benefits and services that partici-pants receive, including earnings supplements, health insurance, and child care assistance. Thereps also act as job coaches, helping unemployed participants find work and helping employedparticipants find better jobs. Finally, during the start-up phase of the demonstration, the repswere responsible for recruiting and enrolling eligible neighborhood residents in the study, callingMDRC to determine applicants' random assignment status, and informing program groupmembers of their rights and responsibilities as program participants. (Chapter 7 describes theproject rep's role in greater detail.) A project team leader who also carries a small participant
caseload coordinates team meetings among the reps and assists the associate director inhiring, training, and reviewing the reps' work.
Two CSJ coordinators develop employment opportunities in community-based, nonprofitorganizations for New Hope participants who are unable to find work in the regular labor market.They interview participants to learn about their work interests and place them in appropriatepositions. The CSJ coordinators also are responsible for monitoring job placements to ensure thatthe employers provide meaningful work opportunities and that participants meet employer
expectations.
The people hired to be project and CSJ coordinators come from a variety of backgroundsand bring a range of interests and talents to the job. Some of them have college training in socialwork or related disciplines; all of them have some professional or volunteer experience outsideNew Hope in human services or community action. New Hope's managers emphasized hiringindividuals whose life experiences would enable them to empathize with the life circumstancesof New Hope participants. Many of the staff, for instance, had experienced material hardship as achild or an adult, came from families that had recently immigrated to the United States, or hadreceived help from welfare or social services at some time in their life. One project rep relatedher experience this way:
'Tom Back was named associate director of New Hope in March 1997.'As noted in Chapters 1 and 6, MDRC dropped five sample members from the study (three in the program group
and two in the control group) because of missing baseline data. The research sample therefore consists of 678 programgroup members and 679 control group members.
-23-58

I am a single mother so I know what it is like. I was on AFDC for awhile. I knowhow it feels to go into the office and have to ask people for money. The [first] jobI got was through the JOBS program.
At all levels of the organization, New Hope hired an ethnically and racially diverse staff. Theproject reps and CSJ coordinators include individuals who identify as African-American,Hispanic, Southeast Asian, white, and biracial. Several project reps and one of the CSJ coordi-nators are fluent in languages other than English, making it possible for New Hope to work withSpanish, Hmong, or Lao-speaking participants in their native language.
Accounting and Information Services. Every organization requires sound fiscalmanagement. Because the New Hope offer is chiefly one of financial assistance whether inthe form of earnings supplements, paid community service work, or help with paying for healthinsurance and child care the accounting function assumes even greater importance. New Hopeemploys an accountant and two accounting clerks (one part-time) to review the monthly benefitcalculations submitted by project representatives on behalf of participants, and to process thechecks that go to participants and the health maintenance organizations and child care providersselected by participants. The accounting staff also process the staff payroll, pay New Hope'sbills, maintain financial records, and generate financial reports.
New Hope developed its own automated system to help project representatives keeprecords on their participants and calculate benefits and services. The system was designed both tofacilitate processing of benefits and services and to provide data for the evaluation. A systemsadministrator oversees and maintains the system, trains staff on its use, and extracts informationfrom the database to produce program reports for New Hope's managers.
Administrative Support. Three administrative positions were created to help New Hope'smanagers operate the program and respond to the demands posed by the evaluation. First, aspecial projects coordinator position was added in 1995 to assist New Hope's recruitment efforts,facilitate evaluation-related activities, and update a procedures manual for staff. Second, anadministrative coordinator role was created to assist with facilities management and to analyzethe welfare and employment data that New Hope receives from the state and county governments(primarily to verify participants' self-reported income and guard against fraud). Third, a humanresource and program support position was added in 1996 to handle personnel issues and policiesaffecting New Hope staff.
New Hope strove to create an office environment in which the questions and needs ofanyone who calls or walks through the door will be responded to in a courteous and timelyfashion. Three secretaries and a CSJ and program support staff member have been instrumentalin achieving this goal. They have fielded telephone calls, greeted participants and other guests,and directed visitors to the appropriate staff member or room. They have also assisted withcorrespondence, filing, and other office tasks needed for the smooth functioning of the organiza-tion.
B. The Role of New Hope's Boards
The New Hope Project is legally governed by a 25-member board of directors, all of
59-24-

whom reside in the Milwaukee area.9 Seven seats on the board are reserved for programparticipants; others are held by leaders from business, government, social services, organizedlabor, and the community. Board members and New Hope staff alike described the board asexceptionally dedicated and involved in the program. In the words of board vice president LindaStewart:
Board members are committed, sincere, open and willing to discuss situations.Board members are also willing to use whatever resources they have to advancethe project. I have served on zillions of boards; some are good and some are notgood. But I have found that when board members agree with the underlying goalsof a program, they will be more active.
New Hope's board of directors meets once each month, with additional time allocated forcommittee work and retreats. The Board engages with New Hope staff on every facet of theprogram's operations, including policies and procedures affecting the delivery of benefits andservices, personnel management, fundraising and financial oversight, evaluation-relatedactivities, and public policy outreach.
A second group, known as the National Advisory Board, comprises 14 prominentresearchers and policy analysts drawn from academic and nonacademic institutions across thecountry.'' This board grew out of the panel formed in 1991 to review the New Hope model andrecommend an evaluation design. The group continues to advise New Hope's board of directorsand staff on research matters as well as on state and federal policy developments that may be ofconsequence to New Hope. The National Advisory Board also supports New Hope's fundraisingefforts particularly with national foundations and the federal government and helps toinform policymakers and analysts at the national level about the project. The group meets abouttwice annually.
9In 1996, the names and organizational affiliations of the board members included Miguel Berry (United MigrantOpportunity Services), Thomas E. Brophy (Milwaukee County Department of Human Services, retired), Bruce Colburn(Milwaukee County Labor Council), Charlie Dee (Milwaukee Area Technical College), Leonor Rosas DeLeon (JobService), Winfred Dill (Milwaukee Christian Center), Julia Doyle (The Exchange Center), Jacqueline Ivy (Jobs forPeace), John K. MacIver (Michael Best and Friedrich), Bagwajikwe Madosh (Southside Resource Center), Rt. Rev.Patrick Matolengwe (All Saints Cathedral), David G. Meissner (Public Policy Forum), Claudette Melton, John Miller(Goodwill Industries of Southeast Wisconsin), Ameenah Muhammed (City-Wide Public Housing), Jerome Nelson(Project Return), Joselito Nieves, Roger D. Peirce (Super Steel, retired), David R. Riemer (City of Milwaukee), AnnieRobinson (Penfield Children's Center), Imelda Roman (Latino Health Organization), Thomas F. Schrader (WisconsinGas Company), Linda Stewart (Wisconsin Board of Vocational, Technical, and Adult Education), Tom VerHage(Arthur Andersen and Company), and Patricia Yunk (American Federation of State, County, and MunicipalEmployees).
'In 1996, the names and organizational affiliations of National Advisory Board members included Rebecca Blank(Northwestern University), Lynn Burbridge (Wellesley College), Gary Burtless (Brookings Institution), Tom Corbett(Institute for Research on Poverty, University of Wisconsin-Madison), Walter C. Farrell (University of Wisconsin-Milwaukee), Roberto M. Fernandez (Stanford University), Robinson Gill Hollister, Jr. (Swarthmore College),Lawrence M. Mead (Harvard University), Joan W. Moore (University of Wisconsin-Milwaukee), Demetra Nightingale(Urban Institute), Lois Quinn (University of Wisconsin-Milwaukee), Deborah Weinstein (Children's Defense Fund),William Julius Wilson (University of Chicago and subsequently at Harvard University), and Michael Wiseman(LaFollette Institute, University of Wisconsin-Madison).
GO-25-

C. Project Budget
From the beginning of the pilot phase, the New Hope Project had a skilled budgetmanager and involved many expert advisers to make projections of its eight-year costs.Nonetheless, budgeting for New Hope has been a constant work-in-progress, as the pilot anddemonstration periods stretched out longer than anticipated (mainly because of slower-than-anticipated fundraising and participant recruitment) and board members and staff learned fromexperience how much money was actually needed to operate the program.
New Hope's most recent budget, prepared in mid-1996, is shown in Table 2.1. The costsare broken down into four major categories:
Management and general. This covers salaries and benefits for New Hope'smanagerial staff and most of New Hope's accounting and information servicesand administrative support staff. The category also includes expenses relatedto the local and national boards and payments to consultants.
Program support. This covers overhead expenses such as rent, utilities, andoffice supplies and equipment.
Program evaluation. This covers the costs of the evaluation contracted byNew Hope to MDRC. Additional funding provided by the MacArthur Net-work on Successful Pathways Through Middle Childhood to study programeffects on families and children is not included in the budget shown.
Direct program costs. This covers two major expenses. First are the salariesand benefits for all staff involved in direct service delivery (the project reps,project team leader, and CSJ coordinators) and three other staff in supportiveroles to direct service staff (the special projects coordinator, the accountingclerk, and the CSJ and program support staff member). Second are the benefitsand services provided by New Hope to participants: in particular, the earningssupplements, health insurance, child care assistance, and CSJ wages. Thebudget contains a contingency fund to cover unanticipated increases in benefitpayments.
The first column of figures in Table 2.1 displays the actual costs of the pilot period and first yearof the full-scale demonstration; the second shows the projected costs of the last four years of thefull-scale demonstration; and the third displays the projected total costs for the entire eight-yearproject. (It is not possible to make a clear separation between the costs of the pilot and the full-scale demonstration. A few pilot group members were still being served when the full demon-stration began, and some activities for the full-scale demonstration including programplanning, staff hiring, and participant recruitment got under way during the pilot.) The grandtotal for these costs, encompassing the pilot and full-scale demonstrations, is projected to beabout $15 million. This figure includes evaluation expenses and organizational start-up andwind-down costs, which would not be present in a steadily operating program.
The largest share of New Hope's costs $9.3 million of the grand total covers the
-26- 61.

Tab
le 2
.1
The
New
Hop
e Pr
ojec
t
New
Hop
e Pr
ojec
t Bud
get:
Fisc
al Y
ears
199
2-19
99
Cat
egor
y
Pilo
t Per
iod
and
Firs
t Yea
r of
Full-
Scal
e D
emon
stra
tion
(Act
ual)
FY 9
2-95
Full-
Scal
e D
emon
stra
tion
(Pro
ject
ed)
FY 9
6-99
Gra
nd T
otal
(Pro
ject
ed)
FY 9
2-99
Man
agem
ent a
nd g
ener
al$1
,080
,014
$1,6
56,8
93$2
,736
,907
Prog
ram
sup
port
552,
006
869,
493
1,42
1,49
9
Prog
ram
eva
luat
ion
295,
033
1,00
4,96
71,
300,
000
Dir
ect p
rogr
am c
osts
Sala
ries
and
ben
efits
(st
aff)
397,
187
1,49
5,59
71,
892,
784
Ben
efits
and
ser
vice
s (p
artic
ipan
ts)
Ear
ning
s su
pple
men
ts40
5,64
61,
082,
520
1,48
8,16
6H
ealth
insu
ranc
e25
3,04
31,
519,
172
1,77
2,21
5C
hild
car
e as
sist
ance
197,
963
2,52
5,83
12,
723,
794
Com
mun
ity s
ervi
ce jo
bs w
ages
216,
475
944,
950
1,16
1,42
5C
omm
unity
ser
vice
jobs
pay
roll
fees
and
con
trac
ts20
,439
145,
495
165,
934
Rec
ruitm
ent
39,3
9421
,000
60,3
94O
ther
'17
,360
48,2
0065
,560
Tot
al d
irec
t pro
gram
cos
ts1,
547,
507
7,78
2,76
59,
330,
272
Con
tinge
ncy
265,
172
265,
172
Tot
al e
xpen
ditu
res
3,47
4,56
011
,579
,290
15,0
53,8
50
SOU
RC
E: N
ew H
ope
Proj
ect.
NO
TE
: a I
nclu
des
plac
emen
t and
sup
port
fee
s, jo
b an
d sk
ills
trai
ning
, par
ticip
ant m
eetin
gs, a
nd m
isce
llane
ous.
G2
(33

direct costs of serving program participants. The single greatest expense is for child care services($2.7 million). Health insurance ($1.8 million), earnings supplements ($1.5 million), andcommunity service jobs wages ($1.2 million) are the other major direct program costs. Thebudget covers three years of benefits and services for each participant during the pilot as well asthe full-scale demonstration.
Because benefits and services account for such a large proportion of New Hope's costs,the budget is highly sensitive to actual use of these benefits and services by participants. Initially,New Hope estimated a high level of use to set fundraising goals and guard against cost overrunsbefore the demonstration was completed. New Hope's local and national advisory boardmembers helped New Hope staff create these estimates, guided in part by the informationavailable from the pilot. The actual use of benefits and services during the full-scale demonstra-tion thus far is lower than projected, which explains why New Hope's overall budget declinedfrom an estimated $18 million in 1994 to the current $15 million. Use of benefits arid servicesduring the full-scale demonstration is discussed in Chapter 9.
III. Organizational Challenges of Implementation
The literature on social program implementation abounds with examples of good ideasgone awry when transferred from the planning stage to the field." While it is too soon to tellwhether New Hope is an effective program, it is at least operational. The program took a numberof years to get off the ground and has, at various times, weathered serious threats but NewHope's boards and staff have not deviated from their original vision. The following discussionaddresses some of the major implementation challenges that New Hope faced as an organizationand the ways New Hope dealt with them.12 One set of challenges related to the political and fiscalenvironment in which New Hope operated. A second set was technological: how to translate theNew Hope idea into concrete systems and procedures. A third set related to building anorganizational culture an esprit de corps among staff that was conducive to the fulfillmentof New Hope's mission.
A. The Political and Fiscal Environment
For any new social program to be implemented successfully, it must secure a steady flowof resources to finance its operations and mobilize external political support for (or at leastneutralize opposition to) the program. As discussed earlier, the New Hope Project began the fulldemonstration with the majority of funding either in hand or pledged, but several million dollarsstill had to be raised. Fortunately, the original budget projections proved to be about $3 milliontoo high; hence, some of the fundraising pressure was minimized as staff learned what theiractual expenditures would be. Nonetheless, budgeting and fundraising were a major andcontinuing concern of New Hope's board of directors and staff
Although New Hope proved to be a less expensive program than first anticipated, the
"See, for example, Bardach, 1980; Brodkin, 1986; Derthick, 1972; Pressman and Wildaysky, 1979.'The organizational framework used in this section is adapted from Hasenfeld, 1983.
-28- 4

effort to raise all the funds needed to cover the life of the project was complicated by shifts in thepolicy environment. The most cataclysmic event was the passage of the federal welfare reformbill, the Personal Responsibility and Work Opportunity Reconciliation Act, in August 1996. Thebill ended the Aid to Families with Dependent Children program and transformed welfare froman entitlement to a block grant payment to states for Temporary Assistance for Needy Families.The U.S. Department of Health and Human Services' financing mechanism for the program wasbased on the savings that would accrue to the federal government when participants used NewHope benefits and services rather than AFDC and other welfare programs. When AFDC ended,the authority that the HHS had to fund New Hope projected at $3.5 million over five yearswas also eliminated.
AFDC's demise, combined with New Hope's pre-existing fiscal gap, left New Hope witha projected revenue shortfall of $4.8 million at the end of 1996. Left unfilled, this gap wouldresult in the termination of benefits and services to New Hope participants before they had spentthree years in the program. The irony was that the welfare reform bill increased New Hope'spolicy relevance even while it jeopardized the demonstration's completion; as Chapter 1
described, the New Hope model is consistent with the policy objectives of the new welfare law.After many discussions with the U.S. Department of Health and Human Services and the State ofWisconsin during late 1996 and early 1997, an agreement was reached to restore $2.9 million ofNew Hope's anticipated federal grant, funneled through Wisconsin's welfare department. Thisaverted New Hope's immediate fiscal crisis, though an additional $1.5 million has yet to beraised to complete the demonstration.
New Hope's board members and staff tried hard to make policymakers in Washingtonand at the state and local levels aware of New Hope's approach and its policy relevance, bothbefore and after the federal welfare reform bill was passed. They concentrated their effortsmostly in Wisconsin, where the governor's welfare reform initiative, Wisconsin Works (W-2),already shared many of New Hope's features. Thomas F. Schrader, president of New Hope'sboard of directors, described this mission as follows:
We need to have a lot of contact with the state. New Hope, with 600 people in theprogram who are similar to W-2's target population, can talk about how peoplereally relate to the program. CSJs: how [they] work. What is the recidivism? Doesit really provide people with contacts, job leads, something they can add to theirrésumé? How to structure economic incentives and phase-outs. The real-worldtesting of these policies is what New Hope was designed to do.
This "real-world testing," in the view of New Hope board members and staff, is what made NewHope's contribution to the policy debate so valuable. Other people could criticize legislation oroffer their own proposals, but New Hope could provide lessons on its approach based onexperience and carefully planned research.
In addition to working with policymakers at the national and state levels, New Hopecultivated a base of support within Milwaukee that included city and county officials andrepresentatives from local social service organizations. These relationships proved mutuallybeneficial. On the one hand, New Hope gained endorsements, funding, access to data, and
-29- 6 5

referrals of potential participants from local government and social service organizations. On theother hand, New Hope offered Milwaukee officials an opportunity to showcase a nationallyrecognized antipoverty initiative. New Hope's benefit structure infused new resources into two ofMilwaukee's poorest areas, and created paid CSJs based in a number of social service agencies.To avoid getting into competition with other agencies for clients or funding, New Hope staffmade it clear that they would not duplicate existing services. This explains why New Hope didnot try to become a "one-stop" center offering education or job training classes, formalized jobclubs, or on-site day care. New Hope participants who needed or expressed interest in theseservices were referred to appropriate agencies by project reps.
B. Technological Factors
As described earlier, New Hope's pilot phase provided an opportunity for staff to makeadjustments in the program design. During the demonstration phase, staff attention was directedto scaling up the program, standardizing program procedures, and becoming more efficient atservice delivery. New Hope created a management information system to help staff calculate andprocess New Hope benefits accurately and provide data for New Hope's managers on how manyparticipants were using benefits and services or were in contact with project reps. Staff wrote anoperations manual to explain procedures, developed a training program for newly hired staff, andcreated a review process to provide feedback to staff on their performance. Although thedevelopment of these systems and procedures required some trial and error, it helped to clarifystaff roles and responsibilities and ensured greater consistency in service delivery. A detailedexplanation of how New Hope delivered benefits and services appears in Chapter 8.
The major challenge related to the delivery of benefits and services during the demon-stration phase was not figuring out how to do it, but rather developing sufficient staff capacity todo it well. Staff discovered that it took much more effort to engage people in the program bothat the initial stage of getting people to apply to New Hope, and later when people were in theprogram than they first expected. The difficulties stemmed from the challenges of communi-cating what this new and complex program was about and how people could use it to improvetheir economic circumstances. Chapters 5 and 8 explain in detail the communication issues andthe strategies that New Hope adopted to overcome them, but the addition of staff was a majorpart of the solution. One-and-a-half project rep positions were added in April 1996, loweringcaseloads from an average of 85 participants to about 70, so that reps could work more inten-sively with active participants and have more contact with inactive or marginally activeparticipants. A second CSJ coordinator was hired at about the same time to increase the numberof participants placed in these jobs and help participants better use community service to enterinto unsubsidized employment. The special project coordinator was hired in February 1995 toimprove recruitment.
New Hope's evaluation and public policy mission also created unusual demands on theorganization and added to the pressure to increase the number of employees. Program staffworked as partners with MDRC on a number of research activities: collecting baseline informa-tion on applicants, calling MDRC to determine random assignment status and informingapplicants of the outcome, documenting services provided to participants in the managementinformation system, meeting with MDRC researchers to discuss their experiences in running
-30- 66

New Hope, and arranging meetings between MDRC researchers and participants. New Hopestaff also played an active role in helping MDRC formulate research questions and plans,particularly concerning the enhancement of the evaluation to examine program effects onfamilies and children. On the public policy side, New Hope staff had to make themselvesavailable to government officials, foundation representatives, reporters, and others who wantedor needed to learn about New Hope. Schulz estimated that up to one-third of her time wasdevoted to evaluation-related and public policy functions. Most staff were not involved inevaluation or public policy activities to this degree, but few staff members were left untouchedby these demands.
The addition of staff positions obviously had cost implications and posed some financialrisk to the organization. Yet, as Schulz pointed out, there were also risks entailed in not doingeverything possible to deliver New Hope benefits and services as effectively as possible:
If we are really going to test the model, are we going to do it based on what wethink are reasonable resources, or at the end of the day are we going to say wecould have done it better? We decided on the former.
New Hope's managers estimated that if New Hope were not trying to support an evaluation orpublic policy mission, the program could have served the same number of participants just aswell with three or four fewer staff (a 12 to 15 percent reduction in personnel). This observationunderscores again the unique challenges of initiating and running a demonstration program andsuggests that a steady-state program without the evaluation and public policy activitiescould be less costly to run.
C. Organizational Culture
One reason that new program ideas fail during implementation is because the line staffwho are responsible for carrying out the policies do not support them. Michael Lipsky's researchon "street-level bureaucrats" (1980) documents the many ways that staff who work directly withclients in human services organizations may exercise their discretion to protect their owninterests, such as minimizing work demands or avoiding conflict with clients. Such discretionmay result in inappropriate delivery of services or failure to complete projects or tasks requestedby program managers. This dynamic was not in evidence at New Hope. To the contrary, NewHope staff believed strongly in the program and often did more than required to help participantstake advantage of program benefits and services. The project reps, for example, frequently stayedlate or came to the office on weekends to meet with participants who could not come duringregular hours, and extended deadlines for participants who did not submit paperwork in time toqualify for benefits.
New Hope staff's commitment to the program and their participants was not accidental.As an employer, New Hope offered neither large salaries nor job security beyond the period ofthe demonstration, so the people who came to work for the program tended to be drawn to itbecause of its mission. New Hope's managers, in turn, considered applicants' understanding ofand identification with the program's objectives as one criterion in their hiring decisions.Interviews with New Hope staff consistently revealed that the positive help they offered
-31- 6

participants was their principal motivation for working at New Hope. The following commentfrom a project rep was typical:
I love what I am doing, especially with the participants. You see the progress thatyou are making. Every month, you see people get jobs or get a better job. You feelgood about yourself, what you accomplish, one step at a time.
Some staff indicated a commitment to New Hope's mission that went beyond the participantsthey served. They believed New Hope had an important message to share with the public aboutwhy people are poor and New Hope's remedy for poverty. As one project rep explained:
I believe promoting the project is a 24 hour thing. I talk whenever anyone willlisten: when I am at church, at my children's school. Anyone willing to listen, Italk about the program.
By spreading word about the New Hope program, man}, staff hoped to help build a movementthat could lead to New Hope's expansion in Milwaukee and other communities.
The dedication that many staff felt toward New Hope was not solely a product of theirideological predisposition. New Hope's managers tried to nurture and build a strong sense ofcommitment to the project by giving all staff a stake in organizational decisionmaking. Manage-ment's objective, as associate director Julie Kerksick explained, was to create "self-directed workteams . . . in which you reduce your need for day-to-day supervision and increase the cooperativeproblem-solving that enables people to do what they need to do." Staff were encouraged to worktogether, whether to plan a meeting, generate ideas on how to help a participant, or develop newprogram procedures when existing practices proved unsatisfactory. New Hope's managers triednot to issue rules or resolve organizational problems by fiat, but rather encouraged staff toassume collective responsibility for program operations and success.
Teamwork did not always prevail at New Hope. Staffs different personality types andcultural backgrounds sometimes led to breakdowns in communication and camaraderie. By manyaccounts, staff tensions became most pronounced during the fall of 1995, when the simultaneouspressures of rising caseloads, completing recruitment, opening a Southside office, and masteringprogram procedures left many staff feeling frustrated and overworked and led to conflicts betweensome project reps and managers. Staff anxieties about New Hope's financial footing and the time-limited nature of the program (which meant that everyone would eventually be laid off) occasion-ally undermined morale and chipped away at the group's cohesion during 1996 and 1997.
New Hope's managers attempted to address staffs concerns and re-establish bonds withinthe group during monthly staff meetings and quarterly retreats. During the monthly meetings, themanagers encouraged every staff member to speak, whether to share accomplishments, raisequestions, identify problems, or address anxieties. The quarterly retreats often involved an outsidepresenter or facilitator who led staff in an in-depth discussion on a programmatic issue of theirchoosing. Examples of retreat topics included training on the Earned Income Credit, New Hopechild care procedures, cultural sensitivity, and communication and empowerment techniques. NewHope's managers participated in the retreats but tried not to dominate. The monthly staff meetingsand retreats provided an important forum in which staff worked through their major conflicts and
-32-
68
frustrations, although as might be expected problems were not always resolved quickly or toeveryone's satisfaction. In a few instances, unhappy staff either left New Hope or changed theirduties within the program. Most staff, however, predicted they would remain committed to NewHope and their participants until the program ceased operations.
IV. Conclusion
New Hope's long developmental process tested the patience and commitment of itsfounders, board members, and staff, but also made it possible for them to build an organizationthat could give the model a fair test. During the pilot phase and the early years of the full-scaledemonstration, New Hope learned from experience what resources were required both humanand financial to operate the program as its founders envisioned. The program faced somesignificant threats: most notably, the loss of substantial federal funding (most of which was laterrestored following congressional passage of the welfare reform bill in 1996). Internally, pressuresrelated to getting this new program off the ground and differences in the ways that staffcommunicated with each other sometimes threatened group cohesion. Nevertheless, throughoutNew Hope's implementation period, board members and staff maintain a deep-rooted belief inthe New Hope model and a genuine desire to learn how and whether the model works. Subse-quent chapters reveal more about New Hope's operations. A future report will address NewHope's effectiveness.
6 9-33-

Chapter 3
Labor Market and Institutional Context
The New Hope Project is part of a larger community that is characterized by uniqueopportunities, resources, and constraints. Further, its operations will be affected by the charac-teristics of the pool of people from which New Hope participants are drawn. Chapters 3 and 4consider the context for the New Hope Project. This chapter considers two dimensions of theprogram environment that may be particularly relevant to New Hope operations and, ultimately,to program effectiveness: the city and metropolitan labor market in which sample members workor try to find work and the network of public and private institutions that sample members maygo to for cash assistance, help in finding employment, or other social services. Chapter 4discusses in more depth the characteristics of the residents of the two New Hope target areas. Itsfindings are based on a special survey of neighborhood residents conducted for this project. Itreveals how residents of these areas have fared within this larger metropolitan context in terms ofkey outcomes such as employment, earnings, income, education, and receipt of public assistance.
An understanding of the labor market, institutional context, and neighborhood character-istics of New Hope may shed light on the use of New Hope's benefits and services. For example,if employment opportunities are readily available especially at the entry level then programgroup members may be less inclined to use New Hope's community service jobs (CSJs).Conversely, if entry-level jobs are scarce, program group members may depend on CSJs. Ananalogous situation exists with regard to welfare, employment services, and social services. Ifwelfare is easy to get and other employment and social service programs are plentiful, programgroup members may feel less of a need for New Hope. If, on the other hand, welfare and otherkinds of services are not easily accessed, then program group members may make greater use ofNew Hope for employment and financial support.
Control group members live and work in the same environment as program groupmembers. Therefore, with the exception of New Hope which only program group memberscan access the two groups face the same opportunities and constraints. In order for New Hopeto produce impacts, it has to offer program group members something better than control groupmembers get on their own. This means, for example, that New Hope has to help significantlymore program than control group members find employment and leave welfare in order for theprogram to have an effect on employment rates and welfare receipt. These benchmarks may beeasier to achieve if the local labor market is characterized by a low demand for entry-levelworkers (since control group members will have a harder time finding work and will not have theadvantage of New Hope's job search assistance or community service jobs) and the welfaresystem provides easy access to cash assistance (since control group members may find it easierto stay on welfare than look for employment).
-34- 70

I. Milwaukee's Metropolitan Labor Market
The city of Milwaukee has long been a major industrial center.' It was incorporated in1846, and grew from a population of about 20,000 at that time to a peak of 740,000 in 1960.Today, its population has shrunk to about 624,000. However, another third of a million peoplelive in the rest of Milwaukee County, and an additional half a million people live in the adjacentcounties of Washington, Ozaukee, and Waukesha (the WOW counties). These three counties,along with Milwaukee County, constitute the Milwaukee Standard Metropolitan Statistical Area(SMSA). In the early 1990s, the WOW counties accounted for 33 percent of the SMSA'spopulation and 31 percent of its jobs. The city of Milwaukee, in contrast, accounted for 43 percentof the metropolitan population and 45 percent of its employment. The remaining population andjobs are in the suburbs of Milwaukee County.
Although at first glance the geographic distribution of jobs in the Milwaukee SMSAappears to be well balanced, it is not. Over time, the working-age population of the city hasbecome less skilled, while jobs in the city have become increasingly white collar. Moreover, theMilwaukee metropolitan area's economy has become more and more decentralized. For example,in 1979, the city accounted for 53 percent of the SMSA's total employment; but in 1994, itaccounted for only 45 percent. This has occurred because the number of jobs in the city hasdeclined, while expanding in the rest of the metropolitan area. Consequently, many moreemployment opportunities are found outside the city than in it. Most of the pool of personswithout a current job who might potentially work live within the city limits, however. Thus,Milwaukee County's suburbs and the three WOW counties are an important potential source ofjobs for these persons.
The remainder of this section describes the Milwaukee labor market in greater detail. Itbegins with an overview of the market, specifically describing changes over time in the industryand occupational structure found in the different areas of the Milwaukee SMSA. This is followedby a description of the jobs open for immediate hire in the Milwaukee area and the credentialsneeded to obtain these jobs. The remarkably low level of unemployment in the MilwaukeeSMSA, especially in the areas outside the city, is discussed next. Finally, it addresses the issue ofwhether available workers in the Milwaukee SMSA, who mainly reside in the city, can reach thejobs that are available, most of which tend to be located in the suburbs.
A. An Overview of Labor Market Trends
Traditionally, the focus of Milwaukee's economy has been on manufacturing. This isimportant because manufacturing jobs are a source of relatively high wage jobs for individualswith a high school education or less, such as many New Hope participants. In 1910, Milwaukeehad a larger number of persons employed in manufacturing than any other city in the country andin 1930 it still ranked ninth. Like most other areas of the country, however, manufacturing inMilwaukee has become a diminishing source of employment and service industries have become
1This section and subsection A draw heavily on material presented in White, Thomas, and Thompson, 1995;and Wilson, 1995. The population estimate was obtained from the Milwaukee City Office of Budget andManagement.
-35-71

increasingly important. In 1950, for example, over 40 percent of all the jobs in the city were inmanufacturing, but today manufacturing accounts for only about 20 percent of all jobs in the city(and 25 percent of all jobs in the rest of the SMSA). Indeed, between 1979 and 1994, the city lostover 31,000 manufacturing jobs and the remainder of the SMSA lost another 18,000 manufac-turing jobs. Nonetheless, the Milwaukee area still has a proportionally greater share of manufac-turing jobs than the rest of the nation.
As manufacturing declined in relative importance, the service sector (transportation,utilities, communication, wholesale and retail trade, finance, insurance, real estate, government,and personal and business services) became more prominent. Thus, the service sector currentlyaccounts for 78 percent of the city's employment and 74 percent of the SMSA's employment.'More specifically, the important growth industries in the city have been in business, engineering,and management services; health services; and social services. These industries have alsoaccounted for much of the growth in the remainder of the SMSA, as has retail trade. Because ofthe growth of jobs in these industries, the total number of jobs in the city shrank by only 14,000between 1979 and 1994, while the remainder of the SMSA added over 100,000 new jobs over thesame period.
The change in industrial structure in the Milwaukee area is also reflected by changes inthe distribution of employed workers among occupations, as can be seen in Table 3.1. Asindicated by the table, the percentage of both male and female workers employed in blue collaroccupations fell considerably between 1970 and 1990, both in the city and in the SMSA as awhole. For men, as blue collar jobs became less important, sales, clerical, and service jobs and, toa lesser extent, professional and managerial jobs became more important. For women, profes-sional and managerial jobs became increasingly important at the expense of both blue collar jobsand sales, clerical, and service jobs.
The labor market trends discussed above have two important implications for currentlow-skilled residents of the city of Milwaukee. First, jobs are less conveniently located than waspreviously the case. There was a migration of jobs from the city to the suburbs; the number ofjobs shrank somewhat in the city, while growing substantially in the suburbs. Second, theimportance of blue collar manufacturing jobs, the traditional avenue for low-skilled workers intothe middle class, declined dramatically in both the city and the suburbs. This change in industryand occupational mix in Milwaukee appears to have been accompanied by reduced wage levels,especially in the city. For example, between 1979 and 1994, the city lost 44,000 jobs that paid.over $25,000 annually (in 1994 dollars), while gaining about 30,000 that paid less than thisamount. Thus, to a considerable degree, lower-wage jobs replaced higher-wage jobs. Theremainder of the metropolitan area gained 22,000 jobs paying $25,000 or more and 83,000 jobspaying less. As a consequence, the proportion of jobs in these areas paying $25,000 or more fellfrom 53.9 to 45.6 percent.
'The remaining jobs are in construction, agriculture, and mining, which together account for less than 4 percentof the metropolitan area's total employment.
-36-
72

Table 3.1
The New Hope Project
Changes in Milwaukee's Occupational Structure: 1970-1990
Occupational Structure
1970 (%)
Men Women TotalCity SMSA City SMSA City SMSA
Blue collar 56.2 51.2 18.1 17.4 40.4 38.1Sales, clerical, service 24.4 22.8 64.4 63.3 41.0 38.5Professional and managerial 19.5 26.0 15.6 17.6 17.9 22.7
1980 (%)Blue collar 52.0 47.3 16.3 14.8 35.4 33.0Sales, clerical, service 27.2 25.2 62.3 61.4 43.5 41.1Professional and managerial 20.9 27.5 20.7 23.2 20.8 25.6
1990 (%)Blue collar 45.8 40.6 13.0 10.6 30.0 26.5Sales, clerical, service 31.3 28.7 54.4 57.3 45.3 42.2Professional and managerial 22.9 30.6 26.8 31.5 24.8 31.0
SOURCES: Wilson, 1995; 1990 Census.
NOTE: The Milwaukee Standard Metropolitan Statistical Area (SMSA) comprises Milwaukee County and thethree WOW counties (Washington, Ozaukee, and Waukesha).
Percentages may not sum to 100.0 because of rounding.
-37- 7 3

B. Job Openings
A major goal of New Hope is full-time employment for program participants. Thus, animportant concern is the number of job openings for full-time workers in the Milwaukee area andwhether the jobs available are suitable for New Hope participants.
Although little information on job openings is typically available in most metropolitanareas, it is available for Milwaukee. Every six months, the Employment and Training Institute(ETI) of the University of Wisconsin-Milwaukee conducts a survey on a stratified sample of the35,812 companies that do business in the Milwaukee SMSA. This survey, which appears to bethe only one of its kind in the country, is used in determining the number of jobs open forimmediate hire and the characteristics of these jobs. The discussion in this section is based on theETI's October 23, 1995, survey.3
Table 3.2 reports some of the key findings from the ETI survey. The table indicates thatin October 1995 there were over 19,000 full-time and over 13,000 part-time jobs openings in theMilwaukee SMSA.4 The number of full-time job openings were virtually identical in October1994, but in October 1993, the first year of the ETI survey, there were under 12,000 full-timeopenings. Thus, the number of full-time openings in the SMSA grew considerably during 1994.Part-time openings were similar in all three survey months.
The rest of this discussion focuses on full-time openings, because full-time employmentis the goal of the New Hope program. Although the three WOW counties account for about 31percent of the employment in the Milwaukee SMSA, 42 percent of the SMSA's full-time jobopenings are located in these counties. Similarly, the Milwaukee County suburbs account for 24percent of the area's employment, but 32 percent of the job openings. In contrast, the cityaccounts for 45 percent of the area's employment, but only 25 percent of the job openings.
As shown in Table 3.2, the preponderance of jobs open in the Milwaukee area areavailable only to persons with some type of credential specifically, a college or communitycollege degree, occupational-specific experience, or an occupational certificate.' This isobviously important from the perspective of the New Hope participants, as only 12 percent havea college or community college degree or an occupational certificate. Indeed, as presented inChapter 6, the average New Hope participant has completed slightly less than 11 years of formaleducation. Although nearly all New Hope participants have had some work experience, this
'Detailed results from this survey can be found in Employment and Training Institute, 1995b. Some of thefindings reported in this section are based on special runs of the survey data file that were provided by the ETI andthus do not appear in the ETI report cited above.
40ne complication in conducting this analysis should be noted. Openings in higher-skilled jobs typically takelonger to fill than openings in lower-skilled jobs. Thus, a "snapshot" of the jobs open at any one point of time (suchas presented here) is likely to show a larger percentage of higher-skilled jobs than their percentage of all jobopenings over the course of a quarter or year. Making an adjustment for this complication is beyond the scope ofthis analysis. Therefore, readers should interpret these findings as somewhat overemphasizing the importance ofhigher-skilled jobs.
'In the Milwaukee area, occupational certificates are usually obtained by taking courses in a specialized fieldfor one or two semesters at a vocational or technical school. Local employers appear to place considerable value onthese certificates.
-38-
74

Table 3.2
The New Hope Project
Credential Requirements for Job Openings in the Milwaukee SMSA: October 1995
Job Opening by Credential RequirementMilwaukee
CityMilwaukee County
SuburbsWOW
CountiesLocation
Unspecified Total
Full-time job openingsB.A. or higher 293 433 328 2 1.056Certification license or A.A. degree 691 1,078 1,238 2 3,009Job-specific experience 1,714 2,601 2,819 51 7,184High school diploma only 560 593 1,554 17 2,724No credential requirements 970 1,093 1,480 194 3,737Credential requirements unspecified 558 303 665 35 1,562
Total full -time job openings 4,786 6,101 8,084 301 19,272
Total part-time job openings 3,176 4,920 4,798 372 13,257
SOURCE: Special computer runs by the Employment and Training Institute, University of Wisconsin-Milwaukee.
NOTE: The Milwaukee Standard Metropolitan Statistical Area (SMSA) comprises Milwaukee County and the threeWOW counties (Washington, Ozaukee, and Waukesha).

experience is not necessarily of the sort required by many of the jobs open in the MilwaukeeSMSA. It is important to recognize, however, that nearly 20 percent of the full-time job openingsdo not require any type of credential and another 14 percent require only a high school diploma.Well over half of the job openings that require only a high school diploma are located in theWOW counties.
Employers who are sampled by the ETI survey are asked to indicate which of the jobopenings listed they consider "difficult to fill." Answers to this question are difficult to interpretbecause they could mean either that there are relatively few available workers capable of fillingthe job or, alternatively, that the job is not attractive to qualified workers because of low wages, adifficult-to-reach location, or poor working conditions. Nevertheless, as the figures shown inTable 3.3 suggest, answers to the question are suggestive of the geographic imbalance inMilwaukee area labor markets.
As shown, the job openings with greater credential requirements are more difficult to fill.Also, job openings that do not require any credentials are much more difficult to fill if located inthe WOW counties than in either the city or the suburbs of Milwaukee County. Job openings thatrequire only a high school diploma are also more difficult to fill if located in the WOW countiesthan in the Milwaukee county suburbs, although not in the city. Thus, it appears that jobs areavailable in the outlining areas of the Milwaukee SMSA for workers with weak job credentials.
The full-time job openings in the Milwaukee SMSA reflect the area's current industrialstructure. Thus, 21 percent are in manufacturing, 32 percent are in the retail and wholesale trade,and 27 percent are in the service sector. Regardless of industry, almost all of these job openingsoffer wages well above the minimum wage, even those that require few or no credentials. Forexample, only 15 percent of the full-time job openings that require no more than a high schooldiploma offer less than $6 an hour, while 56 percent offer between $6 and $7.99, 24 percent offerbetween $8 and $8.99, and 5 percent offer $9 or more. Of the job openings having no credentialrequirements, 10 percent offer less than $5 an hour, 60 percent offer between $5 and $7 an hour,and 4 percent offer over $9.
C. Unemployment in Milwaukee
As evidenced by statistics on unemployment rates, which are produced by the U.S.Bureau of Labor Statistics and the Wisconsin Department of Workforce Development, thedemand for workers by employers in the Milwaukee area has been extraordinarily strong inrecent years. For example, in October 1995, the three WOW counties had a combined unem-ployment rate of about 2.5 percent and the Milwaukee County suburbs had an unemploymentrate of 1.9 percent. This is much lower than the unemployment rate for the nation as a whole,which was 5.6 percent in October 1995.6 Indeed, these rates are not much higher than the lowestofficial unemployment rate ever recorded for the nation as a whole: 1.2 percent in 1944 duringWorld War 11.7 Even the city's unemployment rate of 4.8 percent in October 1995 was lower
6Gardner and Hayghe, 1996.'Ehrenberg and Smith, 1994.
-40- 7 6

Table 3.3
The New Hope Project
Percentage of Full-Time Job Openings That Are Difficult to Fill,by Location in the Milwaukee SMSA
Credential Requirement
MilwaukeeCity
Milwaukee CountySuburbs
WOWCounties
No credentials required (%) 38.8 41.7 60.8
High school only (%) 64.6. 44.9 61.7
All other openingsa (%) 70.2 72.3 71.9
SOURCE: Special computer runs by the Employment and Training Institute, University of Wisconsin-Milwaukee.
NOTE: The Milwaukee Standard Metropolitan Statistical Area (SMSA) comprises Milwaukee County andthe three WOW counties (Washington, Ozaukee, and Waukesha).
aThese are mainly jobs that require job-specific experience or education beyond a high school
diploma.

than the 5.6 percent rate for the nation as a whole, although it was much higher than the rates forthe surrounding suburbs.
Table 3.4 compares the number of full-time job vacancies with the number of officiallyunemployed persons in the Milwaukee area in October 1995. This comparison is inexact, as boththe numbers of job openings and unemployed persons are difficult to measure with precision.Nevertheless, it is quite suggestive. First, in terms of the number of job openings and job seekersthe Milwaukee area's economy appears capable of "absorbing" most of those currently seekingwork.' Second, there appears to be a geographic imbalance between those wanting jobs and thelocation of available jobs. Specifically, there are apparently too few job openings within the city,but an excess of available jobs outside the city. Clearly, many city residents who are seeking jobswill have to cross the city boundaries if they are to succeed in finding employment.
D. Getting to the Job
Because New Hope participants are city residents, one obvious question is whether theycan get to jobs that are located in the suburbs of Milwaukee and the WOW counties. If they canget there, a second question concerns whether they qualify for at least some of the openings.Given the large number of difficult-to-fill job openings in suburban Milwaukee, it is notsurprising that the answer to the second question appears to be "yes" for most New Hopeparticipants.
Several personnel officials at suburban Milwaukee firms were shown the résumés of 11fairly typical New Hope participants. Most were thought by these officials to be readilyemployable. While most of the 11 New Hope participants qualified for only entry-level jobspaying about $5.50 to $6.50 an hour, a few those with certified vocational training orespecially good work histories were thought to qualify for jobs above the entry level.
Central city residents in Milwaukee have two major methods of reaching jobs in thesuburbs: private automobiles and buses.' In addition, some community-based organizationsoperate small programs that provide transportation by van for central city residents who havejobs located in suburban areas that are not serviced by public transportation. Because this vanservice is limited to only a small number of workers during each workday, the remainder of thissection focuses on transportation by private automobile and bus.
Information on how long it would take typical New Hope participants to get to potentialsuburban jobs by private auto and by bus is provided in Table 3.5. For illustrative purposes,seven suburbs and towns within the Milwaukee SMSA were selected. These communities andmajor transportation corridors to them are shown in Figure 3.1. Four of the communities (WestAllis, Shorewood, Cudahy, and Brown Deer) are located within Milwaukee County. Theremaining three are located in the WOW counties. One of these, the city of Waukesha, is
9If welfare reform stimulates a rapid entrance of large numbers of people into the labor force, the situationcould change.
91n principle, private sector employers could provide transportation to central city residents. Because of costconsiderations, however, they do not.
-42-
78

Table 3.4
The New Hope Project
Comparison of Job Openings and Unemployed Workers,by Location in the Milwaukee SMSA
Location
Part-Time JobOpenings
Full-Time JobOpenings
NumberUnemployed
Milwaukee City 3,167 4,786 14,400
Milwaukee County Suburbs 4,920 6,101 3,600
WOW Counties 4,798 8,084 7,220
Total 13,257 19,272 25,220
SOURCE: Employment and Training Institute, 1995.b
NOTES: The Milwaukee Standard Metropolitan Statistical Area (SMSA) comprises Milwaukee County
and the three WOW counties (Washington, Ozaukee, and Waukesha).The location of 372 part-time and 301 full-time job openings were not specified, but these were
included in the totals for part-time and full-time job openings.

especially important because of the large number of employment opportunities in the vicinityowing to the area's rapid growth in recent years.
The times reported in Table 3.5 are estimates of one-way commutes. The reportedcommuting time via private automobile was estimated on the basis of the mileage from the centerpoint of each of the two New Hope zip code areas to the center of each of the seven suburbancommunities. A 25-mile-per-hour speed was assumed for city streets and a 55-mile-per-hourspeed was assumed for highways. Four of the routes were also driven, two during rush hour, andthe times were very similar to those computed on the basis of mileage.' The reported commutingtime by bus is based on published schedules and is computed for the rush-hour period. Whentransfers between buses are necessary, the required waiting time is included in the reportedfigure. However, the time needed by a worker to walk from home to the bus stop, to wait for thebus, and to walk from the bus to the job is not included.
Table 3.5 indicates that there are very large differences between the time it takes to driveto a job in the Milwaukee suburbs and the time needed to reach the same job by bus. Because thetime required to walk to and from bus stops, as mentioned above, is not included in the estimatedcommuting times, the true differences are actually, even larger than those reported. One reasonfor the striking disparity in the times required by the two transportation modes is that, as shownin Figure 3.1, Milwaukee has excellent expressways. Moreover, the population is sufficientlysmall and dispersed that relatively few bottlenecks occur, even during rush hour.
On the other hand, as suggested by Table 3.5, the public transportation system is quitemodest. It would appear that New Hope participants can readily reach suburban jobs byautomobile, but the time required to reach many of these jobs by bus, particularly those locatedin the Waukesha area, is prohibitive. Unfortunately, according to the baseline informationcollected on New Hope sample members, 59 percent do not have access to an automobile thatthey can use to drive to work. Similarly, in a 1994 survey of residents of Milwaukee's centralcity," including those who live in the two New Hope target areas, the Employment and TrainingInstitute found that 64 percent of the unemployed job seekers who were interviewed did not ownan automobile and another. 17 percent had an automobile, but did not possess a valid Wisconsindriver's license. Thus, only 19 percent had both an automobile and a valid license. Not surpris-ingly, only 17 percent of the interviewed unemployed job seekers had applied for jobs in theWOW counties.
E. Conclusions
Even with the decline of manufacturing in Milwaukee, jobs that pay substantially abovethe current minimum wage appear to be available within the metropolitan area, even for jobseekers who possess few educational credentials and little job experience. Wage levels havefallen in the Milwaukee area, however. Moreover, many of the available jobs are located in the
'The largest difference was for Shorewood, which took eight minutes longer to drive to than was estimated onthe basis of mileage.
"See Employment and Training Institute, 1994.
-44-
so

Table 3.5
The New Hope Project
One-Way Commuting Times by Bus and Auto from the New Hope Target Areasto Seven Suburban Communities in the Milwaukee SMSA, in Minutes
Target AreaNorthside Southside
Milwaukee SMSA By Auto By Bus By Auto By Bus
Milwaukee CountyWest Allis 13 48 13 35
Shorewood 12 53 10 46
Cudahy 20 62 13 55
Brown Deer 21 61 19 104
WOW CountiesWaukesha 27 154 22 131
West Bend 49 n/a 44 n/a
Grafton 30 n/a 26 n/a
SOURCES: Auto times based on mileage; bus times based on Milwaukee County Transit System Guide for
1995.
NOTES: The Milwaukee Standard Metropolitan Statistical Area (SMSA) comprises Milwaukee County
and the three WOW counties (Washington, Ozaukee, and Waukesha).
Northside refers to zip code 53208; Southside refers to zip code 53204.
The amount of travel time for one-way commuting by bus does not include time spent walking to and
from bus stops.N/A = not applicable. There is no public transportation available between the city of Milwaukee and
West Bend or Grafton.

Figure 3.1
The New Hope Project
Suburban Communities and Transportation Corridors from New Hope
Milwaukee City
Communities withjob openings
New Hope target areasInterstate highwaysMajor roads
'I'll'''
Scale: 1 inch = 8 miles
Brown Deer
Shorewood
Northside
Southside
udahy
WE
SOURCES: New Hope Project, 1990 and 1992 census TIGER files, and Employment and Training Institute, 1995.
BEST COPY ILABLE-46-
3 2

suburbs and are not very accessible to inner-city residents, as few own automobiles and publictransportation between the city and the suburbs is limited.
One obvious solution to the geographic imbalance in Milwaukee labor markets is forinner-city residents to move to the suburbs. However, many inner-city residents are members of
minority groups, and may not feel that the suburbs provide a welcoming environment. Parts of
the metropolitan area outside the central city of Milwaukee have very few minority residents.
Indeed, 85 percent of the minority population in the entire state of Wisconsin live in the inner-
city area of Milwaukee.' This suggests the unlikelihood that substantial numbers of central city
job seekers will be able or want to move to other parts of the metropolitan area quickly:3
A second potential solution to the geographic imbalance problem is for firms to move
into or close to the inner city. At present, the incentive certainly exists: given the extraordinarily
low rates of unemployment in suburban Milwaukee, the city provides the largest available pool
of potential labor in the area. However, employers are reluctant to locate in the inner city for avariety of reasons, including higher land and construction costs, higher insurance and otheroperating costs, and fear of higher crime rates. Moreover, most potential industrial sites in or
near the inner city were polluted by the manufacturing companies that formerly occupied them,
and firms moving into them would possibly incur environmental liabilities:4 This analysissuggests, therefore, that even in Milwaukee's low unemployment labor market some job seekers
will still face difficulties in finding a job.
II. Institutional Context
The Milwaukee labor market, as the previous discussion revealed, presents particularopportunities and constraints to inner-city residents who want to work. This section describes the
welfare programs available to Milwaukee residents who could not or did not support themselvesthrough employment. It also discusses some of the nonwelfare services, other than New Hope,
that residents could access in order to prepare for or find work.
A. Welfare Programs
During the period in which the New Hope demonstration began, able-bodied persons who
had little or no means of financial support were potentially eligible for two types of cashassistance: Aid to Families with Dependent Children (AFDC) if they had children living withthem or General Assistance (GA) if they did not. In 1994 the monthly AFDC grant for a family
of three in Milwaukee County was $517, which made Wisconsin's AFDC grant the twelfthhighest in the nation:5 The average GA grant was $151.80 per month in 1994.'6 Individualsreceiving AFDC or GA were also eligible for Medicaid, which covers most medical expenses,and may have been eligible to receive Food Stamps. Individuals with disabilities or medical
'White, Thomas, and Thompson, 1995.'See Wilson, 1995."White, Thomas, and Thompson, 1995.'Mead, 1996.I6Wisconsin Legislative Reference Bureau, 1995.
-47- 83

conditions that prevented them from working were eligible to apply for Supplemental SecurityIncome (SST).
Milwaukee County is, by a large margin, the county with the largest AFDC and GAcaseload and expenditures in the state of Wisconsin. The main welfare offices in the city werelarge and impersonal, with staff seeking to handle large caseloads of families and/or individualsin a bureaucratic setting. In December 1995, Milwaukee County had an AFDC caseload of34,727, which was slightly more than one-half of the total caseload of 65,917 for the entire stateat that time." At the same time, Milwaukee's GA caseload of 6,434 also accounted for more thanhalf the state total and was the most costly in the state." This makes Milwaukee County uniquelyimportant to Wisconsin's efforts at welfare reform and the focus of the state's welfare policy.The focus on Milwaukee County has been further sharpened by the fact that from January 1987to December 1995, the AFDC caseload in the average county in Wisconsin fell by more than 50percent, while the caseload in Milwaukee County fell by only 11 percent.
While Wisconsin's primary welfare reform program, Wisconsin Works (sometimes calledW-2), is not scheduled to be implemented until late in 1997, the period covered by this report(1994 to early 1997) was a period of dramatic changes in welfare policy in Wisconsin. InSeptember 1995, Wisconsin terminated its GA program and in March 1996 the state and countiesintroduced new welfare programs in preparation for the implementation of W-2. The focus ofthese programs was to discourage new applicants from coming on the rolls and to encouragerecipients to leave welfare for work. One was a "diversion" program, which required applicantsto conduct 60 hours of job search activities as a condition of getting aid. A second was a "pay forperformance" plan, which reduced grants proportionately for every hour of mandated work ortraining that recipients missed. A third was a program of bureaucratic incentives and penaltiesthat measured caseload reductions in county welfare offices and threatened lagging offices withfinancial cuts. Reducing the AFDC caseload in Milwaukee County was one of the central aims ofthese new policies.
These changes, together with the extended period of strong labor demand and low unem-ployment outlined in the previous section, no doubt contributed to the decline in the AFDCcaseload in Milwaukee during 1996. In the ten months following the implementation of thesenew policies in March 1996, the welfare rolls in Milwaukee County fell by 7,235 families, orabout 20 percent. This was nearly double the reduction of4,076 cases for the nine-year periodfrom the beginning of 1987 to the end of 1995 (a period when the labor market was not asstrong), and more than triple the decline of 2,138 cases, or less than 6 percent, in the year prior toimplementation of these policies. Since March 1996, new applications for AFDC also declinedby 30 percent in Milwaukee County.'
These changes in the welfare environment, which largely occurred after New Hope intakewas completed, may have implications for New Hope. In the period prior to these tougher newpolicies, the fact that Wisconsin's AFDC grant was relatively high may have made AFDC an
"Mead, 1996."Wisconsin Legislative Reference Bureau, 1995.19 Mead, 1996; and DeParle, 1997.
-48-
34

attractive option for some people and New Hope's recruitment effort more difficult. After the
new programs went into effect, anyone who could work would be pushed to do something,perhaps making AFDC less attractive and New Hope more so. It is likely that New Hope's target
population people willing and able to work would be among the group most affected, since
these policies stressed pushing job-ready applicants and recipients of AFDC into the workplace.
The end of GA also meant that the 6,000 individuals previously receiving this type of assistance
would have to find some new means of support. Throughout the period of New Hope implemen-tation, however, individuals and families were likely to find a more welcoming atmosphere in the
project office than in the public assistance centers within the city.
It is not known where all the people who left AFDC or GA have gone. In the context ofsuch an intensive effort to reduce the welfare rolls, people might make increased use of non-welfare services to help them find employment or provide alternatives to the welfare system. The
fact that the Wisconsin economy was very strong, and unemployment very low, during thisperiod may have helped more people who were able to get to jobs move into employment.
The changes in Wisconsin's welfare policy produced unusually large reductions in thenumber of individuals receiving public assistance. Since an evaluation such as this one measures
the effects of a program against the background of the programs otherwise available in thecommunity, New Hope would have to produce even more dramatic reductions in its participants'
use of public assistance than those already taking place in the larger community. Thus, the
challenge facing New Hope in this respect is greater than it would have been in a context of less
dramatic changes in welfare policy.
B. Employment and Social Services
Another important contextual factor influencing the extent to which people in the target
areas would turn to New Hope for assistance is the availability of employment and social
services from other sources in these communities. Interviews with New Hope board members,staff, and Milwaukee social service providers suggest that Milwaukee is amply served byorganizations providing education, employment, community development, and other socialservices. It is a city, in one board member's words, with a strong "social tradition . . . where
things can happen on their merits." Figure 3.2 depicts the number and location of four-yearcolleges; education, training, and employment service providers; neighborhood developmentorganizations; social service agencies; and welfare offices in Milwaukee County. The New Hope
offices are also shown.
Several of Milwaukee's ethnic groups have developed organizations targeted at helping
their communities. The Hispanic community, in particular, has created many helping organiza-tions specializing in services to Spanish speakers and recent immigrants. A number of otherorganizations also provide services to non-English-speaking communities in addition to thoseprovided by these Hispanic organizations. Four agencies provide services to the Hmong, Laotian,
and Vietnamese communities. Two of these organizations are located on the Northside and two
on the Southside. They provide job search assistance, GED/ESL classes, and job training to these
largely refugee populations.

Figure 3.2
The New Hope Project
Location of Milwaukee County Human Service Providers
*New Hope offices
Four-year colleges:
Large (5)Medium (I)
Education, training, or employment services:
<>Large providers (13)Medium providers (30)Small or satellite providers (25)
Neighborhood development organizations (26)Social service organizations (79)Welfare offices (2)
Scale: 1 inch = 2.4 miles
W+E
SOURCES: Helpline Information and Referral Directory, Lincoln Park Community Service Support Directory, 1995/1996, andthe Milwaukee Public Library T.A.P. into Tutoring Guide, 1995.NOTES: Large providers serve 1,000 or more clients, medium providers serve 100 to 999 clients, and small providers servefewer than 100 clients.
Numbers in parentheses indicate number of providers in each category.Entire county not shown. For complete map, see Figure ES.1.
-50- 86T COPY AVAiLAn

There is some evidence that more employment, education, and social services were avail-able in New Hope's Southside target area than in its Northside target area. (See Figure 3.2.) This
may be due to the fact that Milwaukee's Hispanic population (which is concentrated on theSouthside) has created more helping organizations targeted to their community than Milwaukee'sAfrican-American population (which is concentrated on the Northside).
Particularly notable are the Milwaukee Job Centers located on the city's Northside andSouthside, which opened shortly after the New Hope evaluation began and, to MDRC observers,appear to be impressive facilities. They are meant to be a one-stop place for help getting a job,colocating agencies and services related to finding a job. Among the agencies located at thesecenters are the AFL-CIO, the Department of Child Support Enforcement, Goodwill, ManpowerInternational, the Department of Housing and Social Services, the Private Industry Council, andthe Wisconsin Job Service. There is also child care available on site. AFDC applicants arereferred to these centers for their mandatory job search activities, but with the exception of theAFDC JOBS programs, the services of the jobs centers are available to anyone who walks in.New Hope encourages its participants to make use of the computerized job listings and other
services available at these centers.
Low-income people in Milwaukee generally can obtain job search assistance, basic edu-cation, and to some extent vocational training for free. There are many education, training,employment, and social service providers spread throughout the neighborhoods targeted by NewHope. (See Figure 3.2.) Counseling services are also widely available, though these sometimescharge a fee. Child care assistance is available through several programs and health insurance isavailable through Medicaid. New Hope staff feel that most of these services are of good quality.
As the above makes clear, low-income people in the New Hope target areas have manyplaces to turn to for help. Some of the services offered by New Hope in particular, job searchassistance and child care assistance are readily available. No program in Milwaukee, however,offers anything remotely like New Hope's combination of benefits and services. New Hope alsogoes beyond what is provided by other organizations in providing paid community service jobsto those who failed to find other types of employment and providing wage supplements to thosein the lowest-paying jobs. This range of services makes New Hope a unique resource within itstarget communities. The distinctiveness of the New Hope offer is addressed further in Chapter 8.
New Hope was implemented in a strong labor market and during a time of rapid changein the welfare system. In late 1995 at the point recruitment for New Hope ended, the unemploy-ment rate in the Milwaukee metropolitan area was low. However, much of the growth in jobs,especially those open to less educated workers, was occurring in suburban locations difficult forresidents of the New Hope neighborhoods to reach by public transit. These strong labor marketconditions increased the overall probability those in New Hope could find an unsubsidized joband access program benefits, but also meant that community service jobs would remainimportant for some participants. In addition, the public welfare system in Milwaukee and theState of Wisconsin was undergoing major reform. Within AFDC; program participation andwork requirements increased over time and the caseload dropped substantially and cashassistance under the county's General Assistance program ended.

These contextual factors do not invalidate the basic comparisons involved in the study ofprogram impacts because they affect both those served within New Hope and individuals in thecontrol group. However, they probably influenced who applied for the program (making it amore disadvantaged group) and how various New Hope benefits and services were used(probably reducing the need for community service jobs).
With this picture of the larger metropolitan context as background, Chapter 4 turns to amore detailed picture of the characteristics and circumstances of residents in the New Hopetarget areas.

Chapter 4
Residents of the New Hope Neighborhoods
New Hope operates in two inner-city areas in Milwaukee with significant concentrationsof poor people. This chapter describes the people who live in these neighborhoods and examinesthe number and characteristics of households within these areas who appear to fall within NewHope eligibility rules. This analysis gives an estimate of the potential demand for a program likeNew Hope in these low-income central city neighborhoods. It also discusses the extent of aware-ness about New Hope among neighborhood residents, leading to the discussion of recruitmentefforts in Chapter 5. Chapter 6, which describes the characteristics of those who applied for NewHope benefits, will continue the story by comparing the characteristics of applicants with thoseof the eligible population.
The recruiting efforts of New Hope staff sought to draw program applicants out of a poolof eligible households in the two target areas. The "experimental" and "control" groups were cre-ated by random assignment from these recruits. Evaluation of social policies by recruitment andrandom assignment is a common practice. However, the procedure leaves unanswered two im-portant questions. First, are the people reached by means of community recruitment representa-tive of the entire population eligible for and likely to use the program? Second, if the programwere to be made universally available, how many people would use its services? It is possiblethat individuals who are attracted to the New Hope orientations (and therefore given the opportu-nity to participate) differ from those who would seek assistance were such a program to becomea regular part of the neighborhood landscape. If this difference is substantial, the utility of dem-onstration outcomes would be limited as a basis for forecasting the results of such a programwere it to be made universally known and universally available. Even should bias not be a prob-lem, the recruitment procedure provides little guide for estimating the total number of peoplewho might be attracted to such a program. Such estimates are essential for estimating the possi-ble costs of a large-scale New Hope replication.
The New Hope evaluation strategy addressed these issues by conducting a survey ofadults living in the New Hope neighborhoods. The New Hope Neighborhood Survey (NHNS)was designed to provide information on the characteristics of neighborhood residents and theirfamilies, the labor market experience of adults, the extent of awareness of the New Hope project,and the extent of interest in the New Hope idea among potentially eligible adults in the targetneighborhoods. The survey was conducted by the Social Science Research Facility of the Uni-versity of Wisconsin-Milwaukee in the period immediately following recruitment of participantsfor New Hope participation.
Beyond its utility as a basis for making inferences from the results of the New Hope ex-periment, the Neighborhood Survey offers a unique glimpse of the circumstances of people liv-ing in low-income inner-city neighborhoods in the 1990s. The survey also provides a basis forcorrection of some misapprehension about the character of such neighborhoods, especially asthey exist in Milwaukee. This chapter presents many of the survey results and their implicationsfor the New Hope project and work-based antipoverty efforts in general.
-53-

The chapter begins with a brief review of the plan, fielding, and analysis of the survey.(Details on the analysis are contained in Appendix D.) It then uses the survey to discuss thehouseholds from which respondents were drawn and the characteristics of the respondents them-selves. These background data are used to estimate the eligible population for New Hope withinthe target neighborhoods. The chapter concludes with a discussion of residents' awareness ofNew Hope.
I. The New Hope Neighborhood Survey
A. The Context of the "Underclass" Debate
It is useful to begin by putting the New Hope Neighborhood Survey in geographic con-text and relating the geography to an ongoing social policy debate. In 1995 Milwaukee's popula-tion was about 624,000,' down slightly from 633,000 counted in the 1990 census. The city'spoverty rate at the time of the census was 22 percent. Milwaukee city accounts for roughly two-thirds of Milwaukee County's population and over 90 percent of the county's poor.'
In Milwaukee, as in other cities, poor families tend to live in certain core neighborhoods.Poverty rates for all of Milwaukee County are plotted by census tract in Figure 4.1. The extendedhorizontal tract located in the city of Milwaukee's midsection (the Menomonee River Valley) is alargely depopulated industrial-transportation corridor. This belt separates the city's Northsideand Southside and two areas of poverty concentration. Public assistance receipt shows a similarpattern of concentration, and data on recipient family location indicate that the poverty areashave expanded westward during the 1990s.3
Information on poverty rates by census tract, like that in Figure 4.1, plays an importantrole in current social policy discussions. The most heavily shaded tracts are those with povertyrates of 40 percent or more. It is common in the literature on the spatial distribution of poverty toidentify census tracts as "neighborhoods"' and to designate tracts as "high-poverty neighbor-hoods" if the poverty rate exceeds 40 percent.' Since 1970 Milwaukee has experienced an excep-tionally large increase in the number of census tracts with povertyrates of 40 percent or more. In1970 there were just 11; by 1980 the number was 19; and by 1990 the count had increased to 59.6
High-poverty neighborhoods are the object of much research, in part because such neigh-borhoods are thought to reflect "underclass" social conditions discussed in William Julius Wil-son's The Truly Disadvantaged (1987). In subsequent research Paul Jargowsky and Mary JoBane determined that poverty rates of 40 percent or more came closest "to identifying those cen-sus tracts that are considered ghettos, barrios or slums by experienced observers of individual
'The population estimate was obtained from the Milwaukee City Office of Budget and Management.21990 Census.'Wiseman, McGrath, and Wiseman, 1995.'White, 1987, p. 19.'Jargowsky and Bane, 1991.'Jargowsky, 1997.

Figure 4.1
The New Hope Project
New Hope in Context: The Geography of Poverty in Milwaukee, 1989
1111
11111111111111111111111111111144,
11111111111111111111 .11
Immi-1.-010111111-7:-,Tr ,,.
hollinc/ /711,iiiipNit 111111
/,!,,;;,),'1=2'ita*, , //e, -sr
Ifillas %Oil*
411 ri,A,1111 II,Illll =%
111.111File
Milwaukee CityBoundary
Milwaukee County
1989 Poverty Rates byCensus Tract
40% to 100% (59)0 30% to 39% (15)111 20% to 29% (33)
0%to 19% (191)
Scale: 1 inch = 3 miles
SOURCES: 1990 census, and 1990 post-census TIGER files.
-55- 9 BEST COPY AV ILABLE

neighborhoods."' "In our fieldwork," Jargowsky and Bane report, "we found that such neighbor-hoods were predominantly minority. They tended to have a threatening appearance, marked bydilapidated housing, vacant units with broken or boarded-up windows, abandoned and burned-out cars, and men 'hanging out' on street corners."'
The Jargowsky and Bane characterization of high-poverty areas and Figure 4.1 create agrim image of Wisconsin's largest city and of the New Hope neighborhoods, which are largelywithin high poverty areas, as shown later in this chapter. In Poverty and Place (1997), Jargowskydevotes special attention to Milwaukee, and he uses the city's experience "to illustrate the proc-esses at work in the expansion of ghettos across the nation" (p. 57). He argues that the outlookfor the "borderline" tracts, those with poverty rates in the 30-40 percent range, "does not appearpromising" (p. 56). Unfortunately, it is possible that research like that done by Jargowsky andBane creates something of a self-fulfilling prophecy. It is hard to imagine potential employers ornew residents moving into these areas of the city when confronted with maps like Figure 4.1 andterms like "dilapidated," "abandoned," and "not promising."
The NHNS presents a much more varied picture of these neighborhoods. While there isconsiderable poverty and unemployment by definition there are also many working resi-dents and "functioning" families. This more balanced description of two actual high-poverty ar-eas is an important part of understanding the context in which the New Hope program operated.
B. The New Hope Neighborhoods
"Neighborhood" is "a district or area with distinct characteristics" (American HeritageDictionary), "a physically bounded area characterized by some degree of relative homogeneityand/or social cohesion."9 Taking a cue from the social science literature (see discussion of Baneand Jargowsky, above), the New Hope Project initially attempted to define the Catchment area forproject participants on the basis of tracts. This created problems in recruitment, both because theareas selected were quite small (they were made up of 13 census tracts, with approximately38,000 residents) and because people do not identify with their census tracts. In response, thecatchment area was expanded to include zip code areas 53204 (Southside) and 53208(Northside), which each contained about 40,000 residents. The original and expanded target ar-eas are identified, along with major streets and landmarks, in Figure 4.2. For convenience, thisreport refers to the target area north of Interstate Highway 94 as the "Northside" and the targetarea south of the Interstate as the "Southside."
In the mid 1980s Milwaukee's city planning agency, the Department of City Develop-ment, issued a map in which the city was subdivided into 190 neighborhoods based on a varietyof characteristics. In general, the neighborhoods identified by the Department of City Develop-ment do not correspond to census tracts or to zip codes. As Figure 4.3 indicates, the New Hopetarget areas cover or include parts of some 20 neighborhoods and 33 census tracts. Nonetheless,
7Jargowsky, 1997, p. 10.qargowsky, 1997, p. 11.'White, 1987, p. 3.
52

Figure 4.2
The New Hope Project
New Hope in Context: Target Areas
BROWN PEER RD
LINCCRE
CAPITOL
GREENFIELD
Northside
Southside
KOKLAHOMA AV
IC VER
Milwaukee CityBoundary
GRANGE AV
COLLEGE AV
) RAWSON AV
vS ,
Milwaukee County
Target Areas
Original LExpanded 1.1-11
Scale: 1 inch = 3 miles
SOURCES: New Hope Project and 1990 and 1992 census TIGER files.
BEST COPY AVAILABLE -57- 9 3

Figu
re 4
.3
The
New
Hop
e Pr
ojec
t
New
Hop
e in
Con
text
: Cen
sus
Tra
cts
and
Nei
ghbo
rhoo
ds
End
eris
Par
kI-
1Sa
int J
osep
hSh
erm
an P
aN
orth
Div
isio
nH
aram
bee
Met
calf
e Pa
rk
Upt
own
1111
i111
111
Was
hing
ton
Hei
ghts
Tri
angl
e N
orth
-Ial
yar
Park
rew
er's
"H
ill
Riv
erw
est
Low
erE
ast S
ide
.Blu
emou
nd H
eigh
ts
John
son'
s W
oods
Was
hing
ton
P
Mar
tin D
rive
1, II M
iller
Val
ey
III
1111
1
Stor
y H
ill11
.111
11...
1. 1
1111
11m
i iiii
iii
1111
11
Col
d Sp
rin
ark
Par
Vie
w
Kin
g Pa
rk11
1110
111
M1
onco
rdia
erri
ll Pa
rk
Woo
d/V
eter
an'
Hom
e
June
au T
own
arqu
ette
Kilb
oum
Tow
n
Men
omon
ee R
iver
Val
ley
His
tori
cT
hird
War
Mitc
hell
Park
Nat
ions
Park
lark
e Sq
uare
Silv
er C
ity
11.1
111.
1111
1111
1111
111
Bur
nham
Par
k
Jone
s'Is
land
alke
r's P
oin
Har
bor
Vie
wis
tori
citc
hell
Stre
elo
ckow
ercr
es
Lay
ton
Park
Lin
coln
Vill
age
Fore
st H
ome
aran
Bay
Vie
w-/
LH
ills
1Pa
rk/
1
1111
1111
1111
1
Cen
sus
trac
t bou
ndar
y
Nei
ghbo
rhoo
d bo
unda
ry
City
bou
ndar
y
Ori
gina
l
Exp
ande
d
Scal
e: 1
inch
---
1 m
ile
SOU
RC
ES:
New
Hop
e Pr
ojec
t, M
ilwau
kee
Dep
artm
ent o
f C
ity D
evel
opm
ent a
nd 1
990
and
1992
cen
sus
TIG
ER
file
s.
BE
ST
CO
PY
AV
AIL
AB
LE

the areas are relatively compact. The Northside area is only 2.0 miles wide; the Southside area is1.8 miles wide.
Figure 4.4 combines information from Figures 4.1 and 4.3 to illustrate the incidence ofpoverty in 1989 in the tracts that were to become part of the New Hope target areas. In 1989 bothof the target areas contained tracts that met the standard 40 percent "high-poverty" criterion, aswell as some tracts that Jargowsky classes as "borderline." Overall, the poverty rate in the North-side target area was 40 percent; in the Southside it was 37 percent.
In summary, New Hope targets economically troubled neighborhoods. While not uni-formly poor, both areas include high-poverty tracts that should exhibit the characteristics oftenascribed in social science literature to high-poverty neighborhoods. The New Hope Neighbor-hood Survey presents an opportunity to learn more about the people who live in such places; theNew Hope Project offers an opportunity to learn about the potential effects of jobs-related policyin such a context.
C. The Neighborhood Survey Sample
The New Hope Neighborhood Survey was designed to provide information on NewHope's targets: the adult residents of the New Hope neighborhoods. The survey sought informa-tion on the characteristics of adults and their families, their labor market experience, their aware-ness of the New Hope project, and their interest in the New Hope idea. The initial sample wasdrawn from dwelling units recorded in the Milwaukee Master Property File, with each dwellingunit given the same probability (.035) of selection. To convert the sample of dwellings into asample of adults, each selected dwelling unit was visited by an interviewer charged with identi-fying an adult to be interviewed: the "informant." Since all adults in the dwelling unit were po-tentially eligible, this informant needed to be selected at random from among the residents.Randomization was accomplished by inquiring about all adults living in the household andpicking as the informant the adult whose birthday was most recent. An appointment was made tospeak with this adult, and at this meeting the survey was administered. Interviews were con-ducted by the Social Science Research Facility at the University of Wisconsin-Milwaukee. (SeeAppendix D for the details of how the survey was designed, conducted, and analyzed.)
Not all dwelling units in the Master Property File proved to be habitable or inhabited, andcooperation was refused in some that were visited. The disposition of the original units sample issummarized in Table 4.1. The interview response rate ultimately achieved from inhabited dwell-ings was 82 percent. The completed sample size is 719.
Figure 4.5 illustrates the timing of the buildup of the New. Hope control and experimentalsamples and the accumulation of completed interviews for the New Hope Neighborhood Survey.While the survey was not coincident with participant recruitment, the difference in timing is notgreat. Consequently, the survey should provide the basis for an estimate of the total number ofNew Hope "eligibles" (potential New Hope participants) for comparison with the number of in
-59-

II
Lr'7
1111
111
1
_--
_---
-
A- _-
-_
N7
,....;
, on'
*Ai
1N
NN
I
1111
1111
11,L
,A
llik
,kk
::7
ao),
....
,,.0,
1
_N
Ik if
fiiiin
1111
111,
\-A
i
..,
...... _
II11
11'
1
.....
-_41
1111
11/4
....._
et
IMI/
1111
1Mi
Ole
E. .
I -

Table 4.1
The New Hope Project
Response Rates for Neighborhood Survey
Target AreaSample Northside Southside Total
Residential parcels (from city parcel map) 7,262 6,731 13,993
Dwelling units estimate 15,914 13,147 29,061
Original sample 557 460 1,017Empty, not inhabitable 38 24 62Vacant 43 36 79Total not eligible 81 60 141
Interview eligible 476 400 876Refused 44 20 64Never home, broken appointments, etc. 33 22 55Problem dwelling units 8 13 21Other 11 6 17Total uncompleted cases 96 61 157
Total number completed 380 339 719Percentage completed 79.8 84.8 82.1
SOURCE: Social Science Research Facility, University of Wisconsin-Milwaukee.
-61-Li 9

I
1,400
1,200
1,000
800
600
400
200
0
Figure 4.5
The New Hope Project
Participant Recruitment and Neighborhood Survey: 1994-1996
New Hope participants(experimental and control)
Neighborhood Surveysample accumulation
I I I 1 1 1 1 I
19941
I I I 1 1 1 1 1
1995Date (January Marked)
SOURCES: New Hope Project and New Hope Neighborhood survey
-62- 1 0 0
1 1 1 1 1 1 1
11996

dividuals actually enrolled.' In addition, given the near coincidence of the survey and participantrecruitment and the fact that by January 1996 almost 1,400 neighborhood residents had beenthrough a New Hope orientation and volunteered, information about the project should be wide-spread and survey findings on program awareness will reflect the situation following an exten-sive outreach effort.
D. Housing io Milwaukee
While oriented toward individuals, the Neighborhood Survey provides some informationabout housing in Milwaukee's inner-city neighborhoods. Data in Appendix D indicate that acrossboth neighborhoods about 6 percent of the units appearing in the Master Property File proveduninhabitable. Among habitable units, the vacancy rate was slightly higher than 8 percent. Mil-waukee's inner-city housing market is not "tight," but the decline in population has not producedlarge numbers of abandoned or vacant units a feature commonly ascribed to high-povertyneighborhoods.
Both the city and county rental assistance programs provide Section 8 rent vouchers andcertificates to low-income families living in these areas. About two-thirds of the NeighborhoodSurvey respondents were renters, and of this group only 3.2 percent reported receiving rental as-sistance. This translates roughly into 800 such cases in both target areas. This is consistent withreports from the city and county rental assistance offices that approximately 750 families in theNew Hope target areas were receiving rental assistance vouchers and certificates in 1996.
E. Population
Given the adjustment for the child count and nonresponse problems discussed in Appen-dix D, it is possible to use the sample to estimate the population of the two New Hope target ar-eas. The estimates are constructed in four steps: (1) the reported number of adults in thehousehold is summed over all the respondents; (2) the adjusted number of children in the house-hold is summed over all respondents; (3) the sum of adults and children is increased by the in-verse of the response rate; (4) the estimate of total adults and children in all sampled householdsis multiplied by the inverse of the sampling rate (.035). The result appears in Table 4.2. The sur-vey implies that since 1990 the population may have increased on the Northside and has almostcertainly increased in the Southside target area. The number of children has increased in both ar-eas; the change is proportionately greater on the Southside."
mAs discussed later, there are complications in this estimate, including its point-in-time nature, since neighbor-hood residents might move in and out of eligibility over the course of a year.
"These statements take the census count to be accurate. Each spring the Milwaukee Public Schools (MPS)authority conducts a household survey to count the number of children in the city who are likely to attend school inthe fall. The MPS count is 29,000, about 25 percent below the result for the NHNS. This sizable difference probablyresults from three factors. First, the schools survey counts are not adjusted for nonresponse; the figure reported isliterally the number of children found by the district using a number of methods. Second, the schools survey is be-lieved to undercount children in families that include only young children (and therefore have no children already inthe schools). Third, as suggested in Appendix D, if interview failures in the NHNS are concentrated among respon-dents without children, the extrapolation procedure followed to correct for nonresponse will exaggerate the numbersof children in the target areas. In the extreme case that all NHNS nonresponse households included no children, theNHNS child estimate would be 32,300. The true number probably lies somewhere between 32,000 and 39,000.
L63- 1 0 1

Table 4.2
The New Hope Project
Population of Target Areas: 1990 and 1996
Target Area and Age GroupCensus Count(April 1990)
Neighborhood SurveyPopulation Estimate
(April 1996)Standard
Error
Northside (zipcode 53208)Adults 26,445 24,623 662
Children 15,639 18,288 1,457
All 42,084 42,912 1,665
Southside (zipcode 53204)Adults 26,102 24,206 666
Children 15,827 20,851 1,811
All 41,929 45,057 2,124
TotalAdults 52,547 48,829 939
Children 31,466 39,140 2,325
All 84,013 87,968 2,699
SOURCES: U.S. Bureau of the Census and New Hope Neighborhood Survey.
NOTE: Variance estimates for total population exceed sum of variance estimates for adults and children
because the estimates are not independent.
_64_102

II. The New Hope Neighborhood Households
Neighborhood Survey respondents live in a variety of household situations. Table 4.3presents a tabulation of respondents by household type.12 New Hope is exceptional among socialwelfare policy demonstrations in extending eligibility to adults without dependent children. Asthe table indicates, 46 percent of all adults in the target areas live in households with children; 10percent live alone. About half (52 percent) of the adults in the neighborhoods live with a partner,and three-quarters of these partnerships involve marriage. Overall, there is no difference in theincidence of marriage between couples with children and couples without, but this outcome ismodestly confounded by the fact that many couples without children are older, and older couplesare more likely to be married. Among respondents under age 65, 75 percent of couples with chil-dren are married compared with 70 percent of the adults living without children but with part-ners.
Public assistance is an important source of income in the New Hope neighborhoods, butmany families do without. Table 4.4 reports the incidence of public assistance receipt among re-spondent households. Only about one-third of respondents living with families with children re-port receipt of AFDC or Food Stamps. Among single parents with children, the incidence is ofcourse higher, but it still amounts to only about half of all households. It is perhaps surprisingthat these figures are so low, but it should be recalled that both the Northside and Southside tar-get areas include some tracts for which the incidence of poverty in 1990 (see Figure 4.4) wasrelatively low. Nevertheless, taken as a whole the New Hope neighborhoods qualify as "povertyareas." Even with substantial poverty, two and a half times as many families with children in-clude two adults as are headed by lone parents, and three times as many couples with children aremarried as are not. Public assistance receipt is common, but far from universal.
III. The Neighborhood Survey Respondents
All adults in the target areas are potentially eligible for the New Hope offer, regardless ofage or household status. Thus, all adults in the neighborhoods were included in the universe ofhouseholds from which the Neighborhood Survey sample was drawn. However, examination ofdata on persons who responded to the program's outreach efforts suggests that the project ap-pealed primarily to persons below retirement age. Accordingly, where useful the chapter presentsseparate analyses of characteristics of those aged 65 or over and those under age 65. The Neigh-borhood Survey indicates that about 8.2 percent of adults in the target areas are 65 or over.
A. Personal Characteristics
Table 4.5 presents data on sex, age, ethnicity, and mobility of the NHNS sample. Thedata are separately tabulated for the Northside and Southside target areas. Even with the variousadjustments made to the data, there appear to be more women than men in the target areas, with
'2A11 tabulations are weighted to adjust for various properties of the sample. See Appendix D. The Northsidearea is divided by U.S. Highway 41 (see Figure 4.2). The areas west of this barrier (the Washington Heights, Haw-thorne Glen, Wick Field, and Story Hill neighborhoods) are considerably more affluent than those to the east.Wiseman, 1997, includes NHNS tabulations in which the Northside is separated into east and west components.
133

Table 4.3
The New Hope Project
Household Composition of Target Areas
Household Type Percent
Respondent lives alone 10.0
Respondent lives with family 85.7With children 46.0
Couple 33.0Married 24.7Other 8.3
Single parent 12.9Without children 39.8
Couple 19.2Married 14.4Other 4.8
Single 20.6
Respondent lives in household with only other nonfamily persons 4.3With children *Without children 3.8
SOURCE: New Hope Neighborhood Survey.
NOTE: * = less than .5 percent.
1 0 4-66-

Table 4.4
The New Hope Project
Receipt of Public Assistance in Target Areas
Percent of Respondents in Household ClassReporting Receipt of
Household Type Food Stamps AFDC Medicaid
All household types (%) 18.4 15.1 21.1
Respondent lives alone (%) 12.1 0.0 19.0
Respondent lives with family (%) 19.9 17.5 22.1With children 34.7 30.2 34.6
Couple 27.6 22.4 31.5Married 17.7 12.9 22.4Other 56.9 50.8 58.6
Single parent 52.9 50.0 42.6Without children 2.9 2.8 7.6
Couple 0.8 0.8 5.0Married 1.1 0.0 4.6Other 0.0 3.2 6.4
Single 4.8 4.7 10.0
Respondent lives in household withonly other nonfamily persons (%) 2.9 2.9 5.8
With children 28.6 28.6 28.6Without children 0.0 0.0 3.2
SOURCE: New Hope Neighborhood Survey.
NOTE: Percentage may not sum to 100.0 because of rounding.
-67-I v5

Table 4.5
The New Hope Project
Respondent Characteristics in Target Areas
Under Age 65 Age 65 or OverCharacteristic Northside Southside Total Northside Southside Total
Gender (%)Female 56.5 50.3 53.5 54.6 72.4 63.6Male 43.5 49.7 46.5 45.4 27.6 36.4
Age (%)18-19 19.5 6.1 13.020-24 12.9 13.6 13.325-29 9.3 16.8 13.030-34 11.1 16.1 13.535-44 26.3 21.1 23.845-54 16.0 14.4 15.255-64 4.9 11.8 8.3Total tinder 65 91.865-74 76.5 63.1 69.775-84 15.5 28.0 21.985+ 8.0 8.9 8.4
Race/ethnicity (%)African-American, non-Hispanic 62.4 5.8 35.0 25.0 3.7 14.2White, non-Hispanic 30.0 30.8 30.4 57.6 70.5 64.1Hispanic 3.3 55.9 28.8 1.5 25.8 13.8Othera 4.2 7.5 5.8 15.9 0.0 7.8
Highest diploma/degree earned (%)GED 4.9 6.3 5.6 0.0 0.0 0.0High school diploma 38.0 38.3 38.2 29.9 25.5 27.7Technical/A.A./2-year college degree 8.1 6.6 7.4 0.0 3.0 1.54-year college degree or higher 11.3 4.1 7.8 10.6 6.6 8.6Other 3.5 1.5 2.5 0.0 4.4 2.2None of the above 34.0 42.9 38.3 59.5 60.5 60.0
Years at current address (%)Less than 1 32.6 25.0 28.9 0.0 0.0 0.01 to 2 years 12.2 12.9 12.5 8.7 0.0 4.32 to 5 years 24.7 24.8 24.7 11.4 11.1 11.2More than five years 30.5 37.4 33.8 79.9 87.5 83.8
Moved in the last two years (%)No move 55.2 62.2 58.6 91.3 100.0 95.7From other state 17.3 6.8 12.2 0.0 0.0 0.0From other country 0.3 3.8 2.0 0.0 0.0 0.0Both 0.3 2.9 1.6 0.0 0.0 0.0In state 26.9 23.9 25.5 8.7 0.0 4.3
SOURCE: New Hope Neighborhood Survey.
NOTES: Percentages may not sum to 100.0 because of rounding.aThis category includes Asians and Native Americans.
-68- 1 0 6

the imbalance greater on the Northside than on the Southside. The age distribution also differs;the adult population on the Southside is substantially older than on the Northside. Among per-sons aged 18-64 on the Northside, 20 percent are 18 or 19 and 58 percent are 30 or over. In con-trast, on the Southside only 6 percent of adults are 18 or 19, and 63 percent are 30 or over.
The race/ethnicity difference between Northside and Southside is also pronounced. His-torically, African-Americans have largely lived north of the Menomonee River valley. In the1970s the area immediately south of the river began to develop a concentration of Hispanics,principally Mexican-Americans. The pattern is apparent in the table. In the Northside target area,African-Americans account for 62 percent of the population; on the Southside, African-Americans constitute 6 percent of the population. In contrast, 56 percent of the Southside popu-lation, but only 3 percent of the Northside population, is Hispanic. About 30 percent of adults in'both target areas are white, although the percentage is much higher (64 percent) among respon-dents aged 65 years or over. Most whites in the Northside area live west of Highway 41. (SeeFigure 4.2.)
Educational attainment is greater in the Northside target area: 11 percent of the Northsideadults under age 65 have a college degree compared with 4 percent for the Southside. On theother hand, 34 percent of adults on the Northside and 43 percent on the Southside had notachieved a high school diploma or a GED certificate. Here again a Northside division is evident.Most college graduates live west of Highway 41.
Mobility is substantial, and it appears to be greater on the Northside than on the South-side. One-third of the Northsiders reported having lived at their current address less than a year;for Southsiders the proportion was one-quarter. Eighteen percent of all respondents on the North-side and 11 percent on the Southside had moved from another state or country in the two yearspreceding the survey. Nevertheless, well over one-half of the adults in both target areas had livedat their current address for more than two years; over one-third had lived there for more than fiveyears.
B. Relationships
Table 4.6 summarizes responses to questions regarding marriage and partnership. Fortypercent of respondents under age 65 reported never having been married; 39 percent were mar-ried and living with their spouse at the time of the survey. Separate tabulations indicate that 13percent of the never-married adults were, at the time of the survey, living as intimate partnerswith another adult.°
Forty-six percent of respondents under age 65 reported living with their own or theirpartner's children. Table 4.7 presents the number of children reported, by the partnership statusof the respondent. About 71 percent of all persons living with children were also living with aspouse (53 percent) or partner (18 percent); the remainder were living with other adults (16 per-cent) or alone (13 percent). The family size distribution varies only slightly across living situa-tions: about 60 percent of respondents living with children reported living with only one or two.
"See Wiseman, 1997.
-69- 107

Table 4.6
The New Hope Project
Marital Status in Target Areas
Current Marital Status Percent
Never married 39.5Married and living with spouse 39.2Married/living apart 3.0Legally separated 2.9Divorced 10.7Widowed 4.8Total 100.0
SOURCE: New Hope Neighborhood Survey.
-70- 1 0 8

Table 4.7
The New Hope Project
Number of Children for Adults Under Age 65 Who ReportedLiving With at Least One Child Under Age 19
CharacteristicRespondent Household Situation
Living With Spouse/ Partner Single Parent
Respondents living with children (%) 71.0 29.0
Number of children (%)One 33.6 36.6Two 27.2 24.2Three 18.4 21.0Four 7.8 13.1
Five or more 12.9 5.1
Sample size 203 142
SOURCE: New Hope Neighborhood Survey.
, NOTE: Percentages may not sum to 100.0 because of rounding.
109-71-

C. Env lemtniAndEarninga
During the six-month period in which the Neighborhood Survey data were collected, theunemployment rate in Milwaukee County was 4 percent." The unemployment rate in the NewHope target areas was much higher. In Table 4.8 answers made by respondents to questionsabout unemployment are translated into unemployment rates comparable to national statistics.Data are presented for adults under age 65 and for the sample as a whole. Labor force participa-tion among older recipients is quite low, and this discussion will emphasize respondents underage 65.
To be officially part of the labor force, an adult must be either working or looking forwork. Over 70 percent of adults in the target neighborhoods met this standard, and one out offour was jobless. Critics of unemployment statistics have argued in the past that official unem-ployment data understate the actual extent of involuntary joblessness because some people whowant to work give up the search and as a result fail to report recent efforts at jobfinding. SinceNew Hope offers a job to those who cannot find one through normal channels, the NeighborhoodSurvey asked respondents who were unemployed at the time of the survey if they were "currentlyavailable for full-time work." This allows computation of two separate unemployment rates.One, the "standard" rate, approximates the official rate reported by the U.S. Bureau of LaborStatistics. In addition, a second "expanded" unemployment rate includes among the jobless (andin the labor force) unemployed persons who did not, look for work in the month preceding thesurvey, but who said they were "currently available for full-time work." This increases the un-employment rate for all adults from 25 to 30 percent."
Standard unemployment rates differ substantially by race, gender, and neighborhood. Un-employment is highest an extraordinary 47 percent among African-Americans and is low-est among whites. Women are almost twice as likely as men to be unemployed, andunemployment is twice as great in the Northside target area as in the Southside area. These race,sex, and geographic differences are not of course independent. In particular, the higher unem-ployment rates in the Northside target area are associated with the much higher proportion ofresidents who are African-American.
The high incidence of unemployment apparent in these data should not be allowed to ob-scure the fact that more than half of all adults hold jobs, and a substantial majority of these jobsare, by New Hope standards, full time. Table 4.9 presents data on employment. About 12 percentof jobs involved fewer than 30 hours of work per week; 29 percent of employed persons wereworking at least 40 hours per week. The median hourly wage (estimated on the basis of weeklyearnings and hours worked) was $8.50; 35 percent made $7 per hour or less.
These are not high wages, but most jobs held by full-time workers included some sort ofhealth insurance. Child care assistance was far less common. The wages reported in the Neigh
"The unemployment rate was obtained from the Wisconsin Department of Workforce Development homepage.
"The number would be greater still had a question been asked regarding part-time work. Presumably some per-sons not meeting BLS unemployment standards would report availability for part-time work even if for some reasonthey could not accept a full-time job.

Table 4.8
The New Hope Project
Employment Status in Target Areas
Employment Status Under Age 65 All
Employment status (%)Employed 57.3 53.5
Not employed, but looked for job in preceding month 19.1 17.6
Not employed, did not look for job in preceding month 17.6 23.1
Not employed, did not look for job in preceding monthbut currently available for full-time work 6.0 5.8
Unemployment rate (%)Standard 25.0 24.8
Expanded 30.5 30.4
Unemployment rate (standard) by demographic group (%)By race/ethnicity
African-American, non-Hispanic 46.6 46.6
Hispanic 17.5 17.4
White, non-Hispanic 8.1 7.9
Otherb 24.1 22.8
By genderFemale 32.3 31.6
Male 17.7 17.6
By target areaNorthside 32.8 32.2
Southside 15.5 15.4
SOURCE: New Hope Neighborhood Survey.
NOTES: One observation missing information was deleted.'Standard unemployment rate includes only jobless who looked for work in the preceding month.
Expanded unemployment rate includes persons who responded that they were available for full-time
work regardless of recent search history.bThis category includes Asians and Native Americans.

Table 4.9
The New Hope Project
Job Characteristics of Employed Residents
Job Characteristic Under Age 65 All
Hours worked (%)Median=40
19 or less 4.4 4.820-29 7.4 7.330 4.4 4.531-39 6.6 6.540 47.9 47.941-50 17.4 17.151 or more 12.0 11.9
Access to health insurance and child care assistance (%)Part-time workers (29 hours or less)
Job provides health insurance 35.8 35.5Job provides child care, if needed 2.9 3.4
Full-time workers (30 hours or more)Job provides health insurance 72.7 72.8Job provides child care, if needed 8.1 8.0
Hourly wage (%)Median=$8.50
$4.24 or less 5.3 5.2$4.25-$4.99 6.0 5.9$5-$5.99 11.8 12.2$6-$6.99 11.4 11.5$7-$9.99 25.8 25.7$10-$14.99 19.9 19.6$15-$19.99 7.4 7.2$20 or more 5.2 5.1Missing 7.2 7.4
SOURCE: New Hope Neighborhood Survey.

borhood Survey justify the importance attached by New Hope's sponsors to promotion of thestate and federal Earned Income Credit (EIC). For 1996 a taxpayer with one child was eligiblefor the maximum earned income tax credit of $2,125 with earnings of between $6,330 and$11,610.16 The highest earnings level consistent with the EIC payment was $25,078. For a parentworking 40 hours per week, the maximum credit is earned at an hourly wage of $5.80; the credit
goes to zero at about $12.50 per hour. Approximately 70 percent of employed residents of theNew Hope target neighborhoods report earnings falling in this range.
Almost half of the adult respondents to the Neighborhood Survey who were not working
at the time of the survey reported that they were available for full-time work. Reasons for nothaving a job reported by this group are tabulated in Table 4.10 along with reasons that some re-spondents are not available for work. These responses seem to convey two messages. First, lack
of jobs is a problem, but not for all unemployed residents. Eleven percent of persons not workingcited unavailability of jobs as a main reason for being jobless. Second, most reasons reflect notperceived lack of jobs but perceived lack of benefit from and barriers to job-taking. The NewHope offer addresses these concerns: A major objective of the program is to increase the gainand overcome the barriers, especially those related to benefits, experience, and child care.
IV. The Demand for New Hope
Almost 49,000 adults live in the New Hope target areas. If the program were universallyavailable, how many of them might use New Hope services? Caution is advised in answering thisquestion, because forecasting demand is complicated for a variety of reasons. First, New Hope is
a collection of components: job search assistance, community service jobs, earnings supple-ments, child care, and health insurance. Some people may need access only to health insurance,while others may be unable to move to employment without the bridge provided by communityservice employment. A full-fledged demand prediction would address needs for each.
Second, several "timing" issues arise. The need for New Hope services presumably will
vary over time as people's circumstances change. The NHNS provides a way to get a "snapshot"of the eligible population at, a point in time, but over the course of a longer period some who arenot currently eligible are likely to become so and others will lose eligibility. This means that thetotal number of people who might at some point in a year be eligible will be larger than the snap-shot provided by the NHNS. A more subtle timing problem arises because New Hope is intendedto change people's behavior and access to the job market. As a result, the number of people eli-gible and " in need" of the program may change as people access its benefits, build a job history,and achieve incomes beyond program eligibility. Thus, a complete analysis of program demandshould incorporate not just assessment of the circumstances of people in the absence of NewHope (as revealed, in this instance, by survey data) but also predictions of how these circum-stances will change should the program be implemented.
Finally, the NHNS was conducted, and the New Hope program itself operates, in a spe-cific institutional context. In particular, some participants have had alternatives, such as AFDC,
I6U.S. House of Representatives, 1996, p. 805.

Table 4.10
The New Hope Project
Reasons for Nonemployment for Respondents Without Jobs
Reported Barriers by Employment Status' Percent
Available for full-time work 48.5Client-reported barriers to employment
Jobs not available 11.4On layoff 3.9Don't have needed skill or experience 36.8Pay or benefits too low 19.7Lack of transportation 17.9Lack of child care 10.5Health/disability problems, including pregnancy 3.7In school 4.6Previously disinclined to work 15.4Other 4.1
Unavailable for full-time work 51.2Client-reported barriers to work readiness
Retired 38. 7In school 7.5Health/disability problems, including pregnancy 40.3Caring for children 14.0Disinclined to work 9.0Needed at home 6.6Other 3.7
SOURCE: New Hope Neighborhood Survey.
NOTES: One respondent reported that he/she was unemployed, but did not answer the rest of theemployment questions.
'Respondents cited multiple reasons.
-76-
1 i4

that might not be available were New Hope to be universal. In the context of change in other so-
cial assistance systems, attitudes toward New Hope could change substantially. Further, New
Hope as currently operated is small relative to the eligible population even within the target ar-
eas. If access to the program were to be made universal, it is possible that the presence of the
program would affect other institutions and even wages in a way that would affect employer de-
mand and worker behavior and the size and characteristics of the eligible population." Such
contextual interaction is difficult to model. These ambiguities notwithstanding, it is still a useful
exercise to employ the Neighborhood Survey to identify those individuals most likely to be eli-
gible for and interested in gaining access to New Hope services.
The rules used to identify eligible adults in this analysis are the same as those used by
New Hope for prescreening applicants and are summarized in Table 4.11. The basic approach is
to determine the size of the respondent's "family," compute gross income, and consult an income
eligibility table." The income cutoff used in these tables is one and a half times the 1994 federal
poverty standard:9
Three levels of stringency were used in estimating the demand for New Hope. The most
expansive standard (Level 1) automatically counts persons receiving public assistance or who
appear to be already enrolled in New Hope.2° For others, the standard considers only income and
family size, with family defined to include only the respondent's married spouse and dependents.
The middle standard (Level 2) moves from eligibility to likelihood of participation by including
as income the income of an unmarried partner and requiring that the respondent be interested
both in New Hope and full-time employment. Respondents meeting this standard are called
"probable participants."
By demand for New Hope we mean the number of persons who would be likely to use
New Hope benefits and services over the course of a year were they to be made universally
available. We draw a distinction between demand and eligibility. As we use the term, "eligibles"
refers to all persons who satisfy the criteria used for prescreening New Hope applicants. At any
time more persons are at least nominally eligible for New Hope benefits and services than would
be likely to use them.
The most stringent standard (Level 3) requires an expression of greater interest in New
Hope and also addresses a problem concerning adults living as part of a couple, either married or
"For example, an influx of new workers with an earnings supplement might put downward pressure on wages.
"The table employed was used by New Hope when recruitment began; the schedule is reproduced as the ap-
pendix to Wiseman, 1997.19 With inflation and resulting adjustments in the federal poverty standard, this cutoff translates into 1.4 times
the preliminary poverty standard for 1996. Extending eligibility above the poverty level allows New Hope to reduce
the employment disincentive created by high rates of benefit reduction for earners who have made it out of poverty.
20The NHNS did not explicitly ask whether respondents were currently enrolled in New Hope. Current partici-
pation was imputed on the basis of answers to a series of questions intended to assess New Hope awareness. These
questions are discussed further in the next section of this chapter.

Table 4.11
The New Hope Project
New Hope Eligibility and Demand
The following criteria were used to identify respondents to the New Hope Neighborhood Survey judged likelycandidates for New Hope participation:
Level 1
Persons were counted as New Hope eligibles if
they were at the time of the survey receiving AFDC or already participating in New Hope; and/or if
their income and the income of their married spouse fell below New Hope eligibility standards given the sizeof the respondent's family. Included in the respondent's family were all dependent children plus therespondent's (married) spouse.
Level 2
Persons were counted as probable New Hope participants if
they were at the time of the survey under age 65;
they were at the time of the survey receiving AFDC or already participating in New Hope; and/or if
their income combined with the income of their married spouse or unmarried partner fell below New Hopeeligibility standards given the household count of respondent, spouse, or partner (if present), and alldependent children;
they reported not being in school and available for full-time work or are currently working; and
they reported after studying a program description that New Hope would interest either themselves or theirspouse/partner "a great deal" or "somewhat."
Level 3
Persons were counted as likely New Hope participants if
they met Level 2 restrictions, and after studying the program descriptions they reported that New Hopewould interest either them or their spouse/partner "a great deal";
their spouse/partner did not participate.
-78- 1 1 6

not.21 Couples pose a problem if at a point in time both respondents are eligible for New Hope,and one partner joins the program and works full time (possibly by accepting a community serv-ice job); New Hope then becomes less attractive to the other member of the couple because it isalready providing health insurance and financial assistance with child care, reducing its appealrelative to other employment options. In general, the family's interests are probably better served
if the second member of the couple pursues jobs outside New Hope that pay more than the NewHope minimum. The upshot is that an estimate of the demand for the program that does not takeinto account the smaller incentives for the second member of the couple to participate will exag-gerate the total number of adults that the program might attract, and tabulations of characteristicsof potential eligibles will overrepresent adults with partners. As a first approach to this issue, thethird and most stringent level was created for this analysis in which it is assumed that each cou-ple produces only one New Hope participant. The issue of which member of a couple gets theNew Hope opportunity is addressed by assuming that the probability of participation is the same
for each. The way in which couples respond strategically to the New Hope opportunity is a mat-ter for study; it is possible that the results of the analysis of the behavior of families actually re-ceiving the offer will allow more sophisticated simulations in the future. Persons meeting theLevel 3 standard are termed "likely" participants.
Table 4.12 presents the results. Under the Level 2 restrictions, the survey indicates thatapproximately 18,000 adults living in the two target areas would have been candidates for NewHope benefits and services. When couples are assumed to produce only one participant and par-ticipation is limited to those reporting "a great deal" of interest in the program, the total drops to12,400. The outcome is not sensitive to modest variation in the income cutoff.
The characteristics of the people likely to be participants as judged by Level 2 and Level3 criteria are summarized in Table 4.13. Under Level 2, 70 percent are unemployed; one out of
five has never held a full-time job. While most are women, fewer than half are in families re-ceiving income from AFDC. Sixty percent have children. Twenty-six percent are age 35 or over.
More than half lack any educational credential. Under the more stringent Level 3 standard, thepotential participants have a higher unemployment rate, incidence of AFDC, and percentage ofsingle persons and, thus, lower percentage of individuals living with partners. The proportion ofmale potential participants decreases while the number of females increases. Under Level 3, 62percent of potential participants have not graduated from high school or received a GED. Theadditional restrictions shift the focus of the program somewhat from persons of Hispanic origin
to African-Americans.
All things considered, the Level 3 criteria are likely to be best for forecasting demand for
21At the end of the NHNS, respondents were presented with a card that described New Hope benefits and serv-ices. Respondents were first asked to grade each service in terms of how helpful that service might be to them ortheir partner. They were then asked if the project taken as a whole "would interest you (or your {spouse/partner}),"with the question adjusted to be appropriate to each respondent's circumstances. As Table 4.11 indicates, those al-ready in New Hope or who were AFDC recipients were automatically included as probable participants under theLevel 2 standard. The remainder met the earnings standard and responded "a great deal" or "somewhat" to thisquery. Three-quarters said "a great deal." For the Level Three demand evaluation, the "somewhat" group was alsoeliminated.

Table 4.12
The New Hope Project
Estimated Number of Potential New Hope Participants,by Eligibility Criteria
Category Total Percent
All adults 48,829 100.0
Level 1 (eligible) 30,077 61.6
Level 2 (probable) 18,122 37.1
Level 3 (likely) 12,397 25.4
SOURCE: New Hope Neighborhood Survey.
NOTE: aSee Table 4.11 for the New Hope eligibility criteria and basis for estimating demand; thesecategories are mutually exclusive.

Table 4.13
The New Hope Project
Characteristics of Persons Likely to Be New Hope Eligible,by Eligibility Criteria
Characteristic
Proportion of Eligibles Under Restriction"Level 2 by Target Area Level 3
Northside Southside Total Total
Target area 59.0 41.0 100.0 100.0Northside 100.0 0.0 59.0 64.3Southside 0.0 100.0 41.0 35.7
Unemployed (%) 75.8 60.5 69.6 78.3No full-time work experience 20.2 20.5 20.3 20.8
Receiving AFDC (%) 35.4 51.6 42.0 45.6
Household type (%)Respondent lives alone 4.2 3.6 4.0 4.3Respondent lives with family 89.7 95.5 92.0 92.5
Couple 27.3 52.9 37.8 25.0With children 25.1 47.5 34.3 22.8Without children 2.2 5.4 3.5 2.2
Single 62.4 42.6 54.2 67.5With children 23.8 29.8 26.2 35.4Without children 38.6 12.8 28.0 32.1
Respondent lives with others 6.1 0.8 3.9 3.3With children 0.0 0.8 0.3 0.5Without children 6.1 0.0 3.6 2.8
Race/ethnicity (%)African-American 86.2 8.9 54.5 59.9Hispanic 4.5 66.5 29.9 26.1White 2.7 18.9 9.3 8.0Otherb 6.6 5.6 6.2 6.0
Gender and age (%)Male 36.8 42.6 39.1 29.4
18-24 17.7 13.0 15.7 15.225-34 6.1 21.8 12.6 8.535 or over 13.0 7.8 10.8 5.7
Female 63.3 57.5 60.8 70.618-24 34.7 12.1 25.4 33.725-34 15.6 27.9 20.6 21.735 or over 13.0 17.5 14.8 15.2
Highest diploma/degree (%)GED 4.6 9.5 6.6 4.9High school diploma 30.3 31.3 30.7 27.1Technical/A.A./2-year college degree 4.0 1.7 3.1 2.84-year college degree or higher 1.4 0.8 1.2 1.2
Other 3.5 1.2 2.6 1.8
None of the above 56.1 55.5 55.9 62.2
Sample size (unweighted) 137 117 254 221
SOURCE: New Hope Neighborhood Survey.
NOTES: aSee Table 4.11 for the New Hope eligibility criteria and basis for estimating demand; thesecategories are mutually exclusive.
bThis category includes Asians and Native Americans.
-81-5
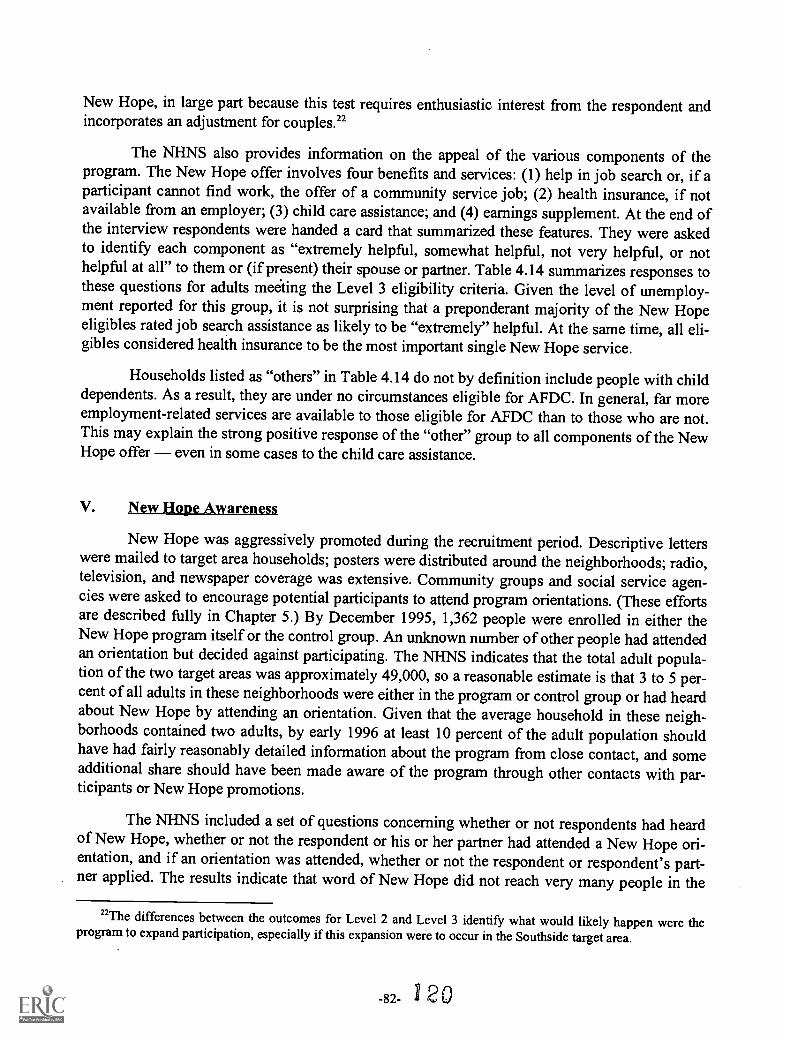
New Hope, in large part because this test requires enthusiastic interest from the respondent andincorporates an adjustment for couples.'
The NHNS also provides information on the appeal of the various components of theprogram. The New Hope offer involves four benefits and services: (1) help in job search or, if aparticipant cannot find work, the offer of a community service job; (2) health insurance, if notavailable from an employer; (3) child care assistance; and (4) earnings supplement. At the end ofthe interview respondents were handed a card that summarized these features. They were askedto identify each component as "extremely helpful, somewhat helpful, not very helpful, or nothelpful at all" to them or (if present) their spouse or partner. Table 4.14 summarizes responses tothese questions for adults meeting the Level 3 eligibility criteria. Given the level of unemploy-ment reported for this group, it is not surprising that a preponderant majority of the New Hopeeligibles rated job search assistance as likely to be "extremely" helpful. At the same time, all eli-gibles considered health insurance to be the most important single New Hope service.
Households listed as "others" in Table 4.14 do not by definition include people with childdependents. As a result, they are under no circumstances eligible for AFDC. In general, far moreemployment-related services are available to those eligible for AFDC than to those who are not.This may explain the strong positive response of the "other" group to all components of the NewHope offer even in some cases to the child care assistance.
V. New Hope Awareness
New Hope was aggressively promoted during the recruitment period. Descriptive letterswere mailed to target area households; posters were distributed around the neighborhoods; radio,television, and newspaper coverage was extensive. Community groups and social service agen-cies were asked to encourage potential participants to attend program orientations. (These effortsare described fully in Chapter 5.) By December 1995, 1,362 people were enrolled in either theNew Hope program itself or the control group. An unknown number of other people had attendedan orientation but decided against participating. The NHNS indicates that the total adult popula-tion of the two target areas was approximately 49,000, so a reasonable estimate is that 3 to 5 per-cent of all adults in these neighborhoods were either in the program or control group or had heardabout New Hope by attending an orientation. Given that the average household in these neigh-borhoods contained two adults, by early 1996 at least 10 percent of the adult population shouldhave had fairly reasonably detailed information about the program from close contact, and someadditional share should have been made aware of the program through other contacts with par-ticipants or New Hope promotions.
The NHNS included a set of questions concerning whether or not respondents had heardof New Hope, whether or not the respondent or his or her partner had attended a New Hope ori-entation, and if an orientation was attended, whether or not the respondent or respondent's part-ner applied. The results indicate that word of New Hope did not reach very many people in the
'The differences between the outcomes for Level 2 and Level 3 identify what would likely happen were theprogram to expand participation, especially if this expansion were to occur in the Southside target area.
-82- 120

Tab
le 4
.14
The
New
Hop
e Pr
ojec
t
Eva
luat
ion
of N
ew H
ope
Ben
efits
and
Ser
vice
s fo
r A
dults
Mee
ting
Lev
el 3
Elig
ibili
tyC
rite
ria'
Elig
ible
Typ
e
Perc
enta
ge R
epor
ting
the
Serv
ice
as:
New
Hop
e B
enef
it or
Ser
vice
Tot
al S
ampl
e(U
nwei
ghte
d)Jo
b Se
arch
Ass
ista
nce
Com
mun
itySe
rvic
e Jo
b
Hea
lthIn
sura
nce
Chi
ld C
are
Ass
ista
nce
Ear
ning
sSu
pple
men
t
All
221
Ext
rem
ely
help
ful
85:7
70.1
88.1
55.7
79.3
Not
hel
pful
4.7
7.9
4.7
33.6
5.7
Cou
ples
with
chi
ldre
n74
Ext
rem
ely
help
ful
76.2
54.9
76.4
61.8
69.7
Not
hel
pful
9.8
16.2
9.8
16.5
14.1
Sing
les
with
chi
ldre
n10
4
Ext
rem
ely
help
ful
77.7
59.5
86.0
75.4
73.8
Not
hel
pful
6.3
11.2
6.3
14.8
7.0
Oth
ers
43
Ext
rem
ely
help
ful
97.6
87.3
96.2
35.8
89.3
Not
hel
pful
0.6
0.6
0.6
58.8
5.2
SOU
RC
E: N
ew H
ope
Nei
ghbo
rhoo
d Su
rvey
.
NO
TE
: aSe
e T
able
4.1
1 fo
r th
e N
ew H
ope
elig
ibili
ty c
rite
ria
and
basi
s fo
r es
timat
ing
dem
and;
thes
eca
tego
ries
are
mut
ually
exc
lusi
ve.
121

neighborhood. Overall, the survey indicates that only about 20 percent of adults in the neighbor-hood reported having heard of New Hope at all. When queried for detail concerning what theyknew, 86 percent of respondents under age 65 reported knowing "nothing" about New Hope. Ta-ble 4.15 reports the results of a more detailed inquiry. Among working-age adults, only 4 percentappeared to be participants or knew "some" or "quite a lot" about the program. Among thosejudged "probably" eligible (Level 2), 89 percent reported knowing nothing of the program. Thereare no statistically significant differences in knowledge of New Hope among those who appearedto have been candidates for New Hope participation under the Level 2 criteria and those whowere not, although there may be some tendency for those best off to be more aware than those inthe eligible group. This may reflect greater exposure to area media coverage of New Hope.
These results suggest that New Hope's substantial outreach effort didnot manage to drawgeneral attention to the program. This raises concern about the characteristics of those actuallyrecruited; since knowledge of New Hope was uncommon, so may be the people who in the endheard about the program and volunteered. This possibility is investigated further in Chapter 6.
VI. Conclusions
The reality of New Hope neighborhoods is far richer than common depictions of inner-city "ghetto poverty" suggest. Joblessness is common, but so is employment. Many families areheaded by lone parents, but just as many are intact. Mobility is common, but so is long-termresidence. And as occurs with such frustrating regularity, the most substantial differences seemto be associated with race: African-American people in Milwaukee are jobless to a degree excep-tional even by the general standards of these high-unemployment neighborhoods.
The New Hope program is founded on the proposition that jobs are the best route out ofpoverty and that there is a shortage of them and the supporting benefits and services necessaryfor people to be able to work. The results of the survey are largely, but not completely, consistentwith this proposition. Unemployment is substantial, and wages paid in the jobs most residents dofind produce earnings not much above poverty levels. Most full-time jobs do appear to offerhealth insurance benefits, but assistance with child care is much less common. For most residentsthe state and federal Earned Income Credits will be, if collected; a valuable supplement to in-come.
The loudest cautionary note comes from the data on skills, as represented by formal edu-cation. It appears from the sample that more than half of potential New Hope eligibles lack anyformal educational credential. It is common in current antipoverty policy to emphasize the im-portance of gaining employment as a first step to self-support and increased well-being. How-ever, if funds used to assist in such efforts are diverted from programs for skills enhancement, thesecond step going from entry-level job to better job may well be retarded.
Perhaps the most surprising result from the New Hope survey, and certainly the mostfrustrating from the perspective of the operators, is the apparent lack of information about theprogram. If the answers made by respondents accurately reflect their contact with the program,knowledge of New Hope was far less pervasive than, for example, understanding of the rules ofcommon assistance policies such as Food Stamps and what was AFDC. This illustrates the im-

Table 4.15
The New Hope Project
Reported Knowledge of New HopeHousehold Survey Respondents
Eligibility/Demand a
Characteristic All Ineligible Level 1 Level 2
Estimated percentage,Adults under age 65 100.0 45.2 15.6 39.2
How much do you feel you knowabout the New Hope Project?
Response (percentage of respondentsin eligibility group):
Quite a lot`' 1.2 1.1 1.1 1.4
Some 2.7 2.8 3.4 2.3
Very little 8.8 11.6 9.4 5.5
Nothing 86.4 84.5 86.1 88.5
Sample size (unweighted) 645 290 101 254
SOURCE: New Hope Neighborhood Survey.
NOTES: aSee Table 4.11 for the New Hope eligibility criteria and basis for estimating demand; these categories are
mutually exclusive.'Includes nine New Hope participants.

portance of understanding the way in which New Hope recruitment was done. This topic is cov-ered in Chapter 5, followed (in Chapter 6) by a comparison of New Hope applicants with the eli-gible population in the New Hope neighborhoods.

Chapter 5
Recruitment and Sample Buildup
One of the biggest challenges that the New Hope Project faced during the full-scaledemonstration was recruiting eligible adults to meet its 1,200-person sample goal. Almost everystaff member was involved in recruitment in some way, whether planning recruitment strategies,making presentations in the community to build interest in the program, talking with potentialapplicants, running orientation sessions, or helping people fill out application forms and researchquestionnaires.
New Hope's recruitment effort extended over 16 months and resulted in 1,362 applicantsrandomly assigned to a program or control group. Although this sample was larger than theoriginal goal, recruitment took considerably longer and was more difficult than staff expected.The central challenge was getting potential applicants into the program office to hear about whatNew Hope could do for them. Staff mounted a broad-based campaign to get the word out andexpended considerable time and energy on recruitment activities, but people in the targetneighborhoods remained largely unaware of the program, as the previous chapter revealed.Another challenge was getting people to believe the New Hope offer. At first, people sometimesreacted with skepticism, though staff found that of those who took the time to listen to a full
presentation about the program most were interested in applying.
This chapter describes New Hope's recruitment experience and the reactions to theprogram that staff encountered from potential applicants. Its primary objective is to describe howpeople in the target neighborhoods were recruited into the research sample and why they applied.In doing so, the chapter provides a foundation for the discussion of sample membercharacteristics and attitudes and the comparison between sample members and other eligibleresidents living in the New Hope target neighborhoods presented in Chapter 6. More broadly,the chapter offers lessons on recruitment that may apply to other demonstrations or community-based employment and social service programs that are beginning operations. One issue that thechapter does not directly address is how recruitment and intake might be handled if New Hope ora similar program were to become a permanent part of the programmatic landscape. Many but
not all of the problems of recruitment encountered in the demonstration were the product ofthe specific features of a research project and would not be present in normal operations. A shiftto ongoing operation on a large scale, without narrow geographic eligibility rules or researchrequirements, would almost certainly affect people's knowledge and perceptions of the programand their decisions to apply and ease the problems of outreach.
The chapter is organized as follows. Section I begins with an overview of the recruitmentprocess and the pattern of sample intake. Section II describes the methods that staffused to bringpeople into the program and assesses how individual methods worked. Section III explores theproblems that staff experienced in helping people to understand and believe the New Hope offer.Section IV reviews the reasons that neighborhood residents applied to New Hope. Section Vsummarizes recruitment lessons and implications for the research sample.

I. Overview of the Recruitment Process and Buildup of the Sample
During the planning stages of the New Hope Project, program designers made a numberof decisions that affected how sample recruitment would be conducted. Two of the mostimportant decisions, discussed in Chapter 2, were to recruit a sample of 1,200 people ofwhom 50 percent would be randomly assigned to a program group and 50 percent to a controlgroup and to restrict eligibility to two (one Northside and one Southside) target areas.'Program designers based the sample goal on statistical and financial calculations. The programand control groups had to be large enough for researchers to detect New Hope's intended effectswith a high level of statistical confidence, and yet the costs of recruitment and delivery ofbenefits and services to program group members had to be kept within reasonable limits.Program designers selected the two target areas in order to achieve ethnic and racial diversitywithin the sample and to concentrate New Hope's resources within inner-city neighborhoodsthat had high concentrations of poverty. They also thought that the small geographic target areasmight allow researchers to examine New Hope's effects on neighborhood employment andeconomic indicators. This research objective was later dropped when it became apparent that thepercentage of neighborhood residents that New Hope could serve would be small and that controlgroup members would be living on the same blocks as program group members.
A third, and more challenging, decision that New Hope's designers faced was how toidentify eligible neighborhood residents to participate in the study and randomly assign them toeither a program or a control group. They considered two different approaches. One was toconduct a door-to-door survey of a sample of housing units within the target areas and, throughthis process, to identify a sample of residents who met program eligibility rules' and randomlyassign them to either the program group or the control group. Program group members wouldthen be contacted by New Hope staff and invited to participate; anyone who wanted to take upthe offer could do so. The second option was the one eventually chosen: to conduct broadoutreach in the community to inform people about the New Hope offer and to randomly assignthose who came forward on their own to apply and met eligibility requirements.
New Hope's designers recognized that both recruitment options had advantages anddisadvantages. The most attractive feature of the door-to-door survey option was that it wouldpermit a calculation of the proportion of a random sample of eligible people who, whenpresented with a detailed explanation of the program, would choose to enroll. This would yield abetter estimate than the demand estimate described in Chapter 4, assuming that New Hope staffcould contact everyone in the program group to inform them of the New Hope offer. However,program designers were not certain that New Hope could mount a door-to-door survey thatwould yield high response rates at a reasonable cost. Moreover, some of New Hope's founders
As noted earlier, by the end of the recruitment period, New Hope enrolled 1,362 people into the researchsample. Five sample members were later dropped from the analysis because they were missing baseline forms. Thefinal sample consists of 678 persons randomly assigned to the program group and 679 randomly assigned to thecontrol group.
2Something like this was eventually done for a sample of residents as part of the New Hope NeighborhoodSurvey used in Chapter 4.

were uncomfortable with the notion of randomly assigning households to a program or controlgroup before household members had a chance to say they wanted to participate in the program.
In contrast, the most attractive feature of the broad community outreach strategy was thatit put neighborhood residents in control of the decision to go through random assignment. It alsoheld the most promise for increasing awareness of and building support for New Hope. However,broad community outreach would also make it harder to measure acceptance of the New Hopeoffer, since knowledge about the program might not filter down to all eligible households.Furthermore, because broad outreach would be directed to all households, presumably moneyand effort would be spent on recruiting people who were ineligible owing to income level orresidence outside the target areas.
In order to minimize these potential problems, New Hope staff developed a broadcommunity outreach strategy that they thought would lead to the recruitment of a diverse sampleof neighborhood residents within a few months. First, with assistance from the MilwaukeeCounty welfare department, New Hope mailed an invitation to attend a program orientation toAFDC, General Assistance, Medicaid, and Food Stamp recipients living in the targetneighborhoods. Second, New Hope staff made presentations to a variety of public and privatecommunity organizations (mainly churches and social service organizations) to inform themabout the program and seek their help in providing referrals. Third, New Hope contacted localmedia to announce the start -up of the project and to run program advertisements. In order toreach the various racial and ethnic groups living in the targeted neighborhoods, New Hopeprepared written materials and hired staff who could speak in English, Spanish, Hmong, and Lao.
New Hope's early recruitment efforts resulted in a few hundred applications to NewHope, but not the outpouring of interest that some staff expected. By the end of December 1994
after five months of recruitment activity 279 people had applied and were randomlyassigned to a program or control group. Staff realized that they needed to do more if they wantedto meet their enrollment goal within a reasonable period of time. Figure 5.1 depicts the pattern ofmonthly random assignments over the course of the entire sample intake period. The experiencewas characterized by four distinct phases:
Start-Up (July through October 1994). Using the three-pronged strategy described above,New Hope began its recruitment process in earnest in July, about six weeks before the programdoors officially opened. Most of the project staff were trained and started work at about this time.The first orientation for potential applicants was held on August 5; the first random assignmentsto program and control groups were made the following week. Mass mailings to welfarerecipients living in the target areas were sent out in July and again in September.
Review and Retool (November 1994 through March 1995). New Hope's managersconsciously slowed down recruitment starting in November to take stock of their recruitmentstrategies and give the project representatives time to master the other facets of their jobsunrelated to recruitment (for example, benefits processing). A special projects coordinator wasadded to the staff roster to develop new recruitment strategies and assist with outreach tocommunity organizations. Finally, New Hope's managers and board of directors consideredand ultimately approved expanding the target neighborhoods from selected census tracts on
-89-I 2

180
160
140
120
100 80 60 40 20
Star
t-up
0 7/94
8/94
9/94
10/9
411
/94
12/9
41/
952/
953/
95
Figu
re 5
.1T
he N
ew H
ope
Proj
ect
Mon
thly
Ran
dom
Ass
ignm
ents
: Jul
y 19
94-D
ecem
ber
1995
Rev
iew
and
ret
ool
SOU
RC
E: M
DR
C r
ando
m a
ssig
nmen
t bui
ldup
rep
orts
.
Rap
id e
nrol
lmen
t-N
O-
Win
d-do
wn
--II.
-
4/95
5/95
6/95
7/95
8/95
9/95
10/9
511
/95
12/9
5
Mon
th o
f R
ando
m A
ssig
nmen
t

the Northside and Southside to the two postal zip code areas covering these two sections of town(53204 and 53208). This expansion went into effect in April 1995.
Rapid Enrollment (April through August 1995). This period was marked by an all-outeffort to bring in the sample. The single biggest factor that facilitated recruitment was theexpansion of the target areas to the postal zip codes, which increased the population in the targetareas from about 38,000 to 84,000 (based on the 1990 census), but, just as important, simplifiedthe message about who was eligible for the program. Most people know their postal zip code butnot their census tract location.
Other factors contributed to the rapid increase in sample enrollment. First, New Hopehired some temporary staff as outreach workers in order to have "more feet on the streets," in thewords of the special projects coordinator. Second, for limited periods of time, programparticipants were offered $5 gift certificates if they brought in other eligible applicants. Third, asatellite office was opened on the Southside to give New Hope a greater presence and make theprogram more accessible to residents of this part of town. (New Hope's main office is located onthe Northside.) Finally, with the arrival of spring, the weather improved an importantconsideration in Milwaukee. As one project representative stated in the early spring, "the weatherplays a big factor in who comes, who doesn't. A lot of people are coming through the doors nowthat it is warmer."
Wind-Down (September through December 1995). New Hope began to wind down itsrecruitment efforts as the program neared its recruitment goal. The temporary outreach workerswere laid off and the $5 gift certificates to participants who brought in other eligible applicantswere discontinued. The satellite office on the Southside, however, remained in operation.Because more Northside than Southside residents had enrolled in the sample, the board elected tostop intake on the Northside a month earlier than on the Southside in order to achieve greaterbalance in enrollments. Random assignment to the New Hope sample ended in December.
It is common for a voluntary social service program especially a demonstration projectsuch as New Hope to require some time before its presence. is established and its recruitmentgoals are met.' If New Hope's experience serves as a guide, the best results may be obtainedfrom a multipronged campaign, sustained over a period of months. The next section describesNew Hope's efforts in greater detail.
II. Recruitment Methods
New Hope's recruitment effort was a two-step process. The first step consisted of outreachto inform potential applicants about the program and invite them to attend an orientation. Thesecond step the orientation involved a detailed explanation of the program and the researchprocedures. Orientation attendees who expressed interest in New Hope met with_project reps todetermine their eligibility. If they were willing to work, had incomes at or below 150 percent ofpoverty level, and lived in the target neighborhoods, the project reps worked with them to complete
See, for example, Auspos et al., 1989; Quint et al., 1991.
-91- 131

the baseline questionnaires. Immediately afterward, the project reps called MDRC so thatapplicants could be randomly assigned to the program or control group.
During most of the sample intake period, New Hope staff ran orientation sessions severaldays per week, including nights and weekends, to make it as convenient as possible for interestedpeople to attend. In addition, during' the rapid enrollment and wind-down periods, staff heldorientations on both the Northside and the Southside so that people could get to these sessionseasily. A large majority of those who attended orientation found the program services attractive andapplied to be in the demonstration. If they did not, it was usually because their incomes were toohigh or they lived outside the target neighborhoods. The real difficulty occurred at the first step ofrecruitment: getting potential applicants interested enough in New Hope to attend a programorientation.
Over the course of the recruitment period, program staff used the following methods toencourage potential applicants to attend a New Hope orientation.
Targeted Mailings. Using address information obtained from the Milwaukee Countywelfare department, New Hope mailed invitation letters to AFDC, General Assistance, FoodStamp, and Medicaid recipients who resided in the two target areas. Invitation letters were alsomailed to people who expressed an interest in the program during the pilot phase and to eligibleindividuals who were interviewed during an early field test of the Neighborhood Survey. Finally,New Hope staff obtained agreements from some local churches, schools, and social serviceorganizations to enclose information about New Hope in letters sent to their members or clientsliving in New Hope's target areas.
New Hope staff found the targeted mailings, welfare mailings in particular, to be one of thebest methods of, bringing people into orientations during the first few months of New Hope'soperations. Nevertheless, the mailings revealed a problem with New Hope's geographicboundaries, especially as originally defined by census tracts rather than zip codes. Many peoplewho received letters no longer lived in the target areas, even though New Hope used the mostcurrent mailing lists available. Often the persons who received the mailings had not moved morethan several blocks away, but as a result were geographically ineligible for New Hope. During theinitial phase of recruitment, when mailings to lists were a major source of recruitment, this led tomany people showing up for orientations who could not be enrolled in the project.
Community Outreach. New Hope staff conducted extensive community outreach toinform Milwaukee-area organizations about New Hope and to obtain their help in getting theword out about the program. Figure 5.2 shows the types of organizations contacted by New Hopestaff during the first 13 months of recruitment activity (July 1994 through July 1995). Staffcontacted social service organizations (including education and training programs, communitydevelopment programs, shelters, food pantries, and others) most frequently. Churches rangingfrom large congregations to storefront missions were the second major focus of communityoutreach. New Hope staff also visited local schools and child care centers, businesses, andgovernment welfare and employment offices; at a minimum, these contacts provided anopportunity for information-sharing about New Hope. Often, New Hope got staff in otherorganizations to distribute flyers, post signs, send out endorsement letters to their constituents,

Figure 5.2
The New Hope Project
Types of Organizations Contacted During Community Outreach:July 1994 - July 1995
Public\Private Schools (K12), Child Care and Head
Start, Public Libraries9%
Churches16%
Community Events2%
Business11%
Probation and Parole1%
Job Service, Job Centers,and Welfare Department
2%
Contacts Wth CommunityLeaders Politicians
3%
Social ServiceOrganizations
56%
SOURCES: Community Outreach Logs; New Hope Project Representative Outreach Log.
NOTES: Percentages based on a total of 943 contacts between July 1994 and July 1995. Counts include duplicatecontacts at the same organizations.
-93-1 3 3
BEST COPY AVAILABLE

and take other active steps to help recruitment. In a few organizations, New Hope staff receivedpermission to conduct on-site orientations or meetings with their clients.
During the early stages of recruitment, New Hope staff mainly contacted officials orsupervisors of organizations. Over time, staff learned that they got better results talking withreceptionists and line staff, who had more contact with potential New Hope applicants. They alsolearned that although social service agencies, churches, schools, and businesses throughout thecity might come in contact with residents from New Hope's target neighborhoods, organizationswithin the target areas were most likely to refer people who met the economic and geographiceligibility criteria.
New Hope staff found community outreach to be one of their most effective recruitmentstrategies. Even asking a business owner to put up a poster in a store window could lead tosomeone calling New Hope for information or attending an orientation. As the special projectscoordinator stated, "we seem to get response from posters in retail areas. Nothing enormous andnothing concentrated in any one place, but every time a poster goes up in a store, it seems tobring someone in." New Hope staff said this was also true about their contacts with social serviceagencies, churches, and other organizations. No single contact generated large numbers ofreferrals, but repeated contacts with many organizations increased awareness of New Hope'spresence and led to a small but steady inflow of potential applicants.
Canvassing. Canvassing involved speaking to potential applicants during communityevents and distributing flyers in public spaces such as parks, bus stops, and libraries. During therapid enrollment phase, New Hope also hired outreach workers to conduct some door-to-doorcanvassing, although in practice they devoted most of their attention to public and outdoor areas,trying to identify people who might attend a New Hope orientation and dispel misconceptionsabout New Hope (for instance, that New Hope was only for welfare recipients).
New Hope staff learned over time that the flyers and posters they distributed had to besimple and direct in order to get their message across. Early in the recruitment period, New Hopeadopted a "truth in advertising" approach in which recruitment materials described each of NewHope's components and eligibility rules. With help from a marketing team from Wisconsin Gas,New Hope modified its flyers and posters to emphasize the benefits of participating in theprogram: namely, that it offered help to people who needed work, extra money, health care, andchild care. Information on who was eligible for the program highlighted the fact that manydifferent types of people living within the two zip code areas (for example, people who wereemployed and unemployed, on welfare and not on welfare) could be served. The objective of thenew flyers and posters was to provide enough of a "hook" so that people would want to call theprogram office for more information. Figure 5.3 presents an example of a revised brochurewritten in English; the same format was used for Spanish and Hmong versions. New Hope hireda delivery service to blanket the two target areas with similarly designed flyers during its rapidenrollment period.
Incentives to Program Participants. As program enrollments increased, New Hope staffrealized that the best spokespersons for the project were program participants. At first, staffsimply encouraged participants to bring their neighbors and friends to an orientation; later, New
-94- 134

Figure 5.3
The New Hope Project
Revised Recruitment Brochure
Who Is Eligible?
NEW HOPE can help you if you:
live In the 53204 or 53208 zip code areas
are at least 18 years old
are able to work full-time
You can put NEW HOPE in your life if you are:
employed or unemployed
receiving public assistance or not receiving publicassistance
single or married
male or female
any family size or without children
In other words, no matter who you are, theremay be NEW HOPE for you.
Target Areas
NORTH AVE.
WRIGHT ST
53208
PIERCE
N
ROGERS
(I FLORIDA
53204 "21-
BECHER
The NEW HOPE Project, Inc. is a pilot programwhich can serve a limited number of participants.Some income guidelines apply.
IDESI COPY AVAILAbLE
IF YOU NEED
HELP GETTING...
WorkHealth careChild care
Extra money...put
NEW HOPEin your life!
For information callthe NEW HOPE Hotline
937-3131Program information is also available in
Spanish, Hmong and Lao.
Building Bridges To Work
nigewHopEr623 North 35th Street Milwaukee,WI 53208
-95- 135
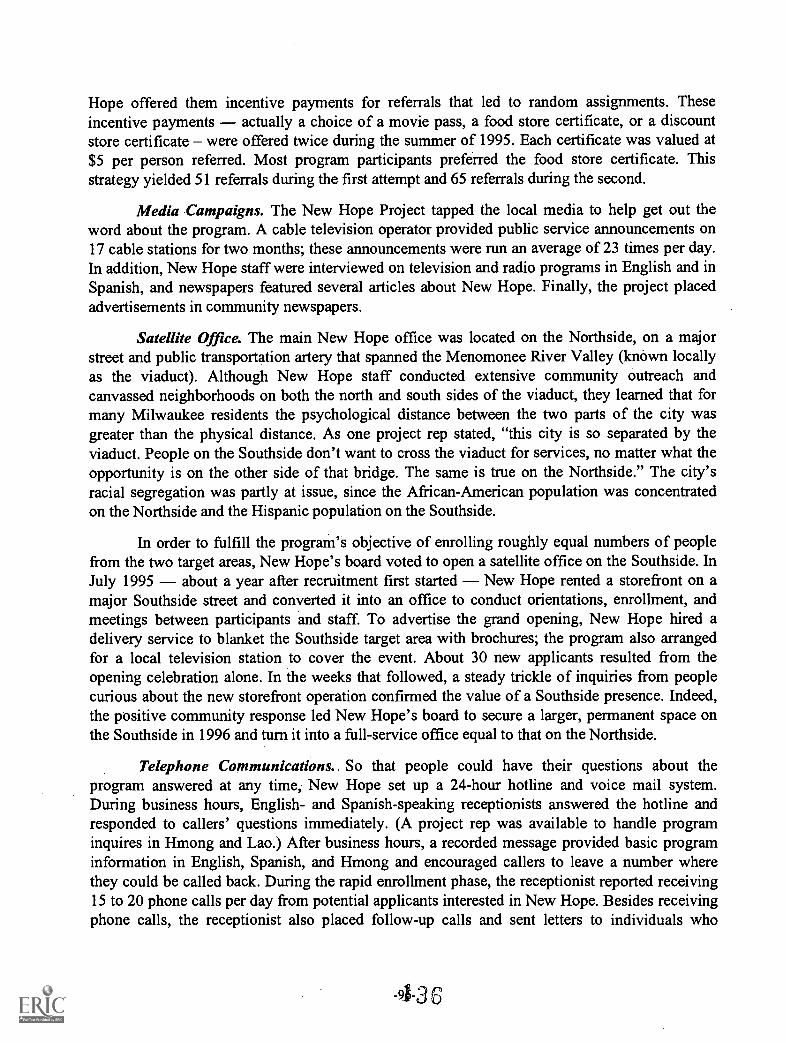
Hope offered them incentive payments for referrals that led to random assignments. Theseincentive payments actually a choice of a movie pass, a food store certificate, or a discountstore certificate were offered twice during the summer of 1995. Each certificate was valued at$5 per person referred. Most program participants preferred the food store certificate. Thisstrategy yielded 51 referrals during the first attempt and 65 referrals during the second.
Media Campaigns. The New Hope Project tapped the local media to help get out theword about the program. A cable television operator provided public service announcements on17 cable stations for two months; these announcements were run an average of 23 times per day.In addition, New Hope staff were interviewed on television and radio programs in English and inSpanish, and newspapers featured several articles about New Hope. Finally, the project placedadvertisements in community newspapers.
Satellite Office. The main New Hope office was located on the Northside, on a majorstreet and public transportation artery that spanned the Menomonee River Valley (known locallyas the viaduct). Although New Hope staff conducted extensive community outreach andcanvassed neighborhoods on both the north and south sides of the viaduct, they learned that formany Milwaukee residents the psychological distance between the two parts of the city wasgreater than the physical distance. As one project rep stated, "this city is so separated by theviaduct. People on the Southside don't want to cross the viaduct for services, no matter what theopportunity is on the other side of that bridge. The same is true on the Northside." The city'sracial segregation was partly at issue, since the African-American population was concentratedon the Northside and the Hispanic population on the Southside.
In order to fulfill the program's objective of enrolling roughly equal numbers of peoplefrom the two target areas, New Hope's board voted to open a satellite office on the Southside. InJuly 1995 about a year after recruitment first started New Hope rented a storefront on amajor Southside street and converted it into an office to conduct orientations, enrollment, andmeetings between participants and staff. To advertise the grand opening, New Hope hired adelivery service to blanket the Southside target area with brochures; the program also arrangedfor a local television station to cover the event. About 30 new applicants resulted from theopening celebration alone. In the weeks that followed, a steady trickle of inquiries from peoplecurious about the new storefront operation confirmed the value of a Southside presence. Indeed,the positive community response led New Hope's board to secure a larger, permanent space onthe Southside in 1996 and turn it into a full-service office equal to that on the Northside.
Telephone Communications.. So that people could have their questions about theprogram answered at any time, New Hope set up a 24-hour hotline and voice mail system.During business hours, English- and Spanish-speaking receptionists answered the hotline andresponded to callers' questions immediately. (A project rep was available to handle programinquires in Hmong and Lao.) After business hours, a recorded message provided basic programinformation in English, Spanish, and Hmong and encouraged callers to leave a number wherethey could be called back. During the rapid enrollment phase, the receptionist reported receiving15 to 20 phone calls per day from potential applicants interested in New Hope. Besides receivingphone calls, the receptionist also placed follow-up calls and sent letters to individuals who
-91-3

expressed interest in New Hope but who did not show for scheduled orientations orappointments.
III. Problems in Communicating the New Hope Offer
The multitude of recruitment strategies used by New Hope would suggest that awarenessof the program within the target neighborhoods would be very high and yet the results fromthe Neighborhood Survey suggest otherwise. Despite all the effort poured into the recruitmentcampaign, the program message did not reach a majority of households. The major problems thatstaff experienced in communicating the New Hope offer are described below.
Complexity of the Offer. Interviews with New Hope staff revealed that the programmessage was not always well absorbed or understood by the neighborhood residents whom theytargeted. Unlike many social programs that offer one or two major services (education andtraining, for example), New Hope offered a package of benefits and services, some of whichwere foreign (for instance, the earnings supplements) or sounded suspiciously like a welfaredepartment or criminal justice program that some people wanted to avoid (for example,community service jobs). Given an opportunity to talk with potential applicants, New Hope stafffelt they could communicate effectively what New Hope was and was not about.Unfortunately, some neighborhood residents seemed to "tune out" before getting to this point.
Information Overload. Some of the tuning out may simply have been due to thecompetition that New Hope faced for people's attention. For example, during the period thatNew Hope was conducting recruitment, the media were filled with reports about welfare reformat the national, state, and local levels. Other social service organizations were seeking applicants,as were some employers especially temporary employment services agencies. New Hope stafffound that it was sometimes difficult getting neighborhood residents to differentiate New Hopefrom these other programs and activities.
People's readiness to respond to New Hope could also be affected by personal problemsor the normal demands of living. In the words of one project rep:
We forget how people in poverty can get down. It's hard to get up and reach forsomething. We have to remember, this is a big step we are asking them to take.We're asking them to give up something [welfare] that is very stable. As for thepeople who are working, they don't want to be bothered; there's too much goingon in their lives. They have to pick up the kids after school, do the laundry, theirshopping. A lot of them are single parents.
In this staff member's opinion, many neighborhood residents were simply too caught up in theroutines and demands of their daily lives to come to a program orientation. Other program staffnoted that they themselves hardly ever pay attention to newspaper or television advertisements,unsolicited letters, or flyers on the doorstep. Why should they expect neighborhood residents toreact any differently to New Hope's materials particularly when the program was largelyunknown to the community?
-97- 137

Skepticism About the Offer. Some neighborhood residents doubted that the New Hopeoffer to program group members was genuine. Why would New Hope give away money (in theform of earnings supplements) or subsidize health insurance or child care expenses for free?Surely there had to be a catch. The associate director of New Hope, who had spent many yearsworking in the targeted communities, said that she "found out that we had to penetrate morelayers today than we did before. There's more despair and cynicism out there. It took time tobuild trust with the community." She speculated that a perception that many programs andreforms had failed to help neighborhood residents in a demonstrable way in the past, combinedwith the negative tone of the political debates about welfare and inner-city poverty, led someresidents to question any new initiative and may have made them reluctant to sign on to NewHope.
Difficulty of Geographic Targeting. Getting people to listen to the New Hope offer wascomplicated by the geographic boundaries of the program. The aforementioned problem ofoutdated mailing lists, which resulted in New Hope letters being sent to people who had movedout of the target areas, was only one factor.' People who lived in the target neighborhoods movedabout frequently to conduct their daily activities. They entered or left the target areas to go towork, conduct personal business, and visit friends or relatives. For New Hope staff and outreachworkers, this meant that the people they encountered on the street, in an agency, or at a businesswere often not from the target neighborhoods. During one outreach session observed by MDRC,New Hope staff spoke to 73 people who were coming to appointments or picking up applicationsat a welfare office on the Northside. Of this number, only six people met New Hope's geographiceligibility requirements.
Explaining the target areas proved cumbersome for staff. The original census tractboundaries that is, before New Hope expanded to serve the full zip code areas wereespecially difficult to describe. Often, staff had to use maps to show people which streets definedthe project borders to the north, south, east, and west. The expansion to the full zip code areas,though unrelated to the way local people defined "neighborhood," was an improvement in thatstaff could identify whether or not potential applicants were geographically eligible simply byasking them for their mailing addresses. Still, many inner-city residents had troubleunderstanding how the boundaries were drawn and why geography should be a factor indetermining their eligibility.
Reaction to the Research. New Hope staff believed that the research and randomassignment process was off-putting to some neighborhood residents and created another barrierin communicating what New Hope had to offer. Some people reacted to the evaluation withsuspicion. As one project rep explained:
They know we will have documentation on them for three years. . . . They figure,"you have all this information on me. What am I going to get out of this?"
°Baseline data collected from New Hope sample members confirmed that changes of address were commonamong the target population. In the two years prior to random assignment, 35 percent of the New Hope samplemoved at least twice.
-98-13

The suspicion ran especially deep in the Southside target area, which was home to anumber of recent immigrants to the United States. For some of them, the requirement to discloseinformation about household composition and income may have seemed especially threatening,even if they were legal residents. A project rep who mainly worked with people from theSouthside described the issue this way:
A lot of people have fears about family members who are undocumented orworking under falsified papers. Even some who are here legally are fearful thatsomething could happen.
Staff reported that some neighborhood residents had difficulty understanding why acontrol group was needed or why control group members were being asked to cooperate with thestudy when they were not getting any program services in return. Although every New Hopeapplicant was told about random assignment and consented to participate in the study, New Hopestaff recounted stories of applicants who became upset or angry when they were told they hadbeen placed in the control group. A couple of project reps said that some control group memberswere telling their friends and neighbors that it was not worth applying to New Hope. The numberof control group members who spoke out against the program was small, but even a few angry orupset individuals could undermine a recruitment process that, like New Hope's, was focused on aspecific geographic area. A disappointed or angry control group member could cause particularproblems for recruitment if he or she belonged to a small and closely-knit population group likethe Hmong (a situation that reportedly occurred).
IV. Reasons That People Applied to New Hope
When MDRC interviewers asked New Hope applicants, participants, and staff to discusswhat aspects of the program appealed to applicants, two patterns emerged. First, most applicantswere interested in one or two program services; few people had their eye on the entire package.Help in finding a job, child care, and health insurance seemed to be the most attractive programbenefits and services to applicants. Second, many people who came to New Hope were either inthe process of making a significant change in their life or were poised to do so. Often this changewas leaving welfare for work, though sometimes people talked about making changes in theirrelationships with their partners or children, or experiencing changes in attitudes aboutthemselves. For example, shortly after random assignment, one participant explained herdecision to apply:
Well, me, the lowest person at the time, I was looking for employment, and I justheard of it by word of mouth, and I thought it was something I'd be interested in,that might benefit me, with being a single person. So it was kind of hard for me,you know. . . . Outside of that, it was to give me extra income every month . . .
it'd help put [my income] up to where I can live off of this money because UncleSam robs the single person, like me, without a gun, and you just don't see themoney. So that's why I did it.
Another recently randomly assigned participant told an MDRC interviewer:
-99-139

I heard about the program through a flyer. I was in a store and I wasn't sure if Iunderstood the concept, then I called and made an appointment. . . . The repexplained the program to me, and I thought it was very good because of thesecurity it gives you when you get in, regards to child care and medical insurance.. . . I was on AFDC since I had my little girl and there's that stereotype they giveyou when you are in AFDC. This is not a very pleasant situation and I wanted toleave from this stereotype.
Many of the applicants or program group members interviewed by MDRC indicated thatthey had already made a decision to find a job, leave welfare, or make another significant changein their life before New Hope came along. They viewed New Hope as a vehicle to help themreach their new goal. For instance, one newly randomly assigned participant put it this way:
I had already made the decision that it was time for me to start working my wayoff AFDC. My youngest child was out. Three, I think she was about to turn fourand . . . I planned to work my way off it. To me New Hope was, it was a securitynet. You could make that step without having to be afraid. You knew if thingsdidn't [go well], if the transition wasn't real smooth, if anything unexpectedhappened, you'd have something there to catch you, for you to fall into so youdon't kill yourself.
This view of New Hope as a safety net was expressed repeatedly during focus group interviewswith newly randomly assigned participants. Former AFDC recipients, in particular, said that theywere attracted to the New Hope program because it offered them some of the same supportslike health insurance that they had come to rely on from the welfare system. Like theindividual quoted above, they indicated that they would have left AFDC with or without NewHope, but said that New Hope made them feel more secure in making their move.
Anxieties related to the changes in Wisconsin's welfare system may have motivated somepeople to apply to New Hope. Although Wisconsin Works (W-2) was still in development duringthe period of sample intake for New Hope, extensive media coverage of welfare debates inWisconsin and in Washington, DC, left many people believing that the drive to "end welfare aswe know it" had already been accomplished. For recipients of Wisconsin's General Assistancegrants, welfare did come to an end in September 1995, during the wind-down phase of NewHope recruitment. According to New Hope staff, program applications increased as the welfarechanges became more certain, although staff also reported that some eligible people stayed awayfrom the program out of fear that it was somehow connected to the welfare department.
Applicants to the program also had to assess the pros and cons of participating in theresearch. To make the research seem less threatening, staff tried during orientation to emphasizethat individuals who went through random assignment had nothing to lose and possibly much togain. People who got assigned to the program group would have access to New Hope; peoplewho got assigned to the control group would receive a list of other employment or social serviceprograms. To ease whatever disappointment control group members might be feeling, New Hopesent them $15 payments after random assignment as a "prepayment" for participating in the
-100 -
140

study.' (Applicants were not told about the $15 during orientation or the application process, soas not to create an incentive for people to apply who were not serious about wanting toparticipate in the program.) Finally, staff told orientation attendees that by participating in thestudy, program and control group members would have an opportunity to inform policymakersabout their needs and the needs of their community. If the evaluation proved that New Hope wasan effective program, staff suggested that the program might one day be expanded to serveeveryone who needed it.
Interviews conducted by MDRC researchers with New Hope staff and with personsattending New Hope's orientations indicated that most orientation attendees thought that thepotential benefits of the program outweighed the risks of random assignment. However, potentialapplicants sometimes expressed a more generalized fear that New Hope would fail to deliver thebenefits and services described during orientation. There was little practical difference, in theeyes of some people attending New Hope orientations, between being in a control group or beingin a program that did not offer meaningful help. Many applicants had sought help from othersocial service programs in the past and had been disappointed, either because they failed toqualify for some reason or the services turned out to be worthless. One applicant expressed herwariness as follows:
I hope it doesn't turn out like the [job search] program. I've done job searchbefore. I sent out résumés, the employers called, and there was no one there togive me a reference. I hope here they will back me up.
Once again, it was the desire for support and security that often led people to apply to New Hopeand to take a chance on getting into the program.
V. Conclusion
New Hope's recruitment experience suggests lessons for other demonstration programsand community-based organizations on the effort required to encourage applications to avoluntary social service or employment program. It also reveals something about thecharacteristics and motivations of the sample members in this evaluation that may not beapparent from the baseline questionnaires completed at random assignment. These issues aresummarized below.
A. Lessons on Recruitment
The New Hope recruitment experience provides ample evidence that finding andenrolling a large sample of people in a new demonstration program takes serious work. It alsoshows that a sustained, multifaceted recruitment campaign pays off. Of all the recruitmentstrategies used, targeted mailings and community outreach yielded the best results, but everyrecruitment strategy used by New Hope produced at least a few applicants. New Hope staff
'At two years after random assignment, program and control group members will receive a small payment forcompleting a follow-up survey about their employment, household income, and other experiences.
-101- 141

learned that people pay attention to different modes of communication; that many of them needto hear about the program repeatedly and have it explained to them in person before theywill attend an orientation or submit an application; and that they are likely to enroll at a time andplace that is most convenient for them.
Some of the problems New Hope experienced in drawing people to the program probablywould occur even if the program had operated for many years in the community. The complexityof the offer, for instance, would always require careful explanation, though it is likely that someof the confusion about the program would dissipate as program staff honed their presentationsskills and as more community residents became involved. Other problems experienced by NewHope are relevant to any new community-based social service or employment program: namely,breaking through people's information overload and combating skepticism about a new offer ofhelp. Two of the problems New Hope encountered during recruitment the complicationsrelated to narrow geographic borders and the adverse reactions to the research may apply onlyto this particular demonstration and target population.
Given the chance to do it over, many of New Hope's board members and staff concludedthat they would not define the program's geographic borders as they did. One of the mostconsistent reactions to the New Hope offer was the disappointment felt by those living outsidethe target areas when they discovered they were not eligible for the program. Nor would many ofNew Hope board members and staff use a research design that involved random assignment to acontrol group, at least not the way it was done during the demonstration. There were, of course,compelling reasons for making these choices, including the desire to target program resources ontwo ethnically diverse, low-income areas, and a strong interest reinforced by many of theprogram fenders in obtaining dependable evidence on New Hope's effects. Time may showthat geographic targeting and the random assignment research design were indeed good choices,especially once the evaluation is completed, though the task of recruiting and enrolling people inthe sample was made more difficult than it would have been if the program had been able todraw from a broader recruitment area and guarantee access to New Hope benefits and services toevery eligible household that applied.
Assuming that the target areas and experimental research design had to stay in place, NewHope may have done better with an altogether different recruitment and random assignmentstrategy. As discussed in Section I of this chapter, New Hope's planners initially considered anapproach in which a sample of households in the target areas would receive a visit by surveyinterviewers. Those who appeared eligible for New Hope would hear an explanation of theprogram, be given an opportunity to express interest, and if they said they wanted toparticipate and met the program's eligibility criteria be randomly assigned to a program orcontrol group. This idea was dropped for a number of reasons, including the logistical challengesit presented and the expense involved. In retrospect, a door-to-door recruitment process or amodified version for a sample of neighborhood residents might not have been any morecomplicated or costly than the lengthy, multipronged recruitment strategy New Hope ultimatelyadopted. Moreover, it might have led to better penetration of the target neighborhoods with theprogram message and yielded a definitive measure of the number of households that would takeup the New Hope offer, given the opportunity.
-102- 142

B Implications for the New Hope Sample
Whatever the imperfections of the recruitment process that was used, New Hopesucceeded in enrolling a sample of residents from the Northside and Southside who met theprogram's eligibility criteria. As program staff and board members had hoped, the samplereflected considerable diversity in racial and ethnic groups, household configurations,employment and welfare backgrounds, and other characteristics. These and other characteristicsof the sample are described in the following chapter. Two attributes of the New Hope sample that
may not be easily gleaned from baseline questionnaires (on which the next chapter is based) areimplied by the recruitment experiences described in this chapter.
First, because New Hope placed a heavy emphasis on visiting other communityorganizations during outreach and sending out letters to members or clients of theseorganizations, the New Hope sample includes a large number of people who sought help fromother Milwaukee institutions. For program group members, this suggests that New Hope may beone of many resources that they will use to accomplish their employment and personal goals.Indeed, program group members are likely to weigh the value of New Hope against the otherprograms and services available to them. How actively they participate in New Hope may dependpartly on their personal assessments of the quality and utility of services they receive from NewHope vis-à-vis these other organizations. Control group members will not have access to NewHope, but since they, too, were recruited from the same organizational networks as programgroup members, they will probably seek out and use other resources in the community to helpthem find work, stay employed, or make the changes that they desire in their lives. This meansthat a comparison of program and control group members will likely reveal a high level ofparticipation in a variety of community services by both research groups. The critical questionsfor this evaluation are whether or not the package of benefits and services that New Hopeprovides will lead to significantly higher rates of employment, less use of welfare, greaterreductions in poverty, and other more favorable outcomes for the program group.
Second, many of the people who applied to New Hope indicated that their lives were intransition. They viewed New Hope not so much as the catalyst for change as an opportunity tomake change easier to achieve and sustain. This also has important implications for the impactanalysis, because it suggests that many sample members in both the program and control groupswere leaving welfare, starting work, or taking other steps to improve their well-being at the timethey entered the sample. In order for New Hope to produce positive impacts, it will need to helpprogram group members meet their economic and personal objectives sooner, hold onto theirachievements longer, achieve gains in income that are larger, and attain other outcomes that arebetter than those of their counterparts in the control group. This report provides a first look at theextent to which program group members use New Hope's benefits and services to help themmeet their goals (see Chapter 9). The impacts that result from these patterns of use will beexamined in a future report.
-103- 143

Chapter 6
Characteristics of New Hope Applicants
This chapter describes the preprogram, or "baseline," characteristics and opinions of theNew Hope volunteers who came forward in response to the recruitment effort described in theprevious chapter. New Hope staff worked to bring into the program a diverse group of individualsand this chapter describes the result of that effort.
The chapter also highlights subgroups within the overall sample that deserve specialattention, either because of hypotheses about how they might use the various New Hope benefits(for example, subgroups based on employment status or on the presence or absence of dependentchildren in the applicant's household) or because they illustrate the extent to which New Hopeachieved its goal of bringing into the program individuals who are not traditionally served by publicincome support programs (for example, single men). Other subgroups are important because oftheir relation to the labor market (outlined in Chapter 3), based on educational credentials andaccess to a car.
Finally, the chapter addresses the question of how the characteristics of New Hopeapplicants compare with those of the eligible population in the target neighborhoods (discussed inChapter 4). The goal of this section is to assess whether particular groups within the eligiblepopulation came forward to a greater extent, because they found New Hope's benefits and servicesattractive or because they were more likely to have heard about the program.
Within the chapter, Section I describes the characteristics of the full New Hope sample,highlighting broad themes about the nature of the sample, Section II discusses characteristics forselected subgroups and Section 111 compares the New Hope sample with residents in the targetareas who meet the program eligibility rules (as estimated from respondents in the New HopeNeighborhood Survey) and expressed an interest in the program when told about its offerings.
Since only one adult (defined as a person aged 18 or over) from a household formallyapplied for New Hope and completed the program application prior to random assignment, thebaseline characteristics presented are of those adults. However, New Hope benefits, as explained inChapter 8, can cover other members of the households. Therefore, this chapter also describes thecomposition of the sample members' households. The analysis is based on the entire New Hopesample, rather than the program group alone. Appendix E, which compares the characteristics ofmembers of the program and control groups, shows that there are very few statistically significantdifferences in baseline characteristics between the two groups.'
'The Background Information Form (BIF) is the primary source of baseline characteristic data for each applicant inthe sample. This form was completed by the New Hope staff person in consultation with the applicant before randomassignment took place. In addition, each sample member was encouraged to complete a confidential Private OpinionSurvey (POS) prior to random assignment, which elicited the person's attitudes and opinions on his or her workexperience and obstacles and aids to obtaining or retaining employment. BIF data are available for more than 99percent of the full sample, while 79 percent of the sample voluntarily completed the POS form.
-104-
144

I. Profile of the Full Sample
Table 6.1 presents information on the full New Hope sample.' The sample members arepredominantly women (72 percent), and their average age is approximately 32. The group isracially and ethnically diverse: 51 percent are African-American, non-Hispanic; 27 percent areHispanic; 13 percent are white; 6 percent are Asian or Pacific Islander (largely Hmong); and 3percent are Native American or Alaskan Native. About half the sample come from each of the twoNew Hope target areas. Seventy percent of the sample live in a household with either their own ortheir partner's children, while 12 percent live alone; 60 percent have never been married. More than60 percent of the full sample and all subgroups analyzed in this chapter reported that they hadmoved at least once in the two years prior to their application to New Hope,' and half of those whochanged residences had moved at least twice. Over 80 percent of every subgroup rent rather thanown their home.
Although the New Hope sample is quite diverse (including families who previouslyreceived public assistance and single individuals not living with children), there are somecommonalities concerning work history, public assistance receipt, education, and perceived barriersto employment across the full sample and most key subgroups.'
Virtually all New Hope applicants had previously worked for pay atsome point in their lives. Ninety-five percent of the sample had some priorwork history and 86 percent had worked full time. This pattern is also true ofmost subgroups discussed later in the chapter. While prior work experiencewas expected in a voluntary, work-based program, the high rates of pastwork are striking, especially among subgroups such as those unemployed atapplication and those with no earnings in the prior 12 months.
Despite this prior work history, most of the sample had low earnings inthe year prior to applying to New Hope. Almost one-third of the samplehad no earnings in the prior 12 months, and another two-fifths had earningsunder $5,000. For comparison, steady full-time work for a year at $5 perhour would produce earnings of approximately $10,000. Again, the patternappeared for most subgroups. Among only one subgroup discussed in thischapter (those employed full time at application) did more than half themembers of the subgroup have prior year earnings equal to $5,000 or more(shown in Table 6.2).
This low level of earnings is reflected in a substantial use of publicassistance, even for those who were working when they entered theprogram. In the prior 12 months, 71 percent of the full sample received
'This table is based on two data sources, as mentioned earlier: the first portion of the table is based on the BIFdata, with a sample size of 1,357, and the second portion is based on the POS, with a sample size of 1,079.
'More precisely, this was in the two years prior to their random assignment to the program or control group. Forease of exposition, the text throughout the chapter uses the term "application" rather than random assignment.
4As mentioned in Chapter 1, the New Hope evaluation will test a set of hypotheses about New Hope's effectson families and children. Appendix F presents information on the New Hope sample with preadolescent children.
-105-
145.

Table 6.1
The New Hope Project
Selected Characteristics, Opinions, and Employment Historyof the New Hope Full Sample at Random Assignment
Sample and Characteristic by Measure Full Sample
Selected Characteristics from Background Information Form
Demographic characteristic
Gender (%)Female 71.6Male 28.4
Age (%)18-19 6.320-24 22.325-34 39.135-44 24.545-54 5.555 or over 2.4
Average age 31.8
Race/ethnicity (%)African-American, non-Hispanic 51.4Hispanic 26.5White, non-Hispanic 13.0Asian/Pacific Islander 5.8Native American/Alaskan Native 3.4
Resides in neighborhood (%)Northside 51.0Southside 49.0
Household status
Shares household with' (%)Spouse 11.9Girlfriend/boyfriend 7.2Children (own or partner's) 70.3Others 24.0
Lives alone (%) 11.8
Marital status (%)Never married 59.8Married, living with spouse 12.2Married, living apart 9.6Separated, divorced, or widowed 18.3
Number of children in householdb(%)None 29.01 20.32 19.23 or more 31.5
Among households with children,Age of youngest child (%)
2 or under 46.43-5 24.06 or over 29.7
Household has second potential wage earner (%) 12.8
(continued)
-106- 146

Table 6.1 (continued)
Sample and Characteristic by Measure Full Sample
Labor force status
Ever employed (%) 95.0
Ever employed full time (%) 85.9
For longest full-time job, among those ever employed full time,Average length of job (months) 36.8
Benefits provided (%)Paid vacation 49.9Paid sick leave 37.7Medical coverage (individual) 29.3Medical coverage (family) 27.4Coverage by a union 13.5
Pension/retirement 19.8
Child care 1.5
Tuition reimbursement 7.6
Approximate earnings in past 12 months (%)None 31.2
$1-999 15.8
$1,000-4,999 25.2$5,000-9,999 16.7
$10,000-14,999 7.8
$15,000 or above 3.3
Current employment status (%)Employed 37.5Not employed 55.1
Missing 7.4
Among those currently employed,Average hourly wage ($) 6.36Average hours worked per week (%)
1-29 23.730 or more 76.3
Public assistance status
Currently receiving AFDC, General Assistance,Food Stamps, or Medicaid (%)
Any type 62.9AFDC 46.0General Assistance 5.4
Food Stamps 57.5Medicaid 51.6
Received assistance (AFDC, FS, GA, or Medicaid) in past 12 months (%) 70.6
Total prior AFDC/GA cash assistanced (%)None 25.1
Less than 2 years 29.52 years or more but less than 5 years 19.7
5 years or more 25.7
Resided as a child in a household receiving AFDC (%) 36.5
Educational status
Received high school diploma or GED' (%) 57.3(continued)
147-107-

Table 6.1 (continued)
Sample and Characteristic by Measure Full Sample
Highest grade completed in school (average) 10.8
Currently enrolled in any type of education or training (%) 31.9
Other factors related to obtaining/retaining employment
Have access to a car (%) 41.5
Ever arrested for anything since 16th birthday (%) 23.5
Housing status (%)Rent 87.7Own 5.3Other 7.0
Number of moves in past 2 years (%)None 30.3
30.02 or more 35.2Missing 4.6
Sample size 1,357
Opinions and Employment History from Private Opinion Survey
Client-reported employment history
Number of full-time jobs (more than 30 hours a week) held in last 5 years (%)None 19.31 31.02 or 3 36.24 or more 13.5
When unemployed, length of time it took to find new work (%)1 month or less2-6 monthsMore than 6 monthsDon't know
Client-reported difficulties while working
Among those ever employed, those who said that they sometimesor often had these problems when they worked (%):
Client felt the boss or supervisor picked onor acted unfairly toward client
Family responsibilities interfered with the job andthis got client into trouble
There was too little help on the job to tell what to do and what not to doand this got client into trouble
Client got in trouble even when client was only a little lateClient and the other workers argued and this got client into troubleClient did not like the way bosses or supervisors were ordering them aroundClient did not want to do work that other people should have been doing
and this got client into troubleClient could never satisfy some customers and this got client into troubleAlcohol or drug use caused problems on client's jobClient got into trouble but never really understood the reasons why
I-108- 4
32.038.512.616.9
25.9
24.5
9.710.22.8
13.9
6.22.84.64.4
(continued)

Table 6.1 (continued)
Sample and Characteristic by Measure
Client-reported situations that affect employment
Those who reported health problems that limit the type of work they can do (%)
Those who have (%):Ever been evicted from an apartment or house over the last 10 yearsEver been homelessEver quit a job
Client-reported education and training preferences
Those who agreed a lot that they wanted to (%):Go to school part-time to study basic reading and mathGo to school part-time to get a GEDGet on-the-job training for 1-3 months in a type of work
that they have not tried beforeGet on-the-job training so that they would know what it is like to work
Full Sample
14.3
17.521.560.0
Sample size
33.134.4
59.051.9
1,079
SOURCES: MDRC calculations from Background Information Forms for 1,357 sample members randomlyassigned from August 1994 through December 1995. Five additional sample members who were missingthese forms were excluded from the sample. MDRC calculations from Private Opinion Survey (POS) data forsample members randomly assigned from August 1994 through December 1995. The POS questions werevoluntarily answered by 1,079 sample members (79 percent) just prior to random assignment.
NOTES: Except for two items, the nonresponse rate for all specific characteristics was less than 1 percentand therefore these missings were excluded from the calculations. For the two characteristics, for which thenonresponse rate ranged from 5 to 7 percent for the full sample, the nonresponses are shown on the table as
missings.Distributions may not add to 100.0 percent because of rounding.aBecause some sample members may be in more than one category, totals may not equal all categories
summed.
'Includes all dependents under age 18.
'Includes all dependents under age 18.dThis refers to the total number of months accumulated from at least one spell on an individual's own
AFDC or GA case or the case of another adult in the household.`The GED credential is given to those who pass the GED test and is intended to signify knowledge of
basic high school subjects.

some kind of public assistance (AFDC, Food Stamps, General Assistance, orMedicaid). Even among those working at application, over 60 percent hadreceived some type of assistance in the prior year; 26 percent of the samplehad received cash public assistance for a total of five years or more over thecourse of their lives.
Many in the sample lacked educational credentials. More than two-fifthsof the sample lacked a high school diploma or GED. The highest gradecompleted was an average of 10.8 grades for the full sample, and relativelyfew in the sample were enrolled at application for New Hope in the type ofprogram that would provide an educational credential. While slightly underone-third were enrolled in some type of education or training at applicationto the program, few were in either a high school, Adult Basic Educationprogram, or GED preparation program. Despite this, approximately one-third of the sample reported that they agreed strongly with a statementexpressing an interest in attending an Adult Basic Education or a GEDpreparation course. Over half the sample, however, expressed a stronginterest in receiving on-the-job training, either to learn new occupationalskills or to acclimate themselves to the world-of-work.
Among those who had worked, a minority reported past problems onthe job with supervisors or coworkers or current employmentlimitations because of health problems. About one-fourth of those withprior work history reported that a boss or supervisor "picked on them" oracted unfairly toward them; about one-fourth reported that familyresponsibilities at some point in the past had interfered with their workingand this got them "into trouble" on the job; and about one-seventh reportedthat current health problems limit the type of work they can do. Other job-related problems were reported by a smaller percentage of the sample.
In the following discussion of subgroups both the commonality and the diversity ofexperience within the sample are described.
II. Subgroups
When New Hope was designed, the goal was to provide a collection of benefits and servicesfrom which participants would select those that addressed their own needs; program plannersexpected that subgroups of individuals with distinct characteristics might use the program in verydifferent ways. For example, the developers of the program expected that applicants working fulltime at low-wage jobs would be attracted by the earnings supplement and if they needed them
the health insurance and child care subsidies. For this group, the likely effect of the programwould be an increase in income, furthering the antipoverty goal ofthe program. Those working parttime might use the package of benefits to increase work hours, in the process increasing income and
quite likely reducing use of public assistance. And those not working at the time ofapplication might be enabled or stimulated to find an unsubsidized job (or take a community
-110 -
150

service job) and shift to full-time work. Further, applicants with children could well find the child
care subsidies especially important. Reflecting these varying program goals and the programrecruitment effort outlined in Chapter 5, the program's client base is especially diverse.
A. Employed and Not Employed Subgroups
One major theme emerges from the analysis of subgroups based on employment status atapplication. While there are subgroups with distinct characteristics who appear to be relatively themost and least successful in the labor market (roughly corresponding to those working full time atapplication and those with no earnings in the prior 12 months, respectively), much of the samplefalls into a large midrange of this distribution. For this middle group, there is no clear difference inbackground characteristics between those who happen to be employed or unemployed.' People getand lose jobs with considerable frequency in the "low-wage end" of Milwaukee's lowunemployment labor market; thus, whether they were employed or unemployed when they appliedto participate in New Hope does not have special significance. For many of the people in thismiddle group, recent experience has been a combination of low-wage work and some form(s) of
public assistance.
Despite the lack of clear and consistent differences in background characteristics amongthose in this large middle group, their employment status at application does have programmaticimplications. New Hope has different strategies for assisting volunteers who are employed andunemployed when they enter the program. New Hope's goal for fully employed individuals is tooffer benefits immediately; for part-time workers, it is to use the offer of benefits (especially childcare and health insurance) to encourage a shift to full-time work; and for the unemployed, it is toassist in a job search, use the offer of New Hope benefits to make available jobs more attractive,
and provide a community service job if needed.
Table 6.2 divides the sample into those employed (full-time and part-time) and those notemployed with and without earnings in the prior 12 months). Both subgroups are similar in gender,age, ethnic breakdown (with the exception of Asians/Pacific Islanders), percentage who as a childresided in a household receiving AFDC, highest grade completed in school, residential mobility,and to some extent marital status. The work histories of the employed and not employedsubgroups do show significant differences, but fewer than might be expected due to employmentstatus. Almost all sample members had worked at some time in the past and more than three-quarters of both groups had held at least one full-time job. Members of both subgroups appear tomove in and out of jobs frequently. For example, 14 percent of each subgroup had held at least fourfull-time jobs in the last five years (not shown in Table 6.2).
Some differences do emerge, however, at this level of disaggregation. Most are closelyrelated to current employment and/or employability: those with a job are less likely to receivepublic assistance (currently or over the prior 12 months), to have received AFDC for an extendedperiod, to have very low earnings over the prior 12 months, to be participating in an education ortraining program, or to have been arrested since their 16th birthday, and they are more likely to live
'The term "unemployed" is used interchangeably with "not employed" for ease of exposition. This is notprecisely accurate because, under the official federal defmition of unemployment, a job seeker must have takenspecific steps to find a job in the recent past.

Tab
le 6
.2
The
New
Hop
e Pr
ojec
t
Sele
cted
Cha
ract
eris
tics
of th
e N
ew H
ope
Full
Sam
ple
at R
ando
mA
ssig
nmen
t,by
Em
ploy
men
t Sta
tus,
Bot
h Pa
rt T
ime
and
Full
Tim
e
Sam
ple
and
Cha
ract
eris
ticFu
ll
Sam
ple
Em
ploy
men
t Sta
tusa
Em
ploy
edE
mpl
oyed
Not
Em
ploy
edN
ot
Em
ploy
edE
arni
ngs
inPr
ior
Yea
rN
o E
arni
ngs
inPr
ior
Yea
rFu
ll T
ime
Part
Tim
e
Dem
ogra
phic
cha
ract
eris
tic
Gen
der
(%)
Fem
ale
71.6
72.5
71.3
76.7
71.0
63.2
79.4
Mal
e28
.427
.528
.723
.329
.036
.820
.6
Ave
rage
age
31.8
31.9
31.4
33.5
31.5
30.9
32.2
Rac
e/et
hnic
ity (
%)
Afr
ican
-Am
eric
an, n
on-H
ispa
nic
51.4
51.7
52.2
50.8
53.7
58.4
48.8
His
pani
c26
.525
.224
.328
.324
.923
.726
.2W
hite
, non
-His
pani
c13
.011
.09.
814
.213
.910
.817
.3A
sian
/Pac
ific
Isl
ande
r5.
810
.011
.93.
52.
64.
5N
ativ
e A
mer
ican
/Ala
skan
Nat
ive
3.4
2.2
4.0
4.6
3.3
Hou
seho
ld s
tatu
s
Shar
es h
ouse
hold
with
b (%
)Sp
ouse
11.9
16.7
17.6
13.3
8.8
6.9
10.9
Gir
lfri
end/
boyf
rien
d7.
25.
55.
2--
8.0
9.3
6.7
Chi
ldre
n (o
wn
or p
artn
er's
)70
.374
.976
.071
.768
.559
.977
.7O
ther
s24
.020
.318
.725
.826
.029
.821
.9
Liv
es a
lone
(%
)11
.811
.210
.612
.511
.413
.68.
9
Mar
ital s
tatu
s (%
)N
ever
mar
ried
59.8
56.2
56.6
55.8
62.4
68.9
55.4
Mar
ried
, liv
ing
with
spo
use
12.2
16.7
17.6
13.3
9.5
7.7
11.4
Mar
ried
, liv
ing
apar
t9.
68.
69.
0--
10.3
9.3
11.4
Sepa
rate
d, d
ivor
ced,
or
wid
owed
18.3
18.5
16.8
23.3
17.8
14.1
21.7
Num
ber
of c
hild
ren
in h
ouse
hold
` (
%)
Non
e29
.024
.422
.530
.030
.437
.522
.61
20.3
22.6
22.7
22.5
19.5
21.1
17.8
219
.221
.821
.224
.216
.816
.217
.63
or m
ore
31.5
31.2
33.6
23.3
33.3
25.2
42.1
(con
tinue
d)

Tab
le 6
.2 (
cont
inue
d)
Sam
ple
and
Cha
ract
eris
ticFu
ll
Sam
ple
Em
ploy
men
t Sta
tus'
Em
ploy
edE
mpl
oyed
Not
Em
ploy
edN
ot
Em
ploy
ed
Ear
ning
s in
Prio
r Y
ear
No
Ear
ning
s in
Prio
r Y
ear
Full
Tim
ePa
rt T
ime
Am
ong
hous
ehol
ds w
ith c
hild
ren,
Age
of
youn
gest
chi
ld (
%)
2 or
und
er46
.445
.247
.038
.147
.444
.050
.4
3-5
24.0
26.5
26.0
28.6
22.3
24.7
20.1
6 or
ove
r29
.728
.327
.033
.330
.331
.329
.5
Hou
seho
ld h
as s
econ
d po
tent
ial w
age
earn
er (
%)
12.8
17.3
18.4
13.3
10.2
7.7
12.8
Lab
or f
orce
sta
tus
Eve
r em
ploy
ed (
%)
95.0
100.
010
0.0
100.
090
.998
.582
.7
Eve
r em
ploy
ed f
ull t
ime
(%)
85.9
96.1
100.
083
.378
.790
.266
.3
For
long
est f
ull-
time
job,
am
ong
thos
e ev
erem
ploy
ed f
ull t
ime,
ave
rage
leng
th o
f jo
b (m
onth
s)36
.836
.834
.843
.336
.233
.040
.9
Ben
efits
pro
vide
d (%
)Pa
id v
acat
ion
49.9
57.9
60.2
49.0
43.8
43.6
44.1
Paid
sic
k le
ave
37.7
43.6
43.4
43.0
34.1
32.8
36.1
Med
ical
cov
erag
e (i
ndiv
idua
l)29
.330
.128
.437
.028
.729
.627
.3
Med
ical
cov
erag
e (f
amily
)27
.432
.534
.425
.023
.121
.126
.1
Cov
erag
e by
a u
nion
13.5
15.1
14.0
20.0
12.4
12.3
12.6
Pens
ions
/ret
irem
ent
19.8
22.1
20.7
27.0
18.3
19.9
16.0
Chi
ld c
are
1.5
1.7
----
Tui
tion
reim
burs
emen
t7.
69.
610
.66.
68.
34.
2
App
roxi
mat
e ea
rnin
gs in
pas
t 12
mon
ths
(%)
Non
e31
.27.
75.
912
.548
.0n/
a10
0.0
$1-9
9915
.816
.115
.319
.215
.529
.8n/
a
$1,0
00-4
,999
25.2
28.1
26.9
32.5
23.1
44.5
n/a
$5,0
00-9
,999
16.7
26.9
27.1
26.7
9.1
17.5
n/a
$10,
000-
14,9
997.
814
.917
.32.
95.
7n/
a
$15,
000
or a
bove
3.3
6.3
7.5
1.3
2.6
n/a
Am
ong
thos
e cu
rren
tly e
mpl
oyed
,A
vera
ge h
ourl
y w
age
($)
6.36
6.36
6.40
6.22
n/a
n/a
n/a
Ave
rage
hou
rs w
orke
d pe
r w
eek
(%)
1-29
23.7
23.7
0.0
100.
0n/
an/
an/
a
30 o
r m
ore
76.3
76.3
100.
00.
0n/
an/
an/
a(c
ontin
ued)
154
155

156
Tab
le 6
.2 (
cont
inue
d)
Sam
ple
and
Cha
ract
eris
ticFu
llSa
mpl
e
Em
ploy
men
t Sta
tusa
Em
ploy
ed.
Em
ploy
edN
ot E
mpl
oyed
Not
Em
ploy
edE
arni
ngs
inPr
ior
Yea
rN
o E
arni
ngs
inPr
ior
Yea
rFu
ll T
ime
Part
Tim
e
Publ
ic a
ssis
tanc
e st
atus
Cur
rent
ly r
ecei
ving
AFD
C, G
ener
al A
ssis
tanc
e,Fo
od S
tam
ps, o
r M
edic
aid
(%)
Any
type
62.9
50.1
47.8
56.7
72.5
60.7
85.2
AFD
C46
.028
.325
.835
.858
.646
.072
.1G
ener
al A
ssis
tanc
e5.
42.
0--
8.3
8.2
8.4
Food
Sta
mps
57.5
42.8
40.3
50.0
68.6
57.6
80.5
Med
icai
d51
.642
.441
.146
.759
.047
.071
.9
Rec
eive
d as
sist
ance
(A
FDC
, FS,
GA
, or
Med
icai
d) in
past
12
mon
ths
(%)
70.6
62.7
63.1
60.8
77.0
66.2
88.6
Tot
al p
rior
AFD
C/G
A c
ash
assi
stan
ced
(%)
Non
e25
.126
.926
.129
.223
.030
.614
.8L
ess
than
2 y
ears
29.5
29.7
30.0
28.3
30.1
31.9
28.2
2 ye
ars
or m
ore
but l
ess
than
5 y
ears
19.7
20.6
21.2
19.2
19.0
15.5
22.6
5 ye
ars
or m
ore
25.7
22.8
22.7
23.3
28.0
22.0
34.4
Res
ided
as
a ch
ild in
a h
ouse
hold
rece
ivin
g A
FDC
(%
)36
.535
.835
.437
.537
.438
.636
.0
Edu
catio
nal s
tatu
s
Rec
eive
d hi
gh s
choo
l dip
lom
a or
GE
D`
( %
)57
.364
.264
.663
.352
.754
.151
.3
Hig
hest
gra
de c
ompl
eted
in s
choo
l (av
erag
e)10
.810
.910
.910
.910
.811
.010
.5
Cur
rent
ly e
nrol
led
in a
ny ty
pe o
f ed
ucat
ion
or tr
aini
ng (
%)
31.9
24.8
23.5
29.2
35.3
29.3
41.8
Oth
er f
acto
rs r
elat
ed to
obt
aini
ng/r
etai
ning
empl
oym
ent
Hav
e ac
cess
to a
car
(%
)41
.554
.555
.252
.533
.335
.630
.9
Eve
r ar
rest
ed f
or a
nyth
ing
sinc
e 16
th b
irth
day
(%)
23.5
19.5
19.4
20.0
26.5
31.4
21.2
Hou
sing
sta
tus
(%)
Ren
t87
.789
.289
.987
.586
.684
.089
.4O
wn
5.3
7.9
7.3
10.0
3.8
3.4
4.2
Oth
er7.
03.
02.
99.
712
.76.
4[.
.:fr
ftt
(con
tinue
d) I
b t

Tab
le 6
.2 (
cont
inue
d)
Sam
ple
and
Cha
ract
eris
ticFu
llSa
mpl
e
Em
ploy
men
t Sta
tus'
Em
ploy
edE
mpl
oyed
Not
Em
ploy
edN
otE
mpl
oyed
Ear
ning
s in
Prio
r Y
ear
No
Ear
ning
s in
Prio
r Y
ear
Full
Tim
ePa
rt T
ime
Num
ber
of m
oves
in p
ast 2
yea
rs (
%)
Non
e30
.332
.230
.238
.329
.326
.732
.01
30.0
28.5
28.7
28.3
29.8
29.6
30.1
2 or
mor
e35
.236
.238
.030
.034
.838
.830
.4M
issi
ng4.
63.
13.
1--
6.2
4.9
7.5
Sam
ple
size
1,35
750
938
712
074
838
935
9
SOU
RC
E: M
DR
C c
alcu
latio
ns f
rom
Bac
kgro
und
Info
rmat
ion
Form
s fo
r 1,
357
sam
ple
mem
bers
ran
dom
ly a
ssig
ned
from
Aug
ust 1
994
thro
ugh
Dec
embe
r 19
95. F
ive
addi
tiona
l sam
ple
mem
bers
who
wer
e m
issi
ng th
ese
form
s w
ere
excl
uded
fro
m th
e sa
mpl
e.
NO
TE
S: E
xcep
t for
two
item
s, th
e no
nres
pons
e ra
te f
or a
ll sp
ecif
ic c
hara
cter
istic
s w
as le
ss th
an 1
per
cent
and
ther
efor
e th
ese
mis
sing
s w
ere
excl
uded
fro
m th
eca
lcul
atio
ns. F
or th
e tw
o ch
arac
teri
stic
s, f
or w
hich
the
nonr
espo
nse
rate
ran
ged
from
5 to
7 p
erce
nt f
or th
e fu
ll sa
mpl
e, th
e no
nres
pons
es a
re s
how
n on
the
tabl
e as
mis
sing
s.D
istr
ibut
ions
may
not
add
to 1
00.0
per
cent
bec
ause
of
roun
ding
.Su
bgro
up s
ampl
e si
zes
do n
ot a
dd u
p to
the
full
sam
ple
size
sin
ce s
ome
resp
onde
nts
wer
e m
issi
ng th
e in
form
atio
n us
ed to
def
ine
subg
roup
s.D
ashe
s in
dica
te th
at th
e sa
mpl
e si
ze is
und
er 1
0; th
eref
ore
the
calc
ulat
ion
has
been
om
itted
.N
/A =
not
app
licab
le.
'Rec
ords
mis
sing
em
ploy
men
t sta
tus
vari
able
s w
ere
excl
uded
fro
m th
is a
naly
sis.
bBec
ause
som
e sa
mpl
e m
embe
rs m
ay b
e in
mor
e th
an o
ne c
ateg
ory,
tota
ls m
ay n
ot e
qual
all
cate
gori
es s
umm
ed.
cInc
lude
s al
l dep
ende
nts
unde
r ag
e 18
.dT
his
refe
rs to
the
tota
l num
ber
of m
onth
s ac
cum
ulat
ed f
rom
at l
east
one
spe
ll on
an
indi
vidu
al's
ow
n A
FDC
or
GA
cas
e or
the
case
of a
noth
er a
dult
in th
e
hous
ehol
d.
'The
GE
D c
rede
ntia
l is
give
n to
thos
e w
ho p
ass
the
GE
D te
st a
nd is
inte
nded
to s
igni
fy k
now
ledg
e of
bas
ic h
igh
scho
ol s
ubje
cts.
159
158

with their own or their partner's children, have a high school diploma or GED, and have access to acar. Finally, current employment status affects why people are drawn to New Hope: unemployedapplicants were likely to be attracted by the prospect of help in finding a job, while employedapplicants were seeking the earnings supplement, health insurance, or child care assistance (notshown in Table 6.2).6
When the employed and not employed subgroups are further disaggregated (for theemployed, into full-time and part-time workers; and for the not employed, into those with andwithout recent earnings) more differences do emerge. Some of the differences among these fourgroups are connected to the fact that the subgroup of unemployed applicants with recent earningscontains a higher percentage of men than the other three subgroups. This "over-representation" ofmen among applicants who were not working but had recent earnings results in the subgrouphaving a lower percentage of applicants currently living with children and receiving some form ofpublic assistance and a higher arrest rate.
B. Jiouseholds With Children and Without Children
If sample members living with dependent, minor children wish to work, they must addresschild care needs that other sample members do not face. While New Hope is designed to addressthis need, the presence or absence of these children, if nothing more, is likely to affect how asample member uses New Hope benefits. Table 6.3 presents selected subgroup characteristics forsample members who are and are not living with their own minor, dependent children or those oftheir spouse or partner. The households with children can be further subdivided into householdswhere the sample member lives with a spouse or partner (labeled two-adult) or does not (labeledone-adult).
These subgroup splits reveal important differences among sample members. Gender is thefirst obvious difference: 94 percent of sample members in one-adult households with children arefemale, compared with 54 percent in two-adult households and only 39 percent in householdswithout children.' Employment and receipt of public assistance also vary. More sample members intwo-adult families were employed at baseline, while the rate of receipt of assistance was by far thehighest for one-adult households with children (80 percent were getting some form of assistance),followed by 65 percent of two-adult households with children, and only 29 percent of householdswithout children (who were by definition not eligible for AFDC)! Sample members in two-adulthouseholds were older than those in one-adult households and had larger families; most of the
6As a further indication of the differences in service preferences, on-the-job training (which is not available in NewHope) held much more appeal for the unemployed, either as a means to gain occupational skills or to learn more aboutthe work world.
'Here it is important to remember that baseline characteristics reported in this chapter concern the adult whoapplied for New Hope. In the case of one-adult households, this was the sole adult. But for two-adult households,there was another adult not included in the baseline characteristics. The finding that 54 percent of the applicantsfrom two-adult families were female suggests that approximately equal numbers of men and women in thesefamilies volunteered for New Hope.
'Over half of employed sample members living with children were receiving some form of public assistance atbaseline, combining work and welfare. Among unemployed sample members living with children, in one-adulthouseholds over 90 percent were receiving some type of assistance, while in two-adult households 75 percent werereceiving some form of aid.
-116-

Table 6.3
The New Hope Project
Selected Characteristics of the New Hope Sample at Random Assignment,by Presence or Absence of Children in Household
Households With Children'Sample and Characteristic One Adult') Two Adults'
Demographic characteristic
Gender (%)Female 94.0 54.0Male 6.0 46.1
Age (%)18-19 5.1 2.820-24 26.0 15.8
25-34 43.5 49.835-44 22.0 25.145-54 2.955 or over
Average age 30.2 32.3
Race/ethnicity (%)African-American, non-Hispanic 58.9 23.3Hispanic 25.1 32.6White, non-Hispanic 11.9 12.1
Asian/Pacific Islander -- 29.8Native American/Alaskan Native 3.2
Household status
Shares household withd (%)Spouse 0.0 69.8Girlfriend/boyfriend 0.0 30.2Children (own or partner's) 95.6 94.0Others 18.3
Lives alone (%) 0.0
Marital status (%)Never married 65.3 23.3Married living with spouse 69.8Married living apart 11.6Separated, divorced, or widowed 22.7
Number of children in household' (%)None 0.0 0.01 30.8 20.92 27.9 24.23 or more 41.3 54.9
Among households with children,Age of youngest child
2 or under 45.0 51.23-5 23.5 25.66 or over 31.5 23.3
Households WithoutChildren
38.761.3
10.418.624.928.811.26.1
34.5
54.425.715.5
--4.3
2.88.19.2
46.0
39.2
69.53.39.2
18.1
100.00.00.00.0
n/an/an/a
(continued)

Table 6.3 (continued)
Sample and CharacteristicHouseholds With Children' Households Without
ChildrenOne Adultb Two Adultsc
Household has second potential wage earner (%) 70.7 3.6
Labor force status
Ever employed (%) 95.1 91.6 96.7
Ever employed full time (%) 84.7 85.1 88.8
Approximate earnings in past 12 months (%)None 34.7 29.3 25.5$1-999 17.2 11.6 15.3$1,000-4,999 22.7 21.9 31.8$5,000-9,999 15.0 15.8 20.6$10,000-14,999 7.7 14.0 4.6$15,000 or above 2.7 7.4
Current employment status (%)Employed 38.1 46.5 31.6Not employed 55.9 47.4 57.8Missing 6.0 6.1 10.7
Among those currently employed,Average hourly wage ($) 6.43 6.76 5.87Average hours worked per week
1-29 22.5 21.2 29.330 or more 77.5 79.8 70.7
Public assistance status
Currently receiving AFDC, General Assistance,Food Stamps, or Medicaid (%)
Any type 80.0 64.7 29.3AFDC 68.8 47.4 --General Assistance -- -- 16.5Food Stamps 75.8 56.7 22.9Medicaid 73.8 58.6 5.3
Received assistance (AFDC, FS, GA, or Medicaid)in past 12 months (%) 86.4 76.3 37.2
Total prior AFDC/GA cash assistancef (%)None 13.1 20.9 50.4Less than 2 years 26.8 30.7 34.02 years or more but less than 5 years 25.0 23.7 7.25 years or more 35.1 24.7 8.4
Resided as a child in a householdreceiving AFDC (%) 42.7 23.7 31.7
Educational status
Received high school diploma or GEDg (%) 60.4 47.0 57.1
Highest grade completed in school (average) 11.1 9.1 11.0
Currently enrolled in any type of education or training (%) 34.6 36.7 24.2(continued)
-118- G 2
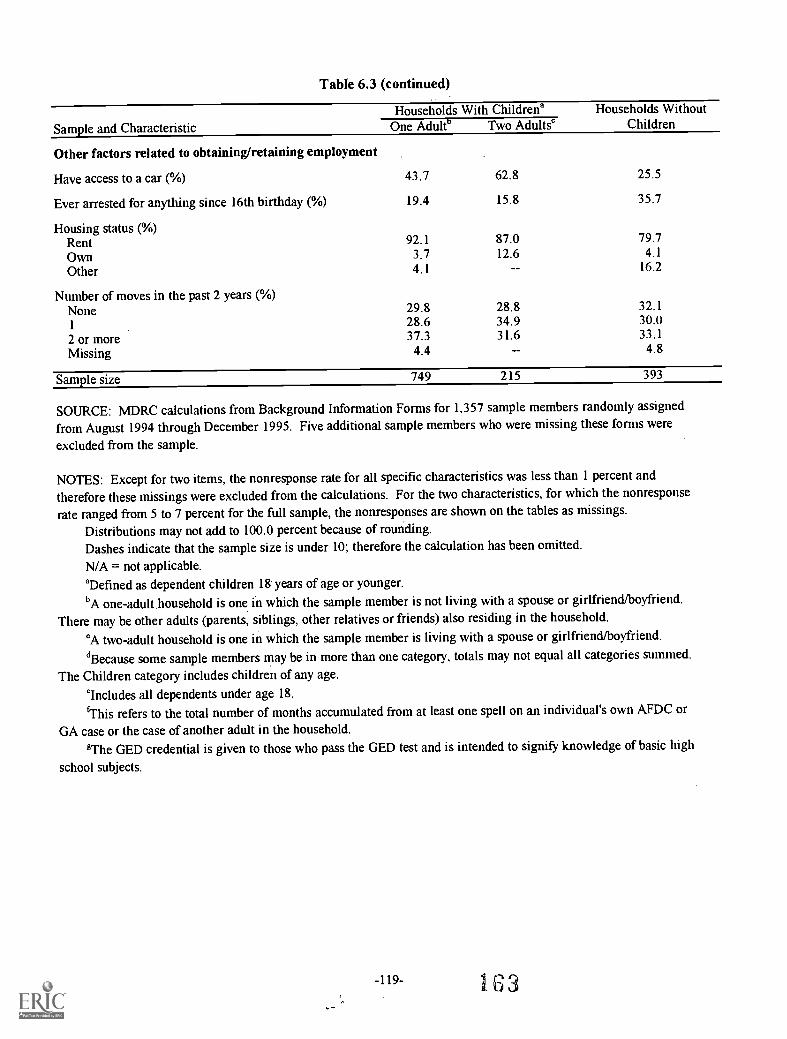
Table 6.3 (continued)
Households With auldrena Households WithoutChildrenSample and Characteristic One Adult" Two Adults'
Other factors related to obtaining/retaining employment
Have access to a car (%) 43.7 62.8 25.5
Ever arrested for anything since 16th birthday (%) 19.4 15.8 35.7
Housing status (%)Rent 92.1 87.0 79.7
Own 3.7 12.6 4.1
Other 4.1 16.2
Number of moves in the past 2 years (%)None 29.8 28.8 32.1
128.6 34.9 30.0
2 or more 37.3 31.6 33.1
Missing 4.4 4.8
Sample size 749 215 393
SOURCE: MDRC calculations from Background Information Forms for 1,357 sample members randomly assigned
from August 1994 through December 1995. Five additional sample members who were missing these forms were
excluded from the sample.
NOTES: Except for two items, the nonresponse rate for all specific characteristics was less than 1 percent and
therefore these missings were excluded from the calculations. For the two characteristics, for which the nonresponse
rate ranged from 5 to 7 percent for the full sample, the nonresponses are shown on the tables as missings.
Distributions may not add to 100.0 percent because of rounding.Dashes indicate that the sample size is under 10; therefore the calculation has been omitted.
N/A = not applicable.'Defined as dependent children 18 years of age or younger.bA one-adult household is one in which the sample member is not living with a spouse or girlfriend/boyfriend.
There may be other adults (parents, siblings, other relatives or friends) also residing in the household.
`A two-adult household is one in which the sample member is living with a spouse or girlfriend/boyfriend.dBecause some sample members may be in more than one category, totals may not equal all categories summed.
The Children category includes children of any age.
'Includes all dependents under age 18.this refers to the total number of months accumulated from at least one spell on an individual's own AFDC or
GA case or the case of another adult in the household.gThe GED credential is given to those who pass the GED test and is intended to signify knowledge of basic high
school subjects.

Asian/Pacific Islander sample members fell into the two-adult subgroup; and two-adult subgroupshad several other economic advantages over one-adult families. For example, they were more likelyto have earned more than $5,000 in the prior 12 months, to have access to a car, and to be livingwith a second potential wage earner (and eligible New Hope participant).
This pattern of higher sample member earnings and the presence of more second potentialearners in two-adult families should be noted; two-adult families are likely to have substantiallymore income from earnings than other subgroups. Interestingly, however, sample members in two-adult households are less likely to have a high school diploma or GED and on average havecompleted fewer years of school.' Sample members in households without children are much morelikely to be living with another adult who is not a spouse or partner (allowing some income sharingto compensate for the lower rates of receipt of assistance and lower earnings) or to live alone, andthey are more likely to have been arrested since their 16th birthday.
Within the one-adult households with children subgroup, there appear to be two distinctsubsets who probably have different barriers to employment: very young women with one child(who, while probably interested in assistance with child care, are especially likely to need help inovercoming their lack of work experience) and older women with several children (for whom theexpense of child care may be the obstacle to employment or full employment).
Finally, New Hope is unusual in its inclusion of sample members who belong to ahousehold with no dependent, minor children. Individuals in this type of household make upalmost 30 percent of the full sample. Fifty-eight percent of sample members in householdswithout children were unemployed when the study began. This subgroup receives little or nopublic assistance; only 29 percent receive any other form of assistance. Food Stamps and GeneralAssistance are the most common form of assistance for those who receive aid. The low rate ofMedicaid receipt (approximately 5 percent) means that the vast majority of this subgroupprobably have no health insurance unless another adult in the household is covering them. Thenext section looks at a specific subset of households without children.
C. Single Men
About one-sixth of the sample is made up of men who are living with neither spouse norother partner and without dependent, minor children. Table 6.4 presents selected characteristics ofthis subgroup, one of substantial policy and research interest.'° About half of these single menreport living with someone else other than spouse, partner, or children. Compared with the fullsample, the men (who are labeled "single men" in the table) are older (average age is 34 comparedwith 32), most were never married, and they are more likely to have completed high school or aGED. Further, over 90 percent have held a full-time job at some point. The average length of thelongest full-time job they ever held is over four years, as opposed to slightly over three years for thefull sample. This full-time job also provided somewhat better fringe benefits than was the case forthe full sample.
'These differences in education and family size are linked to the concentration of Asian/Pacific Islander samplemembers in this subgroup. These sample members tend to have larger-than-average families and lower-than-averageeducation levels.
'Some of the following discussion concerns statistics not shown in Table 6.4.
-120-

Table 6.4
The New Hope Project
Selected Characteristics of the New Hope Sampleat Random Assignment for Single Men
Sample and Characteristic
Demographic characteristic
Average age 34.1 31.8
Race/ethnicity (%)African-American, non-Hispanic 56.6 51.4Hispanic 25.0 26.5White, non-Hispanic 13.7 13.0Asian/Pacific Islander 5.8Native American/Alaskan Native 3.4
Single Men Full Sample
Household status
Lives alone (%)
Marital status (%)Never marriedMarried, living with spouseMarried, living apartSeparated, divorced, or widowed
Labor force status
45.8 11.8
75.90.06.6
17.5
59.812.29.6
18.3
Ever employed (%) 98.1 95.0
Ever employed full time (%) 92.0 85.9
For longest full-time job, among thoseever employed full time,
Average length of job (months) 51.5 36.8
Approximate earnings in past 12 months (%)None 25.9 31.2$1-999 13.2 15.8$1,000-4,999 34.9 25.2$5,000-9,999 18.9 16.7$10,000-14,999 4.7 7.8$15,000 or above 3.3
Current work status (%)Employed 27.4 37.5Not employed 64.6 55.1Missing 8.0 7.4
Among those currently employed,Average hourly wage ($) 6.03 6.36Average hours worked per week (%)
1-29 24.3 23.730 or more 75.8 76.3
Public assistance status
Currently receiving AFDC, General Assistance,Food Stamps, or Medicaid (%)
Any typeAFDCGeneral AssistanceFood StampsMedicaid
30.2
21.722.6
-121-1 5
62.946.0
5.457.551.6
(continued)
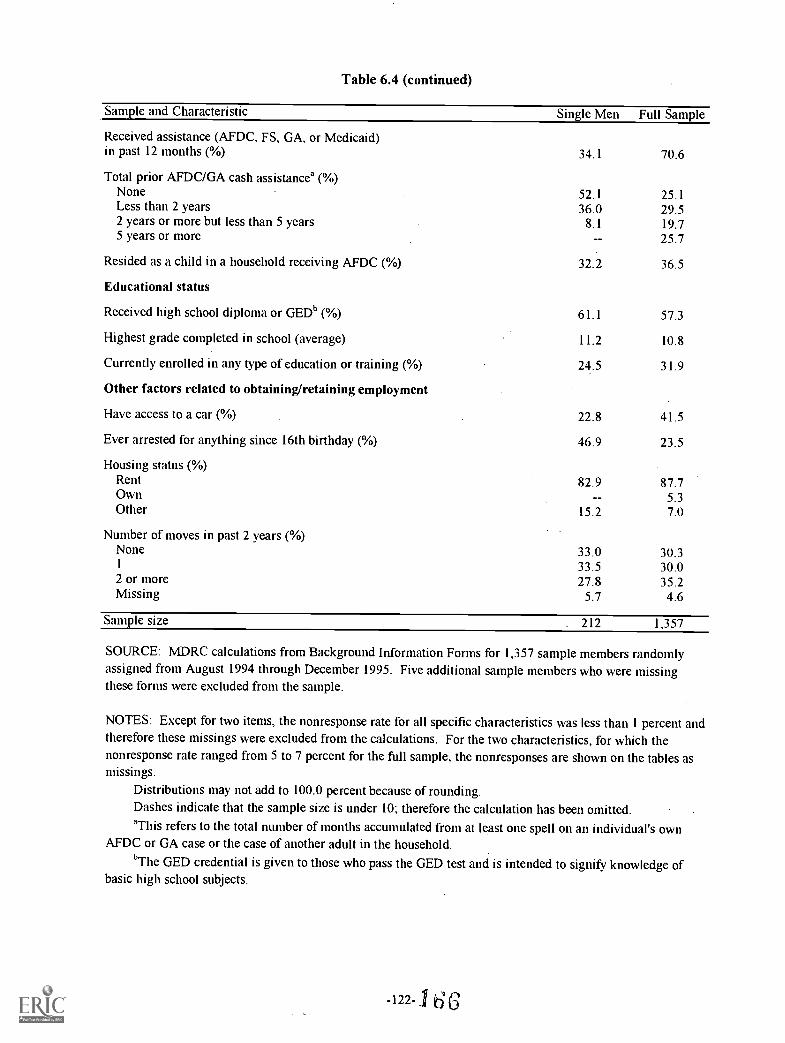
Table 6.4 (continued)
Sample and Characteristic Single Men Full Sample
Received assistance (AFDC, FS, GA, or Medicaid)in past 12 months (%) 34.1 70.6
Total prior AFDC/GA cash assistance' (%)None 52.1 25.1Less than 2 years 36.0 29.52 years or more but less than 5 years 8.1 19.75 years or more 25.7
Resided as a child in a household receiving AFDC ( %) 32.2 36.5
Educational status
Received high school diploma or GEDb (%) 61.1 57.3
Highest grade completed in school (average) 11.2 10.8
Currently enrolled in any type of education or training (%) 24.5 31.9
Other factors related to obtaining/retaining employment
Have access to a car (%) 22.8 41.5
Ever arrested for anything since 16th birthday (%) 46.9 23.5
Housing status (%)Rent 82.9 87.7Own 5.3Other 15.2 7.0
Number of moves in past 2 years (%)None 33.0 30.31 33.5 30.02 or more 27.8 35.2Missing 5.7 4.6
Sample size. 212 1,357
SOURCE: MDRC calculations from Background Information Forms for 1,357 sample members randomlyassigned from August 1994 through December 1995. Five additional sample members who were missingthese forms were excluded from the sample.
NOTES: Except for two items, the nonresponse rate for all specific characteristics was less than 1 percent andtherefore these missings were excluded from the calculations. For the two characteristics, for which thenonresponse rate ranged from 5 to 7 percent for the full sample, the nonresponses are shown on the tables asmissings.
Distributions may not add to 100.0 percent because of rounding.Dashes indicate that the sample size is under 10; therefore the calculation has been omitted."This refers to the total number of months accumulated from at least one spell on an individual's own
AFDC or GA case or the case of another adult in the household.
bThe GED credential is given to those who pass the GED test and is intended to signify knowledge ofbasic high school subjects.
-122 -1 b6

Single men have a stronger work history than the full sample but fewer resources whenunemployed. (Only 30 percent were receiving any type of assistance at application.) This mayexplain the special appeal of New Hope to unemployed single men, producing an unemploymentrate for this subgroup substantially higher than that for the full sample. New Hope promised help infinding regular employment or a community service job for those whose job search wasunsuccessful. Over 80 percent of single men reported applying to New Hope for these two reasons.
This subgroup faced a number of obstacles not directly related to work history that couldaffect their employability (some percentages not shown in Table 6.4). Only 23 percent had accessto a car for work compared with 42 percent of the full sample. Also, 47 percent of single men had aprior arrest record compared with 24 percent of the full sample, and single men also reported morejob-related drug or alcohol problems (12 percent) than those in the full sample (5 percent). Further,though only a small minority of single men reported previous problems on the job, their rate washigher than other subgroups. For example, 17 percent reported getting in trouble when they wereonly a little late to work; 25 percent said they did not like the way bosses or supervisors orderedthem around; and eight percent stated that they got into trouble without understanding the reason.The underlying causes of these work difficulties may lie with either the worker or the supervisor,but either way they obstruct job performance and retention. The case management provided byNew Hope's project reps may be the service most needed in overcoming these situations. Althoughsingle men experience work difficulties, at the same time they are motivated to improve theiremployment situation; 60 percent of this subgroup agreed "a lot" when asked if they wanted to geton-the-job training for one to three months in a type of work they had not tried before.
How do single men meet their basic needs when they become unemployed and there are noother household members to assist them? Among single men in the sample who were unemployedat baseline, only about one-fifth were receiving General Assistance or Food Stamps. This lack ofpublic support explains the fact that 28 percent reported having been homeless.
D. Other Subgroups of Interest
The labor market analysis presented in Chapter 3 highlighted the importance of two factorsin finding a job: educational credentials and access to a car for commuting. Forty-four percent ofthe sample reported they had a high school diploma or a more advanced educational credential"and 42 percent reported they had access to a car they could use for commuting to work.
The differences between high school graduates and those without a high school diploma arenot substantial, though many small differences in background characteristics are statisticallysignificant. Those with a high school diploma are slightly more likely to be African-American;single parents with one or two children, and aged 20-24; to report prior work (both any experienceand full time); to have higher earnings in the prior year; and to be somewhat less likely to be arecipient of various forms of public assistance (either at the time of application or in the year prior).Those with a high school diploma as also somewhat more likely to have access to a car than is therest of the sample.
"Advanced educational credentials include technical/A.A./two-year college degrees and four-year collegedegrees.
-123-
1 6'7

The group reporting access to a car was also strikingly similar to the full sample in mostother baseline characteristics. Most interestingly, they did not report more successful pastemployment or higher recent earnings. However, they did report somewhat fewer problems in pastjobs than the full sample.
Given the racial and ethnic diversity of the New Hope sample, it is also useful to brieflysummarize a clear pattern of differences: Asian/Pacific Islander sample members lived in verydifferent types of households than other groups in the study. Eighty-one percent of all Asian-Pacific Islander applicants lived in two-parent households with children, 70 percent of this grouphad at least three children in their household, nearly 80 percent were married or had at some timebeen married, and a much greater percentage of applicants were males. They were also muchmore likely to have earnings in the prior year of $5,000 or more and to have access to a car; andthey were much less likely to have received AFDC for more than 10 years over the course oftheir lives, to have a high school diploma or GED, and to have been arrested since their 16thbirthday.
III. Comparing the Research Sample with Eligibles in the New Hope Neighborhoods
New Hope never set a goal of recruiting a representative sample of eligible individuals inthe target neighborhoods to participate in the program. In fact, staff knew that achieving arepresentative sample was unlikely because they expected the combination of benefits theprogram offered to appeal to some residents more than others. The goal was to use manydifferent outreach approaches, as discussed in Chapter 5, to seek to make information about theprogram broadly available, and to serve those who came forward. This section examines theextent to which particular groups within the neighborhoods came forward to apply and thesimilarity of the New Hope sample to the eligible population in the neighborhood.
Table 6.5 presents characteristics of both the New Hope sample and the neighborhoodpopulation of "likely-participant" adults estimated from the New Hope Neighborhood Surveydiscussed in Chapter 4. (This table includes the estimate based on the Level 3, or most stringent,definition of the eligible population, which reflects fulfillment of program eligibility rules and anexpression of "a great deal" of interest when offered a description of program benefits.) There aredifferences between the estimated neighborhood likely-participant population and the New Hopeparticipants but they are not as large or extensive as might have been expected, and on many keycharacteristics the two groups are surprisingly alike.
Table 6.5 reveals four main differences. First, as discussed in Chapter 5, New Hope staffworked to achieve approximately equal enrollment from the Northside and Southsideneighborhoods. However, 64 percent of the estimated likely-participant population resided in theNorthside. Second, a smaller percentage of the New Hope sample were not employed than wasthe case among the likely-participant population, though nearly identical percentages werecurrently not employed and lacking any full-time work experience. Third, the householdcomposition varied somewhat, with New Hope recruiting more people living alone, single-parent families, and fewer couples with children than would have been expected from theestimates of the likely-participant population. Finally, the New Hope sample included a lower
-124-
165

Table 6.5
The New Hope Project
Comparison of Eligibles in the New Hope Neighborhood SurveyWith the New Hope Sample
CharacteristicNHNS
Eligibles'New Hope
SampleSignificantDifferenceb
Lives in neighborhood (%)Northside 64.3 51.0 ***Southside 35.7 49.0 ***
Unemployed (%) 78.3 62.5 ***
Among those unemployed,No full-time work experience (%) 20.8 20.2
Receiving AFDC (%) 45.6 46.0
Household type (%)Lives alone 4.3 11.8 ***Lives with family 92.5 81.5 ***
Couple 25.0 19.3 *With children 22.8 15.8 ***Without children 2.2 3.5
Single 67.5 62.2With children 35.4 53.5 ***Without children 32.1 8.7 ***
Lives with others 3.3 6.8 **
With children 0.5 1.5Without children 2.8 5.3 *
Race/ethnicity (%)African-American, non-Hispanic 59.9 51.4 **Hispanic 26.1 26.5White, non-Hispanic 8.0 13.0 **
Other' 6.0 9.2 *
Gender and age (%)Female 70.6 71.6
18-24 33.7 21.7 ***25-34 21.7 29.8 ***35 or over 15.2 20.2 *
Male 29.4 28.418-24 15.2 6.9 ***25-34 8.5 9.435 or over 5.7 12.2 ***
Highest diploma/degree (%)GED 4.9 13.6 ***High school diploma 27.1 , 31.9Technical/A.A./2-year college degree 2.8 10.1 ***4-year college degree or higher 1.2 1.7Other 1.8 0.0 **None of the aboved 62.2 42.7 ***
Unweighted sample count 221 1,357
-125- 169
(continued)

Table 6.5 (continued)
SOURCES: New Hope Neighborhood Survey and Background Information Form.
NOTES: Participants include program and control group members.Distributions may not add to 100.0 percent because of rounding.'Includes individuals identified as meeting the Level 3 standard for eligibility (described in Chapter 4).bA two-tailed t-test was applied to differences between the NI-INS eligibles and the New Hope sample.
Statistical significance levels are indicated as * = 10 percent, ** = 5 percent, and *** = 1 percent.
'This category includes Asians and Native Americans.`Includes "other" in participant survey.
170
-126-

percentage of residents with less than a high school education than was the case among thelikely-participant population.
Other characteristics were similar among the New Hope sample and the neighborhoodlikely-participant population. The incidence of public assistance receipt between the two groupsis virtually identical, as is the gender split. However, the New Hope sample is somewhat olderthan the neighborhood likely-participant population. Finally, the racial/ethnic split was similar,though the New Hope sample includes a slightly lower percentage of African-American, non-Hispanics and a higher percentage of whites than does the neighborhood likely-participantpopulation.
Again, there are no formal criteria for assessing these differences in characteristics.However, it appears that the recruitment process for New Hope did produce a subset of theeligible population that is similar to persons identified in the NHNS as eligible and interested inthe program.
-127-
171

Chapter 7
The Roles of the Project Representatives
New Hope's descriptive literature emphasizes the employment services and financialbenefits that the program offers: namely, the community service jobs, earnings supplements, healthinsurance, and child care assistance. The fact that program staff are available to help participantsaccess these services and benefits is implied, but rarely highlighted. During field visits to the NewHope offices and interviews with New Hope participants, the roles of the project representativesemerged as an important part of the program intervention. Indeed, many participants credited theirproject reps with giving them the information, motivation, and support they needed to achieve theiremployment goals and make other positive changes in their lives. In some instances, participantsindicated that the relationships they established with their reps were equal to or more importantthan the more tangible benefits and services that New Hope provided.
This chapter explores the roles that the project reps played and the ways that they shapedparticipants' experiences in the program. The first section describes how project reps interactedwith participants as gatekeepers, benefits processors, job coaches, and counselors/advisers. Thesecond section presents the views of some participants about the types and quality of assistance thatthey received from their reps. Chapter 8 examines New Hope's procedures for delivering thecommunity service jobs, earnings supplements, health insurance, and child care assistance toparticipants and discusses participants' and staff's experiences with these benefits and services.
I. Interactions Between Project Representatives and Participants
The project reps interacted with New Hope participants more frequently and on a deeperlevel than other program staff. They were responsible for shaping applicants' earliest impressionsof New Hope, since they handled much of the recruitment and all of the enrollment process for theprogram. Once people applied to New Hope and were randomly assigned to the program group, theproject reps served as their ongoing point of contact and source of help. When program services end(after three years), the project reps are responsible for helping participants make the transition tolife without New Hope. The nature and quality of participants' interactions with their reps,therefore, influence the full range of experiences that participants have in New Hope and the short-and long-term effects of the program.
A. Gatekeepers
The project reps served as the point of entry for all New Hope benefits and services. Withfew exceptions, anything that a participant wanted from New Hope was accessed by talking to aproject rep. In employment and social service literature, the term "gatekeeper" is often used todescribe this function, connoting a rationing of services or limiting of access, but in New Hope staffwere encouraged to maximize use of benefits and services. Indeed, although the project repscontrolled access to program benefits and services, they preferred to think of themselves as "gate-openers."
rig

Project reps were assigned a caseload of about 75 participants for whom they wereresponsible. They were expected to be in contact with each of these participants at least once amonth and to produce weekly participant status reports that accounted for everyone who was activeor inactive in the program. New Hope's managers and project rep team leader reviewed thesereports carefully and talked with reps about what steps they were taking to help their participantstake full advantage of New Hope's benefits and services.
Many participants who entered New Hope sought only one or two benefits and services, notthe full package. Others did not fully understand the different program components or how theycould use them. The project reps tried to make participants aware of their options and inquiredregularly about changes in employment or family circumstances that might cause participants toneed different types of benefits and services than they had in the past. All of the project reps foundthat they had to educate participants on a regular basis about the components of the New Hopeoffer. As one rep explained:
What you say and what people hear are often two different things. It takesrepetition. . . . I find sometimes participants are selective about what they want toshare. Some you walk up and hear their whole life story. Others it is a struggle topull out the information you need to work with them. For instance, I had a man whocame into the program and was working. He did not qualify for benefits the firsttime because he didn't have enough hours. I had to explain again our requirements.That is what I mean by repetition. Then he lost his employment. He chose not toshare that with me until the next month. I noticed there were only two check stubsrather than four. I asked him, he said, "oh, well, I lost my job." I had to say, "justinform me, please, when changes occur. You may be eligible for communityservice. I want you to be aware of what resources you can utilize." Just getting themto see, if you lose employment and you don't tell me . . . well, it's like the phrase, "Ican't fix something if I don't know it is broken."
New Hope was designed to help participants cope with changes in employment status, includingfinding or losing a job or experiencing fluctuations in hours of work. Unfortunately, manyparticipants either because they did not realize how New Hope could help them or because theywere too preoccupied with their problems did not alert their project reps promptly about changesthat occurred. As a result, the reps said that participants often failed to access program benefits andservices as quickly as their circumstances warranted.
As the previous example makes clear, project reps performed their gatekeeping functionmost effectively when participants shared what was happening in their lives and asked how NewHope could help them. To facilitate such communication, the reps tried to make contact with eachparticipant at least once a month, either by telephone or in person. They also made themselvesavailable to meet with participants during office hours or in the evenings, if necessary. Toencourage participants to call their project reps, the program regularly sent out letters and flyers toall participants active and inactive to remind them of the benefits and services available andto profile the "success stories" of individuals who used New Hope to find employment and attainother personal goals.
-129-
1 7 3
Sometimes participants requested help that New Hope could not provide: for example,learning a new vocational skill, finding a new place to live, or getting professional counseling. Theproject reps referred participants to appropriate service providers when they detected a need orwhen participants asked for their advice. The reps kept directories of community resources in theiroffices and also relied on personal contacts (both within and outside New Hope) for referralinformation. Staff reported that education and training programs were the most common type ofreferral. Whenever possible, project reps said they would encourage participants to use programslike these on a part-time basis, so that participants could continue to work and receive New Hopebenefits. Nonetheless, New Hope's policy was to respect participants' decisions to enroll in otherprograms, even if this meant that they could not continue in New Hope. The project reps tried tostay in contact with participants who made such decisions to remind them that they could return toNew Hope whenever they were ready to consider full-time employment.
Inactive participants those who had been out of contact with the program for six weeksor more were the subject of special scrutiny by New Hope's managers and project rep teamleader. Why were they inactive? What steps had the rep taken to contact these participants? NewHope's managers and project rep team leader were not concerned about participants who had goodreasons for being inactive: for example, those who had moved out of the area or had decided to stopwork and go back to school. If participants could not be accounted for, New Hope's managers andproject rep team leader encouraged the rep to keep trying to make contact. To reach inactiveparticipants, they usually began by placing telephone calls; if that did not work, they sent personalletters, inviting participants back into the program. Eventually, project reps tried to contact friendsor relatives for help in locating participants who "disappeared" from the program. New Hope staffrespected the wishes of inactive participants who told them they did not want to be bothered, butalso conveyed the message that the door was always open to those wanting to return.
B. $enefits Processors
Once participants decided to take advantage of New Hope's financial benefits, the projectreps' role shifted to benefits processing. The reps determined participants' eligibility for earningssupplements, health insurance, and child care assistance and performed the paper and computertransactions that enabled participants to collect these benefits. The project reps were lessinvolved in the administration of community service jobs, since other staff members specializedin this function. However, once participants started a community service job and worked anaverage of at least 30 hours per week, the project reps processed their earnings supplements andother benefits exactly as they did for participants in unsubsidized jobs. (A detailed discussion ofhow New Hope benefits and services were delivered appears in the following chapter.)
In order to receive earnings supplements, health insurance, or child care assistance, NewHope participants had to submit copies of their wage stubs to their project reps by the 5th of eachmonth. For approximately the next 10 days, reps focused on benefits processing. They reviewedparticipants' wage stubs to determine number of hours worked and income earned. Usingworksheets and New Hope's automated benefits processing system, the project reps calculatedhow much participants should receive in benefits and, in the case of health insurance and childcare assistance, how much participants had to contribute (or "copay") toward these benefits.
-130-
174

Benefits processing was conducted on a monthly basis so that changes in hours of work,amount of earnings, and household circumstances (such as an increase or decrease in number ofhousehold members) could be reflected in the amount that participants received. Participantscould also choose to accept or decline a New Hope benefit in a given month based on theirpersonal assessment of need for a particular benefit. For example, participants might decline NewHope's health insurance plan if they or their spouses became eligible for an employer's healthinsurance plan. (The project reps would, in fact, encourage participants to select an employer'shealth care coverage if the plan was similar to or better than New Hope's.) Or participants whorelied on a family member to watch over their children and thus did not normally rely on NewHope's child care might opt to receive child care assistance for a few weeks if the caregiver intheir family became unavailable for a period of time.
The time-consuming nature of the monthly benefits processing activities underscores oneof the challenges of operating an income-security program that links benefits to employment andearnings, as New Hope does. People employed at the low end of the wage scale such as mostNew Hope participants tend to experience constant fluctuations in earnings because they areusually paid on an hourly basis, and the hours they work vary according to their availability towork, employer demands, and the number of workdays in a month. The amount of New Hopebenefits that participants are eligible to receive therefore changes from month to month. In thenow-defunct AFDC program, program administrators generally assumed that clients' economiccircumstances remained stable (owing to lack of earnings) and that benefits needed to beredetermined only once every six months. Had New Hope operated on a six-month review cycle,the program would have risked providing participants with less support than they needed tosupport their households and get out of poverty (in cases in which participants' earningsdeclined) or overpaying participants whose economic prospects had dramatically improved.Neither outcome would have been desirable from the program's standpoint.
Compared with the other major roles that project reps performed gatekeeping, jobcoaching, and counseling/advising the benefits processing role consumed the most time,filling anywhere from 20 to 35 percent of the reps' work schedule. Benefits processing alwaystook priority. As one rep commented, "the paperwork has to be done. . . . At earnings supplementtime, if a phone call has to be returned, it just has to wait." The project reps tried not to schedulemeetings with participants during benefits processing periods, although they would makeexceptions if participants needed immediate attention. At times, the project reps' desire to beresponsive to their participants resulted in their putting in overtime hours to get the benefitsprocessing done. One rep put it this way:
I get to the paperwork eventually. I will come in on the weekend if I have to. . . .
During the day hours, if a participant comes in and I have paperwork to do, thepaperwork will have to wait. If they come in, they need assistance right now, notafter I get to the paperwork.
As this suggests, the time involved in processing benefits sometimes created conflictswith the project reps' other roles. After starting work, some staff members were surprised at howmuch of their time was consumed by entering data on the computer or filling out worksheets. Afew project reps said that they liked the mixture of technical work and interacting with
-131-
1 7 5

participants, but most said that they would have preferred spending more of their time meetingwith participants. However, a couple of technically oriented reps said that they would havepreferred more emphasis on processing benefits.
For awhile, program staff debated splitting the job so that some of the project reps couldspecialize in the "people" functions (for example, meeting with participants to explain NewHope's benefits and services, helping participants find jobs, listening to participants' problems)while others would handle the paperwork and computer functions. In the end, staff decided that itwas best for them and for participants to keep the roles together. Although interacting withparticipants and processing benefits require different skills, staff concluded that the informationthey gathered in order to process benefits (for example, participants' employment status, amountof earnings, health insurance coverage, and household characteristics) made it possible for themto build trust with participants, understand participants' needs, and be more effective counselors.They also concluded that it was better for participants to establish a relationship with just onestaff person.
C. Job Coaches
A third major role that the project reps played was that of job coach. This role had twodimensions: helping people who were unemployed to find work and encouraging people who werealready employed to move up the career ladder and seek better work opportunities. Project repstried to engage participants in an ongoing conversation about work, covering such topics asparticipants' work history, career goals, and work-related problems and accomplishments. Theyassisted participants in developing an employment plan. They provided participants with job leadsand helped them prepare résumés and practice their interviewing skills. Finally, the reps putparticipants in touch with community service jobs staff if participants could not find work, lost theirjob, or needed more hours of work.
While the project reps defined the functions of job coaching in similar terms, they haddiffering views of how active they should be in helping participants find and obtain work. Some ofthe reps indicated that they played a very active role in their participants' job search. For instance,one rep said:
I find out what kind of experience [participants] have had and I direct them. Idevelop résumés for people. I bring in the Sunday paper and go through the paperwith them. I have them call and set up appointments [with employers] while theyare here in my office.
Other project reps indicated that they expected their participants to do more for themselves. As onestaff member explained:
I put a lot of faith in the responsibility of the individual. I will give concrete jobleads, but I leave it to the individual to make calls. I will ask them later if theyfollowed through, but I won't make the contacts for them.
As a group, the project reps were roughly divided on the level of involvement they had withparticipants' job search. About half said that they intervened as much as necessary; the other half
-132-
£10

said they gave their participants job information, but did not go so far as to help them make contactwith employe rs.
The New Hope office functioned as a clearinghouse for employment information. Staffreceived job announcements from employers throughout Milwaukee and maintained a bulletinboard of current job openings. Participants and staff were free to peruse the bulletin board at anytime. During visits to the New Hope office by MDRC staff, the bulletin board contained between30 and 80 job listings. Most were entry-level positions (for example, openings for office clerks,child care workers, and maintenance staff), but some were more advanced. Many of the listingswere from city or county agencies or large nonprofit organizations that routinely publicizeemployment openings. Some small businesses and large corporations in Milwaukee also sent jobannouncements to New Hope.
New Hope staff did not expect their bulletin board to be the primary source of job leads forparticipants. Indeed, they encouraged participants to use other community resources to track downinformation on employment openings. They usually referred participants to the Milwaukee JobCenters (described briefly in Chapter 3), where participants could look up current job openings oneasy-to-use personal computers. Some of the project reps accompanied their participants to the jobcenters to show them how to use the equipment. Another resource recommended by the project repswere the Sunday Night Meetings sponsored by Work for Wisconsin, an employment advocacygroup. The meetings, which were open to the public, provided a forum in which Work forWisconsin staff and community residents shared information on which employers were hiringworkers. The meetings also allowed education and social service providers to announce trainingprograms or other services that might be of use to job seekers.
Some New Hope staff thought that New Hope needed to provide more formalized jobsearch workshops for participants, although this opinion was not shared by everyone. Some staffand most Board members believed that good job search workshops were available through otherorganizations in Milwaukee and that New Hope should not duplicate these services. In 1995, theboard agreed to have New Hope offer some job search workshops in-house on a trial basis. Twoagencies with experience conducting job search workshops were contracted to run an intensive,two-week workshop for New Hope participants who wanted this service. Although New Hope'smanagers reported that they were satisfied with the workshops, the contracts were not extended.
After it became clear that New Hope would not contract for job search services, a couple ofproject reps decided to take it upon themselves to offer voluntary job search workshops forunemployed participants. Staff encouraged participants to attend the workshops when theirindividual job search process was not yielding any results. One of the reps described the firstworkshop as follows:
We have been meeting once a week for the last seven weeks. The group process hasbeen good. We did a mock résumé. Everyone sets goals for the week and reportsback the following week. We practice interviewing, talk about what gets in the wayof their employment, provide support to each other, and network with each other.
The project reps reported that the group job search workshops seemed to work better for someparticipants than an individualized job search. They said that the group process helped some
-133-
177

participants to boost their self-image, gain more motivation to look for work, and learn better waysto interview. Staff estimated that about 50 participants attended these workshops and that many ofthem found employment.
As a group, the project reps held several strong beliefs about employment that influencedtheir role as job coaches. They believed that work, rather than schooling, offered participants thesurest route to higher incomes and self-sufficiency. While the project reps recognized thateducation and vocational training had value for some participants, they encouraged those whoneeded classroom instruction to attend school part time so that participants could still work the 30hours per week needed to receive New Hope benefits. For example, one rep gave the followingadvice to a Spanish-speaking participant who was debating between going to school and taking ajob in a fast food restaurant:
Think of it as baby steps. Go to McDonald's, go to class, think of this as a six-month stint. You will end this period with some skills, with a reference.McDonald's is not a bad place to work for awhile. You learn customer service, youlearn food preparation, maintenance. For six months, this is not a bad option if it ishelping to move you forward in the longer run.
As evidenced in the example above, project reps believed that unemployed participantswould be better off taking virtually any legitimate job offer than remaining unemployed. Minimumwage jobs and temporary jobs were acceptable. Given the availability of New Hope's earningssupplement and other benefits, staff did not think it made sense for unemployed participants to holdout for better job opportunities. Rather, they advised participants to start working as soon aspossible so that they could begin receiving New Hope benefits and build up an employment history.After participants were employed, staff advised them to look for better jobs.
Project reps also believed that every New Hope participant was employable. Staff tendednot to dwell on participants' barriers to employment, other than to tell them how the benefits andservices offered by New Hope might help them overcome barriers that they might have experiencedin the past. This is not to say that New Hope staff ignored legitimate obstacles to work, such asEnglish literacy or substance abuse. Yet, whenever possible, New Hope staff encouragedparticipants to continue working while seeking appropriate help in acquiring skills or addressingpersonal problems. In situations where participants' employment barriers were serious, project repsadvised them to get help from other organizations first and then return to New Hope when theywere ready to work.
Another belief often expressed by project reps was the importance of a positive attitude infinding and keeping a job. Again, staff did not deny that other factors specific to the participant(such as language or vocational skills) or external factors (such as racial discrimination in the labormarket) might pose barriers for some people. Staff refused to allow, however, participants to turnproblems like these into excuses for not working. One project rep, himself a person of color, saidthat he addressed the issue of racial discrimination as follows:
I think attitude is key. If you go out to [a Milwaukee suburb], some of my AfricanAmerican males say, "no one will hire me for this job." I say, "if you are here at

7:00 . . . , it doesn't matter what color you are, how big or how small. They wantsomeone who will do the job. That is what you need to show."
This project rep, along with many of his colleagues, felt that an important feature of being a jobcoach was helping participants recognize the positive features within themselves that made thememployable, rather than dwell on the reasons why they might not get hired.
Finally, the project reps believed that every employment experience even a bad oneafforded an opportunity for participants to grow. The reps tended not to express disappointmentwith participants who quit jobs or who were fired, even if the job was obtained through New Hope.One project rep recounted the following exchange he had with a participant who walked off acommunity service job after a disagreement with a supervisor:
I asked him, "what did you learn from this? What would you do differently nexttime?" He said he didn't know. I told him to think about it. He said, "I left [thecommunity service job], I don't want to think about it again." I said, "you may findyourself in this situation again; it's important to learn from it." As we talked, herealized that he could have done some things differently so he could have left on abetter note, so that he could use them as a reference. Now he is unable to. Heworked six weeks, but it is just like he had no employment.
The project reps tried to instill in participants a future orientation. They tried to help participants notto become stymied by past negative experiences, but rather to learn from them. Even unpleasant jobsituations, staff suggested, could be used to help participants clarify their employment objectivesand if the participants left on a good note obtain a reference.
D. Counselors/Advisers
As project reps got to know participants and engaged them in conversations about theiremployment, income, and family situations, some participants would start to talk about otherpersonal problems or issues: for example, their relationships with spouses, partners, or children;painful experiences in their past; or their hopes and fears for the future. This sometimes requiredstaff to play the role of counselor or adviser. Although the project reps were not trained asprofessional counselors and held no illusions that they could provide intensive counselingsessions for people with serious problems they generally felt comfortable acting as a soundingboard for participants. As one rep explained:
A lot of people really allow their unemployment to pull them down emotionally.Basically, my role is to listen. I am not trying to be a psychiatrist or anything. Butsometimes I hear things they don't even know they are saying.
The project reps believed that they often performed a useful function simply by allowingparticipants to talk. Staff tried to be active listeners, giving participants their full attention andacknowledging participants' emotions. As appropriate, staff offered specific advice, sometimesdrawing on their own experiences in dealing with problems similar to those that participantsdescribed. If the problems seemed serious for instance, if participants showed signs of mentalillness, domestic violence, or substance abuse the project reps referred participants to otherappropriate service organizations for help. Situations like these did not occur frequently, but most
-135-

reps said that they had at least a few participants who experienced severe social or emotionalproblems.
The role of counselor/adviser sometimes posed a problem for staff. On the one hand, theproject reps tried to make themselves available to participants and worked at building trust andopen communication. On the other hand, they did not want participants to grow overly dependenton them for help with personal problems. From a practical standpoint, staff did not have the time toengage in long conversations with participants on an ongoing basis. More important, staff firmlybelieved that they would get in the way of participants' progress toward self-sufficiency if theyallowed participants to call on them for every problem. One project rep, after saying that shethought a lot of her participants viewed her as a confidante and counselor, added:
I don't think I would ever want it to be a real friendship; that would take away frommy effectiveness. For instance, I have a participant who has really serious self-esteem problems. I was working with her a lot. But it got to the point that she wascoming to spend more time with me. . . . She would come in crying, real upset,when all she wanted was a hug. I didn't want to get too close to that situation or Iwouldn't be able to help her anymore. . . . I pushed her to try to do more for herself.She asked me to recommend a place where she could get some counseling. Wemade some phone calls. It will be up to her whether she takes advantage of this.
As this quotation illustrates, sometimes the most valuable assistance that project reps thought theycould offer participants was encouragement to resolve their problems independently.
II. Participant Views About Their Project Representatives
New Hope participants rarely needed any prompting to talk about their feelings about theirproject reps. Indeed, whenever researchers asked participants to describe what New Hope was likefor them, the nature and quality of their relationship with their project reps was usually one of thefirst things that participants mentioned.' They talked, for example, about the gatekeeper andbenefits processing roles that project reps played. In one participant's words:
My project rep, she's really good. She helps me out a lot. . . . I mean with anything.. . . When I needed help to mail out my check and stuff, she mailed 'em. She helpedme get my daughter into this day care center, right here. Health insurance,everything.
The participants interviewed by MDRC stressed the project reps' helpfulness and responsiveness.No participants said that they were ever denied a benefit or service or suspected that importantprogram information was withheld from them.
'The fmdings from this section are based on focus group interviews with 36 New Hope participants in the fall of1995 (see Appendix A for a description), and on one-on-one or small group interviews conducted with New Hopeparticipants encountered by MDRC researchers during field visits to the New Hope office. The findings therefore mayoverrepresent the opinions of active participants and underrepresent the views of inactive participants.
-136-
Q

New Hope participants described the job coaching they received from project reps chiefly inmotivational terms. Among participants who were working, most said that New Hope did not helpthem find their jobs, but many who started working after they enrolled in New Hope credited theprogram staff with giving them the confidence to look for work. The following comment wastypical:
I found my job on my own, but they gave me the initiative. They gave me, youknow, that push.
Motivation and self-esteem were recurring themes during interviews with New Hope participants.Indeed, many participants stated or implied that a lack of motivation or self-esteem had been amongtheir major barriers to work in the past. One unemployed participant gave an emotional descriptionof how her project rep helped her to feel better about herself and how important this was inmaking her feel ready to conduct a job search:
New Hope gives you self-esteem. When you're depressed and you're down and youcan't look to your friend or your neighbor or nobody. . . . I remember coming herethe very first time. I'll never forget [my rep]. We had these classes in here, and sheset up this little thing, like with the little folder, and what was your goal and wesit there and we did our goal and she did the interviews with us all over again. Sheeven did these exercises with us to relax our mind and bring out things that wecouldn't bring ourselves. And it was really beautiful, and that night, [the project rep]said, "hey, you did it before. Get up, let's go," you know, and I was down indepression, and I had a death in my family, and stuff like that, but you neededsomebody like that to bring it back and they did.
Many participants welcomed the support and encouragement they received from their project repswhile they were looking for work. They liked having someone who was "on their side" a personto whom they could reveal their aspirations and fears about employment. Although family membersor friends might be expected to offer such support, some participants indicated that they feltembarrassed to talk about employment issues with friends or family members or thought that theywould be judged or pressured into taking unwise actions.
Several participants mentioned that they received counseling or advice from their projectreps on personal or family matters unrelated to employment. Several also said that their reps helpedthem with referrals to other social service programs or community resources. One participant, forexample, told an MDRC researcher:
[My rep] was cool. Because he not only treated us [right] because we're New Hopepeople, he treated us [right] 'cause we were people. He'd even talk to me aboutthings that didn't have to do with the job and stuff, just to keep me on an even keel.Any help, he'll find. . . . When I was having trouble with my son, he looked upsomething and found me someplace for me to call.
Being "treated right," in this man's words, was another common theme that emerged duringinterviews with participants. Many participants told about feeling ignored or degraded by welfareand employment programs. New Hope, they said, was different. As one participant stated
-137-

succinctly, "New Hope makes you feel good about yourself and welfare dehumanizes you."Another participant explained:
To your AFDC caseworker, you're just a number. Here, you're a person. My jobwas cut down to two days. I talked to my rep. He helped me with my résumé andlook for a new job. . . . My rep always returns my calls and gets back to me. When Ifirst came to New Hope, I didn't have a GED. My oldest son wanted help with hisalgebra. I couldn't do it. I asked my rep where I could get a GED. He referred me tosix places! . . . Any kind of problem, I get help with here.
For many participants, the active support and encouragement they received from their project repwas what set New Hope apart from other programs they had experienced.
Most of the participants MDRC interviewed about their program experiences had beenenrolled in New Hope for six months or less. It is possible that the nature and quality ofparticipants' relationships with project reps will change over time. Some reps, for example, maybegin to push their participants to make changes in their employment (such as finding a new job orseeking a promotion) that could lead to better pay and benefits. Some participants may appreciatethis push, while others may be frightened or offended by it. For another example, some participantsmay have to create new relationships with project reps because of staff turnover. Theserelationships may be better or worse than the ones that participants enjoyed previously. In the worstcase, participants who grew attached to one project rep may drop out of the program if that staffmember is no longer available. Future research activities, including further qualitative research anda follow-up survey of all program group members at two years after random assignment, willprovide a longer-range view of participant-staff relationships and the value that participantsattached to these relationships.
III. Conclusion
The New Hope Project is usually described in terms of the core benefits and services itoffers to participants: the community service jobs, earnings supplements, health insurance, andchild care assistance. Such a description, however, overlooks the important ways that program staff
in particular, the project reps interact with participants and shape their experiences in theprogram:
As gatekeepers, the project reps encourage the maximum use of benefits andservices by participants. They inform participants of the various ways that NewHope can help them improve their employment and economic circumstancesand reach out to inactive participants to bring them back into the program.
As benefits processors, the project reps perform the computer and papertransactions necessary for participants to receive New Hope's financial benefits.Processing benefits is the most time-consuming of the roles that reps perform,and sometimes limits how much time they can spend talking or meeting withparticipants.
-138-
la2
As job coaches, the project reps give unemployed participants information andsupport to help them in their job search and encourage participants who arealready employed to move up the career ladder. Some reps take a more activerole in advising and directing participants than others, but all of themconsistently communicate the view that participants ought to be working if theyare able.
As counselors/advisers, the project reps try to create a "safe place" forparticipants to talk about personal experiences and problems. The repsacknowledge participants' concerns, offer emotional support, and make referralsto other people or organizations that participants might go to for more help.
The participants whom MDRC interviewed spoke highly of their project reps. Indeed, for someparticipants, the relationships they established with their reps seemed as important as thecommunity service jobs, earnings supplements, health insurance, and child care assistance that NewHope offered. One thing is clear: none of these benefits and services would have been provided toparticipants without the project reps to act as gatekeepers, benefits processors, job coaches, andcounselors/advisers. The following chapter discusses how these "core" benefits and services weredelivered.
-139-
133

Chapter 8
The Delivery of Benefits and Services
This chapter discusses the benefits and services that lay at the heart of the New Hopeoffer: community service jobs, earnings supplements, health insurance, and child care assistance.Drawing upon data gathered through field research, focus group interviews, and programdocuments, the chapter explains the operating procedures of each of the core benefits andservices, the major issues that emerged during benefit and service delivery that required staffattention and problem-solving, and the reactions of participants to individual benefits andservices. It also assesses what was distinctive about New Hope's benefits and services relative toother kinds of help available to welfare recipients and low-income workers in Milwaukee.Finally, the chapter provides illustrations of how New Hope benefits make people better offfinancially than they would be without the program.
The chapter is organized as follows. Section I describes the community service jobs thatNew Hope provided to participants who needed work. Section II discusses the financial benefitsoffered by New Hope: the earnings supplements, health insurance, and child care assistance.Section III assesses the distinctiveness of the New Hope offer. Section IV presents case studiesof how New Hope's financial benefits improve the economic circumstances of three (fictitious)households: a single earner with no children, a single earner with two children, and two earnerswith two children. Chapter 9 follows with an analysis of the use of benefits and services duringthe first 12 months after people were randomly assigned to the program group.
I. Community Service Jobs
New Hope participants who were unable to find work in the regular labor market had theoption of taking a community service job (CSJ) that paid minimum wage. Importantly, these jobsenabled participants to qualify for New Hope's earnings supplements, health insurance, and childcare assistance, so long as participants worked an average of at least 30 hours per week in eachmonth. CSJs were developed and funded by New Hope, but were located in private, nonprofitsocial service agencies throughout Milwaukee often in the target neighborhoods. New Hopestaff described them as "real jobs." The positions were designed to help participants gain workexperience, build skills, and obtain references that they could use to find unsubsidized work.
Operating Procedures. New Hope's project reps referred participants to CSJs if they metone of three conditions: they were unemployed and had not found a regular job after an eight-week job search; they lost a regular job, and could not find another one after a three-week jobsearch; or they were working part time in the regular labor market, but needed additional work tofill out the minimum of 30 hours a week required to qualify for New Hope's financial benefits.The positions lasted no longer than six months, but could be repeated once; that is, participantscould work in a CSJ for a total of 12 months during the three years they were enrolled in NewHope.

Although New Hope staff developed more than enough CSJs for the number ofparticipants who needed them, the jobs were not guaranteed. Participants had to interview for thepositions they wanted and had to perform satisfactorily in order to remain on the job. Worksitesponsors could fire participants who did not show up as scheduled or otherwise did not meettheir standards. Likewise, participants had the right to quit a CSJ if it was not to their liking.Participants who were fired or quit were allowed up to three more CSJ placements while enrolledin New Hope.
New Hope offered participants a range of CSJ assignments to choose from in a variety ofcommunity-based social service agencies. A breakdown of the actual assignments made during1996 is shown in Figure 8.1. Office support positions (namely, reception and clerical work) werethe most common, followed by property maintenance and building construction or rehabilitation.A number of participants also worked in the child care and food service fields.
The management and operations of the CSJs involved a partnership between New Hope,the sponsoring worksite agencies, and the Milwaukee Private Industry Council (PIC). New Hopestaff developed CSJ "slots" in sponsoring agencies, referred participants, and monitored both theparticipants and the worksites. The sponsoring agencies developed job descriptions, supplied thework, and supervised participants. The PIC, under contract with New Hope, acted as the actual"employer" and handled the payroll (using funds provided by New Hope). As the employer, thePIC covered worker's compensation benefits if CSJ participants were injured on the job.However, because the jobs were time-limited, participants were not eligible for unemploymentinsurance benefits.
New Hope participants in CSJs reported to work as scheduled by the worksite. Every twoweeks, they filled out time sheets, which were signed by their worksite supervisor, and submittedthem to New Hope in person or by facsimile. Participants were paid only for the hours that theyworked. New Hope's CSJ staff reviewed the time sheets and distributed copies to the PIC and toparticipants' project reps. The PIC issued participants' paychecks, while the reps checked to seewhether participants had worked enough hours to receive earnings supplements, health insurance,and child care assistance. If so, the project reps processed these benefits as they would for anyparticipant employed in a regular job.
Implementation Issues. As Chapter 9 describes in detail, the CSJs proved to be animportant component of New Hope for many participants. Nearly a quarter of the program groupmembers participated in a CSJ during the first 12 months after they entered the program. Mostparticipants completed their assignment as scheduled or left on good terms. Many participantswho completed CSJ assignments moved on to unsubsidized work, though others reverted tounemployment.
Among participants assigned to CSJs within the first 12 months of their enrollment inNew Hope, 28 percent quit and 20 percent were fired from their first assignment. Staff reportedthat the main reasons for quitting were a conflict with a supervisor or a general dislike for thejob. Firings, on the other hand, were almost always attributed to poor attendance. New Hope staffdid not necessarily view these terminations as a problem. Indeed, for some participants, staffbelieved that getting fired was part of the learning process. The project reps and CSJ staff tried to
-141- 1 35

Figure 8.1
The New Hope Project
Community Service Job Assignments: January-December 1996
Security2%
Manufacturing4%
Building Construction/Rehabilitation
13%
Child Care9%
Accounting/Data Entry
3%
Social Services/Medical Services/Educational Aid
4%
PropertyMaintenance
16%
StOck Inventory4%
SOURCE: The New Hope Project.
Office Support35%
Retail/Marketing2%
Food Service8%
NOTES: Percentages are based on 201 CSJ assignments made between January and December 1996. Someparticipants were given more than one assignment.
BEST COPY AVAILABLE

talk with participants about what went wrong and what participants might do differently in theirnext job. Some participants who quit or were fired ended up being reassigned to new CSJs.(Again, see the next chapter for more information on these patterns.)
New Hope staff learned from the pilot phase that some participants needed more thanwork experience and a reference to get a job in the regular labor market. In order to encourageCSJ participants to increase their educational or vocational skills, New Hope permitted them toattend up to 10 hours of school or training each week and to be paid for this time, provided thatthey also worked at least 30 hours in their work assignments. (This allowance was not made forparticipants in regular employment.) Staff reported that relatively few participants tookadvantage of the offer, but that those who wanted schooling or training welcomed the financialsupport that New Hope offered them under this policy. Staff also said that they found thisprovision to be a useful tool for encouraging some participants to combine work and school.
As an alternative to classroom instruction, New Hope staff offered small groups ofparticipants an opportunity to learn an occupational skill together as part of a specialized "workteam." These positions required full-time work in nonprofit agencies and paid minimum wagejust like any other CSJ, but were more closely supervised and placed a stronger emphasis onteaching a skill or trade. Work teams were offered in manufacturing and in housingrenovation/lead abatement. The training lasted between four and six months and concluded withjob placement assistance in the team's occupational field. As of this writing, New Hope staffhave assigned a total of 25 CSJ participants to work teams.
Some New Hope staff felt that the program needed to do more to help CSJ participantsmake the transition to the regular labor market. As one project rep stated:
[The CSJ component] starts out really good. We are missing a link, though, at theend. Some people don't make the bridge they don't see how to use theirexperience. After six months, they are right back where they started.
This staff member thought that New Hope needed a structured job search activity at the end ofthe CSJ component to teach participants how to obtain work and provide emotional supportwhile they looked. Several staff members also believed that the program needed to do more tohelp some graduates of CSJs complete their schooling or obtain vocational skills training.
New Hope staff encouraged participants to move into unsubsidized jobs as quickly aspossible, before their six-month assignments were finished. (Work teams were an exception.Because work teams involved structured supervision and training, participants were encouragedto complete the full assignment before taking an unsubsidized job.) In general, New Hope staffdid not recommend that participants choose or remain in CSJs over regular work. Rather, staffadvised participants to try to keep as much of their 12-month allotment of CSJ time "in the bank"as possible against future unemployment. New Hope staff believed this policy to be inparticipants' best interest. It, however, did not always please worksite sponsors, who generallywould have preferred knowing that participants would stay on the job for at least a full sixmonths. (The following chapter provides details on how long participants stayed in CSJs andtheir reasons for leaving.)
-143- 1 7

Despite occasional frustrations over the short amounts of time some participants stayed inCSJs, New Hope staff reported that most worksite sponsors responded favorably to theparticipants assigned to them. It probably helped that most of the sponsors were community-based agencies that had social service objectives compatible with New Hope's; hence, theywerewilling to invest the extra time needed with some participants who had low skills or otherdifficulties adjusting to work. A few agencies stopped accepting New Hope participants afterfinding that they required too much supervision or did not stay in the jobs long enough to beproductive workers; likewise, New Hope stopped referring participants to some agencies thatfailed to provide adequate supervision or meaningful work assignments for participants. Onbalance, however, the relationships between New Hope and worksite sponsors were good.Indeed, New Hope always had a surplus of agencies interested in taking CSJ participants. Thisbenefited participants, who never had to wait for a slot to open up and who could choose amongseveral placements.
One concern voiced by New Hope staff was that some CSJ participants grew toocomfortable in their jobs and did not want to leave. The project reps and CSJ staff often had toprod participants into looking for unsubsidized work, particularly as their six-month placementsneared the end. Staff also suspected that some worksite sponsors tried to delay participants'transition from CSJs to unsubsidized work in order to obtain the maximum benefit from theirlabor. The CSJ staff found that they had to pay close attention to the messages that worksitesponsors were sending participants to make sure that they were not being coaxed or pressuredinto staying in a CSJ beyond the point where they could get an unsubsidized job.
Participant Reactions. Interviews conducted by MDRC researchers with New Hope staffand participants provided many examples of people who used the CSJs as they were intended: tobegin developing a work history or to "fill in" when they were between jobs or low on workhours. One participant, for example, recounted how she had spent six months in a CSJ after beingon welfare. She said that the job helped her gain the confidence to obtain an unsubsidized job,though she later returned to a CSJ when her employer cut back her hours. She was grateful tohave it as a fallback:
I don't want to expose my children to anything negative. New Hope allows me tostay positive. Some view it as a step backward that I am in community serviceagain. I don't. It's just a steppingstone.
Many New Hope staff and participants indicated that one of the most important functionsof the CSJs was to give participants increased confidence in themselves. A CSJ staff memberrecounted the following story:
I have one woman placed at [a community organization]. She was so afraid. Shesaid, "I can't speak English." The phone would ring and she would panic. Shelater realized that she knew more English than she thought: she understood othersand others understood her. The host agency ended up offering her a permanentposition.
As in this woman's case, New Hope staff said that it was often as important for participants togain confidence in their social skills as it was for them to acquire or improve specific vocational
-144-

skills. For people who had not had much employment experience, staff felt that the CJSs offeredan opportunity to learn how to communicate and get along with supervisors and coworkers,readily transferable skills.
The CSJs did not appeal to all participants. Indeed, New Hope staff reported that someparticipants rejected them out-of-hand, even if this meant that they would remain unemployed.Participants' main reason for rejecting the jobs was that they paid minimum wage despite thefact that they could receive an earnings supplement and other New Hope benefits if they workedat least 30 hours a week. This may be an example of some participants' failure to understandcompletely how the New Hope benefits worked. Over time, New Hope staff found that they wereable to interest more participants in taking CSJs by explaining what they would take home on amonthly, rather than an hourly, basis. As one CSJ staff member explained:
People don't want to work for $4.25 an hour. When I calculate out that is $680 amonth, they think, "wow!" Plus, they get the New Hope supplement. People don'tunderstand the wages and how much they would be earning.
The CJS staff also tried to sell participants on the many different kinds of jobs available. In somecases, they developed new positions that related to participants' job interests.
II. Financial Benefits
New Hope offers three types of financial benefits: an earnings supplement, healthinsurance, and child care assistance. Participants can access one or more of these benefits as theirneeds dictate. While the following section describes the components individually, it is importantto keep in mind that they were designed as a package. Together, the financial benefits aim to
make work pay by providing better remuneration (cash and benefits) at thelow end of earnings, and preserving incentives to increase earnings;
avoid rewarding unstable earnings patterns;
protect children in low-earnings households from inadequate resources;
make payments as neutral as possible with respect to incentives to create orbreak up families or households;
target payments to "worst-off' families;
reduce barriers to work arising from child care and health insurance, butrequire some participant contribution to obtain these benefits; and
keep the costs of the total benefit package earnings supplements, healthinsurance, and child care assistance within politically feasible bounds.
Appendix C describes in detail how New Hope's designers refined the benefits package so thatthese various objectives could be met to the fullest extent possible.
-145- 1 3 9

A. EMakg53B991tMMti
New Hope's earnings supplements were the most obvious means by which the programhelped to "make work pay" for program participants. Each month, participants who worked anaverage of at least 30 hours per week in a month were eligible to receive a check from New Hopethat, combined with their earnings and the federal and state Earned Income Credit (EIC), wouldraise their household income to near or above the poverty line.' Although the concept seemsstraightforward, the design of the earnings supplement is complex owing to the multiple andsometimes conflicting objectives listed above (for example, protecting children from inadequateresources while trying not to reward unstable earnings patterns). The complexity is also related tothe interactions between the earnings supplements and the federal and states EICs, which havedifferent eligibility rules than New Hope, and between the earnings supplements and NewHope's other financial benefits. Finally, design complications are introduced when householdshave many dependents or more than one earner. (Appendix C describes the design of theearnings supplement and other financial benefits in detail.)
Operating Procedures. In order to receive an earnings supplement, New Hopeparticipants had to present proof of their employment, earnings, and number of hours workedeach month to their project reps by submitting copies of the wage stubs attached to theirpaychecks. The reps reviewed the wage stubs to make sure that participants had worked anaverage of at least 30 hours per week during the previous month. Assuming that this conditionwas met, the project reps determined the amount of the earnings supplement that participantswere eligible to receive. (If participants requested New Hope's health insurance and child careassistance, eligibility for these benefits was also determined at this time.) To determine theamount of supplement for which a participant qualified, the reps reviewed the number of hoursworked, the amount of earnings, the number of earners in the household, and the total householdsize. When New Hope first started, the project reps used worksheets and earnings supplementtables to determine each participant's supplement amount. (The tables for 1996 are included inAppendix G.) Over time, New Hope developed an automated system to make the necessarycalculations.'
Participants had to submit copies of their wage stubs by the 5th of each month in order toreceive an earnings supplement for their previous month's wages. The project reps then spentseveral days determining the earnings supplement and other benefits that participants wouldreceive and processing the paperwork needed to authorize participants' checks. The repsforwarded this paperwork to New Hope's accounting staff, who spent several more days
'Participants' total income after New Hope benefits might remain slightly below poverty level for largefamilies, since the earnings supplements are not adjusted upward for households that have more than fourdependents. In addition, since the earnings supplement is designed to encourage more work effort, participants whowork the minimum of 30 hours per week will still be below poverty level, but will rise near or above it if theyincrease their hours. An illustration of this policy appears in Section IV of this chapter (Case 2: A Single EarnerWith Two Children).
'The automated system alerted the project reps when the participant's prorated annual income exceeded$30,000. The reps would then review the case to determine whether the participant's earnings were near or beyondeligibility criteria. In some cases, the reps had to make these calculations manually.

verifying the information and issuing checks. The accounting staff delivered participants' checksto their reps by the 20th of each month. The project reps reviewed the checks and then distributedthem to participants in person or by mail.
The earnings supplement check that participants received from New Hope was nottaxable, and therefore did not have any of the federal or state deductions of a paycheck.However, if participants elected to use New Hope's health insurance, the amount of theircontribution to this benefit (known as their "copay") was deducted from their earningssupplement check. In addition, New Hope occasionally issued small loans to participants to helpthem with work-related expenses (such as automobile repairs or work clothes). Loan repaymentswere also deducted from the supplement check. New Hope developed a monthly benefitsstatement, which project reps attached to the earnings supplement check, to show the deductionsthat were made and also how the amount of the earnings supplement check was determined.(Figure 8.2 offers an example of the monthly benefits statement.) The statement also showedparticipants the dollar value of all the benefits and services they received that month, and theirpotential income from all sources, including the federal and state EICs. It was intended in part toeducate participants about the availability of the EIC and to encourage them to apply for anadvance of the federal EIC from their employers.3
As with any program that offers cash assistance, New Hope's program founders and staffwere concerned about fraud: that some participants might try to claim they had worked morehours than they actually did to meet the 30 hour work requirement, or that in selectedinstances they might underreport income in order to get more financial benefits than theyqualified for.' The requirement that participants present their wage stubs was the first-linedefense against fraudulent claims. Nonetheless, it was possible that participants who worked atleast 30 hours in one job might have a second job for which they did not present wage stubs orhave a second wage earner in their household whose income they did not report.
In order to guard against these possibilities, New Hope obtained and reviewed stateunemployment insurance (UI) records for all participants and their spouses. These recordsprovided a good check against unreported employment and income, since most employers arerequired by law to report the wages paid to their employees to the state UI system.5 As of thiswriting, New Hope had detected about five instances in which the UI records revealed incomethat participants had not reported to New Hope. All of these cases involved a working spouse.Although New Hope's policy was to terminate participants who failed to reveal all of theirincome sources, staff believed that there may have been an honest misunderstanding in each ofthese cases. (Some participants did not speak English, for example.) New Hope staff worked out
3The Internal Revenue Service permits 60 percent of the minimum EIC that is estimated for a worker at a givenincome level and household size to be prorated and advanced in the worker's paychecks.
'In general, unlike many welfare programs, there was no incentive for participants to underreport employmentincome, since New Hope's benefits were predicated on at least 30 hours of work and were designed to rewardincreased work and income.
51JI records usually do not include self-employment, some domestic work, military jobs, and informal childcare.
-147-

an arrangement with each of these participants to correct and recover the overpayment of benefitsand allowed them to remain in the program.
Implementation Issues. In general, the process of determining eligibility and processingchecks worked smoothly. More participants received an earnings supplement than any other NewHope benefit: 72 percent during the first 12 months after random assignment. More informationon the use of earnings supplements appears in the next chapter.
The main problem that staff encountered in the delivery of earnings supplements wasgetting participants to submit their wage stubs by the 5th of each month. One project repwhose opinion was echoed by many of his colleagues described the problem:
I struggle with some people who don't want to demonstrate responsibility. Theybring in check stubs on the 6th rather than the 5th. Well, I can deal with that. Butnext month they bring it in on the 10th. We need to work more in finding middleground between being sensitive and accommodating and following the procedureswe have established.
New Hope staff resisted becoming too rigid about the 5th deadline, but if participants were morethan one or two days late, they were usually told that they would have to wait until the followingmonth to receive an earnings supplement check.
Sometimes, participants let their wage stubs accumulate for two months or more beforesubmitting them to their project reps. New Hope allowed income-eligible participants to receiveearnings supplements for these months provided that the dates during which participants earnedthese wages did not precede their enrollment in New Hope and participants worked the minimumnumber of hours required. Eventually, New Hope imposed a 90-day time limit, which served tokeep project reps from being overwhelmed by old wage information and to encourageparticipants to use the earnings supplement as it was intended: as an addition to their monthlypaychecks, not as a periodic windfall.
Staff reported that many participants were perplexed about how their earningssupplements were calculated, despite the information presented on the monthly benefitsstatement, particularly why the earnings supplement amounts varied from month to month. OneNew Hope participant grew so frustrated with the variations in her supplement check that shedropped out of the program:
I think that's how to get disappointed every month. I would think I was getting acertain amount and I'd come pick up my check and my check was different fromwhat I was told. . . . So I got fed up with that. That's why I didn't come anymore.
Although this reaction was extreme, virtually all of the participants interviewed by MDRC whoreceived supplement checks said that they did not fully understand how the monthly earningssupplement checks were figured and why the amounts they received fluctuated.
The project reps often sat down with participants to explain that the amount of theearnings supplement check was based on hours of work, amount of earnings, number of earnersin the household, and household size. Changes in any of these circumstances could lead to a
-148- 9 o2

change in the supplement amount from month to month. The supplement amount also variedbecause the number of paychecks that participants received during a calendar month varied; forexample, some months had five Fridays rather than four. If this resulted in more "paydays," thenparticipants' monthly incomes were higher, and their New Hope supplements were lower. Manyparticipants did not understand this logic. The project reps reported that former welfarerecipients, who were used to getting a specified grant from the welfare department each month,had the most difficulty understanding why the amount of their supplement checks fluctuated.
Early on New Hope had to address the problem of how to verify the hours worked andthe earnings of self-employed participants. Several participants, for example, ran their own childcare programs; a few others ran small hair salons out of their home, cleaned houses, painted, ordid odd jobs for hire. After consulting with an accounting firm, New Hope developed a self-employment log for participants to record their work hours and earnings. They also had to attachcopies of bills or payments received from their customers. Self-employed participants werepermitted to deduct legitimate business expenses from their income so long as these expenseswere documented and did not exceed their revenue for that month.
Participant Reactions. During focus group interviews, participants who receivedearnings supplements indicated that they appreciated having the extra money. They said that theearnings supplement allowed them to do and purchase things that otherwise they could notafford. In one participant's words:
I could go to Northridge [mall] and say, "oh, I want them shoes," and I can getthem shoes. I ain't got to wait a whole month.
Another participant said that she used the extra money to go shopping with her teenage daughtersomething she couldn't do when she was on welfare:
We do the mother/daughter thing. We shop together. I'm great at finding bargains.. . . It's been really good for my daughter. It has enhanced our relationship. . . .
The extra money has helped me all the way around.
Participants talked about using the earnings supplements to buy gasoline, purchase differentvarieties or greater quantities of food, pay utility bills, and pay rent. A few said that were startingsavings accounts or paying off debts with the supplement checks.
Although most participants interviewed by MDRC felt that they would be working evenif they were not enrolled in New Hope, a few suggested that the earnings supplement and otherfinancial benefits made the difference in their decision to leave welfare for employment. Oneparticipant, for example, told an MDRC interviewer:
[Without New Hope], if I didn't have a job, in which I'll make at least two timeswhat I'm making right now, I would stay home because I'd be on AFDC. Who isgoing to pay for all my expenses. Because if I go to work and I need to pay forchild care, transportation, etc., it won't be enough money.
Another participant, acknowledging the fact that New Hope's benefits were limited to threeyears, indicated that she viewed the earnings supplement and other benefits as a temporary
-149- 1 Q4 k4

financial cushion, until she could work up to a job that paid adequately to cover her financialneeds:
[New Hope is] not something I would lean on forever, but this will give meenough time to get on my feet, where I can be self-sufficient for myself.
None of the participants interviewed by MDRC spoke about the earnings supplement as makingthe difference between feeling "poor" or "not poor." As these quotations illustrate, they tended todescribe the earnings supplements as a way to help make ends meet or to have somewhat greaterflexibility in how they spent their money. This reaction is understandable, given that thesupplement amounts were modest in many cases. As Chapter 9 reports, the average monthlyearnings supplement for participants who received a check was $114.
B. Health Insurance
Of all the benefits and services that New Hope offered, health insurance was regarded bymany participants and staff as the most valuable. Not every participant needed health insurance;some were covered by an employer's plan, while others were covered by Medicaid (includingtransitional Medicaid). For some participants, however, New Hope was the only affordablemeans of access to health care coverage. Program staff strongly believed that participants had tobe covered by adequate health insurance in order to attain self-sufficiency. They quizzed everyparticipant about health care coverage and insisted that those who lacked health insurance signup for one of New Hope's plans.
Operating Procedures. At the start of the demonstration, New Hope offered four healthplans for participants to choose from, each run by a health maintenance organization (HMO). Bymid 1996, after it became apparent that almost no one was choosing two of the providers, NewHope narrowed the choices to the two most popular. One of the HMOs used by New Hope wasunder contract with Milwaukee County to provide coverage for Medicaid recipients. Most NewHope participants selected this HMO, probably because it was familiar.
The health plans offered by New Hope were comprehensive, covering physician,chiropractic, and optometry services; in-patient and out-patient hospital services; mental health,alcohol, and drug abuse services; dental care; emergency care; and pharmaceutical needs. Solong as participants obtained services within their selected HMO group, most of their health carecosts were covered. Participants who received basic medical coverage from their employer butwho needed dental care coverage could select only this component from one of New Hope'splans.
To qualify for health insurance, a participant had to have worked an average of at least 30hours per week. The project reps confirmed the number of hours by reviewing participants' paystubs. Staff would then give participants an overview of the plans offered by New Hope and anexplanation of how the HMOs operate. The reps encouraged participants to find out which of theHMOs had medical professionals they knew and trusted, and to talk with family, friends, or otherNew Hope participants to get their recommendations. Once participants selected a plan, theycompleted a simple enrollment form and returned it to the project reps.
Participants' choice of health insurance plan normally stayed in effect throughout the
-150-
134
time they were enrolled in New Hope, provided that they continued working at least 30 hours perweek. If participants stopped working or experienced a cutback in hours, New Hope's policy wasto allow them to continue receiving health insurance for three weeks while they looked for a newjob. In practice, New Hope would extend coverage somewhat longer than three weeks ifparticipants were actively seeking work or were waiting to start a new job.
New Hope required each participant to contribute (or make a "copay") toward the cost ofhis or her health insurance. New Hope's designers felt that it was important for participants toshare some responsibility for the costs of health insurance. At the same time, the designerswanted to make sure that the copays took into account participants' ability to contribute and didnot violate the principles of the financial benefits package (see Appendix C). The amount of theco-pay increased as participants' incomes and household sizes increased, but not so much as tocreate a disincentive to work or throw people back into poverty.
The copay amounts were intended to fall within a realistic range of the premiumsrequired of workers in many employer-sponsored health plans in the Milwaukee area. NewHope's copays began at the low end of what local employers required of their employees ($72per year for single individuals and $168 for households with three persons or more), and werecapped at the high end ($600 a year for single persons and $1,548 for households with threepersons or more). New Hope deducted participants' health insurance copays directly from theirmonthly earnings supplements. If participants did not receive earnings supplements or had higherhealth insurance copays than supplement amounts, they were required to reimburse New Hopeeach month in order to stay enrolled in the plan. To help participants understand thesecalculations, the monthly benefits statement showed the monthly premium for which participantswere responsible, as well as New Hope's contribution. (See Figure 8.2.)
Implementation Issues and Participant Reactions. The delivery of the health insurancebenefit to program participants presented no significant problems to New Hope staff. Indeed, inthe words of one project rep, enrolling a participant in health insurance was "a smooth process.As long as a participant is working and shows us proof [of employment], we can get themcovered." As Chapter 9 describes, 38 percent of participants received health insurance during thefirst year that they were involved in the program. Staff reported that the remaining participantswere covered by Medicaid or an employer health plan, or worked too few hours to qualify forNew Hope's health coverage.
During focus group interviews, the response of participants to the health insurancecomponent was overwhelmingly positive. Some participants said that they were able to take careof family health needs that they had delayed addressing, such as getting a complete physical,because they lacked the money; others said they appreciated the security it offered. Oneparticipant told about how she used the insurance to get contact lenses for her two sons:
They been wanting contacts for the longest, I couldn't even dream about it. Butwith that insurance, I have paid just $20 for each one.
Participants in the focus group interviews reported that they were generally pleased withthe choice of doctors in the HMO plans, although a few said that they had encountered doctorswho would not accept their insurance. The only consistent problem that emerged during
-151-195

Participant Doe
NHN:
Representative:
Earnings Month: Feb., 1997
Expected Check Date: 3120197
1 Eamer(s), 1 Adult(s), 4 Children)
Jane Doe123 Yids St:reetWork, State Zip tab.
Figure 8.2
The New Hope Project
Monthly Benefits Statement
Calculations are based on the following pay stubs(and related documentation) recorded by NHP:
Pay Stubs: Pay Date:
2110197
2/24/97
Hours: Unpaid: Gross Wage:71.71 0.00 $488.11
67.12 0.00 $438.28
Totals: 138.83 0.00 $902.39
You are eligible for benefits based on 138.83 total hours (best 4 of 6 weeks).
NHP calculated your supplement check as follows:Supplement
Insurance:
Loan:
Other.
Carry Forward:
Amount of Check:
$193.00
($22.00)
$0.00
$0.00
$0.00
(Your portion of monthly premium.* The rest is paid by NHP)
(Designated monthly repayment amount)
(Other adjustment when applicable)
(Unpaid negative amount from last month carried forward to this
$171.00 (If negative, please pay NHP or see your rep. for payment plan.NHP benefits may terminate if amount not paid)
In addition, your co-pay due to your child care provider is $35.00
NHP's costs for the month are as follows:Supplement
Health Insurance:
Child Care:
CSJ Wages:
Total Cost
$193.00
$600.00
$0.00
$0.00
$793.00
(Please inform your rep of any change in your need for insuranor child care)
This Month's Potential Income:Amount Eligible From Federal EIC $259
Amount Eligible From State EIC + $111
Total Eligible EIC = $370
NHP Wage Supplement + $193.00
Total Wage Supplement Benefit Package = $563
Household Monthly Income + $902
Total Household Monthly Income = $1,465
$105Available to be AdvancedIn your Paycheck
ARE YOU RECEIVING ADVANCE EIC PAYMENTS? ASK YOUR REP ABOUT THE EARNED INCOME CREDIT!
SOURCE: New Hope Project.
NOTE: *This can sometimes be amount contributed to employer less New Hope Project (NHP) requiredcontribution.
-152-
Li 6' COPY MALABO-

interviews was confusion surrounding health insurance eligibility. Questions such as "If I don'twork 30 hours, will I lose my insurance?" and "Do I keep my insurance when my communityservice job ends?" indicated that New Hope's procedures were not always well understood.Clearly, some participants' anxiety about health insurance had not gone away, despite the accessto coverage that New Hope offered.
C. Child Care
New Hope participants who had at least one dependent child under age 13 were eligibleto receive help with child care expenses. The child care assistance was mainly financial. NewHope did not run its own day care facility, nor did New Hope staff play an active role in referringparticipants to specific child care providers. The project reps did, however, encourageparticipants to find a reliable, good-quality provider, and to have a backup in mind in casesomething happened to their regular provider.
Operating Procedures. Like the other financial benefits offered by New Hope, the offerof child care assistance was predicated on participants' working an average of at least 30 hoursper week on a job. If participants were unemployed and looking for work, they were offeredchild care assistance for up to three hours per day for a maximum of three weeks. In two-parentfamilies, the second parent was also required to work at least 15 hours per week in order for thefamily to qualify for child care assistance. Participants were responsible for covering a portion oftheir child care costs.
New Hope reimbursed child care providers up to the same maximum level thatMilwaukee County paid for AFDC recipients enrolled in work programs. Also, like the county,New Hope would pay only for child care given by state-licensed or county-certified providers.How much participants had to contribute toward the cost of their child care depended in part onhow many children they had in child care. For families with one child in day care, the minimumcopay was $33 per month. For families with four children or more in day care, the minimumcopay was $120 per month. These base rates gradually increased as family earnings increased.When family earnings achieved 200 percent of the poverty line or $30,000 (whichever washigher), participants had to pay the full cost of their child care expenses. (See Appendix C formore details on the design.)
New Hope expected participants to find a child care provider and to make arrangementswith that provider for payment of child care services. The project reps issued participants aninstruction packet that explained New Hope's policies and that contained a child care provideragreement. Participants and providers filled out and signed this agreement jointly. The child careproviders were required to indicate the hourly rates they charged for children in different agegroups and for full- or partial-day care, and to provide New Hope with a copy of their license orcertification. Providers could begin receiving payments from New Hope once this paperwork wasapproved by New Hope staff.
Each month, the child care providers and participants completed a voucher form thatdocumented how many hours of child care were provided to participants' children. The providerswere responsible for turning the vouchers in to New Hope, where the project reps would verifyparticipants' work hours against their wage stubs. Assuming that participants met the 30-hours-
-153-
197

per-week requirement, New Hope issued a check to providers for the amount of New Hope'scontribution. Participants were required to make their copayment directly to the child careproviders. In contrast to the health insurance copay, participants' child care copay was notdeducted from their earnings supplement checks or added to the checks that New Hope issued tochild care providers.
Implementation Issues. Just under one-fourth of new Hope's participants took advantageof child care assistance during the year following random assignment to the program group (seeChapter 9). Participants who wanted New Hope's assistance and who qualified for coverage wereserved. The payment system that New Hope devised initially, however, required someadjustments in order to function as well as staff intended.
Until the fall of 1996, New Hope's payments to child care providers were made out astwo-party checks, requiring the signatures of both a New Hope officer and the participant. Thetwo-party checks were intended to "instill in the participant an understanding of what the truecost of child care is," according to one of New Hope's managers. This system, however, led to anumber of conflicts. Sometimes participants did not sign the checks or hand them over toproviders promptly. In a few instances, participants purposely withheld the checks from theproviders if they were unhappy with the way they or their children had been treated. In otherinstances, child care providers unfairly blamed the participants or New Hope for delayedpayments, when in fact the providers had failed to send in the attendance vouchers on time or fillthem out properly. To put an end to these misunderstandings, New Hope eliminated the two-party checks in late 1996 and began to issue payments for participants' child care Costs directlyto the child care providers. Staff reported that the direct payment system has worked much better.
Another type of conflict arose over policy differences between New Hope's child careassistance plan and Milwaukee County's. One of New Hope's project reps described the problemas follows:
The rules and regulations of the child care system are confusing to someparticipants. Because of our statement in our handbook that we pay maximumcounty rates, people think we are the county. But this is not the case. When yousign this agreement, you are accepting our rules. You accept some risk.
Generally speaking, New Hope's child care reimbursement procedures were tighter than thecounty's. Whereas the county reviewed recipients' child care arrangements every six months tomake any necessary adjustments in payments, New Hope reviewed participants' work status andchild care needs every month. If participants' work hours dipped below a minimum average of 30hours per week, New Hope would not provide full reimbursement for that time period. Ifparticipants failed to turn in their wage stubs to their project reps so that their work hours couldbe verified, New Hope would pay only 75 percent of the child care provider's bill for that month,less the participant's copay. If the participant did not produce wage stubs for the second month,New Hope would not cover the provider's child care costs at all.
In late 1995 and 1996, New Hope staff began a series of meetings with providers toclarify the program's policies. They also developed new descriptive materials and instructionsfor providers and participants. Staff found that the key was to help child care providers think
about New Hope's child care assistance as a private pay system, not as a welfare benefit. As oneof New Hope's managers explained:
With providers, we are learning that we have to say, "don't think of this asanalogous to the county system. Think of it as a private pay system." Just sayingthat cut through a lot.
Although some providers threatened to stop serving New Hope participants when theydid not get the full payment due to them, staff reported that their efforts to clarify program ruleseased much of the tension and resulted in better relations between New Hope and child careproviders.
Participant Reactions. All of the participants with young children whom MDRC staffinterviewed during focus groups were pleased with the child care assistance New Hope offered,saying that the child care payments eased some of their financial pressures and made it easier forthem to go to work. One participant explained her situation:
I don't have family here. I'm not from Wisconsin and I'm the only person here.. . . And if I didn't have child care, there would be no way that I could pay forchild care, working transportation, rent, and any other little things that I have topay for to survive. With the child care that New Hope gives me, that gives me theextra help I need to get on my feet.
Several participants mentioned that they liked having the flexibility to select their child careproviders and stressed the importance of being able to choose a safe child care arrangement. Forinstance, one participant said:
With New Hope's payment, I have the opportunity to choose. Before New Hope, Iwas so limited. I needed to leave my baby with a person who I could trust and forfree. Because if I had to pay, I was short of money and I needed to sacrifice otherthings, just to pay child care. . . . With New Hope's payment, I have theopportunity to choose quality and a place with a license . . . a responsible person,so you can go to work without worry. Go to work in peace.
All the participants interviewed by MDRC who used New Hope's child care benefits said thatthe payment was adequate to cover the cost of good-quality child care. None of the participantsindicated that they had difficulty locating a provider or getting providers to accept the New Hopepayments.
III. The Distinctiveness of New Hope's Benefits and Services
As Chapter 1 describes, the New Hope evaluation will measure program effects bycomparing the experiences of eligible applicants who were randomly assigned to a programgroup (which has access to New Hope benefits and services) with the experiences of thoseassigned to a control group (which does not). In order for the program to produce measurableeffects, New Hope must deliver a "treatment" to program group members that is meaningful anddistinctive from the benefits and services available to the control group. Otherwise, the post-
-155-
199

random assignment experiences of the two groups are likely to be the same, and differencesbetween them on employment rates, income levels, welfare receipt, and other measures areunlikely to be statistically significant.
Viewed as a package, New Hope's benefits and services are unique not only inMilwaukee, but also in the United States. No other program offers a similar combination of paidCSJs, earnings supplements, health insurance, and child care assistance. (As the previous chapterexplained, New Hope also offered participants the assistance of project reps, although committedand caring staff undoubtedly exist in organizations outside New Hope). Together, New Hope'sbenefits and services offer program group members who are willing and able to work theopportunity to be employed full time, bring their household income above poverty level, and bebetter off financially than they were on welfare. The package is a potentially powerful one forprogram group members who understand and use it. Although control group members may findorganizations or individuals who are willing to help them find employment and improve theireconomic well-being, nowhere can they access all the assistance that New Hope provides in asingle location.
Viewed individually some of New Hope's benefits and services have features in commonwith government employment, welfare, or social service programs. The earnings supplement, forexample, is structured similarly to the federal and Wisconsin EICs. Both program and controlgroup members may apply for the EICs. Only program group members, however, have theadvantage of the extra money in their pockets that the New Hope earnings supplement provides.Moreover, because New Hope staff regularly inform program participants about the EICs, moreprogram than control group members may take steps to receive the EIC payments. The follow-upsurvey of program and control group members, conducted two years after random assignment,will provide evidence on whether the information New Hope provides leads to more extensiveuse of the EICs by program group members.
Various forms of CSJs, health insurance, and child care assistance exist through otherorganizations, but often have different objectives and may be less easy to access than NewHope's versions. For example, although welfare departments in Milwaukee (and in many othercities) assign welfare recipients to work in positions that are similar to some of New Hope'sCSJs, the recipients work to keep their welfare grants not to earn a paycheck. Importantly,these "workfare" jobs do not allow welfare recipients to qualify for federal or state EICpayments. In contrast, New Hope CSJ participants qualify for the federal and state EICs, alongwith New Hope's earnings supplements and other financial benefits. Also, New Hope's CSJs areavailable to all program participants who lack employment. A few employment and trainingorganizations (and some private employers) offer paid trainee positions to unemployed people,but these programs are rare. When they exist, they tend to be limited in size and selective inenrollment. The two-year follow-up survey will provide information on how many program andcontrol group members participated in training programs, where these programs were located,and how much (if anything) they were paid.
Health insurance, in the form of Medicaid, is provided to all AFDC recipients in
-156- 9

Milwaukee and elsewhere in the United States.' In addition, some low-income families qualifyfor Medicaid assistance for their children if they earn below 100 percent of the federal povertylevel.' As described earlier in this chapter, New Hope offered its participants the same HMO thatMilwaukee County Medicaid recipients used, so there was no difference between the health plansthat some program participants used and the one that welfare recipients in either the program orcontrol group used. The real value of New Hope's plan was in providing affordable health carecoverage to people outside the welfare system who did not qualify for Medicaid (for example,adults without children) or for an employer's health plan. In addition, because New Hope'scopayment system was adjusted according to participants' incomes, it was more affordable forsome participants than the plans offered by their employers,' and certainly more affordable thananything they could purchase on the private market.
Most welfare departments, including Milwaukee's, offered child care payments to AFDCrecipients who were assigned to work positions or to education and training programs as acondition of receiving welfare under the Job Opportunities and Basic Skills Training (JOBS)program. Some low-income families could also receive help on child care payments from theMilwaukee County welfare department, without having to go on welfare.9 As described earlier,the welfare department's child care rules were in some ways less strict than New Hope's, sinceNew Hope required participants to work an average of at least 30 hours per week to qualify forchild care payments and monitored participants' work hours each month.
Some child care providers in Milwaukee offered services to low-income families on asliding-fee basis. The advantage of New Hope was that participants could choose from anycounty-certified provider not just those with subsidized slots; participants could make childcare decisions based on criteria beyond affordability. Once again, the two-year follow-up surveywill provide details on the child care arrangements made by program and control group membersand the subsidies, if any, that they received.
IV. How New Hope Makes People Better Off: Three Case Studies
This report has stated numerous times that New Hope's earnings supplements, healthinsurance, and child care assistance ensure that participants who work full time are better off thanthey would be on welfare and, in most cases, have incomes above the federally defined poverty
'The comparison is made with AFDC because it was in effect through most of the period covered by this report.As noted in Chapter 1, AFDC was ended by Congress and replaced by TANF in 1996. In Wisconsin, the WisconsinWorks (W-2) program is scheduled for implementation in Milwaukee in September 1997.
'U.S. House of Representatives, 1996, p. 882.9If a New Hope participant wanted to use an employer's health care plan that charged a higher premium than
New Hope's health insurance copayment, New Hope would reimburse participants for the difference in the amountsthat their employer charged and New Hope required.
91n 1994 and 1995, families below 220 percent of the poverty level were eligible to receive help on child carepayments from the Milwaukee County welfare department without having to go on AFDC. After 1995, theeligibility criteria for low-income child care changed to 115 percent below the poverty level from January throughAugust 1996, and then 165 percent from August 1996 through the present. County officials reported that there weresome waiting lists for child care payments in 1995 and 1996.
-157- 2 01

level. The following case studies are intended to illustrate how the financial benefits combine toimprove the financial circumstances of New Hope participants.
A. Case 1: A Single Earner With No Children
John is a single man over age 25 with no children who works 30 hours per week at $4.75per hour, resulting in annual earnings of $7,410.10 As a low-income worker, he is eligible for afederal Earned Income Credit (EIC) of $160. (John is not eligible for the Wisconsin EIC, sincestate residents must have at least one child to qualify for this credit.)" The 1996 federal povertystandard for a one-person household is $7,740, so even with the federal EIC his income is belowpoverty level. Moreover, his income is probably inadequate for him to purchase health insurance.
As a New Hope participant, John remains eligible for the federal EIC, but also receives anearnings supplement of $1,693 from New Hope. Combining his earnings, federal EIC, andearnings supplement, John's gross income is now $9,263, which is above the poverty line.
Because John works at least 30 hours per week, he is eligible for health insurance fromNew Hope. If he chooses to receive this benefit, he must share in its cost by copaying $72 peryear. He must also pay a total of $732 in federal and state income taxes and FICA. After thesepayments, John has a net income of $8,459, or about $700 above poverty level. The bar graphs inFigure 8.3 illustrate John's case and demonstrate how New Hope makes him better offfinancially.
B. Case 2: A Single Earner With Two Children
Jane is a single mother with two children. Like John in the example above, she works 30hours per week at the minimum wage, resulting in annual earnings of $7,410, well below thepoverty level of $12,980 for a family of three. She is eligible for a federal EIC of $2,964 and astate EIC of $415. Without New Hope, her income totals $10,789. She probably cannot affordchild care or health insurance.
With New Hope, Jane receives an earnings supplement of $1,574. Combined with thefederal and state EIC, her gross income increases to $12,363. She is still below the poverty line,but is better off financially than she was before. She is also eligible for affordable child care andhealth insurance from New Hope. In this example, she copays $775 for child care and $168 forhealth insurance.'2 She must also pay federal and state income taxes, as well as FICA, which total$567. After these payments, Jane has a net income of $10,853. Her income is higher because ofNew Hope, and she has heavily subsidized child care for her two children and health insurancefor her entire family. See Figure 8.4.
To illustrate how New Hope's benefit levels change when a participant's earningsincrease, assume that Jane increases her number of work hours and that her earnings rise from
'Individuals who are under age 25 and have no children are not eligible for the federal EIC."The maximum 1996 Wisconsin EIC is $86 for families with one child, $498 for those with two children, and
$1,529 for those with three children or more.'This case example assumes that both of Jane's children require child care. If only one needed child care, her
copayment would be lower.
202-158-

Figure 8.3
The New Hope Project
Single Minimum Wage Earner With No Children (Case 1)
$10,000$9,000
$9,263
$8,000 $7,410
$7,000$6,000 Poverty Level
$5,000 ($7,740)
$4,000$3,000 $1,693$2,000$1,000 $160
$0
Earnings Federal EIC New Hope Earnings Gross IncomeSupplement
$10,000$9,000 -I$8,000$7,000$6,000$5,000$4,000$3,000$2,000$1,000
$0
Earnings + Federal EIC + New Hope Earnings Supplement = Gross Income
$9,263$8,459
$72
Poverty Level($7,740)
$732
Gross Income Health InsuranceCopay
Gross Income Copay
-159-
Federal and State Net IncomeIncome Taxes + FICA
Taxes = Net Income
203

Figure 8.4
The New Hope Project
Single Minimum Wage Earner With Two Children (Case 2)
$13,000$12,000$11,000$10,000
$9,000
Poverty Level($12,980)
$12,363
$8,000 $7,410
$7,000$6,000$5,000$4,000 $2,964$3,000$2,000 $1,574
$1,000 + $415
$0
Earnings Federal EIC State EIC New Hope GrossEarnings Income
Supplement
Earnings + Federal and State EIC + New Hope Earnings Supplement = Gross Income
$13,00(1 $12,363
$12,000 $10,853$11,000 - Poverty Level$10,000 - ($12,980)
$9,000$8,000$7,000$6,000$5,000$4,000$3,000$2,000$1,000 $168
$775 $5671 1$0
Gross Income HealthInsurance
Copay
Gross Income - Copays
Child Care FederalCopay and State
Income Taxes+ FICA
Taxes = Net Income
-160- 4,0 L.} (.5A
,k
Net Income

$7,410 per year to $8,500 per year. (Indeed, New Hope's financial benefits were designed toencourage exactly such behavior.) The total amount of Jane's earnings supplement ($1,349) andfederal and state EIC payments ($3,400 and $476, respectively) is higher than it was when shehad fewer work hours and lower earnings. Her gross income, $13,725, is now above poverty line.Jane's copayments for child care and health insurance do not increase because of her higherincome (copayments begin to increase only when a New Hope participant's earnings are above$8,500). However, she has to pay higher federal and state income taxes and FICA, which total$650. The result is a net income of $12,132, or about $850 below poverty level. See Figure 8.5.
Assume that Jane receives a sizable promotion and now earns $15,000 per year. She iseligible for a federal EIC of $2,842 and a state EIC of $398. At her level of earnings, she doesnot receive an earnings supplement from New Hope. Her gross income is therefore $18,240.Although she does not receive an earnings supplement, she is still eligible for New Hope's childcare assistance and health insurance, since these benefits are phased out gradually until totalfamily earnings reach $30,000 or 200 percent of poverty level (whichever is higher). Her copaysare $840 for child care and $201 for health insurance, higher than in the previous scenariobecause of her higher earnings. Also, she pays higher federal and state income taxes and FICA,which total $1,703. After these payments, her net income is $15,496. See Figure 8.6.
C. Case 3: Two' Earners With Two Children(
Albert and Jenny are married (or perhaps unmarried but living in the same household)and have two children. Albert earns $9,000 per year and Jenny earns $5,000 per year. Theircombined earnings of $14,000 are below the official poverty line of $15,600 for a family of four.As a low-income family, they qualify for a federal EIC of $3,053 and a state EIC of $427. Evenwith these EICs, however, they are unlikely to buy health insurance and child care in the privatemarket.
As New Hope participants, Albert's and Jenny's combined earnings qualify them for anearnings supplement of $1,362, along with their federal and state EICs. This results in a grossincome of $18,842. Also, they are eligible for health insurance and child care. Because theychoose to receive these benefits, they copay $433 for health insurance and $775 for child care.They also pay federal and state income taxes and FICA, which total $1,188. Their resulting netincome is $16,446. They are above the poverty line and have subsidized child care for their twochildren and health insurance for their family. See Figure 8.7.
V. Conclusion
The "core" benefits and services that New Hope offered the community service jobs,earnings supplements, health insurance, and child care assistance were delivered by NewHope staff to qualified participants as the program designers intended. As might be expected,experience taught staff how to improve delivery of benefits and services. For instance, when itbecame apparent that some CSJ participants needed more help in acquiring occupational skills,staff developed work teams that offered closer supervision and instruction than regular CSJs. Asanother example, when it became clear that the two-party checks to pay child care providers(signed by New Hope staff and participants) were not working out well, staff revamped their
-161-
205

Figure 8.5
The New Hope Project
Increased Work Hours for a Single Minimum Wage Earner With Two Children (Case 2)
$14,000$13,000$12,000$11,000$10.000
$9,000$8,000$7,000$6,000$5,000$4,000$3,000$2,000$1.000
$0
$8,500
$3,400
+
Poverty Level($12,980)
$476-I-
$1,349
$13,725
I I
Earnings Federal EIC State EIC New Hope GrossEarnings Income
Supplement
Earnings
$14,000$13,000 -$12,000$11,000$10,000$9.000 -$8.000 -1$7,000 1$6.000 -I$5,000 -I$4,000$3,000$2,000$1,000
$0
+ Federal and State EIC + New Hope Earnings Supplement = Gross Income
$13,725
Gross Income
$168
HealthInsurance
Copay
Poverty Level($12,980)
Gross Income Copays
$775 $650
1 1
$12,132
Child Care FederalCopay and State
Income Taxes+ FICA
Taxes = Net Income
-162- 206
Net Income

Figure 8.6
The New Hope Project
Increased Earnings for a Single Earner With Two Children (Case 2)
$19,000$18,000$17,000
$18,240
$16,000 $15,000$15,000$14,000$13,000$12,000$11,000$10,000 Poverty Level$9,000 ($12,980)$8,000$7,000$6,000$5,000$4,000 $2,842$3,000$2,000$1,000 $398 + $0
$0
Earnings Federal EIC State EIC New Hope GrossEarnings Income
Supplement
Earnings + Federal and State EIC + New Hope Earnings Supplement = Gross Income
$19,000 $18,240$18,000$17,000$16,000 $15,496
$15,000$14,000$13,000$12,000$11,000$10,000
$9,000$8,000
Poverty Level($12,980)
$7,000$6,000$5,000$4,000$3,000 $1,703$2,000$1,000 $201 $840$
1$0
Gross Income Health Child CareInsurance Copay
Copay
Federaland State
Income Taxes+ FICA
Gross Income - Copays - Taxes = Net Income
-163- 207
Net Income

Figure 8.7
The New Hope Project
Two Earners With Two Children (Case 3)
$18,842$19,000$18,000$17,000$16,000$15,000 _ $14,000$14,000$13,000$12,000 Poverty Level$11,000$10,000
($15,600)
$9,000$8,000$7,000$6,000$5,000$4,000 $3,053$3,000$2,000$1,000
$1,362$427
$0
Earnings Federal EIC State EIC New Hope GrossEarnings Income
Supplement
Earnings + Federal and State EIC + New Hope Earnings Supplement = Gross Income
$18,842$19,000 1$18,000$17,000 $16,446$16,000$15,000$14,000$13,000$12,000$11,000
Poverty Level
$10,000 ($15,600)$9,000$8,000$7,000$6,000$5,000$4,000$3,000$2,000$1,000
$0
$433 $775 $1,188
I 1
Gross Income Health Child Care Federal Net IncomeInsurance Copay and State
Copay Income Taxes+ FICA
Gross Income - Copays Taxes = Net Income
-164-

procedures. Importantly, neither the operational problems staff encountered nor the programimprovements that staff made altered or compromised the essential design of the New Hopeintervention.
If there was an overarching problem with the delivery of benefits and services, it was thatmany participants seemed to have difficulty understanding fully how the process worked.Perhaps the biggest source of confusion surrounded the calculation of the earnings supplementchecks. Some participants were also uncertain about program eligibility rules: for instance, abouthow long their health insurance would continue if their employment ended, or their responsibilityto cover their child care expenses if they worked less than the minimum number of hours thatNew Hope requires. Staff found that they needed to remind participants often about theopportunities and requirements of New Hope's benefits and services. Over time, they alsolearned ways of communicating program rules and procedures to program participants andservice providers (namely, child care providers).
Some questions and confusion about eligibility and operating procedures are to beexpected in any new program. The design of New Hope's benefits package and the way thedifferent components fit together is especially complex and requires participants and staff tothink about eligibility in very different ways than most welfare or social service programs. NewHope's managers pointed out that the rules and procedures of the AFDC program were also quitecomplicated, and yet most welfare recipients had a good understanding of how this systemoperated. They believed that in time New Hope would become just as clear to participants.Indeed, the program's managers and staff thought that they were making good progress in gettingparticipants to understand and take advantage of the New Hope offer, though they stressed thateducating participants about the offer was an ongoing task.
The next chapter describes the extent and patterns of benefit and service utilizationamong New Hope participants within the first 12 months after they entered the program.
-165- 209

Chapter 9
Participants' Use of Benefits and Services
This chapter reports on the extent to which people in the sample "used" the New Hopeprogram benefits. In many programs for example, training programs and job clubs de-signed to help people find work, participation in the program is still one step removed from theoutcome of central interest: employment. But in New Hope, the story is different: for people touse the New Hope benefits, they have to work full time.'
Analysis of the use of individual New Hope components is also important to policymak-ers and program administrators. New Hope is best thought of as a collection of benefits that par-ticipants access as needed. Program designers did not expect that all participants would use allbenefits all the time. The cost of a program like New Hope is closely linked to the extent towhich participants use the individual components. A program in which participants access onlythe earning supplement and child care assistance, depend on Medicaid for health assistance, andfind unsubsidized work (rather than community service jobs) is much cheaper than one in whichparticipants consistently use all benefits. This chapter, therefore, provides important informationfor calculations of program costs to be included in a later report.
The chapter presents a variety of measures of program use, for both a cohort of the sam-ple with at least 12 months of follow-up and for subgroups within this cohort. The decision tofocus on a cohort with at least 12 months of follow-up rests on two key points. First, for manypeople in the New Hope program especially those who enter the program without a full-timejob the inevitable start-up time when they make the changes in their lives necessary to workand find jobs at which they can work the required hours can take several months. Thus, thechapter focuses on the part of the program group for whom at least 12 months of follow-up isavailable; this is the three-quarters of the full sample randomly assigned prior to September 1,1995. Second, program use patterns for this early cohort are very similar to those for the fullsample during the initial months after random assignment, alleviating concerns that focusing on asubset of the entire sample would present a distorted picture of the New Hope experience.2 In the
'It is likely that the extent to which benefits are used provides a lower-bound estimate of the percentage of theprogram group employed full time. Some people who are employed full time might not report these work hours toNew Hope. Early checks of earnings reports to New Hope against employer reports of the earnings of their employ-ees to the state unemployment insurance system suggests that there could be substantial numbers of working"nonusers" of the New Hope benefits. From the unemployment insurance records it is not possible to determinewhether people are working enough hours to meet the program's defmition of full-time employment. This issue willbe explored more in the upcoming follow-up survey and in a later analysis of unemployment insurance earningsrecords. It is also possible that some people might falsely report work hours to New Hope to claim benefits, but theprogram does require documentation of employment to qualify, and checks of reported income against employerreports of earnings through the state unemployment insurance system suggest that there is little fraud.
21n the first four months following random assignment, use of the various aspects of New Hope was as follows:45.7 percent of the full sample used any New Hope benefit as opposed to 45.0 percent of the early cohort; 43.2 per-cent of the full sample received an earnings supplement versus 42.3 percent of the early cohort; 19.8 percent of thefull sample used health insurance versus 20.5 percent of the early cohort; 9.9 percent of the full sample used child
(continued)
-166- 2 0

chapter, this cohort will at times be referred to as the "early cohort sample."
The key findings in this chapter are relatively straightforward and highlight the impor-tance of the program impact analysis on employment and earnings to be given in a later report:
Approximately three-fourths of the program group at some point in the firstyear of follow-up worked full time and used a New Hope benefit.
Once people moved beyond what might be called an individual start-up periodapproximately two-fifths of the sample used some type of New Hope bene-
fit in a given month. In these post-start-up months, about one-third of thesample used a New Hope benefit continuously or nearly continuously andslightly under one-third never used any New Hope benefits.
During the 12-month follow-up period, about one-fourth of the sample workedin a community service job at some point and during the post-start-up periodabout one-eighth of the sample were working in such a job in the fifth throughninth month following their entry into the program.
Among subgroups, those who were working at entry into the study, and espe-cially those working full time, were more likely to access New Hope benefitsand used these benefits for more months on average. Furthermore, applicantswith children, with access to a car, and with a high school credential weremore likely than those without these characteristics to use benefits.
Whether these results are good or bad news for New Hope is hard to tell at this point.Currently, there is no complete information on the employment behavior of the program group orany information on the employment and service use of the control group (especially on child careand health assistance), and survey information on why program group members did not use NewHope in months of nonuse is not yet available. But these results do suggest the importance ofrecognizing that people do not use a program like New Hope in a simple way: few of the pro-gram group members joined the program and quickly started participating, used the benefits con-tinuously, and moved off the program permanently to self-sufficiency. Instead, the use of bene-fits is likely to be much more complex and "nonlinear." Just as people receive and leave welfare,get and lose jobs, and move into and out of poverty, their use of New Hope benefits will changeto reflect these dynamic elements in their lives. Policymakers need to anticipate this pattern ofuse and program operators need to plan for multiple entries, exits, and spells of activity.
I. The Overall Use of Benefits
This section looks at the percentage of people who ever used the various New Hope bene-fits at any time during the 12 months of follow-up. Then it looks at the rate ofuse during this 12-
care assistance versus 9.5 percent of the early cohort; and 10.5 percent of the full sample worked at a communityservice job versus 11.4 percent of the early cohort.
-167-

month period from a monthly perspective and the overall use in individual months. Togetherthese discussions provide the kind of information that planners and administrators need to antici-pate service needs and financial costs. The section also discusses the complex and nonlinear pat-tern of benefit use by focusing on the period after the initial three months of follow-up (sincepeople sometimes need this much time to find a job and learn program procedures) and on thosewho do not ever use program benefits during the post-start-up period. The section concludes witha more detailed look at the use of community service jobs (CSJs), a component of special interestin the context of welfare reform and one that New Hope is uniquely positioned to address.
A. Benefit Use Within the 12-Month Follow-Up Period
The upper panel of Table 9.1 presents information on the percentage of the early cohortsample who ever used New Hope benefits during the first 12 months of follow-up. The tableshows that 74 percent of this sample ever used any of the New Hope benefits: earnings supple-ment, health insurance, or child care assistance,' implying that approximately one-fourth of thesample either never worked full time or if they did did not submit a claim that resulted inNew Hope benefits. Table 9.1 also shows that the earnings supplement was the most frequentlyused benefit: 72 percent got at least one earnings supplement, 38 percent got at least one monthof health insurance, 23 percent got at least one month of child care, and 24 percent worked in aCSJ during at least one month.4
With these basic numbers in mind, it is also useful to examine the extent of use by thosewho ever used any benefit.' The lower panel of Table 9.1 presents this information, excludingfrom the analysis approximately one-fourth of the sample who never used any New Hope benefitduring the follow-up period. It shows the average number of months during which New Hope'searnings supplement, health insurance, and child care assistance were used during the 12 monthsof follow-up.' On average, those who used any New Hope benefit averaged 5.9 months of sometype of benefit, 5.2 months of earnings supplements, 2.7 months of health insurance, and 1.5months of child care assistance.
It is important to note that averages for the individual types of benefits include zeromonths of receipt for households that are included in the analysis (because they used some NewHope benefit) but did not use the specific New Hope benefit for which an average is being cal-culated. This point is most relevant for health insurance (used by about one-half of those in-cluded) and child care assistance (used by about one-third). For those using health insurance, theaverage number of months of use was 5.2, while those using child care assistance averaged 4.8
'To be counted as using a benefit, the individual need only have used it for one month during the follow-up pe-
4A CSJ is counted for a month if an individual worked at least one day in a CSJ.'The analysis in this chapter makes this choice of sample because the focus is on the implementation experi-
ence. In later reports focusing on program impacts, benefit use information will be presented for the full programgroup. It is important to remember that people are included in this analysis if they used any New Hope benefit andpeople tended to use earning supplements much more than other benefits. Thus, as discussed below, the figures onaverage number of months of use of individual benefits include individuals who did not use the particular benefitbeing examined.
'Because of the importance of the CSJs, they are treated separately later in this section.
riod
-168-2 d 2

Table 9.1
The New Hope Project
Benefits Used by an Early Cohort of Program Group MembersWithin 12 Months After Random Assignment
Outcome Program Group
All households
Ever used a New Hope benefit (%)Any type 73.6
Earnings supplement 72.1Health insurance 38.0Child care 23.3
Ever worked in a CSJ (%) 24.0
Sample size 516
Households that used any type of benefit
Average number of months with a benefit during follow-up,Any type 5.9
Earnings supplement 5.2Health insurance 2.7Child care 1.5
Among households that received earnings supplements (N=372),Number of earnings supplements received (%)
1-3 31.24-6 28.87 or more 40.1
Distribution of amount of monthly earnings supplements (%)$1-$50 23.5$51-$100 20.8$101-$150 25.1$151-$200 17.8$201 or more 12.9
Average amount of monthly earnings supplement ($) 114.06
Among households that used health insurance benefits (N=196),Households using each type ( %)a
New Hope HMO health insurance 78.6New Hope contribution toward employer's health insurance 30.6
Among those using NH HMO health insurance benefits (N=154),Average monthly amounts ($)
Participant contribution 24.29New Hope health insurance benefit 280.80Total health insurance cost (contribution and benefit) 305.09
Sample size 380
SOURCE: MDRC calculations using the New Hope Project's MIS client-tracking database.
NOTE: 'Some households are in both categories because they may have been part of the New Hope HMOplan and then moved to an employer plan (or vice versa).
-169- 2 1 3

months of use. (These last two measures are not shown in Table 9.1.) These average lengths areapproximately the same as the average receipt of earnings supplements among those receivingthe supplement. Thus, those who used one of the New Hope benefits averaged six months ofuseduring the first year in the program. Because child care is relevant only for households with chil-dren, the analysis of benefit use for the subgroup with children in the household presented laterin this chapter provides additional important information on use of this benefit.
Table 9.1 also presents information on the distribution of months of receipt and amountsof earnings supplements among those households receiving this benefit. Approximately 30 per-cent of this group received one to three months of supplements, 30 percent received four to sixmonths, and 40 percent received seven months or more. The average earnings supplement was$114 per month, with 44 percent of monthly earnings supplements falling between $1 and $100and 13 percent being above $200.7
The remainder of Table 9.1 presents information on the use of health insurance during the12-month follow-up period. Among households using insurance, 79 percent used New Hopehealth maintenance organization (HMO) insurance, while 31 percent used a New Hope contribu-tion to their cost of buying employer-based health insurance. (Nine percent of these householdsaccessed both types of insurance at some point in the follow-up period.) Among those using NewHope HMO health insurance, the average monthly participant contribution was $24 and the aver-age New Hope contribution was $281, for an average total monthly insurance cost of $305.8
B. The Cumulative Receipt of New Hope Benefits
Since use of New Hope benefits requires full-time employment, some sample memberscan take up the New Hope offer quickly while others will qualify only with a delay, if at all. Fig-ure 9.1 shows the cumulative percentage of the early cohort sample who have used New Hope'searnings supplement, health insurance, and/or child care, by the month of follow-up.' A largemajority of those who received any of these benefits did so by the sixth month of follow-up. Ap-proximately one-third of the sample had used some New Hope benefit by the third month of fol-low-up, about three-fifths by the sixth month, and about three-quarters by the end of follow-up.
Because many people did not consistently use the New Hope benefits over the follow-upperiod, the percentage of the sample using benefits in individual months did not grow steadilythroughout the 12 months of follow-up. Figure 9.2 shows the percentage of the sample using anybenefit in each month of follow-up. For example, slightly over one-tenth of the sample used abenefit in their first month after entering the program group, about one-fourth in their second
'This average earnings supplement was calculated by adding together all earnings supplements paid to the sam-ple during the 12-month follow-up period and dividing by the number of supplements paid. It therefore differsslightly in definition from that used in an earlier chapter where the focus was on budgeting rather than individualparticipation.
New Hope health insurance cost approximately $120 for each person covered. The New Hope participant paida portion as a copayment, with the amount varying by household income. The $305 HMO total cost implies that onaverage 2.5 household members per month were covered.
'This is the cumulative percentage of all those who had ever used the benefits at that point in the follow-up pe-riod.

Figure 9.1
The New Hope Project
Cumulative Percentage of an Early Cohort of Program Group Members UsingAny New Hope Benefit in Follow-Up Months 1-12
100 -"-1E4.1
El 90
70
4 6050 11
40Lel)
or 30
ft 20
E E 10
80
0
1 2 3 4 5 6 7 8 9 10 11 12
Follow-Up Month After Random Assignment
SOURCE: MDRC calculations using the New Hope Project's MIS client-tracking database.
NOTE: A New Hope benefit is an earnings supplement, child care assistance, or health insurance.

100
90
80
70
60
50
40
30
20
10
0
Figure 9.2
The New Hope Project
Percentage of an Early Cohort of Program Group Members UsingAny New Hope Benefit in Follow-Up Months 1-12
1 2 3 4 5 6 7 8 9 10 11 12
Follow-Up Month After Random Assignment
SOURCE: MDRC calculations using the New Hope Project's MIS client-tracking database.
NOTE: A New Hope benefit is an earnings supplement, child care assistance, or health insurance.
-172- 2 6

month of follow-up, and about one-third in their third month of follow-up, with a gradual growth
through month 6 to a plateau at approximately two-fifths using any benefit in the remaining
months.
C. Post-Start-Up Use and the "Nonusers"
It is also useful to examine the use of New Hope benefits in months 4 through 12 of fol-
low-up, since by this time most participants including those who entered the program unem-
ployed had sufficient time to become qualified to receive them. Figure 9.3 shows the distribu-
tion of months of New Hope benefits after the initial start-up period. Thirty-two percent of the
early cohort sample used at least one of these benefits continuously or nearly continuously (seven
months or more), while 39 percent used benefits intermittently, from one to six months. The re-
maining 29 percent used no New Hope benefit during months 4 through 12 of follow-up.
There are some differences in background characteristics among these three groups. Table
9.2 summarizes key baseline characteristics of those in the three benefit use categories.' One hy-
pothesis might be that those in the "no benefits" group have many more barriers to full-time
work, but no consistent pattern across characteristics emerges from this table. On some charac-
teristics, the groups are similar. Gender does not differ significantly among the three groups, nor
are there obvious differences in race except for an overrepresentation of Asian/Pacific Islanders
(relative to their percentage of the sample) in the categories with more months of use. Differ-
ences in marital status among the groups are not statistically significant, nor are differences in the
percentage with prior work or prior full-time work experience.
However, there are some differences. Those who are employed at application, those with
earnings in the 12 months prior to application, and those with a previous job with important fringebenefits are overrepresented in the continuous benefits category. Those who were receiving public
assistance at application tend to be overrepresented in the intermittent benefits category, as are ap-
plicants from households without a second identified potential wage earner, applicants without ahigh school credential, and applicants without access to a car. Those who live with children for
whom they are responsible (especially those with at least two children) are overrepresented in thecontinuous benefits categories, with those living with relatives or living alone overrepresented in
the intermittent benefits category. The section of this chapter on subgroups continues the analysis
of the link between characteristics at application and use of benefits.
There were many reasons individuals might not use New Hope benefits. They could be
doing job search or working part time; be in contact with their project reps though not using New
Hope benefits; or be out of contact with their project reps for an extended period. Individualswho are out of contact with the project for four to six weeks are placed in inactive status. Table
9.3 lists possible reasons that individuals could be in this status, is based on New Hope Project
'This subset of the sample is different from the subgroups presented in Chapter 6 and analyzed later in this
chapter in that it is defined based on post-random assignment characteristics. Thus, it cannot be used in the laterrandom assignment-based (experimental) impact analysis because it is not possible to identify the control groupcounterparts of the program group members in each of the three categories. However, it may be possible to use this
subset in nonexperimental analysis.
-173- 2 i 8

Figure 9.3
The New Hope Project
Participation of an Early Cohort of Program Group Members After the Start-Up Phase:Benefit Use in Follow-Up Months 4-12
No benefits29.1%
Continuous benefits(7 to 9 months)
32.2%
SOURCE: MDRC calculations using the New Hope Project's MIS client-tracking database.
Intermittent benefits(1 to 6 months)
38.8%
NOTES: A New Hope benefit is an earnings supplement, child care assistance, or health insurance.

Table 9.2
The New Hope Project
Selected Characteristics of an Early Cohort of Program Group Members at Random Assignment,by Post-Start-Up (Follow-Up Months 4-12) Benefit Use Category
Sample and Characteristic No Benefits1 to 6 Months
of Benefits7 to 9 Months
of BenefitsSignificantDifference'
Demographic characteristic
Gender (%)Female 69.3 71.0 74.7Male 30.7 29.0 25.3
Age (%)18-19 8.0 8.0 3.620-24 18.7 22.5 22.325-34 38.0 36.5 42.835-44 30.0 23.0 24.145-54 7.5 --55 or over
Race/ethnicity (%) **
African-American, non-Hispanic 58.0 60.0 53.6Hispanic 22.7 15.0 25.9White, non-Hispanic 12.7 14.0 9.0Asian/Pacific Islander 6.5 10.2Native American/Alaskan Native
Household status
Shares household withb (%)Spouse 8.0 13.0 15.7Girlfriend/boyfriend 8.5 6.6Children (own or partner's) 62.7 68.5 82.5 ***
Others 30.0 22.2 13.9 ***
Lives alone (%) 12.7 14.0 6.6 *
Marital status ( %)Never married 65.3 59.5 59.0Married, living with spouse 8.7 14.0 16.3Married, not living with spouse 9.3 11.0 --Separated, divorced, or widowed 16.7 15.5 21.1
Number of children in household' (%) **
None 35.3 29.5 16.91 20.0 20.5 22.92 16.0 19.0 25.33 or more 28.7 31.0 34.9
Household has second potential wage earner (%) 8.0 16.0 16.3 *
Labor force status
Ever employed (%) 97.3 95.0 98.2
Ever employed full time (%) 86.0 88.5 91.0
-175- 21_9
(continued)
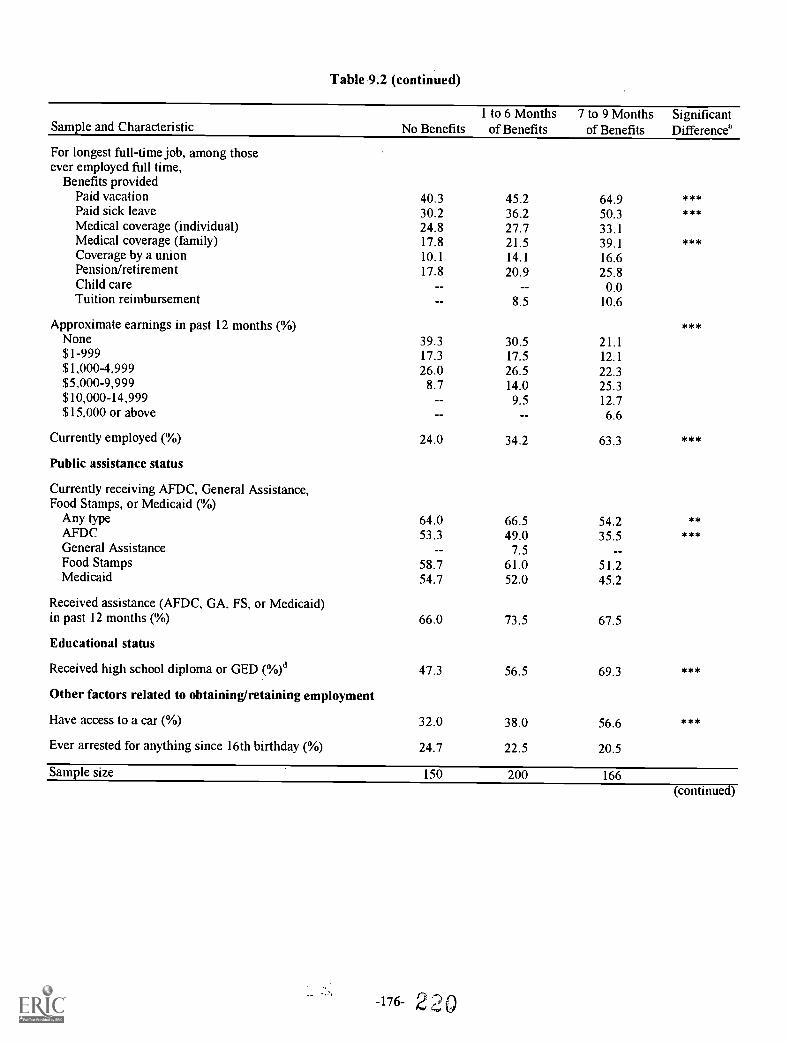
Table 9.2 (continued)
Sample and Characteristic No Benefits1 to 6 Months
of Benefits7 to 9 Months
of BenefitsSignificantDifference'
For longest full-time job, among thoseever employed full time,
Benefits providedPaid vacation 40.3 45.2 64.9 ***Paid sick leave 30.2 36.2 50.3 ***Medical coverage (individual) 24.8 27.7 33.1Medical coverage (family) 17.8 21.5 39.1 ***Coverage by a union 10.1 14.1 16.6Pension/retirement 17.8 20.9 25.8Child care 0.0Tuition reimbursement 8.5 10.6
Approximate earnings in past 12 months (%) ***None 39.3 30.5 21.1$1-999 17.3 17.5 12.1$1,000-4,999 26.0 26.5 22.3$5,000-9,999 8.7 14.0 25.3510,000-14,999 9.5 12.7$15,000 or above 6.6
Currently employed (%) 24.0 34.2 63.3 ***
Public assistance status
Currently receiving AFDC, General Assistance,Food Stamps, or Medicaid (%)
Any type 64.0 66.5 54.2 **AFDC 53.3 49.0 35.5 ***General Assistance -- 7.5 --Food Stamps 58.7 61.0 51.2Medicaid 54.7 52.0 45.2
Received assistance (AFDC, GA, FS, or Medicaid)in past 12 months (%) 66.0 73.5 67.5
Educational status
Received high school diploma or GED (%)d 47.3 56.5 69.3 ***
Other factors related to obtaining/retaining employment
Have access to a car (%) 32.0 38.0 56.6 ***
Ever arrested for anything since 16th birthday (%) 24.7 22.5 20.5
Sample size 150 200 166(continued)

Table 9.2 (continued)
SOURCE: MDRC calculations from Background Information Forms for 1,357 sample members.
NOTES: The nonresponse rate for all specific characteristics was less than 1 percent and, therefore, these missings wereexcluded from the calculations.
Distributions may not add to 100.0 percent because of rounding.Dashes indicate that the sample size is under 10; therefore the calculation has been omitted.aA chi-square test was applied to differences between the benefit use categories. Statistical significance levels are
indicated as * = 10 percent, ** = 5 percent, and *** = 1 percent.bBecause some sample members may be in more than one category, totals may not equal all categories summed.
'Includes all dependents under age 18.dThe GED credential is given to those who pass the GED test and is intended to signify knowledge of basic high
school subjects.
2 e)-177-

Table 9.3
The New Hope Project
Reasons for Program Inactive Status
Status Percent
Moved out of the state 16.0
Does not want to participate' 14.4
Earnings over the guideline 3.5
Incarcerated 3.8
Deceased 2.2
On a medical leave 2.6
Unknown 57.7
Average sample size 171.1
SOURCE: MDRC calculations from weekly participant status reports provided by the New HopeProject for the following time period: November 1996 through January 1997.
NOTES: Reasons listed are as known when last active and in contact with the New Hopeprogram.'These participants are inactive for personal reasons; for example, some of them are enrolled in
training programs or college, and others choose to be homemakers.

weekly status reports for all people in the program group for November 1996 through January1997, a period somewhat later than the other follow-up reported in this analysis. The table showsthat program staff knew little or nothing about the status of a majority (58 percent) of these inac-tive members. Since program staff devote considerable effort to maintaining contact with pro-gram group members, these individuals could be living outside the New Hope area. An addi-tional 16 percent were known by program staff to have moved. Fourteen percent did not want toparticipate for a variety of personal reasons, including a desire to attend school or training or tostay home to care for children. Importantly, only a small number were not using New Hope bene-fits because they had earnings above the income cutoff.
D. The Use of Community Service Jobs
One of the most unusual aspects of New Hope is the provision of paid community servicejobs (CSJs) for individuals unable to find unsubsidized, full-time work. Because of current ef-forts to reform welfare to more closely link income support to work, the New Hope CSJ experi-ence is relevant in the policy debate. CSJs could be used in a variety of ways. When individualscome to New Hope without a job and are unable to find unsubsidized, full-time work during theinitial job search period, New Hope staff provide opportunities for placement in a time-limited,wage-paying CSJ. Assuming that they work at least 30 hours per week, they qualify for otherNew Hope benefits. The CSJ goal is for the person to make the transition to full-time, unsubsi-dized work before the job ends. As discussed in Chapter 8, a CSJ position could last up to sixmonths and could be repeated once, after a period of job search; that is, participants could work amaximum of 12 months in a CSJ. Program staff always encouraged participants to move from aCSJ into unsubsidized employment as quickly as possible, so many assignments would be ex-pected to last less than six months.
During the 12 months of follow-up available for this report, approximately one-fourth ofthe sample worked in a CSJ at some point. Figure 9.4 shows the percentage of the sample work-ing in a CSJ by month of follow-up. When individuals enter New Hope, they are not eligible fora CSJ until they complete an eight-week job search, so no one worked in a CSJ during the firstmonth of follow-up. Between months 2 and 5 of follow-up, the number of CSJ workers grows,remaining at a plateau of 10 to 12 percent of the sample through month 9 of follow-up, when itbegins to decline.
In some instances, CSJ participation was very brief. For example, 12 percent of peopleworked in their initial CSJ less than two weeks and 34 percent of all completed first CSJs lastedone month or less. At the same time, 36 percent of all completed CSJs lasted more than 3months. CSJs ended for a variety of reasons: 25 percent of participants left the CSJ before itended because they had found an unsubsidized job, 28 percent quit, 20 percent were terminated(the program term for fired), and 20 percent ran up against the time limit; an additional 8 percentleft because of a family or medical leave.
Figure 9.4 also shows the percentage of the sample who were working enough hours inCSJs to qualify for other New Hope benefits. The percentage using CSJs to access New Hopebenefits is consistently lower than the percentage working in CSJs. As discussed above, for somepeople the CSJ placement was a "bad match" and they left the position; in a sense this was a

s.
Figure 9.4
The New Hope Project
Early Cohort of Program Group Members Working in a Community Service Job (CSJ)in Follow-Up Months 1-12
20
18
16
14
12
10
8
6
4
2
0
to CSJ
'°°°°°In CSJ and used other NewHope benefit
..seeKWO.
le°
2 3 4 5 6 7 8 9
Follow-Up Month After Random Assignment10
*6*.s44
11
SOURCE: MDRC calculations using the New Hope Project's MIS client-tracking database.
NOTE: A New Hope benefit is an earnings supplement, child care assistance, or health insurance.
12

false start. Others did not meet employer expectations and were terminated. For still others, there
was a lag between the time a CSJ starts and other benefits are accessed because it took until thesecond month for them to build up hours in a CSJ to the point where they qualified for other
benefits.
About half of those who worked in a CSJ during the follow-up period started in their first
CSJ within the first four months of follow-up. Among the group working in a CSJ, 19 percentwere employed in a second CSJ." It is also useful to look at the pattern of CSJ and other benefituse. For 79 percent of those ever employed in a CSJ, it provided their initial access to New Hopebenefits. Twenty-one percent of those ever employed in a CSJ worked full time in a month priorto the start of their first CSJ, as evidenced by use of some other New Hope benefit in one or moreof these prior months. This allowed the CSJ to serve a "safety net" function, helping individualskeep their work hours high enough to qualify for benefits when an unsubsidized job was lost anda new one had not yet been found or work hours dropped below 30 per week.
During employment in a CSJ, about three-fourths of CSJ employees worked enoughhours at some point in the job to also receive New Hope's earnings supplement, health insurance,and/or child care assistance. These linked New Hope benefits were used in about half the monthsthat people were working in community service jobs. During these jobs or after they ended, 62percent were able to shift to full-time, unsubsidized jobs, as evidenced by use of a New Hopebenefit in a subsequent month or months in which there was no CSJ.'2 Thus, many of the 75 per-cent of CSJ workers who left the CSJ without an unsubsidized job (as reported above) were ableto make a later transition to full-time work.
Though the transition rate is high, it did not happen for everyone. This should not be asurprise when one remembers that the individuals employed in CSJs are likely to be those whohave had the most difficulty finding and keeping unsubsidized jobs. Again, it is premature tocharacterize these findings as encouraging or not, in the absence of information on the experi-ences of the control group counterparts of those employed in CSJs.
II. Benefit Use for Subgroups in the Study
Chapter 6 identified several subgroups within the full sample who were chosen becauseof hypotheses about how New Hope benefit use might vary among individuals based on theirbackground characteristics and circumstances on applying to the program. This section analyzes
"One person worked in a third CSJ. This is permitted under New Hope rules when the total number of monthsalready spent in a CSJ was less than 12.
'In this calculation, those individuals who were still in a CSJ at the end of the follow-up period were removedfrom the sample. This calculation also suffers from the fact that those who ended their CSJ in the early months ofthe follow-up period were tracked for more months than those who ended their CSJ late in the period. Anothermeasure of the ability of CSJ jobholders to make the transition is the percentage of the months following a CSJ inwhich New Hope benefits were used, when this use was not due to a subsequent CSJ. About 30 percent of CSJholders used New Hope benefits in 60 percent or more of the months following a CSJ until the end of the 12-monthfollow-up or the next CSJ and another 30 percent used benefits in 20 to 60 percent of these months. The remaining40 percent used benefits in less than 20 percent of the months.

benefit use by discussing separately subgroups based on employment status at entry into thestudy, presence or absence of children in the household, and whether the applicant was a singleman, had a high school credential, or had access to a car (for commuting to work). As this dis-cussion will show, benefit use did differ among these subgroups.
A. Employment Status Subgroups
Employment status at application had a strong influence on the use of New Hope bene-fits, as shown in Table 9.4, because it affected an applicant's ability to immediately access them.As in Chapter 6, the employment status subgroups are further divided into those working fulltime and part time at application and those unemployed applicants with and without earnings inthe prior 12 months. The table shows the percentage of all members of the early cohort samplewho ever received New Hope benefits during the 12 months of follow-up. For example, 89 per-cent of employed applicants used the New Hope earnings supplement, health insurance and/orchild care assistance at some point in the follow-up period, with a noticeably higher proportion(92 percent) for those working full time (and thus immediately eligible) than for those workingpart time (80 percent). In contrast, 63 percent of those who entered the program without a jobused any New Hope benefit, with nearly equal percentages for those with and without recentearnings. Receipt of earnings supplements follow a similar pattern, but use of health insuranceand child care assistance did not follow a consistent pattern across the subgroups. Employment ina CSJ did, however, follow the expected pattern, with higher use for those with a weaker con-nection to employment. Importantly, approximately one-third of those entering the programwithout a job worked in a CSJ at some point within the 12 months of follow-up.
Figure 9.5 illustrates further the importance of employment status by showing the cumu-lative percentage of the employed and unemployed subgroups who had received any New Hopebenefit over the 12 months of follow-up. Those employed at application much more quickly tookup the New Hope offer. In the first month of follow-up, about one in four employed applicantsused some New Hope benefit. By the third month of follow-up, over 70 percent of those em-ployed at application had used some New Hope benefit and by the seventh month virtually allthose employed applicants who were to use program benefits within the 12-month follow-up haddone so. In contrast, less than 5 percent of those unemployed at application used a New Hopebenefit in the first two months. Throughout the 12 months of follow-up, the percentage of unem-ployed applicants who had ever used New Hope benefits continued to grow, as these individualsgradually found employment that qualified them for benefits. This finding highlights the impor-tance of longer follow-up to see the level of benefit use ultimately attained and of the later im-pact analysis, which will allow a contrast with the employment experiences of the control groupcounterparts of unemployed applicants.
Not only do a larger percentage of employed applicants take up the New Hope offer, butamong those who do use tends to be for more months. Table 9.5 presents findings on the
extent of benefit use among those sample members who used any New Hope benefit. The tableshows that among employed applicants who used any benefit, the average length of use was 7.2months (out of the 12 months of follow-up), with those originally working full time averaging7.3 months and those working part time averaging 6.7 months. Applicants without jobs who usedany New Hope benefit averaged 4.8 months, with only a small difference between those with and
-182-

Tab
le 9
.4
The
New
Hop
e Pr
ojec
t
Part
icip
atio
n O
utco
mes
for
an
Ear
ly C
ohor
t of
Prog
ram
Gro
up M
embe
rs W
ithin
Fol
low
-Up
Mon
ths
1-12
,by
Em
ploy
men
t Sta
tus
at R
ando
m A
ssig
nmen
t
Out
com
e
Em
ploy
men
t Sta
tus
at R
ando
m A
ssig
nmen
ts
Em
ploy
edE
mpl
oyed
Not
Em
ploy
ed
Not
Em
ploy
ed.E
arni
ngs
inPr
ior
Yea
rN
o E
arni
ngs
inPr
ior
Yea
rFu
ll T
ime
Part
Tim
e
Eve
r us
ed a
New
Hop
e be
nefi
t (%
)A
ny ty
pe89
.091
.780
.463
.162
.563
.8E
arni
ngs
supp
lem
ent
87.6
90.5
78.4
61.4
61.3
61.6
Hea
lth in
sura
nce
56.0
56.1
56.9
25.5
32.7
16.7
Chi
ld c
are
29.7
30.6
27.5
19.0
16.7
21.7
Eve
r w
orke
d in
a C
SJ (
%)
11.5
9.6
32.7
29.8
36.2
Sam
ple
size
209
457
5130
616
813
8
SOU
RC
E: M
DR
C c
alcu
latio
ns u
sing
the
New
Hop
e Pr
ojec
t's M
IS c
lient
-tra
ckin
g da
taba
se.
NO
TE
S: D
ashe
s in
dica
te th
at th
e sa
mpl
e si
ze is
und
er 1
0; th
eref
ore
the
calc
ulat
ion
has
been
om
itted
.
'Rec
ords
mis
sing
em
ploy
men
t sta
tus
vari
able
s w
ere
excl
uded
fro
m th
is a
naly
sis.
2
2`27

100
90
80
70
60
50
40
30
20
10
0
Figure 9.5
The New Hope Project
Cumulative Percentage of an Early Cohort of Program Group MembersUsing Any New Hope Benefit in Follow-Up Months 1-12,
by Employment Status at Random Assignment
Employed at randomassignment
Unemployed at randomassignment
1 2 3 4 5 6 7 8 9 10
Follow-Up Month After Random Assignment
11 12
SOURCE: MDRC calculations using the New Hope Project's MIS client-tracking database.
NOTE: A New Hope benefit is an earnings supplement, child care assistance or health insurance.
2 9-184-

Tab
le 9
.5
The
New
Hop
e Pr
ojec
t
Part
icip
atio
n O
utco
mes
for
an
Ear
ly C
ohor
t of
Prog
ram
Gro
up M
embe
rs in
Hou
seho
lds
Tha
t Rec
eive
d A
ny N
ew H
ope
Ben
efit
in F
ollo
w-U
p M
onth
s 1-
12, b
y E
mpl
oym
ent S
tatu
s at
Ran
dom
Ass
ignm
ent
Out
com
e
Em
ploy
men
t Sta
tus
at R
ando
m A
ssig
nmen
ta
Em
ploy
edE
mpl
oyed
Not
Em
ploy
edN
otE
mpl
oyed
Ear
ning
s in
Prio
r Y
ear
No
Ear
ning
s in
Prio
r Y
ear
Full
Tim
ePa
rt T
ime
Ave
rage
num
ber
of m
onth
s w
ith a
ben
efit
duri
ng f
ollo
w-u
p.A
ny ty
pe7.
27.
36.
74.
84.
74.
9E
arni
ngs
supp
lem
ent
6.2
6.4
5.8
4.3
4.2
4.4
Hea
lth in
sura
nce
3.6
3.6
3.7
1.8
2.2
1.2
Chi
ld c
are
1.8
1.8
1.8
1.2
1.1
1.4
..
Am
ong
hous
ehol
ds th
at r
ecei
ved
earn
ings
sup
plem
ents
(N
=37
2).
N=
I83
N=
142
N =
40N
=18
8N
=10
3N
=85
Num
ber
of e
arni
ngs
supp
lem
ents
rec
eive
d (%
)1-
324
.023
.937
.837
.937
.7. G
o t, .
4-6
7 or
mor
e23
.053
.021
.154
.930
.047
.534
.627
.735
.027
.234
.128
.2A
vera
ge a
mou
nt o
f m
onth
ly e
arni
ngs
supp
lem
ent (
$)10
2.84
96.6
912
5.89
129.
5111
7.36
143.
73
Am
ong
.hou
seho
lds
that
use
d he
altp
insu
ranc
e be
nefi
ts (
N=
196)
,H
ouse
hold
s us
ing
each
type
(%
)N
=11
7N
=88
N=
29N
=78
N=
55N
=23
New
Hop
e H
MO
hea
lth in
sura
nce
73.5
70.5
82.8
85.9
89.1
78.3
New
Hop
e co
ntri
butio
n to
war
d em
ploy
er's
hea
lth in
sura
nce
39.3
40.9
34.5
18.0
12.7
30.4
Sam
ple
size
186
144
4119
310
588
SOU
RC
E: M
DR
C c
alcu
latio
ns u
sing
the
New
Hop
e Pr
ojec
t's M
IS c
lient
-tra
ckin
g da
taba
se.
NO
TE
S: A
New
Hop
e be
nefi
t is
an e
arni
ngs
supp
lem
ent.
child
car
e as
sist
ance
, or
heal
th in
sura
nce.
Das
hes
indi
cate
that
the
sam
ple
size
is u
nder
10:
ther
efor
e th
e ca
lcul
atio
n ha
s be
en o
mitt
ed.
'Rec
ords
mis
sing
em
ploy
men
t sta
tus
vari
able
s w
ere
excl
uded
fro
m th
is a
naly
sis.
'Som
e ho
useh
olds
are
in b
oth
cate
gori
es b
ecau
se th
ey m
ay h
ave
been
par
t of
the
New
Hop
e H
MO
pla
n an
d th
en m
oved
to a
n em
ploy
er p
lan
(or
vice
vers
a).
23Q
BE
ST
CO
PY
AV
AIL
AB
LE23
1
without recent earnings. This pattern of lengthier use among those with a stronger work connec-tion carried through to the individual New Hope benefits. As in Table 9.1, the base for the cal-culation of average months of use for individual benefits includes all who used any New Hopebenefit, including those who may not have used the specific benefit listed in that line of the table.It is useful to supplement the numbers in the table with average months of use for those receivingeach benefit. Within the basic employment status split (employed versus not employed), the av-erage months of use of earnings supplements, health insurance, and child care (not shown in thetable) were approximately the same across the three benefits: for the employed subgroup, theyranged between 5.4 and 6.1 months and for the unemployed, between 4.0 and 4.5 months.
The middle panel of Table 9.5 provides additional information on the receipt of earningssupplements. About half of the employed subgroup received at least seven earnings supplementscompared with approximately one-fourth of the unemployed subgroup. In terms of the averagedollar amount of earnings supplements received, those employed full time at application receivedthe smallest average supplement (reflecting their higher initial earnings) and those unemployed atapplication without recent earnings averaged the largest supplement (reflecting lower earnings inthe jobs this group found and their higher-than-average number of children)."
The lower panel of Table 9.5 provides additional detail on the use of New Hope's healthinsurance benefit. Among those using this benefit, most used New Hope HMO insurance (70percent or more in every subgroup). A much larger percentage of the employed subgroup endedup working in jobs where the employer provided health insurance and New Hope paid some ofthe employee contribution. A third group, not shown in this table, had access to Medicaid andthus had access to health insurance without using any New Hope health benefit.
B. Households With and Without Children(
In general, households with children were more likely than those without children to useany New Hope benefit during the 12-month follow-up period, and differences in the use of indi-vidual New Hope benefits appear to be linked to the composition of the households. Table 9.6provides information on the use of New Hope benefits among households with children (furtherseparated into those with one and two adult caretakers) and households without children. Theupper panel of the table shows that 75 percent of one-adult households with children and 86 per-cent of two-adult households with children used some New Hope benefit, while only 64 percentof households without children did so. The higher rate in two-adult households is probably linkedto the greater likelihood of employment when there are two potential workers.
The greater use among one-adult households with children than among households with-out children occurred despite the fact that the one-adult families had child care responsibilities,had a higher rate of receipt of welfare, were younger, and had lower recent earnings. Other fac-tors, such as greater access to a car and a lower rate of prior arrests, and possibly motivation frombeing responsible for a child or children, led to higher rates ofuse for one-adult households withchildren.
"New Hope earnings supplements rise with additional household members, up to a ceiling family size of twoadults and four children.

Tab
le 9
.6
The
New
Hop
e Pr
ojec
t
Part
icip
atio
n O
utco
mes
for
an
Ear
ly C
ohor
t of
Prog
ram
Gro
up M
embe
rs in
Fol
low
-Up
Mon
ths
1-12
,by
Pre
senc
e or
Abs
ence
of
Chi
ldre
n at
Ran
dom
Ass
ignm
ent
Out
com
ePr
ogra
mG
roup
Pres
ence
of
Chi
ldre
n at
Ran
dom
Ass
ignm
ent
Hou
seho
lds
With
Chi
ldre
n'H
ouse
hold
s W
ithou
tC
hild
ren
One
'Adu
lt"T
wo
'Adu
lts'
All
hous
ehol
ds
Eve
r us
ed a
New
Hop
e be
nefi
t (%
),A
ny ty
pe73
.674
.785
.764
.3E
arni
ngs
supp
lem
ent
72.1
73.0
85.7
62.1
Hea
lth in
sura
nce
38.0
30.8
44.1
49.3
Chi
ld c
are
23.3
35.6
16.7
Eve
r w
orke
d in
a C
SJ (
%)
24.0
24.7
14.3
28.6
Sam
ple
size
516
292
8414
0
Hou
seho
lds
that
use
d an
y ty
pe o
f be
nefi
t
Ave
rage
num
ber
of m
onth
s w
ith a
ben
efit
duri
ng f
ollo
w-u
p,A
ny ty
pe5.
96.
26.
45.
0E
arni
ngs
supp
lem
ent
5.2
5.3
5.8
4.5
Hea
lth in
sura
nce
2.7
2.4
2.5
3.4
Chi
ld c
are
1.5
2.3
0.9
Am
ong
hous
ehol
ds th
at r
ecei
ved
earn
ings
sup
plem
ents
(N
=37
2),
N=
372
N=
213
N=
72N
=87
Num
ber
of e
arni
ngs
supp
lem
ents
rec
eive
d (%
)1-
331
.229
.627
.837
.94-
628
.827
.727
.832
.27
or m
ore
40.1
42.7
44.4
29.9
Ave
rage
am
ount
of
mon
thly
ear
ning
s su
pple
men
t ($)
114.
0610
8.66
118.
8612
4.67
Am
ong
hous
ehol
ds th
at u
sed
heal
tk in
sura
nce
bene
fits
(N
=19
6),
N=
196
N=
90N
=37
N=
69H
ouse
hold
s us
ing
each
type
(%
)N
ew H
ope
HM
O h
ealth
insu
ranc
e78
.675
.670
.387
.0N
ew H
ope
cont
ribu
tion
tow
ard
empl
oyer
's h
ealth
insu
ranc
e30
.637
.837
.817
.4
Sam
ple
size
380
218
7290
(con
tinue
d)
2

Tab
le 9
.6 (
cont
inue
d)
SOU
RC
E: M
DR
C c
alcu
latio
ns u
sing
the
New
Hop
e Pr
ojec
t's M
IS c
lient
-tra
ckin
g da
taba
se.
NO
TE
S: D
ashe
s in
dica
te th
at th
e sa
mpl
e si
ze is
und
er 1
0; th
eref
ore
the
calc
ulat
ion
has
been
om
itted
.
'Def
ined
as
depe
nden
t chi
ldre
n 18
yea
rs o
f ag
e or
you
nger
.bA
one
-adu
lt ho
useh
old
is o
ne in
whi
ch th
e sa
mpl
e m
embe
r is
not
livi
ng w
ith a
spo
use
or g
irlf
rien
d/bo
yfri
end.
The
re m
ay b
e ot
her
adul
ts(p
aren
ts, s
iblin
gs, o
ther
rel
ativ
es o
r fr
iend
s) a
lso
resi
ding
in th
e ho
useh
old.
cA tw
o-ad
ult h
ouse
hold
is o
ne in
whi
ch th
e sa
mpl
e m
embe
r is
livi
ng w
ith a
spo
use
or g
irlf
rien
d/bo
yfri
end.
dSom
e ho
useh
olds
are
in b
oth
cate
gori
es b
ecau
se th
ey m
ay h
ave
been
par
t of
the
New
Hop
e H
MO
pla
n an
d th
en m
oved
to a
n em
ploy
er p
lan
(or
vice
ver
sa).

Differences in use of specific New Hope benefits appear closely linked to the presence orabsence of children. Households with children used the child care assistance, with the highestrate coming in one-adult households with children, as would be expected. The highest rate ofhealth insurance use occurred for households without children (who were likely to be ineligiblefor Medicaid), but two-adult households with children used the benefit at nearly the same rate.The weaker employment history of applicants from one-adult and no-child households led to ahigher rate of CJS use in these subgroups.
The lower panel of Table 9.6 provides further information supporting the pattern de-scribed above. A much larger percentage of households with children received at least sevenearnings supplements during the follow-up period than was the case for households without chil-dren. Households without children were also most likely to access the New Hope HMO and,conversely, were least likely to use New Hope contributions to a employer insurance plan. Theaverage amount of the monthly earnings supplement was greatest for households without chil-dren (because of their lower earnings), followed by two-adult households with children (becauseof their larger household size).
C. Single Men
Table 9.7 reports on benefit use for single men; that is, men who are not living with aspouse or partner or with dependent children. It shows a lower-than-average rate of benefit use.Compared with the entire sample, a lower percentage of single men used any type of benefit, orreceived an earnings supplement, though about the same percentage used health insurance orworked in a CSJ. Virtually none used the child care assistance:4 A much higher percentage ofsingle men (79 percent) received six or fewer earnings supplements than was the case for the fullsample (60 percent). One explanation is that 27 percent of single men were employed at applica-tion as compared with 38 percent for the full sample. Therefore, a smaller-than-average percent-age of the single men subgroup could immediately access New Hope benefits. Most single menusing health insurance got it through participating in the New Hope HMO.
D. Other Subgroups
This section reviews two subgroups highlighted because of the labor market conditionsoutlined in Chapter 3, for which there are differences in benefit use, and two of general interest,for which there are no substantial differences.
Access to a car: Eighty percent of sample members with access to a car at ap-plication used at least one New Hope benefit, while 69 percent of samplemembers without access to a car did so. Further, this difference emerged in thefirst month of follow-up, when those with access to a car were three times aslikely to use a New Hope benefit (18 versus 6 percent). A higher percentage ofthose with a car used the earnings supplement, health insurance, and child careassistance, but a higher percentage of those without a car worked in a CSJ,
"By definition, this subgroup was very unlikely to use the child care assistance since at application to NewHope they did not live with a dependent child.

Table 9.7
The New Hope Project
Participation Outcomes for an Early Cohort of Program Group Membersin Follow-Up Months 1-12 for Single Men at Random Assignment
Outcome Single Men Program Group
All households
Ever used a New Hope benefit (%),Any type 61.1 73.6
Earnings supplement 59.7 72.1Health insurance 41.7 38.0Child care 23.3
Ever worked in a CSJ (%) 23.6 24.0
Sample size 72 516.
Households that used any type of benefit
Average number of months with a benefit during follow-up,Any type 4:4 5.9
Earnings supplement 3.9 5.2Health insurance 2.9 2.7Child care 1.5
Among households that received earnings supplements (N=372), N=43 N=372Number of earnings supplements received (%)
1-3 46.5 31.24-6 32.6 28.87 or more -- 40.1
Average amount of monthly earnings supplement ($) 123.77 114.06
Among households that used health insurance benefits (N=196), N=30 N=196Households using each types (%)
New Hope HMO health insurance 90.0 78.6New Hope contribution toward employer's health insurance 30.6
Sample size 44 380
SOURCE: MDRC calculations using the New Hope Project's MIS client-tracking database.
NOTES: Dashes indicate that the sample size is under 10; therefore the calculation has been omitted.
aSome households are in both categories because they may have been part of the New Hope HMO plan andthen moved to an employer plan (or vice versa).

which tended to be located in or near the New Hope neighborhood and, hence,accessible without a car.
High school diploma: Seventy-nine percent of sample members with a highschool diploma used some New Hope benefit during the 12-month follow-up,as opposed to 69 percent of those without a diploma. High school graduateshad higher rates of use of the earnings supplement (77 versus 68 percent),health insurance (46 versus 32 percent), and child care (31 versus 17 percent),but the percentage working in a CSJ was virtually the same as for those whodid not complete high school (23 versus 25 percent).
Race: All racial subgroups but one had benefit use rates of slightly over 70percent. Asian/Pacific Islanders mostly Hmong were the exception; 94percent used at least one New Hope benefit. Asian/Pacific Islander householdsoften overlapped with the other "high use" subgroup mentioned above: twoadults with children. Further, within each of the various subgroups reported onearlier (defined by employment and household status), the other racial groupsgenerally had similar benefit use rates.
Prior arrest: Having been arrested since the age of 16 made little differencein New Hope benefit use in either the overall or the individual rate.
This report is the first in a series of reports on the New Hope Project. It describes thechanging state and national policy context (which has made New Hope's work-based strategymore relevant), the origins of the program within the Milwaukee community, and its guidingprinciples and goals. It analyzes the issues that New Hope board members and staff confronted indesigning and implementing program procedures and in recruiting individuals from the targetneighborhoods to participate in the program. It presents information illustrating that they suc-ceeded in recruiting the intended mixture of working and nonworking applicants, individuals re-ceiving and not receiving public assistance, and adults with and without children. And, finally, itpresents findings on the extent to which individuals took up the New Hope offer and used pro-gram benefits and CSJs. The program accomplishments described in this report are important andprovide lessons for other reform efforts, as chapters in this report have highlighted.
Although this report covers a range of topics and provides many insights into NewHope's operations, it is only the first chapter of a complex story. The true impact of the programwill not be known until it is possible to compare the employment, earnings, household income,public assistance receipt, child and family measures, and other key outcomes for program andcontrol groups over an extended period of time. New Hope's goal has always been to make a dif-ference in people's lives and such a comparison is central to judging the success of this effort,which explains the cautious tone of the report and especially this last chapter. The tone is not areflection of doubts about program implementation, but rather of the incompleteness of the storyat this stage in the research. New Hope staff and board members recognized the need for an in-depth evaluation when they committed themselves to the program impact research design onwhich the demonstration research is based.
-191- 239

As this report is released, a two-year follow-up survey for both program and controlgroup members is being fielded and the research team is working to collect administrative rec-ords that can provide information on other key outcomes. Furthermore, there is an ongoing effortto raise funds for a second follow-up survey for members of the research sample at a point afterthe New Hope benefits are no longer available to the program group (which occurs three yearsafter they enter the study). When data from these various efforts are available and analyzed, thefindings will complete the New Hope story. Then it will be possible to understand in a muchfuller way the impacts of New Hope on the lives of those who invested their time, energy, andhopes in this pathbreaking effort.
240-192-

Appendix A
24i

Data Sources
This appendix documents the data sources used to describe the implementation andcontext of New Hope and the use of benefits and services. Table A.1 lists the samples for whomdata were collected.
Field Research. MDRC staff observed New Hope program operations andinterviewed participants, project representatives, and program managers.Information was collected about a range of issues, such as history of theprograin, recruitment strategies, program operations, and support available toparticipants. Materials gathered in these visits were used throughout thereport, but particularly in Chapters 2, 5, and 7.
Baseline Data. Baseline characteristics were collected for all program andcontrol group members using the Background Information Form (BIF) and thePrivate Opinion Survey (POS). The BIF was the primary source of data onbaseline characteristics. In addition, the POS elicited applicants' attitudes andopinions on their work experience and related obstacles and aids to obtainingor retaining employment. Both the BIF and POS were completed prior torandom assignment. These data were used in Chapter 6.
New Hope Management Information System (MIS) Data. The New HopeMIS database contains information on baseline characteristics for the fullsample and tracks all program group members. It provides data on the use ofbenefits and community service jobs (CSJs) for all participants in New Hope.For this report, 12 months of follow-up data are available for those randomlyassigned from the start of random assignment (August 1994) through August31, 1995. The outcomes for this early cohort are presented in Chapter 9.
Focus Groups. MDRC staff conducted focus groups in October 1995 with 36New Hope participants, who were selected based on a random sample of 100program group members who had been in the program for at least threemonths. The purpose of the focus groups was to learn about participants'experiences in the program, as well as to provide an opportunity forparticipants to assess New Hope's impact on their lives. Data gathered in thesefocus groups were used in Chapter 7. (See also the MDRC working paper,Participants in the New Hope Demonstration Discuss Work, Family, and Self-Sufficiency, by Dudley Benoit, 1996.)
Neighborhood Survey. From December 1995 to June 1996, an in-personsurvey was conducted in the Northside and Southside neighborhoods fromwhich New Hope candidates were recruited. A random sample of 900dwelling units (500 on the Northside and 400 on the Southside) were selectedto be surveyed. Of these, 719 surveys (80 percent) were completed, 380 on theNorthside and 339 on the Southside. The purpose of the survey was to
-194-
24

Tab
le A
.1
The
New
Hop
e Pr
ojec
t
Dat
a So
urce
s an
d Sa
mpl
es
Dat
a So
urce
Sam
ple
Num
ber
of S
ampl
e M
embe
rsR
ando
m A
ssig
nmen
t Dat
esFo
llow
-Up
Peri
od
Bas
elin
e da
taB
ackg
roun
d In
form
atio
nFo
rms
(BIF
s)
Priv
ate
Opi
nion
Sur
vey
(PO
S)
New
Hop
e M
IS d
ata
New
Hop
e cl
ient
-tra
ckin
gda
taba
se
c)Fo
cus
grou
ps
Nei
ghbo
rhoo
d Su
rvey
All
prog
ram
and
con
trol
grou
p m
embe
rs'
Prog
ram
and
con
trol
grou
p m
embe
rsb
Ear
ly c
ohor
t of
prog
ram
grou
p m
embe
rs
Sele
cted
pro
gram
gro
upm
embe
rs f
rom
ran
dom
assi
gnm
ent s
ubsa
mpl
eof
100
pro
gram
gro
upm
embe
rs
Ran
dom
sam
ple
of d
wel
ling
units
in N
orth
side
and
Sout
hsid
e ne
ighb
orho
ods
Tot
al s
ampl
e1,
357
Prog
ram
gro
up67
8C
ontr
ol g
roup
679
Tot
al s
ampl
e1,
079
Prog
ram
gro
up54
2C
ontr
ol g
roup
537
Prog
ram
gro
up51
6
Aug
ust 1
994-
Dec
embe
r 19
95
Aug
ust 1
994-
Dec
embe
r 19
95
Aug
ust 1
994-
Aug
ust 1
995
Prog
ram
gro
up36
Aug
ust 1
994-
June
199
5
Tot
al s
ampl
eN
orth
side
Sout
hsid
e
Tot
al r
espo
nden
tsN
orth
side
Sout
hsid
e
900
Not
app
licab
le50
040
0
719
380
339
Dat
a re
port
ed a
s of
rand
om a
ssig
nmen
tda
te
Dat
a re
port
ed a
s of
rand
om a
ssig
nmen
tda
te
Tw
elve
mon
ths
follo
win
g ra
ndom
assi
gnm
ent
Not
app
licab
le
Not
app
licab
le
NO
TE
S: a
Five
of
the
1,36
2 ra
ndom
ly a
ssig
ned
sam
ple
mem
bers
wer
e su
bseq
uent
ly d
ropp
ed f
rom
the
anal
ysis
bec
ause
of
mis
sing
bas
elin
e fo
rms
(BIF
s).
bCom
plet
ion
of th
e PO
S w
as v
olun
tary
. PO
S re
spon
ders
wer
e 79
per
cent
of
the
tota
l sam
ple.
244
243

determine the characteristics of households residing in the targetneighborhoods, what proportion of neighborhood residents were potentiallyeligible for New Hope, and whether residents had heard about the programand factors associated with applying to the program. These data were used inChapter 4. (In addition, Appendix D describes the survey methodology indetail.)
Program Documents and Published Materials. Labor market informationwas compiled using a variety of sources. Data on job openings in theMilwaukee SMSA were obtained from reports published by the Employmentand Training Institute (ETI) of the University of Wisconsin-Milwaukee. ETIalso provided special runs of the survey data file. The U.S. Bureau of LaborStatistics and the Wisconsin Department of Workforce Development providedstatistics on unemployment rates. Calculations on the amount of time neededto travel to jobs by bus were made using data provided by the MilwaukeeCounty Transit System Transit Guide for 1995. These data were used inChapter 3.
Data on the human service providers available in Milwaukee County were compiledusing resource directories from three organizations: Help line Information and Referral Directory,Lincoln Park Community Service Support Directory 1995-1996, and the Milwaukee PublicLibrary T.A.P. Into Tutoring Guide (1995). New Hope staff reviewed the information. Thesedata were used in Chapters 3 and 5.
Various New Hope program documents were used throughout the report, but particularlyin Chapters 3, 5, and 7. These include "community outreach logs," which document recruitmentefforts, and the program procedures manual.
245-196-

Appendix B
246

Table B.1
The New Hope Project
Local, State and National Donors for the Pilot and Full Programs(as of December 1996)
Amount and Donor
$1,000,000 and overU.S. Department of Health and Human Services
State of WisconsinRockefeller FoundationHelen Bader Foundation
$250,000 to $999,999Ford Foundation
Charles Stewart Mott FoundationWisconsin Energy Corporation Foundation, Inc.
Annie Casey FoundationNorthwestern Mutual Life
Wisconsin Bell/ AMERITECH
$100,000 to $249,999Firstar
Time InsuranceJoyce Foundation
WICORMilwaukee Foundation
Johnson Controls
$50,000 to $99,999Faye Mc Beath-Foundation
M and fMarshall and Ilsley BankA.O. Smith Foundation
ANR PipelineBlue Cross/ Blue Shield
City of MilwaukeePollybill Foundation
$25,000 to $49,999Harley-Davidson
Banc OneRobert W. Baird and Company
Marcus CorporationMarquette Electronics
Mortgage Guaranty Insurance CorporationUniversal Foods
Journal CommunicationsNorwest Bank
$5,000 to $24,999Abert Fund
Bucyrus-Erie FoundationKohl's Corporation
Warner Cable CommunicationsArthur Andersen and Company
North Shore BankEmory Clark Foundation
John C. and Harriet Cleaver FundAmerican Express
Dairyland Charitable TrustSteigleder FoundationBirnschein Foundation
Harnischfeger IndustriesJudy and David Meissner
under $5,00013 donors
SOURCE: The New Hope Project.
247-198-

Appendix C
248

Designing the New Hope Benefits Package
In designing the benefits package to be used for the demonstration the following objectiveswere used to guide decisions during the refinement process:
make work pay by providing better remuneration (cash and benefits) at the lowend of earnings and preserving incentives to increase earnings, that is, keep theimplicit real marginal tax rates on earnings as low a possible.
Avoid rewarding unstable earnings patterns;
protect children in low-earnings households from inadequate resources;
make payments as neutral as possible with respect to incentives to create orbreak up families or households;
target payments to "worst off' families;
reduce barriers to work arising from access to child care and health insurancebut require some participant contribution (usually referred to as "copays") toobtain these benefits; and
keep costs of total benefits package within politically feasible bounds.
Rather than launching into a detailed discussion of these objectives we will try to illustratehow they impinged on the design as we review the elements of the package of benefits that resultedfrom the refinement process.
I. Complications in Design
It is clear that it would be very difficult to design a package that met fully all of these sevenobjectives; trade-offs were necessary and further compromises had to be made if the package wasnot to become unduly complicated.
Further complications arose because New Hope is a demonstration and not a legislatedprogram. Existing federal, state, and local tax and expenditure programs had features that could notbe eliminated by the demonstration; the benefits package had to be designed around them, trying tointegrate them where they were helpful to the program goals and to "override" them where theyconflicted.
The major positive feature of existing tax and expenditure policies that could be built onwas the federal Earned Income Credit (EIC). The EIC started in the 1970s at very low levels(basically to offset then-current increases in employee social security taxes) but increased slowlyover the years. Just as the New Hope Project began the Congress passed the Omnibus BudgetReconciliation Act (OBRA 1993) providing for a substantial increase in the levels and coverage ofthe EIC. Still, the EIC alone would not be sufficient to lift any individual or family earning the
-200-
2 4

minimum wage above poverty. It was natural, therefore, for the designers of New Hope to take thisprogram as the starting point for their effort to design a system but to attempt to improve on theEIC to assure poverty alleviation; to try to assure low-income people that "work pays," particularlycompared with what they could obtain through the then existing welfare programs. In addition tothe federal EIC there is a Wisconsin state EIC.
The design of the New Hope benefit package fully integrates these two programs with theNew Hope benefits. In calculating supplements to individuals and families it is assumed that theywill claim and receive the federal and state EIC for which they are eligible, and those amounts arenetted out before the New Hope payments are made. While this is in general a substantial benefit tothe participants and the demonstration in terms of the resources provided, there have been someproblems generated by how the EIC benefits are perceived and claimed.'
The major negative feature of federal and state programs that presented challenges to thedesigners of the New Hope package was the income-conditioning of taxes and some expenditureprograms; basically, these features generate a cascading of marginal tax rates (MTRs) on income. Itmay be helpful here to briefly explain what we mean by the MTRs used in the context of programslike New Hope.
With respect to income taxes the MTR is calculated by considering how after-tax incomechanges when there is an increase in before-tax income; for example, if before-tax earnings increaseby $1,000 and after tax income increases by only $750, then $250 has gone to taxes and the MTR is25 percent ($250/$1,000). In the context of any programs where benefits received are related toincome an equivalent "implicit MTR" can be calculated. For example, suppose that when a givenindividual's earnings are $9,000 per year the program benefit is $2,025 and when the individual'searnings increase to $10,000 the program benefit is $1,825. The reduction in benefits is $200,which can be thought of as a 20 percent ($200/$1,000) marginal tax on earnings.
We can also talk in terms of before-tax-and-benefit income and after-tax and-benefitincome and calculate total real MTRs on the basis of these concepts. Suppose that in the exampleabove the individual earning $9,000 paid taxes (federal and state) totaling $1,179; her before-tax-and-benefit income would be $9,000 and her after-tax-and-benefit income would be $9,846(= $9,000 + $2,025 $1,179). When her earnings rise to $10,000, her taxes rise to $1,460, hercash benefit falls as indicated, and then her before-tax-and-benefit income would be $10,000 andher after-tax-and-benefit income would be $10,365 (= $10,000 + $1,825 $1,460). The changein her before-tax-and-benefit income is $1,000 and the change in her after-tax-and-benefitincome is $519 ($10,365 $9,846). Taxes and benefit reductions have taken $481, so her realMTR is 48.1 percent (= $481/$1,000).
A picture of the federal EIC may facilitate the discussion of how the New Hope benefitsbuild on it. Figure C.1 shows how the federal EIC benefits for an earner with one child were related
'The problems are related to claims for EIC benefits under the Advanced Earned Income Credit provisionswhich allow payment of EIC benefits on a prorated monthly basis "in advance," with a year-end reconciliation.Some New Hope participants were reluctant to claim Advanced EIC in fear of having to pay something back to thegovernment at the year end reconciliation. It has been shown that it is nearly impossible for a New Hope participantto incur such an "overpayment" of the EIC. See Feldman, 1995.
-201-
250

Figure C.1
The New Hope Project
Federal Earned Income Tax Credit (EIC) for a Family With One Child
Federal EIC ($)
$2,125
$6,330 $11,610
Earnings ($)
-202-2 j
$25,078

to earnings per year in 1996. The EIC benefits increase over the range of earnings from zero to$6,330 to reach the maximum benefit ($2,125); this is referred to as the phase-in range of earnings.
The range of earnings ($6,330 $11,610) over which the EIC benefit remains constant; this isreferred to as the plateau. And the range of earnings over which the benefit declines is referred to asthe phase-out range of earnings. The point where benefits become zero has sometimes been referred
to as the break-even level of earnings.
In Wisconsin, a state EIC program mirrors the federal EIC structure.2 Note that whenearnings are in the phase-out range the declining federal and state EICs are generating a real MTRon increased earnings. In addition, there are, of course, the standard taxes for the employeecontribution to Social Security and unemployment insurance and federal and state income taxes.Each of these can add to the total real MTR on income and in different ways over different rangesof income.
In order to meet the objectives of targeting payments to the worst-off individuals andfamilies, keeping payments within the politically feasible range, and having participants contributeto the costs of child care and health insurance, it was necessary, as will be more fully explainedbelow, to reduce the amount of the cash supplements and to increase the copays as incomeincreased. This income conditioning of New Hope benefits could create yet more complex total realMTRs.
The challenge was to try to develop a design that would deal with all these interactionsamong the federal and state tax and expenditure policies' and the characteristics of the New Hopebenefits in such a way as best to meet the multiple objectives outlined above.
It is useful to remember that were a program similar to New Hope in structure to belegislated at either the federal or state level it would be possible to more directly integrate thevarious support programs (though the historical record on conscious program integration is notencouraging in this regard).
II. The Single-Earner Package
We now turn to a detailed discussion of the various components of the New Hope benefitpackage. We first discuss benefits in the context of a single worker within the family, as majorfeatures can be more simply presented in this context. Then we turn to the context in which there ismore than one worker in the family unit, as multiple-earner households pose some specialproblems.
Wage Supplement: The wage supplement is the major unique feature of the New Hopebenefits. While, as noted above, the New Hope wage supplement builds on and integrates thefederal and state EIC, the refined benefit structure deviates from the EICs in important ways.
2For an earner with one child the Wisconsin EIC equals 4 percent of the federal EIC at each earnings level andfor earners with two children or more it equals 43 percent of the federal EIC.
3The decision was made not to try to explicitly take into account marginal tax rates generated by participants'use of Food Stamps or assisted housing programs.
-203-
252

First, the EICs provide little or no supplementation for single earners without children.4 In asense, by making the receipt and size of EIC payments dependent on both earnings and thepresence of children the EIC mixes two functions: supplementation of earnings and income supportfor children.' The most radical decision made by the designers of New Hope was to try to separatethese two functions, at least conceptually, by designing separate components, a wage supplementand a child allowance, and having the level of these benefits operate somewhat separately. Thus, indesigning the wage supplement the focus was on four of the objectives listed above: making workpay, family breakup, political feasibility, and unstable earnings. The separate child allowancewould focus on protecting children, targeting payments to worst-off families and politicalfeasibility.
In mimicking to a degree the features of the ETC basically four parameters ofthe wage supplement were to be set:
the amount of the maximum supplement,
the level of earnings at which the maximum would occur,
the rate at which the supplement would increase as earnings increased (thephase-in rate up to a maximum point, and
the rate at which the supplement would decrease (the phase-out rate) as earningsincreased beyond the maximum point.
The level of earnings selected for the maximum supplement was the level approximated byfull-time, full-year (40-hour weeks all year) earnings at the then-current minimum wage, whichyielded about $8,500.7 The amount of the maximum supplement was set at 25 percent of theearnings level at that point, or $2,125.8
The choice of the level of earnings at which the benefit would reach a maximum and thechoice of the level of maximum benefit implicitly indicated the rate of phase-in, namely 25 percent.Thus, the worker supplement increases by $0.25 for each $1 of earnings.
Given the amount of maximum benefit and the level of earnings at which the phase-outbegins, the phase-out rate determines the level of earnings at which the wage supplement ends. Insetting the rate one considers two objectives: making work pay and political feasibility; that is, howdoes this phase-out rate affect MTRs, and, therefore, incentives to strive to increase earnings, and
4The 1993 OBRA legislation introduced for the first time a very small EIC for earners without children. TheWisconsin State EIC has no such benefit.
'The debate over extension of the federal EIC showed the tension between these two functions as advocatesargued over the purposes that changes in the EIC should serve. For a brief discussion of these various functions seeE. Steurele, 1995 p. 1669.
6One feature of the federal EIC is a range of earnings during which the benefit is held constant, sometimesreferred to "the plateau." The decision was made that there was no good rational for such a "plateau" and thatmaintaining it in the New Hope benefit structure created problems in the phasing-out range.
'This was approximately the midpoint of the plateau range of earnings where the federal and state EICs are attheir maximums.
'Various rationales for this amount of supplementation were touched upon but we will not discuss them here.

how high up in the earnings distribution is it politically feasible to have supplementation ofearnings extend? The decision, balancing these two considerations, was made to have the workersupplement completely phased out by $20,000 of earnings. This yielded a phase-out rate of 20percent, that is for each additional $1 of earnings the wage supplement is reduced by $0.20. (See
Table C.1.)
It is important to note that this wage supplement is designed independently of the household(or family) structure and household (or family) income, which relates it to the family breakupobjective, that is, incentives that the program provides for families to break up9 in order tomaximize benefits or minimize costs. It has long been felt that the Aid to Dependent Children(AFDC) program provided strong incentives for families to break up and form a single-parent unitto qualify for benefits (though there is very limited empirical evidence of such an effect). In the taxliterature these types of incentives are sometimes referred to as "the marriage penalty." Therelevance here is that the amount of the wage supplement does not depend on what other earnersmay be in the family so there is no incentive provided to either breakup the family or to increase thefamily in order to gain higher benefits. We come back to this issue after discussing the childallowance below.
We have discussed here the design of the wage supplement, but, as noted above, inoperation it is calculated in tandem with the estimated federal and state EIC for which the worker iseligible, and the New Hope supplement is the net above that amount which the supplement formulacalls for.
Child Allowance. Given the earnings supplement structure, attention was turned to thestructure of the child allowance. Again, four parameters determine the child allowance:
the maximum benefit,
variation in the maximum benefit with the number of children,
the phase-in rate, and
the phase-out rate.
Initially, how the maximum benefit should increase with the number of children was to bebased on the features of the federal poverty lines - the poverty line increases in steps as the numberof children increase. The governing board of New Hope felt, however, that this type of structure ofthe child allowance yielded total income that was too small for small-size families and too large forlarge-size families. In addition, since child care and health insurance would be subsidizedsomething not taken into account in the federal poverty line family size adjustments somedeviation from the poverty line child increments could be justified. The amounts of maximum childallowance were set at $1,600 (per annum) for the first child, an increment of $1,500 for the second,$1,400 for the third, and $1,300 for the fourth. There are no further increments for larger numbersof children.
'There can also be incentives for families to add members, e.g., to claim an unrelated or weakly related child asa dependent in order to qualify for higher benefits provided to larger families.
-205-
254

Table C.1
The New Hope Project
New Hope Earnings Supplement
Earnings ($) Earnings Supplement ($)
6,500 1,6257,000 1,7507,500 1,8758,000 2,0008,500 2,1259,000 2,0259,500 1,925
10,000 1,82510,500 1,72511,000 1,62511,500 1,52512,000 1,42512,500 1,32513,000 1,22513,500 1,12514,000 1,02514,500 92515,000 82515,500 72516,000 62516,500 52517,000 42517,500 32518,000 25218,500 12519,000 2519,500 0
SOURCE: The New Hope Project.
- 20620.55

In the pilot project, the phase-in of benefits had followed the EIC, which, as noted above,bundled the wage supplement and child allowance in a single package. In making the refinementsfor the actual demonstration, it was decided that there should be no phase-in of the child allowance;that it should start at the maximum amount and the lowest level of income and stay there untilfamily income reached the phase-out point (for single-earner families $8,500). The rationale forhaving no phase-in was based on two objectives: protecting children and targeting payments toworst off families. A phase-in would increase resources as families' income increased (all be it thebetter-off would still be below-poverty households), thus not targeting the worst -off. No phase-ingives the maximum protection to the children in families with the lowest incomes.
For the phase-out, the fundamental proposition is to have the level of the child allowancerelated to total family earnings.' Added to this were concerns about the effects of the phase-out onthe total real MTRs on earnings the making work pay and political feasibility objectives.
In practice, the political feasibility objective and the MTS considerations interact. Politicalfeasibility was taken to impinge on the determination of the highest level of total family income atwhich benefits could still be paid, sometimes referred to as "break-even income.' Once the break-even income level is set and the maximum children's allowance for a given family size has beendetermined, the phase-out rates must be adjusted so the total amount of the children's allowancewill have been phased out by the time the break-even level of income is attained; the lower thebreak-even level of income, the higher must be the phase-out rates.
With respect to political feasibility, after considerable deliberation with interested parties, itwas decided to set complete phase-out of the child allowance the break-even income level at$30,000 of total family earnings, or 200 percent of the poverty line for that family, whichever washigher.'
To set the phase-out rate for the child allowance one could have either a constant (linear)phase-out rate or a phase-out rate that varied across income levels. The MTR criterion requiredconsidering the combined impact of the phase-out rate for the wage supplement, the phase-out ratefor the child allowance, and the MTRs rates due to federal and state taxes. It was decided that sincethe child allowance was to be related to total family earnings, the major concern should be tointegrate its phase-out rate with federal and state income tax rates. Since there is a substantial rangeof low income in which federal and state income taxes are zero, it was decided that in that range thephase-out rate for the child allowance could be higher. Then, when the income taxes begin, thephase-out rate for the child allowance is lowered so as to keep the combined MTRs down. After
'Ideally, it would be related to total family income but it was felt that for this demonstration, and the incomelevel of families in the demonstration, sources of income other than earnings would be negligible.
"We use the "break-even level of income" terminology here because it is common in the literature. However,even below the break-even level individuals are receiving benefits but also paying taxes, and it might be better toapply the term "break-even" at the point where benefits received exactly equals taxes paid. A better term to beapplied to the point where a given program's benefits are completely phased out might be the "zero-benefit level ofincome".
"Recalling again that child allowances are adjusted up to only four children, families with more than fourchildren would face the four-children benefit schedule and have complete phase-out at an income level equivalent to200 percent of the poverty line for a family with four children.
-207-6

considerable experimentation on paper with alternative structures it was decided that the MTRobjective should be to keep the combined MTRs to 70 percent or below."
Although efforts were made not only to keep total MTRs under 70 percent but also to makethe MTS pattern across income ranges as smooth as possible, the complications of interactionbetween the program and taxes and differential child allowances by family size cause the totalMTPs implied to vary both across household types and over different earnings ranges for a givenhousehold type. This is shown in Figure C.2.
The total real MTRs are negative in the range up to $8,500 earnings because this is therange in which the wage supplement phases in; they jump to over 50 percent as the phase-out ofboth the wage supplement and child allowance begins and federal and state taxes increase and. stayat a very high level until about $27,500 of earnings. Note that the MTRs are much higher forfamilies with more children. This is because the much larger child allowance that they receive mustbe phased out before reaching the 200 percent poverty limit set for benefits. It is recognized thatthese high MTRs may discourage efforts by New Hope participants to improve their earnings butthey are an unavoidable consequence of substantial benefits at lower earnings, levels that must bephased out by the point the politically feasible break-even income level is reached combined withthe effects of the federal and state tax systems.
Combined Wage Supplement and Child Allowance. We have described separately twoelements of the New Hope benefits package: the wage supplement and the child allowance. It isuseful, however, to note briefly a few of their combined effects. In Figure C.2 and the paragraphabove we described their combined effects on total real MTRs.
It was stated at the outset that New Hope benefits were designed to be sufficient to raisefamily income above the poverty line when the earner works at least 40 hours a week at theminimum wage. A worker earning the minimum wage working 40 hours a week all year wouldearn $8500 (at the 1993 minimum wage level when the benefits were designed). At that point ofearnings, the value of the New Hope wage supplement and child allowance are both at theirmaximum, and the gross (before tax) income of New Hope beneficiaries is above the poverty linefor every family size.
In addition, we note that at this earnings level, the combined New Hope wage supplementand child allowance exceeds the value of the federal EIC and the combined value of the federal andWisconsin State EIC for every family size.
Health Benefits. Inadequate health insurance coverage has been a national concern forseveral years; at the same time, employer-provided health insurance has declined considerably. It
"One further complication in setting phase-out rates arises from the fact that the more children in thehousehold, the higher the maximum children's allowance. For example, the maximum child allowance with onechild is $1,600 per year whereas it is $5,800 per year for four children. In order to completely phase out highermaximum amounts with more children by the "zero-benefit income level" it is necessary to have higher phase outrates than are required for households with fewer children. Thus, for example, the initial phase-out rate (beforefederal income taxes start) for the child allowance with one child is 27 percent whereas with four children it is 35percent.
-208-7
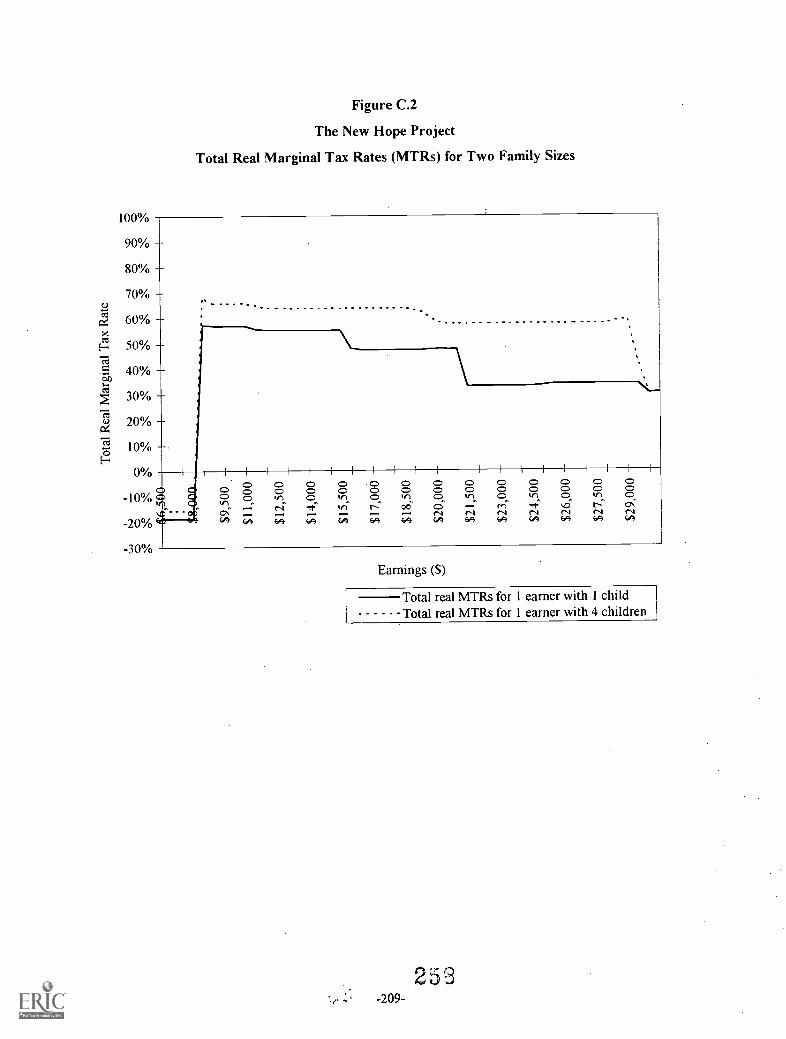
100%
90%
80%
70%
60%
50%
40%
30%
20%
10%
0%
-10%.6-
-20%
-30%
Figure C.2
The New Hope Project
Total Real Marginal Tax Rates (MTRs) for Two Family Sizes
0 0 0 0 0 0 0 0 0 0 0 0 00 0 0 0 0 0 0 0 0 0 0 C> 0 00 0 kr) 0 kr) 0 .r) 0 kr) 0 .1-) 0 trl 0tr) .,
.--. N -1 tri' r: oe o ,-, ri ,t .6 r- Cr,CT" . ,, , .--. .--. N N N N N N NEA L c4 6A 6A EA 6A EA EA EA EA EA EA EA
Earnings ($)
Total real MTRs for 1 earner with 1 childTotal real MTRs for 1 earner with 4 children
258-209-
has been argued that fear of not obtaining health insurance and losing Medicaid coverage hasincreased the reluctance of welfare recipients to increase their work effort. The designers of NewHope insisted from the outset that assuring access to health insurance at a reasonable cost should bean integral part of the demonstration benefit package.
While assuring access to health insurance was a primary goal, the designers of New Hopefelt it was important to have participants feel some personal responsibility for the costs ofinsurance, therefore they required some premium copays on the part of participants receiving healthcare benefits through New Hope.
In designing the health insurance benefit and copays, the designers were once againbalancing objectives in this case, making work pay, targeting payments to worst-off families,and reducing barriers to work but with shared responsibility for costs).
In setting the basic copays the designers looked at information regarding annual averageemployee contributions to HMO premiums in the Milwaukee area." Here is a summary of thesecontributions:
Contribution Individual Two-Person Family Three-Person (or more) Family
Low average $72 $112 $168
High average $600 $685 $1,548
Note that this information indicates that among employees in Milwaukee no employee pays the fullcost of the HMO premiums.
The New Hope copays were set to start at the low average, for example, $72 for singleindividuals, $168 for household with three persons or more, and then to increase slowly as incomeincreases until they reached the high average, for example, $600 for the single individual and$1,548 for the household with three persons or more.
In line with the objective of targeting payments to worst off families", in the range ofearnings up to $8,000 the copay amounts are set at the low average and held constant (just like thechild allowance amounts). After $8,000 of earnings the copays increase as earnings increase.
The concerns about marginal tax rates again enter in. The rate of increase in the copays wasadjusted to be low in the range of income where MTRs due to the effect of the wage supplement,child allowance, and taxes were high and then increase more sharply as necessary to attain the high
14They used the 1993 Annual Milwaukee Area Employer Healthcare Coverage Survey conducted by the GreaterMilwaukee Business Groups on Health.
-2102

average copay when total family earnings are $30,000, or 200 percent of the:poverty line for thathousehold type, which ever is higher."
If participants become unemployed, their health coverage can continue for up to threeweeks. After that they must again meet the 30-hour-per-week work requirement in order toreestablish enrollment in the health care plan. This provision was included to prevent interruptionof coverage as a result of short spells of unemployment.
Child Care Benefits. Inability to obtain child care, either because of access or affordability,has long been regarded as a major barrier to low-income families with children attaining themaximum potential income from work. The designers of New Hope recognized that if work was tobe the centerpiece of the demonstration, steps had to be taken to reduce such child care barriers. Aswith health insurance, the New Hope designers felt that shared responsibility by the participants forthe costs of child care was important. Thus, the benefit is organized as a partnership in which theparticipant arranges care and pays for a portion of the cost and the New Hope Project ensures thatthe provider is licensed by Milwaukee County and is paid in a timely manner. Assistance for childcare is available for children under age 13 at either a child care center or at an individual provider.To be eligible for such benefits a participant who is single must work at least 30 hours per weekand the spouse of a married participant must work at least 15 hours per week.
The participant cost share, or copay, is related to the number of children in child care and iscalculated as a percentage of the children's allowance amount for that number of children. Thebase, or minimum, child care copay is as follows:
Number of Children in Child Care Minimum Child Care CoPay
1 $400 (25% of $1,600)
2 $775 (25% of $3,100)
3 $1,125 (25% of $4,500)
4 or more $1,450 (25% of $5,800)
These minimum copays are held constant as earnings increase up to total family earnings of$8,500 and after that they rise by 1 percent of any increase in earnings; for example, if earningsincrease from $9,000 to $10,000 the child care copay increases by $10. This low rate of increase ofthe copay was dictated by the concern to keep real MTRs or below 70 percent. When the totalfamily earnings exceed 200 percent of the poverty line or $30,000 (which ever is higher) the NewHope subsidy ends and the participant must pay full costs of any child care.
As with the health care coverage, if the worker becomes unemployed the participant iseligible for part-time child care subsidy from New Hope. The program will pay for a certainnumber of hours of child care each day for three weeks, or 20 percent of child care costs duringthree periods of unemployment.
"For the single individual copays are increased so the high average copay ($600) is obtained at $20,000 inearnings.
-211-260

III. The Multiple-Earner Package
The basic parameters of the New Hope benefit package are as we have described themabove for the single earner case. Some complications arise, however, when there is more than oneearner in a household.
With multiple earners in the household, the principle of a wage supplement determinedsolely by each worker's earnings comes strongly into play. The amount of supplement attributed toeach worker is calculated on the basis of that earner's pay without regard to what others in thefamily are earning. The argument for this principle is twofold: first, in the American workplace,almost without exception, the rate of workers pay is unrelated to their family circumstances, eitherthe size of their family or the level of income or wealth of the family. At a given job, in a givenestablishment, all workers are rewarded for their efforts at the same rate. Second, the more thebenefits are determined independent of other family members economic status, the less areincentives introduced to either break up family units or form family units in order to maximizebenefits or to minimize costs (taxes) family breakup objective. It can be argued that, like theminimum wage, this principle works against the targeting payments to worst off families objective),it is "target inefficient" because a low-earning worker in a high-income family qualifies for thesame wage supplement as another worker at the same low-earnings level who is in a low-incomefamily. However, since highlighting the incentives to work and to increase earnings is a centralobjective, it was decided that in this case this principle should override the objective.
Applying this principle of independent worker wage supplements can generate variouscomplicated patterns of implicit MTRs at the household level; one earner might be in the phase-outrange of earnings, for example, increasing earnings from $11,500 to $12,000, and have a benefitreduction rate of 20 percent while the other earner is in the phase-in range of earnings, for example,increasing earnings from $6,000 to $7,000, and has a benefit increase rate of 25 percent. In anotherfamily with the same initial total family earnings, for example, $17,500, one earner might be at the$9,000 earnings level and the second at the $8,500 level and both would face a benefit reductionrate of 20 percent.
The designers of the New Hope benefits package ameliorated these problems first byrelating the child allowance phase-out rates to number of children, total family earnings, and thefederal income tax rates and by keeping a close eye on the overall possible real MTRs (change inafter-benefit-after-tax-after-copay income divided by change in before-benefit-before-tax-before-copay total family earnings) while designing the child care and health insurance co-pays.
However, another problem remained. The political feasibility objective implied that thereshould be some level of total family earnings at which all New Hope benefits had been terminated.As discussed above, this break-even income level was set at $30,000 or 200 percent of poverty,whichever was higher for the given family type. Given this, and the principle of worker's wagesupplement determined solely by that worker's earnings, the situation could arise where a secondearner was still eligible for a worker's supplement when the total family earnings hit $30,000. Forexample in a household with two workers with one child, if the first worker was earning $25,000and the second worker moved up from $5,000 to $6,000. then the wage supplement formula wouldcall for the second worker, who had been receiving $1,250. to now receive a wage supplement of
-212-

$1,500. but the break-even income level cap would dictate no supplement be paid; the MTR on thesecond worker's $1,000 increase in earnings would be 125 percent. This type of phenomenon,implicit MTRs in excess of 100 percent, has sometimes been referred to as a "cliff."
It was decided that the principle of independent worker wage supplements would bemaintained even though in some cases it combined with the break-even income level cappolitical feasibility objective to generate "cliffs," that is, MTRs in excess of 100 percent right atthe break-even income level. It was judged unlikely that many families in the New Hopedemonstration would in fact reach this level of total family earnings. It was hoped that if they did sothe family would have become so committed to high work effort and improvement in earnings thatit would ignore the "cliff' effect at that level.
In the case of the two-earner family the role of the separation of the wage supplement andthe child allowance in reducing the "marriage penalty" family breakup objective becomesmore evident. The greater the portion of the total of the package of benefits is in the wagesupplement, the less is the incentive to form separate family units. It is only the effect of the secondearner's earnings on reducing the child allowance portion that constitutes an incentive to break up.'
Another issue that arises in the two-earner case is what the minimum hours of work shouldbe in order for the second worker to qualify for a wage supplement. Recall that for the singleworker there is a minimum of 30 hours of work before the worker and family qualify for anybenefits. Further note that consistent with the emphasis on making work pay but also providing achild allowance, there is no addition to benefits if there is a second adult in the family who is notworking; in this case the New Hope benefits are the one worker's wage supplement, the childallowance and health insurance subsidy. It was decided that the second adult must work at least 15hours a week in order to qualify for a wage supplement and that it would be related to the level ofthat worker's earnings. In addition, the family would not qualify for the child care subsidy unlessthe second adult were working at least 15 hours a week."
'For example, suppose a family with two children has one worker earning $9,000 and the second $6,500. If thesecond worker had an opportunity to increase earnings to $7,000 his wage supplement would go up by $125 (as heis in the phase-in range). Since total family earnings rise from $15,500 to $16,000 the child allowance they areentitled to falls from $963 to $813. The increase in the wage supplement offsets to a large degree the decline in thechild allowance.
'7A further adjustment in the child care subsidy formula is made where there are two earners. The copaymentrequirement is held constant until total family earnings reach $15,000 and then increases slowly as family totalearnings increase. Recall that in the single earner case the copayment remained constant until $8,000 of earningsand then began to increase. The rationale was that if the fast earner is working 40 hours a week at the minimumwage, obtaining about $8,500 per annum, and the second worker works 30 hours a week at the minimum wage,obtaining about $6,500 per annum, the total family earnings are $15,000. Thus, holding the co-pay constant helps toencourage the second worker to increase work up to 30 hours.
-213-
2 2to

Appendix D
23 3
Methodology of the New Hope Neighborhood Survey
Using the initial dwelling-based sample to make inferences about individuals or about theentire population of the target areas requires adjustment for differential sampling probability, anapparent gender bias in response rates, the New Hope Neighborhood Survey (NHNS) method ofenumeration of children, and nonresponse. Each is discussed in turn.
Differential Sampling Probability. While the probability of selection for the sample wasequal across all dwelling units, the probability of selection for adults was not, because thenumber of adults varies across households. Once a dwelling unit is selected for the sample, anadult in a household with three others aged 18 or over has only one-quarter the chance that asingle adult living alone has of being interviewed. As a result, without adjustment, inferencesabout the situation of all adults in these neighborhoods drawn from the sample of respondentswould be biased toward characteristics of adults living alone.
Table D.1 presents a first tabulation of raw NHNS data. The respondents are counted onthe basis of relationship to other household members and according to the total number of adultsreported to be living in the household. Only about one-third (246 of 719) of the NHNSrespondents were adults living alone, so the "most recent birthday" rule was applied in almosttwo of every three interviews. Almost one NHNS respondent of five lives in a householdcomprising at least three adults. Correction for this differential probability of interviewing isrelatively straightforward: in all instances of inference concerning the characteristics of all NewHope neighborhood residents in the material that follows, responses are weighted by number ofadults in the household the larger the respondent's household, the greater the weight.
Gender Bias. Weighting for the number of adults is not the only adjustment that must bemade. The NHNS results exhibit a gender bias that is common to household survey data.' Thesample includes more women (60 percent) than men (40 percent). This could reflect a genderdifferential in the neighborhood population; in the 1990 census men constituted only 47 percentof the adult population in these neighborhoods. However, evidence that the gender differentialproduced by the survey may reflect something other than actual neighborhood population isprovided by tabulation of gender of the 326 respondents who report being married or living witha partner. These data are reported in Table D.2. For couples, the procedure followed to selectrespondents should produce equal numbers of women and men, since there is no reason tobelieve that on any particular date women are more likely to have been born recently than men.However, for married couples only 45 percent of respondents were male, and only 42 percent ofrespondents reporting living with a partner were male. The differential is roughly the same forelderly respondents as for those who were under age 65. The odds that the overall 44-56 percent
'See O'Rourke and Lakner, 1989, for another example of the problem.
-216- 2 t.;

Table D.1
The New Hope Project
Adults in Respondent's Living Unit
Living Situation Sample PercentNumber of Adults in the Living Unit
1 2 3 4 5 6+ Missing
All circumstances 719 100.0 246 340 80 36 8 8 1
Respondent lives alone 145 20.2 145 0
Respondent lives with family 554 77.1 101 327 77 35 7 6 1
With children 347 48.3 98 188 36 19 3 3 0Couple 206 28.7 0 159 27 15 3 2 0
Married 148 20.6 0 108 21 14 3 2 0Other 58 8.1 0 51 6 1 0 0 0
Single parent 141 19.6 98 29 9 4 0 1 0Without children 207 28.8 3 139 41 16 4 3 1
Couple 120 16.7 0 91 19 8 1 1 0Married 91 12.7 0 68 16 7 0 0 0Other 29 4.0 0 23 3 1 1 1 0
Other 87 12.1 3 48 22 8 3 2 1
Respondent lives in household withonly other nonfamily persons 20 2.8 0 13 3 1 1 2 0
With children 2 0.3 0 1 0 1 0 0 0Without children 18 2.5 0 12 3 0 1 2 0
SOURCE: New Hope Neighborhood Survey.
COPY AVAILIA -217-r - 285

split would have appeared in a sample this large had the true probability of selection been .5 areless than 1 chance in 40.2
This difference in response rates between men and women may reflect both genderdifferences in willingness to participate in interviews and a possible tendency for women, whoare more likely to be the first person contacted by interviewers, to deny survey interviewersaccess to men in the household. In the absence of additional information, the analysis assumesthat the gender response bias evident in Table D.2 applies to all adults who do not reside alone,that is, that women are approximately 25 percent more likely to be respondents' than men. Thetabulations of personal and family characteristics that follow are reweighted to correct for thisdifferential as well as the sampling bias created by variation in household size already discussed.
Enumeration of Children. The structure of questions in the NHNS in part reflectedstandards of eligibility for New Hope itself. This characteristic is reflected in the questioning ofrespondents concerning the numbers of adults and children present. The question posedconcerning adults was straightforward: "Besides yourself, how many adults 18 years of age orolder live in this household?" This is one of the bases for Table D.1. The question posedconcerning the number of children was different. Instead of asking for the number of childrenpresent, NHNS interviewers asked for the number of children of the respondent and/or his or herspouse/partner who were present. Number of children reported this way is what counts indetermining eligibility for some New Hope services. However, the method of posing the questioncreates a problem for estimating the total number of children in the respondent's household,because if the informant selected by the birthday rule turned out not to be a child's parent,guardian, or spouse or partner of his or her parent or guardian, the child would not be reported. Incalculations reported in Chapter 4 for total population for New Hope target neighborhoods,responses for respondents with children who are living in households that include adults otherthan their spouse or partner are reweighted to reflect the fact that some such interviews failed tocount children present.'
Nonresponse. Finally, where inferences are required for total population, adjustment fornonresponse is made by assuming that households for which interviews could not be obtained areidentical to those for which interviews were obtained in the same target area. The Southsideresponse rate was 84.75 percent, so population counts derived from responses are inflated by1/.8475 = 1.18 to obtain a count for the entire sample. On the Northside, where responses rateswere lower, this response inflation factor is 1.25.
It would be useful to refine this procedure on the basis of other characteristics of theaddresses at which interviews were not obtained, but available data offer little immediateprospect of significant estimate improvement from more elaborate approaches. The adjustments
'It is likely that some of the unmarried partnerships reported in the NHNS are same-sex. If these relationshipsare predominantly female, then such arrangements could account for the greater gender imbalance among unmarriedthan married couples. It was not possible to identify such relationships from the survey responses.
'The adjustment applied in estimating total population is to multiply the number of children reported by eachrespondent by T/C, where T is the number of adults in the household and C=1 if the respondent has no spouse orpartner, C=2 otherwise.
-218-,
.66.

Table D.2
The New Hope Project
Distribution of Respondents With Partners, by Gender and Age
Partnership StatusUnder Age 65 Age 65 or Over Total
Sample Percent Sample Percent Sample Percent
MarriedFemale 115 53.5 16 66.7 131 54.8Male 100 46.5 8 33.3 108 45.2
PartnerFemale 50 58.1 0 0.0 50 57.5Male 36 41.9 1 100.0 37 42.5
TotalFemale 165 54.8 16 64.0 181 55.5Male 136 45.2 9 36.0 145 44.5
Sample size 301 100.0 25 100.0 326 100.0
SOURCE: New Hope Neighborhood Survey.

applied are likely to exaggerate population and, in particular, the number of children, if refusalsand other problems are concentrated among households that include only adults.
The earlier discussion of possible gender bias in responses obtained from persons who reportedliving with a spouse or partner emphasizes that in principle the procedure followed in the NHNSto identify respondents gave members of both marital and other partnerships equal chance to beselected. The NHNS includes questions covering partner's status. If each respondent uses thesame standards to evaluate his or her partner's status as is applied personally, the result should bethat the situation of respondents and partners looks the same.
Table D.3 summarizes responses regarding own and partner's unemployment forrespondents under age 65 who live with a spouse or partner. Respondents tend to be marginallymore likely to report themselves as having looked for work if they are jobless than they do fortheir partners, and they are marginally more likely to declare partners "retired" if they are notlooking for full-time work than they are to so designate themselves. The standard error of theestimated difference in unemployment rates between respondents and partners is about 2.9percentage points. The 4 percentage point difference reported in the table is not, therefore,statistically significant by common standards.
-220- rf

Table D.3
The New Hope Project
Respondent and Partner Employment Status
Employment Status and Barrier Respondent Partner
Employment statusEmployed 63.8 66.6Not employed, but looked for job in preceding month 9.6 6.6Not employed, did not look for job in preceding month 19.6 17.2Not employed, did not look for job in preceding month,but currently available for full-time work 7.0 8.7
Didn't answer the question 0.0 0.6
Unemployment rate'Standard 13.1 9.0Expanded 20.6 18.7
Client-reported barriers to work readinessbRetired 12.3 17.2In school 6.2 1.6Health/disability problems, including pregnancy 47.1 40.6Caring for children 22.5 29.9Disinclined to work 11.6 16.4Needed at home 12.3 16.0Other 8.0 7.4
SOURCE: New Hope Neighborhood, Survey.
NOTES: 'Tabulation limited to respondents reported as under age 65, and living with a spouse or living asunmarried partner with a girlfriend or boyfriend.
bRespondents cited multiple reasons.
-221- 2 6' 9

Appendix E
270
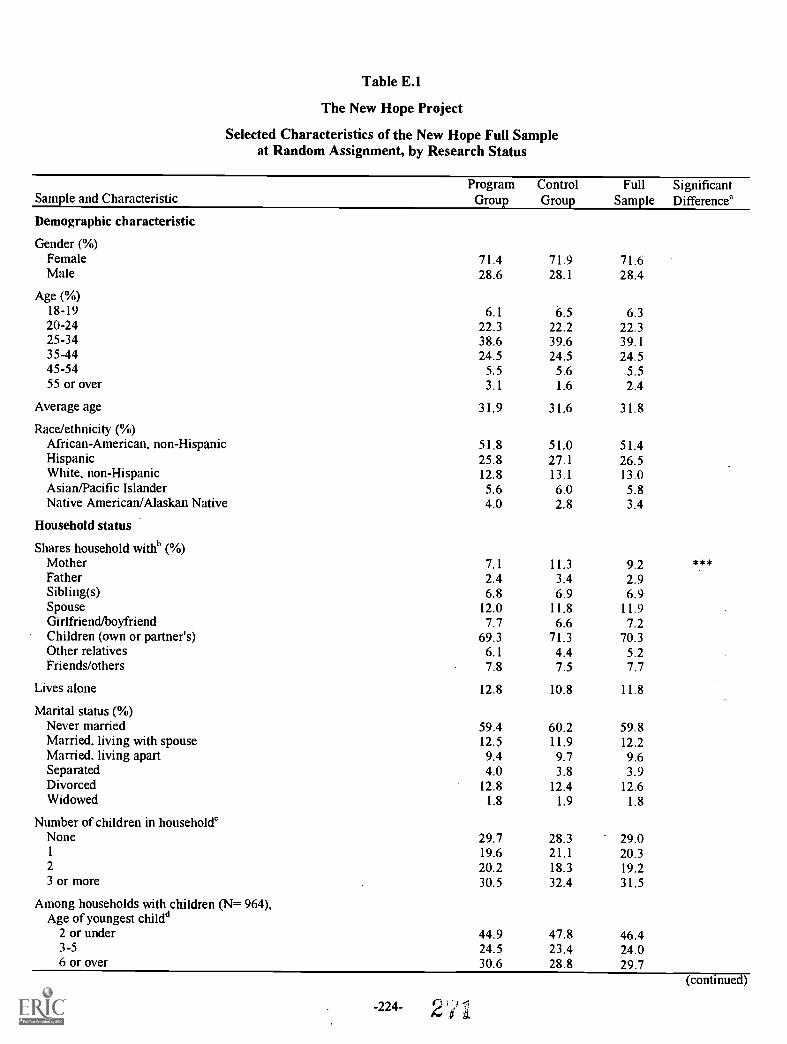
Table E.1
The New Hope Project
Selected Characteristics of the New Hope Full Sampleat Random Assignment, by Research Status
Sample and CharacteristicProgramGroup
ControlGroup
FullSample
SignificantDifference'
Demographic characteristic
Gender (%)Female 71.4 71.9 71.6Male 28.6 28.1 28.4
Age (%)18-19 6.1 6.5 6.320-24 22.3 22.2 22.325-34 38.6 39.6 39.135-44 24.5 24.5 24.545-54 5.5 5.6 5.555 or over 3.1 1.6 2.4
Average age 31.9 31.6 31.8
Race/ethnicity (%)African-American, non-Hispanic 51.8 51.0 51.4Hispanic 25.8 27.1 26.5White. non-Hispanic 12.8 13.1 13.0Asian/Pacific Islander 5.6 6.0 5.8Native American/Alaskan Native 4.0 2.8 3.4
Household status
Shares household withb (%)Mother 7.1 11.3 9.2 ***Father 2.4 3.4 2.9Sibling(s) 6.8 6.9 6.9Spouse 12.0 11.8 11.9Girlfriend/boyfriend 7.7 6.6 7.2Children (own or partner's) 69.3 71.3 70.3Other relatives 6.1 4.4 5.2Friends/others 7.8 7.5 7.7
Lives alone 12.8 10.8 11.8
Marital status (%)Never married 59.4 60.2 59.8Married, living with spouse 12.5 11.9 12.2Married, living apart 9.4 9.7 9.6Separated 4.0 3.8 3.9Divorced 12.8 12.4 12.6Widowed 1.8 1.9 1.8
Number of children in household'None 29.7 28.3 29.01 19.6 21.1 20.32 20.2 18.3 19.23 or more 30.5 32.4 31.5
Among households with children (N.--- 964),Age of youngest childd
2 or under 44.9 47.8 46.43-5 24.5 23.4 24.06 or over 30.6 28.8 29.7
(continued)
-224- 2

Table E.1 (continued)
Sample and Characteristic
ProgramGroup
ControlGroup
FullSample
SignificantDifferences
Household has second potential wage earners (%) 13.1 12.5 12.8
Labor force status
Ever employed (%) 95.9 93.5 94.7
Ever employed full time (%) 85.7 84.1 84.9
For longest full-time job, among those ever employed full time (N=1,151),Average length of job (months) 38.5 36.0 37.2
Benefits provided (%)Paid vacation 50.9 50.1 50.5
Paid sick leave 39.7 36.6 38.1
Medical coverage (individual) 29.1 30.3 29.7
Medical coverage (family) 27.4 27.9 27.6
Coverage by a union 14.3 13.0 13.6
Pension/retirement 21.6 18.6 20.1
Child care 1.2 1.8 1.5
Tuition reimbursement 8.5 7.0 7.7
Still with that employer (%)Yes 15.5 14.4 15.0
No 84.5 85.6 85.0
Among those not with that employer (N=978),Average time since departure (months) 18.7 21.8 20.2
Reason for leaving that job (%)Plant or division closed 8.4 9.2 8.8
Other layoff 12.5 9.0 10.8
Seasonal/temporary job ended 6.6 7.6 7.1
Fired 10.0 7.8 8.9
Quit 25.4 23.2 24.3
Other 37.1 43.1 40.1
Approximate earnings in past 12 months (%)None 30.2 32.1 31.2
$1-999 17.4 14.1 15.8
$1,000-4,999 24.2 26.2 25.2
$5,000-9,999 16.1 17.4 16.7
$10,000-14,999 8.3 7.4 7.8
$15,000 or above 3.8 2.8 3.3
Current work status (%)Employed 37.9 37.1 37.5
Not employed 54.7 55.5 55.1
Missing 7.4 7.4 7.4
Among those currently employed (N=509),Average hourly wage ($) 7.95 8.13 8.04
Average hours worked per week (%)**
1-14 2.3 8.0 5.1
15-19 3.1 4.4 3.8
20-29 17.2 12.4 14.8
30 or more 77.3 75.3 76.3(continued)
T COPY AI AIILA LE -225-

Table E.1 (continued)
Sample and CharacteristicProgram
GroupControlGroup
FullSample
SignificantDifference'
Among those not currently employed (N=748),Job seeking in the past month (%) **
Looking for full time work 81.4 76.4 78.9Looking for part time work 5.9 3.2 4.6Not looking for work 8.4 12.5 10.4Missing 4.3 8.0 6.2
Public assistance status
Currently receiving AFDC, General Assistance,Food Stamps, or Medicaid (%)
Any type 61.1 64.7 62.9AFDC 44.3 47.7 46.0General Assistance 5.2 5.6 5.4Food Stamps 56.1 58.9 57.5Medicaid 49.4 53.8 51.6
Received assistance (AFDC, FS, GA, or Medicaid)in past 12 months (%)
68.9 72.3 70.6
Total prior AFDC/GA cash assistance (%)None 25.0 25.3 25.1Less than 4 months 8.6 8.9 8.74 months or more but less than 1 year 11.4 9.2 10.31 year or more but less than 2 years 10.5 10.5 10.52 years or more but less than 5 years 20.0 19.4 19.75 years or more but less than 10 years 14.1 16.0 15.010 years or more 10.5 10.9 10.7
Resided as a child in a household receiving AFDC (%)Yes
Aid received 5 years or more 27.2 29.0 28.1Aid received less than 5 years 8.3 8.6 8.4
No 56.8 57.0 56.9Don't know 7.7 5.5 6.6
Educational status
Highest diploma/degree earned (%)GEDs 13.3 14.0 13.6High school diploma 32.5 31.3 31.9Technical/A.A./2-year college degree 10.5 9.7 10.14-year college degree or higher 1.9 1.5 1.7None of the above 41.9 43.5 42.7
Highest grade completed in school (average) 10.8 10.8 10.8
Current and recent education and training activities
Currently enrolled in any type of education or training (%)Any type 30.2 33.6 31.9
GED preparations 5.2 5.2 5.2English as a Second Language 2.2 2.8 2.5Adult Basic Education 0.9 1.8 1.3Vocational education/skills training 2.4 4.0 3.2 *
Post-secondary education 2.8 3.1 3.0Job search/job club 14.3 14.9 14.6Work experience 6.6 6.5 6.6High school 1.3 0.7 1.0
(continued)
-226- 2 73

Table E.1 (continued)
Sample and CharacteristicProgramGroup
ControlGroup
FullSample
SignificantDifference'
Enrolled in any type of education or training during thepast 12 months (%)
Any type 34.2 35.5 34.9GED preparations 6.1 5.9 6.0English as a Second Language 3.2 5.0 4.1
Adult Basic Education 1.3 2.5 1.9
Vocational education/skills training 5.6 6.6 6.1
Post-secondary education 3.4 3.7 3.5
Job search/job club 10.8 10.2 10.5
Work experience 8.0 6.2 7.1
High school 2.1 1.6 1.8
Other factors related to obtaining/retaining employment
Have access to a car (%) 41.0 42.0 41.5
Ever arrested for anything since 16th birthday (%) 21.1 26.0 23.5 *4,
Housing status (%)Rent 87.3 88.2 87.7
Own 5.5 5.0 5.3
Other 7.3 6.8 7.0
Number of moves in past 2 yearsNone 31.1 29.5 30.31 30.8 29.2 30.02 or more 33.0 37.3 35.2
Missing 5.0 4.1 4.6
Sample size 678 679 1,357
SOURCE: MDRC calculations from Background Information Forms for 1,357 sample members randomly assigned fromAugust 1994 through December 1995. Five additional sample members who were missing these forms were excluded from the
sample.
NOTES: Except for three items, the nonresponse rate for all specific characteristics was less than 1 percent and thereforethese missings were excluded from the calculations. For the three characteristics, for which the nonresponse rate ranged from5 to 7 percent for the full sample, the nonresponses are shown on the table as missings.
Distributions may not add to 100.0 percent because of rounding.aA chi-square test or a t-test was used to assess the statistical significance of each difference in characteristics between the
program group and the control group. Statistical significance levels are indicated as *=1 percent, **=5 percent, and ***=I
percent.'Because some sample members may be in more than one category, totals may not equal all categories summed.
`Includes all dependents under age 18.dIncludes all dependents under age 18.`The percentage of households with a second potential wage earner represents the number of heads of household who at
the time of random assignment provided the Social Security number of a second adult living in the household who mightparticipate in New Hope.
This refers to the total number of months accumulated from at least one spell on an individual's own AFDC or GA case
or the case of another adult in the household.sThe GED credential is given to those who pass the GED test and is intended to signify knowledge of basic high school
subjects.

Appendix F
275
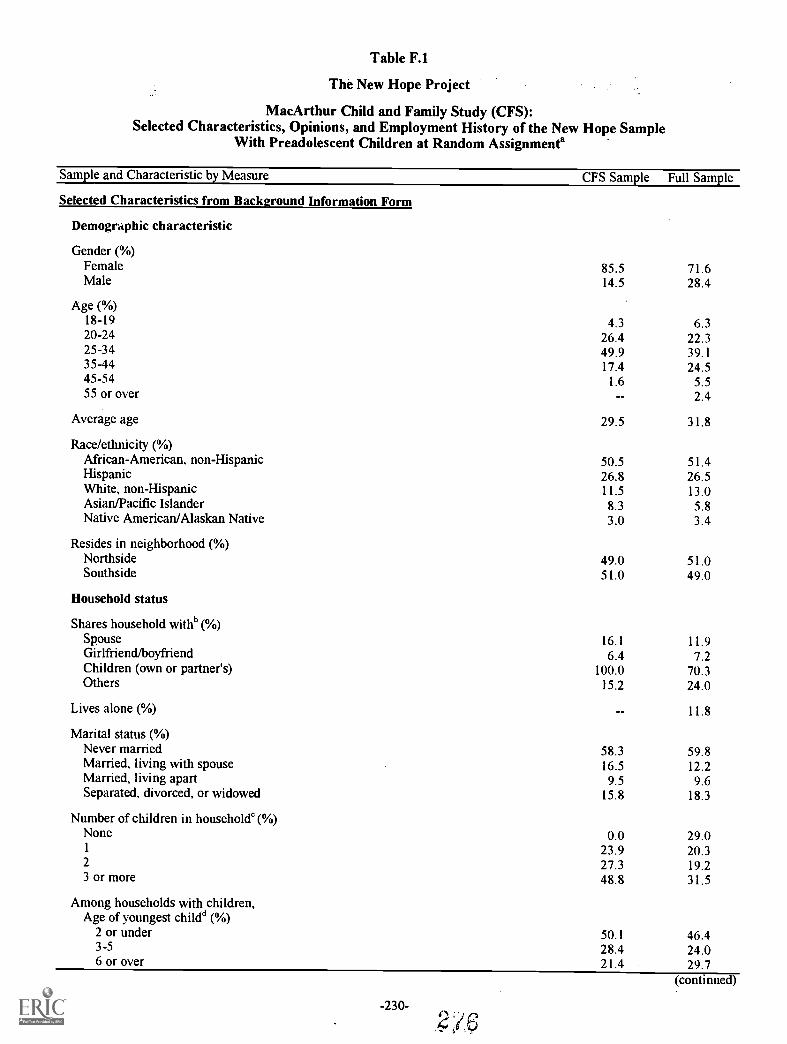
Table F.1
The New Hope Project
MacArthur Child and Family Study (CFS):Selected Characteristics, Opinions, and Employment History of the New Hope Sample
With Preadolescent Children at Random Assignment'
Sample and Characteristic by Measure CFS Sample Full Sample
Selected Characteristics from Background Information Form
Demographic characteristic
Gender (%)Female 85.5 71.6Male 14.5 28.4
Age (%)18-19 4.3 6.320-24 26.4 22.325-34 49.9 39.135-44 17.4 24.545-54 1.6 5.555 or over 2.4
Average age 29.5 31.8
Race/ethnicity (%)African-American, non-Hispanic 50.5 51.4Hispanic 26.8 26.5White, non-Hispanic 11.5 13.0Asian/Pacific Islander 8.3 5.8Native American/Alaskan Native 3.0 3.4
Resides in neighborhood (%)Northside 49.0 51.0Southside 51.0 49.0
Household status
Shares household withb (%)Spouse 16.1 11.9Girlfriend/boyfriend 6.4 7.2Children (own or partner's) 100.0 70.3Others 15.2 24.0
Lives alone ( %) 11.8
Marital status (%)Never married 58.3 59.8Married, living with spouse 16.5 12.2Married, living apart 9.5 9.6Separated, divorced, or widowed 15.8 18.3
Number of children in household' (%)None 0.0 29.01 23.9 20.32 27.3 19.23 or more 48.8 31.5
Among households with children,Age of youngest childd (%)
2 or under 50.1 46.43-5 28.4 24.06 or over 21.4 29.7
(continued)
-230-

Table F.1 (continued)
Sample and Characteristic by Measure CFS Sample Full Sample
Household includes CFS children in age category' (%)1-3 (12-47 months) 60.7 n/a4-10 (48-131 months) 72.4 n/a
Household has second potential wage earner (%) 17.5 12.8
Labor force status
Ever employed (%) 93.1 95.0
Ever employed full time (%) 82.0 85.9
For longest full-time job, among those ever employed full time,Average length of job (months) 31.1 36.8
Benefits provided.(%)Paid vacation 46.7 49.9Paid sick leave 34.4 37.7Medical coverage (individual) 23.0 29.3Medical coverage (family) 28.8 27.4Coverage by a union 10.8 13.5Pension/retirement 16.8 19.8Child care 1.5Tuition reimbursement . 8.1 7.6
Approximate earnings in past 12 months (%)None 35.2 31.2$1-999 16.1 15.8$1,000-4,999 22.7 25.2$5,000-9,999 14.0 16.7$10,000-14,999 8.3 7.8$15,000 or above 3.7 3.3
Current employment status (%)Employed 39.0 37.5Not employed 55.4 55.1Missing 5.5 7.4
Among those currently employed,Average hourly wage ($) 6.53 6.36Average hours worked per week (%)
1-29 19.8 23.730 or more 80.2 76.3
Public assistance status
Currently receiving AFDC, General Assistance,Food Stamps, or Medicaid (%)
Any type 79.8 62.9AFDC 67.1 46.0General Assistance 5.4Food Stamps 74.8 57.5Medicaid 73.9 51.6
Received assistance (AFDC, FS, GA, or Medicaid) in past 12 months (%) 86.6 70.6
Total prior AFDC/GA cash assistance ( %)None 13.9 25.1Less than 2 years 26.8 29.52 years or more but less than 5 years 26.9 19.75 years or more 32.5 25.7
Resided as a child in a household receiving AFDC (%) 39.9 36.5(continued)
-231-
277

Table F.1 (continued)
Sample and Characteristic by Measure CFS Sample Full Sample
Educational status
Received high school diploma or GED8 (%) 57.4 57.3
Highest grade completed in school (average) 10.7 10.8
Currently enrolled in any type of education or training (%) 35.7 31.9
Other factors related to obtaining/retaining employment
Have access to a car (%) 48.1 41.5
Ever arrested for anything since 16th birthday (%) 18.2 23.5
Housing status (%)Rent 91.0 87.1Own 5.8 5.3Other 3.2 7.0
Number of moves in past 2 years ( %)None 29.1 30.31 29.9 30.02 or more 36.8 35.2Missing 4.2 4.6
Sample size 812 1,357
Opinions and Employment History from Private Opinion Survey
Client-reported employment history
Number of full time jobs (more than 30 hours a week) held in last 5 years (%)None 22.4 19.31 30.5 31.02 or 3 36.0 36.24 or more 11.1 13.5 ,
When unemployed, length of time it took to find new work (%)1 month or less 29.7 32.02-6 months . 35.7 38.5More than 6 months 13.2 12.6Don't know 21.4 16.9
Client-reported difficulties while working
Among those ever employed, those who said that they sometimesor often had these problems when they worked (%):
Client felt the boss or supervisor picked onor acted unfairly toward client 23.4 25.9
Family responsibilities interfered with the job andthis got client into trouble 28.7 24.5
There was too little help on the job to tell what to do and what not to doand this got client into trouble 8.4 9.7
Client got in trouble even when client was only a little late 9.1 10.2Client and the other workers argued and this got client into trouble 2.1 2.8Client did not like the way bosses or supervisors were ordering them around 11.2 13.9Client did not want to do work that other people should have been doing
and this got client into trouble 4.0 6.2Client could never satisfy some customers and this got client into trouble 1.9 2.8Alcohol or drug use caused problems on client's job 2.4 4.6Client got into trouble but never really understood the reasons why 2.0 4.4
(continued)
2 7 r)-232- 4s

Table F.1 (continued)
Sample and Characteristic by Measure CFS Sample Full Sample
Client-reported situations that affect employment
Those who reported health problems that limit the type of work they can do (%) 10.7 14.3
Those who have (%):Ever been evicted from an apartment or house over the last 10 years 20.0 17.5Ever been homeless 18.2 21.5Ever quit a job 59.4 60.0
Client-reported education and training preferences
Those who agreed a lot that they wanted to ( %):Go to school part time to study basic reading and math 35.3 33.1Go to school part time to get a GED 35.1 34.4Get on-the-job training for 1-3 months in a type of work
that they have not tried before 58.2 59.0Get on-the-job training so that they would know what it is like to work 54.2 51.9
Sample size 642 1,079
SOURCES: MDRC calculations from Background Information Forms for 812 sample members randomly assigned fromAugust 1994 through December 1995. MDRC calculations from Private Opinion Survey (POS) data for sample membersrandomly assigned from August 1994 through December 1995. The POS questions were voluntarily answered by 642sample members (80 percent) just prior to random assignment.
NOTES: Except for two items, the nonresponse rate for all specific characteristics was less than 1 percent and thereforethese missings were excluded from the calculations. For the two characteristics, for which the nonresponse rate rangedfrom 5 to 7 percent for the full sample, the nonresponses are shown on the table as missings.
Distributions may not add to 100.0 percent because of rounding.Dashes indicate that the sample size is under 10; therefore the calculations were omitted.
'The sample includes all New Hope sample members whose households included at leastone child in the age range of1 to 10 years (12 to 131 months) at the time of random assignment.
'Because some sample members may be in more than one category, totals may not equal all categories summed.cIncludes all dependents under age 18.
dIncludes all dependents under age 18.
`Some CFS households have children in both categories.
This refers to the total number of months accumulated from at least one spell on an individual's own AFDC or GAcase or the case of another adult in the household.
gThe GED credential is given to those who pass the GED test and is intended to signify knowledge of basic highschool subjects.
-2332 7

Appendix G
280

Table G.1
The New Hope Project
Monthly Earnings Supplement for One Earner With No Children: 1996
Worker Supplement'
Phase-in0.25
AnnualMaximum
$2,125Phase-out
0.2
Worker 1Earnings
Worker 1Supplementb
New HopeSupplement'
GovernmentEICd
GrossIncome
TotalTaxes°
Health InsuranceContribution
$83 $21 $15 $6 $105 $6 $6125 31 23 10 157 10 6167 42 30 13 210 13 6208 52 38 16 262 16 6250 63 46 19 315 19 6292 73 53 22 367 22 6333 83 .61 26 420 26 6375 94 71 26 472 29 6417 104 82 26 525 32 6458 115 96 24 578 35 6500 125 110 20 631 38 6542 135 125 17 683 41 6583 146 139 14 736 52 6625 156 153 11 789 63 6667 167 168 8 842 75 6708 177 182 4 895 86 6750 169 176 1 928 98 8792 160 169 0 961 110 10833 152 160 0 994 122 12875 144 151 0 1,026 133 14917 135 143 0 1,059 145 16958 127 134 0 1,092 157 19
1,000 119 125 0 1,125 168 211,042 110 116 0 1,158 181 23L083 102 108 0 1,191 193 251,125 94 99 0 1,224 206 271,167 85 90 0 1,257 218 291,208 77 81 0 1,290 231 311,250 69 72 0 1,322 243 331,292 60 64 0 1,355 256 351,333 52 55 0 1,388 268 371,375 44 46 0 1,421 281 401,417 35 37 0 1,454 293 421,458 27 29 0 1,487 306 441,500 19 20 0 1,520 318 461,542 10 11 0 1,553 331 481,583 2 2 0 1,586 343 501,625 0 0 0 1,625 356 1201,667 0 0 0 1,667 369 1201,708 0 0 0 1,708 381 1201,750 0 0 0 1,750 394 1201,792 0 0 0 1,792 407 1201,833 0 0 0 1,833 419 120
(continued)
2 3-236-

Table G.1
SOURCE: The New Hope Project.
NOTES: All figures are based on 1996 Earned Income Credit (EIC) benefits and poverty guidelines.Total New Hope financial support is made up of two parts: (1), the New Hope supplement, which is based on
earnings (one worker or two) and (2), the child allowance, which is based on earnings and number of dependentchildren under age 13. These financial benefits are set to boost a person's gross income (earnings + New Hopesupplement + government EIC) above poverty level at full-time work at the minimum wage ($708).
aPhase-in refers to the rate at which the total worker supplement would increase as worker's earnings increasedup to the maximum point for the total worker supplement. Annual maximum refers to the maximum dollar amountof the total worker supplement that a worker could receive. Phase-out refers to the rate at which the total workersupplement would decrease as worker's earnings increased beyond the maximum point.
'Represents the amount that New Hope would supplement earnings before netting out federal and state earnedincome credits.
`Has been adjusted for the effects of inflation; as a result, the New Hope supplement and the government EIC donot add precisely to the Worker 1 supplement.
dMay include the federal and state EIC. Individuals with or without children are eligible for the federal EIC,with the exception of one-earner households where the individual is under age 25 and has no children. The state EICis available only for individuals who have children.
`Includes federal and state income taxes and FICA. In addition, taxes may vary depending on income filingstatus.
-237- 2 3 2

Table G.2
The New Hope Project
Monthly Earnings Supplement for One Earner Under Age 25 With No Children: 1996
Worker Supplement
Phase-in0.25
AnnualMaximum
$2,125Phase-out
0.2
Worker 1Earnings
Worker 1Supplement
New HopeSupplement
GrossIncome
TotalTaxes
Health InsuranceContribution
$83 $21 $22 $105 $6 $6125 31 33 158 10 6167 42 44 211 13 6208 52 55 263 16 6250 63 66 316 19 6292 73 77 368 22 6333 83 88 421 26 6375 94 99 474 29 6417 104 110 526 32 6458 115 121 579 35 6500 125 132 632 38 6542 135 143 684 41 6583 146 154 737 52 6625 156 165 790 63 6667 167 176 842 75 6708 177 187 895 86 6750 169 178 928 98 8792 160 169 961 110 10833 152 160 994 122 12875 144 151 1,026 133 14917 135 143 1,059 145 16958 127 134 1,092 157 19
1,000 119 125 1,125 168 211,042 110 116 1,158 181 231,083 102 108 1,191 193 251,125 94 99 1,224 206 271,167 85 90 1,257 218 291,208 77 81 1,290 231 311,250 69 72 1,322 243 331,292 60 64 1,355 256 351,333 52 55 1,388 268 371,375 44 46 1,421 281 401,417 35 37 1,454 293 421,458 27 29 1,487 306 441,500 19 20 1,520 318 461,542 10 11 1,553 331 481,583 2 2 1,586 343 501,625 0 0 1,625 356 1201,667 0 0 1,667 369 1201,708 0 0 1,708 381 1201,750 0 0 1,750 394 1201.792 0 0 1,792 407 1201,833 0 0 1,833 419 120
SOURCE and NOTES: See Table G.1.
-238- 0 t)

Tab
le G
.3
The
New
Hop
e Pr
ojec
t
Mon
thly
Ear
ning
s Su
pple
men
t for
One
Ear
ner
With
One
Chi
ld: 1
996
Wor
ker
Supp
lem
ent
Phas
e-in
0.25
Ann
ual
Max
imum
$2,1
25Ph
ase-
out
0.2
Wor
ker
1
Ear
ning
sW
orke
r 1
Supp
lem
ent
Chi
ldA
llow
ance
New
Hop
eSu
pple
men
t
Gov
ernm
ent
EIC
Gro
ssIn
com
eT
otal
Tax
esC
hild
Day
Car
eC
ontr
ibut
ion
Hea
lth I
nsur
ance
Con
trib
utio
n
$83
$21
$133
$131
$29
$244
$6$3
3$9
125
3113
312
744
296
1033
916
742
133
122
5934
813
339
208
5213
311
874
400
1633
925
063
133
113
8845
219
339
292
7313
310
910
350
322
339
333
8313
310
411
855
526
339
375
9413
310
013
360
729
339
417
104
133
9514
765
932
339
458
115
133
9016
271
135
339
500
125
133
8617
776
338
339
542
135
133
9218
181
541
339
583
146
133
103
181
868
4533
962
515
613
311
418
192
048
339
667
167
133
125
181
973
5133
970
817
713
313
618
11,
026
5433
975
016
912
211
518
11,
047
5734
1079
216
011
396
181
1,07
062
3410
833
152
104
7818
11,
093
6835
1087
514
495
6018
11,
117
7435
1091
713
586
4218
11,
141
7935
1095
812
784
3417
81,
171
9136
11
1,00
011
981
3017
11,
202
103
3611
1,04
211
079
2616
41,
232
115
3711
1,08
310
276
2215
81,
263
127
3711
1,12
594
7418
151
1,29
414
038
11 (con
tinue
d)
234
285

Tab
le G
.3 (
cont
inue
d)
Wor
ker
1W
orke
r 1
Chi
ldN
ew H
ope
Gov
ernm
ent
Gro
ssT
otal
Chi
ld D
ay C
are
Hea
lth I
nsur
ance
Ear
ning
sSu
pple
men
tA
llow
ance
Supp
lem
ent
EIC
Inco
me
Tax
esC
ontr
ibut
ion
Con
trib
utio
n
1,16
785
7315
144
1,32
615
238
12
1,20
877
7112
137
1,35
716
538
12
1,25
069
699
130
1,38
917
839
12
1,29
260
686
123
1,42
019
139
12
1,33
352
662
116
1,45
220
440
12
1,37
544
640
109
1,48
421
640
13
1,41
735
630
102
1,51
922
940
13
1,45
827
610
951,
554
242
4113
1,50
019
590
881,
588
255
4113
1,54
210
580
811,
623
267
4214
1,58
32
560
741,
658
280
4214
1,62
50
550
671,
692
293
4314
1,66
70
540
611,
727
306
4316
1,70
80
530
541,
762
319
4318
1,75
00
525
471,
802
332
4420
ts.) 4:.
1,79
20
5112
401,
843
345
4422
5'1,
833
050
1833
1,88
435
845
24
1,87
50
4924
261,
925
371
4526
1,91
70
4830
191,
966
384
4529
1,95
80
4736
122,
007
397
4631
2,00
00
4643
52,
048
410
4633
2,04
20
4447
02,
089
423
4735
2,08
30
4346
02,
129
436
4737
2,12
50
4244
02,
169
448
4839
2,16
70
4143
02,
210
461
4841
2,20
80
3941
02,
250
474
4844
2,25
00
3840
02,
290
486
4946
2,29
20
3739
02,
330
499
4948
2,33
30
3537
02,
371
512
5050
2,37
50
3436
02,
411
524
5053
2,41
70
3334
02,
451
537
5055
2,45
80
3133
02,
491
550
5157
2,50
00
00
02,
500
562
full
cost
240
n -T
h C
--.
2,54
20
00
02,
542
575
full
cost
240
SOU
RC
E a
nd N
OT
ES:
See
Tab
le G
.1.
4U7

Tab
le G
.4
The
New
Hop
e Pr
ojec
t
Mon
thly
Ear
ning
s Su
pple
men
t for
One
Ear
ner
With
Tw
o C
hild
ren:
199
6
Wor
ker
Supp
lem
ent
Ann
ual
Phas
e-in
Max
imum
Phas
e-ou
t0.
25$2
,125
0.2
Wor
ker
1W
orke
r 1
Chi
ldN
ew H
ope
Gov
ernm
ent
Gro
ssT
otal
Chi
ld D
ay C
are
Hea
lth I
nsur
ance
Ear
ning
sSu
pple
men
tA
llow
ance
Supp
lem
ent
EIC
Inco
me
Tax
esC
ontr
ibut
ion
Con
trib
utio
n
$83
$20
$258
$254
$38
$375
$6$6
5$1
412
531
258
245
5742
710
6514
167
4225
823
676
479
1365
1420
852
258
227
9553
016
6514
250
6325
821
811
458
219
6514
292
7325
820
913
363
422
6514
333
8325
820
015
268
526
6514
375
9425
819
117
173
729
6514
417
104
258
182
190
788
3265
1445
811
525
817
320
984
035
6514
500
125
258
164
228
892
3865
1454
213
525
815
524
794
341
6514
583
146
258
146
266
995
4565
1462
515
625
813
728
51,
047
4865
1466
716
725
813
729
51,
099
5165
1470
817
725
814
729
51,
151
5465
1475
016
924
612
629
51,
171
5765
1479
216
023
310
429
51,
191
6165
1483
315
222
182
295
1,21
164
6615
875
144
211
6229
51,
233
7066
1591
713
520
143
295
1,25
575
6715
958
127
191
2929
11,
278
8167
15
1,00
011
918
120
281
1,30
187
6815
1,04
211
017
111
271
1,32
492
6816
1,08
310
216
12
261
1,34
698
6816
1,12
594
151
025
11,
376
104
6916
1,16
785
148
024
11.
407
116
6916
1,20
877
145
023
11,
439
129
7017
1,25
069
142
022
11,
471
142
7017
1,29
260
139
021
11.
502
155
7017
1,33
352
136
020
11,
534
167
7117
(con
tinue
d)
288
289

Tab
le G
.4 (
cont
inue
d)
Wor
ker
1
Ear
ning
sW
orke
r 1
Supp
lem
ent
Chi
ldA
llow
ance
New
Hop
e
Supp
lem
ent
Gov
ernm
ent
EIC
Gro
ssIn
com
eT
otal
Tax
esC
hild
Day
Car
eC
ontr
ibut
ion
Hea
lth I
nsur
ance
Con
trib
utio
n
1,37
544
133
019
11,
566
180
7117
1,41
735
130
018
11,
597
193
7218
1,45
827
128
017
11,
629
206
7218
1,50
019
125
016
11,
661
219
7318
1,54
210
122
015
11,
692
231
7318
1,58
32
119
014
11,
724
244
7318
1,62
50
113
013
11,
756
257
7419
1,66
70
107
012
11,
787
270
7424
1,70
80
101
011
11,
819
283
7529
1,75
00
950
101
1,85
129
675
351,
792
088
091
1,88
230
975
401,
833
082
281
1,91
632
276
461,
875
076
671
1,95
233
576
511,
917
070
1061
1,98
834
877
571,
958
064
1451
2,02
336
177
622,
000
058
1841
2,05
937
478
672,
042
052
2331
2,09
538
778
732,
083
046
2721
2,13
140
078
782,
125
040
3111
2,16
641
279
842,
167
033
341
2,20
242
579
902,
208
027
290
2,23
743
880
962,
250
021
220
2,27
245
080
102
2,29
20
1415
02,
307
463
8010
7
2,33
30
88
02,
342
476
8111
3
2,37
50
22
02,
377
488
8111
9
2,41
70
00
02,
417
501
8212
5
2,45
80
00
02,
458
514
8212
9
2,50
00
00
02,
500
526
full
cost
360
2,54
20
00
02,
542
539
full
cost
360
SOU
RC
E a
nd N
OT
ES:
See
Tab
le G
.1.
2

Wor
ker
Supp
lem
ent
Ann
ual
Tab
le G
.5
The
New
Hop
e Pr
ojec
t
Mon
thly
Ear
ning
s Su
pple
men
t for
One
Ear
ner.
With
Thr
ee C
hild
ren:
199
6
Phas
e-in
0.25
Max
imum
$2,1
25Ph
ase-
out
0.2
Wor
ker
1
Ear
ning
s
Wor
ker
1
Supp
lem
ent
Chi
ldA
llow
ance
New
Hop
eSu
pple
men
t
Gov
ernm
ent
EIC
Gro
ssIn
com
eT
otal
Tax
esC
hild
Day
Car
eC
ontr
ibut
ion
Hea
lth I
nsur
ance
Con
trib
utio
n
$83
$21
$375
$367
$48
$498
$6$9
4$1
4
125
3137
535
372
549
1094
14
167
4237
533
995
601
1394
14
208
5237
532
411
965
216
9414
250
6337
531
014
370
319
9414
292
7337
529
616
775
522
9414
333
8337
528
219
180
626
9414
375
9437
526
821
585
729
9414
417
104
375
254
238
909
3294
14
458
115
375
240
262
960
3594
14
500
125
375
225
286
1,01
138
9414
542
135
375
211
310
1,06
341
9414
583
146
375
197
334
1,11
445
9414
625
156
375
183
358
1,16
648
9414
667
167
375
180
371
1,21
851
9414
708
177
375
191
371
1,27
054
9414
750
169
361
168
371
1,28
957
9414
792
160
348
145
371
1,30
761
9515
833
152
334
121
371
1,32
564
9515
875
144
320
9837
11,
344
6795
16
917
135
307
7637
11,
363
7196
16
958
127
296
6136
51,
384
7796
17
1,00
011
928
554
352
1,40
682
9717
1,04
211
027
346
340
1,42
888
9717
1,08
310
226
239
327
1,45
094
9818
1,12
594
251
3231
51,
472
100
9818
1,16
785
241
2630
21,
494
107
9819
1,20
877
231
1929
01,
517
113
9919
(con
tinue
d)
293
292

Tab
le G
.5 (
cont
inue
d)
Wor
ker
1
Ear
ning
sW
orke
r 1
Supp
lem
ent
Chi
ldA
llow
ance
New
Hop
eSu
pple
men
t
Gov
ernm
ent
EIC
Gro
ssIn
com
eT
otal
Tax
esC
hild
Day
Car
eC
ontr
ibut
ion
Hea
lth I
nsur
ance
Con
trib
utio
n
1,25
069
220
1327
71,
540
120
9919
1,29
260
210
626
41,
562
126
100
201,
333
5219
90
252
1,58
513
310
020
1,37
544
194
023
91,
614
144
100
21
1,41
735
190
022
71,
643
157
101
21
1,45
827
186
021
41,
673
170
101
221,
500
1918
20
202
1,70
218
310
222
1,54
210
177
018
91,
731
195
102
221,
583
217
30
177
1,76
020
810
323
1,62
50
165
116
41,
790
221
103
231,
667
015
65
152
1,82
323
410
328
1,70
80
147
913
91,
856
247
104
331,
750
013
913
126
1,89
026
010
438
1,79
20
130
1711
41,
923
273
105
431,
833
012
222
101
1,95
628
610
548
i:.)
4=.
1,87
50
113
2689
1,99
029
910
553
4."
1,91
70
105
3076
2,02
331
210
658
1,95
80
9634
642,
056
325
106
632,
000
088
3851
2,09
033
810
768
2,04
20
7943
392,
123
351
107
732,
083
070
4726
2,15
636
410
878
2,12
50
6251
132,
189
376
108
842,
167
053
551
2,22
238
910
890
2,20
80
4446
02,
255
402
109
952,
250
035
370
2,28
741
410
910
1
2,29
20
2628
02,
319
427
110
107
2,33
30
1718
02,
352
440
110
112
2,37
50
99
02,
384
452
110
118
2,41
70
00
02,
417
465
111
124
2,45
80
00
02,
458
478
111
129
2,50
00
00
02,
500
490
full
cost
480
2,54
20
00
02,
542
503
full
cost
480
SOU
RC
E a
nd N
OT
ES:
See
Tab
le G
.1.
24

Tab
le G
.6
The
New
Hop
e Pr
ojec
t
Mon
thly
Ear
ning
s Su
pple
men
t for
One
Ear
ner
With
Fou
r C
hild
ren:
199
6
Wor
ker
Supp
lem
ent
Phas
e-in
0.25
Ann
ual
Max
imum
$2,1
25Ph
ase-
out
0.2
Wor
ker
1
Ear
ning
s
Wor
ker
1
Supp
lem
ent
Chi
ldA
llow
ance
New
Hop
e
Supp
lem
ent
Gov
ernm
ent
EIC
Gro
ssIn
com
eT
otal
Tax
esC
hild
Day
Car
eC
ontr
ibut
ion
Hea
lth I
nsur
ance
Con
trib
utio
n
$83
$21
$483
$481
$48
$612
$6$1
21$1
412
531
483
467
7266
310
121
14
167
4248
345
395
715
1312
114
208
5248
343
911
976
616
121
14
250
6348
342
414
381
719
121
14
292
7348
341
016
786
922
121
14
333
8348
339
619
192
026
121
14
375
9448
338
221
597
229
121
14
417
104
483
368
238
1,02
332
121
14
458
115
483
354
262
1,07
435
121
14
500
125
483
340
286
1,12
638
121
14
542
135
483
326
310
1,17
741
121
14
583
146
483
311
334
1,22
845
121
14
625
156
483
297
358
1,28
048
121
14
667
167
483
294
371
1,33
251
121
14
708
177
483
305
371
1,38
454
121
14
750
169
469
281
371
1,40
257
121
16
792
160
454
257
371
1,41
961
122
17
833
152
440
233
371
1,43
764
122
19
875
144
425
209
371
1,45
467
123
21
917
135
410
185
371
1,47
270
123
22
958
127
396
167
365
1,49
073
123
24
1,00
011
938
315
735
21,
510
7812
426
1,04
211
037
114
934
01,
531
8412
427
1,08
310
235
914
132
71,
551
9012
529
1,12
594
347
133
315
1.57
396
125
31
1,16
785
336
126
302
1.59
510
212
532
1,20
877
325
118
290
1,61
610
912
634 (c
ontin
ued)
296
297

Tab
le G
.6 (
cont
inue
d)
Wor
ker
1
Ear
ning
sW
orke
r 1
Supp
lem
ent
Chi
ldA
llow
ance
New
Hop
e
Supp
lem
ent
Gov
ernm
ent
EIC
Gro
ssIn
com
eT
otal
Tax
esC
hild
Day
Car
eC
ontr
ibut
ion
Hea
lth I
nsur
ance
Con
trib
utio
n
1,25
069
314
1 1
127
71,
638
115
126
361,
292
6030
210
426
41,
660
122
127
371,
333
5229
196
252
1,68
112
912
739
1,37
544
280
8923
91,
703
135
128
411,
417
3526
981
227
1,72
514
212
842
1,45
827
257
7421
41,
747
148
128
441,
500
1924
667
202
1,76
815
512
946
1,54
210
235
5918
91,
790
161
129
471,
583
222
856
177
1,81
617
213
049
1,62
50
217
5616
41,
845
185
130
511,
667
020
657
152
1,87
519
813
054
1,70
80
195
5913
91,
906
211
131
581,
750
018
460
126
1,93
722
413
162
1,79
20
173
6211
41,
967
237
132
661,
833
016
264
101
1,99
825
013
269
1,87
50
151
6589
2,02
926
313
373
1,91
70
139
6776
2,06
027
613
377
1,95
80
128
6864
2,09
028
913
381
2,00
00
117
7051
2,12
130
213
484
2,04
20
106
7139
2,15
231
513
488
2,08
30
9573
262,
182
328
135
922,
125
084
7413
2,21
334
013
596
2,16
70
7375
12,
243
353
135
100
2,20
80
6165
02,
273
366
136
104
2,25
00
5053
02,
303
378
136
108
2,29
20
3941
02,
332
391
137
113
2,33
30
2729
02,
362
404
137
117
2,37
50
1617
02,
392
416
138
121
2,41
70
45
02,
421
429
138
125
2,45
80
00
02,
458
442
138
129
2,50
00
00
02,
500
454
full
cost
600
2,54
20
00
02,
542
467
full
cost
600
SOU
RC
E a
nd N
OT
ES:
See
Tab
le G
.1.
298
229

Wor
ker
Supp
lem
ent
Ann
ual
Tab
le G
.7
The
New
Hop
e Pr
ojec
t
Mon
thly
Ear
ning
s Su
pple
men
t for
Tw
o E
arne
rs W
ith N
o C
hild
ren:
199
6
Phas
e-in
0.25
Max
imum
$2,1
25Ph
ase-
out
0.2
Wor
ker
1E
arni
ngs
Wor
ker
1Su
pple
men
tW
orke
r 2
Ear
ning
sW
orke
r 2
Supp
lem
ent
Tot
al E
arni
ngs
Supp
lem
ent
Tot
al F
amily
Ear
ning
sN
ew H
ope
Supp
lem
ent
Gov
ernm
ent
EIC
Gro
ssIn
com
eT
otal
Tax
esH
ealth
Ins
uran
ceC
ontr
ibut
ion
$83
$21
$0$0
$21
$83
$15
$6$1
05$6
$912
531
00
3112
523
1015
710
9
167
420
042
167
3013
210
139
208
520
052
208
3816
262
169
250
630
063
250
4619
315
199
292
730
073
292
5322
367
229
333
830
083
333
6126
420
269
375
940
094
375
7126
472
299
417
104
00
104
417
8226
525
329
tt.,
4:.
458
500
115
125
0 00 0
115
125
458
500
96 110
24 2057
863
135 38
9 9-;
"54
213
50
013
554
212
517
683
419
583
146
00
146
583
139
1473
645
9
625
156
00
156
625
153
1178
948
9
667
167
00
167
667
168
884
251
9
708
177
500
125
302
1,20
831
80
1,52
714
712
750
169
542
135
304
1,29
232
10
1,61
217
012
792
160
583
146
306
1,37
532
30
1,69
819
413
833
152
625
156
308
1,45
832
50
1,78
321
813
875
144
667
167
310
1,54
232
70
1,86
924
414
917
135
708
177
313
1,62
532
90
1,95
426
914
958
127
750
169
296
1,70
831
20
2,02
029
416
1,00
011
979
216
027
91,
792
294
02,
086
320
19
1,04
211
083
315
226
31,
875
277
02,
152
345
21
1,08
310
287
514
424
61,
958
259
02,
217
371
24
1,12
594
917
135
229
2,04
224
10
2,28
339
626
1,16
785
958
127
213
2,12
522
40
2,34
942
131
1,20
877
1,00
011
919
62,
208
206
02,
415
447
39
1,25
069
1,04
211
017
92,
292
189
02,
480
473
461,
292
601,
083
102
163
2,37
517
10
2,54
649
954
1,33
352
1,12
594
146
2,45
815
40
2,61
252
557
1,37
50
1,16
70
02,
542
00
2,54
255
024
0
300
301
(con
tinue
d)

Tab
le G
.7 (
cont
inue
d)
SOU
RC
E a
nd N
OT
ES:
See
Tab
le G
.1.
Tw
o-ea
rner
tabl
es a
re f
or il
lust
ratio
n on
ly b
ecau
se p
reci
se N
ew H
ope
supp
ort d
epen
ds o
n ea
ch p
erso
n's
earn
ings
. In
addi
tion,
in h
ouse
hold
s w
ith tw
o ea
rner
s th
ese
cond
ear
ner
mus
t wor
k at
leas
t par
t tim
e at
the
min
imum
wag
e.
3L.
3 3

Tab
le G
.8
The
New
Hop
e Pr
ojec
t
Mon
thly
Ear
ning
s Su
pple
men
t for
Tw
o E
arne
rs U
nder
Age
25:
199
6
Wor
ker
Supp
lem
ent
Phas
e-in
0.25
Ann
ual
Max
imum
$2,1
25Ph
ase-
out
0.2
Wor
ker
1
Ear
ning
sW
orke
r 1
Supp
lem
ent
Wor
ker
2
Ear
ning
sW
orke
r 2
Supp
lem
ent
Tot
al E
arni
ngs
Supp
lem
ent
Tot
al F
amily
Ear
ning
sN
ew H
ope
Supp
lem
ent
Gro
ssIn
com
eT
otal
Tax
esH
ealth
Ins
uran
ceC
ontr
ibut
ion
$83
$21
$0$0
$21
$83
$22
$105
$6$9
125
310
031
125
3315
810
916
742
00
4216
744
211
139
208
520
052
208
5526
316
925
063
00
6325
066
316
199
292
730
073
292
7736
822
933
383
00
8333
388
421
269
375
940
094
375
9947
429
941
710
40
010
441
711
052
632
945
811
50
011
545
812
157
935
9A
4:.
500
125
00
125
500
132
632
389
?54
213
50
013
554
214
368
441
958
314
60
014
658
315
473
745
962
515
60
015
662
516
579
048
966
716
70
016
766
717
684
251
970
817
750
012
530
21,
208
318
1,52
714
712
750
169
542
135
304
1,29
232
11,
612
170
1279
216
058
314
630
61,
375
323
1,69
819
413
833
152
625
156
308
1,45
832
51,
783
218
1387
514
466
716
731
01,
542
327
1,86
924
414
917
135
708
177
313
1,62
532
91,
954
269
1495
812
775
016
929
61,
708
312
2,02
029
416
1,00
011
979
216
027
91,
792
294
2,08
632
019
1,04
211
083
315
226
31,
875
277
2,15
234
521
1,08
310
287
514
424
61,
958
259
2,21
737
124
1,12
594
917
135
229
2,04
224
12,
283
396
261,
167
8595
812
721
32,
125
224
2,34
942
131
1,20
877
1,00
011
919
62,
208
206
2,41
544
739
1,25
069
1,04
211
017
92,
292
189
2,48
047
346
1,29
260
L08
310
216
32,
375
171
2,54
649
954
1,33
352
1,12
594
146
2,45
815
42,
612
525
571,
375
01,
167
00
2,54
20
2,54
255
024
0
SOU
RC
E a
nd N
OT
ES:
See
Tab
les
G.1
and
G.7
.
304
305

Tab
le G
.9
The
New
Hop
e Pr
ojec
t
Mon
thly
Ear
ning
s Su
pple
men
t for
Ear
ners
With
One
Chi
ld: 1
996
Wor
ker
Supp
lem
ent
Phas
e-in
0.25
Ann
ual
Max
imum
$2,1
25Ph
ase-
out
0.2
Wor
ker
1
Ear
ning
sW
orke
r 1
Supp
lem
ent
Wor
ker
2
Ear
ning
s
Wor
ker
2
Supp
lem
ent
Tot
al E
arni
ngs
Supp
lem
ent
Tot
al F
amily
Ear
ning
s
Chi
ldA
llow
ance
New
Hop
eSu
pple
men
t
Gov
ernm
ent
EIC
Gro
ssIn
com
eT
otal
Tax
esC
hild
Day
Car
eC
ontr
ibut
ion
Hea
lth I
nsur
ance
Con
trib
utio
n
$83
$21
$0$0
$21
$83
$133
$131
$29
$244
$6$3
3$1
412
531
00
3112
513
312
744
296
1033
1416
742
00
4216
713
312
259
348
1333
1420
852
00
5220
813
311
874
400
1633
1425
063
00
6325
013
311
388
452
1933
1429
273
00
7329
213
310
910
350
322
3314
333
830
083
333
133
104
118
555
2633
1437
594
00
9437
513
310
013
360
729
3314
417
104
00
104
417
133
9514
765
932
3314
458
115
00
115
458
133
9016
271
135
3314
500
125
00
125
500
133
8617
776
338
3314
542
135
00
135
542
133
9218
181
541
3314
583
146
00
146
583
133
103
181
868
4533
1462
515
60
015
662
513
311
418
192
048
3314
667
167
00
167
667
133
125
181
973
5133
1470
817
750
012
530
21,
208
2720
213
71,
547
111
3342
750
169
542
135
304
1,29
223
215
123
1,63
013
434
4679
216
058
314
630
61,
375
2022
810
91,
713
158
3551
833
152
625
156
308
1,45
816
242
951,
795
182
3655
875
144
667
167
310
1,54
215
257
811,
880
208
3760
917
135
708
177
313
1,62
513
272
671,
964
233
3864
958
127
750
169
296
1,70
811
267
542,
029
258
3871
1,00
011
979
216
027
91,
792
926
240
2,09
328
439
771,
042
110
833
152
263
1,87
57
257
262,
158
309
4083
1,08
310
287
514
424
61,
958
625
212
2,22
333
541
891,
125
9491
713
522
92,
042
424
60
2,28
736
042
951,
167
8595
812
721
32,
125
222
60
2,35
138
543
102
1,20
877
1,00
011
919
62,
208
I20
70
2,41
541
143
110
1,25
069
1,04
211
017
92,
292
018
90
2,48
043
744
118
1,29
260
1,08
310
216
32,
375
171
02,
546
463
4512
61,
333
521,
125
9414
62,
458
015
40
2,61
248
946
129
1,37
50
1,16
70
02,
542
00
02,
542
514
full
cost
360
SOU
RC
E a
nd N
OT
ES:
See
Tab
les
G.1
and
G.7
.33
7

Tab
le G
.10
The
New
Hop
e Pr
ojec
t
Mon
thly
Ear
ning
s Su
pple
men
t for
Tw
o E
arne
rs W
ith T
wo
Chi
ldre
n: 1
996
Wor
ker
Supp
lem
ent
Phas
e-in
0.25
Ann
ual
Max
imum
$2,1
25Ph
ase-
out
0.2
Wor
ker
1
Ear
ning
s
Wor
ker
1
Supp
lem
ent
Wor
ker
2
Ear
ning
s
Wor
ker
2
Supp
lem
ent
Tot
al E
arni
ngs
Supp
lem
ent
Tot
al F
amily
Ear
ning
s
Chi
ldA
llow
ance
New
Hop
eSu
pple
men
t
Gov
ernm
ent
EIC
Gro
ssIn
com
eT
otal
Tax
esC
hild
Day
Car
eC
ontr
ibut
ion
Hea
lth I
nsur
ance
Con
trib
utio
n
$83
$21
$0$0
$21
$83
$258
$254
$38
$375
$6$6
5$1
412
531
00
3112
525
824
557
427
1065
1416
742
00
4216
725
823
676
479
1365
1420
852
00
5220
825
822
795
530
1665
14
250
630
063
250
258
218
114
582
1965
14
292
730
073
292
258
209
133
634
2265
14
333
830
083
333
258
200
152
685
2665
1437
594
00
9437
525
819
117
173
729
6514
A.)
417
104
00
104
417
258
182
190
788
3265
14
458
115
00
115
458
258
173
209
840
3565
14
500
125
00
125
500
258
164
228
892
3865
1454
213
50
013
554
225
815
524
794
341
6514
583
146
00
146
583
258
146
266
995
4565
14
625
156
00
156
625
258
137
285
1,04
748
6514
667
167
00
167
667
258
137
295
1,09
951
6514
708
177
500
125
302
1,20
812
020
223
11,
641
105
6539
750
169
542
135
304
1,29
210
020
421
11,
707
116
6543
792
160
583
146
306
1,37
580
206
191
1,77
212
766
4783
315
262
515
630
81,
458
6821
617
11,
846
146
6752
875
144
667
167
310
1,54
262
233
151
1,92
617
268
5691
713
570
817
731
31,
625
5625
013
12,
006
197
6960
958
127
750
169
296
1,70
850
248
111
2,06
722
270
661,
000
119
792
160
279
1,79
244
245
912,
127
248
7071
1,04
211
083
315
226
31,
875
3824
271
2,18
827
371
77
1,08
310
287
514
424
61,
958
3223
951
2,24
829
972
83
1,12
594
917
135
229
2,04
226
237
312,
309
324
7389
1,16
785
958
127
213
2,12
520
234
112,
370
349
7495
1,20
877
1,00
011
919
62,
208
1522
20
2,43
037
575
103
1,25
069
1,04
211
017
92,
292
919
80
2,49
040
175
110
1,29
260
1,08
310
216
32,
375
317
50
2,55
042
776
118
1,33
352
1,12
594
146
2,45
80
154
02,
612
452
7712
5
1,37
544
1,16
785
129
2,54
20
136
02,
678
478
7812
9
1,41
70
1,20
80
02,
625
00
02,
625
504
full
cost
480
SOU
RC
E a
nd N
OT
ES:
See
Tab
les
G.1
and
G.7
.
308
309

Tab
le G
.11
The
New
Hop
e Pr
ojec
t
Mon
thly
Ear
ning
s Su
pple
men
t for
Tw
o E
arne
rs W
ith T
hree
Chi
ldre
n: 1
996
Wor
ker
Supp
lem
ent
Phas
e-in
0.25
Ann
ual
Max
imum
$2,1
25Ph
ase-
out
0.2
Wor
ker
1
Ear
ning
s
Wor
ker
1
Supp
lem
ent
Wor
ker
2
Ear
ning
s
Wor
ker
2
Supp
lem
ent
Tot
al E
arni
ngs
Supp
lem
ent
Tot
al F
amily
Ear
ning
s
Chi
ldA
llow
ance
New
Hop
eSu
pple
men
t
Gov
ernm
ent
EIC
Gro
ssIn
com
eT
otal
Tax
esC
hild
Day
Car
eC
ontr
ibut
ion
Hea
lth I
nsur
ance
Con
trib
utio
n
$83
$21
$0$0
$21
$83
$375
$367
$48
$498
$6$9
4$1
412
531
00
3112
537
535
372
549
1094
1416
742
00
4216
737
533
995
601
1394
1420
852
00
5220
837
532
411
965
216
9414
250
630
063
250
375
310
143
703
1994
1429
273
00
7329
237
529
616
775
522
9414
333
830
083
333
375
282
191
806
2694
1437
594
00
9437
537
526
821
585
729
9414
417
104
00
104
417
375
254
238
909
3294
1445
811
50
011
545
837
524
026
296
035
9414
500
125
00
125
500
375
225
286
1,01
138
9414
542
135
00
135
542
375
211
310
1,06
341
9414
583
146
00
146
583
375
197
334
1,11
445
9414
625
156
00
156
625
375
183
358
1,16
648
9414
667
167
00
167
667
375
180
371
1,21
851
9414
708
177
500
125
302
1,20
821
824
329
01,
741
100
9431
750
169
542
135
304
1,29
219
524
826
41,
804
112
9534
792
160
583
146
306
1,37
517
325
323
91,
867
123
9537
833
152
625
156
308
1,45
815
025
821
41,
930
134
9640
875
144
667
167
310
1,54
212
926
418
91,
995
147
9742
917
135
708
177
313
1,62
510
927
116
42,
060
161
9845
958
127
750
169
296
1,70
810
127
113
92,
119
186
9950
1,00
011
979
216
027
91,
792
9227
111
42,
177
212
100
551,
042
110
833
152
263
1,87
584
271
892,
235
237
100
601,
083
102
875
144
246
1,95
875
271
642,
293
263
101
651,
125
9491
713
522
92,
042
6727
139
2,35
128
810
270
1,16
785
958
127
213
2,12
558
271
132,
410
313
103
751,
208
771,
000
119
196
2,20
850
259
02,
468
339
104
811,
250
691,
042
110
179
2,29
242
233
02,
525
365
105
871,
292
601,
083
102
163
2,37
534
207
02,
582
391
105
921,
333
521,
125
9414
62,
458
2618
10
2,63
941
610
698
1,37
544
1,16
785
129
2,54
218
155
02,
697
442
107
104
1,41
735
1,20
877
113
2,62
510
129
02,
754
468
108
109
1,45
827
1,25
069
962,
708
210
30
2,81
149
410
911
5t)
(con
tinue
d)

Tab
le G
.11
(con
tinue
d)
Wor
ker
1E
arni
ngs
Wor
ker
1Su
pple
men
tW
orke
r 2
Ear
ning
sW
orke
r 2
Supp
lem
ent
Tot
al E
arni
ngs
Supp
lem
ent
Tot
al F
amily
Ear
ning
sC
hild
Allo
wan
ceN
ew H
ope
Supp
lem
ent
Gov
ernm
ent
EIC
Gro
ssIn
com
eT
otal
Tax
esC
hild
Day
Car
eC
ontr
ibut
ion
Hea
lth I
nsur
ance
Con
trib
utio
n
1,50
019
1,29
260
792,
792
083
02,
875
520
110
121
1,54
210
1,33
352
632,
875
066
02,
941
545
110
126
1,58
32
1,37
544
462,
958
048
03,
007
571
111
132
1,62
50
1,41
70
03,
042
00
03,
042
597
full
cost
600
1,66
70
1,45
80
03,
125
00
03,
125
623
full
cost
600
SOU
RC
E a
nd N
OT
E: S
ee T
able
s G
.1 a
nd G
.7.

Tab
le G
.12
The
New
Hop
e Pr
ojec
t
Mon
thly
Ear
ning
s Su
pple
men
t for
Tw
o E
arne
rs W
ith F
our
Chi
ldre
n: 1
996
Wor
ker
Supp
lem
ent
Ann
ual
Phas
e-in
Max
imum
Phas
e-ou
t0.
25$2
,125
0.2
Wor
ker
1W
orke
r I
Wor
ker
2W
orke
r 2
Tot
al E
arni
ngs
Tot
al F
amily
Chi
ldN
ew H
ope
Gov
ernm
ent
Gro
ssT
otal
Chi
ld D
ay C
are
Hea
lth I
nsur
ance
Ear
ning
sSu
pple
men
tE
arni
ngs
Supp
lem
ent
Supp
lem
ent
Ear
ning
sA
llow
ance
Supp
lem
ent
EIC
Inco
me
Tax
esC
ontr
ibut
ion
Con
trib
utio
n
$83
$21
$0$0
$21
$83
$483
$481
$48
$612
$6$1
21$1
412
531
00
3112
548
346
772
663
1012
114
167
420
042
167
483
453
9571
513
121
1420
852
00
5220
848
343
911
976
616
121
1425
063
00
6325
048
342
414
381
719
121
1429
273
00
7329
248
341
016
786
922
121
1433
383
00
8333
348
339
619
192
026
121
1437
594
00
9437
548
338
221
597
229
121
1441
710
40
010
441
748
336
823
81,
023
3212
114
458
115
00
115
458
483
354
262
1,07
435
121
1450
012
50
012
550
048
334
028
61,
126
3812
114
542
135
00
135
542
483
326
310
1,17
741
121
1458
314
60
014
658
348
331
133
41,
228
4512
114
625
156
00
156
625
483
297
358
1,28
048
121
1466
716
70
016
766
748
329
437
11,
332
5112
114
708
177
500
125
302
1,20
831
734
729
01,
845
9612
132
750
169
542
135
304
1,29
229
435
126
41,
907
108
122
3479
216
058
314
630
61,
375
270
355
239
1,97
011
912
337
833
152
625
156
308
1,45
824
735
921
42,
032
130
123
4087
514
466
716
731
01,
542
225
365
189
2,09
614
312
443
917
135
708
177
313
1,62
520
337
116
42,
160
156
125
3295
812
775
016
929
61,
708
182
357
139
2,20
416
912
635
1,00
011
979
216
027
91,
792
160
343
114
2,24
818
212
739
1,04
211
083
315
226
31,
875
144
335
892,
299
201
128
421,
083
102
875
144
246
1,95
813
533
464
2,35
622
612
845
1,12
594
917
135
229
2,04
212
633
339
2,41
425
212
949
1,16
785
958
127
213
2,12
511
633
213
2,47
127
713
053
1,20
877
1,00
011
919
62,
208
107
320
02,
528
303
131
581,
250
691,
042
110
179
2,29
299
293
02,
584
329
132
631,
292
601,
083
102
163
2,37
590
266
02,
641
355
133
68 (con
tinue
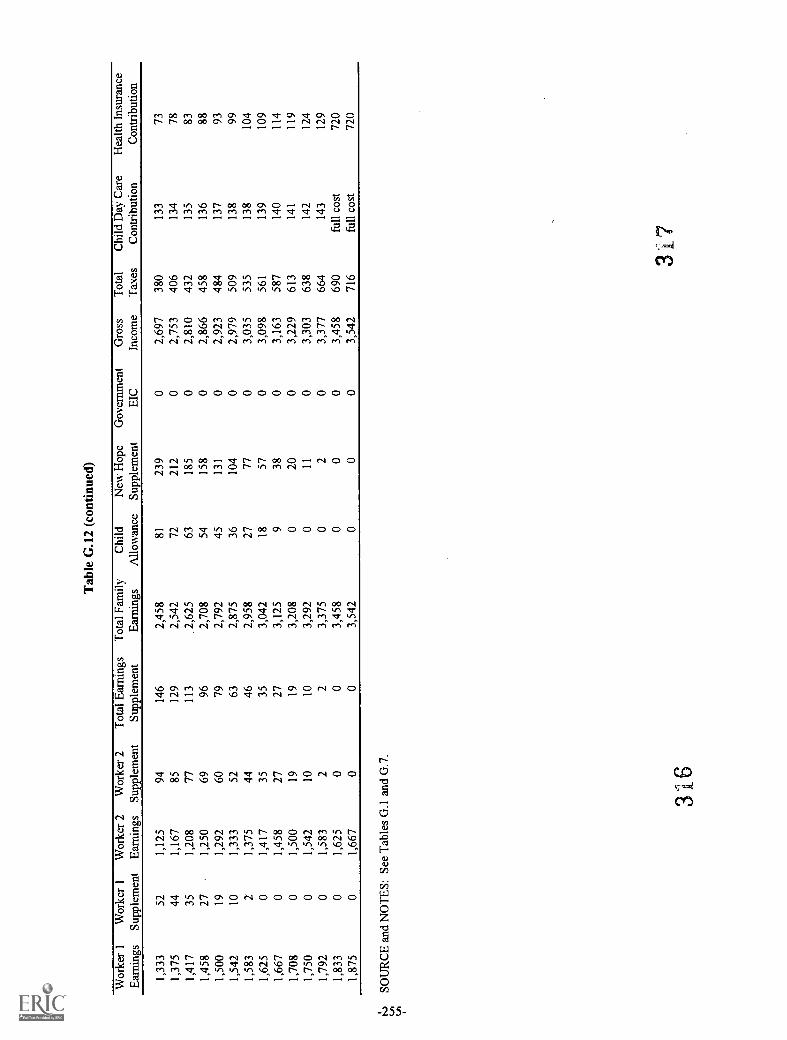
Tab
le G
.12
(con
tinue
d)
Wor
ker
1
Ear
ning
s
Wor
ker
1
Supp
lem
ent
Wor
ker
2
Ear
ning
s
Wor
ker
2
Supp
lem
ent
Tot
al E
arni
ngs
Supp
lem
ent
Tot
al F
amily
Ear
ning
s
Chi
ldA
llow
ance
New
Hop
eSu
pple
men
t
Gov
ernm
ent
EIC
Gro
ssIn
com
eT
otal
Tax
esC
hild
Day
Car
eC
ontr
ibut
ion
Hea
lth I
nsur
ance
Con
trib
utio
n
1,33
352
1,12
594
146
2,45
881
239
02,
697
380
133
73
1,37
544
1,16
785
129
2,54
272
212
02,
753
406
134
78
1,41
735
1,20
877
113
2,62
563
185
02,
810
432
135
83
1,45
827
1,25
069
962,
708
5415
80
2,86
645
813
688
1,50
019
1,29
260
792,
792
4513
10
2,92
348
413
793
1,54
210
1,33
352
632,
875
3610
40
2,97
950
913
899
1,58
32
1,37
544
462,
958
2777
03,
035
535
138
104
1,62
50
1,41
735
353,
042
1857
03,
098
561
139
109
1,66
70
1,45
827
273,
125
938
03,
163
587
140
114
1,70
80
1,50
019
193,
208
020
03,
229
613
141
119
1,75
00
1,54
210
103,
292
011
03,
303
638
142
124
1,79
20
1,58
32
23,
375
02
03,
377
664
143
129
1,83
30
1,62
50
03,
458
00
03,
458
690
full
cost
720
1,87
50
1,66
70
03,
542
00
03,
542
716
full
cost
720
tisa
SOU
RC
E a
nd N
OT
ES:
See
Tab
les
G.1
and
G.7
.U
IY
'

References
Auspos, P., G. Cave, F. Doolittle, and G. Hoerz. 1989. Implementing JOBSTART A Demonstration for SchoolDropouts in the JTPA System. New York: Manpower Demonstration Research Corporation.
Bardach, E. 1980. The Implementation Game. Cambridge, MA: MIT Press.
Bane, M. J., and D. T. Ellwood. 1994. Welfare Realities: From Rhetoric to Reform. Cambridge, MA: HarvardUniversity Press.
Benoit, D. 1996. The New Hope Offer: Participants in the New Hope Demonstration Discuss Work, Family, andSelf-Sufficiency. New York: Manpower Demonstration Research Corporation.
Blank, R. M. 1990. Are Part-Time Jobs Bad Jobs? In G. Burtless, ed., A Future of Lousy Jobs?: The ChangingStructure of U.S. Wages. Washington, DC: The Brookings Institution.
Blank, R. M. 1994. The Employment Strategy: Public Policies to Increase Work and Earnings. In S. H. Danziger,G. D. Sandefur, and D. H. Weinberg, eds., Confronting Poverty: Prescriptions for Change. Cambridge,MA: Harvard University Press.
Brodkin, E. Z. 1986. The False Promise of Administrative Reform: Implementing Quality Control in Welfare.Philadelphia: Temple University Press.
Center on Budget and Policy Priorities. 1996. A Hand Up: How State Earned Income Credits Help WorkingFamilies Escape Poverty. 1996 ed. Washington, DC: Center on Budget and Policy Priorities.
DeParle, J. 1997. "A Sharp Decrease in Welfare Cases Is Gathering Speed." New York Times, February 2, p.18.
Derthick, M. 1972. New Towns in-Town: Why a Federal Program Failed. Washington, DC: The Urban Institute.
Ehrenberg, R., and R. Smith. 1994. Modern Labor Economics. 5th ed. New York: HarperCollins.
Employment and Training Institute. 1994. Linking Job Seekers to Available Job Openings: A Survey of Central CityMilwaukee Workers. Milwaukee: Social Science Research Facility, University of Wisconsin-Milwaukee.
Employment and Training Institute. 1995a. Demographic Analysis. Milwaukee: Social Science Research Facility,University of Wisconsin-Milwaukee.
Employment and Training Institute. 1995b. Survey of Job Openings in the Milwaukee Metropolitan Area: Week ofOctober 23, 1995. Milwaukee: Social Science Research Facility, University of Wisconsin-Milwaukee.
Feldman, A. 1995. The Advanced Payment Option of the EIC: Addressing Recipients ' Fear of Overpayment. NewHope Technical Paper.
Gardner, J. M., and H. V. Hayghe. 1996. Slower Economic Growth Affects the 1995 Job Market. Monthly LaborReview 119 (3), 3-16.
Gottschalk, P., S. McLanahan, and G. D. Sandefur. 1994. The Dynamics and Intergenerational Transmission ofPoverty and Welfare Participation. In S. H. Danziger, G. D. Sandefur, and D. H. Weinberg, eds.,Confronting Poverty: Prescriptions for Change. Cambridge, MA: Harvard University Press.
Greater Milwaukee Committee. 1990. "New Hope Project Task Force Report." July 9.

Greenberg, D., and S. Savner. 1996. A Detailed Summary of Key Provisions of the Temporary Assistance for NeedyFamilies Block Grant of H.R. 3734: The Personal Responsibility and Work Opportunity Reconciliation Actof 1996. Washington, DC: Center for Law and Social Policy.
Hasenfeld, Y. 1983. Human Service Organizations. Englewood Cliffs, NJ: Prentice-Hall.
Huston, A. C., ed. 1991. Children in Poverty. New York: Cambridge University Press.
Jargowsky, P. A. 1997. Poverty and Place: Ghettos, Barrios and the American City. New York: Russell SageFoundation.
Jargowsky, P.A., and M. J. Bane. 1991. Ghetto Poverty in the U.S.: 1970-1980. In C. Jencks and P. E. Petersen,eds., The Urban Underclass. Washington, DC: Brookings Institution.
Lipsky, M. 1980. Street-Level Bureaucracy: Dilemmas of the Individual in Public Services. New York: Russell SageFoundation.
Mead, L. M. 1996. The Decline of Welfare in Wisconsin. Milwaukee: Wisconsin Policy Research Institute.
New Hope Project. 1992. Request for Proposals for Evaluation of the New Hope Project. Milwaukee: New HopeProject.
O'Rourke, D., and E. Lakner. 1989. "Gender Bias: Analysis of Factors Causing Male Underrepresentation inSurveys." International Journal of Public Opinion Research 1(2): 164-176.
Pressman, J., and A. Wildaysky. 1979. Implementation: How Great Expectations in Washington Are Dashed inOakland. Berkeley: University of California Press.
Quint, J. C., B. L. Fink, and S. L. Rowser. 1991. New Chance: Implementing a Comprehensive Program forDisadvantaged Young Mothers and Their Children. New York: Manpower Demonstration ResearchCorporation.
Reimer, D. R. 1988. The Prisoners of Welfare: Liberating America's Poor from Unemployment and Low Wages.New York: Praeger.
Steurele, E. 1995. "The Future of the Earned Income Tax Credit." Tax Notes, June 19, p. 1669.
University of Wisconsin-Madison, Institute for Research on Poverty. 1996. "Welfare Reform in Wisconsin: A CaseStudy." Focus 18(1): 53-85.
U.S. General Accounting Office. 1995. Low-Income Families: Comparison of Incomes of AFDC and Working PoorFamilies. Testimony by Jane L. Ross before the Committee on Governmental Affairs, U.S. Senate, January25, 1995.
U.S. House of Representatives, Committee on Ways and Means. 1996. The 1996 Green Book: Background Materialand Data on Programs Within the Jurisdiction of the Committee on Ways and Means. Washington, DC:U.S. Government Printing Office.
White, M. J. 1987. American Neighborhoods and Residential Differentiation. In the National Committee forResearch on the 1980 Census, ed., The Population of the United States in the 1980s. New York: RussellSage Foundation.
3 9-257-

White, S. B., M. M. Thomas, and N. Thompson. 1995. A. Changing Spatial Patterns of Employment Location:Milwaukee, Wisconsin 1979-1994. Milwaukee: Urban Research Center, University of Wisconsin-Milwaukee.
Willer, B., S. L. Hofferth, E. E. Kisker, P. Divine-Hawkins, E. Farquhar, and F. B. Glantz, F.B. 1991. The Demandand Supply of Child Care in 1990. Washington, DC: National Association for the Education of YoungChildren.
Wilson, J. B. 1995. Industrial Metropolis on the Lake. Faculty Research Working Paper Series R95-19. Cambridge,MA: John F. Kennedy School of Government, Harvard University.
Wisconsin Legislative Reference Bureau. 1995. State of Wisconsin 1995-1996 Blue Book. Madison: JointCommittee on Legislative Organization, Wisconsin Legislature.
Wisconsin State Legislature. 1995. Wisconsin Act 289, enacted April 25, 1996.
Wiseman, M., E. McGrath, and C. Wiseman. 1995. Milwaukee's Children: The Geography of Poverty. Madison:Wisconsin Council on Children and Families.
Wiseman, M. 1997. Who Got New Hope? New York: Manpower Demonstration Research Corporation.
Wolfe, B. L. 1994. Reform of Health Care for the Nonelderly Poor. In S. H. Danziger, G. D. Sandefur, and D. H.Weinberg, eds., Confronting Poverty: Prescriptions for Change. Cambridge, MA: Harvard UniversityPress.

Selected Publications on MDRC Projects
Reforming Welfare
Books and Monographs
Reforming Welfare with Work (Ford Foundation). Monograph. 1987. Judith M. Gueron. A review of welfare-to-work initiatives in five states.
From Welfare to Work (Russell Sage Foundation). Book. 1991. Judith M. Gueron, Edward Pauly. A synthesis ofresearch findings on the effectiveness of welfare-to-work programs. Chapter 1, which is the summary of thebook, is also published separately by MDRC.
Five Years After: The Long-Term Effects of Welfare-to-Work Programs (Russell Sage Foundation). Book. 1995.Daniel Friedlander, Gary Burtless. An analysis of five-year follow-up data on four welfare-to-workprograms.
After AFDC: Welfare-to-Work Choices and Challenges for States. Book. 1997. Dan Bloom. A summary andsynthesis of lessons derived from studies of welfare reform programs.
ReWORKing Welfare: Technical Assistance for States and Localities
After AFDC: Welfare-to-Work Choices and Challenges for States. See under Books and Monographs.Changing to a Work First Strategy: Lessons from Los Angeles County's GAIN Program for Welfare Recipients.
1997. Evan Weissman.Work First: How to Implement an Employment-Focused Approach to Welfare Reform. 1997. Amy Brown.
Connections to Work Project
Alternative approaches to help welfare recipients and other low-income populations access and secure jobs.
Tulsa's IndEx Program: A Business-Led Initiative for Welfare Reform and Economic Development. 1997.Maria Buck.
Working Papers
Working Papers related to a specific project are listed under that project.
Learning from the Voices of Mothers: Single Mothers' Perceptions of the Trade-offs Between Welfare and Work.1993. LaDonna Pavetti.
Unpaid Work Experience for Welfare Recipients: Findings and Lessons from MDRC Research. 1993. ThomasBrock, David Butler, David Long.
From Welfare to Work Among Lone Parents in Britain: Lessons for America. 1996. James Riccio.
Papers for Practitioners
Assessing JOBS Participants: Issues and Trade-offs. 1992. Patricia Auspos, Kay Sherwood.Linking Welfare and Education: A Study of New Programs in Five States. 1992. Edward Pauly, David Long, Karin
Martinson.Improving the Productivity of JOBS Programs. 1993. Eugene Bardach.
Note: For works not published by MDRC, the publisher's name is shown in parentheses.
-259-
321

Reports and Other Publications
Making Work PayThe New Hope Project
A test of a neighborhood-based antipoverty program and welfare alternative operating in Milwaukee.
The New Hope Offer: Participants in the New Hope Demonstration Discuss Work, Family, and Self-Sufficiency.Working Paper. 1996. Dudley Benoit.
Who Got New Hope? Working Paper. 1997. Michael Wiseman.Creating New Hope: Implementation of a Program to Reduce Poverty and Reform Welfare. 1997. Thomas Brock,
Fred Doolittle, Veronica Fellerath, Michael Wiseman.
The Minnesota Family Investment Program (MFIP)
An evaluation of Minnesota's welfare reform initiative.
MFIP: An Early Report on Minnesota's Approach to Welfare Reform. 1995. Virginia Knox, Amy Brown, WinstonLin.
Making Welfare Work and Work Pay: Implementation and 18-Month Impacts of the Minnesota Family InvestmentProgram. 1997. Cynthia Miller, Virginia Knox, Patricia Auspos, Jo Anna Hunter-Manns, Alan Orenstein.
Canada's Self-Sufficiency Project (SSP)
A test of the effectiveness of a temporary earnings supplement on the employment and welfare receipt of publicassistance recipients. Reports on the Self-Sufficiency Project are available from: Social Research andDemonstration Corporation (SRDC), 275 Slater St., Suite 900, Ottawa, Ontario KIP 5H9, Canada. Tel.: 613-237 -4311; Fax: 613-237-5045. In the United States, the reports are also available from MDRC.
Making Work Pay Better Than Welfare: An Early Look at the Self-Sufficiency Project (Social Research andDemonstration Corporation). 1994. Susanna Lui-Gurr, Sheila Currie Vernon, Tod Mijanovich.
Creating an Alternative to Welfare: First-Year Findings on the Implementation, Welfare Impacts, and Costs of theSelf-Sufficiency Project (Social Research and Demonstration Corporation). 1995. Tod Mijanovich, DavidLong.
The Struggle for Self- Sufficiency: SSP Participants Talk About Work, Welfare, and Their Futures (Social Researchand Demonstration Corporation). 1995. Wendy Bancroft, Sheila Currie Vernon.
Do Financial Incentives Encourage Welfare Recipients to Work? Initial 18-Month Findings from the Self-Sufficiency Project (Social Research and Demonstration Corporation). 1996. David Card, Philip Robins.
When Work Pays Better Than Welfare: A Summary of the Self - Sufficiency Project's Implementation, Focus Group,and Initial 18 -Month Impact Reports. 1996. Social Research and Demonstration Corporation.
How Important Are "Entry Effects" in Financial Incentive Programs for Welfare Recipients? ExperimentalEvidence from the Self-Sufficiency Project (Social Research and Demonstration Corporation). WorkingPaper. 1997. David Card, Philip Robins, Winston Lin.
Time-Limited Welfare
Florida's Family Transition Program
A study of Florida's initial time-limited welfare program.
The Family Transition Program: An Early Implementation Report on Florida's Time-Limited Welfare Initiative.1995. Dan Bloom.
The Family Transition Program: Implementation and Early Impacts of Florida's Initial Time-Limited WelfareProgram. 1997. Dan Bloom, James Kemple, Robin Rogers-Dillon.
-260-

The Cross-State Study of Time-Limited Welfare
An examination of the implementation of some of the first state-initiated time-limited welfare programs.
Implementing Time-Limited Welfare: Early Experiences in Three States. 1995. Dan Bloom, David Butler.The View from the Field: As Time Limits Approach, Welfare Recipients and Staff Talk About Their Attitudes and
Expectations. 1997. Amy Brown, Dan Bloom, David Butler.
JOBS ProgramsNational Evaluation of Welfare-to-Work Strategies
An evaluation of welfare-to-work programs launched under the Job Opportunities and Basic Skills Training(JOBS) provisions of the Family Support Act of 1988.
From Welfare to Work (Russell Sage Foundation). See under Books and Monographs.The Saturation Work Initiative Model in San Diego: A Five-Year Follow-up Study. 1993. Daniel Friedlander, Gayle
Hamilton.Early Lessons from Seven Sites (U.S. Department of Health and Human Services [HHS]). 1994. Gayle Hamilton,
Thomas Brock.Five Years After: The Long-Term Effects of Welfare-to-Work Programs. See under Books and Monographs.Adult Education for People on AFDC: A Synthesis of Research. (U.S. Department of Health and Human Services,
Office of the Assistant Secretary for Planning and Evaluation [HHS, ASPE]). 1995. Edward Pauly.Early Findings on Program Impacts in Three Sites (HHS, ASPE). 1995. Stephen Freedman, Daniel Friedlander.How Well Are They Faring? AFDC Families with Preschool-Aged Children in Atlanta at the Outset of the JOBS
Evaluation (HHS, ASPE). 1995. Child Trends, Inc.: Kristin Moore, Martha Zaslow, Mary Jo Coiro, SuzanneMiller, Ellen Magenheim.
Monthly Participation Rates in Three Sites and Factors Affecting Participation Levels in Welfare-to-WorkPrograms (HHS, ASPE). 1995. Gayle Hamilton.
Changing to a Work First Strategy: Lessons from Los Angeles County's GAIN Program for Welfare Recipients.1997. Evan Weissman.
Work First: How to Implement an Employment-Focused Approach to Welfare Reform. 1997. Amy Brown.Evaluating Two Welfare-to-Work Program Approaches: Two-Year Findings on the Labor Force Attachment and
Human Capital Development Programs in Three Sites (MIS, Administration for Children and Families andASPE). 1997. Gayle Hamilton, Thomas Brock, Mary Farrell, Daniel Friedlander, Kristen Harknett.
The GAIN Evaluation
An evaluation of California's Greater Avenues for Independence (GAIN) Program, the state's JOBSprogram.
GAIN: Planning and Early Implementation. 1987. John Wallace, David Long.GAIN: Child Care in a Welfare Employment Initiative. 1989. Karin Martinson, James Riccio.GAIN: Early Implementation Experiences and Lessons. 1989. James Riccio, Barbara Goldman, Gayle Hamilton,
Karin Martinson, Alan Orenstein.GAIN: Participation Patterns in Four Counties. 1991. Stephen Freedman, James Riccio.GAIN: Program Strategies, Participation Patterns, and First-Year Impacts in Six Counties. 1992. James Riccio,
Daniel Friedlander.GAIN: Two-Year Impacts in Six Counties. 1993. Daniel Friedlander, James Riccio, Stephen Freedman.GAIN: Basic Education in a Welfare-to-Work Program. 1994. Karin Martinson, Daniel Friedlander.GAIN: Benefits, Costs, and Three-Year Impacts of a Welfare-to-Work Program. 1994. James Riccio, Daniel
Friedlander, Stephen Freedman.
Related Studies:The Impacts of California's GAIN Program on Different Ethnic Groups: Two-Year Findings on Earnings and AFDC
Payments. Working Paper. 1994. Daniel Friedlander.
-261- 3

Can They All Work? A Study of the Employment Potential of Welfare Recipients in a Welfare-to-Work Program.Working Paper. 1995. James Riccio, Stephen Freedman.
Changing to a Work First Strategy: Lessons from Los Angeles County's GAIN Program for Welfare Recipients.1997. Evan Weissman.
The Evaluation of Florida's Project Independence
An evaluation of Florida's JOBS program.
Florida's Project Independence: Program Implementation, Participation Patterns, and First-Year Impacts. 1994.James Kemple, Joshua Haimson.
Florida's Project Independence: Benefits, Costs, and Two-Year Impacts of Florida's JOBS Program. 1995. JamesKemple, Daniel Friedlander, Veronica Fellerath.
Other Welfare Studies
The Saturation Work Initiative Model (SWIM)
A test of the feasibility and effectiveness of an ongoing participation requirement in a welfare-to-workprogram.
Interim Report on the Saturation Work Initiative Model in San Diego. 1988. Gayle Hamilton.Final Report on the Saturation Work Initiative Model in San Diego. 1989. Gayle Hamilton, Daniel Friedlander.The Saturation Work Initiative Model in San Diego: A Five-Year Follow-up Study. 1993. Daniel Friedlander, Gayle
Hamilton.
The Demonstration of State Work/Welfare Initiatives
A test of the feasibility and effectiveness of various state employment initiatives for welfare recipients.
Arizona: Preliminary Management Lessons from the WIN Demonstration Program. 1984. Kay Sherwood.Arkansas: Final Report on the WORK Program in Two Counties. 1985. Daniel Friedlander, Gregory Hoerz,
Janet Quint, James Riccio.California: Final Report on the San Diego Job Search and Work Experience Demonstration. 1986. Barbara
Goldman, Daniel Friedlander, David Long.Illinois: Final Report on Job Search and Work Experience in Cook County. 1987. Daniel Friedlander, Stephen
Freedman, Gayle Hamilton, Janet Quint.Maine: Final Report on the Training Opportunities in the Private Sector Program. 1988. Patricia Auspos,
George Cave, David Long.Maryland: Final Report on the Employment Initiatives Evaluation. 1985. Daniel Friedlander, Gregory Hoerz,
David Long, Janet Quint.Supplemental Report on the Baltimore Options Program. 1987. Daniel Friedlander.
New Jersey: Final Report on the Grant Diversion Project. 1988. Stephen Freedman, Jan Bryant, George Cave.Virginia: Final Report on the Virginia Employment Services Program. 1986. James Riccio, George Cave,
Stephen Freedman, Marilyn Price.West Virginia: Final Report on the Community Work Experience Demonstrations. 1986. Daniel Friedlander,
Marjorie Erickson, Gayle Hamilton, Virginia Knox.
Other Reports on the Demonstration of State Work/Welfare Initiatives
Relationship Between Earnings and Welfare Benefits for Working Recipients: Four Area Case Studies. 1985.Barbara Goldman, Edward Cavin, Marjorie Erickson, Gayle Hamilton, Darlene Hasselbring, SandraReynolds.
A Survey of Participants and Worksite Supervisors in the New York City Work Experience Program. 1986. GregoryHoerz, Karla Hanson.
Welfare Grant Diversion: Lessons and Prospects. 1986. Michael Bangser, James Healy, Robert Ivry.
-262-

The Subgroup/Performance Indicator Study
A study of the impacts of selected welfare-to-work programs on subgroups of the AFDC caseload.
Subgroup Impacts and Performance Indicators for Selected Welfare Employment Programs. 1988. DanielFriedlander.
The WIN Research Laboratory Project
A test of innovative service delivery approaches in four Work Incentive Program (WIN) offices.
Impacts of the Immediate Job Search Assistance Experiment: Louisville WIN Research Laboratory Project. 1981.Barbara Goldman.
Welfare Women in a Group Job Search Program: Their Experiences in the Louisville WIN Research LaboratoryProject. 1982. Joanna Gould-Stuart.
Job Search Strategies: Lessons from the Louisville WIN Laboratory. 1983. Carl Wolfhagen, Barbara Goldman.
The Self-Employment Investment Demonstration (SEID)
A test of the feasibility of operating a program to encourage self-employment among recipients of AFDC.
Self-Employment for Welfare Recipients: Implementation of the SEID Program. 1991. Cynthia Guy, Fred Doolittle,Barbara Fink.
Programs for Teenage ParentsThe LEAP Evaluation
An evaluation of Ohio's Learning, Earning, and Parenting (LEAP) Program, which uses fmancial incentivesto encourage teenage parents on welfare to stay in or return to school.
LEAP: Implementing a Welfare Initiative to Improve School Attendance Among Teenage Parents. 1991. DanBloom, Hilary Kopp, David Long, Denise Polit.
LEAP: Interim Findings on a Welfare Initiative to Improve School Attendance Among Teenage Parents. 1993. DanBloom, Veronica Fellerath, David Long, Robert Wood.
LEAP: The Educational Effects of LEAP and Enhanced Services in Cleveland. 1994. David Long, Robert Wood,Hilary Kopp.
LEAP: Three-Year Impacts of Ohio's Welfare Initiative to Improve School Attendance Among Teenage Parents.1996. David Long, Judith Gueron, Robert Wood, Rebecca Fisher, Veronica Fellerath.
LEAP: Final Report on Ohio 's Welfare Initiative to Improve School Attendance Among Teenage Parents. 1997.Johannes Bos, Veronica Fellerath.
The New Chance Demonstration
A test of a comprehensive program of services that seeks to improve the economic status and general well-being of a group of highly disadvantaged young women and their children.
New Chance: Implementing a Comprehensive Program for Disadvantaged Young Mothers and Their Children.1991. Janet Quint, Barbara Fink, Sharon Rowser.
Lives of Promise, Lives of Pain: Young Mothers After New Chance. Monograph. 1994. Janet Quint, Judith Musick,with Joyce Ladner.
New Chance: Interim Findings on a Comprehensive Program for Disadvantaged Young Mothers and TheirChildren. 1994. Janet Quint, Denise Polit, Hans Bos, George Cave.
New Chance: The Cost Analysis of a Comprehensive Program for Disadvantaged Young Mothers and TheirChildren. Working Paper. 1994. Barbara Fink.
New Chance: Final Report on a Comprehensive Program for Young Mothers in Poverty and Their Children. 1997.Janet Quint, Johannes Bos, Denise Polit.
-263-
395

Parenting Behavior in a Sample of Young Single Mothers in Poverty: Results of the New Chance ObservationalStudy. 1997. Martha Zaslow, Carolyn Eldred, editors.
Project Redirection
A test of a comprehensive program of services for pregnant and parenting teenagers.
The Challenge of Serving Teenage Mothers: Lessons from Project Redirection. Monograph. 1988. Denise Polit,Janet Quint, James Riccio.
The Community Service Projects
A test of a New York State teenage pregnancy prevention and services initiative.
The Community Service Projects: Final Report on a New York State Adolescent Pregnancy Prevention and ServicesProgram. 1988. Cynthia Guy, Lawrence Bailis, David Palasits, Kay Sherwood.
The Parents' Fair Share DemonstrationA demonstration aimed at reducing child poverty by increasing the job-holding, earnings, and child supportpayments of unemployed, noncustodial parents (usually fathers) of children receiving public assistance.
Caring and Paying: What Fathers and Mothers Say About Child Support. 1992. Frank Furstenberg, Jr., KaySherwood, Mercer Sullivan.
Child Support Enforcement: A Case Study. Working Paper. 1993. Dan Bloom.Matching Opportunities to Obligations: Lessons for Child Support Reform from the Parents' Fair Share Pilot
Phase. 1994. Dan Bloom, Kay Sherwood.Low-Income Parents and the Parents' Fair Share Demonstration: An Early Qualitative Look at Low-Income
Noncustodial Parents (NCPs) and How One Policy Initiative Has Attempted to Improve Their Ability to PayChild Support. 1996. Earl Johnson, Fred Doolittle.
The National Supported Work DemonstrationA test of a transitional work experience program for four disadvantaged groups.
Summary and Findings of the National Supported Work Demonstration. 1980. MDRC Board of Directors.
The Section 3 StudyLessons from the Field on the Implementation of Section 3 (U.S. Department of Housing and Urban Development,
Office of Policy Development and Research). 1996. Maxine Bailey, Suzanne Lynn.
-264-

About MDRC
The Manpower Demonstration Research Corporation (MDRC) is anonprofit social policy research organization founded in 1974 andlocated in New York City and San Francisco. Its mission is todesign and rigorously field-test promising education andemployment-related programs aimed at improving the well-beingof disadvantaged adults and youth, and to provide policymakersand practitioners with reliable evidence on the effectiveness ofsocial programs. Through this work, and its technical assistance toprogram administrators, MDRC seeks to enhance the quality ofpublic policies and programs. MDRC actively disseminates theresults of its research through its publications and through inter-changes with a broad audience of policymakers and practitioners;state, local, and federal officials; program planners and operators;the funding community; educators; scholars; community andnational organizations; the media; and the general public.
Over the past two decades working in partnership with morethan forty states, the federal government, scores of communities,and numerous private philanthropies MDRC has developed andstudied more than three dozen promising social policy initiatives.
,5EST COPY AVAILABLE
3 7

MDRC
16 East 34 StreetNew York, NY 10016
(212) 532-3200www.mclre.org
88 Kearny Street, Suite 1800San Francisco, CA 94108
(415) 781-3800
BEST COPY AVAILABLE
IL"