OKpi: All-KPI Network Slicing Through Efficient Resource ...
Upload
independentCategory
view
0download
0
UTRAN KPI Analysis Guide For InternalUse Only
Huawei Technologies Co.,Ltd
Document name Confidentialitylevel
UTRAN KPI AnalysisGuide
For Internal UseOnly
RAN Maintenance Dept. Total 55 Pages
UTRAN KPI Analysis Guide
Prepared byRAN Maintenance
Dept.Date Aug. 10, 2005
Reviewed by Date
Reviewed by Date
Approved by Date
Huawei Technologies Co., Ltd.
All Rights Reserved

UTRAN KPI Analysis Guide For InternalUse Only
Revision Edition
Date Version Description AuthorAug. 10,2005 The first version is complete. Wang Wei

UTRAN KPI Analysis Guide For Internal UseOnly
Table of Contents
1. Overview.........................................................41.1 Intended Audience............................................41.2 Objectives...................................................4
2. Introduction to Nastar...........................................53. UTRAN KPI Analysis...............................................53.1 Nastar Tasks.................................................5
4. Detailed UTRAN KPI Analysis......................................74.1 Call Completion Rate.........................................74.1.1 RRC Setup Analysis.......................................74.1.2 RAB Setup Analysis......................................11
4.2 Soft Handover Analysis......................................184.2.1 Overview................................................194.2.2 Cell SHO Prepare Failure Analysis.......................204.2.3 Cell SHO Failure Analysis...............................22
4.3 CS Inter-RAT Handover Analysis..............................244.3.1 Overview................................................254.3.2 CS Inter-RAT Handover Prepare Failure Analysis..........264.3.3 CS Inter-RAT Handover Failure Analysis..................284.3.4 Cell Inter-RAT Handover Analysis........................30
4.4 PS Inter-RAT Handover Analysis..............................304.4.1 Overview................................................304.4.2 PS Inter-RAT Handover Failure Analysis..................314.4.3 Cell Inter-RAT Handover Analysis........................33
4.5 Cell Update Analysis........................................334.5.1 Overview................................................334.5.2 Cell Update Failure Analysis............................34
4.6 Call Drop Analysis..........................................354.6.1 Overview................................................354.6.2 CS Call Drop Analysis...................................364.6.3 PS Call Drop Analysis...................................374.6.4 Cell Call Drop Analysis.................................39
4.7 Traffic Load Analysis.......................................404.7.1 Overview................................................414.7.2 Cell Traffic Analysis...................................42
5. Analyzing Complicated Problems..................................445.1 Narrowing Down Area Range and Time Range....................445.2 Analyzing Abnormal Logs.....................................44
Aug. 10, 2005 Confidential Information of HuaweiNo Spreading Without Permission
Page 3 of 55

UTRAN KPI Analysis Guide For Internal UseOnly
5.3 Analyzing Repeated Problems.................................44
Aug. 10, 2005 Confidential Information of HuaweiNo Spreading Without Permission
Page 4 of 55

UTRAN KPI Analysis Guide For Internal UseOnly
UTRAN KPI Analysis Guide
1.Overview
In a commercial network, the QoS and network operation arereflected through KPI. UTRAN KPI analysis is a major methodused for monitoring and evaluating network operation. UTRANKPI analysis is also served to track the network traffic,monitor the resource distribution, and facilitate thenetwork expansion and optimization. Huawei UTRAN trafficstatistics provides sufficient KPI for network operation,algorithm management, and resource distribution. Thesetraffic statistics can be used to locate network problemsand optimize network KPI.
UTRAN KPI analysis is a major method for RAN maintenanceengineers and network optimization engineers to evaluatenetwork performance. Comparing with drive tests, call detaillogs, and alarms, KPI analysis can be used to monitornetwork operation directly and conveniently. To betterlocate network problems and optimize network KPI, abnormalindices, call detail logs, tracked messages, and drive testscan be used together.
Huawei provides a traffic statistics analysis tool Nastarfor UTRAN KPI analysis. Nastar can be used to obtain andanalyze UTRAN KPI. This guide introduces how to use Nastarto analyze UTRAN KPI. For more information, refer to GENEX
Nastar V400R001C01 User Manual.
Aug. 10, 2005 Confidential Information of HuaweiNo Spreading Without Permission
Page 5 of 55

UTRAN KPI Analysis Guide For Internal UseOnly
1.1 Intended Audience
This guide, intended for network maintenance engineers andsite audit engineers, introduces Nastar V400R001, whichsupports the KPI analysis of RNC V100R002C03B092 and RNCV100R002C03B151.
1.2 Objectives
This guide aims to provide guidance for network maintenancepersonnel to monitor network KPI on a timely basis, analyzeabnormal indices, and find out practical solutions.
2.Introduction to Nastar
Nastar provides such functions as index defining, querydefining, and report generating. For more information, referto GENEX Nastar V400R001C01 User Manual.
3.UTRAN KPI Analysis
The QoS of communication network is defined in ITU-T E.800.Considering the features of wireless communication network,the following KPI must be considered for WCDMA RAN, as shownin Table 1-1.
Network performance KPI
Call completion
rate
RRC Setup Success Rate
RAB Setup Success Rate
Call drop rate
Voice Call Drop Rate
VP Call Drop Rate
PS Call Drop Rate
Aug. 10, 2005 Confidential Information of HuaweiNo Spreading Without Permission
Page 6 of 55

UTRAN KPI Analysis Guide For Internal UseOnly
Mobility management
Soft Handover Success Rate
Inter-Frequency HO Success Rate
Intra-Frequency HO Success Rate
CS Inter-RAT HO Success Rate
PS Inter-RAT HO Success Rate
Cell Update Success Rate
Traffic
Equivalent User
Cell Throughput
Cell Resource Allocation
Table 1-1 WCDMA RAN KPI
3.1 Nastar Tasks
Figure 1-1 shows a list of Nastar tasks.
Figure 1-1 Nastar tasks
Aug. 10, 2005 Confidential Information of HuaweiNo Spreading Without Permission
Page 7 of 55

UTRAN KPI Analysis Guide For Internal UseOnly
Perf Daily Report and Perf Weekly Report can be generated in.xls file by Nastar. An object can be a self-defined clutteror RNC. Perf Daily Report is used to monitor networkperformance. By default, Perf Daily Report includes thefollowing KPI, as shown in Table 1-2.
RNC:1CS User Based on Equivalent User 17.13(16:00 ~ 17:00)PS User Based on Equivalent User 54.09(12:00 ~ 13:00)
RRC Connection Setup Success Rate(service)(>95% ) 98.64% (2468/2502)RRC Connection Setup Success Rate(other)(>95% ) 96.87% (36445/37624)
AM R RAB Assignm ent Success Rate(>95% ) 99.00% (990/1000)Video Call RAB Assignm ent Success Rate(>95% ) 100.00% (29/29)
PS RAB Assignm ent Success Rate(>95% ) 99.60% (997/1001)RB Setup Success Rate(>95% ) 99.31% (2016/2030)
Soft Handover Success Rate(>98% ) 99.75% (17090/17132)Softer Handover Success Rate(>98% ) 99.66% (3509/3521)
Soft Handover Factor based on Radio Link Num ber(<40% ) 18.85%Inter-Freq Hard Handover Success Rate(>85% ) 100.00% (16/16)
CS Inter-RAT Handover Success Rate( from UTRAN to GSM )(>85% ) 100.00% (4/4)PS Inter-RAT Handover Success Rate( from UTRAN to GSM )(>85% ) 66.67% (4/6)
CS AM R Call Drop Rate(<1.5% ) 1.92% (19/990)Video Call Drop Rate(<1.5% ) 10.34% (3/29)PS Service Drop Rate(<30% ) 3.01% (30/997)
CDR
RNC Nam e
Traffic
HO
Access
Table 1-2 Perf Daily Report
If network performance cannot meet the previous KPI or theKPI is changed, refer to Section 4 UTRAN KPI Analysis.
4.UTRAN KPI Analysis
4.1 Call Completion Rate
This section consists of the following parts:
RRC Setup Analysis
RAB Setup Analysis
Aug. 10, 2005 Confidential Information of HuaweiNo Spreading Without Permission
Page 8 of 55

UTRAN KPI Analysis Guide For Internal UseOnly
4.1.1 RRC Setup Analysis
1. Overview
RRC Setup Analysis is included in Nastar, as shown in Figure1-1. Double click RRC Setup Analysis to display the RRCsetup details, as shown in Figure 1-3. RRC setup successrate is 97.3%. Most RRC setup failures result from RRC SetupFail No Response while few RRC setup failures (seven times)result from RRC Setup Reject.
78,961 RRC_SETUP_SUCC7 RRC_REJ
2,186 RRC_SETUP_FAIL_NO_RSP
97.3 %
0.01 %2.69 %
Figure 1-3 RRC Setup
There are two reasons for RRC Setup Fail No Response:
Downlink FACH and RACH are covered unevenly.
The networks, built during the early period, are coveredpoorly. In particular, inter-system reselection areasare covered poorly.
A certain area has too many subscribers or any equipmentin this area is faulty.
Aug. 10, 2005 Confidential Information of HuaweiNo Spreading Without Permission
Page 9 of 55

UTRAN KPI Analysis Guide For Internal UseOnly
2. RRC Setup Scenario Analysis
One of the reasons for RRC Setup Fail No Response is poorcoverage, so RRC setup reasons and RRC setup success ratecan be used for further analysis. Start Scenario Analysis todisplay a pie or bar chart for presenting RNC indices.
7,451 RRC_REQ_ORG5,639 RRC_REQ_TERM51,385 RRC_REQ_CELL_RESEL16,387 RRC_REQ_REG
9.21 %
6.97 %
63.55 %
20.27 %
Figure 1-4 RRC setup scenario (pie chart)
Use Scenario Analysis to analyze RRC setup scenarios, as
shown in Figure 1-5. Most RRC setup requests are caused by:
RRC REQ CELL RESEL
If network coverage is poor, inter-system reselectionmay occur.
RRC REQ REG
If network coverage is poor, subscribers attempt toregister for many times.
Aug. 10, 2005 Confidential Information of HuaweiNo Spreading Without Permission
Page 10 of 55

UTRAN KPI Analysis Guide For Internal UseOnly
RNC:41(ID:41)-RRC_SETUP_SUCC_RATE_ORGggggggRNC:41(ID:41)-RRC_SETUP_SUCC_RATE_TERMggggggRNC:41(ID:41)-RRC_SETUP_SUCC_RATE_INTERRAT_CELL_RESELggggggRNC:41(ID:41)-RRC_SETUP_SUCC_RATE_REGgggggg
Time0
Bar V
alue
0.990.9850.980.9750.970.9650.960.9550.950.945
Figure 1-5 RRC setup scenario (bar chart)
Figure 1-5 shows RRC setup success rates. RRC SETUP SUCCRATE ORG is very high while RRC SETUP SUCC RATE REG is verylow. On Huawei networks, resident threshold Ec/Io is greaterthan -18 dB while inter-system reselection start thresholdEc/Io is less than -14 dB. Low RRC SETUP SUCC RATE REGindicates that many registrations are attempted within thearea (Ec/Io falls between -14 dB and -18 dB), which has poorcoverage. High RRC SETUP SUCC RATE ORG (99%) indicates thatthe network is covered by PCH and RRC SETUP SUCC RATE can behigh in a well-covered network.
3. RRC Setup Reject Analysis
RRC setup reject are caused by:
Admission reject due to crowded subscribers
Access failure due to equipment faults
RRC setup reject may occur no matter how poor networkcoverage is; however, RRC setup reject occurs in a small-scale network. Therefore, only the areas of RRC setup rejectmust be analyzed.
Aug. 10, 2005 Confidential Information of HuaweiNo Spreading Without Permission
Page 11 of 55

UTRAN KPI Analysis Guide For Internal UseOnly
In RRC Setup Analysis, start Cell RRC Analysis to query theTOPN. The queried results are outputted in three pages:
(1) The top ten cells that have the highest RRC setup rejecttimes.
(2) The top ten cells that have the highest RRC setupsuccess rates.
(3) The top ten cells that have the highest RRC setupfailure rates.
For the top ten cells that have the maximum RRC setup failrates, start Cell Scenario Analysis for further analysis.For the top ten cells that have the maximum RRC setuprejects, start Cell RRC Reject Analysis for furtheranalysis.
2 RRC_REJ_POW ER_CONG_CELL0 RRC_REJ_CE_CONG_CELL0 RRC_REJ_RL_FAIL_CELL0 RRC_REJ_AAL2_FAIL_CELL0 RRC_REJ_FP_FAIL_CELL0 RRC_REJ_CODE_CONG_CELL0 RRC_REJ_OTHER_CELL
100 % 0 %0 %0 %0 %0 %0 %
Figure 1-6 RRC setup reject analysis
Figure 1-6 shows the results of Cell RRC Reject Analysis. Inthis figure, two RRC setup rejects are caused by PowerCongestion. RRC setup reject may be caused by the followingreasons:
(1) Power Congestion
Aug. 10, 2005 Confidential Information of HuaweiNo Spreading Without Permission
Page 12 of 55
UTRAN KPI Analysis Guide For Internal UseOnly
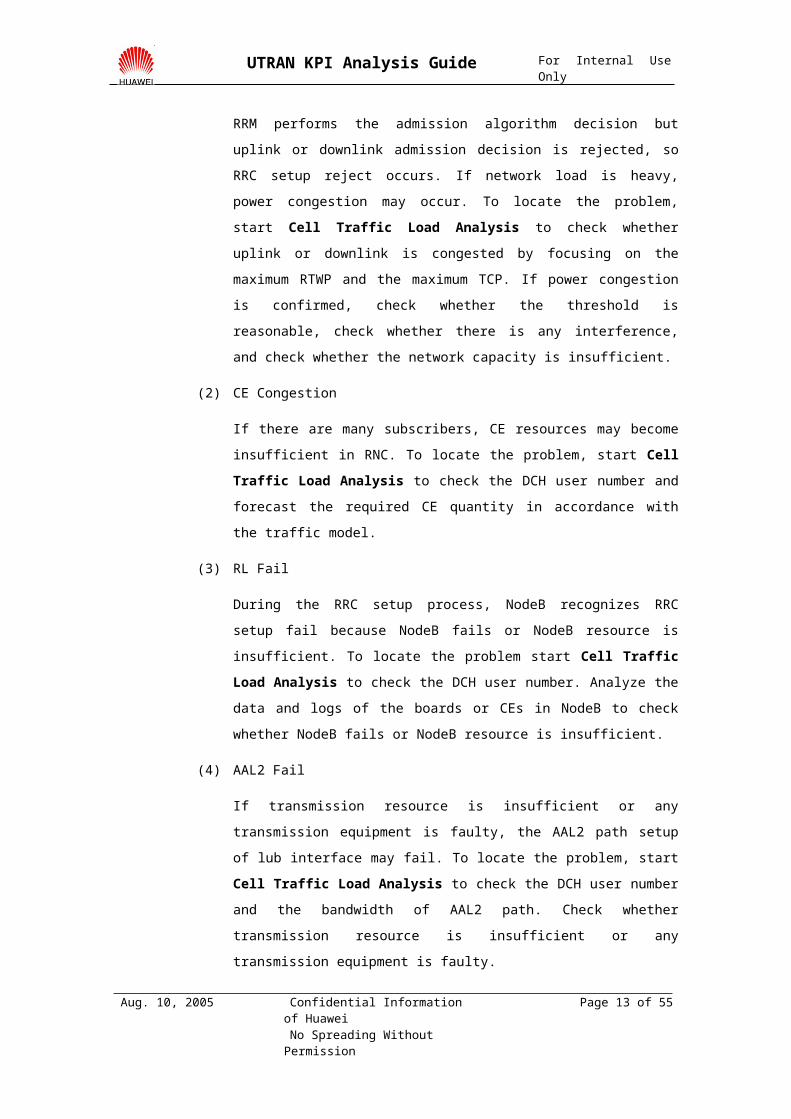
RRM performs the admission algorithm decision butuplink or downlink admission decision is rejected, soRRC setup reject occurs. If network load is heavy,power congestion may occur. To locate the problem,start Cell Traffic Load Analysis to check whetheruplink or downlink is congested by focusing on themaximum RTWP and the maximum TCP. If power congestionis confirmed, check whether the threshold isreasonable, check whether there is any interference,and check whether the network capacity is insufficient.
(2) CE Congestion
If there are many subscribers, CE resources may becomeinsufficient in RNC. To locate the problem, start CellTraffic Load Analysis to check the DCH user number andforecast the required CE quantity in accordance withthe traffic model.
(3) RL Fail
During the RRC setup process, NodeB recognizes RRCsetup fail because NodeB fails or NodeB resource isinsufficient. To locate the problem start Cell TrafficLoad Analysis to check the DCH user number. Analyze thedata and logs of the boards or CEs in NodeB to checkwhether NodeB fails or NodeB resource is insufficient.
(4) AAL2 Fail
If transmission resource is insufficient or anytransmission equipment is faulty, the AAL2 path setupof lub interface may fail. To locate the problem, startCell Traffic Load Analysis to check the DCH user numberand the bandwidth of AAL2 path. Check whethertransmission resource is insufficient or anytransmission equipment is faulty.
Aug. 10, 2005 Confidential Information of HuaweiNo Spreading Without Permission
Page 13 of 55

UTRAN KPI Analysis Guide For Internal UseOnly
(5) FP Fail
If the transmission fails or an equipment is faulty, FPsynchronization may fail. To locate the problem, checkwhether there is any BTS alarm.
(6) Code Congestion
If there is high traffic in the indoor micro cell, coderesource may be insufficient. To locate the problem,start Cell OVSF Code Allocation Analysis to analyze thecode allocation and confirm major services.
(7) Other
If there is any problem in RNC, RRC setup reject mayoccur. To locate the problem, analyze call detail logs.
4.1.2 RAB Setup Analysis
1. Overview
Aug. 10, 2005 Confidential Information of HuaweiNo Spreading Without Permission
Page 14 of 55

UTRAN KPI Analysis Guide For Internal UseOnly
Figure 1-7 Nastar tasks
Figure 1-7 shows a list of Nastar tasks. RAB Setup Analysisis included in Nastar. Double click RAB Setup Analysis todisplay RAB setup details, as shown in Figure 1-8.
2,370 CS_RAB_REQ_SETUP_CONV_0_32101 CS_RAB_REQ_SETUP_CONV_32_645 PS_RAB_REQ_SETUP_64K5 PS_RAB_REQ_SETUP_128K
749 PS_RAB_REQ_SETUP_384K
73.37 %
3.13 % 0.15 %0.15 %
23.19 %
Figure 1-8 RAB setup analysis
Check such RAB setup rates as CS_RAB_REQ_SETUP_CONV_0_32
Aug. 10, 2005 Confidential Information of HuaweiNo Spreading Without Permission
Page 15 of 55
UTRAN KPI Analysis Guide For Internal UseOnly
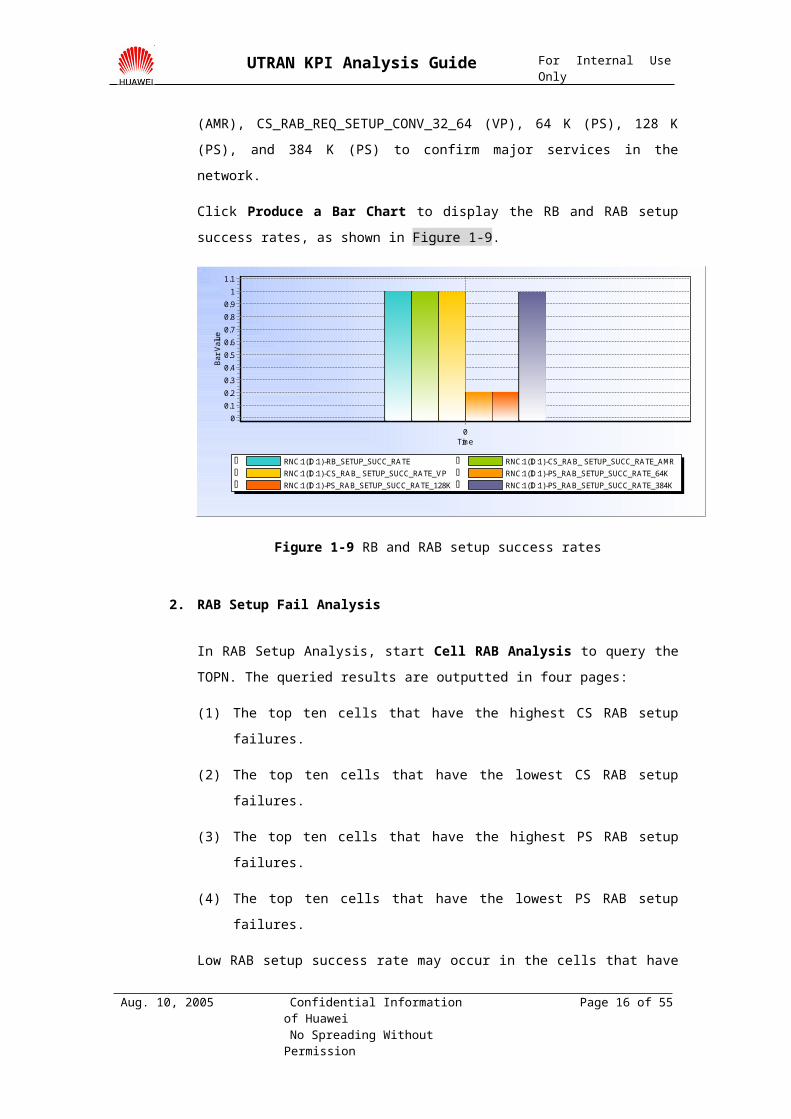
(AMR), CS_RAB_REQ_SETUP_CONV_32_64 (VP), 64 K (PS), 128 K(PS), and 384 K (PS) to confirm major services in thenetwork.
Click Produce a Bar Chart to display the RB and RAB setupsuccess rates, as shown in Figure 1-9.
RNC:1(ID:1)-RB_SETUP_SUCC_RATEgggggg RNC:1(ID:1)-CS_RAB_ SETUP_SUCC_RATE_AMRggggggRNC:1(ID:1)-CS_RAB_ SETUP_SUCC_RATE_VPgggggg RNC:1(ID:1)-PS_RAB_SETUP_SUCC_RATE_64KggggggRNC:1(ID:1)-PS_RAB_SETUP_SUCC_RATE_128Kgggggg RNC:1(ID:1)-PS_RAB_SETUP_SUCC_RATE_384Kgggggg
Time0
Bar V
alue
1.11
0.90.80.70.60.50.40.30.20.10
Figure 1-9 RB and RAB setup success rates
2. RAB Setup Fail Analysis
In RAB Setup Analysis, start Cell RAB Analysis to query theTOPN. The queried results are outputted in four pages:
(1) The top ten cells that have the highest CS RAB setupfailures.
(2) The top ten cells that have the lowest CS RAB setupfailures.
(3) The top ten cells that have the highest PS RAB setupfailures.
(4) The top ten cells that have the lowest PS RAB setupfailures.
Low RAB setup success rate may occur in the cells that have
Aug. 10, 2005 Confidential Information of HuaweiNo Spreading Without Permission
Page 16 of 55

UTRAN KPI Analysis Guide For Internal UseOnly
lowest setup times. To locate the problem, focus on thecells that have the lowest setup failures because the KPI isaffected mostly by these cells.
If CS RAB setup fail rate is high in a cell, start Cell CSRAB Setup Fail Analysis to display the CS RAB setup failrates, as shown in Figure 1-10.
1,571 CS_RAB_SETUP_SUCC_CONV_CELL0 CS_RAB_SETUP_SUCC_STR_CELL0 CS_RAB_SETUP_FAIL_PARAM_CELL0 CS_RAB_SETUP_FAIL_RELOC_CELL10 CS_RAB_SETUP_FAIL_TNL_CELL0 CS_RAB_SETUP_FAIL_CONG_CELL0 CS_RAB_SETUP_FAIL_POW ER_CONG_CELL0 CS_RAB_SETUP_FAIL_CE_CONG_CELL0 CS_RAB_SETUP_FAIL_CODE_CONG_CELL5 CS_RAB_SETUP_FAIL_OTHER_CELL
99.05 %
0 %0 %0 %
0.63 %0 %0 %0 %0 %0.32 %
Figure 1-10 Cell CS RAB setup fail analysis
Cell CS RAB setup failures may be caused by the followingreasons:
(1) PARAM_CELL
RNC regards the parameters transmitted by core networkas invalid parameters. This reason seldom occurs. Tolocate the problem, track the signaling and check theRAB setup messages in specific cells.
(2) RELOC_CELL
When initializing the migration process, RNC receivesthe RAB setup request messages but RNC does not processthe request. This reason is mainly caused by theprocess integration related to subscriber actionsequence, so this reason seldom occurs. In a core
Aug. 10, 2005 Confidential Information of HuaweiNo Spreading Without Permission
Page 17 of 55

UTRAN KPI Analysis Guide For Internal UseOnly
network, this situation is always avoided.
(3) TNL_CELL
RAB setup fails because IU transmission setup fails. Tolocate the problem, check the transmission capacity andoperation stability.
(4) CONG_CELL
This may be caused by RNC resource allocation failure.To locate the problem, analyze the RNC logs and obtainthe detailed resource failure information.
(5) POWER_CONG_CELL
According to RRM admission decision, new RAN cannot beset up because cell load is too heavy. To locate theproblem, check whether the parameters of admissionalgorithm are reasonable. If yes, consider to optimizethe coverage and expand the capacity.
(6) CE_CONG_CELL
CE resource admission fails in RNC. CE must beexpanded.
(7) CODE_CONG_CELL
During the RAB setup process, code resource allocationfails because too many subscribers are crowded on thenetwork or code resource allocation fails. To locatethe problem, analyze the code resource of cell trafficto check whether code resource is restricted due tocell overload.
(8) OTHER_CELL
This may caused by RB setup failure or other reasons.To locate the problem, analyze RB setup success rates.
Aug. 10, 2005 Confidential Information of HuaweiNo Spreading Without Permission
Page 18 of 55

UTRAN KPI Analysis Guide For Internal UseOnly
If PS RAB setup fail rate is high, start Cell PS RAB SetupFail Analysis to display the PS RAB setup fail rates, asshown in Figure 1-11.
0 PS_RAB_SETUP_SUCC_CONV_CELL0 PS_RAB_SETUP_SUCC_STR_CELL37 PS_RAB_SETUP_SUCC_INTER_CELL0 PS_RAB_SETUP_SUCC_BKG_CELL0 PS_RAB_SETUP_FAIL_PARAM_CELL0 PS_RAB_SETUP_FAIL_RELOC_CELL0 PS_RAB_SETUP_FAIL_CONG_CELL3 PS_RAB_SETUP_FAIL_POW ER_CONG_CELL0 PS_RAB_SETUP_FAIL_CE_CONG_CELL0 PS_RAB_SETUP_FAIL_CODE_CONG_CELL4 PS_RAB_SETUP_FAIL_OTHER_CELL
0 %0 %
84.09 %
0 %0 %0 %0 %
6.82 %0 %0 %
9.09 %
Figure 1-11 Cell PS RAB setup fail analysis
Cell CS RAB setup failure may be caused by the followingreasons:
(1) PARAM_CELL
RNC regards the parameters transmitted by core networkas invalid parameters. This reason seldom occurs. Tolocate the problem, track the signaling and check theRAB setup messages in specific cells.
(2) RELOC_CELL
When initializing the migration process, RNC receivesthe RAB setup request messages but RNC does not processthe request. This reason is mainly caused by theprocess integration related to subscriber actionsequence, so this reason seldom occurs. In a corenetwork, this situation is always avoided.
(3) TNL_CELL
RAB setup fails because IU transmission setup fails. To
Aug. 10, 2005 Confidential Information of HuaweiNo Spreading Without Permission
Page 19 of 55

UTRAN KPI Analysis Guide For Internal UseOnly
locate the problem, check the transmission capacity andoperation stability.
(4) CONG_CELL
This may be caused by RNC resource allocation failure.To locate the problem, analyze the RNC logs and obtainthe detailed resource failure information.
(5) POWER_CONG_CELL
According to RRM admission decision, new RAN cannot beset up because cell load is too heavy. To locate theproblem, check whether the parameters of admissionalgorithm are reasonable. If yes, consider to optimizethe coverage and expand the capacity.
(6) CE_CONG_CELL
CE resource admission fails in RNC. CE must beexpanded.
(7) CODE_CONG_CELL
During the RAB setup process, code resource allocationfails because too many subscribers are crowded on thenetwork or code resource allocation fails. To locatethe problem, analyze the code resource of cell trafficto check whether code resource is restricted due tocell overload.
(8) UNSUP_CELL
During the RAB setup process, the QoS is not supportedby RNC or RRM admission fails in RAB.
(9) OTHER_CELL
This may caused by RB setup failure or other reasons.To locate the problem, analyze RB setup success rates.
Aug. 10, 2005 Confidential Information of HuaweiNo Spreading Without Permission
Page 20 of 55

UTRAN KPI Analysis Guide For Internal UseOnly
In a commercial network, RAB setup is mainly caused byadmission failure and RB setup failure. To analyze the RBsetup failure, start Cell RB Setup Fail Analysis to displaythe RB setup fail rates, as shown in Figure 1-12.
1,645 RB_SETUP_SUCC_CELL0 RB_SETUP_FAIL_CFG_UNSUPP_CELL0 RB_SETUP_FAIL_PHYCH_FAIL_CELL0 RB_SETUP_FAIL_SIMU_RECFG_INCOMP_CELL0 RB_SETUP_FAIL_CELL_UPDT_CELL3 RB_SETUP_FAIL_CFG_INVALID_CELL1 RB_SETUP_FAIL_NO_RSP_CELL0 RB_SETUP_FAIL_OTHER_CELL99.76 %
0 %0 %0 %0 %
0.18 %0.06 %0 %
Figure 1-12 Cell RB setup fail analysis
Cell RB setup failure may be caused by the followingreasons:
(1) CFG_UNSUPP
UE acknowledges the RB setup failure because ofconfiguration unsupported. This reason seldom occurs inthe network. It is mainly caused by compatibilityproblem of UE in some unknown scenarios.
(2) PHYCH_FAIL
The RB setup failure may occur if FACH is migrated toDCH but downlink physical layers are not synchronizedduring the RB setup process. The rooted reason is poorcoverage.
(3) SIMU_RECFG_INCOMP
UE regards that the RB setup process and otherprocesses simultaneously occur and they areincompatible. RNC processing ensures RRC processes
Aug. 10, 2005 Confidential Information of HuaweiNo Spreading Without Permission
Page 21 of 55

UTRAN KPI Analysis Guide For Internal UseOnly
nesting. This reason seldom occurs. It is mainly causedby UE defects.
(4) CELL_UPDT
During the RB setup process, the Cell Update processoccurs. The RB setup failure is caused by processnesting.
(5) CFG_INVALID
UE regards the configured parameters are invalid ones.This reason seldom occurs. It is mainly caused byinconsistent understanding of network and UE.
(6) NO_RESPONSE
UE does not acknowledge the RB setup request. Thisreason frequently occurs. It is mainly caused by poorcoverage, so UE cannot receive the RB setup requestmessage.
(7) OTHER
Cell RB setup failure is caused by other reasons. Tolocate the problem, analyze call detail logs.
4.2 Soft Handover Analysis
This section consists of the following parts:
Overview
Cell SHO Prepare Failure Analysis
Cell SHO Failure Analysis
Aug. 10, 2005 Confidential Information of HuaweiNo Spreading Without Permission
Page 22 of 55
UTRAN KPI Analysis Guide For Internal UseOnly
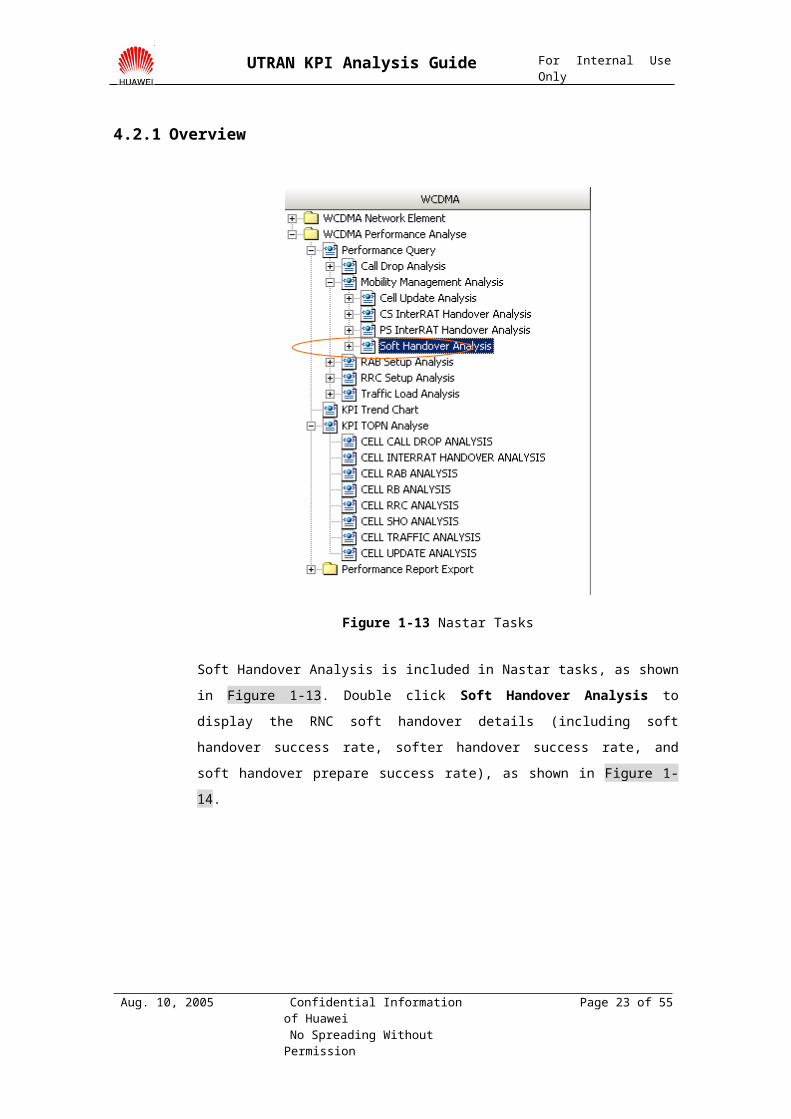
4.2.1 Overview
Figure 1-13 Nastar Tasks
Soft Handover Analysis is included in Nastar tasks, as shownin Figure 1-13. Double click Soft Handover Analysis todisplay the RNC soft handover details (including softhandover success rate, softer handover success rate, andsoft handover prepare success rate), as shown in Figure 1-14.
Aug. 10, 2005 Confidential Information of HuaweiNo Spreading Without Permission
Page 23 of 55

UTRAN KPI Analysis Guide For Internal UseOnly
RNC:1(ID:1)-SHO_SUCC_RATEgggggg RNC:1(ID:1)-SOFTERHO_SUCC_RATEggggggRNC:1(ID:1)-SHO_PREP_SUCC_RATEgggggg
Time0
Bar V
alue
1.0051
0.9950.990.9850.980.9750.970.9650.960.9550.950.9450.940.935
Figure 1-14 Soft Handover Analysis
In the previous figure, soft handover factor is used tomeasure the proportion and cost of soft handover.SHO_FACTOR_RL and SHO_FACTOR_UE are defined as follows:
SHO_FACTOR_RL
SHO_FACTOR_RL is used to measure average link number.SHO_FACTOR-RL can be calculated as follows:
(Subscriber number of link 1 of active set*1 +Subscriber number of link 2 of active set*2 +Subscriber number of link 3 of active set*3)/Totalsubscriber number – 1
SHO_FACTOR_RL is used to indicate the influence of softhandover exerted on NodeB CE and to evaluate thesubscriber resource utililization.
SHO_FACTOR_UE
SHO_FACTOR_UE is used to measure the proportion of softhandover subscribers. SHO_FACTOR_UE can be calculatedas follows:
(Subscriber number of link 2 of active set + Subscriber
Aug. 10, 2005 Confidential Information of HuaweiNo Spreading Without Permission
Page 24 of 55

UTRAN KPI Analysis Guide For Internal UseOnly
number of link 3 of active set)/Total subscriber number
SHO_FACTOR_UE is used to indicate the subscribers inthe soft handover area, which is similar to theproportion of soft handover area by making drive tests.SHO_FACTOR_UE is used to measure the reasonablerelationship between soft handover area and softhandover distribution.
SHO_FACTOR_UE is greater than SHO_FACTOR_UE. The greater thedifference between them is, the greater the subscribernumber of link 3 of active set is. If the subscriber numberof link 3 of active set is very great, SHO_FACTOR_RL isgreater than 1 while SHO_FACTOR_UE is less than 1.
4.2.2 Cell SHO Prepare Failure Analysis
In the Soft Handover Analysis, start Cell SHO Analysis toquery the TOPN. The queried results are outputted in fourpages:
(1) The top ten cells that have the highest soft handoverfailure times
(2) The top ten cells that have the lowest soft handoversuccess rates
(3) The top ten cells that have the highest soft handoverprepare failure times
(4) The top ten cells that have the lowest soft handoverprepare success rates
During the early period, low soft handover success rates mayexist in the cells that have less soft handover times.Attention must be paid to the cells that have the highestsoft handover failure times and the highest soft handover
Aug. 10, 2005 Confidential Information of HuaweiNo Spreading Without Permission
Page 25 of 55
UTRAN KPI Analysis Guide For Internal UseOnly
prepare failure times because they affect the KPI of softhandover greatly.
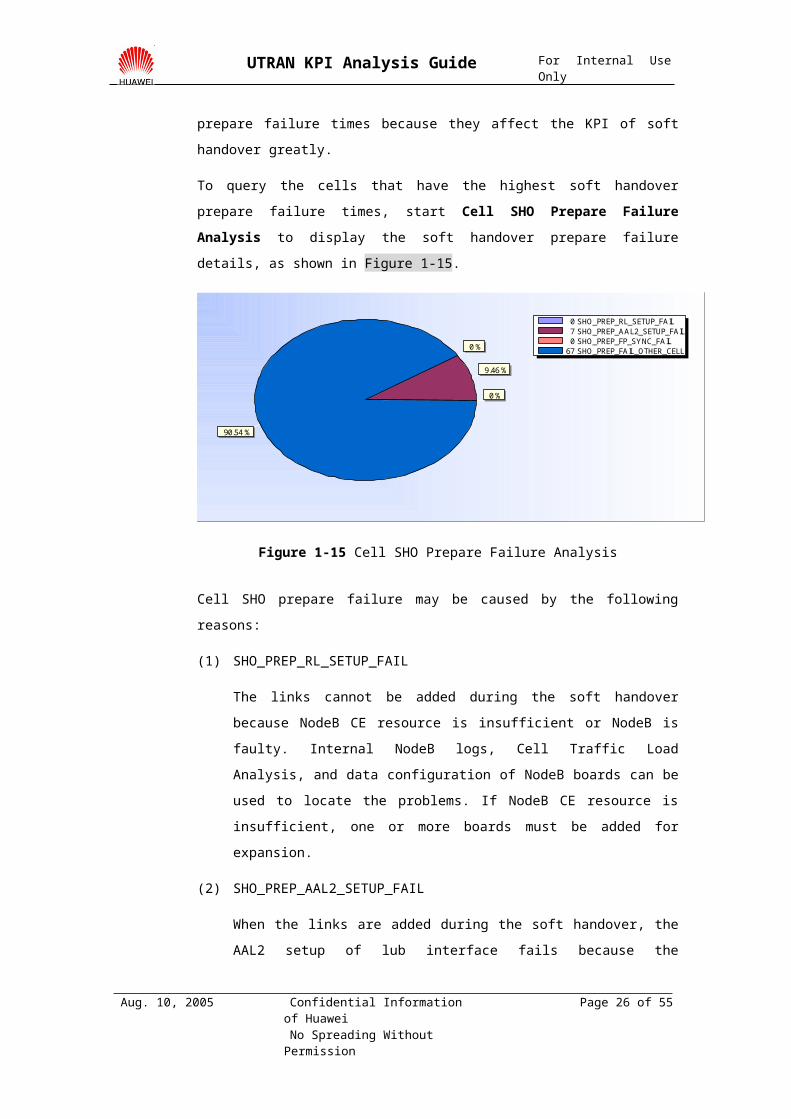
To query the cells that have the highest soft handoverprepare failure times, start Cell SHO Prepare FailureAnalysis to display the soft handover prepare failuredetails, as shown in Figure 1-15.
0 SHO_PREP_RL_SETUP_FAIL7 SHO_PREP_AAL2_SETUP_FAIL0 SHO_PREP_FP_SYNC_FAIL67 SHO_PREP_FAIL_OTHER_CELL
0 %
9.46 %
0 %
90.54 %
Figure 1-15 Cell SHO Prepare Failure Analysis
Cell SHO prepare failure may be caused by the followingreasons:
(1) SHO_PREP_RL_SETUP_FAIL
The links cannot be added during the soft handoverbecause NodeB CE resource is insufficient or NodeB isfaulty. Internal NodeB logs, Cell Traffic LoadAnalysis, and data configuration of NodeB boards can beused to locate the problems. If NodeB CE resource isinsufficient, one or more boards must be added forexpansion.
(2) SHO_PREP_AAL2_SETUP_FAIL
When the links are added during the soft handover, theAAL2 setup of lub interface fails because the
Aug. 10, 2005 Confidential Information of HuaweiNo Spreading Without Permission
Page 26 of 55

UTRAN KPI Analysis Guide For Internal UseOnly
transmission bandwidth is insufficient. If thetransmission bandwidth is insufficient, transmissionequipments must be expanded.
(3) SHO_PREP_FP_SYNC_FAIL
When the links are added during the soft handover, thesynchronization of AAL2 and FP of lub interface fails.To locate the problem, check whether the intermittenttransmission interruption occurs or the IMA grouptransmission is incorrectly configured.
(4) SHO_PREP_ FAIL_OTHER_CELL
Soft handover prepare failure is caused by otherreasons, such as insufficient RNC resource, radioresource admission reject, and RNC link state reject.To locate the problem, RNC logs must be used forfurther analysis.
4.2.3 Cell SHO Failure Analysis
In the Soft Handover Analysis, start Cell SHO Analysis toquery the TOPN. The queried results are outputted in fourpages:
(1) The top ten cells that have the highest soft handoverfailure times
(2) The top ten cells that have the lowest soft handoversuccess rates
(3) The top ten cells that have the highest soft handoverprepare failure times
(4) The top ten cells that have the lowest soft handoverprepare success rates
Aug. 10, 2005 Confidential Information of HuaweiNo Spreading Without Permission
Page 27 of 55

UTRAN KPI Analysis Guide For Internal UseOnly
During the early period, low soft handover success rates mayexist in the cells that have less soft handover times.Attention must be paid to the cells that have the highestsoft handover failure times and the highest soft handoverprepare failure times because they affect the KPI of softhandover greatly.
In the Cell SHO Analysis, start Cell SHO Failure Analysis todisplay the soft handover failure details, as shown inFigure 1-16.
2,797 SHO_SUCC_CELL0 SHO_RL_ADD_FAIL_CFG_UNSUPP0 SHO_RL_ADD_FAIL_SIMU_RECFG_INCOMP0 SHO_RL_ADD_FAIL_CFG_INVALID4 SHO_RL_ADD_FAIL_NO_RSP0 SHO_RL_DEL_FAIL_CFG_UNSUPP0 SHO_RL_DEL_FAIL_SIMU_RECFG_INCOMP0 SHO_RL_DEL_FAIL_CFG_INVALID3 SHO_RL_DEL_FAIL_NO_RSP0 SHO_FAIL_OTHER_CELL
99.75 %0 %0 %0 %
0.14 %0 %0 %0 %
0.11 %0 %
Figure 1-16 Cell SHO Failure Analysis
Soft handover failure may be caused by the followingreasons:
(1) SHO_RL_ADD_FAIL_CFG_UNSUPP
UE does not support to add radio links in RNC duringthe active set update. This reason seldom exists in acommercial network.
(2) SHO_RL_ADD_FAIL_SIMU_RECFG_INCOMP
UE feeds back that the soft handover process isincompatible with other concurrent processes when radiolinks are added in RNC. When handling the processes,RNC performs the serial connection. The problem is
Aug. 10, 2005 Confidential Information of HuaweiNo Spreading Without Permission
Page 28 of 55

UTRAN KPI Analysis Guide For Internal UseOnly
mainly caused by some handsets.
(3) SHO_RL_ADD_FAIL_CFG_INVALID
UE regards active set update of adding radio links inRNC as invalid configuration. This reason seldom occursin a commercial network.
(4) SHO_RL_ADD_FAIL_NO_RSP
RNC does not receive the acknowledgement of active setupdate of adding radio links. Soft handover failure ismainly caused by this reason. If network coverage ispoor or soft handover area is small, soft handoverfailure easily occurs. Thus, the RF optimization isrequired.
(5) SHO_RL_DEL_FAIL_CFG_UNSUPP
UE does not support to delete radio links in RNC duringthe active set update. This reason seldom occurs in acommercial network.
(6) SHO_RL_ADD_FAIL_SIMU_RECFG_INCOMP
UE feeds back that the soft handover is incompatiblewith other concurrent processes when radio links aredeleted in RNC. When handling the processes, RNCperforms the serial connection. The problem is mainlycaused by some handsets.
(7) SHO_RL_ADD_FAIL_CFG_INVALID
UE regards the active set update of deleting radiolinks in RNC as invalid configuration. This reasonseldom occurs in a commercial network.
(8) SHO_RL_ADD_FAIL_NO_RSP
RNC does not receive the acknowledgement of active setupdate of deleting radio links. Soft handover failure
Aug. 10, 2005 Confidential Information of HuaweiNo Spreading Without Permission
Page 29 of 55

UTRAN KPI Analysis Guide For Internal UseOnly
is mainly caused by this reason. If network coverage ispoor or soft handover area is small, soft handoverfailure easily occurs. Thus, the RF optimization isrequired.
(9) SHO_FAIL_OTHER_CELL
Soft handover failure is caused by other reasons;however, soft handover failure is seldom caused byother reasons. If soft handover failure is caused byother reasons, analyze the logs to locate the problems.
4.3 CS Inter-RAT Handover Analysis
This section consists of the following parts:
Overview
CS Inter-RAT Handover Prepare Failure Analysis
CS Inter-RAT Handover Failure Analysis
Cell Inter-RAT Handover Analysis
Aug. 10, 2005 Confidential Information of HuaweiNo Spreading Without Permission
Page 30 of 55

UTRAN KPI Analysis Guide For Internal UseOnly
4.3.1 Overview
Figure 1-17 Nastar tasks
CS Inter-RAT Handover Analysis is included in Nastar tasks,as shown in Figure 1-17. Double click CS Inter-RAT HandoverAnalysis to display the CS inter-RAT handover detailsbetween a 2G network and a 3G network (including CS inter-RAT handover success rate, CS inter-RAT handover preparefailure rate, and CS inter-RAT handover failure rate), asshown in Figure 1-18. In a commercial network, CS inter-RAThandover between a 2G network and a 3G network seldomoccurs.
Aug. 10, 2005 Confidential Information of HuaweiNo Spreading Without Permission
Page 31 of 55
UTRAN KPI Analysis Guide For Internal UseOnly
605 CS_INTRAT_HO_OUT_PREP_FAIL2,735 CS_INTRAT_HO_OUT_SUCC
40 CS_INTRAT_HO_OUT_FAIL17.9 %
80.92 %
1.18 %
Figure 1-18 CS Inter-RAT Handover Analysis
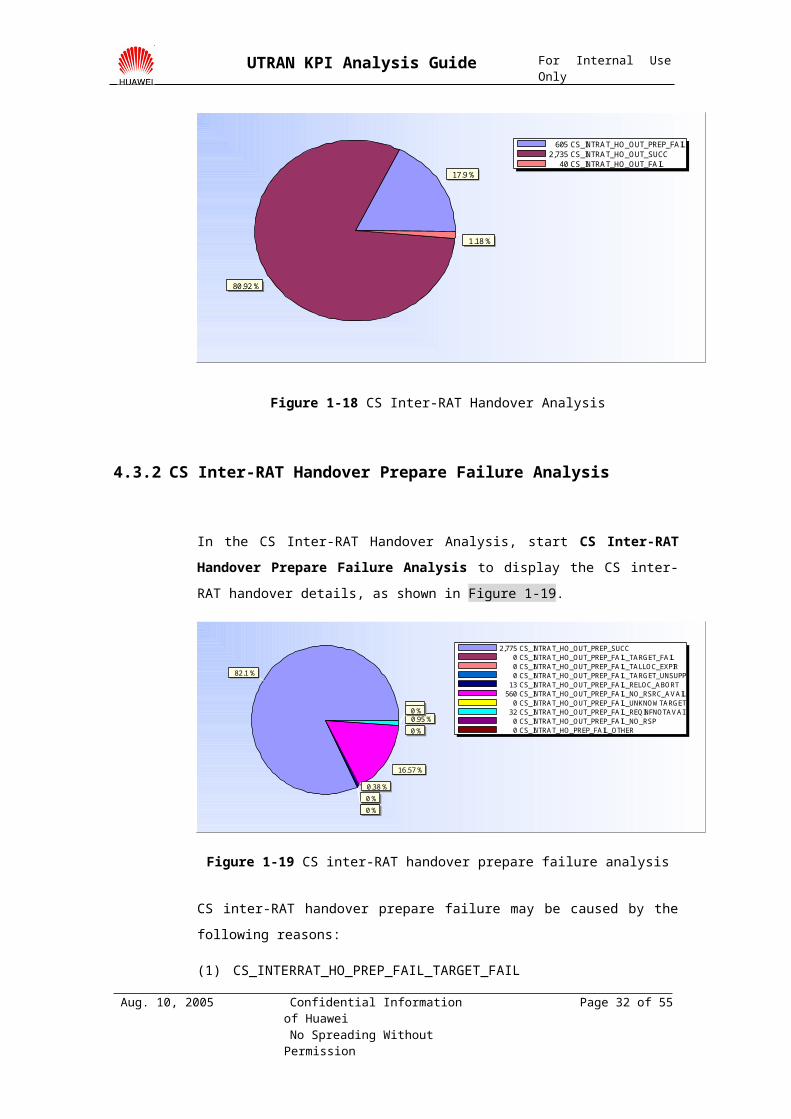
4.3.2 CS Inter-RAT Handover Prepare Failure Analysis
In the CS Inter-RAT Handover Analysis, start CS Inter-RATHandover Prepare Failure Analysis to display the CS inter-RAT handover details, as shown in Figure 1-19.
2,775 CS_INTRAT_HO_OUT_PREP_SUCC0 CS_INTRAT_HO_OUT_PREP_FAIL_TARGET_FAIL0 CS_INTRAT_HO_OUT_PREP_FAIL_TALLOC_EXPIR0 CS_INTRAT_HO_OUT_PREP_FAIL_TARGET_UNSUPP13 CS_INTRAT_HO_OUT_PREP_FAIL_RELOC_ABORT560 CS_INTRAT_HO_OUT_PREP_FAIL_NO_RSRC_AVAIL0 CS_INTRAT_HO_OUT_PREP_FAIL_UNKNOW TARGET32 CS_INTRAT_HO_OUT_PREP_FAIL_REQINFNOTAVAI0 CS_INTRAT_HO_OUT_PREP_FAIL_NO_RSP0 CS_INTRAT_HO_PREP_FAIL_OTHER
82.1 %
0 %0 %0 %
0.38 %
16.57 %
0 %0.95 %0 %0 %
Figure 1-19 CS inter-RAT handover prepare failure analysis
CS inter-RAT handover prepare failure may be caused by thefollowing reasons:
(1) CS_INTERRAT_HO_PREP_FAIL_TARGET_FAIL
Aug. 10, 2005 Confidential Information of HuaweiNo Spreading Without Permission
Page 32 of 55

UTRAN KPI Analysis Guide For Internal UseOnly
CS inter-RAT handover prepare failure is caused byRelocation Failure Target CN/RNC or Target System(cause value) because the data configuration of corenetwork is incorrect or BSS does not support thehandover. To locate the problem, track the signaling ofcore network and BSS for further analysis.
(2) CS_INTERRAT_HO_PREP_FAIL_TALLOC_EXPIR
CS inter-RAT handover prepare failure is caused byTRELOCalloc Expiry (cause value) because the dataconfiguration or link connection of core network isincorrect. To locate the problem, track the signalingof core network and BSS for further analysis.
(3) CS_INTERRAT_HO_PREP_FAIL_TARGET_UNSUPP
CS inter-RAT handover prepare failure is caused byRelocation Not Supported in Target RNC or Target System(cause value) because BSC does not support someparameters of handover requests. To locate the problem,track the signaling of core network and BSS for furtheranalysis.
(4) CS_INTERRAT_HO_PREP_FAIL_RELOC_ABORT
After sending the handover prepare request, RNCreceives the release message from core network. Thismay be caused by two reasons:
(1) Inter-RAT handover is requested during thesignaling processes, such as location update.Location update process is complete before inter-RAT handover process is complete. Thus, corenetwork initializes the release.
(2) When inter-RAT handover prepare process isperformed, an MS hangs up the call. Thus, core
Aug. 10, 2005 Confidential Information of HuaweiNo Spreading Without Permission
Page 33 of 55

UTRAN KPI Analysis Guide For Internal UseOnly
network initializes the release.
Although the previous inter-RAT handover processes areincomplete, they are normal nested processes.
(5) CS_INTERRAT_HO_PREP_FAIL_NO_RSRC_AVAIL
CS inter-RAT handover prepare failure is caused by NoResource Available (cause value) because the dataconfiguration of MSC is incorrect or there is noavailable resource in BSC. To locate the problem, trackthe signaling of core network and BSS for furtheranalysis.
(6) CS_INTERRAT_HO_PREP_FAIL_UNKNOWTARGET
CS inter-RAT handover prepare failure is caused byUnknown Target RNC (cause value) because the dataconfiguration of MSC is incorrect or the LAC of targetcell is not configured. To locate the problem, checkwhether any data is incorrectly configured in the corenetwork. This problem frequently occurs if a 2G networkis adjusted.
(7) CS_INTERRAT_HO_PREP_FAIL_ REQINFNOTAVAI
CS inter-RAT handover prepare failure is caused byRequested Information Not Available because the dataconfiguration is incorrect or target BSC does notsupport the handover. To locate the problem, track thesignaling of core network and BSS for further analysis.
(8) CS_INTERRAT_HO_PREP_FAIL_NO_RSP
CS inter-RAT handover prepare failure occurs becausecore network does not respond to the handover preparerequest. This may be caused by incorrect dataconfiguration or link connection of core network. Tolocate the problem, track the signaling of core network
Aug. 10, 2005 Confidential Information of HuaweiNo Spreading Without Permission
Page 34 of 55

UTRAN KPI Analysis Guide For Internal UseOnly
and BSS for further analysis.
4.3.3 CS Inter-RAT Handover Failure Analysis
In the CS Inter-RAT Handover Analysis, start CS Inter-RATHandover Failure Analysis to display the CS inter-RAThandover details (including CS inter-RAT handover successand failure rates), as shown in Figure 1-20.
0 CS_INTRAT_HO_OUT_FAIL_UNSPEC0 CS_INTRAT_HO_OUT_FAIL_NO_RSP12 CS_INTRAT_HO_OUT_FAIL_RELOC_ABORT1 CS_INTRAT_HO_FAIL_OTHER
2,735 CS_INTRAT_HO_OUT_SUCC0 CS_INTRAT_HO_OUT_FAIL_CFG_UNSUPP27 CS_INTRAT_HO_OUT_FAIL_PHYCH_FAIL
0 %0 %
0.43 %0.04 %98.56 %
0 %0.97 %
Figure 1-20 CS inter-RAT handover failure analysis
CS inter-RAT handover failure may be caused by the followingreasons:
(1) CS_INTERRAT_HO_ FAIL_UNSPEC
CS inter-RAT handover failure is caused by Unspecified(cause value). This reason seldom occurs in a network.
(2) CS_INTERRAT_HO_ FAIL_PHYCN_FAIL
CS inter-RAT handover failure is caused by PhysicalChannel Failure (cause value). CS inter-RAT handoverfailure is mainly caused by:
The signals of 2G network are weak or UE fails toaccess the network due to serious interference.
Aug. 10, 2005 Confidential Information of HuaweiNo Spreading Without Permission
Page 35 of 55

UTRAN KPI Analysis Guide For Internal UseOnly
Some parameters (such as ciphering mode)transmitted to UE are inconsistent with that ofBSC.
To locate the problem, compare the parameters of UEwith that of BSC.
(3) CS_INTERRAT_HO_ FAIL_ CFG_UNSUPP
CS inter-RAT handover failure is caused byConfiguration Unsupported (cause value) because UE doesnot support the handover request. This reason may bemainly caused by abnormal UE.
(4) CS_INTERRAT_HO_ FAIL_ RELOC_ABORT
After sending the handover request message to UE, RNCreceives the release message from core network.However, the cause is not Normal Release because thelink is released abnormally due to other reasons. Thisreason is caused by the nesting of handover process andrelease process.
(5) CS_INTERRAT_HO_ FAIL_NO_RSP
After RNC sends the handover request message to UE, UEdoes not acknowledge the request because networkcoverage is poor.
(6) CS_INTERRAT_HO_ FAIL_OTHER
CS inter-RAT handover failure is caused by otherreasons. To locate the problem, analyze the RNC logs.
4.3.4 Cell Inter-RAT Handover Analysis
In the CS inter-RAT Handover Analysis, start Cell inter-RATHandover Analysis to query the TOPN. The queried results are
Aug. 10, 2005 Confidential Information of HuaweiNo Spreading Without Permission
Page 36 of 55

UTRAN KPI Analysis Guide For Internal UseOnly
outputted to list:
(1) The cell that have the lowest CS inter-RAT handoversuccess rate
(2) The cell that have the greatest CS inter-RAT handoverprepare failure times
(3) The cell that have the greatest CS inter-RAT handoverfailure times
(4) The cell that have the greatest CS inter-RAT handovertimes
Through the previous results, you can find the cell that hasthe greatest CS inter-RAT handover times. Thus, the networkcoverage must be improved. In addition, you can find thecell that has the greatest CS inter-RAT handover failuretimes. Thus, the data configuration must be checked.
4.4 PS Inter-RAT Handover Analysis
This section consists of the following parts:
Overview
PS Inter-RAT Handover Failure Analysis
Cell Inter-RAT Handover Analysis
4.4.1 Overview
PS inter-RAT Handover Analysis is included in Nastar tasks.Double click PS Inter-RAT Handover Analysis to display thePS inter-RAT handover details between a 2G network and a 3Gnetwork, as shown in Figure 1-21. PS inter-RAT handover froma 2G network to a 3G network need not be analyzed because PS
Aug. 10, 2005 Confidential Information of HuaweiNo Spreading Without Permission
Page 37 of 55

UTRAN KPI Analysis Guide For Internal UseOnly
inter-RAT handover from a 2G network to a 3G network cannotbe identified in access network.
10 PS_INTRAT_HO_OUT_UTRAN_REQ0 PS_INTRAT_HO_OUT_UE_REQ
100 % 0 %
Figure 1-21 PS inter-RAT handover analysis
Figure 1-22 shows PS_INTRAT_HO_OUT_UTRAN_REQ andPS_INTRAT_HO_OUT_UTRAN_UE. PS_INTRAT_HO_OUT_UTRAN_REQindicates that the PS inter-RAT handover is initialized bythe UE in a dedicated channel. PS_INTRAT_HO_OUT_UTRAN_UEindicates that the PS inter-RAT handover is initialized bycombined services or the PS inter-RAT reselection isinitialized by the UE that is not in a dedicated channel.
RNC:41(ID:41)-PS_INTRAT_HO_OUT_UTRAN_SUCC_RATEggggggRNC:41(ID:41)-PS_INTRAT_HO_OUT_UE_SUCC_RATEgggggg
Time0
Bar V
alue
0.9
0.8
0.7
0.6
0.5
0.4
0.3
0.2
0.1
0
Figure 1-22 PS inter-RAT handover success rate
Aug. 10, 2005 Confidential Information of HuaweiNo Spreading Without Permission
Page 38 of 55

UTRAN KPI Analysis Guide For Internal UseOnly
4.4.2 PS Inter-RAT Handover Failure Analysis
In the PS inter-RAT Handover Analysis, start PS inter-RATHandover Failure Analysis to display the PS inter-RAThandover success and failure rates, as shown in Figure 1-23.
8 PS_INTRAT_HO_OUT_UTRAN_SUCC0 PS_HO_OUT_FAIL_CFG_UNSUPP0 PS_HO_OUT_FAIL_PHYCH_FAIL0 PS_HO_OUT_FAIL_UNSPEC0 PS_HO_OUT_FAIL_NO_RSP2 PS_HO_OUT_FAIL_OTHER
80 %
0 %0 %0 %0 %
20 %
Figure 1-23 PS inter-RAT handover failure analysis
PS inter-RAT handover failure may be caused by the followingreasons:
(1) PS_INTERRAT_HO_ FAIL_UNSPEC
PS inter-RAT handover failure is caused by Unspecified(cause value). This reason seldom occurs in a network.
(2) PS_INTERRAT_HO_ FAIL_PHYCN_FAIL
PS inter-RAT handover failure is caused by PhysicalChannel Failure (cause value) because the signals of 2Gnetwork are weak or UE fails to access the network dueto serious interference.
(3) PS_INTERRAT_HO_ FAIL_ CFG_UNSUPP
PS inter-RAT handover failure is caused by
Aug. 10, 2005 Confidential Information of HuaweiNo Spreading Without Permission
Page 39 of 55
UTRAN KPI Analysis Guide For Internal UseOnly
Configuration Unsupported (cause value) because UE doesnot support the handover request. This reason may bemainly caused by abnormal UE.
(4) PS_INTERRAT_HO_ FAIL_NO_RSP
After RNC sends the handover request message to UE, UEdoes not acknowledge the request because networkcoverage is poor or UE does not support the handover.
(5) PS_INTERRAT_HO_ FAIL_OTHER
PS inter-RAT handover failure is caused by otherreasons. To locate the problem, analyze the RNC logs.
4.4.3 Cell Inter-RAT Handover Analysis
In the PS Inter-RAT Handover Analysis, start Cell Inter-RATHandover Analysis to query the TOPN. The queried results areoutputted to list:
(1) The cell that have the lowest PS inter-RAT handoversuccess rate
(2) The cell that have the greatest PS inter-RAT handoverprepare failure times
(3) The cell that have the greatest PS inter-RAT handoverfailure times
(4) The cell that have the greatest PS inter-RAT handovertimes
Through the previous results, you can find the cell that hasthe greatest PS inter-RAT handover times. Thus, the networkcoverage must be improved.
Aug. 10, 2005 Confidential Information of HuaweiNo Spreading Without Permission
Page 40 of 55

UTRAN KPI Analysis Guide For Internal UseOnly
4.5 Cell Update Analysis
This section consists of the following parts:
Overview
Cell Update Failure Analysis
4.5.1 Overview
Cell Update Analysis is included in Nastar tasks. Doubleclick Cell Update Analysis to display the cell updatedetails (including cell update times and cell update successrate). Cell update process is initialized because the linksof UE are abnormal or RLC is reset. Cell update process ismainly caused by poor network coverage. This cell updateprocess is different from that of cell reselection, so youmust be familiar with diverse cell update processes. In theCell Update Analysis, start Cell Update Scenario Analysis todisplay different cell update scenarios, as shown in Figure1-24. If the state transition is disabled in a network, thecell update is caused by abnormal links or RLC reset if UEis not in CELL_FACH or CELL_PCH state.
Aug. 10, 2005 Confidential Information of HuaweiNo Spreading Without Permission
Page 41 of 55

UTRAN KPI Analysis Guide For Internal UseOnly
0 CELL_UPDT_REENTER0 CELL_UPDT_PAGE0 CELL_UPDT_UL_DATA_TRANS
211 CELL_UPDT_RLC_ERR15 CELL_UPDT_RL_FAIL0 CELL_UPDT_PRD0 CELL_UPDT_RESEL0 CELL_UPDT_OTHER
0 %0 %0 %
93.36 %
6.64 %
0 %0 %0 %
Figure 1-24 Cell update scenarios
In the Cell Update Scenario Analysis, click Create a BarChart to display the cell update success rates, as shown inFigure 1-25. In general, the cell updates are caused byabnormal links (RL) or RLC reset (RLC_ERR), thus low cellupdate success rate may be caused by poor network coverage.If cell update is caused by other reasons, cell updatesuccess rate must be greater than 85%.
RNC:41(ID:41)-CELL_UPDT_SUCC_RATE_RESELggggggRNC:41(ID:41)-CELL_UPDT_SUCC_RATE_REENTERggggggRNC:41(ID:41)-CELL_UPDT_SUCC_RATE_PAGEggggggRNC:41(ID:41)-CELL_UPDT_SUCC_RATE_UL_DATA_TRANSggggggRNC:41(ID:41)-CELL_UPDT_SUCC_RATE_RLC_ERRggggggRNC:41(ID:41)-CELL_UPDT_SUCC_RATE_RLggggggRNC:41(ID:41)-CELL_UPDT_SUCC_RATE_PRDggggggRNC:41(ID:41)-CELL_UPDT_SUCC_RATE_OTHERgggggg
Time0
Bar V
alue
0.070.060.050.040.030.020.01
0
Figure 1-25 Cell update success rates
Aug. 10, 2005 Confidential Information of HuaweiNo Spreading Without Permission
Page 42 of 55

UTRAN KPI Analysis Guide For Internal UseOnly
4.5.2 Cell Update Failure Analysis
In the Cell Update Analysis, start Cell Update Analysis toquery the TOPN. The queried results are outputted to list:
(1) The cell that has the lowest cell update success rate
(2) The cell that has the greatest cell update failuretimes
If a cell has the lowest cell update success rate, cellupdate times are less. Attention must be paid to the cellthat has the greatest cell update failure times.
In the queried results of Cell Update Analysis, start CellUpdate Scenario Analysis for Cell to analyze the cell updatefailure and summarize the cell update failure scenarios.
4.6 Call Drop Analysis
This section consists of the following parts:
Overview
CS Call Drop Analysis
PS Call Drop Analysis
Cell Call Drop Analysis
4.6.1 Overview
Call Drop Analysis is included in Nastar tasks. Double clickCall Drop Analysis to display the RNC call drop details.Then, click Create a Pie Chart to display the call dropdetails for different services (including voice, VP, CS, and
Aug. 10, 2005 Confidential Information of HuaweiNo Spreading Without Permission
Page 43 of 55

UTRAN KPI Analysis Guide For Internal UseOnly
PS), as shown in Figure 1-27.
75 RNC_CS_RAB_REL_AMR_TRIG_BY_RNC8 RNC_CS_RAB_REL_CONV_64K_TRIG_BY_RNC0 RNC_CS_RAB_REL_STR_TRIG_BY_RNC
515 RNC_PS_RAB_REL_REQ
12.54 %
1.34 %0 %
86.12 %
Figure 1-26 Call drop analysis
In the Cell Drop Analysis, click Create a Bar Chart todisplay the call drop rates for different services(including voice, VP, CS, and PS), as shown in Figure 1-27.In general, the call drop rate of CS service is less thanthat of VP service or PS service because of their differentservice coverage capabilities and service processcomplexities, especially in the poor-covered areas.
RNC:41(ID:41)-CS_RAB_AMR_DROP_RATEgggggg RNC:41(ID:41)-CS_RAB_VP_DROP_RATEggggggRNC:41(ID:41)-CS_RAB_STR_DROP_RATEgggggg RNC:41(ID:41)-PS_RAB_DROP_RATEgggggg
Time0
Bar V
alue
0.650.60.550.50.450.40.350.30.250.20.150.10.05
0
Figure 1-27 Call drop rates
Aug. 10, 2005 Confidential Information of HuaweiNo Spreading Without Permission
Page 44 of 55

UTRAN KPI Analysis Guide For Internal UseOnly
4.6.2 CS Call Drop Analysis
In the CS Call Drop Analysis, click Create a Pie Chart todisplay the CS call drop reasons, as shown in Figure 1-28.
75 RNC_CS_RAB_REL_AMR_TRIG_BY_RNC8 RNC_CS_RAB_REL_CONV_64K_TRIG_BY_RNC0 RNC_CS_RAB_REL_STR_TRIG_BY_RNC
515 RNC_PS_RAB_REL_REQ
12.54 %
1.34 %0 %
86.12 %
Figure 1-28 CS call drop reasons
CS call drops may be caused by the following reasons:
(1) RAB_CS_REL_RF_LOSS
CS call drop may be caused by abnormal release causedby the lost synchronization of links because of poornetwork coverage (including adjacent cell missing,small handover area. As a result, UE closes thetransmitter abnormally or uplink demodulation isasynchronous. To solve the problem, network coveragemust be improved. In the early network, call drops aremainly caused by this reason.
(2) RNC_CS_RAB_REL_TRIG_BY_RNC_SRB_RESET
CS call drops may be caused by link releasing due todownlink SRB reset. This reason is mainly caused bypoor network coverage (including adjacent cell missingand small handover area). To solve the problem, the
Aug. 10, 2005 Confidential Information of HuaweiNo Spreading Without Permission
Page 45 of 55

UTRAN KPI Analysis Guide For Internal UseOnly
network coverage must be improved. In the earlynetwork, call drops are mainly caused by this reason.
(3) RNC_CS_RAB_REL_TRIG_BY_RNC_AAL2_LOSS
If IU CS interface (AAL2 path) is abnormal, RNCinitializes the release. In practice, this reasonseldom occurs. If this reason occurs, the problem maybe caused by any faulty or defective equipment. In someversions of RNC, normal release is recorded as abnormalrelease during the RB setup process.
(4) CS_RAB_DROP_OTHER
CS call drops may be caused by other reasons. There arefew call drop statistics in RNC (Version 12). Suchreasons as process interaction timeout and cell updatefailure are recorded in CS_RAB_DROP_OTHER. In practice,many call drops are caused by process interactiontimeout and cell update failure. Therefore, these calldrops are recorded in CS_RAB_DROP_OTHER.
4.6.3 PS Call Drop Analysis
In the Call Drop Analysis, start PS Call Drop Analysis.Then, click Create a Pie Chart to display the PS call drops,as shown in Figure 1-29.
Aug. 10, 2005 Confidential Information of HuaweiNo Spreading Without Permission
Page 46 of 55

UTRAN KPI Analysis Guide For Internal UseOnly
15 RAB_PS_REL_RF_LOSS26 RNC_PS_RAB_REL_TRIG_BY_RNC_TRB_RESET208 RNC_PS_RAB_REL_TRIG_BY_RNC_SRB_RESET0 RNC_PS_RAB_REL_TRIG_BY_RNC_GTPU_LOSS
266 PS_RAB_DROP_OTHER
2.91 %
5.05 %
40.39 %
0 %
51.65 %
Figure 1-29 PS call drop reasons
PS call drop may be caused by the following reasons:
(1) RAB_PS_REL_RF_LOSS
PS call drops may be caused by abnormal release becausethe links are asynchronous. This reason is mainlycaused by poor network coverage (including adjacentcell missing and small handover area). As a result, UEcloses the transmitter abnormally or uplinkdemodulation is asynchronous. To solve the problem,network coverage must be improved. In the earlynetwork, call drops are mainly caused by this reason.
(2) RNC_PS_RAB_REL_TRIG_BY_RNC_SRB_RESET
PS call drops may be caused by link releasing due todownlink SRB reset. This reason is mainly caused bypoor network coverage (including adjacent cell missingand small handover area). To solve the problem, thenetwork coverage must be improved. In the earlynetwork, call drops are mainly caused by this reason.
(3) RNC_PS_RAB_REL_TRIG_BY_RNC_TRB_RESET
PS call drops may be caused by link releasing due to
Aug. 10, 2005 Confidential Information of HuaweiNo Spreading Without Permission
Page 47 of 55
UTRAN KPI Analysis Guide For Internal UseOnly
downlink TRB reset. This reason is mainly caused bypoor network coverage (including adjacent cell missingand small handover area). To solve the problem, thenetwork coverage must be improved. In the earlynetwork, call drops are mainly caused by this reason.
(4) RNC_PS_RAB_REL_TRIG_BY_RNC_GTPU_LOSS
If IU CS interface (AAL2 path) is abnormal, RNCinitializes the release. In practice, this reasonseldom occurs. If this reason occurs, the problem maybe caused by any faulty or defective equipment.
(5) PS_RAB_DROP_OTHER
PS call drops may be caused by other reasons. There arefew call drop statistics in RNC (Version 12). Suchreasons as process interaction timeout and cell updatefailure are recorded in PS_RAB_DROP_OTHER. In practice,many call drops are caused by process interactiontimeout and cell update failure. Therefore, these calldrops are recorded in PS_RAB_DROP_OTHER.
4.6.4 Cell Call Drop Analysis
In the Cell Drop Call Analysis, query the TOPN to find thecell that has the greatest CS call drop rate, start CellCall Drop Analysis, and then click Create a Pie Chart todisplay the cell drop reasons, as shown in Figure 1-30.
Aug. 10, 2005 Confidential Information of HuaweiNo Spreading Without Permission
Page 48 of 55

UTRAN KPI Analysis Guide For Internal UseOnly
0 RNC_CS_RAB_REL_CELL_TRIG_BY_RNC_OM0 RNC_CS_RAB_REL_CELL_TRIG_BY_RNC_UTRAN0 RNC_CS_RAB_REL_CELL_TRIG_BY_RNC_RAB_PREM2 RNC_CS_RAB_REL_CELL_TRIG_BY_RNC_SRBRESET0 RNC_CS_RAB_REL_CELL_TRIG_BY_RNC_AAL2LOSS4 CS_RAB_DROP_CELL_OTHER
0 %0 %0 %
33.33 %0 %
66.67 %
Figure 1-30 CS cell drop reasons
CS Cell call drops may be caused by the following reasons:
(1) RNC_CS_RAB_REL_CELL_TRIG_BY_RNC_OM
Cell call drops may be caused by CS link releasing dueto operation and maintenance (for example, cell block).Actually, cell call drops caused by this reason arenormal.
(2) RNC_CS_RAB_REL_CELL_TRIG_BY_RNC_SRB_RESET
Cell call drops may be caused by link releasing due todownlink SRB reset. This reason is mainly caused bypoor network coverage (including adjacent cell missingand small handover area). To solve the problem, thenetwork coverage must be improved. In the earlynetwork, call drops are mainly caused by this reason.
(3) RNC_CS_RAB_REL_CELL_TRIG_BY_RNC_UTRAN
Cell call drops may be caused by abnormal linkreleasing due to UTRAN. To solve the problem, use CDLfor further analysis.
(4) RNC_CS_RAB_REL_CELL_TRIG_BY_RNC_AAL2_LOSS
If IU CS interface (AAL2 path) is abnormal, RNC
Aug. 10, 2005 Confidential Information of HuaweiNo Spreading Without Permission
Page 49 of 55

UTRAN KPI Analysis Guide For Internal UseOnly
initializes the release. In practice, this reasonseldom occurs. If this reason occurs, the problem maybe caused by any faulty or defective equipment.
(5) RNC_CS_RAB_REL_CELL_TRIG_BY_RNC_RAB_PREM
Cell call drops may be caused by CS link releasing dueto high priority preemption. If load or resource isinsufficient, cell call drop may occur. Check whetherthe expansion is required according to cell call droptimes.
(6) CS_RAB_DROP_CELL_OTHER
Cell call drops may be caused by other reasons. Thereare few call drop statistics in RNC (Version 12). Suchreasons as process interaction timeout and cell updatefailure are recorded in CS_RAB_DROP_CELL_OTHER. Inpractice, many call drops are caused by processinteraction timeout and cell update failure. Therefore,these call drops are recorded inCS_RAB_DROP_CELL_OTHER.
4.7 Traffic Load Analysis
This section consists of the following parts:
Overview
Cell Traffic Analysis
4.7.1 Overview
Traffic Load Analysis is included in Nastar tasks. Doubleclick Traffic Load Analysis to display the RNC traffic loaddetails. You can choose Time Range or Query Object to query
Aug. 10, 2005 Confidential Information of HuaweiNo Spreading Without Permission
Page 50 of 55

UTRAN KPI Analysis Guide For Internal UseOnly
the RNC traffic load, as shown in Figure 1-32.
Figure 1-32 Query traffic load
Choose Busy Time (Busy Time can be Automatic Querying orDesignated Time). In the Traffic Load Analysis, click Createa Pie Chart to display the traffic load details. Assume thatthe subscribers for different services are equivalent,traffic load proportions are displayed in Figure 1-33.UNKNOWN_USER indicates that the subscribers are from otherRNC and service type is unknown. The unit of traffic load isErl.
Aug. 10, 2005 Confidential Information of HuaweiNo Spreading Without Permission
Page 51 of 55

UTRAN KPI Analysis Guide For Internal UseOnly
4.388 CS_CONV_USER0 CS_STR_USER0 PS_CONV_USER0 PS_STR_USER
25.808 PS_INTER_BKG_USER0.09 UNKNOW N_USER14.49 %
0 %0 %0 %
85.21 %
0.3 %
Figure 1-33 Traffic Load
4.7.2 Cell Traffic Analysis
If a cell has the highest traffic, it is the most importantcell in a network. In addition, the cell is easily congestedand need to be expanded. In the Traffic Load Analysis, startCell Traffic Analysis to query the TOPN. The queried resultsare outputted as follows:
(1) The cell that has the greatest RTWP
(2) The cell that has the greatest TCP
(3) The cell that has the greatest DCH UE
(4) The cell that has the greatest downlink admissionrejects
The cell that has the greatest RTWP represents the cell thathas the greatest uplink radio load. In practice, thisqueried result can be used to find the cell that isseriously interfered. If the RTWP of a cell is greater than
Aug. 10, 2005 Confidential Information of HuaweiNo Spreading Without Permission
Page 52 of 55

UTRAN KPI Analysis Guide For Internal UseOnly
-100 dBm, the cell must be analyzed. Check whether it is theburst interference or continuous interference. The burstinterference exerts little influence on the system but thecontinuous interference must be eliminated on a timelybasis. If the cells have large RTWP_MAX_CELL_DBM values,start Cell RTWP Analysis, as shown in Figure 1-34.
RTW P_MAX_CELL_DBMgggggg
DateTime2005-04-21 00:00:00 2005-04-21 04:30:00 2005-04-21 09:30:00 2005-04-21 14:30:00 2005-04-21 19:30:00
Items
-65
-70
-75
-80
-85
-90
-95
-100
-105
Figure 1-34 Cell RTWP analysis
The cell that has the greatest TCP represents the cell thathas the greatest downlink radio load. In practice, if thecell has the greatest downlink radio load, the cell also hasthe greatest downlink admission rejects. For such cell,check whether the cross coverage is serious and checkwhether the indoor coverage of high traffic area must beimproved to decrease large power consumption.
The cell that has the greatest DCH UE is used to measure thesubscriber number of a cell. Combined with the utilizationof OVSF codes, the average CE and transmission can beestimated to further check whether the resources aresufficient.
The cell that has the greatest DL ADMSN DENY is used to
Aug. 10, 2005 Confidential Information of HuaweiNo Spreading Without Permission
Page 53 of 55

UTRAN KPI Analysis Guide For Internal UseOnly
measure the cell that has the greatest downlink radio load.In practice, downlink radio load is a bottleneck because theuplink is asymmetric to the downlink and the downlink is ofinterference. If a cell has the greatest DL ADMSN DENY,check whether the cross coverage is serious, the handoverarea is unreasonable, or the indoor coverage for hightraffic area must be improved.
For the cell that has the greatest DL ADMSN DENY, start CellResource Analysis to display the admission rejectproportions of call setup, incoming handover, and re-configuration. In this way, you can further understand theinfluence exerted on the subscribers.
5.Analyzing Complicated Problems
Further analysis is necessary because the KPI of trafficstatistics does not represent the processes, but theresults. Some reasons may not be found through the KPIanalysis. Therefore, it is necessary for us to use furtheranalysis to locate complicated problems. To analyzecomplicated problems, use the following methods:
Narrowing down area range and time range
Analyzing abnormal logs
Analyzing repeated problems
5.1 Narrowing Down Area Range and Time Range
The area range of abnormal traffic statistics can bedetermined by querying the TOPN. After determining the arearange, query the time range of problem (The time range fallswithin 30 minutes).
Aug. 10, 2005 Confidential Information of HuaweiNo Spreading Without Permission
Page 54 of 55

UTRAN KPI Analysis Guide For Internal UseOnly
5.2 Analyzing Abnormal Logs
Execute the command LST CELL in MML on the RNC maintenanceconsole to find the service subrack. Then, send the CDL ofservice subrack from BAM to a service engineer for furtheranalyzing abnormal processes, reasons, and involvedsubscribers.
5.3 Analyzing Repeated Problems
If time range or area range falls within a fixed scope afterthe KPI analysis is performed for several days, use SampleTrace on the RNC maintenance console in a given time toobtain the detailed call procedure for further analyzingproblem causes and involved subscribers.
Aug. 10, 2005 Confidential Information of HuaweiNo Spreading Without Permission
Page 55 of 55
Copyright © 2022 FDOKUMEN