All smiles are positive, but some smiles are more positive than others
Upload
independentCategory
view
2download
0
Do Some Business Models Perform Better than Others?
Thomas W. Malone, Peter Weill, Richard K. Lai, Victoria T. D’Urso,
George Herman, Thomas G. Apel, and Stephanie L. Woerner
MIT
Working Paper 4615-06
May 18, 2006
Author addresses
Thomas W. Malone MIT Sloan School of Management 30 Wadsworth Street, E53-333 Cambridge, MA 02142 Email: [email protected] Telephone: 617-253-6843 Fax: 781-647-4536 Peter Weill MIT Sloan School of Management 3 Cambridge Center, NE20-332 Cambridge, MA 02142 email: [email protected] Phone: 617-253-2930 Fax: 617-253-4424 Richard K. Lai Harvard Business School Morgan Hall T47 Boston, MA 02163 Email: [email protected] Telephone: 617-495-6228 Fax: 617-496-4397 Victoria T. D'Urso The University of Tennessee Department of Economics 535 Stokely Management Center Knoxville, TN 37996-0550 Email: [email protected] Telephone: 865-974-5672 Fax: 865-974-4601
George Herman MIT Sloan School of Management 3 Cambridge Center, NE20-336 Cambridge, MA 02142 Email: [email protected] Telephone: 617-253-4413 Fax: 617-253-4424 Thomas G. Apel 15624 Bald Cypress Cove Edmond, OK 73013 Email: [email protected] Telephone: 405-341-2272 Stephanie L. Woerner MIT Sloan School of Management 3 Cambridge Center, NE20-336 Cambridge, MA 02142 Email: [email protected] Telephone: 617-452-3222 Fax: 617-253-4424
i
Summary
This paper defines four basic business models based on what asset rights are sold (Creators, Distributors,
Landlords and Brokers) and four variations of each based on what type of assets are involved (Financial,
Physical, Intangible, and Human). Using this framework, we classified the business models of all 10,970
publicly traded firms in the US economy from 1998 through 2002. Some of these classifications were
done manually, based on the firms’ descriptions of sources of revenue in their financial reports; the rest
were done automatically by a rule-based system using the same data. Based on this analysis, we first
document important stylized facts about the distribution of business models in the U.S. economy. Then
we analyze the firms’ financial performance in three categories: market value, profitability, and operating
efficiency. We find that no model outperforms others on all dimensions. Surprisingly, however, we find
that some models do, indeed, have better financial performance than others. For instance, Physical
Creators (which we call Manufacturers) and Physical Landlords have greater cash flow on assets, and
Intellectual Landlords have poorer q’s, than Physical Distributors (Wholesaler/Retailers),. These
findings are robust to a large number of robustness checks and alternative interpretations. We conclude
with some hypotheses to explain our findings.
Running head: Do Some Business Models Perform Better than Others?
Keywords: business models, performance
Acknowledgements:
Made possible with funding from National Science Foundation Grant No. IIS-0085725. We are grateful
for the insightful comments of Erik Brynjolffson, S.P. Kothari, Wanda Orlikowski and JoAnne Yates on
earlier versions of this paper. We would also like to thank Rani Bhuva, Preeti Chadha, Armando Herrera,
J B. Hohm, Jayne Huang, Sonia E. Koshy, Kelsey Presson, Kristen Quinn, Elisa Rah, Alice Takajan,
Isaac Taylor, and Jason Yeung for their work on coding business models, and Aaron Johnson and Jon
Scott for their work on selecting financial performance measures.
1
Do Some Business Models Perform Better than Others?
Few concepts in business today are as widely discussed—and as seldom systematically studied—
as business models. Many people attribute the success of firms like eBay, Dell, and Amazon, for
example, to the ways they used new technologies—not just to make their operations more efficient—but
to create new business models altogether (e.g., Gurley (2001)). In spite of all the discussion about
business models, however, there have been very few large-scale systematic empirical studies of them.
We do not know, for instance, how common different kinds of business models are in the economy and
whether some business models have better financial performance than others.
This paper provides a first attempt to answer these basic questions about business models. We
first develop a comprehensive typology of business models. We hypothesize that this typology can be
used to classify any for-profit enterprise. As partial confirmation of this hypothesis, we classify the
business models of the 10,970 publicly-traded US companies in COMPUSTAT from 1998 through 2002.
Finally, we analyze six measures of financial performance for the different kinds of business models to
determine whether some models perform better than others.
We find that some business models are much more common than others, and that some do,
indeed, perform better than others. For example, the most common business model for large US firms
involves making and selling ownership of physical assets (i.e., manufacturers). While no one model
seems to do better than another across all six measure of performance, some models do seem to be
superior on specific measures. For example, manufacturers do better than Distributors of physical assets
(i.e., wholesalers and retailers) on cash flow return on assets, and Brokers of financial assets (e.g., stock
and insurance Brokers) do better than the physical Distributors on Tobin’s q. A study like ours involves
very significant empirical challenges. We show a wide range of robustness tests to address issues of
endogeneity (e.g., perhaps good performance leads firms to pick certain business models?), measurement
error (e.g., how would mis-reporting by firms affect our analyses?), and many others.
Although we provide a theory-grounded proposal for a typology of business models, our
2
contribution is primarily empirical. Specifically, we are interested in the first-order question of whether
business models have performance implications. Given the pervasive reference to business models in the
industry and the dearth of rigorous study on the subject, we believe it is significant to carefully document
whether some models do better. This study does not attempt to answer deeper questions about why the
performance implications exist. In particular, we do not investigate whether the rents arising from some
business models might have been monopolistic (as in industrial organization, such as Bain (1959)), game-
theoretic (e.g., Ghemawat (1991)), Ricardian (as in the resource-based perspective, e.g. Wernerfelt (1984)
for a modern statement), Schumpeterian (as in the dynamic capabilities perspective; Teece, et al. (1997)),
or evolutionary (e.g., Nelson and Winter (1982)). We also do not address the normative question of how
individual firms can exploit or modify their business models to improve their performance. We hope that
the work described here provides a foundation for future work on these questions.
Background
Even though the concept of business model is potentially relevant to all firms, in our search of the
organization, economic, and strategy literatures, we found few articles on the subject, and just one large-
scale empirical study (i.e., Amit and Zott (2001)). Instead, several authors have provided useful
frameworks for analyzing businesses, such as profit models (Slywotzky, et al. (1997)) and strategy maps
(Kaplan and Norton (2004)). These approaches are based on a tradition of classifying firms into
“internally consistent sets of firms” referred to as strategic groups or configurations (e.g, Cool and
Schendel (1987)). These groups—typically conceived of, and organized through the use of typologies
and taxonomies (e.g., Miles and Snow (1978)) are often used to explore the determinants of performance.
Most of the academic research on business models has been done in the context of e-business—
new ways of doing business enabled by information technology. Research on e-business models has
focused primarily on two complementary streams: taxonomies of business models and definitions of
components of business models. For example, Timmers (1998) defines a business model as including an
architecture for the product, service, and information flows, a description of the benefits for the business

3
actors involved, and a description of the sources of revenue. Business model definitions and descriptions
have proliferated since Timmers. Tapscott, et al. (2000) focus on the system of suppliers, distributors,
commerce service providers, infrastructure providers, and customers, labeling this system the business-
web or “b-web.” They differentiate business webs along two dimensions: control (from self-control to
hierarchical) and value integration (from high to low). Weill and Vitale (2001) include “roles and
relationships among a firm’s customers, allies, and suppliers, major flows of product, information, and
money, and major benefits to participants” in their definition of a business model. They describe eight
atomic e-business models, each of which can be implemented as a pure e-business model or combined to
create a hybrid model. Rappa (2003) defines a business model as “the method of doing business by
which a firm can sustain itself” and notes that the business model is clear about how a firm generates
revenues and where it is positioned in the value chain. Rappa presents a taxonomy of business models
observed on the web, currently listing nine categories. Osterwalder, et al. (2005) provide an ontology
based on nine dimensions, such as value proposition, target customer, revenue model, and cost structure.
Other definitions of business models emphasize the connections a business model provides
between technical potential and the realization of economic value (Chesbrough and Rosenbloom (2002)),
the design of the transactions of a firm in creating value (Amit and Zott (2001)), the blend of the value
stream for buyers and partners, the revenue stream, and the logical stream (the design of the supply chain)
(Mahadevan (2000)), and the firm’s core logic for creating value (Linder and Cantrell (2000)). In an
attempt to integrate these definitions, Osterwalder, et al. (2002) propose an e-business framework with
four pillars: the products and services a firm offers, the infrastructure and network of partners, the
customer relationship capital, and the financial aspects.
Common to all of these definitions of business and e-business models is an emphasis on how a
firm makes money. Magretta (2002) argues that the strength of a business model is that it tells a story
about the business, focusing attention on how pieces of the business fit together—with the strategy
describing how the firm differentiates itself and deals with competition. The idea of business model is
also consistent with the work on interdependencies (e.g., Levinthal (1997)). In this line of research, value
4
added stems from an enhanced idea of the production function, “based not only on aggregate supplies of
capital and labor, but also on a firm’s specific mix of activities, practices, and resources.” (Lenox, et al.
(2006), pg. 760).
We are aware of only one econometric study that links business models to performance. Amit
and Zott (2001) look at how the fit of business model themes (novelty- versus efficiency-centered) and
product-market strategy (differentiation versus low-cost, and timing of entry) affect firm performance, as
measured by market value. Using a sample of Internet-related firms that have gone public between 1996
and 2000, they find that the novelty-centered business model fits all their types of product-market
strategies, but the efficiency-centered business model fits only a low-cost product-market strategy. Our
study is different from theirs on a number of dimensions. First, we look at large US-listed firms rather
than Internet-related ones that have just gone public. Second, as we describe below, we use a different
definition of business model that captures what firms do and how they create value. This typology also
has the empirical advantage of being observable (e.g., whether a firm sells or distributes products). The
typology aims to be mutually exclusive and collectively exhaustive, whereas Zott and Amit focus on
“design themes that are neither orthogonal…nor…mutually exclusive” (pg. 7). Their study and ours are
consistent in finding that business model is a useful construct and can predict performance.
Defining business models
For a systematic study of business models, we need to define business models and distinguish
their different types. For simplicity, we offer an operational definition, based on two fundamental
dimensions of what a business does. The first dimension considers what types of rights are being sold.
As we will describe, on this dimension, we classify a business as Creator, Distributor, Landlord, or
Broker. The second dimension considers what type of assets is involved. Here, we distinguish among
four important asset types: physical, financial, intangible, and human. The combination of these two
dimensions leads to sixteen detailed business models.
In developing this typology, we went through three major versions of our typology (and

5
numerous minor revisions) over the course of four years. Of course, there is no single right way to
distinguish different types of business models. But some typologies are certainly better—or more
useful—than others. In developing our typology, we were guided by the following desirable criteria (see
Scott (1981) for a related set of criteria for organizational typologies):
(1) The typology should be intuitively sensible. That is, it should capture the common intuitive sense
of what a business model means by grouping together businesses that seem similar in how their
activities create value, and separating businesses that seem different. The names of different
categories should also be self-explanatory.
(2) The typology should be collectively exhaustive and mutually exclusive. That is, it should provide
a systematic way of classifying all businesses, not just “e-businesses” or any other restricted
subset of firms. At some suitably low unit of analysis (e.g., business unit), the classification
should also not assign more than one business model to the same unit. We of course do not rule
out higher units (e.g., firms) having multiple business models (e.g., because they have business
units each with a different model).
(3) The typology should have construct validity. This means that the typology should have
discriminant validity—that is, it should be sufficiently different from related typologies such as
that for “business strategy” or “industry” classification. It should also have convergent validity –
that is, while some amount of subjective judgment is always needed in classifying real
organizations, different people should, as much as possible, classify the same firm in the same
way, if given the same information.
(4) The typology should be conceptually elegant. Conceptual elegance is somewhat subjective, but
we were guided by the desire to use as few concepts as possible, with the additional conditions
that the concepts also had to be simple.
What rights are being sold?
The heart of any business is what it sells. And perhaps the most fundamental aspect of what a

6
business sells is what kind of legal right is conferred to the buyer upon the completion of the transaction.
The first, and most obvious, kind of right a business can sell is the right of ownership of an asset.
Customers who buy the right of ownership of an asset have the continuing right to use the asset in
(almost) any way they want including selling, destroying, or disposing of it. In the framework of
Grossman and Hart (1986), the business is selling residual rights to the buyer.
The second kind of right a business can sell is the right to use an asset, such as a car or a hotel
room. Customers buy the right to use the asset in certain ways for a certain period of time, but the owner
of the asset retains ownership and can restrict the ways customers use the asset. And, at the end of the
time period, rights revert to the owner.
In addition to these kinds of rights, there is one other less obvious—but important—kind of right
a business can sell. This is the right to be matched with potential buyers or sellers of something. A real
estate broker, for instance, often first secures the right to buy, sell, or lease a property on behalf of the
principal. She then sells this right to a counter-party, who without the right, could not be matched to the
principal, sometimes because of the norm of business practice, but often because legally, the principal and
counter-party have to go through the broker.
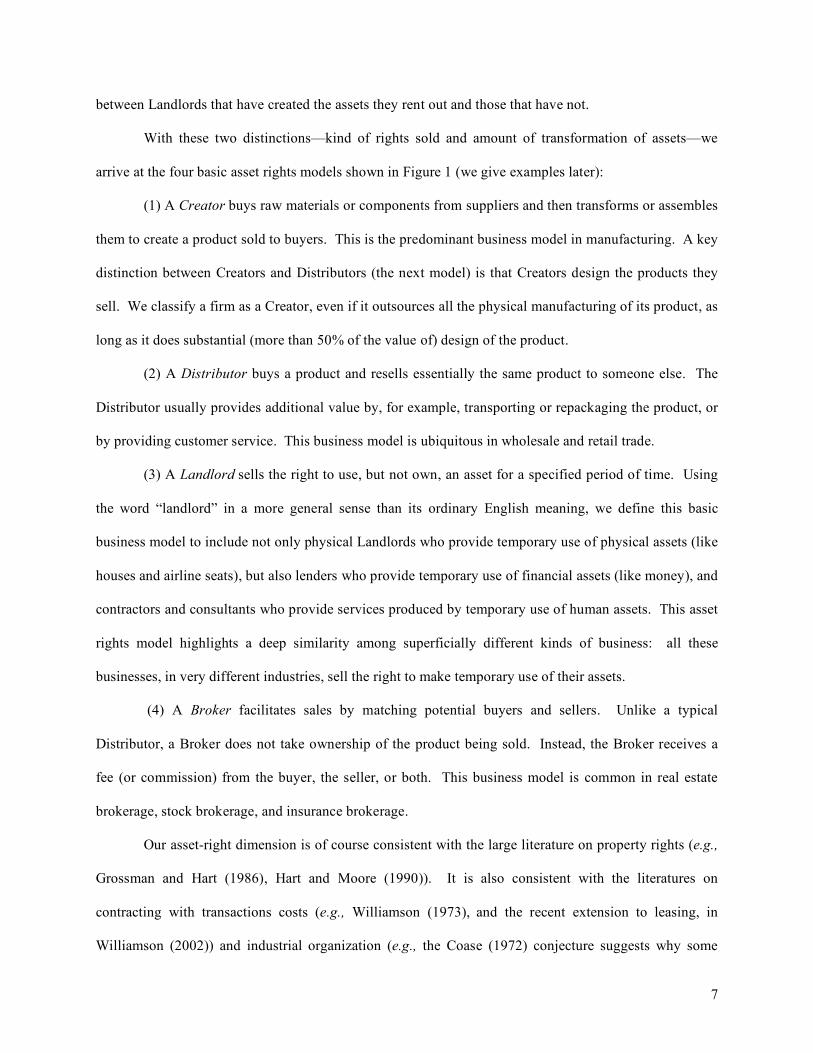
As Figure 1 shows, each of these different kinds of rights corresponds to a different asset rights
model. The figure also reflects one further distinction we find useful. For firms that sell ownership of an
asset, we distinguish between those that significantly transform the asset they are selling and those that do
not. This allows us to distinguish between firms that make what they sell (like manufacturers) and those
that sell things other firms have made (like retailers).
We could have ignored this distinction and had only one model (called, for example, “Seller”)
including all firms selling ownership rights. But if we had done so, the vast majority of all firms in the
economy would have been in this category, and we would have lost an important conceptual distinction
between two very different kinds of asset rights models: Creators and Distributors. Conversely, making
this distinction in all the other rows of the table would have divided intuitively sensible categories in ways
that are of little apparent intuitive value in business. For instance, people do not usually distinguish
7
between Landlords that have created the assets they rent out and those that have not.
With these two distinctions—kind of rights sold and amount of transformation of assets—we
arrive at the four basic asset rights models shown in Figure 1 (we give examples later):
(1) A Creator buys raw materials or components from suppliers and then transforms or assembles
them to create a product sold to buyers. This is the predominant business model in manufacturing. A key
distinction between Creators and Distributors (the next model) is that Creators design the products they
sell. We classify a firm as a Creator, even if it outsources all the physical manufacturing of its product, as
long as it does substantial (more than 50% of the value of) design of the product.
(2) A Distributor buys a product and resells essentially the same product to someone else. The
Distributor usually provides additional value by, for example, transporting or repackaging the product, or
by providing customer service. This business model is ubiquitous in wholesale and retail trade.
(3) A Landlord sells the right to use, but not own, an asset for a specified period of time. Using
the word “landlord” in a more general sense than its ordinary English meaning, we define this basic
business model to include not only physical Landlords who provide temporary use of physical assets (like
houses and airline seats), but also lenders who provide temporary use of financial assets (like money), and
contractors and consultants who provide services produced by temporary use of human assets. This asset
rights model highlights a deep similarity among superficially different kinds of business: all these
businesses, in very different industries, sell the right to make temporary use of their assets.
(4) A Broker facilitates sales by matching potential buyers and sellers. Unlike a typical
Distributor, a Broker does not take ownership of the product being sold. Instead, the Broker receives a
fee (or commission) from the buyer, the seller, or both. This business model is common in real estate
brokerage, stock brokerage, and insurance brokerage.
Our asset-right dimension is of course consistent with the large literature on property rights (e.g.,
Grossman and Hart (1986), Hart and Moore (1990)). It is also consistent with the literatures on
contracting with transactions costs (e.g., Williamson (1973), and the recent extension to leasing, in
Williamson (2002)) and industrial organization (e.g., the Coase (1972) conjecture suggests why some

8
transactions might be better constructed as leases rather than outright sales). Finally, our asset-rights
dimension is also related to similar ideas in contract law. For example, Roman-based law defines
property rights in terms of usus (right to use a good), fructus (right to what a good produces), and abusus
(right to sell a good); the first two falls under our Landlord model and the last our Creator. To
summarize, our point is that the asset-rights dimension is consistent with a variety of literatures, but as we
next describe, the interaction of asset rights with asset types makes for an even more interesting typology
of business models.
What assets are involved?
The other dimension we use to classify business models is the type of asset for which rights are
being sold. We consider four types of assets: physical, financial, intangible, and human. Specifically, we
define physical assets to include durable items (such as houses, computers, and machine tools) as well as
nondurable items (such as food, clothing, and paper). Financial assets include cash and other assets like
stocks, bonds, and insurance policies that give their owners rights to potential future cash flows.
Intangible assets include legally protected intellectual property (such as patents, copyrights, trademarks,
and trade secrets), as well as other intangible assets like knowledge, goodwill, and brand image. Human
assets include people’s time and effort. Of course, people are not “assets” in an accounting sense and
cannot be bought and sold, but their time and knowledge can be “rented out” for a fee.
This distinction among assets types, of course, draws on previous literature (e.g., Rajan and
Zingales (2001) describe the transformation of a physical- to a financial-based economy). Much of the
literature focuses on differences among types of assets, especially the specificity of different types, and
how specificity is associated with organizational boundaries. Here, we are interested in the interaction
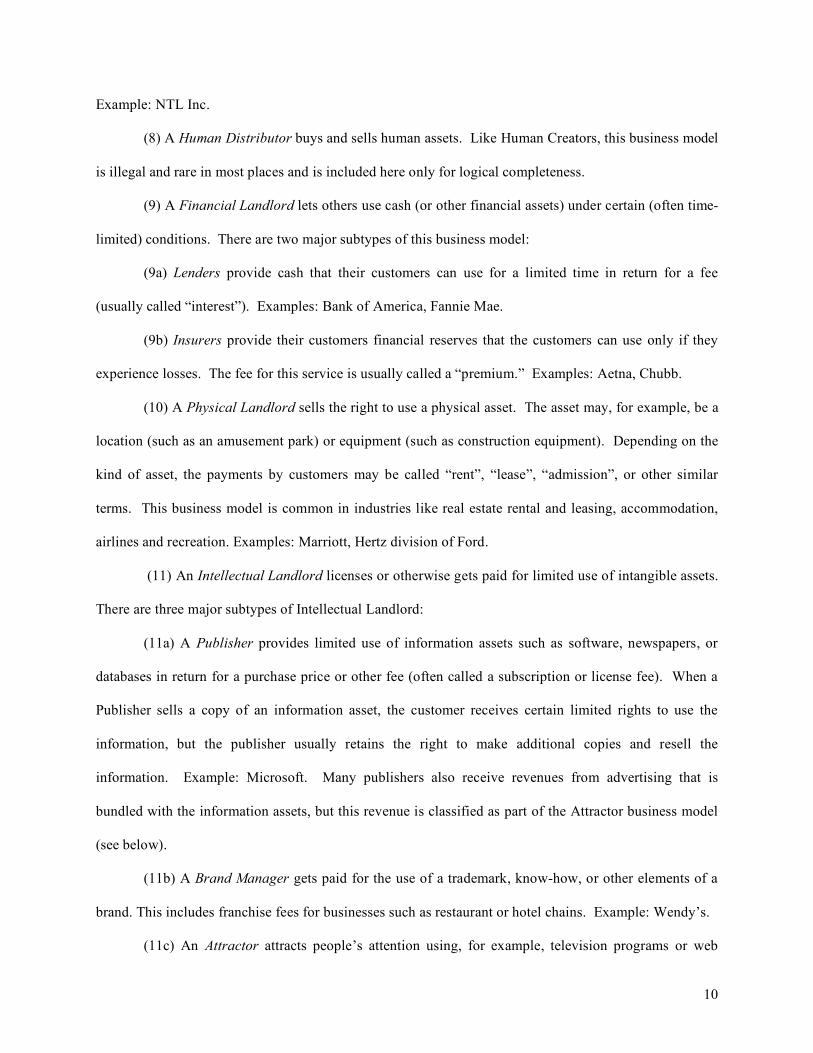
between asset type and asset rights. As Figure 2 shows, each of the asset rights models can be used, at
least in principle, with each of these different types of assets. This results in sixteen business models.
While all of the models are logically possible, some are quite rare, and two (Human Creator and Human
Distributor) are illegal in most places today.

9
The Sixteen Business Models
Definitions and examples of these business models follow:
(1) An Entrepreneur creates and sells financial assets often creating and selling firms. Examples:
serial entrepreneurs, “incubator” firms, other active investors in very early stage firms like Kleiner,
Perkins, Caufield & Byers. We do not include in this business model entrepreneurs who never sell the
firms they create.
(2) A Manufacturer creates and sells physical assets. Manufacturer is the predominant type of
Creator. Examples: General Motors, Bethlehem Steel.
(3) An Inventor creates and then sells intangible assets such as patents and copyrights. Firms
using this business model exclusively are relatively rare, but some technology firms generate part of their
revenues this way. Example: Lucent’s Bell Labs (see patentsales.lucentssg.com). Firms that license the
use of their intangible assets while still retaining ownership are not classified as Inventors; they are
Intellectual Landlords (see below).
(4) A Human Creator creates and sells human assets. Since selling humans—whether they were
created naturally or artificially or obtained by capture—is illegal and morally repugnant in most places
today, this business model is included here for logical completeness and as a historical footnote about a
form of business model that was more common in the past.
(5) A Financial Trader buys and sells financial assets without significantly transforming (or
designing) them. Banks, investment firms, and other financial institutions that invest for their own
account are included in this business model. Example: when Merrill Lynch becomes the investment
banker for a to-be-listed firm on a commitment offering basis, it.purchases the shares of the firm (the
industry standard is at a 7% discount) and effectively re-sells them on public listing.
(6) A Wholesaler/Retailer buys and sells physical assets. This is the most common type of
Distributor. Examples: Wal*Mart, Amazon.
(7) An Intellectual Property (IP) Trader buys and sells intangible assets. This business model
includes firms that buy and sell intellectual property such as copyrights, patents, domain names, etc.
10
Example: NTL Inc.
(8) A Human Distributor buys and sells human assets. Like Human Creators, this business model
is illegal and rare in most places and is included here only for logical completeness.
(9) A Financial Landlord lets others use cash (or other financial assets) under certain (often time-
limited) conditions. There are two major subtypes of this business model:
(9a) Lenders provide cash that their customers can use for a limited time in return for a fee
(usually called “interest”). Examples: Bank of America, Fannie Mae.
(9b) Insurers provide their customers financial reserves that the customers can use only if they
experience losses. The fee for this service is usually called a “premium.” Examples: Aetna, Chubb.
(10) A Physical Landlord sells the right to use a physical asset. The asset may, for example, be a
location (such as an amusement park) or equipment (such as construction equipment). Depending on the
kind of asset, the payments by customers may be called “rent”, “lease”, “admission”, or other similar
terms. This business model is common in industries like real estate rental and leasing, accommodation,
airlines and recreation. Examples: Marriott, Hertz division of Ford.
(11) An Intellectual Landlord licenses or otherwise gets paid for limited use of intangible assets.
There are three major subtypes of Intellectual Landlord:
(11a) A Publisher provides limited use of information assets such as software, newspapers, or
databases in return for a purchase price or other fee (often called a subscription or license fee). When a
Publisher sells a copy of an information asset, the customer receives certain limited rights to use the
information, but the publisher usually retains the right to make additional copies and resell the
information. Example: Microsoft. Many publishers also receive revenues from advertising that is
bundled with the information assets, but this revenue is classified as part of the Attractor business model
(see below).
(11b) A Brand Manager gets paid for the use of a trademark, know-how, or other elements of a
brand. This includes franchise fees for businesses such as restaurant or hotel chains. Example: Wendy’s.
(11c) An Attractor attracts people’s attention using, for example, television programs or web

11
content and then “sells” that attention (an intangible asset) to advertisers. The Attractor may devote
significant effort to creating or distributing the assets that attract attention, but the source of revenue is
from the advertisers who pay to deliver a message to the audience that is attracted. This business model is
common in radio and television broadcasting, some forms of publishing, and some Internet-based
businesses. Example: New York Times, Google.
(12) A Contractor sells a service provided primarily by people, such as consulting, construction,
education, personal care, package delivery, live entertainment or healthcare. Payment is fee for service,
often (but not always) based on the amount of time the service requires. Examples: Accenture, Federal
Express.
In most cases, Contractors also require physical assets (such as tools and workspace), and
Physical Landlords also provide human services (such as cleaning hotel rooms and staffing amusement
parts) associated with their physical assets. In cases where substantial (more than 50% in value) amounts
of both human and physical assets are used to provide a service, we classify a firm’s business model (as
Contractor or Physical Landlord) on the basis of which kind of asset is “essential” to the nature of the
service being provided.
For example, a passenger airline would generally be considered a Physical Landlord—even
though it provides significant human services along with its airplanes—because the essence of the service
provided is to transport passengers from one place to another by airplane. Conversely, a package delivery
service (like Federal Express) would generally be classified as a Contractor because the essence of the
service provided is to have packages picked up and delivered (usually by people) regardless of the
physical transportation mode used (bicycle, truck, train, etc.).
(13) A Financial broker matches buyers and sellers of financial assets. This includes insurance
Brokers and stock Brokerage functions in many large financial firms. Examples: e*Trade, Schwab.
(14) A Physical broker matches buyers and sellers of physical assets. Examples: eBay, Century
21.
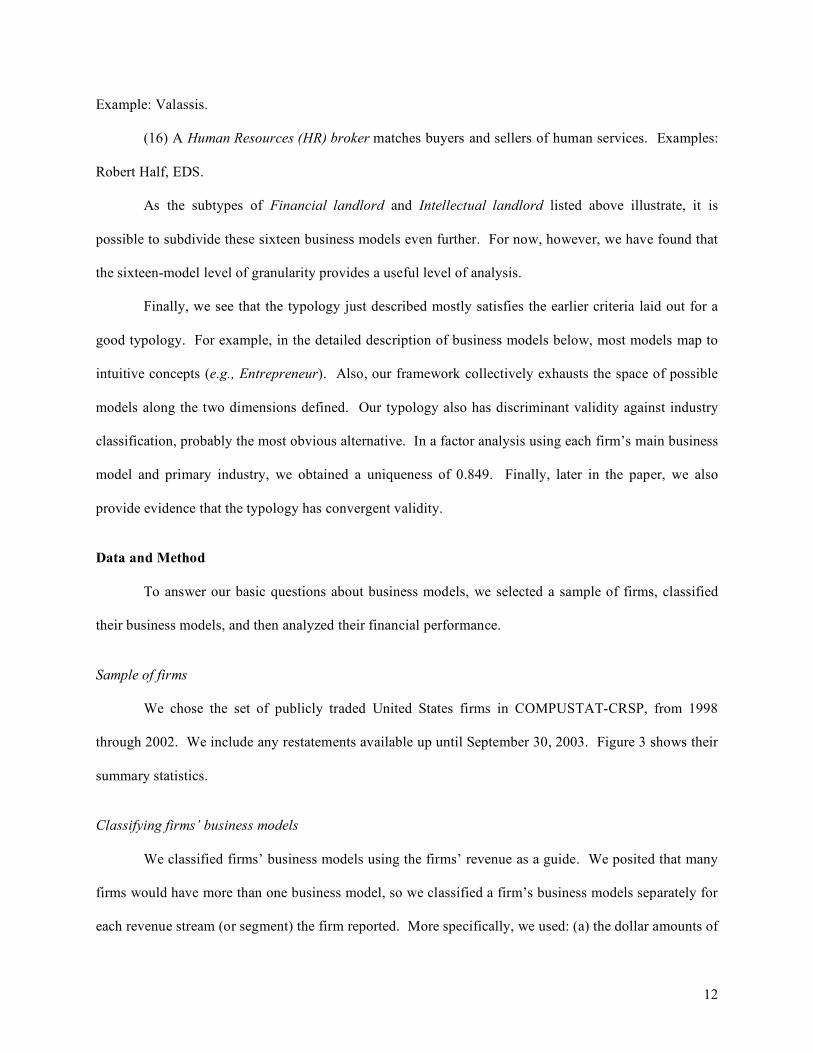
(15) An Intellectual property (IP) broker matches buyers and sellers of intangible assets.
12
Example: Valassis.
(16) A Human Resources (HR) broker matches buyers and sellers of human services. Examples:
Robert Half, EDS.
As the subtypes of Financial landlord and Intellectual landlord listed above illustrate, it is
possible to subdivide these sixteen business models even further. For now, however, we have found that
the sixteen-model level of granularity provides a useful level of analysis.
Finally, we see that the typology just described mostly satisfies the earlier criteria laid out for a
good typology. For example, in the detailed description of business models below, most models map to
intuitive concepts (e.g., Entrepreneur). Also, our framework collectively exhausts the space of possible
models along the two dimensions defined. Our typology also has discriminant validity against industry
classification, probably the most obvious alternative. In a factor analysis using each firm’s main business
model and primary industry, we obtained a uniqueness of 0.849. Finally, later in the paper, we also
provide evidence that the typology has convergent validity.
Data and Method
To answer our basic questions about business models, we selected a sample of firms, classified
their business models, and then analyzed their financial performance.
Sample of firms
We chose the set of publicly traded United States firms in COMPUSTAT-CRSP, from 1998
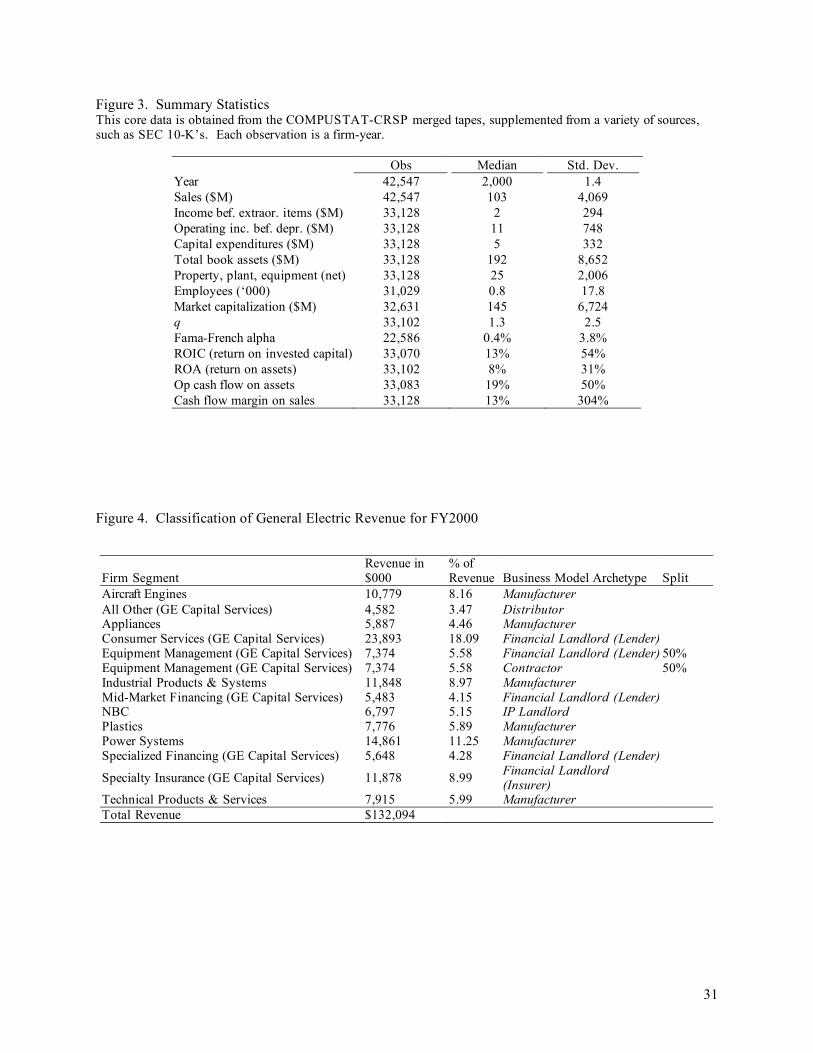
through 2002. We include any restatements available up until September 30, 2003. Figure 3 shows their
summary statistics.
Classifying firms’ business models
We classified firms’ business models using the firms’ revenue as a guide. We posited that many
firms would have more than one business model, so we classified a firm’s business models separately for
each revenue stream (or segment) the firm reported. More specifically, we used: (a) the dollar amounts of

13
the firm’s revenue segments as reported by COMPUSTAT or the publicly filed SEC Form 10-K and (b)
the textual descriptions of the revenue segments as reported in the 10-Ks.
For the top 1,000 firms by revenues in 2000 (we call these the SeeIT1000 firms), we did manual
classifications of every revenue stream. For the rest of the firms and years in our sample, we used a rule-
based computer program to do the classifications automatically.
Manual classification. For manual classification, we read 9,833 textual descriptions of the
revenue segments and used the definitions of business models above to classify the revenue according to
which business model it represented. We faced two major issues in classification. First, we had to
interpret the qualitative, textual descriptions each firm provided for its different business segments. Even
though there is, of necessity, some subjective judgment involved in this process, we trained a team of
raters to do this in a verifiably reliable and consistent way.
The team included eight MIT students and one senior MIT research staff member (Herman).
Each firm’s business models were classified by at least one of the students and all the classifications were
also reviewed (and, if necessary, corrected) by the senior research staff member. We used an interactive
online database to record all the classifications along with comments about how classifications were
determined.
To assess consistency, we tested inter-rater reliability among our eight student raters for a random
sample of 45 firms. For each firm, two raters independently rated each line item. Of these ratings, 97%
of the total revenue were classified identically, with a Cohen (1960)'s Kappa statistic of 0.96 (significant
at p < .01) confirming that the different raters applied the classification methodology consistently.
The second major classification issue arose when the text indicated that multiple business models
were included in a single reported revenue segment. In these cases, we had to somehow allocate revenues
across the different business models. To do this, we first used any detailed information in the 10-K to
make a specific split of the revenue. In the absence of any such details, we used our judgment to allocate
revenue across models. However, we did not attempt to make arbitrarily fine-grained subjective
allocations. Instead, we either split the revenue evenly across all of the different models that were

14
included in the segment or, if the text implied that one model is much more important than the others, we
assigned all the revenue to that model. To illustrate these classifications, Figure 4 shows the
classification for General Electric (GE).1
Automatic classification. To classify firms in the rest of the dataset, we used a rule-based
program that learns from the manually classified sub-sample which words are associated with which
business models. The program considered five features made up of combinations of SIC codes and the
words used in the revenue line item descriptions in the firms’ financial reports (mainly 10-Ks). First, the
program assigned weightings to these different features in a way that maximized accuracy of prediction in
the “training set” consisting of the manually classified firms. Then, the program used these features and
weightings to classify all remaining firms and years. (For a detailed description of the automatic
classification methodology, see Apel, 2006.)
To test the validity of these automatic classifications, three random samples of 500 firms each
were also rated manually. In these three samples, the rule-based program classified an average of 97% of
the revenue in the same way the human rater classified it, and the Cohen’s Kappa statistics were 0.95,
0.94, and 0.95, respectively (p < .01 for each one). Thus, the automatic classification program has
approximately the same level of agreement with human raters as the human raters have with each other.
We could not hope for better performance from any automated system.
Analyzing financial performance
There is no universally or even commonly used set of measures for evaluating the financial
1 Note, for example, that the line item “Equipment Management (GE Capital Services)” is repeated and
assigned to two different business models (Lender and Contractor). The text of the Form 10-K implies
that GE Capital Services both lent money and performed services for the Equipment Management line of
business, but it gives no details as to how much of each is done. Therefore we split the revenue for the
line item equally among the models.
15
performance of firms. A wide range of measures has been used in previous research assessing strategic
groups or other organizational factors against firm performance (e.g., Ketchen, et al. (1993); Capon, et al.
(1990)). For consistency with prior work, we focused on three categories of performance: market value
and growth, profitability, and operating efficiency. And for each category, we used measures commonly
used in the literature. Specifically, for market value and growth, we used Tobin’s Q (Abel and Blanchard
(1986)) and Fama and French’s factor-risk alpha (Fama and French (1993), Carhart (1997)). For
profitability, we used return on invested capital (ROIC) and return on assets (ROA) (e.g., Mcgahan and
Porter (1997)). Finally, for operating efficiency, we used operating cash flow on assets and cash flow
margin on sales (e.g., Healy, et al. (1992)). Details of these measures are in the captions to the figures.
The Fama-French alpha was obtained by regressing excess returns on their risk factors – SML (small
minus large), HML (high minus low) – and Carhart’s UMD (up minus down momentum), all obtained
from Professor French’s website2.
Since these measures of financial performance are reported only for the firm as a whole, we used
regression equations in which each business model gets “credit” for the performance of the whole firm in
proportion to the amount of revenue from that business model. Our baseline specification is:
PERFORMANCEf,t+1 = α + 1
1
n
i
!
=
" βi ·BMf,i,t + firm-effectsf + year-effectst + X.γ + εf,i,t ,
where PERFORMANCEf,t+1 is a measure of firm f’s performance at one period forward t+1, BMf,i,t the
percentage of total firm revenue attributable to business model i, X a matrix of control regressors, and ε is
assumed to be a normally distributed error term. Since the sum of the BMis is one, we used one business
model as a baseline reference.
One empirical issue is that there is potentially some degree of unobserved heterogeneity among
firms (e.g., use of capital) and over time (e.g., levels of inflation affecting their specific input or output
2 http://mba.tuck.dartmouth.edu/pages/faculty/ken.french/data_library.html. Last accessed July 21, 2005.
16
mix). We estimated using fixed effects to eliminate time-constant heterogeneity. However, there might
be time-varying heterogeneity, and this we accounted for in the X control regressors. We included in X
an indicator on whether the firm is in the S&P 500, log assets, and log firm age. These three are standard
in regressions on performance (e.g., Gompers, et al. (2003)) and might potentially bias our business
model coefficients. We were also concerned about confounding business model effects with
concentration effects. For example, if we observed superior performance coming from a firm’s heavy
concentration in Physical Broker, we must partial out the effect of Physical Broker from the performance
attributable to the fact that the firm is focused (on any business model). To account for this, we included
in X the Herfindahl index of the concentration of business models by firm.
Another concern was potential endogeneity. Although somewhat implausible, it could be that
firms chose business models as a result of firm performance. For example, young retail chains might
have started out as Wholesalers/Retailers, but once they achieved the market power that comes with
operating performance, they might prefer to morph into Physical Brokers. In this latter model, powerful
book stores today accept books only on consignment, and strong supermarket chains charge slotting fees
to vendors for putting their goods on supermarket shelves. To deal with this and other endogeneity
issues, we included the lagged value of PERFORMANCE on the right hand side.
Finally, we addressed a collection of more standard econometric issues. It might be argued that
error terms had varying variances. For example, unobserved shocks like the industry-specific factors
might be different in the technology bubble years at the beginning of our period and the crash at the end.
Therefore, we use Huber-White robust standard errors. To minimize potential serial correlation for
observations within firm, we clustered on firms. We also clustered on industries and obtained similar
(unreported) results. To deal with outliers, we winsorized the data at 1% and 99%. We also estimated
without winsorizing, and the (unreported) results were qualitatively unchanged.
We present the results of the above baseline specification next. There were other finer empirical
issues, which we discuss in the subsequent section on robustness and alternative interpretations.

17
Baseline Results
Distribution of Business Models
Figure 5 shows the distribution of different business models from 1998 and 2002, the years at
each end of our dataset period. In panel (a), we report the “popularity” of business models by their sales.
The popularity does not seem to have changed much over the period. Creators account for 49.6% of all
revenues in our dataset at both the beginning and end of the period. Landlord models are next, followed
by Distributors and Brokers. Along the asset type dimension, the greatest portion (about 73%) involves
Physical assets. Financial and Human assets are next, and Intangible assets are only about 3%. The most
popular business models are Manufacturer, Wholesaler/Retailer, Contractor, and Financial Landlord.
In panel (b), we report the “popularity” of business models by the percentage of firms that
employ them. Again, Creators and Physical models are the most popular. One difference from panel (a)
is that Human and Intangible asset models are considerably more popular in numbers than in sales, while
the reverse is true for Financial models. This suggests that Financial models tend to generate more
revenues per firm, but from this alone, it is difficult to tell whether this is due to these models requiring a
large minimum efficient scale, or some other reason. We address these performance questions in the next
section.
The dynamic view over the five-year time presents an interesting reduction in the number of
business models, from 9,563 to 7,123 (bottom right box of panel (b)). This suggests that firms seem to be
consolidating in terms of business models. Also, while the number of Creators decreased, from 5,080 to
3,932, their proportion has actually increased, from 53.1% to 55.2%. Taking panels (a) and (b) together,
we have a tentative picture suggesting that the influence of Creators in the “new economy” is not
diminished. The same comment holds for Physical models.
Performance of Business Models
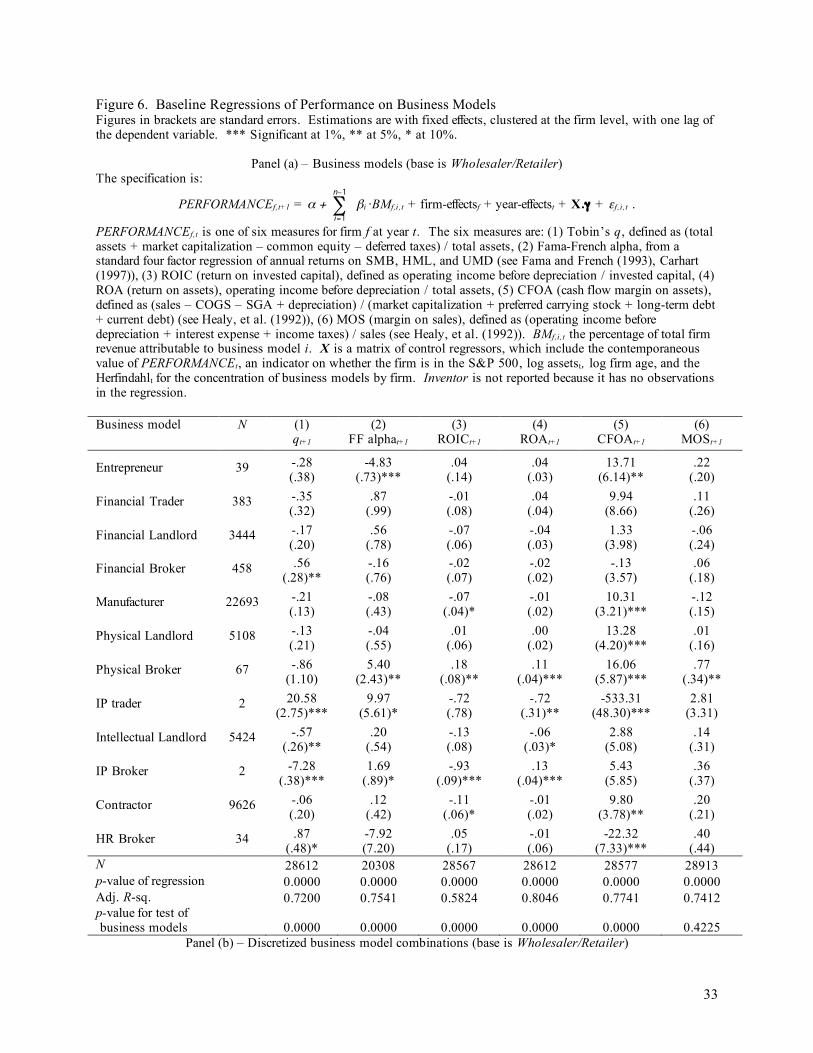
Figure 6 shows estimation results, with each model corresponding to a different measure of
performance as dependent variable. Panel (a) regresses various measures of performance on business
18
models. The baseline model was Wholesaler/Retailer.
The first interesting observation is that business models matter. In a joint test of the significance
of business models on performance, the p values, shown in the bottom-most row of the panel, are
significant except for margin on sales.
Second, some business models appear to perform better than others, although none seem superior
across all performance measures. For example, we see that Entrepreneur, Manufacturer, Physical
Landlord, Physical Broker, and Contractor have superior cash flow on assets, while HR Broker is
significantly worse on this measure (IP Trader also has a negative coefficient on this measure, but it, and
IP Broker, have so few observations that we do not make any claims about them). Similarly, Physical
Brokers did significantly better on FF alpha (abnormal stock return), ROIC, and ROA than
Wholesaler/Retailers, but Entrepreneurs did significantly worse on FF alpha. These results are not only
statistically significant, but also economically so. For example, an additional percentage allocation of
revenues coming from Entrepreneur reduces FF alpha by 4.8 percentage points, holding “all else equal.”
“All else,” of course, cannot be equal since the percentage revenues must sum to one. We address this
issue in the robustness section. Considering that the median abnormal stock return is 0.4% (see the
summary in Figure 3), this is very large point estimate of the impact of Entrepreneur.
Taken together, we interpret these results as evidence that some business models did better than
others in the period examined. In the next section, we check how robust this conclusion is. Following
that, we offer some preliminary explanations for why some models did better than others.
Robustness Checks, Alternative Interpretations
The estimation of the contribution of business models to firm performance involves several
empirical challenges. We incorporated many of these into the baseline specification. Here, we discuss
modifications to the baseline to see if our conclusions are robust.
One issue is whether our classification of business models has overly large measurement error.
For example, two firms might have simultaneously decided to be Financial Brokers, but one generated
19
and reported sales in that model earlier than the other, perhaps because of synergies from other parts of its
business. We would have classified the latter firm as starting Financial Broker later, and incorrectly
attributed better performance to the model as a whole because we understated the latter firm’s poorer
performance. Measurement errors in general would not introduce biases if they were random, but one
could never be sure. One way to address this issue is to “discretize” the business model variables (see,
Morck, et al. (1990)). We tested a specification in which we used dummies for each business model,
which were set to 1 only if the percentage of sales is above a threshold and 0 otherwise. We
experimented with different thresholds—1%, 5%, and 10%. The results were qualitatively unchanged so
we do not report results of this discretized specification here (but we do report results from a discretized
version of a more complex specification, below).
A second issue is the difficulty in interpreting the coefficients for the BMf,i,t variables. For
example, if PERFORMANCE were measured using q and the coefficient for a BMi is 0.3, the specification
taken literally means that a 10 percentage point increase (say) in the portion of firm revenues coming
from BMi would be associated with a 0.03 increase in q, holding the portion of revenues coming from
other business models constant. The last condition, of course, is not possible since the total percentage of
revenues sums to 100%. To address this issue, we employed a technique that also took care of another
empirical issue: whether it is specific combinations of business models that determine performance rather
than the models themselves. Specifically, we measured BMf,i,t with indicators of firm-level business
model combinations. For example, if previously we had a firm-year observation with 10% of revenues
from Manufacturer and 90% from Financial Landlord, we now have the firm-year observation with an
indicator of 1 for “Manufacturer–Financial Landlord” (assuming that in this case, we say that a firm has
a business model if at least 5% of its revenues comes from that model) and 0 on all other combinations of
business models in the dataset. As in the previous paragraph, we used different cut-offs and found the
results invariant, so we report results for the 5% threshold.
Panel (a) also raises another issue: IP Trader and IP Broker have just two observations each.
Disregarding these two models does not invalidate our conclusion; there are still a number of significant
20
coefficients. More important, in the next estimation using combinations of business models, we see that
this concern is addressed.
In Figure 6, panel (b), we report the results of this specification. Once again, business models—
in combination form—matter, as we see with the p-values in the bottom-most row. Also, of the 258
coefficients in the table (these are for model combinations with at least ten observations), 49 are
significant. Taken together, we interpret this as evidence that some business models combinations are
superior to others. Consistent with our baseline conclusion, we see that no combination is superior on all
measures of performance. As with panel (a), we defer discussion of how and why some models or
combinations might be superior to the next section, and focus on confirming our main conclusion that
“some models are superior to others.”
A third empirical issue is about measurement error that could result from how firms account for
segments. When reporting, firms might classify revenues as a new segment only when revenues of that
segment are large enough. Therefore, our classification methodology would have a delayed recognition
of the true distribution of revenues among business models. We did not have a simple way to deal with
this problem, but it seemed reasonable to assume that the delay is not systematically more in some
business models than others. This assumption is not justified if, however, there was a rush to specific
models (e.g., to Entrepreneur during the Internet boom), so our findings are subject to this qualification.
Even this phenomenon, however, is mitigated if the rush is from a varied assortment of models to one
model, so that we might understate the popularity of this one model and not overstate by too much the
reduced popularity of many others.
Fourth, another potential measurement error is associated with the use of auto-classification. The
SeeIT1000 sub-sample was manually classified and the rest of the sample was classified automatically.
Two issues arose. First, even though we had a reasonable inter-rater reliability score in the SeeIT1000
sub-sample, it is possible that the unobserved reliability score within the auto-classified sub-sample might
still be different. To check this, we re-estimated the results using just the SeeIT1000 sub-sample. We
then used a likelihood ratio test to compare if the coefficients were the same as those we reported here.
21
Furthermore, we re-estimated a second time using the SeeIT1000 sub-sample but with the Heckman
sample correction procedure using the rest of the dataset. The specification for our selection model is
based on inspection of the difference between characteristics of the observation in and outside the
SeeIT1000 sub-sample. We tried different specifications and the most parsimonious one (with the highest
adjusted R-squared) is the following probit:
SELECTED = f ( MKTCAP, S&P500, ASSETS, AGE) ,
where MKTCAP was log market capitalization, S&P500 was whether the firm was ever in the S&P 500,
ASSETS was log total assets, and AGE was the log of age of the firm in the COMPUSTAT-CRSP dataset.
In both estimations, the results were qualitatively unchanged. For example, when the performance
measure is q, the statistic in the likelihood ratio test is 4.80, with a p-value of 0.99, so we cannot reject the
null that the coefficients are systematically different. As an example of the Heckman correction, when we
regress FF alpha, our inverse Mills ratio is not significant at conventional levels (p=13.6%). Furthermore,
the business model coefficients are hardly changed. Entrepreneur goes from -4.83 (in Figure 6, panel (a))
to -3.53, Physical Broker from 5.40 to 5.54. Physical Landlord does become more significant, with a
coefficient of 2.18. However, the p value of 9.3% is not too significant. Since the results are mostly
unchanged, we do not report the rest.
Fifth, there was the issue of whether the 1998-2002 dataset had significant survivorship bias—
i.e., was it missing firms in earlier years, which were substantively different? To test this, we employed
the same Heckman sample selection correction procedure, this time using all COMPUSTAT firms from
1985 through 1997. The result (unreported) was an inverse Mills ratio that was insignificant, so that we
were reasonably assured that there was no significant bias.
The sixth issue is whether our main conclusion—that some business models are superior—
accounts for the possibility that firms with these superior business models might have shown wider
variance in performance. In other words, we have to compare not just the first moment (means) but also
higher moments. To check this, we calculated the correlation between the coefficients in Figure 6 (setting
insignificant coefficients to zero) and the within-model standard deviation of firm performance. We
22
found that the correlation ranges from -0.44 for cash flow on assets (i.e., high performing models have
lower standard deviation) to 0.80 for alpha. The range is just as wide when we weigh the standard
deviation by percentage revenues derived from business models. We interpret this as evidence that
variance in performance might explain some, and not all, of why some models do better than others.
Finally, there is an issue of interpretation. Once we identified a firm to have a certain business
model, increases in sales attributed to that model could have been a result of momentum, rather than a
conscious policy decision by the firm to invest in that model. This is a different issue than endogeneity
caused by reverse causality, which we have addressed. Instead, it is about whether the right-hand variable
of interest (percentage in a business model) is even a decision variable. To some extent, this issue could
be addressed by discretizing the measure of business model. Unlike the previous case where we
discretize the level of revenues from a business model, we now discretize the changes in revenues. In
other words, if we observe a firm with say, 15% of revenues coming from Wholesaler/Retailer in 1998,
17% in 1999, and 20% in 2000, and if we set a threshold change of 3 percentage points, then the values
we use are 15%, 15%, and 20%, respectively, because the change in 1999 was not greater than 3 points.
As before, we used different thresholds—1%, 5%, 10%. We also vary when to attribute the change—e.g.,
in the example above, we might have assigned the 20% to 1999. It turns out that these variations do not
change the results qualitatively, so we do not report them here. However, there is second response to this
issue of whether changes in business model reflect managerial decisions. Specifically, we could avoid
interpreting the coefficient for a business model variable as the performance improvement a firm could
get if it invested more in that business model. Rather, we could settle for the more modest, subtler
interpretation that if, for whatever reason, the firm had more sales from that business model, its
performance would change by the magnitude indicated by the coefficient. This interpretation is open to
the challenge that it is uninteresting because sales for a business model might just be hard-wired to the
performance of the firm as a whole. We believe that this view is incorrect, since the explanatory variables
are proportions of sales derived from various business models, and it is not intuitively obvious that such
proportions determine performance.

23
To sum up, we believe our main conclusion, that some business models perform better than
others, is a very robust one.
Discussion and Future Work
The baseline results offer some interesting observations, although at this point, we can only
provide some educated hypotheses about what could explain these. The intention is to suggest new
avenues for research, based on the stylized facts we learned in this study.
The first issue is why some business models are superior to others at all. Recall that we removed
time effects, so the superior performance is beyond any transient effect. There could be more than a few
explanations that hold simultaneously, and we offer a couple for consideration. First, the picture we get
from both panels (a) and (b) is that a number of models perform better than the baseline
Wholesaler/Retailer. For example, in panel (a), all cells that are significant are positively signed, except
for Entrepreneur on the alpha measure, Intellectual Landlord on q, and HR Broker on the cash flow on
assets. This might be surprising, if one believes the popular literature on the rise of retailers like
Wal*Mart. However, the data suggests that it is more likely that the story is that fierce competition in
retailing means that “consumers may be the net beneficiaries” (Messinger and Narasimhan (1995), pg.
189), and not retailers/wholesalers. Also, we note that all three that do not do as well as
Wholesaler/Retailer—Entrepreneur, HR Broker, and Intellectual Landlord—tend to be involved in more
intangible assets than those that do better, such as Manufacturer, Physical Landlord, and Physical Broker.
Furthermore, Entrepreneur and Intellectual Landlord do not do well on precisely the measures that
involve market assessment of their value—i.e., on q and abnormal stock return. This is consistent with a
story in which the market finds it hard to evaluate intangible assets and possibly under-values these
models. HR Broker, on the other hand, appears to have done well on q and suffers on cash flow on assets,
a measure of efficiency. On closer inspection, while firms with HR Broker models have a lower mean
cash flow on assets of 20.1% (compared with 33.4% for Wholesaler/Retailer), they also have a much
smaller standard deviation of 14.0% (compared with 47.0% for Wholesaler/Retailer). This might be
24
consistent with a different story that Wholesaler/Retailer models do better than HR Broker because there
is greater risk in the former model.
There is also a related issue of why any capital might flow to generally poor business models like
Wholesaler/Retailer at all. As explained for the case of HR Broker, one possible answer is that there is a
great enough variation in performance to continually attract firms that learn about their performance only
after entry (e.g., Jovanovic (1982)). Such a mechanism is also observed in the standard “tournament”
result in labor economics (e.g., Lazear and Rosen (1981)).
Another possible reason for persistence in the superiority of some business models is that they
involve complex interdependencies, generally unobservable to competing firms and are difficult to imitate
(see Levinthal (1997) for a pioneering view). Recently, Lenox, et al. (2006) show that interdependencies
can not only explain persistence, but variation in industry profitability. It would be intriguing to
determine the degree of interdependency for each business model, and see if interdependency is another
channel through which business models explain performance.
Apart from understanding why, another issue for future research is how the superior business
models drive performance. Guided by the literature, we can think of a few ways in this could happen.
One possibility is that some business models have lower capital intensity. For example, Ruback and
Sesia (2000) argue that Dell’s business model performs well because it has lower working capital than
competitors do, by purchasing supplies only when orders come in. Indeed, Sheffi (2005) reports that Dell
even has negative working capital, when it could receive revenues ahead of payables. Another interesting
way with which business models could affect performance is through the advantage of scale. The story is
that some business models, such as Wholesaler/Retailer, tend to reward scale and it is through scale that a
Wal*Mart gains superior performance. A third way might be leverage. Some models, such as Physical
ones, might be more attractive to lending banks and therefore more amenable to a higher use of debt (see
the large corporate finance literature on this, especially that related to debt capacity and “pledgeable
income” – e.g., Morellec (2001)). Higher leverage might boost performance on equity-based measures of
performance. Finally, and along the lines of inefficient markets, some models might do better because
25
they liberate firms from financial constraints (e.g., Fazzari, et al. (1988)). For example, it could be easier
to access the capital market with ownership rights to physical collateral.
Conclusion
In this paper, we have taken a first step toward the systematic study of business models. We
defined a reliable and practical typology for business models, and we classified all public US firms listed
in COMPUSTAT for 1998 through 2002. We found that some business models do, indeed, perform
better than others, but on different measures of performance.
We hope that our results will be useful to several different kinds of readers. First, they can help
researchers systematically analyze changes over time in the business models of individual firms and
whole populations of firms. Second, we hope that managers can use our business model concepts to
understand at a deeper level the structural choices they have to make about their own firms’ business
models and how to manage these different business models effectively. Finally, we hope that our
framework can provide investors with a useful lens for analyzing potential investments. Unlike well-
known concepts such as industry classification, this perspective focuses on the deep structure of what
firms actually do. And, since this perspective is not yet well-known, it may lead to novel insights about
which investment opportunities are most attractive.
The work we have done is only the beginning of the systematic study of business models. We
believe it raises more questions than it answers, and we hope it will provide a foundation for future work
on these important questions
References
Abel, A. and O. Blanchard. "The Present Value of Profits and Cyclical Movements in Investment,"
Econometrica 54(1986), 249-274.
Amit, R. and C. Zott. "Value Creation in E-Business," Strategic Management Journal 22(2001), 493-520.
Bain, J. S. Industrial Organization. New York, Wiley, 1959
Capon, N., J. U. Farley and S. Hoenig. "Determinants of Financial Performance: A Meta-Analysis,"
26
Management Science http://links.jstor.org/sici?sici=0025-
1909%28199010%2936%3A10%3C1143%3ADOFPAM%3E2.0.CO%3B2-Z 36(1990), 1143-1159.
Carhart, M. M. "On Persistence in Mutual Fund Performance," Journal of Finance 52(1997), 57-82.
Chesbrough, H. and R. S. Rosenbloom. "The Role of the Business Model in Capturing Value from
Innovation: Evidence from Xerox Corporation's Technology Spin-Off Companies," Industrial &
Corporate Change 11(2002), 529-555.
Coase, R. H. "Durability and Monopoly," Journal of Law & Economics 15(1972), 143-149.
Cohen, J. "A Coefficient of Agreement for Nominal Scales," Educational and Psychological
Measurement 20(1960), 37-46.
Cool, K. O. and D. Schendel. "Strategic Group Formation and Performance: The Case of the U.S.
Pharmaceutical Industry, 1963-1982," Management Science http://links.jstor.org/sici?sici=0025-
1909%28198709%2933%3A9%3C1102%3ASGFAPT%3E2.0.CO%3B2-1 33(1987), 1102-1124.
Fama, E. F. and K. R. French. "Common Risk Factors in the Returns on Stock and Bonds," Journal of
Financial Economics 33(1993), 3-56.
Fazzari, S. M., R. G. Hubbard and B. C. Petersen. "Financing Constraints and Corporate-Investment,"
Brookings Papers on Economic Activity(1988), 141-195.
Ghemawat, P. Commitment: The Dynamics of Strategy. New York, Free Press, 1991
Gompers, P., J. Ishii and A. Metrick. "Corporate Governance and Equity Prices," The Quarterly Journal
of Economics 118(2003), 107-155.
Grossman, S. J. and O. D. Hart. "The Costs and Benefits of Ownership: A Theory of Vertical and Lateral
Integration," The Journal of Political Economy 94(1986), 691-719.
Gurley, J. W. Why Dell’s War Isn’t Dumb, Fortune: 134-136, 2001
Hart, O. and J. Moore. "Property Rights and the Nature of the Firm," Journal of Political Economy
98(1990), 1119-1158.
Healy, P. M., K. G. Palepu and R. S. Ruback. "Does Corporate Performance Improve after Mergers?,"
Journal of Financial Economics 31(1992), 135-175.
27
Jovanovic, B. "Selection and the Evolution of Industry," Econometrica 50(1982), 649-670.
Kaplan, R. S. and D. P. Norton. Strategy Maps: Converting Intangible Assets in to Tangible Outcomes.
Boston, MA, Harvard Business School Press, 2004
Ketchen, D. J., J. B. Thomas and C. C. Snow. "Organizational Configurations and Performance: A
Comparison of Theoretical Approaches," Academy of Management Journal Vol 36(1993), 1278-1313.
Academy of Management, US.
Lazear, E. P. and S. Rosen. "Rank-Order Tournaments as Optimum Labor Contracts," The Journal of
Political Economy 89(1981), 841-864.
Lenox, M. J., S. F. Rockart and A. Y. Lewin. "Interdependency, Competition, and the Distribution of
Firm and Industry Profits," Management Science 52(2006), 757-772.
Levinthal, D. A. "Adaptation on Rugged Landscapes," Management Science 43(1997), 934-950.
Linder, J. and S. Cantrell. Changing Business Models: Surveying the Landscape: Accenture Institute for
Strategic Change, 2000
Magretta, J. Why Business Models Matter, Harvard Business Review, Vol. 80: 86-92, 2002
Mahadevan, B. Business Models for Internet-Based E-Commerce: An Anatomy, California Management
Review, Vol. 42: 55-69, 2000
McGahan, A. M. and M. E. Porter. "How Much Does Industry Matter, Really?," Strategic Management
Journal http://links.jstor.org/sici?sici=0143-
2095%28199707%2918%3C15%3AHMDIMR%3E2.0.CO%3B2-F 18(1997), 15-30.
Messinger, P. R. and C. Narasimhan. "Has Power Shifted in the Grocery Channel?," Marketing Science
14(1995), 189-223.
Miles, G. E. and C. C. Snow. Organizational Strategy, Structure and Process. New York, NY, McGraw-
Hill, 1978
Morck, R., A. Shleifer and R. W. Vishny. "Do Managerial Objectives Drive Bad Acquisitions?," Journal
of Finance 45(1990), 31-48.
Morellec, E. "Asset Liquidity, Capital Structure, and Secured Debt," Journal of Financial Economics
28
61(2001), 173-206.
Nelson, R. R. and S. G. Winter. An Evolutionary Theory of Economic Change. Cambridge, MA, Harvard
University Press, 1982
Osterwalder, A., S. B. Lagha and Y. Pigneur. An Ontology for Developing E-Business Models. Paper
presented at the Proceedings of the International Conference on Decision Making and Decision Support in
the Internet Age (IFIP), Cork, Ireland, 2002.
Osterwalder, A., Y. Pigneur and C. L. Tucci. "Clarifying Business Models: Origins, Present, and Future
of the Concept," Communications of the Association for Information Systems 15(2005), 2-40.
Rajan, R. G. and L. Zingales. "The Influence of the Financial Revolution on the Nature of Firms,"
American Economic Review 91(2001), 206-211.
Rappa, M. Managing the Digital Enterprise - Business Models on the Web, 2003
Ruback, R. S. and A. J. Sesia. Dell's Working Capital, Harvard Business School Case: 6. Boston: Harvard
Business School, 2000
Scott, W. R. Organizations: Rational, Natural, and Open Systems (First ed.). Englewood Cliffs, NJ,
Prentice-Hall, 1981
Sheffi, Y. The Resilient Enterprise. Cambridge, MA, MIT Press, 2005
Slywotzky, A. J., D. J. Morrison and B. Andelman. The Profit Zone. New York, NY, Times Books, 1997
Tapscott, D., D. Ticoll, D. Ticoll and A. Lowy. Digital Capital: Harnessing the Power of Business Webs.
Boston, MA, Harvard Business School Press, 2000
Teece, D. J., G. Pisano and A. Shuen. "Dynamic Capabilities and Strategic Management," Strategic
Management Journal http://links.jstor.org/sici?sici=0143-
2095%28199708%2918%3A7%3C509%3ADCASM%3E2.0.CO%3B2-%23 18(1997), 509-533.
Timmers, P. "Business Models for Electronic Markets," Journal on Electronic Markets 8(1998), 3-8.
Weill, P. and M. R. Vitale. Place to Space: Migrating to Ebusiness Models. Boston, MA, Harvard
Business School Press, 2001
Wernerfelt, B. "A Resource-Based View of the Firm," Strategic Management Journal

29
http://links.jstor.org/sici?sici=0143-
2095%28198404%2F06%295%3A2%3C171%3AARVOTF%3E2.0.CO%3B2-L 5(1984), 171-180.
Williamson, O. E. "Markets and Hierarchies: Some Elementary Considerations," American Economic
Review 63(1973), 316-325.
---. "The Lens of Contract: Private Ordering," American Economic Review 92(2002), 438-443.

30
Figure 1. Asset Rights
How much does the business transform the asset? Significant Limited
Ownership of Asset Creator Distributor Use of Asset Landlord What rights are
being sold? Matching of buyer and seller Broker Figure 2. The Sixteen Business Models What type of asset is involved?
Financial Physical Intangible Human
Creator Entrepreneur Manufacturer Inventor Human Creator*
Distributor Financial Trader Wholesaler/ Retailer IP Trader Human
Distributor*
Landlord Financial Landlord
Physical Landlord
Intellectual Landlord Contractor
What rights are being sold?
Broker Financial Broker Physical Broker IP Broker HR Broker * These models are illegal in the US and most places today because they involve selling human beings. They are included here for logical completeness.
31
Figure 3. Summary Statistics This core data is obtained from the COMPUSTAT-CRSP merged tapes, supplemented from a variety of sources, such as SEC 10-K’s. Each observation is a firm-year.
Obs Median Std. Dev. Year 42,547 2,000 1.4 Sales ($M) 42,547 103 4,069 Income bef. extraor. items ($M) 33,128 2 294 Operating inc. bef. depr. ($M) 33,128 11 748 Capital expenditures ($M) 33,128 5 332 Total book assets ($M) 33,128 192 8,652 Property, plant, equipment (net) 33,128 25 2,006 Employees (‘000) 31,029 0.8 17.8 Market capitalization ($M) 32,631 145 6,724 q 33,102 1.3 2.5 Fama-French alpha 22,586 0.4% 3.8% ROIC (return on invested capital) 33,070 13% 54% ROA (return on assets) 33,102 8% 31% Op cash flow on assets 33,083 19% 50% Cash flow margin on sales 33,128 13% 304%
Figure 4. Classification of General Electric Revenue for FY2000
Firm Segment Revenue in $000
% of Revenue Business Model Archetype Split
Aircraft Engines 10,779 8.16 Manufacturer All Other (GE Capital Services) 4,582 3.47 Distributor Appliances 5,887 4.46 Manufacturer Consumer Services (GE Capital Services) 23,893 18.09 Financial Landlord (Lender) Equipment Management (GE Capital Services) 7,374 5.58 Financial Landlord (Lender) 50% Equipment Management (GE Capital Services) 7,374 5.58 Contractor 50% Industrial Products & Systems 11,848 8.97 Manufacturer Mid-Market Financing (GE Capital Services) 5,483 4.15 Financial Landlord (Lender) NBC 6,797 5.15 IP Landlord Plastics 7,776 5.89 Manufacturer Power Systems 14,861 11.25 Manufacturer Specialized Financing (GE Capital Services) 5,648 4.28 Financial Landlord (Lender)
Specialty Insurance (GE Capital Services) 11,878 8.99 Financial Landlord (Insurer)
Technical Products & Services 7,915 5.99 Manufacturer Total Revenue $132,094

32
Figure 5 - Distribution of Business Models: 1998–2000 The top set of numbers in each cell is for 1998, the bottom for 2002. Numbers may not add up due to rounding.
Panel (a) - Percent of total sample revenue in business model Figures in brackets are revenues in billions of nominal dollars.
What type of asset is involved? Financial Physical Intangible Human Total by Asset Right
Creator (ownership of asset
with significant transformation)
0.0% ($4) 0.0% ($0)
49.6% ($6250) 49.6% ($6863)
0.0% ($0) 0.0% ($0) - 49.6% ($6254)
49.6% ($6863)
Distributor (ownership of asset
with limited transformation)
0.2% ($20) 0.3% ($46)
14.6% ($1836) 14.9% ($2063)
0.0% ($0) 0.0% ($0) - 14.7% ($1856)
15.2% ($2108)
Landlord (use of asset)
14.4% ($1811) 12.5% ($1723)
8.8% ($1106) 8.9% ($1230)
2.4% ($305) 3.0% ($412)
9.6% ($1205) 9.9% ($1372)
35.1% ($4427) 34.3% ($4737)
Broker (matching of buyer
and seller)
0.4% ($54) 0.7% ($96)
0.1% ($13) 0.2% ($22)
0.0% ($0) 0.0% ($0)
0.0% ($4) 0.0% ($1)
0.6% ($71) 0.9% ($120) W
hat r
ight
s ar
e be
ing
sold
?
Total by Asset Type
15.0% ($1889) 13.5% ($1865)
73.0% ($9206) 73.6% ($10178)
2.4% ($305) 3.0% ($412)
9.6% ($1209) 9.9% ($1373)
100.0% ($12608) 100.0% ($13828)
Panel (b) - Percent of firms with any revenue in business model
Figures in brackets are number of firms. Rows and columns do not add up because a single firm can appear in multiple cells.
What type of asset is involved?
Financial Physical Intangible Human Total by Asset Right
Creator (ownership of asset with significant transformation)
0.1% (7) 0.1% (6)
53.1% (5074) 55.1% (3927)
0.0% (0) 0.0% (0) - 53.1% (5080)
55.2% (3932)
Distributor (ownership of asset with limited transformation)
0.7% (71) 1.0% (72)
11.4% (1091) 11.4% (811)
0.0% (0) 0.0% (0) - 12.1% (1160)
12.4% (880)
Landlord (use of asset)
8.2% (787) 8.1% (579)
11.4% (1093) 12.0% (852)
11.5% (1103) 12.2% (872)
21.4% (2046) 22.5% (1606)
46.8% (4474) 47.0% (3346)
Broker (matching of buyer and seller)
0.9% (84) 1.2% (82)
0.1% (11) 0.2% (11)
0.0% (0) 0.0% (0)
0.1% (8) 0.1% (5)
1.1% (102) 1.3% (96) W
hat r
ight
s ar
e be
ing
sold
?
Total by Asset Type
8.8% (845) 8.9% (633)
70.4% (6737) 72.2% (5141)
11.5% (1103) 12.2% (872)
21.4% (2047) 22.6% (1607)
100.0% (9563) 100.0% (7123)
33
Figure 6. Baseline Regressions of Performance on Business Models Figures in brackets are standard errors. Estimations are with fixed effects, clustered at the firm level, with one lag of the dependent variable. *** Significant at 1%, ** at 5%, * at 10%.
Panel (a) – Business models (base is Wholesaler/Retailer)
The specification is:
PERFORMANCEf,t+1 = α + 1
1
n
i
!
=
" βi ·BMf,i,t + firm-effectsf + year-effectst + X.γ + εf ,i ,t .
PERFORMANCEf,t is one of six measures for firm f at year t. The six measures are: (1) Tobin’s q, defined as (total assets + market capitalization – common equity – deferred taxes) / total assets, (2) Fama-French alpha, from a standard four factor regression of annual returns on SMB, HML, and UMD (see Fama and French (1993), Carhart (1997)), (3) ROIC (return on invested capital), defined as operating income before depreciation / invested capital, (4) ROA (return on assets), operating income before depreciation / total assets, (5) CFOA (cash flow margin on assets), defined as (sales – COGS – SGA + depreciation) / (market capitalization + preferred carrying stock + long-term debt + current debt) (see Healy, et al. (1992)), (6) MOS (margin on sales), defined as (operating income before depreciation + interest expense + income taxes) / sales (see Healy, et al. (1992)). BMf,i,t the percentage of total firm revenue attributable to business model i. X is a matrix of control regressors, which include the contemporaneous value of PERFORMANCEt, an indicator on whether the firm is in the S&P 500, log assetst, log firm age, and the Herfindahlt for the concentration of business models by firm. Inventor is not reported because it has no observations in the regression.
Business model N (1)
qt+1 (2)
FF alphat+1 (3)
ROICt+1
(4) ROAt+1
(5) CFOAt+1
(6) MOSt+1
Entrepreneur 39 -.28 (.38)
-4.83 (.73)***
.04 (.14)
.04 (.03)
13.71 (6.14)**
.22 (.20)
Financial Trader 383 -.35 (.32)
.87 (.99)
-.01 (.08)
.04 (.04)
9.94 (8.66)
.11 (.26)
Financial Landlord 3444 -.17 (.20)
.56 (.78)
-.07 (.06)
-.04 (.03)
1.33 (3.98)
-.06 (.24)
Financial Broker 458 .56 (.28)**
-.16 (.76)
-.02 (.07)
-.02 (.02)
-.13 (3.57)
.06 (.18)
Manufacturer 22693 -.21 (.13)
-.08 (.43)
-.07 (.04)*
-.01 (.02)
10.31 (3.21)***
-.12 (.15)
Physical Landlord 5108 -.13 (.21)
-.04 (.55)
.01 (.06)
.00 (.02)
13.28 (4.20)***
.01 (.16)
Physical Broker 67 -.86 (1.10)
5.40 (2.43)**
.18 (.08)**
.11 (.04)***
16.06 (5.87)***
.77 (.34)**
IP trader 2 20.58 (2.75)***
9.97 (5.61)*
-.72 (.78)
-.72 (.31)**
-533.31 (48.30)***
2.81 (3.31)
Intellectual Landlord 5424 -.57 (.26)**
.20 (.54)
-.13 (.08)
-.06 (.03)*
2.88 (5.08)
.14 (.31)
IP Broker 2 -7.28 (.38)***
1.69 (.89)*
-.93 (.09)***
.13 (.04)***
5.43 (5.85)
.36 (.37)
Contractor 9626 -.06 (.20)
.12 (.42)
-.11 (.06)*
-.01 (.02)
9.80 (3.78)**
.20 (.21)
HR Broker 34 .87 (.48)*
-7.92 (7.20)
.05 (.17)
-.01 (.06)
-22.32 (7.33)***
.40 (.44)
N 28612 20308 28567 28612 28577 28913 p-value of regression 0.0000 0.0000 0.0000 0.0000 0.0000 0.0000 Adj. R-sq. 0.7200 0.7541 0.5824 0.8046 0.7741 0.7412 p-value for test of business models 0.0000 0.0000 0.0000 0.0000 0.0000 0.4225
Panel (b) – Discretized business model combinations (base is Wholesaler/Retailer)
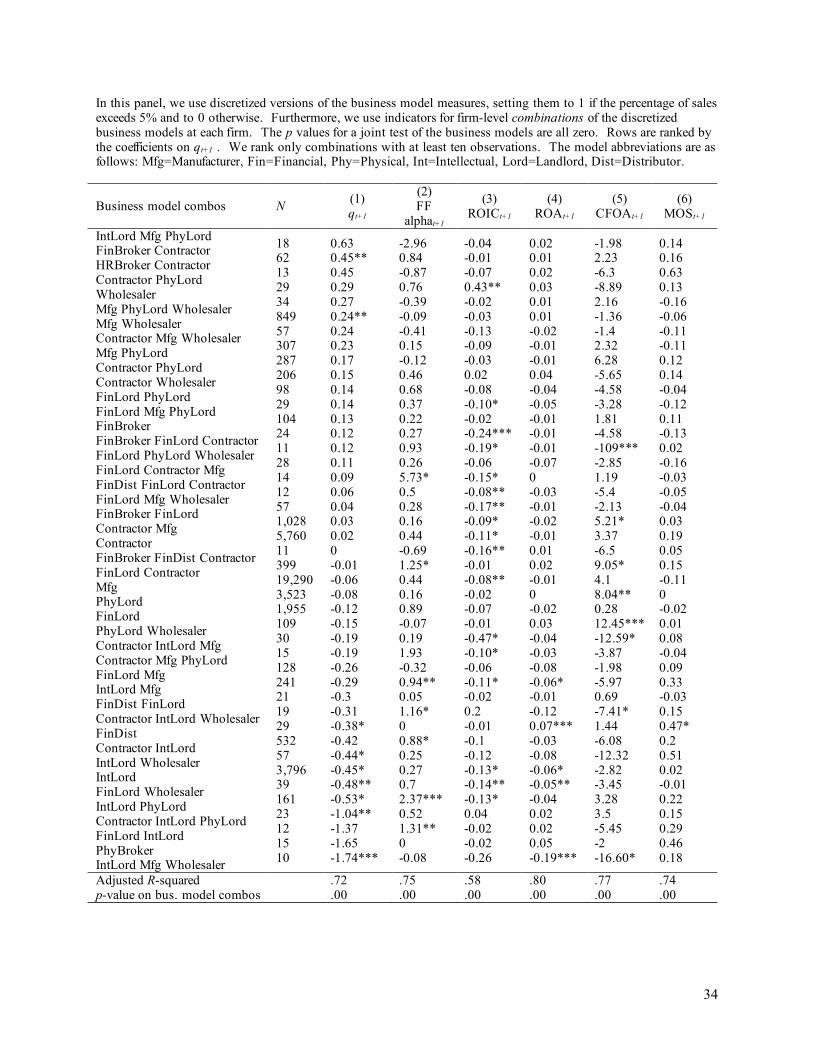
34
In this panel, we use discretized versions of the business model measures, setting them to 1 if the percentage of sales exceeds 5% and to 0 otherwise. Furthermore, we use indicators for firm-level combinations of the discretized business models at each firm. The p values for a joint test of the business models are all zero. Rows are ranked by the coefficients on qt+1 . We rank only combinations with at least ten observations. The model abbreviations are as follows: Mfg=Manufacturer, Fin=Financial, Phy=Physical, Int=Intellectual, Lord=Landlord, Dist=Distributor.
Business model combos N (1) qt+1
(2) FF
alphat+1
(3) ROICt+1
(4) ROAt+1
(5) CFOAt+1
(6) MOSt+1
IntLord Mfg PhyLord FinBroker Contractor HRBroker Contractor Contractor PhyLord Wholesaler Mfg PhyLord Wholesaler Mfg Wholesaler Contractor Mfg Wholesaler Mfg PhyLord Contractor PhyLord Contractor Wholesaler FinLord PhyLord FinLord Mfg PhyLord FinBroker FinBroker FinLord Contractor FinLord PhyLord Wholesaler FinLord Contractor Mfg FinDist FinLord Contractor FinLord Mfg Wholesaler FinBroker FinLord Contractor Mfg Contractor FinBroker FinDist Contractor FinLord Contractor Mfg PhyLord FinLord PhyLord Wholesaler Contractor IntLord Mfg Contractor Mfg PhyLord FinLord Mfg IntLord Mfg FinDist FinLord Contractor IntLord Wholesaler FinDist Contractor IntLord IntLord Wholesaler IntLord FinLord Wholesaler IntLord PhyLord Contractor IntLord PhyLord FinLord IntLord PhyBroker IntLord Mfg Wholesaler
18 62 13 29 34 849 57 307 287 206 98 29 104 24 11 28 14 12 57 1,028 5,760 11 399 19,290 3,523 1,955 109 30 15 128 241 21 19 29 532 57 3,796 39 161 23 12 15 10
0.63 0.45** 0.45 0.29 0.27 0.24** 0.24 0.23 0.17 0.15 0.14 0.14 0.13 0.12 0.12 0.11 0.09 0.06 0.04 0.03 0.02 0 -0.01 -0.06 -0.08 -0.12 -0.15 -0.19 -0.19 -0.26 -0.29 -0.3 -0.31 -0.38* -0.42 -0.44* -0.45* -0.48** -0.53* -1.04** -1.37 -1.65 -1.74***
-2.96 0.84 -0.87 0.76 -0.39 -0.09 -0.41 0.15 -0.12 0.46 0.68 0.37 0.22 0.27 0.93 0.26 5.73* 0.5 0.28 0.16 0.44 -0.69 1.25* 0.44 0.16 0.89 -0.07 0.19 1.93 -0.32 0.94** 0.05 1.16* 0 0.88* 0.25 0.27 0.7 2.37*** 0.52 1.31** 0 -0.08
-0.04 -0.01 -0.07 0.43** -0.02 -0.03 -0.13 -0.09 -0.03 0.02 -0.08 -0.10* -0.02 -0.24*** -0.19* -0.06 -0.15* -0.08** -0.17** -0.09* -0.11* -0.16** -0.01 -0.08** -0.02 -0.07 -0.01 -0.47* -0.10* -0.06 -0.11* -0.02 0.2 -0.01 -0.1 -0.12 -0.13* -0.14** -0.13* 0.04 -0.02 -0.02 -0.26
0.02 0.01 0.02 0.03 0.01 0.01 -0.02 -0.01 -0.01 0.04 -0.04 -0.05 -0.01 -0.01 -0.01 -0.07 0 -0.03 -0.01 -0.02 -0.01 0.01 0.02 -0.01 0 -0.02 0.03 -0.04 -0.03 -0.08 -0.06* -0.01 -0.12 0.07*** -0.03 -0.08 -0.06* -0.05** -0.04 0.02 0.02 0.05 -0.19***
-1.98 2.23 -6.3 -8.89 2.16 -1.36 -1.4 2.32 6.28 -5.65 -4.58 -3.28 1.81 -4.58 -109*** -2.85 1.19 -5.4 -2.13 5.21* 3.37 -6.5 9.05* 4.1 8.04** 0.28 12.45*** -12.59* -3.87 -1.98 -5.97 0.69 -7.41* 1.44 -6.08 -12.32 -2.82 -3.45 3.28 3.5 -5.45 -2 -16.60*
0.14 0.16 0.63 0.13 -0.16 -0.06 -0.11 -0.11 0.12 0.14 -0.04 -0.12 0.11 -0.13 0.02 -0.16 -0.03 -0.05 -0.04 0.03 0.19 0.05 0.15 -0.11 0 -0.02 0.01 0.08 -0.04 0.09 0.33 -0.03 0.15 0.47* 0.2 0.51 0.02 -0.01 0.22 0.15 0.29 0.46 0.18
Adjusted R-squared .72 .75 .58 .80 .77 .74 p-value on bus. model combos .00 .00 .00 .00 .00 .00
Copyright © 2022 FDOKUMEN