And Others An Analy - ERIC
205
CD 100 843 AUTHOR TITLE INSTITUTION sPoNS AGENCY REPORT NO PUB. DATE NOTE AVAILABLE FROM DOCUMENT RESUME RC 008 232 Miles, Guy H.; And Others An Analysis of the Needs of Rural Youth in the Southeast. Final Report. North Star Research and Development Inst., Minneapolis, Minn. Manpower Administration (DOL), Washington, D.C. DLEA-41-2-001-27-2 May 73 215p.; For related document, see RC 008 233 National Technical Information Service, Springfield, Virginia 22181 ?DRS PRICE ME-$0.75 HC-$10.20 PLUS POSTAGE DESCRIPTORS Adjustment (to Environment); Caucasians; Community Study; Comparative Statistics; Dropout Prevention; *Educational Needs; Employment Opportunities; Family Background; *Individual Needs; Longitudinal Studies; Migration Patterns; Negroes; Post Secondary Education; *Rural 'Muth; Secondary education; *Vocational !ducatio : *Youth Programs IDENTIFIERS Rural Urban Migration; *Southeast' ABSTRACT As part of a series aimed at developing better orograas for rural youths, this study tested (summer, 1972) hypotheses about community, educational, and individual factors . affecting the future adjustment of rural southeastern youths, who as Ath graders in 1963-64, represented 16 rural counties, (North and South Carolina, Georgia, Alabama, and Mississippi) remained in the county until age 16, and were eligible for a Neighborhood Youth Corps (NYC) project, and not currently institutionalized, in the armed forces, or deceased. Long -term county residents gathered extensive information about each county, its school system, and staff members during the 1967-68 school year. Questionnaires mailed to 1,764 students, surveyed their early history, experiences since 1967, employment history, social adjustment, advanced education, and migration patterns; those still in school were asked about their school, general course of study, grade point average, and scope of extracurricular activities. Data were analyzed to determine whether the systematic relationships hypothesized actually existed. Some findings were: (1) the dropout problem was critical and its prevention should be the highest priority objective of any program for rural youths; and (2) 27 percent of the black males, 24 percent of *he black females, 8 percent of the white females, and none of the white males were enrolled in an NYC project. Some comparisons are made with *he North Central states' study. (NQ)
-
Upload
khangminh22 -
Category
Documents
-
view
1 -
download
0
Transcript of And Others An Analy - ERIC

CD 100 843
AUTHORTITLE
INSTITUTION
sPoNS AGENCYREPORT NOPUB. DATENOTEAVAILABLE FROM
DOCUMENT RESUME
RC 008 232
Miles, Guy H.; And OthersAn Analysis of the Needs of Rural Youth in theSoutheast. Final Report.North Star Research and Development Inst.,Minneapolis, Minn.Manpower Administration (DOL), Washington, D.C.DLEA-41-2-001-27-2May 73215p.; For related document, see RC 008 233National Technical Information Service, Springfield,Virginia 22181
?DRS PRICE ME-$0.75 HC-$10.20 PLUS POSTAGEDESCRIPTORS Adjustment (to Environment); Caucasians; Community
Study; Comparative Statistics; Dropout Prevention;*Educational Needs; Employment Opportunities; FamilyBackground; *Individual Needs; Longitudinal Studies;Migration Patterns; Negroes; Post SecondaryEducation; *Rural 'Muth; Secondary education;*Vocational !ducatio : *Youth Programs
IDENTIFIERS Rural Urban Migration; *Southeast'
ABSTRACTAs part of a series aimed at developing better
orograas for rural youths, this study tested (summer, 1972)hypotheses about community, educational, and individual factors
.
affecting the future adjustment of rural southeastern youths, who asAth graders in 1963-64, represented 16 rural counties, (North andSouth Carolina, Georgia, Alabama, and Mississippi) remained in thecounty until age 16, and were eligible for a Neighborhood Youth Corps(NYC) project, and not currently institutionalized, in the armedforces, or deceased. Long -term county residents gathered extensiveinformation about each county, its school system, and staff membersduring the 1967-68 school year. Questionnaires mailed to 1,764students, surveyed their early history, experiences since 1967,employment history, social adjustment, advanced education, andmigration patterns; those still in school were asked about theirschool, general course of study, grade point average, and scope ofextracurricular activities. Data were analyzed to determine whetherthe systematic relationships hypothesized actually existed. Somefindings were: (1) the dropout problem was critical and itsprevention should be the highest priority objective of any programfor rural youths; and (2) 27 percent of the black males, 24 percentof *he black females, 8 percent of the white females, and none of thewhite males were enrolled in an NYC project. Some comparisons aremade with *he North Central states' study. (NQ)
ti
L ACPCRI
'1. 6 4, 1114f fi 1(0), M. 11,7rhara Rosot
NT . M.; t


(1:(1! 1i1: 1..1/ .
(1,1.111q ; 1.:11 `.T.11
mix.) kt -t; !T : JoTilotitt ottr.1.4.11.-T 11.141
pt:!! XlImr=oo oql
Itt 11:111;:t [pt.! 64;.i.)1:!1; ! it 1;1.
Jixo Xionno luny: 1:4-4
:
svo.1.1 -.):4 do.t to .
ST1.1110.'; 1 it` ",": ;
Untr....100 0.:11. ; :4.1 .1 ,
. '
14%.
. I
t-4.)TJOS io ..tto !-;1 10,:r
.
'77 .17t
4 .4. .4 ..:)!
4.
; I
'OT 4110VuTIMM "PM '40P4s a TOq quol7dTmea put tiostosoll Jemodu,4w jc lowo
;

!
:t
1;
Is I 1.t.%;,) I.' .
JI . 1)
TABLE OF CONTENTS
Page.
SUM IARY 1
INTRODUCTION 9
An Overview 9
Isolation 15
Race 17
The Availability of Jobs 17
Poverty 21
outmigration 23
Dropouts 25
Quality of Education 25
Size of School 25Expenditure oer Pupil 25Curriculum 28Quality of Staff 28
OUTMIGRATION AND THE CHANGING RURAL COMMUNITY IN THE SOUTHEAST 31
General Population Trends 31
The Effects of W,gration on the Rural Southern Community 33
Selective Aspects of Migration 34
Racial Selectivity 34Educational Selectivity 41Selection by Sex 44
Economic Factors Affecting the Migration of Rural Youth 46
Et ploymont Opportunities 46Proportion Employed in Manufacturing 48Discrimination in Hiring 50Income Level 61
THE EIA:f:ATifiNAL SYSTEM IN THE SOUTHEAST 63
Background
Srhool
Nigh -;-hool Curriculum
Staff filality
:itudent Enrollment
0006
63
63
69
78
82
TABLE OF CONTENTS (Continued)
The Dropout Problem in Southern Schools
Page,
84
Extent of the Problem 84Factors Related to Dropping Out of High School 85
Race 85
Dropout Prevention 89
Income Supplements 89Vocational Training 101
Post-secondary Education 104
College AttendanceVocational or Trade School Attendance
THE EFFECT OF SELECTED VARIABLES ON OCCUPATIONAL ADJUSTMENT
104
116
119
Measures of Occupational Adjustment 119
Adjustment to City Living 121
School Factors That Affect Success 127
Vocational Training 127Size of High School 128
Community Factors Affecting Success 131
Isolation 131Part-time Work 136
Family and Personal Variables 138
Family Income 138Race 140Knnwlcdge About Urban Jobs 145
Participation in Federal Manpower Programs 147
IMPLICATIuNS 151
APPENDIX A BIBLIOGRAPHY
APPENDIX B QUESTIONNAIRES
APPENDIX (: THE THqD3 USED IN THIS STUDY
PPE!;DIX D OCCUPATP;N3 FAMILIA:: Tr, RURAL YOUTH
00()7

.1.
.1t
i? -; :: i t` It' .1 !.t? i!.;
t . r I ttra I !. out Ie:
! :r ,,t :t t t -:14. 1.11 s? ,It ,.4; .14: I I a:1 1 ? t :.0 -'4.tt, he t , wore wied tti Joy,. t'p
... oz . , eduo.e. i cu.? I , Ansi lttt1 i vidua l --.., : t ..t 1: re Al : of vout h.: who `;row op in
; t. ro t h..11 t t td b: le I lowi tt;., up a s.trup le of:. e in the Pi? -14 1.4 sdtool year in a
.; 0:* 'le rural count ics in a 5-?...t at circa.*?-1 it colt' y ;11)0 tit
t wore v. ti led t tho fori'.t r st udent. t: tot r .! r :tist or t ht. it t :Ter i eon since 1961
h ory, ad jut; t?.-..rtt , ativanood education,r :t t r:I.;
'1'; . t ol.:. .i, ti: . 07:-.:-..11:tit,. and those obtained fromi t to den.. rr.lne whthc..r the s,ste-
i r :,:' tIi b4201,. 11?...poth,_::i.....ed actually st.
I I of r4.?.-,earch L.:a,: set up on a regi anal basisw it t:1 th;:t titer,- would Le wide .,ari at I on among the
r : the later success oft r r:r ,? ,:dr: of this citsi...,n was pointed up dramat I callyt'. '2::
rin '; ti I VP' I in the :-:0,:theast and in tic North
are r..ar%.,(1 di fereacei bet woen these two regions_It t!,11.1 ty of jobs, poverty, out-
I .!r 1.1t e!? 4,,I4tr:,;:t
I:- ;,, ir,, 1 I ,1 t, : A 1 ;111,1 :1j -;.:1:,$.1 pp 1 .
-1

:.
! r
Bur con All
t i
.! I to t 1 r-. ::.! !or.
:::ty in I ht
;!..'tt to I n it.
Ltd 1 to 1)c
n It 1 f :trio. is
Ir. '' -,. tn ::.orth at:nilr but to Iierat to OIL:
!,-; In t Sout.11(.a..;t: , Indus-
t.,: LI. r,11-.:1. i.citt rural youtli.4 ;Iry ablet : ;. ark.
.-...t 1- :. t() l.. ;, Abont 70 per-:it t.h., youths repoi to,1 hay-
I:. rk .
:1
:
in :-;) t ii-;t and .;:i t. rural.; e":,tni. 1 y i-.1.-v;t1(.11t and, al-
r! ;
0 () 9
i 114()%.*C'.'c
I If. f rorl

t:
:0...
.:
:.1. 1. !' I t 110!...
I .-! . :It ' !! t on tl'
r.C. et.
2
in :!!.1'
4: ip out. !!0.1-:111 e
wore :-rom
11. , r,.! :oh! , o::.:N.1.0y;;Alit. pattern
f: s wiaely .liffereat incomes aid not
!!L:e'. yot.:1).: r).4: ainea in the rural com-
t1,- were si_nifIcantiv less likely to be
skill level th::n those who came fro::: families
t.: rPrl, bas attracted nationwide at-t ::: :: !: of ifs 1,1terr!:ienal nature. ltnral black families from
in l.tc nu..7crs to the North :tnLl to the Vest.
Yet, w:.. I Is defined as movin..t. away from the rural county in: . 11;, wItmi,.r_it.iin Is a far greater problem to rural youths
!**!: than it is amln4 rural youths in the Southeast.
in th! Nor!h C ?nral state :, 72 percent of high school
!Il not on to col lei. left their home counties, in tilt.
42 ;.,,rce:A of the black youths and 26 percent of the whitey.):.-1:4 in th. cate;:ory
rur,t1-to-urhan ttern.; ar.ong white youths in the:o; .t r. t't of whita youth:. in the North Central states.
;:Tron yontl. are difroreat, however. Among white':' , h lz.av the r 110a10 communitles, and many
is 11 ri,:at t. a city. black youths, about equal
An,! f-: len 1.;.:17... Li-1r rural co=unities.
In h!most fr.quent among
l r ; ):)1 ..\ inv; t.:11 V(I,;t b.; In tho
thoe goin:t on
) u. t,nd..n"y for tho better
0010
:
i
I
i'L 1 k
I: t 1. O1't.:111
1 .1 l t : 1 ;t
.! .; .1' . t '1.- o'.1.,1O;-t.
: t .;;;.:1
j.-1.: .10 t
t.111. t 11Zift
t . ..1 1.1i" r 1 il.o 1 ;. t \ :It I to
r 1 0.1; i to yottt ar1t. r t I Only a &
;.: , f t 11 h l dek
r 1 r r..t. ; t!) ow; iath por.".
!". Y t 1.11110 yout.i.o; moved to- . 1 r 1. or f a 1 rt-.1.1y I I vt.(1.
A.
; f olt..est -I fv.tni-
.;;r,11 anti for fro... 1.. t 1 i
t . '11: i 1:-; not t tue wh t e
I 1
0:.
:;ort h C"nt. rt.! ;tart::- SA! f0t111(.1
r., t It 1 .. t I) ill.' CIL:: ;111d
In till: !.011(.11-
;,: %.*11 tit t!ir'
0011
',.! 1; .

The results of our present study show that black youths do not ad-
just to the city better than white youths do. However, they are less
likely to return home as a result of poor adjustment. For example, of
those migrants who did not make new friends easily in the city, half of
the white youths but only one tenth of the black youths moved back to
their rural communities. Similar patterns were found with other measures
of adjustment to the city. Black youths who move to the city from the
most agricultural parts of the rural South are less likely to return home
than those who come from less agricultural rural areas. This relationship
does not hold for white youths.
In the North Central states a majority of rural youths grow up
under conditions of isolation. Extreme isolation was shown to have a
negative effect on their later employment and social adjustment. This
kind of isolation ie. not present in the Southeast where there are more
people per square mile and better transportation, and where major urban
centers are within easy commuting distances of most rural areas. Even
so, there was some evidence that isolation has an effect on the employ-
ment adjustment of those who grow up in the rural Southeast, although the
effect is not negative. Among those who stay in their rural communities,
about 80 percent of noncollege youths enter blue-collar jobs. In contrast,
of thos ho leave the rural communities and move to a city, only 46 per-
cent of those from communities further than 80 miles from a major urban
center enter blue-collar occupations, and 84 percent who are from communi-
ties within 55 miles from an urban center enter blue-collar jobs.
. ,
In general, we found no relationship between having
job while in school and occupational adjustment later on.
for race and sex, those who had part-time work tend to get
entry level wages, but this difference is not large enough
had a part- tit"
When we control
slightly higher
to be significant.
When schools are compared on a region-by-region basis, southeastern
schools appear to be of much poorer quality than those in other regions of
the country The Southeast is more rural than the other major regions;
therefore, a larger proportion of its schools are rural schools. Our
-5-
findings suggest that Southern rural schools do not compare too unfitoitfa
ably with rural schools in the North; but rural schools throughout tier
Country tend to be smaller and less well-staffed, and to have fewer O0114
Offerings than urban schools. One of the major recommendations steSSONO
from our previous study of the rural areas in the North Central.etitoW
that any program for rural youth must be aimed at stengthening an
opiate rural educational system, rather than depending on that systel(_
provide the supportive services for the rural youth program. This
eendation is equally applicable to our.findings concerning the schOmiiii2
the Southeast.
Rural schools in the Southeast are larger than those in the
Central states. Generally, the Southern schools have a much lower
pupil expenditure than the North Central schools. However, the hi
per pupil expenditures in the North Central states occur in the s
Alva schools; per pupil expenditure in the larger rural schools is-
equal in the two regions.
Core curriculum offerings in schools in the two regions of thR
country were very similar. Schools in the North Central states offOtoid
more in'the way of arts and music education; those in the Southeast VON
mere likely to offer occupational familiarisation, on- the -job training
or work study programs. The broader offering of occupationally role**
subjects in the Southeastern schools was related in large part to the
practice of hiring teachers in the vocational area who do not have dostemi
Most of these are graduates of vocational and technical schools. This pima
tics is not followed in the North Central states. Aside from these SW
degree vocational teachers, the educational level of teachers in rural
Southern schools and rural North Central schools are about the same; with
some slight advantage in terms of numbers of teachers with Masters degrees
in the Southeast.
A cluster of occupationally oriented services in'these schools,
centering around vocational training and counseling, appear to have
negative influence on the college attendance of black students. The
4.
0013

limser schools tend to offer these services; the smaller schools and the
4egriested schools do not. A detailed analysis suggests strongly that
segitive counseling takes place with respect to college education for
Woh students and, to a lesser degree, female students.
Desegregation of the schools has occurred such more rapidly in
counties that are dependent on industry than those that are most
00,044ent on agriculture. Segregated schools tend to lack trained cowl::
Mint and do not offer a broad range of occupation-oriented services.
In 'the North Central states, the more agriculturally based the
mounty is, the higher is the proportion of young people who go to
In the Southeastern counties that had high proportion of p00411:.
itlitn employed in agriculture, $4 percent of the white youths and 42
'Moat of the black youths went on to college; the college attondanse
4or rural youths from less agriculturally oriented *aunties is aueltV.
1000. In view of our finding that 72 percent of the black youths in
thOSO,counties came from families with incomes below $3000, this is a
itu/Orisingly high college attendance rate among blacks. Whereas 31 perm,
int of our black sample said they did not go on to college because they
did lot have enough money, only II percent of our white sample made this
etatement.
*et school-related factors had no apparent effect on the occupes
!tonal adjustment of the noncollege youths in this study. It was found
that those who attend small schools are more likely to enter blue - collar
occupations and not as likely to enter sales occupations as those who at
tend larger rural schools.
Dropping out of school is a major problem in the Southeast. Not
only do many rural youths drop out at the end of Sth grade, but, of those
who do enter high school, large numbers leave before graduation. The drop-
out problem in the rural areas of the North Central states is so small that
prevention of school dropouts becomes a questionable objective for a rural
-1-
0014

youth program. In the Southeast, the dropout problem is critical and it.
prevention perhaps should be the highest priority objective of any proanglifor rural youths.
The dropout rate for black students is much Higher than that of
wits students although the white dropout rate is about 3 to 4 times
roster than we encountered in the rural parts of the North Central 140119,
hudents from poorer families are more likely to drop out of school,
use from families with higher incomes. Of those who indicated the
*lollies did not have enough money to buy essential food, clothingtP*;,k
. Otielter,.62 percent of the white students and 41 percent of the blmilt:10006.
diets dropped out of school. Among those school dropouts who res000100V
40 our questionnaire, over 90 percent of the black youths and only OIA00r0;:.
ant of white youths say they would have stayed in school had fines_.,
'a*
aid been available to them.
0":
One portion of the study dealt with the youths' partieipatiokilk:
MOTA programs, the NYC program and in the Job Corps. We found thatjtV
percent of the black males, 24 percent of the black females, $ perm
of the white females, and none of the white males in our sample were lam,
rolled in one or more of these programs. The proportion of eamenr011iel,
in these programs who later enter college is much higher than among Odlit
youths from families with similar incomes. Participation in these ~MO
does not appear to be related to measures of later employment adjusting*.
;
These findings suggest the need for a rural youth program op4941140
on two levels. The present NYCII program with its emphasis on skill triage
ins for those who have dropped out of school is an adequate model for 4141
level. It should be expanded to cover more rural communities in the Seutbr
east. The second level, an in-school program, is not adequately coveted by
the NYC-I model. The in-school program should supplement the rural *dues,
tional system,particularly in small and in segregated schools, with O$0141
tionally related services and counseling. Emphasis should be on dropout
prevention and, for this reason, the program should be broadened to COM
Ith graders. The guidelines for such a program, based on the findings of
the present study, are presented in a separate report.
mg.
001.5

An Overview
This tod'. IS part of a larer program of research for the
Departxent of Labor to determine the kinds of programs that would
be at optimum benefit to rural youth. Since there are bro-3 re-
gion ii differences in the rural environment and economic base, the
problem; facing rural youths arc likely to vary from region to re-
gion. And within a single region, the problems of the youths from
different ethnic groups differ. Therefore, the program is being
conducted as a ss.ries of regional studies, rather than as a single
nationwid.! stuy.
T1 each study wt arc looking for factors that affect the
later employAbIlity of rural white youths and, where the popula-tion mix warrants it, of rural American Indian youths, rural black
youths, and rural Chicano youths. As a first step, background re-
search is nriertaken in which the opinions of experts are treated
as hypotheses !-.0 be tested in a longitudinal study of the rural
youths in the region or in the cultural group of interest. This
approach Is outlined in Figure 1 on the following page.
-9-
0016

Literature
Urban
rot. IIatcrviews
Interviews
Develop
Hypothes.,?s
T1
t
!Inc
in 1'01
Figure 1
Study Design for BaCkground Research
Col
ic..c
tC
prvi
f :1
4ty
.t
H
c, ,c,
. ,i
1
1),:t::
/ P.7pvthir:
\
1---
Dre-1T-
I
Hypot:-..:31s
I ;

1,otllo...os that are substanti.tted in the lon!,,itudinal
study rural youth aro anal..ca furthvr in a lator phase of thu
rseay.-h.co d_.:yrIno if 0:I:: Information can 41e of use in develop-ing a stt of ,:,uiJ,.1t:ws fov a r.odel program. this analysis and thesteps roquir0.1 to aovelop the gutdelineA are shown in Figure 2.
Ti.e first of these regional studies was conducted in theNorth Ccntral stAte5;. Foll,wing a longitudinal study of 1100 youths,
we del.vtopt_d pvo.rar: guidelines on the basis *o our research find-Thc resultiue, North Central Rural Youth Program emphasizes.
those factors ,,hown h the research to have had a positive effecton'tlio future of the-,c, rural youths and is. aimed at counteractingthose f,, :tors thIt were shown to have had a detrimental effect ontheir fuLur.
The program wc developed has now been implemented in a three-state experiment to evaluate Its effectiveness. About 1000 ruralyouths in Iowa, Nobraska and Minnesota are enrolled in the program,and an equal nu:- :her from matched communities have been assigned toa control 4roup. The design of this evaluation phase is outlinedin Figure 3.
The present report is concerned with the background researchthat we have carried out in the Southeast -« in the States of Alabama,
Georgia. .ltssisslppl, North Carolina 41:1 So'.tth Carolina. The infor-?nation containel in this report will be used in developing guidelinesfor a rural. youth program designed srecltically for youth:, from thesestates.
in examintr4, the data that we have gathered we find that thereare ar.veril major differcnc(!s Ilenteen rural areas of the North Central
nrr,

Vo,ri
/--
MantBy
'
..ziy :
/
Yes
I
10.11111011111.0M 11Ily
incIn lniti-1Guideline.;
4.
'Tor ?1!:-.:1
Co=1;:n1.ty
ModtfyInitial
Cuid lines
-
A4
,,oc,i /
Include InTentltiseCuie.clines
4
Is ModelAoceptaleTo RuralLeaders
Pc;
ModifyTentativeGuidelines
s Include inTentative
Guidelines
-77777777747777.771
111.111
Figure 2
Dvvel(Tkl),, Prrr:1171 ColtdPlines From
thc. Ecsult. of 11;_wkgruund
-1.2-
001.9
Pre

PliA!4!: /-*(Program)
Given11 \/ Baseline
Eaasuresof
Vdtvidualai
FRASE 2
(followo-up)
IZZ0.1.-1'
toccuplittion4
Iand *tat'Adjuttmege_
Exrerimontal.Counties
On-site observatilm of operation
/' \ Allocation
SampleBy Matching
)CommunityCharacteristics
gams do°.
Make ComparisonTo EnsureEquivalkmeTo Begin With
Mak*ToDifftAs A-
Of Pi
IOn-site observation I existing programs
BaselineNkssures
) jeof
firograt:N
not\Given /
Figure 3
Study 1J tin for Evaluatingtruism Effectiveness
MitimitirkI Occupational\
4
and Socialt Adjustoont if

1 L1,k Ont.(+t ' t cto for
;, L. tL, I iv in the
Centrn1
, : : y tai. , pove r t , out:::14.ra.;1
,1t tlitv or euu.ation. To :-.irs.4.!
.1.%r tho tport of thtl- North
aammill-
mijor difforns
In ti'_ C,ptrn1 stotos a cro:;:;-sectional sample of ruralyouth 'e7dF; firqt selecting it sa4.-p1,F. or 18 rural coun-tie3. countles wen: a reprosentative cross aectIon of allNorth ('= :;tall rural counties on the basis of population density,
nnd le.:els of outmtpr;,tion. In the South -ea t, 16 rurli cr)unti--; wcre seter:t0d to ropro,-;cmt a croqs soctiun :Ill rural col,nti,s on th' basiq of population density,
of popu!ation lnd outmipration levol. Inrcejoi,, 11';t--; of situ! -It, hnd l'een in the eighth grade
f;;'lt r5 -;c7lqu; to the ti:c of thc re:,:enrch were used as thesuiri c
-14--
0021

Isnition
T:12 kin2 of faced 'ay rural youths growing up inthe North Co:Icral :::ate:; L; not present in the Southeast. In theSoutheast there .;r0 .-.tore people per square mile, transportation
is hotter, and dLstances to pajor urban centers tend to be shorterthan in the North Central f:tates. For example, only 36 percent ofthe rural yo,:ths In tho Southeast, but 60 percent of the sample inthe North Cetral state!-:, lived 85 miles or more from a city of
100,000 or r!!':,rc. population. Distance of the county from a city of10,000 or more population was also different in the two regions(See Table 1).
As is sh,wn In Table 2, only 17 percent of the North Centralstates' rural counties had populations of more than 28 people per
square mile; in the Southeast 62 percent had more than 28 people
per square :jle. Moreover, over one-third of the counties in the
.North Central states had less than 13 people per square mile; none
of the counties in th,? Southeast were this sparsely settled.
As Tnblo 3 shows, public transportation, in terms of the num-ber of schelui,A stops in the county per week, was better in the
Southeast than in the North Central states. Whereas 19 percent of
the rural youths in the North Central states study had grown up
in counties with no public transportation at all; only 2 percent ofthe rural youth!-; in the Southeast had grown up in counties with no
public tran:,;pJrtation.
-15-
0022

cils't H11
0 L i. . i T... :
N r _ :: 1
Sol t
.
>J1. r ,)1
3 (33:)
5 (31.A)
Population '.?acv Count1e4 That. Are aItcpreso%1:liv0 Cr0 .F.ction of Ail Rural
Countiei; in Two Rcgions
Po pit la t Lon/mi.2
1 <13 7.11. 13-28 mi. i?28 mi.
7 (iL;) b (44;;;)
Southeast 0 (0) ! 6 08:0
3 (17%)
10 (627.)
Table 3
Proportion of Rural Ycuths in Each of Two RegionsWho Lived in Counties :1.th Spc.!cified Levels of
Public Transportation
...J... ...Oa 411. . .......
Ro'l!ort
Nnrth
Sout,ast
.6Sulber of Schcittled Stops/Wk.
' Nonr2 ! 1 - 27 ! 28 or more
1
2");
6091
12% 69Z
987.

L: 1 :..1 half h,d
popul . 1-.1a :ai; is Lu :.harp
tract cot:n:10S in the North Central ::tates, whore
the was, a17:1:...t nono%i!tent. Kace .t an important
compon,..nt dl:ferences hclow in the availability
of ob; ;, poverty, ont.!:-.I:,t4tion. dro7out rats !--; and quality of edu-
catio. be ir,.lic_tIons of race fcr these problems are discussed
under et...h to; ic.
The Availability of Jobs
A major differel,0 between rural areas in the North Central
and lothenqt regions in the proportions of the populations
that are (..i,toyd in agriculture and in manufacturing. In both
regicw, the oppert-unity to farvi is tcoming more limited each
year. Althou.:.h the! nur.ber of acres being farmed have increased,
the nu:*er of farm: have decreased as farms are being consolidated.
However, In the Southeast, perhaps because of its denser rural pop-
ulation, in+;:;try is beginning to rove into the rural areas and
rural ywitIll are Able to find local employment in manufacturing.
The North Central states with its sparser population has
not attricto 7nntif;:,:turIni; ,:onpanir:a to the rural areas as readily
as the SDlthe.it. In the N.th Central states over three-fourths
of the :oal.les 11..ul less than II percent of the population employed
in rawfiwt,ri:17: in the flutheast none of the counties had this
sm:11.1 a pr)p,,rtiw, tho prnivilation ernployed in manufacturing (see
Table the North Crntral .yonths who are forced off the
farm :11!. :7 riLy.rw.e to the larger town:; or cLies
In se Irf..-
0024
. Cr:. v.! I i t ur i :1
:-( t i .I C.,..n! i ; i o
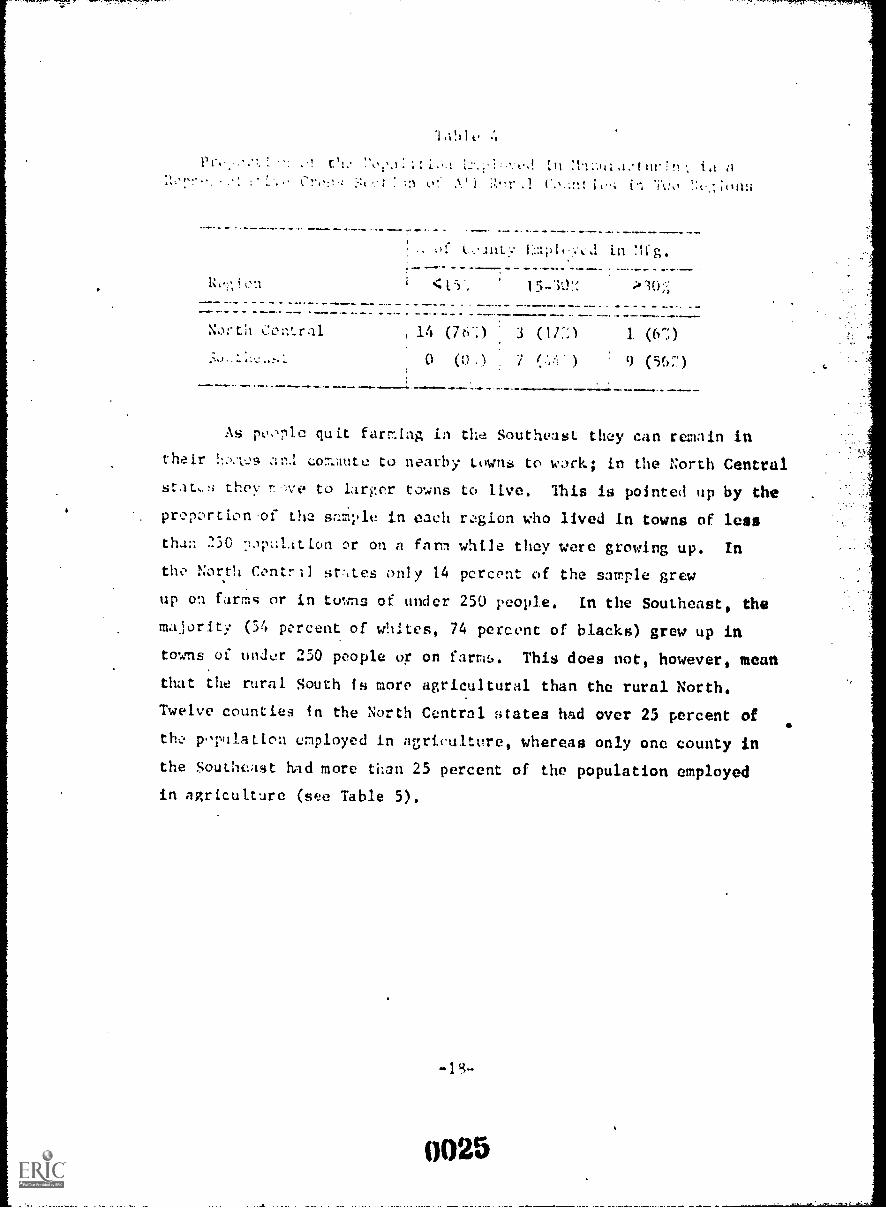
Laph:y...d in lig,
North Cerlr_rl, 14 (76-.) : 3 (11:,1 1 (6":.)
0 (0.) . i 9 (56:7)
As pe.,ple quit farming in the Southeast they can remain in
their !1:)..; conIaute to nearby towns to work; in the North Central
stag.:; they r..ve to larger towns to live. This is pointed up by the
proN,rtion'of th2 sr1Mple in each region who lived in towns of less
that; 230 ppulation or on a farm while they were growing up. In
ti North Contrll sr,tes only 14 percent of the sample grew
up on farms or in towns of under 250 people. In the Southeast, the
majority (54 percent of whites, 74 percent of blacks) grew up in
towns of under 250 people or on farr41,. This does not, however, mean
that the rural South is more agricultural than the rural North.
Twelve counties in the North Central states had over 25 percent of
the vpulation employed in agriculture, whereas only one county in
the Southeast had more than 25 percent of the population employed
in agriculture (see Table 5).
0025

T.O.le 5
kr. .\!;! I 'uI LLII.C.in -1 ...Ci"( t Al 1. Kura I
;\:e ;iv
CounLy LnI,Loyed in Ag.
R ;inn <15*. 15 - 23 >25
North Centual 2 (1L',) 4 (22%). 12 (67%)
Ill (Or) , 4 (25:;) 1 (6%)
....111....w.NONwymswal-
Vhen the young people who moved to the clxy were asked why
they had left the rural areas, 46 percent of North Central youths
and 43 p-reent ot: black youths from the Southeast said lack of jobs
had inf.JIL:need then to move. In the Southeast, however, white youths
apparently have no trouble getting jobs, probably because of the
manufacti.tring pl.Ints that are moving into the rural areas. Only13 percent of wait° youths who had moved said lack of jobs was
a reason for leaving their rural home counties. Thus, althoughthere are jr)1),: available in the rural Southeast, they are more
available to white youths than to black youths (see Table 6).
-19-
0026
aft

r r' i ,, 1. of .101)1z : ot. r l.:, ho
:, jI o
As i Lick f Jobs,41r. 1111. .6* OM,
. Very IP:2 3r rant ly IrApOrtallt: t. cited_
0027
514:';
5% 57%
3/. 87

.0Nor:h Cetral i.rili Southeivitein
regio:is 1. 11. re!-..,-eet to pe\erty :-.0vm to be related to race, The
white sar..:le in the Southeast and the North Central sample, whichis all %;hi:c, were nearly identical In the proportion who answered
that th:qr faHly income was under $3000 a year, or that their fam-ilies diJ no: have enough money for essentials, Only 6 percent ofthe North Central state:; sar.,:)le and 8 percent of the white South-
east sample said their family income was less than $3000, and onlyabout 5 percent of each of these samples said that their familiesdid not have enough money to buy the essentials -- food, clothing,and shelter. However the proportion of black youths in the Southeastwho gave these replies was Incredibly high; 56 percent had familyincorre,i of less than $3000 and 38 percent said that their familieslacked enona money ti purchase essentials (see Tables 7 and 8).
-21-
0028

_ ....
kW: tc! )
; r1
Tiibie 8
;
I n
50;
Pcoport. :nu 1Zur:-.11 Vo..c..1v; 1,ho 5z,41.(1 The Er l'ar.d.1 IiOld !lot !1,1;1 to Purch.isct the
t his -- roud C othi ng and ',11!1.ter --By Ro,,,ion iu Which Thcy Crcv Up
NcT th Cenmi 1
Son t hen!-:t (black)
Soul hea (wh it e )
Did Not Pave EuonhMouoy for Esseatials
-4-e-
0029
4%
38%
5%

trrILI r9L4110,
The patterns of population growth in the rural communities in the
two regions differ considerably. Of the 18 counties studied in the North
Central states, 9 had last 10 percent or more of their population between
1960 and 1970; only five counties had gained population. In the 16 cote,.
ties studied in the Southeast, none had lost 10 percent or more of their
population between 1960 and 1970, and 10 counties had gained more than
134 percent by inmigration (see Table 9).
The destination of the outmisrants was also different in the two
regions. In the North Central states, the majority of the young people
moved to cities of under 100,000 population. In the Southeast, far feat.
rural youths moved from their home counties; those who did, tended to mow
to cities of over 100,000 population (see Table 10).
As shown in Table 11, outmigration in the North Central states is
highly selective of the better-educated youths. This is not as true it
the Southeast, although more college-bound whites than other white youths
do leave.
0030

Table 9
Net Population Change in a Representative Cross Section ofRural Counties in the Southeast and in the North Central States
Region
4..memoomma=popoim,Number with Net Population Change (2)s
-10.0 or more -9.9 to -0.0 +OA) to 13.2 )+12,2;a",",""mersoval00.00
2
10
north Central
Southeast
.11.11
9
0
(282)
(02)
4 (222)
2 (12)
3
4
(17X)
(23X).....4wwwwsrsratstiA*1111,101
Table 10
Proportion of Rural Youths Who Migrated toa City from Their Rural Home Counties
Region
Worth Central
Southeast (black)
Southeast (white)
Migrants to City, by Site of City
(100,000 pop. al00,000 pop.
44*
142
222
292
212
112
2711
Table 11
Proportion of Rural Youths Who Migratedto a City, by Educational Level
Region
Educational Level ofMigrants to Cities
9-11 12 )12
North Central
Southeast (black)
Southeast (white)
4511
392
212
722
422
262
84X
432
412
0031

: .Ii' ;10 (.1.01`.'ilt ! t i 11 Clio rtil.'d 1.SOI:1111 I h cur.' Ceti t tal stot I n t he Southeast
there ore disT,.,uts Ott the end of eighth grade; thin is not thecase in th North Central states. Of lhorw. who did enter highschool in tho southeast, 11 pereent of whtLes and 16 portentof black:4 loft hforo gradaation. In the North Central states*only 4 ;..rLont eLth.lue whe entered high school drovved out of schoolbefore ;',ra.luarlon (-ze Table 12).
Quality of Education
Size o Sc an l
Most rural high schools in the North Central states are small.in the :outhast, Lids is not so true. As shown in Table 13, 84 per-cent of the schools attended by the rural youths whom we studiedIn the North Central states had under 200 students in grades 10throw;h 12, and about half the schools had fewer than 100 students.
In the Southeast only 53 percent of the schools had under 200 pupilsin grad..' 10 through 12,and only 10 percent had fewer than 100 stu-dents.
Ext)er:lit14,-.2 nrr PIM.)
The amount of money spent per pupil is often used as one
measure of the quality of educat ion. Generally, the southern schoolshave a much lower per pupil expenditure than the North Centralschuolq. As can be seen In Table 14, 50 percent of the North Centralrural schll.; spent YAO or v.re per student per year for education.
0032

T,Colo 12
Proporti.:).1 of iy:-.; (1..:crod tt i 1 Hi i S,A1001
anA Oui, By Kcgio!:
Ro,Jon of DropoutA
Nortii Contra]. 4%
Southoat (black) 16%
SouLlivaqt (white) 11%
411. -. 41041- 4.11 -Table 13
Proportion of PairJ1 School$ With Various Enrollmentsin Graden 10-12, By Region-
Size of High School..Region <100 100-199 >199
North Central 49% 357. 167.
Southeast 10% 43% 47%
-26-
0033

777,1"7.5,.
I ;
t I :.1/4t hea.;t :spen
t)t-
Itr, that tho 111,,,1:o:it per
puili I ,
oc,"Irrt.,,! in Hit!
on I I t nr rl.ly rt f lect thecost pr.i. eins,:tion
rei:ion6 rather.
than re! 1,,ct::::; sinolity of trioa. Litt-le dil.feren.:e was foundin tall l.. \pen.h...d per pn,i1 in those southern schol thathad been soy!r,....it.:d r11 school ; that had been integratedduring;
Table 14
Proportion of Rural Schools With VnrionsPer Pupil Npen.litures, By Region
Expenditure Per Pupil
Region <S403 4$400-09 ' >$499
North Central
Southeas t
14 (l8) ; 25 (32%) 39 (50%)l 1
: 30 (487.) 1 27 (44%) ! 5 (8%)l l
:!.....--- .......------.
0
-27-
0084

; ;111vrt.(1 by rural
:!1 Ct.' t: L:t rt. :rsCL 1.0 OCt.'1111,11.1011:11
tan ! tin -t : R job t. Lug or work-study prOarISin C..t. :orCt t.11 :itat t": ztLltd: th.tt Only 13 porcent ofth,2 att,q1(.1.0d a schol. thlt had ;In on- the -,huh training
or wor:,-",..,q*? pro.'r:m. In the So,.1theat 10 r.-roent of the black
p,:rcent of th, white sa:::ple schools (see
Tablo
in th North Ctotral states only 21 percent of the youths had
attc.:%).0d : :c hoof :: whore an occupational familiarization course was
offerCI. in tilt: Southeast 3S poxcent of white and 52 per..
cent of hlckt: attended such schools (see Table 16).
it)/ of S..aci
As shown :n if!)1c 17, IF percent of the sample in the North
Central state :; -tnt!.4.1 -7hocls that had r.o one, either trained or
untralned,assined to I - duties. In the Southeast, 12 per»
cent of whites ow! 30 ,..nt of blacks attended such schools.
In thtl N)rf!1 Cent-.al testes, as can be seen i. Table 18,
S percent of the /*Aral sc:', 1: had one or more teachers who did not
have a drec. In .:.past, 25 percent of the rural schools
had one or teacher, with no degree. On the other hand, 20 per-
cent of tht. Nr1rth Central ates schools hnd 40 percent or more
teacrs with r.,qter's dere..9; this is somewhat less than the 25
perc.,nt tie r,outhoast, ra schoo k,. that had 40 percent or more of
their t.!dohra with m1rJers..; dezre,eq.

i.al.)10 15
Yol:!;;;; Ati.ta,,..a a :;slioolILtt or Wor!.-Sw3y
12,y
AttcnAed Schonl ThatRtyjon Offreci Nf/Work.Study
Nor:11 Central
Sout!loast 014010
South.2ast (white)
13%
30%
38%
Table 16
Proportion of Rural Youths 1410 Attended a SchoolThat Offered a Formal Course in Occupational
Fomillartzation, By Region
Region
North Central
Southeast (black)
South,2ast (white)
Attended School ThatOffered Occupational Familiarization4101=14-0-1. or.
21%
52%
38%14%
-29-
0036

4
T.0) 10 I 7
t'ropot t i.stt :!:r.11 Y.- ;,1 to 1 .1 Schoolt 1., .1 1;%. itt'
Sou t !to.a ;;t (1)
(whitc)
Table 18
t
Wit h
Prvi,orti.:.a of Rural Schools With Toachers of
1;lucattomil LvvoLs, By Kogioa
key; Ion
M.VMO OP .M,Ne.4..
North C..ncral 5%
257.
.,ft.....MMM.,
1 Proportion of Schools in Which:1
t--0;iie le,Icaors ! of :tore liave
Have i Master's or Doctor's,Dogree De Tees
Southcast
30-
20%
25%
0037
'.11,; '
_ ... _ -
1 i''.
The to,.hn.,10-A;(..A1 thit, lu recent years, have
chaugod a.,;rf.niltural nethods anl lite styles to drantically In
other re,:iou, of the country havv been at work In the South also.
However, t:I_ increasing mo,.hlnizition of (arming may hive affected
the porllation of the South more deeply than it has In any other
region. in t11,!. past, many southern farmers utilized the black pop-
ulation to do most of the farm labor. Now, one man is able to do
all the work hi ha l: the time; and, although many blacks continue
to livt! in the rural areas, few are employed in their traditional
roles as frm liborers,
Farm con lolidation has decreased the number of farms. In
addition, poor farming practices in past years have depleted the
land and dirinighod its productivity. This has affected rural em-
ploymnt because the nurlber of arable acres have decreased (and
SOMet!ne..?; the number of farms).
In recent years the southern states have been moving toward
an industrial and commercial economy that is organized around
cities and metropolitan areas (137), although the Southeast is still
the leant urban in character of all of the large regions of the
country.
Migrants to la-ge southern cities most often come from small
towns, rural areas ;,nd small cities in the southern region. There
is nn "typirdl migrant" mwing to a "typieal destination", however(Ill)
-31-
0034

I I " 1 I...., t ion.11 1. it;;',0 of
"a o I ac ir:t et., :,tat e:;
: : I:1 V.; I' c: at; t:;:4.1 I:I 11,1'1 It ill11
! ;t. t rim.11 int .it. ; i)1 (11:2(11.1Y ;ti Of
!.'! 1t°.)) And 1°1.10; U.1. I litInt PZ.;
(7)11, .1 L 10,6111
1111a1.
ar. : Ht. (0;1°, j :. tlt 1sst! 11() ,111.1t 11111 Illd It rb:111 artaS to
T1:11t,t",..11. to th,.. 1.ir);e (At ivs Al too of ten have noof 3:Ivt.1!1 aA bni iThrm work. Studies have shown that those
pers ont. yr tit':' lahoe market at the 1 owe:;t: income level;., and have
gr,!At. ri:;in.A to better Jobs and higher incomc,s(95)
. Many
of t 1 ro tr.o.tt Lt.) do so and th..Tefore simply exchange one form
of r,ovot: rinc,ther.
Incin,ary in the small towns in the South has also become more
mechanized -- esp.2cially tho formerly labor- intensive food and fiber
prone stirs -- and fewer people are needed to do unskilled work fa
indu,Ita.i-s. Again, thts technological advance has affected
the emplwfment of black work,...rs more than that of white workers.
-32-
0039

Effects of Ill,:ra tion on-.Cs ....I-ill-Cy- . .
The miration of youth (mostly black youth) from the rural
areas of the Southeaqt to the cities in the North and the West has
been one of the maJor population shifts of the twentieth. century.
Outmtgration has helped to alleviate some economic prob-
lems in the South. It these youn...; people had remained in their
home comnuni.t les, the South would have been confronted with theneed to provide jobs and heusieg for a great many additional people.On the other hanil, the South's investment in the food, housing,
clothing :end schooling required to raise children from birth to an
age wh.2n they are ready to begin productive employment is lost when
these young people migrate.
The mass exodus of people from low-income rural areas has
often left those who remained worse off than before. In part, this.
is because there are too many old people and children in these areas
for the working-age population to support. In addition, the sparse
populattun cannot support or build a strong and flexible socio-
economic superstructure. Local institutions (schools, churches andgovernments) are dying for lack 'et support; and as local facilities
and services decline, chances for redevelopment diminish(95)
-33-
0040

S010..tiv,1 Acrocts of kTiAion
Rjij1
one-fourth of. the Surh's population in 1940 was black; by
1960 thit; proportion WS reduced to one-fifth. In this twenty-year
purioJ, the s:)uth's share of tho nation's black population declined
from 70 to about 52 percent.
Blacko move to both northern and southern cities; in 1960,
the urbanization of blacks exceeded that of whites in the United
States (73 percent and 70 percent, respectively). Generally, blacks
are more likely than whites to move in stages -- first from the
rural areas to a nearby southern city; later to the North or West(111)
Three major paths of black migration have been noted: along the
Atlantic Seaboard as far north as Boston; north from Mississippi
toward Chicago; .and west from Louisiana and Texas to California(96)
Those rural blacks who do not migrate to the North or West
tend to migrate to southern cities and metropolitan areas(111)
.
tween 1940 rid 1960, the number of blacks in the rural South declined
by 67 percent, while the number living in the urban South rose by 81
percent. Of the 10 million blacks living in the South in 1960, 36
percent were living in cities(71)
This group most clearly resembles
the stereotype of the poorly educated, economically depressed mi-
grant(111)
The South's white population has also been migrating; between
1930 and 1960, 1.46 million left 16 southern states (excluding
Florida(96)
However, natural increases and white immigration have
continued to swell the white population in this region.
-34-
0041

to rete,..!lk! out:;lik of the'Lvnd Lo Lh' \e to
nalority of lhLteTlIA .11,7 .!, , 4 to :.,Ich 0:4 as
vr th,,y z.ucount for much of the growthi)
o! c!titc5;'
iivo st;ite3 inclui:d in thy, prosunt stmly, all showed
p:Ipulator,:; in the last doc. Je, Only two
shcwy6 thvtr bla,:k populations: Cuorgfa's black popu-.
lation hy 5.i percent; North Carolina's, by less than 1.
perc-,:nt. The other threu states showucl losses of black people of
betwen 3 arid 11 p.:rc.en,
To test whether tlw migration patterns of black and white
southorn rural youths are similar to those of the general rural pop
utatiln, thu followin hypotheses were developed:
More black youths than white youthsmove away from the South;
A larger proportion of black thanof white youths migrate to urbandettlngs;
More white than black youth migrateto cities withi6 the southern region; and
More black than white youth migrate tocities outside the South, and to majormetropolitan areas.
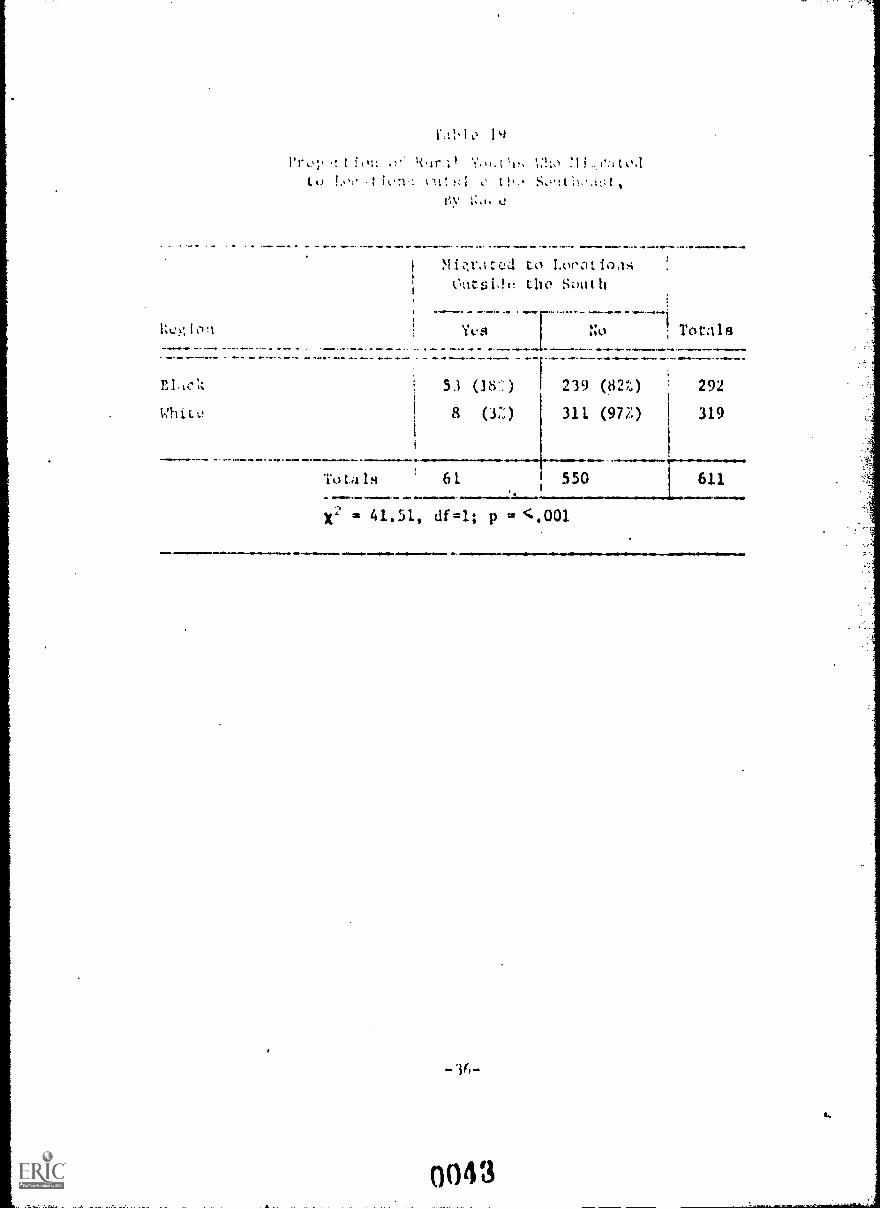
These hypotheses were substAnttated (See Tables 19 through
23). Only 3 percent of the white youths but 1.8 percent of the
black youths in our sample left the southeastern staten within the
8 yell-A siPo th_ly entered the eli..hth grzfle. More blacks than
white rlov,;(1 to. a city. A more detall'A analysis shows, however,
that Ma:: ynuths ru than white youths to move tocitieA or cp.r lc/)000 pop lation but that tame white than black
-35-
0042
:1
to !.0;. t t ,
t'by
to Lorot loaAOutsi.h. tho south
Yt..s No ; Totals
5.1 (18.:)
8 (3:.;)
10-To 61.
239 (8210 292
311 (972) 319
550
41.51, (11=1; p = <.001
..I.IIII.I.VMVIV.=oVVI1lOvVIDVMDVNvl VMMIVI.V1MvOlv,
0043
611
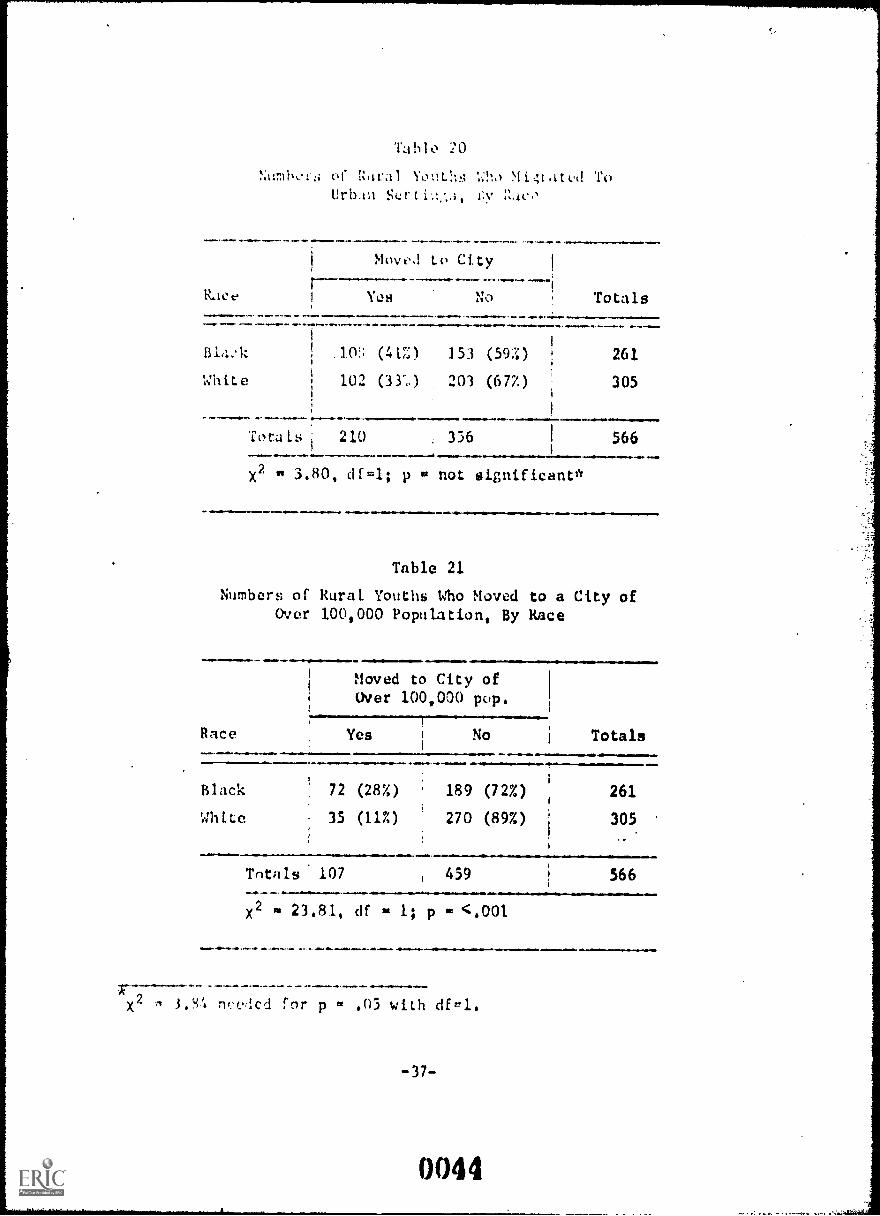
Table 20
NkmhoLzi of tZural Yot!ihs Mi4idted ToUrb.iu
Movo.I to City
11...14.
Race Yes No Totals--4--_-__
BLIA .10'.. (41Z) ]53 (59:0 261
White 102 (33) 203 (677) 305
*0 ...11.4111......1
Totals 210 336 566..x2 n 3.80, df=1; p w not significant*
Table 21
Numbers of Rural. Youths Who Moved to a City ofOver 100,000 Population, By Race
41...MMOmme
Moved to City ofover 100,000 pop.
.1111.+1Pa
Race Yes No Totalsaw....1/11. .
Black
White
_---_---
72
35
(28%)
(11%)
189
270
(72%)
(89%)
i 261
305
Totals 107 , 439 566
X2 n' 23.81, df 1; p = <Mt
........0- .. 4..
x2 3,8!, rice,:cd for p s .03 with dfel.
-37-
0044

MI:x..wt:i to th- CA1V, fly of
ctry ,111
Si:v City
, Did NotKa..o <100,000 ?le0,00v
: Move to City
MtkA 36 (14:) 72 (28:) 153 (597,)
VhiL0 67 (22:) 33 (11:) 203 (67%)
Tot; k 103 107 356
TotalsAO. -
261
305
566.wm . P .O.Fx2 == 25.88, df == 2; p = <.001.. .. 1 10.111011
Table 23
Numbers of Rural Youths Vito Migrated to Cities in theSouth and to Cities Outside the South, By Race
Race
Migrated to Migrated to CitySouthern Outside theCity South Totals
1iim .-1111..m.1111 11.01111111111......1111.1.41111010Mle.. «IF 11111.111.
Black 48 (477.) 54 (53%)
White 88 (90%) 10 (10%)
102
98
.10 41... /11. .401/111.Totals 136 ra 64
X2 - 41.9, df 1; p <.001
200los.«
. .
- 38-
0045
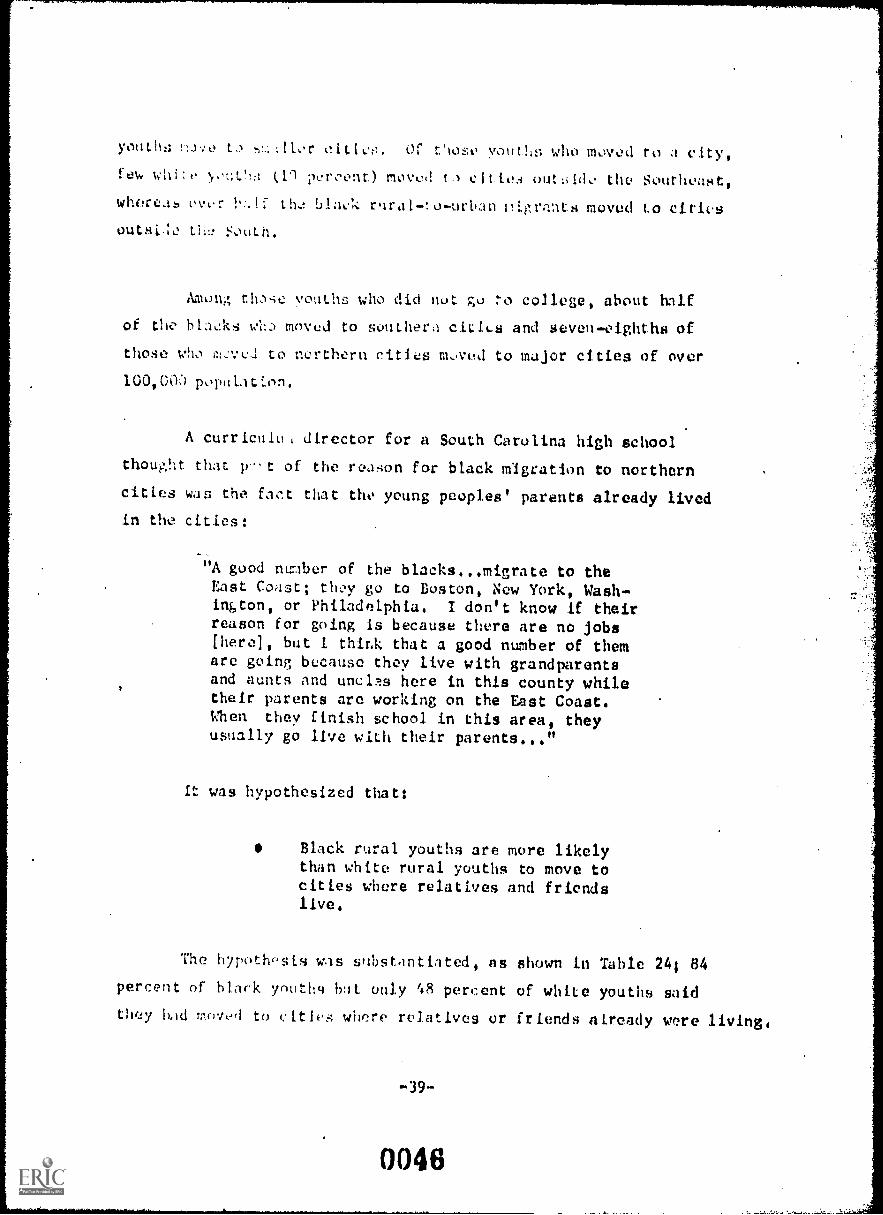
youtho oiLic,t, or Ciose youtilr. who moved to a city,
few will :0 (1'1 per,ent) moved tl CitiO3 outliido the Southeast,
whoreas ovor th..! blaek rurat-!o-urban pigro.nts moved to cities
outsi.:o South.
AmonA those vouths who did nut go Z'o college, about half
of the blaeks moved to souther..1 ciLit_s and seven-eighths of
those who 0!.: of to northern cities moved to major cities of over
100,00 populac!.on.
A curricului director for a South Carolina high school
thought that p...t of the reason for black migration to northern
cities WaS the fact that the young peoples' parents already lived
in the cities:
"A good number of the blacks. .m igrate to theEast Coast; they go to Boston, New York, Wash-ini,ton, or Philadelphia. I don't know if theirreason for going is because there are no jobs[here], but I think that a good number of themare going because they live with grandparentsand aunts and uncls here in this county whiletheir parents are working on the East Coast.When they finish school. in this area, theyusually go live with their parents..."
It was hypothesized that:
Black rural youths are more likelythan white rural youths to move tocities where relatives and friendslive.
The hypothosts was substantilted, as shown in Table 24; 84
percent of black youth4 but only 48 percent of white youths said
th'.±y hdd r-o/d to (Atles where relatives or friends already were livings
-39-
0046

Table 24
Proportion of Rural -to -Urban Migrants Who Moved toCities Where Friends or Relatives Live, by Race
Rae.
slack
White
Moved to Cities Where Friendsor Relatives Lived
Yes No Totals
68
44
112Totals
57 (84%)
21 (48%)
4
11'(162)
23 (52%)
78 1 34
X2 16.46, df 1: p go <.001
-40-
0047

' "01,.1: WI' 50 iircor..t leave" ig a conaon complaint in the
rural Sow.:1w.ist, particularly with rogpuct to black youth, In our
earlier study of rural youth in the North Central states, we found
that drop uts ten:. d1 to remain in and hitch school graduates to mi-
grate from thu rural areas,
The migration patterns of dropouts in the Southeast are
complex: moreover, not everyone agrees as to what happens to them
after th:ty drop out. A Community Action Coordinator in North Car-,
olina stated that there was a tendency for dropouts to migrate:
"The dropout, first of all, is one who is notachieving and is having problems vith his class-work. If he doesn't get sympathy from the...teacher or someone, he'll drop out. When hedrops out, if he caa leave and go to a city andsomebody will take him in--a relative...or someone--that is all there is for him to do,"
A high school counselor in North Carolina, however, believes
that this pattern of migration is changing with the introduction
of industry into the rural areas:
"I feel that in the past we have had quite a number,when they dropped out or finished high school andthere was no work, migrate to the northern cities.After getting there they find no work there, also.However, I feel that most of them had to leave (hero].This is [changing] rapidly because of the expansionof industry in our local communities."
-41-
00411

In view of these incompatible opinions, wo tested the follow-
ing hypotheses:
Rural youths who migrate to urbanareas tend to be better educatedthan those who remain in rural areas.
Rural youths who leave the South2 tend to be bet.:er educated than those
who remain in the South.
When these hypotheses were tested we found a complex in-
teraction existing between migration pattern, educational level
and race. A larger proportion of black youths than of white
youths of every every educational level left the South. Whether
or not whites left the South is not related to their level of ed..
ucation; among blacks, however, school dropouts and those who go
on to college are much less likely to leave the South than those
who complete high school without going on to college (see Table
25).
Table 25
Proportion of Black Youths Who Left the South,By Education Level
Level ofEducation
Left theSouth
Did Not Leavethe South Totals
Dropout or College
High School Graduate
12
31
(10%
(24X)
109
100
(90%)
(76X)
121
131
Totals 43 209 252
8.40, df 1; p (.005
-42-

As Is shown in Tahie 2.6 among black yin there is no
more tu.1,!o1vv for Liter' better eduoated thIn for the le s:: wo11-
eattc3Le.! to mw,, to a city. tut .i.moni; white youths, only those
who g on to co11c;4,, mtgr.lte to cities at it rate approximatini;
that of bliwk youths.
Table 26
Proportion Who Moved to a City,By Race and Lcve1 of Education
ea./- 11.
Race anaEducati:In
Did NotMove to City
Movedto City Totals......
Black:
9 - 11
12
>17
11.10,......m.-
25 (61%)
76 (58 %)
52 (57%)
16 (397.)
54 (42%)
38 (43%)
Totals 153 108
41
130
90
261
x2 = 0.12, df = 2; p = not significant
White:
9 - 11
12
>12
..
27 (79%)
82 (74%)
94 (59%)
Totals 203
7 (21%)
29 (26%)
66 (41%)
102
34
111
160
305
X2 - 9.57, df = 2; p = <.01
-43-
0050

Little information is available in the literature concerning
migrational differences between males and females. In a study done
in rural areas of North Carolina, Baugman and Dahlstrom (3)found
that females (especially black females) were highly critical of the
rural environment; many indicate& that they did not want to raise
their families there. Beale and Bogue(4)
found that more rural
females than rural males indicated a preference for living in cities;
Beale, Banks and Bowles (7) stated that rural females under 25 and
over 35 had higher rates of migration than males. Thus it was
thought that more rural girls than boys would leave their home commun.'
ities and migrate to major urban centers.
We found in this study that male and female youths .leave the
South in approximately equal numbers. This is true for both black*
and whites.
Among black youths, about equal numbers and male and females
move from their rural communities to a city, or from their rural
community to another rural community.
Among white youths, however, the pattern is different. Many
more females than males (64 percent and 43 percent) leave their
home communities within three years of the time they completed
(or should have completed) high school and many more females than
males migrate to a city (50 percent and 28 percent) during the
same time. (See Tables 27 and 28.)
-44-
0051
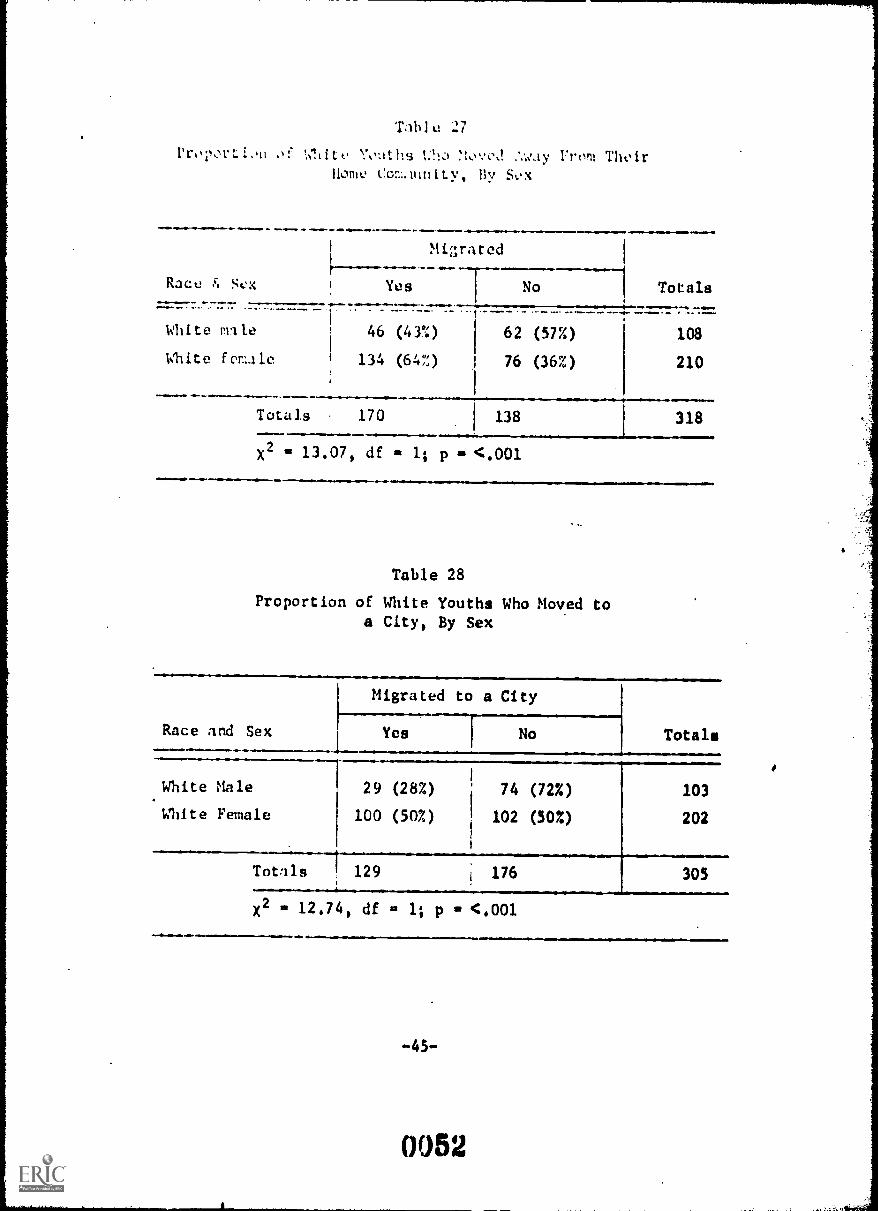
Tablu 27
ProporLill 1,1ifto Yo:Iths 1:!!o novo.1 2,way From Thoir
Home Cor:..lunity, fly Sox
-.11.M...011.1111.11.-
Race & Sex
Migrated
Totals
-411
Yes No-White mile
White female
r46
134
(43%)
(64Z)
62
76
(57%)
(36%)
108
210
Totals 170 138
1101111.M.318
X2 I' 13.07, df 1; p s <.001
11=11.111.11.1-
Table 28
Proportion of White Youths Who Moved toa City, By Sex
...IwOmllIuOaae.O.ow.owIN.,
Race and Sex
Migrated to a City
TotalsYes No
White Male
White Female
29
100
(28%)
(50 %)
i 74
I
1
102
(72%)
(50%)
103
202
Totals 129 ! 176 305
X2 12.74, df 1; p <.001
-45-
0052

Economic Factors. Affecting the-nrATTiof Rurdl
Employment Opportunities
The trend in the Southeast has been toward fewer farm owners,
decreasing amounts of land in production, more farm mechanisation,
and decreasing need for workers to do farm labor. Few white,
and even fewer black, youth are able to become farm operators --
there are not enough farms to take ov ©r and the costs of buying and
running a farm (as well as the machinery needed) that is large
enough to be profit-making are prohibitive.
Since most small towns in rural areas are economically de.
pendent on agriculture -- to the extent that the farmers rely on
them for services -- the decrease in the number of farmers has
affected these towns adversely. There are fewer service jobs avail
able in the small town because there are fewer customers.
Because of the sack of jobs in rural towns as well as on the
farms, it was hypothesised that:
There is no difference betweenthe uutmigration rates of farmand nonfarm youths.
This hypothesis was substantiated among white youths, both
male and female, college and noncollege. Among black youths who
do not attend college, many more farm youths than nonfarm youths
leave their he counties and more farm youths move to a city.
(See Tables 29 and 30 below.)
-46-
0053

'Pahl~: 29
Pcoportio:1, of Non;:ollc;o Youtiu; Vito Left Theirnom,. Countio4, bv Faim-Nonfam
Re:;ico+++++ ++++++ +++
Migrated+++.+++
Did Not Migrate Totals++++ +me+ +++ +++op .111 INOM00.1111"..,.....
41++ +
Farm
+ + +++++
69
++++ + + ve+++++++ ++++
(74.0 24
+++++++++Ow++++++V+Omft++++l++++++++++
(::6%) 93
Nonflrm 32 (457'.,) 39 (55%) 71
Totals 101 63 164
X2 = 1.43, df 1; p <.001
Table 30
Proportion of tioncollege slack Rural Youths Who Migrated toa City, by Farm-Nonfarm Residence
ResidenceMoved to I Did Not Movea City to a City Totals
Farm 54 (58%)
Nonfarm 29 (41%)
39 (42%)
42 (59%)
Totals 83 I 81
93
71
164
2 ,
X ' 4.78, df 1; p <.05
-47-
0054

ECENESim Employed in Manufacturin
Rural towns in the Southeast are somewhat more fortdnate than
rural towns in other areas of the country because industry has been
moving into them. However, this movement has not been extensive
enough as yet to provide full employment for local residents. -S one
southern counties are less fortunate in attracting new industry
than others. As a high school guidance counselor in South Carolina
stated:
"In this county we have a population of about 8000people, and only two plants in the whole countyto serve this community. These plants hire some-where mound 200 to 300 people. But we're talkingabout the availability of only around 600 jobs inthe county, and you have something like 3500 peoplewho will-be looking for work. They'll have to goout of the county to other counties where there aremore plants that are hiring people."
We might infer from the comment of a curriculum director
from Georgia that much of the migration in the South is intercouety
in nature:
"The high school graduates -- if they only finishhigh school -- will stay near here. Not too manyof them actually work here, but they may live hereand commute."
It might be expected, therefore that:
The outmigration rates of noncollegerural youths are higher in thosecounties that have a low proportionof the population employed in manu-facturing.
-48-
0055

WIon tho rol.!tionshtil botoon t1ia.! availability of jobs in
manufao*urini,, tlw migratioo. pattorni or nonoollvAo rural youths
was ox:::Iinc,A, did find a stgntl'Ioant rel-itlomihtp, but not the
expoct.si Oa:. shown in Toile 31 bolow, outmlgratton Is highest
from those rural oountios in whi.h thvro is neither a very low or
a very high proportion vmptoyod in manufacturing.
Table 31
Relationship of Migration and Proportion of theCounty Population rmployed In Manufacturing
.11.00
% in Did Not Miff, toMfg. in County Migrate Rural. Area
Migrated toUrban Setting Totals
White:
<27.0 19 (53%) 4 (11%)
27.0-32.1 "" 20 (40%) 11 (22%)
>33.0 29 (53%) 8 (147..)
alsollimlangs.M...--11.Totals 68
...1..../1.N.N11......01IIIIIIMMIMI
13 (36%)
19 (38%)
18 (33%)
23 50samaill
X2 " 2.99, df 4; p not significant
St
36
50
55
141
Black:
<27.0
27.0-32.9
>33.0
32 (52%)
9 (15%)
27 (54%)
41.11.............
25 (41%)
42 (70%)
18 (36%)
61
60
50
Totals 68 I 18 85 171
X2 = 24.13, df = 4; p = <.001
-49-
0056

Discrimination In Hiring.
Charles Silberman(101)
wrote in 1964 that, because of dis-
criminatory practices in hiring, whites were pre- empting the jobs
opening up in southern industries. He reported that not only were
black people barred from jobs in the new textile mills and other
industries springing up in the region, but they began to find their
"traditional" occupations (such as barber, carpenter, waiter, MA8011,
painter, and sawmill operator) being taken over by the "desperate"
whites.
There is a pattern of hiring 'in many southeastern rural
communities that often seems to successfully exclude certain types
of rural youths from obtaining employment. Black youths, in parft
ticular, are often the last to be hired, especially for the better
jobs.
The Coordinator of a tri -county Community Action Program is
North Carolina said, with regard to black migrants;
"In their minds they feel like there is a betterplace, with more opportunities and lass racialprejudice. I can't fault them for leaving,because there is nothing really for them to dohere."
An NYC Director in a North Carolina county said:
"Migration of kids, especially the blacks, isvery fast. As soon as they get out of high schoolthe ones that don't go on to college are lookingfor a way out of here. The reason is that thiscounty offers them nothing nothing in the wayof employment; nothing in the way of security.They are nothing but a burden to their familyif they stay here. In order to elevate themselvesabove the poverty level it comes to a point wheremost of them must leave here."
-50-
0057
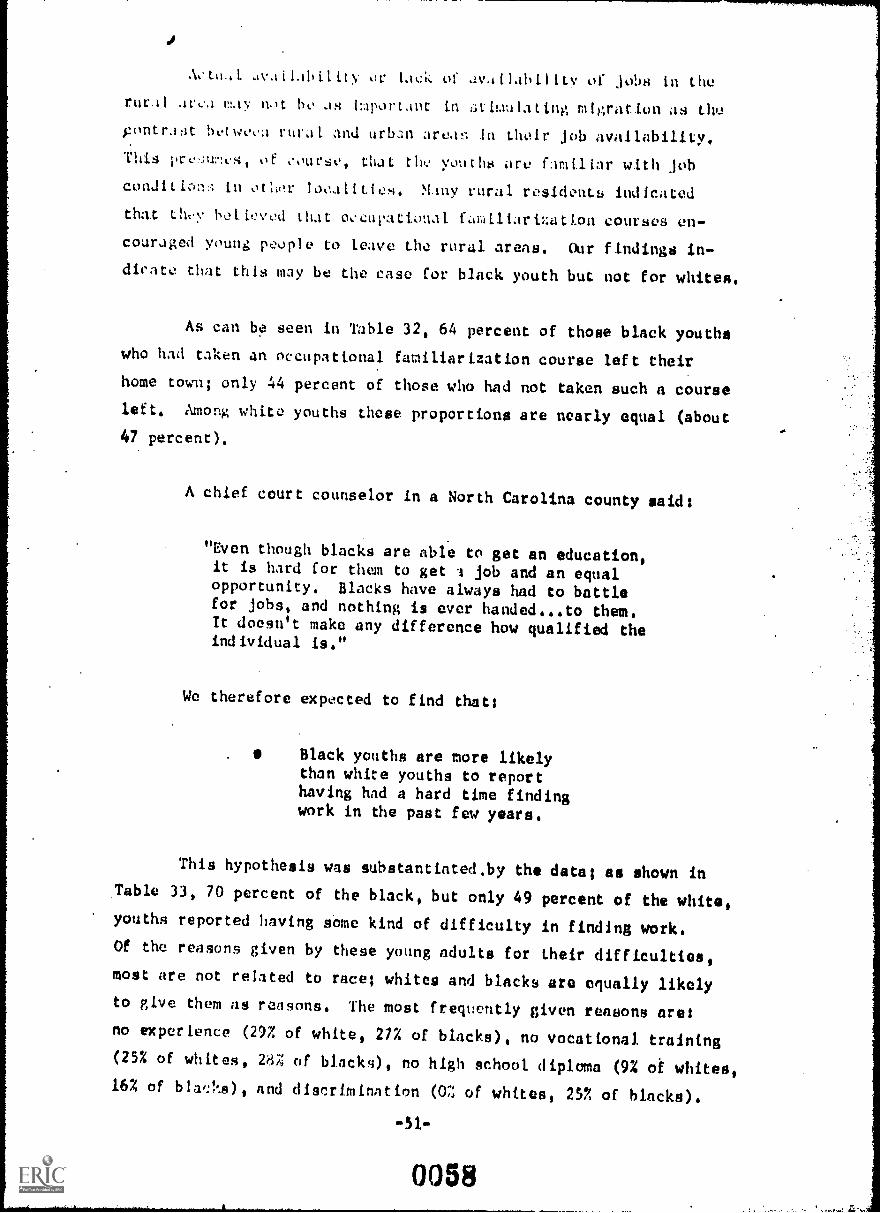
Atu,l .ivailability or of availability of jobs in the
rural avca may n.)t bo as i:aportnt in stimulating migration as thy,
pIntrast hetweo rural and urban areas in their job availability.
This pre,uv:cs, of worst, that thv youths arc familiar with job
conditi:ra,; in otIr M.iny rural residents indicated
that th,y belloved that occupational f.:Imiliari%atton courses en-
couraged young people to leave the rural areas. Oar findings in-
dicate that this may be the case for black youth but not for whites.
As can be seen in Table 32, 64 percent of those black youths
who had taken an occupational familiarization course left their
home town; only 44 percent of those who had not taken such a course
left. Among white youths these proportions are nearly equal (about
47 percent).
A chief court counselor in a North Carolina county said:
"Even though blacks are able to get an education,it is hard for them to get 3 job and an equalopportunity. Blacks have always had to battlefor jobs, and nothing is ever handed...to them.It doesn't make any difference how qualified theindividual is."
We therefore expected to find that:
slack youths are more likelythan white youths to reporthaving had a hard time findingwork in the past few years.
This hypothesis was substantiated.by the data as shown inTable 33, 70 percent of the black, but only 49 percent of the white,
youths reported having some kind of difficulty in finding work.Of the reasons given by these young adults for their difficulties,most are not related to race; whites and blacks are equally likelyto give them as reasons. The most frequently given reasons are:
no experience (29Z of white, 277. of blacks), no vocational training(25% of whites, 28% of blacks), no high school diploma (9% of whites,16% of blalts), and discrimination (OZ of whites, 257, of blacks),
-51-
0058
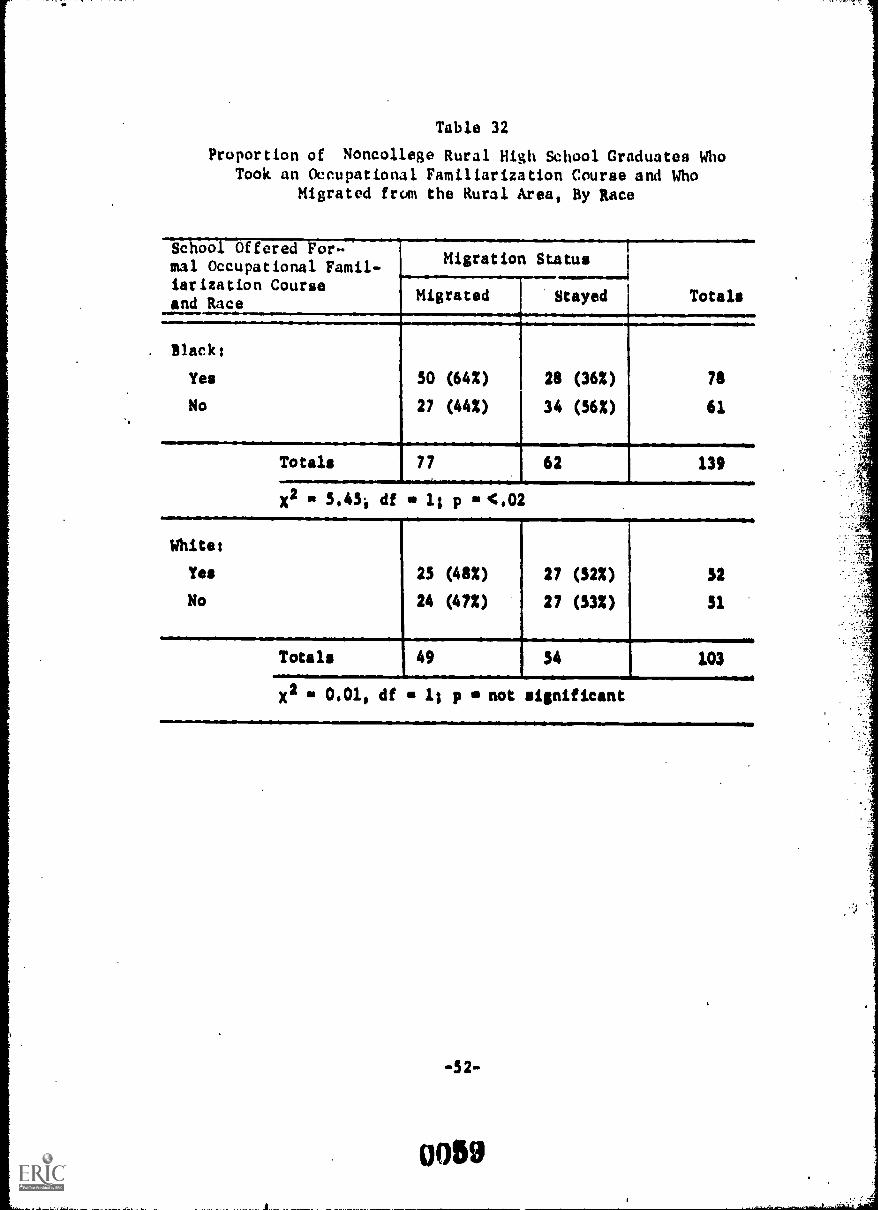
Table 32
Proportion of Noncollege Rural High School Graduates WhoTook an Occupational Familiarization Course and Who
Migrated from the Rural Area, By Race
Schoo Offered For-mal Occupational Famil- Migration Status
Totalsiarization Courseand Race Migrated Stayed
Slack:
Yes
No
50
27
(64%)
(44%)
28
34
(36%)
(562)
7$
61
Totals 77 62 139
X2 5.45; df 1; p <.02
White:
Yes 25 (48%) 27 (32%) 52
No 24 (472) 27 (53%) 31
Totals 49 34 103
X2 0.01, df 1; p not significant
-52-
0059
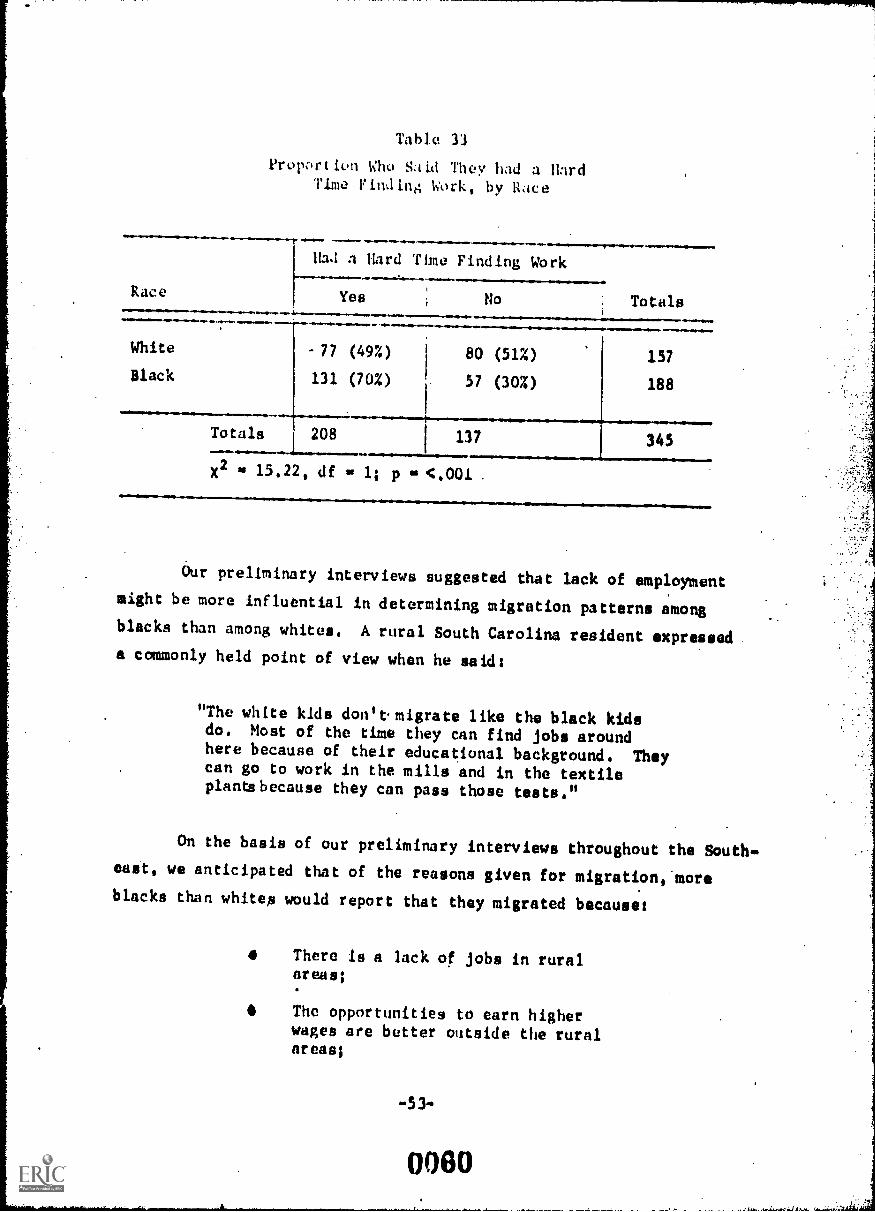
Table 33opor t ion Who Sa id They had a llard
Time Ind anti Work, by Race
Race
.1..111--111111.1.+1110....Mor- 11111,1111111m.Ilas1 a Hard Time Finding Work
TotalsYes No.01../*..1.11........111.-....any.11111111111r11.1.0.1.111.01/1110111.011
White
Black
-77
131
(497..)
(70%)
80
57
11.1................(51%)
(30%)
1.57
188
Totals 208 137 345
X2 as 15.22, df 1; p <,001 .
Our preliminary interviews suggested that lack of employmentmight be more influential in determining migration patterns amongblacks than among whites. A rural South Carolina resident expresseda commonly held point of view when he saids
"The white kids don't migrate like the black kidsdo. Most of the time they can find jobs aroundhere because of their educational background. Theycan go to work in the mills and in the textileplants because they can pass those tests."
On the basis of our preliminary interviews throughout the South*
east, we anticipated that of the reasons given for migration, .more
blacks than whiten would report that they migrated becauses
O There is a lack of jobs in ruralareas;
The opportunities to earn higherwages are better outside the ruralareas;
-53-
0060

There is an opportunity to enter abroader range of jobs outside therural areas; or
They always knew they would have toleave the rural area to obtain work.
Each of these hypotheses was substantiated, as is shown in
Table 34. Much higher proportions of black than of white youths
give these as important reasons for leaving their home commun..'
ities and moving to cities. About 59 percent of blacks but only
17 percent of whites list the lack of jobs in the rural areas as
a "very important" reason. Higher wages in the city is given by
57'percent of blacks and 22 percent of whites; a broader range of
jobs in the city, by 49 percent of blacks and 20 percent of whiteili
and "always knew I would have to leave to obtain work", by 38 waft*
of blacks but only 7 percent of whites.
To test whether there was indeed a difference between migrants
and nonmigrants in the range of jobs obtained, the entry jobs ofali
noncollege youths were examined. It was found that almost no Me,
either migrant or nonmigrant, entered an unfamiliar job. Nonmilitant"
are more likely than migrants (79% vs. 682) to enter blue-collat
occupations; however, this difference is significant only for bleak
youths (See Table M. Migrants are more likely than nonmigrants
(10% vs. 6%) to enter sales occupations; but this difference is net
significant.
Monmigrants are also more likely than migrants (36% vs. 23X)
to enter a skilled trade -- *2 6.29, df Is 1; p <.02. This differ.
once is significant only for females when analysed by sex; and, when
analyzed by race and sex, it is significant only for black females,
(See Tables 36 and 37).
-54-

Table 34.
Proportions of Mack and Islate Nor:college Youths Who Migratvd toCitLtri, Who G.Ivo Dtiforout Job-Rol:Itvd Reasous for Having Migrated
"Very Important"Reasons for Leaving Black
Race
Lack of jobs inrural. area:
White Totals
X2 s 17.66, df 1; p <.001
Higher wages inthe city:
Yes
No
Totals
36 (57%) 9 (22%)
27 (43%) 1 32 (78%)
45
59
63 1 41 104
x2 a 12.53 df a 1; p a <.001,
Broader range ofjobs in the city:
liolYes
No
.41111=1110
31 (49%)
32 (51%)
8 (20%)
33 (80%)
39
65
Totals 63 41 104
X2 a 9.34, df a 1; p <.005
Always kqew wouldhave to leave toobtain work:
Yes 24 (38%) 3 (7%)
No 39 (6270 38 (93%)
Totals 63 j 41
21
77
104
X2 12.24, df a 1; p <.001.01111.11..W...41 111.11..... .11.611111.1.1.11111.1161.0.411...111.11.111111.10
755-
oo6g.

Table 35
Relationship of Migration and Obtaining a Blue-CollarEntry Job, by Race
Race.
Blue-Collar Job
TotalsYes No
Whites
Migrant
Nonmigrant
30 (56%)
56 (67%)
24
27
(44%)
(33%)
54
83
Totals *86 51 137
X2 1.99, df 1; p not significant
Black:
Migrant 60 (77%) 18 (23X) 78
Nonmigrant 68 (92%) 6 (8X) 74 .
Totals 128 24 152
X2n 6.40, df 1; p <.02
-56-
0063

Table 36
Rol:ILL.:1311p of Migration and Obtaining a SkilledTrade Entry Job, for Females
MigrationStatus
of Females110......-....
--IEntry Job in Skilled Trades
Yes No Totals
Migrant 14 (15%) 81 (85%)
Nonmigraat 33 (31%) 73 (69%)
95
106
Tc .tls 47 154 201
x2m1 7.52, df 1; p <.01-.11
Table 37
Proportion of Female Migrants Who Entered a Skilled Trade, by Race
Migration Statusand
Race of FemaleemIIIMalirIMEM-.111...4.0,411.1....111.White:
Migrant
!Immigrant
Entry Job in Skilled Trades
Yes No Totals
6 (14%)
15 (28%)
Totals
;2* 2,69, df
21
37 (86%)
39 (72%)
76
43
54
97
1; p not significant
Blacks
Migrant 8 (15%) 44 (85%) 52
Nonmigrant 18 (35%) 34 (65%) 52
Totals 26 78 104
X2' 5.13, df = 1; p <.025
004
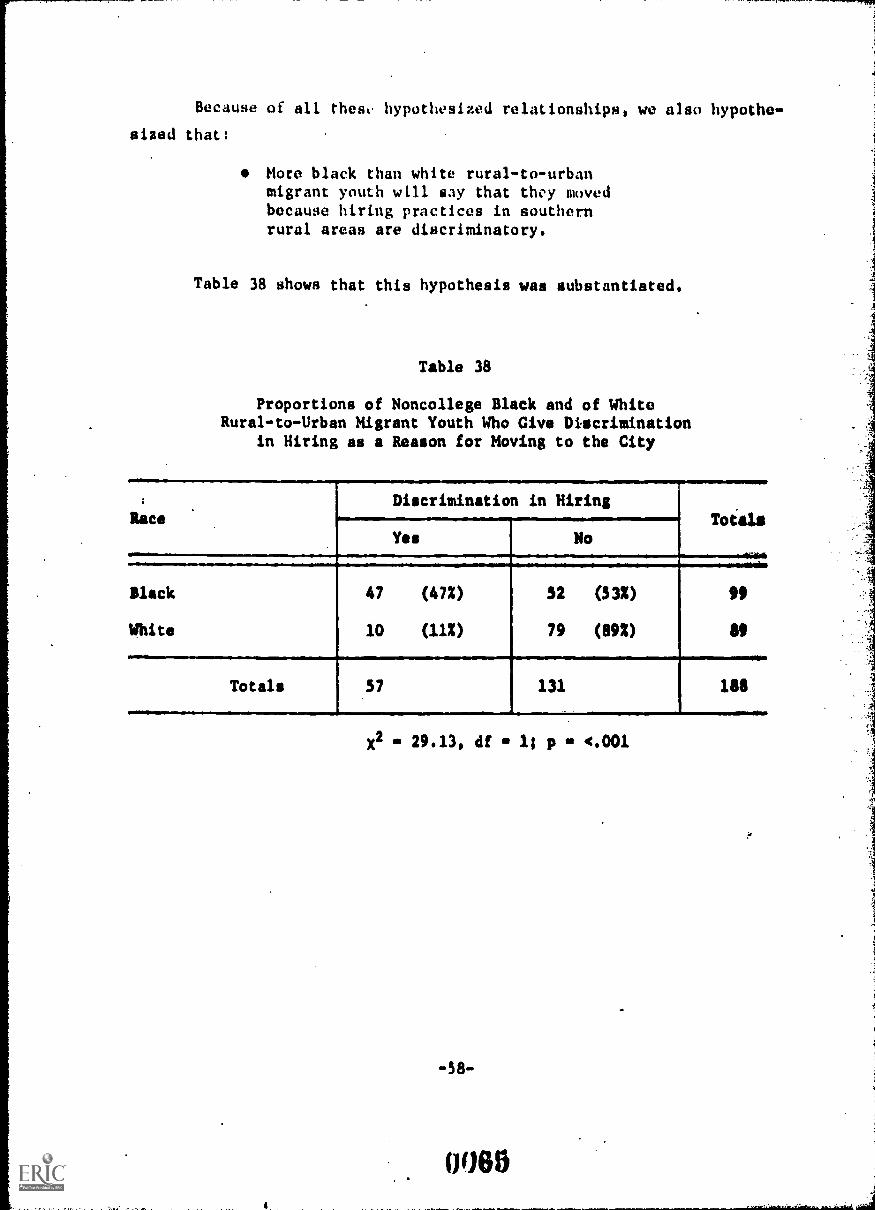
Because of all thest hypothesized relationships, we also hypothe-
sized that:
More black than white rural-to-urbanmigrant youth will say that they movedbecause hiring practices in southernrural areas are discriminatory.
Table 38 shows that this hypothesis was substantiated.
Table 38
Proportions of Noncollege Black and of WhiteRural-to-Urban Migrant Youth Who Give Discrimination
in Hiring as a Reason for Moving to the City
i
laceDiscrimination in Hiring
Toiaiii
Yea No
Slack
White
47
10
(47%)
(112)
52
79
(332)
(892)
MI
89
Totals .57 131 188
x2 29.13, di m 1; p <.001
-58-
005

It is po,iMe that black yeuth anticipate discrimination prob-
lem; whon work in the rueal 5outh. Kuvelsky and Ohlendorf(68)
in a stn,:v o..co;)iti.nal expectation; of black youths, found that
mu :11 deflvctIon" occur rL' -- i.e., blaa youths expected
lower occu..)ati.mal than their chances warranted.
Each youth in our sample was asked if he had expected to have
troute finding a job In his home town after he left school. Although
there is no relationship between answers to this question and migration
of the noncollege youths from their home community, there Is a sig-
nificant relationship with race for both college and noncollege youths.
(See Table 39.) Evidently, a large number of black youth who grow up
. in the South expect to have trouble finding jobs. This is also evident
from Table 40. Black youths are more than twice as likely as white
youths to say that whites have a better chance to get jobs than blacks.White youths who go on to college are more likely to agree with this
viewpoint than white youths who do not go to college. (See Table 41.)
41111111.11101.1100.
Table 39
Proportion who Expected to Have Trouble Findinga Job in Their H(me Town, by Race
Expected Trouble Finding a Job
r
Race Yes I No No answer Totals1,M1.......7....11.1r11.1..
Black
White
./.41..........110.=1/0 41%
142 (51%) 98 (35%)
80 (25%) 190 (59%)
38
54
(14%)
(17%)
278
324
Totals 222 288 1 92 602
x2 I. 46.24, df n 2; p <.001..... arslinaor...
-59-
0066

Table 40
Proportion of Black and of White Youths Who Say ThatBlack and White Persons Have an Equal Chance to Get Jobs
RaceEqual Blacks Have Whites HaveChance Bettor Chance ' Better Chance Totals
White . 196 (63%) . 22 (7%) 92 (30%) 310
I 63 (24%) 0 (C) 268Black1 205 (76%)
Totals . 259 . 22 I 297 578
X2s 130.93, df 2; p a <.001
Table 41.
Proportion of White College and White Noncollege Youths Who. Say That Black and White Persons Have an Equal Chance to Get Jobs
Attended Equal j Blacks. Have Whites HaveCollege Chance Better Chance Better Chance TotalsINV Atom*
Yes $4 (532) i 13 (8%) i '63 (39X), 160
No 112 (75%) 9 (6%) 29.(19%) 150
Totals 196 22 i 92 I 310
X2 16.99, df 2; p <.001
40
0967

t ) tho 197 porulation c..nsus, th, ciodtan family in-
como:A of both w!:ft and blaA in the South wero (.611:adorably
below tho,:, of fa!lilies in tho other throe major regions of the country.
The SOUtIlva:ztv rn st.it,:s also have the lowest rtio of black to white' .
I/
median family income:t; the median income figure for southern whites
was nearly twice that for southern blacks -- see Table 42 below.
Table 42
Median Family Income by Region of the U.S.1969
Regionvombis...................................... 010111
Whites Blacks11.410.110N .1110 =.Northeast $10,721 $ 7,327
North Central 10,298 7,764
South 8,721 4,900
West 10,374 7,379
-61-
0068

In the North Central states study it was found that,within a
rural community,the youths from low-income families tended to stay
while those from the more affluent families tended to migrate; this
was especially true for females. This is the opposite of what ,night
be expected to occur on the basis of median family income of the coun-
ties. When the county data were examined it was found that the
tendency was for young people to leave the low-income counties and to
remain in the high-income counties. We, therefore, tested the following
hypothesis among rural youths in the South:
Among rural youths who do notattend college, the tendency tomigrate to urban centers is notrelated.to family income.
This hypothesis was substantiated for whites but not for blatii%
.(see Table 43). Among black youths who do not attend college, those
whose family's income was $3,000 or more are more apt to migrate to
cities than those from families with lower incomes.
Table 43
Relationship of Family Income Level and Migration to a City, by Ran
Family Incomesod Race
Migrated.to a City
Yes i No
MOW
Whites
443,000 7 (41X) 10 (59X) 17
>$3,000 45 (40%) 67 (60%) 112
Totals , 52 77 129
XZ 0.01, df 11 p so not significant
Slack:
($3,000 42 (41%)
$3,000 j 38 (60%)
Totals 80
60 (59%) i - 102
25 (40%) 6311.1111=.11111411M1.......6.11.41,10
85 165..N.Orr.er aOmIrdismsedar +low -
X2 5.71, df el; p .02
-62-
0069

THE 0liC,VIO!:At.....5y5JELINYHE SOUTHEAST
paclzpnd
The southern educational system has developed largely in this
century(56)
. Delayed by the Civil War and then by reconstruction, the
South during the last half of the 19th century lacked funds to provide
more than a primitiVe system of education. The greatest developments in
southern education have occurred since 1940.
Segregated education has been disappearing since'1954, when the
Supreme,Court ruled that. "separate but equal" facilities were inherentlyunequal
(107). However, the rate of integration has been slowed by the
"freedom of choice" plan and by the development of many private white
academies.'
The Southeast is more rural than the other major regions of the,United States; therefore, a larger proportion of its schools are ruralschools. Compared w$th urban schools, rural schools throughout the cow*/try tend to be smaller, less well-staffed and have fewer course offering*.
Despite the tendency for writers to criticise southern education, our
findings suggest that southern rural schools do not compare too unfaVor..
ably with rural schools in the North.*
School Size
In the present study, 16 rural counties were selected (by a strati*
fled sampling technique) that were a representative cross section of all
the rural counties in the Southeast. These 16 counties were served by 15
high schools, each of which was studied in detail by our staff.
One of the major recommendations stemming from our previous study of therural areas in the North cetitral states wag that any program for ruralyouth mult be attred at mtrengthening an inadequate rural educationalsystem, rather than dep.nding on that system to provide the supportiveservices for the rural youth program.
-63-
0070

In our previous study of the 'orth Central states, we selected 18
counties so as to have a representative cross section of all the rural
. counties in the North Central states. These 18 North Central counties
. were served by 80 high schools. The North Central rural schools tended
to be much smaller than the Southeastern rural schools, as is shown in
Table 44. (The youths in this study were seniors ih high school in the
.1967-68 school year,if they had not dropped out of school. All data on
schools that are shown in the following tables are for that school year,)
Table 44
Number of Schools in Each of Fout Sias Categories Serving16 Representative Rural Counties in 04 Southeast and 18Representative Rural Counties in the North Central. States
*WonNumber of Pupils, Grades 10-12
Tots460 60-99 100-199 >199
Southeast
North Central
2
11
(32)
(14%)
5
28
(7%)
(35%)
32
.28
(44X)
(35%)
34 (46%)
13 (16%)
7i!
Totals 13 33 59
.......................;m
47
gl 31.46, df 3; p 4.001
In the North Central states, the smallest schools were usually,
found.in areas that were highly dependent on agricUlture and sparsely
settled. This is also true in the South for schools having less that
100 pupils in grades 10-12,as is shown in Table 45.
Accurate data were not available on two segregated schools that haddosed sincP the youths in our sample were in high school.
-64-
0071

Tab) v 45
Relationt;hip of Agricultural Dependencyin the County to Size of Schools
.. .1- Ss.
Proportion or CuntyPopulation rmployedin Agriculture. 11..."111. egrawil
Number of Schools with Enrollment of:
<100 100 - 199 200 or more.S.
<15%
152 or more
7
0
(13%)
(0%)
....-24 (43%)
8 (47%)
25
9
(44%)
(53%)
X2 -2 2.37, df ' 2; p is not significant
.rSit '4
In 3967-68, a disproportionate number of segregated schools exist4
in those counties most dependent on agriculture, as shown in Table 46. Yet,
as Table 47 shows, the small schools were not overrepresented among segrkii.
gated schools.
Table 46
. Relationship of Agricultural Dependencyin the County to Segregation in the Schools
Proportion of CountyPopulation Employed
in Agriculture
<15%
15% or more
Number of Schools That Were1NWS.101111Segregated
28 (49%)
15 (83'/.)
Nominally FullyIntegrated Integrated
17 (30%)
1 (6%)
12 (21%)
2 (11%)
11. ......10.1111111.1111..04121.10...1MilISAMIIMOYM10111100411111
X2 6.87, df 2; p 4.05
'65-
0072
; ri.

Table 47
Relationship of Size of School to Segregation in the Schools
School EnrollmentGrades 10-12
Number of Schools That Were:
SegregatedNominally or fully
Integrated1110
4100 4 (9n) 3 (432)
100-199 15 (472) 17 (532)
200 or more 22 (652) 12 (352)
AmmowylwamilmaillINPOPUll
X2 2.13, df 2; p N not significant
Per Pupil Expenditures.
Small rural schools cannot ecoaemise in their operations to 000
advantage. Rural communities with small populations have a limitni
base. In the North Central states we found that it usually costs motalet
pupil for education in the smaller schools, where funds are usually mos*
limited than in larger schools. Lack of money means that some thing* Ines
not be afforded; sometimes only one aspect of a problem can be solvitii.1042*
other aspects must be slighted. Small schools tend to use available foie
for improvement of physical facilities, consolidation of school distrintn,
improvement of school administration and the like. The money is seldom
used to change the curriculum, the instruction offered, or to add spacial
and supportive services and programs.
-66-
0073

In tho pres,-nt study, howevev, wo found that `.mall. schools In the
South12,4A do not tent to spend wre 17:uhey pc.r pupil than larger schools
do. Arion,.. schools with under 203 students In grudes 10-12, the.expendi-*
turf' per ptwil mus:h higher iu the ::orth Cvnttll states than in the
Southeast. Among 01... lar;er rurA schools there Wag not a significant
differeuc.o botwoou thy: two re ,,ions in their expenditures per pupil (see
Table 48).
Table 48
Expenditure Per Pupil, By Size of High School (Grades 10-12) and Region.
YIP
Region
6101110.11110110.111.....
Expenditures Per Pupil
Totals.<$400 $400-499 1 4$499
111111.111. WIVIM
Schools with lei;
17
8
(53%)
(12%)
13
21
(41%)
(32%)
2
36
(6%)
(55%)
32
65
than 200 students:
Southeat
North Central
Schools with 200 ormore students:
Southeast
North Central
X2 a 10.64, df - 2; p <.005
12 (41%) 14 (48%)
6 (46%) 4 (31%).
rawlmary
3 (10%)
3 (23%)
29
13
.-++==sr4www.4...r.smomosewee
X2 a 1.71, df 2; p not significant
Although we had little difficulty getting information on expenditure perpupil for schools in the North Central states, 13 of the 75 schools in the'Southeast refu;ed to divulge these data. These schools were all in coun-ties with 1 hl:th propnrtion of the population employed in agriculture.There was no other factor significantly related to refusal to divulge thisinformation. in most cases a single school in a county would refunv; otherschools in the same county released this information for their expenditures.
-67-
0074

Expendi:ure per pupil Was not related to school segregation; nor
to the county's dependence on agriculture. Moat important, perhaps, is
an almost consistent inverse relationship between expenditures pur pupil
and provision of employment-related services (see Table 49.)
Table 49
Relationship Between Expenditure Per Pupil andProvision of Employment-Related Services to the Students
411, 111.** 41110111... - 104.
Service
Proportion of Schools OfferiMIC:Service, by Expenditure Per PUOil
<$400 $400 or
7N1Plowil
OJT/Work-study 23% . 16%
Occupational familiarizationcourse 33% 31*
"Career Night" or "Vocation Day" 802 632
Field Trips 702 56%
Job Placement Service 272 16%
Trained Counselor 262 35X
As in the North Central states, expenditure per pupil is not
very useful index of quality of education in the nal schools in the
Southeast.
J
-6a-
0075

...
High Scheol
Whitlock(142)
noted in 1968 that, although the great majority ofsouthern !L:a 1 :;,:hoot students wore studying what was essentially a col -
lege rroparatcry thzn 20 percent actually graduated fromcollege. He concluded that the other 80- percent needed a curriculumthat is more appropriate to modern Industrial needs. Godwin
(52)agreed,
saying that the high school curriculum needed some sort of balance be-.
tweed vocational, technical, pro'essional and academic programs. These
same.statements have been made about rural high schools in the North CePik
tral states.
Prior to integration, it was often true in the Southeast that more ,
vocational courses were offered in white than in black schools. A sturdy
of teenage unemployment in several rural North Carolina counties (100)
showed that a much broader range of vocational courses was offered in
the predominantly white and desegregated schools than in the blackschools.
As in the North Central states study, the results of the data-
analysis indicate that th range of courses offered in the rural schools
appears to be not as broad as that offered in.the urban schools. The
course offeringS in various sizes of rural schools in ,our Southeastern
,study are compared In Table 50. For purposes of comparison, similar
data are given for tne 80 schools that we studied in the North Central
states in Table 51.
In general, rural schools in both regions offer about the same
number of core courses. In the commercial skills area, North Central
rural schools are more apt to offer a three-year "commercial" course
than are Southern rural schools, but the Southern schools offer more
years of typing and business machines training.
-69-
0076
North Central schools are more likely than Southern schools to have
three-year sequer.ces in vocational agricurture and industrial arts Cu op-
posed to vocational shop).
The greatest difference, however, seems to be that North Central
rural schools place much more emphasis on art and music offerings ths*t
do the Southern rural schools.
-70-
0077

Table SO
Nm:bor of Co.,:cplete of Instruction !.n SelectedColmw3 Ot'orc,1 1:y .,:c!!(,e1:: of Varioilf-1 St;is
(Cateorized by Nimbor of Studonts in (irNdos 10,42)
(Iurai. Southeast 'itates)
Number .of Years
Offered DuringGrades 1U 12
English
Math-Algebra
Math-Shop
Social Studies
Afro-AmericanCulture
Science
3
1
2
3
0
2
3
0
1
2
3
0
1
2
3
0
1
2
3
Foreign Language#1 0
1
2
3
Foreign Language#2 0
1
2
3
11..........-.....--.-..--- -.Ir.= . -............__ ............ '
Porcentage of Schoolq 1
Urban
100
0
0
100
LeS;than 60Students
p--................____
14.314.342.828.6
0
0
0
100
71.4
14.314.30
0
0
0
100
0
28.657.114.3
57.128.6
14.30
100
0
0
100
50
0
0
50.
0
0
50
50
100
0
0
0
0
0
50
50
100
0
0
0
100
0
0
0
Rural .
60:0- 166-499 200 ormore
Students Students Students.
100 100 100
0 3.2 0 ,,o..
0 9.7 5.9 .L-",t
100 87.1 94.1. §,.,
,....
20 22.6 11.8-ff,,,.ii,.
40 25.8 17.6 ; ' .k.r
0 29.0 55.9.
40 . 22.6 ir---.,,,14.7.
0 34 00 0 0
20 3.2 2.980 93.6 97.1
100 90.3 91..2
0 3.2 8.10 0 00 6.5 0 .
0 6.5 2.90 0 00 6.5 0
100 87.0 97.1
40 16.1 3.060 51.6 38.20 32.3 38.20 0 20.6
40 48.4 38.260 45.2 29.40 6.5 17.70 25.9 14.7

Table 50 (Continued)
Number of Complete Years of Instruction in SelectedCourses Offered by Schools of Various Sizes
(Categorized by Number of Students in Grades 10-12)
(Rural Southeast States)
Number of YearsOffered During.
Grades 10.12Urban
Percentage of SchoolsRural
Less 6 -99 100-199than 60Stu ants Students Stu ents
:7-
siwrainsteineltalafillent
n'arrt".14010
Music
Art
Home Economics
Typing
0 0 50 40 25.81 0 SO 0 22.62 28.6 0 60 6.4 1t43 71.4 0 0 45.2 -$440.
0 57.1 100 80 .80.7 itii1 14.3 O. 0 12.92 28.6 0 4 6.4 43 0 0 20 0
0 0 0 0 01 0 0 0 02 0 SO 0 22.63 100 50 100 77.4
of _
t,t1-2.?
0 0 30 0 01 28.6 0 0 19.3 242 57.1 50 60 71.0 76;43 14.3 0 40 9.7 14.7
Business Machines01
2
3
Commercial
14.3 SO 0 9.7 14.728.5 0 40 25.8 20,642.9 50 0 35.5 28314.3 0 60 29.0 Al
0 14.3 SO 0 9.7 14,71 28.5 0 40 23.8 20.62 42.9 50 0 35.5 26.53 14.3 0 60 29.0 31.2
VocationalAgriculture 0
1
2
3
71.4 0 0 9.7 38.90 0 0 16.1 00 SO 0 74.2 3.9
28.6 SO 100 0 83.2
-72-
0079

Table 50 (Continuod)
Number of Complete Years of Imitruction in SelectedCouvses Offered by Schools or Various Sizes
(CatooriAed by :.411.ber of Students in Grades 10-l2)
(Rural Southeast Statos)*1..0.0".,&
Number of YearsOffered DuringGrades 10-12
......11
---Percenravo of Schools
Urban
-11.mmoRural.
Usti V
than 60Students
60-99
Students
100-199
Students
200 orsnore .
Student'
Vocational
411...
Education 0 57.1 100 100 80.7 55.91 14.3 0 0 3.2 2.92 14.3 0 0 12.9 29.43 14.3 0 0 3.2 11.0
Industrial Arts
0 28.6 100 100 80.7 58.01 0 0 12.9
. 26.32 57.1 0 3.2 11.73 14.3 0 0 3.2 3.0
-73-
0080

Table 51
Number of Complete Years of Instruction in SelectedCourses Offered by Schools of Various Sizes
(Categorized by Number of Students in Oracles 10-12)(Rural North Central States)
Number of YearsOffered Duringurades 10-12
Math-Algebra
Math-Shop
Percenta,e of Schools
Urban
Rural..
Less 60-99 100-199 20 orthan 60 . MOTOSt TStudents St dent
Social Studies
.home Economics
'Science
Typing
Business Machines
Commercial
2 0 18.2 21.4 10.7 03 100 81.8 78.6 85.7 100
other 0 0 0 3.6 0
0 16.7 18.1 35.7 25.0 23411 33.3 45.5 50.0 35.7 61.32 0 27.3 7.1 17.9 03 50.0 9.1 7.1 21.4 13.4
2 0 9.1 14.3 7.1 7.73 100 814 85.7 89.3 92.3
other 0 9.1 0 3.6 0
0 16.7 18.2 0 3.6 7.71 0 27.3 10.7 7.1 02 16.7 27.3 39.3 17.9 1.73 66.7 27.3 50.0 71.4 114.6
1 0 9.1 0 0 02 0 18.2 7.1 3.6 7.73 100 72.7 92.9 96.4 92.3
0 0 9.1 0 0 01 33.3 36.4 46.4 42.1 NO2 66.7 54.5 53.6 46.4 33.03 0 0 0 10.7 7.7
0 33.3 90.9 78.6 78.61 33.3 9.1 21.4 21.42 33.3 0 0 0
336846.2
0 0 21.3 0 3.6 7.71 16.7 9,1 14.3 14.3 7.72 16.7 63.6 50.0 35.7 23.13 66.7 0 35.7 42.9 61,5
other 0.01
0 3.6 0
-74-
081
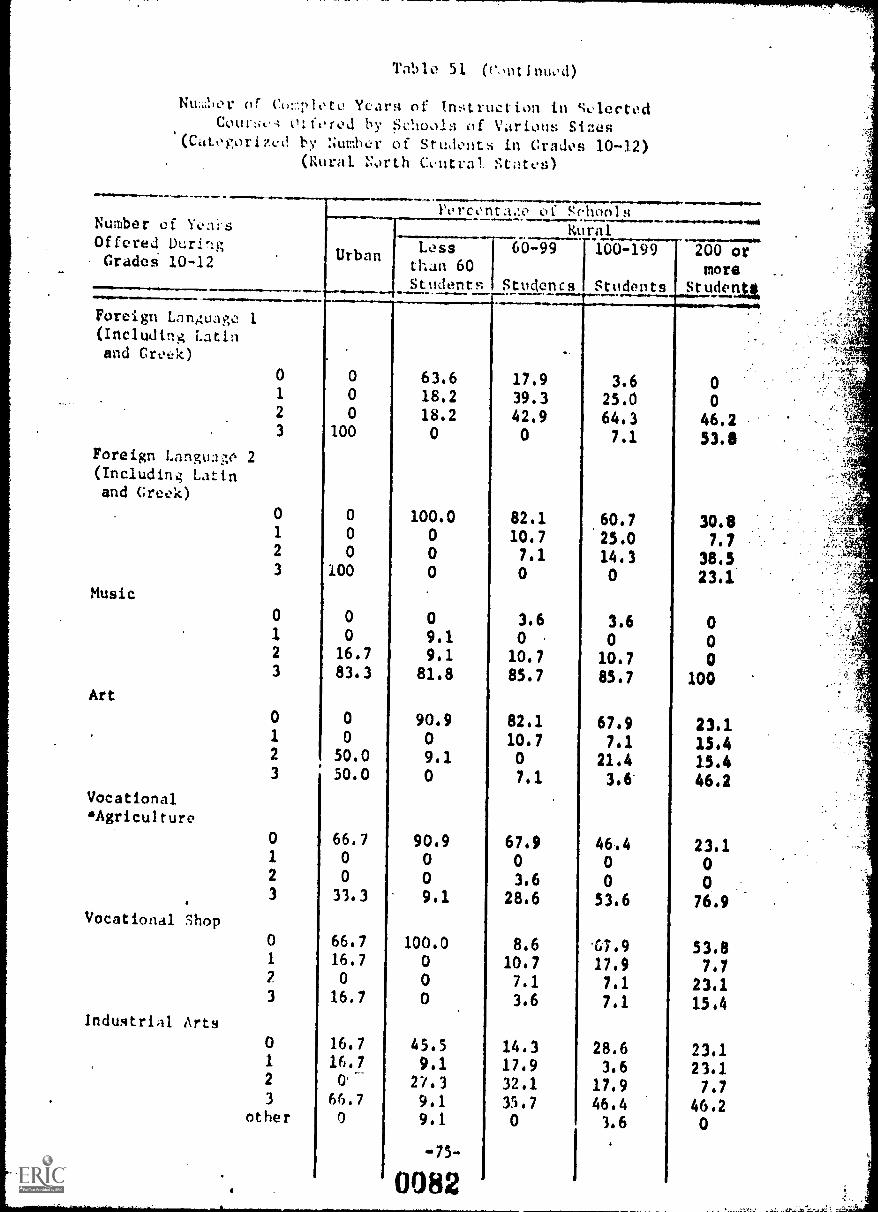
Table 51 (c,ntinuod)
Nubor of Colote Years of Instruction in (;electedCourt;A otfored by Schools of Various Sizes
(Categoria by Number of Studontli in Grades 10-12)(Rural rorth Cxntral Statvs)-
Fercntao of SchoolsNumber cf Yeai.s
Offered Duri%,Grades. 10-12 Urban
RuralLess 60-99 100-199 200 orthan 60 moreStudents Stuclencs Students Student!.
Foreign Language 1(Including Latinand Creek)
Foreign Langun;;6 2(Including Latinand Creek)
Music
Art
Vocational&Agriculture
Vocational Shop
Industrial Arts
0
1
2
3
0
0
0
100
63.618.2
18.20
0 0 100.01 0 02 0 03 100 0
0 0 01 0 9.12 16.7 9.13 83.3 81.8
0 0 90.91 0 02 50.0 9.13 50.0 0
012
3
01
2
3
01
2
3
other
- -S
17.939.342.90
82.110.77.10
3.60
10.785.7
82.1
10.70
7.1
66.7 90.9 67.90 0 00 0 3.633.3 9.1 28.6
66.7 100.0 8.616.7 0 10.70 0 7.1
16.7 0 3.6
16.7 45.5 14.316.7 9.1 17.90' 27.3 32.1
66.7 9.1 35.70 9.1 0
-
0082
3.625.0
64.3
7.1
60.7
'25.014.30
3.60
10.785.7
67.9
7.121.4
3.6'
46.40
0
53.6
61.917.9
7.1
7.1
28.63.6
17.9
46.43.6
0
0
46.253.8
30.87.7
38.523.1
00
0100
23.115,415.446.2
23.10
76.9
53.87.7
23.115.4
23.123.1
7.7
46.20

When the various vocational courses offered by the Southewn schools
are examined in more detail, we find that the schools attended by the blacks,
tend to differ in their course offerings from those attended by the whites,
Smaller proportions of black than of white students attended high schools
that offered two or more years of comporcial subjects or industrial art.
courses (see Tables 52 and 53). (Smaller proportions of black students .
also attended schools that offered business machines or vocational etWea's
tion; be these differences were not statistically significant.)
On Ow uth,:r Land, as can be seen in Table 54, larger proportions
of black than of white students attended schools that offered cour:.es
vocational agriculture -- a shrinking employment area.
Proportion of Youths Who Attended Schools That OfferedTwo or More Years of Commercial Courses, by Race.
Race
School Offered 2 or More Yearsof Commercial
Total*
Yes No
Black
White. . ..
.....
146 (56%)
244 (77%)
2,...."...
114
71
(44%)
(23%)
260
315
46,11446.44.-
575Totals 390 185
-1164+..
X2 'B 29.63, df 1; p * (.001

Race
TAblo 51
Proportiou of Youths Aton,led schools That Of ftTwo !.love .oars Atth Coursv.:, by R .
-i
i School Offe'rod 2 or Moro Yearsof Industrial Arcs
'...---
!Yes Nu
_........._ ,... ......._. Totals
...00 M10. 011.0. 40.04.0...1.WW1/10,4..V.IP ow.n,.40- /*W.. 4004..0 * .0mb
Black
White
8 (3%)
91 (29Z)
Race
Tot.a1H
252 (97%)
224 (71%)
99 476- ,---X2 = 66.58, df 1; p <.001
Table 54 .
260
315
Proportion of Youths Who Attended Schools That OfferedCourses in Vocational Agriculture, by Race
...MM...
575-School Offered Vocational
Agriculture
Yes No
Totals
4 41-171-errrs--10-irre- - -7.111...1111.1.41.-1. 41 - ID aa-411.1%1Ide eg ....... 4 . awl.. :a .
Black 245 (94 :')
White
Totals
254 (81
15 (6%)
61 (19 %)
1
4991 76
1-. ....ram- - -x2 ?, 22,95, dt n 1; p <.001
-77--
00 84
260
315
575
1

-11747777,7L.ISPTVIv.T.'"'r,r
laffPallY
Every teacher, counselor, and school administrator who had
been ou the staff of the 75 rural and il'urhan (control) high ichools
during the 1967-68 school year the students in our sample were
seniors that year -- was sent a short questionnaire. This question..
'ire dealt with the background of the staff, their teaching prepar-
ation, and their duties during the 1967 -68 school year.
Teachers in rural schools tend to be less well-prepared for
teaching than those in urban schools; this was also true in the Nofth
Central states. Although about 38 percent of the urban school" in
the Southeast had 40 percent or more staff with masters degrees or
above, less than 25 percent of rural schools in the Southeast had 40
prpent or more staff with at least masters degrees; only 20 percent
of the North Central rural schools had 40 percent or more staff with
masters degrees.
The major difference that we found in staff quality between
North Central rural schools and southeastern rural schools is in the
use of nondegree staff in the southeastern schools. Eighteen of the
rural high schools that we studied in the Southeast had one or more
teachers with no college degree; only one of the North Central schools0: ! ;Ay. AlILA 4, .:1.6-4.,7 *.s 'I.... .......
These teachers without degrees are found in the larger schools;
13 percent of schools with less than 200 students and 36 percent of
schools with 200 or more students had one or more teachers without
degrees. Mnqt of these teachers are used as part of the vocational
training staff; many have attended vocational, or technical schools.
The benefits achieved are obvious from Table 55, which is based on data
from only HIP larger (200 or more pupils) schools.
-78-
1)0)85

Table 55
Rotatio,!,0111, Botwoen ibo ilex of Tt...,ehors 'Atheut Dogreesand Provision by thc School a 1'....aploy:m2nt-Kolated
Sorvicvti (1..t,:,t, Schools Only)
Services
111/ 01...
OJT/Wolk St.:12y
Occupatio:;.11 FA:Aliari.zationCourSC
"Career Night" or "VocationDay"
Field Trips
Job Placement:
i'roport ion i)f. Schools Offering Service
Schools Tluit Have Schools That HaveNo Teachers With- One or More Teach»
out Degrees ars Without Degrees-0..10Z
35%
67
68%
18%
-r
55
82%
92%
82
36%
rimy, .-OIlw.I.sao..O1llw.IbrIII1In11.aINOI.M11.O.IMeoOwIM
Those nnndegree teachers are found in 46 percent of the fully
integrated schools but in only 17 percent of the segregated or nominally
integrated schools.
;There is a similar staffing pattern .for trained counselors.
Trained colsolors are characteristic of fully integrated, large rural
64-.***41.74vm '14"51111 Taw,51., anM- 57.610 41114 -44, 1111 1.0
ab
. _. -
. O
-79-

io
Table 56
Relationship Werween Counselor Training andSegregation-Integration Status of Schools
School is:
....-...School Counnolot. Let
Trained Untrained No Counselor.14 11 .1 P. NMI.
.111.-1111.1
Segregated 10 (26%) 6 (33%) 6 (41%)
Nominally Integrated 13 (33%) 11 (61%) 4 (6%)
Fully inLegrated 16 (42%) 1 (29T) 4 (29%)
eine11 .1. 11. 111 m 1111.111.1111 ...1111. ...me IP 11 11. 11. .111mOmEmMo.1.111MMI.,01
X; 9.20, df 4; p not significant
Table 57
Relationship Between Counselor Training and School Sias
Number EnrolledIn Grades 10-12
<200
200 or more
1 1
School Counselor is:
Trained Untrained No Counselor
15 (42%)
7 (20%)
.% .6244 Of
:1
-80-
.q.:!:rt`
2.1 Y.° IA.

,Olows that havinA a tra.inod conusclor in the school
is rolacJ tk, .,,rovki.o0 of e:%pic.)Iwnt.-ri..lat.cd selvices; but havingthv,4e a n.itter of 11,1Vin sorivone assigncdto coun-
Ln rh,2 1lo 1 rathvr than 1ving a trained counselor inthe Jata for Table 58 ar c. those oKtained from lar..;c
schools so Tabl.. 54 is compacable with Table 55.
Table 58
ilotwoen Ceunsolnr Tralnine, and Provisionby the Shoot of C.nploymeut-ftelatu,1 ScrviccH
.(1.1r.zw Schools ('nly)
Services**** * - -OJT/Work Stud!
Occupationalzation rourse
"Caruer NiAht" or "Vo-catton Dly"
Field Trips
....1110..b.II. M.... AI,
Proportion of Schools Offering Services
Schools That 1
Schools That j Have an Un- Schools ThatHave a TraiLed trained I Have No Coun-Counselor Counselor 1 selor
!. -.
42%
73%
75%
677,
23%
50%
92%
85%
irtt 1. OA al )111, .
Job Placo71,:mt 42Z.
-81-
0088
0%
29%
57%
71%
a, *1.47: a q. Ayip401101111.

Student Enrollment
The proportion of students enrolled in southern high school.
has been low, but has been increasing steadily in recent years. only
Mississippi reported a smaller proportion of students enrolled in
1970 than in 1960. Alabama increased enrollments by 4 percent durtig.
this period; South Carolina, by 7 percent; North Carolina, by 8 pet*,
cent, and Georgia, by 20 percent(87)
These enrollment increases Sat*
however, lower than the national average.
Table 59 compares enrollment of two age groups-- 14-13 year.*
olds and 1617 year-olds -- on a state-by-state basis for the south*
eastern states and the North Central states.*
It can be seen that th,
total enrollment figures for the North Central states exceeds the selsth*
eastern states total enrollment by 2.4.to 3.7 percentage points, thi
small variation depending upon age group and race.
The population of black youths in rural Illinois, Indiana,
Michigan, Missouri, and Ohio is very stable. up through ages 14-15.
The influx from other areas occurs among the 16-17 year-olds. Thus
the enrollment statistics for the 14-15 year-olds do not reflect any
substantial effect of migration patterns. In contrast to much of
t f ....liha.C.fs'atittte'nihAtt'llittfititftrfellt..4avtledkrAso r tit *.1.11415,I Aftrt4 1. ea w ? *Sit
black youth is more apt to be enrolled in school if he lives in the
rural South than he is if he lives in the rural areas of Illinoii,
Indiana, Michigan, Missouri, or Ohio -- the only North Central states
that have significant numbers of rural, black residents.
A summary evaluation of census data shows a clearcct downward shiftin enrollment rates and an upward shift in migration rates at age16. This mudden stepwise change may be related to laws which re-quire school attendance until age 16.
-82-

7.
State
(-4
yr:.-77 ,117177737Tirrrirr"nr"77-: '711W, 4
AlabamaGeorgiaMississippiNorth CarolinaSouth Carolina
Total
I l linoisIndiana
r0W3
K;:n5IRS
3irneftota
titi:f Me:At ..
::c,.rth Dakota
ckto
Dakotaonsin
Percent Enrolled in School for
Total State
42.
Total Aura/
14-151 16-17
94.6[85.094.3 82.791.8 84.194.9 1 84.293.6 ' 82.6
83
14-15 16-17 14-15,16-17
B
14 -13 16-17 14-15
91.8
92.1
92.892.792.7
84,179.482.081.982.9
97.4! 91.196.9, 88.7
95.3 91.4
96.4' 91.1
97.8 91,7i 97.6 95.3
95.8 88.3.951%7- lab.2.93.8 93.197.2 92.0
i 95,7 93,5
97.3 94.3Total ! 9;,0
94.3 :85.896.0 !fil.9
93.2 i89.995.7 115.6
94.8 :85.191.2 '90.094.5 '82.7
WM. 4i14* ' *
95.6 ;88.1* ! *
92.6 :87.9
93.1 82.193.8 79.190.0 82.294.2 83.892.9 83.393
91.7 83.791.9 I, 76.8
93.3 82.292.9 82.4
3.4 85.1
95.9 91.896.2 89.595.8 92.796.0 91.897.1 90.797.0 95.194.0 1 87.3
9 2
99,696129,43054,965
146,45069 456
9
84.5 78.291.1 45.8
* ! *
* *79.6 $2.1
* *8E3 78.4
"11...6t:941.94!..+ 4!
96.0 93.7 * *
96.5 91.1 94.1 90.994.1 ' 91.8 * *
96.2 92.4
365,514195,140113,43484,950331,066156,574159,779
*.57.,1135627,043
391,75728,125176 106 I
* - Black population very small- North and South Dakota excluded- States with low black populations excluded

..11."Pr7'we FIrrTrr "fl""17:37711197.:-t
Total Population by Race,Ales 14-15 6 1647
wella .410-y
Total State Total Rural s,
93.1 82.193.8 79.190.0 82.294.2 83.8
92,9 83.393 .2 82.2
91.7 83.791.9 76.893.3 82.292.9 82.4
93.4 85.192.7 82.2
95.9 91.896.2 89.595.8 92.7
96.0 91.8
97.1 90.7
97.0 95.194.0 87.395.6 93.9
84.5 78.291.1 45.8
* *
* *
79.6 82.1* *
85.3 78.4* *
940,1,a34.7 .iittadeat
96.5 91.1 94.1 90.994.1 91.8 * *
96.2 92.4 * *
6.1 91. . .24
99,696 94,456129,430 122, .,71
54,963 51,484146,450 143,67869 456 68 244
499,997 80,433
45,09355,09441,775
56,89042 005
78
365,514 347,669195,140 186,317113,434 109,57984,950 ,
331,066156,574159,779
81,242
312,148149,870
150,509
68,033 58,87817,639 16,6011,486 1,3574,885 4,256
47,239 42,0981,504 . 1,341
23,144 20,43957,435 55,413 2,004 1,705
391,757 . 369,086 46,829 41,79728,125 ' 26,903 48 744.1.8.6.77r.rr2=ren.76400 167 540 61572 5,685
,086,923 . , 8 , 2 214,315** 191;15fit*
emailexcluded
populations excluded
60 9/
44,626 42,127 19,30 4,356,923 52,949 22,31730,662 28,642 29,20/ 26,23/85,935 83,183 34,282 SIMI36 350 34 669 27 989 21
254,496 4 3
78,513 73,62879#489 74,71754,607 52,54432,658 31,439
104,942 97,69659,659 57,08657,006 52,64024,929 24,141
119,461 110,602it; 4N
16,690 16,03868,399 641249712,990 !6)1Y,910
-7111110.-
1,236 1,274340 1,29242
231 2091,584 1,312
29 251,383 1,247
r :15017:
$3t
1,481 1,7019 47
1.81L _116
6,024e 1,026o

e0992
The Oro out Problem in Southern Schools
Extent of the Problem
Table 59 shows that a smaller percentage of 16-17 year-oldi than
of 14-15 year-olds are enrolled in school; the difference reflects thi
dropouts that occur during the most critical age level when schoolins
is suddenly no longer mandatory. When we look at Table 59, arilLfitid.*4-
exceptionally small dropout rate (4.7 percentage points drop in en*
rollment) among rural youths in the North Central states, a fact that
is in line with the findings of our earlier study, and a marked drcip
out (11.0 percentage points drop) among the 16-17 year-old white IMO*
dents in the rural South.
The picture for black rural youths is not as clear with respect
to dropout rates. In the North Central states, the number of black
rural youths 16-17 years old is greater than the number who are 1443
years old. The additional youths are, no doubt, immigrants; obviotssty,
large proportions of those who dropped out of southern schools did net
re-enroll when they moved North. A very logical argument can be made
that these dropouts from southern schools show up in the statistics in
a way that overweights the apparent dropout rate in the rural North andunderwcights the apparent dropout rate in the rural South. If tos.tite..a 61" ... a .4). 11. t 4!so 4.11 trt: :.. *te.dropOut picture for' yoilih; in the rural South is indeed much worse
than in the rural North, although this is not obvious from the statistics
in Table 59.
Among the rural youths in our sample*
, all of whom entered high
school, 10.9 percent of whge and 18.2 percent of black youths dropped
out of high school before graduating. In comparison with the 3.5 per-
cent dropout rate in the North Central states, this is indeed high.
17--St's Appundix C for an explanation of why this sample did not includetho,;e wh() drop; 'd out of scho,)1 before the 9th grade.
.1-84-

Factors Mat0,1 t'J It'oni!lci CIL Of Hi,lh
Rd ;:s1. nal.v of th bla:k youths in fhe Southeast come from
. tiles that aro L.:tr.:mak, poor. M:lny of rim' cannot afford to buy lunch
at school or to illy other :;chool-related oTen:ies. A chief court coun-
selor J North Carolina county stated;
"So miny of thcse kWh are very much aware that theirclothes are not as nice as [those ofl their peers.And tl :e will :;tay home to keep from being embarrassedfrom s:in;; to sc.`iool with shoes with the soles off,dray, t:,s that It tva been patched and patched, clothesChat are not in style. They lack clothes; lacklun,:h money. I 1CW a lot of kids that will stayhome from school rather than admit that they don'thave lunch mcney. ...I have seen these kids stayhome for lai:k of having their fees the first daysof .school, and they, of course, miss the orientationof the school the orientation of the classesthey are in. They get behind, their grades are low,and they drop out because they lose interest."
An WC worker in a Mississippi county said much the same thing:
"A lot of them drop out because of econanic reasonsI have had so many say to me 'I can't keep up withthe otbors.' It would have to go back to economicreasons. The-family tsn't_mainmpovh.so.litlx
tt!,° ?:4f .rpd 11; 11.41.,1. tt I tic! , ti dame hsCi.i.e' 4-*
a
whites."
Others who were interviewed said that black youths were likely
to drop out to help support their families, and that many black girls
drop out because of pre4nancy. Thus, the following hypothesis was
tested:
-85-
009a

-,V7FM7.grAT-.,,,-.-7-rx--, T7ww797.77,54'
More black than white youthsleave high school before gradu-ation, and report the followingreasons for doing sot
- lacked proper clothing,lacked money to finance theireducation,
- had to help support the family,- pregnancy.
Among those rural youths in our sample who did not goto college,
24 percent of the white youths and 31 percent of the black youths drop.
ped out of high school; this difference was not statistically sigaift.
cant. The college attendance rates differ for the races, however, and
Among all rural youth, a significant difference in dropout rates is
found (see Table 60.)
There is not a significant difference between black and white
youths insofar as saying they dropped out to help support their fool.
lies, or because the lacked clothing or money. However, there is a
significant difference between the numbers of black and white girls who
said they dropped out because of pregnancy; 8 percent of black girls hoe
less than 2 percent of white girls dropped out of school for this
reason (see Table 61). Despite this relationship, the proportion of
'''..1.1ZOC Eq:' el) fr;ici 0144 Of .1;c6.th..afttf .4greater Shan the proportion of white girls who dropped out. White males
are no more likely to drop out than white girls but black males are fat
more likely to drop out than black girls (see Table 62).
-86-
0094

Table o0
Proportion of All Kurul Youth Who OroppcdOut. of !!fv.h S...hr.)I, C
.__....._ ._______________:__,__ ______
....___......
r
Race....11140
-'Black 1
White
Irotuls
Race
proppa out or H.S.-- ++Yes Nu Total.s-
51 (18.-J 229 (Sr) 280
35 OM 287 Vo..1:-.,) '322
86 51u 602
x2m 6.59, df 1; p r <.02
Table 61
Proportion Who Dropped Out of High SchoolBecause of Pregnancy, by Race
4.0
Dropped out of B.S. Be-cause of Pregnancy
Yes No Totals. U"..."4411. 4 a"' I... 41.
Whit&
Totals41111111mr
46 4111 4. S.-* ,*/*Asywr. 1
k /)) L
3 (1%) 1 209 (99Z)
20 397
4.0 di* 4soa
4 205'
212
417-wmmwerw4smmmftorft.1+rmmmr
)(221 10.79, df 1; p 0 <.005
-87-

Table 62
Proportion Who Dropped Out of High School, by Race & Sex
Race & Sex
Dropped out of H.8.
TotalsYes No
White Male
White Female
13
22
(10%)
(12%)
97
190
(90%)
(88%)
110
212
Totals 35 287 322
x2- 0.16, d' 1; p not
Slack Male 22 (29%) 53 (71%) 73
Black Female 29 (14%) 176 (86%) 203
Totals 51 229 280
X ' 8.50, df 1; p <.003
"`t .00 .6 .. . . . w AV 111, 01, ? a. ill .41 . 11q ,
-88-
0098

Ir. .*..., c 1 :!,:t c: f.!10 poOplo 1111..t.qViCy01 In ih0 S011th"".i,.
....... . ... . .
east i::.ii,..t,:.! !.!..:t m,:y you:.1 rck.rIc &op i`l:i of school bt..cau.ic o1
poverty. rtL.rot,vt. w tostk: Lhc, fwllowia ypothet3is:
Fr..hoot dropout rate doesnot differ systo:liticallywith family in,:vme.
It w,1 fou1, for both blacks and whites, that students frw
the iJnt:v are move likely to drop out of school than those
from families with higher incomes, as shown In Table 63. However, the.critic ii St. _n:; to be diffel:eu, for the two races: for blacks
the key divit;ion polut appears to be I ;s than $2000 per year; for
whites, le :s than $3000 A year.

Table 67
Proport ton Who Droppod Out of School, by RAC and income Level
Family Inc omo
Level & }taco
... .11.0-41. 0111.0.1......1
Dropped Out of School11.11.11, ...-..... 0.11. 111-
Yes I
-- mown..-.Far
Mate:<$3,000
$3,000-1,699
Totals
8 (38%) 1
20 (15%)
10 (6%)-38
No.11. .0
13 (62%)
110 (850
152 (94%)
275
Totals
..-,ww-410116
x2 - 19.95, a 2; p e <.001
Black:
<$2,000 28 (31%) 63 (69%) 91
$2,000-7,499 26 (16%) 132 (84%) 158
7.500 2 (12%) 14 (88%) 16-----.---Totals 56 209 265
.
-90-
00914

r't
tatatIv Income may be tn-
Llere Arc v, H'.! .+; for not accpting reportod
14_.o It ;!.; Cur o:lo LO figure ac-
MOrk"Vcr, it' survey wsIrk indicated that respon-
dents, rural .1r often reluctant. to divulge
tho th,fr yearly I arlIlv income. This reluctance takes
either of t refu,:11 to e:.;timite family income; or an
1.,Al::-10 it Ls in:onsfstent wfth other answers, is
chviou,;_lv hi than the ac.tual
thc,:e prohle:,s, we used two measures of family in-
come, firt wIs the "ct;timaled total yearly income" of the family
In dollar::: the :)ther, a "Purchasing Power Index" (PPI) based on the
answer to the following questionnaire item:
Between 1964 and 1968: (eheck the appropriate box)
Lj Our fa:Iily did not have enough money for food, clothingand trangp.,rtatLon;
Cl Our fAmily had enou;;h money for food, clothing andtran.;portation;
J Our family had some surplus money left over forext raL ;;
0 Our fx,nity hal enough money for vacations, educationand eith2r s:Ivin3 or inve3tment.
The purehastn4 pow -u. incl.!): was shown in the North Central states
study to be very highly related to the mean income per fa ily member,
It ha a s,1?',-hat lower correlatir,n with estimates of total yearly
family in-r,...1'; .tho relatIon.;',Ip of total family income to Purehaqing
Power 1-I..... the subje,t ; in thc, presctnt study is shown in Table 64.
0099

Table 64
Relationship of Purchasing Power Indexto Estimated Total Family income
Purchasing PowerIndex Level
.14......
2
3
4
White:
1
2
3
4
Number of Families with EstimatedYearly Family Income of:
43,000$3,0004,999
52 10
52 27
3 0
1 1
7 1
12 21
1 3
0 0
$5,000-7,499
5
12
4
2
$7,500- $10,000 n9,999 & over "n""7"-
2
3
1
1
1
1
0
1 a
'1.1111.........4110...........me.....rmwswwwwwmPlimmem=111011.11.11410111P.
0
30
.70
6
0
12
14
7
0
2
6
10
'92-
O100

J :00% pro...ed LO bv. a more sol:;ltly me,:tsure
of the ;ovo::y th.1L i Li' via. of school, Of
k. ! (. y!!;10::t r:oncv 10 buy et.;vatial food,
clothL,1: r...!!'scrl, 02 Nrc,olt whiL,! svudont:4 and 41 poreeut
of th b s dropiloa our of school (s(c Table 65).
Table 65
Proportion ':110 DroppA Ont., by Purchaiang Pow6r index Level and Race.
Wbfte:
2
3 & 4
1111c..1,:
1
2
3 & 4
Tottiq
Dropped Out of H.S.
Yes No Totals-/ 411. .111
5 (627) 3 (33%)
17 (22%) 62 (78Z)
12 (17.0 57 (83%)
8
79
69
41
34 1122 156
29
14
3
46
X2
8. 56 I df v 2 I <.02-(41; 42 (59%) 71
(15%) 81 (85%) 95
(20%) 12 (80%) 15
1135 181
X2 1: 14.86, df 4 2; p v <.001
-93-
0101

Among those school dropouts who responded to our questionnaire,
over 90 percent of the black youths but only 36 percent of white youths
say they would have stayed in school had financial aid been available
to them, (See Table 66).
Our findings then, show that one effect of poverty is a tendency
for poor youths to drop out of school. Agreement can probably be
reached that this Is an undesirable cause-effect relationship that
sho.tI -t d,,nit vitt, by any program claiming to he aimed at mitigatift
the problems of rural youth in the Southeast. Some form of income
supplement is indicated as part of the youth program as long as welfare
payments or other systems of monetary aid fail to provide enough money.
for essentills,
Table 66
Proportion of School Dropouts Who Say They Would Have Stayed InSchool Had Financial Aid Been Available, By Race
Race
Would Have Stayedif Financial Aid
Available
in SchoolHad Been
No Totals
1.---------------z--------.Yes
.--_-___-- ...-.
White
Black_
12
40
(36%)
(91%)
21
4
(64%)
(9%)
33
44
Totals
-----52 25
.
77
X2 25.59, df 1; p <.001
-94-
0102

M,,st a,proochs.:: to proviin.-, tuirple:!!ents for students
from As 1--.eAtire to proveat school dropouts (most
su :h p.ivmts-; w.)uld to 1 E vo,:lhO will. :lot gain the acceptanceof the rut ,t1
t -;oe !y that the only .t ceptable wayit which cAn be provided to these youths it; by pay-Lug for p.irt-t.le work. This approach will gain acceptance fromthe rural leiJcrs who, we have found from our interviews, aro primarilywork ork.nted.
A part-:imo job or "work experience" was found, in the NorthCentr:! 10 tir,:,1a:.,20, to tater emilloy:.aent c::perienee and couldnot be in.;Lified as a preventative nieasure against school dropouts inthe rural parts of the North Central states where the school dropoutrate is ...ery 1,,w. It 4:.,es al.p2ar to have relevance in the Southeast
where the exopout rate is higher and where large proportions of the
dropouts !!:1;;;;I stay in school if financial aid were available to them. .
If part-time work is to be considered as a means of providing
an incf.mLt supple%tent to prevent school dropouts, it becomes importantto know something about the availability of part-time work in the ruralSoutheast.
The avoilabilitye4f part-time work in a small town in the South-east is affected by numbers of population both within the townand in t'le ,;nrrou:!ding area -- as was the case in the North Centralstate.; stu.ly. Most of the nnnfarm business in these small towns inthe Snuthetst Is it gervice w.:oupations, an employment sector that re-lies on An ldTiate population base. Thus the smaller the town, theless Moly it is that part-time employment will be available. A South
l';!oe i -; !Li . in ir thp t the part-time job his any(..It in staten or in the
1,,Li7,,.s or latk.r employ:;ent. Seethe, Hr! : report "Fw:t ors that Affect Employment --Part -t
-95--
0103

Carolina guidance counselor discussed the relationship between size of
town and the availability of part-time jobs:
"There are only a small number of part-time jobsbecause there are only five or six businesseswhich can hire. Usually these jobs are in theclothing stores which hire only two or threepeople. They can't hire more because you don'thave a large volume of people coming in to buy.They would be spending out more money than they'dbe taking in."
A Community Action Program coordinator in North Carolina blamed
the scarcity of part-time jobs for youth in his county on a lack of
local leadership:
"We just do not have enough interested leaders inthis area to.get some type of good youth programgoing. It seems, since this is an industrialarea, that these people could come together andcould form some form of rural youth co-ops wherethey would have part-time employment during theschool season and full-time employment during thesummer."
In the North Central states study, it was found that young people
from the "better families" in small towns were most likely to be hired
for any available jobs. In the South, class bias in hiring might
appear to be less important than racial bias. However, it is very often
difficult to separate the two factors.
When we controlled for race and sex we found no difference in
the proportion of youths from poor families who obtained part-time
work and the proportion of youths from more affluent families who ob-
tained part-time work.
Some of the trouble southeastern youths have in obtaining part-
time emplornent does appear to be related to racial factors. This was
pointed out by a high school curriculum director in Georgia:
-96-
0104

"About three weeks aAo ! dz;%ed four bl,toks to go toth. stcres tiley ar tw,-bit grcerystoe:: its-.re, dna not redllv 'white' storos -- andthe su,'er,ret, the fivn-dni-teu, an./ the drugstores, whioh hire v,nni..; people to help out during
ChrisLmJs....Vhey were turned d.wn."
Several persons in the rural Sootheast said that discrimination
in hiring *%ractics.e-; for part-tirle jobs occur there. A man who directs
. a trainini; pro,;ram for rural youth stated:
"Th2 bi44st rt: :ht now In school is this employ-ment thid,,...,The (youn.c; people] sign up some timedurin; the school season for employment, and they'retold flatly that they 'don't want any blacks.' Thisis all wrong. The racial problems hire are sugarcoated. They want you to feel like everything isfine....They'll tell you that what we have is wonder-ful -- the racial situation here. But when you comeright down to the nitty gritty. it is not so wonder-ful."
Even though black youths are qualified to do the work, they
often are not hired. A woman working for a South Carolina Community
Action Program remarked:
"We do have black children that can run a cash registerand can type, but they aren't hired. We have a youngman that works here with us during the summer I
know that he is capable He's determined to go onto college. He's very -- now you talk about poverty;he is on the poverty level. (His mother had a largefamily; his father is dead.) He drives a school bus,and that's his only source of income 6... I sent himto ask for a job In the drug store during the Christmasholidays .... He was turned down.
"Another example of thin was one young lady who told methat the man in the grocery store asked her ifshe knew how to run C1:41i register. Did she know thedifferent pr tees? :1!e told him that the prices arest,1.,..0,A on th2 thin.;; that the pr:.rson wds purch.isIngand she roill,1 read Sh., even asked him to giveher a test on the cash register, but he didn't do it."
0105

?3;.`--.7^ -+Z+
We found about the same proportions of black and of white girls
worked part-time while in school (42 percent and 47 percent respectively).
White males were much more likely than black males to have done part-
_ time work while in school, as Table 67 shows.
Table 67
Proportions of Male Rural Youth, by Race, WhoWorked Part-time While in School
Race
White
Black
Worked Part-timeaaaaallailaaaalada
Yes+1111
No
...=aala
77 (72%)
38 (52%)
30 (28%)
35 (48%)mallailaaaaPalaaa
X2- 7.45, df 1; p 00 <.01
Table 68 shows the percentage of each group who looked for part.,
time work in town and were unable to find it in each of the four years
1965-1968. Very few of those who looked for work in town were not
able to find it; low- income blacks had the most difficulty.
Table 68
Proportions Who Looked for Work in a Small Town and Couldn'tFind it Between 1965 & 1968, by Race, Sex & Family Income
FamilyRace Sex Income
ore...Map
Year
1965
Black Males <$3000
a$3000
White Males <$3000
+Waal/a.
1966 1967aaaaaaa.a9% 9% 62
07, 07 4%
0% . 0% 0%
e$3000 0% 0% 17, 1%
Black Females <$3000 87,, 3% 3% 4%
3000 27 32 3%anaaaaallao
White Fcmaleg <$3000 OZ OZ OZ 02
0$ irin() 37 1. 57, 57,
-98-
106
aaa aaa a. a. a a aa

The proportions who worked on a farm at some time between1965-1968 are shown below in Table 69. Approximately equal prop'r-tions of white and black males worked on a farm. Thus it also appearsthat race is not a factor that affects part-time farm work, exceptamong girls. Most girls who work part-time for pay on farms comefrom low-income black families.
Table 69
Proportion Who Worked on a Farm Between 1965 & 1968, by Race & Sex
Race & Sex
Worked on a FarmBetween 1965-1968
TotalsYes No
Black Females
White Females
37
18
(19%)
(9%)
159 (81%)
190 (91%)
196
208
Totals 55 349 404
X2- 8.97, df = 1; p <.005
Black Hales
White Males11.11114111111
23
33
(29%)
(30%)
57 (71%)
76 (70%)
80
109
Totals 56 133 189
x2- 0.05, df = 1; p not significant
Very few young people who looked for part-time farm work wereunable to find it. And, as might be expected, it was easier for themto obtain employment on a farm as they got older. Table 70 shows thepercentage of each group who looked for farm work and were unable tofind it in each of the four years 1965 - 1.968.
-99-
0107
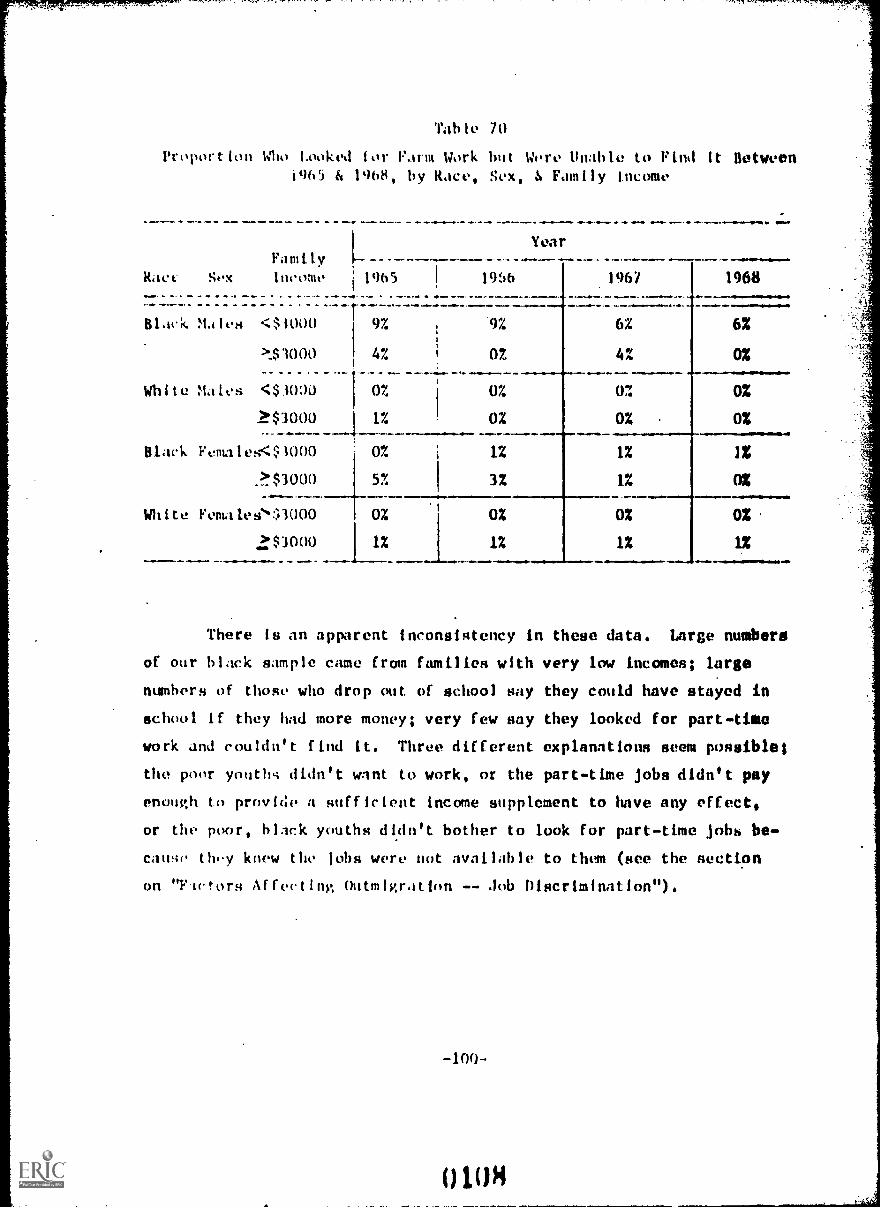
Table 70
Looked tor ram Work but Were Unable to Find it Between'465 & 1%8, by Race, Sex, Family income
FamilyRace. Sex lnome ' 1965 1956
Black Males <WO rO 9% 9.2
I?$1000 4% 0%.... ... .. . ... .. .1. .-. . .... ... ....- ........... or- Ca. ..........
Year
White Males <MOO 0% 0%
1!$3000 I 1%____---- --
0%
j 1%
I 32
Stack Females<$1000 0%
..?!.$3000 5%
White Female s`::;3000 0%
::$300° 1%
196/ 1968
6%
4%
.......-.11.011.1111,14116%
0%
0% 0%
r -02 0%
it 1%
1% 0%
0% 0%
1% 1%-=1111....01.0.0...
There Is an apparent inconsistency in these data. Large numbers
of our black sample came from families with very low Incomes; large
numbers of those who drop out of school say they could have stayed in
school If they had more money; very few say they looked for part-tiee
work and couldn't find it. Three different explanations seem possible;
the poor youth'; didn't want to work, or the part-time jobs didn't pay
enough to provide a sufficient Income supplement to have any effect,
or the poor, black youths didn't bother to look for part -time jobs be-
canqo they knew the lobs were not available to than (see the section
on "Fictors Affecting Outmigration Job Discrimination").
-100-
0 10H

Vocational Traini21. Many educators whom we interviewed in the
South stressed the noed for vocational training in the public schools,
and linked vocational training to the correction of the dropout prob-
lem. They felt that the provision of a broader range of vocational
training programs in the public schools would hold the interest of
the student enough to keep him in school. A high school superintendent
in Georgia stated:
"At the eighth or ninth grade level you have gotto provide something vocational, or those stu-dents who are not able to go on to college willget disinterested in school and end up by drop-ping out. Vocational courses have a kind ofholding power to keep these students in theschools."
It is interesting that an NYC Director in North Carolina saw
vocational training as being primarily for low-ability or misfit stu-
d,.!uts:
"It used to be in public schools that everyonewas suppose-1 to do the same thing -- take thesame courses. This was one of the reasons thatthe students dropped out. The schools justdidn't adjust to anyone with low ability, orthose who started behind, or those who didn't fittheir pattern. Now, more vocational courses arebeing provided in the schools to retain the in-terest of these students. This should cut downon the dropout problem tremendously."
Some schools in the Soutn that are unable to provide a variety
of vocational programs for their students because of low enrollments
or financial problems allow olidents to take vocational courses at
separate vocational- technical schools. The students are given high
school credits for these courses. A high school principal in a
small town in Georgia talked about such a program:
U109

"Our high school seniors get the opportunity to takepart in a program of 'vocational courses at
Vocational School, which is quite a distance -- infact, about 60 miles from here. We have a bus going there from our school. This is the first yearof operation and we have about 30 or 35 studentstaking part in the program. Next year we anticipate a full busload of about 60 or 70 students. Thisis going to be a tremendous help for us. We wouldvery much like to offer them more vocationally."
From the data it appears that whether or not vocational courses
are offered in the Southeast high schools may, indeed, be an important
factor influencing whether youths drop out of or remain in high school,
Schools that offered courses in business machines and in vocational
education had lower dropout rates than those that did not offer such
courses (see Tables /1 and 72).
-102-
011U

TablJ 71
Rolsolonship of 1)r,Tut gate .1,l Oiteriu.; Courses
lu Blisino:;s acine:;, by g.toe
5H10, I o'ro!
Bust...
YO8
No...rab- .4. olo
Totals
iDroiyeti out of ll!gh School....
Yes No
19 (140) 113 (WO
37 (2970 91 (71%)
36 1 204
Totals
132.
128
260...v....1100 10...
Yes
No
Totals
X2 = 8.09, df 1; p <.005
22 (ln) 160 (58%)
18 (14%) 115 (86%)me. ..
..101.....-
182
133
40 275
X2
315
R 0.14, df 84 1; p not significant
Table 72
Relation4htp of Drcpout Rate and Offering Coursesin Vocational Education, by Race
.......-....41.11Mmba.P.00/14.111.......IIMIIMI1111......10/811110
School OfferedDropped Out of High School
.0.0.111.1111.411..Vocationll Eductfon Yes No
Block:
411Yes 30 (21%) 111 (79%)
No 26 (22%) 93 (78%)
Totals
/11.411.
56 204WillY.MONII0.0.111......B.411....11/4Whola
Totals
141
1.19
1 260
X ' $2R 0.01, df. a 1; p R not significant
White:qNur eammalidorM AMmaa=
Yes 15 (9%) 155 (917.)
No 25 (J7%) 120 (83%)Sus
Totlls 40 275
SoWm./,
o -a& .*Almo.....0
I 170
145..j 315
x2 n 5.00, df m 1; p m <.05
-103-
0111

Post-Secondary Education
College Attendance
Because of the large proportion of poverty-level :,lack families
in the rural Southeast, we expected to find that:
More black than white youthsreport not going to collegebecause they could not affordto go to college.
This hypothesis is substantiated, as shown in Table 73a. Only
9 percent of white noncollege youth, but 31 percent of black non-
college youth, said they did not attend college because they could not
afford to go to college.
Table 73a
Proportion of Noncollege Youths Who Said They did not go to CollegeBecause They did not Have Enough Money to go to College, by Race
Race
Had No Money for College
TotalsYes No
White
Black
14 (9%)
58 (31%)
143
131
(91%)
(69%)
157
189
Totals f 72 274 346
X2 24.66, df 1; p <.001
Table 13b shows college attendance for each race by family in-
come, The critical income level is different for blacks and whites,
White students from families with 1.'comes of less than $3000 tend not
to go to college; black students from families with incomes between
$21)(Y) and $3000 are as likely to go to college as those from families
with incumeg above $3000, Those below $2000 tend not to go to college.
-104-
0112

Family
Table 73h
C.)11,;0 AtcenItne by !t.:.e and incow
Attended
Ntuber Who
Stud,:t:.::
CollegePILL Not
Attend College.....enri- 00
<$30 0 3 (12) 22 (88%)
...:1$11000 162 (55;%) 132 (45%)foo. .1. ow -
x2. 17.14, df 1; p .<.001
S:kients:
<$2000 18 (19n 77 (81%)
-°S2000 73 (42n 102 (58%)aw.....v -..- -x2= 14.28, df 1; p a <.001
In the North Central states study it was found that the higher
the proportion of the county population employed in agriculture, the
higher the proportion of young people that attended college. However,
in many of the sotheastern counties that are dependent on agricul-
ture, incidence of poverty is high, especially among blacksos
shown In Mble 74.
-105-

Tablo 74
Proportion or Rural Youths Whose Families Had lncomus Ii6low $3,000by Proportion of County Population Engaged in Agriculture
% of CountyPop. Employedin Agriculture
15% or loss
Over 157.
III(White Youths)
Numbor of Youths from Families With Incomdlort
Gess than $3,000 $3,000 or More
22 (8%)
4 (10%)
259 (92%)
35 (90%)
.111.
x2 0.27, df is 1; p not significant
(Black Youths)
157. or less
Over 15%
109 (49%) 111 (51%)
49 (72%) 19 (28%)
x2= 10.63, df = 1; p = <.005
It was anticipated, therefore, that the following hypothesis
would hold for white youths but not for black youths:
A larger proportion of youngpeople go on to college fromrural counties that are highlydependent upon agriculturethan from counties that are lessdependent upon agriculture.
As expected, the data show that this hypothesis is substan-
tiated for white youths but not for black youths (see Table 75).
In counties where a large proportion of the population (over 15
percent) were employed in agricultural occupatioas,84 percent of white
youths went to college; only 47 percent of white youths from counties
with a small proportion (Pi percent or less) employed in agriculture
wont to collogo.
-106-
0114

,t.trt1H1,,LulfIc.inc, the re!lults for black
,,,1:11.; In rlicd th2t 72 per,nt of
the !.,1. ocuntloA eme from fawi;ls with
- , lo :;:!! .t college artenlinco
rat,1 o! in the le, s .i.-ri..o!tur;!1. rural counties (in which
rer,.e t helc-x $30,00) 1ho oollui;e atteadince rate
Is ui
T.Ale 75
Proror:.!.,n Attc',11:%1 Colleo from Counties With Lowand Cih 1::3pleye.i in Agriculture, by Race
)r; ofCount.:
in
White:
Yes
At College.No
..11
Totals
Low 135 (47) 150 (53%)
-High l 31 (84,;) 6 (16%)
Totals 166'
156
285
37.1111.0
I 322...111111.11.11W oll=1...11111.......11.01.mowl
X2- 17.39, df 1; p = <.001
Black_:
..- 111. 11........... -
Low 63 (30%) 148 (70%) 211
Higl,
ot:11s
29 (420 40 (58%) 69
92 188 : 2801 Mired.
e'm 3.49, df 1; p g not significant
-107-
°115

College attendance among rural youths was found to be related
to the size of the high school they attended. The interrelationships
found among the variables suggest that this effect is independent of
the relationship of college attendance to family income or to growing
up in a rural county highly dependent on agriculture. The following
tables show the interrelationships that lead to this conclusion.
Table 76 shows that family income and size of school attended
are not strongly related.
Table 76
Family Income of Students Enrolled in Small Schoolsand of those Enrolled in Large Schools, by Race
(White Students)
Family Income
e3,000EnrollmentGrades 10-12
<200
0200
9 (8%)
12 (6%)
102 (92%)
190 (94%)
x2 = 0.54, df = 1; p = not significant
(Black Students)
<200
200
46 (65%)
110 (53%)
25 (35%)
97 (47%)
X2m 2.91, df = 1; p = not significant
Table 77 shows that:a) by far the majority of small schools are
in the more industrialized rural counties; b) white students in highly
agricultural counties are more apt to attend small schools than are
white students in less agricultural rural counties; c) white students
are more apt to attend small schools than black students are; and d) black
students In highly agricultural counties are no more likely to attend
small schools than are black students in more industrialized rural
counties.
-108-
0116

Talolo 77
its:4 r.i.;:11., noihndcnt: .tnd Not highlyAL:c;1.1.0L1. H.,1,ront Schools, by Race
Sti!!yn!s)of StvJents tho
o: Atten,lvd School t.:ith:County
Errlcvoi :n <2f.!0 Students 200 or More Totals
or
Over 11.
./. =0
90 (32;) 192 (68 ;) 282
23 13 (36%) 36-*!
Totals 113 205:....11.. ...-. 411
15;Y or less
Over 1.7)
x2= 14,25, df 1; p <,001
(111a:..k Stulents)
57 (27Z)
17 (245.:)
318
158 (73%) 215
55 (767) 72
Totals 74 213 287..--x2= 0.24, df - 1; p " not significant
We found that among black students and female students (es-
pertA:(y xnong black, female students) that those who attended small
high schools were mire likely to attend college than those who attended
larger high gcools (see Table 78).
-109-
0117

Table 78
Proportion of Students from Different High Schools WhoAttended College, by Race and Sex
Size of High SchoolAttendedNumber ofPupils, Grades 10-12
ON,
Attended College
Ecite FeTales:
<200
.'200
Yes No
38
59
(57%)
(44Z)
28
75
(43%)
(56%)
White Males:
<200
Z2001
e' 3.25, df s 1; p - not significant
21 (50%) 21 (502)
44 (65%) 24 (35%)
ItX2' 2.32, df = 1; p = not significant
Alackiemaltg:
<200 24 (512) 23 (49%)
>200 48 (32%) 104 (68%)
X2= 5.90, df 1; p = <.02
Back Male:
<200 7 (29%) 17 (712)
#200 12 (25%) 36 (75%)
Combined Groups:
222° 0.14, df 1; p = not significant
White: x2 = 0.004, df 1; p = not significant
Black: x2 0 4.385, df 0 1; p s <.05
Male: x2 0.580, df 1; p = not significant
Female: x2 = 7.140, df s 1; p = <.01
-110-
0 1P4

luestion tl!it natur.111v arises is, %hat at the duirac-
tecisti,..; pr'7.pt student:.; and female
student.; to go to colle.;o:" in an ,:arlier section of this report we
talc' eour:;e 0:ferin:s of s:::.11.1 6,1h02,1s were less varied
in snhools. Sincv many s! ll schools can afford
only curricu11:1, evoryoR0 cakes amounts to a college prepar-
atory ceurs,.. :his :.iay Nr:, of the answer. However, this explan-
ation t,*Itt11 l_lvo to ,u;:;um:! a soloctiN:o effect. -- taking a college
proanItor... c-,urs., would lead to college attendance among females to
a mich -.1c,;rec than amo:Ig males. Our other findings do not
substaidi.1!-e this Lv'oothesls.
A J...tt.ii1c.d analysis of our data leads us to conclude that a
cluster o o,:zuiriti,nally oriented services centering around vocational
'counself:-.g have a negative influence on the college attendance of
black s:.ints. The larger schools tend to offer these services; the
smaller s7h,3ols en :.: segregated schools do not.
In a pre.Ios section of this report, entitled "Staff Quality",
we have shown the strong relationships that exist between school size,
school -..,e4regation, the presence of counselors in the school, the
presence of teaching staff without degrees, and the provision of OJT/
Work Study, Occupational Familiarization courses, "Career Night" or
Vocation nay", field trips, and job placement services. We will not
repeat this material ar. this point, but the reader should review the
section on "Staff C!uality" to better understand the implications of
the following findings.
Tahle 79 shows that black students who attend schools that
offer a brood array of employment-related services are less apt to go
to colle,,,e than their peers who attend schools that lack these ser-
vices.
0119

Table 79
Proportion of Students From Schools That Offer
Specified Services Who Attend College, by Race
School Offers:
White Students
Black Students
College
Noncollege
College
Noncollege
OJT/Work Study
Yes
69
(512)
67
(49%)
No
96
(52%)
88(WO
x2= 0.06, df = 1; p = not significant
OcCupational
Familiarization
Course
Yes
No
76
83
(53%)
68
(49%)
85
(47%)
(51%)
X2= 0.35, df =1; p = not significant
"Career Night" or
"Vocation Day"Yes
136
(54%)
115
(46%)
No
29
(42%)
40
(58%)
X2- 3.20, df = 1; p = not significant
Field Trips
Yes
113
(60%)
74
(40%)
No
51
(39%)
81
(61%)
x2= 14.71, df =
' p 'C.001
21 (27%)
57 (73%)
65 (36%)
1115 (64%)
x2= 2.06, df = 1; p = not significant
33 (26%)
93 (74%)
49 (40%)
72 (60%)
x2= 5.70, df =
1; p = <.02
76
(31%)
169 (69%)
16
(48%)
±17 (52%)
7l2284.01, df =
1;
p = <.05
60
(31%)
131 (69%)
41
(37%)
26 (63%)
X2= 1.21, df = 1; p = not significant
Job Placement
Yes
58
(572)
43 MP
29
(342)
56
(662)
Ito
106
(492)
111 (512)
56
(332)
114
(672)
g2= 2.03, df = 1; p = not significant
ea 0.03,4f = 1; p = not significant

is
3C' .1!;.1. thAt. t Ii :aff that govA:i *. 1. 7; 1.1.o; i ::.ro Iniltionce
rv:;u1. rotvly sug:.,o:4t. thatno;rit H.' r.,...ct to cot1c,,t2 tclocntiou forbiac! to .1 less...,r
-113-
0121

Table 80
Relationship of Attending High School in Which One or More TeachersDid Not Have a Degree and At College, by Race and Sex
School HadTeachersWithout Degrees
Number of Students WhoAttended College
illIINION1111..Attended College i Did Not Attend College
.x- ....11111.11.111D
White Femiles:
Yes
No
40 (46%) 47 (54%)
57 (482) 61 (52%)
x2= 0.11, df = 1; p mg not significant
White Males:
Yes
No.
26 (70%) 11 (30%)
38 (532) 34 (47%)
X2' 3.08, df 0 1; p = not significant
Black Males:
Yes
No
6 (17%)
11 (31%)
30 (83%)
24 (69%) =willeX2' 2.12, df = 1; p is not significant
Black Females:
Yes
No
.20 (222)
46 (44%)
71 (782)
59 (56%)
X`= 10.40, df = 1; p = <.005
-114-

Tab!e 81
Rolatiew;!tir of Coum;olor ..,..Aning and Attending
ColLgo, by 1:z:we and Sex
Counsclor Training
Attended Collegeor -am
YesMO.AO
(49%) 102
(56%) 79
(62%) 29
210
No Totals
White rcate::
Trained Co3nlor1 52 (51%) 50
Untrained Coun,;elor1
35 (44) ! 44
:.o Couu:lelorI 11 (38) . 18----------------
Totals 1 98I
112-X2' 1.83, df . 2; p not significant....1on........ !* ...1..
White Males:....1.1.4.
Trained Counselor
Untrained Counselor
No Counselor
Totals
Black Males:.1.1Trained Counselor
Untrained Counselor
No Counselor41.* we/.
Totals
Black Fe-illes:
Trained Counselor
Untrained Counselor
No Counqelor ___Totals 1
5 (26%)
8 (29%)
7 (28%)
31 (62%) i 19 (387) 50
28 (62%) 17 (387..) 45
6 (50%)I 6 (50%) 12
65 42 107
70- 0.66, df a 2; p - not significant
20 52
17 (23%) 57 (71%) 74
22 (31%) 48 (69%) 70
31 (530 27 (47% 58
70 132 202
x2m 0.02, df 2; p = not significant
14 (74%)
20 (71%)
18 (72%)
19
28
25
72
X2- 13.83, df - 2; p <.001
-115-
0123

Vocation31 or Tr Jo School Attendance
Because white youths are more likely to attend college than
black youths, it was thought that black youths might show more inclin-
ation to go to a vocational or trade school than whites. However, 21
percent of blacks and 18 percent of whites went to such a school, and
this difference is not statistically significant.
When other factors are taken into account some interesting rela-
tionships are noted. It was found that males who grew up closer than
81 miles to a major city are more likely to attend a vocational or
trade school than males who grew up farther than 80 miles away from a
large city (25 percent and 8 percent respectively -- see Table 82).
This relationship does not occur among females. Nor was there any sig-
nificant relationship, for any group, between attending vocational
or trade school and the proportion employed in agriculture in their home
county.
Table 82
Proportion of Rural Males Who Attended a Vocational or TradeSchool, by Distance from a City of 100,000 or More Population
Distance fromMajor City
Attended Vocational School
TotalsYes No
(81 mi.
'80 mi.
31
5
(25%)
(8%)
93 (15%)
56 (92%)
124
61
Totals 36 149 185
1.31, df 0 1; p - .01
-116-
0124

.,..1`1:.!; th.re ,ii?.,nifloant relat tott:dtli)
'.!i! t 0:it.r4.-si job t1.1co.'lent. a.:d got tingh
; t r:t i 1),,t ,1L 41 :i011011 I
;1 11 ...4 i:::.1 1.t'!' 111,'. 1).:t. .;11 SC11001. \'00:t traitt-
tug, j b woo.": tat:11 twre
I I ;sely t t .1 '.'0..11. 10'0.11 Lq.k.s.,) 1 ter I ion than those whose
high sil.h.,)!.; (U.! not ef1 r this service (`co Table 83).
Table 83
Proportto:: of %;)ncoItee WhItc. Youths Who Attended a VocationalSchool ,''J :.'L t!: ;,h Schokl, by Sclv.aol Offc.rod Job Placement Services
-,School Of.fored
.....o.1,-.-..Ir'Attended Vocational School
- .411.......ral.....Job N 1e,-:.2nt Yes
Yes
:40
Totals
17 (4l%)
21 (l87,)als law
No Totals110...
24 (597.)
93 (82%)
rli.1.111.
41.
114
38 117 155......0111110.11, ...111011111.1114.1.1111
x2'- 8.65, df 1; p <.005
''ht.te students who attended a high school that had a trained
counselt,r were le;-; likely to attend a vocational or trade school after
gra,biati,Ju than Cmse who attcnded a school that had an untrained coun-
selor vr nn coun3cior (see Table 84).
0125

Table 84
Proportion of Noncollege White Youth Who Attvnded Vocational SchoolAfter Graduation, by School Had a Trained Counselor
School Had a Attended Vocatjonal School
Trained CouAselor Yea No
Yes 12 (17%) 59 (83%)
No 26 (31%) . 57 (69%)...Pain. 40 0. OP.. -?....
TotalsNs...
.38 116
0.~.10./
1 Totals
4
71
83
154
x2- 4.28, df 1; p <.05
For noncollege black students, the only significant relationship
with attending a vocational or trade school was whether or not they
had taken vocational courses in high school. Those who had taken such
courses were more apt to get post-high school vocational training (see
Table 85).
Table 85
Proportion of Noncollege Black Youths Who Attended a Vocational orTrade School After Graduation, by Tt.Jk High School Vocational Courses
Took VocationalCourses inHigh School
Attended Vocational School
TotalsYes No
Yen
No
28
17
(36%)
(20%)
49
68
(64%)
(80%)
77
85
Totals 45 117 162
ess 5.39, df 1; p <.025
-118-
0126

"" T t': "T';'. r
. _ . OCCPATIONAr ADJUS7ENT
!....1sArs of Occ)Ition)1 Adiustwent
Two mea:;I:roi of quality of errloyeat wore used In this study --
the hourly w.: t1:0 responient received in his entry job and an employ-
ment score fer the three years between June of 1968 and June of 1971.
These r.:.!:;urs wre used with only the noncollege students, since any
measure of e:7;,1oy7_ nt adjusti;;ent for college students is neither mean-
ingful nor reLvant to the purposes of the present study.
The hourly waive obtained by the respondent when he began his
first fuli-tin job fellowing graduation from high school was used as
the measure of "salary in entry level job". If the respondent had not
held a full-tixe job during the three-year period under consideration,
then the hourly wage for the first part-time job held during the three
years was used.
A complete empl,)yment history was obtained for each youth for
the perLod b.2tween June 196g and June 1971 (including periods of un-
employment). Each respondent also indicated the highest skill level
job he hl ever. This work history was.zcored, by a system de-*
veloped in an earlier study , to obtain an employment score -- called
the "0:m1;,ational Adjw.tment Score". This scoring system (see Table 86)
takes into Account quality as well as quantity of employment, and auto-
matically prorates the scores for those periods of time in which the
subject was un,.mployed but not looking for work,
a -- a.-. - a-*
Miles, f;. H., "Preliminary PhaAe: Effects of Vocational Training andother ii. ctr.r4 on Erployv.nt ExperfPnee", prepared for the Office ofManp-wi.r. `.1'oatIon and Training; U, S. Department of Labor (1966) .
10127

Table 86
Scoring System Used to Rate the EmploymentHistory of Each Individual in the Sample
*M. ._.s...0--
,3-year e:mployment_core:
- fully employed at highest skill level
No. ofMonths
x5
- fully employed in seasonal occupationat hiheqt .(111 level and did notseek other employment in off season x 4
- part-time at highest skill level and didnot desire full-time employment x 4
- unemployed and did not desire employment x 4
- fully employed but not at highest skilllevel x 3
- fully employed in seasonal occupation atless than highest skill level and did notseek other employment in off season x 2
- part-time at highest skill level butdesired full-time x 2
- part-time at less than highest skilllevel; did not desire full-time x 2
- part-time at less than highest skilllevel and desired full-time x 1
- unemployed; desired employment x 0 10
GRAND TOTAL
Sae
swommewlsis
Total 36
-120-
012H

Every noncollo)y respondent w.,s assigned au Occupational Adjust-meat OIL; scoring system.
Adiot:imt to City Livina
In discussing the problems a rural migrant is likely to en-
counter upon moving to the city, the Director of Manpower for the
Chicago Urban 1.031;110 SraLed:
"In the South, you can virtually stop a person on thestreet and ask directions, talk to him, ask for helpor this kind of thing. In the city, you get an entirelynew feeling of cold and indifferent attitudes and sus-piciousnss on the part of people. It makes for avery difficult time in terms of making friends."
Most rural people, accustomed to the friendliness and openness
of their rural neighbors, sec city people as being cold and suspicious.
One 35-year-old Mis3issippi woman, a returnee from the North, put it
this way:
"I've been up there to visit, and I don't like the city.It's too fast for me. If you don't know anybody beforeyou go, you never meet anybody. They don't even knowtheir on neighbors, and lock themselves in and lockthemselves out."
Large numbers of rural youths leave their homes and move to
the city. For these youth' ;, ability to adjust to life in the city is
a large part of occupational adjustment. In our study of rural youths
in the North Central states we found that many young rural-to-urban
migrants, especially males, were unable to adjust to living in the
city and returned home to rural communities where jobs were scarce.
The findings of this study idith respect to adjustment to the
city differ markedly from our findings in the North Central states.
-121-
0129

Yoothful tn.i 1 xul female rutal ,to-urban migrants from the rural !;outheast
adjt equally w-ll to the Equal proportiow; of eavh sex returned
to tho rural South; equal proportions say they would prefer to return
how rather than stay in the eity if good jobs were available in their
home CoWillaitio4; equal. proportions say that they were able to make
friends easily to the city.
On the other hand, we find entirely different adjustment patterns
between white Youths and Hick youths.
Earlier research by Eldon Smith(105)
showed that, of the rural
relocatees In InAlanapolls, black migrants from Mississippi adjusted
much better than whites from southern Kentucky-and Tennessee. Smith
further noted that because southern white migrants had a propensity to
return home after a brief period, employers often regard them as poor
employment risks for jobs requiring any substantial training period and
consider them inferior workers for even unskilled jobs.
The results of our present study tend to show that black youths
do not adjust to the city better than white youths do. However, they
are less likely to return home as a result of poor adjustment.
sit
Eighty-seven percent of the white migrnnts,compared with 79 per-
cent of the black migrants, say they made new friends easily in the city.
This difference is not statistically significant, but the direction of
the relationship does not support the idea that black youths adjust
more readily to the city than white youths do.
The important finding with respect to making new friends in
the city Is that half of the white youths but only one-tenth of the
black ,putlf-; who did not make new friends easily left the city and
moved back to their rural cof,Imunities (see Table 87) . In fact, as shown

13 11'11.0 whot!',.r or not black youths return to the rural setting is
tulroll to thi., r.oaAure of social 1,1just1To11t.
Table 87
1;ot:-..,.,a Not noing Able to Make New Friends Easily inthe Cit/ arlA !':,:turniu to the iWral Community to Live, by Race
RaceActually Returned
TotalsYes No
W ito 6 (50!;) 6 (50%) 12
Black 2 (10%) 18 (90%) 20
Totals 8 24 32
x2 ' 4.44, df = 1; p = <.05
Table 88
RelatiwIship nkinf. New Friends Easilyan'.! Stay l,.,;, in the City, by Race
Made New FriendsEasily and Race
frame
Stayed in City
TotalsYes Nora ......rammra.....m ... .. ................................. .....
White!
. . ..........
69
6
(83%)
(50%)14
6
(17%)
(50%)
8312
Yes
No
Totals 75 20 95
5.07, df = 1; p = <.025
Black:
Yes 68 (88%) 9 (12Z) 77No 18 (90%) 2 (10%) 20...............rarararararara.............. `........
Totals 86
-.a.11 97
_ -
_.------...r.r.m. ...mime
X2 * 0.03, df = 1; not significant
-123-

Among the noneollege youths who moved to the city, blacks are much
more likely than whites to say that, if jobs wore available there, they
would profor to return to their rural home communities (see Table 89)
Of those who state a preference to return, 57 percent of the white
youths, but only 20 percent of the black youths, actually left the city
and went back to the rural South (see Table 90).
Despite these measures, which seem to indicate that rural black
youths don't adjust to.the city very well, only 15 percent of the non-
college black youths who migrated to the city returned to their rural
homes. As shown in Table 91, this contrasts with a 41 percent rate of
return among their white peers.
In terms of "sticking with" a job in the city, the black youth is
a better bet than the white youth. This does not seem to be a matter of
better adjustment to the city; rather, they have less to go back to (in
terms of jobs at least) in the rural South.
Table 89
Proportion of Young Rural-to-Urban Migrants Who StateThat They Would Prefer to Return to Their Home Community
if Good Jobs were Available to Them There, by Race
Race
111..-
White
Black
Prefer to I No Stated Prefer toReturn Preference Stay in City
.0101111b
Totals
14 (23%) 28 (46%) 19 (31%)
42 (47%) 25 (28%) 22 (25%)
-......o+Totals
61
89
56 53 41 150
Y2 , 9.49, df 2; p '.01
-124-
0132

Tablo 90
',t.:4t1 ny a PVC!.t.'CL-1170 to Roturn
an.1 t t;.t! o Put-a 1 :;1/4,uth A:nong
Kurll-to-UrHa i.Arants, by Race
------
-- , Totals
Actually Returned
Yes No
8 (57%) 6 (43%) 14
8 (20%) 32 (80%) 40
X2 $2 5.20, df a 1; p = <.025
Table 91
Proportion of Noncollege !ilgrants Who Stayed in the City, by Race
Stayed in City
Yes NoTotals
Black 56 (85%) 10 (15%) 66
White 24 (59%) 17 (41%) 41
80 21 107
X2 w 9.28, df 1; p a <.005
-125-
0133

Bla...k youths who come to the city from the most agricultural. parts
of the rural South are much lest; likely to return home than those who come
from less al4ri,ultural rural areas (seo Table 9..!). Whether white youths
:itay in the city or return home is unrelated to this factor.
Table 92
Proportion of Black Noncollege Migrants Who Stayedin the City, by Agricultural Employment in Home County
Percent Employed inAgriculture 111 homeCounty
Stayed ReturnedTotals
in City I Hoge .
=.......m....-..........MINIM.sno.
Low
Medium
high
15 (58%) i 11 (42%)
34 (81%) 8 (19%)
15. (94%) 1 (6%)
26
42
16
r
Totals 64 I 20 84
x2 se 8.15, df = 2; p <.02
In an earlier section of this report we noted that black youths
are more likely than white youths to move to cities where friends or rela-
tives already live. Since black youths are also more likely to stay in the
city than white youths, it was thought that the presence of friends and rel.a..
tives might be the factor that encouraged them to remain. However, when the
data were examined, it was found that the relationship was just the opposite
of the expected one. Rural migrants (both black and white) who moved to
cities where friends or relatives already lived were more likely to return
to the rural area than those who moved to cities where they knew no one
previously. (Of ...hose who did move where relatives or friends live, 82
percent of blacks and 55 percent of whites stayed; of those who did not,
100 percent of blacks and 61 percent of whites stayed.) This relationship,
although consistent, was not statistically significant.
-126-
0134

. .1 t 1 rt !I !' or rel.:I 1%,'L'S l tVo.'
't ,t t: .'Itt `,l'0 t':, 010,1,11()-; l tt
. for i , i tt,,c r i t I p t ; .; t I scant.
Se!',
In the North Central study, ur:,an ,,mployers tended to discount the
value of vo;.ati,,:!al .;;Ivt.11 by rural high schools; thoy slated that
Ow youth :4 Jis! 10.1ry up-to-dote shilli necessary to compete in modern. (14.)) ,
indu5trv. Loud that in r:.any sdioels the vocational programs
are not trainins; the 6tudents to enter the areas in which job opportunities
exist. N,_r are they leiw; trained In the speciftc job skills that employers
would prel'or .aem Co have. Therefore, we tested the following hypothesis*
Arol;g rural high st:hocl graduates who do notattend colle,..e, those who have taken a highschool vocational course, other than vocationalariculture, have ti:e sarp Occupational Adjust-ment score as graduates who have not taken sucha course.
Althoui;11 in many cases there tends to be a pattern in which those
who took a p3rticular vocational course are likely to get a higher occu-
pational adiustment core than those who did not, in most cases the num-
ber of studynts who had taken a course is small and this relationship is
not statistically significant. Only among those males, both black and
white, who had taeu on or more years of a general commercial course
does thiq rlatio:,-:hip attain statktical significance (see Table 53
be The 11,mh,..r1 of high school graduates who took Vocational Shop
or Industrial :trts is ton small to provide reliable determinations of
the effo-t,; of the:a ('our-es on occupational adjustment.
-127-
,0135

Table 93
Relatien.diip ot ocoupatienal Adlustt,.nt .cote and Taking commercial
Courses, ter Male High :lchoel Graduates Who Did Not Co On To College
Took A counercial
Course
Yes
No
Occupational AdjustmentScore Totals
Low I High10=M....
6 (322)
14 (74%)
Totals 20
OINA.1.
13 (WM 1 19
5 (26%) . 19
X2 A 6.76, df 1; p <.01
We also hypothesized that:
Graduates of a rural high school that offers aformal course in occupational familiarizationenter a broader range of entry-level jobs than
those it exposed to this kind of study unit.
38
..111.
We were unable to test this hypothesis because, of our entire now!ollege
sample who migrated to cities,only two youths (about 2 percent of those
who obtained Jobs) entered jobs that are uncommon in the rural community.
In contrast, using the same objective rating system for determining whether
a job is familiar or unfamiliar to rural residentn, we found that about 14
percent of noncollege rural youths in the North Central states who migrated
to cities entered unfamiliar occupations.
Size f Hiy1 -)(Jipol
Although ram, ()Our school-related factors were Included to the
an4,.;;H, N.),:t did not prove to be importlnt influences on occupational
adjuqteut; thereior, they are not discussPd in this report. Among the
mayly hvpothesP; that we te..ted way; the following:
-128-
ono

Among noncollee rural ymuth, tho.:o fromsmaller rural schools are ore likely thanthosc fro lrgor rural schools to enter
oecu.ptions and less likely toenter sales Jobs.
This hypothesis was in large part substantiated; males, both black
and white, vho attended small schools (>200 students in grades 10-12) are
likely to enter blue-collar occupations; these who attend small schools
are not likely to enter sales occu:,ations (see Tables 94 to 96). this
relations:tip is statistically significant for females and for whites; but
only 5 white males, 4 black females and 13 white females entered sales jobs.
Table 94
Proportion of Rural Noncollege Males Who Entered Blue-Collarand. ',:hite-Collar Jobs, by Size of High School (Grades 10-12)
Size of High SchoolEntry Job .
TotalsBlue-Collar White-Collar
.--.--.-----.-
<200 students
400 students
.
21
46
(95%)
(88%)
1
6
(5%)
(12%)
22
52
Totals 67 7 74
X2 5.18, df p (.025
-129-
0137
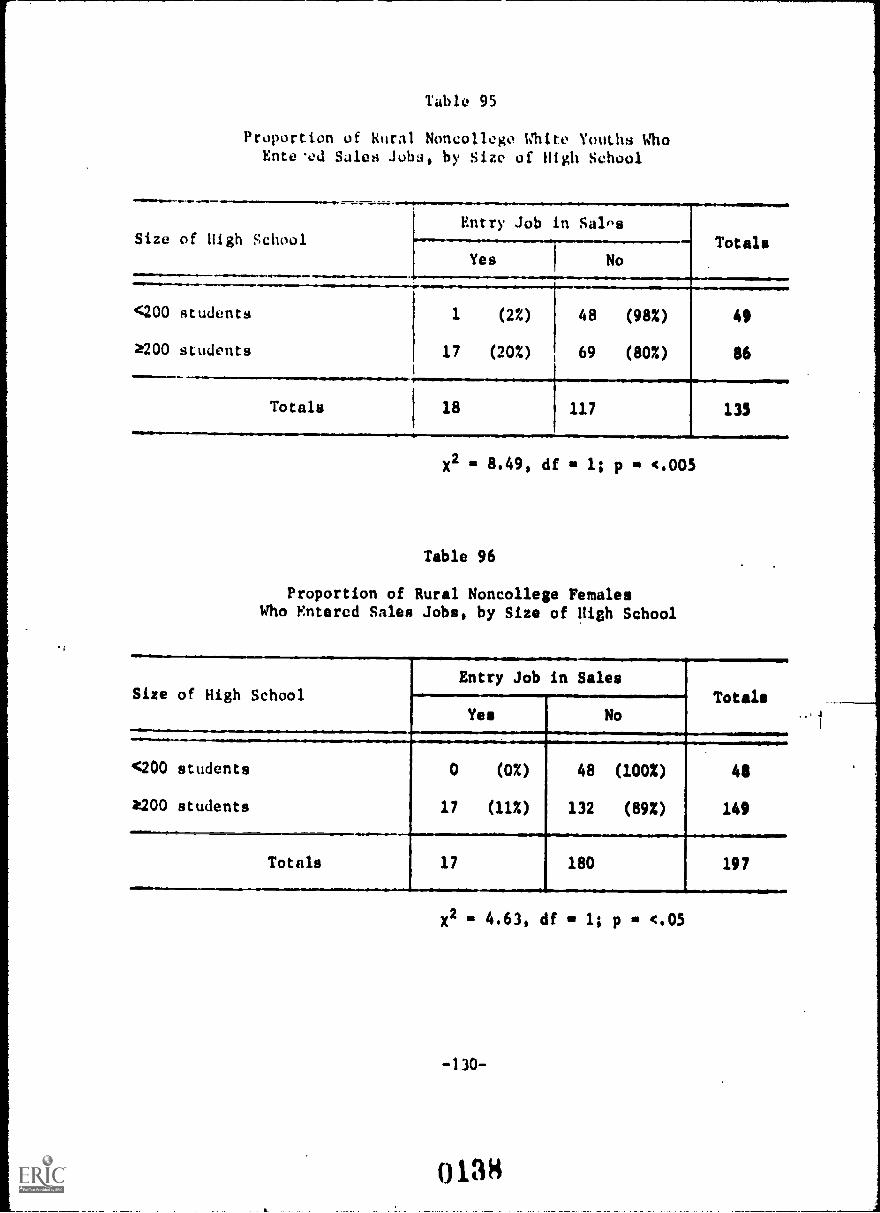
Table 95
Proportion of Rural Noncollogo White Youths WhoEnte.ed Sales Jobs, by Size of High School
Size of High School
<200 students
X200 students
1 (2%)
17 (20%)
48 (98%)
69 (80%)
Totals
49
86
Totals 18 117 135
X2 8.49, df 1; p (.005
Table 96
Proportion of Rural Noncollege FemalesWho Entered Sales; Jobs, by Size of High School
Size of High SchoolEntry Job in Sales
TotalsYes No
<200 students
1200 students
0
17
(0%)
(11%)
48
132
(100%)
(89%)
48
149
Totals 17 180 197
X2 . 4,63, df 1; p <.05
-130-
: i S
In okx ,t,:dies we toud that a.la....go proportion of rural
yotth.i in ill:, or Central states live in extreme isolation. Over 60
percent of r:tra1 youths that we !ttudied lived more than 85 miles
from a city of 100,On population, anti about 70 percent lived more than
30 miles fro71 a city of 10,000 population. One out of five of theseyouthl; in co:mtic in which there ws no public transportation ofany About 40 ;percent lived in counties that had a population den
si ty of lo,;s than 13 people per square mile.
our findings in the present study show that this kind of isolation
does not exist fur must youths in the Southeast. There are more people
per square mile; distances to major urban centers tend to be shorter and
transportation better than in the rural parts of the North Central states.
In the Southeast, only 36 percent of rural youths in our sample live more
than 85 miles from a city of 100,000 population, and only about 30 percent
live more than 30 miles from a city of 10,000 population. None of the young
people live in counties that have fewer than 13 people per square mile, and
only 2 percent live in counties that have no form of scheduled public trans-portation. (See Tables 1 through 3 in the section entitled "Introduction --
An Overview".)
In the North Central states we found that young rural-to-urban
migrants from most isolated counties received lower wages than migrants
from the legs isolated rural counties; they also tended to be employed moreoften in a job below their highest skill level or to be employed for shorterperiods of time. The migrants from the isolated rural counties did not make
as good an adlustnent to the city as migrants from less isolated communities.
Yet they stated more frequently than the others that they would prefer to re-main in Cie oity rh:In return to their rural communities, even if jobs were
available to them there.
0139

On the baN14 of these and other similar findings, the guidelines
for the North Central !itatos Rural Youth Program treated all rural youths
growing up in extrerely isolated communities as "disadvantaged" youths who
were eligible for tIu program. our findings in the Southeast, however; do
not appear to justify this kind of eligibility criterion for a program de-
sigmA to meat the needs of rural youths in the Southeast.
The present Southeast study shows that:
- Population density of the rural community in whichthe youth v,rows up ig not an impartant factor de-
termining his later occupational adjustment if hemigrates from that rural area to the city.
- Young rural-to-urban migrants who come from coun-ties that are beyond commuting distance to a cityof 100,000 population tend to receive higher occu-pational.scores than those who come from less iso-lated rural counties (see Table 97).
- Males who migrate from rural counties with a highpopulation density make lower wages on their entry-level job than those males who come from countieswith a sparser population, although this is nottrue of the female rural-to-urban migrants (seeTable 98.)
These findings appear to be in direct contrast with our findings
in the North Central states. However, it must be remembered that in the
North Central states we were studying a degree of isolation which is not
found among the communities that we studied in our present sample.
-132-
0 1 4 0

Ts0.10 97
:',or...; andr....;. c.-:.:io . (:11.:,
:or Rural '.1i)!.c.int.:: to t'ities
Distanco (:!tNi
:7:100,1J:it) i.yulation
./.80
>80 miles
11.- -- 110.111....1
OectTarlonal AdlusttleniScore:; of Rural-to-Urban
Migrants
Low
.11High
Totals
-mII.NIPPM
63 (60n
16 (39;',)
42 (40%)
25 (61%)
105
43.
Totals 79 67 146
X2 5.22, df 1; p <.025
Table 98
Entry Wages of Males and Females,by County Population Density
Population Densityof County
-=1...... 41Low
Hig
..11.0.11.11111.0
Male
Sex
Female
$3.11
$2.33
$1.97
$1.98
11.....111=4.....1111110...111r1..............1/11.411111.imil.
-133-
0141

notwolle.,4e rural youths from the Southeast, nearly everyone
(98 percent) enter:; a job that is already familiar to him from his experi-
ence in the rural area. (The corresponding figure in the North Central
state:; is nn percent.) A large proportion (68 percent) enter blue-collar
jobs. Only 23 percent enter a skilled trade; 10 percent, a sales job.
About 5 percent obtain entry jobs that require heavy physical labor.
There is an interesting relationship between obtaining a blue-collar
job and distance of the youth's home community from a major urban center.
Amone the who remain in their rural communities, regardless of how far
that community is from a major urban center, about 80 percent of the non-
college youths enter blue-collar jobs. In contrast, among those noncollege
youths who leave their rural communities and move to the city, only 46 per-
cent of thos. from communities further than 80 miles from a major urban
center enter blue-collar occupations. As Table 99 shows, 59 percent of
those who are from communities that are 55 to 80 miles from a major urban
center and 84 percent who are from communities within 55 miles of an urban
center enter blue-collar jobs.
Only 1 black male and 2 white males entered white-collar jobs, so
that an analysis of results by race and sex could be done only for females.
The results for black female migrants are shown in Table 100. Those who
grew up close to a major city tend to enter blue-collar jobs; those who
grew up further away, to enter white-collar jobs. The same pattern occurs
among white females, but the relationship is not statistically significant.
-134-
0142

Ta'Ac 99
i dn.! I.:hit...y-(2 )1.1:1r .1()1): by.1 city 0; )..L.1 vopui:ttioils
V.,10 to a Ctty
Di:itstneo city
A: iOn.
4.-.Entry Job is:
-dr.., -re II/O
Aito-collarTotals
....... ar "kw .4% .M.P.111..-.arr.
Migrints:
57 (84,') 11 (16%) 6855-) mi. 16 (5.) 11 (41) 27
>80 ri. 17 (46) 20 (54:.;) 37rTotals 90 42 132
x2 m 17.09, df - 2; p <.001
<55 -.I. 49 (8070 12 (2070 6155-60 :A. 37 (82%) 8 (18%) 45
>80 mi. 38 (76%) 12 (24%) 50
Totals.ral.II............
124. 32r 156
X2 - 0.61, df ... 2; p not significant
Table 100
Propirtion of Mack Female Migrants Ao Entered Blue- and White-Collar Jol)s, by Distance from City Over 100,000 Population.
Distance fr)7. city
:..100,000 Population
11
Entry Job is:
Blue-collar Vbite-collar-ar rw. -.doer ........ 111=1111.0.
<55 mi.
55-80 mi.
;080 mi. =624 (86%) ' 5 (14%)
4 (67%) 2 (33%)
7 (417.)
1
1 10 (59%)
11-..35 I 17
Totals
X2 ' 8.42, df a 2; p ft <.02
-135-
0143
29
6
17r52

Part-time Work
In the North Central states study one finding was of special im-
portance to the planning of the ideal rural youth program for that regions
youths who had held part-time jobs during their high school years in the
rural community did not show any measurable beneficial effects of this ex-
perience in terms of entry level wages or employment score when compared
with their peers who had not held part-time jobs. In view of the fact
that the part-time job did not serve any purpose in terms of keeping young
people in school (the rural dropout rate in the North Central states is ex-
tremely low) it was concluded that a work program for rural youths would
not, in itself, be effective in preparing them for either urban or rural
occupations. A work experience component was included in the North Central
states rural youth program, but only as a vehicle for providing occupational
counseling, occupational familiarization, familiarization with city living,
and other needed services, while.gaining acceptance of the rural leaders in
that region, who are primarily work oriented.
Because of these findings in our previous study, we tested the fol-
lowing hypothesis in the present study:
There will be no relationship between having part-time work while in high school and either occupa-tional adjustment score or entry level wage ob-tained following graduation.
This hypothesis was substantiated. In general, there is no rela-
tionship between having had a part-time job while in high school and oc-
cupational adjustment score. This is true even when we control for race
and sex. Those who had part-time work tend to get slightly higher entry
level wages; but this difference is not large enough to be significant.
In the North Central states a hypothesis was raised which predicted
a positive relationship between part-time employment and obtaining a full-
time urban job. In that study, some employers said that they believed that
part-time farm employment taught a rural youth the value of hard work and
-136-
0144

u
r, Io\cl:i In Ch1ca.0 and
tture el and the cohl,otittent
i.tht loo! the
t to 1:ri.loyrt...nt Service
"In th. .'u. ;t, a r-an w.lfts on a lob 1.11 the
.'d he or:,!: for 02,-, farf.--.r and then
an:, there's no prejudiooh.,cio had iD jol)s. In other
wend,., von 1:a;-q out of a man, from their
day's vork. You can quitat 2 o'clo..!,, in tl. a ftornoou and ... you chop
nt.-tlr of cords of wood, and you're beingpaid Lour; you're not be:n paid foryour In the city, they want to know,1Goe, how d) w know that you're going to stays."
We also find no si7nii.icant statistical relationship between part. -
time farm work ud occupational adjustment, even when we control for
droppir.4 out, race' and sex. Vhethr or not youths had worked part-timeon a farm durin.4 hiA school male no difference in whether they got a
high or lcw occupational adjustment score. Again, there is no signifi-
cant dif:"erence in entry level wages between those who had worked and
those who had not.
In view of the fact that there is no other method of providing
income supple!:.ents that will be as acceptable to the rural leadership
as the rt,vision of a part-time job, the part tine work or "work experi-
ence" co:-..ponent hermlo!-; a desirable part of a rural youth program in theSoutheat. The reason, however, is not the one usually given -- to pre-
pare youth,1 for the world of work -- but rather to prevent them from
dropping out of schoril because of lack of financial help. This approach
is disc:,;,ed in more detail under the section entitled "Dropout Prevention --Income
-137-
0145

FamilLand Personal Variables_
Family- Income
Existing Federal programs for youth are based largely on serving
those from financially disadvantaged families. It becomes especially im-
portant, therefore, to understand exactly what can be expected to result
from these programs. That is, we should know what the implications are
of growing up in poverty. We have shown in an earlier part of this re-
rnrt cno -uch implication is an increased probability of dropping
out of school. On this basis, if a program for poor youths is successful
in overcoming the effects of poverty, it would be expected to reduce the
school dropout rate. This section of the report deals with the implica-
tion that growing up in poverty has on later employment experience.
In our North Central states study we found that coming from a
poverty-level family did not affect a noncollege youth's later occupa-
tional adjustment, whereas graduating from a small school or coming from
a very isolated community did. The implications of these findings weret
1) if the youth program was to be aimed at poor youths only, then facili-
tation of later employment was not a very meaningful criterion because it
was unrelated to the problems of this group; 2) if the youth program was
to be aimed at poor youths only, then immediate gratification of essential
needs, income redistribution, preyention of school dropouts (for a very
small group), and facilitation of entry into vocational school or college
following graduation from high school (for a larger group) were achievable
goals related to the problems of this group; and 3) if facilitation of
later employment for those youths who would be at a disadvantage in the
labor market was to be a goal of the programs, then youths from poor fami-
lies should not be any more eligible for the program than other youths --
the definition of "disadvantaged" would have to be changed.
This rather lengthy discussion of the issue seems Justified because
it is 40 basic to the concept of "helping" youths by means of any structured
program.
-138-
0146

1:: I I i.: 1 :h : ! .11...1 !timid 'h) re 1 at 1:IShip! i , .tt oL ional ad-
') . . s i j..1 Ecla-
t: i .;.. -.: by or, 1 c.vel
, 7 poront Li I t hoso in the
lower 2 occ:,:ttion.n! scoro..,; only 26 percent of
ti:.)..;. in :1h.. 2 levt Is low occ adiu:;tr.....nt scores (see
1s15 1 Li IC I)
Toble 101
Pro..),!rt f c ral 1 :110 Got LowOccupit. I j tu:tr.nt Scores, by Purchasi ng Power Index Level
Pur
T nd T..
+ 2
+ 4
r
vo 1
Occupational AdjustmentSC 10O
TotalsLow High
3
el.26
10
(47;;)
(26)
111.0- OnainOIN1110
29 (5370
29 (14%)
55
39
Totalsi 36
ag-
58 94-4--X2 4
=11110111111.1=1
4.52, df 1; p <.05
It was expected that class and family ties would work against lower-
class whiteA who tried to obtain "prestige" types of jobs in the rural areas.
As an elerentary school principal noted:
"In ran instances, the employrs are not goingto hit% unless ttr.y know something about theyouths or their parents; about where they live,and a5out ho:4 they came up. in many instances,the yoqzio; have to contact the foreman, and hewould have to It:low the parson seekin employ-mont or the parent before he would hire theyouth."
-139-
0147
Therefore, the following hypothesis was tested:
Rural nonmigrants from low-income familiesreport that they have had to take lower-paying, less attractive jobs than theywere qualified for.
This hypothesis was not substantiated. When controlled for race, there
is no difference in the proportions of noncollege youths from poor fami-
lies and from more affluent families who say they had to take lower-pay-
ing jobs than those for which they believed they are qualified (28 per-
cent of low-income whites, 32 percent of high-income whites; 64 percent
of low-income blacks and 60 percent of high-income blacks).
A commonly held opinion is that youths, particularly black youths,
leave the rural South because better-paying, higher-status jobs are avail-
able to them in the cities (see the Section on "Factors Affecting Outmi-
gration"). Among black youths who stayed in their home communities, 66
percent of those from low-income families and 66 percent of those from
high-income families report that they had to take lower-paying, less-
attractive jobs than they are qualified for. Among black youths who mi-
grated, the percentages were 63 percent of those from low-income and 55
percent from higher-income families -- not a significant difference,
These findings do not support the notion that poverty, in itself,
leads to a later disadvantage in the labor market among youths growing up
in the rural Southeast. That being black is a disadvantage in the labor
market is obvious. This will be discussed in the next section of this
report.
Race
Black noncollege youths obtain lower occupational adjustment scores
than their white peers. The differences are shown in Table 102 and are
statistically significant for females but not for males.
-140-
WAN

Rare and
Female:
Ta!,le 13'2
's .tnd ionalFa'r.il lout
Oec.u-,,ntioal Adjut:tutScorvs
--------1-2 3-4
Totals
.0 .....50
79
(44Z) ' 63 (56n 113
(6270 48 (38) 127
129
1-111 240
x2 7.76, df = 1; p = <.01-1MIIMale:
White 18 (42Z) 25 (58%) 43Black 28 (56%) 1 22 (44) 50
411..0.=1..110......../..10
Totals 46 47 931-01.1 11141......
x2 = 1.85, df = 1; p = not significant
When type of entry job of white and black rural youth, both migrants
and nonmigrants, is examined, it is evident that blacks are more likely than
whites to tinter blue- collar jobs, slightly less likely to enter the skilled
trades, and much less Li4e1y to enter white-collar and sales occupations.
These relationships are significant for migrants and nonmigrants who enter
white- or blue-collar jobs, for migrants who enter sales jobs and for non-migrant alPs who unter skilled trades (see Tables 103 through 105).
-143.-
0149

Table 103
Proportion Who Entered Blue- and White-Collar Jobs,by Race and Migration Status
_____ ---------------------.----------.
Migration Statusand Race
Entry Job is:Totals--
Blue-collar White-collar
.7.1..tiliarants:
White
Black
_
30
60
(56%)
(77%)
24
18
(44%)
(232)
54
78
Totals 90 42 132
-
X2 6.72, df 1; 'p <.01
Nonmigrants:
White 56 (68%) 27 (32%) $3
Black 68 (92%) 6 (8%) 74
Totals 124 33 157
X2 14.06, df 1; p <.001
Table 104
Proportion of Migrants Who Entered Sales Jobs, by Race
RaceEntered Sales Job
TotalsYes No
White
Black-reaormoy,e.m....../.......=aMrWal.a01116.
10
3
(18%)
(4%)
46
75
(82%)
(96%)
36
78
Totals , 13 121 134
X2 "' 7.30, df 1; p <.01
-142-
150

Race
Tahi 10i
Proportio:1 of `talesWho Epi,:rod ::%11Ivd by Race
EnterQd Skilled Trade
White
Black1
Totals !
Yes No
17
6
(59%)
(30%)
12
14
(41%)
(60%)
23 26
x2= 3.89, df = 1; P <.05
Totals
1 29
20
49
Far more black than white noncollege youths report that they had to
take lower-paying, less-attractive jobs than they were qualified for (see
Table 106).
Table 106
F,oportion of Black and of White Rural NoncollegeYouths Who Report Having to Take Lower-Paying,
Less-Attractive Jobs Than They Were Qualified For
RaceHad to Take Poorer Jobs
TotalsYer No.,
1111110.4. .111......0.1111..1.war...
Female:.111=111.
White 27 (26%) I 76Black 67 (55%) ! 55
(74%)
(45%)103122
Totals 94 131 225
x2 = 18.92, df = 1; p = <.001
Male:
WhiteBlack
18 (45%)41 (79%)
22
11(55%)
(21%)40
52
Totals 59 33/1....N....emoOm011...1.0..
9211....010000111.
X2 gi 11.26, df = 1; p = <.001
-143-
0151

08)IRogors a, of t. , In their study or dtopout employwont in two
rur: ::orth Catelina countios, fount th.tt most wore omployed In the un-
skilicd and sttli ;killod vateorics. Itt fact, 1' percent of the firm
surveyed in that study had job positions In the skilled category, yet
less than 1 por%.ent hired dropouts for those positions. Only one youth
In the study found to ho working in a skilled position; 14 were work-
ing at clorical jobs, 70 were ln semiskilled and unrkl1led positions and
31 youths we n. unomployed.
Lm the present study) black rural youths who drop out of school
tend to get lower occupational adjustment scores than white rural dropouts,
but this difference is significant only for rural nonmigrants. In this
latter group, ,9 percent of black but only 21 percent of white dropouts
got a low occupational adjustment score (see Table 107).
Table 101
Proportion of Rural Nonmigrants Who GotLow Occupational Adjustment Scores, by Race
(School Dropouts Only)
Race
Occupational AdjustmentScore
Totals
Low High.141111.410.111aNOW.1110*
Black 16 (59%) 11 (41%) 27
White 5 (21%) 19 (79%) 2411To 21 30 51
X2 7.74, df 1; p <.01
Related information about racial discrimination in hiring is re-
porred In an earlior sect ion or this roport on the factors affecting out -
mi grat i on from the rural Soutiv.ast.
-144-
0152

st
1,- t:ro!.1 the dat:t to thisyofh.; are about. the kinds
of jo!,, .Ire' i :1.1e th.. city lie.:er, tho urioan erployers
who were intervi.. ed co:.isteutly ;...ontioned prollems that rural
youth:; hrive 1,,.cAse of their Lack of knowledAo about job requiremnts
and oft ice proc..dAros.
Ac.erdint; Lo the On-the-lob Training Director of the Atlanta Urban
LeAv.ue, 7.111: rural youths are n.lt familiar with the urban job market and
have unreali,:tit- goals fur their first job:
"They'll core in and they'll say, 'I want anythingthat you have open', or II want a counselor job',or 'I want to work in advertising or radio' --all of the glamorous jobs. (Even the people withcollege degrees do this.) It's so frustrating,and I've spoken of it to sore of the collegesmany tirles in trying to implant the idea that ifyou !ant to go into Industry you don't take edu-cation, history and English. You find out aboutthe top lobs that are available in indUstry, andthen start trainitv, for them. You will find inthe liberal arts colleges here, most people takesociology, psychology, English, history, or edu-cation, but they don't want to go into that.They'll take sociology and expect to [enter] aprofessional social work job. And this is notwhat is happening. Here in Atlanta ... you haveMSWs [persons who hold Master's degree in SocialWorkj ... who are looking, too. So, it is a prob-lm -- and then they say, 'Well, I'll do anything'.Most of our jobs here are clerical. Tf they can'ttype, they're cut tut of the clerical field, be-cause .... all of the clerical jobs now are coupledwith typing."
Black youths in particular faced employment problems in Atlanta:

"You might be advertiain.A for a biochemistry de-gree, and all they hear to a job is available.And they start ringing that phone, and it ringsand rings. All I hear is, 'What kind of job isthat that you've got?' So many of the blackpeople we get who just moved to Atlanta ....
are not aware of the crucial problems concerningemployment when they get here, and it's so easyfor them to just become discouraged."
Many young people are dismayed when they learn about the require-
ments of a particular job. A man working for the Labor Department Employ-
ment Service in Atlanta indicated:
"Oftentimes you get a young man who wants to getinto a sales job, and the only knowledge he hasof a sales job is the young man at the local de-partment store. He saw him in a shirt and tieall day, and he had a clean job, and apparentlyhe had a good income, so he thought he wanted toget into sales. When we talked to him about work-ing nights and oftentimes working Sundays in adepartment store ... this was news to him and of-ten discouraged him. Knowledge of employer re-quirements in Atlanta, attendance, grooming, thesesorts of things, are news to them, is frightening,and is a problem."
-146-
0154

;;;,r. in 'r L.1.1.,11 ['n,"!)..!;1;c1
hc;ti- (+City. it to ru!..1! vs,ab mnrA, Aoh
COry:i t cr.
by 1111A1
or very often called
La Ccntr.11 .:taton :4Ludy II was found that many young
peel: did want to take part in the NYC proi:ram because it was a
povc.rt.:. s t:'' type of situation occurs in the Southeast
icrorrg wh:te Nrectot* from a North Carolina county stated:
"1 thi:C:. w:1:to is a'r't': .* reluctant to identifywith pa\erty. This is nut only true for theNei.;ahehood Youth Corps program but is true inthe ri-Coulty roram, it is true in the Man-power Ad:!.ini,;trAtica Vrograrl, and all your anti-povi.rtv throughout thiL, area. Everyoneis tryin to recruit more whites -- with verylittle su,2e0::s."
In the Southeast,the presence of many black participants in fed-
erally sponsored manpowk!r programs may lead to a decrease in the numberof white yo'.10a that are willing to take part in them. An NYC Director
in a small city in South Carolina said:
"There i!.; no race barrier, and the only thingwhite youths have to do is apply. But otherkids at schaol see the NYC youths with theblack,:, and nobody wants to be a5sociated withthe colored. Poor and black are synonymous.I understand that in one school district, 30or 40 '.;bite youth :; received NY: applications,and son(' of them hrooght them back with mes-sagcs from their parents that they didn'twant them to work here, A lot of them thinkthat this is just for black kid:;."
Aricordin;; to a stud./ condursted in North Carolina (100) , more black
than white rural_ youth; tire knowledgeable about these protrama and par-tIipat, lit th..n.
-147-
0155

With this information in nand, the following hypothesis about
participation in federal manpower programs was tested:
More black than white youths report thatthey are familiar with and took part infederally sponsored programs such as JobCorps, MDTA, or NYC.
The data show that about four ttmos as many black youths as white
youths say they were enrolled in one or more federally sponsored programs.
Table 108 shows the numbers who participated in each of the three programa.
The numbers in Table 108 ar7 somewhat deceptive, however. Sixty
black youths (21 percent of the black sample) and 17 white youths (5 per-
cent of the white sample) were enrolled. Of the 60 black youths, 11 were
enrolled in two of the three programs; none of the 17 white youths ware
enrolled in two programs.
A more detailed breakdown shows that 27 percent of the black males,
24 percent of the black females, 8 percent of the white females and none
of the white males were enrolled in one or more of these programs (set
Table 109). These findings are in line with the family income disparity
between black and white families noted in an earlier section of this
report.
An unexpected finding was that, although these programs enroll
only low-income youths (and college attendance was found to be highly
related to income), about equal proportions of those who attended college
and those who did not attend college had been enrolled in these programs.
The proportion of ex-enrollees who attended college was about 33 percent
for black youths and 47 percent for white youths -- much higher than other
youths from families with similar incomes. Two explanations are equally
plausible; the income from the programs is saved for further education or
program slots are filled selectively with those low-income youths who are
"college material".
148
0156
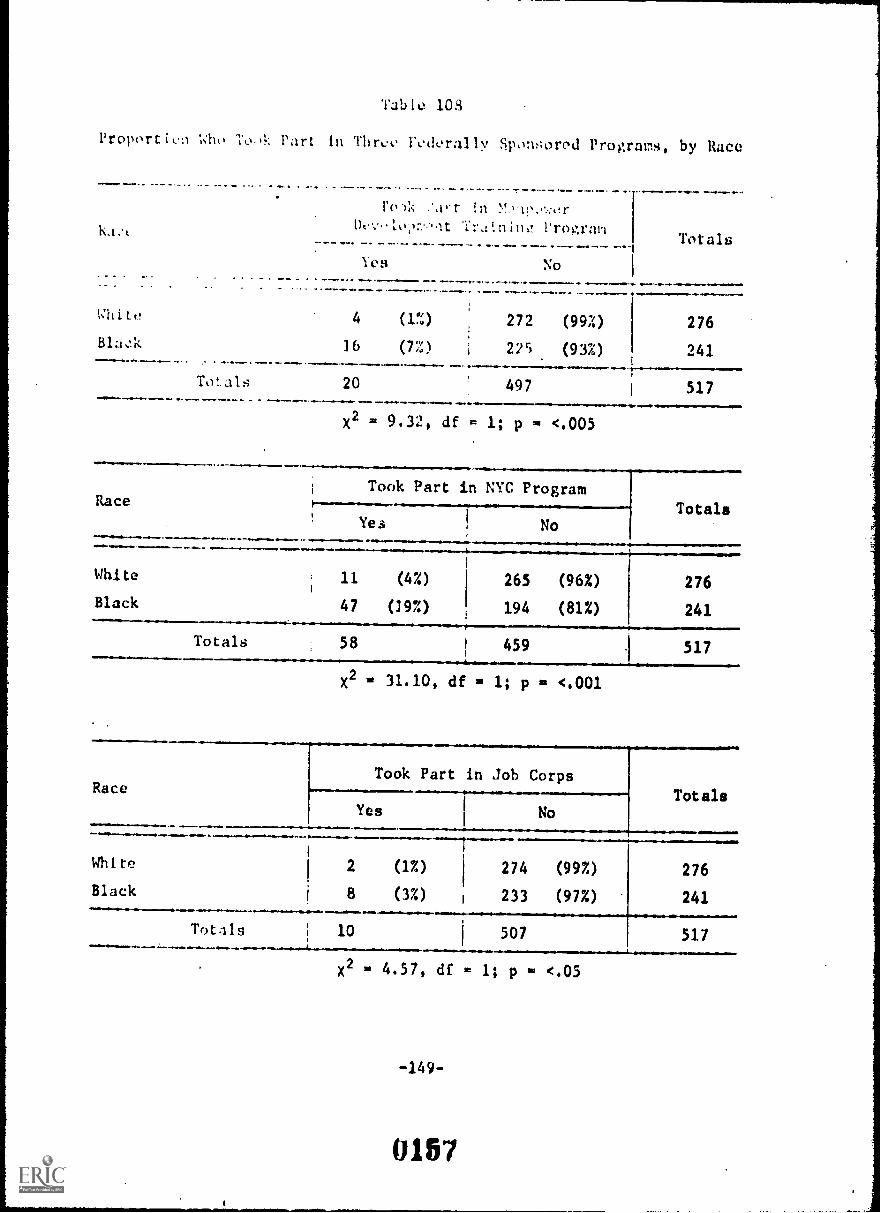
Table lOS
Proportic:1 Who To.4-. Part in Three Federally Spont;orod Prograys, by Race
White
81a 'k
ro)k fart inDvv-iot Prograll
Yea No
4 (1%) 272 (99%)
16 (7%) i 225 (93%)-Totals
.1.11
276
241
Totals 20 497 517
X2 = 9.32, df = 1; p = <.005
Race
White
Black
Totals
Took Part in NYC Program.------
Yes No4.
Totals
11 (4%)
47 (19%)
265 (96%)
194 (81%)
276
241
58 459 517
Race
X2 31.10, df = 1; p = <.001
=.................1111......
ria..el.
White
Black
....111.11Totlls
11.... /111
Took Part in Job Corps
TotalsYes No
2 (1%) 1 274 (99%)
8 (3%) 233 (97%)- 276
241
10 507
X2 = 4.57, df = 1; p = <.05
-149-
0157
517

Race
Black
White
Table 109
Proportion of YouthH Enrolled InOne or More Federal Programs, by Race
Enrolled Not Enrolled
60 (21%)
17 (5%)
230 (792)
311 (95%)
,=1111.111
x 2 33.93, di == I; p <.001
The disproportionate number of black youths who participated in
theHe programs assumes even more significance when we consider that black
youths are more likely than whites to say that the programs were not of-
fered in their communities or that they wanted to take part but didn't
(see Table 110).
Table 110
Proportion Who Say They Did Not Take Part Because ThesePrograms Were Not Available in Their Communities, by Race
Race
Wanted to Take Part But Couldn'tBecause Programs Not Available
No Yes
White
Black
306 (80%)
216 (74%)
22 (7%)
74 (26%)
X2 41.50, df 1; p <.001
-150-
015H
In rcsp,..cts, rho problc:%-; .eJ by a rural youth growing up
in tn,. rural youth growing up in the
:\orth ,;.nth uttond ::ehJols that do not provide the breadth'
of curri;n:lu71 or :,:rvi00-: cht. are pr,,vided In urban schools. The chances
are .gC..11 Chi: Attend a schol in which no one, either trained or un-
traind, is to coun:ielin;,, duttos. BJth lark familiarity with
urban lob- and tel:d to enter the kiNas of jobs with which they are fa-
miliar in the. rural :;otting. Both tend to adjust poorly to life in the
large citie3 to w:ti_ch they are likely to migrate.
Thus, in both settings there is a clear need for an in-school pro-
gram to supplement a weak rural educational system, rather than relying
upon the scLools for leadership in the rural youth program. In both re-
gions, however, the range of services varies so markedly that youths com-
ing from dtfcer'ent communities require different kinds of services fromoutside the community. The ideal project must allow for individualizedapproaches to the problems of individuals and individual communities.
This can best be achieved by providing a wide range of components
from which the project director can choose those components that fill the
gaps in available services. The in-school program should make available
vocational training, occupational familiarizatIon, counseling, office
skills coursPA, and special education in those communities where these
asIcts of education are not provided by the schools. An individual
training plan nhould be developed for each in-school enrollee. The kinds
of components that would be made available to the enrollee through the
program would be dependent upon the kindA of services already being pro-
vided by other local institutions, including the schools.
Inadquacies in local education should- be reason for eligibility
for the in- 'school pro !ram. Thus, the concept of "disadvantaged" would
be broldened to in'ude those rural youths who attend a school in which
-151-
0159

the total enrollment in grades 10, 11, and 12 is less than 100 (an average
of 33.3 or less per clan:;) or who attend a schoOl which has inadequate job
preparation for ita students who are not going to college (no school coun-
selor -- either trained or untrained -- no job familiarization, lack of
relevant vocational courses, etc.). These uonpoverty "disadvantaged" en-
rolleoa would not be paid for participating in the program, nor would they
be placed in work experience slots.
Although outmigration from the rural community is not as extensive
as in the North Central states, a significant proportion of rural youths,
particularly blank youths, do move to the city. This pattern should be
recognized, and one of the objectives of any rural youth program in the
Southeast should be to aid rural youths in making the transition from
rural to urban living if that is their choice. Occupational familiarisa-
tion and occupational counseling should be aimed at both urban and rural
jobs. A component should be provided to familiarize the enrollee with
urban living.
A student should not have to drop out of school to obtain meaning-
ful vocational training. Skill training should be a program component
that can be utilized in rural communities that cannot provide such train-
ing in the school. The training should result in the development of mar-
ketable skills that are not tied to special local employment conditions.
It is neither necessary nor desirable that every enrollee be en-
gaged in a work experience situation. The failure to show any signifi-
cant relationship between part-time work while in high school and either
finding a job after high school or success on the job implies a need to
reassess the value of this program component. The primary role of work
experience in an in-school program for rural youths in the Southeast
should be as a mechanism to provide income supplements; in an in-school
program the primary purpose of these supplements should be to provide
enough money to prevent youths from dropping out of school for lack of
clothing, fees, or other minor expenses.
-152-
01160

11. .1 t.rio;, ,-. lot uhl :;:'t very1 it.it rk;r tor! t v tor ay.11.1.1, le work eY.perience, slot s
sho.11...1 a LI voaths with tin' very lowest in -
Avili1A10.0 e.:1...ciy:.ce slot should not limit
rul i". zt...o r .113 s 0: the pror,ram, howevcr,
Every i, 1..;,1e to increase Cat ntr:hor of work experienceI;lots ava;i.ible 10W1000r.:0 youths in the in-school program. CurrentpAlicies chan....!ed to allow a lirAted nn..,ber of work experience
slot in private settke,ls, particularly if the work experience can be
....howu to he d. ,.ctly relevant to the enrollee's occupational goals.
o'f the large qumer of dropouts that occur at the comple-
tion of the Sth grade, the rural youth in-school program should cover all
eighth-graers, by providing a limited work experience component and an
introJuLtior to the nonacademic offerings, particularly the occupation-
related cour,:es and services of their local high school. The work ex-
perience component for this age group would require a change in currentpolicius.
In part, the in-school program would be an educational program, inthat it would provide many services normally provided by an urban schoolsystem. The prograqi would have two major objectives: to prevent school
aropoutn, and to prepare those who do not drop out to compete more effec-tively with their urban peers after they coLiplete high school, either in
the labor market or in advanced e4ucation. In view of the well-established
relationship between lack of formal education and unemployment, these two
objectives really are reduced to one; the objective is the same as that
of pro.Ading skill training to the school dropout -- to eventually improve
the enrollee's co:vetitIve position in the labor market. It does not make
sense, then, to di:itinguish between an "educational" program for in-school
traines :znd a "manpower training" proxram for out-of-school enrollees.
In th,.. North Central staten, the value of an out-of-school programfor rural youth:; is doubtful. Few drop out of school, and many of those
who do not drop out leave for the city imrnediately. In an experimental
-153-
0161

project in Nebraska, Iowa and Minnesota that covers a rural area as large
as southern New England, we have located so few dropouts who are not em-
ployed that an economical out-of-school project is not feasible. This is
not the case in the rural Southeast. There are more dropouts, and fewer
of the dropouts leave their rural communities to live elsewhere.
;ecause of the very strong relationship in the Southeast between
poverty and dropping out of school, it should not be assumed that the
school dropout has less ability than his peers who did not drop out.
First priority for the overall program should be given to prevent-
ing school dropouts; second priority should be given to returning the
dropouts to school. If these efforts fail, itis essential to have an
out-of-school program that emphasizes skill training as preparation for
an entry level job. The present NYC-II program, with minor modification,
seems appropriate. The modification should be in the direction or empha-
sis, not in the content of the program. It should be recognized that the
present high dropout rate from schools in the rural parts of the Southeast
is not part of a nationwide rural trend. It seems doubtful that any out-
of-school program can make tte rural dropout from a Southern school emir
petitive with the rural high school graduate from the North when they both
move to the same city. The out-of-school enrollee should be made aware of
this fact. Every effort should be made to "graduate" him back into the
formal educational system rather than into the labor force.
If the out-of-school program and the in-school program are properly
coordinated, much might be achieved toward this end. The kind of in-school
program outlined above has the possibility of enriching the offerings of
the rural school so they will be attractive to the dropout. If the out-
of-school enrollee left school for lack of money, an in-school work ex-
perience slot can be arranged. The school dropout should be made aware
that with a GED certificate he can "skip" returning to high school and go
immediately into college or vocational/technical school if.he has the abil-
ity. The GED should be given more emphasis than at present.
-154-
0162

t otIt. 1 i 1..ttc.!( r..orc dotU.1 iti.t ...61, t 1 .kt "Ct 1.1 I for 1:ttral YouthPro r." :luso t orn


L.' i. Ik'
1.. :1 t
stc.;11.:. ( ..-1:))
2.
3. Bau,h....kn, E. Earl, and D.1.1:trom, W. Grant, and White ChilcIsplaA l';-,',11:*1 1 ;.tus...: of tisk.. Pmr.;1 Youth, ;ew York: Acadk.n..ic Press (lc" ,1).
4. Dc.11,, Calvin L., and Doue, Donald L., Recent in theco Rk.!:..,1 AreaF, V. S. Doparte. i6 of Agri.
culture, Lcun. Res. 6ur., I.u:::):Jr 23 (January 19(,3).
54 Be:11c, Calvin L. , "Rural Dcpopulation in the United States: Some Demo*graphic Cousecucnccs of Ai.ricultural Adjustments", Denaraphy, 1,pp. 264-272 (1)64).'
6. Beale, Calvin L. , "The No:-;ro in A=rican Agriculture", in Davis, JohnP., Editor, Th,2 Refrenco Lnglewood Cliffs, New Jersey:Frvutic(!-Hall, Luc., pp. 161-205 (1c)69).
COrt 161104
Bact.n, 1,1..) ys!, iTovotv RurA. to Urban igrants",(Junk 1:;71).
Calvintf
rQparLmut. of
L., Ranks, J. Vera, and Bowles, Gladys X., Trends and Outlook tn, 41:1.,:ulture OuLlo:)k ConferenZerldr.
A&riculturo, Econ. Res. Serv. (November 1966).
8. Bealu, Calvin L. and Tarver, James D., "RelatiDnship of Changes in Em*ploy:':.c.nt and Age Coposition to the Population Chalves in Southern Vonmetr000litan Towns", Rural Soi11slaz;!:, 1A,. No 1 (March 1969).
9, Beale, Cnlvin L., "Burch-Urb.m1 Migration of Blacks: Past 'Ind Future",Jornd of ..,n..icultural Fooncnics, 22, No. 2 G ;./1).
10. Beegle, J. Allen, Scr:c ChariclerIF:ties of PAm'.1 ycluth,Papur for LL,- NItionr.1 Conlcrrcnce on Problems of Rural Youth in a Chang-ing (Sc.pter 1963).
11. Beer,', Vo,:rd and Heflin, C7thc.rim.!, Rural Pcolle in The City, Agricultural Expc:rir..Alt Station Builtin ro. 4Th (July 1945).
12. Bei'm ;!nd Ocxand,.r, flucation, Chicago,Lnd Cf,rpa:!y
13. iyfrtrnd, Le) E.outh: A Repion Confron-Latlx% Yilh 4 (Doccr.ber. 1960.
14. hire!,
U. F.
Al,n dad :(:;(1, irbn L, V.1;!tri_(:)1::; In nr*Povf.rty,Dopr t:. of. of Ecrin. lk4 (.ovet.:)er 1907).
- A-1 -
0165

113T COPY Nmutom4....._ ,..,;
i
31. Cmhi, .1:1.7t.'S D. and Beale, Calvin L., "Rvlati .0 Socioeconomic Statusof So.thertt Whites and :;on.:1,ites, 1950 ar.d 196 ", The So...thwesternSoci.!l S.....:icce$Y1rctrtx, p5, pp. 113-124 ( September 1964),
32. Cowhif!, J. D. and Nam, C. B., "Educational Status, College Plans and'Occup4tional Status of Form and Nonfarm Youth", Form Ponklaritiu,Washinton, D. C., Econ. Res. Ser., U. S. Department of Agriculture,(August 1961).
33. Cowhig,-J. D. and Beale, C. L., "The Rising Levels of Education AmongYoung 1:orkers'; monthlyhitarlEire, pp. 625-628 (January 1965).
34. Crecink, John C., and Steptol, Roosevelt, Runsin_Wources in the RuralvRaLwio OWAlig_on thejteer, Washington, D. C.,
Leon. ges. Ser., U. S. Di:partnont of ..%griculture (January 1970).
35. Cushman, M. L., The Role of SchtiistrietikequienisntioInitRurAl rducntien, Paper for the National Conference on Problems of RuralYouth in a Changing EnvironT.ent (Sei.tember 1963).
36. Davis, Foster, "Darkness on the Delta", New Yorks 11112sporter (September21,1967). ,^
37. Davis, John P., Ed., The Arerican Neero Reference Book, EnglewoodCliffs, New Jersey: Prentice-Hall (1966).
38. Davey, Donald, "Negro Employment in Southern Industry", Journal of,PolitIcni rec:-.o-w, 55, pp. 279-293 (August 1952).
39. Dollard, John, Caste and Class in a Southern To:El, Garden City, NewYorks Doubleday-Anchur Book (1937).
40. Douglas, G. V. and Agthe, D., "The Impact of Urban Out-Migration of.
Rural Youth", Extension Service Ravie, 2i, pp. 148-149 (August 1963).
41. Doems, Anthony, "Alternate Futures for the American Ghetto", paedeluk,97, pp. 331-1376 (Fall 1968).
42. Drabick, Lawrence W., Occupational and Educational Plans of vocAllgalAviculturt stoonts_inNorttLoirotn., Research Series No. 1, Raleigh,North C.Irolina, :orth Carolina State University, Department of Agricul-tural tducation and Rural Sociology (1963).
43. Ducoff, L. J., Beale, Calvin L, and Vats, Charles B., Ae.o-Orade SchoolofFarnenfernh Youth - 19f0, ashin;;ton, D. C., Econ.
Res. U. 5. DF,part.r._qa. of AEriculture (August 1963).
44. Ducoff, L. J. , Seale, Calvin %.1 and ::nm, Chhrlcs t. , robra:0 _Dropout.Amors_yarm Apd.RonfAimth-1, A,:r. Econ. i!eport 42, Va:lhingion,
D. C., Econ. Res. Ser., U. S. rkpart:.2nt of /4;riculture (September 1963).
- A-3 -
0166

BUT COPY AVAIUMLE
15. Bird, Ronald and Boverly, Lucia, r.tu.s of Rural Housim! in The UniteA
Mates, M. Econ. neport 144, Waaini,ton, D.C., U. S. Department ofAgriculture, Econ. F.4s. Ser. (Soptezlier 196S).
16. Boxley, Robert F., Jr., White and NonYhlte_0::ners of. Rural Land in theEsathest, Econ. Res. Ser. No. 23S, Washington, D. C., U. S. Departmentof Agriculture, Econ. Res. Ser. (June .1965).
17. Boykin, William C., Sr., Edu:ntional and Occunationnl Orientation °tNegro Xale Youth in the Mississin,i Delta, Washington, D. C., U. S.Departnt of health, Education and Welfare (1969).
18. Briggs, Vernon M., Jr., "Manpower Programs and Regional Development",Monthly Labor Review, 21, pp. 55-61 (March 1968).
19. Brown, Claude, manchild in a Promised Land, New York: Signet Books (1965).
20. Bryan, C. Hobon and Bertrand, Alvin L., Prommitv fu Change AmoasahlRural Poor in the Missillipti Delta, Washington, D. C., U. S. Departoment of Agriculture (June 1970).
S.
21. Burchinal, Lee G., "Faro Versus Nonfarm Youth in the Urban Labor MArket", Extension Service Review, 3, p. 144 (August 1963);
22. Burchinal, Lee O. and Cowhig, James D., Rural Youth in An Vrban Socills,Washington, D.C., Econ. Res. Ser., U. S. Department of Agriculture(September-October 1963).
23. Carter, Uodding, "The Negro Exodus From the Delta Continues", New YorksY.ork Tires Marazine (March 10, 1960.
24. Clancy, Paul, "Can The Southern Negro Exodus Be Stemmed", New YorksThe Reporter (November 2, 1967).
25. Clark, Kenneth, Social and Econoiic Innlications of InaultiogslaiPublic Schools, Seminar on Manpower Policy and Programs,Washington,A. C., U. S.' Department of Labor (1964).
26. Clark, Kenneth; Dark Ghetto, New York: Harper Torchbooks (1965).
27. Cole's, Robert, Toe Peseartletion of PtMic Schools, The Biai erith Leagueand the'Southern Regional Co: trance (July 1963).
28. Coles, Robert, Children of tr_Sres, toston: Little, Brown and Company (1964).
29. Canby, Arftur, "Bl;!ck-!.:hit Differences in Aspirations Among Deep SouthHigh Sc!.9)1 Stm.:(1;ts", offic-ro Eeucntion (1970).
30. Cowhig, J, D., (",iract.Pri:itics of .Schaal Droinuts and PIO School Crsd-
Nonfart1101 As. rAun. Report :4). 65, se:asbington,D. C. Lcon Str., U. S. liepartc7::nt. of Agriculture (Decm:ber 1964).
- A-2 -
0161

IIST COPY AVAILAILE
45. Eckstein, Otto, Education Fnnlov-mc ond Nor!ro Eepalitv, Seminar onManpower Policy and 1'rogr4ms, l;:.$1:ington, D. C., U. S. Department ofLabor (1968).
46. Edins ton, Everett D., "Disadvantaged Rural Youth", Review of EducationakResearch, 40, pp. 69-85 (rebruary 1970).
47. Elder, Glen H., "Achiewmant Orientations and Career Patterns of RuralYo-uth" Sociolocv of Education, 37, No. 1 (1963).
48. Freedman, Ronald and Fruadman, Deborah, "Farm Reared Elements in theNonfarm Population", Bull_tociclozy, 21, pp. 50-60 (1956).
49. Freeman, Robert E., Rural Housinz: Trends and Prosnects, Econ. Res.Ser. Report No. 193, Washington, D. C., Econ. Res. Ser., U. S. Departsent of Agriculture (1970.
30. Fried, Marc, 'Deprivation and Migration: Dilemmas of Casual Interpretation,"in l!oynihan, Daniel P., Ed. 'On UnderstanAine Poverty, New York:
Basic Books, pp. 111-159 (1969)
51. Ciles, Harvey, The Inte rated Classroom, New York: Basic Book (1959).
32. Godwin, Winifred, "A Determined Effort to Improve Higher Education",lignAhlyjobor Review, 21, pp. 44-49 (1968).
53. Colden, Harry, "Welfare and the Poor in North Carolina", New York:The Nation (May 20, 1968).
54. Cottleib, D., "Goal Aspirations and Social Fulfillment: Difference le.tween Deprived and Affluent American Adolescents", American amail.21agstaygaux, 2i, pp. 934.941 (October 1964).
55. Cray, Irwin, "Now Industry in a Rural Area", Monthly Labor iwits4,pp. 26-31 (June 1969).
56. Hamlin, Herbert, "Education to Serve Occupational.Needs", Hollaulku.review, IL, pp. 49-54 (arch 1968).
57. Hansen, Niles M., Rural Poverty and the Urban Crises: A StraugyauRealLnal Develoonent, Bloomington, Indiana : Indiana University Press (1070).
58. Holloway, R. G. and Bereman, J. V., "The Educational and OccupationalAspiraticns of Negro and 1:hite Male Elementary School Students",Pacific Sociolo-icn1 Rc,yiew, 2., pp. 56-60 (Fall 1959).
59. Howe, T. G., 'Tomer Stufknts Leek at Vocational Technical Education,Tot..i.L1"arn _!_ervice, 18, pp. 562-564 (November 1963).
60, Hurst, Po$wrt L., rurllyn,lf;ir,.i.n_tte?._Nortr;:nt Crotatlinin Arc1121swith Vcnn. Sr!r, it(i.ort Nu. 163, %11:;hinLcon, D. C4,
Econ. iJ2s. U. S. TPA,Artve.Int of Agriculture (19G9).
-A-4
0168

OIST COPY AMMAN
61. Isenber!z, Exhort M., "Are Rural Youth Cettin::, an Equal Drc!ak Education-ally", E::ton5ton Scrvice R!view, 34, pp. 146-147 (Aupst 1963).
62. Jam:Is, G. B., yocatonal and Tecl,rical Education at PoFtlieSclareiLevel for Rural jouth, P.:par for ti;e National Conference c1:1 Vroblomsof Rural Youtn in a C:lan;;ins Environmf:nt ,,tptev.^..: 1963) .
63. Jones, E. Walton, "Farm Labor and Public Policy", Monthly 1,0221Aultx,21, pp. 12-15 (arch 1968).
64. Kadel, David E., "Environmental Factors, Student Variables, and tinplormeat Adjustment of Male Nawoes", Journal of Nevi.° Education, & NO.4, pp. 333-340 (Fall 1970).
65. Kidder, Alice Handsaker, "Racial Differences in Job Search and Wages",hanthlv Lzhor Review, 91, pp. 24-26 (July 1968).
66. Killian, Lewis M., "The Adjustment of Southern White Migrants to NoritilernUrban ;;orms", Social Forces, 42 pp. 66-69 (October 1953).
67. Kuvelsky, W. P. and Sealer, R. C., "The Relevance of AdolescentsOccupational Aspirations and Subsequent Job Attainment", ural ilikaux2z, pp. 290-301 (September 1967).
68. Kuvelsky, Uilliam P. and Ohlendorf, George W., "A Rural-Urban Comparisonof the Occupational Status Orientations of Negro Boys", Ruml Soot,21, 2 (June 1968).
69. Kuvelsky, William P. anc. Pelham, John T., "Place of Residence Projectionsof Rural Youth: A Racial Comparison", Social Science .Quart, 11,(June 1970).
70. Liebhafsky, E. E., "Migration and the Labor Force: Prospects", ligmAblxLabor Review, 91, No. 3 (}larch 1968).
71. Maddox, Jams, Liebhaysky, E. E., Henderson, Vivian, and Hamlin, Herabert, The Advaneinl South: :!Anoover Proiectionsj ProupstsirsstdPbleTs, :;ew York: The Twentieth Century Fund (1967).
72. Maitland, Sheridan T., and Knebel, Stanley M., "Rural to Urban Tran-sition", La or P.ei.(!wl 91, pp. 28-33 (June 1962).
73. McCoy, John L. Rural Pn?ertv in Threc. SoutHrn rmvions: Mississil1)^1t- --e 11-", CcAst,1 P,,ir Wshinncon D C Econ.
1.(:r., U. S. Dc;,rt:-.!nt of A':;r1cuiture (Wren 1970).
74. mc;:ivp,m, r! ,ryr!.;;,t.fr of VumanPv:murcr,s_int_heturalsnisfile.w nr 1 "14in, WAs.:;tri,ton, D. G., Econ. Res. Ser., Us S.
n: i,lriculiuru W69) .
- A-5 -
0169

PEST COPY ARIUS!
75. McLaughlin, Glenn E., and Robock, Stefan, Wk. Industry Moves Sout h,Ningsport, Tennessco: Nuiopport Press (1949).
76. Mercer, Blaine E., "Rural Migration to Urban Settings,- Educational andWelfare Prugrams", The Social Stt:dies, 21, pp. 59.66 (February 1964).
77. Middleton, Russell and Gregg, Charles M., "Rural-Urban Differences inAspirations", Rural Sosielesx, 24, (1959).
78. Moon, Seung Gya and McCann, Glenn C., Sub-RePio ofFactors of Rurallimilies in the.12Ath, Washington, D. C.,
Econ. Res. Ser., U. S. Department of Agriculture (January 1966).
79. Moore, E. J., Baum, E. L., and Glasiow, R. B., fsehomic Factors Inflirencinc,Educztional Arcatimull_and Atairations oflarmyogths, Apr.Econ. Report 51, Washin;ton, D. C., Econ. Res. Ser., U. S. Departmentof Agriculture (April 1964).
$0. Moore, J. W., Pro bar. of. Rural Schools to Reduce The IncidvaLs=22outs, Paper For Lne National Conference on Problems of Rural Youth in &Changing Lnvirortment (September 1963).
$1. Morris, Glyn, Guidance Counselincjor Adult qartul, Paper for theNational Conference on Problems of Rural Youth in a Changing Environment(September 1963).
82. Moynihan, Daniel P., On Lnderstandine Poverty, Now York: Basic Seeks(1968).
83. Nam, Charles and C0big, J. D., "Factors Related to College Attendanceof Farm and Nonfarm High School Graduates, 1960", Ciatrent Poet,mat, No. 32, Washington, D. C., Census Econ. Rea. Ser., pp. 17.45(June 1962).
$4. Nam, Charles and Powers,' Mary, Educational Itstal_gEural Yota, Paperfo'r the National Conference on Problems of Rural Youth in a ChangingEnvironment (September 1963).
$5. National Center For Educational Statistics, SatiltjcsofgAteStatSchool Syr.teri.34. (1967-8).
86. National Center For Educational Statistics, Statisticsof Public(Pall 1969).
87. National Education Association, Rankin ,of States 1971.
88. N,-Ilson, Eirdin H., et. al., Factortlaty,1 to tevels of Liying_ofPoir.112(1L(.1,1sin!1:-..crAle Arens of the fin:Ith, Washington, D. C.,U. S. Dopari!::nE of 4ricuaure Gecember 1960.
89. V,.:wmin, r)o:-c,i1,7 K., "Th,2 ::rour, journey to the City - Part I", Ilraltht/Ft.;
- A-6 -
017U

OUT COPY AWARE
90. Omari, Thompson Peter, "Factors Associated With Urban Adjustrent ofRural Southern Mi;rants", Social fo: , 21, pp. 47-53 (1956-1957).
91. O'Reilly, 11obert, Racial ar:: Social Closs Isoktion In th,e Scholl,New Yorks Priieer Publishers (1V70).
92. Orfield, Gary, The Reco-aatrt:ction of Southern Uucation, Now YorksJohn Wiley and Sons (1969).
93. Piore, Michael J., "Negro Workers in the Mtssissippi Delta", mawLabor Review, 91, pp. 23-25 (April 1968).
94. Ponder, Henry, "Prospects for Black Farmers in the Years Ahead",American JgazIal Airicultural Ecoumics, 53, No. 2 (May 1971).
95 Presidents Advisory Commission on Rural Poverty, ThPeele uttuttind,Washington, D. C., U. S. Government Printing Office (September 1967).
96. Ramsey, Ralph-J., Services cni rnvireamloal Wallmont Needoljtx.
R.pral Youth Who Move to Urb:In Communities, Speechltesented at the*National Outlook Conference on Rurcl Youth, Washington, D. C. (1967).
9Z. Reoort of the National Advisory Commission on Civil Disorkm, NowYork: Bantam Books (March 1969).
98. Rogers, Charles H., et. al., Teenomynemoloopent in Two SelectodamalCounties in tt South,- Raleigh, North Carolina, North Carolina Stateunivursity, center for Occupational Education (1969).
99. Rose, Arnold, The hero in America, New York: Harper and Row (1944).
100. Selected Studies of ::ergo Emplument in the South, Report No. 6, logepared for the National Planning Association Committee of the South,Washington, D. C., National Publishing Company (1955).
101. Silberman, Charles, Crises in Black and White, New Yorks Random House(1964).
102. Skare,'Orlan and Hartig, Edward, "Counseling Rural Students", mammaJournal of reucation, LA, pp. 11-12 (May 1966).
103. Slocum, Walter L., "Recent Changes in American Agriculture", in Mn'Sociolo2v, New York: Harper Brother (1962).
104. Slocum, Walter L., i1Fnirat!prs an-1 rxoectations of the Rural Poor -
A c.!ii,2 to k,-.-0-t-h C., Leon. Res. Ser., U. S. Depart-ctcnt. of Ai;ricu1ture (October 1967).
105. S:7ith, Dec,"Mirration and AdjuA:lent Experiences of Rural MigrantVorkerb in Irelianapolib, Indiana"(Ph.d. Desscrtation, University ofWismnr.in) (M3).
- A.7 .
0171
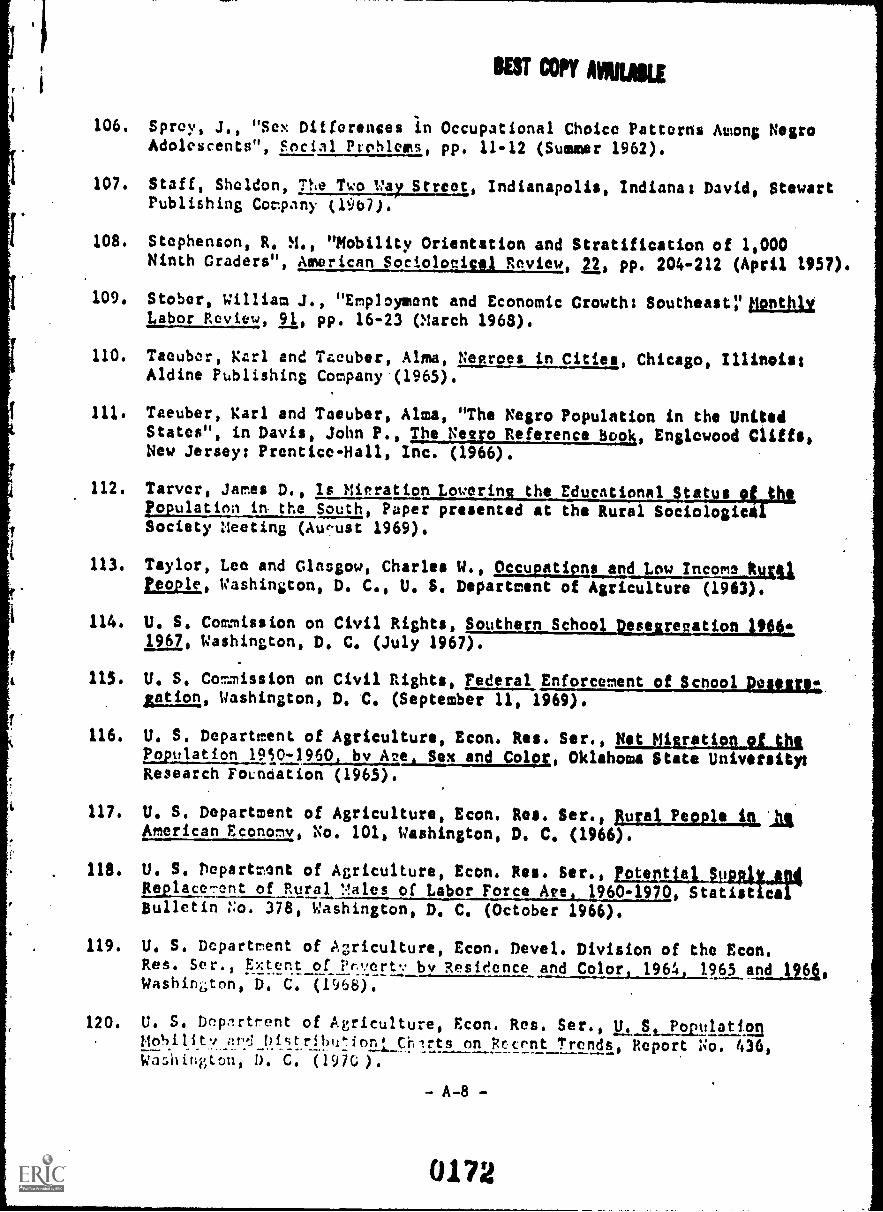
BEST COPY MUM
106. Sprey, J., "Sex Differences in Occupational Choice Patterns Among NegroAdolescents", Social Prohlems, pp. 11-12 (Summer 1962).
107. Staff, Sheldon, IThexelaxLIcsi, Indianapolis, Indiana: David, StewartPublishing Company (1%?).
108. Stephenson, R. M., "Mobility Orientation and Stratification of 1,000Ninth Graders", American Socioloeicel Review, 21, pp. 204-212 (April 1957).
109. Stober, William J., "Employment and Economic Growth: Southeastrponth1VLabor Review, 91, pp. 16-23 (March 1968).
110. Taeuber, Karl and Taeuber, Alma, Negroes in Cities, Chicago, Illinois:Aldine Publishing Company (1965).
111. Taeuber, Karl and Taeuber, Alma, "The Kegro Population in the UnitedStates", in Davis, John P., The Negro Reference Book, Englewood Cliffs,New Jersey: Prentice-Hall, Inc. (1966).
112. Tarver, James D., Is Mieration Lowerine the Educational StatusPopulation in the South, Paper presented at the Rural Sociologic*Society Meeting (august 1969).
113. Taylor, Lee and Glasgow, Charles W., Occupations and Low Income MAIPeople, Washington, D. C., U. S. Department of Agriculture (1963).
114. U. S. Commission on Civil Rights, Southern School angulation 196641967, Washington, D. C. (July 1967).
115. U. S. Commission on Civil Rights, Federal Enforcement of unsoullum.ration, Washington, D. Z. (September 11, 1969).
116. U. S. Department of Agriculture, Econ. Res. Ser., NitPopulation 1950 1960 by Aee Sex and Colot, Oklahoma State University'sResearch Foundation (1965).
117. U. S. Department of Agriculture, Econ. Res. Ser., Aural Pegg* 0,14American Economy, No. 101, Washington, D. C. (1966).
118. U. S. Pcpartmont of Agriculture, Econ. Res. Ser., totentid_Reelace.rent of Rural Males of Labor Force Ate 1960-1970, Statist eaBulletin No. 378, Washington, D. C. (October 1966).
119. U. S. Department of Agriculture, Econ. Devel. Division of the Econ.Res. Ser., Txter.t_of Pr,.,ert by Resiecnce and ColorA126A,1963 and 190,Washington, D. C. (1968).
120. U. S. Deprtrent of Agriculture, Econ. Res. Ser., U. S. PopulationmoSility aNi bi%tribution. Chirts on Recrnt Trends Report No. 436,Wa5hiugton, D. C. (1970) .
-A-8-
0172

OUT COPY AVAILAILE
121. U. S. Departme7t of Agriculture, Econ. Res. Ser., The Economic andpciqcoildic :en of Rural America in the 1970's, Washington, D. C.(May 1911).
122. U. S. Department of Commerce, Bureau of Census, _Educational AttainmeniFor the Years 1965 146 1967 1968. 19C9 and 19 0, Washington, Z. C.
123. U.S... Department of Commerce, Bureau of Census, School Enrollment,Washington, D. C. ;October 1970).
124. U. S. Department of Commerce, Bureau of the Census, 1220csnsus Qs,
Population and Housing, Reports Numbered (PHC (2)2; Pnc (2)-12;PHC (2)-26; ?iIC (2)-35; PliC (2)-42, Washington, D. C. (May, June,July 1971).
125. U. S. Department of Commerce, Bureau of the Census, Statistical Abu.gtre.ct of_thplinited States 1971 92nd Edition, Washington:T:1r(1971).
126. U. S. Department of Commerce, Bureau of the Census, Population Tropifau, Reports Numbered PHC (2)2; PHC (2)-12; PHC (2)26; PHC (2).314Z'HC (2) -42, Washington, D. C. (Hay, June, and July 1971).
127. U. S. Department of Commerce, Office of Business Economics, Survey ofCurrent Fusiness, Washington, D. C. (1970).
128. U. S. Department of Health, Education and WelfarellallasathinCrises Facts Myths And Social Chance, Washington, D. C. (1963).
129. U. S. Department of Health, Education and Welfare, Statuscansiz..Public School Districts in 17 Southern and Border States, Washington,D. C. (September 1967).
130. U. S. Department of Health, Education. and Welfare, howlimIsteolSystems ante rested, Planned Educational Change, Volume 4, Washington,IL C. (1969).
131. U. S. Department of Labor, Bureau of Labor Statistics, Black Americans -A_Ch.nrtb.s70,i, Bulletin 1699, Washington, D.C. (1971).
132. U. S. Dep,Irtr7.ent of Labor, Bureau of Labor Statistics, NeEroes in theUnited Str.tes: Their Ecoro-lic Are Social Situation, Washington, D. C.(June 1966).
133. U. S. ncipart!-..ant of. Labor, and U. S. Departme.ynt of Commerce, Soeinand YconomicC::,7d:tic,n7;nLpesrr2s in the Vnited States, Washington,D. C. (Oct.o6r 1967) .
-A-9-

APPENDIX B
QUESTIONNAIRES
0174

t
N.
!
UST COPY AVAILABLE
t: ''. ! t
stud,
4'1! ..1 L 11r t, Wt.. I Re? !It ' ?-1te.m 11,11 C: /S.A.)!
(It t. gn'
% 1: 4,1? AL4 N.,14h . N.o- -.0 :4, -, )11 A.) with Or atd trr,rn'
In 0 I,. , ),4 V Vol. Leon t.o.;.it.411(r I t t. toI iv !r..11 tA4v.i-
wreicA,
1 L: ,2 7C
.:t J (.1.itn y
11 4 14r" LJ 111 t,wn eovi. Lt:! n l atm l'n reNtor%Jt (WI
I. c It et he I ea. ....I...or .11.
:1 4 g ..o( u. lit /lift l4144! . (write in.
kr 4rP totetrtr In 4, if 4, 4st. 0410 ( .1,,tnl t,.. V0414 1464 th(c)1,h 146t1.
LI tablu1: attvi nd 1. * I1v1 r t: A 'lb !) . .! (I :1.
Strl tu aster e... tytt; tiet 41 14-(t:.4.1 but not °Ilan.1,:rit "2- a! tat rah tiv(t% .11 y4.1 vet vi t- Act
_
kAi!.NIL% ut_
L'n.(.14 ii:t-,rr111..1 alone .r:4;tt
you usually didh 1r told%
Atte,al:A .N11,4 -- I Lolier LA with it landsAt tr, /0,- 1: Piro(' 1. alone Livith friends"unties -
Li alor.e tlwlth friendsri,! . -
alone fiwith frfelids
Mr.6.11ritLi alone Li with friends
Llotertfl4 to 1.1 ..... U with friends
-.1o4Lca1 --.--------- ...... Li alone Lltrith Wends
olfin4. %kW. 'Akin*, Writ, orsport ----- 2alone Chitin friends
Whileb411, roothfill, halladt.541/ or Wet L.11sports (nut solo:tato:1 tb .=
Vat, bins TV Jslons Ciiilth friends
"0qi; 'Hoakf h it -N tr ).p t other *n-.1.41 cl,bq - - - Udlane Uwith friendsMI :W.._ Arr,M In 4r4 Li m lutio Litolth friends
ter (r.41Irg 4,11(4,Mt t Pt '.) "' Li alone L, with friehis
LoIM4 , bit tVr!2. .)
Li alone Li with friends
vt.lor tat I. slop' u with friends
slots 0 with friends
.11111.- slnne wit'. frionds
.OA". ... . ...a
--Illaymotyay-
11 . to .:r- )4.,. 4i 1 I 4. A: !,-;14 m te:. Re(' t.. y .4 no
1: 1 1 .4 s, t 141,4, _1 Or rme (Any r. .sr 4 Pa:, did y,o waists T% ?
Ito/ I. Fell , 11;4 4h* 1/1* 114 /mol Megq1Aliv t0.14 a -!1$ %It)," now.pater nr MOWN
,.11 ri0 "f 7) 4 ' I1 :14 r tv!' Il% I: 4 f It ( ti.4!' one year?
'U, -0 0-ot
( 11r1 (4.4tr1
n - 1
0175

toft NOVO
11- me.. Lc.. 4 :., 14:. Lite .:.er 1 voolation fat
llt ,t, - .ttles %:t1C44.
Stele
41
A114 1111411
---------..--!-e cede, '0.1 .1..y .:.:se :rtends nr relatives who lived In
late. :%tv ve4Betaeeu r,,1 of Inv C!:.4312f3 stoup of C10.! that wok,10,0. 1 bee city 4,..1 et at 1.:41v1 once 4 !Out!.?
yes Li no
(IF YEi :n ;ma cite41.
(city) (state)la. Se:ween 1954 1;OR din voa make cloning trice, on a regular baia, to a city of
over popx.:atinn!1..113
(IF YES) T. city'
(city) (stele)
Abo ut how. often' less thin once ronth Ci about mica a month
C.2 to 4 times month C)one or MOTs 110101 a WOOk
1). Between lYt,i Av.! wh.it did vaur father do fur a living' (If he had friOfe thanone 10',, 1/it only the major one.) Please tell .111 vhet Pni of work he did, nutwho he worked for.
(writ in)
20. Meals ar.,D tte last grads of school that your father completed.
Grade Sch.col: IllAh $ thopl: col,leket
1 2 3 4 5 e. 7 8 9 10 11 12 1 2 3 4 mote21. Please e.7771-; the last grade of school that vou completed. If you aro still
pin; to scrool, please ritle your preeert grade.
Grade se!hnol: Wk Scool: Wan:1 2 7 4 5 6 7 8 1 10 11 12 1 2 3 4 more
22. What high school(s) lid you attend' (Use Parts A through D, as needed.)
is dig :.mot attend high school (Skip to Question 30)
A. Went to high school 13(new of school) (town)
(mober) (Moiyr)
(state)
from to
Nlirom-1110.
B. went to
(n..* of school)
from
(Mu/yr)amgool
high school to
to
rrtoriTi-
- B-2 -
0176
(town) etatel
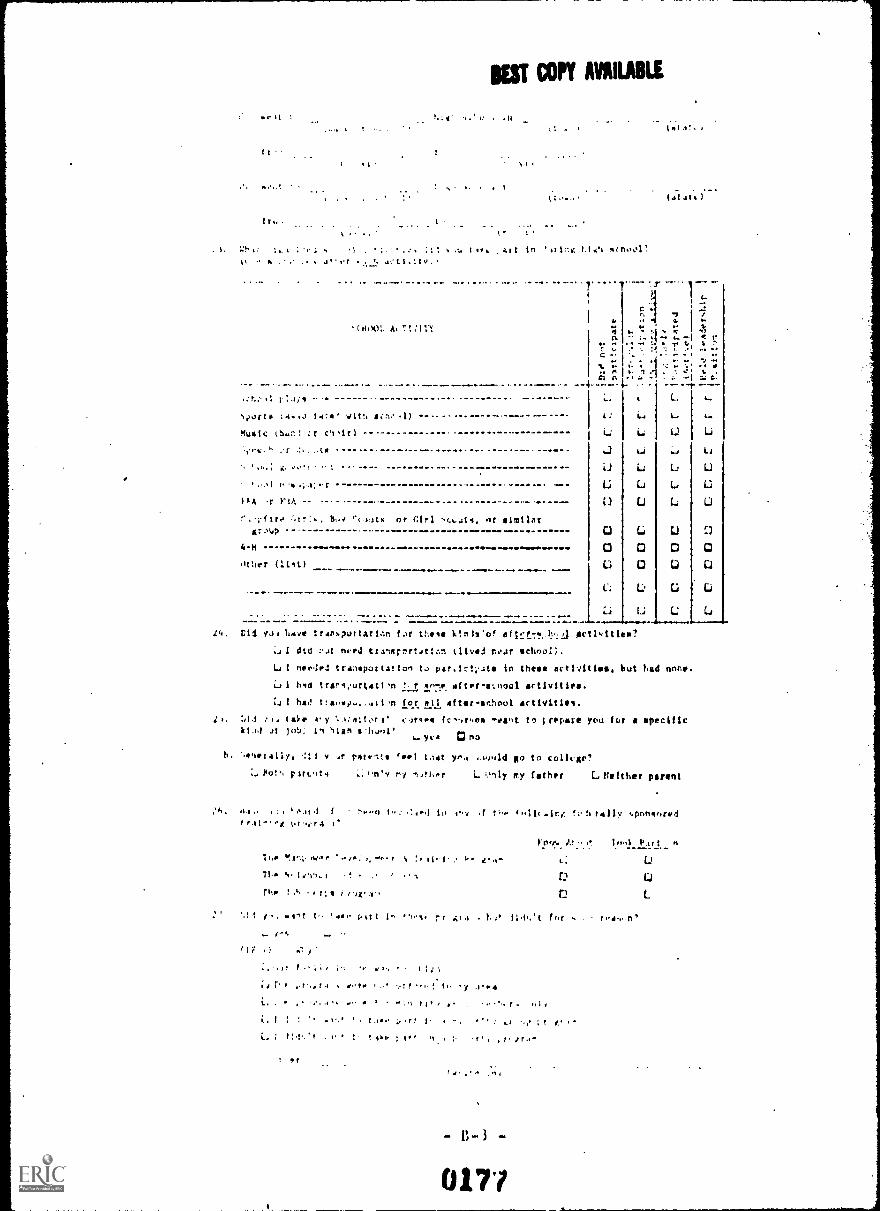
f I
tr .
- I. 1.1' t, 1.. 1 ..1
t.,
MT COPY AVAILABLE
t
(81.1: I
. N 1 Is. ..11t in .1t1:-.v, 1.1,0 s; n.'.'1'a.er
,(ti,$):. A, 7!;11,"f
11 dithmusic (S. c't ir )
v.: ....... -7
..,1 p ow D on .
-r
True Girl c.uts, or similara: Nun -
6.1t ------other (list)
(4(..ste I
L
O
l';
1.
U
OO
L.
U
U
U0
U
Lai
14
U
U
O
Li
4'.. Vid yol have tranupottatie.n for kfols'o' actities?I dttl ;.Lt need tranern.rtaric.n. klivei roar school).
U 1 tterled transportation to par.ir.!;at in these activities, but had none
tind tr 7,urtatim ftr-s..noul activities.
U I had for all after-school activities.It. '01.1 take 4. y i:itt tor c NtrIt to lrepaire you for SPeCiliCkto Jt jo), in Tian
ya no
h. v Af pat .-its 'ell that y.1 .suu1d so to collage?no!'. pgrr.,,t4 ray L r.cily try father C.Heither parent
.,1. III, ; '..u1 ft ral 4
11, t-,v ,f t, f tally .ponsored
n
Y..vv, 11 -1.
Ti '
11, tt r)a a.
/ .4! t ' t, it t Fr .41 c f or . r044-n'
'IFf;.. ; at, 11e1
4L.. --.1 ,L. I ' .,. ;,,r:L. ; . p LL,. ; It ot.
f
.10.4
, t
- B-3 -
017/

:11
KST COPY AVAILABLE
. ' , . .1..
1
1A..." t . . ;
!I; . , I.VI: I t
...v.,* t .
t.. ri.mat to help ey
etelo.azy
(*rite 1-.1
.:1 5 , 6a.* in h.h1J; it firalcivi het? had bo.q: ghan to you?
%-14
C. -. !,a:r w:m.el in 4..f. .! if tho tioJ hid a r,unaelor with whv4' .L pi
yeq L no
you work ;,frt-tiP.e t.,l vov while uoa in high school?
vas :,.7Q (Co on t.' .;eatiort
(IF YFA! Please illl it tip to::owing table; to be sure that the informationis co:reit for rich year.
Nom ; :his ta:,1 e :o :, re three kniJ4 c i work.Fill in the a.lawers for ecrh kind.
.1. .11011.,641...SOMM110.
Sept1964
to Aug190
Sept1965
to Aug1966
fept
1966
to Aug1,4t7
Sept-1967
to Aug196a
0) Fawn .p:i:
e. N1.:34C 3f months cmplryrd dt.ring school year(write in;
b. N.. -.er of h.onthi e-p1-..0.1 'during summer
vacation tem. in)
c. if not *ploved on CIe farm. did you try toget farm w...60
...
LI yes
Li no
......
Li yes
C.4 no
...4 yes
.:.: no
-.-.
0 yesc., no
(2) ijnferm work (In tn" of lees than 5',01............
pooulailun):
a. Number of months employal ciiring +.hool year(writs in)
b. Number of month* *-mlvyed during summer%watt: 'write in)
c. ff not e:.; toyed in town, did you try to getwort there'
-----
Li Mt;": uo
G yeaLi no
L...1 yes
Li no
--0 yeaL., no
--------CS) 'ionfacl,yitk (I.n %ill.of Deer SOIn population):
.....-.
_LI yes
i..) no
a. N.;ber of mantes employed during school year(writ* in)
b. tilrlAq of aotths employed during summerearati'n (write in)
c. tf not elpluyed in a city, did you try toNot wute tnere?
......-
........
.-.......
.....,_
C.) yru(.. no
.......-
.....-
L.) Yen....1 nu
Li yes
U no
IIFST:;'ie. )1, 31. A4.1 V !E UP!) 1'0 CZIT2°N PEA41NS OF CAS11 1Y.0 4t. lFVEl14 tW% .1.;,4iPtS 010. 6! TREVE) AS C;IFI:k4T1AL
Y,,j!. ST:61 '1,11Li, !,ST, 1 :LEA:1 TESE ANS4E1.S TO k00E.;
Betrern 1964 and 1961, Wirt wee your family's estimated IOTAL Y«arlx intone (fromall ercesl?
Lieges than "a2,,W1
L32,0') - $2,994
(.'S),%Ov - $4,9')9
)1. H-41 t^sny o,plit wire aqroorted ny ttitr incums!
1/,560 - $9,979
L 810,095 - $1S,010
Cower $15,6A
0178

: . .3 1 . .
.r
;`,. .
LI OS,
t.11 .1*
A P.fi tl
VS CM OMANI
l , l c g : ; I t
.. .1. h.1V.! ? %,1
(" I
1.-.!:10:
(Nit t hitt')
t .1" .Iry .1.1
I .1.: .0.
.
a.- at e:.;1.y-..nt twompliwrent IronA brluie, do teacJ.
ren presr.ltr
Z.-4 ;its Arr far t wora7
40 4. . o '70.1 Ca tab' !Asti 4.." .. . a. 40.
.) ft v,, are r -t ..!;,I .o. t
A
t..f"... 1
.treat
t
It 1 ,t1, i t
(s a 14 I
.
W-V.P. Jt : e I r 1 . I ,I. At. i 1 3 II .
0.17J

1;
MST COPY. AVAILAIILI
-1 t ; ..,, 1.11 1..11 ' bot4..
0'; 1 , IT '
t
'1 . ... rI t .1: r trt tl 1.
.:? v d 4 ts v .
t,,:,)))A .1 .1 Crow'
t
t t
t it 1.r.
t ls .111 this
Rate .41 p.iv Cot r..t th,:c-0 it ,tit twrI. (II te ,Mat
nit taw IR.Inti r Aid y fl t t.,t 44 yiu (him job'ef.r Icyr r1
I. 1.r ,..11- t t
; .11 . ye(
. ,
0 1111 0 111 0 0 .0 0 . 0 0 0 0 . 4111. . .1111. . 04. - .
-t I
(t It I.)
17 ,1 0 ,,./e 1..1 '
. . ...... - . . . . . . . .
1'. 4. 1, . .,.,!) pur %seri - I,
(r1 Oh,( 1,..; NN, t'.1, j h
. :.,1

o a 4). 4#
.5
I ve. . I I 1.1 1 ii lg.,,
1. ,
. 0 . ,: ; . , 1,1
ii)
vt ....I
1 . 11Ct.4.
*Li! i.. 4i ! 3 1 . 1:1111 .1
1.4141v)
. . .
a 11 t It - I 3v1 F.. Wed(i1i. I. our )
4,1 . t.of,to you Iv ri.1 thin 11'
et
1
o .::1 .tv
i: IN:
I. . lt .1..t
*;,4*
.
0'1
.; 1.,.
1..1
v
r .
! I
!
'
.1'
.
t
r I
.11
.
It I
hi
-I
; VP
I Vw
1:
'a t
1...
.III', toti 11 10
;11".0
1.41 lt v;110
i.1.0.)
po, hour was it n,unt:1Cc Li.%e ttcm
11.1
%.,.I ItII I.
101,.ts.
1.41:t
i.) I
f tw
:
. 1
. . .
.I .1
I f t 1.
I, f..,
1. 11,1.14 50

BEST COPY ANIMA
1,! tor, ve ir tIt .11.! to. 411 1,104 vt *VP(' ui yolk V.,u04, . A, t S L.tel.I v. ,.1 t, !on 1%)
A. 3.! f. ; t' r .031 3 1.1ed
lf
5. 4 1.41.:er t ;0 test 0,411 11 Tweeted?e 4
:11'.t : i ; or 141., tarts expr. L0,1 to giti!.s1.. i'vlther livr Ware
how . 6tt161 L... ittit (..11.ttnx job?.:4' o...1 hell .1 1.1:t !ot
r : : A: I er7. he.41
carviv, 401r
,.r it" e; ;,1,..rer t ,,r3.v
. h met .
ep",..."-ant
(write In)t lnatr K 1Ltb 114433 st34,,td Num. %,ften'
Al,v4re employment aigency
L.1 employment agficyothot
trITA3. yr tel 'the%L 461 :,tfi(
newsaper ads----7;t1te In)
40. Ft,. you t:+11.11. tt.4t 1.14, k ar:,1 Whi to pimple have equal rh.mtes of sett lug KuoJ lobs?L., yes
IF :..) ? Z.ar no bettor chance Of {Mins sood jobs?bl :k peopledl,lte yeple
P ; ti . ; A t t6, t1 b - 4, tv r . . ot r.t1.. is 1.4 t 52(1'411111'J !.)t :..tor
L, no
g
0182

4.1
4
t'
I
. s
.1. Fr l"'
. . .
4 : It
l f-,t:' 11 It .::4.
, ...
-
BESI COP. AINOUNI1
' : 1,
with It lothlt
..lth I tl11,1:.
with t lvtvis
1141 f:
L. with f r:rmin
It 1.4111.4
i; with fttends
L. with frivnds
.:.q; giv 4 -....Arte. I ; sr t,r v v ute, '404 1V1iron ur hf -e o:te.. ch .,P1.
(14. / ) .Oita:0
b. Fr, tl
T.
(Po/yr)
(MIA'.,t
1.0
01N3
.0* . 54. Mb

I -41 1.a
1 L.,
: : .
41. r
, . :
:
.1 I
le, . ..i 1.1 lily t ..1' 1i ':1:11 t. tO al 41.
. rot'. tclet al: e
co,! . p.-:,F t t ,f !o:48, c r 4.. ogrottn - ---- ........
. 11.111 t 114.1: r.ite. 1 .ear . cr --
j I. Its t 41re:, or.l' Yrs L. no1 I r : 4: t :4 ef1.111.1 1.1 tint city? C yrs ano
1. If 4 ' .:. , y f t.:* 4,4 lia'.1e in y ,Ar curitY would youprt. r :. tr - I/ 1P t .'It!f! rturn oty in city
UST COPY MIMI
!'.11 : 4t.,
U
U
I..s
ULi
"OW ly" or 'very rtnt"11..ttr tient
.
N.1..-
L
L.
al iV
L
LI
. .
. doe 4.4.4 ..,i,...
r'
' ;' .'t le 4.'41 ..11' . ro .
I.1 '7, If r..ft; 411 . ft-
: :AO ' .11', t11.4., + (.i:
. t
01h4

.41
11,
t .' .t 4,- o
trt
(*tatty)
4. hold long was (vt td) tn. ca,plet ItIntni proatsl?(flu. 0( rJothui
d. rtt V..14 (.r y".) r r..eletw the '1,t .1-1? Ye (: uo
Al '
. '1 I al 5:)
t!ir 1! 'Atli A thi,"( ,
How y#3r of 1,40 e,mpleted! (yeI)b. tft what Nzttvol. dt1 vu t lot Ara y0., (411110 "0.11 01 V9ST C911111 t0,11:1,)
11.1,1! .(1341)
Ity,c. 1'110 t,
;...:.1: :11. : vear cs.1:t
NA,41 vt tp40tr's
U. Wvit ( WAY "410! f A sit 11 tollett.?
(ittite In)
E. "0:4: 1 y 1.! ".rrdl! nvvr 4c 11 6.5110,..4 C A 0 C.) C
P. Y... 4i' re t16 to rollfie
1...) 1 411. dflyC.:Cat r !
41. ;:i- * .5 A4 IS,... ;1 t.); 4., 01 i i ti't c rtt3 .. . .. 41.
Cer..i r I: .:. ' ,1L afr tit.ii.ot I 1
t, , je j I, . , ..1", ' ' t. t II A. ...! ....., r.r ., .tc: 1., 411 h NI hi vow' rr1 holly -- torr 1.1., ; le ..;.: # .t ...9, -- .,, .. 0; 4 t o.,4 of 1 I ret Or PP: lr Of .4 'ingot council?
!! I .? t ' . e 1'
,_ '1 01.1 I
Lit " I t 1 ){fn.. ., P ."t1 4' ro
et 1,e
ia ;11 .
L .1 ,
f r
1;-11
! I!! 5' /.t Hoe..
O.1N

.1
mt Can MIVIAIU
7
6. .6 i 1 6616 . .1 .1 ( Pi
1.
1
Ouyn (County)
1
(County)'Pr..Y.7ont
Otre,t
Kicc t bi..lzk
(state)
(ciLy) (State)
t: ruHl durine final year in high school.C.0 7 r L)Vocation.11 al_J-iculture
°co. UGenoral0 U Industrial Arts
3. Ty e of :11:s pupil recoived?
a,..!:.1r 0 Droppcd outAtt-vv"..!tu::c
If this drop out, how many full years of high school (grades 10-12) had hecorpleted?
5. Currir.,.:1n:
Circle th,, nu:.1.!:. that corret;;..-ends to the number of complete years of instruction taken bythi9
0 1 2
A.
B.
C.
D.
'41" 41:
Engli!..11 (Liter:iture, Grammar, Speech, etc.)
Xath Ce:1;1., Trig. , Advanced)
Matt Businoss)
Social Stt:!io-; (History, Geography, Civics, etc.)' .. ..;2:1( i C
od
0
0
0
0. .4.0
1
1
1
1
.41.
2
2
2
2
2
3
3
3
3
m3F. Chemi5try, Physics, etc.) 0 1 2 3C. 1ypi:1:.: 0 1 2 3H. !%: 0 1 2 3I. Com:...er::Hi Law, Shorthand, etc.) 0 1 2 3J. For-i;:,:;
0 1 2 3K. For. 0 1 2 3L. 1.it r 0 1 2 34. i' (' ,:r, :. '., Or,!.- tr.', (.f(.) 0 1 2 34..o. Art 0 1 2 30 1,%.) .' ; ': :1 ...il r : ' I; i t ',I I 0 1 2 3P. ,-- I :.. ;. .') trai:.;:) 0 1 2 3
Q. 11.!-. ..:- , (- .
:.. .!1 ,:!.:1 1,;..ilidr;;'.it:(:.) () 1 2 3
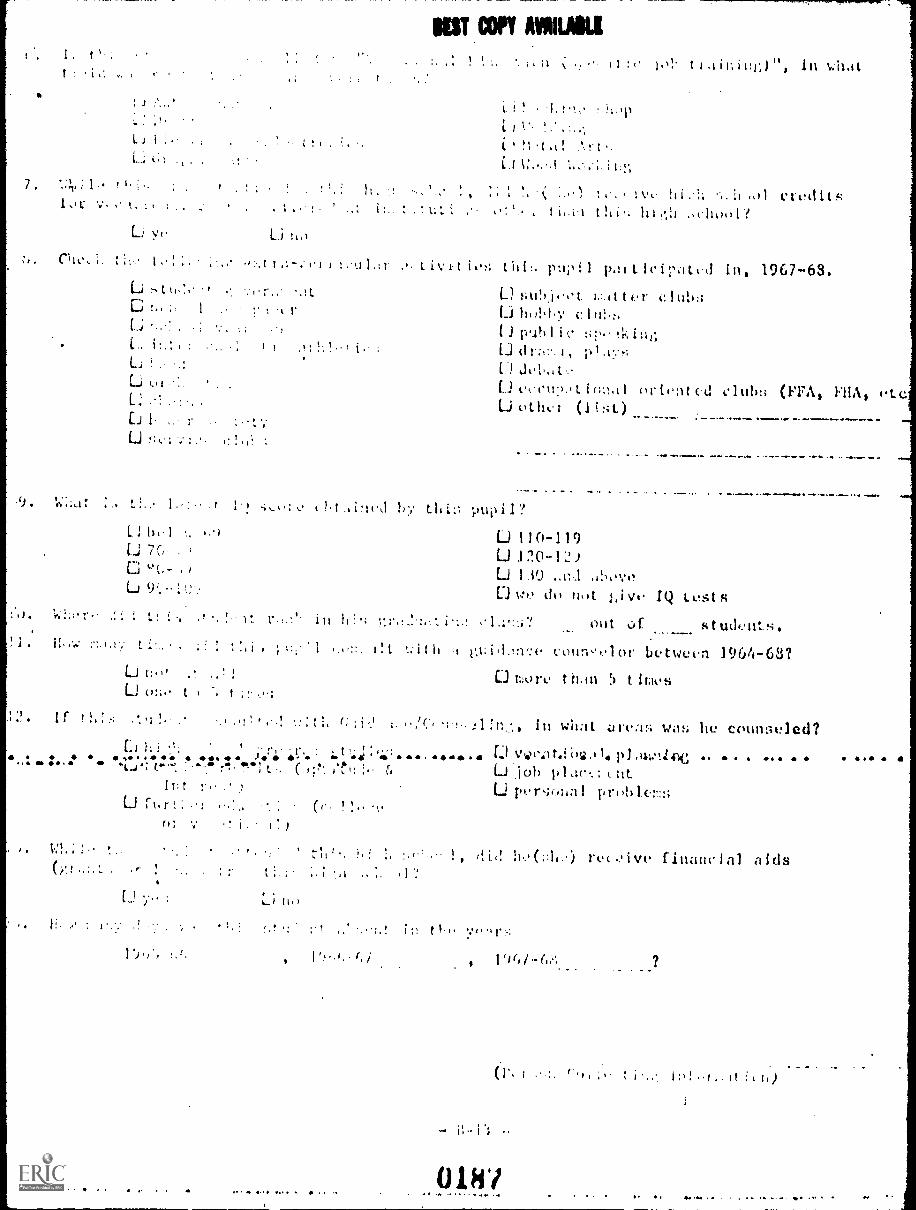
1 , f.11111 COPY MIMI
I I. 1 ttair, ",
I
!I t t
.1 1:... t
7. "..';,; 1 It: ! ' hi ,.)1 cycilits.tor . . `.. , t t 11
;, t I;
L...; , - . . t t . , : . , ...
L.i
C !.. ;: I ... : -, r1...i ' . . . ., .... , .
1.. i-.-... : , 1 I .! .. ... 1. i i . ;
L.; ', .
U ..h.C..) i. .. r : ...,-LJ!....; -..: ...'..,1. :
.9 . ; . 1 r .
t LV k( Pup: I pal t icir:Ited in, 1967-68.L) m i ! , 1 . . . . t . 1.:.it t et. clul)A1.1 ho'ol,:,' c I W.:.I I 1)...il, I i c :;;,....1.--in4Li dt.;.:. i, vil ay,:ii J.'0,.tyIJ ect.n.),,t. i o..,c I orient (,d clui,:; (FFA, 1,11A1 LcLi otli,1 (1 h,.t.)
1.t .,11t.! pupil?
Li 110-119U 120-121U 110 ..11,1 ,1!..oo(Ti wt., do not. 1,i vt IQ Lost S
:t : 1 ? out of s t Lident.s.! 1. t t:. H it t conn,....1 or between ]9614-6S?
nfo tt:o t natl 5 t( ' t t
If ., ' In what ....irea; was lie counseled?h .r. n 1, 1. . %. .. 0104 41, el . &boas 46 4..
t.- . !1 U lob 1)1 ; tntt; t pt..1-,;(.,tia I pr..1)1.c.:-.:s
r (c.
t t
-
S
1 , .) finattc i al a ids
,
(1'..1 I :1 it 1.)
WW1. 6 KI
.OMIII10

Rural Youth Stu.4 - :13
BUT COPY ANUS!
(TC.:N) (CO')L:NT
Betwe,n nAnv of tht! t;ervice and facilities were available iruv.O.Liblc duri,1;; this period. If not availablewrite .)
A. Essent:.11 serviccs
1. liospit-ln
2. Doctors
3. !Dentists
4. 'Public fl,2.11 th nurses
Druz ntores
6. Church'.
7. StTer r.11.17. (Chain- or multi-dept.)
"3. Full-line clothin; stores
9. Opt:%etrists, 0;,ticians, or Ophthalmologists
B.
*
Total
Recreti.:n:t1 and cultural facilities
1. Pnr;:s (with pIrc,..;,rouad faz!litias)
2. Parks (without playground facilities)
3. Libraries
4. (0x..ratin) r.,vie theaters
5. SwIL.in3 Pools and/or lakes and/or sirmible rivers6. Coll cuursas
7. Bowling alleys*A*, 44,4 40 . ....So p
Pt' 01. tv.1121 parlors).
...Mb
...or.%
Total
* .
If Nopli .1r,2 e7n1r.yel in your co: unity in the following tincil_led or setni-sItilled,OCCJI;:,.::, ':rit.r'. in tij! clIrre:It. 1).:.',":=4._ Lourly wage rate for full-title elTiuyeesin each occ.:6,ition. p:
A. C.1 :Itation att,.:11.int $ /hr
B. Waltro,-,s$ _ /hr
C. Far:1 1..1.orcr$ /hr
D. Crry jtnre clerk $ /hr
/hr
F. C-;;..r;i1 II),,)r,.r. (other thrl fm) $ /hr............. . ...Y. ... .
ty?
C;lyon C.) n
th,:,re any or 1.,ovvrw7.unt ploy:lont nuncle5 in yourBI -
01M8
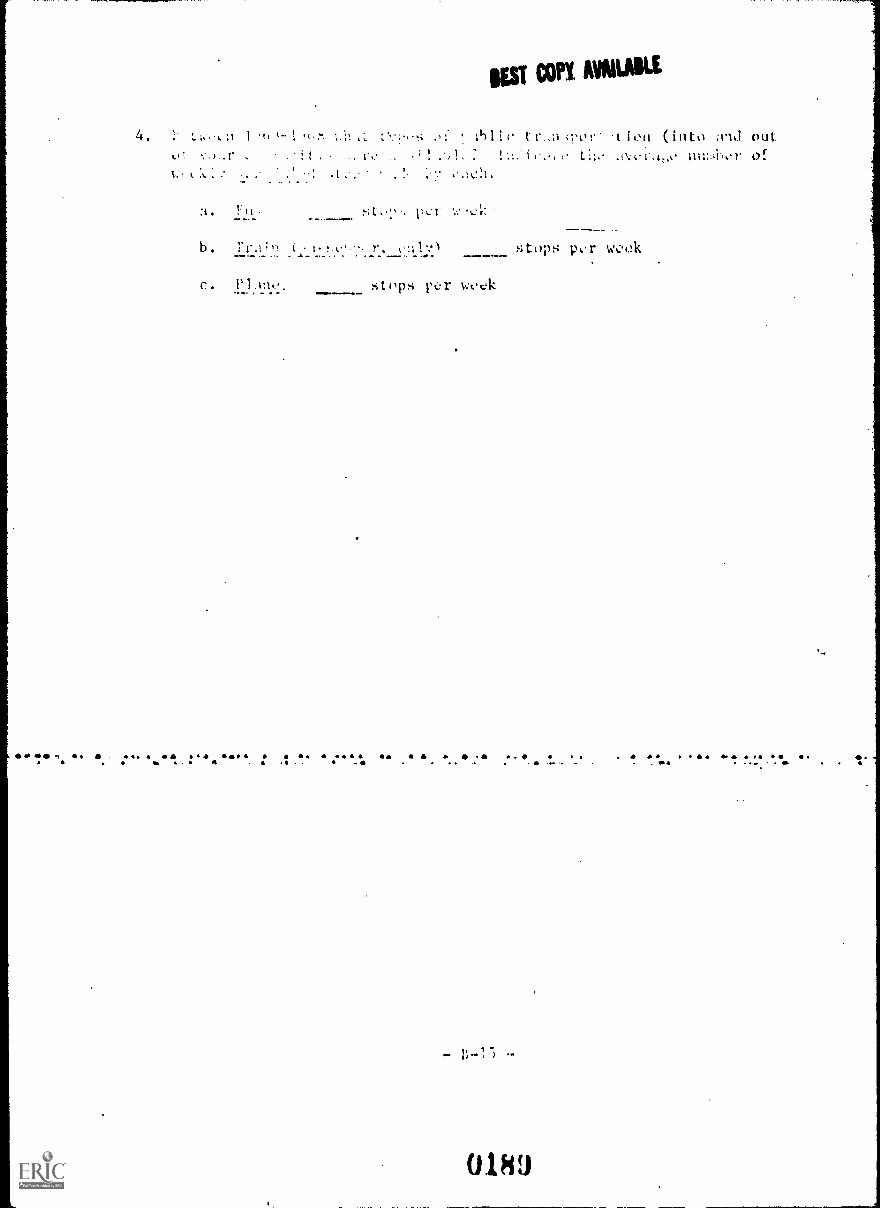
REST COP1. AWAKE
11 lc t r..a ;Ior I ion (into :rld out; 1 ! i ,,!, 111:. :L!'.' 1. of
b ( ,
stops ri2r wt.ek
t op s
. o4 .4
- 1;-1-)
01811

MT COPY MUM
ano o },t'r'ot et 11121
Git; fol.1
ecl!atV .Matt'
1,y 1.1:.147en,.y in 1967-19A?
L; >i`7 (;vovi-; 0::10,n:11) nu
vr hi " (thit 1. , ..1.od with othcr schools to providu a
f.3 yos 0 noJ. Viat wav the ;$:_tt.1,: of thit: sch;,o1 in 19,,7-6S?
A.::t111 LTeratioas _B.
anJ/or poe;siblo disruptionsC. attcorco norr.A1 operationsWas bul:
school stu,!ents, 1967-1968?yo C:no
Nue Jf(6rae.es 10-12) durin.,; 1967-1968:
. Numer of (c,;rAJs 10-12) tonch.!rs in 1967-196 0.P.
7. Nu:n5er o: .19f1S 1.;raduating
. NnIter ofreceivcd re7,ular diplomas:
9. Numl)er cf zral.atei; rocclived attendance certificates:I . Nu....1:er of st:.-2.ynt,; who enrolled in h4r.h school in 196,4 but did not grnluatc in 1968
but thole left because of illness, armed forces,etc.) :
1 of 1969 :;raduates who wont on to a college or university (2- or 4-yr):12. of 196 zra:luates who went onto further training (Vocational, tradertechni;,1,
1,. What, ap?romi:-..ty, wan the 1967-19()S expenditure per pupil?1' -
Circ1:: the r..:-t^4cc.nwro,;p,s,?Ar. .tt.tIte ttu=1:13i. of complete yeati of instruction offered
, ,,, .. .. .. .... .. I.:,
. 2 .1..1.:LW:f 1...itgl::":::.!;:.1, ,Irldc":1 10-12.A. tngli3h (Literatur.:,
'.:-.177:-...ar, Sp:ech, etc.) 0 1 2 3B. nth (17-1.:1, i'.;:c.-., Tri;;, A:!.:.anced) 0 1 2 3C. :.!-Ith (::..-^, :n, ..;-: or G.:ner:1)0 1 2 3D. !,ocil: :.:_-;:t..; (:.i.,t.,r-..., ":,,-;.7-1.:h...., Civics, etc.) 0 1 2 3E. !.,-,w .fr.-:...:rir.:r. Cul!:.:ri-',.:ry0 1 2 3F. f,r:ii-,:, (:.-..--r11, !.:.: ..-.., Ch 711trl, Phyics, etc.) 0 1 2 3G. Forr.::,-1 7 1: -!,..r. ,fl (I,..!,.;,.: !..-,tin and c;re,.%) 0 1 2 3H. Fcr,: .: :,..: ...,.- ,2 (::.11:.-2. ;:itin ;1:11 Grcc.i...) 0 1 2 3I. !!,Hc (::'...ir, ::,,,n6, Gr:.1,,:stri, etc.)0 1 2 3J. la- t0 1 2 3K. V--,:at! V-- --..:--;0 1 2 3L. Ty;::..
0 1 2 3H. 1;,..1,::.... :! :,::!..;0 1 2 3V. C... ...r,:i :1 1: i;.. .; :!..:11.-rl., !;1,-. Law, Shr)taanl, vtc.) 0 1 2 3O. v-.),-:-.- .,: ! .r- ::...!
0 1 2 3.
P. V.-..-: .. .. ( '.-,-: ' ', tr:I:h;;;,;) 0 1 2 3Q. Itvl.....v: .1 ...r1.; (. :,. .;1-4.:::::,.;,:i b :rtr.,H-ti n) 0 1. 3
...II -
fc.r yo. lir( did thil
-0190

1.). lt:67-1(..,08;
nsit.. . 111- yonr qchLol have,
0 ty7,-....r I r L.J 1-.1,!!n!-.
O:1:cs
cL,:.; Uotl,er(s) -- list
11118. Were on-t1:4--job traininz, or uork-study courses offered during 1967-1968?
0 yes O. no19. Wery offerc.1 during 1967-1968?
0 ye:;; 0 no20. Did your se0.1 offer a "Career Ni.;_,ht" or a "Vocation Day" in 1967-196S?
O ye Ono21. Did your offer or sponsor dany occupational familiarization field trips during196/-193?
D yes Ono22. Did your s.:1-tcol of f.:!r a job plae:.-.nt service for its students during 1967-1968?
Oyes Onoc-....t.:-.Lcu::ricular activities that were offered by your high school, 1967-19681
rt.. !...nt 0 school newspapera thlet ics 0 band
O i3 chorus;3;32 subject matter clubs
, U public speaking.. ....a lb Zij **, '; :) I d. .0. I.: 0.2 : Zs II. 04 Lap
clubs service clubs etc.)) 0 other (list)
s : :yearb:;c-,:. ..11111........110.0.r.1
24. Ir. 71ny ext77;rr:r-1::r scIlool:;7,c nsored travel on a regular basis)to 7C,"._::)
L 1-2
U 5-7
O 8-10over 10
CJ now..
rq tly t.1 :n e;.:t r,:curricular
yor, Ono
0191

t ,
ticheduled basit. cnrine
O. L;pc...°1 C..:!.'rt1:1 l ::,.r b y v s 0.
noU. tv... .!:Al .: LJ y..: b noC, tr.H.lt at...,,, 1.; yos LI nod . 1 i : F.: : 1. L) yes i.1 noc. g::,..: ..... !,..:. b yo, 0 nof. :...-ci I I. ,...-:.:.,:- D v et D Lo1. :Ii...2i..! . .11 :0.,Lher 1_
.
...c... L1110
LI lc.,6*4-1p.- :::.! ..'.,:. h'..-,1.1 ,c",: .,o1 hi..vo a pro.,r.fa to provide grants or loans to studentkwho nee !,.,! .:;....,;::::,70 ..,..:.i10 Att,-.1.1i:;., hi_'. 11 :;:".lool?
0 yes no
G. !',1 standrtrod achi..c.mont tostc; in one or r.:ore grades during
r)Dno
Di.: interc-,:t inv.,s.ntor:es in one or motr grAdw; between 19641968?Lt yes L7 no
33. Did dour uio intelligence tests in one or more grades between 1964-1968?
1.2 yes C] no
31, Li .t the: a:II counselors (nnd their present addresses, if known) who taught at
high sch,Jel between 196!i-1968. (Add more sheets ifnrCSuri.I
1.
2.
3.
N:ne
.-............................................ ......
0 .40*.41 ' .. +.
4
5.
6.
7.
8.
9.
10,
13.
I 4.
1").
..Address.
...... ........... ......................................0.....a - ...be, . .. 4.0. .. . . . .. .0
-.
1.10.
.......0........-601.66.1. 60.
I.* .- . .01., a.... 0.0 / gra .
....

16.
17.
18. -21.
22.
23.
14.
-1111114.11.1411.
25.
....111.11.11-..
26.
IMP.1111
27.
28.
29.
30.
31.
32.
33.
34.
35.
36.
37.
38.
39.
40.
41.
42.
43.
44.- B.19
45.
-
0193
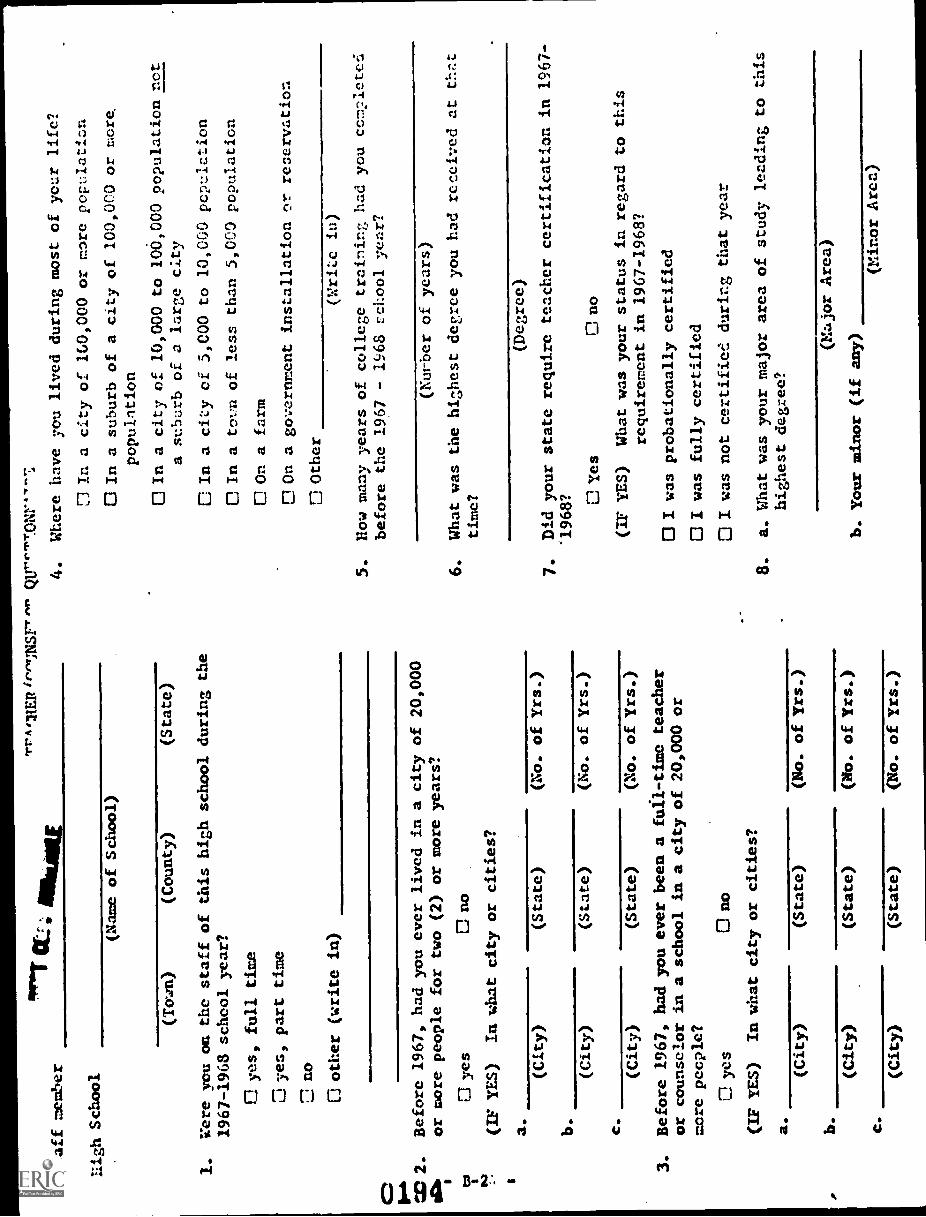
Staff member
nigh School
rrr.
AtHER te-"Tag-
TwF''^ QU""1:0Nr"-:
4.
Where have you lived during most of your life?
In a city of 160,000 or more population
(Name of School)
(Town)
(County)
(State)
I.
Were you on the staff of this high school during the
1967 -1963 school year?
Oyes, full time
O yes, part time
L no
other (write in)
4.
CD 2.
Before 1967, had you ever lived in a city of 20,000
401.
or more people for two (2) or more years?
r
D yes
no
(IF YES)
In what city or cities?
a.
b. c.
(City)
(City)
(State)
(State)
(No. of Yrs.)
(No. of Yrs.)
(City)
(State)
(No. of Yrs.)
3.
Before 1967, had you ever been a
fuil-time teacher
or counselor in a school in a city of
20,000 or
more people?
ye
OO
D
(IF YES)
In what city or cities?
a.
b.
c.
(City)
(State)
(City)
(State)
(City)
(State)
(No. of Yrs.)
(No. of Yrs.)
(No. of Yrs.)
In a suburb of a city of 100,000 or mere.
population
0In a city of 10,000 to 100,000 population not
a suburb of a large city
C3 In a city cf 5,000 to 10,000 pop-,:lation
In a torn of less than 5,000 population
00n a farm
ElOn a government installation or reservation
Other
(:;rise in)
5.
How many years of college training had you ccm2letc::
before the 1967 - 1968 vchool year?
(Nurber of years)
6.
What was the highest degree you had received at thr.t
time?
(Degree)
7.
Did your state require teacher certification
in 1967-
'1968? 0 Yes
Ono
(IF YES)
What was your status in regard to this
requirement in 1967-1968?
01 was probationally certified
I was fully certified
C3 I was not certified during that year
8.
a. What was your major area of study
leading to this
highest degree?
(Major Area)
b. Your minor (if any)
(Minor Area)

I
9.
UNich of the categories below best describes the insti-
tution where you took most of your undergraduate courses
before 1567?
El University or college
Noma/ school or teacher's college
0 Junior colle:;e
Ei Other
(Write in)
10. During the I967-65 school yenr, approximately what per-
centage of your time was assi:u/ed to each of the
following school activities:
% Teaching (including home-room
activities)
% Counseling (do rot count home-
rem:: activities)
Z Coaching of Athletics
% Administration
7. Other (Explain)
F. to;
11. If teaching was one of your assigned duties, please
answer the following:
a.
What subject(s) did you ...Inch (Write in)
b.
As of July, 1967, how many years of full time
teaching experience did you have?
(no. of Years)
12. If counseling wac one of yeur aid duties, pllsc
answer the followinr:
a.
As of July, 1:367, how nary ye::rs of full ti-e
counselin:; e?.perienc2 did you LLI.i?
of tear:)
b.
During the 1:67-19
S se.nool year, he
rany
students were
to
in
your capacity as
..uidance co-ni:elor?
(;o. of 1:t.z.,,i%)
c.
On the average, 1-.ow =any diffnt stu.2eLtr,
did you counsel on an
a week's ti . ::.' (No. of Students)
d.
Approximately what percectse of your eot,7.7sel-
ing was done in eael of tip.:
Zselt-ction,
Educ:AionfA
colh::;c mn](7.
Z Pernonzzi
tionli
cIc.)
% Discinary
% VocntLylal (Tr.'de sci!cs1 slecticn,
job selection, etc.)
e.
In the area of vocational co-n7,eliu:,,
of the
following methods did you u!.e in i
school year: Please check
of the
you used.).- -2ersonal
D Ability tests
7:3Formal lectures in an organi.7ed crl,urse
cuest
-rt) lectures
riTvzining
.oplyi:Ig for a IG5
interest inventoriPs
rlField trips to industry
0"Career day" or "Career 7..71.;;ht"
El
cri

APPENDIX C
THE METHODS USED Iti THIS STUDY
01%

.1100'r
.161r.
APPMIX C
THE METP)1); USFD THIS SillOY
SDIJOing Tecnn.ftuc
Th." sampling technique used this study is designed to ensure
that a small sample will be representative of a larger population, with
respect to one or more relovant variables. This "Controlled Selection"
technique has been outlined in detail by Kish.- Basically, the pro-
cedure consists of dividing the total population into equal strata with
respect to rank order on some relevant variable, and then further divid-
ing the population within each stratum in relation to one or more addi-
tional relevant variables. Each stratum is thus divided into cells;
all the observations within a cell are similar with respect to the rele-
vant variables. The actual selection is done by randomly picking
patterns which dictate the cell that will be entered in each stratum.
Then a table of random numbers is used to pick a memINT from within each
cell. (Although highly simplified, the above description covers the
major aspects of the procedure.)
The variables used to ensure the selection of a tepresentative
cross section of rural counties were: population per square mile, pro-
portion of nonwhite population, and net population change. All of the
non-Appalachian rural counties in the southeastern states of North Caro-
lina, South Carolina, Georgia, Alabama and Mississippi were divided
into two equal strata on the basis of population per square mile. With-
in these strata, the counties were further classified by population
mix and net population change. This resulted in the following 16-cell
frequency table.
rws.wolo
Kish, Leslie, Survey.5a7)ling, John Wiley and Sons, New York, 1965.(pp. 491-495)
- C-1 -
0197

Net Population Change
+13.3 0 to +13.2 0 to -9.9 -10.0+
Low populationper sq. mile
Lownonwhite
1 8 5 30
Highnonwhite
0 1 15 54
High populationper sq. mile
Lownonwhitee:
22 17' 14 23
Highnonwhite
4 3 14 25
Following this procedure outlined above, 16 rural counties were
selected to be studied. These 16 counties are described in Table C-1.
Table C-1
The 16 Rural Counties Included in the Study
County State Pop/sq.mi.Population
Change
ZNonwhite
Bullock Alabama 18.8 -12.2 67
Greene Alabama 16.1 -21.7 75
Clay Georgia 18.2 -20.1 62
Tattnall Georgia 33.8 + 4.5 31
Treutlein Georgia 29.1 - 3.9 33
Franklin Mississippi 14.1 -13.7 39
Lemke Mississippi 29.2 - 8.4 39
Perry Mississippi 13.9 + 3.7 26
Sunflower Mississippi 53.4 -19.0 63
Anson North Carolina 44.1 - 5.9 45
Bladen North Carolina 30.0 - 8.3 40
Nash North Carolina 108.7 - 3.1 36
Bamberg South Carolina 39.1 - 2.0 55
Chester South Carolina 50.1 - 3.5 39
Florence South Carolina 108.9 + 6.2 37
McCormick South Carolina 21.4 - 7.8 60
- C-2 -
0198

Sample of Students
In each of the 16 rural counties, the names of all students en-
rolled in the 8th grade during the 1963 -64 school year were obtained
from school records. Long-term residents of these counties (selected
by the local school superintendents) were employed to determine, through
interviews and local records, the present home addresses of these stu-
dents.
The same local residents also obtained information about the
counties in which these students grew up and of the town in which the
students attended high school. They also obtained extensive informa-
tion about every high school in the county or city, including present
addresses of all persons who were staff members during the 1967 -68
school year. The sample was then examined to restrict it to those who
remained in the county until age 16 and would have been eligible (dis-
regarding income) to enter an NYC project, had such a project been
operating in their community. The sample was further restricted through
elimination of those currently institutionalized, in the armed forces,
or deceased.
Of the eligible students, 2620 were selected randomly; addresses
were found for 1764 of them, and each was mailed a questionnaire.* The
information solicited was concerned with the person's early history
(particularly those variables believed, on the basis of preliminary
interviews, to be important in successful transfer to the adult social
and occupational environment), and with his experiences in school and
in the rural community.
Those who were still enrolled in school at the time of the study
(summer of 1972) were asked about the kind of school they were attending,
the general type of course they were taking, their grade point average,
and the scope of their extracurricular activities. Those in the labor
*Sea Appendix B for copies of all questionnaires used in this study.
C-3 -
0199

force were asked about lheir employment history, job-seeking experiences
and social experiences,
The data obtained in the ho -le community iad those obtained from
the student questionnaire were combined for each subject. These data
were analyzed to determine the degree to which each of the factors
previously hypothesized to affect the success of rural youth is related
to the actual experiences of these young adults.
By using different analytical approaches to these same data it
has been possible to determine the patterns of migration, higher edu-
cation, occupational choice, and residential choice that are prevalent
among young people from different kinds of rural settings. It has
been possible to determine whether the rural factors being studied
have a differential effect on the later experiences of those who re-
mained in a rural setting, those who moved to a medium-sized city, and
those who migrated to a major metropolitan setting.
In our previous study of rural youth in the North Central states,
we had little difficulty in locating our sample of young people, even
though over 80 percent had left their home counties. Most of the
young outmigrants maintained close personal ties back in their home
communities. Addresses were found for all but 3.2 percent of the
former students.
In contrast, in the Southeast we found that large numbers of
rural youths, both blacks and whites, leave their home towns and cut
all personal ties there. Whole families move and leave no information
about their destination. Of the 2620 young people in our original
sample, 856 (32.7 percent) could not be traced. Their school class-
mates were asked if they had current addresses for these missing
youths and on -site contacts were made with the local Post Office, local
schools, and those family members who remained in the community.
- C -4 -
0200

In part, t.1:is dillictilLy in tr;1,..in:; :itudents was due to
o tre.:ily record ke,p(1:-. 1)y ,1,11c,11 :mthoritles. In 0.10 county, 50
years of scl:o,-l 1rt- filed in nlillativt.ical order nither thAn
by s: hoot. yeo.r, ln ..a: r county, the rLcord vi,rdt! frcu 20 school::
were literally du.-.piA in an unlIF:lited basement in a large, unsorted
pile. our field staff reconstructed lists of eighth grade students
for the school year l96_;-64, but the original records proved to be
very inaccurate. In lieu of recorded addresses, it was found that
larl.e numbers of records throv7hc.mt the region were marked "dropped
out" or "records not avail4ble."
Of those youths whose school records stated that they had "dropped
out", we found that a large preportioa are not really dropouts; they
moved to other localities and continued their education. Among those
youths who completed our questionnaire, 123 were carried as "dropouts"
on local school records. We found that 32 of these 123 youths com-
pleted high school in other localities; 12 actually attended college.
Assuming this same proportion of error with respect to the "drop
outs" who did not respond to our questionnaire, our respondents include
a representative proportion of youths who entered high school and then
dropped out. We did not receive a representative proportion of responses
from those who did not enter high school, however.
We were able to obtain personal data from only a very few of
those youths about whom the local school records state either "dropped
out between 8th grade and high school" or "high school records not
available". For many, as noted above, we could not obtain any addresses.
Of those in this group for whom we obtained addresses (of unknown validity),
only 10 percent filled out a questionnaire, despite an offer of $5.00
for completing the questionnaire in each of three consecutive mailings.
This was not a sufficient oanple response rate for reliable generali-
zations to be made about this population. We therefore have limited this
- C-5 -
0201

report to the results wo obullned coacerning those youths who entered
high school.
The respon:10 rats' among .hit; latter iroup was 51 percent among
the white youths and 42 percent a14ong the black youths. The results
discussed in this report must be interpreted as results of a nonrandom,
somehow bias0 sample. We don't know e%actly how. this sample is
biased; we have a+zleral indication that our results. are about a more
able and better educated subsection of the population than the entire
'population which a rural youth program in the Southeast must serve. We
have taken this into account in describing a model program for the
Southeast.
- C-6 -
0202

APPENDIX 0
OCCUPATIONS FAMILIAR TO RURAL YOUTH
0203
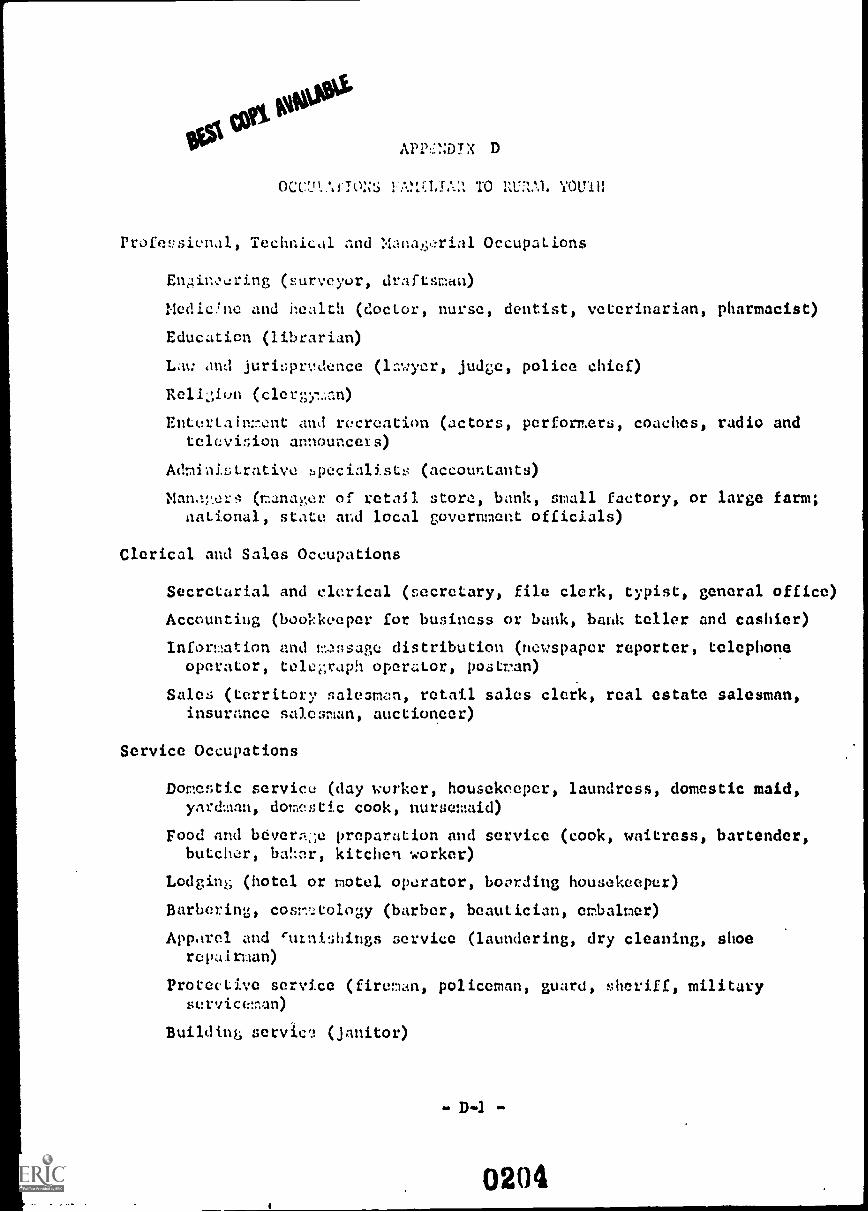
D
OCCnAFTO::S 11..r,CLIA:1 TO nunL ?OVA
Professienal, Technical and Maha!;,:rial Occupations
Engineering (surveyor, draftsman)
Medic!nc and health (doctor, nurse, dentist, veterinarian, pharmacist)
Education (librarian)
Las: and jurisprvdence (lawyer, judge, police chief)
Roll:jun (clergy:an)
Entertainent and recreation (actors, performers, coaches, radio andtelevision announcels)
Administrative :4)ecialists (accountants)
Manaer!I (manager of retail store, bank, small factory, or large farm;national, state and local government officials)
Clerical and Sales Occupations
Secretarial and clerical (secretary, file clerk, typist, general office)
Accounting (bookkeeper for business or bank, bank teller and cashier)
Infor!mtion and mIssage distribution (newspaper reporter, telephoneoperator, telci;raph operator, postman)
Sales (territory salesman, retail sales clerk, real estate salesman,insurance salesman, auctioneer)
Service Occupations
Domestic service (clay worker, housekeeper, laundress, domestic maid,yard:aan, domestic cook, nursemid)
Food and bevero.;;e preparation and service (cook, waitress, bartender,butcher, ha!:er, kitchen worker)
Lodgini, (hotel or motel operator, boording housekeeper)
Barbering, cosmtology. (barber, beautician, embalmer)
Apparel and cntnishings service (laundering, dry cleaning, shoerepairman)
Protective service (fireman, policeman, guard, sheriff, militaryserviceman)
Buildin& service (janitor)
- D-1 -
0204

Forv:!flv '.1o;
st-si con witaUsa
rirh:lry ;:11:
limq11v ;:t1.! trcrpr, s;uidc)
(co uty (..tvnttion a, enL, bli6ht and post controloccupaticp)
Machin:. Trade:. Occupations
Metal workinl. (mchinist, welder,
Mcch:inic anrj repailn (. "alto mchanic, farta machineryrep;vir;An)
(nespaper typo:;t.Ator, prcs:atl)
Wood machinine, cw,.-...11.11 operator)
Benchwork Occupations
Repair of vatches and clocks (watch repairman)
Assembly and repair of sheet metal products
Repair of elttctrical equir:,ent (teler:,ono repairman, raeio andtelevision repairman, electrical appliance repairman)
Fainting (brush painter, spray painter)
Textile fabrie-ation (seamstress)
Structural Work Occupations
Metal fabrication (automole body man)
Electrical installing and repair (electrician, lineman)
Building trades (brick tuld stone mason, plumber, roofer, carpenter,painter, plasterer, paperhanger, cement finisher, excavating,grading, paving)
Miscellaneous Occupations
Motor freight. (truck driver, loader)
Transportation (bus driver, ticket agent)
Amusement, recreation, motion picture (ticket sal.ls, usher, projectionist)
D-2 -
0205