Do Consumers Want Seaweed in Their Food? A Study ... - MDPI
16
foods Article Do Consumers Want Seaweed in Their Food? A Study Evaluating Emotional Responses to Foods Containing Seaweed Rachael Moss and Matthew B. McSweeney * Citation: Moss, R.; McSweeney, M.B. Do Consumers Want Seaweed in Their Food? A Study Evaluating Emotional Responses to Foods Containing Seaweed. Foods 2021, 10, 2737. https://doi.org/10.3390/ foods10112737 Academic Editor: Herbert L. Meiselman Received: 8 October 2021 Accepted: 7 November 2021 Published: 9 November 2021 Publisher’s Note: MDPI stays neutral with regard to jurisdictional claims in published maps and institutional affil- iations. Copyright: © 2021 by the authors. Licensee MDPI, Basel, Switzerland. This article is an open access article distributed under the terms and conditions of the Creative Commons Attribution (CC BY) license (https:// creativecommons.org/licenses/by/ 4.0/). School of Nutrition and Dietetics, Acadia University, Wolfville, NS B4P 2K5, Canada; [email protected] * Correspondence: [email protected] Abstract: Seaweeds are nutrient-dense marine organisms that have been proposed as a key ingredient to produce new functional foods. This study’s first objective was to identify consumers’ emotional responses and purchase intent towards a variety of food products containing seaweed. The secondary objective was to evaluate how hunger status and lifestyle affect consumers’ emotional responses. Participants (n = 108) were asked to evaluate pictures of different food items containing seaweed (beef burger, cheddar cheese, fettuccine, fish filet, sausage, bread, yogurt, and dried seaweed) using the CATA variant of EsSense25 Profile ® and a purchase-intent scale. The consumers also answered questions about their hunger status, food neophobia, food-related lifestyle, as well as open-ended comment questions about seaweed. Participants’ purchase-intent scores were highest for bread and dried seaweed, which they associated with positive emotions. The participants disliked yogurt and sausage, indicating that they were disgusted with them. Participants believed seaweed could be added to fish, savoury, and cereal grains-based foods. The participants’ hunger status as well as their food neophobia and lifestyle impacted their emotional responses. Future research should continue to investigate how emotions affect purchase intent, how participant’s hunger status affects their emotions, and how participants’ lifestyle changes how they perceive new food products. Keywords: food product development; functional foods; check all that apply; emotions; consumer perceptions 1. Introduction Seaweeds, more formally known as macroalgae, are large colonies of diversified algae that grow in both freshwater and marine ecosystems around the world. Seaweeds have been on earth dating back to 1.2 billion years ago [1]. Macroalgae differ from microalgae, such as cyanobacteria and phytoplankton, in that they are large enough to be observable by the naked eye, ranging from a few millimetres to upwards of 30–50 m [2,3]. Seaweeds range in size, shape, and colour; they are mainly differentiated based on the ratio of colour pigments used for photosynthesis, which separates the various species of seaweed into green (Chlorophyta), red (Rhodophyta), and brown (Phaeophyta) varieties [4]. Seaweeds are nutrient-dense marine organisms [5] that are low in fat (by dry weight 0.51–2.8%) [6], and their fatty acid profiles are comprised of high levels of monounsaturated and polyunsaturated fatty acids [7,8]. Seaweeds are also excellent sources of protein [9–12]. Moreover, seaweeds are approximately 50% carbohydrates by dry weight [9,13]. Ku- mar et al. [6] found that in five species of brown macroalgae examined, the carbohydrate concentration was between 19.4–34.9% by dry weight. Of the carbohydrates present in seaweed, portions exist as insoluble and soluble fibre in unusually abundant amounts ranging from 29.3 to 50% dry weight [14,15]. Such high values are consistent with or exceed many commonly consumed fruits and vegetables. Seaweeds are also excellent sources of both macro- and micro-minerals, even more so than most terrestrial plants [14]. The most abundant vitamins in seaweed were found to be vitamin C, vitamin E, and vitamin A[13,16]. The most prominent macro-minerals found in seaweeds include sodium, cal- Foods 2021, 10, 2737. https://doi.org/10.3390/foods10112737 https://www.mdpi.com/journal/foods
-
Upload
khangminh22 -
Category
Documents
-
view
0 -
download
0
Transcript of Do Consumers Want Seaweed in Their Food? A Study ... - MDPI

foods
Article
Do Consumers Want Seaweed in Their Food? A StudyEvaluating Emotional Responses to Foods Containing Seaweed
Rachael Moss and Matthew B. McSweeney *
�����������������
Citation: Moss, R.; McSweeney, M.B.
Do Consumers Want Seaweed in
Their Food? A Study Evaluating
Emotional Responses to Foods
Containing Seaweed. Foods 2021, 10,
2737. https://doi.org/10.3390/
foods10112737
Academic Editor: Herbert
L. Meiselman
Received: 8 October 2021
Accepted: 7 November 2021
Published: 9 November 2021
Publisher’s Note: MDPI stays neutral
with regard to jurisdictional claims in
published maps and institutional affil-
iations.
Copyright: © 2021 by the authors.
Licensee MDPI, Basel, Switzerland.
This article is an open access article
distributed under the terms and
conditions of the Creative Commons
Attribution (CC BY) license (https://
creativecommons.org/licenses/by/
4.0/).
School of Nutrition and Dietetics, Acadia University, Wolfville, NS B4P 2K5, Canada; [email protected]* Correspondence: [email protected]
Abstract: Seaweeds are nutrient-dense marine organisms that have been proposed as a key ingredientto produce new functional foods. This study’s first objective was to identify consumers’ emotionalresponses and purchase intent towards a variety of food products containing seaweed. The secondaryobjective was to evaluate how hunger status and lifestyle affect consumers’ emotional responses.Participants (n = 108) were asked to evaluate pictures of different food items containing seaweed(beef burger, cheddar cheese, fettuccine, fish filet, sausage, bread, yogurt, and dried seaweed) usingthe CATA variant of EsSense25 Profile® and a purchase-intent scale. The consumers also answeredquestions about their hunger status, food neophobia, food-related lifestyle, as well as open-endedcomment questions about seaweed. Participants’ purchase-intent scores were highest for bread anddried seaweed, which they associated with positive emotions. The participants disliked yogurt andsausage, indicating that they were disgusted with them. Participants believed seaweed could beadded to fish, savoury, and cereal grains-based foods. The participants’ hunger status as well as theirfood neophobia and lifestyle impacted their emotional responses. Future research should continueto investigate how emotions affect purchase intent, how participant’s hunger status affects theiremotions, and how participants’ lifestyle changes how they perceive new food products.
Keywords: food product development; functional foods; check all that apply; emotions;consumer perceptions
1. Introduction
Seaweeds, more formally known as macroalgae, are large colonies of diversified algaethat grow in both freshwater and marine ecosystems around the world. Seaweeds havebeen on earth dating back to 1.2 billion years ago [1]. Macroalgae differ from microalgae,such as cyanobacteria and phytoplankton, in that they are large enough to be observableby the naked eye, ranging from a few millimetres to upwards of 30–50 m [2,3]. Seaweedsrange in size, shape, and colour; they are mainly differentiated based on the ratio of colourpigments used for photosynthesis, which separates the various species of seaweed intogreen (Chlorophyta), red (Rhodophyta), and brown (Phaeophyta) varieties [4].
Seaweeds are nutrient-dense marine organisms [5] that are low in fat (by dry weight0.51–2.8%) [6], and their fatty acid profiles are comprised of high levels of monounsaturatedand polyunsaturated fatty acids [7,8]. Seaweeds are also excellent sources of protein [9–12].Moreover, seaweeds are approximately 50% carbohydrates by dry weight [9,13]. Ku-mar et al. [6] found that in five species of brown macroalgae examined, the carbohydrateconcentration was between 19.4–34.9% by dry weight. Of the carbohydrates present inseaweed, portions exist as insoluble and soluble fibre in unusually abundant amountsranging from 29.3 to 50% dry weight [14,15]. Such high values are consistent with or exceedmany commonly consumed fruits and vegetables. Seaweeds are also excellent sourcesof both macro- and micro-minerals, even more so than most terrestrial plants [14]. Themost abundant vitamins in seaweed were found to be vitamin C, vitamin E, and vitaminA [13,16]. The most prominent macro-minerals found in seaweeds include sodium, cal-
Foods 2021, 10, 2737. https://doi.org/10.3390/foods10112737 https://www.mdpi.com/journal/foods

Foods 2021, 10, 2737 2 of 16
cium, and potassium [14,16]. The micro-minerals with the highest concentrations found inseaweed include iron, nickel, cobalt, copper, and manganese [6,16].
Based on their nutritional properties and sustainability, seaweeds have more fre-quently been incorporated into a variety of different food products [17–20]. Therefore, thisstudy aimed to evaluate consumers’ emotional responses to foods containing seaweed.Interest in measuring product-related emotions has grown in recent years [21]. Past stud-ies have found that consumers choice of food has an emotional component [22,23], andconsumers’ emotions have been evaluated using the EsSense Profile® [24]. The EsSenseProfile® asks participants to look at 39 common emotional terms and to score the intensityof each term. Jaeger et al. [25] built on this research and created a check-all-that-apply(CATA) variant of the EsSense Profile®. The CATA variant can overcome some of thelimitations of the EsSense Profile®, including some consumers not experiencing certainwords and rating them as “slight” or “moderate”, which will not add much product in-sight [26,27]. The CATA variant also requires less cognitive effort from the participants [25].Additionally, the EsSense Profile® was shortened to 25 words by Nestrud et al. [27] andcalled EsSense25. The EsSense25 method has been found to show good repeatability andreplicability as well as being easy for the participants to understand [27]. Based on theseresults, this study used the CATA variant of the EsSense25 version.
A secondary objective was to evaluate how hunger and lifestyle affect the emotionalresponses of the participants. Humans tend to be aroused, alert, and irritable whenhungry [28]. After eating a meal, humans are typically calm, lethargic, and their mood ismore likely to be positive [29]. Emotions have been linked to the energy content of foods,and as the energy content of the food increased, negative emotions were more frequent [30].This study aims to build on this work by asking participants to self-identify their hungerstatus and evaluate their emotional responses to different foods containing seaweed. Inaddition, lifestyle is a popular base for segmentation in consumer marketing, and as such,a food-related lifestyle (FRL) instrument was developed in the mid-1990s [31]. The FRLhopes to identify differences in how consumers view food and beverages. The FRL wasoriginally a 69-item questionnaire [31]; however, it was shortened to 15 items [32] andwas found to be cross-culturally valid. This study used the 15-item version of the FRL toevaluate whether different consumers (based on their lifestyle) use different emotions todescribe the food products made with seaweed.
The aim of this study was to evaluate consumers’ emotional responses to differentfood products containing seaweeds. A secondary objective was to evaluate how hungerstatus and lifestyle affects consumers’ emotional responses. Firstly, consumers identifiedhow hungry they were and then evaluated their emotional responses to food products. Thefood products included were identified by a literature review of studies investigating theaddition of seaweeds to food products. Consumers also identified which foods they thoughtshould include seaweed as well as the sensory properties they associate with seaweedsusing open-ended comment questions. Lastly, participants completed a food neophobiaquestionnaire [33], food-related lifestyle questionnaire [32], and demographic questions.
2. Materials and Methods2.1. Food Products
A literature review was completed to identify which food items should be includedin the survey. The literature review was focused on studies that had included sensoryanalysis trials and products containing seaweed. The keywords used were “seaweedsensory analysis”, “seaweed sensory evaluation”, and “seaweed consumer perception.” Thesearch was refined by year (from 2000 to present) and revealed 19 studies (SupplementaryTable S1). The studies are identified in Supplementary Table S1, and the sensory method(either consumer panel, semi-trained panel, or trained panel) is also provided. Based onthe literature review, beef burger, cheddar cheese, fettuccine (noodles), fish filet, sausage,bread, and yogurt were selected and included in the questionnaire. Furthermore, driedseaweed without addition to any food products was included.

Foods 2021, 10, 2737 3 of 16
2.2. Participants
Participants were recruited from the Annapolis Valley, Nova Scotia community usingposted advertisements on social media sites. All participants (n = 108; SupplementaryTable S2) were screened to ensure they did not work in a sensitive industry (food orsensory analysis).
2.3. Questionnaire
Approval for the study was received from the Acadia University Research EthicsBoard (REB 13-72). The participants first completed an informed consent form and thenidentified their hunger status using scales adapted from Friedman et al. [34]. Participantswere then presented with a picture of each food product described above and a statementindicating that the product contained seaweed. For instance, above the picture of cheddarcheese, was the following statement: “Cheddar cheese made with added seaweed.” Theparticipants completed a CATA question containing the 25 emotional terms in the EsSense25Profile® [27]. The question was worded as “How do you expect to feel after eating thisproduct? Check or click all that apply” [25]. Participants were also asked their purchaseintent for each sample ranging from 1 = “Definitely will not buy” to 9 = “Definitely willbuy.” Then, the participants had the option to describe what they liked and disliked aboutthe samples in an open-ended comment question. Participants were also asked to identifywhich foods they would add seaweed to, the flavours they associate with seaweed andseaweed-containing products, and the nutritional benefits of seaweed through open-endedcomment questions. Additionally, participants completed a food neophobia scale [33], the15-item FRL [32], and demographic questions. The questionnaire was presented usingCompusense Cloud software (Guelph, Ontario, Canada).
2.4. Statistical Analysis
A two-way random factor (samples and participants) ANOVA followed by a Tukey’sHSD test was completed to determine any significant differences in liking among thedifferent samples. The frequency of use of each emotional term used by the participants todescribe each sample was calculated. Cochran’s Q test was used to identify significant dif-ferences among the samples for each of the emotional terms included in the CATA question.If there was a significant difference among the attributes, then post-hoc multiple pairwisecomparisons were conducted using McNemar’s test with Bonferroni alpha adjustment.Correspondence analysis was performed on the total frequency count of the emotionsfor each product to identify relationships between the emotions and the samples [35]. Apenalty lift analysis was carried out following the procedure by Meyners and Casture [36];however, it was adapted by using the purchase intent.
The participant’s responses to the open-ended comment questions were visualizedusing the comment visualization tools (Word Cloud and Text Network) in the CompusenseCloud software. Additionally, the procedure by Fonseca et al. [37] was followed to refinethe definitions. The procedure included (a) verifying spelling and correcting grammaticalmistakes; (b) removing connectors and auxiliary terms; (c) reducing derivatives of the sameterm; and (d) grouping synonyms together. Lastly, recurring themes and key concepts inthe responses were identified. Results were also discussed among the authors to reacha consensus.
The FNS was used to segment the participants based on their degree of food neophobia.The sum score of the ten questions from the FNS was calculated and participants weredivided at the median score into either a high food neophobia (HFN) group (n = 54, sumscore = 30–48) or a low food neophobia (LFN) group (n = 54, sum score = 12–29). Thesame procedure was followed to segment the population based on the FRL into higherfood-related lifestyle (HFRL, n = 54, sum score = 82–101) and lower food-related lifestyle(LFRL, n = 54, sum score = 57–81). Lastly, the procedure was followed to divide thepopulation based on the hunger scales into those who were high hunger (HH, n = 54,sum score = 15.9–29.7) and low hunger (LH, n = 54, sum score = 6.0–15.3). This method of

Foods 2021, 10, 2737 4 of 16
population segmentation was modelled after Laaksonen et al. [38], who separated theirparticipants into three approximately evenly sized groups based on sum scores. However,due to the number of participants (n = 108), the procedure by Romaniw et al. [39] wasfollowed, and the participants were segmented at the median to achieve two groups basedon each scale (FNS, FRL, and Hunger). To determine any significant differences in likingbetween the participant segments, t-tests (p = 0.05) were performed. Furthermore, statisticalanalysis of the responses to the CATA question from each participant segment (based onFNS, FRL, and Hunger) was performed as described above. All analyses were completedusing XLSTAT software (Version 2021.2, New York, NY, USA) in Microsoft ExcelTM.
3. Results and Discussion3.1. Seaweed Product Development
The mean purchase-intent scores are listed in Table 1. The overall study population(n = 108) identified that they would be significantly more likely to purchase dried seaweedand bread made with seaweed over the other food items (p < 0.05). Additionally, theparticipants identified that they would prefer seaweed added to fish filets, cheese, and beefburgers rather than yogurt and sausages (p < 0.05). Interestingly, the dried seaweed byitself had a significantly higher purchase intent than all the food items except for bread.This finding disagrees with many statements from the studies in Supplementary Table S1,as the studies stated that seaweed should be incorporated into food items to increase theconsumption of seaweed. These studies also discussed how incorporating seaweed intofood items can increase the nutritional benefits of food products [40,41]. Based on theresults of this study, consumers are more interested in seaweed on its own. Therefore,companies may want to look at increasing education about the sustainability of consumingdried seaweed instead of incorporating seaweed into food items [42,43]. However, theresults may have differed if the participants’ consumed the products, as seaweed has beenfound to not be well liked by consumers [2]. Overall, most mean purchase-intent scoreswere quite low on the 9-point purchase intent scale, ranging from 4 to 6. This may indicatethat the participants are not interested in purchasing seaweed-incorporated food items.Based on the purchase-intent scores, the bread and dried seaweed seem to be most likely tobe purchased by the participants. Additionally, the seaweed-incorporated food items werenot compared to conventional food items (without seaweed addition), and this would haveindicated how the consumers’ purchase intent changed based on the seaweed addition.
Table 1. Consumer mean (±standard deviation) purchase-intent scores for the different food items.
OverallPopulation
(n = 108)Low Hunger
(LH)High Hunger
(HH)Low Food
Neophobia(LFN)
High FoodNeophobia
(HFN)
LowerFood-Related
Lifestyle(LFRL)
HigherFood-Related
Lifestyle(HFRL)
Bread 6.6a ± 1.2 1,2 6.8a ± 1.0 6.4ab ± 0.9 6.7a ± 0.9 6.1ab ± 1.0 6.2a ± 0.8 6.7a ± 1.0Dried
Seaweed 6.4a ± 1.0 6.2ab ± 0.8 6.8a ± 1.1 6.7a ± 1.1 6.4ab ± 1.0 6.4a ± 0.9 6.9a ± 0.8
Fish Filet 6.0b ± 1.5 5.8ab ± 1.1 6.3ab ± 1.2 6.1ab ± 0.9 6.1abc ± 0.9 5.5ab ± 0.8 * 6.7a ± 0.9 *Cheese 5.9bc ± 1.1 5.7ab ± 0.7 6.2ab ± 1.0 6.0ab ± 1.2 5.8abc ± 1.2 5.7ab ± 1.0 6.1ab ± 1.1
Beef Burger 5.9bc ± 1.3 5.7ab ± 0.7 6.2ab ± 1.1 6.0ab ± 1.1 5.8abc ± 1.1 5.7ab ± 1.1 6.1ab ± 1.0Fettuccine[Noodles] 5.4bc ± 1.0 5.5ab ± 0.8 5.4bc ± 1.0 5.6abc ± 0.8 5.3abc ± 1.0 5.2ab ± 1.0 5.8bc ± 1.0
Yogurt 4.9c ± 1.3 5.1b ± 0.8 4.6cd ± 1.2 5.0bc ± 1.3 4.7bc ± 1.2 4.7b ± 1.0 5.1cd ± 1.1Sausage[Pork] 4.5c ± 1.2 5.0b ± 1.2 * 3.9d ± 1.1 * 4.4c ± 1.0 4.7c ± 1.0 4.5b ± 1.3 4.5d ± 1.1
1 Means in the same column with the same letter are not significantly different at α = 0.05. 2 Data input on the 9-point purchase intent scale,where 1 = Definitely will not buy, and 9 = Definitely will buy. * Means between the population segments (LH vs. HH, LFN vs. HFN, LFRLvs. HFRL) differed based on a t-test.
The emotional terms included in the CATA question were evaluated using correspon-dence analysis (CA), as found in Figure 1A. The biplot explained 68.3% of the variance,with the first dimension accounting for 45.0% and the second dimension for 23.3%. Thefirst dimension separated the beef burger, sausage, and yogurt seaweed from the other

Foods 2021, 10, 2737 5 of 16
food items (cheese, fish filet, fettuccine, and bread). The second dimension separated breadand dried seaweed from the other food items. The dried seaweed was associated withnostalgic, free, wild, active, and adventurous. In the open-ended comment question aboutthe food items, participants stated they remembered their parents eating dried seaweed ordulse, which may explain why the dried seaweed was associated with nostalgia. Nostalgiahas been found to be associated with pleasure and pleasantness [44], and this may explainwhy the purchase-intent scores for dried seaweed were significantly higher than all otherfood items except for bread (p < 0.05). Furthermore, participants identified that they hadconsumed dried seaweed before or were familiar with the product. Familiarity has beenshown to increase consumers’ purchase intent [45]. Although familiarity was not explicitlyasked about in the questionnaire, the results of the open-ended comment question indi-cate that participants are familiar with dried seaweed, which could have influenced thepurchase-intent scores. In addition, Nova Scotia, Canada is located on the Atlantic Ocean,and many residents would be familiar with seaweed. Dried seaweed was also associatedwith adventurous, wild, active, and free. This result may have occurred as many of theparticipants stated that dried seaweed is a “great on-the-go snack” and also a “healthysnack that is part of an active lifestyle, like hiking.”
Foods 2021, 10, x FOR PEER REVIEW 6 of 17
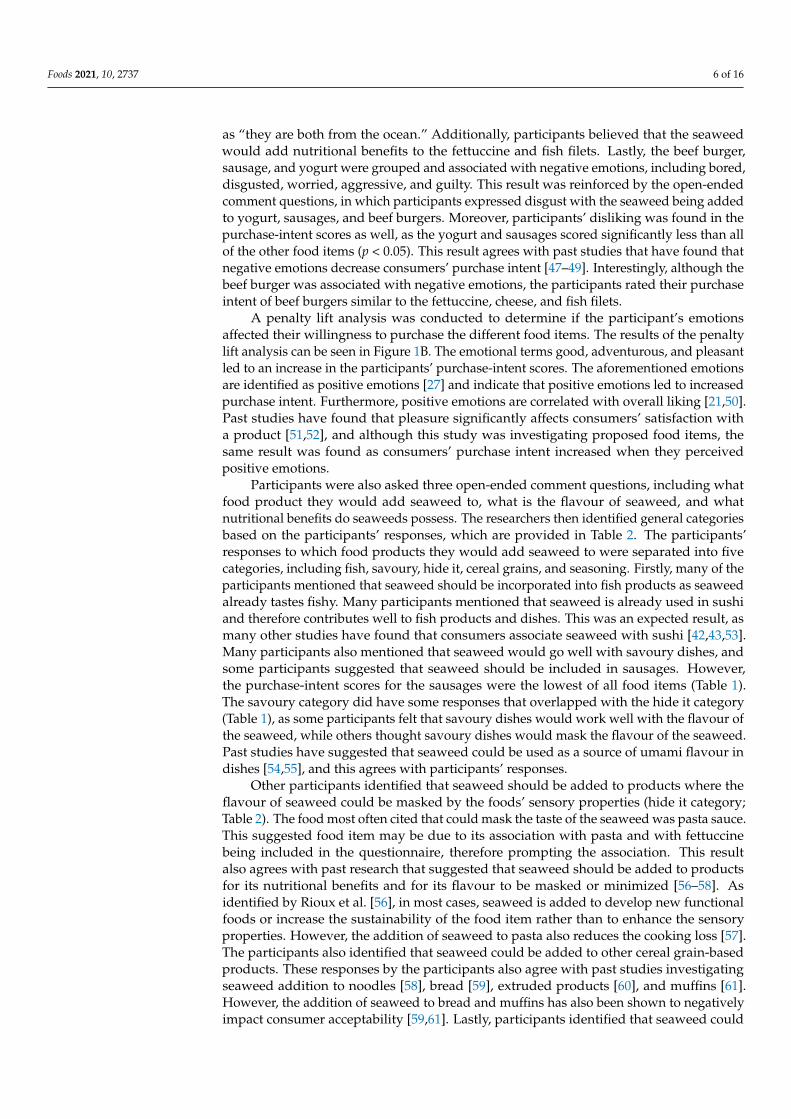
Figure 1. (A) Biplot representation of the seaweed-containing food items and emotional terms on the first two dimensions of the correspondence analysis for the overall population. (B) Penalty lift analysis of the emotional terms and willingness to pay based on the overall population’s evaluation of the seaweed-containing food items.
The bread, which was the only food item not to be significantly different from the dried seaweed, was also on the negative side of the second dimension. The bread was associated with positive emotions, including understanding, good-natured, pleasant, secure, joyful, warm, and good. Similar to past studies, products associated with positive emotions were also associated with increased purchase-intent scores [46]. Bread had the highest purchase intent score (6.6 ± 1.2; Table 1) of all food products. Bread is also a very common product that consumers are familiar with, and as stated above, familiarity has been shown to increase consumers’ purchase intent [45]. The cheese, fish filet, and fettuccine food products were grouped together and associated with positive emotions, including satisfied, interested, tame, happy, and enthusiastic. In the open-ended comment questions, participants said the added seaweed would “match with the saltiness” of the cheese. The participants also stated that the seaweed would pair well with the fish filet, as “they are both from the ocean.” Additionally, participants believed that the seaweed would add nutritional benefits to the fettuccine and fish filets. Lastly, the beef burger, sausage, and yogurt were grouped and associated with negative emotions, including bored, disgusted, worried, aggressive, and guilty. This result was reinforced by the open-ended comment questions, in which participants expressed disgust with the seaweed being added to yogurt, sausages, and beef burgers. Moreover, participants’ disliking was found in the purchase-intent scores as well, as the yogurt and sausages scored significantly less than all of the other food items (p < 0.05). This result agrees with past studies that have found that negative emotions decrease consumers’ purchase intent [47–49]. Interestingly, although the beef burger was associated with negative emotions, the participants rated their purchase intent of beef burgers similar to the fettuccine, cheese, and fish filets.
A penalty lift analysis was conducted to determine if the participant’s emotions affected their willingness to purchase the different food items. The results of the penalty lift analysis can be seen in Figure 1B. The emotional terms good, adventurous, and pleasant led to an increase in the participants’ purchase-intent scores. The aforementioned emotions are identified as positive emotions [27] and indicate that positive emotions led
Figure 1. (A) Biplot representation of the seaweed-containing food items and emotional terms on the first two dimensionsof the correspondence analysis for the overall population. (B) Penalty lift analysis of the emotional terms and willingness topay based on the overall population’s evaluation of the seaweed-containing food items.
The bread, which was the only food item not to be significantly different from thedried seaweed, was also on the negative side of the second dimension. The bread wasassociated with positive emotions, including understanding, good-natured, pleasant, se-cure, joyful, warm, and good. Similar to past studies, products associated with positiveemotions were also associated with increased purchase-intent scores [46]. Bread had thehighest purchase intent score (6.6 ± 1.2; Table 1) of all food products. Bread is also avery common product that consumers are familiar with, and as stated above, familiarityhas been shown to increase consumers’ purchase intent [45]. The cheese, fish filet, andfettuccine food products were grouped together and associated with positive emotions,including satisfied, interested, tame, happy, and enthusiastic. In the open-ended commentquestions, participants said the added seaweed would “match with the saltiness” of thecheese. The participants also stated that the seaweed would pair well with the fish filet,
Foods 2021, 10, 2737 6 of 16
as “they are both from the ocean.” Additionally, participants believed that the seaweedwould add nutritional benefits to the fettuccine and fish filets. Lastly, the beef burger,sausage, and yogurt were grouped and associated with negative emotions, including bored,disgusted, worried, aggressive, and guilty. This result was reinforced by the open-endedcomment questions, in which participants expressed disgust with the seaweed being addedto yogurt, sausages, and beef burgers. Moreover, participants’ disliking was found in thepurchase-intent scores as well, as the yogurt and sausages scored significantly less than allof the other food items (p < 0.05). This result agrees with past studies that have found thatnegative emotions decrease consumers’ purchase intent [47–49]. Interestingly, although thebeef burger was associated with negative emotions, the participants rated their purchaseintent of beef burgers similar to the fettuccine, cheese, and fish filets.
A penalty lift analysis was conducted to determine if the participant’s emotionsaffected their willingness to purchase the different food items. The results of the penaltylift analysis can be seen in Figure 1B. The emotional terms good, adventurous, and pleasantled to an increase in the participants’ purchase-intent scores. The aforementioned emotionsare identified as positive emotions [27] and indicate that positive emotions led to increasedpurchase intent. Furthermore, positive emotions are correlated with overall liking [21,50].Past studies have found that pleasure significantly affects consumers’ satisfaction witha product [51,52], and although this study was investigating proposed food items, thesame result was found as consumers’ purchase intent increased when they perceivedpositive emotions.
Participants were also asked three open-ended comment questions, including whatfood product they would add seaweed to, what is the flavour of seaweed, and whatnutritional benefits do seaweeds possess. The researchers then identified general categoriesbased on the participants’ responses, which are provided in Table 2. The participants’responses to which food products they would add seaweed to were separated into fivecategories, including fish, savoury, hide it, cereal grains, and seasoning. Firstly, many of theparticipants mentioned that seaweed should be incorporated into fish products as seaweedalready tastes fishy. Many participants mentioned that seaweed is already used in sushiand therefore contributes well to fish products and dishes. This was an expected result, asmany other studies have found that consumers associate seaweed with sushi [42,43,53].Many participants also mentioned that seaweed would go well with savoury dishes, andsome participants suggested that seaweed should be included in sausages. However,the purchase-intent scores for the sausages were the lowest of all food items (Table 1).The savoury category did have some responses that overlapped with the hide it category(Table 1), as some participants felt that savoury dishes would work well with the flavour ofthe seaweed, while others thought savoury dishes would mask the flavour of the seaweed.Past studies have suggested that seaweed could be used as a source of umami flavour indishes [54,55], and this agrees with participants’ responses.
Other participants identified that seaweed should be added to products where theflavour of seaweed could be masked by the foods’ sensory properties (hide it category;Table 2). The food most often cited that could mask the taste of the seaweed was pasta sauce.This suggested food item may be due to its association with pasta and with fettuccinebeing included in the questionnaire, therefore prompting the association. This resultalso agrees with past research that suggested that seaweed should be added to productsfor its nutritional benefits and for its flavour to be masked or minimized [56–58]. Asidentified by Rioux et al. [56], in most cases, seaweed is added to develop new functionalfoods or increase the sustainability of the food item rather than to enhance the sensoryproperties. However, the addition of seaweed to pasta also reduces the cooking loss [57].The participants also identified that seaweed could be added to other cereal grain-basedproducts. These responses by the participants also agree with past studies investigatingseaweed addition to noodles [58], bread [59], extruded products [60], and muffins [61].However, the addition of seaweed to bread and muffins has also been shown to negativelyimpact consumer acceptability [59,61]. Lastly, participants identified that seaweed could

Foods 2021, 10, 2737 7 of 16
be used as a seasoning on a variety of different products to enhance the flavour of the dishor to add a salty taste. In addition, some participants discussed how seaweed could addtexture to a dish or a “crunch factor.” The responses to this question mainly discussed thetaste, aroma, or flavour of the seaweed, but some participants did identify that seaweedcould add texture to a product, which has also been identified in a past study by [62]. Theseresponses also agree with a study by Senthil et al. [63] that incorporated seaweed into aspice mix as well as a study where brown seaweed was used to season corn snacks [64].
Table 2. Results of the comment analysis conducted on the open-ended comments pertaining to seaweeds (n = 108).
Category Summary of Responses and Keywords Identified
If you had to use seaweed in a food product, what product would you add it to and why?
Fish - Sushi, any fish products, fish [the taste might go well together], something with a fishy tastealready, fish filets
Savoury - Soup mix, savoury dish—such as sausage, potatoes, noodles, miso soup, eggs, ramen,cheese, casserole, easily disguised in savoury dishes, pesto sauce—herbs can mask the flavour
Hide it- Meat sauce, casserole, smoothie—because I could hide the taste, salad dressing, pasta sauceto downplay the bitter taste, spaghetti sauce to mask the taste, add it to foods where it can be
easily disguised
Cereal Grains - Crackers, chips, bread, seaweed crackers, sourdough bread, pasta, grains-based products
Seasoning- Salty flavouring to a variety of products, sprinkle on rice, compliment things with a strongtaste, crunch factor, enhance flavour of ramen, add it to something that tastes mild to add a
salty taste
What do you think is the flavour of seaweeds and seaweed-containing products?
Salt - Salt and the sea, brine taste, ocean, saltiness, a bit salty, salty, briny
Fishy - Mild fishy, a little bit fishy, fishy but umami, fishy aftertaste,
Earthy - Earthy, mushroom, grainy, grass-like, green, bitter—but earthy bitterness
Savoury - Savoury, umami, mild savoury taste,
Do you think seaweeds have any nutrition benefits, and if so, what are they?
Fibre - Lots of fibre, roughage, healthy fibre
Vitamins/ Nutrients - Iodine, minerals, iron, range of minerals, calcium, magnesium, potassium, omega-3, sodium,vitamin C, micronutrient, some vitamins, nutrient-dense
Heart Disease - Reduces risk of heart disease, reduces major heart disease risks,
Antioxidants - Antioxidants, phytochemicals, high in antioxidants, antioxidant characteristics
The participants were also asked to identify the flavour of seaweed. There was agreat deal of agreement in the responses, as almost all participants identified salty or fishyor both. Both properties have been identified in sensory analysis trials on seaweed andseaweed-containing products [4,20,59,65,66]. This result also agrees with the participants’responses to the first open-ended comment question, as participants thought seaweed couldbe used as “salt flavouring” (Seasoning-Table 2) and that the fishy taste of seaweed wouldwork well with fish products (Fish-Table 2). Participants also stated that seaweed wouldtaste earthy and bitter. Earthy or a mushroom aroma have been found to characterizered seaweeds [67], while bitterness has been associated with both red [66] and brownseaweed [68]. Many participants stated that the “earthiness is due to the bitterness of theseaweed.” It is interesting to note that the participants associated earthy and bitter to bevery similar when discussing seaweeds. Some of the participants also indicated that theseaweed would taste savoury, as they felt seaweed could be added to savoury food items,which agrees with the responses above. Savoury or umami has also been identified in paststudies as a taste associated with seaweed [68,69].

Foods 2021, 10, 2737 8 of 16
Lastly, participants were asked if they thought seaweeds had nutritional benefits,and overwhelmingly, the participants responded that they did. This result agrees witha past study on Australian consumers’ attitudes towards seaweeds [42] and indicatesthat consumers are aware that seaweed is a healthy option. Participants identified fourgeneral categories, including fibre, vitamins/nutrients, heart disease, and antioxidants.The participants were able to identify many different nutritional benefits that have beenidentified in past studies [52,70–73]. Other studies on consumer attitudes towards seaweedshave stated that education on the health benefits of seaweeds could increase consumptionand acceptance of seaweed [74,75].
3.2. Segmentation
The secondary objective was to evaluate how hunger status, food neophobia, andlifestyle affect consumers’ emotional responses. The participants were separated into dif-ferent groups based on their responses to the respective scales. First, the participants wereseparated based on their hunger status into low hunger (LH, n = 54, sum score = 6.0–15.3)and high hunger (HH, n = 54, sum score = 15.9–29.7). The liking scores between the twogroups were then compared using a t-test (Table 1). The only product that was significantlydifferent between the two groups was the sausage, which the HH participants scoredsignificantly lower than the LH group (p < 0.05). The CATA results of the two groups werethen evaluated using CA and a penalty lift analysis (Figure 2). Both biplots (Figure 2A,C)were quite similar when looking at the first dimension separating the beef burger, yogurt,sausage, and seaweed from the bread, cheese, fettuccine, and fish filet. However, the LH(Figure 2A) separated the seaweed from the beef burger, yogurt, and sausage on the seconddimension. Additionally, the seaweed was mainly associated with wild, nostalgic, active,adventurous, and free. The HH (Figure 2C) grouped the seaweed with the yogurt andassociated it with wild, free, and active but also with bored and disgusted. The sausagewas grouped with the beef burger and was associated with understanding, interested,guilty, and worried. The difference between the two groups becomes evident when lookingat the penalty lift analyses (Figure 2B,D). The LH’s purchase-intent scores increased whenadventurous and good were selected, while the HH’s purchase-intent scores increasedwhen satisfied, good, and pleasant were selected. All of these emotions are categorizedas positive emotions and have been shown to impact overall liking scores [49]. The LHparticipants’ purchase-intent scores were significantly impacted by the adventurous emo-tion. This result may indicate that since these participants are not hungry or satiated, theyare willing to be more adventurous in their food choices. The HH purchase-intent scoresincreased when they selected the term satisfied. These participants may have been hungryat the time and wished to be satiated. When hungry, most humans want to be satiated [76],and this may have been seen in the results based on the impact of the emotional responses.Furthermore, de-Magistris and Gracia [77] found that hungry participants were more likelyto pay a higher premium price for cheese than satiated participants. de-Magistris and Gra-cia [77] also found that participants overvalued the food product when they were hungry.This is the first study in which the authors are aware of what connects hunger status withemotional responses (EsSense25 Profile®; [27]). Furthermore, this study demonstrated thathunger status did impact the emotional responses chosen by participants as well as thepurchase-intent scores. Future studies should be conducted to confirm these findings.

Foods 2021, 10, 2737 9 of 16
Foods 2021, 10, x FOR PEER REVIEW 10 of 17
positive emotions by both groups even though different positive emotions were identified. The penalty lift analyses (Figure 3B,D) demonstrated a difference between the two groups as well. The emotions of enthusiastic and satisfied increased the purchase intent of both groups; however, only the emotion of good increased the purchase-intent scores of the LFN group. This result may indicate that the HFN group did not associate many of the foods with good and would not purchase them. However, this thought is contradicted by the impact of the enthusiastic term used by the HFN group. This result may have occurred because the participants did not actually consume the food but rather just looked at pictures of food items. In a study in which consumers consumed sustainable food products, food neophobia did not affect consumers emotional responses [79]. Future studies need to be completed to investigate food neophobia and how it affects emotional responses to food items.
Figure 2. (A) Biplot representation of the seaweed-containing food items and emotional terms on the first two dimensionsof the correspondence analysis for the population categorized as low hunger (LH). (B) Penalty lift analysis of the emotionalterms and willingness to pay based on the LH population’s evaluation of the seaweed-containing food items. (C) Biplotrepresentation of the seaweed-containing food items and emotional terms on the first two dimensions of the correspondenceanalysis for the population categorized as high hunger (HH). (D) Penalty lift analysis of the emotional terms and willingnessto pay based on the HH population’s evaluation of the seaweed-containing food items.
The participants were also separated based on their responses to the FNS. They wereseparated into high food neophobia (HFN; n = 54, sum score = 30–48) and low foodneophobia (LFN; n = 54, sum score = 12–29). There were no significant differences betweenthe two groups for their purchase-intent scores (Table 1). However, for all food itemsexcept for the fish filet, the HFN group had lower purchase-intent scores. Food neophobiahas been found to negatively impact consumer liking of food products [78]; however, asthe participants did not consume the products in this study, the effect of food neophobia

Foods 2021, 10, 2737 10 of 16
may have not been found. In both biplots (Figure 3A,C), the first dimension separatedthe sausage, beef burger, and yogurt from the fettuccine, bread, cheese, and fish filet. Onthe second dimension, the LFN separated the seaweed, cheese, and fish filet from thefettuccine, bread, sausage, beef burger, and yogurt. While the HFN group separated thebread and seaweed from the other food items, the biggest difference between the twogroups was the placement of the bread. The LFN group associated the bread with happy,interested, satisfied, good, and enthusiastic, while the HFN group associated the breadwith joyful, pleasant, warm, loving, and nostalgic. Overall, the bread was associated withpositive emotions by both groups even though different positive emotions were identified.The penalty lift analyses (Figure 3B,D) demonstrated a difference between the two groupsas well. The emotions of enthusiastic and satisfied increased the purchase intent of bothgroups; however, only the emotion of good increased the purchase-intent scores of the LFNgroup. This result may indicate that the HFN group did not associate many of the foodswith good and would not purchase them. However, this thought is contradicted by theimpact of the enthusiastic term used by the HFN group. This result may have occurredbecause the participants did not actually consume the food but rather just looked at picturesof food items. In a study in which consumers consumed sustainable food products, foodneophobia did not affect consumers emotional responses [79]. Future studies need tobe completed to investigate food neophobia and how it affects emotional responses tofood items.
Lastly, the participants were separated based on their responses to the FRL. There wasone significant difference between the two groups for their purchase-intent scores (Table 2).The HFRL (higher food-related lifestyle, n = 54, sum score = 82–101) group liked the fish filetsignificantly more than the LFRL (lower food-related lifestyle, n = 54, sum score = 57–81)group (p < 0.05). In addition, the purchase-intent scores for the HFRL group were higherthan the LFRL group except for the sausage, in which both groups scored it the same.The biggest difference between the groups’ emotional responses is evident in the biplots(Figure 4A,C), as bread was separated from the other items and was associated with happy,guilty, calm, secure, loving, warm, and joyful by the LFRL group. The HFRL associated thebread with the fettuccine and fish filet and associated the bread with the terms pleasant,joyful, warm, secure, happy, good, enthusiastic, and pleasant. On both biplots, sausage,yogurt, and seaweed were separated from the other food items (Figure 4A by the firstdimension and Figure 4C by the second dimension). The penalty lift analysis indicates aclear difference between the two consumer groups. The LFRL group purchase-intent scoreswere positively impacted by the term good (Figure 4B), while the HFRL group’s scores werepositively impacted by the terms adventurous, enthusiastic, and good (Figure 4D). The FRLattempts to capture the differences in how consumers view food and beverages [32]. Thosethat score highly on the FRL are considered to be foodies [80] and variety seekers [81]. Theparticipants who scored highly on the FRL indicate that food is very important to them,and they spend considerable time and resources on food [32]. In addition, food has a majorrole in achieving their life values [32]. With food having this importance in their life, it mayexplain why adventurous and enthusiastic terms positively impacted their purchase-intentscores of the proposed seaweed products. The FRL identified differences in the participants’emotional responses to seaweed-containing food items. More studies need to be completedto determine how FRL impacts the emotional responses of consumers.

Foods 2021, 10, 2737 11 of 16Foods 2021, 10, x FOR PEER REVIEW 12 of 17
Figure 3. (A) Biplot representation of the seaweed-containing food items and emotional terms on the first two dimensions of the correspondence analysis for the population categorized as lower food neophobia (LFN). (B) Penalty lift analysis of the emotional terms and willingness to pay based on the LFN population’s evaluation of the seaweed-containing food items. (C) Biplot representation of the seaweed-containing food items and emotional terms on the first two dimensions of the correspondence analysis for the population categorized as higher food neophobia (HFN). (D) Penalty lift analysis of the emotional terms and willingness to pay based on the HFN population’s evaluation of the seaweed-containing food items.
Figure 3. (A) Biplot representation of the seaweed-containing food items and emotional terms on the first two dimensionsof the correspondence analysis for the population categorized as lower food neophobia (LFN). (B) Penalty lift analysis ofthe emotional terms and willingness to pay based on the LFN population’s evaluation of the seaweed-containing fooditems. (C) Biplot representation of the seaweed-containing food items and emotional terms on the first two dimensions ofthe correspondence analysis for the population categorized as higher food neophobia (HFN). (D) Penalty lift analysis of theemotional terms and willingness to pay based on the HFN population’s evaluation of the seaweed-containing food items.

Foods 2021, 10, 2737 12 of 16Foods 2021, 10, x FOR PEER REVIEW 13 of 17
Figure 4. (A) Biplot representation of the seaweed-containing food items and emotions terms on the first two dimensions of the correspondence analysis for the population categorized as lower food-related lifestyle (LFRL). (B) Penalty lift analysis of the emotional terms and willingness to pay based on the LFRL population’s evaluation of the seaweed-containing food items. (C) Biplot representation of the seaweed-containing food items and emotional terms on the first two dimensions of the correspondence analysis for the population categorized as higher food-related lifestyle (HFRL). (D) Penalty lift analysis of the emotional terms and willingness to pay based on the HFRL population’s evaluation of the seaweed-containing food items.
3.3. Limitations This study presented an evaluation of how consumers perceive seaweed addition to
food products, but some limitations need to be identified. Firstly, the emotional responses and purchase-intent scores were evaluated by looking at pictures of the food items. The results may have differed if participants consumed the food items. Secondly, the participants’ familiarity with consuming seaweed could have been evaluated, as familiarity has been found to influence participants’ liking and emotional responses to
Figure 4. (A) Biplot representation of the seaweed-containing food items and emotions terms on the first two dimensions ofthe correspondence analysis for the population categorized as lower food-related lifestyle (LFRL). (B) Penalty lift analysis ofthe emotional terms and willingness to pay based on the LFRL population’s evaluation of the seaweed-containing fooditems. (C) Biplot representation of the seaweed-containing food items and emotional terms on the first two dimensions ofthe correspondence analysis for the population categorized as higher food-related lifestyle (HFRL). (D) Penalty lift analysisof the emotional terms and willingness to pay based on the HFRL population’s evaluation of the seaweed-containingfood items.
3.3. Limitations
This study presented an evaluation of how consumers perceive seaweed addition tofood products, but some limitations need to be identified. Firstly, the emotional responsesand purchase-intent scores were evaluated by looking at pictures of the food items. The re-sults may have differed if participants consumed the food items. Secondly, the participants’familiarity with consuming seaweed could have been evaluated, as familiarity has beenfound to influence participants’ liking and emotional responses to food products [82,83].
Foods 2021, 10, 2737 13 of 16
Additionally, the participants’ response to conventional food items (without seaweed) wasnot evaluated. Future studies should investigate how seaweed addition to food itemschanges consumers’ purchase intent. From a methodology perspective, the CATA ques-tionnaire can be restrictive for participants in their choice of emotional responses. Morestudies are needed to confirm these results and to determine how hunger and FRL impactconsumers’ emotional responses. In addition, more studies are needed to determine howemotional responses and purchase-intent scores are intertwined. Furthermore, the culturalbackground of the participants could have been evaluated, as it may have affected the FRL,food neophobia, emotional responses, and purchase-intent scores.
4. Conclusions
Purchase-intent scores were highest for bread and dried seaweed. The participants didnot want to purchase yogurt and sausages with added seaweed. The dried seaweed andbread were associated with positive emotions and nostalgia, as outlined in the open-endedcomment questions. Participants identified negative emotions when evaluating the beefburger, sausage, and yogurt, indicating that they were disgusted with the thought of sea-weed being added to these food items. The purchase-intent scores increased when positiveemotions (good, adventurous, and pleasant) were selected based on the penalty lift analysis.The participants identified that seaweed would work well with fish, savoury, and cerealgrain-based food products as well as a seasoning or hidden in food products to promotenutritional benefits. Participants identified that seaweed has salty, fishy, earthy, bitter, andsavoury flavours and associated it with many health benefits. The participants were alsosegmented based on their responses to hunger scales, FNS, and FRL. Hunger status aswell as food neophobia and lifestyle all impacted participants emotional responses. Futureresearch should expand on this study and evaluate how hunger and FRL impact emotionalresponses. In addition, future studies should investigate emotional responses to the con-sumption of seaweed-containing food products as well as investigate how familiarity andcultural background affect consumers’ emotional responses to new food products.
Supplementary Materials: The following are available online at https://www.mdpi.com/article/10.3390/foods10112737/s1, Table S1: Studies investigating incorporation of seaweed in different foodproducts using sensory analysis, Table S2: Demographic details of the participants.
Author Contributions: Conceptualization R.M. and M.B.M.; methodology, M.B.M.; software, M.B.M.;validation, R.M. and M.B.M.; formal analysis, R.M. and M.B.M.; investigation, R.M. and M.B.M.;resources, M.B.M.; data curation, M.B.M.; writing—original draft preparation, R.M.; writing—review and editing, M.B.M.; visualization, M.B.M.; supervision, M.B.M.; project administration,M.B.M.; funding acquisition, M.B.M. All authors have read and agreed to the published version ofthe manuscript.
Funding: This research was funded by the Centre for the Sensory Research of Food.
Institutional Review Board Statement: The study was conducted according to the guidelines of theDeclaration of Helsinki, and approved by the Research Ethics Board of Acadia University (REB 13-72and date of approval: 10 May 2021).
Informed Consent Statement: Informed consent was obtained from all subjects involved in the study.
Data Availability Statement: The data presented in this study are available on request from thecorresponding author (M.M).
Acknowledgments: Thank you to all the volunteers who participated in this project.
Conflicts of Interest: The authors declare no conflict of interest.
References1. Butterfield, N.J. Bangiomorpha pubescens n. gen., n. sp.: Implications for the evolution of sex, multicellularity, and the
Mesoproterozoic/Neoproterozoic radiation of eukaryotes. Paleobiology 2000, 26, 386–404. [CrossRef]2. Mouritsen, O.G.; Rhatigan, P.; Pérez-Lloréns, J.L. World cuisine of seaweeds: Science meets gastronomy. Int. J. Gastron. Food Sci.
2018, 14, 55–65. [CrossRef]

Foods 2021, 10, 2737 14 of 16
3. Chung, I.K.; Sondak, C.F.A.; Beardall, J. The future of seaweed aquaculture in a rapidly changing world. Eur. J. Phycol. 2017, 52,495–505. [CrossRef]
4. Kumar, Y.; Tarafdar, A.; Kumar, D.; Badgujar, P.C. Effect of Indian brown seaweed Sargassum wightii as a functional ingredienton the phytochemical content and antioxidant activity of coffee beverage. J. Food Sci. Technol. 2019, 56, 4516–4525. [CrossRef][PubMed]
5. McDermid, K.J.; Stuercke, B. Nutritional composition of edible Hawaiian seaweeds. J. Appl. Phycol. 2003, 15, 513–524. [CrossRef]6. Kumar, M.; Kumari, P.; Trivedi, N.; Shukla, M.K.; Gupta, V.; Reddy, C.R.K.; Jha, B. Minerals, PUFAs and antioxidant properties of
some tropical seaweeds from Saurashtra coast of India. J. Appl. Phycol. 2011, 23, 797–810. [CrossRef]7. Sánchez-Machado, D.I.; López-Cervantes, J.; López-Hernández, J.; Paseiro-Losada, P. Fatty acids, total lipid, protein and ash
contents of processed edible seaweeds. Food Chem. 2004, 85, 439–444. [CrossRef]8. Wells, M.L.; Potin, P.; Craigie, J.S.; Raven, J.A.; Merchant, S.S.; Helliwell, K.E.; Smith, A.G.; Camire, M.E.; Brawley, S.H. Algae as
nutritional and functional food sources: Revisiting our understanding. J. Appl. Phycol. 2017, 29, 949–982. [CrossRef] [PubMed]9. Rasyid, A. Evaluation of Nutritional Composition of The Dried Seaweed Ulva lactuca from Pameungpeuk Waters, Indonesia.
Trop. Life Sci. Res. 2017, 28, 119–125. [CrossRef]10. Sakthivel, R.; Pandima Devi, K. Evaluation of physicochemical properties, proximate and nutritional composition of Gracilaria
edulis collected from Palk Bay. Food Chem. 2015, 174, 68–74. [CrossRef] [PubMed]11. Kadam, S.U.; Álvarez, C.; Tiwari, B.K.; O’Donnell, C.P. Extraction and characterization of protein from Irish brown seaweed
Ascophyllum nodosum. Food Res. Int. 2017, 99, 1021–1027. [CrossRef] [PubMed]12. Mæhre, H.K.; Malde, M.K.; Eilertsen, K.-E.; Elvevoll, E.O. Characterization of protein, lipid and mineral contents in common
Norwegian seaweeds and evaluation of their potential as food and feed. J. Sci. Food Agric. 2014, 94, 3281–3290. [CrossRef]13. Syad, A.N.; Shunmugiah, K.P.; Kasi, P.D. Seaweeds as nutritional supplements: Analysis of nutritional profile, physicochemical
properties and proximate composition of G. acerosa and S. wightii. Biomed. Prev. Nutr. 2013, 3, 139–144. [CrossRef]14. Cofrades, S.; Benedí, J.; Garcimartin, A.; Sánchez-Muniz, F.J.; Jimenez-Colmenero, F. A comprehensive approach to formulation of
seaweed-enriched meat products: From technological development to assessment of healthy properties. Food Res. Int. 2017, 99,1084–1094. [CrossRef] [PubMed]
15. Gómez-Ordóñez, E.; Jiménez-Escrig, A.; Rupérez, P. Dietary fibre and physicochemical properties of several edible seaweedsfrom the northwestern Spanish coast. Food Res. Int. 2010, 43, 2289–2294. [CrossRef]
16. Taboada, M.C.; Millán, R.; Miguez, M.I. Nutritional value of the marine algae wakame (Undaria pinnatifida) and nori (Porphyrapurpurea) as food supplements. J. Appl. Phycol. 2013, 25, 1271–1276. [CrossRef]
17. Arufe, S.; Della Valle, G.; Chiron, H.; Chenlo, F.; Sineiro, J.; Moreira, R. Effect of brown seaweed powder on physical and texturalproperties of wheat bread. Eur. Food Res. Technol. 2018, 244, 1–10. [CrossRef]
18. Chang, H.C.; Wu, L.-C. Texture and Quality Properties of Chinese Fresh Egg Noodles Formulated with Green Seaweed [Monos-troma nitidum] Powder. J. Food Sci. 2008, 73, S398–S404. [CrossRef]
19. Dolea, D.; Rizo, A.; Fuentes, A.; Barat, J.; Fernández-Segovia, I. Effect of thyme and oregano essential oils on the shelf life ofsalmon and seaweed burgers. Food Sci. Technol. Int. 2018, 24, 394–403. [CrossRef]
20. Nuñez, M.; Picon, A. Seaweeds in yogurt and quark supplementation: Influence of five dehydrated edible seaweeds on sensorycharacteristics. Int. J. Food Sci. Technol. 2017, 52, 431–438. [CrossRef]
21. Jaeger, S.R.; Hedderley, D.I. Impact of individual differences in emotional intensity and private body consciousness on EsSenseProfile® responses. Food Qual. Prefer. 2013, 27, 54–62. [CrossRef]
22. Cardello, A.V.; Meiselman, H.L.; Schutz, H.G.; Craig, C.; Given, Z.; Lesher, L.L.; Eicher, S. Measuring emotional responses tofoods and food names using questionnaires. Food Qual. Prefer. 2012, 24, 243–250. [CrossRef]
23. Ferrarini, R.; Carbognin, C.; Casarotti, E.M.; Nicolis, E.; Nencini, A.; Meneghini, A.M. The emotional response to wine consump-tion. Food Qual. Prefer. 2010, 21, 720–725. [CrossRef]
24. King, S.C.; Meiselman, H.L. Development of a method to measure consumer emotions associated with foods. Food Qual. Prefer.2010, 21, 168–177. [CrossRef]
25. Jaeger, S.R.; Swaney-Stueve, M.; Chheang, S.L.; Hunter, D.C.; Pineau, B.; Ares, G. An assessment of the CATA-variant of theEsSense Profile®. Food Qual. Prefer. 2018, 68, 360–370. [CrossRef]
26. Jaeger, S.R.; Cardello, A.V.; Schutz, H.G. Emotion questionnaires: A consumer-centric perspective. Food Qual. Prefer. 2013, 30,229–241. [CrossRef]
27. Nestrud, M.A.; Meiselman, H.L.; King, S.C.; Lesher, L.L.; Cardello, A.V. Development of EsSense25, a shorter version of theEsSense Profile®. Food Qual. Prefer. 2016, 48, 107–117. [CrossRef]
28. Leigh Gibson, E. Emotional influences on food choice: Sensory, physiological and psychological pathways. Physiol. Behav. 2006,89, 53–61. [CrossRef]
29. Macht, M.; Simons, G. Emotions and eating in everyday life. Appetite 2000, 35, 65–71. [CrossRef]30. Macht, M.; Gerer, J.; Ellgring, H. Emotions in overweight and normal-weight women immediately after eating foods differing in
energy. Physiol. Behav. 2003, 80, 367–374. [CrossRef]31. Brunsø, K.; Grunert, K.G. Cross-Cultural Similarities and Differences in Shopping for Food. J. Bus. Res. 1998, 42, 145–150.
[CrossRef]

Foods 2021, 10, 2737 15 of 16
32. Brunsø, K.; Birch, D.; Memery, J.; Temesi, Á.; Lakner, Z.; Lang, M.; Dean, D.; Grunert, K.G. Core dimensions of food-relatedlifestyle: A new instrument for measuring food involvement, innovativeness and responsibility. Food Qual. Prefer. 2021, 91, 104192.[CrossRef]
33. Pliner, P.; Hobden, K. Development of a scale to measure the trait of food neophobia in humans. Appetite 1992, 19, 105–120.[CrossRef]
34. Friedman, M.I.; Ulrich, P.; Mattes, R.D. A Figurative Measure of Subjective Hunger Sensations. Appetite 1999, 32, 395–404.[CrossRef]
35. Ng, M.; Chaya, C.; Hort, J. Beyond liking: Comparing the measurement of emotional response using EsSense Profile andconsumer defined check-all-that-apply methodologies. Food Qual. Prefer. 2013, 28, 193–205. [CrossRef]
36. Meyners, M.; Castura, J. Check-All-That-Apply Questions. Nov. Tech. Sens. Charact. Consum. Profiling 2014, 271–305. [CrossRef]37. Fonseca, F.G.A.; Esmerino, E.A.; Filho, E.R.T.; Ferraz, J.P.; da Cruz, A.G.; Bolini, H.M.A. Novel and successful free comments
method for sensory characterization of chocolate ice cream: A comparative study between pivot profile and comment analysis. J.Dairy Sci. 2016, 99, 3408–3420. [CrossRef]
38. Laaksonen, O.; Knaapila, A.; Niva, T.; Deegan, K.C.; Sandell, M. Sensory properties and consumer characteristics contributing toliking of berries. Food Qual. Prefer. 2016, 53, 117–126. [CrossRef]
39. Romaniw, O.C.; Rajpal, R.; Duncan, A.M.; Keller, H.H.; Duizer, L.M. Nutrition in Disguise: Effects of Food Neophobia, HealthyEating Interests and Provision of Health Information on Liking and Perceptions of Nutrient-Dense Foods in Older Adults. Foods2021, 10, 60. [CrossRef]
40. Gullón, B.; Gagaoua, M.; Barba, F.J.; Gullón, P.; Zhang, W.; Lorenzo, J.M. Seaweeds as promising resource of bioactive compounds:Overview of novel extraction strategies and design of tailored meat products. Trends Food Sci. Technol. 2020, 100, 1–18. [CrossRef]
41. Roohinejad, S.; Koubaa, M.; Barba, F.J.; Saljoughian, S.; Amid, M.; Greiner, R. Application of seaweeds to develop new foodproducts with enhanced shelf-life, quality and health-related beneficial properties. Food Res. Int. 2017, 99, 1066–1083. [CrossRef][PubMed]
42. Birch, D.; Skallerud, K.; Paul, N.A. Who are the future seaweed consumers in a Western society? Insights from Australia. Br. FoodJ. 2018, 121, 603–615. [CrossRef]
43. Birch, D.; Skallerud, K.; Paul, N. Who Eats Seaweed? An Australian Perspective. J. Int. Food Agribus. Mark. 2019, 31, 329–351.[CrossRef]
44. Beyts, C.; Chaya, C.; Dehrmann, F.; James, S.; Smart, K.; Hort, J. A comparison of self-reported emotional and implicit responsesto aromas in beer. Food Qual. Prefer. 2017, 59, 68–80. [CrossRef]
45. Kam, K.; Murray, J.M.; Arcot, J.; Ward, R. Fortification of parboiled rice with folic acid: Consumer acceptance and sensoryevaluation. Food Res. Int. 2012, 49, 354–363. [CrossRef]
46. Danner, L.; Ristic, R.; Johnson, T.E.; Meiselman, H.L.; Hoek, A.C.; Jeffery, D.W.; Bastian, S.E. Context and wine quality effectson consumers’ mood, emotions, liking and willingness to pay for Australian Shiraz wines. Food Res. Int. 2016, 89, 254–265.[CrossRef] [PubMed]
47. Chonpracha, P.; Ardoin, R.; Gao, Y.; Waimaleongora-ek, P.; Tuuri, G.; Prinyawiwatkul, W. Effects of Intrinsic and Extrinsic VisualCues on Consumer Emotion and Purchase Intent: A Case of Ready-to-Eat Salad. Foods 2020, 9, 396. [CrossRef]
48. Poonnakasem, N.; Pujols, K.D.; Chaiwanichsiri, S.; Laohasongkram, K.; Prinyawiwatkul, W. Different Oils and Health BenefitStatements Affect Physicochemical Properties, Consumer Liking, Emotion, and Purchase Intent: A Case of Sponge Cake. J. FoodSci. 2016, 81, S165–S173. [CrossRef] [PubMed]
49. Spinelli, S.; Masi, C.; Dinnella, C.; Zoboli, G.P.; Monteleone, E. How does it make you feel? A new approach to measuringemotions in food product experience. Food Qual. Prefer. 2014, 37, 109–122. [CrossRef]
50. Gutjar, S.; Dalenberg, J.R.; de Graaf, C.; de Wijk, R.A.; Palascha, A.; Renken, R.J.; Jager, G. What reported food-evoked emotionsmay add: A model to predict consumer food choice. Food Qual. Prefer. 2015, 45, 140–148. [CrossRef]
51. Ladhari, R. The movie experience: A revised approach to determinants of satisfaction. J. Bus. Res. 2007, 60, 454–462. [CrossRef]52. Mabeau, S.; Fleurence, J. Seaweed in food products: Biochemical and nutritional aspects. Trends Food Sci. Technol. 1993, 4, 103–107.
[CrossRef]53. Marcus, J.B. Enhancing umami taste in foods. In Modifying Flavour in Food [Internet]; Taylor, A., Hort, J., Eds.; Woodhead
Publishing: Sawston, UK, 2007.54. Mouritsen, O.G.; Williams, L.; Bjerregaard, R.; Duelund, L. Seaweeds for umami flavour in the New Nordic Cuisine. Flavour 2012,
1, 4. [CrossRef]55. Cardoso, S.M.; Pereira, O.R.; Seca, A.M.L.; Pinto, D.C.G.A.; Silva, A.M.S. Seaweeds as Preventive Agents for Cardiovascular
Diseases: From Nutrients to Functional Foods. Mar. Drugs 2015, 13, 6838–6865. [CrossRef] [PubMed]56. Rioux, L.-E.; Beaulieu, L.; Turgeon, S.L. Seaweeds: A traditional ingredients for new gastronomic sensation. Food Hydrocoll. 2017,
68, 255–265. [CrossRef]57. Prabhasankar, P.; Ganesan, P.; Bhaskar, N.; Hirose, A.; Stephen, N.; Gowda, L.R.; Hosokawa, M.; Miyashita, K. Edible Japanese
seaweed, wakame (Undaria pinnatifida) as an ingredient in pasta: Chemical, functional and structural evaluation. Food Chem. 2009,115, 501–508. [CrossRef]
58. Kumoro, A.; Johnny, D.; Alfilovita, D. Incorporation of microalgae and seaweed in instant fried wheat noodles manufacturing:Nutrition and culinary properties study. Int. Food Res. J. 2016, 23, 715–722.

Foods 2021, 10, 2737 16 of 16
59. Lamont, T.; McSweeney, M. Consumer acceptability and chemical composition of whole-wheat breads incorporated with brownseaweed (Ascophyllum nodosum) or red seaweed (Chondrus crispus). J. Sci. Food Agric. 2021, 101, 1507–1514. [CrossRef]
60. Singh, C.B.; Xavier, K.A.M.; Deshmukhe, G.; Gudipati, V.; Shitole, S.S.; Balange, A.K. Fortification of Extruded Product with BrownSeaweed (Sargassum tenerrimum) and Its Process Optimization by Response Surface Methodology. Waste Biomass Valorization 2018,9, 755–764. [CrossRef]
61. Mamat, H.; Akanda, J.M.H.; Zainol, M.K.; Ling, Y.A. The Influence of Seaweed Composite Flour on the PhysicochemicalProperties of Muffin. J Aquat Food Prod Technol. 2018, 27, 635–642. [CrossRef]
62. Chapman, A.S.; Stévant, P.; Larssen, W.E. Food or fad? Challenges and opportunities for including seaweeds in a Nordic diet. Bot.Mar. 2015, 58, 423–433. [CrossRef]
63. Senthil, A.; Mamatha, B.S.; Vishwanath, P.; Bhat, K.K.; Ravishankar, G.A. Studies on development and storage stability of instantspice adjunct mix from seaweed [Eucheuma]. J. Food Sci. Technol. 2011, 48, 712–717. [CrossRef]
64. Etemadian, Y.; Shabanpour, B.; Ramzanpour, Z.; Shaviklo, A.R.; Kordjazi, M. Production of the corn snack seasoned with brownseaweeds and their characteristics. J. Food Meas. Charact. 2018, 12, 2068–2079. [CrossRef]
65. Chee, C.P.; Gallaher, J.J.; Djordjevic, D.; Faraji, H.; McClements, D.J.; Decker, E.A.; Hollender, R.; Peterson, D.G.; Roberts, R.F.;Coupland, J.N. Chemical and sensory analysis of strawberry flavoured yogurt supplemented with an algae oil emulsion. J. DairyRes. 2005, 72, 311–316. [CrossRef] [PubMed]
66. Stévant, P.; Ólafsdóttir, A.; Déléris, P.; Dumay, J.; Fleurence, J.; Ingadóttir, B.; Jónsdóttir, R.; Ragueneau, É.; Rebours, C.; Rustad, T.Semi-dry storage as a maturation process for improving the sensory characteristics of the edible red seaweed dulse (Palmariapalmata). Algal Res. 2020, 51, 102048. [CrossRef]
67. Vilar, E.G.; O’Sullivan, M.G.; Kerry, J.P.; Kilcawley, K.N. A chemometric approach to characterize the aroma of selected brownand red edible seaweeds / extracts. J. Sci. Food Agric. 2021, 101, 1228–1238. [CrossRef]
68. Peinado, I.; Girón, J.; Koutsidis, G.; Ames, J.M. Chemical composition, antioxidant activity and sensory evaluation of five differentspecies of brown edible seaweeds. Food Res. Int. 2014, 66, 36–44. [CrossRef]
69. Frøst, M.B.; Hartmann, A.; Petersen, M.A.; Duelund, L.; Mouritsen, O.G. Odour-induced umami—Olfactory contribution toumami taste in seaweed extracts (dashi) by sensory interactions. Int. J. Gastron. Food Sci. 2021, 25, 100363. [CrossRef]
70. Dawczynski, C.; Schubert, R.; Jahreis, G. Amino acids, fatty acids, and dietary fibre in edible seaweed products. Food Chem. 2007,103, 891–899. [CrossRef]
71. Gupta, S.; Abu-Ghannam, N. Recent developments in the application of seaweeds or seaweed extracts as a means for enhancingthe safety and quality attributes of foods. Innov. Food Sci. Emerg. Technol. 2011, 12, 600–609. [CrossRef]
72. Murai, U.; Yamagishi, K.; Kishida, R.; Iso, H. Impact of seaweed intake on health. Eur. J. Clin. Nutr. 2020, 202, 877–889. [CrossRef][PubMed]
73. Nielsen, C.W.; Rustad, T.; Holdt, S.L. Vitamin C from Seaweed: A Review Assessing Seaweed as Contributor to Daily Intake.Foods 2021, 10, 198. [CrossRef] [PubMed]
74. Losada-Lopez, C.; Dopico, D.C.; Faína-Medín, J.A. Neophobia and seaweed consumption: Effects on consumer attitude andwillingness to consume seaweed. Int. J. Gastron. Food Sci. 2021, 24, 100338. [CrossRef]
75. Palmieri, N.; Forleo, M.B. The potential of edible seaweed within the western diet. A segmentation of Italian consumers. Int. J.Gastron. Food Sci. 2020, 20, 100202. [CrossRef]
76. Cornell, C.E.; Rodin, J.; Weingarten, H. Stimulus-induced eating when satiated. Physiol. Behav. 1989, 45, 695–704. [CrossRef]77. de-Magistris, T.; Gracia, A. Assessing Projection Bias in Consumers’ Food Preferences. PLoS ONE 2016, 11, e0146308. [CrossRef]78. Jaeger, S.R.; Chheang, S.L.; Jin, D.; Ryan, G.; Worch, T. The negative influence of food neophobia on food and beverage liking:
Time to look beyond extreme groups analysis? Food Qual. Pref. 2021, 92, 104217. [CrossRef]79. Yang, Q.; Shen, Y.; Foster, T.; Hort, J. Measuring consumer emotional response and acceptance to sustainable food products. Food
Res. Int. 2020, 131, 108992. [CrossRef]80. Casini, L.; Boncinelli, F.; Contini, C.; Gerini, F.; Scozzafava, G.; Alfnes, F. Heterogeneous preferences with respect to food
preparation time: Foodies and quickies. Food Qual. Prefer. 2019, 71, 233–241. [CrossRef]81. Kim, S.; Lee, K.; Lee, Y. Selection attributes of home meal replacement by food-related lifestyles of single-person households in
South Korea. Food Qual. Prefer. 2018, 66, 44–51. [CrossRef]82. Borgogno, M.; Favotto, S.; Corazzin, M.; Cardello, A.V.; Piasentier, E. The role of product familiarity and consumer involvement
on liking and perceptions of fresh meat. Food Qual. Prefer. 2015, 44, 139–147. [CrossRef]83. Torrico, D.D.; Fuentes, S.; Gonzalez Viejo, C.; Ashman, H.; Dunshea, F.R. Cross-cultural effects of food product familiarity on
sensory acceptability and non-invasive physiological responses of consumers. Food Res. Int. 2019, 115, 439–450. [CrossRef][PubMed]