DnaA-ATP acts as a molecular switch to control levels of ribonucleotide reductase expression in...
53
For Peer Review DnaA-ATP acts as a molecular switch to control levels of ribonucleotide reductase expression in Escherichia coli. Journal: Molecular Microbiology Manuscript ID: MMI-2010-09798.R2 Manuscript Type: Research Article Date Submitted by the Author: 16-Apr-2010 Complete List of Authors: Olliver, Anne; CNRS, ENS Cachan, LBPA, UMR 8113 Saggioro, Chiara; CNRS, ENS Cachan, LBPA, UMR 8113 Herrick, John; 3, rue des Jeûneurs, 75002 Sclavi, Bianca; CNRS, ENS-Cachan, LBPA, UMR 8113 Key Words: ribonucleotide reductase, DnaA, transcription regulation, cell cycle, DNA replication Molecular Microbiology peer-00552635, version 1 - 6 Jan 2011 Author manuscript, published in "Molecular Microbiology 76, 6 (2010) 1555" DOI : 10.1111/j.1365-2958.2010.07185.x
-
Upload
independent -
Category
Documents
-
view
0 -
download
0
Transcript of DnaA-ATP acts as a molecular switch to control levels of ribonucleotide reductase expression in...

For Peer Review
DnaA-ATP acts as a molecular switch to control levels of
ribonucleotide reductase expression in Escherichia coli.
Journal: Molecular Microbiology
Manuscript ID: MMI-2010-09798.R2
Manuscript Type: Research Article
Date Submitted by the Author:
16-Apr-2010
Complete List of Authors: Olliver, Anne; CNRS, ENS Cachan, LBPA, UMR 8113 Saggioro, Chiara; CNRS, ENS Cachan, LBPA, UMR 8113 Herrick, John; 3, rue des Jeûneurs, 75002 Sclavi, Bianca; CNRS, ENS-Cachan, LBPA, UMR 8113
Key Words: ribonucleotide reductase, DnaA, transcription regulation, cell cycle, DNA replication
Molecular Microbiologype
er-0
0552
635,
ver
sion
1 -
6 Ja
n 20
11Author manuscript, published in "Molecular Microbiology 76, 6 (2010) 1555"
DOI : 10.1111/j.1365-2958.2010.07185.x

For Peer Review
1
DnaA-ATP acts as a molecular switch to control levels of ribonucleotide 1
reductase expression in Escherichia coli. 2
3
Anne Olliver, Chiara Saggioro, John Herrick#, Bianca Sclavi* 4
LBPA, UMR 8113 du CNRS, 5
ENS Cachan 6
61 Avenue du Président Wilson, 7
94235 Cachan, France 8
9
# 3 rue de Jeûneurs 10
75002 Paris, France 11
12
*corresponding author 13
14
Running title : DnaA and ribonucleotide reductase expression 15
Keywords: 16
Transcription regulation 17
DNA replication 18
DnaA 19
Ribonucleotide reductase 20
21
22
23
Page 1 of 50 Molecular Microbiologype
er-0
0552
635,
ver
sion
1 -
6 Ja
n 20
11

For Peer Review
2
Summary 1
Ribonucleotide reductase (RNR) is the bottleneck enzyme in the synthesis of dNTPs 2
required for DNA replication. In order to avoid the mutagenic effects of imbalances in dNTPs 3
the amount and activity of RNR enzyme in the cell is tightly regulated. RNR expression from 4
the nrdAB operon is thus coupled to coincide with the initiation of DNA replication. However 5
the mechanism for the coordination of gene transcription and DNA replication remains to be 6
elucidated. The timing and synchrony of DNA replication initiation in Escherichia coli is 7
controlled in part by the binding of the DnaA protein to the origin of replication. DnaA is also 8
a transcription factor of the nrdAB operon and could thus be the link between these two 9
processes. Here we show that RNA polymerase can form a stable transcription initiation 10
complex at the nrdAB promoter by direct interaction with the far upstream sites required for 11
the timing of expression as a function of DNA replication. In addition, we show that the 12
binding of DnaA on the promoter can either activate or repress transcription as a function of 13
its concentration and its nucleotide-bound state. However, transcription regulation by DnaA 14
does not significantly affect the timing of expression of RNR from the nrdAB operon. 15
16
Introduction 17
Ribonucleotide reductase (RNR) is an essential enzyme for the growth and 18
reproduction of all DNA-dependent living organisms (Nordlund & Reichard, 2006). This 19
enzyme is responsible for the last step in the synthesis of the deoxynucleotides (dNTPs) 20
necessary for DNA replication. Imbalances in the amounts of dNTPs in the cell cause an 21
increase in the rate of mutagenesis (Stubbe, 2000, Gon et al., 2006, Wheeler et al., 2005, 22
Mathews, 2006) and double strand breaks (Guarino et al., 2007), therefore the activity and the 23
expression of the RNR enzyme must be tightly regulated as a function of the cell’s replicative 24
state. The activity of the enzyme is influenced by negative feedback by dNTPs, by the 25
Page 2 of 50Molecular Microbiologype
er-0
0552
635,
ver
sion
1 -
6 Ja
n 20
11
For Peer Review
3
concentration of ATP and by the availability of reducing equivalents (Nordlund & Reichard, 1
2006). In Escherichia coli (E. coli) the concentration of the enzyme in the cell is mainly 2
regulated at the level of transcription whereas in yeast and higher eukaryotes it is also 3
regulated by proteolysis (reviewed in (Herrick & Sclavi, 2007)) and compartmentalization 4
(Lee et al., 2008). 5
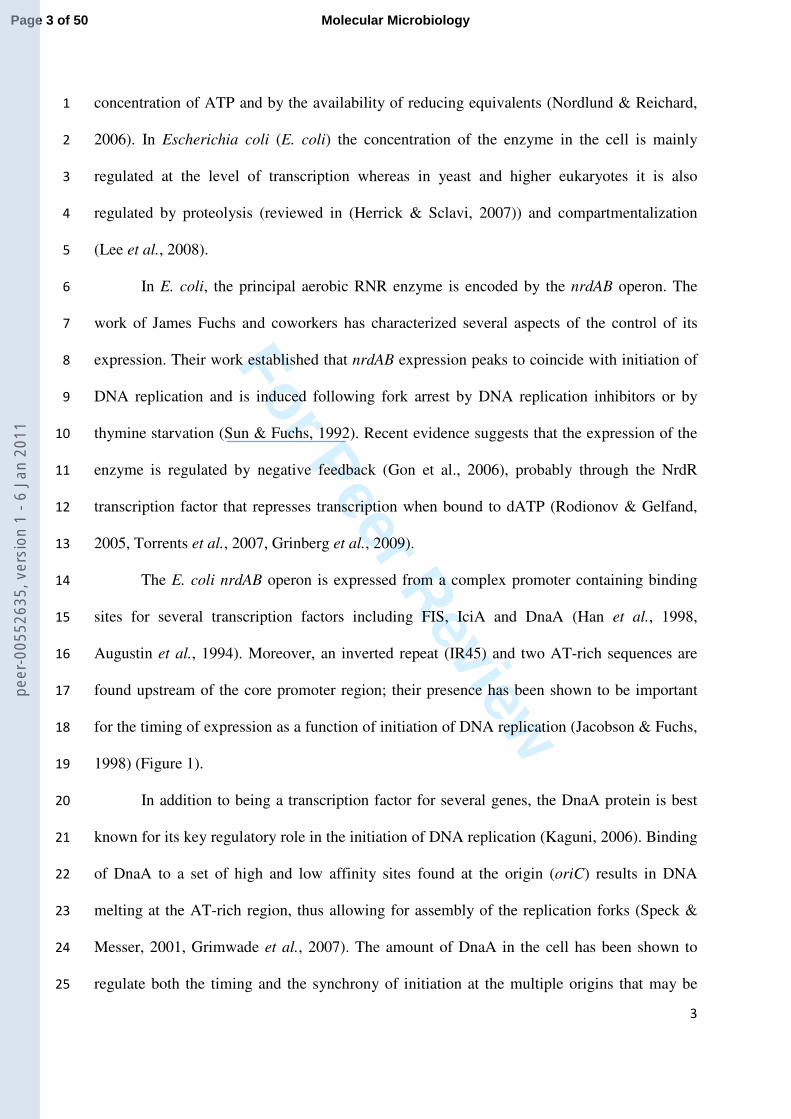
In E. coli, the principal aerobic RNR enzyme is encoded by the nrdAB operon. The 6
work of James Fuchs and coworkers has characterized several aspects of the control of its 7
expression. Their work established that nrdAB expression peaks to coincide with initiation of 8
DNA replication and is induced following fork arrest by DNA replication inhibitors or by 9
thymine starvation (Sun & Fuchs, 1992). Recent evidence suggests that the expression of the 10
enzyme is regulated by negative feedback (Gon et al., 2006), probably through the NrdR 11
transcription factor that represses transcription when bound to dATP (Rodionov & Gelfand, 12
2005, Torrents et al., 2007, Grinberg et al., 2009). 13
The E. coli nrdAB operon is expressed from a complex promoter containing binding 14
sites for several transcription factors including FIS, IciA and DnaA (Han et al., 1998, 15
Augustin et al., 1994). Moreover, an inverted repeat (IR45) and two AT-rich sequences are 16
found upstream of the core promoter region; their presence has been shown to be important 17
for the timing of expression as a function of initiation of DNA replication (Jacobson & Fuchs, 18
1998) (Figure 1). 19
In addition to being a transcription factor for several genes, the DnaA protein is best 20
known for its key regulatory role in the initiation of DNA replication (Kaguni, 2006). Binding 21
of DnaA to a set of high and low affinity sites found at the origin (oriC) results in DNA 22
melting at the AT-rich region, thus allowing for assembly of the replication forks (Speck & 23
Messer, 2001, Grimwade et al., 2007). The amount of DnaA in the cell has been shown to 24
regulate both the timing and the synchrony of initiation at the multiple origins that may be 25
Page 3 of 50 Molecular Microbiologype
er-0
0552
635,
ver
sion
1 -
6 Ja
n 20
11

For Peer Review
4
present in the cell (Skarstad et al., 1986). The activity of DnaA is dependent on its nucleotide 1
bound state (Speck et al., 1999). When DnaA is produced it is under the ATP-bound form. 2
DnaA-ATP, contrary to DnaA-ADP, binds with high affinity to its binding sites and is able to 3
form oligomeric structures (Sekimizu et al., 1987, Simmons et al., 2003, Erzberger et al., 4
2006). The rate of ATP hydrolysis is significantly enhanced by the formation of a complex 5
with the Hda protein and the beta clamp during ongoing DNA replication (Katayama et al., 6
1998). Thus the ratio of DnaA-ATP to DnaA-ADP in the cell is a complex function of the 7
number of replication forks, the rate of DNA replication and the rate of DnaA-ATP 8
production (Kurokawa et al., 1999, Donachie & Blakely, 2003). The rate of production of 9
DnaA-ATP is in part regulated by autorepression of transcription of the dnaA gene in addition 10
to possible regeneration of DnaA-ATP from DnaA-ADP (Polaczek & Wright, 1990, Fujimitsu 11
et al., 2009). It has been proposed that the cyclic changes in the DnaA-ATP to DnaA-ADP 12
ratio contributes to the timing of initiation of DNA replication (Donachie & Blakely, 2003). 13
14
Fuchs and coworkers identified two binding sites for the DnaA protein upstream of the 15
-35 region of the nrdAB promoter (Augustin et al., 1994). Their work showed that DnaA acts 16
as a transcriptional activator of nrdAB expression but does not influence its cell-cycle 17
dependent expression (Sun et al., 1994). Later studies by Beckwith and coworkers highlighted 18
a negative role of DnaA-ATP in nrdAB expression, and proposed that the decrease in DnaA-19
ATP by Hda-dependent ATP hydrolysis following replication initiation results in the cell 20
cycle control of nrdAB expression (Gon et al., 2006). From an analysis of the DnaA binding 21
sites found at the nrdAB promoter we previously proposed that DnaA-ATP activates 22
transcription at low concentrations and represses at high concentrations (Herrick & Sclavi, 23
2007). The aim of this work is to test this hypothesis and to elucidate the role of DnaA in the 24
Page 4 of 50Molecular Microbiologype
er-0
0552
635,
ver
sion
1 -
6 Ja
n 20
11
For Peer Review
5
regulation of nrdAB expression and its possible effect on the timing of expression as a 1
function of the cell cycle. 2
By the use of quantitative footprinting coupled with in vivo measurements of promoter 3
activity we have characterized the binding of RNA polymerase (RNAP) and of DnaA at the 4
nrdAB promoter and DnaA’s role in its transcription regulation. Here we show that RNAP 5
directly interacts with the AT-rich regions and the inverted-repeat region upstream of the 6
promoter, previously identified as important for cell-cycle control (Sun et al., 1994, Jacobson 7
& Fuchs, 1998) and that DnaA does not affect these interactions. In addition we have found 8
that DnaA can act both as an activator and a repressor, depending on the changing 9
concentration of DnaA-ATP during the cell cycle. These results allow us to propose a model 10
for nrdAB gene regulation by which DnaA can influence the total amount of RNR expression 11
but not its timing as a function of DNA replication. 12
13
Results 14
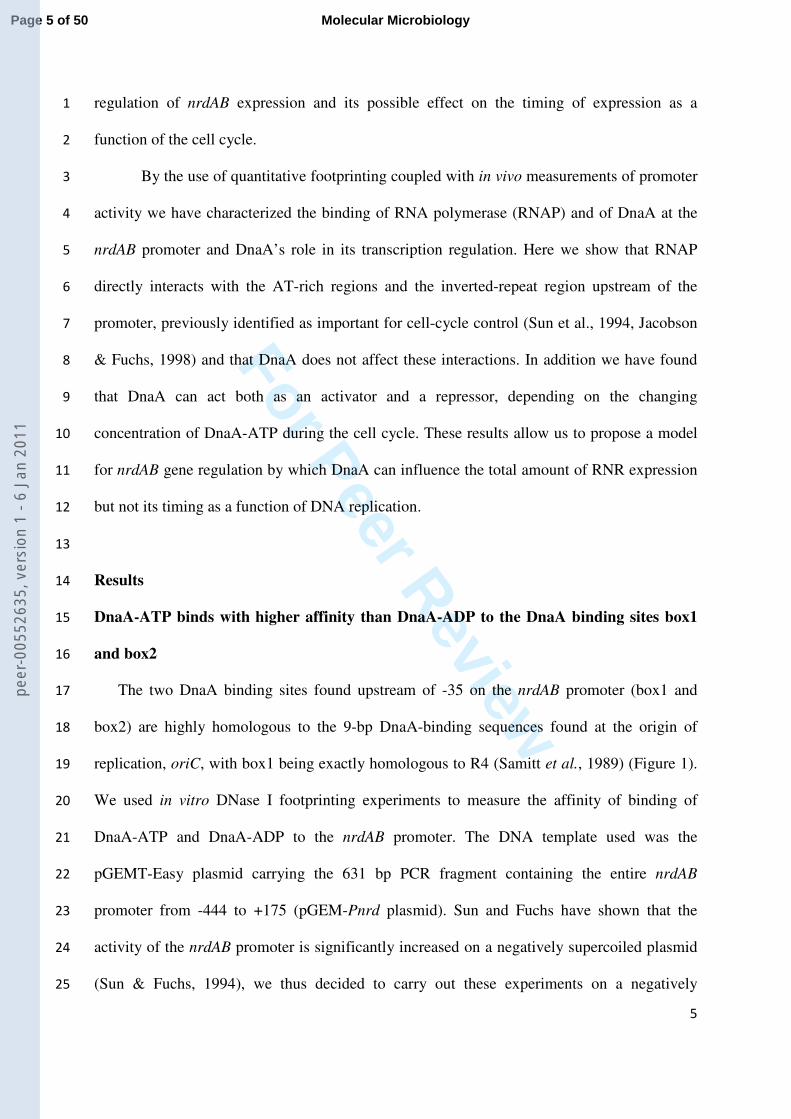
DnaA-ATP binds with higher affinity than DnaA-ADP to the DnaA binding sites box1 15
and box2 16
The two DnaA binding sites found upstream of -35 on the nrdAB promoter (box1 and 17
box2) are highly homologous to the 9-bp DnaA-binding sequences found at the origin of 18
replication, oriC, with box1 being exactly homologous to R4 (Samitt et al., 1989) (Figure 1). 19
We used in vitro DNase I footprinting experiments to measure the affinity of binding of 20
DnaA-ATP and DnaA-ADP to the nrdAB promoter. The DNA template used was the 21
pGEMT-Easy plasmid carrying the 631 bp PCR fragment containing the entire nrdAB 22
promoter from -444 to +175 (pGEM-Pnrd plasmid). Sun and Fuchs have shown that the 23
activity of the nrdAB promoter is significantly increased on a negatively supercoiled plasmid 24
(Sun & Fuchs, 1994), we thus decided to carry out these experiments on a negatively 25
Page 5 of 50 Molecular Microbiologype
er-0
0552
635,
ver
sion
1 -
6 Ja
n 20
11

For Peer Review
6
supercoiled plasmid. The pGEM-Pnrd plasmid was incubated with increasing amounts of 1
DnaA-ATP or DnaA-ADP and cut by DNase I. Figure 2 shows the footprinting pattern of 2
DnaA-ATP and DnaA-ADP on the template strand of the nrdAB promoter. Both forms of 3
DnaA show protection and hypersensitive sites. DnaA binding to its sites on this promoter 4
results in protection from nucleotides -58 to -48 (DnaA box1) and from nucleotides -40 to -30 5
(DnaA box2) (Figure 2). In these experiments, we see that DnaA also exposes hypersensitive 6
DNaseI cleavage sites at -59 and -46, respectively, upstream of and between box1 and box2. 7
This indicates that DnaA bends the DNA while binding to the nrdAB promoter. 8
This region has been shown to bind DnaA (Augustin et al., 1994). At the time of these 9
experiments the importance of two different nucleotide-bound states of DnaA had yet to be 10
described. Consequently, Augustin and coworkers used a mixture of DnaA-ATP and DnaA-11
ADP. Using Cu-phenanthroline footprinting on linear DNA, they showed protection of bases -12
55 to -35 by DnaA. We found that DnaA-ATP has a higher affinity for these sites than DnaA-13
ADP, which agrees with previous studies of DnaA binding to its own promoter and to the 14
sites found at oriC (Speck et al., 1999, Speck & Messer, 2001, Grimwade et al., 2007). This 15
can be seen in Figure 2a in the gel image and in Figure 2b in the line representation of the 16
band intensities after normalization with a band at nucleotide -100 that does not vary with 17
increasing concentrations of DnaA-ATP or DnaA-ADP. 18
19
A lower affinity site for DnaA-ATP is present near the -10 region. 20
In order to obtain a quantitative measure of the binding affinity of DnaA-ATP for the 21
different sites on the promoter DNase I footprinting titration experiments were carried out 22
with increasing concentrations of DnaA-ATP on either a linear or a supercoiled DNA 23
template. The linear DNA is a 32P end-labeled 226 bp PCR fragment generated with primers 24
PeR and PeF (Figure 1a and Table 1S of Supporting Information). The supercoiled DNA is 25
Page 6 of 50Molecular Microbiologype
er-0
0552
635,
ver
sion
1 -
6 Ja
n 20
11

For Peer Review
7
the pGEM-Pnrd plasmid described above. Figure 3 shows the footprinting titration pattern of 1
DnaA-ATP on the non-template strand of the nrdAB promoter on linear and supercoiled DNA 2
(Figure 3a and 3b respectively). In both cases, DnaA-ATP shows protection of box1 and 3
box2, together with exposure of hypersensitive sites at -59 and -46 as in Figure 2. The 4
nucleotides protected by the protein are approximately the same as those that are protected on 5
the template strand as shown in Figure 2, ie -58 to -48 (box1) and -45 to -30 (box2) for both 6
linear and supercoiled DNA. 7
The quantification and profiles of the titration experiments are shown in Figure 3 c and d. 8
Nonlinear least squares fitting of the data to the binding equation (see Experimental 9
Procedures) yields the dissociation constant, Kd, and Hill coefficient, n. These values are 10
summarized in Table 1. The Kd is around 20 nM and the Hill coefficient is about 2 for DnaA-11
ATP binding to either linear or supercoiled DNA, indicating that DnaA-ATP binds to these 12
two sites in a cooperative manner on both linear and supercoiled templates. 13
Interestingly, however, at the higher concentrations of DnaA-ATP, protection of the 14
downstream promoter region is observed on linear DNA from -29 to +15 (Figure 3a and 15
Figure 6S of Supporting Information). In this region a possible DnaA binding site is identified 16
using the Virtual Footprint software (Münch et al., 2005) according to the DnaA consensus 17
binding sequence (TTA/TTNCACA). The protection of bases -4 to +1 appears with a Kd of 18
103 nM of DnaA-ATP (Table 1), and is not observed with DnaA-ADP within this 19
concentration range (data not shown). Protection at this site was also observed with 20
supercoiled DNA (data not shown); however, it is significantly weaker and thus it is not 21
possible to properly quantify this binding. Together these results show that DnaA-ATP binds 22
to two high affinity sites upstream of -35 and to lower affinity sites overlapping the nrdAB 23
core promoter region. The DnaA protein in its ATP-bound form thus forms different 24
Page 7 of 50 Molecular Microbiologype
er-0
0552
635,
ver
sion
1 -
6 Ja
n 20
11

For Peer Review
8
structures on the promoter depending on its concentration and, as the evidence here suggests, 1
the topological state of the DNA. 2
3
RNAP binding results in an extended protection on the nrdAB promoter independently 4
of DnaA. 5
In order to determine how DnaA-ATP binding may affect the activity of RNA 6
polymerase at the nrdAB promoter we carried out DNase I footprinting experiments with 7
RNAP and/or DnaA-ATP on the supercoiled promoter. The results presented in Figure 4 8
show the protection patterns of both proteins at a 50 nM concentration on the template strand. 9
RNAP can bind to the promoter in the absence of other proteins and protects a large region of 10
DNA within the core and upstream regions of the promoter, in agreement with previous 11
results showing that RNAP can transcribe from this promoter in the absence of additional 12
transcription factors (Sun & Fuchs, 1994, Gon et al., 2006). 13
Most interestingly, RNAP binding results in the protection of the AT-rich regions and the 14
upstream half of the inverted repeat (IR45) sequence identified by Fuchs and coworkers as 15
being important for cell cycle control of expression (Sun et al., 1994, Jacobson & Fuchs, 16
1998). A protection of the regions upstream of -140 is also observed in the presence of 17
RNAP. In an experiment when the nrdAB core promoter sequence is disrupted (data not 18
shown) the protections of the core and upstream regions are lost except for those upstream of 19
-140. We have assigned this protection to a second RNAP binding site that could correspond 20
to the Px promoter previously identified by in vitro transcription assays (Sun & Fuchs, 1994). 21
It has been shown that Px transcription is repressed by FIS binding (Sun & Fuchs, 1994). 22
Whether transcription from the Px promoter occurs in vivo remains to be determined. 23
When both RNAP and DnaA-ATP are incubated with the promoter region we observe the 24
sum of the footprints of both proteins almost covering the entire promoter region, but no 25
Page 8 of 50Molecular Microbiologype
er-0
0552
635,
ver
sion
1 -
6 Ja
n 20
11

For Peer Review
9
significant changes are observed in either the extent or the pattern of protection under these 1
conditions. It has been shown that one DnaA monomer bound to a DnaA box induces a bend 2
of 42°; this distortion of the double helix in turn results in the increased accessibility to 3
DNaseI cleavage observed here and at the dnaA promoter (Schaper & Messer, 1995, Speck et 4
al., 1999). DNA bending by DnaA may act to stabilize the upstream contacts by RNAP. These 5
results show that DnaA is not necessary to recruit RNAP to the promoter in vitro, however the 6
close proximity of the DnaA binding sites to the -35 region suggest that in vivo it may play a 7
stabilizing role in the presence of possible transcription repressors, such as NrdR, that can 8
compete with RNAP for promoter binding (Torrents et al., 2007). 9
10
Quantitative DNase I footprinting of DnaA binding shows decreased affinity for 11
mutated DnaA sites on the promoter. 12
In order to study the effect of DnaA binding on the activity of the promoter in vivo we 13
carried out directed mutagenesis to its different binding sites. Based on our in vitro 14
footprinting results and on previous work by Augustin et al (Augustin et al., 1994), the nrdAB 15
promoter was mutated by introducing different point mutations. These mutations alter DnaA 16
box1, DnaA box2, and the downstream DnaA binding site. Four different mutated nrdAB 17
promoters carried by the PGEM plasmid were analyzed: M12-14GG (C to G at positions -12 18
and -14), M40-42box2 (A to T and T to A at positions -42 and -40), M45-47box1 (C to G at 19
positions -45 and -47) and M49box1 (T to A at position -49) (Figure 1b). 20
Affinity of DnaA-ATP for wild type and mutated DnaA box1 and box2 promoters was 21
measured by quantitative DNase I footprinting experiments on supercoiled DNA. In each 22
case, the dissociation constant Kd is measured, as shown in the bar graph in Figure 5a. 23
Representative gels are shown in Figure 1S of Supporting Information. The quantification of 24
the DnaA titration on the wild type and mutant promoters is presented in Figure 2S. The 25
Page 9 of 50 Molecular Microbiologype
er-0
0552
635,
ver
sion
1 -
6 Ja
n 20
11

For Peer Review
10
values of the dissociation constant (Kd) and the Hill coefficient (n) are summarized in Table 1
2S of Supporting Information. The first observation is that the mutation in the DnaA box near 2
the -10 region (M12-14GG) does not affect DnaA binding to the upstream regions in box1 or 3
box2. The mutation altering the DnaA box 2 (M40-42box2) decreases, as expected, the 4
affinity of DnaA-ATP for DnaA box2 (by a factor of 2), and to a less extent DnaA binding to 5
box1. Finally, the mutation altering DnaA box1 (M49box1) significantly decreases the 6
affinity of DnaA-ATP for both DnaA box1 (by a factor of 4) and for DnaA box2 (by a factor 7
of 3). The same is observed with the other mutant altering DnaA box1 (M45-47box1). The 8
resulting affinity was so low that we could not properly quantify DnaA-ATP binding to this 9
mutated DNA. 10
Affinity of DnaA-ATP for downstream DNA (DnaA-ATP boxDown) was assessed by 11
DNaseI footprinting on linear DNA, as the protection was easier to observe in these 12
conditions. The DnaA-ATP protection pattern on wild type and mutant M12-14GG is shown 13
in Figure 5b. A decreased affinity of DnaA-ATP for the binding sites overlapping the core 14
promoter (boxDown) in the mutant M12-14GG is clearly evident. This agrees with the 15
presence of an oligomeric form of DnaA-ATP that is dependent on the presence of 16
downstream low affinity sites. In order to determine whether the binding of DnaA-ATP to the 17
downstream sites is dependent on the presence of the high affinity sites we carried out DNase 18
I footprinting experiments on linear DNA in the presence of the M45-47box1 and M49box1 19
mutations (Figure 6S of Supporting Information). These results show that the protection of the 20
promoter region due to the oligmer is not significantly affected by the absence of DnaA 21
binding to the high affinity sites. 22
23
DnaA binding to the high affinity sites is required for activation of nrdAB transcription 24
in vivo, while binding to the downstream low affinity site represses its transcription. 25
Page 10 of 50Molecular Microbiologype
er-0
0552
635,
ver
sion
1 -
6 Ja
n 20
11

For Peer Review
11
In order to determine the effects on nrdAB expression in vivo of DnaA binding to its 1
different sites we measured the rate of change in the cellular level of the GFP protein 2
((dGFP/dt)/OD) expressed under control of the nrdAB promoter and its mutants in the low 3
copy pKK plasmid by growing the cells in a 96-well fluorimeter (Zaslaver et al., 2006). Cells 4
carrying the different plasmids containing either the wild type or mutant promoter were 5
diluted 1 to 10000 from an overnight culture and grown at 30°C in M9 minimal medium 6
supplemented with 0.4 % glucose or M9 minimal medium (Figure 6) with 0.4% glucose and 7
0.5% casamino acids (Figure 3S). The results shown in Figure 6a show the rate of change in 8
the cellular level of the GFP protein ((dGFP/dt)/OD), a measure of the promoter activity, as a 9
function of time. The OD600 curve provides a simultaneous measure of the growing cell 10
culture. In this experiment cells grow at a constant rate with a generation time of 69 minutes 11
up to 800 minutes when the growth rate begins to decrease, as the culture enters the transition 12
to stationary phase (see Figure 3SB in Supporting Information for the plots of the growth rate 13
as a function of time). The rate of expression from the nrdAB promoter increases to peak 14
before the decrease in growth rate. The changing activity of the promoter suggests that even 15
though the cells are growing at a constant rate they are no longer in balanced growth. This 16
may be due to the threshold for the measurement of the optical density in the fluorimeter 17
resulting in the measurement of the cells only after early exponential phase, when the cellular 18
metabolism has begun to respond to changes in the growth environment. 19
The increased level of nrdAB expression in mutants M12-14GG and M12-14AG can be 20
considered to be due to the loss of the low affinity DnaA-ATP boxDown repressing site, 21
whereas the decreased level of nrdAB expression in the mutants M40-42box2, M45-47box1 22
and M49box1 can be considered to be due to the loss of the high affinity DnaA box1 and 23
box2 activating sites. Thus the change of nrdAB promoter activity induced by the mutations of 24
Page 11 of 50 Molecular Microbiologype
er-0
0552
635,
ver
sion
1 -
6 Ja
n 20
11

For Peer Review
12
the DnaA binding sites is directly proportional to the changes in DnaA binding affinity by 1
these same mutations as measured in vitro. 2
The M12-14GG mutation substitutes a cytosine with a guanine at both positions -12 and -3
14 to create a thymine-guanine step at -15 and -14 upstream of the transcription initiation site. 4
This new sequence resembles an “extended -10” promoter configuration and could stabilize 5
interactions with RNAP and explain the enhanced nrdAB expression observed (Mitchell et al., 6
2003). To control for this possible effect, we constructed mutant M12-14AG which 7
substitutes a cytosine with an adenine at position -14 (Figure 1b). Expression was similar for 8
both mutants, confirming that the increase in expression is not due to a stabilization of RNAP 9
on the promoter. In addition in vitro transcription experiments show that the M12-14GG 10
mutations has a small positive effect on transcription from the nrdAB promoter, which 11
however cannot account for the three-fold increase of expression in vivo. The presence of the 12
other mutations on the promoter region does not significantly influence RNA polymerase 13
activity in the absence of DnaA (Figure 7S of Supporting Information). 14
The M12-14GG mutations also overlaps one of the two possible binding sites for the 15
NrdR protein, albeit the lower affinity site (Torrents et al., 2007). NrdR has been proposed to 16
be a repressor of nrdAB transcription as a function of its nucleotide bound state. This could 17
result in a mechanism for the observed negative feedback of nrdAB expression as a function 18
of dNTP concentration (Torrents et al., 2007, Gon et al., 2006, Grinberg et al., 2009). In order 19
to determine whether the effect observed in the presence of this mutation is due to the loss of 20
binding of NrdR we carried out in vivo fluorescence measurements with a strain lacking the 21
NrdR protein (BW25113 ∆nrdR) (Figure 6b). In this genetic background the M12-14GG 22
mutation still has a significant positive effect on the level of transcription, confirming that the 23
loss of repression is due to the decrease in binding affinity for DnaA. 24
Page 12 of 50Molecular Microbiologype
er-0
0552
635,
ver
sion
1 -
6 Ja
n 20
11

For Peer Review
13
While the increase in expression due to the M12-14GG mutation does not affect the 1
pattern of expression in response to a change in the growth rate, the pattern of expression in 2
the absence of NrdR is significantly different (Figure 6b). These results show that NrdR-3
dependent negative feedback dependent on dNTP accumulation occurs throughout the growth 4
curve. However it plays a more significant role upon entry into stationary phase in accordance 5
with the results of Torrents et al (Torrents et al., 2007). 6
These results clearly show that DnaA binding upstream of the promoter is required for 7
transcription activation while its oligomerisation to the downstream sites results in 8
transcription repression. This indicates that DnaA has both a positive and a negative effect on 9
the level of in vivo nrdAB expression. The same amplitude of the effect of the mutations is 10
observed for the two growth conditions tested (Figure 6 and Figure 3S of Supporting 11
Information). In addition the same “bell type” pattern of expression is observed for both wild 12
type and mutated nrdAB promoters, suggesting that this expression profile is independent of 13
DnaA binding to the promoter. 14
15
The timing of expression of nrdAB with replication initiation is only partly affected by 16
DnaA activation and independent of DnaA repression. 17
In order to determine the effects of DnaA activation and repression on the cell-cycle 18
dependent expression of nrdAB we carried out flow cytometry measurements of the amount of 19
GFP per cell as a function of DNA content (Figure 7). The strains containing a pKK plasmid 20
with one of the different promoters regulating gfp expression were grown at 30°C in M9 21
minimal media. When the cultures reached an OD450 of about 0.15, rifampicin and cephalexin 22
were added to stop re-initiation and cell division (see Experimental Procedures). The active 23
replication forks continue replication to termination while all ongoing transcription will stop 24
due to the presence of rifampicin. Flow cytometry analysis of DNA content shows three peaks 25
Page 13 of 50 Molecular Microbiologype
er-0
0552
635,
ver
sion
1 -
6 Ja
n 20
11

For Peer Review
14
corresponding to 2, 4 and 8 chromosomes, with 4 chromosomes being the most populated 1
(Figure 7a). The presence of a small percentage of cells with 8 chromosomes indicates that 2
the initiation interval in these growth conditions spans the time of cell division and that there 3
may be a fraction of the population that initiates DNA replication just before division, instead 4
of right after cell birth. From the percentage of cells in each of the DNA peaks one can 5
estimate the initiation age (Skarstad et al., 1985) (Experimental Procedures). The initiation 6
age varies between 3 and 10 minutes with a doubling time of 45 to 50 minutes (Figure 4S). 7
Flow cytometry quantification of GFP content (Figure 7b) largely supports the results 8
obtained on the effect of the mutations on gene expression by the measurement of the GFP 9
expression rate (Figure 6a). This corresponds to the amount of GFP present at the time of 10
antibiotic addition. The two dimensional dot plot shows the GFP content for each of the DNA 11
peaks (Figure 7c). The median of GFP content for each two-dimensional peak was used to 12
determine the ratios of GFP for 4 and 2 chromosomes (GFP_4/2) and 8 and 4 chromosomes 13
(GFP_8/4) (Figure 8A and B). 14
From the initiation age one can estimate the amount of GFP that has accumulated during 15
that time for a specific pattern of expression. For example, for a stochastically expressed gene 16
that doubles the amount of expressed protein during each cell cycle, the value for GFP_4/2 17
and GFP_8/4 for the whole population will be at around 1.47 and 1.35 respectively, with a 18
variation of ± 0.02 to take into account the range of initiation age values (Experimental 19
Procedures). For a gene that is expressed only at the time of initiation however, the value of 20
this ratio will be higher, due to the increase in expressed protein taking place at the same time 21
for every cell in the population, and will approach 2 for a gene whose expression in addition 22
follows a step function (Figure 8C). We have compared the GFP_4/2 and GFP_8/4 values for 23
the wild type and mutant nrdAB promoters characterized above to those measured from the 24
GFP content in a strain containing the uninduced lac promoter on the pKK plasmid (Figure 25
Page 14 of 50Molecular Microbiologype
er-0
0552
635,
ver
sion
1 -
6 Ja
n 20
11

For Peer Review
15
8A). The uninduced lac promoter is a control for a gene that is expressed stochastically 1
throughout the cell cycle (Yu et al., 2006). 2
The nrdAB wild type promoter construct results in a value of GFP_4/2 that is consistent 3
with a cooperative activation of transcription at the time of replication initiation, 1.91 ± 0.14. 4
The M12-14GG mutation increases the rate of expression by relieving the repression by 5
DnaA-ATP (Figure 6, Figure 7b). In this case the pattern of expression however, is not very 6
different from the wild type promoter as measured by a GFP_4/2 value of 1.75 ± 0.14. DnaA 7
repression thus plays a role in limiting the amount of transcript produced at the nrdAB operon 8
but not its timing. The M45-47box1 mutation results in a decrease of the GFP_4/2 value, 1.64 9
± 0.06, which however is still higher than the control lac promoter, 1.37 ± 0.10, indicating 10
that activation by DnaA may influence the cooperativity of induction as well as the overall 11
expression level of the nrdAB gene. The values for the GFP_8/4 are lower than those of 12
GFP_4/2, probably due to the short amount of time between replication initiation, and thus 13
gene induction, and cell division, not being sufficient to contain the full peak of transcription 14
activity (Figure 5S in Supporting Information). Together these results show that the coupling 15
of nrdAB expression with the time of replication initiation is not determined by DnaA alone. 16
17
Discussion 18
DnaA is both an activator and a repressor of RNR expression. 19
In 2006 Gon et al. showed that DnaA represses transcription from the nrdAB promoter 20
controlling expression of the major aerobic ribonucleotide reductase gene in Escherichia coli 21
(Gon et al., 2006) while earlier the Fuchs laboratory had shown an activating role for DnaA at 22
the same promoter (Augustin et al., 1994). Here we demonstrate that both DnaA-ADP and 23
DnaA-ATP can bind to the nrdAB promoter at two activating sites, and that the DnaA protein 24
in its ATP-bound form can form oligomers at higher concentrations that result in repression of 25
Page 15 of 50 Molecular Microbiologype
er-0
0552
635,
ver
sion
1 -
6 Ja
n 20
11

For Peer Review
16
transcription. This new information can help to explain the seemingly inconsistent results 1
observed previously and opens the possibility that the change in DnaA-ATP to DnaA-ADP 2
ratio at the time of replication initiation may contribute to the cell cycle dependent pattern of 3
NrdAB expression. 4
Our in vitro footprinting results show that DnaA interacts with the promoter to form 5
two different structures depending on its nucleotide-bound form and its concentration. At low 6
concentrations, DnaA-ATP binds upstream of the -35 region to two DnaA high affinity sites, 7
box1 and box2, and enhances nrdAB expression, as shown by the in vivo GFP expression 8
results in agreement with previous work (Augustin et al., 1994). Here we also show that in 9
vitro RNAP can also bind to the promoter in the absence of additional factors and protects a 10
large region up to -125 base pairs upstream of the transcription initiation site. Furthermore, 11
due to the high affinity of RNAP for this promoter we do not observe significant RNAP 12
recruitment by DnaA in vitro by DNaseI footprinting (data not shown). The footprinting 13
pattern obtained in the presence of both proteins appears to be the sum of the individual 14
proteins’ patterns, indicating that DnaA binding does not significantly affect the structure of 15
the RNAP-promoter complex (Figure 4). 16
Stabilization of the RNAP-promoter complex by DnaA and upstream contacts 17
however, may be more significant for RNAP recruitment in vivo than in our in vitro system. 18
In the cell, RNAP is competing with other proteins for access to the promoter, notably NrdR 19
(Torrents et al., 2007), DnaA-ATP itself (Gon et al., 2006) and possibly abundant nucleoid 20
proteins. The position of the DnaA binding sites immediately upstream of the -35 sequence 21
suggests a class II mode of activation i.e. via a direct interaction with region 4 of the σ 22
subunit and the α-NTD of RNAP bound to this promoter element (Dove et al., 2003). 23
Recently, the presence of DnaA bound to the upstream sites of the dnaA P2 promoter has been 24
shown to stabilize the activity of RNAP in the presence of the transcription inhibitor 25
Page 16 of 50Molecular Microbiologype
er-0
0552
635,
ver
sion
1 -
6 Ja
n 20
11

For Peer Review
17
rifampicin (Flåtten et al., 2009). In a similar fashion, at the acs promoter, for example, the 1
binding of CRP to similarly placed activating sites stabilizes RNAP binding in the presence of 2
nucleoid proteins such as FIS and IHF (Sclavi et al., 2007). 3
The combination of our in vitro and in vivo results shows that, when the concentration 4
of DnaA-ATP increases, the protein can bind to downstream low affinity sites overlapping 5
with promoter’s -10 region and can thus directly inhibit RNA polymerase binding. At these 6
higher DnaA-ATP concentrations we observe protection of bases located between position -7
29 and +15. In contrast to what is observed at oriC, binding of DnaA at the high affinity sites 8
does not appear to significantly decrease the concentration at which the oligomer is formed 9
(Miller et al., 2009). The structure of the DnaA oligomer published by Berger and coworkers 10
shows a right-handed superhelix that stabilizes a positive supercoil (Erzberger et al., 2006). 11
This may be a reason for the weaker protections observed on a negatively supercoiled plasmid 12
compared to linear DNA at high DnaA-ATP concentrations (Figure 3), and implies that the 13
degree of negative supercoiling in vivo may affect repression by DnaA-ATP. The absence of 14
downstream protection at high concentrations of DnaA-ADP (data not shown) is due to its 15
inability to form oligomeric structures (Erzberger et al., 2006). This does not exclude the 16
possibility that DnaA-ADP may, however, act as an activator from the upstream sites, albeit at 17
high DnaA-ADP/DnaA-ATP ratios (Figure 2). 18
19
Oscillation in DnaA-ATP as a function of DNA replication activates and represses 20
transcription from the nrdAB promoter but does not determine the timing of expression 21
as a function of DNA replication initiation. 22
James Fuchs and coworkers have shown that nrdAB expression coincides with 23
initiation of DNA synthesis (Sun & Fuchs, 1992). This could act to supply the newly 24
assembled replication forks with the required dNTPs. However, the mechanism by which 25
Page 17 of 50 Molecular Microbiologype
er-0
0552
635,
ver
sion
1 -
6 Ja
n 20
11

For Peer Review
18
gene expression can be precisely timed in a prokaryotic cell to coincide with a specific cell 1
cycle event, such as replication initiation, in the absence of a well-defined checkpoint control 2
remains to be identified. Given the positive and negative roles that DnaA-ATP has on 3
transcription regulation at the nrdAB promoter, one could propose that the timing of nrdAB 4
expression could result from the oscillation in DnaA-ATP to DnaA-ADP ratio during the cell 5
cycle ((Fujimitsu et al., 2009) and reviewed by (Katayama, 2001, Kaguni, 2006)) and thus 6
mirror DnaA’s interactions with the origin of DNA replication, oriC (Gon et al., 2006). While 7
Fuchs and coworkers had shown that DnaA activation did not influence the pattern of nrdAB 8
expression as a function of the cell cycle (Augustin et al., 1994), the role of DnaA-dependent 9
transcription repression remains to be established. 10
The current models for the timing of replication initiation propose that at oriC DnaA is 11
bound at the high affinity R sites throughout the cell cycle. These sites act to stabilize a higher 12
order oligomeric structure of DnaA resulting from the increase in DnaA-ATP at the time of 13
initiation. This structure in turn induces DNA melting at the AT-rich region creating a 14
substrate for assembly of the replication forks (Erzberger et al., 2006, Ozaki et al., 2008, 15
Grimwade et al., 2007, Miller et al., 2009, Riber et al., 2009). Following initiation the 16
hydrolysis of the DnaA-bound ATP by the Hda-dependent RIDA process enhanced by 17
ongoing DNA replication and the synthesis of new datA loci result in a decrease in free 18
DnaA-ATP that contributes to the eclipse period (reviewed in (Nielsen & Løbner-Olesen, 19
2008)). 20
The observation that the effect of the mutations of the activating DnaA sites on 21
promoter activity in vivo reflects the changes in binding affinity measured in vitro (Figures 5 22
and 6) indicates that the concentration of DnaA-ATP in the cell is within the range of its 23
affinity constant for these upstream sites, at least for the period during which RNAP is 24
recruited to the promoter. In addition, the 6-fold difference between the affinity of DnaA-ATP 25
Page 18 of 50Molecular Microbiologype
er-0
0552
635,
ver
sion
1 -
6 Ja
n 20
11

For Peer Review
19
for its high and low affinity sites indicates that repression of the nrdAB promoter does not 1
occur until the proportion of DnaA-ATP reaches its maximum at the time of initiation in 2
agreement with the known oscillations in the DnaA-ATP to DnaA-ADP ratio (Figure 8D). 3
This mode of nrdAB transcription regulation however would seem to be incompatible with 4
NrdAB expression coinciding with replication initiation (Sun & Fuchs, 1992). 5
6
In order to test whether DnaA activation and repression of the nrdAB promoter 7
influences its timing of expression we have measured the effect of relieving DnaA-dependent 8
repression or activation on the pattern of gene transcription. In order to measure changes in 9
the level of gene expression as a function of the DNA replication status in an unsynchronized 10
population we measured the amount of GFP per cell as a function of its DNA content by flow 11
cytometry (Figures 7 and 8). By the addition of rifampicin and cephalexin, transcription, 12
replication initiation and cell division are blocked, while ongoing replication is allowed to 13
reach termination. The cells will thus contain an integral number of chromosomes, and the 14
amount of GFP that was present at the time of antibiotic addition. We thus obtain a measure 15
of the median amount of GFP before and after replication initiation has taken place. 16
The experimental values we obtain for the GFP ratios for wild type nrdAB promoter 17
and the uninduced lac promoter are in agreement with their expected pattern of expression, 18
i.e. a gene that is expressed to coincide with the time of initiation (Sun & Fuchs, 1992) and a 19
gene that is expressed stochastically, at a different time for each cell in the population (Yu et 20
al., 2006) (Figure 8). The values obtained from GFP expression under control of the mutant 21
promoters show that even though the M12-14GG mutation results in a 3 fold increase in 22
expression rate, it has only a small effect on the timing of expression. These results are 23
consistent with transcription repression by DnaA-ATP taking place at the time of replication 24
initiation to limit the height of the peak of expression after the nrdAB promoter has been 25
Page 19 of 50 Molecular Microbiologype
er-0
0552
635,
ver
sion
1 -
6 Ja
n 20
11

For Peer Review
20
activated (Figure 8C,D). This would result in the amount of RNR produced being proportional 1
to the amount of free DnaA-ATP, consistent with the results of Beckwith and coworkers on 2
the effect of DnaA mutations in vivo (Gon et al. 2006). 3
The M45-47box1 mutation on the other hand results in a more significant change in 4
the GFP ratio of 4 and 2 chromosomes cells. Here we show that DnaA oligomerisation can 5
take place independently of DnaA binding to the high affinity sites. This mutation therefore 6
affects activation and not repression by DnaA-ATP. Augustin et al have shown that the timing 7
of the peak in nrdAB expression with replication initiation is not affected by the presence of 8
mutations to the DnaA high affinity sites (Augustin et al., 1994). The effect of these mutations 9
on the GFP ratio observed here confirms their results and suggests that the presence of DnaA 10
at the high affinity sites influences the cooperativity and synchrony of activation by insuring 11
that all the copies of the nrdAB promoter are occupied by RNAP at the time of induction 12
(Figure 8C). The fact that we can measure these differences in cells where GFP is expressed 13
from a promoter-gfp construct on a plasmid, shows that the timing of nrdAB expression is 14
independent of its position on the chromosome and the timing of gene doubling, in agreement 15
with the results of Fuchs and coworkers (Sun & Fuchs, 1992). DnaA binding alone therefore 16
does not suffice to control the timing of nrdAB expression. 17
18
The upstream region of the promoter responsible for cell-cycle dependent expression is 19
contacted directly by RNA polymerase. 20
Fuchs and coworkers identified an upstream region of the promoter containing a 45 21
base pair inverted repeat flanked by two AT-rich regions as being necessary for the timing of 22
RNR expression (Sun et al., 1994, Jacobson & Fuchs, 1998). Here we show that RNAP can 23
directly contact these sites. The C-terminal domains of the α subunits of RNAP (α-CTDs), 24
connected to the core of the enzyme through flexible linkers, have been shown to have a high 25
Page 20 of 50Molecular Microbiologype
er-0
0552
635,
ver
sion
1 -
6 Ja
n 20
11

For Peer Review
21
affinity for the long AT stretches that make up the regulatory region known as the UP element 1
found upstream of several promoters from -40 up to –120 (Pemberton et al., 2002, Aiyar et 2
al., 1998). These upstream interactions induce DNA wrapping around the enzyme (Cellai et 3
al., 2007) and DNA bending by DnaA may further increase the stability of the nucleo-protein 4
complex by decreasing the energy required by RNAP to wrap the DNA. Stable RNAP-5
promoter complexes have been identified on several genes’ regulatory regions in both 6
prokaryotes and eukaryotes, indicating that the transition into transcription elongation is a 7
common target for regulation of gene expression (reviewed in (Wade & Struhl, 2008)). At the 8
time of replication initiation a local change in DNA topology could affect the binding of the 9
RNAP to the upstream region of the promoter to decrease the stability of the RNAP-promoter 10
complex, facilitating promoter escape and gene expression. The latter is in agreement with the 11
known effects of DNA supercoiling on promoter escape (Hsu, 2002) and with the results 12
published by Fuchs and coworkers where a change in the distance between the promoter core 13
region and the upstream sites resulted in both a loss of supercoiling dependence of expression 14
in vitro and of cell cycle dependent expression in vivo of the nrdAB operon (Sun & Fuchs, 15
1994). 16
17
Together these results allow us to propose a model for the role of DnaA in the 18
regulation of RNR expression (Figure 8D). DnaA bound to the high affinity sites, in its ATP 19
or ADP-bound form, stabilizes RNAP binding at the nrdAB promoter. The α-CTDs of the 20
RNAP form contacts with the upstream AT-rich region, contributing to the stability of the 21
nucleoprotein complex. The presence of a stable RNAP-promoter complex protects it from 22
inhibition by DnaA-ATP as its concentration increases prior to initiation. We propose that 23
transcription is induced at the time of replication initiation by a local change in DNA topology 24
releasing the upstream contacts of RNAP. At this time the concentration of DnaA-ATP has 25
Page 21 of 50 Molecular Microbiologype
er-0
0552
635,
ver
sion
1 -
6 Ja
n 20
11

For Peer Review
22
increased enough to oligomerize and occupy the low affinity sites, inhibiting RNAP 1
rebinding. The level of nrdAB expression is thus limited by the amount of free DnaA-ATP at 2
initiation. Once DNA replication elongation has begun, the combined effects of RIDA and the 3
increase in DnaA binding sites available on the chromosome result in a decrease in free 4
DnaA-ATP, allowing RNAP to bind again to the nrdAB promoter prior to the following 5
initiation event. The amount of NrdAB enzyme and dNTPs can affect both the frequency of 6
initiation and the rate of DNA replication (Fujimitsu et al., 2008, Odsbu et al., 2009). While 7
transcription regulation by DnaA-ATP does not play a significant role in the timing of cell 8
cycle dependent RNR expression, it may play a more important role in maintaining the 9
amount of RNR proportional to the number of replication forks. Finally, DnaA’s double role, 10
at the origin and as a transcription factor of several genes, may allow it to act as a general 11
mediator in the coupling of DNA replication initiation and elongation (Messer & Weigel, 12
1997, Goranov et al., 2005, Ishikawa et al., 2007). 13
14
15
16
Experimental procedures 17
Bacterial strains, plasmids, and growth conditions 18
E.coli K-12 strains BW25113 [rrnB3 ∆ lacZ4787 hsdR514 ∆(araBAD)567 ∆ 19
(rhaBAD)568 rph-1], referred to as the wild type, and its BW25113 yabD (nrdR) derivative 20
JWKO0403 (yabD knock-out, referred to as BW25113 ∆nrdR) were used for the fluorimeter 21
experiments (Baba et al., 2006). E. coli JM109 strain was used for classical cloning 22
(Promega). E. coli WM2287 strain carrying the pdnaA116 plasmid was used for DnaA 23
purification (Schaper & Messer, 1995). Plasmid pGEMT-Easy (Promega) was used for 24
classical cloning procedures. The medium-to-low copy plasmid pKK-gfp was used for 25
Page 22 of 50Molecular Microbiologype
er-0
0552
635,
ver
sion
1 -
6 Ja
n 20
11

For Peer Review
23
construction of Pnrd-gfp fusions. The gfp gene was obtained from the pQBIT7GFP 1
(Qbiogene) plasmid by digestion with BglII and HindIII restriction enzymes, and inserted in 2
pKK232-8 (GE Healthcare) (see (Bouffartigues et al., 2007) for details). Strains were grown 3
routinely in Luria-Bertani (LB) medium at 37°C, and antibiotic selection was maintained 4
either with ampicillin at 100 µg/ml, kanamycin at 50 µg/ml or chloramphenicol at 30 µg/ml. 5
For in vivo measurements of GFP expression in Pnrd-gfp fusions, strains were grown in M9 6
minimal medium (Na2HPO4 ·2H2O 8.9 g/L; KH2PO4 3 g/L; NH4Cl 1 g/L; NaCl 0.5 g/L; 7
CaCl2 0.0001 M; MgSO4 0.002 M; Tryptophane 0.004 g/L; Tymidine 0.005 g/L) 8
supplemented or not with glucose 0.4 % and/or casamino acids 0.5 %. 9
10
DNA manipulation 11
Standard methods were used for DNA manipulation as PCR, DNA analysis, cloning, 12
and chemical transformation. Plasmid DNA was isolated using the NucleoSpin plasmid kit 13
(Macherey-Nagel). PCR fragments were purified with the QIAquick PCR purification kit 14
(Qiagen), and with the QIAquick Gel Extraction Kit (Qiagen) when isolated from a 0.8 % 15
agarose gel. DNA digestions and ligations were carried out according to the manufacturer’s 16
instructions (Ozyme). 17
18
Oligonucleotides 19
The oligonucleotides used in this study are listed in Table 1S in Supporting 20
Information. 21
22
Plasmid construction 23
The nrdAB promoter sequence (Pnrd) was amplified by PCR using E. coli MG1655 24
chromosomal DNA as template, and PnrdR and PnrdF primers that introduce a XbaI and a 25
Page 23 of 50 Molecular Microbiologype
er-0
0552
635,
ver
sion
1 -
6 Ja
n 20
11

For Peer Review
24
XmaI restriction sites. Plasmid pGEM-Pnrd carrying this Pnrd PCR fragment of 631 bp 1
(including the XmaI and XbaI sites) was constructed using classical cloning methods 2
according to pGEMT-Easy protocol (Promega), and transformed in E. coli JM109 strains. 3
This Pnrd sequence was then cloned in the pKK-gfp plasmid in order to obtain fusions where 4
the fluorescent protein GFP is expressed under the nrdAB promoter. The PnrdF-PnrdR DNA 5
fragment was extracted from pGEM-Pnrd by XmaI and XbaI digestion, and ligated into the 6
same sites of pKK-gfp to create plasmid pKK-Pnrd-gfp. Plasmid pKK-Pnrd-gfp was 7
transformed in BW25113 strains. A 215 bp PCR fragment containing the lac promoter 8
sequence (Plac) was cloned according to the same protocols in pGEMT-Easy and in pKK-gfp 9
plasmids using primers PlacR and PlacF, and used as a control for fluorimeter and flow 10
cytometry experiments. Plasmid pKK-gfp carrying no promoter was used to measure 11
background fluorescence for both fluorimeter and flow cytometry experiments. Universal 12
primer T7ter was used in combination with an internal primer to verify plasmid constructions. 13
14
Mutagenesis 15
Based on our in vitro footprinting results and on previous work done by Augustin et al 16
(Augustin et al., 1994), the nrdAB promoter carried by the pGEM-Pnrd plasmid was mutated 17
in the DnaA binding sites by introducing different point mutations. Oligonucleotides were 18
designed to incorporate these point mutations within the promoter (Table 1S). Two 19
complementary mutated oligonucleotides were used for the construction of each mutant. In 20
two separate reactions, fragments upstream and downstream of the point mutation were PCR-21
amplified using one of the flanking primers (PnrdF or PnrdR) and one of the complementary 22
oligonucleotides containing the point mutation to be introduced. This PCR was performed at 23
50°C, a low enough temperature allowing mismatches at positions to be mutated, and with the 24
PfuUltra High-Fidelity DNA Polymerase (Stratagene). We thus created two fragments of 25
Page 24 of 50Molecular Microbiologype
er-0
0552
635,
ver
sion
1 -
6 Ja
n 20
11

For Peer Review
25
Pnrd carrying the mutation at one end, that we gel-purified. By an additional PCR at 53°C 1
using only the flanking primers (PnrdF or PnrdR), we fused these two fragments in one, thus 2
creating a mutated promoter. This amplified fragment was purified and cloned into pGEMT-3
Easy vector. The latter was used to transform JM109 strains. Sequencing was performed by 4
Genome express (Cogenics, genome express, Grenoble, France). Six different mutated Pnrd 5
promoters carried by the pGEM plasmid were created: pGEM-PnrdM12-14GG (C to G at -12 6
and -14), pGEM-PnrdM12-14AG (C to G at -12 and C to A at -14), pGEM-PnrdM40-42box2 7
(A to T and T to A at -42 and -40), pGEM-PnrdM45-47box1 (C to G at -45 and -47), pGEM-8
PnrdM49box1 (T to A at position -49), and pGEM-PnrdMoff (T to G at -7 and -9) (Figure 9
1b). These mutated pGEM-Pnrd vectors were then digested by XmaI and XbaI, and the 10
mutated Pnrd fragments extracted were subcloned into pKK-gfp plasmid in order to measure 11
GFP expression in living cells. Plasmids pKK-PnrdM12-14GG-gfp, pKK-PnrdM12-14AG-12
gfp, pKK-PnrdM40-42box2-gfp, pKK-PnrdM45-47box1-gfp, pKK-PnrdM49box1-gfp and 13
pKK-PnrdMoff-gfp were thus created. 14
15
DnaA purification 16
Native DnaA protein was overexpressed from the E. coli WM2287 strain carrying the 17
pdnaA116 plasmid. Protein production was induced by 0.3 mM of isopropyl β-D-18
thiogalactopyranoside (IPTG). The purification was performed according to Walter Messer’s 19
protocol (Messer & Weigel, 2003) except minor changes to the protocol. After precipitation 20
with 28 % (NH4)2SO4, the proteins from the pellet were resuspended and desalted using a 5 21
ml HiTrap fast desalting column (GE Healthcare). The protein solution was applied to a 1 ml 22
MonoS column (HR 5/5, Amersham, Pharmacia), the pooled fractions were concentrated 23
using an Ultra-15 centrifugal filter device of 30 KDa exclusion limit (Amicon), and loaded 24
onto a 24 ml gel filtration column (Superdex 75 HR 10/30, Amersham Biosciences). Note that 25
Page 25 of 50 Molecular Microbiologype
er-0
0552
635,
ver
sion
1 -
6 Ja
n 20
11

For Peer Review
26
all along the purification, 5 % glycerol was used instead of 20 % sucrose in the buffers that 1
otherwise were as described by (Messer & Weigel, 2003). The purified protein was stored in 2
aliquots at -20°C in LG-buffer (45 mM Hepes/KOH pH 7.6, 600 mM K-glu, 1 mM DTT, 10 3
mM Mg-acetate, 0.5 mM EDTA, and 20 % glycerol). 4
5
Dialysis of DnaA 6
According to the method of Speck et al (Speck et al., 1999), we dialyzed the protein 7
against ATP or ADP in order to work with an “exclusive” nucleotide state of DnaA (DnaA-8
ATP- or DnaA-ADP). This was obtained by an overnight incubation at 4°C of 5 µM of DnaA 9
with 3 mM of ATP or ADP in a total volume of 20 µl of LG-buffer (45 mM HEPES-KOH pH 10
7,6 ; 600 mM K-glu ; 10 mM Mg-acetate ; 1 mM DTT ; 0.5 mM EDTA ; 5 % glycerol), 11
followed by dialysis against the same buffer containing 3 mM of the corresponding 12
nucleotide: the 20 µl of protein were placed onto a 0.025 µm MF-Millipore membrane 13
(Millipore) floating on the buffer solution and dialyzed for 40 min at room temperature. 14
15
RNA polymerase purification 16
RNA polymerase was purified as described earlier (Sclavi et al., 2005) 17
18
DNase I Protection assay 19
Protection patterns of the nrdAB promoter region by DnaA and/or RNA polymerase 20
(RNAP) were assayed by in vitro DNase I footprinting. Template DNA was linear (a 226 bp 21
PCR fragment using primers PeF and PeR, one or the other being labeled) or supercoiled 22
(plasmid pGEM-Pnrd). 23
DNA labeling: Primers PeF and PeR were 5’ labeled with γ32P-ATP (GE Healthcare) 24
and T4 polynucleotide kinase (Fermentas). They were quickly purified with the Bio-Spin 6 25
Page 26 of 50Molecular Microbiologype
er-0
0552
635,
ver
sion
1 -
6 Ja
n 20
11

For Peer Review
27
Columns (BioRad) according to the manufacturer instructions. Purified oligonucleotides were 1
then used for primer extension of supercoiled plasmid cut by DNase I, or for amplification of 2
PCR fragments used as linear DNA. Both were carried out by a standard PCR with 30 cycles 3
of amplification at 53°C. 4
Protection assay. Binding reactions were carried out with 1 nM of DNA (linear or 5
supercoiled), and 0 to 500 nM of dialysed DnaA-ATP or DnaA-ADP, and/or 0 to 100 nM of 6
RNAP, in 10 µl of binding buffer (1 mM DTT; 0.5 mg/ml Ac-BSA, 20 mM Hepes pH 7.6, 50 7
mM K-glu and 5 mM MgCl2) and 3 mM of ATP or ADP (Sigma-Aldrich). Samples were 8
incubated for 20 min at 37°C. When DnaA and RNAP were used in the same binding 9
reaction, DnaA was added first and incubated for 15 min, and RNAP was added in second 10
time for an extra 10 min. DNA was then cut by 4 µg/ml of DNase I diluted in a digestion 11
buffer (25 mM Tris pH 7; 5 mM MgCl2; 1 mM CaCl2; 2 mM DTT; 100 mM KCl) during 25 12
seconds at 37°C. When using “cold” supercoiled plasmid DNA, the reaction was stopped by 13
addition of 10 µl of a primer extension mix containing a labeled primer (PeF or PeR). A 14
classical PCR was run out to extend from the labeled fragment on the cut DNA, during 30 15
cycles at 53°C. When using labeled linear PCR fragments of DNA, the reaction was stopped 16
by addition of 50 µl of a STOP solution (0.2 µg/ml of glycogen; 0.04 mg/ml of calf thymus 17
non specific DNA; and TE buffer). In both cases, DNA was then precipitated with ethanol and 18
resuspended in 12 µl of a gel loading buffer (90 % of formamide; 0.025 % of bomophenol 19
blue; 0.025 % of xylene cyanol). The DNA fragments were visualized on sequencing gels. 20
Samples were incubated for 5 min at 95°C and loaded onto 6 % acrylamide gels in denaturing 21
conditions (8 M of urea; 1 X TBE buffer). After electrophoresis, gels were dried and 22
autoradiographed. A G+A-specific DNA sequencing reaction was realized for each DNase I 23
experiment in order to localize the protected regions (Maxam & Gilbert, 1977). 24
Page 27 of 50 Molecular Microbiologype
er-0
0552
635,
ver
sion
1 -
6 Ja
n 20
11

For Peer Review
28
Quantification of binding. The intensities of the bands in the gels were quantified 1
using the ImageQuant 5.0 software. The band intensities were normalized with the intensity of 2
a reference band that does not change as a function of DnaA concentration and with the 3
intensity of the band in the absence of protein (Brenowitz et al., 2001). Nonlinear least square 4
curve fitting of the data was carried out using the following binding equation: 5
y = L+(U-L)*(Kn*xn/(1+Kn*xn)) 6
with L: lower y value; U: upper y value, K: affinity constant, and n: Hill coefficient using the 7
Origin software (OriginLab). The values obtained for the U and L were used to normalize the 8
data from 1 to 0 to obtain the value for the normalized band intensity shown in the plots in 9
Figure 3 and Figure 1S in Supporting Information. This value is inversely proportional to the 10
fractional saturation of the site by the protein. The results of at least three independent 11
experiments were combined and fit again to obtain the values for the affinity constant and the 12
Hill coefficient shown in Table 1 and Figure 5 and Table 2S of Supporting Information. 13
14
In vivo measurement of Pnrd expression. 15
We used the fluorescence of the GFP protein expressed under control of the nrdAB 16
promoter in the medium-to-low copy pKK plasmid to follow wild type and mutated Pnrd 17
activity. The rate of GFP production, divided by the OD, provides a measure of the promoter 18
activity [(dGFP/dt)/OD] as a function of time (Zaslaver et al., 2006). Cells carrying these 19
different plasmids were diluted 1:10000 from an overnight culture in M9 minimal medium 20
were grown in 96-wells plates, in a WallacVictor3 multiwell fluorimeter (Perkin-Elmer) set 21
with an automatically repeating protocol of shaking and OD600 and fluorescence readings. 22
GFP fluorescence was measured at 535 nm after excitation at 485 nm. Background 23
fluorescence was determined from the fluorescence of cells bearing a promoterless GFP 24
vector and background absorbance was determined from wells containing only the growth 25
Page 28 of 50Molecular Microbiologype
er-0
0552
635,
ver
sion
1 -
6 Ja
n 20
11

For Peer Review
29
medium. The data analysis was carried out as described by (Zaslaver et al., 2006) using a 1
program written specifically for these experiments to be described in a separate publication. 2
3
Flow Cytometry 4
Cells were grown overnight in M9 minimal media supplemented with 0.2 % glucose 5
and 0.5 % casamino acids. Following a 1:1000 dilution in the same medium the cells were 6
grown at 30°C up to an OD450 of 0.15-0.2. Rifampicin and cephalexin (300 µg/ml and 36 7
µg/ml final concentrations respectively) were added to block transcription and cell division. 8
After 2 hours, 2 ml of the cells were harvested on ice, spun 3 minutes at 3000 rpm, 9
resuspended in 400 µl of PBS and an equal volume of 2X fixing solution (4.8 % 10
paraformaldehyde and 0.03 % gluteraldehyde) was added as described by (Maithreye et al., 11
2008). After 15 minutes at room temperature and 30 minutes on ice the cells were washed by 12
three consecutive cycles of spin (3 minutes at 3000 rpm) and wash with 1 ml of PBS. Finally 13
cells were resuspended in 500 µl of PBS. These samples can be stored at 4°C for up to two 14
months. The night prior to the flow cytometer measurements 500 µl of Hoechst 33342 15
(Molecular Probes, Eugene, OR) in PBS (1.5 µg/ml final) was added to the cells to label the 16
DNA overnight. The measurements were obtained on a Influx500 (BDBiosciences) flow 17
cytometer at the Flow Cytometry Platform of the Institute Jacques Monod, Paris, France. 18
The initiation age, ai, was determined from the fraction (F) of cells with the number of 19
genome equivalents present prior to initiation as determined by the flow cytometry DNA 20
plots, such as the one in Figure 7 (Skarstad et al., 1985), 21
F = 2(1-ai) 22
ai = τ - τ * (log (2 - F)) / log(2)) 23
with, in this case, a doubling time, τ, of 50 minutes. We carried out a simulation of a 24
population of cells doubling the amount of GFP gene at random times throughout the cell 25
Page 29 of 50 Molecular Microbiologype
er-0
0552
635,
ver
sion
1 -
6 Ja
n 20
11

For Peer Review
30
cycle, such as the example shown in Figure 8B, by using Microsoft Excel. We then used the 1
measured initiation age to estimate the average amount of GFP in the population before and 2
after initiation has taken place (simulation value shown in Figure 8 A and B). 3
4
Acknowledgments 5
This work was supported by the Agence Nationale pour la Recherche (projet ANR-6
JCJC-0113-01) and by the Association pour la Recherche sur le Cancer (ARC). We thank 7
Ulisse Ferrari and Marco Cosentino Lagomarsino for the program for data analysis of the 8
fluorimeter experiments and for useful discussions, Kirsten Skarstad for providing us with the 9
DnaA-expressing strain WM2287, Nicole Boggetto of the Plate-forme Cytométrie en Flux of 10
the Institut Jacques Monod, Paris, France, for technical assistance for the flow cytometry 11
experiments. 12
13
Figure Legends 14
15
Fig 1. Schematic representation of the E. coli nrdAB promoter (Pnrd). (a) Pnrd 16
contains multiple transcription factor binding sites. Here are represented binding sites for 17
IciA, Fis, DnaA and NrdR (Han et al., 1998, Augustin et al., 1994, Rodionov & Gelfand, 18
2005, Torrents et al., 2007). The two AT-rich sequences (AT) flanking a 45-bp inverted 19
repeat (IR45) are represented as grey boxes, and a region required for nrd cell cycle 20
dependent expression is indicated as a hatched box (Sun et al., 1994, Jacobson & Fuchs, 21
1998). Positions indicated are based on the +1 start site of transcription of Pnrd 110 bp 22
upstream of the ATG codon of nrdA (Tuggle & Fuchs, 1986). The start site of transcription of 23
Px (Sun & Fuchs, 1994) is also represented. The main primers used in this study (PnrdF, 24
PnrdR, PeF and PeR) are represented as grey arrows and detailed in supplementary Table 1. 25
Page 30 of 50Molecular Microbiologype
er-0
0552
635,
ver
sion
1 -
6 Ja
n 20
11

For Peer Review
31
(b) Sequence surrounding the DnaA binding sites. The -35 and -10 regions are underlined by 1
a dotted line. The two nine-base sequences with homology to the DnaA consensus binding 2
sequence, box1 and box2, are indicated as open boxes. A putative DnaA binding site 3
identified by the Virtual Footprint software (dotted line box) (Münch et al., 2005) and two 4
NrdR binding sites found at the nrd promoter (light grey boxes) (Rodionov & Gelfand, 2005, 5
Torrents et al., 2007) are also shown. The site directed mutations in the DnaA binding sites 6
constructed in this study are shown. M49box1: T to A at position -49; M45-47box1: C to G at 7
positions -45 and -47; M40-42box2: A to T and T to A at positions -42 and -40; M12-14GG: 8
C to G at positions -12 and -14; M12-14AG: C to A at -12 and C to G at -14, and Moff: T to 9
G at positions -7 and -9. 10
11
Fig 2. DnaA-ATP and DnaA-ADP binding to the nrdAB promoter. DNase I protection 12
pattern of the nrdAB promoter region by DnaA-ATP and DnaA-ADP on the template strand 13
on supercoiled DNA. (a) Lane 1: G+A-specific DNA sequencing reaction, lane 2: free DNA 14
with ATP, lanes 3 and 4: DNA with 20 nM and 50 nM of DnaA-ATP respectively, lane 5: 15
free DNA with ADP, lane 6 and 7: DNA with 20 nM and 50 nM of DnaA-ADP respectively. 16
Thick lines indicate a region protected by DnaA and stars indicate hypersensitive sites 17
exposed by protein binding. (b) Line representation of the protection pattern. Normalization 18
was carried out with a band at position -100 that does not vary with increasing concentrations 19
of DnaA-ATP or DnaA-ADP. Black line: free DNA, grey line: DNA with DnaA-ATP (50 20
nM), dotted line: DNA with DnaA-ADP (50 nM). 21
22
Fig 3. Titration of DnaA-ATP binding to the nrdAB promoter. (a) DNase I protection 23
pattern on the non template strand of DnaA-ATP binding to the nrdAB promoter on a linear 24
fragment. Thick lines indicate a region protected by DnaA and stars indicate hypersensitive 25
Page 31 of 50 Molecular Microbiologype
er-0
0552
635,
ver
sion
1 -
6 Ja
n 20
11

For Peer Review
32
sites exposed by binding of the protein. Lane 1: free DNA, lane 2 to lane 9: DNA with DnaA-1
ATP at 10, 20, 30, 50, 100, 200, 300 and 500 nM respectively. (b) DNase I protection pattern 2
on the non template strand of the nrdAB promoter on a supercoiled plasmid. Lane 1: free 3
DNA, lane 2 to lane 9: DNA with DnaA-ATP at 5, 10, 20, 30, 50, 100, 150 and 200 nM 4
respectively. Two different preparations of DnaA were used in the experiments shown in (A) 5
and (B), explaining the different range in DnaA concentrations. (c) Quantification of DnaA-6
ATP binding to box1, box2 and boxDown regions on the linear DNA. (d) Quantification of 7
DnaA-ATP binding to box1 and box2 regions on supercoiled DNA. The values obtained from 8
the nonlinear least square fitting of the data (dissociation constant and Hill coefficient) are 9
summarized in Table 1. Results are shown from at least three independent experiments. 10
11
Fig 4. RNA polymerase binding to the nrdAB promoter. DNase I protection pattern of 12
the nrdAB promoter region by RNAP (50 nM) and DnaA-ATP (50 nM), on the template 13
strand of a supercoiled plasmid. Lane 1: G+A-specific DNA sequencing reaction, lane 2 to 14
lane 5: DNA without (-) or with (+) proteins as indicated in the figure. The start site of 15
transcription of the Px promoter is indicated by the arrow. Thick lines indicate the regions 16
protected by proteins and stars indicate hypersensitive sites exposed to DNaseI cleavage by 17
binding of DnaA and/or RNAP (grey for RNAP, black for DnaA-ATP). The Px footprint 18
indicated in the figure represents the RNAP footprint in an experiment where Pnrd has been 19
inactivated (data not shown). The two AT-rich sequences (AT), the 45-bp inverted repeat 20
(IR45) and the region required for nrd cell cycle regulation are represented as in Figure 1a. 21
22
Fig 5. Effect of nrdAB mutations on binding of DnaA-ATP. (a) Comparison of DnaA-23
ATP binding to high affinity sites box1 and box2 in wild type (wt) and mutated nrdAB 24
promoters. The values of the dissociation constants (Kd) are represented as bar plots (See 25
Page 32 of 50Molecular Microbiologype
er-0
0552
635,
ver
sion
1 -
6 Ja
n 20
11

For Peer Review
33
Figure 1S and 2S for DNase I footprinting gels and binding curves). (b) DNase I protection 1
pattern of the linear nrdAB promoter by DnaA-ATP on the non template strand showing the 2
protection of low affinity sites by DnaA binding to the downstream regions (DnaA-ATP 3
boxDown). Thick lines indicate a region protected by DnaA and stars indicate hypersensitive 4
sites exposed by binding of the protein. Lane 1 to lane 4: wt DNA with 0, 100, 200 and 300 5
nM of DnaA-ATP. Lane 5 to lane 8: M12-14GG mutated DNA with 0, 100, 200 and 300 nM 6
of DnaA-ATP. 7
8
Fig 6. GFP expression rate from Pnrd-gfp plasmid fusions measured in living cells. 9
BW25113 (A) and BW25113 ∆nrdR (B) cells carrying wild type and mutated nrd promoters 10
fused to gfp in the pKK plasmid were grown at 30°C on a multiwell fluorimeter in M9 11
minimal medium supplemented with 0.4 % glucose (a) or 0.4 % glucose and 0.5 % casamino 12
acids (b). [(dGFP/dt)/OD] provides a measure of the promoter activity as a function of time 13
(left Y-axis, arbitrary units). OD provides a simultaneous measure of growing cells as a 14
function of time (right Y-axis). The error bars represent the results from the variation of 15
respective cultures in one experiment. The legend is as shown in the figure. The Moff 16
mutation corresponds to the inactivation of the nrdAB promoter by mutation of its -10 17
sequence (Figure 1). 18
19
Fig.7. Flow cytometry measurements of DNA and GFP content in the strains 20
containing the pKK-gfp plasmid with the nrdAB promoter. (a) DNA content. The peaks 21
corresponding to 2, 4 and 8 genome equivalents are labeled. (b) Superposition of the three 22
plots corresponding to the GFP content measured by flow cytometry for the strain containing 23
the nrdAB wild type promoter pKK-gfp plasmid and the two strains containing either the 24
M12-14GG or the M45-47box1 mutant promoters on the pKK-gfp plasmid. (c) Two 25
Page 33 of 50 Molecular Microbiologype
er-0
0552
635,
ver
sion
1 -
6 Ja
n 20
11
For Peer Review
34
dimensional plot of DNA vs GFP used to measure the amount of GFP in 2, 4 and 8 1
chromosome cells. Only the data from the strain with the wild type nrdAB promoter-GFP 2
plasmid is shown for clarity. 3
4
Fig. 8. (A) Ratio of the GFP content in 4 and 2 chromosomes cells and (B) in 8 and 4 5
chromosomes cells. The ratio obtained from the simulation is compared to the value obtained 6
for the uninduced lac promoter, the wild type nrdAB promoter and two of its mutants. The 7
values shown are the average of either 3 (lac) or 6 independent experiments. The error bars on 8
the simulation values result from the range of different initiation ages used, reflecting those of 9
the samples (see Figure 4S). (C) Graphic representation of the change in promoter activity 10
(grey lines) and the relative GFP content (black lines) in the bacterial population during the 11
cell cycle from cell birth to cell division for cells initiating replication after cell birth. The 12
time of replication initiation is indicated by an “ i ”. The expected pattern of expression for a 13
stochastic promoter is compared to that of a gene expressed at the time of initiation. The 14
effect of the two promoter mutations is also shown. The dotted line corresponds to the loss of 15
DnaA-ATP dependent repression (M12-14GG); the dashed line corresponds to the loss of 16
DnaA-ATP dependent activation (M45-47box1). The GFP content lines have been aligned in 17
the vertical axis, the amount of GFP in the two mutants at cell birth however is 3 fold higher 18
and 3 fold lower than wild type respectively. (D) Model for DnaA-dependent transcription 19
regulation of the nrdAB promoter. The DnaA-ATP to DnaA-ADP ratio is shown as the black 20
line while expression from the nrdAB promoter is shown by the grey line. The lower case 21
letters indicate the position of the different steps in transcription regulation shown below. 22
DnaA bound at the high affinity sites (grey ovals), in either its ATP or ADP-bound form, 23
binds to the upstream, high affinity, sites (a) and stabilizes RNAP binding (white oval). 24
RNAP forms an interaction to the upstream AT-rich region via its α-CTDs (small white 25
Page 34 of 50Molecular Microbiologype
er-0
0552
635,
ver
sion
1 -
6 Ja
n 20
11
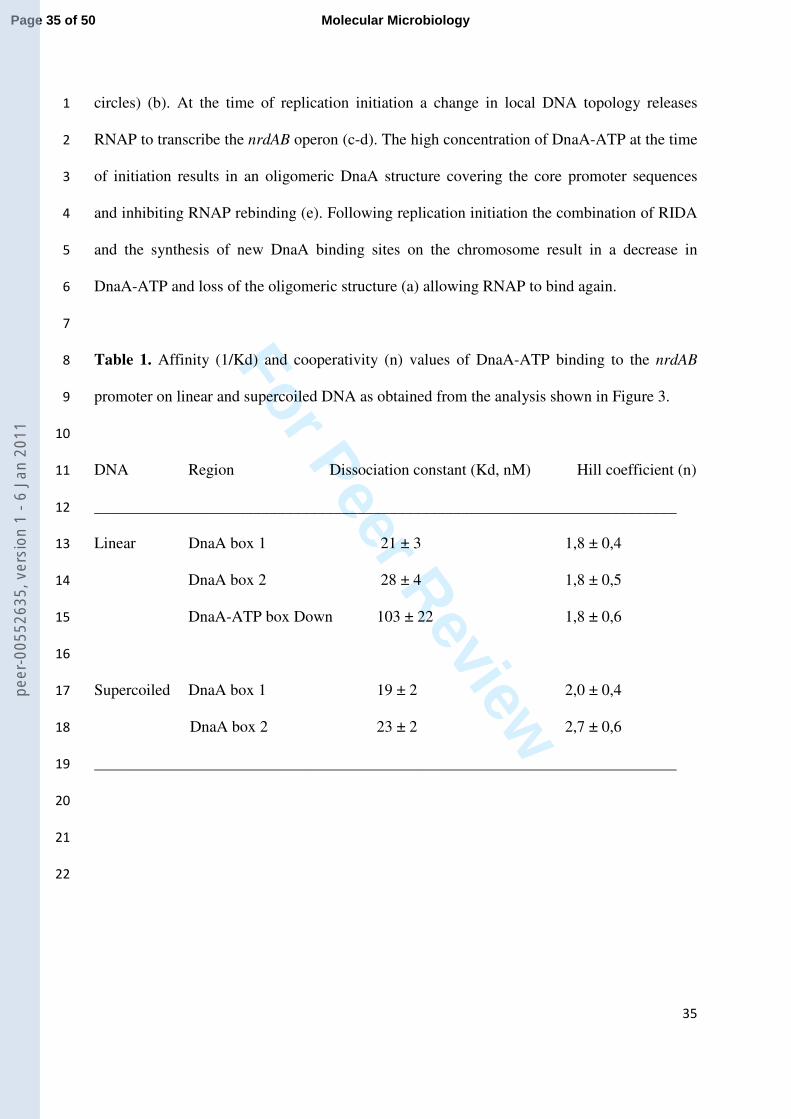
For Peer Review
35
circles) (b). At the time of replication initiation a change in local DNA topology releases 1
RNAP to transcribe the nrdAB operon (c-d). The high concentration of DnaA-ATP at the time 2
of initiation results in an oligomeric DnaA structure covering the core promoter sequences 3
and inhibiting RNAP rebinding (e). Following replication initiation the combination of RIDA 4
and the synthesis of new DnaA binding sites on the chromosome result in a decrease in 5
DnaA-ATP and loss of the oligomeric structure (a) allowing RNAP to bind again. 6
7
Table 1. Affinity (1/Kd) and cooperativity (n) values of DnaA-ATP binding to the nrdAB 8
promoter on linear and supercoiled DNA as obtained from the analysis shown in Figure 3. 9
10
DNA Region Dissociation constant (Kd, nM) Hill coefficient (n) 11
_________________________________________________________________________ 12
Linear DnaA box 1 21 ± 3 1,8 ± 0,4 13
DnaA box 2 28 ± 4 1,8 ± 0,5 14
DnaA-ATP box Down 103 ± 22 1,8 ± 0,6 15
16
Supercoiled DnaA box 1 19 ± 2 2,0 ± 0,4 17
DnaA box 2 23 ± 2 2,7 ± 0,6 18
_________________________________________________________________________ 19
20
21
22
Page 35 of 50 Molecular Microbiologype
er-0
0552
635,
ver
sion
1 -
6 Ja
n 20
11
For Peer Review
36
References 1
Aiyar, S. E., R. L. Gourse & W. Ross, (1998) Upstream A-tracts increase bacterial promoter activity 2
through interactions with the RNA polymerase alpha subunit. Proceedings of the National 3
Academy of Sciences of the United States of America 95: 14652-14657. 4
Augustin, L. B., B. A. Jacobson & J. A. Fuchs, (1994) Escherichia coli Fis and DnaA proteins bind 5
specifically to the nrd promoter region and affect expression of an nrd-lac fusion. The Journal 6
of Bacteriology 176: 378-387. 7
Baba, T., T. Ara, M. Hasegawa, Y. Takai, Y. Okumura, M. Baba, K. Datsenko, M. Tomita, B. Wanner & 8
H. Mori, (2006) Construction of Escherichia coli K-12 in-frame, single-gene knockout mutants: 9
the Keio collection. Mol Syst Biol 2: 2006.0008. 10
Bouffartigues, E., M. Buckle, C. Badaut, A. Travers & S. Rimsky, (2007) H-NS cooperative binding to 11
high-affinity sites in a regulatory element results in transcriptional silencing. 12
Nat.Struct.Mol.Biol. 14: 441-448. 13
Brenowitz, M., D. Senear & R. Kingston, (2001) DNase I footprint analysis of protein-DNA binding. 14
Curr Protoc Mol Biol Chapter 12: Unit 12.14. 15
Cellai, S., L. Mangiarotti, N. Vannini, N. Naryshkin, E. Kortkhonjia, R. H. Ebright & C. Rivetti, (2007) 16
Upstream promoter sequences and alphaCTD mediate stable DNA wrapping within the RNA 17
polymerase-promoter open complex. EMBO Reports 8: 271-278. 18
Donachie, W. D. & G. W. Blakely, (2003) Coupling the initiation of chromosome replication to cell size 19
in Escherichia coli. Curr.Opin.Microbiol. 6: 146-150. 20
Dove, S., S. Darst & A. Hochschild, (2003) Region 4 of sigma as a target for transcription regulation. 21
Mol Microbiol 48: 863-874. 22
Erzberger, J. P., M. L. Mott & J. M. Berger, (2006) Structural basis for ATP-dependent DnaA assembly 23
and replication-origin remodeling. Nat.Struct.Mol.Biol. 13: 676-683. 24
Page 36 of 50Molecular Microbiologype
er-0
0552
635,
ver
sion
1 -
6 Ja
n 20
11

For Peer Review
37
Flåtten, I., Morigen & K. Skarstad, (2009) DnaA protein interacts with RNA polymerase and partially 1
protects it from the effect of rifampicin. Mol Microbiol 71: 1018-1030. 2
Fujimitsu, K., T. Senriuchi & T. Katayama, (2009) Specific genomic sequences of E. coli promote 3
replicational initiation by directly reactivating ADP-DnaA. Genes Dev 23: 1221-1233. 4
Fujimitsu, K., M. Su'etsugu, Y. Yamaguchi, K. Mazda, N. Fu, H. Kawakami & T. Katayama, (2008) 5
Modes of over-initiation, dnaA gene expression and the inhibition of cell division in a novel 6
cold-sensitive hda mutant in Escherichia coli. J Bacteriol. 7
Gon, S., J. E. Camara, H. K. Klungsoyr, E. Crooke, K. Skarstad & J. Beckwith, (2006) A novel regulatory 8
mechanism couples deoxyribonucleotide synthesis and DNA replication in Escherichia coli. 9
EMBO J. 25: 1137-1147. 10
Goranov, A., L. Katz, A. Breier, C. Burge & A. Grossman, (2005) A transcriptional response to 11
replication status mediated by the conserved bacterial replication protein DnaA. Proc Natl 12
Acad Sci U S A 102: 12932-12937. 13
Grimwade, J., J. Torgue, K. McGarry, T. Rozgaja, S. Enloe & A. Leonard, (2007) Mutational analysis 14
reveals Escherichia coli oriC interacts with both DnaA-ATP and DnaA-ADP during pre-RC 15
assembly. Mol Microbiol 66: 428-439. 16
Grinberg, I., T. Shteinberg, A. Hassan, Y. Aharonowitz, I. Borovok & G. Cohen, (2009) Functional 17
analysis of the Streptomyces coelicolor NrdR ATP-cone domain: role in nucleotide binding, 18
oligomerization, and DNA interactions. J Bacteriol 191: 1169-1179. 19
Guarino, E., I. Salguero, A. Jimenez-Sanchez & E. C. Guzman, (2007) Double-strand break generation 20
under deoxyribonucleotide starvation in Escherichia coli. J Bacteriol 189: 5782-5786. 21
Han, J. S., H. S. Kwon, J. B. Yim & D. S. Hwang, (1998) Effect of IciA protein on the expression of the 22
nrd gene encoding ribonucleoside diphosphate reductase in E. coli. Mol.Gen.Genet. 259: 610-23
614. 24
Page 37 of 50 Molecular Microbiologype
er-0
0552
635,
ver
sion
1 -
6 Ja
n 20
11
For Peer Review
38
Herrick, J. & B. Sclavi, (2007) Ribonucleotide reductase and the regulation of DNA replication: an old 1
story and an ancient heritage. Mol.Microbiol. 63: 22-34. 2
Hsu, L., (2002) Promoter clearance and escape in prokaryotes. Biochim Biophys Acta 1577: 191-207. 3
Ishikawa, S., Y. Ogura, M. Yoshimura, H. Okumura, E. Cho, Y. Kawai, K. Kurokawa, T. Oshima & N. 4
Ogasawara, (2007) Distribution of stable DnaA-binding sites on the Bacillus subtilis genome 5
detected using a modified ChIP-chip method. DNA Res 14: 155-168. 6
Jacobson, B. A. & J. A. Fuchs, (1998) A 45 bp inverted repeat is required for cell cycle regulation of the 7
Escherichia coli nrd operon. Mol.Microbiol. 28: 1307-1314. 8
Kaguni, J. M., (2006) DnaA: Controlling the Initiation of Bacterial DNA Replication and More. 9
Annu.Rev.Microbiol. 60: 351-371. 10
Katayama, T., (2001) Feedback controls restrain the initiation of Escherichia coli chromosomal 11
replication. Mol Microbiol 41: 9-17. 12
Katayama, T., T. Kubota, K. Kurokawa, E. Crooke & K. Sekimizu, (1998) The initiator function of DnaA 13
protein is negatively regulated by the sliding clamp of the E. coli chromosomal replicase. Cell 14
94: 61-71. 15
Kurokawa, K., S. Nishida, A. Emoto, K. Sekimizu & T. Katayama, (1999) Replication cycle-coordinated 16
change of the adenine nucleotide-bound forms of DnaA protein in Escherichia coli. EMBO J 17
18: 6642-6652. 18
Lee, Y., J. Wang, J. Stubbe & S. Elledge, (2008) Dif1 is a DNA-damage-regulated facilitator of nuclear 19
import for ribonucleotide reductase. Mol Cell 32: 70-80. 20
Maithreye, R., R. R. Sarkar, V. K. Parnaik & S. Sinha, (2008) Delay-induced transient increase and 21
heterogeneity in gene expression in negatively auto-regulated gene circuits. PLoS One 3: 22
e2972. 23
Mathews, C. K., (2006) DNA precursor metabolism and genomic stability. FASEB J. 20: 1300-1314. 24
Page 38 of 50Molecular Microbiologype
er-0
0552
635,
ver
sion
1 -
6 Ja
n 20
11
For Peer Review
39
Maxam, A. & W. Gilbert, (1977) A new method for sequencing DNA. Proc Natl Acad Sci U S A 74: 560-1
564. 2
Messer, W. & C. Weigel, (1997) DnaA initiator--also a transcription factor. Mol Microbiol 24: 1-6. 3
Messer, W. & C. Weigel, (2003) DnaA as a transcription regulator. Methods Enzymol. 370: 338-349. 4
Miller, D., J. Grimwade, T. Betteridge, T. Rozgaja, J. Torgue & A. Leonard, (2009) Bacterial origin 5
recognition complexes direct assembly of higher-order DnaA oligomeric structures. Proc Natl 6
Acad Sci U S A 106: 18479-18484. 7
Mitchell, J. E., D. Zheng, S. J. W. Busby & S. D. Minchin, (2003) Identification and analysis of 'extended 8
-10' promoters in Escherichia coli. 31: 4689-4695. 9
Münch, R., K. Hiller, A. Grote, M. Scheer, J. Klein, M. Schobert & D. Jahn, (2005) Virtual Footprint and 10
PRODORIC: an integrative framework for regulon prediction in prokaryotes. Bioinformatics 11
21: 4187-4189. 12
Nielsen, O. & A. Løbner-Olesen, (2008) Once in a lifetime: strategies for preventing re-replication in 13
prokaryotic and eukaryotic cells. EMBO Rep 9: 151-156. 14
Nordlund, P. & P. Reichard, (2006) Ribonucleotide reductases. Annu.Rev.Biochem. 75: 681-706. 15
Odsbu, I., Morigen & K. Skarstad, (2009) A reduction in ribonucleotide reductase activity slows down 16
the chromosome replication fork but does not change its localization. PLoS One 4: e7617. 17
Ozaki, S., H. Kawakami, K. Nakamura, N. Fujikawa, W. Kagawa, S. Park, S. Yokoyama, H. Kurumizaka & 18
T. Katayama, (2008) A common mechanism for the ATP-DnaA-dependent formation of open 19
complexes at the replication origin. J Biol Chem 283: 8351-8362. 20
Pemberton, I. K., G. Muskhelishvili, A. A. Travers & M. Buckle, (2002) FIS modulates the kinetics of 21
successive interactions of RNA polymerase with the core and upstream regions of the tyrT 22
promoter. J Mol Biol 318: 651-663. 23
Polaczek, P. & A. Wright, (1990) Regulation of expression of the dnaA gene in Escherichia coli: role of 24
the two promoters and the DnaA box. New Biol 2: 574-582. 25
Page 39 of 50 Molecular Microbiologype
er-0
0552
635,
ver
sion
1 -
6 Ja
n 20
11

For Peer Review
40
Riber, L., K. Fujimitsu, T. Katayama & A. Løbner-Olesen, (2009) Loss of Hda activity stimulates 1
replication initiation from I-box, but not R4 mutant origins in Escherichia coli. Mol Microbiol 2
71: 107-122. 3
Rodionov, D. A. & M. S. Gelfand, (2005) Identification of a bacterial regulatory system for 4
ribonucleotide reductases by phylogenetic profiling. Trends Genet. 21: 385-389. 5
Samitt, C. E., F. G. Hansen, J. F. Miller & M. Schaechter, (1989) In vivo studies of DnaA binding to the 6
origin of replication of Escherichia coli. EMBO J. 8: 989-993. 7
Schaper, S. & W. Messer, (1995) Interaction of the initiator protein DnaA of Escherichia coli with its 8
DNA target. J Biol Chem 270: 17622-17626. 9
Sclavi, B., C. Beatty, D. Thach, C. Fredericks, M. Buckle & A. Wolfe, (2007) The multiple roles of CRP at 10
the complex acs promoter depend on activation region 2 and IHF. Mol Microbiol 65: 425-440. 11
Sclavi, B., E. Zaychikov, A. Rogozina, F. Walther, M. Buckle & H. Heumann, (2005) Real-time 12
characterization of intermediates in the pathway to open complex formation by Escherichia 13
coli RNA polymerase at the T7A1 promoter. Proc Natl Acad Sci U S A 102: 4706-4711. 14
Sekimizu, K., D. Bramhill & A. Kornberg, (1987) ATP activates dnaA protein in initiating replication of 15
plasmids bearing the origin of the E. coli chromosome. Cell 50: 259-265. 16
Simmons, L., M. Felczak & J. Kaguni, (2003) DnaA Protein of Escherichia coli: oligomerization at the E. 17
coli chromosomal origin is required for initiation and involves specific N-terminal amino 18
acids. Mol Microbiol 49: 849-858. 19
Skarstad, K., E. Boye & H. B. Steen, (1986) Timing of initiation of chromosome replication in individual 20
Escherichia coli cells. EMBO J. 5: 1711-1717. 21
Skarstad, K., H. B. Steen & E. Boye, (1985) Escherichia coli DNA distributions measured by flow 22
cytometry and compared with theoretical computer simulations. The Journal of Bacteriology 23
163: 661-668. 24
Page 40 of 50Molecular Microbiologype
er-0
0552
635,
ver
sion
1 -
6 Ja
n 20
11

For Peer Review
41
Speck, C. & W. Messer, (2001) Mechanism of origin unwinding: sequential binding of DnaA to double- 1
and single-stranded DNA. EMBO J 20: 1469-1476. 2
Speck, C., C. Weigel & W. Messer, (1999) ATP- and ADP-dnaA protein, a molecular switch in gene 3
regulation. EMBO J 18: 6169-6176. 4
Stubbe, J., (2000) Ribonucleotide reductases: the link between an RNA and a DNA world? 5
Curr.Opin.Struct.Biol 10: 731-736. 6
Sun, L. & J. A. Fuchs, (1992) Escherichia coli ribonucleotide reductase expression is cell cycle 7
regulated. Mol.Biol.Cell 3: 1095-1105. 8
Sun, L. & J. A. Fuchs, (1994) Regulation of the Escherichia coli nrd operon: role of DNA supercoiling. J 9
Bacteriol. 176: 4617-4626. 10
Sun, L., B. A. Jacobson, B. S. Dien, F. Srienc & J. A. Fuchs, (1994) Cell cycle regulation of the 11
Escherichia coli nrd operon: requirement for a cis-acting upstream AT-rich sequence. The 12
Journal of Bacteriology 176: 2415-2426. 13
Torrents, E., I. Grinberg, B. Gorovitz-Harris, H. Lundstrom, I. Borovok, Y. Aharonowitz, B. M. Sjoberg & 14
G. Cohen, (2007) NrdR controls differential expression of the Escherichia coli ribonucleotide 15
reductase genes. J Bacteriol 189: 5012-5021. 16
Tuggle, C. K. & J. A. Fuchs, (1986) Regulation of the operon encoding ribonucleotide reductase in 17
Escherichia coli: evidence for both positive and negative control. EMBO J. 5: 1077-1085. 18
Wade, J. T. & K. Struhl, (2008) The transition from transcriptional initiation to elongation. Curr Opin 19
Genet Dev 18: 130-136. 20
Wheeler, L. J., I. Rajagopal & C. K. Mathews, (2005) Stimulation of mutagenesis by proportional 21
deoxyribonucleoside triphosphate accumulation in Escherichia coli. DNA Repair (Amst) 4: 22
1450-1456. 23
Yu, J., J. Xiao, X. Ren, K. Lao & X. Xie, (2006) Probing gene expression in live cells, one protein 24
molecule at a time. Science 311: 1600-1603. 25
Page 41 of 50 Molecular Microbiologype
er-0
0552
635,
ver
sion
1 -
6 Ja
n 20
11

For Peer Review
42
Zaslaver, A., A. Bren, M. Ronen, S. Itzkovitz, I. Kikoin, S. Shavit, W. Liebermeister, M. G. Surette & U. 1
Alon, (2006) A comprehensive library of fluorescent transcriptional reporters for Escherichia 2
coli. 3: 623-628. 3
4
5
Page 42 of 50Molecular Microbiologype
er-0
0552
635,
ver
sion
1 -
6 Ja
n 20
11
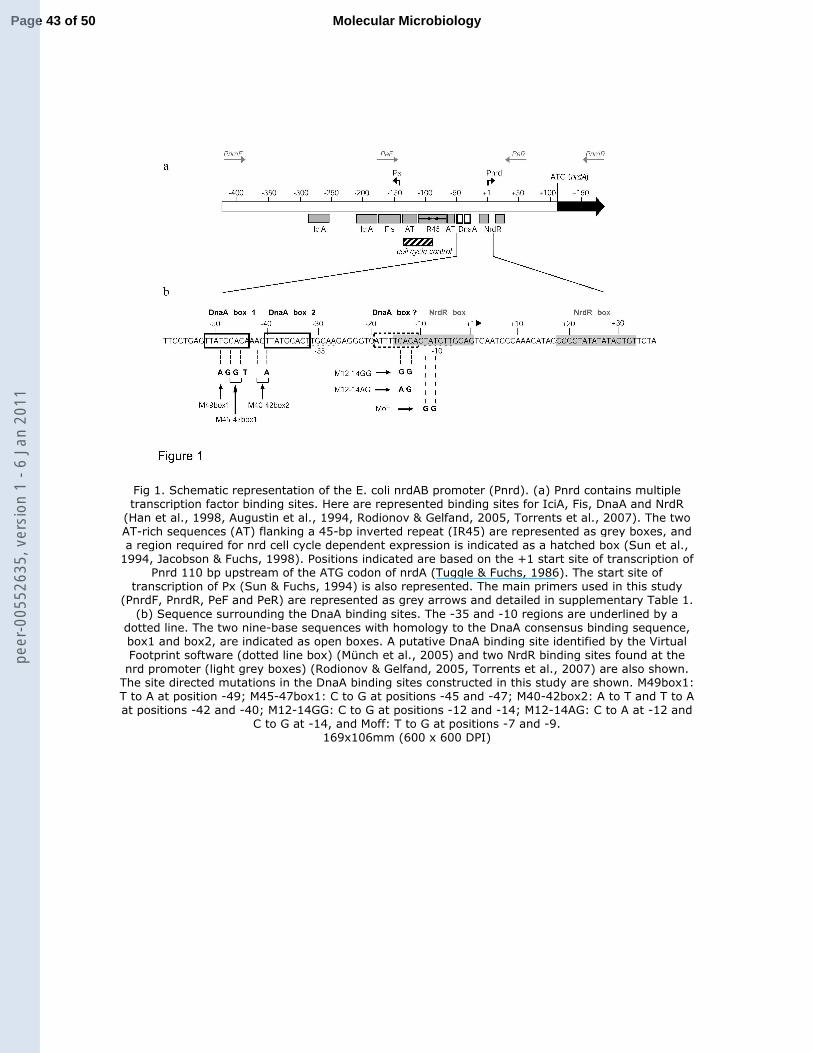
For Peer Review
Fig 1. Schematic representation of the E. coli nrdAB promoter (Pnrd). (a) Pnrd contains multiple transcription factor binding sites. Here are represented binding sites for IciA, Fis, DnaA and NrdR
(Han et al., 1998, Augustin et al., 1994, Rodionov & Gelfand, 2005, Torrents et al., 2007). The two AT-rich sequences (AT) flanking a 45-bp inverted repeat (IR45) are represented as grey boxes, and a region required for nrd cell cycle dependent expression is indicated as a hatched box (Sun et al.,
1994, Jacobson & Fuchs, 1998). Positions indicated are based on the +1 start site of transcription of Pnrd 110 bp upstream of the ATG codon of nrdA (Tuggle & Fuchs, 1986). The start site of
transcription of Px (Sun & Fuchs, 1994) is also represented. The main primers used in this study (PnrdF, PnrdR, PeF and PeR) are represented as grey arrows and detailed in supplementary Table 1.
(b) Sequence surrounding the DnaA binding sites. The -35 and -10 regions are underlined by a dotted line. The two nine-base sequences with homology to the DnaA consensus binding sequence, box1 and box2, are indicated as open boxes. A putative DnaA binding site identified by the Virtual Footprint software (dotted line box) (Münch et al., 2005) and two NrdR binding sites found at the nrd promoter (light grey boxes) (Rodionov & Gelfand, 2005, Torrents et al., 2007) are also shown.
The site directed mutations in the DnaA binding sites constructed in this study are shown. M49box1: T to A at position -49; M45-47box1: C to G at positions -45 and -47; M40-42box2: A to T and T to A at positions -42 and -40; M12-14GG: C to G at positions -12 and -14; M12-14AG: C to A at -12 and
C to G at -14, and Moff: T to G at positions -7 and -9. 169x106mm (600 x 600 DPI)
Page 43 of 50 Molecular Microbiologype
er-0
0552
635,
ver
sion
1 -
6 Ja
n 20
11

For Peer Review
Fig 2. DnaA-ATP and DnaA-ADP binding to the nrdAB promoter. DNase I protection pattern of the nrdAB promoter region by DnaA-ATP and DnaA-ADP on the template strand on supercoiled DNA. (A) Lane 1: G+A-specific DNA sequencing reaction, lane 2: free DNA with ATP, lanes 3 and 4: DNA with 20 nM and 50 nM of DnaA-ATP respectively, lane 5: free DNA with ADP, lane 6 and 7: DNA with 20 nM and 50 nM of DnaA-ADP respectively. Thick lines indicate a region protected by DnaA and stars indicate hypersensitive sites exposed by protein binding. (B) Line representation of the protection
pattern. Normalization was carried out with a band at position -100 that does not vary with increasing concentrations of DnaA-ATP or DnaA-ADP. Black line: free DNA, grey line: DNA with
DnaA-ATP (50 nM), dotted line: DNA with DnaA-ADP (50 nM).
71x143mm (300 x 300 DPI)
Page 44 of 50Molecular Microbiologype
er-0
0552
635,
ver
sion
1 -
6 Ja
n 20
11

For Peer Review
Fig 3. Titration of DnaA-ATP binding to the nrdAB promoter. (a) DNase I protection pattern on the non template strand of DnaA-ATP binding to the nrdAB promoter on a linear fragment. Thick lines indicate a region protected by DnaA and stars indicate hypersensitive sites exposed by binding of the protein. Lane 1: free DNA, lane 2 to lane 9: DNA with DnaA-ATP at 10, 20, 30, 50, 100, 200, 300 and 500 nM respectively. (b) DNase I protection pattern on the non template strand of the
nrdAB promoter on a supercoiled plasmid. Lane 1: free DNA, lane 2 to lane 9: DNA with DnaA-ATP at 5, 10, 20, 30, 50, 100, 150 and 200 nM respectively. Two different preparations of DnaA were
used in the experiments shown in (A) and (B), explaining the different range in DnaA concentrations. (c) Quantification of DnaA-ATP binding to box1, box2 and boxDown regions on the linear DNA. (d) Quantification of DnaA-ATP binding to box1 and box2 regions on supercoiled DNA.
The values obtained from the nonlinear least square fitting of the data (dissociation constant and Hill coefficient) are summarized in Table 1. Results are shown from at least three independent
experiments.
Page 45 of 50 Molecular Microbiologype
er-0
0552
635,
ver
sion
1 -
6 Ja
n 20
11

For Peer Review
106x184mm (300 x 300 DPI)
Page 46 of 50Molecular Microbiologype
er-0
0552
635,
ver
sion
1 -
6 Ja
n 20
11

For Peer Review
Fig 4. RNA polymerase binding to the nrdAB promoter. DNase I protection pattern of the nrdAB promoter region by RNAP (50 nM) and DnaA-ATP (50 nM), on the template strand of a supercoiled plasmid. Lane 1: G+A-specific DNA sequencing reaction, lane 2 to lane 5: DNA without (-) or with (+) proteins as indicated in the figure. The start site of transcription of the Px promoter is indicated by the arrow. Thick lines indicate the regions protected by proteins and stars indicate hypersensitive sites exposed to DNaseI cleavage by binding of DnaA and/or RNAP (grey for RNAP, black for DnaA-ATP). The Px footprint indicated in the figure represents the RNAP footprint in an experiment where Pnrd has been inactivated (data not shown). The two AT-rich sequences (AT), the 45-bp inverted repeat (IR45) and the region required for nrd cell cycle regulation are represented as in Figure 1A.
64x174mm (300 x 300 DPI)
Page 47 of 50 Molecular Microbiologype
er-0
0552
635,
ver
sion
1 -
6 Ja
n 20
11
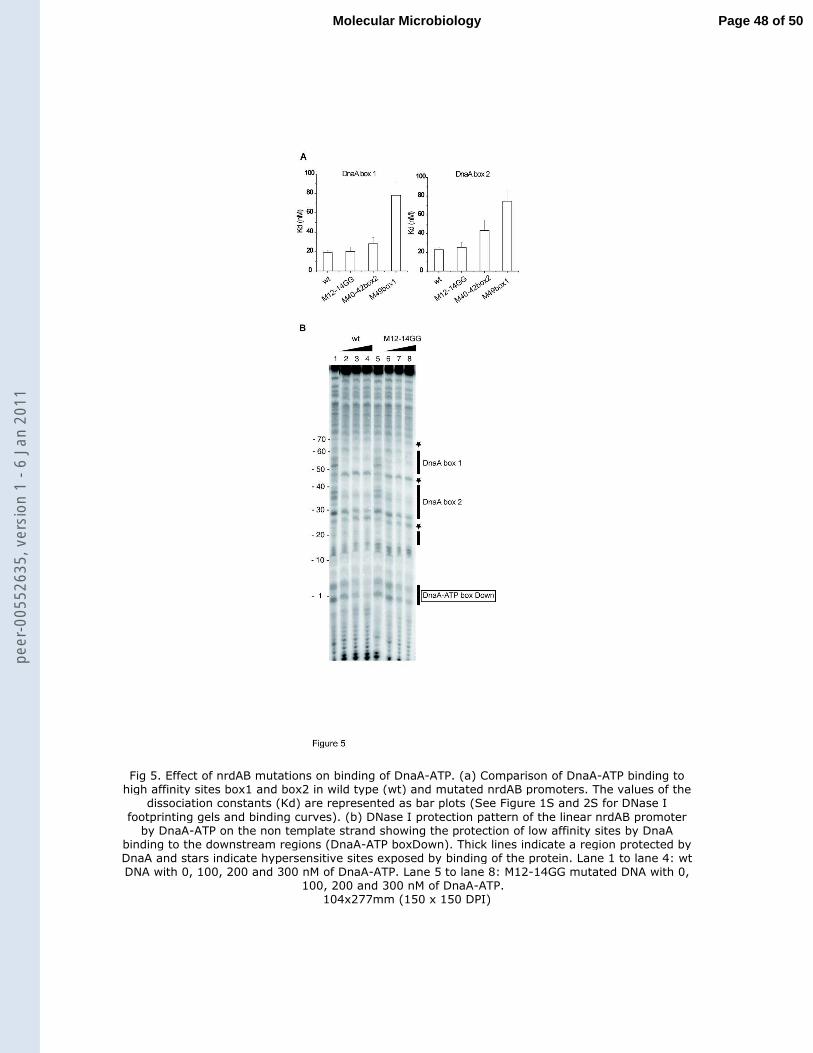
For Peer Review
Fig 5. Effect of nrdAB mutations on binding of DnaA-ATP. (a) Comparison of DnaA-ATP binding to high affinity sites box1 and box2 in wild type (wt) and mutated nrdAB promoters. The values of the
dissociation constants (Kd) are represented as bar plots (See Figure 1S and 2S for DNase I
footprinting gels and binding curves). (b) DNase I protection pattern of the linear nrdAB promoter by DnaA-ATP on the non template strand showing the protection of low affinity sites by DnaA
binding to the downstream regions (DnaA-ATP boxDown). Thick lines indicate a region protected by DnaA and stars indicate hypersensitive sites exposed by binding of the protein. Lane 1 to lane 4: wt DNA with 0, 100, 200 and 300 nM of DnaA-ATP. Lane 5 to lane 8: M12-14GG mutated DNA with 0,
100, 200 and 300 nM of DnaA-ATP. 104x277mm (150 x 150 DPI)
Page 48 of 50Molecular Microbiologype
er-0
0552
635,
ver
sion
1 -
6 Ja
n 20
11

For Peer Review
Fig 6. GFP expression rate from Pnrd-gfp plasmid fusions measured in living cells. BW25113 (A) and BW25113 ∆nrdR (B) cells carrying wild type and mutated nrd promoters fused to gfp in the pKK
plasmid were grown at 30°C on a multiwell fluorimeter in M9 minimal medium supplemented with 0.4 % glucose (a) or 0.4 % glucose and 0.5 % casamino acids (b). [(dGFP/dt)/OD] provides a
measure of the promoter activity as a function of time (left Y-axis, arbitrary units). OD provides a simultaneous measure of growing cells as a function of time (right Y-axis). The error bars represent the results from the variation of respective cultures in one experiment. The legend is as shown in
the figure. The Moff mutation corresponds to the inactivation of the nrdAB promoter by mutation of its -10 sequence (Figure 1).
170x113mm (600 x 600 DPI)
Page 49 of 50 Molecular Microbiologype
er-0
0552
635,
ver
sion
1 -
6 Ja
n 20
11

For Peer Review
Flow cytometry measurements of DNA and GFP content in the strains containing the pKK-gfp plasmid with the nrdAB promoter. (a) DNA content. The peaks corresponding to 2, 4 and 8 genome
equivalents are labeled. (b) Superposition of the three plots corresponding to the GFP content measured by flow cytometry for the strain containing the nrdAB wild type promoter pKK-gfp plasmid
and the two strains containing either the M12-14GG or the M45-47box1 mutant promoters on the
pKK-gfp plasmid. (c) Two dimensional plot of DNA vs GFP used to measure the amount of GFP in 2, 4 and 8 chromosome cells. Only the data from the strain with the wild type nrdAB promoter-GFP
plasmid is shown for clarity. 128x128mm (600 x 600 DPI)
Page 50 of 50Molecular Microbiologype
er-0
0552
635,
ver
sion
1 -
6 Ja
n 20
11
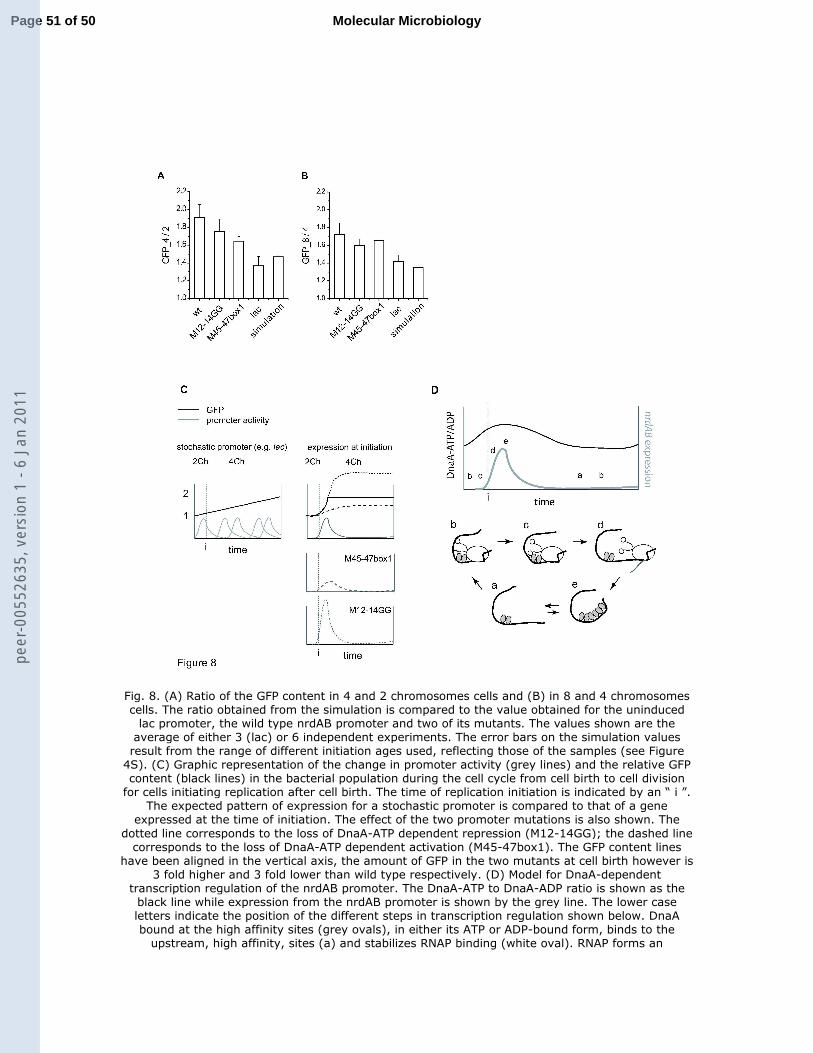
For Peer Review
Fig. 8. (A) Ratio of the GFP content in 4 and 2 chromosomes cells and (B) in 8 and 4 chromosomes cells. The ratio obtained from the simulation is compared to the value obtained for the uninduced
lac promoter, the wild type nrdAB promoter and two of its mutants. The values shown are the average of either 3 (lac) or 6 independent experiments. The error bars on the simulation values result from the range of different initiation ages used, reflecting those of the samples (see Figure
4S). (C) Graphic representation of the change in promoter activity (grey lines) and the relative GFP content (black lines) in the bacterial population during the cell cycle from cell birth to cell division
for cells initiating replication after cell birth. The time of replication initiation is indicated by an “ i ”. The expected pattern of expression for a stochastic promoter is compared to that of a gene
expressed at the time of initiation. The effect of the two promoter mutations is also shown. The
dotted line corresponds to the loss of DnaA-ATP dependent repression (M12-14GG); the dashed line corresponds to the loss of DnaA-ATP dependent activation (M45-47box1). The GFP content lines
have been aligned in the vertical axis, the amount of GFP in the two mutants at cell birth however is 3 fold higher and 3 fold lower than wild type respectively. (D) Model for DnaA-dependent
transcription regulation of the nrdAB promoter. The DnaA-ATP to DnaA-ADP ratio is shown as the black line while expression from the nrdAB promoter is shown by the grey line. The lower case letters indicate the position of the different steps in transcription regulation shown below. DnaA bound at the high affinity sites (grey ovals), in either its ATP or ADP-bound form, binds to the
upstream, high affinity, sites (a) and stabilizes RNAP binding (white oval). RNAP forms an
Page 51 of 50 Molecular Microbiologype
er-0
0552
635,
ver
sion
1 -
6 Ja
n 20
11
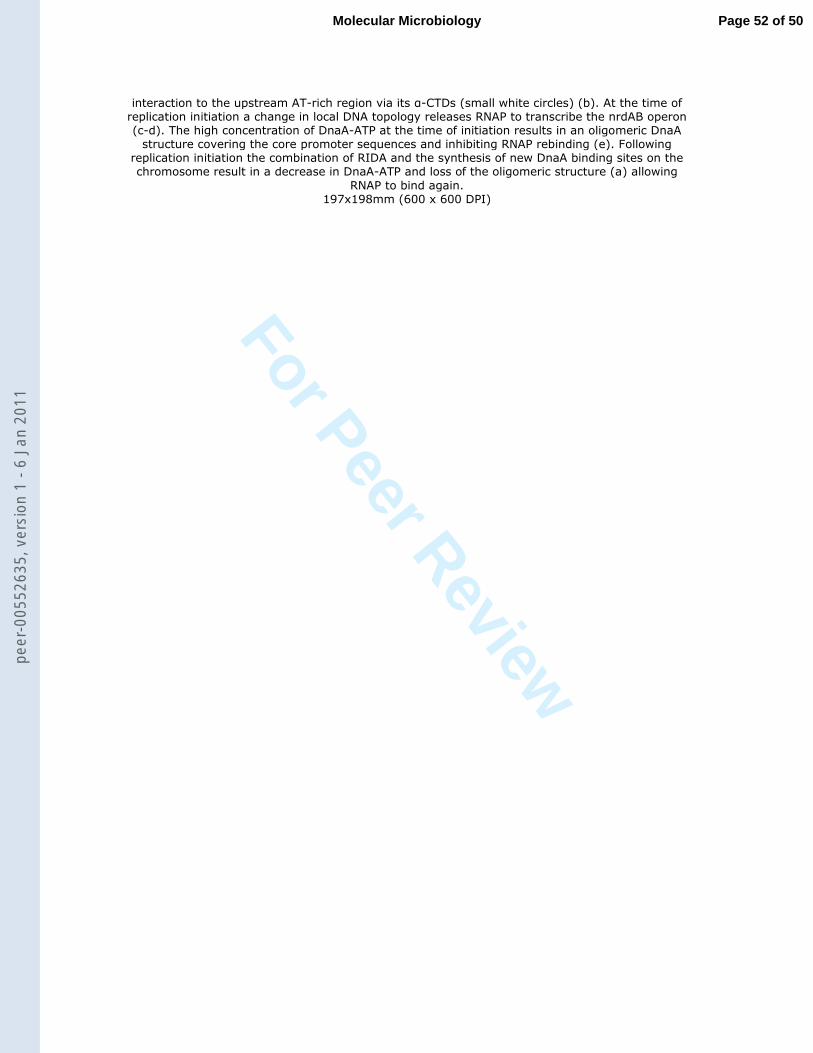
For Peer Review
interaction to the upstream AT-rich region via its α-CTDs (small white circles) (b). At the time of replication initiation a change in local DNA topology releases RNAP to transcribe the nrdAB operon (c-d). The high concentration of DnaA-ATP at the time of initiation results in an oligomeric DnaA
structure covering the core promoter sequences and inhibiting RNAP rebinding (e). Following replication initiation the combination of RIDA and the synthesis of new DnaA binding sites on the chromosome result in a decrease in DnaA-ATP and loss of the oligomeric structure (a) allowing
RNAP to bind again. 197x198mm (600 x 600 DPI)
Page 52 of 50Molecular Microbiologype
er-0
0552
635,
ver
sion
1 -
6 Ja
n 20
11


![Exposure to benzo[a]pyrene of Hepatic Cytochrome P450 Reductase Null (HRN) and P450 Reductase Conditional Null (RCN) mice: Detection of benzo[a]pyrene diol epoxide-DNA adducts by immunohistochemistry](https://static.fdokumen.com/doc/165x107/63259f17c9c7f5721c022d3b/exposure-to-benzoapyrene-of-hepatic-cytochrome-p450-reductase-null-hrn-and-p450.jpg)