
Division of labour between Myc and G1 cyclins in cell cycle commitment and pace control
11
ARTICLE Received 21 Feb 2014 | Accepted 17 Jul 2014 | Published 1 Sep 2014 Division of labour between Myc and G1 cyclins in cell cycle commitment and pace control Peng Dong 1 , Manoj V. Maddali 2,w , Jaydeep K. Srimani 2 , Franc ¸ois The ´lot 3 , Joseph R. Nevins 4 , Bernard Mathey-Prevot 3,5 & Lingchong You 2,6,7 A body of evidence has shown that the control of E2F transcription factor activity is critical for determining cell cycle entry and cell proliferation. However, an understanding of the precise determinants of this control, including the role of other cell-cycle regulatory activities, has not been clearly defined. Here, recognizing that the contributions of individual regulatory components could be masked by heterogeneity in populations of cells, we model the potential roles of individual components together with the use of an integrated system to follow E2F dynamics at the single-cell level and in real time. These analyses reveal that crossing a threshold amplitude of E2F accumulation determines cell cycle commitment. Importantly, we find that Myc is critical in modulating the amplitude, whereas cyclin D/E activities have little effect on amplitude but do contribute to the modulation of duration of E2F activation, thereby affecting the pace of cell cycle progression. DOI: 10.1038/ncomms5750 OPEN 1 Computational Biology and Bioinformatics Program, Duke University, Durham, North Carolina 27708, USA. 2 Department of Biomedical Engineering, Duke University, Durham, North Carolina 27708, USA. 3 Department of Pharmacology and Cancer Biology, Duke University, Durham, North Carolina 27708, USA. 4 Department of Molecular Genetics and Microbiology, Duke University, Durham, North Carolina 27708, USA. 5 Department of Pediatrics, Duke University, Durham, North Carolina 27708, USA. 6 Center for Genomic and Computational Biology, Duke University, Durham, North Carolina 27708, USA. 7 Duke Center for Systems Biology, Duke University, Durham, North Carolina 27708, USA. w Present address: School of Medicine, Johns Hopkins University, Baltimore, Maryland 21205, USA. Correspondence and requests for materials should be addressed to B.M.-P. (email: [email protected]) or to L.Y. (email: [email protected]). NATURE COMMUNICATIONS | 5:4750 | DOI: 10.1038/ncomms5750 | www.nature.com/naturecommunications 1 & 2014 Macmillan Publishers Limited. All rights reserved.
Transcript of Division of labour between Myc and G1 cyclins in cell cycle commitment and pace control
ARTICLE
Received 21 Feb 2014 | Accepted 17 Jul 2014 | Published 1 Sep 2014
Division of labour between Myc and G1 cyclinsin cell cycle commitment and pace controlPeng Dong1, Manoj V. Maddali2,w, Jaydeep K. Srimani2, Francois Thelot3, Joseph R. Nevins4,
Bernard Mathey-Prevot3,5 & Lingchong You2,6,7
A body of evidence has shown that the control of E2F transcription factor activity is critical for
determining cell cycle entry and cell proliferation. However, an understanding of the precise
determinants of this control, including the role of other cell-cycle regulatory activities, has
not been clearly defined. Here, recognizing that the contributions of individual regulatory
components could be masked by heterogeneity in populations of cells, we model the potential
roles of individual components together with the use of an integrated system to follow E2F
dynamics at the single-cell level and in real time. These analyses reveal that crossing a
threshold amplitude of E2F accumulation determines cell cycle commitment. Importantly, we
find that Myc is critical in modulating the amplitude, whereas cyclin D/E activities have little
effect on amplitude but do contribute to the modulation of duration of E2F activation, thereby
affecting the pace of cell cycle progression.
DOI: 10.1038/ncomms5750 OPEN
1 Computational Biology and Bioinformatics Program, Duke University, Durham, North Carolina 27708, USA. 2 Department of Biomedical Engineering, DukeUniversity, Durham, North Carolina 27708, USA. 3 Department of Pharmacology and Cancer Biology, Duke University, Durham, North Carolina 27708, USA.4 Department of Molecular Genetics and Microbiology, Duke University, Durham, North Carolina 27708, USA. 5 Department of Pediatrics, Duke University,Durham, North Carolina 27708, USA. 6 Center for Genomic and Computational Biology, Duke University, Durham, North Carolina 27708, USA.7 Duke Center for Systems Biology, Duke University, Durham, North Carolina 27708, USA. w Present address: School of Medicine, Johns Hopkins University,Baltimore, Maryland 21205, USA. Correspondence and requests for materials should be addressed to B.M.-P. (email: [email protected]) or toL.Y. (email: [email protected]).
NATURE COMMUNICATIONS | 5:4750 | DOI: 10.1038/ncomms5750 | www.nature.com/naturecommunications 1
& 2014 Macmillan Publishers Limited. All rights reserved.
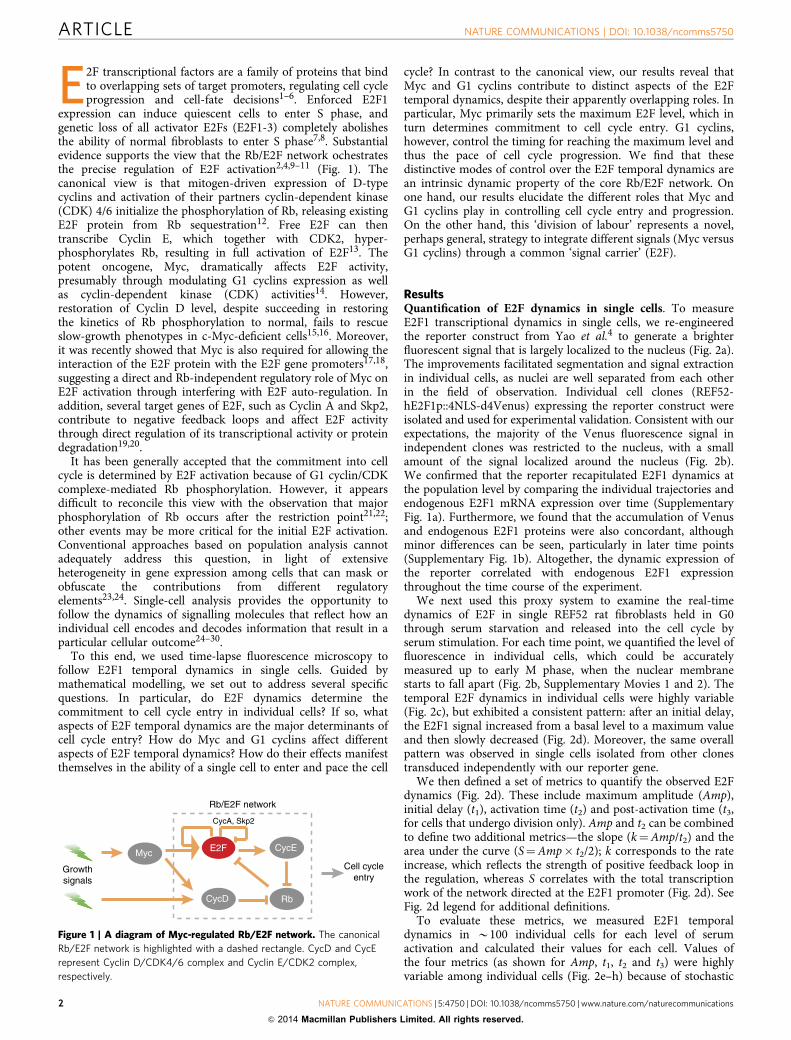
E2F transcriptional factors are a family of proteins that bindto overlapping sets of target promoters, regulating cell cycleprogression and cell-fate decisions1–6. Enforced E2F1
expression can induce quiescent cells to enter S phase, andgenetic loss of all activator E2Fs (E2F1-3) completely abolishesthe ability of normal fibroblasts to enter S phase7,8. Substantialevidence supports the view that the Rb/E2F network ochestratesthe precise regulation of E2F activation2,4,9–11 (Fig. 1). Thecanonical view is that mitogen-driven expression of D-typecyclins and activation of their partners cyclin-dependent kinase(CDK) 4/6 initialize the phosphorylation of Rb, releasing existingE2F protein from Rb sequestration12. Free E2F can thentranscribe Cyclin E, which together with CDK2, hyper-phosphorylates Rb, resulting in full activation of E2F13. Thepotent oncogene, Myc, dramatically affects E2F activity,presumably through modulating G1 cyclins expression as wellas cyclin-dependent kinase (CDK) activities14. However,restoration of Cyclin D level, despite succeeding in restoringthe kinetics of Rb phosphorylation to normal, fails to rescueslow-growth phenotypes in c-Myc-deficient cells15,16. Moreover,it was recently showed that Myc is also required for allowing theinteraction of the E2F protein with the E2F gene promoters17,18,suggesting a direct and Rb-independent regulatory role of Myc onE2F activation through interfering with E2F auto-regulation. Inaddition, several target genes of E2F, such as Cyclin A and Skp2,contribute to negative feedback loops and affect E2F activitythrough direct regulation of its transcriptional activity or proteindegradation19,20.
It has been generally accepted that the commitment into cellcycle is determined by E2F activation because of G1 cyclin/CDKcomplexe-mediated Rb phosphorylation. However, it appearsdifficult to reconcile this view with the observation that majorphosphorylation of Rb occurs after the restriction point21,22;other events may be more critical for the initial E2F activation.Conventional approaches based on population analysis cannotadequately address this question, in light of extensiveheterogeneity in gene expression among cells that can mask orobfuscate the contributions from different regulatoryelements23,24. Single-cell analysis provides the opportunity tofollow the dynamics of signalling molecules that reflect how anindividual cell encodes and decodes information that result in aparticular cellular outcome24–30.
To this end, we used time-lapse fluorescence microscopy tofollow E2F1 temporal dynamics in single cells. Guided bymathematical modelling, we set out to address several specificquestions. In particular, do E2F dynamics determine thecommitment to cell cycle entry in individual cells? If so, whataspects of E2F temporal dynamics are the major determinants ofcell cycle entry? How do Myc and G1 cyclins affect differentaspects of E2F temporal dynamics? How do their effects manifestthemselves in the ability of a single cell to enter and pace the cell
cycle? In contrast to the canonical view, our results reveal thatMyc and G1 cyclins contribute to distinct aspects of the E2Ftemporal dynamics, despite their apparently overlapping roles. Inparticular, Myc primarily sets the maximum E2F level, which inturn determines commitment to cell cycle entry. G1 cyclins,however, control the timing for reaching the maximum level andthus the pace of cell cycle progression. We find that thesedistinctive modes of control over the E2F temporal dynamics arean intrinsic dynamic property of the core Rb/E2F network. Onone hand, our results elucidate the different roles that Myc andG1 cyclins play in controlling cell cycle entry and progression.On the other hand, this ‘division of labour’ represents a novel,perhaps general, strategy to integrate different signals (Myc versusG1 cyclins) through a common ‘signal carrier’ (E2F).
ResultsQuantification of E2F dynamics in single cells. To measureE2F1 transcriptional dynamics in single cells, we re-engineeredthe reporter construct from Yao et al.4 to generate a brighterfluorescent signal that is largely localized to the nucleus (Fig. 2a).The improvements facilitated segmentation and signal extractionin individual cells, as nuclei are well separated from each otherin the field of observation. Individual cell clones (REF52-hE2F1p::4NLS-d4Venus) expressing the reporter construct wereisolated and used for experimental validation. Consistent with ourexpectations, the majority of the Venus fluorescence signal inindependent clones was restricted to the nucleus, with a smallamount of the signal localized around the nucleus (Fig. 2b).We confirmed that the reporter recapitulated E2F1 dynamics atthe population level by comparing the individual trajectories andendogenous E2F1 mRNA expression over time (SupplementaryFig. 1a). Furthermore, we found that the accumulation of Venusand endogenous E2F1 proteins were also concordant, althoughminor differences can be seen, particularly in later time points(Supplementary Fig. 1b). Altogether, the dynamic expression ofthe reporter correlated with endogenous E2F1 expressionthroughout the time course of the experiment.
We next used this proxy system to examine the real-timedynamics of E2F in single REF52 rat fibroblasts held in G0through serum starvation and released into the cell cycle byserum stimulation. For each time point, we quantified the level offluorescence in individual cells, which could be accuratelymeasured up to early M phase, when the nuclear membranestarts to fall apart (Fig. 2b, Supplementary Movies 1 and 2). Thetemporal E2F dynamics in individual cells were highly variable(Fig. 2c), but exhibited a consistent pattern: after an initial delay,the E2F1 signal increased from a basal level to a maximum valueand then slowly decreased (Fig. 2d). Moreover, the same overallpattern was observed in single cells isolated from other clonestransduced independently with our reporter gene.
We then defined a set of metrics to quantify the observed E2Fdynamics (Fig. 2d). These include maximum amplitude (Amp),initial delay (t1), activation time (t2) and post-activation time (t3,for cells that undergo division only). Amp and t2 can be combinedto define two additional metrics—the slope (k¼Amp/t2) and thearea under the curve (S¼Amp� t2/2); k corresponds to the rateincrease, which reflects the strength of positive feedback loop inthe regulation, whereas S correlates with the total transcriptionwork of the network directed at the E2F1 promoter (Fig. 2d). SeeFig. 2d legend for additional definitions.
To evaluate these metrics, we measured E2F1 temporaldynamics in B100 individual cells for each level of serumactivation and calculated their values for each cell. Values ofthe four metrics (as shown for Amp, t1, t2 and t3) were highlyvariable among individual cells (Fig. 2e–h) because of stochastic
Growthsignals
Cell cycleentry
CycD Rb
E2FMyc CycE
Rb/E2F network
CycA, Skp2
Figure 1 | A diagram of Myc-regulated Rb/E2F network. The canonical
Rb/E2F network is highlighted with a dashed rectangle. CycD and CycE
represent Cyclin D/CDK4/6 complex and Cyclin E/CDK2 complex,
respectively.
ARTICLE NATURE COMMUNICATIONS | DOI: 10.1038/ncomms5750
2 NATURE COMMUNICATIONS | 5:4750 | DOI: 10.1038/ncomms5750 | www.nature.com/naturecommunications
& 2014 Macmillan Publishers Limited. All rights reserved.

gene expression. Notably, Amp exhibited bimodal distribution(ON/OFF) at an intermediate serum concentration (Fig. 2e),consistent with the bistability of the Rb/E2F switch4. Moreover,decreasing serum concentration led to significant change in thedistribution of Amp but moderate increase of average values of t1,t2 and t3 (Fig. 2e–h). Pairwise correlation analyses revealed a weakcorrelation between Amp and t2, and no significant correlationsbetween other pairs, suggesting little dependence among thesemetrics (Supplementary Fig. 1c).
Amp as the predictor of commitment and division. We nextexamined the extent by which the metrics defined above couldpredict cell-cycle entry commitment and proliferation (Fig. 3a).
To this end, we combined measurements of single-cell E2Fdynamics with measurement of 5-ethynyl-20-deoxyuridine(EdU) incorporation into newly synthesized DNA, a surrogatefor determining cell cycle entry (Fig. 3b and c). We foundthat Amp is a reliable predictor of commitment. Specifically,plotting EdU signals against Amp values for B100 cellsrevealed two distinct groups of cells: cells with high EdUincorporation had an Amp value above a threshold (Ampth),whereas cells with no EdU labelling showed a value of Ampbelow it (Fig. 3d). Two Amp-related metrics—k and S—werealso informative, albeit less accurate at predicting cellcycle entry (Supplementary Fig. 2a and b). The other metrics(t1 and t2) were much less reliable predictors (SupplementaryFig. 2c and d).
b
c
a
e
t2 (h)
Mea
n
t3 (h)M
ean
f g h
Time (h)
E2F
1 flu
ores
cenc
e (a
.u.)
Amp (a.u.)
Fra
ctio
n of
cel
ls
d
Time
t1 t2 t3
AmpS
k
T
0
E2F
1 flu
ores
cenc
e
5′LTR Myc site E2F site 4NLS d4Venus 3′LTR
+32–40–360–784
Human E2F1 promoter
1 h 5 h 9 h 13 h 17 h 21 h
t1 (h)
Mea
n
10
5
00 10 20 30
0.4
0.3
0.2
0.1
0
0.4 0.5
0.4
0.3
0.2
0.1
0
0.3
0.2
0.1
0
0.4
0.3
0.2
0.1
00 0 10 20 30 0 0 5 10 1510 20 302 4 6 8 10
10% BGS2% BGS1% BGS
15
10
5
0
15
10
5
0
10
5
0
Figure 2 | Quantification of E2F dynamics in single cells. (a) hE2F1p::4NLS-d4Venus reporter construct. Box with cross indicates that 50 long terminal
repeat (LTR) is inactivated after viral integration. (b) Time-lapse microscopy images of REF52 rat fibroblasts expressing hE2F1p::4NLS-d4Venus reporter
released from serum starvation by adding 10% bovine growth serum (BGS). Upper panel, phase channel; low panel, Venus channel. Scale bar, 50 mm.
(c) E2F1 dynamics trajectories of the five individual cells shown in b. Time-series raw data (sampled per hour) were smoothened in a 3-h time window.
(d) Characterization of E2F1 dynamics trajectory in divided (green) cells with defined metrics: t1, initial delay; t2, activation time; t3, post-activation
time; Amp, amplitude; S (shadow area), total E2F1 work during activation time; k, slope; T, the entire cell cycle length. Orange triangle indicates E2F1
signal upturn time point and the blue one indicates cell division time point. (e) Histogram shows the distribution of Amp at different serum levels.
(f–h) Histograms show distributions of t1, t2 and t3 (in divided cells) at different serum levels. The mean values were compared among different
serum concentrations and plotted as insets.
NATURE COMMUNICATIONS | DOI: 10.1038/ncomms5750 ARTICLE
NATURE COMMUNICATIONS | 5:4750 | DOI: 10.1038/ncomms5750 | www.nature.com/naturecommunications 3
& 2014 Macmillan Publishers Limited. All rights reserved.
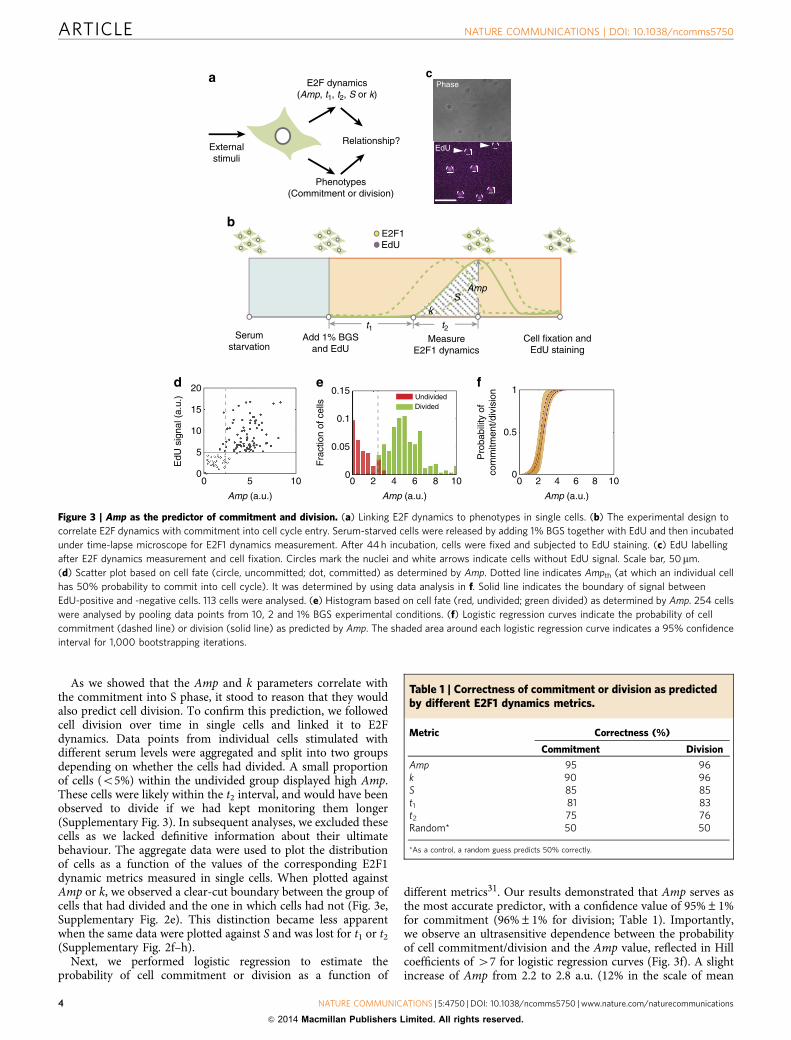
As we showed that the Amp and k parameters correlate withthe commitment into S phase, it stood to reason that they wouldalso predict cell division. To confirm this prediction, we followedcell division over time in single cells and linked it to E2Fdynamics. Data points from individual cells stimulated withdifferent serum levels were aggregated and split into two groupsdepending on whether the cells had divided. A small proportionof cells (o5%) within the undivided group displayed high Amp.These cells were likely within the t2 interval, and would have beenobserved to divide if we had kept monitoring them longer(Supplementary Fig. 3). In subsequent analyses, we excluded thesecells as we lacked definitive information about their ultimatebehaviour. The aggregate data were used to plot the distributionof cells as a function of the values of the corresponding E2F1dynamic metrics measured in single cells. When plotted againstAmp or k, we observed a clear-cut boundary between the group ofcells that had divided and the one in which cells had not (Fig. 3e,Supplementary Fig. 2e). This distinction became less apparentwhen the same data were plotted against S and was lost for t1 or t2
(Supplementary Fig. 2f–h).Next, we performed logistic regression to estimate the
probability of cell commitment or division as a function of
different metrics31. Our results demonstrated that Amp serves asthe most accurate predictor, with a confidence value of 95%±1%for commitment (96%±1% for division; Table 1). Importantly,we observe an ultrasensitive dependence between the probabilityof cell commitment/division and the Amp value, reflected in Hillcoefficients of 47 for logistic regression curves (Fig. 3f). A slightincrease of Amp from 2.2 to 2.8 a.u. (12% in the scale of mean
a
Externalstimuli
E2F dynamics(Amp, t1, t2, S or k)
Phenotypes(Commitment or division)
Relationship?
cPhase
EdU
b
d
Amp (a.u.)
Pro
babi
lity
ofco
mm
itmen
t/div
isio
n
f
Amp (a.u.)
EdU
sig
nal (
a.u.
)
e
Fra
ctio
n of
cel
ls
Amp (a.u.)
UndividedDivided
Serumstarvation
Add 1% BGSand EdU
Cell fixation andEdU staining
E2F1EdU
t1 t2Measure
E2F1 dynamics
SAmp
k
20
15
10
5
00 5 10
0.15 1
0.5
00 2 4 6 8 10
0.1
0.05
00 2 4 6 8 10
Figure 3 | Amp as the predictor of commitment and division. (a) Linking E2F dynamics to phenotypes in single cells. (b) The experimental design to
correlate E2F dynamics with commitment into cell cycle entry. Serum-starved cells were released by adding 1% BGS together with EdU and then incubated
under time-lapse microscope for E2F1 dynamics measurement. After 44 h incubation, cells were fixed and subjected to EdU staining. (c) EdU labelling
after E2F dynamics measurement and cell fixation. Circles mark the nuclei and white arrows indicate cells without EdU signal. Scale bar, 50 mm.
(d) Scatter plot based on cell fate (circle, uncommitted; dot, committed) as determined by Amp. Dotted line indicates Ampth (at which an individual cell
has 50% probability to commit into cell cycle). It was determined by using data analysis in f. Solid line indicates the boundary of signal between
EdU-positive and -negative cells. 113 cells were analysed. (e) Histogram based on cell fate (red, undivided; green divided) as determined by Amp. 254 cells
were analysed by pooling data points from 10, 2 and 1% BGS experimental conditions. (f) Logistic regression curves indicate the probability of cell
commitment (dashed line) or division (solid line) as predicted by Amp. The shaded area around each logistic regression curve indicates a 95% confidence
interval for 1,000 bootstrapping iterations.
Table 1 | Correctness of commitment or division as predictedby different E2F1 dynamics metrics.
Metric Correctness (%)
Commitment Division
Amp 95 96k 90 96S 85 85t1 81 83t2 75 76Random* 50 50
*As a control, a random guess predicts 50% correctly.
ARTICLE NATURE COMMUNICATIONS | DOI: 10.1038/ncomms5750
4 NATURE COMMUNICATIONS | 5:4750 | DOI: 10.1038/ncomms5750 | www.nature.com/naturecommunications
& 2014 Macmillan Publishers Limited. All rights reserved.

Amp in E2F1-activated cells) within the ultra-sensitive region canlead to a 50% relative increase in the proportion of divided cells(Fig. 3f). This observed ultrasensitive dependence further definesa threshold value Ampth. If Amp of an individual cell reaches thisthreshold, it has at least a 50% probability to commit into the cellcycle. Moreover, we observed a similar requirement for Amp incell-cycle commitment and division in mouse embryo fibroblastNIH3T3 cells, in which the integrated reporter gene was drivenby the mouse E2F1 promoter (Supplementary Fig. 2i–k).
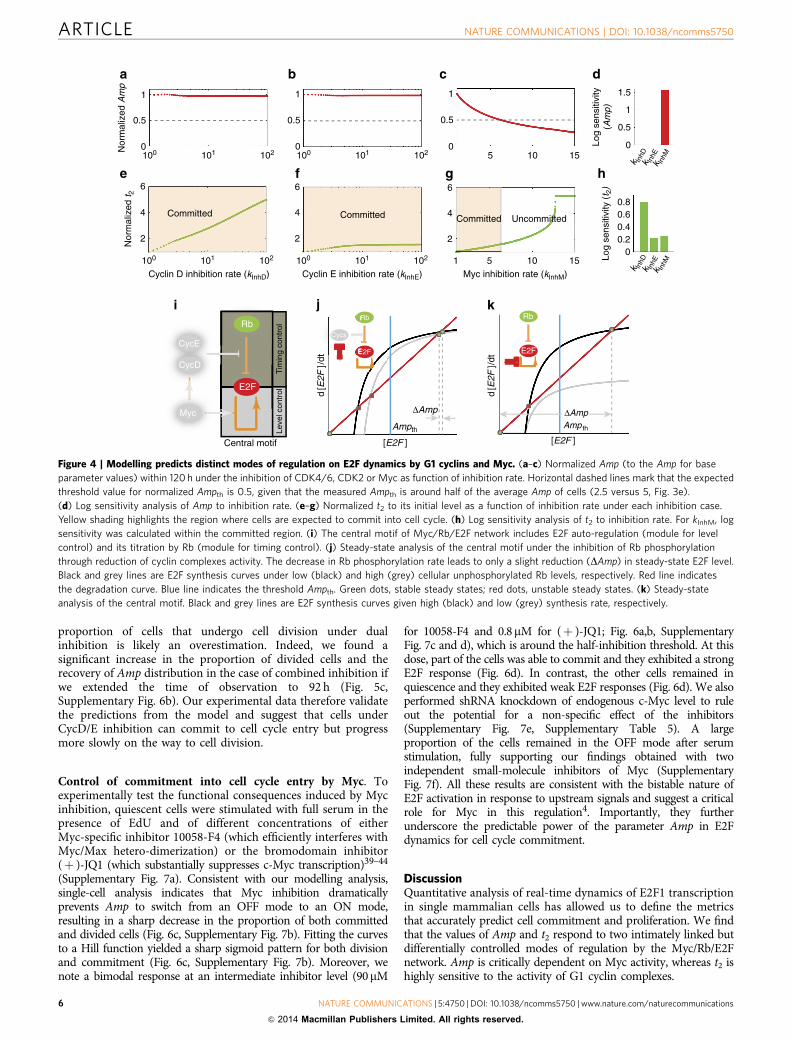
Distinct roles of G1 Cyclins and Myc revealed by modelling.Considering the predictive power of E2F Amp for individual cells’commitment to division, we wondered how it would be affectedby perturbations on the Rb/E2F network. To this end, weemployed an established kinetic model to perform time-coursesimulations, which can be compared with our experimentalobservations (Fig. 1, Supplementary Tables 1–4)4,10,32,33. The fullmodel generates E2F transcriptional dynamics that are consistentwith our experimental observations (Supplementary Fig. 4). Thecharacteristic E2F pulsatile dynamics are maintained even wheneach parameter was varied by 100-fold around its base value. Wefurther performed sensitivity analysis of each metric (Amp, t2, kand S) with respect to changes in 33 parameters in the full model.The analysis indicates that only parameters associated withMyc-dependent E2F autoregulation can lead to dramatic changein Amp (Supplementary Fig. 5a). Parameters associated withMyc-dependent E2F autoregulation, Rb-E2F interaction, or CycDand CycE accumulation can significantly affect t2, k and S(Supplementary Fig. 5b–d). In comparison, parameters associatedwith the E2F-negative feedback loop have little effect on eitherAmp, t2 or k (Supplementary Fig. 5a–c). These results suggest thatdifferent modules within the full system influence differentaspects of E2F dynamics.
We next examined the modulation of Amp by perturbations onthree main regulators—CycD, CycE and Myc4,11,33. CycD andCycE nodes play a critical role in controlling the function of Rbby phosphorylation, facilitating activation of E2F. They have beensuggested as constituting the rate-limiting step in cell cycleentry1,34. In contrast, Myc has been shown to be critical formodulating the strength of E2F auto-regulation, in addition tocontributing to the production of CycD17,18. We simulated theinhibition of each node by reducing its synthesis rate constant,while maintaining the other model parameters constant. Usingour full ordinary differential equation (ODE) model, we ransimulations under a wide range of either CycD or CycEinhibition. Under these conditions, normalized Amp exhibitsonly a slight decrease (Fig. 4a,b,d). In contrast to the robustbehaviour of Amp, t2 shows a significant lengthening as inhibitionof either CycD or CycE is increased (Fig. 4e,f). Moreover,sensitivity analysis suggests that CycD inhibition has muchstronger influence on t2 extension as compared with CycEinhibition (Fig. 4h). This is likely because CycD triggers Rbphosphorylation before CycE further directs additionalphosphorylation. We next assessed the consequence ofperturbing Myc, as it is known to exert a positive feedback loopon the Rb/E2F network, and to contribute to the bistable propertyof E2F signalling17,18. Surprisingly, our simulation analysisindicates that increased inhibition of Myc activity induces asignificant decline of normalized Amp (Fig. 4c,d). Moreover, t2 ispredicted to moderately increase within the range of inhibitionthat does not affect the ability of cells to commit (Fig. 4g,h).
As the G1 cyclin and Myc are both positive regulators of E2F,their qualitatively different impact on E2F Amp appears counterintuitive. Nevertheless, close inspection indicates that thisis an intrinsic dynamic property of the underlying network.
To illustrate the control logic, we simplified the network to amotif comprising an E2F-positive feedback and a negativeregulation through Rb sequestration (Fig. 4i). Other regulatoryinputs impinge on this motif by affecting the positive feedbackloop strength or affecting Rb phosphorylation. This motif can bedescribed by a single equation (1):
d½E2F�dt
¼ ksyn½E2F�e
K þ ½E2F�e� d½E2F�
½E2F�e ¼ 0; if ½E2F�o½Rb�; ½E2F�e ¼ ½E2F� � ½Rb�; if ½E2F� � ½Rb�;ð1Þ
where [E2F] represents E2F concentration, [Rb] the concentrationof active Rb (unphosphorylated) that can bind to and titrate E2F,[E2F]e the concentration of free E2F, ksyn the E2F synthesis rateconstant, K the half-maximal constant for E2F auto-regulationand d the degradation rate constant. This equation describes thedynamics of the motif in the limiting case of extremely tightbinding between Rb and E2F.
As illustrated by our steady-state analysis, inhibition of Mycdrastically reduces the E2F amplitude by decreasing E2F synthesisrate, suggesting that Myc is largely responsible for settingmaximum levels of E2F (Fig. 4k). In contrast, inhibition of CycDor CycE decreases the phosphorylation rate of Rb, which acts as a‘sink’ against the initial E2F activation. Despite the drasticslowdown in phosphorylation, and as long as Rb gets completelyphosphorylated by Cyclin/CDK complexes, E2F will reach itsmaximum level set by Myc (Fig. 4j). As a result, inhibition of thecyclin nodes primarily modulates the time it takes to overcomethe Rb-sink but has little impact on the eventual E2F amplitude.
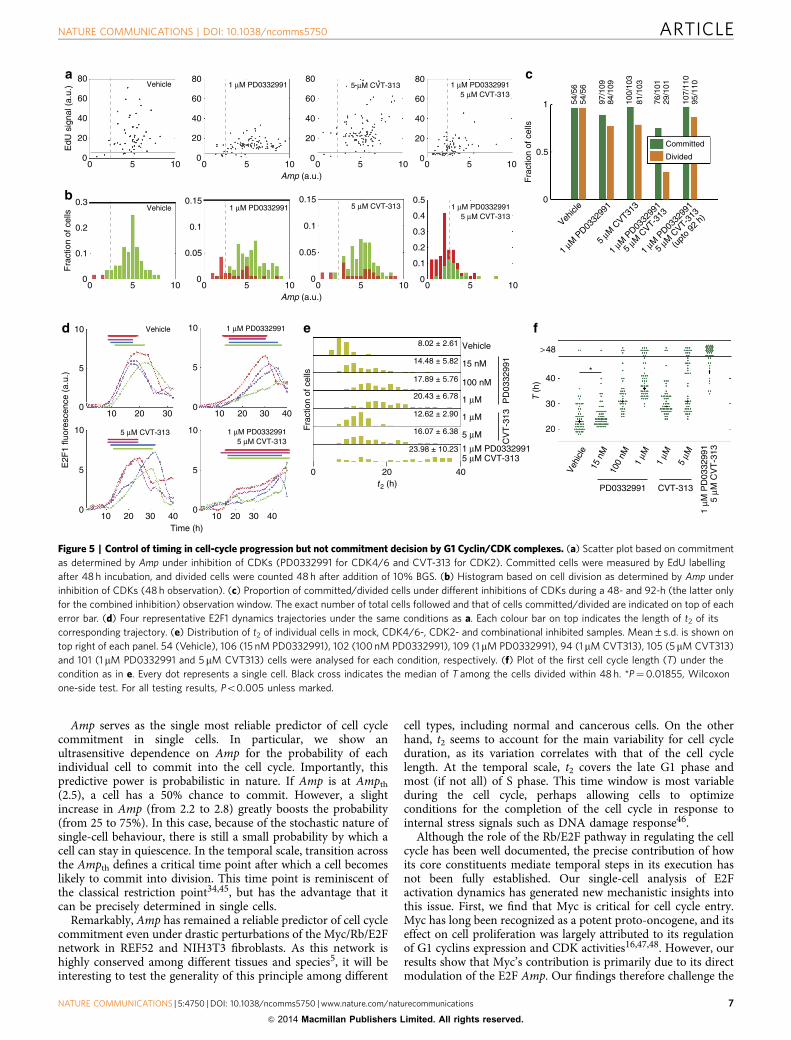
Control of timing but not commitment by G1 Cyclin/CDKs.To experimentally monitor the behaviour of the network afterCycD/E inhibition, we used the CDK4/6- and CDK2-specificinhibitors—PD0332991 and CVT-313—in a wide range of con-centrations35–38. We confirmed the inhibitory effect at eachconcentration by monitoring phosphorylation of Rb at variousSer or Thr residues (Supplementary Fig. 6a). To exclude thepossibility of an off-target effect from CDK2 inhibition, wegenerated short hairpin RNAs (shRNAs) to knockdownendogenous CDK2 level (Supplementary Fig. 6e, SupplementaryTable 5). Single-cell analysis of E2F1 dynamics after serumstimulation was combined with EdU incorporation or visualinspection of cell division in the presence of the CDK4- andCDK2-specific inhibitors or CDK2 shRNA. Consistent with ourmodelling analysis, inhibition of CycD or CycE complexes had noeffect on the distribution of Amp (o5% of cells found in the OFFmode; Fig. 5a,b, Supplementary Fig. 6b). Inhibition of bothcomplexes moderately increased the proportion of cells showing alow-mode Amp (B25% of cells in the OFF mode) given a 48-hobservation window (Fig. 5a,b, Supplementary Fig. 6b). Whencells were monitored for cell division, we observed that inhibitionof CycD or of CycE complexes (or both) led to a decrease in thefraction of cells that completed division during the time windowof our assay (Fig. 5c). However, it had little effect on the fractionof cells that incorporated EdU (and presumably had committedto the cell cycle; Fig. 5c, Supplementary Fig. 6f).
In contrast, and consistent with our simulation results,inhibition of CycD, CycE or both led to significant increases int2 and its variance (Fig. 5d,e, Supplementary Fig. 6g). Theprolonged t2 results in a significant extension of the entire cellcycle length (Fig. 5f, Supplementary Fig. 6h). As t1 and t3 showmoderate changes under inhibition of CycD/E (SupplementaryFig. 6c and d), the increase in t2 is the primary contributor to cellcycle elongation. For this reason, the observed reduction in the
NATURE COMMUNICATIONS | DOI: 10.1038/ncomms5750 ARTICLE
NATURE COMMUNICATIONS | 5:4750 | DOI: 10.1038/ncomms5750 | www.nature.com/naturecommunications 5
& 2014 Macmillan Publishers Limited. All rights reserved.
proportion of cells that undergo cell division under dualinhibition is likely an overestimation. Indeed, we found asignificant increase in the proportion of divided cells and therecovery of Amp distribution in the case of combined inhibition ifwe extended the time of observation to 92 h (Fig. 5c,Supplementary Fig. 6b). Our experimental data therefore validatethe predictions from the model and suggest that cells underCycD/E inhibition can commit to cell cycle entry but progressmore slowly on the way to cell division.
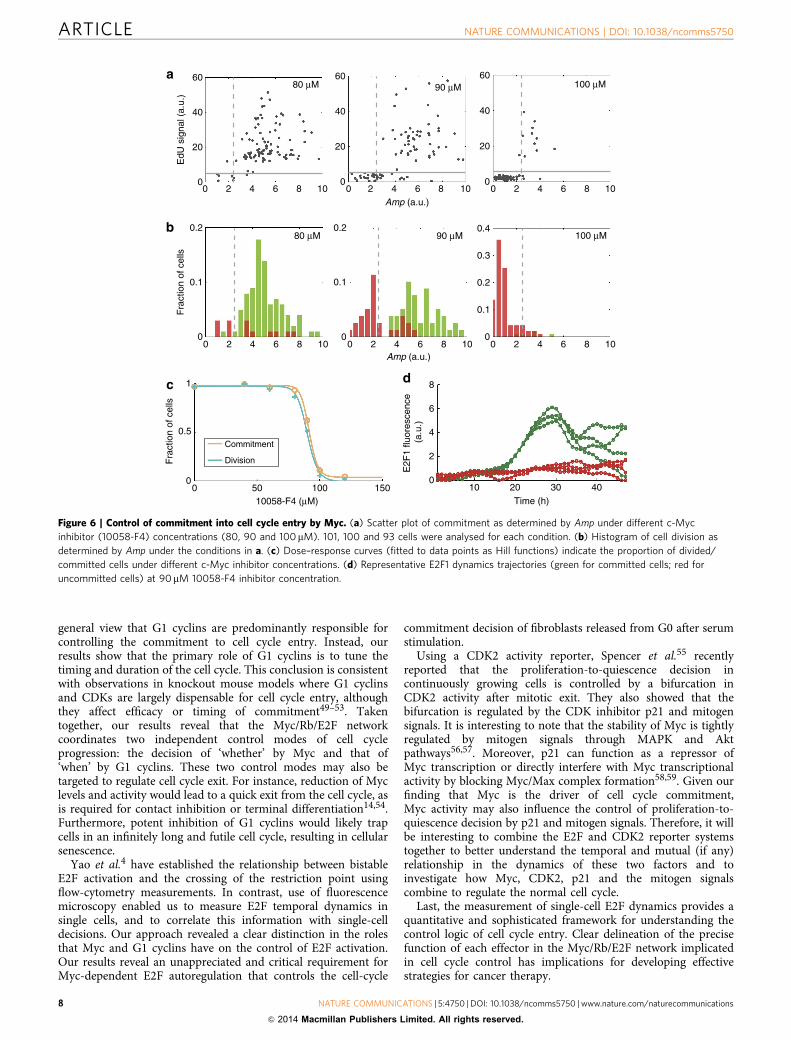
Control of commitment into cell cycle entry by Myc. Toexperimentally test the functional consequences induced by Mycinhibition, quiescent cells were stimulated with full serum in thepresence of EdU and of different concentrations of eitherMyc-specific inhibitor 10058-F4 (which efficiently interferes withMyc/Max hetero-dimerization) or the bromodomain inhibitor(þ )-JQ1 (which substantially suppresses c-Myc transcription)39–44
(Supplementary Fig. 7a). Consistent with our modelling analysis,single-cell analysis indicates that Myc inhibition dramaticallyprevents Amp to switch from an OFF mode to an ON mode,resulting in a sharp decrease in the proportion of both committedand divided cells (Fig. 6c, Supplementary Fig. 7b). Fitting the curvesto a Hill function yielded a sharp sigmoid pattern for both divisionand commitment (Fig. 6c, Supplementary Fig. 7b). Moreover, wenote a bimodal response at an intermediate inhibitor level (90mM
for 10058-F4 and 0.8mM for (þ )-JQ1; Fig. 6a,b, SupplementaryFig. 7c and d), which is around the half-inhibition threshold. At thisdose, part of the cells was able to commit and they exhibited a strongE2F response (Fig. 6d). In contrast, the other cells remained inquiescence and they exhibited weak E2F responses (Fig. 6d). We alsoperformed shRNA knockdown of endogenous c-Myc level to ruleout the potential for a non-specific effect of the inhibitors(Supplementary Fig. 7e, Supplementary Table 5). A largeproportion of the cells remained in the OFF mode after serumstimulation, fully supporting our findings obtained with twoindependent small-molecule inhibitors of Myc (SupplementaryFig. 7f). All these results are consistent with the bistable nature ofE2F activation in response to upstream signals and suggest a criticalrole for Myc in this regulation4. Importantly, they furtherunderscore the predictable power of the parameter Amp in E2Fdynamics for cell cycle commitment.
DiscussionQuantitative analysis of real-time dynamics of E2F1 transcriptionin single mammalian cells has allowed us to define the metricsthat accurately predict cell commitment and proliferation. We findthat the values of Amp and t2 respond to two intimately linked butdifferentially controlled modes of regulation by the Myc/Rb/E2Fnetwork. Amp is critically dependent on Myc activity, whereas t2 ishighly sensitive to the activity of G1 cyclin complexes.
i
CycD
E2F
Rb
Myc
CycE
Central motif
Tim
ing
cont
rol
Leve
l con
trol
E2F
Rb
[E2F ]
Amp th
ΔAmp
d[E
2F]/
dt
[E2F ]
d[E
2F]/
dt
Ampth
ΔAmp
E2F
Rb
Cycs
j k
a b
e
c
Nor
mal
ized
Am
p
f
Log
sens
itivi
ty(A
mp)
k InhM
k InhE
k InhD
k InhM
k InhE
k InhD
d
h
Myc inhibition rate (kInhM)
Committed Uncommitted
Cyclin E inhibition rate (kInhE)
Committed
Cyclin D inhibition rate (kInhD)
Nor
mal
ized
t 2
Committed
Log
sens
itivi
ty (
t 2)
g
1
0.5
0
6
4
2
6
4
2
6
4
2
100 101 102
1
0.5
0100 101 102
1
0.5
05 10 15
1.5
1
0.5
0
0.80.60.40.2
051 10 15100 101 102100 101 102
Figure 4 | Modelling predicts distinct modes of regulation on E2F dynamics by G1 cyclins and Myc. (a–c) Normalized Amp (to the Amp for base
parameter values) within 120 h under the inhibition of CDK4/6, CDK2 or Myc as function of inhibition rate. Horizontal dashed lines mark that the expected
threshold value for normalized Ampth is 0.5, given that the measured Ampth is around half of the average Amp of cells (2.5 versus 5, Fig. 3e).
(d) Log sensitivity analysis of Amp to inhibition rate. (e–g) Normalized t2 to its initial level as a function of inhibition rate under each inhibition case.
Yellow shading highlights the region where cells are expected to commit into cell cycle. (h) Log sensitivity analysis of t2 to inhibition rate. For kInhM, log
sensitivity was calculated within the committed region. (i) The central motif of Myc/Rb/E2F network includes E2F auto-regulation (module for level
control) and its titration by Rb (module for timing control). (j) Steady-state analysis of the central motif under the inhibition of Rb phosphorylation
through reduction of cyclin complexes activity. The decrease in Rb phosphorylation rate leads to only a slight reduction (DAmp) in steady-state E2F level.
Black and grey lines are E2F synthesis curves under low (black) and high (grey) cellular unphosphorylated Rb levels, respectively. Red line indicates
the degradation curve. Blue line indicates the threshold Ampth. Green dots, stable steady states; red dots, unstable steady states. (k) Steady-state
analysis of the central motif. Black and grey lines are E2F synthesis curves given high (black) and low (grey) synthesis rate, respectively.
ARTICLE NATURE COMMUNICATIONS | DOI: 10.1038/ncomms5750
6 NATURE COMMUNICATIONS | 5:4750 | DOI: 10.1038/ncomms5750 | www.nature.com/naturecommunications
& 2014 Macmillan Publishers Limited. All rights reserved.
Amp serves as the single most reliable predictor of cell cyclecommitment in single cells. In particular, we show anultrasensitive dependence on Amp for the probability of eachindividual cell to commit into the cell cycle. Importantly, thispredictive power is probabilistic in nature. If Amp is at Ampth
(2.5), a cell has a 50% chance to commit. However, a slightincrease in Amp (from 2.2 to 2.8) greatly boosts the probability(from 25 to 75%). In this case, because of the stochastic nature ofsingle-cell behaviour, there is still a small probability by which acell can stay in quiescence. In the temporal scale, transition acrossthe Ampth defines a critical time point after which a cell becomeslikely to commit into division. This time point is reminiscent ofthe classical restriction point34,45, but has the advantage that itcan be precisely determined in single cells.
Remarkably, Amp has remained a reliable predictor of cell cyclecommitment even under drastic perturbations of the Myc/Rb/E2Fnetwork in REF52 and NIH3T3 fibroblasts. As this network ishighly conserved among different tissues and species5, it will beinteresting to test the generality of this principle among different
cell types, including normal and cancerous cells. On the otherhand, t2 seems to account for the main variability for cell cycleduration, as its variation correlates with that of the cell cyclelength. At the temporal scale, t2 covers the late G1 phase andmost (if not all) of S phase. This time window is most variableduring the cell cycle, perhaps allowing cells to optimizeconditions for the completion of the cell cycle in response tointernal stress signals such as DNA damage response46.
Although the role of the Rb/E2F pathway in regulating the cellcycle has been well documented, the precise contribution of howits core constituents mediate temporal steps in its execution hasnot been fully established. Our single-cell analysis of E2Factivation dynamics has generated new mechanistic insights intothis issue. First, we find that Myc is critical for cell cycle entry.Myc has long been recognized as a potent proto-oncogene, and itseffect on cell proliferation was largely attributed to its regulationof G1 cyclins expression and CDK activities16,47,48. However, ourresults show that Myc’s contribution is primarily due to its directmodulation of the E2F Amp. Our findings therefore challenge the
c
f
>48
Vehi
cle
15 n
M10
0 nM
1 μM
1 μM
5 μM
1 μM
PD
0332
991
5 μM
CV
T-3
13
PD0332991 CVT-313
T (
h)
*
d
a
b
Vehicle
Time (h)
E2F
1 flu
ores
cenc
e (a
.u.)
1 μM PD0332991
5 μM CVT-313 1 μM PD03329915 μM CVT-313
Fra
ctio
n of
cel
ls
54/5
654
/56
97/1
0984
/109
100/
103
81/1
03
29/1
0176
/101
Vehicl
e
1 μM
PD03
3299
1
5 μM
CVT31
3
1 μM
PD03
3299
1
5 μM
CVT-3
13
95/1
1010
7/11
0
1 μM
PD03
3299
1
5 μM
CVT-3
13
(upt
o 92
h)
Vehicle
EdU
sig
nal (
a.u.
) 1 μM PD0332991 5 μM CVT-313 1 μM PD03329915 μM CVT-313
Amp (a.u.)
PD
0332
991
CV
T-3
13
0 20 40t2 (h)
Fra
ctio
n of
cel
ls
8.02 ± 2.61
14.48 ± 5.82
17.89 ± 5.76
20.43 ± 6.78
12.62 ± 2.90
16.07 ± 6.38
23.98 ± 10.23
Vehicle
1 μM
15 nM
100 nM
1 μM
5 μM
1 μM PD03329915 μM CVT-313
e
Fra
ctio
n of
cel
ls
Amp (a.u.)
1 μM PD03329915 μM CVT-313
1 μM PD0332991 5 μM CVT-313Vehicle
80
60
40
20
00
0.3 0.15
0.1
0.05
0
0.15
0.1
0.05
0
0.2
0.1
00 5 10 0 5 10 0 5 10 0 5 10
5 10
80
60
40
20
00 5 10
80
60
40
20
00 5 10
80
60
40
20
00 5 10
1
0.5
0
Committed
Divided
0.5
0.4
0.3
0.2
0.1
0
10
5
010 20 30
10
5
0
10
5
0
10
5
0
10 20 30 40
10 20 30 4010 20 30 40
40
30
20
Figure 5 | Control of timing in cell-cycle progression but not commitment decision by G1 Cyclin/CDK complexes. (a) Scatter plot based on commitment
as determined by Amp under inhibition of CDKs (PD0332991 for CDK4/6 and CVT-313 for CDK2). Committed cells were measured by EdU labelling
after 48 h incubation, and divided cells were counted 48 h after addition of 10% BGS. (b) Histogram based on cell division as determined by Amp under
inhibition of CDKs (48 h observation). (c) Proportion of committed/divided cells under different inhibitions of CDKs during a 48- and 92-h (the latter only
for the combined inhibition) observation window. The exact number of total cells followed and that of cells committed/divided are indicated on top of each
error bar. (d) Four representative E2F1 dynamics trajectories under the same conditions as a. Each colour bar on top indicates the length of t2 of its
corresponding trajectory. (e) Distribution of t2 of individual cells in mock, CDK4/6-, CDK2- and combinational inhibited samples. Mean±s.d. is shown on
top right of each panel. 54 (Vehicle), 106 (15 nM PD0332991), 102 (100 nM PD0332991), 109 (1 mM PD0332991), 94 (1mM CVT313), 105 (5mM CVT313)
and 101 (1 mM PD0332991 and 5 mM CVT313) cells were analysed for each condition, respectively. (f) Plot of the first cell cycle length (T) under the
condition as in e. Every dot represents a single cell. Black cross indicates the median of T among the cells divided within 48 h. *P¼0.01855, Wilcoxon
one-side test. For all testing results, Po0.005 unless marked.
NATURE COMMUNICATIONS | DOI: 10.1038/ncomms5750 ARTICLE
NATURE COMMUNICATIONS | 5:4750 | DOI: 10.1038/ncomms5750 | www.nature.com/naturecommunications 7
& 2014 Macmillan Publishers Limited. All rights reserved.
general view that G1 cyclins are predominantly responsible forcontrolling the commitment to cell cycle entry. Instead, ourresults show that the primary role of G1 cyclins is to tune thetiming and duration of the cell cycle. This conclusion is consistentwith observations in knockout mouse models where G1 cyclinsand CDKs are largely dispensable for cell cycle entry, althoughthey affect efficacy or timing of commitment49–53. Takentogether, our results reveal that the Myc/Rb/E2F networkcoordinates two independent control modes of cell cycleprogression: the decision of ‘whether’ by Myc and that of‘when’ by G1 cyclins. These two control modes may also betargeted to regulate cell cycle exit. For instance, reduction of Myclevels and activity would lead to a quick exit from the cell cycle, asis required for contact inhibition or terminal differentiation14,54.Furthermore, potent inhibition of G1 cyclins would likely trapcells in an infinitely long and futile cell cycle, resulting in cellularsenescence.
Yao et al.4 have established the relationship between bistableE2F activation and the crossing of the restriction point usingflow-cytometry measurements. In contrast, use of fluorescencemicroscopy enabled us to measure E2F temporal dynamics insingle cells, and to correlate this information with single-celldecisions. Our approach revealed a clear distinction in the rolesthat Myc and G1 cyclins have on the control of E2F activation.Our results reveal an unappreciated and critical requirement forMyc-dependent E2F autoregulation that controls the cell-cycle
commitment decision of fibroblasts released from G0 after serumstimulation.
Using a CDK2 activity reporter, Spencer et al.55 recentlyreported that the proliferation-to-quiescence decision incontinuously growing cells is controlled by a bifurcation inCDK2 activity after mitotic exit. They also showed that thebifurcation is regulated by the CDK inhibitor p21 and mitogensignals. It is interesting to note that the stability of Myc is tightlyregulated by mitogen signals through MAPK and Aktpathways56,57. Moreover, p21 can function as a repressor ofMyc transcription or directly interfere with Myc transcriptionalactivity by blocking Myc/Max complex formation58,59. Given ourfinding that Myc is the driver of cell cycle commitment,Myc activity may also influence the control of proliferation-to-quiescence decision by p21 and mitogen signals. Therefore, it willbe interesting to combine the E2F and CDK2 reporter systemstogether to better understand the temporal and mutual (if any)relationship in the dynamics of these two factors and toinvestigate how Myc, CDK2, p21 and the mitogen signalscombine to regulate the normal cell cycle.
Last, the measurement of single-cell E2F dynamics provides aquantitative and sophisticated framework for understanding thecontrol logic of cell cycle entry. Clear delineation of the precisefunction of each effector in the Myc/Rb/E2F network implicatedin cell cycle control has implications for developing effectivestrategies for cancer therapy.
a
b
80 μM 90 μM 100 μM
EdU
sig
nal (
a.u.
)
Amp (a.u.)
10058-F4 (μM)
Fra
ctio
n of
cel
ls
c
Time (h)
E2F
1 flu
ores
cenc
e (
a.u.
)
d
Amp (a.u.)
80 μM 90 μM 100 μM
Fra
ctio
n of
cel
ls
60
40
20
0
0.2
0.1
0
0.2 0.4
0.3
0.2
0.1
0
0.1
0
0 2 4 6 8 10
60
40
20
00 2 4 6 8 10
60
40
20
00 2 4 6 8 10
0
1
0.5
00 50
Commitment
Division
100 150
8
6
4
2
010 20 30 40
2 4 6 8 10 0 2 4 6 8 10 0 2 4 6 8 10
Figure 6 | Control of commitment into cell cycle entry by Myc. (a) Scatter plot of commitment as determined by Amp under different c-Myc
inhibitor (10058-F4) concentrations (80, 90 and 100mM). 101, 100 and 93 cells were analysed for each condition. (b) Histogram of cell division as
determined by Amp under the conditions in a. (c) Dose–response curves (fitted to data points as Hill functions) indicate the proportion of divided/
committed cells under different c-Myc inhibitor concentrations. (d) Representative E2F1 dynamics trajectories (green for committed cells; red for
uncommitted cells) at 90mM 10058-F4 inhibitor concentration.
ARTICLE NATURE COMMUNICATIONS | DOI: 10.1038/ncomms5750
8 NATURE COMMUNICATIONS | 5:4750 | DOI: 10.1038/ncomms5750 | www.nature.com/naturecommunications
& 2014 Macmillan Publishers Limited. All rights reserved.
MethodsE2F1 transcriptional reporter system. A DNA fragment encoding d4Venus(destabilized Venus with B4 h half-life) was cut from pd4Venus-N1 and fusedwith four repeats of SV40 nuclear localization sequence (NLS) at its N-terminus togenerate the 4NLS-d4Venus-expressing cassette60. This cassette was then sub-cloned after the human E2F1 promoter (� 784 to þ 32) into a pQCXIP vector(Clontech) to construct the pQCXIP-hE2F1p::4NLS-d4Venus reporter plasmid17.The derived construct was transfected into an ecotropic packaging cell line, Plat-E61.Forty-eight hours after transfection, the culture medium containing retrovirusparticles was filtered and applied to REF52 cells. A clonal pool genetically integratedwith the reporter system was selected after cells were cultured in medium containingpuromycin (2mg ml� 1) for approximately 10 days. Single clones (REF52-hE2F1p::4NLS-d4Venus) were then picked up from the clonal pool by dilution. The developedhE2F1p::4NLS-d4Venus reporter system leads to two significant improvementsappropriate for single-cell analysis. On one hand, the incorporation of four NLSs inthe protein drives its localization into the nucleus, thereby increasing the intensity ofthe fluorescent signal. On the other hand, it facilitates segmentation and signalextraction in individual cells, as nuclei in different cells are well separated. Based on asimilar strategy, a mouse E2F1 promoter (� 1,165 to þ 123) was amplified frommouse genomic DNA as a substitute for human E2F1 promoter to derive theconstruct pQCXIP-mE2F1p::4NLS-d4Venus, which was later introduced into mouseembryonic fibroblast NIH3T3 cells to derive the NIH3T3-mE2F1p::4NLS-d4Venusreporter cells.
Cell culture. REF52 (an immortal line of postcrisis Fischer rat embryo cells)4,62,63
and NIH3T3 mouse fibroblasts (CRL-1658, ATCC) were routinely grown inMinimum Essential Medium Alpha Medium (Gibco/Invitrogen) supplemented with10% bovine growth medium (BGS, Hyclone/Thermo Scientific). For the preparationof E2F dynamics measurement by using time-lapse microscopy, cells were firsttrypsinized, resuspended at a density of 1� 105 per ml and then seeded in m-Slide I(tissue culture treated, ibidi) channel slides by adding 1 ml volume of the cellsuspension. After overnight culturing, cells were synchronized in quiescence byshifting into Minimum Essential Medium Alpha medium with 0.02% BGS (starvationmedium) for 36 h. For perturbation experiments, PD0332991 (CDK4/6 inhibitor,ChemieTek), CVT-313 (CDK2 inhibitor, Enzo Life Science), 10058-F4 (c-Mycinhibitor, Sigma Aldrich) and (þ )-JQ1 (bromodomain and extra terminal domaininhibitor, Cayman Chemical) were added into cells immediately after cells werereleased from serum starvation (by adding 10% BGS) in either single or combinedway. For 92 h perturbation experiment with both PD0332991 and CVT-313, cellswere growing with replaced fresh medium with fresh inhibitors after the initial 48 h.
Live cell imaging. For time-lapse microscopy, quiescent cells growing in m-Slide Islides were released from starvation by shifting to serum containing medium andplaced under Leica DMI 6000 B inverted fluorescence microscope (Leica). Imageswere taken using Leica N PLAN L 20� 0.4 objective lens with phase contrastor a Semrock BrightLine YFP filter set (500/542 nm, excitation/emission) andHamamatsu ORCA AG digital camera (Hamamatsu) with uniform parametersetting: binning¼ 4, offset¼ 0, gain¼ 255 and exposure time¼ 0.01 s (phasechannel) or 0.15 s (YFP channel). The microscope was enclosed with anenvironmental chamber with 37 �C temperature, atmosphere (5% CO2) andhumidity. Images were acquired every 30 or 60 min for 24–48 h. Time-series imageacquisition was controlled by SimplePCI6 Software (Hamamatsu).
EdU staining and imaging. EdU staining was performed after E2F dynamicsmeasurement in ibidi m-Slide I slides by using Click-iT EdU Imaging Kits(Invitrogen) with Alexa Fluro 594 azide according the manufacturer’s instructions.The only modification of the protocol was to wash cells with PBS with 0.2% Tweenthree times after all the staining steps. Images were taken using Leica N PLAN L20� 0.4 objective lens with phase contrast or a Semrock BrightLine Texas Red filterset (562/624 nm, excitation/emission) and Hamamatsu ORCA AG digital camerawith uniform parameter setting: binning¼ 4, offset¼ 0, gain¼ 255 and exposuretime¼ 0.01 s (phase channel) or 0.8 s (Red channel).
Western blot analysis. Antibodies against E2F1 (1:1,000, Cell Signaling), phos-phorylated Rb Ser780 (C-15, 1:1,000, Santa Cruz), phosphorylated Rb Thr821/826
(sc-16669-R, 1:1,000, Santa Cruz), GFP (XP Rabbit mAb, 1:1,000, Cell Signaling),c-Myc ((D84C12) XP Rabbit mAb, 1:1,000, Cell Signaling), CDK2 (78B2 RabbitmAb, 1:1,000, Cell Signaling) and Actin (C-2, 1:1,000; Santa Cruz) were selected forthe quantification of protein expression at the population level. REF52-E2F1p::4NLS-d4Venus cells were harvested and protein extract was obtained bylysis at different time points after release from quiescence. Total protein amountwas quantified with the BCA assay (Pierce). Equal protein amounts were separatedby 4–20% Mini PROTEAN TGX gradient gels (Bio-Rad) and transferred topolyvinylidene membranes by electro-blotting. Membranes were then blocked with5% nonfat dried milk, incubated overnight at 4 �C with primary antibody, washedin TBS with 0.2% Tween, and incubated again with secondary antibody coupledto peroxidase. Protein levels were detected by using LumiGLO PeroxidaseChemiluminescent Substrate Kit (Cell Signaling) after additional washing steps.All the photos of full blots are displayed in Supplementary Fig. 9.
Quantitative reverse transcription–PCR analysis. RNA extracts were preparedfrom REF52-hE2F1p::4NLS-d4Venus reporter cells using the RNeasy ProtectCell Mini Kit (Qiagen) according to the manufacturer’s protocol. E2F1 RNAexpression was interrogated by real-time PCR using the Power SYBR GreenRNA-to-CT 1-step Kit (Applied Biosystems). Gene-specific primers used: 50-TTGACCCCTCTGGATTTCTG-30 and 50-CCCTTTGGTCTGCTCAATGT-30 for ratE2F1; 50-GTCGTACCACTGGCATTGTG-30 and 50-CTCTCAGCTGTGGTGGTGAA-30 for rat b-actin.
RNA interference. shRNAs for targeting CDK2 or c-Myc were generated bycloning shRNA sequences (Supplementary Table 5) into Tet-pLKO-2A-mCherryvector64. Lentiviral packaging reactions were performed in the 293T cell line in thepresence of packaging plasmids psPAX and pMD2.G using LipofectamineTransfection Reagent (Invitrogen). Viral supernatants were collected 48 h aftertransfection, filtered through disposable 0.45 mm acrodisc syringe filters (PallCorporation). For infection, cells were plated in 10 cm tissue culture dishes andallowed to achieve 20–30% confluence before adding viral supernatant in thepresence of 7 mg ml� 1 polybrene for 12 h (EMD Millipore). Cells were collectedand sorted by flow cytometry for 5% of the population with highest mCherrysignals. Sorted cells were grown up and induced to express shRNA at differentconcentration of doxycycline (Sigma-Aldrich) for 48 h. After induction, cells werelysed and knockdown efficiency was determined by western blot analysis.Meanwhile, sorted cells with confirmed knockdown effect were subjected to themeasurement of E2F dynamics in the presence of doxycycline at different doses.
Image analysis. The time-lapse microscopy resulted in two series of raw images ofthe cells in 30 or 60-min increments for 24–48 h, one each for the phase channeland the YFP channel. E2F signals were extracted from these images using ImageJ(NIH) software. The first time-point of each series of images was loaded side-by-side into the software. Using the ROI Manager Tool, a circular selective markerwith a fixed area was placed around each cell nucleus in the phase channel image.The location of each marker was then copied to the YFP channel image and theintegrated grey value of the selected pixels was measured. In the case of celldivision, the selective marker was applied to one of the daughter cells. This valuewas normalized to the background by subtracting the integrated grey value of thesame area of pixels in an empty part of the image. This process of measuringnormalized grey value of the nuclei was repeated for each time point by adjustingthe location of the selective marker to account for the movement of cells, thusgiving a time-series measurement of the fluorescence reporter on the E2F sequence.Throughout this process, data from cells that left the field of view at any time werediscarded; and the time of cell division was also noted. The similar approach wasapplied to quantify the fluorescence signal from EdU staining.
Analysis of E2F dynamics trajectories. Time-series E2F dynamics trajectorieswere analysed in Matlab (MathWorks) to determine various E2F parameters, forexample, time delay, amplitude and so on. We developed a smoothing algorithmbased on the recognition to remove the large fluorescence spike that occurs duringmitosis, possibly as a result of either the increased concentration of endogenousE2F that accompanies cell mass shrinkage or the change from a ‘flat’ to a ‘globular’cell shape that immediately precedes division. The processed trajectories withoutspikes were then smoothened by using a three-window Gaussian averaging algo-rithm. Each smoothed and processed trajectory was then fit to the followingtwo-phase regression model (equation (2), Supplementary Fig. 8) to automaticallyderive optimal values for t1and t2 (ref. 65):
y ¼ y0; if 0 � tot1; y ¼ ðymax � y0Þðt� t1Þ=t2; if t1 � t � t2: ð2ÞThus, the problem equals to search for arg{t1,t2} that gives min{
P0 r t r t2
[yE2F(t) � y(t)]2}.Relevant parameters represent:t1: initial delayt2: activation timey0: E2F basal level (the average of fluorescence values of the initial four time
points)ymax: E2F peak level (maximum fluorescence value of each trajectory)yE2F(t): E2F signal in dynamic trajectory at the moment t.
Modelling and simulation analysis. A modified version of a previously developedODE model of Myc/Rb/E2F network was applied for simulation analysis4,11.Compared with models applied in previous analysis, we neglected the hypotheticalfeed-forward loop from Myc to E2F and microRNA-mediated negative feedbackloops, rendering the model more concise but completely maintain essentialregulatory characteristics. However, we include a representative factor R, whichrepresents regulators in E2F-related negative feedback loops, such as Cyclin A andSkp2 (Fig. 1)19,20,66. The introduction of R does not influence stead-state analysis,but shapes the curves with slight decrease after Amp reaching the maximum level,which is consistent with experimental observation.
Given the fact that Myc and Cyclin D levels usually rise 6–8 h after serumaddition during cell cycle entry67, we reasoned that the initial delay (t1) is mainlydue to the delayed activation of these upstream factors. Therefore, we performed
NATURE COMMUNICATIONS | DOI: 10.1038/ncomms5750 ARTICLE
NATURE COMMUNICATIONS | 5:4750 | DOI: 10.1038/ncomms5750 | www.nature.com/naturecommunications 9
& 2014 Macmillan Publishers Limited. All rights reserved.
simulation with an initial constraint that Myc and Cyclin D are forced to be zerountil the simulation precedes to 8-h time point at the temporal scale. Simulationsbased on these assumptions were able to generate E2F dynamics trajectoriesincluding a significant length of t1 (Supplementary Fig. 4). On the other hand, wenoted the fact that a time lag exists between Cyclin E activation and that of CyclinA68,69. Moreover, population dynamics of Skp2 show a peak after that of E2F1(ref. 20). Therefore, we reasoned that the activation of negative feedback loopthrough R is a delayed event after E2Fp increases. We introduced a time lagbetween these two events by setting a threshold for E2Fp (0.4 mM), above whichE2F starts to transcribe R. The introduction of this delayed negative feedback loopwas able to generate a slight decrease in E2Fm dynamics after it reaches the peaklevel, consistent with our experimental observations (Fig. 2c,d).
To mimic the perturbation of Cyclin D/E or Myc node, we multiplied thedegradation term with a coefficient (kInh, inhibition rate) as shown in the followingequation (3):
d½MYC�dt
¼ kMC½S�
KS þ ½S�� kInhdMC½MYC� ð3Þ
Through varying the inhibition rate kInh within a wide range (1- to 100-fold),we performed simulations and derived a series of E2F temporal trajectories. Thenormalized peak values of E2F (corresponding to Amp) for each trajectory werecalculated and plotted against the inhibitor concentration (Fig. 4a–c). t2 wascalculated from each trajectory by using the similar method as described above andplotted as Fig. 4e–g.
Log sensitivity analysis. Log sensitivity of the four metrics to each parameter wascalculated by the following equation (4):
SensitivitylogðmetricÞ ¼ d logðmetricÞð ÞdðlogðparameterÞÞ
����
����: ð4Þ
References1. Malumbres, M. & Barbacid, M. To cycle or not to cycle: a critical decision in
cancer. Nat. Rev. Cancer 1, 222–231 (2001).2. Wong, J. V., Dong, P., Nevins, J. R., Mathey-Prevot, B. & You, L. Network
calisthenics: control of E2F dynamics in cell cycle entry. Cell Cycle 10,3086–3094 (2011).
3. Chen, H. Z., Tsai, S. Y. & Leone, G. Emerging roles of E2Fs in cancer: an exitfrom cell cycle control. Nat. Rev. Cancer 9, 785–797 (2009).
4. Yao, G., Lee, T. J., Mori, S., Nevins, J. R. & You, L. A bistable Rb-E2F switchunderlies the restriction point. Nat. Cell Biol. 10, 476–482 (2008).
5. van den Heuvel, S. & Dyson, N. J. Conserved functions of the pRB and E2Ffamilies. Nat. Rev. Mol. Cell Biol. 9, 713–724 (2008).
6. Cam, H. & Dynlacht, B. D. Emerging roles for E2F: beyond the G1/S transitionand DNA replication. Cancer Cell 3, 311–316 (2003).
7. Johnson, D. G., Schwarz, J. K., Cress, W. D. & Nevins, J. R. Expression oftranscription factor E2F1 induces quiescent cells to enter S phase. Nature 365,349–352 (1993).
8. Wu, L. et al. The E2F1-3 transcription factors are essential for cellularproliferation. Nature 414, 457–462 (2001).
9. Coller, H. A. What’s taking so long? S-phase entry from quiescence versusproliferation. Nat. Rev. Mol. Cell Biol. 8, 667–670 (2007).
10. Yao, G., Tan, C., West, M., Nevins, J. R. & You, L. Origin of bistabilityunderlying mammalian cell cycle entry. Mol. Syst. Biol. 7, 485 (2011).
11. Wong, J. V., Li, B. & You, L. Tension and robustness in multitasking cellularnetworks. PLoS Comput. Biol. 8, e1002491 (2012).
12. Musgrove, E. A., Caldon, C. E., Barraclough, J., Stone, A. & Sutherland, R. L.Cyclin D as a therapeutic target in cancer. Nat. Rev. Cancer 11, 558–572 (2011).
13. Ohtani, K., DeGregori, J. & Nevins, J. R. Regulation of the cyclin E gene bytranscription factor E2F1. Proc. Natl Acad. Sci. USA 92, 12146–12150 (1995).
14. Holzel, M. et al. Myc/Max/Mad regulate the frequency but not the duration ofproductive cell cycles. EMBO Rep. 2, 1125–1132 (2001).
15. Mateyak, M. K., Obaya, A. J. & Sedivy, J. M. c-Myc regulates cyclin D-Cdk4 and-Cdk6 activity but affects cell cycle progression at multiple independent points.Mol. Cell Biol. 19, 4672–4683 (1999).
16. Obaya, A. J., Mateyak, M. K. & Sedivy, J. M. Mysterious liaisons: therelationship between c-Myc and the cell cycle. Oncogene 18, 2934–2941 (1999).
17. Johnson, D. G., Ohtani, K. & Nevins, J. R. Autoregulatory control of E2F1expression in response to positive and negative regulators of cell cycleprogression. Genes Dev. 8, 1514–1525 (1994).
18. Leung, J. Y., Ehmann, G. L., Giangrande, P. H. & Nevins, J. R. A role for Myc infacilitating transcription activation by E2F1. Oncogene 27, 4172–4179 (2008).
19. Krek, W., Xu, G. & Livingston, D. M. Cyclin A-kinase regulation of E2F-1 DNAbinding function underlies suppression of an S phase checkpoint. Cell 83,1149–1158 (1995).
20. Marti, A., Wirbelauer, C., Scheffner, M. & Krek, W. Interaction betweenubiquitin-protein ligase SCFSKP2 and E2F-1 underlies the regulation of E2F-1degradation. Nat. Cell Biol. 1, 14–19 (1999).
21. Martinsson, H. S., Starborg, M., Erlandsson, F. & Zetterberg, A. Single cellanalysis of G1 check points-the relationship between the restriction point andphosphorylation of pRb. Exp. Cell Res. 305, 383–391 (2005).
22. Foster, D. A., Yellen, P., Xu, L. & Saqcena, M. Regulation of G1 Cell cycleprogression: distinguishing the restriction point from a nutrient-sensing cellgrowth checkpoint(s). Genes Cancer 1, 1124–1131 (2010).
23. Raser, J. M. & O’Shea, E. K. Noise in gene expression: origins, consequences,and control. Science 309, 2010–2013 (2005).
24. Balazsi, G., van Oudenaarden, A. & Collins, J. J. Cellular decision making andbiological noise: from microbes to mammals. Cell 144, 910–925 (2011).
25. Loewer, A., Batchelor, E., Gaglia, G. & Lahav, G. Basal dynamics of p53 revealtranscriptionally attenuated pulses in cycling cells. Cell 142, 89–100 (2010).
26. Purvis, J. E. & Lahav, G. Encoding and decoding cellular information throughsignaling dynamics. Cell 152, 945–956 (2013).
27. Purvis, J. E. et al. p53 dynamics control cell fate. Science 336, 1440–1444(2012).
28. Skotheim, J. M., Di Talia, S., Siggia, E. D. & Cross, F. R. Positive feedback of G1cyclins ensures coherent cell cycle entry. Nature 454, 291–296 (2008).
29. Doncic, A., Falleur-Fettig, M. & Skotheim, J. M. Distinct interactions select andmaintain a specific cell fate. Mol. Cell 43, 528–539 (2011).
30. Yang, X., Lau, K. Y., Sevim, V. & Tang, C. Design principles of the yeast G1/Sswitch. PLoS Biol. 11, e1001673 (2013).
31. Hosmer, D. W. & Lemeshow, S. Applied Logistic Regression 2nd edn (Wiley, 2000).32. Lee, T. J., Yao, G., Bennett, D. C., Nevins, J. R. & You, L. Stochastic E2F
activation and reconciliation of phenomenological cell-cycle models. PLoS Biol.8, e1000488 (2010).
33. Wong, J. V., Yao, G., Nevins, J. R. & You, L. Viral-mediated noisy geneexpression reveals biphasic E2f1 response to MYC. Mol. Cell 41, 275–285 (2011).
34. Blagosklonny, M. V. & Pardee, A. B. The restriction point of the cell cycle. CellCycle 1, 103–110 (2002).
35. Fry, D. W. et al. Specific inhibition of cyclin-dependent kinase 4/6 by PD0332991 and associated antitumor activity in human tumor xenografts.Mol. Cancer Ther. 3, 1427–1438 (2004).
36. Brooks, E. E. et al. CVT-313, a specific and potent inhibitor of CDK2 thatprevents neointimal proliferation. J. Biol. Chem. 272, 29207–29211 (1997).
37. Choi, Y. J. et al. The requirement for cyclin D function in tumor maintenance.Cancer Cell 22, 438–451 (2012).
38. Campaner, S. et al. Cdk2 suppresses cellular senescence induced by the c-myconcogene. Nat. Cell Biol. 12, 54–59(sup pp 51–14); (2010).
39. Rahl, P. B. et al. c-Myc regulates transcriptional pause release. Cell 141,432–445 (2010).
40. Nie, Z. et al. c-Myc is a universal amplifier of expressed genes in lymphocytesand embryonic stem cells. Cell 151, 68–79 (2012).
41. Yin, X., Giap, C., Lazo, J. S. & Prochownik, E. V. Low molecular weight inhibitorsof Myc-Max interaction and function. Oncogene 22, 6151–6159 (2003).
42. Wang, H. et al. Improved low molecular weight Myc-Max inhibitors. Mol.Cancer Ther. 6, 2399–2408 (2007).
43. Delmore, J. E. et al. BET bromodomain inhibition as a therapeutic strategy totarget c-Myc. Cell 146, 904–917 (2011).
44. Mertz, J. A. et al. Targeting MYC dependence in cancer by inhibiting BETbromodomains. Proc. Natl Acad. Sci. USA 108, 16669–16674 (2011).
45. Pardee, A. B. A restriction point for control of normal animal cell proliferation.Proc. Natl Acad. Sci. USA 71, 1286–1290 (1974).
46. Zetterberg, A. & Larsson, O. Kinetic analysis of regulatory events in G1 leadingto proliferation or quiescence of Swiss 3T3 cells. Proc. Natl Acad. Sci. USA 82,5365–5369 (1985).
47. Pelengaris, S., Khan, M. & Evan, G. c-MYC: more than just a matter of life anddeath. Nat. Rev. Cancer 2, 764–776 (2002).
48. Dang, C. V. MYC on the path to cancer. Cell 149, 22–35 (2012).49. Kozar, K. et al. Mouse development and cell proliferation in the absence of
D-cyclins. Cell 118, 477–491 (2004).50. Berthet, C., Aleem, E., Coppola, V., Tessarollo, L. & Kaldis, P. Cdk2 knockout
mice are viable. Curr. Biol. 13, 1775–1785 (2003).51. Geng, Y. et al. Cyclin E ablation in the mouse. Cell 114, 431–443 (2003).52. Malumbres, M. et al. Mammalian cells cycle without the D-type cyclin-
dependent kinases Cdk4 and Cdk6. Cell 118, 493–504 (2004).53. Malumbres, M. & Barbacid, M. Cell cycle, CDKs and cancer: a changing
paradigm. Nat. Rev. Cancer 9, 153–166 (2009).54. Lin, K. I., Lin, Y. & Calame, K. Repression of c-myc is necessary but not
sufficient for terminal differentiation of B lymphocytes in vitro. Mol. Cell. Biol.20, 8684–8695 (2000).
55. Spencer, S. L. et al. The proliferation-quiescence decision is controlled by abifurcation in CDK2 activity at mitotic exit. Cell 155, 369–383 (2013).
56. Sears, R. et al. Multiple Ras-dependent phosphorylation pathways regulateMyc protein stability. Genes Dev. 14, 2501–2514 (2000).
57. Kelly, K., Cochran, B. H., Stiles, C. D. & Leder, P. Cell-specific regulation of thec-myc gene by lymphocyte mitogens and platelet-derived growth factor. Cell35, 603–610 (1983).
ARTICLE NATURE COMMUNICATIONS | DOI: 10.1038/ncomms5750
10 NATURE COMMUNICATIONS | 5:4750 | DOI: 10.1038/ncomms5750 | www.nature.com/naturecommunications
& 2014 Macmillan Publishers Limited. All rights reserved.

58. Kitaura, H. et al. Reciprocal regulation via protein-protein interaction betweenc-Myc and p21(cip1/waf1/sdi1) in DNA replication and transcription. J. Biol.Chem. 275, 10477–10483 (2000).
59. Vigneron, A., Cherier, J., Barre, B., Gamelin, E. & Coqueret, O. The cell cycleinhibitor p21waf1 binds to the myc and cdc25A promoters upon DNA damageand induces transcriptional repression. J. Biol. Chem. 281, 34742–34750 (2006).
60. Nagai, T. et al. A variant of yellow fluorescent protein with fast and efficientmaturation for cell-biological applications. Nat. Biotechnol. 20, 87–90 (2002).
61. Morita, S., Kojima, T. & Kitamura, T. Plat-E: an efficient and stable system fortransient packaging of retroviruses. Gene Ther. 7, 1063–1066 (2000).
62. Logan, J. et al. Transformation by adenovirus early region 2A temperature-sensitive mutants and their revertants. Virology 115, 419–422 (1981).
63. Leone, G., DeGregori, J., Sears, R., Jakoi, L. & Nevins, J. R. Myc and Rascollaborate in inducing accumulation of active cyclin E/Cdk2 and E2F. Nature387, 422–426 (1997).
64. He, M., Jenkins, P. & Bennett, V. Cysteine 70 of ankyrin-G is S-palmitoylatedand is required for function of ankyrin-G in membrane domain assembly.J. Biol. Chem. 287, 43995–44005 (2012).
65. Bjorck, Å. Numerical Methods for Least Squares Problems (SIAM, 1996).66. Krek, W. et al. Negative regulation of the growth-promoting transcription
factor E2F-1 by a stably bound cyclin A-dependent protein kinase. Cell 78,161–172 (1994).
67. Jones, S. M. & Kazlauskas, A. Growth-factor-dependent mitogenesis requirestwo distinct phases of signalling. Nat. Cell Biol. 3, 165–172 (2001).
68. Coverley, D., Laman, H. & Laskey, R. A. Distinct roles for cyclins E and Aduring DNA replication complex assembly and activation. Nat. Cell Biol. 4,523–528 (2002).
69. Kalaszczynska, I. et al. Cyclin A is redundant in fibroblasts but essential inhematopoietic and embryonic stem cells. Cell 138, 352–365 (2009).
AcknowledgementsWe thank J. Wong, G. Yao and M. He for the plasmid with human endogenous E2F1promoter, REF52 cells and the shRNA vector, respectively; S.A. Johnson, Y. Gao andB.R. Carlson for their help in time-lapse microscopy; S. Payne, Y. Tanouchi and A. Pai
for their help in experiments; Drs A.J. Hartemink, X. Wang, J. Harer and N.L. Allbrittonfor their suggestions on experimental design; B. Li, C. Tan, T.J. Lee, G. Yao and I. Shatsfor comments and discussion. This research was supported by the grant from NorthCarolina Biotech Center Multidisciplinary Research Grant Grogram (2012-MRG-1102;L.Y. and B.M.P.), David and Lucile Packard Fellowship (L.Y.), DuPont YoungProfessorship (L.Y.) and NSF Career Award (L.Y.).
Author contributionsP.D., B.M.-P. and L.Y. designed research and developed the concept of the paper;P.D. performed experiments with contributions from F.T. and B.M.-P.; P.D. and J.K.S.performed simulation analyses with contributions from L.Y.; P.D. and M.V.M. analysedand interpreted data; P.D., B.M.-P. and L.Y. wrote the manuscript with contributionsfrom J.R.N. and M.V.M.
Additional informationSupplementary Information accompanies this paper at http://www.nature.com/naturecommunications
Competing financial interests: The authors declare no competing financial interests.
Reprints and permission information is available online at http://www.nature.com/reprintsandpermissions/
How to cite this article: Dong, P. et al. Division of labour between Myc and G1cyclins in cell cycle commitment and pace control. Nat. Commun. 5:4750doi: 10.1038/ncomms5750 (2014).
This work is licensed under a Creative Commons Attribution-NonCommercial-ShareAlike 4.0 International License. The images or
other third party material in this article are included in the article’s Creative Commonslicense, unless indicated otherwise in the credit line; if the material is not included underthe Creative Commons license, users will need to obtain permission from the licenseholder to reproduce the material. To view a copy of this license, visit http://creativecommons.org/licenses/by-nc-sa/4.0/
NATURE COMMUNICATIONS | DOI: 10.1038/ncomms5750 ARTICLE
NATURE COMMUNICATIONS | 5:4750 | DOI: 10.1038/ncomms5750 | www.nature.com/naturecommunications 11
& 2014 Macmillan Publishers Limited. All rights reserved.