Diversity, Relative Abundance and Some Aspects of the ...
70
Diversity, Relative Abundance and Some Aspects of the Biology of Fishes below the Tisisat Fall of the Blue Nile River, Ethiopia Author Tadlo Awoke Mengesha Department of Animal Production and Extension, Gondar, Ethiopia Publication Month and Year: November 2019 Pages: 60 E-BOOK ISBN: 978-81-944644-2-6 Academic Publications C-11, 169, Sector-3, Rohini, Delhi, India Website: www.publishbookonline.com Email: [email protected] Phone: +91-9999744933
-
Upload
khangminh22 -
Category
Documents
-
view
4 -
download
0
Transcript of Diversity, Relative Abundance and Some Aspects of the ...

Diversity, Relative Abundance and
Some Aspects of the Biology of Fishes
below the Tisisat Fall of the Blue Nile
River, Ethiopia
Author
Tadlo Awoke Mengesha
Department of Animal Production and Extension, Gondar, Ethiopia
Publication Month and Year: November 2019
Pages: 60
E-BOOK ISBN: 978-81-944644-2-6
Academic Publications
C-11, 169, Sector-3, Rohini, Delhi, India
Website: www.publishbookonline.com
Email: [email protected]
Phone: +91-9999744933


Acknowledgement
This thesis work could not have been successful without the contribution of
many individuals and institutions. I have no words to express my deepest
gratitude and sincere appreciation to my research advisors, Dr. Minwyelet
Mengist from Bahir Dar University; Fisheries, Wetlands and Wildlife
Management Department, and Abebe Getahun from Addis Ababa University
for their unreserved scientific advice, guidance and the accomplishment of
this study. Their critical constructive comments starting from the proposal
until the thesis writing and supply of related literature facilitated the smooth
completion of this study.
Indeed, it is quite difficult to me to express my internal feeling with the
languages I know so far to acknowledge Dr. Minwyelet Mengist
contributions to the realization of this study. He was seriously committed
right from the beginning by suggesting the research area. He was also
supplied me the necessary field materials in time. He is so friendly and has
helpful attitude, which I consider it was an important quality.
I am grateful to the staff members of the Bahir Dar Fish and Other
Aquatic Life Research Center for their technically assist during my filed and
allow the laboratory works. Especially Biniam Hailu and Temesgen for their
support in both the field and the laboratory work.
I would like to thanks Bahir Dar University for Budget and logistic
support, which is required for fieldwork for my thesis. I am grateful to my
friends Shewit G/Medium and Marcos Buddha for their hospitality and
encouragement in my two-year stay and in accessing their computer.
My due thanks go to my family, especially my father Awoke Mengesha
and my mother Fenty Teshager their sympathy and sensitive follow up while
I was in fieldwork.
Finally yet importantly, peoples of Fich, Angar and Wazir Ki Bela and
Amhara National Regional State police commission working are duly
acknowledged for their unreserved efforts in providing valuable information
and support letters for the study.
Almighty god, thank you! You make everything possible for me. Save
my family and help me to realize my dreams.


Contents
S. No. Chapters Page No.
1. Introduction 01-06
1.1 Freshwater bodies in Ethiopia 01
1.2 Fish species diversity in main drainage basins of
Ethiopia 02
1.3 Justification 05
2. Objectives 07-07
2.1 General objective 07
2.2 Specific objectives 07
3. General Description of the Study Area 08-13
3.1 Climate 10
3.2 Fauna 12
4. Materials and Methods 14-18
4.1 Site selection and sampling 14
4.2 Laboratory studies 15
4.3 Species diversity and relative abundance 15
4.4 Shannon index of diversity (H') 16
4.5 Length-weight relationship 16
4.6 Condition Factor (Fulton Factor) 16
4.7 Sex Ratio 17
4.8 Fecundity 17
4.9 Data analysis 18
4.10 Species description 18
5. Results and Discussion 19-39
5.1 A biotic Parameters 19
5.2 Fish species composition in the upper part of Blue
Nile River 20
5.2.1 Diagnostic and descriptive characteristics of
fishes 23

5.2.2 Species diversity and abundance 27
5.2.2.1 Species diversity 27
5.2.2.2 Relative abundance of fish during wet and dry
seasons 29
5.2.2.3 Length frequency distribution of the dominate
fish species 33
5.3 Some biological aspects of the dominant fish
species 34
5.3.1 Length-weight relationship 34
5.3.2 Fulton’s condition factor (FCF) 36
5.3.3 Some aspect of reproductive biology 37
5.3.3.1 Sex ratio 37
5.3.3.2 Fecundity 38
6. Fishing Activity and Its Problems in the Study Area 40-42
6.1 Fishing activity 40
6.2 Problems in fishing activities 42
7. Limitation of the Study 43-43
8. Conclusion and Recommandations 44-46
8.1 Conclusion 44
8.2 Recommendations 45
References 47-53
Appendixs 54-60
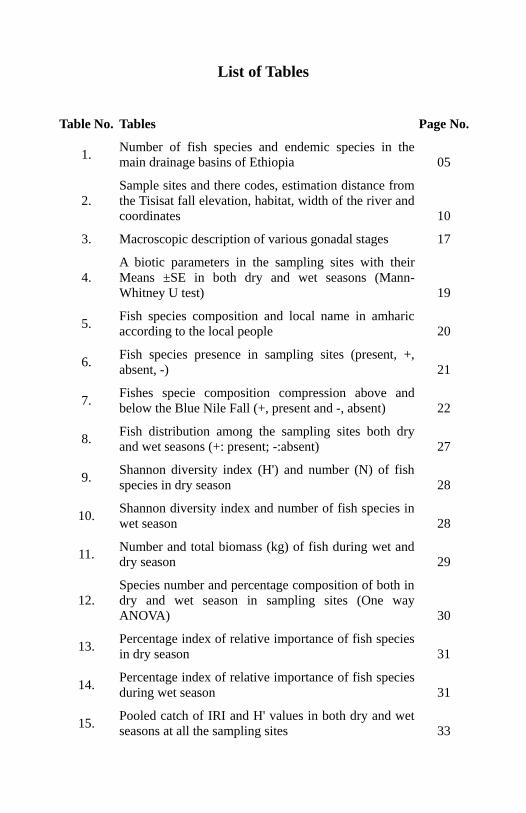
List of Tables
Table No. Tables Page No.
1. Number of fish species and endemic species in the
main drainage basins of Ethiopia 05
2.
Sample sites and there codes, estimation distance from
the Tisisat fall elevation, habitat, width of the river and
coordinates 10
3. Macroscopic description of various gonadal stages 17
4.
A biotic parameters in the sampling sites with their
Means ±SE in both dry and wet seasons (Mann-
Whitney U test) 19
5. Fish species composition and local name in amharic
according to the local people 20
6. Fish species presence in sampling sites (present, +,
absent, -) 21
7. Fishes specie composition compression above and
below the Blue Nile Fall (+, present and -, absent) 22
8. Fish distribution among the sampling sites both dry
and wet seasons (+: present; -:absent) 27
9. Shannon diversity index (H') and number (N) of fish
species in dry season 28
10. Shannon diversity index and number of fish species in
wet season 28
11. Number and total biomass (kg) of fish during wet and
dry season 29
12.
Species number and percentage composition of both in
dry and wet season in sampling sites (One way
ANOVA) 30
13. Percentage index of relative importance of fish species
in dry season 31
14. Percentage index of relative importance of fish species
during wet season 31
15. Pooled catch of IRI and H' values in both dry and wet
seasons at all the sampling sites 33

16.
Mean and Standard deviation of Fulton condition
factor both by sex and season: P= significance
difference (Mann-Whitney U test) between sex and
seasons of dominant fish species 36
17. Number of males, females and the corresponding sex
ratio 38

List of Figures
S. No. Figures Page No.
1. Map of study area 09
2. Mean maximum and minimum air temperature 11
3. Mean monthly rain fall 12
4. Lateral view of Labeobarbus intermedius 23
5. Lateral view of Labeobarbus crassibarbis 24
6. Lateral view of Labeobarbus nedgia 24
7. Lateral view of Clarias gariepinus 25
8. Lateral view of Mormyrus kannume 25
9. Lateral view of Bagrus docmak 26
10. Lateral view of Labeo forskalii 26
11. Lateral view of Oreochromis niloticus 27
12. Shannon diversity index (H') and Number of fish
species in both dry and wet seasons
28
13. Percentage IRI of dominant fish species in sampling
sites during dry and wet season
32
14. Length frequency distribution of L. intermedius 34
15. Length-weight relationship of L. intermedius, L.
forskalii and M. kannume respectively
36
16. ABC Absolute fecundity with total length, total weight
and Gonad weight relation in L. intermedius
39
17. Farmers fishing time in the study area 41

Page | 1
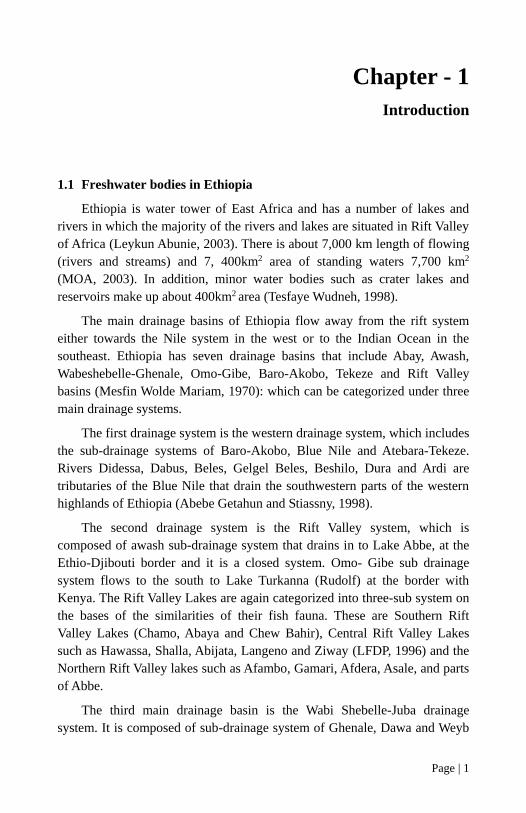
Chapter - 1
Introduction
1.1 Freshwater bodies in Ethiopia
Ethiopia is water tower of East Africa and has a number of lakes and
rivers in which the majority of the rivers and lakes are situated in Rift Valley
of Africa (Leykun Abunie, 2003). There is about 7,000 km length of flowing
(rivers and streams) and 7, 400km2 area of standing waters 7,700 km2
(MOA, 2003). In addition, minor water bodies such as crater lakes and
reservoirs make up about 400km2 area (Tesfaye Wudneh, 1998).
The main drainage basins of Ethiopia flow away from the rift system
either towards the Nile system in the west or to the Indian Ocean in the
southeast. Ethiopia has seven drainage basins that include Abay, Awash,
Wabeshebelle-Ghenale, Omo-Gibe, Baro-Akobo, Tekeze and Rift Valley
basins (Mesfin Wolde Mariam, 1970): which can be categorized under three
main drainage systems.
The first drainage system is the western drainage system, which includes
the sub-drainage systems of Baro-Akobo, Blue Nile and Atebara-Tekeze.
Rivers Didessa, Dabus, Beles, Gelgel Beles, Beshilo, Dura and Ardi are
tributaries of the Blue Nile that drain the southwestern parts of the western
highlands of Ethiopia (Abebe Getahun and Stiassny, 1998).
The second drainage system is the Rift Valley system, which is
composed of awash sub-drainage system that drains in to Lake Abbe, at the
Ethio-Djibouti border and it is a closed system. Omo- Gibe sub drainage
system flows to the south to Lake Turkanna (Rudolf) at the border with
Kenya. The Rift Valley Lakes are again categorized into three-sub system on
the bases of the similarities of their fish fauna. These are Southern Rift
Valley Lakes (Chamo, Abaya and Chew Bahir), Central Rift Valley Lakes
such as Hawassa, Shalla, Abijata, Langeno and Ziway (LFDP, 1996) and the
Northern Rift Valley lakes such as Afambo, Gamari, Afdera, Asale, and parts
of Abbe.
The third main drainage basin is the Wabi Shebelle-Juba drainage
system. It is composed of sub-drainage system of Ghenale, Dawa and Weyb

Page | 2
Rivers that join Shebelle River and drain to southwestern parts of the eastern
highlands. The Wabi Shebelle River is called Juba in Somalia. The major
rivers in this drainage system arise from the eastern highlands in the Bale
Mountains of Ethiopia and flow into the Indian Ocean (Roberts, 1975).
Four major river systems originate in the Ethiopian highlands. The
Awash arises in Shoa and flows northwards following the Great Rift Valley
where it disappears in the desert near the Djibouti border. The Omo begins in
Kafa and drains into Lake Turkana, in the south, on the border with Kenya.
The Wabi Shebelle originates in the Bale Mountains and flows in a
southeastern direction towards Somalia. The most impressive river, however,
is the Nile, which flows MOR than 6,000 km from its source (Lake Tana) to
the shores of the Mediterranean (De Graaf, 2003). The Nile River is
principally fed by two great rivers, the White Nile and the Blue Nile, which
fuse at Khartoum, Sudan's capital city.
1.2 Fish species diversity in main drainage basins of Ethiopia
Ethiopia has a rich diversity of ichthyofauna in its lakes, rivers and
reservoirs, although they are poorly known (Abebe Getahun and Stiassny,
1998). Even though, Ethiopian has high production potential and notable
fishery investigation has been carried out only in a few of numerous
freshwater bodies. The territory of Ethiopia encompasses parts of the
catchment areas of two oceans, separated by the north portion of the Great
African Rift. Two major biogeographic units, the Nilo-Sudan and the east
coast ichthyofauna provinces are in contact to this region (Golubtsov et al.,
2002).
Shibru Tedla (1973) has listed 94 species of fish in Ethiopia. Although
extensive review work is in progress, it appears that there are 153 valid
indigenous fish species included in 25 families in Ethiopia freshwater
(Abebe Getahun, 2002). According to Golubtsov and Mina (2003), the total
number of valid species in Ethiopia inland waters is about 168 to 183
including 37 to 57 countrywide endemics. There are also 10 exotic fish
species introduced from abroad into Ethiopian fresh waters (Shibru Tedla
and Fisseha H/Meskel, 1981). Currently results of various studies indicate
that the number of fish species could increase to 200 and above (JERBE,
2007).
The freshwater fish fauna of Ethiopia is a mixture of Nilo-Sudanic, East
African and endemic forms (JERBE, 1995; Abebe Getahun and Stiassny,
1998; Abebe Getahun, 2007). The Nilo-Sudanic forms are represented by
many representative species. For example, the genera Alestes, Bagrus,

Page | 3
Citharinus, Hydrocynus, Hyperopisus, Labeo, Malapterurus, Mormyrus,
Polypterus and Protopterus are some of the representatives from Baro
Akobo, Omo-Gibe and Abay basins. The Nilo-Sudanic forms are related to
West African forms and are believed to occur here due to past connection of
the Nile to Central and West African river systems. According to Abebe
Getahun (2002), some of the elements of Nilo-Sudanic species are reported
from southern rift valley lakes (Chamo and Abaya). These include the
families Mormyridae, Cyprinidae, Bagridae, Clariidae and Mochokidae.
Wabi Shebele and Jube basins also have element of Nilo-Sudanic forms.
The highland East African forms are found in the northern rift valley
lakes (Lake Awassa, Ziwai and Langano), highland lakes (Lakes Hayq and
Tana) and awash drainage basin. The genera include Labeobarbus, Clarias,
Garra, Oreochromis and Varicornis. They are related to fishes of Eastern and
Southern Africa and Arabian Peninsula (Skelton et al., 1991).
Fish fauna of Ethiopian high lands are dominated by species of fish in
the family Cyprinidae (Roberts, 1975). The fishes of the high mountain
torrential streams largely belong to Cyprindae (Abebe Getahun and Stiassny,
1998) adapted to the swiftly flowing floodwaters that occur seasonally. Two
genera of fishes (Barbus and Garra) are dominant in these streams. It
appears that there is high endemism of fish, but fauna is not well known.
Endemic fishes of the genus Garra (e.g. G. dembecha, G. duobarbis) have
been described recently (Abebe Getahun, 2002). Some of endemic fish
species are found in Abay basin: Labeobarbus zephyrus Boulenger 1906, V.
beso and some Garra species (Golubtsov and Mina, 2003).
Some of the family of fish identified within the Nile basin and its
tributary rivers are Mormyridae, Characidae, Cyprinidae, Bagridae,
Schilbeidae, Mochokidae, Clariidae and Cichlidae (MoWR, 1998). Moges
Beletew (2007) assessed fish diversity in Beshilo, Ardi and Dura Rivers of
Abay basin and found twelve species of fishes. These represent by five
families i.e. Cyprinidae, Clariidae, Bagridae, Mochokidae and Cichlidae.
Some of the species were L. intermedius, L. nedgia, C. gariepinus, V. beso,
O. niloticus, S. schall, R. loti, B. docmak, B. bajad, L. forskalii and H.
longfillus. According to Zeleke Berie (2007) a total of 22 species of fishes
were recorded from Beles and Gelgel Beles Rivers of Abay basin. Seven
families represent these: Cyprinidae, Clariidae, Bagridae, Mochokidae,
Characidae, Mormyridae and Cichlidae, represent these.
There is no clear, complete list and description of the diversity of the
fish fauna of Ethiopia. Many of the drainage basins especially the rivers are

Page | 4
not exhaustively explored (Abebe Getahun, 2002). There are 38 endemic
species and sub species to Ethiopia (Abebe Getahun, 2005a). Lake Tana
from Abay drainage basin exclusively has large number of endemic fish
species in the country (Abebe Getahun, 2005a).
The Abay basin is one of the tributaries of Nile and consists of 36
species (Abebe Getahun, 2007) of fish of which 23 are endemic (Golubtsov
and Mina, 2003; Abebe Getahun, 2007). Most of the endemic species of
Blue Nile basin occur exclusively in Lake Tana. Lake Tana is a lake in the
northern high lands of Ethiopia and is the source of the Blue Nile. The Blue
Nile descends from Lake Tana to Tissisat Falls (ca. 40 m high), effectively
isolating the lake’s fresh water fauna from the rest of the Nile (Thieme and
Brown, 2007). It was formed by a volcanic blockage that reversed the
previously north-flowing river system. The isolation of the lake from all but
in flowing rivers has led to an endemic freshwater biota. Fish species in the
lake are most closely related to those of the Nilo-Sudan biogeographic
region.
Seventeen species of large barbs have been described from Lake Tana
(Nagelkerke & Sibbing, 1998 & 2000). Eight of the large barbs are
piscivorous, and Barbus humilis and the newly described, Barbus
tanapelagius, are thought to be the major prey species (de Graaf et al.,
2000).
About 70% of the fish species in this highland lake are endemic,
including 20 endemic Cyprinids. The tilapia of Lake Tana belongs to a wide
spread species but is described as an endemic subspecies, Oreochromis
niloticus tana (Eshete Dejen, 2003; Thieme et al., 2007).
The family Cyprinidae is the only group of fish that is more diverse in
the Blue Nile drainage system than in White Nile system. All other forms
occurring in the latter system are represented by few species or absent in the
former system. This might be the lack of flood plain in the Blue Nile system
as was suggested by Golubtsov and Mina (2003).
According to Golubtsov and Mina (2003), the fish diversity in Atbara-
Tekeze is less in comparison with Blue Nile and White Nile due to
accessibility in the former system. JERBE (2008) reported 34 fish species
belonging to 10 families and 22 genera from Atebra-Tekeze basin system.
That means two to three times fewer species than Blue Nile and Whit Nile
system respectively. The JERBE recorded 22-23 fish species from Abaya-
Chamo system, 12-14 fish species for Chew Bahir, 12 species for Zwai-
Langano, Abijata-Shalla system, 6-7 fish species for Awassa-Shalla system

Page | 5
and 13-25 fish species for Awash and its adjacent enclosed basins (Golubtsov
and Mina, 2003).
The highest fish diversity recorded, among Ethiopian main drainage
basins, is from the Baro basin. According to Golubtsov and Mina (2008), 113
fish species belonging to 26 families and 60 genera were recorded from
Baro-Akobo basin. However, the basins are low level of endemism as
compared to other Ethiopia drainage basins. Low level endemism is
probably because of the Baro basin have connections (past and present) with
the Nile and West and Central African river systems and as a result of all the
fish fauna represent widespread Nilo-Sudanic forms (Abebe Getahun, 2007).
According to Golubtsov and Mina (2003), 33 fish species belonging to
12 families and 21 genera were recorded from Wabi Shebelle and Juba
drainage basins within the limits of Ethiopia. This region is inhabited by
most distinct ichthyofauna within the country. A number of East African fish
taxa occur in this basin such as the Characid Alestes affinis, the Cyprinid,
Neobola bottegoi, the Schilbeidae irvine orientalis, the loach catfish
Amphilius species, the Cichlid Oreochromis spilurus. There are 2-3
introduced fish species in this drainage system (Golubtsov and Mina, 2003).
The highest fish species diversity in Ethiopia has been recorded from
Baro basin, followed by Abay, Wabi Shebelle and Omo-Gibe basins.
However, endemicity seems to be highest in Abay and Awash basins. This is
attributed, in the former case, to the endemic species flock of Labeobarbus
in Lake Tana (Abebe Getahun, 2002) (Table 1).
Table 1: Number of fish species and endemic species in the main drainage basins of
Ethiopia (Abebe Getahun, 2007)
Abay 36 23
Awash 15 6
Baro 87 1
Omo 26 2
Rift valley lakes 32 7
Wabi Shebelle 26 4
Drainage basins No. of species No. of endemics species
1.3 Justification
Knowledge on diversity, population structure, distribution and
population of the Ethiopian ichthyofauna and biology of fish species has
been poorly known: relatively a number of small, medium and even some
large rivers have not been well studied and explored (Abebe Getahun,

Page | 6
2005b). Therefore, further study on rivers is a time demanding phenomena.
Blue Nile River originates from Lake Tana and flows down approximately
35 km in the southeast direction where it forms the famous Tisisat falls. This
river especially below the fall has not been given adequate attention with
regard to the study of the diversity, abundance and biology the fish fauna due
to the presence of some harsh geographical features, inaccessibility for
transportation, security and logistic problems. The purpose of the study is,
therefore, to answer the following research question with the objectives
mentioned.
What is the fish composition of the Blue Nile River below the
Tisisat fall?
Do species vary in their relative abundance?
What are some aspects of the biology of the dominant fish species
found in this river?
Is there some fishing activity around this river?
Page | 7
Chapter - 2
Objectives
2.1 General objective
Major objective of the study is to generate baseline scientific
information about fish species found in upper part of Blue Nile River below
the “Tisisat” fall for management and sustainable utilization of the fish
resources and recommend ways of conserving the diversity of ichthyofauna
of the River.
2.2 Specific objectives
To identify fish species composition of the Blue Nile River below
the Tisisat fall.
To assess relative abundance of fish species in the river.
To determine some aspects of the biology (Length-weight
relationship, Condition factor, Sex ratio and Fecundity) of the
dominant fish species.
To investigate the fisheries activities and recommend appropriate
resource utilization strategies.

Page | 8
Chapter - 3
General Description of the Study Area
The Nile River is the longest in Africa and the second longest in the world. It
flows 6,700 km from its source in the equatorial lake basin to the
Mediterranean Sea north of Cairo, Egypt. In between, it receives flows from
a major tributary, the Blue Nile from the Ethiopian highland plateau, which
contributes significantly to the Nile River’s total annual flow of almost 84
billion m3 per year at Aswan, Egypt (UNECA, 2000). The catchment area of
over 3 million km2 of the Nile cuts across ten African countries namely,
Burundi, the Democratic Republic of Congo, Rwanda, Tanzania, Kenya,
Uganda, Ethiopia, Eritrea, Sudan and Egypt. This catchment area represents
over 10% of the total land surface area of the African continent. The sources
of the Nile are located in humid regions of Ethiopian highlands and the Great
Lakes of East-Central Africa with an average rainfall rate of over 1,000 mm
per year (UNECA, 2000).
The out flow from Lake Tana is the main source of Blue Nile River. The
Blue Nile River flows the Eastern outskirts of the city of Bahir Dar at the
Southern end of the Lake Tana flows down approximately 35 km in a
southeast direction where it forms the famous Blue Nile Fall to drop in to a
gorge having a depth of about 45 m (Yihun Dile, 2009).
Blue Nile River basin lies in the west of Ethiopia between latitude 7°45'
and 12°45' N, and longitude 34° 05' and 39°45' E (MoWR, 2010). River
Didissa, Dabus, Beles, Gelgel Beles, Beshilo, Dura and Ardi are tributaries
of Abay (Blue Nile) that drain the southwestern parts of the western
highlands of Ethiopia (Abebe Getahun and Stiassny, 1998). The Bashilo rises
near Magdala and drains eastern Amhara; the Jamma rises near Ankober and
drains northern Shoa; the Muger rises near Addis Ababa and drains south-
western Shoa; the Didessa, the largest of the Abay's affluents, rises in the
Kaffa hills and has a generally south-to-north course; the Dabus runs near
the western edge of the plateau escarpment. All these are perennial rivers.
The right rising mostly on the western sides of the plateau have steep slopes
and are generally torrential in character. The Beles, however, is perennial,
and the Rahad and Dinder are important rivers in flood-time.

Page | 9
Blue Nile basin shares common boundaries with the Tekeze basin to the
north, the awash basin to the east and southeast, the Omo-Gibe basin to the
south, and Baro-Akobo basin to the west (MoWR, 2002). The total area of
the basin is 199,812 km2 including Lake Tana which has an area of about
3200km2. About 46, 31 and 23% of the total basin area falls in Amhara,
Oromiya and Benishangul-Gumuz, respectively (MoWR, 2002). The River
basin’s elevation ranges from 500 m to 4261 m and the total mean annual
flow from the River basin is estimated to be 54.8 billion m3 (Seleshi Bekele
et al., 2007).
The study was conducted in the upper part of the Blue Nile River
(Starting from the Blue Nile Fall/Tissisat Fall to the border between East and
West Gojjam). It lies between West Gojjam and South Gondar zones,
specifically the adjacent Kebeles are Tis Abay, Wajir, Anigar, Gibish, Fichi
and Dibaye (Figure 1).
Fig 1: Map of study area
Source: GIS Case Team Bureau of finance and economic at Bahir Dar

Page | 10
Table 2: Sample sites and there codes, estimation distance from the Tisisat fall
elevation, habitat, width of the river and coordinates. Here on wards, Se, Ab and Wm
refers to the sampling code
Site Code Distance
(km) Elevation Habitat Width
Coordinate
(GPS)
Sefania Se 8 1548m Clear water and
rocky, sandy Medium
110 27.7' 07" N
E ״60 '37.9 37
Abenaze Ab 30 1528m Turbid muddy Wider 110 24.3' 06'' N
370 40' 71'' E
Wotetomider Wm 60 1493m Clear water and rock
gravel Medium
110 31.5' 03" N
370 72.9' 48" E
3.1 Climate
According to Conway (1999), the local climate classification in Ethiopia
is based on elevation and temperature. In other words, depending on
elevation for any area there is associated mean annual temperature range.
This enables identifying traditional climate zone of a given area. The three
traditional climate zones of Ethiopia are: Kola (elevation less than 1800 m
A.M.S.L and mean annual temperature 20-28 oC), Woina Dega (elevation
between 1800 m and 2400m A.M.S.L and mean annual temperature 16-20 oC), and Dega (elevation between greater than 2400m A.M.S.L and mean
annual temperature 6-16 oC). Based on the above local climate classification
the climate zone of the study area is Kola (elevation is less than 1800m
A.M.S.L).
The maximum and minimum mean monthly air temperatures of upper
part of Blue Nile basin are 26.29 oC and 10.78 oC respectively at the Adet
station and 25.39 oC and 11.31 oC at the Bahir Dar station (Fig. 2). The mean
monthly rainfall was 141.5 mm at Adet station and 105.22 mm at Bahir Dar
station. The main rainy season of this basin is between May and end of
October (Fig. 3).

Page | 11
(A)
(B)
Fig 2: Mean maximum and minimum air temperature (a) at Adet station and (b) at
Bahir Dar from 2006- 2010 (Ethiopian Meteorological Agency, Bahir Dar Branch,
2011)

Page | 12
(C)
(D)
Fig 3: Mean monthly rain fall (c) at Adet station and (d) at Bahir Dar station from
2006-2010 (Ethiopian Meteorological Agency, Bahir Dar Branch, 2011)
3.2 Fauna
Blue Nile River below the Tissisat fall besides fishes there are other
vertebrate animals found in the river. These are Crocodile, Snakes, “Arjano”
(Monitor lizard) and different species of amphibians and birds. Species of

Page | 13
birds observed during the study period were Cattle egrets (Bubulcus ibis),
Great white pelican (Pelecanus onocrotalus), Grey heron (Ardea cinerea),
Sacred ibis (Threskiornis aethiopicus) and African Jacana (Actophilornis
africana).
3.3 Flora
There is high deforestation in the Blue Nile River basin below the
Tissisat fall mainly hillside farming is devastating the forest and soil.
Farmers in this area cultivate two crops a year and perennial crop farming is
practiced. The changes in vegetation patterns result from land degradation
along the Blue Nile basin below the Tissisat fall that may lead to unexpected
abnormal floods and reducing soil nutrients of the basin. The other factors
that a lead to deforestation is because of all of the residents do not have
access to the electricity. The people use kerosene lamp and fuel wood as a
source of light and for cooking. Therefore, the villagers continue to denude
the remaining shrubs and trees for their daily consumption. Shrubs and trees
mainly cover vegetations on either side of the riverbank. The dominant trees
are Syzygium guineense (“Dokma”), Mimusops kummel (“Eshe”), Olea
europaea (“Woyira”) and Ficus (“Shola”).

Page | 14
Chapter - 4
Materials and Methods
4.1 Site selection and sampling
A reconnaissance survey was conducted to fix the sampling sites. The
survey was conducted in three woredas along the River. Three sampling sites
were selected taking into consideration; the velocity of the flowing river,
interference by human beings and other farm animals, substrate type of
sediments and accessibility, depth of water, and access to road. These sub
areas are namely; Wotetomider site found in Wotetomider village at Fichi
kebele, which is about 60 km down stream of Blue Nile fall, Abenaze site
found in Abenaze village at Anigar kebele, which approximately 30km far
from Blue Nile fall and Sefania site found in Wojir kebele, which is
approximately 8km far from Blue Nile Fall. These sites were found in West
Gojjam Zone under three woredas namly Gonje Kolela, Yelmanadensa and
Bahir Dar Zuria, respectively. Data on fishing activity were collected using
semi-structured questionnaires (Appendix 10.3). Conductivity, temperature,
pH, Total dissolved solid (TDS) were measured using standard multi -meter
and transparency was measured using secchi disk 20 cm in diameter. In
addition to this cast, net was used in unsuitable areas of the river. Fish
samples were collected in both wet season (November 2010) and dry season
(March 2011). Each site was sampled two twice (one time in the wet season
and one time in the dry season). Samples were collected using gillnet of
various mesh sizes (6, 8, 10 and 12 cm stretched mesh) and monofilament
nets with various stretched mesh size (5, 10, 15, 20, 25, 30, 35, 40, 45, 50
and 55 mm). In all studied sites, monofilaments were set during the daytime
for two hours. Gill and monofilament nets were set, using swimmers, across
the width of the river during dry sampling period when the water volume is
less and parallel to the river flow during wet season when the water
discharge is high. Gillnets were set late in the afternoon and collected in the
water for 14 hours at deeper parts of the river and collected in the following
morning. Cast net was also used by selecting an appropriate site.
Immediately after capture, a gentle pressure was applied on the abdomen to
check whether reproductive maturity has occurred or not. Then total length,
fork length, standard length, total weight and gonad weight of all specimens

Page | 15
of fish were measured to the nearest 0.1 cm and 0.1 g precision for length
and weight, respectively. Picture of fish specimen was taken for each
species. After dissection, gonad maturity of each fish specimen was
identified using a five-point maturity scale (Nikolsky, 1963). Four specimens
were preserved by 5% formalin from each species and transport to Bahir Dar
Fish and Other Aquatic Life Research Center for morphometric study and
comparison with previously identified specimens available.
4.2 Laboratory studies
Specimens were soaked in tap water for one day to wash the formalin
from the specimens and then specimens were identified to species level
using taxonomic keys found in Boluenger (1909-1916) and Golubtsov et al.
(1995). The specimens were also compared with previously identified
specimens, especially Labeobarbus species, available at Bahir Dar Fish and
Other Aquatic Life Research Center.
4.3 Species diversity and relative abundance
Estimation of relative abundance of fish was made by taking the
contribution in number and weight of each species in the total catch in each
sampling effort. An Index of Relative Importance (IRI) and Shannon
diversity index (H') were used to evaluate relative abundance and species
diversity of fishes, respectively. IRI is a measure of the relative abundance or
commonness of the species based on number and weight of individuals in
catches, as well as their frequency of occurrence (Kolding, 1989, 1999). IRI
gives a better representation of the ecological importance of species rather
than the weight, numbers or frequency of occurrence alone (Sanyanga,
1996).
Index of relative importance (% IRI) was calculated by the following
formula:
IRI = X 100
Where % Wi and %Ni are percentage weight and number of each
species of total catch, respectively. % Fi is percentage frequency of
occurrence of each species in total number of settings. % Wj and % Nj are
percentage weight and number of total species in total catch. % Fj is
percentage frequency occurrence of total species in total number of setting. S
is total number of species.

Page | 16
4.4 Shannon index of diversity (H')
The Shannon index of diversity is a measure of the number of species
weighted by their relative abundance (Begon et al., 1990). Shannon index of
diversity (H’) was calculated using the formula:
H' =
Where:
H' = the Shannon diversity index
Pi = fraction of the entire population made up of species i
S = numbers of species encountered
∑ = sum from species 1 to species S
Shannon’s diversity index (H') was used to indicate diversity at different
sampling sites and/or rivers. A high value indicates high species diversity.
4.5 Length-weight relationship
The relationship between total length and total weight of the most
dominant fish species was computed using power function as in Bagenal and
Tesch (1978) as follows:
TW= a X TLb
Where
TW= Total weight (gm)
TL= Total length (cm)
a = Intercept of the regression line
b = Slope of the regression line
4.6 Condition factor (Fulton factor)
The well-being or plumpness of each dominant species was calculated
as total weight in percent of total length cube (Lecren, 1951; Bagenal and
Tesch, 1978). Fulton Condition Factor (%) was calculated as:
FCF = X 100
Where,
FCF = Fulton condition factor
TW = total weight in grams
TL = total length in cm

Page | 17
4.7 Sex ratio
The ratio between the number of female and male. Sex ratio was
determined using the formula:
Sex ratio=
4.8 Fecundity
Fecundity was determined gravimetrically method (MacGregor, 1957),
by weighing all the eggs from each of the ovaries of gravid fish species
(gonad maturity stage IV). Three sub-samples of 1 gm eggs were taken from
different parts of ovary and counted and the average was calculated. The
total number of eggs per ovary was calculated by extrapolation from the
mean calculated. The relative fecundity was calculated by dividing the total
number of eggs per fish weight. The relationship of fecundity with total
length, total weight and ovary weight was determined. Fecundity was
determined by the following formula.
F = aTLb
F = aTWb
F = aGwb
Where
F-Fecundity
TL-Total length (cm)
TW-Total weight (g)
GW-Gonad weight (g)
a. Constant
b. Exponent
Table 3: Macroscopic description of various gonadal stages, (Nikolsky, 1963)
Maturity
stage Male Female
I
Immature, virgin-A pair of small
thread-like, colourless organs (with
slightly serrated edges, in C.
gariepinus). Difficult to distinguish
between the sexes (except in C.
gariepinus).
Immature virgin-A pair of small,
thread-like colourless organ. Difficult
to distinguish between the sexes in B.
tsanensis and O. niloticus. In C.
gariepinus (size >18 cm) the ovary is
discernible as tiny, bulb-like and
pinkish in colour.
II Developing virgin or recovering Developing virgin or recovering

Page | 18
spent-Long thin, up to 1/2 length of
body cavity but distinct opaque
white in B. tsanensis and O.
niloticus and translucent white in
C. gariepinus, with distinct serrated
edges and shorter.
spent- Long thin, up to 1/2 length of
body cavity thicker than the testis and
translucent yellowish-white in B.
tsanensis and O. niloticus and pink in
C. gariepinus. Recovering spent has
larger gonad size and athicker wall.
III
Maturing or ripening-Long and
thicker, 2/3 body cavity (or 1/2 in
C. gariepinus), firm and more
solid. Colour white in B. tsanensis,
cream or beige in O. niloticus and
greyish-white in C. gariepinus.
Maturing or ripening-Long and
thicker, 2/3 body cavity Colour
yellowish in all. Ova discernible in
all.
IV
Ripe and Running-Large thick and
slimy. Milky white in B. tsanensis,
creamy in O. niloticus and white in
C. gariepinus. Sperm easily flows
when pressed or cut. C. gariepinus
testis has smoother edge.
Ripe and running-Ovary large,
yellow, almost filling the peritoneal
cavity in all. Ova well developed and
large may flow out when pressed.
V
Spent-testis shrunk and flaccid.
Numerous folds appear in O.
niloticus, and serrated edges revert
to original sharpness and colour
changes grey in C. gariepinus
Spent-Ovary shrunk and flaccid.
Some remnants of disintegrating,
opaque and ripe eggs appear in ovary
of O. niloticus and sometimes in B.
tsanensis; rarely in C. gariepinus.
Colour changes translucent in O.
niloticus and B. tsanensis but in C.
gariepinus the ovary changes colour
to greyish-red.
Description of gonads
4.9 Data analysis
Data collected were collated and analyzed using descriptive statistic
(mean, standard error and percentage). Statistical comparison of data
between and within zones was carried out using SPSS Version 16, analysis of
variance (ANOVA), Mann-Whitney U test and line graphs using Origin 6
and excel statistical package (2007). Sex ratio of the fish was studied using
Chi-square test (χ2) and values were tested using 95% confidence level.
Correlation analysis was used ascertain the significance of these
relationships. The exponents (b) of length weight relation were tested for
departure from isometry (b=3) using t- statistics
4.10 Species description
The morphometric data have been converted into percentages with
respect to standard length and head length. Standard univariate statistics
methods (mean, standard deviation, maximum and minimum) have been
used to summarize the morph metric and meristic data.
Page | 19
Chapter - 5
Results and Discussion
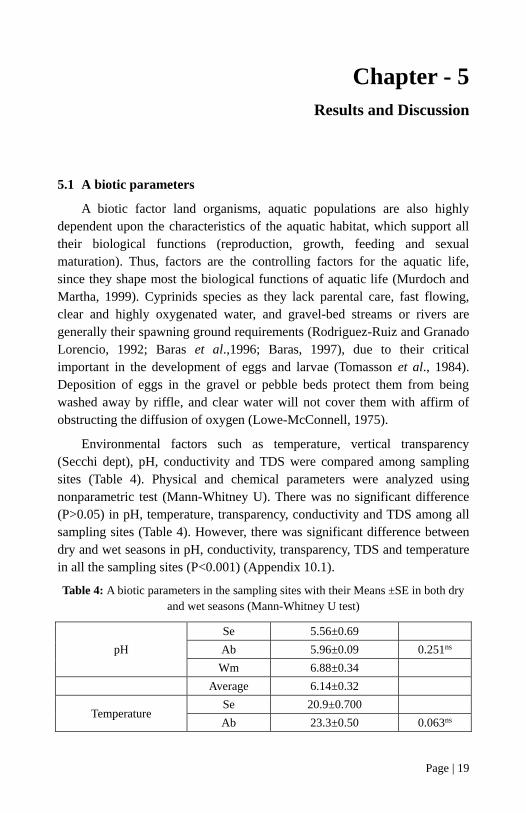
5.1 A biotic parameters
A biotic factor land organisms, aquatic populations are also highly
dependent upon the characteristics of the aquatic habitat, which support all
their biological functions (reproduction, growth, feeding and sexual
maturation). Thus, factors are the controlling factors for the aquatic life,
since they shape most the biological functions of aquatic life (Murdoch and
Martha, 1999). Cyprinids species as they lack parental care, fast flowing,
clear and highly oxygenated water, and gravel-bed streams or rivers are
generally their spawning ground requirements (Rodriguez-Ruiz and Granado
Lorencio, 1992; Baras et al.,1996; Baras, 1997), due to their critical
important in the development of eggs and larvae (Tomasson et al., 1984).
Deposition of eggs in the gravel or pebble beds protect them from being
washed away by riffle, and clear water will not cover them with affirm of
obstructing the diffusion of oxygen (Lowe-McConnell, 1975).
Environmental factors such as temperature, vertical transparency
(Secchi dept), pH, conductivity and TDS were compared among sampling
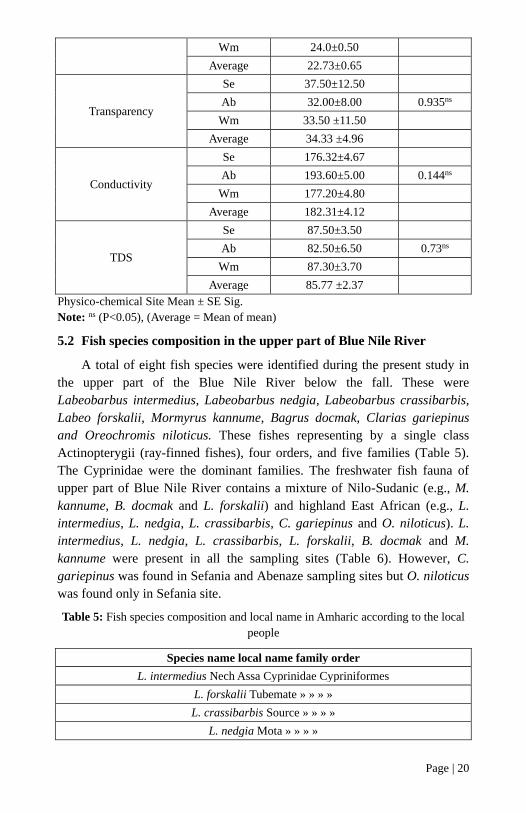
sites (Table 4). Physical and chemical parameters were analyzed using
nonparametric test (Mann-Whitney U). There was no significant difference
(P>0.05) in pH, temperature, transparency, conductivity and TDS among all
sampling sites (Table 4). However, there was significant difference between
dry and wet seasons in pH, conductivity, transparency, TDS and temperature
in all the sampling sites (P<0.001) (Appendix 10.1).
Table 4: A biotic parameters in the sampling sites with their Means ±SE in both dry
and wet seasons (Mann-Whitney U test)
pH
Se 5.56±0.69
Ab 5.96±0.09 0.251ns
Wm 6.88±0.34
Average 6.14±0.32
Temperature Se 20.9±0.700
Ab 23.3±0.50 0.063ns
Page | 20
Wm 24.0±0.50
Average 22.73±0.65
Transparency
Se 37.50±12.50
Ab 32.00±8.00 0.935ns
Wm 33.50 ±11.50
Average 34.33 ±4.96
Conductivity
Se 176.32±4.67
Ab 193.60±5.00 0.144ns
Wm 177.20±4.80
Average 182.31±4.12
TDS
Se 87.50±3.50
Ab 82.50±6.50 0.73ns
Wm 87.30±3.70
Average 85.77 ±2.37
Physico-chemical Site Mean ± SE Sig.
Note: ns (P<0.05), (Average = Mean of mean)
5.2 Fish species composition in the upper part of Blue Nile River
A total of eight fish species were identified during the present study in
the upper part of the Blue Nile River below the fall. These were
Labeobarbus intermedius, Labeobarbus nedgia, Labeobarbus crassibarbis,
Labeo forskalii, Mormyrus kannume, Bagrus docmak, Clarias gariepinus
and Oreochromis niloticus. These fishes representing by a single class
Actinopterygii (ray-finned fishes), four orders, and five families (Table 5).
The Cyprinidae were the dominant families. The freshwater fish fauna of
upper part of Blue Nile River contains a mixture of Nilo-Sudanic (e.g., M.
kannume, B. docmak and L. forskalii) and highland East African (e.g., L.
intermedius, L. nedgia, L. crassibarbis, C. gariepinus and O. niloticus). L.
intermedius, L. nedgia, L. crassibarbis, L. forskalii, B. docmak and M.
kannume were present in all the sampling sites (Table 6). However, C.
gariepinus was found in Sefania and Abenaze sampling sites but O. niloticus
was found only in Sefania site.
Table 5: Fish species composition and local name in Amharic according to the local
people
Species name local name family order
L. intermedius Nech Assa Cyprinidae Cypriniformes
L. forskalii Tubemate » » » »
L. crassibarbis Source » » » »
L. nedgia Mota » » » »

Page | 21
M. kannume Aishe Mormyridae Osteoglossiformes
B. docmak Fergus Bagridae Siluriformes
C. gariepinus Ambaza Clariidae » »
O. niloticus Koroso Cichlidae Perciformes
Table 6: Fish species presence in sampling sites (present, +, absent, -)
Sampling sites
Fish species Se Ab Wm
L. intermedius + + +
L. forskalii + + +
L. nedgia + + +
L. crassibarbis + + +
M. kannume + + +
B. docmak + + +
C. gariepinus + + _
O. niloticus + - -
The fish species composition in upper part of the Blue Nile River during
the study period was low as compared to results obtained by other workers in
the Blue Nile and Tekeze drainage basins. Mohammed Omer (2010),
reported 17 species from head of Blue Nile River (Lake Tana to Tisisat fall),
Genanaw Tesfaye (2006), 10 species identified from Sanja, and Angereb
Rivers, Moges Beletew (2007) 17 species from Beshilo, Dura and Ardi
Rivers, Zeleke Berie (2007) 23 species from Beles and Gelegel Beles, Dereje
Tewabe (2008) 27 species in Guang, Ayima, Gondwana and Shinfa Rivers,
Tesfaye Melak (2009) 59 species from Baro and Tekeze Basins. Flow
variability has an effect on fish assemblage, sometimes-high flows for
instance can destroy fish habitat and can wash the eggs of the fish that have
been already laid. On the other hand, during the dry season when the flow is
low and when the water is reduced, the fishes are trapped in very small
shallow pools that cause stress on fish and make very visible.
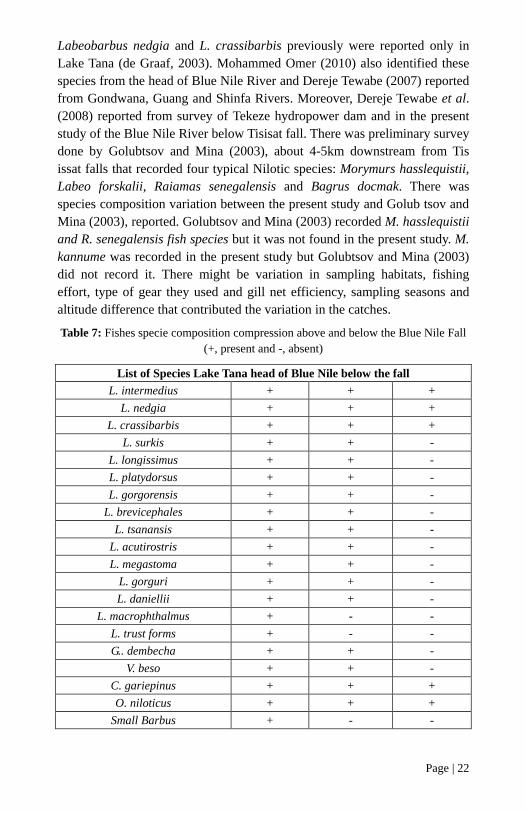
Below the Tisisat fall of Blue Nile River, fish species compositions were
different from head of Blue Nile River and Lake Tana fish species
composition as compared Mohammed Omer (2010) and (Nagekerke, 1997)
works, respectively (Table 7). These result due to high waterfalls (40 m) at
Tissisat ('smoking waters'), 30 km downstream from the Blue Nile outflow,
effectively isolate the lake’s ichthyofauna from the lower Nile basin (de
Graaf, 2003). In the present study L. forskalii, M. kannume and B. docmak
were identified which were not recorded from de Graaf (2003) in Lake Tana
and Mohammed Omer (2010) in head of Blue Nile River (Table 7).
Page | 22
Labeobarbus nedgia and L. crassibarbis previously were reported only in
Lake Tana (de Graaf, 2003). Mohammed Omer (2010) also identified these
species from the head of Blue Nile River and Dereje Tewabe (2007) reported
from Gondwana, Guang and Shinfa Rivers. Moreover, Dereje Tewabe et al.
(2008) reported from survey of Tekeze hydropower dam and in the present
study of the Blue Nile River below Tisisat fall. There was preliminary survey
done by Golubtsov and Mina (2003), about 4-5km downstream from Tis
issat falls that recorded four typical Nilotic species: Morymurs hasslequistii,
Labeo forskalii, Raiamas senegalensis and Bagrus docmak. There was
species composition variation between the present study and Golub tsov and
Mina (2003), reported. Golubtsov and Mina (2003) recorded M. hasslequistii
and R. senegalensis fish species but it was not found in the present study. M.
kannume was recorded in the present study but Golubtsov and Mina (2003)
did not record it. There might be variation in sampling habitats, fishing
effort, type of gear they used and gill net efficiency, sampling seasons and
altitude difference that contributed the variation in the catches.
Table 7: Fishes specie composition compression above and below the Blue Nile Fall
(+, present and -, absent)
List of Species Lake Tana head of Blue Nile below the fall
L. intermedius + + +
L. nedgia + + +
L. crassibarbis + + +
L. surkis + + -
L. longissimus + + -
L. platydorsus + + -
L. gorgorensis + + -
L. brevicephales + + -
L. tsanansis + + -
L. acutirostris + + -
L. megastoma + + -
L. gorguri + + -
L. daniellii + + -
L. macrophthalmus + - -
L. trust forms + - -
G.. dembecha + + -
V. beso + + -
C. gariepinus + + +
O. niloticus + + +
Small Barbus + - -

Page | 23
B. docmak - - +
L. forskalii - - +
M. kannume - - +
(Nagelkerke, 1997) (Mohammed Omer, 2010 (Present study, 2011)
5.2.1 Diagnostic and descriptive characteristics of fishes
Labeobarbus intermedius (Banister, 1973) (Fig 4)
Diagnosis: It has variable body shape and heads, has characteristics of
most L. intermedius species.
Description: It has variable body shape and head, has characteristics of
most Labeobarbus species. Head naked, variable in dorsal profile. Mouth is
terminal and protractile. Its HL 17.5-15.43% in SL. Depth of the body is
little greater than head length; its depth 25.68-27.43% SL. It has medium eye
24.87-26.55% in HL. Its DFL and AFL are 20.61- 27.38% and 15.48-22.57%
of SL respectively. Lip development is variable. Lower lip is interrupted and
sometime continuous. Have two barbells on each side of the head. Its caudal
peduncle length is greater than depth.
Coloration: Olive above yellow or pinkish beneath fins first brown or
olive.
Distribution: The species is widely distributed in Ethiopian freshwater
for example in Gibe, Megech, Sanja and Angereb, Borkena and Mille Rivers.
Fig 4: Lateral view of Labeobarbus intermedius
Labeobarbus crassibarbis (Nagelkerke & Sibbing, 1997) (Fig. 5)
Diagnosis: It has irregular dorsal, head profile.
Description: Body depth is greater than head length (its depth 15.30-
49.05% SL). It has small eye (its diameter, 14.71-19.77). Its snout length and
interorbital width is 27.45-35.44 and 27.45-35.46% in HL respectively.
Coloration: Mostly silver white beneath, the fins are whitish; but it
differs depending on the habitat.
Distribution: It was reported from Tekeze River by Genanaw Tesfaye
(2006) and Dereje Tewab (2008) and Lake Tana. (de Graaf, 2003).

Page | 24
Fig 5: Lateral view of Labeobarbus crassibarbis
Labeobarbus nedgia (Ruppell, 1836) (Fig. 6)
Diagnosis: Lips strongly developed both upper and lower, produced into
a rounded or sub triangular lobes. It has fleshy rounded lobe on upper lip that
curls back over the snout.
Description: Depth of the body is little greater than length of head (its
depth 21.08-22.76% in SL). Its eye diameter is 22.5-32.36% in HL. Caudal
peduncle length is grater than its depth (31.34-31.74% in SL).
Coloration: Fins olive or greenish above yellow beneath fins
Distribution: It was reported from Lake Tana, Angereb, Sanja, Omo,
Dedessa, Beles, Gelegel Beles and Borkena Rivers.
Fig 6: Lateral view of Labeobarbus nedgia
Clarias gariepinus (Burchell, 1822) (Fig. 7)
Diagnosis: It has no adipose fin and scales in caudal peduncles and
lateral line.
Description: depth of the body is less than length of the head (its depth
8-12.95 in % SL). The upper surface of head more or less distinctly
granulate; occipital process angular. Its Eye is very small, its diameter of
4.44-6.02% in HL. It has wide interorbital width (30-31.91% in HL). Mouth
is terminal and large Pectoral spin.
Coloration: Dark, grayish-black above and creamy-white underside.
Distribution: All Ethiopian freshwater.

Page | 25
Fig 7: Lateral view of Clarias gariepinus
Mormyrus Kannume (Forsskål, 1775) (Fig. 8)
Diagnosis: Snout at least nearly as long as postorbital part of head;
dorsal in advance of base of ventral fins with rays; anal rays; scale in lateral
line.
Description: Depth of the body is less than length of head (its depth
20.71-23.41% in SL). Upper profile of head is descending in straight line. It
has small eye (14.4 -19.67% in HL). Paired and vertical fins all present;
narrow caudal peduncle depth (6.82-9.39% SL) and deeply forked caudal
fin. Dorsal fin rays 51-59, Anal fin rays 22-23. Dorsal and anal fins are
opposite each other on the posterior part of body.
Coloration: Brownish or olive above and white in beneath.
Distribution: Gendewuha, Guang, Omo, Angereb, Ayima and Gibe
Rivers.
Fig 8: Lateral view of Mormyrus kannume
Bagrus docmak (Forskalii, 1775) (Fig. 9).
Diagnosis: Body is slightly elongated. It has long barbells.
Description: Depth of the body is almost equal to head length (18.9-
26.33% SL). Its head much depressed and smooth above. It has short snout
length (7.94-10.61% in HL). It has relatively small eye (10-14.22% HL).
Barbell length is much greater than head length. Caudal peduncle length is
greater than its depth. Caudal is deeply forked.

Page | 26
Coloration: Grayish blue to dark olive above, white beneath.
Distribution: Guang, Omo, Sanja, Angereb, Ayima, Beles and Gelegel
Beles Rivers.
Fig 9: Lateral view of Bagrus docmak
Labeo forskalii (Rüppell, 1835) (Fig. 10)
Diagnosis: Labial folds well-developed sucker around the mouth
distinguishes this species, rostral flap large and horny tubercles on the snout.
Description: Body more or less compressed, its depth 19.02- 20.99%in
SL. Snout is swollen with distinct curved transverse groove above. Snout
length is greater than head length (its length 41.12 – 54.55%in HL). It has 11
to 12 dorsal fin rays and 18 to 21 caudal fin rays.
Coloration: Dark olive above and on the sides, whet beneath.
Distribution: Dubus, Angereb, Sanja, Tekeze, Baro, Omo, Gendewuha,
Guang, Ayima and Gibe, Beles and Gelgel Beles Rivers.
Fig 10: Lateral view of Labeo forskalii
Oreochromis niloticus (Linnaeus, 1758) (Fig. 11)
Diagnosis: The most distinguishing characteristic of O. niloticus species
is the presence of regular vertical stripes throughout the depth of caudal fin.
Description: Depth of the body is greater than the length of head (its
depth 34.97-43.56% SL). Snout rounded, with straight or slightly convex
upper profile. It has relative large eye, its diameter 16.37-24.07% in HL. The
pectoral and pelvic fin length is 28-34.25 and 21.33-25.56% SL respectively.

Page | 27
Coloration: Brown or grey to dark olive color.
Distribution: Almost all Ethiopian freshwater.
Fig 11: Lateral view of Oreochromis niloticus
5.2.2 Species diversity and abundance
5.2.2.1 Species diversity
Labeobarbus intermedius, L. nedgia and L. forskalii were common in all
the sampling sites in both seasons. However, M. kannume and B. docmak
were found in all the sampling sites during wet season but it was absent
during dry season at Wm site (Table 9). Clarias gariepinus was found both
in Se and Ab sites during the dry and wet seasons but absent in Wm site at
both sampling periods. Oreochromis niloticus did not found in both Ab and
Wm sites during the dry and wet seasons. The number of fish species is
higher at Se sampling site and lower in Wm sampling site (Table 9). Eight
species at Se and six species from Wm sampling sites were recorded (Table
8). Blue Nile River below the Blue Nile Fall was dominated by the Family
Cyprinidae and mainly by the genus Labeobarbus.
Table 8: Fish distribution among the sampling sites both dry and wet seasons (+:
present;- :absent)
Sampling sites
Se Ab Wm
Fish species family dry wet dry wet dry wet
L. intermedius Cyprinidae + + + + + +
L. nedgia Cyprinidae + + + + + +
L. crassibarbis Cyprinidae + + + + + +
L. forskalii Cyprinidae + + + + + +
M. kannume Mormyridae + + + + _ +
B. docmak Bagridae + + + + _ +
C. gariepinus Clariidae + + + + _ _
O. niloticus Cichlidae + _ _ _ _ _

Page | 28
Shannon diversity index (H') was used to evaluate species diversity of
sampling sites. Shannon diversity index explains both variety and the
relative abundance of fish species (Naesje et al., 2004). The species diversity
in Se site showed more diversity than Abenaze and Wotetomider in dry
season but it is the lowest in wet seasons (Table 9 &10 and Fig 14). The H'
was higher in Se sampling site with the values of (H' = 1.44) followed by Ab
(H'= 1.33) and Wm (H' = 1.23) in dry season sampling period (Table 9).
However, the H' was higher in Wm sampling site with the values of (H' =
1.62) followed by Ab (H' = 1.60) and Se (H’ = 1.58) in wet season sampling
period (Table 10).
Table 9: Shannon diversity index (H') and number (N) of fish species in dry
season
H'/N Sampling sites
Se Ab Wm
H' 1.44 1.33 1.23
N 8 6 4
Table 10: Shannon diversity index and number of fish species in wet season
H'/N Sampling sites
Se Ab Wm
H' 1.58 1.60 1.64
N 7 7 6
Fig 12: Shannon diversity index (H') and Number of fish species in both dry and wet
seasons
During the study period, 128 kg and 232 kg total biomass of specimens
were collected during wet and dry seasons, respectively (Table 11). The

Page | 29
number of fish species was higher in dry season than wet season. However,
Shannon diversity index (H') value was higher in wet season in all the
sampling sites (Fig 12).
Table 11: Number and total biomass (kg) of fish during wet and dry season
Season Total weight (kg) Total number
Dry 232 553
Wet 128 304
Dry season showed higher values than wet season in terms of weight
(kg) and number of specimens of fishes. The reason would probably be
during wet seasons there is high turbidity of river, speedy run-off, and low
temperature that attributed less number of fish catch in wet season. During
wet season, there is also higher water discharge; fishes could be highly
dispersed in the large volume of water than dry season and it becomes
difficult to catch them. In addition to the variation in catches between wet
and dry seasons might be variation gill net efficiency and time of setting of
gill net might also contribute to variation in the catches. The efficiency of
gill nets could be decreased by logs, leaves, roots that were brought by
flooding.
5.2.2.2 Relative abundance of fish during wet and dry seasons
The species composition of gillnet and monofilament catches both in dry
and wet season ranked based on the IRI value for different sampling site
(Table 12 and 13). Labeobarbus intermedius was the most abundant species
during the study period and constituting of 39.67% in the total number of
catch. L. forskalii and M. kannume were found in relative abundance of
27.77% and 11.67% respectively (Table 12). The other species, L. nedgia, B.
docmak, L. crassibarbis, C. gariepinus and O. niloticus were found in
9.59%, 5.13%, 3.5%, 1.98% and 0.70%, respectively.
There was significant difference in fish specimen abundance between
dry and wet season except L. crassibarbis, B. docmak and C. gariepinus
(Table 12). Labeobarbus intermedius was the most important fish species in
both dry and wet season in all sites (Table 12 and 13). Labeo forskalii was
very important in all sampling site except Wm during the wet season.
Mormyrus kannume was important in all sites except in Wm in wet season
but was less important in all sites during dry season.
Labeobarbus intermedius and L. forskalii showed very highly
significant variation in number of catch between dry and wet season
(P<0.001). Mormyrus kannume and L. nedgia showed significant variation in

Page | 30
number of catch between dry and wet season (P<0.01) and (P< 0.05)
respectively (Table 12). However, B. docmak, C. gariepinus, L. crassibarbis
and O. niloticus did not show significant variation in number of catch
between dry and wet season (P>0.05).
Table 12: Species number and percentage composition of both in dry and wet season
in sampling sites (One way ANOVA)
Seasons
Fish species dry wet total percentage composition sig.
L. intermedius 243 97 340 39.67 0.000***
L. forskalii 179 59 238 27.77 0.000 ***
L. nedgia 52 30 82 9.57 0.015*
L. crassibarbis 14 16 30 3.50 0.715 ns
M. kannume 31 69 100 11.67 0.00 **
B. docmak 17 27 44 5.13 0.132 ns
C. gariepinus 11 6 17 1.98 0.225 ns
O. niloticus 6 0 6 0.70-
Note: *(P<0.05) (significant), **(P<0.01) (highly significant), ***(P<0.001) (very
highly significant), and ns (P>0.05) (non-significant)
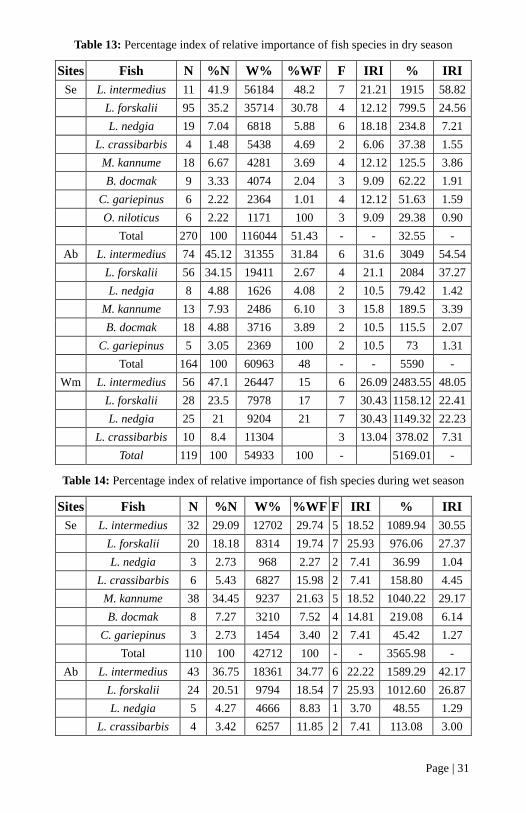
The species collected were analyzed based on the Index of Relative
Importance. Accordingly, L. intermedius % IRI values (58.82%, 54.54%, and
48.05%) and (30.55%, 42.17%, 43.58%) in Se, Ab and Wm during wet and
dry seasons respectively given in Table (13and 14). The percentage IRI of L.
forskalii in dry season was (24.56%, 37.27% and 22.41%) in Se, Ab and
Wm, respectively. The percentage IRI value of L. forskalii was higher both
in dry and wet season in all the sampling sites (Table 13 and 14). The % IRI
value of M. kannume was higher in Se and Ab sites during wet season.
Nevertheless, it had small % IRI value in Wm site during wet season and in
all sampling sites during dry season (Table 13 and 14). During dry season L.
intermedius, L. forskalii and L. nedgia were the most important species with
in Se and Wm sampling sites whereas in Ab site the most important species
were L. intermedius, L. forskalii and M. kannume. Percentage IRI value from
the pooled catch in sampling sites for L. intermedius (51.92%), L. forskalii
(29.14%), L. nedgia (6.81%) and M. kannume (5.99%) were in order of their
decreasing importance (Table 15).
Page | 31
Table 13: Percentage index of relative importance of fish species in dry season
Sites Fish N %N W% %WF F IRI % IRI
Se L. intermedius 11 41.9 56184 48.2 7 21.21 1915 58.82
L. forskalii 95 35.2 35714 30.78 4 12.12 799.5 24.56
L. nedgia 19 7.04 6818 5.88 6 18.18 234.8 7.21
L. crassibarbis 4 1.48 5438 4.69 2 6.06 37.38 1.55
M. kannume 18 6.67 4281 3.69 4 12.12 125.5 3.86
B. docmak 9 3.33 4074 2.04 3 9.09 62.22 1.91
C. gariepinus 6 2.22 2364 1.01 4 12.12 51.63 1.59
O. niloticus 6 2.22 1171 100 3 9.09 29.38 0.90
Total 270 100 116044 51.43 - - 32.55 -
Ab L. intermedius 74 45.12 31355 31.84 6 31.6 3049 54.54
L. forskalii 56 34.15 19411 2.67 4 21.1 2084 37.27
L. nedgia 8 4.88 1626 4.08 2 10.5 79.42 1.42
M. kannume 13 7.93 2486 6.10 3 15.8 189.5 3.39
B. docmak 18 4.88 3716 3.89 2 10.5 115.5 2.07
C. gariepinus 5 3.05 2369 100 2 10.5 73 1.31
Total 164 100 60963 48 - - 5590 -
Wm L. intermedius 56 47.1 26447 15 6 26.09 2483.55 48.05
L. forskalii 28 23.5 7978 17 7 30.43 1158.12 22.41
L. nedgia 25 21 9204 21 7 30.43 1149.32 22.23
L. crassibarbis 10 8.4 11304 3 13.04 378.02 7.31
Total 119 100 54933 100 - 5169.01 -
Table 14: Percentage index of relative importance of fish species during wet season
Sites Fish N %N W% %WF F IRI % IRI
Se L. intermedius 32 29.09 12702 29.74 5 18.52 1089.94 30.55
L. forskalii 20 18.18 8314 19.74 7 25.93 976.06 27.37
L. nedgia 3 2.73 968 2.27 2 7.41 36.99 1.04
L. crassibarbis 6 5.43 6827 15.98 2 7.41 158.80 4.45
M. kannume 38 34.45 9237 21.63 5 18.52 1040.22 29.17
B. docmak 8 7.27 3210 7.52 4 14.81 219.08 6.14
C. gariepinus 3 2.73 1454 3.40 2 7.41 45.42 1.27
Total 110 100 42712 100 - - 3565.98 -
Ab L. intermedius 43 36.75 18361 34.77 6 22.22 1589.29 42.17
L. forskalii 24 20.51 9794 18.54 7 25.93 1012.60 26.87
L. nedgia 5 4.27 4666 8.83 1 3.70 48.55 1.29
L. crassibarbis 4 3.42 6257 11.85 2 7.41 113.08 3.00

Page | 32
M. kannume 27 23.08 7048.6 14.78 5 18.52 701.03 18.60
B. docmak 11 9.40 4488 8.50 4 14.81 265.18 7.04
C. gariepinus 3 2.56 1442 2.73 2 7.41 39.22 1.04
Total 117 100 52813 100 - - 3768.95 -
Wm L. intermedius 22 28.57 8606 27.75 7 31.82 1728.44 43.58
L. forskalii 15 19.48 5401 16.16 4 18.18 648.03 16.34
L. nedgia 22 28.57 8598 25.73 4 18.18 987.25 24.89
L. crassibarbis 6 7.79 6490 19.42 2 9.09 247.34 6.24
M. kannume 4 5.19 755 2.26 2 9.09 67.76 1.71
B. docmak 8 10.39 3570 10.68 3 13.64 287.34 7.24
Total 77 100 33420 100 - 3966.20
Percentage IRI of L. intermedius was higher at Se and lower at Wm in
dry season and it was higher at Wm and lower at Se site in wet season.
Percentage of IRI of L. forskalii was higher at Ab and lower at Wm in dry
season and it was higher at Se and lower at Wm (Table 13 and Fig 13).
Percentage IRI of M. kannume was higher during wet season and lower
during dry season in all sampling sites.
Fig 13: Percentage IRI of dominant fish species in sampling sites during dry and wet
season
There might be several reasons for changes in abundance between wet
and dry seasons. Variation in available nutrients and habitats, fishing effort,
fish behavior, size and life history stages of fishes might all contribute to
variation in abundance of the catches. Moreover, water level (Karenge and
Kolding, 1995) and turbidity of water may also affect abundance.

Page | 33
Table 15: Pooled catch of IRI and H' values in both dry and wet seasons at all the
sampling sites
Sites N %N W% WF %F IRI % IRI H’
L. intermedius 340 39.67 153655 42.69 37 24.50 2018.22 51.92 0.37
L. forskalii 238 27.77 86612 24.06 33 21.82 1132.83 29.14 0.36
L. nedgia 82 9.57 30912 8.59 22 14.57 264.54 6.81 0.22
L. crassibarbis 30 3.50 36316 10.09 11 7.28 99.01 2.55 0.12
M. kannume 100 11.67 24563.6 6.82 19 12.58 232.70 5.99 0.25
B. docmak 44 5.13 19058 5.30 16 10.06 110.51 2.84 0.15
C. gariepinus 17 1.98 7629 2.12 10 6.62 27.17 0.70 0.08
O. niloticus 6 0.70 1171 0.50 3 4.00 4.82 0.12 0.03
Total 857 - 359916.6 - - - 3887.01
5.2.2.3 Length frequency distribution of the dominate fish species
The length frequency distribution of the most dominant species of L.
intermedius, L. forskalii and M. kannume are showed in (Figure 14).
Labeobarbus intermedius the most dominant species had total length rage
from 17 to 52.3 cm, with the mean and standard error of total length was
32.5±0.50 (Fig 14). Labeo forskalii is the second most abundant species with
total length range from 13.8 to 46.5 cm with mean and standard error of 34.3
±0.39 (Fig 14). Mormyrus kannume is the third abundant species had total
length rage from 25.2 to 40.8 cm with mean and standard error of 32.2± 0.44
(Fig 14).

Page | 34
Fig 14: Length frequency distribution of L. intermedius (N= 340), L. forskalii
(N=238) and M. kannume (N= 100) respectively
5.3 Some biological aspects of the dominant fish species
5.3.1 Length-weight relationship
The relationship between total length and total weight for most
dominant species of L. intermedius, L. forskalii and M. kannume were
curvilinear and showed significant variation (P<0.001).
In fishes, the regression coefficient b=3 describes isometric growth,
when the value becomes exactly 3, if the fishes retain the same shape and
their specific gravity remains unchanged during their life time (Ricker,
1975). If the weight increased according to the fish length, it is said to be
isometric growth (Mansor Mat Isa S.A.S.A., 2001). However, fishes may
have “b” value greater or less than 3, a condition of allometric growth
(Bagenal and Tesch, 1978). A value less than 3.0 shows that the fish becomes
lighter (-ve allometric) or greater than 3.0 indicates that the fish become
heavier (+ve allometric) for a particular length as it increases in size
(Wootton, 1998; Zafar et al., 2003). L. intermedius in the upper part of Blue
Nile River showed nearly isometric growth, which means the weight of these

Page | 35
fishes increases as the cub of length because the b value is nearly 3 for these
fish species in river (Fig 15). This value was close to the values reported for
some freshwater fish species by Genanew Tesfaye (2006), in Angereb and
Sanja Rivers, Wassie Anteneh (2005), in Dirma and Megech Rivers, Abebe
Getahun et al., (2008) in Rib River, Assefa Tessema (2010), in Borkena and
Mille Rivers and Mohammed Omer (2010), in head of Blue Nile River. On
the other hand the b values obtained in this study area for L. forskalii and M.
kannume show negative allometric growth unlike that reported by Dereje
Tewabe (2006) in Gendewuha, Guang, Shinfa and Ayima Rivers and
Genanaw Tesfaye (2006), in River Angreb. However, the result obtained in
this study b value for L. forskalii in upper part of Blue Nile River is in
agreement with the values obtained by Zeleke Berie (2009) from Gelegel
Beles River.

Page | 36
Fig 15: Length-weight relationship of L. intermedius, L. forskalii and M. kannume
respectively
5.3.2 Fulton’s condition factor (FCF)
The mean Fulton condition factor value obtained in the present study for
L. intermedius in the Blue Nile River below the Tisisat fall was 0.99, which
was less than reported by Genanaw Tesfaye (2006), from Angereb and Sanja
Rivers with a value of 1.06, Dereje Tewabe (2008), from Gondwana, Guang
and Shinfa Rivers with a value of 1.12, Assefa Tessema (2010), with a values
of 1.23 and 1.31 in Borkena and Mille Rivers. Nevertheless, it is higher than
the result obtained by Mohammed Omer (2010), with value of 0.87 in a head
of Blue Nile River. The present FCF value of L. intermedius was similar to
that reported by Zeleke Berie (2009), in Gelegel Beles River. The
measurement of fish condition can be linked to the general health, fat and
lipid content prey or food availability, reproductive potential, environmental
condition and water level fluctuation. In general, higher condition is
associated with higher energy (fat) content, increasing food base,
reproduction potential or more favorable environmental condition (Pauker
and Cottle, 2004).
Table 16: Mean and Standard deviation of Fulton condition factor both by sex and
season: P= significance difference (Mann-Whitney U test) between sex and seasons
of dominant fish species
Fish Sex Mean ± SD P Season Mean ± SD P
L. intermedius
F
M
Average
0.99±0.16
0.97±0.09
0.99±0.15
ns Wet
Dry
0.97±0.14
0.99±0.16
0.98±0.15
ns
L. forskalii
F
M
Average
0.83±0.09
0.86±0.18
0.84±0.11
ns
Wet
Dry
0.80±0.06
0.850.12
0.83±0.11
***
Page | 37
M. kannume
F
M
Average
1.00±0.00
1.00±0.00
1.49±0.050
ns Wet
Dry
1.00±0.00
1.00±0.00
1.32±0.047
ns
Note: ** =P<0.01, ns =P>0.05, (Average =Mean of mean)
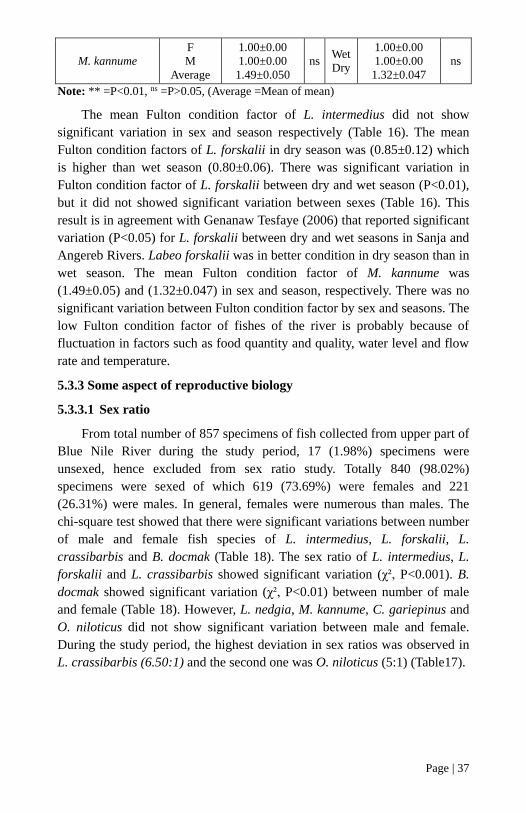
The mean Fulton condition factor of L. intermedius did not show
significant variation in sex and season respectively (Table 16). The mean
Fulton condition factors of L. forskalii in dry season was (0.85±0.12) which
is higher than wet season (0.80±0.06). There was significant variation in
Fulton condition factor of L. forskalii between dry and wet season (P<0.01),
but it did not showed significant variation between sexes (Table 16). This
result is in agreement with Genanaw Tesfaye (2006) that reported significant
variation (P<0.05) for L. forskalii between dry and wet seasons in Sanja and
Angereb Rivers. Labeo forskalii was in better condition in dry season than in
wet season. The mean Fulton condition factor of M. kannume was
(1.49±0.05) and (1.32±0.047) in sex and season, respectively. There was no
significant variation between Fulton condition factor by sex and seasons. The
low Fulton condition factor of fishes of the river is probably because of
fluctuation in factors such as food quantity and quality, water level and flow
rate and temperature.
5.3.3 Some aspect of reproductive biology
5.3.3.1 Sex ratio
From total number of 857 specimens of fish collected from upper part of
Blue Nile River during the study period, 17 (1.98%) specimens were
unsexed, hence excluded from sex ratio study. Totally 840 (98.02%)
specimens were sexed of which 619 (73.69%) were females and 221
(26.31%) were males. In general, females were numerous than males. The
chi-square test showed that there were significant variations between number
of male and female fish species of L. intermedius, L. forskalii, L.
crassibarbis and B. docmak (Table 18). The sex ratio of L. intermedius, L.
forskalii and L. crassibarbis showed significant variation (χ², P<0.001). B.
docmak showed significant variation (χ², P<0.01) between number of male
and female (Table 18). However, L. nedgia, M. kannume, C. gariepinus and
O. niloticus did not show significant variation between male and female.
During the study period, the highest deviation in sex ratios was observed in
L. crassibarbis (6.50:1) and the second one was O. niloticus (5:1) (Table17).
Page | 38
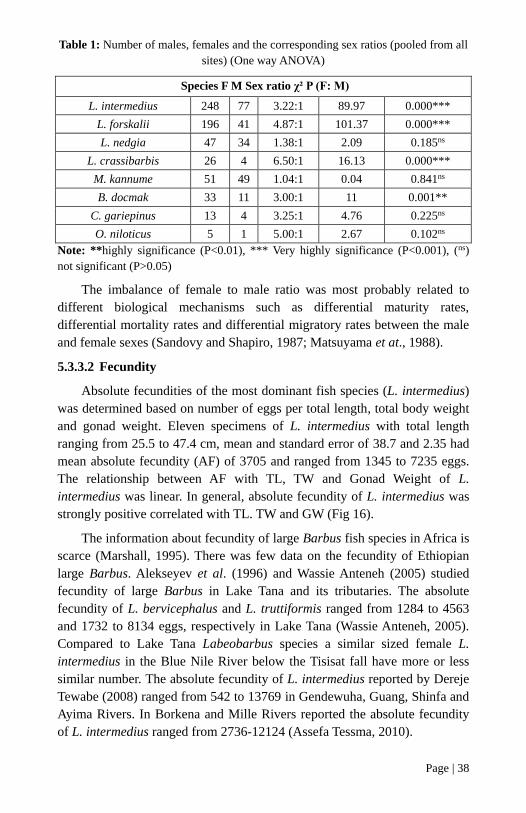
Table 1: Number of males, females and the corresponding sex ratios (pooled from all
sites) (One way ANOVA)
Species F M Sex ratio χ² P (F: M)
L. intermedius 248 77 3.22:1 89.97 0.000***
L. forskalii 196 41 4.87:1 101.37 0.000***
L. nedgia 47 34 1.38:1 2.09 0.185ns
L. crassibarbis 26 4 6.50:1 16.13 0.000***
M. kannume 51 49 1.04:1 0.04 0.841ns
B. docmak 33 11 3.00:1 11 0.001**
C. gariepinus 13 4 3.25:1 4.76 0.225ns
O. niloticus 5 1 5.00:1 2.67 0.102ns
Note: **highly significance (P<0.01), *** Very highly significance (P<0.001), (ns)
not significant (P>0.05)
The imbalance of female to male ratio was most probably related to
different biological mechanisms such as differential maturity rates,
differential mortality rates and differential migratory rates between the male
and female sexes (Sandovy and Shapiro, 1987; Matsuyama et at., 1988).
5.3.3.2 Fecundity
Absolute fecundities of the most dominant fish species (L. intermedius)
was determined based on number of eggs per total length, total body weight
and gonad weight. Eleven specimens of L. intermedius with total length
ranging from 25.5 to 47.4 cm, mean and standard error of 38.7 and 2.35 had
mean absolute fecundity (AF) of 3705 and ranged from 1345 to 7235 eggs.
The relationship between AF with TL, TW and Gonad Weight of L.
intermedius was linear. In general, absolute fecundity of L. intermedius was
strongly positive correlated with TL. TW and GW (Fig 16).
The information about fecundity of large Barbus fish species in Africa is
scarce (Marshall, 1995). There was few data on the fecundity of Ethiopian
large Barbus. Alekseyev et al. (1996) and Wassie Anteneh (2005) studied
fecundity of large Barbus in Lake Tana and its tributaries. The absolute
fecundity of L. bervicephalus and L. truttiformis ranged from 1284 to 4563
and 1732 to 8134 eggs, respectively in Lake Tana (Wassie Anteneh, 2005).
Compared to Lake Tana Labeobarbus species a similar sized female L.
intermedius in the Blue Nile River below the Tisisat fall have more or less
similar number. The absolute fecundity of L. intermedius reported by Dereje
Tewabe (2008) ranged from 542 to 13769 in Gendewuha, Guang, Shinfa and
Ayima Rivers. In Borkena and Mille Rivers reported the absolute fecundity
of L. intermedius ranged from 2736-12124 (Assefa Tessma, 2010).

Page | 39
(A)
(B)
Fig 16: ABC Absolute fecundity with total length, total weight and Gonad weight
relation in L. intermedius (n= 11)
Page | 40
Chapter - 6
Fishing Activity and Its Problems in the Study Area
6.1 Fishing Activity
Questionnaires were developed and interviewed the local inhabitant of
villages near the River: Sefania, Abenaze and Wotetomider to know the
fishing activity of the farmers and identify major problems. The information
obtained from the questionnaires and from personal communication was
used to state about the fishing activity in the river and identify its problems.
There were 30 farmers in the study area that were selected and
interviewed. The farmers’ source of income is crop and animal farming.
Fishery was an additional source of food. They fish for their own
consumption and as a gift for relatives. The entire farmers in upper part of
Blue Nile River were seasonal and the fishing activity takes place only from
the river. They usually start fishing activities in the river in the middle of
November. They start during this time because in most cases the water level
starts to lower.
The fish catch data from upper part of the Blue Nile River was not
available. The farmers fishing activity takes place at night. However, rough
estimates can be made from the observations I had and interviews made with
the farmers. Accordingly, fishing activity takes place at about three sites
along the stretch of the river. It takes place for about six months (15
November to end of May) sometimes in June and July. Farmers catches fish
on average four day per week and 17 days per month. They estimated their
daily catch up on average five fish/night/person (about 10 kg/night/person).
From each site 204kg of fish harvest per six months per person per site. In all
sampling site an average of 18.36 quintals of fish has been harvest annually
from the three sampling site. The method I used to estimate based on
interview result. Fishing intensity in the study area was higher starting from
January to May (Fig 17). Fish potential of the river is decline from time to
time due to environmental fluctuation (personal communication). According
to Gebru Asrat (personal communication), few species extinct from the river
for example, L. horie in local language “Assam nalbari”. This fish was
present in the river few years ago and they were catch frequently but now it

Page | 41
does not found. The probable reason they put was fluctuation of the river
volume year-to-year and other environmental variations. For example, in
2010 the river was total blocked at the source in Lake Tana, during this time
there was numerous fish massive fish death and also catch by the local
people using hand. In addition, huge amount of fish was dead on October
(2010) after heavy ran fall. The reason of this the rainfall is mixe up with
snow. This leads to increase the coldness of the river.
0
5
10
15
20
25
30
35
Sept
Oct
Nov
Dec
Juan
Feb
Mar
Apr
May
Jan
Jul
Aug
Month
Nu
mb
er
of
resp
on
dan
t
Fig 17: Farmers fishing time in the study area
There is no as such any technical assistance (extension service) for the
local community with regard to utilization and management of the fish
resource. There is no any modern fishing gear in the area. Most local
fishermen use hook and line (Local name is mekatin) and Castnet (Local
name is mereab) for catching fish. The hook and line has got three size
categories (Large, medium and small). Those local fishermen used part of
the flesh of fish as bait. Some of the local fishermen used locally made gill
nets with mesh size of approximately 12cm.
When the volume of the river is becoming low there is high fishing
intensity by local community and the fish prey by other aquatic animals such
as birds and crocodiles. Most of the respondents are willing to cooperate in
any measures that would lead to sustainable utilization of the fish resources.
They are also eager to get modem fishing gear like gillnets.
Farmers identify some of the fish species with their local names: "Nech
Assa" (L. intermedius), "Tubemate" (L. forskalii), "Source" (L. crassibarbis),
"Mota" (L. nedgia), “Aishe” (M. kannume),”Fergus” (B. docmak), "Ambaza"
(C. gariepinus), "Koroso" (O. niloticus, Nile tilapia). They very well

Page | 42
understand that there is diversity of fish in upper head of Blue Nile River.
Almost all of the respondents said that more than, 90% of the catch is
composed of L. forskalii, M. kannume, L. intermedius, and B. docmak (this
especially used after drying). Among the above fish, species the farmer
prefer to consume L. intermedius and L. forskalii. They prefer the two
species because they assume high quality and the fishes are attractive when
seen externally. All of the respondents do not have storage facilities but they
have tried to improve the shelf life of the fish by sun drying methods by
making a strip of the flesh of catfish and Bagrus docmak
6.2 Problems in fishing activities
Main problems mentioned by respondents in upper part of Blue Nile
River were: Lack of proper fishing gears; almost all of them use hook and
line and castnet for fishing, lack of knowledge in fishing and fish processing,
lack of infrastructure and market, especially those local fisherman live far
from woreda town, lack of post-harvest technology in case of excess
production. As a result, the fishermen catch fish only for household
consumption purposes. There is no extension service that assists the fishery
activities.

Page | 43
Chapter - 7
Limitation of the Study
Data were collected only in two seasons due to logistic and budget
constraints and hence it was difficult to collect enough information on
reproductive biology of dominant fish species: L. intermedius, L. forskalii
and M. kannume. In addition to this, sampling duration and sampling sites
were limited due to budget and rugged topography location so that the
chance of obtaining many new species in the rivers became low. The
efficiency of fishing gears was also another limitation for my current study.

Page | 44
Chapter - 8
Conclusion and Recommandations
8.1 Conclusion
Eight species of fishes included in 5 families and 4 orders were
investigated from upper part of Blue Nile River.
Diversity of the fish fauna of the River is dominated by cyprinid
fish species. L. intermedius, L. forskalii and M. kannume were the
most dominant fish species in number and total biomass during the
study periods.
Sefania site had higher fish diversity in dry season than the other
sampling sites. But it had lower diversity in wet season as compared
to Abenaze and Wotetomider. Shannon diversity value (H’) of
Sefania was (1.44) in dry and (1.58)in wet season, where as
Abenaze and Wotetomider had 1.33 and 1.23 in dry and 1.60 and
1.62 in wet season respectively.
L. intermedius, L. forskalii and M. kannume were the most
important fish species during wet season with IRI value of 46.64%,
17.69% and 16.87%, respectively. Whereas L. intermedius, L.
forskalii and L. nedgia were the most dominant fish, species during
dry season with IRI value of 57.32%, 28.96% and 8.27%,
respectively.
L. intermedius, L. forskalii and M. kannume were with highest
diversity, with the Shannon diversity index value of 0.37, 0.36 and
0.25, respectively.
L. intermedius, L. forskalii and M. kannume were the most
important fish species in the upper part of the Blue Nile River. Their
compositions from the total catches were 39.67%, 27.77% and
11.67% respectively.
The length weight relationships for L. intermedius, L. forskalii and
M. kannume were curvilinear. L. intermedius showed nearly
isometric relation, but L. forskalii and M. kannume showed negative
allometric relation.

Page | 45
There was significant difference in Fulton condition factor for L.
forskalii between dry and wet seasons (P<0.01).
Fulton condition factor of L. forskalii in dry and wet seasons was
(0.85±0.12) and (0.80±0.06), respectively. Therefore, L. forskalii
was in better condition in dry season than wet season.
The chi-square test analysis showed that there was significance
variation in number of male and female of L. intermedius and L.
forskalii with (P< 0.001). However, M. kannume did not showed
significant variation in number of male and female.
Fecundity was found to have linear relation with total length, total
weight and gonad weight for L. intermedius.
The upper part of Blue Nile River has a number of fish species and
the people in this area have fish consuming habit.
L. intermedius, L. forskalii, M. kannume and B. docmak are the
most subsistence fish species in of Blue Nile River below the Tisisat
fall.
L. intermedius and L. forskalii are the most preferred fish species
consumed by the local people.
8.2 Recommendations
Detailed studies and investigations are required on:
The diversity, abundance and biology of fish species was carried
out only in upper part of the River only in two seasons over
relatively short period of time. Besides, the study was conducted
only at three sites. For comprehensive assessment on the magnitude
of fish, diversity in these river investigations should be conducted
throughout the year using more sites and different sampling
methods. Investigations should also be done along the river until the
border of Sudan by selecting many more suitable sampling sites.
Food and feeding behaviors of the fish species in the river.
Ecological issues specially that of catchment area of the rivers.
There are indications of severe degradations of the river basins
particularly the upper part of the river catchment area. Major threats
to the basins are related to deforestation and erosion. This issue
requires scientific study so that sustainable utilization of the
resources is designed.
The water released from Lake Tana should be constant, so that it
does not affect the natural flow of the regime.

Page | 46
There is lack of information on the fish and fisheries in the river.
This should be given emphasis by the respective institutions or
organizations so as to introduce appropriate extension systems to
identify and exploit the fishery resources in a sustainable manner.
Fishermen need to be encouraged through training and provision of
appropriate fishing gears, since crocodile problem for gillnet is
paramount in the area. Organizing fishermen in cooperatives with
strong extension network with expertise is recommended.
The government should be implement fisheries legislation to
encourage the fishermen
Awareness creassion should be given for fishermen’s about fishing
activity and supply appropriate fishing gears.
Integrated watershed management should be done in the river
drainage basins.
Fish species of L. nedgia and L. crassibarbis were required further
identification because of previously the two species are endemic to
Lake Tana only.

Page | 47
References
1. Abebe Getahun (2002). The Nile basin: Riverine fish and Fisheries,
Department of Biology Addis Ababa University, Ethiopia 19pp.
2. Abebe Getahun (2005a). Fresh water eco-regions of Ethiopia. In:
Theime et al., (eds) Freshwater eco-region of Africa. Aconservation
assessment/ Island press, Washington, D.C., U.S.A.
3. Abebe Getahun (2005b). An over View of the diversity and conservation
status of Ethiopian freshwater fish fauna. In proceeding of the Pan.
Africa fish and fisheries society, Cotonou, Benin, Nov.2003.
4. Abebe Getahun (2007). An overview of the diversity and conservation
status of the Ethiopian freshwater fish fauna. J. Afrotropical Zoology
special Issue: 87-96.
5. Abebe Getahun and Stiassny, M.L.J. (1998). The freshwater
Biodiversity Crisis: the case of Ethiopian fish fauna. SINET. Eth. J. Sci
21(2):207-230.
6. Abebe Getahun, Eshete Dejen and Wassie Anteneh (2008). Fishery
Studies of Rib River, Lake Tana Basin, Ethiopia Final Report VOL.2
Presented to the World Bank- financed Ethiopia- Nile Irrigation and
Drainage Project Coordination Office, Ministry of Water Resources:
January 2008 Addis Ababa, Ethiopia.
7. Assefa Tessema (2010). Diversity Relative Abundance and Biology of
Fish in Mille and Borkena River, Awash Basin, Ethiopia. MSc Thesis
Bahir Dar University, Ethiopia.
8. Bagenal, T.B. and Tesh, F.W., (1978). Age and growth. IN Bagenal. T.B
(Ed.). Methods for assessment of fish production in freshwater. Black
well Oxoford, New York, 1o1-136 Pp.
9. Baras, E. (1997). Environmental determinants of residence area
selection and longterm utilization in a shoaling teleost, the common
barbell (Barbus barbus L.). Aquat. Living Resour., 10:195-206.
10. Baras, E., Philipart, J.C., and Nindaba, J. (1996). Important of gravel
bars as spawning grounds and nurseries for European running water
cyprinids. 2nd International Symposium on Habitat Hydraulics, volume
a, 367-378.

Page | 48
11. Begon, M., Harper, J.L and Townsed, C.R. (1990). Ecology: individuals,
Population and communities. 2nd jet-Black well, scientific publication,
945pp. 2001, University Saints Malaysias, Penang, Malaysia. 6pp.
12. Boulen ger, G. A. (1909). Catalogue of the fresh water fish of Africa.
Vol. I. British Museum (Natural History), London, 373 pp.
13. Boulenger, G. A. (1911). Catalogue of the fresh water fish of Africa. Vol.
II. British Museum (Natural History), London, 529 pp.
14. Boulenger, G. A. (1915). Catalogue of the fresh water fish of Africa. Vol.
III. British Museum (Natural History), London, 526 pp.
15. Boulen ger, G. A. (1916). Catalogue of the fresh water fish of Africa.
Vol. IV. British Museum (Natural History), London, 392 pp.
16. BCEOM. (1999). Abay River Basin Integrated Development Master
Plan Project: phase 2 data collection-site Investigation Survey and
Analysis.
17. Conway. D (1999): The Climate and Hydrology of the Upper Blue Nile
River, School of Development Studies, University of East Anglia,
Norwich NR4 7U,The Geographical Journal, Vol. 166, No. 1, March
2000, pp. 49-62.
18. Demeke Admasu (1994). Maturity, fecundity, brood size and sex ratio of
Tilapia (Oreochromis niloticus) in Lake Awassa, Ethiopia. SINET Eth. J.
Sci. 17:1:53-69.
19. Dereje Tewabe (2008). Diversity, Relative abundance and Biology of
fishes in Gendewuha, Guang, Shinfa and Ayima Rivers, Tekeze and
Abay Basins, Ethiopia. MSc Thesis, Addis Ababa University, Ethiopia.
108Pp.
20. Dereje Tewbe, Goraw Goshu and Chalachew Aragaw (2008). Survey on
determine its water quality and the diversity of the fish community of
newly constracted reservoir, Tekeze hydropower dam, Proceedings of
the First Annual Conference of EFASA. Held at Zwai Fisheries
Resource Research Center Zwai, Ethiopia.
21. De Graaf, M., Eshete Dejen, Sibbing, F. A. and Osse, J. W. M. (2000).
Barbus tanapelagius, a new species from Lake Tana (Ethiopia): its
morphology and ecology". Env. Biol. Fishes 59:1 – 9.
22. Eshete Dejen (2003). The small barbus of Lake Tana. Doctorial thesis,
Experimental Zoology group, Wageningen University, 190Pp.

Page | 49
23. Ethiopian Meteorological Agency (EMA) (2011). Meteorological data
compiled from Bahir Dar and Adate station at Bahir Dar, Amhara
Regional State, Ethiopia.
24. Genanaw Tesfaye (2006). Diversity, Relative abundance and Biology of
fishes in Angereb and Sanja Rivers, Tekeze basin, Ethiopia, M.sc Thesis,
Addis Ababa University, Ethiopia.89.Pp.
25. Golubstov, A. S., Darkov, A. A., Dgebuadze, Yu. Yu. and Mina, M. V.
(1995). An artificial key to fish species of the Gambela Region (The
White Nile basin in the limits of Ethiopia). Joint Ethio- Russian
Biological expedition. Addis Ababa, Ethiopia, 84 pp.
26. Golubtsov, A. S., Dgebuadze, Yu. Yu. and Mina, M. V. (2002). Fishes of
the Ethiopian Rift Valley, Pp., 167-258. In: C. Tudorancea and W.D.
Taylor (eds.) Ethiopian Rift valley Lakes. Backhuys Publishers, Leiden,
Holland
27. Golubtsov, A.S. and Mina, M.V. (2003). Fish species diversity in the
main drainage System of Ethiopia: Current status of Knowledge and
research perspectives, Ethiop. J. Natu Reso. 2003. 5 (2):281-318.
28. Golubts ov, A. S. and Darkov, A. A. (2008). A review of fish diversity in
the main drainage systems of Ethiopia based on the data obtained by
2008, pp 69 -102. I n: Pavlov, D. S., Dgebuadze, Yu. Yu., Darkove,
A.A., Golubtsov, A. A. S. and Mina, M.V., (eds), 2008. Ecological and
faunastic studies in Ethiopia. Proceedings of Jubilee meeting ‘Joint
Ethio -Russian Biological Expedition: 20 years of scientific
cooperation’, Addis Ababa, xvi +173 p.
29. Joint Ethio-Russian Biological Expedition (JERBE) (1995). Report on
the study carried out by the freshwater biology group of the joint Ethio-
Russian Biological Expedition in November 200-January 2001.
30. Joint Ethio-Russian Biological Expedition (JERBE) (2007). Fish
diversity in the main drainage systems of Ethiopia. Addis Ababa.
31. Joint Ethio-Russian Biological Expedition (JERBE) (2008). Ethio-
Russian Biological Expedition, Twenty years of Biological Scientific
Cooperation ecological and faunistic studies in Ethiopia; Proceeding of
Jubiees Meeting in Addis Ababa February 21-23, Moscow.
32. Kolding, J. (1989). The fish resource of Lake Turkana and their
environment. Thesis. University of Bergen, Norway, 262, Pp.
33. Kolding, J. (1999) PASGEAR. A data base package for experimental or
Page | 50
artisanal fishery data from passive gears. An introductory manual.
University of Bergen, Department of Fisheries and Marine Biology.
34. Lake Fishery Development Project (LEDP) (1998). Seventh Annual
Progress Report, July 1997 to June 1998.
35. Leykun Abunie (2003). The distribution and status of Ethiopian
wetlands: an overview. In: Abebe, Y. D. and Geheb, K. (Eds),
2003.Wetlands of Ethiopia. Proceedings of aseminar on the resources
and status of Ethiopia'su wetlands, V I + 116 Pp.
36. Lowe-McConnel, R. (1975). Fish Communities in Tropical Freshwaters:
their Distribution, Ecology, and Evolution. Longman, London, 337pp.
37. MacGregor JS. (1957). Fecundity of the Pacific sardine (Sardinops
caerulea). Fish Bull Fish Wildl Serv U.S 121: 427-449.
38. Marshal BE. (1995). Why is Limnothrissa miodon such a successful
introduced species and is there anywhere else we should put it? In: The
impact of species changes in Africa lakes, Pitcher TJ, Hart PJB (ed),
Chapman and Hall, London.
39. Matsuyama, M., Adachi, S., Nagahama, Y. and Matsuura, S. (1988).
Diurnal rhythm of oocyte development and plasma steroid hormone
levels in the females red sea bream during the spawning season.
Aquaculture 73: 357-372
40. Mesfin Wolde Mariam (1970). An Atlas of Ethiopia. Polgrafico, Priv.
Ltd. Co Asmara, Ethiopia.101Pp.
41. Ministry of Agriculture (MoA) (2003). The Federal Democratic
Republic of Ethiopia. Ministry of Agriculture Abay basin. Beshilo River
master plan. 492pp.
42. Ministry of Water Resources (MoWR) (1998). Tekeze basin Integrated
master plan project. Sectoral report Vo1-NR6 Fisheries.
43. Ministry of Water Resources (MoWR) (2002). Water Sector
Development Program (WSDP), Addis Ababa: Ethiopia.
44. Ministry of Water Resources (MoWR) (2010). Assessment of Abay
River Basin Master plans project and programs Hydrometeorology.
Addis Ababa –Ethiopia.
45. Moges Beletew (2007). Diversity, Relative abundance and Biology of
fishes in some rivers, and cestode parasites of African catfish (C.
gariepinus) in some lakes of Ethiopia.

Page | 51
46. Mohammed Omer (2010). Diversity, Relative abundance and Biology of
fishes in the head of Blue Nile River, Blue Nile Basin, M.Sc. Thesis,
Bahir Dar University, Ethiopia.
47. Naesje, T.F., Hay. C.J., Nickansor, N., Koekemoer, J.H., Strand, R., and
thorstad, E.B., (2004).Fish population, gill net catch and gill net
selectivity in the Kwando river. Namibia. Norwegian Institute for Nature
research Tungasletta 2.No-7485.
48. Nagelkerke, L. AJ. (1997). The Barbus of Lake Tana, Ethiopia:
Morphological Diversity and its Implication for Taxonomy, Trophic
Resource Partitioning, and Fisheries. Thesis, Agricultural University,
Wageningen.
49. Nagelkerke, L. A J, Sibbing FA. (1998). The Barbus intermedius species
flock of Lake Tana (Ethiopia): I-The ecological and evolutionary
significance of morphological diversity. Ital J Zool 65 (supp.1.): 3-7.
50. Nagelkerke, L.A. J. and Sibbing, F. A. (2000). The large barbs (Barbus
spp., Cyprinidae, Teleostei) of Lake Tana (Ethiopia) with a description
of a new species, Barbus osseensis. Netherlands J. Zool. 50:179–214.
51. Nikolsky, G. V. (1963). The ecology of fish pp1-600. London. Academic,
Press
52. Paukert, C. and Coot, R.S.R., (2004).Factors affecting condition of
Flanmelmout Suckers in Colorado River, Grand Canyon, Arizona. North
American J. of Fish Management, 24:648-653
53. Ricker, W. E., (1975). Computation of interpretation of biological
statistics of fish population. Bull. Fish Board of Canada, 191: 382.
54. Roberts, T. R., (1975). Geographical distribution of the African fresh
water fish Zool. J. linn. Soc 57:241- 319.
55. Rodrique-Ruiz., A. and Granado, C. (1992). Spawning period and
migration of three species of cyprinids in a stream with Mediterranean
regimen (SW Spain).J. Fish Biol., 41: 545-556.
56. Sandovy, Y. and Shapiro, D.Y., (1978). Criteria for the diagnosis of
hermaphroditism in fishes. Copeia 1:136-156.
57. Seleshi Bekele, Awulachew; Yilma, A. D.; Loulseged, M.; Loiskandl,
W., Ayana, M.; Alamirew, T. (2007).Water Resources and Irrigation
Development in Ethiopia. Colombo, Sri Lanka: International Water
Management Institute.78p. (Working Paper 123).

Page | 52
58. Shibru Tedla (1973). Freshwater Fishes of Ethiopia. Department of
Biology. Haile Selassie I University, Addis Ababa, Ethiopia. 101pp.
59. Shibru Tedla and Fisseha H/Meskel (1981). Introduction and
transplantation of freshwater fish species in Ethiopia. SINET: Ethiop. J.
Sci. 4: 69-72.
60. Skelton, P.H., Tweddle, D. and Jackson. P. B. N. (1991). Cyprinids of
Africa, PP. 211–239, In: Winfields, J.J. and Nelson, J.S. (eds), Cyprinid
fishes, Systematic, biology and exploitation, Chapman and Hall, London,
667 pp.
61. Tesfaye Melake (2009). Diversity, Relative abundance and some biology
of fish in Baro and Tekeze basins. MSc. Thesis, Addis Ababa University.
62. Tesfaye Wudneh (1998). Biology and Management of fish stack in Bahir
Dar gulf, Lake Tana, Ethiopia, PhD Thesis, Wageningen institute of
Animal Science, Wageningen Agricultural University, The Netherlands.
63. Thieme, M. L. and Brown, A. (2007). Lake Tana. In: Fresh water
Ecoregions of Africa and Madagascar, pp 180 -181 (Thieme, M. L.,
Abell, R., Stiassny, M. L. J. and Skeleton, P., eds). Osland press, Covelo,
London, Washington.
64. Tomasson, T., Cambray, J. A., and Jackson, P.B.N. (1984). Reproductive
biology of four large riverine fishes (Cyprinidae) in a man-made lake,
Orange River, South Africa. Hydrobiologia 112: 179-195.
65. UNECA (2000). Transboundary River/ Lake Basin Water Development
in Africa: Prospect s, Problems, and Achievements.
66. Wassie Anteneh (2005). The spawning migration of Labeobarbus
(Cyprinidae: Teleostei) of Lake Tana to Dirma and Megech Rivers,
Ethiopia. M.Sc Thesis, Department of Biology, Addis Ababa University.
67. Wood, R. and Talling, J. 1988. Chemical and algal relationship in
salinity series of Ethiopian waters. Hydrobiologia 158:29-67.
68. WOOTTON, R. J. (1998). Ecology of Teleost Fishes. 2nd Edition.
Dordrecht Kulwer.
69. Yihun Dile (2009). Hydrological Modeling to Assess Climate Change
Impact at Gilgel Abay River, Lake Tana Basin Ethiopia.
70. Zafar, M., Mussaddeq, Y., Akhter, S. and Sultan, A. (2003). Weight-
length and condition factor relationship of Thaila, Catla catla from
Rawal Dam Islamabad, Pakistan. Pakistan Journal of Biological
Sciences, 6 (17): 1532–1534.
Page | 53
71. Zeleke Berie. 2007. Diversity, relative abundance and biology of fishes
in Beles and Gelgel Beles Rivers, Abay basin Ethiopia, MSc. Thesis,
Addis Ababa University, Ethiopia.
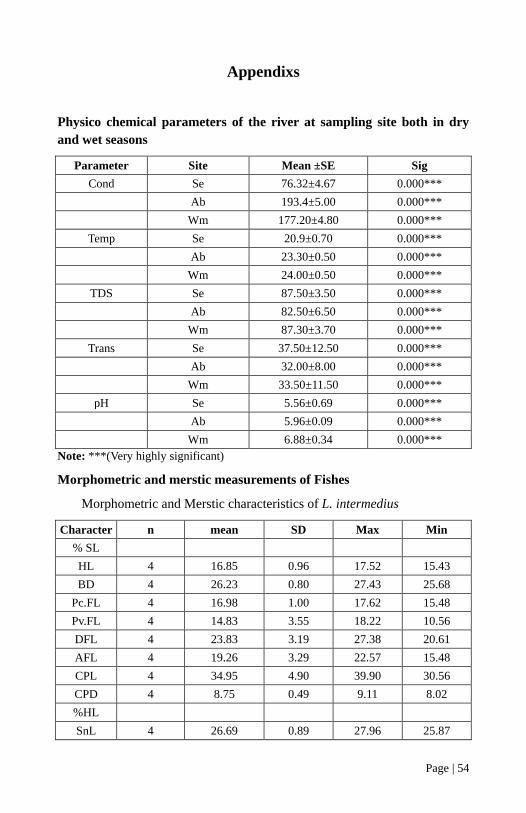
Page | 54
Appendixs
Physico chemical parameters of the river at sampling site both in dry
and wet seasons
Parameter Site Mean ±SE Sig
Cond Se 76.32±4.67 0.000***
Ab 193.4±5.00 0.000***
Wm 177.20±4.80 0.000***
Temp Se 20.9±0.70 0.000***
Ab 23.30±0.50 0.000***
Wm 24.00±0.50 0.000***
TDS Se 87.50±3.50 0.000***
Ab 82.50±6.50 0.000***
Wm 87.30±3.70 0.000***
Trans Se 37.50±12.50 0.000***
Ab 32.00±8.00 0.000***
Wm 33.50±11.50 0.000***
pH Se 5.56±0.69 0.000***
Ab 5.96±0.09 0.000***
Wm 6.88±0.34 0.000***
Note: ***(Very highly significant)
Morphometric and merstic measurements of Fishes
Morphometric and Merstic characteristics of L. intermedius
Character n mean SD Max Min
% SL
HL 4 16.85 0.96 17.52 15.43
BD 4 26.23 0.80 27.43 25.68
Pc.FL 4 16.98 1.00 17.62 15.48
Pv.FL 4 14.83 3.55 18.22 10.56
DFL 4 23.83 3.19 27.38 20.61
AFL 4 19.26 3.29 22.57 15.48
CPL 4 34.95 4.90 39.90 30.56
CPD 4 8.75 0.49 9.11 8.02
%HL
SnL 4 26.69 0.89 27.96 25.87

Page | 55
HD 4 71.96 4.26 75.39 66.12
ED 4 25.71 0.84 26.55 24.87
IOW 4 26.38 1.15 27.14 24.67
Merstic
DFR 4 9.75 0.5 10 9
CFR 4 20.75 0.5 21 20
LLS 4 32.25 1.71 34 30
Morphometric and merstic characteristics of L. forskalii
Character n mean SD Max Min
% SL
HL 4 20.79 1.92 23.3 18.93
BD 4 20.11 0.88 20.99 19.02
Pc.FL 4 22.43 0.82 23.26 21.4
Pv.FL 4 21.28 1.74 22.63 18.84
DFL 4 34.16 3.41 39.15 31.28
AFL 4 18.75 1.66 21.08 17.28
CPL 4 11.15 1.02 11.79 9.63
CPD 4 38.08 4.48 43.05 32.56
%HL
SnL 4 48.65 5.72 54.55 41.12
HD 4 72.3 8.83 79.55 60.28
ED 4 16.36 3.61 20.45 11.98
IOW 4 45.93 3.66 50 41.9
Merstic 4
DFR 4 11.5 0.58 12 11
CFR 4 20 1.41 21 18
LLS 4 41.25 0.5 42 41
Morphometric and merstic characteristics of L. nedgia
Character n mean SD Max Min
% SL
HL 4 18.22 1.86 20.62 16.09
BD 4 21.92 0.85 22.76 21.08
Pc.FL 4 19.43 3.69 22.17 13.98
Pv.FL 4 17.12 3.02 20.83 13.80
DFL 4 23.32 3.72 26.21 18.37
AFL 4 18.45 3.28 20.94 13.89
CPL 4 9.18 0.76 10.52 9.12

Page | 56
CPD 4 31.53 0.20 31.72 31.34
%HL
SnL 4 28.52 4.08 34.63 26.18
HD 4 60.98 11.37 74.45 51.5
ED 4 26.15 4.29 32.36 22.5
IOW 4 28.44 3.91 34.30 26.43
Merstic 4
DFR 4 10.5 0.58 11 10
CFR 4 20.75 1.5 22 19
LLS 4 31.5 1.29 33 30
Morphometric and merstic characteristics of M. kannume
Character n mean SD Max Min
% SL
HL 6 23.81 1.09 25.69 22.81
BD 6 21.96 1.12 23.41 20.72
Pc.FL 6 16.42 1.76 17.96 13.06
Pv.FL 6 11.46 0.27 11.83 11.15
DFL 6 48.27 2.46 51.70 45.36
AFL 6 16.68 2.09 19.46 13.66
CPD 6 6.36 0.42 6.81 5.71
CPL 6 10.35 0.99 11.45 8.67
%HL
SnL 6 27.27 3.80 33.93 22.89
HD 6 46.88 5.34 55.36 40.96
ED 6 16.98 1.82 19.67 14.46
IOW 6 27.24 1.66 28.57 24.09
Merstic
DFR 6 54 2.68 59 51
CFR 6 22.5 0.55 23 22
LLS 6 - - - -
Morphometric and merstic characteristics of B. docmak
Character n mean SD Max Min
% SL
HL 4 23.76 1.25 25.1 22.4
BD 4 21.81 3.33 26.33 18.9
P.F.L 4 14.9 1.89 16.73 13.21
Pe.FL 4 15.21 2.05 17.11 13.31
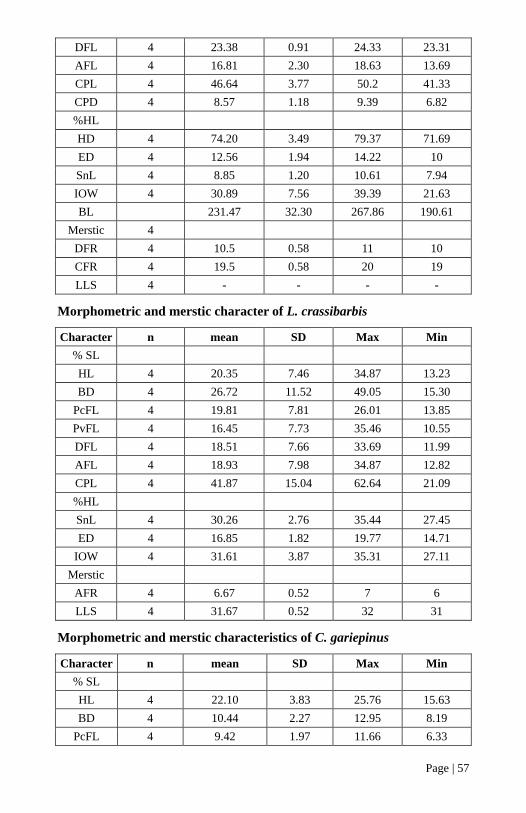
Page | 57
DFL 4 23.38 0.91 24.33 23.31
AFL 4 16.81 2.30 18.63 13.69
CPL 4 46.64 3.77 50.2 41.33
CPD 4 8.57 1.18 9.39 6.82
%HL
HD 4 74.20 3.49 79.37 71.69
ED 4 12.56 1.94 14.22 10
SnL 4 8.85 1.20 10.61 7.94
IOW 4 30.89 7.56 39.39 21.63
BL 231.47 32.30 267.86 190.61
Merstic 4
DFR 4 10.5 0.58 11 10
CFR 4 19.5 0.58 20 19
LLS 4 - - - -
Morphometric and merstic character of L. crassibarbis
Character n mean SD Max Min
% SL
HL 4 20.35 7.46 34.87 13.23
BD 4 26.72 11.52 49.05 15.30
PcFL 4 19.81 7.81 26.01 13.85
PvFL 4 16.45 7.73 35.46 10.55
DFL 4 18.51 7.66 33.69 11.99
AFL 4 18.93 7.98 34.87 12.82
CPL 4 41.87 15.04 62.64 21.09
%HL
SnL 4 30.26 2.76 35.44 27.45
ED 4 16.85 1.82 19.77 14.71
IOW 4 31.61 3.87 35.31 27.11
Merstic
AFR 4 6.67 0.52 7 6
LLS 4 31.67 0.52 32 31
Morphometric and merstic characteristics of C. gariepinus
Character n mean SD Max Min
% SL
HL 4 22.10 3.83 25.76 15.63
BD 4 10.44 2.27 12.95 8.19
PcFL 4 9.42 1.97 11.66 6.33

Page | 58
PvFL 4 7.28 1.53 8.63 4.65
DFL 4 47.33 8.16 55.98 35.53
AFL 4 34.02 5.61 41.28 26.42
CPL 4 3.15 0.13 3.3 3.04
CPD 4 6.95 1.02 7.69 5.22
%HL
SnL 4 5.54 2.22 8.89 3.23
ED 4 5.13 0.70 6.02 4.44
IOW 4 30.83 0.83 31.92 30.00
Merstic
DFR 4 - - - -
CFR 4 - - - -
LLS 4 - - - -
Morphometric and Merstic characteristics of O. niloticus
Character n mean SD Max Min
% SL
HL 4 28.95 1.73 31.11 26.99
BD 4 38.19 1.44 43.56 34.97
PcFL 4 31.19 2.26 34.25 28
PvFL 4 22.88 1.67 25.56 21.33
DFL 4 58.24 4.19 64.42 54.63
AFL 4 26.01 1.65 28.63 24.54
%HL
SnL 4 17.10 2.86 20.83 12.96
ED 4 20.79 3.52 24.07 16.37
IOW 4 36.80 3.69 41.67 32.74
Merstic
ARF 4 10.8 0.45 11 10
LLS 4 30.8 4.09 14
Questionnaires
Date __________
Name of respondent ___________
1. Age of respondent _________
2. Sex _____________
3. Educational Background.
A. Basic

Page | 59
B. Elementary
C. Secondary
D. above
4. Marital status_________
A. Single
B. Married
5. Total number of family___________?
6. Income per month in ET. Birr _____________?
7. What is your Source of Income?
A. Animal farming
B. Crop farming
C. Mixed farming
D. Fishing
E. All
F. Other___________.
8. Do you engage fishing activity?
A. Yes
B. No
9. If your answer is yes for Q.7. Where do you fish?
A. River
B. Pond
C. Lake
D. other_________.
10. When do you actively involved in fishing (within a day)?
A. Morning
B. Midday
C. Late day
D. Night
E. Other__________.
11. When did you start fishing__________?
12. What type of fishing gear you use?

Page | 60
A. Gillnet
B. Hook and line
C. Castanet
D. Other__________
13. How much the mesh size you use for fishing__________?
14. What types of fish you fish? ____________
15. How many days do you fish per month____________?
16. How many kg of fish you catch per week__________?
17. Which type of fish you prefer to eat____________?
Why_________
18. Which type of fish consumers prefer to buy__________?
Why__________
19. When do you fish more fish within a year___________?
Which type of fish___________?
20. Do you use prevention methods of fish spoilage?
A. Yes
B. No
21. If your answer is yes, what type of prevention method you
use__________?
22. How much the Price of each fish that you fish__________?
23. How is trend of the price?
A. Increasing
B. Decreasing
C. Constant
24. How much is income generated from fishing_________?
25. What are the major changes occurred in fishery__________?
26. What are the major problems to stay in this business_________?
27. Do you know the type of fish that has become extinct in this area?
A. Yes
B. No
28. If your answer yes for Q.28 which type of fish are extinct?